Embed Size (px)
Citation preview
Publisher’s version / Version de l'éditeur:
Contact us / Contactez nous: [email protected].
http://nparc.cisti-icist.nrc-cnrc.gc.ca/npsi/jsp/nparc_cp.jsp?lang=fr
L’accès à ce site Web et l’utilisation de son contenu sont assujettis aux conditions présentées dans le site
LISEZ CES CONDITIONS ATTENTIVEMENT AVANT D’UTILISER CE SITE WEB.
READ THESE TERMS AND CONDITIONS CAREFULLY BEFORE USING THIS WEBSITE.
NRC Publications Record / Notice d'Archives des publications de CNRC:http://nparc.cisti-icist.nrc-cnrc.gc.ca/npsi/ctrl?action=rtdoc&an=14806199&lang=en
http://nparc.cisti-icist.nrc-cnrc.gc.ca/npsi/ctrl?action=rtdoc&an=14806199&lang=fr
Access and use of this website and the material on it are subject to the Terms and Conditions set forth at
http://nparc.cisti-icist.nrc-cnrc.gc.ca/npsi/jsp/nparc_cp.jsp?lang=en
NRC Publications Archive
Archives des publications du CNRC
This publication could be one of several versions: author’s original, accepted manuscript or the publisher’s version. / La version de cette publication peut être l’une des suivantes : la version prépublication de l’auteur, la version acceptée du manuscrit ou la version de l’éditeur.
For the publisher’s version, please access the DOI link below./ Pour consulter la version de l’éditeur, utilisez le lien DOI ci-dessous.
http://dx.doi.org/10.1016/j.jssc.2008.11.008
Journal of Solid State Chemistry, 182, pp. 442-450, 2009
Lanthanum Pyrochlores and the Effect of Yttrium Addition in the
Systems La2-xYxZR2O7 and La2-xYxHf2O7Whittle, Karl R.; Cranswick, Lachlan M.D.; Redfern, Simon A.T.; Swainson, Ian P.; Lumpkin, Gregory R.

Author's personal copy
Lanthanum pyrochlores and the effect of yttrium addition in the systems
La2!xYxZr2O7 and La2!xYxHf2O7
Karl R. Whittle a,b,!, Lachlan M.D. Cranswick c, Simon A.T. Redfern b, Ian P. Swainson c,Gregory R. Lumpkin a,b
a Institute of Materials Engineering, Australian Nuclear Science and Technology Organisation, PMB 1, Menai, NSW 2234, Australiab Department of Earth Sciences, University of Cambridge, Downing Street, Cambridge, CB2 3EQ, UKc Neutron Program for Materials Research, Chalk River Laboratories, Chalk River, Ontario, Canada K0J 1J0
a r t i c l e i n f o
Article history:
Received 31 August 2008
Received in revised form
12 November 2008
Accepted 13 November 2008Available online 21 November 2008
Keywords:
Pyrochlore
Fluorite
Ordered defect fluorite
a b s t r a c t
The crystal structures of the compounds La2!xYxZr2O7 and La2!xYxHf2O7 with x ¼ 0.0, 0.4, 0.8, 1.2, 1.6,
and 2.0 have been studied using neutron powder diffraction and electron microscopy to determine the
stability fields of the pyrochlore and fluorite solid solutions. The limits of pyrochlore stability in these
solid solutions are found to be close to La0.8Y1.2Zr2O7 and La0.4Y1.6Hf2O7, respectively. In both systems
the unit cell parameter is found to vary linearly with Y content across those compositions where the
pyrochlore phase is stable, as does the x-coordinate of the oxygen atoms on the 48f (x,38,38) sites. In both
systems, linear extrapolations of the pyrochlore data suggest that the disordering is accompanied by a
small decrease in the lattice parameter of approximately 0.4%. After the pyrochlore solid solution limit is
reached, a sharp change is observed from x#0.41 to 0.375 as the disordered defect fluorite structure is
favoured. Electron diffraction patterns illustrate that some short-range order remains in the disordered
defect fluorite phases.
& 2008 Elsevier Inc. All rights reserved.
1. Introduction
The pyrochlore structure type has great many uses, examples
of which include magnetic materials [1,2], oxide fast ion
conductors [3–6], and matrices for immobilisation of highly
active radionuclides from nuclear wastes [7–10]. The last two
applications are currently of major interest, as in both cases
pyrochlores are capable of overcoming many technological
problems, whilst remaining cost effective. The ideal pyrochlore
structure type [11,12], A2B2X6Z, is a superstructure of the fluorite
(MX2) structure, and is based upon a 2$2$2 super cell with Fd
3m symmetry, while that of the parent fluorite is Fm3m. A
schematic of the crystal structure is shown in Fig. 1, along with a
comparison of the fluorite equivalent.
The cation superstructure of pyrochlore is based upon ordering
of A and B cations parallel to the /110S directions, separated by
(121212), with respect to the origin. Using Wyckoff notation, for origin
choice 2 and placing A at the origin, these are located on the 16c
(000) and 16d (121212) atomic positions, respectively, both having 3m
site symmetry. The A cation adopts a distorted cubic coordination
with oxygen, while B is octahedrally coordinated. There are three
crystallographically distinct anion sites in the pyrochlore lattice,
two of these are the occupied X and Z sites on 48f (x1818) and 8a
(181818), respectively. The third site is on 8b (38
3838) and is normally
vacant. This 48f site has site symmetry of 2mm, whereas 8a and 8b
have site symmetry of 43m. The vacancy on 8b allows the adjacent
O2! anions on 48f to relax and change position from x ¼ 0.375 in
the ideal fluorite structure to x#0.419 in the example of La2Zr2O7.
Ordered pyrochlore is favoured when the radius ratio (rA/rB)
[13] of the cations lies within the range 1.46–1.78 (e.g., La2Zr2O7,
rA/rB ¼ 1.61). However, if the radius ratio is higher than 1.78, then
a monoclinic layered perovskite type structure is often formed
(e.g., La2Ti2O7, rA/rB ¼ 1.92) [14]. Conversely, when the ratio is less
than 1.46, a defect fluorite structure is favoured (e.g., Y2Zr2O7,
rA/rB ¼ 1.42). In certain nominal pyrochlore solid solutions
involving a significant decrease in rA/rB, an increase in cation
disorder is observed and accompanied by anion disorder as the
vacant 8b site becomes progressively occupied by partial removal
of oxygen from the 48f and 8a sites. With increasing disorder,
the x-coordinate of the 48f site changes towards the fluorite
position, 0.375. Coupled with the observation that the total
O2! content remains constant, it is possible to describe fluorite
using the pyrochlore structure, but with 78 occupancy across all
three O2! sites.
The use of a pyrochlore to immobilise actinide elements has
long been studied and compositions have been postulated as
‘ideal’. However, the recoil from alpha-decay places strain on the
ARTICLE IN PRESS
Contents lists available at ScienceDirect
journal homepage: www.elsevier.com/locate/jssc
Journal of Solid State Chemistry
0022-4596/$ - see front matter & 2008 Elsevier Inc. All rights reserved.
doi:10.1016/j.jssc.2008.11.008
! Corresponding author at: Institute of Materials Engineering, Australian Nuclear
Science and Technology Organisation, PMB 1, Menai, NSW 2234, Australia.
E-mail address: [email protected] (K.R. Whittle).
Journal of Solid State Chemistry 182 (2009) 442–450

Author's personal copy
lattice, which in some compositions causes the structure to
become amorphous, while others are radiation tolerant [15–18].
The objective of this work is to study systematic yttrium addition
on the La2Hf2O7, and La2Zr2O7 systems. As most trivalent actinide
elements proposed as being immobilised in pyrochlore structures
give rise to a cationic radius (rA/rB) ratio less than 1.48, it is
important to examine the effect of such fluorite drivers on the
stability of pyrochlore. Since Y3+ gives rise to a ratio less than 1.48,
the results for this work will aid both simulations and ion-beam
work [19] on similar systems.
2. Experimental procedures
2.1. Sample preparation
Samples based on La2!xYxZr2O7 and La2!xYxHf2O7 with x ¼ 0.4,
0.8, 1.2, 1.6, and 2.0 were prepared by the calcination of metal
oxides. Stoichiometric amounts of La2O3 (Aldrich, 99.5%), Y2O3
(Aldrich, 99%), ZrO2 (Aldrich, 99.5%) and HfO2 (Alfa-Aesar, 99%)
were used. The powders were pre-fired at 850 1C and then
intimately mixed in acetone using a ball-mill and dried. Once
dried the powders were heated as pellets at 1500 1C for 7 days,
reground to a fine powder, sufficient to pass through a 38mm
sieve, and reformed into pellets prior to a further heating at
1600 1C for 7 days. Portions of these sintered samples were ground
to a fine powder, again sufficient to pass through a 38mm sieve
and used for diffraction analysis.
2.2. Electron microscopy and microanalysis
Samples were checked for purity by scanning electron
microscopy and microanalysis (SEM–EDX) using a JEOL 6400
operating at 15kV. Microanalyses were obtained using a Noran
Voyager energy dispersive spectrometer attached to this micro-
scope. The instrument was operated in standardless mode;
however, the sensitivity factors were calibrated for semi-
quantitative analysis using a range of synthetic and natural
standard materials. Spectra were usually acquired for 500 seconds
and reduced to weight percent oxides using a digital top hat filter
to suppress the background, a library of reference spectra for
multiple least squares peak fitting and full matrix corrections.
Selected samples were additionally analysed using transmis-
sion electron microscopy and microanalysis (TEM–EDX). TEM
samples were prepared by crushing small fragments in methanol
and collecting the suspension on holey carbon coated copper
grids. Samples were using a JEOL 2000FXII TEM operated at
200 kV and calibrated for selected area diffraction over a range of
objective lens currents using a gold film standard. The composi-
tions of the grains were checked by EDX analysis using a Link ISIS
energy dispersive spectrometer attached to the TEM. The k-factors
required for the quantitative thin film analyses were determined
from a range of synthetic and natural standard materials. Spectra
were usually acquired for 600 seconds and processed using a
digital top hat filter to suppress the background, a library of
reference spectra for multiple least squares peak fitting, and a
Cliff–Lorimer ratio procedure to reduce the data to weight percent
oxides (details are given in Lumpkin et al. [20]).
2.3. Neutron diffraction
Neutron diffraction was used to obtain information on both
cations and anion locations in these materials as is more accurate
in the determination of oxygen parameters in the presence of
heavier metal atoms than X-ray diffraction. Constant wavelength
neutron diffraction patterns were collected, from densely packed
powder in thin-walled cylindrical vanadium cans, using the
C2-DualSpec diffractometer at the Chalk River National Labora-
tory, Canada, operating at an incident wavelength of 1.3283 A
(determined using an Al2O3 standard). Diffraction patterns
were collected over the angular range 51–1201 2y, with an angular
resolution of 0.11, corresponding to a d-spacing range of
0.767–15.226 A, and at a temperature of 298K. The set of
instrumental and structural parameters refined were an overall
ARTICLE IN PRESS
Fig. 1. Images of the crystal structures of fluorite (left) and pyrochlore (right). Projected along the [100] direction. The large red spheres are oxygen, the green (La/Y) and
blue (Zr/Hf) smaller spheres are the cations. Small black spheres indicate the unoccupied 8b position. The fluorite cell has been generated using the pyrochlore structure
with x ¼ 0.375 hence the appearance of a larger unit cell.
K.R. Whittle et al. / Journal of Solid State Chemistry 182 (2009) 442–450 443

Author's personal copy
scale factor, lattice parameters, a background function (Chebyschev
polynomial), the widths of the Gaussian and Lorentzian compo-
nents of the reflection line shape function, the x-coordinate of the
O(1) atom on the 48f site, and isotropic displacement parameters
for each site. Absorption correction parameters for cylindrical
samples were calculated from the masses and volumes of samples
loaded and not refined. The attenuation corrections applied were
those calculated using standard practices. Structure refinement
was by the Rietveld method [21] using the GSAS [22] suite of
software with the additional EXPGUI toolkit [23]. The fit index
values for determining the quality of fit were Rp and wRp [22]. The
compositions used in the Rietveld refinement of each phase were
based on those from the electron microanalysis, with the overall
scale of each phase being refined.
ARTICLE IN PRESS
Fig. 2. Backscattered electron (BSE) images from La2!xYxZr2O7 showing the various phases in each sample. The sub-images are: (a) x ¼ 0.0, (b) x ¼ 0.4, (c) x ¼ 0.8,
(d) x ¼ 1.2, (e) x ¼ 1.6, and (f) x ¼ 2.0. As can be seen in (d) the mixture seems to be two phase, while (c) and (e) are two phase with a smaller amount of the secondary phase.
K.R. Whittle et al. / Journal of Solid State Chemistry 182 (2009) 442–450444
Author's personal copy
3. Results
3.1. Microstructure and chemistry
SEM observations revealed that the materials are reasonably
sintered given the refractory nature of the compositions. Back-
scattered electron images (see Fig. 2) of samples in the
La2!xYxZr2O7 series reveal that the products are single phase up
to the nominal composition with x ¼ 0.8 Y atoms per formula
unit; however, this sample only contains 1–2% of the defect
fluorite phase. The sample with nominal x ¼ 1.2 contains roughly
equal proportions of pyrochlore and defect fluorite. We also
observed about 1–2% of the pyrochlore phase in the sample with
x ¼ 1.6, suggesting that the limit of defect fluorite solubility is
ARTICLE IN PRESS
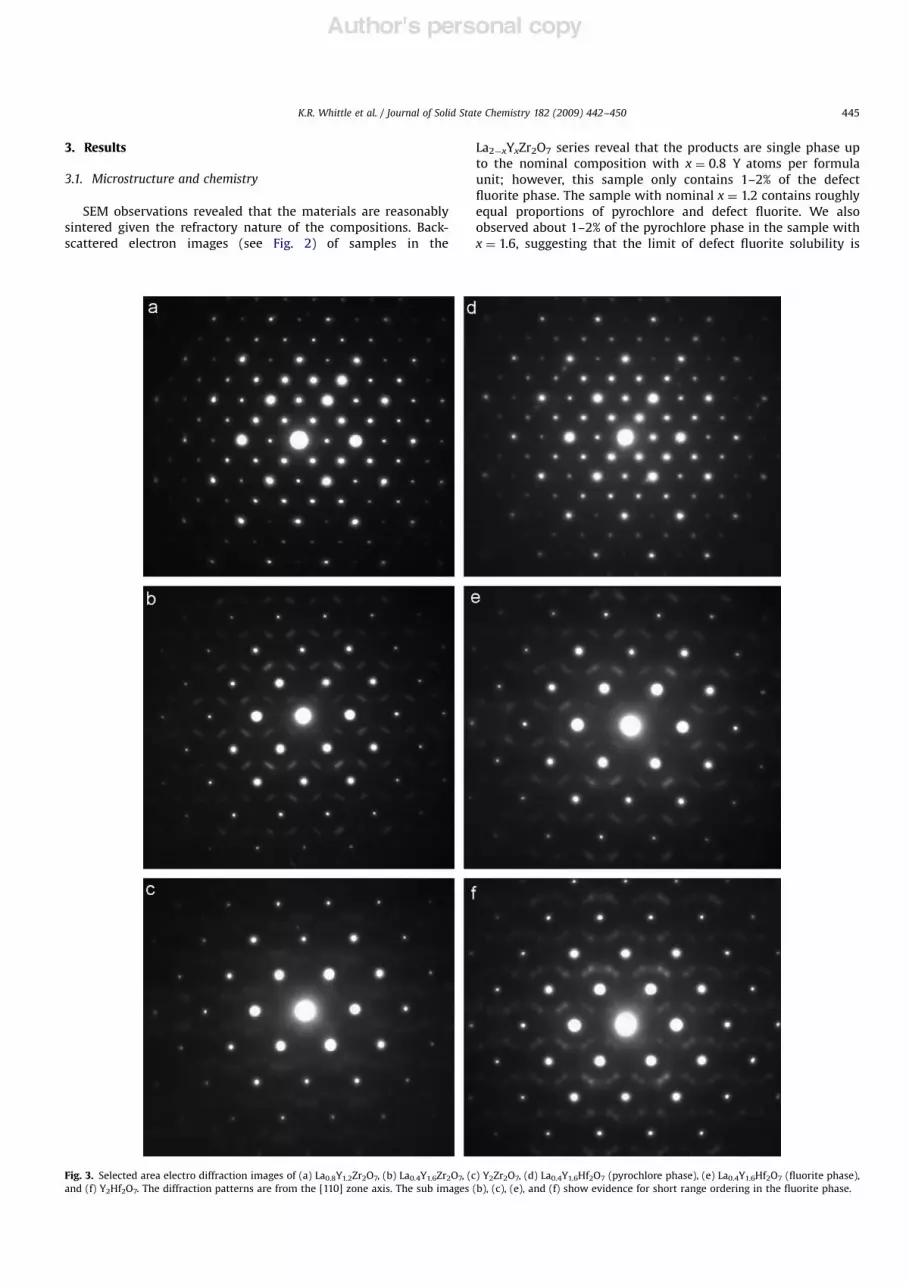
Fig. 3. Selected area electro diffraction images of (a) La0.8Y1.2Zr2O7, (b) La0.4Y1.6Zr2O7, (c) Y2Zr2O7, (d) La0.4Y1.6Hf2O7 (pyrochlore phase), (e) La0.4Y1.6Hf2O7 (fluorite phase),
and (f) Y2Hf2O7. The diffraction patterns are from the [110] zone axis. The sub images (b), (c), (e), and (f) show evidence for short range ordering in the fluorite phase.
K.R. Whittle et al. / Journal of Solid State Chemistry 182 (2009) 442–450 445
Author's personal copy
close to x#1.61 in this system. Due to the fine grain structure and
limited resolution of our SEM, we did not observe the two-phase
region in images of the La2!xYxHf2O7 samples; however, electron
diffraction work clearly shows the presence of a two-phase region
in the sample with x ¼ 1.6.
Elemental analysis by SEM–EDX analyses confirmed that all of
the single-phase pyrochlore samples in both series and the two Y
end-member defect fluorite samples are very close to the nominal
compositions (generally within 70.02–0.03 atoms per formula
unit). However, we encountered difficulty in obtaining good
quality analyses in the two-phase region due to the small grain
size and resulting X-ray generation from surrounding grains. In
the La0.8Y1.2Zr2O7 sample the estimated compositions of the
coexisting pyrochlore and defect fluorite phases are approxi-
mately x ¼ 0.8 and 1.7 Y atoms per formula unit, respectively.
More reliable TEM–EDX analyses give compositions of x ¼ 0.9 for
the pyrochlore phase and x ¼ 1.6 for the defect fluorite phase in
this sample. No reliable SEM–EDX analyses were obtained in the
two-phase region of the Hf samples due to the grain size, thus we
rely solely on the TEM–EDX data which put the compositions of
the coexisting pyrochlore and defect fluorite phases at close to
x ¼ 1.5 and 1.9, respectively, in the La0.4Y1.6Hf2O7 sample.
We also recorded the selected area diffraction (SAED) patterns
of the pyrochlore and defect fluorite phases in both of the primary
two-phase samples noted above and the two Y end-members.
These were taken in the [110] zone axis orientation and
representative patterns are illustrated in Fig. 3. In both samples,
the pyrochlore phase exhibits the classical pattern of sharp and
distinct pyrochlore superlattice diffraction intensities with some-
what stronger fluorite subcell intensities (Figs. 3a and d). We did
not observe evidence for structured diffuse scattering of the
cristobalite type, represented by {110}* sheets of diffuse intensity,
as found by Tabira et al. [24] in quenched samples of La2Zr2O7. In
La0.8Y1.2Zr2O7, La0.4Y1.6Hf2O7, and Y2Hf2O7, we observe strong
diffracted intensity characteristic of the fluorite subcell and
diffuse scattering that appears to be split into a pair of nodes
lying on either side of the GF712/111S* regions of reciprocal space
(Figs. 3b, e, and f). These pairs of nodes are actually sections
through rings of diffuse intensity oriented normal to the /111S*
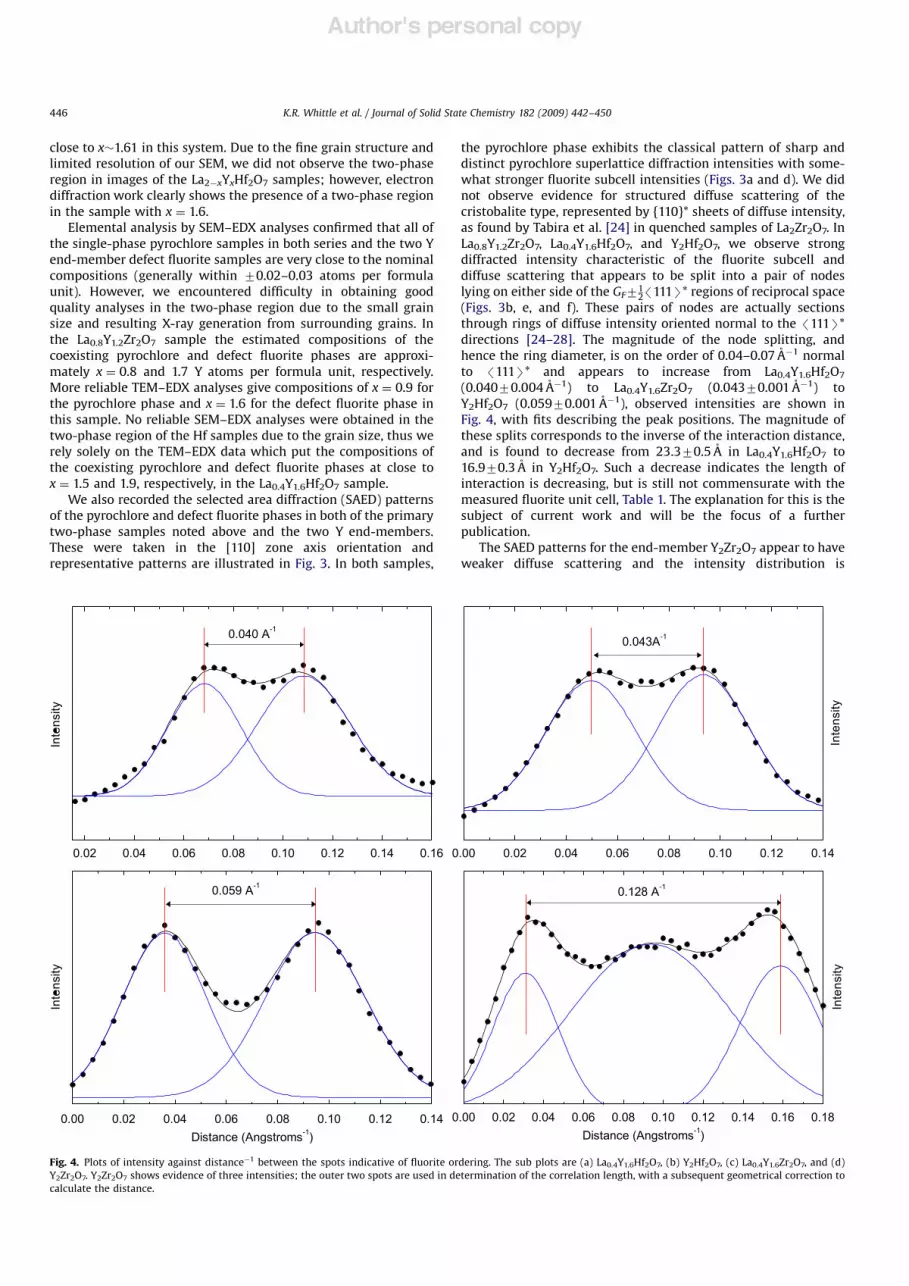
directions [24–28]. The magnitude of the node splitting, and
hence the ring diameter, is on the order of 0.04–0.07 A!1 normal
to /111S* and appears to increase from La0.4Y1.6Hf2O7
(0.04070.004 A!1) to La0.4Y1.6Zr2O7 (0.04370.001 A!1) to
Y2Hf2O7 (0.05970.001 A!1), observed intensities are shown in
Fig. 4, with fits describing the peak positions. The magnitude of
these splits corresponds to the inverse of the interaction distance,
and is found to decrease from 23.370.5 A in La0.4Y1.6Hf2O7 to
16.970.3 A in Y2Hf2O7. Such a decrease indicates the length of
interaction is decreasing, but is still not commensurate with the
measured fluorite unit cell, Table 1. The explanation for this is the
subject of current work and will be the focus of a further
publication.
The SAED patterns for the end-member Y2Zr2O7 appear to have
weaker diffuse scattering and the intensity distribution is
ARTICLE IN PRESS
Fig. 4. Plots of intensity against distance!1 between the spots indicative of fluorite ordering. The sub plots are (a) La0.4Y1.6Hf2O7, (b) Y2Hf2O7, (c) La0.4Y1.6Zr2O7, and (d)
Y2Zr2O7. Y2Zr2O7 shows evidence of three intensities; the outer two spots are used in determination of the correlation length, with a subsequent geometrical correction to
calculate the distance.
K.R. Whittle et al. / Journal of Solid State Chemistry 182 (2009) 442–450446

Author's personal copy
different to that of the other samples (Fig. 3e). This material still
shows the GF71
2/111S* type splitting in the [110] zone axis;
however, the magnitude of the splitting of the nodes is greater and
there exists a diffuse scattering distribution between the nodes
oriented normal to the /110S* directions in reciprocal space. This
scattering distribution appears to be due in part to a third node of
the type GF7(14+x)/220S* located between the other two nodes.
The modulation features in this composition result in a pattern of
diffuse triplets extending parallel to /001S* with a characteristic
offset normal to the /110S* direction of the defect fluorite lattice.
Analysis of these peaks gives a distance of 0.09070.001 A!1,
which gives a correlation distance of 11.170.2 A, which is smaller
than that observed for La0.4Y1.6Zr2O7. As a final observation, none
of the defect fluorite SAEDs showed evidence for scattering at the
GF7/100S* regions of reciprocal space. Similar results have been
seen with other defect fluorite systems, e.g. Y2O3–Nb2O5 [29].
3.2. Neutron diffraction
The results from the Rietveld refinements are shown in Table 1,
where we report the lattice parameter, x-coordinate of the 48f
position, the refined weight fractions of the coexisting pyrochlore
and defect fluorite phases, and the crystallographic Rp and WRpfactors. In the La2!xYxZr2O7 solid solution series we found the
samples to be single-phase pyrochlore for x ¼ 0.0–0.8. For the
sample with x ¼ 1.2, the refinements gave 58 wt% pyrochlore and
42 wt% defect fluorite. This distribution agrees with the relative
proportions found by SEM analysis using back-scattered electrons,
Fig. 2(d). No second phase was found in the sample with x ¼ 1.6.
There is a minor discrepancy between the diffraction and electron
microscopy data for the samples with x ¼ 0.8 and 1.6, where we
found about 1–2% defect fluorite by SEM imaging. It is not
unreasonable to have missed this small amount of second phase
as it is within 2–3 standard deviations of the typical error in the
Rietveld phase analysis procedure. The lattice parameters
(doubled for the defect fluorite) are shown in Fig. 5 plotted
against the nominal sample compositions. The diagonal lines
show the trends in the single-phase fields, and are fitted using a
linear equation. The pyrochlore line, extrapolated into the defect
fluorite field, indicates that the lattice parameter is higher that the
equivalent defect fluorite by about 0.04 A. The horizontal lines,
drawn through the points in the main two-phase field, indicate
that the compositions of the coexisting pyrochlore and defect
fluorite phases are approximately La1.1Y0.9 Zr2O7 and La0.36Y1.64
Zr2O7, respectively.
In the La2!xYxHf2O7 series the samples with x ¼ 0.0–0.8 were
also found to be single-phase pyrochlore with no detectable
secondary phase. The next sample in the series based on the
composition La0.8Y1.2Hf2O7 was found by neutron diffraction to
contain a small amount of the defect fluorite phase (#2%), but
only showed the (111) reflection, just enough for determination of
the unit cell parameter and an estimate of phase fraction. The
ability of neutron diffraction to see such a small amount of phase
is due, in this case, to both samples being cubic, but with a
significant difference in lattice parameter for the peaks to be
separated. This is not always the case, particularly where the
phases are non-cubic and have overlapping peaks. For the
sample with x ¼ 1.6, the refinements gave 57 wt% pyrochlore
and 43 wt% defect fluorite. This was the only composition that
showed two phases in appreciable amounts. In both systems, the
linear decrease in lattice parameter for the pyrochlore
phase is found to agree with Vegard’s law for cubic systems and
is directly related to the change in average ionic radius
from La3+(1.16 A) to Y3+ (1.019 A). This agrees with previously
published results based on lattice simulations of disordered
pyrochlores [30–34].
The change in the value of the x-coordinate of the 48f position
as a function of increasing Y content is more complex and is
illustrated for both systems in Fig. 6. In both cases, excluding the
data points in the principal two-phase regions, the variation of the
x-coordinate of the pyrochlore phase appears to be non-linear
with composition. This change is found to adopt a similar
quadratic profile as reported by Heremans et al. [35] for the
Y2Ti2!xZr2O7 system. Both data points representing the pyrochlore
phases in their respective two-phase regions can be interpreted in
a similar fashion to the lattice parameters. Thus, the intersection
of the horizontal lines with the curves shown in Fig. 6 gives the
compositions of the pyrochlore phases. In this case, we find that
the data provide estimates of x ¼ 0.86 for the Zr sample and
x ¼ 1.47 for the Hf sample.
Using similar procedures for refinement previously suggested
by Wuensch et al. [36], it is possible to obtain the degree of
anionic disorder independently of cation disorder. This technique
was only possible in those samples where the pyrochlore phase
was dominant, in some cases the degree of overlap between the
ARTICLE IN PRESS
Table 1
Results obtained from the Rietveld refinements.
Ideal system A (A) 48f Wt Frac wRp Rp
La2Hf2O7 10.7728(3) 0.4202(2) 1 0.0519 0.0387
La1.6Y0.4Hf2O7 10.7212(3) 0.4185(2) 1 0.0505 0.0383
La1.2Y0 .8Hf2O7 10.6460(3) 0.4166(2) 1 0.0488 0.0358
La0.8Y1.2Hf2O7 10.5718(3) 0.4124(2) 0.98(1) 0.0492 0.0373
5.1955(1) 0.02(1)
La0.4Y1.6Hf2O7 10.5148(5) 0.4093(37) 0.57(1) 0.0518 0.0401
5.2116(3) 0.43(1)
Y2Hf2O7 5.1958(2) 1 0.0696 0.0528
La2Zr2O7 10.8076(5) 0.4189(2) 1 0.0732 0.044
La1.6Y0.4Zr2O7 10.7484(4) 0.4174(2) 1 0.0685 0.044
La1.2Y0.8Zr2O7 10.6714(4) 0.4140(2) 1 0.0674 0.0443
La0.8Y1.2Zr2O7 10.6572(5) 0.4134(3) 0.58(1) 0.0605 0.0428
5.2428(3) 0.42(1)
La0.4Y1.6Zr2O7 5.2469(2) 1 0.0548 0.0379
Y2Zr2O7 5.2105(2) 1 0.0486 0.0332
The values shown are the unit cell size, x in 48f, phase fractions were appropiate
and the wRp and Rp values [22].The errors quoted are those presented by GSAS, and
are shown as the error in the last digit. The systems where no 48f-x position is
quoted are the observed fluorite phase.
Fig. 5. Plot of lattice parameter against composition in La2!xYxZr2O7. The values for
the fluorite unit cell have been doubled to be consistent with the pyrochlore
lattice. The linear fits to the points have been extended showing the estimated size
based on pyrochlore and fluorite ordering. The hatched region indicates the
expected two-phase region; see Harvey et al. [43].
K.R. Whittle et al. / Journal of Solid State Chemistry 182 (2009) 442–450 447

Author's personal copy
pyrochlore and fluorite phases prevented those peaks under
refinement from being isolated sufficiently. In those samples
where the diffraction data showed a single phase, the ‘ideal’
composition was used. The anionic disorder was found to start at
x ¼ 0.4 in the La2!xYxZr2O7 series and at x ¼ 0.8 in the
La2!xYxHf2O7 series. In both of the pyrochlore solid solutions we
found the refined 8b site occupancy is nearly the same and
reaches a level of #0.15–0.17, representing approximately 15–20%
disorder at the beginning of the two-phase regions. As expected
the degree of disorder is directly linked to the observed
x-coordinate of the 48f position, in that when disorder begins
the oxygen atoms on the 48f sites start to relax towards an
x-coordinate of 0.375, the value for the defect fluorite structure.
The relaxation is greater in the Hf pyrochlores because the two-
phase field begins at a much higher Y content (see Tables 1 and 2).
As expected, the relationship between the x anion coordinate and
the degree of disorder is effectively linear.
4. Comparison with predicted values
If both sets of samples are compared with the predicted values
for unit-cell sizes, based on statistical analysis of published data,
from Chakoumakos [11], Eq. (1) presented in Table 3 and Fig. 7,
there is close agreement in samples which show pyrochlore as the
predominant phase:
a ¼ 1:914RA þ 2:91RB þ 6:422 (1)
However, once cationic/anionic disorder happens, the agree-
ment is not so good. The deviation from Eq. (1) is primarily down
to the assumptions used in the original generation and the ionic
radii used. The ionic radius of an element is determined by both
it’s charge and coordination, for example Hf4+ has an ionic radius
of 0.71 A in six-fold coordination [37,38], while in eight-fold
coordination it is 0.83 A, thus with any cation disorder, the values
should disagree. Even though Eq. (1) does not agree with the
refined data once disorder begins, it is still a valid tool in the
prediction of unit-cell sizes for A2B2O7 pyrochlores. The equation
allows model parameters to be used in the structural possibilities
for actinide containing pyrochlores.
5. Bond valence analysis
Bond valence analysis is a method that is routinely used for
predicting bond lengths in unknown structures. However, it also
provides a semi-empirical check on measured structures, and has
been applied to these samples. The results obtained from this
analysis are reported in Table 4. The calculated values for the bond
valence sums, Sij, to the A and B sites indicate that the deformation
from the ideal pyrochlore structure is consistent with the effect of
Y on the structure, i.e., the structure becomes more fluorite-like as
the Y content is increased. The values of Sij tend to remain around
ARTICLE IN PRESS
Table 2
The values obtained from anion site mixing.
Ideal system Frac-48f Frac-8a Frac-8b
La2Hf2O7 1 1 0
La1.6Y0.4Hf2O7 1 1 0
La1.2Y0 .8Hf2O7 0.997(3) 0.983(18) 0.044(23)
La0.8Y1.2Hf2O7 0.980(3) 0.995(17) 0.168(24)
La0.4Y1.6Hf2O7 0.978(6) 0.945(34) 0.235(45)
La2Zr2O7 1 1 0
La1.6Y0.4Zr2O7 0.994(2) 1 0.049(16)
La1.2Y0.8Zr2O7 0.981(2) 1 0.152(17)
La0.8Y1.2Zr2O7 0.979(2) 1 0.168(24)
The errors quoted are those presented by GSAS and are shown as the error in the
last digit.
Fig. 6. Plots of 48f-x position against x in La2!xYxZr/Hf2O7. The curves are quadratic
fits to those positions that come from observable single phase refinements. The
horizontal lines link the position from two-phase samples, and give an indication
of the composition limit of these phases.
Table 3
Comparison of measured unit cell values and those predicted by Chakoumakos
[11].
Ideal system Measured Predicted Difference
La2Hf2O7 10.7728(3) 10.6872(0.0133) 0.0855
La1.6Y0.4Hf2O7 10.7212(3) 10.6671(0.0609) 0.0541
La1.2Y0.8Hf2O7 10.6460(3) 10.6063(0.0477) 0.0397
La0.8Y1.2Hf2O7 10.5718(3) 10.5456(0.0774) 0.0261
La0.4Y1.6Hf2O7 10.5148(5) 10.4463(0.0420) 0.0685
La2Zr2O7 10.8076(5) 10.7152(0.0333) 0.0924
La1.6Y0.4Zr2O7 10.7484(4) 10.7111(0.0306) 0.0373
La1.2Y0.8Zr2O7 10.6714(4) 10.6719(0.0306) !0.0005
La0.8Y1.2Zr2O7 10.6572(5) 10.6335(0.0612) 0.0237
The errors in the predicted values are based on the compositional errors from the
electron microanalysis and are shown as the absolute error; all the other errors are
shown as those in the last digit.
Fig. 7. Refined unit-cell sizes obtained using GSAS (solid circles and line) and
predicted unit-cell sizes using the equation by Chakomouakos 11(empty circles and
dotted line). (a) The values obtained for the La2!xYxHf2O7 system and (b) for the
La2!xYxZr2O7 system.
K.R. Whittle et al. / Journal of Solid State Chemistry 182 (2009) 442–450448

Author's personal copy
3 and 4 for the A and B sites, respectively. These values are in
agreement with those previously published on bond valence
analysis of order/disorder in pyrochlores [39].
6. General discussion
The data indicate that two-phase regions in La2!xYxZr2O7 and
La2!xYxHf2O7 exist for composition ranges of x ¼ 0.8–1.6 and
x ¼ 1.2–1.6, respectively. In the Hf series, the single-phase
pyrochlore stability field extends to a composition much larger
in Y than would be expected when predicted using radius ratio
rules for the cations. The composition at which a pyrochlore
structure is unfavoured is La0.42Y1.58Hf2O7, giving a cation radius
ratio of 1.48. In these samples predominantly single-phase
pyrochlore forms up to La0.6Y1.4Hf2O7, which gives a formal radius
ratio of 1.44, below the predicted limit. In this sample however
the composition by electron microanalysis was found to be
slightly deficient in cations. It is likely that this deficiency gives
the false impression that these samples should be fluorite instead
of pyrochlore. In reality it is at the limit of the stability range, as
shown in the next composition being entirely fluorite, shown by
neutron diffraction.
In the La2!xYxZr2O7 system the last pyrochlore containing
composition is La1.2Y0.8Zr2O7 giving a cation radius ratio of 1.48.
The next composition La0.4Y1.6Zr2O7 gives a ratio of 1.45, since this
system is fully occupied on the A-site it is clearly within the
expected fluorite range and is found to be fluorite. The anion
disorder is found to increase across both systems, and shows that
disorder begins to increase as the Y content increases; this is to be
expected as Y drives the system to become fluorite, with an
average 78 occupancy for all oxygen positions.
Comparison with other pyrochlores doped with fluorite drivers
[40] shows a similar process, the only major difference is the
method for doping. In these samples the A-cation was exchanged
while in Heremans et al. [40] the B-cation was exchanged. Slight
differences in the process of disorder are found and are probably
due to the different sample heating profiles, i.e., the longer the
heating the more ordered the sample is likely to be. In this work
the samples were heated at 1500–1600 1C for a total of 14 days,
whereas Heremans et al. [40] use the Pechini process with heating
at 1100 and 1350 1C each for 2 days. These different heating
regimes can probably account for the discrepancies between the
two sets of results, not discounting of course the differences in
composition.
The recent work of Ashbrook et al. [41] using 89Y MAS NMR
shows that in the series Y2Ti2!xSnxO7 there is effectively random
disorder across the B-site between the Sn and Ti, it is expected
that this process occurs in these samples between the Y and La.
However, it is impossible to determine this from a single neutron
diffraction pattern alone.
The difference in pyrochlore stability between the Hf and Zr
series is more difficult to interpret, in the majority of cases Hf is
often expected to behave in the same manner as Zr. However, in
these samples this is not the case. It may simply be that since the
ionic radius [37,38] of Zr4+ (0.72 A) is closer to that of Y3+ (0.9 A)
than Hf4+ (0.71 A), this small difference is enough to decrease the
stability of the pyrochlore phase.
An example of a change in stability of phase between Zr and Hf
based pyrochlores are the radiation tolerance of La2Zr2O7, and
La2Hf2O7 [42]. In these samples it was found there was a large
difference in the measured critical temperature for amorphisation
(Tc), the temperature above which the sample crystallises at a rate
greater than the damage accumulation rate. La2Zr2O7 was found
to have a Tc of 339749K, while La2Hf2O7 was 563710K, which
implies that La2Zr2O7 is more ‘stable’ than La2Hf2O7. As both Zr
and Hf are in the same group (group IVB) and should behave in a
similar manner, this is not always the case and they can behave
differently.
7. Conclusion
The addition of a fluorite driver such as Y3+ in place of La3+ in
pyrochlores containing Zr or Hf on the B site ultimately removes
the superstructure and the compositional limit for a single phase
fluorite is 1.4oxo1.6 in the La2!xYxZr2O7 series and for
1.6oxo2.0 in the La2!xYxHf2O7 series. The main two-phase region
in the Hf-based pyrochlores is shifted to a much higher level of Y3+
doping than in the Zr-based series, close to x ¼ 1.2 in these slowly
cooled samples. For the same level of Y doping, the Hf samples are
also more pyrochlore-like with regard to the systematically larger
x-coordinate of the 48f oxygen position. TEM investigations
illustrate that the defect fluorite phase exhibits evidence of
short-range correlations in both systems, with the modulated
structure being somewhat more ordered (e.g., pyrochlore-like) in
the Hf-based samples. These results suggest that as a waste form
pyrochlore based materials are ideal for elements such as U4+ and
Pu4+, which are both fluorite drivers.
References
[1] S.L. Chamberlain, S.T. Hess, L.R. Corruccini, Physics Letters A 323 (2004)310–314.
[2] N.P. Raju, M. Dion, M.J.P. Gingras, T.E. Mason, J.E. Greedan, Physical Review B59 (1999) 14489–14498.
[3] N. Kim, C.P. Grey, Journal of Solid State Chemistry 175 (2003) 110–115.[4] J. Lian, L.M. Wang, S.X. Wang, J. Chen, L.A. Boatner, R.C. Ewing, Physical Review
Letters 8714 (2001), (145901).[5] F.W. Poulsen, M. Glerup, P. Holtappels, Solid State Ionics 135 (2000) 595–602.[6] P.J. Wilde, C.R.A. Catlow, Solid State Ionics 112 (1998) 185–195.[7] S.X. Wang, B.D. Begg, L.M. Wang, R.C. Ewing, W.J. Weber, K.V.G. Kutty, Journal
of Materials Research 14 (1999) 4470–4473.[8] S.X. Wang, L.M. Wang, R.C. Ewing, K.V.G. Kutty, Nuclear Instruments &
Methods in Physics Research Section B—Beam Interactions with Materialsand Atoms 169 (2000) 135–140.
[9] W.J. Weber, R.C. Ewing, Scientific Basis for Nuclear Waste Management XXV,vol. 713, Materials Research Society, Warrendale, 2002, pp. 443–454.
[10] S.V. Yudintsev, Geology of Ore Deposits 45 (2003) 151–165.[11] B.C. Chakoumakos, Journal of Solid State Chemistry 53 (1984) 120–129.[12] M.A. Subramanian, G. Aravamudan, G.V.S. Rao, Progress in Solid State
Chemistry 15 (1983) 55–143.
ARTICLE IN PRESS
Table 4
Bond valence summations calculated for the pyrochlore phases studied.
Ideal system Rij–La/Y Sij–La/Y Rij–Zr/Hf Sij–Zr/Hf
La2Hf2O7 2.644(1) 2.974(6) 2.090(1) 3.826(7)
2.332(1)
La1.6Y0.4Hf2O7 2.619(1) 2.913(5) 2.087(1) 3.854(6)
2.321(1)
La1.2Y0.8Hf2O7 2.586(1) 2.865(6) 2.081(1) 3.933(8)
2.305(1)
La0.8Y1.2Hf2O7 2.538(1) 2.879(6) 2.086(1) 3.915(8)
2.289(1)
La0.4Y1.6Hf2O7 2.502(3) 2.776(12) 2.089(2) 3.923(18)
2.277(1)
La2Zr2O7 2.643(2) 2.952(8) 2.102(1) 3.700(10)
2.340(1)
La1.6Y0.4Zr2O7 2.617(2) 2.890(7) 2.097(1) 3.824(10)
2.327(2)
La1.2Y0.8Zr2O7 2.574(2) 2.990(8) 2.098(1) 3.778(11)
2.310(1)
La0.8Y1.2Zr2O7 2.565(2) 2.954(12) 2.098(2) 3.778(16)
2.307(1)
Rij are the bond lengths in Angstroms and Sij is the bond valence summation. The
errors in the final digit are presented and are based on the calculated errors in
bond lengths which have been derived from the Rietveld refinements.
K.R. Whittle et al. / Journal of Solid State Chemistry 182 (2009) 442–450 449

Author's personal copy
[13] B.D. Begg, N.J. Hess, D.E. McCready, S. Thevuthasan, W.J. Weber, Journal of
Nuclear Materials 289 (2001) 188–193.
[14] H.W. Schmalle, T. Williams, A. Reller, A. Linden, J.G. Bednorz, Acta Crystal-
lographica Section B—Structural Science 49 (1993) 235–244.
[15] J. Lian, J. Chen, L.M. Wang, R.C. Ewing, J.M. Farmer, L.A. Boatner, K.B. Helean,
Physical Review B 68 (2003), (134107).
[16] A. Meldrum, L.A. Boatner, R.C. Ewing, Physical Review Letters 8802 (2002),
(025503).
[17] S. Zhu, X.T. Zu, L.M. Wang, R.C. Ewing, Applied Physics Letters 80 (2002)
4327–4329.
[18] J. Lian, X.T. Zu, K.V.G. Kutty, J. Chen, L.M. Wang, R.C. Ewing, Physical Review B
66 (2002) 054108.
[19] G.R. Lumpkin, K.R. Whittle, S. Rios, K.L. Smith, N.J. Zaluzec, Journal of Physics:
Condensed Matter 16 (2004) 8557–8570.
[20] G.R. Lumpkin, K.L. Smith, M.G. Blackford, R. Giere, C.T. Williams, Micron 25
(1994) 581–587.
[21] H.M. Rietveld, Journal of Applied Crystallography 2 (1969) 65–71.
[22] A.C. Larson, R.B. Von Dreele, General Structure Analysis System (GSAS), Los
Alamos National Laboratory Report LAUR 86-748, 2000.
[23] B.H. Toby, Journal of Applied Crystallography 34 (2001) 210–213.
[24] Y. Tabira, R. Withers, J. Thompson, S. Schmid, Journal of Solid State Chemistry
142 (1999) 393–399.
[25] Y. Liu, R.L. Withers, L. Noren, Journal of Solid State Chemistry 177 (2004)
4404–4412.
[26] Y. Tabira, R.L. Withers, J.C. Barry, L. Elcoro, Journal of Solid State Chemistry
159 (2001) 121–129.
[27] S. Garcia-Martin, M.A. Alario-Franco, D.P. Fagg, J.T.S. Irvine, Journal of
Materials Chemistry 15 (2005) 1903–1907.
[28] P. Garcia-Chain, R.M. Rojas, P. Herrero, J.R. Gunter, Journal of Solid State
Chemistry 108 (1994) 236–242.
[29] R. Miida, F. Sato, M. Tanaka, H. Naito, H. Arashi, Journal of AppliedCrystallography 30 (1997) 272–279.
[30] L. Minervini, R.W. Grimes, K.E. Sickafus, Journal of the American CeramicSociety 83 (2000) 1873–1878.
[31] Y. Tabira, R.L. Withers, L. Minervini, R.W. Grimes, Journal of Solid StateChemistry 153 (2000) 16–25.
[32] M. Pirzada, R.W. Grimes, L. Minervini, J.F. Maguire, K.E. Sickafus, Solid StateIonics 140 (2001) 201–208.
[33] C.R. Stanek, R.W. Grimes, Journal of the American Ceramic Society 85 (2002)2139–2141.
[34] M.J.D. Rushton, R.W. Grimes, C.R. Stanek, S. Owens, Journal of MaterialsResearch 19 (2004) 1603–1604.
[35] K.W. Eberman, B.J. Wuensch, J.D. Jorgensen, Solid State Ionics 148 (2002)521–526.
[36] B.J. Wuensch, K.W. Eberman, C. Heremans, E.M. Ku, P. Onnerud, E.M.E. Yeo,S.M. Haile, J.K. Stalick, J.D. Jorgensen, Solid State Ionics 129 (2000) 111–133.
[37] R.D. Shannon, Acta Crystallographica Section A A32 (1976) 751–767.[38] R.D. Shannon, C.T. Prewitt, Acta Crystallographica Section B—Structural
Science B 25 (1969) 925–946.[39] B.J. Wuensch, K.W. Eberman, in: P. Vincenzini, V. Buscaglia (Eds.), Oxygen-Ion
Conductivity, Disorder and Bonding in Pyrochlore Fuel–Cell Materials as aFunction of Composition, Mass and Charge Transport in Inorganic Materials II,2003.
[40] C. Heremans, B.J. Wuensch, J.K. Stalick, E. Prince, Journal of Solid StateChemistry 117 (1995) 108–121.
[41] S.E. Ashbrook, K.R. Whittle, G.R. Lumpkin, I. Farnan, Journal of PhysicalChemistry B 110 (2006) 10358–10364.
[42] G.R. Lumpkin, K.R. Whittle, S. Rios, K.L. Smith, N.J. Zaluzec, Journal of Physics:Condensed Matter 16 (2004) 8557–8570.
[43] E.J. Harvey, K.R. Whittle, G.R. Lumpkin, R.I. Smith, S.A.T. Redfern, Journal ofSolid State Chemistry 178 (2005) 800–810.
ARTICLE IN PRESS
K.R. Whittle et al. / Journal of Solid State Chemistry 182 (2009) 442–450450


