Embed Size (px)
Citation preview
1
Response to the Reviewers’ comments
Anonymous Referee #1
This review paper addresses humankind impacts on soil development. The authors highlight the
importance of humankind impact as new soil formation factor and distinguish it from natural soil
formation factor due to the impact that it has on the soil development. As the authors pointed out
in their text the importance of humankind impacts on soil formation has been acknowledged by
some researchers but what makes the view of authors special here is the way they take into
account its contribution in soil development. They argue that the natural soil processes result in
soils with diverse functions and properties, while the humankind interferences in the ecosystem
result in soils with uniform and similar functions and properties. In this sense, the impact of
humankind on soil development is introduced as a convergence factor and neutral soil formation
factors as a divergence factor.
The authors’ opinion here is mainly supported by some examples at which different land uses
(mainly forest) were converted to agricultural use. I found the view of authors interesting and
considered it as an emerging topic in the field of fundamental soil science. In general, I do not
have any fundamental comments on the concept presented here and believe that this review
should be published as a review paper in the journal of Biogeosciences Discussion.
We are very thankful to the Reviewer for his very positive assessment and suggested
improvements.
Please see our improvements and answers below.
Given that all the authors are very experienced scientists with a substantial track record, this is a
pity, and I cannot refrain from emphasizing that the text and figures need some careful revisions.
Some examples are listed below:
Fig.1 is an interesting figure showing the main concept presented in this review. However, it was
hard for me to follow its context and would suggest some modifications to this figure as follows:
2) place the legend on the right side of the figure. In its current location is confusing and the
readers may relate it to the time, 2) Does the red arrow on x-axis show start of cultivation
decades? if yes remove its label out of the figure that one can read it. otherwise, it looks like two
different labelings,3) it is not clear what does it show the label " duration/intensity of cultivation.
Do you mean a time period between the start of cultivation till now? If yes, show it with an arrows
bellow the x-axis, 4) move the label of x-axis more to the bottom and make some space with
indicated time.
Many thanks – we can understand well that these points are not clear.
We improved the Fig 1 as suggested by the Reviewer and hope that it is easier to follow now.
We added legend, removed Millenia and Decades, added additional x axis for agropedogenesis.
2
In fig. 2, what does it mean ‘Soil genesis based on the development of concepts’ in the caption
of figure? I would recommend the authors to rearrange this figure and improve its readability. In
the current version, it is hard to follow its context and massage. Found a better away of relating
this information together, for instance, the factors and parental materials, climate, etc. Here and
elsewhere in the figures, I found it annoying for readers to follow a diagram with varying font
sizes and styles.
We completely rewrote the caption.
We have unified better the font sizes within each Fig. We still left some various fonts to show the
importance of processes.
In Fig. 4: It is hard to understand the message of this figure. What does it mean factors 2: 38%
and 1: 48% in the label of x-axis and y-axis. Do you mean a relative increase of 38% and 48%?
Where does the 1 start?
This is the results of a principal component analysis on various parameters measured in the
abandoned agricultural soils with increasing abandonment periods. We improved the Figure and
also add more details to the legend for better understanding. 75% of variation in soil properties is
explained by factor 1 and 19% by factor 2.
If the Reviewer mean that this is superfluous Fig., we will move it to Supplementary Materials.
Fig. 5: rephrase the caption, it is a confusing sentence and hard to read. In Fig. 5a and 5b,
explain in the legend what do show the solid lines. The legend of Fig. 5c and 5d are confusing.
Use a separate legend for every four cases.
The fig. caption has been modified.
Fig. 6: This is an interesting figure. State that this is a hypothetical trend. How do the authors
argue on the proposed time? It looked to me that the authors aimed to show here the relative
responses of each process with time and the selection of time is not based on any experimental
evidence. If that is true I suggest using a normalized time between 0 and 1 to avoid giving a
weak impression.
The fig. is actually based on the real values stated for each soil property in various studies
(including that presented in the Fig. 3 and 4). Nonetheless, the values written on each curve are
our suggestion for the attractor of each soil property over long-term cultivation. See also line
380-385.
Fig. 9: how did the authors generate these figures? Are they hypothetical figures? If yes mention
it in the caption. What does it mean stage in these figures? Stage of what?
The figures are conceptual phase diagrams as it is mentioned in the caption. These phase
diagrams were made based on the curves in the Fig 6 (now 5), which are experimentally based.
The stages show the changing trend in a given soil property over the degradation processes.
3
The stages are time laps to reach a threshold for a given soil property when after that the trend
may slow down or become reversed. See line 291-292 for definition of stages of degradation.
The fig. caption has been modified.
Some minor typos:
Line 220: Replace “decreases “ with “decrease “
Decreases in Line 234 has revised
Line 33: replace ‘fulfils’ with ‘fulfills’
It is revised in Line 35
Line 378: replace because with become
The sentence has been modified
Line 279: replace “independent of” with “independency of”
“Independent of” looks grammatically correct here.
Line 149: Do the author mean the function rather than production?
No, the (crop) production is one of the soil functions. So, when only one function can be
increased at a time the other functions (other than production) will be decreased.
Line 138: Replace “ develops” with “ develop.”
The sentence has been modified
…………….
Anonymous Referee #2
The authors introduce a theory of anthropedogenesis – soil development under the main factor
‘humankind’ – the 6th factor of soil formation, and deepen it to encompass agropedogenesis as
the most important direction of anthropedogenesis. The theory of agropedogenesis is a very
important issue in pedology and there is a clear gap in knowledge related to this issue and the
outcomes of this research certainly help to better understand the dynamics of soil development
under agricultural practices.
We are very thankful for this positive evaluation and suggested improvements.
Please see our improvements and answers below.
4
Although the contents of the manuscript is fairly good, it would benefit from better editing (e.g.
grammar and clarity), which would improve its clarity.
We sent the ms once again for the improvement of the English language.
In addition, some necessary improvements are suggested in the following:
1) More comprehensive literature review on soils [e.g. semi-arid tropical soils] showing no sign of
soil degradation by growing agricultural crops in soils.
This point is based on the comments given by Dr. Pal about the necessity to exclude semi-arid
tropical soils from the concept of agropedogenesis. The point that Dr. Pal emphasized to be “no-
sign-of-degradation” is solely based on stability of SOC content over 25 years of cultivation in
semi-arid tropical soils of India. This is however, because of yearly addition of large amount of
organic fertilizers which keeps the SOC content at a high level along with the presence of
alkaline soils which prohibit soil acidification. This, in our opinion, is temporary condition (i.e.
pedogenic inertia) and following decalcification of topsoil (when attractor of CaCO3 is achieved)
the mentioned soils will also face acidification and so, degradation and crop reduction. We
already addressed in the text that such conditions may also take place (see lines 210-211) due
to soil intrinsic master properties which are from their threshold values to cause soil degradation.
2) It is also important to discuss more thoroughly, why these soil properties were selected
[Master soil properties]. In particular, a reader would like to know whether these soil properties
are intrinsically more important than the others or simply more important in this study due to
some identified characteristics and assumptions.
The main characteristic of a soil property to be a master property in agropedogenesis concept is
its sensitivity to agricultural use. Further, changes in the values of the so-called master
properties should determine the state many other properties over cultivation period. See section
2.4 as we defined the master properties and their particular characteristics. Also the most other
studies suggested these properties (see Table 3).
We would like to discuss these soil properties and the reasons in the next paper. This paper is
already too long for individual description of each of the nine properties.
3) It is necessary to explain clearly the figures in the main body of the manuscript.
We agree. The Reviewer #1 mentioned the same. In the improved version we presented more
explanations and details to the figure legend.
Some other comments are made along with the text:
Keywords: I think five keywords are enough.
We developed a theory which is not only connected to the effects of human on soil conditions
but also to the effects of human in general on planet Earth and so, to the Anthropocene. This
5
includes many aspects which we tried to address by the key-words for a better indexing by the
searching programs.
We deleted 4 Keywords (but added 2).
Line 4-5: This first sentence of the abstract should be removed.
This sentence actually shows the relevance and significance of studying the effects of human on
agricultural soils. It shows that human through agricultural practices may affect a huge land
surface area. Deleting this sentence will raise the question of how significant or relevant is this
study.
If the Reviewer insists on it, we will delete this sentence.
Line48-49: Please clarify this sentence “Since the suitable land resources for agriculture are
limited and increasingly located in ecologically marginal conditions”.
The suitable land areas for agricultural practices are limited. Therefore, many studies are
focusing on protecting strategies to save such areas against degradation causing decreasing
food production. Furthermore, if intensification in crop production on the available land is not
considered then, we have to cultivate the ecologically susceptible areas for example shallow
soils on steep slopes. We simplified the sentence.
Line 50: add cit.
Lal et al., 2005 has been added.
Line 73: run-off irrigation and terracing
“and” has been added.
Line 80: add cit.
FAO 2018 has been added.
Line 87: “The human factor can even change soil types as defined by classification systems
(Supplementary Fig. 1)”.
The sentence is correct similar to what the reviewer has written.
Figure 1 indicates the convergence and divergence of soil properties!
Under natural soil genesis, yes (the green lines) but convergence under agropedogenesis (red
lines). The fig. is however, improved for better clarifications.
Line104: add cit.
6
See Dudal, 2004 (line 101).
Table 2: justify Table 2
We wanted to bold the main soil formation processes under agricultural practices and their
consequences on soil properties. Could you please let us know what you mean with justifying
the table?
Line 122: climate, organisms, relief and time
It has been revised accordingly.
Line 139: climate, organisms, and relief
It has been revised accordingly.
Line 140: “...over time. Thus, morphological soil properties...”. This sentence should be rewritten.
The sentence is re-written as: Therefore, visible morphological soil properties in the field and
measurable parameters in the lab were very well described leading to development of various
(semi)genetic soil classifications
Line 143: Figure 2.
Corrected
Line 153:add cit.
This is authors definition of soil degradation and its stages.
Line 180: climate, organisms, and relief
It has been revised accordingly.
Line 201: How is possible to infer the decreasing in the spatial variability of soil properties in
figure 5.
The sentence has been corrected.
Line 847: “(c) and(d) total soil carbon”!
The sentence has been corrected.
Lines 273-lines 299: the definition of phase diagrams would be necessary. Not sure that every
Biogeosciences reader is familiar with them.
7
We added the definition of the phase diagrams (see line 277).
# Other comments and minor corrections by Peter Kühn
It was a pleasure to read the manuscript. I have some minor remarks, which may improve the
strength of the discussion, if considered. Best wishes, Peter Kühn
We are very thankful to Prof. Kühn for his positive assessment and suggested improvements.
General Remarks Chapters 1.2 and 2.1 In this context the scorpan model by McBratney et al.
(2003; “On digital soil mapping”) should be discussed as well, which includes more than five soil
forming factors and particularly their functions.
The reference McBratney et al. (2003) has been added to the text.
188-190: If the “convergence of soil properties” is not true in all cases, I recommend rephrasing
the statement in line 188.
The sentence has been deleted.
Chapter 2.7 Additionally different topographic positions should be discussed: upslope, Mid-
slope, toe-slope and even positions. Do not soil properties diverge or converge despite of human
impact just related to the topographic position of the soil? E.g. imagine calcareous substrate with
a decalcified soil, at upslope positions and human-induced soil erosion; after some time the soil
will have many properties of the substrate, particularly regarding carbonate content, pH, EC, and
the content of some elements as e.g. Ca and Mg. These are also master properties of
agropedogenesis as you defined in chapter 2.4. - And e.g. in toe-slope positions you have often
an additional material input from upslope positions, which influences also some master
properties and might rule out convergent tendencies. Of course this is different under humid and
arid climate conditions.
We assumed that agricultural soils are generally located on flat and leveled grounds or on gentle
slopes and there would be terracing on steeper slopes. On the other hand, we hypothesized that
there will be an equilibrium between the erosion rate and soil genesis rate over long time farming
(see supplementary fig. 1).
1
Cover page 1
2
Title: Agropedogenesis: Humankind as the 6th
soil-forming factor and attractors of 3
agrogenic agricultural soil degradation 4
5
6
Authors: Yakov Kuzyakov1, 2*
, Kazem Zamanian
1* 7
8
9
1. Department of Soil Science of Temperate Ecosystems, Georg-August University of Göttingen, Büsgenweg 10
2, 37077 Göttingen, Germany 11
2. Department of Agricultural Soil Science, Georg-August University of Göttingen, Büsgenweg 2, 37077 12
Göttingen, Germany 13
14
* Authors for correspondence 15
Kazem Zamanian 16
Phone: +49 (0)551 39 12104 17
E-mail: [email protected] 18
Yakov Kuzyakov 19
Phone: +49 (0)551 401 33235 20
E-mail: [email protected] 21
22
23
Keywords: Anthropogenic soil change, Soil formation and degradation, Soil forming factors, 24
Pedogenesis, Agropedogenesis, Land-use, Intensive agriculture, Soil erosion, 25
Anthropocene, Human impact, Ecosystem engineer 26
2
Agropedogenesis: Humankind as the 6th
soil-forming factor and attractors of agrogenic 27
agricultural soil degradation 28
29
Abstract 30
Agricultural land covers 5100 million ha (ca. 50% of potentially suitable land area) and 31
agriculture has immense effects on soil formation and degradation. Although, the we have an 32
advanced mechanistical understanding of individual degradation processes of soils under agricultural 33
use concepts or theories of agropedogenesis have already been advanced,; the general concepts of 34
agropedogenesis are absent., We therefore,and webut urgently still need an further consideration to 35
unifying theory better understand the dynamics of soil development under agricultural practices, of – 36
the agropedogenesis. We introduce a theory of anthropedogenesis – soil development under the main 37
factor ‘humankind’ – the 6th
factor of soil formation, and deepen it to encompass agropedogenesis as 38
the most important direction of anthropedogenesis. The developed theory of agropedogenesis 39
consists of (1) broadening the classical concept of Factors – Processes – Properties with the addition 40
of Functions along with their feedbacks to the Processes, (2) a new concept of attractors of soil 41
degradation, (3) selection and analysis of master soil properties, (4) analysis of phase diagrams of 42
master soil properties to identify thresholds and stages of soil degradation, and finally (5) a definition 43
of the multi-dimensional attractor space of agropedogenesis. The main feature of anthropedogenesis 44
is the narrowing of soil development to only one function (e.g. crop production for agropedogenesis), 45
and this function is gettingbecoming the main soil- forming factor. The focus onf only one function 46
and disregard of other functions inevitably lead indispensable to soil degradation. We show that the 47
factor ‘humankind’ dominates over the effects of the five natural soil-forming factors and that 48
agropedogenesis is therefore much faster than natural soil formation. The direction of 49
agropedogenesis is mainly largely opposite to that of natural soil development and is thus mainly 50
usually associated with soil degradation. In contrast to natural pedogenesis leading to divergence of 51
soil properties, agropedogenesis leads to their convergence because of the efforts to optimize 52
conditions for crop production. Agricultural practices lead soil development toward a quasi-steady 53
state with a predefined range of measured properties – attractors (an attractor is a minimal or 54
maximal value of a soil property, toward which the property will develop via long-term intensive 55
agricultural use from any natural state). Based on phase diagrams and expert knowledge, we define a 56
set of ‘master properties’ (bulk density and macroaggregates, soil organic matter content, and C/N 57
3
ratio, pH and EC, microbial biomass and basal respiration) as well as soil depth (A and B horizons). 58
These master properties are especially sensitive to land- use and determine the other properties 59
during agropedogenesis. Phase diagrams of master soil properties help identify thresholds and stages 60
of soil degradation, each of which is characterized each by one dominating process. Combining 61
individual attractors to a multi-dimensional attractor space enables predicting the trajectory and the 62
final state of agrogenic soil development and to develop measures to combat soil degradation. 63
ConcludingIn conclusion, the suggested new theory of anthro- and agropedogenesis is a prerequisite 64
for merging various degradation processes to a general view, and for understanding the functions of 65
humankind not only as the 6th
soil-forming factor but also as an ecosystem engineer optimizing its 66
environment to fulfil aon few desired functions. 67
68
Keywords: Anthropogenic soil change, Soil formation and degradation, Soil- forming factors, 69
Pedogenesis, Agropedogenesis, Land- use, Intensive agriculture, Soil erosion, Anthropocene, Human 70
impact, Ecosystem engineer 71
72
1. Introduction 73
1.1. Soil degradation by agricultural land-use 74
Soils (S) as natural bodies are formed via interactions of soil-forming factors, i.e. climate (cl), 75
organisms (o), relief (r), and parent material (p) over time (t) (Dokuchaev, 1883; Glinka, 1927; 76
Jenny, 1941; Zakharov, 1927): S = f(cl, o, r, p, t, ...) (see the history of the equation in Supplementary 77
Materials). 78
The processes of additions, losses, transfers/translocation, and transformations of matter and 79
energy over centuries and millennia produce a medium – soil (Simonson, 1959), which supports plant 80
roots and fulfills many other ecosystem functions (Lal, 2008; Nannipieri et al., 2003; Paul, 2014). 81
These functions however, commonly decrease due to human activities, in particular through 82
agricultural practices because of accelerateding soil erosion, nutrient loss (despite intensive 83
fertilization), aggregate destruction, compaction, acidification, alkalization and salinization 84
(Homburg and Sandor, 2011; Sandor and Homburg, 2017). Accordingly, the factor ‘humankind’ has 85
nearly always been considered as a soil-degrading entity that, by converting natural forests and 86
grasslands to arable lands, changes the natural cycles of energy and matter. Except in very rare cases 87
which thatare leading to the formation of fertile soils such as Tterra Ppreta in the Amazonian Basin 88
4
(Glaser et al., 2001), Pplaggen in North northern Europe (Pape, 1970) as well as Hhortisols 89
(Burghardt et al., 2018), soil degradation is in most cases the most common outcome of long-term 90
agricultural practices (DeLong et al., 2015; Homburg and Sandor, 2011). Soil degradation begins 91
immediately after conversion of natural soil coverage and land preparation for cultivation and 92
involves the degradation in all physical, chemical and biological properties (Table 1). The result is a 93
decline in ecosystem functions. 94
SoilThis degradation gains importance when consideringbywith the rapid increase in human 95
populations (Carozza et al., 2007) and technological progress. Increasing food demand necessitates 96
requires either ever larger areas for croplands or/and intensification of crop production per area of 97
already cultivated land. BecauseSince the suitable land resources suitable for agriculture are limited 98
and increasingly located in ecologically marginal conditions, any most increases in food production 99
will depends on the second option: intensification (Lal, 2005). This will intensify the imbalance 100
between input to and output from the soil, resulting in faster and stronger soil degradation. While 101
prohibiting or reducing degradation is essential in achieving sustainable food production (Lal, 2009), 102
many studies have addressed individual mechanisms and specific drivers of soil degradation (Table 103
1). Nonetheless, there is still no standard and comprehensive measure to determine soil degradation 104
intensity and to differentiate between degradation stages. 105
Agricultural soils (croplands + grasslands) cover 5100 million ha, corresponding to about 34% of 106
the global land area. Importantly, hHuge areas are located in very cold regions that are continuously 107
covered by ice (1500 million ha), located in hot deserts, mountainous areas, or barren regions (2800 108
million ha), as well as sealed in urban and industrial regions and roads (150 million ha). Accordingly, 109
agricultural lands cover about 50% of the area potentially suitable for agriculture 110
(https://ourworldindata.org/yields-and-land-use-in-agriculture). Even though huge areas of land are 111
occupied by agriculture, and humans have modified natural soils over the last 10-12 thousand years, 112
the a theory of soil formation as affected by humankind – anthropedogenesis and its subcategory 113
agropedogenesis – is still far from proper attentionabsent. This paper therefore presents for the first 114
time an unifying theory of anthropedogenesis – soil development under the main factor ‘humankind’ 115
– the 6th
factor of soil formation. Moreover, we expand it to encompass agropedogenesis as a key 116
aspect of general anthropedogenesis. 117
118
1.2. Humans as the main soil-forming factor 119
5
Humans began to modify natural soils with at the onset of agriculture ca. 10-12 thousand years ago 120
(Diamond, 2002; Richter, 2007), resulting in soil degradation. Examples of soil degradation leading 121
to civilization collapses are well known starting at least from with Mesopotamia (18th
to 6th
122
centuries BC) (Diamond, 2002; Weiss et al., 1993). Notwithstanding all the negative impacts of 123
humans have on soils and on cycles of energy and matter, the intention was always to increase 124
fertility to boost crop production (Richter et al., 2011; Sandor and Homburg, 2017), reduce negative 125
environmental consequences, and achieve more stable agroecosystems. To attain these aims, 126
humans have (i) modified soil physical and hydrological properties (for example, by removing 127
stones, loosening soil by tillage, run-off irrigation, draining, and terracing), (ii) altered soil chemical 128
conditions through fertilization, liming, desalinization, and (iii) controlled soil biodiversity by 129
sowing domesticated plant species and applying biocides (Richter et al., 2015; Richter, 2007). 130
Although these manipulations commonly lead to soil degradation (Homburg and Sandor, 2011; Paz-131
González et al., 2000; Sandor et al., 2008), they are aimed at decreasing the most limiting factors 132
(nutrient contents, soil acidity, water scarcity, etc.) for crop production, regardless of the original 133
environmental conditions in which the soil was formed (Guillaume et al., 2016a; Liu et al., 2009). 134
Thus, agricultural land-use always focused on removing limiting factors and providing optimal 135
growth conditions for a few selected crops: 15 species make up 90% of the world's food, and 3 of 136
them – corn, wheat, corn, and rice – supply 2/3 of this amount (FAO, 2018). These crops (except 137
rice) have similar water and nutrient requirements (except rice) compared in contrast to the plants 138
growing under natural conditions. Consequently, agricultural land-use has always striven to narrow 139
soil propertiesy space to uniform environmental conditions. 140
The hHumans factor can even change soil types as defined by classification systems 141
(Supplementary Fig. 1) by inducing erosion, changing the thickness of horizons and their mixture, 142
decreasing soil organic matter (SOM) content, destroying aggregates, and accumulating salts (Dazzi 143
and Monteleone, 2007; Ellis and Newsome, 1991; Shpedt et al., 2017). A Mollisol (~ Chernozems or 144
Phaeozems), for example, turns into an Inceptisol (~ Cambisols) by decreasing total SOM (Lo Papa 145
et al., 2013; Tugel et al., 2005) or/and thinning of the mollic epipedon by tillage and erosion and 146
destroying granular and sub-polyedric structure (Ayoubi et al., 2012; Lo Papa et al., 2013). 147
Accordingly, humankind can no longer be treated solely as only a soil-degrading but also as a soil-148
forming factor (Amundson and Jenny, 1991; Dudal, 2004; Gerasimov and Fridland, 1984; Richter et 149
al., 2015; Sandor et al., 2005). The result is the formation of anthropogenic soils (soils formed under 150
6
the main factor ‘humankind’). This is very well known for rice paddies, i.e. Hydragric Anthrosols 151
(Chen et al., 2011; Cheng et al., 2009; Kölbl et al., 2014; Sedov et al., 2007), as well as Hortic 152
Anthrosols (long-term fertilized soils with household wastes and manure) and Irragric Anthrosols 153
(long-term irrigated soils in dry regions) (WRB, 2014). These effects have stimulated the on-going 154
development of soil classifications to reflect new directions of soil evolution (Bryant and Galbraith, 155
2003; Richter, 2007): anthropedogenesis, i.e. soil genesis under the main factor ‘humankind’ and in 156
particular agropedogenesis, i.e. soil genesis under agricultural practices as a subcategory of 157
anthropedogenesis (Bryant and Galbraith, 2003). 158
Human impacts on soil formation have immensely accelerated in the last 50-100 years (Dudal, 159
2004; Gerasimov and Fridland, 1984; Richter, 2007) with the (1) introduction of heavy machinery, 160
(2) application of high rates of mineral fertilizers, especially after discovery of N fixation by the 161
Haber-Bosch technology, (3) application of chemical plant protection, and (4) introduction of crops 162
with higher yield and reduced root systems. We expect that, despite various ecological measures 163
(no-till practices, restrictions of chemical fertilizer applications and heavy machinery, etc.); the 164
effects of humans on soil formation will increase in the Anthropocene and will be even stronger 165
than for most other components of global change. This urgently calls for a concept and theory of 166
soil formation under humans as the main factor. 167
168
2. Concept of Agropedogenesis 169
Anthropedogenesis is the soil formation under the main factor ‘humans’ (Amundson and Jenny, 170
1991; Bidwell and Hole, 1965; Howard, 2017; Meuser, 2010; Richter, 2007; Yaalon and Yaron, 171
1966). Agropedogenesis is the dominant form of anthropedogenesis and includes soil formation 172
under agricultural use – mainly cropland (Sandor et al., 2005). The other forms of 173
anthropedogenesis are construction of completely new soils (Technosols, e.g. Urban soils or Mine 174
soils). These other forms of anthropedogenesis will are not treatedbe described in this paperhere, 175
because they are not directly connected with agriculture. 176
Agropedogenesis should be clearly separated from the natural pedogenesis because of: (1) strong 177
dominance of the factor ‘humans’ over all other five factors of soil formation, (2) new processes 178
and mechanisms that are not preabsent under natural soil development (Table 2), (3) new directions 179
of soil developments, compared to natural processes (Table 2), (4) frequent development of 180
processes in the reverse direction compared to natural pedogenesis, (5) much higher intensity of 181
7
many specific processes compared to natural developments and consequently faster rates of all 182
changes. 183
Agropedogenesis and natural pedogenesis are partly opposite processes. Natural soil formation 184
involves the development of soils from parent materials under the effects of climate, organisms, 185
relief, organisms and time (Dokuchaev, 1883; Jenny, 1941; Zakharov, 1927; Supplementary 186
Materials). Here, soil formation will reach the quasi-steady state conditions typical for the 187
combination of the five soil-forming factors (Fig. 1). Agropedogenesis, in most cases, is a process 188
involving the loss of losing soil fertility, i.e. degradation because of intensive agriculture and 189
narrowing of soil properties. Agropedogenesis is partly the reverse of soil formation but the final 190
stage is not the parent material (except on in a few cases of extreme erosion). Agropedogenesis also 191
leads to a quasi-steady state of soils (Fig. 1) (Eleftheriadis et al., 2018; Wei et al., 2014). The time 192
needed to reach this quasi-steady state, however, is much shorter (in the range of a few centuries, 193
decades, or even less) than in for natural pedogenesis, which involves millennia (Tugel et al., 2005). 194
The range of soil properties at this quasi-steady state condition will show the end-limit of agricultural 195
effects on soil development. 196
Our theory of agropedogenesis is based on five components: (1) Concept of ‘Factors 197
Processes Properties Functions’, (2) Concept of ‘attractors of soil degradation’, (3) Selection 198
and analysis of ‘master soil properties’, (4) Analysis of phase diagrams between the ‘master soil 199
properties’ and identification of thresholds and stages of soil degradation, and (5) ‘Multi-dimensional 200
attractor space’ and trajectory of pedogenesis. 201
202
2.1. Concept: Factors , Processes, Properties and Functions 203
The original concept of “Soil Factors Soil Properties” was initially suggested by (Dokuchaev (, 204
1883) and ; Zakharov (1927Jenny, 1941) and was modified by “Pprocesses”, which are dependent s 205
on the factors of soil formation and develops the properties (Gerasimov, 1984; McBratney et al., 206
2003). This triad: Factors → Processes → Properties enables understanding the soil development of 207
soils from the initial parent materials by the effects of climate, organisms, and relief, vegetation and 208
organisms over time. Thus,This very well describes the visible morphological soil properties that 209
are visible in the field and measurable parameters in the lab, are very well described and 210
yieldedleading to the development of various (semi)genetic soil classifications (KA-5, 2005; 211
KDPR, 2004; WRB, 2014). 212
8
Considering the recent development of functional approaches and ecosystem perspectives, this triad 213
is insufficient. We therefore introduce the concept: “Factors Processes Properties 214
Functions” (Fig. 32). We do notRather than describinge here the very broad range of functions of 215
natural soils as related to clean air and water, biodiversity, decontamination of pollutants, biofuel 216
and waste management, etc., but we refer to excellent reviews focused on soil functions (Lal, 2008; 217
Nannipieri et al., 2003). 218
One function – plant growthroduction – is, however, crucial for agropedogenesis (Fig. 2); because 219
humans change this natural function to an anthropogenic function – crop growth, and thus adapt and 220
modify natural soils to maximize crop productivity and crop yields. As it is not possible to 221
simultaneously maximize all functions, the functions other than ‘production’ crop growth’ decrease 222
or even disappear. Accordingly, agropedogenesis is driven by processes pursuing the maximization 223
of only one function – crop productiongrowth. The consequence is that all other soil functions are 224
reduced. We define soil degradation as a reduction of functions. Initially, all functions will be 225
reduced at the cost of increased crop production. As degradation advances, however, the production 226
function decreases as well. Nearly all previous definitions of soil degradation were based on 227
declining crop productivity. The principal difference between our concept of soil degradation and 228
the most common other concepts is that the degradation starts with the reduction of one or more 229
functions – before crop productivity decreases. This concept, based on multi-functionality, is much 230
broader and considers the ecosystem functions and services of soil and the growing human demand 231
for a healthy environment. 232
Agropedogenesis clearly shows that the natural sequence ‘Factors Processes Properties 233
Functions’ is changed by humans: Functions are no longer the final step in this sequence because 234
the one functions becomes a factor (Fig. 2). This is because humans tailor the processes of soil 235
development for the main function of agricultural soils – crop productionvity. Based on the example 236
of agropedogenesis, we conclude that all types of anthropedogenesis are directed at the functions 237
which that humans desire from the soil; hence, the one functions isare gettingbecomes the factors of 238
soil development (Fig. 2). 239
240
2.2. Attractors of soil degradation: definitions and concept 241
Despite a very broad range of individual properties of natural soils, long-term intensive agricultural 242
land-use strongly narrows their range (Homburg and Sandor, 2011; Kozlovskii, 1999; Sandor et al., 243
9
2008) their range and ultimately brings individual properties to the so-called attractors of 244
degradation (Kozlovskii, 1999). We define: 245
246
An attractor of a soil property is a numerical value toward which the property tends to 247
develops from a wide variety of initial or intermediate states of pedogenesis. 248
249
An attractor of agriculturalogenic soil degradation is a minimal or maximal value, of a soil 250
property toward which the property tends to develop by long-term intensive agricultural 251
practices use from a wide variety of initial conditions common for natural soils. 252
253
Attractors of soil properties are common for natural pedogenesis and anthropedogenesis (Fig. 1). 254
The well-known examples of natural pedogenic attractors are the maximal SOM accumulation (C ≈ 255
5-6% for mineral soils), highest increase of clay content in the Bt horizon by a ~ two-fold 256
illuviation compared to the upper horizon (without lithological discontinuity), the upper depth of the 257
Bt horizon for sheet erosion, a minimal bulk density of mineral soils of ~ 0.8 g cm³, the maximal 258
weathering in wet tropics by removal of all minerals until only Fe and Al oxides remain (Chadwick 259
and Chorover, 2001). 260
Natural pedogenesis leads to a divergence of pedogenic properties and consequently to the 261
broadening of the multi-dimensional attractor space (see below) because various soils develop to 262
steady state from the same parent materials depending on climate, organisms, and relief and 263
organisms (Fig. 1). The time necessary for natural processes to reach these attractors is at least 1-2 264
orders of magnitude longer than the periods to reach thefor attractors of agropedogenesis (see 265
below). 266
In contrast to natural pedogenesis, agropedogenesis narrows the soil properties by optimizing 267
environmental conditions for agricultural crops with similar requirements (Lo Papa et al., 2011, 268
2013). Consequently, each soil property follows a trajectory from a specific natural level toward the 269
unified agrogenic attractor (Fig. 1). Therefore, in contrast to Natural pedogenesis resulting in 270
divergence of soil properties, Aagropedogenesis leads to convergence of soil properties. 271
272
2.3. Examples of attractors of soil degradation 273
10
The convergence in soil properties (and thus reaching an attractor) after having a started from 274
various initial states is evident by comparing soils under long-term (e.g. decades and centuries) 275
cultivation (Sandor and Homburg, 2017). The challenges that ancient farmers faced were 276
fundamentally the same as today, although recent decades are characterized byalbeit with a 277
majormuch stronger intensification of chemical impacts (fertilization, pesticides) and heavy 278
machinery in the last decades (Dudal, 2004; Sandor and Homburg, 2017). The main difference 279
between soil degradation in the past and in the modern era is the rates and extent, but not the 280
processes or mechanisms themselves. The dynamics of soil properties in long-term cultivations 281
have revealed a narrowing in the measured values of a given property over time, i.e. a tendency 282
toward the attractor of that property (Alletto and Coquet, 2009; Dalal and Mayer, 1986b; Dalal and 283
J. Mayer, 1986; Haas et al., 1957; Nyberg et al., 2012) (Figs. 3, and 4, and the Supplementary fig. 284
2). Continuous agricultural practices also decrease the temporal and spatial variability of all 285
properties in the topsoil – in the Ap horizon (Jones and Dalal, 2017; Scott et al., 1994) (Fig. 5). 286
In reaching the attractor values, however, the process rates and dynamics differ among various soil 287
properties (Fig. 6), in various geo-climatological regions (Chen et al., 2011, p.29011; Guillaume et 288
al., 2016a; Hartemink, 2006) and according to land-use intensity. For example, microbial biomass 289
carbon (C) (Henrot and Robertson, 1994) and aggregate stability (Wei et al., 2014) respond faster 290
than SOM and total N to cultivation. Cultivation affects total N and P content less than organic C 291
because of N and P fertilization (Guillaume et al., 2016b), whereby a strong decrease of C input is 292
inferred by the decreasing C:N ratio with cultivation duration (Wei et al., 2014). Whereas 293
cultivation on deforested lands in the tropics can lead to soil degradeation soils within a few years, 294
converting temperate prairies and steppes to agricultural fields supports crop production without 295
fertilization for decades (Tiessen et al., 1994). Generally, the degradation rates (e.g. C losses) in the 296
moist tropics are faster (e.g. about 4-fold) than in the dry tropics (Hall et al., 2013). Despite the 297
differences in rates, however, the long-term cultivated soils ultimately reach similar degradation 298
levels (Lisetskii et al., 2015) (Fig. 3f). 299
300
2.4. Master soil properties 301
Soils and their functions are characterized by and are dependent on the full range of physical, 302
chemical and biological properties. A A selected fFew of themse properties – the master soil 303
properties – however, are responsible for a very broad range of functions and define other properties 304
11
(Lincoln et al., 2014; Lisetskii et al., 2013; Seybold et al., 1997). We define a soil property as being a 305
master property if it has a strong effect on a broad range of other properties and functions, and if it 306
cannot be easily assessed based on the other properties. For natural pedogenesis, such master 307
properties – inherited partly from the parent material – are: clay mineralogy and CaCO3 content, 308
texture, nutrient content, and bulk density. The master properties which that are cumulated or formed 309
during pedogenesis are: soil aggregation/structure, depth of A+B horizons, SOM stock and C:N ratio, 310
pH, electrical conductivity, etc. (Table 3). These properties largely define the other properties and 311
soil functions under natural conditions and generally under agricultural use as well. 312
The master properties of agropedogenesis may differ from those of natural soil development. 313
The crucial difference is that the master properties of agropedogenesis must sensitively respond to 314
agricultural use over the cultivation period. Accordingly, properties such as texture, clay content and 315
mineralogy – crucial master properties of natural pedogenesis , do not reflectare unimportant forare 316
not relevant in agropedogenesis. Note that, although these properties may change under certain 317
circumstances (Karathanasis and Wells, 1989; Velde and Peck, 2002), they fail to qualify as master 318
properties in agropedogenesis because they are relatively insensitive to agricultural land-use and soil 319
degradation. 320
Master soil properties have an additional important function: they are (co)responsible for the 321
changes in other properties. Changes in a master property over time may therefore intensify or 322
dampen changes in other (secondary) properties. The stability of macroaggregates, for example, 323
increases with the content and quality of SOM (Boix-Fayos et al., 2001; Celik, 2005). The infiltration 324
rate and water holding capacity decreases with increasing bulk density (Rasa and Horn, 2013; Raty et 325
al., 2010), promoting erosion. These relations between soil properties, however, seem to be 326
significant only within certain ranges, i.e. until thresholds are reached. Beyond such thresholds, new 327
relations or new master properties may govern. For example, an increasing effect of SOM content on 328
aggregate stability in extremely arid regions of the Mediterranean was recorded at above 5% SOM 329
contents (Boix-Fayos et al., 2001). Increasing organic matter contents up to this 5% threshold had no 330
effect on aggregate stability: instead, the carbonate content was the main regulator (Boix-Fayos et al., 331
2001). Microbial biomass and respiration in well-drained Acrisoils in Indonesia are resistant to 332
decreasing SOM down to 2.7% of SOM, but strongly dropped beyond that value (Guillaume et al., 333
2016b). While the amounts of SOM and total N in sand and silt fractions may continuously decrease 334
with cultivation duration, those values in the clay fraction remain stable (Eleftheriadis et al., 2018) 335
12
(Fig. 3e). Bulk density increases non-linearly with SOM decrease, and the rates depend on SOM 336
content (Fig. 7). Phase diagrams are very useful to identify such thresholds (see below). 337
Summarizing, we define ‘Master properties’ as a group of soil-fertility-related parameters that 338
(1) are directly affected by management, i.e. – are sensitive to agricultural use and soil degradation, 339
(2) determine the state of many other (non-master) parameters and soil fertility indicators during 340
agropedogenesis, and (3) should be orthogonal to each other, i.e. independent (or minimally 341
dependent) of one other (Kozlovskii, 1999), modified). Note that, in reality all soil properties are at 342
least partly dependent on each other. Nonetheless, the last prerequisite – orthogonality – ensures the 343
best separation of soils in multi-dimensional space (see below) and reduces the redundancy of the 344
properties. 345
Considering the three prerequisites and based on expert knowledge, as well as on phase diagrams 346
(see below), we suggest soil depth (A+BA horizons) and 8 properties as being master (Table 3): 347
Density,; Macroaggregates, SOM, C/N ratio, pH, EC, Microbial biomass C, and Basal respiration. 348
We consider these 8 9 to be sufficient to describe the degradation state of most other parameters 349
during agropedogenesis and to define their multi-dimensional attractor space (see below). Their 350
definition enables assessing the other properties: water permeability, penetration resistance, 351
erodibility, base saturation, exchangeable sodium percentage, sodium absorption ratio, N 352
mineralization, availability of other nutrients, etc. 353
The combination of master properties provides a minimum dataset to determine soil 354
development stages with cultivation duration (Andrews et al., 2002). Organic C content is the most 355
important and universally accepted master property that directly and indirectly determines the state of 356
many physical (soil structure, density, porosity, water holding capacity, percolation rate, erodibility) 357
(Andrews et al., 2003; Nabiollahi et al., 2017; Seybold et al., 1997; Shpedt et al., 2017), chemical 358
(nutrient availability, sorption capacity, pH) (Lal, 2006; Minasny and Hartemink, 2011), and 359
biological (biodiversity, microbial biomass, basal respiration) (Raiesi, 2017) properties. The values of 360
the mentioned secondary properties can be estimated with an acceptable uncertainty based on robust 361
data on SOM content (Gharahi Ghehi et al., 2012). Finding additional soil properties beyond SOM to 362
form the set of master properties is, however, not straightforward (Homburg et al., 2005) because it 363
depends on the desired soil functions (Andrews et al., 2003) such as nutrient availability, water 364
permeability and holding capacity, crop yield quantity and quality, etc. (Andrews et al., 2002). 365
Therefore, various types of master properties, depending on geo-climatological conditions (Cannell 366
13
and Hawes, 1994), have already been suggested (Table 3). Nonetheless, the dynamics, sensitivity and 367
resistance of such properties to degradation and with cultivation duration are remain unknown 368
(Guillaume et al., 2016b). 369
370
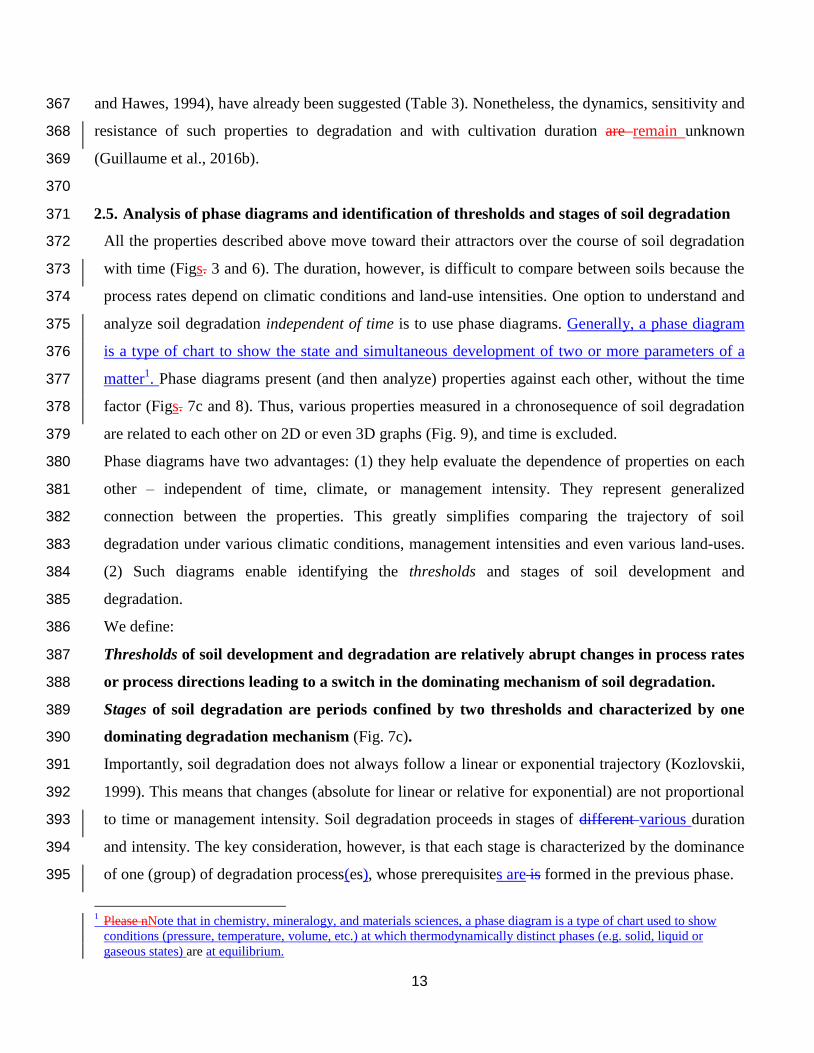
2.5. Analysis of phase diagrams and identification of thresholds and stages of soil degradation 371
All the properties described above move toward their attractors over the course of soil degradation 372
with time (Figs. 3 and 6). The duration, however, is difficult to compare between soils because the 373
process rates depend on climatic conditions and land-use intensities. One option to understand and 374
analyze soil degradation independent of time is to use phase diagrams. Generally, a phase diagram 375
is a type of chart to show the state and simultaneous development of two or more parameters of a 376
matter1. Phase diagrams present (and then analyze) properties against each other, without the time 377
factor (Figs. 7c and 8). Thus, various properties measured in a chronosequence of soil degradation 378
are related to each other on 2D or even 3D graphs (Fig. 9), and time is excluded. 379
Phase diagrams have two advantages: (1) they help evaluate the dependence of properties on each 380
other – independent of time, climate, or management intensity. They represent generalized 381
connection between the properties. This greatly simplifies comparing the trajectory of soil 382
degradation under various climatic conditions, management intensities and even various land-uses. 383
(2) Such diagrams enable identifying the thresholds and stages of soil development and 384
degradation. 385
We define: 386
Thresholds of soil development and degradation are relatively abrupt changes in process rates 387
or process directions leading to a switch in the dominating mechanism of soil degradation. 388
Stages of soil degradation are periods confined by two thresholds and characterized by one 389
dominating degradation mechanism (Fig. 7c). 390
Importantly, soil degradation does not always follow a linear or exponential trajectory (Kozlovskii, 391
1999). This means that changes (absolute for linear or relative for exponential) are not proportional 392
to time or management intensity. Soil degradation proceeds in stages of different various duration 393
and intensity. The key consideration, however, is that each stage is characterized by the dominance 394
of one (group) of degradation process(es), whose prerequisites are is formed in the previous phase. 395
1 Please nNote that in chemistry, mineralogy, and materials sciences, a phase diagram is a type of chart used to show
conditions (pressure, temperature, volume, etc.) at which thermodynamically distinct phases (e.g. solid, liquid or
gaseous states) are at equilibrium.
14
We conclude that phase diagrams (1) enable tracing the trajectory of various soil properties as they 396
reach their attractors, independent of time, land-use or management intensity, and (2) are useful into 397
analyze not only the dependence (or at least correlation) between individual properties, but also to 398
identify the thresholds of soil degradation. The thresholds clearly show that soil degradation 399
proceeds in stages (Figs. 7c, 8 and 9), each of which is characterized by the dominance of one 400
specific degradation process with its specific rates (and affecting the degradation of related soil 401
properties). 402
403
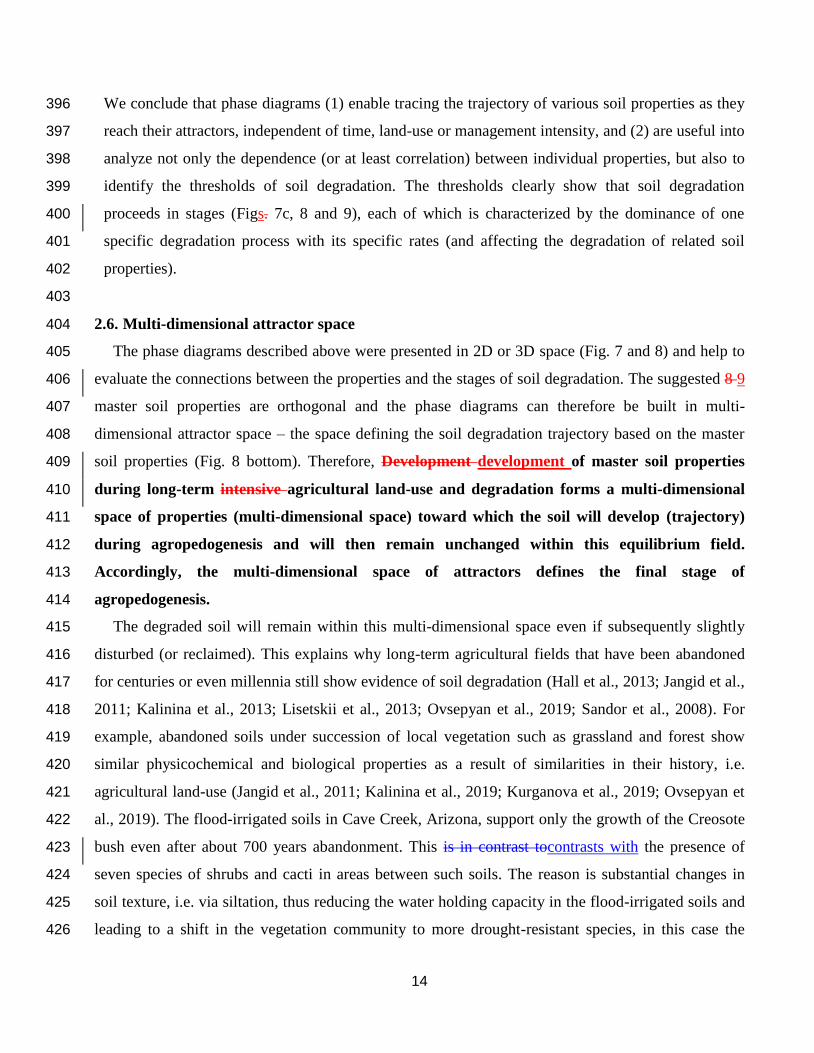
2.6. Multi-dimensional attractor space 404
The phase diagrams described above were presented in 2D or 3D space (Fig. 7 and 8) and help to 405
evaluate the connections between the properties and the stages of soil degradation. The suggested 8 9 406
master soil properties are orthogonal and the phase diagrams can therefore be built in multi-407
dimensional attractor space – the space defining the soil degradation trajectory based on the master 408
soil properties (Fig. 8 bottom). Therefore, Development development of master soil properties 409
during long-term intensive agricultural land-use and degradation forms a multi-dimensional 410
space of properties (multi-dimensional space) toward which the soil will develop (trajectory) 411
during agropedogenesis and will then remain unchanged within this equilibrium field. 412
Accordingly, the multi-dimensional space of attractors defines the final stage of 413
agropedogenesis. 414
The degraded soil will remain within this multi-dimensional space even if subsequently slightly 415
disturbed (or reclaimed). This explains why long-term agricultural fields that have been abandoned 416
for centuries or even millennia still show evidence of soil degradation (Hall et al., 2013; Jangid et al., 417
2011; Kalinina et al., 2013; Lisetskii et al., 2013; Ovsepyan et al., 2019; Sandor et al., 2008). For 418
example, abandoned soils under succession of local vegetation such as grassland and forest show 419
similar physicochemical and biological properties as a result of similarities in their history, i.e. 420
agricultural land-use (Jangid et al., 2011; Kalinina et al., 2019; Kurganova et al., 2019; Ovsepyan et 421
al., 2019). The flood-irrigated soils in Cave Creek, Arizona, support only the growth of the Creosote 422
bush even after about 700 years abandonment. This is in contrast tocontrasts with the presence of 423
seven species of shrubs and cacti in areas between such soils. The reason is substantial changes in 424
soil texture, i.e. via siltation, thus reducing the water holding capacity in the flood-irrigated soils and 425
leading to a shift in the vegetation community to more drought-resistant species, in this case the 426
15
Creosote bush (Hall et al., 2013). While Whereas establishing a no-till system on former pasture-land 427
leads to a decrease in SOM, changing a formerly plowed land to no-till had no such effect (Francis 428
and Knight, 1993). The amidase activity in Colca soils, Peru, is still relatively high 400 years after of 429
land abandonment due to the remaining effect of applied organic amendments on soil 430
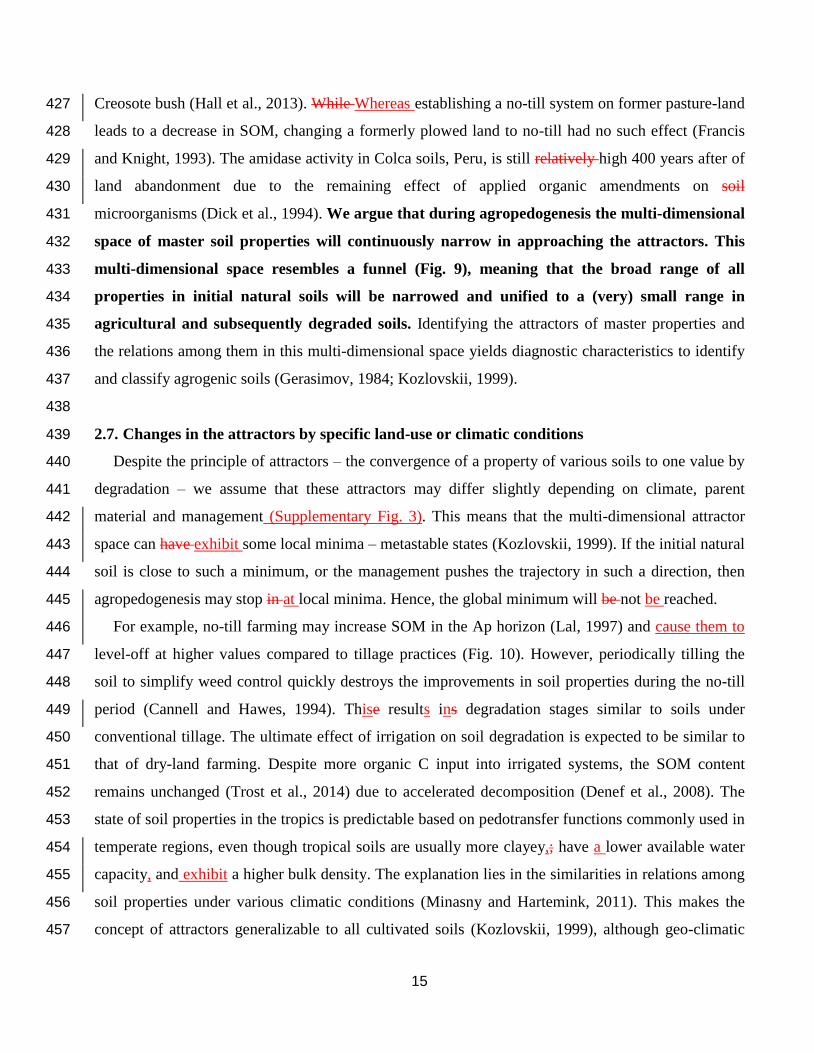
microorganisms (Dick et al., 1994). We argue that during agropedogenesis the multi-dimensional 431
space of master soil properties will continuously narrow in approaching the attractors. This 432
multi-dimensional space resembles a funnel (Fig. 9), meaning that the broad range of all 433
properties in initial natural soils will be narrowed and unified to a (very) small range in 434
agricultural and subsequently degraded soils. Identifying the attractors of master properties and 435
the relations among them in this multi-dimensional space yields diagnostic characteristics to identify 436
and classify agrogenic soils (Gerasimov, 1984; Kozlovskii, 1999). 437
438
2.7. Changes in the attractors by specific land-use or climatic conditions 439
Despite the principle of attractors – the convergence of a property of various soils to one value by 440
degradation – we assume that these attractors may differ slightly depending on climate, parent 441
material and management (Supplementary Fig. 3). This means that the multi-dimensional attractor 442
space can have exhibit some local minima – metastable states (Kozlovskii, 1999). If the initial natural 443
soil is close to such a minimum, or the management pushes the trajectory in such a direction, then 444
agropedogenesis may stop in at local minima. Hence, the global minimum will be not be reached. 445
For example, no-till farming may increase SOM in the Ap horizon (Lal, 1997) and cause them to 446
level-off at higher values compared to tillage practices (Fig. 10). However, periodically tilling the 447
soil to simplify weed control quickly destroys the improvements in soil properties during the no-till 448
period (Cannell and Hawes, 1994). Thise results ins degradation stages similar to soils under 449
conventional tillage. The ultimate effect of irrigation on soil degradation is expected to be similar to 450
that of dry-land farming. Despite more organic C input into irrigated systems, the SOM content 451
remains unchanged (Trost et al., 2014) due to accelerated decomposition (Denef et al., 2008). The 452
state of soil properties in the tropics is predictable based on pedotransfer functions commonly used in 453
temperate regions, even though tropical soils are usually more clayey,; have a lower available water 454
capacity, and exhibit a higher bulk density. The explanation lies in the similarities in relations among 455
soil properties under various climatic conditions (Minasny and Hartemink, 2011). This makes the 456
concept of attractors generalizable to all cultivated soils (Kozlovskii, 1999), although geo-climatic 457
16
conditions and specific managements may modify the attractor values and affect the rates of soil 458
degradation following cultivation (Tiessen et al., 1994). 459
460
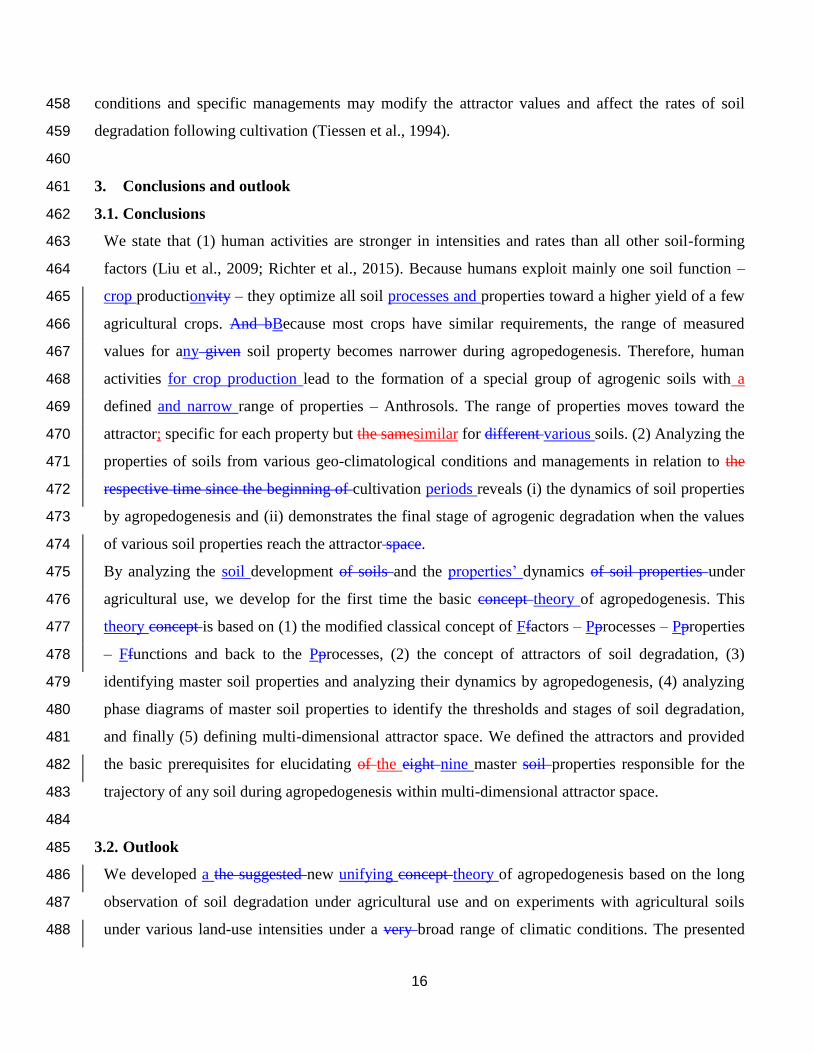
3. Conclusions and outlook 461
3.1. Conclusions 462
We state that (1) human activities are stronger in intensities and rates than all other soil-forming 463
factors (Liu et al., 2009; Richter et al., 2015). Because humans exploit mainly one soil function – 464
crop productionvity – they optimize all soil processes and properties toward a higher yield of a few 465
agricultural crops. And bBecause most crops have similar requirements, the range of measured 466
values for any given soil property becomes narrower during agropedogenesis. Therefore, human 467
activities for crop production lead to the formation of a special group of agrogenic soils with a 468
defined and narrow range of properties – Anthrosols. The range of properties moves toward the 469
attractor; specific for each property but the samesimilar for different various soils. (2) Analyzing the 470
properties of soils from various geo-climatological conditions and managements in relation to the 471
respective time since the beginning of cultivation periods reveals (i) the dynamics of soil properties 472
by agropedogenesis and (ii) demonstrates the final stage of agrogenic degradation when the values 473
of various soil properties reach the attractor space. 474
By analyzing the soil development of soils and the properties’ dynamics of soil properties under 475
agricultural use, we develop for the first time the basic concept theory of agropedogenesis. This 476
theory concept is based on (1) the modified classical concept of Ffactors – Pprocesses – Pproperties 477
– Ffunctions and back to the Pprocesses, (2) the concept of attractors of soil degradation, (3) 478
identifying master soil properties and analyzing their dynamics by agropedogenesis, (4) analyzing 479
phase diagrams of master soil properties to identify the thresholds and stages of soil degradation, 480
and finally (5) defining multi-dimensional attractor space. We defined the attractors and provided 481
the basic prerequisites for elucidating of the eight nine master soil properties responsible for the 482
trajectory of any soil during agropedogenesis within multi-dimensional attractor space. 483
484
3.2. Outlook 485
We developed a the suggested new unifying concept theory of agropedogenesis based on the long 486
observation of soil degradation under agricultural use and on experiments with agricultural soils 487
under various land-use intensities under a very broad range of climatic conditions. The presented 488
17
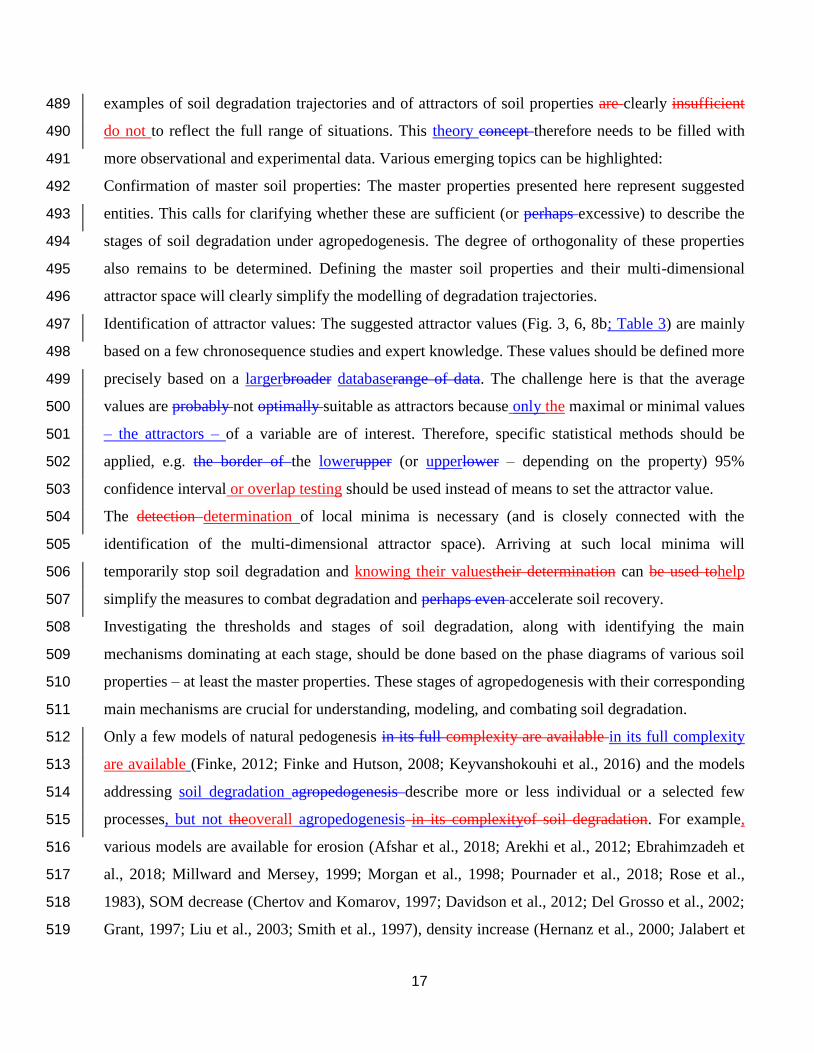
examples of soil degradation trajectories and of attractors of soil properties are clearly insufficient 489
do not to reflect the full range of situations. This theory concept therefore needs to be filled with 490
more observational and experimental data. Various emerging topics can be highlighted: 491
Confirmation of master soil properties: The master properties presented here represent suggested 492
entities. This calls for clarifying whether these are sufficient (or perhaps excessive) to describe the 493
stages of soil degradation under agropedogenesis. The degree of orthogonality of these properties 494
also remains to be determined. Defining the master soil properties and their multi-dimensional 495
attractor space will clearly simplify the modelling of degradation trajectories. 496
Identification of attractor values: The suggested attractor values (Fig. 3, 6, 8b; Table 3) are mainly 497
based on a few chronosequence studies and expert knowledge. These values should be defined more 498
precisely based on a largerbroader databaserange of data. The challenge here is that the average 499
values are probably not optimally suitable as attractors because only the maximal or minimal values 500
– the attractors – of a variable are of interest. Therefore, specific statistical methods should be 501
applied, e.g. the border of the lowerupper (or upperlower – depending on the property) 95% 502
confidence interval or overlap testing should be used instead of means to set the attractor value. 503
The detection determination of local minima is necessary (and is closely connected with the 504
identification of the multi-dimensional attractor space). Arriving at such local minima will 505
temporarily stop soil degradation and knowing their valuestheir determination can be used tohelp 506
simplify the measures to combat degradation and perhaps even accelerate soil recovery. 507
Investigating the thresholds and stages of soil degradation, along with identifying the main 508
mechanisms dominating at each stage, should be done based on the phase diagrams of various soil 509
properties – at least the master properties. These stages of agropedogenesis with their corresponding 510
main mechanisms are crucial for understanding, modeling, and combating soil degradation. 511
Only a few models of natural pedogenesis in its full complexity are available in its full complexity 512
are available (Finke, 2012; Finke and Hutson, 2008; Keyvanshokouhi et al., 2016) and the models 513
addressing soil degradation agropedogenesis describe more or less individual or a selected few 514
processes, but not theoverall agropedogenesis in its complexityof soil degradation. For example, 515
various models are available for erosion (Afshar et al., 2018; Arekhi et al., 2012; Ebrahimzadeh et 516
al., 2018; Millward and Mersey, 1999; Morgan et al., 1998; Pournader et al., 2018; Rose et al., 517
1983), SOM decrease (Chertov and Komarov, 1997; Davidson et al., 2012; Del Grosso et al., 2002; 518
Grant, 1997; Liu et al., 2003; Smith et al., 1997), density increase (Hernanz et al., 2000; Jalabert et 519
18
al., 2010; Makovnikova et al., 2017; Shiri et al., 2017; Taalab et al., 2013; Tranter et al., 2007) and 520
other processes due to land-use. ThusThis, calls for complex theory-based models of 521
agropedogenesis are required. 522
523
Author contribution 524
YK and KZ contributed equally on to writing of the paper. 525
526
Competing interest 527
The authors declare that they have no conflict of interest. 528
529
Acknowledgements 530
This paper is devoted to the 90th
anniversary of Dr. Sci. Felix I. Kozlovskii – eminent pedologist and 531
geo-ecologist, who introduced the theory of agropedogenesis more than 30 years ago and was the 532
first to suggest the concept of attractors of soil degradation. We are very thankful for to Prof. Dr. S. 533
Goryachkin for very helpful critical suggestions to the first version of the concept. 534
535
References 536
Afshar, E., Yarnia, M., Bagherzadeh, A., Mirshekari, B. and Haghighi, R. S.: The Effect of Crops 537 Cultivation on Soil Erosion Indices Based on Impelero Model in Northeast Iran, Appl. Ecol. Environ. 538 Res., 16(1), 855–866, doi:10.15666/aeer/1601_855866, 2018. 539
Alletto, L. and Coquet, Y.: Temporal and spatial variability of soil bulk density and near-saturated 540 hydraulic conductivity under two contrasted tillage management systems, Geoderma, 152(1), 85–94, 541 doi:10.1016/j.geoderma.2009.05.023, 2009. 542
Amundson, R. and Jenny, H.: The Place of Humans in the State Factor Theory of Ecosystems and 543 Their Soils, Soil Sci., 151(1), 99, 1991. 544
Andrews, S. S., Karlen, D. L. and Mitchell, J. P.: A comparison of soil quality indexing methods for 545 vegetable production systems in Northern California, Agric. Ecosyst. Environ., 90(1), 25–45, 546 doi:10.1016/S0167-8809(01)00174-8, 2002. 547
Andrews, S. S., Flora, C. B., Mitchell, J. P. and Karlen, D. L.: Growers’ perceptions and acceptance 548 of soil quality indices, Geoderma, 114(3), 187–213, doi:10.1016/S0016-7061(03)00041-7, 2003. 549
Arekhi, S., Niazi, Y. and Kalteh, A. M.: Soil erosion and sediment yield modeling using RS and GIS 550 techniques: a case study, Iran, Arab. J. Geosci., 5(2), 285–296, doi:10.1007/s12517-010-0220-4, 551 2012. 552
19
Askari, M. S. and Holden, N. M.: Quantitative soil quality indexing of temperate arable management 553 systems, Soil Tillage Res., 150(Supplement C), 57–67, doi:10.1016/j.still.2015.01.010, 2015. 554
Ayoubi, S., Mokhtari Karchegani, P., Mosaddeghi, M. R. and Honarjoo, N.: Soil aggregation and 555 organic carbon as affected by topography and land use change in western Iran, Soil Tillage Res., 556 121(Supplement C), 18–26, doi:10.1016/j.still.2012.01.011, 2012. 557
Bidwell, O. W. and Hole, F. D.: Man as a factor of soil formation, Soil Sci., 99(1), 65, 1965. 558
Boix-Fayos, C., Calvo-Cases, A., Imeson, A. C. and Soriano-Soto, M. D.: Influence of soil properties 559 on the aggregation of some Mediterranean soils and the use of aggregate size and stability as land 560 degradation indicators, CATENA, 44(1), 47–67, doi:10.1016/S0341-8162(00)00176-4, 2001. 561
Bosch-Serra, A. D., Padro, R., Boixadera-Bosch, R. R., Orobitg, J. and Yaguee, M. R.: Tillage and 562 slurry over-fertilization affect oribatid mite communities in a semiarid Mediterranean environment, 563 Appl. Soil Ecol., 84, 124–139, doi:10.1016/j.apsoil.2014.06.010, 2014. 564
Breland, T. A. and Eltun, R.: Soil microbial biomass and mineralization of carbon and nitrogen in 565 ecological, integrated and conventional forage and arable cropping systems, Biol. Fertil. Soils, 30(3), 566 193–201, doi:10.1007/s003740050608, 1999. 567
Bryant, R. B. and Galbraith, J. M.: Incorporating Anthropogenic Processes in Soil Classification, in 568 Soil Classification: A Global Desk Reference, edited by H. Eswaran, R. Ahrens, T. J. Rice, and B. A. 569 Stewart, CRC Press, Boca Raton, FL., 2003. 570
Bünemann, E. K., Bongiorno, G., Bai, Z., Creamer, R. E., De Deyn, G., de Goede, R., Fleskens, L., 571 Geissen, V., Kuyper, T. W., Mäder, P., Pulleman, M., Sukkel, W., van Groenigen, J. W. and 572 Brussaard, L.: Soil quality – A critical review, Soil Biol. Biochem., 120, 105–125, 573 doi:10.1016/j.soilbio.2018.01.030, 2018. 574
Burghardt, W., Heintz, D. and Hocke, N.: Soil Fertility Characteristics and Organic Carbon Stock in 575 Soils of Vegetable Gardens Compared with Surrounding Arable Land at the Center of the Urban and 576 Industrial Area of Ruhr, Germany, Eurasian Soil Sci., 51(9), 1067–1079, 577 doi:10.1134/S106422931809003X, 2018. 578
Cannell, R. Q. and Hawes, J. D.: Trends in tillage practices in relation to sustainable crop production 579 with special reference to temperate climates, Soil Tillage Res., 30(2), 245–282, doi:10.1016/0167-580 1987(94)90007-8, 1994. 581
Carducci, C. E., Zinn, Y. L., Rossoni, D. F., Heck, R. J. and Oliveira, G. C.: Visual analysis and X-582 ray computed tomography for assessing the spatial variability of soil structure in a cultivated Oxisol, 583 Soil Tillage Res., 173(Supplement C), 15–23, doi:10.1016/j.still.2016.03.006, 2017. 584
Carozza, J.-M., Galop, D., Metailie, J.-P., Vanniere, B., Bossuet, G., Monna, F., Lopez-Saez, J. A., 585 Arnauld, M.-C., Breuil, V., Forne, M. and Lemonnier, E.: Landuse and soil degradation in the 586 southern Maya lowlands, from Pre-Classic to Post-Classic times: The case of La Joyanca (Petén, 587 Guatemala), Geodin. Acta, 20(4), 195–207, doi:10.3166/ga.20.195-207, 2007. 588
Celik, I.: Land-use effects on organic matter and physical properties of soil in a southern 589 Mediterranean highland of Turkey, Soil Tillage Res., 83(2), 270–277, doi:10.1016/j.still.2004.08.001, 590 2005. 591
20
Chadwick, O. A. and Chorover, J.: The chemistry of pedogenic thresholds, Geoderma, 100(3–4), 592 321–353, doi:10.1016/S0016-7061(01)00027-1, 2001. 593
Chen, L.-M., Zhang, G.-L. and Effland, W. R.: Soil Characteristic Response Times and Pedogenic 594 Thresholds during the 1000-Year Evolution of a Paddy Soil Chronosequence, Soil Sci. Soc. Am. J., 595 75(5), 1807–1820, doi:10.2136/sssaj2011.0006, 2011. 596
Cheng, Y.-Q., Yang, L.-Z., Cao, Z.-H., Ci, E. and Yin, S.: Chronosequential changes of selected 597 pedogenic properties in paddy soils as compared with non-paddy soils, Geoderma, 151(1), 31–41, 598 doi:10.1016/j.geoderma.2009.03.016, 2009. 599
Chertov, O. G. and Komarov, A. S.: SOMM: A model of soil organic matter dynamics, Ecol. Model., 600 94(2–3), 177–189, doi:10.1016/S0304-3800(96)00017-8, 1997. 601
Dalal, R. and J. Mayer, R.: Long term trends in fertility of soils under continuous cultivation and 602 cereal cropping in southern Queensland. II. Total organic carbon and its rate of loss from the soil 603 profile, Aust. J. Soil Res. - AUST J SOIL RES, 24, 281–292, doi:10.1071/SR9860281, 1986. 604
Dalal, R. and Mayer, R.: Long-term trends in fertility of soils under continuous cultivation and cereal 605 cropping in southern Queensland. IV. Loss of organic carbon for different density functions., Aust. J. 606 Soil Res. - AUST J SOIL RES, 24, 281–292, doi:10.1071/SR9860301, 1986a. 607
Dalal, R. C. and Mayer, R. J.: Long term trends in fertility of soils under continuous cultivation and 608 cereal cropping in southern Queensland .V. Rate of loss of total nitrogen from the soil profile and 609 changes in carbon : nitrogen ratios, Soil Res., 24(4), 493–504, doi:10.1071/sr9860493, 1986b. 610
Davidson, E. A., Samanta, S., Caramori, S. S. and Savage, K.: The Dual Arrhenius and Michaelis-611 Menten kinetics model for decomposition of soil organic matter at hourly to seasonal time scales, 612 Glob. Change Biol., 18(1), 371–384, doi:10.1111/j.1365-2486.2011.02546.x, 2012. 613
Dazzi, C. and Monteleone, S.: Anthropogenic processes in the evolution of a soil chronosequence 614 on marly-limestone substrata in an Italian Mediterranean environment, Geoderma, 141(3), 201–209, 615 doi:10.1016/j.geoderma.2007.05.016, 2007. 616
Dehaan, R. L. and Taylor, G. R.: Field-derived spectra of salinized soils and vegetation as indicators 617 of irrigation-induced soil salinization, Remote Sens. Environ., 80(3), 406–417, doi:10.1016/S0034-618 4257(01)00321-2, 2002. 619
Del Grosso, S., Ojima, D., Parton, W., Mosier, A., Peterson, G. and Schimel, D.: Simulated effects of 620 dryland cropping intensification on soil organic matter and greenhouse gas exchanges using the 621 DAYCENT ecosystem model, Environ. Pollut., 116, S75–S83, doi:10.1016/S0269-7491(01)00260-3, 622 2002. 623
DeLong, C., Cruse, R. and Wiener, J.: The Soil Degradation Paradox: Compromising Our 624 Resources When We Need Them the Most, Sustainability, 7(1), 866–879, doi:10.3390/su7010866, 625 2015. 626
Denef, K., Stewart, C. E., Brenner, J. and Paustian, K.: Does long-term center-pivot irrigation 627 increase soil carbon stocks in semi-arid agro-ecosystems?, Geoderma, 145(1–2), 121–129, 628 doi:10.1016/j.geoderma.2008.03.002, 2008. 629
21
Diamond, J.: Evolution, consequences and future of plant and animal domestication, Nature, 630 doi:10.1038/nature01019, 2002. 631
Dick, R. P., Sandor, J. A. and Eash, N. S.: Soil enzyme activities after 1500 years of terrace 632 agriculture in the Colca Valley, Peru, Agric. Ecosyst. Environ., 50(2), 123–131, doi:10.1016/0167-633 8809(94)90131-7, 1994. 634
Diedhiou, A. G., Dupouey, J.-L., Buée, M., Dambrine, E., Laüt, L. and Garbaye, J.: Response of 635 ectomycorrhizal communities to past Roman occupation in an oak forest, Soil Biol. Biochem., 636 41(10), 2206–2213, doi:10.1016/j.soilbio.2009.08.005, 2009. 637
Dokuchaev, V.: Russian Chernozem, Saint Petersburg., 1883. 638
Dudal, R.: The sixth factor of soil formation, [online] Available from: 639 https://www.researchgate.net/publication/228669778_The_sixth_factor_of_soil_formation (Accessed 640 5 October 2018), 2004. 641
Ebrahimzadeh, S., Motagh, M., Mahboub, V. and Harijani, F. M.: An improved RUSLE/SDR model 642 for the evaluation of soil erosion, Environ. Earth Sci., 77(12), 454, doi:10.1007/s12665-018-7635-8, 643 2018. 644
Eleftheriadis, A., Lafuente, F. and Turrión, M.-B.: Effect of land use, time since deforestation and 645 management on organic C and N in soil textural fractions, Soil Tillage Res., 183, 1–7, 646 doi:10.1016/j.still.2018.05.012, 2018. 647
Ellis, S. and Newsome, D.: Chalkland soil formation and erosion on the Yorkshire Wolds, northern 648 England, Geoderma, 48(1), 59–72, doi:10.1016/0016-7061(91)90006-F, 1991. 649
Emdad, M. R., Raine, S. R., Smith, R. J. and Fardad, H.: Effect of water quality on soil structure and 650 infiltration under furrow irrigation, Irrig. Sci., 23(2), 55–60, doi:10.1007/s00271-004-0093-y, 2004. 651
Fageria, N. K.: Role of Soil Organic Matter in Maintaining Sustainability of Cropping Systems, 652 Commun. Soil Sci. Plant Anal., 43(16), 2063–2113, doi:10.1080/00103624.2012.697234, 2012. 653
FAO: World Food and Agriculture: Statistical Pocketbook, Rome., 2018. 654
Finke, P. A.: Modeling the genesis of luvisols as a function of topographic position in loess parent 655 material, Quat. Int., 265, 3–17, doi:10.1016/j.quaint.2011.10.016, 2012. 656
Finke, P. A. and Hutson, J. L.: Modelling soil genesis in calcareous loess, Geoderma, 145(3–4), 657 462–479, doi:10.1016/j.geoderma.2008.01.017, 2008. 658
Flynn, D. F. B., Gogol-Prokurat, M., Nogeire, T., Molinari, N., Richers, B. T., Lin, B. B., Simpson, N., 659 Mayfield, M. M. and DeClerck, F.: Loss of functional diversity under land use intensification across 660 multiple taxa, Ecol. Lett., 12(1), 22–33, doi:10.1111/j.1461-0248.2008.01255.x, 2009. 661
Francis, G. S. and Knight, T. L.: Long-term effects of conventional and no-tillage on selected soil 662 properties and crop yields in Canterbury, New Zealand, Soil Tillage Res., 26(3), 193–210, 663 doi:10.1016/0167-1987(93)90044-P, 1993. 664
Gerasimov, I.: The System of Basic Genetic Concepts That Should Be Included in Modern 665 Dokuchayevian Soil Science, Sov. Geogr., 25(1), 1–14, 1984. 666
22
Gerasimov, I. P. and Fridland, V. .: Historical role and current problems of genetical soil science of 667 Dokuchaev, Pochvovedenie, 4, 5–10, 1984. 668
Gharahi Ghehi, N., Nemes, A., Verdoodt, A., Van Ranst, E., Cornelis, W. and Boeckx, P.: 669 Nonparametric techniques for predicting soil bulk density of tropical rainforest topsoils in Rwanda, 670 SOIL Sci. Soc. Am. J., 76(4), 1172–1183, doi:http://dx.doi.org/10.2136/sssaj2011.0330, 2012. 671
Glaser, B., Haumaier, L., Guggenberger, G. and Zech, W.: The “Terra Preta” phenomenon: a model 672 for sustainable agriculture in the humid tropics, Naturwissenschaften, 88(1), 37–41, 673 doi:10.1007/s001140000193, 2001. 674
Glinka, K. D.: Dokuchaiev’s ideas in the development of pedology and cognate sciences., The 675 Academy, Leningrad,., 1927. 676
Govers, G., Vandaele, K., Desmet, P., Poesen, J. and Bunte, K.: The Role of Tillage in Soil 677 Redistribution on Hillslopes, Eur. J. Soil Sci., 45(4), 469–478, doi:10.1111/j.1365-678 2389.1994.tb00532.x, 1994. 679
Grant, R. F.: Changes in soil organic matter under different tillage and rotation: Mathematical 680 modeling in ecosys, Soil Sci. Soc. Am. J., 61(4), 1159–1175, 681 doi:10.2136/sssaj1997.03615995006100040023x, 1997. 682
Guillaume, T., Maranguit, D., Murtilaksono, K. and Kuzyakov, Y.: Sensitivity and resistance of soil 683 fertility indicators to land-use changes: New concept and examples from conversion of Indonesian 684 rainforest to plantations, Ecol. Indic., 67, 49–57, doi:10.1016/j.ecolind.2016.02.039, 2016a. 685
Guillaume, T., Holtkamp, A. M., Damris, M., Brummer, B. and Kuzyakov, Y.: Soil degradation in oil 686 palm and rubber plantations under land resource scarcity, Agric. Ecosyst. Environ., 232, 110–118, 687 doi:10.1016/j.agee.2016.07.002, 2016b. 688
Haas, H. J., Evans, C. E. and Miles, E. F.: Nitrogen and Carbon Changes in Great Plains Soils as 689 Influenced by Cropping and Soil Treatments, U.S. Department of Agriculture., 1957. 690
Hall, S. J., Trujillo, J., Nakase, D., Strawhacker, C., Kruse-Peeples, M., Schaafsma, H. and Briggs, 691 J.: Legacies of Prehistoric Agricultural Practices Within Plant and Soil Properties Across an Arid 692 Ecosystem, Ecosystems, 16(7), 1273–1293, doi:10.1007/s10021-013-9681-0, 2013. 693
Hartemink, A. E.: Assessing Soil Fertility Decline in the Tropics Using Soil Chemical Data, in 694 Advances in Agronomy, vol. 89, pp. 179–225, Academic Press., 2006. 695
Hartemink, A. E. and Bridges, E. M.: The influence of parent material on soil fertility degradation in 696 the coastal plain of Tanzania, Land Degrad. Dev., 6(4), 215–221, doi:10.1002/ldr.3400060403, 697 1995. 698
Henrot, J. and Robertson, G. P.: Vegetation removal in two soils of the humid tropics: Effect on 699 microbial biomass, Soil Biol. Biochem., 26(1), 111–116, doi:10.1016/0038-0717(94)90202-X, 1994. 700
Hernanz, J. L., Peixoto, H., Cerisola, C. and Sanchez-Giron, V.: An empirical model to predict soil 701 bulk density profiles in field conditions using penetration resistance, moisture content and soil depth, 702 J. Terramechanics, 37(4), 167–184, doi:10.1016/S0022-4898(99)00020-8, 2000. 703
23
Holthusen, D., Brandt, A. A., Reichert, J. M. and Horn, R.: Soil porosity, permeability and static and 704 dynamic strength parameters under native forest/grassland compared to no-tillage cropping, Soil 705 Tillage Res., 177, 113–124, doi:10.1016/j.still.2017.12.003, 2018. 706
Homburg, J. A. and Sandor, J. A.: Anthropogenic effects on soil quality of ancient agricultural 707 systems of the American Southwest, CATENA, 85(2), 144–154, doi:10.1016/j.catena.2010.08.005, 708 2011. 709
Homburg, J. A., Sandor, J. A. and Norton, J. B.: Anthropogenic influences on Zuni agricultural soils, 710 Geoarchaeology Int. J., 20(7), 661–693, doi:10.1002/gea.20076, 2005. 711
Horn, R. and Fleige, H.: Risk assessment of subsoil compaction for arable soils in Northwest 712 Germany at farm scale, Soil Tillage Res., 102(2), 201–208, doi:10.1016/j.still.2008.07.015, 2009. 713
Howard, J.: Anthropogenic Soils, Springer International Publishing. [online] Available from: 714 https://www.springer.com/de/book/9783319543307 (Accessed 22 April 2019), 2017. 715
Jalabert, S. S. M., Martin, M. P., Renaud, J.-P., Boulonne, L., Jolivet, C., Montanarella, L. and 716 Arrouays, D.: Estimating forest soil bulk density using boosted regression modelling, Soil Use 717 Manag., 26(4), 516–528, doi:10.1111/j.1475-2743.2010.00305.x, 2010. 718
Jalali, M. and Ranjbar, F.: Effects of sodic water on soil sodicity and nutrient leaching in poultry and 719 sheep manure amended soils, Geoderma, 153(1–2), 194–204, 720 doi:10.1016/j.geoderma.2009.08.004, 2009. 721
Jangid, K., Williams, M. A., Franzluebbers, A. J., Schmidt, T. M., Coleman, D. C. and Whitman, W. 722 B.: Land-use history has a stronger impact on soil microbial community composition than 723 aboveground vegetation and soil properties, Soil Biol. Biochem., 43(10), 2184–2193, 724 doi:10.1016/j.soilbio.2011.06.022, 2011. 725
Jenny, H.: Factors of soil formation: a system of quantitative pedology, McGraw-Hill., 1941. 726
KA-5: Bodenkundliche Kartieranleitung, 5th ed., Schweizerbart’sche, E., Stuttgart., 2005. 727
Kalinina, O., Chertov, O., Dolgikh, A. V., Goryachkin, S. V., Lyuri, D. I., Vormstein, S. and Giani, L.: 728 Self-restoration of post-agrogenic Albeluvisols: Soil development, carbon stocks and dynamics of 729 carbon pools, Geoderma, 207–208, 221–233, doi:10.1016/j.geoderma.2013.05.019, 2013. 730
Kalinina, O., Cherkinsky, A., Chertov, O., Goryachkin, S., Kurganova, I., Lopes de Gerenyu, V., 731 Lyuri, D., Kuzyakov, Y. and Giani, L.: Post-agricultural restoration: Implications for dynamics of soil 732 organic matter pools, CATENA, 181, 104096, doi:10.1016/j.catena.2019.104096, 2019. 733
Karathanasis, A. D. and Wells, K. L.: A Comparison of Mineral Weathering Trends Between Two 734 Management Systems on a Catena of Loess-Derived Soils, Soil Sci. Soc. Am. J., 53(2), 582–588, 735 doi:10.2136/sssaj1989.03615995005300020047x, 1989. 736
KDPR: KDPR: Klassifikazia i Diagnostika Pochv Rossii (Classification and Diagnostics of Soil of 737 Russia), edited by L. L. Shishov, I. I. Lebedeva, M. I. Gerasimova, and V. D. Tonkongov, Smolensk: 738 Oikumena. [online] Available from: http://infosoil.ru/index.php?pageID=clas04mode (Accessed 10 739 September 2018), 2004. 740
24
Keyvanshokouhi, S., Cornu, S., Samouelian, A. and Finke, P.: Evaluating SoilGen2 as a tool for 741 projecting soil evolution induced by global change, Sci. Total Environ., 571, 110–123, 742 doi:10.1016/j.scitotenv.2016.07.119, 2016. 743
Khormali, F., Ajami, M., Ayoubi, S., Srinivasarao, C. and Wani, S. P.: Role of deforestation and 744 hillslope position on soil quality attributes of loess-derived soils in Golestan province, Iran, Agric. 745 Ecosyst. Environ., 134(3), 178–189, doi:10.1016/j.agee.2009.06.017, 2009. 746
Kölbl, A., Schad, P., Jahn, R., Amelung, W., Bannert, A., Cao, Z. H., Fiedler, S., Kalbitz, K., 747 Lehndorff, E., Müller-Niggemann, C., Schloter, M., Schwark, L., Vogelsang, V., Wissing, L. and 748 Kögel-Knabner, I.: Accelerated soil formation due to paddy management on marshlands (Zhejiang 749 Province, China), Geoderma, 228–229(Supplement C), 67–89, 750 doi:10.1016/j.geoderma.2013.09.005, 2014. 751
Kozlovskii, F. I.: The Modeling of Agropedogenesis in Plowed Soils on Mantle Loams, EURASIAN 752 SOIL Sci. CC POCHVOVEDENIE, 32(6), 710–720, 1999. 753
Kurganova, I., Merino, A., Lopes de Gerenyu, V., Barros, N., Kalinina, O., Giani, L. and Kuzyakov, 754 Y.: Mechanisms of carbon sequestration and stabilization by restoration of arable soils after 755 abandonment: A chronosequence study on Phaeozems and Chernozems, Geoderma, 354, 113882, 756 doi:10.1016/j.geoderma.2019.113882, 2019. 757
Lal, R.: Long-term tillage and maize monoculture effects on a tropical Alfisol in western Nigeria. I. 758 Crop yield and soil physical properties, Soil Tillage Res., 42(3), 145–160, doi:10.1016/S0167-759 1987(97)00006-8, 1997. 760
Lal, R.: Soil degradation by erosion, Land Degrad. Dev., 12(6), 519–539, doi:10.1002/ldr.472, 2001. 761
Lal, R.: Climate change, soil carbon dynamics and global food security, in Climate change and 762 global food security, edited by R. Lal, B. A. Stewart, N. Uphoff, and D. O. Hansen, pp. 113–143, 763 CRC Press, Taylor & Francis., 2005. 764
Lal, R.: Enhancing crop yields in the developing countries through restoration of the soil organic 765 carbon pool in agricultural lands, Land Degrad. Dev., 17(2), 197–209, doi:10.1002/ldr.696, 2006. 766
Lal, R.: Soils and sustainable agriculture. A review, Agron. Sustain. Dev., 28(1), 57–64, 767 doi:10.1051/agro:2007025, 2008. 768
Lal, R.: Soil degradation as a reason for inadequate human nutrition, Food Secur., 1(1), 45–57, 769 doi:10.1007/s12571-009-0009-z, 2009. 770
Lal, R.: Restoring Soil Quality to Mitigate Soil Degradation, Sustainability, 7(5), 5875–5895, 771 doi:10.3390/su7055875, 2015. 772
Lemenih, M., Karltun, E. and Olsson, M.: Assessing soil chemical and physical property responses 773 to deforestation and subsequent cultivation in smallholders farming system in Ethiopia, Agric. 774 Ecosyst. Environ., 105(1), 373–386, doi:10.1016/j.agee.2004.01.046, 2005. 775
Lincoln, N., Chadwick, O. and Vitousek, P.: Indicators of soil fertility and opportunities for precontact 776 agriculture in Kona, Hawai’i, Ecosphere, 5(4), art42, doi:10.1890/ES13-00328.1, 2014. 777
25
Lipiec, J., Horn, R., Pietrusiewicz, J. and Siczek, A.: Effects of soil compaction on root elongation 778 and anatomy of different cereal plant species, Soil Tillage Res., 121, 74–81, 779 doi:10.1016/j.still.2012.01.013, 2012. 780
Lisetskii, F., Stolba, V., Ergina, E., Rodionova, M. and Terekhin, E.: Post-agrogenic evolution of soils 781 in ancient Greek land use areas in the Herakleian Peninsula, southwestern Crimea, The Holocene, 782 23(4), 504–514, doi:10.1177/0959683612463098, 2013. 783
Lisetskii, F., Stolba, V. F. and Marininа, O.: Indicators of agricultural soil genesis under varying 784 conditions of land use, Steppe Crimea, Geoderma, 239–240(Supplement C), 304–316, 785 doi:10.1016/j.geoderma.2014.11.006, 2015. 786
Liu, S. G., Bliss, N., Sundquist, E. and Huntington, T. G.: Modeling carbon dynamics in vegetation 787 and soil under the impact of soil erosion and deposition, Glob. Biogeochem. Cycles, 17(2), 1074, 788 doi:10.1029/2002GB002010, 2003. 789
Liu, X., Zhang, W., Zhang, M., Ficklin, D. L. and Wang, F.: Spatio-temporal variations of soil 790 nutrients influenced by an altered land tenure system in China, Geoderma, 152(1), 23–34, 791 doi:10.1016/j.geoderma.2009.05.022, 2009. 792
Lo Papa, G., Palermo, V. and Dazzi, C.: Is land-use change a cause of loss of pedodiversity? The 793 case of the Mazzarrone study area, Sicily, Geomorphology, 135(3), 332–342, 794 doi:10.1016/j.geomorph.2011.02.015, 2011. 795
Lo Papa, G., Palermo, V. and Dazzi, C.: The “genetic erosion” of the soil ecosystem, Int. Soil Water 796 Conserv. Res., 1(1), 11–18, doi:10.1016/S2095-6339(15)30045-9, 2013. 797
Lobe, I., Amelung, W. and Preez, C. C. D.: Losses of carbon and nitrogen with prolonged arable 798 cropping from sandy soils of the South African Highveld, Eur. J. Soil Sci., 52(1), 93–101, 799 doi:10.1046/j.1365-2389.2001.t01-1-00362.x, 2001. 800
Makovnikova, J., Siran, M., Houskova, B., Palka, B. and Jones, A.: Comparison of different models 801 for predicting soil bulk density. Case study - Slovakian agricultural soils, Int. Agrophysics, 31(4), 802 491–498, doi:10.1515/intag-2016-0079, 2017. 803
McBratney, A. B., Mendonça Santos, M. L. and Minasny, B.: On digital soil mapping, Geoderma, 804 117, 3–52, 2003. 805
Meuser, H.: Anthropogenic Soils, in Contaminated Urban Soils, edited by H. Meuser, pp. 121–193, 806 Springer Netherlands, Dordrecht., 2010. 807
Millward, A. A. and Mersey, J. E.: Adapting the RUSLE to model soil erosion potential in a 808 mountainous tropical watershed, Catena, 38(2), 109–129, doi:10.1016/S0341-8162(99)00067-3, 809 1999. 810
Minasny, B. and Hartemink, A. E.: Predicting soil properties in the tropics, Earth-Sci. Rev., 106(1), 811 52–62, doi:10.1016/j.earscirev.2011.01.005, 2011. 812
Morgan, R. P. C., Quinton, J. N., Smith, R. E., Govers, G., Poesen, J. W. A., Auerswald, K., Chisci, 813 G., Torri, D. and Styczen, M. E.: The European Soil Erosion Model (EUROSEM): A dynamic 814 approach for predicting sediment transport from fields and small catchments, Earth Surf. Process. 815
26
Landf., 23(6), 527–544, doi:10.1002/(SICI)1096-9837(199806)23:6<527::AID-ESP868>3.0.CO;2-5, 816 1998. 817
Morrison, R. J. and Gawander, J. S.: Changes in the properties of Fijian Oxisols over 30 years of 818 sugarcane cultivation, Soil Res., 54(4), 418–429, doi:10.1071/SR15173, 2016. 819
Nabiollahi, K., Taghizadeh-Mehrjardi, R., Kerry, R. and Moradian, S.: Assessment of soil quality 820 indices for salt-affected agricultural land in Kurdistan Province, Iran, Ecol. Indic., 83, 482–494, 821 doi:10.1016/j.ecolind.2017.08.001, 2017. 822
Nannipieri, P., Ascher, J., Ceccherini, M. T., Landi, L., Pietramellara, G. and Renella, G.: Microbial 823 diversity and soil functions, Eur. J. Soil Sci., 54(4), 655–670, doi:10.1046/j.1351-0754.2003.0556.x, 824 2003. 825
Nyberg, G., Bargués Tobella, A., Kinyangi, J. and Ilstedt, U.: Soil property changes over a 120-yr 826 chronosequence from forest to agriculture in western Kenya, Hydrol Earth Syst Sci, 16(7), 2085–827 2094, doi:10.5194/hess-16-2085-2012, 2012. 828
Obour, A. K., Mikha, M. M., Holman, J. D. and Stahlman, P. W.: Changes in soil surface chemistry 829 after fifty years of tillage and nitrogen fertilization, Geoderma, 308, 46–53, 830 doi:10.1016/j.geoderma.2017.08.020, 2017. 831
Ovsepyan, L., Kurganova, I., Gerenyu, V. L. de and Kuzyakov, Y.: Recovery of organic matter and 832 microbial biomass after abandonment of degraded agricultural soils: the influence of climate, Land 833 Degrad. Dev., 30(15), 1861–1874, doi:10.1002/ldr.3387, 2019. 834
Pape, J. C.: Plaggen soils in the Netherlands, Geoderma, 4(3), 229–255, doi:10.1016/0016-835 7061(70)90005-4, 1970. 836
Paul, E. A.: Soil Microbiology, Ecology and Biochemistry, Academic Press., 2014. 837
Paz-González, A., Vieira, S. R. and Taboada Castro, M. T.: The effect of cultivation on the spatial 838 variability of selected properties of an umbric horizon, Geoderma, 97(3), 273–292, 839 doi:10.1016/S0016-7061(00)00066-5, 2000. 840
Ponge, J.-F., Peres, G., Guernion, M., Ruiz-Camacho, N., Cortet, J., Pernin, C., Villenave, C., 841 Chaussod, R., Martin-Laurent, F., Bispo, A. and Cluzeau, D.: The impact of agricultural practices on 842 soil biota: A regional study, Soil Biol. Biochem., 67, 271–284, doi:10.1016/j.soilbio.2013.08.026, 843 2013. 844
Pournader, M., Ahmadi, H., Feiznia, S., Karimi, H. and Peirovan, H. R.: Spatial prediction of soil 845 erosion susceptibility: an evaluation of the maximum entropy model, Earth Sci. Inform., 11(3), 389–846 401, doi:10.1007/s12145-018-0338-6, 2018. 847
Raiesi, F.: A minimum data set and soil quality index to quantify the effect of land use conversion on 848 soil quality and degradation in native rangelands of upland arid and semiarid regions, Ecol. Indic., 849 75, 307–320, doi:10.1016/j.ecolind.2016.12.049, 2017. 850
Raiesi, F. and Kabiri, V.: Identification of soil quality indicators for assessing the effect of different 851 tillage practices through a soil quality index in a semi-arid environment, Ecol. Indic., 71, 198–207, 852 doi:10.1016/j.ecolind.2016.06.061, 2016. 853
27
Rasa, K. and Horn, R.: Structure and hydraulic properties of the boreal clay soil under differently 854 managed buffer zones, Soil Use Manag., 29(3), 410–418, doi:10.1111/sum.12043, 2013. 855
Raty, M., Horn, R., Rasa, K., Yli-Halla, M. and Pietola, L.: Compressive behaviour of the soil in 856 buffer zones under different management practices in Finland, Agric. Food Sci., 19(2), 160–172, 857 2010. 858
Rezapour, S. and Samadi, A.: Assessment of inceptisols soil quality following long-term cropping in 859 a calcareous environment, Environ. Monit. Assess., 184(3), 1311–1323, doi:10.1007/s10661-011-860 2042-6, 2012. 861
Richter, D. D. B., Bacon, A. R., Megan, L. M., Richardson, C. J., Andrews, S. S., West, L., Wills, S., 862 Billings, S., Cambardella, C. A., Cavallaro, N., DeMeester, J. E., Franzluebbers, A. J., Grandy, A. S., 863 Grunwald, S., Gruver, J., Hartshorn, A. S., Janzen, H., Kramer, M. G., Ladha, J. K., Lajtha, K., Liles, 864 G. C., Markewitz, D., Megonigal, P. J., Mermut, A. R., Rasmussen, C., Robinson, D. A., Smith, P., 865 Stiles, C. A., Tate, R. L., Thompson, A., Tugel, A. J., Es, H. V., Yaalon, D. and Zobeck, T. M.: 866 Human-soil relations are changing rapidly: Proposals from SSSA’s cross-divisional soil change 867 working group, Soil Sci. Soc. Am. J., 75(6), 2079–2084, doi:10.2136/sssaj2011.0124, 2011. 868
Richter, D. deB, Bacon, A. R., Brecheisen, Z. and Mobley, M. L.: Soil in the Anthropocene, IOP 869 Conf. Ser. Earth Environ. Sci., 25(1), 012010, doi:10.1088/1755-1315/25/1/012010, 2015. 870
Richter, D. deB J.: HUMANITY’S TRANSFORMATION OF EARTH’S SOIL: PEDOLOGY’S NEW 871 FRONTIER, Soil Sci., 172(12), 957, doi:10.1097/ss.0b013e3181586bb7, 2007. 872
Rose, C. W., Williams, J. R., Sander, G. C. and Barry, D. A.: A Mathematical Model of Soil Erosion 873 and Deposition Processes: I. Theory for a Plane Land Element 1, Soil Sci. Soc. Am. J., 47(5), 991–874 995, doi:10.2136/sssaj1983.03615995004700050030x, 1983. 875
Sandor, J., Burras, C. L. and Thompson, M.: Factors of soil formation: human impacts, in 876 Encyclopedia of Soils in the Environment, edited by D. Hillel, pp. 520–532, Elsevier Ltd. [online] 877 Available from: https://www.elsevier.com/books/encyclopedia-of-soils-in-the-878 environment/9780123485304 (Accessed 22 April 2019), 2005. 879
Sandor, J. A. and Homburg, J. A.: Anthropogenic Soil Change in Ancient and Traditional Agricultural 880 Fields in Arid to Semiarid Regions of the Americas, J. Ethnobiol., 37(2), 196–217, doi:10.2993/0278-881 0771-37.2.196, 2017. 882
Sandor, J. A., Hawley, J. W., Schiowitz, R. H. and Gersper, P. L.: Soil-geomorphic setting and 883 change in prehistoric agricultural terraces in the Mimbres area, New Mexico, in Geology of the Gila 884 Wilderness-Silver City area: New Mexico Geological Society Fifty-ninth Annual Field Conference, 885 October 23-25, 2008, pp. 167–176, New Mexico Geological Society, Socorro, N.M., 2008. 886
Sedov, S., Solleiro-Rebolledo, E., Fedick, S. L., Gama-Castro, J., Palacios-Mayorga, S. and Vallejo 887 Gómez, E.: Soil genesis in relation to landscape evolution and ancient sustainable land use in the 888 northeastern Yucatan Peninsula, Mexico, Atti Della Soc. Toscana Sci. Nat. Mem. Ser. A, 112, 115–889 126, 2007. 890
Severiano, E. da C., de Oliveira, G. C., Dias Junior, M. de S., Curi, N., de Pinho Costa, K. A. and 891 Carducci, C. E.: Preconsolidation pressure, soil water retention characteristics, and texture of 892 Latosols in the Brazilian Cerrado, Soil Res., 51(3), 193–202, doi:10.1071/SR12366, 2013. 893
28
Seybold, C. A., Mausbach, M. J., Karlen, D. L. and Rogers, H. H.: Quantification of soil quality, in 894 Soil Processes and the Carbon Cycle, edited by R. Lal, J. M. Kimble, R. F. Follett, and B. A. 895 Stewart, CRC Press, Boca Raton, FL., 1997. 896
Shiri, J., Keshavarzi, A., Kisi, O., Karimi, S. and Iturraran-Viveros, U.: Modeling soil bulk density 897 through a complete data scanning procedure: Heuristic alternatives, J. Hydrol., 549, 592–602, 898 doi:10.1016/j.jhydrol.2017.04.035, 2017. 899
Shpedt, A. A., Trubnikov, Y. N. and Zharinova, N. Y.: Agrogenic degradation of soils in Krasnoyarsk 900 forest-steppe, Eurasian Soil Sci., 50(10), 1209–1216, doi:10.1134/S106422931710012X, 2017. 901
Simonson, R. W.: Outline of a Generalized Theory of Soil Genesis 1, Soil Sci. Soc. Am. J., 23(2), 902 152–156, doi:10.2136/sssaj1959.03615995002300020021x, 1959. 903
Smith, P., Smith, J. U., Powlson, D. S., McGill, W. B., Arah, J. R. M., Chertov, O. G., Coleman, K., 904 Franko, U., Frolking, S., Jenkinson, D. S., Jensen, L. S., Kelly, R. H., Klein-Gunnewiek, H., 905 Komarov, A. S., Li, C., Molina, J. a. E., Mueller, T., Parton, W. J., Thornley, J. H. M. and Whitmore, 906 A. P.: A comparison of the performance of nine soil organic matter models using datasets from 907 seven long-term experiments, Geoderma, 81(1–2), 153–225, doi:10.1016/S0016-7061(97)00087-6, 908 1997. 909
Taalab, K. P., Corstanje, R., Creamer, R. and Whelan, M. J.: Modelling soil bulk density at the 910 landscape scale and its contributions to C stock uncertainty, Biogeosciences, 10(7), 4691–4704, 911 doi:10.5194/bg-10-4691-2013, 2013. 912
Tiessen, H., Cuevas, E. and Chacon, P.: The role of soil organic matter in sustaining soil fertility, 913 Nature, 371(6500), 783–785, doi:10.1038/371783a0, 1994. 914
Tranter, G., Minasny, B., Mcbratney, A. B., Murphy, B., Mckenzie, N. J., Grundy, M. and Brough, D.: 915 Building and testing conceptual and empirical models for predicting soil bulk density, Soil Use 916 Manag., 23(4), 437–443, doi:10.1111/j.1475-2743.2007.00092.x, 2007. 917
Trost, B., Ellmer, F., Baumecker, M., Meyer‐Aurich, A., Prochnow, A. and Drastig, K.: Effects of 918 irrigation and nitrogen fertilizer on yield, carbon inputs from above ground harvest residues and soil 919 organic carbon contents of a sandy soil in Germany, Soil Use Manag., 30(2), 209–218, 920 doi:10.1111/sum.12123, 2014. 921
Tugel, A. J., Herrick, J. E., Brown, J. R., Mausbach, M. J., Puckett, W. and Hipple, K.: Soil Change, 922 Soil Survey, and Natural Resources Decision Making, Soil Sci. Soc. Am. J., 69(3), 738–747, 923 doi:10.2136/sssaj2004.0163, 2005. 924
Velde, B. and Peck, T.: CLAY MINERAL CHANGES IN THE MORROW EXPERIMENTAL PLOTS, 925 UNIVERSITY OF ILLINOIS, Clays Clay Miner., 50(3), 364–370, 2002. 926
Wei, G., Zhou, Z., Guo, Y., Dong, Y., Dang, H., Wang, Y. and Ma, J.: Long-Term Effects of Tillage 927 on Soil Aggregates and the Distribution of Soil Organic Carbon, Total Nitrogen, and Other Nutrients 928 in Aggregates on the Semi-Arid Loess Plateau, China, Arid Land Res. Manag., 28(3), 291–310, 929 doi:10.1080/15324982.2013.845803, 2014. 930
Weiss, H., Courty, M., Wetterstrom, W., Guichard, F., Senior, L., Meadow, R. and Curnow, A.: The 931 Genesis and Collapse of 3rd Millennium North Mesopotamian Civilization, Science, 261(5124), 995–932 1004, doi:10.1126/science.261.5124.995, 1993. 933
29
WRB: World reference base for soil resources 2014: International soil classification system for 934 naming soils and creating legends for soil maps - Update 2015, Food & Agriculture Org., 2014. 935
Yaalon, D. H. and Yaron, B.: Framework for man-made soil changes - an outline of 936 metapedogenesis, Soil Sci., 102(4), 272, 1966. 937
Zakharov, S. A.: A Course of Soil Science, Gosizdat, Moscow., 1927. 938
Zamanian, K. and Kuzyakov, Y.: Contribution of soil inorganic carbon to atmospheric CO2: More 939 important than previously thought, Glob. Change Biol., 25(1), E1–E3, doi:10.1111/gcb.14463, 2019. 940
Zhang, Y., Zhao, W. and Fu, L.: Soil macropore characteristics following conversion of native desert 941 soils to irrigated croplands in a desert-oasis ecotone, Northwest China, Soil Tillage Res., 168, 176–942 186, doi:10.1016/j.still.2017.01.004, 2017. 943
944
945
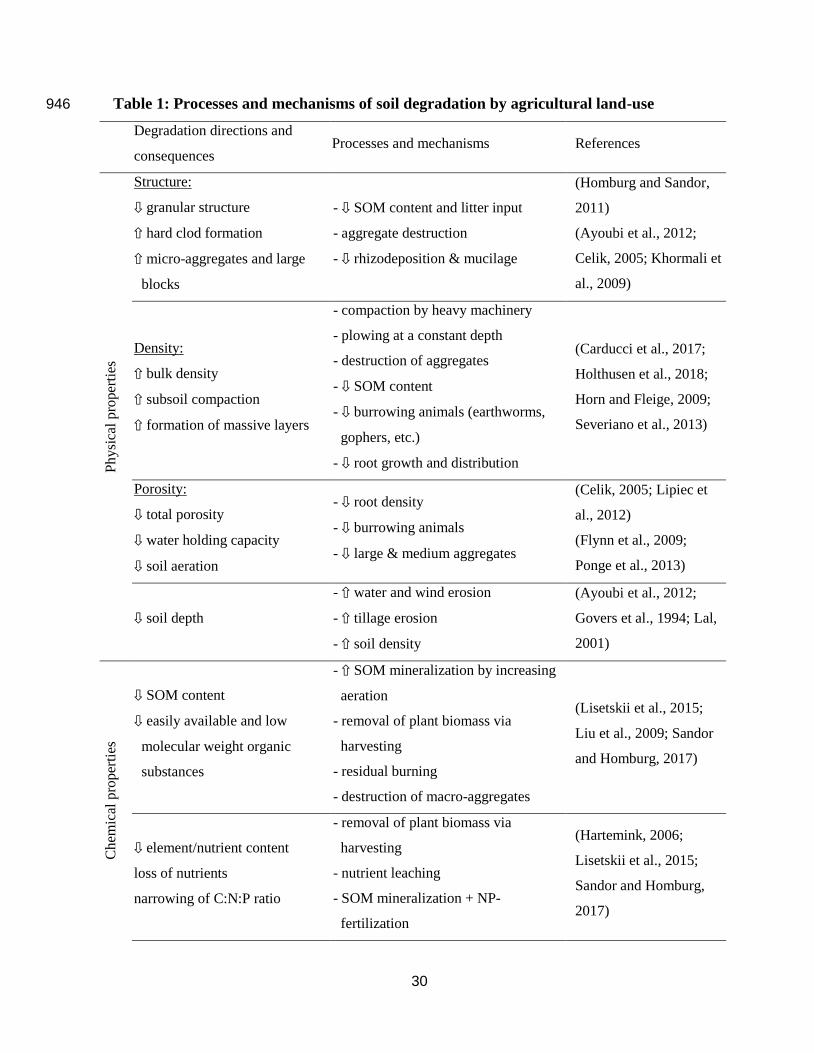
30
Table 1: Processes and mechanisms of soil degradation by agricultural land-use 946
Degradation directions and
consequences Processes and mechanisms References
Physi
cal
pro
per
ties
Structure:
⇩ granular structure
⇧ hard clod formation
⇧ micro-aggregates and large
blocks
- ⇩ SOM content and litter input
- aggregate destruction
- ⇩ rhizodeposition & mucilage
(Homburg and Sandor,
2011)
(Ayoubi et al., 2012;
Celik, 2005; Khormali et
al., 2009)
Density:
⇧ bulk density
⇧ subsoil compaction
⇧ formation of massive layers
- compaction by heavy machinery
- plowing at a constant depth
- destruction of aggregates
- ⇩ SOM content
- ⇩ burrowing animals (earthworms,
gophers, etc.)
- ⇩ root growth and distribution
(Carducci et al., 2017;
Holthusen et al., 2018;
Horn and Fleige, 2009;
Severiano et al., 2013)
Porosity:
⇩ total porosity
⇩ water holding capacity
⇩ soil aeration
- ⇩ root density
- ⇩ burrowing animals
- ⇩ large & medium aggregates
(Celik, 2005; Lipiec et
al., 2012)
(Flynn et al., 2009;
Ponge et al., 2013)
⇩ soil depth
- ⇧ water and wind erosion
- ⇧ tillage erosion
- ⇧ soil density
(Ayoubi et al., 2012;
Govers et al., 1994; Lal,
2001)
Ch
emic
al p
rop
erti
es
⇩ SOM content
⇩ easily available and low
molecular weight organic
substances
- ⇧ SOM mineralization by increasing
aeration
- removal of plant biomass via
harvesting
- residual burning
- destruction of macro-aggregates
(Lisetskii et al., 2015;
Liu et al., 2009; Sandor
and Homburg, 2017)
⇩ element/nutrient content
loss of nutrients
narrowing of C:N:P ratio
- removal of plant biomass via
harvesting
- nutrient leaching
- SOM mineralization + NP-
fertilization
(Hartemink, 2006;
Lisetskii et al., 2015;
Sandor and Homburg,
2017)
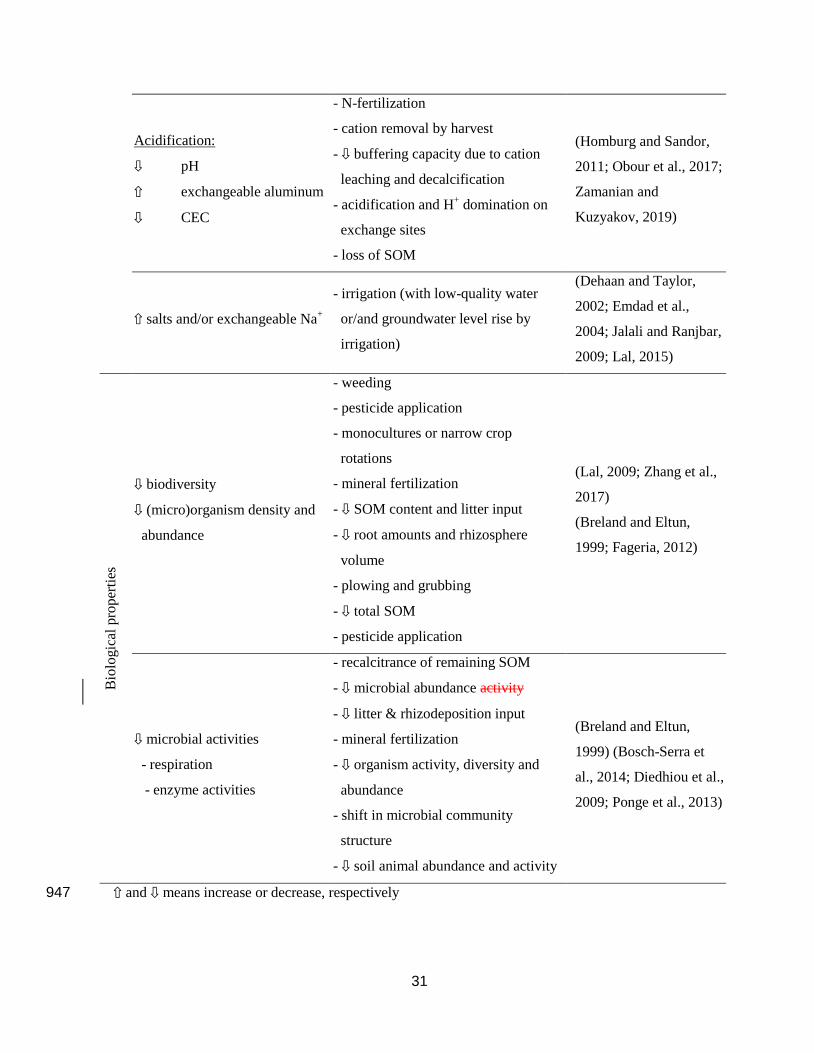
31
Acidification:
⇩ pH
⇧ exchangeable aluminum
⇩ CEC
- N-fertilization
- cation removal by harvest
- ⇩ buffering capacity due to cation
leaching and decalcification
- acidification and H+ domination on
exchange sites
- loss of SOM
(Homburg and Sandor,
2011; Obour et al., 2017;
Zamanian and
Kuzyakov, 2019)
⇧ salts and/or exchangeable Na+
- irrigation (with low-quality water
or/and groundwater level rise by
irrigation)
(Dehaan and Taylor,
2002; Emdad et al.,
2004; Jalali and Ranjbar,
2009; Lal, 2015)
Bio
logic
al p
roper
ties
⇩ biodiversity
⇩ (micro)organism density and
abundance
- weeding
- pesticide application
- monocultures or narrow crop
rotations
- mineral fertilization
- ⇩ SOM content and litter input
- ⇩ root amounts and rhizosphere
volume
- plowing and grubbing
- ⇩ total SOM
- pesticide application
(Lal, 2009; Zhang et al.,
2017)
(Breland and Eltun,
1999; Fageria, 2012)
⇩ microbial activities
- respiration
- enzyme activities
- recalcitrance of remaining SOM
- ⇩ microbial abundance activity
- ⇩ litter & rhizodeposition input
- mineral fertilization
- ⇩ organism activity, diversity and
abundance
- shift in microbial community
structure
- ⇩ soil animal abundance and activity
(Breland and Eltun,
1999) (Bosch-Serra et
al., 2014; Diedhiou et al.,
2009; Ponge et al., 2013)
⇧ and ⇩ means increase or decrease, respectively 947
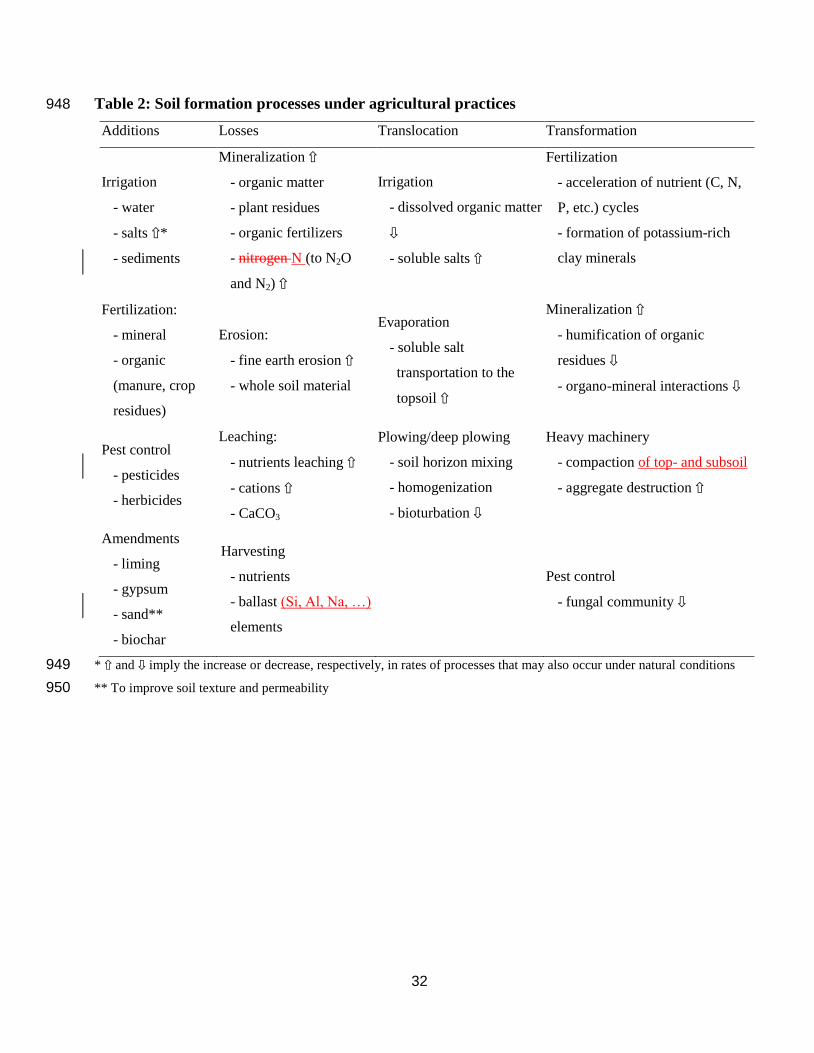
32
Table 2: Soil formation processes under agricultural practices 948
Additions Losses Translocation Transformation
Irrigation
- water
- salts ⇧*
- sediments
Mineralization ⇧
- organic matter
- plant residues
- organic fertilizers
- nitrogen N (to N2O
and N2) ⇧
Irrigation
- dissolved organic matter
⇩
- soluble salts ⇧
Fertilization
- acceleration of nutrient (C, N,
P, etc.) cycles
- formation of potassium-rich
clay minerals
Fertilization:
- mineral
- organic
(manure, crop
residues)
Erosion:
- fine earth erosion ⇧
- whole soil material
Evaporation
- soluble salt
transportation to the
topsoil ⇧
Mineralization ⇧
- humification of organic
residues ⇩
- organo-mineral interactions ⇩
Pest control
- pesticides
- herbicides
Leaching:
- nutrients leaching ⇧
- cations ⇧
- CaCO3
Plowing/deep plowing
- soil horizon mixing
- homogenization
- bioturbation ⇩
Heavy machinery
- compaction of top- and subsoil
- aggregate destruction ⇧
Amendments
- liming
- gypsum
- sand**
- biochar
Harvesting
- nutrients
- ballast (Si, Al, Na, …)
elements
Pest control
- fungal community ⇩
* ⇧ and ⇩ imply the increase or decrease, respectively, in rates of processes that may also occur under natural conditions 949
** To improve soil texture and permeability 950
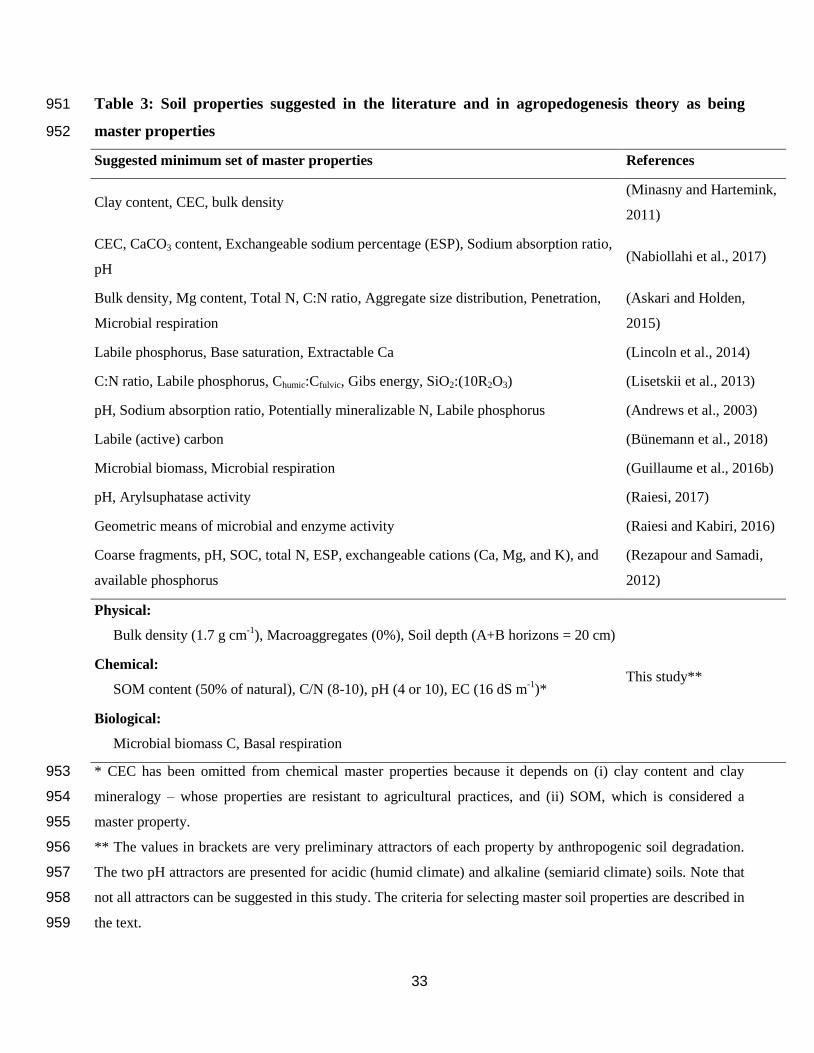
33
Table 3: Soil properties suggested in the literature and in agropedogenesis theory as being 951
master properties 952
Suggested minimum set of master properties References
Clay content, CEC, bulk density (Minasny and Hartemink,
2011)
CEC, CaCO3 content, Exchangeable sodium percentage (ESP), Sodium absorption ratio,
pH (Nabiollahi et al., 2017)
Bulk density, Mg content, Total N, C:N ratio, Aggregate size distribution, Penetration,
Microbial respiration
(Askari and Holden,
2015)
Labile phosphorus, Base saturation, Extractable Ca (Lincoln et al., 2014)
C:N ratio, Labile phosphorus, Chumic:Cfulvic, Gibs energy, SiO2:(10R2O3) (Lisetskii et al., 2013)
pH, Sodium absorption ratio, Potentially mineralizable N, Labile phosphorus (Andrews et al., 2003)
Labile (active) carbon (Bünemann et al., 2018)
Microbial biomass, Microbial respiration (Guillaume et al., 2016b)
pH, Arylsuphatase activity (Raiesi, 2017)
Geometric means of microbial and enzyme activity (Raiesi and Kabiri, 2016)
Coarse fragments, pH, SOC, total N, ESP, exchangeable cations (Ca, Mg, and K), and
available phosphorus
(Rezapour and Samadi,
2012)
Physical:
Bulk density (1.7 g cm-1
), Macroaggregates (0%), Soil depth (A+B horizons = 20 cm)
This study** Chemical:
SOM content (50% of natural), C/N (8-10), pH (4 or 10), EC (16 dS m-1
)*
Biological:
Microbial biomass C, Basal respiration
* CEC has been omitted from chemical master properties because it depends on (i) clay content and clay 953
mineralogy – whose properties are resistant to agricultural practices, and (ii) SOM, which is considered a 954
master property. 955
** The values in brackets are very preliminary attractors of each property by anthropogenic soil degradation. 956
The two pH attractors are presented for acidic (humid climate) and alkaline (semiarid climate) soils. Note that 957
not all attractors can be suggested in this study. The criteria for selecting master soil properties are described in 958
the text. 959
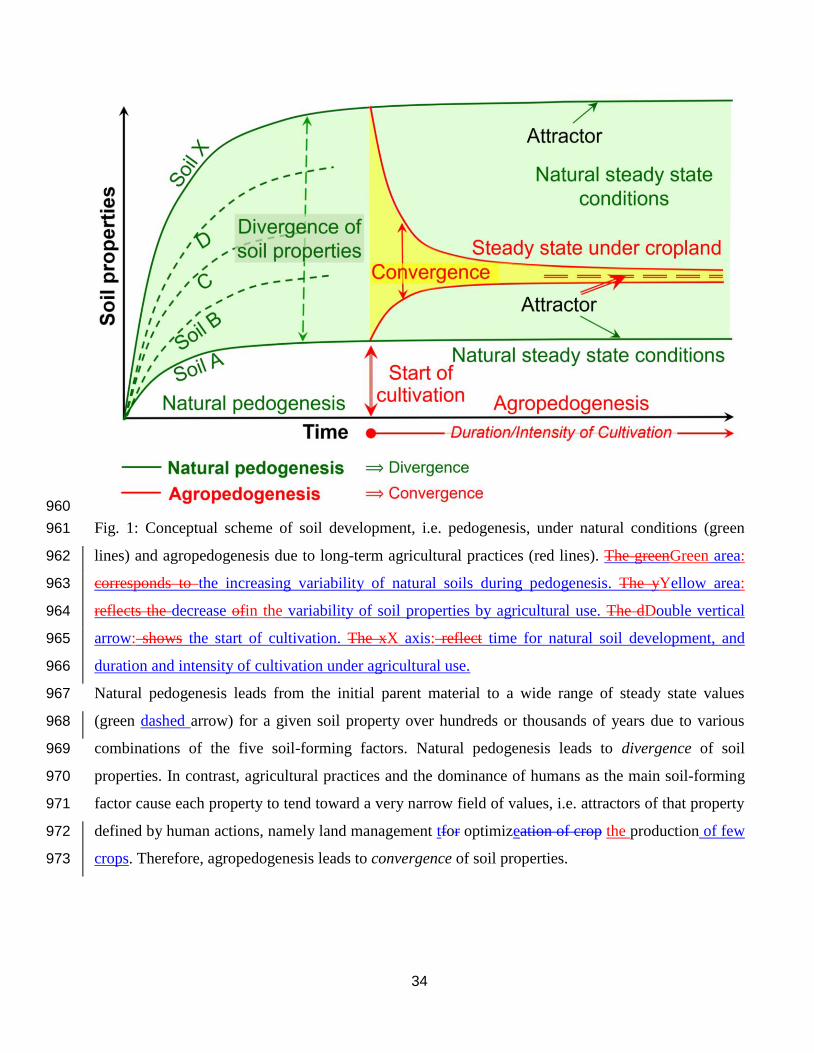
34
960
Fig. 1: Conceptual scheme of soil development, i.e. pedogenesis, under natural conditions (green 961
lines) and agropedogenesis due to long-term agricultural practices (red lines). The greenGreen area: 962
corresponds to the increasing variability of natural soils during pedogenesis. The yYellow area: 963
reflects the decrease ofin the variability of soil properties by agricultural use. The dDouble vertical 964
arrow: shows the start of cultivation. The xX axis: reflect time for natural soil development, and 965
duration and intensity of cultivation under agricultural use. 966
Natural pedogenesis leads from the initial parent material to a wide range of steady state values 967
(green dashed arrow) for a given soil property over hundreds or thousands of years due to various 968
combinations of the five soil-forming factors. Natural pedogenesis leads to divergence of soil 969
properties. In contrast, agricultural practices and the dominance of humans as the main soil-forming 970
factor cause each property to tend toward a very narrow field of values, i.e. attractors of that property 971
defined by human actions, namely land management tfor optimizeation of crop the production of few 972
crops. Therefore, agropedogenesis leads to convergence of soil properties. 973
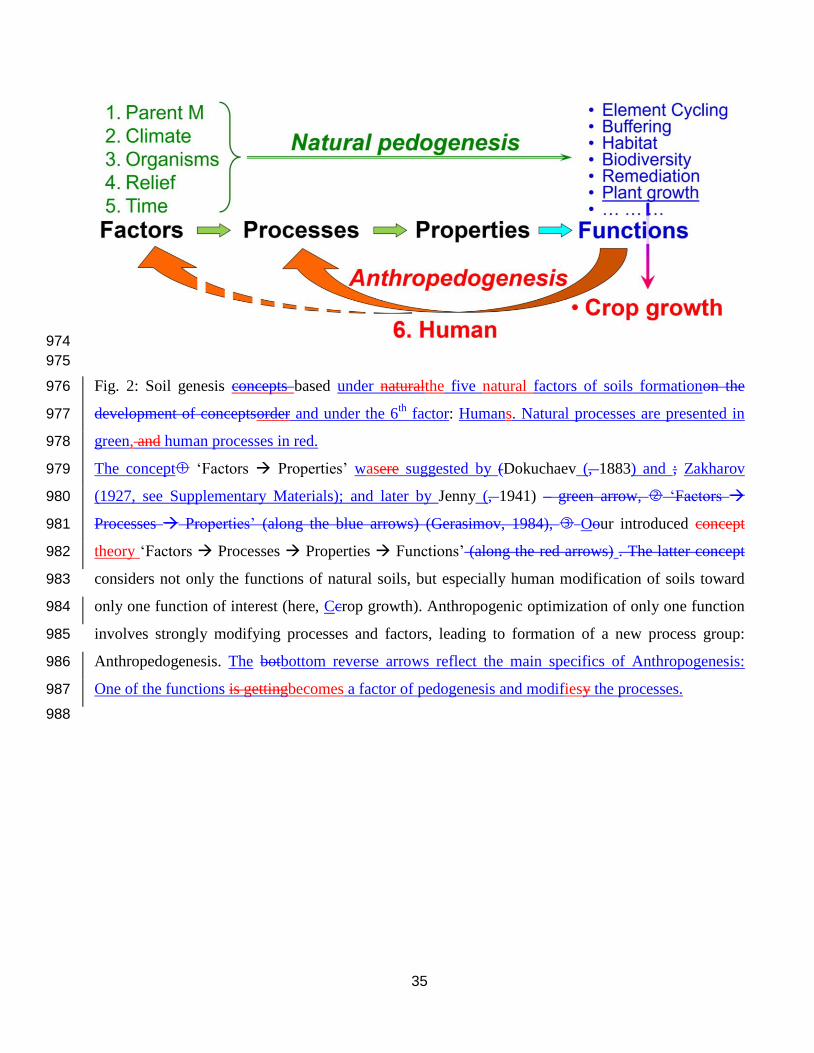
35
974
975
Fig. 2: Soil genesis concepts based under naturalthe five natural factors of soils formationon the 976
development of conceptsorder and under the 6th
factor: Humans. Natural processes are presented in 977
green, and human processes in red. 978
The concept ‘Factors Properties’ wasere suggested by (Dokuchaev (, 1883) and ; Zakharov 979
(1927, see Supplementary Materials); and later by Jenny (, 1941) – green arrow, ‘Factors 980
Processes Properties’ (along the blue arrows) (Gerasimov, 1984), Oour introduced concept 981
theory ‘Factors Processes Properties Functions’ (along the red arrows) . The latter concept 982
considers not only the functions of natural soils, but especially human modification of soils toward 983
only one function of interest (here, Ccrop growth). Anthropogenic optimization of only one function 984
involves strongly modifying processes and factors, leading to formation of a new process group: 985
Anthropedogenesis. The botbottom reverse arrows reflect the main specifics of Anthropogenesis: 986
One of the functions is gettingbecomes a factor of pedogenesis and modifiesy the processes. 987
988
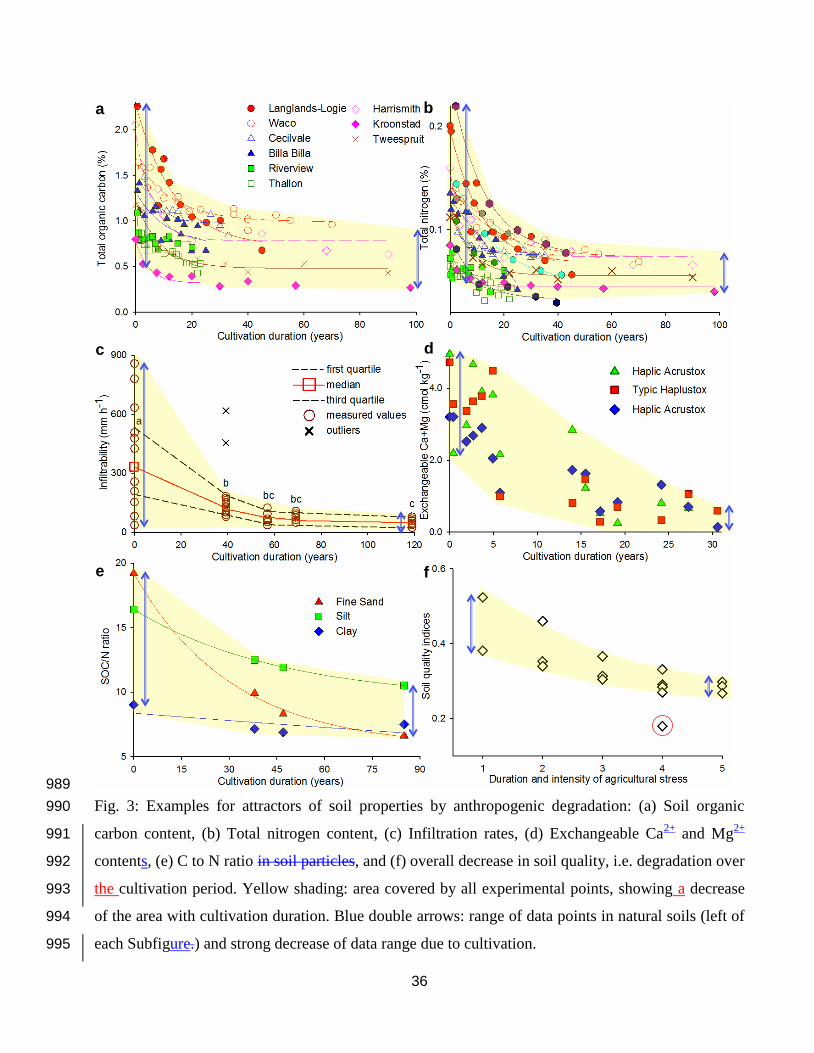
36
989
Fig. 3: Examples for attractors of soil properties by anthropogenic degradation: (a) Soil organic 990
carbon content, (b) Total nitrogen content, (c) Infiltration rates, (d) Exchangeable Ca2+
and Mg2+
991
contents, (e) C to N ratio in soil particles, and (f) overall decrease in soil quality, i.e. degradation over 992
the cultivation period. Yellow shading: area covered by all experimental points, showing a decrease 993
of the area with cultivation duration. Blue double arrows: range of data points in natural soils (left of 994
each Subfigure.) and strong decrease of data range due to cultivation. 995
a b
c d
e f
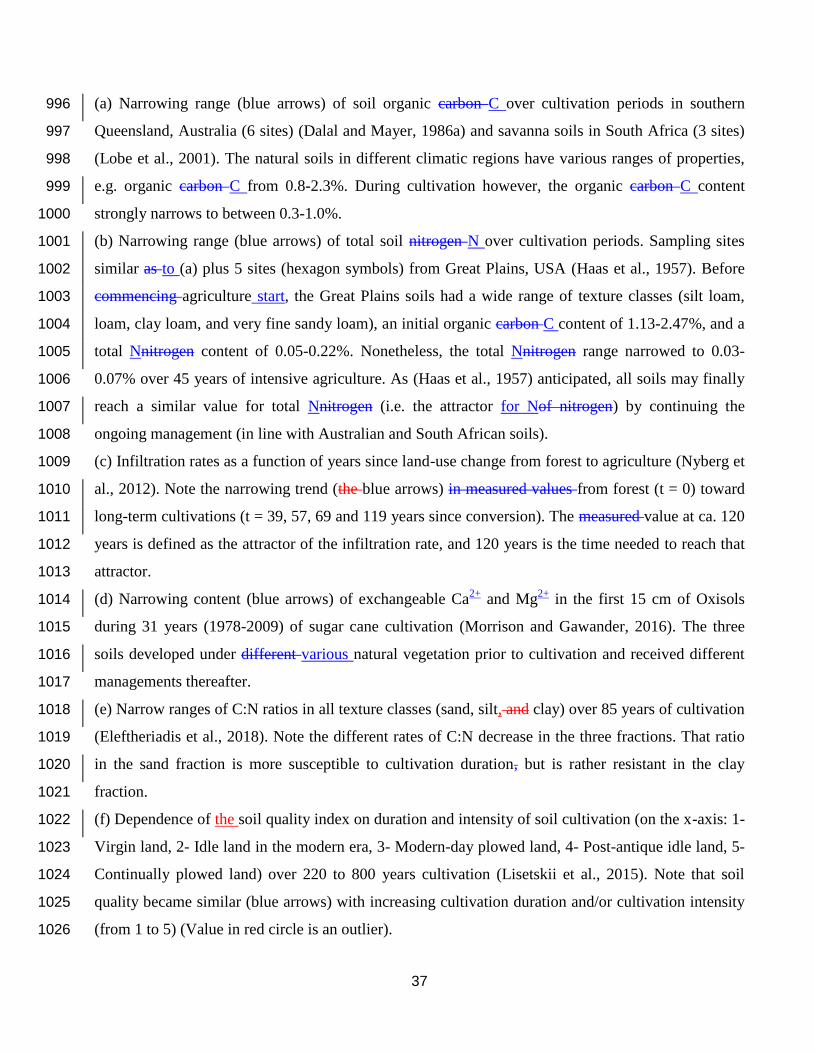
37
(a) Narrowing range (blue arrows) of soil organic carbon C over cultivation periods in southern 996
Queensland, Australia (6 sites) (Dalal and Mayer, 1986a) and savanna soils in South Africa (3 sites) 997
(Lobe et al., 2001). The natural soils in different climatic regions have various ranges of properties, 998
e.g. organic carbon C from 0.8-2.3%. During cultivation however, the organic carbon C content 999
strongly narrows to between 0.3-1.0%. 1000
(b) Narrowing range (blue arrows) of total soil nitrogen N over cultivation periods. Sampling sites 1001
similar as to (a) plus 5 sites (hexagon symbols) from Great Plains, USA (Haas et al., 1957). Before 1002
commencing agriculture start, the Great Plains soils had a wide range of texture classes (silt loam, 1003
loam, clay loam, and very fine sandy loam), an initial organic carbon C content of 1.13-2.47%, and a 1004
total Nnitrogen content of 0.05-0.22%. Nonetheless, the total Nnitrogen range narrowed to 0.03-1005
0.07% over 45 years of intensive agriculture. As (Haas et al., 1957) anticipated, all soils may finally 1006
reach a similar value for total Nnitrogen (i.e. the attractor for Nof nitrogen) by continuing the 1007
ongoing management (in line with Australian and South African soils). 1008
(c) Infiltration rates as a function of years since land-use change from forest to agriculture (Nyberg et 1009
al., 2012). Note the narrowing trend (the blue arrows) in measured values from forest (t = 0) toward 1010
long-term cultivations (t = 39, 57, 69 and 119 years since conversion). The measured value at ca. 120 1011
years is defined as the attractor of the infiltration rate, and 120 years is the time needed to reach that 1012
attractor. 1013
(d) Narrowing content (blue arrows) of exchangeable Ca2+
and Mg2+
in the first 15 cm of Oxisols 1014
during 31 years (1978-2009) of sugar cane cultivation (Morrison and Gawander, 2016). The three 1015
soils developed under different various natural vegetation prior to cultivation and received different 1016
managements thereafter. 1017
(e) Narrow ranges of C:N ratios in all texture classes (sand, silt, and clay) over 85 years of cultivation 1018
(Eleftheriadis et al., 2018). Note the different rates of C:N decrease in the three fractions. That ratio 1019
in the sand fraction is more susceptible to cultivation duration, but is rather resistant in the clay 1020
fraction. 1021
(f) Dependence of the soil quality index on duration and intensity of soil cultivation (on the x-axis: 1- 1022
Virgin land, 2- Idle land in the modern era, 3- Modern-day plowed land, 4- Post-antique idle land, 5- 1023
Continually plowed land) over 220 to 800 years cultivation (Lisetskii et al., 2015). Note that soil 1024
quality became similar (blue arrows) with increasing cultivation duration and/or cultivation intensity 1025
(from 1 to 5) (Value in red circle is an outlier). 1026
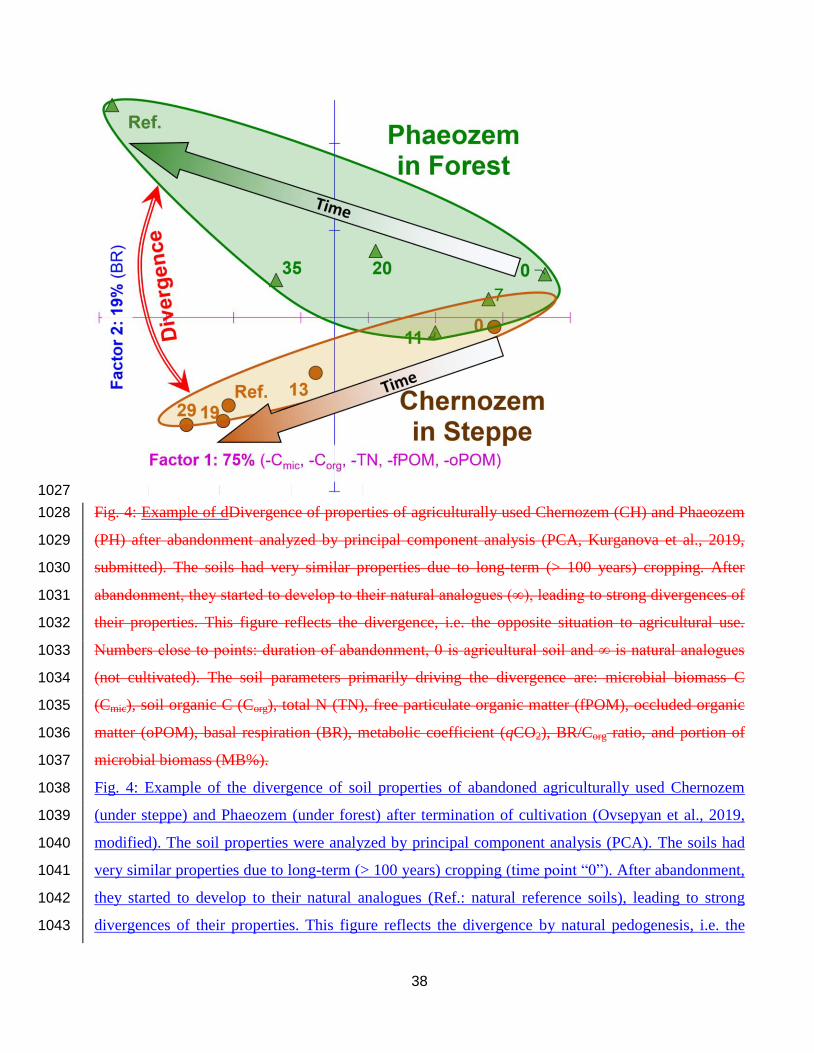
38
1027
Fig. 4: Example of dDivergence of properties of agriculturally used Chernozem (CH) and Phaeozem 1028
(PH) after abandonment analyzed by principal component analysis (PCA, Kurganova et al., 2019, 1029
submitted). The soils had very similar properties due to long-term (> 100 years) cropping. After 1030
abandonment, they started to develop to their natural analogues (∞), leading to strong divergences of 1031
their properties. This figure reflects the divergence, i.e. the opposite situation to agricultural use. 1032
Numbers close to points: duration of abandonment, 0 is agricultural soil and ∞ is natural analogues 1033
(not cultivated). The soil parameters primarily driving the divergence are: microbial biomass C 1034
(Cmic), soil organic C (Corg), total N (TN), free particulate organic matter (fPOM), occluded organic 1035
matter (oPOM), basal respiration (BR), metabolic coefficient (qCO2), BR/Corg ratio, and portion of 1036
microbial biomass (MB%). 1037
Fig. 4: Example of the divergence of soil properties of abandoned agriculturally used Chernozem 1038
(under steppe) and Phaeozem (under forest) after termination of cultivation (Ovsepyan et al., 2019, 1039
modified). The soil properties were analyzed by principal component analysis (PCA). The soils had 1040
very similar properties due to long-term (> 100 years) cropping (time point “0”). After abandonment, 1041
they started to develop to their natural analogues (Ref.: natural reference soils), leading to strong 1042
divergences of their properties. This figure reflects the divergence by natural pedogenesis, i.e. the 1043
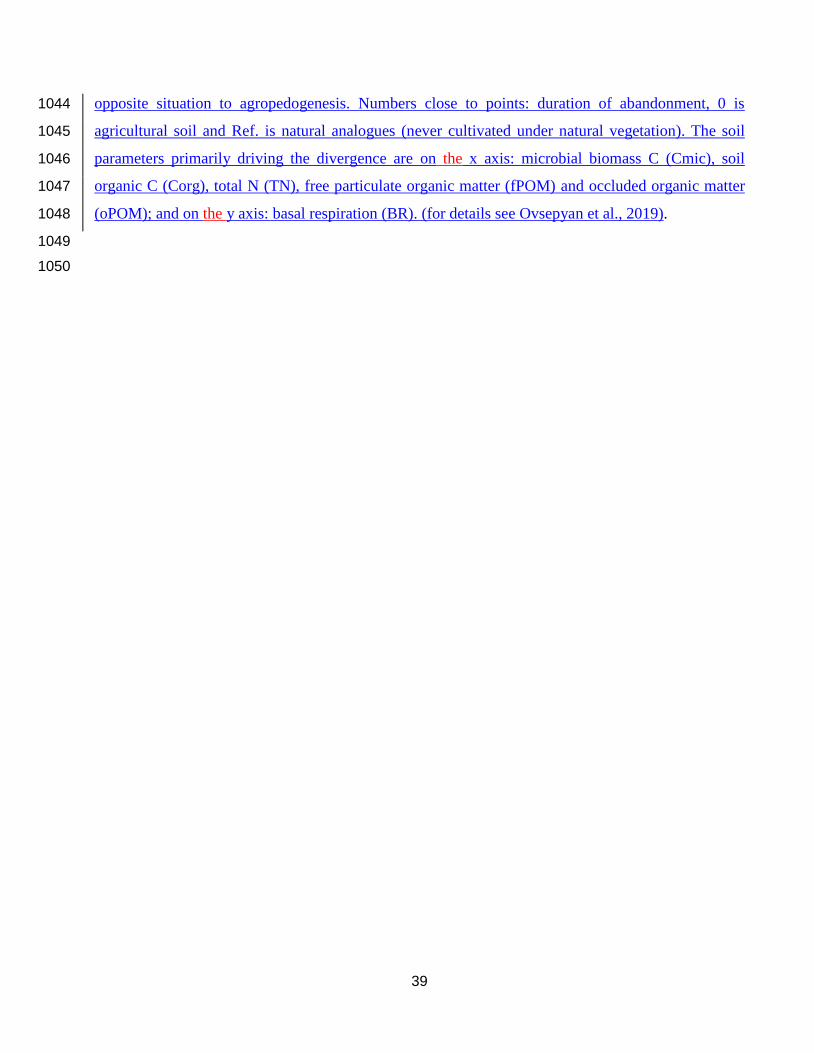
39
opposite situation to agropedogenesis. Numbers close to points: duration of abandonment, 0 is 1044
agricultural soil and Ref. is natural analogues (never cultivated under natural vegetation). The soil 1045
parameters primarily driving the divergence are on the x axis: microbial biomass C (Cmic), soil 1046
organic C (Corg), total N (TN), free particulate organic matter (fPOM) and occluded organic matter 1047
(oPOM); and on the y axis: basal respiration (BR). (for details see Ovsepyan et al., 2019). 1048
1049
1050
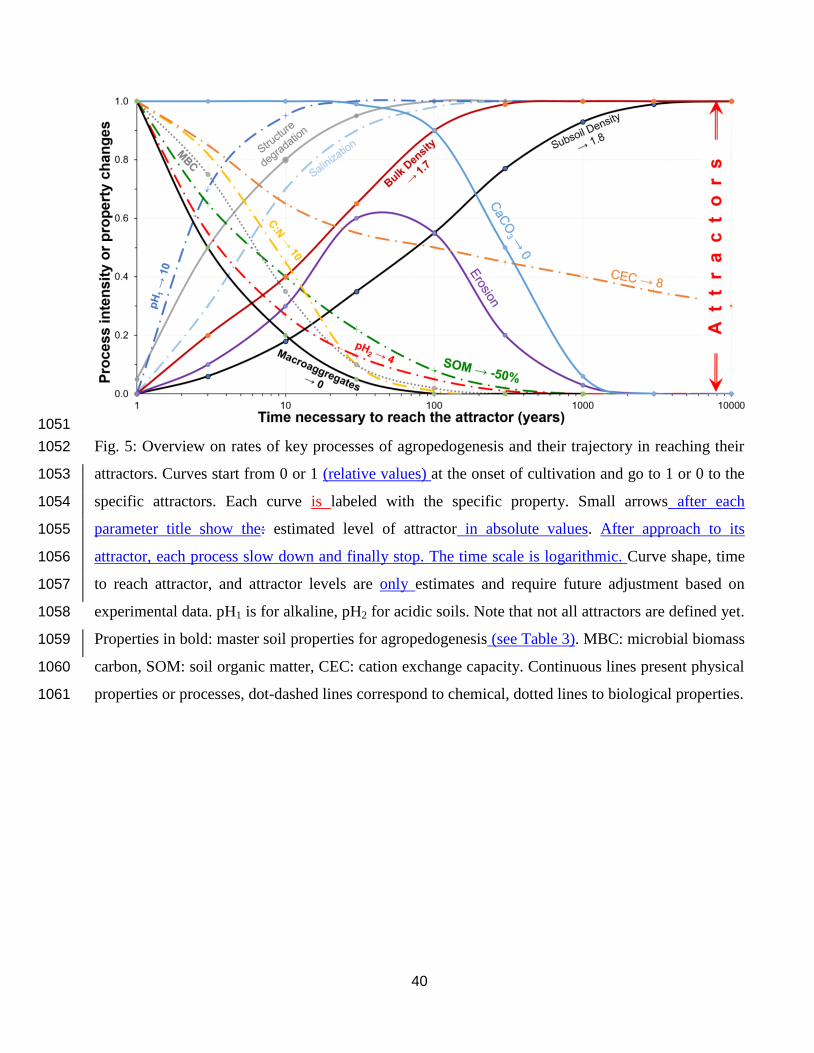
40
1051
Fig. 5: Overview on rates of key processes of agropedogenesis and their trajectory in reaching their 1052
attractors. Curves start from 0 or 1 (relative values) at the onset of cultivation and go to 1 or 0 to the 1053
specific attractors. Each curve is labeled with the specific property. Small arrows after each 1054
parameter title show the: estimated level of attractor in absolute values. After approach to its 1055
attractor, each process slow down and finally stop. The time scale is logarithmic. Curve shape, time 1056
to reach attractor, and attractor levels are only estimates and require future adjustment based on 1057
experimental data. pH1 is for alkaline, pH2 for acidic soils. Note that not all attractors are defined yet. 1058
Properties in bold: master soil properties for agropedogenesis (see Table 3). MBC: microbial biomass 1059
carbon, SOM: soil organic matter, CEC: cation exchange capacity. Continuous lines present physical 1060
properties or processes, dot-dashed lines correspond to chemical, dotted lines to biological properties. 1061
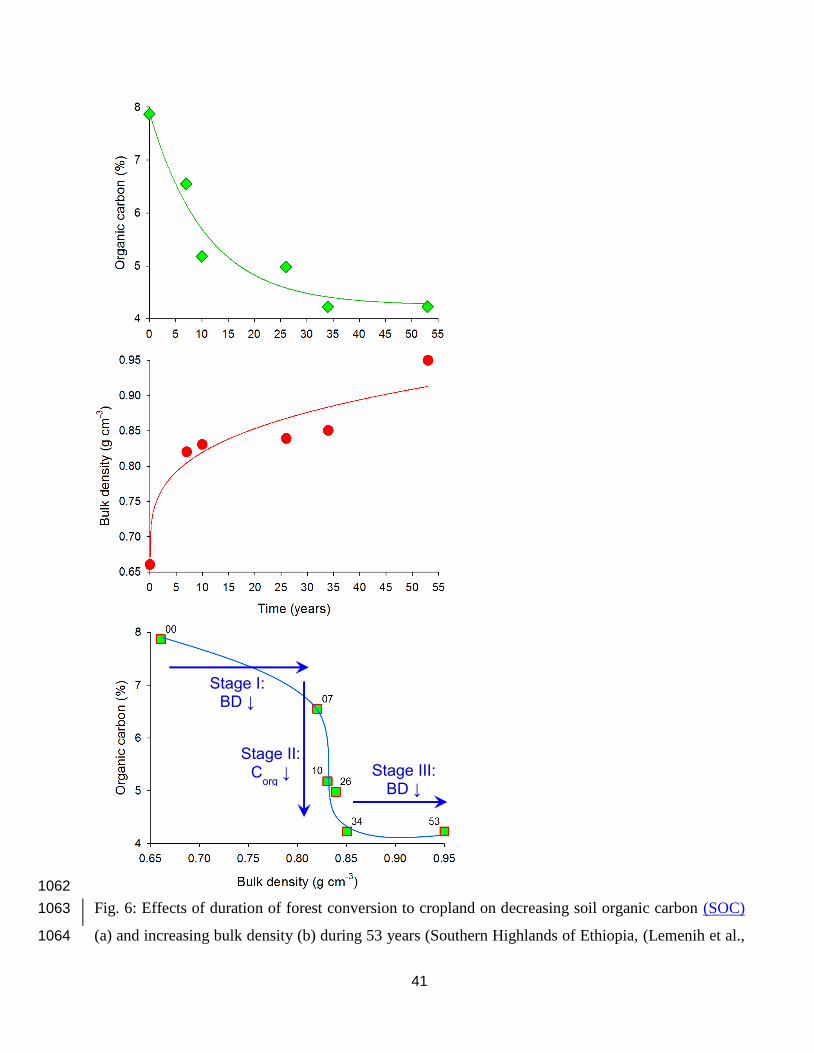
41
1062
Fig. 6: Effects of duration of forest conversion to cropland on decreasing soil organic carbon (SOC) 1063
(a) and increasing bulk density (b) during 53 years (Southern Highlands of Ethiopia, (Lemenih et al., 1064
Stage I: BD ↓
Stage II: C
org ↓ Stage III:
BD ↓
42
2005). (c) Phase diagram: relation between SOC and bulk density at corresponding time. Note the 1065
stepwise changes in bulk density following decreasing SOC content below the thresholds of 7.8, 6.5 1066
and 4.2%. Numbers beside symbols refer to years after conversion. 1067
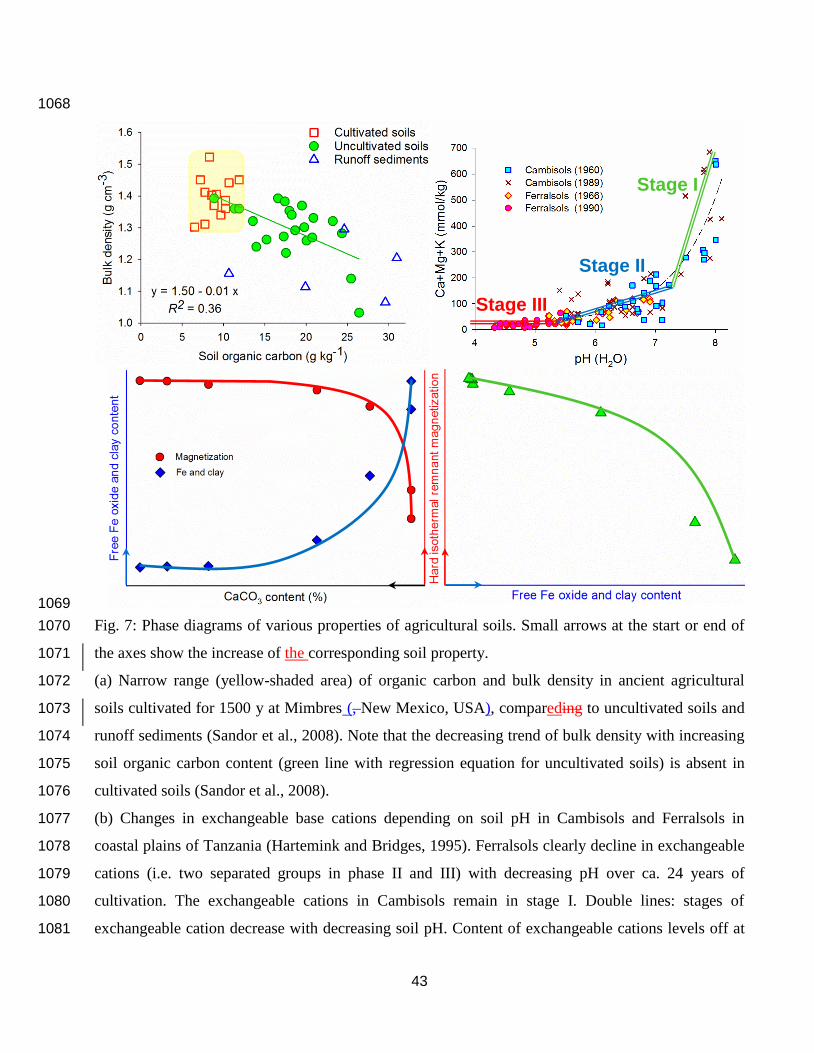
43
1068
1069
Fig. 7: Phase diagrams of various properties of agricultural soils. Small arrows at the start or end of 1070
the axes show the increase of the corresponding soil property. 1071
(a) Narrow range (yellow-shaded area) of organic carbon and bulk density in ancient agricultural 1072
soils cultivated for 1500 y at Mimbres (, New Mexico, USA), compareding to uncultivated soils and 1073
runoff sediments (Sandor et al., 2008). Note that the decreasing trend of bulk density with increasing 1074
soil organic carbon content (green line with regression equation for uncultivated soils) is absent in 1075
cultivated soils (Sandor et al., 2008). 1076
(b) Changes in exchangeable base cations depending on soil pH in Cambisols and Ferralsols in 1077
coastal plains of Tanzania (Hartemink and Bridges, 1995). Ferralsols clearly decline in exchangeable 1078
cations (i.e. two separated groups in phase II and III) with decreasing pH over ca. 24 years of 1079
cultivation. The exchangeable cations in Cambisols remain in stage I. Double lines: stages of 1080
exchangeable cation decrease with decreasing soil pH. Content of exchangeable cations levels off at 1081
Stage I
Stage II
Stage III
44
~ 25 mmol+ kg-1
(stage III). This value – which corresponds to the amount of exchangeable Ca2+
and 1082
Mg2+
shown on Fig. 3d (31 years of sugar cane cultivation on Fijian Ferralsols) – is an attractor. 1083
(c) The content of free iron oxides, clay content and hard isothermal remnant magnetization (IRMh) 1084
as a function of CaCO3 content in soil (adopted from (Chen et al., 2011).). 1085
(d) The relation between IRMh and free iron oxides vs. clay content. 1086
1087
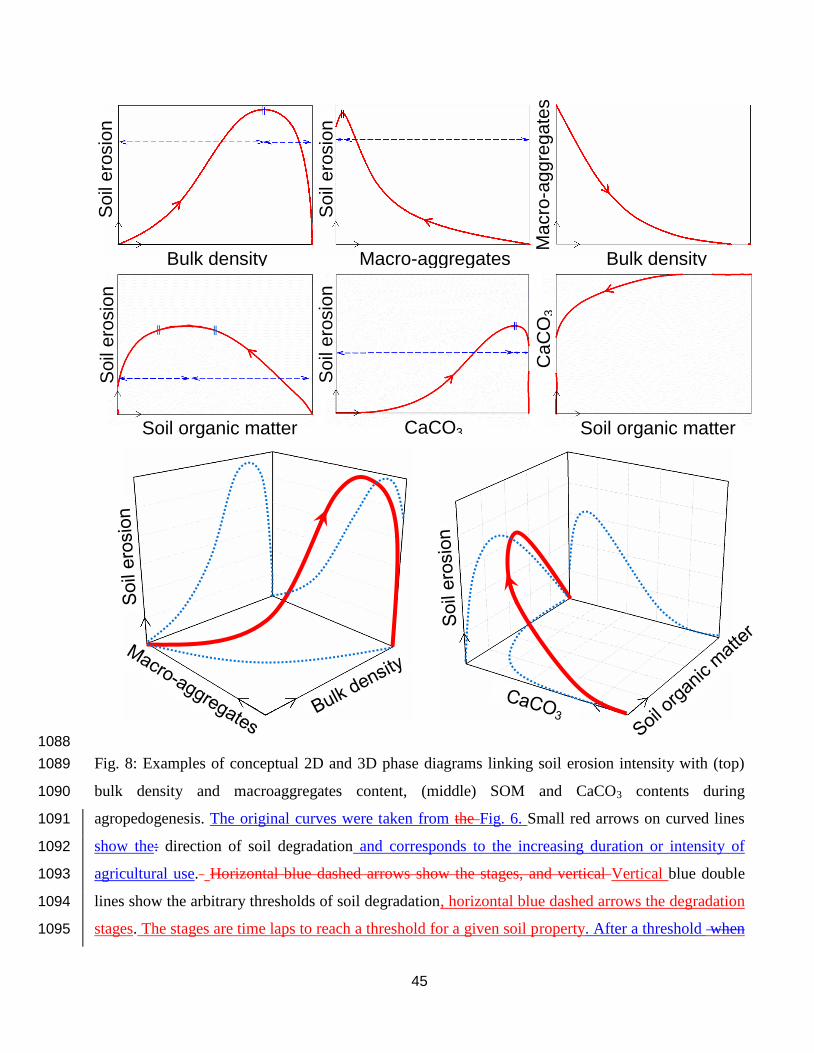
45
1088
Fig. 8: Examples of conceptual 2D and 3D phase diagrams linking soil erosion intensity with (top) 1089
bulk density and macroaggregates content, (middle) SOM and CaCO3 contents during 1090
agropedogenesis. The original curves were taken from the Fig. 6. Small red arrows on curved lines 1091
show the: direction of soil degradation and corresponds to the increasing duration or intensity of 1092
agricultural use. Horizontal blue dashed arrows show the stages, and vertical Vertical blue double 1093
lines show the arbitrary thresholds of soil degradation, horizontal blue dashed arrows the degradation 1094
stages. The stages are time laps to reach a threshold for a given soil property. After a threshold when 1095
Bulk density
So
il e
rosio
n
So
il e
rosio
n
Macro-aggregates
Ma
cro
-ag
gre
ga
tes
Bulk density
So
il e
rosio
n
Soil organic matter
So
il e
rosio
n
CaCO3
Ca
CO
3
Soil organic matter

46
after that the trend may slow down or reverse. Projections of 3D lines (light blue) on last Subfigures 1096
(bottom) correspond to the individual lines on the 2D phase diagrams in top and middle. Similar 1097
phase diagrams can be built in multi-dimensional space corresponding to the number of the master 1098
soil properties (Table 3). 1099
1100
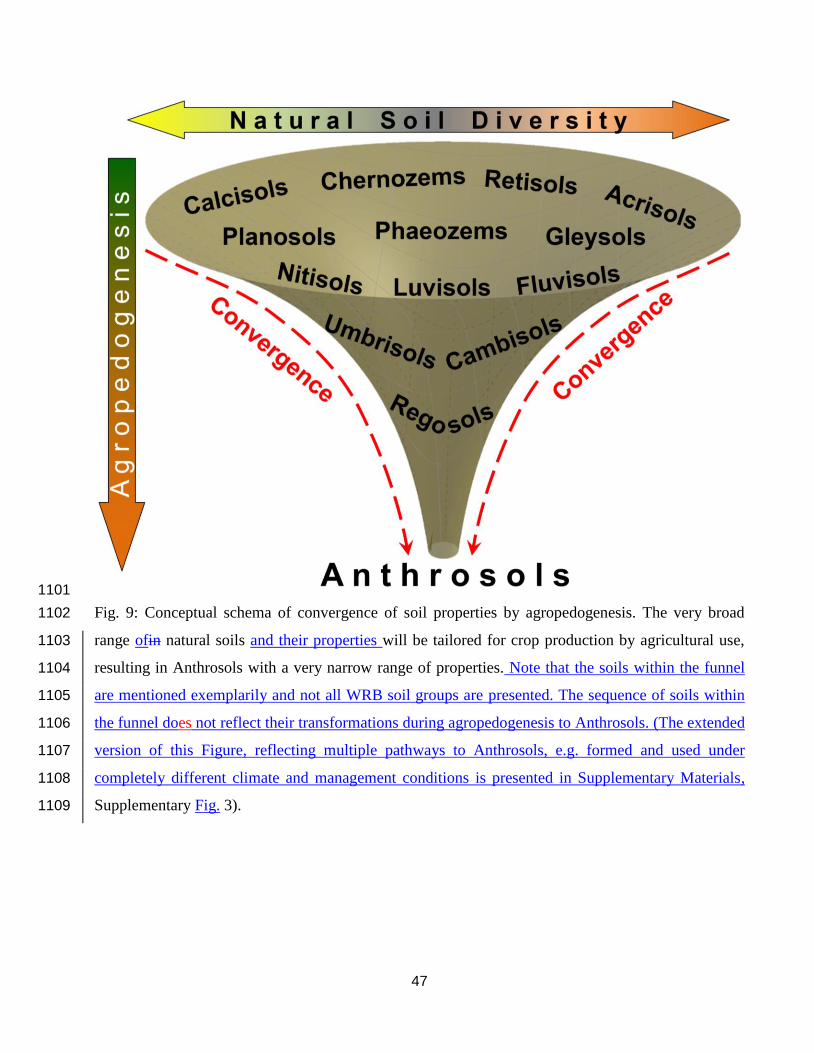
47
1101
Fig. 9: Conceptual schema of convergence of soil properties by agropedogenesis. The very broad 1102
range ofin natural soils and their properties will be tailored for crop production by agricultural use, 1103
resulting in Anthrosols with a very narrow range of properties. Note that the soils within the funnel 1104
are mentioned exemplarily and not all WRB soil groups are presented. The sequence of soils within 1105
the funnel does not reflect their transformations during agropedogenesis to Anthrosols. (The extended 1106
version of this Figure, reflecting multiple pathways to Anthrosols, e.g. formed and used under 1107
completely different climate and management conditions is presented in Supplementary Materials, 1108
Supplementary Fig. 3). 1109
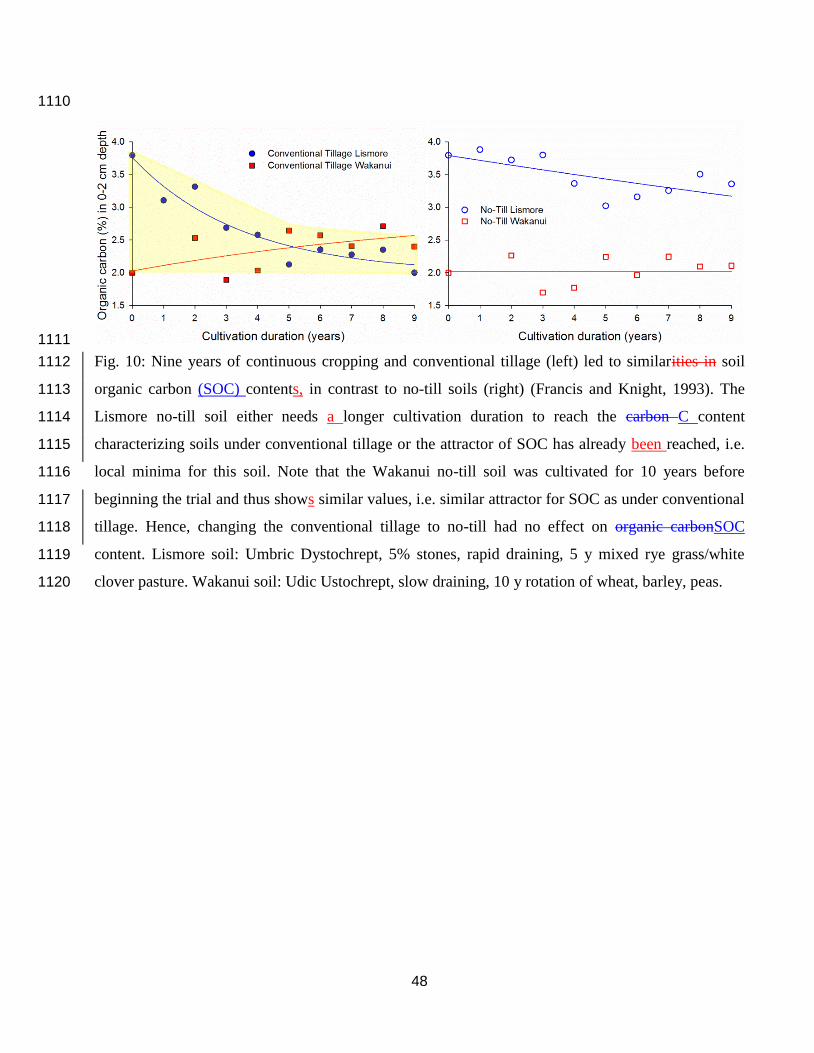
48
1110
1111
Fig. 10: Nine years of continuous cropping and conventional tillage (left) led to similarities in soil 1112
organic carbon (SOC) contents, in contrast to no-till soils (right) (Francis and Knight, 1993). The 1113
Lismore no-till soil either needs a longer cultivation duration to reach the carbon C content 1114
characterizing soils under conventional tillage or the attractor of SOC has already been reached, i.e. 1115
local minima for this soil. Note that the Wakanui no-till soil was cultivated for 10 years before 1116
beginning the trial and thus shows similar values, i.e. similar attractor for SOC as under conventional 1117
tillage. Hence, changing the conventional tillage to no-till had no effect on organic carbonSOC 1118
content. Lismore soil: Umbric Dystochrept, 5% stones, rapid draining, 5 y mixed rye grass/white 1119
clover pasture. Wakanui soil: Udic Ustochrept, slow draining, 10 y rotation of wheat, barley, peas. 1120
Supplementary Materials
for
Agropedogenesis: Humankind as the 6th soil-forming factor and attractors of agricultural soil degradation
by Yakov Kuzyakov and Kazem Zamanian
Florinsky, I.V. 2012. The Dokuchaev hypothesis as a basis for predictive digital soil mapping (on the 125th
anniversary of its publication). Eurasian Soil Science 45 (4), 445-451.
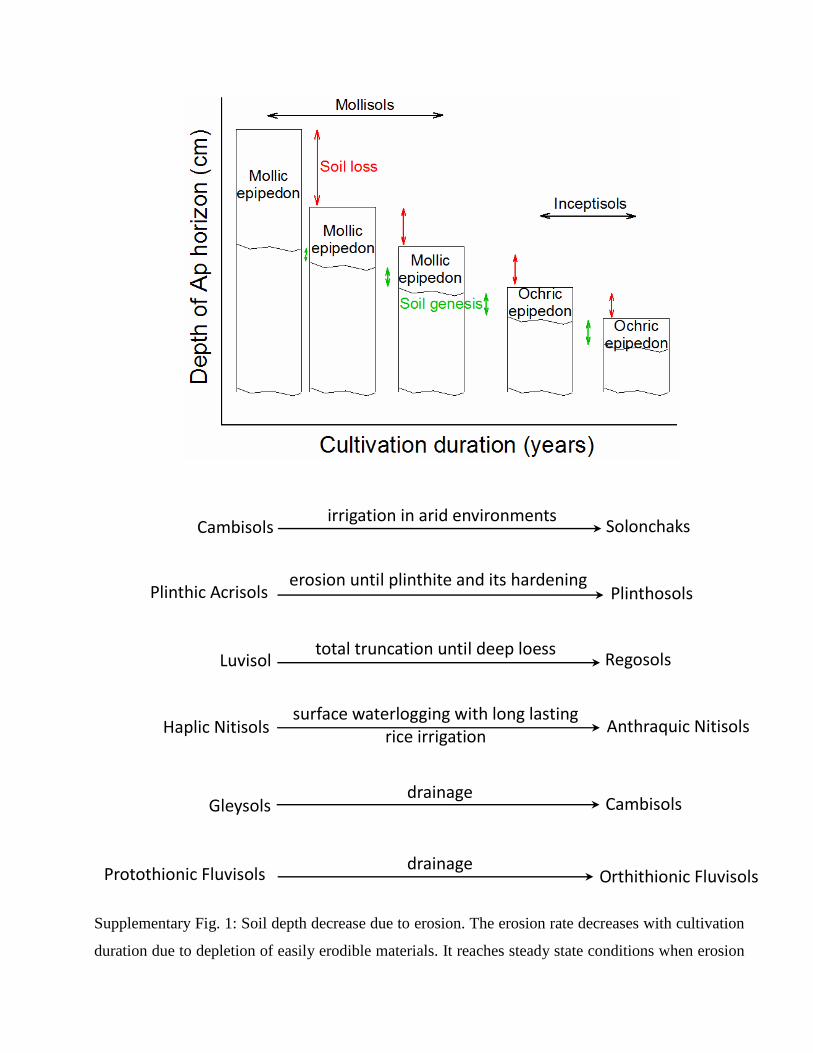
Supplementary Fig. 1: Soil depth decrease due to erosion. The erosion rate decreases with cultivation
duration due to depletion of easily erodible materials. It reaches steady state conditions when erosion
irrigation in arid environments Cambisols Solonchaks
erosion until plinthite and its hardening
near the surface Plinthic Acrisols Plinthosols
total truncation until deep loess Luvisol Regosols
surface waterlogging with long lasting rice irrigation
Haplic Nitisols Anthraquic Nitisols
drainage Gleysols Cambisols
drainage Protothionic Fluvisols Orthithionic Fluvisols

becomes equal to soil genesis. After major erosion, the soil taxonomic group changed due to a strong
decrease in the Ah / Ap horizon depth, which led to new qualifiers and master properties. Other
frequent examples of soil class changes are presented in Dudal (2004)
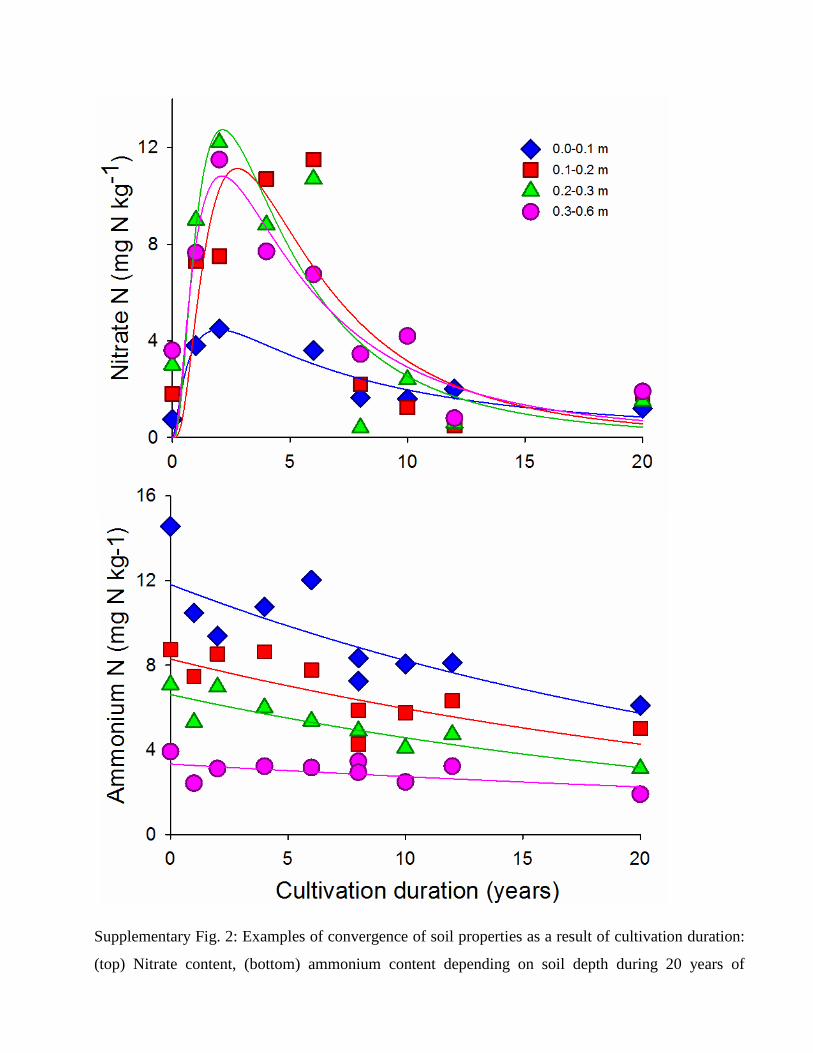
Supplementary Fig. 2: Examples of convergence of soil properties as a result of cultivation duration:
(top) Nitrate content, (bottom) ammonium content depending on soil depth during 20 years of

cultivation (Jones and Dalal, 2017). The solid lines are added to better visualize the changing trends
in nitrate and ammonium contents as a function of cultivation duration.
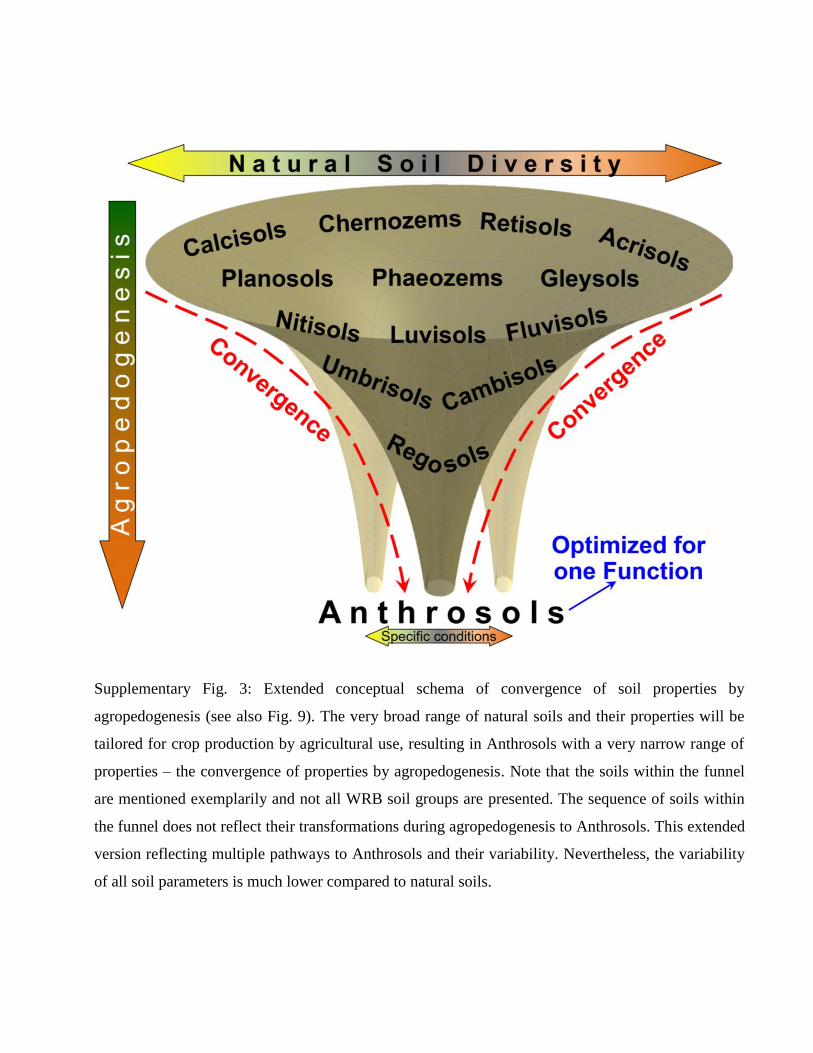
Supplementary Fig. 3: Extended conceptual schema of convergence of soil properties by
agropedogenesis (see also Fig. 9). The very broad range of natural soils and their properties will be
tailored for crop production by agricultural use, resulting in Anthrosols with a very narrow range of
properties – the convergence of properties by agropedogenesis. Note that the soils within the funnel
are mentioned exemplarily and not all WRB soil groups are presented. The sequence of soils within
the funnel does not reflect their transformations during agropedogenesis to Anthrosols. This extended
version reflecting multiple pathways to Anthrosols and their variability. Nevertheless, the variability
of all soil parameters is much lower compared to natural soils.