Embed Size (px)
Citation preview

Biomarker Selection for Predicting Alzheimer
Disease Using High-Resolution MALDI-TOF Data
Jung Hun Ohl, Young Bun Kim',Prem Gurnani2, Kevin P. Rosenblatt2* and Jean Gaol*
'Department of Computer Science and Engineering,The University of Texas, Arlington, TX 76019, USA
2Department of Pathology, Division of Translational Pathology,University of Texas at Southwestern Medical Center, Dallas, TX 75390, USA
Email:{jung.oh, ybkim, gao}@uta.edu* Joint senior authors
Abstract- High-resolution MALDI-TOF (matrix-assisted laserdesorption/ionization time-of-flight) mass spectrometry hasshown promise as a screening tool for detecting discriminatorypeptide/protein patterns. The major computational obstacle inanalyzing MALDI-TOF data is the large number of mass/chargepeaks (a.k.a. features, data points). With such a huge numberof data points for a single sample, efficient feature selection iscritical for unequivocal protein pattern discovery. In this paper,we propose a feature selection method and a new biclassificationalgorithm based on error-correcting output coding (ECOC) inmulticlass problems. Our scheme is applied to the analysis ofAlzheimer's disease (AD) data. To validate the performance of theproposed algorithm, experiments are performed in comparisonwith other methods. We show that our proposed frameworkoutperforms not only the standard ECOC framework but alsoother algorithms.
I. INTRODUCTION
Alzheimer's disease (AD) is characterized by progressivememory loss and other impaired abilities to carry out dailyactivities. AD is the most common form of dementia in peopleover age 65. The risk increases with age. It is estimated thatas many as 4.5 million in the United States suffer from thedisease. One of the causes of AD is genetic mutation whichleads to accumulation of beta amyloid protein in the brain.Amyloid plaques and neurofibrillary tangles are consideredsigns of AD. Unfortunately, since the ultimate cause andtreatment of AD are not known, it is urgent to identifybiomarkers for the disease in order to accelerate drug andtherapeutic development.
High-resolution MALDI-TOF mass spectrometry has in-creasingly been used to early disease diagnosis, monitoringdisease progression and therapeutic effects of drugs. Yu et al.presented two approaches using different preprocessing andclassification methods to analyze SELDI-TOF high-resolutionovarian mass spectrometry data [1], [2]. A computationalmethod that combines particle swarm optimization with SVMwas applied to distinguish liver cancer patients from healthyindividuals in SELDI-QqTOF spectra [3]. Particle swarmoptimization and ant colony optimization are interesting swarmintelligence techniques which have been successfully applied
to a number of optimization problems. A comparative studyof several well-known classification algorithms, such as lin-ear discriminant analysis (LDA), k-nearest neighbor (KNN),random forest (RF), bagging, boosting, and support vectormachine (SVM), has been carried out for ovarian cancerdiagnosis [4]. MALDI-TOF mass spectrometry was used toobtain the dataset. It was demonstrated that RF approach leadsto an overall higher accuracy rate as well as a more stableassessment for classification errors.
Disease progresses with stage. Therefore, one needs to dealwith multiclass samples in analysis of the disease. There areseveral algorithms for multicategory classification [5], [6], [7],[8]. Among them, error-correcting output coding (ECOC) iswell known for its generalization ability of classifiers. ECOCwas inspired from communication theory, where misclassifica-tions wrongly guessed by several classifiers can be corrected.Many methods to design codes have been studied [9], [10],[11], [12]. Dietterich and Bakiri provided methods for con-structing good error-correcting codes in which different codingmethods were employed according to the number of classesincluded in the problem [9]. Also they showed the robustnessof ECOC in several attributes such as the small sample sizeand the assignment of codewords. Pujol et al. introduced thediscriminant ECOC which dealt successfully with the problemof application dependent discrete ECOC matrice design [11].le et al. proposed a multi-category classification method basedon ECOC for classification problem by assigning a sequenceof amino acids to one of the known protein structures [7].Decoding rule is also a very important component in ECOC[13], [14]. The decoding rule presented by Passerini et al.combined margins through an estimate of class conditionalprobabilities, which recalibrates the outputs of the classifiersand improves the overall multiclass classification accuracy[14]. Escalera et al. introduced a variant of ECOC, calledECOC-ONE, which generates a matrix with an initial optimaltree and forms a network by using dichotomies as nodes [15].Kuncheva proposed to use diversity measures rather than thestandard minimum Hamming distance to evaluate the qualityof an error-correcting code and suggested an evolutionary
1-4244-1509-8/07/$25.00 02007 IEEE 464

algorithm to construct the code [16]. Methods combiningboosting and ECOC have been studied to take the performanceadvantages of boosting [17], [18].
In this paper, we propose a new multi-category classificationstrategy based on ECOC. To tackle the large number of peaksand noise in high-resolution MALDI-TOF data, we havedeveloped a multi-step feature selection algorithm [19].We apply the feature selection method used in binaryclassification problems to multiclass problems. Alzheimerdataset used by Lopez et al. consists of three classes, mildcognitive impairment (MCI), Alzheimer disease (AD), andnormal [20]. However, they analyzed the dataset as a binaryclass problem combining MCI and AD. In this study, weanalyze the Alzheimer dataset as three classes.
II. DATA PREPROCESSING
In this study, we make use of the m/z values in therange between 1k and 10k Da (Dalton) where each spectrumcontains about 730,000 m/z values. To reduce the noise anddimensionality of the raw spectrum, we design a three-steppreprocessing procedure: (1) binning, (2) baseline correctionand (3) normalization.
In the first step, binning is performed to divide the m/z axisinto intervals of desired length. Prior to the task, we need todecide the starting m/z where dividing the spectrum begins.The very first point along the m/z axis, where the intensitieschange from decreasing to increasing, becomes the startingpoint. From the starting m/z, we proceed to the right as 100Da and from the moved m/z again move to the right until aminimum is reached within a given small m/z. The m/z thathas the minimum intensity is an end point of the first window.After then, the range between the starting point and end pointis divided by 100, which yields 100 bins (1 window). In eachbin, peaks whose intensities are less than 10% of the maximumintensity in the bin are removed, which appear to be noise.The mean value of all the remaining intensities of each binis placed on the middle position of the bin. We continue toproceed to find the next window starting in the end point ofthe preceding window. The preprocessing work starts with aspectrum which has the most number of m/z values. Afterpreprocessing, it becomes a reference file. All other samplespectra will use the position information of windows of thereference file to be aligned. To estimate the baseline of eachspectrum, the window is divided into 10 groups, each groupconsisting of 10 bins.
For baseline subtraction, we take advantage of 200 bins(20 groups) because the more smooth curve is obtained when200 bins are used than 100 bins (1 window). The baselineis estimated by fitting a fourth order polynomial to theminimum intensities in 20 groups. The regressed baseline issubtracted from the binned spectrum. Furthermore, we chooseto normalize the baseline corrected spectrum because theamount of proteins is different according to samples. Eachspectrum is normalized by dividing the baseline correctedspectrum by its total ion current (the summed intensity over
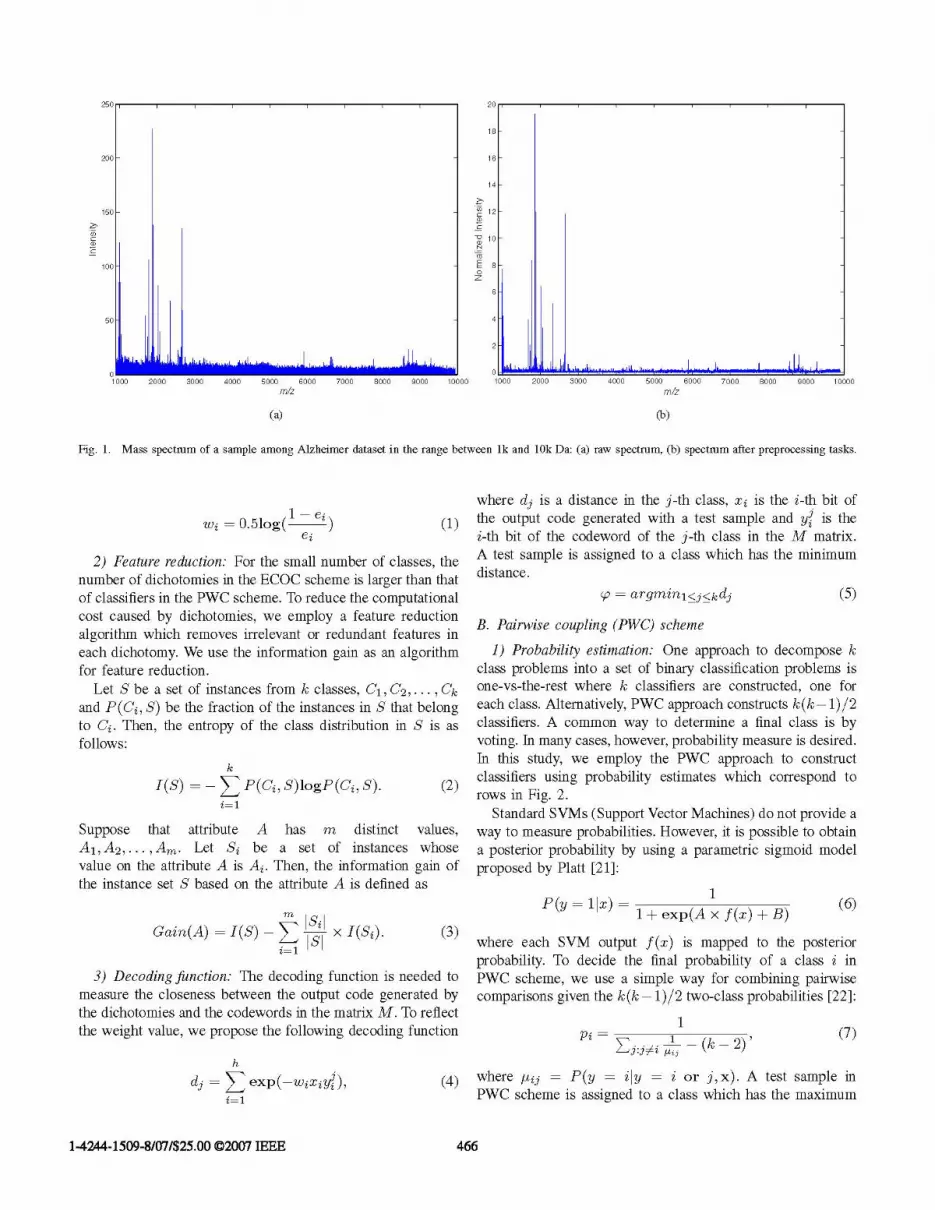
all m/z values in the baseline corrected spectrum). Because ofthe very small normalized intensity value, all the intensitiesare multiplied by 1000 for computational convenience. Asshown in Fig. 1 (b), our preprocessing task appears to besatisfactory because almost all significant peaks are retained.
III. PROPOSED METHOD
In this study, we propose a new method to improve thestandard ECOC performance based on a biclassification thatconsists of two schemes. One is the ECOC scheme wherea feature reduction algorithm is added into the standardECOC. The other is the pairwise coupling (PWC) schemethat uses the original class information, yielding k(k -1)/2binary classifiers. Fig. 2 shows a framework of the proposedalgorithm. Each scheme produces its best class prediction. Ifboth results are the same, a test sample is assigned to the class;Otherwise, we retrain samples which belong to only the twodifferent classes. As a result of the retrained binary classifier,the final class is determined for the test sample. In the PWCscheme, we count the frequency of occurrence for featureswhich are contained in the best feature subset of each pairof classes. After finishing experiments, we can find the mostfrequently used features by sorting features according to thefrequency.
A. ECOC scheme
ECOC is a classification method that breaks down k-classproblems into two-class problems. In the ECOC framework,each class is assigned a codeword that is a unique string oflength h made by {-1,1}, entirely forming a k x h codingmatrix M. In other words, the rows Mi are unique codewordsassigned to the corresponding classes Ci and the columnsM3 represent class partitions newly defined according to theassigned codes. Based on the class partitions, the matrixproduces h binary functions called dichotomies. For a testsample, a code of length h is obtained as a result of the outputsof the h binary functions. This code is compared with each ofthe k codewords defined in the matrix M, and the sample isassigned to a class with the closet codeword to the generatedcode using some distance measure.
1) Weighting strategy: In the standard ECOC, the influenceof all dichotomies in the task of the class labeling of anunknown sample is equal. Indeed, however, the importanceor accuracy of dichotomies is different. Here, we employ aweighting function which is similar to that used in boostingalgorithms as shown in Eq. (1). The weight value of eachdichotomy is computed by using the error rate generated by thedichotomy with the validation dataset. Therefore, the weightvalue represents how confident the dichotomy is. In Eq. (1),wi and ei are the weight value and the error rate of the i-thdichotomy which are obtained with the validation dataset. Incase where the accuracy of the dichotomy is larger than 50%,the weight value becomes positive; otherwise a negative valueis returned.
1-4244-1509-8/07/$25.00 02007 IEEE 465
E1000 2000 3000 4000 5000
m/z6000 7000 8000 9000
18
16
14
C 12ao
-010
N
P 8
z
6
4
2
10000
(a)
1000 2000 3000 4000 5000 6000 7000 8000 9000 1(
m/z
(b)
Fig. 1. Mass spectrum of a sample among Alzheimer dataset in the range between 1k and 10k Da: (a) raw spectrum, (b) spectrum after preprocessing tasks.
wi = 0.5log(I i) (1)1e?
2) Feature reduction: For the small number of classes, thenumber of dichotomies in the ECOC scheme is larger than thatof classifiers in the PWC scheme. To reduce the computationalcost caused by dichotomies, we employ a feature reductionalgorithm which removes irrelevant or redundant features ineach dichotomy. We use the information gain as an algorithmfor feature reduction.
Let S be a set of instances from k classes, C1, C2. . C,and P(Ci, S) be the fraction of the instances in S that belongto Ci. Then, the entropy of the class distribution in S is as
follows:
k
i=l
Suppose that attribute A has m distinct values,A1, A2, ... , Am. Let Si be a set of instances whosevalue on the attribute A is Ai. Then, the information gain ofthe instance set S based on the attribute A is defined as
where dj is a distance in the j-th class, xi is the i-th bit ofthe output code generated with a test sample and yi is thei-th bit of the codeword of the j-th class in the M matrix.A test sample is assigned to a class which has the minimumdistance.
o = argminl<j<kdj (5)
B. Pairwise coupling (PWC) scheme
1) Probability estimation: One approach to decompose kclass problems into a set of binary classification problems isone-vs-the-rest where k classifiers are constructed, one foreach class. Alternatively, PWC approach constructs k(k -1)/2classifiers. A common way to determine a final class is byvoting. In many cases, however, probability measure is desired.In this study, we employ the PWC approach to constructclassifiers using probability estimates which correspond torows in Fig. 2.
Standard SVMs (Support Vector Machines) do not provide a
way to measure probabilities. However, it is possible to obtaina posterior probability by using a parametric sigmoid modelproposed by Platt [21]:
P(y = l I)1+ exp(A x f(x) + B) (6)
(3)lm IsGain(A) = I(S)-E xSX-[(Si)i=l
S
3) Decoding function: The decoding function is needed tomeasure the closeness between the output code generated bythe dichotomies and the codewords in the matrix M. To reflectthe weight value, we propose the following decoding function
h
dj =E exp(-wiiyjy), (4)i=l
where each SVM output f (x) is mapped to the posteriorprobability. To decide the final probability of a class i inPWC scheme, we use a simple way for combining pairwisecomparisons given the k(k -1)/2 two-class probabilities [22]:
(7)
where uij = P(y = Ily = i or j,x). A test sample inPWC scheme is assigned to a class which has the maximum
1-4244-1509-8/07/$25.00 02007 IEEE
200 -
150
100
50
0000
20i
EL I, Ill l~1 h.'.11,~1.,l ,01
466

Di. D2 D3 D4 D D8 D7
ite I Ie t.HLKK*Featurte Re3ductioni
D'ichotomni'esDecoding
Weight]Estimatioa
*- _CD
}
Fig. 2. Framework of the proposed algorithm.
probability.L argmax1<i<P (8)
C. Feature Selection AlgorithmI) Markov Blanket (MB): Markov blanket filtering is an
instance of backward feature elimination algorithm [23], [24].Let F be a set of features with size r defined as F =
(FL: Fr) and M C F be a set of features which doesnot contain F1. Feature set M is called Markov blanket forFi if F, is conditionally independent of F- M-{F } givenM. Hence, the information embedded in feature Fi is coveredby its Markov blanket. Features with the best coverage are
mostly likely to be the redundant and should be removedfrom the feature set. However, in most cases, the full sizeMarkov blanket may not be available. Instead, an approximateone that subsumes the feature information has to be sought.Denote Mi as one Markov blanket candidate for F1. We use
the Pearson correlation to select m features in Markov blanketM1 that are most correlated to feature F1. In general, to reducecomputational overhead and to avoid fragmenting the trainingsamples, the small value m is used.To evaluate how close M1 is to being a Markov blanket for
F1, instead of directly computing the conditional independencefrom definition, cross-entropy concept in information theoryis applied. For any distributions vt and a, the cross-entropy of
to a is D(lillr) = 12At(x)1og9}('). The idea behindthis concept is that if At is the right distribution and uf is
the approximation to it, D(Atilu) measures the extent of thedifference which is made by using oC instead of A. Theexpected cross-entropy of feature F, given Markov blanketM. is
A(F IMj) PE (Mi = fm,, F = f) (9)fMj,fi
D(P(LVM - m,, f) IP(LM fM1j),
where fM1 and fA are feature values to Mi and Fi, respec-
tively, and D(.11.) represents the cross-entropy. In Eq. (9),/iN(FI Mi) O means that M? is a Markov blanket for F/,therefore Fi does not provide any information about classlabels beyond what is already contained in M. Since thisfortunate case is less likely to occur, we look for a set Misuch that A(Fi M ) is small. The lower A(F1 IM ) means thatthe approximate Markov blanket of F1 is strongly correlatedto F1. The feature F1 with the lowest /i(F1 M1) value in theremaining features is considered to be the most redundant, andshould be eliminated first.
To decide the Markov blanket of each feature, intensityvalues after the preprocessing task are used in the calcu-lation of Pearson correlation coefficient. For computationalconvenience, the discretized binary values are used in thecalculation of the expected cross-entropy A(1 Mi) [25]. Forthe discretization, suppose that there is a given set S of allsamples and a partition boundary T by which S is partitionedinto two subsets S1 and S2. Let P(ci, Sj) be the proportions ofsamples in subset Sj that belong to class ci. The class entropyfor subset Si is expressed as.
k
EnIt(Sj) = -E P(ci Sj)log(P(c Sj))_T=
(1.0)
where k is the number of classes. Assuming the subsets S,and S2 are derived from partitioning a feature A at a point T,then the class information entropy of the partition is definedby:
E(A,T,S) = S Ent(Sj) +LS Ent(S2).lsls
(11)
The cut point TA for which E(A, T, S) is minimal among allthe candidate cut points is selected for a binary discretizationfor feature A [26]. Therefore, the expected cross-entropy
1-4244-1509-80171/$2500 02007 IEEE
Ci.C2
C3
C4
! Retraining
467

A(F M ) can be calculated as:
A\(Fi ~Mi) =-EEPj(c,lMj,Fj)1ogt (( i)nj= 1=1 1i(l
(12)where n is the number of samples and cl is the class label.
2) Feature Selection: We have developed a feature selectionalgorithm in binary class problems [19]. In this study, weapply the feature selection algorithm to multiclass problems.Our proposed method creates two feature subsets for a featureFi with 1 < i < r where r is the number of features leftafter preprocessing. One feature subset contains the highlycorrelated features for feature Fi, which is used in Markovblanket. The other one is the low correlated feature subsetthat includes the lowest correlated d features for feature Fi.The size of the low correlated feature subset used in thisstudy is 20. Generally, good performance is achieved whenclassification algorithms are carried out with the reciprocallylow correlated features. Also it accords with the principle ofMarkov blanket which attempts to reduce the high correlatedfeatures leaving the low correlated ones.We perform Markov blanket algorithm with the high corre-
lated feature subset to obtain A(Fi Mi) value for Fi where1 < i < r. On the other hand, with the low correlated featuresubset, we run the linear SVM algorithm where 2 samplesare utilized for training and the remaining 3 for testing. Then,we compute the proposed weight for each feature in the lowcorrelated feature subset using the following function:
{ Wkl xQ0x if-y<QWkElwjl ~~~~~~* (13)
Wk (1f ) X nX d otherwise,
where
-{1 otherwiseand / is the accuracy using testing samples in linear SVM, yis a predefined threshold and IWk is the absolute SVM weight.For more information about SVM weight, see Eq (6) in [19].Variable k represents a specific feature in the low correlatedfeature subset of a feature and the range of variable j liesbetween 1 and the size of the low correlated feature subset.After computing IWk, for d features in the low correlatedfeature subset, each IWk, is normalized by dividing it by thesummed absolute SVM weight of all the features in the subset.
In SVM-RFE (SVM-Recursive Feature Elimination) a fea-ture with the smallest absolute SVM weight is eliminated ateach iteration [27]. On the contrary, we take into account thatfeatures with the large absolute SVM weight are important.Although the normalized SVM weight of a feature is high inthe low correlated feature subset, the accuracy of the linearSVM performed with the subset can be low if the feature isonly locally discriminant in the subset, not globally. Therefore,we multiply the normalized SVM weight by the accuracy.If the accuracy is larger than a predefined threshold -y, theproposed weight becomes positive by multiplying 1 as a value
of 6. Otherwise, we regard it as a penalty using -1 as the 6.Through a few experiments, we found that ty 0.5 assures agood performance.
In the case where the accuracy is less than 50%, the smallerthe absolute SVM weight or the accuracy is, the more thepenalty is. We perform the linear SVM p times randomlydividing the dataset into 3 training and 3 testing samples. Themean proposed weight Wk = E Wk is used as the weightvalue of the kth feature in the low correlated feature subset.This work is performed iteratively for the corresponding lowcorrelated feature subset of each feature.
After computing the mean values of proposed weights forall features as mentioned above, one feature with the smallestA(Fi Mj) value is removed according to Markov blanket rule.Then, the two subsets for all but the removed feature arerebuilt. In fact, subsets that only contain the removed featurewill be modified. Again, we carry out the linear SVM withthe corresponding low correlated feature subsets rebuilt for allleft features to compute the proposed weight and accumulatethe mean weight value E Wk. Actually, one feature might beused in several subsets as one member of the low correlatedfeature subset or the high correlated feature subset. Wk valuescomputed in all the low correlated feature subsets which thefeature belongs to are accumulated as well. This method keepsgoing on until the predefined number of features remains,which should be larger than the size of the low correlatedfeature subset.We rank the features according to their final weights and
perform a backward feature selection method with the top 50features. The backward feature selection tries to remove onefeature at a time from the current feature set where everyfeature can be considered in removal. After running the linearSVM with the k-fold cross validation as many times as thenumber of features of current set, a feature without whichthe accuracy is improved will be excluded. The backwardfeature selection stops when no further performance gainis achieved. The remaining features are an optimal featuresubset for the pair classes. This method is performed foreach pair of classes. We count how many times each featureis included in the optimal feature subset. After finishing allexperiments, features are sorted according to the frequency.High frequency means reliable features.
IV. EXPERIMENTS
We used the Alzheimer disease dataset from http://www.perkinelmer.com/. The dataset used in this study con-sists of 124 samples, mild cognitive impairment (MCI:24),Alzheimer disease (AD:40) and normal (60). We implementedthe proposed algorithm based on LIBSVM [28]. Linear SVMwas used in retraining and in both ECOC scheme and PWCscheme. For ECOC scheme, random coding strategy was usedin which values {+1, -1} were selected uniformly at randomto make codes. With ANOVA (analysis of variance) statisticalmethod after preprocessing tasks, we ranked the features andperformed the experiments with the top 100, then the top 200
1-4244-1509-8/07/$25.00 02007 IEEE 468

TABLE I
THE MEAN AND STANDARD DEVIATION (IN PARENTHESIS) OF ACCURACIES IN ALZHEIMER DISEASE DATASET.
Methods / No. of features 100 200 300 400 500Proposed Method 71.37(2.53) 74.84(1.65) 76.13(3.25) 74.44(4.53) 69.76(2.32)
ECOC 61.69(1.48) 63.47(2.47) 62.74(2.96) 64.44(3.35) 60.40(1.88)Random Forest 62.58(2.05) 59.03(2.40) 58.47(4.63) 60.89(2.83) 61.13(2.24)Naive Bayes 64.03(2.44) 65.16(1.36) 66.77(2.14) 65.16(1.36) 65.81(2.16)
J48 50.40(2.61) 48.23(2.92) 48.47(3.03) 47.58(3.25) 48.87(3.67)
80
70
60
0
O)
(00-
cDZ3
50 -
40 -
30 -
20
10
0100 200 300 400 500
No. of features
Fig. 3. Histograms of classification accuracies on Alzheimer disease dataset.
and so forth up to the top 500 features. The performanceof our method was compared with other algorithms, standardECOC, Random Forest, Naive Bayes, and J48. All comparisonalgorithms were experimented in WEKA tools [29].
In all experiments, 10-CV (Cross Validation) was appliedwhere at each CV, 90% of samples were used for training andthe rest for testing. In order to obtain the weight value of eachdichotomy, the 90% samples for training were further split into10 folds. Again, with the 10 folds, 10-CV was carried out 20times and the averaged error was put into Eq. (1) to obtainthe weight value. This task was separately performed in eachdichotomy. The whole procedure was iterated 30 times.
Table I and Fig. (3) illustrate the experimental results onAlzheimer disease dataset. The proposed method achievedthe best accuracy 76.13% starting with 300 features. Ourmethod showed the better performance than other algorithmsin all cases. In contrast, J48 obtained the worst performancefor all the number of features. The standard ECOC also doesnot show a good performance. As a result, we are motivatedto make a variant of the standard ECOC. Fig. (4) showsa boxplot of the proposed method. In the PWC scheme,for each pair of classes we count how many times eachfeature is included in the optimal feature subset after the
TABLE IIFREQUENTLY USED TEN m/z IN THE PROPOSED ALGORITHM.
1 2 3 4 5
1028.2963 1244.2951 1520.3494 2839.1266 2854.1289
6 7 8 9 10
3096.1595 3149.1647 4582.9816 4814.0211 8025.7217
backward feature elimination. At the end of experiments, weinvestigate the frequency. We regard high frequency featuresas being important to discriminate samples. Table II shows10 m/z values which are the most frequently used features inthe optimal feature subset. Fig. 5 illustrates comparison ofaverage intensities for the 10 m/z values.
V. CONCLUSION
We proposed a new biclassification strategy based onECOC, where both results of the dichotomy in ECOC schemeand PWC scheme are considered to predict a final class.In the ECOC scheme, a feature reduction algorithm wasused to reduce cost caused by dichotomies. Also a new
1-4244-1509-8/07/$25.00 02007 IEEE 469

84 _ O
82 _
80 _
78 _ I.-, IIa,c- 76
C 74
C-)C 72
70
68
66
Fig. 4Alzhei
>1
U)C:(1)-I.-c
Ci)
Acknowledgments
This work was supported in part by NSF under grants IIS-0612152 and IIS-0612214.
REFERENCES
[1] J.S. Yu, S. Ongarello, R. Fiedler, X.W. Chen, G. Toffolo, C. Cobelli,and Z. Trajanoski, "Ovarian cancer identification based on dimensionalityreduction for high-throughput mass spectrometry data," Bioinformatics,vol. 21, pp. 2200-2209, 2005.
[2] J. Yu and X.W. Chen, "Bayesian neural network approaches to ovariancnancer identification from high-resolution mass spectrometry data,"Bioinformatics, vol. 21, pp. i487-i494, 2005.
[3] H.W. Ressom, R.S. Varghese, M. Abdel-Hamid, S.A.L. Eissa, D. Saha,L. Goldman, E.F. Petricoin, T.P. Conrads, T.D. Veenstra, C.A. Loffredo,and R. Goldman, "Analysis of mass spectral serum profiles for biomarkerselection," Bioinformatics, vol. 21, pp. 4039-4045, 2005.
_______________________________________________ _ l l[4] B. Wu, T. Abbott, D. Fishman, W. McMurray, G. Mor, K. Stone, D. Ward,100 200 300 400 500 K. Williams, and H. Zhao, "Comparison of statistical methods for classi-
fication of ovarian cancer using mass spectrometry data," Bioinformatics,Boxplots of classification accuracies of the proposed method on vol. 19, pp. 1636-1643, 2003.
imer disease dataset. 'x' represents the mean accuracy. [5] C.W. Hsu and C.J. Lin, "A Comparison of Methods for Multi-classSupport Vector Machines," IEEE Trans. Neural Networks, vol. 13, pp.415-425, 2002.
[6] B. Fei and J. Liu, "Binary Tree of SVM: A New Fast Multiclass Training
1.2 and Classification Algorithm," IEEE Trans. Neural Networks, vol. 17, no.3, 2006.MCI [7] E. le, J. Weston, W.S. Noble, and C. Leslie, "Multi-class Protein Fold
1l0 AD Recognition Using Adaptive Codes," ICML 2005, pp. 329-336, 2005.Normal [8] E.L. Allwein, R.E. Schapire, and Y Singer, "Reducing Multiclass to
Binary: A Unifying Approach for Margin Classifiers," Journal ofMachine
0.8 Learning Research, vol. 1, pp. 113-141, 2002.[9] T.G. Dietterich and G. Bakiri, "Solving Multiclass Learning Problems
via EfRor Coffecting Output Codes," Journal of Artifcial Intelligence
0.6 3 4 5 6 7 8 9 1 Output CodeEnsembles,Research,vol. 2, pp. 2633286, 1995.06 [10] K. Crammer andY Singer, "On the Learnability and Design of Output
Codes for Multiclass Problems," Machine Learning, vol. 47, no.2N3, pp.201S233, 2002.
0.4 [11] 0. Pujol, P. Radeva, and J. Vitria, "Discriminant ECOC: A HeuristicMethod for Application Dependent Design of Error Correcting OutputCodes,"IEE Trans. pattern analyss and machine intelligence, vol. 28,
0.2 ~~~~~~~~~~~~~~~no.6, 2006.[12] T. Windeatt and R. Ghaderi, "Coding and Decoding for Multiclass
Learning Problems," Information Fusion, vol. 4, no. 1, pp. 11521, 2003.0f0 [13] R.S. Smith and T. Windeatt, "Decoding Rules for Error Correcting
1 2 3 4 5 6 7 8 9 d0 Output Code Ensembles," MCS 2005, LNCS 3511, pp. 53p63, 2005.No [14] A. Passerini, M. Pontil, and P. Frasconi, "New Results on Error Correct
ing Output Codes of Kernel Machines," IEEE Trans. Neural Networks,Comparison of average intensities for the most frequently used 10 vol. 15, no. 1, 2004.
deues. [15] 5. Escalera and 0. Pujol, "ECOC ONE: A Novel Coding and DecodingStrategy," ICPR 2006, pp. 578 581, 2006.
[16] PI. Kuncheva and C.J. Whitaker, "Measures of Diversity in ClassifierEnsembles," Mach. Learn., vol. 51, pp. 181 207, 2003.
[17] V. Guruswami and A. Sahai, "Multiclass Leairning, Boosting, and Error-
ding functase was presentedthasedt on the weight value. Correcting Codes," COLT 99, pp. 1451155, 1999.
dingfuanctionh wasgpremsen basowed shon theweightvald [[18] R.E. Schapire, "Using Output Codes to Boost Multiclass Learningidichotomy was given its own weight value. In the Problems," Proc. 14th Intl. Conf on Machine LeaMring, pp. 313 321,schem we ap lied a fetr se ction method we 1997.scheme, wemotivappliedto feated e sectiondd mEthOC Te [19] J.H. Oh, A. Nandi, P Gurnani, P Bryant Greenwood, K.P Rosenblatt,developed to multiclass problems to find important and J. Gao, "Prediction of Labor for Pregnant Women Using High-
res. Our feature selection method can find significant Resolution Mass Spectrometry Data," BIBE 2006, pp. 332I339, 2006.ires not only for between each pair of classes but [20] M.F. Lopez, A. Mikulskis, S. Kuzdzal et al., "High-Resolution Serum
for al clases.Though xperimnts wth AlzeimerProteomic Profiling of Alzheimer Disease Samples Reveals Disease-
for allclasse.Throuh expeiments ith Alheimer Specific, Carrier-Protein-Bound Mass Signatures," Clin Chem., vol. 51,se dataset, we showed that our method performed no. 10, pp. 19461954, 2005.r than other algorithms. Also, we showed the standard [21] J. Platt, "Probabilistic Outputs for SVMs and Compairisons to Regular
ized Likelihood Methods," Advances in Large Margin Classifiers. MITC does nt provid a goodperformace againt other Press, 1999.iods. It motivated us to extend the standard ECOC. The [22] D. Price, S. Kneff, L. Personnaz, and G. Dreyfus, "Pairwise Nerual
,ssification method can be a way to enhance the standard Network Classifiers with Probabilistic Outputs," Neural Information Pro-IC in multiclassproblems. ~~~~~~cessing Systems, vol 7, pp. 1109 1116. The MIT Press, 1995.C in multiclassproblems. ~~~~~~[23]J. Pearl, Probabilistic reasoning i'n i'ntelligent systems, San Mateo,
CA:Morgan Kaufmann, 1988.
1-4244-1509-8/07/$25.00 02007 IEEE
Fig. 5m/z va
deco(EachPWChavefeatu:featu:alsodiseabetteiECOmethbiclaECO
470

[24] D. Koller, and M. Sahami, "Toward optimal feature selection," Proc. ofthe Thirteenth Intl. Conf on Machine Learning, 1996.
[25] E.P. Xing, and R.M. Karp, "CLIFF: clustering of high-dimensionalmicroarray data via iterative feature filtering using normalized cuts,"Bioinformatics, vol. 17, pp. S306-S315, 2001.
[26] U.M. Fayyad, and K.B. Irani, "Multi-Interval Discretization ofContinuous-Valued Attributes for Classification Learning," Proc. of 13thInt. Joint Conf on AI, pp. 1022-1029, 1993.
[27] I. Guyon, J. Weston, S. Barnhill, and V. Vapnik, "Gene selection forcancer classification using support vector machines," Machine Learning,vol. 46, pp. 389-422, 2002.
[28] C.-C. Chang and C.-J. Lin, LIBSVM: a library for support vectormachines, Software available at http://www.csie.ntu.edu.tw/ cjlin/libsvm
[29] 1. Witten and E. Frank, Data Mining: Practical Machine Learning Toolsand Techniques, 2nd ed. San Francisco: Morgan Kaufmann, 2005.
1-4244-1509-8/07/$25.00 02007 IEEE 471


