Embed Size (px)
Citation preview
Blood Types of Brazilian Indians(Matto Grosso)
F. OTTENSOOSER AND R. PASQUALIN
Laborat6rio Paulista de Biologia, Sao Paulo, Brazil
AMERICAN Indians occupy a unique position in mankind with regard to thedistribution of the various hereditary blood factors. For example, the frequencyof group 0 generally exceeds 70 per cent among U. S. Indians, and not in-frequently reaches 100 per cent among Central American and South AmericanIndians. In contrast, the frequency of group 0 among most other peoples isless than 50 per cent, though in some, such as Indonesians, Melanesians,Filipinos, and Australian aborigines on the one hand, and in Eskimos and Ice-landers on the other, values have been encountered ranging from 50 to 65 percent.
In Brazil, observations have been made on tribes from the southern andnorthern extremes of the country. In Guarani Indians of Rio Grande do Sul(Berardinelli & Roiter, 1934; Ribeiro, 1934) and in Tucano Indians of AltoRio Negro, Amazonas (Biocca & Ottensooser, 1944), every individual testedbelonged to group 0. In Calingangue Indians of Parana (Fernandes, 1939),and in Canela Indians of Maranhio (da Silva, 1948), the frequency of group0 reaches 92 to 93 per cent, the small difference from 100 per cent probablybeing due to slight racial admixture. The same interpretation may explain thesimilar percentage of group 0 among other North and South American tribes.It is obviously difficult to exclude mixing with other ethnic groups which hadcenturies to take place.The predominance of type M among Indians is another well known feature,
though investigations on the M-N types in Indians have been relatively scanty.Caucasians have about 30 per cent type M individuals, U. S. and ChileanIndians (Henckel et al., 1941), about 60 per cent, while the incidence amongNorth Brazilian Indians is intermediate (Biocca & Ottensooser, 1944; daSilva, 1948).Only a few investigations on the Rh factor have been made in Indians, be-
cause sufficient quantities of antiserum have not become available until re-cently. The three main racial groups, Caucasoids, Negroids, and Mongoloids,are distinctly differentiated by the incidence of the Rh-negative type.' Most
Received October 15, 1949.1 An exceptional people are the Basques (Etcheverry, 1945, 1949; Chalmers et al., 1948; Vaccaro
et al., 1948) with 30 to 35 per cent Rh-negatives and other peculiarities, such as low percentage ofgroup B and lack of rhw.
141
F. OTTENSOOSER AND R. PASQUALIN
Caucasoids have 13 to 15 per cent Rh-negatives, Negroids 5 to 10 per cent, whileMongoloids have still lower frequencies, often zero. The incidence of Rh-negative individuals among Asiatic Indians (Greval & Roychowdhury, 1946;das Gupta, 1944; Khanolkar & Sanghvi, 1945; Ranganathan et al., 1946), is2 to 10 per cent, which is intermediate between Caucasoids and Mongoloidsand similar to that of Negroids, from whom they deviate, however, with regardto the frequencies of the other Rh types. The frequency of Rh-negative in-dividuals among Japanese was found to be 0.3 to 1.3 per cent (Waller & Levine,1944; Miller & Taguchi, 1945; Pinkerton, 1944; Graydon & Simmons, 1945),among Chinese 0.7 and 1.5 per cent (Wiener, Sonn & Yi ,1944; Levine & Wong,1943), among Filipinos 0.3 and 0 per cent (Simmons & Graydon, 1945; Pink-erton, 1944), and among Australian aborigines 0.2 per cent (Simmons, Graydon& Hamilton, 1946). In the following series of 200 or more individuals all werefound to be Rh-positive: Maori (Graydon & Simmons, 1946), Fijians (Simmons,Graydon & Barnes, 1945), Hawaiians (Pinkerton, 1945), Papuans (Simmons,Graydon, Woods, Smith & Lancaster, 1946), Burmese (Mollison & Reddy,1946), and Eskimos (Jordan, 1946).In American Indians, similarly, the frequency of Rh-negatives is small or
zero: 1 to 2 per cent in two series of 100 and 120 U. S. Indians, according toLandsteiner, Wiener, and Matson (1942) and Wiener, Hassler, et al., respec-tively. The same low incidence was observed by Sandoval, Henckel and Givo-vich (1945) among 205 Chilean Mapuches. Moreover, among 98 MexicanIndians (Wiener, 1947; Wiener, Zepeda, Sonn & Polivka, 1945), and 104 U. S.Indians (Matson & Piper, 1947), all were Rh-positive. Summing up, Amer-ican Indians are, with rare exceptions, all Rh-positive; in the cases where among100 Indians a single Rh-negative individual is encountered it is difficult toexclude the possibility of more or less recent admixture with other races.While the distributions of the A-B-O groups and of the M-N types are unique
among American Indians, they do not enable one to classify Indians as Mon-goloids; a better criterion of such a relationship is provided by the Rh-nega-tive element. The latter is not the only serological indication, however, becausethe relationship of Indians to Mongoloids is also shown by the absence of sub-group A2 and by the distribution of other Rh factors. These more refined dif-ferences will be discussed later.
MATERIAL AND METHODS
The preceding brief discussion shows how scanty have been the serological investigationson Indians in Brazil, where there are so many tribes of differing cultures. We had an oppor-tunity to study the incidence of the blood factors in a considerable number of Brazilian In-
dians, when during the months of May to July of 1947 Dr. Ernani Martins da Silva madeexcursions to the south of Matto Grosso, where he studied Caiua Indians in the frontier
142
BLOOD TYPES OF BRAZILIAN INDIANS
regions of Paraguay, and Bororo Indians in the north in the Sio Lourengo Valley2. He sentus blood samples from these two tribes in six series, three from Caiua Indians and threefromBororo Indians (table 1).From Caiu& Indians (comprising one large and several small families) samples were taken
in the following places:1st series at the Jose Bonificio Post (municipality of Ponta Pori).2nd series at the Francisco Horta Post near the town Dourados.3rd series at the Reserva Cerro Peron and the Benjamin Constant Post, near the place
of Amambaf.From the Bororo samples were taken in 3 villages within a period of 4 days:1st series at Quejara.2nd series at Col6nia.3rd series at C6rrego Grande.
In both tribes there was a predominance of pure Indians; the few mixed Indians wereeasily recognized. Separation was carried out rigorously by inquiring concerning theirancestry, and by examining their somatic characteristics such as the color of the skin, colorof the eyes, quality of the hair, slit of the eyelids, and manner of implantation of the lobe ofthe ear. Only individuals who passed all tests are included in the following statistics. Thereliability of our method of selecting pure-bred Indians is confirmed (da Silva), by compar-ing the blood group distribution among Whites, Indians and mixed Indians in that regionwith the aid of the race mixture formula derived by one of us (Ottensooser, 1944). Venousblood was difficult to obtain from these Indians, so that finger puncture had to be employed.Several drops of blood were distributed among 2 or 3 capillary tubes which were put intonumbered slips of paper.
Dr. Ernani Martins da Silva carried out tests for the common A-B-O blood groups andthe Rho factor on Bororo Indians and on the last series of CaiuA on the spot, in a makeshiftlaboratory at a post or in a "hotel". The capillaries were broken and placed into test tubeswith a few drops of saline solution. Blood suspensions were obtained by shaking. The com-mon blood grouping tests were carried out on slides. In the Rh tests, the tubes containingthe mixture of serum and blood suspension were tied together, wrapped in cotton, andplaced into a saucepan with water heated to 370C by means of an alcohol burner. Readingswere taken after i to 1 hour.
Our own examinations were made in Sfo Paulo, 3 to 6 days after the blood specimenshad been drawn. The blood samples were sent by air mail in a small wooden box, and ar-rived in good condition. Due to the low temperature (below 200C) of the season hardly anyspecimens were spoiled. In order to prepare the blood suspensions, the capillaries were openedand placed into numbered tubes with 1 to 2 c.c. of'saline solution and then centrifuged,in batches of about 40 at a time, for 15 minutes at about 1,500 r.p.m. This made the smallclot come out of the capillaries producing a sediment in the tube. The supernatant fluid wassiphoned off and saline added again to suspend the red cells. In rare cases, where centrif-ugation yielded no sediment, the capillaries were broken as described above. The 1 to 2per cent blood suspensions were examined on the day of their preparation whenever possible.
The common blood groups were determined on slides or dishes with sera of groups 0,A, and B. A few doubtful reactions, possibly due to changes in the blood sample duringtransportation, were checked further with group AB serum.
' Our good friend, Dr. Ernani Martins da Silva, died a victim of his exploring zeal in December1948, during an expedition in Goiaz.
143
F. OTTENSOOSER AND R. PASQUALIN
To test for the M-N types, equal parts of blood suspension and serum (from CertifiedBlood Donor Service, N. Y. C.) were mixed; control tests with samples of known M-N typeswere also included. Readings were taken after 10 minutes with a hand lens.
For Rh typing we used anti-Rho sera prepared by ourselves, and also anti-Rho, anti-rh', and anti-rh" sera kindly furnished by Dr. A. S. Wiener and by the Certified BloodDonor Service. For some of the latter sera we are obliged to Dr. Arnaldo Amado Ferreira.We are also indebted to Dr. J. M. Hill for supplying us with anti-hr' serum. Tests with thesesera were carried out by mixing, in small tubes, equal parts of diluted serum and blood sus-pensions, the first reading was taken after J to 1 hour of incubation at 370C, and a secondreading after keeping the tubes at room temperature (150C to 200C) for a few hours or over-night. Duplicate tests with sera of the same specificity always gave identical results.
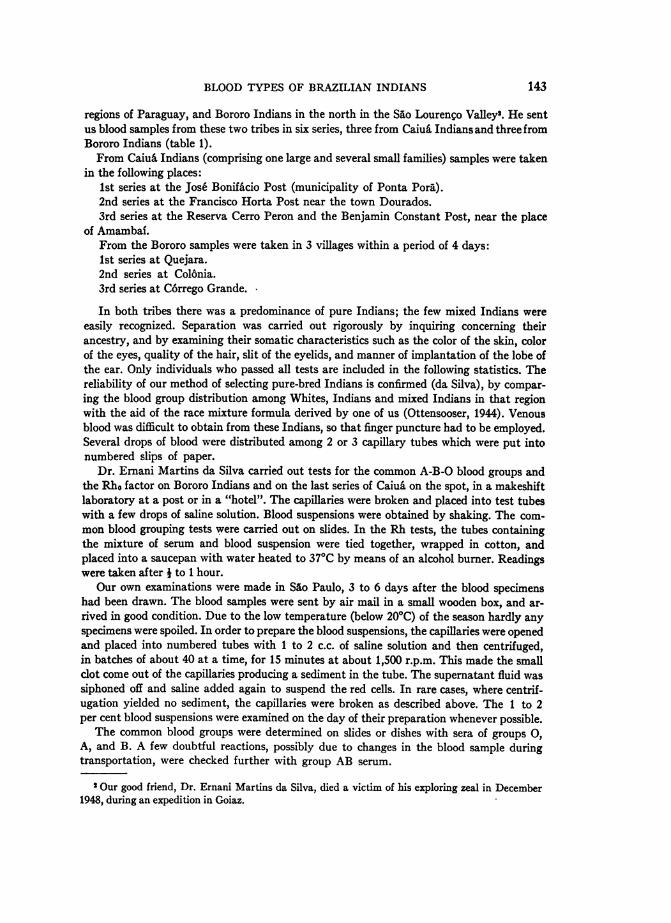
TABLE 1. DISTRIBUTION OF THE BLOOD TYPES AMONG MATTO GROSSO INDIANS
TRIBE SEESNO. 0 ROUP. OS. P0R.h 0o. >Rh2 h1NRhO. M N MN
SEISNO. GROUP0 NO. Rh-. NO. Rh '(Rh,,) OBs.
CaiuA1 89 89 89 89 89 23 17 49 88 68 1 192 46 46 46 46 46 7 11 28 46 39 0 73 102 102 38 38
Total 237 237 173 173 135 30 28 77 134 107 1 26% 100 100 22.2 20.7 57.1 79.9 0.7 19.4
Bororo1 39 39 39 39 39 8 9 222 31 31 31 31 31 7 5 193 49 49 33 33 33 9 4 20
Total 119 119 103 103 103 24 18 61% 100 100 23.3 17.5 59.2
RESULTS
A-B-O System-Table 1 shows that the 237 Caiu& and 119 Bororo all be-longed to group 0. Also all other Matto Grosso Indians investigated at thesame time invariably proved to be group 0 (da Silva). As already mentionedseveral South American tribes behave in this way, including Brazilian Indians.M-N System-As shown in table 1, among the 134 Caiu6 examined 79.9
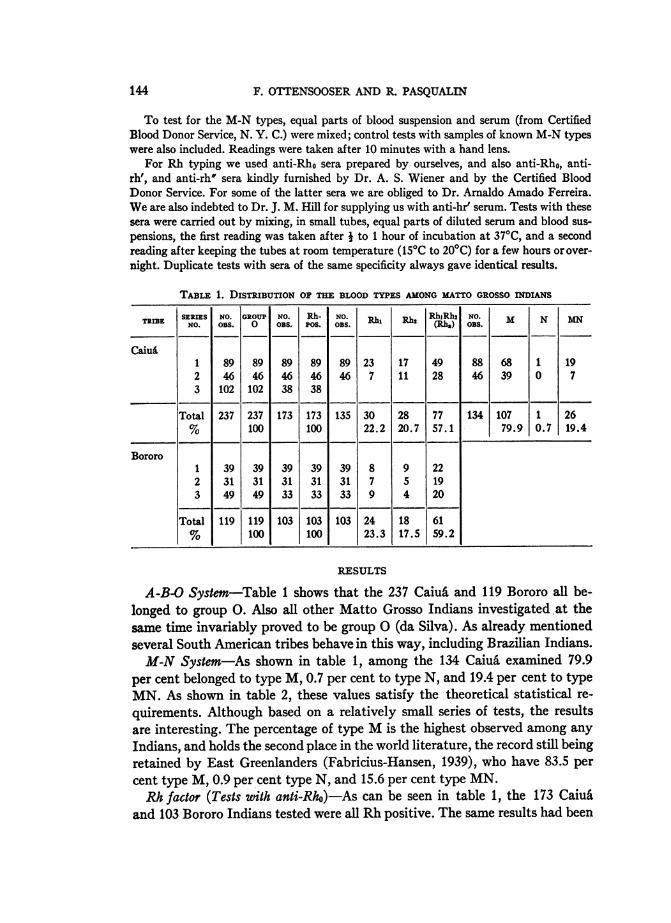
per cent belonged to type M, 0.7 per cent to type N, and 19.4 per cent to typeMN. As shown in table 2, these values satisfy the theoretical statistical re-quirements. Although based on a relatively small series of tests, the resultsare interesting. The percentage of type M is the highest observed among anyIndians, and holds the second place in the world literature, the record still beingretained by East Greenlanders (Fabricius-Hansen, 1939), who have 83.5 percent type M, 0.9 per cent type N, and 15.6 per cent type MN.Rh factor (Tests with anti-Rho)-As can be seen in table 1, the 173 Caiu&
and 103 Bororo Indians tested were all Rh positive. The same results had been
144
BLOOD TYPES OF BRAZILIAN INDIANS
obtained in a previous study on 165 Matto Grosso Indians (da Silva). Thus,in all, 441 Indians in that State tested with anti-Rho serum proved to be Rhpositive. These observations agree well with previous investigations on NorthAmerican Indians.Rh types-To our best knowledge, the incidence of the various Rh types
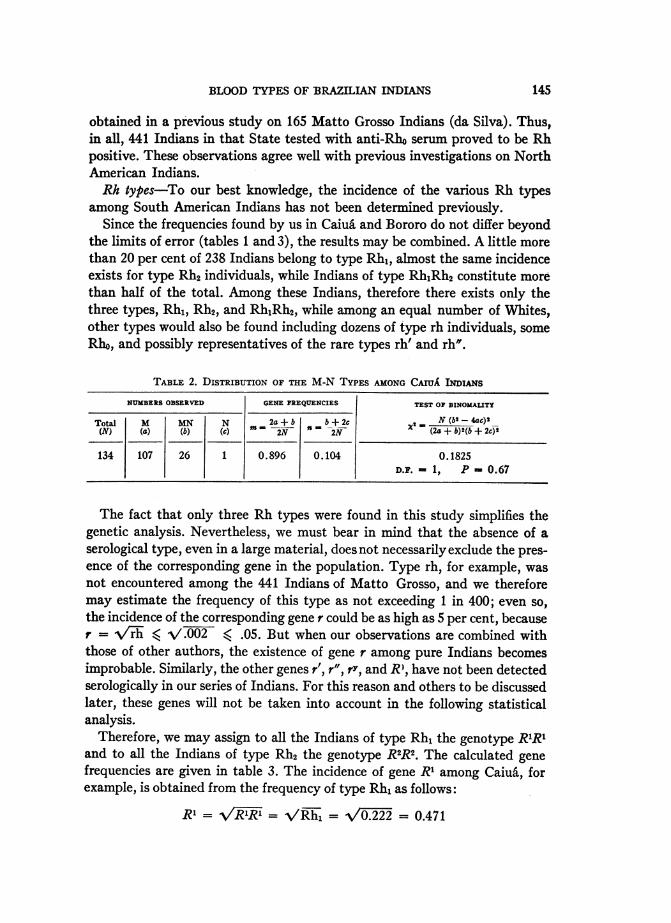
among South American Indians has not been determined previously.Since the frequencies found by us in Caiu& and Bororo do not differ beyond
the limits of error (tables 1 and 3), the results may be combined. A little morethan 20 per cent of 238 Indians belong to type Rh,, almost the same incidenceexists for type Rh2 individuals, while Indians of type RhRh2 constitute morethan half of the total. Among these Indians, therefore there exists only thethree types, Rh,, Rh2, and RhRh2, while among an equal number of Whites,other types would also be found including dozens of type rh individuals, someRho, and possibly representatives of the rare types rh' and rho.
TABLE 2. DISTRIBUTION OF THE M-N TYPES AMONG CAruA IbrnDNs
NUMBERS OBSERVED GENE FREQUENCIES TEST OF BINOMALITY
Total M MN N 2a + b b + 2c 2 N(b-4ac)2(N) (a) (b) (c) m 2N " 2N (2a+ b)2(b+ 2c)2
134 107 26 1 0.896 0.104 0.1825D.F. 1, P -0.67
The fact that only three Rh types were found in this study simplifies thegenetic analysis. Nevertheless, we must bear in mind that the absence of aserological type, even in a large material, does not necessarily exclude the pres-ence of the corresponding gene in the population. Type rh, for example, wasnot encountered among the 441 Indians of Matto Grosso, and we thereforemay estimate the frequency of this type as not exceeding 1 in 400; even so,the incidence of the corresponding gene r could be as high as 5 per cent, becauser = 'V-i %/.002 < .05. But when our observations are combined withthose of other authors, the existence of gene r among pure Indians becomesimprobable. Similarly, the other genes r', r", ry, and R, have not been detectedserologically in our series of Indians. For this reason and others to be discussedlater, these genes will not be taken into account in the following statisticalanalysis.
Therefore, we may assign to all the Indians of type Rh, the genotype R'R1and to all the Indians of type Rh2 the genotype R2R2. The calculated genefrequencies are given in table 3. The incidence of gene R1 among Caiua, forexample, is obtained from the frequency of type Rh1 as follows:
RI = = V/Rh, = V02 = 0.471
145
F. OTTENSOOSER AND R. PASQUALIN
In the same manner, we obtain RI = 0.456. The sum RI + R2 is less than unityor 100 per cent by the relatively high value of 7.3 per cent. In the Bororo,there is a corresponding shortage of 9.9 per cent. Since these two values (7.3and 9.9 per cent) agree within the limits of statistical error for the two tribes,they are almost surely significant.Wiener et al. (1947; 1945), had observed previously that among Mexican
Indians there is a similar deficiency in the sum of the gene frequencies and ex-
plained it by postulating the existence of a third gene RE in addition to R1 and
TABLE 3. DIBUTBoN OF THE RH TYPES AND OF THE CORRESPONDING GENES AMONG MATTO GROSSOINDIANS
PERCENTAGE OF TYPES INCIDENCE OF GENES
TRIBE NO. OBS. RhtRh| RI- -= R-
RhN Rh1 (Rhz) oN,/'Rj N/R-h (1-Ri-RI)
Caiul......1. 135 22.2 20.7 57.1 0.471 0.456 0.073Bororo .............. 103 23.3 17.5 59.2 0.483 0.418 0.099
Total ............. 238 22.7 19.3 58.0 0.476 0.440 0.084
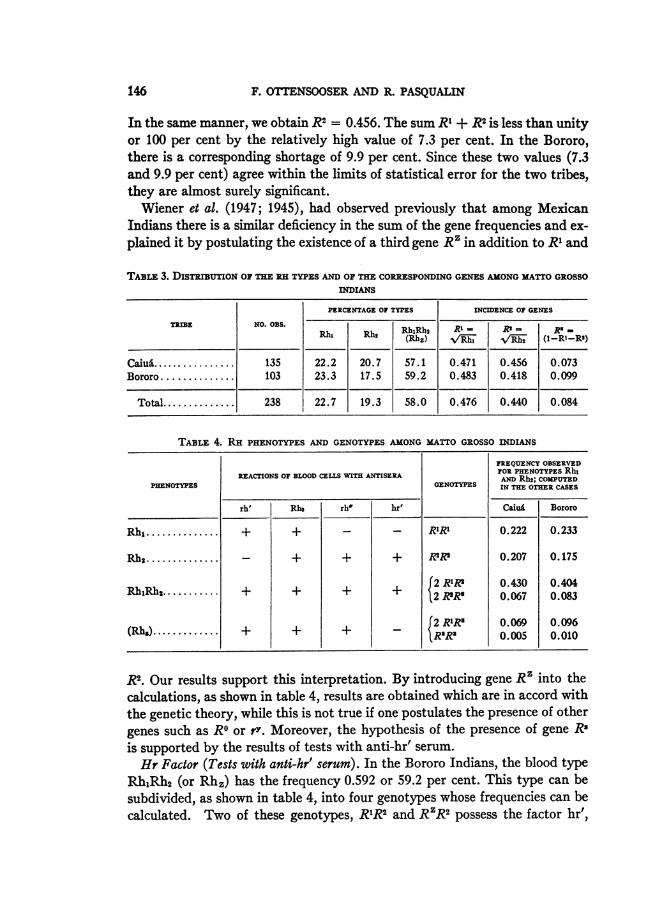
TABLE 4. RH PHENOTYPES AND GENOTYPES AMONG MATTO GROSSO INDIANS
FREQUENCY OBSERVEDREACTIONS OF BLOOD CELLS WITH ANTISERA FOR PHENOTYPES Rh,
PHENOTYPES GENOTYPES AN RHE; COPED
rh' Rho rho hr' Caiu5 Bororo
Rh1 ............. + + - - R1R1 0.222 0.233
Rhs ............ - + + + R'1? 0.207 0.175
RhiRh2...'...|.. + + + + 2 RIK* 0.430 0.4042 RRs 0.067 0.083
(Rhs)............ + + + - 2 R1R' | 0.096R"R" 0.005 0.010
2. Our results support this interpretation. By introducing gene R' into the
calculations, as shown in table 4, results are obtained which are in accord withthe genetic theory, while this is not true if one postulates the presence of other
genes such as RO or r7. Moreover, the hypothesis of the presence of gene Rsis supported by the results of tests with anti-hr' serum.
Hr Factor (Tests with anti-hr' serum). In the Bororo Indians, the blood typeRhjRh2 (or Rh,) has the frequency 0.592 or 59.2 per cent. This type can besubdivided, as shown in table 4, into four genotypes whose frequencies can becalculated. Two of these genotypes, R1R2 and RZR2 possess the factor hr',
146
BLOOD TYPES OF BRAZILIAN INDIANS
while the two other genotypes RZRz and RZR1, which together should have theincidence among type RhRh2 Bororo Indians of 1.0 + 9.6 = 10.6 per cent,have no hr'. The existence of hr'-negative individuals of type Rh1Rh2 would beproof of the existence of gene RZ. The expected proportion of such individualsamong type RhjRh2 Bororo Indians is 10.6:59.2 or approximately one in six.Tests were made with anti-hr' serum on 12 Bororo of type RhIRh2, and oneproved to be hr' negative instead of the expected two such individuals. How-ever, this is as good an agreement between calculation and observation as onecould reasonably expect, the number of tests being very small due to the scar-
RI R2 - Rz ROI I I IDe *D Do *D
Cl Ic Cl Ic
A LE ES 5eI I I I
The CDE notations used by British workers are readily understood with the aid of the followingequivalents:
Blood Factors Genetic UnitsAmerican British Genes "Chromosomes"
nomenclature notations(Wiener) (Fisher-Race) r cdeRho D r' Cderh' C r" cdErh" E pr CdEHro d RO cDehr' c RK CDehr" e R2 cDE
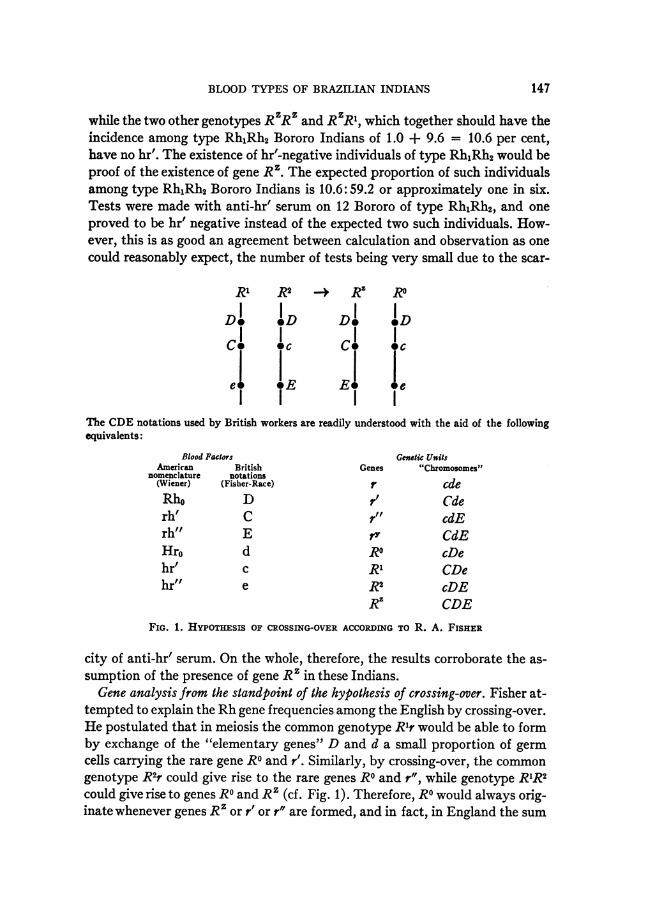
RZ CDEFIG. 1. HYPOTHESIS OF CROSSING-OVER ACCORDING To R. A. FISHER
city of anti-hr' serum. On the whole, therefore, the results corroborate the as-sumption of the presence of gene RZ in these Indians.Gene analysis from the standpoint of the hypothesis of crossing-over. Fisher at-
tempted to explain the Rh gene frequencies among the English by crossing-over.He postulated that in meiosis the common genotype RKr would be able to formby exchange of the "elementary genes" D and d a small proportion of germcells carrying the rare gene RO and r'. Similarly, by crossing-over, the commongenotype R2r could give rise to the rare genes RO and r", while genotype R1R2could give rise to genes RO and RZ (cf. Fig. 1). Therefore, RO would always orig-inate whenever genes RZ or r' or r" are formed, and in fact, in England the sum
147
F. OTITENSOOSER AND R. PASQUALIN
of the frequencies of these last three genes approximately equals the frequencyof RO. Gene ry would be expected to be extremely rare because it would haveto be formed from a rare genotype such as R2r' or RKr". However, Fisher'ssuggestion has not been confirmed serologically, so that one is justified in as-suming that in the Rh gene complex the three postulated elementary genes arelinked together permanently to form units. In practical cases of disputed pa-ternity (Ottensooser & Versiani, 1949), the cross-over hypothesis can thereforebe disregarded at the present stage of our knowledge.
Extensive family studies on the heredity of the Rh-Hr types have shown thatcrossing-over, if it occurs at all, must be extremely rare (Wiener, Belkin, &Sonn, 1944). For example, in the case of genotype RKr, which is the most com-mon in the United States, the formation of genes RO and r' has not yet beenobserved. A case explicable by crossing-over has been claimed recently byGlass (1948), but this single case is not conclusive because it can be explainedfar more reasonably on the basis of illegitimacy.
A further test of Fisher's hypothesis is provided by the results of serological-anthro-pological investigations. The Rh gene frequencies of various populations which we have cal-culated are summarized in table 6, but some of the series are too small to be of much value.On the whole, the results do not favor the crossing-over hypothesis, because the relationsRO = RZ, or Ro = Rz + r' + r" do not hold, except in Mexican Indians where the frequen-cies of Ro and Rz approximate one another.
In order to test whether the crossing-over hypothesis is supported by our own observa-tions, arbitrarily chosen RO values will be introduced into the gene analysis, to determinewhich assumption conforms best with the actual observations.
1st assumption: Ro lacking.
The sum of the gene frequencies RI + R1 = 91.6 per cent; the difference from 100 percent is 8.4 per cent. We believe that the entire difference represents the frequency of geneRZ, but since only a few Hr tests have been made it could be that the percentage of R'makes up only part of the difference 8.4 per cent.
2nd assumption: Equal frequencies of Rl and R".
According to this assumption the difference, 8.4 per cent, comprises equal percentages of
genes RZ and R'.If RO - 4.2 per cent the frequency of type Rho should be very small (0.042)2 0.18
per cent, which agrees with the actual observation that not one type Rho individual was
found among more than 200 Indians.The frequencies of genes RI and RK can then be recalculated as follows:
Rh1 - 0.227 - RIRI + 2R'R',R'RI + 2RK(0.042) + (0.042)2 = 0.227 + (0.042)2,RI + 0.042 = 0.227 + 0.002,RK = V10.229 - 0.042 = 43.6%.
148
BLOOD TYPES OF BRAZILIAN INDIANS
Similarly, RI = a/0.193 + 0.002 - 0.042 = 38.4%,and the sum RI + R2 + RO = 43.6 + 38.4 + 4.2 = 86.2%,
which is very low. Correspondingly, the difference from 100 per cent is considerable, namely,13.8 per cent.
Therefore, the first assumption that RO = 0, in which the difference is much smaller(only 8.4 per cent), appears more plausible.
3rd assumption: Relatively high RO value.
According to the serological findings, the Ro frequency could also be greater than 4.2per cent. If, for instance, it were 7 per cent, only one type Rho individual among 200 In-dians would be expected. Actually no type Rho individual was found, but this is not neces-sarily contrary to the assumption RO = 0.07.On this assumption we get the following gene frequencies:
RO = V/o.o05 = 0.071 or 7.1%,RI= V/0.227 + 0.005 - 0.071 = 41.1%,R2 = V/0.193 + 0.005 - 0.071 = 37.4%.
The sum of the gene frequencies, R' + R2 + RO = 41.1 + 37.4 + 7.1 = 85.6 per cent.is accordingly still smaller, and the disagreement even greater than under the second as-sumption.
4th assumption: Small RO value.Assume that RO = 1 per cent, so that the frequency of type Rho would be very low, 0.01
per cent. The gene distribution would be then as follows:
RO = = .01 or 1%,RI = a/0.227 + 0.0001 - 0.01 = 46.7%,R2 = V/O.193 + 0.0001 - 0.01 = 42.9%.
We see that when even a very small RO value is introduced into the calculation, the genesum RI + R2 + RO = 46.7 + 42.9 + 1.0 90.6 per cent already becomes smaller thanunder our first assumption.
The following table shows the gene sums and their differences from 100 per cent, result-ing from different RO values arbitrarily assumed.
RD PERCENTAGES ARBITRARILY ASSUMED
0 1 4.2 7.
Gene sum RI + R2.+R .91.6 90.6 86.2 85.6Difference from100% (= RZ?).8.4 9.4 13.8 14.4
Even the assumption of a small RO value (1 per cent) lowers the gene sum, which de-creases continually with increasing RO values. The introduction of higher R5 values tobalance the difference from 100 per cent, however, is not a satisfactory solution.
Therefore, the assumption that there is a substantial proportion of gene RO in our materialbecomes improbable, and our observations do not support the crossing-over hypothesis.
149
F. OQTENSOOSER AND R. PASQUALIN
il '66q.
0% %O - U).f)4f00Ce
0 0
0 U)V- C~4
0 0 V-4C4U) 4trI
U)
9 C4o qd6C
U)
- 4 ~el) C
00 %0 mEmm#) U)
- '4 C4 -O tn - I- C4 -.
00C~~~~~~4
I. .0oJ N + o oU) o0 %0t-. oo.
~~~1)0 0 I~~0 0 .
0n'-Wmt~ C'
tn0 00 0 10%
.0 all, Cf~0 _ _ _ _ _
04 V-4 0- ) - vo 0 0 -coC4C4 tn V-~4 tn4
.0 I in t
if) LI)~mUl 0
o % - "? o0 o
JNOt-l I) ° - eifneO)
00 -
C Iu) 0 I t o
$.o 0%
V'0 -) 0 0V w
ON W o~: 4 . 8 me}oo
-g 0%S!EI y 8 ! t!0's000 0% a) 0% ~~~~~~~~~ -d 0~~C 'c 4
- '-4,.~~~~~~~ 0 a04-
4-)~~~~00 0 0 ..
___ U1 ~~ ~ 0 ~ ~ C') Cl) 00(/2GI (DQC
*n '0
I .X4aC't) w m
co U
C/I
0t
*0b
.)0
.C
14IdinS
En
04
P4
0
I).-
.
.2a)0
Iis
IA9S
0Cd
"0
0 9!uI...IC O ¢ ¢)
a)
fe.
150
0
to
0
?5
U)
0
0
ZO0
0
0r.
U)
0
BLOOD TYPES OF BRAZILIAN INDIANS
- 0% 0 U')
I
In U)o
0C+
0 00 C4* +
I +
C4 0 I 0
+ I
151
C~4 IRV 1' 0-
-
I ++
0 - ")~~~~~~~n0 W-4 C'4 C4 G0
0 In1co0to" to1NO 11 W' 0% 00 01to00 00V V0--- - - -wI~~)Cm4 C4 C4C4)
00 m NO %O lq4 C~4 m mC1)o 02%in 00 00co000%OC;p)0EC '0 ~4 C1)0(6 ) 0% 00 tl%
j 4~4 - 11i 0% 0% 00 .
%0 C~'-40 t'~.00 e~) - ' e1)00 0
|4 a.- r_.o
__00- __140 4 U)- -''- ~ 4c 4 0
i oC"t4oC4 t- 'lC>40 oooo*" %0t __00 '0o CS4Ct4U)o1 o-)~rC1C4 C14 C4 -
1-00 _1tof)%C° - ^"4 - - C"4 -4
1- -°141 1 -1 1 o
0 0
j'0 C6 w
bo
U9'0
Ii
"0d4-44la
I¢m00cI00
.
4)4)C
CO)b
"d 0
0 co
U3 .4c,9 0a o4
o ,
$u
- A
8 R 1a
CoM0
o0
cn
Co
Com
0'
r34
F. OTTENSOOSER AND R. PASQUALIN
DISCUSSION
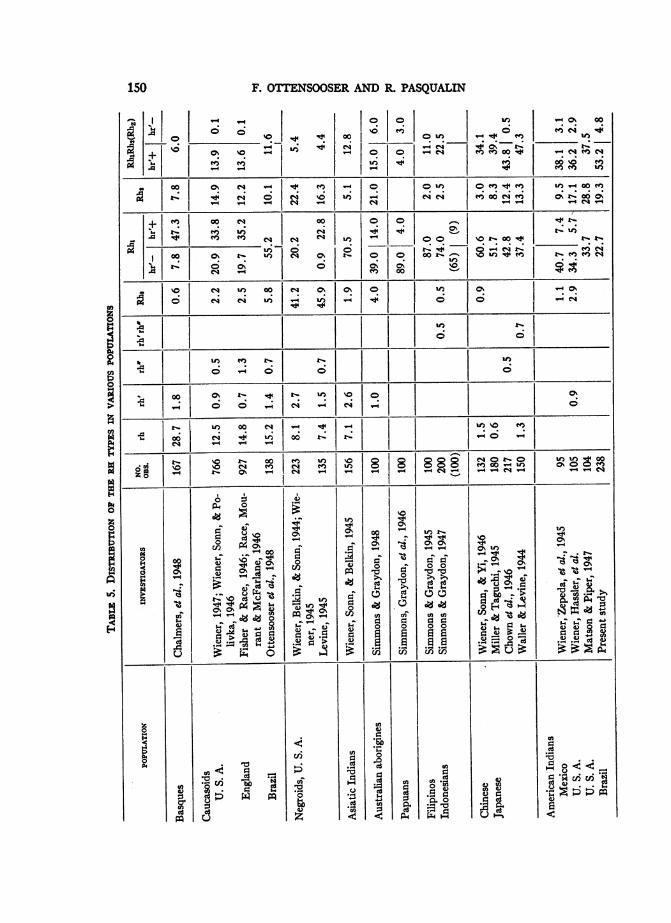
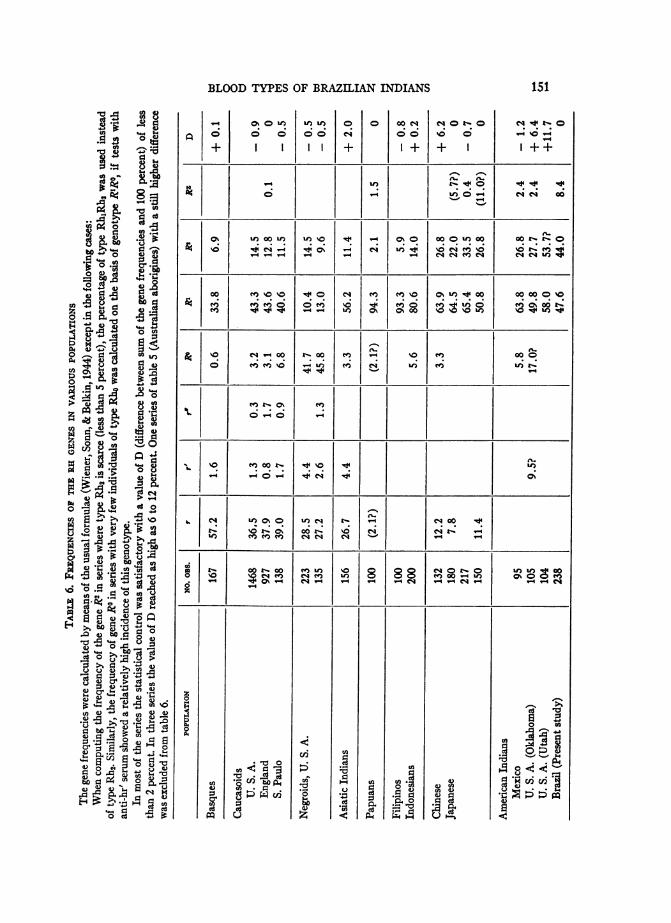
Data on the distribution of Rh-Hr types in mankind have been compiledonly in recent years and are therefore scarce. Among the populations examinedthere are rather variegated recent mixtures, and one cannot tell to what degreethe material selected is representative without consulting the original papers,which are not always accessible. Nevertheless, the combined results of theseinvestigations already have anthropological significance (Levine, 1945; Wiener,1945; Wiener, 1947; Potter, 1947).In table 5 our data are compared with those obtained in other countries,
especially by Simmons, Graydon, et al. in Mongoloids, by Wiener, Zepeda,Sonn and Polivka (1945) in Mexican Indians, and by Wiener, Hassler, et al.and by Matson and Piper (1947) in U. S. Indians. Table 6 gives the correspond-ing gene frequencies for each population.The Negroid group differs fundamentally from Caucasoids and Mongoloids
in the high proportion of gene RO. The Mongoloid group, on the other hand, isdifferentiated from Whites and Negroes and also Asiatic Indians by the scarcityor even lack of gene r.The genes RK and R2 together enable one to distinguish the three major races.
The Negroids (Wiener, 1945; Wiener, Belkin & Sonn, 1944; Levine, 1945),have the lowest values of R' (less than 15 per cent), the Mongoloids the highest(more than 45 per cent), while the Caucasoids are intermediate (40 to 45 percent). Some Mongoloids, namely, North American and Brazilian Indians, haverelatively low RK values approaching those of Whites, but differ sharply fromWhites as well as from Asiatic Indians in their high R2 values.
PERCENTAGE OP GENEPOPULATIONS_
RI R2
Papuans and Filipinos ............................... More than 90 Less than 10Indonesians........................................About 80 About 15
Chinese, Japanese, Mexican Indians, 1 series of U. S.Indians ......................................... 45-65 20-35
U. S. and Brazilian Indians .......................... 45-58 More than 40
Also among themselves, Mongoloid peoples differ in their RK and R2 fre-quencies. The percentage of other genes being small, there is a roughly recipro-cal relationship between the frequencies of genes R1 and R2. As a result, thedifferent populations can be arranged according to the frequencies of genesRK and R, and almost the same order is obtained from the frequencies of theblood types Rh, and Rh2. This is shown in tables 5 and 6, which have beenarranged according to this principle.
152
BLOOD TYPES OF BRAZILIAN INDIANS
Summarizing, gene RI seems to have its maximum frequencies in Australiaand Indonesia, decreasing in the direction of the Asiatic, African and Americancontinents. Gene RK behaves inversely. These gradients may be, as in the caseof genes A and B in Eurasia, manifestations of old migrations. The most ex-treme distributions are especially interesting. The Papuans and Filipinos onone hand have the highest R1 values and the lowest R2 values of all the peoplesexamined; Brazilian and U. S. Indians (Matson & Piper, 1947), on the otherhand, have the highest R2 values and consequently, relatively low RI values.There are also American Indians whose R1 and RK frequencies resemble thoseof Japanese and Chinese.Even among the American Indians themselves, there occur distinct dif-
ferences in the distribution of these genes. For example, gene RI is more fre-quent in Mexican than Brazilian Indians, the difference being statisticallysignificant. This is a second variation in the otherwise uniform serological fea-tures of American Indians, the other difference consisting of a high percentageof group A in certain U. S. tribes.The presence of a substantial quota of Rz seems characteristic of American
Indians and some other Mongoloid peoples who possess this gene in a fre-quency 25 to 100 times as high as Whites (Simmons & Graydon, 1947, 1948;Simmons, Graydon, Woods, Smith & Lancaster, 1946; Wiener, 1947; Wiener,Zepeda, Sonn & Polivka, 1945; Wiener, Hassler, et al.). This is a positive sero-logical attribute of Mongoloids in contrast to the negative ones, virtual ab-sence of A2 and Rh-negative individuals.The particular distribution found in Matto Grosso Indians, with equal RK
and R2 frequencies and high proportion of RZ, extends over vast territories.The Caiud and the Bororo, separated by hundreds of kilometers, have similarfrequencies of all the blood types examined. We may therefore assume that ourvalues are representative for certain other Brazilian and Paraguayan tribesalso.
SUMMARY AND CONCLUSIONS
Investigations have been carried out on the distribution of the A-B-Ogroups, M-N types, and Rh types among Caiua6 and Bororo Indians in theState of Matto Grosso (Brazil).
All 356 Indians tested (237 Caiua and 119 Bororo) belonged to group 0.Among 134 Caiua, 79.9 per cent belonged to type M, 0.7 per cent to type N,
and 19.4 per cent to type MN.Among 173 Caiua and 103 Bororo, not a single Rh-negative individual
was found.The distribution of the Rh types among 135 CaiuA and 103 Bororo were
almost identical. The average frequencies of the types are 22.7 per cent typeRh,, 19.3 per cent type Rh2, and 58.0 per cent RhRh2. The sum of the gene
153
F. OTTENSOOSER AND R. PASQUALIN
frequencies R1 + R2 = 0.476 + 0.440 is less than 1, and the difference .084apparently is due to the presence of a third gene, Rz, as can be demonstratedby Hr tests. The findings do not support the crossing-over hypothesis.
American Indians are related to Mongoloids as shown by certain serologicalfindings such as an appreciable frequency of Rz, scarcity or absence of theRh-negative type, and they are also distinguished by their frequencies of 0,.M,and Rh2. Among Matto Grosso Indians these frequencies are especially high.
REFERENCES
BERARDINELLI, W., & RoITER, M. 1934. Hospital, Rio. 6: 1129-1135.BIoccA, E., & OTTENSOOSER, F. 1944. Arq. biol., S. Paulo, 28: 111-118.CHALMERS, J. N. M., IKIN, E. W., & MoURANT, A. E. 1948. Nature, Lond. 162: 27.CHOWN, B., OKAMURA, Y., & PETERSON, R. F. 1946. Canad. J. Res. 24: 135-143.ETCHEVERRY, M. A. 1945. Dia mMd., B. Air. 17: 1237-1245.ETCHEVERRY, M. A. 1949. Hemat. y Hemoter. 1: 114.FABRICIUS-HANSEN, V. 1939. J. Immun., Balt. 36: 523-530.FERNANDES, L. 1939. Rev. mid. Parand. 8: 17-24.FISHER, R. A. 1947. Am. Scientist, 35: 95-102-113.FISHER, R. A., & RAcE, R. R. 1946. Nature, Lond. 157: 48-49.GLASS, B. 1948. Proc. 8th International Cong. Genetics; Unpublished.GRAYDON, J. J., & SmnONS, R. T. 1945. Med. J. Australia, 1: 601-604.GRAYDON, J. J., & SMEIONS, R. T. 1946. Med. J. Australia, 1: 135-138.GREVAL, S. D. S., & ROYCHOWDHURY, A. B. 1946. Nature, Lond. 157: 411.DAS GUPTA, C. R. 1944. Ind. M. Gaz. 77: 372-376.HENCKEL, K. O., CASTELLI, A., & DAL BORGO, J. 1941. Bol. Soc. biol. Concepcin. 15: 37-41.JORDAN, D. 1946. Canad. M. Ass. J. 54: 429-434.KHANOLKAR, V. R., & SANGHVI, L. D. 1945. Nature, Lond. 155: 427-428.LANDSTEINER, K., WIENER, A. S., & MATSON, G. A. 1942. J. Exp. M. 76: 73-78.LEVINE, P. 1945. Biometr. Bull. 1: 20-21.LEvINE, P. 1945. Nature, Lond. 156: 418-419.LEVINE, P., & WONG, H. 1943. Am. J. Obst. 45: 832-835.MATSON, G. A., & PIPER, C. L. 1947. Am. J. Phys. Anthrop. 5: 357-368.MILLER, E. B., & TAGUCHI, T. 1945. 51: J. Immun., Balt. 51: 227-230.MOLLISON, P. L., & REDDY, D. J. 1946. Nature, Lond. 158: 629.MURRAY, J. 1946. Nature, Lond. 158: 306.OTTENSOOSER, F. 1944. Rev. brasil. biol. 4: 531-537.OTTENSOOSER, F., LAcAZ, C. S., FERREIRA, H. C., & MELLONE, 0. 1948. Blood, Balt. 3: 696-
698.OTTENSOOSER, F., & PASQUALIN, R. 1949. Arq. biol., S. Paulo, 33: 8-18.OTTENSOOSER, F., & VERSIANI, V. 1949. Arq. biol., S. Paulo, 33: 43-46.PINKERTON, F. J. 1944. Hawaii M. J. 4: 84-85.POTTER, E. L. 1947. Rh ... its relation, etc. Chicago: Year Book Publishers.RAcE, R. R., MouRANT, A. E., & McFARLANE, M. N. 1946. Rev. hfnat., Par. 1: 9-21.RANGANATHAN, K. S., RAMAcHANDRA RAo, C. S., & RATNAKANNAN, N. R. 1946. Nature,
Lond. 157: 411.RIBEIRO, L. 1934. C. rend. Soc. biol. 117: 777-778.SANDovAL, L., HENCKEL, C., & GIvovIcH, L. 1946. Blood, Bait. 1: 555-559.DA SILVA, E. M. 1948. Am. J. Phys. Anthrop. 6: 423-428.
154
BLOOD TYPES OF BRAZILIAN INDIANS
DA SILVA, E. M. In press.SIMONS, R. T., GRAYDON, J. J., & OuwTmAND, C. 1945. M. J. Australia, 1: 108-110.SIMONS, R. T., & GRAYDON, J. J. 1945. Med. J. Australia, 2: 325-328.SIMONS, R. T., GRAYDON, J. J., & BARNES, G. 1945. Med. J. Australia, 1: 529-532.SimONS, R. T., GRAYDON, J. J., WOODS, E. F., HUGH SMITH, W. A., & LANCESTER, H. 0.
1946. M. J. Australia, 1: 537-539.SIMMONS, R. T., GRAYDON, J. J., & HAMILTON. 1946. M. J. Australia, 1: 553.SImONS, R. T., & GRAYDON, J. J. 1947. Med. J. Australia, 1: 577-581.SIMONS, R. T., & GRAYDON, J. J. 1948. Med. J. Australia. 2: 113-118.VACCARO, H., STAEING, J., & GANzARAIN, R. 1948. Rev. chilena hig. 10: 121-147.WALLER, R. K., & LEvnIE, P. 1944. Science, 100: 453-454.WIENER, A. S. 1945. Tr. Coll. Physicians Philadelphia. 13: 105-122.WIENER, A. S. 1946. Science, 103: 147.WIENER, A. S. 1947. This Month in American Medicine, January 1-12.WIENER, A. S. 1947. Advance. Int. Med., N. Y. 2: 439-480.WIENER, A. S. 1949. Proc. 8th Internat. Cong. Genetics, Hereditas, Suppi. Vol., 500-519.WIENER, A. S., BELKIN, R. B., & SoNN, E. B. 1944. Am. J. Phys. Anthrop. 2:187-194.WIENER, A. S., HASSLER, F. R., SONN, E. B., & POLIVIA, H. R. Unpublished data.WIENER, A. S., SoNN, E. B., & YI, C. L. 1944. Am. J. Phys. Anthrop. 2: 267-273.WIENER, A. S., SONN, E. B., & BELKIN, R. B. 1944. J. Exp. M. 97: 235-253.WIENER, A. S., SoNN, E. B., & BELKIN, R. B. 1945. J. Immun., Balt. 50: 341-348.WIENER, A. S., SoNN, E. B., & POLIVxA, H. R. 1946. Proc. Soc. Exp. Biol., N. Y. 61: 382-
390.WIENER, A. S., ZEPEDA, J. P., SoNN, E. B. & POLIVxA, H. R. 1945. J. Exp. M. 81: 559-571.
155