Embed Size (px)
Citation preview
This article was originally published in a journal published byElsevier, and the attached copy is provided by Elsevier for the
author’s benefit and for the benefit of the author’s institution, fornon-commercial research and educational use including without
limitation use in instruction at your institution, sending it to specificcolleagues that you know, and providing a copy to your institution’s
administrator.
All other uses, reproduction and distribution, including withoutlimitation commercial reprints, selling or licensing copies or access,
or posting on open internet sites, your personal or institution’swebsite or repository, are prohibited. For exceptions, permission
may be sought for such use through Elsevier’s permissions site at:
http://www.elsevier.com/locate/permissionusematerial
Autho
r's
pers
onal
co
py
Blue agave fiber esterification for the reinforcementof thermoplastic composites
E. Tronc a, C.A. Hernandez-Escobar b, R. Ibarra-Gomez b, A. Estrada-Monje b,J. Navarrete-Bolanos c, E.A. Zaragoza-Contreras b,*
a Laboratoire de Chimie Agro-Industrialle, UMR INRA, Ecole Nationale Superieure de Chimie de Toulouse, INP Toulouse,
118 route de Narbonne, 31077 Toulousse Cedex 04, Franceb Centro de Investigacion en Materiales Avanzados, S.C., Miguel de Cervantes No. 120, Complejo Industrial Chihuahua, CP 31109, Chihuahua Chih, Mexico
c Instituto Mexicano del Petroleo, Eje Central Lazaro Cardenas No. 152, Col. Sn. Bartolo Atepehuacan, CP 07730, Mexico, DF, Mexico
Received 10 September 2004; received in revised form 26 April 2006; accepted 30 May 2006Available online 23 August 2006
Abstract
Blue agave fiber esterification and its use in thermoplastic composite reinforcement was the purpose of this research. Spectroscopictechniques indicated the occurrence of the esterification reaction, since signals for carbonyl groups were found through FT-IR(1750 cm�1) and 13C-CPMAS-NMR (172 ppm). Mechanical properties characterization showed that superficial modification was suc-cessfully achieved, since a change in the elastic modulus and improved impact resistance were observed when the modified fiber was used.In addition, electron microscopy studies indicated that the modified fiber produced an enhancement in fiber/HDPE interfacial interac-tion, since less fiber sliding evidence was observed on the composite surface. The Cox–Merz rule was used as an alternative tool in orderto study composites rheometry along an expanded range of shear rate in the power law region.� 2006 Elsevier Ltd. All rights reserved.
Keywords: Lignocellulosic; Blue agave fiber; Esterification; Thermoplastic composite; Rheology
1. Introduction
Lignocellulosics are biodegradable materials that naturerecycles through biological, thermal, chemical and photo-chemical processes. Theses materials are hygroscopic bynature, since they are designed to perform in a wet environ-ment. The chemical constitution of lignocellulosics variesfrom specie to specie but cellulose, hemicelluloses and lig-nin are the common constituents. Annually large amountsof lignocellulosics are produced as wastes, where wood andits derivatives constitute around 40% of the residual solid
wastes from residential, commercial, industrial and institu-tional sources. Since lignocellulosic fibers can improve thetoughness and strength of plastics, the production of ther-moplastic composites is becoming important in applica-tions for recovering and recycling these materials.However, as mentioned above, the hydrophilic nature oflignocellulosics difficult their interaction with most thermo-plastic polymers and the resulting composites present poormechanical properties. In order to improve the interfacialinteraction lignocellulosic/thermoplastic, the modificationof one of them should be achieved. In general, it is conve-nient to modify the fiber through physical or chemicalmethods. Physical methods include: corona or plasmatreatments and mercerization, where fiber surface is modi-fied by influencing its mechanical bonding with the poly-meric matrix; whereas chemical methods consist in thereaction of some groups of the fiber with a proper reactive
0144-8617/$ - see front matter � 2006 Elsevier Ltd. All rights reserved.
doi:10.1016/j.carbpol.2006.05.027
* Corresponding author. Tel.: +52 614 439 4811; fax: +52 614 439 4811.E-mail address: [email protected] (E.A. Zaragoza-
Contreras).
www.elsevier.com/locate/carbpol
Carbohydrate Polymers 67 (2007) 245–255
Autho
r's
pers
onal
co
py
compound in order to form covalent bonds. The new com-ponent acts as an interface between both the fiber and thethermoplastic matrix, thus improving composite perfor-mance as a result of a better interfacial interaction (Bledzki& Gassan, 1999).
There are two main techniques for carrying out ligno-cellulosics chemical modification; the first technique con-sists of grafting polymeric chains on the fiber surface byforming free radicals using a redox-initiator and subse-quently, propagate polymeric chains (Gupta & Sahoo,2001; Gurdag, Yas�ar, & Gurkaynak, 1997; Gurdag, Guclu,& Ozgumus�, 2001; Huang, Zhao, Zheng, He, & Gao, 1992;Mohanty, Mubarak, & Hinrichsen, 2000; Roman-Aguirre,Marquez-Lucero, & Zaragoza-Contreras, 2004). The sec-ond method includes the reaction of the cellulose hydroxylgroups (OH) with certain kinds of reagents such as silanes(Coutinho, Costa, Carvalho, Gorelova, & Claudio de San-ta Maria, 1998; Redondo, Radovanovic, Goncalves, &Yoshida, 2002; Rong, Zhang, Liu, Yang, & Zeng, 2001),acyl halogenures (Chuavelon et al., 1999; Nair, Thomas,& Groeninckx, 2001; Sun, Fan, Tomkinson, Geng, &Liu, 2001; Thiebaud & Borredon, 1995; Thiebaud, Borre-don, Baziard, & Senocq, 1997), isocianates (Ellis & O’Dell,1999; Joseph, Rabello, Mattoso, Joseph, & Thomas, 2002;Vazquez, Domınguez, & Kenny, 1999), carboxylic acids(Rong et al., 2001; Sun, Sun, & Sun, 2002) or anhydrides(Rowell et al., 1994; Sun et al., 2002; Vaca-Garcıa &Borredon, 1999; Vaca-Garcıa, Thiebaud, Borredon, &Gozzelino, 1998). Commonly, these reagents have reaction-able functional groups where a polymer chain can bepropagated or grafted (Joseph et al., 2002). The effect oflignocellulosics chemical modification is the reduction ofhydrophilicity (if the new group lignocellulosic-modifier ishydrophobic), which in first instance should solve theproblem related to polarity differences between the fiberand the thermoplastic.
As mentioned above, the chemical modification produc-es changes on the fiber hydrophilicity, which shouldimprove the interfacial interaction fiber/thermoplasticand the composite mechanical performance. The presentresearch was aimed to study the chemical modification ofa lignocellulosic fiber; such modification consisted in theesterification reaction between the cellulosic fraction ofthe fiber and a nonsymmetric anhydride (in non-aqueousmedia). It is worthy to mention that solid 13C NMR wasused as a basic tool in order to obtain strong evidenceabout the modified fiber structure. The fiber used was anagro-industrial waste derived from Weber blue agave fiber(agave tequilana weber blue variety or agave palmaris) whichgrows in Western Mexico (Jalisco) and through its fermen-tation tequila has been produced for long time. With tequi-la massive industrialization, large amounts of fiber areproduced yearly as byproduct, and together with manyother similar materials, its accumulation and disposal hasbecome a critical environmental problem (Iniguez-Cova-rrubias, Lange, & Rowell, 2001). The study was comple-mented with the evaluation of mechanical properties of
fiber/polyethylene (HDPE) composites and the obtentionof viscosity curves applying the Cox–Merz rule.
2. Experimental
2.1. Chemicals
In order to achieve fiber chemical modification the fol-lowing reagents were used: acetic anhydride (J.T. Baker),octanoic acid (Aldrich Co.) and acetone (Fisher), all ofthem used as received. The used water was tridistillatedquality. Prior to modification the fiber was washed withwarm water in order to eliminate dust and sugar remainsfrom the fermentation process. Afterwards, the fiber wasdried in an air convection oven at 110 �C for 24 h. Final-ly, the fiber was milled in a rotatory mill. The fiberaspect radio (length/diameter, relationship), determinedby measuring around 800 fibers (optic microscopy andimage analysis), was 13.24. It is important to mentionthat fiber population was conformed by two groups ofsize; the first of finely milled fiber [powder (40%weight) = 0.007 to 1.0 mm] and the second, of largerfiber [long fiber (60% weight) = 1.001 to 10.0 mm].High-density polyethylene (HDPE) from Chevron (Mar-flex Hi-D94312; MI = 12; q = 0.943 g cm�3) was usedas the composite matrix.
2.2. Esterification
The fiber modification was performed by using a similarsystem, acetic anhydride/octanoic acid, as reported in liter-ature (Vaca-Garcıa et al., 1998). However, in the presentwork the fiber was not milled completely to powder butwas kept to a much longer average size, in order to evaluatea broad distribution of fiber size. It has to be mentionedthat the fiber for composite formulation was not selectedin a particular size range but used as obtained form themill. That was due to the fact that after milling the fiber,around 40% weight of it was obtained as powder and therest as long fiber (60% weight), so for practical purposesand to use as much fiber as possible, it was decided touse it as a mixture, with the characteristics mentionedabove.
The esterification reaction was carried out in a three-neck-round-bottomed flask of 1000 mL provided withmechanical agitation and a glass condenser. A typicalexperiment was performed as follows: 190 mL (2.0 eq)of acetic anhydride and 888 mL (5.6 eq) of octanoic acidwere mechanically mixed (200 rpm) for 1.0 h at 90 �C.These compounds react to form a so-called mixed anhy-dride (MAn = CH3–OCOCO–(CH2)6–CH3). Next, thecorresponding amount to 2.0 eq of fiber (108.0 g) wasadded to MAn. The reaction mixture was allowed toreact for 3.0 h at 135 �C with mechanical agitation. Afterthe reaction time the modified fiber was cleaned byextraction with acetone; the fiber was considered cleanonce any remain of MAn was not visible and any scent
246 E. Tronc et al. / Carbohydrate Polymers 67 (2007) 245–255
Autho
r's
pers
onal
co
py
of the mixture was not perceived. Finally, in order toevaporate the solvent the fiber was put into an air con-vection oven at 50 �C for 6 h.
2.3. Ester content
The ester content was calculated according to areported method (Girerdeau et al., 2001) as follows: first,1.0 g of modified fiber plus 40 mL of ethanol (95%) wereloaded into a glass recipient and heated at 55 �C for30 min. Next, 25 mL of a sodium hydroxide (NaOH)aqueous solution 0.5 N was added and let in agitationfor 15 min more at 55 �C. The mixture was kept inrepose for 3 days at room temperature. Afterwards,NaOH solution was fed in order to saponificate theformed ester groups. The saponification process con-sumed certain amount of NaOH, which was determinedby titration with a hydrochloric acid (HCl) aqueous solu-tion 0.5 N, using phenolphthalein as color indicator. Ablank sample (unmodified fiber) was also treated throughthe same described method in order to have a referencefor comparison. The difference in concentration of HClsolution used for titrating the blank sample and themodified sample determines the concentration of NaOHinvolved in the saponification of the ester groups (orthe formed ones during esterification). The ester content(EC) was determined according to the followingequation:
ECð%Þ ¼ ½ðA� BÞ � NB � ðC � DÞ � NA� �M
10 � W; ð1Þ
where A and B are the volume (mL) of NaOH solutionadded to the modified sample and to the blank, respec-tively. C and D are the volume (mL) of HCl solutionused to neutralize the modified sample and the blank,respectively. NA and NB are the normal concentration(N) of the HCl and NaOH, respectively. W is the weightof the sample and M the molar mass of the grafted acylgroup.
2.4. Oil/water test
A qualitative oil/water test was performed in order toevaluate the new hydrophobic property of the modifiedfiber. Samples of 1.5 g of unmodified and modified fiberwere loaded in separate recipients, where 50 mL of tapwater were previously added. Afterwards, the fiber sampleswere allowed to hydrate for 5 min and 10 mL of mineral oilwere added to every recipient. Finally, the mixture wasthoroughly mixed and let in repose for 30 min.
2.5. Infrared spectroscopy (FT-IR)
Esterification product was characterized by infraredspectroscopy. The analyses were performed in a FT-IRNicolett Series 2 Magna IR 750. Before running the spec-tra, the samples of modified and unmodified fiber were
dried at 110 �C for 12 h. The samples were analyzedthrough the KBr tablet technique.
2.6. Solids 13C NMR
Nuclear magnetic resonance (NMR) spectra were runusing a Bruker 300 JCAMPDX-V1.0 spectrometer operat-ing at 100 MHz for 13C and 400 KHz for 1H. Spectra acqui-sition was performed at 6 KHz using a zirconium oxiderotor of 4 mm. 13C NMR spectra were performed in thecross-polarization mode with magic angle spin (CPMAS).
2.7. Thermal properties
To evaluate chemical modification effects on the fiberthermal properties, thermogravimetric analysis (TGA) anddifferential thermal analysis (DTA) were performed. Ther-mograms were run on a simultaneous TGA–DTA TAInstruments SDT 2960, under air atmosphere. The analyseswere carried out at a heating speed of 10 �C/min. Prior toanalysis the samples were dried at 110 �C for 12 h.
2.8. X-ray diffraction
X-ray measurements were run on a Philips X-Pert dif-fractometer at 40 KV and 30 mA, under the following con-ditions: start angle (2H) = 5�, end angle (2H) = 80�, stepsize (2H) = 0.1�, time/step (s) = 5 and scanning time(h:min:s) = 1:0:0.
2.9. Mechanical properties
Fiber/HDPE composites, with different contents ofmodified or unmodified fiber, were prepared in order toevaluate the effect of both modification and fiber contenton the composites mechanical properties. Samples wereprepared according to ASTM-D 256 and ASTM-D 790procedures. The samples were prepared as follow: first, aseries of mixtures fiber/HDPE were prepared using a mix-ing chamber of 60 cm3 (coupled to a Plasticorder C.W.Brabender) at 180 �C and 30 rpm. Second, plaques(15 · 15 cm and 2.0 mm wide) were prepared by compres-sion molding at 10 metric tons and 200 �C. A CEAST mod-el CCF-50 device was used to machine the probes. Third,composite impact resistance was determined by using anIzod analyzer with 12 cm and 0.245 g of length and pendu-lous mass, respectively. Fourth, Young module of sampleswas determined with an Instron series 4301 connected to aPC for data acquisition. Finally, samples were run using5 kN cells at room temperature.
2.10. Scanning electron microscopy
The interfacial interaction fiber/HDPE was analyzed byscanning electron microscopy (SEM) in a SEM Jeol Model5800 LV. Samples were prepared by frizzing the probeswith liquid nitrogen and breaking them with the Izod
E. Tronc et al. / Carbohydrate Polymers 67 (2007) 245–255 247
Autho
r's
pers
onal
co
py
analyzer; before the analyses the composite samples werecovered with gold in order to avoid static charge.
2.11. Rheology
Composite viscosity curves were performed with aHaake Rheostress 150 universal rheometer. Cone and plategeometry was used in both rotational and oscillatorymodes at 160 �C. Fixed stress for frequency sweep in oscil-latory motion was 10 Pa.
3. Results and discussion
3.1. Degree of substitution (esterification)
Before discussing esterification characterization, it hasto be mentioned that lignocellulosics structure is constitut-ed by several layers concentrically arranged and with differ-ent composition. Each fiber is formed by a series ofmicrofibril aggregates into longer macrofibril helicallywounded along the fiber axis and embedded into an amor-phous lignin/hemicelluloses matrix (Rong et al., 2001).Considering lignocellulosics structure is important sincein this research it was assumed that only the cellulosic frac-tion participate in the esterification reaction. The methodused in this research comprises the reaction of a non-sym-metric anhydride [MAn = CH3–OCOCO–(CH2)6–CH3]with the cellulose hydroxyl (OH) groups, where the octano-ic acid reacts first with the acetic anhydride (co-reagent) inorder to produce a more reactive specie (with OH groups ofcellulose) than the fatty acid by itself (Vaca-Garcıa et al.,1998). Experimentation indicated that the esterificationdepended importantly on the fiber size (powder or longfiber). As can be seen in Table 1, the fraction of powderfiber presented ester content three times higher than thelong ones. It is believed that in the case of the powderthe diffusion of the reaction mixture (MAn) towards thericher cellulose regions was more efficient than in the caseof the long fiber, where the amorphous phase lignin/hemi-celluloses apparently restricted MAn diffusion towards cel-lulose. Therefore, and in accordance with these results, it isevident that the external layers in the long fiber structureare not appropriate enough for the esterification reaction.
3.2. Hydrophobicity
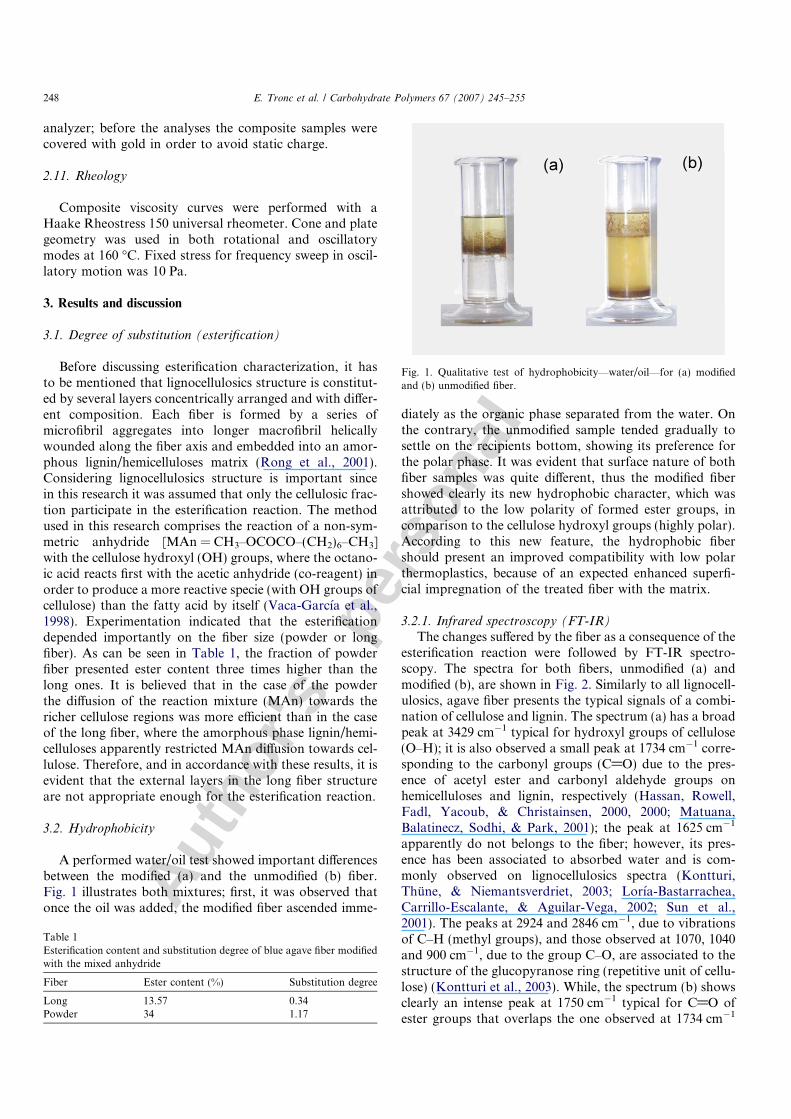
A performed water/oil test showed important differencesbetween the modified (a) and the unmodified (b) fiber.Fig. 1 illustrates both mixtures; first, it was observed thatonce the oil was added, the modified fiber ascended imme-
diately as the organic phase separated from the water. Onthe contrary, the unmodified sample tended gradually tosettle on the recipients bottom, showing its preference forthe polar phase. It was evident that surface nature of bothfiber samples was quite different, thus the modified fibershowed clearly its new hydrophobic character, which wasattributed to the low polarity of formed ester groups, incomparison to the cellulose hydroxyl groups (highly polar).According to this new feature, the hydrophobic fibershould present an improved compatibility with low polarthermoplastics, because of an expected enhanced superfi-cial impregnation of the treated fiber with the matrix.
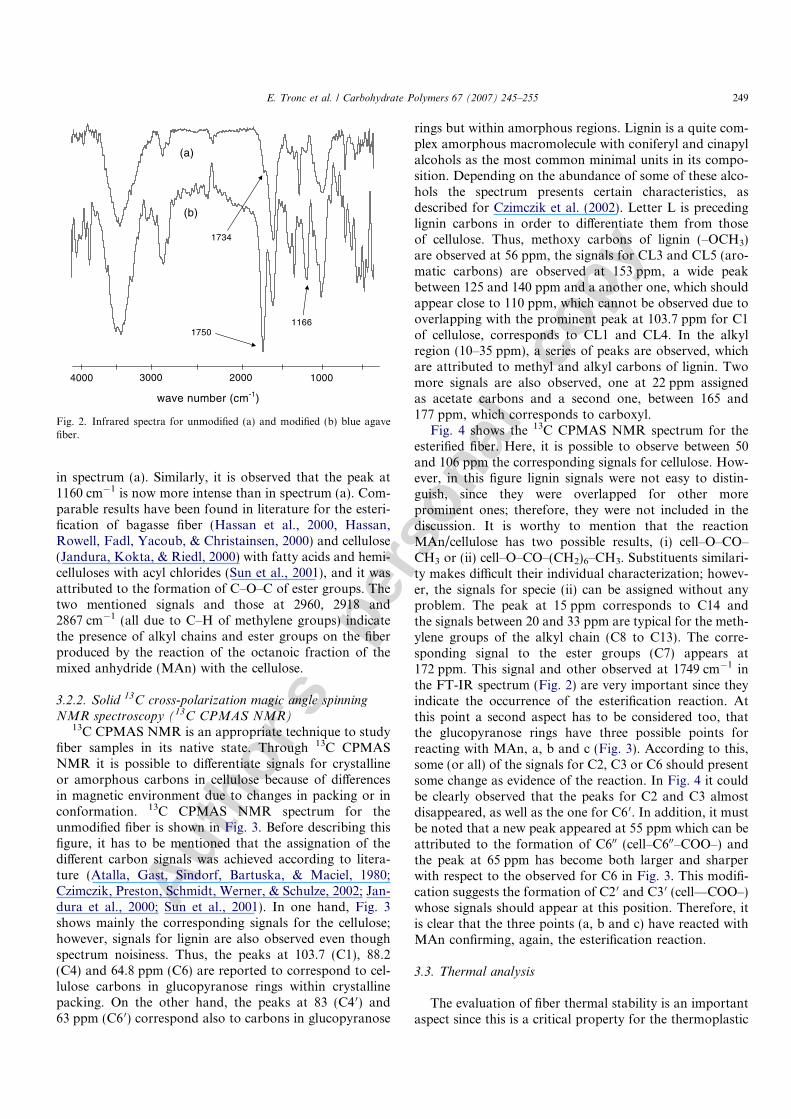
3.2.1. Infrared spectroscopy (FT-IR)The changes suffered by the fiber as a consequence of the
esterification reaction were followed by FT-IR spectro-scopy. The spectra for both fibers, unmodified (a) andmodified (b), are shown in Fig. 2. Similarly to all lignocell-ulosics, agave fiber presents the typical signals of a combi-nation of cellulose and lignin. The spectrum (a) has a broadpeak at 3429 cm�1 typical for hydroxyl groups of cellulose(O–H); it is also observed a small peak at 1734 cm�1 corre-sponding to the carbonyl groups (C@O) due to the pres-ence of acetyl ester and carbonyl aldehyde groups onhemicelluloses and lignin, respectively (Hassan, Rowell,Fadl, Yacoub, & Christainsen, 2000, 2000; Matuana,Balatinecz, Sodhi, & Park, 2001); the peak at 1625 cm�1
apparently do not belongs to the fiber; however, its pres-ence has been associated to absorbed water and is com-monly observed on lignocellulosics spectra (Kontturi,Thune, & Niemantsverdriet, 2003; Lorıa-Bastarrachea,Carrillo-Escalante, & Aguilar-Vega, 2002; Sun et al.,2001). The peaks at 2924 and 2846 cm�1, due to vibrationsof C–H (methyl groups), and those observed at 1070, 1040and 900 cm�1, due to the group C–O, are associated to thestructure of the glucopyranose ring (repetitive unit of cellu-lose) (Kontturi et al., 2003). While, the spectrum (b) showsclearly an intense peak at 1750 cm�1 typical for C@O ofester groups that overlaps the one observed at 1734 cm�1
Table 1Esterification content and substitution degree of blue agave fiber modifiedwith the mixed anhydride
Fiber Ester content (%) Substitution degree
Long 13.57 0.34Powder 34 1.17
Fig. 1. Qualitative test of hydrophobicity—water/oil—for (a) modifiedand (b) unmodified fiber.
248 E. Tronc et al. / Carbohydrate Polymers 67 (2007) 245–255
Autho
r's
pers
onal
co
py
in spectrum (a). Similarly, it is observed that the peak at1160 cm�1 is now more intense than in spectrum (a). Com-parable results have been found in literature for the esteri-fication of bagasse fiber (Hassan et al., 2000, Hassan,Rowell, Fadl, Yacoub, & Christainsen, 2000) and cellulose(Jandura, Kokta, & Riedl, 2000) with fatty acids and hemi-celluloses with acyl chlorides (Sun et al., 2001), and it wasattributed to the formation of C–O–C of ester groups. Thetwo mentioned signals and those at 2960, 2918 and2867 cm�1 (all due to C–H of methylene groups) indicatethe presence of alkyl chains and ester groups on the fiberproduced by the reaction of the octanoic fraction of themixed anhydride (MAn) with the cellulose.
3.2.2. Solid 13C cross-polarization magic angle spinning
NMR spectroscopy (13C CPMAS NMR)13C CPMAS NMR is an appropriate technique to study
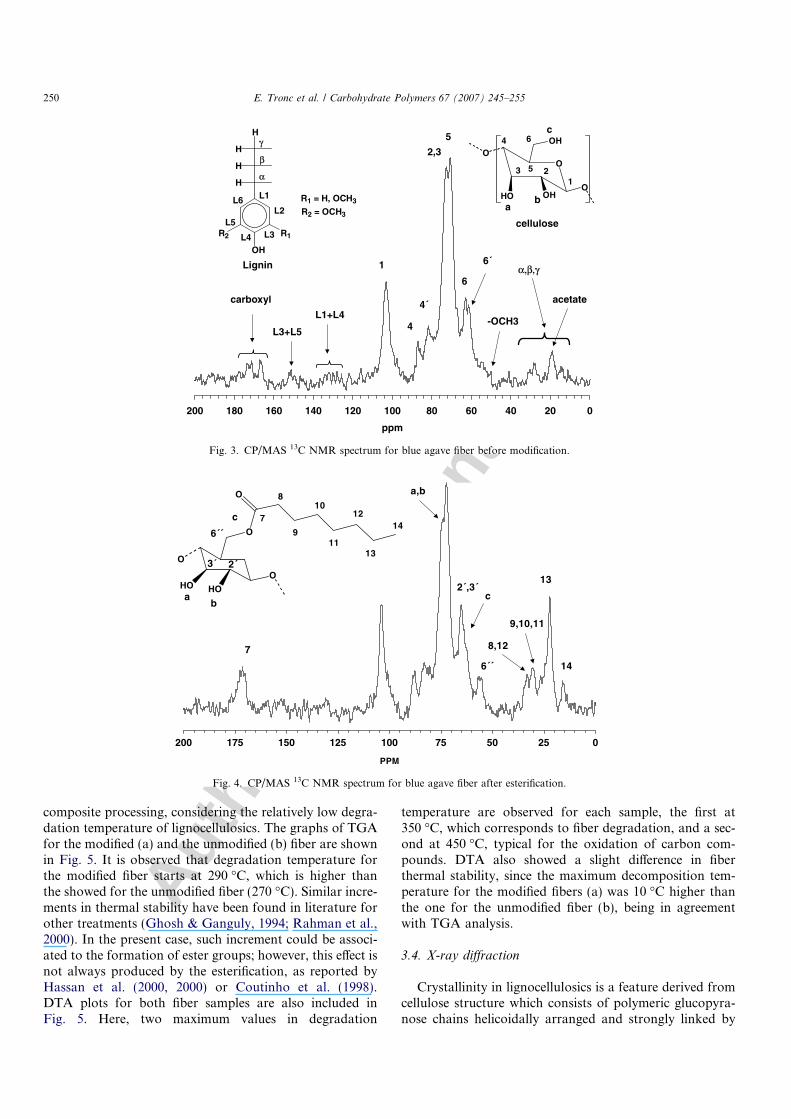
fiber samples in its native state. Through 13C CPMASNMR it is possible to differentiate signals for crystallineor amorphous carbons in cellulose because of differencesin magnetic environment due to changes in packing or inconformation. 13C CPMAS NMR spectrum for theunmodified fiber is shown in Fig. 3. Before describing thisfigure, it has to be mentioned that the assignation of thedifferent carbon signals was achieved according to litera-ture (Atalla, Gast, Sindorf, Bartuska, & Maciel, 1980;Czimczik, Preston, Schmidt, Werner, & Schulze, 2002; Jan-dura et al., 2000; Sun et al., 2001). In one hand, Fig. 3shows mainly the corresponding signals for the cellulose;however, signals for lignin are also observed even thoughspectrum noisiness. Thus, the peaks at 103.7 (C1), 88.2(C4) and 64.8 ppm (C6) are reported to correspond to cel-lulose carbons in glucopyranose rings within crystallinepacking. On the other hand, the peaks at 83 (C4 0) and63 ppm (C6 0) correspond also to carbons in glucopyranose
rings but within amorphous regions. Lignin is a quite com-plex amorphous macromolecule with coniferyl and cinapylalcohols as the most common minimal units in its compo-sition. Depending on the abundance of some of these alco-hols the spectrum presents certain characteristics, asdescribed for Czimczik et al. (2002). Letter L is precedinglignin carbons in order to differentiate them from thoseof cellulose. Thus, methoxy carbons of lignin (–OCH3)are observed at 56 ppm, the signals for CL3 and CL5 (aro-matic carbons) are observed at 153 ppm, a wide peakbetween 125 and 140 ppm and a another one, which shouldappear close to 110 ppm, which cannot be observed due tooverlapping with the prominent peak at 103.7 ppm for C1of cellulose, corresponds to CL1 and CL4. In the alkylregion (10–35 ppm), a series of peaks are observed, whichare attributed to methyl and alkyl carbons of lignin. Twomore signals are also observed, one at 22 ppm assignedas acetate carbons and a second one, between 165 and177 ppm, which corresponds to carboxyl.
Fig. 4 shows the 13C CPMAS NMR spectrum for theesterified fiber. Here, it is possible to observe between 50and 106 ppm the corresponding signals for cellulose. How-ever, in this figure lignin signals were not easy to distin-guish, since they were overlapped for other moreprominent ones; therefore, they were not included in thediscussion. It is worthy to mention that the reactionMAn/cellulose has two possible results, (i) cell–O–CO–CH3 or (ii) cell–O–CO–(CH2)6–CH3. Substituents similari-ty makes difficult their individual characterization; howev-er, the signals for specie (ii) can be assigned without anyproblem. The peak at 15 ppm corresponds to C14 andthe signals between 20 and 33 ppm are typical for the meth-ylene groups of the alkyl chain (C8 to C13). The corre-sponding signal to the ester groups (C7) appears at172 ppm. This signal and other observed at 1749 cm�1 inthe FT-IR spectrum (Fig. 2) are very important since theyindicate the occurrence of the esterification reaction. Atthis point a second aspect has to be considered too, thatthe glucopyranose rings have three possible points forreacting with MAn, a, b and c (Fig. 3). According to this,some (or all) of the signals for C2, C3 or C6 should presentsome change as evidence of the reaction. In Fig. 4 it couldbe clearly observed that the peaks for C2 and C3 almostdisappeared, as well as the one for C6 0. In addition, it mustbe noted that a new peak appeared at 55 ppm which can beattributed to the formation of C600 (cell–C600–COO–) andthe peak at 65 ppm has become both larger and sharperwith respect to the observed for C6 in Fig. 3. This modifi-cation suggests the formation of C2 0 and C3 0 (cell—COO–)whose signals should appear at this position. Therefore, itis clear that the three points (a, b and c) have reacted withMAn confirming, again, the esterification reaction.
3.3. Thermal analysis
The evaluation of fiber thermal stability is an importantaspect since this is a critical property for the thermoplastic
(a)
(b)
100020003000 4000
wave number (cm-1)
1734
1750 1166
Fig. 2. Infrared spectra for unmodified (a) and modified (b) blue agavefiber.
E. Tronc et al. / Carbohydrate Polymers 67 (2007) 245–255 249
Autho
r's
pers
onal
co
py
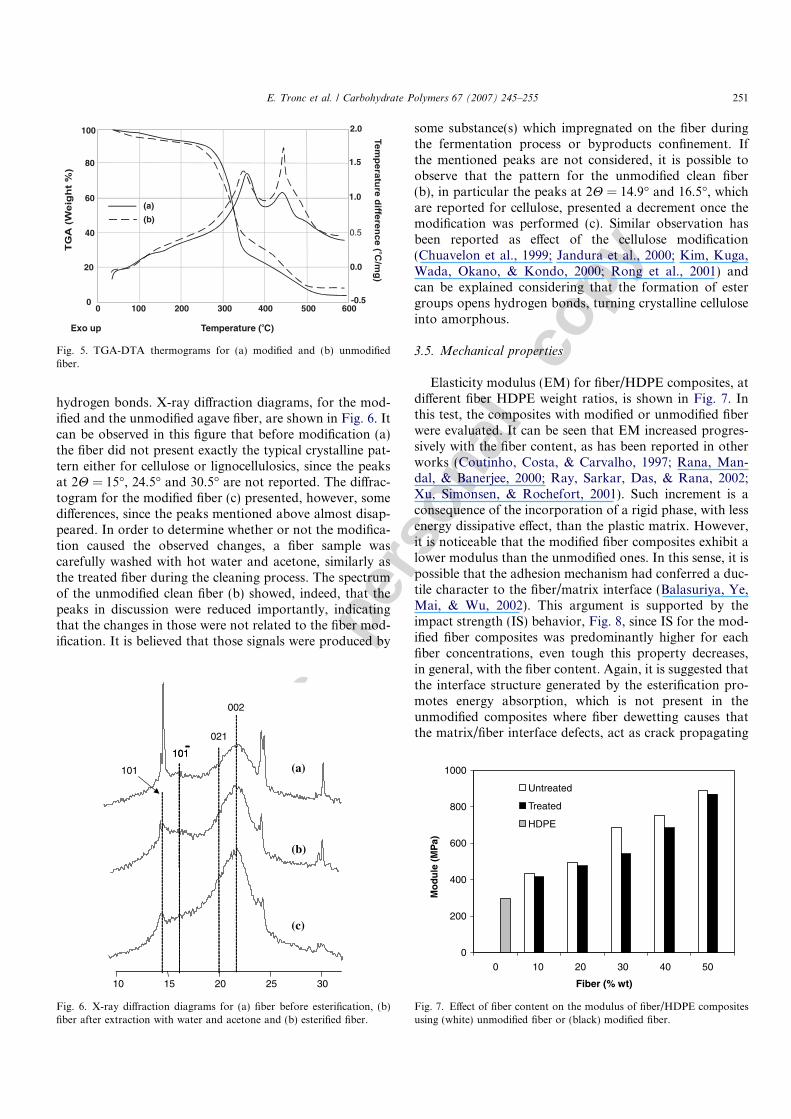
composite processing, considering the relatively low degra-dation temperature of lignocellulosics. The graphs of TGAfor the modified (a) and the unmodified (b) fiber are shownin Fig. 5. It is observed that degradation temperature forthe modified fiber starts at 290 �C, which is higher thanthe showed for the unmodified fiber (270 �C). Similar incre-ments in thermal stability have been found in literature forother treatments (Ghosh & Ganguly, 1994; Rahman et al.,2000). In the present case, such increment could be associ-ated to the formation of ester groups; however, this effect isnot always produced by the esterification, as reported byHassan et al. (2000, 2000) or Coutinho et al. (1998).DTA plots for both fiber samples are also included inFig. 5. Here, two maximum values in degradation
temperature are observed for each sample, the first at350 �C, which corresponds to fiber degradation, and a sec-ond at 450 �C, typical for the oxidation of carbon com-pounds. DTA also showed a slight difference in fiberthermal stability, since the maximum decomposition tem-perature for the modified fibers (a) was 10 �C higher thanthe one for the unmodified fiber (b), being in agreementwith TGA analysis.
3.4. X-ray diffraction
Crystallinity in lignocellulosics is a feature derived fromcellulose structure which consists of polymeric glucopyra-nose chains helicoidally arranged and strongly linked by
020406080100120140160180200
ppm
1
4
4´
2,3
5
6
6´
OO
OHO OH
OH
123
4
5
6
ab
c
Lignin
cellulose
L1+L4
L3+L5-OCH3
acetatecarboxyl
R2
OH
R1
H
H
H
H
R1 = H, OCH3
R2 = OCH3
L1
L2
L3L5
L4
L6
α
β
γ
α,β,γ
Fig. 3. CP/MAS 13C NMR spectrum for blue agave fiber before modification.
0255075100125150175200
PPM
7
14
8,12
13HO HO
O
O
O
O
7
8
9
10
11
12
13
14
ab
c
c
a,b
6´´
6´´
9,10,11
3´ 2´
2´,3´
Fig. 4. CP/MAS 13C NMR spectrum for blue agave fiber after esterification.
250 E. Tronc et al. / Carbohydrate Polymers 67 (2007) 245–255
Autho
r's
pers
onal
co
py
hydrogen bonds. X-ray diffraction diagrams, for the mod-ified and the unmodified agave fiber, are shown in Fig. 6. Itcan be observed in this figure that before modification (a)the fiber did not present exactly the typical crystalline pat-tern either for cellulose or lignocellulosics, since the peaksat 2H = 15�, 24.5� and 30.5� are not reported. The diffrac-togram for the modified fiber (c) presented, however, somedifferences, since the peaks mentioned above almost disap-peared. In order to determine whether or not the modifica-tion caused the observed changes, a fiber sample wascarefully washed with hot water and acetone, similarly asthe treated fiber during the cleaning process. The spectrumof the unmodified clean fiber (b) showed, indeed, that thepeaks in discussion were reduced importantly, indicatingthat the changes in those were not related to the fiber mod-ification. It is believed that those signals were produced by
some substance(s) which impregnated on the fiber duringthe fermentation process or byproducts confinement. Ifthe mentioned peaks are not considered, it is possible toobserve that the pattern for the unmodified clean fiber(b), in particular the peaks at 2H = 14.9� and 16.5�, whichare reported for cellulose, presented a decrement once themodification was performed (c). Similar observation hasbeen reported as effect of the cellulose modification(Chuavelon et al., 1999; Jandura et al., 2000; Kim, Kuga,Wada, Okano, & Kondo, 2000; Rong et al., 2001) andcan be explained considering that the formation of estergroups opens hydrogen bonds, turning crystalline celluloseinto amorphous.
3.5. Mechanical properties
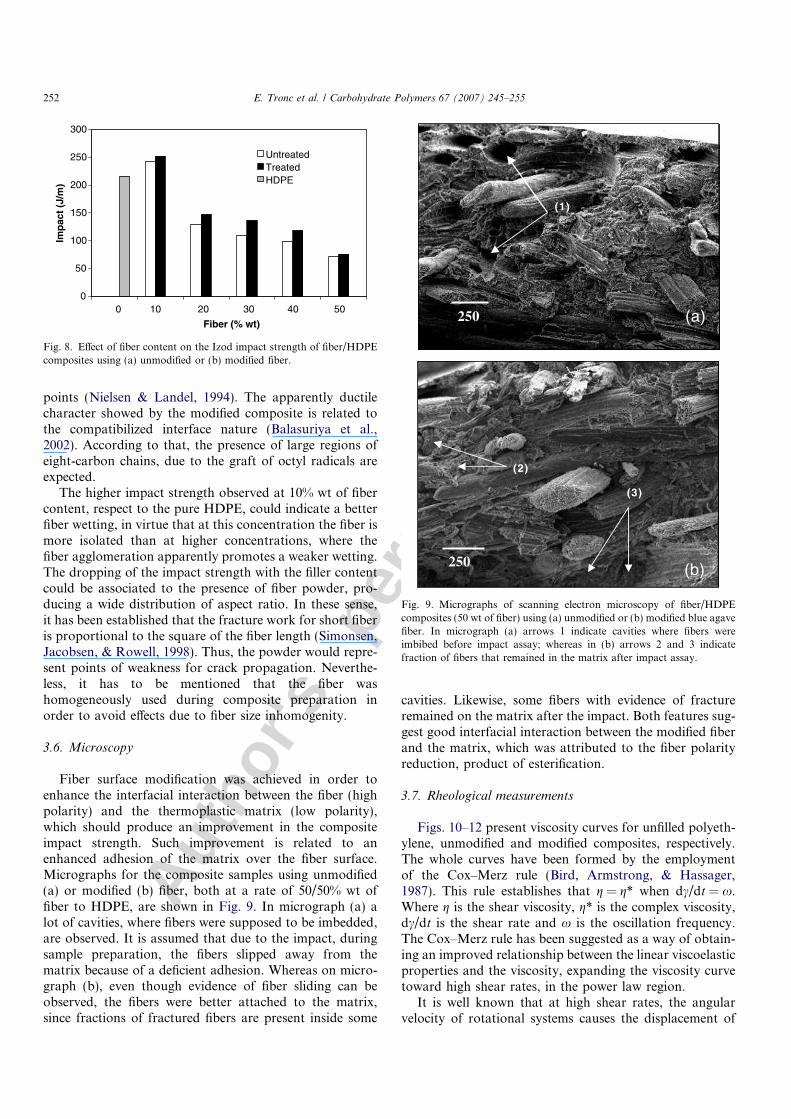
Elasticity modulus (EM) for fiber/HDPE composites, atdifferent fiber HDPE weight ratios, is shown in Fig. 7. Inthis test, the composites with modified or unmodified fiberwere evaluated. It can be seen that EM increased progres-sively with the fiber content, as has been reported in otherworks (Coutinho, Costa, & Carvalho, 1997; Rana, Man-dal, & Banerjee, 2000; Ray, Sarkar, Das, & Rana, 2002;Xu, Simonsen, & Rochefort, 2001). Such increment is aconsequence of the incorporation of a rigid phase, with lessenergy dissipative effect, than the plastic matrix. However,it is noticeable that the modified fiber composites exhibit alower modulus than the unmodified ones. In this sense, it ispossible that the adhesion mechanism had conferred a duc-tile character to the fiber/matrix interface (Balasuriya, Ye,Mai, & Wu, 2002). This argument is supported by theimpact strength (IS) behavior, Fig. 8, since IS for the mod-ified fiber composites was predominantly higher for eachfiber concentrations, even tough this property decreases,in general, with the fiber content. Again, it is suggested thatthe interface structure generated by the esterification pro-motes energy absorption, which is not present in theunmodified composites where fiber dewetting causes thatthe matrix/fiber interface defects, act as crack propagating
(a)
(b)
0
20
40
60
80
100 2.0
1.5
0.5
0.0
-0.5
1.0
0 100 200 300 400 500 600
Exo up Temperature ( C)o
Fig. 5. TGA-DTA thermograms for (a) modified and (b) unmodifiedfiber.
101
021
002
101101
10 15 20 25 30
(a)
(b)
(c)
Fig. 6. X-ray diffraction diagrams for (a) fiber before esterification, (b)fiber after extraction with water and acetone and (b) esterified fiber.
0
200
400
600
800
1000
0 10 20 30 40 50
Fiber (% wt)
Mo
du
le (
MP
a)
v
Untreated
Treated
HDPE
Fig. 7. Effect of fiber content on the modulus of fiber/HDPE compositesusing (white) unmodified fiber or (black) modified fiber.
E. Tronc et al. / Carbohydrate Polymers 67 (2007) 245–255 251
Autho
r's
pers
onal
co
py
points (Nielsen & Landel, 1994). The apparently ductilecharacter showed by the modified composite is related tothe compatibilized interface nature (Balasuriya et al.,2002). According to that, the presence of large regions ofeight-carbon chains, due to the graft of octyl radicals areexpected.
The higher impact strength observed at 10% wt of fibercontent, respect to the pure HDPE, could indicate a betterfiber wetting, in virtue that at this concentration the fiber ismore isolated than at higher concentrations, where thefiber agglomeration apparently promotes a weaker wetting.The dropping of the impact strength with the filler contentcould be associated to the presence of fiber powder, pro-ducing a wide distribution of aspect ratio. In these sense,it has been established that the fracture work for short fiberis proportional to the square of the fiber length (Simonsen,Jacobsen, & Rowell, 1998). Thus, the powder would repre-sent points of weakness for crack propagation. Neverthe-less, it has to be mentioned that the fiber washomogeneously used during composite preparation inorder to avoid effects due to fiber size inhomogenity.
3.6. Microscopy
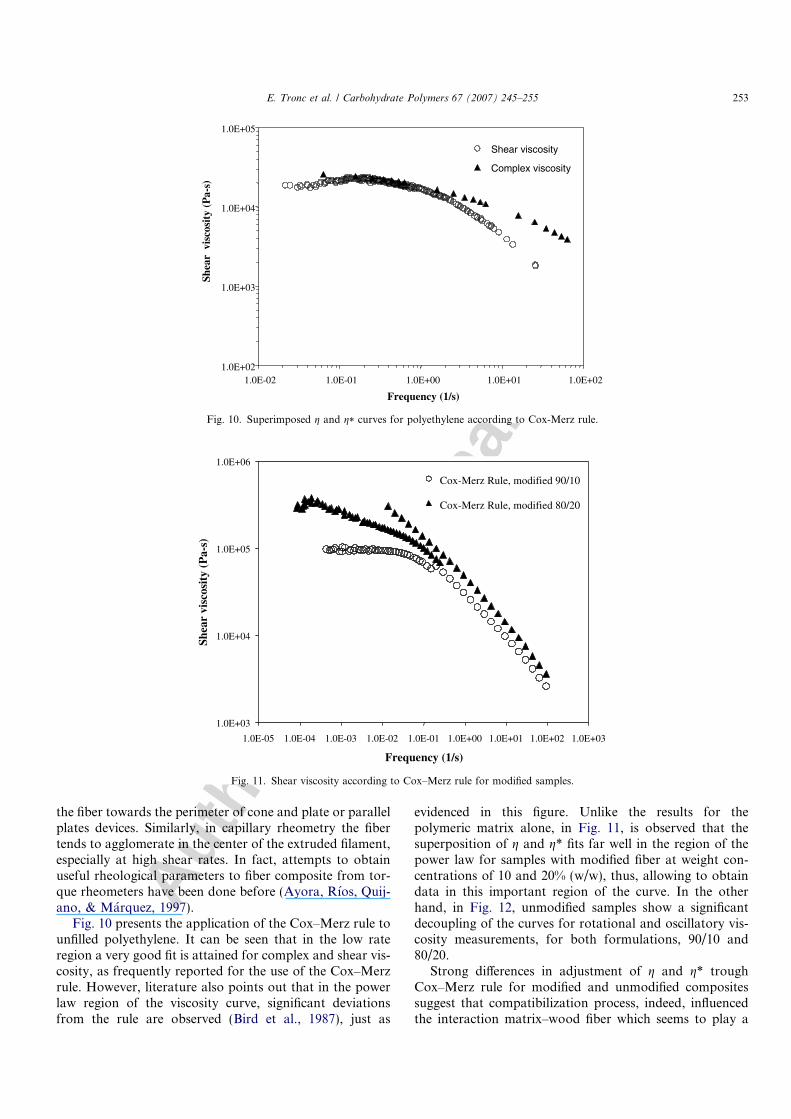
Fiber surface modification was achieved in order toenhance the interfacial interaction between the fiber (highpolarity) and the thermoplastic matrix (low polarity),which should produce an improvement in the compositeimpact strength. Such improvement is related to anenhanced adhesion of the matrix over the fiber surface.Micrographs for the composite samples using unmodified(a) or modified (b) fiber, both at a rate of 50/50% wt offiber to HDPE, are shown in Fig. 9. In micrograph (a) alot of cavities, where fibers were supposed to be imbedded,are observed. It is assumed that due to the impact, duringsample preparation, the fibers slipped away from thematrix because of a deficient adhesion. Whereas on micro-graph (b), even though evidence of fiber sliding can beobserved, the fibers were better attached to the matrix,since fractions of fractured fibers are present inside some
cavities. Likewise, some fibers with evidence of fractureremained on the matrix after the impact. Both features sug-gest good interfacial interaction between the modified fiberand the matrix, which was attributed to the fiber polarityreduction, product of esterification.
3.7. Rheological measurements
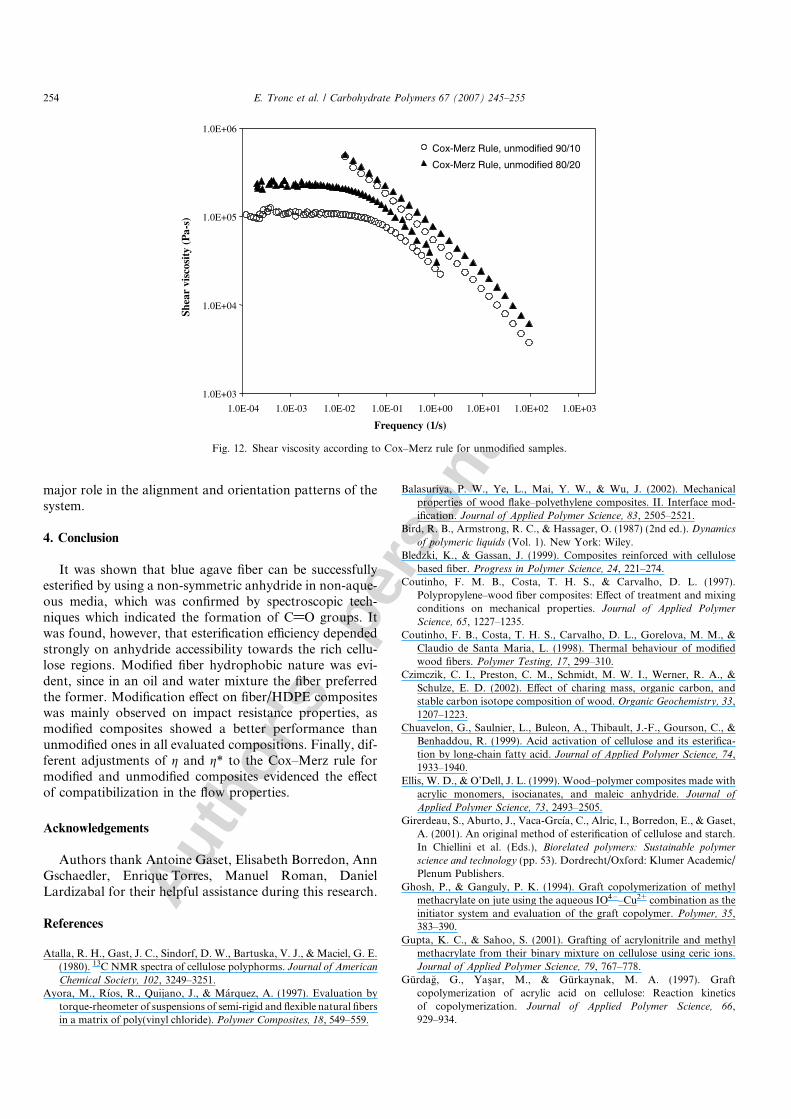
Figs. 10–12 present viscosity curves for unfilled polyeth-ylene, unmodified and modified composites, respectively.The whole curves have been formed by the employmentof the Cox–Merz rule (Bird, Armstrong, & Hassager,1987). This rule establishes that g = g* when dc/dt = x.Where g is the shear viscosity, g* is the complex viscosity,dc/dt is the shear rate and x is the oscillation frequency.The Cox–Merz rule has been suggested as a way of obtain-ing an improved relationship between the linear viscoelasticproperties and the viscosity, expanding the viscosity curvetoward high shear rates, in the power law region.
It is well known that at high shear rates, the angularvelocity of rotational systems causes the displacement of
0
50
100
150
200
250
300
0 10 20 30 40 50
Fiber (% wt)
Imp
act
(J/m
)
UntreatedTreatedHDPE
Fig. 8. Effect of fiber content on the Izod impact strength of fiber/HDPEcomposites using (a) unmodified or (b) modified fiber.
μ250 (b)
(2)
(3)
250 (a)
(1)
Fig. 9. Micrographs of scanning electron microscopy of fiber/HDPEcomposites (50 wt of fiber) using (a) unmodified or (b) modified blue agavefiber. In micrograph (a) arrows 1 indicate cavities where fibers wereimbibed before impact assay; whereas in (b) arrows 2 and 3 indicatefraction of fibers that remained in the matrix after impact assay.
252 E. Tronc et al. / Carbohydrate Polymers 67 (2007) 245–255
Autho
r's
pers
onal
co
py
the fiber towards the perimeter of cone and plate or parallelplates devices. Similarly, in capillary rheometry the fibertends to agglomerate in the center of the extruded filament,especially at high shear rates. In fact, attempts to obtainuseful rheological parameters to fiber composite from tor-que rheometers have been done before (Ayora, Rıos, Quij-ano, & Marquez, 1997).
Fig. 10 presents the application of the Cox–Merz rule tounfilled polyethylene. It can be seen that in the low rateregion a very good fit is attained for complex and shear vis-cosity, as frequently reported for the use of the Cox–Merzrule. However, literature also points out that in the powerlaw region of the viscosity curve, significant deviationsfrom the rule are observed (Bird et al., 1987), just as
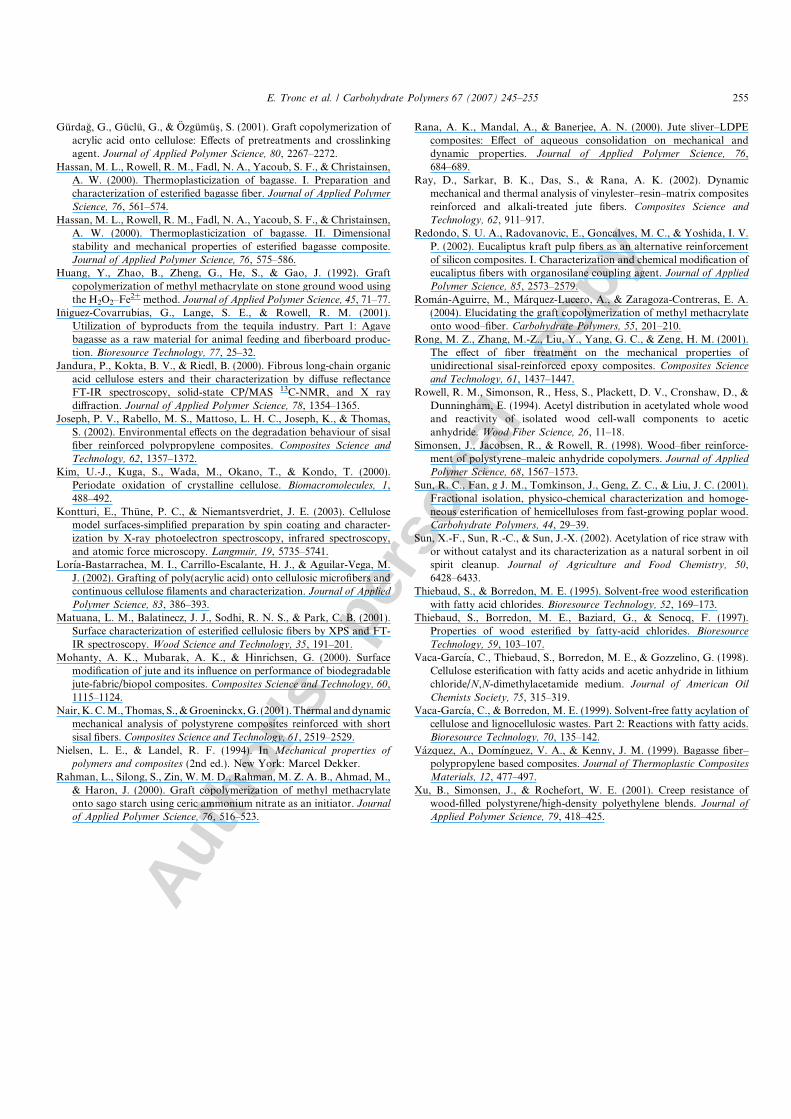
evidenced in this figure. Unlike the results for thepolymeric matrix alone, in Fig. 11, is observed that thesuperposition of g and g* fits far well in the region of thepower law for samples with modified fiber at weight con-centrations of 10 and 20% (w/w), thus, allowing to obtaindata in this important region of the curve. In the otherhand, in Fig. 12, unmodified samples show a significantdecoupling of the curves for rotational and oscillatory vis-cosity measurements, for both formulations, 90/10 and80/20.
Strong differences in adjustment of g and g* troughCox–Merz rule for modified and unmodified compositessuggest that compatibilization process, indeed, influencedthe interaction matrix–wood fiber which seems to play a
1.0E+02
1.0E+03
1.0E+04
1.0E+05
1.0E-02 1.0E-01 1.0E+00 1.0E+01 1.0E+02
Frequency (1/s)
Shea
rvi
scos
ity
(Pa-
s)
Shear viscosity
Complex viscosity
Fig. 10. Superimposed g and g* curves for polyethylene according to Cox-Merz rule.
1.0E+03
1.0E+04
1.0E+05
1.0E+06
1.0E-05 1.0E-04 1.0E-03 1.0E-02 1.0E-01 1.0E+00 1.0E+01 1.0E+02 1.0E+03
Frequency (1/s)
Shea
rvi
scos
ity
(Pa-
s)
Cox-Merz Rule, modified 90/10
Cox-Merz Rule, modified 80/20
Fig. 11. Shear viscosity according to Cox–Merz rule for modified samples.
E. Tronc et al. / Carbohydrate Polymers 67 (2007) 245–255 253
Autho
r's
pers
onal
co
py
major role in the alignment and orientation patterns of thesystem.
4. Conclusion
It was shown that blue agave fiber can be successfullyesterified by using a non-symmetric anhydride in non-aque-ous media, which was confirmed by spectroscopic tech-niques which indicated the formation of C@O groups. Itwas found, however, that esterification efficiency dependedstrongly on anhydride accessibility towards the rich cellu-lose regions. Modified fiber hydrophobic nature was evi-dent, since in an oil and water mixture the fiber preferredthe former. Modification effect on fiber/HDPE compositeswas mainly observed on impact resistance properties, asmodified composites showed a better performance thanunmodified ones in all evaluated compositions. Finally, dif-ferent adjustments of g and g* to the Cox–Merz rule formodified and unmodified composites evidenced the effectof compatibilization in the flow properties.
Acknowledgements
Authors thank Antoine Gaset, Elisabeth Borredon, AnnGschaedler, Enrique Torres, Manuel Roman, DanielLardizabal for their helpful assistance during this research.
References
Atalla, R. H., Gast, J. C., Sindorf, D. W., Bartuska, V. J., & Maciel, G. E.(1980). 13C NMR spectra of cellulose polyphorms. Journal of American
Chemical Society, 102, 3249–3251.Ayora, M., Rıos, R., Quijano, J., & Marquez, A. (1997). Evaluation by
torque-rheometer of suspensions of semi-rigid and flexible natural fibersin a matrix of poly(vinyl chloride). Polymer Composites, 18, 549–559.
Balasuriya, P. W., Ye, L., Mai, Y. W., & Wu, J. (2002). Mechanicalproperties of wood flake–polyethylene composites. II. Interface mod-ification. Journal of Applied Polymer Science, 83, 2505–2521.
Bird, R. B., Armstrong, R. C., & Hassager, O. (1987) (2nd ed.). Dynamics
of polymeric liquids (Vol. 1). New York: Wiley.Bledzki, K., & Gassan, J. (1999). Composites reinforced with cellulose
based fiber. Progress in Polymer Science, 24, 221–274.Coutinho, F. M. B., Costa, T. H. S., & Carvalho, D. L. (1997).
Polypropylene–wood fiber composites: Effect of treatment and mixingconditions on mechanical properties. Journal of Applied Polymer
Science, 65, 1227–1235.Coutinho, F. B., Costa, T. H. S., Carvalho, D. L., Gorelova, M. M., &
Claudio de Santa Maria, L. (1998). Thermal behaviour of modifiedwood fibers. Polymer Testing, 17, 299–310.
Czimczik, C. I., Preston, C. M., Schmidt, M. W. I., Werner, R. A., &Schulze, E. D. (2002). Effect of charing mass, organic carbon, andstable carbon isotope composition of wood. Organic Geochemistry, 33,1207–1223.
Chuavelon, G., Saulnier, L., Buleon, A., Thibault, J.-F., Gourson, C., &Benhaddou, R. (1999). Acid activation of cellulose and its esterifica-tion by long-chain fatty acid. Journal of Applied Polymer Science, 74,1933–1940.
Ellis, W. D., & O’Dell, J. L. (1999). Wood–polymer composites made withacrylic monomers, isocianates, and maleic anhydride. Journal of
Applied Polymer Science, 73, 2493–2505.Girerdeau, S., Aburto, J., Vaca-Grcıa, C., Alric, I., Borredon, E., & Gaset,
A. (2001). An original method of esterification of cellulose and starch.In Chiellini et al. (Eds.), Biorelated polymers: Sustainable polymer
science and technology (pp. 53). Dordrecht/Oxford: Klumer Academic/Plenum Publishers.
Ghosh, P., & Ganguly, P. K. (1994). Graft copolymerization of methylmethacrylate on jute using the aqueous IO4�–Cu2+ combination as theinitiator system and evaluation of the graft copolymer. Polymer, 35,383–390.
Gupta, K. C., & Sahoo, S. (2001). Grafting of acrylonitrile and methylmethacrylate from their binary mixture on cellulose using ceric ions.Journal of Applied Polymer Science, 79, 767–778.
Gurdag, G., Yas�ar, M., & Gurkaynak, M. A. (1997). Graftcopolymerization of acrylic acid on cellulose: Reaction kineticsof copolymerization. Journal of Applied Polymer Science, 66,929–934.
1.0E+03
1.0E+04
1.0E+05
1.0E+06
1.0E-04 1.0E-03 1.0E-02 1.0E-01 1.0E+00 1.0E+01 1.0E+02 1.0E+03
Frequency (1/s)
Shea
rvi
scos
ity
(Pa-
s)
Cox-Merz Rule, unmodified 90/10
Cox-Merz Rule, unmodified 80/20
Fig. 12. Shear viscosity according to Cox–Merz rule for unmodified samples.
254 E. Tronc et al. / Carbohydrate Polymers 67 (2007) 245–255
Autho
r's
pers
onal
co
py
Gurdag, G., Guclu, G., & Ozgumus�, S. (2001). Graft copolymerization ofacrylic acid onto cellulose: Effects of pretreatments and crosslinkingagent. Journal of Applied Polymer Science, 80, 2267–2272.
Hassan, M. L., Rowell, R. M., Fadl, N. A., Yacoub, S. F., & Christainsen,A. W. (2000). Thermoplasticization of bagasse. I. Preparation andcharacterization of esterified bagasse fiber. Journal of Applied Polymer
Science, 76, 561–574.Hassan, M. L., Rowell, R. M., Fadl, N. A., Yacoub, S. F., & Christainsen,
A. W. (2000). Thermoplasticization of bagasse. II. Dimensionalstability and mechanical properties of esterified bagasse composite.Journal of Applied Polymer Science, 76, 575–586.
Huang, Y., Zhao, B., Zheng, G., He, S., & Gao, J. (1992). Graftcopolymerization of methyl methacrylate on stone ground wood usingthe H2O2–Fe2+ method. Journal of Applied Polymer Science, 45, 71–77.
Iniguez-Covarrubias, G., Lange, S. E., & Rowell, R. M. (2001).Utilization of byproducts from the tequila industry. Part 1: Agavebagasse as a raw material for animal feeding and fiberboard produc-tion. Bioresource Technology, 77, 25–32.
Jandura, P., Kokta, B. V., & Riedl, B. (2000). Fibrous long-chain organicacid cellulose esters and their characterization by diffuse reflectanceFT-IR spectroscopy, solid-state CP/MAS 13C-NMR, and X raydiffraction. Journal of Applied Polymer Science, 78, 1354–1365.
Joseph, P. V., Rabello, M. S., Mattoso, L. H. C., Joseph, K., & Thomas,S. (2002). Environmental effects on the degradation behaviour of sisalfiber reinforced polypropylene composites. Composites Science and
Technology, 62, 1357–1372.Kim, U.-J., Kuga, S., Wada, M., Okano, T., & Kondo, T. (2000).
Periodate oxidation of crystalline cellulose. Biomacromolecules, 1,488–492.
Kontturi, E., Thune, P. C., & Niemantsverdriet, J. E. (2003). Cellulosemodel surfaces-simplified preparation by spin coating and character-ization by X-ray photoelectron spectroscopy, infrared spectroscopy,and atomic force microscopy. Langmuir, 19, 5735–5741.
Lorıa-Bastarrachea, M. I., Carrillo-Escalante, H. J., & Aguilar-Vega, M.J. (2002). Grafting of poly(acrylic acid) onto cellulosic microfibers andcontinuous cellulose filaments and characterization. Journal of Applied
Polymer Science, 83, 386–393.Matuana, L. M., Balatinecz, J. J., Sodhi, R. N. S., & Park, C. B. (2001).
Surface characterization of esterified cellulosic fibers by XPS and FT-IR spectroscopy. Wood Science and Technology, 35, 191–201.
Mohanty, A. K., Mubarak, A. K., & Hinrichsen, G. (2000). Surfacemodification of jute and its influence on performance of biodegradablejute-fabric/biopol composites. Composites Science and Technology, 60,1115–1124.
Nair, K. C. M., Thomas, S., & Groeninckx, G. (2001). Thermal and dynamicmechanical analysis of polystyrene composites reinforced with shortsisal fibers. Composites Science and Technology, 61, 2519–2529.
Nielsen, L. E., & Landel, R. F. (1994). In Mechanical properties of
polymers and composites (2nd ed.). New York: Marcel Dekker.Rahman, L., Silong, S., Zin, W. M. D., Rahman, M. Z. A. B., Ahmad, M.,
& Haron, J. (2000). Graft copolymerization of methyl methacrylateonto sago starch using ceric ammonium nitrate as an initiator. Journal
of Applied Polymer Science, 76, 516–523.
Rana, A. K., Mandal, A., & Banerjee, A. N. (2000). Jute sliver–LDPEcomposites: Effect of aqueous consolidation on mechanical anddynamic properties. Journal of Applied Polymer Science, 76,684–689.
Ray, D., Sarkar, B. K., Das, S., & Rana, A. K. (2002). Dynamicmechanical and thermal analysis of vinylester–resin–matrix compositesreinforced and alkali-treated jute fibers. Composites Science and
Technology, 62, 911–917.Redondo, S. U. A., Radovanovic, E., Goncalves, M. C., & Yoshida, I. V.
P. (2002). Eucaliptus kraft pulp fibers as an alternative reinforcementof silicon composites. I. Characterization and chemical modification ofeucaliptus fibers with organosilane coupling agent. Journal of Applied
Polymer Science, 85, 2573–2579.Roman-Aguirre, M., Marquez-Lucero, A., & Zaragoza-Contreras, E. A.
(2004). Elucidating the graft copolymerization of methyl methacrylateonto wood–fiber. Carbohydrate Polymers, 55, 201–210.
Rong, M. Z., Zhang, M.-Z., Liu, Y., Yang, G. C., & Zeng, H. M. (2001).The effect of fiber treatment on the mechanical properties ofunidirectional sisal-reinforced epoxy composites. Composites Science
and Technology, 61, 1437–1447.Rowell, R. M., Simonson, R., Hess, S., Plackett, D. V., Cronshaw, D., &
Dunningham, E. (1994). Acetyl distribution in acetylated whole woodand reactivity of isolated wood cell-wall components to aceticanhydride. Wood Fiber Science, 26, 11–18.
Simonsen, J., Jacobsen, R., & Rowell, R. (1998). Wood–fiber reinforce-ment of polystyrene–maleic anhydride copolymers. Journal of Applied
Polymer Science, 68, 1567–1573.Sun, R. C., Fan, g J. M., Tomkinson, J., Geng, Z. C., & Liu, J. C. (2001).
Fractional isolation, physico-chemical characterization and homoge-neous esterification of hemicelluloses from fast-growing poplar wood.Carbohydrate Polymers, 44, 29–39.
Sun, X.-F., Sun, R.-C., & Sun, J.-X. (2002). Acetylation of rice straw withor without catalyst and its characterization as a natural sorbent in oilspirit cleanup. Journal of Agriculture and Food Chemistry, 50,6428–6433.
Thiebaud, S., & Borredon, M. E. (1995). Solvent-free wood esterificationwith fatty acid chlorides. Bioresource Technology, 52, 169–173.
Thiebaud, S., Borredon, M. E., Baziard, G., & Senocq, F. (1997).Properties of wood esterified by fatty-acid chlorides. Bioresource
Technology, 59, 103–107.Vaca-Garcıa, C., Thiebaud, S., Borredon, M. E., & Gozzelino, G. (1998).
Cellulose esterification with fatty acids and acetic anhydride in lithiumchloride/N,N-dimethylacetamide medium. Journal of American Oil
Chemists Society, 75, 315–319.Vaca-Garcıa, C., & Borredon, M. E. (1999). Solvent-free fatty acylation of
cellulose and lignocellulosic wastes. Part 2: Reactions with fatty acids.Bioresource Technology, 70, 135–142.
Vazquez, A., Domınguez, V. A., & Kenny, J. M. (1999). Bagasse fiber–polypropylene based composites. Journal of Thermoplastic Composites
Materials, 12, 477–497.Xu, B., Simonsen, J., & Rochefort, W. E. (2001). Creep resistance of
wood-filled polystyrene/high-density polyethylene blends. Journal of
Applied Polymer Science, 79, 418–425.
E. Tronc et al. / Carbohydrate Polymers 67 (2007) 245–255 255


