Embed Size (px)
Citation preview
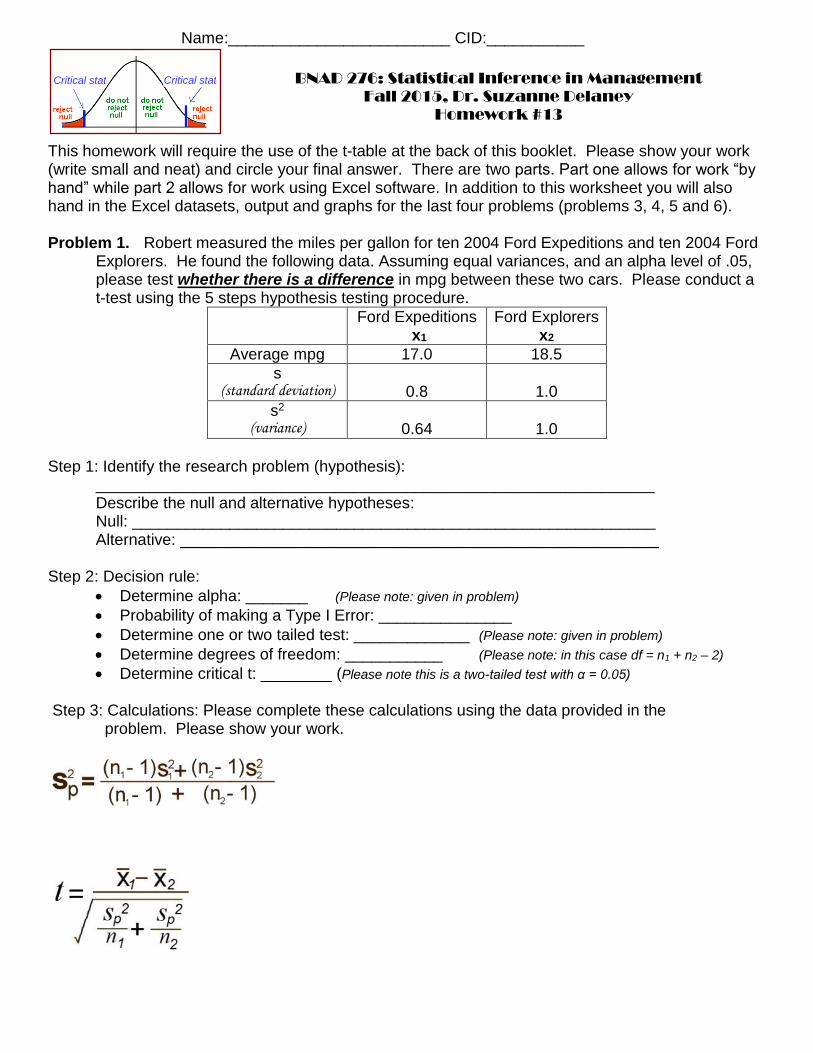
BNAD 276: Statistical Inference in Management
Fall 2015, Dr. Suzanne Delaney Homework #13
This homework will require the use of the t-table at the back of this booklet. Please show your work (write small and neat) and circle your final answer. There are two parts. Part one allows for work “by hand” while part 2 allows for work using Excel software. In addition to this worksheet you will also hand in the Excel datasets, output and graphs for the last four problems (problems 3, 4, 5 and 6). Problem 1. Robert measured the miles per gallon for ten 2004 Ford Expeditions and ten 2004 Ford
Explorers. He found the following data. Assuming equal variances, and an alpha level of .05, please test whether there is a difference in mpg between these two cars. Please conduct a t-test using the 5 steps hypothesis testing procedure.
Ford Expeditions x1
Ford Explorers x2
Average mpg 17.0 18.5
s (standard deviation)
0.8 1.0
s2 (variance)
0.64 1.0
Step 1: Identify the research problem (hypothesis): _______________________________________________________________ Describe the null and alternative hypotheses: Null: ___________________________________________________________ Alternative: ______________________________________________________ Step 2: Decision rule:
Determine alpha: _______ (Please note: given in problem)
Probability of making a Type I Error: _______________
Determine one or two tailed test: _____________ (Please note: given in problem)
Determine degrees of freedom: ___________ (Please note: in this case df = n1 + n2 – 2)
Determine critical t: ________ (Please note this is a two-tailed test with α = 0.05) Step 3: Calculations: Please complete these calculations using the data provided in the problem. Please show your work.
Critical stat Critical stat
Name:_________________________ CID:___________

Summary of calculations (Here are some summary calculations so that you can check your work.)
n = 10 n = 10 mean = 17.0 mean = 18.5
s1 = 0.8 s2 = 1.0 s2
1 = .64 s22 = 1.0
sp2 = .82 t (18) = -3.704 critical t (18) = 2.101
Please note this is a two-tailed test with α = 0.05
Step 4: Make decision whether or not to reject the null hypothesis Would you reject the null? ________________________________________
Is this a significant difference? _____________________________________
Is p < 0.05? ___________________________________________________ Describe what a Type I and Type II error would be in this case
“Type I error would be concluding _____________________ when in fact ____________________.”
“Type II error would be concluding ____________________ when in fact ____________________.” Step 5: Please construct a brief (one paragraph) summary of your results comparing the mpg for
the Ford Explorers and Ford Expeditions problem using the format presented in class and on previous homework assignments. Remember there are three parts to this summary
List independent and dependent variables, and the means for the two groups
Describe type of test completed (t-test in this case) and whether it was significant
Include statistical summary statement that looks like this (for example): t(12) = 4.3; p < 0.05
______________________________________________________________________________ ______________________________________________________________________________ ______________________________________________________________________________ ______________________________________________________________________________
Please draw your two means on this graph (Be sure to properly label your axes)

Problem 2. Are women’s feet getting bigger? Retailers in the last 20 years have had to increase their stock of larger sizes. Assuming equal variances, and an alpha level of .05, is there an increase in the foot size of women born in 1960 and women born in 1980? Please conduct a t-test using the 5 steps hypothesis testing procedure.
Born in 1980
x1
Born in 1960 x2
8 8.5
7.5 7.5
8.5 8
8.5 8
8 7.5
7.5 7.5
9.5 7.5
7.5 8
8 7
8 8
8.5 7
9 8
Step 1: Identify the research problem (hypothesis): _______________________________________________________________ Describe the null and alternative hypotheses:
Null: ___________________________________________________________
Alternative: ______________________________________________________ Step 2: Decision rule:
Determine alpha: _______ (Please note: given in problem)
Probability of making a Type I Error: _______________
Determine one or two tailed test: _________ (Please note: given in problem) Determine degrees of freedom: ___________ (Please note: in this case df = n1 + n2 – 2)
Determine critical t: ________ (Please note this is a one-tailed test with α = 0.05)
Step 3: Calculations: Please complete these yourself using the data provided in the problem.
Please show your work.
1 2

Summary of calculations
(Here are some summary calculations so that you can check your work.)
Σx1 = 98.5 Σx2 = 92.5 n = 12 n = 12
mean = 8.208 mean = 7.708 Σx2
1 = 812.75 Σx22 = 715.25
s1 = .6201 s2 = .4502 s2
1 = .3845 s22 = .2027
sp2 = .2936 t (22) = 2.26 critical t (22) = 1.717
Please note this is a one-tailed test with α = 0.05
Step 4: Make decision whether or not to reject the null hypothesis Would you reject the null? ________________________________________
Is this a significant difference? _____________________________________
Is p < 0.05? ___________________________________________________ Describe what a Type I and Type II error would be in this case
“Type I error would be concluding _____________________ when in fact ____________________.”
“Type II error would be concluding ____________________ when in fact ____________________.” Step 5: Please construct a brief (one paragraph) summary of your results in this problem using the format presented in class and on previous homework assignments. Remember there are three parts to this summary
List independent and dependent variables, and the means for the two groups
Describe type of test completed (t-test in this case) and whether it was significant
Include statistical summary statement that looks like this (for example): t(12) = 4.3; p < 0.05
______________________________________________________________________________ ______________________________________________________________________________ ______________________________________________________________________________ ______________________________________________________________________________
Please draw your two means on this graph (Be sure to properly label your axes)

Problem 3. Please re-work this last problem using excel. (You should get same results) Please note: that the lecture notes also provide examples of
how to complete these tests. For this problem please hand in both your excel printouts and your graph
“Are women’s feet getting bigger? Retailers in the last 20 years have had to increase their stock of larger sizes. Assuming equal variances, and an alpha level of .05, is there an increase in the foot size of women born in 1960 and women born in 1980?
Step 1: Let’s calculate our t-test Input your data in an excel spreadsheet On toolbar on top click “Data” and choose “Data Analysis” You’ll see a box like this: Choose “t-test: Two-Sample Assuming Equal Variances.” Click OK
You’ll see a box like this: For the “Variable 1 range” we want to choose the “Born 1980” scores
For the “Variable 2 range” we want to choose the “Born 1960” scores
(Be careful that if you click the “Labels” box that you include the first row)
Click OK Your results will be displayed in a t-test results table. This gives you a lot of numbers including everything you need to report the results of the t-test and graph the results. You’ll see a table like this:
Print out your t-test results table Step 2: Interpret results Independent Variable: _______________________________ Dependent Variable: _______________________________ Mean shoe size for those Born in 1980: ___________________
Mean shoe size for those Born in 1960: ___________________
State whether this is a one or two-tailed test ________________ State the alpha level _______________________________ Value for the observed t-statistic (called t Stat):________________
Value for the critical t-statistic:____________________________ Value for the degrees of freedom: ________________________ What is the p value: ___________________________________ Was it a significant difference: _________________________
(remember, there should be a good match between what you learn by 1) comparing your p value with alpha and 2) what you learn by comparing the critical and observed t stats)
Report finding in proper form: Please construct a brief (one paragraph) summary of your results comparing the shoe sizes for women born in 1960 with women born in 1980 using the format presented in class and on the previous problem ______________________________________________________________________________ ______________________________________________________________________________ _______________________________________________________
Step 3: Let’s draw a bar graph of the two means. It should look like this:

Problem 4. You’ve been hired by a company that has a new reading program for children, and they want to know
whether (or not) this new reading program is associated with improved test scores. One group of students is given the special instruction, while the other group is not. We are comparing the test scores for the two groups (yes instructions versus no instruction). This worksheet will help you to use excel to complete a t-test. Step 1: Calculate the means for the two groups Please enter the data at right into an excel spreadsheet
The first open cell at the bottom of the “Yes Instruction” column is A22 Please click on cell A22 and type this command: = AVERAGE (A2:A21) Please click on cell B22 and type this command: = AVERAGE (B2:B21)
(HINT: Once you enter a formula hit “enter” right away. Be careful you
don’t click on other cells or it will become confused )
Make a note of the two means on the second page of this worksheet
Step 2: Let’s calculate t-tests On toolbar on top click “Data” and choose “Data Analysis” Choose “t-test: Two-Sample Assuming Equal Variances.”
You’ll see a box like this: For the “Variable 1 range” we want to choose the “Yes Instruction” scores
(Be careful not to include the mean you put into row 22)
For the “Variable 2 range” we want to choose the “No Instruction” scores
(Be careful not to include the mean you put into row 22)
(Be careful that if you click the “Labels” box that you include the first row
and that if you do not click the “Labels” box that you do not include the first row)
Click OK - Print out your data and your t-test results
Step 3: Interpret results The results of the t-test will show up in a table. This gives you a lot of numbers
including everything you need to report the results of the t-test and graph the results. Here is an example of what it looks like.
Make a note of these data on the second page of this worksheet
Step 4: Let’s draw a bar graph of the two means Type the labels and means into four new cells, highlight all four cells and click on the Insert tab and choose Columns. (Even though we are making a bar graph, we click on Columns.) Just add the labels and make it look attractive. You could call the X-axis “Type of Instruction” and the Y-axis “Exam Score” and the title something like “Effect Type of Instruction on Exam Score”

For your t-test on the effect of instruction, please identify the following: Independent Variable: __________________________
Dependent Variable: __________________________
Mean Exam Score for Yes Instruction: __________________________
Mean Exam Score for No Instruction: __________________________
State whether this is a one or two-tailed test __________________________
State the alpha level __________________________
Value for the observed t-statistic: __________________________
Value for the critical t-statistic: __________________________
Value for the degrees of freedom: __________________________
What is the p value: __________________________
Was it a significant difference: __________________________
(remember, there should be a good match between what you learn by 1) comparing your p value with alpha and 2) what you learn by comparing the critical and observed t stats)
Report finding in proper form __________________________ for example (t(12) = 6.12; p <0.05)
Report finding in proper form: Please construct a brief (one paragraph) summary of your results. Remember there are three parts to this summary
List independent and dependent variables, and the means for the two groups
Describe type of test completed (t-test in this case) and whether it was significant
Include statistical summary statement that looks like this (for example): t(12) = 4.3; p < 0.05
______________________________________________________________________________ ______________________________________________________________________________ ______________________________________________________________________________ ______________________________________________________________________________ ______________________________________________________________________________ Complete a graph of these results using excel and print out your graph

Problem 5. Please complete another t-test: Marcella is a regional manager for a
national company. She would like to compare the daily travel expenses for the sales staff and the audit staff. She collected daily travel expense reports from six sales staff, and seven audit staff. Please test for significant difference with an alpha of 0.05. Independent Variable: __________________________
Dependent Variable: __________________________
Mean Travel Expense Amount Sales Staff: __________________________
Mean Travel Expense Amount Audit Staff: __________________________
State whether this is a one or two-tailed test __________________________
State the alpha level __________________________
Value for the observed t-statistic: __________________________
Value for the critical t-statistic: __________________________
Value for the degrees of freedom: __________________________
What is the p value: __________________________
Was it a significant difference: __________________________
(remember, there should be a good match between what you learn by 1) comparing your p value with alpha and 2) what you learn by comparing the critical and observed t stats)
Report finding in proper form __________________________ for example (t(12) = 6.12; p <0.05)
Report finding in proper form: Please construct a brief (one paragraph) summary of your results. Remember there are three parts to this summary
List independent and dependent variables, and the means for the two groups
Describe type of test completed (t-test in this case) and whether it was significant
Include statistical summary statement that looks like this (for example): t(12) = 4.3; p < 0.05
______________________________________________________________________________ ______________________________________________________________________________ ______________________________________________________________________________ ______________________________________________________________________________ ______________________________________________________________________________ Complete a graph of these results using excel and print out your graph

Problem 6. Please another t-test. City planners counted the number of cars parked at
two beach-side parking lots, and wanted to test to see if one was more heavily used than the other. Please test for significant difference with an alpha of 0.05 Independent Variable: __________________________
Dependent Variable: __________________________
Mean Number of Cars parked Ocean Drive Lot: __________________________
Mean Number of Cars parked Rio Rancho Lot: __________________________
State whether this is a one or two-tailed test __________________________
State the alpha level __________________________
Value for the observed t-statistic: __________________________
Value for the critical t-statistic: __________________________
Value for the degrees of freedom: __________________________
What is the p value: __________________________
Was it a significant difference: __________________________
(remember, there should be a good match between what you learn by 1) comparing your p value with alpha and 2) what you learn by comparing the critical and observed t stats)
Report finding in proper form __________________________ for example (t(12) = 6.12; p <0.05)
Report finding in proper form: Please construct a brief (one paragraph) summary of your. Remember there are three parts to this summary
List independent and dependent variables, and the means for the two groups
Describe type of test completed (t-test in this case) and whether it was significant
Include statistical summary statement that looks like this (for example): t(12) = 4.3; p < 0.05
______________________________________________________________________________ ______________________________________________________________________________ ______________________________________________________________________________ ______________________________________________________________________________ ______________________________________________________________________________
Complete a graph of these results using excel and print out your graph

t-table
d15f_hw13_t-tests&excel.docx


