Embed Size (px)
Citation preview

BPI INTERNATIONAL FINANCE LIMITED
BANKING DISCLOSURE STATEMENTS FOR THE YEAR ENDED 31 DECEMBER 2020 (UNAUDITED)

BPI INTERNATIONAL FINANCE LIMITED
Contents Page(s)
Basis of Preparation 1
Part I: Key Prudential Ratios, Overview of Risk Management and RWATable 1 - KM1: Key Prudential Ratios
1 - 2
OVA: Overview of risk management 3 - 4
Table 2 - OV1: Overview of RWAs 4 - 5
Part II: Linkages between financial statements and regulatory exposures Table 3 - PV1: Prudent valuation adjustments
6
Table 4 - LI1: Differences between accounting and regulatory scopes of consolidation and mapping of financial statement categories with regulatory risk categories
7
Table 5 - LI2: Main sources of differences between regulatory exposure amounts and carrying values in financial statements
8
LIA: Explanations of differences between accounting and regulatory exposure amounts
8
Part IIA: Composition of Regulatory Capital Table 6 - CC1: Composition of Regulatory Capital
9 - 13
Table 7 - CC2: Reconciliation of Regulatory Capital to Balance Sheet 14
Table 8 – CCA: Main Features of Regulatory Capital Instruments 15 - 16
Part IIB: Macroprudential supervisory measuresTable 9 – CCyB1: Geographical Distribution of Credit Exposures used in
Countercyclical Capital Buffer16
Part IIC: Leverage Ratio Table 10 – LR1: Summary Comparison of Accounting Assets against Leverage Ratio
Exposure Measure17
Table 11 – LR2: Leverage Ratio (“LR”) 18
Part IID: LiquidityLIQA: Liquidity Risk Management
19 - 20
Part III: Credit Risk for Non-securitization exposures CRA: General information about credit risk
21 - 22
Table 12 - CR1: Credit Quality of Exposures 23
Table 13 - CR2: Changes in defaulted loans and debts securities 23
CRB: Additional disclosure related to credit quality of exposures 24 - 25
CRC: Qualitative disclosures related to credit risk mitigation 26
Table 14 - CR3: Overview of recognized credit risk mitigation 26
Table 15 - CR4: Credit risk exposures and effects of recognized credit risk mitigation (BSC approach)
27

BPI INTERNATIONAL FINANCE LIMITED
Contents (continued) Page(s)
Table 16 - CR5: Credit risk exposures by asset classes and by risk weights (BSC Approach)
28
Part IV: Counterparty Credit RiskCCRA: Qualitative disclosures related to counterparty credit risk (including those
arising from clearing through CCPs)29
Table 17 - CCR1: Analysis of counterparty default risk exposures (other than those to CCPs) by approaches
29
Table 18 - CCR2: CVA capital charge 30
Table 19 - CCR3: Counterparty default risk exposures (other than those to CCPs) by asset classes and by risk weights – for BSC approach
31
Table 20 - CCR5: Composition of collateral for counterparty default risk exposures 32
Table 21 -CCR6: Credit-related derivative contracts 32
Table 22 - CCR8: Exposures to CCPs 33
Part V: Securitization Exposures 34
Part VI: Market Risk 34
Part VII: Interest Rate Risk in Banking Book IRRBBA: Interest rate risk in banking book- risk management objectives and
policies35 - 36
Table 23- IRRBB1: Quantitative information on interest rate risk in banking book 36
Part VIII: RemunerationREMA: Remuneration Policy
37
Table 24 - REM1: Remuneration awarded during financial year 38
Table 25 - REM2: Special payments 39
Table 26 - REM3: Deferred remuneration 39
Part IX: Other Disclosures 40 - 421.International Claims2. Sector Information3. Overdue or rescheduled assets4. Non-Bank Mainland China Exposures5. Other than functional currency concentrations
BPI INTERNATIONAL FINANCE LIMITED
1
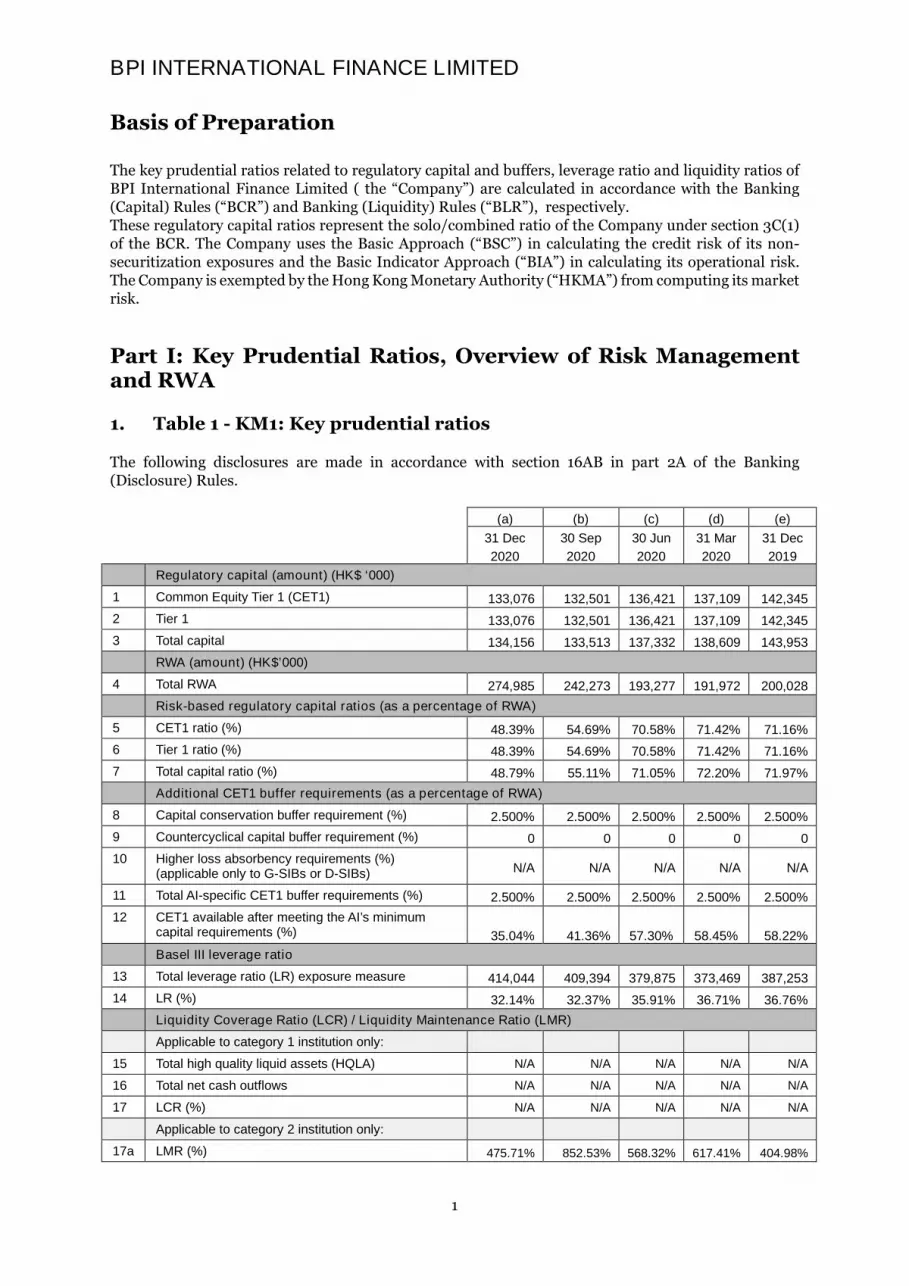
Basis of Preparation
The key prudential ratios related to regulatory capital and buffers, leverage ratio and liquidity ratios of BPI International Finance Limited ( the “Company”) are calculated in accordance with the Banking (Capital) Rules (“BCR”) and Banking (Liquidity) Rules (“BLR”), respectively. These regulatory capital ratios represent the solo/combined ratio of the Company under section 3C(1) of the BCR. The Company uses the Basic Approach (“BSC”) in calculating the credit risk of its non-securitization exposures and the Basic Indicator Approach (“BIA”) in calculating its operational risk. The Company is exempted by the Hong Kong Monetary Authority (“HKMA”) from computing its market risk.
Part I: Key Prudential Ratios, Overview of Risk Management and RWA
1. Table 1 - KM1: Key prudential ratios
The following disclosures are made in accordance with section 16AB in part 2A of the Banking (Disclosure) Rules.
(a) (b) (c) (d) (e)
31 Dec
2020
30 Sep
2020
30 Jun
2020
31 Mar
2020
31 Dec
2019
Regulatory capital (amount) (HK$ ‘000)
1 Common Equity Tier 1 (CET1) 133,076 132,501 136,421 137,109 142,345
2 Tier 1 133,076 132,501 136,421 137,109 142,345
3 Total capital 134,156 133,513 137,332 138,609 143,953
RWA (amount) (HK$’000)
4 Total RWA 274,985 242,273 193,277 191,972 200,028
Risk-based regulatory capital ratios (as a percentage of RWA)
5 CET1 ratio (%) 48.39% 54.69% 70.58% 71.42% 71.16%
6 Tier 1 ratio (%) 48.39% 54.69% 70.58% 71.42% 71.16%
7 Total capital ratio (%) 48.79% 55.11% 71.05% 72.20% 71.97%
Additional CET1 buffer requirements (as a percentage of RWA)
8 Capital conservation buffer requirement (%) 2.500% 2.500% 2.500% 2.500% 2.500%
9 Countercyclical capital buffer requirement (%) 0 0 0 0 0
10 Higher loss absorbency requirements (%) (applicable only to G-SIBs or D-SIBs) N/A N/A N/A N/A N/A
11 Total AI-specific CET1 buffer requirements (%) 2.500% 2.500% 2.500% 2.500% 2.500%
12 CET1 available after meeting the AI’s minimum capital requirements (%) 35.04% 41.36% 57.30% 58.45% 58.22%
Basel III leverage ratio
13 Total leverage ratio (LR) exposure measure 414,044 409,394 379,875 373,469 387,253
14 LR (%) 32.14% 32.37% 35.91% 36.71% 36.76%
Liquidity Coverage Ratio (LCR) / Liquidity Maintenance Ratio (LMR)
Applicable to category 1 institution only:
15 Total high quality liquid assets (HQLA) N/A N/A N/A N/A N/A
16 Total net cash outflows N/A N/A N/A N/A N/A
17 LCR (%) N/A N/A N/A N/A N/A
Applicable to category 2 institution only:
17a LMR (%) 475.71% 852.53% 568.32% 617.41% 404.98%

BPI INTERNATIONAL FINANCE LIMITED
2
(a) (b) (c) (d) (e)
31 Dec
2020
30 Sep
2020
30 Jun
2020
31 Mar
2020
31 Dec
2019
Net Stable Funding Ratio (NSFR) / Core Funding Ratio (CFR)
Applicable to category 1 institution only:
18 Total available stable funding N/A N/A N/A N/A N/A
19 Total required stable funding N/A N/A N/A N/A N/A
20 NSFR (%) N/A N/A N/A N/A N/A
Applicable to category 2A institution only:
20a CFR (%) N/A N/A N/A N/A N/A
The Company is categorized as category 2 institution by the Hong Kong Monetary Authority (HKMA); thus, the following ratios does not apply: Liquidity Coverage Ratio (“LCR”), Net Stable Funding Ratio (“NSFR”), and Core Funding Ratio (“CFR”).
The regulatory capital, RWA’s, risk-based regulatory capital ratios, and additional buffer requirements are from the Return of Capital Adequacy Ratio submitted to the HKMA on a solo/combined basis under
section 3C(1) of the BCR.
The decrease in the regulatory capital ratios is mainly due to the increase in the loan portfolio by HK$ 30M from the previous quarter, which resulted in an increase in the RWA for credit risk.
The Basel III Leverage ratio disclosures are from the Return of Leverage Ratio submitted to the HKMA
under Part 1C of the BCR.
The increase in the total leverage ratio exposure measure is mainly due to the increase in the time deposits taken from the customers, which provide part of the funding to the business.
The liquidity condition of the Company is monitored on a daily basis by the Company’s Chief Executive. The balance between liquidity and profitability is carefully considered but the former is given higher priority in case of conflicts in meeting targets or regulatory requirements.
The Company computes its Liquidity Maintenance Ratio (“LMR”) on Hong Kong office basis as required under rule 10(1)(a) of the BLR. The LMR is calculated based on the average value of the LMR for each calendar month, as reported in the Return of Liquidity position submitted to the HKMA and the ratios presented above are the average quarterly LMR for the reporting period.
The decrease in the average LMR from the last quarter was mainly due to an increase in the average Customer’s Time Deposit that falls within one month.

BPI INTERNATIONAL FINANCE LIMITED
3
2. OVA: Overview of risk management
Our Risk Management Framework
The Company’s overall business strategy is set by the Board of Directors (the “Board”) and is accompanied by a clear strategic plan, business objectives and risk appetite statement. The Company’s risk profile is closely monitored by its Risk Management Units through Board-approved risk metrics and risk reports and in close coordination with the business lines.
The Company has established an effective risk governance and management framework in line with the requirements set out by the HKMA and other regulators. Risk metrics are established in line with the Company’s business strategy and are aligned with regulatory requirements. These are approved by the Board or by the Risk Committee (the “RC,” a Board-level Committee), and are reviewed at least annually. These metrics, as well as the overall risk profile of the Company, are reported on a monthly basis to the RC.
The Company implements the three lines of defense, a framework designed to allow clear identification of roles and responsibilities, cultivate functional independence and control, strengthen communication and dialogue, and sustain ongoing risk management activities. This framework allows the Company to proactively manage risk while remaining focused on achieving its business goals and objectives.
Risk Culture
The Company recognizes the importance of strong risk culture, and this is cultivated through the various implementation of policies which align expected employee behavior with the Company’s overall risk/return objectives including the code of ethics and standards of professional conduct, policies on staff dealing, conflicts of interest, self-assessments and various Human Resources policies such as those concerning personal development and continuous professional training and development.
All policies are approved by the Board (or a Board-level committee such as the RC) and are disseminated to all employees in a timely manner. Procedures are likewise put in place for proper escalation in cases of violations and breaches, incident reporting, and internal, regulatory, and Group-wide reporting. Having well-trained and properly guided professionals promotes a strong risk culture that is reinforced and supported by the Company’s senior management.
Risk Measurement and Reporting Systems
The Company adheres to all applicable regulatory guidelines, both local and global, and various industry-recognized and accepted risk metrics. The Company’s risk measurement systems effectively and efficiently capture the types and levels of risks inherent to the Company’s business activities, both quantitatively and qualitatively. Other features include standardized risk and control categories, linkages to compliance and audit reports, and continuous monitoring processes to ensure any weaknesses are addressed. These systems are designed to cater to the Company’s unique business requirements. Still, they remain aligned with the overall risk management framework of the Company’s parent bank, Bank of the Philippine Islands, and its subsidiaries (the “BPI Group”).
The Company promotes continuous improvement and development in its risk measurement and management systems in order to consistently produce high-quality risk analysis and information to support all decision-making processes across the board.

BPI INTERNATIONAL FINANCE LIMITED
4
Overview of risk management (continued)
Stress Testing
The Company conduct regular stress testing by Risk Department to complement its capital plan and risk management processes. Stress testing of the Company’s capital adequacy is conducted annually during its capital planning exercise. The main objective of the exercise is to assess whether the Company has sufficient capital to cover all of its material risk exposures. These assessments are conducted in line with the Company’s Internal Capital Adequacy Assessment Process (“ICAAP”), also conducted annually, which includes an assessment of the materiality of the Company’s Pillar 1 and Pillar 2 risk exposures.
In addition, liquidity and price stress tests are conducted quarterly to evaluate the resilience of the Company’s liquidity positions, earnings, and economic value. The Company has contingency plans in place in the event of a capital or liquidity shortfall.
3. Table 2 - OV1: Overview of RWAs
The following table provides an overview of the capital requirement in terms of a detailed breakdown of RWAs for credit risk, market risk, and operational risk. The minimum capital requirements are calculated as 8% of the risk-weighted assets as of the reporting date.
(a) (b) (c)
RWA
Minimum
capital
requirements
31 Dec
2020
HK$’000
30 Sep
2020
HKD$’000
31 Dec
2020
HKD$’000
1 Credit risk for non-securitization exposures 198,497 169,960 15,880
2 Of which STC approach - - -
2a Of which BSC approach 198,497 169,960 15,880
3 Of which foundation IRB approach - - -
4 Of which supervisory slotting criteria approach - - -
5 Of which advanced IRB approach - - -
6 Counterparty default risk and default fund contributions - - -
7 Of which SA-CCR* N/A N/A N/A
7a Of which CEM - - -
8 Of which IMM(CCR) approach - - -
9 Of which others - - -
10 CVA risk - - -
11 Equity positions in banking book under the simple risk-weight
method and internal models method
- - -
12 Collective investment scheme (“CIS”) exposures – LTA* N/A N/A N/A
13 CIS exposures – MBA* N/A N/A N/A
14 CIS exposures – FBA* N/A N/A N/A
14a CIS exposures – combination of approaches* N/A N/A N/A
15 Settlement risk - - -
16 Securitization exposures in banking book - - -
17 Of which SEC-IRBA - - -
18 Of which SEC-ERBA - - -

BPI INTERNATIONAL FINANCE LIMITED
5
(a) (b) (c)
RWA
Minimum
capital
requirements
31 Dec
2020
HK$’000
30 Sep
2020
HKD$’000
31 Dec
2020
HKD$’000
19 Of which SEC-SA - - -
19a Of which SEC-FBA - - -
20 Market risk - - -
21 Of which STM approach - - -
22 Of which IMM approach - - -
23 Capital charge for switch between exposures in trading book and
banking book (not applicable before the revised market risk
framework takes effect)*
N/A N/A N/A
24 Operational risk 76,488 72,313 6,119
24a Sovereign concentration risk - - -
25 Amounts below the thresholds for deduction (subject to 250% RW) - - -
26 Capital floor adjustment - - -
26a Deduction to RWA - - -
26b Of which portion of regulatory reserve for general banking risks
and collective provisions which is not included in Tier 2 Capital
- - -
26c Of which portion of cumulative fair value gains arising from the
revaluation of land and buildings which is not included in Tier 2
Capital
27 Total 274,985 242,273 21,999
The increase in the RWA from the previous quarter is mainly due to an increase in the Company’s loan portfolio by HK$30M.

BPI INTERNATIONAL FINANCE LIMITED
6
Part II: Linkages between financial statements and regulatory exposures
4. Table 3 - PV1: Prudent valuation adjustments
Prudent value adjustments are for assets measured at fair value (marked-to-market or mark to model) and for which PVA is required. The Company has taken the concentration of covering liquidity adjustment on bonds of valuation adjustment into consideration and makes adjustments, if any, in accordance with the Company’s valuation process. Currently, there is no valuation adjustment on the investment portfolio.
Other elements of valuation adjustment are considered either not applicable or insignificant (if any) in the process of making valuation adjustments.
(a) (b) (c) (d) (e) (f) (g) (h)
Equity Interest
rates FX Credit Commodities Total
Of which:In the
trading book
Of which:In the
banking book
1 Close-out uncertainty, of which:
- - - - - - - -
2 Mid-market value
- - - - - - - -
3 Close-out costs - - - - - - - -
4 Concentration - - - - - - - -
5 Early termination - - - - - - - -
6 Model risk - - - - - - - -
7 Operational risks - - - - - - - -
8 Investing and funding costs
9 Unearned credit spreads
10 Future administrative costs
- - - - - - - -
11 Other adjustments - - - - - - - -
12 Total adjustments - - - - - - - -

BPI INTERNATIONAL FINANCE LIMITED
7
5. Table 4 - LI1: Differences between accounting and regulatory scopes of consolidation and mapping of financial statement categories with regulatory risk categories
The difference between the carrying values, as reported in published financial statements and under the scope of regulatory consolidation is the ECL provisions of the financial assets.
(a) (b) (c) (d) (e) (f) (g)
Carrying values
as reported in
published
financial
statements
Carrying values
under scope of
regulatory
consolidation
Carrying values of items:
subject to credit
risk framework
subject to
counterparty
credit risk
framework
subject to the
securitization
framework
subject to market
risk framework
not subject to
capital
requirements or
subject to deduction
from capital
HK$’000 HK$’000 HK$’000 HK$’000 HK$’000 HK$’000 HK$’000
Assets
Cash and short term funds 73,612 73,626 73,624 - - - 2
Placement with banks and other
financial institutions maturing
between one and twelve months 142,164 142,186 142,186 - - - -
Advances and other accounts 115,199 115,394 115,394 - - - -
Financial Assets designated at fair
value through other comprehensive
income
72,634 72,634 72,634 - - - -
Fixed Assets 10,508 10,508 10,508 - - - -
Intangible assets 342 342 342
Total assets 414,459 414,690 414,688 - - - 2
Liabilities
Time Deposits from customers 266,084 266,084 - - - - 266,084
Lease liabilities 6,973 6,973 - - - - 6,973
Other payables 7,480 7,480 7,480
Total liabilities 280,537 280,537 - - - - 280,537

BPI INTERNATIONAL FINANCE LIMITED
8
6. Table 5 - LI2: Main sources of differences between regulatory exposure amounts and carrying values in financial statements
7. LIA: Explanations of differences between accounting and regulatory exposure amounts
The difference between the carrying values, as reported in published financial statements and under the scope of regulatory consolidation is the ECL provisions of the financial assets. The off-balance sheet amounts are subject to credit risk framework represents the undrawn portion of credit facilities.
(a) (b) (c) (d) (e)
Total
Items subject to:
credit risk
framework
securitization
framework
counterparty credit
risk framework
market risk
framework
HK$’000 HK$’000 HK$’000 HK$’000 HK$’000
1 Asset carrying value amount under scope of
regulatory consolidation (as per template LI1) 414,690 414,688 - - -
2 Liabilities carrying value amount under regulatory scope of
consolidation (as per template LI1) 280,537 - - - -
3 Total net amount under regulatory scope of consolidation 134,153 - - - -
4 Off-balance sheet amounts 985 985 - - -
5 Differences in valuations - - - - -
6 Differences due to different netting rules, other than those
already included in row 2 - - - - -
7 Differences due to consideration of provisions - - - - -
8 Differences due to prudential filters - - - - -
Exposure amounts considered for regulatory
purposes 135,138 415,673 - - -

BPI INTERNATIONAL FINANCE LIMITED
9
Part IIA: Composition of Regulatory Capital
8. Table 6 - CC1: Composition of Regulatory Capital
The following table provides the breakdown of regulatory capital according to the scope of regulatory consolidation. The Company has already applied full capital deductions under the BCR. The Capital Disclosure showed below as at 31 December 2020.
(a) (b)
Amount
(HK$ ‘000)
Cross-reference
to Table 7
numbers/letters
of the balance
sheet under the
regulatory scope
of consolidation
CET1 capital: instruments and reserves
1 Directly issued qualifying CET1 capital instruments plus any related share
premium
75,000 [a]
2 Retained earnings 58,130 [b-d]
3 Disclosed reserves 792 [e]
4 Directly issued capital subject to phase-out arrangements from CET1 (only
applicable to non-joint stock companies) Not applicable Not applicable
5 Minority interests arising from CET1 capital instruments issued by
consolidated bank subsidiaries and held by third parties (amount allowed in
CET1 capital of the consolidation group)
-
6 CET1 capital before regulatory adjustments 133,922
CET1 capital: regulatory deductions
7 Valuation adjustments -
8 Goodwill (net of associated deferred tax liabilities) -
9 Other intangible assets (net of associated deferred tax liabilities) -
10 Deferred tax assets (net of associated deferred tax liabilities)
11 Cash flow hedge reserve -
12 Excess of total EL amount over total eligible provisions under the IRB
approach
-
13 Credit-enhancing interest-only strip, and any gain-on-sale and other
increase in the CET1 capital arising from securitization transactions
-
14 Gains and losses due to changes in own credit risk on fair valued liabilities -
15 Defined benefit pension fund net assets (net of associated deferred tax
liabilities)
-
16 Investments in own CET1 capital instruments (if not already netted off paid-
in capital on reported balance sheet)
-
17 Reciprocal cross-holdings in CET1 capital instruments -
18 Insignificant capital investments in CET1 capital instruments issued by
financial sector entities that are outside the scope of regulatory
consolidation (amount above 10% threshold)
-
19 Significant capital investments in CET1 capital instruments issued by
financial sector entities that are outside the scope of regulatory
consolidation (amount above 10% threshold)
-
20 Mortgage servicing rights (net of associated deferred tax liabilities) Not applicable Not applicable

BPI INTERNATIONAL FINANCE LIMITED
10
(a) (b)
Amount
(HK$ ‘000)
Cross-reference
to Table 7
numbers/letters
of the balance
sheet under the
regulatory scope
of consolidation
21 Deferred tax assets arising from temporary differences (net of associated
deferred tax liabilities)
Not applicable Not applicable
22 Amount exceeding the 15% threshold Not applicable Not applicable
23 of which: significant investments in the ordinary share of financial
sector entities
Not applicable Not applicable
24 of which: mortgage servicing rights Not applicable Not applicable
25 of which: deferred tax assets arising from temporary differences Not applicable Not applicable
26 National specific regulatory adjustments applied to CET1 capital 846
26a Cumulative fair value gains arising from the revaluation of land and
buildings (own-use and investment properties)
-
26b Regulatory reserve for general banking risks 846 [c]
26c Securitization exposures specified in a notice given by the MA -
26d Cumulative losses below depreciated cost arising from the institution’s
holdings of land and buildings
-
26e Capital shortfall of regulated non-bank subsidiaries -
26f Capital investment in a connected company which is a commercial entity
(amount above 15% of the reporting institution’s capital base)
-
27 Regulatory deductions applied to CET1 capital due to insufficient AT1 capital
and Tier 2 capital to cover deductions
-
28 Total regulatory deductions to CET1 capital 846
29 CET1 capital 133,076
AT1 capital: instruments
30 Qualifying AT1 capital instruments plus any related share premium -
31 of which: classified as equity under applicable accounting standards -
32 of which: classified as liabilities under applicable accounting standards -
33 Capital instruments subject to phase-out arrangements from AT1 capital -
34 AT1 capital instruments issued by consolidated bank subsidiaries and held
by third parties (amount allowed in AT1 capital of the consolidation group)
-
35 of which: AT1 capital instruments issued by subsidiaries subject to phase-
out arrangements
-
36 AT1 capital before regulatory deductions -
AT1 capital: regulatory deductions
37 Investments in own AT1 capital instruments -
38 Reciprocal cross-holdings in AT1 capital instruments -
39 Insignificant capital investments in AT1 capital instruments issued by
financial sector entities that are outside the scope of regulatory
consolidation (amount above 10% threshold)
-
40 Significant capital investments in AT1 capital instruments issued by financial
sector entities that are outside the scope of regulatory consolidation
-
41 National specific regulatory adjustments applied to AT1 capital -

BPI INTERNATIONAL FINANCE LIMITED
11
(a) (b)
Amount
(HK$ ‘000)
Cross-reference
to Table 7
numbers/letters
of the balance
sheet under the
regulatory scope
of consolidation
42 Regulatory deductions applied to AT1 capital due to insufficient Tier 2
capital to cover deductions
-
43 Total regulatory deductions to AT1 capital -
44 AT1 capital -
45 Tier 1 capital (T1 = CET1 + AT1) 133,076
Tier 2 capital: instruments and provisions
46 Qualifying Tier 2 capital instruments plus any related share premium -
47 Capital instruments subject to phase-out arrangements from Tier 2 capital -
48 Tier 2 capital instruments issued by consolidated bank subsidiaries and held
by third parties (amount allowed in Tier 2 capital of the consolidation group)
-
49 of which: capital instruments issued by subsidiaries subject to phase-out
arrangements
-
50 Collective provisions and regulatory reserve for general banking risks
eligible for inclusion in Tier 2 capital
1,080 [c +d]
51 Tier 2 capital before regulatory deductions 1,080
Tier 2 capital: regulatory deductions
52 Investments in own Tier 2 capital instruments -
53 Reciprocal cross-holdings in Tier 2 capital instruments -
54 Insignificant capital investments in Tier 2 capital instruments issued by
financial sector entities that are outside the scope of regulatory
consolidation (amount above 10% threshold)
-
55 Significant capital investments in Tier 2 capital instruments issued by
financial sector entities that are outside the scope of regulatory
consolidation (net of eligible short positions)
-
56 National specific regulatory adjustments applied to Tier 2 capital -
56a Add back of cumulative fair value gains arising from the revaluation of land
and buildings (own-use and investment properties) eligible for inclusion in
Tier 2 capital
-
57 Total regulatory adjustments to Tier 2 capital -
58 Tier 2 capital (T2) 1,080
59 Total regulatory capital (TC = T1 + T2) 134,156
60 Total RWA 274,985
Capital ratios (as a percentage of RWA)
61 CET1 capital ratio 48.39%
62 Tier 1 capital ratio 48.39%
63 Total capital ratio 48.79%
64 Institution-specific buffer requirement (capital conservation buffer
plus countercyclical capital buffer plus higher loss absorbency
requirements)
2.500%

BPI INTERNATIONAL FINANCE LIMITED
12
(a) (b)
Amount
(HK$ ‘000)
Cross-reference
to Table 7
numbers/letters
of the balance
sheet under the
regulatory scope
of consolidation
65 of which: capital conservation buffer requirement 2.500%
66 of which: bank specific countercyclical capital buffer requirement 0%
67 of which: higher loss absorbency requirement N/A
68 CET1 (as a percentage of RWA) available after meeting minimum capital
requirements 35.04%
National minima (if different from Basel 3 minimum)
69 National CET1 minimum ratio Not applicable Not applicable
70 National Tier 1 minimum ratio Not applicable Not applicable
71 National Total capital minimum ratio Not applicable Not applicable
Amounts below the thresholds for deduction (before risk weighting)
72 Insignificant capital investments in CET1, AT1 and Tier 2 capital instruments
issued by financial sector entities that are outside the scope of regulatory
consolidation
Not applicable Not applicable
73 Significant capital investments in CET1 capital instruments issued by
financial sector entities that are outside the scope of regulatory
consolidation
Not applicable Not applicable
74 Mortgage servicing rights (net of associated deferred tax liabilities) Not applicable Not applicable
75 Deferred tax assets arising from temporary differences (net of associated
deferred tax liabilities) Not applicable Not applicable
Applicable caps on the inclusion of provisions in Tier 2 capital
76 Provisions eligible for inclusion in Tier 2 in respect of exposures subject to
the BSC approach, or the STC approach and SEC-ERBA, SEC-SA and SEC-FBA
(prior to application of cap)
1,080
77 Cap on inclusion of provisions in Tier 2 under the BSC approach, or the STC
approach, and SEC-ERBA, SEC-SA and SEC-FBA1,080
78 Provisions eligible for inclusion in Tier 2 in respect of exposures subject to
the IRB approach and SEC-IRBA (prior to application of cap)Not applicable Not applicable
79 Cap for inclusion of provisions in Tier 2 under the IRB approach and SEC-
IRBANot applicable Not applicable
Capital instruments subject to phase-out arrangements
(only applicable between 1 Jan 2018 and 1 Jan 2022)
80 Current cap on CET1 capital instruments subject to phase-out arrangements Not applicable Not applicable
81 Amount excluded from CET1 due to cap (excess over cap after redemptions
and maturities) Not applicable Not applicable
82 Current cap on AT1 capital instruments subject to phase-out arrangements Not applicable Not applicable
83 Amount excluded from AT1 capital due to cap (excess over cap after
redemptions and maturities) Not applicable Not applicable
84 Current cap on Tier 2 capital instruments subject to phase-out arrangements Not applicable Not applicable
85 Amount excluded from Tier 2 capital due to cap (excess over cap after
redemptions and maturities)
-

BPI INTERNATIONAL FINANCE LIMITED
13
Notes:
Elements where a more conservative definition has been applied in the BCR relative to that set out in Basel III capital standards:
Row Description Hong Kong Basel IIINo. basis basis
(HK$ ‘000) (HK$’000)10 Deferred tax assets net of deferred tax liabilities - -
Explanation
As set out in paragraphs 69 and 87 of the Basel III text issued by the Basel Committee (December 2010), DTAs that rely on future profitability of the bank to be realised is to be deducted, whereas DTAs which
relate to temporary differences may be given limited recognition in CET1 capital (and hence be excluded
from deduction from CET1 capital up to the specified threshold). In Hong Kong, an AI is required to
deduct all DTAs in full, irrespective of their origin, from CET1 capital. Therefore, the amount to be deducted as reported in row 10 may be greater than that required under Basel III.
The amount reported under the column “Basel III basis” in this box represents the amount reported in row 10 (i.e., the amount reported under the “Hong Kong basis”) adjusted by reducing the amount of DTAs to be deducted which relate to temporary differences to the extent, not in excess of the 10% threshold set for DTAs arising from temporary differences and the aggregate 15% threshold set for
MSRs, DTAs arising from temporary differences and significant investments in CET1 capital instruments issued by financial sector entities (excluding those that are loans, facilities, and other credit exposures to connected companies) under Basel III.

BPI INTERNATIONAL FINANCE LIMITED
14
9. Table 7 – CC2: Reconciliation of Regulatory Capital to Balance Sheet
The table below shows the reconciliation of the capital components from the statement of financial position based on the regulatory scope of consolidation to the regulatory capital in Table 6.
(a) (b) (c)
Balance sheet as in
published financial
statements
as at 31 Dec 2020
HK$’000
Under regulatory
scope of
consolidation
As at 31 Dec 2020
HK$’000
Cross-referenced
to definition of
Capital
Components
Assets
Cash and short-term funds 73,612 73,626
Placements with banks and other financial institutions
maturing between one and twelve months 142,164 142,186
Advances and other accounts 115,199 115,394
Financial investments measured at fair value through other
comprehensive income 72,634 72,634
Fixed assets 10,508 10,508
Intangible assets 342 342
Total assets 414,459 414,690
Liabilities
Time deposits from customers 266,084 266,084
Lease liabilities 6,973 6,973
Other payables 7,480 7,480
Total liabilities 280,537 280,537
Shareholders’ equity
Paid-in share capital 75,000 75,000
of which: amount eligible for CET1 75,000 75,000 [a]
Retained earnings 58,130 58,361 [b]
of which: Regulatory Reserves for general banking risk 846 846 [c]
of which: Collective provisions under IFRS 9 234 231 [d]
of which: Regulatory reserve for general banking risk and
collective provisions excluded from Tier 2 capital due to cap
- -
Accumulated other comprehensive income 792 792 [e]
of which: ECL provision on financial assets under OCI - 3 [f]
Total shareholders’ equity 133,922 134,153

BPI INTERNATIONAL FINANCE LIMITED
15
10. Table 8 – CCA: Main Features of Regulatory Capital Instruments
The table below describes the main features of the CET 1 instruments as at 31 December 2020.
(a)
Quantitative / qualitative
information
1 Issuer BPI International Finance
Limited
2 Unique identifier (e.g., CUSIP, ISIN or Bloomberg identifier for private placement) N.A.
3 Governing law(s) of the instrument Hong Kong
Regulatory treatment
4 Transitional Basel III rules1 N.A.
5 Post-transitional Basel III rules2 Common Equity Tier 1
6 Eligible at solo/group/solo and group Solo and Group
7 Instrument type (types to be specified by each jurisdiction) Ordinary Shares
8 Amount recognised in regulatory capital (currency in millions, as of most recent
reporting date)
HK$ 75 Million
9 Par value of instrument N.A.
10 Accounting classification Shareholders’ equity
11 Original date of issuance 16 August 1974
12 Perpetual or dated Perpetual
13 Original maturity date No Maturity
14 Issuer call subject to prior supervisory approval No
15 Optional call date, contingent call dates and redemption amount N.A.
16 Subsequent call dates, if applicable N.A.
Coupons / dividends
17 Fixed or floating dividend / coupon Floating
18 Coupon rate and any related index N.A.
19 Existence of a dividend stopper No
20 Fully discretionary, partially discretionary or mandatory Fully discretionary
21 Existence of step-up or other incentive to redeem No
22 Non-cumulative or cumulative Non-cumulative
23 Convertible or non-convertible Non-convertible
24 If convertible, conversion trigger(s) N.A.
25 If convertible, fully or partially N.A.
26 If convertible, conversion rate N.A.
27 If convertible, mandatory or optional conversion N.A.
28 If convertible, specify instrument type convertible into N.A.
29 If convertible, specify issuer of instrument it converts into N.A.
30 Write-down feature No
31 If write-down, write-down trigger(s) N.A.
32 If write-down, full or partial N.A.
33 If write-down, permanent or temporary N.A.
34 If temporary write-down, description of write-up mechanism N.A.
1 Regulatory treatment of capital instruments subject to transitional arrangements provided for in Schedule 4H to the BCR.
2 Regulatory treatment of capital instruments not subject to transitional arrangements provided for in Schedule 4H to the BCR.

BPI INTERNATIONAL FINANCE LIMITED
16
(a)
Quantitative / qualitative
information
35 Position in subordination hierarchy in liquidation (specify instrument type
immediately senior to instrument in the insolvency creditor hierarchy of the legal
entity concerned).
N.A.
36 Non-compliant transitioned features No
37 If yes, specify non-compliant features N.A.
This Main Features of Regulatory Capital Instruments can be found in the Company’s website: www.bpi-ifl.com.hk
Part IIB: Macroprudential supervisory measures
11. Table 9 – CCyB1: Geographical Distribution of Credit Exposures used in Countercyclical Capital Buffer
The table below provides the Company’s countercyclical capital buffer ratio computed as the aggregate risk-weighted amount (‘RWA”) of geographically allocated private sector credit exposures (to the extent allocated to jurisdictions on the “ultimate risk” basis) over the sum of RWA for each geographical allocated private sector credit exposures multiplied by its appropriate JCCyB ratio.
(a) (c) (d) (e)
Geographical
breakdown by
Jurisdiction (J)
Applicable
JCCyB ratio in
effect (%)
RWA used in
computation of
CCyB ratio
(HK$’000)
AI-specific CCyB
ratio (%) CCyB amount
1 -
2 -
3 -
N+1 Sum -
N+2 Total 105,706 0% 0
The Company has no credit exposure to private sectors with a non-zero countercyclical buffer ratio. N+2 column C represents the Company’s RWAs for the private sector credit exposures in all jurisdictions with no countercyclical buffer rate or with a countercyclical buffer rate set at zero.

BPI INTERNATIONAL FINANCE LIMITED
17
Part IIC: Leverage Ratio
12. Table 10 – LR1: Summary Comparison of Accounting Assets against Leverage Ratio Exposure Measure
The table below represents the reconciliation of the total assets in the published financial statements to the Leverage Ratio exposure measure as at 31 December 2020.
(a)
Item Value under the
LR framework
(HK$ ‘000)
1 Total consolidated assets as per published financial statements 414,459
2 Adjustment for investments in banking, financial, insurance or commercial entities that are
consolidated for accounting purposes but outside the scope of regulatory consolidation -
3 Adjustment for fiduciary assets recognised on the balance sheet pursuant to the applicable
accounting standard but excluded from the LR exposure measure
-
4 Adjustments for derivative contracts -
5 Adjustment for SFTs (i.e. repos and similar secured lending) -
6 Adjustment for off-balance sheet (“OBS”) items (i.e., conversion to credit equivalent
amounts of OBS exposures)
197
6a Adjustment for specific and collective provisions that are allowed to be excluded from
exposure measure
234
7 Other adjustments (846)
8 Leverage ratio exposure measure 414,044
Other adjustments represent the regulatory reserve for general banking risk that is deducted from computing the Tier 1 capital.

BPI INTERNATIONAL FINANCE LIMITED
18
13. Table 11 – LR2: Leverage Ratio (“LR”)
The table below provides a detailed breakdown of the components of the Leverage ratio denominator as at 31 December 2020.
(a) (b)
HK$ ‘000
31 Dec 2020 30 Sep 2020
On-balance sheet exposures
1 On-balance sheet exposures (excluding those arising from derivative contracts
and SFTs, but including collateral)
414,927 407,457
2 Less: Asset amounts deducted in determining Tier 1 capital 846 846
3 Total on-balance sheet exposures (excluding derivative contracts and SFTs) 414,081 406,611
Exposures arising from derivative contracts
4 Replacement cost associated with all derivative contracts (where applicable net
of eligible cash variation margin and/or with bilateral netting)
- -
5 Add-on amounts for PFE associated with all derivative contracts - -
6 Gross-up for derivatives collateral provided where deducted from the balance
sheet assets pursuant to the applicable accounting framework
- -
7 Less: Deductions of receivables assets for cash variation margin provided under
derivative contracts
- -
8 Less: Exempted CCP leg of client-cleared trade exposures - -
9 Adjusted effective notional amount of written credit derivative contracts - -
10 Less: Adjusted effective notional offsets and add-on deductions for written
credit derivative contracts
- -
11 Total exposures arising from derivative contracts - -
Exposures arising from SFTs
12 Gross SFT assets (with no recognition of netting), after adjusting for sale
accounting transactions
- -
13 Less: Netted amounts of cash payables and cash receivables of gross SFT assets - -
14 CCR exposure for SFT assets - -
15 Agent transaction exposures - -
16 Total exposures arising from SFTs - -
Other off-balance sheet exposures
17 Off-balance sheet exposure at gross notional amount 985 19,946
18 Less: Adjustments for conversion to credit equivalent amounts (788) (16,997)
19 Off-balance sheet items 197 2,949
Capital and total exposures
20 Tier 1 capital 133,076 132,501
20a Total exposures before adjustments for specific and collective provisions 414,278 409,560
20b Adjustments for specific and collective provisions (234) (166)
21 Total exposures after adjustments for specific and collective provisions 414,044 409,394
Leverage ratio
Leverage ratio 32.14% 32.37%

BPI INTERNATIONAL FINANCE LIMITED
19
Part IID: Liquidity
14. LIQA: Liquidity Risk Management
Liquidity risk is defined as the risk of impact on the Company’s earnings or capital from its inability to meet its financial or payment obligations as they fall due or its incapability of meeting its liquidity needs without incurring significant costs or losses.
Liquidity risk is managed within the framework of policies and limits that are approved by senior management in the Asset-Liability Committee (ALCO) and are in compliance with the local regulatory standard. Senior management receive reports on risk exposure and performance against approved limits. The ALCO provides senior management oversight of liquidity risk.
Liquidity risk is measured and managed on a projected cash flow basis with daily monitoring and reporting to senior management together with regular stress-testing. The Company also employs early warning indicators and trigger limits to detect earlier on any emerging liquidity risk.
The Company performs liquidity stress testing regularly, to evaluate the effect of both industry-wide and bank-specific disruptions on the Company’s liquidity position. The liquidity stress tests consider the effect on changes in the market value of liquid assets. The stress testing results to be reported to senior management in ALCO for consideration in making liquidity management decisions.
Contingency plan is in place to identify potential liquidity crisis using a series of early warning indicators. The Company also maintain a certain percentage of liquid assets as a buffer against unforeseen liquidity requirement. The main objective is to honor all cash outflow commitments on an on-going basis and to satisfy the statutory liquidity requirement.
Liquidity position
31 December 2020 31 December 2019
Average Liquidity Maintenance Ratio 628.49% 383.23%
The Liquidity Maintenance Ratio (“LMR”) is calculated in accordance with the Banking (Liquidity) Rules effective from 1 January 2015. The average liquidity maintenance ratio is calculated based on the average value of the LMR for each calendar month, as reported in the liquidity position return submitted to the Hong Kong Monetary Authority (“HKMA”).
The Company is categorized as Category 2 institution by the HKMA; thus the following ratios does not apply: Liquidity Coverage Ratio (“LCR”), Net Stable Funding Ratio (“NSFR”), and Core Funding Ratio (“CFR”).

BPI INTERNATIONAL FINANCE LIMITED
20
LIQA: Liquidity Risk Management (continued)
Maturity analysis
The table below analyse assets and liabilities of the Company as at 31 December 2020 into relevant maturity groupings based on the remaining period at the balance sheet date to the contractual maturity date. The amounts disclosed in the tables below are the approximation of the contractual undiscounted cash flows, whereas the Company manages the inherent liquidity risk based on expected undiscounted cash flows.
2020
Repayable
on demand
Up to
1 month
1 - 3
months
3-12
months
1-5
years
Over 5
years Undated Total
HK$’000 HK$’000 HK$’000 HK$’000 HK$’000 HK$’000 HK$’000 HK$’000
Assets
Cash and short-term funds 50,350 23,262 - - - - - 73,612
Placements with banks and
other financial institutions
maturing between one and
twelve months - - 142,226 - - - - 142,226
Advances and other accounts - 3,780 13,863 90,253 1,890 - 6,394 116,180
Financial assets designated at
fair value through other
comprehensive income - 281 7,911 30,889 34,589 1,428 - 75,098
Fixed assets - - - - - - 10,508 10,508
Intangible Assets - - - - - - 342 342
Total assets 50,350 27,323 164,000 121,142 36,479 1,428 17,244 417,966
--------- --------- --------- --------- --------- --------- --------- ---------
Liabilities
Deposits from customers - 42,109 103,195 121,433 - - - 266,737
Lease liabilities - 475 949 4,271 1,363 - - 7,058
Other payables - 149 4,940 763 23 - 1,605 7,480
Total liabilities - 42,733 109,084 126,467 1,386 - 1,605 281,275
--------- --------- --------- --------- --------- --------- --------- ---------
Net liquidity gap 50,350 (15,410) 54,916 (5,325) 35,093 1,428 15,639 136,691

BPI INTERNATIONAL FINANCE LIMITED
21
Part III: Credit Risk for Non-securitization exposures
15. CRA: General information about credit risk
Overview
The Company’s current business model emphasizes a conservative approach in managing credit risk as reflected in (i) zero past due/non-performing loans and default rates in recent history, (ii) the maintenance of the Company’s accounts and placements predominantly with authorized financial institutions prudently supervised by the Hong Kong Monetary Authority, and (iii) Company investments in debt securities concentrated in the higher credit quality bands with exposures diversified across banks, non-bank financial institutions, corporates, and sovereign entities.
The Company’s credit risk management framework is aligned with (i) the prescribed regulatory requirements, including but not limited to the Hong Kong Banking Ordinance and related regulations, as well as the HKMA’s Supervisory Policy Manuals, (ii) the credit risk management framework of its parent bank, Bank of the Philippine Islands, and (iii) the Company’s risk appetite statement, set by its Board of Directors and reviewed annually.
In its credit risk management framework, the Company takes into consideration prescriptive limits such as limitations on advances (e.g., single borrower’s limits), limitations on aggregate advances to directors and other connected parties, limitations on advances to employees, limitations on aggregate holdings and exposures to directors and other connected parties, share capital of other companies, and interests in land in or outside of Hong Kong, the Company’s level of regulatory reserves, and its internal targets and regulatory limits for CET1, Tier 1 and capital ratios, loan-to-collateral ratios, and country/sovereign risk limits.
Credit exposures involving short term loans and facilities granted to the Company’s clients undergo a standardized process involving information gathering, borrower evaluation, loan approval, and on-going monitoring.
The performance of all client loans and facilities is monitored daily and reported to the Board periodically. Collateral values are likewise evaluated regularly to ensure the underlying collateral remains sufficient to cover any outstanding obligation.
Credit Risk Management
The overarching objectives of the Company’s credit risk management function are:
To facilitate the proper evaluation and management of risk exposures to achieve risk-adjusted returns on capital consistent with the Company’s objectives
To establish identifiable procedures/uniform mechanism to properly assess the Company’s risk-taking activities
To integrate marketing, policy formulation, and risk limits monitoring into a matrix of complementary responsibilities. The Board of Directors (“Board”) sets the Company’s credit policies and risk appetite and ensures its credit risk strategy remains appropriate to the Company’s business model, the current operating environment and stage of the economic cycle, and supported by adequate levels of capital and allocated resources. The credit strategy is annually reviewed and incorporated into the Company’s annual capital plan.

BPI INTERNATIONAL FINANCE LIMITED
22
CRA: General information about credit risk - Credit Risk Management (continued)
The Office of the Chief Executive is responsible for the overall implementation of the Board’s credit strategies. It is responsible for ensuring that the necessary credit-related policies and procedures are established to carry out the business. It likewise acts through the authority delegated by the Board to approve credit risk exposures acceptable to the Company’s credit standards. Beyond these standards, approval must be sought from the Board. The credit process requires an annual review for any outstanding loan or facility granted, or more frequently as may be required given any unforeseen credit event.
To ensure that the BPI Group’s total credit exposures remain within the appropriate limits, client loans and facilities proposed on the Company level are routed to the relevant BPI Group Credit Committee for aggregation and endorsement and subsequently presented to the Company’s Office of the Chief Executive for final approval. All approved client loans and facilities are presented to the Board of Directors for information.
The Company’s risk department structure works as an independent function, in conjunction with the parent’s risk management department to maintain its alignment and consistency with the overall credit strategy of the BPI Group. Credit limits for certain portfolios such as those managed by the Company’s Treasury department covering sovereigns, supra-nationals, banks, and non-bank financial institutions and some corporate credits are approved centrally with BPI but confirmed at the Company’s Board level. This credit system allows for credit risk aggregation at the BPI Group level but permits independence and cascades the responsibility to the operating business unit (e.g., the Company) for proper evaluation prior to taking the actual credit exposure. Similar to loans and advances granted by the Company, the credit limits for these portfolios are evaluated annually at the BPI Group level, and likewise reviewed and confirmed at least annually at the Company level.
As with the overall risk governance structure, the Company employs the three lines of defense in the management of credit risk. The first line is responsible for evaluating new and existing credit exposures and the overall quality of the relevant portfolios. Controls are in place to ensure sufficient checks and balances govern the activities of the business units extending credit. Backroom functions are responsible for these controls by Operations department such as (i) the overall administration of the Company’s credit portfolio, including checking credit approval, handling loan disbursements, maintenance of credit files, and compilation of relevant management information reports, (ii) the valuation of collateral, execution of hold-out and lien on assets, and preparation of relevant reports, and (iii) loan documentation.
The second line of defense involves the independent oversight of the Risk Management Department. The credit risk profile is regularly reported to the RC or the Board, as necessary.
The third line of defense is the independent internal audit function, responsible for the independent assessment of the adequacy and reliability of the credit risk measures set in place.
Reports on credit risk exposures cover all regulatory and internal limits and are monitored by the Risk Management Department. Breaches in limits are escalated to senior management and the RC.

BPI INTERNATIONAL FINANCE LIMITED
23
16. Table 12 - CR1: Credit Quality of Exposures
The following table provides an overview of the credit quality of on- and off-balance sheet exposures as at 31 December 2020.
(a) (b) (c) (d)
Gross carrying amounts of Allowances /
impairments Net values Defaulted
exposures
Non-defaulted
exposures
(HK$ ‘000) (HK$ ‘000) (HK$ ‘000) (HK$ ‘000)
1 Loans - 105,706 (195) 105,511
2 Debt securities - 72,634 - 72,634
3 Off-balance sheet exposures - 985 - 985
4 Total - 179,325 (195) 179,130
17. Table 13 - CR2: Changes in defaulted loans and debts securities
(a)
Amount
1 Defaulted loans and debt securities at end of the previous reporting period -
2 Loans and debt securities that have defaulted since the last reporting period -
3 Returned to non-defaulted status -
4 Amounts written off -
5 Other changes -
6 Defaulted loans and debt securities at end of the current reporting period -
The Company does not have any defaulted loans and debt securities for the reporting period.

BPI INTERNATIONAL FINANCE LIMITED
24
18. CRB: Additional disclosure related to credit quality of exposures
The Company classifies the loans and advances in accordance with the loan classification system for the reporting to HKMA. The Company adopts the impairment classification of 3 stages allocations under HKFRS9.
Pass Borrower is current in meeting commitments
Special Mention
The borrower exhibits potential weaknesses that, if not corrected in a timely manner, may adversely affect future repayments and warrant close attention
Substandard The borrower exhibits potential weaknesses that may adversely affect future repayments and warrant close attention
Doubtful Collection in full is improbable and the lender expects to sustain a loss
Loss Uncollectible after exhausting all collection efforts
For impairment purposes, the Company measure impairment allowances for 12-month or lifetime expected credit losses (“ECL”) using 3 stage approach as followed
Stage 1: consists of an asset with no significant increase in credit risk since initial booking (12 – month ECL)
Stage 2: consists of assets that have evidence of a significant increase in credit risk since initial booking but do not have objective evidence of impairment (lifetime ECL)
Stage 3: consists of assets that have shown objective evidence of impairment at the reporting date. (Lifetime ECL)
At each reporting date, the Company assesses whether financial assets carried at amortized cost and debt financial assets carried at FVOCI are credit-impaired.
The financial asset is considered credit-impaired when, based on observable data, one or more events have occurred and have a significant impact on the expected future cash flows of the financial asset. These events may include the following:
Significant financial difficulty of the issuer or borrower
A breach of contract, such as a default or past-due event
The lenders, for economic or contractual reasons relating to the borrower’s financial difficulty, granted the borrower a concession that would not otherwise be considered
It becomes probable that the borrower will enter bankruptcy or other financial reorganization
The disappearance of an active market for the financial asset because of financial difficulties, or
The purchase or origination of a financial asset at a deep discount that reflects incurred credit losses.
There is no past due for the Loans and advances as at 31 December 2020, and all client loans are fully collateralized. The Company has made ECL provision for loan and advances to the customers at the amount of HK$195,566 as at 31 Decemebr 2020.

BPI INTERNATIONAL FINANCE LIMITED
25
CRB: Additional disclosure related to credit quality of exposures (continued)
1. Exposures by Geographic Location
Table 1: Credit Exposures as at end-December 2020, grouped by geographic location
Country Gross Carrying Amounts in HK$ Mn
1 Japan 65
2 United States of America 36
3 Singapore 51
4 Republic of the Philippines 110
5 Australia 19
6 Malaysia 21
7 Thailand 24
8 Others* 68
9 Total 394
*Segments constituting less than 10% of the Company’s total Credit Risk-Weighted Assets are aggregated as “Others.”
2. Exposures by Industry
Table 2: Credit Exposures as at end-December 2020, grouped by industry
Industry Gross Carrying Amounts in HK$ Mn
1 Financial Institutions 261
2 Sovereigns 25
3 Miscellaneous - for private purposes 106
4 Others* 2
5 Total 394
*Segments constituting less than 10% of the Company’s total Credit Risk-Weighted Assets are aggregated as “Others.”
3. Exposures by Maturity
Table 3: Credit Exposures as at end-December 2020, grouped by maturity
Maturity Gross Carrying Amounts in HK$ Mn
1 Less than one year 359
2 One to five years 34
3 Over five years 1
4 Total 394

BPI INTERNATIONAL FINANCE LIMITED
26
19. CRC: Qualitative disclosures related to credit risk mitigation
The Company, when granting credit facilities, is to do so on the basis of capacity to repay, financial strength, and repayment ability. Credit risk may be mitigated by obtaining collateral from the customer.
The Company currently does not have netting arrangements as it does not engage in derivative or securities financing transactions (“SFTs”). For its loan exposures, the Company utilizes standardized loan documentation that governs the Company’s rights to the collateral and includes the right to set-off or the realization of the collateral to repay the outstanding obligation should the client default on their obligations.
For credit risk mitigation, the Company’s client loan portfolio is supported by the use of two types of financial assets, namely a) debt securities held under the client’s securities account maintained with the Company, and/or b) time deposits placed by clients with the Company.
Marketable securities held as collateral are marked-to-market on a daily basis. Loan-to-collateral ratios for each approved loan line is calculated and monitored daily to ensure that the collateral holds sufficient value to provide an alternative source of loan repayment should a loan becomes impaired. The Company applies safe custodian of collaterals; regular re-valuation parameters are subject to periodic reviews to ensure their effectiveness over credit risk management.
Loans that are collateralized by time deposits are tagged in the system as under hold-out and time deposits are automatically rolled over as long as the client’s loan facility remains outstanding.
20. Table 14 - CR3: Overview of recognized credit risk mitigation
The following table discloses the extent of credit risk exposures covered by different types of recognized CRM as at 31 December 2020.
(a) (b1) (b) (d) (f)
Exposures
unsecured:
carrying
amount
Exposures to
be secured
Exposures
secured by
recognized
collateral
Exposures
secured by
recognized
guarantees
Exposures
secured by
recognized
credit
derivative
contracts
HK$’000 HK$’000 HK$’000 HK$’000 HK$’000
1 Loans - 105,511 105,511 - -
2 Debt securities 72,634 - - - -
3 Total 72,634 105,511 105,511 - -
4 Of which defaulted - - - - -

BPI INTERNATIONAL FINANCE LIMITED
27
21. Table 15 - CR4: Credit risk exposures and effects of recognized credit risk mitigation (BSC approach)
The following table illustrates the effect of any recognized CRM on the calculation of capital requirements as at 31 December 2020.
(a) (b) (c) (d) (e) (f)
Exposures pre-CCF and pre-CRM Exposures post-CCF and post-CRM RWA and RWA density
Exposure classes On-balance sheet amount Off-balance sheet amount On-balance sheet amount Off-balance sheet amount RWA RWA density
HK$’000 HK$’000 HK$’000 HK$’000 HK$’000
1 Sovereign exposures 24,734 - 24,734 - 17,757 4.28%
2 PSE exposures 1,947 - 1,947 - 1,947 0.47%
3 Multilateral development bank exposures - - - - - -
4 Bank exposures 261,763 - 261,763 - 52,352 12.63%
5 Cash items 2 - 2 - - -
6 Exposures in respect of failed delivery on
transactions entered into on a basis other
than a delivery-versus-payment basis
- - - - - -
7 Residential mortgage loans - - - - - -
8 Other exposures 126,244 985 126,244 985 126,441 30.49%
9 Significant exposures to commercial
entities
- - - - - -
10 Total 414,690 985 414,690 985 198,497 47.87%
The Company currently does not recognize collateral in calculating risk-weighted assets; hence, the exposures pre-CRM and post-CRM are equivalent.

BPI INTERNATIONAL FINANCE LIMITED
28
22. Table 16 - CR5: Credit risk exposures by asset classes and by risk weights (BSC Approach)
The following table presents the breakdown of credit risk exposures by asset classes and by risk weights as of 31 December 2020.
Presented in HK$’000 (a) (b) (c) (d) (e) (f) (g) (h) (i)
Risk Weight
Exposure class 0% 10% 20% 35% 50% 100% 250% Others
Total credit risk exposures amount
(post CCF and post CRM)
1 Sovereign exposures
- 7,752 - - - 16,982 - - 24,734
2 PSE exposures
- - - - - 1,947 - - 1,947
3 Multilateral development bank exposures
- - - - - - - - -
4 Bank exposures
- - 261,763 - - - - - 261,763
5 Cash items
2 - - - - - - - 2
6 Exposures in respect of failed delivery on transactions entered
into on a basis other than a delivery-versus-payment basis - - - - - - - - -
7 Residential mortgage loans
- - - - - - - - -
8 Other exposures
- - 985 - - 126,244 - - 127,229
9 Significant exposures to commercial entities
- - - - - - - - -
10 ¤ Total
2 7,752 262,748 - - 145,173 - - 415,675

BPI INTERNATIONAL FINANCE LIMITED
29
Part IV: Counterparty Credit Risk
23. CCRA: Qualitative disclosures related to counterparty credit risk (including those arising from clearing through CCPs)
Counterparty credit risk is defined by the Banking (Capital) Rules as counterparty default risk and credit valuation adjustment (“CVA”) risk. Counterparty default risk is, in relation to a derivative contract or a securities financing transaction (“SFT”) entered into with a counterparty, is the risk that the counterparty could default before the final settlement of the cash flows of the contract or transaction. On the other hand, credit valuation adjustment is the adjustment made to the valuation of a netting set with a counterparty to reflect the market value of the credit risk of that counterparty. Hence, CVA risk is the risk of marked-to-market losses in the transaction arising from a change in the CVA for the counterparty. Wrong way risk is defined here as the risk that arises when the exposure to a counterparty is positively correlated with the probability of default of the counterparty due to the nature of the transactions with the counterparty.
As at 31 December 2020, the Company does not engage in derivatives, securities financing transactions, nor enter into any bilateral netting arrangements for counterparty exposures, hence does not incur counterparty credit risk exposures and wrong way risks. Given its current business model, there are no internal capital limits, no collaterals pledged, no governing policies relating to guarantees and other forms of credit risk mitigation for counterparty credit risk, credit exposures to central counterparties (“CCPs”) and wrong way risks.
24. Table 17 - CCR1: Analysis of counterparty default risk exposures (other than those to CCPs) by approaches
(a) (b) (c) (d) (e) (f)
Replacement
cost (RC) PFE
Effective
EPE
Alpha (α) used for
computing default
risk exposure
Default risk
exposure
after CRM
RWA
1 SA-CCR (for derivative contracts) - - - - -
1a CEM - - - - -
2 IMM (CCR) approach - - - -
3 Simple Approach (for SFTs) - -
4 Comprehensive Approach (for SFTs) - -
5 VaR (for SFTs) - -
6 Total -
The Company has no derivative contracts and SFTs exposures for the reporting period.

BPI INTERNATIONAL FINANCE LIMITED
30
25. Table 18 - CCR2: CVA capital charge (a) (b)
EAD post CRM RWA
Netting sets for which CVA capital charge is calculated by the advanced
CVA method - -
1 (i) VaR (after application of multiplication factor if applicable) -
2 (ii) Stressed VaR (after application of multiplication factor if applicable) -
3 Netting sets for which CVA capital charge is calculated by the
standardized CVA method - -
4 Total - -
The Company has no exposures that are subject to CVA capital charge.

BPI INTERNATIONAL FINANCE LIMITED
31
26. Table 19 - CCR3: Counterparty default risk exposures (other than those to CCPs) by asset classes and by risk weights – for BSC approach
The Company has no default risk exposures in respect of derivative contracts and SFT’s.
(a) (b) (c) (ca) (d) (f) (ga) (h) (i)
Risk Weight
Exposure class 0% 10% 20% 35% 50% 100% 250% Others
Total default risk
exposure after CRM
1 Sovereign exposures - - - - - - - - -
2 PSE exposures - - - - - - - - -
3 Multilateral development bank exposures - - - - - - - - -
4 Bank exposures - - - - - - - - -
5 CIS exposures2 - - - - - - - - -
6 Other exposures - - - - - - - - -
7 Significant exposures to commercial entities - - - - - - - - -
8 Total - - - - - - - - -

BPI INTERNATIONAL FINANCE LIMITED
32
27. Table 20 - CCR5: Composition of collateral for counterparty default risk exposures
(a) (b) (c) (d) (e) (f)
Derivative contracts SFTs
Fair value of recognized
collateral received
Fair value of posted
collateral
Fair value of
recognized
collateral
received
Fair value of
posted
collateral Segregated Unsegregated Segregated Unsegregated
Cash - domestic currency\
- - - - - -
Cash - other currencies - - - - - -
Domestic sovereign debt - - - - - -
Other sovereign debt - - - - - -
Government agency debt - - - - - -
Corporate bonds - - - - - -
Equity securities - - - - - -
Other collateral - - - - - -
Total - - - - - -
The Company has no collateral posted and recognized collateral received in the context of derivative contracts or SFTs.
28. Table 21 -CCR6: Credit-related derivative contracts
(a) (b)
Protection bought Protection sold
Notional amounts
Single-name credit default swaps - -
Index credit default swaps - -
Total return swaps - -
Credit-related options - -
Other credit-related derivative contracts - -
Total notional amounts - -
Fair values
Positive fair value (asset) - -
Negative fair value (liability) - -
The Company has no derivative contracts exposure for the reporting period.
BPI INTERNATIONAL FINANCE LIMITED
33
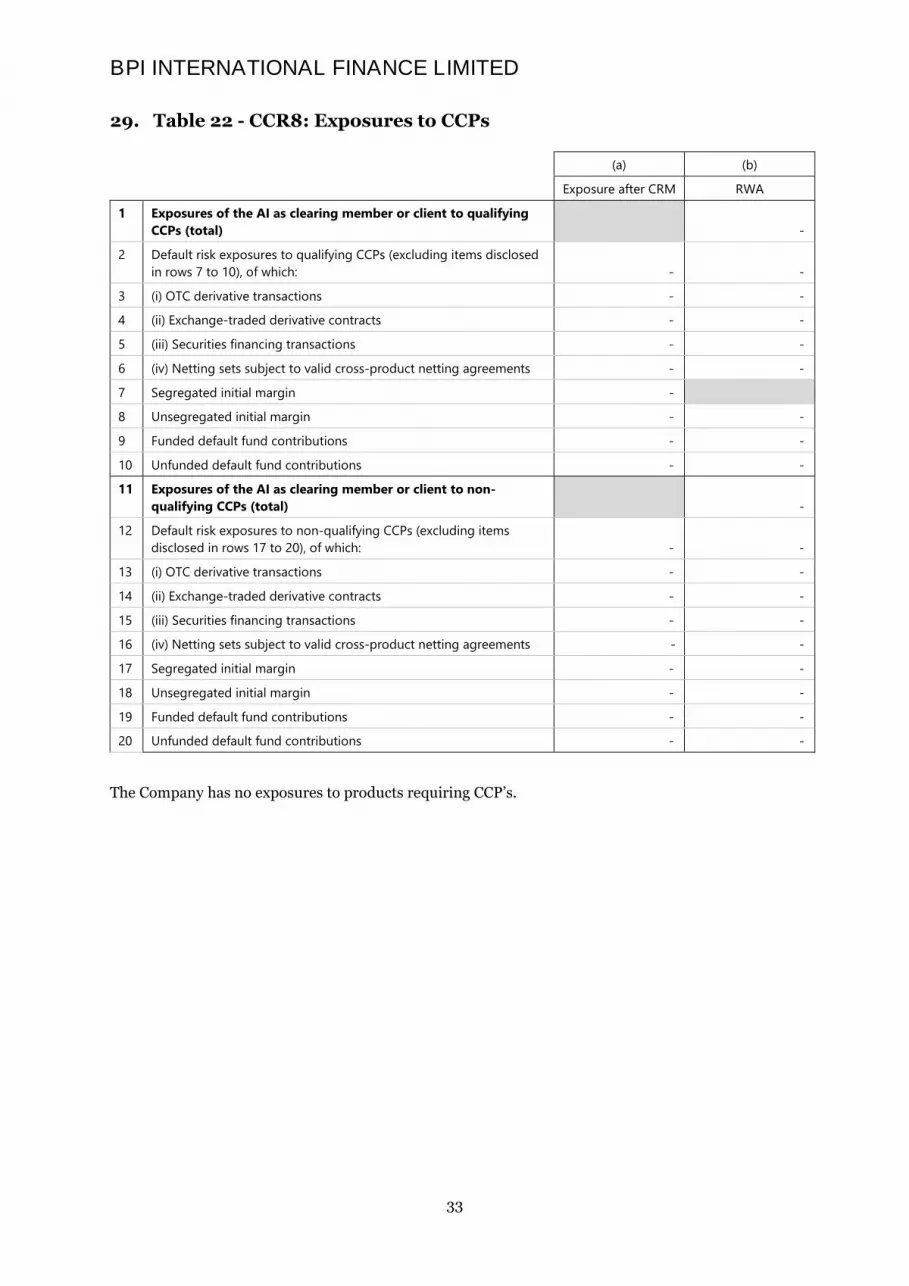
29. Table 22 - CCR8: Exposures to CCPs
(a) (b)
Exposure after CRM RWA
1 Exposures of the AI as clearing member or client to qualifying
CCPs (total) -
2 Default risk exposures to qualifying CCPs (excluding items disclosed
in rows 7 to 10), of which: - -
3 (i) OTC derivative transactions - -
4 (ii) Exchange-traded derivative contracts - -
5 (iii) Securities financing transactions - -
6 (iv) Netting sets subject to valid cross-product netting agreements - -
7 Segregated initial margin -
8 Unsegregated initial margin - -
9 Funded default fund contributions - -
10 Unfunded default fund contributions - -
11 Exposures of the AI as clearing member or client to non-
qualifying CCPs (total) -
12 Default risk exposures to non-qualifying CCPs (excluding items
disclosed in rows 17 to 20), of which: - -
13 (i) OTC derivative transactions - -
14 (ii) Exchange-traded derivative contracts - -
15 (iii) Securities financing transactions - -
16 (iv) Netting sets subject to valid cross-product netting agreements - -
17 Segregated initial margin - -
18 Unsegregated initial margin - -
19 Funded default fund contributions - -
20 Unfunded default fund contributions - -
The Company has no exposures to products requiring CCP’s.

BPI INTERNATIONAL FINANCE LIMITED
34
Part V: Securitization Exposures
SECA: Qualitative disclosures related to securitization exposures
SEC1: Securitization exposures in banking book
SEC2: Securitization exposures in trading book
SEC3: Securitization exposures in banking book and associated capital requirements – where AI acts as originator
SEC4: Securitization exposures in banking book and associated capital requirements – where AI acts as investor
The above disclosure sections do not apply to the Company for the reason that it has no securitization exposures.
Part VI: Market Risk
MRA: Qualitative disclosures related to market risk
The Company is exempt from computing market risk
MR1: Market risk under STM approach
MR2: RWA flow statements of market risk exposures under IMM approach
MR3: IMM approach values for market risk exposures
MR4: Comparison of VaR estimates with gains or losses
The above disclosure sections do not apply to the Company for the reason that it is under Basic Approach (BSC).

BPI INTERNATIONAL FINANCE LIMITED
35
Part VII: Interest Rate Risk in Banking Book
30. IRRBBA: Interest rate risk in banking book- risk management objectives and policies
The Company defines Interest Rate Risk in Banking Book (“IRRBB”) as the current or prospective risk to its capital and earnings arising from adverse movements in interest rates that affect the Company's banking book positions. This, in turn, changes the underlying value of the Company's assets, liabilities, and off-balance sheet items, and ultimately its economic value.
The Company has an established IRRBB risk governance framework. The Board exercise oversight and approves the Company’s IRRBB management framework, strategies as well as ensures the interest risk is in line with the risk appetite. The Board level Risk Committee (“RC”) oversee the Company’s interest rate risk management, set the strategy and policy for managing interest rate risk. RC assists the Board in overseeing the practices of IRRBB management framework, reviewing the procedures and major policies.
The Management level Asset and Liability Management Committee (“Management Level ALCO”) assists the Office of the Chief Executive and the Board in conducting firm-wide asset/liabilities management including policy formulation, liquidity and managing interest rate risk on the Banking Book. The functions of the ALCO are to approve the balance sheet structure and investment portfolio structure and off-balance sheet management strategies and submit to the Committee’s review and Board‘s approval. Management Level Risk Management Committee assists the Board Level Risk Committee to monitor and manage IRRBB. It is responsible for designing the IRRBB management framework and draft relevant policies, reviewing risk limits, monitoring the interest rate risk limit set by Board and reviewing stress-testing results for IRRBB.
Interest rate risk is daily managed by different business units. The activities of business units and interest rate limits are monitored on a regular basis. Actions will be taken to mitigate any potential risks. Interest rate risk reporting and regulatory return results are submitted to HKMA quarterly. To further ensure the integrity, accuracy, and reasonableness of the interest rate risk measurement system, independent review from internal and/or external auditors are carried out regularly to evaluate the effectiveness of the Company’s internal control system. All identified audit issues are discussed with senior management and responded to mitigate the gaps.
The Company adopts the standardized calculation methodologies in measuring interest rate risk exposure on the Economic Values of shareholders’ Equity (“EVE”) and Net Interest Income (“NII”), based on the Hong Kong Monetary Authority Supervisory Policy Manual IR-1 Interest Rate Risk in Banking Book.
To measure the impacts on EVE in stressed market conditions, stress testing is conducted through the six prescribed interest rate shock scenarios under different currencies defined by the Basel Committee. Descriptions are shown as follows:
(i) Parallel shock up: Yield curve constantly parallel shifts up
(ii) Parallel shock down: Yield curve constantly parallel shifts down
(iii) Steepener shock: Short-term interest rates decrease while long-term interest rates increase
(iv) Flattener shock: Short-term interest rates increase while long-term interest rates decrease
(v) Short rates shock up: Interest rate shock up is the greatest at the shortest time band and diminishes towards current rates in the longer time band
(vi) Short rates shock down: Interest rate shock down is the greatest at the shortest time band and diminishes towards current rates in the longer time band

BPI INTERNATIONAL FINANCE LIMITED
36
30. IRRBBA: Interest rate risk in banking book- risk management objectives and policies (continued)
The impacts on the NII over the next 12 months are assessed through the parallel shock up and parallel shock down scenarios. The Company utilizes the same assumptions for regulatory reporting and internal monitoring. As of 31 December 2020, there are no significant changes compared with the previous disclosure.
31. Table 23- IRRBB1: Quantitative information on interest rate risk in banking book
This table provides information on the change in EVE and the change in net interest income (“NII”) over the next 12 months in respect of the date indicated in the table below under each of the prescribed interest rate shock scenario in respect of the Company’s interest rate exposures arising from banking book positions for the current annual reporting date as at 31 December 2020.
(a) (b) (c) (d)
(in HKD miilion) ΔEVE ΔNII
Period 31 Dec 2020 31 Dec 2019 31 Dec 2020 31 Dec 2019
1 Parallel up 1 2 - -
2 Parallel down 1 0 - -
3 Steepener 1 0
4 Flattener 0 1
5 Short rate up 0 3
6 Short rate down 1 0
7 Maximum 1 3 - -
Period 31 Dec 2020 31 Dec 2019
8 Tier 1 capital 134 143

BPI INTERNATIONAL FINANCE LIMITED
37
Part VIII: Remuneration
32. REMA: Remuneration Policy
The Company has established a Remuneration Policy, which governs the setup of a Board Level Remuneration Committee and formulates the principles of remuneration for its staff. The Remuneration Policy of the Company promotes an overall scheme of remuneration that matches the Company’s business objectives, risk tolerance, and risk management framework.
The Company has complied with the requirement set out in Part 3 (disclosure on remuneration) of the Supervisory Policy Manual CG-5 entitled “Guideline on a Sound Remuneration System” issued by the Hong Kong Monetary Authority in all material aspects.
Below are some relevant Policies:
Governance
The Remuneration Committee is a BPI IFL Board level committee that reviews and approves BPI IFL’s remuneration policy. The consistent, continuing implementation of the policy shall be the responsibility of the Board and the local human resources personnel. An annual review of the policy shall be conducted and passed upon by the Board to ensure compliance with the guideline.
Remuneration Structures
Besides monthly fixed pay, employee may be entitled to a variable compensation, which depends on the performance of the Company, team, and individual employee.
Performance Measurement
Employee Performance Appraisee (EPA) process is conducted annually. Individual employee’s goal and performance objective for next year should be set at the beginning of a year and to be agreed with his/her manager. Under the EPA process, employees are required to set, with the approval of their managers, their objectives and expected deliverables (which are quantifiable) for the coming year. The EPA is a base to evaluate the performance of each employee for the previous year.
Senior Management and Key personnel
Senior management is defined as those persons responsible for oversight of the Company’s firm-wide strategy, activities, or material business lines. This includes the Chief Executive, the Chief Operating Officer, the Chief Financial Officer, Executive Officer(s), Head of Risk, Legal, Compliance, Operations, Information Technology and Relationship Management, and those Managers registered under HKMA.
Key personnel is employees whose duties or activities in the course of their employment involve the assumption of taking material risk on behalf of the Company. There were 14 members of senior management and key personnel in 2020.
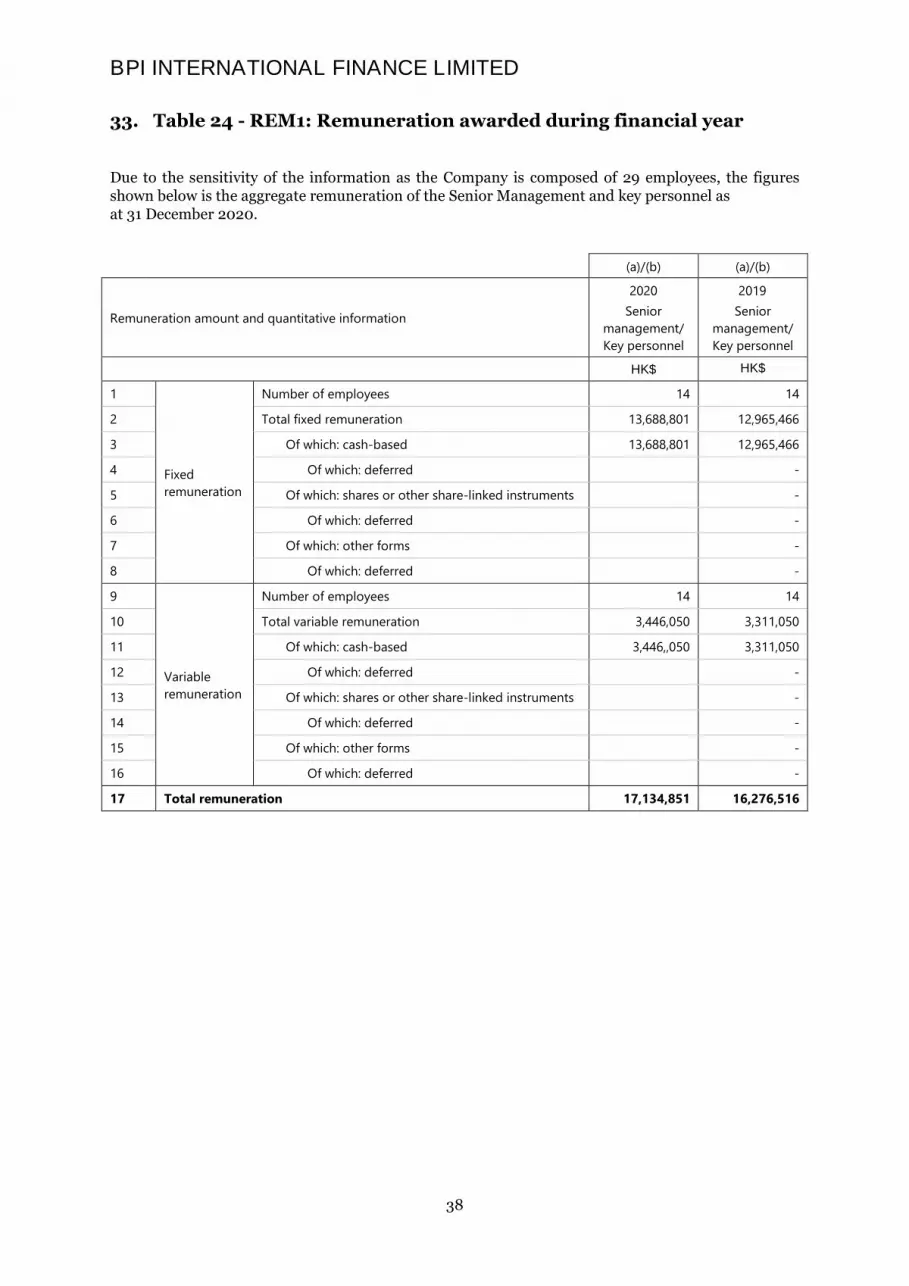
BPI INTERNATIONAL FINANCE LIMITED
38
33. Table 24 - REM1: Remuneration awarded during financial year
Due to the sensitivity of the information as the Company is composed of 29 employees, the figures shown below is the aggregate remuneration of the Senior Management and key personnel as at 31 December 2020.
(a)/(b) (a)/(b)
Remuneration amount and quantitative information
2020
Senior
management/
Key personnel
2019
Senior
management/
Key personnel
HK$ HK$
1
Fixed
remuneration
Number of employees 14 14
2 Total fixed remuneration 13,688,801 12,965,466
3 Of which: cash-based 13,688,801 12,965,466
4 Of which: deferred -
5 Of which: shares or other share-linked instruments -
6 Of which: deferred -
7 Of which: other forms -
8 Of which: deferred -
9
Variable
remuneration
Number of employees 14 14
10 Total variable remuneration 3,446,050 3,311,050
11 Of which: cash-based 3,446,,050 3,311,050
12 Of which: deferred -
13 Of which: shares or other share-linked instruments -
14 Of which: deferred -
15 Of which: other forms -
16 Of which: deferred -
17 Total remuneration 17,134,851 16,276,516

BPI INTERNATIONAL FINANCE LIMITED
39
34. Table 25 - REM2: Special payments
(a) (b) (c) (d) (e) (f)
Special payments
Guaranteed bonuses Sign-on awards Severance payments
Number of
employees
Total
amount
Number of
employees
Total
amount
Number of
employees
Total
amount
1 Senior
management
- - - - - -
2 Key personnel - - - - - -
The Company has no special payments for 2020.
35. Table 26 - REM3: Deferred remuneration
(a) (b) (c) (d) (e)
Deferred and retained
remuneration
Total amount of
outstanding
deferred
remuneration
Of which: Total
amount of
outstanding
deferred and
retained
remuneration
exposed to ex
post explicit
and/or implicit
adjustment
Total amount of
amendment
during the year
due to ex post
explicit
adjustments
Total amount of
amendment
during the year
due to ex post
implicit
adjustments
Total amount of
deferred
remuneration
paid out in the
financial year
1 Senior
management
2 Cash - - - - -
3 Shares - - - - -
4 Cash-linked
instruments
- - - - -
5 Other - - - - -
6 Key personnel - - - - -
7 Cash - - - - -
8 Shares - - - - -
9 Cash-linked
instruments
- - - - -
10 Other - - - - -
11 Total - - - - -
The Company has no deferred remuneration for 2020.

BPI INTERNATIONAL FINANCE LIMITED
40
Part IX: Other Disclosures
36. International Claims
International claims are on-balance sheet exposure to counterparties based on the location of the counterparties after taking into account the transfer of risk, and represent the sum of cross-border claims in all currencies and local claims in foreign currencies. The table shows claims on individual countries and territories or areas, after recognised risk transfer, amounting to not less than 10% of the Company’s total international claims.
31 December 2020
Non-Bank
Private Sector
Banks
Official
Sector
Of which:
Non-bank
financial
institution
Of which:
non-
financial
private
sector Other Total
HK$’000 HK$’000 HK$’000 HK$’000 HK$’000 HK$’000
1. Developed Countries
of which Australia 19,000 - - - - 19,000
of which United States 1,000 8,000 - - - 9,000
of which Japan 8,000 - - - - 8,000
2. Offshore Centers
of which Singapore 14,000 - - - - 14,000
of which Hong Kong 198,000 - 1,000 - - 199,000
3. Developing Asia and Pacific
of which Philippines 1,000 1,000 - 115,000 - 117,000
of which Indonesia - 16,000 - - - 16,000
of which South Korea - - 6,000 - - 6,000
31 December 2019
Non-Bank
Private Sector
Banks
Official
Sector
Of which:
Non-bank
financial
institution
Of which:
non-
financial
private
sector Other Total
HK$’000 HK$’000 HK$’000 HK$’000 HK$’000 HK$’000
1. Developed Countries
of which Australia 18,000 - - - - 18,000
of which United States 8,000 35,000 - - - 43,000
of which Japan 8,000 - - - - 8,000
2. Offshore Centers
of which Singapore 23,000 - - - - 23,000
of which Hong Kong 186,000 - 1,000 - - 187,000
3. Developing Asia and Pacific
of which Philippines 4,000 1,000 - 25,000 - 30,000
of which Indonesia - 23,000 - - - 23,000
of which South Korea - - 6,000 - - 6,000

BPI INTERNATIONAL FINANCE LIMITED
41
37. Sector Information
(i) By geographical areas
Information has been classified according to the location of the principal operations of the Company. All of the Company’s principal operations are conducted in Hong Kong.
(ii) Advances to customers
Gross advances to customers by industry sectors
As at 31 Dec 2020
As at 31 Dec 2019
HK$’000 HK$’000Loans for use outside Hong KongIndividuals - others 105,706 18,956
105,706 18,956
Gross advances to customers by geographical area
As at 31 Dec 2020
As at 31 Dec 2019
HK$’000 HK$’000
Residential status of customers:
The Philippines 105,706 18,956
The above gross advances only include gross advances to customers less collective impariment The related general provisions maintained in regulatory reserve source from the same geographical area.
38. Overdue or rescheduled assets
There were no overdue and rescheduled loans and repossessed assets as at 31 December 2020 (2019: Nil).
39. Non-Bank Mainland China Exposures
The Company does not have non-bank mainland China exposures as at 31 December 2020 (2019: Nil).

BPI INTERNATIONAL FINANCE LIMITED
42
40. Other than functional currency concentrations
USD EUR GBP AUD PHP Total
HK$’000 HK$’000 HK$’000 HK$’000 HK$’000 HK$’000
Equivalent in Hong Kong dollars
31 December 2020
Spot assets 368,085 105 361 19,410 26 387,987
Spot liabilities (247,307) - - (18,937) (28) (266,272)
Net long position 120,778 105 361 473 (2) 121,715
Net structural position - -
Equivalent in Hong Kong dollars
31 December 2019
Spot assets 318,421 280 456 18,009 14 337,180
Spot liabilities (207,094) - - (17,663) (3) (224,760)
Net long position 111,327 280 456 346 11 112,420
Net structural position - -


