Embed Size (px)
Citation preview
Andravizou et al. Autoimmun Highlights (2019) 10:7 https://doi.org/10.1186/s13317-019-0117-5
REVIEW
Brain atrophy in multiple sclerosis: mechanisms, clinical relevance and treatment optionsAthina Andravizou1†, Efthimios Dardiotis1† , Artemios Artemiadis2, Maria Sokratous1,3, Vasileios Siokas1, Zisis Tsouris1, Athina‑Maria Aloizou1, Ioannis Nikolaidis4, Christos Bakirtzis4, Georgios Tsivgoulis5, Georgia Deretzi6, Nikolaos Grigoriadis4, Dimitrios P. Bogdanos3 and Georgios M. Hadjigeorgiou1,7*
Abstract
Multiple sclerosis (MS) is an immune‑mediated disease of the central nervous system characterized by focal or diffuse inflammation, demyelination, axonal loss and neurodegeneration. Brain atrophy can be seen in the earliest stages of MS, progresses faster compared to healthy adults, and is a reliable predictor of future physical and cognitive disabil‑ity. In addition, it is widely accepted to be a valid, sensitive and reproducible measure of neurodegeneration in MS. Reducing the rate of brain atrophy has only recently been incorporated as a critical endpoint into the clinical trials of new or emerging disease modifying drugs (DMDs) in MS. With the advent of easily accessible neuroimaging softwares along with the accumulating evidence, clinicians may be able to use brain atrophy measures in their everyday clinical practice to monitor disease course and response to DMDs. In this review, we will describe the different mechanisms contributing to brain atrophy, their clinical relevance on disease presentation and course and the effect of current or emergent DMDs on brain atrophy and neuroprotection.
Keywords: Multiple sclerosis, Bran, Atrophy, Neurodegeneration, Axon, Inflammation, Neuroprotection, Drugs
© The Author(s) 2019. This article is distributed under the terms of the Creative Commons Attribution 4.0 International License (http://creat iveco mmons .org/licen ses/by/4.0/), which permits unrestricted use, distribution, and reproduction in any medium, provided you give appropriate credit to the original author(s) and the source, provide a link to the Creative Commons license, and indicate if changes were made.
IntroductionMultiple sclerosis (MS) is an immune-mediated disease that affects the entire central nervous system (CNS) [1–3]. Magnetic resonance imaging (MRI) lesions are well-scattered at white matter (WM) and grey matter (GM) [4], while normal-appearing brain tissue in MRI also seems to be affected in pathological studies [4]. Brain atrophy, the gradual loss of brain volume, is quite exten-sive in MS, nearly 0.5–1.35% per year, far off the limits of normal aging [5, 6]. It arises early in the course of the disease, accelerates with disease progression [7–12] but is attenuated by disease-modifying drugs [13].
There has been increasing interest in measuring tissue loss in CNS, as it represents the net effect of all destruc-tive pathogenic processes during the disease course [14–17]. It is worth recalling that neurons occupy almost half (46%) of the tissue volume, myelin is 24%, and glial and other cells almost 30% [5]. GM [4] holds much less mye-lin than WM (about one tenth), while neurons comprise its most abundant component [18]. Relative to glial cells, oligodendrocytes outweigh the number of astrocytes, microglia and oligodendrocyte progenitor cells, although the exact percentage is still unknown [19, 20].
Atrophy in MS is often considered to be the result of extensive axonal transection and demyelination [21–23]. The contribution of neuroglia may be less clear; reactive gliosis has the potential to mask considerable tissue loss in WM lesions [24, 25]. Measurement of brain atrophy is also considerably influenced by the amount of tissue flu-ids [26], which is increased by active inflammation and vasogenic edema in WM plaques, and decreased during
Open Access
Autoimmunity Highlights
*Correspondence: [email protected] †Athina Andravizou and Efthimios Dardiotis shared first authorship1 Department of Neurology, Laboratory of Neurogenetics, Faculty of Medicine, University of Thessaly, University Hospital of Larissa, Biopolis, Mezourlo Hill, 41100 Larissa, GreeceFull list of author information is available at the end of the article
Page 2 of 25Andravizou et al. Autoimmun Highlights (2019) 10:7
treatment with agents with strong anti-inflammatory properties (pseudoatrophy effect) [14, 26].
Transient volume changes could also be attributed to idiosyncrasic and technical factors [14]. Dehydration may affect functional integrity of neuroglial cells, while decreased protein levels mainly affect synaptic densities [26]. Unlike demyelination, water volume fluctuations and transient biological factors, neuroaxonal damage is irreversible in CNS, and atrophy is primarily considered to reflect this neurodegenerative component in MS [27–30]. Finally, the atrophy rates may also be influenced to some extent by the genetic makeup of a person; Human leukocyte antigen (HLA) genotypes considered as ‘high risk for MS’, namely DRB1 and DQB1, have been asso-ciated with significantly lower WM and GM volumes, alongside with higher mean annualized percentage of brain volume change (PBVC) compared with medium and low risk HLA genotypes independent from patients clinical features (age, gender, disease course) or the DMTs used [31].
Pathogenesis of brain atrophyThe time trajectory of brain atrophyFocal tissue loss in WM plaques is undoubtedly a major contributor to brain atrophy. However, the correlation between demyelination foci and whole brain atrophy is still a matter of debate [16]. Some studies have found a strong association [32, 33], while others have not [25, 34–36], suggesting that separate pathologic processes may also contribute to tissue destruction.
Chard et al. [37] in a longitudinal 14-year study found that atrophy is more related to early rather than late focal lesion volumes. Inflammation may be an important con-tributor to global tissue loss in early disease stages (i.e. in clinically isolated syndrome). As the disease progresses, additional mechanisms emerge that are, at least partly, independent from WM injury, such as microglia activa-tion, meningeal inflammation, iron deposition, oxidative stress and diffuse axonal damage in normal appearing white matter (NAWM). The lack of a significant relation-ship between white matter fraction (WMF) and T2 lesion load [34, 38] further support this hypothesis. Biopsy studies also confirm that the atrophy may proceed even in the absence of inflammation [39, 40].
Regional atrophy studies may also be helpful. Indeed, the volume loss of deep GM structures may be present in the early stages of the disease and it is strongly cor-related with the disease course [41]. In MS, brain atro-phy may develop in different CNS structures and varies depending on the clinical disease phenotypes; ventricular enlargement is more prominent in relapsing–remitting MS [RRMS], whereas cortical atrophy seems to be more important in the progressive forms of the disease [42].
All things considered, it has been suggested that the pathogenic trajectory of brain atrophy changes with dis-ease progression; from primarily inflammatory to less inflammatory and primarily neurodegenerative in the late stages of the disease [43, 44].
Pathogenesis of acute demyelination and axonal injuryIn the initial stages of MS, many different components of the adaptive and the innate immunity induce demy-elination and neuronal loss [43]. The activation of auto-reactive CD4+ T lymphocytes in the peripheral immune system is necessary for their migration across the blood–brain-barrier (BBB) and into the CNS. After myelin destruction, T cells are in situ reactivated by antigens within myelin debris and their clonal expansion results in multifocal demyelinating plaques [45]. Peripheral B lymphocytes are involved in the antigen presentation and initial stimulation of CD4 T cells. Also, they are an essen-tial source of pro- and anti-inflammatory cytokines (IL-6 among others) promoting every autoimmunity response (driven by Th1, Th2, Th 17 cells) driving MS. In addition, the presence of chemokines (CXCL13) and survival fac-tors (BAFF and APRIL) in the CSF of patients with MS, promotes the formation of meningeal follicle like struc-tures, in progressive phases but also in early RRMS [46]. T cells and B cells may, therefore, play an equally impor-tant role in the immunopathology of MS [47].
Axonal destruction is quite extensive (up to 60–80%) in all active WM lesions [9, 12, 48] and the extend of axonal loss is related to the number of immune cells within the plaques [49]. Activated immune cells (T and B cells) and microglia/macrophages release a number of pro-inflam-matory cytokines (e.g. TNFa, INFγ), proteolyticenzymes (e.g. perforin, granzymes) and free radicals (e.g. nitric oxide, glutamate) that can directly damage axons [50]. Additionally, axons may die secondarily, due to the loss of pre- and post-synaptic signals (i.e. dying-back and Wal-lerian axonal degeneration) in regions far from the lesion site [43].
Active MS lesions are characterized by profound het-erogeneity regarding their demyelination pattern [51], which is persistent over time [52]. The most commonly observed patterns are pattern II, which is a complement- and antibody-mediated demyelination, and pattern III, in which the initial event in lesion formation is a brief yet exorbitant oligodendrocyte injury [53]. In other patients with RRMS, new lesions are associated with T cells, and activated microglia only. Pathologic heterogeneity across individuals in demyelination may imply different stimuli in the initial inflammation or different vulnerability to tissue loss across individuals [54].
In WM lesions, inflammation and brain edema, demy-elination, axonal loss, gliosis, and remyelination, all
Page 3 of 25Andravizou et al. Autoimmun Highlights (2019) 10:7
happen simultaneously [35, 55]. Brain edema which increases brain volume might bias atrophy measure-ments, but it resolves in the first few weeks after lesion formation. Notably, CNS has the capacity to use a great number of compensatory mechanisms (i.e. remyelina-tion, redistribution of sodium channels, expression of neurotrophic factors etc.) to re-establish lost functioning to demyelinated foci [48].
To conclude, tissue loss due to inflammation and demy-elination maybe partly reversible in RRMS [56, 57], while tissue loss and axonal damage due to mechanisms other than inflammation is irreversible, and remains the major component of brain atrophy especially in the progressive disease stages.
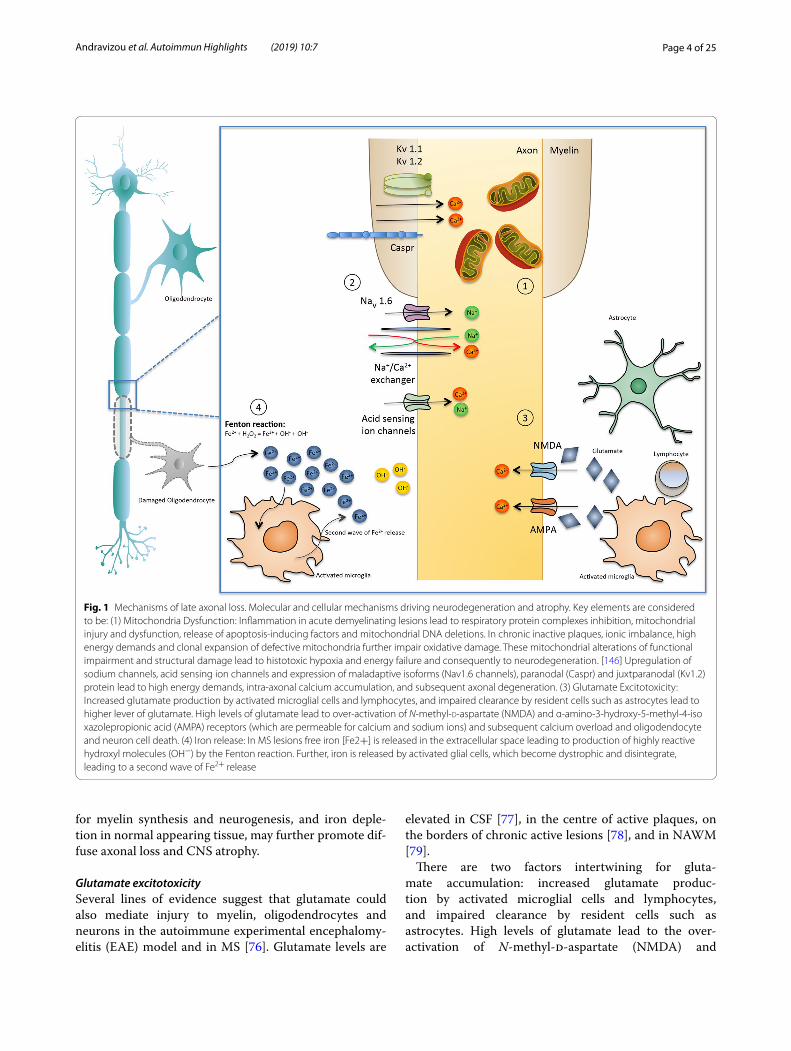
Mechanisms of late axonal loss (Fig. 1)While the destruction of CNS myelin is associated with clinical relapses, acute or late axonal loss is considered to be the main cause of permanent clinical disability in MS [49]. Axons are more vulnerable to acute injury by inflammatory mediators, due to their shape and struc-ture, compared to cell bodies or dendrites [43], while thin axons (< 2.5 μm in diameter) are mainly affected [24, 58]. Neurofilament light chain (NfL) protein is only expressed in neurons. It is an essential component of the axonal cytoskeleton, and reflects the axonal integrity and the sta-bility of neurons. Under conditions of acute axonal tran-section, NfL are released and can be found as a result, in the cerebrospinal fluid (CSF) and blood of patients with MS. Of note, ultra high versus low blood NfL levels have been associated with MRI related (increased number of gadolinium enhancing or T2 lesion load, whole brain atrophy) and clinical measures (number of relapses, dis-ability worsening) of disease activity and evolution and may, therefore, have prognostic value for patients and cli-nicians [59].
Transected axons and ovoids are abundant in MS lesions [9, 27] but, abnormalities have also been reported in chronic inactive plaques, in normal appearing white matter (NAWM), and cortical areas, in which inflam-mation is less prominent [48, 57]. Therefore, additional mechanisms of axonal loss coexist with disease progres-sion. It should be noted that these mechanisms have been postulated for both acute and late axonal loss (i.e. “late” signifying the absence of apparent inflammation):
Ion overloadSeveral ion channels show compensatory changes a few weeks after demyelination [60] a process that eventu-ally promotes energy deficiency, and neurodegeneration. Aberrant expression of sodium channels, acid sens-ing ion channels, increased expression of maladaptive isoforms (i.e. Nav1.6 channels) [61], paranodal (Caspr)
and juxtparanodal (Kv1.2) protein alterations [62] have also been detected in WM lesions, in NAWM, and GM. Alternation in the expression of these ion channels lead to intra-axonal calcium accumulation, and subsequent axonal degeneration and atrophy, particularly in second-ary progressive MS [49].
Mitochondria dysfunctionThere has been increasing interest in the role of mito-chondrial injury in MS demyelination and axonal destruction. In acute inflammatory lesions mitochondrial nicotinamide adenine dinucleotide-hydrogen (NADH) oxidase [63] and complex IV defects (COX I) have been described, in axons, oligodendrocytes, and astrocytes [58]. In chronic inactive plaques, ionic imbalance and high energy demands result to swollen and dysfunctional mitochondria [64, 65], a phenomenon in which is par-tially reversed in remyelinating axons [66]. There are also additional mtDNA deletions in GM structures of patients with SPMS [67]. Furthermore, the respiration deficient neurons were diffusely distributed in the subcortical WM resulting in axonal loss in the absence of demyelination or inflammation. In oligodendrocytes, mitochondrial damage results in cell death and demyelination. Progeni-tor cells are also impaired, regarding their capacity to dif-ferentiate and produce myelin [48]. Plus, genetic defects in mitochondrial genes potentiate MS lesions [68]. From what can be deducted, mitochondrial dysfunction, in neurons and glia, is recognized as an important cause of atrophy and degeneration in MS and in other primarily neurodegenerative deceases such as Alzheimer’s disease and Parkinson’s disease [65, 69].
Iron dysregulationIron [Fe] loading accumulates with age and in patients with MS, it can further increase oxidative tissue loss. In the CNS, iron is mainly stored in oligodendrocytes, bind-ing with ferritin. Under conditions of oxidative stress, such as MS lesions, when oligodendrocytes are destroyed, free iron [Fe2+] is released in the extracellular space and becomes an additional source of reactive oxygen species (Fenton reaction: Fe2+ + H2O2 = Fe3+ + OH. + OH−) [48]. Further, iron is released by activated glial cells, which become dystrophic and disintegrate, leading to a second wave of Fe2+release.
Diffuse T2hypointenselesions, which represent increased iron deposition [70] are commonly found in patients with MS in cortical and deep GM areas (i.e. thalamus, basal ganglia, dentate nucleus [71–73] and WM plaques [74]. Notably, T2 hypointensity has been associated with brain atrophy and early axonal loss [73]. Furthermore, in progressive MS, there is a significant decrease in iron levels in NAWM [75]. Iron is important
Page 4 of 25Andravizou et al. Autoimmun Highlights (2019) 10:7
for myelin synthesis and neurogenesis, and iron deple-tion in normal appearing tissue, may further promote dif-fuse axonal loss and CNS atrophy.
Glutamate excitotoxicitySeveral lines of evidence suggest that glutamate could also mediate injury to myelin, oligodendrocytes and neurons in the autoimmune experimental encephalomy-elitis (EAE) model and in MS [76]. Glutamate levels are
elevated in CSF [77], in the centre of active plaques, on the borders of chronic active lesions [78], and in NAWM [79].
There are two factors intertwining for gluta-mate accumulation: increased glutamate produc-tion by activated microglial cells and lymphocytes, and impaired clearance by resident cells such as astrocytes. High levels of glutamate lead to the over-activation of N-methyl-d-aspartate (NMDA) and
Fig. 1 Mechanisms of late axonal loss. Molecular and cellular mechanisms driving neurodegeneration and atrophy. Key elements are considered to be: (1) Mitochondria Dysfunction: Inflammation in acute demyelinating lesions lead to respiratory protein complexes inhibition, mitochondrial injury and dysfunction, release of apoptosis‑inducing factors and mitochondrial DNA deletions. In chronic inactive plaques, ionic imbalance, high energy demands and clonal expansion of defective mitochondria further impair oxidative damage. These mitochondrial alterations of functional impairment and structural damage lead to histotoxic hypoxia and energy failure and consequently to neurodegeneration. [146] Upregulation of sodium channels, acid sensing ion channels and expression of maladaptive isoforms (Nav1.6 channels), paranodal (Caspr) and juxtparanodal (Kv1.2) protein lead to high energy demands, intra‑axonal calcium accumulation, and subsequent axonal degeneration. (3) Glutamate Excitotoxicity: Increased glutamate production by activated microglial cells and lymphocytes, and impaired clearance by resident cells such as astrocytes lead to higher lever of glutamate. High levels of glutamate lead to over‑activation of N‑methyl‑d‑aspartate (NMDA) and α‑amino‑3‑hydroxy‑5‑methyl‑4‑isoxazolepropionic acid (AMPA) receptors (which are permeable for calcium and sodium ions) and subsequent calcium overload and oligodendocyte and neuron cell death. (4) Iron release: In MS lesions free iron [Fe2+] is released in the extracellular space leading to production of highly reactive hydroxyl molecules (OH−) by the Fenton reaction. Further, iron is released by activated glial cells, which become dystrophic and disintegrate, leading to a second wave of Fe2+ release
Page 5 of 25Andravizou et al. Autoimmun Highlights (2019) 10:7
α-amino-3-hydroxy-5-methyl-4-isoxazolepropionic acid (AMPA) [80] receptors (permeable for calcium and sodium ions) and subsequent calcium overload and oli-godendocyte and neuron cell death.
Clinical correlates of brain atrophyClinical symptoms and signs do not usually correlate with changes seen on conventional MRI measures (the “clinical-MRI paradox”) [81, 82]. Whole brain atrophy, on the other hand, has a significant imaging association with physical disability as measured by Expanded Dis-ability Status Scale (EDSS) score [83–88]. In a longitudi-nal study, whole brain (WB) and cortical atrophy as well as other MRI related metrics such as the enlargement of ventricular CSF spaces have been associated with dis-ability progression over a 10 year follow up [89]. Further-more, brain volume changes during the first year after disease onset, estimated by PBVC, were the best predic-tor of future neurologic impairment [90] regardless of the intermediate relapse rate [91]. Increased brain volume loss (BVL) has been correlated disability progression, independent from the number of previous relapses or the T2 lesion load in RRMS [92].
In a similar vein, when patients with clinically definite MS were compared to patients with clinically isolated syndrome (CIS), at baseline, all brain volume metrics, except for cortical GM, were significantly lower in the MS cohort. Over a mean follow-up period of about 3 years, the annual PBVC values were significantly lower in CIS patients when compared to the MS cohort [93]. Neuropsychological impairment, affecting mental speed processing, episodic memory, executive functions and attention, may be present in up to 50% of patients with MS [94] and has been found to occur early in the disease course [95]. Changes of brain parenchymal fraction (BPF) have been shown to predict cognitive impairment over 2 years in patients with early MS [96]. Cortical atrophy was the best predictor of poor cognitive functioning, even when mild impairment was detected. Poorcognitive functioning has been associated with significant cortical thinning [97], especially in the fronto-parietal cortical and subcortical regions [98]. Pravatà et al. [98] specifi-cally reported that the thinning of the right precuneus and high T2 lesion load were the best predictors of cog-nitive impairment. Strong correlations have also been reported between cognitive impairment and thalamic atrophy [80, 98, 99]. Not surprisingly, patients with brain atrophy and higher education or high “cognitive reserve” are relatively protected against cognitive decline [100].
Other clinical aspects of CNS atrophy include mood and personality disorders (i.e. euphoria, disinhibition, aggression, major depressive disorder) [101] autonomic dysfunction and sexual disorders [85]. Fatigue has been
reported to be associated with GM atrophy in frontal regions [102] and depressed patients were found to pre-sent selective cortical thinning in the fronto-temporal regions, while the frontal thinning was found to be the best predictor for depression in MS patients [98].
Taken together, this growing body of evidence suggests that brain atrophy is a valid and sensitive measure of disease burden and progression in MS patients and may effectively be used in routine clinical practice and treat-ment trials.
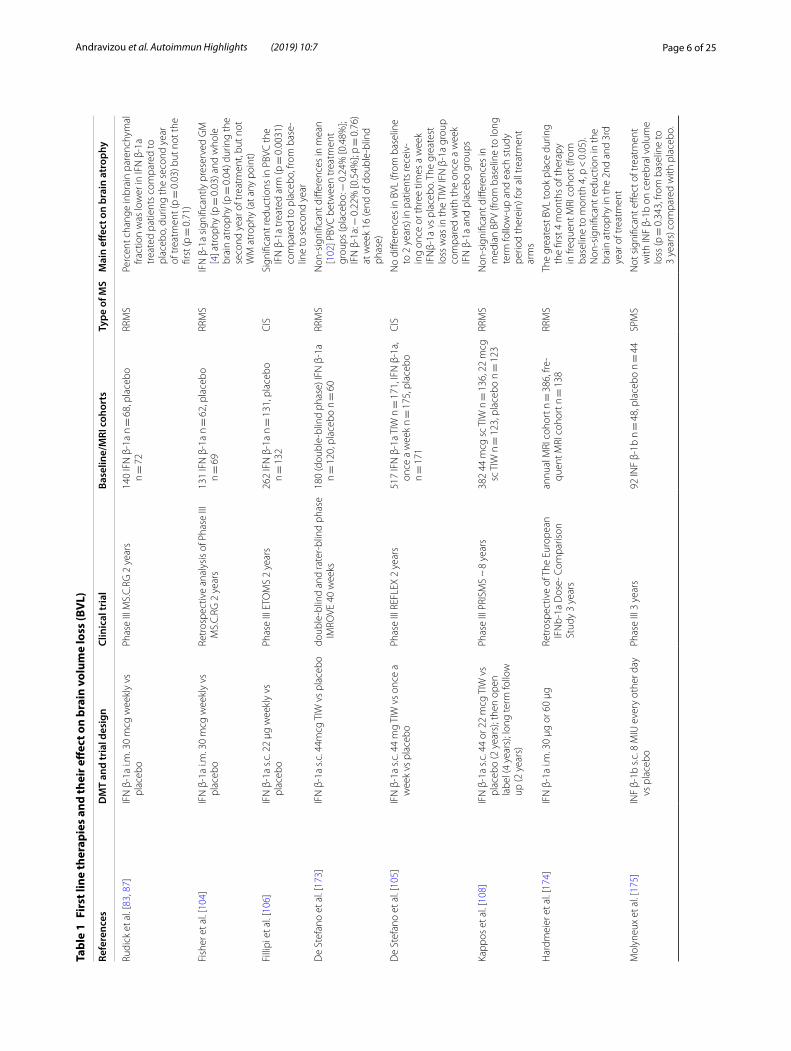
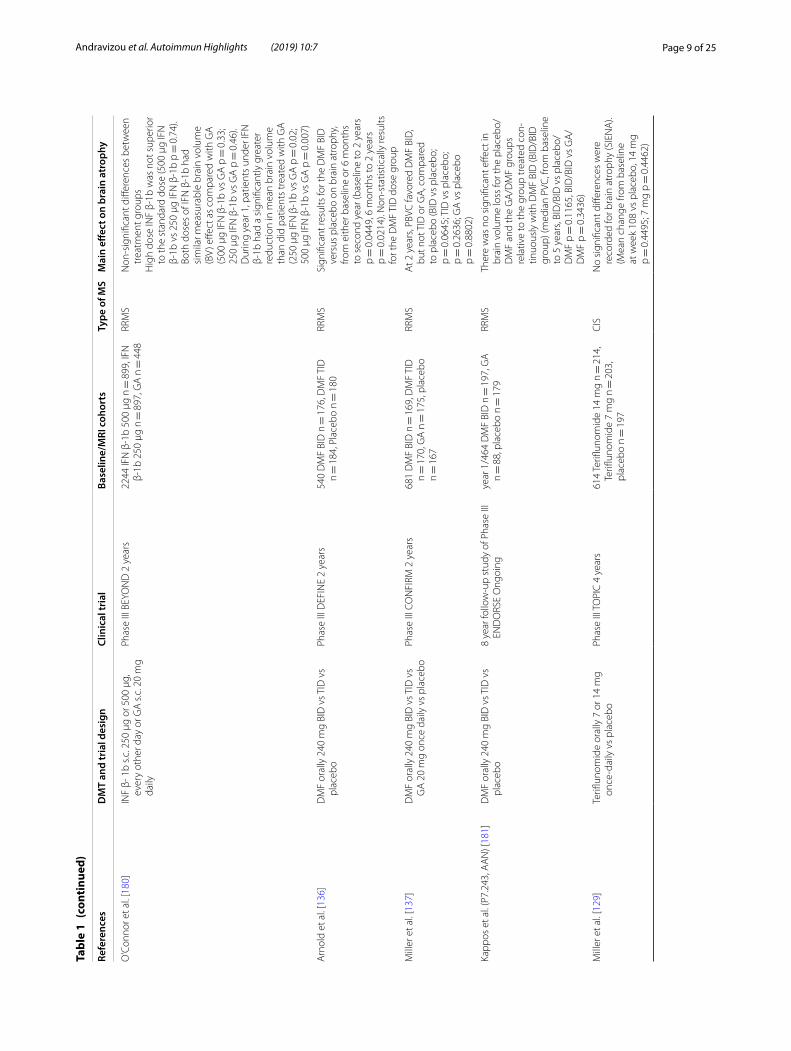
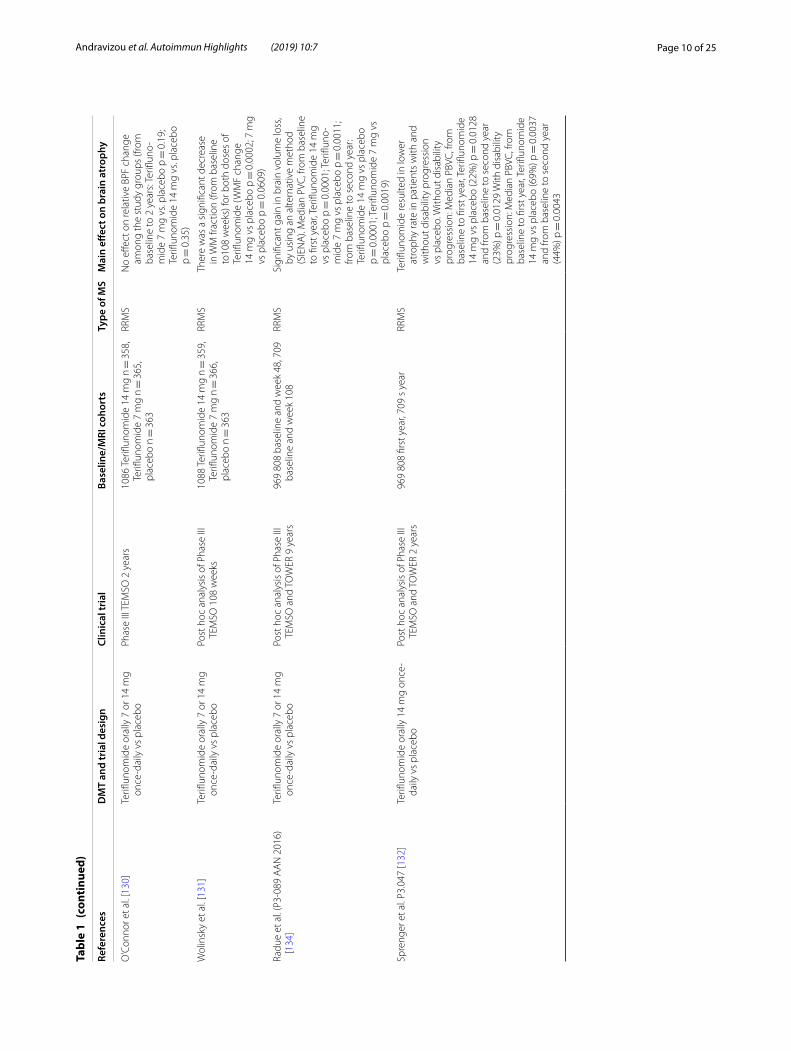
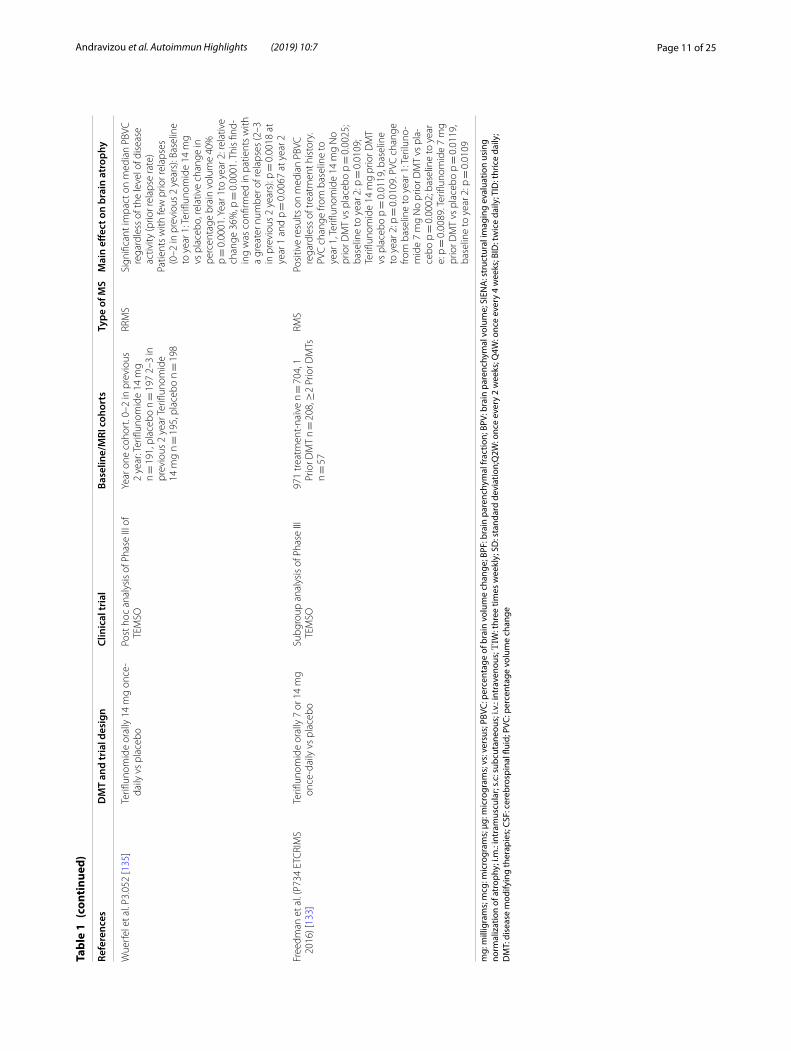
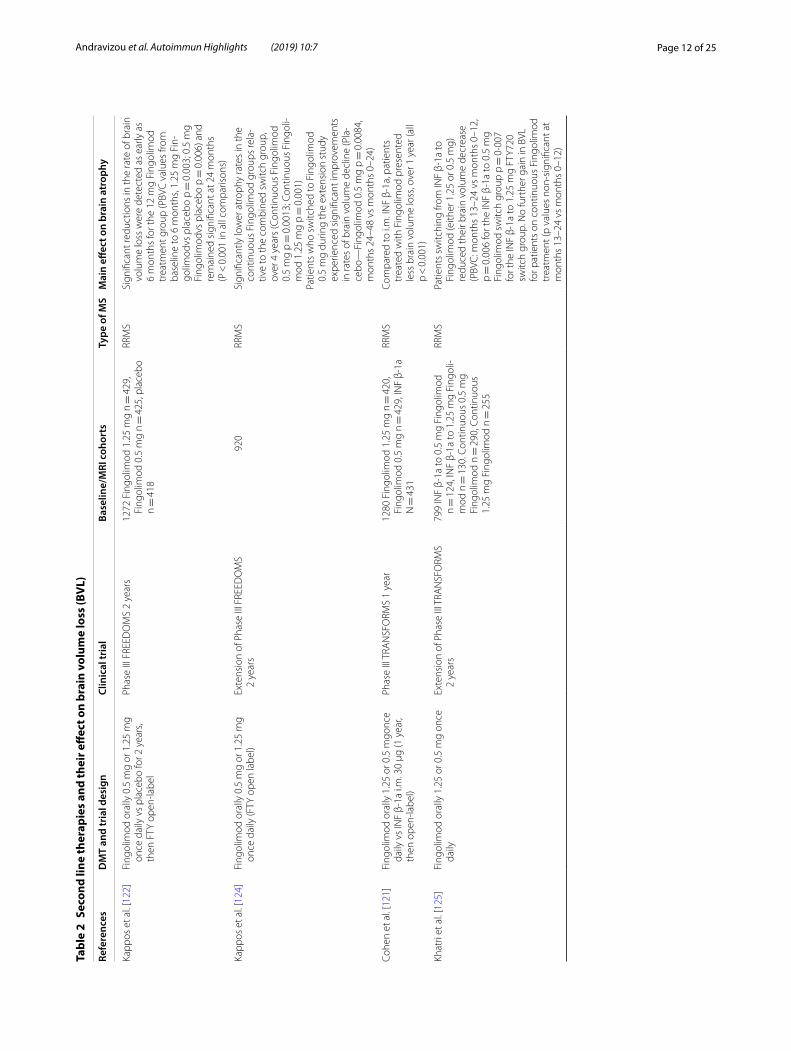
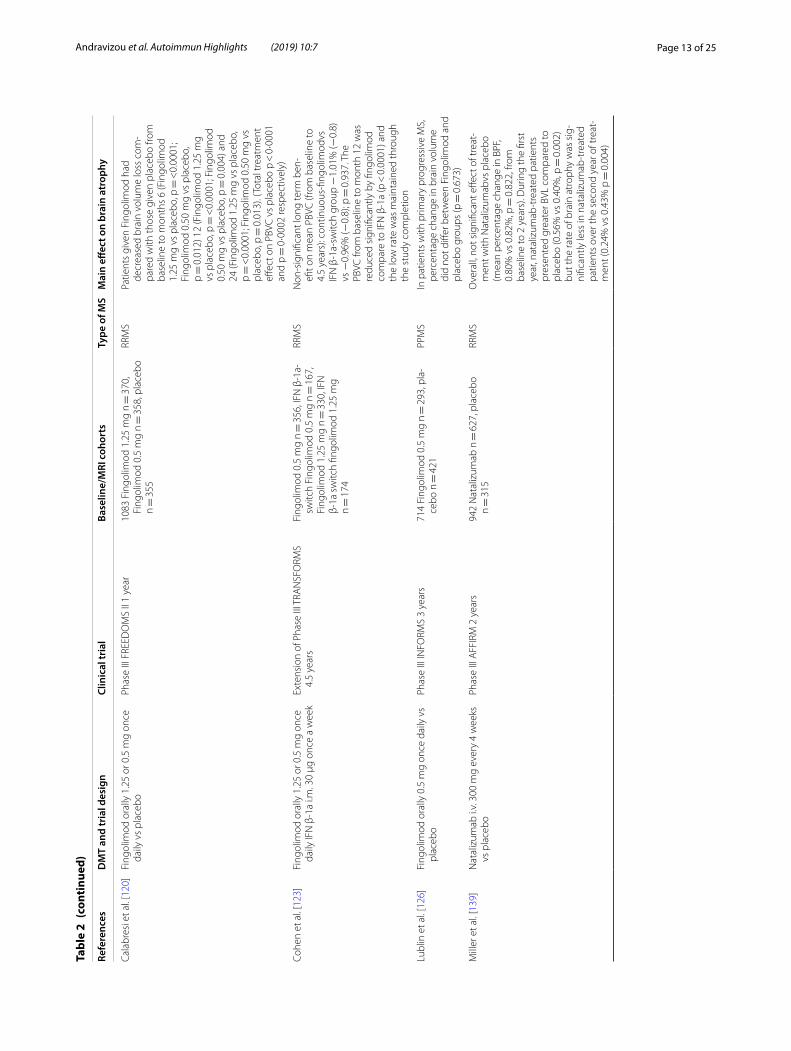
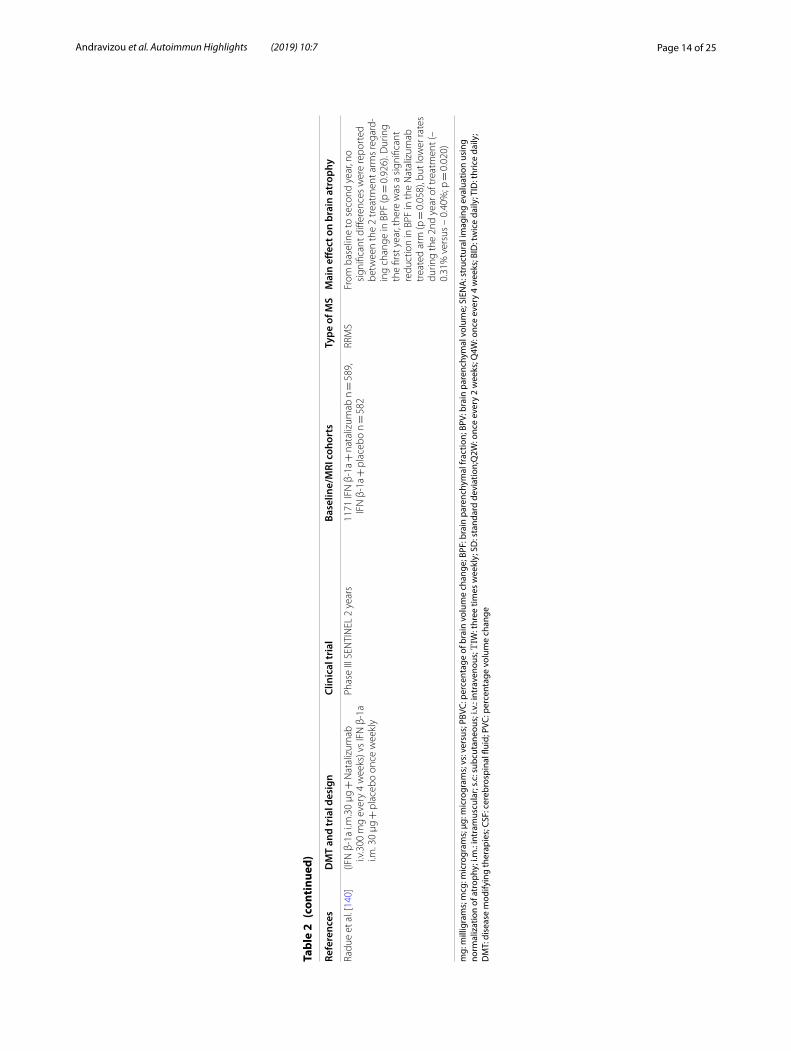
Effect of disease modifying treatments (Tables 1, 2 and 3)Approved DMTs and brain volume outcomesThe need of agents to control the inflammatory process in multiple sclerosis pathology is obvious, but the need for medications to halt brain atrophy progression and neurodegeneration is also evident. Currently approved treatments for MS differ in their effects on brain atro-phy [103] (Table 1 for the first line therapies, Table 2 for the second line therapies and Table 3 for the emerging therapies).
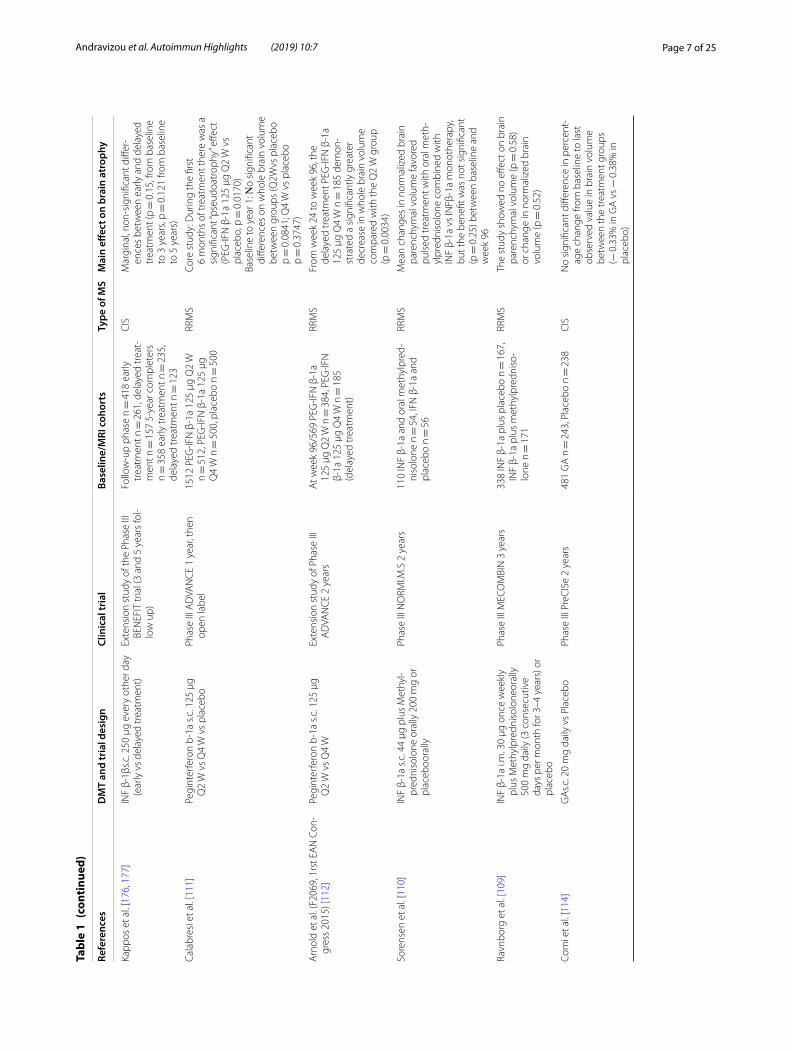
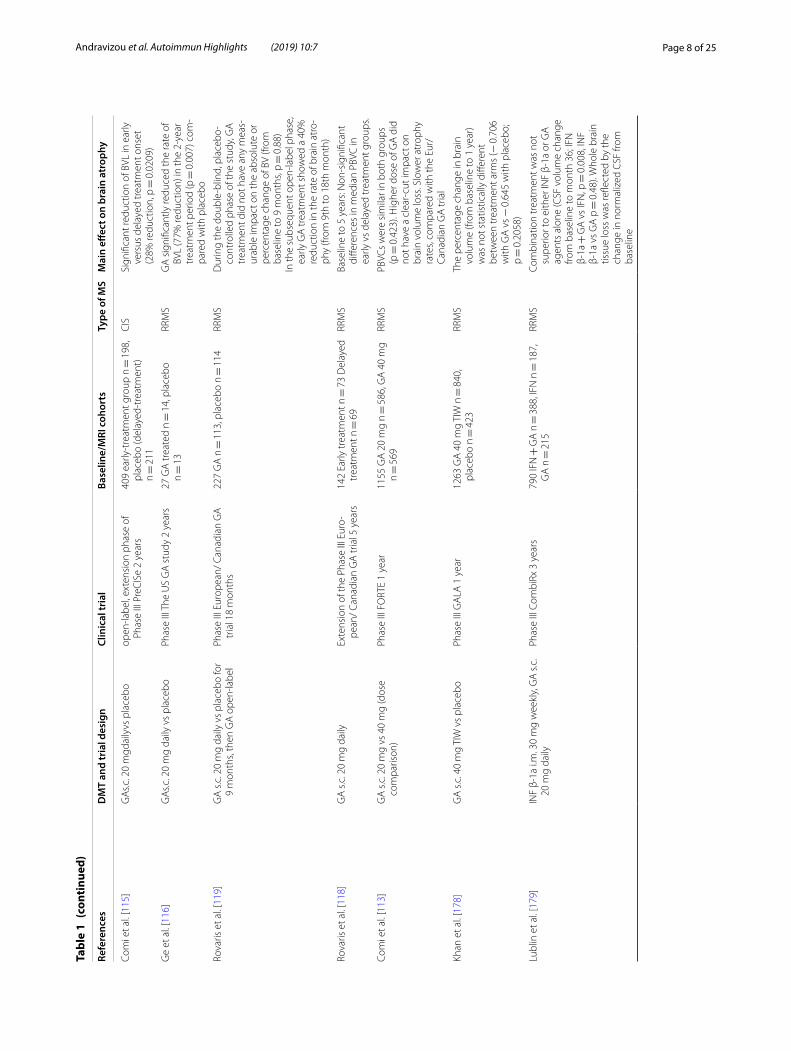
In general, studies of traditional injectable treatments have not exerted robust beneficial effects in the rate of brain atrophy. Intramuscular IFN-β-1a produced lower rates of brain volume loss (BVL) when compared to pla-cebo during the second year of treatment in relapsing–remitting MS patients (− 0.23% vs − 0.51%; p = 0.03) [83, 104]. However, the subcutaneous (sc) IFN-β-1a produced inconsistent results in both CIS and RRMS patients [105–108]. BV data for intramuscular INF-β-1a in CIS patients and for subcutaneous INF-β-1b in relapsing MS patients has not been made available to date. The addi-tion of monthly oral methylprednisolone pulses to subcu-taneous interferon beta-1a treatment provided no further gain in normalized BV change in two published trials against placebo [109, 110]. The approved long-acting pegylated interferon beta-1a has only shown limited and inconclusive evidence for a beneficial effect on BV change in RRMS [111, 112]. A possible delayed effect in reducing brain atrophy has been reported for Glatiramer acetate [GA] [113–119]. In the PReCISe clinical trial, GA failed to show an immediate effect on brain volume outcomes versus placebo (− 0.38% vs 0.33%), but the subsequent open label phase of the trial showed a clear–cut benefit on PBCV for the early treatment group, when compared to patients with delayed treatment onset (40% reduction, p = 0.0209) [114, 115]. In relapsing–remitting MS, data from the extension phase of the European/Canadian GA trial come back as negative [118].
Available oral therapies (Fingolimod, Teriflunomide, Dimethyl fumarate) have shown various effects on BV decline. Fingolimod has been reported consistentin
Page 6 of 25Andravizou et al. Autoimmun Highlights (2019) 10:7
Tabl
e 1
Firs
t lin
e th
erap
ies
and
thei
r eff
ect o
n br
ain
volu
me
loss
(BV
L)
Refe
renc
esD
MT
and
tria
l des
ign
Clin
ical
tria
lBa
selin
e/M
RI c
ohor
tsTy
pe o
f MS
Mai
n eff
ect o
n br
ain
atro
phy
Rudi
ck e
t al.
[83,
87]
IFN
β‑1
a i.m
. 30
mcg
wee
kly
vs
plac
ebo
Phas
e III
MS.
C.R
G 2
yea
rs14
0 IF
N β
‑1a
n =
68,
pla
cebo
n =
72
RRM
SPe
rcen
t cha
nge
inbr
ain
pare
nchy
mal
fra
ctio
n w
as lo
wer
in IF
N β
‑1a
trea
ted
patie
nts
com
pare
d to
pl
aceb
o, d
urin
g th
e se
cond
yea
r of
trea
tmen
t (p =
0.0
3) b
ut n
ot th
e fir
st (p
= 0
.71)
Fish
er e
t al.
[104
]IF
N β
‑1a
i.m. 3
0 m
cg w
eekl
y vs
pl
aceb
oRe
tros
pect
ive
anal
ysis
of P
hase
III
MS.
C.R
G 2
yea
rs13
1 IF
N β
‑1a
n =
62,
pla
cebo
n =
69
RRM
SIF
N β
‑1a
sign
ifica
ntly
pre
serv
ed G
M
[4] a
trop
hy (p
= 0
.03)
and
who
le
brai
n at
roph
y (p
= 0
.04)
dur
ing
the
seco
nd y
ear o
f tre
atm
ent,
but n
ot
WM
atr
ophy
(at a
ny p
oint
)
Filli
pi e
t al.
[106
]IF
N β
‑1a
s.c. 2
2 μg
wee
kly
vs
plac
ebo
Phas
e III
ETO
MS
2 ye
ars
262
IFN
β‑1
a n =
131
, pla
cebo
n =
132
CIS
Sign
ifica
nt re
duct
ions
in P
BVC
the
IFN
β‑1
a tr
eate
d ar
m (p
= 0
.003
1)
com
pare
d to
pla
cebo
, fro
m b
ase‑
line
to s
econ
d ye
ar
De
Stef
ano
et a
l. [1
73]
IFN
β‑1
a s.c
. 44m
cg T
IW v
s pl
aceb
odo
uble
‑blin
d an
d ra
ter‑
blin
d ph
ase
IMRO
VE 4
0 w
eeks
180
(dou
ble‑
blin
d ph
ase)
IFN
β‑1
a n =
120
, pla
cebo
n =
60
RRM
SN
on‑s
igni
fican
t diff
eren
ces
in m
ean
[102
] PBV
C b
etw
een
trea
tmen
t gr
oups
(pla
cebo
: − 0
.24%
[0.4
8%];
IFN
β‑1
a: −
0.2
2% [0
.54%
]; p =
0.7
6)
at w
eek
16 (e
nd o
f dou
ble‑
blin
d ph
ase)
De
Stef
ano
et a
l. [1
05]
IFN
β‑1
a s.c
. 44
mg
TIW
vs
once
a
wee
k vs
pla
cebo
Phas
e III
REF
LEX
2 ye
ars
517
IFN
β‑1
a TI
W n
= 1
71, I
FN β
‑1a,
on
ce a
wee
k n =
175
, pla
cebo
n =
171
CIS
No
diffe
renc
es in
BVL
(fro
m b
asel
ine
to 2
yea
rs) i
n pa
tient
s re
ceiv
‑in
g on
ce o
r thr
ee ti
mes
a w
eek
IFN
β‑1a
vs
plac
ebo.
The
gre
ates
t lo
ss w
as in
the
TIW
IFN
β‑1
a gr
oup
com
pare
d w
ith th
e on
ce a
wee
k IF
N β
‑1a
and
plac
ebo
grou
ps
Kapp
os e
t al.
[108
]IF
N β
‑1a
s.c. 4
4 or
22
mcg
TIW
vs
plac
ebo
(2 y
ears
); th
en o
pen
labe
l (4
year
s); l
ong
term
follo
w
up (2
yea
rs)
Phas
e III
PRI
SMS
~ 8
yea
rs38
2 44
mcg
sc
TIW
n =
136
, 22
mcg
sc
TIW
n =
123
, pla
cebo
n =
123
RRM
SN
on‑s
igni
fican
t diff
eren
ces
in
med
ian
BPV
(from
bas
elin
e to
long
te
rm fo
llow
‑up
and
each
stu
dy
perio
d th
erei
n) fo
r all
trea
tmen
t ar
ms
Har
dmei
er e
t al.
[174
]IF
N β
‑1a
i.m. 3
0 μg
or 6
0 μg
Retr
ospe
ctiv
e of
The
Eur
opea
n IF
Nb‑
1a D
ose‑
Com
paris
on
Stud
y 3
year
s
annu
al M
RI c
ohor
t n =
386
, fre
‑qu
ent M
RI c
ohor
t n =
138
RRM
STh
e gr
eate
st B
VL to
ok p
lace
dur
ing
the
first
4 m
onth
s of
ther
apy
in fr
eque
nt M
RI c
ohor
t (fro
m
base
line
to m
onth
4, p
< 0
.05)
. N
on‑s
igni
fican
t red
uctio
n in
the
brai
n at
roph
y in
the
2nd
and
3rd
year
of t
reat
men
t
Mol
yneu
x et
al.
[175
]IN
F β‑
1b s
.c. 8
MIU
eve
ry o
ther
day
vs
pla
cebo
Phas
e III
3 y
ears
92 IN
F β‑
1b n
= 4
8, p
lace
bo n
= 4
4SP
MS
Not
sig
nific
ant e
ffect
of t
reat
men
t w
ith IN
F β‑
1b o
n ce
rebr
al v
olum
e lo
ss (p
= 0
.343
, fro
m b
asel
ine
to
3 ye
ars)
com
pare
d w
ith p
lace
bo.
Page 7 of 25Andravizou et al. Autoimmun Highlights (2019) 10:7
Tabl
e 1
(con
tinu
ed)
Refe
renc
esD
MT
and
tria
l des
ign
Clin
ical
tria
lBa
selin
e/M
RI c
ohor
tsTy
pe o
f MS
Mai
n eff
ect o
n br
ain
atro
phy
Kapp
os e
t al.
[176
, 177
]IN
F β‑
1βs.c
. 250
μg
ever
y ot
her d
ay
(ear
ly v
s de
laye
d tr
eatm
ent)
Exte
nsio
n st
udy
of th
e Ph
ase
III
BEN
EFIT
tria
l (3
and
5 ye
ars
fol‑
low
up)
Follo
w‑u
p ph
ase
n =
418
ear
ly
trea
tmen
t n =
261
, del
ayed
trea
t‑m
ent n
= 1
57 5
‑yea
r com
plet
ers
n =
358
ear
ly tr
eatm
ent n
= 2
35,
dela
yed
trea
tmen
t n =
123
CIS
Mar
gina
l, no
n‑si
gnifi
cant
diff
er‑
ence
s be
twee
n ea
rly a
nd d
elay
ed
trea
tmen
t (p =
0.1
5, fr
om b
asel
ine
to 3
yea
rs, p
= 0
.121
from
bas
elin
e to
5 y
ears
)
Cala
bres
i et a
l. [1
11]
Pegi
nter
fero
n b‑
1a s
.c. 1
25 μ
g Q
2 W
vs
Q4
W v
s pl
aceb
oPh
ase
III A
DVA
NC
E 1
year
, the
n op
en la
bel
1512
PEG
‑IFN
β‑1
a 12
5 μg
Q2
W
n =
512
, PEG
‑IFN
β‑1
a 12
5 μg
Q
4 W
n =
500
, pla
cebo
n =
500
RRM
SCo
re s
tudy
: Dur
ing
the
first
6
mon
ths
of tr
eatm
ent t
here
was
a
sign
ifica
nt “p
seud
oatr
ophy
” effe
ct
(PEG
‑IFN
β‑1
a 12
5 μg
Q2
W v
s pl
aceb
o, p
= 0
.017
0)Ba
selin
e to
yea
r 1: Ν
o si
gnifi
cant
di
ffere
nces
on
who
le b
rain
vol
ume
betw
een
grou
ps (Q
2Wvs
pla
cebo
p =
0.0
841;
Q4
W v
s pl
aceb
o p =
0.3
747)
Arn
old
et a
l. (F
2069
, 1rs
t EA
N C
on‑
gres
s 20
15) [
112]
Pegi
nter
fero
n b‑
1a s
.c. 1
25 μ
g Q
2 W
vs
Q4
WEx
tens
ion
stud
y of
Pha
se II
I A
DVA
NC
E 2
year
sA
t wee
k 96
/569
PEG
‑IFN
β‑1
a 12
5 μg
Q2
W n
= 3
84, P
EG‑IF
N
β‑1a
125
μg
Q4
W n
= 1
85
(del
ayed
trea
tmen
t)
RRM
SFr
om w
eek
24 to
wee
k 96
, the
de
laye
d tr
eatm
ent P
EG‑IF
N β
‑1a
125
μg Q
4 W
n =
185
dem
on‑
stra
ted
a si
gnifi
cant
ly g
reat
er
decr
ease
in w
hole
bra
in v
olum
e co
mpa
red
with
the
Q2
W g
roup
(p
= 0
.003
4)
Sore
nsen
et a
l. [1
10]
INF
β‑1a
s.c
. 44
μg p
lus
Met
hyl‑
pred
niso
lone
ora
lly 2
00 m
g or
pl
aceb
oora
lly
Phas
e III
NO
RMI.M
.S 2
yea
rs11
0 IN
F β‑
1a a
nd o
ral m
ethy
lpre
d‑ni
solo
ne n
= 5
4, IF
N β
‑1a
and
plac
ebo
n =
56
RRM
SM
ean
chan
ges
in n
orm
aliz
ed b
rain
pa
renc
hym
al v
olum
e fa
vore
d pu
lsed
trea
tmen
t with
ora
l met
h‑yl
pred
niso
lone
com
bine
d w
ith
INF
β‑1a
vs
INFβ
‑1a
mon
othe
rapy
, bu
t the
ben
efit w
as n
ot s
igni
fican
t (p
= 0
.25)
bet
wee
n ba
selin
e an
d w
eek
96
Ravn
borg
et a
l. [1
09]
INF
β‑1a
i.m
. 30
μg o
nce
wee
kly
plus
Met
hylp
redn
isol
oneo
rally
50
0 m
g da
ily (3
con
secu
tive
days
per
mon
th fo
r 3–4
yea
rs) o
r pl
aceb
o
Phas
e III
MEC
OM
BIN
3 y
ears
338
INF
β‑1a
plu
s pl
aceb
o n =
167
, IN
F β‑
1a p
lus
met
hylp
redn
iso‑
lone
n =
171
RRM
STh
e st
udy
show
ed n
o eff
ect o
n br
ain
pare
nchy
mal
vol
ume
(p =
0.5
8)
or c
hang
e in
nor
mal
ized
bra
in
volu
me
(p =
0.5
2)
Com
i et a
l. [1
14]
GA
s.c. 2
0 m
g da
ily v
s Pl
aceb
oPh
ase
III P
reC
ISe
2 ye
ars
481
GA
n =
243
, Pla
cebo
n =
238
CIS
No
sign
ifica
nt d
iffer
ence
in p
erce
nt‑
age
chan
ge fr
om b
asel
ine
to la
st
obse
rved
val
ue in
bra
in v
olum
e be
twee
n th
e tr
eatm
ent g
roup
s (−
0.3
3% in
GA
vs −
0.3
8% in
pl
aceb
o)
Page 8 of 25Andravizou et al. Autoimmun Highlights (2019) 10:7
Tabl
e 1
(con
tinu
ed)
Refe
renc
esD
MT
and
tria
l des
ign
Clin
ical
tria
lBa
selin
e/M
RI c
ohor
tsTy
pe o
f MS
Mai
n eff
ect o
n br
ain
atro
phy
Com
i et a
l. [1
15]
GA
s.c. 2
0 m
gdai
lyvs
pla
cebo
open
‑labe
l, ex
tens
ion
phas
e of
Ph
ase
III P
reC
ISe
2 ye
ars
409
early
‑tre
atm
ent g
roup
n =
198
, pl
aceb
o (d
elay
ed‑t
reat
men
t)
n =
211
CIS
Sign
ifica
nt re
duct
ion
of B
VL in
ear
ly
vers
us d
elay
ed tr
eatm
ent o
nset
(2
8% re
duct
ion,
p =
0.0
209)
Ge
et a
l. [1
16]
GA
s.c. 2
0 m
g da
ily v
s pl
aceb
oPh
ase
III T
he U
S G
A s
tudy
2 y
ears
27 G
A tr
eate
d n =
14,
pla
cebo
n =
13
RRM
SG
A s
igni
fican
tly re
duce
d th
e ra
te o
f BV
L (7
7% re
duct
ion)
in th
e 2‑
year
tr
eatm
ent p
erio
d (p
= 0
.007
) com
‑pa
red
with
pla
cebo
Rova
ris e
t al.
[119
]G
A s
.c. 2
0 m
g da
ily v
s pl
aceb
o fo
r 9
mon
ths,
then
GA
ope
n‑la
bel
Phas
e III
Eur
opea
n/ C
anad
ian
GA
tr
ial 1
8 m
onth
s22
7 G
A n
= 1
13, p
lace
bo n
= 1
14RR
MS
Dur
ing
the
doub
le‑b
lind,
pla
cebo
‑co
ntro
lled
phas
e of
the
stud
y, G
A
trea
tmen
t did
not
hav
e an
y m
eas‑
urab
le im
pact
on
the
abso
lute
or
perc
enta
ge c
hang
e of
BV
(from
ba
selin
e to
9 m
onth
s, p =
0.8
8)In
the
subs
eque
nt o
pen‑
labe
l pha
se,
early
GA
trea
tmen
t sho
wed
a 4
0%
redu
ctio
n in
the
rate
of b
rain
atr
o‑ph
y (fr
om 9
th to
18t
h m
onth
)
Rova
ris e
t al.
[118
]G
A s
.c. 2
0 m
g da
ilyEx
tens
ion
of th
e Ph
ase
III E
uro‑
pean
/ Ca
nadi
an G
A tr
ial 5
yea
rs14
2 Ea
rly tr
eatm
ent n
= 7
3 D
elay
ed
trea
tmen
t n =
69
RRM
SBa
selin
e to
5 y
ears
: Non
‑sig
nific
ant
diffe
renc
es in
med
ian
PBVC
in
early
vs
dela
yed
trea
tmen
t gro
ups.
Com
i et a
l. [1
13]
GA
s.c
. 20
mg
vs 4
0 m
g (d
ose
com
paris
on)
Phas
e III
FO
RTE
1 ye
ar11
55 G
A 2
0 m
g n =
586
, GA
40
mg
n =
569
RRM
SPB
VCs
wer
e si
mila
r in
both
gro
ups
(p =
0.4
23).
Hig
her d
ose
of G
A d
id
not h
ave
a cl
ear‑
cut i
mpa
ct o
n br
ain
volu
me
loss
. Slo
wer
atr
ophy
ra
tes,
com
pare
d w
ith th
e Eu
r/Ca
nadi
an G
A tr
ial
Khan
et a
l. [1
78]
GA
s.c
. 40
mg
TIW
vs
plac
ebo
Phas
e III
GA
LA 1
yea
r12
63 G
A 4
0 m
g TI
W n
= 8
40,
plac
ebo
n =
423
RRM
STh
e pe
rcen
tage
cha
nge
in b
rain
vo
lum
e (fr
om b
asel
ine
to 1
yea
r) w
as n
ot s
tatis
tical
ly d
iffer
ent
betw
een
trea
tmen
t arm
s (−
0.7
06
with
GA
vs −
0.6
45 w
ith p
lace
bo;
p =
0.2
058)
Lubl
in e
t al.
[179
]IN
F β‑
1a i.
m. 3
0 m
g w
eekl
y, G
A s
.c.
20 m
g da
ilyPh
ase
III C
ombi
Rx 3
yea
rs79
0 IF
N +
GA
n =
388
, IFN
n =
187
, G
A n
= 2
15RR
MS
Com
bina
tion
trea
tmen
t was
not
su
perio
r to
eith
er IN
F β‑
1a o
r GA
ag
ents
alo
ne (C
SF v
olum
e ch
ange
fro
m b
asel
ine
to m
onth
36;
IFN
β‑
1a +
GA
vs
IFN
, p =
0.0
08, I
NF
β‑1a
vs
GA
p =
0.4
8). W
hole
bra
in
tissu
e lo
ss w
as re
flect
ed b
y th
e ch
ange
in n
orm
aliz
ed C
SF fr
om
base
line
Page 9 of 25Andravizou et al. Autoimmun Highlights (2019) 10:7
Tabl
e 1
(con
tinu
ed)
Refe
renc
esD
MT
and
tria
l des
ign
Clin
ical
tria
lBa
selin
e/M
RI c
ohor
tsTy
pe o
f MS
Mai
n eff
ect o
n br
ain
atro
phy
O’C
onno
r et a
l. [1
80]
INF
β‑ 1
b s.c
. 250
μg
or 5
00 μ
g,
ever
y ot
her d
ay o
r GA
s.c
. 20
mg
daily
Phas
e III
BEY
ON
D 2
yea
rs22
44 IF
N β
‑1b
500
μg n
= 8
99, I
FN
β‑1b
250
μg
n =
897
, GA
n =
448
RRM
SN
on‑s
igni
fican
t diff
eren
ces
betw
een
trea
tmen
t gro
ups
Hig
h do
se IN
F β‑
1b w
as n
ot s
uper
ior
to th
e st
anda
rd d
ose
(500
μg
IFN
β‑
1b v
s 25
0 μg
IFN
β‑1
b p =
0.7
4).
Both
dos
es o
f IFN
β‑1
b ha
d si
mila
r mea
sura
ble
brai
n vo
lum
e (B
V) e
ffect
as
com
pare
d w
ith G
A
(500
μg
IFN
β‑1
b vs
GA
p =
0.3
3;
250
μg IF
N β
‑1b
vs G
A p
= 0
.46)
. D
urin
g ye
ar 1
, pat
ient
s un
der I
FN
β‑1b
had
a s
igni
fican
tly g
reat
er
redu
ctio
n in
mea
n br
ain
volu
me
than
did
pat
ient
s tr
eate
d w
ith G
A
(250
μg
IFN
β‑1
b vs
GA
p =
0.0
2;
500
μg IF
N β
‑1b
vs G
A p
= 0
.007
)
Arn
old
et a
l. [1
36]
DM
F or
ally
240
mg
BID
vs T
ID v
s pl
aceb
oPh
ase
III D
EFIN
E 2
year
s54
0 D
MF
BID
n =
176
, DM
F TI
D
n =
184
, Pla
cebo
n =
180
RRM
SSi
gnifi
cant
resu
lts fo
r the
DM
F BI
D
vers
us p
lace
bo o
n br
ain
atro
phy,
fro
m e
ither
bas
elin
e or
6 m
onth
s to
sec
ond
year
(bas
elin
e to
2 y
ears
p =
0.0
449,
6 m
onth
s to
2 y
ears
p =
0.0
214)
. Non
‑sta
tistic
ally
resu
lts
for t
he D
MF
TID
dos
e gr
oup
Mill
er e
t al.
[137
]D
MF
oral
ly 2
40 m
g BI
D v
s TID
vs
GA
20
mg
once
dai
ly v
s pl
aceb
oPh
ase
III C
ON
FIRM
2 y
ears
681
DM
F BI
D n
= 1
69, D
MF
TID
n =
170
, GA
n =
175
, pla
cebo
n =
167
RRM
SA
t 2 y
ears
, PBV
C fa
vore
d D
MF
BID
, bu
t not
TID
or G
A, c
ompa
red
to p
lace
bo (B
ID v
s pl
aceb
o;
p =
0.0
645;
TID
vs
plac
ebo;
p =
0.2
636;
GA
vs
plac
ebo
p =
0.8
802)
Kapp
os e
t al.
(P7.
243,
AA
N) [
181]
DM
F or
ally
240
mg
BID
vs T
ID v
s pl
aceb
o8
year
follo
w‑u
p st
udy
of P
hase
III
END
ORS
E O
ngoi
ngye
ar 1
/464
DM
F BI
D n
= 1
97, G
A
n =
88,
pla
cebo
n =
179
RRM
STh
ere
was
no
sign
ifica
nt e
ffect
in
brai
n vo
lum
e lo
ss fo
r the
pla
cebo
/D
MF
and
the
GA
/DM
F gr
oups
re
lativ
e to
the
grou
p tr
eate
d co
n‑tin
uous
ly w
ith D
MF
BID
(BID
/BID
gr
oup)
(med
ian
PVC
, fro
m b
asel
ine
to 5
yea
rs, B
ID/B
ID v
s pl
aceb
o/D
MF
p =
0.1
165,
BID
/BID
vs
GA
/D
MF
p =
0.3
436)
Mill
er e
t al.
[129
]Te
riflun
omid
e or
ally
7 o
r 14
mg
once
‑dai
ly v
s pl
aceb
oPh
ase
III T
OPI
C 4
yea
rs61
4 Te
riflun
omid
e 14
mg
n =
214
, Te
riflun
omid
e 7
mg
n =
203
, pl
aceb
o n =
197
CIS
No
sign
ifica
nt d
iffer
ence
s w
ere
reco
rded
for b
rain
atr
ophy
(SIE
NA
). (M
ean
chan
ge fr
om b
asel
ine
at w
eek
108
vs p
lace
bo, 1
4 m
g p =
0.4
495;
7 m
g p =
0.4
462)
Page 10 of 25Andravizou et al. Autoimmun Highlights (2019) 10:7
Tabl
e 1
(con
tinu
ed)
Refe
renc
esD
MT
and
tria
l des
ign
Clin
ical
tria
lBa
selin
e/M
RI c
ohor
tsTy
pe o
f MS
Mai
n eff
ect o
n br
ain
atro
phy
O’C
onno
r et a
l. [1
30]
Terifl
unom
ide
oral
ly 7
or 1
4 m
g on
ce‑d
aily
vs
plac
ebo
Phas
e III
TEM
SO 2
yea
rs10
86 T
erifl
unom
ide
14 m
g n =
358
, Te
riflun
omid
e 7
mg
n =
365
, pl
aceb
o n =
363
RRM
SN
o eff
ect o
n re
lativ
e BP
F ch
ange
am
ong
the
stud
y gr
oups
(fro
m
base
line
to 2
yea
rs: T
erifl
uno‑
mid
e 7
mg
vs. p
lace
bo p
= 0
.19;
Te
riflun
omid
e 14
mg
vs. p
lace
bo
p =
0.3
5)
Wol
insk
y et
al.
[131
]Te
riflun
omid
e or
ally
7 o
r 14
mg
once
‑dai
ly v
s pl
aceb
oPo
st h
oc a
naly
sis
of P
hase
III
TEM
SO 1
08 w
eeks
1088
Ter
iflun
omid
e 14
mg
n =
359
, Te
riflun
omid
e 7
mg
n =
366
, pl
aceb
o n =
363
RRM
STh
ere
was
a s
igni
fican
t dec
reas
e in
WM
frac
tion
(from
bas
elin
e to
108
wee
ks) f
or b
oth
dose
s of
Te
riflun
omid
e (W
MF
chan
ge
14 m
g vs
pla
cebo
p =
0.0
002;
7 m
g vs
pla
cebo
p =
0.0
609)
Radu
e et
al.
(P3‑
089
AA
N 2
016)
[1
34]
Terifl
unom
ide
oral
ly 7
or 1
4 m
g on
ce‑d
aily
vs
plac
ebo
Post
hoc
ana
lysi
s of
Pha
se II
I TE
MSO
and
TO
WER
9 y
ears
969
808
base
line
and
wee
k 48
, 709
ba
selin
e an
d w
eek
108
RRM
SSi
gnifi
cant
gai
n in
bra
in v
olum
e lo
ss,
by u
sing
an
alte
rnat
ive
met
hod
(SIE
NA
). M
edia
n PV
C, f
rom
bas
elin
e to
firs
t yea
r, Te
riflun
omid
e 14
mg
vs p
lace
bo p
= 0
.000
1; T
erifl
uno‑
mid
e 7
mg
vs p
lace
bo p
= 0
.001
1;
from
bas
elin
e to
sec
ond
year
: Te
riflun
omid
e 14
mg
vs p
lace
bo
p =
0.0
001;
Ter
iflun
omid
e 7
mg
vs
plac
ebo
p =
0.0
019)
Spre
nger
et a
l. P3
.047
[132
]Te
riflun
omid
e or
ally
14
mg
once
‑da
ily v
s pl
aceb
oPo
st h
oc a
naly
sis
of P
hase
III
TEM
SO a
nd T
OW
ER 2
yea
rs96
9 80
8 fir
st y
ear,
709
s ye
arRR
MS
Terifl
unom
ide
resu
lted
in lo
wer
at
roph
y ra
te in
pat
ient
s w
ith a
nd
with
out d
isab
ility
pro
gres
sion
vs
pla
cebo
. With
out d
isab
ility
pr
ogre
ssio
n: M
edia
n PB
VC, f
rom
ba
selin
e to
firs
t yea
r, Te
riflun
omid
e 14
mg
vs p
lace
bo (2
2%) p
= 0
.012
8 an
d fro
m b
asel
ine
to s
econ
d ye
ar
(23%
) p =
0.0
129
With
dis
abili
ty
prog
ress
ion:
Med
ian
PBVC
, fro
m
base
line
to fi
rst y
ear,
Terifl
unom
ide
14 m
g vs
pla
cebo
(69%
) p =
0.0
037
and
from
bas
elin
e to
sec
ond
year
(4
4%) p
= 0
.004
3
Page 11 of 25Andravizou et al. Autoimmun Highlights (2019) 10:7
Tabl
e 1
(con
tinu
ed)
Refe
renc
esD
MT
and
tria
l des
ign
Clin
ical
tria
lBa
selin
e/M
RI c
ohor
tsTy
pe o
f MS
Mai
n eff
ect o
n br
ain
atro
phy
Wue
rfel
et a
l. P3
.052
[135
]Te
riflun
omid
e or
ally
14
mg
once
‑da
ily v
s pl
aceb
oPo
st h
oc a
naly
sis
of P
hase
III o
f TE
MSO
Year
one
coh
ort.
0–2
in p
revi
ous
2 ye
ar: T
erifl
unom
ide
14 m
g n =
191
, pla
cebo
n =
197
2–3
in
prev
ious
2 y
ear T
erifl
unom
ide
14 m
g n =
195
, pla
cebo
n =
198
RRM
SSi
gnifi
cant
impa
ct o
n m
edia
n PB
VC
rega
rdle
ss o
f the
leve
l of d
isea
se
activ
ity (p
rior r
elap
se ra
te)
Patie
nts
with
few
prio
r rel
apse
s (0
–2 in
pre
viou
s 2
year
s): B
asel
ine
to y
ear 1
: Ter
iflun
omid
e 14
mg
vs p
lace
bo, r
elat
ive
chan
ge in
pe
rcen
tage
bra
in v
olum
e 40
%
p =
0.0
001.
Yea
r 1to
yea
r 2: r
elat
ive
chan
ge 3
6%, p
= 0
.000
1. T
his
find‑
ing
was
con
firm
ed in
pat
ient
s w
ith
a gr
eate
r num
ber o
f rel
apse
s (2
–3
in p
revi
ous
2 ye
ars)
: p =
0.0
018
at
year
1 a
nd p
= 0
.006
7 at
yea
r 2
Free
dman
et a
l. (P
734
ETC
RIM
S 20
16) [
133]
Terifl
unom
ide
oral
ly 7
or 1
4 m
g on
ce‑d
aily
vs
plac
ebo
Subg
roup
ana
lysi
s of
Pha
se II
I TE
MSO
971
trea
tmen
t‑na
ïve
n =
704
, 1
Prio
r DM
T n =
208
, ≥2
Prio
r DM
Ts
n =
57
RMS
Posi
tive
resu
lts o
n m
edia
n PB
VC
rega
rdle
ss o
f tre
atm
ent h
isto
ry.
PVC
cha
nge
from
bas
elin
e to
ye
ar 1
, Ter
iflun
omid
e 14
mg
No
prio
r DM
T vs
pla
cebo
p =
0.0
025;
ba
selin
e to
yea
r 2: p
= 0
.010
9;
Terifl
unom
ide
14 m
g pr
ior D
MT
vs p
lace
bo p
= 0
.011
9, b
asel
ine
to y
ear 2
: p =
0.0
109.
PVC
cha
nge
from
bas
elin
e to
yea
r 1: T
erilu
no‑
mid
e 7
mg
No
prio
r DM
T vs
pla
‑ce
bo p
= 0
.000
2; b
asel
ine
to y
ear
e: p
= 0
.008
9. T
erifl
unom
ide
7 m
g pr
ior D
MT
vs p
lace
bo p
= 0
.011
9,
base
line
to y
ear 2
: p =
0.0
109
mg:
mill
igra
ms;
mcg
: mic
rogr
ams;
μg:
mic
rogr
ams;
vs:
ver
sus;
PBV
C: p
erce
ntag
e of
bra
in v
olum
e ch
ange
; BPF
: bra
in p
aren
chym
al fr
actio
n; B
PV: b
rain
par
ench
ymal
vol
ume;
SIE
NA
: str
uctu
ral i
mag
ing
eval
uatio
n us
ing
norm
aliz
atio
n of
atr
ophy
; i.m
.: in
tram
uscu
lar;
s.c: s
ubcu
tane
ous;
i.v.
: int
rave
nous
; ΤΙW
: thr
ee ti
mes
wee
kly;
SD
: sta
ndar
d de
viat
ion;
Q2W
: onc
e ev
ery
2 w
eeks
; Q4W
: onc
e ev
ery
4 w
eeks
; BID
: tw
ice
daily
; TID
: thr
ice
daily
; D
MT:
dis
ease
mod
ifyin
g th
erap
ies;
CSF
: cer
ebro
spin
al fl
uid;
PVC
: per
cent
age
volu
me
chan
ge
Page 12 of 25Andravizou et al. Autoimmun Highlights (2019) 10:7
Tabl
e 2
Seco
nd li
ne th
erap
ies
and
thei
r eff
ect o
n br
ain
volu
me
loss
(BV
L)
Refe
renc
esD
MT
and
tria
l des
ign
Clin
ical
tria
lBa
selin
e/M
RI c
ohor
tsTy
pe o
f MS
Mai
n eff
ect o
n br
ain
atro
phy
Kapp
os e
t al.
[122
]Fi
ngol
imod
ora
lly 0
.5 m
g or
1.2
5 m
g on
ce d
aily
vs
plac
ebo
for 2
yea
rs,
then
FTY
ope
n‑la
bel
Phas
e III
FRE
EDO
MS
2 ye
ars
1272
Fin
golim
od 1
.25
mg
n =
429
, Fi
ngol
imod
0.5
mg
n =
425
, pla
cebo
n =
418
RRM
SSi
gnifi
cant
redu
ctio
ns in
the
rate
of b
rain
vo
lum
e lo
ss w
ere
dete
cted
as
early
as
6 m
onth
s fo
r the
12
mg
Fing
olim
od
trea
tmen
t gro
up (P
BVC
val
ues
from
ba
selin
e to
6 m
onth
s, 1.
25 m
g Fi
n‑go
limod
vs p
lace
bo p
= 0
.003
; 0.5
mg
Fing
olim
odvs
pla
cebo
p =
0.0
06) a
nd
rem
aine
d si
gnifi
cant
at 2
4 m
onth
s (P
< 0
.001
in a
ll co
mpa
rison
s)
Kapp
os e
t al.
[124
]Fi
ngol
imod
ora
lly 0
.5 m
g or
1.2
5 m
g on
ce d
aily
(FTY
ope
n la
bel)
Exte
nsio
n of
Pha
se II
I FRE
EDO
MS
2 ye
ars
920
RRM
SSi
gnifi
cant
ly lo
wer
atr
ophy
rate
s in
the
cont
inuo
us F
ingo
limod
gro
ups
rela
‑tiv
e to
the
com
bine
d sw
itch
grou
p,
over
4 y
ears
(Con
tinuo
us F
ingo
limod
0.
5 m
g p =
0.0
013;
Con
tinuo
us F
ingo
li‑m
od 1
.25
mg
p =
0.0
01)
Patie
nts
who
sw
itche
d to
Fin
golim
od
0.5
mg
durin
g th
e ex
tens
ion
stud
y ex
perie
nced
sig
nific
ant i
mpr
ovem
ents
in
rate
s of
bra
in v
olum
e de
clin
e (P
la‑
cebo
—Fi
ngol
imod
0.5
mg
p =
0.0
084,
m
onth
s 24
–48
vs m
onth
s 0–
24)
Cohe
n et
al.
[121
]Fi
ngol
imod
ora
lly 1
.25
or 0
.5 m
gonc
e da
ily v
s IN
F β‑
1a i.
m. 3
0 μg
(1 y
ear,
then
ope
n‑la
bel)
Phas
e III
TRA
NSF
ORM
S 1
year
1280
Fin
golim
od 1
.25
mg
n =
420
, Fi
ngol
imod
0.5
mg
n =
429
, IN
F β‑
1a
N =
431
RRM
SCo
mpa
red
to i.
m. I
NF
β‑1a
, pat
ient
s tr
eate
d w
ith F
ingo
limod
pre
sent
ed
less
bra
in v
olum
e lo
ss, o
ver 1
yea
r (al
l p
< 0
.001
)
Khat
ri et
al.
[125
]Fi
ngol
imod
ora
lly 1
.25
or 0
.5 m
g on
ce
daily
Exte
nsio
n of
Pha
se II
I TRA
NSF
ORM
S 2
year
s79
9 IN
F β‑
1a to
0.5
mg
Fing
olim
od
n =
124
, IN
F β‑
1a to
1.2
5 m
g Fi
ngol
i‑m
od n
= 1
30. C
ontin
uous
0.5
mg
Fing
olim
od n
= 2
90, C
ontin
uous
1.
25 m
g Fi
ngol
imod
n =
255
RRM
SPa
tient
s sw
itchi
ng fr
om IN
F β‑
1a to
Fi
ngol
imod
(eith
er 1
.25
or 0
.5 m
g)
redu
ced
thei
r bra
in v
olum
e de
crea
se
(PBV
C: m
onth
s 13
–24
vs m
onth
s 0–
12,
p =
0.0
06 fo
r the
INF
β‑1a
to 0
.5 m
g Fi
ngol
imod
sw
itch
grou
p p =
0·0
07
for t
he IN
F β‑
1a to
1.2
5 m
g FT
Y720
sw
itch
grou
p. N
o fu
rthe
r gai
n in
BVL
fo
r pat
ient
s on
con
tinuo
us F
ingo
limod
tr
eatm
ent (
p va
lues
non
‑sig
nific
ant a
t m
onth
s 13
–24
vs m
onth
s 0–
12)
Page 13 of 25Andravizou et al. Autoimmun Highlights (2019) 10:7
Tabl
e 2
(con
tinu
ed)
Refe
renc
esD
MT
and
tria
l des
ign
Clin
ical
tria
lBa
selin
e/M
RI c
ohor
tsTy
pe o
f MS
Mai
n eff
ect o
n br
ain
atro
phy
Cala
bres
i et a
l. [1
20]
Fing
olim
od o
rally
1.2
5 or
0.5
mg
once
da
ily v
s pl
aceb
oPh
ase
III F
REED
OM
S II
1 ye
ar10
83 F
ingo
limod
1.2
5 m
g n =
370
, Fi
ngol
imod
0.5
mg
n =
358
, pla
cebo
n =
355
RRM
SPa
tient
s gi
ven
Fing
olim
od h
ad
decr
ease
d br
ain
volu
me
loss
com
‑pa
red
with
thos
e gi
ven
plac
ebo
from
ba
selin
e to
mon
ths
6 (F
ingo
limod
1.
25 m
g vs
pla
cebo
, p =
<0.
0001
; Fi
ngol
imod
0.5
0 m
g vs
pla
cebo
, p =
0.0
12) 1
2 (F
ingo
limod
1.2
5 m
g vs
pla
cebo
, p =
<0.
0001
; Fin
golim
od
0.50
mg
vs p
lace
bo, p
= 0
.004
) and
24
(Fin
golim
od 1
.25
mg
vs p
lace
bo,
p =
<0.
0001
; Fin
golim
od 0
.50
mg
vs
plac
ebo,
p =
0.0
13).
(Tot
al tr
eatm
ent
effec
t on
PBVC
vs
plac
ebo
p <
0·0
001
and
p =
0·0
002
resp
ectiv
ely)
Cohe
n et
al.
[123
]Fi
ngol
imod
ora
lly 1
.25
or 0
.5 m
g on
ce
daily
IFN
β‑1
a i.m
. 30
μg o
nce
a w
eek
Exte
nsio
n of
Pha
se II
I TRA
NSF
ORM
S 4.
5 ye
ars
Fing
olim
od 0
.5 m
g n =
356
, IFN
β‑1
a‑sw
itch
Fing
olim
od 0
.5 m
g n =
167
, Fi
ngol
imod
1.2
5 m
g n =
330
, IFN
β‑
1a s
witc
h fin
golim
od 1
.25
mg
n =
174
RRM
SN
on‑s
igni
fican
t lon
g te
rm b
en‑
efit o
n m
ean
PBVC
(fro
m b
asel
ine
to
4.5
year
s): c
ontin
uous
‑fing
olim
odvs
IF
N β
‑1a‑
switc
h gr
oup −
1.01
% (−
0.8)
vs
−0.
96%
(−0.
8); p
= 0
.937
. The
PB
VC fr
om b
asel
ine
to m
onth
12
was
re
duce
d si
gnifi
cant
ly b
y fin
golim
od
com
pare
to IF
N β
‑1a
(p <
0.0
001)
and
th
e lo
w ra
te w
as m
aint
aine
d th
roug
h th
e st
udy
com
plet
ion
Lubl
in e
t al.
[126
]Fi
ngol
imod
ora
lly 0
.5 m
g on
ce d
aily
vs
plac
ebo
Phas
e III
INFO
RMS
3 ye
ars
714
Fing
olim
od 0
.5 m
g n =
293
, pla
‑ce
bo n
= 4
21PP
MS
In p
atie
nts
with
prim
ary
prog
ress
ive
MS,
pe
rcen
tage
cha
nge
in b
rain
vol
ume
did
not d
iffer
bet
wee
n Fi
ngol
imod
and
pl
aceb
o gr
oups
(p =
0.6
73)
Mill
er e
t al.
[139
]N
atal
izum
ab i.
v. 3
00 m
g ev
ery
4 w
eeks
vs
pla
cebo
Phas
e III
AFF
IRM
2 y
ears
942
Nat
aliz
umab
n =
627
, pla
cebo
n =
315
RRM
SO
vera
ll, n
ot s
igni
fican
t effe
ct o
f tre
at‑
men
t with
Nat
aliz
umab
vs p
lace
bo
(mea
n pe
rcen
tage
cha
nge
in B
PF,
0.80
% v
s 0.
82%
, p =
0.8
22, f
rom
ba
selin
e to
2 y
ears
). D
urin
g th
e fir
st
year
, nat
aliz
umab
‑tre
ated
pat
ient
s pr
esen
ted
grea
ter B
VL c
ompa
red
to
plac
ebo
(0.5
6% v
s 0.
40%
, p =
0.0
02)
but t
he ra
te o
f bra
in a
trop
hy w
as s
ig‑
nific
antly
less
in n
atal
izum
ab‑t
reat
ed
patie
nts
over
the
seco
nd y
ear o
f tre
at‑
men
t (0.
24%
vs
0.43
% p
= 0
.004
)
Page 14 of 25Andravizou et al. Autoimmun Highlights (2019) 10:7
Tabl
e 2
(con
tinu
ed)
Refe
renc
esD
MT
and
tria
l des
ign
Clin
ical
tria
lBa
selin
e/M
RI c
ohor
tsTy
pe o
f MS
Mai
n eff
ect o
n br
ain
atro
phy
Radu
e et
al.
[140
](IF
N β
‑1a
i.m.3
0 μg
+ N
atal
izum
ab
i.v.3
00 m
g ev
ery
4 w
eeks
) vs
IFN
β‑1
a i.m
. 30
μg +
pla
cebo
onc
e w
eekl
y
Phas
e III
SEN
TIN
EL 2
yea
rs11
71 IF
N β
‑1a +
nat
aliz
umab
n =
589
, IF
N β
‑1a +
pla
cebo
n =
582
RRM
SFr
om b
asel
ine
to s
econ
d ye
ar, n
o si
gnifi
cant
diff
eren
ces
wer
e re
port
ed
betw
een
the
2 tr
eatm
ent a
rms
rega
rd‑
ing
chan
ge in
BPF
(p =
0.9
26).
Dur
ing
the
first
yea
r, th
ere
was
a s
igni
fican
t re
duct
ion
in B
PF in
the
Nat
aliz
umab
tr
eate
d ar
m (p
= 0
.058
), bu
t low
er ra
tes
durin
g th
e 2n
d ye
ar o
f tre
atm
ent (
– 0.
31%
ver
sus
– 0.
40%
; p =
0.0
20)
mg:
mill
igra
ms;
mcg
: mic
rogr
ams;
μg:
mic
rogr
ams;
vs:
ver
sus;
PBV
C: p
erce
ntag
e of
bra
in v
olum
e ch
ange
; BPF
: bra
in p
aren
chym
al fr
actio
n; B
PV: b
rain
par
ench
ymal
vol
ume;
SIE
NA
: str
uctu
ral i
mag
ing
eval
uatio
n us
ing
norm
aliz
atio
n of
atr
ophy
; i.m
.: in
tram
uscu
lar;
s.c: s
ubcu
tane
ous;
i.v.
: int
rave
nous
; ΤΙW
: thr
ee ti
mes
wee
kly;
SD
: sta
ndar
d de
viat
ion;
Q2W
: onc
e ev
ery
2 w
eeks
; Q4W
: onc
e ev
ery
4 w
eeks
; BID
: tw
ice
daily
; TID
: thr
ice
daily
; D
MT:
dis
ease
mod
ifyin
g th
erap
ies;
CSF
: cer
ebro
spin
al fl
uid;
PVC
: per
cent
age
volu
me
chan
ge
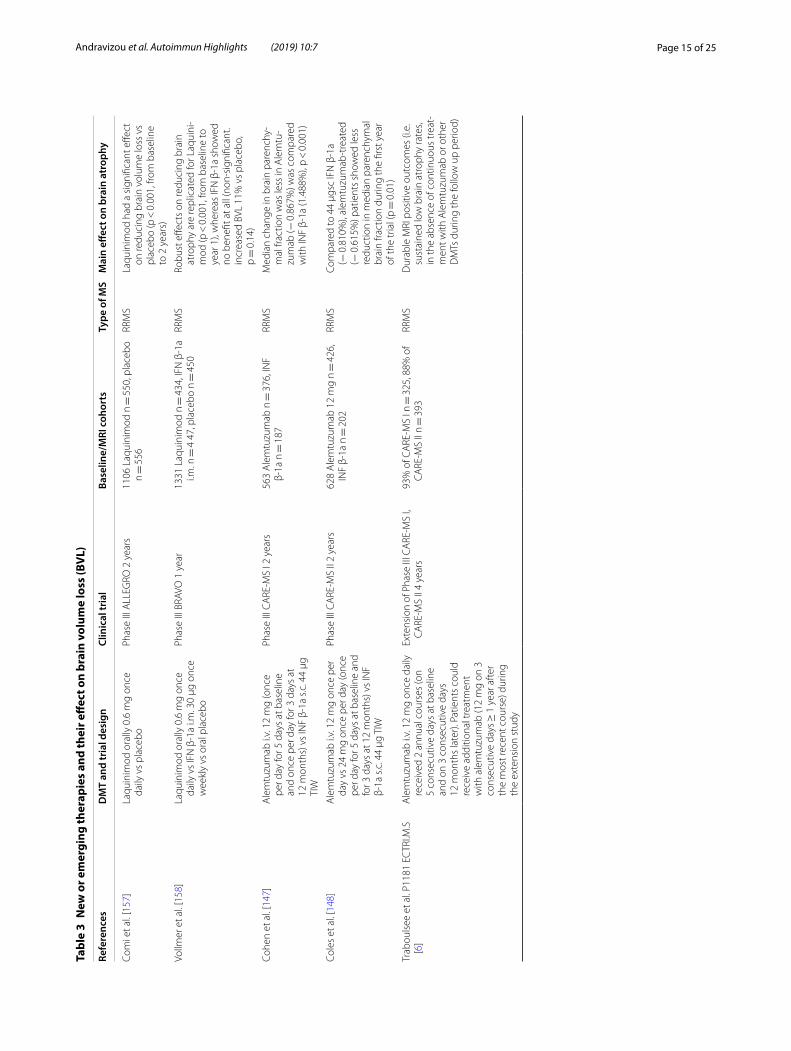
Page 15 of 25Andravizou et al. Autoimmun Highlights (2019) 10:7
Tabl
e 3
New
or e
mer
ging
ther
apie
s an
d th
eir e
ffec
t on
brai
n vo
lum
e lo
ss (B
VL)
Refe
renc
esD
MT
and
tria
l des
ign
Clin
ical
tria
lBa
selin
e/M
RI c
ohor
tsTy
pe o
f MS
Mai
n eff
ect o
n br
ain
atro
phy
Com
i et a
l. [1
57]
Laqu
inim
od o
rally
0.6
mg
once
da
ily v
s pl
aceb
oPh
ase
III A
LLEG
RO 2
yea
rs11
06 L
aqui
nim
od n
= 5
50, p
lace
bo
n =
556
RRM
SLa
quin
imod
had
a s
igni
fican
t effe
ct
on re
duci
ng b
rain
vol
ume
loss
vs
plac
ebo
(p <
0.0
01, f
rom
bas
elin
e to
2 y
ears
)
Vollm
er e
t al.
[158
]La
quin
imod
ora
lly 0
.6 m
g on
ce
daily
vs
IFN
β‑1
a i.m
. 30
μg o
nce
wee
kly
vs o
ral p
lace
bo
Phas
e III
BRA
VO 1
yea
r13
31 L
aqui
nim
od n
= 4
34, I
FN β
‑1a
i.m. n
= 4
47,
pla
cebo
n =
450
RRM
SRo
bust
effe
cts
on re
duci
ng b
rain
at
roph
y ar
e re
plic
ated
for L
aqui
ni‑
mod
(p <
0.0
01, f
rom
bas
elin
e to
ye
ar 1
), w
here
as IF
N β
‑1a
show
ed
no b
enefi
t at a
ll (n
on‑s
igni
fican
t. in
crea
sed
BVL
11%
vs
plac
ebo,
p =
0.1
4)
Cohe
n et
al.
[147
]A
lem
tuzu
mab
i.v.
12
mg
(onc
e pe
r day
for 5
day
s at
bas
elin
e an
d on
ce p
er d
ay fo
r 3 d
ays
at
12 m
onth
s) v
s IN
F β‑
1a s
.c. 4
4 μg
TI
W
Phas
e III
CA
RE‑M
S I 2
yea
rs56
3 A
lem
tuzu
mab
n =
376
, IN
F β‑
1a n
= 1
87RR
MS
Med
ian
chan
ge in
bra
in p
aren
chy‑
mal
frac
tion
was
less
in A
lem
tu‑
zum
ab (−
0.8
67%
) was
com
pare
d w
ith IN
F β‑
1a (1
.488
%),
p <
0.0
01)
Cole
s et
al.
[148
]A
lem
tuzu
mab
i.v.
12
mg
once
per
da
y vs
24
mg
once
per
day
(onc
e pe
r day
for 5
day
s at
bas
elin
e an
d fo
r 3 d
ays
at 1
2 m
onth
s) v
s IN
F β‑
1a s
.c. 4
4 μg
TIW
Phas
e III
CA
RE‑M
S II
2 ye
ars
628
Ale
mtu
zum
ab 1
2 m
g n =
426
, IN
F β‑
1a n
= 2
02RR
MS
Com
pare
d to
44
μgsc
IFN
β‑1
a (−
0.8
10%
), al
emtu
zum
ab‑t
reat
ed
(− 0
.615
%) p
atie
nts
show
ed le
ss
redu
ctio
n in
med
ian
pare
nchy
mal
br
ain
fract
ion
durin
g th
e fir
st y
ear
of th
e tr
ial (
p =
0.0
1)
Trab
ouls
ee e
t al.
P118
1 EC
TRI.M
.S
[6]
Ale
mtu
zum
ab i.
v. 1
2 m
g on
ce d
aily
re
ceiv
ed 2
ann
ual c
ours
es (o
n 5
cons
ecut
ive
days
at b
asel
ine
and
on 3
con
secu
tive
days
12
mon
ths
late
r). P
atie
nts
coul
d re
ceiv
e ad
ditio
nal t
reat
men
t w
ith a
lem
tuzu
mab
(12
mg
on 3
co
nsec
utiv
e da
ys ≥
1 y
ear a
fter
th
e m
ost r
ecen
t cou
rse)
dur
ing
the
exte
nsio
n st
udy
Exte
nsio
n of
Pha
se II
I CA
RE‑M
S I,
CA
RE‑M
S II
4 ye
ars
93%
of C
ARE
‑MS
I n =
325
, 88%
of
CA
RE‑M
S II
n =
393
RRM
SD
urab
le M
RI p
ositi
ve o
utco
mes
(i.e
. su
stai
ned
low
bra
in a
trop
hy ra
tes,
in th
e ab
senc
e of
con
tinuo
us tr
eat‑
men
t with
Ale
mtu
zum
ab o
r oth
er
DM
Ts d
urin
g th
e fo
llow
up
perio
d)
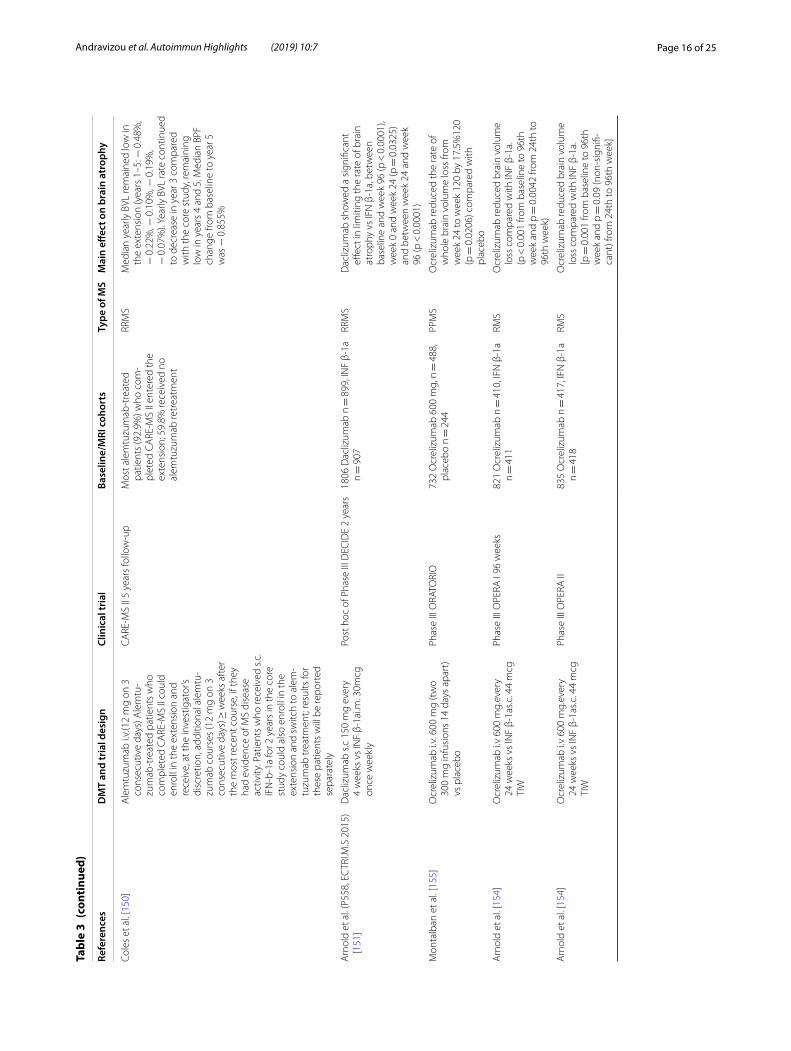
Page 16 of 25Andravizou et al. Autoimmun Highlights (2019) 10:7
Tabl
e 3
(con
tinu
ed)
Refe
renc
esD
MT
and
tria
l des
ign
Clin
ical
tria
lBa
selin
e/M
RI c
ohor
tsTy
pe o
f MS
Mai
n eff
ect o
n br
ain
atro
phy
Cole
s et
al.
[150
]A
lem
tuzu
mab
i.v.
(12
mg
on 3
co
nsec
utiv
e da
ys) A
lem
tu‑
zum
ab‑t
reat
ed p
atie
nts
who
co
mpl
eted
CA
RE‑M
S II
coul
d en
roll
in th
e ex
tens
ion
and
rece
ive,
at t
he in
vest
igat
or’s
disc
retio
n, a
dditi
onal
ale
mtu
‑zu
mab
cou
rses
(12
mg
on 3
co
nsec
utiv
e da
ys) ≥
wee
ks a
fter
th
e m
ost r
ecen
t cou
rse,
if th
ey
had
evid
ence
of M
S di
seas
e ac
tivity
. Pat
ient
s w
ho re
ceiv
ed s
.c.
IFN
‑b‑1
a fo
r 2 y
ears
in th
e co
re
stud
y co
uld
also
enr
oll i
n th
e ex
tens
ion
and
switc
h to
ale
m‑
tuzu
mab
trea
tmen
t; re
sults
for
thes
e pa
tient
s w
ill b
e re
port
ed
sepa
rate
ly
CA
RE‑M
S II
5 ye
ars
follo
w‑u
pM
ost a
lem
tuzu
mab
‑tre
ated
pa
tient
s (9
2.9%
) who
com
‑pl
eted
CA
RE‑M
S II
ente
red
the
exte
nsio
n; 5
9.8%
rece
ived
no
alem
tuzu
mab
retr
eatm
ent
RRM
SM
edia
n ye
arly
BVL
rem
aine
d lo
w in
th
e ex
tens
ion
(yea
rs 1
–5: −
0.4
8%,
− 0
.22%
, − 0
.10%
, − 0
.19%
, −
0.0
7%).
Year
ly B
VL ra
te c
ontin
ued
to d
ecre
ase
in y
ear 3
com
pare
d w
ith th
e co
re s
tudy
, rem
aini
ng
low
in y
ears
4 a
nd 5
. Med
ian
BPF
chan
ge fr
om b
asel
ine
to y
ear 5
w
as −
0.8
55%
Arn
old
et a
l. (P
558,
EC
TRI.M
.S 2
015)
[1
51]
Dac
lizum
ab s
.c 1
50 m
g ev
ery
4 w
eeks
vs
INF
β‑1a
i.m. 3
0mcg
on
ce w
eekl
y
Post
hoc
of P
hase
III D
ECID
E 2
year
s18
06 D
acliz
umab
n =
899
, IN
F β‑
1a
n =
907
RRM
SD
acliz
umab
sho
wed
a s
igni
fican
t eff
ect i
n lim
iting
the
rate
of b
rain
at
roph
y vs
IFN
β‑1
a, b
etw
een
base
line
and
wee
k 96
(p <
0.0
001)
, w
eek
0 an
d w
eek
24 (p
= 0
.032
5)
and
betw
een
wee
k 24
and
wee
k 96
(p <
0.0
001)
Mon
talb
an e
t al.
[155
]O
crel
izum
ab i.
v. 6
00 m
g (t
wo
300
mg
infu
sion
s 14
day
s ap
art)
vs
pla
cebo
Phas
e III
ORA
TORI
O73
2 O
crel
izum
ab 6
00 m
g, n
= 4
88,
plac
ebo
n =
244
PPM
SO
crel
izum
ab re
duce
d th
e ra
te o
f w
hole
bra
in v
olum
e lo
ss fr
om
wee
k 24
to w
eek
120
by 1
7.5%
120
(p =
0.0
206)
com
pare
d w
ith
plac
ebo
Arn
old
et a
l. [1
54]
Ocr
eliz
umab
i.v
600
mg.
ever
y 24
wee
ks v
s IN
F β‑
1as.c
. 44
mcg
TI
W
Phas
e III
OPE
RA I
96 w
eeks
821
Ocr
eliz
umab
n =
410
, IFN
β‑1
a n =
411
RMS
Ocr
eliz
umab
redu
ced
brai
n vo
lum
e lo
ss c
ompa
red
with
INF
β‑1a
. (p
< 0
.001
from
bas
elin
e to
96t
h w
eek
and
p =
0.0
042
from
24t
h to
96
th w
eek)
Arn
old
et a
l. [1
54]
Ocr
eliz
umab
i.v
600
mg.
ever
y 24
wee
ks v
s IN
F β‑
1as.c
. 44
mcg
TI
W
Phas
e III
OPE
RA II
835
Ocr
eliz
umab
n =
417
, IFN
β‑1
a n =
418
RMS
Ocr
eliz
umab
redu
ced
brai
n vo
lum
e lo
ss c
ompa
red
with
INF
β‑1a
. [p
= 0
.001
from
bas
elin
e to
96t
h w
eek
and
p =
0.0
9 (n
on‑s
igni
fi‑ca
nt) f
rom
24t
h to
96t
h w
eek]
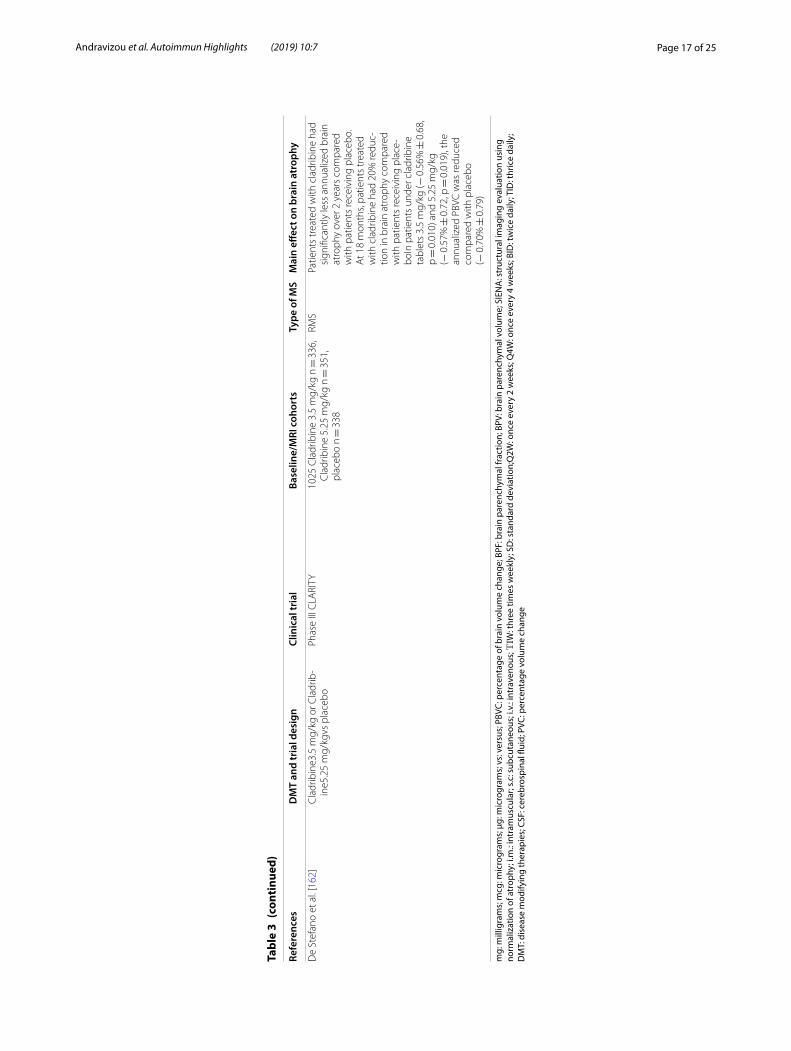
Page 17 of 25Andravizou et al. Autoimmun Highlights (2019) 10:7
Tabl
e 3
(con
tinu
ed)
Refe
renc
esD
MT
and
tria
l des
ign
Clin
ical
tria
lBa
selin
e/M
RI c
ohor
tsTy
pe o
f MS
Mai
n eff
ect o
n br
ain
atro
phy
De
Stef
ano
et a
l. [1
62]
Cla
drib
ine3
.5 m
g/kg
or C
ladr
ib‑
ine5
.25
mg/
kgvs
pla
cebo
Phas
e III
CLA
RITY
1025
Cla
drib
ine
3.5
mg/
kg n
= 3
36,
Cla
drib
ine
5.25
mg/
kg n
= 3
51,
plac
ebo
n =
338
RMS
Patie
nts
trea
ted
with
cla
drib
ine
had
sign
ifica
ntly
less
ann
ualiz
ed b
rain
at
roph
y ov
er 2
yea
rs c
ompa
red
with
pat
ient
s re
ceiv
ing
plac
ebo.
A
t 18
mon
ths,
patie
nts
trea
ted
with
cla
drib
ine
had
20%
redu
c‑tio
n in
bra
in a
trop
hy c
ompa
red
with
pat
ient
s re
ceiv
ing
plac
e‑bo
In p
atie
nts
unde
r cla
drib
ine
tabl
ets
3.5
mg/
kg (−
0.5
6% ±
0.6
8,
p =
0.0
10) a
nd 5
.25
mg/
kg
(− 0
.57%
± 0
.72,
p =
0.0
19),
the
annu
aliz
ed P
BVC
was
redu
ced
com
pare
d w
ith p
lace
bo
(− 0
.70%
± 0
.79)
mg:
mill
igra
ms;
mcg
: mic
rogr
ams;
μg:
mic
rogr
ams;
vs:
ver
sus;
PBV
C: p
erce
ntag
e of
bra
in v
olum
e ch
ange
; BPF
: bra
in p
aren
chym
al fr
actio
n; B
PV: b
rain
par
ench
ymal
vol
ume;
SIE
NA
: str
uctu
ral i
mag
ing
eval
uatio
n us
ing
norm
aliz
atio
n of
atr
ophy
; i.m
.: in
tram
uscu
lar;
s.c: s
ubcu
tane
ous;
i.v.
: int
rave
nous
; ΤΙW
: thr
ee ti
mes
wee
kly;
SD
: sta
ndar
d de
viat
ion;
Q2W
: onc
e ev
ery
2 w
eeks
; Q4W
: onc
e ev
ery
4 w
eeks
; BID
: tw
ice
daily
; TID
: thr
ice
daily
; D
MT:
dis
ease
mod
ifyin
g th
erap
ies;
CSF
: cer
ebro
spin
al fl
uid;
PVC
: per
cent
age
volu
me
chan
ge
Page 18 of 25Andravizou et al. Autoimmun Highlights (2019) 10:7
reducing median PBVC by approximately 30 to 45% ver-sus placebo or IFNβ-1a, in its three phase III clinical tri-als [120–122] and their extensions [123–125]. Of note, this reduction was observed as early as 6 months after treatment onset [120, 122]. In the extension phase of the TRANFORMS trial, patients switching from intramuscu-lar (i.m.) INF β1a to FTY720 slowed their median PBVC, and patients continuing on FTY720 sustained low atro-phy rates, over the following 4.5 years of therapy [123]. However, no similar effects were reproduced in patients with the primary progressive form of MS, a finding that that could have otherwise strengthened the evidence for a direct action of fingolimod on brain cellular com-ponents [126]. Finally, further condoning the aforemen-tioned observations, in a study by Yousuf et al. [127], cortical GM, alongside T2 lesion volume, remained sta-ble in the cohort treated with fingolimod, as compared to the untreated group, where it decreased and increased respectively, in the first 2 years of treatment.
Regarding Teriflunomide [128], brain volume outcomes have been reported for clinically isolated syndrome and relapsing- remitting MS in the TOPIC and TEMSO clini-cal trials respectively. Both doses of 7 mg or 14 mg failed to show a clear effect on slowing BVL when compared to placebo [129, 130]. However, when tissue specific volume changes were examined a significant reduction in the rate of WM loss was detected for the 14 mg terifluno-mide treatment arm versus placebo [131]. Similar results have recently been reported in 4 retrospective analyses of TOWER and TEMSO trials when an alternative method of brain loss evaluation was implemented [132–135].
Dimethyl fumarate (DMF/BG12) showed a 21% reduc-tion in BVL compared to placebo in the DEFINE study (the 240 mg twice daily regimen only) [136] and pro-duced only marginal but beneficial effects in BVL reduc-tion in the CONFIRM study [137]. A recent pilot study of 20 patients with RRMS showed a protective effect of DMF treatment in whole brain atrophy (PBVC: − 0.37 ± 0.49% vs. − 1.04 ± 0.67%, p = 0.005) and puta-men atrophy (− 0.06 ± 0.22 vs. − 0.32 ± 0.28 ml, p = 0.02), but no effect on other subcortical volumes or total GM atrophy [138].
Natalizumab, a monoclonal antibody against the cell adhesion molecule a 4-integrin, in two pivotal clinical trials was found to increase the rate of BVL in the first year of treatment and then significantly reduced it when compared to the placebo in the second year [139, 140]. Post–marketing observational studies confirmed that most of the BVL occurring while on Natalizumabtherapy takes place during the first months of therapy, and that it primarily involves WM volume changes [141, 142]. One trial has shown superiority of Natalizumab over conventional MS therapies (IFN-β and GA) and placebo
regarding cortical atrophy [143]. Recently, treatment with Natalizumabdid not affect the loss of brain volume com-pared to placebo in secondary progressive MS patients (ASCENT) [144]. Τhe study by Arpín et al. [145] also suggests a neuroprotective effect of Natalizumab, after the measurement and comparison of the corpus calo-sum index, and the absence of brain atrophy in several patients under treatment during the follow up.
Alemtuzumab, a monoclonal antibody against cells that express the CD52, has demonstrated greater MRI and clinical improvement in comparison to IFNb-1a in its three pivotal studies in active relapsing MS patients [146–148]. Additionally, most patients remained free of disability and MRI progression, for the following 6 years of the initial treatment [6]. Brain atrophy measures showed that brain parenchymal fraction was smaller in Alemtuzumab compared to the INF β-1a treatment arm either in treatment naïve patients [149] or in participants who had relapsed on prior therapy [147–149]. Extension studies showed sustained low brain atrophy rates, in the absence of continuous treatment with Alemtuzumab or other DMTs during the follow up period [149]. The CARE-MS II 5-year follow-up study (2017) provided class III evidence that Alemtuzumab slows brain atrophy; the annual BVL rate continued to drop during the third year and remained low through the fourth and fifth year as well [150].
The immune-modulatory agent Daclizumab in a 3-year post hoc analysis of 899 RRMS patients was compared to IFN beta-1a on brain volume change. Median annu-alised PBVC was significantly reduced in the DAC treat-ment group during both the first and the second year of treatment (baseline—24th weeks: − 0.674 vs − 0.745; 24th–96th weeks: − 0.511 vs − 0.549; all p < 0.0001) in comparison to INF β treatment [151], a finding which was consistent with previous longitudinal data [151–153].
Ocrelizumab is a humanized mAb designed to tar-get CD20+ B cells. MRI outcomes hint towards a posi-tive effect on BVL and clinical disability progression. Treatment with Ocrelizumab has significantly slowed brain atrophy rates in comparison to INF-β1a (base-line to 96 weeks: 23.5% p < 0.0001 in OPERA 1 and 23.8% p < 0.0001 in OPERA 2) along with clinical dis-ability [154]. Ocrelizumab reduced the rate of whole BVL in PPMS from week 24 to week 120 by 17.5%120 (p = 0.0206) compared with placebo (ORATORIO) [155].
Emerging DMTs and their effect on PBVCSeveral new agents are currently undergoing clinical development, including immuno-modulatory, neuropro-tective or remyelinating compounds.
Laquinimod, a linomide derivative, has also shown promising results on PVC rates in RRMS, most probably
Page 19 of 25Andravizou et al. Autoimmun Highlights (2019) 10:7
as a result of reduced astrocytic activation within the CNS [156]. In the ALLEGRO clinical trial, after adjusting for baseline active inflammation, laquinimod markedly reduced BVL as compared to the placebo [157]. Positive effects on PBVC are replicated in one active comparator trial [BRAVO] versus im IFN-β-1a [158, 159]. At present, the agent is further investigated in RRMS [CONCERTO] and PPMS patients [ARPEGGIO].
Cladribine, an antiproliferative agent that takes effect by interfering with DNA synthesis, has shown significant effects in terms of relapse rate and disability progres-sion [160, 161]. Data from CLARITY study suggested that at 18 months, patients treated with cladribine had 20%reduction in brain atrophy compared with patients receiving placebo [162]. However, further studies are needed, in order to cladribine’s effect on brain atrophy rates, be fully elucidated [161, 163, 164].
ConclusionsMS is an evolving disease, now considered of both inflammatory and neurodegenerative nature [165–168]. Axonal injury and loss accounting for brain atrophy may be either acute (i.e. due to inflammation) or chronic/late due to pathogenic mechanisms primed by the preceding inflammation and later perpetuating with disease pro-gression [169–171]. Brain atrophy occurs as early as CIS, progresses faster than it does in healthy adults, and is the best predictor of future disability, physical and cogni-tive [166, 172]. It is widely accepted to be a valid, sensi-tive and reproducible measure of neuroprotection in MS research studies and therapeutic trials.
There is now a variety of approved DMDs, with sec-ondary neuroprotective properties, and an even greater number of novel compounds, in various stages of devel-opment and investigation. A firm belief remains that for a therapy to be effective in delaying the disease progres-sion, its impact on axon and neuronal survival needs to be monitored. Conventional MRI findings (T1-hypoten-sive or T2 hypertensive lesion load) have already shown their limits for monitoring the disease burden and pro-gression in MS patients. Newly introduced sophisticated imaging methods hold promise for the future of the clini-cal surveillance of the disease. Trials incorporating brain atrophy in their endpoints are providing accumulating evidence that rises substantial hopes for treating neuro-degeneration in the near future.
AcknowledgementsNot applicable
Authors’ contributionsAA, ED, AA, MS, VS, GMH were involved in the conception of the study. AA, ED, AA, MS, VS, GMH, ZT, AMA, IN, CB, GT, GD, NG, DPB were involved in the acquisition of the data and study design. AA, ED, AA, MS, VS, GMH, ZT, AMA, IN, CB, GT, GD, NG, DPB were involved in the writing of the article. AA, ED, AA, MS,
VS, GMH, ZT, AMA, IN, CB, GT, GD, NG, DPB critically revised the manuscript. All authors read and approved the final manuscript.
FundingThe author(s) received no specific funding for this work.
Ethics approval and consent to participateCompliance with ethical standards. Human and animal rights: This article does not contain any studies with animals performed by any of the authors. This article does not require informed consent due to the lack of human participants.
Consent for publicationThis article does not require informed consent due to the lack of human participants.
Competing interestsThe authors declare that they have no competing interests.
Author details1 Department of Neurology, Laboratory of Neurogenetics, Faculty of Medi‑cine, University of Thessaly, University Hospital of Larissa, Biopolis, Mezourlo Hill, 41100 Larissa, Greece. 2 Immunogenetics Laboratory, 1st Department of Neurology, Medical School, National and Kapodistrian University of Athens, Aeginition Hospital, Vas. Sophias Ave 72‑74, 11528 Athens, Greece. 3 Depart‑ment of Rheumatology and Clinical Immunology, Faculty of Medicine, School of Health Sciences, University General Hospital of Larissa, University of Thes‑saly, Viopolis, 40500 Larissa, Greece. 4 Multiple Sclerosis Center, 2nd Depart‑ment of Neurology, AHEPA University Hospital, Aristotle University of Thes‑saloniki, Thessaloniki, Greece. 5 Second Department of Neurology, School of Medicine, University of Athens, “Attikon” University Hospital, Athens, Greece. 6 Department of Neurology, Papageorgiou General Hospital, Thessaloniki, Greece. 7 Department of Neurology, Medical School, University of Cyprus, Nicosia, Cyprus.
Received: 13 March 2019 Accepted: 28 June 2019
References 1. Vasileiadis GK, Dardiotis E, Mavropoulos A, Tsouris Z, Tsimourtou V,
Bogdanos DP, Sakkas LI, Hadjigeorgiou GM. Regulatory B and T lym‑phocytes in multiple sclerosis: friends or foes? Auto Immun Highlights. 2018;9(1):9. https ://doi.org/10.1007/s1331 7‑018‑0109‑x.
2. Mitrovič M, Patsopoulos NA, Beecham AH, Dankowski T, Goris A, Dubois B, D’hooghe MB, Lemmens R, Van Damme P, Søndergaard HB, Sellebjerg F. Low‑frequency and rare‑coding variation contributes to multiple sclerosis risk. Cell. 2018;175(6):1679–1687.e1677. https ://doi.org/10.1016/j.cell.2018.09.049.
3. Hadjigeorgiou GM, Kountra PM, Koutsis G, Tsimourtou V, Siokas V, Dardioti M, Rikos D, Marogianni C, Aloizou AM, Karadima G, Ralli S, Grigoriadis N, Bogdanos D, Panas M, Dardiotis E. Replication study of GWAS risk loci in Greek multiple sclerosis patients. Neurol Sci. 2018. https ://doi.org/10.1007/s1007 2‑018‑3617‑6.
4. Kutzelnigg A, Lucchinetti CF, Stadelmann C, Bruck W, Rauschka H, Berg‑mann M, Schmidbauer M, Parisi JE, Lassmann H. Cortical demyelination and diffuse white matter injury in multiple sclerosis. Brain. 2005;128(Pt 11):2705–12. https ://doi.org/10.1093/brain /awh64 1.
5. Lycklama A, Nijeholt GJ. Reduction of brain volume in MS. MRI and pathology findings. J Neurol Sci. 2005;233(1–2):199–202. https ://doi.org/10.1016/j.jns.2005.03.016.
6. Giovannoni G, Butzkueven H, Dhib‑Jalbut S, Hobart J, Kobelt G, Pepper G, Sormani MP, Thalheim C, Traboulsee A, Vollmer T. Brain health: time matters in multiple sclerosis. Mult Scler Relat Disord. 2016;9:S5–48.
7. Calabrese M, Atzori M, Bernardi V, Morra A, Romualdi C, Rinaldi L, McAuliffe MJ, Barachino L, Perini P, Fischl B, Battistin L, Gallo P. Cortical atrophy is relevant in multiple sclerosis at clinical onset. J Neurol. 2007;254(9):1212–20. https ://doi.org/10.1007/s0041 5‑006‑0503‑6.
8. Paolillo A, Pozzilli C, Gasperini C, Giugni E, Mainero C, Giuliani S, Tomassini V, Millefiorini E, Bastianello S. Brain atrophy in
Page 20 of 25Andravizou et al. Autoimmun Highlights (2019) 10:7
relapsing‑remitting multiple sclerosis: relationship with ‘black holes’, disease duration and clinical disability. J Neurol Sci. 2000;174(2):85–91.
9. Ferguson B, Matyszak MK, Esiri MM, Perry VH. Axonal damage in acute multiple sclerosis lesions. Brain. 1997;120(Pt 3):393–9.
10. Bruck W. The pathology of multiple sclerosis is the result of focal inflam‑matory demyelination with axonal damage. J Neurol. 2005;252(Suppl 5):v3–9. https ://doi.org/10.1007/s0041 5‑005‑5002‑7.
11. Jacobsen C, Hagemeier J, Myhr KM, Nyland H, Lode K, Bergsland N, Ramasamy DP, Dalaker TO, Larsen JP, Farbu E, Zivadinov R. Brain atrophy and disability progression in multiple sclerosis patients: a 10‑year follow‑up study. J Neurol Neurosurg Psychiatry. 2014;85(10):1109–15. https ://doi.org/10.1136/jnnp‑2013‑30690 6.
12. Fisher E, Lee JC, Nakamura K, Rudick RA. Gray matter atrophy in multiple sclerosis: a longitudinal study. Ann Neurol. 2008;64(3):255–65. https ://doi.org/10.1002/ana.21436 .
13. Tsivgoulis G, Katsanos AH, Grigoriadis N, Hadjigeorgiou GM, Helio‑poulos I, Papathanasopoulos P, Dardiotis E, Kilidireas C, Voumvourakis K. The effect of disease‑modifying therapies on brain atrophy in patients with clinically isolated syndrome: a systematic review and meta‑analysis. Ther Adv Neurol Disord. 2015;8(5):193–202. https ://doi.org/10.1177/17562 85615 60038 1.
14. Bermel RA, Bakshi R. The measurement and clinical relevance of brain atrophy in multiple sclerosis. Lancet Neurol. 2006;5(2):158–70. https ://doi.org/10.1016/s1474 ‑4422(06)70349 ‑0.
15. Pelletier D, Garrison K, Henry R. Measurement of whole‑brain atrophy in multiple sclerosis. J Neuroimaging. 2004;14(3 Suppl):11s–9s. https ://doi.org/10.1177/10512 28404 26626 4.
16. Riley C, Azevedo C, Bailey M, Pelletier D. Clinical applications of imag‑ing disease burden in multiple sclerosis: MRI and advanced imaging techniques. Expert Rev Neurother. 2012;12(3):323–33. https ://doi.org/10.1586/ern.11.196.
17. Ghione E, Bergsland N, Dwyer MG, Hagemeier J, Jakimovski D, Paun‑koski I, Ramasamy DP, Silva D, Carl E, Hojnacki D, Kolb C, Weinstock‑Guttman B, Zivadinov R. Brain atrophy is associated with disability progression in patients with MS followed in a clinical routine. AJNR Am J Neuroradiol. 2018;39(12):2237–42. https ://doi.org/10.3174/ajnr.A5876 .
18. Chard D, Miller D. Grey matter pathology in clinically early multiple sclerosis: evidence from magnetic resonance imaging. J Neurol Sci. 2009;282(1–2):5–11. https ://doi.org/10.1016/j.jns.2009.01.012.
19. Pelvig DP, Pakkenberg H, Stark AK, Pakkenberg B. Neocortical glial cell numbers in human brains. Neurobiol Aging. 2008;29(11):1754–62. https ://doi.org/10.1016/j.neuro biola ging.2007.04.013.
20. von Bartheld CS, Bahney J, Herculano‑Houzel S. The search for true numbers of neurons and glial cells in the human brain: a review of 150 years of cell counting. J Comp Neurol. 2016;524(18):3865–95.
21. Filippi M, Charil A, Rovaris M, Absinta M, Rocca MA. Insights from mag‑netic resonance imaging. Handb Clin Neurol. 2014;122:115–49. https ://doi.org/10.1016/b978‑0‑444‑52001 ‑2.00006 ‑6.
22. Chu R, Kim G, Tauhid S, Khalid F, Healy BC, Bakshi R. Whole brain and deep gray matter atrophy detection over 5 years with 3T MRI in multiple sclerosis using a variety of automated segmentation pipelines. PLoS ONE. 2018;13(11):e0206939. https ://doi.org/10.1371/journ al.pone.02069 39.
23. Amiri H, de Sitter A, Bendfeldt K, Battaglini M, Gandini Wheeler‑Kingshott CAM, Calabrese M, Geurts JJG, Rocca MA, Sastre‑Garriga J, Enzinger C, de Stefano N, Filippi M, Rovira A, Barkhof F, Vrenken H. Urgent challenges in quantification and interpretation of brain grey matter atrophy in individual MS patients using MRI. Neuroimage Clin. 2018;19:466–75. https ://doi.org/10.1016/j.nicl.2018.04.023.
24. Miller DH, Barkhof F, Frank JA, Parker GJ, Thompson AJ. Measurement of atrophy in multiple sclerosis: pathological basis, methodological aspects and clinical relevance. Brain. 2002;125(Pt 8):1676–95.
25. Anderson VM, Fox NC, Miller DH. Magnetic resonance imaging measures of brain atrophy in multiple sclerosis. J Magn Reson Imaging. 2006;23(5):605–18. https ://doi.org/10.1002/jmri.20550 .
26. Zivadinov R, Reder AT, Filippi M, Minagar A, Stuve O, Lassmann H, Racke MK, Dwyer MG, Frohman EM, Khan O. Mechanisms of action of disease‑modifying agents and brain volume changes in multiple sclerosis. Neurology. 2008;71(2):136–44. https ://doi.org/10.1212/01.wnl.00003 16810 .01120 .05.
27. Dutta R, Trapp BD. Pathogenesis of axonal and neuronal damage in multiple sclerosis. Neurology. 2007;68(22 Suppl 3):S22–31. https ://doi.org/10.1212/01.wnl.00002 75229 .13012 .32 (Discussion S43–54).
28. Neacsu V, Jasperse B, Korteweg T, Knol DL, Valsasina P, Filippi M, Barkhof F, Rovaris M, Vrenken H. Agreement between different input image types in brain atrophy measurement in multiple sclerosis using SIENAX and SIENA. J Magn Reson Imaging. 2008;28(3):559–65.
29. Saidha S, Al‑Louzi O, Ratchford JN, Bhargava P, Oh J, Newsome SD, Prince JL, Pham D, Roy S, Van Zijl P. Optical coherence tomography reflects brain atrophy in multiple sclerosis: a four‑year study. Ann Neu‑rol. 2015;78(5):801–13.
30. Ruberte E, Sinnecker T, Amann M, Gaetano L, Naegelin Y, Penner IK, Kuhle J, Derfuss T, Kappos L, Granziera C, Wuerfel J, Yaldizli O. Central slab versus whole brain to measure brain atrophy in multiple sclerosis. Eur Neurol. 2019;80(3–4):207–14. https ://doi.org/10.1159/00049 5798.
31. Lorefice L, Fenu G, Sardu C, Frau J, Coghe G, Costa G, Schirru L, Secci MA, Sechi V, Barracciu MA, Marrosu MG, Cocco E. Multiple sclerosis and HLA genotypes: a possible influence on brain atrophy. Mult Scler. 2017. https ://doi.org/10.1177/13524 58517 73998 9.
32. Brex PA, Ciccarelli O, O’Riordan JI, Sailer M, Thompson AJ, Miller DH. A longitudinal study of abnormalities on MRI and disability from multiple sclerosis. N Engl J Med. 2002;346(3):158–64. https ://doi.org/10.1056/NEJMo a0113 41.
33. Tedeschi G, Lavorgna L, Russo P, Prinster A, Dinacci D, Savettieri G, Quattrone A, Livrea P, Messina C, Reggio A, Bresciamorra V, Orefice G, Paciello M, Brunetti A, Coniglio G, Bonavita S, Di Costanzo A, Bellacosa A, Valentino P, Quarantelli M, Patti F, Salemi G, Cammarata E, Simone IL, Salvatore M, Bonavita V, Alfano B. Brain atrophy and lesion load in a large population of patients with multiple sclerosis. Neurology. 2005;65(2):280–5. https ://doi.org/10.1212/01.wnl.00001 68837 .87351 .1f.
34. Dalton CM, Chard DT, Davies GR, Miszkiel KA, Altmann DR, Fernando K, Plant GT, Thompson AJ, Miller DH. Early development of multiple sclerosis is associated with progressive grey matter atrophy in patients presenting with clinically isolated syndromes. Brain. 2004;127(Pt 5):1101–7. https ://doi.org/10.1093/brain /awh12 6.
35. Meier DS, Weiner HL, Khoury SJ, Guttmann CR. Magnetic resonance imaging surrogates of multiple sclerosis pathology and their relation‑ship to central nervous system atrophy. J Neuroimaging. 2004;14(3 Suppl):46s–53s. https ://doi.org/10.1177/10512 28404 26626 8.
36. Pelletier D, Nelson SJ, Oh J, Antel JP, Kita M, Zamvil SS, Goodkin DE. MRI lesion volume heterogeneity in primary progressive MS in relation with axonal damage and brain atrophy. J Neurol Neurosurg Psychiatry. 2003;74(7):950–2.
37. Chard DT, Brex PA, Ciccarelli O, Griffin CM, Parker GJ, Dalton C, Altmann DR, Thompson AJ, Miller DH. The longitudinal relation between brain lesion load and atrophy in multiple sclerosis: a 14 year follow up study. J Neurol Neurosurg Psychiatry. 2003;74(11):1551–4.
38. Chard DT, Griffin CM, Parker GJ, Kapoor R, Thompson AJ, Miller DH. Brain atrophy in clinically early relapsing‑remitting multiple sclerosis. Brain. 2002;125(Pt 2):327–37.
39. Hochmeister S, Grundtner R, Bauer J, Engelhardt B, Lyck R, Gordon G, Korosec T, Kutzelnigg A, Berger JJ, Bradl M, Bittner RE, Lassmann H. Dysferlin is a new marker for leaky brain blood vessels in multiple sclerosis. J Neuropathol Exp Neurol. 2006;65(9):855–65. https ://doi.org/10.1097/01.jnen.00002 35119 .52311 .16.
40. Trapp BD, Vignos M, Dudman J, Chang A, Fisher E, Staugaitis SM, Batta‑pady H, Mork S, Ontaneda D, Jones SE. Cortical neuronal densities and cerebral white matter demyelination in multiple sclerosis: a retrospec‑tive study. Lancet Neurol. 2018;17(10):870–84.
41. Eshaghi A, Prados F, Brownlee WJ, Altmann DR, Tur C, Cardoso MJ, De Angelis F, van de Pavert SH, Cawley N, De Stefano N, Stromillo ML, Battaglini M, Ruggieri S, Gasperini C, Filippi M, Rocca MA, Rovira A, Sastre‑Garriga J, Vrenken H, Leurs CE, Killestein J, Pirpamer L, Enzinger C, Ourselin S, Wheeler‑Kingshott C, Chard D, Thompson AJ, Alexander DC, Barkhof F, Ciccarelli O. Deep gray matter volume loss drives disability worsening in multiple sclerosis. Ann Neurol. 2018;83(2):210–22. https ://doi.org/10.1002/ana.25145 .
42. Pagani E, Rocca MA, Gallo A, Rovaris M, Martinelli V, Comi G, Filippi M. Regional brain atrophy evolves differently in patients with multiple sclerosis according to clinical phenotype. AJNR Am J Neuroradiol. 2005;26(2):341–6.
Page 21 of 25Andravizou et al. Autoimmun Highlights (2019) 10:7
43. Minagar A, Toledo EG, Alexander JS, Kelley RE. Pathogenesis of brain and spinal cord atrophy in multiple sclerosis. J Neuroimaging. 2004;14(3 Suppl):5s–10s. https ://doi.org/10.1177/10512 28404 26626 3.
44. Mahad DH, Trapp BD, Lassmann H. Pathological mechanisms in pro‑gressive multiple sclerosis. Lancet Neurol. 2015;14(2):183–93.
45. Noseworthy JH, Lucchinetti C, Rodriguez M, Weinshenker BG. Multiple sclerosis. N Engl J Med. 2000;343(13):938–52. https ://doi.org/10.1056/nejm2 00009 28343 1307.
46. Popescu BFG, Lucchinetti CF. Meningeal and cortical grey matter pathology in multiple sclerosis. BMC Neurol. 2012;12(1):11.
47. Häusser‑Kinzel S, Weber MS. The role of B cells and antibodies in multiple sclerosis, neuromyelitis optica, and related disorders. Front Immunol. 2019;10:201.
48. Lassmann H, van Horssen J, Mahad D. Progressive multiple sclerosis: pathology and pathogenesis. Nat Rev Neurol. 2012;8(11):647–56. https ://doi.org/10.1038/nrneu rol.2012.168.
49. Dutta R, Trapp BD. Mechanisms of neuronal dysfunction and degenera‑tion in multiple sclerosis. Prog Neurobiol. 2011;93(1):1–12. https ://doi.org/10.1016/j.pneur obio.2010.09.005.
50. Ellwardt E, Zipp F. Molecular mechanisms linking neuroinflammation and neurodegeneration in MS. Exp Neurol. 2014;262(Pt A):8–17. https ://doi.org/10.1016/j.expne urol.2014.02.006.
51. Lucchinetti C, Bruck W, Parisi J, Scheithauer B, Rodriguez M, Lassmann H. Heterogeneity of multiple sclerosis lesions: implications for the pathogenesis of demyelination. Ann Neurol. 2000;47(6):707–17.
52. Metz I, Weigand SD, Popescu BF, Frischer JM, Parisi JE, Guo Y, Lassmann H, Bruck W, Lucchinetti CF. Pathologic heterogeneity persists in early active multiple sclerosis lesions. Ann Neurol. 2014;75(5):728–38. https ://doi.org/10.1002/ana.24163 .
53. Barnett MH, Prineas JW. Relapsing and remitting multiple sclerosis: pathology of the newly forming lesion. Ann Neurol. 2004;55(4):458–68. https ://doi.org/10.1002/ana.20016 .
54. Enzinger C, Ropele S, Smith S, Strasser‑Fuchs S, Poltrum B, Schmidt H, Matthews PM, Fazekas F. Accelerated evolution of brain atrophy and “black holes” in MS patients with APOE‑epsilon 4. Ann Neurol. 2004;55(4):563–9. https ://doi.org/10.1002/ana.20027 .
55. Koudriavtseva T, Mainero C. Neuroinflammation, neurodegeneration and regeneration in multiple sclerosis: intercorrelated manifestations of the immune response. Neural Regen Res. 2016;11(11):1727.
56. Filippi M, Rocca MA. MR imaging of multiple sclerosis. Radiology. 2011;259(3):659–81. https ://doi.org/10.1148/radio l.11101 362.
57. Trapp BD, Nave KA. Multiple sclerosis: an immune or neurodegenerative disorder? Annu Rev Neurosci. 2008;31:247–69. https ://doi.org/10.1146/annur ev.neuro .30.05160 6.09431 3.
58. Mahad D, Ziabreva I, Lassmann H, Turnbull D. Mitochondrial defects in acute multiple sclerosis lesions. Brain. 2008;131(Pt 7):1722–35. https ://doi.org/10.1093/brain /awn10 5.
59. Kuhle J, Kropshofer H, Haering DA, Kundu U, Meinert R, Barro C, Dahlke F, Tomic D, Leppert D, Kappos L. Blood neurofilament light chain as a biomarker of MS disease activity and treatment response. Neurology. 2019;92(10):e1007–15. https ://doi.org/10.1212/wnl.00000 00000 00703 2.
60. Lubetzki C, Stankoff B. Demyelination in multiple sclerosis. Handb Clin Neurol. 2014;122:89–99. https ://doi.org/10.1016/b978‑0‑444‑52001 ‑2.00004 ‑2.
61. Waxman SG, Craner MJ, Black JA. Na + channel expression along axons in multiple sclerosis and its models. Trends Pharmacol Sci. 2004;25(11):584–91. https ://doi.org/10.1016/j.tips.2004.09.001.
62. Desmazieres A, Sol‑Foulon N, Lubetzki C. Changes at the nodal and perinodal axonal domains: a basis for multiple sclerosis pathology? Mult Scler. 2012;18(2):133–7. https ://doi.org/10.1177/13524 58511 43437 0.
63. Fischer MT, Sharma R, Lim JL, Haider L, Frischer JM, Drexhage J, Mahad D, Bradl M, van Horssen J, Lassmann H. NADPH oxidase expression in active multiple sclerosis lesions in relation to oxidative tissue damage and mitochondrial injury. Brain. 2012;135(Pt 3):886–99. https ://doi.org/10.1093/brain /aws01 2.
64. Campbell GR, Mahad DJ. Mitochondria as crucial players in demy‑elinated axons: lessons from neuropathology and experimental demyelination. Autoimmune Dis. 2011;2011:262847. https ://doi.org/10.4061/2011/26284 7.
65. Witte ME, Mahad DJ, Lassmann H, van Horssen J. Mitochondrial dysfunction contributes to neurodegeneration in multiple sclerosis. Trends Mol Med. 2014;20(3):179–87. https ://doi.org/10.1016/j.molme d.2013.11.007.
66. Zambonin JL, Zhao C, Ohno N, Campbell GR, Engeham S, Ziabreva I, Schwarz N, Lee SE, Frischer JM, Turnbull DM, Trapp BD, Lassmann H, Franklin RJ, Mahad DJ. Increased mitochondrial content in remyelinated axons: implications for multiple sclerosis. Brain. 2011;134(Pt 7):1901–13. https ://doi.org/10.1093/brain /awr11 0.
67. Campbell GR, Ziabreva I, Reeve AK, Krishnan KJ, Reynolds R, Howell O, Lassmann H, Turnbull DM, Mahad DJ. Mitochondrial DNA deletions and neurodegeneration in multiple sclerosis. Ann Neurol. 2011;69(3):481–92. https ://doi.org/10.1002/ana.22109 .
68. Mao P, Reddy PH. Is multiple sclerosis a mitochondrial disease? Bio‑chimica et biophysica acta 1802. Biochim Biophys Acta. 2010;1:66–79. https ://doi.org/10.1016/j.bbadi s.2009.07.002.
69. Carvalho KS. Mitochondrial dysfunction in demyelinating diseases. Semin Pediatr Neurol. 2013;20(3):194–201. https ://doi.org/10.1016/j.spen.2013.09.001.
70. Filippi M, Rocca MA, Barkhof F, Bruck W, Chen JT, Comi G, DeLuca G, De Stefano N, Erickson BJ, Evangelou N, Fazekas F, Geurts JJ, Lucchinetti C, Miller DH, Pelletier D, Popescu BF, Lassmann H. Association between pathological and MRI findings in multiple sclerosis. Lancet Neurol. 2012;11(4):349–60. https ://doi.org/10.1016/s1474 ‑4422(12)70003 ‑0.
71. Bakshi R, Shaikh ZA, Janardhan V. MRI T2 shortening (‘black T2’) in multi‑ple sclerosis: frequency, location, and clinical correlation. NeuroReport. 2000;11(1):15–21.
72. Bermel RA, Puli SR, Rudick RA, Weinstock‑Guttman B, Fisher E, Mun‑schauer FE 3rd, Bakshi R. Prediction of longitudinal brain atrophy in multiple sclerosis by gray matter magnetic resonance imaging T2 hypointensity. Arch Neurol. 2005;62(9):1371–6. https ://doi.org/10.1001/archn eur.62.9.1371.
73. Ceccarelli A, Rocca MA, Perego E, Moiola L, Ghezzi A, Martinelli V, Comi G, Filippi M. Deep grey matter T2 hypo‑intensity in patients with paediatric multiple sclerosis. Mult Scler. 2011;17(6):702–7. https ://doi.org/10.1177/13524 58510 39564 5.
74. Stankiewicz JM, Neema M, Ceccarelli A. Iron and multiple sclerosis. Neurobiology of aging 35. Supplement. 2014;2:S51–8. https ://doi.org/10.1016/j.neuro biola ging.2014.03.039.
75. Stephenson E, Nathoo N, Mahjoub Y, Dunn JF, Yong VW. Iron in multiple sclerosis: roles in neurodegeneration and repair. Nat Rev Neurol. 2014;10(8):459–68. https ://doi.org/10.1038/nrneu rol.2014.118.
76. Stojanovic IR, Kostic M, Ljubisavljevic S. The role of glutamate and its receptors in multiple sclerosis. J Neural Transm. 2014;121(8):945–55. https ://doi.org/10.1007/s0070 2‑014‑1188‑0.
77. Sarchielli P, Greco L, Floridi A, Floridi A, Gallai V. Excitatory amino acids and multiple sclerosis: evidence from cerebrospinal fluid. Arch Neurol. 2003;60(8):1082–8. https ://doi.org/10.1001/archn eur.60.8.1082.
78. Geurts JJ, Wolswijk G, Bo L, van der Valk P, Polman CH, Troost D, Aronica E. Altered expression patterns of group I and II metabotropic glutamate receptors in multiple sclerosis. Brain. 2003;126(Pt 8):1755–66. https ://doi.org/10.1093/brain /awg17 9.
79. Srinivasan R, Sailasuta N, Hurd R, Nelson S, Pelletier D. Evidence of elevated glutamate in multiple sclerosis using magnetic resonance spectroscopy at 3 T. Brain. 2005;128(Pt 5):1016–25. https ://doi.org/10.1093/brain /awh46 7.
80. Papathanasiou A, Messinis L, Zampakis P, Panagiotakis G, Gourzis P, Georgiou V, Papathanasopoulos P. Thalamic atrophy predicts cognitive impairment in relapsing remitting multiple sclerosis. Effect on instru‑mental activities of daily living and employment status. J Neurol Sci. 2015;358(1–2):236–42.
81. Barkhof F. The clinico‑radiological paradox in multiple sclerosis revisited. Curr Opin Neurol. 2002;15(3):239–45.
82. Healy BC, Buckle GJ, Ali EN, Egorova S, Khalid F, Tauhid S, Glanz BI, Chitnis T, Guttmann CR, Weiner HL. Characterizing clinical and MRI dissociation in patients with multiple sclerosis. J Neuroimaging. 2017;27(5):481–5.
83. Rudick RA, Fisher E, Lee JC, Duda JT, Simon J. Brain atrophy in relapsing multiple sclerosis: relationship to relapses, EDSS, and treatment with interferon beta‑1a. Mult Scler. 2000;6(6):365–72.
Page 22 of 25Andravizou et al. Autoimmun Highlights (2019) 10:7
84. Fisher E, Rudick RA, Simon JH, Cutter G, Baier M, Lee JC, Miller D, Weinstock‑Guttman B, Mass MK, Dougherty DS, Simonian NA. Eight‑year follow‑up study of brain atrophy in patients with MS. Neurology. 2002;59(9):1412–20.
85. Zivadinov R, Bakshi R. Central nervous system atrophy and clinical status in multiple sclerosis. J Neuroimaging. 2004;14(3 Suppl):27s–35s. https ://doi.org/10.1177/10512 28404 26626 6.
86. Sormani MP, Arnold DL, De Stefano N. Treatment effect on brain atro‑phy correlates with treatment effect on disability in multiple sclerosis. Ann Neurol. 2014;75(1):43–9. https ://doi.org/10.1002/ana.24018 .
87. Rudick RA, Fisher E, Lee JC, Simon J, Jacobs L. Use of the brain paren‑chymal fraction to measure whole brain atrophy in relapsing‑remitting MS. Multiple Sclerosis Collaborative Research Group. Neurology. 1999;53(8):1698–704.
88. Rocca MA, Comi G, Filippi M. The role of T1‑weighted derived measures of neurodegeneration for assessing disability progression in multiple sclerosis. Front Neurol. 2017;8:433.
89. Zivadinov R, Uher T, Hagemeier J, Vaneckova M, Ramasamy DP, Tyblova M, Bergsland N, Seidl Z, Dwyer MG, Krasensky J, Havrdova E, Horakova D. A serial 10‑year follow‑up study of brain atrophy and disability pro‑gression in RRMS patients. Mult Scler. 2016;22(13):1709–18. https ://doi.org/10.1177/13524 58516 62976 9.
90. Rojas JI, Patrucco L, Besada C, Bengolea L, Cristiano E. Brain atrophy at onset and physical disability in multiple sclerosis. Arq Neuropsiquiatr. 2012;70(10):765–8.
91. Samann PG, Knop M, Golgor E, Messler S, Czisch M, Weber F. Brain volume and diffusion markers as predictors of disability and short‑term disease evolution in multiple sclerosis. AJNR Am J Neuroradiol. 2012;33(7):1356–62. https ://doi.org/10.3174/ajnr.A2972 .
92. Fragoso YD, Wille PR, Abreu M, Brooks JBB, Dias RM, Duarte JA, Farage L, Finkelsztejn A, Frohlich AC, Goncalves MVM, Guedes BVS, Medeiros L, Oliveira RA, Ribas FD, da Rocha FCG, Santos GAC, Scorcine C, da Silveira GL, Spedo CT, Tauil CB, Varela JS, Vieira VLF. Correlation of clinical findings and brain volume data in multiple sclerosis. J Clin Neurosci. 2017;44:155–7. https ://doi.org/10.1016/j.jocn.2017.06.006.
93. Pichler A, Khalil M, Langkammer C, Pinter D, Bachmaier G, Ropele S, Fuchs S, Enzinger C, Fazekas F. Combined analysis of global and com‑partmental brain volume changes in early multiple sclerosis in clinical practice. Mult Scler. 2016;22(3):340–6. https ://doi.org/10.1177/13524 58515 59340 5.
94. Bakirtzis C, Ioannidis P, Messinis L, Nasios G, Konstantinopoulou E, Papa‑thanasopoulos P, Grigoriadis N. The rationale for monitoring cognitive function in multiple sclerosis: practical issues for clinicians. Open Neurol J. 2018;12:31–40. https ://doi.org/10.2174/18742 05x01 81201 0031.
95. Anhoque CF, Biccas Neto L, Domingues SCA, Teixeira AL, Domingues RB. Cognitive impairment in patients with clinically isolated syndrome. Dement Neuropsychol. 2012;6:266–9.
96. Zivadinov R, Sepcic J, Nasuelli D, De Masi R, Bragadin LM, Tommasi MA, Zambito‑Marsala S, Moretti R, Bratina A, Ukmar M, Pozzi‑Mucelli RS, Grop A, Cazzato G, Zorzon M. A longitudinal study of brain atrophy and cognitive disturbances in the early phase of relapsing‑remitting multiple sclerosis. J Neurol Neurosurg Psychiatry. 2001;70(6):773–80.
97. Calabrese M, Rinaldi F, Mattisi I, Grossi P, Favaretto A, Atzori M, Bernardi V, Barachino L, Romualdi C, Rinaldi L, Perini P, Gallo P. Widespread corti‑cal thinning characterizes patients with MS with mild cognitive impair‑ment. Neurology. 2010;74(4):321–8. https ://doi.org/10.1212/WNL.0b013 e3181 cbcd0 3.
98. Pravata E, Rocca MA, Valsasina P, Riccitelli GC, Gobbi C, Comi G, Falini A, Filippi M. Gray matter trophism, cognitive impairment, and depression in patients with multiple sclerosis. Mult Scler. 2017;23(14):1864–74. https ://doi.org/10.1177/13524 58517 69288 6.
99. Houtchens MK, Benedict RH, Killiany R, Sharma J, Jaisani Z, Singh B, Weinstock‑Guttman B, Guttmann CR, Bakshi R. Thalamic atrophy and cognition in multiple sclerosis. Neurology. 2007;69(12):1213–23. https ://doi.org/10.1212/01.wnl.00002 76992 .17011 .b5.
100. Sumowski JF, Chiaravalloti N, Wylie G, Deluca J. Cognitive reserve moderates the negative effect of brain atrophy on cognitive efficiency in multiple sclerosis. J Int Neuropsychol Soc. 2009;15(4):606–12. https ://doi.org/10.1017/s1355 61770 90909 12.
101. Benedict RH, Wahlig E, Bakshi R, Fishman I, Munschauer F, Zivadinov R, Weinstock‑Guttman B. Predicting quality of life in multiple sclerosis:
accounting for physical disability, fatigue, cognition, mood disorder, personality, and behavior change. J Neurol Sci. 2005;231(1–2):29–34. https ://doi.org/10.1016/j.jns.2004.12.009.
102. Sepulcre J, Masdeu JC, Goni J, Arrondo G, Velez de Mendizabal N, Beja‑rano B, Villoslada P. Fatigue in multiple sclerosis is associated with the disruption of frontal and parietal pathways. Mult Scler. 2009;15(3):337–44. https ://doi.org/10.1177/13524 58508 09837 3.
103. Luessi F, Siffrin V, Zipp F. Neurodegeneration in multiple sclerosis: novel treatment strategies. Expert Rev Neurother. 2012;12(9):1061–76. https ://doi.org/10.1586/ern.12.59 (quiz 1077).
104. Fisher E, Nakamura K, Lee JC, You X, Sperling B, Rudick RA. Effect of intramuscular interferon beta‑1a on gray matter atrophy in relapsing‑remitting multiple sclerosis: a retrospective analysis. Mult Scler. 2016;22(5):668–76. https ://doi.org/10.1177/13524 58515 59907 2.
105. De Stefano N, Comi G, Kappos L, Freedman MS, Polman CH, Uitdehaag BM, Hennessy B, Casset‑Semanaz F, Lehr L, Stubinski B, Jack DL, Barkhof F. Efficacy of subcutaneous interferon beta‑1a on MRI outcomes in a randomised controlled trial of patients with clinically isolated syn‑dromes. J Neurol Neurosurg Psychiatry. 2014;85(6):647–53. https ://doi.org/10.1136/jnnp‑2013‑30628 9.
106. Filippi M, Rovaris M, Inglese M, Barkhof F, De Stefano N, Smith S, Comi G. Interferon beta‑1a for brain tissue loss in patients at presentation with syndromes suggestive of multiple sclerosis: a randomised, double‑blind, placebo‑controlled trial. Lancet. 2004;364(9444):1489–96. https ://doi.org/10.1016/s0140 ‑6736(04)17271 ‑1.
107. Jones CK, Riddehough A, Li DKB, Zhao G, Paty DW, Group. atPS. MRI cerebral atrophy in relapsing‑remitting MS: results from the PRISMS trial. Neurology. 2001;56(suppl 3):379 (abstr).
108. Kappos L, Traboulsee A, Constantinescu C, Eralinna JP, Forrestal F, Jon‑gen P, Pollard J, Sandberg‑Wollheim M, Sindic C, Stubinski B, Uitdehaag B, Li D. Long‑term subcutaneous interferon beta‑1a therapy in patients with relapsing‑remitting MS. Neurology. 2006;67(6):944–53. https ://doi.org/10.1212/01.wnl.00002 37994 .95410 .ce.
109. Ravnborg M, Sorensen PS, Andersson M, Celius EG, Jongen PJ, Elovaara I, Bartholome E, Constantinescu CS, Beer K, Garde E, Sperling B. Meth‑ylprednisolone in combination with interferon beta‑1a for relapsing‑remitting multiple sclerosis (MECOMBIN study): a multicentre, double‑blind, randomised, placebo‑controlled, parallel‑group trial. Lancet Neurol. 2010;9(7):672–80. https ://doi.org/10.1016/s1474 ‑4422(10)70132 ‑0.
110. Sorensen PS, Mellgren SI, Svenningsson A, Elovaara I, Frederiksen JL, Beiske AG, Myhr KM, Sogaard LV, Olsen IC, Sandberg‑Wollheim M. NORdic trial of oral Methylprednisolone as add‑on therapy to Interferon beta‑1a for treatment of relapsing‑remitting Multiple Sclerosis (NOR‑MIMS study): a randomised, placebo‑controlled trial. Lancet Neurol. 2009;8(6):519–29. https ://doi.org/10.1016/s1474 ‑4422(09)70085 ‑7.
111. Calabresi PA, Kieseier BC, Arnold DL, Balcer LJ, Boyko A, Pelletier J, Liu S, Zhu Y, Seddighzadeh A, Hung S, Deykin A. Pegylated interferon beta‑1a for relapsing‑remitting multiple sclerosis (ADVANCE): a randomised, phase 3, double‑blind study. Lancet Neurol. 2014;13(7):657–65. https ://doi.org/10.1016/s1474 ‑4422(14)70068 ‑7.
112. Arnold DL, Kieseier BC, You X, Liu S, Sperling B, Hung S. Effects of Peginterferon Beta‑1a on brain volume loss and magnetisation transfer ratio in patients with relapsing‑remitting multiple sclerosis: 2‑year advance results flash poster 2069. Eur J Neurol. 2015;22:614. https ://doi.org/10.1111/ene.12808 .
113. Comi G, Cohen JA, Arnold DL, Wynn D, Filippi M. Phase III dose‑com‑parison study of glatiramer acetate for multiple sclerosis. Ann Neurol. 2011;69(1):75–82. https ://doi.org/10.1002/ana.22316 .
114. Comi G, Martinelli V, Rodegher M, Moiola L, Bajenaru O, Carra A, Elovaara I, Fazekas F, Hartung HP, Hillert J, King J, Komoly S, Lubetzki C, Montalban X, Myhr KM, Ravnborg M, Rieckmann P, Wynn D, Young C, Filippi M. Effect of glatiramer acetate on conversion to clinically definite multiple sclerosis in patients with clinically isolated syndrome (PreCISe study): a randomised, double‑blind, placebo‑controlled trial. Lancet. 2009;374(9700):1503–11. https ://doi.org/10.1016/s0140 ‑6736(09)61259 ‑9.
115. Comi G, Martinelli V, Rodegher M, Moiola L, Leocani L, Bajenaru O, Carra A, Elovaara I, Fazekas F, Hartung HP, Hillert J, King J, Komoly S, Lubetzki C, Montalban X, Myhr KM, Preziosa P, Ravnborg M, Rieckmann P, Rocca MA, Wynn D, Young C, Filippi M. Effects of early treatment with
Page 23 of 25Andravizou et al. Autoimmun Highlights (2019) 10:7
glatiramer acetate in patients with clinically isolated syndrome. Mult Scler. 2013;19(8):1074–83. https ://doi.org/10.1177/13524 58512 46969 5.
116. Ge Y, Grossman RI, Udupa JK, Fulton J, Constantinescu CS, Gonzales‑Scarano F, Babb JS, Mannon LJ, Kolson DL, Cohen JA. Glatiramer acetate (Copaxone) treatment in relapsing‑remitting MS: quantitative MR assessment. Neurology. 2000;54(4):813–7.
117. Khan O, Shen Y, Caon C, Bao F, Ching W, Reznar M, Buccheister A, Hu J, Latif Z, Tselis A, Lisak R. Axonal metabolic recovery and potential neuro‑protective effect of glatiramer acetate in relapsing‑remitting multiple sclerosis. Mult Scler. 2005;11(6):646–51.
118. Rovaris M, Comi G, Rocca MA, Valsasina P, Ladkani D, Pieri E, Weiss S, Shi‑froni G, Wolinsky JS, Filippi M. Long‑term follow‑up of patients treated with glatiramer acetate: a multicentre, multinational extension of the European/Canadian double‑blind, placebo‑controlled, MRI‑monitored trial. Mult Scler. 2007;13(4):502–8. https ://doi.org/10.1177/13524 58506 07070 4.
119. Rovaris M, Comi G, Rocca MA, Wolinsky JS, Filippi M. Short‑term brain volume change in relapsing‑remitting multiple sclerosis: effect of glatiramer acetate and implications. Brain. 2001;124(Pt 9):1803–12.
120. Calabresi PA, Radue EW, Goodin D, Jeffery D, Rammohan KW, Reder AT, Vollmer T, Agius MA, Kappos L, Stites T, Li B, Cappiello L, von Rosenstiel P, Lublin FD. Safety and efficacy of fingolimod in patients with relapsing‑remitting multiple sclerosis (FREEDOMS II): a double‑blind, randomised, placebo‑controlled, phase 3 trial. Lancet Neurol. 2014;13(6):545–56. https ://doi.org/10.1016/s1474 ‑4422(14)70049 ‑3.
121. Cohen JA, Barkhof F, Comi G, Hartung HP, Khatri BO, Montalban X, Pel‑letier J, Capra R, Gallo P, Izquierdo G, Tiel‑Wilck K, de Vera A, Jin J, Stites T, Wu S, Aradhye S, Kappos L. Oral fingolimod or intramuscular interferon for relapsing multiple sclerosis. N Engl J Med. 2010;362(5):402–15. https ://doi.org/10.1056/NEJMo a0907 839.
122. Kappos L, Radue EW, O’Connor P, Polman C, Hohlfeld R, Calabresi P, Selmaj K, Agoropoulou C, Leyk M, Zhang‑Auberson L, Burtin P. A placebo‑controlled trial of oral fingolimod in relapsing multiple sclero‑sis. N Engl J Med. 2010;362(5):387–401. https ://doi.org/10.1056/NEJMo a0909 494.
123. Cohen JA, Khatri B, Barkhof F, Comi G, Hartung HP, Montalban X, Pel‑letier J, Stites T, Ritter S, von Rosenstiel P, Tomic D, Kappos L. Long‑term (up to 4.5 years) treatment with fingolimod in multiple sclerosis: results from the extension of the randomised TRANSFORMS study. J Neurol Neurosurg Psychiatry. 2016;87(5):468–75. https ://doi.org/10.1136/jnnp‑2015‑31059 7.
124. Kappos L, O’Connor P, Radue EW, Polman C, Hohlfeld R, Selmaj K, Rit‑ter S, Schlosshauer R, von Rosenstiel P, Zhang‑Auberson L, Francis G. Long‑term effects of fingolimod in multiple sclerosis: the randomized FREEDOMS extension trial. Neurology. 2015;84(15):1582–91. https ://doi.org/10.1212/wnl.00000 00000 00146 2.
125. Khatri B, Barkhof F, Comi G, Hartung HP, Kappos L, Montalban X, Pelletier J, Stites T, Wu S, Holdbrook F, Zhang‑Auberson L, Francis G, Cohen JA. Comparison of fingolimod with interferon beta‑1a in relapsing‑remit‑ting multiple sclerosis: a randomised extension of the TRANSFORMS study. Lancet Neurol. 2011;10(6):520–9. https ://doi.org/10.1016/s1474 ‑4422(11)70099 ‑0.
126. Lublin F, Miller DH, Freedman MS, Cree BA, Wolinsky JS, Weiner H, Lubetzki C, Hartung HP, Montalban X, Uitdehaag BM, Merschhemke M, Li B, Putzki N, Liu FC, Haring DA, Kappos L. Oral fingolimod in primary progressive multiple sclerosis (INFORMS): a phase 3, randomised, double‑blind, placebo‑controlled trial. Lancet. 2016;387(10023):1075–84. https ://doi.org/10.1016/s0140 ‑6736(15)01314 ‑8.
127. Yousuf F, Dupuy SL, Tauhid S, Chu R, Kim G, Tummala S, Khalid F, Weiner HL, Chitnis T, Healy BC, Bakshi R. A two‑year study using cerebral gray matter volume to assess the response to fingolimod therapy in mul‑tiple sclerosis. J Neurol Sci. 2017;383:221–9. https ://doi.org/10.1016/j.jns.2017.10.019.
128. Khalil M, Enzinger C, Langkammer C, Petrovic K, Loitfelder M, Tscherner M, Jehna M, Bachmaier G, Wallner‑Blazek M, Ropele S. Cognitive impairment in relation to MRI metrics in patients with clinically isolated syndrome. Mult Scler J. 2011;17(2):173–80.
129. Miller AE, Wolinsky JS, Kappos L, Comi G, Freedman MS, Olsson TP, Bauer D, Benamor M, Truffinet P, O’Connor PW. Oral teriflunomide for patients with a first clinical episode suggestive of multiple sclerosis (TOPIC): a randomised, double‑blind, placebo‑controlled, phase 3
trial. Lancet Neurol. 2014;13(10):977–86. https ://doi.org/10.1016/s1474 ‑4422(14)70191 ‑7.
130. O’Connor P, Wolinsky JS, Confavreux C, Comi G, Kappos L, Olsson TP, Benzerdjeb H, Truffinet P, Wang L, Miller A, Freedman MS. Randomized trial of Oral teriflunomide for relapsing multiple sclerosis. N Engl J Med. 2011;365(14):1293–303. https ://doi.org/10.1056/NEJMo a1014 656.
131. Wolinsky JS, Narayana PA, Nelson F, Datta S, O’Connor P, Confavreux C, Comi G, Kappos L, Olsson TP, Truffinet P, Wang L, Miller A, Freedman MS. Magnetic resonance imaging outcomes from a phase III trial of teriflu‑nomide. Mult Scler. 2013;19(10):1310–9. https ://doi.org/10.1177/13524 58513 47572 3.
132. Sprenger T, Kappos L, Radue E‑W, Gaetano L, Mueller‑Lenke N, Wuerfel J, Thangavelu K, Panzara M, Cavalier S, Wolinsky J. Teriflunomide signifi‑cantly slows brain volume loss in MS patients irrespective of disability progression (P3.047). Neurology 2016;86 (16 Supplement). https ://n.neuro logy.org/conte nt/86/16_Suppl ement /P3.047.
133. Freedman MS, T Sprenger T, Radue E‑W, Wuerfel J, Miller AE, Thangav‑elu K, Panzara MA, Cavalier S, Kappos L. Teriflunomide is effective in reducing brain volume loss in previously treated patients: a subgroup analysis of TEMSO SIENA data (P734). ECTRIMS 2016; 2016. https ://onlin elibr ary.ectri ms‑congr ess.eu/ectri ms/2016/32nd/14657 4/mark.s.freed man.terifl unom ide.is.effec tive.in.reduc ing.brain .volum e.loss.in.html?f=p6m3e 1031o 14010 .
134. Radue E‑W, Sprenger T, Gaetano L, Mueller‑Lenke N, Wuerfel J, Thangav‑elu K, Cavalier S, Kappos L. Teriflunomide slows brain volume loss in relapsing MS: A SIENA analysis of the TEMSO MRI dataset (P3.089). Neurology 2016;86 (16 Supplement). https ://n.neuro logy.org/conte nt/86/16_Suppl ement /P3.089.
135. Wuerfel J, Kappos L, Radue E‑W, Gaetano L, Mueller‑Lenke N, Thangav‑elu K, Panzara M, Cavalier S, Wolinsky J, Sprenger T. Teriflunomide slows brain volume loss: subgroup analysis of the SIENA TEMSO MRI dataset (P3.052). Neurology 2016;86 (16 Supplement). https ://n.neuro logy.org/conte nt/86/16_Suppl ement /P3.052.
136. Arnold DL, Gold R, Kappos L, Bar‑Or A, Giovannoni G, Selmaj K, Yang M, Zhang R, Stephan M, Sheikh SI, Dawson KT. Effects of delayed‑release dimethyl fumarate on MRI measures in the Phase 3 DEFINE study. J Neurol. 2014;261(9):1794–802. https ://doi.org/10.1007/s0041 5‑014‑7412‑x.
137. Miller DH, Fox RJ, Phillips JT, Hutchinson M, Havrdova E, Kita M, Wheeler‑Kingshott CAM, Tozer DJ, MacManus DG, Yousry TA, Goodsell M, Yang M, Zhang R, Viglietta V, Dawson KT, For the Csi. Effects of delayed‑release dimethyl fumarate on MRI measures in the phase 3 CONFIRM study. Neurology. 2015;84(11):1145–52. https ://doi.org/10.1212/WNL.00000 00000 00136 0.
138. Dupuy SL, Tauhid S, Hurwitz S, Chu R, Yousuf F, Bakshi R. The effect of dimethyl fumarate on cerebral gray matter atrophy in multiple sclerosis. Neurol Ther. 2016. https ://doi.org/10.1007/s4012 0‑016‑0054‑4.
139. Miller DH, Soon D, Fernando KT, MacManus DG, Barker GJ, Yousry TA, Fisher E, O’Connor PW, Phillips JT, Polman CH, Kappos L, Hutchinson M, Havrdova E, Lublin FD, Giovannoni G, Wajgt A, Rudick R, Lynn F, Panzara MA, Sandrock AW. MRI outcomes in a placebo‑controlled trial of natali‑zumab in relapsing MS. Neurology. 2007;68(17):1390–401. https ://doi.org/10.1212/01.wnl.00002 60064 .77700 .fd.
140. Radue EW, Stuart WH, Calabresi PA, Confavreux C, Galetta SL, Rudick RA, Lublin FD, Weinstock‑Guttman B, Wynn DR, Fisher E, Papadopoulou A, Lynn F, Panzara MA, Sandrock AW. Natalizumab plus interferon beta‑1a reduces lesion formation in relapsing multiple sclerosis. J Neurol Sci. 2010;292(1–2):28–35. https ://doi.org/10.1016/j.jns.2010.02.012.
141. Portaccio E, Stromillo ML, Goretti B, Hakiki B, Giorgio A, Rossi F, De Leucio A, De Stefano N, Amato MP. Natalizumab may reduce cogni‑tive changes and brain atrophy rate in relapsing‑remitting multiple sclerosis—a prospective, non‑randomized pilot study. Eur J Neurol. 2013;20(6):986–90. https ://doi.org/10.1111/j.1468‑1331.2012.03882 .x.
142. Vidal‑Jordana A, Sastre‑Garriga J, Perez‑Miralles F, Tur C, Tintore M, Horga A, Auger C, Rio J, Nos C, Edo MC, Arevalo MJ, Castillo J, Rovira A, Montalban X. Early brain pseudoatrophy while on natalizumab therapy is due to white matter volume changes. Mult Scler. 2013;19(9):1175–81. https ://doi.org/10.1177/13524 58512 47319 0.
143. Rinaldi F, Calabrese M, Seppi D, Puthenparampil M, Perini P, Gallo P. Natalizumab strongly suppresses cortical pathology in
Page 24 of 25Andravizou et al. Autoimmun Highlights (2019) 10:7
relapsing‑remitting multiple sclerosis. Mult Scler. 2012;18(12):1760–7. https ://doi.org/10.1177/13524 58512 44770 4.
144. Kapoor R, Ho P‑R, Campbell N, Chang I, Deykin A, Forrestal F, Lucas N, Yu B, Arnold DL, Freedman MS. Effect of natalizumab on disease progres‑sion in secondary progressive multiple sclerosis (ASCEND): a phase 3, randomised, double‑blind, placebo‑controlled trial with an open‑label extension. Lancet Neurol. 2018;17(5):405–15.
145. Arpin EC, Sobrino TG, Vivero CD, del Campo Amigo Jorrin M, Regal AR, Gonzalez JP, Bouzas ML. Changes in brain atrophy indices in patients with relapsing‑remitting multiple sclerosis treated with natalizumab. Neurodegener Dis Manag. 2016;6(1):5–12. https ://doi.org/10.2217/nmt.15.53.
146. Investigators TCT. Alemtuzumab vs interferon beta‑1a in early multiple sclerosis. N Engl J Med. 2008;359(17):1786–801. https ://doi.org/10.1056/nejmo a0802 670.
147. Cohen JA, Coles AJ, Arnold DL, Confavreux C, Fox EJ, Hartung HP, Havrdova E, Selmaj KW, Weiner HL, Fisher E, Brinar VV, Giovannoni G, Stojanovic M, Ertik BI, Lake SL, Margolin DH, Panzara MA, Compston DA. Alemtuzumab versus interferon beta 1a as first‑line treatment for patients with relapsing‑remitting multiple sclerosis: a randomised controlled phase 3 trial. Lancet. 2012;380(9856):1819–28. https ://doi.org/10.1016/s0140 ‑6736(12)61769 ‑3.
148. Coles AJ, Twyman CL, Arnold DL, Cohen JA, Confavreux C, Fox EJ, Hartung HP, Havrdova E, Selmaj KW, Weiner HL, Miller T, Fisher E, Sandbrink R, Lake SL, Margolin DH, Oyuela P, Panzara MA, Compston DA. Alemtuzumab for patients with relapsing multiple sclerosis after disease‑modifying therapy: a randomised controlled phase 3 trial. Lancet. 2012;380(9856):1829–39. https ://doi.org/10.1016/s0140 ‑6736(12)61768 ‑1.
149. Traboulsee A, Barnett M, Comi G, LaGanke C, Pelletier D, Rovira A, Schip‑pling S, Margolin DH, Thangavelu K, Nakamura K, Arnold DL, Investiga‑tors obotC‑MIaC‑MI. Alemtuzumab durably slows brain volume loss over 6 years in the absence of continuous treatment in patients with active RRMS who were treatment‑naive (CARE‑MS I) or had an inad‑equate response to prior therapy (CARE‑MS II) (P1181). ECTRIMS 2016; 2016.
150. Coles AJ, Cohen JA, Fox EJ, Giovannoni G, Hartung HP, Havrdova E, Schippling S, Selmaj KW, Traboulsee A, Compston DAS, Margolin DH, Thangavelu K, Chirieac MC, Jody D, Xenopoulos P, Hogan RJ, Panzara MA, Arnold DL. Alemtuzumab CARE‑MS II 5‑year follow‑up: efficacy and safety findings. Neurology. 2017;89(11):1117–26. https ://doi.org/10.1212/wnl.00000 00000 00435 4.
151. Arnold DL, Kappos L, Khan O, Gauthier SA, Greenberg S, Ma W, Wang P, Elkins J, Sabatella G. Reduction in brain volume loss in patients receiv‑ing daclizumab HYP versus intramuscular interferon beta‑1a: results of the DECIDE study (P558). ECTRIMS 2015; 2015.
152. Borges IT, Shea CD, Ohayon J, Jones BC, Stone RD, Ostuni J, Shiee N, McFarland H, Bielekova B, Reich DS. The effect of daclizumab on brain atrophy in relapsing‑remitting multiple sclerosis. Mult Scler Relat Disord. 2013;2(2):133–40. https ://doi.org/10.1016/j.msard .2012.10.002.
153. Gold R, Giovannoni G, Selmaj K, Havrdova E, Montalban X, Radue EW, Stefoski D, Robinson R, Riester K, Rana J, Elkins J, O’Neill G. Dacli‑zumab high‑yield process in relapsing‑remitting multiple sclerosis (SELECT): a randomised, double‑blind, placebo‑controlled trial. Lancet. 2013;381(9884):2167–75. https ://doi.org/10.1016/s0140 ‑6736(12)62190 ‑4.
154. Arnold D, Bar‑Or A, Comi G, Hartung H‑P, Hauser S, Kappos L, Lublin F, Selmaj K, Traboulsee A, Klingelschmitt G, Masterman D, Fontoura P, Chin P, Garren H, Wolinsky J. Effect of ocrelizumab on MRI inflammatory and neurodegenerative markers of disease in patients with relapsing mul‑tiple sclerosis: analysis of the phase III, double‑blind, double‑dummy, interferon beta‑1a‑controlled OPERA I and OPERA II studies (S49.002). Neurology 2016;86 (16 Supplement). https ://n.neuro logy.org/conte nt/86/16_Suppl ement /S49.002.
155. Montalban X, Hemmer B, Rammohan K, Giovannoni G, De Seze J, Bar‑Or A, Arnold D, Sauter A, Masterman D, Fontoura P, Garren H, Chin P, Wolinsky J. Efficacy and safety of ocrelizumab in primary progressive multiple sclerosis: results of the phase III double‑blind, placebo‑con‑trolled ORATORIO study (S49.001). Neurology 2016;86 (16 Supplement). https ://onlin elibr ary.ectri ms‑congr ess.eu/ectri ms/2015/31st/11670 1/xavie r.monta lban.effic acy.and.safet y.of.ocrel izuma b.in.prima ry.progr essiv e.html?f=m3.
156. Bruck W, Pfortner R, Pham T, Zhang J, Hayardeny L, Piryatinsky V, Hanisch UK, Regen T, van Rossum D, Brakelmann L, Hagemeier K, Kuhlmann T, Stadelmann C, John GR, Kramann N, Wegner C. Reduced astrocytic NF‑kappaB activation by laquinimod protects from cuprizone‑induced demyelination. Acta Neuropathol. 2012;124(3):411–24. https ://doi.org/10.1007/s0040 1‑012‑1009‑1.
157. Comi G, Jeffery D, Kappos L, Montalban X, Boyko A, Rocca MA, Filippi M. Placebo‑Controlled Trial of Oral Laquinimod for Multiple Sclerosis. N Engl J Med. 2012;366(11):1000–9. https ://doi.org/10.1056/NEJMo a1104 318.
158. Vollmer TL, Sorensen PS, Selmaj K, Zipp F, Havrdova E, Cohen JA, Sas‑son N, Gilgun‑Sherki Y, Arnold DL. A randomized placebo‑controlled phase III trial of oral laquinimod for multiple sclerosis. J Neurol. 2014;261(4):773–83. https ://doi.org/10.1007/s0041 5‑014‑7264‑4.
159. Alroughani R, Deleu D, El Salem K, Al‑Hashel J, Alexander KJ, Abdelrazek MA, Aljishi A, Alkhaboori J, Al Azri F, Al Zadjali N. A regional consensus recommendation on brain atrophy as an outcome measure in multiple sclerosis. BMC Neurol. 2016;16(1):240.
160. Filippi M, Rovaris M, Iannucci G, Mennea S, Sormani MP, Comi G. Whole brain volume changes in patients with progressive MS treated with cladribine. Neurology. 2000;55(11):1714–8.
161. Giovannoni G, Comi G, Cook S, Rammohan K, Rieckmann P, Sørensen PS, Vermersch P, Chang P, Hamlett A, Musch B, Greenberg SJ. A placebo‑controlled trial of oral cladribine for relapsing multiple sclerosis. N Engl J Med. 2010;362(5):416–26. https ://doi.org/10.1056/NEJMo a0902 533.
162. De Stefano N, Giorgio A, Battaglini M, De Leucio A, Hicking C, Dan‑gond F, Giovannoni G, Sormani MP. Reduced brain atrophy rates are associated with lower risk of disability progression in patients with relapsing multiple sclerosis treated with cladribine tablets. Mult Scler. 2018;24(2):222–6. https ://doi.org/10.1177/13524 58517 69026 9.
163. De Stefano N, Giorgio A, et al. Response to ‘Does cladribine have an impact on brain atrophy in people with relapsing remitting multiple sclerosis?’ by Schiffmann et al. Mult Scler. 2018;24(10):1388–9. https ://doi.org/10.1177/13524 58517 74847 6.
164. Schiffmann I, Scheiderbauer J, Riemann‑Lorenz K, Heesen C. Does cladribine have an impact on brain atrophy in people with relapsing remitting multiple sclerosis? Mult Scler. 2018;24(10):1387–8. https ://doi.org/10.1177/13524 58517 74989 5.
165. Dardiotis E, Arseniou S, Sokratous M, Tsouris Z, Siokas V, Mentis AA, Michalopoulou A, Andravizou A, Dastamani M, Paterakis K, Bogdanos D, Brotis A. Vitamin B12, folate, and homocysteine levels and multiple sclerosis: a meta‑analysis. Mult Scler Relat Disord. 2017;17:190–7. https ://doi.org/10.1016/j.msard .2017.08.004.
166. Dardiotis E, Nousia A, Siokas V, Tsouris Z, Andravizou A, Mentis AA, Florou D, Messinis L, Nasios G. Efficacy of computer‑based cognitive training in neuropsychological performance of patients with multiple sclerosis: a systematic review and meta‑analysis. Mult Scler Relat Disord. 2018;20:58–66. https ://doi.org/10.1016/j.msard .2017.12.017.
167. Sokratous M, Dardiotis E, Bellou E, Tsouris Z, Michalopoulou A, Dardioti M, Siokas V, Rikos D, Tsatsakis A, Kovatsi L, Bogdanos DP, Hadjigeorgiou GM. CpG island methylation patterns in relapsing‑remitting multiple sclerosis. J Mol Neurosci. 2018;64(3):478–84. https ://doi.org/10.1007/s1203 1‑018‑1046‑x.
168. Dardiotis E, Tsouris Z, Aslanidou P, Aloizou AM, Sokratous M, Provatas A, Siokas V, Deretzi G, Hadjigeorgiou GM. Body mass index in patients with multiple sclerosis: a meta‑analysis. Neurol Res. 2019. https ://doi.org/10.1080/01616 412.2019.16228 73.
169. Sokratous M, Dardiotis E, Tsouris Z, Bellou E, Michalopoulou A, Siokas V, Arseniou S, Stamati T, Tsivgoulis G, Bogdanos D, Hadjigeorgiou GM. Deciphering the role of DNA methylation in multiple sclerosis: emerging issues. Auto Immun Highlights. 2016;7(1):12. https ://doi.org/10.1007/s1331 7‑016‑0084‑z.
170. Efthymiou G, Dardiotis E, Liaskos C, Marou E, Tsimourtou V, Rigopou‑lou EI, Scheper T, Daponte A, Meyer W, Sakkas LI, Hadjigeorgiou G, Bogdanos DP. Immune responses against Helicobacter pylori‑specific antigens differentiate relapsing remitting from secondary progressive multiple sclerosis. Sci Rep. 2017;7(1):7929. https ://doi.org/10.1038/s4159 8‑017‑07801 ‑9.
171. Dardiotis E, Panayiotou E, Siokas V, Aloizou A‑M, Christodoulou K, Had‑jisavvas A, Pantzaris M, Grigoriadis N, Hadjigeorgiou GM, Kyriakides T. Gene variants of adhesion molecules predispose to MS: a case‑control
Page 25 of 25Andravizou et al. Autoimmun Highlights (2019) 10:7
• fast, convenient online submission
•
thorough peer review by experienced researchers in your field
• rapid publication on acceptance
• support for research data, including large and complex data types
•
gold Open Access which fosters wider collaboration and increased citations
maximum visibility for your research: over 100M website views per year •
At BMC, research is always in progress.
Learn more biomedcentral.com/submissions
Ready to submit your research ? Choose BMC and benefit from:
study. Neurol Genet. 2019;5(1):e304. https ://doi.org/10.1212/nxg.00000 00000 00030 4.
172. Dardiotis E, Panayiotou E, Provatas A, Christodoulou K, Hadjisavvas A, Antoniades A, Lourbopoulos A, Pantzaris M, Grigoriadis N, Hadjigeor‑giou GM, Kyriakides T. Gene variants of adhesion molecules act as modifiers of disease severity in MS. Neurol Neuroimmunol Neuroin‑flamm. 2017;4(4):e350. https ://doi.org/10.1212/nxi.00000 00000 00035 0.
173. De Stefano N, Sormani MP, Stubinski B, Blevins G, Drulovic JS, Issard D, Shotekov P, Gasperini C. Efficacy and safety of subcutaneous interferon beta‑1a in relapsing‑remitting multiple sclerosis: further outcomes from the IMPROVE study. J Neurol Sci. 2012;312(1–2):97–101. https ://doi.org/10.1016/j.jns.2011.08.013.
174. Hardmeier M, Wagenpfeil S, Freitag P, Fisher E, Rudick RA, Kooijmans M, Clanet M, Radue EW, Kappos L. Rate of brain atrophy in relaps‑ing MS decreases during treatment with IFNbeta‑1a. Neurology. 2005;64(2):236–40. https ://doi.org/10.1212/01.wnl.00001 49516 .30155 .b8.
175. Molyneux PD, Kappos L, Polman C, Pozzilli C, Barkhof F, Filippi M, Yousry T, Hahn D, Wagner K, Ghazi M, Beckmann K, Dahlke F, Losseff N, Barker GJ, Thompson AJ, Miller DH. The effect of interferon beta‑1b treatment on MRI measures of cerebral atrophy in secondary progressive multiple sclerosis. European Study Group on Interferon beta‑1b in secondary progressive multiple sclerosis. Brain. 2000;123(Pt 11):2256–63.
176. Kappos L, Freedman MS, Polman CH, Edan G, Hartung HP, Miller DH, Montalban X, Barkhof F, Radu EW, Bauer L, Dahms S, Lanius V, Pohl C, Sandbrink R. Effect of early versus delayed interferon beta‑1b treat‑ment on disability after a first clinical event suggestive of multiple sclerosis: a 3‑year follow‑up analysis of the BENEFIT study. Lancet. 2007;370(9585):389–97. https ://doi.org/10.1016/s0140 ‑6736(07)61194 ‑5.
177. Kappos L, Freedman MS, Polman CH, Edan G, Hartung HP, Miller DH, Montalban X, Barkhof F, Radu EW, Metzig C, Bauer L, Lanius V, Sandbrink
R, Pohl C. Long‑term effect of early treatment with interferon beta‑1b after a first clinical event suggestive of multiple sclerosis: 5‑year active treatment extension of the phase 3 BENEFIT trial. Lancet Neurol. 2009;8(11):987–97. https ://doi.org/10.1016/s1474 ‑4422(09)70237 ‑6.
178. Khan O, Rieckmann P, Boyko A, Selmaj K, Zivadinov R. Three times weekly glatiramer acetate in relapsing‑remitting multiple sclerosis. Ann Neurol. 2013;73(6):705–13. https ://doi.org/10.1002/ana.23938 .
179. Lublin FD, Cofield SS, Cutter GR, Conwit R, Narayana PA, Nelson F, Salter AR, Gustafson T, Wolinsky JS. Randomized study combining interferon and glatiramer acetate in multiple sclerosis. Ann Neurol. 2013;73(3):327–40. https ://doi.org/10.1002/ana.23863 .
180. O’Connor P, Filippi M, Arnason B, Comi G, Cook S, Goodin D, Hartung HP, Jeffery D, Kappos L, Boateng F, Filippov V, Groth M, Knappertz V, Kraus C, Sandbrink R, Pohl C, Bogumil T, O’Connor P, Filippi M, Arnason B, Cook S, Goodin D, Hartung HP, Kappos L, Jeffery D, Comi G. 250 microg or 500 microg interferon beta‑1b versus 20 mg glatiramer acetate in relapsing‑remitting multiple sclerosis: a prospective, randomised, multicentre study. Lancet Neurol. 2009;8(10):889–97. https ://doi.org/10.1016/s1474 ‑4422(09)70226 ‑1.
181. Kappos L, Fox R, Gold R, Arnold D, Potts J, Zhang A, Kurukulasuriya N. Sustained low rate of brain volume loss under long‑term delayed‑release dimethyl fumarate treatment in relapsing‑remitting multiple sclerosis patients: results from the ENDORSE study (P7.243). Neurology 2015;84 (14 Supplement). https ://n.neuro logy.org/conte nt/84/14_Suppl ement /P7.243.
Publisher’s NoteSpringer Nature remains neutral with regard to jurisdictional claims in pub‑lished maps and institutional affiliations.


