Embed Size (px)
Citation preview
arX
iv:a
stro
-ph/
0111
547v
3 2
1 M
ay 2
002
Mon. Not. R. Astron. Soc. 000, 1–?? (2001) Printed 1 February 2008 (MN LATEX style file v1.4)
Breaking the “Redshift Deadlock” - I: Constraining the
star formation history of galaxies with sub-millimetre
photometric redshifts
D.H. Hughes1, I. Aretxaga1, E.L. Chapin1, E. Gaztanaga1,2, J.S. Dunlop3,
M.J. Devlin4, M. Halpern5, J. Gundersen6, J. Klein4, C.B. Netterfield7,
L. Olmi8, D. Scott9, G. Tucker10
1Instituto Nacional de Astrofısica, Optica y Electronica (INAOE), Aptdo. Postal 51 y 216, Puebla, Mexico2Institut d’Estudis Espacials de Catalunya - IEEC/CSIC Gran Capitan 2-4, 08034 Barcelona, Spain3Institute for Astronomy, Univ. of Edinburgh, Blackford Hill, Edinburgh, EH9 3HJ, UK4Dept. of Physics & Astronomy, Univ. of Pennslyvania, 209 South 33rd St., Philadelphia PA 19104-6396, USA5Dept. of Physics & Astronomy, Univ. of British Columbia, 6224 Agricultural Road, Vancouver, B.C. V6T 1Z1, Canada6Dept. of Physics, Univ. of Miami, 1320 Campo Sano Drive, Coral Gables, FL 33416, USA7Dept. of Astronomy, Univ. of Toronto, 60 St. George St., Toronto, Ontario, MSS 1A1, Canada8Physics Department, University of Puerto Rico, PO box 23343, University Station San Juan, PR 00931-3343, Puerto Rico9Dept. of Physics & Astronomy, Univ. of British Columbia, 2219 Main Mall, Vancouver, B.C. V6T 1Z4, Canada10Dept. of Physics, Box 1843, Brown Univ., Providence, RI 02912-1843, USA
1 February 2008
ABSTRACT
Future extragalactic sub-millimetre and millimetre surveys have the potential to pro-vide a sensitive census of the level of obscured star formation in galaxies at all redshifts.While in general there is good agreement between the source counts from existingSCUBA (850µm) and MAMBO (1.25mm) surveys of different depths and areas, itremains difficult to determine the redshift distribution and bolometric luminosities ofthe sub-millimetre and millimetre galaxy population. This is principally due to theambiguity in identifying an individual sub-millimetre source with its optical, IR or ra-dio counterpart which, in turn, prevents a confident measurement of the spectroscopicredshift. Additionally, the lack of data measuring the rest-frame FIR spectral peak ofthe sub-millimetre galaxies gives rise to poor constraints on their rest-frame FIR lumi-nosities and star formation rates. In this paper we describe Monte-Carlo simulationsof ground-based, balloon-borne and satellite sub-mm surveys that demonstrate howthe rest-frame FIR–sub-mm spectral energy distributions (250–850µm) can be used toderive photometric redshifts with an r.m.s accuracy of ±0.4 over the range 0 < z < 6.This opportunity to break the redshift deadlock will provide an estimate of the globalstar formation history for luminous optically-obscured galaxies (LFIR > 3 × 10¹²L⊙)with an accuracy of ∼ 20 per cent.
Key words: submillimetre — surveys — cosmology: observations — galaxies: for-mation — galaxies: evolution — galaxies: high-redshift
1 INTRODUCTION
The star-formation history of the high-z starburst galaxypopulation can be determined from an accurate measure-ment of the integral sub-millimetre (sub-mm) and millimetre(mm) source-counts, and the luminosity and redshift distri-butions of sub-mm and mm-selected galaxies. The contri-bution of these sources to the total FIR–mm background,measured by COBE (Puget et al. 1996; Hauser et al. 1998;
Fixsen et al. 1998), places an additional strong constrainton the acceptable evolutionary models. It is now generallybelieved that the luminosity density, due to star formationactivity in galaxies, is roughly constant between z ∼ 1 − 4.A series of ground-based 850µm surveys (Smail et al. 1997;Hughes et al. 1998; Barger et al. 1998; Eales et al. 1999;Eales et al. 2000; Scott et al. 2001; Fox et al. 2001; Borys etal. 2001), undertaken with the SCUBA camera (Holland etal. 1999) on the 15-m JCMT and 1.25 mm surveys (Bertoldi

2 David H. Hughes et al.
et al. 2000) using the MAMBO camera (Kreysa et al. 1998)on the 30-m IRAM telescope, have contributed significantlyto this understanding. Prior to the first SCUBA results, theoptical surveys suggested (contrastingly) that the density ofstar-formation declined by a factor of ∼ 5 over the sameredshift range (Steidel et al. 1996; Madau et al. 1996). Thisdiscrepancy has highlighted the importance of including acorrection for dust extinction in the optical-UV estimatesof star formation rates. Nevertheless, the contribution ofoptically-selected starburst galaxies to the sub-mm back-ground still remains uncertain (Chapman et al. 2000; Pea-cock et al. 2000). Hereafter, for the sake of brevity, sub-mmand mm wavelengths will be referred to as sub-mm unlessexplicitly stated otherwise, and a sub-mm galaxy is consid-ered to be an optically-obscured starburst galaxy detectedin a blank-field SCUBA or MAMBO survey.
One important caveat to this opening statement isthe fact that we actually have no accurate information onthe redshift distribution of the sub-mm galaxy population.There are ∼ 100 galaxies identified in 850µm surveys at alevel > 2 mJy. The lack of confident optical, or IR identi-fications (e.g. Hughes et al. 1998; Richards 1999), and thusprecise redshifts for the sub-mm galaxies, was a source forthe early scepticism of the claims that there existed no evi-dence for a decline in density of star formation at z > 2.
The use of the radio–sub-mm (850µm/1.4GHz) spec-tral index has gained popularity as a valuable diagnosticof redshift (Hughes et al. 1998; Carilli & Yun 1999; Carilli& Yun 2000; Smail et al. 2000; Barger, Cowie & Richards2000; Dunne, Clements & Eales 2000). The radio follow-upof SCUBA surveys, and more recently 1.25mm MAMBOsurveys (Bertoldi et al. 2000), with the VLA at 1.4GHzhas become the commonly accepted method to measure theredshift distribution of sub-mm galaxies. However this tech-nique requires extremely sensitive observations if radio coun-terparts are to be detected. For example, in order that aradio survey detects > 90 per cent of bright sub-mm galax-ies (S850µm > 8 mJy) at z > 1.5, then a 3σ ≤ 7µJy surveymust be conducted at 1.4 GHz (Aretxaga et al. 2002). Un-fortunately the necessity of such an ultra-deep radio surveyprohibits this technique from being applied to the wider-area(∼ 1−10 deg2) sub-mm surveys that will be conducted in thenext few years (section 2) without an excessive committmentof radio telescope time (e.g. 400–4000 hours per survey). Analternative, and, we argue, a more reliable method exists:namely the use of sub-mm–FIR photometric redshifts, pro-vided that one can obtain experimental data with sufficientS/N and absolute calibration accuracy.
Although the possibility of conducting cosmological sur-veys at sub-mm and mm wavelengths has been realised inthe last few years with the development and successful com-missioning of sensitive bolometer arrays, the existing 850 µmSCUBA and 1.25 mm MAMBO surveys are limited in theirability to constrain the evolutionary models of the sub-mmgalaxy population. The practical reasons for these limita-tions have been described elsewhere (Hughes 2000) and canbe summarised as follows: restricted wavelength coverage(enforced by the limited number of FIR–mm atmosphericwindows available to ground-based observatories); low spa-tial resolution (resulting in both a high extragalactic con-fusion limit and poor positional accuracy); restricted field-of-view with the current sub-mm and mm bolometer ar-
rays (typically 5 sq. arcmin); and low system sensitivity (acombination of instrument noise, size of telescope apertureand telescope surface accuracy, sky transmission and skynoise) which restrict even the widest and shallowest sub-mm surveys to areas < 0.1 deg2 (Scott et al. 2001; Foxet al. 2001). In the effort to obtain these wide-area shal-low surveys, the current sub-mm and mm observations arenecessarily only sensitive to the most luminous star-forminggalaxies (LFIR > 1012L⊙, or SFR > 100M⊙yr−1) assumingthe population is dominated by galaxies at redshifts > 1.
The discrepancy shown in Fig.1 between the bright-endsource-counts in the 850µm SCUBA and 1.25 mm MAMBOsurveys (Eales et al. 2000; Bertoldi et al. 2000; Scott et al.2001; Borys et al. 2001), and a visual inspection of theirreconstructed maps, suggests that the clustering of sub-mm galaxies may be influencing the statistics (Gaztanaga& Hughes 2001). Taken at face value, the steepening of the850µm counts for sources > 10 mJy can be interpreted asevidence for an under-density of galaxies in the survey-fieldproviding those particular data (due to cosmic variance), orperhaps a high-luminosity cut-off in the luminosity functionfor galaxies > 1013L⊙ (Fig.1). A plausible alternative expla-nation is simply the fact that, with so few bright sources de-tected (5–10 galaxies in 0.1 deg2), the counts in this regimeare extremely sensitive to differences between the SEDs ofthe most luminous sub-mm galaxies. Sensitive, wider-area(≥ 1 deg2), rest-frame FIR surveys with accurate redshiftinformation (similar to those discussed in this paper) candistinguish between these possible alternatives.
1.1 Ambiguities in the Counterparts of Sub-mm
Galaxies
The current 850µm SCUBA and 1.25 mm MAMBO surveysare struggling to identify the sub-mm sources with their op-tical, IR and radio counterparts. Positional errors of ∼ 2−3arcsec are associated with the brightest sub-mm sources(S850µm > 8mJy) which, with some exceptions, are detectedin the widest, shallowest SCUBA surveys (Scott et al. 2001;Eales et al. 2000). These errors can be improved with follow-up mm-interferometric observations (Frayer et al. 1998; Gearet al. 2000; Lutz et al. 2001). However ambiguous opticalidentifications still remain, even with ≤ 2 arcsec resolutionand sub-arcsec positional errors (e.g. Downes et al. 1999). Itshould be no surprise that sub-mm selected galaxies, includ-ing those with mm-interferometric detections, do not alwayshave optical counterparts, since high-z galaxies observed inthe earliest stages of formation may be heavily obscured bydust. Indeed, this is the most compelling reason for con-ducting the sub-mm surveys in the first instance. Searchesfor counterparts at longer IR wavelengths have proven tobe more successful (Smail et al. 1999; Frayer et al. 2000;Gear et al. 2000; Lutz et al. 2001), and have shown earlieridentifications of lower-z bright optical galaxies to be theincorrect counterpart to the sub-mm galaxies (Smail et al.1999; Frayer et al. 2000). The natural consequence of theseambiguous and potential mis-identifications is an inaccuratedetermination of redshift distribution, luminosities and star-formation history of high-z galaxies.

Breaking the “Redshift Deadlock” - I 3
Figure 1. Integrated source-counts at sub-mm wavelengths for a model in which the IRAS 60µm luminosity function is evolved as (1+z)3.2
upto z = 2, and maintained constant (with no further evolution) for 2 < z < 6. The SED of Arp220 is adopted to represent the wholegalaxy population. Left panel: The curves represent the predicted source-counts at 850, 500, 350 and 250µm. The measured source-countsfrom SCUBA surveys at 850µm (Scott et al. 2001, and references therein) are shown as filled squares. Additional 850µm source-countsfrom Borys et al. (2001) are shown as solid triangles. The flux-densities of the MAMBO 1.25mm source-counts are scaled upwards bya factor of 2.25 to represent the equivalent measurements at 850µm, assuming the MAMBO sources lie at redshifts 0 < z < 6, and areshown as crosses (Bertoldi et al. 2000). The models also show the effect of a high-luminosity cut-off (at LFIR > 1013L⊙) in the sub-mmpopulation. The shaded areas illustrate the regions of parameter space that need to be searched with future experiments to improve ourunderstanding of the evolution of the luminous high-z sub-mm galaxies. Right panel: Integrated source-counts for extragalactic BLASTsurveys at 250, 350 and 500µm. The dashed-lines show the same evolutionary model described for the left-panel. The histograms illustratethe extracted source-counts at each wavelength from two different Monte-Carlo simulations of 1 deg2 surveys that use a library of 13SEDs. These simulations explore evolutionary models with small differences in the strength of evolution and the redshift distribution ofsources. The details of the Monte-Carlo simulations are summarised in §2.2
Figure 2. Left panel: Rest-frame spectral energy distributions (SEDs) of 13 starburst galaxies, ULIRGs and AGN, normalized at 60µm.Lines represent the best-fitting SED models to the data (diamonds) and include contributions from non-thermal synchrotron emission,free-free and grey-body thermal emission. The parameters that describe the composite model for each galaxy, previously unpublished
SED data and references for the remaining SED data are given in Chapin et al. (in preparation); Right panel: Composite SED modelsfor the identical 13 template galaxies shown in the left panel, normalized at 60µm and scaled to the flux density of Arp220 at eachwavelength. The vertically bounded-regions (slanted, crossed and shaded) correspond to the rest-frame wavelength regimes covered byobservations at 1.4 GHz, 850µm and in the BLAST filters (500–250µm) respectively for galaxies at z = 0− 6. This representation of theSEDs shows more clearly the wavelength regimes in which the minimum dispersion in galaxy colours can be expected. Hence photometricredshifts determined from flux ratios between ∼ 100 − 1000µm are the most independent of assumptions regarding the SED of thesub-mm galaxy.

4 David H. Hughes et al.
1.2 Uncertainties in the SEDs and Redshifts of
Sub-mm Galaxies
Despite the diversity in the properties of sub-mm galaxies(Ivison et al. 2000), efforts have been made to place them inthe context of an evolutionary model of galaxy formation.The current estimate of the redshift distribution of sub-mmgalaxies is based on simple comparisons of their IR–radioSEDs with those of redshifted template SEDs, drawn fromlocal starburst galaxies and radio-quiet AGN (Hughes etal. 1998; Smail et al. 1999; Lilly et al. 1999; Carilli & Yun1999; Barger, Cowie & Richards 2000; Carilli & Yun 2000;Smail et al. 2000; Bertoldi et al. 2000; Dunne, Clements &Eales 2000; Dunlop 2001; Smail et al. 2001; Chapman etal. 2002). The consensus is that the population of sub-mmgalaxies is distributed between redshifts z = 1 − 4, witha median z = 2 − 3. The details of this distribution arestill unknown, and it is common to describe the redshifts ofindividual galaxies as “in the range of ...., with a best guess
of ....”.
This raises an obvious question:What classes of local
galaxies offer the most useful analogues of the high-z sub-
mm population? In order to address this we must measurethe full rest-frame X-ray to radio SEDs of individual high-z sub-mm galaxies, measure the dispersion in the shapesof their SEDs and their range of luminosities (which maydepend on redshift), and thus determine the accuracy withwhich the SEDs of high-z sub-mm galaxies can be charac-terised by a limited number of local template galaxies. Inpractise, the observed SEDs of high-z sub-mm galaxies arerestricted to a few detections and limits at 850, 450µm and1.4 GHz, with occasional mm interferometric observationsand a K-band identification. No data exists at rest-frameFIR wavelengths with sufficient sensitivity to place addi-tional useful constraints on redshifts.
As mentioned previously, optical and IR follow-up ob-servations of those few SCUBA sources for which unam-biguous identifications exist have revealed that the sub-mmcounterparts are often optically-obscured, extremely red ob-jects (EROs) with I − K > 6 (Smail et al. 1999; Gear etal. 2000; Lutz et al. 2001), although in a few cases the sub-mm counterparts are blue galaxies, with a weak AGN (e.g.SMM02399–0136, Ivison et al. 2001). Also the suggestionthat SCUBA galaxies are forming stars at a very high-rate(> 100M⊙/yr) implies that local dusty ULIRGs may alsobe suitable analogues of high-z sub-mm sources. Unfortu-nately the SEDs of this local class of luminous star-forminggalaxies vary significantly with increasing FIR luminosity(Sanders & Mirabel 1996). Furthermore, there are few star-burst galaxies at z > 1 for which complete IR–radio SEDsexist.
These initial SCUBA and MAMBO observations havedemonstrated the necessity for larger-area surveys, and alsoshorter-wavelength (250–500µm) sub-mm observations. Al-though new (and future) ground-based facilities (100-mGBT, 50-m LMT, SMA) will offer partial solutions to someof these problems over the next 6 years, there will still re-main ambiguity in the optical, IR and radio identificationsof sub-mm galaxies. The consequence is a lack of precisionin the redshift distribution and rest-frame FIR luminosities,and thus an inaccurate constraint on the star formation his-tory of the entire sub-mm population.
Once it begins operation beyond 2008, ALMA will un-doubtedly solve many of these difficulties with its power-ful combination of receivers operating between 350µm and3 mm, and high (sub-arcsec) spatial resolution. The ex-pected launch of the Herschel satellite in 2008 will alsobring the chance to map large areas of the extragalac-tic sky at 250–500µm with high sensitivity. However, inlate 2003 onwards, a series of long-duration (∼ 15 day)sub-orbital balloon flights will be undertaken by BLAST
– Balloon-borne Large-Aperture Sub-millimetre Telescope(Devlin et al. 2001). BLAST has a 2-m primary aperture,and is equipped with large-format bolometer cameras op-erating at 250, 350 and 500µm which are prototypes ofthe SPIRE focal-plane cameras for the Herschel satellite.BLAST will conduct sub-mm surveys over ∼ 0.5 − 40 deg2
(Table 1), and will provide rest-frame FIR–sub-mm data for> 5000 galaxies, with a point-source sensitivity 3 timesgreater than is available from even the largest ground-basedsub-mm telescopes.
In this paper (Paper I) we describe Monte-Carlo simu-lations of sub-mm surveys that demonstrate how the rest-frame FIR–sub-mm SEDs (250-500µm) of galaxies can beused to measure their photometric redshifts with a conser-vative 1σ accuracy of ∆z ∼ ±0.6 over the redshift range1 < z < 6. Thus we can finally break the current redshift
deadlock that limits our understanding of the evolution ofthe sub-mm galaxy population. From such precision in theindividual galaxy redshifts, we can determine the star for-mation history for luminous sub-mm galaxies brighter than3× 1012L⊙ with an accuracy of ∼ 20 per cent. We considerthe specific example of future surveys from BLAST. Further-more we illustrate how these estimates can be improved withsub-mm observations using the more sensitive SPIRE cam-era on the Herschel satellite, and additionally with the in-clusion of longer-wavelength ground-based 850µm data fromSCUBA. In paper II of this series (Aretxaga et al. 2002) wedevelop this photometric-redshift estimation technique, andapply it to the existing multi-frequency data for the popu-lation of ∼ 140 sub-mm galaxies detected in SCUBA andMAMBO surveys. We include, for the first time, an appro-priate treatment of the observational errors at sub-mm toradio wavelengths, and provide an accurate measurement ofthe redshift distribution for sub-mm galaxies. In paper III ofthis series (Gaztanaga et al., in preparation) we address theclustering of sub-mm galaxies, given their redshift distribu-tion derived from these photometric redshifts.
The following cosmological model is adopted through-out the paper: ΩΛ = 0.7, ΩM = 0.3, H0 = 67 kms−1Mpc−1.
2 PHOTOMETRIC REDSHIFTS FROM
WIDE-AREA SUB-MILLIMETRE SURVEYS
2.1 Designing the Sub-mm Surveys
To assess the accuracy of the photometric redshifts that canbe determined from rest-frame FIR–sub-mm data, we gener-ate mock catalogues of sub-mm galaxies from Monte-Carlosimulations that mimic realistic observing data (§2.2). Thus,we must first have prior knowledge of the areas and sensi-tivities of the sub-mm surveys that will be conducted withBLAST, SPIRE, or any other existing or future sub-mm ex-periment, in order to achieve the scientific goals. We have

Breaking the “Redshift Deadlock” - I 5
Figure 3. Colour-colour (350µm/500µm vs. 250µm/500µm) vs. redshift distribution for 424 galaxies detected (> 3σ) simultaneously byBLAST in all 3 filters in a simulated 1 deg2 survey. Top Panel: Colour distribution of detected galaxies without the inclusion of obser-vational (photometric or calibration) errors. Bottom Panel: Colour distribution of detected galaxies with the inclusion of observationalerrors (5 per cent absolute calibration and a random measurement error drawn from a 1σ = 5mJy distribution), which dominate thescatter. The black cross marks the position of a 4 × 10¹²L⊙ galaxy at z = 2.81. The hashed rectangle represents the 1σ error on themeasured colours. The redshift probability distribution for this galaxy is shown in Fig.4.

6 David H. Hughes et al.
simulated realistic surveys to satisfy this requirement. Thesesimulations, which include an evolving population of sub-mm galaxies that are consistent with the observed number-counts (Fig.1), and a foreground Galactic cirrus component,are described in more detail elsewhere (Hughes & Gaztanaga2000; Gaztanaga & Hughes 2001; Chapin et al. 2001). In par-ticular these simualtions help understand how the analysisof the experimental survey data can be affected by telescoperesolution, extragalactic and Galactic source-confusion, sur-vey sensitivity and noise, and sampling variances due to clus-tering and shot-noise.
Provided the BLAST surveys are conducted towards re-gions of low Galactic cirrus (I100µm < 1.4 MJy/sr), then theBLAST survey confusion limit will be dominated by extra-galactic sources. In the absence of any foreground cirrus,the simulation indicates that the extragalactic 3σ confusionlimit of BLAST at 250–500µm will be ∼ 20 − 30 mJy. Forcomparison the traditional estimate of extragalactic confu-sion, 1 source/30 beams (Condon 1974), suggests that con-fusion will begin to dominate below 30 mJy.
Hence, during a single long-duration balloon flight,BLAST will conduct a series of simultaneous large-area sur-veys (∼ 0.5 − 40 deg2) at 250, 350 and 500µm, down to a1σ sensitivity of 5 mJy, detecting in each survey ∼ 1000 lu-minous sub-mm galaxies (> 1012L⊙) between 0.5 < z < 6(Table 1). The accuracy with which photometric redshiftscan be determined from surveys of this magnitude is dis-cussed in the following sections.
2.2 Monte-Carlo Simulations of Sub-mm Galaxy
Colours
Measurements of photometric redshifts determined fromFIR–sub-mm–radio data usually do not include a rigorousanalysis of the errors and the uncertainties in the calcula-tions (Hughes et al. 1998; Blain 1999; Carilli & Yun 1999;Carilli & Yun 2000; Dunne, Clements & Eales 2000; Ealeset al. 2000; Barger, Cowie & Richards 2000). The desire toassign a degree of confidence (probability) to the photomet-ric redshift of any individual sub-mm galaxy motivated thedevelopment of the Monte-Carlo simulations, taking into ac-count the imprecise knowledge of the luminosity function ofsub-mm galaxies, the dispersion in the luminosity-dependentSEDs, absolute calibration and observational photometricerrors (Aretxaga et al. 2001; Aretxaga et al. 2002). Fromthese individual redshifts it is then possible to provide a ro-bust statistical measure of the redshift distribution for theentire sub-mm population.
In the case of BLAST (and also SPIRE), the powerof this simple technique to derive redshifts arises from theunique ability of these experiments to conduct observa-tions at 250–500µm that bracket the ubiquitous rest-frameFIR peak (at ∼ 60 − 150µm) in the SEDs of high-redshift(1 ≤ z ≤ 4) galaxies undergoing a significant amount of starformation.
The adopted recipe that generates mock catalogues ofgalaxies between z = 0 and z ∼ 6, for a given wavelengthand under the chosen cosmological model, is summarised:
(i) use a single representative SED to calculate the dis-tribution of rest-frame FIR luminosities of galaxies, at allredshifts, from an evolving 60µm local luminosity function,
Figure 4. Redshift probability distributions for a selection ofgalaxies detected by BLAST. In all panels the diamonds mark thetrue redshifts of the galaxies. The photometric redshifts (modesand 68 per cent confidence intervals) are indicated in the la-bels and represented as the shaded areas of the histograms.Top panel: 4 × 10¹²L⊙ galaxy at z = 2.81, detected at 250µm(19mJy), 350µm (21 mJy) and 500µm (26 mJy), slightly belowthe BLAST survey confusion limit. The colours of this galaxy arerepresented as a cross in Fig.3. Middle panel: 6 × 10¹²L⊙ galaxyat z = 2.81, detected at 250µm (34mJy), 350µm (56 mJy) and500µm (45mJy) with high S/N, above the BLAST survey confu-sion limit. Bottom panel: 4×10¹²L⊙ galaxy at z = 4.46, detectedonly at 500µm (22 mJy).

Breaking the “Redshift Deadlock” - I 7
Figure 5. Monte-Carlo simulations of the colour–colour (350µm/500µm vs. 250µm/500µm) vs. redshift distribution for 1380 galaxiesdetected simultaneously by SPIRE at 250, 350 and 500µm with observational errors (5 per cent absolute calibration and a randommeasurement error of 2.5mJy) in a 1 deg2 survey. The black cross and hashed rectangle marks the colours for the identical 4 × 10¹²L⊙
galaxy at z = 2.81 shown in Figs.3 and 4.
survey area 1σ depth no. of pixels no. of detected galaxies no. of > 5σ galaxies(deg2) > 5σ > 10σ z > 1 z > 3
1.0 5 mJy 18334 835 265 765 1472.0 7 mJy 36668 1012 291 927 1514.0 10 mJy 73336 1100 294 988 1479.0 15 mJy 165006 1111 247 1023 12936.0 30 mJy 660024 990 246 895 105
Table 1. Examples of the number of detected galaxies and their redshift distributions in alternative 50 hour 250µm BLAST surveys tobe undertaken during a series of future long duration (∼ 10 − 15 day) balloon flights.
φ[L, 0] (Saunders et al. 1990), that reproduces the observedsub-mm number counts. We adopt a model of pure luminos-ity evolution, φ[L, z] = φ[L/L∗(z)], where
L∗(z) =
(1 + z)3.2 L∗(0) for z ≤ 233.6 L∗(0) for 2 < z ≤ 6
(1)
It has been verified that an alternative choice of SED cancompensate for small differences in the evolutionary model,and hence still reproduce the source-counts (Fig.1);
(ii) randomly assign an SED from a library of 13 tem-plate starburst galaxies, ULIRGs and AGN (Fig.2) toeach of the galaxies in the mock catalogue, and use thisSED to calculate the intrinsic sub-mm colours. The mostcrucial assumption of the paper occurs at this point inthe simulation. We assume no correlation between the
shape of the SED and luminosity (or redshift), and in-stead rely on the assumption that our library of 13 tem-plate SEDs is representative of those that exist at high-z. The library, which includes M82, NGC1614, NGC3227,NGC2992, NGC4151, NGC7469, NGC7771, IZw1, Mkn231,Mkn273, Arp220, IRAS10214 and the “Cloverleaf” quasar(H1413+117), contains galaxies with FIR luminosities in therange of log LFIR/L⊙ = 9.6 − 12.3. The sample includesa mixture of AGN and starburst galaxies, and compositegalaxies with both an AGN and a luminous extended FIRstarburst region. The dust temperature (∼ 30 − 60 K) andemissivity index (β = 1.4 ± 0.3), which define the shape oftheir rest-frame FIR–sub-mm spectra are independent of thetype or strength of nuclear activity. As mentioned in §1, thesensitivity of the sub-mm observations restricts the surveys

8 David H. Hughes et al.
Figure 6. A comparison of the redshift probability distributions for two galaxies observed in a SPIRE survey, and a shallower BLASTsurvey (previously discussed in Fig.4). Symbols and labels are the same as in Fig.4. Left panel: 4 × 10¹²L⊙ galaxy at z = 2.81 detectedsimultaneously with 3 SPIRE filters (shaded histogram), compared with the BLAST redshift distribution (open histogram). Right panel:4 × 10¹²L⊙ galaxy at z = 4.46 detected simultaneously in 2 SPIRE filters; at 350µm (11 mJy) and 500µm (20mJy), compared with thedistribution obtained from a single filter (500µm) detection with BLAST.
to a detection threshold of log LFIR/L⊙ > 12. Thus, an im-plicit assumption in this method is that one can simply scalethe SED of a lower luminosity galaxy to represent that of ahigh-redshift sub-mm galaxy. Furthermore, there is no con-clusive evidence that the rest-frame FIR–sub-mm SEDs ofgalaxies vary with luminosity, and redshift beyond the rangeof SEDs considered here - there is simply a lack of sufficienthigh signal-to-noise observational data, over the appropriatewavelength regime, to come to any secure conclusions;
(iii) add random noise (drawn from the distribution de-scribing the measurement errors), and add a constant abso-lute flux calibration error to the intrinsic fluxes to allow amore realistic assessment of the photometric redshift accu-racy: 1σ photometric errors of 5 and 2.5 mJy for the BLAST
and Herschel/SPIRE observations respectively, and in bothcases an absolute calibration error of 5 per cent. The com-bined simulated images of extragalactic sources and cirrus,described earlier in §2.1, determine the depth of the surveysconsidered here, ensuring that galaxy confusion dominates.However this Monte-Carlo treatment of the photometric ac-curacy does not consider the contaminating effects of cirrus,clustering of galaxies, shot-noise or projection effects. Theseconsiderations are deferred to a future paper;
(iv) finally, extract flux-limited catalogues from a 1 deg2
confusion-limited surveys at 250, 350 and 500µm with 1σ =5mJy and 2.5 mJy sensitivities, appropriate for BLAST andSPIRE observations.
Fig.3 shows an example of one of the possible combina-tions of sub-mm colours, for a catalogue of ∼ 424 galaxiesdetected (> 3σ) simultaneously at 250, 350 and 500µm ina 1 deg2 BLAST survey. As expected the dispersion in sub-
mm colours is dominated by the observational errors andnot by the differences between the shapes of the templateSEDs. This is particularly true when the colour ratios aredetermined over a relatively small wavelength interval, as isthe case for the 250, 350 and 500µm observations. However,as we extend the wavelength baseline over which coloursare calculated then the effect of differences in the galaxySEDs on the photometric colours becomes increasingly sig-nificant (see Fig.2). An example of this important effect canbe found with the inclusion of longer wavelength data tothe BLAST observations (§2.3.3), or perhaps more extreme,with the combination of 850µm and 1.4GHz fluxes (Carilli& Yun 2000) which are separated in wavelength by a fac-tor > 200. Thus, in general, without an adequate treatmentof observational errors and a representative set of referenceSEDs, photometric redshifts will be estimated with an over-optimistic accuracy.
2.3 Sub-mm Photometric Redshifts
Sub-mm photometric redshifts can be determined by cal-culating the probability that the the colours (including er-rors) of an observed sub-mm galaxy are consistent with thecolours of every galaxy (with a known redshift) in the mockcatalogue. The final redshift probability distribution, P (z),of any galaxy is then simply the sum of the individual prob-abilities from the entire catalogue, or explicitly
P (z) = a∑
i,∀zi
Φ(ci − c0) , (2)

Breaking the “Redshift Deadlock” - I 9
Figure 7. Redshift probability distributions demonstrating theadvantages of follow-up observations that extend the sub-mmwavelength coverage. Symbols and labels are the same as in Fig.4.
Top panel: 6× 10¹²L⊙ galaxy at z = 2.81 detected by BLAST inall 3 filters (open histogram), previously discussed in Fig.4. Theredshift estimate improves with follow-up observations at longerwavelengths. The shaded histogram illustrates the benefit of de-tecting the same galaxy at 850µm (8mJy) in a shallow sub-mmsurvey (σ850µm = 2.5mJy), e.g. similar to the UK 8mJy SCUBAsurvey (Scott et al. 2001); Middle panel: This example shows the4 × 1012L⊙ galaxy at z = 4.46, initially detected by BLAST inonly one filter (500µm), previously discussed in Fig.4 (open his-togram). Again, the detection at 850µm (16 mJy) is sufficientlydiscriminating to constrain the distribution to higher redshifts(shaded histogram). Bottom Panel: 5× 10¹²L⊙ galaxy at = 4.78detected at 850µm (8mJy) in a shallow SCUBA survey (open his-togram). Despite the non-detection of this galaxy by BLAST, inall 3 filters (250, 350, 500µm), these shorter wavelength data canplace an improved constraint on the redshift distribution (shadedhistogram).
where a is the normalization constant, such that∫ zmax
0P (z)dz = 1 where zmax = 6. The multi-variate Gaus-
sian probability distribution, Φ, for k colours, is given by
Φ(ci − c0) = (2π)−k/2 | A−1 |1/2 ×
exp(
− 12(ci − c0)′A−1(ci − c0)
)
, (3)
where ci is the colour vector of the ith mock galaxy, suchthat zi ∈ [z − dz, z + dz], and c0 is the colour vector ofthe test sub-mm galaxy, for which we want to derive itsredshift distribution. A is the covariance matrix of the colourdistribution, of elements
Aαβ = 〈(cα − cα)(cβ − cβ)〉 , (4)
for two colours α, β. In the majority of the analysis per-formed for this paper, the non-diagonal elements of the co-variance matrix are small. When more than two colours areconsidered, for simplicity, the above prescription can be sub-stituted with standard χ2 statistics.
In this analysis, we have adopted redshift bins of width0.5 (dz = 0.25). The most probable redshift of the test sub-mm galaxy will be given by the mode of the discrete P (z)distribution, estimated as the centroid of the Gaussian thatbest fits the 5 bins around the maximum of P (z). The asym-metric error bars (z−, z+) correspond to 68 per cent confi-dence levels such that
∫ z+
z−
P (z)dz = 0.68 and (z+ − z−) is
minimised.
2.3.1 BLAST colours
Fig.4 shows two examples of the redshift distributions forsub-mm galaxies detected by BLAST at different levels ofsignificance in all 3 filters. A further example of the broaderdistribution derived for a higher-z galaxy detected only at500µm is also shown in Fig.4. The accuracy of the redshiftsdetermined from BLAST data is described in more detail in§2.4, where we also compare the accuracy to those obtainedfrom optical–IR colours and the 850µm/1.4 GHz spectral in-dex. The dispersion in the sub-mm photometric redshiftsderived from 3 BLAST bands is ∆z = ±0.6 averaged overall redshifts in the range 0 < z < 6.
2.3.2 SPIRE colours
An increase in the sensitivity of the sub-mm observations(with SPIRE for instance) naturally translates into an in-creased accuracy of the redshift distributions. Fig.5 showsthe increased sample-size (at all redshifts) for the deeperSPIRE survey (compared to Fig.3). However the greater sen-sitivity of the SPIRE observations (1σ = 2.5 mJy) does notsignificantly improve the accuracy of the redshift distribu-tions, compared to those determined from detections in all3 BLAST filters. The redshift uncertainties for these sourcesare due to a combination of the absolute calibration errorsand the dispersion in the template SEDs. However SPIREdoes provide a far greater redshift accuracy for the sourcesthat BLAST detects in only one or two filters with low S/N(Fig.6). Thus, if the advantage of the larger aperture of Her-schel, the reduced confusion limit and higher sensitivity ofSPIRE is to be realised, then a clearer understanding of theSEDs of high-z galaxies is first required.

10 David H. Hughes et al.
Figure 8. Left panel: Photometric redshift vs. true redshift relationship for 424 mock galaxies simultaneously detected at 250, 350 and500µm with BLAST in a 1 deg2 survey. Open symbols show the relationship inferred using only BLAST data to derive the redshifts. Filledsymbols show the relationships when the redshifts are estimated using colours based on BLAST and complementary 850µm detectionsfrom a ground-based survey. The addition of 850µm measurements significantly increases the accuracy at z ≥ 4 since, at these redshifts,BLAST filters sample the rest-frame mid-IR to FIR (∼ 35 − 100µm). The longer wavelength data bracket the rest-frame FIR peak ofthe highest-z objects, which enhances the diagnostic power for the photometric technique discussed in this paper. Right panel: Exampleof the correction obtained for galaxies at z > 4 when 850µm observations are included in the photometric redshift analysis. The redshiftdistributions for a 1 × 10¹³L⊙ galaxy at z = 4.65 with detections at 250µm (18 mJy), 350µm (29 mJy), 500µm (27mJy) and 850µm(20 mJy) are shown as open (BLAST detections only) and shaded (BLAST and 850µm detections) histograms. This correction, whilstsignificant, only applies to 4 per cent of the entire sample detected in 3 bands.
2.3.3 BLAST + 850µm colours
A greater improvement in the accuracy of the sub-mm pho-tometric redshifts can be achieved by following-up BLAST
(or SPIRE) surveys with longer-wavelength survey data (e.g.ground-based 850µm SCUBA data), or vice-versa. Fig.7shows the result of simulations that combine BLAST and850µm observations. The SCUBA data include a photomet-ric measurement error of 2.5 mJy, to compare with the shal-low UK 8mJy SCUBA survey (Scott et al. 2001), and anabsolute calibration error of 9 per cent. The addition of alonger-wavelength datum to the colour information has twoadvantages. First, the inclusion of one more colour simply as-sists the ability to constrain the redshift. This is particularlyimportant for galaxies detected only at 500 and/or 350µm(40 per cent of the sources in the BLAST surveys), whichlie at the highest redshifts. Second, at z > 4 the BLAST fil-ters all begin to sample the short-wavelength (rest-framemid-IR) side of the FIR peak. This 850µm extension tothe BLAST wavelength coverage (250–500µm) ensures thatthere is still a long-wavelength datum that brackets the rest-frame FIR peak (at least until z ∼ 7). A clear illustrationof these benefits is shown in Fig.8 where high-z galaxiesat z > 4, that had previously been confused with lower-zgalaxies at z = 2 − 3 (using only data at 250–500µm), arenow symmetrically distributed about the z = zphot regres-sion line over the entire range 0 < z < 6, with an improvedaverage error of ∆z ∼ ±0.4. This correction applies only to
a small fraction (4 per cent) of the galaxies detected in all3 BLAST bands. This sub-mm method therefore continuesto provide un-biased estimates of photometric redshifts forthe most distant galaxies.
Given this benefit of including longer-wavelength data,the deepest BLAST surveys will be selected to overlap thelargest (0.5–1.0 deg2) surveys carried out by the JCMT at850 µm and IRAM at 1.25 mm. The extended wavelengthcoverage (250µm – 1.1 mm) will provide accurate redshiftconstraints out z ∼ 8.
The analysis described in this paper simultaneouslymakes use of all of the available multi-frequency data (un-like the simple one–colour vs. redshift treatments describedelsewhere), and takes into account the measurement errorsand uncertainties in the SEDs of the template galaxies usedto extrapolate the rest-frame luminosities of the sub-mmgalaxies from their observed data.
2.4 Comparison of Optical–IR, Sub-mm and
Sub-mm–Radio Photometric Redshifts
The photometric redshifts of galaxies derived from sub-mmBLAST data (250, 350 and 500µm), using the method de-scribed above, are compared with the true redshifts in ourmock catalogues. We have demonstrated that an averageaccuracy of ∆ z(submm) ∼ 0.6 can be achieved over therange 0 < z < 6, although, as Table 2 shows, the scatter in-

Breaking the “Redshift Deadlock” - I 11
Figure 9. Top panel: Sub-mm photometric redshifts vs. true red-shifts for 189 mock galaxies simultaneously detected at 250, 350,500 and 850µm in 1 deg2. The overall r.m.s. scatter in the sub-mmphotometric redshifts, determined from the combined BLASTand SCUBA 850µm data, is ∆ z(submm) ∼ 0.4 in the redshiftrange 0 < z < 6; Middle panel: Sub-mm–radio photometric red-shifts vs. true redshifts for galaxies selected from the same cat-alogue as in the top panel, using α350
1.4 , the 350–1.4 GHz spectralindex described by Carilli & Yun (2000); Bottom panel: Optical–IR photometric redshifts vs. spectroscopic redshifts in the HubbleDeep Field - 108 galaxies (Fernandez-Soto, Lanzetta, Yahil 1999- diamonds), 156 galaxies (Rowan-Robinson 2001 - crosses). Theoptical–IR photometric redshifts, for galaxies at ztrue ≥ 2, showa dispersion of ∆ z(opt) ∼ 0.5 (excluding the outlying sources).
creases significantly for z > 3.5 for the reasons described in§2.3. The photometric redshifts measured from the optical-IR SEDs of galaxies in the HDF (Fernandez-Soto, Lanzetta& Yahil 1999; Rowan-Robinson 2001) have an accuracy thatvaries between ∆ z(opt) ∼ 0.1 − 0.6 over the same redshiftrange. However we note that the optical galaxies describedin this HDF analysis are obviously not drawn from the samepopulation as the sub-mm galaxies. The accuracy of the op-tical photometric redshifts must be much poorer if the tech-nique is applied to the optically-obscured SCUBA galaxies.The inclusion of longer wavelength data (e.g. 850µm) to theBLAST data improves the photometric redshift accuracyto ∆ z(submm) ∼ 0.4, and extends the redshift range overwhich we can measure reliable redshifts to 0 < z < 6 (Fig.9and Table 2). This means that, despite the greater wealthof data describing the optical–IR SEDs of galaxies and thenumber of available optical–IR bands, the sub-mm photo-metric redshifts of the sub-mm galaxy population can bedetermined with a similar accuracy to the optical-IR pho-tometric redshifts of optically-selected galaxies at z > 1.5(Fig.9).
We also draw attention to the lowest-redshift bin, 0.5 <z < 1.5, in Table 2, which shows that the addition of 850µmdata decreases the redshift accuracy, compared to that de-rived from the shorter wavelength 250–500µm observations.This is due to the fact that the brightness of low-redshiftgalaxies, assuming our evolutionary model for the luminos-ity function, will necessarily have low S/N detections in an850µm survey with a 1σ sensitivity of 2.5 mJy. Thus the lowS/N 850µm detections, when combined with the BLASTdata, allows a greater range of redshifts to be consistentwith the observed colours. Conversely the addition of shorterwavelength SIRTF data with high S/N will improve the ac-curacy of our photometric redshift estimates at z < 1.5.
The redshift accuracies determined from BLAST andBLAST+850µm data (cols. 3 and 4 in Table 2) are comparedwith those obtained from the identical data in our mockcatalogues using the 350 GHz (850µm) to 1.4 GHz spectralindex (α350
1.4 ) described by Carilli & Yun (2000). The sim-ulations include a photometric error of 7µJy, and absolutecalibration error of 3 per cent to compare with the deepestVLA surveys. As Fig.9 clearly illustrates, the photometricredshifts obtained with the sub-mm/radio method suffer alarge scatter (∆ z(α350
1.4 ) > 1.5), particularly at z > 2, wheresmall differences in α350
1.4 result in large differences in theredshift estimates. The inability of the 850–1.4 GHz indexto determine accurate redshifts at z > 2 has already beennoted by Carilli & Yun (2000). At z < 2.5, photometricredshifts using α350
1.4 are still less accurate than those deter-mined from the sub-mm (250–850µm) method described inthis paper. This is due, in part, to the larger scatter of theSEDs at radio wavelengths (Fig.2). Naturally, any redshiftestimated from a single colour index (e.g. α350
1.4 ) is also, ingeneral, going to a offer a less stringent constraint than theuse of two or more colours.
2.5 Measuring the Star Formation History from
Sub-mm Surveys
The measurement of redshift probability distributions for alarge sample of sub-mm galaxies provides the informationnecessary to derive robust estimates of global properties of
12 David H. Hughes et al.
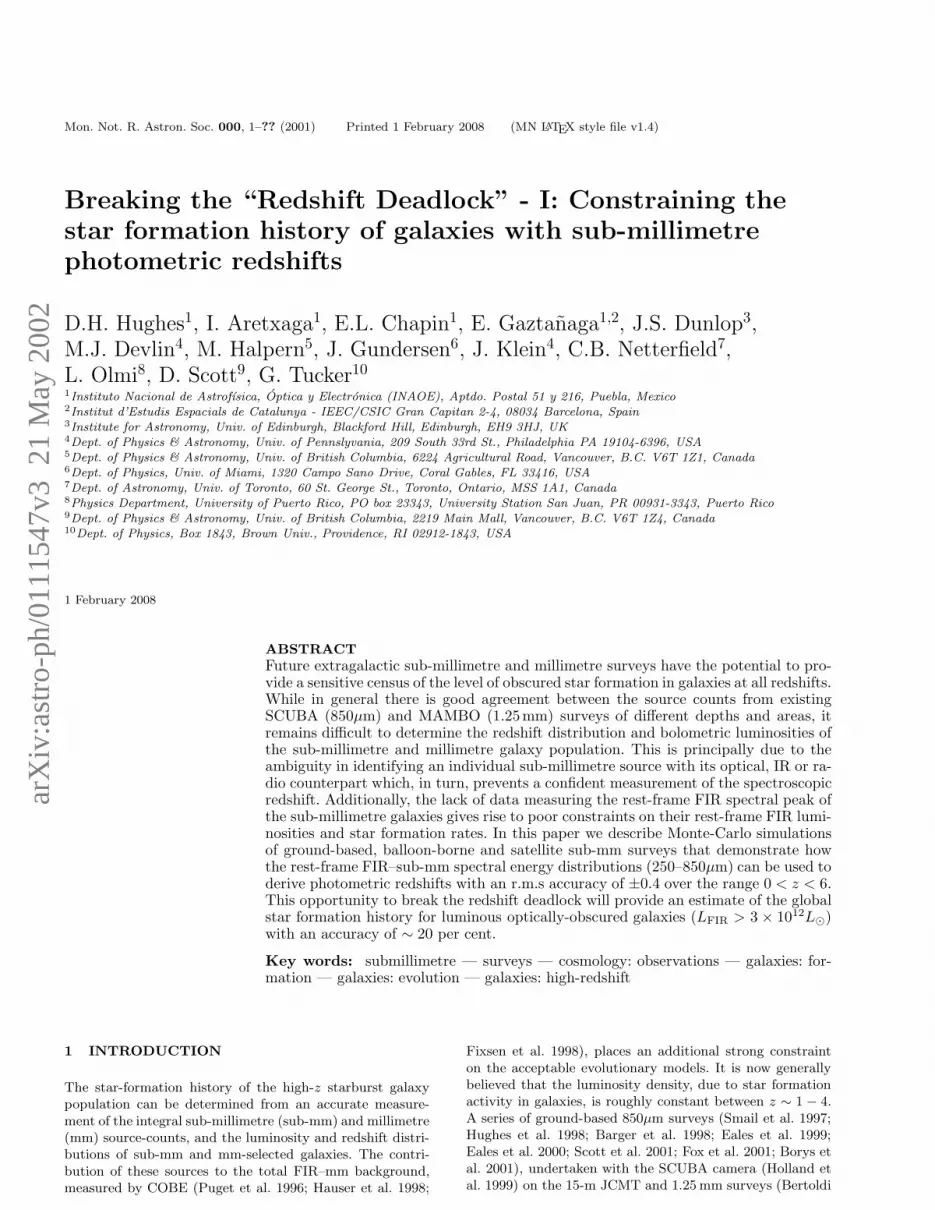
Figure 10. Left panel: Global star formation rate history of galaxies detected in at least 2 filters from a combined BLAST (3σ = 15 mJy)and wide-area SCUBA 850µm survey (3σ = 8 mJy). Filled diamonds represent the recovered values of the SFR using the photometricredshift distributions. We compare these values with the true SFR included in the mock catalogue (shown as a solid line) beforemeasurement errors are introduced. The 3σ error bars of the reconstructed SFR are dominated by the uncertainty of the SED thatshould be used to derive the 60µm luminosities of the mock galaxies (which have intrinsically different SEDs), and not by the accuracyof the redshift determinations. The long-dashed horizontal line shows an estimate of the minimum SFR density for sub-mm galaxies that
have been detected in the UK 8mJy SCUBA 850µm survey (Scott et al. 2001), assuming that the SCUBA galaxies lie between 2 < z < 4.The short-dashed curves represent the theoretical SFR due to galaxies of FIR luminosities > 1011−13L⊙ derived from the evolutionarymodel adopted in the simulations §2.2. Right Panel: Fraction of galaxies, per luminosity interval, detected at all redshifts in the mockcombined BLAST and wide-area SCUBA survey. The completeness of the survey is ∼98 per cent for galaxies > 3 × 10¹²L⊙.
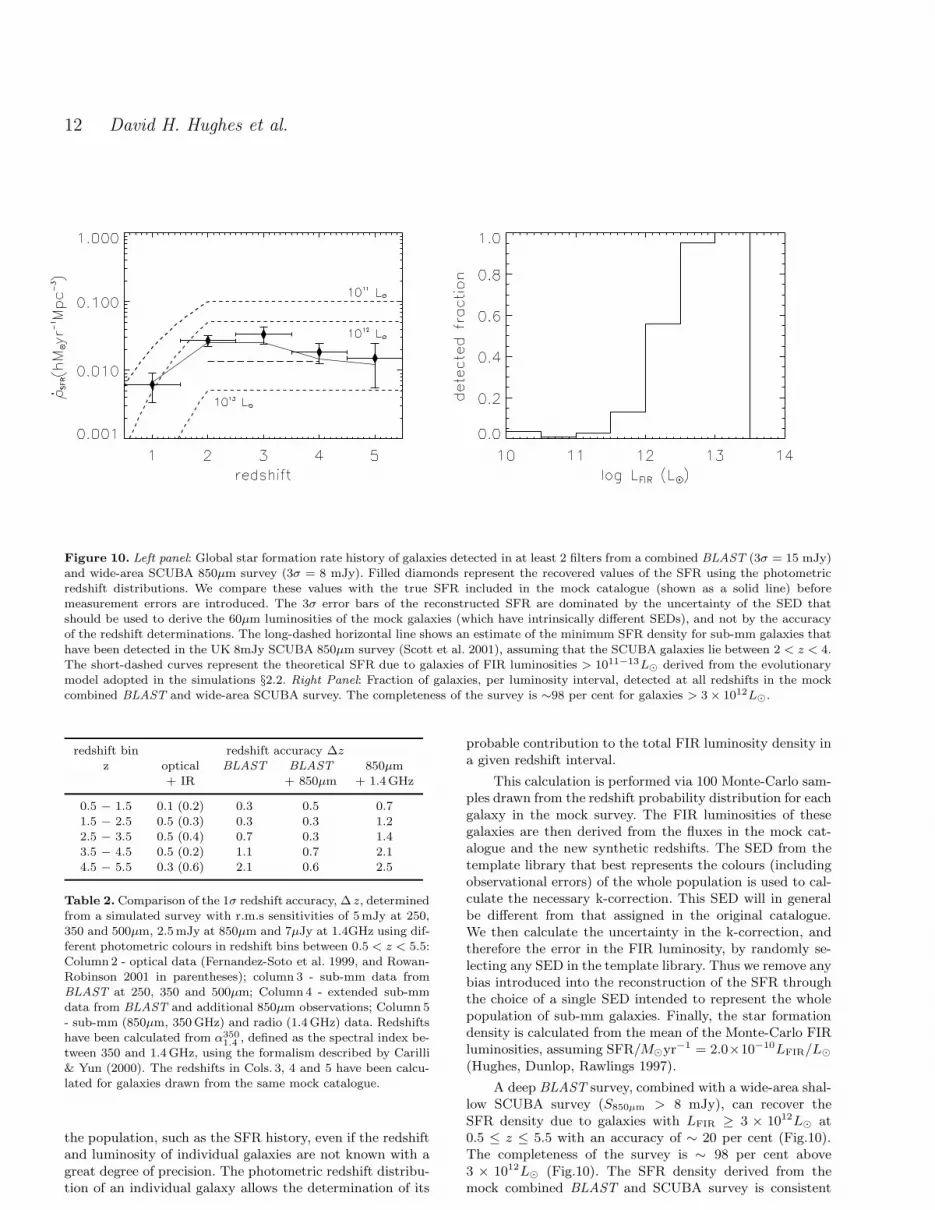
redshift bin redshift accuracy ∆z
z optical BLAST BLAST 850µm+ IR + 850µm + 1.4GHz
0.5 − 1.5 0.1 (0.2) 0.3 0.5 0.71.5 − 2.5 0.5 (0.3) 0.3 0.3 1.22.5 − 3.5 0.5 (0.4) 0.7 0.3 1.43.5 − 4.5 0.5 (0.2) 1.1 0.7 2.14.5 − 5.5 0.3 (0.6) 2.1 0.6 2.5
Table 2. Comparison of the 1σ redshift accuracy, ∆ z, determinedfrom a simulated survey with r.m.s sensitivities of 5mJy at 250,350 and 500µm, 2.5mJy at 850µm and 7µJy at 1.4GHz using dif-ferent photometric colours in redshift bins between 0.5 < z < 5.5:Column 2 - optical data (Fernandez-Soto et al. 1999, and Rowan-Robinson 2001 in parentheses); column 3 - sub-mm data fromBLAST at 250, 350 and 500µm; Column 4 - extended sub-mmdata from BLAST and additional 850µm observations; Column 5- sub-mm (850µm, 350 GHz) and radio (1.4GHz) data. Redshiftshave been calculated from α350
1.4 , defined as the spectral index be-tween 350 and 1.4GHz, using the formalism described by Carilli& Yun (2000). The redshifts in Cols. 3, 4 and 5 have been calcu-lated for galaxies drawn from the same mock catalogue.
the population, such as the SFR history, even if the redshiftand luminosity of individual galaxies are not known with agreat degree of precision. The photometric redshift distribu-tion of an individual galaxy allows the determination of its
probable contribution to the total FIR luminosity density ina given redshift interval.
This calculation is performed via 100 Monte-Carlo sam-ples drawn from the redshift probability distribution for eachgalaxy in the mock survey. The FIR luminosities of thesegalaxies are then derived from the fluxes in the mock cat-alogue and the new synthetic redshifts. The SED from thetemplate library that best represents the colours (includingobservational errors) of the whole population is used to cal-culate the necessary k-correction. This SED will in generalbe different from that assigned in the original catalogue.We then calculate the uncertainty in the k-correction, andtherefore the error in the FIR luminosity, by randomly se-lecting any SED in the template library. Thus we remove anybias introduced into the reconstruction of the SFR throughthe choice of a single SED intended to represent the wholepopulation of sub-mm galaxies. Finally, the star formationdensity is calculated from the mean of the Monte-Carlo FIRluminosities, assuming SFR/M⊙yr−1 = 2.0×10⁻¹⁰LFIR/L⊙
(Hughes, Dunlop, Rawlings 1997).
A deep BLAST survey, combined with a wide-area shal-low SCUBA survey (S850µm > 8 mJy), can recover theSFR density due to galaxies with LFIR ≥ 3 × 10¹²L⊙ at0.5 ≤ z ≤ 5.5 with an accuracy of ∼ 20 per cent (Fig.10).The completeness of the survey is ∼ 98 per cent above3 × 1012L⊙ (Fig.10). The SFR density derived from themock combined BLAST and SCUBA survey is consistent

Breaking the “Redshift Deadlock” - I 13
with the preliminary results from the UK 8 mJy SCUBAsurvey (Scott et al. 2001), and provides a good illustration ofthe advantage of being able to derive photometric redshiftsfor the entire survey sample over a large redshift range.
3 CONCLUSIONS
Monte-Carlo simulations of multi-wavelength (250–850µm)sub-mm surveys show that the majority of the scatter inthe derived sub-mm colours will be due, in approximatelyequal parts, to the dispersion in the SEDs of galaxies in alibrary of templates, and the observational and calibrationerrors. Since we can control to some extent the quality ofthe experimental data, it is still the uncertainty in the ob-served (or model) SEDs of high-z starburst galaxies that willultimately limit the accuracy of these photometric redshiftpredictions. Theoretical SEDs, based on radiative transfermodels for high-z starburst galaxies (Efstathiou, Rowan-Robinson & Siebenmorgen 2000), can help in principle. How-ever the low S/N, and restricted wavelength coverage of theavailable observational data for high-z starburst galaxies areconsistent with such a broad range of theoretical models thatthey currently provide little discriminatory power in deter-mining the most appropriate SEDs to use as templates. Con-sequently, one of the most straight-forward achievements ofBLAST, but no less important, will be simply to provide anaccurate empirical model of the temperature-sensitive SEDsfor 1000’s of high-z galaxies at these critical short sub-mmwavelengths (250–500µm).
The product of the simulations of sub-mm surveys de-scribed in this paper is the ability to calculate the proba-bility distribution for the redshift of any individual galaxy,taking into account observational errors and the uncertaintyin the appropriate template SED, without the requirementto first identify the optical, IR or radio counterpart. Thesesimulations demonstrate that the combination of balloon-borne (airborne or satellite) short-wavelength sub-mm dataat 250–500µm, and longer-wavelength ground-based 850µmdata, for a statistical sample of galaxies can provide therest-frame FIR luminosity distribution, and hence the starformation history of the entire sub-mm population.
The precision of redshift estimates determined fromshort-wavelength sub-mm observations (250–500µm) is en-couraging, with a 1σ dispersion of ∆ z(submm) = 0.4 − 0.6(depending on the availability of longer-wavelength ground-based data, λ ≥ 850µm) over the range 0 < z < 6. Thissub-mm precision is comparable to the accuracy of theoptical-IR photometric estimates of redshift, ∆ z(opt) ∼ 0.5at z > 2, and significantly better than those provided bythe 850µm/1.4 GHz spectral index. An important conse-quence of these sub-mm redshift constraints is the abilityto measure the star-formation of luminous sub-mm galaxies(LFIR > 3 × 10¹²L⊙) with an unprecedented error of ∼ 20per cent.
The advantage of having a constrained redshift proba-bility distribution for individual sub-mm galaxies, withoutoptical, IR or radio (continuum) counterparts, is that we cannow determine the likelihood that a redshifted rotational COtransition-line falls into the frequency range of any partic-ular spectral-line receiver on the next generation of largemm–cm telescopes (e.g. 100-m GBT, 50-m LMT). The op-
portunities to conduct mm-wavelength spectroscopic follow-up observations that will provide definitive molecular-lineredshifts, and dynamical-mass estimates of sub-mm galax-ies, are discussed further in Paper II (Aretxaga et al. 2002).
The combination of short-wavelength sub-mm datafrom BLAST, SPIRE or other facilities, and large single-dish millimetre wavelength telescopes provides a powerfulcombination to break the redshift deadlock that hinders ourability to understand the evolution and nature of the sub-mm starburst galaxy population.
4 ACKNOWLEDGMENTS
We thank the anonymous referee for constructive sugges-tions to improve this paper. This work has been funded byCONACYT grants 32180-E and 32143-E. The developmentof BLAST is supported in part by NASA grant NAG5-92291.DHH, IA, and ELC would like to thank Mark Devlin andthe Physics & Astronomy Dept. at Univ. of Pennsylvania,Philadelphia for their financial support and hospitality inJune 2001 during which time part of this work was carriedout.
REFERENCES
Aretxaga I., Hughes D.H, Chapin E., Gaztanaga E., 2001, in M.de Petris & M. Gervasi, eds, Experimental Cosmology at Mil-limetre Wavelengths. AIP, in press, astro-ph/0111508
Aretxaga I., Hughes D.H, Chapin E., Gaztanaga E.,Dunlop J.S.,2002 (paper II), MNRAS, submitted
Barger A.J., Cowie L.L., Sanders D.B., Fulton E., Taniguichi, Y.,Sato, Y., Kawara, K, Okuda, H., 1998, Nat, 394, 248
Barger A.J., Cowie, L.L, Richards, E.A., 2000, AJ, 119, 2092
Bertoldi F., et al., 2000, in D.J.Wilner et al., eds., Highlights ofAstronomy 12, Cold Gas and Dust at High Redshift. in press,astro-ph/0010553
Blain A.W., 1999, MNRAS, 309, 955
Blain A.W., Longair M.S., 1993, MNRAS, 264, 509Borys C. Chapman S.C., Halpern M., Scott D., 2001, preprint,
astro-ph/0107515Carilli C.L., Yun M.S., 1999, ApJ, 513, L13
Carilli C.L., Yun M.S., 2000, ApJ, 530, 618Chapin E., Hughes D.H., Kelly B.D., Holland W.S., 2001, in M.
de Petris & M. Gervasi, eds, Experimental Cosmology at Mil-limetre Wavelengths. AIP, in press, astro-ph/0109330
Chapman S.C. et al., 2000, MNRAS, 319, 318Chapman S.C., Scott D., Borys C., Fahlman G.G., 2002, MNRAS,
330, 92
Condon J.J., 1974, ApJ, 188, 279Desert F.X., Boulanger F., Puget J.L., 1990, A&A, 237, 215
Devlin M. et al., 2001, in J.Lowenthal & D.H.Hughes, eds, DeepMillimetre Surveys: Implications for Galaxy Formation andEvolution. World Scientific, in press, astro-ph/0012327
Downes D., et al., 1999, A&A, 347, 809Dunlop J.S., 2001, in M. van Bemmel, B. Wilkes, P. Barthel, eds.,
The FIR and Submillimeter Spectral Energy Distributions of
Active and Starburst Galaxies, Elsevier New Astronomy Re-views, in press, astro-ph/0101297
Dunne L., Clements D.L., Eales S.A., 2000, MNRAS, 319, 813Eales S.A., Lilly S., Gear W., Dunne L., Bond J.R., Hammer F.,
Le Fevre O., Crampton D., 1999, ApJ, 515, 518
Eales S.A., Lilly S., Webb T., Dunne L., Gear W., Clements D.L.,Yun Min, 2000, AJ, 120, 2244
14 David H. Hughes et al.
Efstahiou A., Rowan-Robinson M., Siebenmorgen R., 2000, MN-
RAS, 313, 734Fernandez-Soto A., Lanzetta K., Yahil A., 1999, ApJ, 513, 34Fixsen D.J., Dwek E., Mather J.C., Bennett C.L., Shafer R.A.,
1998, ApJ, 508, 123Fox M.J., et al., 2001, MNRAS, in press, astro-ph/0107585Frayer D.T., Ivison R.J., Scoville N.Z., Yun M., Evans M.S., Smail
I., Blain A.W., Kneib J.-P., 1998, ApJ, 506, L7Frayer D.T., Smail I., Ivison R.J., Scoville N.Z., 2000, AJ, 120,
1668Gautier T.N., Boulanger F., Perault M., Puget J.L., 1992, AJ,
103, 1313Gaztanaga E., Hughes D.H., 2001, in J.Lowenthal & D.H.Hughes,
eds, Deep Millimetre Surveys: Implications for Galaxy For-mation and Evolution. World Scientific, in press, astro-ph/0103127
Gear W.K., Lilly S.J., Stevens J.A., Clements D.L., Webb T.M.,Eales S.A., Dunne L., 2000, MNRAS, 316, 51 Advanced Tech-nology MMW, Radio, and Terahetrz Telescopes.
Hauser M.G., et al. 1998, ApJ, 508, 25Holland W.S., et al., 1999, MNRAS, 303, 659Hughes D.H., 2000, in A.Mazure, O. Le Fevre, V. Le Brun,
eds, Clustering at High Redshift. ASP Conf. 200, 81, astro-ph/0003414
Hughes D.H., Dunlop J.S., Rawlings S., 1997, MNRAS, 289, 766Hughes D.H., et al., 1998, Nat, 394, 241Hughes D.H., Gaztanaga, E., 2000, in F.Favata & A.Kass, eds,
Star formation from the Small to the Large Scale. ESA SP-445, p.29, astro-ph/0004002
Ivison R.J., Smail I., Barger A.J., Kneib J.-P., Blain A.W., OwenF.N., Kerr T.H., Cowie L.L., 2000, MNRAS, 315, 209
Ivison R.I., et al., 1999, Ap&SS, 266, 285Knudsen K.K., van der Werf P.P., Jaffe W., 2001 in J.Lowenthal
& D.H.Hughes, eds, Deep Millimetre Surveys: Implications forGalaxy Formation and Evolution. World Scientific, in press,astro-ph/0009024
Kreysa E. et al., 1998, in T.G. Phillips, ed, Proceedings of SPIEVol. 3357, Advanced Technology MMW, Radio, and TerahetrzTelescopes.
Lagache G., Puget J.L, 2000, A&A, 355, L17Lilly S.J., Eales S.A., Gear W.K., Hammer F., Le Fevre O.,
Crampton D., Bond J. R., Dunne L., 1999, ApJ, 518, 641Lutz D., et al., 2001, A&A, 378, 70Madau P., Ferguson H.C., Dickinson M.E., Giavalisco M., Steidel
C.C., Fruchter A., 1996, MNRAS, 283, 1388Peacock J.A., et al. 2000, MNRAS, 318, 535Puget J.-L., Abergel A., Bernard J.-P., Boulanger F., Burton
W.B., Desert F.-X., Hartmann D., 1996, A&A, 308, L5Richards E.A., 1999, ApJ, 513, L9Rowan-Robinson M., 2001, ApJ, submitted,
http://astro.ic.ac.uk/∼mrr/photz/photzapj.psSanders D.B., Mirabel I.F., 1996, ARA&A, 34, 749Saunders W., Rowan-Robinson M., Lawrence A., Efstathiou G.,
Kaiser N., Ellis R.S., Frenk C.S., 1990, MNRAS, 242, 318Schlegel D.J., Finkbiener D.P., Davis, M., 1998, ApJ, 500, 525Scott S., et al., 2001, MNRAS, in press, astro-ph/0107446Smail I., Ivison R.J., Blain A.W., 1997, ApJ, 490, L5Smail I., Ivison R.J., Kneib J.-P., Cowie L.L., Blain A.W., Barger
A.J., Owen F.N., Morrison G., 1999, MNRAS, 308, 1061Smail I., Ivison R.J., Owen F.N., Blain A.W., Kneib J.-P., 2000,
ApJ, 528, 612Smail I., Ivison R.J., Blain A.W., Kneib J.-P., 2001, astro-
ph/0112100Steidel C.C., Giavalisco M., Pettini M., Dickinson M., Adelberger
K.L., 1996, ApJ, 462, L17


