Embed Size (px)
Citation preview
Bridge Embankment Stabilization in Deep Soft Lacustrine Clays Under High Artesian Pressures
Jon Friesen, P.Eng., Dami Adedapo, Ph.D., P.Eng., R.M. Kenyon, Ph.D., P.Eng. KGS Group, Winnipeg, Manitoba, Canada Ruth J. Eden, M.Sc., P.Eng. Manitoba Infrastructure and Transportation, Winnipeg, Manitoba, Canada ABSTRACT This paper details the modeling, design, and implementation of stabilization measures of the west embankment of the Manitoba Infrastructure and Transportation (MIT) Letellier Bridge crossing of the Red River in southern Manitoba. Those measures included an array of closely spaced large diameter pipe piles, slope re-grading, and the use of cellular concrete lightweight fill. Stratigraphic conditions were dominated by forty-three (43) metre thick residual strength high plasticity glacio-lacustrine clays in a section of the Lake Agassiz basin that is also dominated by very high artesian pressures in the underlying limestone bedrock aquifer. The pipe pile array, driven through the clay and anchored 5 m into till, are considered a passive support system and are only engaged when soil movement occurs and lateral loads are imposed on the piles. Therefore the stress strain behaviour of the reinforced bank and consequent movements of the embankment governed versus a conventional limit equilibrium design. As well, the skin friction between the pile wall and clay was known to be low such that the spacing of the piles had to ensure bridging was occurring. Design of the slope stability measures were completed using a fully coupled finite element based seepage/effective-stress/stability model. A comprehensive construction stability monitoring program using piezometric monitoring data as input into the slope stability model was carried out during construction. The results of the fully coupled design model and the construction stability monitoring model are compared. RÉSUMÉ Ce document expose en détail la modélisation, la conception, la mise en œuvre et des mesures de stabilisation de la culée ouest du pont de Letellier appartenant à Infrastructure et Transports Manitoba (MIT) traversant la rivière Rouge dans le sud du Manitoba. Ces mesures ont comprit d'une série de piliers tubulaires de grand diamètre peu espacé, des ajustements à l'inclinaison de la pente, et l'utilisation de béton mousse léger comme matière de remblayage. Les conditions stratigraphiques ont été dominées par quarante trois (43) mètre d'épaisseur d'argiles glacio-lacustres à résistance résiduelles et haute plasticité dans une section du bassin du lac Agassiz qui est également dominé par de très hautes pressions artésiennes dans l'aquifère calcaire sous-jacent. Les piliers qui ont été conduit à travers l'argile et ancré à 5 m de prefondeur dans le till, sont considérés comme un système de soutien passif et ne sont engagées qu'au moment ou un mouvement du sol se produit et les forces latérales sont imposées sur les piliers. Par conséquent, le comportement contrainte-déformation des mouvements de la pente et les movements conséquent de la butée ont dérigés la conception et non l'équilibre limite conventionnelle. Et aussi, la friction entre les parois des piliers et de l'argile était connu comme étant faible, telle que l'espacement des piliers devaient assurer qu'un pontage existait. La conception des mesures de stabilité des pentes a été achevés en utilisant un modèle d'infiltration/contrainte-effictif/stabilité basé sur une méthode d'analyse par élément finis entièrement couplé. Un programme comprehensif de surveillance de la stabilité, utilisant les données piézométriques comme entrée dans le modèle la stabilité des pentes, a été réalisée lors de la construction. Les résultats du modèle de conception entièrement couplé et les résultats du programme de surveillance de la stabilité durant la construction sont comparés. 1 INTRODUCTION The Letellier Bridge on PR 201, located approximately 70 km south of Winnipeg was first constructed in 1955. The original bridge was founded on timber friction piles in weak clay and frequently required repair and retrofitting due to riverbank instability-induced movements of up to three metres over the years.
A new five-span trapezoidal box girder structure was constructed beginning in fall of 2009. A very weak 43 m thick high plasticity clay deposit underlying the site, coupled with very high upward groundwater gradients,
precluded the possibility of implementing traditional riverbank stabilizing measures such as conventionally drilled rockfill columns or shear keys (Thiessen, et.al., 2011).
The required service-life safety factor was achieved by offloading and re-grading the bank prior to construction and by implementing two unique means of slope stabilization, both being first-time applications for Manitoba Infrastructure and Transportation (MIT): Pipe Piles: A tight array of composite reinforced-concrete columns / steel-pipe piles driven deep into the underlying
till was designed to reinforce the riverbank. Instead of the classic limit-equilibrium approach to slope stabilization, this group of piles acted to not only resist the shearing of the riverbank but also were designed to limit the surface movement at the base of the embankment. Cellular Concrete Lightweight Fill: The weight of a conventional earth fill embankment would have reduced the stability of the riverbank to unacceptable levels. An engineered composite lightweight fill embankment was designed and constructed to minimize the generation of excess pore-water pressure (PWP) and the net destabilizing surcharge load applied to the crest of the bank.
Pneumatic and vibrating wire piezometers were installed to various depths within the west bank at various locations in the immediate vicinity of the new structure to monitor PWP’s during construction. Several slope inclinometers were also installed to measure potential riverbank movements. A comprehensive slope stability monitoring program was implemented during the two years of bridge construction to monitor slope stability during this critical period.
2 BACKGROUND AND HISTORY The bridge site is on a gently sweeping bend of the Red River’s meandering alignment. The east embankment is on the inside of the bend and the west embankment is on the outside. The natural stratigraphy is typically one of weak Lake Agassiz-deposited glacio-lacustrine clays on outside bends. The instability discussed herein occurred largely because of this stratigraphy.
The riverbank slope of the west bank was characterized by a hummocky, irregular shape with multiple, retrogressive headscarps and failures were extensive and deep.
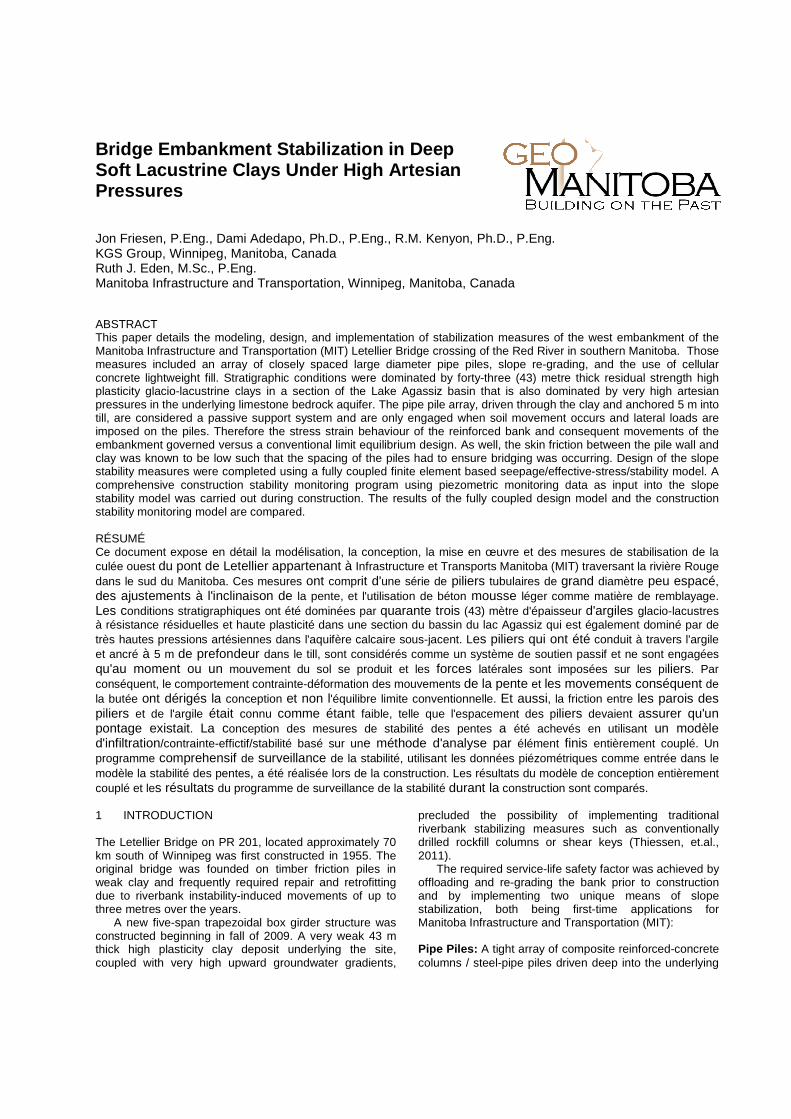
Shortly after the initial construction in 1955, the five-span truss-bridge bearing on short timber friction piles sustained significant structural damage due to classic rotational slope failures on the west bank. Three years later, the ongoing movements warranted major alterations including overall flattening of the bank and replacement of the approach embankments with structural bent-supported approach slabs as shown in Figure 1.
Figure 1. West bank of original 1955 Letellier Bridge
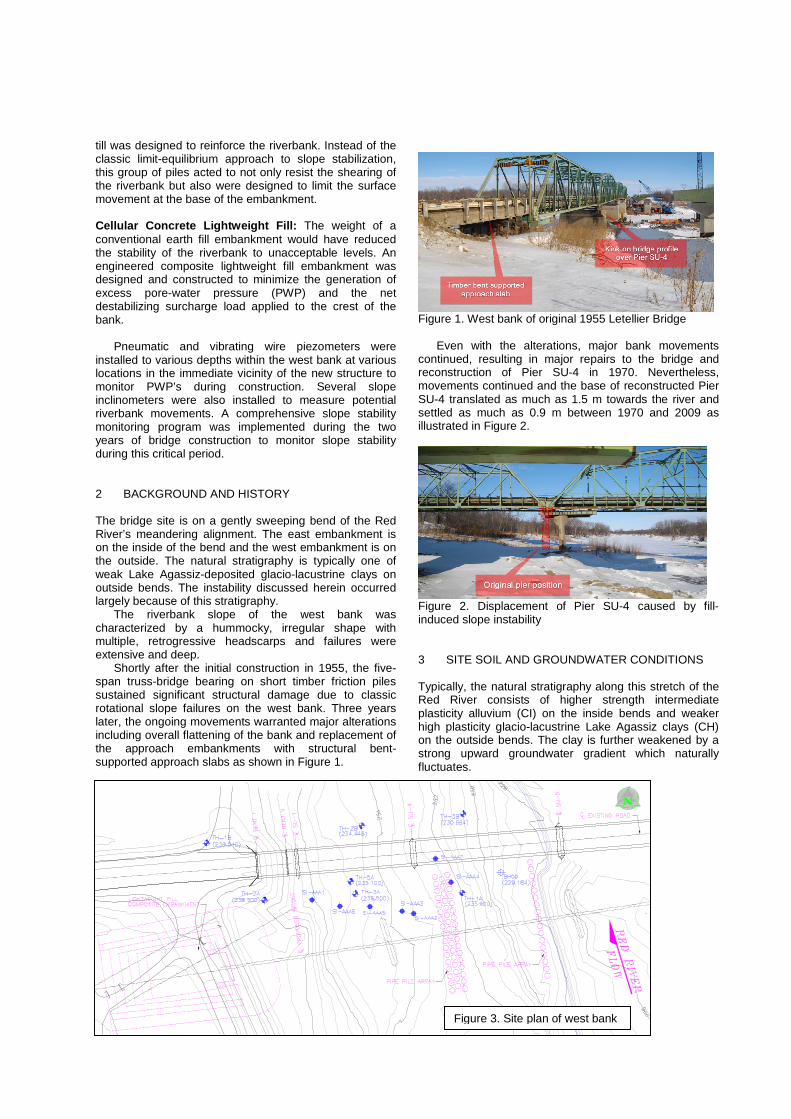
Even with the alterations, major bank movements
continued, resulting in major repairs to the bridge and reconstruction of Pier SU-4 in 1970. Nevertheless, movements continued and the base of reconstructed Pier SU-4 translated as much as 1.5 m towards the river and settled as much as 0.9 m between 1970 and 2009 as illustrated in Figure 2.
Figure 2. Displacement of Pier SU-4 caused by fill-induced slope instability 3 SITE SOIL AND GROUNDWATER CONDITIONS Typically, the natural stratigraphy along this stretch of the Red River consists of higher strength intermediate plasticity alluvium (CI) on the inside bends and weaker high plasticity glacio-lacustrine Lake Agassiz clays (CH) on the outside bends. The clay is further weakened by a strong upward groundwater gradient which naturally fluctuates.
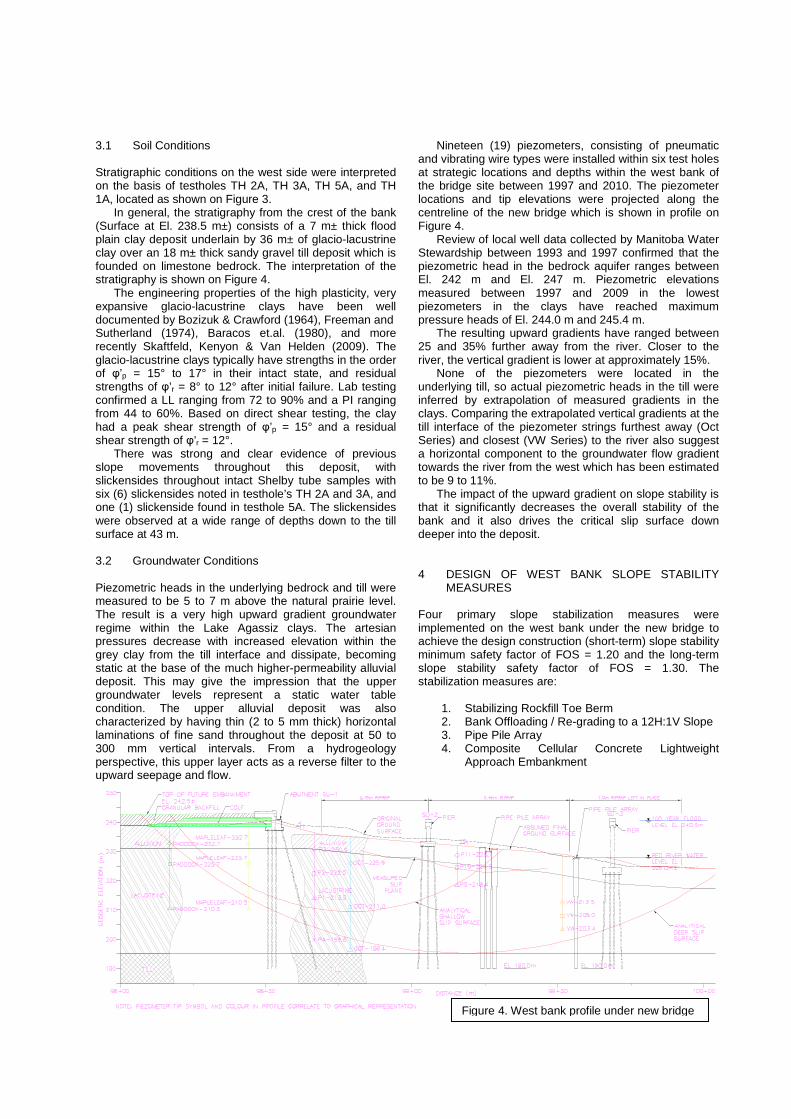
Figure 3. Site plan of west bank
3.1 Soil Conditions
Stratigraphic conditions on the west side were interpreted on the basis of testholes TH 2A, TH 3A, TH 5A, and TH 1A, located as shown on Figure 3.
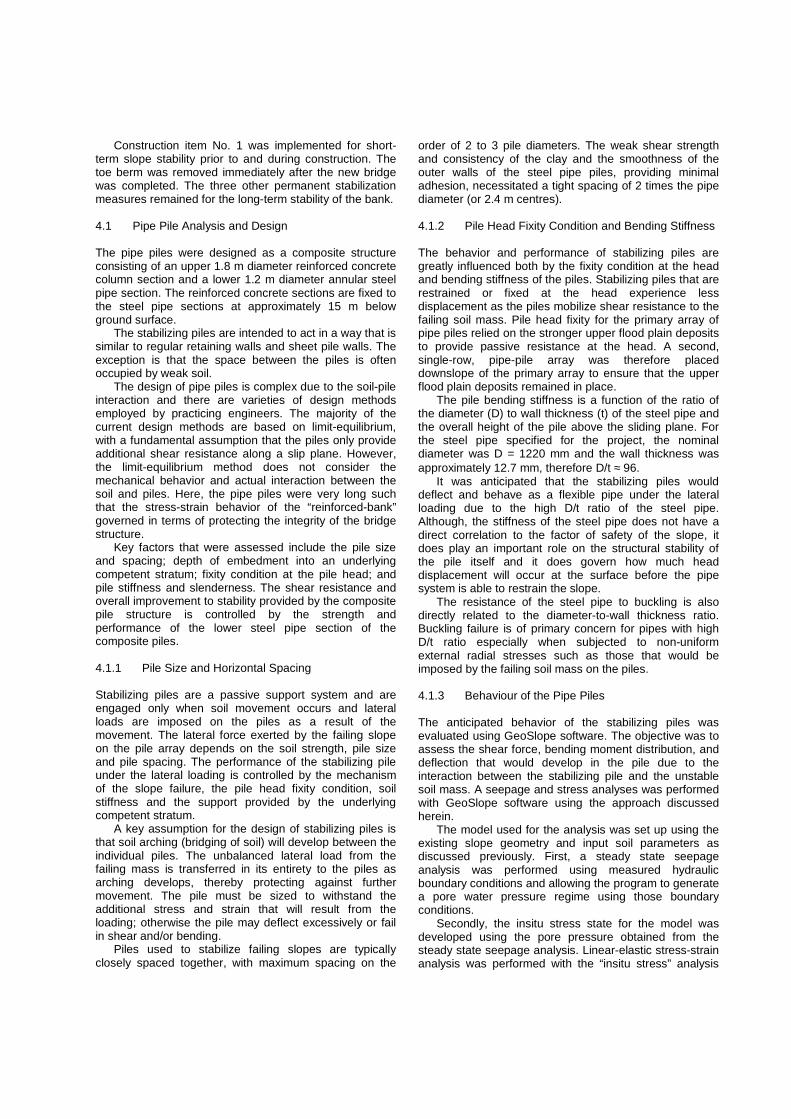
In general, the stratigraphy from the crest of the bank (Surface at El. 238.5 m±) consists of a 7 m± thick flood plain clay deposit underlain by 36 m± of glacio-lacustrine clay over an 18 m± thick sandy gravel till deposit which is founded on limestone bedrock. The interpretation of the stratigraphy is shown on Figure 4.
The engineering properties of the high plasticity, very expansive glacio-lacustrine clays have been well documented by Bozizuk & Crawford (1964), Freeman and Sutherland (1974), Baracos et.al. (1980), and more recently Skaftfeld, Kenyon & Van Helden (2009). The glacio-lacustrine clays typically have strengths in the order of φ’p = 15° to 17° in their intact state, and residual strengths of φ’r = 8° to 12° after initial failure. Lab testing confirmed a LL ranging from 72 to 90% and a PI ranging from 44 to 60%. Based on direct shear testing, the clay had a peak shear strength of φ’p = 15° and a residual shear strength of φ’r = 12°.
There was strong and clear evidence of previous slope movements throughout this deposit, with slickensides throughout intact Shelby tube samples with six (6) slickensides noted in testhole’s TH 2A and 3A, and one (1) slickenside found in testhole 5A. The slickensides were observed at a wide range of depths down to the till surface at 43 m. 3.2 Groundwater Conditions
Piezometric heads in the underlying bedrock and till were measured to be 5 to 7 m above the natural prairie level. The result is a very high upward gradient groundwater regime within the Lake Agassiz clays. The artesian pressures decrease with increased elevation within the grey clay from the till interface and dissipate, becoming static at the base of the much higher-permeability alluvial deposit. This may give the impression that the upper groundwater levels represent a static water table condition. The upper alluvial deposit was also characterized by having thin (2 to 5 mm thick) horizontal laminations of fine sand throughout the deposit at 50 to 300 mm vertical intervals. From a hydrogeology perspective, this upper layer acts as a reverse filter to the upward seepage and flow.
Nineteen (19) piezometers, consisting of pneumatic and vibrating wire types were installed within six test holes at strategic locations and depths within the west bank of the bridge site between 1997 and 2010. The piezometer locations and tip elevations were projected along the centreline of the new bridge which is shown in profile on Figure 4.
Review of local well data collected by Manitoba Water Stewardship between 1993 and 1997 confirmed that the piezometric head in the bedrock aquifer ranges between El. 242 m and El. 247 m. Piezometric elevations measured between 1997 and 2009 in the lowest piezometers in the clays have reached maximum pressure heads of El. 244.0 m and 245.4 m.
The resulting upward gradients have ranged between 25 and 35% further away from the river. Closer to the river, the vertical gradient is lower at approximately 15%.
None of the piezometers were located in the underlying till, so actual piezometric heads in the till were inferred by extrapolation of measured gradients in the clays. Comparing the extrapolated vertical gradients at the till interface of the piezometer strings furthest away (Oct Series) and closest (VW Series) to the river also suggest a horizontal component to the groundwater flow gradient towards the river from the west which has been estimated to be 9 to 11%.
The impact of the upward gradient on slope stability is that it significantly decreases the overall stability of the bank and it also drives the critical slip surface down deeper into the deposit.
4 DESIGN OF WEST BANK SLOPE STABILITY MEASURES
Four primary slope stabilization measures were implemented on the west bank under the new bridge to achieve the design construction (short-term) slope stability minimum safety factor of FOS = 1.20 and the long-term slope stability safety factor of FOS = 1.30. The stabilization measures are:
1. Stabilizing Rockfill Toe Berm 2. Bank Offloading / Re-grading to a 12H:1V Slope 3. Pipe Pile Array 4. Composite Cellular Concrete Lightweight
Approach Embankment
Figure 4. West bank profile under new bridge
Construction item No. 1 was implemented for short-term slope stability prior to and during construction. The toe berm was removed immediately after the new bridge was completed. The three other permanent stabilization measures remained for the long-term stability of the bank.
4.1 Pipe Pile Analysis and Design The pipe piles were designed as a composite structure consisting of an upper 1.8 m diameter reinforced concrete column section and a lower 1.2 m diameter annular steel pipe section. The reinforced concrete sections are fixed to the steel pipe sections at approximately 15 m below ground surface.
The stabilizing piles are intended to act in a way that is similar to regular retaining walls and sheet pile walls. The exception is that the space between the piles is often occupied by weak soil.
The design of pipe piles is complex due to the soil-pile interaction and there are varieties of design methods employed by practicing engineers. The majority of the current design methods are based on limit-equilibrium, with a fundamental assumption that the piles only provide additional shear resistance along a slip plane. However, the limit-equilibrium method does not consider the mechanical behavior and actual interaction between the soil and piles. Here, the pipe piles were very long such that the stress-strain behavior of the “reinforced-bank” governed in terms of protecting the integrity of the bridge structure.
Key factors that were assessed include the pile size and spacing; depth of embedment into an underlying competent stratum; fixity condition at the pile head; and pile stiffness and slenderness. The shear resistance and overall improvement to stability provided by the composite pile structure is controlled by the strength and performance of the lower steel pipe section of the composite piles.
4.1.1 Pile Size and Horizontal Spacing Stabilizing piles are a passive support system and are engaged only when soil movement occurs and lateral loads are imposed on the piles as a result of the movement. The lateral force exerted by the failing slope on the pile array depends on the soil strength, pile size and pile spacing. The performance of the stabilizing pile under the lateral loading is controlled by the mechanism of the slope failure, the pile head fixity condition, soil stiffness and the support provided by the underlying competent stratum.
A key assumption for the design of stabilizing piles is that soil arching (bridging of soil) will develop between the individual piles. The unbalanced lateral load from the failing mass is transferred in its entirety to the piles as arching develops, thereby protecting against further movement. The pile must be sized to withstand the additional stress and strain that will result from the loading; otherwise the pile may deflect excessively or fail in shear and/or bending.
Piles used to stabilize failing slopes are typically closely spaced together, with maximum spacing on the
order of 2 to 3 pile diameters. The weak shear strength and consistency of the clay and the smoothness of the outer walls of the steel pipe piles, providing minimal adhesion, necessitated a tight spacing of 2 times the pipe diameter (or 2.4 m centres). 4.1.2 Pile Head Fixity Condition and Bending Stiffness The behavior and performance of stabilizing piles are greatly influenced both by the fixity condition at the head and bending stiffness of the piles. Stabilizing piles that are restrained or fixed at the head experience less displacement as the piles mobilize shear resistance to the failing soil mass. Pile head fixity for the primary array of pipe piles relied on the stronger upper flood plain deposits to provide passive resistance at the head. A second, single-row, pipe-pile array was therefore placed downslope of the primary array to ensure that the upper flood plain deposits remained in place.
The pile bending stiffness is a function of the ratio of the diameter (D) to wall thickness (t) of the steel pipe and the overall height of the pile above the sliding plane. For the steel pipe specified for the project, the nominal diameter was D = 1220 mm and the wall thickness was approximately 12.7 mm, therefore D/t ≈ 96.
It was anticipated that the stabilizing piles would deflect and behave as a flexible pipe under the lateral loading due to the high D/t ratio of the steel pipe. Although, the stiffness of the steel pipe does not have a direct correlation to the factor of safety of the slope, it does play an important role on the structural stability of the pile itself and it does govern how much head displacement will occur at the surface before the pipe system is able to restrain the slope.
The resistance of the steel pipe to buckling is also directly related to the diameter-to-wall thickness ratio. Buckling failure is of primary concern for pipes with high D/t ratio especially when subjected to non-uniform external radial stresses such as those that would be imposed by the failing soil mass on the piles.
4.1.3 Behaviour of the Pipe Piles
The anticipated behavior of the stabilizing piles was evaluated using GeoSlope software. The objective was to assess the shear force, bending moment distribution, and deflection that would develop in the pile due to the interaction between the stabilizing pile and the unstable soil mass. A seepage and stress analyses was performed with GeoSlope software using the approach discussed herein.
The model used for the analysis was set up using the existing slope geometry and input soil parameters as discussed previously. First, a steady state seepage analysis was performed using measured hydraulic boundary conditions and allowing the program to generate a pore water pressure regime using those boundary conditions.
Secondly, the insitu stress state for the model was developed using the pore pressure obtained from the steady state seepage analysis. Linear-elastic stress-strain analysis was performed with the “insitu stress” analysis
routine available in Sigma/W. The stabilizing piles were excluded from the model at this stage of the analysis.
The stabilizing piles were installed after an initial insitu stable state was developed. Elastic-plastic stress-strain properties and representative shear strength parameters were assigned to the soil. The initial stresses obtained from the linear-elastic analysis may have exceeded the actual soil strength. Hence, the stresses were redistributed within the model (with the piles in place) using a special stress-strain analysis routine available in Sigma/W. To achieve this, Sigma/W computes a load vector for each element that represents the over-stressed portion within the element using the Elastic-Plastic Material (constitutive) soil model. The load vector (or the unbalanced load) is the portion of the stress that exceeds the available shear strength of the soil. The unbalanced load vector is applied as in any regular finite element analysis, and results in deformations and stress changes. The procedure is iteratively repeated until the unbalanced load is zero or within some tolerable convergence criteria. The response of the piles (shear force, bending moment distribution and deflections) was extracted after the stress redistribution was completed and equilibrium was achieved.
The pipe piles were modeled as structural beam elements. Each node of had one rotational and two-displacement degrees-of-freedom. The input parameters of the steel pipe pile were elastic modulus E = 200 GPa; moment of inertia I = 0.00366 m4/m and cross-sectional A = 0.02007 m2 based on an outside diameter of 1220 mm and a wall thickness of 12.7 mm. The actual magnitudes of the moment of inertia and cross sectional area were scaled to reflect a pile spacing of 2.4 m on centres.
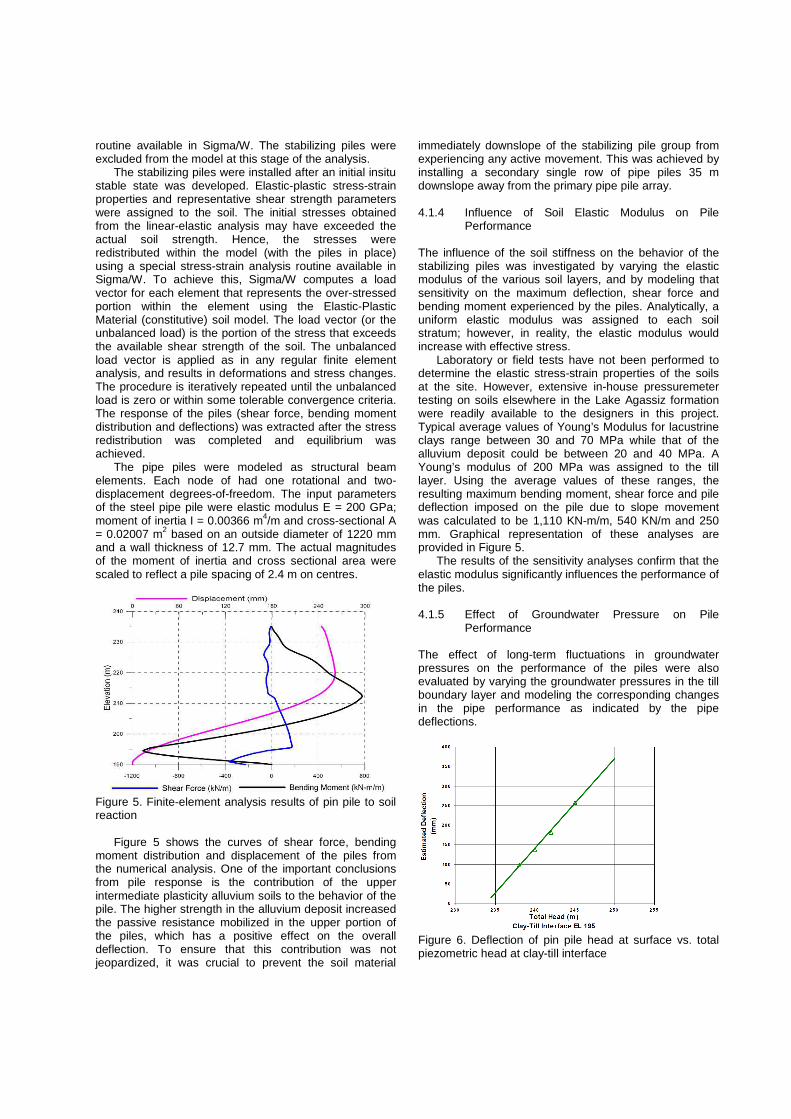
Figure 5. Finite-element analysis results of pin pile to soil reaction
Figure 5 shows the curves of shear force, bending moment distribution and displacement of the piles from the numerical analysis. One of the important conclusions from pile response is the contribution of the upper intermediate plasticity alluvium soils to the behavior of the pile. The higher strength in the alluvium deposit increased the passive resistance mobilized in the upper portion of the piles, which has a positive effect on the overall deflection. To ensure that this contribution was not jeopardized, it was crucial to prevent the soil material
immediately downslope of the stabilizing pile group from experiencing any active movement. This was achieved by installing a secondary single row of pipe piles 35 m downslope away from the primary pipe pile array. 4.1.4 Influence of Soil Elastic Modulus on Pile
Performance
The influence of the soil stiffness on the behavior of the stabilizing piles was investigated by varying the elastic modulus of the various soil layers, and by modeling that sensitivity on the maximum deflection, shear force and bending moment experienced by the piles. Analytically, a uniform elastic modulus was assigned to each soil stratum; however, in reality, the elastic modulus would increase with effective stress.
Laboratory or field tests have not been performed to determine the elastic stress-strain properties of the soils at the site. However, extensive in-house pressuremeter testing on soils elsewhere in the Lake Agassiz formation were readily available to the designers in this project. Typical average values of Young’s Modulus for lacustrine clays range between 30 and 70 MPa while that of the alluvium deposit could be between 20 and 40 MPa. A Young’s modulus of 200 MPa was assigned to the till layer. Using the average values of these ranges, the resulting maximum bending moment, shear force and pile deflection imposed on the pile due to slope movement was calculated to be 1,110 KN-m/m, 540 KN/m and 250 mm. Graphical representation of these analyses are provided in Figure 5.
The results of the sensitivity analyses confirm that the elastic modulus significantly influences the performance of the piles.
4.1.5 Effect of Groundwater Pressure on Pile
Performance The effect of long-term fluctuations in groundwater pressures on the performance of the piles were also evaluated by varying the groundwater pressures in the till boundary layer and modeling the corresponding changes in the pipe performance as indicated by the pipe deflections.
Figure 6. Deflection of pin pile head at surface vs. total piezometric head at clay-till interface
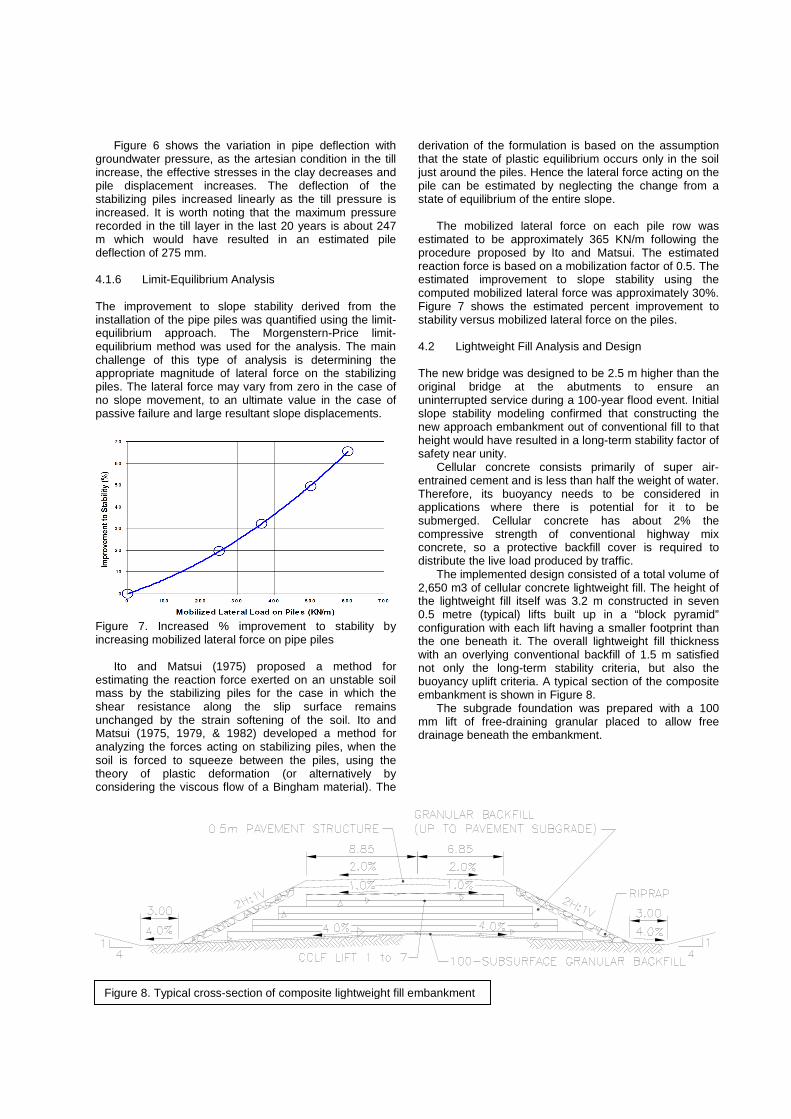
Figure 6 shows the variation in pipe deflection with groundwater pressure, as the artesian condition in the till increase, the effective stresses in the clay decreases and pile displacement increases. The deflection of the stabilizing piles increased linearly as the till pressure is increased. It is worth noting that the maximum pressure recorded in the till layer in the last 20 years is about 247 m which would have resulted in an estimated pile deflection of 275 mm. 4.1.6 Limit-Equilibrium Analysis
The improvement to slope stability derived from the installation of the pipe piles was quantified using the limit-equilibrium approach. The Morgenstern-Price limit-equilibrium method was used for the analysis. The main challenge of this type of analysis is determining the appropriate magnitude of lateral force on the stabilizing piles. The lateral force may vary from zero in the case of no slope movement, to an ultimate value in the case of passive failure and large resultant slope displacements.
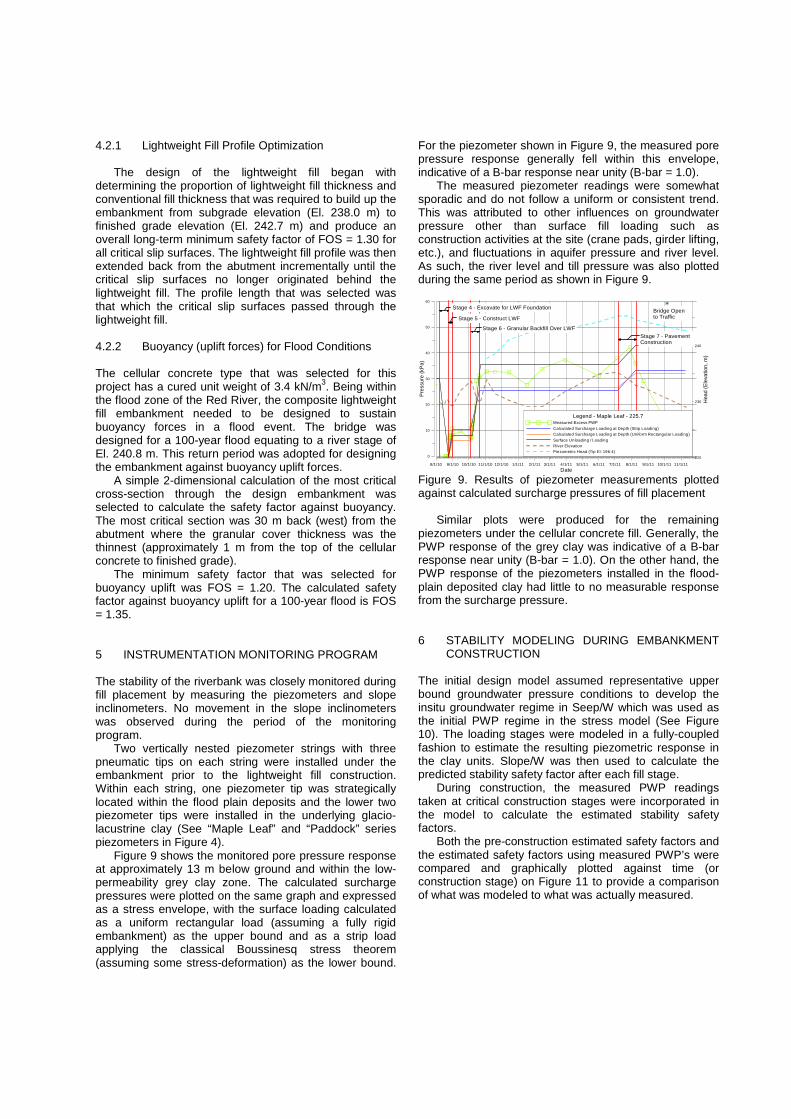
Figure 7. Increased % improvement to stability by increasing mobilized lateral force on pipe piles
Ito and Matsui (1975) proposed a method for estimating the reaction force exerted on an unstable soil mass by the stabilizing piles for the case in which the shear resistance along the slip surface remains unchanged by the strain softening of the soil. Ito and Matsui (1975, 1979, & 1982) developed a method for analyzing the forces acting on stabilizing piles, when the soil is forced to squeeze between the piles, using the theory of plastic deformation (or alternatively by considering the viscous flow of a Bingham material). The
derivation of the formulation is based on the assumption that the state of plastic equilibrium occurs only in the soil just around the piles. Hence the lateral force acting on the pile can be estimated by neglecting the change from a state of equilibrium of the entire slope.
The mobilized lateral force on each pile row was
estimated to be approximately 365 KN/m following the procedure proposed by Ito and Matsui. The estimated reaction force is based on a mobilization factor of 0.5. The estimated improvement to slope stability using the computed mobilized lateral force was approximately 30%. Figure 7 shows the estimated percent improvement to stability versus mobilized lateral force on the piles. 4.2 Lightweight Fill Analysis and Design The new bridge was designed to be 2.5 m higher than the original bridge at the abutments to ensure an uninterrupted service during a 100-year flood event. Initial slope stability modeling confirmed that constructing the new approach embankment out of conventional fill to that height would have resulted in a long-term stability factor of safety near unity.
Cellular concrete consists primarily of super air-entrained cement and is less than half the weight of water. Therefore, its buoyancy needs to be considered in applications where there is potential for it to be submerged. Cellular concrete has about 2% the compressive strength of conventional highway mix concrete, so a protective backfill cover is required to distribute the live load produced by traffic.
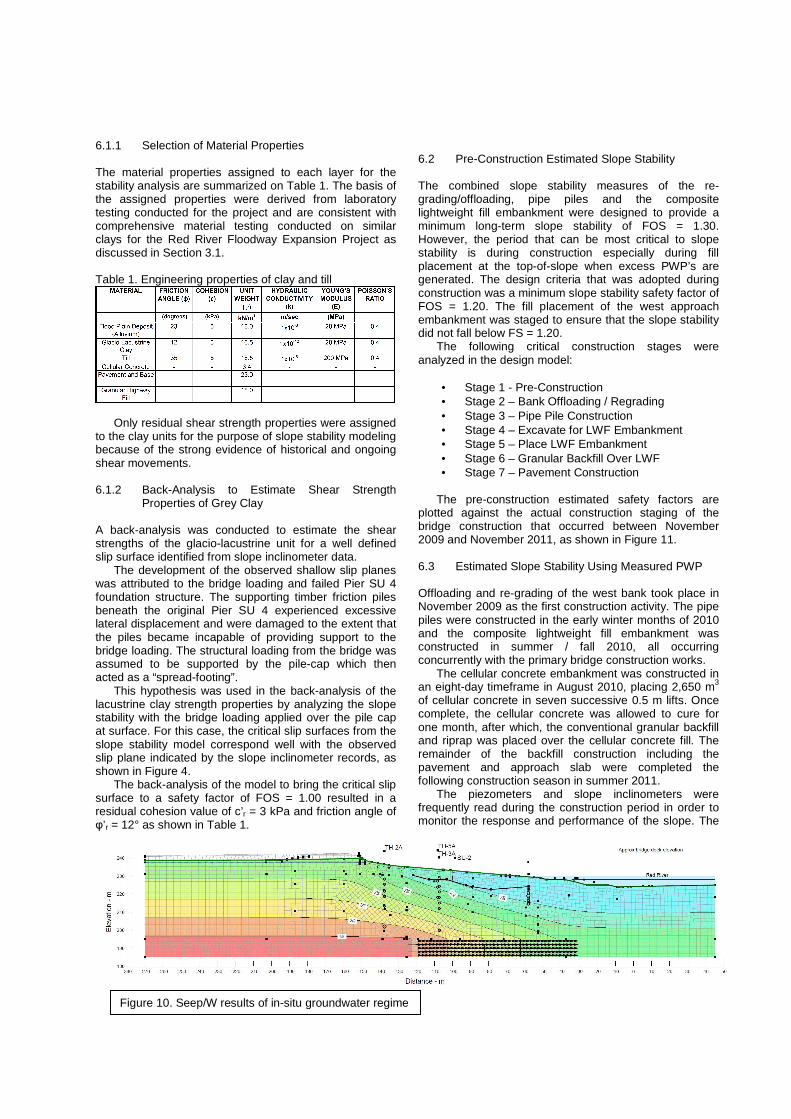
The implemented design consisted of a total volume of 2,650 m3 of cellular concrete lightweight fill. The height of the lightweight fill itself was 3.2 m constructed in seven 0.5 metre (typical) lifts built up in a “block pyramid” configuration with each lift having a smaller footprint than the one beneath it. The overall lightweight fill thickness with an overlying conventional backfill of 1.5 m satisfied not only the long-term stability criteria, but also the buoyancy uplift criteria. A typical section of the composite embankment is shown in Figure 8.
The subgrade foundation was prepared with a 100 mm lift of free-draining granular placed to allow free drainage beneath the embankment.
Figure 8. Typical cross-section of composite lightweight fill embankment
4.2.1 Lightweight Fill Profile Optimization
The design of the lightweight fill began with determining the proportion of lightweight fill thickness and conventional fill thickness that was required to build up the embankment from subgrade elevation (El. 238.0 m) to finished grade elevation (El. 242.7 m) and produce an overall long-term minimum safety factor of FOS = 1.30 for all critical slip surfaces. The lightweight fill profile was then extended back from the abutment incrementally until the critical slip surfaces no longer originated behind the lightweight fill. The profile length that was selected was that which the critical slip surfaces passed through the lightweight fill. 4.2.2 Buoyancy (uplift forces) for Flood Conditions The cellular concrete type that was selected for this project has a cured unit weight of 3.4 kN/m3. Being within the flood zone of the Red River, the composite lightweight fill embankment needed to be designed to sustain buoyancy forces in a flood event. The bridge was designed for a 100-year flood equating to a river stage of El. 240.8 m. This return period was adopted for designing the embankment against buoyancy uplift forces.
A simple 2-dimensional calculation of the most critical cross-section through the design embankment was selected to calculate the safety factor against buoyancy. The most critical section was 30 m back (west) from the abutment where the granular cover thickness was the thinnest (approximately 1 m from the top of the cellular concrete to finished grade).
The minimum safety factor that was selected for buoyancy uplift was FOS = 1.20. The calculated safety factor against buoyancy uplift for a 100-year flood is FOS = 1.35. 5 INSTRUMENTATION MONITORING PROGRAM
The stability of the riverbank was closely monitored during fill placement by measuring the piezometers and slope inclinometers. No movement in the slope inclinometers was observed during the period of the monitoring program.
Two vertically nested piezometer strings with three pneumatic tips on each string were installed under the embankment prior to the lightweight fill construction. Within each string, one piezometer tip was strategically located within the flood plain deposits and the lower two piezometer tips were installed in the underlying glacio-lacustrine clay (See “Maple Leaf” and “Paddock” series piezometers in Figure 4).
Figure 9 shows the monitored pore pressure response at approximately 13 m below ground and within the low-permeability grey clay zone. The calculated surcharge pressures were plotted on the same graph and expressed as a stress envelope, with the surface loading calculated as a uniform rectangular load (assuming a fully rigid embankment) as the upper bound and as a strip load applying the classical Boussinesq stress theorem (assuming some stress-deformation) as the lower bound.
For the piezometer shown in Figure 9, the measured pore pressure response generally fell within this envelope, indicative of a B-bar response near unity (B-bar = 1.0).
The measured piezometer readings were somewhat sporadic and do not follow a uniform or consistent trend. This was attributed to other influences on groundwater pressure other than surface fill loading such as construction activities at the site (crane pads, girder lifting, etc.), and fluctuations in aquifer pressure and river level. As such, the river level and till pressure was also plotted during the same period as shown in Figure 9.
8/1/10 9/1/10 10/1/10 11/1/10 12/1/10 1/1/11 2/1/11 3/1/11 4/1/11 5/1/11 6/1/11 7/1/11 8/1/11 9/1/11 10/1/11 11/1/11
Date
0
10
20
30
40
50
60
Pre
ssur
e (k
Pa)
Legend - Maple Leaf - 225.7Measured Excess PWPCalculated Surcharge Loading at Depth (Strip Loading)Calculated Surcharge Loading at Depth (Uniform Rectangular Loading)Surface Unloading / LoadingRiver ElevationPiezometric Head (Tip El: 196.4)
220
230
240
Hea
d (E
leva
tion,
m)
Stage 4 - Excavate for LWF FoundationBridge Open to TrafficStage 5 - Construct LWF
Stage 6 - Granular Backfill Over LWFStage 7 - Pavement Construction
Figure 9. Results of piezometer measurements plotted against calculated surcharge pressures of fill placement
Similar plots were produced for the remaining
piezometers under the cellular concrete fill. Generally, the PWP response of the grey clay was indicative of a B-bar response near unity (B-bar = 1.0). On the other hand, the PWP response of the piezometers installed in the flood-plain deposited clay had little to no measurable response from the surcharge pressure.
6 STABILITY MODELING DURING EMBANKMENT CONSTRUCTION
The initial design model assumed representative upper bound groundwater pressure conditions to develop the insitu groundwater regime in Seep/W which was used as the initial PWP regime in the stress model (See Figure 10). The loading stages were modeled in a fully-coupled fashion to estimate the resulting piezometric response in the clay units. Slope/W was then used to calculate the predicted stability safety factor after each fill stage.
During construction, the measured PWP readings taken at critical construction stages were incorporated in the model to calculate the estimated stability safety factors.
Both the pre-construction estimated safety factors and the estimated safety factors using measured PWP’s were compared and graphically plotted against time (or construction stage) on Figure 11 to provide a comparison of what was modeled to what was actually measured.
6.1.1 Selection of Material Properties The material properties assigned to each layer for the stability analysis are summarized on Table 1. The basis of the assigned properties were derived from laboratory testing conducted for the project and are consistent with comprehensive material testing conducted on similar clays for the Red River Floodway Expansion Project as discussed in Section 3.1. Table 1. Engineering properties of clay and till
Only residual shear strength properties were assigned
to the clay units for the purpose of slope stability modeling because of the strong evidence of historical and ongoing shear movements.
6.1.2 Back-Analysis to Estimate Shear Strength
Properties of Grey Clay
A back-analysis was conducted to estimate the shear strengths of the glacio-lacustrine unit for a well defined slip surface identified from slope inclinometer data.
The development of the observed shallow slip planes was attributed to the bridge loading and failed Pier SU 4 foundation structure. The supporting timber friction piles beneath the original Pier SU 4 experienced excessive lateral displacement and were damaged to the extent that the piles became incapable of providing support to the bridge loading. The structural loading from the bridge was assumed to be supported by the pile-cap which then acted as a “spread-footing”.
This hypothesis was used in the back-analysis of the lacustrine clay strength properties by analyzing the slope stability with the bridge loading applied over the pile cap at surface. For this case, the critical slip surfaces from the slope stability model correspond well with the observed slip plane indicated by the slope inclinometer records, as shown in Figure 4.
The back-analysis of the model to bring the critical slip surface to a safety factor of FOS = 1.00 resulted in a residual cohesion value of c’r = 3 kPa and friction angle of φ’r = 12° as shown in Table 1.
6.2 Pre-Construction Estimated Slope Stability The combined slope stability measures of the re-grading/offloading, pipe piles and the composite lightweight fill embankment were designed to provide a minimum long-term slope stability of FOS = 1.30. However, the period that can be most critical to slope stability is during construction especially during fill placement at the top-of-slope when excess PWP’s are generated. The design criteria that was adopted during construction was a minimum slope stability safety factor of FOS = 1.20. The fill placement of the west approach embankment was staged to ensure that the slope stability did not fall below FS = 1.20.
The following critical construction stages were analyzed in the design model:
• Stage 1 - Pre-Construction • Stage 2 – Bank Offloading / Regrading • Stage 3 – Pipe Pile Construction • Stage 4 – Excavate for LWF Embankment • Stage 5 – Place LWF Embankment • Stage 6 – Granular Backfill Over LWF • Stage 7 – Pavement Construction
The pre-construction estimated safety factors are
plotted against the actual construction staging of the bridge construction that occurred between November 2009 and November 2011, as shown in Figure 11.
6.3 Estimated Slope Stability Using Measured PWP Offloading and re-grading of the west bank took place in November 2009 as the first construction activity. The pipe piles were constructed in the early winter months of 2010 and the composite lightweight fill embankment was constructed in summer / fall 2010, all occurring concurrently with the primary bridge construction works.
The cellular concrete embankment was constructed in an eight-day timeframe in August 2010, placing 2,650 m3 of cellular concrete in seven successive 0.5 m lifts. Once complete, the cellular concrete was allowed to cure for one month, after which, the conventional granular backfill and riprap was placed over the cellular concrete fill. The remainder of the backfill construction including the pavement and approach slab were completed the following construction season in summer 2011.
The piezometers and slope inclinometers were frequently read during the construction period in order to monitor the response and performance of the slope. The
Figure 10. Seep/W results of in-situ groundwater regime
11/1/09 12/1/09 1/1/10 2/1/10 3/1/10 4/1/10 5/1/10 6/1/10 7/1/10 8/1/10 9/1/10 10/1/10 11/1/10 12/1/10 1/1/11 2/1/11 3/1/11 4/1/11 5/1/11 6/1/11 7/1/11 8/1/11 9/1/11 10/1/11 11/1/11
Date (Nov. 2009 to Nov. 2011)
1
2
0.7
0.8
0.9
1.1
1.2
1.3
1.4
1.5
1.6
1.7
1.8
1.9
2.1
2.2
2.3
2.4
2.5
Saf
ety
Fac
tor
0
10
20
30
40
50
Unl
oadi
ng /
Load
ing
Pre
ssur
e at
Cre
st o
f Riv
erba
nk -
El.
238.
0 (k
Pa)
Stage 2 - Bank Offloading/Regrading
Bridge Open to Traffic
Stage 3 - Pin Pile Construction
Stage 4 - Excavate for LWF Foundation
Stage 5 - Construct LWF
Stage 6 - Granular Backfill Over LWF
Stage 7 - Pavement Construction
Stage 1 - Pre-Construction
Deep SS (pre-const. estimated)
Deep SS (w/ measured PWP)
Shallow SS (w/ measured PWP)
Shallow SS (pre-const. estimated)
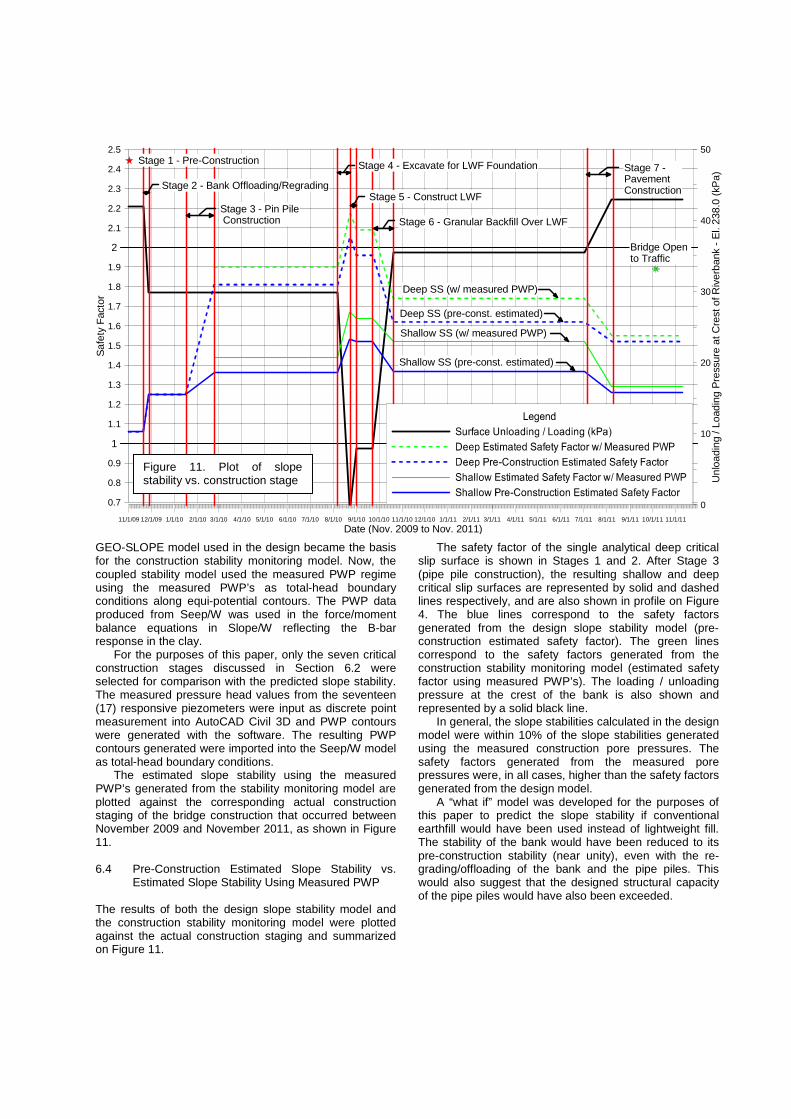
GEO-SLOPE model used in the design became the basis for the construction stability monitoring model. Now, the coupled stability model used the measured PWP regime using the measured PWP’s as total-head boundary conditions along equi-potential contours. The PWP data produced from Seep/W was used in the force/moment balance equations in Slope/W reflecting the B-bar response in the clay.
For the purposes of this paper, only the seven critical construction stages discussed in Section 6.2 were selected for comparison with the predicted slope stability. The measured pressure head values from the seventeen (17) responsive piezometers were input as discrete point measurement into AutoCAD Civil 3D and PWP contours were generated with the software. The resulting PWP contours generated were imported into the Seep/W model as total-head boundary conditions.
The estimated slope stability using the measured PWP’s generated from the stability monitoring model are plotted against the corresponding actual construction staging of the bridge construction that occurred between November 2009 and November 2011, as shown in Figure 11. 6.4 Pre-Construction Estimated Slope Stability vs.
Estimated Slope Stability Using Measured PWP The results of both the design slope stability model and the construction stability monitoring model were plotted against the actual construction staging and summarized on Figure 11.
The safety factor of the single analytical deep critical slip surface is shown in Stages 1 and 2. After Stage 3 (pipe pile construction), the resulting shallow and deep critical slip surfaces are represented by solid and dashed lines respectively, and are also shown in profile on Figure 4. The blue lines correspond to the safety factors generated from the design slope stability model (pre-construction estimated safety factor). The green lines correspond to the safety factors generated from the construction stability monitoring model (estimated safety factor using measured PWP’s). The loading / unloading pressure at the crest of the bank is also shown and represented by a solid black line.
In general, the slope stabilities calculated in the design model were within 10% of the slope stabilities generated using the measured construction pore pressures. The safety factors generated from the measured pore pressures were, in all cases, higher than the safety factors generated from the design model.
A “what if” model was developed for the purposes of this paper to predict the slope stability if conventional earthfill would have been used instead of lightweight fill. The stability of the bank would have been reduced to its pre-construction stability (near unity), even with the re-grading/offloading of the bank and the pipe piles. This would also suggest that the designed structural capacity of the pipe piles would have also been exceeded.
Figure 11. Plot of slope stability vs. construction stage
7 CONCLUSION The west embankment slope of the new Letellier Bridge was designed using four slope stabilization measures; two of the four were first-time applications of their kind in Manitoba. The resulting design, with pipe piles improving the shear resistance of the slope coupled with the lightweight fill minimizing the bank load formed a harmonized approach to both short-term and long-term slope stability.
It was crucial to assess the stress-strain behavior of the soil / pipe pile interaction, the governing factor of the pipe pile’s performance. The finite-element model that was used employs a fully dynamic equation of motion, mechanical-groundwater flow coupling and linear-elastic stress-strain behavior.
The spacing of the pipe pile array was designed so that the group behaved like a “wall” with the piles spaced to mobilize soil arching and prevent the clay from squeezing between the piles. As a group, the pipe piles collectively improve stability by intercepting a multitude of potential slip planes and by providing additional shear resistance along those slip planes.
Because the resistance provided by the pipe piles is passive, there is some magnitude of displacement that is required to engage the reinforcement of the piles. The pipe piles were designed to limit the magnitude of pile head (at ground surface) deflection to be within the displacement tolerances of the abutment piles.
The west approach embankment was designed to be approximately 2.5 m higher than the original upper bank elevation to meet performance requirements during a 100-year flood. Cellular concrete lightweight fill was selected for the construction of the new embankment in order to achieve the design elevation.
An extensive array of piezometers and slope inclinometers were used to measure the banks performance during construction. The measurements taken from the instruments were used in the design model to monitor slope stability during construction. The modeled stability values and the measured stability values were in good agreement.
ACKNOWLEDGEMENTS The writers would like to acknowledge the contributions of Manitoba Infrastructure and Transportation and Dillon Consulting to the paper. REFERENCES Gould, D. (2004) Geotechnical Report for the Letellier
Bridge over the Red River, January 2004.
Fredlund, D.G., Scoular, R.E.G., and Zakerzadeh, N. (1999). Using a finite element stress analysis to compute the factory of safety. In Proceedings of the 52nd Conference of the Canadian Geotechnical Society, Regina, Sask., pp. 73–80.
Ito, T., and Matsui, T. (1975). Methods to estimate lateral
force acting on stabilizing piles. Soils and Foundations, 15(4); 43–59.
Ito, T., and Matsui, T. (1979). Design method for the
stability analysis of the slope with landing pier. Soils and Foundations, 19(4); 43–57.
Ito, T., Matsui T and W.P. Hong, (1982), Extended design
method for multi-row stabilizing piles against landslide, Soils and Foundation, 22 (1); 1–13.
KGS Group (2009), Preliminary Construction Slope
Stability Assessment for Construction of Bridge Replacement of the Red River Bridge on PR No 201- MIT Tender No 5962, November 2009.
KGS Group (2010), Letellier Bridge Replacement
Stabilization of West Bank Abutment Type 1 Concrete Caisson, June 2010.
Thiessen, K.J., Alfaro, M.C., Blatz, J.A., (2011),
Measuring the load–deformation response of rockfill columns by a full-scale field test on a natural riverbank. Canadian Geotechnical Journal, 2011, 48(7): 1032-1043, 10.1139/t11-019
Skaftfeld, K.M., Kenyon, R.M. Van Helden, M.J., (2009)
,The design, construction and expansion of the Red River Floodway, 57th Annual Geotechnical Engineering Conference, University of Minnesota.
Baracos, A., Graham, J., Domaschuk, L. (1980), Yielding
and Rupture in a lacustrine clay. Canadian Geotechnical Journal, Volume 17, pp 559-573.
Freeman, W.S., Sutherland, H.B. (1973), Slope stability
analysis in anistropic Winnipeg clays. Anderson, D.E.S., Kenyon R.M., Blatz, J.A, Smith, J.B.
(2004), Numerical modeling of the 1962 Red River Floodway test pit excavation. Canadian Geotechnical Conference, Quebec City, QC.


