Embed Size (px)
Citation preview
Available online at www.worldscientificnews.com
( Received 12 March 2019; Accepted 03 April 2019; Date of Publication 04 April 2019 )
WSN 126 (2019) 118-135 EISSN 2392-2192
Stability Analysis of Mahananda River Embankment in Bangladesh
Rubieyat Bin Ali*, Md. Mofizul Islam, Bijoy Sikder, Md. Abdul Alim
Department of Civil Engineering, Rajshahi University of Engineering & Technology, Rajshahi, Bangladesh
*E-mail address: [email protected]
ABSTRACT
Stability of structures such as embankments, dams and natural riverside slopes are hampered due
to the seismic loading. To evaluate the seismic effect on the stability of slopes is a major concern in the
field of geotechnical engineering. Two-dimensional limit equilibrium method (LEM) is a common
approach for analyzing slope stability. Usually LEM is used to find out potential failure mechanisms
and factors of safety for the slopes. The aim of this study is to evaluate the effect of seismic loading on
the stability of Mahananda River Embankment of Bangladesh by using LEM. The Bishop, Spencer,
Fellenius, Janbu and Morgenster-price simplified methods were used for LEM. To conduct the study
three locations of Mahananda River Embankment were selected. Soil properties were obtained from
laboratory testing. The numerical analysis was carried out using geotechnical software GEO5 which is
generally used for analyzing LEM based slope stability problems. From the analysis, it was noted that
the factors of safety decreased with the increase of horizontal seismic coefficient for the slopes. The
horizontal seismic coefficient alone affects the stability of slope severely than the combined effect of
horizontal and vertical seismic coefficient. The results concluded that the present condition of the
Mahananda river embankment is stabilized under seismic loading.
Keywords: Stability of slope, limit equilibrium method, seismic coefficient, Mahananda River
World Scientific News 126 (2019) 118-135
-119-
1. INTRODUCTION
Bangladesh is a land of river. Many rivers have flown through in this country. Three of
Asia's largest rivers, the Ganges (locally known as the Padma), the Brahmaputra (locally known
as the Jamuna) and the Meghna, flow through Bangladesh and form the fertile Bengal delta
which is the largest delta in the world. In rainy season, flood is a common phenomenon in
Bangladesh. Many types of crop are damaged during that time. River bank locality is also
affected by the flood. The houses and roads go underwater. To overcome this sever problem
embankments are constructed parallel those rivers to protect living lands, towns, cities,
important structures etc.
The Mahananda River is a trans-boundary river originates in the Himalayas, Paglajhora
Falls on Mahaldiram Hill near Chimli, east of Kurseong in Darjeeling district at an elevation of
2,100 meters (6,900 ft). It flows through the Indian states of West Bengal, Bihar, and
Bangladesh. Its right bank tributary, the Mechi River forms part of Nepal's eastern boundary
with West Bengal while the Kankai flows out of Nepal. The total length of the river is 360
kilometers, out of which 324 kilometers are in India and 36 kilometers are in Bangladesh. The
heavy monsoonal rainfalls on the upstream catchment sometimes increase the river water level
above the danger level. In most of the year the land near the bank of river floods in the normal
flooding condition. For this reason in 2000 the Mohananda embankment was constructed on
the bank of Mohananda River which is situated in the district of Chapai in the division of
Rajshahi of Bangladesh. The Mahananda embankment is 18 kilometers long. The embankment
material consists of sands with silt and clay. Weathering, soil erosion and man-made activities
in and around the embankment have been noticeably intended.
A slope becomes unstable when the shear stresses on a potential failure plane exceed the
shearing resistance of the soil. The additional stress due to earthquake further increases the
stresses on these planes and decreases the factor of safety further [1-4]. The present of water
also plays a vital role to evaluate the factor of safety of soil slope. The combined effect of
earthquake and present of water can create the worst condition for the slope of riverfront
structure. Tayler and Burns (2005) [5] reported that earthquake which is a burning issue is a
great threat to the long term stability of slopes, particularly in earthquake active zones. Xip HP
(2008) [6] showed that Wenchuan’s (Sichuan province of China) embankment slope
destructively ruined during the effect of the earthquake.
Most commonly adopted methods for slope stability analysis in static condition are the
limit equilibrium methods. This method is implemented in the field of geotechnical engineering
due to their simplicity and effectiveness. Many methods based on this approach are available.
For example, Bishop (1955), Janbu (1957), Morgentern and Price (1965), Spencer (1967),
Sarma (1979). Yu et al. (1998) [7] compared the results of LEM with other rigorous methods
for the stability analysis of simple earth slopes. They concluded that LEM could achieve
reasonable results. Roohollah and Nazri ali (2013) [8] presented a review on the applications
and limitations of existing three-dimensional slope stability analyses based on limit equilibrium
method. Cheng et al. (2007) [9] combined finite element analysis to obtain the stresses in soil
and a limit equilibrium method to obtain the factor of safety.
The present study evaluates the seismic effect on the stability of Mohananda
embankment. Two-dimensional limit equilibrium method (LEM) is used to analyze the stability
of the slope of the embankment. GEO5 software is used for numerical analysis.
World Scientific News 126 (2019) 118-135
-120-
2. FIELD AND LABORATORY TESTS
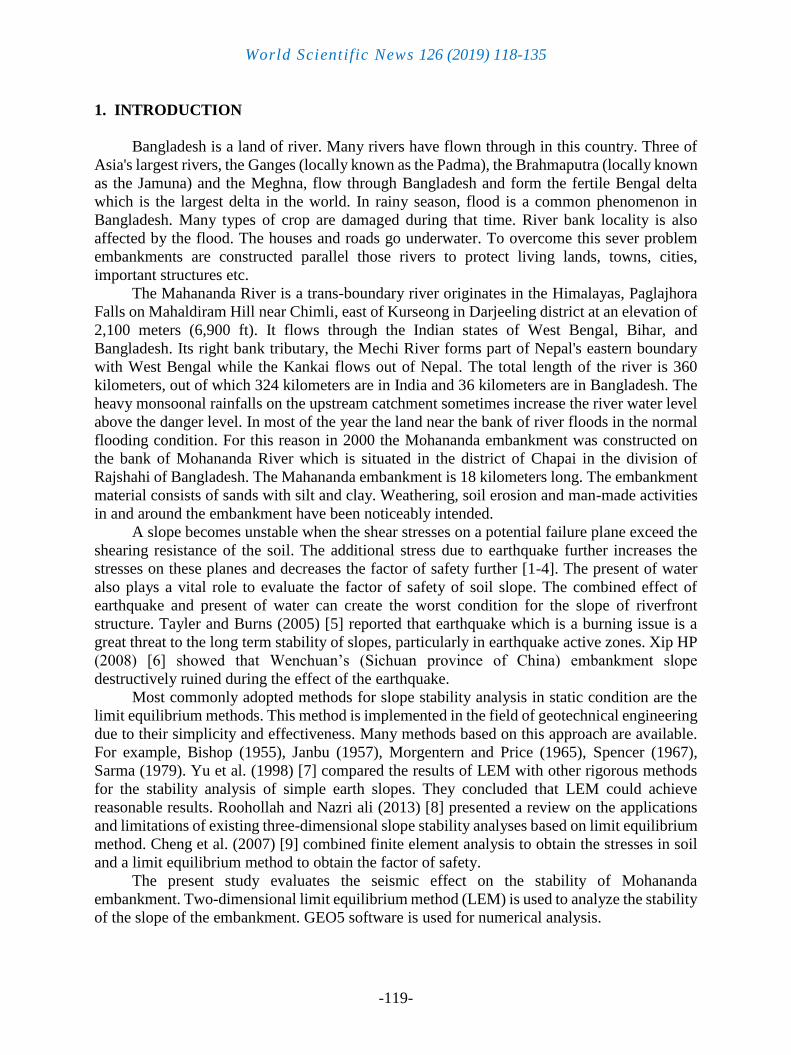
To conduct the research three samples i.e., sample 1, sample 2 and sample 3 were
collected from three different locations which are known as Dhainagor, Nakkatitola and
Moheshpur located at the Chapai Nawabganj district, Rajshahi in Bangladesh. Figure 1 shows
the three locations of the Mahananda River embankment from where the samples were
collected.
Figure 1. Three locations of the Mahananda
River embankment from where the samples
are collected.
Figure 2. Soil collected from Dhainagor
location.
Figure 3. Measuring the slope at Nakkatitola
location.
Figure 4. Location of the Moheshpur ferry
ghat.
After collecting samples, different laboratory tests were performed such as field density,
specific gravity, moisture content, direct shear test, grain size analysis in our laboratory. From
those test results void ratio, dry unit weight, saturated unit weight were calculated.
World Scientific News 126 (2019) 118-135
-121-
2. 1. Field density measurement
Field density test is performed to determine the in-place density of undisturbed soil
obtained by pushing or drilling a thin-walled cylinder using the core cutter method. ASTM
D2937-00 Standard Test is followed to measure the field density. It is found, the field densities
were 15.46 kN/m3, 15.08 kN/m3 and 15.87 kN/m3 for sample 1, sample 2 and sample 3
respectively.
2. 2. Specific gravity
The specific gravity of soil is measured by using a pycnometer. First, the weight of the
empty clean and dry pycnometer was determined and 10g of a dry soil sample in the pycnometer
was placed. The weight of the pycnometer containing dry soil was determined. Then added
distilled water to fill about half to three-four of the pycnometer. A partial vacuum to the contents
for 10 minutes was applied to remove the entrapped air. The pycnometer with distilled water
was filled to the mark. The weight of the pycnometer and the contents were determined. Then
it was filled with distilled water only (to the mark). Finally the weight of the pycnometer and
distilled water was determined. Specific gravity of sample 1, sample 2 and sample 3 were 2.70,
2.67 and 2.66 respectively.
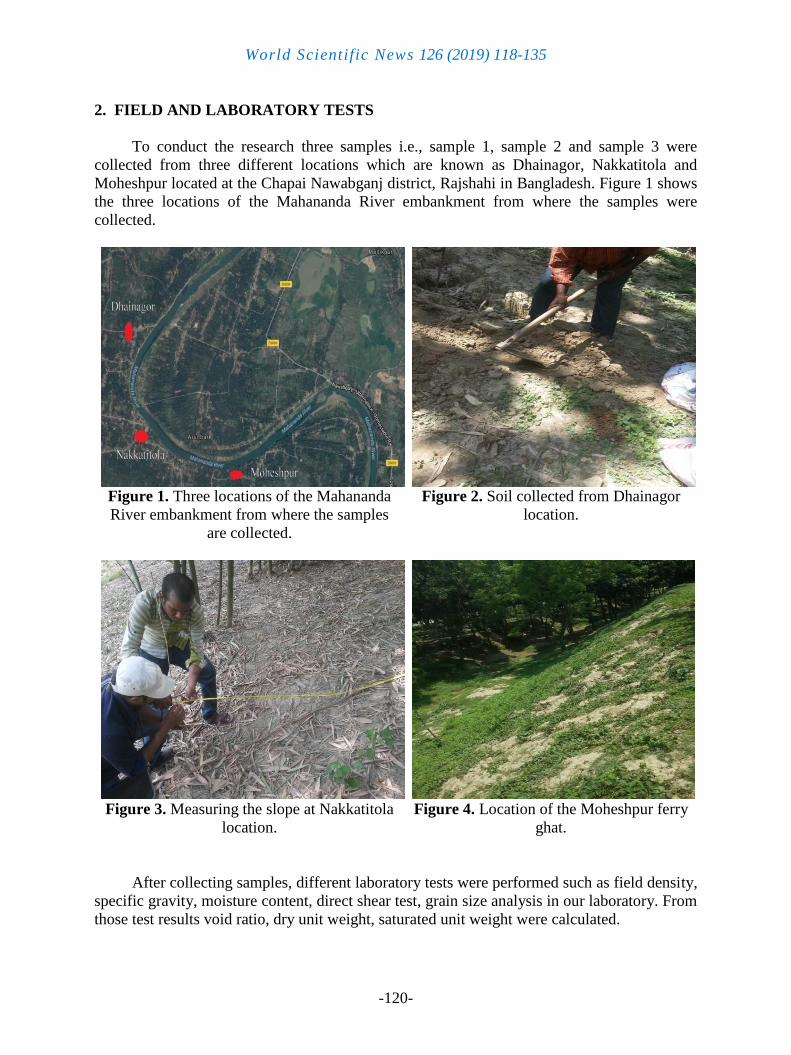
2. 3. Direct shear test
Figure 5. Direct shear test apparatus.
A direct shear test is a laboratory or field test which is used by geotechnical engineers to
measure the shear strength properties of soil. ASTM D 3080 is followed to perform this test.
World Scientific News 126 (2019) 118-135
-122-
The first test was executed on three or four specimens from a relatively undisturbed soil
sample.
Then a specimen was placed in a shear box which had two stacked rings to hold the
sample; the contact between the two rings was at approximately the mid-height of the sample.
Confining stress was applied vertically to the specimen, and the upper ring was pulled laterally
until the sample fails, or through a specified strain.
The local applied and the strain induced were recorded at frequent intervals to determine
a stress-strain curve for each confining stress. Several specimens were tested at varying
confining stresses to determine the shear strength parameters, the soil cohesion (C) and the
angle of internal friction.
Finally the results of the tests on each specimen were plotted on a graph with the peak (or
residual) stress on the y-axis and the confining stress on the x-axis. The y-intercept of the curve
which fits the test results is the cohesion, and the slope of the line or curve is friction angle. It
was found that cohesion (C) of samples are 6.96, 7.94 and 7.53 and angle of internal frictions
are 34.82, 29.89 and 30.76 for sample 1, sample 2 and sample 3 respectively.
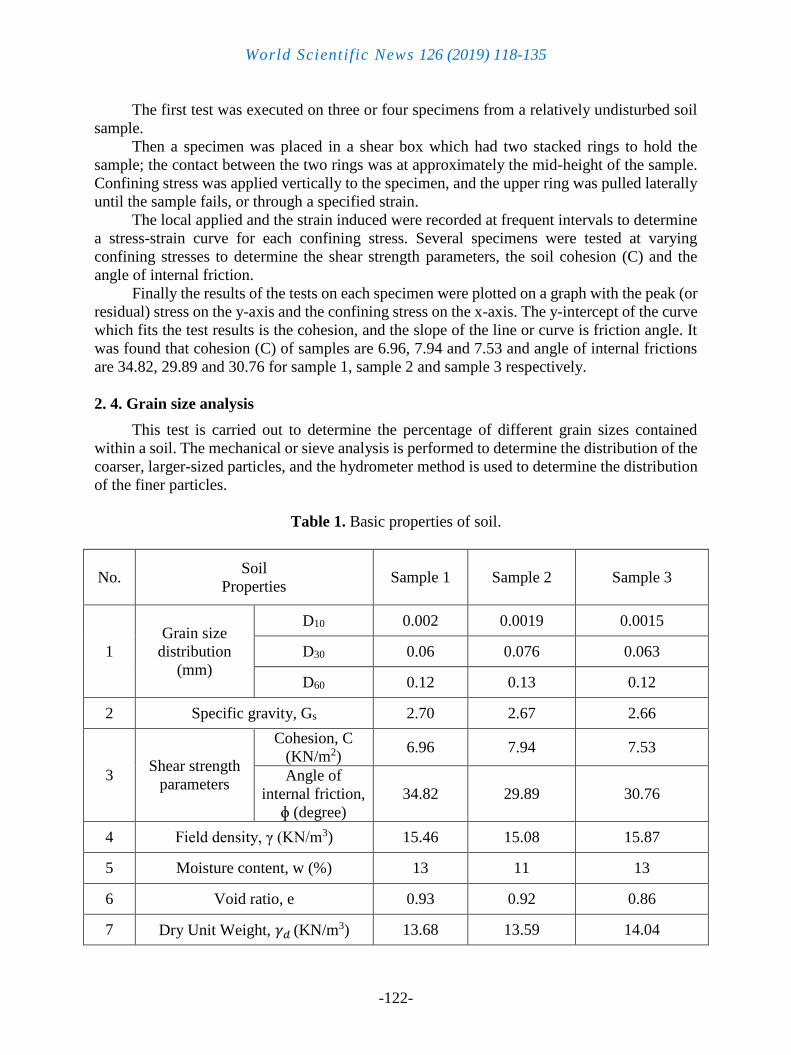
2. 4. Grain size analysis
This test is carried out to determine the percentage of different grain sizes contained
within a soil. The mechanical or sieve analysis is performed to determine the distribution of the
coarser, larger-sized particles, and the hydrometer method is used to determine the distribution
of the finer particles.
Table 1. Basic properties of soil.
No. Soil
Properties Sample 1
Sample 2
Sample 3
1
Grain size
distribution
(mm)
D10 0.002 0.0019 0.0015
D30 0.06 0.076 0.063
D60 0.12 0.13 0.12
2 Specific gravity, Gs 2.70 2.67 2.66
3
Shear strength
parameters
Cohesion, C
(KN/m2) 6.96 7.94 7.53
Angle of
internal friction,
ɸ (degree)
34.82 29.89 30.76
4 Field density, γ (KN/m3) 15.46 15.08 15.87
5 Moisture content, w (%) 13 11 13
6 Void ratio, e 0.93 0.92 0.86
7 Dry Unit Weight, 𝛾𝑑 (KN/m3) 13.68 13.59 14.04
World Scientific News 126 (2019) 118-135
-123-
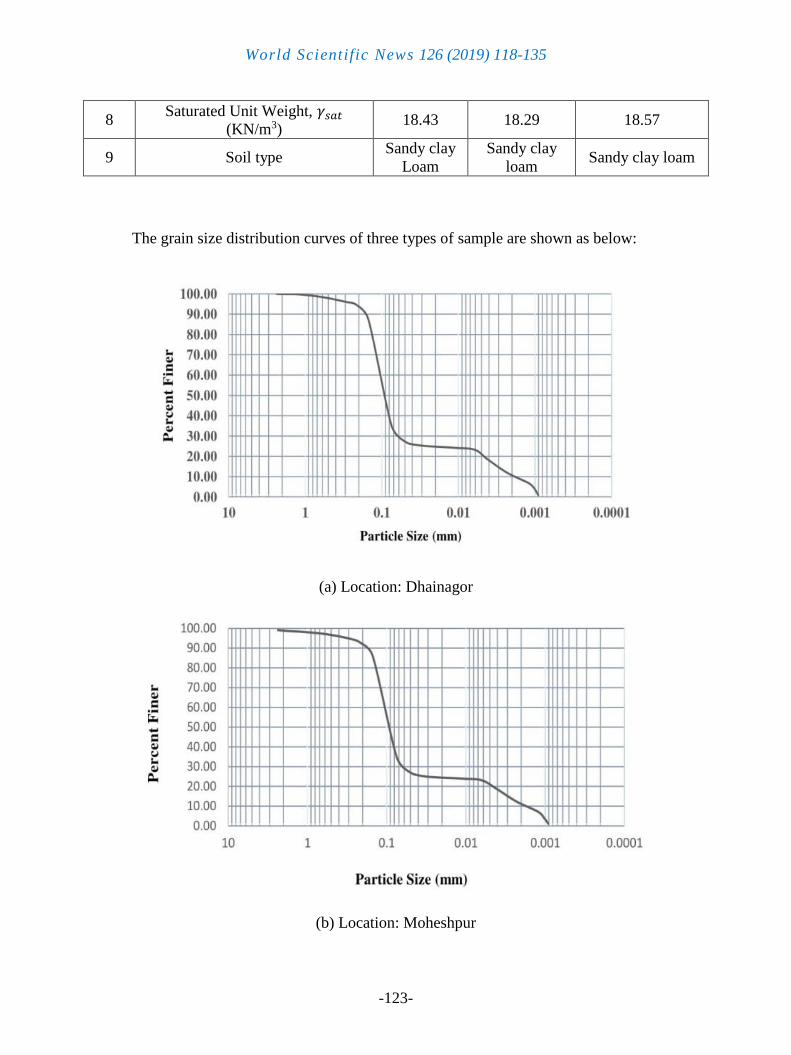
8 Saturated Unit Weight, 𝛾𝑠𝑎𝑡
(KN/m3) 18.43 18.29 18.57
9 Soil type Sandy clay
Loam
Sandy clay
loam Sandy clay loam
The grain size distribution curves of three types of sample are shown as below:
(a) Location: Dhainagor
(b) Location: Moheshpur
World Scientific News 126 (2019) 118-135
-124-
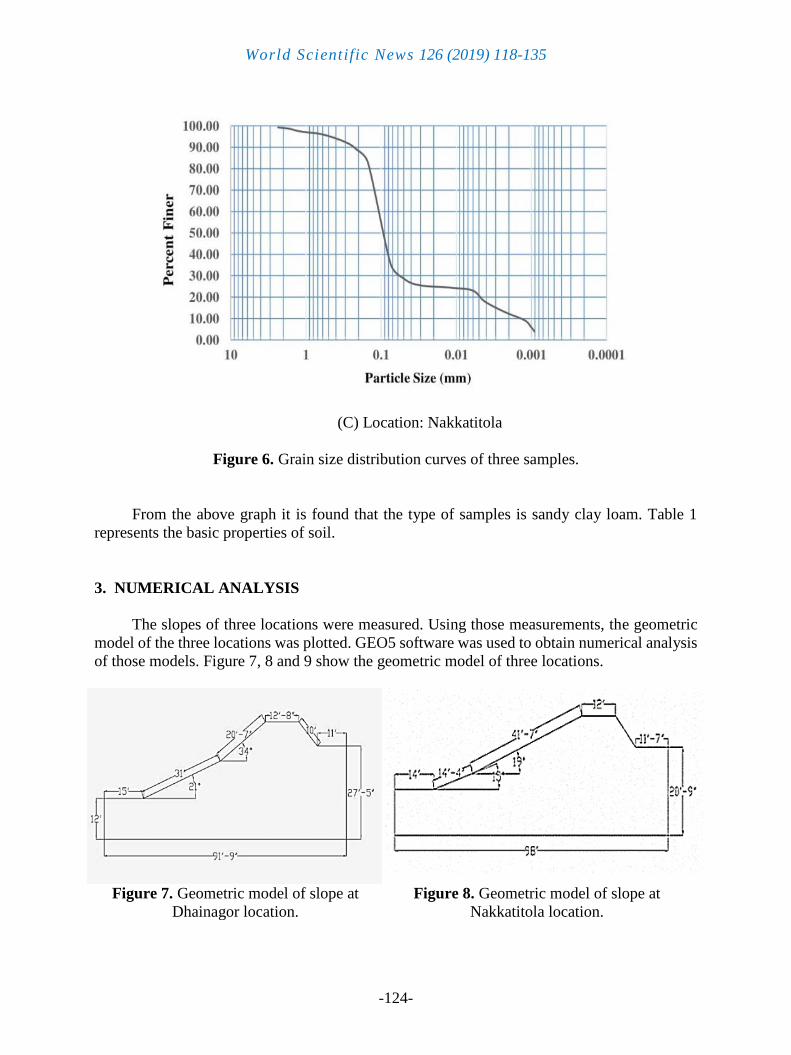
(C) Location: Nakkatitola
Figure 6. Grain size distribution curves of three samples.
From the above graph it is found that the type of samples is sandy clay loam. Table 1
represents the basic properties of soil.
3. NUMERICAL ANALYSIS
The slopes of three locations were measured. Using those measurements, the geometric
model of the three locations was plotted. GEO5 software was used to obtain numerical analysis
of those models. Figure 7, 8 and 9 show the geometric model of three locations.
Figure 7. Geometric model of slope at
Dhainagor location.
Figure 8. Geometric model of slope at
Nakkatitola location.
World Scientific News 126 (2019) 118-135
-125-
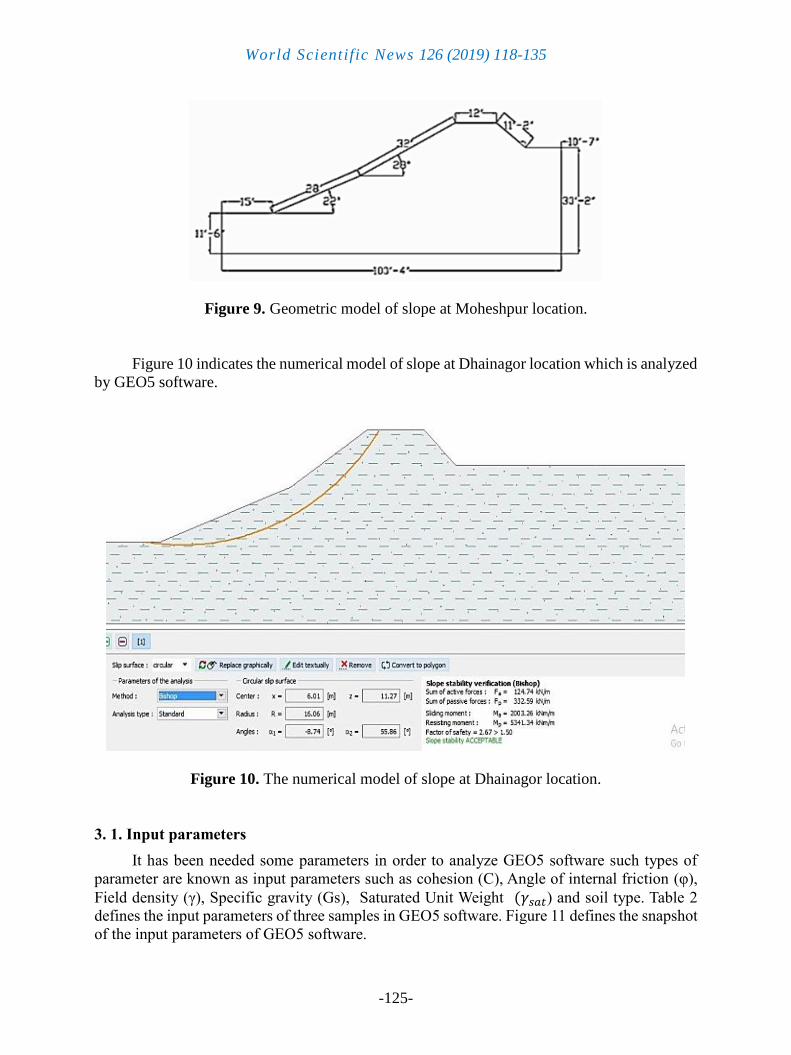
Figure 9. Geometric model of slope at Moheshpur location.
Figure 10 indicates the numerical model of slope at Dhainagor location which is analyzed
by GEO5 software.
Figure 10. The numerical model of slope at Dhainagor location.
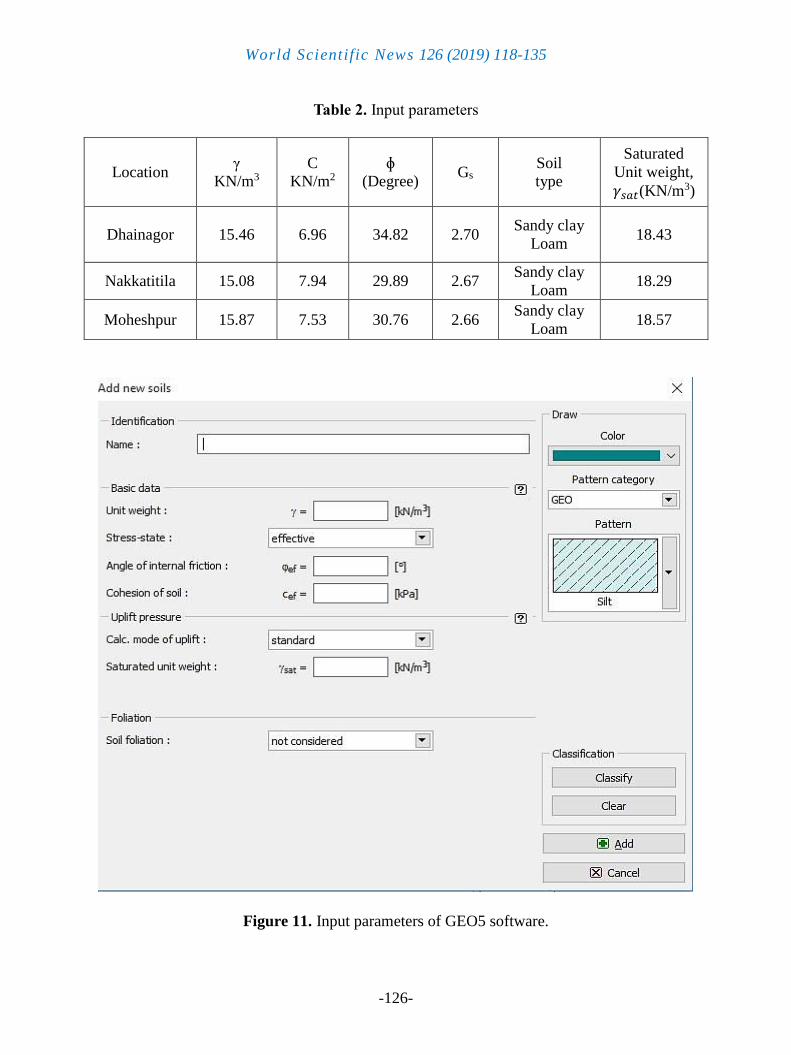
3. 1. Input parameters
It has been needed some parameters in order to analyze GEO5 software such types of
parameter are known as input parameters such as cohesion (C), Angle of internal friction (φ),
Field density (γ), Specific gravity (Gs), Saturated Unit Weight (𝛾𝑠𝑎𝑡) and soil type. Table 2
defines the input parameters of three samples in GEO5 software. Figure 11 defines the snapshot
of the input parameters of GEO5 software.
World Scientific News 126 (2019) 118-135
-126-
Table 2. Input parameters
Location γ
KN/m3 C
KN/m2
ɸ
(Degree) Gs
Soil
type
Saturated
Unit weight,
𝛾𝑠𝑎𝑡(KN/m3)
Dhainagor 15.46
6.96
34.82 2.70 Sandy clay
Loam 18.43
Nakkatitila 15.08 7.94 29.89 2.67 Sandy clay
Loam 18.29
Moheshpur 15.87 7.53 30.76 2.66 Sandy clay
Loam 18.57
Figure 11. Input parameters of GEO5 software.
World Scientific News 126 (2019) 118-135
-127-
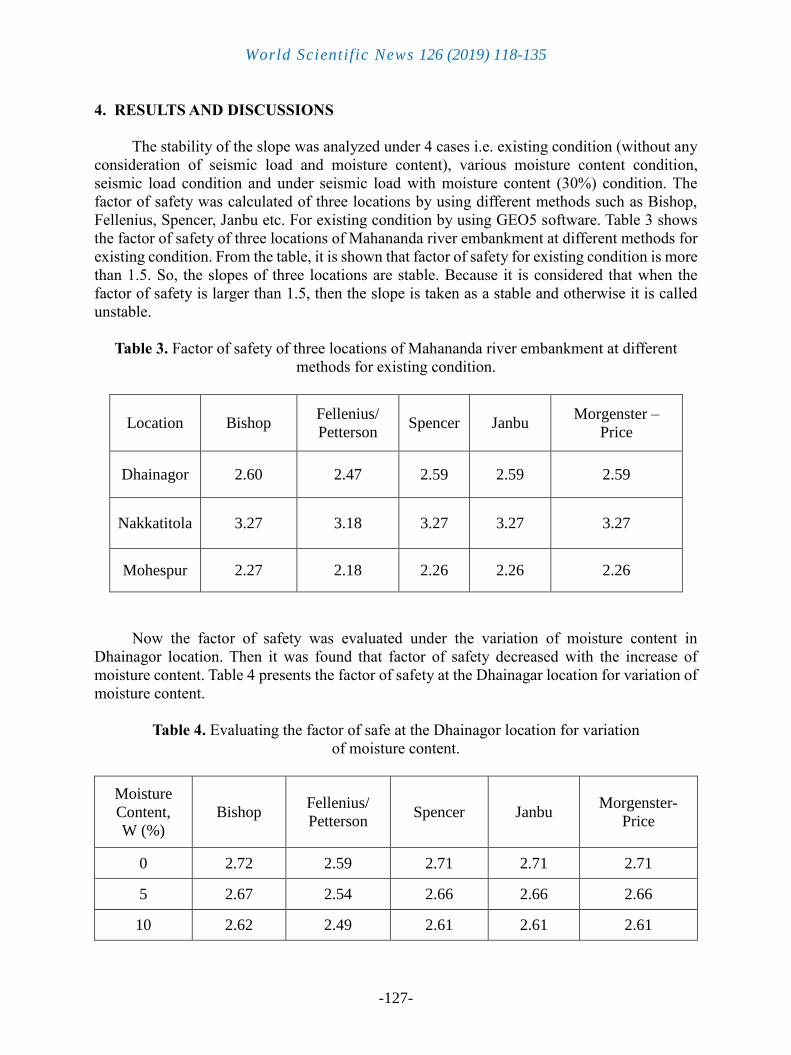
4. RESULTS AND DISCUSSIONS
The stability of the slope was analyzed under 4 cases i.e. existing condition (without any
consideration of seismic load and moisture content), various moisture content condition,
seismic load condition and under seismic load with moisture content (30%) condition. The
factor of safety was calculated of three locations by using different methods such as Bishop,
Fellenius, Spencer, Janbu etc. For existing condition by using GEO5 software. Table 3 shows
the factor of safety of three locations of Mahananda river embankment at different methods for
existing condition. From the table, it is shown that factor of safety for existing condition is more
than 1.5. So, the slopes of three locations are stable. Because it is considered that when the
factor of safety is larger than 1.5, then the slope is taken as a stable and otherwise it is called
unstable.
Table 3. Factor of safety of three locations of Mahananda river embankment at different
methods for existing condition.
Location Bishop Fellenius/
Petterson Spencer Janbu
Morgenster –
Price
Dhainagor 2.60 2.47 2.59 2.59 2.59
Nakkatitola 3.27 3.18 3.27 3.27 3.27
Mohespur 2.27 2.18 2.26 2.26 2.26
Now the factor of safety was evaluated under the variation of moisture content in
Dhainagor location. Then it was found that factor of safety decreased with the increase of
moisture content. Table 4 presents the factor of safety at the Dhainagar location for variation of
moisture content.
Table 4. Evaluating the factor of safe at the Dhainagor location for variation
of moisture content.
Moisture
Content,
W (%)
Bishop Fellenius/
Petterson Spencer Janbu
Morgenster-
Price
0 2.72 2.59 2.71 2.71 2.71
5 2.67 2.54 2.66 2.66 2.66
10 2.62 2.49 2.61 2.61 2.61
World Scientific News 126 (2019) 118-135
-128-
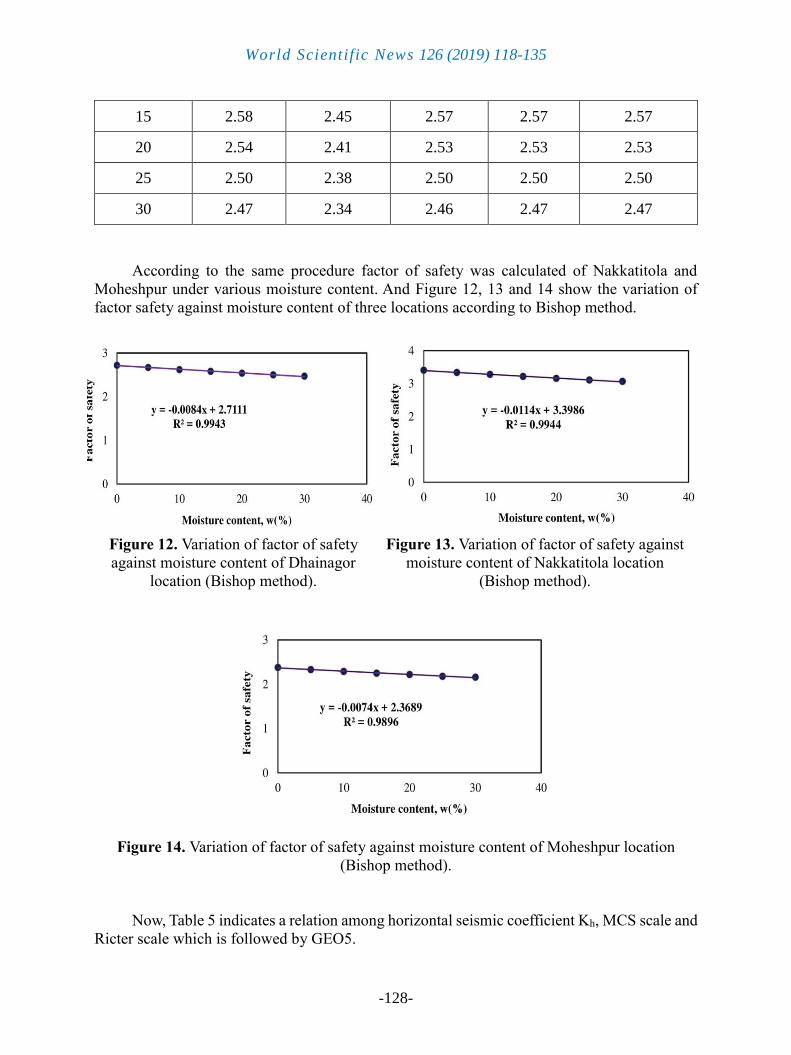
15 2.58 2.45 2.57 2.57 2.57
20 2.54 2.41 2.53 2.53 2.53
25 2.50 2.38 2.50 2.50 2.50
30 2.47 2.34 2.46 2.47 2.47
According to the same procedure factor of safety was calculated of Nakkatitola and
Moheshpur under various moisture content. And Figure 12, 13 and 14 show the variation of
factor safety against moisture content of three locations according to Bishop method.
Figure 12. Variation of factor of safety
against moisture content of Dhainagor
location (Bishop method).
Figure 13. Variation of factor of safety against
moisture content of Nakkatitola location
(Bishop method).
Figure 14. Variation of factor of safety against moisture content of Moheshpur location
(Bishop method).
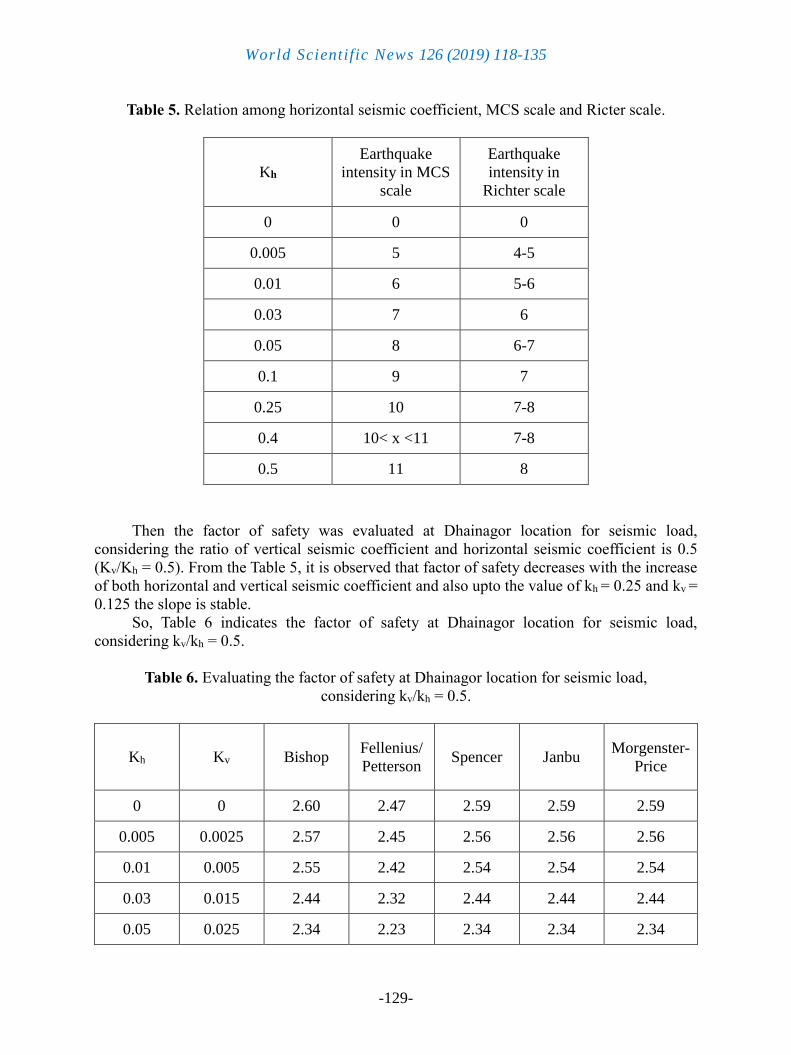
Now, Table 5 indicates a relation among horizontal seismic coefficient Kh, MCS scale and
Ricter scale which is followed by GEO5.
World Scientific News 126 (2019) 118-135
-129-
Table 5. Relation among horizontal seismic coefficient, MCS scale and Ricter scale.
Kh
Earthquake
intensity in MCS
scale
Earthquake
intensity in
Richter scale
0 0 0
0.005 5 4-5
0.01 6 5-6
0.03 7 6
0.05 8 6-7
0.1 9 7
0.25 10 7-8
0.4 10< x <11 7-8
0.5 11 8
Then the factor of safety was evaluated at Dhainagor location for seismic load,
considering the ratio of vertical seismic coefficient and horizontal seismic coefficient is 0.5
(Kv/Kh = 0.5). From the Table 5, it is observed that factor of safety decreases with the increase
of both horizontal and vertical seismic coefficient and also upto the value of kh = 0.25 and kv =
0.125 the slope is stable.
So, Table 6 indicates the factor of safety at Dhainagor location for seismic load,
considering kv/kh = 0.5.
Table 6. Evaluating the factor of safety at Dhainagor location for seismic load,
considering kv/kh = 0.5.
Kh Kv Bishop Fellenius/
Petterson Spencer Janbu
Morgenster-
Price
0 0 2.60 2.47 2.59 2.59 2.59
0.005 0.0025 2.57 2.45 2.56 2.56 2.56
0.01 0.005 2.55 2.42 2.54 2.54 2.54
0.03 0.015 2.44 2.32 2.44 2.44 2.44
0.05 0.025 2.34 2.23 2.34 2.34 2.34
World Scientific News 126 (2019) 118-135
-130-
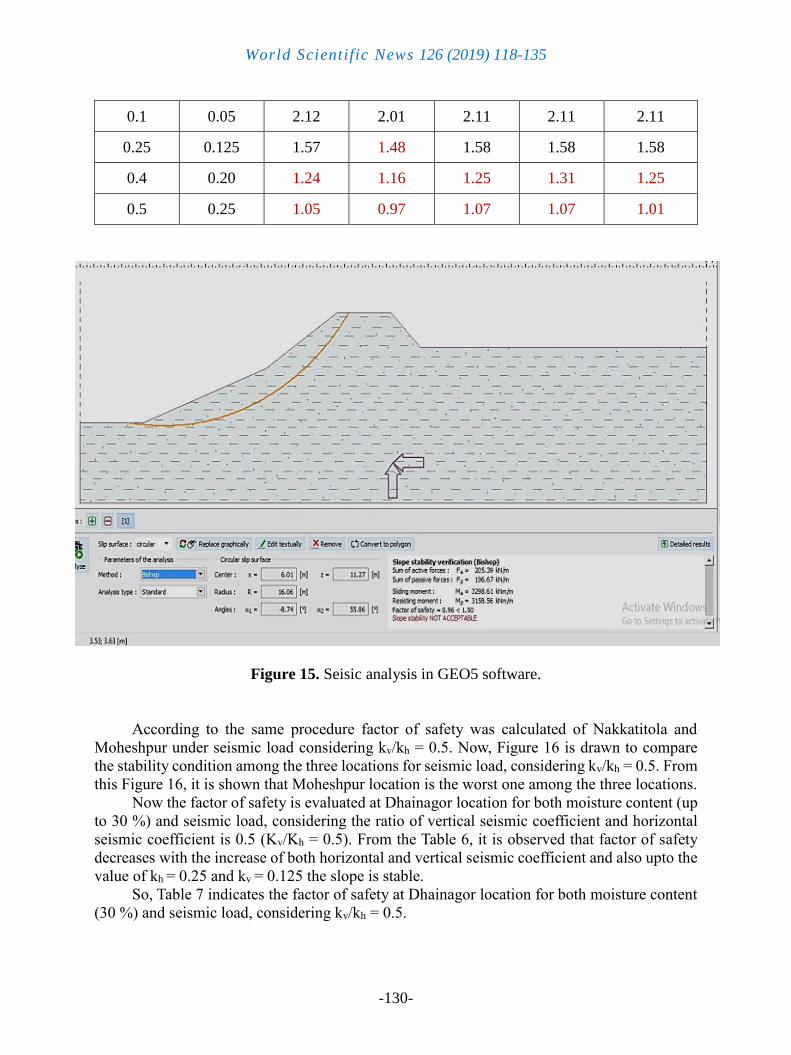
0.1 0.05 2.12 2.01 2.11 2.11 2.11
0.25 0.125 1.57 1.48 1.58 1.58 1.58
0.4 0.20 1.24 1.16 1.25 1.31 1.25
0.5 0.25 1.05 0.97 1.07 1.07 1.01
Figure 15. Seisic analysis in GEO5 software.
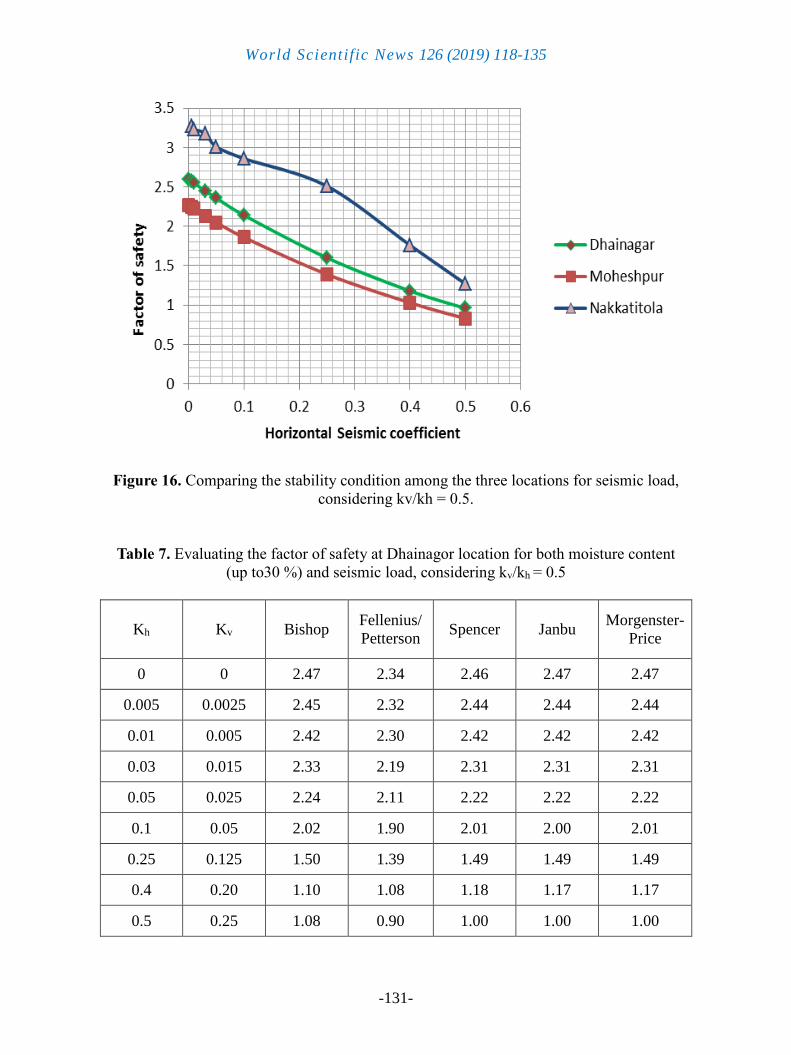
According to the same procedure factor of safety was calculated of Nakkatitola and
Moheshpur under seismic load considering kv/kh = 0.5. Now, Figure 16 is drawn to compare
the stability condition among the three locations for seismic load, considering kv/kh = 0.5. From
this Figure 16, it is shown that Moheshpur location is the worst one among the three locations.
Now the factor of safety is evaluated at Dhainagor location for both moisture content (up
to 30 %) and seismic load, considering the ratio of vertical seismic coefficient and horizontal
seismic coefficient is 0.5 (Kv/Kh = 0.5). From the Table 6, it is observed that factor of safety
decreases with the increase of both horizontal and vertical seismic coefficient and also upto the
value of kh = 0.25 and kv = 0.125 the slope is stable.
So, Table 7 indicates the factor of safety at Dhainagor location for both moisture content
(30 %) and seismic load, considering kv/kh = 0.5.
World Scientific News 126 (2019) 118-135
-131-
Figure 16. Comparing the stability condition among the three locations for seismic load,
considering kv/kh = 0.5.
Table 7. Evaluating the factor of safety at Dhainagor location for both moisture content
(up to30 %) and seismic load, considering kv/kh = 0.5
Kh Kv Bishop Fellenius/
Petterson Spencer Janbu
Morgenster-
Price
0 0 2.47 2.34 2.46 2.47 2.47
0.005 0.0025 2.45 2.32 2.44 2.44 2.44
0.01 0.005 2.42 2.30 2.42 2.42 2.42
0.03 0.015 2.33 2.19 2.31 2.31 2.31
0.05 0.025 2.24 2.11 2.22 2.22 2.22
0.1 0.05 2.02 1.90 2.01 2.00 2.01
0.25 0.125 1.50 1.39 1.49 1.49 1.49
0.4 0.20 1.10 1.08 1.18 1.17 1.17
0.5 0.25 1.08 0.90 1.00 1.00 1.00
World Scientific News 126 (2019) 118-135
-132-
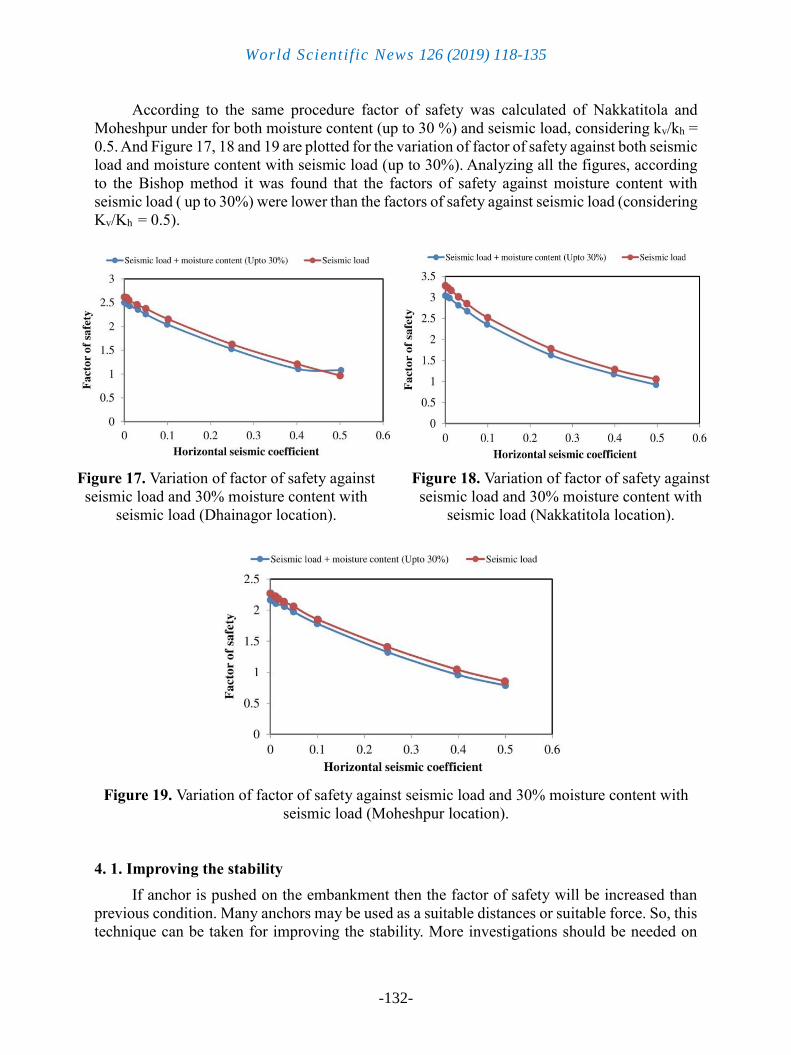
According to the same procedure factor of safety was calculated of Nakkatitola and
Moheshpur under for both moisture content (up to 30 %) and seismic load, considering kv/kh =
0.5. And Figure 17, 18 and 19 are plotted for the variation of factor of safety against both seismic
load and moisture content with seismic load (up to 30%). Analyzing all the figures, according
to the Bishop method it was found that the factors of safety against moisture content with
seismic load ( up to 30%) were lower than the factors of safety against seismic load (considering
Kv/Kh = 0.5).
Figure 17. Variation of factor of safety against
seismic load and 30% moisture content with
seismic load (Dhainagor location).
Figure 18. Variation of factor of safety against
seismic load and 30% moisture content with
seismic load (Nakkatitola location).
Figure 19. Variation of factor of safety against seismic load and 30% moisture content with
seismic load (Moheshpur location).
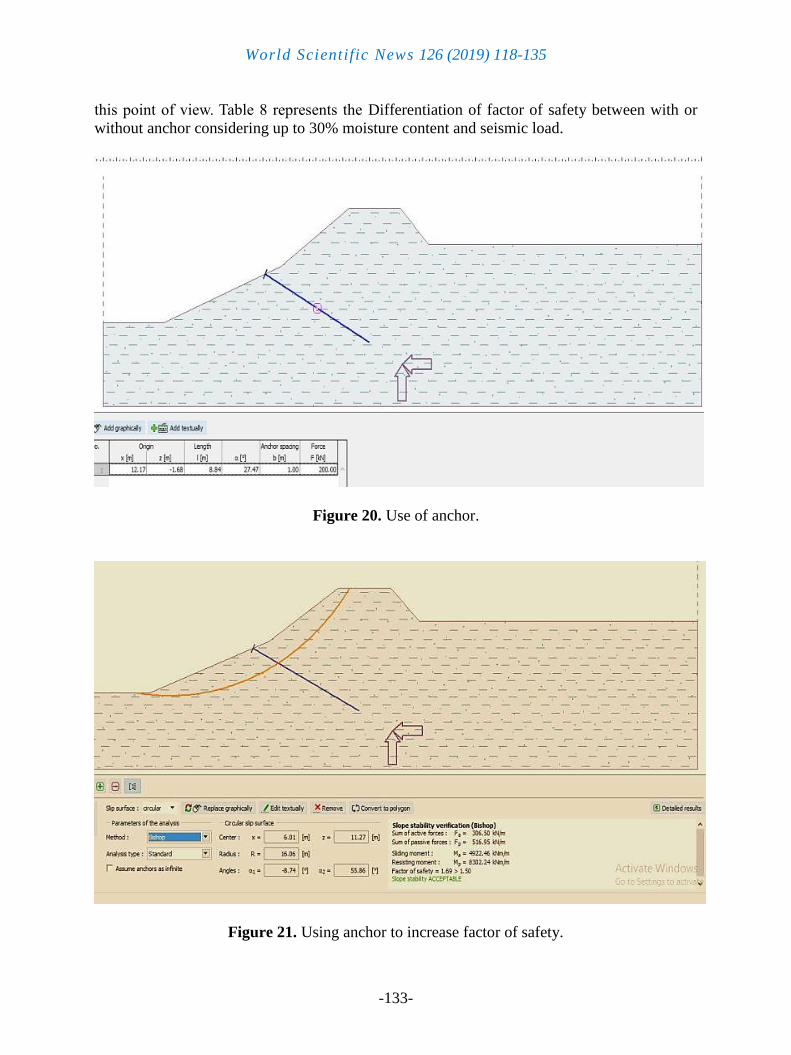
4. 1. Improving the stability
If anchor is pushed on the embankment then the factor of safety will be increased than
previous condition. Many anchors may be used as a suitable distances or suitable force. So, this
technique can be taken for improving the stability. More investigations should be needed on
World Scientific News 126 (2019) 118-135
-133-
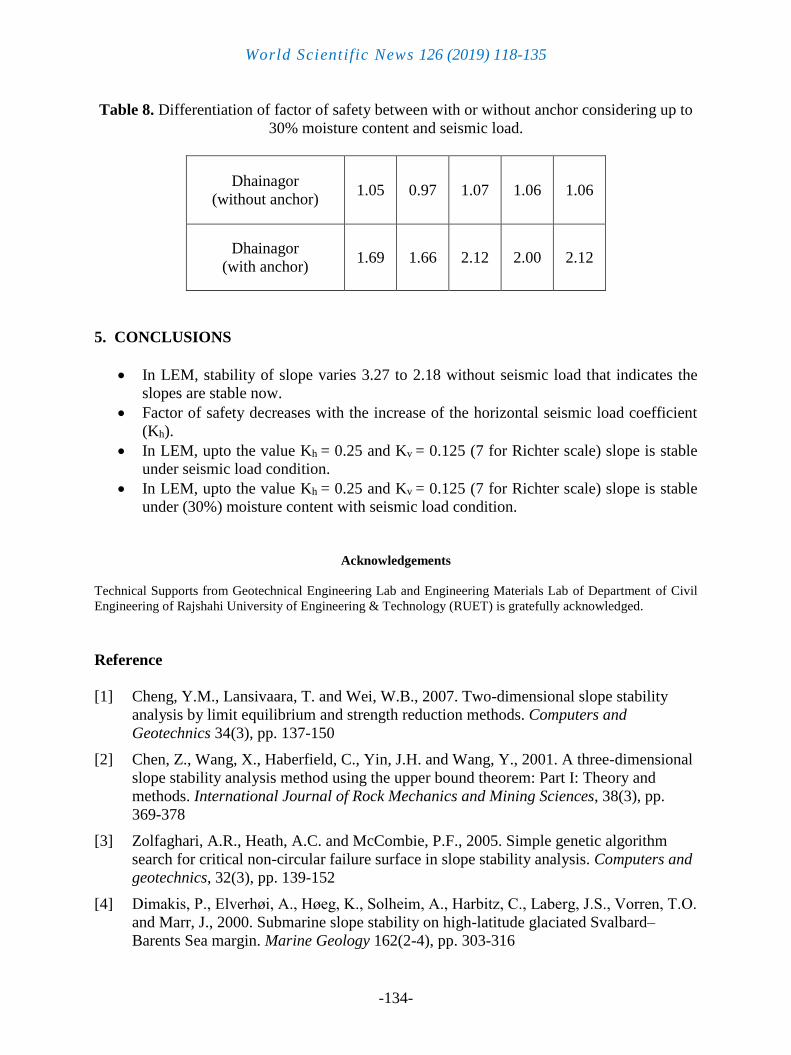
this point of view. Table 8 represents the Differentiation of factor of safety between with or
without anchor considering up to 30% moisture content and seismic load.
Figure 20. Use of anchor.
Figure 21. Using anchor to increase factor of safety.
World Scientific News 126 (2019) 118-135
-134-
Table 8. Differentiation of factor of safety between with or without anchor considering up to
30% moisture content and seismic load.
Dhainagor
(without anchor) 1.05 0.97 1.07 1.06 1.06
Dhainagor
(with anchor) 1.69 1.66 2.12 2.00 2.12
5. CONCLUSIONS
In LEM, stability of slope varies 3.27 to 2.18 without seismic load that indicates the
slopes are stable now.
Factor of safety decreases with the increase of the horizontal seismic load coefficient
(Kh).
In LEM, upto the value Kh = 0.25 and Kv = 0.125 (7 for Richter scale) slope is stable
under seismic load condition.
In LEM, upto the value Kh = 0.25 and Kv = 0.125 (7 for Richter scale) slope is stable
under (30%) moisture content with seismic load condition.
Acknowledgements
Technical Supports from Geotechnical Engineering Lab and Engineering Materials Lab of Department of Civil
Engineering of Rajshahi University of Engineering & Technology (RUET) is gratefully acknowledged.
Reference
[1] Cheng, Y.M., Lansivaara, T. and Wei, W.B., 2007. Two-dimensional slope stability
analysis by limit equilibrium and strength reduction methods. Computers and
Geotechnics 34(3), pp. 137-150
[2] Chen, Z., Wang, X., Haberfield, C., Yin, J.H. and Wang, Y., 2001. A three-dimensional
slope stability analysis method using the upper bound theorem: Part I: Theory and
methods. International Journal of Rock Mechanics and Mining Sciences, 38(3), pp.
369-378
[3] Zolfaghari, A.R., Heath, A.C. and McCombie, P.F., 2005. Simple genetic algorithm
search for critical non-circular failure surface in slope stability analysis. Computers and
geotechnics, 32(3), pp. 139-152
[4] Dimakis, P., Elverhøi, A., Høeg, K., Solheim, A., Harbitz, C., Laberg, J.S., Vorren, T.O.
and Marr, J., 2000. Submarine slope stability on high-latitude glaciated Svalbard–
Barents Sea margin. Marine Geology 162(2-4), pp. 303-316
World Scientific News 126 (2019) 118-135
-135-
[5] Taylor, J.M. and Burns, S.E., 2006. Slope and seismic stability of Castle Lake Debris
Dam, Mt. St. Helens, Washington. Mitochondrial Medicine, p. 349.
[6] Won, J., You, K., Jeong, S. and Kim, S., 2005. Coupled effects in stability analysis of
pile–slope systems. Computers and Geotechnics, 32(4), pp. 304-315
[7] Yu, H.S., Salgado, R., Sloan, S.W. and Kim, J.M., 1998. Limit analysis versus limit
equilibrium for slope stability. Journal of Geotechnical and Geoenvironmental
Engineering, 124(1), pp. 1-11
[8] Kalatehjari, R. and Ali, N., 2013. A review of three-dimensional slope stability analyses
based on limit equilibrium method. Electronic Journal of Geotechnical Engineering, 18,
pp. 119-134
[9] Cheng, Y.M., Li, L., Chi, S.C. and Wei, W.B., 2007. Particle swarm optimization
algorithm for the location of the critical non-circular failure surface in two-dimensional
slope stability analysis. Computers and Geotechnics, 34(2), pp. 92-103


