Embed Size (px)
Citation preview
1
Bringing back nature into cities:
Urban land environments, indigenous cover and
urban restoration
Bruce D. Clarkson, Priscilla M. Wehi and Lars Brabyn
Centre for Biodiversity and Ecology Research
Report No. 52, University of Waikato, Hamilton
March 2007

2
Project title: Bringing back nature into cities
Project number: CBER Report No. 52
Project Leader: Dr Bruce Clarkson
Project Team: Dr Cilla Wehi (urban ecology)
Dr Lars Brabyn (GIS analyst)
Funding: FRST contract no. UOWX0501
Centre for Biodiversity and Ecology Research 2006

3
Summary 1. The restoration of urban ecosystems is an increasingly important strategy to
maintain and enhance indigenous biodiversity as well as reconnecting people to
the environment. High levels of endemism, the sensitivity of species that have
evolved without humans, and the invasion of exotic species have all contributed
to severe depletion of indigenous biodiversity in New Zealand. In this work, we
analysed national patterns of urban biodiversity in New Zealand and the
contribution that urban restoration can make to maximising and enhancing
indigenous biodiversity.
2. We analysed data from two national databases in relation to the 20 largest New
Zealand cities. We quantified existing indigenous biodiversity within cities, both
within the core built up matrix and in centroid buffer zones of 5, 10 and 20 km
around this urban centre. We analysed the type and frequency of land
environments underlying cities as indicators of the range of native ecosystems
that are (or can potentially be) represented within the broader environmental
profile of New Zealand. We identified acutely threatened land environments that
are represented within urban and periurban areas and the potential role of cities
in enhancing biodiversity from these land environments.
3. New Zealand cities are highly variable in both landform and level of indigenous
resource. Thirteen of 20 major land environments in New Zealand are
represented in cities, and nearly three-quarters of all acutely threatened land
environments are represented within 20 km of city cores nationally. Indigenous
land cover is low within urban cores, with less than 2% on average remaining,
and fragmentation is high. However, indigenous cover increases to more than
10% on average in the periurban zone, and the size of indigenous remnants also
increases. The number of remaining indigenous landcover types also increases
from only 5 types within the urban centre, to 14 types within 20 km of the inner
urban cores.
4. In New Zealand, ecosystem restoration alone is not enough to prevent
biodiversity loss from urban environments, with remnant indigenous cover in
the urban core too small (and currently too degraded) to support biodiversity
long-term. For some cities, indigenous cover in the periurban zone is also

4
extremely low. This has significant ramifications for the threatened lowland and
coastal environments that are most commonly represented in cities.
Reconstruction of ecosystems is required to achieve a target of 10% indigenous
cover in cities: the addition of land to land banks for this purpose is crucial.
Future planning that protects indigenous remnants within the periurban zone is
critical to the survival of many species within urban areas, mitigating the
homogenisation and depletion of indigenous flora and fauna typical of
urbanisation. A national urban biodiversity plan would help city councils
address biodiversity issues beyond a local and regional focus, while encouraging
predominantly local solutions to restoration challenges, based on the highly
variable land environments, ecosystems and patch connectivity present within
different urban areas.

5
Contents
Introduction 8
Methods 9 Land environments and indigenous cover 9 Postal Questionnaire 12 Other information sources 13
Results 13 Underlying urban land environments (LENZ) 13
Discussion 26
Acknowledgements 31
Appendix 1. Largest twenty cities used in this analysis: populations, area (ha) administered by the territorial authority, and density (no. 100 people/ha) 32
Appendix 2. Acutely threatened land environments with more than 50% of their area represented within a 20 km buffer zone of the urban core of the 20 largest New Zealand cities. 33
Appendix 3. Information Sheet and Postal Questionnaire sent to cities, 2006. 35
Appendix 4. The percentage of indigenous and exotic cover present in individual New Zealand cities, along an urban-rural gradient through buffer zones of 5 km, 10 km and 20 km from an urban core (0 km). 39
Appendix 5. Curves showing patterns of indigenous cover for individual cities. 42
References 45

6
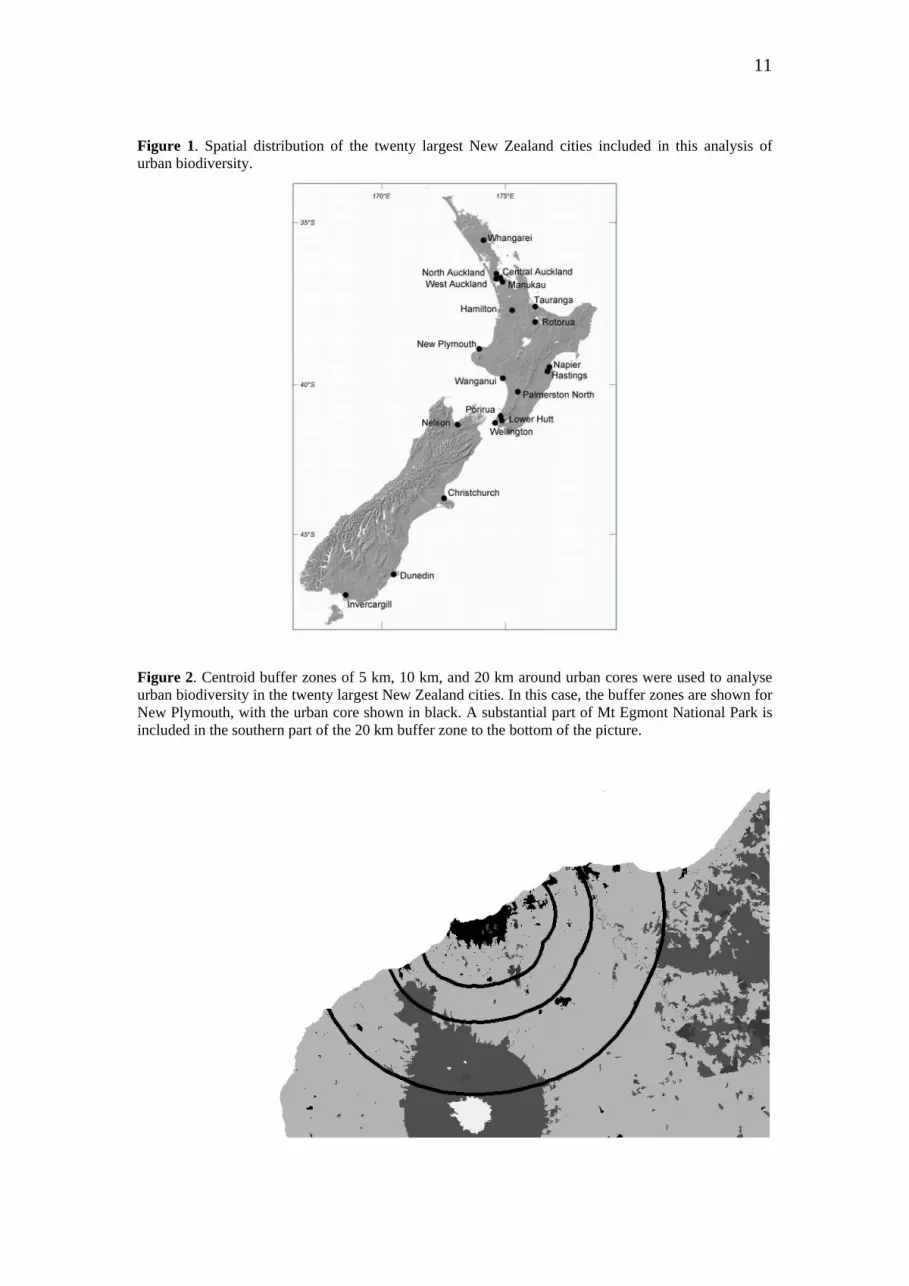
List of Figures Figure 1. Spatial distribution of the twenty largest New Zealand cities included in this
analysis of urban biodiversity. ______________________________________ 11
Figure 2. Centroid buffer zones of 5 km, 10 km, and 20 km around urban cores were
used to analyse urban biodiversity in the twenty largest New Zealand cities. __ 11
Figure 3. The number of land environments present in urban centres in New Zealand
(LENZ Level I analysis). __________________________________________ 14
Figure 4. The type of land environments present in urban centres in New Zealand
(LENZ Level I analysis), and their proportional representation. ____________ 14
Figure 5. Dendrogram using city-block (Manhattan distances) and complete linkages
to analyse the land environment relationships in the 20 largest New Zealand
cities from the LENZ Level 1 database. _______________________________ 16
Figure 6. Mean percentage of indigenous and exotic cover in cities in each buffer zone
(n=20 cities). ____________________________________________________ 19
Figure 7. Percentage indigenous cover within the urban core for individual cities. __ 19
Figure 8. Patterns of indigenous land cover over a gradient of centroid buffer zones at
5, 10 and 20 km moving from an urban core to the periurban surrounds. _____ 20
Figure 9. Total indigenous resource identified by city councils within city boundaries.
_______________________________________________________________ 23
Figure 10. Estimates of urban restoration spending in New Zealand cities from 2002-
2006. __________________________________________________________ 24
Figure 11. Size of ecologically important fragments within the boundaries of urban
centres (mean ± SE, n=8). __________________________________________ 26

7
List of Tables Table 1 Total land area (ha) of the underlying land environments represented beneath
the core urban areas (n=20). ________________________________________ 15
Table 2. Patterns of indigenous biodiversity presence and threat in relation to buffer
zones at increasing distances from the built up matrix of urban centres, across all
cities (n=20). ____________________________________________________ 18
Table 3. Indigenous landcover types, and water environments, represented within the
urban core of the largest 20 New Zealand cities, and the current area. 21

8
Introduction New Zealand is a biodiversity hotspot (Mittermeier and others 1999), where high
levels of endemism have helped create a unique flora and fauna. However,
biodiversity decline is a world-wide concern, and what remains of habitats and
biodiversity in cities is of disproportionate importance (Crane and Kinzig 2005).
Researchers have argued that interactions with nature in close proximity to places
where people live and work can strengthen human connections to the natural world
(Miller 2005). In New Zealand, more than 87% of our population are now urbanised
(Statistics New Zealand 2001). Urban environments offer opportunities to reverse
ecosystem degradation and biodiversity loss in a meaningful way through human
engagement in ecological restoration.
Case studies form the vast majority of urban ecology. Many urban ecological
restoration projects are small scale, developed by communities concerned about
degradation of local ecosystems (e.g. Clarkson and Downs 2002). However,
restoration data has rarely been analysed at a broad scale to determine the scale of
restoration effort, and how it can best benefit threatened ecosystems. It is unclear, as
yet, what restoration of patches can and cannot achieve for biodiversity conservation
and there is uncertainty over the impact of using restoration plans to mitigate
development (Sutherland and others 2006).
Ecological research on species loss frequently focuses on human mediated
impacts such as the effects of invasive species (e.g. Vitousek and others 1997) and
habitat modification and fragmentation. A number of ecological studies (e.g. Drinnan
2005; McIntyre and Hobbs 1999) have suggested that below 10% relictual habitat
cover in a landscape may trigger a decline in many species with severe fragmentation
effects. Both population and species loss can be driven by land transformations
associated with urbanisation (e.g. Luck and Wu 2002; McDonnell and others 1997)
yet many cities plan independently for their perceived biodiversity needs without
reference to national patterns. The current upsurge of urban restoration activity in
New Zealand suggests it is timely to address the potential of urban centres to
successfully contribute to biodiversity goals. Analysing patterns of urban indigenous
cover, urban land environments and restoration efforts in relation to national
biodiversity is an essential part of that planning process.

9
In this research, we critically analysed patterns of geographical and ecological
differentiation across all New Zealand cities to understand the current biodiversity
resource in New Zealand cities. An analysis of both the existing resource potential
within the built up matrix, and within a 20 km buffer zone, allowed us to consider the
resource potential which can potentially be incorporated within the city as it expands.
We have set out to determine the range of urban indigenous ecosystems and
environments that are represented within the broader environmental profile of New
Zealand, and hence the potential contribution of New Zealand cities to biodiversity
retention and restoration. To achieve these aims, we examined the types of land
environments that lie beneath New Zealand cities. We compared this with the range of
existing landcover types, and the degree of remaining landcover on these land
environments. We have identifed the degree of biodiversity (measured as indigenous
cover) remaining in the built up matrices in New Zealand cities, hence comparing
structurally/ ecologically equivalent parts of the city rather than variable historical
administrative units (and thus precluding use of administrative boundaries). This
allowed us to determine the persistence of ecological features in the built up matrix.
From a postal questionnaire, we determined current and past levels of restoration
spending by city councils within city boundaries and where urban restoration efforts
lie.
Methods
Land environments and indigenous cover We analysed two databases– The Land Environment NZ (LENZ) database (Leathwick
and others 2003) developed by Landcare Research, and the Landcover 2 (LCDB2)
data set (Ministry for the Environment, 2000). LENZ indicates the land environment
which existed prior to human settlement in around 1200 AD, and has four levels
which vary from the general to the detailed. LENZ 1 is useful for identification of
general patterns of which land environments are represented in cities, while LENZ 4
is the most detailed level of analysis which is most appropriate for environmental
profiles and the examination of land environments in cities.
LCDB2 is a database which quantifies current landcover across New Zealand.
The Landcover data set has approximately 50 classes. A generalised landcover data
set was developed from the initial landcover data set by combining classes. Although

10
there are some discrepancies and incorrect assignment of LCDB2 categories (mainly
confusion of natural and planted forest), by focusing on general trends in land
categorisation rather than absolute values, the requirement for data accuracy is more
relaxed than would otherwise be required, and the results robust.
The twenty largest cities (by population) in New Zealand were identified for
analysis (Figure 1; see Appendix 1 for details of population, land area and density).
For this part of the analysis, we defined the urban area according to a contiguous
algorithm to construct an urban ‘core’, with a 5km, 10 km and 20 km buffer zone
around this core. We did this so we could compare like with like, as some cities
encompass large amounts of rural land. The ‘urban’ area defined by the city boundary
is administered by city councils and district councils (as defined by their legal
obligations in the case of city councils and the District Plan for each district council),
but large amounts of rural land within cities can confuse analysis of urban-rural
gradients. However, complex heterogeneous habitats such as urban areas can be
usefully ordinated along conceptual ‘urban-rural’gradients (McDonnell and Pickett
1990). In this case, the analysis involved identifying the contiguous urban core, and
the surrounding rural areas of each city using a range of proximity (buffer) distances –
0 km, 5 km, 10 km, and 20 km (Figure 2). Small satellite urban areas associated with
a city can distort urban analyses because such areas add large buffer regions: to
prevent this distortion, only the core part of the urban area was used. This deleted
small urban areas that were not contiguous to the core urban area, which were then
included in the next buffer zone.
11
Figure 1. Spatial distribution of the twenty largest New Zealand cities included in this analysis of urban biodiversity.
Figure 2. Centroid buffer zones of 5 km, 10 km, and 20 km around urban cores were used to analyse urban biodiversity in the twenty largest New Zealand cities. In this case, the buffer zones are shown for New Plymouth, with the urban core shown in black. A substantial part of Mt Egmont National Park is included in the southern part of the 20 km buffer zone to the bottom of the picture.

12
The contiguous urban core (also referred to as the 0 km buffer zone) was
defined as an urban area over 300 ha, and was derived by deleting urban patches less
than 300 ha in size. The four buffer regions of an urban area did not extend into the
buffer region of a neighbouring urban region to prevent double counting of LENZ or
LCDB2 classes. These buffers defined the analysis area for summarising the LENZ
classifications (levels 1, 2, 3, and 4), LCDB2 classification and the generalised
version of LCDB2. Statistics on the hectares of the different LENZ classes and
LCDB2 classes were produced. The analysis area varies between the LCDB2 and
LENZ summaries because LENZ excludes the sea and internal water bodies (eg
lakes). Internal water bodies in the LENZ classification are represented by “NULL.”
Postal Questionnaire We sent out a postal questionnaire survey to the city councils of all 20 New Zealand
cities with a population greater than 40,000, as well as four others (Taupo,
Whakatane, Gisborne and Masterton). Questionnaires are often used by ecologists to
make generalisations in a cost-effective, comprehensive manner as part of a macro
scale approach (White and others 2005). We pre-tested the questionnaire to minimise
the possibility of errors. Once the questionnaire had been sent, we followed up
progress with both email and phone contact to the city council staff responsible for its
completion; the mean number of contacts per city was 4.4 for the 20 largest cities
(range: 1-9). Because smaller cities may have limited resources, we did not follow up
on surveys sent to the smaller cities as intensively with the result that only one postal
questionnaire was returned with any data (Taupo). For this reason, we decided to
concentrate our analyses on the 20 cities with the highest populations only.
The questionnaire is reproduced in Appendix 2. Briefly, in the survey we
asked park managers to quantify the existing indigenous resource and the potential
resource which could return to mixed exotic- indigenous ecosystems in their city, as
well as the level of restoration activity in the last 5 years. Survey estimates were cross
checked for accuracy against statistical data from LCDB2, existing inventories of
indigenous biodiversity, and information from the District Plans and city biodiversity
surveys and inventories. Respondent biases are likely to be greater where no
documented records exist (White and others 2005), so we took particular care to

13
confirm where possible the sizes, biodiversity descriptions and location of restoration
areas within each city.
Other information sources In addition to these two databases and the postal questionnaire, we have used
inventories and surveys, state of the environment reports, and asset lists provided by
the cities (where available) to identify ‘significant’ ecological areas within cities and
ascertain the number, size and general ecosystem type of ecological sites.
Results
Underlying urban land environments (LENZ) Thirteen of 20 land environments at the most generalised level of LENZ (Level 1)
occur within the urban cores of the largest 20 cities. Most cities have more than one
land environment represented, with the most common number of environments being
two or three ( x =2.8, range 1-5; Figure 3). Nonetheless, one land environment
frequently tends to predominate in each city, so that, for example, the northern
lowlands (A) form the most commonly found environment with more than 90% of the
land area in each of the seven northern cities (Figure 4, Table 1). The central hill
country and volcanic plateau (F) and western and southern north Island lowlands (C)
are also well represented in urban centres. On the other hand, the central dry foothills
(E) occur in only one city, and also occupy the smallest area, while environments L
(the southern lowlands), N (the eastern South Island plains), and Q (the southeastern
hill country and mountains) are similarly sparsely represented in an urban setting
(Table 1).

14
Figure 3. The number of land environments present in urban centres in New Zealand (LENZ Level I analysis).
Figure 4. The type of land environments present in urban centres in New Zealand (LENZ Level I analysis), and their proportional representation. Each colour represents a different land environment. The percentage of the land area is represented on the y-axis.

15
Table 1 Total land area (ha) of the underlying land environments represented beneath the core urban areas (n=20). Thirteen of 20 land environments are represented across all 20 cities. Water bodies are excluded from the analysis. Cities are arranged approximately north to south. The first 16 cities are all in the North Island. Blank cells indicate a zero value for that land category. A full list of descriptions for land environment categories can be found in Leathwick et al. 2003

16
The similarity of land environment patterns in cities can be seen in Figure 5. There are
four main groupings at a linkage distance of 1000. Christchurch has the most unique
set of land environments and is alone in group one; the second group comprises
mainly southern and central cities. Northern cities are represented in the third and
fourth groups, so that cities such as Waitakere and Hamilton have some overall
similarities in land environment. Collaborative biodiversity strategies could be useful
where these similarities exist; for example, between Hamilton (which has low
indigenous cover in all urban buffer zones) and Waitakere (which has higher
indigenous cover). However, the range and diversity of environments evident in Table
1, also emphasises the need for each city to put in place individual solutions to
biodiversity retention.
Figure 5. Dendrogram using city-block (Manhattan distances) and complete linkages to analyse the land environment relationships in the 20 largest New Zealand cities from the LENZ Level 1 database.
0 5000 10000 15000 20000 25000 30000
Linkage Distance
Central AucklandManukauTauranga
WhangareiNorth Shore
HamiltonWaitakereWellingtonLower Hutt
Palmerston NorthRotorua
New PlymouthPorirua
WanganuiNelsonNapier
HastingsInvercargill
DunedinChristchurch
A more detailed analysis of land environments at Level IV of LENZ shows
that 100 of 500 identified land environments lie beneath core urban areas, increasing
to 181 in the 5 km buffer zone, and 214 in the 10 km buffer zone. In fact, 275 Level
IV LENZ land environments are represented within the total area of the urban core
and buffer zones, indicating the extent of potential biodiversity in urban and periurban
areas.
Using the five threat categories for land environments in New Zealand that
have been identified (ranging from acutely threatened, chronically threatened, and at

17
risk, to critically underprotected, underprotected, and a further category of no threat
(Walker and others 2005), the urban cores comprise 63 (of a total of 158) acutely
threatened land environments (which make up 66% of the land area) and 13
chronically threatened environments. Only 10 of the 100 land environments in the
urban core are classified as ‘no threat’.
Within the 5 km buffer zone around the urban core, the number of acutely
threatened land environments increases to 83, representing 52.5% of all acutely
threatened environments on a national scale (Table 2). Moreover, the number of
acutely threatened land environments represented continues to increase with buffer
zone distance around the urban cores, although they form the highest proportion of the
land environment within the urban cores themselves (Table 2). Sixty acutely
threatened environments (38% of all acutely threatened environments) have more than
10% of their land area within the total urban and periurban area defined at its outer
limits by the 20 km buffer zone. Twenty-two acutely threatened environments have
more than 50% of their area represented within the urban and periurban zones
(Appendix 2). Despite human modification of land environments in cities, 598 ha of
indigenous cover currently exists on these acutely threatened land environments
within the built up urban cores (an average of 29.9 ha per city), and nearly 35000 ha
remains within a 20 km buffer zone around the built up matrix. Only nine of the 114
acutely threatened land environments have no existing indigenous cover within 20 km
of the urban core of cities. That is, although indigenous cover on these land
environments is relatively low, the vast majority of land environments have some
remaining indigenous biodiversity. The high proportion of acutely threatened
environments indicates enormous potential to contribute to the protection, restoration
and reconstruction of threatened environments in cities.
Indigenous cover in the urban and periurban zones
The percentage of indigenous cover within the urban core of cities ranged from 0-
8.9% ( x = 1.96%; Figure 4). As expected, the amount of remaining indigenous cover
increased with distance from the urban core, with the greatest amount of indigenous
cover, on average, in the 20 km zone (Figure 6; Table 2). Many New Zealand cities
are coastal, and water is hence represented strongly within the buffer zones.

18
Table 2. Patterns of indigenous biodiversity presence and threat in relation to buffer zones at increasing distances from the built up matrix of urban centres, across all cities (n=20). Data analysis uses LENZ Level IV and LCDB2.
Distance from urban core (km)
0 5 10 20
No. acutely threatened land environments
63
83
93
114
Acutely threatened environments as a percentage of the total area in the buffer zone
66.2 58.7 53.5 47.4
Mean no. indigenous patches ± SE
42±9 196±28 373±52 864±149
Patch density (mean no./100 ha± SE)
0.98±0.18 0.66±0.09 0.60±0.07 0.59±0.08
Indigenous cover (%). Mean ± SE
1.96±0.5 9.9±2.6 12.8±3.2 15±2.8
Total no. of indigenous cover types (richness indicator) Mean patch size (total area of indigenous cover in ha/ no. patches)
5
301.6
10
4877.5
11
4555.1
14
4244.7
There is considerable variation in the proportion of indigenous cover remaining in
individual cities, with some cities depauperate, especially in the urban core. The
proportion of indigenous cover in the 5 km, 10 km and 20 km buffer zone for
individual cities is shown in Appendix 3. The total area (ha) of indigenous cover and
exotic cover for the urban core is also shown in Appendix 3. Nine of the 20 largest
New Zealand cities reach a threshold of 10% indigenous cover approximately 5 km
from the urban core, but at a distance of 10 km from the urban core, only one other
city can be added to this list. If water bodies are excluded from the analysis, the figure
rises by only one to 11 cities. At 20 km from the urban core, only 12 cities have
indigenous cover at or above the 10% threshold, although two cities are just below
this threshold. However, if water bodies are excluded from the analysis for the 20 km
buffer zone, 16 cities comfortably reach the 10% threshold 20 km from the urban
core.

19
Figure 6. Mean percentage of indigenous and exotic cover in cities in each buffer zone (n=20 cities).
Figure 7. Percentage indigenous cover within the urban core for individual cities.
Three distinct patterns of increasing indigenous cover were revealed on a core
to 20 km buffer zone gradient: New Plymouth was the only city with a pattern of
indigenous cover which did not fit one of the other three patterns (Figure 8). Napier is
typical of cities with a flat, farmed periurban zone. Nelson has a green belt on the

20
outer edge of the city and then the increasing areas of remnant indigenous ecosystem
further away from the city. Wellington is typical of cities built in hilly environments
around a harbour, with the influence of an inner city green belt also present. The
administrative boundaries between urban centres and adjoining district councils occur
at different points along this gradient: this has major implications for the protection
and restoration of biodiversity in different cities. New Plymouth is the only New
Zealand city with this curve shape- a combination of history and topography with
many reserves established within the built up matrix as early as 1920 and then the
very efficient conversion to dairying in the peri-urban zone but with a significant
forest reserve created in 1886 by the application of the surveyors compass to the peak
to create the proto Egmont National Park. Curves for individual cities are shown in
Appendix 4.
Figure 8. Patterns of indigenous land cover over a gradient of centroid buffer zones at 5, 10 and 20 km moving from an urban core to the periurban surrounds. Pattern (a) is representive of 7 cities, (b) of 7 cities and (c) of 5 cities. New Plymouth is the only city with a periurban indigenous cover of curve type (d).
We determined the number of indigenous landcover types represented in each zone.
The number of indigenous landcover types increased with distance from the city
centre (Table 2). In the urban cores, only 5 types of indigenous landcover are
represented nationwide, with 4 types of water environments (Table 3). Of the

21
terrestrial landcovers, only broadleaved indigenous hardwoods and indigenous forest
occur in more than half of the urban centres; at the other extreme, flaxland and
herbaceous freshwater vegetation are both recorded in only one city each. One urban
centre has no recorded indigenous vegetation in the urban core.
Indigenous hardwoods and indigenous forest occur in the 5 km buffer zone of
all 20 cities. As well, unusual indigenous biodiversity is represented within 5 km of
the urban cores, with fernland in New Plymouth’s environs, tall tussock grassland
near Dunedin, and alpine gravel and rock in that of Lower Hutt. Within 20 km of the
urban core of cities, 14 types of indigenous landcover have been recorded, including
flaxland, grey scrub, herbaceous saline vegetation, subalpine shrubland and
matagouri.
Table 3. Indigenous landcover types, and water environments, represented within the urban core of the largest 20 New Zealand cities, and the current area. Exotic landcover is not quantified here.
Type of
indigenous Landcover,
or water body
NZ ha Total area in the top 20 cities
(ha)
No. Cities Location
Broadleaved Indigenous Hardwoods
534271 722 15
Flaxland 6450 7 1 Central Auckland Herbaceous Freshwater Vegetation
88594 39 1 Christchurch
Indigenous Forest
6449166 964 14
Manuka and or Kanuka
1181354 62 7
Estuarine Open Water
37214 17 1 Central Auckland
Sea 0 68 3 Central and Southern Auckland, Whangarei
River 81246 129 5 Chch, Hamilton, Lower Hutt, Nelson, New
Plymouth Lake and Pond
357170 83 9
Patch densities indicate that fragmentation of indigenous habitat is highest in
the inner core of cities, as might be expected. Three patch densities of less than
0.09/100 ha were recorded for the inner urban matrix (for Palmerston North,
Christchurch and Napier), all of which have almost nil indigenous cover in this zone.
New Plymouth has both the greatest percentage of indigenous cover, and the highest
22
patch density (2.94 patches/100 ha) within this zone. However, there was little
difference between patch densities in the 5km, 10 km and 20 km buffer zones. Within
the 5km buffer zone, only one city had a patch density of less than 0.09/100 ha, but
the highest patch density was only 1.46/100 ha, again for New Plymouth. In the 20
km buffer zone, one city (Whangarei) had a patch density of greater than 1/100 ha,
and no cities had a patch density of less than 0.09/100 ha.
Mean patch size in the inner core is skewed by values for a small number of
cities, and particularly by values for Lower Hutt. Within the inner city matrix, the
mean patch size for Lower Hutt is 6609 ha, while the next largest mean patch size is
282 ha for West Auckland (Waitakere). Only two other cities have a mean patch size
greater than 100 ha in this zone. Conversely, 14 cities have a mean patch size in the
inner core of less than 20 ha, and of these, eight have a mean patch size of less than 10
ha. Additionally, one city (Palmerston North) had no recorded indigenous patches at
all in this zone. In general, then, patch size is relatively small for most New Zealand
cities within the inner core, but a small number are strongly connected from the inner
core to surrounding forest (including national parks). Opportunities for urban
restoration will therefore differ for these cities. Mean patch size remains relatively
similar in the 5km, 10 km, and 20 km buffer zones, but the large patch size also
suggests strong indigenous connectivity in the outer urban zones. As well, the number
of indigenous patches increases dramatically from the inner city cores towards the
periurban zone. Although these patch sizes and numbers are artificially inflated by
double counting of patches which cross buffer zones, we believe the data indicate that
maintenance of indigenous biodiversity within cities is a real possibility.
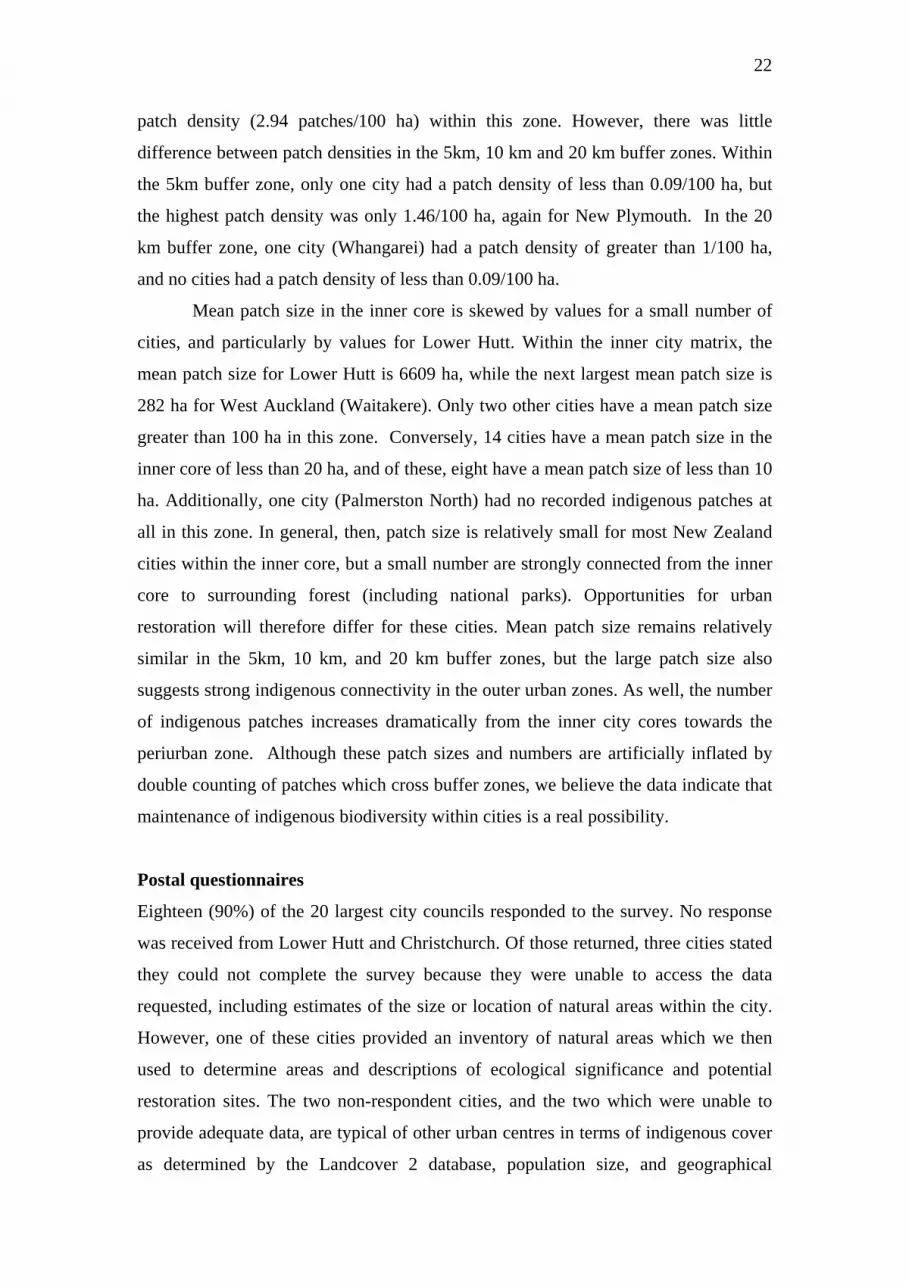
Postal questionnaires
Eighteen (90%) of the 20 largest city councils responded to the survey. No response
was received from Lower Hutt and Christchurch. Of those returned, three cities stated
they could not complete the survey because they were unable to access the data
requested, including estimates of the size or location of natural areas within the city.
However, one of these cities provided an inventory of natural areas which we then
used to determine areas and descriptions of ecological significance and potential
restoration sites. The two non-respondent cities, and the two which were unable to
provide adequate data, are typical of other urban centres in terms of indigenous cover
as determined by the Landcover 2 database, population size, and geographical

23
location (which places them in close proximity to other cities with similar land
environments). We therefore do not expect the trends identified in this analysis to
deviate significantly from those described, if these cities were included in this part of
the analysis.
Indigenous ecoystems within city boundaries
Cities quantified the amount and ecosystem type of indigenous resource in their cities,
as well as the amount of potential indigenous resource that is currently dominated by
exotic species but could be restored to indigenous ecosystem (Figure 9). According to
this data, there is comparatively little potential indigenous resource remaining in cities
for restoration. As well, most of the resource is concentrated as forest or scrub. Given
that total indigenous cover in almost all urban centres is well below 10%, this
suggests that restoration of existing indigenous ecosystems is not enough to maintain
biodiversity. Six of the 20 largest urban centres have less than 0.5% indigenous cover
currently. The mean amount required to reach 10% indigenous biodiversity across all
cities is 8%, or an average of 395.8 hectares per city.
Figure 9. Total indigenous resource identified by city councils within city boundaries.
Restoration effort
Between ten and thirteen cities indicated their restoration spending (depending on
year), the rest being unable to provide estimates. In total, more than three and a half
million dollars was spent by these cities in 2006. Restoration spending has increased
on average over the last 5 years to just under $300,000 (Figure 10), but this figure

24
conceals several important trends in spending. In fact, restoration spending increased
in around half of the urban centres over the five year period, but spending for the
remainder was low. Cities with high spending on restoration tended to be those with
increasing restoration budgets, while the minimal spenders showed little change. This
difference can be partly explained by the amount of remaining biodiversity; Hastings
for example, is a low restoration spender, which correlates with a low level of
remaining indigenous cover. Nonetheless, it also indicates that depauperate cities have
not yet begun the reconstruction of ecosystems to increase indigenous biodiversity.
That is, restoration spending overall remains firmly focused on improving the quality
of the existing indigenous resource. Further, it suggests that while the policies and
staff of some councils clearly support a vision of nature in cities (and in particular a
vision of retaining native biota in cities) others have yet to understand its value.
Figure 10. Estimates of urban restoration spending in New Zealand cities from 2002-2006. Data was provided by 10 city or district councils for 2002, 12 for 2003 and 2006, and 13 for 2004 and 2005.
The number of restoration projects supported by councils tended to be highly
variable, with cities such as Manukau leading the way with 36 projects and more than
$800k in restoration spending in 2006. However, of 11 councils that supplied data,
nine indicated that they supported fewer than 10 projects in 2006. On average, around
seven projects were supported by councils in each city each year. Restoration projects
ranged in size from discrete 2 ha blocks, to co-ordinated city wide planting and pest

25
control in North Shore. Ecosystems chosen for restoration were similarly variable,
ranging from dune systems to estuaries to forests.
Sites of ecological significance Nine cities provided documentation of special ecological areas within the city
boundaries, including descriptions and size: it appears that for many cities sites of
special interest have not yet been identified, or are in the process of being identified.
SES site inventories or similar, pertaining to sites within city boundaries, were
provided by Dunedin, Nelson, North Shore, Palmerston North, Tauranga, Hamilton
and Porirua (n=7). Some of these figures are provisional: Nelson’s listed sites are in
private ownership and another 135 sites in the city were being surveyed in the
summer of 2006/07. A similar inventory has been produced for Christchurch but was
unavailable. One further city indicated there are no sites of ecological significance
because of the highly modified nature of the city.
The mean size of ecologically significant sites is highly variable: however, in
some cities it is clearly very small. Connectivity, as highlighted by the patch analysis,
is therefore an issue that needs to be fully considered. North Shore has the largest
number of SES sites, followed by Dunedin. Tauranga has the fewest, but this may not
be a complete list as stated in their District Plan (Appendix 14A). Only SES sites
with values 1-3 were included in the inventory for Porirua, but SES sites with lower
values can be regarded as potential restoration sites. All sites with SES values of 1-3
are regarded as significant and are included for Hamilton. It therefore appears that
only approximately half of our 20 largest cities have adequate knowledge of sites of
special ecological significance.

26
Figure 11. Size of ecologically important fragments within the boundaries of urban centres (mean ± SE, n=8). Cities are identified only by number.
Discussion This is the first meta-analysis of indigenous biodiversity in New Zealand cities and
reveals national patterns of biodiversity which have not previously been identified,
including the degree of penetration of indigenous biodiversity in the urban cores.
Urban centres are situated most often in the lowland coastal environments which are
known to have the greatest number of threatened species and environments (Rogers
and Walker 2002). In fact, the majority of land environments in New Zealand are
represented to some degree within cities, including x acutely threatened environments.
Three well defined generalised gradient patterns of increasing quantity of indigenous
cover occur from the urban core to the periurban areas. Significantly, the number of
indigenous cover types also increases significantly within a 20 km buffer zone around
the core. The municipal boundaries of a number of cities differ significantly from the
boundaries of the built up matrix we identified in this research. Cities, therefore,
frequently include large rural areas which may be intensively used for farming, but
may equally include representative indigenous remnants. Real opportunities exist for
urban planning to protect ecological areas with high indigenous biodiversity values, or
purchase land suitable for ecosystem reconstruction. Within a national urban
biodiversity framework, there is potential for significant enhancement of the national
biodiversity resource.

27
Currently, large remnant areas tend to be close to the city boundary, and hence
are rarely situated within the built up matrix. Palmerston North, for example, has only
around 300 ha of ecological sites within the built up matrix, or less than 1% of the city
area, but large forest catchments close to the city boundary (Boffa Miskell 2002).
This has implications for future urban growth; These areas tend to be in ‘dynamic’
landscapes where the landscape continues to be modified and communities may be in
transition (Hansen and others 2005). The city core however, requires a different
approach for restoration of biodiversity with its more ‘static’ landscape and larger
degree of fragmentation. It is notable, nonetheless, that several cities have as many as
five indigenous landcover types remaining within the heart of the city. Protection of
biodiversity requires an understanding of ecosystem types and their underlying
environments. The impact of urbanisation is partly a function of the original
composition of the landscape. Similarly, opportunities for enhancing biodiversity will
also vary. Restoration projects require attention to environmental parameters which
will ensure that the species or ecosystem under restoration flourishes. An overall
analysis of urban development and landcover allows us to consider how restoration
projects fit into the broad scale of ecosystem diversity, and threatened species
protection.
Species movements between urban and periurban space demonstrate some of
the dynamic exchanges between urban and rural areas, and the need for local
authorities to coordinate restoration action. Tui movement between the urban and
periurban buffer zones clearly indicates the complementary nature of the indigenous
resource. This effect is not limited to birds: endangered native fish access the many
gully streams where they live and breed via the Waikato River (Aldridge and Hicks
2006) which runs through the centre of Hamilton city. These gully systems extend
beyond city boundaries into the outlying rural area administered by district councils,
emphasizing the need for integrated management across catchments to enable the
persistence of wildlife. Both city and rural authorities are moving to restore the gullies
adjoining the city and enhance other habitats such as the peat lakes. City restoration
can therefore become a key component or even a driver for a regional restoration.
Given the low percentage of land available for urban restoration, and low
percentage of indigenous cover, we must consider how we can create viable
ecosystems within cities if we are indeed to enhance all indigenous biodiversity which

28
could be represented. In real terms, managers are currently making tradeoffs between
viability and biodiversity representation.
Urban parkland often contain elements of indigenous biodiversity. The
parkland can have negative impacts in terms of increased human disturbance or
positive benefits of buffering or interaction such as additional variety and seasonal
offering of flowers and fruits for native birds. Most importantly urban parkland could
be potential additional resource for restoration or reconstruction of depleted
ecosystems. Urban greenspace offers a multitude of untapped conservation
opportunities.
The small size of many special ecological sites and restoration sites in cities is
a concern. Small patches are likely to have increased invasive pest rates, as well as
demographic problems sustaining species populations. The smaller the reserve, the
harder it has been to maintain habitat in the right condition to maintain all constituent
species (Warren 1993 in Sutherland et al. 2006). That is, despite research which
emphasizes the importance of both fragment size and edge effects for restoration,
biological invasion and so on, indigenous fragment sizes in many urban areas are in
fact, extremely small. What solutions can we offer? Analysis of fragment size in the
periurban zone may be useful to determine whether protection of these areas can
ameliorate some of the effects of small fragment size in the urban core, for example,
by allowing breeding zones from which birds for example can travel for feeding in
smaller fragments. It is clear, however, that restoration or protection of existing
indigenous fragments is not enough to protect biodiversity. Hamilton city has evolved
from revegetation to the beginnings of ecosystem management in 30 years. At first,
emphasis was on the tiny remnants but has gradually moved to revegetation and now
to something more akin to reconstruction with the establishment of the Waiwhakareke
Natural Heritage Park. Each city has its own setting, physical and natural resources
but it is likely that the approach adopted for Hamilton will have relevance for other
cities which have been severely depleted in biodiversity resource from the early stages
of city development. Moreover, one such large project in a city can increase
indigenous cover dramatically within a relatively short timeframe (such as, for
Hamilton, within 25 years).
Most New Zealand cities occur within the North Island, with most large cities
occurring in the North Island northern lowlands environment. The New Zealand
flora has a high degree of rarity (c.22%) (de Lange and others 1999). There are

29
unexpectedly large numbers of threatened taxa in the lowland zone (Rogers and
Walker 2002). Taxonomic richness in the rare flora is greater in the coastal and
lowland zones than in montane and alpine zones. The lowland zone tends to have
grater than expected numbers of ferns and orchids, and large numbers of rare
dicotyledonous trees and shrubs. Ninety-two taxa are restricted to the northern North
Island (Rogers and Walker 2002). Despite this, these environments have low levels of
statutory protection. Furthermore, the high number of landcover types represented
within 20 km of cities suggests that particular care is needed to protect these remnant
types. This contrasts with some overseas examples, where cities occur in low
productivity lands (Collins and others 2000). More research on the underlying land
environments of cities worldwide could point to trends in biodiversity loss from
urbanisation, and accompanying opportunities.
Current indications are that most North Island cities will continue to grow at a
faster rate than South Island cities. According to UN predictions, cities will absorb
nearly all the growth in the human population over the next three decades (Crane and
Kinzig 2005). The number of urban areas with over one million people is expected to
grow by over 40% between 2000 and 2015. The vast majority of this growth will be
in middle and low income countries. What remains of habitats and biodiversity
within the city is of disproportionate importance (Crane and Kinzig 2005) and these
may even be of national or global significance. We need partnerships for managing
nature in the city – ex partnerships already underway. Integrated science of
urbanisation is woefully inadequate.
The relationship between city terrain and indigenous cover suggests that most
urban natural areas that remain are inaccessible or unsuitable for city development,
and perhaps also for recreation. However, these areas remain a reservoir for wildlife.
As yet the value of natural ecosystems in cities is poorly known, as many
cities do not have inventories or databases which quantify these areas.
Cities offer special opportunities for conserving biodiversity that are not
available elsewhere, and these opportunities are particularly pertinent for areas with
highly vulnerable endemic flora and fauna which are susceptible to foreign invasion.
The concentration of people makes for a huge potential volunteer base; the complete
absence of grazing animals enables undergrowths and ground covers rare in many
wildland ecosystems; the lack of grazing and other threats provides opportunities for
establishing populations of threatened plants struggling in their natural habitat; and

30
the juxtaposition of people and biodiversity resources enables more efficient and
effective activities such as education about biodiversity and the environment, cultural
harvesting by indigenous people and so on. Despite many species being poorly
adapted to human dominated systems, solutions to some of these problems are also
achievable with further urban ecological research.
Modern urban planning which clearly separates rural and urban areas has
developed from European notion of cities based on densely populated core (castle)
surrounded by moat and with agricultural land outside, in contrast to a Japanese
model of mixed agricultural and urban land (Yokohari and Amati 2005) over a similar
time span. A new model which incorporates indigenous cover within the matrix of
urban planning would be a desirable alternative approach supplemented of course by
green belts and periurban conservation.
To meet the goals of the NZ Biodiversity Strategy we need to more explicitly
address the need for a representative set of ecosystems and healthy populations of
characteristic and iconic indigenous plants and animals. Because of the vulnerability
of our fauna and flora to invasive species, the focus must remain on indigenous
biodiversity rather than species richness per se, as emphasised by other urban ecology
research. In Europe for example, it is often difficult to differentiate between early
invaders and true natives (Wittig 2004), leading to different management
considerations than those required here. Furthermore, we do not have a history of
managed urban woodlands, as is the case in parts of Europe (Gundersen and others
2005), so that management of enrichment planting and restoration areas is still
relatively new. However, acceptance of mixed origin native and exotic urban forest as
a goal is growing with the recognition that management, rather than extermination, of
invasive species is the reality (Stewart and others 2004). To manage all of this
effectively will require further capability development beyond management of utilities
and infrastructure into the realms of ecosystem management. This includes different
organisational scales for action (Savard and others 2000) including strengthening
relationships between municipal and regional authorities, in particular because of the
need for integrated urban-periurban actions, and the inconsistencies between the city
and district boundaries in relation to the urban core. As well, reconstruction of
ecosystems requires a different toolbox from restoration, including research direction.
We emphasise the need for an explicit analysis of the indigenous resource available
and targeted for as opposed to a laissez faire or ad hoc approach. NZ has a strong

31
record in wildland ecology research and many aspects will provide a good platform
for urban ecological studies. However, as yet, less than half of cities have inventoried
indigenous and special ecological sites within their boundaries. People-wildlife
interactions are crucial in shaping people’s views of the environment and
environmental issues. McDonnell (2005) argued that maintaining a diversity of
indigenous organisms and ecosystem processes in cities is critical to the ecology of a
region. Understanding the landscape mosaic at a national level further informs this
process. The increasing effort and spending in urban restoration in New Zealand
seems a promising beginning to reversing the decline in urban indigenous
biodiversity. The time seems ripe for a greater concentration on solving urban ecology
problems.
Acknowledgements We thank all the city council and district council staff in New Zealand who provided
useful data and answered questions. Your input has been invaluable. Max Oulton
assisted greatly with figures and cartography. This research was funded by the
Foundation for Research Science and Technology.

32
Appendix 1. Largest twenty cities used in this analysis: populations, area (ha) administered by the territorial authority, and density (no. 100 people/ha)
City Population Area (ha) Population density/100
ha
Size of urban core (ha)
Central Auckland
332 993 62957 531.96 14015
Christchurch 324 586 44247 733.6 13570 Dunedin 110 314 327276 33.7 3757 Hamilton 131 286 9427 1392.7 5658 Hastings 58 152 521169 11.2 2282 Invercargill 49 052 39406 124.5 2463 Lower Hutt 94 571 37958 249.2 3493 Manukau 283 292 55099 514.2 12135 Napier 53 427 10247 521.4 2280 Nelson 50 181 42659 117.6 2207 New Plymouth 47 644 221348 21.5 2298 North Shore 194 268 12826 1514.6 7448 Palmerston North
73 860 33551 220.1 2832
Porirua 46 473 17730 262.1 1110 Rotorua 52 062 261496 19.9 2802 Tauranga 77 507 12828 604.2 3626 Waitakere (West Auckland)
154 539 36857 419.3 5819
Wellington 154 307 29211 528.3 4928 Whanganui 41 097 237558 17.3 1921 Whangarei 45 685 269928 16.9 1542 NB: Five cities are in district councils: New Plymouth, Hastings, Rotorua, Whangarei and Whanganui. This distorts population density figures in particular for these regions.

33
Appendix 2. Acutely threatened land environments with more than 50% of their area represented within a 20 km buffer zone of the urban core of the 20 largest New Zealand cities. Figures shown are the number of hectares within each centroid zone (5, 10 and 20 km) surrounding the urban centre, as well as the total area of that land environment throughout New Zealand. LENZ Level IV was used for this analysis. Note that remaining indigenous cover on each land environment varies.
LENZ Class 0km 5km 10km 20km
Total NZ ha
Urban Percentage
B2.1b 64 687 2952 28459 10.4 J4.2c 118 224 262 2499 10.5 C2.1a 124 396 968 2717 23295 11.7 N1.2b 245 5504 46958 11.7 C3.1b 1848 3123 3545 6958 59118 11.8 N1.2a 187 269 393 8261 64536 12.8 I2.1c 450 538 705 5290 13.3 C3.2c 143 1129 5181 38492 13.5 G3.2c 90 1961 14408 13.6 J4.1c 6 1660 3215 5443 39500 13.8 A5.1b 989 2621 4198 7478 42470 17.6 A5.3c 57 874 1187 1836 9594 19.1 J4.1b 3 10 1199 6163 19.5 B2.1a 1590 7713 20.6 A5.3b 831 6471 15255 17237 82187 21.0 J4.2a 24 78 1546 7296 21.2 C2.1e 2614 8062 9569 11671 54339 21.5 A7.2b 997 7499 17315 28584 132256 21.6 B6.1d 47 1032 1079 1079 4812 22.4 F5.2a 192 5179 26981 115542 23.4 C3.2b 2009 12891 20368 83539 24.4 H1.3a 2 170 381 2509 10093 24.9 L1.3b 86 1733 1801 6496 27.7 I2.1b 19 2457 5297 7971 27901 28.6 J1.1c 10 383 733 1777 6017 29.5 N1.1a 3383 7840 18395 56464 179949 31.4 A7.2c 5173 16498 27659 40807 124624 32.7 L4.1c 562 4159 7152 14064 40779 34.5 A5.3a 1141 13940 28461 53725 155062 34.7 Q4.2c 2098 11146 21721 55882 153183 36.5 C3.2d 275 3325 6084 13725 37578 36.5 D3.1d 453 4517 8013 21097 38.0 C2.1b 1939 9734 16711 23778 58567 40.6 J4.1d 1262 1992 8404 20603 40.8 B1.3b 2 1316 7640 14987 36367 41.2 A5.1c 46 1769 5948 16365 35522 46.1 J1.1d 80 1867 3835 48.7 F3.1a 295 4435 7745 16091 32452 49.6 N1.2c 8120 15613 25216 36311 65751 55.2

34
B1.1a 1743 5615 8109 19206 33818 56.8 B4.1a 217 1050 1355 1355 2335 58.0 C3.1a 950 3869 5936 7130 12222 58.3 A7.2d 1132 10762 17709 28318 46631 60.7 J2.1b 966 16032 23367 31808 51032 62.3 B1.3d 2 5 5828 13036 19715 66.1 B5.2b 685 3186 6269 14320 21625 66.2 J1.1b 106 2470 6413 8994 13327 67.5 B7.1c 20 1466 10024 14398 69.6 A7.2a 14041 29333 36363 46800 65231 71.7 B5.2a 1098 1402 1489 6501 8583 75.7 B1.2a 2552 11473 14840 77.3 F5.2b 2222 14006 24949 38112 49275 77.4 L2.1b 200 2633 2789 3753 4803 78.1 I5.2a 90 6826 8548 10324 11233 91.9 B5.1b 2592 5676 7583 8614 9331 92.3 B7.1d 5 3441 8716 16461 17183 95.8 I6.1b 75 2574 3556 3556 3615 98.4 I3.2b 361 3404 4437 5721 5800 98.6 I5.1b 487 11405 15764 16725 16768 99.7
35
Appendix 3. Information Sheet and Postal Questionnaire sent to cities, 2006.
Centre for Biodiversity and Ecology Research Department of Biological Sciences University of Waikato Private Bag 3105 Hamilton
Dear Parks Manager
Bringing back nature into cities is the theme of our FRST funded research project which
will investigate aspects of urban restoration in New Zealand over the next four years. We
invite you to contribute to this project by returning the attached postal questionnaire to us by
the end of July 2006.
Our research programme is based at the Centre for Biodiversity and Ecology Research at the
University of Waikato under the leadership of Dr. Bruce Clarkson. We aim to provide the
underpinning science for city based initiatives to restore indigenous ecosystems. This
involves both “retrofitting” cities to sustain indigenous biodiversity and redressing the
balance of biodiversity loss. Our website has further material relating to this project
http://cber.bio.waikato.ac.nz/ .
This questionnaire will provide us with baseline data on the natural resources which exist in
New Zealand cities. We believe the data generated by this questionnaire will provide a
valuable overview of what’s happening in urban centres. We expect to present our analysis at
a symposium on urban restoration at the New Zealand Ecological society conference in
August this year. Please indicate if you would like to be further informed of the outcome of
this phase of the project.
If you have any questions, please contact either Dr. Priscilla Wehi or project leader Dr. Bruce
Clarkson. You may also wish to pass the questionnaire to other staff who can help answer the
questions. Thank you for your time and effort in assisting us with this research.
Yours faithfully,
Priscilla Wehi

36
Postal Questionnaire: Urban ecosystems and restoration
1. How many hectares of parks and reserves or other green space exist in your
city?
2. How many parks and reserves are there? What is the biggest in size and what
is the smallest?
3. What is the size of the indigenous resource in your city (including areas
dominated by indigenous species but which may also include exotics)? Please
circle in BLACK all these areas (wetlands, bush etc) on the attached map.
Ecosystem type Hectares (or estimate) Comments
Forest
Scrub or
regenerating forest
Freshwater wetland
Estuarine wetland
Other

37
4. What areas are dominated by exotics but have the potential to return to
indigenous ecosystem? Please circle these areas on the attached map
of your city in RED.
Ecosystem type Hectares (or estimate) Comments
Forest
Scrub or regenerating
forest
Freshwater wetland
Estuarine wetland
Other
5. Please estimate the level of ecological restoration activity over the last 5 years.
Year Money spent Number of
projects
Area of the city
involved
2006
2005
2004
2003
2002

38
6. The total area of your city is . . . . . . . . . .
7. The total population of your city is . . . . . . . . . .
• Please return this questionnaire to us by the end of July 2006.
• If you have any queries please do not hesitate to contact us, via email at
[email protected] in the first instance, or [email protected]
• If you feel you are unable to answer a question, please answer as best you can,
including any of your own estimates. Your estimates will undoubtedly be
better than ours! Incomplete questionnaires are still valuable to us.
Thank you for your assistance with this research. We
appreciate the time and effort you have taken to complete
this questionnaire.

39
Appendix 4. The percentage of indigenous and exotic cover present in individual New Zealand cities, along an urban-rural gradient through buffer zones of 5 km, 10 km and 20 km from an urban core (0 km). Note that West Auckland corresponds approximately to Waitakere, North Auckland to North Shore, and South Auckland to Manukau city.
(a) 0 km Buffer
City Total indigenous
% Indigenous
Total non indigenous
% Non indigenous Water % Water Total ha
Invercargill 0 0 2466.0 100 0 0 2466 Napier 0 0 2283.0 99.9 3 0.1 2286 Palmerston North 0 0 2840.0 100 0 0 2840 Christchurch 3 0 13583.0 99.3 97 0.7 13683 Hastings 1 0 2281.0 99.96 0 0 2282 Whangarei 7 0 1541.0 98.9 10 0.6 1558 Tauranga 20 1 3646.0 99.5 0 0 3666 Rotorua 16 1 2791.0 99.4 1 0.03 2808 South Auckland 107 1 12049.0 99.1 7 0.06 12163 Nelson 21 1 2198.0 98.9 3 0.1 2222 Dunedin 54 1 3711.0 98.6 0 0 3765 Whanganui 30 2 1958.0 98.5 0 0 1988 Central Auckland 256 2 13773.0 97.7 72 0.5 14101 Hamilton 121 2.1 5550 96.4 85 1.5 5756 West Auckland 179 3.1 5650 96.9 0 0 5829 Hutt Valley 119 3.4 3378 96.4 9 0.3 3506 Porirua 51 4.6 1060 95.2 3 0.3 1114 Wellington 229 4.6 4707 95.4 0 0 4936 North Auckland 350 4.7 7123 95.3 3 0.04 7476 New Plymouth 197 8.5 2114 91.3 4 0.2 2315 Totals 1761 94702 297 96760 Average 88.05 1.96 4735.1 97.8 14.85 0.2 4838
(b) 5 km buffer zone surrounding cities
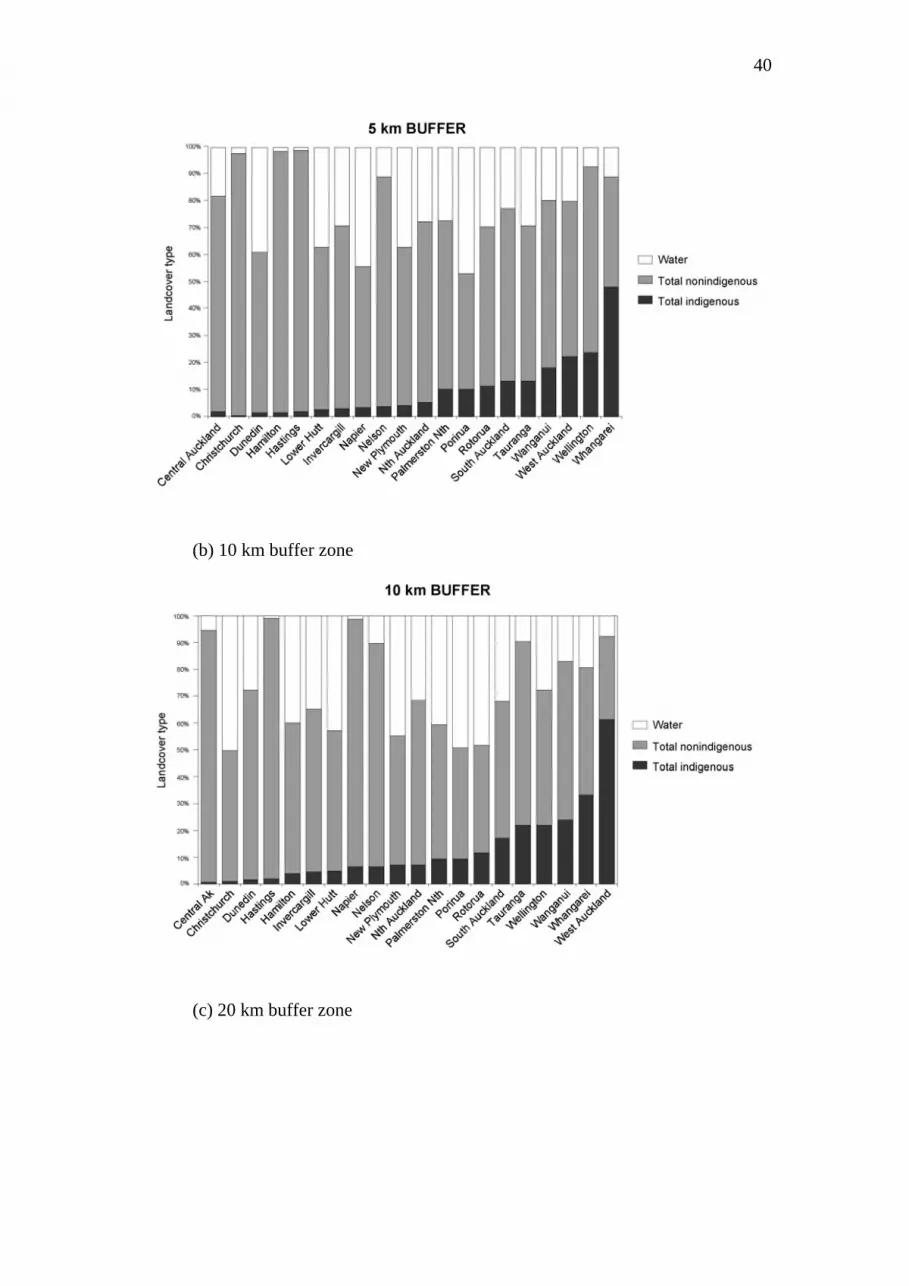
40
(b) 10 km buffer zone
(c) 20 km buffer zone

41

42
Appendix 5. Curves showing patterns of indigenous cover for individual cities.
(a) Curve type
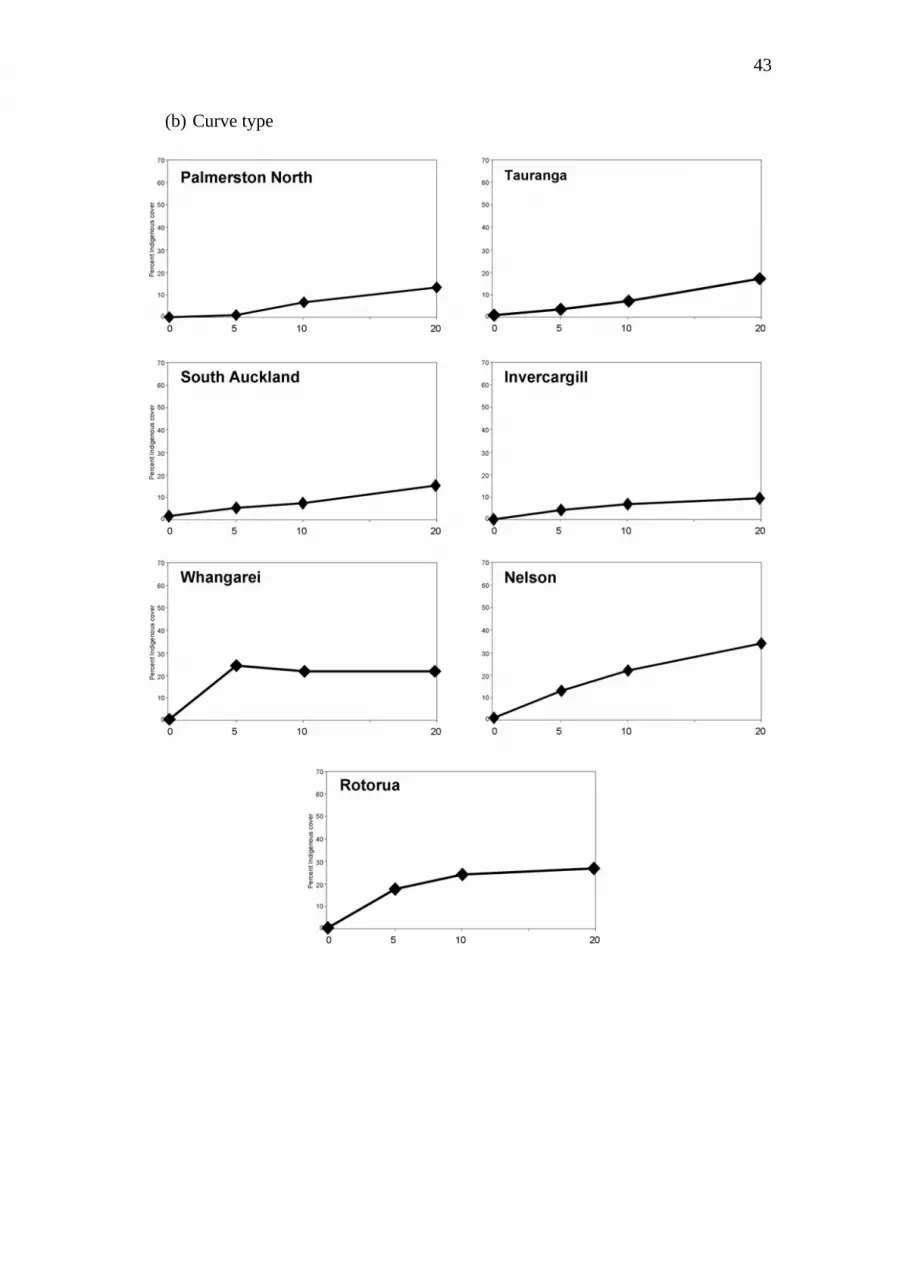
43
(b) Curve type

44
(c) Curve type
(d) Curve type New Plymouth

45
References Aldridge BMTA, Hicks BJ. 2006. The distribution of fish in the urban gully system
streams of Hamilton City. CBER Contract Report No. 48. Client report prepared for Environment Waikato and Hamilton City Council. Centre for Biodiversity and Ecology Research, Department of Biological Sciences, School of Science and Engineering, University of Waikato, Hamilton.
Boffa Miskell. 2002. Ecological processes in Palmerston North city. Palmerston North: Palmerston North City Council.
Clarkson BD, Downs TM. 2002. Hamilton gullies: ecological restoration in an urban setting. New Zealand Map Society Journal 15:25-33.
Collins JP, Kinzig A, Grimm NB, Fagan WF, Hope D, Wu J, Borer ET. 2000. A new urban ecology. Modeling human communities as integral parts of ecosystems poses special problems for the development and testing of ecological theory. American Scientist 88:416-425.
Crane P, Kinzig A. 2005. Nature in the Metropolis. Science 308:1225. de Lange PJ, Heenan PB, Given DR, Norton DA, Ogle CC, Johnson PN, Cameron
EK. 1999. Threatened and uncommon plants of New Zealand. New Zealand Journal of Botany 37:603-628.
Drinnan IN. 2005. The search for fragmentation thresholds in a southern Sydney suburb. Biological Conservation 124:339-349.
Gundersen V, Frivold LH, Lofstrom I, Jorgensen BB, Falck J, Oyen B-H. 2005. Urban woodland management - the case of 13 major Nordic cities. Urban Forestry and Urban Greening 3:189-202.
Hansen AJ, Knight RL, Marzluff JM, Powell S, Brown K, Gude PH, Jones K. 2005. Effects of exurban development on biodiversity: patterns, mechanisms, and research needs. Ecological Applications 15(6):1893-1905.
Leathwick J, Morgan F, Wilson G, Rutledge D, McLeod M, Johnston K. 2003. Land environments of New Zealand: Technical Guide. . Auckland: David Bateman Ltd.
Luck M, Wu J. 2002. A gradient analysis of urban landscape pattern: a case study from the Phoenix metropolitan region, Arizona, USA. Landscape Ecology 17:327-339.
McDonnell MJ. Maintaining biodiversity and ecosystem processes in cities and towns; 2005; Lincoln. Lincoln University.
McDonnell MJ, Pickett STA. 1990. Ecosystem structure and function along urban-rural gradients: an unexplored opportunity for ecology. Ecology 71:1232-1237.
McDonnell MJ, Pickett STA, Groffman P, Bohlen P, Pouyat RV, Zipperer WC, Parmelee RW, Carreiro MM, Medley K. 1997. Ecosystem processes along an urban-to-rural gradient. Urban Ecosystems 1:21-36.
McIntyre S, Hobbs R. 1999. A framework for conceptualizing human effects in landscapes and its relevance to management and research models. Conservation Biology 13(6):1282-1292.
Miller JR. 2005. Biodiversity conservation and the extinction of experience. Trends in Ecology and Evolution 20(8):430-434.
Mittermeier RA, Myers N, Robles GP, Mittermeier CG, editors. 1999. Hotspots: Earth's biologically richest and most endangered terrestrial ecosystems. Mexico City, Mexico: CEMEX.

46
Rogers G, Walker S. 2002. Taxonomic and ecological profiles of rarity in the New Zealand vascular flora. New Zealand Journal of Botany 40:73-93.
Savard J-PL, Clergeau P, Mennechez G. 2000. Biodiversity concepts and urban ecosystems. Landscape and Urban Planning 48:131-142.
Stewart GH, Ignatieva ME, Meurk C, Earl RD. 2004. The re-emergence of indigenous forest in an urban environment, Christchurch, New Zealand. Urban Forestry and Urban Greening 2:149-158.
Sutherland WJ, Armstrong-Brown S, Armsworth PR, Brereton T, Brickland J, Campbell CD, Chamberlain DE, Cooke AI, Dulvy NK, Dusic NR and others. 2006. The identification of 100 ecological questions of high policy relevance in the UK. Journal of Applied Ecology 43:617-627.
Vitousek PM, D'Antonio CM, Loope LL, Rejmanek M, Westbrooks R. 1997. Introduced species: a significant component of human-caused global change. New Zealand Journal of Ecology 21:1-16.
Walker S, Price R, Rutledge D. 2005. New Zealand's remaining indigenous cover: recent changes and biodiversity protection needs. Wellington: Landcare Research Report nr Contract Report LC0405/038. 1-76 p.
White PC, Jennings NV, Renwick AR, Barker NHL. 2005. Questionnaires in ecology: a review of past use and recommendations for best practice. Journal of Applied Ecology 42:421-430.
Wittig R. 2004. The origin and development of the urban flora of Central Europe. Urban Ecosystems 7:323-339.
Yokohari M, Amati M. 2005. Nature in the city, city in the nature: case studies of the restoration of urban nature in Tokyo, Japan and Toronto, Canada. Landscape Ecology and Engineering 1:53-59.


![Urban Design of Environmental Restoration: Applying Principles and Strategies of Restorative Design [2012]](https://img.pdfslide.net/doc/110x75/631eb1200ff042c6110c7b18/urban-design-of-environmental-restoration-applying-principles-and-strategies-of.jpg)


