Embed Size (px)
Citation preview
BROKEN PROMISESA study on the socio-economic status of Indian Muslims:
Seven years post Sachar

BROKEN PROMISESA study on the socio-economic status of Indian Muslims:
Seven years post Sachar
Centre for Peace Studies
Supported by
Copyright © Centre for Peace Studies, 2014www.cps-india.org
All rights reserved. No part of this book may be reproduced or utilized in any form or by any means, electronic or mechanical, including photocopying or by any information or retrieval system, without permission in writing from the publisher/author.
Broken Promises: A study on the socio-economic status of Indian Muslims — Seven years post Sachar was fi rst published in India in 2014 by
Daanish BooksEditorial: 25 C, Skylark Apartments, Gazipur, Delhi-110 096Sales: G-221, Plot No. 96, Gazipur, Delhi-110 096Ph.: 011-4306 7412, 2224 0260; Cell: +91 98685 43637www.daanishbooks.comE-mail: [email protected]
Patna:‘Jaishanti,’ 123, Kautilya NagarPatna-800 014, BiharCell: +91 90975 98361, 95761 85468
Nagpur:34A, Kashi Nagar, Post-Parvati NagarNagpur-440 027, MaharashtraCell: +91 81800 66517
Supported by:
R-7 Hauz Khas EnclaveNew Delhi-110 016. IndiaPhone: 011-40640500www.actionaid.org/india
ISBN 978-93-81144-41-1 (Pb)
Editorial Assistance: Suchita Vemuri and Dhruva NarayanProduction Assistance: Akhilesh ChoudharyCover and Design Supervision: Soumya Parker
Published by Dhruva Narayan for Daanish BooksPrinted at Om Printers, Delhi -110092.
v
C O N T E N T S
Glossary xv
Abbreviations xix
Acknowledgements xxiii
Foreword by Ghanshyam Shah xxv
1. Introduction 1
2. What is the PM’s New 15-Point Programme? 7
2.1 The Multi-Sector Development Programme 82.1.1 Objectives 9
3. Research Methodology 11
3.1 Timeline of the Study 20
4. PM’s New 15-Point Programme and ICDs, Auxiliary Services 21
4.1 What Does the PM’s New15-Point Programme Promise? 214.2 What is the Present Situation? 22
4.2.1 Where are the anganwadis in Karnataka? A case study 244.2.2. Children and anganwadis 254.2.3 A look at the ICDS centres in West Bengal 294.2.4 Stale food in Hyderabad 314.2.5 Discussing ICDS at Rahmat Nagar in Bellary, Karnataka 324.2.6 Are children receiving pre-school education at ICDS centre? 334.2.7 Discriminated! An anganwadi helper not allowed to cook! 37
4.3 People’s Recommendations: What is the Ideal Anganwadi Centre 374.4 Access to Government Healthcare and Education Cacilities
by Women and Girls 384.5 ICDS Facilities and Other Socio-religious Communities 40
5. ACCESS TO PRIMARY HEALTHCARE FOR MUSLIMS 43
5.1 Introduction 435.2 Availability of Healthcare Centres 44
5.2.1 State-wise look at healthcare infrastructure 455.3. Some Case Studies from Murshidabad District, West Bengal 47
5.4 Muslim Women not Wanted in Hospitals 485.5 The Auxiliary Nurse Midwife (ANM) 485.7 The ASHA (Accredited Social Healthcare Activist) 535.8 Unani Medicine and the State Patronage 54
v i
Broken Promises: A study on the socio-economic status of Indian Muslims - Seven years post Sachar
5.9 Access to Healthcare Services and Non-Muslim Socio-religious Communities 56
6. Access to Education by Muslims 59
6.1 Introduction 596.2 What does the PM’s New 15-Point Programme Promise? 616.3 What is the Present Situation? 61
6.3.1 Status of Kasturba Gandhi Balika Vidyalayas in Uttar Pradesh: A case study 676.3.2 School drop-out children as child labourers: A case study from Moradabad 676.3.3 Poverty and drop-out rates 686.3.4 Discrimination faced by school children 696.3.5 MDM, Books, Uniforms and SMCS 71
6.4 Does the School have a SMC? 736.5 Scholarships for Meritorious Students from Minority
Communities as per the PM’s New 15-Point Programme 746.5.1 What is the present situation? 746.5.2 Scholarships and access to education 776.5.3 Procedural diffi culties in applying for scholarship 786.5.4 Scholarships denied 816.5.5 Discussion and fi gures from minority departments in states 82
6.6 Recommendations 846.7 Education and Non-Muslim Socio-religious communities 87
7. Urdu and the PM’s New 15-Point Programme 89
7.1 What does the PM’s 15-Point Programme Promise? 897.2 Urdu and the Indian Story 897.3 The Condition of Urdu Medium Schools and Urdu Teachers:
A Sad State of Affairs 907.3.1 Urdu medium schools in India 907.3.2 Situation in Maharashtra 947.3.3 A case of Bihar 947.3.4 Urdu as a mother tongue 95
7.4 Urdu Teachers Missing! 967.4.1 No Urdu Teachers in Delhi 967.4.2 No Urdu teachers in Malegaon 97
7.5 Sachar Committee Report and the Urdu Language 98
8. Economic Condition of Muslims 99
8.1 Introduction 998.2 Economic Liberalization and Livelihoods 998.3 Right to Employment and the PM’s New 15-Point Programme 1008.4 The Present Economic Condition of Indian Muslims 100
8.4.1 Malegaon powerlooms in a state of neglect 1018.4.2 Artisans like leather workers affected 103
v i i
Contents
8.5 Income Situation 1048.6 Loans and PM’s New 15-Point Programme 105
8.6.1 The reality about loans 1058.6.2 Sources of loan 1108.6.3 Art forms of Muslims being discriminated upon in Bidar, Karnataka 1128.6.4 The case of Syed Salahuddin 112
8.7 Access to Credit 1138.7.1 Evaluation study of the National Minorities Finance Development Corporation 1148.7.2 No skill enhancement 117
8.8 Women Workers 1178.9 Work Participation Rate (WPR) 1188.10 Women Beedi-makers of Rahatgarh 1208.11 Physical Performance of the SGSY 1218.12 Vocational Training for Minorities 121
8.12.1 What does the PM’s 15-Point Programme promise? 1218.12.2 What do NSS fi gures say? 1228.12.3 A look at ITIs in Karnataka 1228.12.4 Our fi ndings 1228.12.5 The Sachar Committee recommendations 124
8.13 Migration Trends 124
9. Recruitment to State and Central Services 127
9.1 Introduction 1279.2 ID Status of the Indian Muslim 1289.3 Application and Selection in Government Jobs 1309.4 Malegaon Municipal Corporation Elects but does Not Select Muslims! 132
9.4.1 Situation in the Old City of Hyderabad 1339.5 The Attitude of the Police 1339.6 Entitlements: ‘Ab ummeed toot gayi hai’ (We have lost hope now) 1369.7 Caste System and Discrimination 138
9.7.2 Identity a threat 142
10. Housing/Improvement of Slums/Sanitation and Basic Infrastructure 145
10.1 What Does the PM’s New 15-Point Programme Promise? 14510.2 What Does JNNURM Say? 14510.3 Atal Aif Ayyaub Nagar Basti in Bhopal: Case Study 14610.4 Access to Safe Water and Drainage in Minority Population Areas in India 147
10.4.1 Clean drinking water: A luxury in many Muslim households 14810.4.2 Do you face any discrimination in accessing water? 152
10.5 Drainage and Toilet Facilities 15310.6 Malegaon, a Sad State of Affairs! 156
v i i i
Broken Promises: A study on the socio-economic status of Indian Muslims - Seven years post Sachar
10.7 Housing and Civic Infrastructure 15710.7.1 Comparative study of two slums in Bengaluru 15810.7.2 Legal electricity connections 15810.7.3 Urban amenities – and infrastructures in Muslim dominated
areas in Mumbai 16210.8 Other Infrastructure 166
11. Conclusion and Recommendations 173
Bibliography 177
Annexures 179
Annex 1: List of Individuals and organizations that Contributed to This Study 181Annex 2: Terms of Reference of the High-Level Committee appointed
by the PM, the Justice Sachar Committee 187Annex 3: Main Observations made by Justice Ranganath Mishra Commission 189Annex 4: Prime Minister’s New 15 Point Programme for Welfare of Minorities 199Annex 5: Details of Funds Allocated under the Prime Minister’s
New 15-Point Programme for the Welfare of Minorities 203Annex 6: List of Minority Concentration Districts in India 223Annex 7: Socio-Economic Indicators of Top 100 Districts
(by size of Muslim Population), 2001 Census 227Annex 8: Interview Schedule 231Annex 9: List of Instructions given to Researchers for This Study 247Annex 10: Maulana Azad National Fellowship for Minority Students Scheme 249Annex 11: ITI College Information in Gulburga district 251Annex 12: List of Castes of People met with for This Study 259
i x
L I S T O F B O X E S , F I G U R E S & TA B L E S
BoxesBOX 1: Anganwadis with the Madaris in Maharashtra 23BOX 2: What the Muslim women of Bengaluru slums have to say…. 32BOX 3: No knowledge of services 39BOX 4: Poor healthcare infrastructure 50BOX 5: From the Minority Commissioner, Rajasthan 52BOX 6: No middle school in village! 63BOX 7: Unable to access formal education due to poverty! 76BOX 8: Name game 79BOX 9: Uncertain future 80BOX 10: The fate of Urdu 89BOX 11: Infrastructural woes 91BOX 12: Seventy-three percent of Urdu teachers’ posts vacant in Delhi 97BOX 13: Weavers of Uttar Pradesh 102BOX 14: The Madaris still left with begging as one of their professions! 103BOX 15: Catch 22 – Can’t repay but forced to borrow 112BOX 16: The case of Salahuddin 113BOX 17: Illegal money lending 113BOX 18: Migration for livelihood 118BOX 19: Irreplaceable cards 127BOX 20: Imprisoned, intimidated and threatened! 135BOX 21: Identity and harassment 135BOX 22: No benefi ts for Mahawats 143BOX 23: Poor civic infrastructure…. Ghettos and stigmas 156BOX 24: No Indira Awas without adequate bribes 158BOX 25: Let there be light only for party workers 162BOX 26: Ration card missing in Alingar, N. Dinajpur. West Bengal!! 169
FiguresFIGURE 4.1: Percentage of children under 5 who are underweight and stunted
and percentage of low-birthweight (<2,500 gms.) babies among Muslims and non-Muslims, 1998-99 25
FIGURE 5.1: Patient in OPD 55FIGURE 6.1: Distance of school from habitation 62FIGURE 6.2: State-wise schools within locality 63FIGURE 6.3: Number of children facing discrimination in school 69FIGURE 6.4: State-wise access to school material 72FIGURE 6.5: SMCs in schools 73
x
Broken Promises: A study on the socio-economic status of Indian Muslims - Seven years post Sachar
FIGURE 6.6: Pre-matric scholarship received state-wise 78FIGURE 6.7: Number of students getting scholarship 81FIGURE 6.8: Details of benefi ciaries 82FIGURE 6.9: Scholarships availed state-wise 83FIGURE 6.10: Decline in scholarship application 84FIGURE 8.1: Zone-wise and category-wise recovery rate 115FIGURE 8.2: Category-wise distribution of loan in different zones 115FIGURE 8.3: Distribution of benefi ciaries over major sectors 116FIGURE 10.1: Urban water sources as per study 149FIGURE 10.2: Rural water sources as per study 149
TablesTABLE 3.1: Sample of Muslim respondents for the study 11TABLE 3.2: The control sample for the study 12TABLE 3.3: The rural-distribution of the sample for this study 16TABLE 3.4: State-wise distribution of the primary research survey 17TABLE 3.5: The gender distribution of the sample for this study 17TABLE 3.6: State-wise gender data for the sample for
non-Muslim socio-religious communities 18TABLE 3.7: Age-wise distribution of the sample for this study 18TABLE 3.8: Education levels of the sample 19TABLE 4.2: Anganwadis in Seelampur, north-east Delhi 22TABLE 4.3: Anganwadis in Shakarpur, Delhi 22TABLE 4.4: Responses to the question ‘Do your children go to the anganwadi?’ 24TABLE 4.5: Percentage coverage of the ICDS for 0-6 years population by states
and socio-religious communities 2004-05 26TABLE 4.6: Coverage of the anganwadis 27TABLE 4.7: Anganwadis in Raninagar II Block, Islampur, Murshidabad, West Bengal 31TABLE 4.8: Anganwadi centres in Karnataka 34TABLE 4.9: Anganwadi centres in Bengaluru district of Karnataka 34TABLE 4.1: Responses to the question ‘Do you have
an anganwadi in your locality?’ 21TABLE 4.10: Responses to the question ‘Are children receiving
pre-school education at the anganwadi centre?’ 35TABLE 4.11: Services provided at the anganwadi centres 36TABLE 4.12: Responses to the question ‘How frequently does
the anganwadi worker visit?’ 36TABLE 4.13: Number of girls benefi ting from the ICDS programme 38TABLE 4.14: Details of funds for girls from minority communities
under the Ladli Yojna of the Delhi government 39TABLE 4.15: ICDS facilities by socio-religious communities 40TABLE 5.1: Early childhood mortality rates by background characteristics 43
x i
Contents
TABLE 5.2: Response to the question ’What healthcare centre is available in your locality?’ 44
TABLE 5.3: Healthcare services across states 45TABLE 5.4: Number of children born at home 46TABLE 5.5: Status of healthcare centres in Murshidabad District, West Bengal 47TABLE 5.6: Response to the question ‘Does the ANM visit regularly?’ 48TABLE 5.7: Profi le of women benefi ting from antenatal care 49TABLE 5.8: Reasons why a mother did not receive ante-natal care 50TABLE 5.9: Pregnant women receiving TT, iron and folic acid tablets 51TABLE 5.10: Responses to the question ‘To which community
does the ANM belong?’ 52TABLE 5.11: Responses to the question ‘How often does
the ASHA visit your house?’ 53TABLE 5.12: A look at the Uttar Pradesh budget for healthcare 55TABLE 5.13: Expenditure for the 259 Unani dispensaries in Uttar Pradesh 55TABLE 5.14: Access to healthcare services and
non-Muslim socio-religious communities 56TABLE 6.1: Literacy rate by socio-religious communities 60TABLE 6.2: Number of school-going children in a family 61TABLE 6.3: State-wise look at the distance of schools from homes 62TABLE 6.4: Number of children who have never enrolled in school 64TABLE 6.5: Reasons for dropping out of school 65TABLE 6.6: Educational levels among different religious communities 66TABLE 6.7: School drop-out rates (state-wise) 68TABLE 6.8: State-wise complaints of discrimination in schools 71TABLE 6.9: Availability of school materials (state-wise) 72TABLE 6.10: Responses to the question ‘Does the school have
a school management committee?’ 73TABLE 6.11: Responses to the question ‘Did your child benefi t under
the scholarship scheme?’ 75TABLE 6.12: Benefi ciaries of the minority scholarships, scheme-wise 75TABLE 6.13: Access to scholarships in rural and urban areas 77TABLE 6.14: Access to scholarships (state-wise) 82TABLE 6.15: Access to scholarships in Alwar District in Rajasthan 83TABLE 6.16: Access to scholarships in Haryana (2009-10) 85TABLE 6.17: Access to scholarships in Haryana (2011-12) 86TABLE 6.18: Access to scholarships in Karnataka 87TABLE 6.19: Muslims vis-à-vis other socio-religious communities in education 88TABLE 7.1: Presence of Urdu-medium schools 90TABLE 7.2: Situation of Urdu schools and teachers in select states 91TABLE 7.3: English-medium schools in the Old City of Hyderabad 92TABLE 7.4: Mother tongue of respondents in the sample for this study 95
x i i
Broken Promises: A study on the socio-economic status of Indian Muslims - Seven years post Sachar
TABLE 7.5: People speaking Urdu in different states 96TABLE 8.1: Decline in real incomes as per our survey (in percentage) 101TABLE 8.2: Responses to the question ‘Do you have a bank account in
a nationalized bank?’ 105TABLE 8.3: Distance of bank from habitation 106TABLE 8.4: Responses to the question ‘What kind of loan did you apply for?’ 107TABLE 8.5: Rural-urban comparisons of loan applications 107TABLE 8.6: Details of funds under Minorities Scheme
from Delhi government (in lakh) 108TABLE 8.7: Number of people benefi ted under SGSY in Uttar Pradesh 109TABLE 8.8: Loan applications submitted by purpose (state-wise, in percentage) 109TABLE 8.9: Source of loan 111TABLE 8.10: Size of loans granted state-wise and by income-group (in percentages) 111TABLE 8.11: Loans sanctioned under the Rajiv Yuva Shakthi scheme in
the Old City of Hyderabad 114TABLE 8.12: Loans by size 115TABLE 8.13: Break-up of loans per sector 116TABLE 8.14: Status of ITIs in Gulbaraga, Karnataka 123TABLE 8.15: Responses to the question ‘How many years
have you been staying here?’ 125TABLE 9.1: Responses to the question ‘Do you have an ID proof?’ 128TABLE 9.2: Responses to the question ‘Which of the following cards do you possess?’ 128TABLE 9.3: Ownership of ID cards by type (in percentage, state-wise) 129TABLE 9.4: Responses to the question ‘Has any member of your family applied for a
government job in the last six years?’ 131TABLE 9.5: Employment by type 131TABLE 9.6: Responses to the question ‘If any member of your family applied for
a government job, for what kind of job was s/he was selected? 132TABLE 9.7: Number of Muslims working at Malegaon Municipal Corporation 133TABLE 9.8: Responses to the question ‘In the last six years,
if there was an incident, were you able to fi le a FIR?’ 134TABLE 9.9: State-wise responses to the question ‘In the last six years,
if there was an incident, were you able to fi le a FIR?’ 134TABLE 9.10: Responses to the question ‘Which caste group do you belong to?’ 138TABLE 9.11: State-wise caste break-up 140TABLE 9.12: Caste-wise distribution of Muslim and
other socio-religious communities 141TABLE 10.1: Sources of drinking water of respondents 147TABLE 10.2: Break-up of respondents 147TABLE 10.3: Responses to the question ‘What is the arrangement for
drinking water in your house?’ 148TABLE 10.4: Access to drinking water 150
x i i i
Contents
TABLE 10.5: Responses to the question ‘Do you face any discrimination in accessing water?’ 152
TABLE 10.6: Responses to the question ‘Does your village/locality have proper drainage?’ 153
TABLE 10.7: Responses to the question ‘Do you have a toilet facility at home?’ 154TABLE 10.8: Household sanitation facilities 155TABLE 10.9: IAY in Bidar District in Karnataka (information received
from ten GPs following an RTI application) 157TABLE 10.10: Comparison of two Hindu-majority and
Muslim-majority slums in Bengaluru 159TABLE 10.11: Responses to the question ‘Do you have
a legal electricity connection at home?’ 161TABLE 10.12: Responses to the question ‘Do you have a ration card?’ 168TABLE 10.13: Total leakage in public distribution/rationing system 169TABLE 10.14: Responses to the question ‘Is your card BPL/APL?’ 170TABLE 10.15: State-wise availability of ration shops in locality (as per sample) 170TABLE 10.16: Access to poverty alleviation schemes 171TABLE 10.17: Rural-urban break-up in access to poverty alleviation schemes 172
x v
G L O S S A RY
Aadhar card: Aadhar Card is an identity card issued by the Government of India for Indian citizens and carries a unique identifi cation number.
Adivasi: Tribals.
Anganwadi (AW): An anganwadi is a government-sponsored child-care and mother-care centre in India. It caters to children in the 0-6 age-group. The word means ‘courtyard shelter’ in Hindi. Anganwadis were started by the Government of India in 1975 as part of the Integrated Child Development Services (ICDS) scheme to combat hunger and malnutrition among children.
Antodaya: Antyodaya Anna Yojana, a food scheme of the Government of India, was started in March 2001 with the aim of providing help to the poorest people in rural and urban areas. The targeted group of families under the scheme are the ones who are the more poor families among the BPL (below poverty line) families. There is a provision of providing 35 kgs. of wheat and rice per month at the rate of `2.00 per kg and `3.00 per kg, respectively in rural and urban areas, to the targeted families, keeping in view their purchasing power.
Bandhani: A tie-and-dye art of printing on cloth.
Bastis: Slums.
Beedi: Local rolled tobacco leaf; Indian ‘cigarette’.
Biradari: Community/fraternity
Block: An administrative unit delineating a physical area within districts of a state (province); a ‘block’ is also called a ‘taluk’ and/or a ‘mandal’.
Bridge Network: A local NGO from Karnataka.
Burqa: A full-body cloak, usually black in colour, worn by some Muslim women in India and parts of South Asia.
Caste: Many defi nitions are available. According to Sir H. Risley, ‘a caste may be defi ned as a collection of families or groups of families bearing a common name which usually denotes or is associated with specifi c occupation, claiming common descent from a mythical ancestor, human or divine, professing to follow the same professional callings and are regarded by those who are competent to give an opinion as forming a single homogeneous community.’
Dalits: The English equivalent would be ‘downtrodden’, but in India signifi es the Scheduled Caste community, who are subject to social and economic inequity.
Dars e aliah: Curriculum followed by the Bihar Madrasa Board.
District: An administrative unit delineating a physical area within a state (province).
Fakir: A Muslim or a Hindu religious ascetic who lives solely on alms.
Fokaniya level: Equivalent to the Matric degree, given by Bihar Madrasa.
Ganpati: Festival of the Hindu elephant god, Ganesha.
x v i
Broken Promises: A study on the socio-economic status of Indian Muslims - Seven years post Sachar
Gaushala: A secure shelter for cows.
Godown: A warehouse.
Gram Panchayat: Local self-government body at the village level in India.
Gujjars: Gujjars constitute a pastoral community that is largely nomadic and Muslim by faith.
Gundas: Goons.
Hindutva: Right-wing Hindu Nationalism.
Kisan: Farmer.
Kuchcha house: House with a thatched roof and mud walls.
Lakhs: Indian numeral equivalent to a hundred thousand.
Madrasa: A school of Islamic learning; for children who desire to specialise in Islamic religious studies and train as imams, maulavis, aalims, faazils and so on; many large seminaries or Madrasas exist in different parts of the country.
Maha Shivaratri: A festival celebrated by the Hindu community in reverence of Lord Shiva, the Hindu god.
Maktab: Primary schools that have been providing traditional Islamic education in India. Most mosques have a primary religious school or maktab attached to them, where Muslim children learn the Qur’an and the basics of their faith.
Mandi: Local market.
Maulavi level: Equivalent to SSC (i.e., class 10).
Mecca Masjid: A mosque in Hyderabad.
Mukhyamantri Kanyadaan Yojana: A scheme adopted by some state governments that provides fi nancial assistance for the wedding of young girls belonging to poor households.
Nagar Panchayat: A ‘Nagar Palika’ or ‘Nagar Panchayat’ is an urban administrative unit comparable to a municipality.
Nandi Foundation: A Hyderabad-based NGO.
Neo Buddhist: The new converts to Buddhism.
Pucca house: A concrete house.
Purdah: Veil; women from both Hindu and Muslim households stay veiled (‘observe purdah’) before men who are not immediate relatives.
Rakhi-making: Rakhi is a decorative thread tied around a brother’s wrist by sisters as a pledge of loyalty and protection during the festival called Raksha Bandhan.
Rawa, Khichdi, Upma, Dal, Dosa, Vada, Papad: Kinds of Indian food.
RTI: Right to Information; the Right to Information Act, 2005, is a legislation in India that mandates timely response to citizens’ requests for information from any and all government bodies.
Sauhard Manch: The name of a non-government activists’ forum for promoting peace and harmony.
x v i i
Glossary
Savarna Hindus: A person considered to be a part of the four ‘high-caste’ Varnas of the Hindu system.
Sevika: Helper, used in the context of ICDS.
SSA: Sarva Shiksha Abhiyan (SSA); a fl agship programme for Universalization of Elementary Education (UEE) in a time-bound manner launched by the Government of India.
Streedhan: A transfer of wealth that is a part of a bride’s right at the time of her wedding.
Sub-centre: The fi rst contact point between the community and the service provider in the primary healthcare system, reporting to the primary healthcare centre (PHC). One sub-centre is to cover a population of 3,000 in hilly and remote areas and 5,000 in the plains.
Sufi tradition: ‘Sufi ’ literally means ‘one who is pure’. In Greek, ‘Sufi ’ means an ‘enlightened person’. Sufi sm was born in Arabia, very early in Islamic history. The Sufi s came to India following the Muslim conquests. The Sufi s in India and Iran under the infl uence of Greek philosophy emphasized the importance of an emotionally rich life.
Swarozgaris: The self-employed.
Taluk: An administrative unit; a ‘block’ is also called a ‘taluk’.
Tamil/Telegu/Marathi/Urdu: Languages recognized under the 8th Schedule of the Constitution of India.
Unani: It refers to a tradition of Graeco-Arabic medicine widely practised by Muslims.
Waqf: Wakf is a permanent dedication of movable or immovable properties for religious, pious or charitable purposes as recognized by Muslim Law, given by philanthropists. The grant is known as mushrut-ul-khidmat, while a person making such dedication is known as Wakif. The Central Wakf Council is a statutory body established in 1964 by the Government of India under the Wakf Act, 1954 (amended by the Wakf Act, 1995) for the purpose of advising it on matters pertaining to working and proper administration of the state (as well as district and block-level) Wakf boards, which are established by the state governments.
Zaat/Jaati: Caste/community.
Zari, zardozi: Types of brocade embroidery.
x i x
A B B R E V I AT I O N S
ANC: Ante Natal CareAW: AnganwadiANW: Auxiliary Nurse MidwifeAP: Andhra PradeshAP Foods: Andhra Pradesh FoodsAPL: Above Poverty LineAPMFC: Andhra Pradesh State Minorities Finance CorporationASHA: Accredited Social Health ActivistAWC: Anganwadi centreAWW: Anganwadi workerAYUSH: Department of Ayurveda, Yoga & Naturopathy, Unani, Siddha and Homoeopathy BAMS: Bachelor of Ayurveda, Medicine and SurgeryBC: Backward ClassesBCC: Behaviour Change CommunicationBCG: Bacillus Calmette–Guérin, a vaccine against tuberculosisBDO: Block Development Offi cerBPL: Below Poverty LineBUMS: Bachelor in Unani Medical ScienceCFL: Compact Fluorescent LampCHC: Cluster Healthcare Centre CM: Chief MinisterCRH: Committee for Rights to Housing, a Mumbai-based organization advocating rights to
housingDISE: District Information System for EducationDPL: Double the Poverty LineDSSSB: Delhi Subordinate Services Selection BoardFGD: Focus group discussion FIR: First Information ReportGDP: Gross Domestic ProductGOI: Government of IndiaHP: Himachal PradeshIAY: Indira Awas Yojana, a Government of India housing scheme for rural areasICDS: Integrated Child Development ServicesID: IdentityIFA: Iron and Folic AcidIHSDP: Integrated Housing & Slum Development Programme
x x
Broken Promises: A study on the socio-economic status of Indian Muslims - Seven years post Sachar
IIM: Indian Institute of ManagementIIT: Indian Institute of TechnologyIMR: Infant Mortality RateITI: Industrial Training InstituteJNNURM: Jawaharlal Nehru National Urban Renewal MissionKGBV: Kasturbha Gandhi Balika VidyalayaKMFDC: Karnataka Minorities Finance Development CorporationMCD: Minority-Concentrated DistrictsMDM: Mid-day MealMMC: Malegaon Municipal CorporationMMR: Maternal Mortality RateMNC: Multinational CorporationMOMA: Ministry of Minority AffairsMP: Madhya PradeshMSDP: Multi-Sectoral Development ProgrammeMTF: Multi-Therapy FoodMYS: Mean years of schoolingNFHS: National Family Health Survey, Government of IndiaNGO: Non-government OrganizationNMFDC: National Minorities Finance Development CorporationNRHM: National Rural Health MissionNSS: National Sample Survey NSSO: National Sample Survey OrganizationOBS: Other backward ClassesPDS: Public Distribution SystemPHC: Primary Healthcare CentrePIO: Public Information Offi cerPMGSY: Pradhan Mantri Gram Sadak YojanaPUC: Pre-University Course/Certifi cateRCH: Reproductive and Child Health RTE: Right to EducationRTI: Right to Information SC: Scheduled CasteSGSY: Swarnajayanti Gram Swarozgar YojanaSMC: School Management CommitteeSNA: System of National AccountsSRCS: Socio-religious CommunitiesSPO: Special Police Offi cerSSA: Sarva Shiksha Abhiyan
x x i
Abbreviations
ST: Scheduled TribeTGT: Trained Graduate TeachersTHR: Take Home Ration TN: Tamil NaduTT: Tetanus ToxoidUID: Unique Identity Database U.N.: United NationsU.P.: Uttar Pradesh UNSNA: United Nations (U.N.) System of National AccountsUT: Union TerritoryWB: West BengalWCD: Women and Child DevelopmentWPR: Work Participation Rate
x x i i i
A C K N O W L E D G E M E N T S
This study became possible owing to the involvement, participation and contribution of several individuals and organizations across India. We are grateful to all those who responded to our
questionnaire, to those who participated in various group discussions, to all who have shared their experiences and perspectives. We are grateful to all the individuals who have allowed us to include their stories in the case studies, through interviews and other means. A comprehensive list of individuals and organizations that contributed to this study is included in Annex 1.
Gratitude is due to the respected Late Dr. Asghar Ali Engineer for his guidance in the conception of this study and for inspiring it. I had the privilege to spend hours in discussions with him, in which he dwelt at great length on the context and the need for an objective assessment of the condition of Muslims after the release of the Justice Rajinder Sachar report and the action taken on its recommendations. He was very keen that an empirical assessment should be undertaken involving not only key civil society players but also the very people whose lives were at stake. For him, the continued socio-economic and political exclusion of the largest minority was a matter of grave concern for our democratic nation. I am indebted to him for opening up horizons on critical thoughts such as citizenship, rights of minorities, constitutional values such as equity and social justice, all of which went into the formulation of this study.
We are also thankful to Prof. Rakesh Basant, Shabnam Hashmi and Dr. Ram Puniyani for providing insights that helped in the conceptualizing the framework of this study. We are immensely thankful to Gauhar Raza and Surjit Dabas for their contribution in analyzing extensive and complex data.
Thanks are due to Dr. Masood Falahi and Dr. Imran Ali for their contribution in designing the tools for and initiating the data-gathering exercise. Much thanks are owed to S.Q. Masood, Meera Khatun, Nasreen, Aleem Faizee, Salim Baig, Sabir Khan, Deepak Bhat, Ansar Ahmed, Mubeen, Rubina Parveen, C.K. Subair and Ramanie Mathew and appreciation for their commitment and steadfastness in leading the research for this study in their respective states. Their perseverance, patience and precision and, especially, their hard and sustained labour in working with enumerators’ teams, civil society members and offi cials made this study possible. Heartfelt thanks to you all! Thanks are due to women volunteers of Bharatiya Muslim Mahila Andolan for their help and contribution to this study. The contribution and support by various regional offi ces of ActionAid has been of immense value. Thanks are due to all the team members at the ActionAid regional offi ces and the country offi ce in Delhi for their help. Special thanks to Sandeep Chachra for believing in this project and for ensuring sustained support throughout the conduct of the study. Last, but very importantly, much thanks to Mariya Salim and Madhumita Ray for their commitment, perseverance and hard work throughout the course of this study. Their dedication and contribution to this study has been invaluable.
Thanks also to Sunita and Dhruva at Daanish Books for their help in the publication of the study. We are grateful to Dr. Ghanshyam Shah for writing the Foreword.
Zakia SomanApril 2014, Ahmedabad
x x v
F O R E W O R D
Modern multi-cultural societies with competitive milieu minorities (in the socio-economic and political spheres) are placed in certain disadvantageous and vulnerable positions.
This is more so when a large number of the community members are economically poor. Such a situation calls for more vigilant roles on the part of concerned citizens as well as civil society organizations that stand for democratic values and raise their collective voice against injustice. The Muslim community in India, constituting 13.5 percent of the population, is today the most vulnerable religious minority. The majority of Muslims constantly live in a state of insecurity, identity crisis and deprivation. All the three are closely interlinked. The reports of the Gopal Singh Committee in the 1980s and the Sachar Committee in 2005 highlight the condition of deprivation of the Muslims vis-à-vis other socio-religious communities in various dimensions of development. Following the Sachar Committee report, the Government of India announced the ‘new’ 15-point programme in 2006 for the ‘welfare of minorities’, providing more opportunities for education, credit and equitable share in credit and employment and improving their living conditions. This raised high expectations in the country in general and Muslims in particular.
Though seven years is not a long period to evaluate tangible results of the initiatives, it is not a short period to gauge the process and direction of these. Concerned citizens are interested to understand whether the process of implementation has begun and, if so, with what approach and sincerity. Besides the government and political parties, it is the task of civil society organizations to engage not only in advocacy for policy-making but also to carry out periodical critical objective evaluations of the implementation of the government’s various policies to point out the achievements, limitations and the constraints. The Centre for Peace Studies, a civil society organization, is actively involved in such two-pronged activities. It was engaged in collecting and analyzing socio-economic information on Muslims in different parts of the country to present before the Sachar Committee. In the same way this report (BrokenPromised: A study on the Socio-economic Status of Muslims in India—seven years past Sachar Report) is an exercise to learn about the outcome of the Prime Minister’s New 15-Point Programme for the Welfare of Minorities (henceforth referred to as the ‘PM’s New 15-Point Programme’). This study is based on extensive fi eld research in 15 states, involving 8,082 individuals (males and females from different age-groups and engaged in a range of economic activities) from three districts in each of the states. The research also involved conducting in-depth interviews for a few case studies, as well as collating observations and secondary data obtained through Right to Information Act. The researchers also interviewed non-Muslim households as a control group. The study was carried out over a period of four months in 2012.
The study takes note that the process of the implementation of the PM’s New 15-Point Programme has begun. But despite the promise of the Prime Minister in 2005, this has not, so far, been placed on ‘high priority’ for implementation. The government has instituted the pre- and post-matric scholarships for Muslim students. However, the programme has not reached
x x v i
Broken Promises: A study on the socio-economic status of Indian Muslims - Seven years post Sachar
1. Times of India(Ahmedabad), 19 August
2013.2. Thorat and Attewell
(2010: pp 35–51).
the majority of the students. Only 17.7 percent students have benefi ted so far, a majority receiving the pre-matric scholarships. Since the programme is being implemented through the state governments, the proportion of benefi ciaries ranges from 53 percent in Haryana and 46 percent in Kerala on the one hand to 3 percent in Gujarat and 2 percent in Rajasthan on the other. According to National Sample Survey 2013 (NSS 2013) of the National Sample Survey Organization (NSSO), unemployment among all social groups — both in rural and urban areas — has declined between 2004-05 and 2010-11. It is so among the Muslims also; however, the nature of employment is a different issue, as a majority of them are in the informal sector. The present study reveals that the real income of Muslim households has declined in the last fi ve years. NSS data also bears out this that among the all religious communities, Muslims have the lowest per capita consumer expenditure (covering household expenditure on basic needs); according to the NSS data, Muslim households spend `980 per capita (`1,272 in urban areas and `833 in rural areas).
However, it is also heartening to note that employment of Muslims in central government organizations has increased more than 3 percent in six years, from 6.93 percent in 2006-07 to 10.18 percent in 2010-11.1 We do not have information about the situation in state government employment. The study found that the proportion of Muslims in government services is strikingly low compared to other socio-religious communities. It also found that of those who applied for jobs, only 1 percent reported being selected. The reasons for non-selection can be several. But what is disturbing is the perception of young educated Muslims that they were not selected because of their religious affi liation. Such perception is not completely baseless as an empirical study by social scientists demonstrates.2 This raises the relevant but disturbing question: Why has the Indian Muslim stopped aspiring for government jobs?
Among others, the marginalized communities in India suffer on two counts: One, overall weak, indifferent and callous governance for all social welfare programmes; two, certain communities, such as the dalits and the Muslims, experience discrimination as well as humiliation. In the present political scenario, the Muslims are the worse victims. Besides educational and economic deprivation, in the contemporary political environment, like the scheduled caste (SC)communities, Muslims not only face discrimination but are also stigmatized and experience humiliation. The poorer strata are the worse sufferers; they are discriminated as Muslims by the majority community and, as so-called ‘backward caste Muslims’, treated as ‘low’ by Muslims from the upper strata. This study reiterates and emphasizes that, like all religious- as well as caste-based communities, the Muslim community in India is not monolithic. The poor among these communities are further discriminated against and marginalized. Some of these castes in several states are classifi ed as part of the ‘other backward classes’ (OBCs) by the state governments. But more often than not, they do not get benefi ts as OBCs because of their Muslim identity. They fi nd diffi culties in getting ‘OBC’ certifi cates from the offi cers. The study cites a number of examples of such instances from different states.
Without ensuring social security and citizenship in letter and spirit, our concern for equity is more rhetorical than sincere. In several parts of the country, Muslims constantly face insecurity for their very lives. A series of planned events of communal violence, an ineffective
x x v i i
Foreword
and partisan system that has failed to deliver justice to the victims and an unchecked ‘hate the Muslim’ campaign alienate them from the mainstream. Such insecurity breeds fear and forces them to ghettoize. The worst sufferers are Muslim women. The political system, irrespective of which party is in power, has so far failed to take up the issue squarely. In this context, the measures suggested by the Sachar Committee — such as (a) constant monitoring and evaluation of programmes, and (b) building of a data bank — need to be implemented. It is high time to build pressure on the government for the formation of an Equal Opportunities Commission to look into the grievances of the deprived groups. Besides providing a remedial mechanism for different types of discrimination; this would reassure Muslims that any unfair action against them would invite the vigilance of the law.
Ghanshyam ShahJanuary 2014, Ahmedabad
1
1. Census of India 2001. We use 2001 census data as the new fi gures pertaining to 2011 census are not yet announced.2. Planning Commission (2013).
1 . I N T R O D U C T I O N
Muslims comprise the largest minority in India. As per the provisions of the National Commission of Minorities (NCM) Act, 1992, fi ve religious communities — Muslims,
Christians, Sikhs, Buddhists and Parsis — have been notifi ed as ‘minorities’. According to the 2001 Census,1 18.4 percent of the Indian population comprises minority communities: Muslims constitute 13.4 percent, Christians 2.3 percent, Sikhs 1.9 percent, Buddhists 0.8 percent and Parsis 0.07 percent of the country’s total population. In absolute numbers, Muslims (nearly 140 million) account for 72.8 percent of the total minority population of 189.5 million.
The Muslims, who have been disadvantaged and vulnerable in spite of the Constitutional safeguards, continue to live in poverty and backwardness. This situation was highlighted by the Gopal Singh Committee set up in 1980 by the then Prime Minister, Indira Gandhi, to study the conditions of the community. The Gopal Singh Committee highlighted in its report that the poor among the Muslims could not avail opportunities in education, employment and in the economic sphere because of isolation and various historical factors. This was further corroborated by the 2006 report of the Sachar Committee, which was set up by the Prime Minister Manmohan Singh.
It must be stated at the outset that the founding visionaries of India had a special commitment to the rights and safety of the minorities. This found refl ection in the Constitution of India, which enshrines the values of equality, democracy and justice for all citizens. There are safeguards for minorities in the form of various constitutional articles prohibiting discrimination on religious grounds and enabling development for minority communities. The Constitution guarantees Fundamental Rights to all citizens, irrespective of religion, caste, sex or language. Further reiteration of our secular intent was made by the amendment to the Constitution Preamble in 1976 (42nd Amendment); the Sardar Swaran Singh Committee, constituted to study the question of amending the Constitution in the light of past experience, recommended that this amendment be enacted. But even a cursory look at the ground reality is enough to suggest that all is not well. This unfortunate reality has fi nally found mention in the 11th and 12th Five-Year Plans of the Government of India. The Plan documents state that amongst the minorities, the Muslims, and especially Muslim women, need special attention since, compared to other religious communities, they have remained socially, educationally and economically backward.2
Successive democratically elected governments since 1947, including governments led by avowedly secular political parties, have done little more than pay lip sympathy to the plight of the minorities. Be it persistent socio-economic exclusion as in the case of the Muslims or the menace of communal violence affecting Muslims and — now increasingly — the Christians, the minorities have not been able to become full citizens. Politics has overtaken priorities such as socio-economic well-being, safety and security. Consequently, the minorities have lived in poverty, fear and insecurity. The survivors of the 1984 anti-Sikh riots are yet awaiting justice, even nearly three decades after the atrocities, even as attacks on Christians are becoming a regular feature in some parts of the country.
2
Broken Promises: A study on the socio-economic status of Indian Muslims - Seven years post Sachar
3. Engineer (2004).4. Indian Social Institute,
Jahangirabad Media Institute, ActionAid India
(2006).
The Sachar Committee Report highlights how Muslims live in poverty and backwardness in ghettos across the country with a sense of fear and insecurity. Though India is a secular country, a large number of riots have taken place in which thousands of lives have been lost.3
It appears that in spite of the plural fabric of society and the constitutional ethos, the forces of hatred and divisiveness have continued to engage in communal violence, killings and vandalism across the country. This has led to the Muslims becoming extremely vulnerable and prone to attacks and danger to lives and property. The communal violence in Aligarh, Meerut, Moradabad, Bhiwandi and Gujarat and Assam in recent times bears testimony to the fact that the Muslims have become a community under siege from the forces of hatred on the one hand and poverty and backwardness on the other.
Though myths and stereotypes about Muslims have always been prevalent, the terrorist strikes on the World Trade Center in USA in September 2011 and the subsequent global war on terror has led to increased stereotyping and even demonizing of Muslims. There has been incidence of terror attacks in India and the fallout has seen large number of Muslim boys and men being detained by the police without evidence. The various high courts have acquitted innocent Muslims thus arrested as terrorists following terror blasts at Mecca Masjid in Hyderabad, Malegaon in Maharashtra and Ajmer in Rajasthan. Nevertheless, insensitive portrayal and stereotyping continues in sections of the media, which reports raise questions about the identity of the entire community.
A major issue affl icting Muslims in most parts of India is that of forced ghettoization. Periodic anti-Muslim riots and pogroms, sometimes instigated by state authorities in league with fi ercely anti-Muslim Hindutva groups, have forced Muslims in several places to shift to Muslim-dominated localities for safety, and conversely seen the movement of Hindu families out of Muslim localities, leading to ghettoization. In recent times, the starkest demonstration of this process is the case of Gujarat, where, in the wake of the anti-Muslim genocide of 2002, Muslims were forced to fl ee to safer areas to save their lives. In such places, migration has been forced, for that has been the only way for many Muslims to save their lives. In other cases, even in places where there have been no riots, many Muslims prefer to live in Muslim-majority localities for fear that anti-Muslim violence can break out any time. Living in their ‘own’ localities gives them a sense of security. Many middle-class Muslims, too, prefer living in such areas although the levels of infrastructural provision are poor and even though they can afford living in more ‘posh’, ‘upper’ class Hindu-dominated areas.4
Often, ghettoization is encouraged by the fact that Hindu landlords simply refuse to rent out their houses to Muslim tenants. The deepening of this trend is seen in this study, with rural areas also increasingly seeing homogeneous populations living together, in previously assimilated pockets, as in Uttar Pradesh, Bihar and West Bengal.
The arrival of the forces of globalization and privatization in India, from the early 1990s, have led to the poor — dalits, adivasis, women-headed households and minorities — being driven further to the margins, with a direct onslaught on their lands and livelihoods. Peoples’ movements have been protesting about the widespread exclusion of India’s large masses due to the questionable notions of development, which are becoming increasingly rooted in the policies of successive governments. A malfunctioning public distribution system (PDS) and
3
Introduction
5. ActionAid India (2012).
non-functional primary schools both aggravate the social exclusion faced by the minorities as also by the dalits and adivasis.5
Barring political pronouncements, very little attention has been paid by the successive governments since 1947 to enable participation of the Muslims in the socio-economic processes in the country. As reported by the Sachar Committee, they continue to remain out of the purview of most entitlement schemes and opportunities such as higher education, and jobs are denied to them.
In 2004, the Ministry of Social Justice and Empowerment (MoSJE), Government of India, issued a notifi cation for the constitution of National Commission on Religious and Linguistic Minorities (NCRLM), under the chairpersonship of (Retd.) Justice Ranganath Mishra. (See Annex 2 for the main observations of the Ranganath Mishra Commission). The Commission submitted its report on 10 May 2007 which was made public in January 2010. The Commission made recommendations on education, jobs, administration and legislative system; it recommended reservations for minorities in central and state government jobs.
The appointment of the Sachar Committee was announced in March 2005 by the Prime Minister. The terms of reference (ToR) of the Committee covered the study of the socio-economic conditions of Muslims (See Annex 3 for the full TOR). The Sachar Committee report highlighted educational, economic and social exclusion of Muslims and presented elaborate recommendations to alleviate the situation.
The Sachar Committee report is a work of great signifi cance in the history of independent India and in the history of parliamentary democracy. It holds tremendous meaning not just for Muslims but for all Indians. The incidence of poverty and backwardness amongst Indian Muslims is known; the Gopal Singh Committee had highlighted these bitter truths as early as in 1983. The Sachar Committee fi ndings only reinforce what the Gopal Singh Committee established over three decades ago: That Muslims are increasingly getting educationally, economically and politically excluded; that, worse, they live in ghettos across the country with a sense of fear and insecurity; and that the community suffers from a perception of discrimination and a sense of alienation.
The announcement by the Prime Minister in March 2005 about the formation of a high-level committee under the chairpersonship of Justice Rajinder Sachar was received with great enthusiasm and expectation by the community and the civil society. Different groups and individuals from the community thronged the meetings of the Committee across various cities as did various secular groups, intellectuals and activists. The ToR of the Committee and the overall warm and encouraging demeanour of the various individuals who were members of the Committee generated a lot of hope and expectation. The Committee did a tremendous job of highlighting how the community lives in poverty and exclusion and how it lags behind socially, educationally and economically. It made several important recommendations to alleviate the plight of the largest minority community. Among other things, it recommended that the policies to deal with the relative deprivation of the Muslims in the country should sharply
4
Broken Promises: A study on the socio-economic status of Indian Muslims - Seven years post Sachar
focus on inclusive development and ‘mainstreaming’ of the community, while respecting diversity. The report generated a lot of expectation for the problems being addressed and debate about if and how that would happen. The opposition from some political quarters was on expected lines and paled into insignifi cance against the sheer gravity of the deprivation and backwardness that the report so amply brought out. Statements were made by political leaders depending on which party they represented and the outcome was an announcement about the Prime Minister’s New 15-Point Programme. The Gopal Singh Committee report had led to the announcement of the Prime Minister’s 15-Point Programme. One view holds that the announcement of one more programme — the Prime Minister’s ‘New’ 15-Point Programme — was indicative of the failure of the Prime Minister’s old 15-Point Programme. Nevertheless, the announcement of the ‘new’ programme was received with enthusiasm by the community and the civil society.
Several community and civil society groups voluntarily engaged with a range of actions following the Sachar Committee Report, beginning with the dissemination of fi ndings in the community and the media and, later, campaigning for the effective implementation of the recommendations. There was a realization, early on and across different states, that the existing 15-Point Programme was not working effectively on the ground. By early 2009, there was near-consensus among the voluntary groups and activists that, barring educational scholarships, there was very little gain to the community. There was a range of experiences — from total ignorance on the part of offi cials to callousness and indifference in implementation — evident across different states. The situation was exacerbated by faulty policy design and lack of co-ordination between different arms of the central and state governments. All of this led to the perception of a lack of political will to alleviate the socio-economic conditions of the Muslims. But the enthusiasm generated by the Sachar Report soon waned, on seeing very little change in the conditions of the poor who were supposed to be at the centre of the Multi-Sectoral Development Programme and the PM’s New15-Point Programme.
This study was undertaken in this climate of poverty and marginalization and hope and expectations. Some organizations have undertaken similar assessments, notable among these the US India Policy Institute and Centre for Equity Studies; others have undertaken studies on smaller scales. These studies have established the non-implementation of the recommendations of the Sachar Committee Report and the persisting marginalization and exclusion of the Muslim community. The outcomes have all pointed out the disappointment faced by the community and the belying of all expectations of redress of problems.
However, the Government of India continues to make claims to the contrary. ‘The recommendations of the Justice Sachar Committee are being implemented and these initiatives are bringing about a positive change as well. These initiatives need to be speeded up,’ the Prime Minister said in his inaugural address at a conference. The Prime Minister dismissed apprehensions about his government having ignored the recommendations of the Sachar Committee, saying that this was not true. In the same address, the Prime Minister, as an illustration of his government’s policy favouring minorities, said that there had been an increase in the recruitment of minorities in government jobs, the security forces and the banking sector
5
Introduction
6. Suhrawardy (2012).7. www.ummid.com and news agencies, 4 January 2013.
during the past four years. The same period has been witness to loans for these communities being given priority; loans to the minority communities had risen from 9 percent to 15 percent, he said.6 The minister for minority affairs, K. Rahman Khan, speaking at the Indian Consulate General in Jeddah, said that the Congress-led government was taking all measures to implement the Justice Sachar Commission’s recommendations to boost the Muslim community, giving female education a priority. He also expressed total satisfaction over the implementation of the Prime Minister’s New 15-Point Programme for empowering minorities in India and said the programme was yielding positive results.7 Our study fi ndings indicate that this is not true.
Not just the civil society organizations, but also the Standing Committee on Social Justice and Empowerment does not agree with the government’s claims. In its 17th report, the Standing Committee said that except for the scholarship schemes and fi nancial aid to the community under Maulana Azad Foundation, the Ministry for Minority Affairs was ‘not paying heed to the root of the problems as publicised in the report of Sachar Committee.’ The panel said that the measures can be implemented forcefully if there is legal power to ensure that the recommendations are implemented. The panel rejected the government’s claims that it was giving high priority to the implementation of decisions taken on the basis of the Sachar Committee’s recommendations, stating that the recommendations were not being implemented in a serious manner. The panel demanded that the Ministry of Minority Affairs (MoMA) should work towards bringing a law in Parliament in this regard. This criticism has been widely reported in the media.
During the tenure of the Sachar Committee, we had the privilege of working closely in supporting the Committee with, amongst other things, a national study of the socio-economic conditions of Indian Muslims. Nobody could then have predicted that we would be called upon to do an assessment of the conditions of Muslims after the Sachar Committee Report was out. The need for the present study has been felt over the last few years to establish through empirical data, the non-implementation of the various programmes and the persistent marginalization of the Muslim community.
7
2 . W H AT I S T H E P M ’ S N E W 1 5 - P O I N T P R O G R A M M E ?
The PM’s New 15-Point Programme was announced in June 2006 with defi nite goals to be achieved in a specifi c timeframe for the welfare of the minorities. Listed below are some
of the goals and objectives that the Government of India stated were to be achieved under this programme. (See Annex 4 for the full text of the PM’s New15-Point Programme).
The important features aimed at: Enhancing opportunities for education.
Providing an equitable share in economic activities and employment.
Improving the living conditions of minorities.
Prevention and control of communal riots.
The Programme seeks to: Ensure that the benefi ts of various government schemes reach disadvantaged sections of the minority communities.
Earmark for minorities, wherever possible, 15 percent of targets and outlays under various schemes considered amenable to such earmarking.
Fix targets every year for all such schemes.
Monitor implementation closely at the centre and in the states.
It announced the following government programmes to be specially considered for the purpose of inclusion of minorities:
Integrated Child Development Services (ICDS),
Sarva Shiksha Abhiyan (SSA),
Kasturba Gandhi Balika Vidhyalaya Scheme (KGBV),
Swaranjayanti Gram Swarojgar Yojana (SGSY),
Indira Awas Yojana (IAY),
Upgradation of existing Industrial Training Institutes (ITIs) into centres of excellence,
Bank credit under priority sector lending,
Swaran Jayanti Shahari Rojgar Yojana (SJSRY), and
Integrated Housing and Slum Development Programme (IHSDP), and Basic Services for Urban Poor (BSUP) under Jawaharlal Nehru National Urban Renewal Mission (JNNURM).
It was announced that every year the union budget would make fi nancial allocations for the purpose and allocations were also made in the subsequent plans of the Planning Commission of India. The Ministry of Minorities Affairs (MoMA) was the key vehicle for taking forward this
8
Broken Promises: A study on the socio-economic status of Indian Muslims - Seven years post Sachar
programme and funds were earmarked under various schemes. (See Annex 5 for details of funds allocated under the PM’s New 15-Point Programme).
2.1 The Multi-Sector Development Programme
The government simultaneously announced the Multi-Sectoral Development Programme (MSDP) for the inclusion of minorities in the different schemes and programmes in 90 minority-concentrated districts across the country (See Annex 6). These 90 districts were chosen based on the following indicators (See Annex 7 for socio-economic indicators of the top 100 districts by size of Muslim Population):
Religion-specifi c socio-economic indicators at the district level Literacy rate;
Female literacy rate;
Work participation rate; and
Female work participation rate.
Basic amenities indicators at the district level Percentage of households having houses with pucca (concrete) walls;
Percentage of households with safe drinking water;
Percentage of households with electricity; and
Percentage of households with water closet latrines.
The 90 minority-concentration districts identifi ed throughout the country are relatively backward and are behind the national average in terms of socio-economic and basic amenities indicators. According to MoMA, this programme was announced to enable focused attention of government programmes and schemes on these districts. These 90 minority-concentration districts identifi ed by the government have a substantial minority population and are backward, with unacceptably low levels of socio-economic and/or basic amenities indicators, requiring focused attention and specifi c programme intervention.
The following suggestions were made under this programme to the Union ministries and departments to prepare their plans in a manner that these districts get the required attention and resources:
(i) The schemes and programmes for poverty alleviation, education, health and other welfare schemes of government may be focused in these districts. Existing schemes for infrastructure development, such as rural electrifi cation, road connectivity (PMGSY,Prime Minister’s Gram Sadak Yojana), etc. may be taken up in these districts on a priority basis.
9
What is the PM’S New 15-Point Programme?
(ii) Provision for basic amenities such as pucca (concrete) housing, safe drinking water supply, water closet toilets and electricity for each household may be made.
(iii) Schemes included in the Prime Minister’s New 15-Point Programme for the Welfare of Minorities may be implemented in these districts vigorously, targeting each minority household and village.
(iv) In the districts with low socio-economic conditions, special focus should be on schemes for poverty alleviation, employment generation, literacy, etc.
2.1.1 ObjectivesThe following were the stated objectives of the Multi-Sectoral Development Programme:
This programme aims at improving the socio-economic parameters of basic amenities for improving the quality of life of the people and reducing imbalances in the minority-concentration districts during the Eleventh Five-Year Plan period. Identifi ed ‘development defi cits’ would be made up through a district-specifi c plan for provision of better infrastructure for school and secondary education, sanitation, pucca housing, drinking water and electricity supply, besides benefi ciary-oriented schemes for income-generating activities.
This programme aims at improving absolutely critical infrastructure linkages like connecting roads, basic healthcare infrastructure and ICDS centres, as well as skill development and marketing facilities required for improving livelihood conditions and income-generating activities and catalyzing the growth process.
It was announced that this initiative would be a joint effort of the Government of India and the governments at the state and Union Territory levels for inclusive growth, acceleration of the development process and to improve the quality of life of the people. The scheme aims at focused development programmes for backward minority-concentration districts to help reduce imbalances and speed up development.
1 1
3 . R E S E A R C H M E T H O D O L O G Y
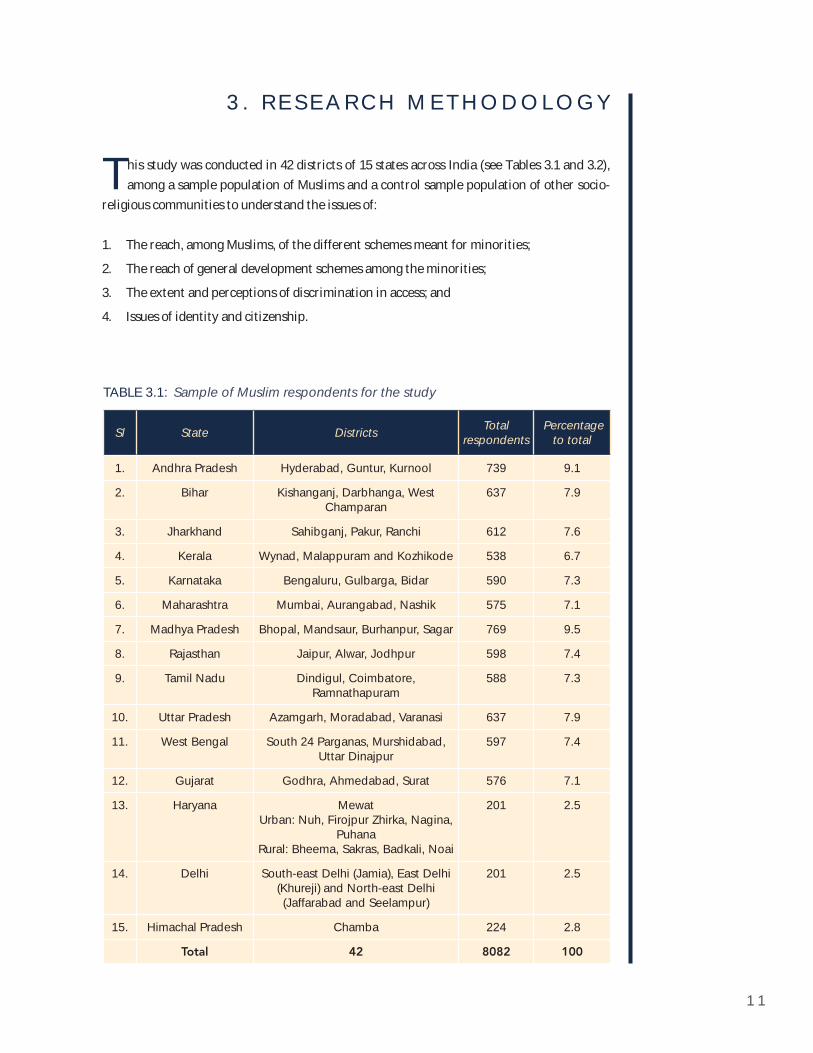
This study was conducted in 42 districts of 15 states across India (see Tables 3.1 and 3.2), among a sample population of Muslims and a control sample population of other socio-
religious communities to understand the issues of:
1. The reach, among Muslims, of the different schemes meant for minorities;
2. The reach of general development schemes among the minorities;
3. The extent and perceptions of discrimination in access; and
4. Issues of identity and citizenship.
TABLE 3.1: Sample of Muslim respondents for the study
Sl State Districts Total respondents
Percentage to total
1. Andhra Pradesh Hyderabad, Guntur, Kurnool 739 9.1
2. Bihar Kishanganj, Darbhanga, West Champaran
637 7.9
3. Jharkhand Sahibganj, Pakur, Ranchi 612 7.6
4. Kerala Wynad, Malappuram and Kozhikode 538 6.7
5. Karnataka Bengaluru, Gulbarga, Bidar 590 7.3
6. Maharashtra Mumbai, Aurangabad, Nashik 575 7.1
7. Madhya Pradesh Bhopal, Mandsaur, Burhanpur, Sagar 769 9.5
8. Rajasthan Jaipur, Alwar, Jodhpur 598 7.4
9. Tamil Nadu Dindigul, Coimbatore, Ramnathapuram
588 7.3
10. Uttar Pradesh Azamgarh, Moradabad, Varanasi 637 7.9
11. West Bengal South 24 Parganas, Murshidabad, Uttar Dinajpur
597 7.4
12. Gujarat Godhra, Ahmedabad, Surat 576 7.1
13. Haryana Mewat Urban: Nuh, Firojpur Zhirka, Nagina,
PuhanaRural: Bheema, Sakras, Badkali, Noai
201 2.5
14. Delhi South-east Delhi (Jamia), East Delhi (Khureji) and North-east Delhi (Jaffarabad and Seelampur)
201 2.5
15. Himachal Pradesh Chamba 224 2.8
Total 42 8082 100
1 2
Broken Promises: A study on the socio-economic status of Indian Muslims - Seven years post Sachar
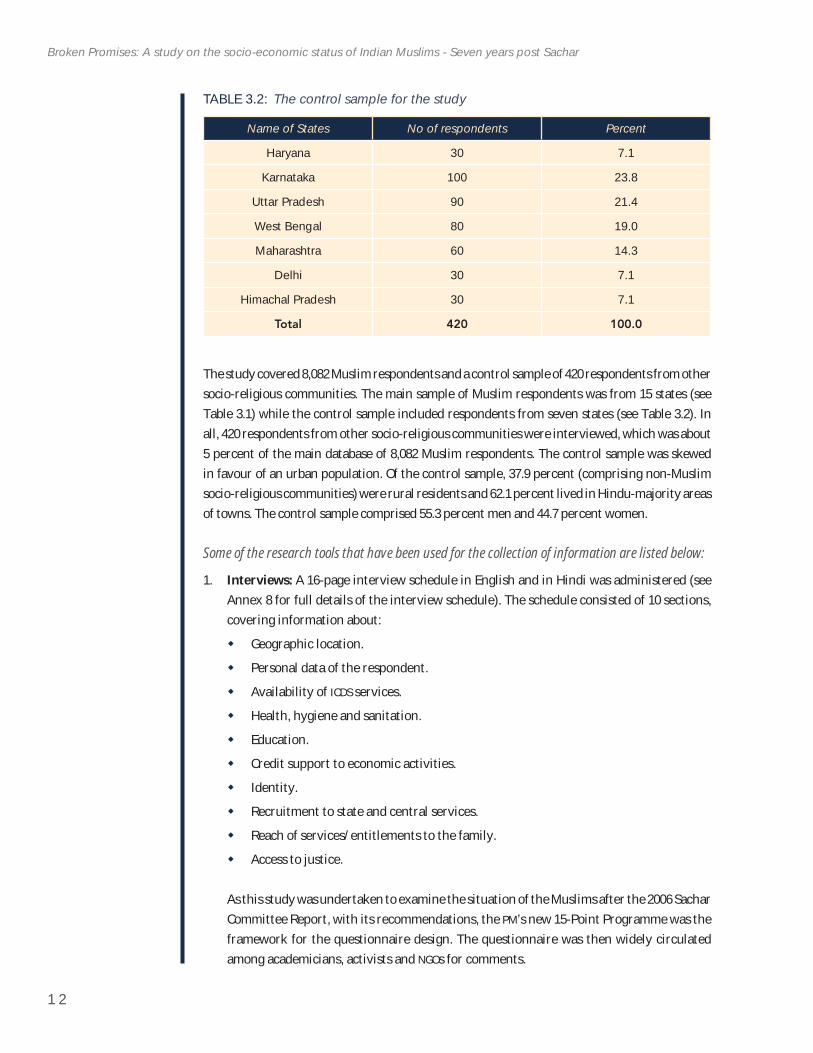
The study covered 8,082 Muslim respondents and a control sample of 420 respondents from other socio-religious communities. The main sample of Muslim respondents was from 15 states (see Table 3.1) while the control sample included respondents from seven states (see Table 3.2). In all, 420 respondents from other socio-religious communities were interviewed, which was about 5 percent of the main database of 8,082 Muslim respondents. The control sample was skewed in favour of an urban population. Of the control sample, 37.9 percent (comprising non-Muslim socio-religious communities) were rural residents and 62.1 percent lived in Hindu-majority areas of towns. The control sample comprised 55.3 percent men and 44.7 percent women.
Some of the research tools that have been used for the collection of information are listed below:
1. Interviews: A 16-page interview schedule in English and in Hindi was administered (see Annex 8 for full details of the interview schedule). The schedule consisted of 10 sections, covering information about:
Geographic location.
Personal data of the respondent.
Availability of ICDS services.
Health, hygiene and sanitation.
Education.
Credit support to economic activities.
Identity.
Recruitment to state and central services.
Reach of services/entitlements to the family.
Access to justice.
As this study was undertaken to examine the situation of the Muslims after the 2006 Sachar Committee Report, with its recommendations, the PM’s new 15-Point Programme was the framework for the questionnaire design. The questionnaire was then widely circulated among academicians, activists and NGOs for comments.
TABLE 3.2: The control sample for the study
Name of States No of respondents Percent
Haryana 30 7.1
Karnataka 100 23.8
Uttar Pradesh 90 21.4
West Bengal 80 19.0
Maharashtra 60 14.3
Delhi 30 7.1
Himachal Pradesh 30 7.1
Total 420 100.0
1 3
Research Methodology
State level consultations were organized with academicians, activists and NGOs in a few states like Delhi, West Bengal, Maharashtra, Andhra Pradesh, Gujarat and Bihar to ensure inclusion and perspectives from various regional viewpoints. After consolidation of the comments, the interview schedule was administered in a pilot exercise, before being fi nalized.
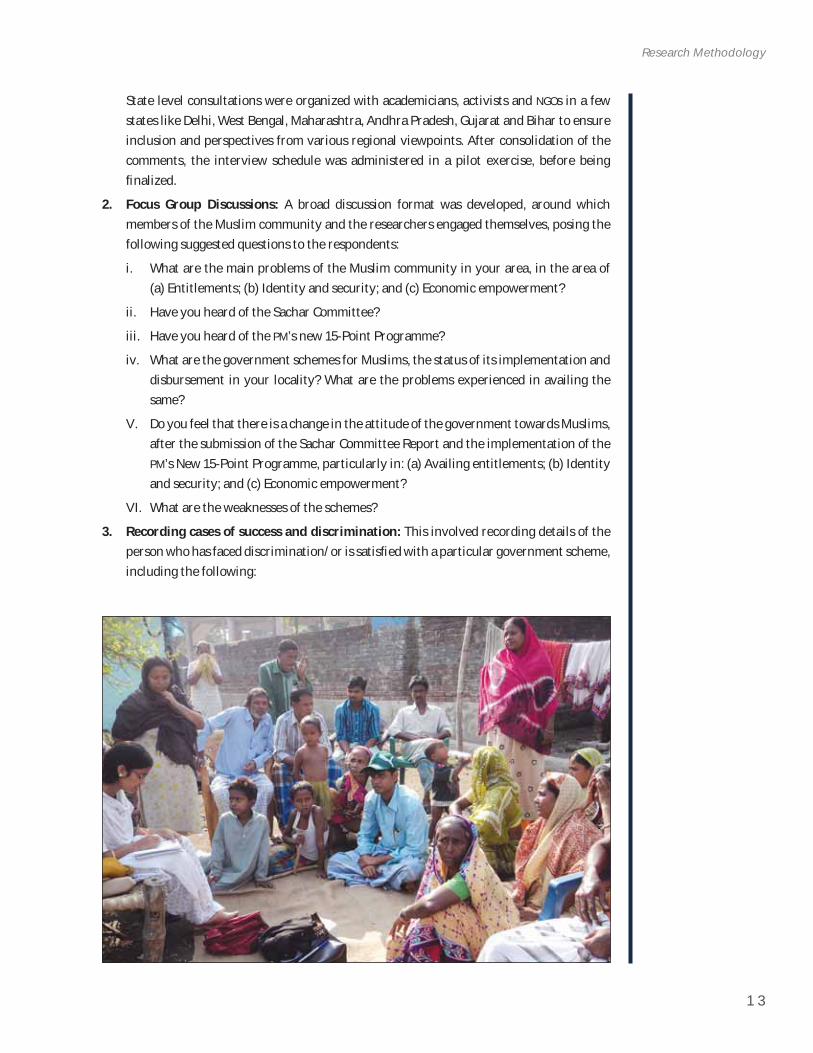
2. Focus Group Discussions: A broad discussion format was developed, around which members of the Muslim community and the researchers engaged themselves, posing the following suggested questions to the respondents:
i. What are the main problems of the Muslim community in your area, in the area of (a) Entitlements; (b) Identity and security; and (c) Economic empowerment?
ii. Have you heard of the Sachar Committee?
iii. Have you heard of the PM’s new 15-Point Programme?
iv. What are the government schemes for Muslims, the status of its implementation and disbursement in your locality? What are the problems experienced in availing the same?
V. Do you feel that there is a change in the attitude of the government towards Muslims, after the submission of the Sachar Committee Report and the implementation of the PM’s New 15-Point Programme, particularly in: (a) Availing entitlements; (b) Identity and security; and (c) Economic empowerment?
VI. What are the weaknesses of the schemes?
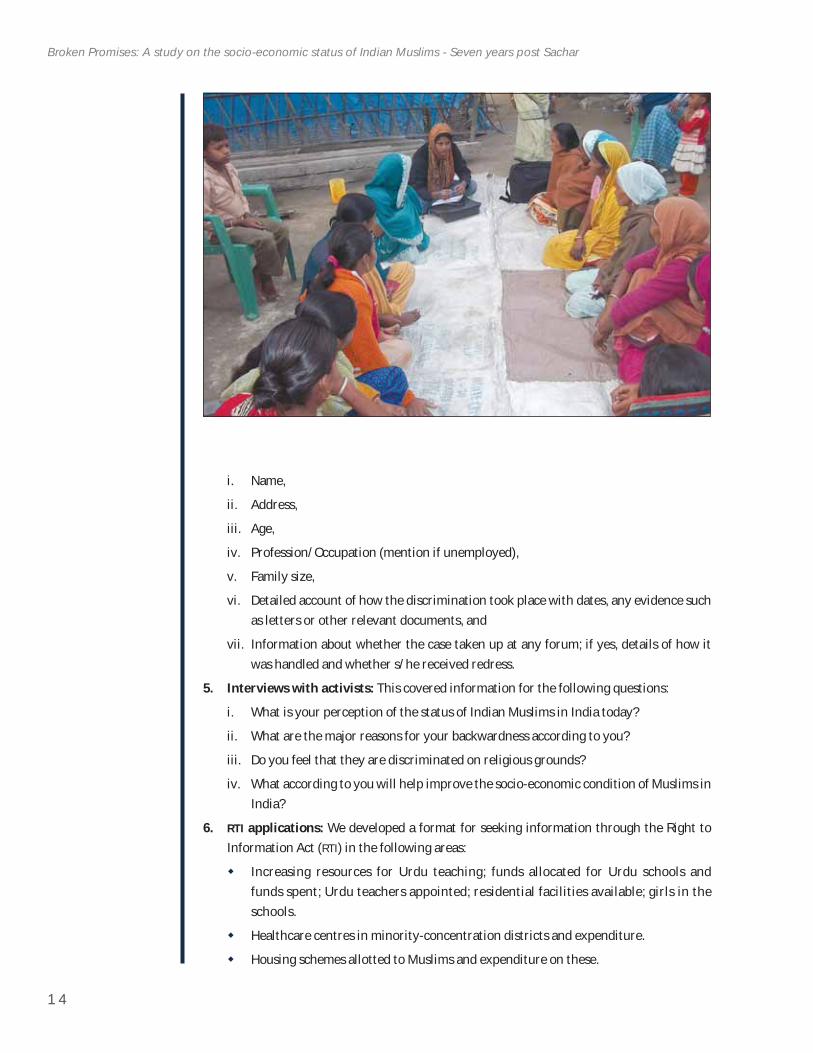
3. Recording cases of success and discrimination: This involved recording details of the person who has faced discrimination/or is satisfi ed with a particular government scheme, including the following:
1 4
Broken Promises: A study on the socio-economic status of Indian Muslims - Seven years post Sachar
i. Name,
ii. Address,
iii. Age,
iv. Profession/Occupation (mention if unemployed),
v. Family size,
vi. Detailed account of how the discrimination took place with dates, any evidence such as letters or other relevant documents, and
vii. Information about whether the case taken up at any forum; if yes, details of how it was handled and whether s/he received redress.
5. Interviews with activists: This covered information for the following questions:
i. What is your perception of the status of Indian Muslims in India today?
ii. What are the major reasons for your backwardness according to you?
iii. Do you feel that they are discriminated on religious grounds?
iv. What according to you will help improve the socio-economic condition of Muslims in India?
6. RTI applications: We developed a format for seeking information through the Right to Information Act (RTI) in the following areas:
Increasing resources for Urdu teaching; funds allocated for Urdu schools and funds spent; Urdu teachers appointed; residential facilities available; girls in the schools.
Healthcare centres in minority-concentration districts and expenditure.
Housing schemes allotted to Muslims and expenditure on these.
1 5
Research Methodology
ICDS centres in Muslim-concentrated localities; services available in the localities; number of Muslim children and women covered, and fund allocation and expenditure for these services.
Improving access to school education for minority children; number of KGBVs(Kasturba Gandhi Balika Vidyalayas); minority students enrolled in these schools and funds allocated and expenditure for these.
Expenditures of the National and State Minority Finance Development Corporations and the number of benefi ciaries, state-wise.
Number of Madrasas in minority-concentration districts, modernisation grants received, teachers appointed for science and computers.
Minority students benefi tted under the schemes for pre-matric, post-matric and other scholarships for students from the religious-minority communities; funds allocated and expenditure for these.
Number of ITIs (Industrial Training Institutes) and polytechnics in minority-concentration districts and students admitted in these.
Data was sourced from several secondary sources (over and above the primary data collected), including from various government departments and institutions at the Union and the state levels, mainly through the use of RTI Act, and in discussions with district level and state level officials. Research fellows and enumerators involved in this survey frequently even conducted physical checks to verify information obtained through RTIapplications.
Some of the prominent national level surveys that were used for the purpose of comparison and analysis, apart from Census 2001 are the National Sample Survey (NSS), National Family Health Surveys (NFHS) and the Sachar Committee survey fi ndings on the Social, Economic and Educational Status of the Muslim Community in India (Sachar Committee Report 2006). The availability of relevant data and information is a critical basis for effective advocacy and subsequent policy-making.
7. Data from the national surveys and studies included the following:
i. NSSO 66th Round data has been used to analyze issues relating to employment, education, and vocational training.
II. NFHS-III data (2005-06) has been used for religion-wise classifi cation to help compare the data collected in this study for the sample of Muslim respondents with other socio-religious communities.
iii. Statistics on healthcare infrastructure and comparison of health related indicators was also collected from the Family Welfare Statistics in India, 2011, Statistics Division, Ministry of Health and Family Welfare (MoHFW), Government of India.
iv. Sachar Committee Report, 2006, was the most important referral document for this study, which took the Report as the benchmark for purposes of comparison, analysis and understanding.
1 6
Broken Promises: A study on the socio-economic status of Indian Muslims - Seven years post Sachar
v. The study also used data giving information and updates from the websites of different Union and state government departments, particularly Ministry of Minority Affairs, Ministry of Rural Development and Ministry of Health.
vi. Finally, the study took information and data from in-depth studies conducted by researchers from premier institutions.
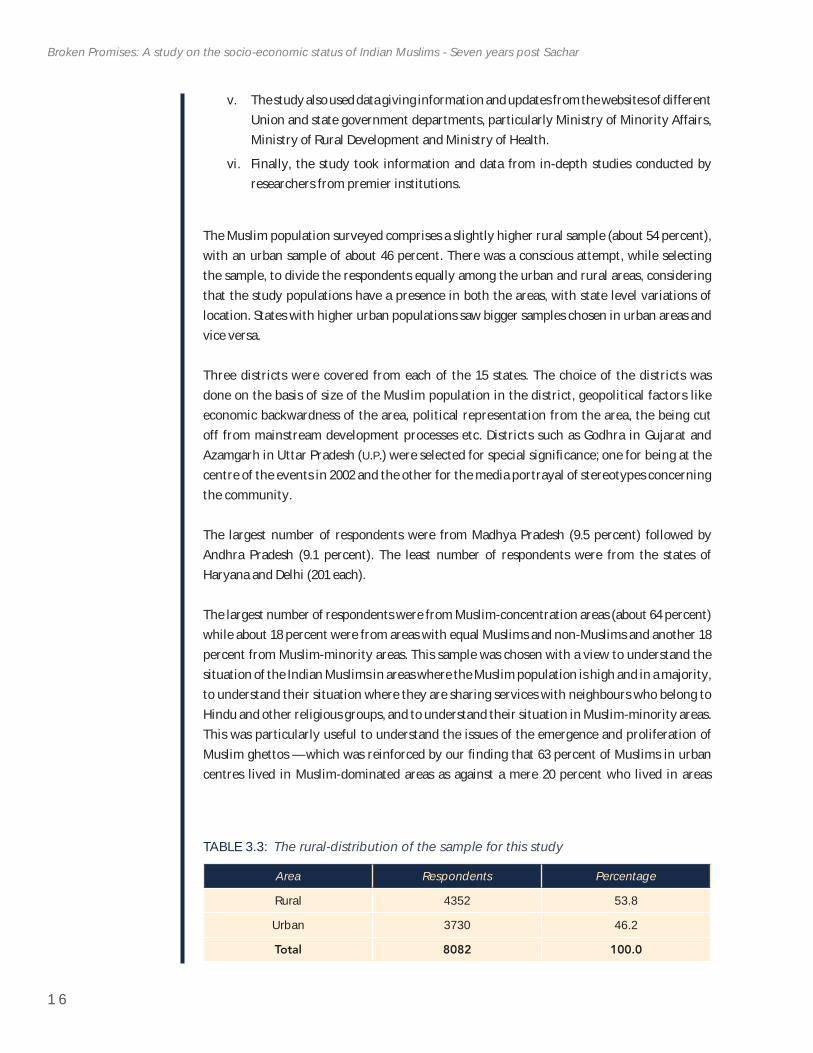
The Muslim population surveyed comprises a slightly higher rural sample (about 54 percent), with an urban sample of about 46 percent. There was a conscious attempt, while selecting the sample, to divide the respondents equally among the urban and rural areas, considering that the study populations have a presence in both the areas, with state level variations of location. States with higher urban populations saw bigger samples chosen in urban areas and vice versa.
Three districts were covered from each of the 15 states. The choice of the districts was done on the basis of size of the Muslim population in the district, geopolitical factors like economic backwardness of the area, political representation from the area, the being cut off from mainstream development processes etc. Districts such as Godhra in Gujarat and Azamgarh in Uttar Pradesh (U.P.) were selected for special signifi cance; one for being at the centre of the events in 2002 and the other for the media portrayal of stereotypes concerning the community.
The largest number of respondents were from Madhya Pradesh (9.5 percent) followed by Andhra Pradesh (9.1 percent). The least number of respondents were from the states of Haryana and Delhi (201 each).
The largest number of respondents were from Muslim-concentration areas (about 64 percent) while about 18 percent were from areas with equal Muslims and non-Muslims and another 18 percent from Muslim-minority areas. This sample was chosen with a view to understand the situation of the Indian Muslims in areas where the Muslim population is high and in a majority, to understand their situation where they are sharing services with neighbours who belong to Hindu and other religious groups, and to understand their situation in Muslim-minority areas. This was particularly useful to understand the issues of the emergence and proliferation of Muslim ghettos — which was reinforced by our fi nding that 63 percent of Muslims in urban centres lived in Muslim-dominated areas as against a mere 20 percent who lived in areas
TABLE 3.3: The rural-distribution of the sample for this study
Area Respondents Percentage
Rural 4352 53.8
Urban 3730 46.2
Total 8082 100.0
1 7
Research Methodology
with both Muslim and non-Muslim populations and of discrimination in providing services and entitlements — leading to overall neglect by civic service providers — in the Muslim-concentration areas. Even understanding the insecurities of the Indian Muslim was possible through this lens.
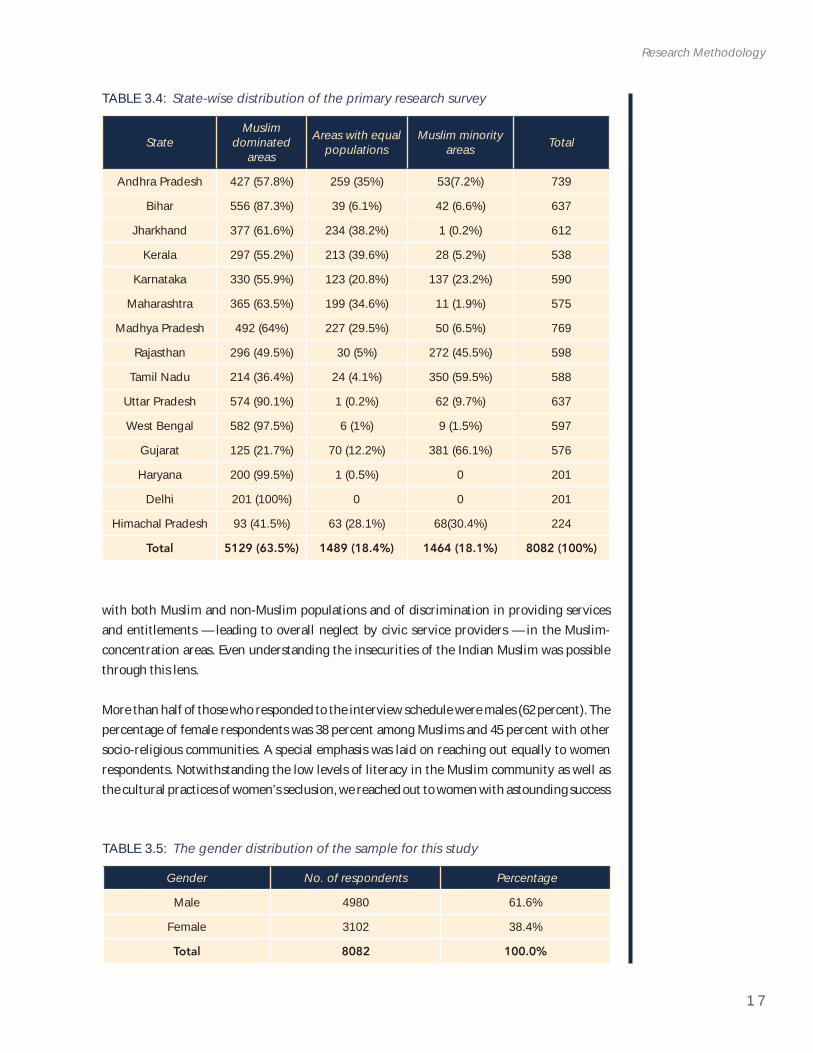
More than half of those who responded to the interview schedule were males (62 percent). The percentage of female respondents was 38 percent among Muslims and 45 percent with other socio-religious communities. A special emphasis was laid on reaching out equally to women respondents. Notwithstanding the low levels of literacy in the Muslim community as well as the cultural practices of women’s seclusion, we reached out to women with astounding success
TABLE 3.4: State-wise distribution of the primary research survey
StateMuslim
dominatedareas
Areas with equal populations
Muslim minority areas Total
Andhra Pradesh 427 (57.8%) 259 (35%) 53(7.2%) 739
Bihar 556 (87.3%) 39 (6.1%) 42 (6.6%) 637
Jharkhand 377 (61.6%) 234 (38.2%) 1 (0.2%) 612
Kerala 297 (55.2%) 213 (39.6%) 28 (5.2%) 538
Karnataka 330 (55.9%) 123 (20.8%) 137 (23.2%) 590
Maharashtra 365 (63.5%) 199 (34.6%) 11 (1.9%) 575
Madhya Pradesh 492 (64%) 227 (29.5%) 50 (6.5%) 769
Rajasthan 296 (49.5%) 30 (5%) 272 (45.5%) 598
Tamil Nadu 214 (36.4%) 24 (4.1%) 350 (59.5%) 588
Uttar Pradesh 574 (90.1%) 1 (0.2%) 62 (9.7%) 637
West Bengal 582 (97.5%) 6 (1%) 9 (1.5%) 597
Gujarat 125 (21.7%) 70 (12.2%) 381 (66.1%) 576
Haryana 200 (99.5%) 1 (0.5%) 0 201
Delhi 201 (100%) 0 0 201
Himachal Pradesh 93 (41.5%) 63 (28.1%) 68(30.4%) 224
Total 5129 (63.5%) 1489 (18.4%) 1464 (18.1%) 8082 (100%)
TABLE 3.5: The gender distribution of the sample for this study
Gender No. of respondents Percentage
Male 4980 61.6%
Female 3102 38.4%
Total 8082 100.0%
1 8
Broken Promises: A study on the socio-economic status of Indian Muslims - Seven years post Sachar
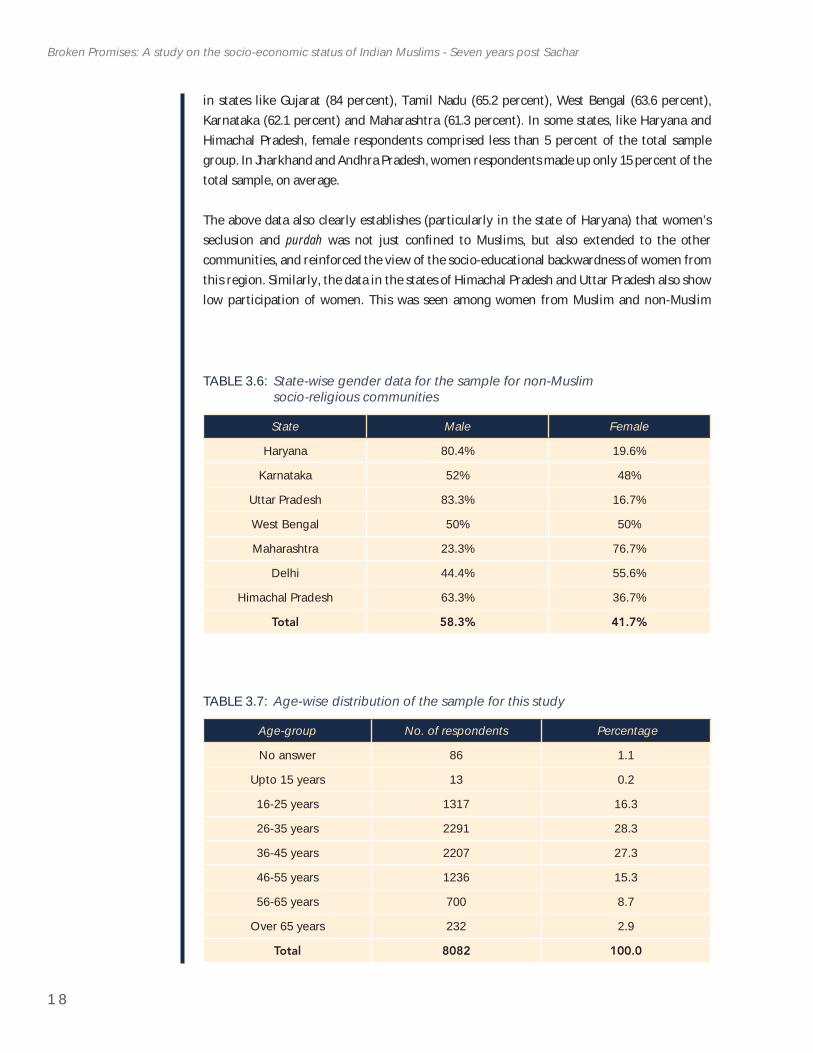
in states like Gujarat (84 percent), Tamil Nadu (65.2 percent), West Bengal (63.6 percent), Karnataka (62.1 percent) and Maharashtra (61.3 percent). In some states, like Haryana and Himachal Pradesh, female respondents comprised less than 5 percent of the total sample group. In Jharkhand and Andhra Pradesh, women respondents made up only 15 percent of the total sample, on average.
The above data also clearly establishes (particularly in the state of Haryana) that women’s seclusion and purdah was not just confi ned to Muslims, but also extended to the other communities, and reinforced the view of the socio-educational backwardness of women from this region. Similarly, the data in the states of Himachal Pradesh and Uttar Pradesh also show low participation of women. This was seen among women from Muslim and non-Muslim
TABLE 3.7: Age-wise distribution of the sample for this study
Age-group No. of respondents Percentage
No answer 86 1.1
Upto 15 years 13 0.2
16-25 years 1317 16.3
26-35 years 2291 28.3
36-45 years 2207 27.3
46-55 years 1236 15.3
56-65 years 700 8.7
Over 65 years 232 2.9
Total 8082 100.0
TABLE 3.6: State-wise gender data for the sample for non-Muslim socio-religious communities
State Male Female
Haryana 80.4% 19.6%
Karnataka 52% 48%
Uttar Pradesh 83.3% 16.7%
West Bengal 50% 50%
Maharashtra 23.3% 76.7%
Delhi 44.4% 55.6%
Himachal Pradesh 63.3% 36.7%
Total 58.3% 41.7%
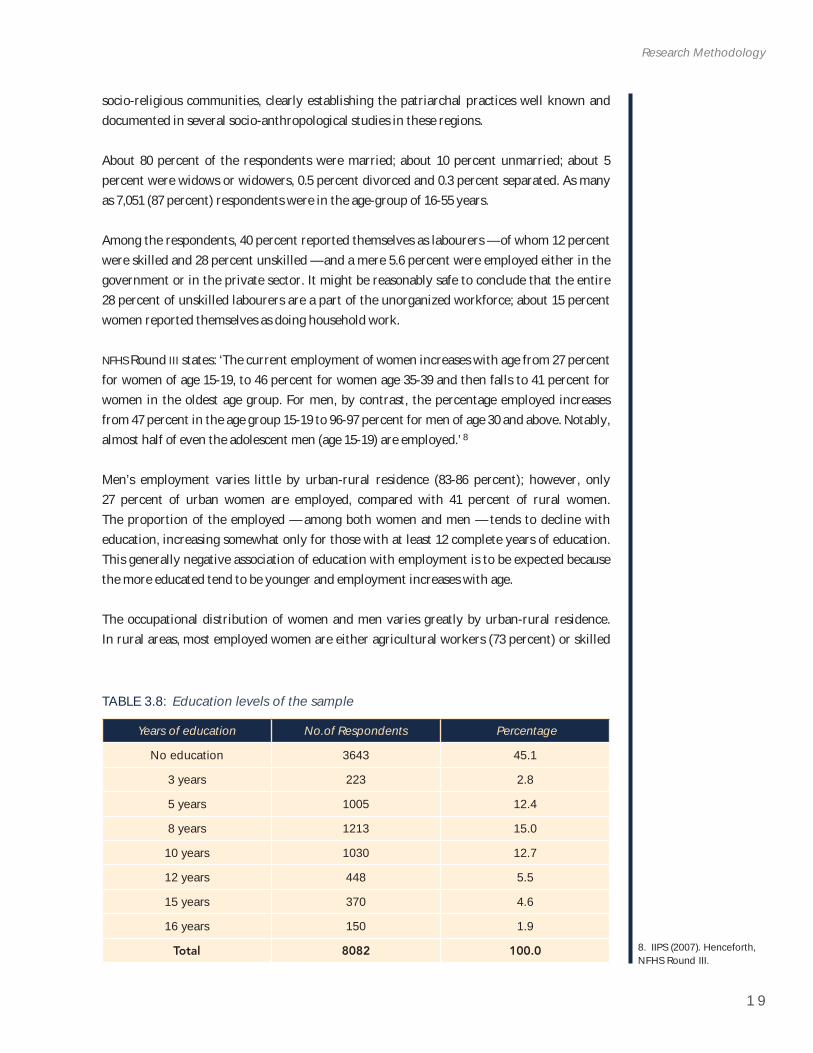
1 9
Research Methodology
8. IIPS (2007). Henceforth, NFHS Round III.
socio-religious communities, clearly establishing the patriarchal practices well known and documented in several socio-anthropological studies in these regions.
About 80 percent of the respondents were married; about 10 percent unmarried; about 5 percent were widows or widowers, 0.5 percent divorced and 0.3 percent separated. As many as 7,051 (87 percent) respondents were in the age-group of 16-55 years.
Among the respondents, 40 percent reported themselves as labourers — of whom 12 percent were skilled and 28 percent unskilled — and a mere 5.6 percent were employed either in the government or in the private sector. It might be reasonably safe to conclude that the entire 28 percent of unskilled labourers are a part of the unorganized workforce; about 15 percent women reported themselves as doing household work.
NFHS Round III states: ‘The current employment of women increases with age from 27 percent for women of age 15-19, to 46 percent for women age 35-39 and then falls to 41 percent for women in the oldest age group. For men, by contrast, the percentage employed increases from 47 percent in the age group 15-19 to 96-97 percent for men of age 30 and above. Notably, almost half of even the adolescent men (age 15-19) are employed.’ 8
Men’s employment varies little by urban-rural residence (83-86 percent); however, only 27 percent of urban women are employed, compared with 41 percent of rural women. The proportion of the employed — among both women and men — tends to decline with education, increasing somewhat only for those with at least 12 complete years of education. This generally negative association of education with employment is to be expected because the more educated tend to be younger and employment increases with age.
The occupational distribution of women and men varies greatly by urban-rural residence. In rural areas, most employed women are either agricultural workers (73 percent) or skilled
TABLE 3.8: Education levels of the sample
Years of education No.of Respondents Percentage
No education 3643 45.1
3 years 223 2.8
5 years 1005 12.4
8 years 1213 15.0
10 years 1030 12.7
12 years 448 5.5
15 years 370 4.6
16 years 150 1.9
Total 8082 100.0
2 0
Broken Promises: A study on the socio-economic status of Indian Muslims - Seven years post Sachar
or unskilled production workers (18 percent); the rest of the occupations account for only 9 percent of rural employed women. Urban employed women have much greater occupational diversity; 36 percent of urban employed women are skilled or unskilled production workers, 20 percent are service workers, 19 percent are in professional, technical, administrative, and managerial occupations, 11 percent are agricultural workers, and 9 percent are sales workers.
3.1 Timeline of the Study
A civil society meeting was called in June 2012, where the concept of this study was shared and discussed. The participants gave their opinions on how to make the scope of the study comprehensive in order to assess the changes in the lives of Muslims after the Sachar Committee Report. After this, the design and tools were devised and shared with different civil society representatives and academics. This was followed by the recruitment of team leaders in different states as well as enumerators for the conduct of the primary research. A team of researchers was put in place nation-wide to oversee the exercise. After the fi nalization of the list of states to be covered on the basis of population, backwardness and other factors, we identifi ed and selected two to four enumerators in each of the 15 states. The list of districts was also fi nalized thus. A detailed training of state co-ordinators and enumerators was held in August 2012. Surveyors were given detailed instructions to follow in conducting the interview schedule, to ensure sensitivity, objectivity and comprehensiveness in the exercise. (See Annex 9 for the list of instructions). The study was thus initiated in August 2012. The primary data collection began by end of August 2012 and concluded in November, 2012. Most of the RTI applications too were fi led during this period and the interviews were conducted simultaneously. This was followed by data entry and analysis in January 2013 through March 2013. We began writing the report in April 2013 and it is being fi nalized now in August 2013.
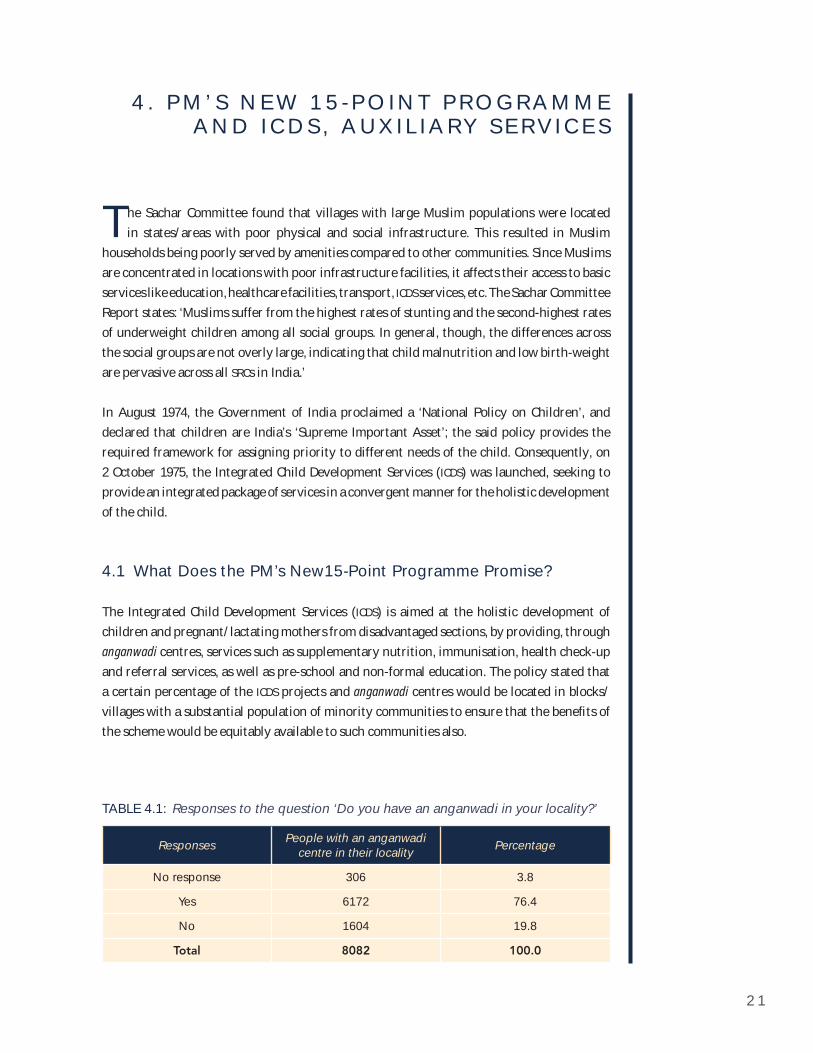
2 1
4 . P M ’ S N E W 1 5 - P O I N T P R O G R A M M E A N D I C D S , A U X I L I A RY S E R V I C E S
The Sachar Committee found that villages with large Muslim populations were located in states/areas with poor physical and social infrastructure. This resulted in Muslim
households being poorly served by amenities compared to other communities. Since Muslims are concentrated in locations with poor infrastructure facilities, it affects their access to basic services like education, healthcare facilities, transport, ICDS services, etc. The Sachar Committee Report states: ‘Muslims suffer from the highest rates of stunting and the second-highest rates of underweight children among all social groups. In general, though, the differences across the social groups are not overly large, indicating that child malnutrition and low birth-weight are pervasive across all SRCs in India.’
In August 1974, the Government of India proclaimed a ‘National Policy on Children’, and declared that children are India’s ‘Supreme Important Asset’; the said policy provides the required framework for assigning priority to different needs of the child. Consequently, on 2 October 1975, the Integrated Child Development Services (ICDS) was launched, seeking to provide an integrated package of services in a convergent manner for the holistic development of the child.
4.1 What Does the PM’s New15-Point Programme Promise?
The Integrated Child Development Services (ICDS) is aimed at the holistic development of children and pregnant/lactating mothers from disadvantaged sections, by providing, through anganwadi centres, services such as supplementary nutrition, immunisation, health check-up and referral services, as well as pre-school and non-formal education. The policy stated that a certain percentage of the ICDS projects and anganwadi centres would be located in blocks/villages with a substantial population of minority communities to ensure that the benefi ts of the scheme would be equitably available to such communities also.
TABLE 4.1: Responses to the question ‘Do you have an anganwadi in your locality?’
Responses People with an anganwadi centre in their locality Percentage
No response 306 3.8
Yes 6172 76.4
No 1604 19.8
Total 8082 100.0
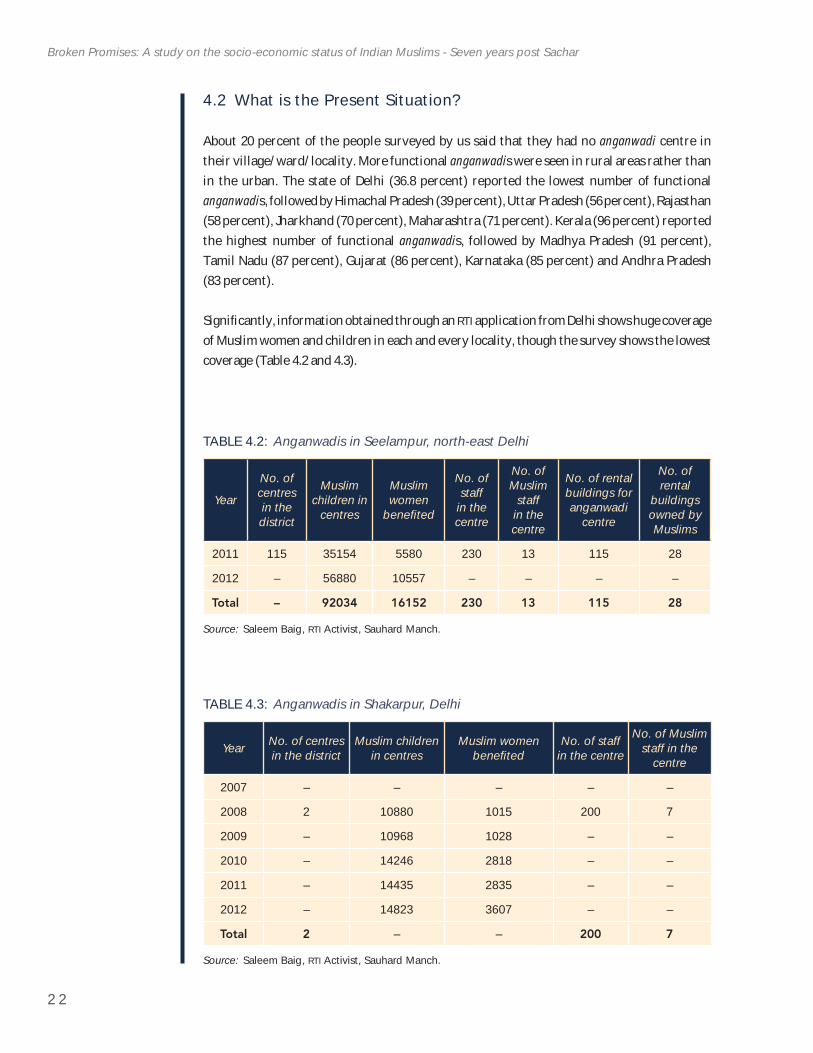
2 2
Broken Promises: A study on the socio-economic status of Indian Muslims - Seven years post Sachar
4.2 What is the Present Situation?
About 20 percent of the people surveyed by us said that they had no anganwadi centre in their village/ward/locality. More functional anganwadis were seen in rural areas rather than in the urban. The state of Delhi (36.8 percent) reported the lowest number of functional anganwadis, followed by Himachal Pradesh (39 percent), Uttar Pradesh (56 percent), Rajasthan (58 percent), Jharkhand (70 percent), Maharashtra (71 percent). Kerala (96 percent) reported the highest number of functional anganwadis, followed by Madhya Pradesh (91 percent), Tamil Nadu (87 percent), Gujarat (86 percent), Karnataka (85 percent) and Andhra Pradesh (83 percent).
Signifi cantly, information obtained through an RTI application from Delhi shows huge coverage of Muslim women and children in each and every locality, though the survey shows the lowest coverage (Table 4.2 and 4.3).
TABLE 4.2: Anganwadis in Seelampur, north-east Delhi
Year
No. of centres in the district
Muslimchildren in
centres
Muslimwomen
benefi ted
No. of staff
in the centre
No. of Muslim
staff in the centre
No. of rental buildings for anganwadi
centre
No. of rental
buildingsowned by Muslims
2011 115 35154 5580 230 13 115 28
2012 – 56880 10557 – – – –
Total – 92034 16152 230 13 115 28
Source: Saleem Baig, RTI Activist, Sauhard Manch.
TABLE 4.3: Anganwadis in Shakarpur, Delhi
Year No. of centres in the district
Muslim children in centres
Muslim women benefi ted
No. of staff in the centre
No. of Muslim staff in the
centre
2007 – – – – –
2008 2 10880 1015 200 7
2009 – 10968 1028 – –
2010 – 14246 2818 – –
2011 – 14435 2835 – –
2012 – 14823 3607 – –
Total 2 – – 200 7
Source: Saleem Baig, RTI Activist, Sauhard Manch.
2 3
PM’S New 15-Point Programme and ICDS, Auxiliary Services
9. NFHS Round III.
Table 4.3 shows that on an average each of the two centres at Shakarpur in Delhi has 5,000-7,000 children enrolled every year! This is in total contrast to our study fi ndings, which show that a mere 36.8 percent of the respondents reported having an anganwadi in their locality in Delhi.
Overall, one in three children in areas served by an anganwadi centre received one or more services from the centre and this proportion does not vary greatly by age or sex of the child. 9
Utilization of anganwadi services is higher in rural than in urban areas. Sikh and Jain children are least likely to have received any service from an anganwadi centre. Utilization of services is highest among Buddhist/Neo-Buddhist children (64 percent). Fifty percent of scheduled tribe children received services, compared with 28 percent of children who do not belong to any scheduled caste, scheduled tribe, or other backward classes. Utilization of services is more common among children living in enumeration areas where an anganwadi centre has existed for six or more years (35 percent) than in areas where the anganwadi has been established in the past fi ve years (27 percent).
The Supplementary Nutrition Programme has two broad components: Morning Snacks and Hot Cooked Mid-Day Meal.These are provided to children between three and six years who attend the anganwadi centres. For children between six months and three years, pregnant and lactating mothers as well as severely malnourished children, ‘Take-Home Rations’ (THR)is provided.
Take-Home Rations is given to pregnant and lactating mothers and infants as they do not attend the anganwadi centre on a daily basis. The severely malnourished children between three and six years are also given THR over and above the Hot Cooked Mid-Day Meal. The Government of India (Ministry of Health and Family Welfare) has fi xed the per benefi ciary cost, calorie and protein norm to be maintained across the states.
The per head ration cost of THR is ̀ 7 for pregnant and lactating mothers, ̀ 6 for normal children under three years and `9 for severely malnourished children.
BOX 1: Anganwadis with the Madaris in Maharashtra
There is an Anganwadi centre close by, where we send our children, say the Madari women of Indira Nagar, Titwala, Thane, Maharashtra. Here the children get meals which are packets to take home, and not hot cooked food as is advisable. There is no ANM who visits and no facilities/services for pregnant and lactating mothers. The anganwadi worker and assistant are from the SC/ST community. There is no building for the ICDS. It is being run on a rental basis in the house of a woman since inception.
Children enjoy the benefi t of ICDS and no discrimination is seen here. Approximately 30 children from the Madari community enjoy the benefi ts of ICDS in Indiranagar.
Source: Himani Rawat, Action Aid, Mumbai.
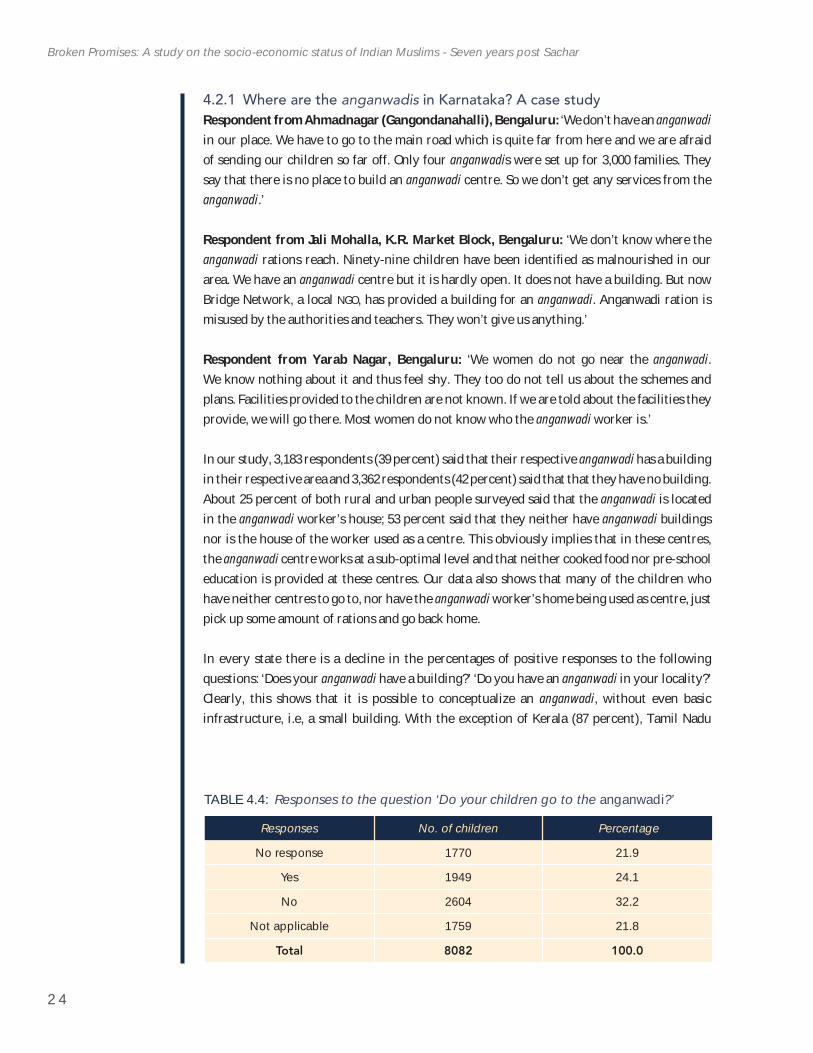
2 4
Broken Promises: A study on the socio-economic status of Indian Muslims - Seven years post Sachar
4.2.1 Where are the anganwadis in Karnataka? A case study Respondent from Ahmadnagar (Gangondanahalli), Bengaluru: ‘We don’t have an anganwadiin our place. We have to go to the main road which is quite far from here and we are afraid of sending our children so far off. Only four anganwadis were set up for 3,000 families. They say that there is no place to build an anganwadi centre. So we don’t get any services from the anganwadi.’
Respondent from Jali Mohalla, K.R. Market Block, Bengaluru: ‘We don’t know where the anganwadi rations reach. Ninety-nine children have been identifi ed as malnourished in our area. We have an anganwadi centre but it is hardly open. It does not have a building. But now Bridge Network, a local NGO, has provided a building for an anganwadi. Anganwadi ration is misused by the authorities and teachers. They won’t give us anything.’
Respondent from Yarab Nagar, Bengaluru: ‘We women do not go near the anganwadi.We know nothing about it and thus feel shy. They too do not tell us about the schemes and plans. Facilities provided to the children are not known. If we are told about the facilities they provide, we will go there. Most women do not know who the anganwadi worker is.’
In our study, 3,183 respondents (39 percent) said that their respective anganwadi has a building in their respective area and 3,362 respondents (42 percent) said that that they have no building. About 25 percent of both rural and urban people surveyed said that the anganwadi is located in the anganwadi worker’s house; 53 percent said that they neither have anganwadi buildings nor is the house of the worker used as a centre. This obviously implies that in these centres, the anganwadi centre works at a sub-optimal level and that neither cooked food nor pre-school education is provided at these centres. Our data also shows that many of the children who have neither centres to go to, nor have the anganwadi worker’s home being used as centre, just pick up some amount of rations and go back home.
In every state there is a decline in the percentages of positive responses to the following questions: ‘Does your anganwadi have a building?’ ‘Do you have an anganwadi in your locality?’ Clearly, this shows that it is possible to conceptualize an anganwadi, without even basic infrastructure, i.e, a small building. With the exception of Kerala (87 percent), Tamil Nadu
TABLE 4.4: Responses to the question ‘Do your children go to the anganwadi?’
Responses No. of children Percentage
No response 1770 21.9
Yes 1949 24.1
No 2604 32.2
Not applicable 1759 21.8
Total 8082 100.0
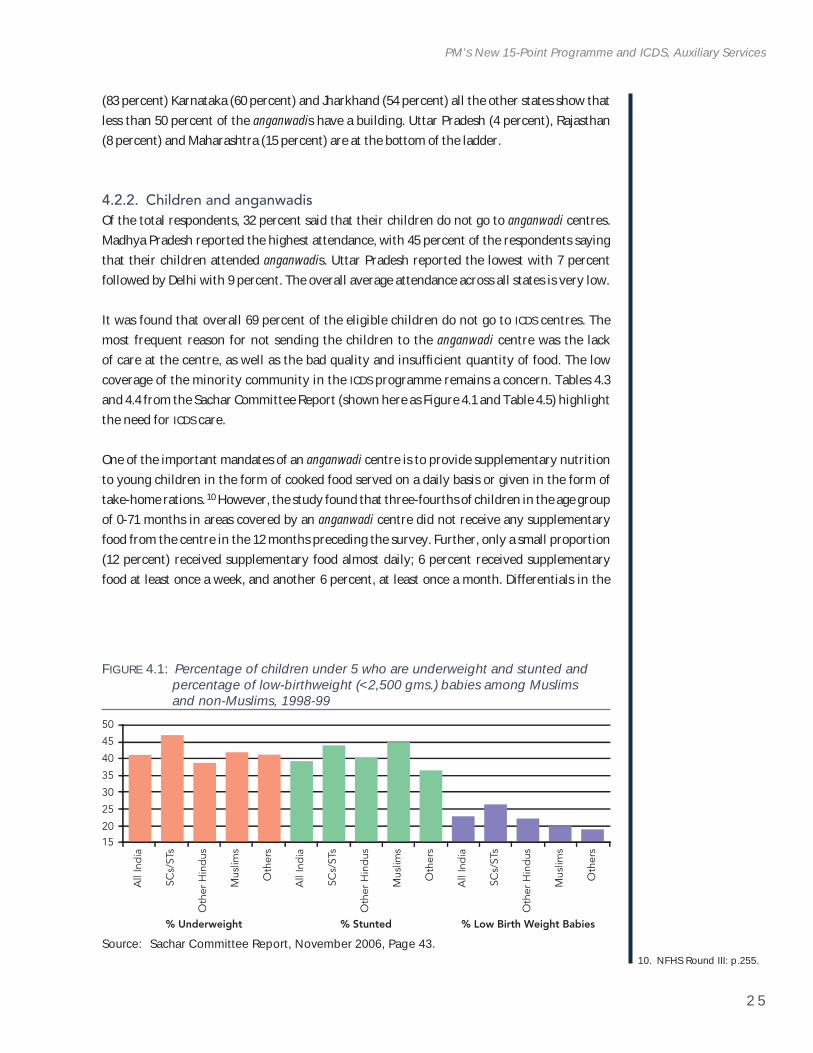
2 5
PM’S New 15-Point Programme and ICDS, Auxiliary Services
10. NFHS Round III: p.255.
(83 percent) Karnataka (60 percent) and Jharkhand (54 percent) all the other states show that less than 50 percent of the anganwadis have a building. Uttar Pradesh (4 percent), Rajasthan (8 percent) and Maharashtra (15 percent) are at the bottom of the ladder.
4.2.2. Children and anganwadisOf the total respondents, 32 percent said that their children do not go to anganwadi centres. Madhya Pradesh reported the highest attendance, with 45 percent of the respondents saying that their children attended anganwadis. Uttar Pradesh reported the lowest with 7 percent followed by Delhi with 9 percent. The overall average attendance across all states is very low.
It was found that overall 69 percent of the eligible children do not go to ICDS centres. The most frequent reason for not sending the children to the anganwadi centre was the lack of care at the centre, as well as the bad quality and insuffi cient quantity of food. The low coverage of the minority community in the ICDS programme remains a concern. Tables 4.3 and 4.4 from the Sachar Committee Report (shown here as Figure 4.1 and Table 4.5) highlight the need for ICDS care.
One of the important mandates of an anganwadi centre is to provide supplementary nutrition to young children in the form of cooked food served on a daily basis or given in the form of take-home rations. 10 However, the study found that three-fourths of children in the age group of 0-71 months in areas covered by an anganwadi centre did not receive any supplementary food from the centre in the 12 months preceding the survey. Further, only a small proportion (12 percent) received supplementary food almost daily; 6 percent received supplementary food at least once a week, and another 6 percent, at least once a month. Differentials in the
50
% Underweight % Stunted % Low Birth Weight Babies
45
40
35
30
25
2015
All
Ind
ia
SCs/
STs
Oth
er H
ind
us
Mus
lims
Oth
ers
All
Ind
ia
SCs/
STs
Oth
er H
ind
us
Mus
lims
Oth
ers
All
Ind
ia
SCs/
STs
Oth
er H
ind
us
Mus
lims
Oth
ers
FIGURE 4.1: Percentage of children under 5 who are underweight and stunted and percentage of low-birthweight (<2,500 gms.) babies among Muslims and non-Muslims, 1998-99
Source: Sachar Committee Report, November 2006, Page 43.
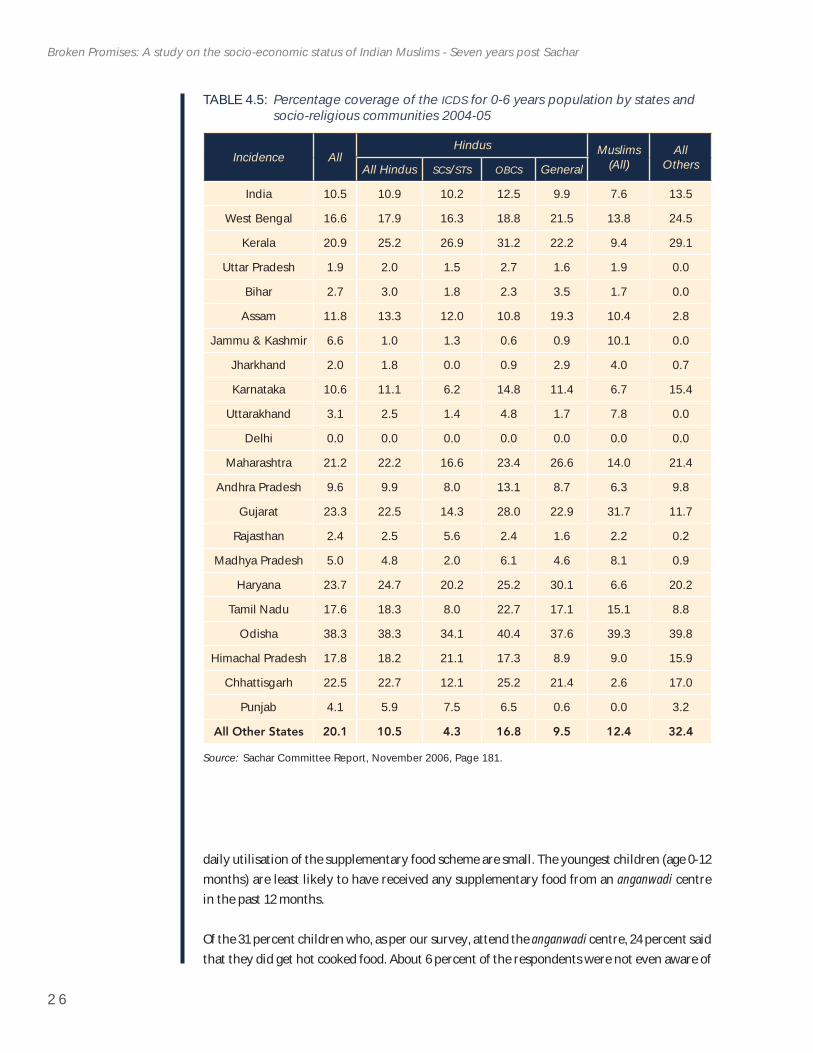
2 6
Broken Promises: A study on the socio-economic status of Indian Muslims - Seven years post Sachar
TABLE 4.5: Percentage coverage of the ICDS for 0-6 years population by states and socio-religious communities 2004-05
Incidence AllHindus Muslims
(All)All
OthersAll Hindus SCs/STs OBCs General
India 10.5 10.9 10.2 12.5 9.9 7.6 13.5
West Bengal 16.6 17.9 16.3 18.8 21.5 13.8 24.5
Kerala 20.9 25.2 26.9 31.2 22.2 9.4 29.1
Uttar Pradesh 1.9 2.0 1.5 2.7 1.6 1.9 0.0
Bihar 2.7 3.0 1.8 2.3 3.5 1.7 0.0
Assam 11.8 13.3 12.0 10.8 19.3 10.4 2.8
Jammu & Kashmir 6.6 1.0 1.3 0.6 0.9 10.1 0.0
Jharkhand 2.0 1.8 0.0 0.9 2.9 4.0 0.7
Karnataka 10.6 11.1 6.2 14.8 11.4 6.7 15.4
Uttarakhand 3.1 2.5 1.4 4.8 1.7 7.8 0.0
Delhi 0.0 0.0 0.0 0.0 0.0 0.0 0.0
Maharashtra 21.2 22.2 16.6 23.4 26.6 14.0 21.4
Andhra Pradesh 9.6 9.9 8.0 13.1 8.7 6.3 9.8
Gujarat 23.3 22.5 14.3 28.0 22.9 31.7 11.7
Rajasthan 2.4 2.5 5.6 2.4 1.6 2.2 0.2
Madhya Pradesh 5.0 4.8 2.0 6.1 4.6 8.1 0.9
Haryana 23.7 24.7 20.2 25.2 30.1 6.6 20.2
Tamil Nadu 17.6 18.3 8.0 22.7 17.1 15.1 8.8
Odisha 38.3 38.3 34.1 40.4 37.6 39.3 39.8
Himachal Pradesh 17.8 18.2 21.1 17.3 8.9 9.0 15.9
Chhattisgarh 22.5 22.7 12.1 25.2 21.4 2.6 17.0
Punjab 4.1 5.9 7.5 6.5 0.6 0.0 3.2
All Other States 20.1 10.5 4.3 16.8 9.5 12.4 32.4
Source: Sachar Committee Report, November 2006, Page 181.
daily utilisation of the supplementary food scheme are small. The youngest children (age 0-12 months) are least likely to have received any supplementary food from an anganwadi centre in the past 12 months.
Of the 31 percent children who, as per our survey, attend the anganwadi centre, 24 percent said that they did get hot cooked food. About 6 percent of the respondents were not even aware of
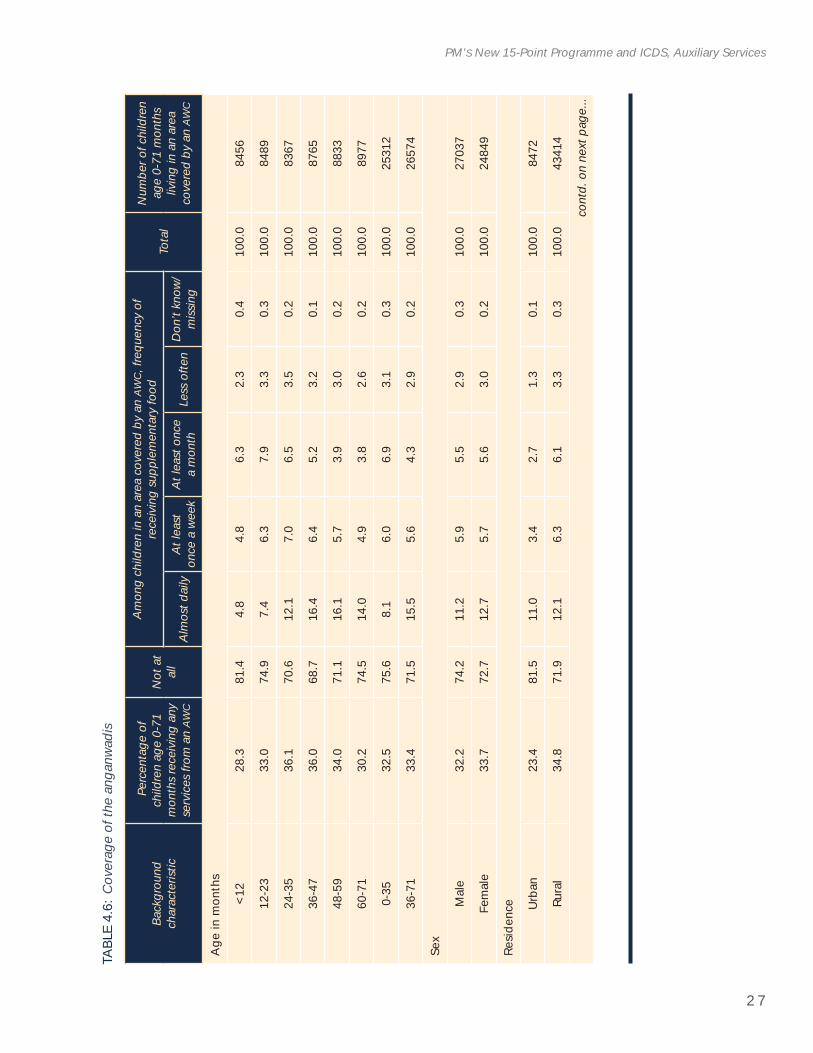
2 7
PM’S New 15-Point Programme and ICDS, Auxiliary Services
TABL
E 4.
6: C
over
age
of th
e an
ganw
adis
Back
grou
nd
char
acte
ristic
Per
cent
age
of
child
ren
age
0-71
m
onth
s rec
eivi
ng a
ny
serv
ices
from
an
AWC
Not
at
all
Amon
g ch
ildre
n in
an
area
cov
ered
by
an A
WC,
freq
uenc
y of
re
ceiv
ing
supp
lem
enta
ry fo
odTo
tal
Num
ber o
f chi
ldre
n ag
e 0-
71 m
onth
s liv
ing
in a
n ar
ea
cove
red
by a
n AW
CAl
mos
t dai
lyAt
leas
t on
ce a
wee
kAt
leas
t onc
e a
mon
thLe
ss o
ften
Don
’t kn
ow/
miss
ing
Age
in m
onth
s
<12
28.3
81.4
4.8
4.8
6.3
2.3
0.4
100.
084
56
12-2
333
.074
.97.
46.
37.
93.
30.
310
0.0
8489
24-3
536
.170
.612
.17.
06.
53.
50.
210
0.0
8367
36-4
736
.068
.716
.46.
45.
23.
20.
110
0.0
8765
48-5
934
.071
.116
.15.
73.
93.
00.
210
0.0
8833
60-7
130
.274
.514
.04.
93.
82.
60.
210
0.0
8977
0-35
32.5
75.6
8.1
6.0
6.9
3.1
0.3
100.
025
312
36-7
133
.471
.515
.55.
64.
32.
90.
210
0.0
2657
4
Sex
Mal
e32
.274
.211
.25.
95.
52.
90.
310
0.0
2703
7
Fem
ale
33.7
72.7
12.7
5.7
5.6
3.0
0.2
100.
024
849
Resid
ence Ur
ban
23.4
81.5
11.0
3.4
2.7
1.3
0.1
100.
084
72
Rura
l34
.871
.912
.16.
36.
13.
30.
310
0.0
4341
4
cont
d. o
n ne
xt p
age.
..
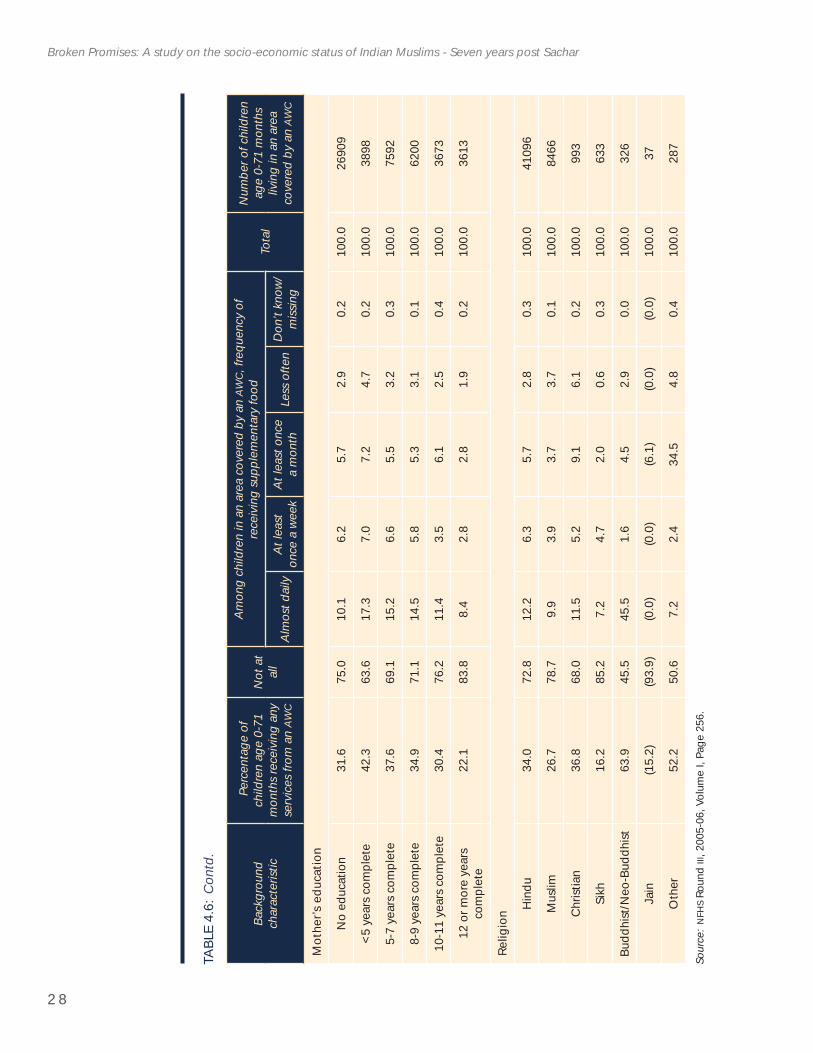
2 8
Broken Promises: A study on the socio-economic status of Indian Muslims - Seven years post Sachar
Back
grou
nd
char
acte
ristic
Per
cent
age
of
child
ren
age
0-71
m
onth
s rec
eivi
ng a
ny
serv
ices
from
an
AWC
Not
at
all
Amon
g ch
ildre
n in
an
area
cov
ered
by
an A
WC,
freq
uenc
y of
re
ceiv
ing
supp
lem
enta
ry fo
odTo
tal
Num
ber o
f chi
ldre
n ag
e 0-
71 m
onth
s liv
ing
in a
n ar
ea
cove
red
by a
n AW
CAl
mos
t dai
lyAt
leas
t on
ce a
wee
kAt
leas
t onc
e a
mon
thLe
ss o
ften
Don
’t kn
ow/
miss
ing
Mot
her’s
edu
catio
n
No
educ
atio
n31
.675
.010
.16.
25.
72.
90.
210
0.0
2690
9
<5 y
ears
com
plet
e42
.363
.617
.37.
07.
24.
70.
210
0.0
3898
5-7
year
s com
plet
e37
.669
.115
.26.
65.
53.
20.
310
0.0
7592
8-9
year
s com
plet
e34
.971
.114
.55.
85.
33.
10.
110
0.0
6200
10-1
1 ye
ars c
ompl
ete
30.4
76.2
11.4
3.5
6.1
2.5
0.4
100.
036
73
12 o
r mor
e ye
ars
com
plet
e22
.183
.88.
42.
82.
81.
90.
210
0.0
3613
Relig
ion H
indu
34.0
72.8
12.2
6.3
5.7
2.8
0.3
100.
041
096
Mus
lim26
.778
.79.
93.
93.
73.
70.
110
0.0
8466
Chris
tian
36.8
68.0
11.5
5.2
9.1
6.1
0.2
100.
099
3
Sikh
16.2
85.2
7.2
4.7
2.0
0.6
0.3
100.
063
3
Budd
hist
/Neo
-Bud
dhist
63.9
45.5
45.5
1.6
4.5
2.9
0.0
100.
032
6
Jain
(15.
2)(9
3.9)
(0.0
)(0
.0)
(6.1
)(0
.0)
(0.0
)10
0.0
37
Oth
er52
.250
.67.
22.
434
.54.
80.
410
0.0
287
Sour
ce:N
FHS
Roun
d III
, 200
5-06
, Vol
ume
I, Pa
ge 2
56.
TABL
E 4.
6: C
ontd
.
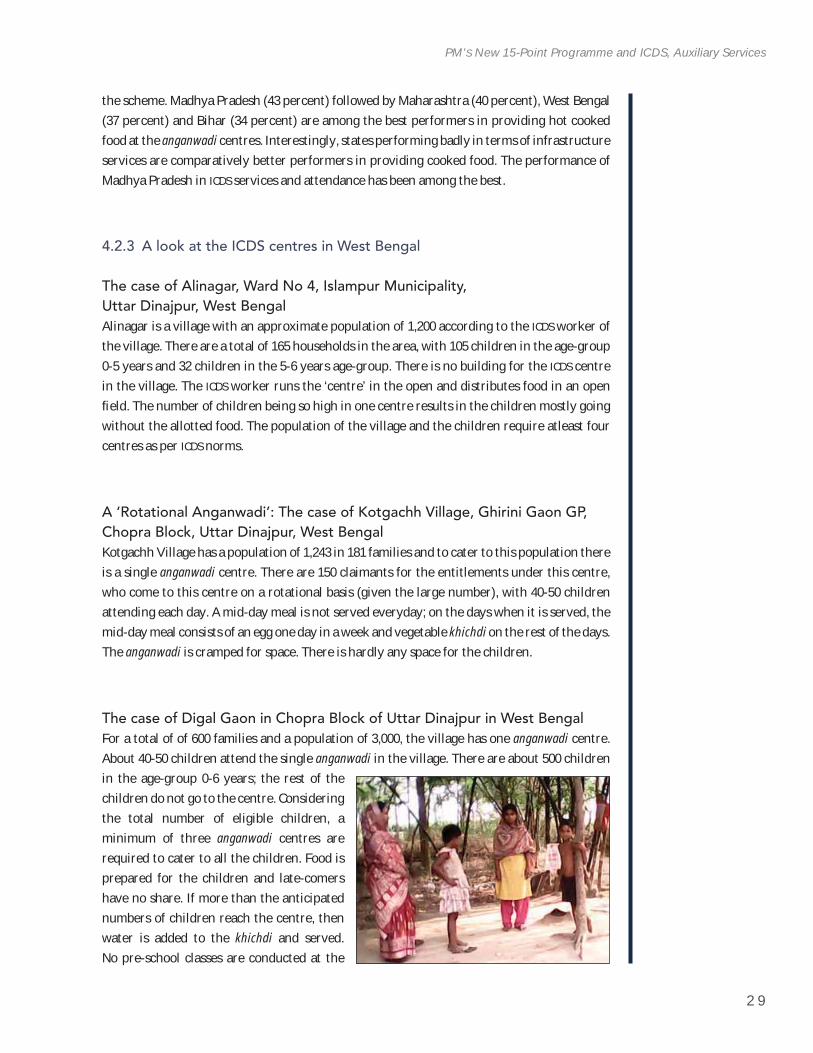
2 9
PM’S New 15-Point Programme and ICDS, Auxiliary Services
the scheme. Madhya Pradesh (43 percent) followed by Maharashtra (40 percent), West Bengal (37 percent) and Bihar (34 percent) are among the best performers in providing hot cooked food at the anganwadi centres. Interestingly, states performing badly in terms of infrastructure services are comparatively better performers in providing cooked food. The performance of Madhya Pradesh in ICDS services and attendance has been among the best.
4.2.3 A look at the ICDS centres in West Bengal
The case of Alinagar, Ward No 4, Islampur Municipality, Uttar Dinajpur, West Bengal Alinagar is a village with an approximate population of 1,200 according to the ICDS worker of the village. There are a total of 165 households in the area, with 105 children in the age-group 0-5 years and 32 children in the 5-6 years age-group. There is no building for the ICDS centre in the village. The ICDS worker runs the ‘centre’ in the open and distributes food in an open fi eld. The number of children being so high in one centre results in the children mostly going without the allotted food. The population of the village and the children require atleast four centres as per ICDS norms.
A ‘Rotational Anganwadi’: The case of Kotgachh Village, Ghirini Gaon GP, Chopra Block, Uttar Dinajpur, West Bengal Kotgachh Village has a population of 1,243 in 181 families and to cater to this population there is a single anganwadi centre. There are 150 claimants for the entitlements under this centre, who come to this centre on a rotational basis (given the large number), with 40-50 children attending each day. A mid-day meal is not served everyday; on the days when it is served, the mid-day meal consists of an egg one day in a week and vegetable khichdi on the rest of the days. The anganwadi is cramped for space. There is hardly any space for the children.
The case of Digal Gaon in Chopra Block of Uttar Dinajpur in West BengalFor a total of of 600 families and a population of 3,000, the village has one anganwadi centre. About 40-50 children attend the single anganwadi in the village. There are about 500 children in the age-group 0-6 years; the rest of the children do not go to the centre. Considering the total number of eligible children, a minimum of three anganwadi centres are required to cater to all the children. Food is prepared for the children and late-comers have no share. If more than the anticipated numbers of children reach the centre, then water is added to the khichdi and served. No pre-school classes are conducted at the
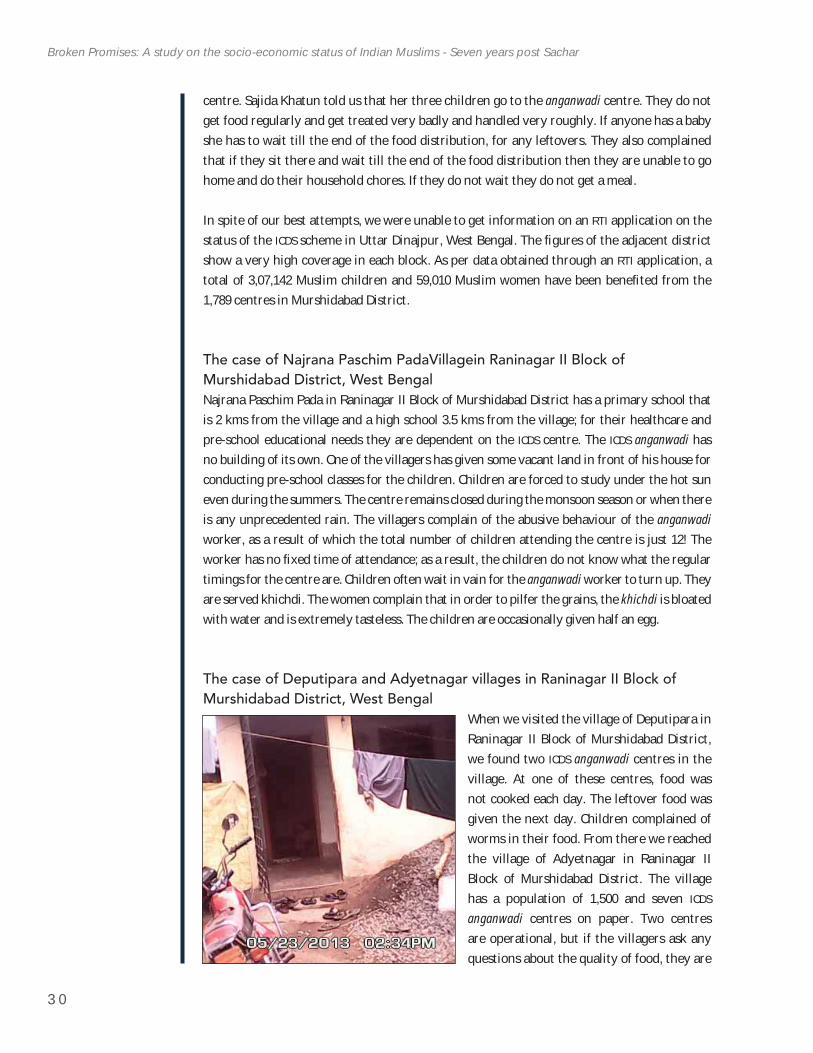
3 0
Broken Promises: A study on the socio-economic status of Indian Muslims - Seven years post Sachar
centre. Sajida Khatun told us that her three children go to the anganwadi centre. They do not get food regularly and get treated very badly and handled very roughly. If anyone has a baby she has to wait till the end of the food distribution, for any leftovers. They also complained that if they sit there and wait till the end of the food distribution then they are unable to go home and do their household chores. If they do not wait they do not get a meal.
In spite of our best attempts, we were unable to get information on an RTI application on the status of the ICDS scheme in Uttar Dinajpur, West Bengal. The fi gures of the adjacent district show a very high coverage in each block. As per data obtained through an RTI application, a total of 3,07,142 Muslim children and 59,010 Muslim women have been benefi ted from the 1,789 centres in Murshidabad District.
The case of Najrana Paschim PadaVillagein Raninagar II Block of Murshidabad District, West BengalNajrana Paschim Pada in Raninagar II Block of Murshidabad District has a primary school that is 2 kms from the village and a high school 3.5 kms from the village; for their healthcare and pre-school educational needs they are dependent on the ICDS centre. The ICDS anganwadi has no building of its own. One of the villagers has given some vacant land in front of his house for conducting pre-school classes for the children. Children are forced to study under the hot sun even during the summers. The centre remains closed during the monsoon season or when there is any unprecedented rain. The villagers complain of the abusive behaviour of the anganwadiworker, as a result of which the total number of children attending the centre is just 12! The worker has no fi xed time of attendance; as a result, the children do not know what the regular timings for the centre are. Children often wait in vain for the anganwadi worker to turn up. They are served khichdi. The women complain that in order to pilfer the grains, the khichdi is bloated with water and is extremely tasteless. The children are occasionally given half an egg.
The case of Deputipara and Adyetnagar villages in Raninagar II Block of Murshidabad District, West Bengal
When we visited the village of Deputipara in Raninagar II Block of Murshidabad District, we found two ICDS anganwadi centres in the village. At one of these centres, food was not cooked each day. The leftover food was given the next day. Children complained of worms in their food. From there we reached the village of Adyetnagar in Raninagar II Block of Murshidabad District. The village has a population of 1,500 and seven ICDSanganwadi centres on paper. Two centres are operational, but if the villagers ask any questions about the quality of food, they are
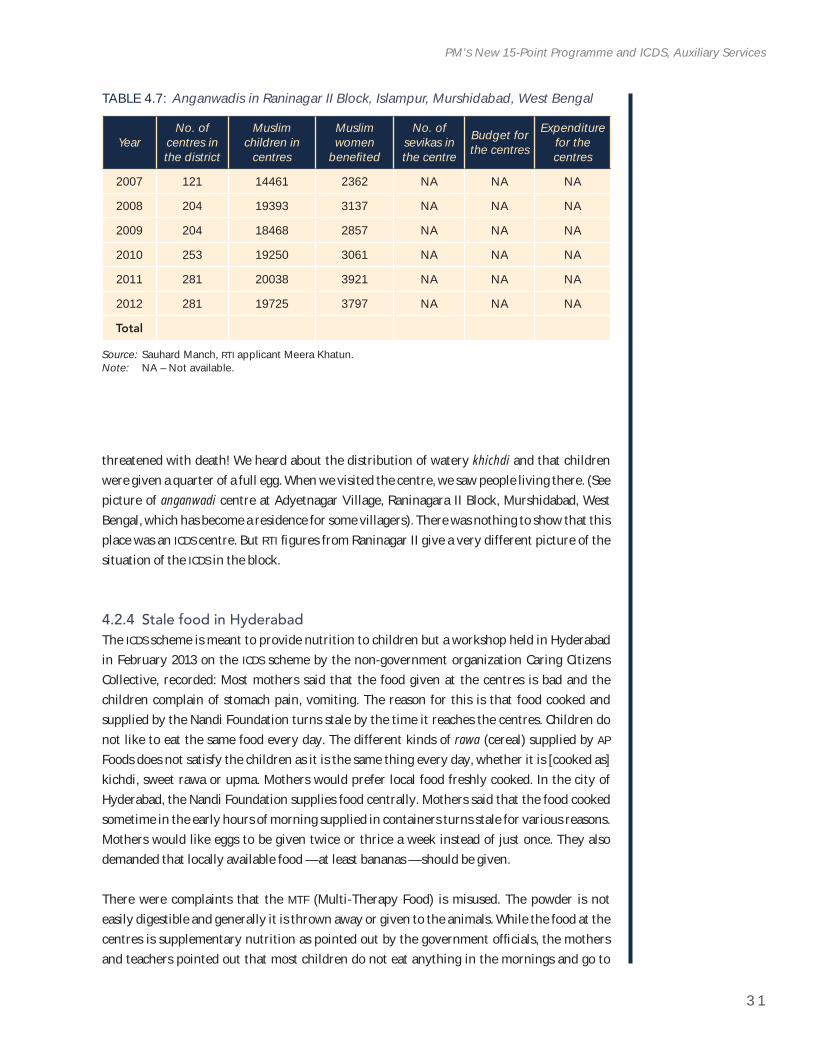
3 1
PM’S New 15-Point Programme and ICDS, Auxiliary Services
threatened with death! We heard about the distribution of watery khichdi and that children were given a quarter of a full egg. When we visited the centre, we saw people living there. (See picture of anganwadi centre at Adyetnagar Village, Raninagara II Block, Murshidabad, West Bengal, which has become a residence for some villagers). There was nothing to show that this place was an ICDS centre. But RTI fi gures from Raninagar II give a very different picture of the situation of the ICDS in the block.
4.2.4 Stale food in HyderabadThe ICDS scheme is meant to provide nutrition to children but a workshop held in Hyderabad in February 2013 on the ICDS scheme by the non-government organization Caring Citizens Collective, recorded: Most mothers said that the food given at the centres is bad and the children complain of stomach pain, vomiting. The reason for this is that food cooked and supplied by the Nandi Foundation turns stale by the time it reaches the centres. Children do not like to eat the same food every day. The different kinds of rawa (cereal) supplied by APFoods does not satisfy the children as it is the same thing every day, whether it is [cooked as] kichdi, sweet rawa or upma. Mothers would prefer local food freshly cooked. In the city of Hyderabad, the Nandi Foundation supplies food centrally. Mothers said that the food cooked sometime in the early hours of morning supplied in containers turns stale for various reasons. Mothers would like eggs to be given twice or thrice a week instead of just once. They also demanded that locally available food — at least bananas — should be given.
There were complaints that the MTF (Multi-Therapy Food) is misused. The powder is not easily digestible and generally it is thrown away or given to the animals. While the food at the centres is supplementary nutrition as pointed out by the government offi cials, the mothers and teachers pointed out that most children do not eat anything in the mornings and go to
TABLE 4.7: Anganwadis in Raninagar II Block, Islampur, Murshidabad, West Bengal
YearNo. of
centres in the district
Muslimchildren in
centres
Muslimwomen
benefi ted
No. of sevikas in the centre
Budget for the centres
Expenditure for the centres
2007 121 14461 2362 NA NA NA
2008 204 19393 3137 NA NA NA
2009 204 18468 2857 NA NA NA
2010 253 19250 3061 NA NA NA
2011 281 20038 3921 NA NA NA
2012 281 19725 3797 NA NA NA
Total
Source: Sauhard Manch, RTI applicant Meera Khatun.Note: NA – Not available.
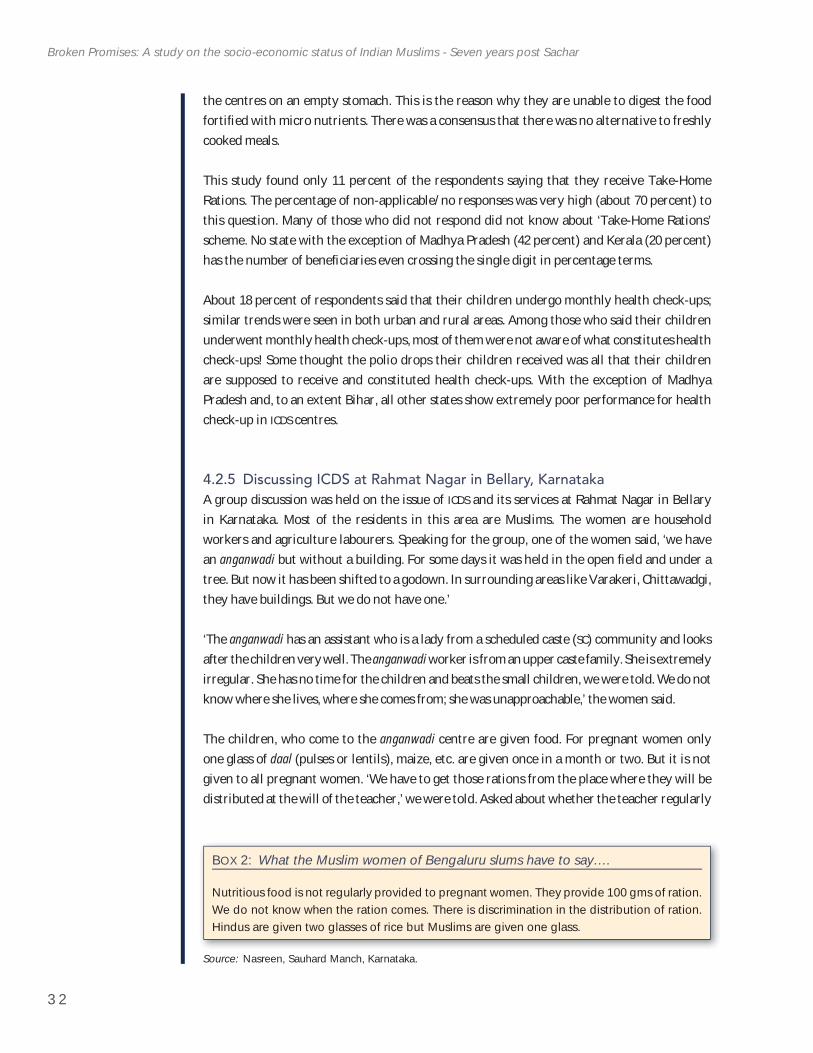
3 2
Broken Promises: A study on the socio-economic status of Indian Muslims - Seven years post Sachar
the centres on an empty stomach. This is the reason why they are unable to digest the food fortifi ed with micro nutrients. There was a consensus that there was no alternative to freshly cooked meals.
This study found only 11 percent of the respondents saying that they receive Take-Home Rations. The percentage of non-applicable/no responses was very high (about 70 percent) to this question. Many of those who did not respond did not know about ‘Take-Home Rations’ scheme. No state with the exception of Madhya Pradesh (42 percent) and Kerala (20 percent) has the number of benefi ciaries even crossing the single digit in percentage terms.
About 18 percent of respondents said that their children undergo monthly health check-ups; similar trends were seen in both urban and rural areas. Among those who said their children underwent monthly health check-ups, most of them were not aware of what constitutes health check-ups! Some thought the polio drops their children received was all that their children are supposed to receive and constituted health check-ups. With the exception of Madhya Pradesh and, to an extent Bihar, all other states show extremely poor performance for health check-up in ICDS centres.
4.2.5 Discussing ICDS at Rahmat Nagar in Bellary, KarnatakaA group discussion was held on the issue of ICDS and its services at Rahmat Nagar in Bellary in Karnataka. Most of the residents in this area are Muslims. The women are household workers and agriculture labourers. Speaking for the group, one of the women said, ‘we have an anganwadi but without a building. For some days it was held in the open fi eld and under a tree. But now it has been shifted to a godown. In surrounding areas like Varakeri, Chittawadgi, they have buildings. But we do not have one.’
‘The anganwadi has an assistant who is a lady from a scheduled caste (SC) community and looks after the children very well. The anganwadi worker is from an upper caste family. She is extremely irregular. She has no time for the children and beats the small children, we were told. We do not know where she lives, where she comes from; she was unapproachable,’ the women said.
The children, who come to the anganwadi centre are given food. For pregnant women only one glass of daal (pulses or lentils), maize, etc. are given once in a month or two. But it is not given to all pregnant women. ‘We have to get those rations from the place where they will be distributed at the will of the teacher,’ we were told. Asked about whether the teacher regularly
BOX 2: What the Muslim women of Bengaluru slums have to say….
Nutritious food is not regularly provided to pregnant women. They provide 100 gms of ration. We do not know when the ration comes. There is discrimination in the distribution of ration. Hindus are given two glasses of rice but Muslims are given one glass.
Source: Nasreen, Sauhard Manch, Karnataka.
3 3
PM’S New 15-Point Programme and ICDS, Auxiliary Services
conducts health check-ups of the children and mothers, the responses were encapsulated in this statement: ‘The anganwadi worker never interacts. She never visits us or fi nds out about our children’s needs. She takes the weight of the children but never enquires about their health or the mothers’ health.’
The Bhagyalaxmi Scheme of Karnataka Government is meant for upto two girl children of BPLfamilies. The scholarship benefi ts upto PUC level and insurance is covered by LIC and maturity grant of `20,000 deposited in the name of the girl child who will receive it at the age of 18, if she remains unmarried.
‘Earlier there was an anganwadi worker who took so much effort in going from door to door, creating awareness about health. She used to advise people on importance of remaining clean, how and why to remain clean after childbirth, how to look after the baby, etc. After her death, the new anganwadi worker does not bother about all these things.’
On being asked whether the anganwadi worker refers their children to doctors if there is any serious health issue, we were told that she ‘neglects them very much. Once a child was seriously ill, the anganwadi worker took it to a hospital. It remained there for fi ve days and then died. When asked about this, the teacher’s answer was — “What can I do? Nobody cares about the health of the children, why should I?’’ ’
On being asked about the benefi ts under the Bhagyalakshmi scheme, the participants angrily responded saying only three or four children had received it. We were told: ‘Moreover, we have to pay thousands of rupees as a commission to the anganwadi worker. We are forced to pay money for every application and signature. If money is not paid, work is not done. If we complain about this to the supervisor, we will be taken to task later by the anganwadi worker. The anganwadi worker blackmails us [saying] that if we complain about her, she would cancel our Bhagyalakshmi Bonds.’
But as per the information received through RTI applications, all is reported to be well with the ICDS scheme in the three Karnataka districts of Gulbarga, Bidar and Bengaluru. A look at the Tables 4.8 and 4.9 gives an indication.
Similarly, a look at the fi gures provided in Table 4.9 from Bengaluru district, received through an RTI application, show 94 percent overall realization.
4.2.6 Are children receiving pre-school education at ICDS centre?Only about 20 percent of the respondents said that their children were receiving pre-school education. About 59 percent did not respond, the reasons being: Some were not aware that their children are supposed to receive pre-school education at ICDS anganwadi centres and it was not applicable for some others who did not have children of the requisite age group. Madhya Pradesh (40 percent), Bihar (35 percent), Maharashtra (33 percent) show best performance in
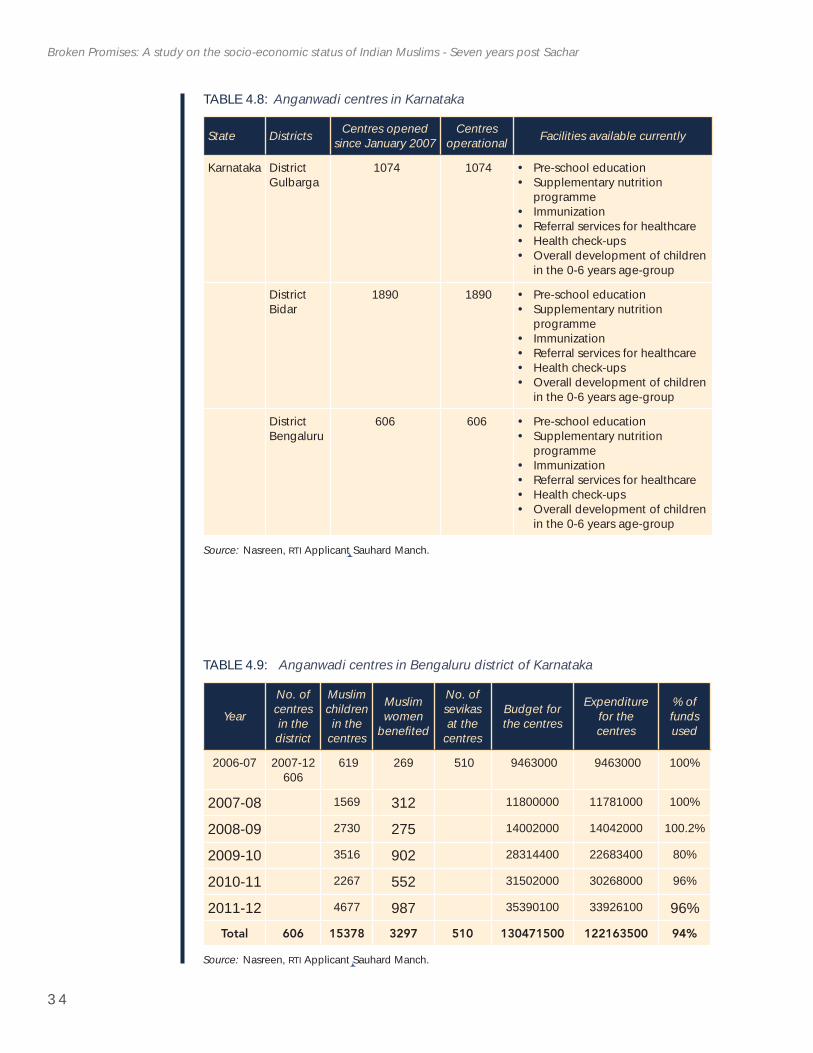
3 4
Broken Promises: A study on the socio-economic status of Indian Muslims - Seven years post Sachar
TABLE 4.8: Anganwadi centres in Karnataka
State Districts Centres opened since January 2007
Centres operational Facilities available currently
Karnataka District Gulbarga
1074 1074 Pre-school educationSupplementary nutrition programmeImmunizationReferral services for healthcareHealth check-upsOverall development of children in the 0-6 years age-group
DistrictBidar
1890 1890 Pre-school educationSupplementary nutrition programmeImmunizationReferral services for healthcareHealth check-upsOverall development of children in the 0-6 years age-group
DistrictBengaluru
606 606 Pre-school educationSupplementary nutrition programmeImmunizationReferral services for healthcareHealth check-upsOverall development of children in the 0-6 years age-group
Source: Nasreen, RTI Applicant Sauhard Manch.
TABLE 4.9: Anganwadi centres in Bengaluru district of Karnataka
Year
No. of centres in the district
Muslimchildren in the
centres
Muslimwomen
benefi ted
No. of sevikasat the
centres
Budget for the centres
Expenditure for the centres
% of fundsused
2006-07 2007-12606
619 269 510 9463000 9463000 100%
2007-08 1569 312 11800000 11781000 100%
2008-09 2730 275 14002000 14042000 100.2%
2009-10 3516 902 28314400 22683400 80%
2010-11 2267 552 31502000 30268000 96%
2011-12 4677 987 35390100 33926100 96%Total 606 15378 3297 510 130471500 122163500 94%
Source: Nasreen, RTI Applicant Sauhard Manch.
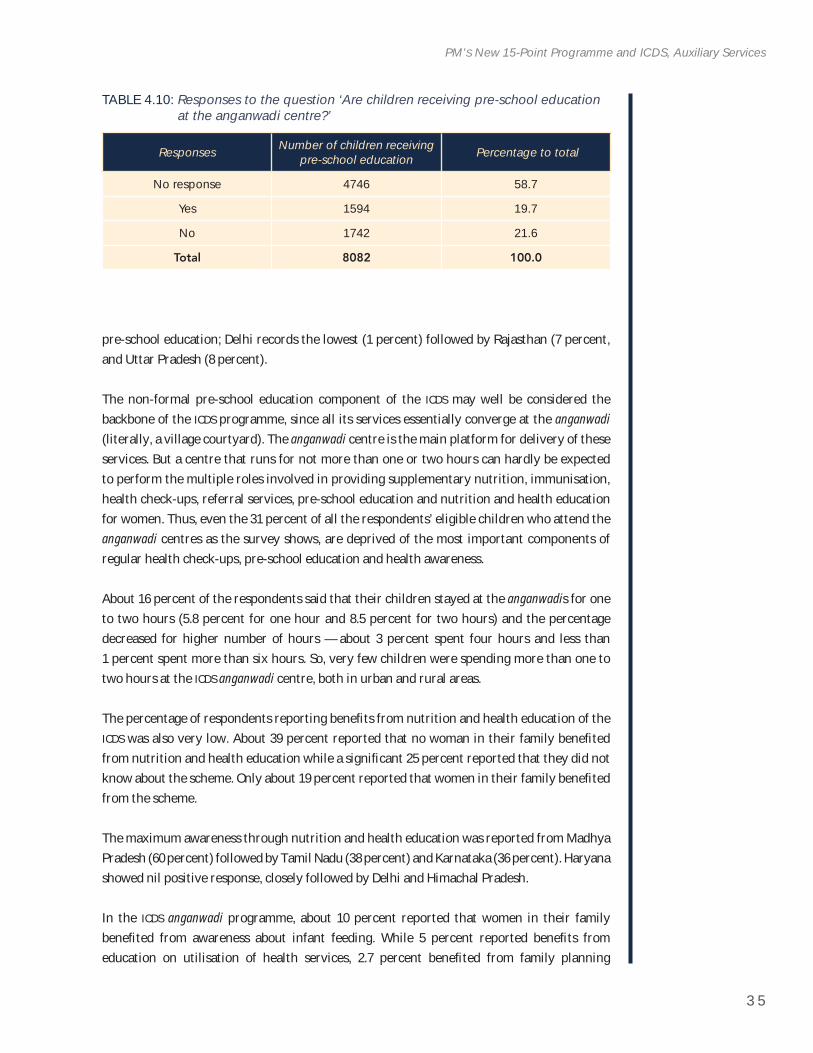
3 5
PM’S New 15-Point Programme and ICDS, Auxiliary Services
pre-school education; Delhi records the lowest (1 percent) followed by Rajasthan (7 percent, and Uttar Pradesh (8 percent).
The non-formal pre-school education component of the ICDS may well be considered the backbone of the ICDS programme, since all its services essentially converge at the anganwadi(literally, a village courtyard). The anganwadi centre is the main platform for delivery of these services. But a centre that runs for not more than one or two hours can hardly be expected to perform the multiple roles involved in providing supplementary nutrition, immunisation, health check-ups, referral services, pre-school education and nutrition and health education for women. Thus, even the 31 percent of all the respondents’ eligible children who attend the anganwadi centres as the survey shows, are deprived of the most important components of regular health check-ups, pre-school education and health awareness.
About 16 percent of the respondents said that their children stayed at the anganwadis for one to two hours (5.8 percent for one hour and 8.5 percent for two hours) and the percentage decreased for higher number of hours — about 3 percent spent four hours and less than 1 percent spent more than six hours. So, very few children were spending more than one to two hours at the ICDS anganwadi centre, both in urban and rural areas.
The percentage of respondents reporting benefi ts from nutrition and health education of the ICDS was also very low. About 39 percent reported that no woman in their family benefi ted from nutrition and health education while a signifi cant 25 percent reported that they did not know about the scheme. Only about 19 percent reported that women in their family benefi ted from the scheme.
The maximum awareness through nutrition and health education was reported from Madhya Pradesh (60 percent) followed by Tamil Nadu (38 percent) and Karnataka (36 percent). Haryana showed nil positive response, closely followed by Delhi and Himachal Pradesh.
In the ICDS anganwadi programme, about 10 percent reported that women in their family benefi ted from awareness about infant feeding. While 5 percent reported benefi ts from education on utilisation of health services, 2.7 percent benefi ted from family planning
TABLE 4.10: Responses to the question ‘Are children receiving pre-school education at the anganwadi centre?’
Responses Number of children receiving pre-school education Percentage to total
No response 4746 58.7
Yes 1594 19.7
No 1742 21.6
Total 8082 100.0
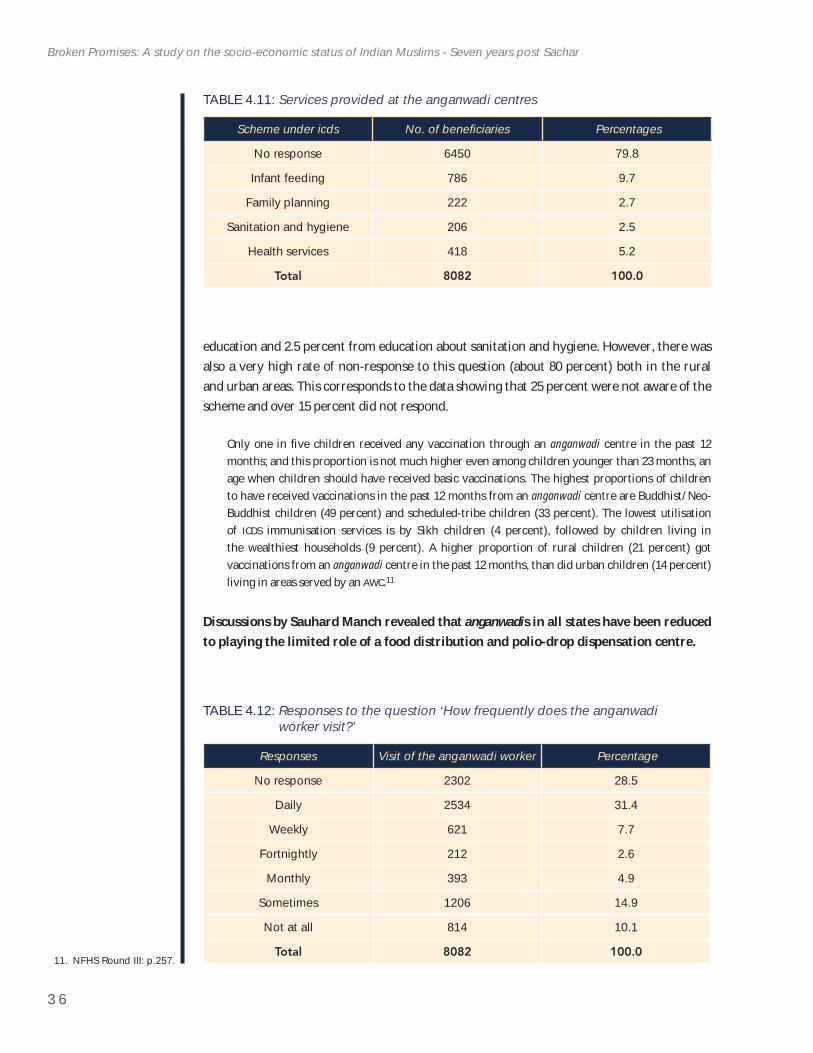
3 6
Broken Promises: A study on the socio-economic status of Indian Muslims - Seven years post Sachar
11. NFHS Round III: p.257.
education and 2.5 percent from education about sanitation and hygiene. However, there was also a very high rate of non-response to this question (about 80 percent) both in the rural and urban areas. This corresponds to the data showing that 25 percent were not aware of the scheme and over 15 percent did not respond.
Only one in fi ve children received any vaccination through an anganwadi centre in the past 12 months; and this proportion is not much higher even among children younger than 23 months, an age when children should have received basic vaccinations. The highest proportions of children to have received vaccinations in the past 12 months from an anganwadi centre are Buddhist/Neo-Buddhist children (49 percent) and scheduled-tribe children (33 percent). The lowest utilisation of ICDS immunisation services is by Sikh children (4 percent), followed by children living in the wealthiest households (9 percent). A higher proportion of rural children (21 percent) got vaccinations from an anganwadi centre in the past 12 months, than did urban children (14 percent) living in areas served by an AWC.11
Discussions by Sauhard Manch revealed that anganwadis in all states have been reduced to playing the limited role of a food distribution and polio-drop dispensation centre.
TABLE 4.11: Services provided at the anganwadi centres
Scheme under icds No. of benefi ciaries Percentages
No response 6450 79.8
Infant feeding 786 9.7
Family planning 222 2.7
Sanitation and hygiene 206 2.5
Health services 418 5.2
Total 8082 100.0
TABLE 4.12: Responses to the question ‘How frequently does the anganwadi worker visit?’
Responses Visit of the anganwadi worker Percentage
No response 2302 28.5
Daily 2534 31.4
Weekly 621 7.7
Fortnightly 212 2.6
Monthly 393 4.9
Sometimes 1206 14.9
Not at all 814 10.1
Total 8082 100.0
3 7
PM’S New 15-Point Programme and ICDS, Auxiliary Services
Less than one-third of the respondents (about 31 percent) said that the anganwadi worker visited their houses daily while about 15 percent said that the visits were ‘sometimes’ (defeating the whole purpose of ICDS and the defi nition of an anganwadi worker) and 10 percent reported that there were no visits at all. Of 814 respondents who reported no visits, 552 were from urban areas.
4.2.7 Discriminated! An anganwadi helper not allowed to cook!In a village of Barabanki District, Uttar Pradesh, Razia (details withheld to avoid identifi cation) was appointed as helper in an anganwadi centre a few years back. She was not a good cook at the time she joined. But she was very keen to learn cooking and when the anganwadi started providing food, she started helping in cooking for the anganwadi children.
But soon the villagers complained that being a ‘backward Muslim (burji)’, she should not cook food for their children, saying that they would stop sending their children to the anganwadicentre if she was not stopped from cooking. Because a majority of the students belonged to the upper caste Hindu communities, Razia was asked to stay away from cooking. She is still working as a helper in the same anganwadi centre but she is not allowed to touch any utensils and other cooking items. Razia says, ‘I understand this problem. Even if we open a grocery store then an upper caste customer probably wouldn’t shop there.’ She added that caste-based discrimination is a part of her day-to-day life.
4.3 People’s Recommendations: What is the Ideal Anganwadi Centre
Voices from the ground
1. ‘We want that our children should be taken care of with love and affection. Children should be provided with charts and toys in the anganwadi.’
2. ‘If our children are found malnourished, we should be provided with proper guidance and advice. Timely advice should be given about the lack of vitamins and minerals and quality and quantity of food to be given.’
3. ‘We are illiterate and uneducated. If we do not go to work we will suffer. There is nobody to look after our children at home when we go to work. So there should be good facilities in the anganwadi.’
4. ‘Women on fi rst delivery do not have any basic knowledge. Such women should get necessary information from the anganwadi.’
5. ‘Health concerns should be free from corruption. Poor people cannot afford to go to private hospitals. If we pour whatever we earn to a private hospital how can we get nutritious food?’
6. ‘Co-operative and competent candidates, who will adjust with each community, should be selected as the in-charge of each centre. Savarna (Hindus) anganwadi workers may not adjust with the dalits, tribals and minorities.’
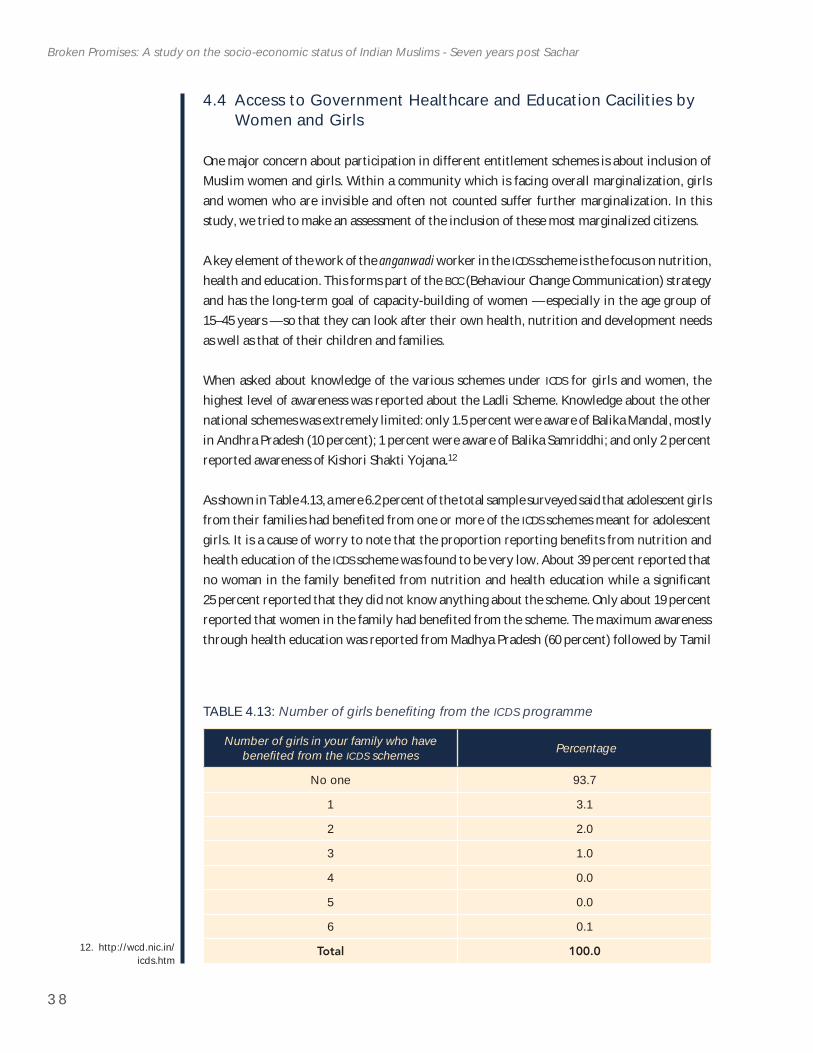
3 8
Broken Promises: A study on the socio-economic status of Indian Muslims - Seven years post Sachar
12. http://wcd.nic.in/icds.htm
4.4 Access to Government Healthcare and Education Cacilities by Women and Girls
One major concern about participation in different entitlement schemes is about inclusion of Muslim women and girls. Within a community which is facing overall marginalization, girls and women who are invisible and often not counted suffer further marginalization. In this study, we tried to make an assessment of the inclusion of these most marginalized citizens.
A key element of the work of the anganwadi worker in the ICDS scheme is the focus on nutrition, health and education. This forms part of the BCC (Behaviour Change Communication) strategy and has the long-term goal of capacity-building of women — especially in the age group of 15–45 years — so that they can look after their own health, nutrition and development needs as well as that of their children and families.
When asked about knowledge of the various schemes under ICDS for girls and women, the highest level of awareness was reported about the Ladli Scheme. Knowledge about the other national schemes was extremely limited: only 1.5 percent were aware of Balika Mandal, mostly in Andhra Pradesh (10 percent); 1 percent were aware of Balika Samriddhi; and only 2 percent reported awareness of Kishori Shakti Yojana.12
As shown in Table 4.13, a mere 6.2 percent of the total sample surveyed said that adolescent girls from their families had benefi ted from one or more of the ICDS schemes meant for adolescent girls. It is a cause of worry to note that the proportion reporting benefi ts from nutrition and health education of the ICDS scheme was found to be very low. About 39 percent reported that no woman in the family benefi ted from nutrition and health education while a signifi cant 25 percent reported that they did not know anything about the scheme. Only about 19 percent reported that women in the family had benefi ted from the scheme. The maximum awareness through health education was reported from Madhya Pradesh (60 percent) followed by Tamil
TABLE 4.13: Number of girls benefi ting from the ICDS programme
Number of girls in your family who have benefi ted from the ICDS schemes Percentage
No one 93.7
1 3.1
2 2.0
3 1.0
4 0.0
5 0.0
6 0.1
Total 100.0
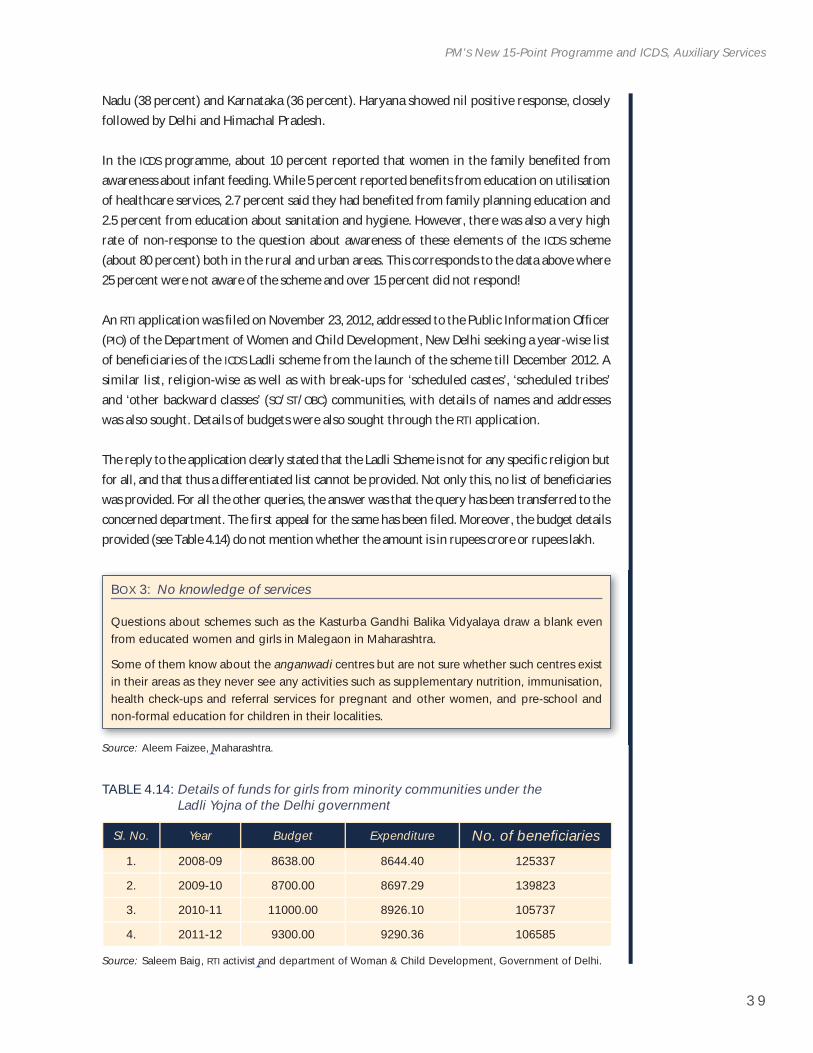
3 9
PM’S New 15-Point Programme and ICDS, Auxiliary Services
Nadu (38 percent) and Karnataka (36 percent). Haryana showed nil positive response, closely followed by Delhi and Himachal Pradesh.
In the ICDS programme, about 10 percent reported that women in the family benefi ted from awareness about infant feeding. While 5 percent reported benefi ts from education on utilisation of healthcare services, 2.7 percent said they had benefi ted from family planning education and 2.5 percent from education about sanitation and hygiene. However, there was also a very high rate of non-response to the question about awareness of these elements of the ICDS scheme (about 80 percent) both in the rural and urban areas. This corresponds to the data above where 25 percent were not aware of the scheme and over 15 percent did not respond!
An RTI application was fi led on November 23, 2012, addressed to the Public Information Offi cer (PIO) of the Department of Women and Child Development, New Delhi seeking a year-wise list of benefi ciaries of the ICDS Ladli scheme from the launch of the scheme till December 2012. A similar list, religion-wise as well as with break-ups for ‘scheduled castes’, ‘scheduled tribes’ and ‘other backward classes’ (SC/ST/OBC) communities, with details of names and addresses was also sought. Details of budgets were also sought through the RTI application.
The reply to the application clearly stated that the Ladli Scheme is not for any specifi c religion but for all, and that thus a differentiated list cannot be provided. Not only this, no list of benefi ciaries was provided. For all the other queries, the answer was that the query has been transferred to the concerned department. The fi rst appeal for the same has been fi led. Moreover, the budget details provided (see Table 4.14) do not mention whether the amount is in rupees crore or rupees lakh.
TABLE 4.14: Details of funds for girls from minority communities under the Ladli Yojna of the Delhi government
Sl. No. Year Budget Expenditure No. of benefi ciaries1. 2008-09 8638.00 8644.40 125337
2. 2009-10 8700.00 8697.29 139823
3. 2010-11 11000.00 8926.10 105737
4. 2011-12 9300.00 9290.36 106585
Source: Saleem Baig, RTI activist and department of Woman & Child Development, Government of Delhi.
BOX 3: No knowledge of services
Questions about schemes such as the Kasturba Gandhi Balika Vidyalaya draw a blank even from educated women and girls in Malegaon in Maharashtra.
Some of them know about the anganwadi centres but are not sure whether such centres exist in their areas as they never see any activities such as supplementary nutrition, immunisation, health check-ups and referral services for pregnant and other women, and pre-school and non-formal education for children in their localities.
Source: Aleem Faizee, Maharashtra.
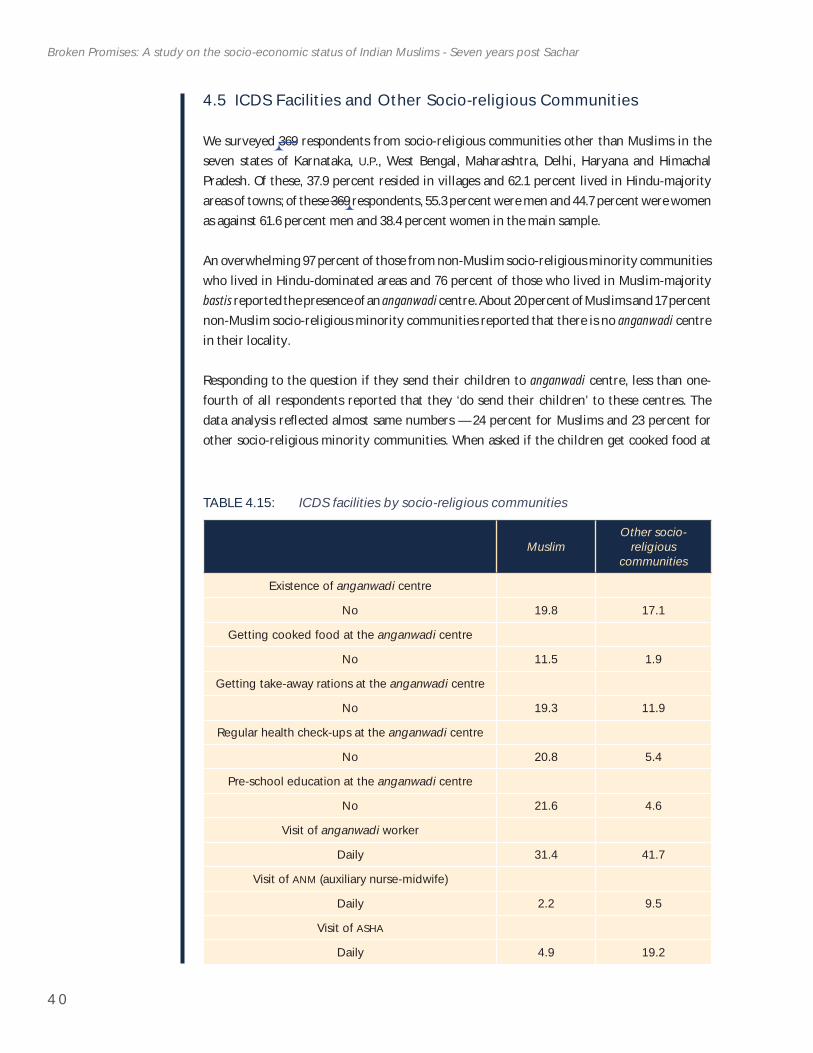
4 0
Broken Promises: A study on the socio-economic status of Indian Muslims - Seven years post Sachar
4.5 ICDS Facilities and Other Socio-religious Communities
We surveyed 369 respondents from socio-religious communities other than Muslims in the seven states of Karnataka, U.P., West Bengal, Maharashtra, Delhi, Haryana and Himachal Pradesh. Of these, 37.9 percent resided in villages and 62.1 percent lived in Hindu-majority areas of towns; of these 369 respondents, 55.3 percent were men and 44.7 percent were women as against 61.6 percent men and 38.4 percent women in the main sample.
An overwhelming 97 percent of those from non-Muslim socio-religious minority communities who lived in Hindu-dominated areas and 76 percent of those who lived in Muslim-majority bastis reported the presence of an anganwadi centre. About 20 percent of Muslims and 17 percent non-Muslim socio-religious minority communities reported that there is no anganwadi centre in their locality.
Responding to the question if they send their children to anganwadi centre, less than one-fourth of all respondents reported that they ‘do send their children’ to these centres. The data analysis refl ected almost same numbers — 24 percent for Muslims and 23 percent for other socio-religious minority communities. When asked if the children get cooked food at
TABLE 4.15: ICDS facilities by socio-religious communities
MuslimOther socio-
religious communities
Existence of anganwadi centre
No 19.8 17.1
Getting cooked food at the anganwadi centre
No 11.5 1.9
Getting take-away rations at the anganwadi centre
No 19.3 11.9
Regular health check-ups at the anganwadi centre
No 20.8 5.4
Pre-school education at the anganwadi centre
No 21.6 4.6
Visit of anganwadi worker
Daily 31.4 41.7
Visit of ANM (auxiliary nurse-midwife)
Daily 2.2 9.5
Visit of ASHA
Daily 4.9 19.2
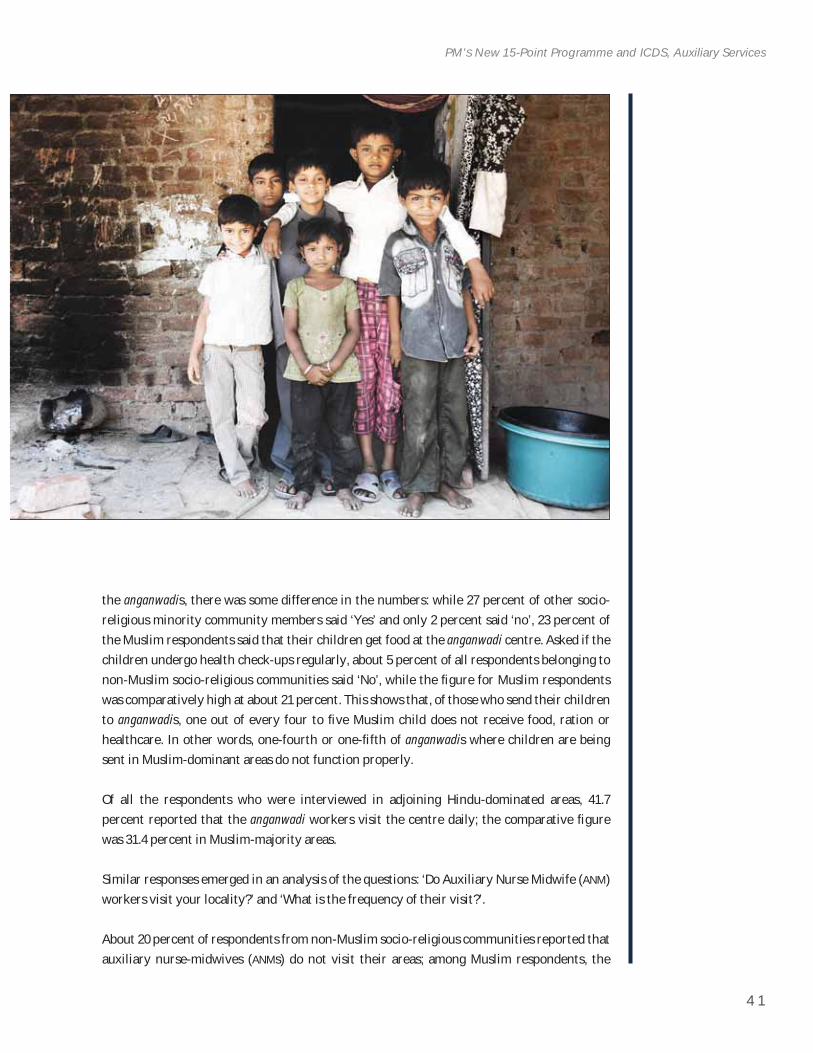
4 1
PM’S New 15-Point Programme and ICDS, Auxiliary Services
the anganwadis, there was some difference in the numbers: while 27 percent of other socio-religious minority community members said ‘Yes’ and only 2 percent said ‘no’, 23 percent of the Muslim respondents said that their children get food at the anganwadi centre. Asked if the children undergo health check-ups regularly, about 5 percent of all respondents belonging to non-Muslim socio-religious communities said ‘No’, while the fi gure for Muslim respondents was comparatively high at about 21 percent. This shows that, of those who send their children to anganwadis, one out of every four to fi ve Muslim child does not receive food, ration or healthcare. In other words, one-fourth or one-fi fth of anganwadis where children are being sent in Muslim-dominant areas do not function properly.
Of all the respondents who were interviewed in adjoining Hindu-dominated areas, 41.7 percent reported that the anganwadi workers visit the centre daily; the comparative fi gure was 31.4 percent in Muslim-majority areas.
Similar responses emerged in an analysis of the questions: ‘Do Auxiliary Nurse Midwife (ANM)workers visit your locality?’ and ‘What is the frequency of their visit?’.
About 20 percent of respondents from non-Muslim socio-religious communities reported that auxiliary nurse-midwives (ANMs) do not visit their areas; among Muslim respondents, the
4 2
Broken Promises: A study on the socio-economic status of Indian Muslims - Seven years post Sachar
comparative fi gure was 32 percent. If we merge the following three categories — ‘Monthly’, ‘Sometimes’, and ‘Never’ — of irregularity, the difference between or non-Muslim socio-religious communities and Muslim respondents is about 20 percent. Similarly, about 50 percent Muslim residents reported that an Accredited Social Health Activist (ASHA) visit their area less than once a month; of these, 25 percent reported that the ASHA worker ‘Never’ visited and above 13 percent said ‘sometimes’. These percentages were relatively quite low for other non-Muslim socio-religious communities, among who only 7.6 percent said ‘Never’ and 7.9 percent said ‘sometimes’.
The response of those who answered the question on what was the caste and religious affi liation of the anganwadi worker in their area, showed that in Hindu-majority localities, 25 percent were ‘upper caste Hindus’, 19 percent were from scheduled caste or tribe communities, 6 percent belonged to the category of ‘other backward classes’ (OBCs) and only 1.6 percent belonged to a minority community. In Muslim-dominated localities, 14.5 percent were from ‘upper caste’ Hindu communities, 10 percent from scheduled caste or tribe communities and 11 percent from OBCs. Anganwadi workers are placed at the lowest rank on the salary ladder of the government.
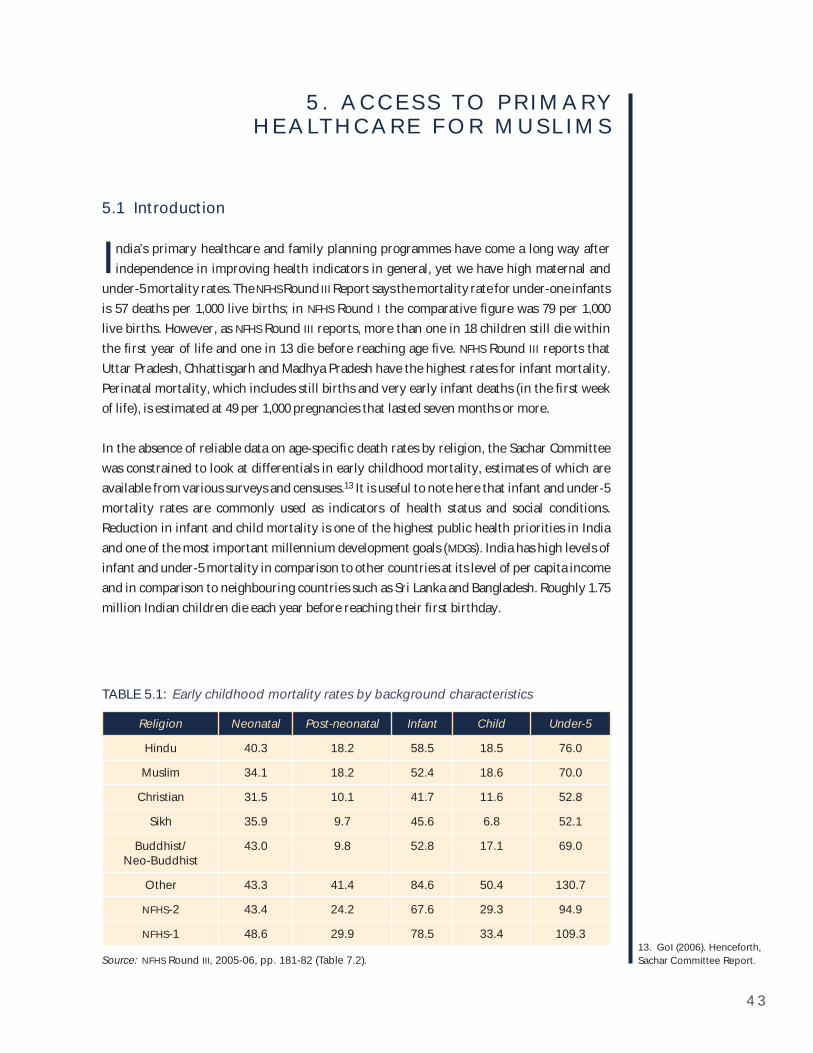
4 3
13. GoI (2006). Henceforth, Sachar Committee Report.
5 . A C C E S S T O P R I M A RY H E A LT H C A R E F O R M U S L I M S
5.1 Introduction
India’s primary healthcare and family planning programmes have come a long way after independence in improving health indicators in general, yet we have high maternal and
under-5 mortality rates. The NFHS Round III Report says the mortality rate for under-one infants is 57 deaths per 1,000 live births; in NFHS Round I the comparative fi gure was 79 per 1,000 live births. However, as NFHS Round III reports, more than one in 18 children still die within the fi rst year of life and one in 13 die before reaching age fi ve. NFHS Round III reports that Uttar Pradesh, Chhattisgarh and Madhya Pradesh have the highest rates for infant mortality. Perinatal mortality, which includes still births and very early infant deaths (in the fi rst week of life), is estimated at 49 per 1,000 pregnancies that lasted seven months or more.
In the absence of reliable data on age-specifi c death rates by religion, the Sachar Committee was constrained to look at differentials in early childhood mortality, estimates of which are available from various surveys and censuses.13 It is useful to note here that infant and under-5 mortality rates are commonly used as indicators of health status and social conditions. Reduction in infant and child mortality is one of the highest public health priorities in India and one of the most important millennium development goals (MDGs). India has high levels of infant and under-5 mortality in comparison to other countries at its level of per capita income and in comparison to neighbouring countries such as Sri Lanka and Bangladesh. Roughly 1.75 million Indian children die each year before reaching their fi rst birthday.
TABLE 5.1: Early childhood mortality rates by background characteristics
Religion Neonatal Post-neonatal Infant Child Under-5
Hindu 40.3 18.2 58.5 18.5 76.0
Muslim 34.1 18.2 52.4 18.6 70.0
Christian 31.5 10.1 41.7 11.6 52.8
Sikh 35.9 9.7 45.6 6.8 52.1
Buddhist/Neo-Buddhist
43.0 9.8 52.8 17.1 69.0
Other 43.3 41.4 84.6 50.4 130.7
NFHS-2 43.4 24.2 67.6 29.3 94.9
NFHS-1 48.6 29.9 78.5 33.4 109.3
Source: NFHS Round III, 2005-06, pp. 181-82 (Table 7.2).
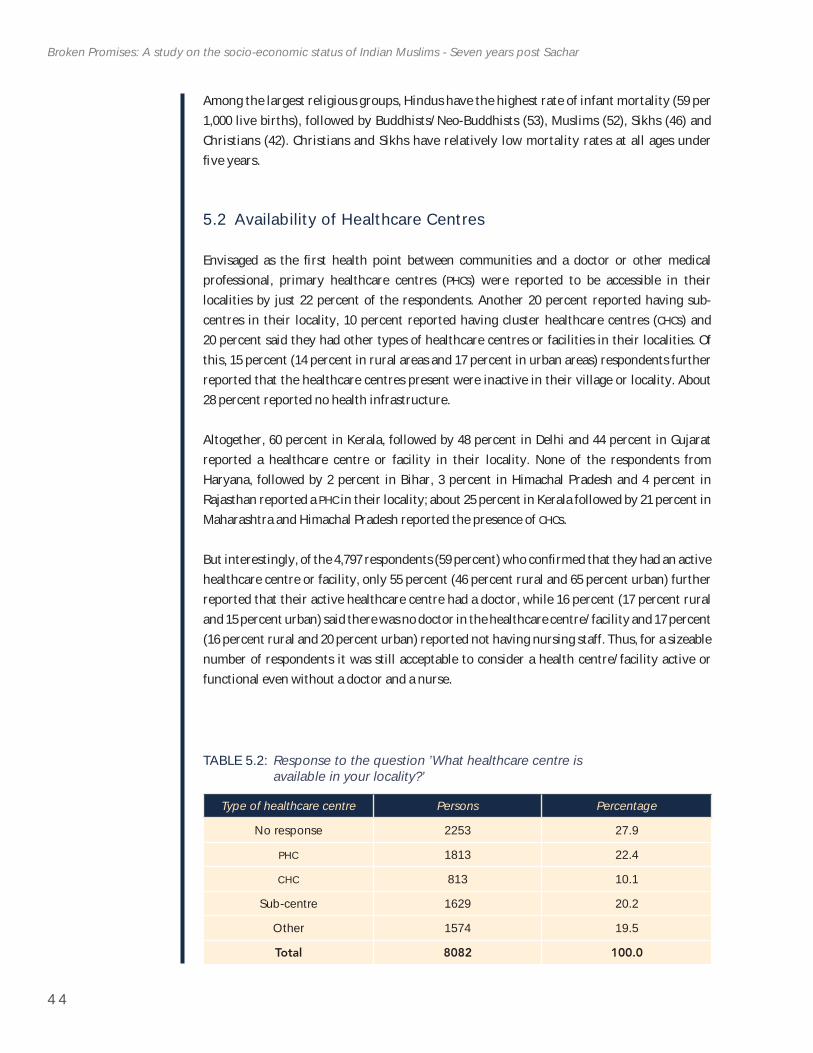
4 4
Broken Promises: A study on the socio-economic status of Indian Muslims - Seven years post Sachar
Among the largest religious groups, Hindus have the highest rate of infant mortality (59 per 1,000 live births), followed by Buddhists/Neo-Buddhists (53), Muslims (52), Sikhs (46) and Christians (42). Christians and Sikhs have relatively low mortality rates at all ages under fi ve years.
5.2 Availability of Healthcare Centres
Envisaged as the fi rst health point between communities and a doctor or other medical professional, primary healthcare centres (PHCs) were reported to be accessible in their localities by just 22 percent of the respondents. Another 20 percent reported having sub-centres in their locality, 10 percent reported having cluster healthcare centres (CHCs) and 20 percent said they had other types of healthcare centres or facilities in their localities. Of this, 15 percent (14 percent in rural areas and 17 percent in urban areas) respondents further reported that the healthcare centres present were inactive in their village or locality. About 28 percent reported no health infrastructure.
Altogether, 60 percent in Kerala, followed by 48 percent in Delhi and 44 percent in Gujarat reported a healthcare centre or facility in their locality. None of the respondents from Haryana, followed by 2 percent in Bihar, 3 percent in Himachal Pradesh and 4 percent in Rajasthan reported a PHC in their locality; about 25 percent in Kerala followed by 21 percent in Maharashtra and Himachal Pradesh reported the presence of CHCs.
But interestingly, of the 4,797 respondents (59 percent) who confi rmed that they had an active healthcare centre or facility, only 55 percent (46 percent rural and 65 percent urban) further reported that their active healthcare centre had a doctor, while 16 percent (17 percent rural and 15 percent urban) said there was no doctor in the healthcare centre/facility and 17 percent (16 percent rural and 20 percent urban) reported not having nursing staff. Thus, for a sizeable number of respondents it was still acceptable to consider a health centre/facility active or functional even without a doctor and a nurse.
TABLE 5.2: Response to the question ’What healthcare centre is available in your locality?’
Type of healthcare centre Persons Percentage
No response 2253 27.9
PHC 1813 22.4
CHC 813 10.1
Sub-centre 1629 20.2
Other 1574 19.5
Total 8082 100.0
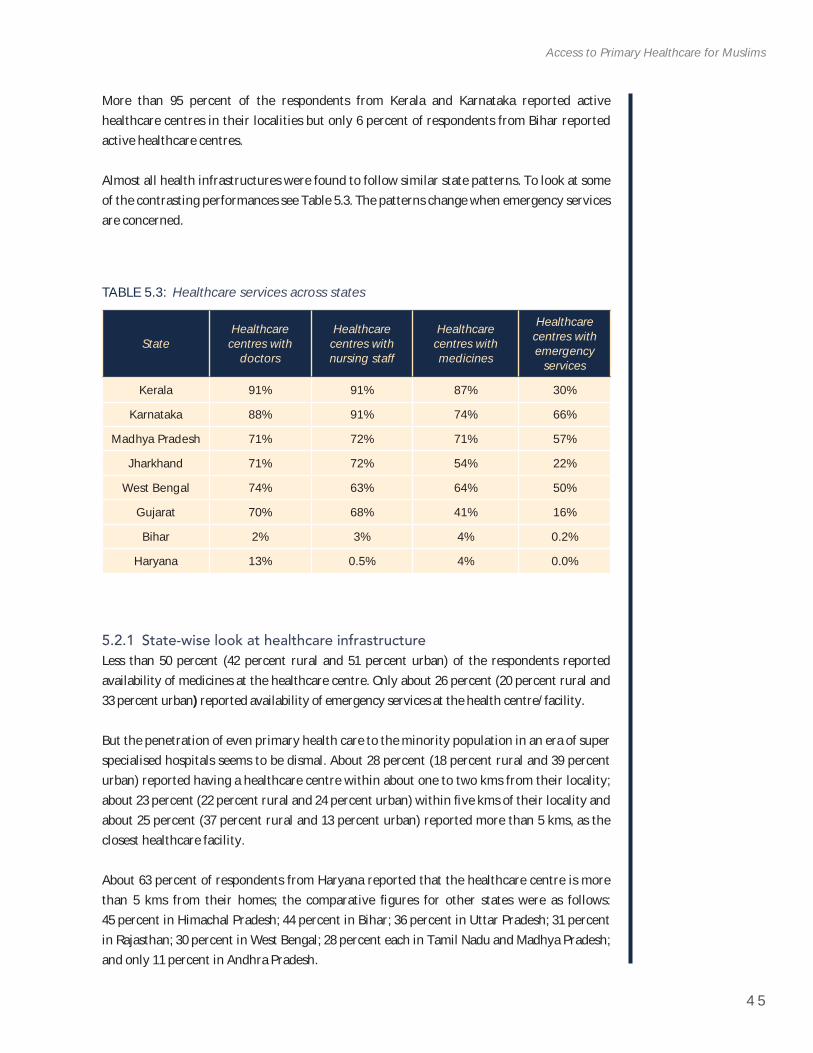
4 5
Access to Primary Healthcare for Muslims
More than 95 percent of the respondents from Kerala and Karnataka reported active healthcare centres in their localities but only 6 percent of respondents from Bihar reported active healthcare centres.
Almost all health infrastructures were found to follow similar state patterns. To look at some of the contrasting performances see Table 5.3. The patterns change when emergency services are concerned.
TABLE 5.3: Healthcare services across states
StateHealthcare centres with
doctors
Healthcare centres with nursing staff
Healthcare centres with medicines
Healthcare centres with emergency
services
Kerala 91% 91% 87% 30%
Karnataka 88% 91% 74% 66%
Madhya Pradesh 71% 72% 71% 57%
Jharkhand 71% 72% 54% 22%
West Bengal 74% 63% 64% 50%
Gujarat 70% 68% 41% 16%
Bihar 2% 3% 4% 0.2%
Haryana 13% 0.5% 4% 0.0%
5.2.1 State-wise look at healthcare infrastructureLess than 50 percent (42 percent rural and 51 percent urban) of the respondents reported availability of medicines at the healthcare centre. Only about 26 percent (20 percent rural and 33 percent urban) reported availability of emergency services at the health centre/facility.
But the penetration of even primary health care to the minority population in an era of super specialised hospitals seems to be dismal. About 28 percent (18 percent rural and 39 percent urban) reported having a healthcare centre within about one to two kms from their locality; about 23 percent (22 percent rural and 24 percent urban) within fi ve kms of their locality and about 25 percent (37 percent rural and 13 percent urban) reported more than 5 kms, as the closest healthcare facility.
About 63 percent of respondents from Haryana reported that the healthcare centre is more than 5 kms from their homes; the comparative fi gures for other states were as follows: 45 percent in Himachal Pradesh; 44 percent in Bihar; 36 percent in Uttar Pradesh; 31 percent in Rajasthan; 30 percent in West Bengal; 28 percent each in Tamil Nadu and Madhya Pradesh; and only 11 percent in Andhra Pradesh.
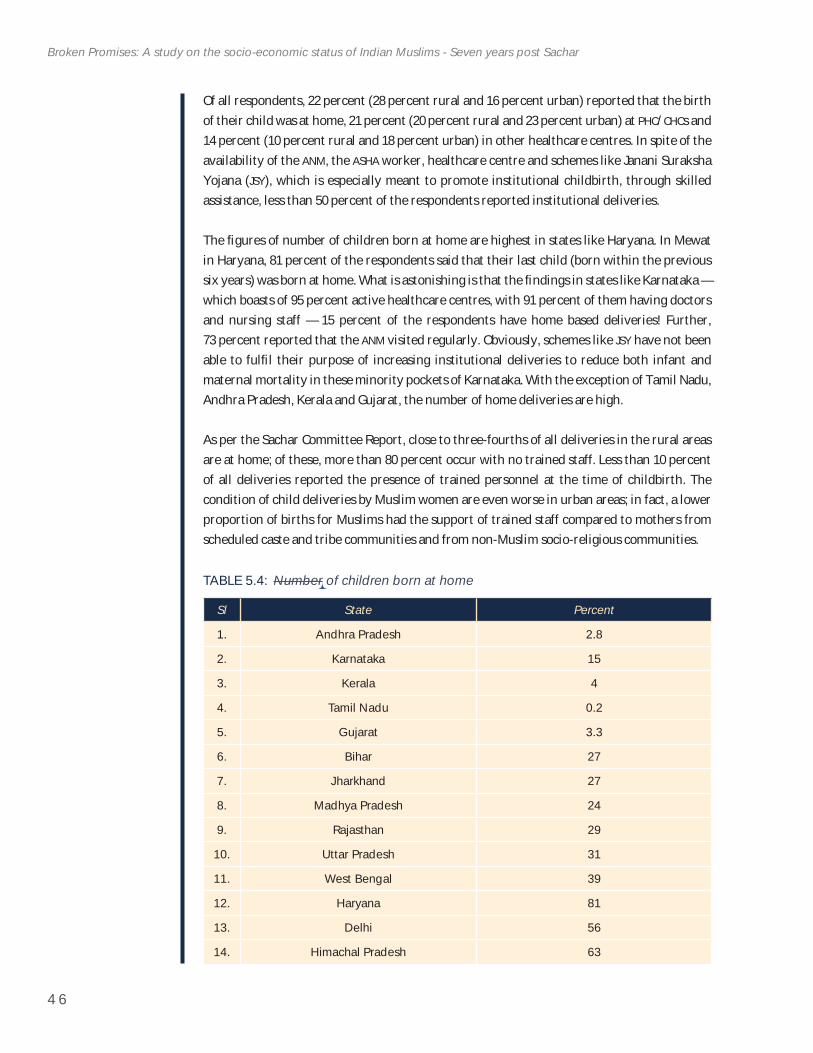
4 6
Broken Promises: A study on the socio-economic status of Indian Muslims - Seven years post Sachar
Of all respondents, 22 percent (28 percent rural and 16 percent urban) reported that the birth of their child was at home, 21 percent (20 percent rural and 23 percent urban) at PHC/CHCs and 14 percent (10 percent rural and 18 percent urban) in other healthcare centres. In spite of the availability of the ANM, the ASHA worker, healthcare centre and schemes like Janani Suraksha Yojana (JSY), which is especially meant to promote institutional childbirth, through skilled assistance, less than 50 percent of the respondents reported institutional deliveries.
The fi gures of number of children born at home are highest in states like Haryana. In Mewat in Haryana, 81 percent of the respondents said that their last child (born within the previous six years) was born at home. What is astonishing is that the fi ndings in states like Karnataka — which boasts of 95 percent active healthcare centres, with 91 percent of them having doctors and nursing staff — 15 percent of the respondents have home based deliveries! Further, 73 percent reported that the ANM visited regularly. Obviously, schemes like JSY have not been able to fulfi l their purpose of increasing institutional deliveries to reduce both infant and maternal mortality in these minority pockets of Karnataka. With the exception of Tamil Nadu, Andhra Pradesh, Kerala and Gujarat, the number of home deliveries are high.
As per the Sachar Committee Report, close to three-fourths of all deliveries in the rural areas are at home; of these, more than 80 percent occur with no trained staff. Less than 10 percent of all deliveries reported the presence of trained personnel at the time of childbirth. The condition of child deliveries by Muslim women are even worse in urban areas; in fact, a lower proportion of births for Muslims had the support of trained staff compared to mothers from scheduled caste and tribe communities and from non-Muslim socio-religious communities.
TABLE 5.4: Number of children born at home
Sl State Percent
1. Andhra Pradesh 2.8
2. Karnataka 15
3. Kerala 4
4. Tamil Nadu 0.2
5. Gujarat 3.3
6. Bihar 27
7. Jharkhand 27
8. Madhya Pradesh 24
9. Rajasthan 29
10. Uttar Pradesh 31
11. West Bengal 39
12. Haryana 81
13. Delhi 56
14. Himachal Pradesh 63
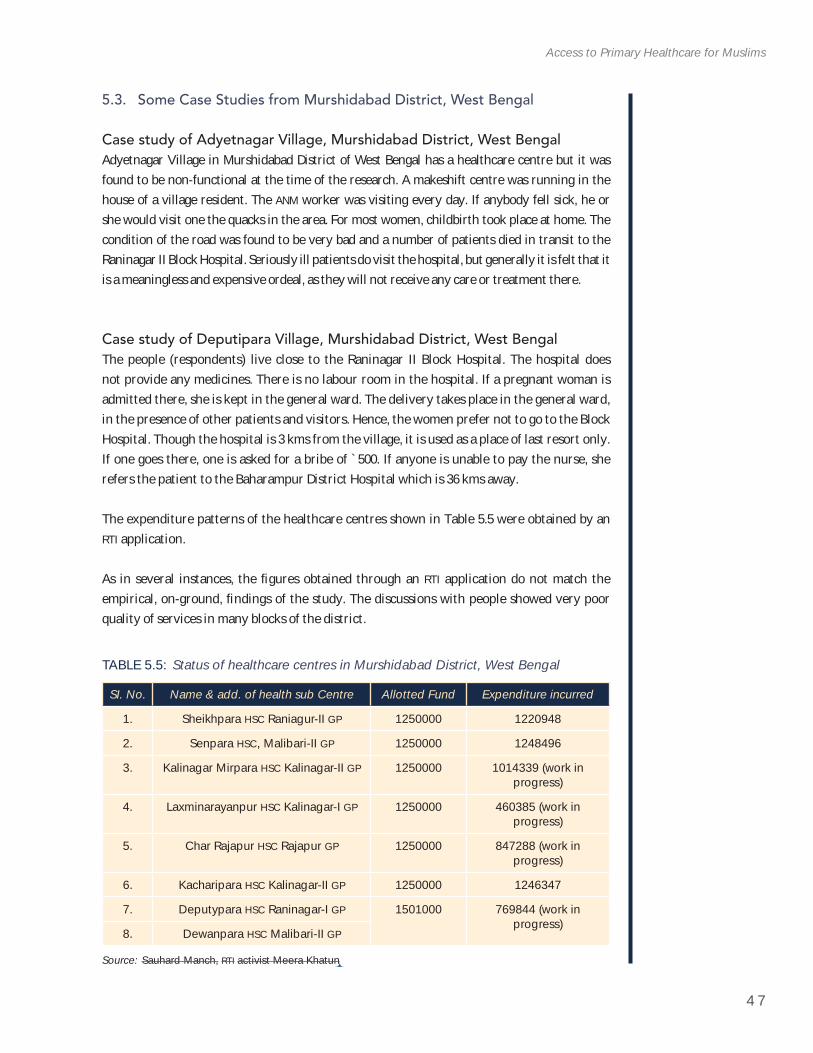
4 7
Access to Primary Healthcare for Muslims
5.3. Some Case Studies from Murshidabad District, West Bengal
Case study of Adyetnagar Village, Murshidabad District, West BengalAdyetnagar Village in Murshidabad District of West Bengal has a healthcare centre but it was found to be non-functional at the time of the research. A makeshift centre was running in the house of a village resident. The ANM worker was visiting every day. If anybody fell sick, he or she would visit one the quacks in the area. For most women, childbirth took place at home. The condition of the road was found to be very bad and a number of patients died in transit to the Raninagar II Block Hospital. Seriously ill patients do visit the hospital, but generally it is felt that it is a meaningless and expensive ordeal, as they will not receive any care or treatment there.
Case study of Deputipara Village, Murshidabad District, West Bengal The people (respondents) live close to the Raninagar II Block Hospital. The hospital does not provide any medicines. There is no labour room in the hospital. If a pregnant woman is admitted there, she is kept in the general ward. The delivery takes place in the general ward, in the presence of other patients and visitors. Hence, the women prefer not to go to the Block Hospital. Though the hospital is 3 kms from the village, it is used as a place of last resort only. If one goes there, one is asked for a bribe of `500. If anyone is unable to pay the nurse, she refers the patient to the Baharampur District Hospital which is 36 kms away.
The expenditure patterns of the healthcare centres shown in Table 5.5 were obtained by an RTI application.
As in several instances, the fi gures obtained through an RTI application do not match the empirical, on-ground, fi ndings of the study. The discussions with people showed very poor quality of services in many blocks of the district.
TABLE 5.5: Status of healthcare centres in Murshidabad District, West Bengal
SI. No. Name & add. of health sub Centre Allotted Fund Expenditure incurred
1. Sheikhpara HSC Raniagur-II GP 1250000 1220948
2. Senpara HSC, Malibari-II GP 1250000 1248496
3. Kalinagar Mirpara HSC Kalinagar-II GP 1250000 1014339 (work in progress)
4. Laxminarayanpur HSC Kalinagar-I GP 1250000 460385 (work in progress)
5. Char Rajapur HSC Rajapur GP 1250000 847288 (work in progress)
6. Kacharipara HSC Kalinagar-II GP 1250000 1246347
7. Deputypara HSC Raninagar-I GP 1501000 769844 (work in progress)
8. Dewanpara HSC Malibari-II GP
Source: Sauhard Manch, RTI activist Meera Khatun
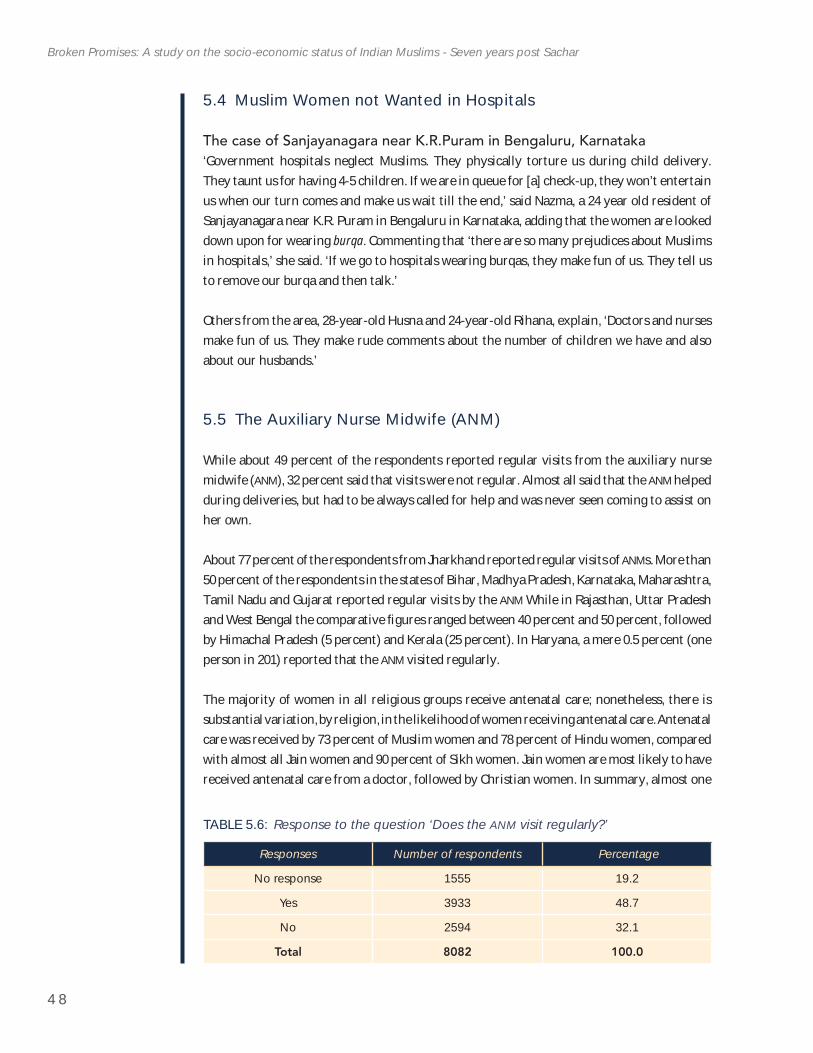
4 8
Broken Promises: A study on the socio-economic status of Indian Muslims - Seven years post Sachar
5.4 Muslim Women not Wanted in Hospitals
The case of Sanjayanagara near K.R.Puram in Bengaluru, Karnataka‘Government hospitals neglect Muslims. They physically torture us during child delivery. They taunt us for having 4-5 children. If we are in queue for [a] check-up, they won’t entertain us when our turn comes and make us wait till the end,’ said Nazma, a 24 year old resident of Sanjayanagara near K.R. Puram in Bengaluru in Karnataka, adding that the women are looked down upon for wearing burqa. Commenting that ‘there are so many prejudices about Muslims in hospitals,’ she said. ‘If we go to hospitals wearing burqas, they make fun of us. They tell us to remove our burqa and then talk.’
Others from the area, 28-year-old Husna and 24-year-old Rihana, explain, ‘Doctors and nurses make fun of us. They make rude comments about the number of children we have and also about our husbands.’
5.5 The Auxiliary Nurse Midwife (ANM)
While about 49 percent of the respondents reported regular visits from the auxiliary nurse midwife (ANM), 32 percent said that visits were not regular. Almost all said that the ANM helped during deliveries, but had to be always called for help and was never seen coming to assist on her own.
About 77 percent of the respondents from Jharkhand reported regular visits of ANMs. More than 50 percent of the respondents in the states of Bihar, Madhya Pradesh, Karnataka, Maharashtra, Tamil Nadu and Gujarat reported regular visits by the ANM While in Rajasthan, Uttar Pradesh and West Bengal the comparative fi gures ranged between 40 percent and 50 percent, followed by Himachal Pradesh (5 percent) and Kerala (25 percent). In Haryana, a mere 0.5 percent (one person in 201) reported that the ANM visited regularly.
The majority of women in all religious groups receive antenatal care; nonetheless, there is substantial variation, by religion, in the likelihood of women receiving antenatal care. Antenatal care was received by 73 percent of Muslim women and 78 percent of Hindu women, compared with almost all Jain women and 90 percent of Sikh women. Jain women are most likely to have received antenatal care from a doctor, followed by Christian women. In summary, almost one
TABLE 5.6: Response to the question ‘Does the ANM visit regularly?’
Responses Number of respondents Percentage
No response 1555 19.2
Yes 3933 48.7
No 2594 32.1
Total 8082 100.0
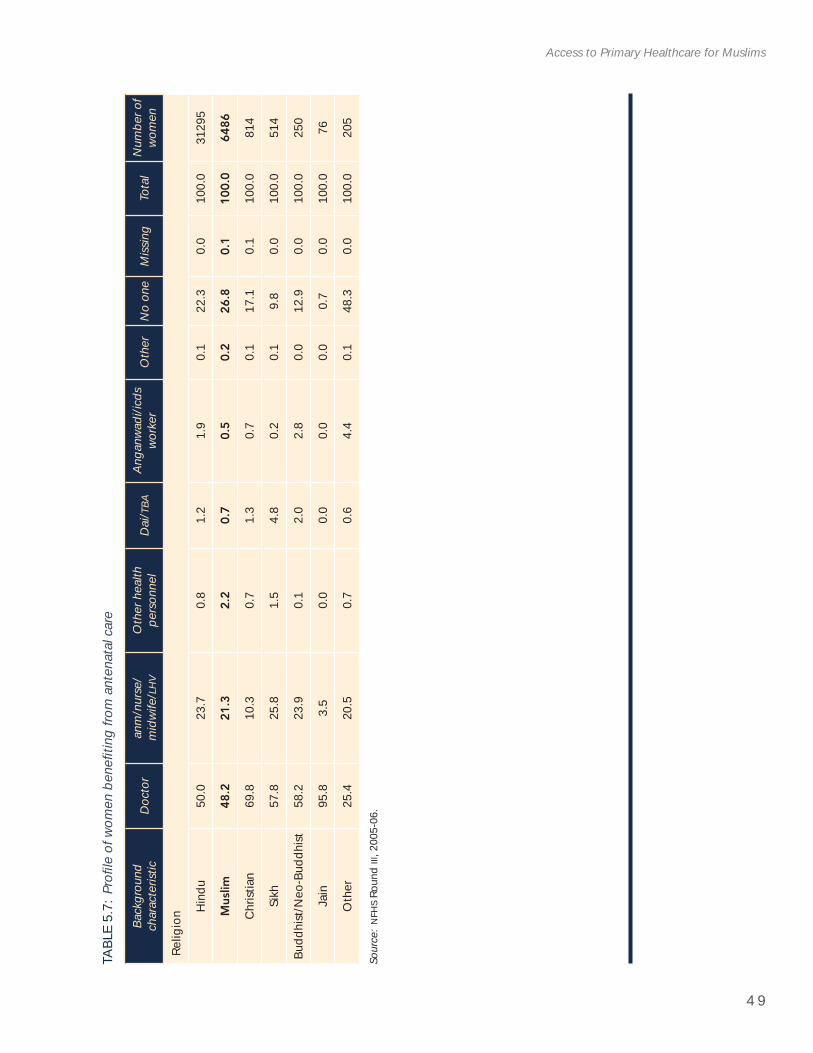
4 9
Access to Primary Healthcare for Muslims
TABL
E 5.
7: P
rofi l
e of
wom
en b
enefi
ting
from
ant
enat
al c
are
Back
grou
nd
char
acte
ristic
Doc
tor
anm
/nur
se/
mid
wife
/ LH
VO
ther
hea
lth
pers
onne
lD
ai/ T
BAAn
ganw
adi/i
cds
wor
ker
Oth
erN
o on
eM
issin
gTo
tal
Num
ber o
f w
omen
Relig
ion H
indu
50.0
23.7
0.8
1.2
1.9
0.1
22.3
0.0
100.
031
295
Mus
lim48
.221
.32.
20.
70.
50.
226
.80.
110
0.0
6486
Chris
tian
69.8
10.3
0.7
1.3
0.7
0.1
17.1
0.1
100.
081
4
Sikh
57.8
25.8
1.5
4.8
0.2
0.1
9.8
0.0
100.
051
4
Budd
hist
/Neo
-Bud
dhist
58.2
23.9
0.1
2.0
2.8
0.0
12.9
0.0
100.
025
0
Jain
95.8
3.5
0.0
0.0
0.0
0.0
0.7
0.0
100.
076
Oth
er25
.420
.50.
70.
64.
40.
148
.30.
010
0.0
205
Sour
ce:N
FHS
Roun
d III
, 200
5-06
.
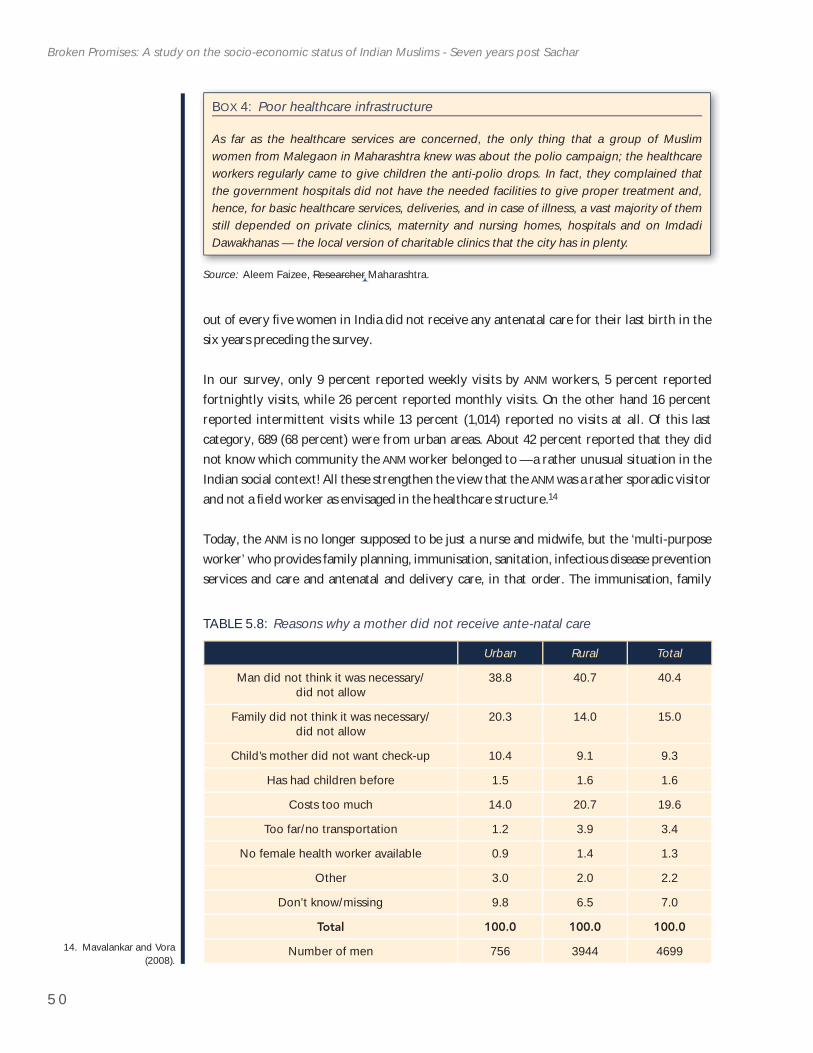
5 0
Broken Promises: A study on the socio-economic status of Indian Muslims - Seven years post Sachar
14. Mavalankar and Vora (2008).
out of every fi ve women in India did not receive any antenatal care for their last birth in the six years preceding the survey.
In our survey, only 9 percent reported weekly visits by ANM workers, 5 percent reported fortnightly visits, while 26 percent reported monthly visits. On the other hand 16 percent reported intermittent visits while 13 percent (1,014) reported no visits at all. Of this last category, 689 (68 percent) were from urban areas. About 42 percent reported that they did not know which community the ANM worker belonged to — a rather unusual situation in the Indian social context! All these strengthen the view that the ANM was a rather sporadic visitor and not a fi eld worker as envisaged in the healthcare structure.14
Today, the ANM is no longer supposed to be just a nurse and midwife, but the ‘multi-purpose worker’ who provides family planning, immunisation, sanitation, infectious disease prevention services and care and antenatal and delivery care, in that order. The immunisation, family
TABLE 5.8: Reasons why a mother did not receive ante-natal care
Urban Rural Total
Man did not think it was necessary/did not allow
38.8 40.7 40.4
Family did not think it was necessary/did not allow
20.3 14.0 15.0
Child’s mother did not want check-up 10.4 9.1 9.3
Has had children before 1.5 1.6 1.6
Costs too much 14.0 20.7 19.6
Too far/no transportation 1.2 3.9 3.4
No female health worker available 0.9 1.4 1.3
Other 3.0 2.0 2.2
Don’t know/missing 9.8 6.5 7.0
Total 100.0 100.0 100.0
Number of men 756 3944 4699
BOX 4: Poor healthcare infrastructure
As far as the healthcare services are concerned, the only thing that a group of Muslim women from Malegaon in Maharashtra knew was about the polio campaign; the healthcare workers regularly came to give children the anti-polio drops. In fact, they complained that the government hospitals did not have the needed facilities to give proper treatment and, hence, for basic healthcare services, deliveries, and in case of illness, a vast majority of them still depended on private clinics, maternity and nursing homes, hospitals and on Imdadi Dawakhanas — the local version of charitable clinics that the city has in plenty.
Source: Aleem Faizee, Researcher Maharashtra.
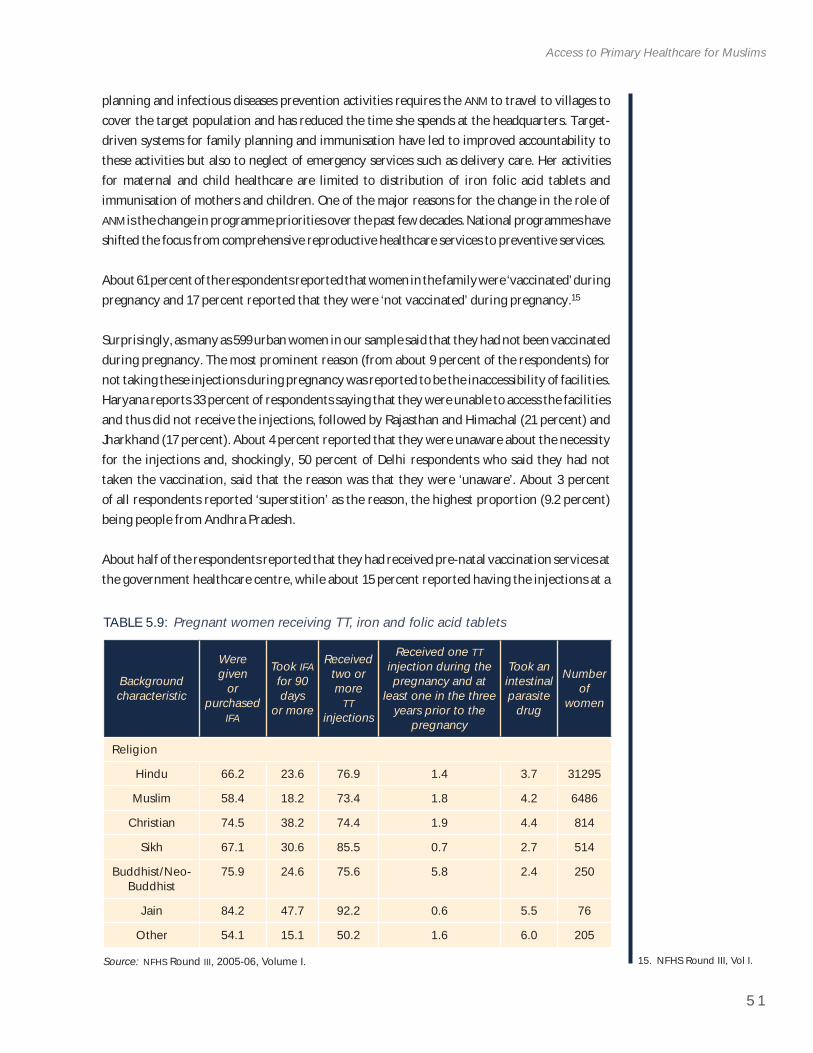
5 1
Access to Primary Healthcare for Muslims
15. NFHS Round III, Vol I.
planning and infectious diseases prevention activities requires the ANM to travel to villages to cover the target population and has reduced the time she spends at the headquarters. Target-driven systems for family planning and immunisation have led to improved accountability to these activities but also to neglect of emergency services such as delivery care. Her activities for maternal and child healthcare are limited to distribution of iron folic acid tablets and immunisation of mothers and children. One of the major reasons for the change in the role of ANM is the change in programme priorities over the past few decades. National programmes have shifted the focus from comprehensive reproductive healthcare services to preventive services.
About 61 percent of the respondents reported that women in the family were ‘vaccinated’ during pregnancy and 17 percent reported that they were ‘not vaccinated’ during pregnancy.15
Surprisingly, as many as 599 urban women in our sample said that they had not been vaccinated during pregnancy. The most prominent reason (from about 9 percent of the respondents) for not taking these injections during pregnancy was reported to be the inaccessibility of facilities. Haryana reports 33 percent of respondents saying that they were unable to access the facilities and thus did not receive the injections, followed by Rajasthan and Himachal (21 percent) and Jharkhand (17 percent). About 4 percent reported that they were unaware about the necessity for the injections and, shockingly, 50 percent of Delhi respondents who said they had not taken the vaccination, said that the reason was that they were ‘unaware’. About 3 percent of all respondents reported ‘superstition’ as the reason, the highest proportion (9.2 percent) being people from Andhra Pradesh.
About half of the respondents reported that they had received pre-natal vaccination services at the government healthcare centre, while about 15 percent reported having the injections at a
TABLE 5.9: Pregnant women receiving TT, iron and folic acid tablets
Background characteristic
Were given
orpurchased
IFA
Took IFAfor 90 days
or more
Receivedtwo or more
TTinjections
Received one TTinjection during the pregnancy and at
least one in the three years prior to the
pregnancy
Took an intestinalparasite
drug
Numberof
women
Religion
Hindu 66.2 23.6 76.9 1.4 3.7 31295
Muslim 58.4 18.2 73.4 1.8 4.2 6486
Christian 74.5 38.2 74.4 1.9 4.4 814
Sikh 67.1 30.6 85.5 0.7 2.7 514
Buddhist/Neo-Buddhist
75.9 24.6 75.6 5.8 2.4 250
Jain 84.2 47.7 92.2 0.6 5.5 76
Other 54.1 15.1 50.2 1.6 6.0 205
Source: NFHS Round III, 2005-06, Volume I.
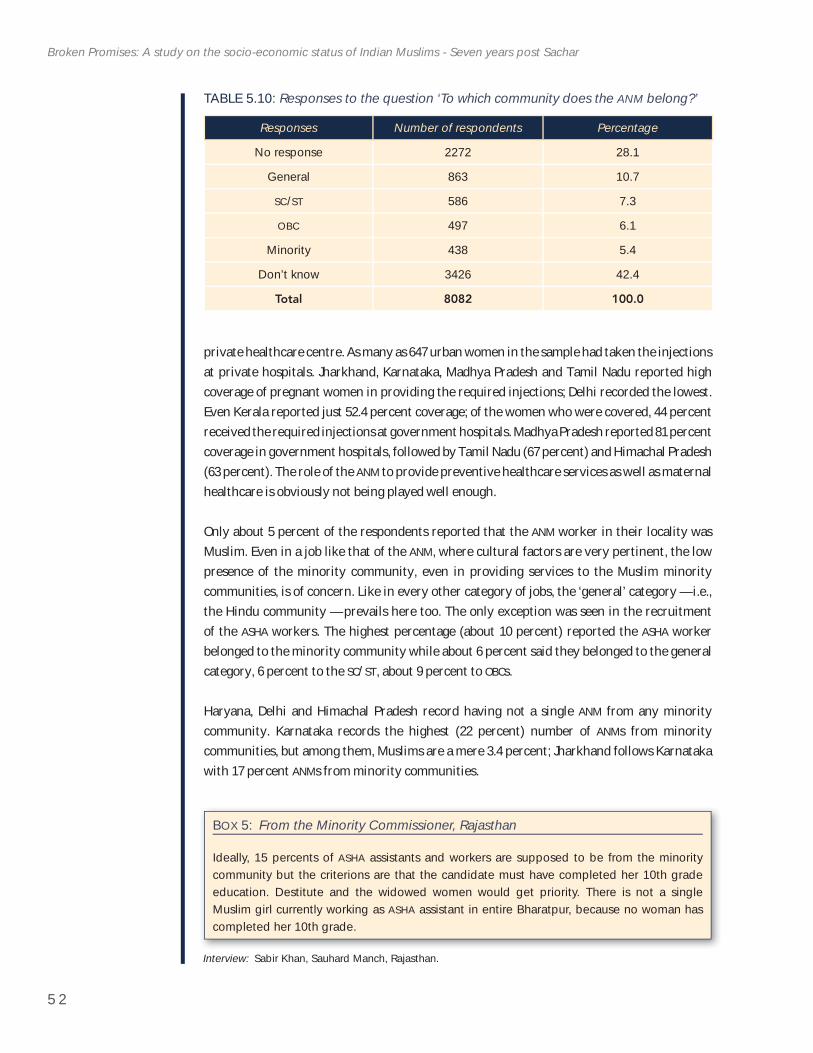
5 2
Broken Promises: A study on the socio-economic status of Indian Muslims - Seven years post Sachar
private healthcare centre. As many as 647 urban women in the sample had taken the injections at private hospitals. Jharkhand, Karnataka, Madhya Pradesh and Tamil Nadu reported high coverage of pregnant women in providing the required injections; Delhi recorded the lowest. Even Kerala reported just 52.4 percent coverage; of the women who were covered, 44 percent received the required injections at government hospitals. Madhya Pradesh reported 81 percent coverage in government hospitals, followed by Tamil Nadu (67 percent) and Himachal Pradesh (63 percent). The role of the ANM to provide preventive healthcare services as well as maternal healthcare is obviously not being played well enough.
Only about 5 percent of the respondents reported that the ANM worker in their locality was Muslim. Even in a job like that of the ANM, where cultural factors are very pertinent, the low presence of the minority community, even in providing services to the Muslim minority communities, is of concern. Like in every other category of jobs, the ‘general’ category — i.e., the Hindu community — prevails here too. The only exception was seen in the recruitment of the ASHA workers. The highest percentage (about 10 percent) reported the ASHA worker belonged to the minority community while about 6 percent said they belonged to the general category, 6 percent to the SC/ST, about 9 percent to OBCs.
Haryana, Delhi and Himachal Pradesh record having not a single ANM from any minority community. Karnataka records the highest (22 percent) number of ANMs from minority communities, but among them, Muslims are a mere 3.4 percent; Jharkhand follows Karnataka with 17 percent ANMs from minority communities.
TABLE 5.10: Responses to the question ‘To which community does the ANM belong?’
Responses Number of respondents Percentage
No response 2272 28.1
General 863 10.7
SC/ST 586 7.3
OBC 497 6.1
Minority 438 5.4
Don’t know 3426 42.4
Total 8082 100.0
BOX 5: From the Minority Commissioner, Rajasthan
Ideally, 15 percents of ASHA assistants and workers are supposed to be from the minority community but the criterions are that the candidate must have completed her 10th grade education. Destitute and the widowed women would get priority. There is not a single Muslim girl currently working as ASHA assistant in entire Bharatpur, because no woman has completed her 10th grade.
Interview: Sabir Khan, Sauhard Manch, Rajasthan.
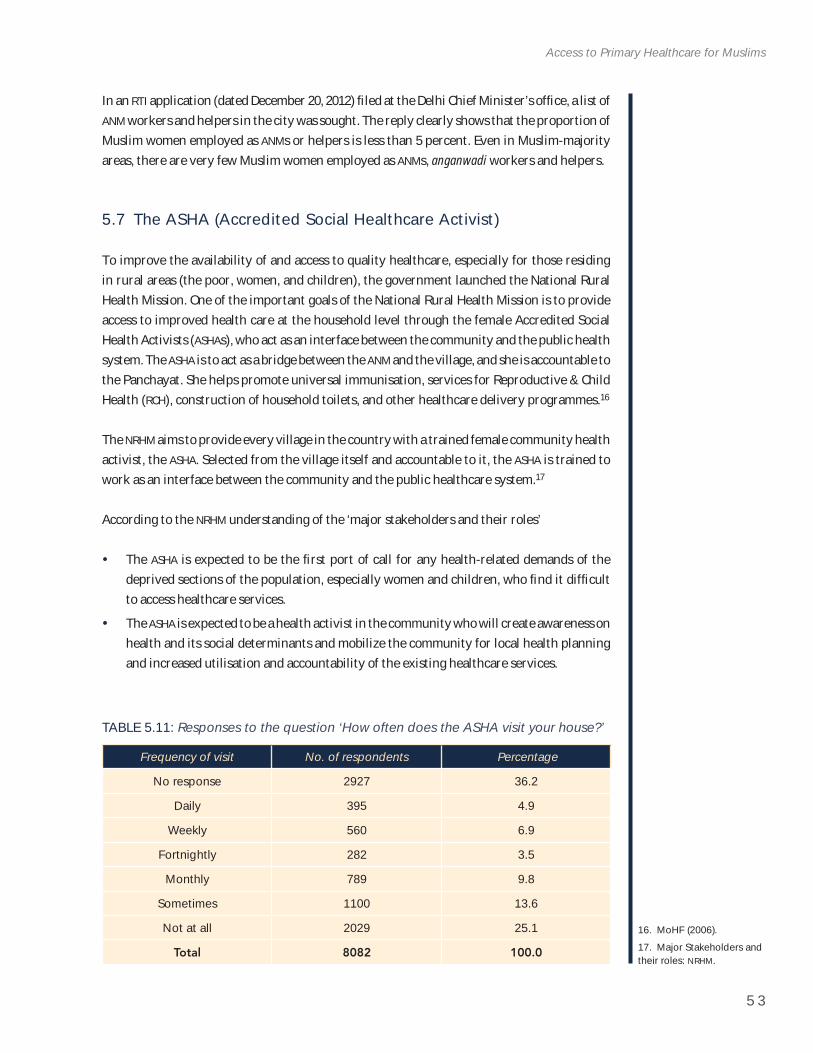
5 3
Access to Primary Healthcare for Muslims
16. MoHF (2006).17. Major Stakeholders and their roles: NRHM.
In an RTI application (dated December 20, 2012) fi led at the Delhi Chief Minister’s offi ce, a list of ANM workers and helpers in the city was sought. The reply clearly shows that the proportion of Muslim women employed as ANMs or helpers is less than 5 percent. Even in Muslim-majority areas, there are very few Muslim women employed as ANMs, anganwadi workers and helpers.
5.7 The ASHA (Accredited Social Healthcare Activist)
To improve the availability of and access to quality healthcare, especially for those residing in rural areas (the poor, women, and children), the government launched the National Rural Health Mission. One of the important goals of the National Rural Health Mission is to provide access to improved health care at the household level through the female Accredited Social Health Activists (ASHAs), who act as an interface between the community and the public health system. The ASHA is to act as a bridge between the ANM and the village, and she is accountable to the Panchayat. She helps promote universal immunisation, services for Reproductive & Child Health (RCH), construction of household toilets, and other healthcare delivery programmes.16
The NRHM aims to provide every village in the country with a trained female community health activist, the ASHA. Selected from the village itself and accountable to it, the ASHA is trained to work as an interface between the community and the public healthcare system.17
According to the NRHM understanding of the ‘major stakeholders and their roles’
The ASHA is expected to be the fi rst port of call for any health-related demands of the deprived sections of the population, especially women and children, who fi nd it diffi cult to access healthcare services.
The ASHA is expected to be a health activist in the community who will create awareness on health and its social determinants and mobilize the community for local health planning and increased utilisation and accountability of the existing healthcare services.
TABLE 5.11: Responses to the question ‘How often does the ASHA visit your house?’
Frequency of visit No. of respondents Percentage
No response 2927 36.2
Daily 395 4.9
Weekly 560 6.9
Fortnightly 282 3.5
Monthly 789 9.8
Sometimes 1100 13.6
Not at all 2029 25.1
Total 8082 100.0
5 4
Broken Promises: A study on the socio-economic status of Indian Muslims - Seven years post Sachar
About 25 percent of the respondents to this study research said that the ASHA did not visit them at all. Another 14 percent said that the ASHA visited them ‘sometimes’ and 10 percent said that she visited once a month. For a person who is expected to be the fi rst port of call for health-related issues for women and children, this is very indifferent performance. Only 15 percent responded saying that the ASHA in their localities visited them regularly.
No healthcare centre; no sub-centre; no immunisation; no tetanus; no iron tablets: The plight of pregnant women in Islampur Sub-division, North Dinajpur, West BengalMaleka Khatun, 30, has four children, the youngest just 22 days old. None was born in a hospital, none immunized. She has never taken an anti-tetanus (‘TT’) shot for any of her pregnancies. She is not alone in this. This is the plight of all the women in this sub-division of Islampur in Uttar Dinajpur District, West Bengal. There was a healthcare sub-centre here. It closed because the person who had given the land for it withdrew the offer as the administration did not fulfi l the promise to give a job to any one member of his family. Now, if anyone is critically ill, he or she has to travel 3 kms to Lakshmipur and pay ten rupees for local commutation.There are fair chances that a critically ill patient would not survive the ordeal because doctors and nurses are rarely available at the Lakshmipur hospital, which, further, is not well equipped. The Ramgunj block healthcare centre and hospital, 13 kms from the village, is also not fully equipped and critical cases are often referred to the Islampur sub-divisional hospital. There is no direct commutation from Digalgown village to the Islampur sub-divisional hospital. People either need to hire an ambulance or bus from Lakshmipur to Islampur which runs twice a day. The medical and related costs are so high that villagers often need to collect money from others in the village — during which time the patient’s condition may well worsen. There are also cases of patients just being treated by the local quack. The poor local facilities and the distances to the block and sub-divisional hospitals are also reasons for the high rate of childbirth at home; the focus group discussion (FGD) revealed that 90 percent of the births take place at home.
The sub-divisional hospital at Islampur has doctors and nurses but the Muslims there get treated badly. Almost none of the women from the villages of Digalgown, Kotgachh, Alinagar, Kathalbari in North Dinajpur in West Bengal have had institutional deliveries. They do not take iron tablets as they have the notion that if they consume iron the child will grow fat and a normal delivery may not be possible at home! The children in the villages have just been administered polio drops and even BCG has not been given to most children. They have never seen an ASHA worker in these villages!
5.8 Unani Medicine and the State Patronage
Uttar Pradesh has two government-run Unani medical colleges (both founded in July 1982) and 253 Unani clinics. Lucknow Medical College is spread on 8.75 acres. There are 45 rooms and the staff strength is 177. But 52 posts are still vacant!
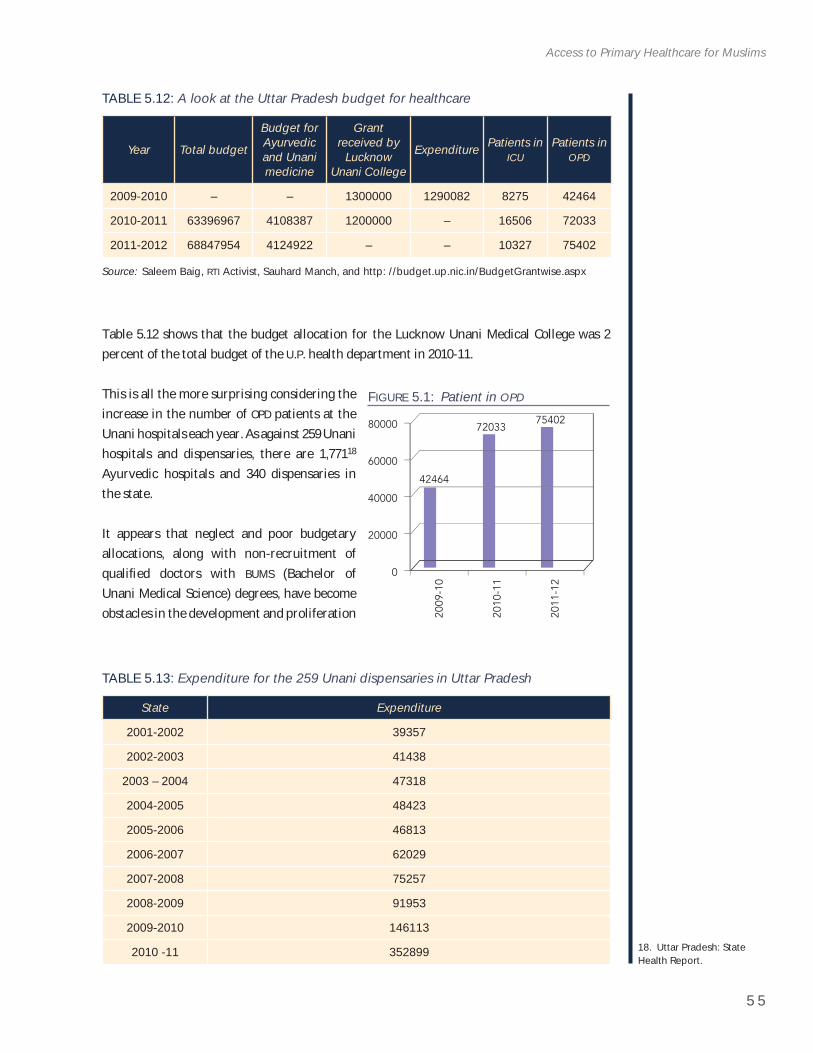
5 5
Access to Primary Healthcare for Muslims
18. Uttar Pradesh: State Health Report.
TABLE 5.12: A look at the Uttar Pradesh budget for healthcare
Year Total budget
Budget for Ayurvedic and Unani medicine
Grantreceived by
LucknowUnani College
Expenditure Patients in ICU
Patients in OPD
2009-2010 – – 1300000 1290082 8275 42464
2010-2011 63396967 4108387 1200000 – 16506 72033
2011-2012 68847954 4124922 – – 10327 75402
Source: Saleem Baig, RTI Activist, Sauhard Manch, and http: //budget.up.nic.in/BudgetGrantwise.aspx
TABLE 5.13: Expenditure for the 259 Unani dispensaries in Uttar Pradesh
State Expenditure
2001-2002 39357
2002-2003 41438
2003 – 2004 47318
2004-2005 48423
2005-2006 46813
2006-2007 62029
2007-2008 75257
2008-2009 91953
2009-2010 146113
2010 -11 352899
Table 5.12 shows that the budget allocation for the Lucknow Unani Medical College was 2 percent of the total budget of the U.P. health department in 2010-11.
This is all the more surprising considering the increase in the number of OPD patients at the Unani hospitals each year. As against 259 Unani hospitals and dispensaries, there are 1,77118
Ayurvedic hospitals and 340 dispensaries in the state.
It appears that neglect and poor budgetary allocations, along with non-recruitment of qualifi ed doctors with BUMS (Bachelor of Unani Medical Science) degrees, have become obstacles in the development and proliferation
80000
60000
42464
7203375402
40000
20000
0
2009
-10
2010
-11
2011
-12
FIGURE 5.1: Patient in OPD
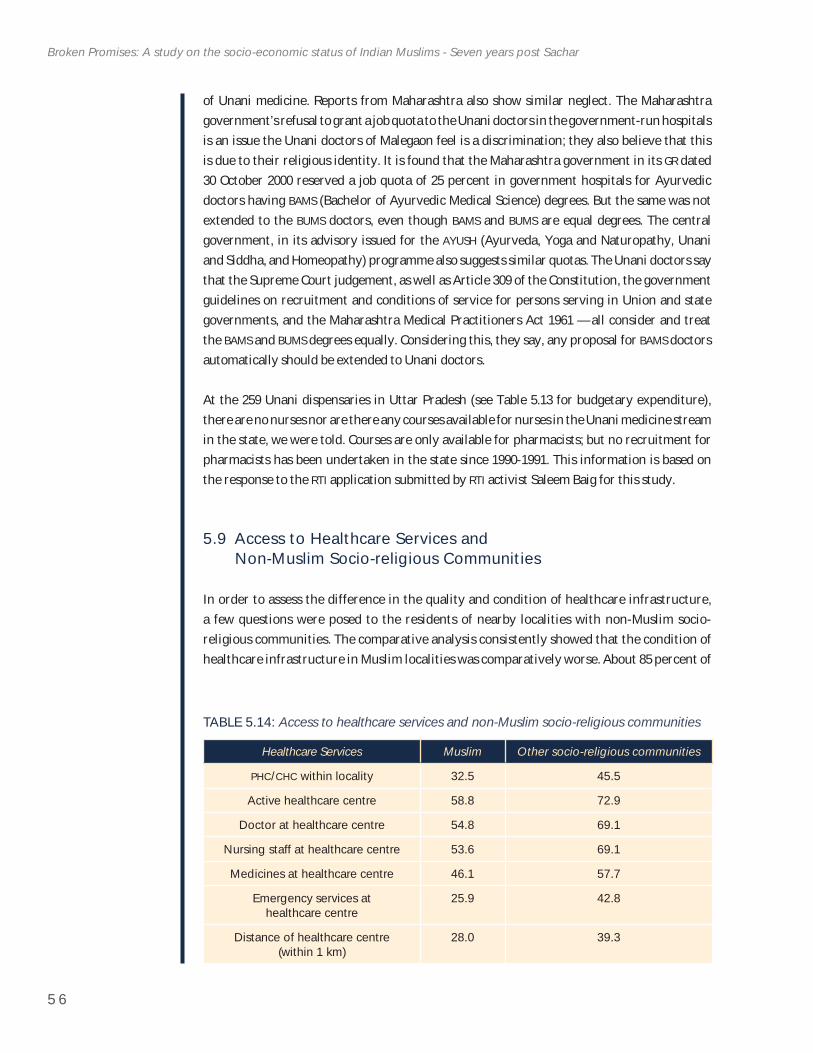
5 6
Broken Promises: A study on the socio-economic status of Indian Muslims - Seven years post Sachar
of Unani medicine. Reports from Maharashtra also show similar neglect. The Maharashtra government’s refusal to grant a job quota to the Unani doctors in the government-run hospitals is an issue the Unani doctors of Malegaon feel is a discrimination; they also believe that this is due to their religious identity. It is found that the Maharashtra government in its GR dated 30 October 2000 reserved a job quota of 25 percent in government hospitals for Ayurvedic doctors having BAMS (Bachelor of Ayurvedic Medical Science) degrees. But the same was not extended to the BUMS doctors, even though BAMS and BUMS are equal degrees. The central government, in its advisory issued for the AYUSH (Ayurveda, Yoga and Naturopathy, Unani and Siddha, and Homeopathy) programme also suggests similar quotas. The Unani doctors say that the Supreme Court judgement, as well as Article 309 of the Constitution, the government guidelines on recruitment and conditions of service for persons serving in Union and state governments, and the Maharashtra Medical Practitioners Act 1961 — all consider and treat the BAMS and BUMS degrees equally. Considering this, they say, any proposal for BAMS doctors automatically should be extended to Unani doctors.
At the 259 Unani dispensaries in Uttar Pradesh (see Table 5.13 for budgetary expenditure), there are no nurses nor are there any courses available for nurses in the Unani medicine stream in the state, we were told. Courses are only available for pharmacists; but no recruitment for pharmacists has been undertaken in the state since 1990-1991. This information is based on the response to the RTI application submitted by RTI activist Saleem Baig for this study.
5.9 Access to Healthcare Services and Non-Muslim Socio-religious Communities
In order to assess the difference in the quality and condition of healthcare infrastructure, a few questions were posed to the residents of nearby localities with non-Muslim socio-religious communities. The comparative analysis consistently showed that the condition of healthcare infrastructure in Muslim localities was comparatively worse. About 85 percent of
TABLE 5.14: Access to healthcare services and non-Muslim socio-religious communities
Healthcare Services Muslim Other socio-religious communities
PHC/CHC within locality 32.5 45.5
Active healthcare centre 58.8 72.9
Doctor at healthcare centre 54.8 69.1
Nursing staff at healthcare centre 53.6 69.1
Medicines at healthcare centre 46.1 57.7
Emergency services at healthcare centre
25.9 42.8
Distance of healthcare centre (within 1 km)
28.0 39.3
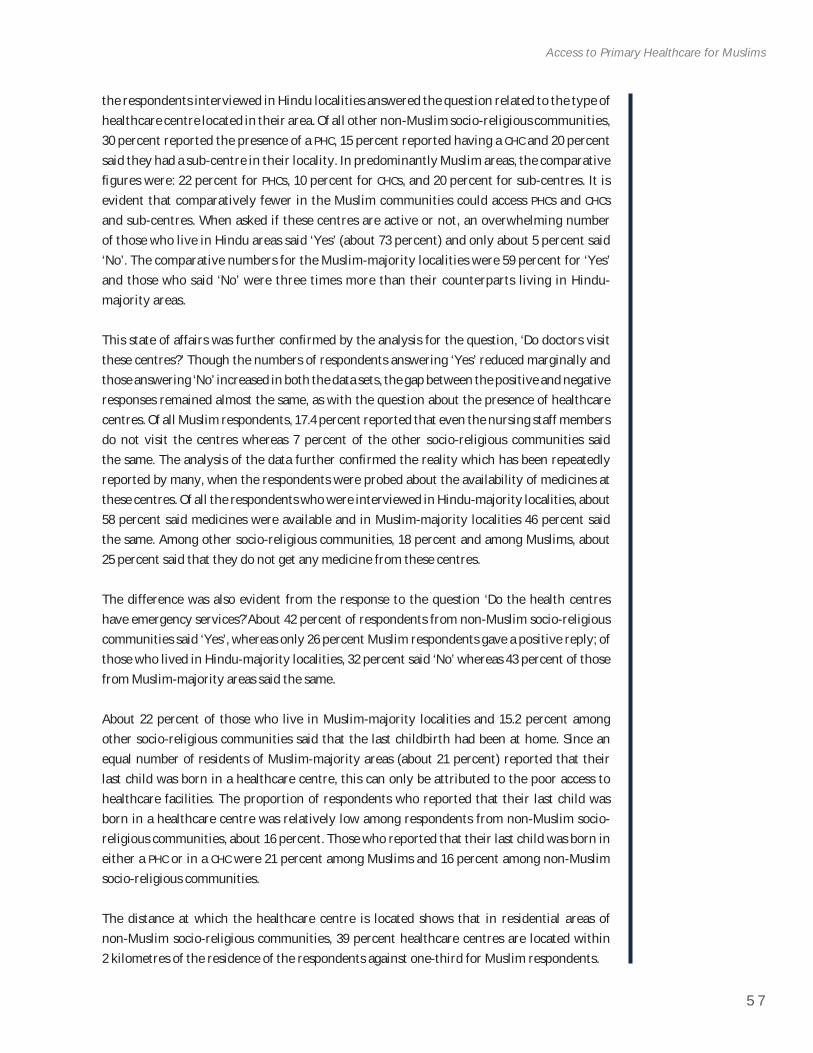
5 7
Access to Primary Healthcare for Muslims
the respondents interviewed in Hindu localities answered the question related to the type of healthcare centre located in their area. Of all other non-Muslim socio-religious communities, 30 percent reported the presence of a PHC, 15 percent reported having a CHC and 20 percent said they had a sub-centre in their locality. In predominantly Muslim areas, the comparative fi gures were: 22 percent for PHCs, 10 percent for CHCs, and 20 percent for sub-centres. It is evident that comparatively fewer in the Muslim communities could access PHCs and CHCsand sub-centres. When asked if these centres are active or not, an overwhelming number of those who live in Hindu areas said ‘Yes’ (about 73 percent) and only about 5 percent said ‘No’. The comparative numbers for the Muslim-majority localities were 59 percent for ‘Yes’ and those who said ‘No’ were three times more than their counterparts living in Hindu-majority areas.
This state of affairs was further confi rmed by the analysis for the question, ‘Do doctors visit these centres?’ Though the numbers of respondents answering ‘Yes’ reduced marginally and those answering ‘No’ increased in both the data sets, the gap between the positive and negative responses remained almost the same, as with the question about the presence of healthcare centres. Of all Muslim respondents, 17.4 percent reported that even the nursing staff members do not visit the centres whereas 7 percent of the other socio-religious communities said the same. The analysis of the data further confi rmed the reality which has been repeatedly reported by many, when the respondents were probed about the availability of medicines at these centres. Of all the respondents who were interviewed in Hindu-majority localities, about 58 percent said medicines were available and in Muslim-majority localities 46 percent said the same. Among other socio-religious communities, 18 percent and among Muslims, about 25 percent said that they do not get any medicine from these centres.
The difference was also evident from the response to the question ‘Do the health centres have emergency services?’About 42 percent of respondents from non-Muslim socio-religious communities said ‘Yes’, whereas only 26 percent Muslim respondents gave a positive reply; of those who lived in Hindu-majority localities, 32 percent said ‘No’ whereas 43 percent of those from Muslim-majority areas said the same.
About 22 percent of those who live in Muslim-majority localities and 15.2 percent among other socio-religious communities said that the last childbirth had been at home. Since an equal number of residents of Muslim-majority areas (about 21 percent) reported that their last child was born in a healthcare centre, this can only be attributed to the poor access to healthcare facilities. The proportion of respondents who reported that their last child was born in a healthcare centre was relatively low among respondents from non-Muslim socio-religious communities, about 16 percent. Those who reported that their last child was born in either a PHC or in a CHC were 21 percent among Muslims and 16 percent among non-Muslim socio-religious communities.
The distance at which the healthcare centre is located shows that in residential areas of non-Muslim socio-religious communities, 39 percent healthcare centres are located within 2 kilometres of the residence of the respondents against one-third for Muslim respondents.
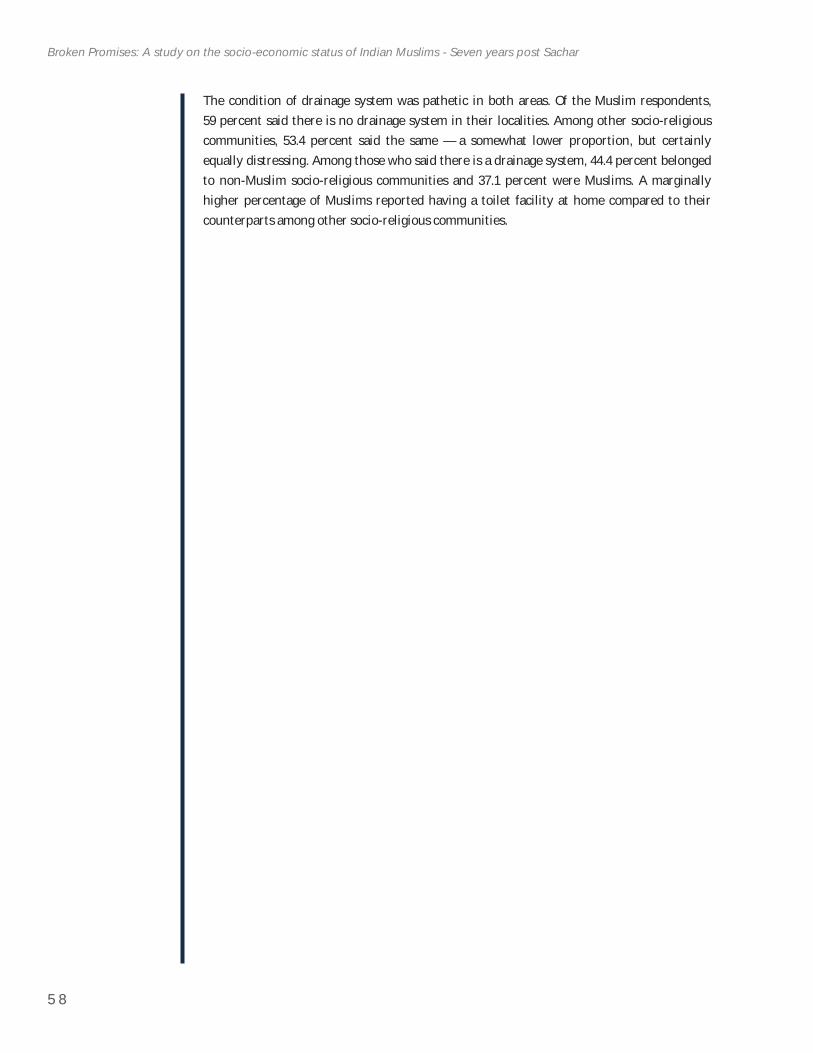
5 8
Broken Promises: A study on the socio-economic status of Indian Muslims - Seven years post Sachar
The condition of drainage system was pathetic in both areas. Of the Muslim respondents, 59 percent said there is no drainage system in their localities. Among other socio-religious communities, 53.4 percent said the same — a somewhat lower proportion, but certainly equally distressing. Among those who said there is a drainage system, 44.4 percent belonged to non-Muslim socio-religious communities and 37.1 percent were Muslims. A marginally higher percentage of Muslims reported having a toilet facility at home compared to their counterparts among other socio-religious communities.
5 9
19. Indian Social Institute, Jahangirabad Media Institute, Action Aid India (2006).
6 . A C C E S S T O E D U C AT I O N B Y M U S L I M S
6.1 Introduction
Educational backwardness has been one of the key problems that affl ict the Muslim community in India. Lack of opportunities for education and, particularly, higher
education, is a marked feature for the community. It is widely known that very few Muslim students make it to universities and other institutions of higher learning. According to Census data, while only about 7 percent of the overall population aged 20 years and above are graduates or hold diplomas, this proportion is less than 4 percent amongst Muslims. Besides, those having technical education at the appropriate ages (18 years and above) are as low as 1 percent amongst Muslims. The Sachar Committee found a negligible presence of Muslims in institutions of higher learning. Muslims constituted only 1.3 percent of students studying in all courses in all the Indian institutes of management (IIMs) in India and 4 percent in the post-graduate courses and 1.7 percent in the undergraduate courses at the Indian institutes of technology (IITs). The representation of Muslims in the top medical colleges was only marginally better at about 4 percent.
Education is the key to economic and social empowerment. A persistent denial of opportunities for people to educate themselves can lead to poverty and economic decline in the long term. This is especially true for a community, which, to a large extent, derives livelihood from employment in the informal sector as well as self-owned small businesses and trades. The early 1990s have seen the beginning of a new economic paradigm in India owing to the policy of liberalization and globalization. While this has led to the arrival of global capital in the country, it has also sounded a death knell for so many small enterprises and businesses. This phenomenon has particularly affected the Muslims by cutting into their livelihoods. At the same time, they have not been able to capitalize by fi nding jobs in the emerging sectors such as information technology, service, retail, etc., owing to overall low educational attainments. The competitive job market demands basic English and computer skills which are both low among Muslim youth who can hardly make it to higher-secondary school certifi cate (HSC)levels, leave alone college graduation! This sad reality, coupled with a misperception that Muslims avoid modern education, has also contributed to alienation and stereotyping of the community (although it is now well-known that Muslims want modern education and not just that, they want English medium for their daughters as well).19
The Sachar Committee notes that Muslims are at a double disadvantage with low levels of education combined with low quality education; the deprivation increases manifold with higher levels of education. The literacy rate among Muslims as per the Census of 2001 was 59.1 percent. This is below the national average of 65.1 percent. If the scheduled caste and tribe (SC and ST)communities, with an even lower literacy level of 52.2 percent, and Muslims are excluded, the
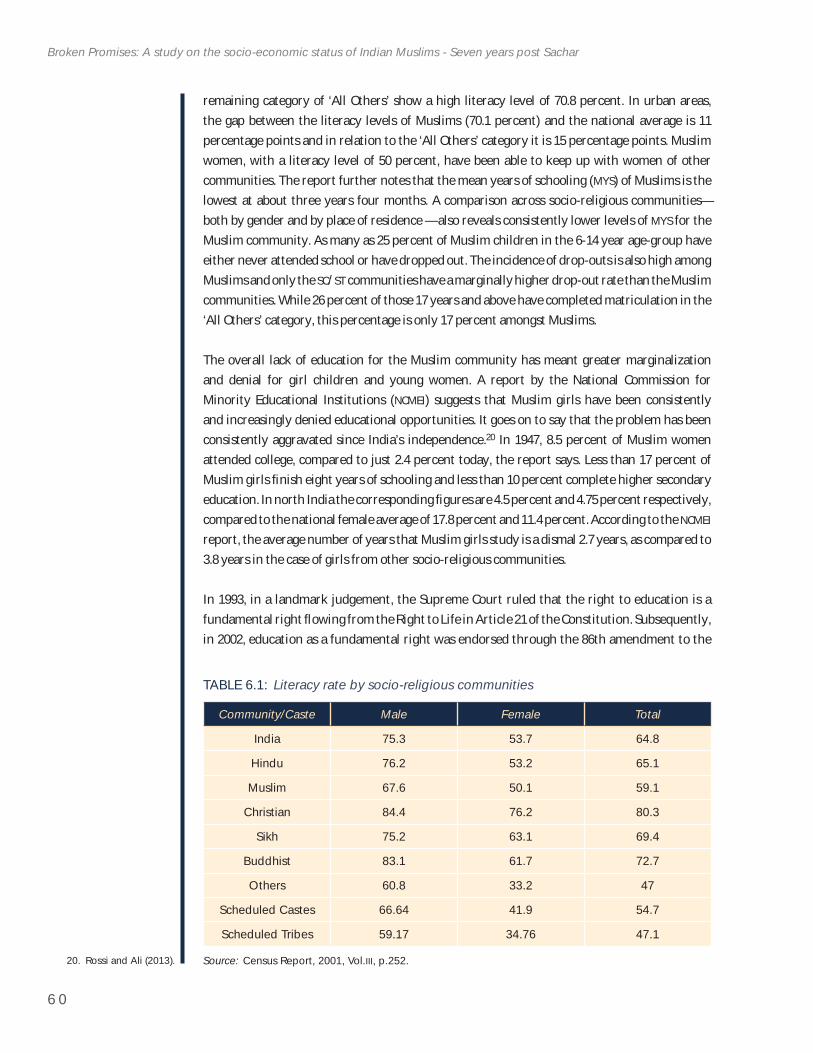
6 0
Broken Promises: A study on the socio-economic status of Indian Muslims - Seven years post Sachar
20. Rossi and Ali (2013).
remaining category of ‘All Others’ show a high literacy level of 70.8 percent. In urban areas, the gap between the literacy levels of Muslims (70.1 percent) and the national average is 11 percentage points and in relation to the ‘All Others’ category it is 15 percentage points. Muslim women, with a literacy level of 50 percent, have been able to keep up with women of other communities. The report further notes that the mean years of schooling (MYS) of Muslims is the lowest at about three years four months. A comparison across socio-religious communities— both by gender and by place of residence — also reveals consistently lower levels of MYS for the Muslim community. As many as 25 percent of Muslim children in the 6-14 year age-group have either never attended school or have dropped out. The incidence of drop-outs is also high among Muslims and only the SC/ST communities have a marginally higher drop-out rate than the Muslim communities. While 26 percent of those 17 years and above have completed matriculation in the ‘All Others’ category, this percentage is only 17 percent amongst Muslims.
The overall lack of education for the Muslim community has meant greater marginalization and denial for girl children and young women. A report by the National Commission for Minority Educational Institutions (NCMEI) suggests that Muslim girls have been consistently and increasingly denied educational opportunities. It goes on to say that the problem has been consistently aggravated since India’s independence.20 In 1947, 8.5 percent of Muslim women attended college, compared to just 2.4 percent today, the report says. Less than 17 percent of Muslim girls fi nish eight years of schooling and less than 10 percent complete higher secondary education. In north India the corresponding fi gures are 4.5 percent and 4.75 percent respectively, compared to the national female average of 17.8 percent and 11.4 percent. According to the NCMEIreport, the average number of years that Muslim girls study is a dismal 2.7 years, as compared to 3.8 years in the case of girls from other socio-religious communities.
In 1993, in a landmark judgement, the Supreme Court ruled that the right to education is a fundamental right fl owing from the Right to Life in Article 21 of the Constitution. Subsequently, in 2002, education as a fundamental right was endorsed through the 86th amendment to the
TABLE 6.1: Literacy rate by socio-religious communities
Community/Caste Male Female Total
India 75.3 53.7 64.8
Hindu 76.2 53.2 65.1
Muslim 67.6 50.1 59.1
Christian 84.4 76.2 80.3
Sikh 75.2 63.1 69.4
Buddhist 83.1 61.7 72.7
Others 60.8 33.2 47
Scheduled Castes 66.64 41.9 54.7
Scheduled Tribes 59.17 34.76 47.1
Source: Census Report, 2001, Vol.III, p.252.
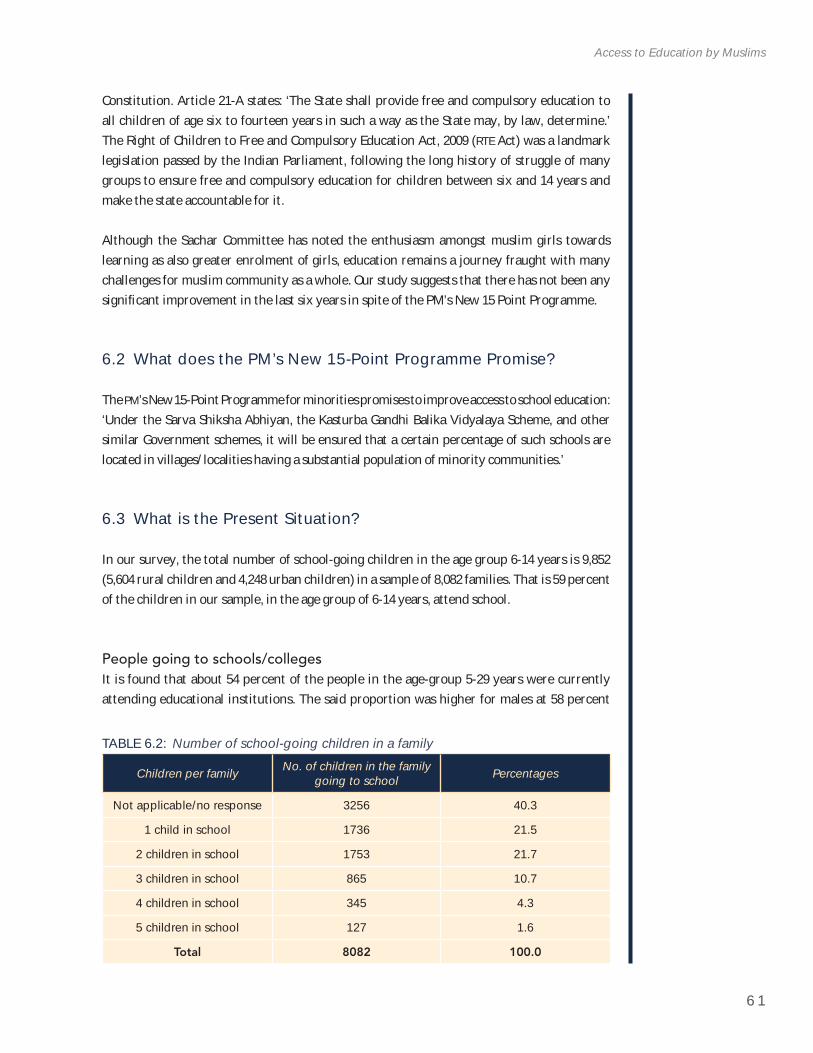
6 1
Access to Education by Muslims
Constitution. Article 21-A states: ‘The State shall provide free and compulsory education to all children of age six to fourteen years in such a way as the State may, by law, determine.’ The Right of Children to Free and Compulsory Education Act, 2009 (RTE Act) was a landmark legislation passed by the Indian Parliament, following the long history of struggle of many groups to ensure free and compulsory education for children between six and 14 years and make the state accountable for it.
Although the Sachar Committee has noted the enthusiasm amongst muslim girls towards learning as also greater enrolment of girls, education remains a journey fraught with many challenges for muslim community as a whole. Our study suggests that there has not been any signifi cant improvement in the last six years in spite of the PM’s New 15 Point Programme.
6.2 What does the PM’s New 15-Point Programme Promise?
The PM’s New 15-Point Programme for minorities promises to improve access to school education: ‘Under the Sarva Shiksha Abhiyan, the Kasturba Gandhi Balika Vidyalaya Scheme, and other similar Government schemes, it will be ensured that a certain percentage of such schools are located in villages/localities having a substantial population of minority communities.’
6.3 What is the Present Situation?
In our survey, the total number of school-going children in the age group 6-14 years is 9,852 (5,604 rural children and 4,248 urban children) in a sample of 8,082 families. That is 59 percent of the children in our sample, in the age group of 6-14 years, attend school.
People going to schools/collegesIt is found that about 54 percent of the people in the age-group 5-29 years were currently attending educational institutions. The said proportion was higher for males at 58 percent
TABLE 6.2: Number of school-going children in a family
Children per family No. of children in the family going to school Percentages
Not applicable/no response 3256 40.3
1 child in school 1736 21.5
2 children in school 1753 21.7
3 children in school 865 10.7
4 children in school 345 4.3
5 children in school 127 1.6
Total 8082 100.0
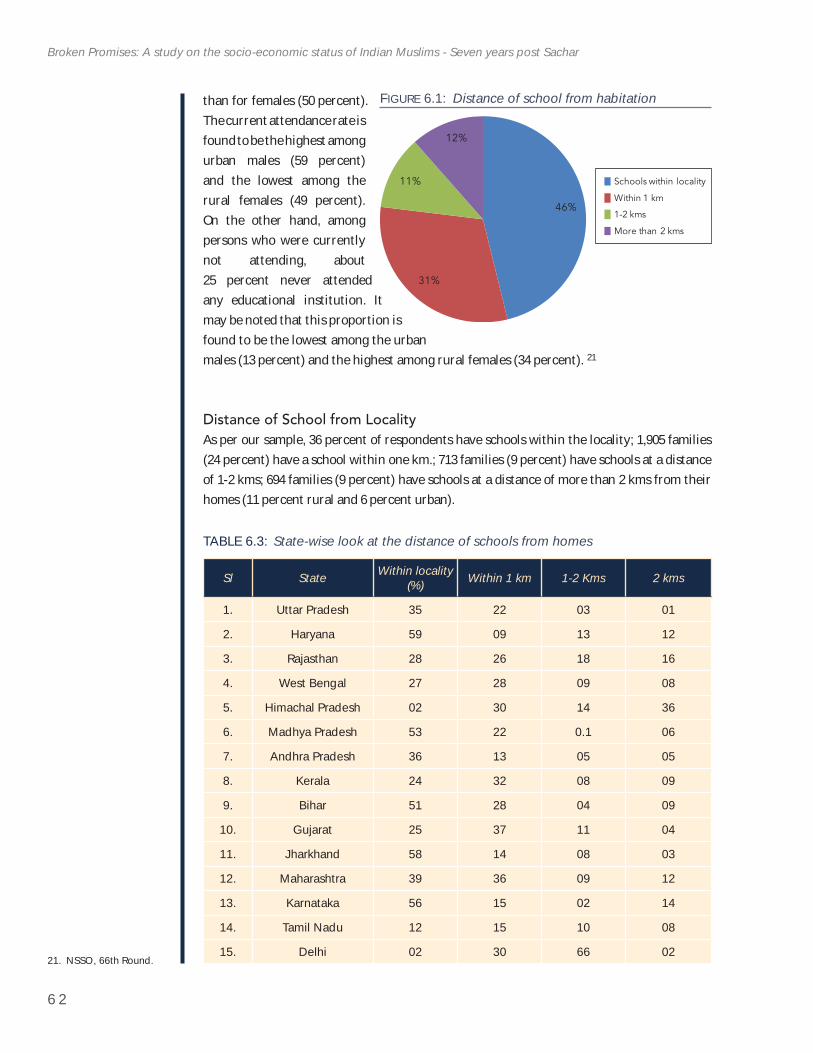
6 2
Broken Promises: A study on the socio-economic status of Indian Muslims - Seven years post Sachar
21. NSSO, 66th Round.
than for females (50 percent). The current attendance rate is found to be the highest among urban males (59 percent) and the lowest among the rural females (49 percent). On the other hand, among persons who were currently not attending, about 25 percent never attended any educational institution. It may be noted that this proportion is found to be the lowest among the urban males (13 percent) and the highest among rural females (34 percent). 21
Distance of School from LocalityAs per our sample, 36 percent of respondents have schools within the locality; 1,905 families (24 percent) have a school within one km.; 713 families (9 percent) have schools at a distance of 1-2 kms; 694 families (9 percent) have schools at a distance of more than 2 kms from their homes (11 percent rural and 6 percent urban).
46%
31%
11%
12%
Schools within locality
Within 1 km
1-2 kms
More than 2 kms
FIGURE 6.1: Distance of school from habitation
TABLE 6.3: State-wise look at the distance of schools from homes
Sl State Within locality (%) Within 1 km 1-2 Kms 2 kms
1. Uttar Pradesh 35 22 03 01
2. Haryana 59 09 13 12
3. Rajasthan 28 26 18 16
4. West Bengal 27 28 09 08
5. Himachal Pradesh 02 30 14 36
6. Madhya Pradesh 53 22 0.1 06
7. Andhra Pradesh 36 13 05 05
8. Kerala 24 32 08 09
9. Bihar 51 28 04 09
10. Gujarat 25 37 11 04
11. Jharkhand 58 14 08 03
12. Maharashtra 39 36 09 12
13. Karnataka 56 15 02 14
14. Tamil Nadu 12 15 10 08
15. Delhi 02 30 66 02
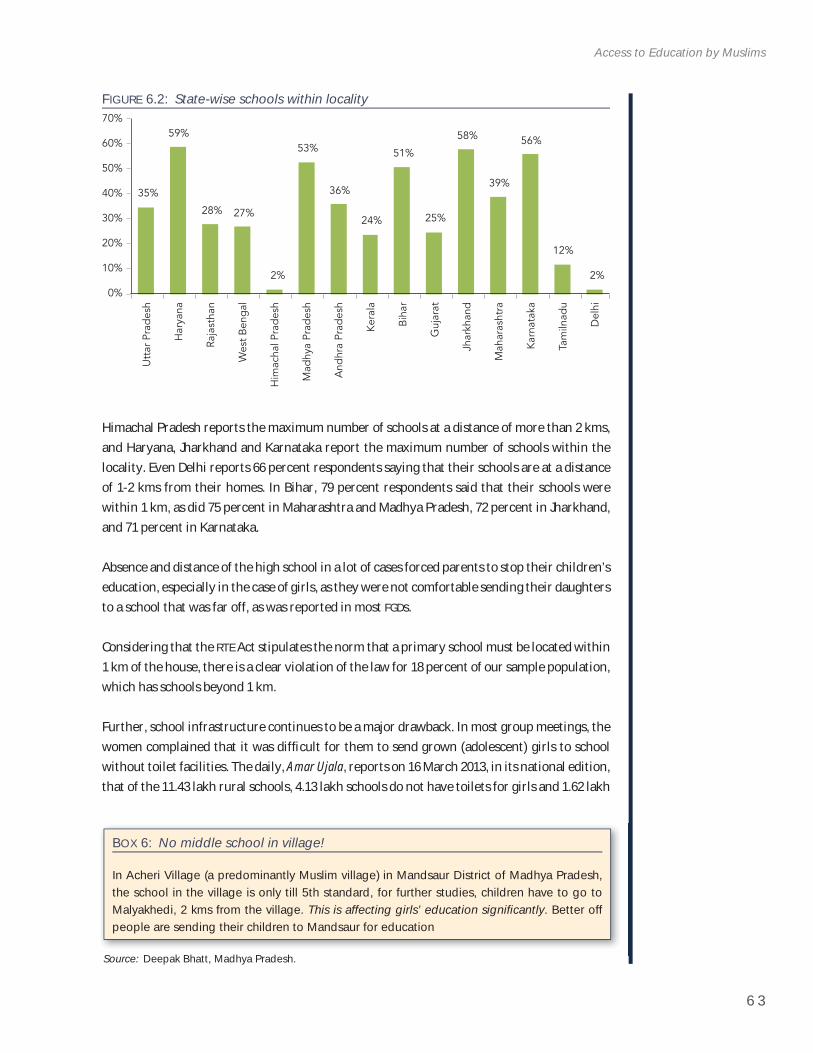
6 3
Access to Education by Muslims
Himachal Pradesh reports the maximum number of schools at a distance of more than 2 kms, and Haryana, Jharkhand and Karnataka report the maximum number of schools within the locality. Even Delhi reports 66 percent respondents saying that their schools are at a distance of 1-2 kms from their homes. In Bihar, 79 percent respondents said that their schools were within 1 km, as did 75 percent in Maharashtra and Madhya Pradesh, 72 percent in Jharkhand, and 71 percent in Karnataka.
Absence and distance of the high school in a lot of cases forced parents to stop their children’s education, especially in the case of girls, as they were not comfortable sending their daughters to a school that was far off, as was reported in most FGDs.
Considering that the RTE Act stipulates the norm that a primary school must be located within 1 km of the house, there is a clear violation of the law for 18 percent of our sample population, which has schools beyond 1 km.
Further, school infrastructure continues to be a major drawback. In most group meetings, the women complained that it was diffi cult for them to send grown (adolescent) girls to school without toilet facilities. The daily, Amar Ujala, reports on 16 March 2013, in its national edition, that of the 11.43 lakh rural schools, 4.13 lakh schools do not have toilets for girls and 1.62 lakh
BOX 6: No middle school in village!
In Acheri Village (a predominantly Muslim village) in Mandsaur District of Madhya Pradesh, the school in the village is only till 5th standard, for further studies, children have to go to Malyakhedi, 2 kms from the village. This is affecting girls’ education signifi cantly. Better off people are sending their children to Mandsaur for education
Source: Deepak Bhatt, Madhya Pradesh.
FIGURE 6.2: State-wise schools within locality
35%
59%
28% 27%
2%
53%
36%
24%
51%
25%
58%
39%
56%
12%
2%
0%
10%
20%
30%
40%
50%
60%
70%
And
hra
Prad
esh
Bih
ar
Jhar
khan
d
Ker
ala
Kar
nata
ka
Mah
aras
htra
Mad
hya
Prad
esh
Raja
stha
n
Tam
ilnad
u
Wes
t B
eng
al
Utt
ar P
rad
esh
Guj
arat
Har
yana
Del
hi
Him
acha
l Pra
des
h
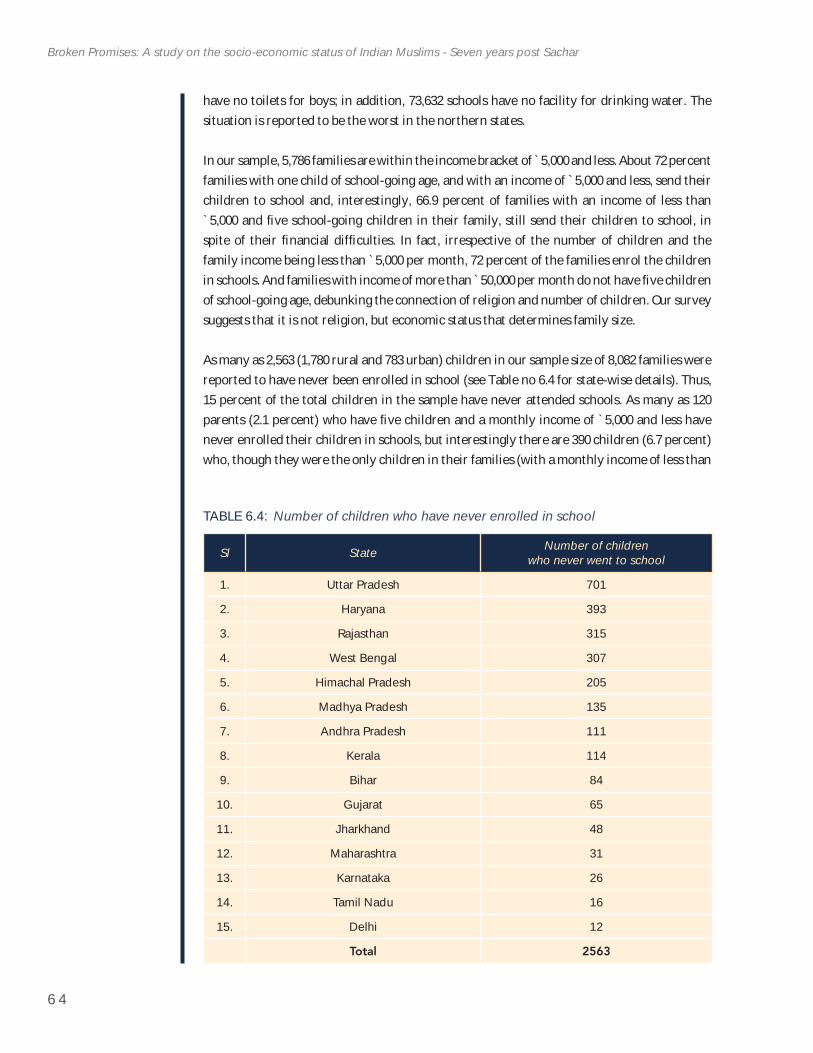
6 4
Broken Promises: A study on the socio-economic status of Indian Muslims - Seven years post Sachar
have no toilets for boys; in addition, 73,632 schools have no facility for drinking water. The situation is reported to be the worst in the northern states.
In our sample, 5,786 families are within the income bracket of ̀ 5,000 and less. About 72 percent families with one child of school-going age, and with an income of `5,000 and less, send their children to school and, interestingly, 66.9 percent of families with an income of less than `5,000 and fi ve school-going children in their family, still send their children to school, in spite of their fi nancial diffi culties. In fact, irrespective of the number of children and the family income being less than `5,000 per month, 72 percent of the families enrol the children in schools. And families with income of more than ̀ 50,000 per month do not have fi ve children of school-going age, debunking the connection of religion and number of children. Our survey suggests that it is not religion, but economic status that determines family size.
As many as 2,563 (1,780 rural and 783 urban) children in our sample size of 8,082 families were reported to have never been enrolled in school (see Table no 6.4 for state-wise details). Thus, 15 percent of the total children in the sample have never attended schools. As many as 120 parents (2.1 percent) who have fi ve children and a monthly income of `5,000 and less have never enrolled their children in schools, but interestingly there are 390 children (6.7 percent) who, though they were the only children in their families (with a monthly income of less than
TABLE 6.4: Number of children who have never enrolled in school
Sl State Number of childrenwho never went to school
1. Uttar Pradesh 701
2. Haryana 393
3. Rajasthan 315
4. West Bengal 307
5. Himachal Pradesh 205
6. Madhya Pradesh 135
7. Andhra Pradesh 111
8. Kerala 114
9. Bihar 84
10. Gujarat 65
11. Jharkhand 48
12. Maharashtra 31
13. Karnataka 26
14. Tamil Nadu 16
15. Delhi 12
Total 2563
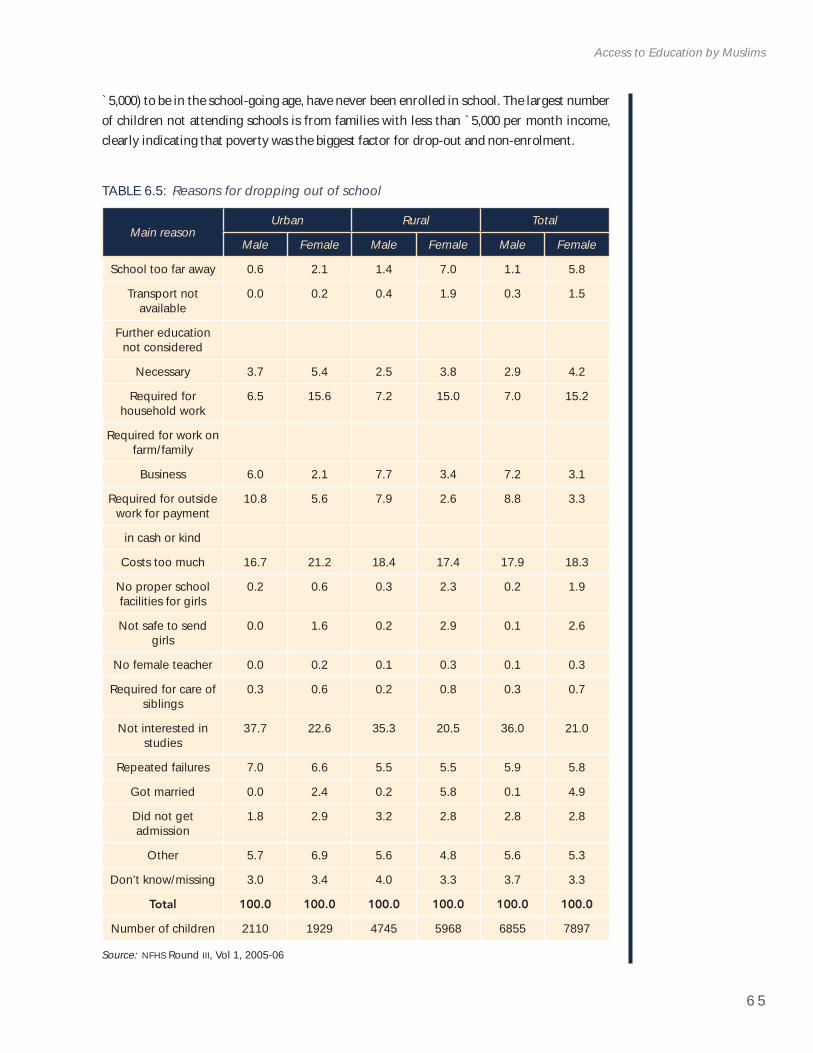
6 5
Access to Education by Muslims
TABLE 6.5: Reasons for dropping out of school
Main reasonUrban Rural Total
Male Female Male Female Male Female
School too far away 0.6 2.1 1.4 7.0 1.1 5.8
Transport not available
0.0 0.2 0.4 1.9 0.3 1.5
Further education not considered
Necessary 3.7 5.4 2.5 3.8 2.9 4.2
Required for household work
6.5 15.6 7.2 15.0 7.0 15.2
Required for work on farm/family
Business 6.0 2.1 7.7 3.4 7.2 3.1
Required for outside work for payment
10.8 5.6 7.9 2.6 8.8 3.3
in cash or kind
Costs too much 16.7 21.2 18.4 17.4 17.9 18.3
No proper school facilities for girls
0.2 0.6 0.3 2.3 0.2 1.9
Not safe to send girls
0.0 1.6 0.2 2.9 0.1 2.6
No female teacher 0.0 0.2 0.1 0.3 0.1 0.3
Required for care of siblings
0.3 0.6 0.2 0.8 0.3 0.7
Not interested in studies
37.7 22.6 35.3 20.5 36.0 21.0
Repeated failures 7.0 6.6 5.5 5.5 5.9 5.8
Got married 0.0 2.4 0.2 5.8 0.1 4.9
Did not get admission
1.8 2.9 3.2 2.8 2.8 2.8
Other 5.7 6.9 5.6 4.8 5.6 5.3
Don’t know/missing 3.0 3.4 4.0 3.3 3.7 3.3
Total 100.0 100.0 100.0 100.0 100.0 100.0
Number of children 2110 1929 4745 5968 6855 7897
Source: NFHS Round III, Vol 1, 2005-06
`5,000) to be in the school-going age, have never been enrolled in school. The largest number of children not attending schools is from families with less than `5,000 per month income, clearly indicating that poverty was the biggest factor for drop-out and non-enrolment.
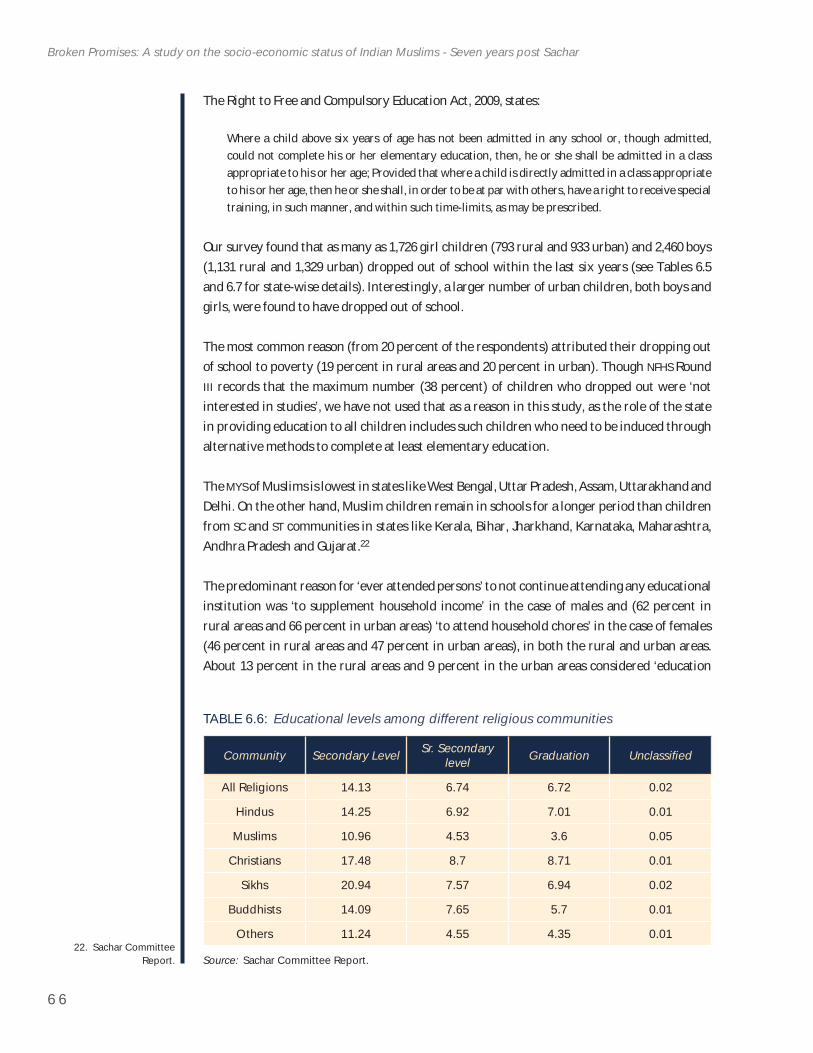
6 6
Broken Promises: A study on the socio-economic status of Indian Muslims - Seven years post Sachar
22. Sachar Committee Report.
The Right to Free and Compulsory Education Act, 2009, states:
Where a child above six years of age has not been admitted in any school or, though admitted, could not complete his or her elementary education, then, he or she shall be admitted in a class appropriate to his or her age; Provided that where a child is directly admitted in a class appropriate to his or her age, then he or she shall, in order to be at par with others, have a right to receive special training, in such manner, and within such time-limits, as may be prescribed.
Our survey found that as many as 1,726 girl children (793 rural and 933 urban) and 2,460 boys (1,131 rural and 1,329 urban) dropped out of school within the last six years (see Tables 6.5 and 6.7 for state-wise details). Interestingly, a larger number of urban children, both boys and girls, were found to have dropped out of school.
The most common reason (from 20 percent of the respondents) attributed their dropping out of school to poverty (19 percent in rural areas and 20 percent in urban). Though NFHS Round III records that the maximum number (38 percent) of children who dropped out were ‘not interested in studies’, we have not used that as a reason in this study, as the role of the state in providing education to all children includes such children who need to be induced through alternative methods to complete at least elementary education.
The MYS of Muslims is lowest in states like West Bengal, Uttar Pradesh, Assam, Uttarakhand and Delhi. On the other hand, Muslim children remain in schools for a longer period than children from SC and ST communities in states like Kerala, Bihar, Jharkhand, Karnataka, Maharashtra, Andhra Pradesh and Gujarat.22
The predominant reason for ‘ever attended persons’ to not continue attending any educational institution was ‘to supplement household income’ in the case of males and (62 percent in rural areas and 66 percent in urban areas) ‘to attend household chores’ in the case of females (46 percent in rural areas and 47 percent in urban areas), in both the rural and urban areas. About 13 percent in the rural areas and 9 percent in the urban areas considered ‘education
TABLE 6.6: Educational levels among different religious communities
Community Secondary Level Sr. Secondary level Graduation Unclassifi ed
All Religions 14.13 6.74 6.72 0.02
Hindus 14.25 6.92 7.01 0.01
Muslims 10.96 4.53 3.6 0.05
Christians 17.48 8.7 8.71 0.01
Sikhs 20.94 7.57 6.94 0.02
Buddhists 14.09 7.65 5.7 0.01
Others 11.24 4.55 4.35 0.01
Source: Sachar Committee Report.
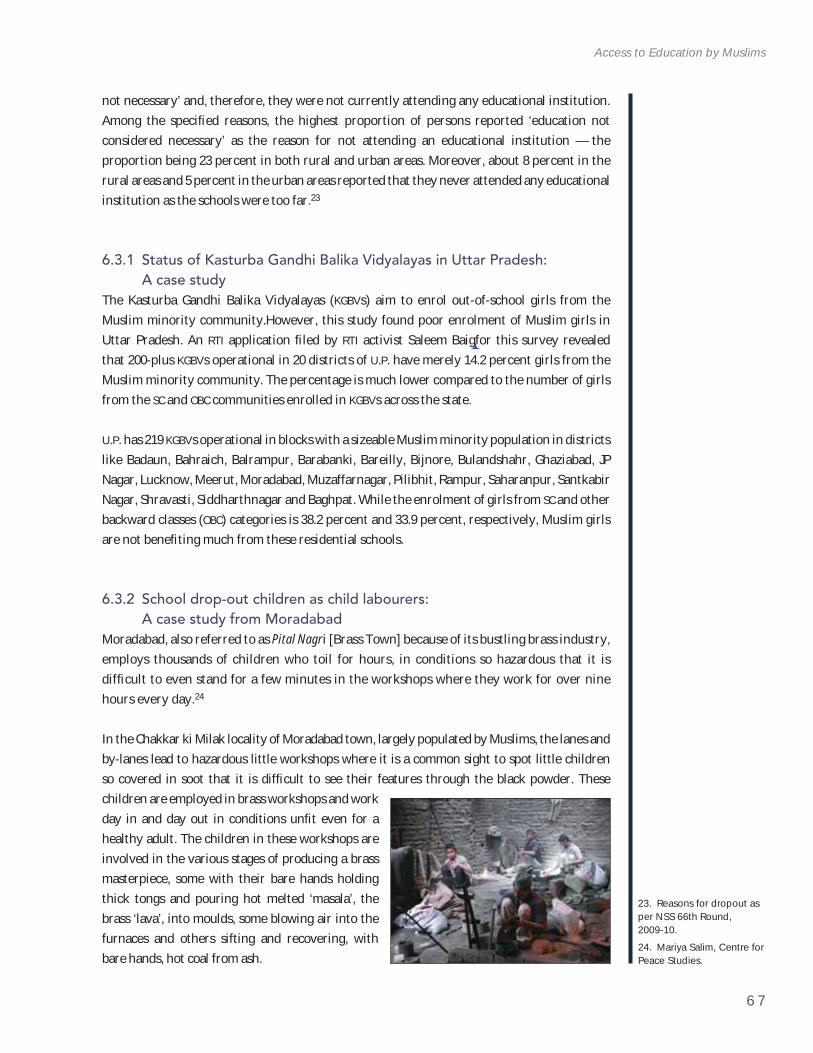
6 7
Access to Education by Muslims
23. Reasons for dropout as per NSS 66th Round, 2009-10.24. Mariya Salim, Centre for Peace Studies.
not necessary’ and, therefore, they were not currently attending any educational institution. Among the specifi ed reasons, the highest proportion of persons reported ‘education not considered necessary’ as the reason for not attending an educational institution — the proportion being 23 percent in both rural and urban areas. Moreover, about 8 percent in the rural areas and 5 percent in the urban areas reported that they never attended any educational institution as the schools were too far.23
6.3.1 Status of Kasturba Gandhi Balika Vidyalayas in Uttar Pradesh: A case study
The Kasturba Gandhi Balika Vidyalayas (KGBVs) aim to enrol out-of-school girls from the Muslim minority community.However, this study found poor enrolment of Muslim girls in Uttar Pradesh. An RTI application fi led by RTI activist Saleem Baigfor this survey revealed that 200-plus KGBVs operational in 20 districts of U.P. have merely 14.2 percent girls from the Muslim minority community. The percentage is much lower compared to the number of girls from the SC and OBC communities enrolled in KGBVs across the state.
U.P. has 219 KGBVs operational in blocks with a sizeable Muslim minority population in districts like Badaun, Bahraich, Balrampur, Barabanki, Bareilly, Bijnore, Bulandshahr, Ghaziabad, JP Nagar, Lucknow, Meerut, Moradabad, Muzaffarnagar, Pilibhit, Rampur, Saharanpur, Santkabir Nagar, Shravasti, Siddharthnagar and Baghpat. While the enrolment of girls from SC and other backward classes (OBC) categories is 38.2 percent and 33.9 percent, respectively, Muslim girls are not benefi ting much from these residential schools.
6.3.2 School drop-out children as child labourers: A case study from Moradabad
Moradabad, also referred to as Pital Nagri [Brass Town] because of its bustling brass industry, employs thousands of children who toil for hours, in conditions so hazardous that it is diffi cult to even stand for a few minutes in the workshops where they work for over nine hours every day.24
In the Chakkar ki Milak locality of Moradabad town, largely populated by Muslims, the lanes and by-lanes lead to hazardous little workshops where it is a common sight to spot little children so covered in soot that it is diffi cult to see their features through the black powder. These children are employed in brass workshops and work day in and day out in conditions unfi t even for a healthy adult. The children in these workshops are involved in the various stages of producing a brass masterpiece, some with their bare hands holding thick tongs and pouring hot melted ‘masala’, the brass ‘lava’, into moulds, some blowing air into the furnaces and others sifting and recovering, with bare hands, hot coal from ash.
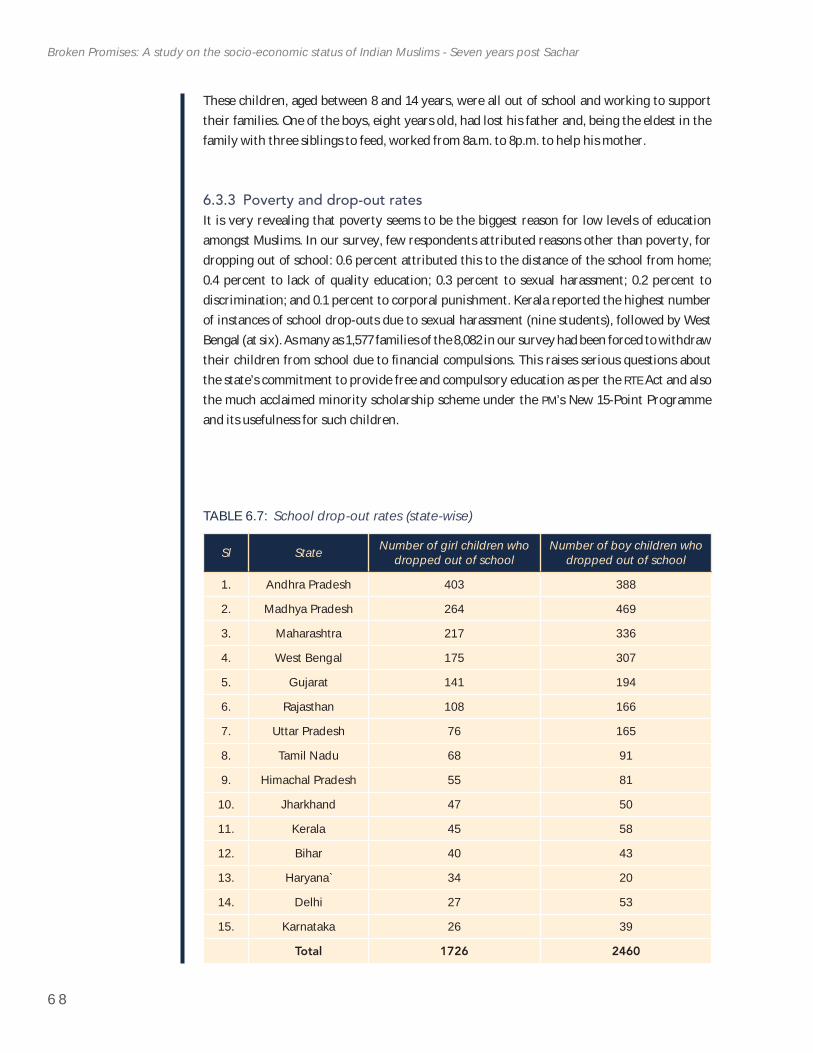
6 8
Broken Promises: A study on the socio-economic status of Indian Muslims - Seven years post Sachar
These children, aged between 8 and 14 years, were all out of school and working to support their families. One of the boys, eight years old, had lost his father and, being the eldest in the family with three siblings to feed, worked from 8a.m. to 8p.m. to help his mother.
6.3.3 Poverty and drop-out ratesIt is very revealing that poverty seems to be the biggest reason for low levels of education amongst Muslims. In our survey, few respondents attributed reasons other than poverty, for dropping out of school: 0.6 percent attributed this to the distance of the school from home; 0.4 percent to lack of quality education; 0.3 percent to sexual harassment; 0.2 percent to discrimination; and 0.1 percent to corporal punishment. Kerala reported the highest number of instances of school drop-outs due to sexual harassment (nine students), followed by West Bengal (at six). As many as 1,577 families of the 8,082 in our survey had been forced to withdraw their children from school due to fi nancial compulsions. This raises serious questions about the state’s commitment to provide free and compulsory education as per the RTE Act and also the much acclaimed minority scholarship scheme under the PM’s New 15-Point Programme and its usefulness for such children.
TABLE 6.7: School drop-out rates (state-wise)
Sl State Number of girl children who dropped out of school
Number of boy children who dropped out of school
1. Andhra Pradesh 403 388
2. Madhya Pradesh 264 469
3. Maharashtra 217 336
4. West Bengal 175 307
5. Gujarat 141 194
6. Rajasthan 108 166
7. Uttar Pradesh 76 165
8. Tamil Nadu 68 91
9. Himachal Pradesh 55 81
10. Jharkhand 47 50
11. Kerala 45 58
12. Bihar 40 43
13. Haryana` 34 20
14. Delhi 27 53
15. Karnataka 26 39
Total 1726 2460
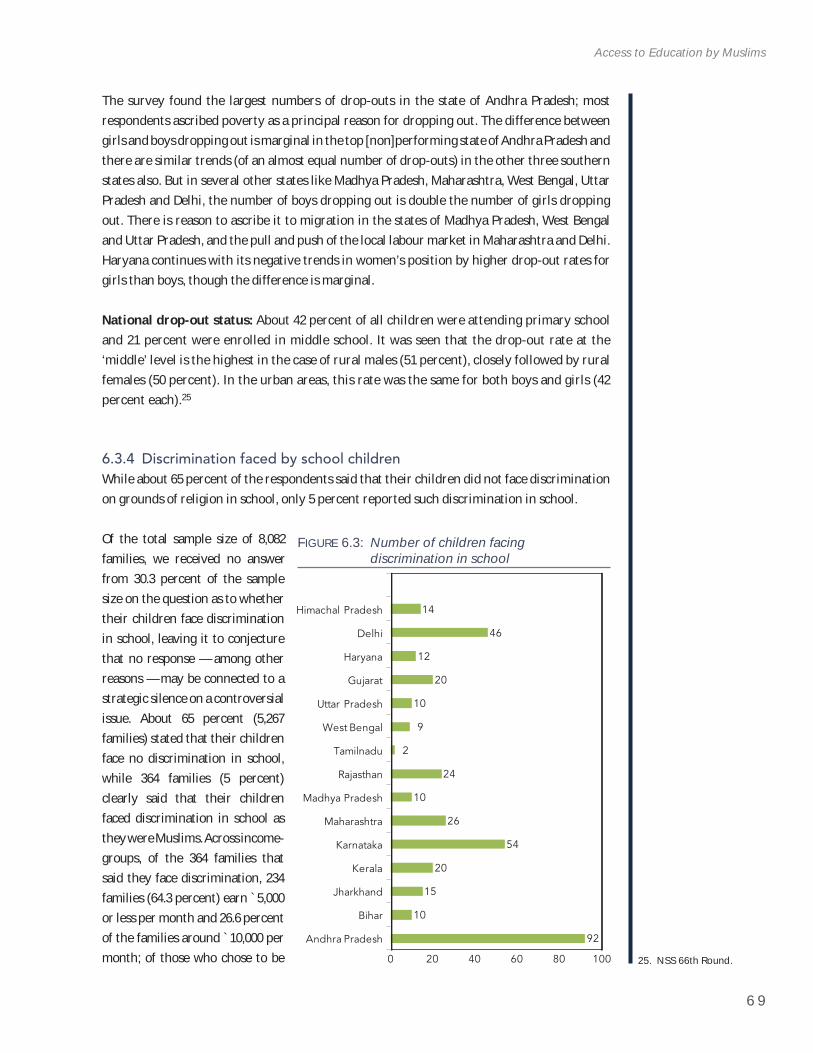
6 9
Access to Education by Muslims
25. NSS 66th Round.
The survey found the largest numbers of drop-outs in the state of Andhra Pradesh; most respondents ascribed poverty as a principal reason for dropping out. The difference between girls and boys dropping out is marginal in the top [non]performing state of Andhra Pradesh and there are similar trends (of an almost equal number of drop-outs) in the other three southern states also. But in several other states like Madhya Pradesh, Maharashtra, West Bengal, Uttar Pradesh and Delhi, the number of boys dropping out is double the number of girls dropping out. There is reason to ascribe it to migration in the states of Madhya Pradesh, West Bengal and Uttar Pradesh, and the pull and push of the local labour market in Maharashtra and Delhi. Haryana continues with its negative trends in women’s position by higher drop-out rates for girls than boys, though the difference is marginal.
National drop-out status: About 42 percent of all children were attending primary school and 21 percent were enrolled in middle school. It was seen that the drop-out rate at the ‘middle’ level is the highest in the case of rural males (51 percent), closely followed by rural females (50 percent). In the urban areas, this rate was the same for both boys and girls (42 percent each).25
6.3.4 Discrimination faced by school childrenWhile about 65 percent of the respondents said that their children did not face discrimination on grounds of religion in school, only 5 percent reported such discrimination in school.
Of the total sample size of 8,082 families, we received no answer from 30.3 percent of the sample size on the question as to whether their children face discrimination in school, leaving it to conjecture that no response — among other reasons — may be connected to a strategic silence on a controversial issue. About 65 percent (5,267 families) stated that their children face no discrimination in school, while 364 families (5 percent) clearly said that their children faced discrimination in school as they were Muslims. Across income-groups, of the 364 families that said they face discrimination, 234 families (64.3 percent) earn `5,000 or less per month and 26.6 percent of the families around `10,000 per month; of those who chose to be
FIGURE 6.3: Number of children facing discrimination in school
92
10
15
20
54
26
10
24
2
9
10
20
12
46
14
0 20 40 60 80 100
Andhra Pradesh
Bihar
Jharkhand
Kerala
Karnataka
Maharashtra
Madhya Pradesh
Rajasthan
Tamilnadu
West Bengal
Uttar Pradesh
Gujarat
Haryana
Delhi
Himachal Pradesh
7 0
Broken Promises: A study on the socio-economic status of Indian Muslims - Seven years post Sachar
silent or deny discrimination, most were from the higher income group, with family incomes of `40,000 or more per month. Whether economic status/situation have a direct correlation with or infl uence on the attitudes of service providers such as teachers, is a question that remains. Men far outnumbered women in reporting discrimination in schools.
Of the respondents in Delhi, 23 percent reported facing discrimination in schools; Andhra Pradesh came next with 12 percent and Karnataka followed with 9 percent. The least discrimination was reported from Tamil Nadu (0.3 percent), followed by Madhya Pradesh (1.3 percent) and Uttar Pradesh (1.6 percent).
Muslim students said that the single most source of discrimination faced by them comes from teachers; this is followed by the discrimination in the language/medium of education. The largest numbers (69 percent) of those who complained of discrimination from teachers were Muslim children whose family income is less than `5,000 per month. Only one child in the higher income category complained of discrimination; a mere 6.5 percent of children with salaried parents (in government or private jobs), complained of discrimination, showing a clear correlation of both religion and economic status with societal attitudes.
Of the 364 children whose parents agreed that their children face discrimination, 63.7 percent study in government schools. Interestingly, even 14.3 percent of the surveyed, studying in private schools being charged fees for education, complained of discrimination towards Muslim children. Also interestingly, about 2.5 percent of children going to recognized Madrasas and 1.4 percent going to non-recognized Madrasas also complained of discrimination, in terms of behaviour. This could be ascribed to differences in the economic standards of the children attending the Madrasas, where poorer children get treated worse than those better off. This study returned 83 castes among Muslims and, interestingly, ’Sheikh’ (a high caste among Muslims) children reported the maximum discrimination.
Not surprisingly, only one child in the entire survey complained of discrimination in a Maktab. More urban children allege discrimination than their rural counterparts. A look at Table 6.8 shows clearly that in almost all states the teacher’s attitude towards Muslim children stands out as the most common discriminatory behaviour faced by the children. Delhi tops the list with 12 percent. In the two states of Karnataka and Andhra Pradesh the teacher’s attitude is translated to discrimination in dispensing the mid-day meal. Ridicule of Muslim children for their language is also seen in Delhi, Andhra Pradesh, Kerala and Karnataka.
About 43 percent reported getting mid-day meals at schools while about 10 percent reported not getting mid-day meals. The largest number of complaints of not getting the mid-day meal came from 569 (71.4 percent) families with an income of less than `5,000 per month. Of those who said that they did not receive mid-day meals in schools, 50 percent were from urban areas and 38 percent from rural.
Himachal Pradesh shows the best performance in children getting the mid-day meal, books and uniforms in schools, followed by Delhi, Kerala and Karnataka. With the exception of Himachal
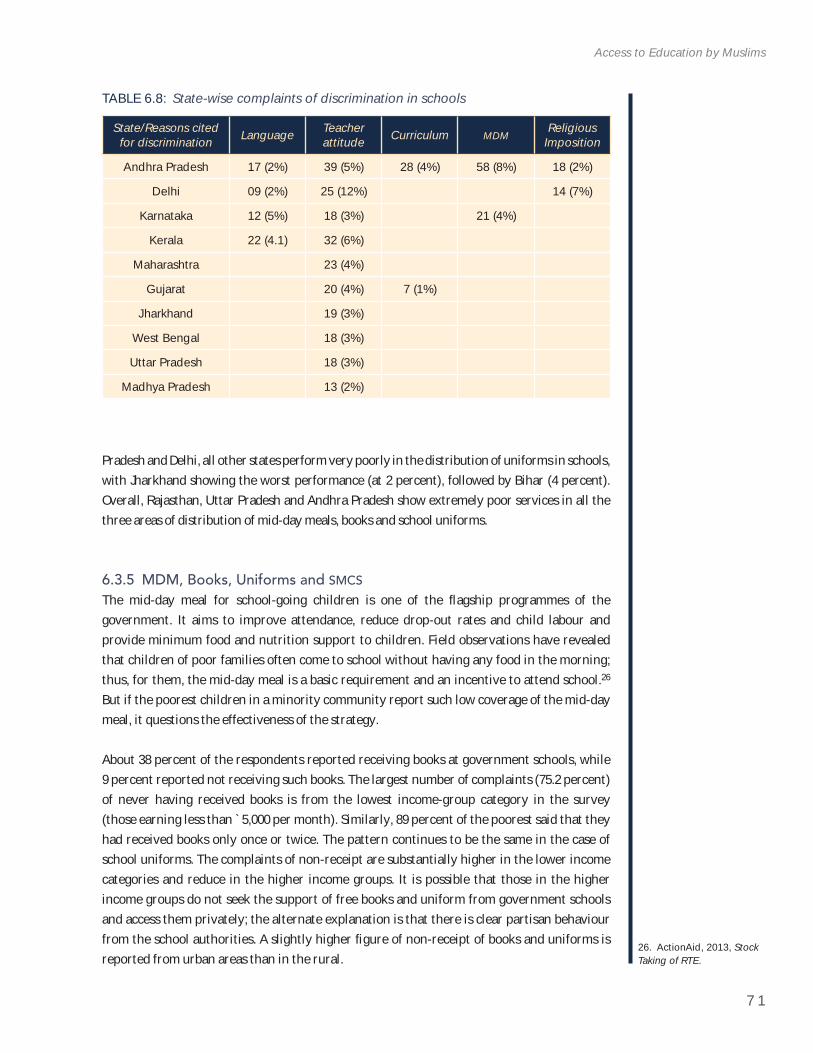
7 1
Access to Education by Muslims
26. ActionAid, 2013, StockTaking of RTE.
Pradesh and Delhi, all other states perform very poorly in the distribution of uniforms in schools, with Jharkhand showing the worst performance (at 2 percent), followed by Bihar (4 percent). Overall, Rajasthan, Uttar Pradesh and Andhra Pradesh show extremely poor services in all the three areas of distribution of mid-day meals, books and school uniforms.
6.3.5 MDM, Books, Uniforms and SMCS
The mid-day meal for school-going children is one of the fl agship programmes of the government. It aims to improve attendance, reduce drop-out rates and child labour and provide minimum food and nutrition support to children. Field observations have revealed that children of poor families often come to school without having any food in the morning; thus, for them, the mid-day meal is a basic requirement and an incentive to attend school.26
But if the poorest children in a minority community report such low coverage of the mid-day meal, it questions the effectiveness of the strategy.
About 38 percent of the respondents reported receiving books at government schools, while 9 percent reported not receiving such books. The largest number of complaints (75.2 percent) of never having received books is from the lowest income-group category in the survey (those earning less than `5,000 per month). Similarly, 89 percent of the poorest said that they had received books only once or twice. The pattern continues to be the same in the case of school uniforms. The complaints of non-receipt are substantially higher in the lower income categories and reduce in the higher income groups. It is possible that those in the higher income groups do not seek the support of free books and uniform from government schools and access them privately; the alternate explanation is that there is clear partisan behaviour from the school authorities. A slightly higher fi gure of non-receipt of books and uniforms is reported from urban areas than in the rural.
TABLE 6.8: State-wise complaints of discrimination in schools
State/Reasons cited for discrimination Language Teacher
attitude Curriculum MDMReligious
Imposition
Andhra Pradesh 17 (2%) 39 (5%) 28 (4%) 58 (8%) 18 (2%)
Delhi 09 (2%) 25 (12%) 14 (7%)
Karnataka 12 (5%) 18 (3%) 21 (4%)
Kerala 22 (4.1) 32 (6%)
Maharashtra 23 (4%)
Gujarat 20 (4%) 7 (1%)
Jharkhand 19 (3%)
West Bengal 18 (3%)
Uttar Pradesh 18 (3%)
Madhya Pradesh 13 (2%)
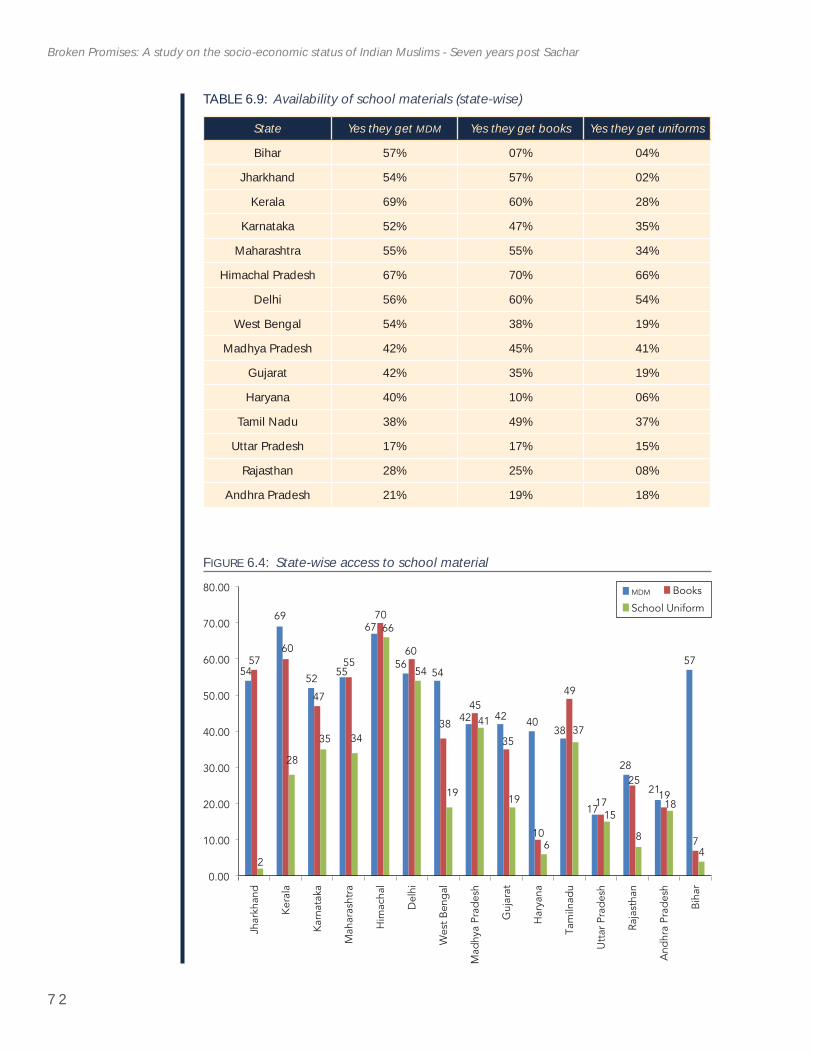
7 2
Broken Promises: A study on the socio-economic status of Indian Muslims - Seven years post Sachar
TABLE 6.9: Availability of school materials (state-wise)
State Yes they get MDM Yes they get books Yes they get uniforms
Bihar 57% 07% 04%
Jharkhand 54% 57% 02%
Kerala 69% 60% 28%
Karnataka 52% 47% 35%
Maharashtra 55% 55% 34%
Himachal Pradesh 67% 70% 66%
Delhi 56% 60% 54%
West Bengal 54% 38% 19%
Madhya Pradesh 42% 45% 41%
Gujarat 42% 35% 19%
Haryana 40% 10% 06%
Tamil Nadu 38% 49% 37%
Uttar Pradesh 17% 17% 15%
Rajasthan 28% 25% 08%
Andhra Pradesh 21% 19% 18%
FIGURE 6.4: State-wise access to school material
54
69
5255
67
5654
42 42 4038
17
28
21
575760
47
55
70
60
38
45
35
10
49
17
2519
7
2
28
35 34
66
54
19
41
19
6
37
15
8
18
4
0.00
10.00
20.00
30.00
40.00
50.00
60.00
70.00
80.00
Jhar
khan
d
Ker
ala
Kar
nata
ka
Mah
aras
htra
Him
acha
l
Del
hi
Wes
t B
eng
al
Mad
hya
Prad
esh
Guj
arat
Har
yana
Tam
ilnad
u
Utt
ar P
rad
esh
Raja
stha
n
And
hra
Prad
esh
Bih
ar
MDM Books
School Uniform
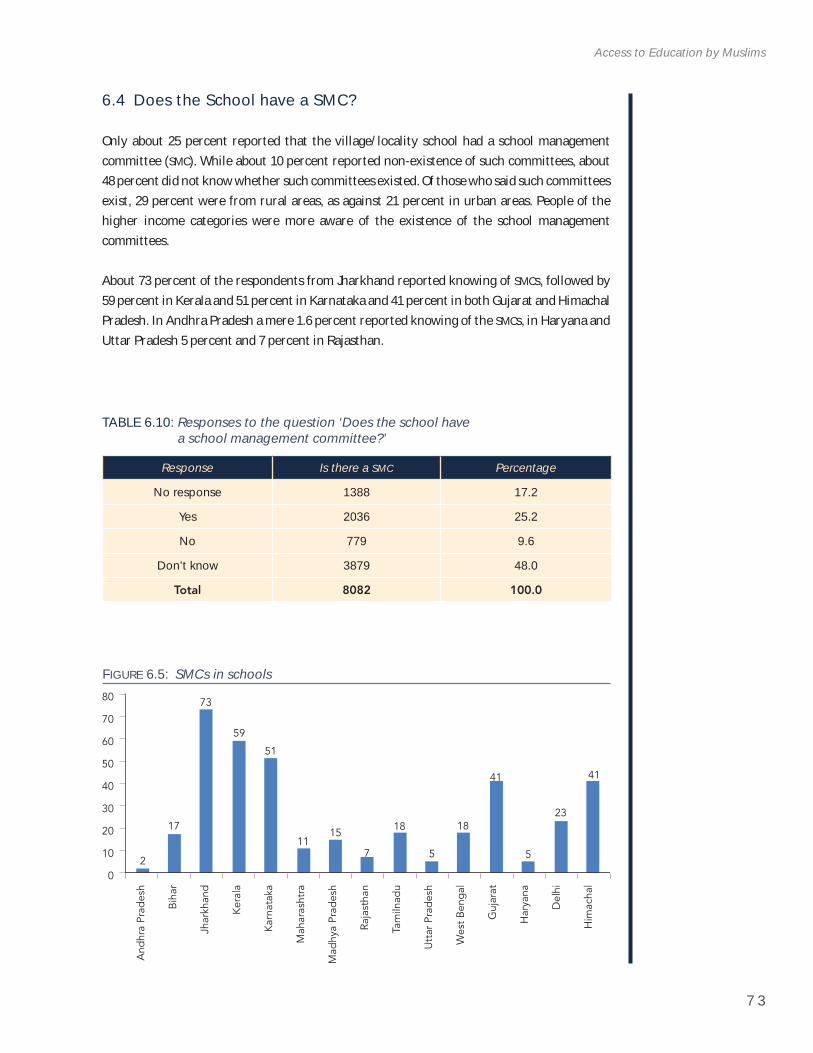
7 3
Access to Education by Muslims
6.4 Does the School have a SMC?
Only about 25 percent reported that the village/locality school had a school management committee (SMC). While about 10 percent reported non-existence of such committees, about 48 percent did not know whether such committees existed. Of those who said such committees exist, 29 percent were from rural areas, as against 21 percent in urban areas. People of the higher income categories were more aware of the existence of the school management committees.
About 73 percent of the respondents from Jharkhand reported knowing of SMCs, followed by 59 percent in Kerala and 51 percent in Karnataka and 41 percent in both Gujarat and Himachal Pradesh. In Andhra Pradesh a mere 1.6 percent reported knowing of the SMCs, in Haryana and Uttar Pradesh 5 percent and 7 percent in Rajasthan.
TABLE 6.10: Responses to the question ‘Does the school have a school management committee?’
Response Is there a SMC Percentage
No response 1388 17.2
Yes 2036 25.2
No 779 9.6
Don’t know 3879 48.0
Total 8082 100.0
FIGURE 6.5: SMCs in schools
0
102
17
73
59
51
1115
7
18
5
18
41
5
23
41
20
30
40
50
60
70
80
And
hra
Prad
esh
Bih
ar
Jhar
khan
d
Ker
ala
Kar
nata
ka
Mah
aras
htra
Mad
hya
Prad
esh
Raja
stha
n
Tam
ilnad
u
Utt
ar P
rad
esh
Wes
t B
eng
al
Guj
arat
Har
yana
Del
hi
Him
acha
l
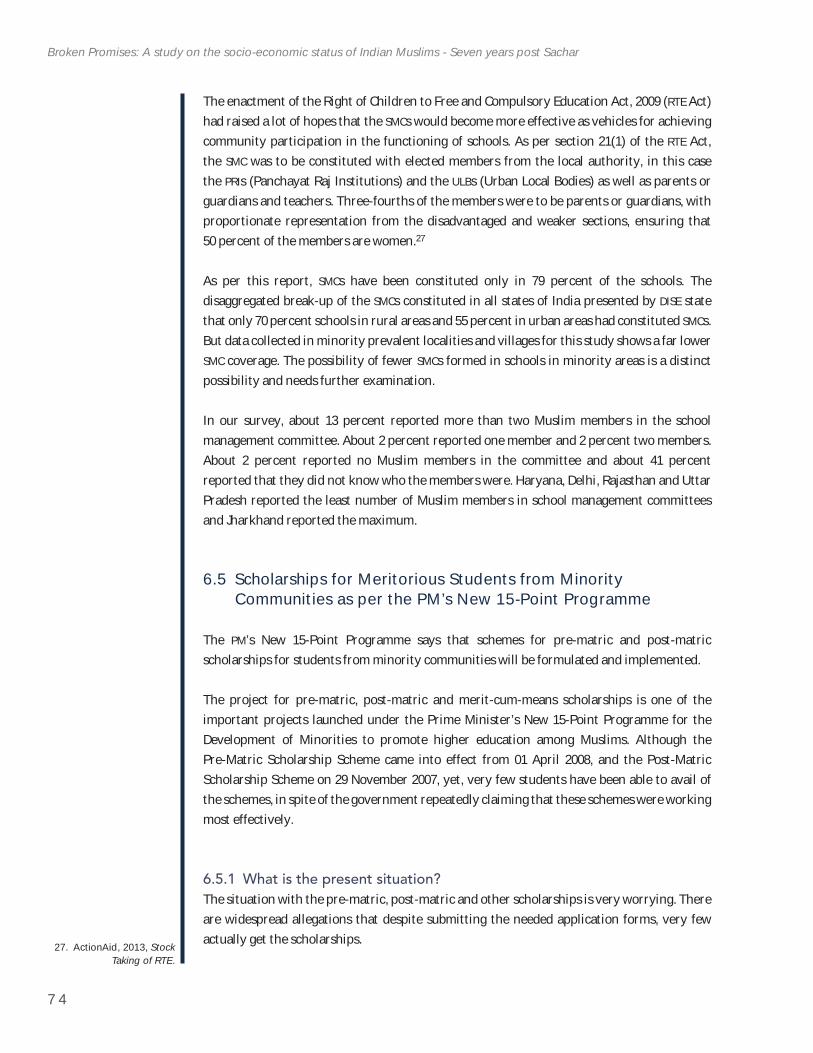
7 4
Broken Promises: A study on the socio-economic status of Indian Muslims - Seven years post Sachar
27. ActionAid, 2013, StockTaking of RTE.
The enactment of the Right of Children to Free and Compulsory Education Act, 2009 (RTE Act) had raised a lot of hopes that the SMCs would become more effective as vehicles for achieving community participation in the functioning of schools. As per section 21(1) of the RTE Act, the SMC was to be constituted with elected members from the local authority, in this case the PRIs (Panchayat Raj Institutions) and the ULBs (Urban Local Bodies) as well as parents or guardians and teachers. Three-fourths of the members were to be parents or guardians, with proportionate representation from the disadvantaged and weaker sections, ensuring that 50 percent of the members are women.27
As per this report, SMCs have been constituted only in 79 percent of the schools. The disaggregated break-up of the SMCs constituted in all states of India presented by DISE state that only 70 percent schools in rural areas and 55 percent in urban areas had constituted SMCs.But data collected in minority prevalent localities and villages for this study shows a far lower SMC coverage. The possibility of fewer SMCs formed in schools in minority areas is a distinct possibility and needs further examination.
In our survey, about 13 percent reported more than two Muslim members in the school management committee. About 2 percent reported one member and 2 percent two members. About 2 percent reported no Muslim members in the committee and about 41 percent reported that they did not know who the members were. Haryana, Delhi, Rajasthan and Uttar Pradesh reported the least number of Muslim members in school management committees and Jharkhand reported the maximum.
6.5 Scholarships for Meritorious Students from Minority Communities as per the PM’s New 15-Point Programme
The PM’s New 15-Point Programme says that schemes for pre-matric and post-matric scholarships for students from minority communities will be formulated and implemented.
The project for pre-matric, post-matric and merit-cum-means scholarships is one of the important projects launched under the Prime Minister’s New 15-Point Programme for the Development of Minorities to promote higher education among Muslims. Although the Pre-Matric Scholarship Scheme came into effect from 01 April 2008, and the Post-Matric Scholarship Scheme on 29 November 2007, yet, very few students have been able to avail of the schemes, in spite of the government repeatedly claiming that these schemes were working most effectively.
6.5.1 What is the present situation?The situation with the pre-matric, post-matric and other scholarships is very worrying. There are widespread allegations that despite submitting the needed application forms, very few actually get the scholarships.
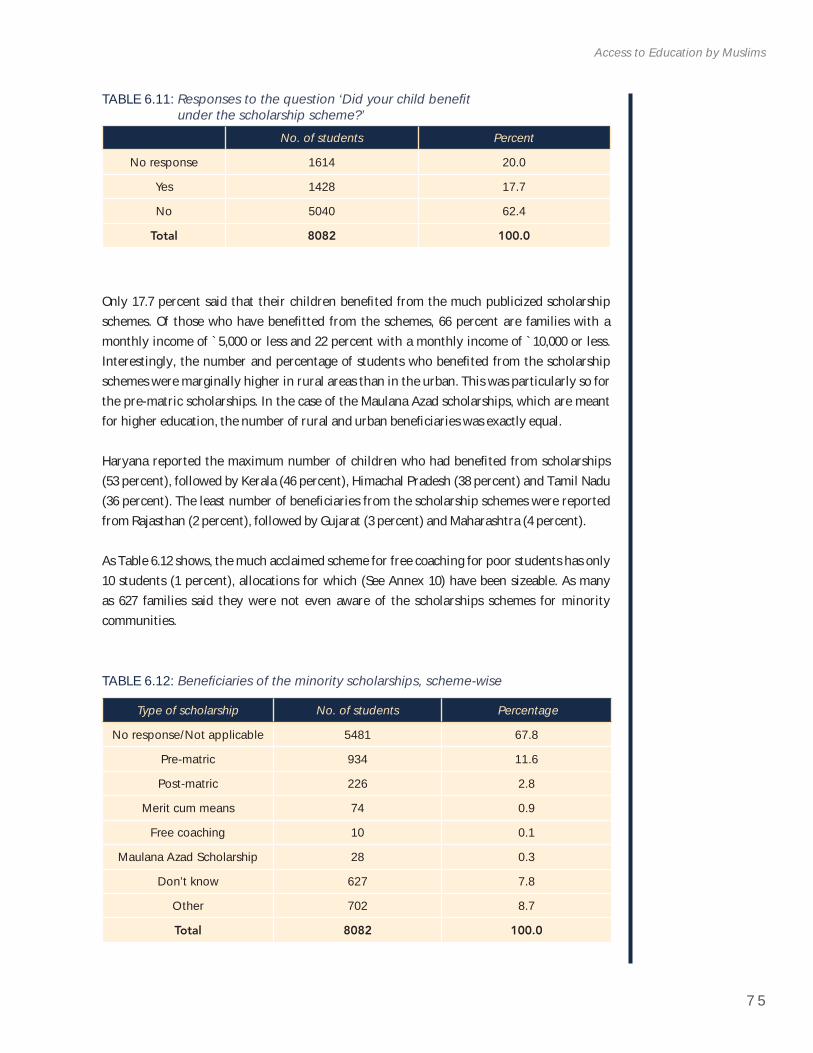
7 5
Access to Education by Muslims
Only 17.7 percent said that their children benefi ted from the much publicized scholarship schemes. Of those who have benefi tted from the schemes, 66 percent are families with a monthly income of `5,000 or less and 22 percent with a monthly income of `10,000 or less. Interestingly, the number and percentage of students who benefi ted from the scholarship schemes were marginally higher in rural areas than in the urban. This was particularly so for the pre-matric scholarships. In the case of the Maulana Azad scholarships, which are meant for higher education, the number of rural and urban benefi ciaries was exactly equal.
Haryana reported the maximum number of children who had benefi ted from scholarships (53 percent), followed by Kerala (46 percent), Himachal Pradesh (38 percent) and Tamil Nadu (36 percent). The least number of benefi ciaries from the scholarship schemes were reported from Rajasthan (2 percent), followed by Gujarat (3 percent) and Maharashtra (4 percent).
As Table 6.12 shows, the much acclaimed scheme for free coaching for poor students has only 10 students (1 percent), allocations for which (See Annex 10) have been sizeable. As many as 627 families said they were not even aware of the scholarships schemes for minority communities.
TABLE 6.11: Responses to the question ‘Did your child benefi t under the scholarship scheme?’
No. of students Percent
No response 1614 20.0
Yes 1428 17.7
No 5040 62.4
Total 8082 100.0
TABLE 6.12: Benefi ciaries of the minority scholarships, scheme-wise
Type of scholarship No. of students Percentage
No response/Not applicable 5481 67.8
Pre-matric 934 11.6
Post-matric 226 2.8
Merit cum means 74 0.9
Free coaching 10 0.1
Maulana Azad Scholarship 28 0.3
Don’t know 627 7.8
Other 702 8.7
Total 8082 100.0
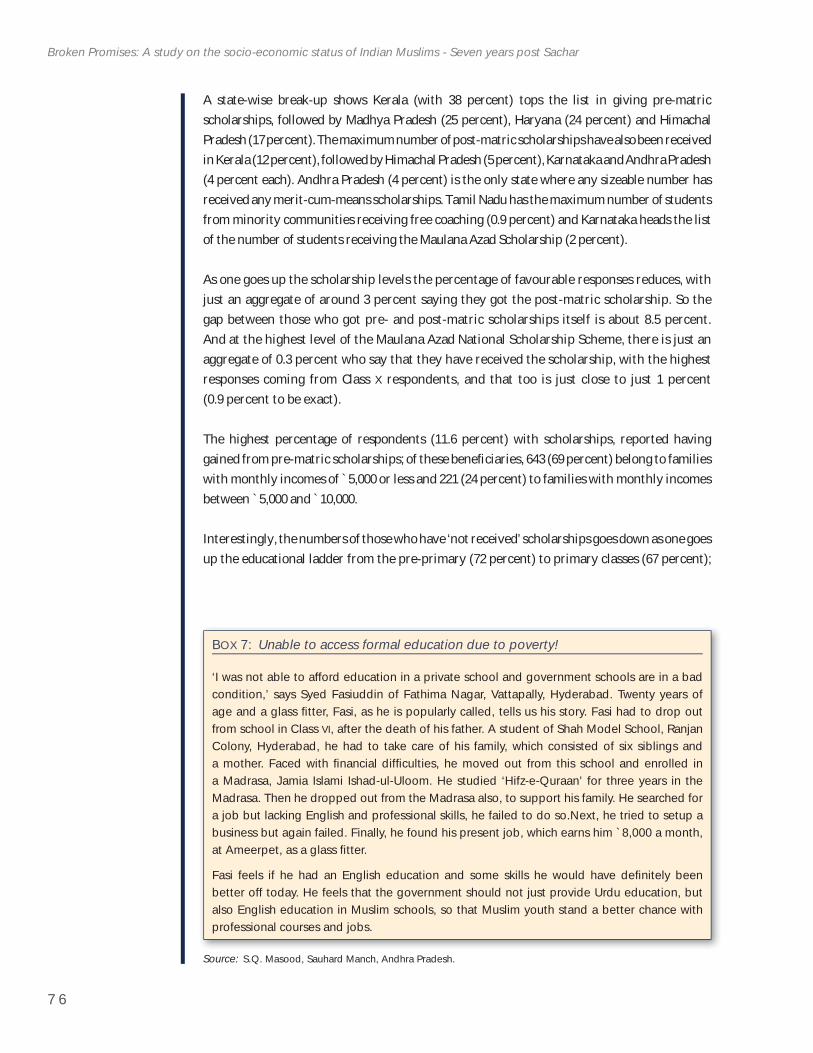
7 6
Broken Promises: A study on the socio-economic status of Indian Muslims - Seven years post Sachar
A state-wise break-up shows Kerala (with 38 percent) tops the list in giving pre-matric scholarships, followed by Madhya Pradesh (25 percent), Haryana (24 percent) and Himachal Pradesh (17 percent). The maximum number of post-matric scholarships have also been received in Kerala (12 percent), followed by Himachal Pradesh (5 percent), Karnataka and Andhra Pradesh (4 percent each). Andhra Pradesh (4 percent) is the only state where any sizeable number has received any merit-cum-means scholarships. Tamil Nadu has the maximum number of students from minority communities receiving free coaching (0.9 percent) and Karnataka heads the list of the number of students receiving the Maulana Azad Scholarship (2 percent).
As one goes up the scholarship levels the percentage of favourable responses reduces, with just an aggregate of around 3 percent saying they got the post-matric scholarship. So the gap between those who got pre- and post-matric scholarships itself is about 8.5 percent. And at the highest level of the Maulana Azad National Scholarship Scheme, there is just an aggregate of 0.3 percent who say that they have received the scholarship, with the highest responses coming from Class X respondents, and that too is just close to just 1 percent (0.9 percent to be exact).
The highest percentage of respondents (11.6 percent) with scholarships, reported having gained from pre-matric scholarships; of these benefi ciaries, 643 (69 percent) belong to families with monthly incomes of `5,000 or less and 221 (24 percent) to families with monthly incomes between `5,000 and `10,000.
Interestingly, the numbers of those who have ‘not received’ scholarships goes down as one goes up the educational ladder from the pre-primary (72 percent) to primary classes (67 percent);
BOX 7: Unable to access formal education due to poverty!
‘I was not able to afford education in a private school and government schools are in a bad condition,’ says Syed Fasiuddin of Fathima Nagar, Vattapally, Hyderabad. Twenty years of age and a glass fi tter, Fasi, as he is popularly called, tells us his story. Fasi had to drop out from school in Class VI, after the death of his father. A student of Shah Model School, Ranjan Colony, Hyderabad, he had to take care of his family, which consisted of six siblings and a mother. Faced with fi nancial diffi culties, he moved out from this school and enrolled in a Madrasa, Jamia Islami Ishad-ul-Uloom. He studied ‘Hifz-e-Quraan’ for three years in the Madrasa. Then he dropped out from the Madrasa also, to support his family. He searched for a job but lacking English and professional skills, he failed to do so.Next, he tried to setup a business but again failed. Finally, he found his present job, which earns him `8,000 a month, at Ameerpet, as a glass fi tter.
Fasi feels if he had an English education and some skills he would have defi nitely been better off today. He feels that the government should not just provide Urdu education, but also English education in Muslim schools, so that Muslim youth stand a better chance with professional courses and jobs.
Source: S.Q. Masood, Sauhard Manch, Andhra Pradesh.
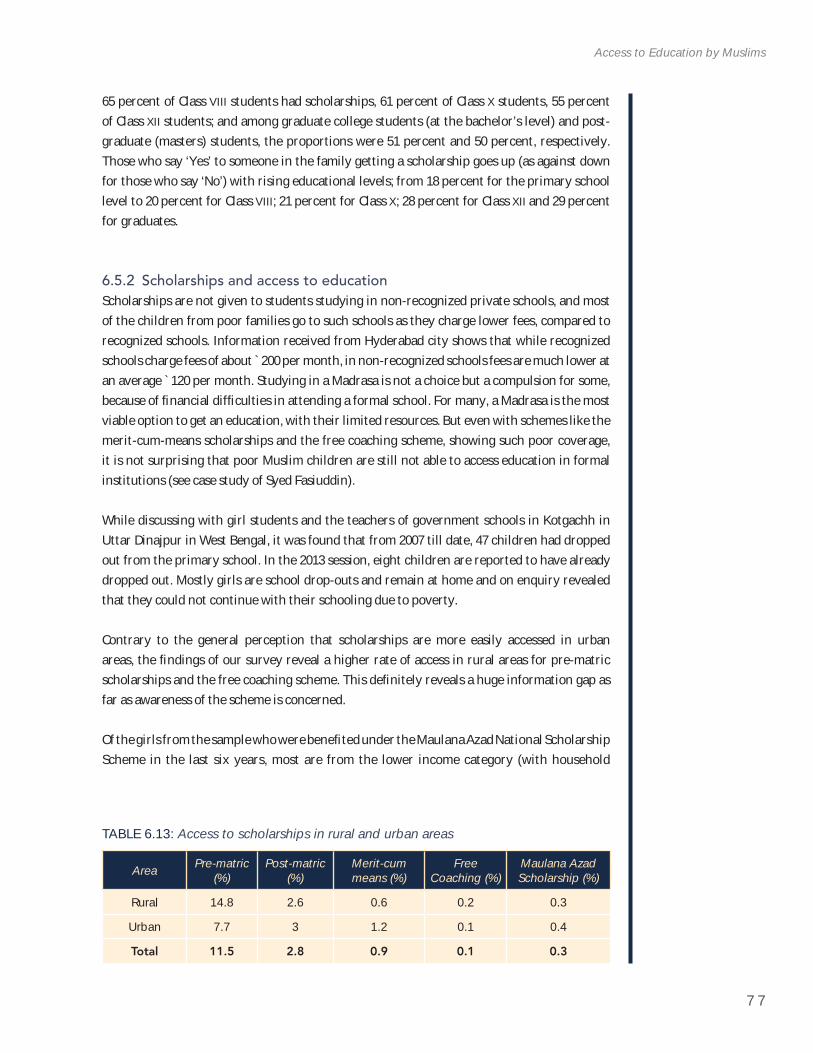
7 7
Access to Education by Muslims
65 percent of Class VIII students had scholarships, 61 percent of Class X students, 55 percent of Class XII students; and among graduate college students (at the bachelor’s level) and post-graduate (masters) students, the proportions were 51 percent and 50 percent, respectively. Those who say ‘Yes’ to someone in the family getting a scholarship goes up (as against down for those who say ‘No’) with rising educational levels; from 18 percent for the primary school level to 20 percent for Class VIII; 21 percent for Class X; 28 percent for Class XII and 29 percent for graduates.
6.5.2 Scholarships and access to educationScholarships are not given to students studying in non-recognized private schools, and most of the children from poor families go to such schools as they charge lower fees, compared to recognized schools. Information received from Hyderabad city shows that while recognized schools charge fees of about ̀ 200 per month, in non-recognized schools fees are much lower at an average `120 per month. Studying in a Madrasa is not a choice but a compulsion for some, because of fi nancial diffi culties in attending a formal school. For many, a Madrasa is the most viable option to get an education, with their limited resources. But even with schemes like the merit-cum-means scholarships and the free coaching scheme, showing such poor coverage, it is not surprising that poor Muslim children are still not able to access education in formal institutions (see case study of Syed Fasiuddin).
While discussing with girl students and the teachers of government schools in Kotgachh in Uttar Dinajpur in West Bengal, it was found that from 2007 till date, 47 children had dropped out from the primary school. In the 2013 session, eight children are reported to have already dropped out. Mostly girls are school drop-outs and remain at home and on enquiry revealed that they could not continue with their schooling due to poverty.
Contrary to the general perception that scholarships are more easily accessed in urban areas, the fi ndings of our survey reveal a higher rate of access in rural areas for pre-matric scholarships and the free coaching scheme. This defi nitely reveals a huge information gap as far as awareness of the scheme is concerned.
Of the girls from the sample who were benefi ted under the Maulana Azad National Scholarship Scheme in the last six years, most are from the lower income category (with household
TABLE 6.13: Access to scholarships in rural and urban areas
Area Pre-matric (%)
Post-matric(%)
Merit-cummeans (%)
Free Coaching (%)
Maulana Azad Scholarship (%)
Rural 14.8 2.6 0.6 0.2 0.3
Urban 7.7 3 1.2 0.1 0.4
Total 11.5 2.8 0.9 0.1 0.3
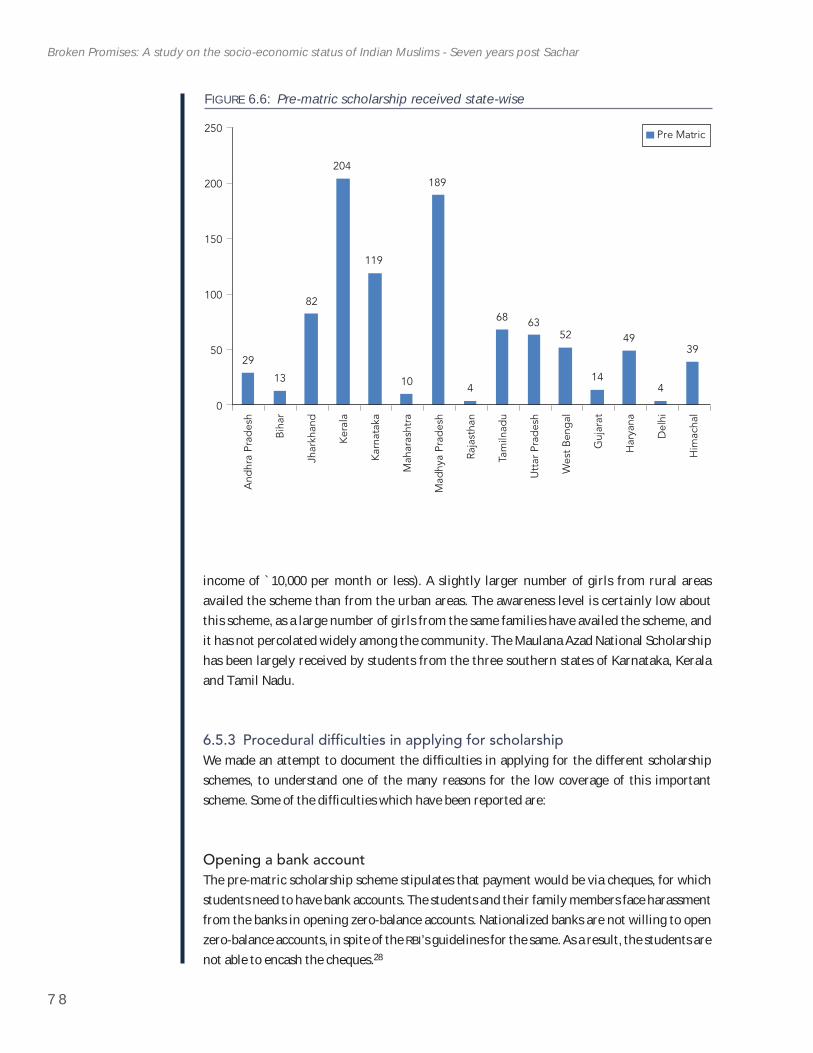
7 8
Broken Promises: A study on the socio-economic status of Indian Muslims - Seven years post Sachar
FIGURE 6.6: Pre-matric scholarship received state-wise
And
hra
Prad
esh
Bih
ar
Jhar
khan
d
Ker
ala
Kar
nata
ka
Mah
aras
htra
Mad
hya
Prad
esh
Raja
stha
n
Tam
ilnad
u
Utt
ar P
rad
esh
Wes
t B
eng
al
Guj
arat
Har
yana
Del
hi
Him
acha
l
29
13
82
204
119
10
189
4
68 6352
14
49
4
39
0
50
100
150
200
250 Pre Matric
income of `10,000 per month or less). A slightly larger number of girls from rural areas availed the scheme than from the urban areas. The awareness level is certainly low about this scheme, as a large number of girls from the same families have availed the scheme, and it has not percolated widely among the community. The Maulana Azad National Scholarship has been largely received by students from the three southern states of Karnataka, Kerala and Tamil Nadu.
6.5.3 Procedural diffi culties in applying for scholarshipWe made an attempt to document the diffi culties in applying for the different scholarship schemes, to understand one of the many reasons for the low coverage of this important scheme. Some of the diffi culties which have been reported are:
Opening a bank accountThe pre-matric scholarship scheme stipulates that payment would be via cheques, for which students need to have bank accounts. The students and their family members face harassment from the banks in opening zero-balance accounts. Nationalized banks are not willing to open zero-balance accounts, in spite of the RBI’s guidelines for the same. As a result, the students are not able to encash the cheques.28
7 9
Access to Education by Muslims
28. Bharatiya Muslim Mahila Andolan (2012).
Accounts closedScholarship reimbursements normally take 8-9 months, and in some cases, even more than a year. Most of the students who found their names in the list of students selected for scholarships, when they approached the bank, were informed that their accounts were closed as there was no activity in them. For account closure, the banks cited RBI rules that said if an account is non-functional for more than six months, it should be closed.
Problems with chequesThere are some serious problems with the cheques by which the students receive the ‘Maintenance Allowance’ under the pre-matric scholarship scheme. Most of the time, the cheques of a particular school are sent to another school and, as a result, the students do not receive the same. Even if the headmaster takes the initiative of returning the cheques to the actual school, by the time the students receive the cheques, the validity has expired. Apart from that, the cheques received by the students have their names wrongly spelt, which prevents them from encashing the same.
BOX 8: Name game
Privately collected data showed that errors in names of students — which might have occurred due to software problems or negligence — could be one of the reasons students did not get scholarships despite having their names in the list. For example, the name of Rushda Sameen Laeeque Ahmed (User ID OPD0314107M2006) appeared in the list as Sameen Laeeque Rushda Ahmed. Similarly, the name of Uzma Shaheen Sultan Ahmed (User ID OPD0408617M2009) appeared in the list as Shaheen Sultan Uzma Ahmed and the name of Awais Ah Seraj Ah (User ID OPD0349077M2008) as Ah Seraj Awais Ah. It can be noted that in all these names, the student’s name has been replaced by his or her father’s name.
We also found a number of students had received cheques issued in their names but without any date mentioned.
Lack of awarenessOne of the major hindrances, noticed during the survey, that prevents the students from accessing the scheme, is that most of the schools have no idea about what minority scholarship is and how the students can apply for the same. In most of the schools, in the six districts surveyed in West Bengal by Bharatiya Muslim Mahila Andolan, the head teachers and the teachers said that they know nothing about minority scholarships and therefore are unable to help the students apply for the same. In one of the schools in South 24 Parganas, under Maheshtala Municipality, the forms from the requisite offi ce were received; however, the teachers said that since they had no idea how to go forward with the same, they did not
8 0
Broken Promises: A study on the socio-economic status of Indian Muslims - Seven years post Sachar
distribute the forms among the students or their parents or guardians. The parents/guardians too are unaware of the scholarship programmes and also about the other schemes under the PM’s New15-Point Programme. As a result, a large number of students who are eligible for the scholarships, both in terms of marks and fi nancial condition, were unable to avail the same.
The percentage of women who reported not knowing about the scholarships (about 9 percent) was higher than the percentage of men (about 7 percent). No knowledge of the scholarship scheme was reported by 12 percent in Andhra Pradesh, 13 percent in Madhya Pradesh and a whopping 83 percent in Delhi.
There are many problems even for parents who are aware of the scholarship scheme. Most parents said that it is very diffi cult to comply with all the procedures and requirements. Among the main procedural diffi culties are: obtaining income certifi cates, and lack of knowledge of time deadlines for the applications to be submitted. Many parents are not applying due to these hurdles, realizing that it is almost impossible to get their child a scholarship.
Online applications: technology a barrier!The students applying for the post-matric scholarship face problems due to the fact that the mode of application has been made online.
Discussions with the Community Coordination Initiative (CCI, an NGO providing support to minority students for scholarship related issues) revealed that since the government decided to invite online applications in the year 2011, a severe setback was faced in the number of students who were able to apply. The main reasons for this were that the online application procedure was very slow, and it had various technical errors. Even after complaining to the concerned authorities, the errors and technical hitches in the online procedure were left unresolved. The result was that the number of applications decreased considerably. In fact, according to the CCI members, the problems in 2012 were multiplied. The time taken to fi ll-up a single form increased as the same details were asked repeatedly. Completed forms were not submitted successfully forcing the students to fi ll up forms repeatedly. Worse, the print-outs were never taken out in a single attempt.
BOX 9: Uncertain future
This year, (2012-13) in the middle of the academic career, students who are studying B. Sc. (Computer Science), B. Pharm and some other courses have been informed by the Maharahtra government, that they will no longer be eligible for OBC/minority scholarships as the government has listed B.Sc. (Computer Science) under Z group courses and students opting for Z group courses are not eligible. It was found after discussion with many such students that they had taken the admission thinking they would pay the course fees once they got the scholarships. Now they are facing an uncertain future. They are left with just two options – either to discontinue education midway or take a loan and pay the fees.
Source: Aleem Faizee, Sauhard Manch, Maharashtra.
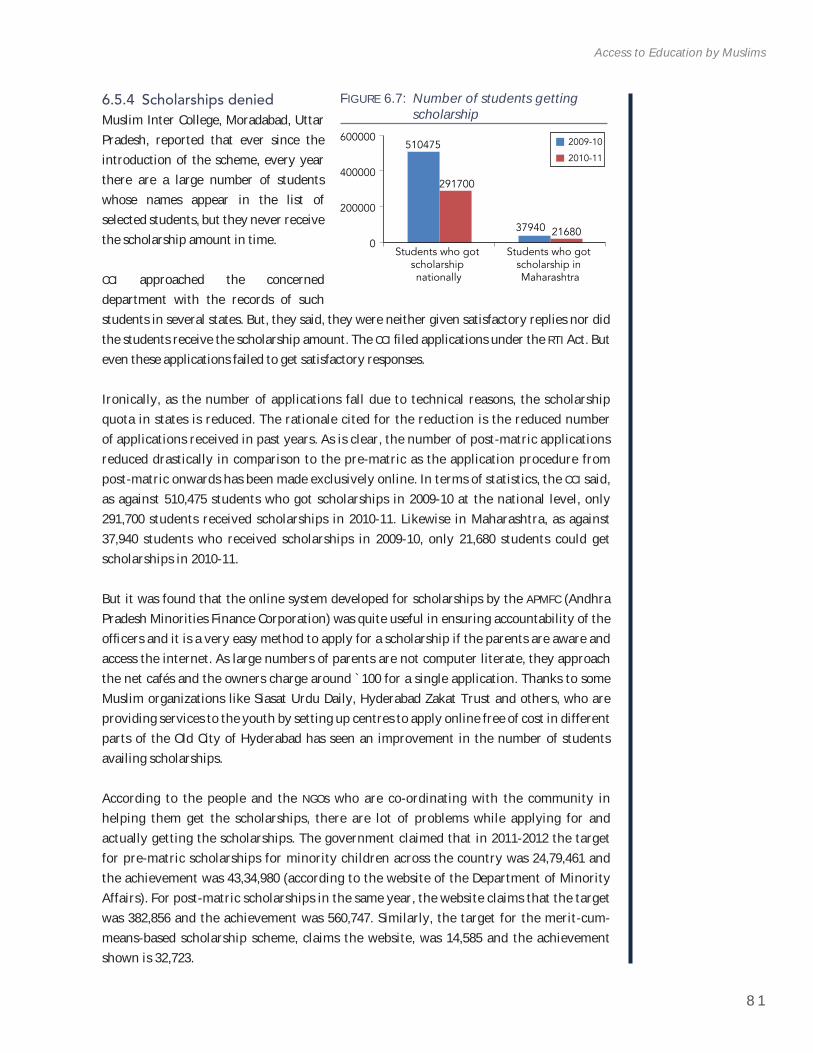
8 1
Access to Education by Muslims
6.5.4 Scholarships deniedMuslim Inter College, Moradabad, Uttar Pradesh, reported that ever since the introduction of the scheme, every year there are a large number of students whose names appear in the list of selected students, but they never receive the scholarship amount in time.
CCI approached the concerned department with the records of such students in several states. But, they said, they were neither given satisfactory replies nor did the students receive the scholarship amount. The CCI fi led applications under the RTI Act. But even these applications failed to get satisfactory responses.
Ironically, as the number of applications fall due to technical reasons, the scholarship quota in states is reduced. The rationale cited for the reduction is the reduced number of applications received in past years. As is clear, the number of post-matric applications reduced drastically in comparison to the pre-matric as the application procedure from post-matric onwards has been made exclusively online. In terms of statistics, the CCI said, as against 510,475 students who got scholarships in 2009-10 at the national level, only 291,700 students received scholarships in 2010-11. Likewise in Maharashtra, as against 37,940 students who received scholarships in 2009-10, only 21,680 students could get scholarships in 2010-11.
But it was found that the online system developed for scholarships by the APMFC (Andhra Pradesh Minorities Finance Corporation) was quite useful in ensuring accountability of the offi cers and it is a very easy method to apply for a scholarship if the parents are aware and access the internet. As large numbers of parents are not computer literate, they approach the net cafés and the owners charge around `100 for a single application. Thanks to some Muslim organizations like Siasat Urdu Daily, Hyderabad Zakat Trust and others, who are providing services to the youth by setting up centres to apply online free of cost in different parts of the Old City of Hyderabad has seen an improvement in the number of students availing scholarships.
According to the people and the NGOs who are co-ordinating with the community in helping them get the scholarships, there are lot of problems while applying for and actually getting the scholarships. The government claimed that in 2011-2012 the target for pre-matric scholarships for minority children across the country was 24,79,461 and the achievement was 43,34,980 (according to the website of the Department of Minority Affairs). For post-matric scholarships in the same year, the website claims that the target was 382,856 and the achievement was 560,747. Similarly, the target for the merit-cum-means-based scholarship scheme, claims the website, was 14,585 and the achievement shown is 32,723.
FIGURE 6.7: Number of students getting scholarship
0
200000
400000
510475
291700
37940 21680
600000
Students who got scholarship nationally
Students who got scholarship in Maharashtra
2009-10
2010-11
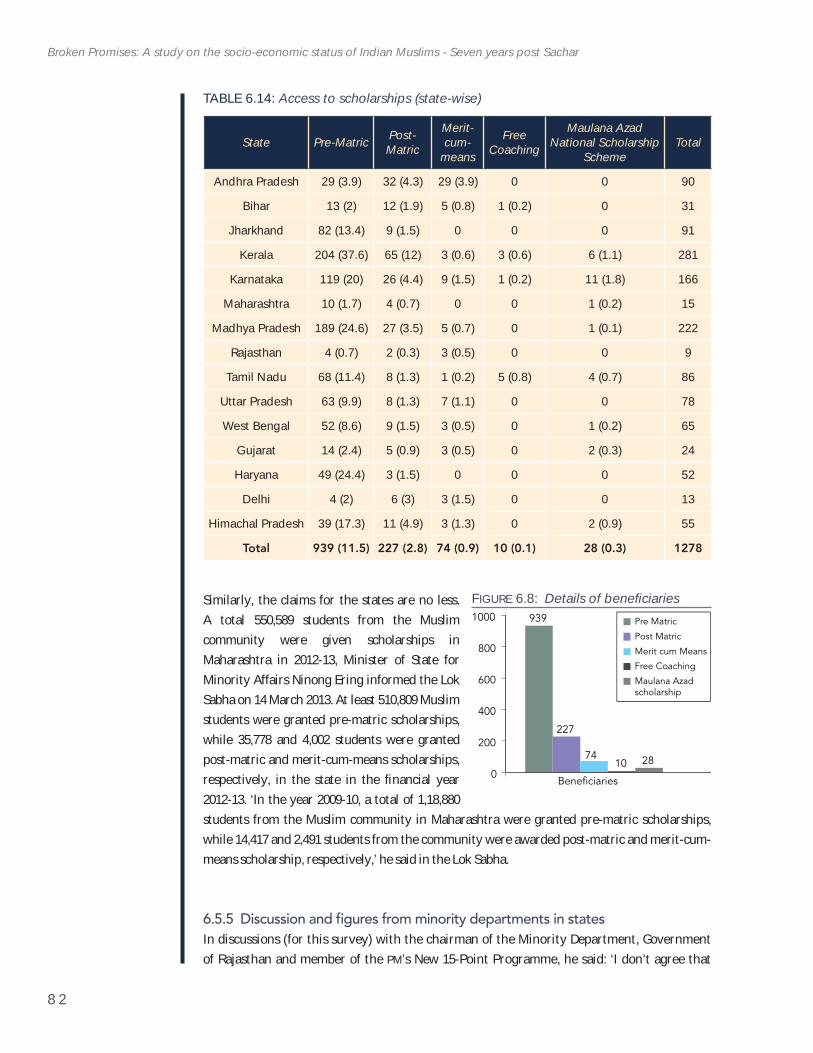
8 2
Broken Promises: A study on the socio-economic status of Indian Muslims - Seven years post Sachar
Similarly, the claims for the states are no less. A total 550,589 students from the Muslim community were given scholarships in Maharashtra in 2012-13, Minister of State for Minority Affairs Ninong Ering informed the Lok Sabha on 14 March 2013. At least 510,809 Muslim students were granted pre-matric scholarships, while 35,778 and 4,002 students were granted post-matric and merit-cum-means scholarships, respectively, in the state in the fi nancial year 2012-13. ‘In the year 2009-10, a total of 1,18,880 students from the Muslim community in Maharashtra were granted pre-matric scholarships, while 14,417 and 2,491 students from the community were awarded post-matric and merit-cum-means scholarship, respectively,’ he said in the Lok Sabha.
6.5.5 Discussion and fi gures from minority departments in statesIn discussions (for this survey) with the chairman of the Minority Department, Government of Rajasthan and member of the PM’s New 15-Point Programme, he said: ‘I don’t agree that
TABLE 6.14: Access to scholarships (state-wise)
State Pre-Matric Post-Matric
Merit-cum-
means
Free Coaching
Maulana Azad National Scholarship
SchemeTotal
Andhra Pradesh 29 (3.9) 32 (4.3) 29 (3.9) 0 0 90
Bihar 13 (2) 12 (1.9) 5 (0.8) 1 (0.2) 0 31
Jharkhand 82 (13.4) 9 (1.5) 0 0 0 91
Kerala 204 (37.6) 65 (12) 3 (0.6) 3 (0.6) 6 (1.1) 281
Karnataka 119 (20) 26 (4.4) 9 (1.5) 1 (0.2) 11 (1.8) 166
Maharashtra 10 (1.7) 4 (0.7) 0 0 1 (0.2) 15
Madhya Pradesh 189 (24.6) 27 (3.5) 5 (0.7) 0 1 (0.1) 222
Rajasthan 4 (0.7) 2 (0.3) 3 (0.5) 0 0 9
Tamil Nadu 68 (11.4) 8 (1.3) 1 (0.2) 5 (0.8) 4 (0.7) 86
Uttar Pradesh 63 (9.9) 8 (1.3) 7 (1.1) 0 0 78
West Bengal 52 (8.6) 9 (1.5) 3 (0.5) 0 1 (0.2) 65
Gujarat 14 (2.4) 5 (0.9) 3 (0.5) 0 2 (0.3) 24
Haryana 49 (24.4) 3 (1.5) 0 0 0 52
Delhi 4 (2) 6 (3) 3 (1.5) 0 0 13
Himachal Pradesh 39 (17.3) 11 (4.9) 3 (1.3) 0 2 (0.9) 55
Total 939 (11.5) 227 (2.8) 74 (0.9) 10 (0.1) 28 (0.3) 1278
FIGURE 6.8: Details of benefi ciaries
0
200
400
600
800
1000 939
227
7410 28
Beneficiaries
Pre Matric
Post Matric
Merit cum Means
Free Coaching
Maulana Azad scholarship
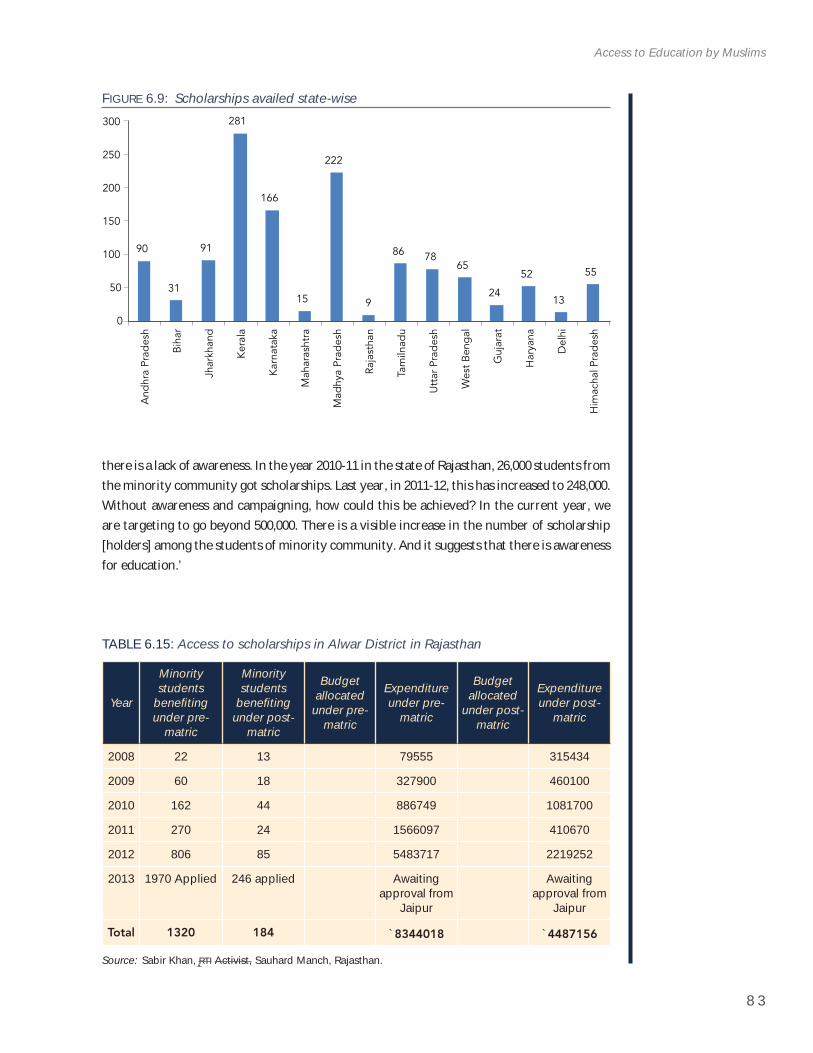
8 3
Access to Education by Muslims
there is a lack of awareness. In the year 2010-11 in the state of Rajasthan, 26,000 students from the minority community got scholarships. Last year, in 2011-12, this has increased to 248,000. Without awareness and campaigning, how could this be achieved? In the current year, we are targeting to go beyond 500,000. There is a visible increase in the number of scholarship [holders] among the students of minority community. And it suggests that there is awareness for education.’
9
90
31
91
281
166
15
222
86 7865
24
52
13
55
0
50
100
150
200
250
300
And
hra
Prad
esh
Bih
ar
Jhar
khan
d
Ker
ala
Kar
nata
ka
Mah
aras
htra
Mad
hya
Prad
esh
Raja
stha
n
Tam
ilnad
u
Utt
ar P
rad
esh
Wes
t B
eng
al
Guj
arat
Har
yana
Del
hi
Him
acha
l Pra
des
h
FIGURE 6.9: Scholarships availed state-wise
TABLE 6.15: Access to scholarships in Alwar District in Rajasthan
Year
Minoritystudents
benefi ting under pre-
matric
Minoritystudents
benefi ting under post-
matric
Budgetallocated
under pre-matric
Expenditure under pre-
matric
Budgetallocated
under post-matric
Expenditure under post-
matric
2008 22 13 79555 315434
2009 60 18 327900 460100
2010 162 44 886749 1081700
2011 270 24 1566097 410670
2012 806 85 5483717 2219252
2013 1970 Applied 246 applied Awaiting approval from
Jaipur
Awaiting approval from
Jaipur
Total 1320 184 `8344018 `4487156
Source: Sabir Khan, RTI Activist, Sauhard Manch, Rajasthan.
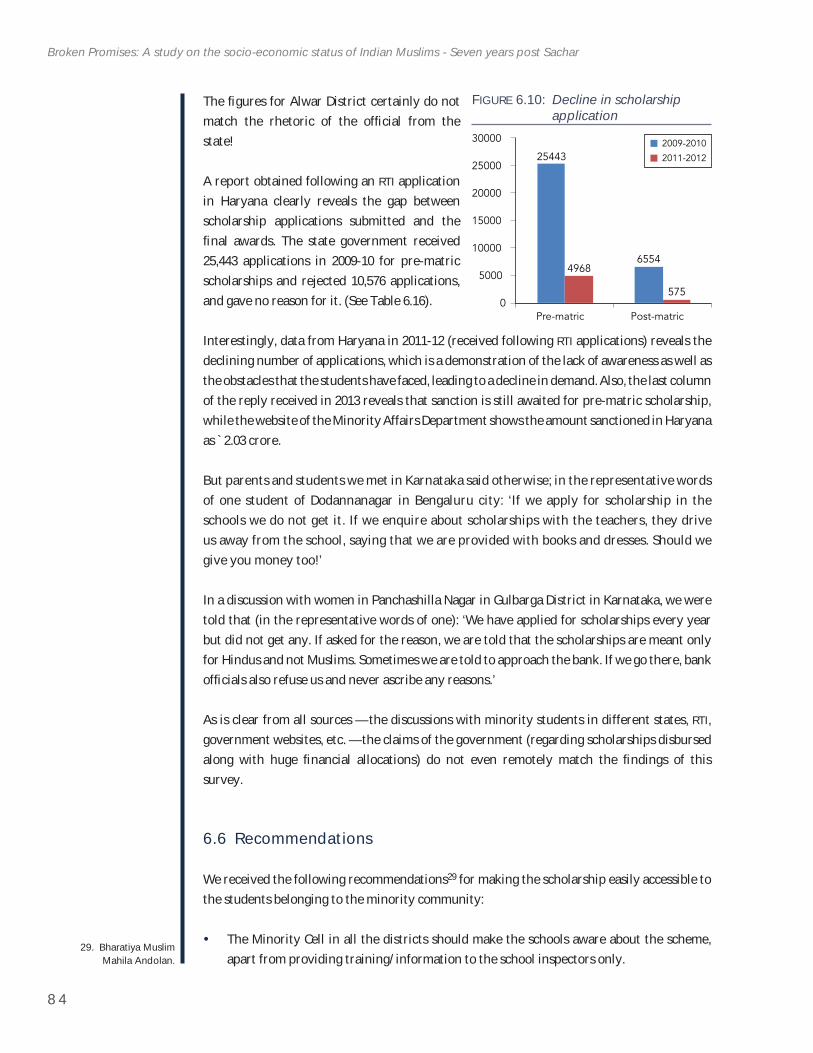
8 4
Broken Promises: A study on the socio-economic status of Indian Muslims - Seven years post Sachar
29. Bharatiya Muslim Mahila Andolan.
The fi gures for Alwar District certainly do not match the rhetoric of the offi cial from the state!
A report obtained following an RTI application in Haryana clearly reveals the gap between scholarship applications submitted and the fi nal awards. The state government received 25,443 applications in 2009-10 for pre-matric scholarships and rejected 10,576 applications, and gave no reason for it. (See Table 6.16).
Interestingly, data from Haryana in 2011-12 (received following RTI applications) reveals the declining number of applications, which is a demonstration of the lack of awareness as well as the obstacles that the students have faced, leading to a decline in demand. Also, the last column of the reply received in 2013 reveals that sanction is still awaited for pre-matric scholarship, while the website of the Minority Affairs Department shows the amount sanctioned in Haryana as `2.03 crore.
But parents and students we met in Karnataka said otherwise; in the representative words of one student of Dodannanagar in Bengaluru city: ‘If we apply for scholarship in the schools we do not get it. If we enquire about scholarships with the teachers, they drive us away from the school, saying that we are provided with books and dresses. Should we give you money too!’
In a discussion with women in Panchashilla Nagar in Gulbarga District in Karnataka, we were told that (in the representative words of one): ‘We have applied for scholarships every year but did not get any. If asked for the reason, we are told that the scholarships are meant only for Hindus and not Muslims. Sometimes we are told to approach the bank. If we go there, bank offi cials also refuse us and never ascribe any reasons.’
As is clear from all sources — the discussions with minority students in different states, RTI,government websites, etc. — the claims of the government (regarding scholarships disbursed along with huge fi nancial allocations) do not even remotely match the fi ndings of this survey.
6.6 Recommendations
We received the following recommendations29 for making the scholarship easily accessible to the students belonging to the minority community:
The Minority Cell in all the districts should make the schools aware about the scheme, apart from providing training/information to the school inspectors only.
FIGURE 6.10: Decline in scholarship application
0
5000
10000
15000
20000
25000
30000
25443
49686554
575
Pre-matric Post-matric
2009-2010
2011-2012
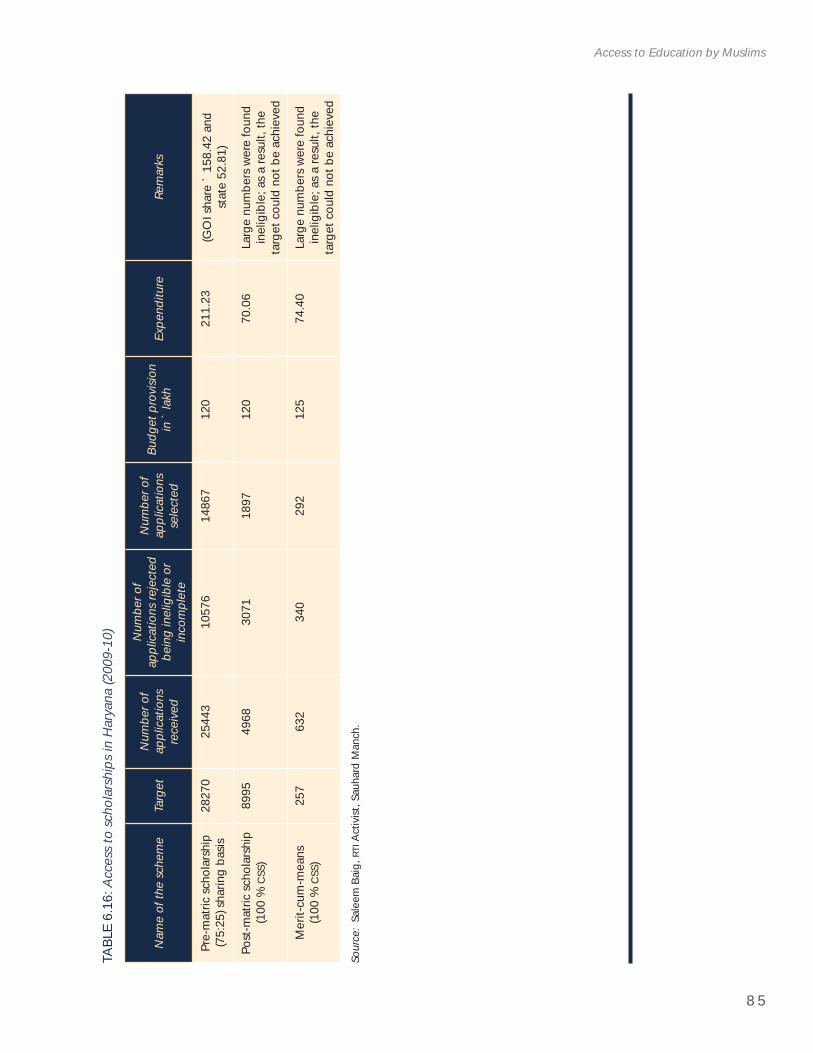
8 5
Access to Education by Muslims
TABL
E 6.
16: A
cces
s to
scho
lars
hips
in H
arya
na (2
009-
10)
Nam
e of
the
sche
me
Targ
etN
umbe
r of
appl
icat
ions
rece
ived
Num
ber o
f ap
plic
atio
ns re
ject
ed
bein
g in
elig
ible
or
inco
mpl
ete
Num
ber o
f ap
plic
atio
nsse
lect
ed
Budg
et p
rovi
sion
in`
lakh
Expe
nditu
reRe
mar
ks
Pre-
mat
ric sc
hola
rshi
p (7
5:25
) sha
ring
basis
28
270
2544
310
576
1486
712
021
1.23
(GO
I sha
re `
158
.42
and
stat
e 52
.81)
Post
-mat
ric sc
hola
rshi
p (1
00 %
CSS
)89
9549
6830
7118
9712
070
.06
Larg
e nu
mbe
rs w
ere
foun
d in
elig
ible
; as a
resu
lt, th
e ta
rget
cou
ld n
ot b
e ac
hiev
ed
Mer
it-cu
m-m
eans
(100
% C
SS)
257
632
340
292
125
74.4
0La
rge
num
bers
wer
e fo
und
inel
igib
le; a
s a re
sult,
the
targ
et c
ould
not
be
achi
eved
Sour
ce:
Sale
em B
aig,
RTI
Act
ivist
, Sau
hard
Man
ch.
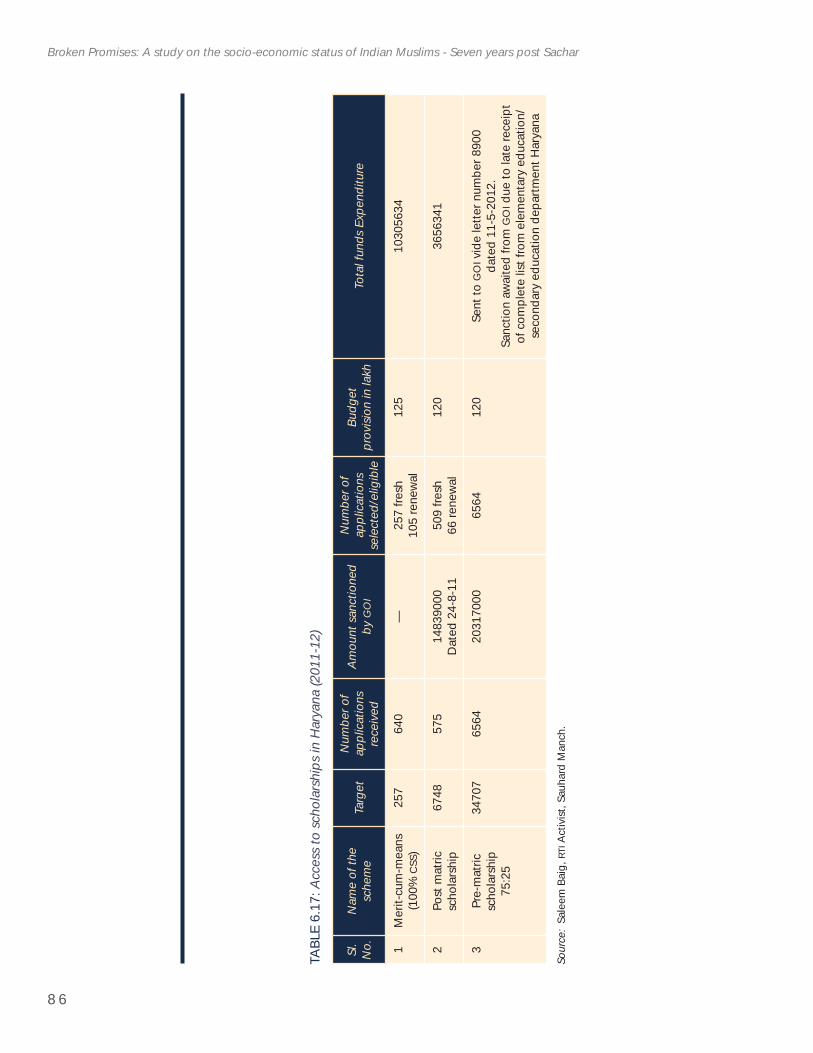
8 6
Broken Promises: A study on the socio-economic status of Indian Muslims - Seven years post Sachar
TABL
E 6.
17: A
cces
s to
scho
lars
hips
in H
arya
na (2
011-
12)
Sl.
No.
Nam
e of
the
sche
me
Targ
etN
umbe
r of
appl
icat
ions
rece
ived
Amou
nt sa
nctio
ned
byG
OI
Num
ber o
f ap
plic
atio
nsse
lect
ed/e
ligib
le
Budg
etpr
ovisi
on in
lakh
Tota
l fun
ds E
xpen
ditu
re
1M
erit-
cum
-mea
ns
(100
%CS
S)25
764
0—
257
fresh
105
rene
wal
125
1030
5634
2Po
st m
atric
sc
hola
rshi
p67
4857
514
8390
00D
ated
24-
8-11
509
fresh
66 re
new
al12
036
5634
1
3Pr
e-m
atric
sc
hola
rshi
p75
:25
3470
765
6420
3170
0065
6412
0Se
nt to
GO
I vid
e le
tter n
umbe
r 890
0 da
ted
11-5
-201
2.Sa
nctio
n aw
aite
d fro
m G
OI d
ue to
late
rece
ipt
of c
ompl
ete
list f
rom
ele
men
tary
edu
catio
n/se
cond
ary
educ
atio
n de
partm
ent H
arya
na
Sour
ce:
Sale
em B
aig,
RTI
Act
ivist
, Sau
hard
Man
ch.
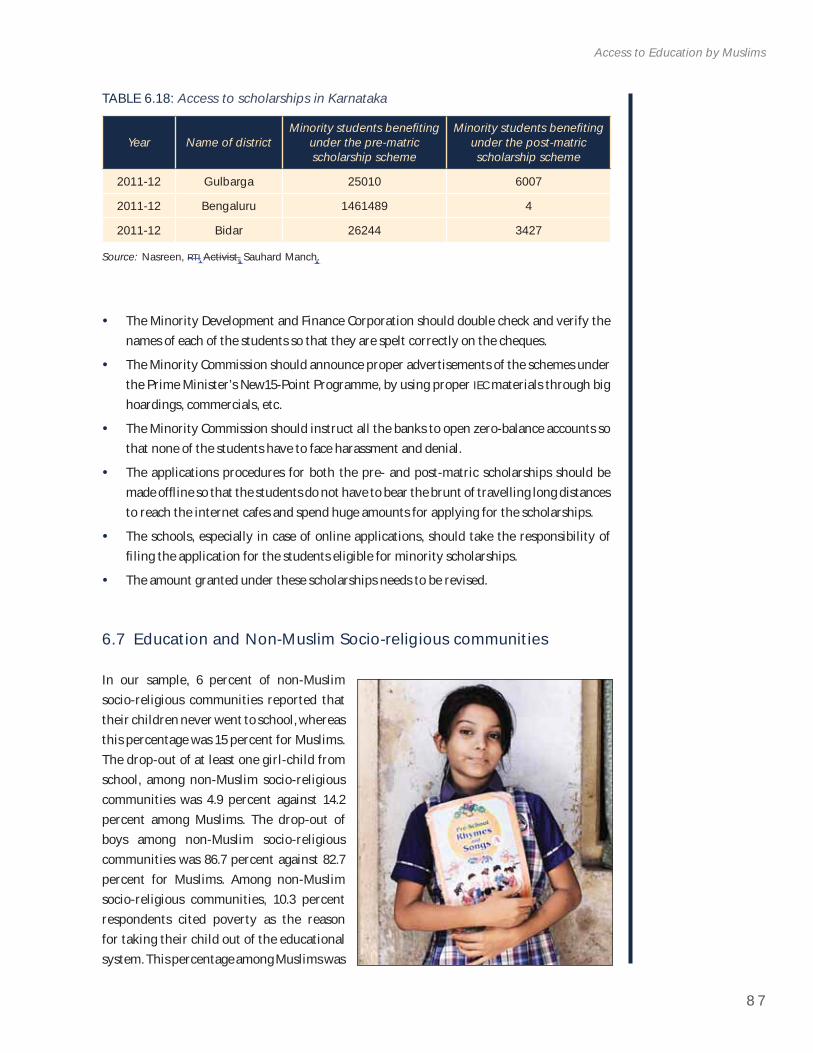
8 7
Access to Education by Muslims
TABLE 6.18: Access to scholarships in Karnataka
Year Name of districtMinority students benefi ting
under the pre-matric scholarship scheme
Minority students benefi ting under the post-matric scholarship scheme
2011-12 Gulbarga 25010 6007
2011-12 Bengaluru 1461489 4
2011-12 Bidar 26244 3427
Source: Nasreen, RTI Activist, Sauhard Manch.
The Minority Development and Finance Corporation should double check and verify the names of each of the students so that they are spelt correctly on the cheques.
The Minority Commission should announce proper advertisements of the schemes under the Prime Minister’s New15-Point Programme, by using proper IEC materials through big hoardings, commercials, etc.
The Minority Commission should instruct all the banks to open zero-balance accounts so that none of the students have to face harassment and denial.
The applications procedures for both the pre- and post-matric scholarships should be made offl ine so that the students do not have to bear the brunt of travelling long distances to reach the internet cafes and spend huge amounts for applying for the scholarships.
The schools, especially in case of online applications, should take the responsibility of fi ling the application for the students eligible for minority scholarships.
The amount granted under these scholarships needs to be revised.
6.7 Education and Non-Muslim Socio-religious communities
In our sample, 6 percent of non-Muslim socio-religious communities reported that their children never went to school, whereas this percentage was 15 percent for Muslims. The drop-out of at least one girl-child from school, among non-Muslim socio-religious communities was 4.9 percent against 14.2 percent among Muslims. The drop-out of boys among non-Muslim socio-religious communities was 86.7 percent against 82.7 percent for Muslims. Among non-Muslim socio-religious communities, 10.3 percent respondents cited poverty as the reason for taking their child out of the educational system. This percentage among Muslims was
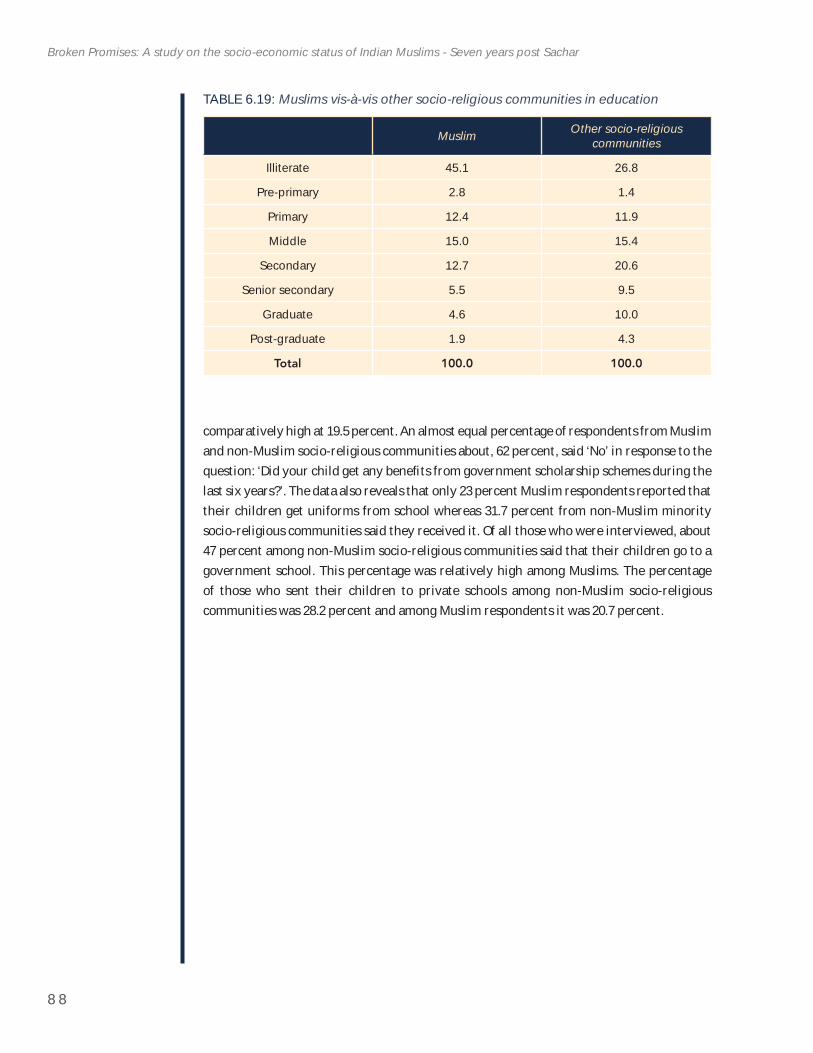
8 8
Broken Promises: A study on the socio-economic status of Indian Muslims - Seven years post Sachar
comparatively high at 19.5 percent. An almost equal percentage of respondents from Muslim and non-Muslim socio-religious communities about, 62 percent, said ‘No’ in response to the question: ‘Did your child get any benefi ts from government scholarship schemes during the last six years?’. The data also reveals that only 23 percent Muslim respondents reported that their children get uniforms from school whereas 31.7 percent from non-Muslim minority socio-religious communities said they received it. Of all those who were interviewed, about 47 percent among non-Muslim socio-religious communities said that their children go to a government school. This percentage was relatively high among Muslims. The percentage of those who sent their children to private schools among non-Muslim socio-religious communities was 28.2 percent and among Muslim respondents it was 20.7 percent.
TABLE 6.19: Muslims vis-à-vis other socio-religious communities in education
Muslim Other socio-religious communities
Illiterate 45.1 26.8
Pre-primary 2.8 1.4
Primary 12.4 11.9
Middle 15.0 15.4
Secondary 12.7 20.6
Senior secondary 5.5 9.5
Graduate 4.6 10.0
Post-graduate 1.9 4.3
Total 100.0 100.0
8 9
30. Russell (1999).
7 . U R D U A N D T H E P M ’ S N E W 1 5 - P O I N T P R O G R A M M E
7.1 What does the PM’s 15-Point Programme Promise?
Central assistance will be provided for recruitment and posting of Urdu language teachers in primary and upper primary schools that serve a population in which at least one-fourth belong to that
language group.
7.2 Urdu and the Indian Story
According to Census 2001 data, Urdu occupies the sixth position amongst the 22 scheduled languages listed, reported as the mother tongue of 5 percent of the total Indian population, preceded by Hindi, Bengali, Telugu, Marathi and Tamil.
Committees set up to protect Urdu languageA committee was set up in 1972, headed by I.K. Gujral (who went on to become Prime Minister in 1997-98), to consider how the cause of Urdu could be advanced. The report of the committee was presented in 1975 and 187 recommendations were made. However, in due course, the Gujral Committee Report was laid before Parliament. Then, successively, two committees were set up to look once more at the situation of Urdu — another headed by Ale Ahmad Suroor (‘a sub-committee to examine the recommendations of the Gujral Committee,’ set up in 1979; report submitted in 1983) and one headed by Ali Sardar Jafari (set up in February 1990; report submitted, with unusual promptness, in September 1990). The Jafari Committee discovered that 95 percent of the recommendations made in the Gujral report had not been adopted. The state Government of Bihar and, shortly afterwards, that of U.P., recognized — on paper — Urdu as an offi cial language of their respective states.30
Despite all of these efforts, the census data clearly indicates a fall in the decadal percentage increase as far as Urdu as a language is concerned, the decadal percentage increase being 22.08
BOX 10: The fate of Urdu
Urdu’s Fate: Urdu’s fate was sealed with its ouster from the secular curriculum. After 1947, Urdu was hit by a communalist mindset thinking it was only the language of Muslims. This is entirely wrong - languages have no religion. But slowly, Urdu was erased from our social and cultural spheres. The last nail in its coffi n was the Offi cial Languages Act, 1951, or the Education Order of 1953, ensuring that Urdu education was terminated in its traditional heartland of Uttar Pradesh. Today, Urdu-medium schools are tottering everywhere.
Source: Khwaja Mohammed Ekramuddin, Director, National Council for Promotion of Urdu Language (NCPUL), Interview in Times of India, dated 15 June 2012.
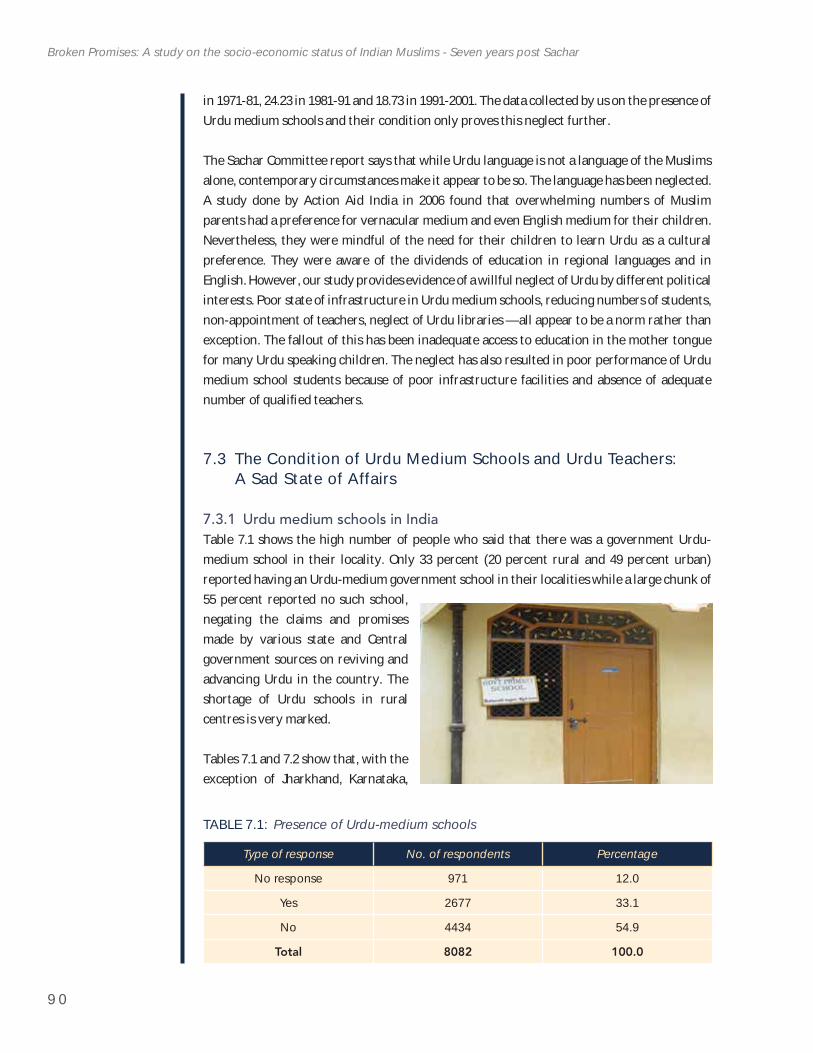
9 0
Broken Promises: A study on the socio-economic status of Indian Muslims - Seven years post Sachar
in 1971-81, 24.23 in 1981-91 and 18.73 in 1991-2001. The data collected by us on the presence of Urdu medium schools and their condition only proves this neglect further.
The Sachar Committee report says that while Urdu language is not a language of the Muslims alone, contemporary circumstances make it appear to be so. The language has been neglected. A study done by Action Aid India in 2006 found that overwhelming numbers of Muslim parents had a preference for vernacular medium and even English medium for their children. Nevertheless, they were mindful of the need for their children to learn Urdu as a cultural preference. They were aware of the dividends of education in regional languages and in English. However, our study provides evidence of a willful neglect of Urdu by different political interests. Poor state of infrastructure in Urdu medium schools, reducing numbers of students, non-appointment of teachers, neglect of Urdu libraries — all appear to be a norm rather than exception. The fallout of this has been inadequate access to education in the mother tongue for many Urdu speaking children. The neglect has also resulted in poor performance of Urdu medium school students because of poor infrastructure facilities and absence of adequate number of qualifi ed teachers.
7.3 The Condition of Urdu Medium Schools and Urdu Teachers: A Sad State of Affairs
7.3.1 Urdu medium schools in IndiaTable 7.1 shows the high number of people who said that there was a government Urdu-medium school in their locality. Only 33 percent (20 percent rural and 49 percent urban) reported having an Urdu-medium government school in their localities while a large chunk of 55 percent reported no such school, negating the claims and promises made by various state and Central government sources on reviving and advancing Urdu in the country. The shortage of Urdu schools in rural centres is very marked.
Tables 7.1 and 7.2 show that, with the exception of Jharkhand, Karnataka,
TABLE 7.1: Presence of Urdu-medium schools
Type of response No. of respondents Percentage
No response 971 12.0
Yes 2677 33.1
No 4434 54.9
Total 8082 100.0
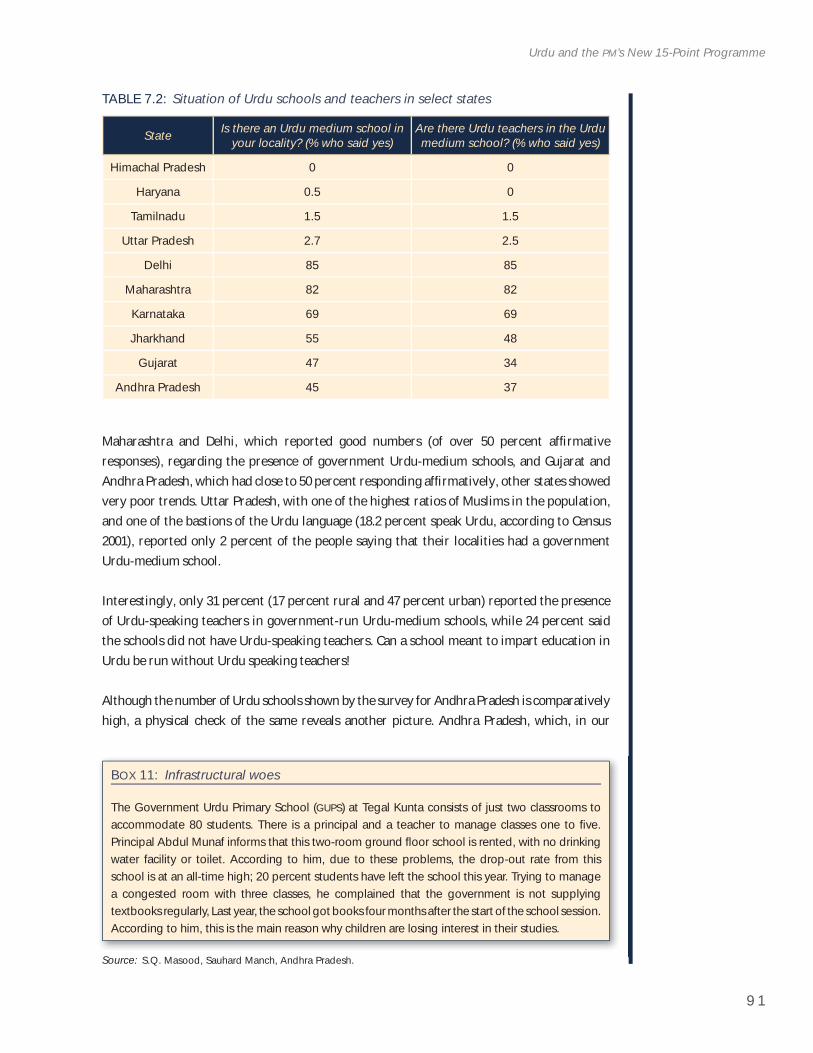
9 1
Urdu and the PM’s New 15-Point Programme
Maharashtra and Delhi, which reported good numbers (of over 50 percent affi rmative responses), regarding the presence of government Urdu-medium schools, and Gujarat and Andhra Pradesh, which had close to 50 percent responding affi rmatively, other states showed very poor trends. Uttar Pradesh, with one of the highest ratios of Muslims in the population, and one of the bastions of the Urdu language (18.2 percent speak Urdu, according to Census 2001), reported only 2 percent of the people saying that their localities had a government Urdu-medium school.
Interestingly, only 31 percent (17 percent rural and 47 percent urban) reported the presence of Urdu-speaking teachers in government-run Urdu-medium schools, while 24 percent said the schools did not have Urdu-speaking teachers. Can a school meant to impart education in Urdu be run without Urdu speaking teachers!
Although the number of Urdu schools shown by the survey for Andhra Pradesh is comparatively high, a physical check of the same reveals another picture. Andhra Pradesh, which, in our
TABLE 7.2: Situation of Urdu schools and teachers in select states
State Is there an Urdu medium school in your locality? (% who said yes)
Are there Urdu teachers in the Urdu medium school? (% who said yes)
Himachal Pradesh 0 0
Haryana 0.5 0
Tamilnadu 1.5 1.5
Uttar Pradesh 2.7 2.5
Delhi 85 85
Maharashtra 82 82
Karnataka 69 69
Jharkhand 55 48
Gujarat 47 34
Andhra Pradesh 45 37
BOX 11: Infrastructural woes
The Government Urdu Primary School (GUPS) at Tegal Kunta consists of just two classrooms to accommodate 80 students. There is a principal and a teacher to manage classes one to fi ve. Principal Abdul Munaf informs that this two-room ground fl oor school is rented, with no drinking water facility or toilet. According to him, due to these problems, the drop-out rate from this school is at an all-time high; 20 percent students have left the school this year. Trying to manage a congested room with three classes, he complained that the government is not supplying textbooks regularly, Last year, the school got books four months after the start of the school session. According to him, this is the main reason why children are losing interest in their studies.
Source: S.Q. Masood, Sauhard Manch, Andhra Pradesh.
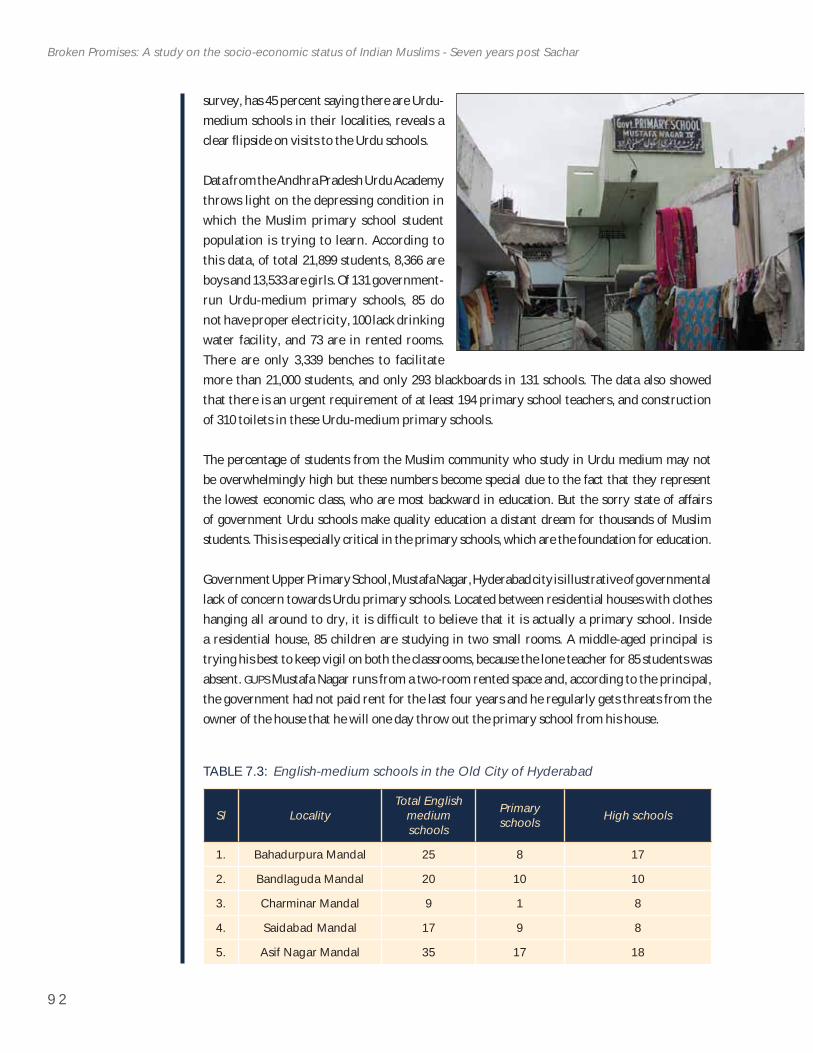
9 2
Broken Promises: A study on the socio-economic status of Indian Muslims - Seven years post Sachar
survey, has 45 percent saying there are Urdu-medium schools in their localities, reveals a clear fl ipside on visits to the Urdu schools.
Data from the Andhra Pradesh Urdu Academy throws light on the depressing condition in which the Muslim primary school student population is trying to learn. According to this data, of total 21,899 students, 8,366 are boys and 13,533 are girls. Of 131 government-run Urdu-medium primary schools, 85 do not have proper electricity, 100 lack drinking water facility, and 73 are in rented rooms. There are only 3,339 benches to facilitate more than 21,000 students, and only 293 blackboards in 131 schools. The data also showed that there is an urgent requirement of at least 194 primary school teachers, and construction of 310 toilets in these Urdu-medium primary schools.
The percentage of students from the Muslim community who study in Urdu medium may not be overwhelmingly high but these numbers become special due to the fact that they represent the lowest economic class, who are most backward in education. But the sorry state of affairs of government Urdu schools make quality education a distant dream for thousands of Muslim students. This is especially critical in the primary schools, which are the foundation for education.
Government Upper Primary School, Mustafa Nagar, Hyderabad city is illustrative of governmental lack of concern towards Urdu primary schools. Located between residential houses with clothes hanging all around to dry, it is diffi cult to believe that it is actually a primary school. Inside a residential house, 85 children are studying in two small rooms. A middle-aged principal is trying his best to keep vigil on both the classrooms, because the lone teacher for 85 students was absent. GUPS Mustafa Nagar runs from a two-room rented space and, according to the principal, the government had not paid rent for the last four years and he regularly gets threats from the owner of the house that he will one day throw out the primary school from his house.
TABLE 7.3: English-medium schools in the Old City of Hyderabad
Sl LocalityTotal English
mediumschools
Primaryschools High schools
1. Bahadurpura Mandal 25 8 17
2. Bandlaguda Mandal 20 10 10
3. Charminar Mandal 9 1 8
4. Saidabad Mandal 17 9 8
5. Asif Nagar Mandal 35 17 18
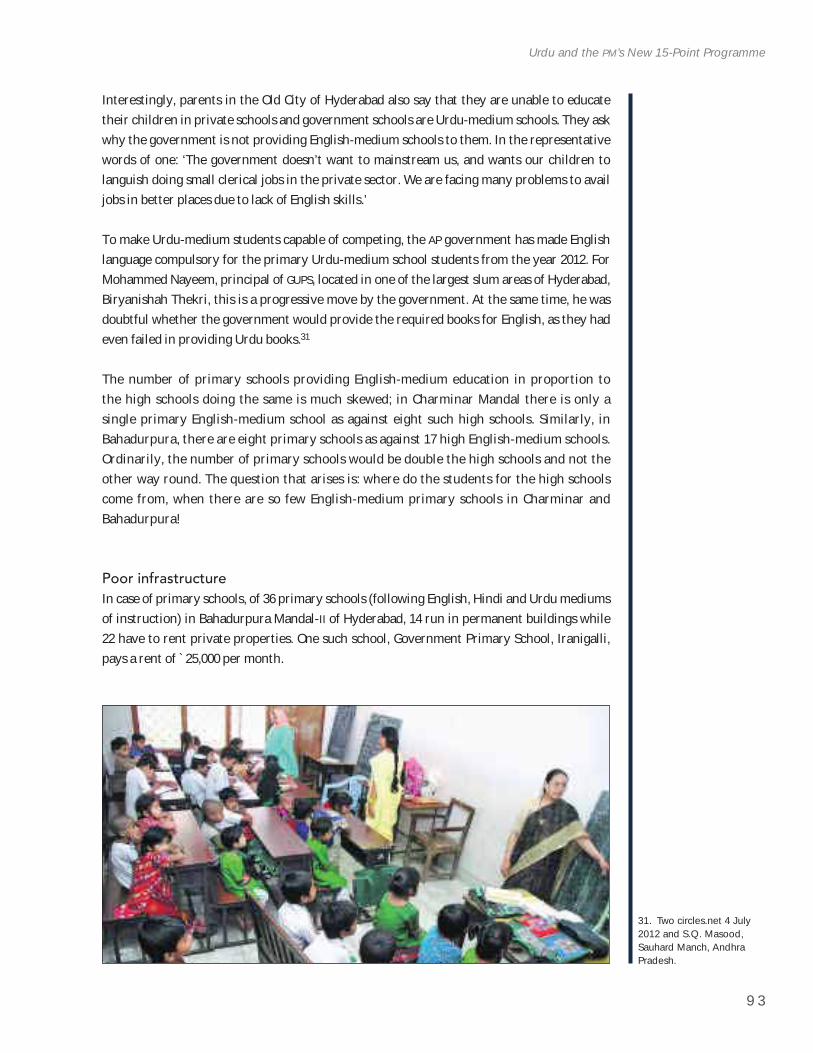
9 3
Urdu and the PM’s New 15-Point Programme
31. Two circles.net 4 July 2012 and S.Q. Masood, Sauhard Manch, Andhra Pradesh.
Interestingly, parents in the Old City of Hyderabad also say that they are unable to educate their children in private schools and government schools are Urdu-medium schools. They ask why the government is not providing English-medium schools to them. In the representative words of one: ‘The government doesn’t want to mainstream us, and wants our children to languish doing small clerical jobs in the private sector. We are facing many problems to avail jobs in better places due to lack of English skills.’
To make Urdu-medium students capable of competing, the AP government has made English language compulsory for the primary Urdu-medium school students from the year 2012. For Mohammed Nayeem, principal of GUPS, located in one of the largest slum areas of Hyderabad, Biryanishah Thekri, this is a progressive move by the government. At the same time, he was doubtful whether the government would provide the required books for English, as they had even failed in providing Urdu books.31
The number of primary schools providing English-medium education in proportion to the high schools doing the same is much skewed; in Charminar Mandal there is only a single primary English-medium school as against eight such high schools. Similarly, in Bahadurpura, there are eight primary schools as against 17 high English-medium schools. Ordinarily, the number of primary schools would be double the high schools and not the other way round. The question that arises is: where do the students for the high schools come from, when there are so few English-medium primary schools in Charminar and Bahadurpura!
Poor infrastructureIn case of primary schools, of 36 primary schools (following English, Hindi and Urdu mediums of instruction) in Bahadurpura Mandal-II of Hyderabad, 14 run in permanent buildings while 22 have to rent private properties. One such school, Government Primary School, Iranigalli, pays a rent of `25,000 per month.
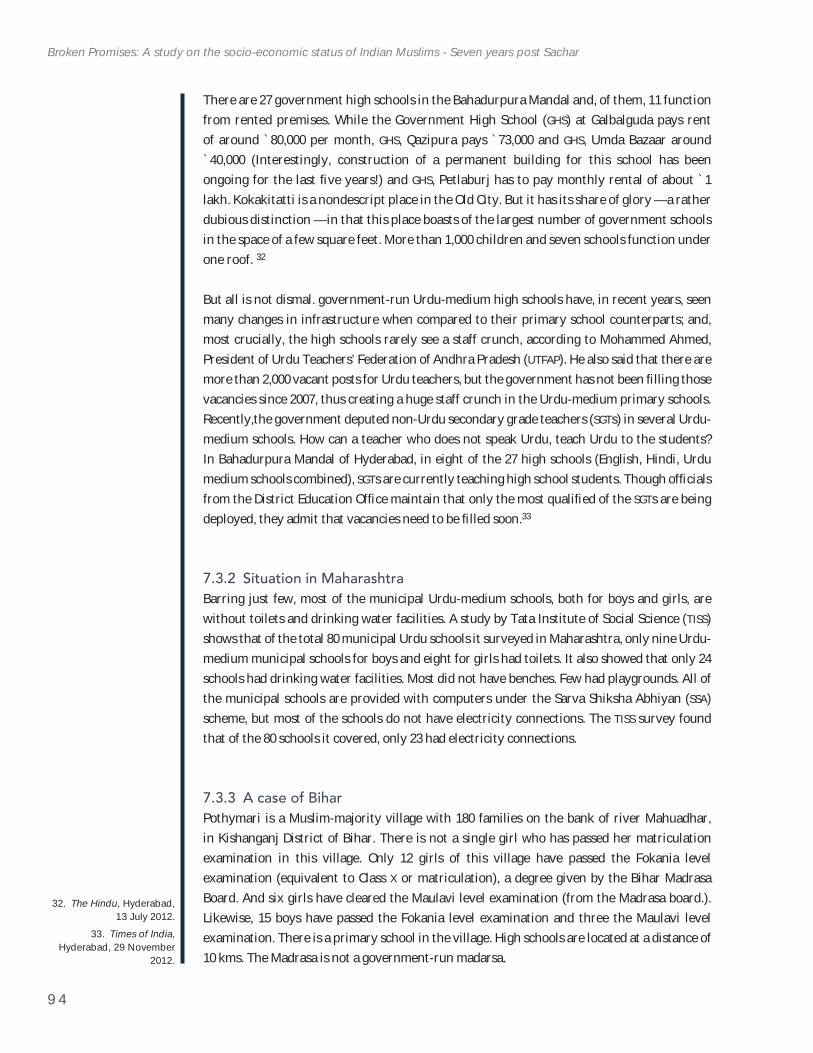
9 4
Broken Promises: A study on the socio-economic status of Indian Muslims - Seven years post Sachar
32. The Hindu, Hyderabad, 13 July 2012.
33. Times of India,Hyderabad, 29 November
2012.
There are 27 government high schools in the Bahadurpura Mandal and, of them, 11 function from rented premises. While the Government High School (GHS) at Galbalguda pays rent of around `80,000 per month, GHS, Qazipura pays `73,000 and GHS, Umda Bazaar around `40,000 (Interestingly, construction of a permanent building for this school has been ongoing for the last fi ve years!) and GHS, Petlaburj has to pay monthly rental of about `1lakh. Kokakitatti is a nondescript place in the Old City. But it has its share of glory — a rather dubious distinction — in that this place boasts of the largest number of government schools in the space of a few square feet. More than 1,000 children and seven schools function under one roof. 32
But all is not dismal. government-run Urdu-medium high schools have, in recent years, seen many changes in infrastructure when compared to their primary school counterparts; and, most crucially, the high schools rarely see a staff crunch, according to Mohammed Ahmed, President of Urdu Teachers’ Federation of Andhra Pradesh (UTFAP). He also said that there are more than 2,000 vacant posts for Urdu teachers, but the government has not been fi lling those vacancies since 2007, thus creating a huge staff crunch in the Urdu-medium primary schools. Recently,the government deputed non-Urdu secondary grade teachers (SGTs) in several Urdu-medium schools. How can a teacher who does not speak Urdu, teach Urdu to the students? In Bahadurpura Mandal of Hyderabad, in eight of the 27 high schools (English, Hindi, Urdu medium schools combined), SGTs are currently teaching high school students. Though offi cials from the District Education Offi ce maintain that only the most qualifi ed of the SGTs are being deployed, they admit that vacancies need to be fi lled soon.33
7.3.2 Situation in MaharashtraBarring just few, most of the municipal Urdu-medium schools, both for boys and girls, are without toilets and drinking water facilities. A study by Tata Institute of Social Science (TISS)shows that of the total 80 municipal Urdu schools it surveyed in Maharashtra, only nine Urdu-medium municipal schools for boys and eight for girls had toilets. It also showed that only 24 schools had drinking water facilities. Most did not have benches. Few had playgrounds. All of the municipal schools are provided with computers under the Sarva Shiksha Abhiyan (SSA)scheme, but most of the schools do not have electricity connections. The TISS survey found that of the 80 schools it covered, only 23 had electricity connections.
7.3.3 A case of BiharPothymari is a Muslim-majority village with 180 families on the bank of river Mahuadhar, in Kishanganj District of Bihar. There is not a single girl who has passed her matriculation examination in this village. Only 12 girls of this village have passed the Fokania level examination (equivalent to Class X or matriculation), a degree given by the Bihar Madrasa Board. And six girls have cleared the Maulavi level examination (from the Madrasa board.). Likewise, 15 boys have passed the Fokania level examination and three the Maulavi level examination. There is a primary school in the village. High schools are located at a distance of 10 kms. The Madrasa is not a government-run madarsa.
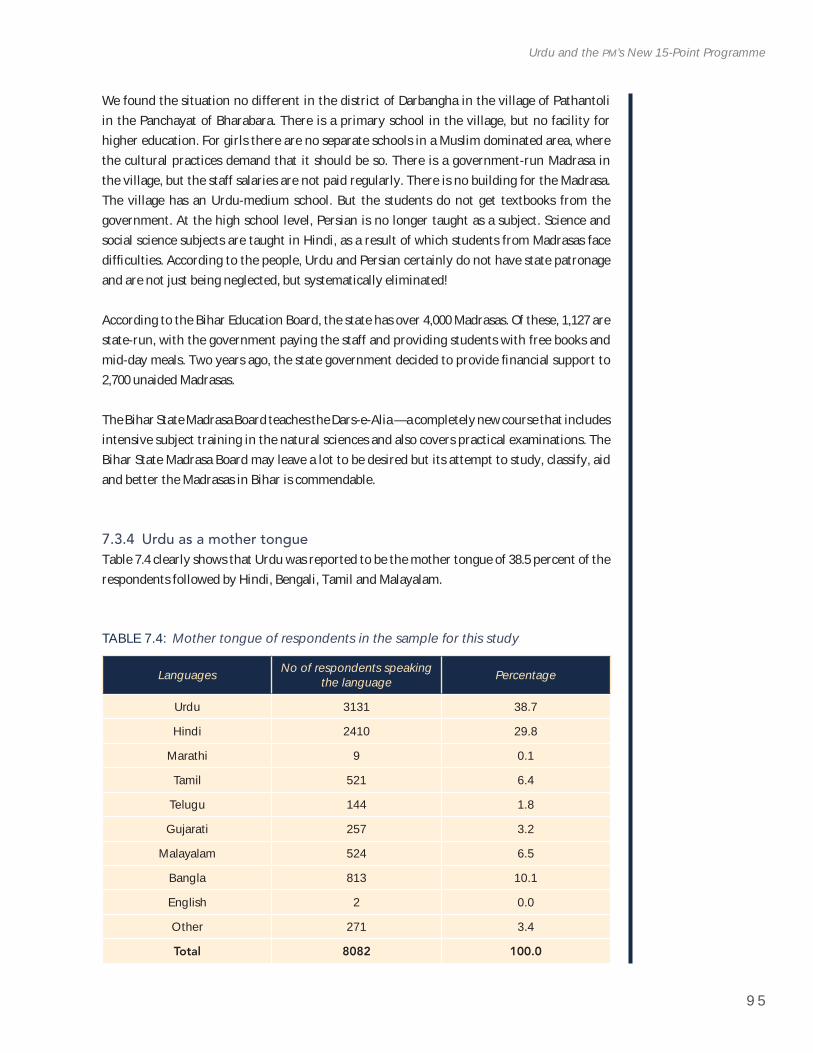
9 5
Urdu and the PM’s New 15-Point Programme
We found the situation no different in the district of Darbangha in the village of Pathantoli in the Panchayat of Bharabara. There is a primary school in the village, but no facility for higher education. For girls there are no separate schools in a Muslim dominated area, where the cultural practices demand that it should be so. There is a government-run Madrasa in the village, but the staff salaries are not paid regularly. There is no building for the Madrasa. The village has an Urdu-medium school. But the students do not get textbooks from the government. At the high school level, Persian is no longer taught as a subject. Science and social science subjects are taught in Hindi, as a result of which students from Madrasas face diffi culties. According to the people, Urdu and Persian certainly do not have state patronage and are not just being neglected, but systematically eliminated!
According to the Bihar Education Board, the state has over 4,000 Madrasas. Of these, 1,127 are state-run, with the government paying the staff and providing students with free books and mid-day meals. Two years ago, the state government decided to provide fi nancial support to 2,700 unaided Madrasas.
The Bihar State Madrasa Board teaches the Dars-e-Alia — a completely new course that includes intensive subject training in the natural sciences and also covers practical examinations. The Bihar State Madrasa Board may leave a lot to be desired but its attempt to study, classify, aid and better the Madrasas in Bihar is commendable.
7.3.4 Urdu as a mother tongueTable 7.4 clearly shows that Urdu was reported to be the mother tongue of 38.5 percent of the respondents followed by Hindi, Bengali, Tamil and Malayalam.
TABLE 7.4: Mother tongue of respondents in the sample for this study
Languages No of respondents speaking the language Percentage
Urdu 3131 38.7
Hindi 2410 29.8
Marathi 9 0.1
Tamil 521 6.4
Telugu 144 1.8
Gujarati 257 3.2
Malayalam 524 6.5
Bangla 813 10.1
English 2 0.0
Other 271 3.4
Total 8082 100.0
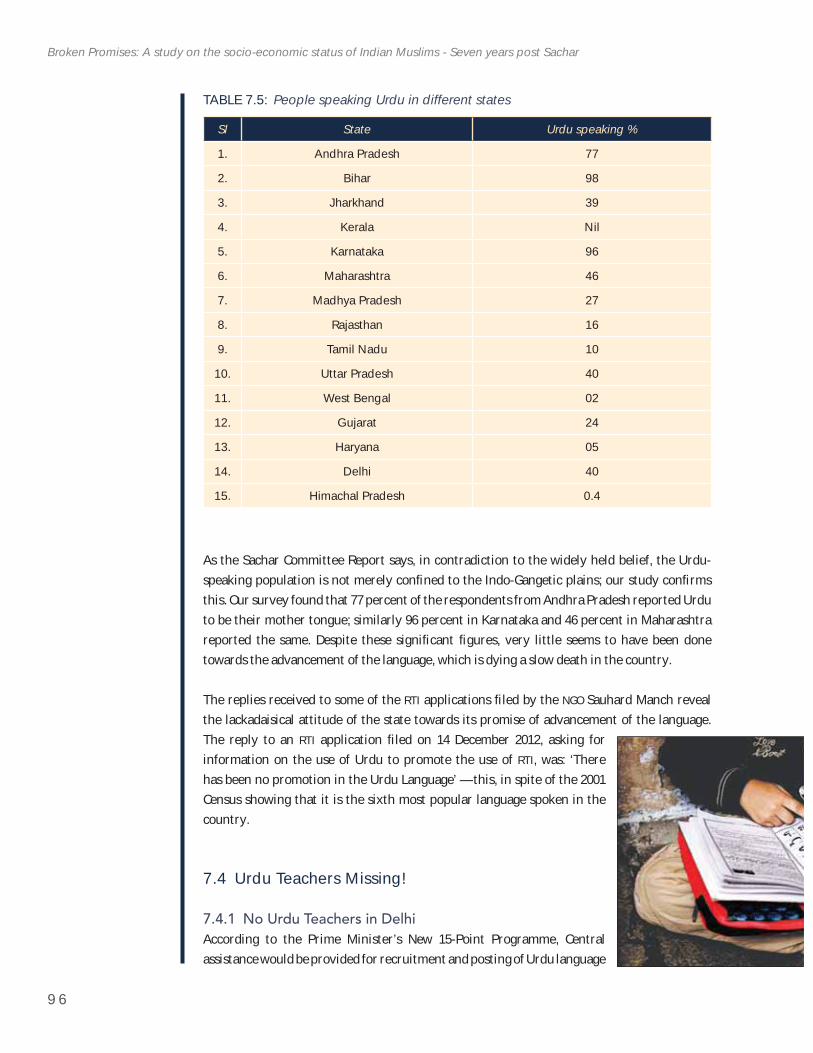
9 6
Broken Promises: A study on the socio-economic status of Indian Muslims - Seven years post Sachar
As the Sachar Committee Report says, in contradiction to the widely held belief, the Urdu-speaking population is not merely confi ned to the Indo-Gangetic plains; our study confi rms this. Our survey found that 77 percent of the respondents from Andhra Pradesh reported Urdu to be their mother tongue; similarly 96 percent in Karnataka and 46 percent in Maharashtra reported the same. Despite these signifi cant fi gures, very little seems to have been done towards the advancement of the language, which is dying a slow death in the country.
The replies received to some of the RTI applications fi led by the NGO Sauhard Manch reveal the lackadaisical attitude of the state towards its promise of advancement of the language. The reply to an RTI application fi led on 14 December 2012, asking for information on the use of Urdu to promote the use of RTI, was: ‘There has been no promotion in the Urdu Language’ — this, in spite of the 2001 Census showing that it is the sixth most popular language spoken in the country.
7.4 Urdu Teachers Missing!
7.4.1 No Urdu Teachers in DelhiAccording to the Prime Minister’s New 15-Point Programme, Central assistance would be provided for recruitment and posting of Urdu language
TABLE 7.5: People speaking Urdu in different states
Sl State Urdu speaking %
1. Andhra Pradesh 77
2. Bihar 98
3. Jharkhand 39
4. Kerala Nil
5. Karnataka 96
6. Maharashtra 46
7. Madhya Pradesh 27
8. Rajasthan 16
9. Tamil Nadu 10
10. Uttar Pradesh 40
11. West Bengal 02
12. Gujarat 24
13. Haryana 05
14. Delhi 40
15. Himachal Pradesh 0.4
9 7
Urdu and the PM’s New 15-Point Programme
34. Aleem Faizee, Fellow, Sauhard Manch and Ummid.com
teachers in primary and upper primary schools that serve a population in which at least one-fourth report that language as ‘mother tongue’. Central assistance is being provided to state governments for the appointment of Urdu language teachers in blocks or districts where there is a concentration of educationally backward minorities.
The reply to an RTI application, received on 6 February 2013, from the Government of the National Capital Region of Delhi, Directorate of Education, read: ‘This Directorate has already written to the DSSSB regarding direct recruitment of 102 TGT Urdu positions from 1.1.2007 to 1.11.2013. There is a possibility that these positions will be fi lled in the near future…’
Similarly, a reply received on 13 February 2013, from the offi ce of the PIO-cum-Deputy Director for Elementary Education, Una (in Himachal Pradesh), on the recruitment of Urdu teachers in the district read: ‘No Urdu teacher has been appointed in this district.’
7.4.2 No Urdu teachers in MalegaonA large number of teacher vacancies in Urdu-medium schools have not been fi lled for many years but the School Board and the MMC (Malegaon Municipal Corporation) are not fi lling these vacancies. The MMC School Board also confi rms that there has been no appointment made since 2009. As of August 2012, a total of 172 posts of teachers are vacant. Of these 172 vacant posts, 154 posts are in Urdu-medium schools.
The most striking case is of the teachers working in schools under the Malegaon Municipal Corporation (MMC). As per the MMC records, the 102 municipal schools recruit a total of 547 teachers; additionally, 866 retired municipal school teachers are entitled to get pensions.
However, for more than ten years now they have not been getting their salaries and pensions on time. And the delays are for months. The teachers disclose that they get part of their salaries after three to four months and the due amount is increasing with every passing day. The result is that a considerable number of teachers are working in textile industries while some are working as rickshaw-drivers after duty hours and during nights.34
Poor state of Urdu education in GujaratAhmedabad presents a very curious case of state of affairs concerning Urdu-medium education in the schools run by the Ahmedabad Municipal
BOX 12: Seventy-three percent of Urdu teachers’ posts vacant in Delhi
Over 73 percent of Urdu teacher posts are vacant in Delhi. Of the total 262 Urdu teacher posts sanctioned by the Education Directorate, only 70 posts are fi lled, leaving 192 vacant posts. This was revealed in response to a Right to Information (RTI) application fi led by Qasim Rasool Ilyas, a social activist.
9 8
Broken Promises: A study on the socio-economic status of Indian Muslims - Seven years post Sachar
Corporation (AMC). These Urdu-medium primary schools do not have suffi cient teachers and this affects the fundamental right of students. The Gujarat High Court issued a notice to the state education department and the AMC in response to a public interest litigation (PIL) fi led by a citizen. There are 44 lower-primary schools in Ahmedabad imparting education in the Urdu language. It has 12,972 students and, as per the Right to Education Act, these schools should have 396 teachers; but in reality there are only 354 teachers. This leaves a shortage of 42 teachers as per the complaint made in the PIL. Similarly, upper-primary Urdu-medium schools have 7,507 students with only 129 teachers. Here there is a shortage of 108 teachers. There is also a shortage of teachers in Urdu-medium girls’ schools. Ahmedabad Municipal Corporation runs six Urdu-medium schools for girls with around 4,000 students. As per a report published in the Indian Express, Ahmedabad edition, 24 September 2013), there was a case of harassment against a male teacher. This was made a pretext by the municipal corporation school board to do away altogether with male Urdu teachers and they were all transferred out. They are supposed to be replaced with female teachers. While the male teachers got transferred, the female teachers were not appointed simultaneously.
7.5 Sachar Committee Report and the Urdu Language
The situation described in the comments made by the Sachar Committee Report, listed below, seems to have remained unchanged in the seven years since:
Often Urdu schools have teachers who have no knowledge of Urdu. This problem is partly compounded by the fact that posts of Urdu teachers are reserved for the SCs/STs and such candidates are not available. This anomaly needs to be corrected urgently.
High quality Urdu medium schools can be opened in those parts of the country wherever there is demand for them. However, it needs to be ensured that good quality text books are available in Urdu language and the products of these schools are employable.
Urdu should be introduced as an optional subject in all government and government-aided schools in states having a substantial Urdu speaking population.
9 9
35. Sharief et al. (2012).
8 . E C O N O M I C C O N D I T I O N O F M U S L I M S
8.1 Introduction
Economic condition is a key parameter to assess the well-being of any community particularly the minorities. The poverty and economic marginalization faced by Muslims
does not portray a very happy picture of the largest minority in the country. One of the important fi ndings of the Sachar Committee has been about economic deprivation of Muslims both in terms of viability of self-owned small businesses in an increasingly globalized and liberalized market as well as the denial of jobs in government and private sectors. Muslims, by and large, are engaged in the unorganized sector of the economy which rarely enjoys protection of any kind; therefore, the adverse impact of liberalization has been most acute for them. The traditional occupations of Muslims in industries such as silk and sericulture, handloom and powerloom weaving, the leather industry, automobile-repairing and garment making have borne the brunt of liberalization. About 33 percent of the Muslim workforce is employed in traditional sectors, which is highest proportion among all communities.35
8.2 Economic Liberalization and Livelihoods
Large sections of Muslims are employed in the unorganized sector which has taken the brunt of the new economic paradigm set in motion in the early 1990s in India. The policies of economic liberalization, globalization and privatization have led to the entry of big global capital in various sectors such as textiles and garments, automobiles, retail, etc. It has become extremely diffi cult for small players without resources for upgradation of technology and machinery to withstand the competition. The small enterprises and businesses owned by Muslims fi nd it diffi cult to get loans or fi nancial assistance from government sources. Besides, they do not qualify for any protection or any schemes that would help sustain them in the face of growing competition from modern and big companies, which have an adverse impact on small businesses.
Large sections of the Muslim population comprise of artisans and craftspersons who have relied on traditional skills for generations. These informally skilled persons have been employed in work related to textiles and garments, such as bandhnior tie and dye, mirror-work, patchwork, zari, zardozi, etc., as well as leather-work, brassware, glass products,. There have been crafts-based traditional occupations based on paper such as kite-making, rakhi-making, bag-making, etc., operating from small rooms, often within homes, that have been employing large numbers of workers. All of these occupations are facing tough competition from modern enterprises. This has resulted in fewer income opportunities for those engaged in informal and traditional skill based work.
Our fi ndings point to increased ghettoization and segregated living across the urban as well as the rural areas we surveyed. This too has had an adverse impact on livelihoods, making it that much
1 0 0
Broken Promises: A study on the socio-economic status of Indian Muslims - Seven years post Sachar
36. Soman (2013). 37. ActionAid International
(n.d.).
more diffi cult for those living inside a ghetto to fi nd income opportunities outside. Our fi ndings in Gujarat show a curious situation for Muslims who were uprooted in the communal violence in 2002: the rehabilitation colonies built by religious and civil society groups are located far from cities or towns. Those survivors who live there fi nd it arduous and costly to commute daily to the city to fi nd work. These survivors have been forced to give up their traditional occupations on account of the violence and insecurity; there is continued denial of opportunity to access work on account of living in ghettos in far-fl ung areas. Muslim women pay the greatest price through low wages in home-based work and lack of opportunities for suitable employment in ghettos.36
The picture of a community living under poverty brought out by the Sachar Committee gets intensifi ed owing to continued pauperization through declining income and earning opportunities.
Handloom weavers who make traditional items such as saris, dhotis, sheets and shawls, have been hit the hardest. Of the 38 million people employed in the textiles sector, 12.4 million are concentrated in handloom weaving. The majority of them are Muslims or dalits and extremely poor, working in small family units. More than 60 percent are women. Lack of education coupled with unemployment and low wages is a problem faced by large number of Muslims. It is a common sight in urban and rural areas to see Muslim women toiling for a pittance. Exploitative wages and hazardous work conditions are a familiar milieu for poor Muslim women. In the course of this study we came across women making bidis for as little as `25 per thousand bidis in Murshidabad in West Bengal and Sagar in Madhya Pradesh. Even so, we found the women assiduously carrying out bidi making work daily for they had no options whatsoever to support themselves. All the provisions of any schemes meant for women workers did not seem to have reached them.37
8.3 Right to Employment and the PM’s New 15-Point Programme
The PM’s New15-Point Programme promises that —
A certain percentage of the physical and fi nancial targets under the SGSY will be earmarked for benefi ciaries belonging to the minority communities living below the poverty line in rural areas.
A certain percentage of the allocation will be earmarked for the creation of infrastructure in such villages, which have a substantial population of minorities.
8.4 The Present Economic Condition of Indian Muslims
Table 8.1 clearly shows that there has been a rise in the nominal income which does not necessarly refl ect the real income of the people which depends on the comparative price changes during the periods, covered in the survey (For details, please read section on income).
More than 500,000 weavers live in and around Varanasi, weaving silk saris mainly for the domestic market. But since the 1990s, these silk handloom weavers have seen their markets
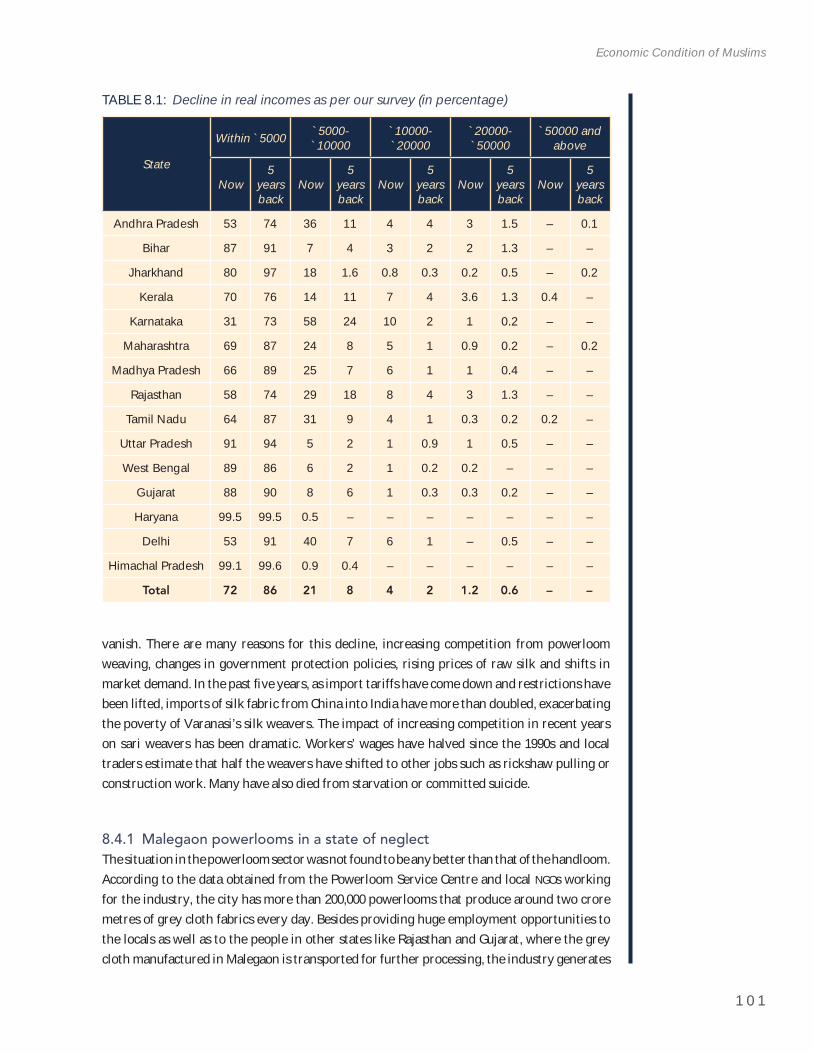
1 0 1
Economic Condition of Muslims
vanish. There are many reasons for this decline, increasing competition from powerloom weaving, changes in government protection policies, rising prices of raw silk and shifts in market demand. In the past fi ve years, as import tariffs have come down and restrictions have been lifted, imports of silk fabric from China into India have more than doubled, exacerbating the poverty of Varanasi’s silk weavers. The impact of increasing competition in recent years on sari weavers has been dramatic. Workers’ wages have halved since the 1990s and local traders estimate that half the weavers have shifted to other jobs such as rickshaw pulling or construction work. Many have also died from starvation or committed suicide.
8.4.1 Malegaon powerlooms in a state of neglectThe situation in the powerloom sector was not found to be any better than that of the handloom. According to the data obtained from the Powerloom Service Centre and local NGOs working for the industry, the city has more than 200,000 powerlooms that produce around two crore metres of grey cloth fabrics every day. Besides providing huge employment opportunities to the locals as well as to the people in other states like Rajasthan and Gujarat, where the grey cloth manufactured in Malegaon is transported for further processing, the industry generates
TABLE 8.1: Decline in real incomes as per our survey (in percentage)
State
Within `5000 `5000-`10000
`10000-`20000
`20000-`50000
`50000 and above
Now5
yearsback
Now5
yearsback
Now5
yearsback
Now5
yearsback
Now5
yearsback
Andhra Pradesh 53 74 36 11 4 4 3 1.5 – 0.1
Bihar 87 91 7 4 3 2 2 1.3 – –
Jharkhand 80 97 18 1.6 0.8 0.3 0.2 0.5 – 0.2
Kerala 70 76 14 11 7 4 3.6 1.3 0.4 –
Karnataka 31 73 58 24 10 2 1 0.2 – –
Maharashtra 69 87 24 8 5 1 0.9 0.2 – 0.2
Madhya Pradesh 66 89 25 7 6 1 1 0.4 – –
Rajasthan 58 74 29 18 8 4 3 1.3 – –
Tamil Nadu 64 87 31 9 4 1 0.3 0.2 0.2 –
Uttar Pradesh 91 94 5 2 1 0.9 1 0.5 – –
West Bengal 89 86 6 2 1 0.2 0.2 – – –
Gujarat 88 90 8 6 1 0.3 0.3 0.2 – –
Haryana 99.5 99.5 0.5 – – – – – – –
Delhi 53 91 40 7 6 1 – 0.5 – –
Himachal Pradesh 99.1 99.6 0.9 0.4 – – – – – –
Total 72 86 21 8 4 2 1.2 0.6 – –
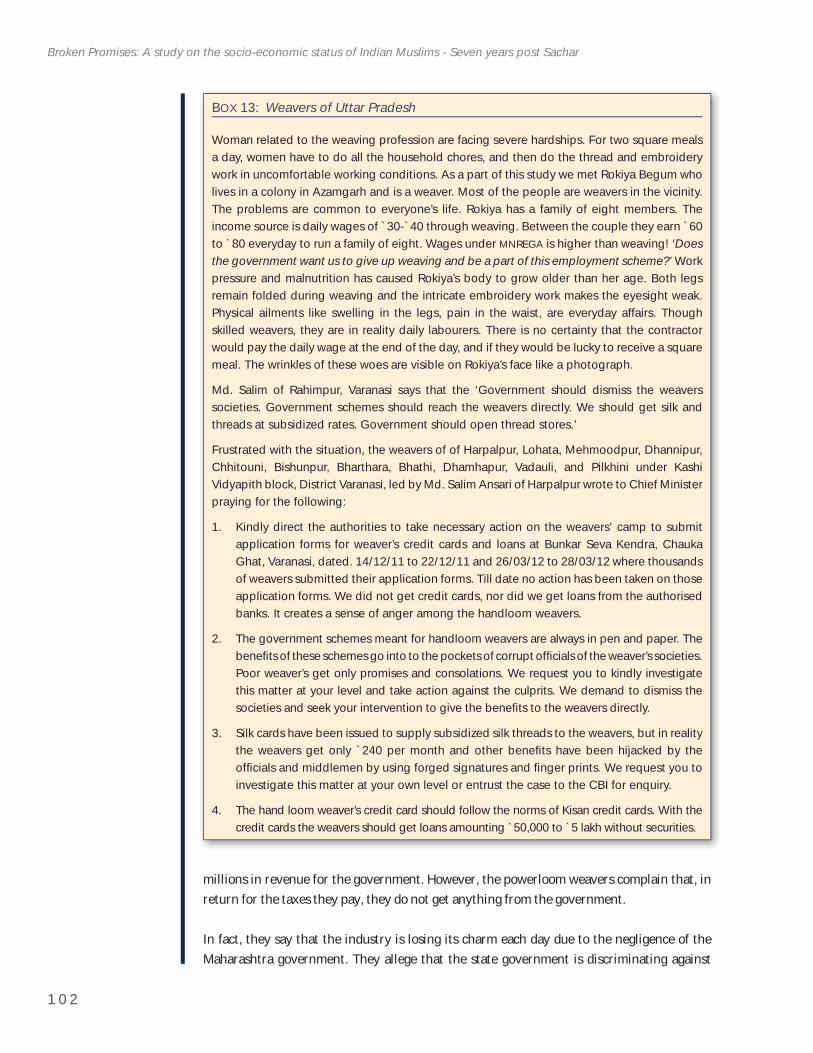
1 0 2
Broken Promises: A study on the socio-economic status of Indian Muslims - Seven years post Sachar
millions in revenue for the government. However, the powerloom weavers complain that, in return for the taxes they pay, they do not get anything from the government.
In fact, they say that the industry is losing its charm each day due to the negligence of the Maharashtra government. They allege that the state government is discriminating against
BOX 13: Weavers of Uttar Pradesh
Woman related to the weaving profession are facing severe hardships. For two square meals a day, women have to do all the household chores, and then do the thread and embroidery work in uncomfortable working conditions. As a part of this study we met Rokiya Begum who lives in a colony in Azamgarh and is a weaver. Most of the people are weavers in the vicinity. The problems are common to everyone’s life. Rokiya has a family of eight members. The income source is daily wages of `30-`40 through weaving. Between the couple they earn `60to `80 everyday to run a family of eight. Wages under MNREGA is higher than weaving! ‘Doesthe government want us to give up weaving and be a part of this employment scheme?’ Work pressure and malnutrition has caused Rokiya’s body to grow older than her age. Both legs remain folded during weaving and the intricate embroidery work makes the eyesight weak. Physical ailments like swelling in the legs, pain in the waist, are everyday affairs. Though skilled weavers, they are in reality daily labourers. There is no certainty that the contractor would pay the daily wage at the end of the day, and if they would be lucky to receive a square meal. The wrinkles of these woes are visible on Rokiya’s face like a photograph.
Md. Salim of Rahimpur, Varanasi says that the ‘Government should dismiss the weavers societies. Government schemes should reach the weavers directly. We should get silk and threads at subsidized rates. Government should open thread stores.’
Frustrated with the situation, the weavers of of Harpalpur, Lohata, Mehmoodpur, Dhannipur, Chhitouni, Bishunpur, Bharthara, Bhathi, Dhamhapur, Vadauli, and Pilkhini under Kashi Vidyapith block, District Varanasi, led by Md. Salim Ansari of Harpalpur wrote to Chief Minister praying for the following:
Kindly direct the authorities to take necessary action on the weavers’ camp to submit 1.application forms for weaver’s credit cards and loans at Bunkar Seva Kendra, Chauka Ghat, Varanasi, dated. 14/12/11 to 22/12/11 and 26/03/12 to 28/03/12 where thousands of weavers submitted their application forms. Till date no action has been taken on those application forms. We did not get credit cards, nor did we get loans from the authorised banks. It creates a sense of anger among the handloom weavers.
The government schemes meant for handloom weavers are always in pen and paper. The 2.benefi ts of these schemes go into to the pockets of corrupt offi cials of the weaver’s societies. Poor weaver’s get only promises and consolations. We request you to kindly investigate this matter at your level and take action against the culprits. We demand to dismiss the societies and seek your intervention to give the benefi ts to the weavers directly.
Silk cards have been issued to supply subsidized silk threads to the weavers, but in reality 3.the weavers get only `240 per month and other benefi ts have been hijacked by the offi cials and middlemen by using forged signatures and fi nger prints. We request you to investigate this matter at your own level or entrust the case to the CBI for enquiry.
The hand loom weaver’s credit card should follow the norms of Kisan credit cards. With the 4.credit cards the weavers should get loans amounting `50,000 to `5 lakh without securities.
1 0 3
Economic Condition of Muslims
38. Aleem Faizee, Fellow, Sauhard Manch, Maharashtra.
them, because the city is dominated by Muslims and major stakeholders in this trade are Muslims. To prove their point, they say that the state government in the year 2001 granted D+ zone status to all the textile centres of the state. It, however, excluded Malegaon and Bhiwandi — both major textile clusters but with a huge population of Muslims — from this list. As per the Maharashtra State Industry Policy, the textile clusters and other industries coming under the D+ zone were granted 35 percent subsidy on the purchase of modern machineries. This, combined with the 20 percent subsidy from the central government, amounted to a whopping 55 percent total subsidy. Due to this huge amount of subsidy, the textile clusters like Ichalkiranji, Sholapur, Sangli, Satara, Veeta and other centres that have negligible presence of Muslim powerloom weavers, got benefi ted in terms of modernisation. But since Malegaon and Bhiwandi were not granted the D+ zone status despite popular demands, the two centres could not modernize and remained with outdated machineries.
After Malegaon Industries & Manufacturers Association (MIMA), a local NGO working for the industries raised the matter with the Planning Commission of India in 2007; it pushed the state government to correct the decision. The state government then on 30 March 2007 granted D+ zone status to Malegaon and Bhiwandi. However, to the shock of the local weavers, the state government simultaneously announced the new industrial policy to be implemented from 01 April 2007. Among other policy decisions recommended in the new industrial policy, it was also decided to discontinue the 35 percent subsidy earlier given to industries coming under the D+ zone.
The local community also says that the bankers have blacklisted the textile industry in their rule books and do not sanction loans, despite their fulfi lling all the pre-requisites.38
8.4.2 Artisans like leather workers affectedAgra accounted for around 65 percent of domestic shoe sales in 2005. Around 200,000 people were employed in the sector, primarily in small, home- and family-based workshops. Since the onset of liberalization, the city has seen a steady decline in the production and earnings of its small-scale shoe-making units. Many of the artisans have turned to construction work or
BOX 14: The Madaris still left with begging as one of their professions!
The Madari community is included in the ‘OBC’ classifi cation in Maharashtra. The Madaris are nomads and belong to the Sufi tradition. There are some leaders in Maharashtra from the community who are asking for inclusion of their community in the Scheduled Caste category. This is a mixed community of dalits (Marathi speaking), adivasis, Madaris and ‘Bhaiyas’ (in their words, referring to the Hindi speaking north Indians).
There are around 100-150 houses of the Madari community in Indira Nagar, Titwala, Thane district, Maharashtra. They have been living here since almost 40 years. The men are either daily wage workers in the unorganized sector or roam around as fakirs collecting money or conducting street shows. The women either work as domestic workers, or are housewives or also roam around collecting money as fakirs with their children.
Source: Himani Rawat, Actionaid, Mumbai.
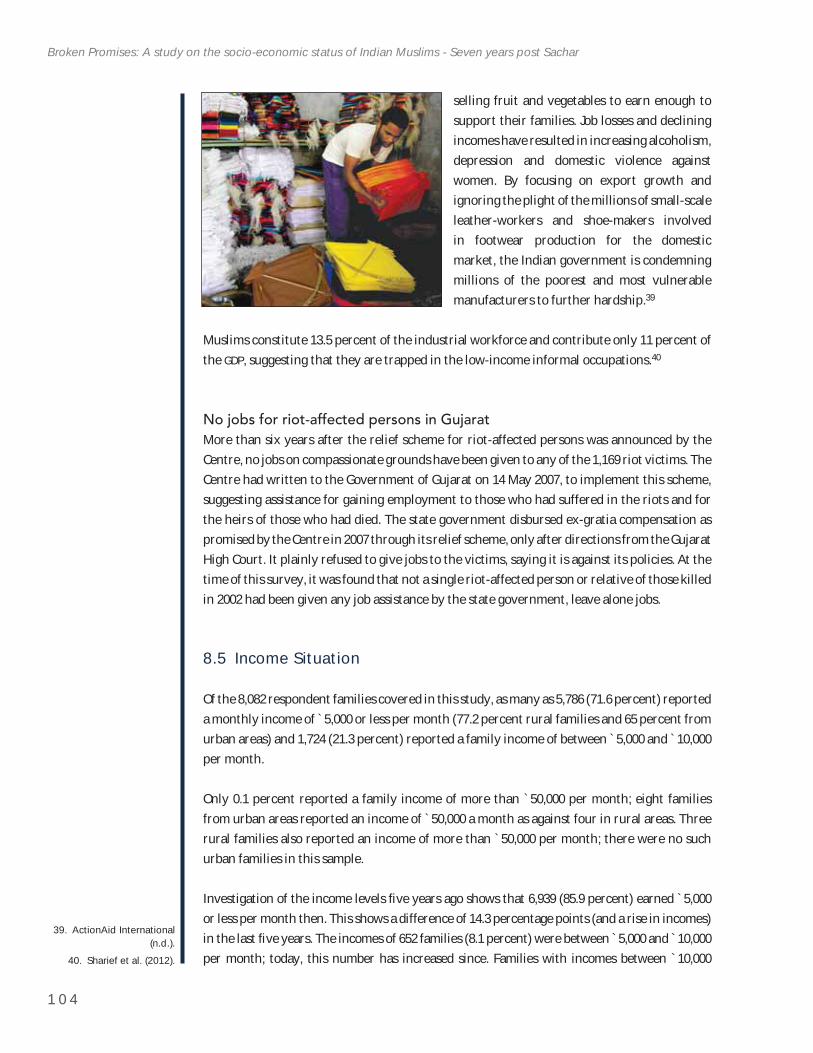
1 0 4
Broken Promises: A study on the socio-economic status of Indian Muslims - Seven years post Sachar
39. ActionAid International (n.d.).
40. Sharief et al. (2012).
selling fruit and vegetables to earn enough to support their families. Job losses and declining incomes have resulted in increasing alcoholism, depression and domestic violence against women. By focusing on export growth and ignoring the plight of the millions of small-scale leather-workers and shoe-makers involved in footwear production for the domestic market, the Indian government is condemning millions of the poorest and most vulnerable manufacturers to further hardship.39
Muslims constitute 13.5 percent of the industrial workforce and contribute only 11 percent of the GDP, suggesting that they are trapped in the low-income informal occupations.40
No jobs for riot-affected persons in GujaratMore than six years after the relief scheme for riot-affected persons was announced by the Centre, no jobs on compassionate grounds have been given to any of the 1,169 riot victims. The Centre had written to the Government of Gujarat on 14 May 2007, to implement this scheme, suggesting assistance for gaining employment to those who had suffered in the riots and for the heirs of those who had died. The state government disbursed ex-gratia compensation as promised by the Centre in 2007 through its relief scheme, only after directions from the Gujarat High Court. It plainly refused to give jobs to the victims, saying it is against its policies. At the time of this survey, it was found that not a single riot-affected person or relative of those killed in 2002 had been given any job assistance by the state government, leave alone jobs.
8.5 Income Situation
Of the 8,082 respondent families covered in this study, as many as 5,786 (71.6 percent) reported a monthly income of `5,000 or less per month (77.2 percent rural families and 65 percent from urban areas) and 1,724 (21.3 percent) reported a family income of between `5,000 and `10,000per month.
Only 0.1 percent reported a family income of more than `50,000 per month; eight families from urban areas reported an income of `50,000 a month as against four in rural areas. Three rural families also reported an income of more than `50,000 per month; there were no such urban families in this sample.
Investigation of the income levels fi ve years ago shows that 6,939 (85.9 percent) earned `5,000 or less per month then. This shows a difference of 14.3 percentage points (and a rise in incomes) in the last fi ve years. The incomes of 652 families (8.1 percent) were between `5,000 and `10,000 per month; today, this number has increased since. Families with incomes between `10,000
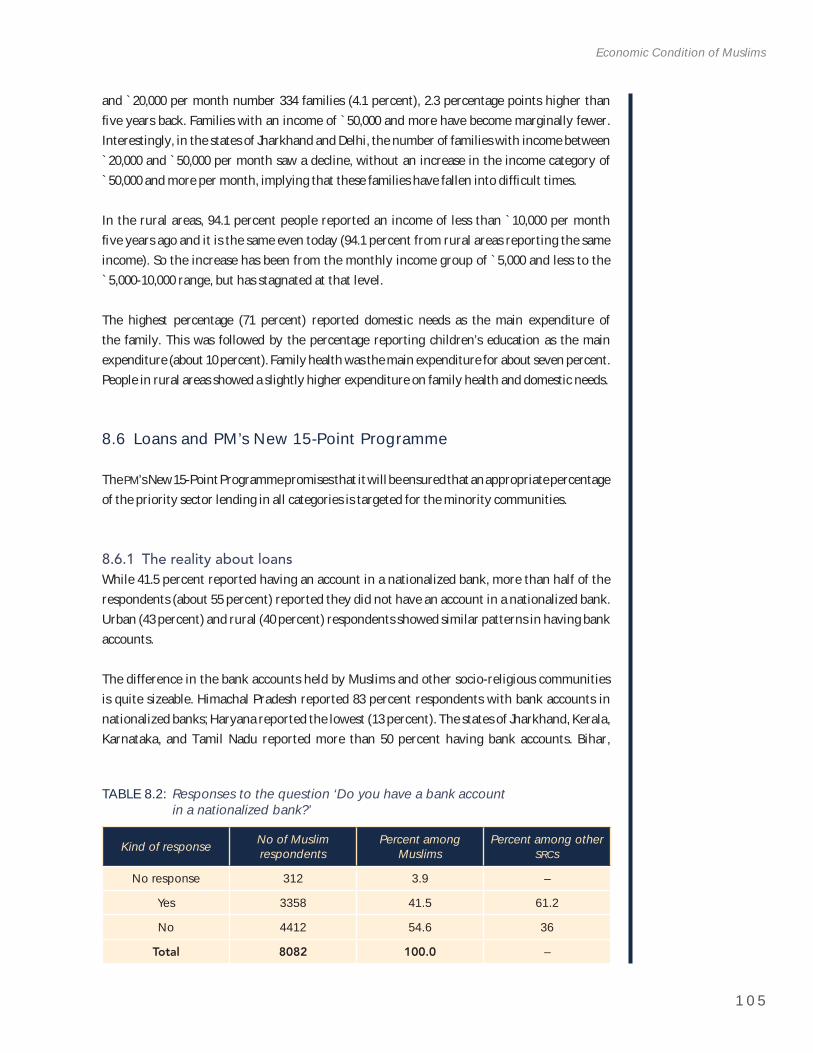
1 0 5
Economic Condition of Muslims
and `20,000 per month number 334 families (4.1 percent), 2.3 percentage points higher than fi ve years back. Families with an income of `50,000 and more have become marginally fewer. Interestingly, in the states of Jharkhand and Delhi, the number of families with income between `20,000 and `50,000 per month saw a decline, without an increase in the income category of `50,000 and more per month, implying that these families have fallen into diffi cult times.
In the rural areas, 94.1 percent people reported an income of less than `10,000 per month fi ve years ago and it is the same even today (94.1 percent from rural areas reporting the same income). So the increase has been from the monthly income group of `5,000 and less to the `5,000-10,000 range, but has stagnated at that level.
The highest percentage (71 percent) reported domestic needs as the main expenditure of the family. This was followed by the percentage reporting children’s education as the main expenditure (about 10 percent). Family health was the main expenditure for about seven percent. People in rural areas showed a slightly higher expenditure on family health and domestic needs.
8.6 Loans and PM’s New 15-Point Programme
ThePM’s New 15-Point Programme promises that it will be ensured that an appropriate percentage of the priority sector lending in all categories is targeted for the minority communities.
8.6.1 The reality about loansWhile 41.5 percent reported having an account in a nationalized bank, more than half of the respondents (about 55 percent) reported they did not have an account in a nationalized bank. Urban (43 percent) and rural (40 percent) respondents showed similar patterns in having bank accounts.
The difference in the bank accounts held by Muslims and other socio-religious communities is quite sizeable. Himachal Pradesh reported 83 percent respondents with bank accounts in nationalized banks; Haryana reported the lowest (13 percent). The states of Jharkhand, Kerala, Karnataka, and Tamil Nadu reported more than 50 percent having bank accounts. Bihar,
TABLE 8.2: Responses to the question ‘Do you have a bank account in a nationalized bank?’
Kind of response No of Muslim respondents
Percent among Muslims
Percent among other SRCs
No response 312 3.9 –
Yes 3358 41.5 61.2
No 4412 54.6 36
Total 8082 100.0 –
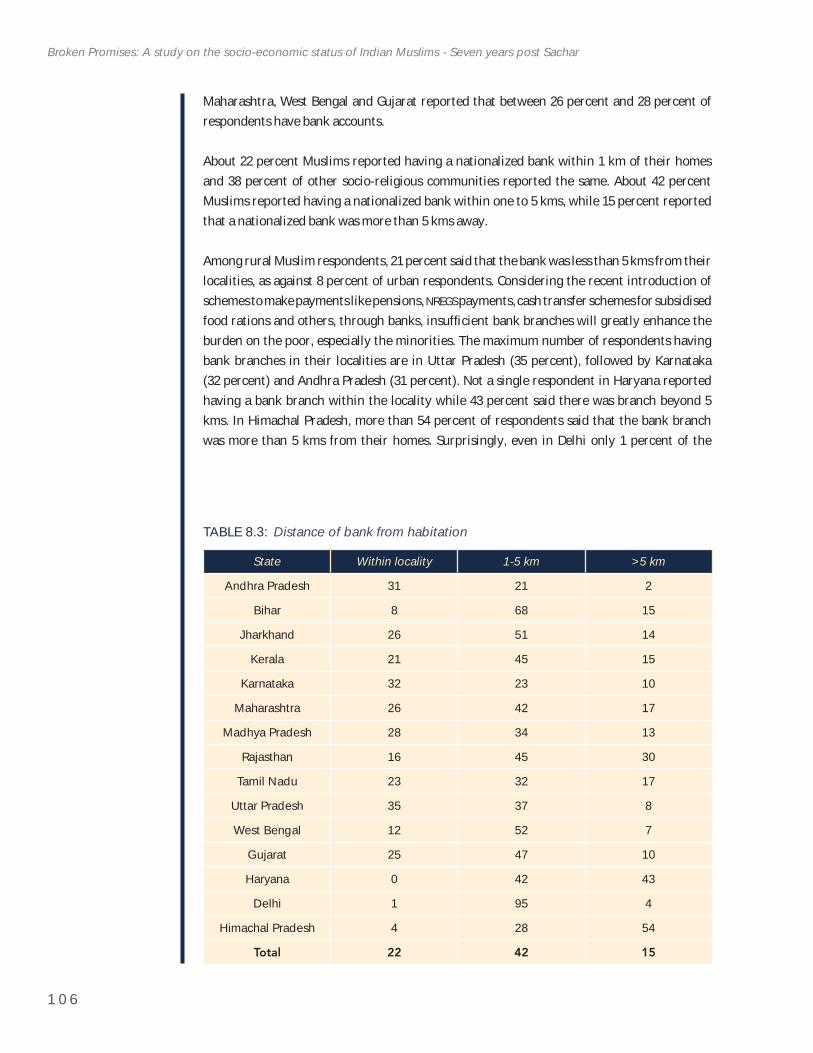
1 0 6
Broken Promises: A study on the socio-economic status of Indian Muslims - Seven years post Sachar
Maharashtra, West Bengal and Gujarat reported that between 26 percent and 28 percent of respondents have bank accounts.
About 22 percent Muslims reported having a nationalized bank within 1 km of their homes and 38 percent of other socio-religious communities reported the same. About 42 percent Muslims reported having a nationalized bank within one to 5 kms, while 15 percent reported that a nationalized bank was more than 5 kms away.
Among rural Muslim respondents, 21 percent said that the bank was less than 5 kms from their localities, as against 8 percent of urban respondents. Considering the recent introduction of schemes to make payments like pensions, NREGS payments, cash transfer schemes for subsidised food rations and others, through banks, insuffi cient bank branches will greatly enhance the burden on the poor, especially the minorities. The maximum number of respondents having bank branches in their localities are in Uttar Pradesh (35 percent), followed by Karnataka (32 percent) and Andhra Pradesh (31 percent). Not a single respondent in Haryana reported having a bank branch within the locality while 43 percent said there was branch beyond 5 kms. In Himachal Pradesh, more than 54 percent of respondents said that the bank branch was more than 5 kms from their homes. Surprisingly, even in Delhi only 1 percent of the
TABLE 8.3: Distance of bank from habitation
State Within locality 1-5 km >5 km
Andhra Pradesh 31 21 2
Bihar 8 68 15
Jharkhand 26 51 14
Kerala 21 45 15
Karnataka 32 23 10
Maharashtra 26 42 17
Madhya Pradesh 28 34 13
Rajasthan 16 45 30
Tamil Nadu 23 32 17
Uttar Pradesh 35 37 8
West Bengal 12 52 7
Gujarat 25 47 10
Haryana 0 42 43
Delhi 1 95 4
Himachal Pradesh 4 28 54
Total 22 42 15
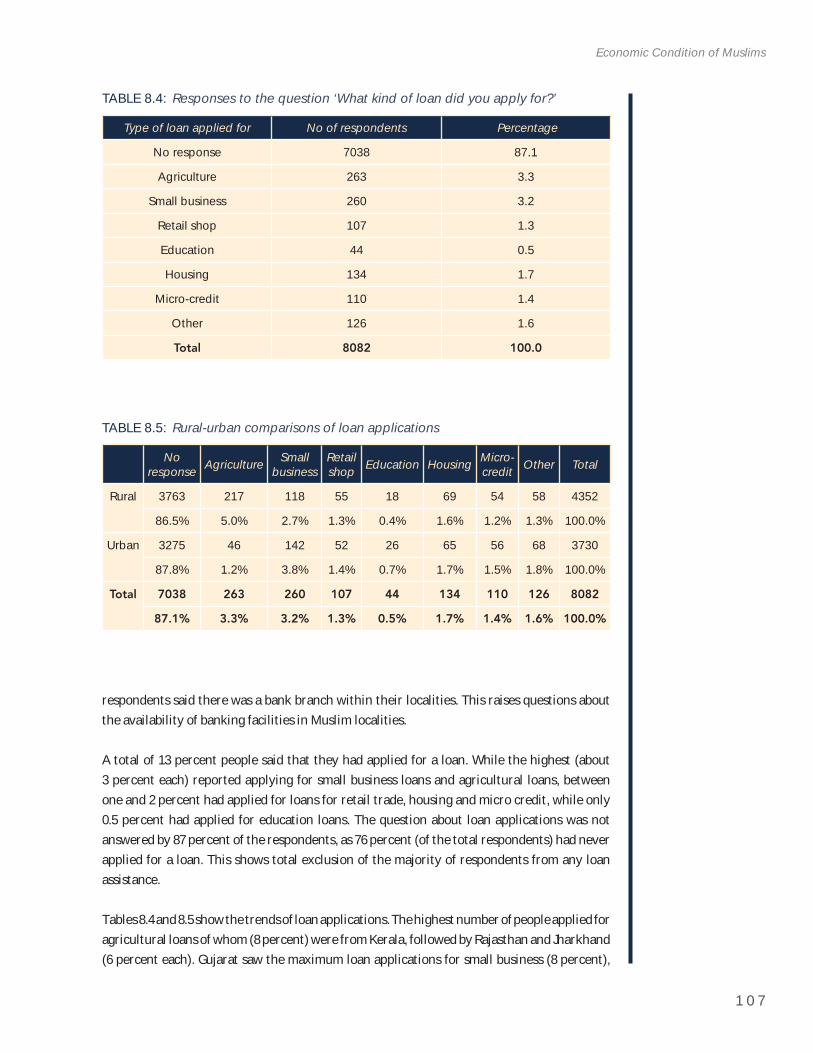
1 0 7
Economic Condition of Muslims
respondents said there was a bank branch within their localities. This raises questions about the availability of banking facilities in Muslim localities.
A total of 13 percent people said that they had applied for a loan. While the highest (about 3 percent each) reported applying for small business loans and agricultural loans, between one and 2 percent had applied for loans for retail trade, housing and micro credit, while only 0.5 percent had applied for education loans. The question about loan applications was not answered by 87 percent of the respondents, as 76 percent (of the total respondents) had never applied for a loan. This shows total exclusion of the majority of respondents from any loan assistance.
Tables 8.4 and 8.5 show the trends of loan applications. The highest number of people applied for agricultural loans of whom (8 percent) were from Kerala, followed by Rajasthan and Jharkhand (6 percent each). Gujarat saw the maximum loan applications for small business (8 percent),
TABLE 8.4: Responses to the question ‘What kind of loan did you apply for?’
Type of loan applied for No of respondents Percentage
No response 7038 87.1
Agriculture 263 3.3
Small business 260 3.2
Retail shop 107 1.3
Education 44 0.5
Housing 134 1.7
Micro-credit 110 1.4
Other 126 1.6
Total 8082 100.0
TABLE 8.5: Rural-urban comparisons of loan applications
Noresponse Agriculture Small
businessRetailshop Education Housing Micro-
credit Other Total
Rural 3763 217 118 55 18 69 54 58 4352
86.5% 5.0% 2.7% 1.3% 0.4% 1.6% 1.2% 1.3% 100.0%
Urban 3275 46 142 52 26 65 56 68 3730
87.8% 1.2% 3.8% 1.4% 0.7% 1.7% 1.5% 1.8% 100.0%
Total 7038 263 260 107 44 134 110 126 8082
87.1% 3.3% 3.2% 1.3% 0.5% 1.7% 1.4% 1.6% 100.0%
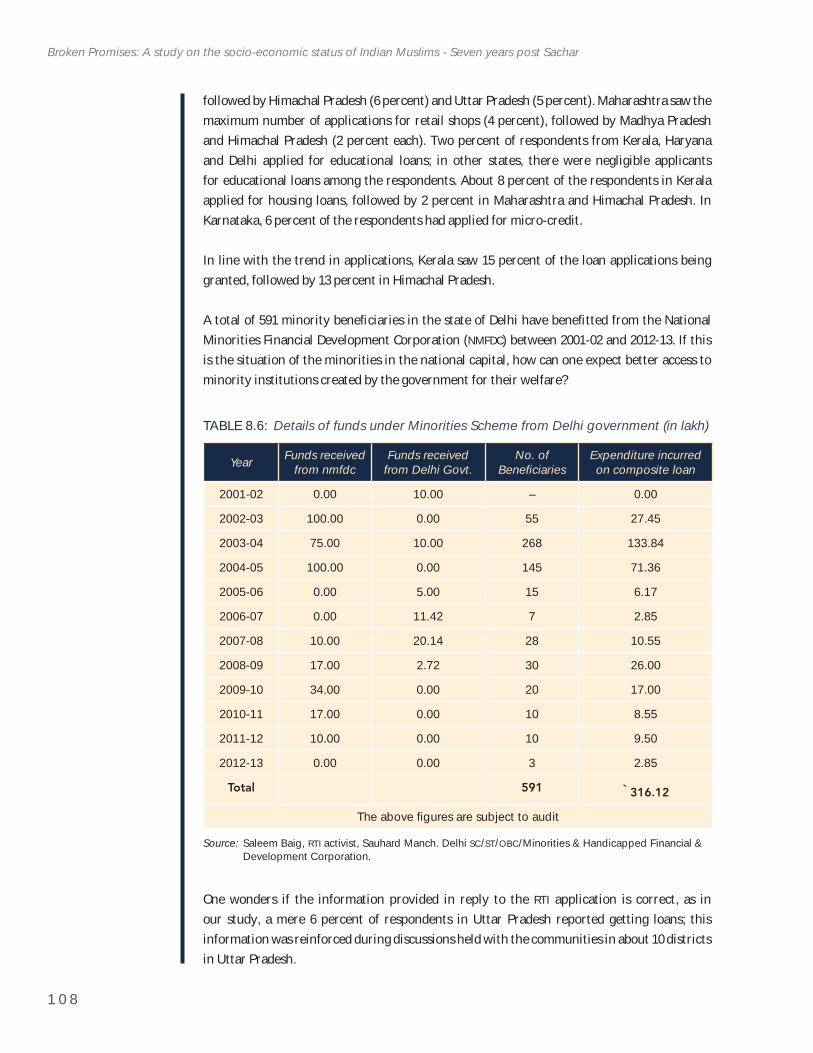
1 0 8
Broken Promises: A study on the socio-economic status of Indian Muslims - Seven years post Sachar
followed by Himachal Pradesh (6 percent) and Uttar Pradesh (5 percent). Maharashtra saw the maximum number of applications for retail shops (4 percent), followed by Madhya Pradesh and Himachal Pradesh (2 percent each). Two percent of respondents from Kerala, Haryana and Delhi applied for educational loans; in other states, there were negligible applicants for educational loans among the respondents. About 8 percent of the respondents in Kerala applied for housing loans, followed by 2 percent in Maharashtra and Himachal Pradesh. In Karnataka, 6 percent of the respondents had applied for micro-credit.
In line with the trend in applications, Kerala saw 15 percent of the loan applications being granted, followed by 13 percent in Himachal Pradesh.
A total of 591 minority benefi ciaries in the state of Delhi have benefi tted from the National Minorities Financial Development Corporation (NMFDC) between 2001-02 and 2012-13. If this is the situation of the minorities in the national capital, how can one expect better access to minority institutions created by the government for their welfare?
TABLE 8.6: Details of funds under Minorities Scheme from Delhi government (in lakh)
Year Funds received from nmfdc
Funds received from Delhi Govt.
No. of Benefi ciaries
Expenditure incurred on composite loan
2001-02 0.00 10.00 – 0.00
2002-03 100.00 0.00 55 27.45
2003-04 75.00 10.00 268 133.84
2004-05 100.00 0.00 145 71.36
2005-06 0.00 5.00 15 6.17
2006-07 0.00 11.42 7 2.85
2007-08 10.00 20.14 28 10.55
2008-09 17.00 2.72 30 26.00
2009-10 34.00 0.00 20 17.00
2010-11 17.00 0.00 10 8.55
2011-12 10.00 0.00 10 9.50
2012-13 0.00 0.00 3 2.85
Total 591 `316.12
The above fi gures are subject to audit
Source: Saleem Baig, RTI activist, Sauhard Manch. Delhi SC/ST/OBC/Minorities & Handicapped Financial & Development Corporation.
One wonders if the information provided in reply to the RTI application is correct, as in our study, a mere 6 percent of respondents in Uttar Pradesh reported getting loans; this information was reinforced during discussions held with the communities in about 10 districts in Uttar Pradesh.
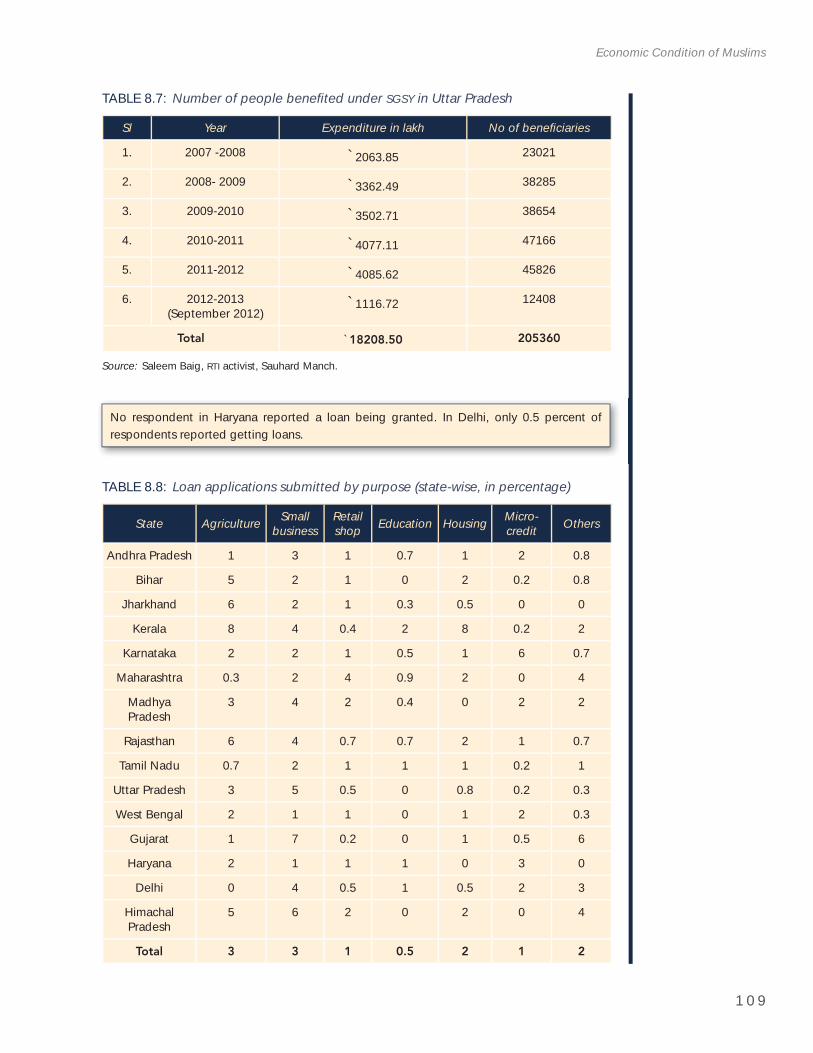
1 0 9
Economic Condition of Muslims
No respondent in Haryana reported a loan being granted. In Delhi, only 0.5 percent of respondents reported getting loans.
TABLE 8.7: Number of people benefi ted under SGSY in Uttar Pradesh
Sl Year Expenditure in lakh No of benefi ciaries
1. 2007 -2008 `2063.85 23021
2. 2008- 2009 `3362.49 38285
3. 2009-2010 `3502.71 38654
4. 2010-2011 `4077.11 47166
5. 2011-2012 `4085.62 45826
6. 2012-2013(September 2012)
`1116.72 12408
Total `18208.50 205360
Source: Saleem Baig, RTI activist, Sauhard Manch.
TABLE 8.8: Loan applications submitted by purpose (state-wise, in percentage)
State Agriculture Smallbusiness
Retailshop Education Housing Micro-
credit Others
Andhra Pradesh 1 3 1 0.7 1 2 0.8
Bihar 5 2 1 0 2 0.2 0.8
Jharkhand 6 2 1 0.3 0.5 0 0
Kerala 8 4 0.4 2 8 0.2 2
Karnataka 2 2 1 0.5 1 6 0.7
Maharashtra 0.3 2 4 0.9 2 0 4
MadhyaPradesh
3 4 2 0.4 0 2 2
Rajasthan 6 4 0.7 0.7 2 1 0.7
Tamil Nadu 0.7 2 1 1 1 0.2 1
Uttar Pradesh 3 5 0.5 0 0.8 0.2 0.3
West Bengal 2 1 1 0 1 2 0.3
Gujarat 1 7 0.2 0 1 0.5 6
Haryana 2 1 1 1 0 3 0
Delhi 0 4 0.5 1 0.5 2 3
HimachalPradesh
5 6 2 0 2 0 4
Total 3 3 1 0.5 2 1 2
1 1 0
Broken Promises: A study on the socio-economic status of Indian Muslims - Seven years post Sachar
The most common reason cited for not applying for loans was reported to be lack of information (32 percent). About 61 percent of the respondents from Bihar said that they did not apply for loans as they are not aware of the loans they are eligible for while 9 percent reported procedural diffi culties in applying for loans as a constraint. The maximum complaints on this were from Tamil Nadu and Uttar Pradesh. Overall, 8 percent reported non-eligibility and 7 percent high interest rates as a constraint. About 4 percent reported the reason to be unwillingness or inability to pay the bribe or commission and 3 percent reported discrimination. Gujarat had 22 percent of respondents reporting discrimination, way ahead of the others.
In our survey, 523 (7 percent) respondents reported that the loan was granted; of these, 61 percent were from the lowest income group. A larger number of urban respondents (12 percent) said that in spite of applying for a loan it was not granted while 12 percent also said that in spite of an account with the nationalized bank, they were not able to access a loan. The largest number of respondents said that they received no response from the bank when asked why the loan applications were rejected. Loans were procured by 7.4 percent of rural respondents as against 4.5 percent of urban people in the sample. Maximum loans were granted to people with monthly incomes of `50,000-plus (2.2 percent). The maximum loans in this category were granted from Karnataka (6 percent), followed by Bihar (4 percent). Only 1 percent of respondents in the income bracket of `5,000 to `10,000 per month were granted loans of which 6 percent were from Kerala (32 loans).
In case of emergency the highest percentage (about 35 percent) reported approaching relatives for loans. In the states of Jharkhand, Kerala, Maharashtra, Madhya Pradesh, Rajasthan, Uttar Pradesh, Haryana and Delhi, more than 50 percent, on average, reported turning to relatives in fi nancial emergency. While about 23 percent reported approaching the moneylender. This stranglehold seems to be the most in Bihar, Andhra Pradesh and Tamil Nadu, with almost 50 percent people turning to moneylenders. About 17 percent reported approaching neighbours. Only 7 percent approached credit societies, which was a clear trend in the southern states of Tamil Nadu, Karnataka and Andhra Pradesh, followed by West Bengal. How credible these credit societies in different states are, from which the poor borrow and save, is an important consideration. How much control does the state and its banking watchdogs have on these credit societies is a question, and are the poor investing and borrowing from dubious institutions, as the banks have failed in this role, with the danger of their hard earned money being swindled! The recent chit fund scams in many Indian states leave a lot to worry!
8.6.2 Sources of loanOf the total respondents, 743 (39.4 percent) who have bank accounts are still not able to access bank loans and are forced to borrow from moneylenders, while 1,217 (43.3 percent) families with bank accounts borrow from relatives and 452 (32.8 percent) families with bank accounts have turned to neighbours in case of fi nancial emergency.
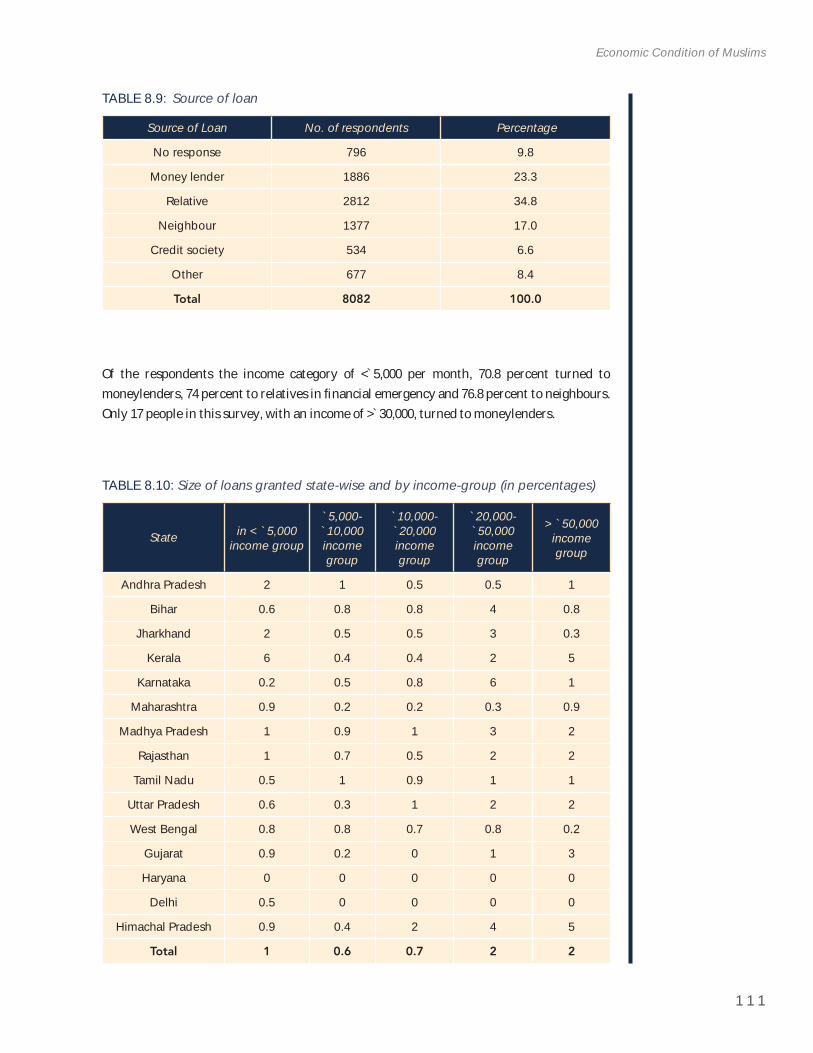
1 1 1
Economic Condition of Muslims
TABLE 8.9: Source of loan
Source of Loan No. of respondents Percentage
No response 796 9.8
Money lender 1886 23.3
Relative 2812 34.8
Neighbour 1377 17.0
Credit society 534 6.6
Other 677 8.4
Total 8082 100.0
TABLE 8.10: Size of loans granted state-wise and by income-group (in percentages)
State in < `5,000income group
`5,000-`10,000incomegroup
`10,000-`20,000incomegroup
`20,000-`50,000incomegroup
> `50,000incomegroup
Andhra Pradesh 2 1 0.5 0.5 1
Bihar 0.6 0.8 0.8 4 0.8
Jharkhand 2 0.5 0.5 3 0.3
Kerala 6 0.4 0.4 2 5
Karnataka 0.2 0.5 0.8 6 1
Maharashtra 0.9 0.2 0.2 0.3 0.9
Madhya Pradesh 1 0.9 1 3 2
Rajasthan 1 0.7 0.5 2 2
Tamil Nadu 0.5 1 0.9 1 1
Uttar Pradesh 0.6 0.3 1 2 2
West Bengal 0.8 0.8 0.7 0.8 0.2
Gujarat 0.9 0.2 0 1 3
Haryana 0 0 0 0 0
Delhi 0.5 0 0 0 0
Himachal Pradesh 0.9 0.4 2 4 5
Total 1 0.6 0.7 2 2
Of the respondents the income category of <`5,000 per month, 70.8 percent turned to moneylenders, 74 percent to relatives in fi nancial emergency and 76.8 percent to neighbours. Only 17 people in this survey, with an income of >`30,000, turned to moneylenders.
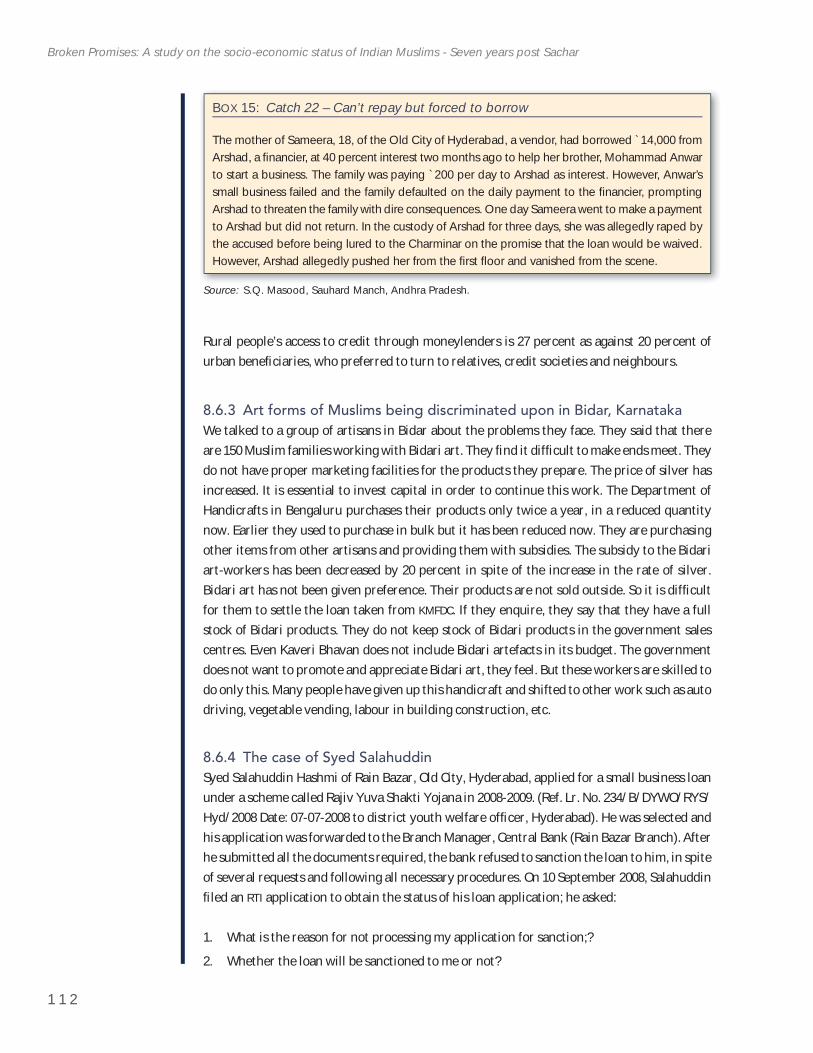
1 1 2
Broken Promises: A study on the socio-economic status of Indian Muslims - Seven years post Sachar
Rural people’s access to credit through moneylenders is 27 percent as against 20 percent of urban benefi ciaries, who preferred to turn to relatives, credit societies and neighbours.
8.6.3 Art forms of Muslims being discriminated upon in Bidar, KarnatakaWe talked to a group of artisans in Bidar about the problems they face. They said that there are 150 Muslim families working with Bidari art. They fi nd it diffi cult to make ends meet. They do not have proper marketing facilities for the products they prepare. The price of silver has increased. It is essential to invest capital in order to continue this work. The Department of Handicrafts in Bengaluru purchases their products only twice a year, in a reduced quantity now. Earlier they used to purchase in bulk but it has been reduced now. They are purchasing other items from other artisans and providing them with subsidies. The subsidy to the Bidari art-workers has been decreased by 20 percent in spite of the increase in the rate of silver. Bidari art has not been given preference. Their products are not sold outside. So it is diffi cult for them to settle the loan taken from KMFDC. If they enquire, they say that they have a full stock of Bidari products. They do not keep stock of Bidari products in the government sales centres. Even Kaveri Bhavan does not include Bidari artefacts in its budget. The government does not want to promote and appreciate Bidari art, they feel. But these workers are skilled to do only this. Many people have given up this handicraft and shifted to other work such as auto driving, vegetable vending, labour in building construction, etc.
8.6.4 The case of Syed SalahuddinSyed Salahuddin Hashmi of Rain Bazar, Old City, Hyderabad, applied for a small business loan under a scheme called Rajiv Yuva Shakti Yojana in 2008-2009. (Ref. Lr. No. 234/B/DYWO/RYS/Hyd/2008 Date: 07-07-2008 to district youth welfare offi cer, Hyderabad). He was selected and his application was forwarded to the Branch Manager, Central Bank (Rain Bazar Branch). After he submitted all the documents required, the bank refused to sanction the loan to him, in spite of several requests and following all necessary procedures. On 10 September 2008, Salahuddin fi led an RTI application to obtain the status of his loan application; he asked:
1. What is the reason for not processing my application for sanction;?
2. Whether the loan will be sanctioned to me or not?
BOX 15: Catch 22 – Can’t repay but forced to borrow
The mother of Sameera, 18, of the Old City of Hyderabad, a vendor, had borrowed ̀ 14,000 from Arshad, a fi nancier, at 40 percent interest two months ago to help her brother, Mohammad Anwar to start a business. The family was paying `200 per day to Arshad as interest. However, Anwar’s small business failed and the family defaulted on the daily payment to the fi nancier, prompting Arshad to threaten the family with dire consequences. One day Sameera went to make a payment to Arshad but did not return. In the custody of Arshad for three days, she was allegedly raped by the accused before being lured to the Charminar on the promise that the loan would be waived. However, Arshad allegedly pushed her from the fi rst fl oor and vanished from the scene.
Source: S.Q. Masood, Sauhard Manch, Andhra Pradesh.
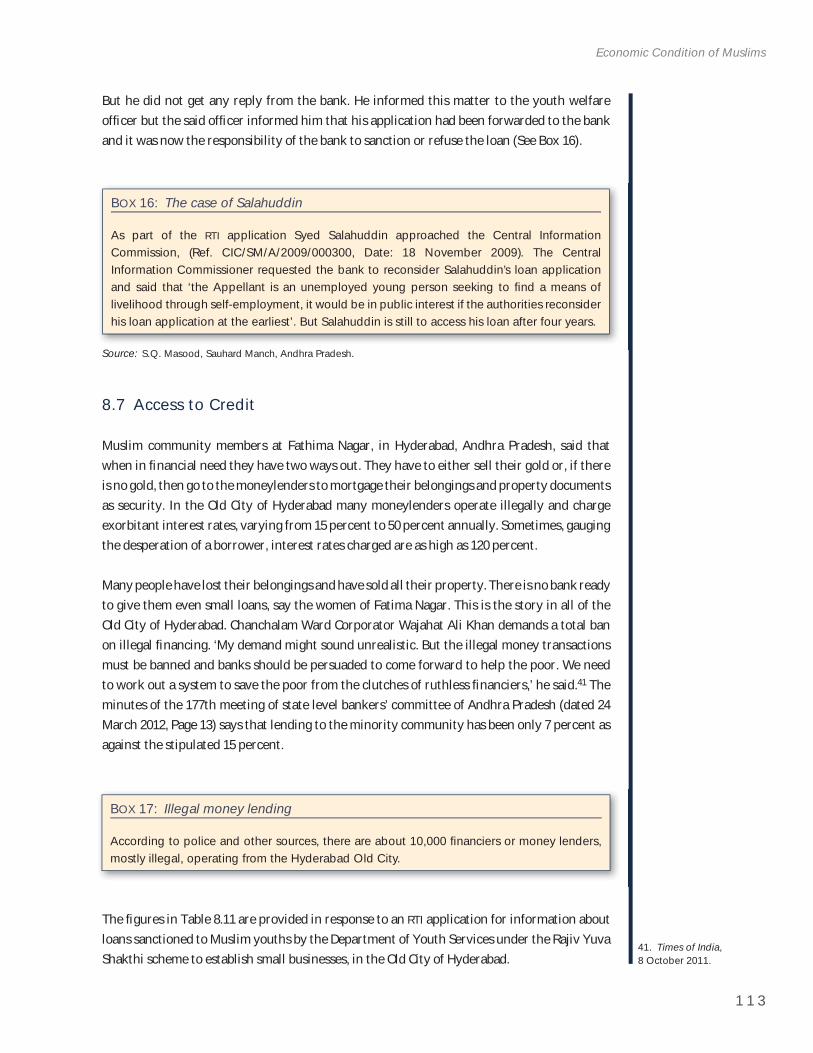
1 1 3
Economic Condition of Muslims
41. Times of India,8 October 2011.
But he did not get any reply from the bank. He informed this matter to the youth welfare offi cer but the said offi cer informed him that his application had been forwarded to the bank and it was now the responsibility of the bank to sanction or refuse the loan (See Box 16).
BOX 17: Illegal money lending
According to police and other sources, there are about 10,000 fi nanciers or money lenders, mostly illegal, operating from the Hyderabad Old City.
BOX 16: The case of Salahuddin
As part of the RTI application Syed Salahuddin approached the Central Information Commission, (Ref. CIC/SM/A/2009/000300, Date: 18 November 2009). The Central Information Commissioner requested the bank to reconsider Salahuddin’s loan application and said that ‘the Appellant is an unemployed young person seeking to fi nd a means of livelihood through self-employment, it would be in public interest if the authorities reconsider his loan application at the earliest’. But Salahuddin is still to access his loan after four years.
Source: S.Q. Masood, Sauhard Manch, Andhra Pradesh.
The fi gures in Table 8.11 are provided in response to an RTI application for information about loans sanctioned to Muslim youths by the Department of Youth Services under the Rajiv Yuva Shakthi scheme to establish small businesses, in the Old City of Hyderabad.
8.7 Access to Credit
Muslim community members at Fathima Nagar, in Hyderabad, Andhra Pradesh, said that when in fi nancial need they have two ways out. They have to either sell their gold or, if there is no gold, then go to the moneylenders to mortgage their belongings and property documents as security. In the Old City of Hyderabad many moneylenders operate illegally and charge exorbitant interest rates, varying from 15 percent to 50 percent annually. Sometimes, gauging the desperation of a borrower, interest rates charged are as high as 120 percent.
Many people have lost their belongings and have sold all their property. There is no bank ready to give them even small loans, say the women of Fatima Nagar. This is the story in all of the Old City of Hyderabad. Chanchalam Ward Corporator Wajahat Ali Khan demands a total ban on illegal fi nancing. ‘My demand might sound unrealistic. But the illegal money transactions must be banned and banks should be persuaded to come forward to help the poor. We need to work out a system to save the poor from the clutches of ruthless fi nanciers,’ he said.41 The minutes of the 177th meeting of state level bankers’ committee of Andhra Pradesh (dated 24 March 2012, Page 13) says that lending to the minority community has been only 7 percent as against the stipulated 15 percent.
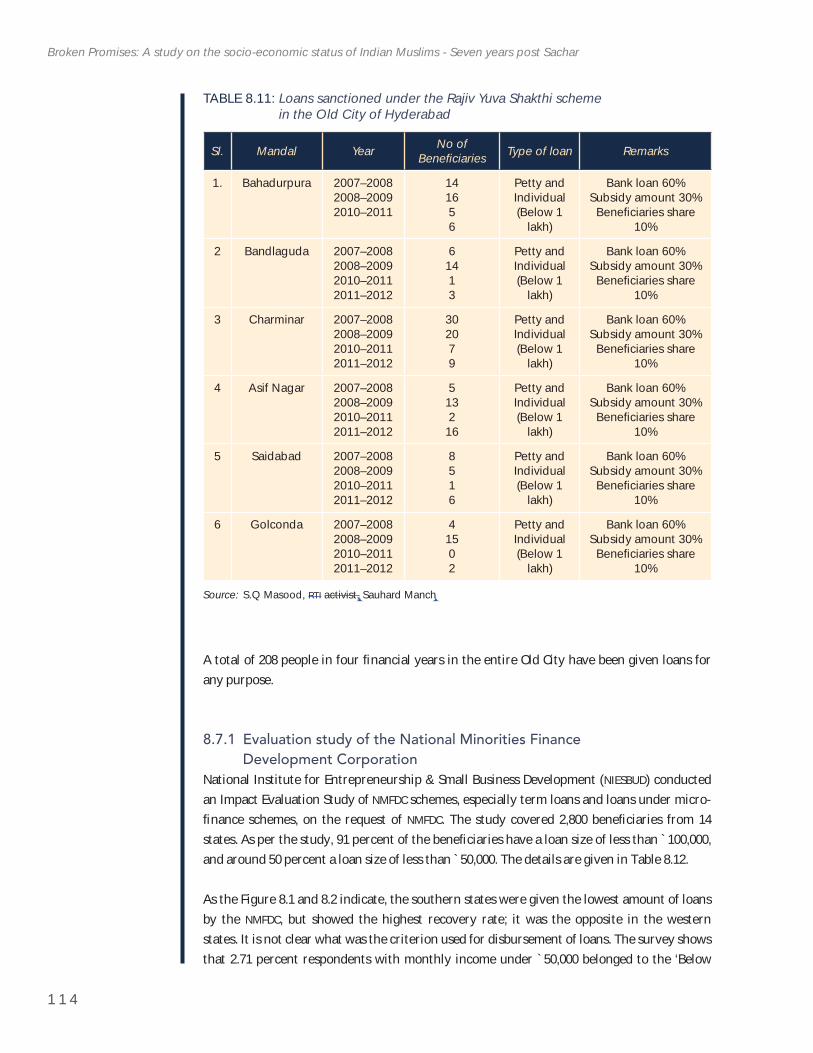
1 1 4
Broken Promises: A study on the socio-economic status of Indian Muslims - Seven years post Sachar
A total of 208 people in four fi nancial years in the entire Old City have been given loans for any purpose.
8.7.1 Evaluation study of the National Minorities Finance Development Corporation
National Institute for Entrepreneurship & Small Business Development (NIESBUD) conducted an Impact Evaluation Study of NMFDC schemes, especially term loans and loans under micro-fi nance schemes, on the request of NMFDC. The study covered 2,800 benefi ciaries from 14 states. As per the study, 91 percent of the benefi ciaries have a loan size of less than `100,000,and around 50 percent a loan size of less than `50,000. The details are given in Table 8.12.
As the Figure 8.1 and 8.2 indicate, the southern states were given the lowest amount of loans by the NMFDC, but showed the highest recovery rate; it was the opposite in the western states. It is not clear what was the criterion used for disbursement of loans. The survey shows that 2.71 percent respondents with monthly income under `50,000 belonged to the ‘Below
TABLE 8.11: Loans sanctioned under the Rajiv Yuva Shakthi scheme in the Old City of Hyderabad
Sl. Mandal Year No of Benefi ciaries Type of loan Remarks
1. Bahadurpura 2007–20082008–20092010–2011
141656
Petty and Individual(Below 1
lakh)
Bank loan 60%Subsidy amount 30%Benefi ciaries share
10%
2 Bandlaguda 2007–20082008–20092010–20112011–2012
61413
Petty and Individual(Below 1
lakh)
Bank loan 60%Subsidy amount 30%Benefi ciaries share
10%
3 Charminar 2007–20082008–20092010–20112011–2012
302079
Petty and Individual(Below 1
lakh)
Bank loan 60%Subsidy amount 30%Benefi ciaries share
10%
4 Asif Nagar 2007–20082008–20092010–20112011–2012
5132
16
Petty and Individual(Below 1
lakh)
Bank loan 60%Subsidy amount 30%Benefi ciaries share
10%
5 Saidabad 2007–20082008–20092010–20112011–2012
8516
Petty and Individual(Below 1
lakh)
Bank loan 60%Subsidy amount 30%Benefi ciaries share
10%
6 Golconda 2007–20082008–20092010–20112011–2012
41502
Petty and Individual(Below 1
lakh)
Bank loan 60%Subsidy amount 30%Benefi ciaries share
10%
Source: S.Q Masood, RTI activist, Sauhard Manch
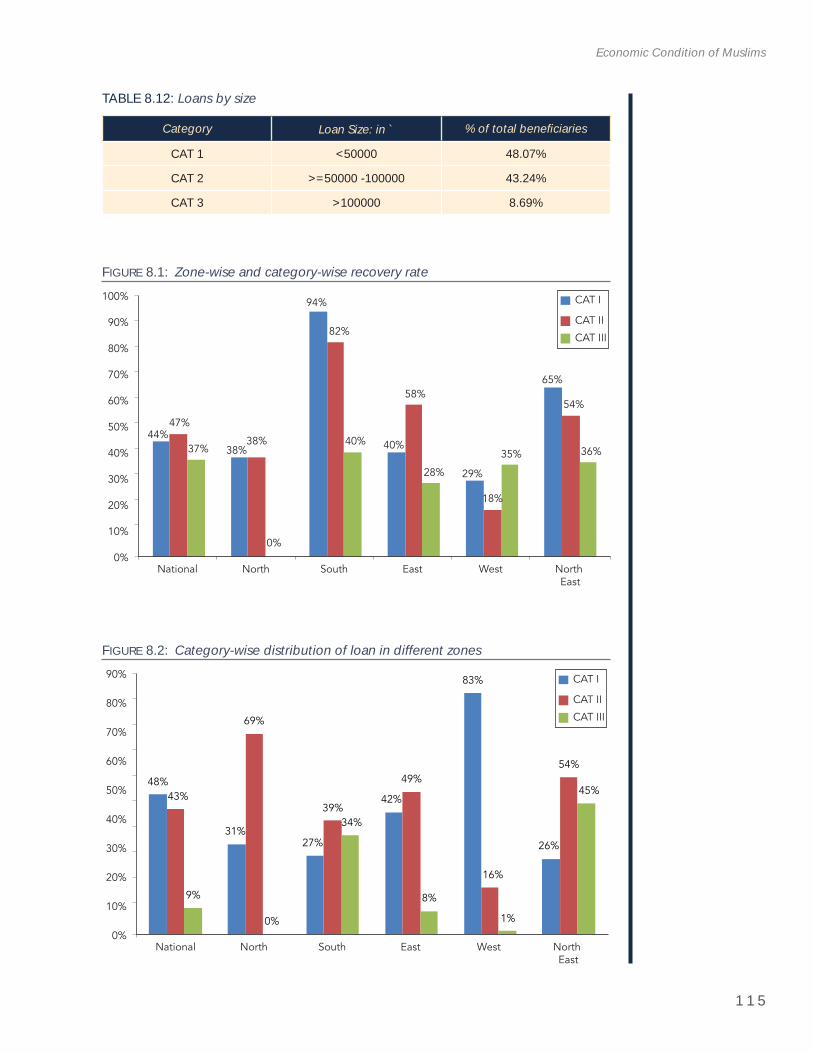
1 1 5
Economic Condition of Muslims
TABLE 8.12: Loans by size
Category Loan Size: in ` % of total benefi ciaries
CAT 1 <50000 48.07%
CAT 2 >=50000 -100000 43.24%
CAT 3 >100000 8.69%
44%38%
94%
40%
29%
65%
47%
38%
82%
58%
18%
54%
37%
0%
40%
28%
35% 36%
0%
10%
20%
30%
40%
50%
60%
70%
80%
90%
100%
National North South East West North East
CAT I
CAT II
CAT III
FIGURE 8.1: Zone-wise and category-wise recovery rate
48%
31%27%
42%
83%
26%
43%
69%
39%
49%
16%
54%
9%
0%
34%
8%
1%
45%
0%
10%
20%
30%
40%
50%
60%
70%
80%
90%
National North South East West North East
CAT I
CAT II
CAT III
FIGURE 8.2: Category-wise distribution of loan in different zones
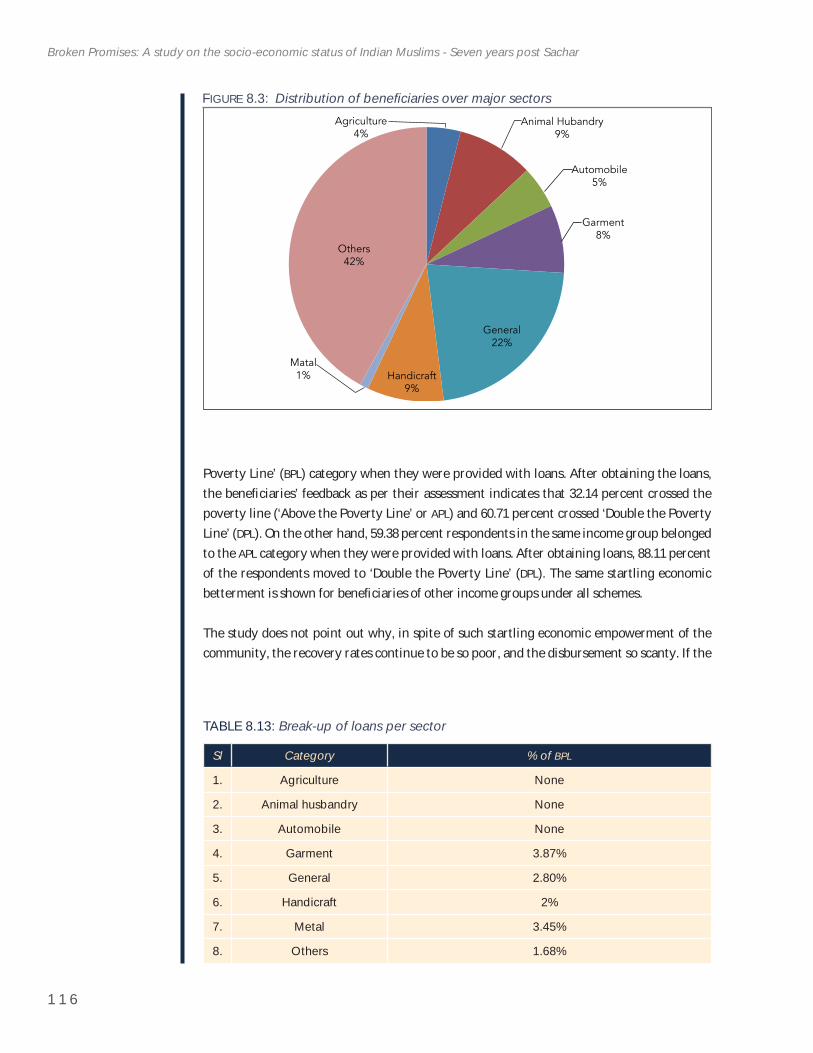
1 1 6
Broken Promises: A study on the socio-economic status of Indian Muslims - Seven years post Sachar
Agriculture4%
Animal Hubandry9%
Automobile5%
Garment8%
General22%
Handicraft9%
Matal1%
Others42%
Poverty Line’ (BPL) category when they were provided with loans. After obtaining the loans, the benefi ciaries’ feedback as per their assessment indicates that 32.14 percent crossed the poverty line (‘Above the Poverty Line’ or APL) and 60.71 percent crossed ‘Double the Poverty Line’ (DPL). On the other hand, 59.38 percent respondents in the same income group belonged to the APL category when they were provided with loans. After obtaining loans, 88.11 percent of the respondents moved to ‘Double the Poverty Line’ (DPL). The same startling economic betterment is shown for benefi ciaries of other income groups under all schemes.
The study does not point out why, in spite of such startling economic empowerment of the community, the recovery rates continue to be so poor, and the disbursement so scanty. If the
FIGURE 8.3: Distribution of benefi ciaries over major sectors
TABLE 8.13: Break-up of loans per sector
Sl Category % of BPL
1. Agriculture None
2. Animal husbandry None
3. Automobile None
4. Garment 3.87%
5. General 2.80%
6. Handicraft 2%
7. Metal 3.45%
8. Others 1.68%
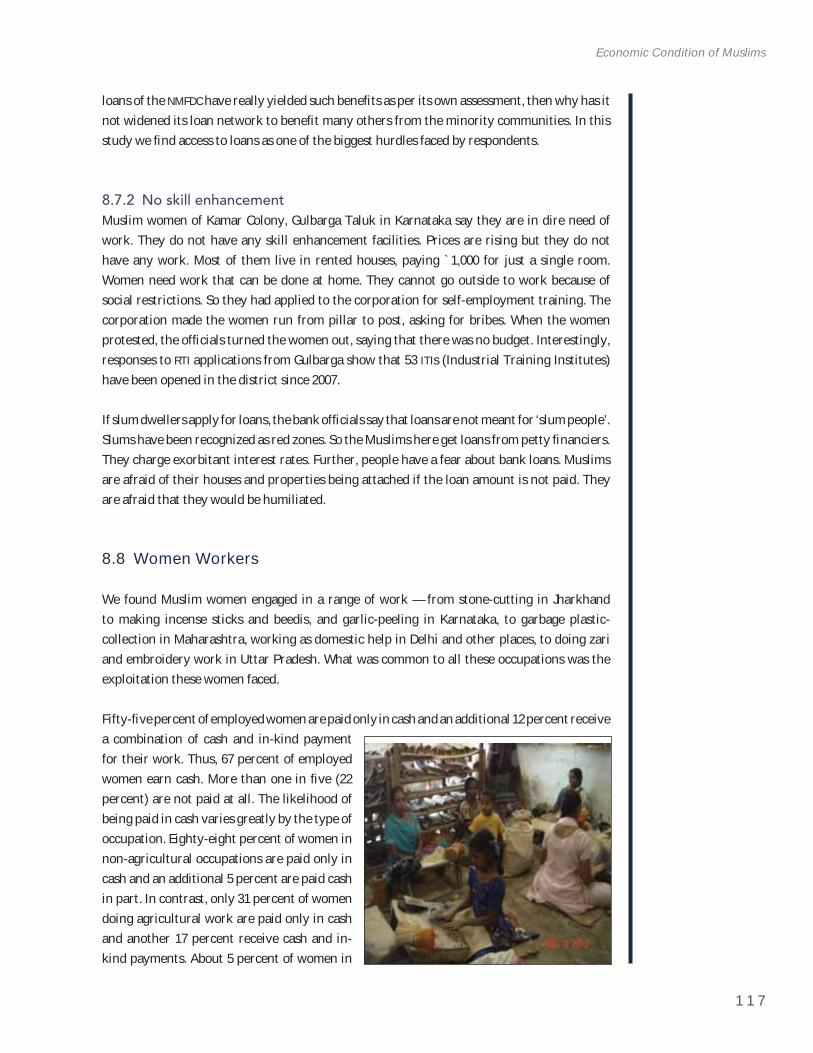
1 1 7
Economic Condition of Muslims
loans of the NMFDC have really yielded such benefi ts as per its own assessment, then why has it not widened its loan network to benefi t many others from the minority communities. In this study we fi nd access to loans as one of the biggest hurdles faced by respondents.
8.7.2 No skill enhancementMuslim women of Kamar Colony, Gulbarga Taluk in Karnataka say they are in dire need of work. They do not have any skill enhancement facilities. Prices are rising but they do not have any work. Most of them live in rented houses, paying `1,000 for just a single room. Women need work that can be done at home. They cannot go outside to work because of social restrictions. So they had applied to the corporation for self-employment training. The corporation made the women run from pillar to post, asking for bribes. When the women protested, the offi cials turned the women out, saying that there was no budget. Interestingly, responses to RTI applications from Gulbarga show that 53 ITIs (Industrial Training Institutes) have been opened in the district since 2007.
If slum dwellers apply for loans, the bank offi cials say that loans are not meant for ‘slum people’. Slums have been recognized as red zones. So the Muslims here get loans from petty fi nanciers. They charge exorbitant interest rates. Further, people have a fear about bank loans. Muslims are afraid of their houses and properties being attached if the loan amount is not paid. They are afraid that they would be humiliated.
8.8 Women Workers
We found Muslim women engaged in a range of work — from stone-cutting in Jharkhand to making incense sticks and beedis, and garlic-peeling in Karnataka, to garbage plastic-collection in Maharashtra, working as domestic help in Delhi and other places, to doing zari and embroidery work in Uttar Pradesh. What was common to all these occupations was the exploitation these women faced.
Fifty-fi ve percent of employed women are paid only in cash and an additional 12 percent receive a combination of cash and in-kind payment for their work. Thus, 67 percent of employed women earn cash. More than one in fi ve (22 percent) are not paid at all. The likelihood of being paid in cash varies greatly by the type of occupation. Eighty-eight percent of women in non-agricultural occupations are paid only in cash and an additional 5 percent are paid cash in part. In contrast, only 31 percent of women doing agricultural work are paid only in cash and another 17 percent receive cash and in-kind payments. About 5 percent of women in
1 1 8
Broken Promises: A study on the socio-economic status of Indian Muslims - Seven years post Sachar
42. NSSO Round III, Volume I.
43. Census of India 2001, Vol.1: p.126.
non-agricultural occupations are not paid at all, compared with 35 percent in agricultural occupations.42
Data shows that with regard to employment, women are doubly disadvantaged. Not only are women much less likely than men to be employed, but, when employed, they are only 74 percent as likely as men to earn cash. The gender differential in cash earnings is much greater for those employed in agricultural work than in non-agricultural work. Whereas in urban areas, employed women are only marginally less likely than employed men to earn cash, in rural areas, employed women are 63 percent as likely as employed men to earn cash.
Non-recognition of ‘Household’ work as work and in its non-inclusion in the System of National Accounts (SNA) continues in India. As noted economist Indira Hirway points out, this non-inclusion has been justifi ed on the grounds that this work has limited repercussions on the economy and is diffi cult to account for. But a sizeable amount of work, both at home and on farms, by women can fall into this category, leading to their exclusion as workers and thus from benefi ts provided to workers in the organized sector. This is all the more tangible among Muslim women, who are generally workers operating from home due to socio-cultural factors.
8.9 Work Participation Rate (WPR)
According to Census of India 2001: The First Report on Religion Data, the work participation rate (WPR)‘for all religious communities was 39.1 percent in 2001. The “Other Religions and Persuasions” (largely tribal) category had the highest WPR at 48.4 percent, Buddhists had 40.6 percent WPR,Christians 39.7 percent, Jains 32.9 percent and Muslims 31.3 percent (being the lowest).’43
During the course of our study we tried to understand the phenomenon of low WPR for Muslims. We found most of the adult members in the respondents’ families engaged in some or the other form of work. During discussions with women in several states we found Muslim women keen
BOX 18: Migration for livelihood
In Chousia Basti, Islampur municipality of Uttar Dinajpur, the men said that more than 100 students had left the village due to their poor economic conditions and now earn their living in various cities like Mumbai, Jaipur, Guwahati, and various hotels in Siliguri, West Bengal. They also work in factories, pull rickshaws, do masonry and other labour work in these cities. This was the story repeated in all the Panchayats and municipalities that we covered in Uttar Dinajpur District of West Bengal, as a part of this study.
Not a single person of Kortgochi Village in West Bengal, right on the Bangladesh border, has got a home under Indira Awas Yojana. The very poor Muslim community, with poor education infrastructure and no skill training (which was promised to minorities), nor loans under SGSY(also promised), they are dependent on traffi cking cows across the international border with Bangladesh.
Source: Meera Khatun, Sauhard Manch, West Bengal.
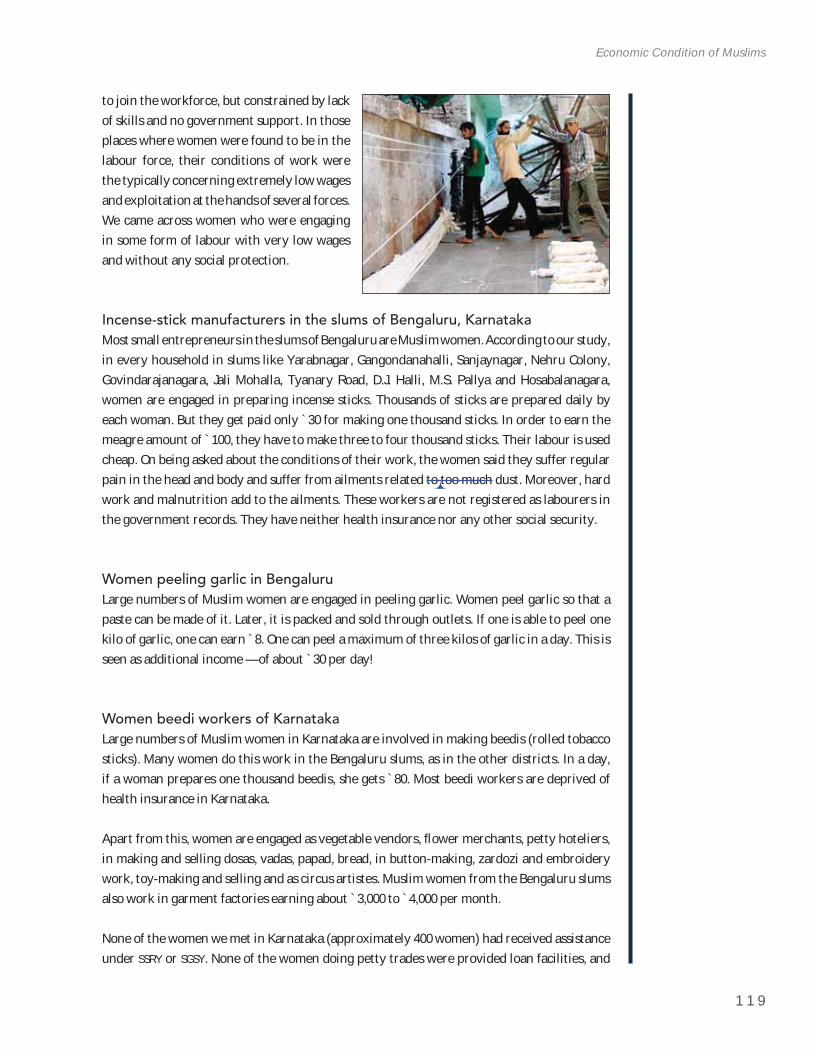
1 1 9
Economic Condition of Muslims
to join the workforce, but constrained by lack of skills and no government support. In those places where women were found to be in the labour force, their conditions of work were the typically concerning extremely low wages and exploitation at the hands of several forces. We came across women who were engaging in some form of labour with very low wages and without any social protection.
Incense-stick manufacturers in the slums of Bengaluru, KarnatakaMost small entrepreneurs in the slums of Bengaluru are Muslim women. According to our study, in every household in slums like Yarabnagar, Gangondanahalli, Sanjaynagar, Nehru Colony, Govindarajanagara, Jali Mohalla, Tyanary Road, D.J. Halli, M.S. Pallya and Hosabalanagara, women are engaged in preparing incense sticks. Thousands of sticks are prepared daily by each woman. But they get paid only `30 for making one thousand sticks. In order to earn the meagre amount of `100, they have to make three to four thousand sticks. Their labour is used cheap. On being asked about the conditions of their work, the women said they suffer regular pain in the head and body and suffer from ailments related to too much dust. Moreover, hard work and malnutrition add to the ailments. These workers are not registered as labourers in the government records. They have neither health insurance nor any other social security.
Women peeling garlic in BengaluruLarge numbers of Muslim women are engaged in peeling garlic. Women peel garlic so that a paste can be made of it. Later, it is packed and sold through outlets. If one is able to peel one kilo of garlic, one can earn `8. One can peel a maximum of three kilos of garlic in a day. This is seen as additional income — of about `30 per day!
Women beedi workers of KarnatakaLarge numbers of Muslim women in Karnataka are involved in making beedis (rolled tobacco sticks). Many women do this work in the Bengaluru slums, as in the other districts. In a day, if a woman prepares one thousand beedis, she gets `80. Most beedi workers are deprived of health insurance in Karnataka.
Apart from this, women are engaged as vegetable vendors, fl ower merchants, petty hoteliers, in making and selling dosas, vadas, papad, bread, in button-making, zardozi and embroidery work, toy-making and selling and as circus artistes. Muslim women from the Bengaluru slums also work in garment factories earning about `3,000 to `4,000 per month.
None of the women we met in Karnataka (approximately 400 women) had received assistance under SSRY or SGSY. None of the women doing petty trades were provided loan facilities, and
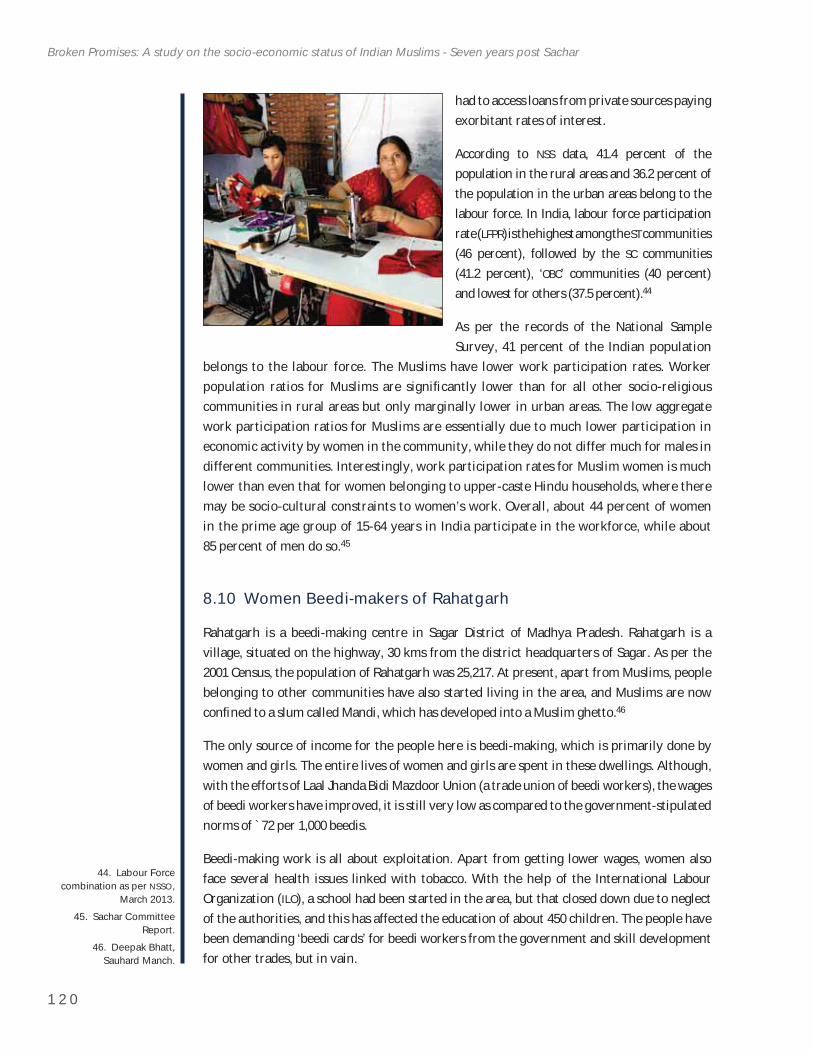
1 2 0
Broken Promises: A study on the socio-economic status of Indian Muslims - Seven years post Sachar
44. Labour Force combination as per NSSO,
March 2013.45. Sachar Committee
Report.46. Deepak Bhatt,
Sauhard Manch.
had to access loans from private sources paying exorbitant rates of interest.
According to NSS data, 41.4 percent of the population in the rural areas and 36.2 percent of the population in the urban areas belong to the labour force. In India, labour force participation rate (LFPR) is the highest among the ST communities (46 percent), followed by the SC communities (41.2 percent), ‘OBC’ communities (40 percent) and lowest for others (37.5 percent).44
As per the records of the National Sample Survey, 41 percent of the Indian population
belongs to the labour force. The Muslims have lower work participation rates. Worker population ratios for Muslims are signifi cantly lower than for all other socio-religious communities in rural areas but only marginally lower in urban areas. The low aggregate work participation ratios for Muslims are essentially due to much lower participation in economic activity by women in the community, while they do not differ much for males in different communities. Interestingly, work participation rates for Muslim women is much lower than even that for women belonging to upper-caste Hindu households, where there may be socio-cultural constraints to women’s work. Overall, about 44 percent of women in the prime age group of 15-64 years in India participate in the workforce, while about 85 percent of men do so.45
8.10 Women Beedi-makers of Rahatgarh
Rahatgarh is a beedi-making centre in Sagar District of Madhya Pradesh. Rahatgarh is a village, situated on the highway, 30 kms from the district headquarters of Sagar. As per the 2001 Census, the population of Rahatgarh was 25,217. At present, apart from Muslims, people belonging to other communities have also started living in the area, and Muslims are now confi ned to a slum called Mandi, which has developed into a Muslim ghetto.46
The only source of income for the people here is beedi-making, which is primarily done by women and girls. The entire lives of women and girls are spent in these dwellings. Although, with the efforts of Laal Jhanda Bidi Mazdoor Union (a trade union of beedi workers), the wages of beedi workers have improved, it is still very low as compared to the government-stipulated norms of `72 per 1,000 beedis.
Beedi-making work is all about exploitation. Apart from getting lower wages, women also face several health issues linked with tobacco. With the help of the International Labour Organization (ILO), a school had been started in the area, but that closed down due to neglect of the authorities, and this has affected the education of about 450 children. The people have been demanding ‘beedi cards’ for beedi workers from the government and skill development for other trades, but in vain.
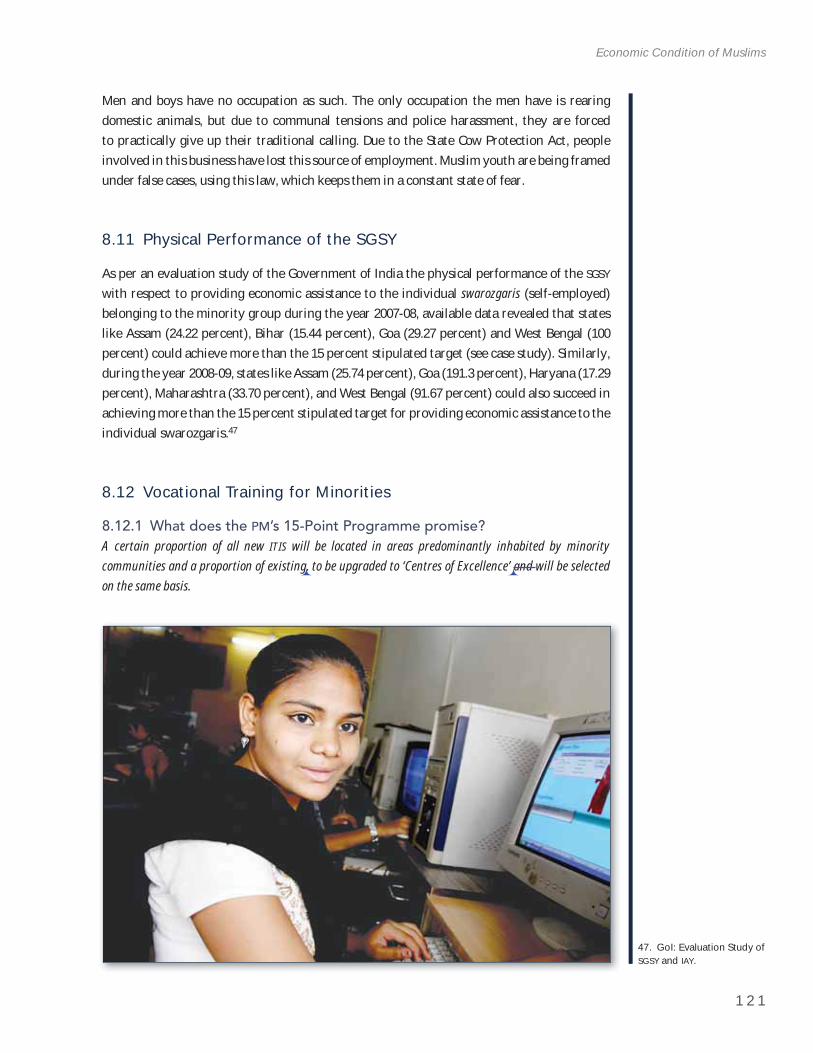
1 2 1
Economic Condition of Muslims
47. GoI: Evaluation Study of SGSY and IAY.
Men and boys have no occupation as such. The only occupation the men have is rearing domestic animals, but due to communal tensions and police harassment, they are forced to practically give up their traditional calling. Due to the State Cow Protection Act, people involved in this business have lost this source of employment. Muslim youth are being framed under false cases, using this law, which keeps them in a constant state of fear.
8.11 Physical Performance of the SGSY
As per an evaluation study of the Government of India the physical performance of the SGSYwith respect to providing economic assistance to the individual swarozgaris (self-employed) belonging to the minority group during the year 2007-08, available data revealed that states like Assam (24.22 percent), Bihar (15.44 percent), Goa (29.27 percent) and West Bengal (100 percent) could achieve more than the 15 percent stipulated target (see case study). Similarly, during the year 2008-09, states like Assam (25.74 percent), Goa (191.3 percent), Haryana (17.29 percent), Maharashtra (33.70 percent), and West Bengal (91.67 percent) could also succeed in achieving more than the 15 percent stipulated target for providing economic assistance to the individual swarozgaris.47
8.12 Vocational Training for Minorities
8.12.1 What does the PM’s 15-Point Programme promise? A certain proportion of all new ITIS will be located in areas predominantly inhabited by minority communities and a proportion of existing, to be upgraded to ‘Centres of Excellence’ and will be selected on the same basis.
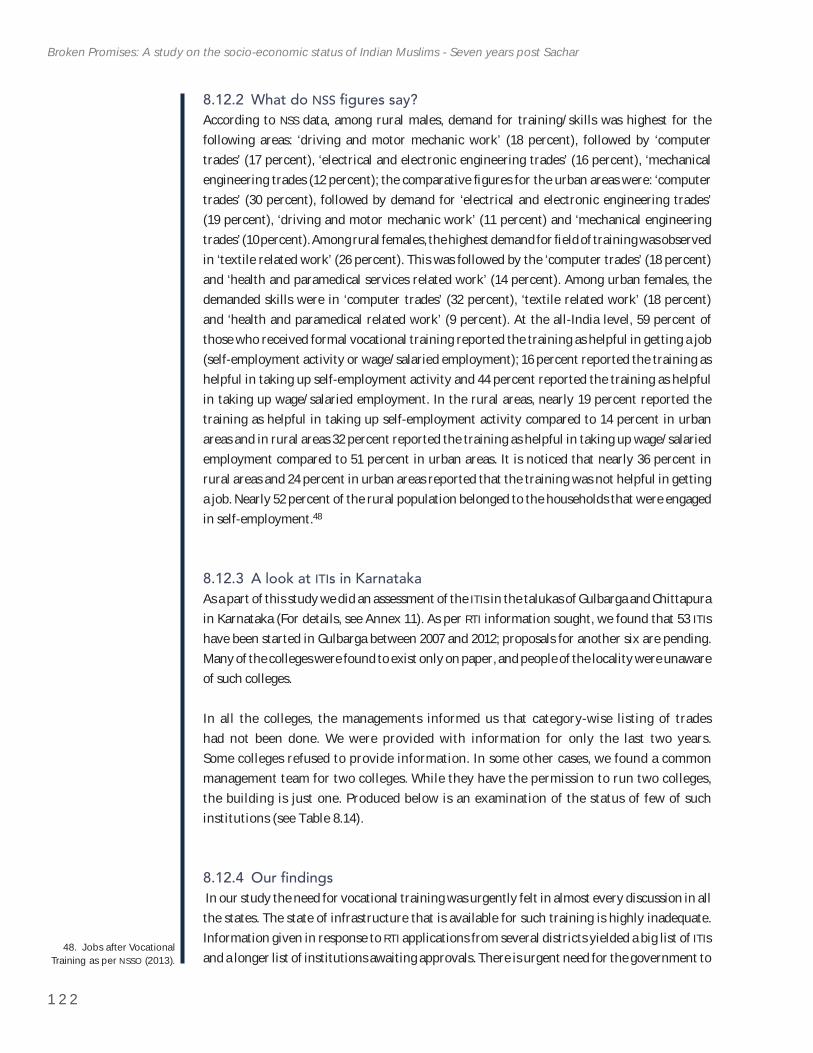
1 2 2
Broken Promises: A study on the socio-economic status of Indian Muslims - Seven years post Sachar
48. Jobs after Vocational Training as per NSSO (2013).
8.12.2 What do NSS fi gures say?According to NSS data, among rural males, demand for training/skills was highest for the following areas: ‘driving and motor mechanic work’ (18 percent), followed by ‘computer trades’ (17 percent), ‘electrical and electronic engineering trades’ (16 percent), ‘mechanical engineering trades (12 percent); the comparative fi gures for the urban areas were: ‘computer trades’ (30 percent), followed by demand for ‘electrical and electronic engineering trades’ (19 percent), ‘driving and motor mechanic work’ (11 percent) and ‘mechanical engineering trades’ (10 percent). Among rural females, the highest demand for fi eld of training was observed in ‘textile related work’ (26 percent). This was followed by the ‘computer trades’ (18 percent) and ‘health and paramedical services related work’ (14 percent). Among urban females, the demanded skills were in ‘computer trades’ (32 percent), ‘textile related work’ (18 percent) and ‘health and paramedical related work’ (9 percent). At the all-India level, 59 percent of those who received formal vocational training reported the training as helpful in getting a job (self-employment activity or wage/salaried employment); 16 percent reported the training as helpful in taking up self-employment activity and 44 percent reported the training as helpful in taking up wage/salaried employment. In the rural areas, nearly 19 percent reported the training as helpful in taking up self-employment activity compared to 14 percent in urban areas and in rural areas 32 percent reported the training as helpful in taking up wage/salaried employment compared to 51 percent in urban areas. It is noticed that nearly 36 percent in rural areas and 24 percent in urban areas reported that the training was not helpful in getting a job. Nearly 52 percent of the rural population belonged to the households that were engaged in self-employment.48
8.12.3 A look at ITIs in KarnatakaAs a part of this study we did an assessment of the ITIs in the talukas of Gulbarga and Chittapura in Karnataka (For details, see Annex 11). As per RTI information sought, we found that 53 ITIshave been started in Gulbarga between 2007 and 2012; proposals for another six are pending. Many of the colleges were found to exist only on paper, and people of the locality were unaware of such colleges.
In all the colleges, the managements informed us that category-wise listing of trades had not been done. We were provided with information for only the last two years. Some colleges refused to provide information. In some other cases, we found a common management team for two colleges. While they have the permission to run two colleges, the building is just one. Produced below is an examination of the status of few of such institutions (see Table 8.14).
8.12.4 Our fi ndings In our study the need for vocational training was urgently felt in almost every discussion in all the states. The state of infrastructure that is available for such training is highly inadequate. Information given in response to RTI applications from several districts yielded a big list of ITIsand a longer list of institutions awaiting approvals. There is urgent need for the government to
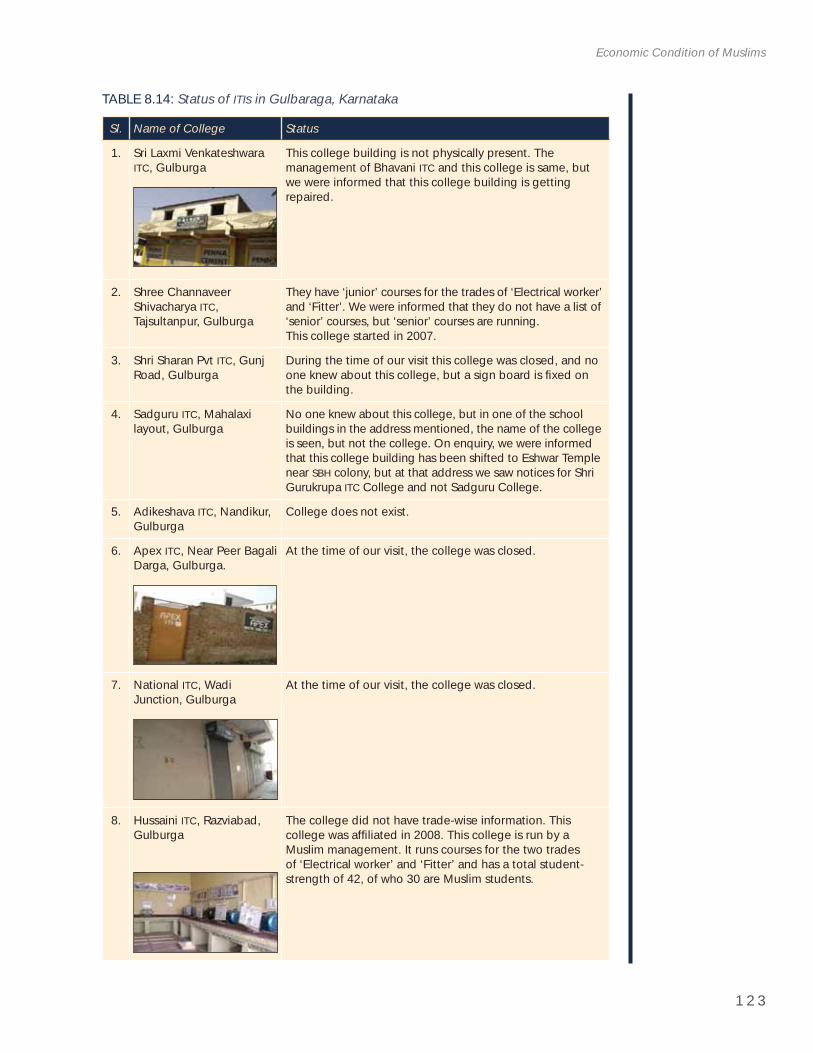
1 2 3
Economic Condition of Muslims
TABLE 8.14: Status of ITIs in Gulbaraga, Karnataka
Sl. Name of College Status
1. Sri Laxmi Venkateshwara ITC, Gulburga
This college building is not physically present. The management of Bhavani ITC and this college is same, but we were informed that this college building is getting repaired.
2. Shree Channaveer Shivacharya ITC,Tajsultanpur, Gulburga
They have ‘junior’ courses for the trades of ‘Electrical worker’ and ‘Fitter’. We were informed that they do not have a list of ‘senior’ courses, but ‘senior’ courses are running. This college started in 2007.
3. Shri Sharan Pvt ITC, Gunj Road, Gulburga
During the time of our visit this college was closed, and no one knew about this college, but a sign board is fi xed on the building.
4. Sadguru ITC, Mahalaxi layout, Gulburga
No one knew about this college, but in one of the school buildings in the address mentioned, the name of the college is seen, but not the college. On enquiry, we were informed that this college building has been shifted to Eshwar Temple near SBH colony, but at that address we saw notices for Shri Gurukrupa ITC College and not Sadguru College.
5. Adikeshava ITC, Nandikur, Gulburga
College does not exist.
6. Apex ITC, Near Peer Bagali Darga, Gulburga.
At the time of our visit, the college was closed.
7. National ITC, Wadi Junction, Gulburga
At the time of our visit, the college was closed.
8. Hussaini ITC, Razviabad, Gulburga
The college did not have trade-wise information. This college was affi liated in 2008. This college is run by a Muslim management. It runs courses for the two trades of ‘Electrical worker’ and ‘Fitter’ and has a total student-strength of 42, of who 30 are Muslim students.
1 2 4
Broken Promises: A study on the socio-economic status of Indian Muslims - Seven years post Sachar
49. Sachar Committee Report.
examine the actual infrastructure and close down fake institutions and regulate and support genuine efforts.
At the block and district levels, identifi cation of benefi ciaries should be more transparent and genuine. Women in SHGs and small groups expressed the need for vocational training in a big way. The need to link up their traditional skills with the market, by also increasing their capacities, is urgently felt. Women employed in various manufacturing activity through daily wage earn abysmally low wages; whereas the end products are sold at high prices over retail counters. The need to have co-operatives and link such efforts to markets, so that the women get fair returns for their labour, is urgently felt.
8.12.5 The Sachar Committee recommendationsThe Sachar Committee noted that a majority of Muslim girls and boys fail in their matriculation examinations or drop out before that. This group of children who have completed middle school but have not managed to study further needs to be incorporated in different types of technical training. The skill demands in the manufacturing and service sectors are changing continuously. And for many of these, highly educated/trained persons may not be required and youth with middle school education with adequate technical training may be appropriate for meeting these needs. However, almost all vocational training programmes run by the ITIsand polytechnics require a matriculation certifi cate.
The Sachar Committee recommended that49
The pre-entry qualifi cation for admission to ITIs should be reduced to Class VIII. The scope of ITI courses should be expanded to focus on emerging market needs including those of the retail sector.
The eligibility for such programmes should also be extended to the Madrasa-educated children, as they are ineligible to get trained under many current formal technical education streams.
But none of these recommendations of the Sachar Committee seems to have been taken into cognizance. Low levels of literacy, compounded by poor training and low employment opportunities, both in the public and private sectors, has precipitated the migration of large amount of youth from rural areas to urban pockets, to work in the unorganized sector largely as unskilled labour with poor wages and no social securities.
8.13 Migration Trends
The respondents surveyed have a very low migration trend. About 62 percent (4,972) of the respondents have never migrated from their place of birth; only 6.8 percent (547) of the respondents have migrated from their original residence and have been in the present place
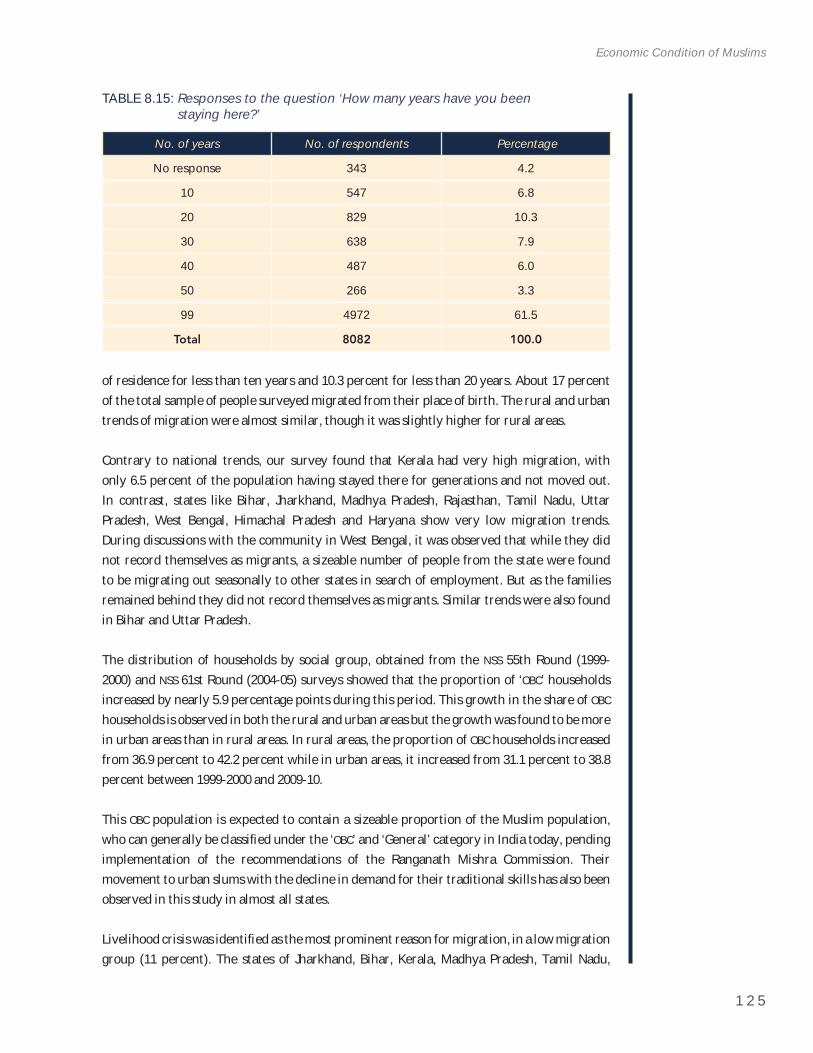
1 2 5
Economic Condition of Muslims
of residence for less than ten years and 10.3 percent for less than 20 years. About 17 percent of the total sample of people surveyed migrated from their place of birth. The rural and urban trends of migration were almost similar, though it was slightly higher for rural areas.
Contrary to national trends, our survey found that Kerala had very high migration, with only 6.5 percent of the population having stayed there for generations and not moved out. In contrast, states like Bihar, Jharkhand, Madhya Pradesh, Rajasthan, Tamil Nadu, Uttar Pradesh, West Bengal, Himachal Pradesh and Haryana show very low migration trends. During discussions with the community in West Bengal, it was observed that while they did not record themselves as migrants, a sizeable number of people from the state were found to be migrating out seasonally to other states in search of employment. But as the families remained behind they did not record themselves as migrants. Similar trends were also found in Bihar and Uttar Pradesh.
The distribution of households by social group, obtained from the NSS 55th Round (1999-2000) and NSS 61st Round (2004-05) surveys showed that the proportion of ‘OBC’ households increased by nearly 5.9 percentage points during this period. This growth in the share of OBChouseholds is observed in both the rural and urban areas but the growth was found to be more in urban areas than in rural areas. In rural areas, the proportion of OBC households increased from 36.9 percent to 42.2 percent while in urban areas, it increased from 31.1 percent to 38.8 percent between 1999-2000 and 2009-10.
This OBC population is expected to contain a sizeable proportion of the Muslim population, who can generally be classifi ed under the ‘OBC’ and ‘General’ category in India today, pending implementation of the recommendations of the Ranganath Mishra Commission. Their movement to urban slums with the decline in demand for their traditional skills has also been observed in this study in almost all states.
Livelihood crisis was identifi ed as the most prominent reason for migration, in a low migration group (11 percent). The states of Jharkhand, Bihar, Kerala, Madhya Pradesh, Tamil Nadu,
TABLE 8.15: Responses to the question ‘How many years have you been staying here?’
No. of years No. of respondents Percentage
No response 343 4.2
10 547 6.8
20 829 10.3
30 638 7.9
40 487 6.0
50 266 3.3
99 4972 61.5
Total 8082 100.0
1 2 6
Broken Promises: A study on the socio-economic status of Indian Muslims - Seven years post Sachar
Uttar Pradesh, Gujarat and Delhi showed livelihood crisis as one of the important factors for migration. This corroborates with the larger fi ndings of the survey that low skills and low levels of literacy due to lack of outreach of government skill development programmes and high drop-out levels at the school level, is the principal factor pushing the Muslim youth out of their villages. Privatization and the neo-liberal economic policy has led to reduced support to self-employed units of Muslims who are some of the most affected communities with the reduced subsidies to local manufacturing and retailing. The entrance of big corporate organizations and MNCs (multinational corporations) has destroyed the retail and small goods manufacturing and repair, a monopoly that the small Muslim entrepreneur had in some of these areas. Both in urban and rural areas, the single biggest factor identifi ed for migration has been the crisis in livelihood and job endeavours. The worrying trend is that local livelihood crisis fuelled by low job opportunities and practically no employment of Muslims in government jobs, has led the community to an economic crisis.
Andhra Pradesh, followed by Gujarat, showed the maximum migration arising from communal riots. Similarly, Andhra Pradesh, followed by Maharashtra and Gujarat, showed insecurity as a principal reason for migration. Worryingly, of all the people who have migrated from Andhra Pradesh, 44 percent reported riots and insecurity as a reason for migration. Though in the last one year 2012-13, Uttar Pradesh, Maharashtra record frequent communal riots, but migration due to riots and insecurity was still recorded comparatively low in these states.
1 2 7
9 . R E C R U I T M E N T T O S TAT E A N D C E N T R A L S E R V I C E S
9.1 Introduction
The poverty and socio-economic backwardness of Muslims is exacerbated by the onslaught on their identity and questions about their patriotism. The community, which has been living with stereotypes and prejudices generated by sections of the media and votaries of divisive politics, has suffered greater stigmatization following the events around 9/11 and the so-called global war on terror. The occurrence of communal violence continues six decades after Independence and the Muslims now bear the brunt of stereotyping and consequent biases and prejudices. The divisive politics around identity and religion has made the community further vulnerable and fearful of harm because of their religious identity. During this study, discussions at the community level clearly brought out the insecurity and humiliation that an Indian Muslim is subject to in his/her everyday interactions in public institutions and private lives. Interestingly, the data collected through interviews showed the hesitation of the Muslims to reveal their exact level of insecurities, and we often faced silence to our questions. The resulting insecurities has shown the ghettos emerging in all the major and minor cities in India, but penetration of such insecurities into rural India were also clearly seen in our interactions.
Apparently, the social, cultural and public interactive spaces in India can be very daunting for the Indian Muslims. The general sense of unease among Muslims can be seen on a number of fronts — in the relationships that exist between the Muslims and non-Muslim socio-religious communities, as well as in the variations in understanding and interpreting them. One aspect of this understanding relates to patriotism. Muslims carry a double burden of being labelled as ‘anti-national’ and as being ‘appeased’ at the same time. While Muslims need to prove on a daily basis that they are not ‘anti-national’ and ‘terrorists’, it is not recognized that the alleged ‘appeasement’ has not resulted in the desired level of socio-economic development of the Muslim community. In general, Muslims complained that they are constantly looked upon with a great degree of suspicion not only by certain sections of society but also by public institutions and governance structures. This has a depressing effect on their psyche; this was reported by the Sachar Committee. If we give credence to the initial conditions as
BOX 19: Irreplaceable cards
Most of the Muslim families in Uttar Dinajpur, West Bengal, bordering Bangladesh, said that any young Muslim who wants to make a voter ID card, or old people who want to replace a card they have lost or damaged, now fi nd it impossible to do so without being humiliated.
Source: Meera Khatun, West Bengal.
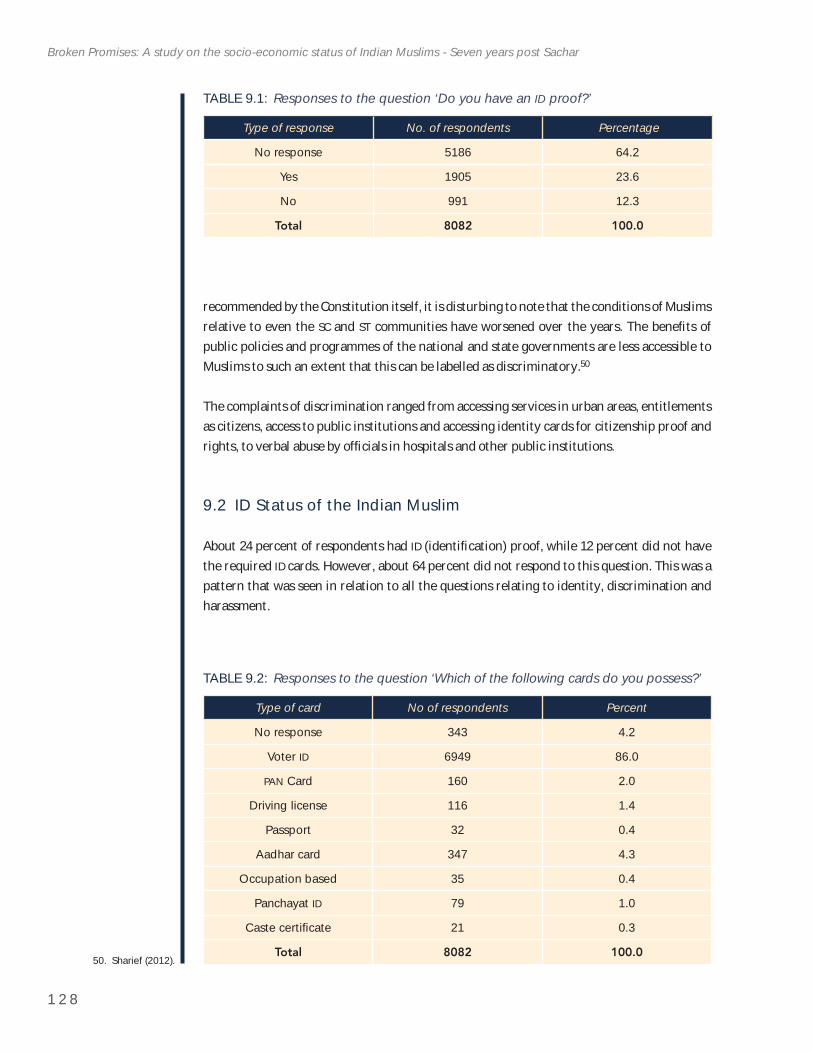
1 2 8
Broken Promises: A study on the socio-economic status of Indian Muslims - Seven years post Sachar
50. Sharief (2012).
recommended by the Constitution itself, it is disturbing to note that the conditions of Muslims relative to even the SC and ST communities have worsened over the years. The benefi ts of public policies and programmes of the national and state governments are less accessible to Muslims to such an extent that this can be labelled as discriminatory.50
The complaints of discrimination ranged from accessing services in urban areas, entitlements as citizens, access to public institutions and accessing identity cards for citizenship proof and rights, to verbal abuse by offi cials in hospitals and other public institutions.
9.2 ID Status of the Indian Muslim
About 24 percent of respondents had ID (identifi cation) proof, while 12 percent did not have the required ID cards. However, about 64 percent did not respond to this question. This was a pattern that was seen in relation to all the questions relating to identity, discrimination and harassment.
TABLE 9.1: Responses to the question ‘Do you have an ID proof?’
Type of response No. of respondents Percentage
No response 5186 64.2
Yes 1905 23.6
No 991 12.3
Total 8082 100.0
TABLE 9.2: Responses to the question ‘Which of the following cards do you possess?’
Type of card No of respondents Percent
No response 343 4.2
Voter ID 6949 86.0
PAN Card 160 2.0
Driving license 116 1.4
Passport 32 0.4
Aadhar card 347 4.3
Occupation based 35 0.4
Panchayat ID 79 1.0
Caste certifi cate 21 0.3
Total 8082 100.0
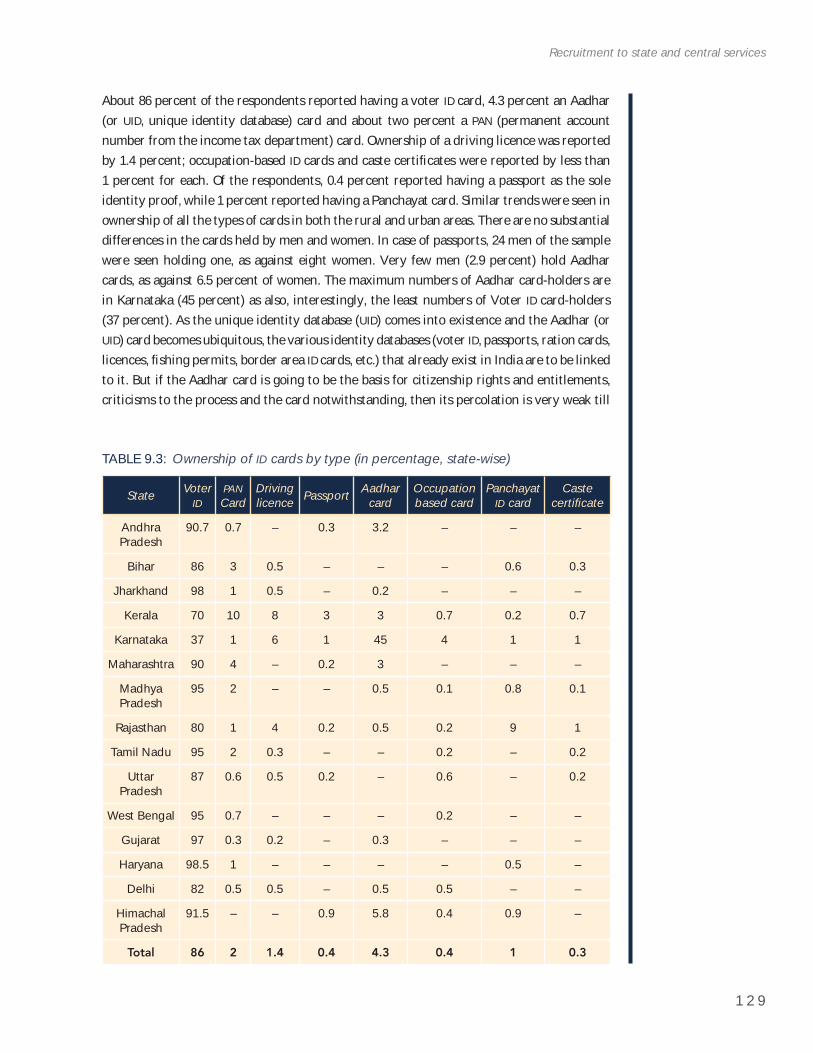
1 2 9
Recruitment to state and central services
About 86 percent of the respondents reported having a voter ID card, 4.3 percent an Aadhar (or UID, unique identity database) card and about two percent a PAN (permanent account number from the income tax department) card. Ownership of a driving licence was reported by 1.4 percent; occupation-based ID cards and caste certifi cates were reported by less than 1 percent for each. Of the respondents, 0.4 percent reported having a passport as the sole identity proof, while 1 percent reported having a Panchayat card. Similar trends were seen in ownership of all the types of cards in both the rural and urban areas. There are no substantial differences in the cards held by men and women. In case of passports, 24 men of the sample were seen holding one, as against eight women. Very few men (2.9 percent) hold Aadhar cards, as against 6.5 percent of women. The maximum numbers of Aadhar card-holders are in Karnataka (45 percent) as also, interestingly, the least numbers of Voter ID card-holders (37 percent). As the unique identity database (UID) comes into existence and the Aadhar (or UID) card becomes ubiquitous, the various identity databases (voter ID, passports, ration cards, licences, fi shing permits, border area ID cards, etc.) that already exist in India are to be linked to it. But if the Aadhar card is going to be the basis for citizenship rights and entitlements, criticisms to the process and the card notwithstanding, then its percolation is very weak till
TABLE 9.3: Ownership of ID cards by type (in percentage, state-wise)
State Voter ID
PANCard
Drivinglicence Passport Aadhar
cardOccupationbased card
PanchayatID card
Castecertifi cate
AndhraPradesh
90.7 0.7 – 0.3 3.2 – – –
Bihar 86 3 0.5 – – – 0.6 0.3
Jharkhand 98 1 0.5 – 0.2 – – –
Kerala 70 10 8 3 3 0.7 0.2 0.7
Karnataka 37 1 6 1 45 4 1 1
Maharashtra 90 4 – 0.2 3 – – –
MadhyaPradesh
95 2 – – 0.5 0.1 0.8 0.1
Rajasthan 80 1 4 0.2 0.5 0.2 9 1
Tamil Nadu 95 2 0.3 – – 0.2 – 0.2
UttarPradesh
87 0.6 0.5 0.2 – 0.6 – 0.2
West Bengal 95 0.7 – – – 0.2 – –
Gujarat 97 0.3 0.2 – 0.3 – – –
Haryana 98.5 1 – – – – 0.5 –
Delhi 82 0.5 0.5 – 0.5 0.5 – –
HimachalPradesh
91.5 – – 0.9 5.8 0.4 0.9 –
Total 86 2 1.4 0.4 4.3 0.4 1 0.3
1 3 0
Broken Promises: A study on the socio-economic status of Indian Muslims - Seven years post Sachar
now and, with the exception of Karnataka, the coverage is very poor. One of the reasons for it could be that the formal process of issuing the Aadhar card was delayed.
Of the respondents, the highest number (99 percent) having Voter ID cards were found in Haryana, while the maximum numbers of PAN card-holders were in Kerala and Maharashtra. The low use of occupation-based ID cards among the respondents was also a clear indication of the large numbers of Muslims in the unorganized sector. What was also seen was that only 0.3 percent people in the sample had caste certifi cates. This was all the more surprising considering that 43 percent people in the sample, across states, reported themselves as ‘OBCs’and about 23.5 percent reported themselves as other backward formations like ‘BC’, ‘BCE’, etc..
While 66 percent reported no problem in accessing these ID cards, 23 percent reported having faced problems. About 10 percent did not respond to this question. A larger number of urban respondents said that they had faced diffi culties in accessing these cards; of these 81 percent respondents were from Delhi, 46 percent from Andhra Pradesh, and between 20 percent and 30 percent from Jharkhand, Maharashtra and Karnataka. Clearly, Muslims migrating out of their homes for different reasons — livelihood, job opportunities, insecurities, riots, etc. — have to face similar uncertainty in their new habitat. About 20 percent of the women respondents complained of diffi culty in accessing cards as against 25 percent of the men. The least diffi culty was reported from Bihar.
While 75.3 percent did not report the problems they faced while accessing these cards, 11 percent reported that it had taken a long time. More than 2 percent reported procedural diffi culties and wrong information, each. About 1.5 percent reported discrimination. No political backing and negligence was reported by less than 1 percent, while about 8 percent reported ‘other reasons’. More urban respondents complained of procedural diffi culties while rural respondents complained that they were returned documents saying that the information provided was wrong or insuffi cient.
The only states from which there were major complaints of discrimination were Delhi (8 percent) followed by Gujarat (7 percent) and Haryana (4 percent). About 43 percent from Delhi also said that it was a very time-taking procedure, as did 33 percent from Jharkhand. Respondents from Delhi (8 percent) also reported that offi cials had asked for bribes for identity proofs and 14 percent mentioned procedural diffi culties. Delhi recorded the most number of complaints and diffi culties faced by citizens to access citizenship cards on the whole.
More than 5 percent reported that they had an ID card (31 percent from Delhi, followed by 21 percent from Andhra Pradesh) before and their ID had been taken away for correction and other purposes by offi cials and not returned. Here too urban respondents complained of it more than rural.
9.3 Application and Selection in Government Jobs
Only about 10 percent— in both urban and rural areas — reported that members of their family had applied for government jobs over the last six years, while 78 percent said that they did
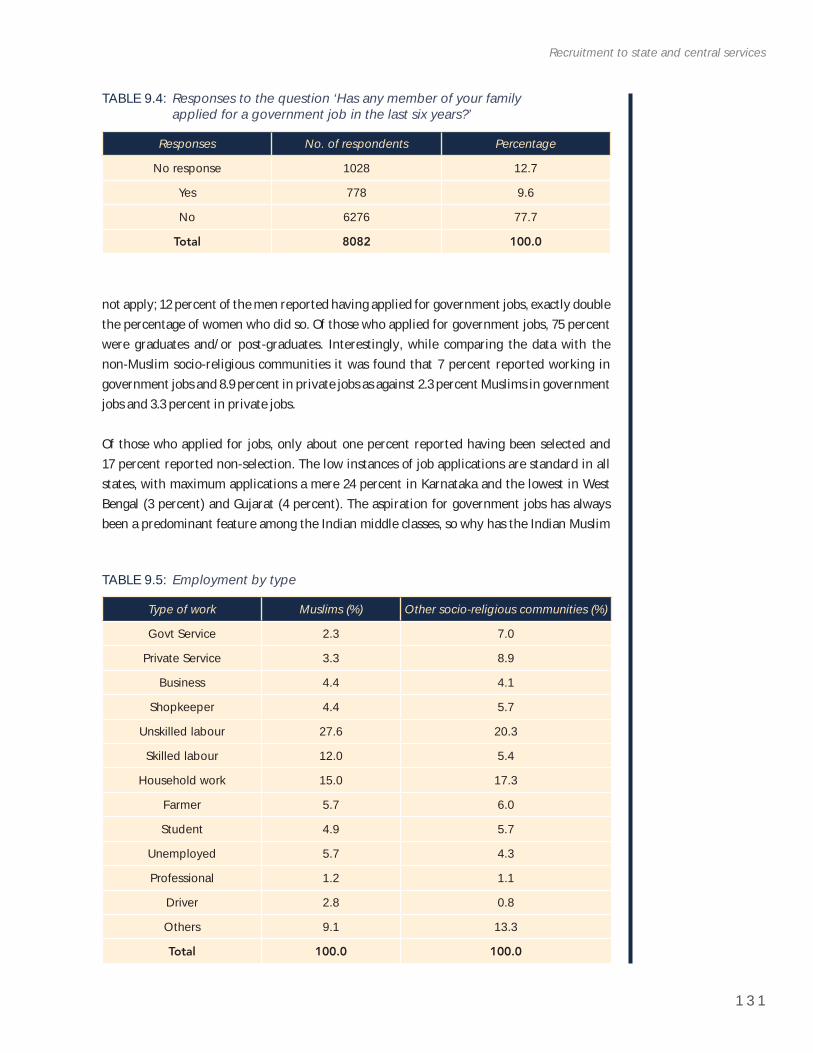
1 3 1
Recruitment to state and central services
not apply; 12 percent of the men reported having applied for government jobs, exactly double the percentage of women who did so. Of those who applied for government jobs, 75 percent were graduates and/or post-graduates. Interestingly, while comparing the data with the non-Muslim socio-religious communities it was found that 7 percent reported working in government jobs and 8.9 percent in private jobs as against 2.3 percent Muslims in government jobs and 3.3 percent in private jobs.
Of those who applied for jobs, only about one percent reported having been selected and 17 percent reported non-selection. The low instances of job applications are standard in all states, with maximum applications a mere 24 percent in Karnataka and the lowest in West Bengal (3 percent) and Gujarat (4 percent). The aspiration for government jobs has always been a predominant feature among the Indian middle classes, so why has the Indian Muslim
TABLE 9.4: Responses to the question ‘Has any member of your family applied for a government job in the last six years?’
Responses No. of respondents Percentage
No response 1028 12.7
Yes 778 9.6
No 6276 77.7
Total 8082 100.0
TABLE 9.5: Employment by type
Type of work Muslims (%) Other socio-religious communities (%)
Govt Service 2.3 7.0
Private Service 3.3 8.9
Business 4.4 4.1
Shopkeeper 4.4 5.7
Unskilled labour 27.6 20.3
Skilled labour 12.0 5.4
Household work 15.0 17.3
Farmer 5.7 6.0
Student 4.9 5.7
Unemployed 5.7 4.3
Professional 1.2 1.1
Driver 2.8 0.8
Others 9.1 13.3
Total 100.0 100.0
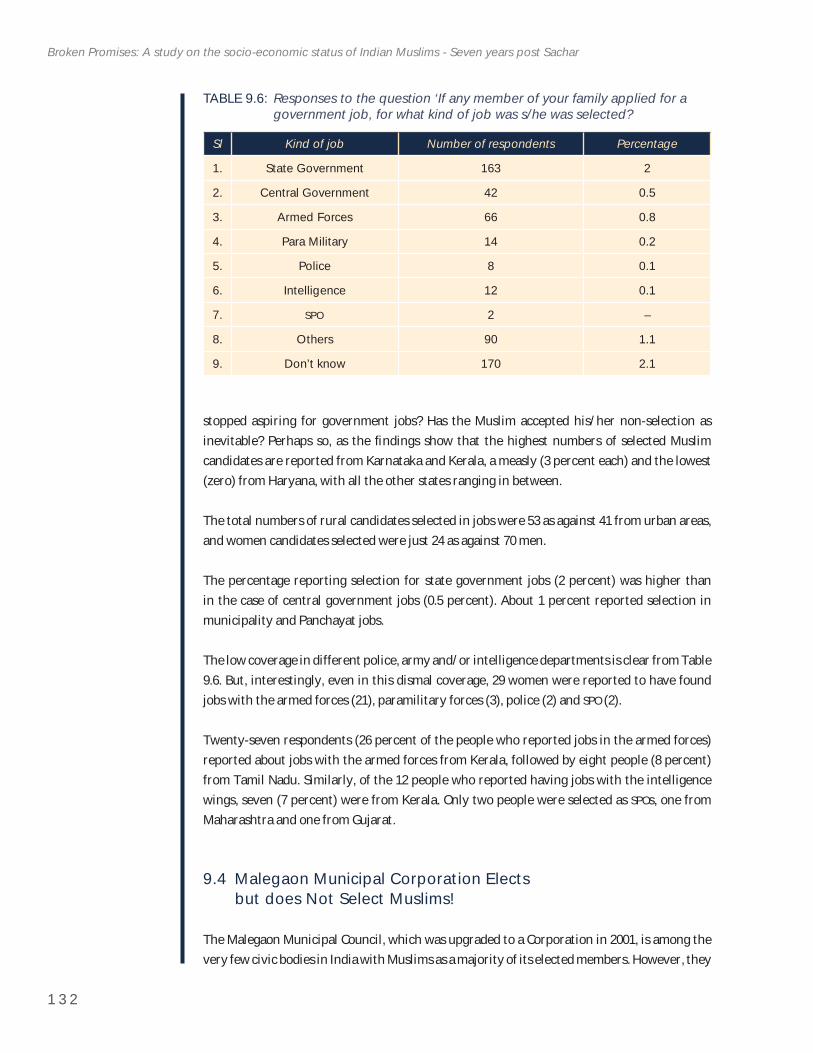
1 3 2
Broken Promises: A study on the socio-economic status of Indian Muslims - Seven years post Sachar
stopped aspiring for government jobs? Has the Muslim accepted his/her non-selection as inevitable? Perhaps so, as the fi ndings show that the highest numbers of selected Muslim candidates are reported from Karnataka and Kerala, a measly (3 percent each) and the lowest (zero) from Haryana, with all the other states ranging in between.
The total numbers of rural candidates selected in jobs were 53 as against 41 from urban areas, and women candidates selected were just 24 as against 70 men.
The percentage reporting selection for state government jobs (2 percent) was higher than in the case of central government jobs (0.5 percent). About 1 percent reported selection in municipality and Panchayat jobs.
The low coverage in different police, army and/or intelligence departments is clear from Table 9.6. But, interestingly, even in this dismal coverage, 29 women were reported to have found jobs with the armed forces (21), paramilitary forces (3), police (2) and SPO (2).
Twenty-seven respondents (26 percent of the people who reported jobs in the armed forces) reported about jobs with the armed forces from Kerala, followed by eight people (8 percent) from Tamil Nadu. Similarly, of the 12 people who reported having jobs with the intelligence wings, seven (7 percent) were from Kerala. Only two people were selected as SPOs, one from Maharashtra and one from Gujarat.
9.4 Malegaon Municipal Corporation Elects but does Not Select Muslims!
The Malegaon Municipal Council, which was upgraded to a Corporation in 2001, is among the very few civic bodies in India with Muslims as a majority of its elected members. However, they
TABLE 9.6: Responses to the question ‘If any member of your family applied for a government job, for what kind of job was s/he was selected?
Sl Kind of job Number of respondents Percentage
1. State Government 163 2
2. Central Government 42 0.5
3. Armed Forces 66 0.8
4. Para Military 14 0.2
5. Police 8 0.1
6. Intelligence 12 0.1
7. SPO 2 –
8. Others 90 1.1
9. Don’t know 170 2.1
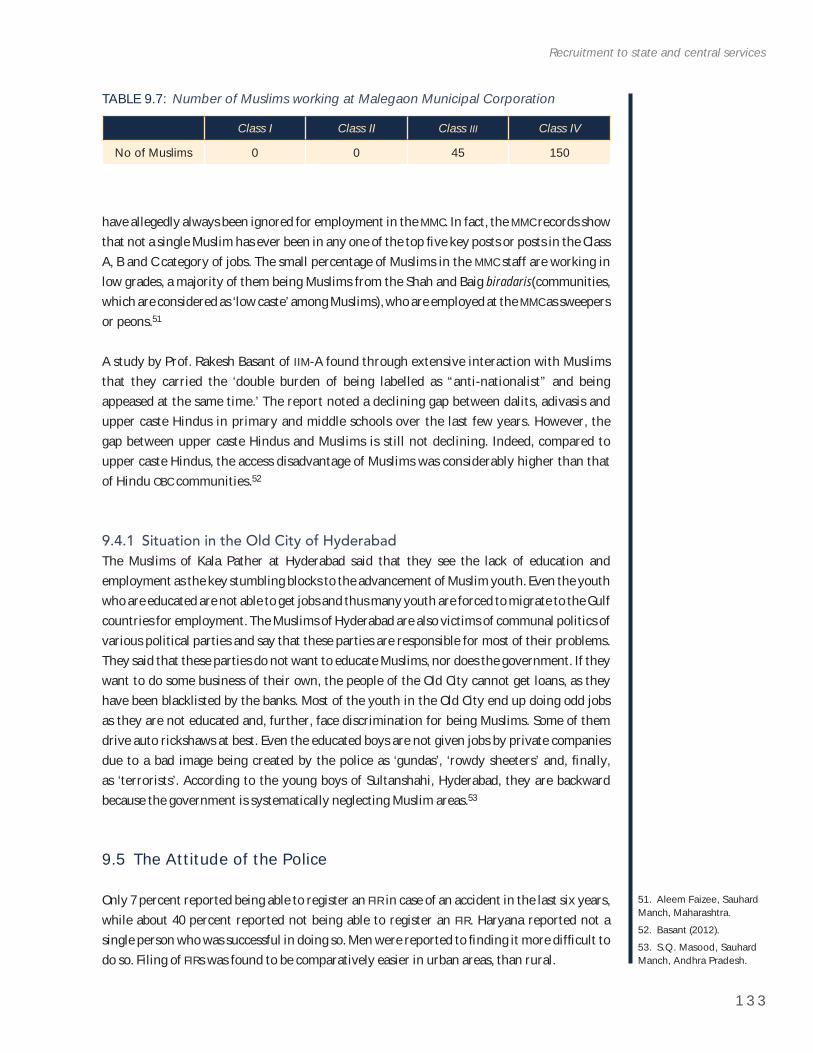
1 3 3
Recruitment to state and central services
51. Aleem Faizee, Sauhard Manch, Maharashtra.52. Basant (2012). 53. S.Q. Masood, Sauhard Manch, Andhra Pradesh.
have allegedly always been ignored for employment in the MMC. In fact, the MMC records show that not a single Muslim has ever been in any one of the top fi ve key posts or posts in the Class A, B and C category of jobs. The small percentage of Muslims in the MMC staff are working in low grades, a majority of them being Muslims from the Shah and Baig biradaris(communities,which are considered as ‘low caste’ among Muslims), who are employed at the MMC as sweepers or peons.51
A study by Prof. Rakesh Basant of IIM-A found through extensive interaction with Muslims that they carried the ‘double burden of being labelled as “anti-nationalist” and being appeased at the same time.’ The report noted a declining gap between dalits, adivasis and upper caste Hindus in primary and middle schools over the last few years. However, the gap between upper caste Hindus and Muslims is still not declining. Indeed, compared to upper caste Hindus, the access disadvantage of Muslims was considerably higher than that of Hindu OBC communities.52
9.4.1 Situation in the Old City of Hyderabad The Muslims of Kala Pather at Hyderabad said that they see the lack of education and employment as the key stumbling blocks to the advancement of Muslim youth. Even the youth who are educated are not able to get jobs and thus many youth are forced to migrate to the Gulf countries for employment. The Muslims of Hyderabad are also victims of communal politics of various political parties and say that these parties are responsible for most of their problems. They said that these parties do not want to educate Muslims, nor does the government. If they want to do some business of their own, the people of the Old City cannot get loans, as they have been blacklisted by the banks. Most of the youth in the Old City end up doing odd jobs as they are not educated and, further, face discrimination for being Muslims. Some of them drive auto rickshaws at best. Even the educated boys are not given jobs by private companies due to a bad image being created by the police as ‘gundas’, ‘rowdy sheeters’ and, fi nally, as ‘terrorists’. According to the young boys of Sultanshahi, Hyderabad, they are backward because the government is systematically neglecting Muslim areas.53
9.5 The Attitude of the Police
Only 7 percent reported being able to register an FIR in case of an accident in the last six years, while about 40 percent reported not being able to register an FIR. Haryana reported not a single person who was successful in doing so. Men were reported to fi nding it more diffi cult to do so. Filing of FIRs was found to be comparatively easier in urban areas, than rural.
TABLE 9.7: Number of Muslims working at Malegaon Municipal Corporation
Class I Class II Class III Class IV
No of Muslims 0 0 45 150
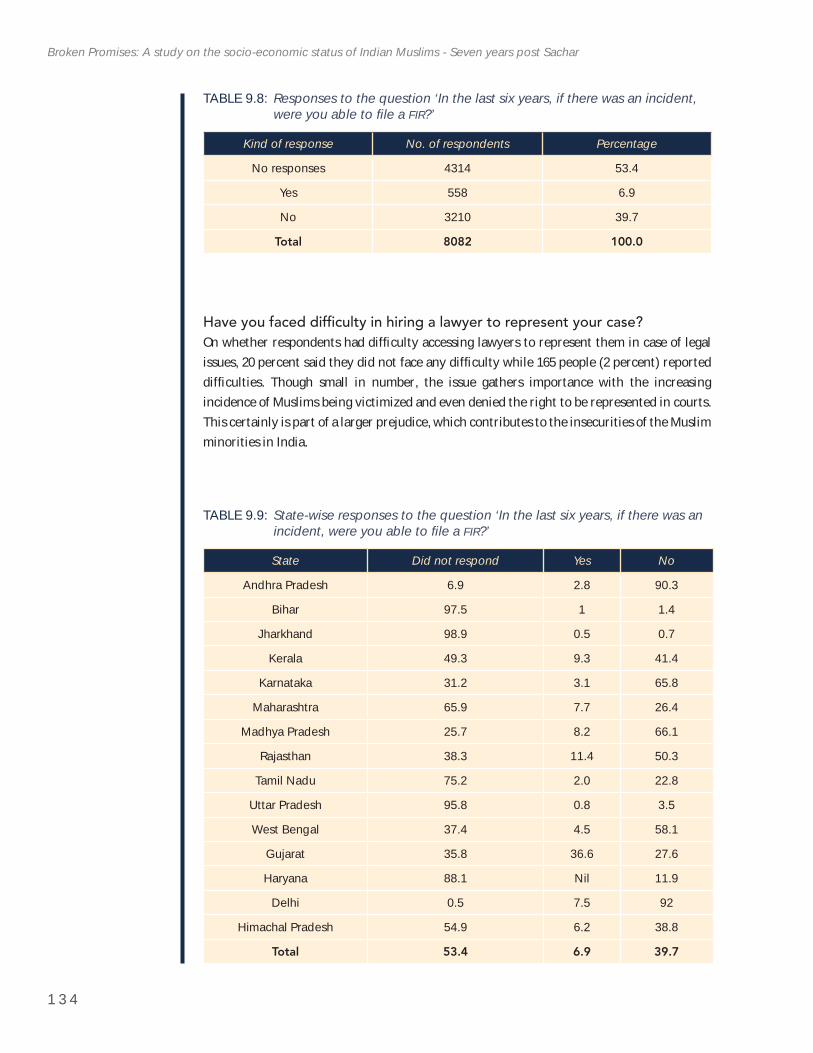
1 3 4
Broken Promises: A study on the socio-economic status of Indian Muslims - Seven years post Sachar
Have you faced diffi culty in hiring a lawyer to represent your case?On whether respondents had diffi culty accessing lawyers to represent them in case of legal issues, 20 percent said they did not face any diffi culty while 165 people (2 percent) reported diffi culties. Though small in number, the issue gathers importance with the increasing incidence of Muslims being victimized and even denied the right to be represented in courts. This certainly is part of a larger prejudice, which contributes to the insecurities of the Muslim minorities in India.
TABLE 9.8: Responses to the question ‘In the last six years, if there was an incident, were you able to fi le a FIR?’
Kind of response No. of respondents Percentage
No responses 4314 53.4
Yes 558 6.9
No 3210 39.7
Total 8082 100.0
TABLE 9.9: State-wise responses to the question ‘In the last six years, if there was an incident, were you able to fi le a FIR?’
State Did not respond Yes No
Andhra Pradesh 6.9 2.8 90.3
Bihar 97.5 1 1.4
Jharkhand 98.9 0.5 0.7
Kerala 49.3 9.3 41.4
Karnataka 31.2 3.1 65.8
Maharashtra 65.9 7.7 26.4
Madhya Pradesh 25.7 8.2 66.1
Rajasthan 38.3 11.4 50.3
Tamil Nadu 75.2 2.0 22.8
Uttar Pradesh 95.8 0.8 3.5
West Bengal 37.4 4.5 58.1
Gujarat 35.8 36.6 27.6
Haryana 88.1 Nil 11.9
Delhi 0.5 7.5 92
Himachal Pradesh 54.9 6.2 38.8
Total 53.4 6.9 39.7
1 3 5
Recruitment to state and central services
Fight against terrorism: A case of Andhra PradeshScores of Muslim youth are victims of police harassment in the guise of fi ght against ‘terrorism’. Innocent youth are picked up or arrested by the police regularly. After the Mecca Masjid blast in Andhra Pradesh, such interrogations became common. Many young men were picked up and were kept for days in illegal custody in farmhouses on the outskirts of the city and some of them were released after days, while 21 were labelled as ‘terrorists’ and booked under sections 120 (B), 125 and 126 of the Indian Penal Code (IPC), for allegedly ‘waging war against the nation’ (FIR No. 198/2007, Gopalpuram Police Station). The police used electric shocks during the interrogation.
An enquiry commission was appointed by AP State Minorities Commission and Advocate. L. Ravichander was appointed as Commissioner. He visited Cherlapally Central Prison and
BOX 20: Imprisoned, intimidated and threatened!
Dr. Ibrahim Ali Junaid was arrested in the Macca Masji Blast case U/s 120 (B), 125 and 126, IPC (FIR No. 198/2007).
Dr. Junaid played a responsible role as a citizen by exposing the story of torture by police, after acquittal from the case. The police pressurized all the youth that if they speak about their stories in front of the media and civil liberties organizations they would implicate them in other false cases. But Dr. Junaid and his parents exposed this in front of the media and the public. He encouraged the others to speak out against police atrocities also.
Source: S.Q. Masood, Sauhard Manch, Andhra Pradesh.
BOX 21: Identity and harassment
In the Muslim localities in Azamgarh town and nearby Mau (Uttar Pradesh), large numbers of people are forced to earn a livelihood by displaying animals like monkeys, etc. These people are from the Kalandar community. The police regularly harass them. Tara Bazzo from this community fi nally changed her name to Tara Devi just because she wanted to get rid of the police harassment, as displaying animals is illegal and when you are a Muslim, the police harassment is certain … and the police fi nd new techniques to harass them every day.
Chain-seller Rafi uddin from Moradabad gets detained everyday by the police for his beard.
Salim from Benaras says that he is afraid to go to the station to receive his relative. As he has a beard and wears a topi, the police look at him with suspicion and detain him frequently. People in the same get-up as Salim made almost similar statements.
Abdullah Hazi was a vendor. Harassed and detained endlessly by the police innumerable times for no reason, except for apparently being a Muslim, he went into hiding. Ratifi ed as a jovial and good fellow by all his neighbours, including Hindu families, Abdullah today, for no apparent reason, remains a fugitive from law.
Source: Afaqullah, Awadh Peoples’ Forum, Uttar Pradesh.
1 3 6
Broken Promises: A study on the socio-economic status of Indian Muslims - Seven years post Sachar
54. S.Q. Masood, Sauhard Manch, Andhra Pradesh.
55. Sachar Committee Report.
56. Meera Khatun, Sauhard Manch.
scanned the documents and facts and found serious injuries on the bodies of many youth, and he met the parents who explained how and when the youth were arrested. The Commissioner submitted his interim report to the Commission but the government did not act on the report and did not punish the guilty!
In 2010, these 21 youth were acquitted by the Court and in 2012, fi nally, the state government gave them compensation along with character certifi cates! Shockingly, in 2012, the commissioner of police fi led a reply on the same case and stated that no single Muslim youth was arrested, tortured or implicated in false cases. And in the aftermath of the Dilshukh Nagar bomb blast, the Hyderabad police arrested the same youth again to investigate the bomb blast!54
The Sachar Committee Report also stated that Muslim women in burqa complain of impolite treatment in the marketplaces, in hospitals, in schools, in accessing public facilities such as public transport, and so on. Apart from the reluctance of owners to rent/sell property to Muslims, several housing societies in ‘non-Muslim’ localities ‘dissuade’ Muslims from locating there. Muslims say they feel inferior as ‘every bearded man is considered an “ISI agent”;’ ‘whenever any incident occurs, Muslim boys are picked up by the police’ and ‘fake encounters are common’ is a representative cry.55 Obviously, between the Sachar Committee Report in 2006 and the present, identity related harassment has not reduced. In fact, in the national capital, just as one submits cameras and phones, etc., to the security staff at Akshardham temple, there is a notice saying ‘Burqa and Lungi not allowed’ at the entrance!
9.6 Entitlements: ‘Ab ummeed toot gayi hai’ (We have lost hope now)
The perceptions of discrimination in entitlements, particularly from women and more so from single and widowed women, were an all pervading feature observed in this study, without exception, across all the 15 states where the study was conducted. The Indira Gandhi National Widow Pension Scheme came into existence in February 2009 to assist widows (between 49 and 64 years of age) living below the poverty line; but very few of the women interviewed reported any help from the scheme. Some of the women who had crossed 60 years of age and were also widows reported many problems in getting the benefi t of the old age pension as well as the widow pension and reported harassment at the hands of offi cials who have only delayed the process.
A case from West BengalThere are 10 widows in the village. None of them get old age pension or widow pension. One widow — Khairunnisa, 62 years old and blind — could not get old age pension after applying twice, and fi nally gave up. This trend of poverty-stricken old widowed women not getting either the old age pension or widow pension was repeated in every Muslim hamlet that the study covered in the Uttar Dinajpur District of West Bengal.56
1 3 7
Recruitment to state and central services
57. Mariya Salim, Centre for Peace Studies.58. Himani Rawat, Actionaid, Mumbai.59. Case study compiled by Advocate K.P. Gangore, Indore.
A case from JharkhandAnother cause of worry is the lack of benefi ts or atleast an opportunity to avail the same by many young widows we came across. There are debates ongoing to reduce the age limit but, in the meantime, this has had an adverse effect on the lives of young widows. This was reported by three young widows in Jharkhand who were denied any pension as the offi cer told them ‘they are very young.’ 57
The case of Madari women in Thane, Maharashtra Madari women in Thane, Maharashtra, say that widow pension is received in other areas but not in Muslim areas. They refuse to accept that there are poor people in the Muslim community. Offi cials refuse to visit Muslim areas to confi rm the fact, say the women of Navpada, Mumbai. They said also that even if they know about the schemes, they believe that there is no hope.58
Are Muslim women benefi ting from government schemes? A case study on the ‘Mukhyamantri kanyadan yojana’ of Madhya Pradesh59
A writ petition was fi led by Rukhsar bi and Tanzeem Aftaabe Millat Indore Committee concerning discrepancy in allotment of the ‘Mukhyamantri Kanyadaan Yojana’ under which an amount of ̀ 9,000 is to be provided to girls as ‘streedhan’ and ̀ 1,000 towards their wedding. The organization fi ling the writ petition requested the government offi cials for assistance for a mass wedding of 55 girls belonging to poor Muslim families in Indore, organized by them, and orders were given to the municipal corporation to ensure assistance for this mass wedding. After not hearing from the offi cials despite repeated written requests, the date of the mass wedding was fi xed for 16 February 2011. Two days before the mass wedding, the Samiti was informed that no assistance would be provided for the ceremony and no substantial reason was given for the same. However, because it was too late and as all preparations were complete, a huge loan was taken from the community and the mass wedding was successfully concluded.
The organization then went to meet the Chief Minister personally with all the married girls and he ordered an inquiry into the matter. A false claim was made by the offi cers involved in the inquiry which said that since all the girls belonged to the Muslim community and benefi t of the scheme cannot be given to the Muslim community alone and also because the ceremony was already concluded there was no provision for payment in this case.
The institution sent, a legal notice to demand the benefi t of the scheme on behalf of all the girls. After no response was forthcoming from the Municipal Corporation of Indore, a writ petition (No.7805/2011 fi led by Rukhsar bi, wife of Roshan Ali and others vs Municipal Corporation Indore and others) was presented. The MP High Court has admitted the petition and has orally said that it is the responsibility of the government to pay the entire amount.
Following this, the Municipal Corporation fi led a reply and falsely stated that some girls and boys had not attained the age of maturity thus the government cannot support them
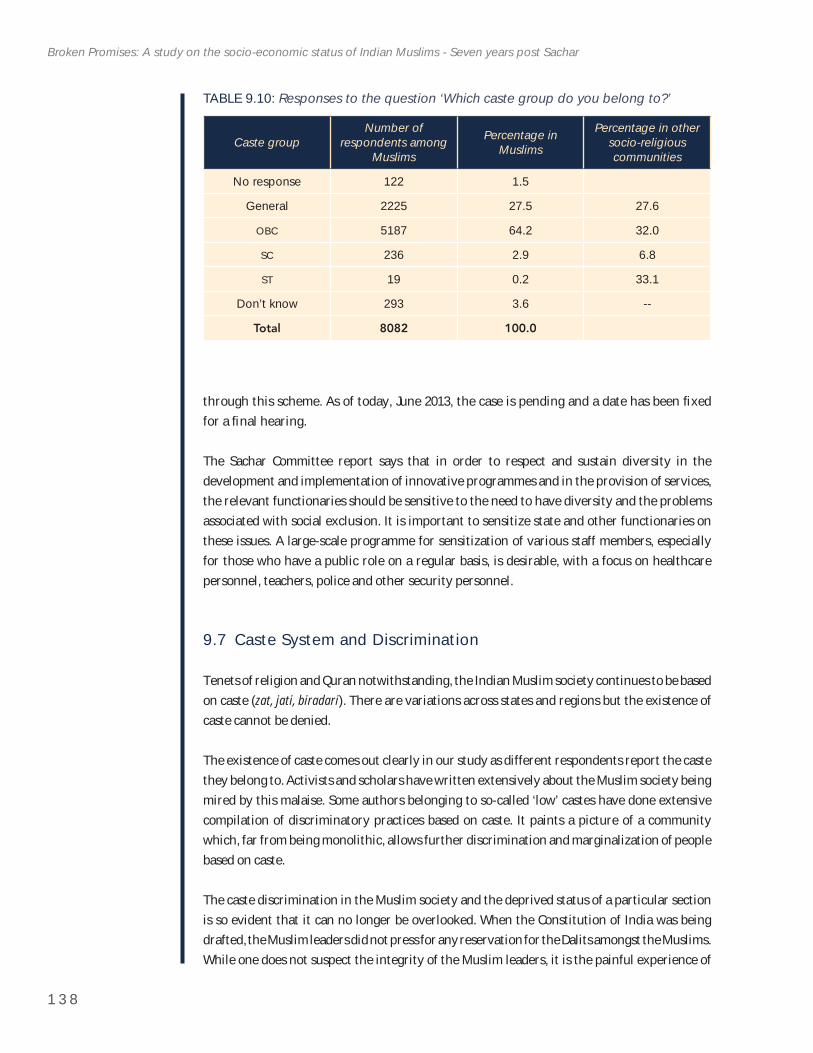
1 3 8
Broken Promises: A study on the socio-economic status of Indian Muslims - Seven years post Sachar
through this scheme. As of today, June 2013, the case is pending and a date has been fi xed for a fi nal hearing.
The Sachar Committee report says that in order to respect and sustain diversity in the development and implementation of innovative programmes and in the provision of services, the relevant functionaries should be sensitive to the need to have diversity and the problems associated with social exclusion. It is important to sensitize state and other functionaries on these issues. A large-scale programme for sensitization of various staff members, especially for those who have a public role on a regular basis, is desirable, with a focus on healthcare personnel, teachers, police and other security personnel.
9.7 Caste System and Discrimination
Tenets of religion and Quran notwithstanding, the Indian Muslim society continues to be based on caste (zat, jati, biradari). There are variations across states and regions but the existence of caste cannot be denied.
The existence of caste comes out clearly in our study as different respondents report the caste they belong to. Activists and scholars have written extensively about the Muslim society being mired by this malaise. Some authors belonging to so-called ‘low’ castes have done extensive compilation of discriminatory practices based on caste. It paints a picture of a community which, far from being monolithic, allows further discrimination and marginalization of people based on caste.
The caste discrimination in the Muslim society and the deprived status of a particular section is so evident that it can no longer be overlooked. When the Constitution of India was being drafted, the Muslim leaders did not press for any reservation for the Dalits amongst the Muslims. While one does not suspect the integrity of the Muslim leaders, it is the painful experience of
TABLE 9.10: Responses to the question ‘Which caste group do you belong to?’
Caste groupNumber of
respondents among Muslims
Percentage in Muslims
Percentage in other socio-religious communities
No response 122 1.5
General 2225 27.5 27.6
OBC 5187 64.2 32.0
SC 236 2.9 6.8
ST 19 0.2 33.1
Don’t know 293 3.6 --
Total 8082 100.0
1 3 9
Recruitment to state and central services
60. Anwar (2005). 61. Sikand (2004).62. Sabir Khan, Fellow, Sauhard Manch.
the last 50 years that the tendency to gloss over the discrimination and inequality within leaves a deep wound.60
In most parts of India, Muslim society is based on the existence of numerous endogamous and generally occupationally-specifi c caste groups that have their own caste appellations. This disjunction between Qur’anic egalitarianism and Indian Muslim social practice has been theorized by Muslim scholars in different ways. While some have sought to reconcile the two by interpreting the scripturalist sources of Islam to support social hierarchy, others have pointed out that the continued existence of caste-like features in Indian Muslim society is a fl agrant violation of the Qur’anic worldview.61
Most people we talked to reported great diffi culties in obtaining caste certifi cates. They reported apathy and lack of response from offi cials in giving these certifi cates. A look at some instances from different states:
A look at the Yogis from RajasthanIbrahim alias Vijendra from Alwar District in Rajasthan says: ‘My personal problem is that I am a Yogi Mussalman. Sometimes the authorities are ready to certify me as an OBC, but some other times there are hurdles. The present Tahsildar posted in Malkheda is not willing to issue OBC certifi cate to any Muslim. According to the criterion Yogi and Nath castes belong to the OBC list. But offi cials deny issuing certifi cates by saying that we are Muslims [and are] therefore denied the OBC certifi cates. To obtain OBCcertifi cates, one has to write Hindu Yogi as his caste.62
Case of Khwaja communitySimilarly when Shaheen from Saharanpur in Uttar Pradesh was required to submit her community/caste certifi cate for higher studies in 1990, she and her family realized that their community, Khwaja, was not registered by the state or Central government as an offi cial community/caste within Muslims. It was thus decided that she would submit her mother’s caste certifi cate, that of Ansari. Shaheen tells us that, like her, most belonging to the ‘Khwaja community’ make caste or community certifi cates according to the areas they reside in. Thus, in Sultanpur, the people belonging to the Khwaja community make ‘Ansari and Teli’ certifi cates, Khwaja residents of Kolkagar village in Dehradun have made ‘Nai’ certifi cates, and so on.
Though this community is a close-knit one and marriages also mostly take place within the community, the absence of its name in the government’s offi cial list is slowly making the community offi cially non-existent, with all of them making certifi cates of other communities. Those belonging to the ‘Khwaja community’ reside in Uttarakhand, Punjab, Haryana, etc., and feel that the current arrangement will lead to their community becoming invisible in the near future.
Similarly, the Madaris of Maharashtra do not have caste certifi cates and were not even aware about it.
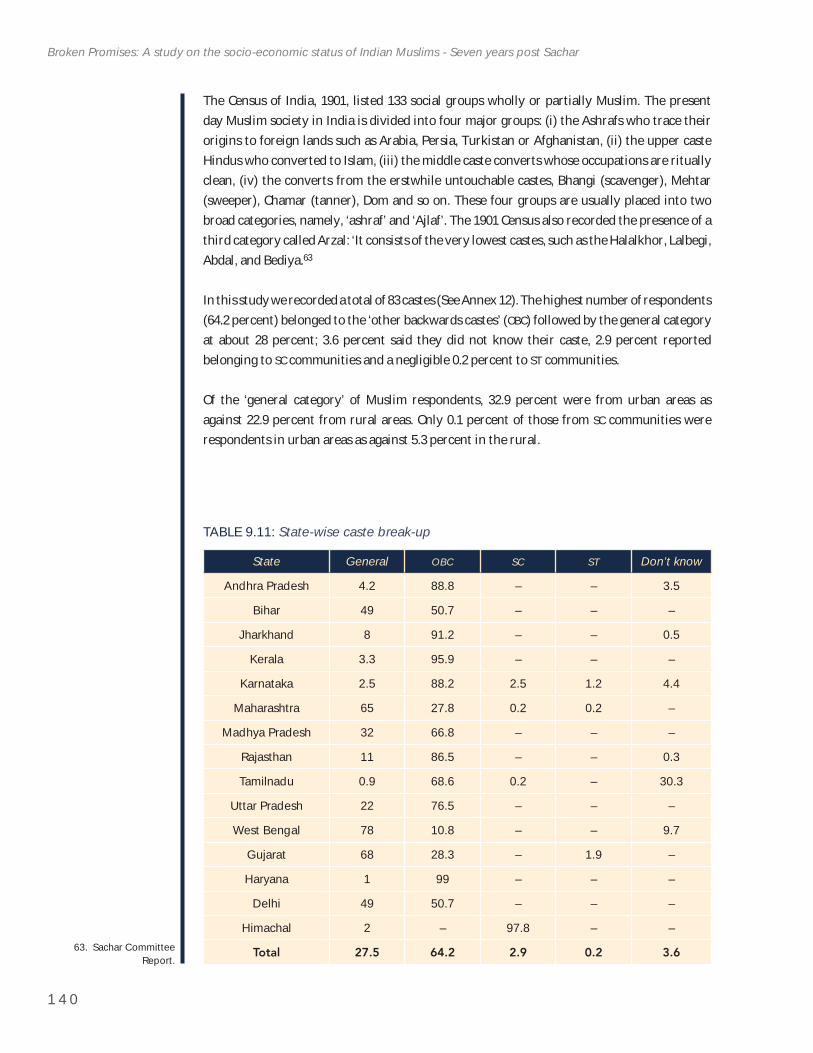
1 4 0
Broken Promises: A study on the socio-economic status of Indian Muslims - Seven years post Sachar
63. Sachar Committee Report.
The Census of India, 1901, listed 133 social groups wholly or partially Muslim. The present day Muslim society in India is divided into four major groups: (i) the Ashrafs who trace their origins to foreign lands such as Arabia, Persia, Turkistan or Afghanistan, (ii) the upper caste Hindus who converted to Islam, (iii) the middle caste converts whose occupations are ritually clean, (iv) the converts from the erstwhile untouchable castes, Bhangi (scavenger), Mehtar (sweeper), Chamar (tanner), Dom and so on. These four groups are usually placed into two broad categories, namely, ‘ashraf’ and ‘Ajlaf’. The 1901 Census also recorded the presence of a third category called Arzal: ‘It consists of the very lowest castes, such as the Halalkhor, Lalbegi, Abdal, and Bediya.63
In this study we recorded a total of 83 castes (See Annex 12). The highest number of respondents (64.2 percent) belonged to the ‘other backwards castes’ (OBC) followed by the general category at about 28 percent; 3.6 percent said they did not know their caste, 2.9 percent reported belonging to SC communities and a negligible 0.2 percent to ST communities.
Of the ‘general category’ of Muslim respondents, 32.9 percent were from urban areas as against 22.9 percent from rural areas. Only 0.1 percent of those from SC communities were respondents in urban areas as against 5.3 percent in the rural.
TABLE 9.11: State-wise caste break-up
State General OBC SC ST Don’t know
Andhra Pradesh 4.2 88.8 – – 3.5
Bihar 49 50.7 – – –
Jharkhand 8 91.2 – – 0.5
Kerala 3.3 95.9 – – –
Karnataka 2.5 88.2 2.5 1.2 4.4
Maharashtra 65 27.8 0.2 0.2 –
Madhya Pradesh 32 66.8 – – –
Rajasthan 11 86.5 – – 0.3
Tamilnadu 0.9 68.6 0.2 – 30.3
Uttar Pradesh 22 76.5 – – –
West Bengal 78 10.8 – – 9.7
Gujarat 68 28.3 – 1.9 –
Haryana 1 99 – – –
Delhi 49 50.7 – – –
Himachal 2 – 97.8 – –
Total 27.5 64.2 2.9 0.2 3.6
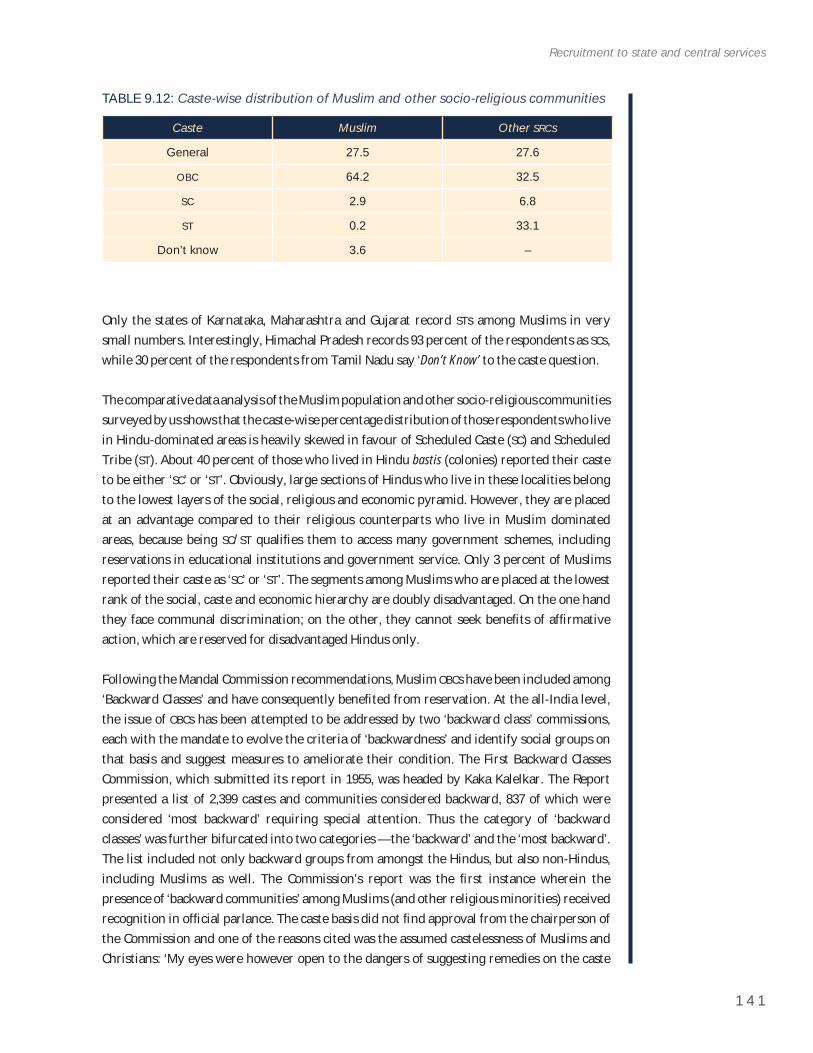
1 4 1
Recruitment to state and central services
Only the states of Karnataka, Maharashtra and Gujarat record STs among Muslims in very small numbers. Interestingly, Himachal Pradesh records 93 percent of the respondents as SCs,while 30 percent of the respondents from Tamil Nadu say ‘Don’t Know’ to the caste question.
The comparative data analysis of the Muslim population and other socio-religious communities surveyed by us shows that the caste-wise percentage distribution of those respondents who live in Hindu-dominated areas is heavily skewed in favour of Scheduled Caste (SC) and Scheduled Tribe (ST). About 40 percent of those who lived in Hindu bastis (colonies) reported their caste to be either ‘SC’ or ‘ST’. Obviously, large sections of Hindus who live in these localities belong to the lowest layers of the social, religious and economic pyramid. However, they are placed at an advantage compared to their religious counterparts who live in Muslim dominated areas, because being SC/ST qualifi es them to access many government schemes, including reservations in educational institutions and government service. Only 3 percent of Muslims reported their caste as ‘SC’ or ‘ST’. The segments among Muslims who are placed at the lowest rank of the social, caste and economic hierarchy are doubly disadvantaged. On the one hand they face communal discrimination; on the other, they cannot seek benefi ts of affi rmative action, which are reserved for disadvantaged Hindus only.
Following the Mandal Commission recommendations, Muslim OBCs have been included among ‘Backward Classes’ and have consequently benefi ted from reservation. At the all-India level, the issue of OBCs has been attempted to be addressed by two ‘backward class’ commissions, each with the mandate to evolve the criteria of ‘backwardness’ and identify social groups on that basis and suggest measures to ameliorate their condition. The First Backward Classes Commission, which submitted its report in 1955, was headed by Kaka Kalelkar. The Report presented a list of 2,399 castes and communities considered backward, 837 of which were considered ‘most backward’ requiring special attention. Thus the category of ‘backward classes’ was further bifurcated into two categories — the ‘backward’ and the ‘most backward’. The list included not only backward groups from amongst the Hindus, but also non-Hindus, including Muslims as well. The Commission’s report was the fi rst instance wherein the presence of ‘backward communities’ among Muslims (and other religious minorities) received recognition in offi cial parlance. The caste basis did not fi nd approval from the chairperson of the Commission and one of the reasons cited was the assumed castelessness of Muslims and Christians: ‘My eyes were however open to the dangers of suggesting remedies on the caste
TABLE 9.12: Caste-wise distribution of Muslim and other socio-religious communities
Caste Muslim Other SRCs
General 27.5 27.6
OBC 64.2 32.5
SC 2.9 6.8
ST 0.2 33.1
Don’t know 3.6 –
1 4 2
Broken Promises: A study on the socio-economic status of Indian Muslims - Seven years post Sachar
64. Sachar Committee Report.
65. Ibid.66. Ibid.
basis when I discovered that it is going to have a most unhealthy effect on the Muslim and Christian sections of the nation.’ 64
The Second All-India Backward Classes Commission, the B.P. Mandal Commission, submitted its report in 1980. The Commission evolved eleven indicators, a mix of caste and class features, for assessing social and educational backwardness. The Commission saw castes as the ‘building bricks of Hindu social structure’ that, despite the constitutional commitment to establish a casteless and egalitarian society, had continued to persist. It arrived at an exhaustive list of 3,743 castes that were declared as backward. The Commission, in principle, accepted that occurrence of caste or caste like feature was not restricted to the Hindu society, its infl uence was also found among non-Hindu groups, Muslims, Sikhs and Christians, as well. Based on the data provided by 1931 Census and fi eld survey conducted at the instance of the Commission, at least 82 different social groups among Muslims were declared OBCs.65
The Commission, however, desisted from employing ‘caste’ as a criterion to identify non-Hindu OBCs as ‘these religions are (were) totally egalitarian in their outlook’. The Commission, however, refrained from invoking ‘poverty’ too as the sole criterion. The ‘rough and ready’ criteria that the Commission evolved had two conditions:
a. All ‘untouchables’ converted to any non-Hindu religion. In the case of muslims, they are the Arzals.
b. Such occupational communities which are known by the name of their traditional hereditary occupation and whose Hindu counterparts have been included in the list of Hindu OBCs. Among Muslims, this comprises the Ajlaf category.
By clubbing the Arzals and the Ajlafs among Muslims in an all encompassing OBC category, the Mandal Commission overlooked the disparity in the nature of deprivations that they faced. Being at the bottom of the social hierarchy, the Arzals are the worst off and need to be handled separately. It would be most appropriate if they were absorbed in the SC list, or at least in a separate category, Most Backward Classes (MBCs) carved out of the OBCs.66
9.7.2 Identity a threatA case of Meo muslimsMeo Muslims live in Rajasthan and Haryana. The Meos are known for their valour, for their contributions in the fi rst war of Indian Independence, 1857. Ibrahim, a Meo, shares this: ‘Today, from our past position as freedom fi ghters, we are treated as common criminals. Whenever any crime occurs in and around the area, Meos are picked up fi rst. The government is interfering in our religious rights succumbing to the pressure of local political parties. They have stopped the building of the Minar on the Madrasa mosque of Dawatpur which is a legal property of the Waqf Board.’
Muslims of Rajasthan say they are harassed for no fault. Hari Saheb says: ‘In March 2002, four people from our village were coming from the Sikar cattle market after buying four milch cows.
1 4 3
Recruitment to state and central services
67. Sabir Khan, Sauhard Manch.
In Alwar they were attacked and falsely charged that the cows are bought for slaughtering. Police arrested the four villagers.’
Nothing has changed in 10 years. Says Indu Madari: ‘In August 2012, in the village Banjir, villagers took their cattle for grazing. Few people came there and forcefully took away 40/50 cows to their gaushala. The villagers lost their cows, prestige and money.’ 67
Similarly, Sultanshahi area in the Old City of Hyderabad in AP is a communally sensitive area, with a mixed population of both the communities. The area has witnessed several incidents of communal violence and in response to this the police has fi xed CCTV cameras in the locality and is regularly picking up Muslim youth, even those who have no charges against them. Local residents say their lives are under severe stress on account of this.
Our survey clearly brings out the fact that different Muslims identify themselves as belonging to different castes. They are aware of the implications of belonging to a certain caste or biradari or jaat. Quite a few of our respondents have undergone tremendous efforts to obtain certifi cate of caste, sometimes successfully but unsuccessfully most times. Although we have not very thoroughly probed the linkages between caste and socio-economic status there are enough indicators in our study to suggest the need for further work in this area.
BOX 22: No benefi ts for Mahawats
In some villages of Barabanki District, in Uttar Pradesh reside Muslims who call themselves ‘Mahawats’. These people are mainly engaged in making handmade decorative plastic fl owers and other items and sell these in nearby areas.
All of them have a very poor economic background and have been struggling to get caste certifi cates, but the government does not have any caste category for Mahawat so they cannot be considered Scheduled Castes or Backward Castes. As a result they have been deprived from any benefi t from the government welfare schemes or entitlements.
Source: Nahed, Uttar Pradesh.
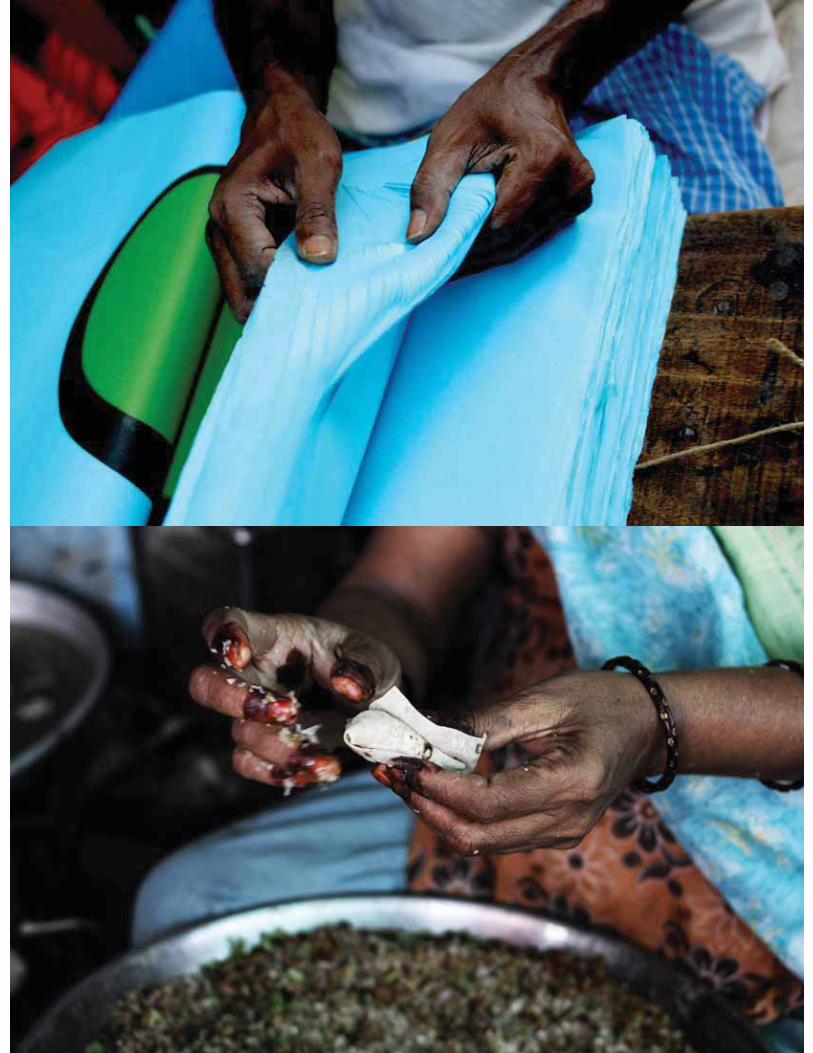
1 4 5
68. jnnurmmis.nic.in
1 0 . H O U S I N G / I M P R O V E M E N T O F S L U M S / S A N I TAT I O N A N D
B A S I C I N F R A S T R U C T U R E
10.1 What Does the PM’s New 15-Point Programme Promise?
The PM’s New 15-Point Programme promises improvements in the conditions of living of minorities, an equitable share in the rural housing scheme, the Indira Awaas Yojana (IAY),
which provides fi nancial assistance for shelter to the rural poor living below the poverty line. A certain percentage of the physical and fi nancial targets under IAY will be earmarked for poor benefi ciaries from minority communities living in rural areas.
It promises improvement in the condition of slums inhabited by minority communities under the schemes of Integrated Housing & Slum Development Programme (IHSDP) and the Jawaharlal Nehru National Urban Renewal Mission (JNNRUM), through which the Central government provides assistance to states/UTs for development of urban slums through provision of physical amenities and basic services. It would be ensured that the benefi ts of these programmes fl ow equitably to members of the minority communities and to cities/slums, predominantly inhabited by minority communities.
10.2 What Does JNNURM Say?
Cities and towns have a vital role in India’s socio-economic transformation and change. Host to about 30 percent of the country’s population, they contribute 50 percent to 55 percent of the gross domestic product (GDP). At the same time, most cities and towns are severely stressed in terms of infrastructure and service availability, and their growth and development is constrained by indifferent implementation of the Constitution (Seventy-Fourth) Amendment Act, 1992, and continuation of statutes, systems and procedures that impede the operation of land and housing markets. As this is incompatible with the country’s socio-economic objectives, the Government of India has launched the Jawaharlal Nehru National Urban Renewal Mission (JNNURM). The JNNURM aims to encourage cities to initiate steps to bring about improvement in the existing service levels in a fi nancially sustainable manner. The JNNURM consists of two sub-missions: one for Urban Infrastructure and Governance and the other for Basic Services to the Urban Poor. It believes that in order to make cities work effi ciently and equitably, it is essential to create incentives and support urban reforms at state and city levels; develop appropriate enabling and regulatory frameworks; enhance the credit worthiness of municipalities; and integrate the poor with the service delivery system.68
The JNNURM is designed to support:
1. Water supply including setting up of desalination plants; Sewerage and sanitation;
2. Solid waste management including hospital waste management;
1 4 6
Broken Promises: A study on the socio-economic status of Indian Muslims - Seven years post Sachar
69. Sachar Committee Report, p.14.
70. Deepak Bhatt for Sauhard Manch.
3. Construction and improvement of drains and storm-water drainage system;
4. Road network;
5. Urban transport;
6. Construction and development of bus and truck terminals;
7. Renewal and re-development of inner city areas; Development of heritage areas;
8. Preservation of water bodies;
9. Integrated development of slums, i.e. housing and development of infrastructure in slum settlements;
10. Provision of basic services to the urban poor; and
11. Street lighting.
The Sachar Committee Report says:
It was suggested that Muslims living together in concentrated pockets (both because of historical reasons and a deepening sense of insecurity) has made them easy targets for neglect by municipal and government authorities. Water, sanitation, electricity, schools, public health facilities, banking facilities, anganwadis, ration shops, roads, and transport facilities — are all in short supply in these areas.69
10.3 Atal Aif Ayyaub Nagar Basti in Bhopal: Case Study
Atal Aif Ayyaub Nagar Basti, a slum in Bhopal, is located adjacent to the plant of the erstwhile Union Carbide factory wall and railway track. The District Corporation has made a road in this slum, but it is so narrow that even a fi re engine will not reach in case of an emergency. There is no drainage system. There is no water supply system either. Since, the underground water of the area has been badly affected by polluted waste from the factory, the Supreme Court had ordered for the provision of a separate pipe line, so as to ensure availability of safe drinking water, but no such provision has been made. The living conditions are precarious here.
Most of the residents here are Muslims, and the rest are from backward castes. Apart from being affected by poisonous waste from the factory (now owned by Dow Chemicals), people of the area also face problems of mosquito, fl ies and related diseases, due to effl uents from the factory accumulating as stagnant water waste. There are practically no toilets in the colony. Most families use the railway tracks to defecate. Just a glance would show the attitude of the Municipal Corporation for the development of the area.
No offi cial documents are available showing their land possession. Nevertheless, there is electricity. People of the area have been charged between `20,000 and `1.5 lakh for electricity, which bills they have been unable to pay. The carelessly scattered electricity wires could lead to any mishap during rains or high winds. The youth suspect that the government intends to dismantle this slum after the elections.70
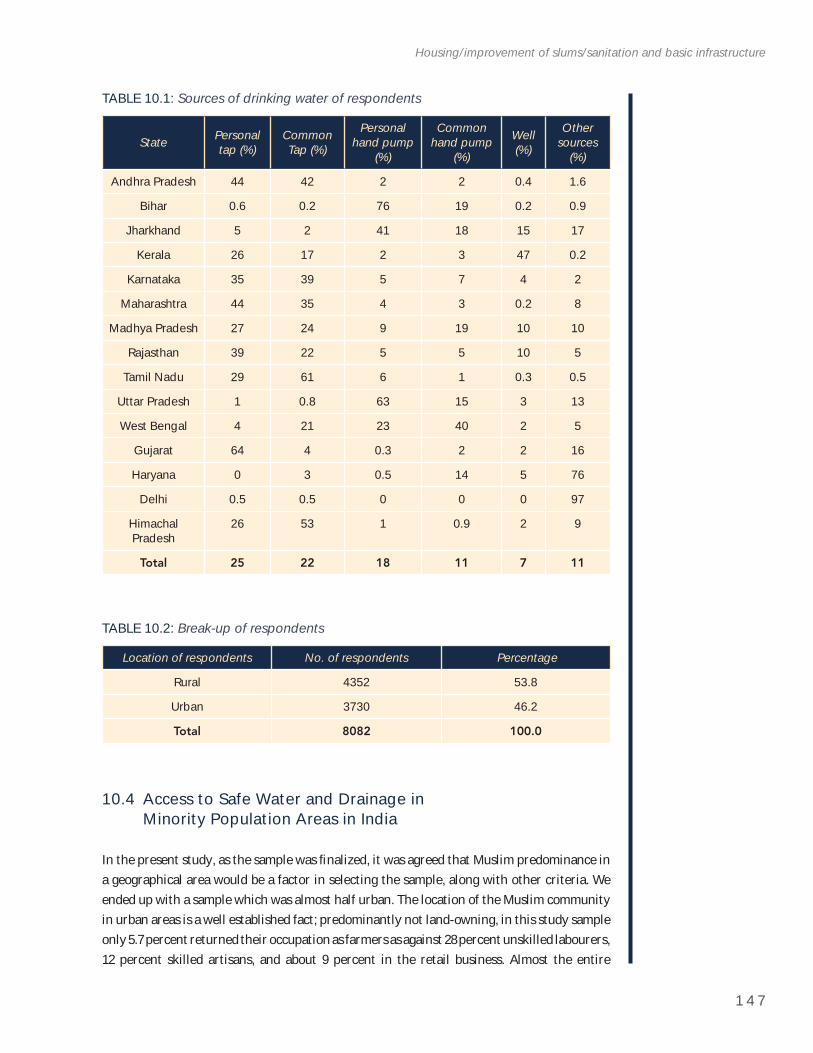
1 4 7
Housing/improvement of slums/sanitation and basic infrastructure
TABLE 10.1: Sources of drinking water of respondents
State Personaltap (%)
CommonTap (%)
Personalhand pump
(%)
Commonhand pump
(%)
Well (%)
Othersources
(%)
Andhra Pradesh 44 42 2 2 0.4 1.6
Bihar 0.6 0.2 76 19 0.2 0.9
Jharkhand 5 2 41 18 15 17
Kerala 26 17 2 3 47 0.2
Karnataka 35 39 5 7 4 2
Maharashtra 44 35 4 3 0.2 8
Madhya Pradesh 27 24 9 19 10 10
Rajasthan 39 22 5 5 10 5
Tamil Nadu 29 61 6 1 0.3 0.5
Uttar Pradesh 1 0.8 63 15 3 13
West Bengal 4 21 23 40 2 5
Gujarat 64 4 0.3 2 2 16
Haryana 0 3 0.5 14 5 76
Delhi 0.5 0.5 0 0 0 97
HimachalPradesh
26 53 1 0.9 2 9
Total 25 22 18 11 7 11
TABLE 10.2: Break-up of respondents
Location of respondents No. of respondents Percentage
Rural 4352 53.8
Urban 3730 46.2
Total 8082 100.0
10.4 Access to Safe Water and Drainage in Minority Population Areas in India
In the present study, as the sample was fi nalized, it was agreed that Muslim predominance in a geographical area would be a factor in selecting the sample, along with other criteria. We ended up with a sample which was almost half urban. The location of the Muslim community in urban areas is a well established fact; predominantly not land-owning, in this study sample only 5.7 percent returned their occupation as farmers as against 28 percent unskilled labourers, 12 percent skilled artisans, and about 9 percent in the retail business. Almost the entire
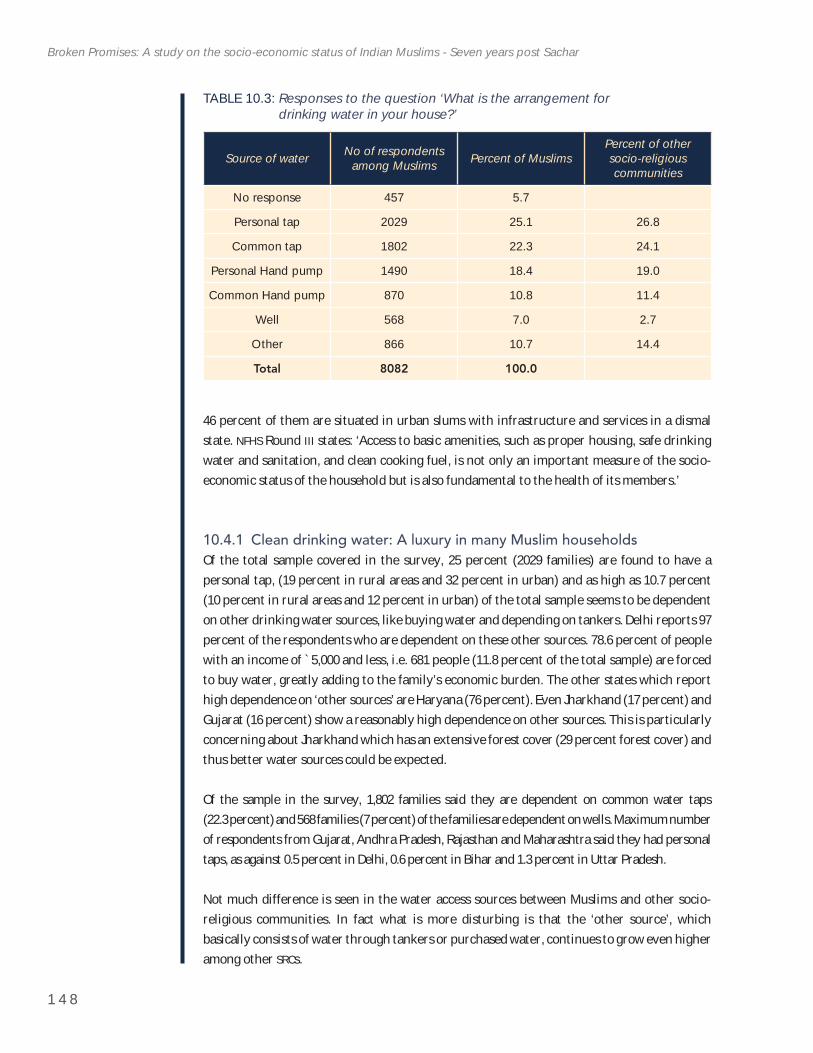
1 4 8
Broken Promises: A study on the socio-economic status of Indian Muslims - Seven years post Sachar
46 percent of them are situated in urban slums with infrastructure and services in a dismal state. NFHS Round III states: ‘Access to basic amenities, such as proper housing, safe drinking water and sanitation, and clean cooking fuel, is not only an important measure of the socio-economic status of the household but is also fundamental to the health of its members.’
10.4.1 Clean drinking water: A luxury in many Muslim householdsOf the total sample covered in the survey, 25 percent (2029 families) are found to have a personal tap, (19 percent in rural areas and 32 percent in urban) and as high as 10.7 percent (10 percent in rural areas and 12 percent in urban) of the total sample seems to be dependent on other drinking water sources, like buying water and depending on tankers. Delhi reports 97 percent of the respondents who are dependent on these other sources. 78.6 percent of people with an income of `5,000 and less, i.e. 681 people (11.8 percent of the total sample) are forced to buy water, greatly adding to the family’s economic burden. The other states which report high dependence on ‘other sources’ are Haryana (76 percent). Even Jharkhand (17 percent) and Gujarat (16 percent) show a reasonably high dependence on other sources. This is particularly concerning about Jharkhand which has an extensive forest cover (29 percent forest cover) and thus better water sources could be expected.
Of the sample in the survey, 1,802 families said they are dependent on common water taps (22.3 percent) and 568 families (7 percent) of the families are dependent on wells. Maximum number of respondents from Gujarat, Andhra Pradesh, Rajasthan and Maharashtra said they had personal taps, as against 0.5 percent in Delhi, 0.6 percent in Bihar and 1.3 percent in Uttar Pradesh.
Not much difference is seen in the water access sources between Muslims and other socio-religious communities. In fact what is more disturbing is that the ‘other source’, which basically consists of water through tankers or purchased water, continues to grow even higher among other SRCs.
TABLE 10.3: Responses to the question ‘What is the arrangement for drinking water in your house?’
Source of water No of respondents among Muslims Percent of Muslims
Percent of other socio-religious communities
No response 457 5.7
Personal tap 2029 25.1 26.8
Common tap 1802 22.3 24.1
Personal Hand pump 1490 18.4 19.0
Common Hand pump 870 10.8 11.4
Well 568 7.0 2.7
Other 866 10.7 14.4
Total 8082 100.0
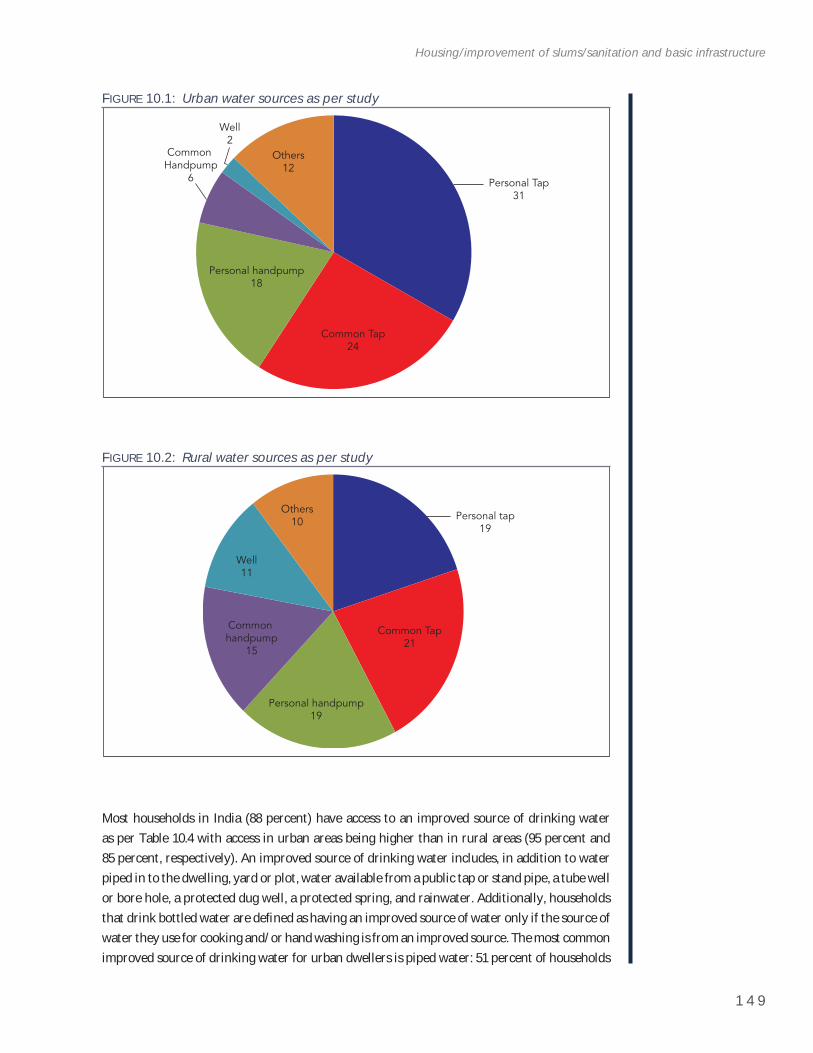
1 4 9
Housing/improvement of slums/sanitation and basic infrastructure
Personal Tap31
Common Tap24
Personal handpump18
Common Handpump
6
Well2
Others12
Most households in India (88 percent) have access to an improved source of drinking water as per Table 10.4 with access in urban areas being higher than in rural areas (95 percent and 85 percent, respectively). An improved source of drinking water includes, in addition to water piped in to the dwelling, yard or plot, water available from a public tap or stand pipe, a tube well or bore hole, a protected dug well, a protected spring, and rainwater. Additionally, households that drink bottled water are defi ned as having an improved source of water only if the source of water they use for cooking and/or hand washing is from an improved source. The most common improved source of drinking water for urban dwellers is piped water: 51 percent of households
FIGURE 10.1: Urban water sources as per study
Personal tap19
Common Tap21
Personal handpump19
Common handpump
15
Well11
Others10
FIGURE 10.2: Rural water sources as per study
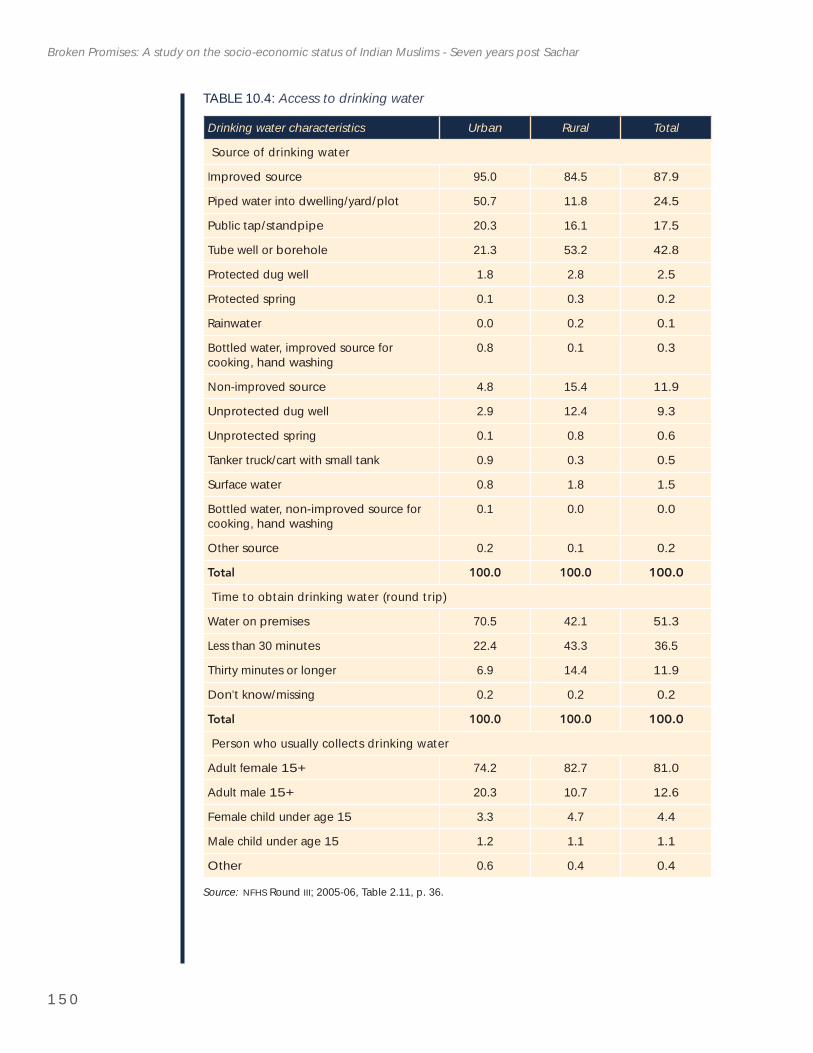
1 5 0
Broken Promises: A study on the socio-economic status of Indian Muslims - Seven years post Sachar
TABLE 10.4: Access to drinking water
Drinking water characteristics Urban Rural Total
Source of drinking water
Improved source 95.0 84.5 87.9
Piped water into dwelling/yard/plot 50.7 11.8 24.5
Public tap/standpipe 20.3 16.1 17.5
Tube well or borehole 21.3 53.2 42.8
Protected dug well 1.8 2.8 2.5
Protected spring 0.1 0.3 0.2
Rainwater 0.0 0.2 0.1
Bottled water, improved source for cooking, hand washing
0.8 0.1 0.3
Non-improved source 4.8 15.4 11.9
Unprotected dug well 2.9 12.4 9.3
Unprotected spring 0.1 0.8 0.6
Tanker truck/cart with small tank 0.9 0.3 0.5
Surface water 0.8 1.8 1.5
Bottled water, non-improved source for cooking, hand washing
0.1 0.0 0.0
Other source 0.2 0.1 0.2
Total 100.0 100.0 100.0
Time to obtain drinking water (round trip)
Water on premises 70.5 42.1 51.3
Less than 30 minutes 22.4 43.3 36.5
Thirty minutes or longer 6.9 14.4 11.9
Don’t know/missing 0.2 0.2 0.2
Total 100.0 100.0 100.0
Person who usually collects drinking water
Adult female 15+ 74.2 82.7 81.0
Adult male 15+ 20.3 10.7 12.6
Female child under age 15 3.3 4.7 4.4
Male child under age 15 1.2 1.1 1.1
Other 0.6 0.4 0.4
Source: NFHS Round III; 2005-06, Table 2.11, p. 36.
1 5 1
Housing/improvement of slums/sanitation and basic infrastructure
71. NFHS Round III.
use water that is piped into their living area and 20 percent use a public tap. On the other hand, only 28 percent of households in rural areas have access to piped water. Most people in rural areas obtain their drinking water from a tube well or borehole (53 percent); however, one in eight rural households gets their drinking water from unprotected wells or springs. In NFHS-III,households that did not have access to water on their residential premises, were asked for the typical time it takes to go to the water source, get water, and return with the water, and for the person who usually goes to collect the water. Half the households in India reported having drinking water on their premises, 37 percent of households do not have water on their premises and it takes less than 30 minutes for a round trip to fetch drinking water and for the remaining 12 percent who also do not have water on their premises, one round-trip to fetch water takes more than half an hour. Urban households are more likely to have a source of drinking water on their premises (71 percent) than are rural households (42 percent). In rural areas, for one in seven households, each round trip to collect water takes at least half an hour. In 81 percent of households that do not have a source of drinking water on the premises, it is an adult female who usually collects the water. Female children under age 15 are more than four times as likely as male children of the same age to go to fetch drinking water. 71
No water, no roads, no anganwadi. A settlement as old as independence with 86 families and a population of 850 people in Renwal, Village Sultania, Pachala Panchayat, Tehesil – Phagi, Dist – Jaipur, RajasthanAfter 65 years of independence there is still no road, no anganwadi centres, no photo ID cards for the people. There are 40 government water connection points in this area but none is functional. Says Jamal Mohammad sahib, ‘how do we pay bills for non functional water points?’ Governments offi cials say pay the bill fi rst, and then only we will supply water. The water resources department dug a bore well and constructed a water storage tank six months back, but the connection from boring to storage tank is yet to be done. And to top it, the water has high fl uoride content and leads to illness.
Poor drinking water quality was a story repeated in the course of our discussions in each and every state that we held community consultations in.
The Sachar Committee Report says that Muslim concentration localities are said not to have anganwadis, ration shops and government schools. While offi cials denied any discrimination in the provision of these services in Muslim areas, the residents of these areas were convinced of it. Some attributed it to historical reasons and referred to it as the usual ‘developmental lag’; others felt that the low participation of Muslims in local self-government bodies resulted in developmental benefi ts failing to reach areas of Muslim concentration.
Yellow water in Karnataka!The government has installed water pipelines, say the people of Yarab Nagar and Doddana Nagar in Bengaluru, Karnataka, but there is no water. The problem is grievous where Muslims and Tamils reside; the women say that this is the condition of all the slums here.
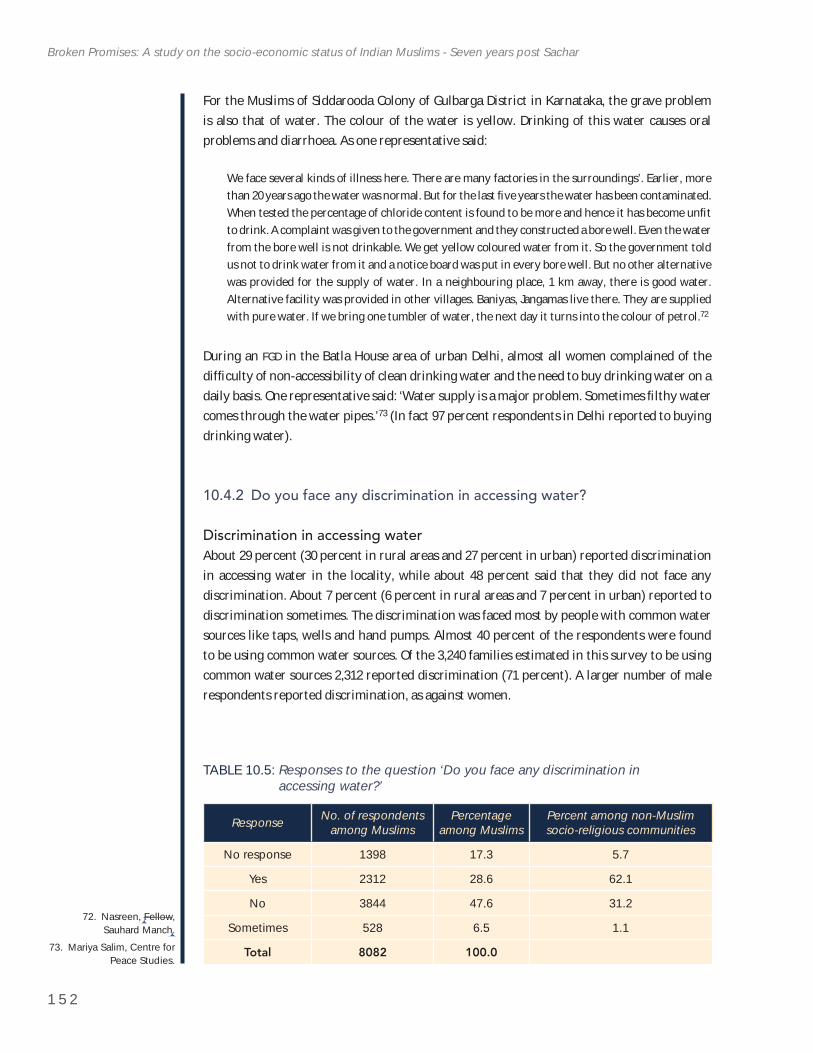
1 5 2
Broken Promises: A study on the socio-economic status of Indian Muslims - Seven years post Sachar
72. Nasreen, Fellow, Sauhard Manch.
73. Mariya Salim, Centre for Peace Studies.
For the Muslims of Siddarooda Colony of Gulbarga District in Karnataka, the grave problem is also that of water. The colour of the water is yellow. Drinking of this water causes oral problems and diarrhoea. As one representative said:
We face several kinds of illness here. There are many factories in the surroundings’. Earlier, more than 20 years ago the water was normal. But for the last fi ve years the water has been contaminated. When tested the percentage of chloride content is found to be more and hence it has become unfi t to drink. A complaint was given to the government and they constructed a bore well. Even the water from the bore well is not drinkable. We get yellow coloured water from it. So the government told us not to drink water from it and a notice board was put in every bore well. But no other alternative was provided for the supply of water. In a neighbouring place, 1 km away, there is good water. Alternative facility was provided in other villages. Baniyas, Jangamas live there. They are supplied with pure water. If we bring one tumbler of water, the next day it turns into the colour of petrol.72
During an FGD in the Batla House area of urban Delhi, almost all women complained of the diffi culty of non-accessibility of clean drinking water and the need to buy drinking water on a daily basis. One representative said: ‘Water supply is a major problem. Sometimes fi lthy water comes through the water pipes.’73 (In fact 97 percent respondents in Delhi reported to buying drinking water).
10.4.2 Do you face any discrimination in accessing water?
Discrimination in accessing waterAbout 29 percent (30 percent in rural areas and 27 percent in urban) reported discrimination in accessing water in the locality, while about 48 percent said that they did not face any discrimination. About 7 percent (6 percent in rural areas and 7 percent in urban) reported to discrimination sometimes. The discrimination was faced most by people with common water sources like taps, wells and hand pumps. Almost 40 percent of the respondents were found to be using common water sources. Of the 3,240 families estimated in this survey to be using common water sources 2,312 reported discrimination (71 percent). A larger number of male respondents reported discrimination, as against women.
TABLE 10.5: Responses to the question ‘Do you face any discrimination in accessing water?’
Response No. of respondents among Muslims
Percentage among Muslims
Percent among non-Muslim socio-religious communities
No response 1398 17.3 5.7
Yes 2312 28.6 62.1
No 3844 47.6 31.2
Sometimes 528 6.5 1.1
Total 8082 100.0
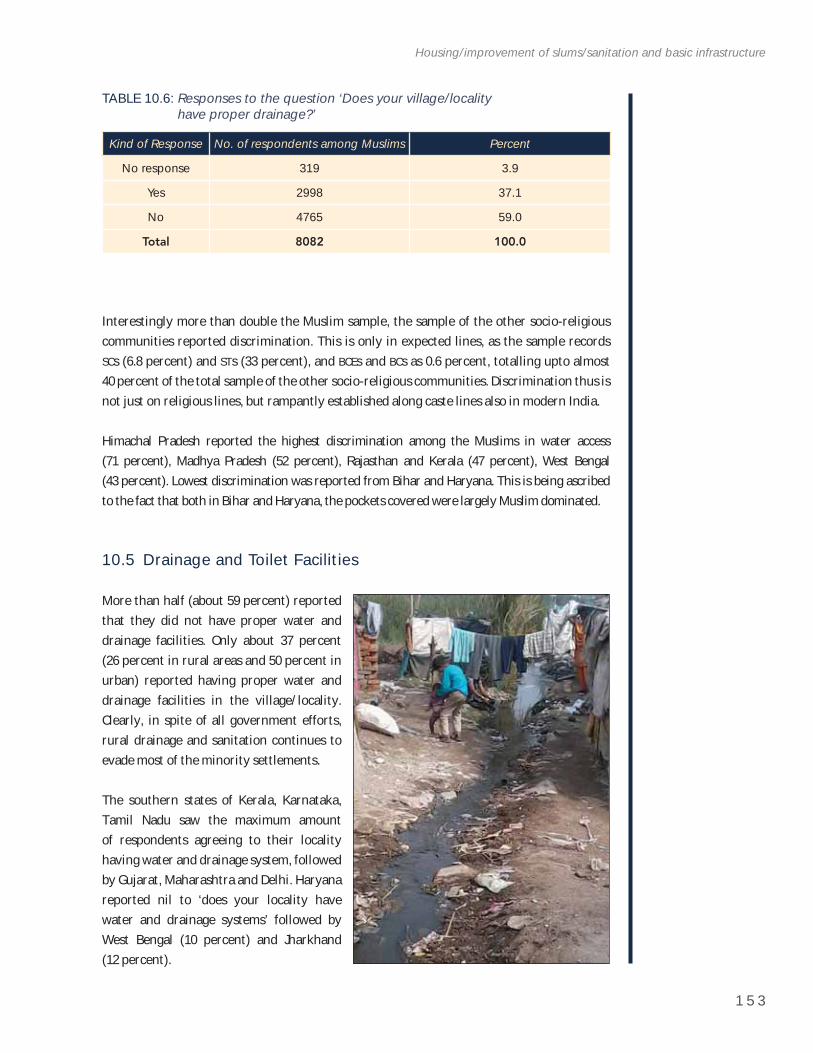
1 5 3
Housing/improvement of slums/sanitation and basic infrastructure
Interestingly more than double the Muslim sample, the sample of the other socio-religious communities reported discrimination. This is only in expected lines, as the sample records SCs (6.8 percent) and STs (33 percent), and BCEs and BCs as 0.6 percent, totalling upto almost 40 percent of the total sample of the other socio-religious communities. Discrimination thus is not just on religious lines, but rampantly established along caste lines also in modern India.
Himachal Pradesh reported the highest discrimination among the Muslims in water access (71 percent), Madhya Pradesh (52 percent), Rajasthan and Kerala (47 percent), West Bengal (43 percent). Lowest discrimination was reported from Bihar and Haryana. This is being ascribed to the fact that both in Bihar and Haryana, the pockets covered were largely Muslim dominated.
10.5 Drainage and Toilet Facilities
More than half (about 59 percent) reported that they did not have proper water and drainage facilities. Only about 37 percent (26 percent in rural areas and 50 percent in urban) reported having proper water and drainage facilities in the village/locality. Clearly, in spite of all government efforts, rural drainage and sanitation continues to evade most of the minority settlements.
The southern states of Kerala, Karnataka, Tamil Nadu saw the maximum amount of respondents agreeing to their locality having water and drainage system, followed by Gujarat, Maharashtra and Delhi. Haryana reported nil to ‘does your locality have water and drainage systems’ followed by West Bengal (10 percent) and Jharkhand (12 percent).
TABLE 10.6: Responses to the question ‘Does your village/locality have proper drainage?’
Kind of Response No. of respondents among Muslims Percent
No response 319 3.9
Yes 2998 37.1
No 4765 59.0
Total 8082 100.0
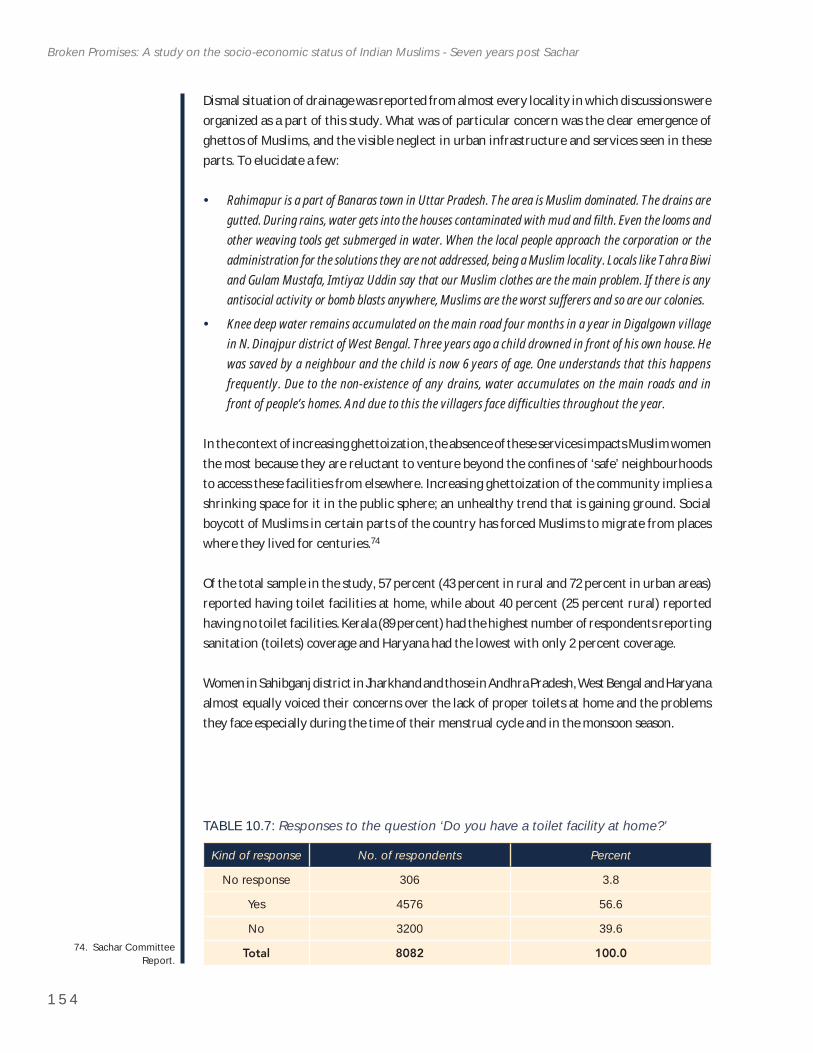
1 5 4
Broken Promises: A study on the socio-economic status of Indian Muslims - Seven years post Sachar
74. Sachar Committee Report.
Dismal situation of drainage was reported from almost every locality in which discussions were organized as a part of this study. What was of particular concern was the clear emergence of ghettos of Muslims, and the visible neglect in urban infrastructure and services seen in these parts. To elucidate a few:
Rahimapur is a part of Banaras town in Uttar Pradesh. The area is Muslim dominated. The drains are gutted. During rains, water gets into the houses contaminated with mud and fi lth. Even the looms and other weaving tools get submerged in water. When the local people approach the corporation or the administration for the solutions they are not addressed, being a Muslim locality. Locals like Tahra Biwi and Gulam Mustafa, Imtiyaz Uddin say that our Muslim clothes are the main problem. If there is any antisocial activity or bomb blasts anywhere, Muslims are the worst sufferers and so are our colonies.
Knee deep water remains accumulated on the main road four months in a year in Digalgown village in N. Dinajpur district of West Bengal. Three years ago a child drowned in front of his own house. He was saved by a neighbour and the child is now 6 years of age. One understands that this happens frequently. Due to the non-existence of any drains, water accumulates on the main roads and in front of people’s homes. And due to this the villagers face diffi culties throughout the year.
In the context of increasing ghettoization, the absence of these services impacts Muslim women the most because they are reluctant to venture beyond the confi nes of ‘safe’ neighbourhoods to access these facilities from elsewhere. Increasing ghettoization of the community implies a shrinking space for it in the public sphere; an unhealthy trend that is gaining ground. Social boycott of Muslims in certain parts of the country has forced Muslims to migrate from places where they lived for centuries.74
Of the total sample in the study, 57 percent (43 percent in rural and 72 percent in urban areas) reported having toilet facilities at home, while about 40 percent (25 percent rural) reported having no toilet facilities. Kerala (89 percent) had the highest number of respondents reporting sanitation (toilets) coverage and Haryana had the lowest with only 2 percent coverage.
Women in Sahibganj district in Jharkhand and those in Andhra Pradesh, West Bengal and Haryana almost equally voiced their concerns over the lack of proper toilets at home and the problems they face especially during the time of their menstrual cycle and in the monsoon season.
TABLE 10.7: Responses to the question ‘Do you have a toilet facility at home?’
Kind of response No. of respondents Percent
No response 306 3.8
Yes 4576 56.6
No 3200 39.6
Total 8082 100.0
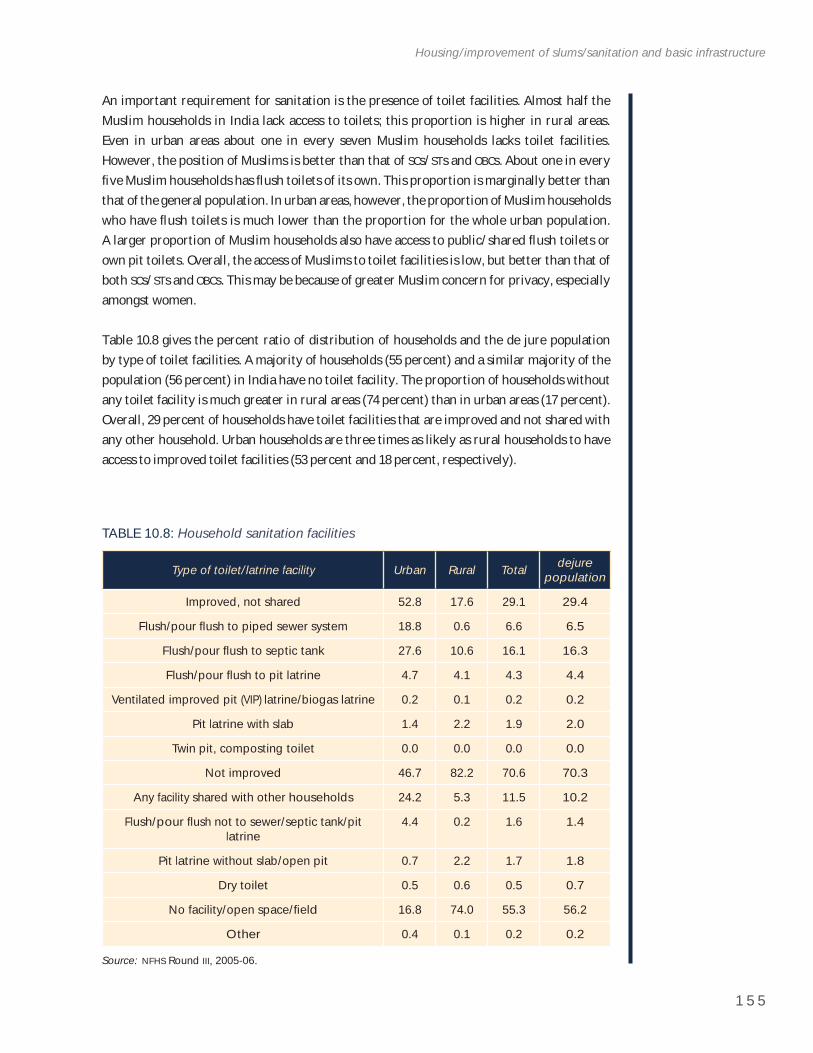
1 5 5
Housing/improvement of slums/sanitation and basic infrastructure
An important requirement for sanitation is the presence of toilet facilities. Almost half the Muslim households in India lack access to toilets; this proportion is higher in rural areas. Even in urban areas about one in every seven Muslim households lacks toilet facilities. However, the position of Muslims is better than that of SCs/STs and OBCs. About one in every fi ve Muslim households has fl ush toilets of its own. This proportion is marginally better than that of the general population. In urban areas, however, the proportion of Muslim households who have fl ush toilets is much lower than the proportion for the whole urban population. A larger proportion of Muslim households also have access to public/shared fl ush toilets or own pit toilets. Overall, the access of Muslims to toilet facilities is low, but better than that of both SCs/STs and OBCs. This may be because of greater Muslim concern for privacy, especially amongst women.
Table 10.8 gives the percent ratio of distribution of households and the de jure population by type of toilet facilities. A majority of households (55 percent) and a similar majority of the population (56 percent) in India have no toilet facility. The proportion of households without any toilet facility is much greater in rural areas (74 percent) than in urban areas (17 percent). Overall, 29 percent of households have toilet facilities that are improved and not shared with any other household. Urban households are three times as likely as rural households to have access to improved toilet facilities (53 percent and 18 percent, respectively).
TABLE 10.8: Household sanitation facilities
Type of toilet/latrine facility Urban Rural Total dejurepopulation
Improved, not shared 52.8 17.6 29.1 29.4
Flush/pour fl ush to piped sewer system 18.8 0.6 6.6 6.5
Flush/pour fl ush to septic tank 27.6 10.6 16.1 16.3
Flush/pour fl ush to pit latrine 4.7 4.1 4.3 4.4
Ventilated improved pit (VIP) latrine/biogas latrine 0.2 0.1 0.2 0.2
Pit latrine with slab 1.4 2.2 1.9 2.0
Twin pit, composting toilet 0.0 0.0 0.0 0.0
Not improved 46.7 82.2 70.6 70.3
Any facility shared with other households 24.2 5.3 11.5 10.2
Flush/pour fl ush not to sewer/septic tank/pit latrine
4.4 0.2 1.6 1.4
Pit latrine without slab/open pit 0.7 2.2 1.7 1.8
Dry toilet 0.5 0.6 0.5 0.7
No facility/open space/fi eld 16.8 74.0 55.3 56.2
Other 0.4 0.1 0.2 0.2
Source: NFHS Round III, 2005-06.
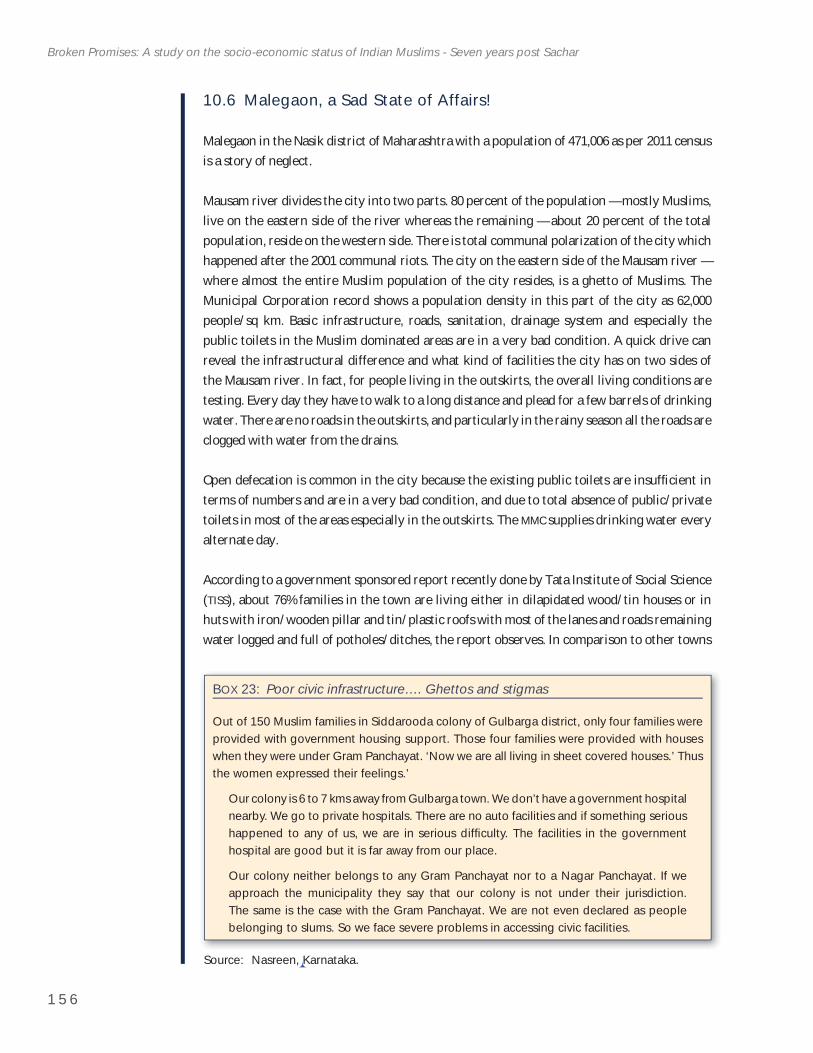
1 5 6
Broken Promises: A study on the socio-economic status of Indian Muslims - Seven years post Sachar
10.6 Malegaon, a Sad State of Affairs!
Malegaon in the Nasik district of Maharashtra with a population of 471,006 as per 2011 census is a story of neglect.
Mausam river divides the city into two parts. 80 percent of the population — mostly Muslims, live on the eastern side of the river whereas the remaining — about 20 percent of the total population, reside on the western side. There is total communal polarization of the city which happened after the 2001 communal riots. The city on the eastern side of the Mausam river — where almost the entire Muslim population of the city resides, is a ghetto of Muslims. The Municipal Corporation record shows a population density in this part of the city as 62,000 people/sq km. Basic infrastructure, roads, sanitation, drainage system and especially the public toilets in the Muslim dominated areas are in a very bad condition. A quick drive can reveal the infrastructural difference and what kind of facilities the city has on two sides of the Mausam river. In fact, for people living in the outskirts, the overall living conditions are testing. Every day they have to walk to a long distance and plead for a few barrels of drinking water. There are no roads in the outskirts, and particularly in the rainy season all the roads are clogged with water from the drains.
Open defecation is common in the city because the existing public toilets are insuffi cient in terms of numbers and are in a very bad condition, and due to total absence of public/private toilets in most of the areas especially in the outskirts. The MMC supplies drinking water every alternate day.
According to a government sponsored report recently done by Tata Institute of Social Science (TISS), about 76% families in the town are living either in dilapidated wood/tin houses or in huts with iron/wooden pillar and tin/plastic roofs with most of the lanes and roads remaining water logged and full of potholes/ditches, the report observes. In comparison to other towns
BOX 23: Poor civic infrastructure…. Ghettos and stigmas
Out of 150 Muslim families in Siddarooda colony of Gulbarga district, only four families were provided with government housing support. Those four families were provided with houses when they were under Gram Panchayat. ‘Now we are all living in sheet covered houses.’ Thus the women expressed their feelings.’
Our colony is 6 to 7 kms away from Gulbarga town. We don’t have a government hospital nearby. We go to private hospitals. There are no auto facilities and if something serious happened to any of us, we are in serious diffi culty. The facilities in the government hospital are good but it is far away from our place.
Our colony neither belongs to any Gram Panchayat nor to a Nagar Panchayat. If we approach the municipality they say that our colony is not under their jurisdiction. The same is the case with the Gram Panchayat. We are not even declared as people belonging to slums. So we face severe problems in accessing civic facilities.
Source: Nasreen, Karnataka.
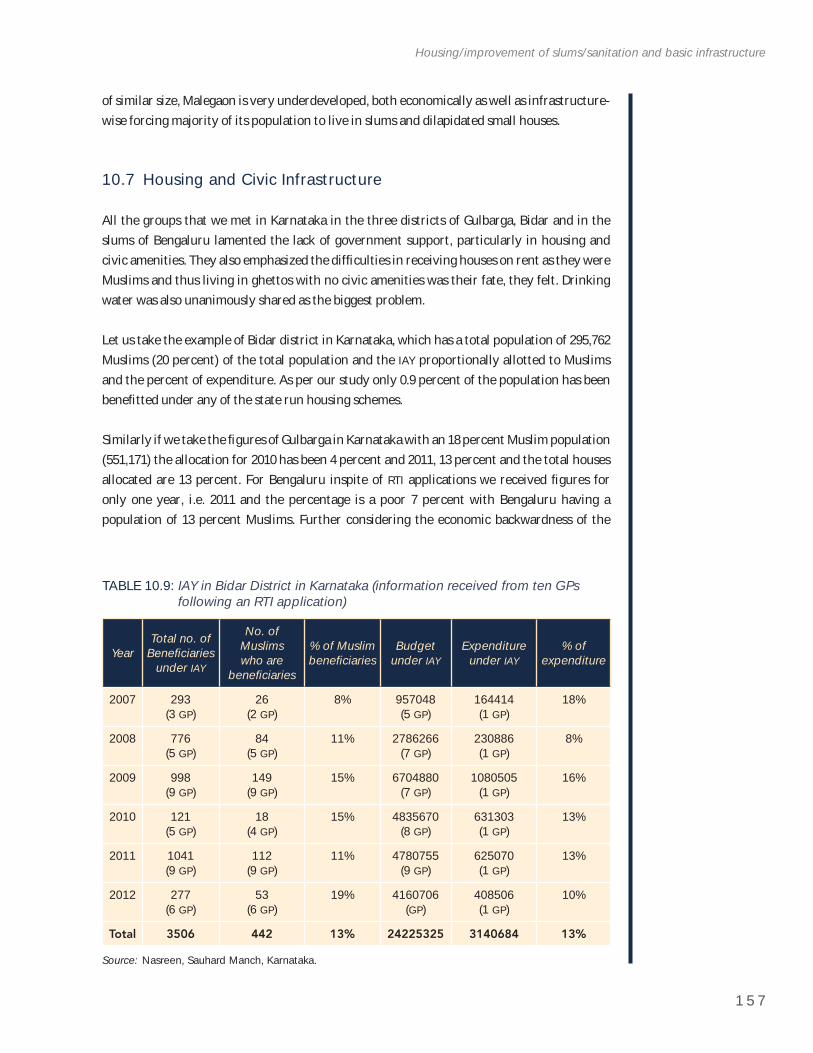
1 5 7
Housing/improvement of slums/sanitation and basic infrastructure
of similar size, Malegaon is very underdeveloped, both economically as well as infrastructure-wise forcing majority of its population to live in slums and dilapidated small houses.
10.7 Housing and Civic Infrastructure
All the groups that we met in Karnataka in the three districts of Gulbarga, Bidar and in the slums of Bengaluru lamented the lack of government support, particularly in housing and civic amenities. They also emphasized the diffi culties in receiving houses on rent as they were Muslims and thus living in ghettos with no civic amenities was their fate, they felt. Drinking water was also unanimously shared as the biggest problem.
Let us take the example of Bidar district in Karnataka, which has a total population of 295,762 Muslims (20 percent) of the total population and the IAY proportionally allotted to Muslims and the percent of expenditure. As per our study only 0.9 percent of the population has been benefi tted under any of the state run housing schemes.
Similarly if we take the fi gures of Gulbarga in Karnataka with an 18 percent Muslim population (551,171) the allocation for 2010 has been 4 percent and 2011, 13 percent and the total houses allocated are 13 percent. For Bengaluru inspite of RTI applications we received fi gures for only one year, i.e. 2011 and the percentage is a poor 7 percent with Bengaluru having a population of 13 percent Muslims. Further considering the economic backwardness of the
TABLE 10.9: IAY in Bidar District in Karnataka (information received from ten GPs following an RTI application)
YearTotal no. of
Benefi ciaries under IAY
No. of Muslimswho are
benefi ciaries
% of Muslim benefi ciaries
Budgetunder IAY
Expenditure under IAY
% of expenditure
2007 293 (3 GP)
26(2 GP)
8% 957048 (5 GP)
164414(1 GP)
18%
2008 776 (5 GP)
84(5 GP)
11% 2786266 (7 GP)
230886(1 GP)
8%
2009 998 (9 GP)
149(9 GP)
15% 6704880 (7 GP)
1080505(1 GP)
16%
2010 121(5 GP)
18(4 GP)
15% 4835670 (8 GP)
631303(1 GP)
13%
2011 1041(9 GP)
112(9 GP)
11% 4780755 (9 GP)
625070(1 GP)
13%
2012 277(6 GP)
53(6 GP)
19% 4160706 (GP)
408506(1 GP)
10%
Total 3506 442 13% 24225325 3140684 13%
Source: Nasreen, Sauhard Manch, Karnataka.
1 5 8
Broken Promises: A study on the socio-economic status of Indian Muslims - Seven years post Sachar
75. http://rural.nic.in/sites/downloads/monitoring/
Study%20of%20SGSY%20and%20IAY%20minorities.
pdf.76. Nasreen, Fellow,
Sauhard Manch.
Muslim community in India, the percentage of slum dwellers and BPL families among Muslims is expected to be much higher than the other communities.
While an evaluation study done by the government on SGSY and IAY says….
Most of the States succeeded in earmarking 15% of funds from the IAY allocation towards minorities during the year 2007-08 and 2008-09. When we analysed the percentage utilisation of the earmarked funds for the minorities under the IAY during the year 2007-08, data revealed that the extent of utilisation was 54.96% at all India level. In the seven States where the evaluation study was carried out, the available data revealed that maximum utilisation of funds in favour of the minorities was done in Kerala (106.99%) followed by Uttar Pradesh (66.13%), Bihar (61.74 percent), Jharkhand (57.03 percent), West Bengal (54.21 percent), Karnataka (38.93 percent), and Uttarakhand (36.85 percent). Similarly, when we examine the utilisation of the earmarked funds under the IAY at all India level during the year 2008-09, it increased to 85.29 percent in comparison to the total utilisation of 54.96 percent during the year 2007-09. This clearly shows that the percentage utilisation of the earmarked funds under the IAY for the minorities has increased.75
10.7.1 Comparative study of two slums in BengaluruThis study was conducted with the help of the staff of Bridge Network, a local NGO. For this purpose Gangondanahalli, a Muslim majority slum area and MCT Quarters, a Hindu majority slum area, were selected. The report of the study is given in Table 10.10. 76
10.7.2 Legal electricity connectionsTwenty-three percent reported that they did not have legal electricity connections at home while about 70 percent reported that they had a legal electricity connection. 76 percent of urban people reported to electric connections as against 64 percent rural respondents.
The regional divide was very clear here, with all the four southern states led by Tamil Nadu reporting more than 85 percent houses with electricity. Gujarat follows with 83 percent coverage. The lowest (33 percent) coverage in electricity was reported from Bihar, followed by West Bengal (43 percent) and Delhi (45 percent). A clear picture of two Delhi’s emerge,
BOX 24: No Indira Awas without adequate bribes
Marjina Khatun in Alinagar village in North Dinajpur district of West Bengal told us that a few days ago Abdul Sattar’s and her house was totally destroyed in fi re. On approaching the Municipal authority, they got only one polythene sheet and were told to divide it equally between the two. The approached the local councillor for ex-gratia several times to but it did not yield any results. Similarly the Panchayat demanded `16,000 from Sabin Khatun and Idni Khatun, for allotting IAY houses, which they paid as bribes, but then the Panchayat again demanded another `4,000 from them. They were unable to pay the additional amount and thus were not allotted houses under Indira Awas Yojana. Even in the village of Digalgown of West Bengal, we found no one who had got a house under Indira Awaas Yojna.
Source: Meera Khatun, Sauhard Manch, WB.
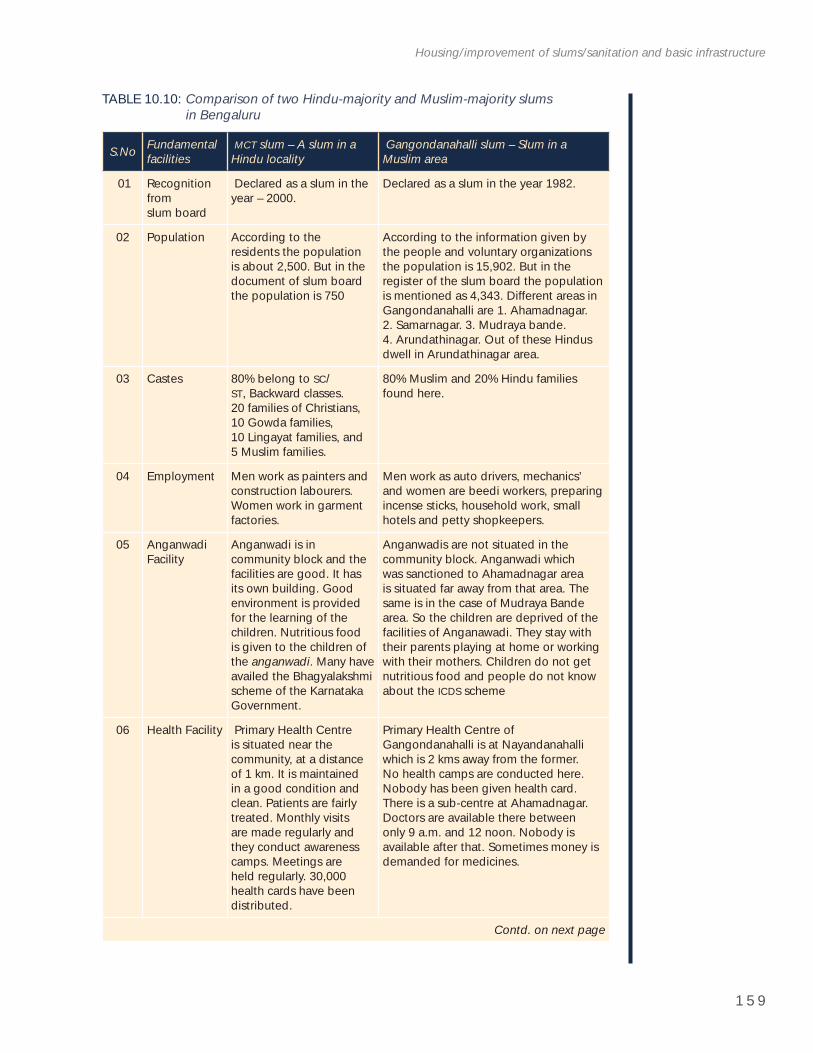
1 5 9
Housing/improvement of slums/sanitation and basic infrastructure
TABLE 10.10: Comparison of two Hindu-majority and Muslim-majority slums in Bengaluru
S.No Fundamentalfacilities
MCT slum – A slum in a Hindu locality
Gangondanahalli slum – Slum in a Muslim area
01 Recognition from slum board
Declared as a slum in the year – 2000.
Declared as a slum in the year 1982.
02 Population According to the residents the population is about 2,500. But in the document of slum board the population is 750
According to the information given by the people and voluntary organizations the population is 15,902. But in the register of the slum board the population is mentioned as 4,343. Different areas in Gangondanahalli are 1. Ahamadnagar. 2. Samarnagar. 3. Mudraya bande. 4. Arundathinagar. Out of these Hindus dwell in Arundathinagar area.
03 Castes 80% belong to SC/ST, Backward classes. 20 families of Christians, 10 Gowda families, 10 Lingayat families, and 5 Muslim families.
80% Muslim and 20% Hindu families found here.
04 Employment Men work as painters and construction labourers. Women work in garment factories.
Men work as auto drivers, mechanics’ and women are beedi workers, preparing incense sticks, household work, small hotels and petty shopkeepers.
05 Anganwadi Facility
Anganwadi is in community block and the facilities are good. It has its own building. Good environment is provided for the learning of the children. Nutritious food is given to the children of the anganwadi. Many have availed the Bhagyalakshmi scheme of the Karnataka Government.
Anganwadis are not situated in the community block. Anganwadi which was sanctioned to Ahamadnagar area is situated far away from that area. The same is in the case of Mudraya Bande area. So the children are deprived of the facilities of Anganawadi. They stay with their parents playing at home or working with their mothers. Children do not get nutritious food and people do not know about the ICDS scheme
06 Health Facility Primary Health Centre is situated near the community, at a distance of 1 km. It is maintained in a good condition and clean. Patients are fairly treated. Monthly visits are made regularly and they conduct awareness camps. Meetings are held regularly. 30,000 health cards have been distributed.
Primary Health Centre of Gangondanahalli is at Nayandanahalli which is 2 kms away from the former. No health camps are conducted here. Nobody has been given health card. There is a sub-centre at Ahamadnagar. Doctors are available there between only 9 a.m. and 12 noon. Nobody is available after that. Sometimes money is demanded for medicines.
Contd. on next page
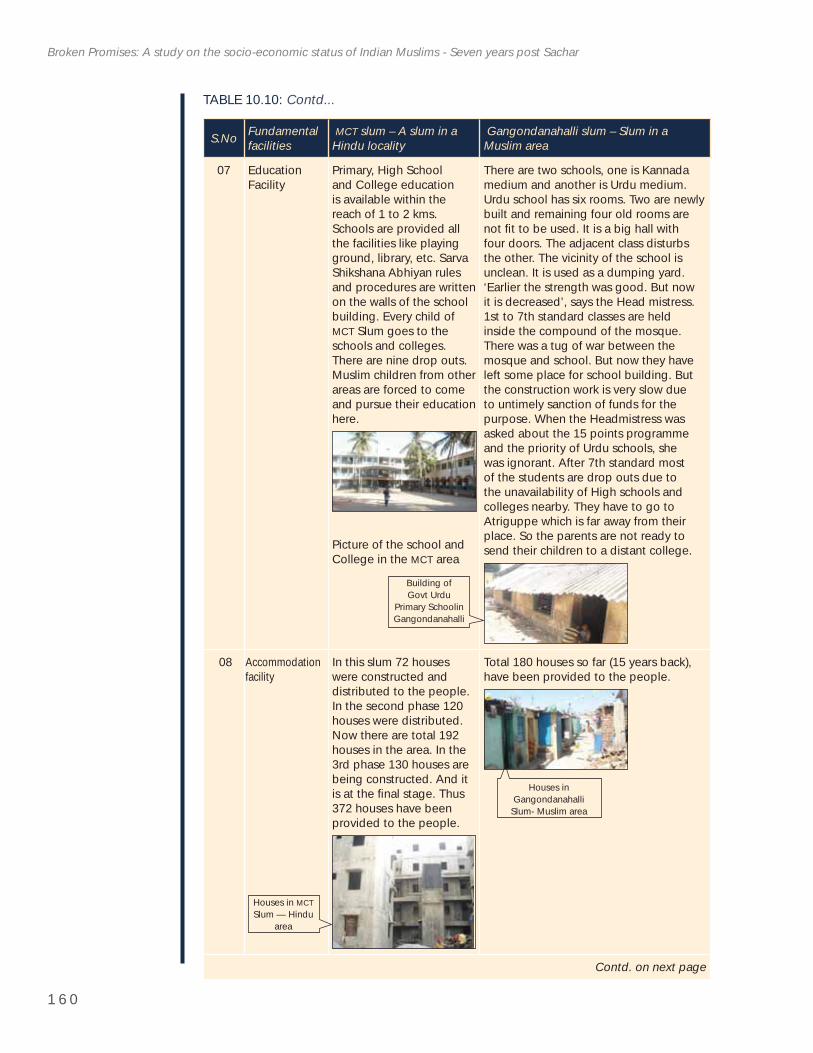
1 6 0
Broken Promises: A study on the socio-economic status of Indian Muslims - Seven years post Sachar
S.No Fundamentalfacilities
MCT slum – A slum in a Hindu locality
Gangondanahalli slum – Slum in a Muslim area
07 Education Facility
Primary, High School and College education is available within the reach of 1 to 2 kms. Schools are provided all the facilities like playing ground, library, etc. Sarva Shikshana Abhiyan rules and procedures are written on the walls of the school building. Every child of MCT Slum goes to the schools and colleges. There are nine drop outs. Muslim children from other areas are forced to come and pursue their education here.
Picture of the school and College in the MCT area
There are two schools, one is Kannada medium and another is Urdu medium. Urdu school has six rooms. Two are newly built and remaining four old rooms are not fi t to be used. It is a big hall with four doors. The adjacent class disturbs the other. The vicinity of the school is unclean. It is used as a dumping yard. ‘Earlier the strength was good. But now it is decreased’, says the Head mistress. 1st to 7th standard classes are held inside the compound of the mosque. There was a tug of war between the mosque and school. But now they have left some place for school building. But the construction work is very slow due to untimely sanction of funds for the purpose. When the Headmistress was asked about the 15 points programme and the priority of Urdu schools, she was ignorant. After 7th standard most of the students are drop outs due to the unavailability of High schools and colleges nearby. They have to go to Atriguppe which is far away from their place. So the parents are not ready to send their children to a distant college.
08 Accommodationfacility
In this slum 72 houses were constructed and distributed to the people. In the second phase 120 houses were distributed. Now there are total 192 houses in the area. In the 3rd phase 130 houses are being constructed. And it is at the fi nal stage. Thus 372 houses have been provided to the people.
Total 180 houses so far (15 years back), have been provided to the people.
Contd. on next page
TABLE 10.10: Contd...
Building of Govt Urdu
Primary Schoolin Gangondanahalli
Houses in MCTSlum — Hindu
area
Houses in Gangondanahalli
Slum- Muslim area
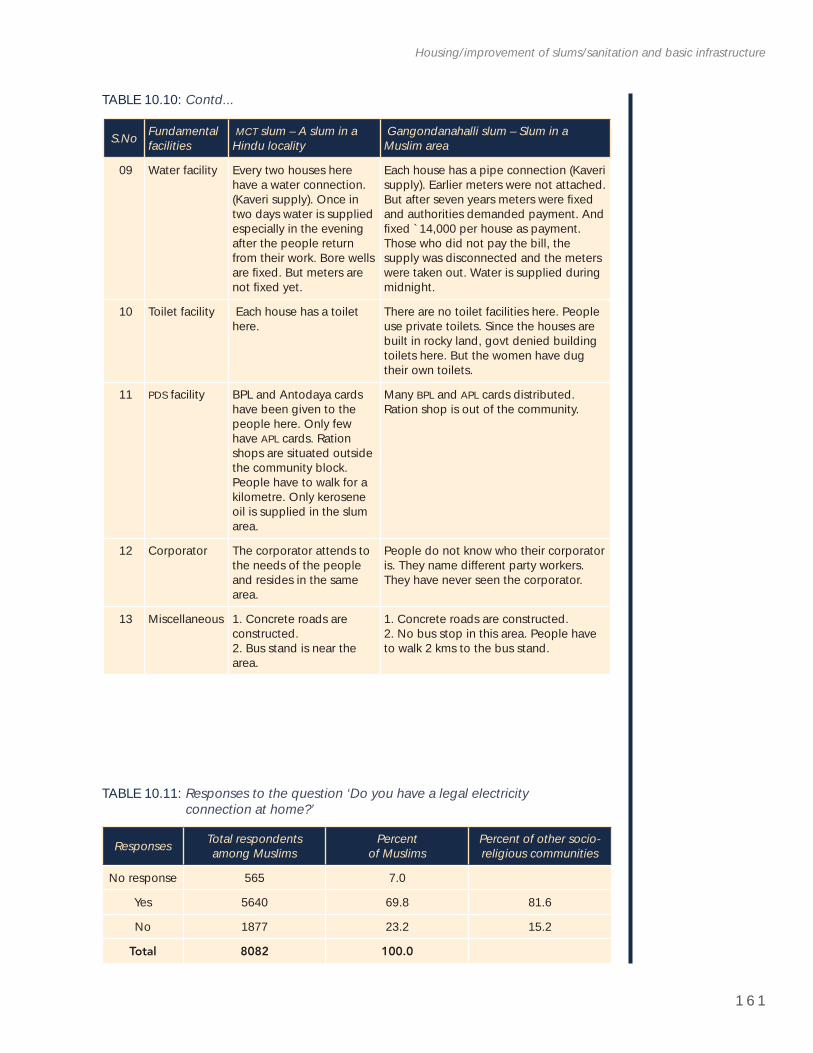
1 6 1
Housing/improvement of slums/sanitation and basic infrastructure
TABLE 10.10: Contd...
S.No Fundamentalfacilities
MCT slum – A slum in a Hindu locality
Gangondanahalli slum – Slum in a Muslim area
09 Water facility Every two houses here have a water connection. (Kaveri supply). Once in two days water is supplied especially in the evening after the people return from their work. Bore wells are fi xed. But meters are not fi xed yet.
Each house has a pipe connection (Kaveri supply). Earlier meters were not attached. But after seven years meters were fi xed and authorities demanded payment. And fi xed `14,000 per house as payment. Those who did not pay the bill, the supply was disconnected and the meters were taken out. Water is supplied during midnight.
10 Toilet facility Each house has a toilet here.
There are no toilet facilities here. People use private toilets. Since the houses are built in rocky land, govt denied building toilets here. But the women have dug their own toilets.
11 PDS facility BPL and Antodaya cards have been given to the people here. Only few have APL cards. Ration shops are situated outside the community block. People have to walk for a kilometre. Only kerosene oil is supplied in the slum area.
Many BPL and APL cards distributed. Ration shop is out of the community.
12 Corporator The corporator attends to the needs of the people and resides in the same area.
People do not know who their corporator is. They name different party workers. They have never seen the corporator.
13 Miscellaneous 1. Concrete roads are constructed.2. Bus stand is near the area.
1. Concrete roads are constructed.2. No bus stop in this area. People have to walk 2 kms to the bus stand.
TABLE 10.11: Responses to the question ‘Do you have a legal electricity connection at home?’
Responses Total respondents among Muslims
Percent of Muslims
Percent of other socio-religious communities
No response 565 7.0
Yes 5640 69.8 81.6
No 1877 23.2 15.2
Total 8082 100.0
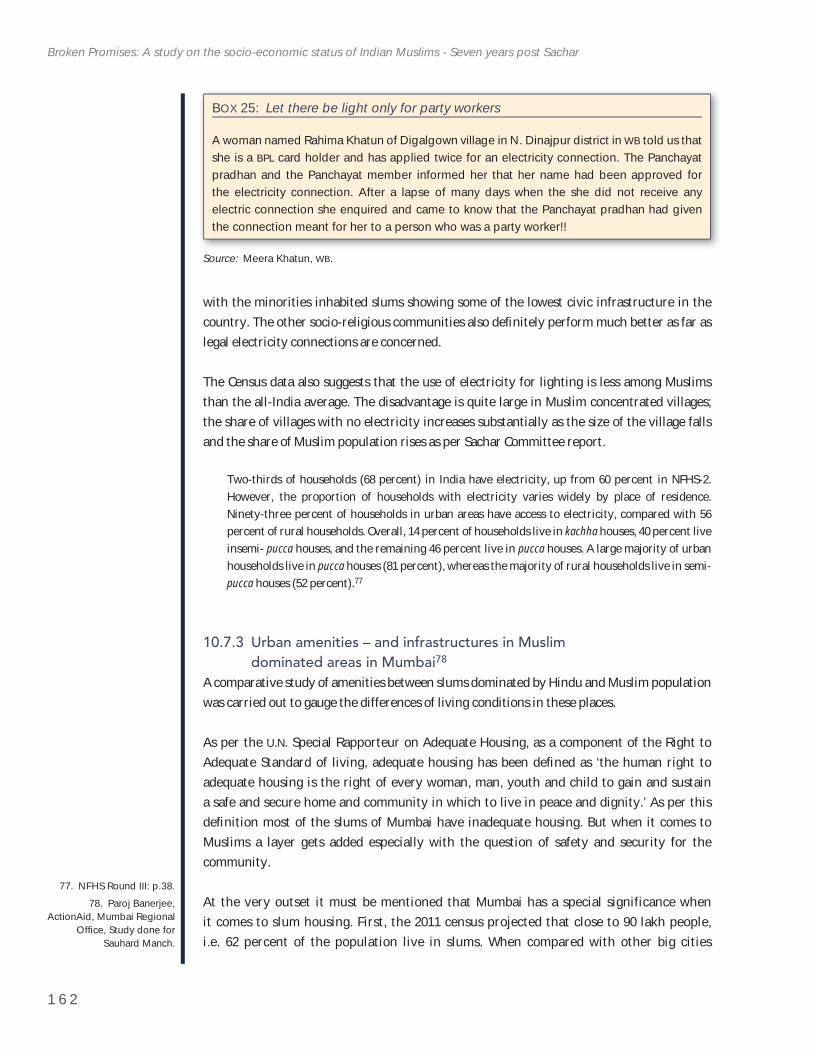
1 6 2
Broken Promises: A study on the socio-economic status of Indian Muslims - Seven years post Sachar
77. NFHS Round III: p.38.78. Paroj Banerjee,
ActionAid, Mumbai Regional Offi ce, Study done for
Sauhard Manch.
with the minorities inhabited slums showing some of the lowest civic infrastructure in the country. The other socio-religious communities also defi nitely perform much better as far as legal electricity connections are concerned.
The Census data also suggests that the use of electricity for lighting is less among Muslims than the all-India average. The disadvantage is quite large in Muslim concentrated villages; the share of villages with no electricity increases substantially as the size of the village falls and the share of Muslim population rises as per Sachar Committee report.
Two-thirds of households (68 percent) in India have electricity, up from 60 percent in NFHS-2. However, the proportion of households with electricity varies widely by place of residence. Ninety-three percent of households in urban areas have access to electricity, compared with 56 percent of rural households. Overall, 14 percent of households live in kachha houses, 40 percent live insemi- pucca houses, and the remaining 46 percent live in pucca houses. A large majority of urban households live in pucca houses (81 percent), whereas the majority of rural households live in semi-pucca houses (52 percent).77
10.7.3 Urban amenities – and infrastructures in Muslim dominated areas in Mumbai78
A comparative study of amenities between slums dominated by Hindu and Muslim population was carried out to gauge the differences of living conditions in these places.
As per the U.N. Special Rapporteur on Adequate Housing, as a component of the Right to Adequate Standard of living, adequate housing has been defi ned as ‘the human right to adequate housing is the right of every woman, man, youth and child to gain and sustain a safe and secure home and community in which to live in peace and dignity.’ As per this defi nition most of the slums of Mumbai have inadequate housing. But when it comes to Muslims a layer gets added especially with the question of safety and security for the community.
At the very outset it must be mentioned that Mumbai has a special significance when it comes to slum housing. First, the 2011 census projected that close to 90 lakh people, i.e. 62 percent of the population live in slums. When compared with other big cities
BOX 25: Let there be light only for party workers
A woman named Rahima Khatun of Digalgown village in N. Dinajpur district in WB told us that she is a BPL card holder and has applied twice for an electricity connection. The Panchayat pradhan and the Panchayat member informed her that her name had been approved for the electricity connection. After a lapse of many days when the she did not receive any electric connection she enquired and came to know that the Panchayat pradhan had given the connection meant for her to a person who was a party worker!!
Source: Meera Khatun, WB.
1 6 3
Housing/improvement of slums/sanitation and basic infrastructure
this number undoubtedly is the highest. Second, unlike most other metropolitan cities slums in Mumbai have proved to be of a special economic significance. This means that slums are not only residential spaces but also spaces for people to earn their livelihood. Third, almost all slums are built in a manner that there are tenements above the ground floor, which sometimes become the house that is usually rented out to families or for commercial purposes. Fourth, unlike most cities (especially Delhi) slums occupy important geographical areas in the city and therefore remain under constant threats of eviction and other forms of harassment from the state, builder lobby and the mafia. Slums in Mumbai therefore have great economic and political significance.
It is a fact that it is often the minority population that lives in the degraded forms of housing like slums. It is the Scheduled Castes, Scheduled Tribes, OBCs and of course Muslims that live in slums. Mumbai is no different. Although most of the slums have mixed population over the years the scene has been drastically changing. Few observations are as such:
There is an increasing formation of Muslim ghettos in the suburban districts of Mumbai. Places like Mumbra, Shivaji Nagar in Mankhurd and Behrampada are ghettos that were formed following the riots of 1992. These places are highly neglected and are under constant scanner of the police. Whenever there is a bomb blast anywhere in the country invariably young men from these areas are framed by the police. The most obvious example is the case of Ishrat Jahan, a young girl who was killed in an encounter by the Gujarat police on the suspicion that she was involved in the terror attack. All the charges against her were proved to be false and fabricated subsequently.
The increase in land values of the central spots in the city are leading to families to sell their plots and shift to suburban areas like Virar. And this formation of settlement is clearly taking place on religious grounds.
Even within slums that have mixed population, Muslims often face gross discrimination which even the SCs/STs sometimes do not face. This will be explained later with examples.
Places which have a domination of Muslims have been highly neglected from state services.
The political representation of Muslims in local administration is very poor if not totally non-existent. The 2012 municipal elections show that there are only 14 Muslim corporators in Mumbai out of the 227 corporators.
The study looked at four different slum pockets in the city to fi nd out the level of discrimination in infrastructure between Muslims and others. Broadly the study was based in two most signifi cant slums of Mumbai-Dharavi (Rajiv Gandhi Nagar and Kumbarwada) and H East ward (Behrampada and Dhywaneshwar Nagar in Bandra.) The reason for selecting Dharavi was that this slum is the oldest slum settlement in Mumbai which dates back to pre-independence. The slums of H East ward occupy a very important position in the city. While the study was conducted to enquire about the status of infrastructure in slums it was also essential to gain an understanding of all
1 6 4
Broken Promises: A study on the socio-economic status of Indian Muslims - Seven years post Sachar
the factors that may affect their lives. The methodology adopted for the study was focused group discussions with residents of the slums.
Kumbarwada, Dharavi – This is where the initial settlers to Dharavi began building their homes. During the colonial regime it was the British who had got potters from Ahmedabad and since then migrants from various parts of the country started coming here. Today, there are people from Karnataka, Maharashtra, Andhra Pradesh and Tamil Nadu living here. One of the major problems of the slum is lack of toilets in their houses. While people have made little spaces in their houses for washing and bathing for other purposes they have to go to toilets located at fi ve minutes distance from their homes. This causes great inconvenience to women especially if they have to use the toilet at wee hours of the morning. As far as roads are concerned, it will be fair to say that leaving the main road, the concept of a road or street is literally non-existent in the area. The lanes are extremely narrow and open drains are running through each lane. The conditions invariably worsen during monsoons. There are some private schools in the area. It is interesting to note that while this area has schools in the respective regional languages of the residents in the area (Tamil, Telugu, Marathi and English) there are no Urdu medium schools. As a result many Muslim girls either drop out after a certain grade while others never go to school.
When enquired if the people sense any communal tensions the participants responded that it was a harmonious neighbourhood. While talking of the 1992 riots they said that Hindu families protected their Muslim neighbours from the rioters. However, they did say that owing to the fear of their lives many Muslims left the area and fl ed to different parts of the city. They also gave example of a very prosperous general store that used to be there in the neighbourhood which was looted during the riots and was never allowed to be set up again. Another interesting feature across Dharavi which was also noticeable in these two areas was that it usually is the Muslims who are the tenants in Dharavi. During the 1992 riots thousands of Muslim families fl ed Dharavi leaving everything behind, including the homes that their previous generations built in Mumbai. When the families came back not only they did not get their houses back, but were forced to live as tenants. In recent debates of Dharavi redevelopment there is no place for tenants. Clearly this a very blatant way by which Muslims are being denied place in the city’s development processes!
Dhyaneshwar Nagar – is a slum community close to Bandra Kurla Complex. It is a post-1995 slum pocket located on the Collector’s Land. It is a linear slum with a population of 15,000 of which there are 12,000 voters. Majority of the people are occupied in the unorganized sector — vending, hawking, construction industry and garment units, auto rickshaw drivers and a few other occupations. Like any other slum in Mumbai, Dnayneshwar Nagar also faces the problems of lack of amenities, no tenural rights, fl ooding due to a tributary of Mithi river that fl ows along the community and an added burden of destroyed amenities because of partial rehabilitation of the community.
The state provides very few services to the area in terms of occasional solid waste management, gas connection and few water connections. The discussants said that once in a while when
1 6 5
Housing/improvement of slums/sanitation and basic infrastructure
the BMC representative comes to clear the garbage they collect `20 from Muslim families and `10 from Hindu families. This is in excess of the salary they get from the BMC contract. Being located in an area of highest land value in Mumbai the community pays much more for services that others living in slums in Mumbai pay. For instance the rent here is as high as `5,000 per tenement. Families here barely earn `8,000 a month. A very blatant form of discrimination that was observed here is that although there was a community centre in the area it was only used for celebration of Hindu festivals like Ganpati and Maha Shivaratri. While it is mandatory for each resident to pay before any big Hindu festival for Eid it is never so proactive. Moreover there are temples within the slum pocket but no mosque. The closest mosque is at a distance of 2 kms.
This area has many resident welfare societies which are meant to work for the well being of the people living in slums. Discussions with the participants led us to realize that in that particular chawl the president of the committee is an extremely communal man. Relating to a recent incident Zubeida Sayeed of CRH, a resident of the area and a member of the Ekta Welfare Society, said that during Eid when she had approached the President of the Society to borrow a CFL lamp to decorate her lane she was refused. She also admitted that Muslim tenants in the slum paid more than others. On top of that whenever a Muslim tenant moves in the person has to report to the local police station. Often the police harass the family and extracts lot of money.
Behrampada – This is perhaps the only predominantly Muslim dominated slum that formed a part of the Mumbai slums study. It was an area that was signifi cantly affected by the riots in 1992-93, following Babri Masjid demolition. In fact there are reports of in-migration of Muslim families from other parts of Mumbai, after the riots. Today Behrampada is a bustling settlement of approximately one lakh population on seven acres of reclaimed land. The land belongs to the Municipal Corporation and is serviced by them. Behrampada is strategically located, close to Bandra Station on the right and Bandra Kurla Complex to the left. A striking feature of Behrampada is the tightly packed vertical structures over 4-5 fl oors, along extremely narrow lanes. The structures are so closely packed that most of the houses do not receive adequate sunlight and ventilation. One of the reasons Behrampada grew vertically is the fact that the area is enclosed on three sides by an open drain, leaving very little scope for horizontal expansion. Majority of the residents work in the informal sectors or in the various garment units present in the community. High density and overcrowding has led to tremendous pressure on the facilities available to the slum population. The open drain encloses the area from three sides which results in fl ooding and contamination of water that runs parallel to the drain is a major cause of health problem that are rampant in the area. Behrampada has complex tenural arrangements which led to exclusion of a number of residents from availing the benefi ts of any rehabilitation or redevelopment package of the government.
AnalysisIn Mumbai life in slums is miserable for all, but for some it means multiple forms of deprivation. In slums having a mixed population there are clear evidences of Muslims
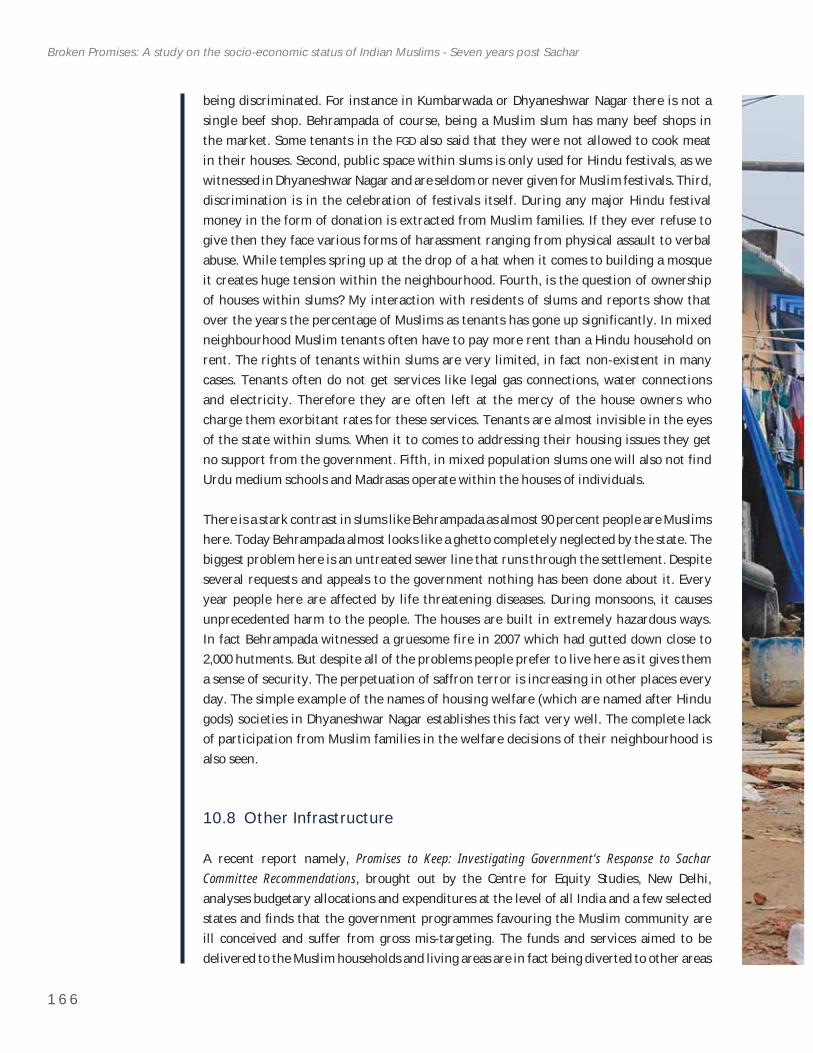
1 6 6
Broken Promises: A study on the socio-economic status of Indian Muslims - Seven years post Sachar
being discriminated. For instance in Kumbarwada or Dhyaneshwar Nagar there is not a single beef shop. Behrampada of course, being a Muslim slum has many beef shops in the market. Some tenants in the FGD also said that they were not allowed to cook meat in their houses. Second, public space within slums is only used for Hindu festivals, as we witnessed in Dhyaneshwar Nagar and are seldom or never given for Muslim festivals. Third, discrimination is in the celebration of festivals itself. During any major Hindu festival money in the form of donation is extracted from Muslim families. If they ever refuse to give then they face various forms of harassment ranging from physical assault to verbal abuse. While temples spring up at the drop of a hat when it comes to building a mosque it creates huge tension within the neighbourhood. Fourth, is the question of ownership of houses within slums? My interaction with residents of slums and reports show that over the years the percentage of Muslims as tenants has gone up significantly. In mixed neighbourhood Muslim tenants often have to pay more rent than a Hindu household on rent. The rights of tenants within slums are very limited, in fact non-existent in many cases. Tenants often do not get services like legal gas connections, water connections and electricity. Therefore they are often left at the mercy of the house owners who charge them exorbitant rates for these services. Tenants are almost invisible in the eyes of the state within slums. When it to comes to addressing their housing issues they get no support from the government. Fifth, in mixed population slums one will also not find Urdu medium schools and Madrasas operate within the houses of individuals.
There is a stark contrast in slums like Behrampada as almost 90 percent people are Muslims here. Today Behrampada almost looks like a ghetto completely neglected by the state. The biggest problem here is an untreated sewer line that runs through the settlement. Despite several requests and appeals to the government nothing has been done about it. Every year people here are affected by life threatening diseases. During monsoons, it causes unprecedented harm to the people. The houses are built in extremely hazardous ways. In fact Behrampada witnessed a gruesome fire in 2007 which had gutted down close to 2,000 hutments. But despite all of the problems people prefer to live here as it gives them a sense of security. The perpetuation of saffron terror is increasing in other places every day. The simple example of the names of housing welfare (which are named after Hindu gods) societies in Dhyaneshwar Nagar establishes this fact very well. The complete lack of participation from Muslim families in the welfare decisions of their neighbourhood is also seen.
10.8 Other Infrastructure
A recent report namely, Promises to Keep: Investigating Government’s Response to Sachar Committee Recommendations, brought out by the Centre for Equity Studies, New Delhi, analyses budgetary allocations and expenditures at the level of all India and a few selected states and fi nds that the government programmes favouring the Muslim community are ill conceived and suffer from gross mis-targeting. The funds and services aimed to be delivered to the Muslim households and living areas are in fact being diverted to other areas
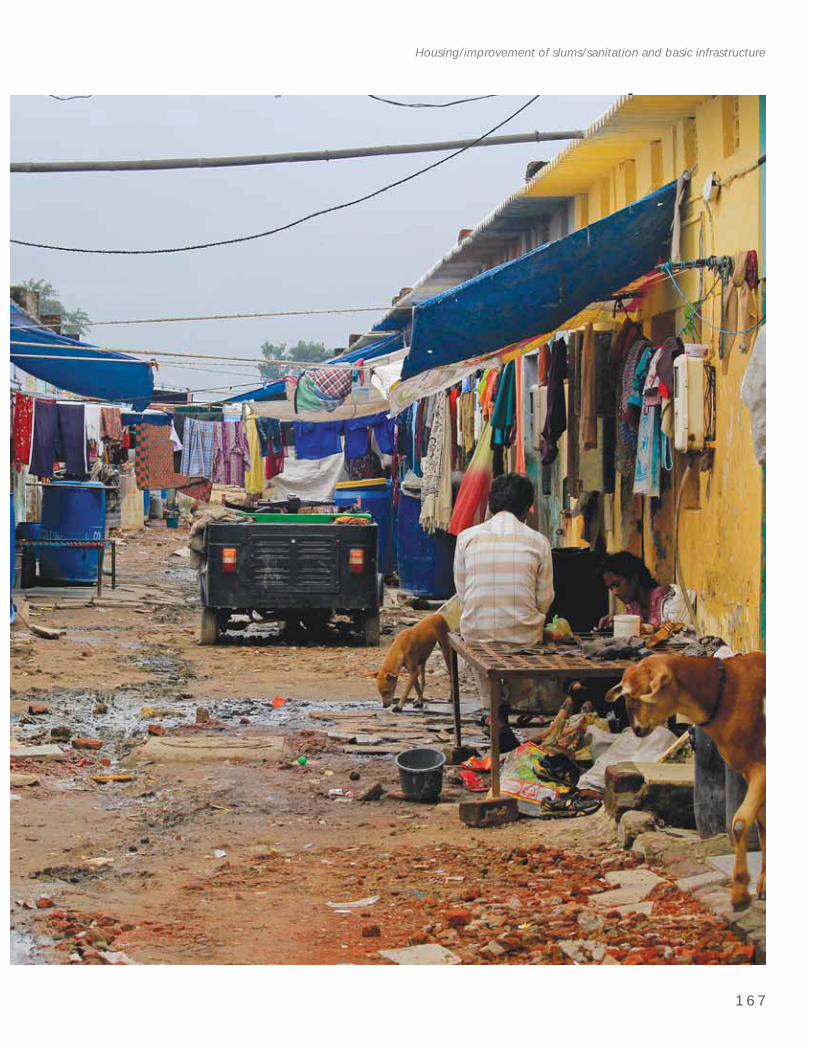
1 6 7
Housing/improvement of slums/sanitation and basic infrastructure
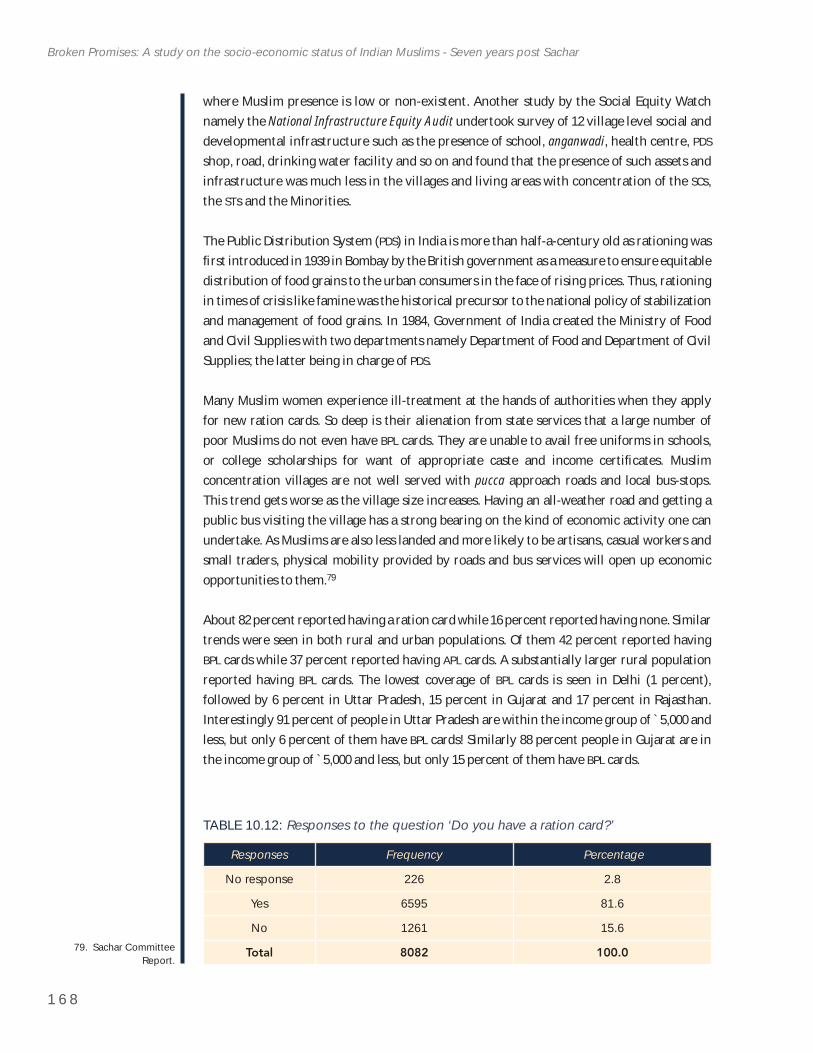
1 6 8
Broken Promises: A study on the socio-economic status of Indian Muslims - Seven years post Sachar
79. Sachar Committee Report.
where Muslim presence is low or non-existent. Another study by the Social Equity Watch namely the National Infrastructure Equity Audit undertook survey of 12 village level social and developmental infrastructure such as the presence of school, anganwadi, health centre, PDSshop, road, drinking water facility and so on and found that the presence of such assets and infrastructure was much less in the villages and living areas with concentration of the SCs, the STs and the Minorities.
The Public Distribution System (PDS) in India is more than half-a-century old as rationing was fi rst introduced in 1939 in Bombay by the British government as a measure to ensure equitable distribution of food grains to the urban consumers in the face of rising prices. Thus, rationing in times of crisis like famine was the historical precursor to the national policy of stabilization and management of food grains. In 1984, Government of India created the Ministry of Food and Civil Supplies with two departments namely Department of Food and Department of Civil Supplies; the latter being in charge of PDS.
Many Muslim women experience ill-treatment at the hands of authorities when they apply for new ration cards. So deep is their alienation from state services that a large number of poor Muslims do not even have BPL cards. They are unable to avail free uniforms in schools, or college scholarships for want of appropriate caste and income certifi cates. Muslim concentration villages are not well served with pucca approach roads and local bus-stops. This trend gets worse as the village size increases. Having an all-weather road and getting a public bus visiting the village has a strong bearing on the kind of economic activity one can undertake. As Muslims are also less landed and more likely to be artisans, casual workers and small traders, physical mobility provided by roads and bus services will open up economic opportunities to them.79
About 82 percent reported having a ration card while 16 percent reported having none. Similar trends were seen in both rural and urban populations. Of them 42 percent reported having BPL cards while 37 percent reported having APL cards. A substantially larger rural population reported having BPL cards. The lowest coverage of BPL cards is seen in Delhi (1 percent), followed by 6 percent in Uttar Pradesh, 15 percent in Gujarat and 17 percent in Rajasthan. Interestingly 91 percent of people in Uttar Pradesh are within the income group of `5,000 and less, but only 6 percent of them have BPL cards! Similarly 88 percent people in Gujarat are in the income group of `5,000 and less, but only 15 percent of them have BPL cards.
TABLE 10.12: Responses to the question ‘Do you have a ration card?’
Responses Frequency Percentage
No response 226 2.8
Yes 6595 81.6
No 1261 15.6
Total 8082 100.0
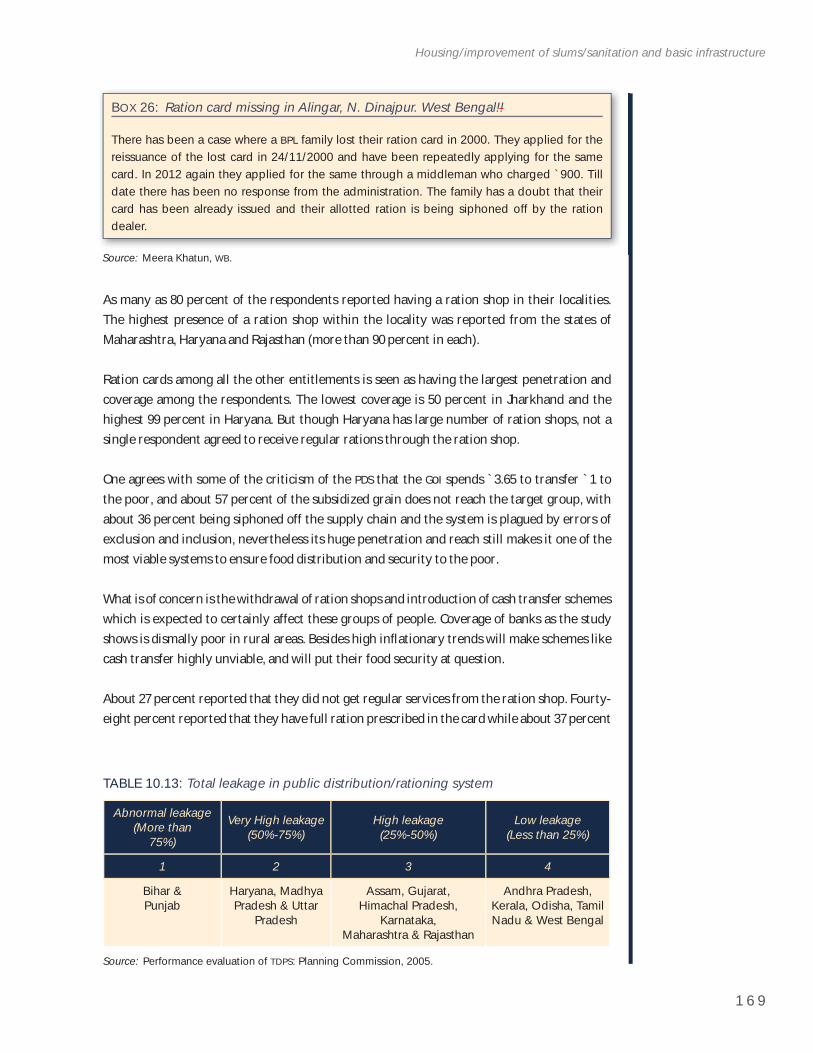
1 6 9
Housing/improvement of slums/sanitation and basic infrastructure
As many as 80 percent of the respondents reported having a ration shop in their localities. The highest presence of a ration shop within the locality was reported from the states of Maharashtra, Haryana and Rajasthan (more than 90 percent in each).
Ration cards among all the other entitlements is seen as having the largest penetration and coverage among the respondents. The lowest coverage is 50 percent in Jharkhand and the highest 99 percent in Haryana. But though Haryana has large number of ration shops, not a single respondent agreed to receive regular rations through the ration shop.
One agrees with some of the criticism of the PDS that the GoI spends `3.65 to transfer `1 to the poor, and about 57 percent of the subsidized grain does not reach the target group, with about 36 percent being siphoned off the supply chain and the system is plagued by errors of exclusion and inclusion, nevertheless its huge penetration and reach still makes it one of the most viable systems to ensure food distribution and security to the poor.
What is of concern is the withdrawal of ration shops and introduction of cash transfer schemes which is expected to certainly affect these groups of people. Coverage of banks as the study shows is dismally poor in rural areas. Besides high infl ationary trends will make schemes like cash transfer highly unviable, and will put their food security at question.
About 27 percent reported that they did not get regular services from the ration shop. Fourty-eight percent reported that they have full ration prescribed in the card while about 37 percent
TABLE 10.13: Total leakage in public distribution/rationing system
Abnormal leakage (More than
75%)
Very High leakage (50%-75%)
High leakage(25%-50%)
Low leakage(Less than 25%)
1 2 3 4
Bihar &Punjab
Haryana, MadhyaPradesh & Uttar
Pradesh
Assam, Gujarat,Himachal Pradesh,
Karnataka,Maharashtra & Rajasthan
Andhra Pradesh,Kerala, Odisha, Tamil Nadu & West Bengal
Source: Performance evaluation of TDPS: Planning Commission, 2005.
BOX 26: Ration card missing in Alingar, N. Dinajpur. West Bengal!!
There has been a case where a BPL family lost their ration card in 2000. They applied for the reissuance of the lost card in 24/11/2000 and have been repeatedly applying for the same card. In 2012 again they applied for the same through a middleman who charged `900. Till date there has been no response from the administration. The family has a doubt that their card has been already issued and their allotted ration is being siphoned off by the ration dealer.
Source: Meera Khatun, WB.
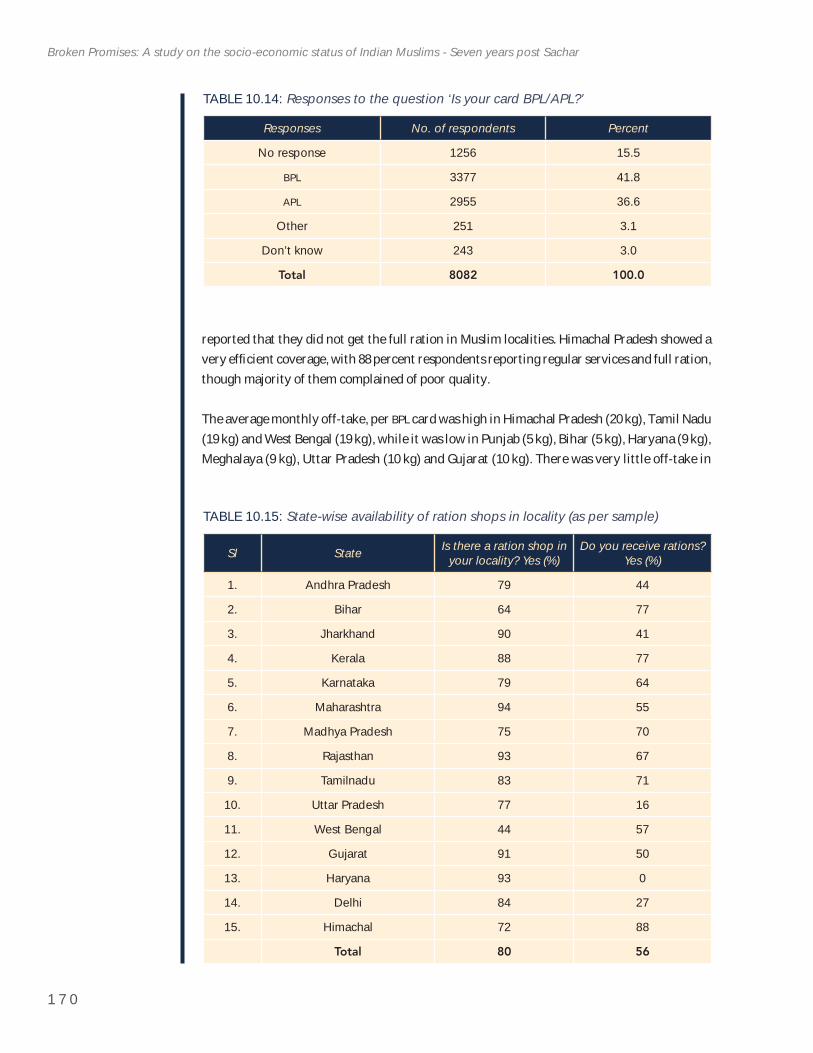
1 7 0
Broken Promises: A study on the socio-economic status of Indian Muslims - Seven years post Sachar
reported that they did not get the full ration in Muslim localities. Himachal Pradesh showed a very effi cient coverage, with 88 percent respondents reporting regular services and full ration, though majority of them complained of poor quality.
The average monthly off-take, per BPL card was high in Himachal Pradesh (20 kg), Tamil Nadu (19 kg) and West Bengal (19 kg), while it was low in Punjab (5 kg), Bihar (5 kg), Haryana (9 kg), Meghalaya (9 kg), Uttar Pradesh (10 kg) and Gujarat (10 kg). There was very little off-take in
TABLE 10.14: Responses to the question ‘Is your card BPL/APL?’
Responses No. of respondents Percent
No response 1256 15.5
BPL 3377 41.8
APL 2955 36.6
Other 251 3.1
Don’t know 243 3.0
Total 8082 100.0
TABLE 10.15: State-wise availability of ration shops in locality (as per sample)
Sl State Is there a ration shop in your locality? Yes (%)
Do you receive rations?Yes (%)
1. Andhra Pradesh 79 44
2. Bihar 64 77
3. Jharkhand 90 41
4. Kerala 88 77
5. Karnataka 79 64
6. Maharashtra 94 55
7. Madhya Pradesh 75 70
8. Rajasthan 93 67
9. Tamilnadu 83 71
10. Uttar Pradesh 77 16
11. West Bengal 44 57
12. Gujarat 91 50
13. Haryana 93 0
14. Delhi 84 27
15. Himachal 72 88
Total 80 56
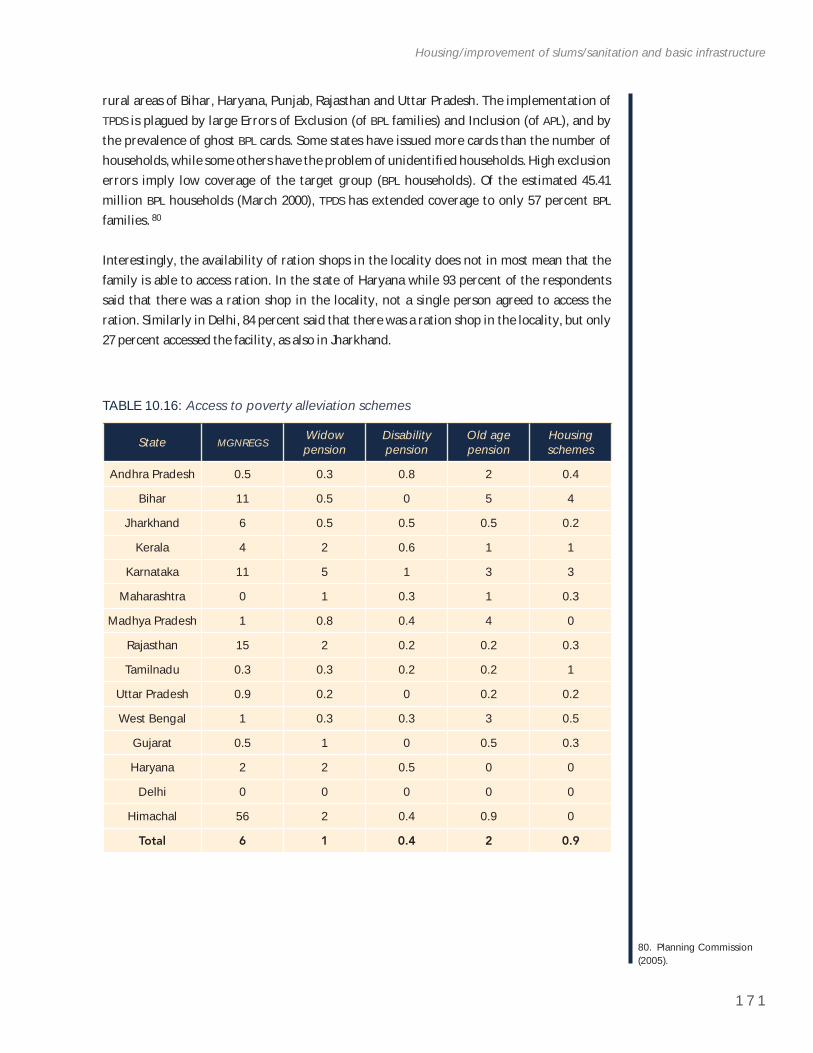
1 7 1
Housing/improvement of slums/sanitation and basic infrastructure
80. Planning Commission (2005).
rural areas of Bihar, Haryana, Punjab, Rajasthan and Uttar Pradesh. The implementation of TPDS is plagued by large Errors of Exclusion (of BPL families) and Inclusion (of APL), and by the prevalence of ghost BPL cards. Some states have issued more cards than the number of households, while some others have the problem of unidentifi ed households. High exclusion errors imply low coverage of the target group (BPL households). Of the estimated 45.41 million BPL households (March 2000), TPDS has extended coverage to only 57 percent BPLfamilies. 80
Interestingly, the availability of ration shops in the locality does not in most mean that the family is able to access ration. In the state of Haryana while 93 percent of the respondents said that there was a ration shop in the locality, not a single person agreed to access the ration. Similarly in Delhi, 84 percent said that there was a ration shop in the locality, but only 27 percent accessed the facility, as also in Jharkhand.
TABLE 10.16: Access to poverty alleviation schemes
State MGNREGSWidow pension
Disabilitypension
Old age pension
Housingschemes
Andhra Pradesh 0.5 0.3 0.8 2 0.4
Bihar 11 0.5 0 5 4
Jharkhand 6 0.5 0.5 0.5 0.2
Kerala 4 2 0.6 1 1
Karnataka 11 5 1 3 3
Maharashtra 0 1 0.3 1 0.3
Madhya Pradesh 1 0.8 0.4 4 0
Rajasthan 15 2 0.2 0.2 0.3
Tamilnadu 0.3 0.3 0.2 0.2 1
Uttar Pradesh 0.9 0.2 0 0.2 0.2
West Bengal 1 0.3 0.3 3 0.5
Gujarat 0.5 1 0 0.5 0.3
Haryana 2 2 0.5 0 0
Delhi 0 0 0 0 0
Himachal 56 2 0.4 0.9 0
Total 6 1 0.4 2 0.9
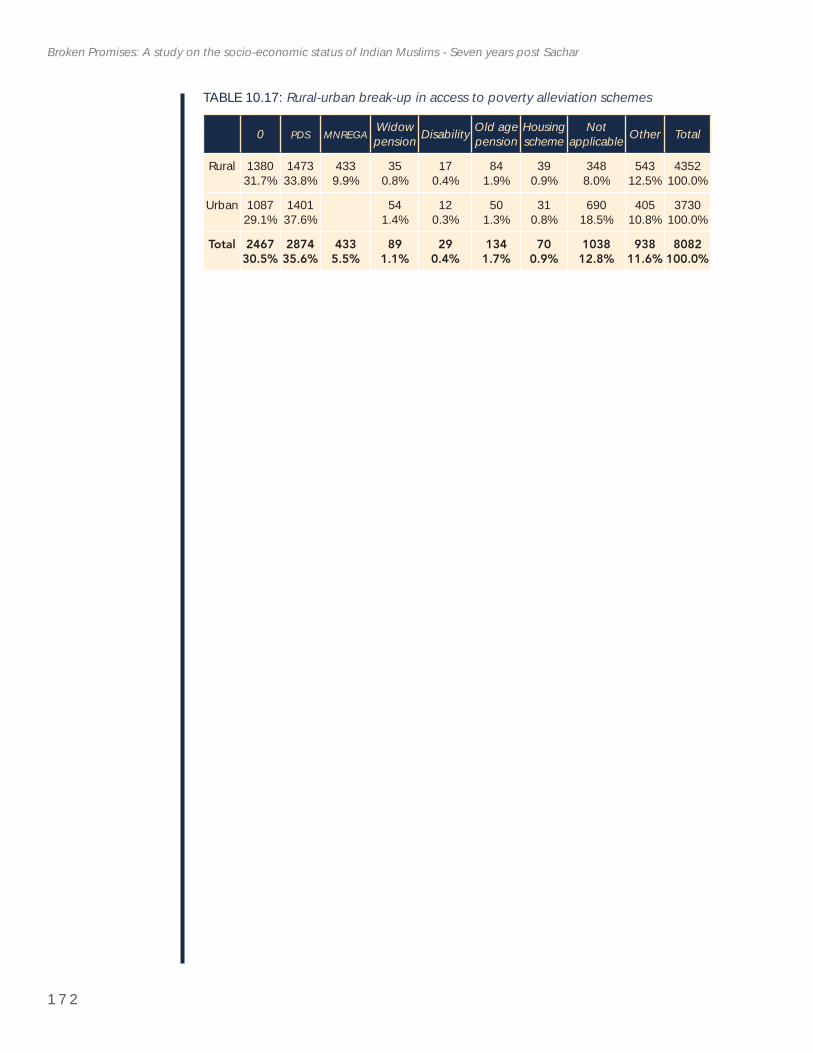
1 7 2
Broken Promises: A study on the socio-economic status of Indian Muslims - Seven years post Sachar
TABLE 10.17: Rural-urban break-up in access to poverty alleviation schemes
0 PDS MNREGAWidow pension Disability Old age
pensionHousing scheme
Not applicable Other Total
Rural 138031.7%
147333.8%
4339.9%
350.8%
170.4%
841.9%
390.9%
3488.0%
54312.5%
4352100.0%
Urban 108729.1%
140137.6%
541.4%
120.3%
501.3%
310.8%
69018.5%
40510.8%
3730100.0%
Total 246730.5%
287435.6%
4335.5%
891.1%
290.4%
1341.7%
700.9%
103812.8%
93811.6%
8082100.0%
1 7 3
1 1 . C O N C L U S I O N A N D R E C O M M E N D AT I O N S
Our Study makes it eminently clear that as far the socio-economic condition of Indian Muslims is concerned the status quo continues seven years after the Sachar Committee
Report. The path-breaking report by the Sachar Committee not only highlighted the continued incidence of poverty and socio-economic backwardness for the largest minority, it also suggested some elaborate and far-reaching steps to be taken by the government to alleviate their plight. But sadly, till the time our Study was conducted, these recommendations seem to have remained on paper. We found the Muslims lagging behind across geographical locations and on all socio-economic indicators. It is a sad reality of economic and educational backwardness coupled with a sense of alienation and discrimination that continues to plague the community. The sense of lack of being cared for by the government and neglect of their concerns by political parties and leaders came out clearly in our various discussions. It is shocking how a community which is not culturally and linguistically monolithic, has a uniform collective experience of neglect, lack of concern, alienation and discrimination. The Muslim citizens live across almost the entire country, speak all the different languages, are divided in different castes and biradaris and yet somewhere they seem to have got singled out making them unequal citizens. They seem to have been singled out for non-inclusion and non-participation in all the entitlements and development programmes. Our Study makes it evident that neither the Sachar Committee Report nor the PM’s New 15-Point Programme that followed seem to have made a difference in this direction. Time alone will tell what will be the outcome of these efforts including our own!
The Sachar Committee Report made very comprehensive recommendations which do not seem to have been implemented. However, based on our fi ndings and our experience of conducting the exercise following are some suggestions which can help the inclusion of Muslims in our democracy:
There is need to focus on Muslim citizens’ plight while laying down policies and this should be backed by fi nancial allocations. The mind-sets of the elected representatives need to undergo a change to recognize the continued exclusion faced by Muslims and the need to change this.
Ensuring that in all development schemes, the states allocate resources to Muslims in different localities on a scale proportionate to their population. There should be proper mechanism in place to ensure that the allocation is suitably made and implemented and there is proper representation and participation of the community.
There should be specifi c budgetary allocations announced and systems and procedures should be set in motion to ensure that these reach the community.
The administration and its offi cials in states should be made accountable for effective and successful implementation of the inclusion of minorities in different schemes.
1 7 4
Broken Promises: A study on the socio-economic status of Indian Muslims - Seven years post Sachar
Any development schemes must be culturally sensitive to enable participation by Muslims. The district administration should be sensitized towards their conditions.
A comprehensive programme to build perspective of the people forming the administration centrally and in states is called for towards greater understanding of citizenship rights of minorities and the need for their inclusion. A greater emphasis on constitutional guarantees and obligations of the state should be brought about.
Local community members including Muslim women must be involved in all planning of development schemes followed by empowered committees for effective implementation, monitoring and evaluation of the functioning.
The government should consider instituting reforms in the existing laws and rules regarding Waqf Boards and Dargahs to ensure Muslim community participation in their functioning and use of resources that they generate.
All recommendations by the Sachar Committee should be implemented seriously in a time-bound manner.
Strengthen the MoMA by adequate human resources, infrastructure and fi nancial allocations.
Minorities welfare department should be set up in every state with clear mandate and guidelines. This department should have a full-time welfare offi cer who besides others should be mandated with inclusion of women and girls in all schemes.
Recommendations concerning MSDP
The MSDP needs to work in co-ordination and synergy with PM’s New 15-Point Programme. There is need to specifi cally direct the various line ministries along with fi nancial allocation to include backward castes and women amongst minorities specially Muslims.
There is need to go beyond 90 districts and to universalize the programme to cover districts, cities, towns with any minority population including Muslims.
Local support and monitoring committees should be formed with half the specifi ed members of minority community and women as members.
There should be regular social audits of schemes involving offi cials, community representatives, women and civil society members.
District Planning Committees should be working mandatorily and not left to the goodwill of administration. They should involve community activists mandatorily.
Training to women and men who are elected representatives and community women and men leaders in social audit, effective monitoring and implementation locally.
Every minority neighbourhood should mandatorily have basic amenities such as drinking water, ICDS, health centre, primary school, and sanitation and drainage facility.
The best of schemes fail to reach out because the design itself is faulty. The mindsets of the bureaucracy need to change to make such rules and regulations that it becomes possible for ordinary minority citizens to access any scheme. Our discussions brought out the perception that the intention is how not to implement the schemes. Cumbersome
1 7 5
Conclusion and Recommendations
rules and regulations are deliberately made so that benefi ciaries themselves give up their claim. The rules should be simplifi ed and made transparent.
There should be strict implementation of the 12th fi ve year plan recommendations. There should be formation of a civil society monitoring committee, the government should stop dealing with the religious middlemen of the community, bring schemes for NGOs to work among Muslim youth and women.
Better implementation of schemes for educational and credit support to men and women is necessary. All other stakeholders like the schools, colleges, banks, etc. must be given guidelines for mandatory implementation of schemes.
Scholarships for minorities should be brought at par with that meant for dalits: no fi xed quota on how many will get scholarships and how much; full fees should be reimbursed for all economically deprived students.
Accessing scholarships should be made easy and without any costs. The schools and administration should be sensitized to enable maximum number of students avail scholarships.
There is need for a systematic effort towards sensitization of civil society and administration towards the plight and needs of the Muslims. This should deal with the prevalence of myths and biases against the minorities overall.
There should be a stress on overall promotion of secular values and values of Indian Constitution in all awareness and education programmes of the government.
An elaborate and comprehensive programme to sensitize the police, from constabulary to senior ranks is necessary to sensitize them to the plight and needs of the community for fair and equal treatment in all cases of crime and violence.
Relief, rehabilitation and legal justice must be carried out effectively in incidents of communal violence. Apart from providing compensation to the affected, measures must be initiated by the bureaucracy and the police to punish those guilty of spreading hatred and violence.
For inclusion of women and girls
Populist considerations have prevented the government from looking at Muslim women and girls as citizens in dire need of support. While designing programmes for the alleviation of poverty and backwardness of minorities, special attention must to be paid to the women to design programmes that would help them socially, educationally and economically.
Public schools must give quality education. It must introduce English from class I. Public schools must have good infrastructure especially toilets. Steps must be taken for better security for girls, especially outside the school to prevent harassment by anti-social elements. There should be higher secondary schools in all villages/taluka so that girls do not have to travel far for getting education.
Government must ensure that working women’s hostels give admission to Muslim women without discrimination. Government must also set up hostels for Muslim women in minority dominated districts.
1 7 6
Broken Promises: A study on the socio-economic status of Indian Muslims - Seven years post Sachar
There should be availability of modern secular education in private schools for girls in Muslim neighbourhoods. There should be monitoring against enforced dress code for girls in these schools.
Special provisions for secular education for Muslim girls in ghettoes where they are forced to live should be made. These schools should be of good quality. These schools need to encourage the Muslim community as a whole and girls in particular, to avail of the facilities in the areas close to their residence. These schools should promote trainings on the modern employments enabling skills such as English, computers, IT and software, tourism, etc. These schools should also have specially designed counselling centres for guidance in further education and employment bureaus, which ensure that those needing early employment are also helped.
The various commissions like the National Minorities Commission, Women’s Commission, and National Human Rights Commission must be sensitive towards the issues of Muslims. Amendments should be made in the Minorities Commission Act to mandate them for taking up issues of Muslim women. The ambiguity between the NCMand NCW causes lot of hardship to Muslim women activists as they are made to shunt between the two on account of lack of clarity as to under which commission’s purview does Muslim woman fall!
The training for leadership development of women’s programme of the Union Minority Affairs Ministry must be redesigned to make it more effective, democratic and accessible. This scheme must be reworked so that women’s organizations are able to take it forward. In addition to training, the trained women should be given at least a two-year stipend to facilitate their functioning as catalysts. This would create a large cadre of empowered Muslim women across the country which can devote its energies in addressing a variety of concerns of women.
There is need for promoting social measures to prevent gendered violence against Muslim women particularly during incidences of communal violence. Broad measures to prevent communal violence, effi cient local committees to defuse the situation of violence can go a long way in providing security to women.
1 7 7
B I B L I O G R A P H Y
ActionAid India. 2011. People First, country strategy paper 4. ActionAid International. n.d. Looming Crisis: The threat of industrial trade liberalisation negotiations at the
WTO on India’s textile and leather industries. https://www.actionaid.org.uk/sites/default/fi les/doc_lib/59_1_looming_crisis_report.pdf.
Ahmed, Firoz Bakht. 2012. ‘Urdu’s renewal will show the survival of our secular credentials,’ interview with Khwaja Mohammad Iqramuddin, Director, National council for promotion of Urdu Language (NCPUL) in The Times of India, 15 June 2012.
Anwar, Ali. 2005. Struggle for Equality (Masawat Ki Jung, translated by Mohammad Imran Ali & Zakia Jowher). New Delhi: Indian Social Institute.
Basant, Rakesh. 2012. Education and Employment among Muslims in India: An Analysis of Patterns and Trends.Ahmedabad: Indian Institute of Management. http://www.iimahd.ernet.in/assets/snippets/workingpaperpdf/12051717332012-09-03.pdf.
Bharatiya Muslim Mahila Andolan. 2012. Study on pre-matric/post-matric scholarships in West Bengal.Census of India, 2001.Engineer, Asghar Ali. 2004. Communal Riot after Independence: A Comprehensive Account. Mumbai: CSSS.GoI. 2006. Socio-Economic and Educational Status of the Muslim Community in India: A Report. PM’s High Level
Committee, Nov 2006 (Sachar Commitee report).———. n.d. Evaluation study of the Government of India on the physical performance of SGSY. HTTP://
RURAL.NIC.IN/SITES/DOWNLOADS/MONITORING/STUDY%20OF%20SGSY%20AND%20IAY%20MINORITIES.PDF.Hirway, Indira. 2005. ‘Integrating Unpaid Work into Development Policy’. Paper prepared for the
Conference on ‘Unpaid Work and Economy: Gender, Poverty and Millennium Development Goals’ organized at Levy Economics Institute, New York, on 1-3 October.
IIPS. 2007. National Family Health Survey, Round III, 2005–06. Mumbai: International Institute of Population Sciences. http://pdf.usaid.gov/pdf_docs/PNADK385.pdf.
Indian Express, Ahmedabad, 29 August, 2013 and 24 September, 2013. Indian Social Institute, Jahangirabad Media Institute, ActionAid India. 2006. Report on the socio-economic
conditions of Muslims in India.Mavalankar, Dileep and Kranti Suresh Vohra. 2008. The changing role of Auxiliary Nurse Midwife (ANM)
in India: Implications for maternal and child health (MCH). W.P.No.2008-03-01. Ahmedabad: Indian Institute of Management.
MoHF. 2006. Annual Report. New Delhi: Ministry of Health and Family Welfare.NIESBUD. n.d. Evaluation study of the National Minorities Finance Development Corporation. National Institute
for Entrepreneurship & Small Business Development (NIESBUD). http://www.nmdfc.org/Impact.pdf
NSSO. 2011. Status of Educational and Vocational Training in India: July 2009-June 2010, NSS 66th round.———. 2012. Status of Employment among Social Groups. September.———. 2013. Status of Educational and Vocational Training in India, March.Planning Commission. 2005. Performance Evaluation of Targeted Public Distribution System (TDPS). http://
eprints.cscsarchive.org/336/1/peo_tpds.pdf.———. 2013. 12th Five-Year Plan, Volume 3, Social Sector. New Delhi: Sage Publications. http://
planningcommission.gov.in/plans/planrel/12thplan/pdf/12fyp_vol3.pdf.Prime Minister’s New 15-Point Programme, Details available on http://ncm.nic.in/PM’s_15_Point_
Programme.html.
1 7 8
Broken Promises: A study on the socio-economic status of Indian Muslims - Seven years post Sachar
Rossi, Victoria and Mohammad Ali. 2013. ‘Bottom of the rung,’ The Hindu, 5 March. http://www.thehindu.com/news/cities/Delhi/bottom-of-the-rung/article4478245.ece
RTE Forum. 2013. Status of Implementation of the right of children to free and compulsory Education Act 2009:Year Three (2012-2013) : A report by RTE Forum. http://www.rtemaharashtra.org/downloads/rteforumdraft.pdf.
Russell, Ralph, 1999, ‘Urdu in India since Independence,’ Economic and Political Weekly, 34(1–2): 44–48. http://www.indowindow.com/sad/article.php?child=14&article=5.
Sharief, Abusaleh. 2012. Inclusive Development Paradigm in India: Post Sachar Perspective. USIPI Occasional Paper No: 1. http://www.usindiapolicy.org/wp-content/uploads/2013/12/USIPI-Pub-InclusiveDevelopment.pdf.
Sharief, Abusaleh, Khursheed Anwar Siddiqui, Amit Sharma, and Prabir Kumar Ghosh. 2012. Roleof Education and Diversity in India: How Social Structure Impacts the Gross Domestic Products. USIPI, Occasional paper no-3. http://www.usindiapolicy.org/documents/publications/USIPI-Publication-03-Social-Web.pdf.
Sikand, Yoginder. 2004. ‘Islam and Caste Inequality among Indian Muslims’. http://www.countercurrents.org/sikand150204.htm.
Soman, Zakia. 2010. ‘Situation of Minorities — Promises and Reality’, Peoples’ Mid-Term appraisal of Eleventh Five Year Plan. New Delhi: CBGA.
Suhrawardy, Nilofar. 2012. twocircles.net, 3 January. http://twocircles.in/node/274206.Tata Institute of Social Sciences. 2011. ‘Multi-Sectoral Development Plan for Malegaon Town’,
Submitted to Maharashtra State Minorities commission, Government of Maharashtra, Mumbai, December 2011.
The Hindu. 2012. Hyderabad, 13 July.Thorat, S. and P. Attewell. 2010. ‘The Legacy of Social Exclusion: A Correspondence Study of Job
Discrimination in India’s Private Sector’, in S. Thorat and K. Newman (eds.), Blocked by Caste: Economic Discrimination in Modern India. Delhi: Oxford University Press.
Times of India. 2012. Hyderabad, 29 November.Two circles.net. 2012: ‘Dying Urdu education in Hyderabad’, 4 July. http://twocircles.net/2012jul04/
dying_urdu_education_hyderabad.html.Website of Delhi ST/SC/OBC/Minorities and Handicapped Financial and Development Corporation.Workshop report on ICDS, 10 February 2012. www.righttofoodindia.org/.../July_2012_report_icds_
workshop_hydera.

1 7 9
A N N E X E S

1 8 1
Annex 1
List of Individuals and Organizations that Contributed to this Study
This study was made possible by the active participation, support and help from the following organizations and individuals. We are grateful to them for their time and
contribution.
Andhra Pradesh
The Siasat Urdu Daily1.
GRAIN2. (Grass Root Action and Information Network)
Forum for a Better Hyderabad3.
Hyderabad Zakat and Charitable Trust4.
DBF5. (Dalit Bahujan Front)
ActionAid,6. AP Region Offi ce
Hyderabad Aman Manch7.
HRLN8. (Human Rights Law Network), AP
Centre for Social Justice9.
APMWS10. (AP Mahila Welfare Society)
Iqbal Academy11.
MY Collective12.
S.Q. Masood, Sauhard Manch13.
Feroz Khan 14.
Mr. Mohd. Azam Khan, Social Activist15.
Mr. Yousuf Quarashi, Former Chairman, 16. AP Minorities Commission
Mr. Mohd Afzal, Social Activist17.
Bihar
Ansar Anwer1.
Enumerators: Tarique Anwer and Huma Naz 2.
Abrar Hussain, 3. DPC (District Programme Co-ordinator), enumerator; helped with RTI
fi ling
Saksher Bharat Mission, Kishanganj; helped with 4. FGD
Samser Alam Darbhanga, Singhwara Block, Shankerpur Panchayat5.
Upender Kumar, social worker, West Champaran6.
Samer Shaikh, Jale Block, Darbhanga7.
Sarfaraz Ahmad, Mukhiya, Doghara Panchayat, Darbhanga8.
1 8 2
Broken Promises: A study on the socio-economic status of Indian Muslims - Seven years post Sachar
Delhi NCR/Himachal Pradesh/Haryana
Md. Saleem Baig, 1. RTI activist
Enumerators: Md. Aadil, Akram Akhtar and Hassan Deen2.
Yuva Koshish 3.
Adigram Samiti4.
Jafrabad Welfare Association5.
Muslim Gujjar Samiti 6.
Gujarat
Jamila Banu Khan1.
Akhtarunissa2.
Shakil Shaikh3.
Sushila Prajapati4.
Jahan-e-Niswan5.
Janpath6.
Noorjehan Dewan7.
Faiyaz Hawa8.
Ramesh Rathod9.
Chintan Gohil10.
Women activists of Bharatiya Muslim Mahila Andolan (11. BMMA)
Jharkhand
Mobin Ahmed, advocate1.
Imran Ali2.
Karnataka
Nasreen M.1.
Anjali and Moizuddin2.
Jana Sahayog, Bengaluru3.
Bridge Network, Bengaluru4.
Jana Sahayog, Gulburga5.
Sahayog, Bidar6.
Sakhi, Hospet, Bellary 7.
Kerala
Subair, C.K.1.
Young Men’s Kkanthapuram, Kozhikode2.
Seeds Vanimal, Kozhikode3.
1 8 3
Annexes
Maharashtra
Aleem Faizee: 1. CEO & Editor, http://ummid.com, Convener, Citizens for Development & Peace (CDP)
Enumerators: Saleem Shaikh and Shahzaad2.
Malegaon Municipal Corporation (3. MMC)
MMC4. School Board
Qamruddin,5. MMC
Syed Hashim, 6. MMC School Board
Noble Education & Welfare Society, Malegaon (7. NEWS)
Malegaon Industrialists’ & Manufacturers’ Association (8. MIMA)
Community Co-ordination Initiative (9. CCI)
Sharique Naqshabandi, Asia Express, Aurangabad10.
Ahmed Tauseef, Aurangabad Municipal Corporation11.
Shaikh Saleem, Aurangabad Urdu Schools Association12.
Arshad Mukhtar, Jamia Mohammadia Education Society, Mumbai13.
Unani Doctors Association, Mumbai14.
Karim Salar, Jalgaon15.
Salim Alware, Mumbai16.
G.S. Ansari, Aurangabad17.
Paroj Banerjee18.
Khatun Shaikh, Bharatiya Muslim Mahila Andolan (19. BMMA)
Noorjehan Safi a Niaz, Bharatiya Muslim Mahila Andolan (20. BMMA)
Women activists of Bharatiya Muslim Mahila Andolan (21. BMMA)
Madhya Pradesh
Deepak Bhatt, People’s Research Society1.
Enumerators: Kisanlal Sahu and Sanjay Kumar Rarariya2.
Adil Raza, Rahi Welfare Research Society and Center for Social Justice3.
L.S. Hardenia, Convenor, All-India Secular Forum4.
Yogesh Diwan, Janpahel 5.
Owais Arab Association of Indian Muslims 6.
Harun Qureshi, Lal Jhanda Bidi Mazdoor Union, Rahatgarh7.
Ashif Sheikh, Jansahas, Dewas8.
Safi a Akhatar, Bharatiya Muslim Mahila Andolan (9. BMMA)
Asad Ansari, Comrade Harnam Singh Progressive Writers Association (10. PWA)
Lal Jhanda Beedi Mazdoor Union11.
Progressive Writers Association12.
1 8 4
Broken Promises: A study on the socio-economic status of Indian Muslims - Seven years post Sachar
Rajasthan
Sabir Khan, Sauhard Manch: Art, Culture and Literature Resource Centre for Peace 1.and Justice
Chandradeep Hada2.
PUCL3. , Rajasthan
Chaju Ram, Aman Gramin Vikas Shiksha Sansthan, Phagi-Renwal4.
Shabbir Husain, school teacher, Jodhpur5.
Saheb Khan, social activist, Alwar6.
Vijay Goyal, social activist, Jaipur7.
Kaiser Shikoh, social activist, Jaipur 8.
Zafar Khan, Jaipur9.
Iqbal Qureshi, Jaipur10.
Noor Mohd. Amied, Alwar11.
Azeez Mohd., theatre artist, Jaipur12.
Roshan Ara, theatre artist, Jaipur13.
Tamil Nadu
Ramanie Mathew1.
A. Kamila, Wind Trust, Trichy2.
Enumerators: Reyaz Babu and Gayathri3.
Association for Integrated Rural Development, Ramanathapuram4.
Manitham Trust, Dindigul5.
Women activists of Bharatiya Muslim Mahila Andolan (6. BMMA)
Uttar Pradesh
Rubeena Parveen1.
Enumerators: Khesal Ahmed and Nadeem Arshad2.
Sharique Nizami, social worker, Azamgarh3.
Masood Alam Falahi4.
Gulam Qadir, social worker5.
Dr. Vaseem Akhtar, Lucknow6.
Nabi Hassan7.
Hashim Ppasmanda, All India Pasmanda Muslim Mahaz8.
Riyasat Hussain and Ghanshyam, Mizwan Welfare Society9.
Subhash Chandra and Gulzar Fatma, Government Primary School, Azamgarh10.
Muzaffar Alam and Rehana Rahman, Moradabad11.
Mahtab Alam, teacher, Varanasi12.
Md. Zakir13.
1 8 5
Annexes
Md. Khursheed Ahmed Khan and Noor Fatima, A.O. Muslim Inter College14.
Nesar Ahmed Ansari, social worker, Varanasi15.
Mahmood Hasan and Hayat Mohd., Varanasi16.
Dr. Mohammad Arif, Chairman, Centre for Harmony and Peace17.
Dr. Qudsia Anjum18.
West Bengal
Mira Khatoon, Sauhard Manch/1. BMMA
Women activists of Bharatiya Muslim Mahila Andolan (2. BMMA)
Enumerators: Samim Parvez, Maroofa Mandal and Rizwan Mullick 3.
Haleema4.
Hafi jur Gaji5.
Mofi juddin Laskar6.
Robiul Islam Purkaite7.
Araf Gaji8.
Sahanara Sarder9.
Sajamal10.
Julfi kkar Laskar11.
Abul Kalam Sarder12.
Tapash Halder13.
Bablu14.
Nanne Bhai15.
Minoty Bug16.
Jayanta Sarder17.
Ratan18.
Mojaffar Sarder19.
Md. Masud Ahmed20.
Aubdur Rahaman21.
Azmira Khatun22.
Firdaush Hossen23.
Samol Kumar Sarkar24.
Mostafi jur Rahaman25.
Bappa26.
Jahangir Alam27.
Alambari28.
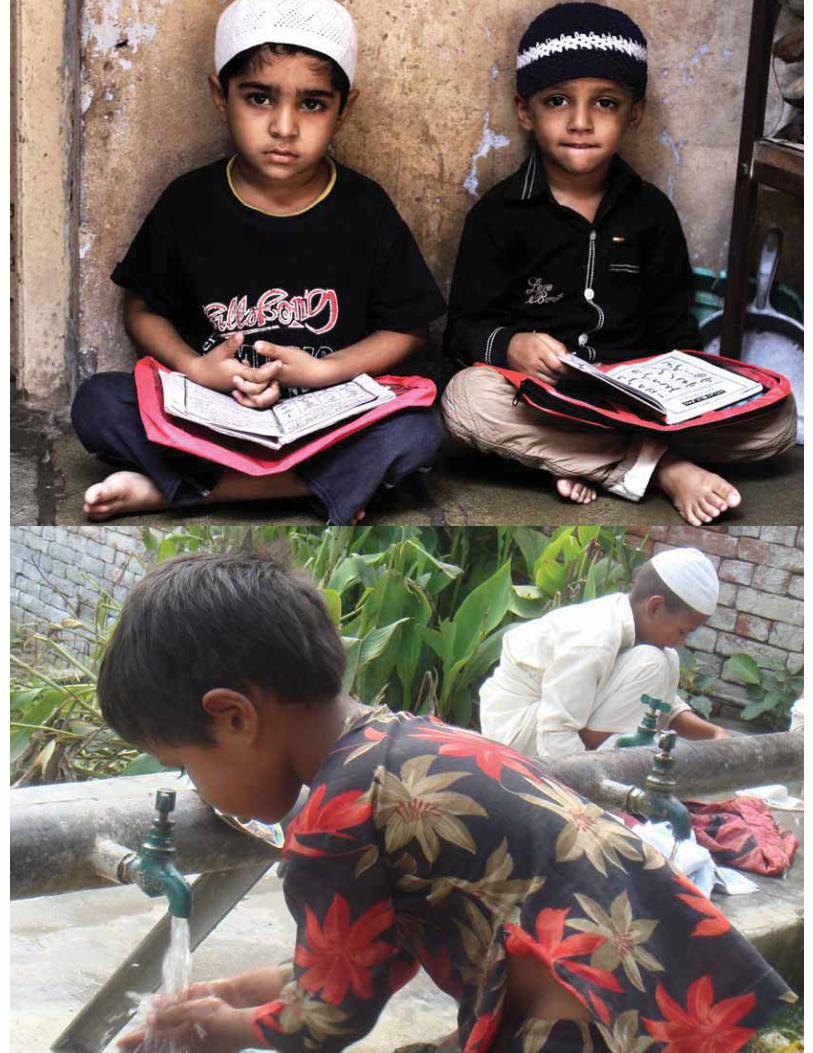
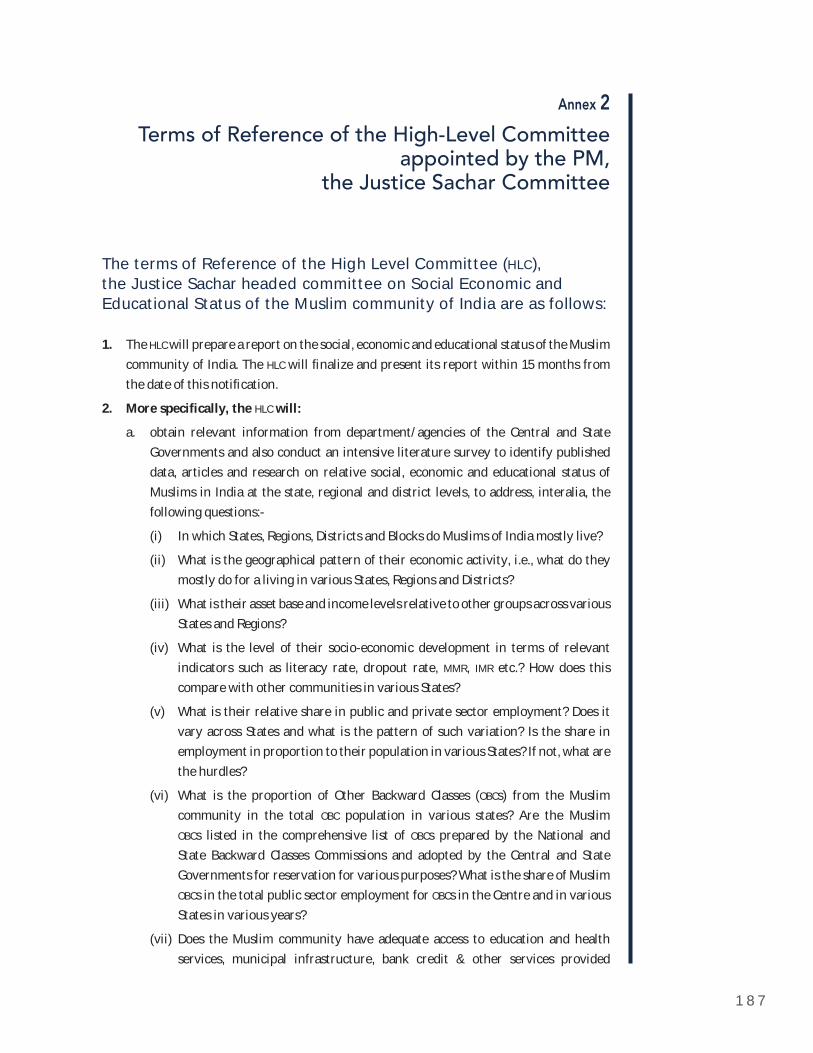
1 8 7
Annex 2
Terms of Reference of the High-Level Committee appointed by the PM,
the Justice Sachar Committee
The terms of Reference of the High Level Committee (HLC),the Justice Sachar headed committee on Social Economic and Educational Status of the Muslim community of India are as follows:
1. The HLC will prepare a report on the social, economic and educational status of the Muslim community of India. The HLC will fi nalize and present its report within 15 months from the date of this notifi cation.
2. More specifi cally, the HLC will:
a. obtain relevant information from department/agencies of the Central and State Governments and also conduct an intensive literature survey to identify published data, articles and research on relative social, economic and educational status of Muslims in India at the state, regional and district levels, to address, interalia, the following questions:-
(i) In which States, Regions, Districts and Blocks do Muslims of India mostly live?
(ii) What is the geographical pattern of their economic activity, i.e., what do they mostly do for a living in various States, Regions and Districts?
(iii) What is their asset base and income levels relative to other groups across various States and Regions?
(iv) What is the level of their socio-economic development in terms of relevant indicators such as literacy rate, dropout rate, MMR, IMR etc.? How does this compare with other communities in various States?
(v) What is their relative share in public and private sector employment? Does it vary across States and what is the pattern of such variation? Is the share in employment in proportion to their population in various States? If not, what are the hurdles?
(vi) What is the proportion of Other Backward Classes (OBCs) from the Muslim community in the total OBC population in various states? Are the Muslim OBCs listed in the comprehensive list of OBCs prepared by the National and State Backward Classes Commissions and adopted by the Central and State Governments for reservation for various purposes? What is the share of Muslim OBCs in the total public sector employment for OBCs in the Centre and in various States in various years?
(vii) Does the Muslim community have adequate access to education and health services, municipal infrastructure, bank credit & other services provided

1 8 8
Broken Promises: A study on the socio-economic status of Indian Muslims - Seven years post Sachar
by Government/public sector entities? How does this compare to access enjoyed by other communities in various States? What is the level of social infrastructure (schools, health centres, ICDS centres etc.) located in areas of Muslim concentration in comparison to the general level of such infrastructure in various States?
(b) Consolidate, collate and analyze the above information/literature to identify areas of intervention by Government to address relevant issues relating to the social, economic and educational status of the Muslim community.
3. The above High Level Committee will be provided all possible assistance by all Ministries/Departments and other bodies under the Government to ensure timely collection of data and information to facilitate their task.
4. The High Level committee may co-opt or invite such person(s) as it deems appropriate, to participate in any of its meeting as special invitee(s).
5. The High Level Committee will be located under the Cabinet Secretariat and will be covered within the defi nition and explanation of High Level Committees as given in Cabinet Secretariat O.M. No. 105/1/1/75- CF, dated 20.11.1975.
6. The Chairperson of the Committee shall work in an honorary capacity. However, he shall be provided conveyance facility and travelling facilities/allowances as admissible to a Chief Justice of a High Court.
7. The Committee will be provided required offi ce space, equipment and secretarial/other staff. An offi cer not below the rank of Director to Government of India will be attached to the Committee during its tenure. On the recommendation of the Committee, the Cabinet Secretariat may appoint Consultants for specifi c periods, in accordance with the prescribed guidelines, to carry out specifi c technical tasks such as data collection, collation and analysis. Expenditure relating to the conveyance and travelling facilities/allowances made available to the Chairperson of the Committee, the meetings of the Committee, the functioning of its Secretariat, fees payable to consultants, TA/DA of the Members of the Committee(as admissible to Grade 1 offi cers of the Highest Category in Government of India) and the TA/DA of the consultants to cover the travel related to the work of the Committee, etc., will be borne by the Cabinet Secretariat.
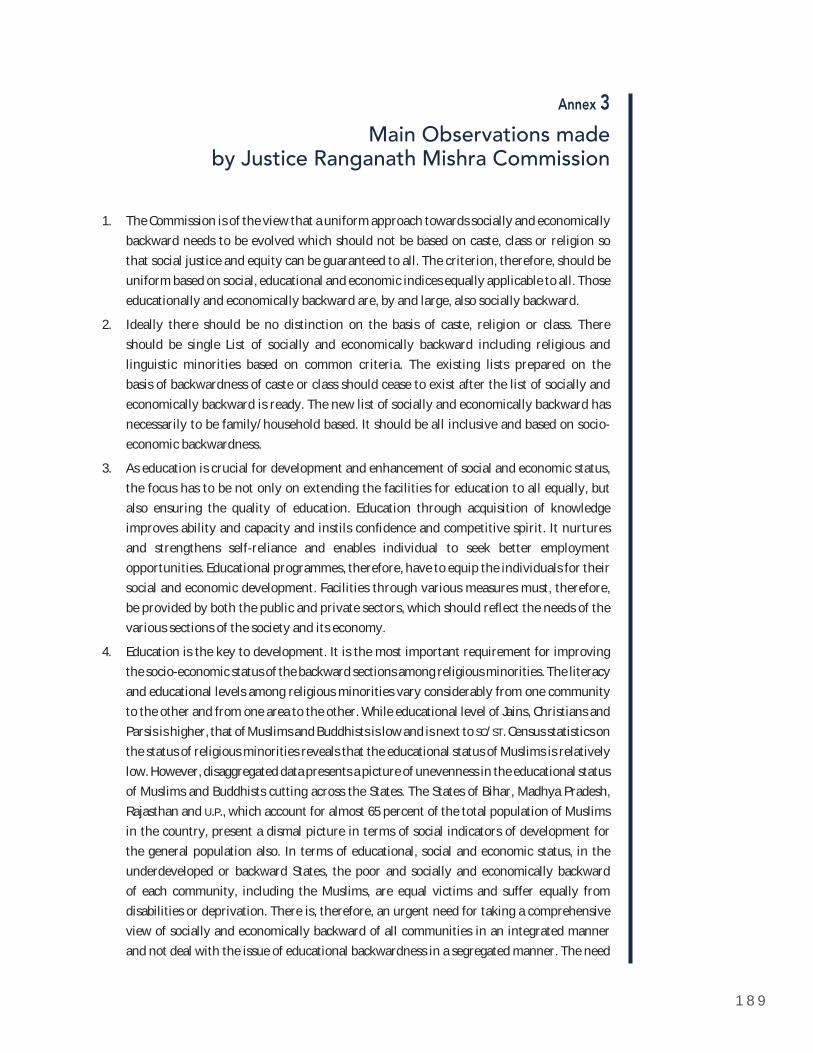
1 8 9
Annex 3
Main Observations made by Justice Ranganath Mishra Commission
The Commission is of the view that a uniform approach towards socially and economically 1.backward needs to be evolved which should not be based on caste, class or religion so that social justice and equity can be guaranteed to all. The criterion, therefore, should be uniform based on social, educational and economic indices equally applicable to all. Those educationally and economically backward are, by and large, also socially backward.
Ideally there should be no distinction on the basis of caste, religion or class. There 2.should be single List of socially and economically backward including religious and linguistic minorities based on common criteria. The existing lists prepared on the basis of backwardness of caste or class should cease to exist after the list of socially and economically backward is ready. The new list of socially and economically backward has necessarily to be family/household based. It should be all inclusive and based on socio-economic backwardness.
As education is crucial for development and enhancement of social and economic status, 3.the focus has to be not only on extending the facilities for education to all equally, but also ensuring the quality of education. Education through acquisition of knowledge improves ability and capacity and instils confi dence and competitive spirit. It nurtures and strengthens self-reliance and enables individual to seek better employment opportunities. Educational programmes, therefore, have to equip the individuals for their social and economic development. Facilities through various measures must, therefore, be provided by both the public and private sectors, which should refl ect the needs of the various sections of the society and its economy.
Education is the key to development. It is the most important requirement for improving 4.the socio-economic status of the backward sections among religious minorities. The literacy and educational levels among religious minorities vary considerably from one community to the other and from one area to the other. While educational level of Jains, Christians and Parsis is higher, that of Muslims and Buddhists is low and is next to SC/ST. Census statistics on the status of religious minorities reveals that the educational status of Muslims is relatively low. However, disaggregated data presents a picture of unevenness in the educational status of Muslims and Buddhists cutting across the States. The States of Bihar, Madhya Pradesh, Rajasthan and U.P., which account for almost 65 percent of the total population of Muslims in the country, present a dismal picture in terms of social indicators of development for the general population also. In terms of educational, social and economic status, in the underdeveloped or backward States, the poor and socially and economically backward of each community, including the Muslims, are equal victims and suffer equally from disabilities or deprivation. There is, therefore, an urgent need for taking a comprehensive view of socially and economically backward of all communities in an integrated manner and not deal with the issue of educational backwardness in a segregated manner. The need
1 9 0
Broken Promises: A study on the socio-economic status of Indian Muslims - Seven years post Sachar
for expanding coverage and providing quality education, focusing on girl’s education and strengthening vocational education is vital for educational development of weaker sections among all backward classes, SCs and STs and Minorities.
National programmes like ‘Sarva Siksha Abhiyan’ are available to all sections of society 5.throughout the country, there is a need to ensure participation in the programme by all children belonging to religious minorities, SCs/STs and other backward classes so that the facilities are equally shared and dropout rates can be contained. Area based approach needs to be adopted and socially and economically backwards targeted locally.
The enrolment of children of religious Minorities at the primary level is better than that 6.of SC/ST. However, the dropout rate of Muslims is higher at the middle and secondary level. Social and economic prosperity is closely linked to the level of education and training of an individual. Acquisition of knowledge and competitive spirit is essential for accessing facilities and opportunities that the society and its economy offer. The socially and economically backward Minorities need to be enlightened about the importance of acquiring knowledge and creating competitive spirit with a view to ensuring that merit is properly rewarded and reservation is not used to kill initiative and competitive spirit. The intelligentsia among the religious Minorities should convince the community for active participation in educational programmes/schemes and nurture initiative and spirit of competition amongst them.
The economic status of religious Minorities varies from group to group and area to 7.area. While level of education and status has direct linkage with the employability and economic well-being of an individual, economic empowerment is also dependent on several other factors. The work participation both in the case of females and males, traditional and cultural infl uences especially with regard to female participation, the type and nature of work etc. also infl uence the economic status of individuals, households and often of communities. In the case of religious Minorities, the Work Participation Rate (WPR) of Buddhists, Hindus and Christians is approximately the same as for all religious populations which is 39.1 percent. The WPR of Sikhs is slightly less than the national average. However, in the case of both Jains and Muslims it is low though, perhaps, for different reasons. Muslims are the lowest at 31.3 percent. In terms of categories of workers more Hindus, Sikhs and Christians are cultivators than Muslims. Christians and Sikhs are lowest in terms of agriculture workers while Muslims have the highest percentage of workers in the household industry sector. In terms of ‘other occupations’ the number of Christians is proportionately the largest in this category at 52.8 percent. The number of Muslims in this category stands at 49.1 percent, Hindus at the lowest at 35.5 percent. The level of poverty determines the economic status of individuals. In terms of poverty fi gures while percentage of people living below the poverty line, Muslims approximate to that of Hindus in the rural areas, the percentage of Muslims living below poverty line in the urban areas is high. The largest number of people in the rural areas who live below poverty line belong to the category of other religions.
The religious Minorities are more urban-based than rural-based. While more Christians 8.are engaged in wage employment, more Muslims are employed in household industries and are by and large self-employed. Despite these variations, it is apparent that the
1 9 1
Annexes
population of religious minorities is as dispersed as that of majority community. It is, therefore, necessary that to economically empower the poor in a holistic manner adequate infrastructure has to be created and access through State and community interventions ensured keeping in mind their varied needs and requirements both in the rural and urban areas. Jain and Parsi communities are economically better of and very few of them would, if at all, come into the category of people below poverty line or backward classes.
The status of women in the society largely determines the social and economic well-9.being of a society and country. Their participation in economic activities at home and outside on equal footing and the response of the community in providing support system to facilitate their continuous involvement at all levels indicates socio-economic health of the society. It is, therefore, important that equal rights are not only guaranteed to them but are ensured in all spheres and a protective, secure environment conducive to women’s involvement is provided.
In every organization — governmental or non-governmental, planning and implementation 10.are both equally important aspects of administration. Planning, formulating policies and programmes for the development of the country and its peoples for fulfi lling the objectives that are laid down, is vital for sustainable development. Good governance not only depends on appropriate policies which are need-based, identify target areas and groups or households but is equally dependent on a suitable administrative framework and mechanism that ensures delivery of services and facilities in an equitable and just manner. For effective implementation of programmes, it is important that infrastructure — institutional and administrative — is in place. Systems need to be in place to regularly review policies, programmes and mechanisms to assess their appropriateness and feasibility as also to constantly monitor to ensure that the target groups and benefi ciaries are availing the services and facilities being provided for them. Concurrent evaluation is necessary to identify the gaps and/or causes for tardy implementation and corrective measures taken midstream for realization of aims and objectives.
Shortfalls and lacunae in the existing policies and programmes, and the anomalies that 11.exist and have come to light in implementation. It has also been highlighted that these have resulted in marginalising the socially and economically backward of all categories since the benefi ts have gone to the upper crust within the groups of backwards. Changes in the existing criterion for identifying the eligible out of the backwards is necessary. In a democracy, decentralisation of administrative and fi nancial powers and authority is important. This is specially vital in a vast country like ours which has variations in terrain, population distribution, culture, tradition, state of development and needs —area and people-wise. In order to ensure that the socially and economically backward amongst all categories including the Minorities are able to take benefi ts from the schemes and programmes, powers must be vested at a level from where the access to and for each individual/household of socially and economically backward is possible. In order to establish the effi cacy of administration, it has to be ensured that the constitutional provision of equal treatment to socially and economically backwards irrespective of caste, creed is followed in word and spirit for ensuring the fl ow of benefi ts to the Socially and Economically Backward families.
1 9 2
Broken Promises: A study on the socio-economic status of Indian Muslims - Seven years post Sachar
Ideally the criteria for reservation should be socio-economic backwardness and not religion 12.or caste. Further, Article 16(4) should be the basis for providing reservation benefi ts to Minority groups who are socially and economically backward. Reservation should be provided only as a short-term, time-bound measure for enabling greater participation, both in education and employment. The lists of SC/ST and OBC have not been scientifi cally prepared either on the basis of a proper survey or reliable data on socio-economic status of a particular caste or class. Therefore, the entire system of reservation, including that for SCs/STs and OBCs needs to be overhauled. Reservation as available to SCs and STs is open-ended as it is available to all belonging to the category irrespective of income, educational and economic status. OBCs enjoy 27 percent reservation in employment, though creamy layer is excluded. The norms and methodology adopted, is full of anomalies and hence amenable to large-scale abuse. For this reason, the better off among the groups take advantage of reservation at the cost of the socially and economically backward and deprived. It is, therefore, necessary to limit benefi ts of reservation to the socially and economically backward only. Since BPL (Below Poverty Line) lists are prepared on the basis of social/educational and economic criteria, they are more scientifi c. They are also revised periodically. BPL lists should, therefore, be made eligible for grant of reservation without distinction on caste, class, group or religion basis.
Provision of educational facilities to all sections of population at all levels is most 13.important. The quality of education at primary and secondary level is paramount to equip the weaker sections for competing on merit for admission in higher/professional educational institutions. The four main dimensions of group disadvantages are caste/community, gender, region and sector of resident (rural or urban). It is also essential to ensure that creamy layer among the backward classes is kept out failing which concessions granted by the Reservation Policy will be grabbed by the creamy layer and not reach the poorest of the poor.
Recommendations relating to religious minorities
The ultimate goal should be the evolution of a uniform pattern of criteria for identifying 1.the backward, which should be based only on the educational and economic status of people and not on their caste or religion, and its application equally to all sections of the citizens irrespective of their caste or religion.
And, the Commission suggests that overall efforts should be directed towards gradually leading the nation to that goal.
The achievement of that ultimate goal will take a long time as it would obviously require 2.building public opinion and procuring national consensus in its favour, as also a strong political will for translating it into concrete action. The Commission is, therefore, recommending some other measures to be adopted now, pending the possible achievement of what the Commission has called the ultimate goal.
The measures recommended above will pave the way for achieving the afore-stated 3.ultimate goal in future on one hand, while ensuring on the other hand a faithful compliance at present with the constitutional directives of social, economic and political justice and
1 9 3
Annexes
equality of status and opportunity as proclaimed by the Preamble to the Constitution and detailed in its provisions on Fundamental Rights.
The recommendations are not only for the communities notifi ed as “Minorities” by 4.executive action under the National Commission for Minorities Act 1992 but for all religious Minorities — large or small — including the Hindus in the Union Territory of Lakshadweep and the States of Jammu & Kashmir, Meghalaya, Mizoram, Nagaland and Punjab.
The matter of criteria for identifying backward classes there should be absolutely no 5.discrimination whatsoever between the majority community and the Minorities; and, therefore, the criteria now applied for this purpose to the majority community — whatever that criteria may be — must be unreservedly applied also to all the Minorities.
As a natural corollary to the aforesaid recommendation, all those classes, sections and 6.groups among the Minorities should be treated as backward whose counterparts in the majority community are regarded as backward under the present scheme of things.
All those classes, sections and groups among the various Minorities as are generally 7.regarded as ‘inferior’ within the social strata and societal system of those communities — whether called ‘ z a f or known by any other synonymous expression — should be treated as backward.
To be more specifi c, all those social and vocational groups among the 8.Minorities who but for their religious identity would have been covered by the present net of Scheduled Castes should be unquestionably treated as sociallybackward, irrespective of whether the religion of those other communities recognises the caste system or not.
Those groups among the Minorities whose counterparts in the majority community are 9.at present covered by the net of Scheduled Tribes should also be included in that net; and also, more specifi cally, members of the Minority communities living in any Tribal Area from pre-independence days should be so included irrespective of their ethnic characteristics.
As democracy is a game of numbers, the numerically weaker sections of the citizenry 10.in any society may and often do get marginalised by the majority. This is eminently true of the religious Minorities in India where the society remains intensively religious and religion conscious and the religious Minorities live with a predominant religious community accounting for over 80 percent of the national population. In such a situation legal protection from the hegemony and preponderance of the majority community becomes a pressing need of the religious Minorities as a whole, and not just that of the ‘backward’ sections among them. To provide such necessary protection by law we do have in the Constitution a Directive Principle of State Policy, Article 46, which speaks of “weaker sections of the people” — notably without subjecting them to the condition of backwardness —and mandates the State to “promote with special care” the educational and economic interests of such sections. It is keeping this in mind that the Commission is making certain recommendations for the religious communities as such — though the Commission is, of course, also recommending some special measures for the socially and educationally backward sections among the Minorities.
1 9 4
Broken Promises: A study on the socio-economic status of Indian Muslims - Seven years post Sachar
Backwardness — both social and economic — actually emanates from educational 11.backwardness. The Commission is, therefore, making certain measures for the educational advancement of the religious minorities. -especially the Muslims and the Neo — Buddhists — who were identifi ed under the National Education Policy of 1986 as educationally most backward among all the religious communities of the country. At the same time the Commission is also recommending some measures for the economic betterment of the backward sections among the religious Minorities.
By the word ‘education’ and its derivatives as used below, the Commission mean not only 12.general education at the primary, secondary, graduate and postgraduate levels, but also instruction and training in engineering, technology, managerial and vocational courses and professional studies like medicine, law and accountancy. All these subjects and disciplines — as also the paraphernalia required for these like libraries, reading rooms, laboratories, hostels, dormitories etc. — are included in our recommendations for the advancement of education among the Minorities.
As the meaning and scope of Article 30 of the Constitution has become quite uncertain, 13.complicated and diluted due to their varied and sometimes confl icting judicial interpretations, a comprehensive law should be enacted without delay to detail all aspects of Minorities’ educational rights under that provision with a view to reinforcing its original dictates in letter and spirit.
The statute of the National Minority Educational Institutions Commission should be 14.amended to make it wide-based in its composition, powers, functions and responsibilities and to enable it to work as the watch-dog for a meticulous enforcement of all aspects of Minorities’ educational rights under the Constitution.
As by the force of judicial decisions the Minority intake in Minority educational institutions 15.has, in the interest of national integration, been restricted to about 50 percent, thus virtually earmarking the remaining 50 percent or so for the majority community — by the same analogy and for the same purpose, at least 15 percent seats in all non-minority educational institutions should be earmarked by law for the Minorities as follows:-
a. The break-up within the recommended 15 percent earmarked seats in institutions shall be 10 percent for the Muslims (commensurate with their 73 percent share of the former in the total Minority population at the national level) and the remaining 5 percent for the other minorities.
b. Minor adjustments inter se can be made in the 15 percent earmarked seats. In the case of non-availability of Muslim candidates to fi ll 10 percent earmarked seats, the remaining vacancies may be given to the other Minorities if their members are available over and above their share of 5 percent; but in no case shall any seat within the recommended 15 percent go to the majority community.
c. As is the case with the Scheduled Castes and Scheduled Tribes at present, those minority community candidates who can compete with others and secure admission on their own merit shall not be included in these 15 percent earmarked seats.
As regards the backward sections among all the minorities, the concessions now available 16.in terms of lower eligibility criteria for admission and lower rate of fee, now available
1 9 5
Annexes
to the Scheduled Castes and Scheduled Tribes, should be extended also to such sections among the minorities. Since women among some Minorities — especially the Muslims and Buddhists — are generally educationally backward, the same measure for them as well and suggest that other possible measures be also initiated for their educational advancement.
In respect of the Muslims — who are the largest Minority at the national level with a 17.country-wide presence and yet educationally the most backward of the religious communities — certain exclusive measures are recommended as follows:
a. Select institutions in the country like the Aligarh Muslim University and the Jamia Millia Islamia should be legally given a special responsibility to promote education at all levels to Muslim students by taking all possible steps for this purpose. At least one such institution should be selected for this purpose in each of those states and Union Territories which has a substantial Muslim population.
b. All schools and colleges run by the Muslims should be provided enhanced aid and other logistic facilities adequate enough to raise their standards by all possible means and maintain the same.
c. The Madarsa Modernisation Scheme of the government should be suitably revised, strengthened and provided with more funds so that it can provide fi nances and necessary paraphernalia either (a) for the provision of modern education up to Standard X within those madarsas themselves which are at present imparting only religious education or, alternatively, (b) to enable the students of such madarsas to receive such education simultaneously in the general schools in their neigbourhood. The Madarsa Modernisation Scheme may, for all these purposes, be operated through a central agency like the Central Wakf Council or the proposed Central Madarsa Education Board.
d. The rules and processes of the Central Wakf Council should be revised in such a way that its main responsibility should be educational development of the Muslims. For this purpose the Council may be legally authorised (i) to collect a special 5 percent educational levy from all Wakfs, and (ii) to sanction utilisation of wakf-lands for establishing educational institutions, polytechnics, libraries and hostels.
e. In the funds to be distributed by the Maulana Azad Educational Foundation a suitable portion should be earmarked for the Muslims proportionate to their share in the total minority population. Out of this portion funds should be provided not only to the existing Muslim institutions but also for setting up new institutions from nursery to the highest level and for technical and vocational education anywhere in India but especially in the Muslim concentration areas.
f. Anganwadis, Navodaya Vidyalayas and other similar institutions should be opened under their respective schemes especially in each of the Muslim-concentration areas and Muslim families be given suitable incentives to send their children to such institutions.
As many Minority groups specialise in certain household and small-scale industries, an 18.effective mechanism should be adopted to work for the development and modernisation
1 9 6
Broken Promises: A study on the socio-economic status of Indian Muslims - Seven years post Sachar
of all such industries and for a proper training of artisans and workmen among the Minorities — especially among the Muslims among whom such industries, artisans and workmen are in urgent need of developmental assistance.
As the largest Minority of the country, the Muslims, as also some other Minorities have a 19.scant or weak presence in the agrarian sector, special schemes should be formulated for the promotion and development of agriculture, agronomy and agricultural trade among them.
Effective ways should be adopted to popularise and promote all the self-employment and 20.income-generating schemes among the Minorities and to encourage them to benefi t from such schemes.
The rules, regulations and processes of the National Minorities Development and Finance 21.Corporation be overhauled on a priority basis — in the light of the recent report recently submitted by the NMDFC Review Committee and in consultation with the National Commission for Minorities — with a view to making it more effi cient, effective and far-reaching among the Minorities.
A 15 percent share be earmarked for the Minorities — with a break-up of 10 percent 22.for the Muslims (commensurate with their 73 percent share of the former in the total minority population at the national level) — and 5 percent for the other minorities in all government schemes like Rural Employment Generation Programme, Prime Minister’s Rozgar Yojna, Grameen Rozgar Yojna, etc.
Since the Minorities — especially the Muslims — are very much under-represented, and 23.sometimes wholly unrepresented, in government employment, they should be regarded as backward in this respect within the meaning of that term as used in Article 16(4) of the Constitution — notably without qualifying the word ‘backward’ with the words “socially and educationally” — and that 15 percent of posts in all cadres and grades under the Central and State Governments should be earmarked for them as follows:
a. The break-up within the recommended 15 percent shall be 10 percent for the Muslims (commensurate with their 73 percent share of the former in the total minority population at the national level) and the remaining 5 percent for the other minorities.
b. Minor adjustment inter se can be made within the 15 percent earmarked seats. In the case of non-availability of Muslims to fi ll 10 percent earmarked seats, the remaining vacancies may be given to other Minorities if their members are available over and above their share of 5 percent; but in no case shall any seat within the recommended 15 percent go to the majority community.
The action recommended as above will have full sanction of Article 16(4) of the 24.Constitution. Yet, should there be some insurmountable diffi culty in implementing this recommendation, as an alternative since according to the Mandal Commission Report, the Minorities constitute 8.4 percent of the total OBC population, in the 27 percent OBC
quota, an 8.4 percent sub-quota should be earmarked for the Minorities with an internal break-up of 6 percent for the Muslims (commensurate with their 73 percent share in the total minority population at the national level) and 2.4 percent for the other minorities —
1 9 7
Annexes
with minor adjustments inter se in accordance with population of various Minorities in various states and UTs.
The reservation now extended to the Scheduled Tribes, which is a religion-neutral class, 25.should be carefully examined to assess the extent of Minority presence in it and remedial measures should be initiated to correct the imbalance, if any. The situation in Meghalaya, Mizoram, Nagaland and Lakshadweep which are Minority dominated and predominantly tribal, as also such tribal areas/districts in Assam and all other states, is to be especially taken into account in this respect.
The judicial reservation recently expressed in several cases about the continued inclusion 26.of the creamy layer in various classes enjoying reservation, inclusive of the Scheduled Castes and Scheduled Tribes, should be seriously considered for acceptance as a State policy.
On a careful examination of prevalence of the caste system among various sections of the 27.Indian citizenry, it is concluded that caste is in fact a social phenomenon shared by almost all Indian communities irrespective of their religious persuasions. Many of the particular castes are found simultaneously in various religious communities, equally facing problems of social degradation and mistreatment both by their co-religionists and the others.
The Constitution of India prohibits any discrimination between the citizens on the basis 28.of caste, and yet it sanctions special affi rmative measures for Scheduled Castes. At the same time it prohibits any discrimination on the ground of religion. Reading all these constitutional provisions together, it is convinced that any religion-based discrimination in selecting particular castes for affi rmative action will confl ict with the letter and spirit of the constitutional provisions. The Commission is making following recommendations:-
The caste system should be recognized as a general social characteristic of the Indian 29.society as a whole, without questioning whether the philosophy and teachings of any particular religion recognize it or not — since the Indian brands of certain faith traditions like Christianity and Islam have never assimilated many puritan principles of those religions, posing this question in respect of the caste system only and singling out for a differential treatment is unreasonable and unrealistic.
This fact is duly recognized that among the Muslims of India the concepts of 30. zat (caste)and arzal (lower castes) are very much in practice; and even the Muslim law of marriage recognises the doctrine of kufw -parity in marriage between the parties in all vital respects including social status and descent -which in this country means nothing but caste.
In view of what has been said above, it is recommended that Para 3 of the Constitution 31.(Scheduled Castes) Order 1950 — which originally restricted the Scheduled Caste net to the Hindus and later opened it to Sikhs and Buddhists, thus still excluding from its purview the Muslims, Christians, Jains and Parsis, etc. — should be wholly deleted by appropriate action so as to completely delink the Scheduled Caste status from religion and make the Scheduled Castes net fully religion-neutral like that of the Scheduled Tribes.
All those groups and classes among the Muslims and Christians, etc. whose counterparts 32.among the Hindus, Sikhs or Buddhists, are included in the Central or State Scheduled Castes lists should also be covered by the Scheduled Caste net. If any such group or class
1 9 8
Broken Promises: A study on the socio-economic status of Indian Muslims - Seven years post Sachar
among the Muslims and Christians, etc. is now included in an OBC list, it should be deleted from there while transferring it to the Scheduled Castes — placing the same persons in the Scheduled Caste list if they are Hindu, Sikh or Buddhist but in the OBC list if they follow any other religion — which is the case in many states — in our opinion clearly amounts to religion-based discrimination.
As the Constitution of India guarantees freedom of conscience and religious freedom as 33.a Fundamental Right, once a person has been included in a Scheduled Caste list a willful change of religion on his part should not affect adversely his or her Scheduled Caste status — as that would in Commission’s opinion confl ict with the basic constitutional provisions relating to equality, justice and non-discrimination on religious grounds; as also with the spirit of the old and time-tested Caste Disabilities Removal Act of 1850.
1 9 9
Annex 4
Prime Minister’s New 15-Point Programme for Welfare of Minorities
(A) Enhancing opportunities for Education.
(1) Equitable availability of ICDS Services
The integrated Child Development Services (ICDS) Scheme is aimed at holistic development of children and pregnant/lactating mothers from disadvantaged section, by providing services through Anganwadi Centres such as supplementary nutrition, immunisation, health check-up, referral services, pre-school and non-formal education. A certain percentage of the ICDS projects and Anganwadi Centres will be located in blocks/villages with a substantial population of minority communities to ensure that the benefi ts of the scheme are equitable available to such communities also.
(2) Improving access to School Education
Under the Sarva Shiksha Abhiyan, the Kasturba Gandhi Balika Vidyalaya Scheme, and other similar Government schemes, it will be ensured that a certain percentage of such school are located in villages/localities having a substantial population of minority communities.
(3) Greater resources for teaching Urdu
Central assistance will be provided for recruitment and posting of Urdu language teachers in primary and upper primary schools that serve a population in which at least one-fourth belong to that language group.
(4) Modernising Madarsa Education
The Central Plan Scheme of Area Intensive and Madarsa Modernisation Programme provides basis educational infrastructure in areas of concentration of educationally backward minorities and resources for the modernisation of Madarsa education. Keeping in view of importance of addressing this need, this programme will be substantially strengthened and implemented effectively.
(5) Scholarships for meritorious students from minority communities
Schemes for pre-matric and post-matric scholarships for students from minority communities will be formulated and implemented.
(6) Improving educational infrastructure through the Maulana Azad Education Foundation
The Government shall provide all possible assistance to Maulana Azad Education, Foundation (MAEF) to strengthen and enable it to expand its activities more effectively.
(B) Equitable Share in Economic Activities and Employment
(7) Self-Employment and Wage Employment for the poor.
2 0 0
Broken Promises: A study on the socio-economic status of Indian Muslims - Seven years post Sachar
The Swarnjayanti Gram Swarojgar Yojna (SGSY), the primary self-employment programme for rural areas, has the objective for bringing assisted poor rural families above the poverty line by providing them income generating assets through a mix of bank credit and Governmental subsidy. A certain percentage of the physical and fi nancial targets under the SGSY will be earmarked for benefi ciaries belonging to the minority communities living below the poverty line in rural areas.
The Swarnjayanti Shahary Rozgar Yojna (SSRY) consists of two major components namely, the Urban Self-Employment Programme (USEP) and the Urban Wage Employment Programme (UWEP). A certain percentage of the physical and fi nancial targets under USEP and UWEP will be earmarked to benefi t people below the poverty line from the minority communities.
The Sampurna Grameen Rozgar Yojna (SGRY) is aimed at providing additional wage employment in rural areas alongside the creation of durable community, social and economic infrastructure. Since the National Rural Employment Guarantee Programme (NREGP) has been launched in 200 districts, and SGRY has been merged with NREGP in these districts, in the remaining districts, a certain percentage of the allocation under SGRY will be earmarked for benefi ciaries belonging to the minority communities living below the poverty line till these districts are taken up under NREGP. Simultaneously, a certain percentage of the allocation will be earmarked for the creation of infrastructure in such villages, which have a substantial population of minorities.
(8) Upgradation of skill through technical training
A very large proportion of the population of minority communities is engaged in low-level technical work or earns its living as handicraftsmen. Provision of technical training to such people would upgrade their skills and earning capability. Therefore, a certain proportion of all new ITIs will be located in areas predominantly inhabited by minority communities and a proportion of existing ITIs to be upgraded to ‘Centres of Excellence’ will be selected on the same basis.
(9) Enhanced credit support for economic activities
The National Minorities Development & Finance Corporation (NMDFC) was set up in 1994 with the objective of promoting economic development activities among the minority communities. The Government is committed to strengthen the NMDFC by providing it greater equity support to enable it to fully achieve its objective.
Bank credit is essential for creation and sustenance of self-employment initiative. A target of 40% of net bank credit for priority sector lending has been fi xed for domestic banks. The priority sector includes, inter alia, agricultural loans, loan to small-scale industries & small business, loans to retail trade, professional and self-employed persons, education loans, housing loans and micro-credit. It will be ensured that an appropriate percentage of the priority sector lending in all categories is targeted for the minority communities.
(10) Recruitment to State and Central Services
In the recruitment of police personnel, State Governments will be advised to give special consideration to minorities. For this purpose, the composition of selection committees should be representative.
2 0 1
Annexes
The Central Government will take similar action in the recruitment of personnel to the Central police forces.
Large scale employment opportunities are provided by the Railways, nationalized banks and public sector enterprises. In these cases also, the concerned departments will ensure that special consideration is given to recruitment from minority communities.
An exclusive scheme will be launched for candidates belonging to minority communities to provide coaching in Government institutions as well as private coaching institutes with credibility.
The programme does not envisage any change or relaxation of any criteria, norms or eligibility conditions in any scheme for minorities. These would continue to be as provided for in the original schemes included in the programme.
An important aim of the new programme is to ensure that the benefi ts of various government schemes for the underprivileged reach the disadvantaged sections of the minority communities. The underprivileged among the minorities are, of course, included in the target groups of various government schemes. But in order to ensure that the benefi ts of these schemes fl ow equitably to minorities, the new programme envisages location of a certain proportion of development projects in minority concentration areas. It also provides that, wherever possible, 15% of targets and outlays under various schemes should be earmarked for minorities.
(C) Improving the conditions of living of minorities.
(11) Equitable share in rural housing scheme
The Indira Awaas Yojna (IAY) provides fi nancial assistance for shelter to the rural poor living below the poverty line. A certain percentage of the physical and fi nancial targets under IAY will be earmarked for poor benefi ciaries from minority communities living in rural areas.
(12) Improvement in condition of slums inhabited by minority communities.
Under the schemes of Integrated Housing & Slum Development Programme (IHSDP) and Jawaharlal Nehru National Urban Renewal Mission (JNNURM), the Central Government provides assistance to States/UTs for development of urban slums through provision of physical amenities and basic services. It would be ensured that the benefi ts of these programmes fl ow equitable to members of the minority communities and to cities/slums, predominantly inhabited by minority communities.
(D) Prevention & Control of Communal Riots
(13) Prevention of communal incidents
In the areas, which have been identifi ed as communally sensitive and riot prone districts and police offi cials of the highest known effi ciency, impartiality and secular record must be posted. In such areas and even elsewhere, the prevention of communal tension should be one of the primary duties of the district magistrate and superintendent of police. Their performance in this regard should be an important factor in determining their promotion prospects.
2 0 2
Broken Promises: A study on the socio-economic status of Indian Muslims - Seven years post Sachar
(14) Prosecution for communal offences
Severe action should be taken against all those who incite communal tension or take part in violence. Special court or courts specifi cally earmarked to try communal offences should be set up so that offenders are brought to book speedily.
(15) Rehabilitation of victims of communal riots
Victims of communal riots should be given immediate relief and provided prompt and adequate fi nancial assistance for their rehabilitation.
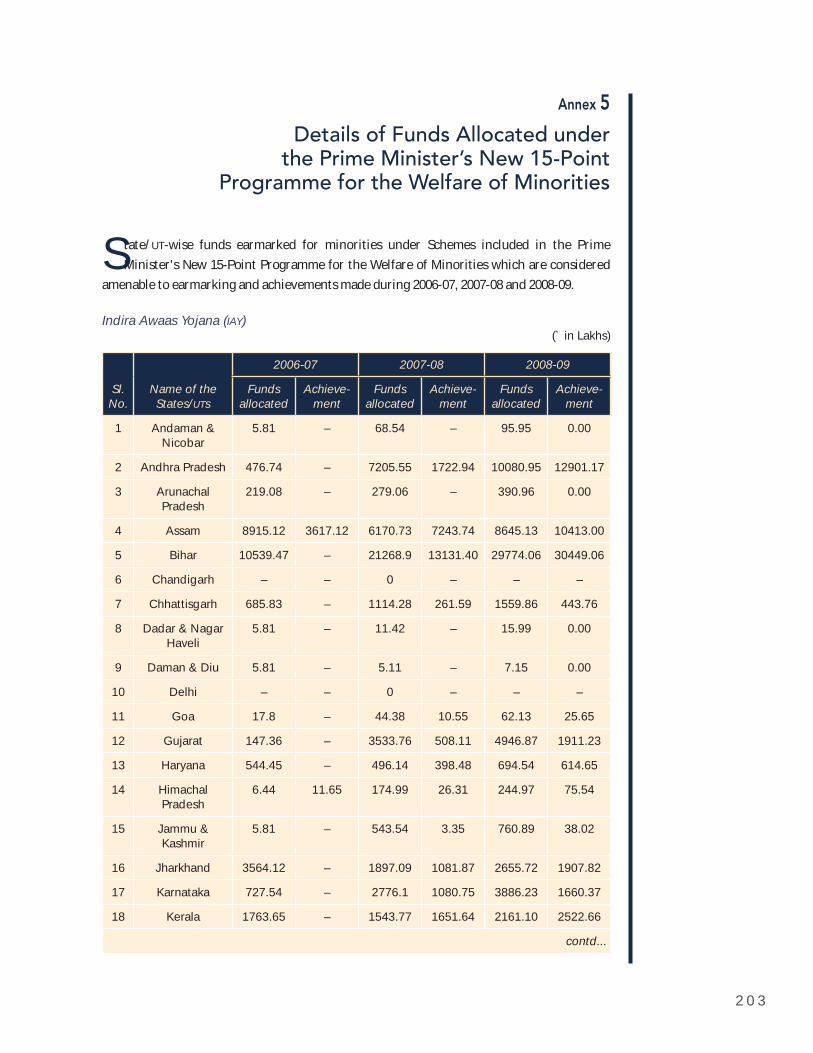
2 0 3
Annex 5
Details of Funds Allocated under the Prime Minister’s New 15-Point
Programme for the Welfare of Minorities
State/UT-wise funds earmarked for minorities under Schemes included in the Prime Minister's New 15-Point Programme for the Welfare of Minorities which are considered
amenable to earmarking and achievements made during 2006-07, 2007-08 and 2008-09.
Indira Awaas Yojana (IAY)(` in Lakhs)
Sl.No.
Name of the States/UTs
2006-07 2007-08 2008-09
Fundsallocated
Achieve-ment
Fundsallocated
Achieve-ment
Fundsallocated
Achieve-ment
1 Andaman & Nicobar
5.81 – 68.54 – 95.95 0.00
2 Andhra Pradesh 476.74 – 7205.55 1722.94 10080.95 12901.17
3 Arunachal Pradesh
219.08 – 279.06 – 390.96 0.00
4 Assam 8915.12 3617.12 6170.73 7243.74 8645.13 10413.00
5 Bihar 10539.47 – 21268.9 13131.40 29774.06 30449.06
6 Chandigarh – – 0 – – –
7 Chhattisgarh 685.83 – 1114.28 261.59 1559.86 443.76
8 Dadar & Nagar Haveli
5.81 – 11.42 – 15.99 0.00
9 Daman & Diu 5.81 – 5.11 – 7.15 0.00
10 Delhi – – 0 – – –
11 Goa 17.8 – 44.38 10.55 62.13 25.65
12 Gujarat 147.36 – 3533.76 508.11 4946.87 1911.23
13 Haryana 544.45 – 496.14 398.48 694.54 614.65
14 Himachal Pradesh
6.44 11.65 174.99 26.31 244.97 75.54
15 Jammu & Kashmir
5.81 – 543.54 3.35 760.89 38.02
16 Jharkhand 3564.12 – 1897.09 1081.87 2655.72 1907.82
17 Karnataka 727.54 – 2776.1 1080.75 3886.23 1660.37
18 Kerala 1763.65 – 1543.77 1651.64 2161.10 2522.66
contd...
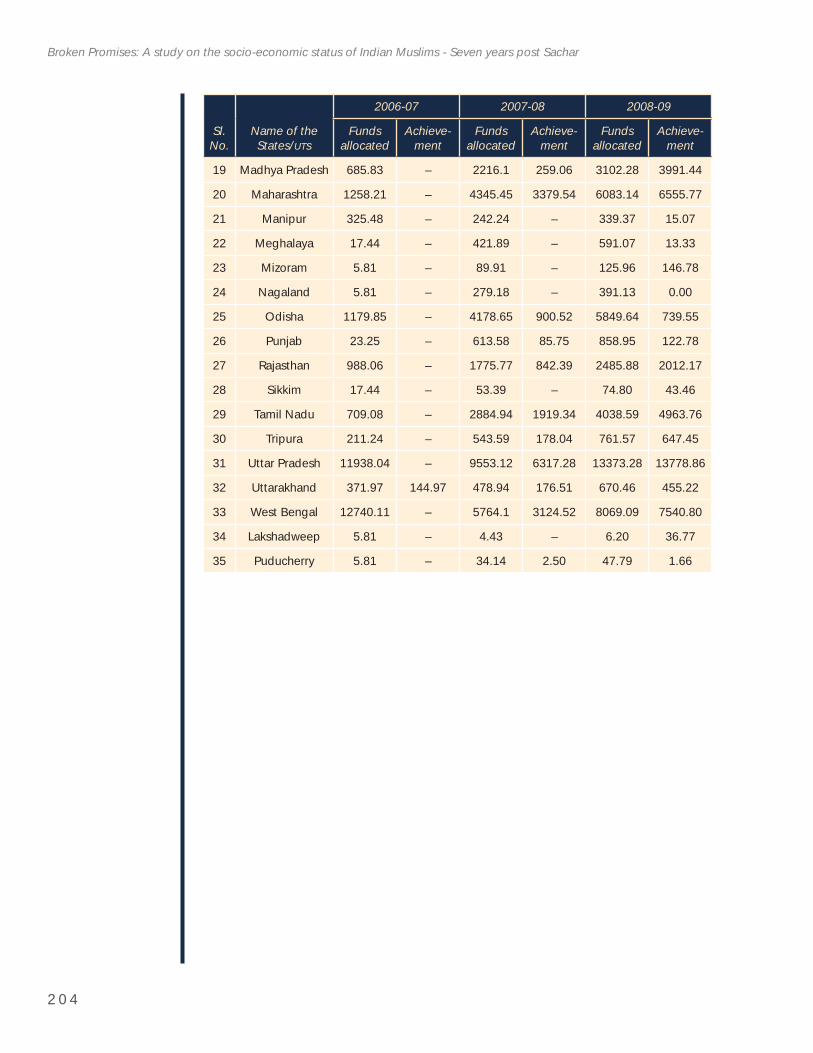
2 0 4
Broken Promises: A study on the socio-economic status of Indian Muslims - Seven years post Sachar
Sl.No.
Name of the States/UTs
2006-07 2007-08 2008-09
Fundsallocated
Achieve-ment
Fundsallocated
Achieve-ment
Fundsallocated
Achieve-ment
19 Madhya Pradesh 685.83 – 2216.1 259.06 3102.28 3991.44
20 Maharashtra 1258.21 – 4345.45 3379.54 6083.14 6555.77
21 Manipur 325.48 – 242.24 – 339.37 15.07
22 Meghalaya 17.44 – 421.89 – 591.07 13.33
23 Mizoram 5.81 – 89.91 – 125.96 146.78
24 Nagaland 5.81 – 279.18 – 391.13 0.00
25 Odisha 1179.85 – 4178.65 900.52 5849.64 739.55
26 Punjab 23.25 – 613.58 85.75 858.95 122.78
27 Rajasthan 988.06 – 1775.77 842.39 2485.88 2012.17
28 Sikkim 17.44 – 53.39 – 74.80 43.46
29 Tamil Nadu 709.08 – 2884.94 1919.34 4038.59 4963.76
30 Tripura 211.24 – 543.59 178.04 761.57 647.45
31 Uttar Pradesh 11938.04 – 9553.12 6317.28 13373.28 13778.86
32 Uttarakhand 371.97 144.97 478.94 176.51 670.46 455.22
33 West Bengal 12740.11 – 5764.1 3124.52 8069.09 7540.80
34 Lakshadweep 5.81 – 4.43 – 6.20 36.77
35 Puducherry 5.81 – 34.14 2.50 47.79 1.66
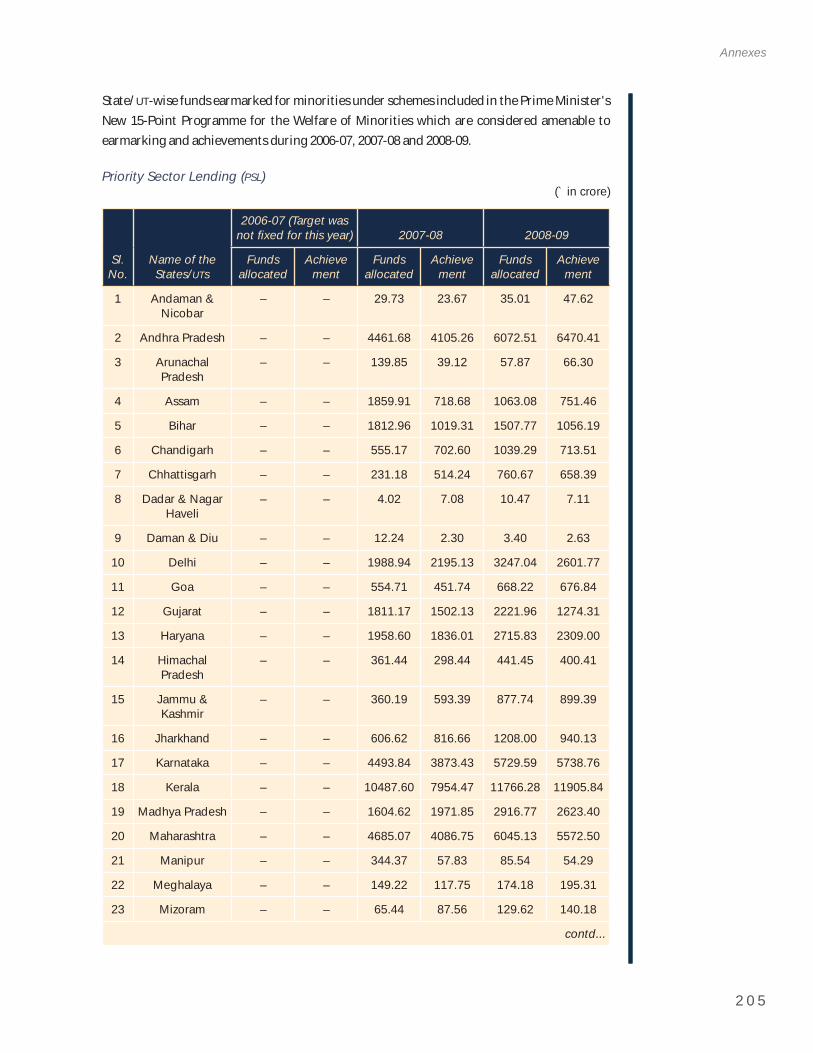
2 0 5
Annexes
State/UT-wise funds earmarked for minorities under schemes included in the Prime Minister's New 15-Point Programme for the Welfare of Minorities which are considered amenable to earmarking and achievements during 2006-07, 2007-08 and 2008-09.
Priority Sector Lending (PSL)(` in crore)
Sl.No.
Name of the States/UTs
2006-07 (Target was not fi xed for this year) 2007-08 2008-09
Fundsallocated
Achievement
Fundsallocated
Achievement
Fundsallocated
Achievement
1 Andaman & Nicobar
– – 29.73 23.67 35.01 47.62
2 Andhra Pradesh – – 4461.68 4105.26 6072.51 6470.41
3 Arunachal Pradesh
– – 139.85 39.12 57.87 66.30
4 Assam – – 1859.91 718.68 1063.08 751.46
5 Bihar – – 1812.96 1019.31 1507.77 1056.19
6 Chandigarh – – 555.17 702.60 1039.29 713.51
7 Chhattisgarh – – 231.18 514.24 760.67 658.39
8 Dadar & Nagar Haveli
– – 4.02 7.08 10.47 7.11
9 Daman & Diu – – 12.24 2.30 3.40 2.63
10 Delhi – – 1988.94 2195.13 3247.04 2601.77
11 Goa – – 554.71 451.74 668.22 676.84
12 Gujarat – – 1811.17 1502.13 2221.96 1274.31
13 Haryana – – 1958.60 1836.01 2715.83 2309.00
14 Himachal Pradesh
– – 361.44 298.44 441.45 400.41
15 Jammu & Kashmir
– – 360.19 593.39 877.74 899.39
16 Jharkhand – – 606.62 816.66 1208.00 940.13
17 Karnataka – – 4493.84 3873.43 5729.59 5738.76
18 Kerala – – 10487.60 7954.47 11766.28 11905.84
19 Madhya Pradesh – – 1604.62 1971.85 2916.77 2623.40
20 Maharashtra – – 4685.07 4086.75 6045.13 5572.50
21 Manipur – – 344.37 57.83 85.54 54.29
22 Meghalaya – – 149.22 117.75 174.18 195.31
23 Mizoram – – 65.44 87.56 129.62 140.18
contd...
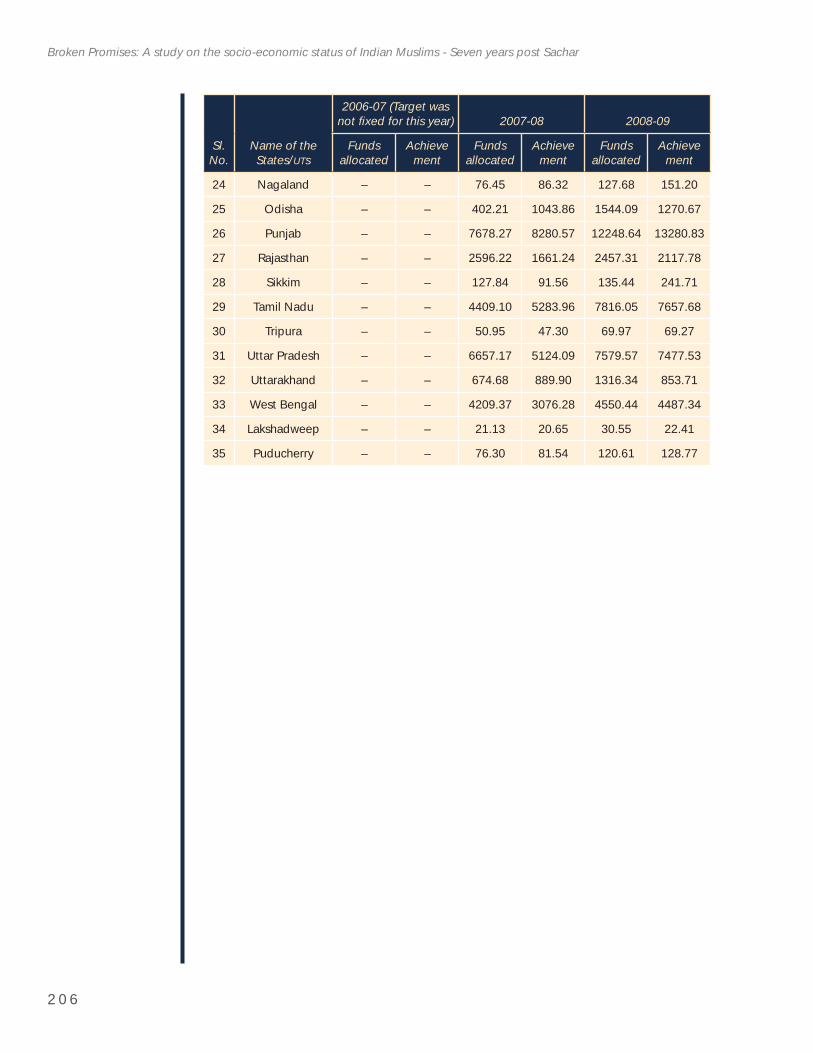
2 0 6
Broken Promises: A study on the socio-economic status of Indian Muslims - Seven years post Sachar
Sl.No.
Name of the States/UTs
2006-07 (Target was not fi xed for this year) 2007-08 2008-09
Fundsallocated
Achievement
Fundsallocated
Achievement
Fundsallocated
Achievement
24 Nagaland – – 76.45 86.32 127.68 151.20
25 Odisha – – 402.21 1043.86 1544.09 1270.67
26 Punjab – – 7678.27 8280.57 12248.64 13280.83
27 Rajasthan – – 2596.22 1661.24 2457.31 2117.78
28 Sikkim – – 127.84 91.56 135.44 241.71
29 Tamil Nadu – – 4409.10 5283.96 7816.05 7657.68
30 Tripura – – 50.95 47.30 69.97 69.27
31 Uttar Pradesh – – 6657.17 5124.09 7579.57 7477.53
32 Uttarakhand – – 674.68 889.90 1316.34 853.71
33 West Bengal – – 4209.37 3076.28 4550.44 4487.34
34 Lakshadweep – – 21.13 20.65 30.55 22.41
35 Puducherry – – 76.30 81.54 120.61 128.77
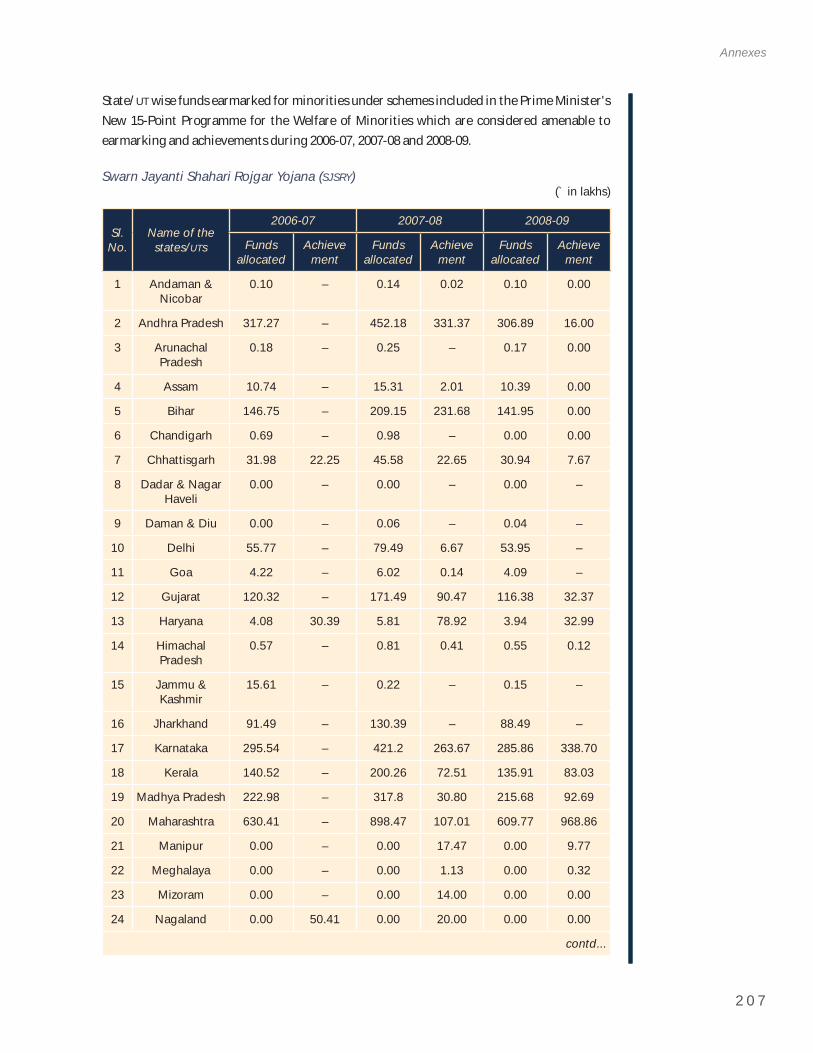
2 0 7
Annexes
State/UT wise funds earmarked for minorities under schemes included in the Prime Minister's New 15-Point Programme for the Welfare of Minorities which are considered amenable to earmarking and achievements during 2006-07, 2007-08 and 2008-09.
Swarn Jayanti Shahari Rojgar Yojana (SJSRY)(` in lakhs)
Sl.No.
Name of the states/UTs
2006-07 2007-08 2008-09
Fundsallocated
Achievement
Fundsallocated
Achievement
Fundsallocated
Achievement
1 Andaman & Nicobar
0.10 – 0.14 0.02 0.10 0.00
2 Andhra Pradesh 317.27 – 452.18 331.37 306.89 16.00
3 Arunachal Pradesh
0.18 – 0.25 – 0.17 0.00
4 Assam 10.74 – 15.31 2.01 10.39 0.00
5 Bihar 146.75 – 209.15 231.68 141.95 0.00
6 Chandigarh 0.69 – 0.98 – 0.00 0.00
7 Chhattisgarh 31.98 22.25 45.58 22.65 30.94 7.67
8 Dadar & Nagar Haveli
0.00 – 0.00 – 0.00 –
9 Daman & Diu 0.00 – 0.06 – 0.04 –
10 Delhi 55.77 – 79.49 6.67 53.95 –
11 Goa 4.22 – 6.02 0.14 4.09 –
12 Gujarat 120.32 – 171.49 90.47 116.38 32.37
13 Haryana 4.08 30.39 5.81 78.92 3.94 32.99
14 Himachal Pradesh
0.57 – 0.81 0.41 0.55 0.12
15 Jammu & Kashmir
15.61 – 0.22 – 0.15 –
16 Jharkhand 91.49 – 130.39 – 88.49 –
17 Karnataka 295.54 – 421.2 263.67 285.86 338.70
18 Kerala 140.52 – 200.26 72.51 135.91 83.03
19 Madhya Pradesh 222.98 – 317.8 30.80 215.68 92.69
20 Maharashtra 630.41 – 898.47 107.01 609.77 968.86
21 Manipur 0.00 – 0.00 17.47 0.00 9.77
22 Meghalaya 0.00 – 0.00 1.13 0.00 0.32
23 Mizoram 0.00 – 0.00 14.00 0.00 0.00
24 Nagaland 0.00 50.41 0.00 20.00 0.00 0.00
contd...
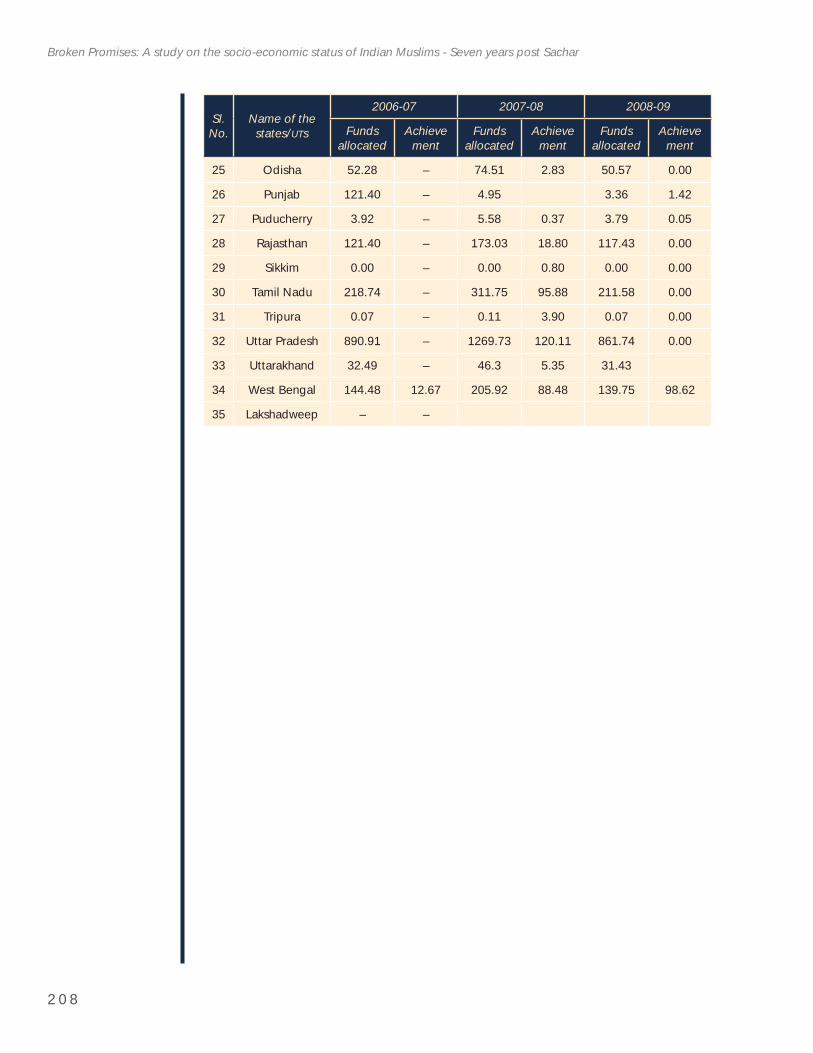
2 0 8
Broken Promises: A study on the socio-economic status of Indian Muslims - Seven years post Sachar
Sl.No.
Name of the states/UTs
2006-07 2007-08 2008-09
Fundsallocated
Achievement
Fundsallocated
Achievement
Fundsallocated
Achievement
25 Odisha 52.28 – 74.51 2.83 50.57 0.00
26 Punjab 121.40 – 4.95 3.36 1.42
27 Puducherry 3.92 – 5.58 0.37 3.79 0.05
28 Rajasthan 121.40 – 173.03 18.80 117.43 0.00
29 Sikkim 0.00 – 0.00 0.80 0.00 0.00
30 Tamil Nadu 218.74 – 311.75 95.88 211.58 0.00
31 Tripura 0.07 – 0.11 3.90 0.07 0.00
32 Uttar Pradesh 890.91 – 1269.73 120.11 861.74 0.00
33 Uttarakhand 32.49 – 46.3 5.35 31.43
34 West Bengal 144.48 12.67 205.92 88.48 139.75 98.62
35 Lakshadweep – –
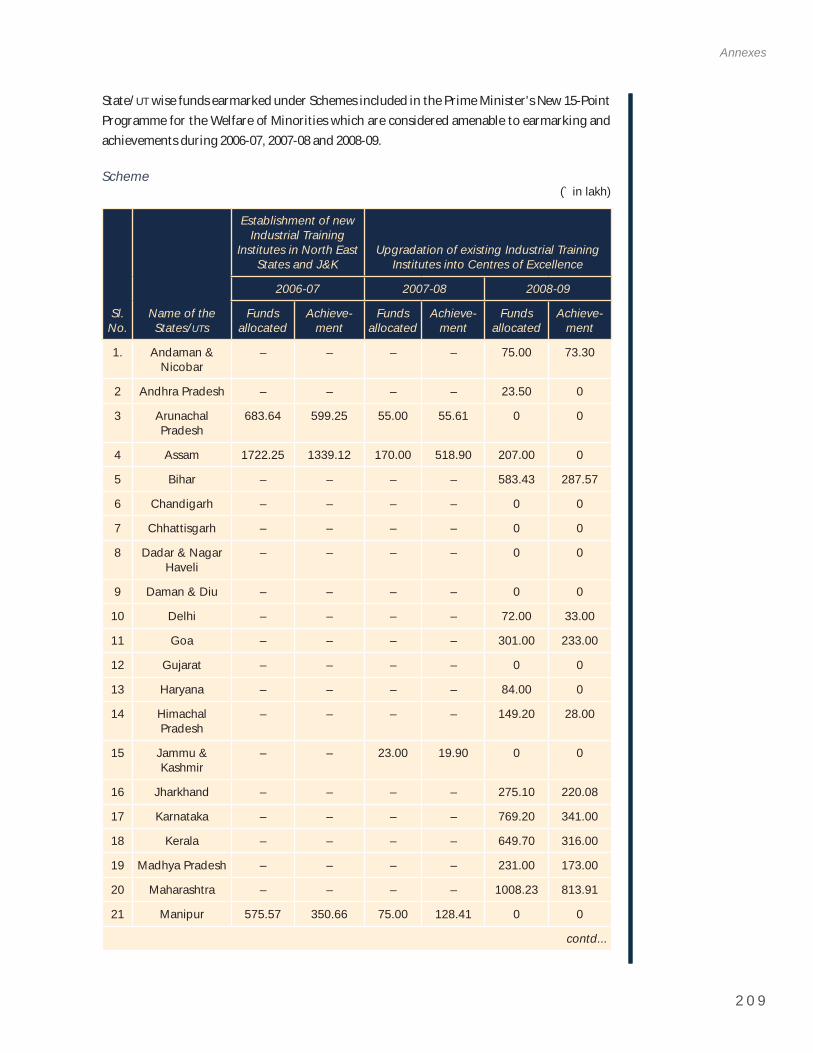
2 0 9
Annexes
State/UT wise funds earmarked under Schemes included in the Prime Minister's New 15-Point Programme for the Welfare of Minorities which are considered amenable to earmarking and achievements during 2006-07, 2007-08 and 2008-09.
Scheme(` in lakh)
Sl.No.
Name of the States/UTs
Establishment of new Industrial Training
Institutes in North East States and J&K
Upgradation of existing Industrial Training Institutes into Centres of Excellence
2006-07 2007-08 2008-09
Fundsallocated
Achieve-ment
Fundsallocated
Achieve-ment
Fundsallocated
Achieve-ment
1. Andaman & Nicobar
– – – – 75.00 73.30
2 Andhra Pradesh – – – – 23.50 0
3 Arunachal Pradesh
683.64 599.25 55.00 55.61 0 0
4 Assam 1722.25 1339.12 170.00 518.90 207.00 0
5 Bihar – – – – 583.43 287.57
6 Chandigarh – – – – 0 0
7 Chhattisgarh – – – – 0 0
8 Dadar & Nagar Haveli
– – – – 0 0
9 Daman & Diu – – – – 0 0
10 Delhi – – – – 72.00 33.00
11 Goa – – – – 301.00 233.00
12 Gujarat – – – – 0 0
13 Haryana – – – – 84.00 0
14 Himachal Pradesh
– – – – 149.20 28.00
15 Jammu & Kashmir
– – 23.00 19.90 0 0
16 Jharkhand – – – – 275.10 220.08
17 Karnataka – – – – 769.20 341.00
18 Kerala – – – – 649.70 316.00
19 Madhya Pradesh – – – – 231.00 173.00
20 Maharashtra – – – – 1008.23 813.91
21 Manipur 575.57 350.66 75.00 128.41 0 0
contd...
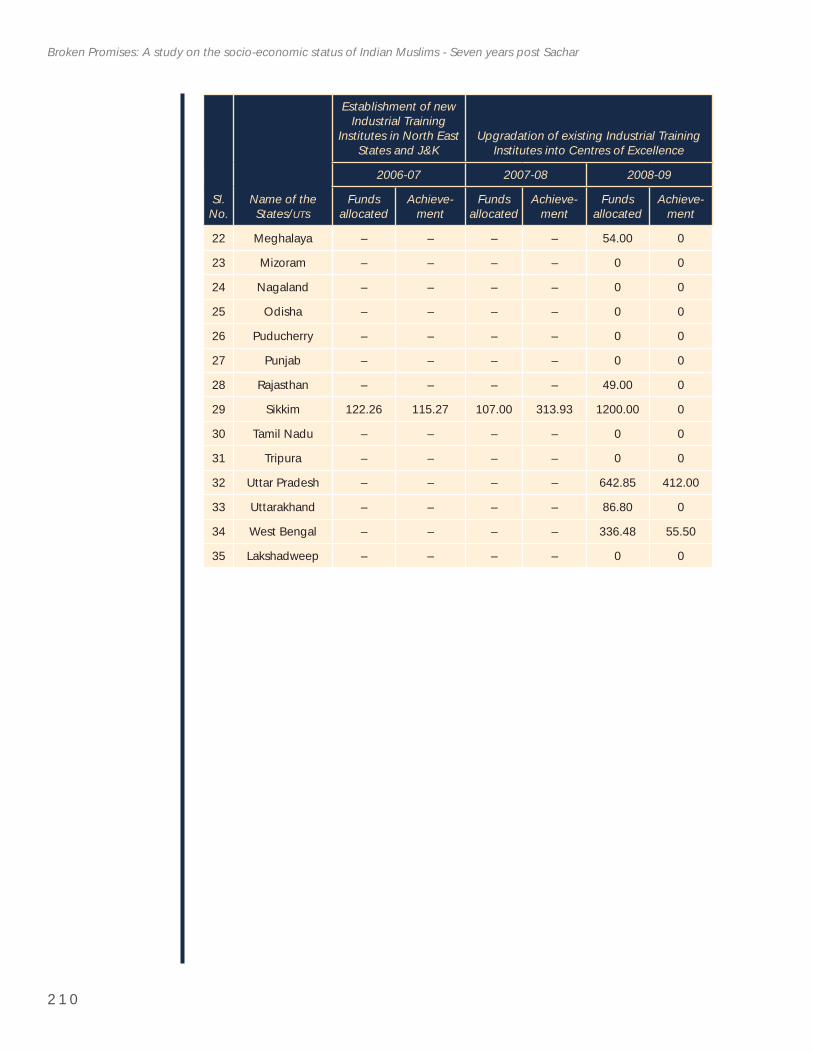
2 1 0
Broken Promises: A study on the socio-economic status of Indian Muslims - Seven years post Sachar
Sl.No.
Name of the States/UTs
Establishment of new Industrial Training
Institutes in North East States and J&K
Upgradation of existing Industrial Training Institutes into Centres of Excellence
2006-07 2007-08 2008-09
Fundsallocated
Achieve-ment
Fundsallocated
Achieve-ment
Fundsallocated
Achieve-ment
22 Meghalaya – – – – 54.00 0
23 Mizoram – – – – 0 0
24 Nagaland – – – – 0 0
25 Odisha – – – – 0 0
26 Puducherry – – – – 0 0
27 Punjab – – – – 0 0
28 Rajasthan – – – – 49.00 0
29 Sikkim 122.26 115.27 107.00 313.93 1200.00 0
30 Tamil Nadu – – – – 0 0
31 Tripura – – – – 0 0
32 Uttar Pradesh – – – – 642.85 412.00
33 Uttarakhand – – – – 86.80 0
34 West Bengal – – – – 336.48 55.50
35 Lakshadweep – – – – 0 0
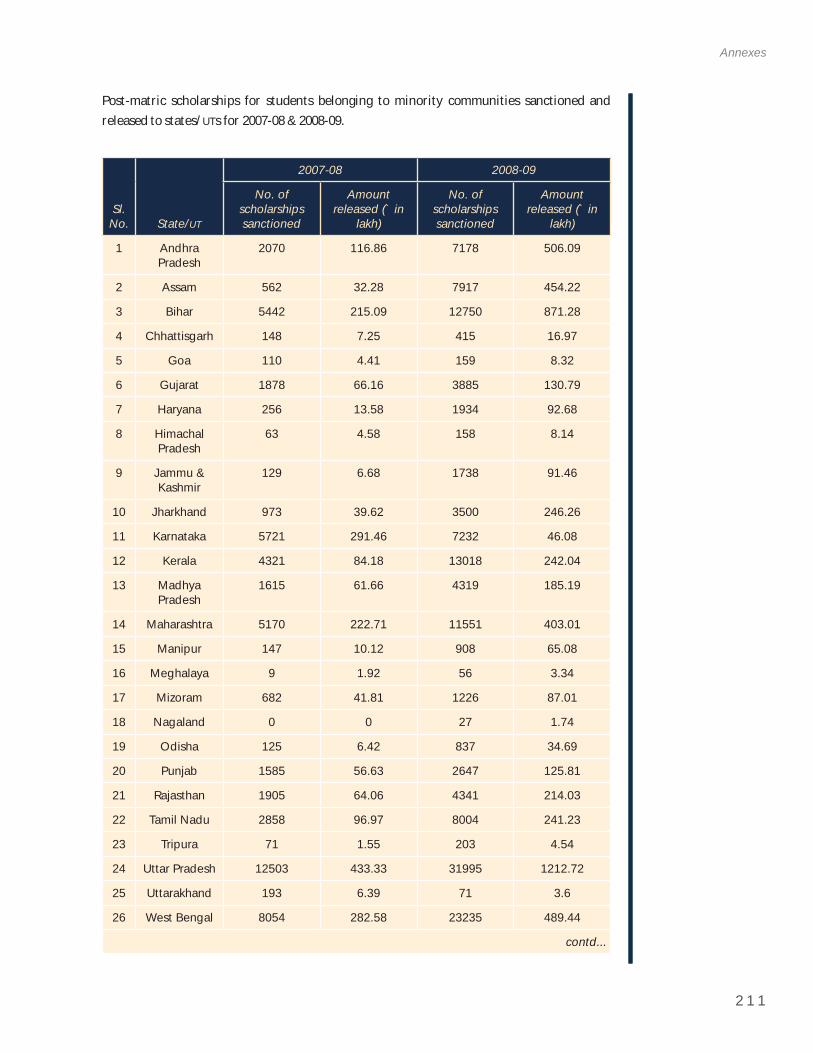
2 1 1
Annexes
Post-matric scholarships for students belonging to minority communities sanctioned and released to states/UTs for 2007-08 & 2008-09.
Sl.No. State/UT
2007-08 2008-09
No. of scholarshipssanctioned
Amountreleased (` in
lakh)
No. of scholarshipssanctioned
Amountreleased (` in
lakh)
1 Andhra Pradesh
2070 116.86 7178 506.09
2 Assam 562 32.28 7917 454.22
3 Bihar 5442 215.09 12750 871.28
4 Chhattisgarh 148 7.25 415 16.97
5 Goa 110 4.41 159 8.32
6 Gujarat 1878 66.16 3885 130.79
7 Haryana 256 13.58 1934 92.68
8 Himachal Pradesh
63 4.58 158 8.14
9 Jammu & Kashmir
129 6.68 1738 91.46
10 Jharkhand 973 39.62 3500 246.26
11 Karnataka 5721 291.46 7232 46.08
12 Kerala 4321 84.18 13018 242.04
13 Madhya Pradesh
1615 61.66 4319 185.19
14 Maharashtra 5170 222.71 11551 403.01
15 Manipur 147 10.12 908 65.08
16 Meghalaya 9 1.92 56 3.34
17 Mizoram 682 41.81 1226 87.01
18 Nagaland 0 0 27 1.74
19 Odisha 125 6.42 837 34.69
20 Punjab 1585 56.63 2647 125.81
21 Rajasthan 1905 64.06 4341 214.03
22 Tamil Nadu 2858 96.97 8004 241.23
23 Tripura 71 1.55 203 4.54
24 Uttar Pradesh 12503 433.33 31995 1212.72
25 Uttarakhand 193 6.39 71 3.6
26 West Bengal 8054 282.58 23235 489.44
contd...
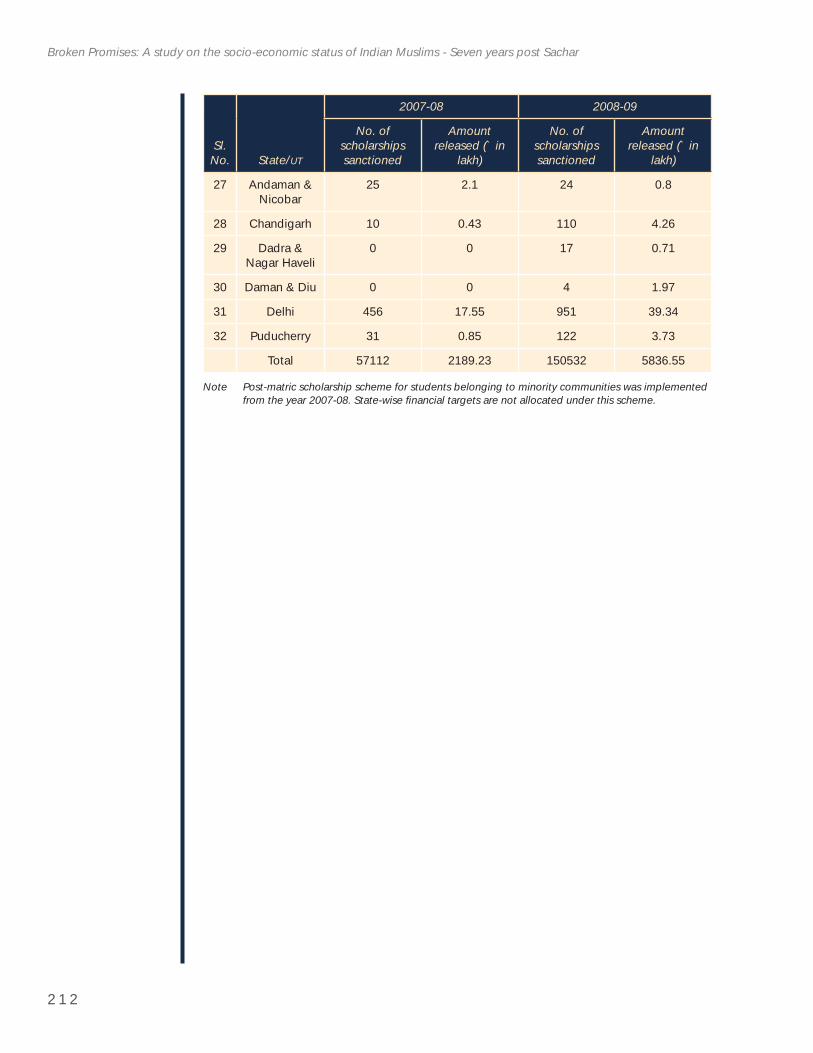
2 1 2
Broken Promises: A study on the socio-economic status of Indian Muslims - Seven years post Sachar
Sl.No. State/UT
2007-08 2008-09
No. of scholarshipssanctioned
Amountreleased (` in
lakh)
No. of scholarshipssanctioned
Amountreleased (` in
lakh)
27 Andaman & Nicobar
25 2.1 24 0.8
28 Chandigarh 10 0.43 110 4.26
29 Dadra & Nagar Haveli
0 0 17 0.71
30 Daman & Diu 0 0 4 1.97
31 Delhi 456 17.55 951 39.34
32 Puducherry 31 0.85 122 3.73
Total 57112 2189.23 150532 5836.55
Note Post-matric scholarship scheme for students belonging to minority communities was implemented from the year 2007-08. State-wise fi nancial targets are not allocated under this scheme.
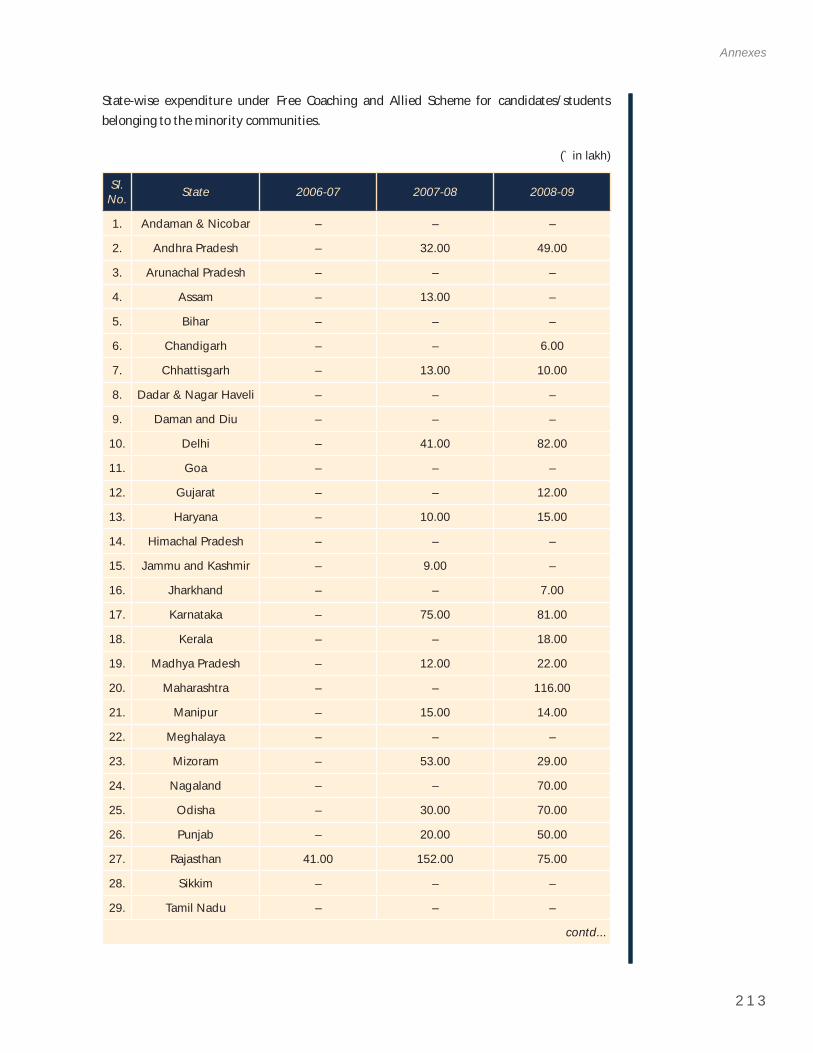
2 1 3
Annexes
State-wise expenditure under Free Coaching and Allied Scheme for candidates/students belonging to the minority communities.
(` in lakh)
Sl.No. State 2006-07 2007-08 2008-09
1. Andaman & Nicobar – – –
2. Andhra Pradesh – 32.00 49.00
3. Arunachal Pradesh – – –
4. Assam – 13.00 –
5. Bihar – – –
6. Chandigarh – – 6.00
7. Chhattisgarh – 13.00 10.00
8. Dadar & Nagar Haveli – – –
9. Daman and Diu – – –
10. Delhi – 41.00 82.00
11. Goa – – –
12. Gujarat – – 12.00
13. Haryana – 10.00 15.00
14. Himachal Pradesh – – –
15. Jammu and Kashmir – 9.00 –
16. Jharkhand – – 7.00
17. Karnataka – 75.00 81.00
18. Kerala – – 18.00
19. Madhya Pradesh – 12.00 22.00
20. Maharashtra – – 116.00
21. Manipur – 15.00 14.00
22. Meghalaya – – –
23. Mizoram – 53.00 29.00
24. Nagaland – – 70.00
25. Odisha – 30.00 70.00
26. Punjab – 20.00 50.00
27. Rajasthan 41.00 152.00 75.00
28. Sikkim – – –
29. Tamil Nadu – – –
contd...
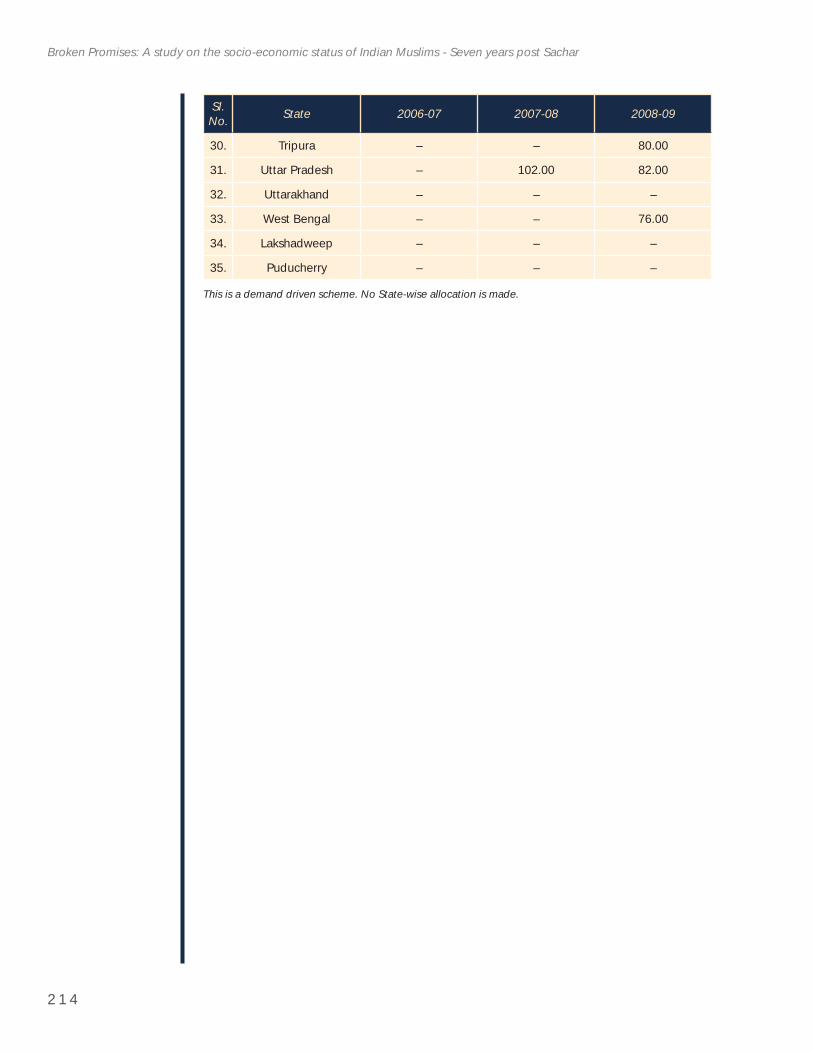
2 1 4
Broken Promises: A study on the socio-economic status of Indian Muslims - Seven years post Sachar
Sl.No. State 2006-07 2007-08 2008-09
30. Tripura – – 80.00
31. Uttar Pradesh – 102.00 82.00
32. Uttarakhand – – –
33. West Bengal – – 76.00
34. Lakshadweep – – –
35. Puducherry – – –
This is a demand driven scheme. No State-wise allocation is made.
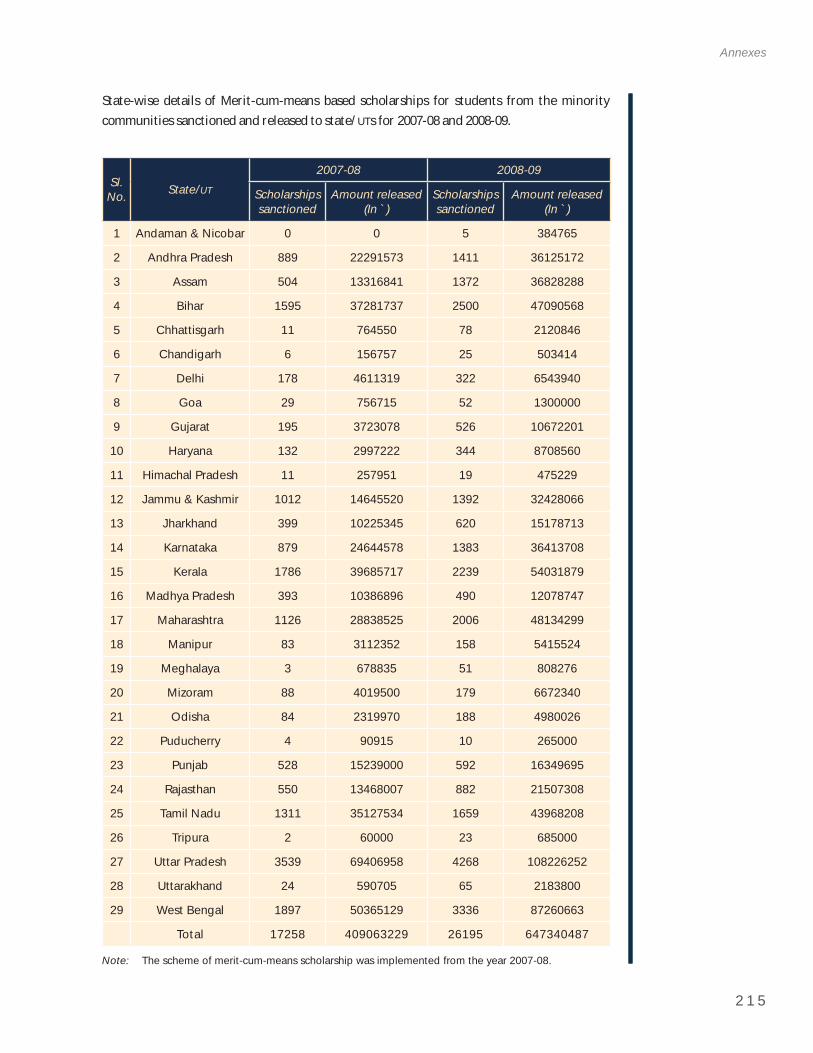
2 1 5
Annexes
State-wise details of Merit-cum-means based scholarships for students from the minority communities sanctioned and released to state/UTs for 2007-08 and 2008-09.
Sl.No. State/UT
2007-08 2008-09
Scholarshipssanctioned
Amount released (In `)
Scholarshipssanctioned
Amount released (In `)
1 Andaman & Nicobar 0 0 5 384765
2 Andhra Pradesh 889 22291573 1411 36125172
3 Assam 504 13316841 1372 36828288
4 Bihar 1595 37281737 2500 47090568
5 Chhattisgarh 11 764550 78 2120846
6 Chandigarh 6 156757 25 503414
7 Delhi 178 4611319 322 6543940
8 Goa 29 756715 52 1300000
9 Gujarat 195 3723078 526 10672201
10 Haryana 132 2997222 344 8708560
11 Himachal Pradesh 11 257951 19 475229
12 Jammu & Kashmir 1012 14645520 1392 32428066
13 Jharkhand 399 10225345 620 15178713
14 Karnataka 879 24644578 1383 36413708
15 Kerala 1786 39685717 2239 54031879
16 Madhya Pradesh 393 10386896 490 12078747
17 Maharashtra 1126 28838525 2006 48134299
18 Manipur 83 3112352 158 5415524
19 Meghalaya 3 678835 51 808276
20 Mizoram 88 4019500 179 6672340
21 Odisha 84 2319970 188 4980026
22 Puducherry 4 90915 10 265000
23 Punjab 528 15239000 592 16349695
24 Rajasthan 550 13468007 882 21507308
25 Tamil Nadu 1311 35127534 1659 43968208
26 Tripura 2 60000 23 685000
27 Uttar Pradesh 3539 69406958 4268 108226252
28 Uttarakhand 24 590705 65 2183800
29 West Bengal 1897 50365129 3336 87260663
Total 17258 409063229 26195 647340487
Note: The scheme of merit-cum-means scholarship was implemented from the year 2007-08.
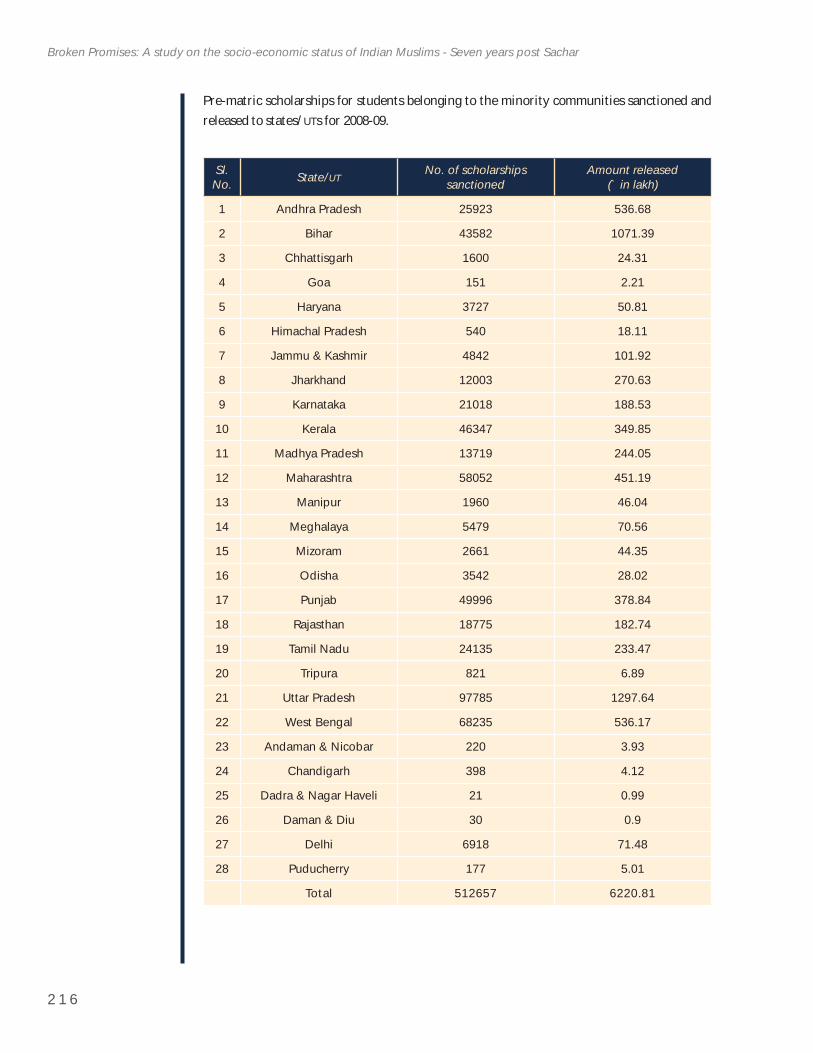
2 1 6
Broken Promises: A study on the socio-economic status of Indian Muslims - Seven years post Sachar
Pre-matric scholarships for students belonging to the minority communities sanctioned and released to states/UTs for 2008-09.
Sl.No. State/UT
No. of scholarships sanctioned
Amount released(` in lakh)
1 Andhra Pradesh 25923 536.68
2 Bihar 43582 1071.39
3 Chhattisgarh 1600 24.31
4 Goa 151 2.21
5 Haryana 3727 50.81
6 Himachal Pradesh 540 18.11
7 Jammu & Kashmir 4842 101.92
8 Jharkhand 12003 270.63
9 Karnataka 21018 188.53
10 Kerala 46347 349.85
11 Madhya Pradesh 13719 244.05
12 Maharashtra 58052 451.19
13 Manipur 1960 46.04
14 Meghalaya 5479 70.56
15 Mizoram 2661 44.35
16 Odisha 3542 28.02
17 Punjab 49996 378.84
18 Rajasthan 18775 182.74
19 Tamil Nadu 24135 233.47
20 Tripura 821 6.89
21 Uttar Pradesh 97785 1297.64
22 West Bengal 68235 536.17
23 Andaman & Nicobar 220 3.93
24 Chandigarh 398 4.12
25 Dadra & Nagar Haveli 21 0.99
26 Daman & Diu 30 0.9
27 Delhi 6918 71.48
28 Puducherry 177 5.01
Total 512657 6220.81
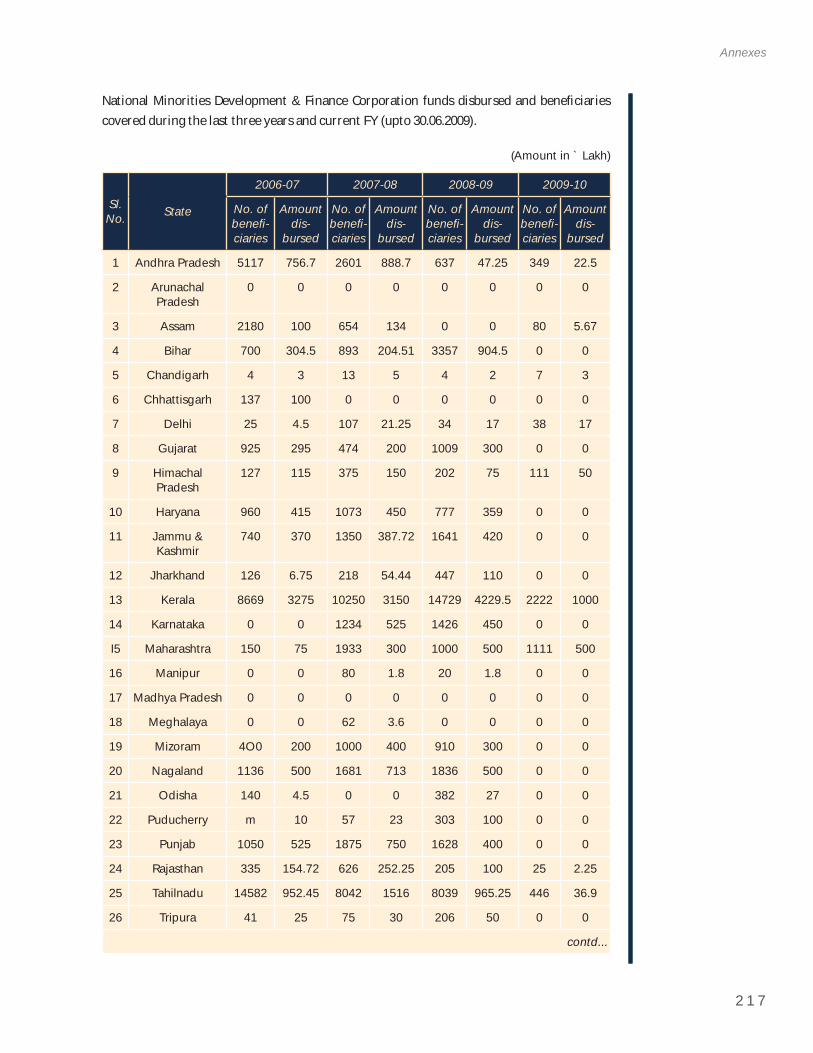
2 1 7
Annexes
National Minorities Development & Finance Corporation funds disbursed and benefi ciaries covered during the last three years and current FY (upto 30.06.2009).
(Amount in ` Lakh)
Sl.No. State
2006-07 2007-08 2008-09 2009-10
No. of benefi -ciaries
Amountdis-
bursed
No. of benefi -ciaries
Amountdis-
bursed
No. of benefi -ciaries
Amountdis-
bursed
No. of benefi -ciaries
Amountdis-
bursed
1 Andhra Pradesh 5117 756.7 2601 888.7 637 47.25 349 22.5
2 Arunachal Pradesh
0 0 0 0 0 0 0 0
3 Assam 2180 100 654 134 0 0 80 5.67
4 Bihar 700 304.5 893 204.51 3357 904.5 0 0
5 Chandigarh 4 3 13 5 4 2 7 3
6 Chhattisgarh 137 100 0 0 0 0 0 0
7 Delhi 25 4.5 107 21.25 34 17 38 17
8 Gujarat 925 295 474 200 1009 300 0 0
9 Himachal Pradesh
127 115 375 150 202 75 111 50
10 Haryana 960 415 1073 450 777 359 0 0
11 Jammu & Kashmir
740 370 1350 387.72 1641 420 0 0
12 Jharkhand 126 6.75 218 54.44 447 110 0 0
13 Kerala 8669 3275 10250 3150 14729 4229.5 2222 1000
14 Karnataka 0 0 1234 525 1426 450 0 0
I5 Maharashtra 150 75 1933 300 1000 500 1111 500
16 Manipur 0 0 80 1.8 20 1.8 0 0
17 Madhya Pradesh 0 0 0 0 0 0 0 0
18 Meghalaya 0 0 62 3.6 0 0 0 0
19 Mizoram 4O0 200 1000 400 910 300 0 0
20 Nagaland 1136 500 1681 713 1836 500 0 0
21 Odisha 140 4.5 0 0 382 27 0 0
22 Puducherry m 10 57 23 303 100 0 0
23 Punjab 1050 525 1875 750 1628 400 0 0
24 Rajasthan 335 154.72 626 252.25 205 100 25 2.25
25 Tahilnadu 14582 952.45 8042 1516 8039 965.25 446 36.9
26 Tripura 41 25 75 30 206 50 0 0
contd...
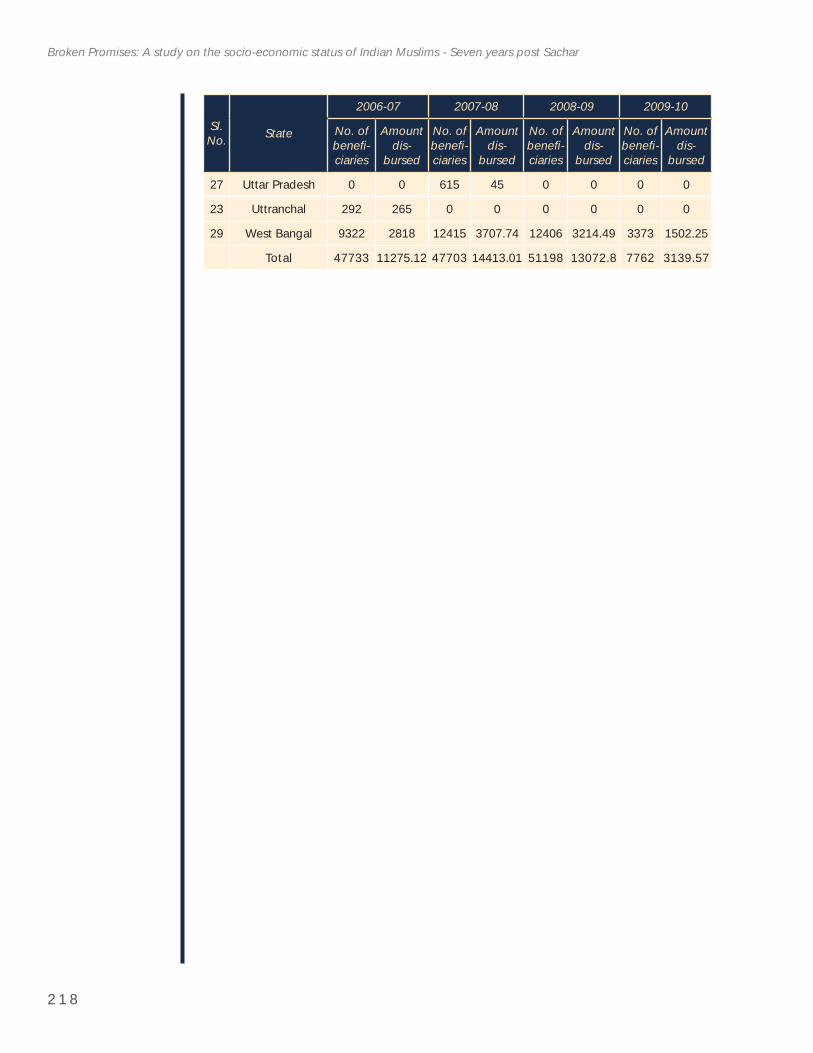
2 1 8
Broken Promises: A study on the socio-economic status of Indian Muslims - Seven years post Sachar
Sl.No. State
2006-07 2007-08 2008-09 2009-10
No. of benefi -ciaries
Amountdis-
bursed
No. of benefi -ciaries
Amountdis-
bursed
No. of benefi -ciaries
Amountdis-
bursed
No. of benefi -ciaries
Amountdis-
bursed
27 Uttar Pradesh 0 0 615 45 0 0 0 0
23 Uttranchal 292 265 0 0 0 0 0 0
29 West Bangal 9322 2818 12415 3707.74 12406 3214.49 3373 1502.25
Total 47733 11275.12 47703 14413.01 51198 13072.8 7762 3139.57
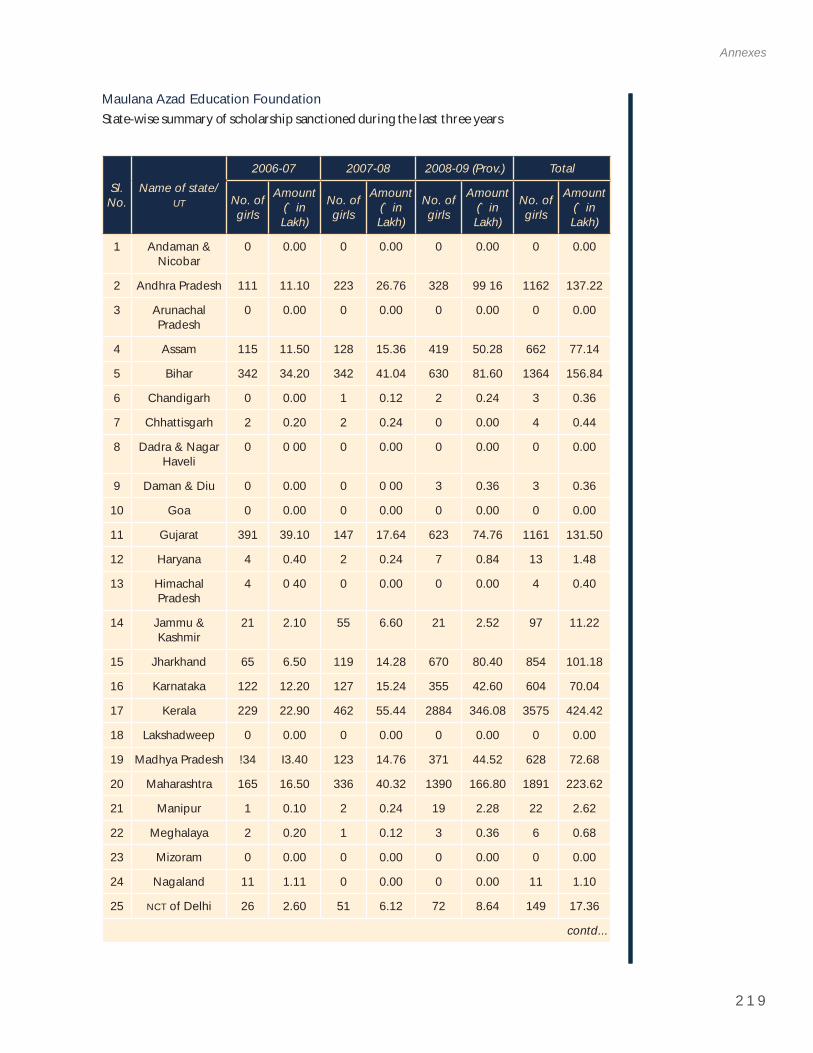
2 1 9
Annexes
Maulana Azad Education FoundationState-wise summary of scholarship sanctioned during the last three years
Sl.No.
Name of state/UT
2006-07 2007-08 2008-09 (Prov.) Total
No. of girls
Amount(` in Lakh)
No. of girls
Amount(` in Lakh)
No. of girls
Amount(` in Lakh)
No. of girls
Amount(` in Lakh)
1 Andaman & Nicobar
0 0.00 0 0.00 0 0.00 0 0.00
2 Andhra Pradesh 111 11.10 223 26.76 328 99 16 1162 137.22
3 Arunachal Pradesh
0 0.00 0 0.00 0 0.00 0 0.00
4 Assam 115 11.50 128 15.36 419 50.28 662 77.14
5 Bihar 342 34.20 342 41.04 630 81.60 1364 156.84
6 Chandigarh 0 0.00 1 0.12 2 0.24 3 0.36
7 Chhattisgarh 2 0.20 2 0.24 0 0.00 4 0.44
8 Dadra & Nagar Haveli
0 0 00 0 0.00 0 0.00 0 0.00
9 Daman & Diu 0 0.00 0 0 00 3 0.36 3 0.36
10 Goa 0 0.00 0 0.00 0 0.00 0 0.00
11 Gujarat 391 39.10 147 17.64 623 74.76 1161 131.50
12 Haryana 4 0.40 2 0.24 7 0.84 13 1.48
13 Himachal Pradesh
4 0 40 0 0.00 0 0.00 4 0.40
14 Jammu & Kashmir
21 2.10 55 6.60 21 2.52 97 11.22
15 Jharkhand 65 6.50 119 14.28 670 80.40 854 101.18
16 Karnataka 122 12.20 127 15.24 355 42.60 604 70.04
17 Kerala 229 22.90 462 55.44 2884 346.08 3575 424.42
18 Lakshadweep 0 0.00 0 0.00 0 0.00 0 0.00
19 Madhya Pradesh !34 I3.40 123 14.76 371 44.52 628 72.68
20 Maharashtra 165 16.50 336 40.32 1390 166.80 1891 223.62
21 Manipur 1 0.10 2 0.24 19 2.28 22 2.62
22 Meghalaya 2 0.20 1 0.12 3 0.36 6 0.68
23 Mizoram 0 0.00 0 0.00 0 0.00 0 0.00
24 Nagaland 11 1.11 0 0.00 0 0.00 11 1.10
25 NCT of Delhi 26 2.60 51 6.12 72 8.64 149 17.36
contd...
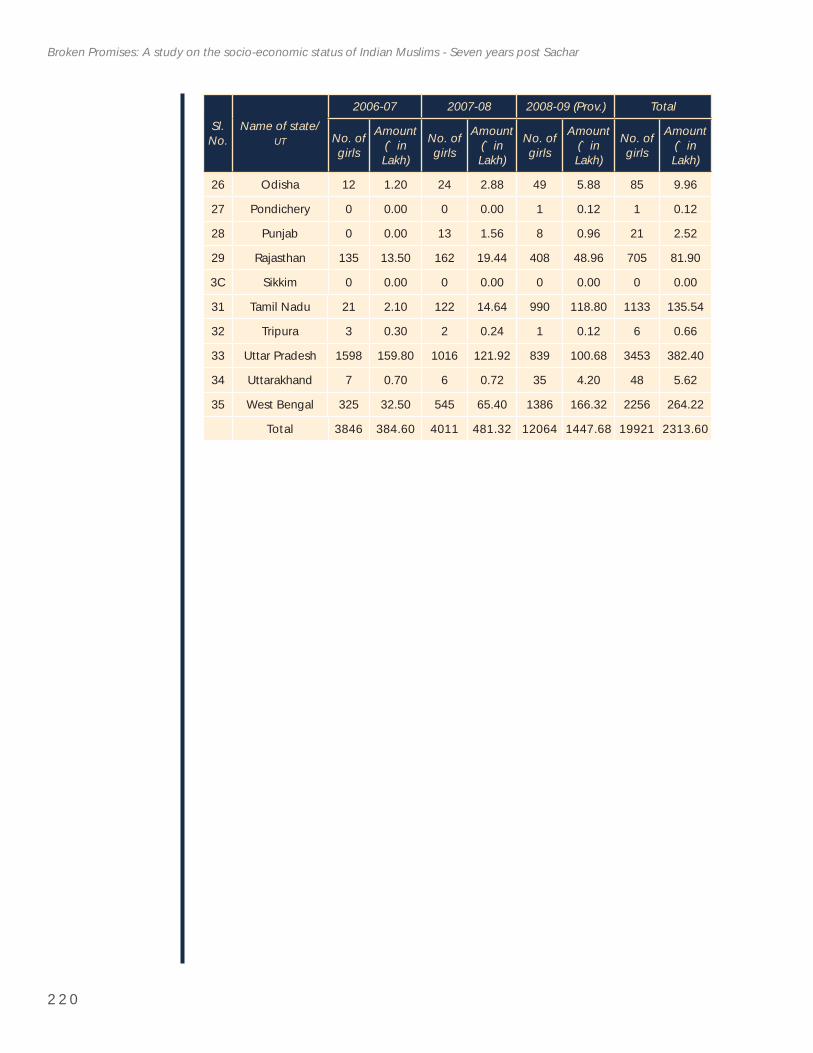
2 2 0
Broken Promises: A study on the socio-economic status of Indian Muslims - Seven years post Sachar
Sl.No.
Name of state/UT
2006-07 2007-08 2008-09 (Prov.) Total
No. of girls
Amount(` in Lakh)
No. of girls
Amount(` in Lakh)
No. of girls
Amount(` in Lakh)
No. of girls
Amount(` in Lakh)
26 Odisha 12 1.20 24 2.88 49 5.88 85 9.96
27 Pondichery 0 0.00 0 0.00 1 0.12 1 0.12
28 Punjab 0 0.00 13 1.56 8 0.96 21 2.52
29 Rajasthan 135 13.50 162 19.44 408 48.96 705 81.90
3C Sikkim 0 0.00 0 0.00 0 0.00 0 0.00
31 Tamil Nadu 21 2.10 122 14.64 990 118.80 1133 135.54
32 Tripura 3 0.30 2 0.24 1 0.12 6 0.66
33 Uttar Pradesh 1598 159.80 1016 121.92 839 100.68 3453 382.40
34 Uttarakhand 7 0.70 6 0.72 35 4.20 48 5.62
35 West Bengal 325 32.50 545 65.40 1386 166.32 2256 264.22
Total 3846 384.60 4011 481.32 12064 1447.68 19921 2313.60
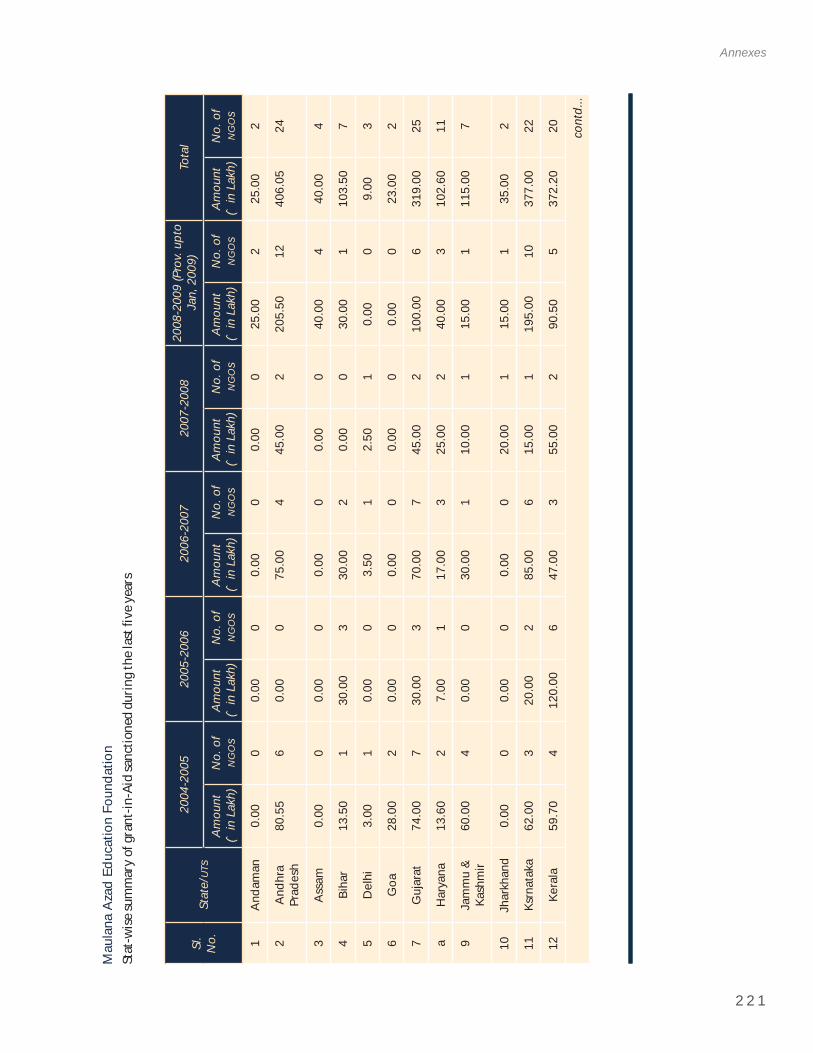
2 2 1
Annexes
Mau
lana
Aza
d Ed
ucat
ion
Foun
datio
nSt
at-w
ise su
mm
ary o
f gra
nt-in
-Aid
sanc
tione
d du
ring t
he la
st fi
ve ye
ars
Sl.
No.
Stat
e/UT
s20
04-2
005
2005
-200
620
06-2
007
2007
-200
820
08-2
009
(Pro
v. up
to
Jan,
200
9)To
tal
Amou
nt(`
in L
akh)
No.
of
NG
Os
Amou
nt(`
in L
akh)
No.
of
NG
Os
Amou
nt(`
in L
akh)
No.
of
NG
Os
Amou
nt(`
in L
akh)
No.
of
NG
Os
Amou
nt(`
in L
akh)
No.
of
NG
Os
Amou
nt(`
in L
akh)
No.
of
NG
Os
1An
dam
an0.
000
0.00
00.
000
0.00
025
.00
225
.00
2
2An
dhra
Pr
ades
h80
.55
60.
000
75.0
04
45.0
02
205.
5012
406.
0524
3As
sam
0.00
00.
000
0.00
00.
000
40.0
04
40.0
04
4Bi
har
13.5
01
30.0
03
30.0
02
0.00
030
.00
110
3.50
7
5D
elhi
3.00
10.
000
3.50
12.
501
0.00
09.
003
6G
oa28
.00
20.
000
0.00
00.
000
0.00
023
.00
2
7G
ujar
at74
.00
730
.00
370
.00
745
.00
210
0.00
631
9.00
25
aH
arya
na13
.60
27.
001
17.0
03
25.0
02
40.0
03
102.
6011
9Ja
mm
u &
Kash
mir
60.0
04
0.00
030
.00
110
.00
115
.00
111
5.00
7
10Jh
arkh
and
0.00
00.
000
0.00
020
.00
115
.00
135
.00
2
11Ks
rnat
aka
62.0
03
20.0
02
85.0
06
15.0
01
195.
0010
377.
0022
12Ke
rala
59.7
04
120.
006
47.0
03
55.0
02
90.5
05
372.
2020 co
ntd.
..
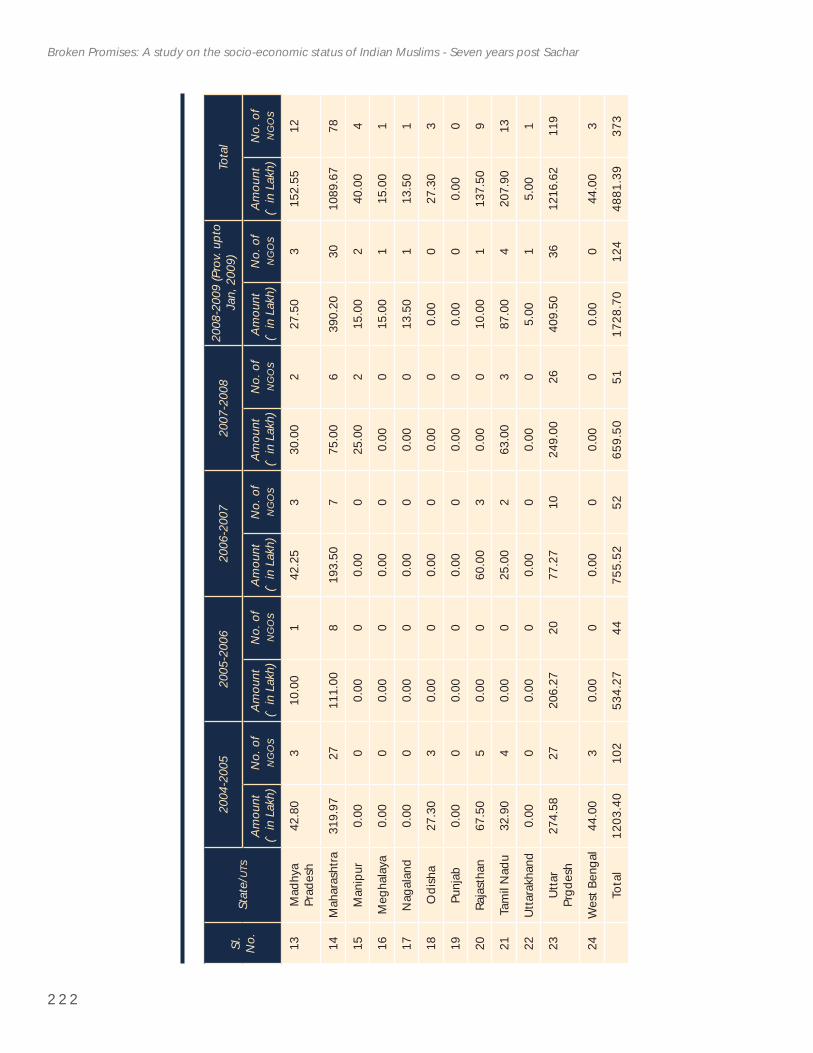
2 2 2
Broken Promises: A study on the socio-economic status of Indian Muslims - Seven years post Sachar
Sl.
No.
Stat
e/UT
s20
04-2
005
2005
-200
620
06-2
007
2007
-200
820
08-2
009
(Pro
v. up
to
Jan,
200
9)To
tal
Amou
nt(`
in L
akh)
No.
of
NG
Os
Amou
nt(`
in L
akh)
No.
of
NG
Os
Amou
nt(`
in L
akh)
No.
of
NG
Os
Amou
nt(`
in L
akh)
No.
of
NG
Os
Amou
nt(`
in L
akh)
No.
of
NG
Os
Amou
nt(`
in L
akh)
No.
of
NG
Os
13M
adhy
a Pr
ades
h42
.80
310
.00
142
.25
330
.00
227
.50
315
2.55
12
14M
ahar
asht
ra31
9.97
2711
1.00
819
3.50
775
.00
639
0.20
3010
89.6
778
15M
anip
ur0.
000
0.00
00.
000
25.0
02
15.0
02
40.0
04
16M
egha
laya
0.00
00.
000
0.00
00.
000
15.0
01
15.0
01
17N
agal
and
0.00
00.
000
0.00
00.
000
13.5
01
13.5
01
18O
dish
a27
.30
30.
000
0.00
00.
000
0.00
027
.30
3
19Pu
njab
0.00
00.
000
0.00
00.
000
0.00
00.
000
20Ra
jast
han
67.5
05
0.00
060
.00
30.
000
10.0
01
137.
509
21Ta
mil
Nad
u32
.90
40.
000
25.0
02
63.0
03
87.0
04
207.
9013
22Ut
tara
khan
d0.
000
0.00
00.
000
0.00
05.
001
5.00
1
23Ut
tar
Prgd
esh
274.
5827
206.
2720
77.2
710
249.
0026
409.
5036
1216
.62
119
24W
est B
enga
l44
.00
30.
000
0.00
00.
000
0.00
044
.00
3
Tota
l12
03.4
010
253
4.27
4475
5.52
5265
9.50
5117
28.7
012
448
81.3
937
3
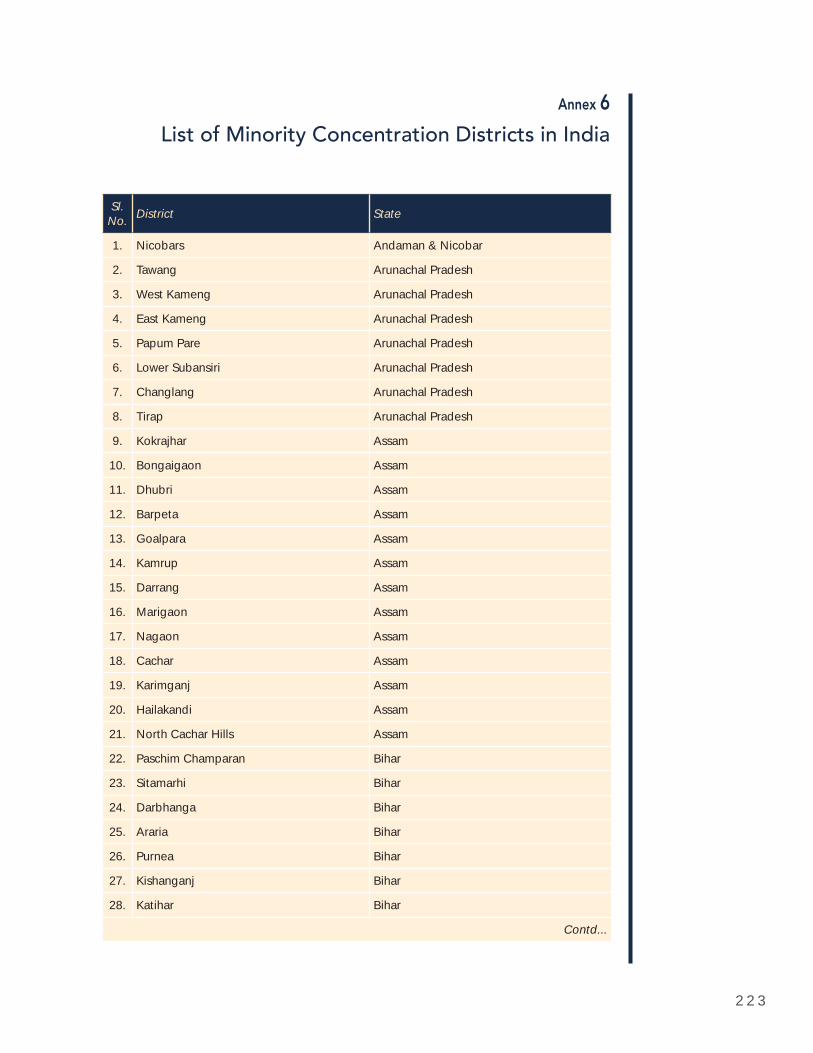
2 2 3
Annex 6
List of Minority Concentration Districts in India
Sl.No. District State
1. Nicobars Andaman & Nicobar
2. Tawang Arunachal Pradesh
3. West Kameng Arunachal Pradesh
4. East Kameng Arunachal Pradesh
5. Papum Pare Arunachal Pradesh
6. Lower Subansiri Arunachal Pradesh
7. Changlang Arunachal Pradesh
8. Tirap Arunachal Pradesh
9. Kokrajhar Assam
10. Bongaigaon Assam
11. Dhubri Assam
12. Barpeta Assam
13. Goalpara Assam
14. Kamrup Assam
15. Darrang Assam
16. Marigaon Assam
17. Nagaon Assam
18. Cachar Assam
19. Karimganj Assam
20. Hailakandi Assam
21. North Cachar Hills Assam
22. Paschim Champaran Bihar
23. Sitamarhi Bihar
24. Darbhanga Bihar
25. Araria Bihar
26. Purnea Bihar
27. Kishanganj Bihar
28. Katihar Bihar
Contd...
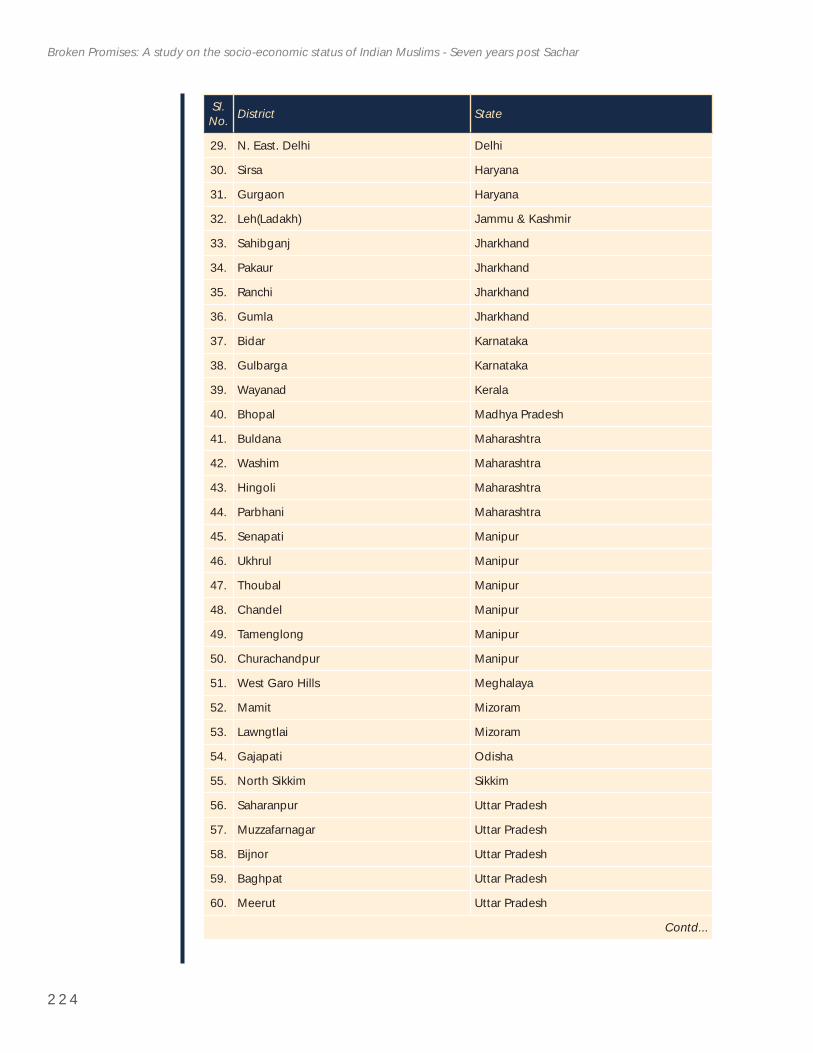
2 2 4
Broken Promises: A study on the socio-economic status of Indian Muslims - Seven years post Sachar
Sl.No. District State
29. N. East. Delhi Delhi
30. Sirsa Haryana
31. Gurgaon Haryana
32. Leh(Ladakh) Jammu & Kashmir
33. Sahibganj Jharkhand
34. Pakaur Jharkhand
35. Ranchi Jharkhand
36. Gumla Jharkhand
37. Bidar Karnataka
38. Gulbarga Karnataka
39. Wayanad Kerala
40. Bhopal Madhya Pradesh
41. Buldana Maharashtra
42. Washim Maharashtra
43. Hingoli Maharashtra
44. Parbhani Maharashtra
45. Senapati Manipur
46. Ukhrul Manipur
47. Thoubal Manipur
48. Chandel Manipur
49. Tamenglong Manipur
50. Churachandpur Manipur
51. West Garo Hills Meghalaya
52. Mamit Mizoram
53. Lawngtlai Mizoram
54. Gajapati Odisha
55. North Sikkim Sikkim
56. Saharanpur Uttar Pradesh
57. Muzzafarnagar Uttar Pradesh
58. Bijnor Uttar Pradesh
59. Baghpat Uttar Pradesh
60. Meerut Uttar Pradesh
Contd...
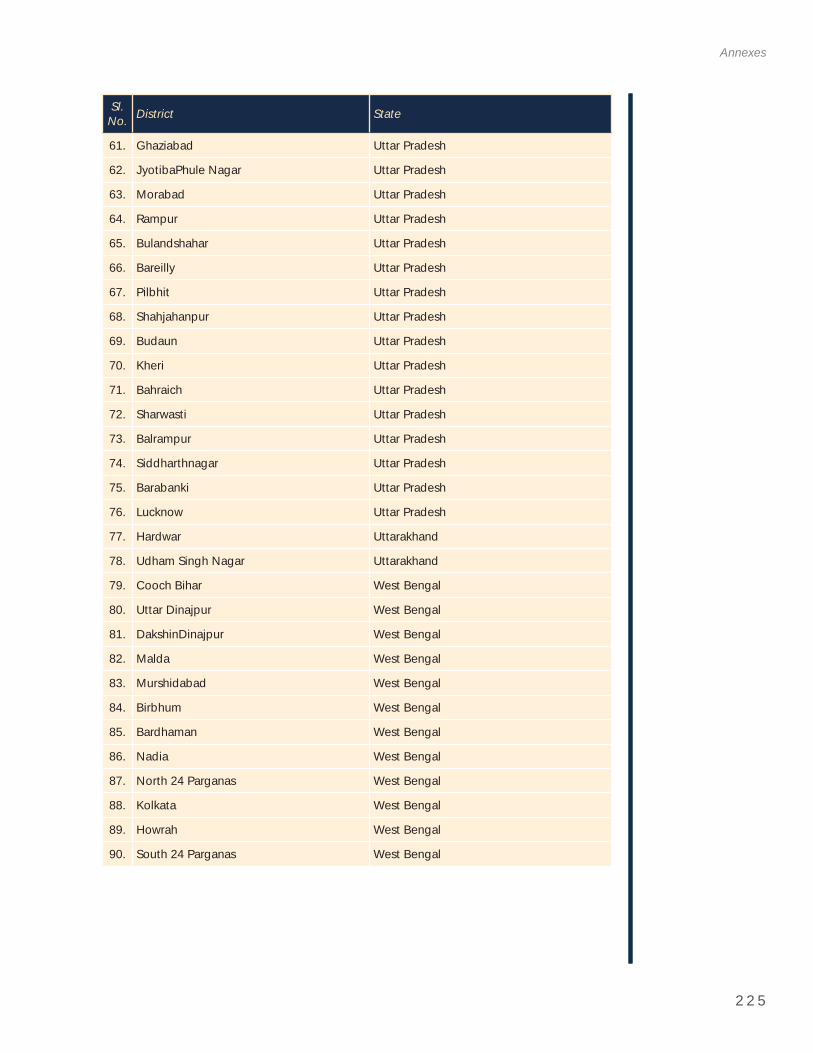
2 2 5
Annexes
Sl.No. District State
61. Ghaziabad Uttar Pradesh
62. JyotibaPhule Nagar Uttar Pradesh
63. Morabad Uttar Pradesh
64. Rampur Uttar Pradesh
65. Bulandshahar Uttar Pradesh
66. Bareilly Uttar Pradesh
67. Pilbhit Uttar Pradesh
68. Shahjahanpur Uttar Pradesh
69. Budaun Uttar Pradesh
70. Kheri Uttar Pradesh
71. Bahraich Uttar Pradesh
72. Sharwasti Uttar Pradesh
73. Balrampur Uttar Pradesh
74. Siddharthnagar Uttar Pradesh
75. Barabanki Uttar Pradesh
76. Lucknow Uttar Pradesh
77. Hardwar Uttarakhand
78. Udham Singh Nagar Uttarakhand
79. Cooch Bihar West Bengal
80. Uttar Dinajpur West Bengal
81. DakshinDinajpur West Bengal
82. Malda West Bengal
83. Murshidabad West Bengal
84. Birbhum West Bengal
85. Bardhaman West Bengal
86. Nadia West Bengal
87. North 24 Parganas West Bengal
88. Kolkata West Bengal
89. Howrah West Bengal
90. South 24 Parganas West Bengal
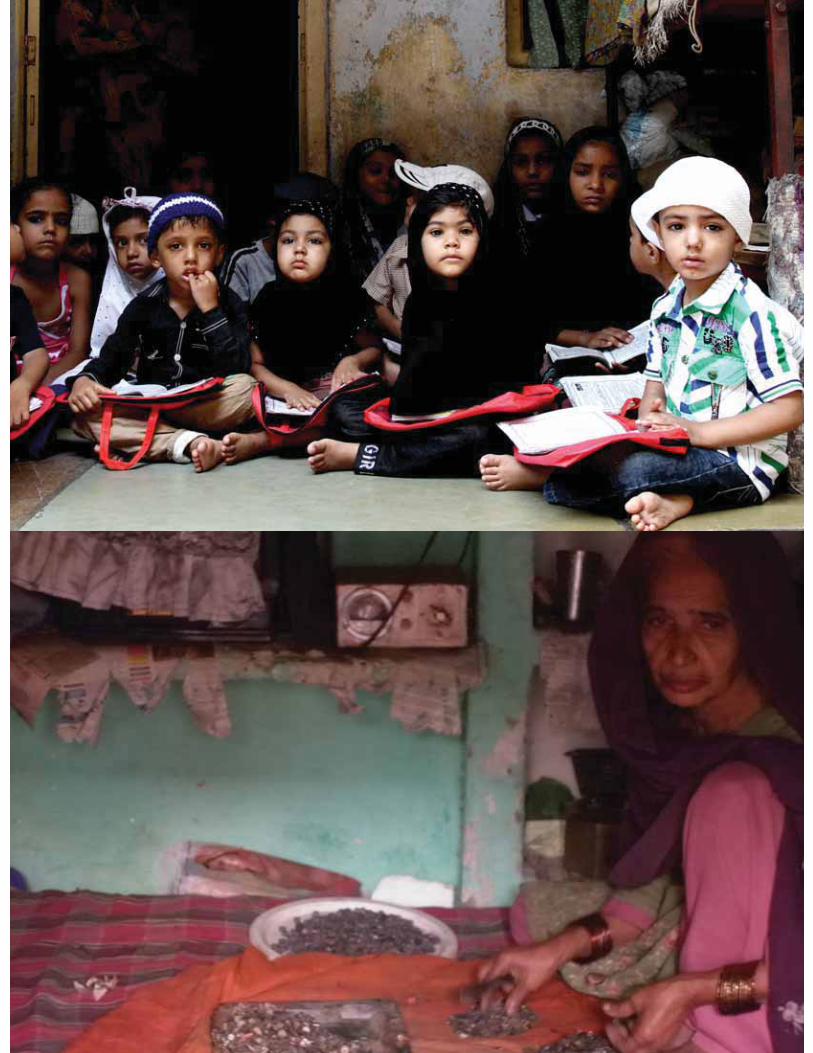
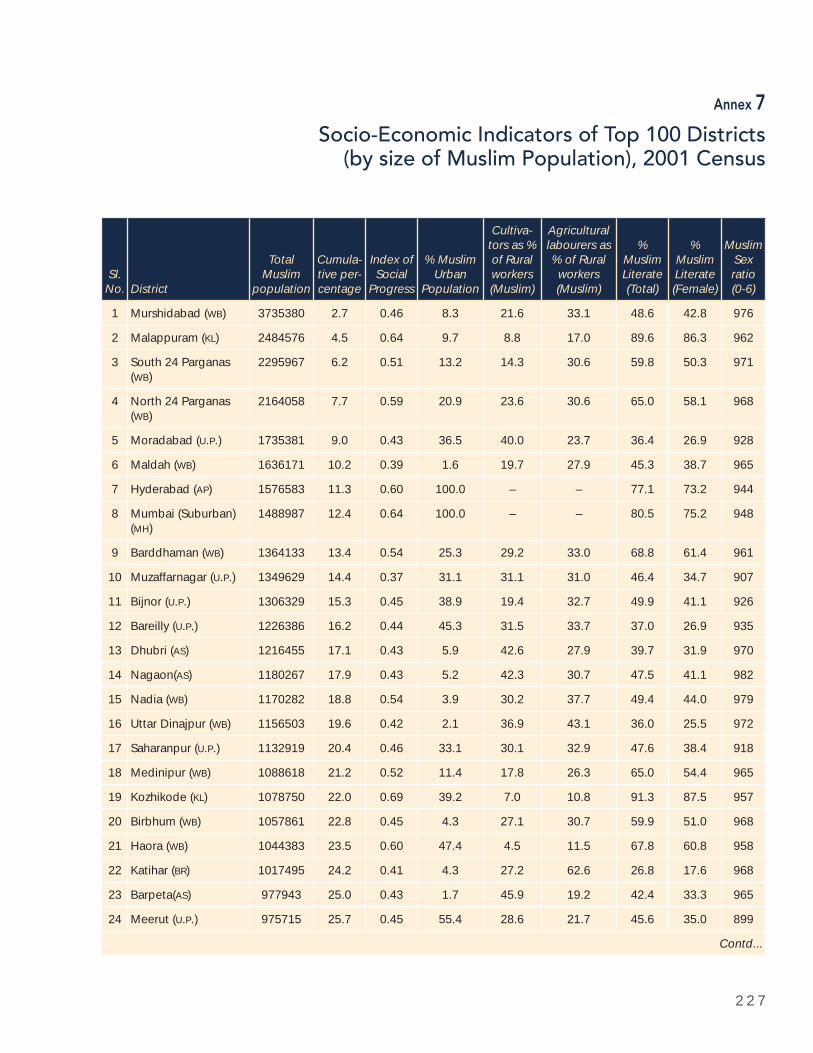
2 2 7
Annex 7
Socio-Economic Indicators of Top 100 Districts (by size of Muslim Population), 2001 Census
Sl.No. District
Total Muslim
population
Cumula-tive per-centage
Index of Social
Progress
% Muslim Urban
Population
Cultiva-tors as % of Rural workers(Muslim)
Agriculturallabourers as % of Rural workers(Muslim)
%MuslimLiterate(Total)
%MuslimLiterate(Female)
MuslimSexratio(0-6)
1 Murshidabad (WB) 3735380 2.7 0.46 8.3 21.6 33.1 48.6 42.8 976
2 Malappuram (KL) 2484576 4.5 0.64 9.7 8.8 17.0 89.6 86.3 962
3 South 24 Parganas (WB)
2295967 6.2 0.51 13.2 14.3 30.6 59.8 50.3 971
4 North 24 Parganas (WB)
2164058 7.7 0.59 20.9 23.6 30.6 65.0 58.1 968
5 Moradabad (U.P.) 1735381 9.0 0.43 36.5 40.0 23.7 36.4 26.9 928
6 Maldah (WB) 1636171 10.2 0.39 1.6 19.7 27.9 45.3 38.7 965
7 Hyderabad (AP) 1576583 11.3 0.60 100.0 – – 77.1 73.2 944
8 Mumbai (Suburban) (MH)
1488987 12.4 0.64 100.0 – – 80.5 75.2 948
9 Barddhaman (WB) 1364133 13.4 0.54 25.3 29.2 33.0 68.8 61.4 961
10 Muzaffarnagar (U.P.) 1349629 14.4 0.37 31.1 31.1 31.0 46.4 34.7 907
11 Bijnor (U.P.) 1306329 15.3 0.45 38.9 19.4 32.7 49.9 41.1 926
12 Bareilly (U.P.) 1226386 16.2 0.44 45.3 31.5 33.7 37.0 26.9 935
13 Dhubri (AS) 1216455 17.1 0.43 5.9 42.6 27.9 39.7 31.9 970
14 Nagaon(AS) 1180267 17.9 0.43 5.2 42.3 30.7 47.5 41.1 982
15 Nadia (WB) 1170282 18.8 0.54 3.9 30.2 37.7 49.4 44.0 979
16 Uttar Dinajpur (WB) 1156503 19.6 0.42 2.1 36.9 43.1 36.0 25.5 972
17 Saharanpur (U.P.) 1132919 20.4 0.46 33.1 30.1 32.9 47.6 38.4 918
18 Medinipur (WB) 1088618 21.2 0.52 11.4 17.8 26.3 65.0 54.4 965
19 Kozhikode (KL) 1078750 22.0 0.69 39.2 7.0 10.8 91.3 87.5 957
20 Birbhum (WB) 1057861 22.8 0.45 4.3 27.1 30.7 59.9 51.0 968
21 Haora (WB) 1044383 23.5 0.60 47.4 4.5 11.5 67.8 60.8 958
22 Katihar (BR) 1017495 24.2 0.41 4.3 27.2 62.6 26.8 17.6 968
23 Barpeta(AS) 977943 25.0 0.43 1.7 45.9 19.2 42.4 33.3 965
24 Meerut (U.P.) 975715 25.7 0.45 55.4 28.6 21.7 45.6 35.0 899
Contd...
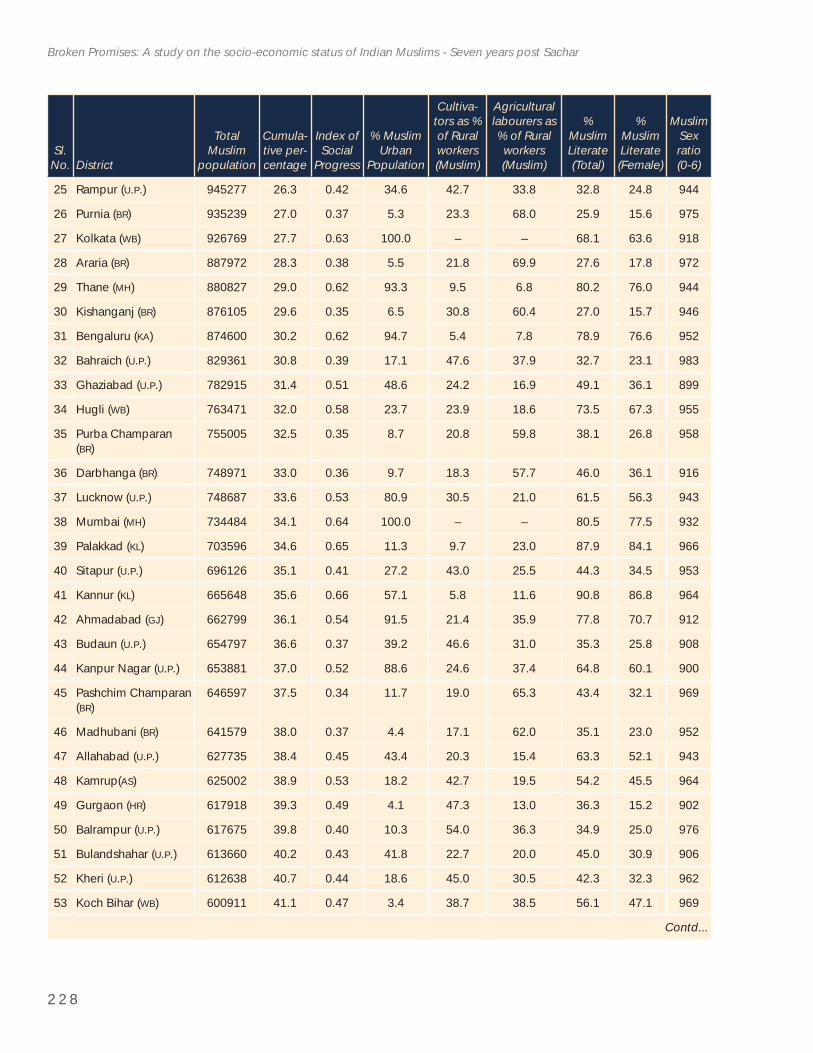
2 2 8
Broken Promises: A study on the socio-economic status of Indian Muslims - Seven years post Sachar
Sl.No. District
Total Muslim
population
Cumula-tive per-centage
Index of Social
Progress
% Muslim Urban
Population
Cultiva-tors as % of Rural workers(Muslim)
Agriculturallabourers as % of Rural workers(Muslim)
%MuslimLiterate(Total)
%MuslimLiterate(Female)
MuslimSexratio(0-6)
25 Rampur (U.P.) 945277 26.3 0.42 34.6 42.7 33.8 32.8 24.8 944
26 Purnia (BR) 935239 27.0 0.37 5.3 23.3 68.0 25.9 15.6 975
27 Kolkata (WB) 926769 27.7 0.63 100.0 – – 68.1 63.6 918
28 Araria (BR) 887972 28.3 0.38 5.5 21.8 69.9 27.6 17.8 972
29 Thane (MH) 880827 29.0 0.62 93.3 9.5 6.8 80.2 76.0 944
30 Kishanganj (BR) 876105 29.6 0.35 6.5 30.8 60.4 27.0 15.7 946
31 Bengaluru (KA) 874600 30.2 0.62 94.7 5.4 7.8 78.9 76.6 952
32 Bahraich (U.P.) 829361 30.8 0.39 17.1 47.6 37.9 32.7 23.1 983
33 Ghaziabad (U.P.) 782915 31.4 0.51 48.6 24.2 16.9 49.1 36.1 899
34 Hugli (WB) 763471 32.0 0.58 23.7 23.9 18.6 73.5 67.3 955
35 Purba Champaran (BR)
755005 32.5 0.35 8.7 20.8 59.8 38.1 26.8 958
36 Darbhanga (BR) 748971 33.0 0.36 9.7 18.3 57.7 46.0 36.1 916
37 Lucknow (U.P.) 748687 33.6 0.53 80.9 30.5 21.0 61.5 56.3 943
38 Mumbai (MH) 734484 34.1 0.64 100.0 – – 80.5 77.5 932
39 Palakkad (KL) 703596 34.6 0.65 11.3 9.7 23.0 87.9 84.1 966
40 Sitapur (U.P.) 696126 35.1 0.41 27.2 43.0 25.5 44.3 34.5 953
41 Kannur (KL) 665648 35.6 0.66 57.1 5.8 11.6 90.8 86.8 964
42 Ahmadabad (GJ) 662799 36.1 0.54 91.5 21.4 35.9 77.8 70.7 912
43 Budaun (U.P.) 654797 36.6 0.37 39.2 46.6 31.0 35.3 25.8 908
44 Kanpur Nagar (U.P.) 653881 37.0 0.52 88.6 24.6 37.4 64.8 60.1 900
45 Pashchim Champaran (BR)
646597 37.5 0.34 11.7 19.0 65.3 43.4 32.1 969
46 Madhubani (BR) 641579 38.0 0.37 4.4 17.1 62.0 35.1 23.0 952
47 Allahabad (U.P.) 627735 38.4 0.45 43.4 20.3 15.4 63.3 52.1 943
48 Kamrup(AS) 625002 38.9 0.53 18.2 42.7 19.5 54.2 45.5 964
49 Gurgaon (HR) 617918 39.3 0.49 4.1 47.3 13.0 36.3 15.2 902
50 Balrampur (U.P.) 617675 39.8 0.40 10.3 54.0 36.3 34.9 25.0 976
51 Bulandshahar (U.P.) 613660 40.2 0.43 41.8 22.7 20.0 45.0 30.9 906
52 Kheri (U.P.) 612638 40.7 0.44 18.6 45.0 30.5 42.3 32.3 962
53 Koch Bihar (WB) 600911 41.1 0.47 3.4 38.7 38.5 56.1 47.1 969
Contd...
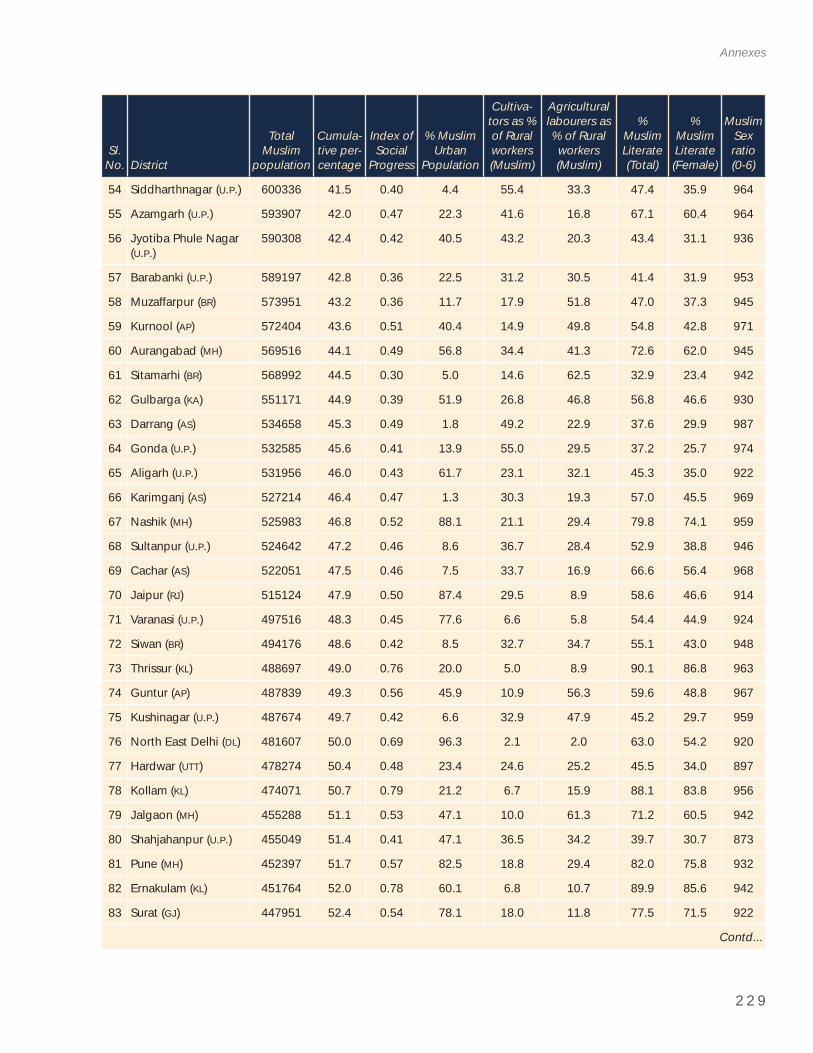
2 2 9
Annexes
Sl.No. District
Total Muslim
population
Cumula-tive per-centage
Index of Social
Progress
% Muslim Urban
Population
Cultiva-tors as % of Rural workers(Muslim)
Agriculturallabourers as % of Rural workers(Muslim)
%MuslimLiterate(Total)
%MuslimLiterate(Female)
MuslimSexratio(0-6)
54 Siddharthnagar (U.P.) 600336 41.5 0.40 4.4 55.4 33.3 47.4 35.9 964
55 Azamgarh (U.P.) 593907 42.0 0.47 22.3 41.6 16.8 67.1 60.4 964
56 Jyotiba Phule Nagar (U.P.)
590308 42.4 0.42 40.5 43.2 20.3 43.4 31.1 936
57 Barabanki (U.P.) 589197 42.8 0.36 22.5 31.2 30.5 41.4 31.9 953
58 Muzaffarpur (BR) 573951 43.2 0.36 11.7 17.9 51.8 47.0 37.3 945
59 Kurnool (AP) 572404 43.6 0.51 40.4 14.9 49.8 54.8 42.8 971
60 Aurangabad (MH) 569516 44.1 0.49 56.8 34.4 41.3 72.6 62.0 945
61 Sitamarhi (BR) 568992 44.5 0.30 5.0 14.6 62.5 32.9 23.4 942
62 Gulbarga (KA) 551171 44.9 0.39 51.9 26.8 46.8 56.8 46.6 930
63 Darrang (AS) 534658 45.3 0.49 1.8 49.2 22.9 37.6 29.9 987
64 Gonda (U.P.) 532585 45.6 0.41 13.9 55.0 29.5 37.2 25.7 974
65 Aligarh (U.P.) 531956 46.0 0.43 61.7 23.1 32.1 45.3 35.0 922
66 Karimganj (AS) 527214 46.4 0.47 1.3 30.3 19.3 57.0 45.5 969
67 Nashik (MH) 525983 46.8 0.52 88.1 21.1 29.4 79.8 74.1 959
68 Sultanpur (U.P.) 524642 47.2 0.46 8.6 36.7 28.4 52.9 38.8 946
69 Cachar (AS) 522051 47.5 0.46 7.5 33.7 16.9 66.6 56.4 968
70 Jaipur (RJ) 515124 47.9 0.50 87.4 29.5 8.9 58.6 46.6 914
71 Varanasi (U.P.) 497516 48.3 0.45 77.6 6.6 5.8 54.4 44.9 924
72 Siwan (BR) 494176 48.6 0.42 8.5 32.7 34.7 55.1 43.0 948
73 Thrissur (KL) 488697 49.0 0.76 20.0 5.0 8.9 90.1 86.8 963
74 Guntur (AP) 487839 49.3 0.56 45.9 10.9 56.3 59.6 48.8 967
75 Kushinagar (U.P.) 487674 49.7 0.42 6.6 32.9 47.9 45.2 29.7 959
76 North East Delhi (DL) 481607 50.0 0.69 96.3 2.1 2.0 63.0 54.2 920
77 Hardwar (UTT) 478274 50.4 0.48 23.4 24.6 25.2 45.5 34.0 897
78 Kollam (KL) 474071 50.7 0.79 21.2 6.7 15.9 88.1 83.8 956
79 Jalgaon (MH) 455288 51.1 0.53 47.1 10.0 61.3 71.2 60.5 942
80 Shahjahanpur (U.P.) 455049 51.4 0.41 47.1 36.5 34.2 39.7 30.7 873
81 Pune (MH) 452397 51.7 0.57 82.5 18.8 29.4 82.0 75.8 932
82 Ernakulam (KL) 451764 52.0 0.78 60.1 6.8 10.7 89.9 85.6 942
83 Surat (GJ) 447951 52.4 0.54 78.1 18.0 11.8 77.5 71.5 922
Contd...
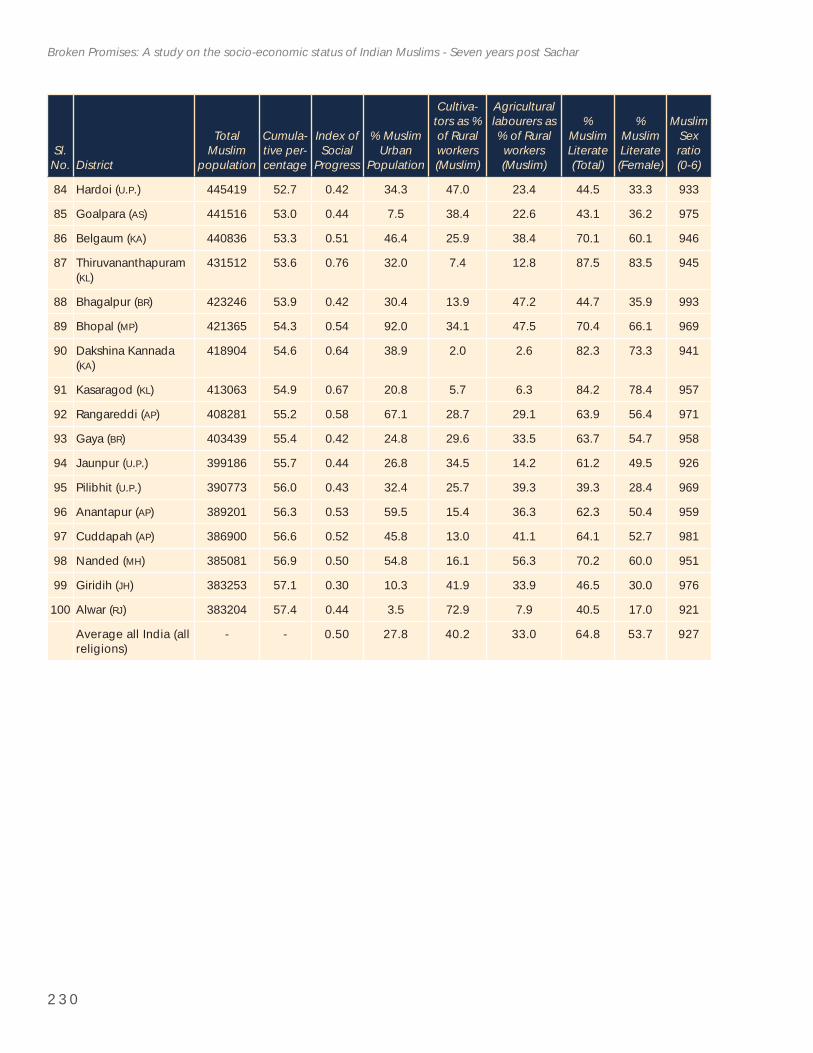
2 3 0
Broken Promises: A study on the socio-economic status of Indian Muslims - Seven years post Sachar
Sl.No. District
Total Muslim
population
Cumula-tive per-centage
Index of Social
Progress
% Muslim Urban
Population
Cultiva-tors as % of Rural workers(Muslim)
Agriculturallabourers as % of Rural workers(Muslim)
%MuslimLiterate(Total)
%MuslimLiterate(Female)
MuslimSexratio(0-6)
84 Hardoi (U.P.) 445419 52.7 0.42 34.3 47.0 23.4 44.5 33.3 933
85 Goalpara (AS) 441516 53.0 0.44 7.5 38.4 22.6 43.1 36.2 975
86 Belgaum (KA) 440836 53.3 0.51 46.4 25.9 38.4 70.1 60.1 946
87 Thiruvananthapuram (KL)
431512 53.6 0.76 32.0 7.4 12.8 87.5 83.5 945
88 Bhagalpur (BR) 423246 53.9 0.42 30.4 13.9 47.2 44.7 35.9 993
89 Bhopal (MP) 421365 54.3 0.54 92.0 34.1 47.5 70.4 66.1 969
90 Dakshina Kannada (KA)
418904 54.6 0.64 38.9 2.0 2.6 82.3 73.3 941
91 Kasaragod (KL) 413063 54.9 0.67 20.8 5.7 6.3 84.2 78.4 957
92 Rangareddi (AP) 408281 55.2 0.58 67.1 28.7 29.1 63.9 56.4 971
93 Gaya (BR) 403439 55.4 0.42 24.8 29.6 33.5 63.7 54.7 958
94 Jaunpur (U.P.) 399186 55.7 0.44 26.8 34.5 14.2 61.2 49.5 926
95 Pilibhit (U.P.) 390773 56.0 0.43 32.4 25.7 39.3 39.3 28.4 969
96 Anantapur (AP) 389201 56.3 0.53 59.5 15.4 36.3 62.3 50.4 959
97 Cuddapah (AP) 386900 56.6 0.52 45.8 13.0 41.1 64.1 52.7 981
98 Nanded (MH) 385081 56.9 0.50 54.8 16.1 56.3 70.2 60.0 951
99 Giridih (JH) 383253 57.1 0.30 10.3 41.9 33.9 46.5 30.0 976
100 Alwar (RJ) 383204 57.4 0.44 3.5 72.9 7.9 40.5 17.0 921
Average all India (all religions)
- - 0.50 27.8 40.2 33.0 64.8 53.7 927
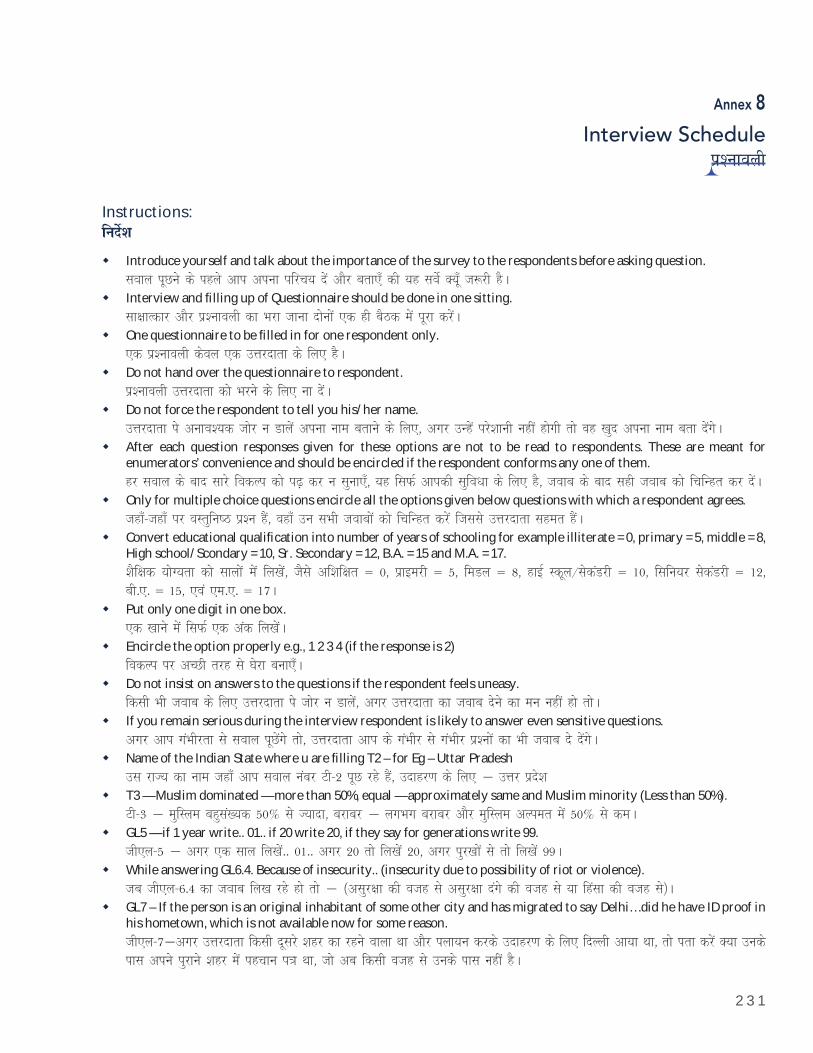
2 3 1
Annex 8
Interview Scheduleiz'ukoyh
Instructions:funsZ'k
Introduce yourself and talk about the importance of the survey to the respondents before asking question.loky iwNus ds igys vki viuk ifjp; nsa vkSj crk,¡ dh ;g losZ D;w¡ t:jh gSAInterview and fi lling up of Questionnaire should be done in one sitting.lk{kkRdkj vkSj iz'ukoyh dk Hkjk tkuk nksuksa ,d gh cSBd esa iwjk djsaAOne questionnaire to be fi lled in for one respondent only.,d iz'ukoyh dsoy ,d mÙkjnkrk ds fy, gSADo not hand over the questionnaire to respondent.iz'ukoyh mÙkjnkrk dks Hkjus ds fy, uk nsaADo not force the respondent to tell you his/her name.mÙkjnkrk is vuko';d tksj u Mkysa viuk uke crkus ds fy,] vxj mUgsa ijs'kkuh ugha gksxh rks og [kqn viuk uke crk nsaxsAAfter each question responses given for these options are not to be read to respondents. These are meant for enumerators’ convenience and should be encircled if the respondent conforms any one of them.gj loky ds ckn lkjs fodYi dks i<+ dj u lquk,¡] ;g flQZ vkidh lqfoèkk ds fy, gS] tokc ds ckn lgh tokc dks fpfUgr dj nsaAOnly for multiple choice questions encircle all the options given below questions with which a respondent agrees.tgk¡&tgk¡ ij oLrqfu"B iz'u gSa] ogk¡ mu lHkh tokcksa dks fpfUgr djsa ftlls mÙkjnkrk lger gSaAConvert educational qualifi cation into number of years of schooling for example illiterate = 0, primary = 5, middle = 8, High school/Scondary = 10, Sr. Secondary = 12, B.A. = 15 and M.A. = 17.'kSf{kd ;ksX;rk dks lkyksa esa fy[ksa] tSls vf'kf{kr ¾ 0] izkbejh ¾ 5] feMy ¾ 8] gkbZ Ldwy@lsdaMjh ¾ 10] flfu;j lsdaMjh ¾ 12] ch-,- ¾ 15] ,oa ,e-,- ¾ 17APut only one digit in one box.,d [kkus esa flQZ ,d vad fy[ksaAEncircle the option properly e.g., 1 2 3 4 (if the response is 2)fodYi ij vPNh rjg ls ?ksjk cuk,¡ADo not insist on answers to the questions if the respondent feels uneasy.fdlh Hkh tokc ds fy, mÙkjnkrk is tksj u Mkysa] vxj mÙkjnkrk dk tokc nsus dk eu ugha gks rksAIf you remain serious during the interview respondent is likely to answer even sensitive questions.vxj vki xaHkhjrk ls loky iwNsaxs rks] mÙkjnkrk vki ds xaHkhj ls xaHkhj iz'uksa dk Hkh tokc ns nsaxsAName of the Indian State where u are fi lling T2 – for Eg – Uttar Pradeshml jkT; dk uke tgk¡ vki loky uacj Vh&2 iwN jgs gSa] mnkgj.k ds fy, µ mÙkj izns'kT3 — Muslim dominated — more than 50%, equal — approximately same and Muslim minority (Less than 50%).Vh&3 µ eqfLye cgqla[;d 50» ls T;knk] cjkcj µ yxHkx cjkcj vkSj eqfLye vYier esa 50» ls deAGL5 — if 1 year write.. 01.. if 20 write 20, if they say for generations write 99.th,y&5 µ vxj ,d lky fy[ksa-- 01-- vxj 20 rks fy[ksa 20] vxj iqj[kksa ls rks fy[ksa 99AWhile answering GL6.4. Because of insecurity.. (insecurity due to possibility of riot or violence).tc th,y&6-4 dk tokc fy[k jgs gks rks µ ¼vlqj{kk dh otg ls vlqj{kk naxs dh otg ls ;k fgalk dh otg ls½AGL7 – If the person is an original inhabitant of some other city and has migrated to say Delhi… did he have ID proof in his hometown, which is not available now for some reason.th,y&7µvxj mÙkjnkrk fdlh nwljs 'kgj dk jgus okyk Fkk vkSj iyk;u djds mnkgj.k ds fy, fnYyh vk;k Fkk] rks irk djsa D;k muds ikl vius iqjkus 'kgj esa igpku i=k Fkk] tks vc fdlh otg ls muds ikl ugha gSA
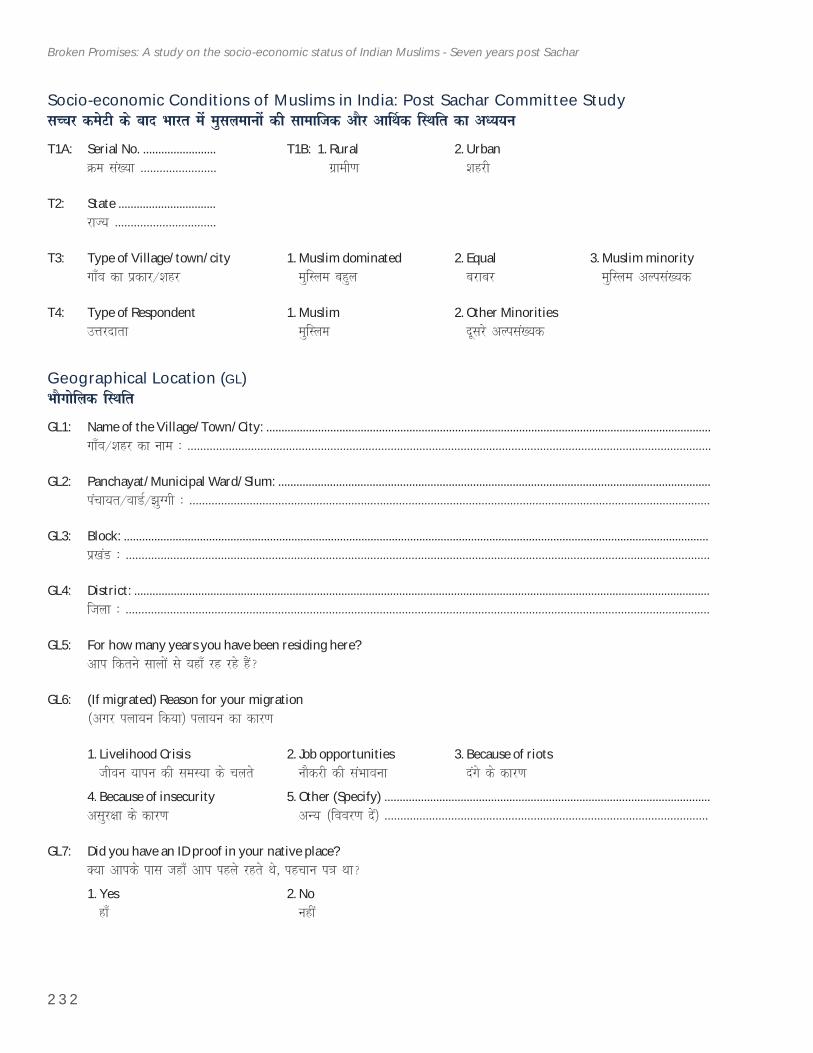
2 3 2
Broken Promises: A study on the socio-economic status of Indian Muslims - Seven years post Sachar
Socio-economic Conditions of Muslims in India: Post Sachar Committee StudylPpj desVh ds ckn Hkkjr esa eqlyekuksa dh lkekftd vkSj vk£Fkd fLFkfr dk vè;;u
T1A: Serial No. ........................ T1B: 1. Rural 2. UrbanØe la[;k ------------------------ xzkeh.k 'kgjh
T2: State ................................jkT; --------------------------------
T3: Type of Village/town/city 1. Muslim dominated 2. Equal 3. Muslim minorityxk¡o dk izdkj@'kgj eqfLye cgqy cjkcj eqfLye vYila[;d
T4: Type of Respondent 1. Muslim 2. Other MinoritiesmÙkjnkrk eqfLye nwljs vYila[;d
Geographical Location (GL)HkkSxksfyd fLFkfr
GL1: Name of the Village/Town/City: ..................................................................................................................................................xk¡o@'kgj dk uke % ---------------------------------------------------------------------------------------------------------------------------------------------------------------------
GL2: Panchayat/Municipal Ward/Slum: ..............................................................................................................................................iapk;r@okMZ@>qXxh % --------------------------------------------------------------------------------------------------------------------------------------------------------------------
GL3: Block: ................................................................................................................................................................................................iz[kaM % ----------------------------------------------------------------------------------------------------------------------------------------------------------------------------------------
GL4: District: .............................................................................................................................................................................................ftyk % ----------------------------------------------------------------------------------------------------------------------------------------------------------------------------------------
GL5: For how many years you have been residing here?vki fdrus lkyksa ls ;gk¡ jg jgs gSa\
GL6: (If migrated) Reason for your migration¼vxj iyk;u fd;k½ iyk;u dk dkj.k
1. Livelihood Crisis 2. Job opportunities 3. Because of riots thou ;kiu dh leL;k ds pyrs ukSdjh dh laHkkouk naxs ds dkj.k
4. Because of insecurity 5. Other (Specify) ...........................................................................................................vlqj{kk ds dkj.k vU; ¼fooj.k nsa½ ------------------------------------------------------------------------------------------------------
GL7: Did you have an ID proof in your native place?D;k vkids ikl tgk¡ vki igys jgrs Fks] igpku i=k Fkk\
1. Yes 2. No gk¡ ugha
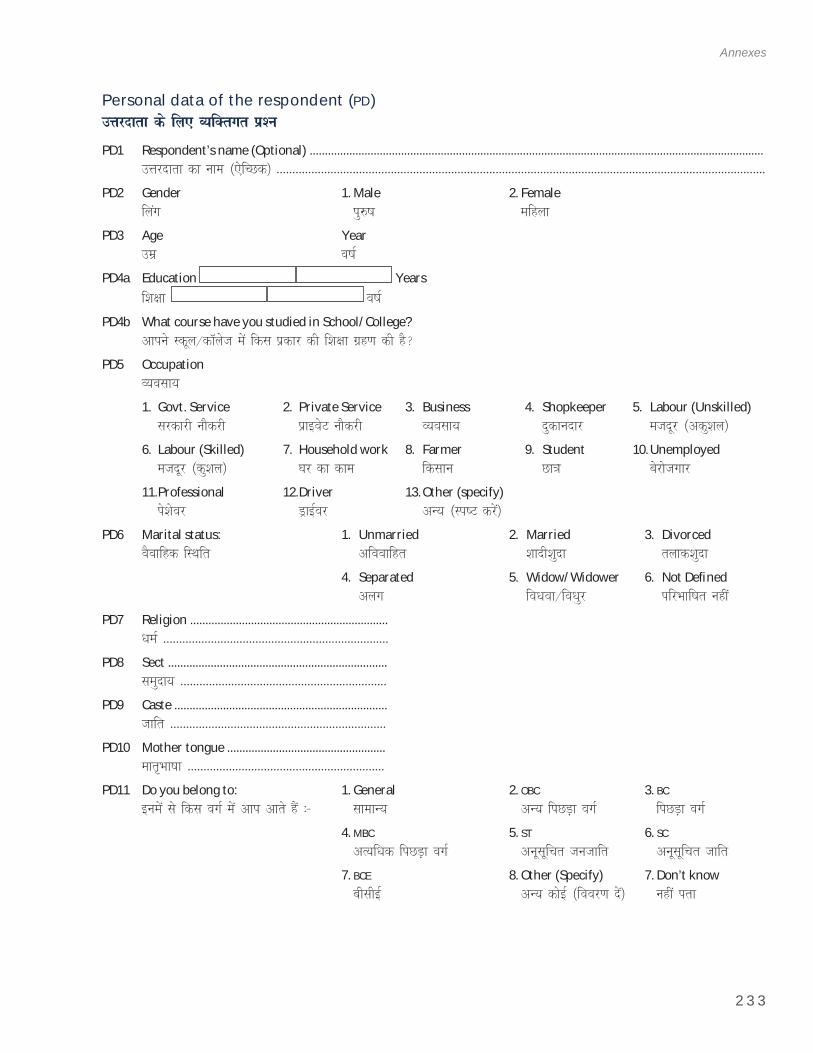
2 3 3
Annexes
Personal data of the respondent (PD)mÙkjnkrk ds fy, O;fDrxr iz'u
PD1 Respondent’s name (Optional) .....................................................................................................................................................mÙkjnkrk dk uke ¼,sfPNd½ ----------------------------------------------------------------------------------------------------------------------------------------------------------
PD2 Gender 1. Male 2. Femalefyax iq#"k efgyk
PD3 Age Yearmez o"kZ
PD4a Education Yearsf'k{kk o"kZ
PD4b What course have you studied in School/College?vkius Ldwy@dkWyst esa fdl izdkj dh f'k{kk xzg.k dh gS\
PD5 Occupation O;olk;
1. Govt. Service 2. Private Service 3. Business 4. Shopkeeper 5. Labour (Unskilled) ljdkjh ukSdjh izkbosV ukSdjh O;olk; nqdkunkj etnwj ¼vdq'ky½
6. Labour (Skilled) 7. Household work 8. Farmer 9. Student 10. Unemployed etnwj ¼dq'ky½ ?kj dk dke fdlku Nk=k csjkstxkj
11. Professional 12. Driver 13. Other (specify) is'ksoj MªkbZoj vU; ¼Li"V djsa½
PD6 Marital status: 1. Unmarried 2. Married 3. DivorcedoSokfgd fLFkfr vfookfgr 'kknh'kqnk rykd'kqnk
4. Separated 5. Widow/Widower 6. Not Defi ned vyx fo/kok@fo/kqj ifjHkkf"kr ugha
PD7 Religion ................................................................./keZ -----------------------------------------------------------------------
PD8 Sect ........................................................................leqnk; -----------------------------------------------------------------
PD9 Caste ......................................................................tkfr --------------------------------------------------------------------
PD10 Mother tongue ....................................................ekr`Hkk"kk --------------------------------------------------------------
PD11 Do you belong to: 1. General 2. OBC 3. BCbuesa ls fdl oxZ esa vki vkrs gSa %& lkekU; vU; fiNM+k oxZ fiNM+k oxZ
4. MBC 5. ST 6. SC vR;f/kd fiNM+k oxZ vuwlwfpr tutkfr vuwlwfpr tkfr
7. BCE 8. Other (Specify) 7. Don’t know chlhbZ vU; dksbZ ¼fooj.k nsa½ ugha irk
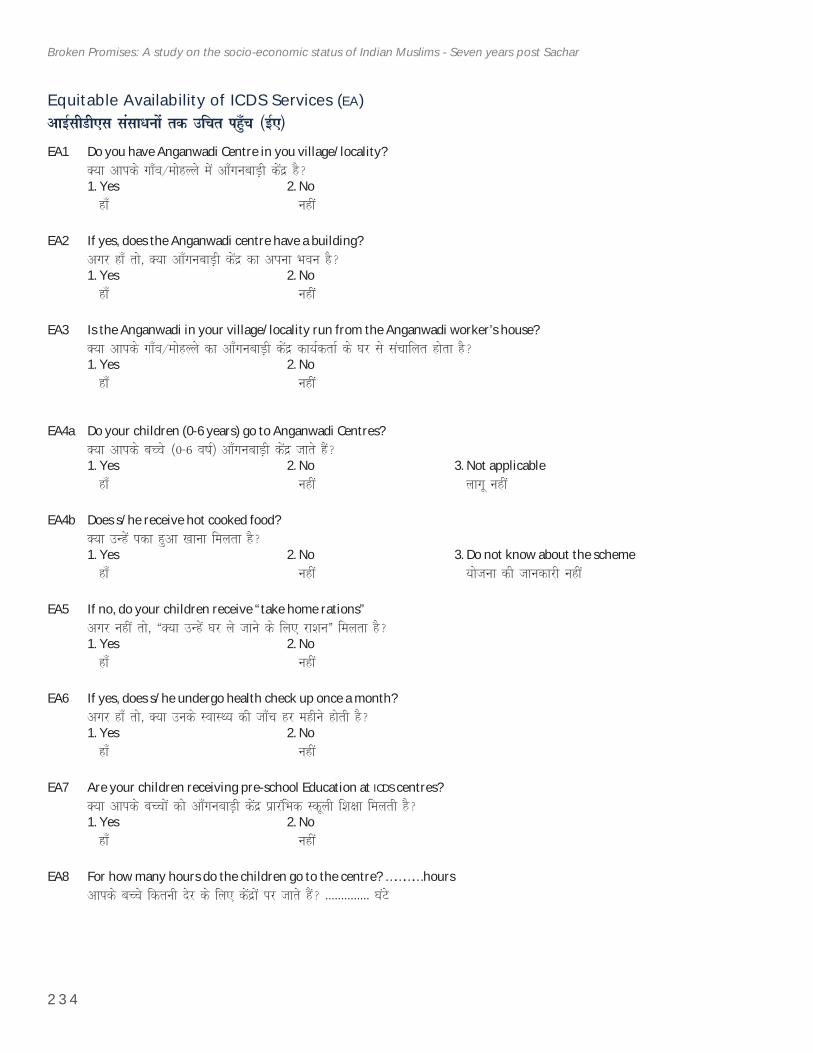
2 3 4
Broken Promises: A study on the socio-economic status of Indian Muslims - Seven years post Sachar
Equitable Availability of ICDS Services (EA)vkbZlhMh,l lalk/kuksa rd mfpr igq¡p ¼bZ,½
EA1 Do you have Anganwadi Centre in you village/locality?D;k vkids xk¡o@eksgYys esa vk¡xuckM+h dsanz gS\
1. Yes 2. No gk¡ ugha
EA2 If yes, does the Anganwadi centre have a building?vxj gk¡ rks] D;k vk¡xuckM+h dsanz dk viuk Hkou gS\
1. Yes 2. No gk¡ ugha
EA3 Is the Anganwadi in your village/locality run from the Anganwadi worker’s house?D;k vkids xk¡o@eksgYys dk vk¡xuckM+h dsanz dk;ZdrkZ ds ?kj ls lapkfyr gksrk gS\
1. Yes 2. No gk¡ ugha
EA4a Do your children (0-6 years) go to Anganwadi Centres?D;k vkids cPps ¼0&6 o"kZ½ vk¡xuckM+h dsanz tkrs gSa\
1. Yes 2. No 3. Not applicable gk¡ ugha ykxw ugha
EA4b Does s/he receive hot cooked food?D;k mUgsa idk gqvk [kkuk feyrk gS\
1. Yes 2. No 3. Do not know about the scheme gk¡ ugha ;kstuk dh tkudkjh ugha
EA5 If no, do your children receive “take home rations”vxj ugha rks] ßD;k mUgsa ?kj ys tkus ds fy, jk'kuÞ feyrk gS\
1. Yes 2. No gk¡ ugha
EA6 If yes, does s/he undergo health check up once a month? vxj gk¡ rks] D;k muds LokLF; dh tk¡p gj eghus gksrh gS\ 1. Yes 2. No
gk¡ ugha
EA7 Are your children receiving pre-school Education at ICDS centres?D;k vkids cPpksa dks vk¡xuckM+h dsanz izkjafHkd Ldwyh f'k{kk feyrh gS\
1. Yes 2. No gk¡ ugha
EA8 For how many hours do the children go to the centre? ………… hoursvkids cPps fdruh nsj ds fy, dsanzksa ij tkrs gSa\ -------------- ?kaVs
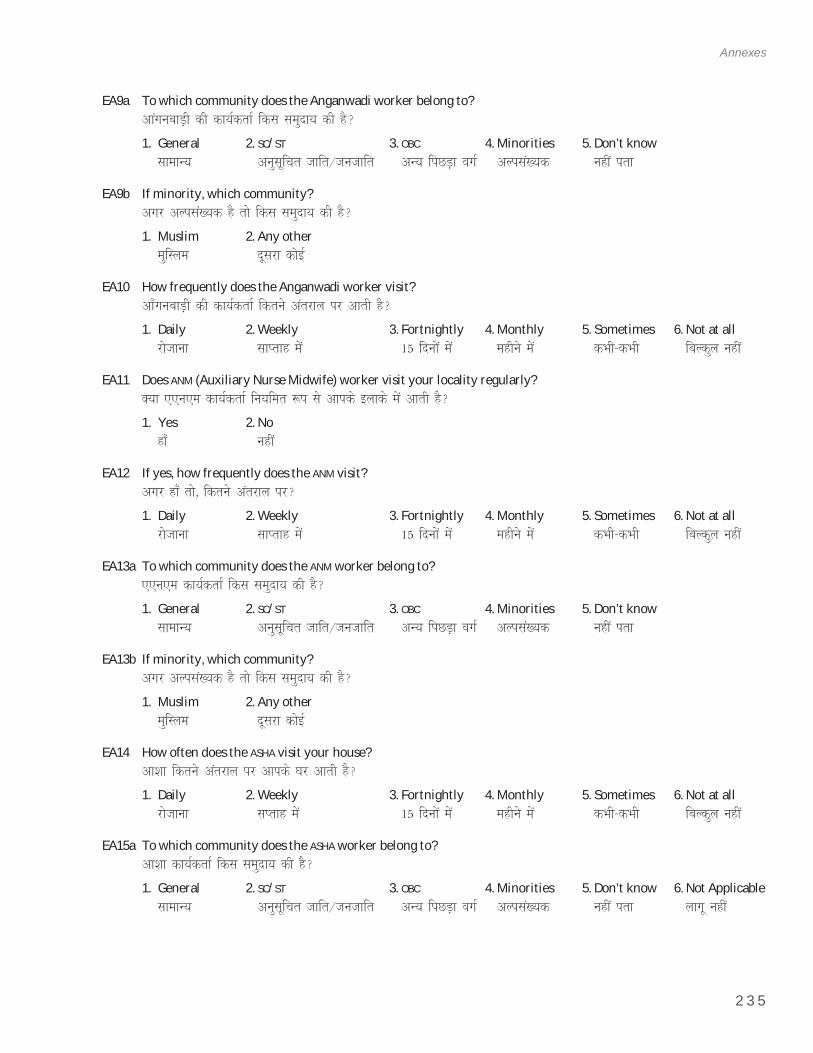
2 3 5
Annexes
EA9a To which community does the Anganwadi worker belong to?vkaxuckM+h dh dk;ZdrkZ fdl leqnk; dh gS\
1. General 2. SC/ST 3. OBC 4. Minorities 5. Don’t know lkekU; vuqlwfpr tkfr@tutkfr vU; fiNM+k oxZ vYila[;d ugha irk
EA9b If minority, which community?vxj vYila[;d gS rks fdl leqnk; dh gS\
1. Muslim 2. Any other eqfLye nwljk dksbZ
EA10 How frequently does the Anganwadi worker visit?vk¡xuckM+h dh dk;ZdrkZ fdrus varjky ij vkrh gS\
1. Daily 2. Weekly 3. Fortnightly 4. Monthly 5. Sometimes 6. Not at all jkstkuk lkIrkg esa 15 fnuksa esa eghus esa dHkh&dHkh fcYdqy ugha
EA11 Does ANM (Auxiliary Nurse Midwife) worker visit your locality regularly?D;k ,,u,e dk;ZdrkZ fu;fer :i ls vkids bykds esa vkrh gS\
1. Yes 2. No gk¡ ugha
EA12 If yes, how frequently does the ANM visit? vxj gk¡ rks] fdrus varjky ij\
1. Daily 2. Weekly 3. Fortnightly 4. Monthly 5. Sometimes 6. Not at all jkstkuk lkIrkg esa 15 fnuksa esa eghus esa dHkh&dHkh fcYdqy ugha
EA13a To which community does the ANM worker belong to?,,u,e dk;ZdrkZ fdl leqnk; dh gS\
1. General 2. SC/ST 3. OBC 4. Minorities 5. Don’t know lkekU; vuqlwfpr tkfr@tutkfr vU; fiNM+k oxZ vYila[;d ugha irk
EA13b If minority, which community?vxj vYila[;d gS rks fdl leqnk; dh gS\
1. Muslim 2. Any other eqfLye nwljk dksbZ
EA14 How often does the ASHA visit your house?vk'kk fdrus varjky ij vkids ?kj vkrh gS\
1. Daily 2. Weekly 3. Fortnightly 4. Monthly 5. Sometimes 6. Not at all jkstkuk lIrkg esa 15 fnuksa esa eghus esa dHkh&dHkh fcYdqy ugha
EA15a To which community does the ASHA worker belong to?vk'kk dk;ZdrkZ fdl leqnk; dh gS\
1. General 2. SC/ST 3. OBC 4. Minorities 5. Don’t know 6. Not Applicable lkekU; vuqlwfpr tkfr@tutkfr vU; fiNM+k oxZ vYila[;d ugha irk ykxw ugha
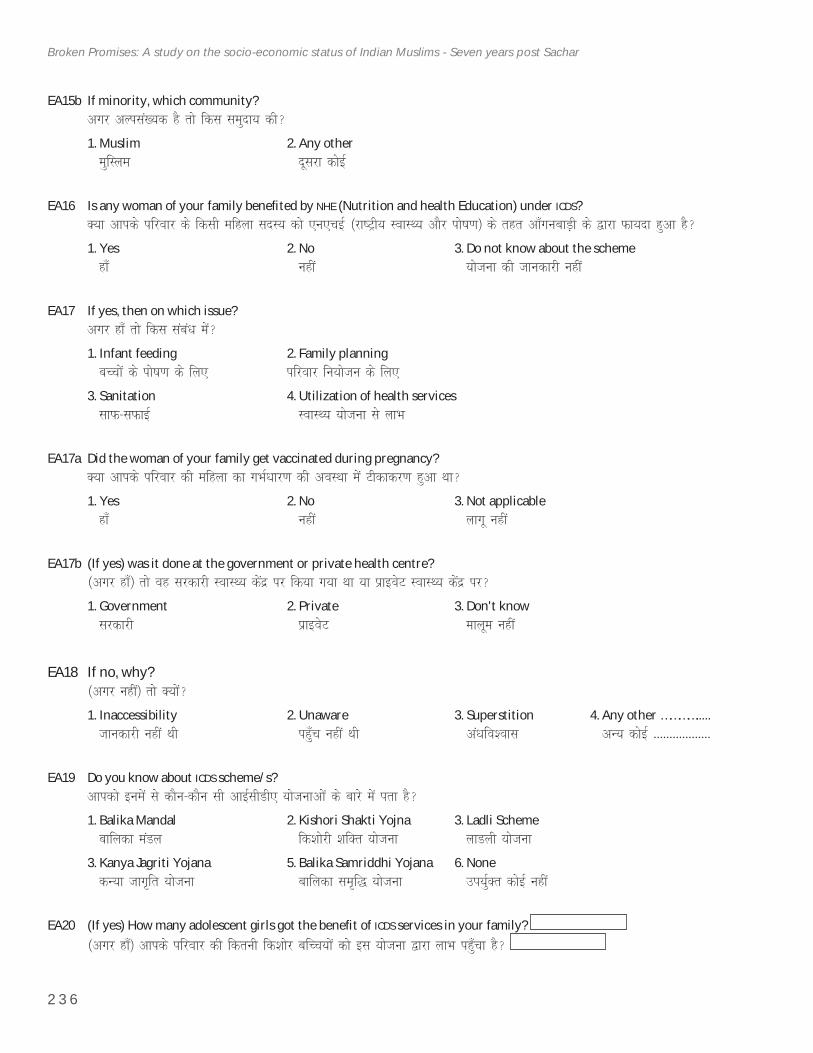
2 3 6
Broken Promises: A study on the socio-economic status of Indian Muslims - Seven years post Sachar
EA15b If minority, which community?vxj vYila[;d gS rks fdl leqnk; dh\
1. Muslim 2. Any other eqfLye nwljk dksbZ
EA16 Is any woman of your family benefi ted by NHE (Nutrition and health Education) under ICDS?D;k vkids ifjokj ds fdlh efgyk lnL; dks ,u,pbZ ¼jk"Vªh; LokLF; vkSj iks"k.k½ ds rgr vk¡xuckM+h ds }kjk Qk;nk gqvk gS\
1. Yes 2. No 3. Do not know about the scheme gk¡ ugha ;kstuk dh tkudkjh ugha
EA17 If yes, then on which issue?vxj gk¡ rks fdl laca/k esa\
1. Infant feeding 2. Family planning cPpksa ds iks"k.k ds fy, ifjokj fu;kstu ds fy,
3. Sanitation 4. Utilization of health services lkQ&lQkbZ LokLF; ;kstuk ls ykHk
EA17a Did the woman of your family get vaccinated during pregnancy?D;k vkids ifjokj dh efgyk dk xHkZ/kkj.k dh voLFkk esa Vhdkdj.k gqvk Fkk\
1. Yes 2. No 3. Not applicable gk¡ ugha ykxw ugha
EA17b (If yes) was it done at the government or private health centre?¼vxj gk¡½ rks og ljdkjh LokLF; dsanz ij fd;k x;k Fkk ;k izkbosV LokLF; dsanz ij\
1. Government 2. Private 3. Don't know ljdkjh izkbosV ekywe ugha
EA18 If no, why?¼vxj ugha½ rks D;ksa\
1. Inaccessibility 2. Unaware 3. Superstition 4. Any other …………..... tkudkjh ugha Fkh igq¡p ugha Fkh va/kfo'okl vU; dksbZ ------------------
EA19 Do you know about ICDS scheme/s?vkidks buesa ls dkSu&dkSu lh vkbZlhMh, ;kstukvksa ds ckjs esa irk gS\
1. Balika Mandal 2. Kishori Shakti Yojna 3. Ladli Scheme ckfydk eaMy fd'kksjh 'kfDr ;kstuk ykMyh ;kstuk
3. Kanya Jagriti Yojana 5. Balika Samriddhi Yojana 6. None dU;k tkx`fr ;kstuk ckfydk le`f) ;kstuk mi;qZDr dksbZ ugha
EA20 (If yes) How many adolescent girls got the benefi t of ICDS services in your family? ¼vxj gk¡½ vkids ifjokj dh fdruh fd'kksj cfPp;ksa dks bl ;kstuk }kjk ykHk igq¡pk gS\
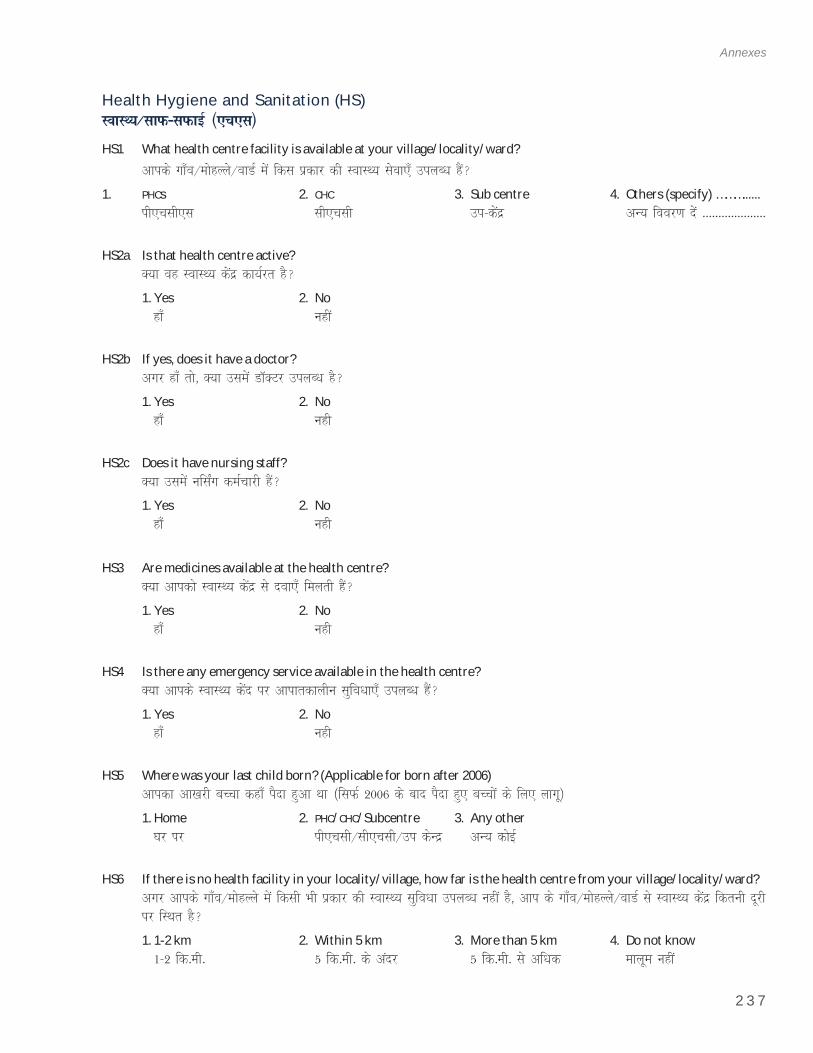
2 3 7
Annexes
Health Hygiene and Sanitation (HS)LokLF;@lkQ&lQkbZ ¼,p,l½
HS1 What health centre facility is available at your village/locality/ward?vkids xk¡o@eksgYys@okMZ esa fdl izdkj dh LokLF; lsok,¡ miyCèk gSa\
1. PHCs 2. CHC 3. Sub centre 4. Others (specify) ………......ih,plh,l lh,plh mi&dsanz vU; fooj.k nsa --------------------
HS2a Is that health centre active?D;k og LokLF; dsanz dk;Zjr gS\
1. Yes 2. No gk¡ ugha
HS2b If yes, does it have a doctor?vxj gk¡ rks] D;k mlesa MkWDVj miyC/k gS\
1. Yes 2. No gk¡ ugh
HS2c Does it have nursing staff?D;k mlesa uflZax deZpkjh gSa\
1. Yes 2. No gk¡ ugh
HS3 Are medicines available at the health centre?D;k vkidks LokLF; dsanz ls nok,¡ feyrh gSa\
1. Yes 2. No gk¡ ugh
HS4 Is there any emergency service available in the health centre?D;k vkids LokLF; dsan ij vkikrdkyhu lqfo/kk,¡ miyC/k gSa\
1. Yes 2. No gk¡ ugh
HS5 Where was your last child born? (Applicable for born after 2006)vkidk vk[kjh cPpk dgk¡ iSnk gqvk Fkk ¼flQZ 2006 ds ckn iSnk gq, cPpksa ds fy, ykxw½
1. Home 2. PHC/CHC/Subcentre 3. Any other ?kj ij ih,plh@lh,plh@mi dsUnz vU; dksbZ
HS6 If there is no health facility in your locality/village, how far is the health centre from your village/locality/ward?vxj vkids xk¡o@eksgYys esa fdlh Hkh izdkj dh LokLF; lqfo/kk miyC/k ugha gS] vki ds xk¡o@eksgYys@okMZ ls LokLF; dsanz fdruh nwjh ij fLFkr gS\
1. 1-2 km 2. Within 5 km 3. More than 5 km 4. Do not know 1&2 fd-eh- 5 fd-eh- ds vanj 5 fd-eh- ls vf/kd ekywe ugha
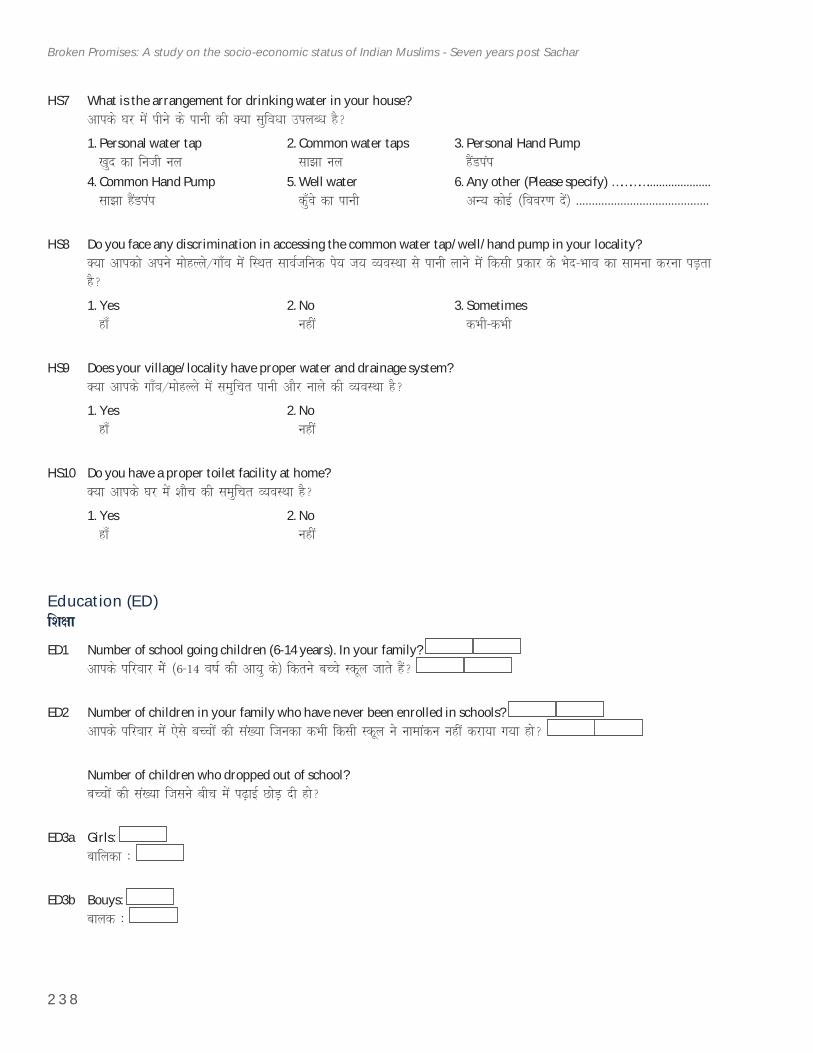
2 3 8
Broken Promises: A study on the socio-economic status of Indian Muslims - Seven years post Sachar
HS7 What is the arrangement for drinking water in your house?vkids ?kj esa ihus ds ikuh dh D;k lqfo/kk miyC/k gS\
1. Personal water tap 2. Common water taps 3. Personal Hand Pump [kqn dk futh uy lk>k uy gSaMiai
4. Common Hand Pump 5. Well water 6. Any other (Please specify) …………..................... lk>k gSaMiai dq¡os dk ikuh vU; dksbZ ¼fooj.k nsa½ ------------------------------------------
HS8 Do you face any discrimination in accessing the common water tap/well/hand pump in your locality?D;k vkidks vius eksgYys@xk¡o esa fLFkr lkoZtfud is; t; O;oLFkk ls ikuh ykus esa fdlh izdkj ds Hksn&Hkko dk lkeuk djuk iM+rk gS\
1. Yes 2. No 3. Sometimes gk¡ ugha dHkh&dHkh
HS9 Does your village/locality have proper water and drainage system?D;k vkids xk¡o@eksgYys esa leqfpr ikuh vkSj ukys dh O;oLFkk gS\
1. Yes 2. No gk¡ ugha
HS10 Do you have a proper toilet facility at home?D;k vkids ?kj esa 'kkSp dh leqfpr O;oLFkk gS\
1. Yes 2. No gk¡ ugha
Education (ED)f'k{kk
ED1 Number of school going children (6-14 years). In your family? vkids ifjokj esas ¼6&14 o"kZ dh vk;q ds½ fdrus cPps Ldwy tkrs gSa\
ED2 Number of children in your family who have never been enrolled in schools? vkids ifjokj esa ,sls cPpksa dh la[;k ftudk dHkh fdlh Ldwy us ukekadu ugha djk;k x;k gks\
Number of children who dropped out of school?cPpksa dh la[;k ftlus chp esa i<+kbZ NksM+ nh gks\
ED3a Girls: ckfydk %
ED3b Bouys: ckyd %
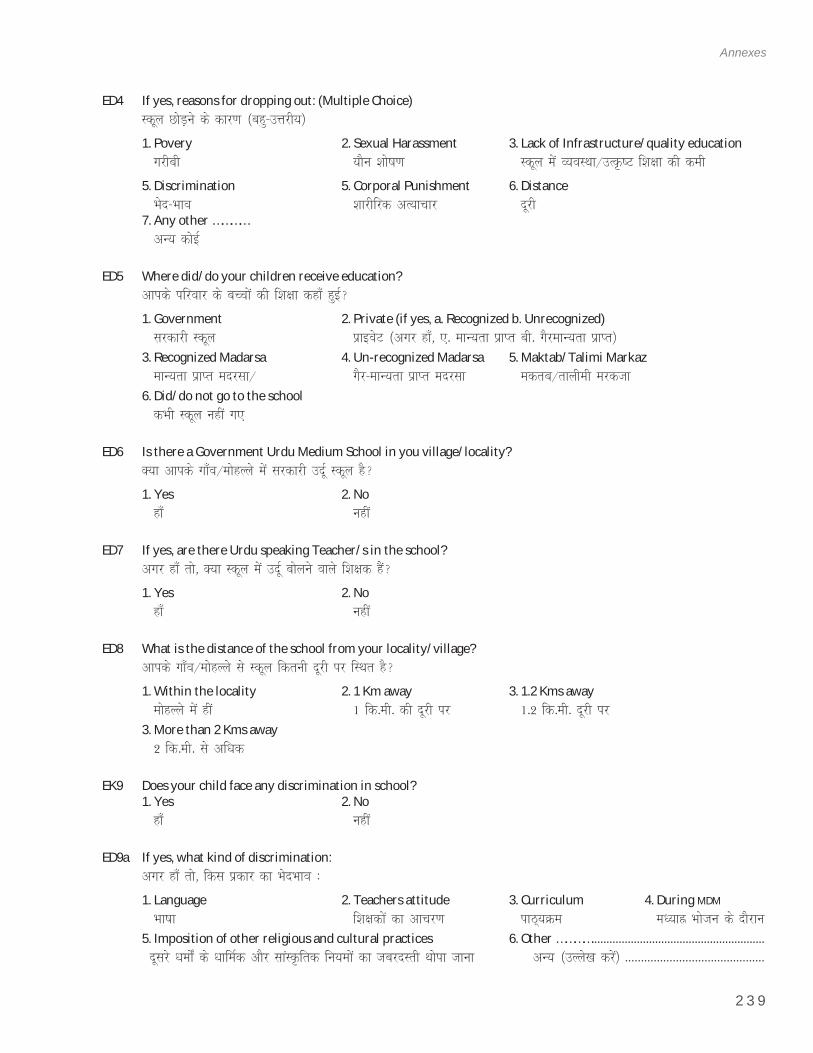
2 3 9
Annexes
ED4 If yes, reasons for dropping out: (Multiple Choice)Ldwy NksM+us ds dkj.k ¼cgq&mÙkjh;½
1. Povery 2. Sexual Harassment 3. Lack of Infrastructure/quality education xjhch ;kSu 'kks"k.k Ldwy esa O;oLFkk@mRÑ"V f'k{kk dh deh
5. Discrimination 5. Corporal Punishment 6. Distance Hksn&Hkko 'kkjhfjd vR;kpkj nwjh
7. Any other ………… vU; dksbZ
ED5 Where did/do your children receive education?vkids ifjokj ds cPpksa dh f'k{kk dgk¡ gqbZ\
1. Government 2. Private (if yes, a. Recognized b. Unrecognized) ljdkjh Ldwy izkbosV ¼vxj gk¡] ,- ekU;rk izkIr ch- xSjekU;rk izkIr½
3. Recognized Madarsa 4. Un-recognized Madarsa 5. Maktab/Talimi Markaz ekU;rk izkIr enjlk@ xSj&ekU;rk izkIr enjlk edrc@rkyheh ejdtk
6. Did/do not go to the school dHkh Ldwy ugha x,
ED6 Is there a Government Urdu Medium School in you village/locality?D;k vkids xk¡o@eksgYys esa ljdkjh mnwZ Ldwy gS\
1. Yes 2. No gk¡ ugha
ED7 If yes, are there Urdu speaking Teacher/s in the school?vxj gk¡ rks] D;k Ldwy esa mnwZ cksyus okys f'k{kd gSa\
1. Yes 2. No gk¡ ugha
ED8 What is the distance of the school from your locality/village?vkids xk¡o@eksgYys ls Ldwy fdruh nwjh ij fLFkr gS\
1. Within the locality 2. 1 Km away 3. 1.2 Kms away eksgYys esa gha 1 fd-eh- dh nwjh ij 1-2 fd-eh- nwjh ij
3. More than 2 Kms away 2 fd-eh- ls vf/kd
EK9 Does your child face any discrimination in school? 1. Yes 2. No
gk¡ ugha
ED9a If yes, what kind of discrimination:vxj gk¡ rks] fdl izdkj dk HksnHkko %
1. Language 2. Teachers attitude 3. Curriculum 4. During MDM Hkk"kk f'k{kdksa dk vkpj.k ikB~;Øe e/;kÌ Hkkstu ds nkSjku
5. Imposition of other religious and cultural practices 6. Other …………......................................................... nwljs /keksZa ds /kkfeZd vkSj lkaLÑfrd fu;eksa dk tcjnLrh Fkksik tkuk vU; ¼mYys[k djsa½ --------------------------------------------
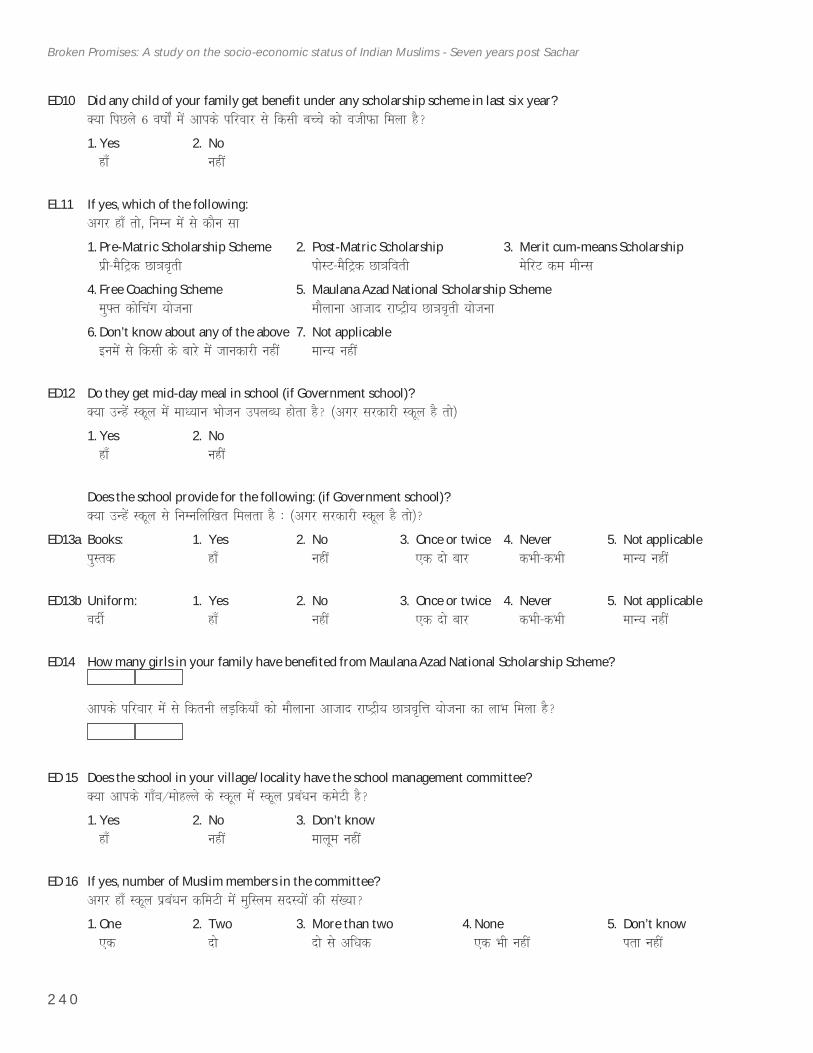
2 4 0
Broken Promises: A study on the socio-economic status of Indian Muslims - Seven years post Sachar
ED10 Did any child of your family get benefi t under any scholarship scheme in last six year?D;k fiNys 6 o"kksZa esa vkids ifjokj ls fdlh cPps dks othQk feyk gS\
1. Yes 2. No gk¡ ugha
EL11 If yes, which of the following:vxj gk¡ rks] fuEu esa ls dkSu lk
1. Pre-Matric Scholarship Scheme 2. Post-Matric Scholarship 3. Merit cum-means Scholarship izh&eSfVªd Nk=ko`rh iksLV&eSfVªd Nk=kforh esfjV de ehUl
4. Free Coaching Scheme 5. Maulana Azad National Scholarship Scheme eq¶r dksfpax ;kstuk ekSykuk vktkn jk"Vªh; Nk=ko`rh ;kstuk
6. Don’t know about any of the above 7. Not applicable buesa ls fdlh ds ckjs esa tkudkjh ugha ekU; ugha
ED12 Do they get mid-day meal in school (if Government school)?D;k mUgsa Ldwy esa ek/;ku Hkkstu miyC/k gksrk gS\ ¼vxj ljdkjh Ldwy gS rks½
1. Yes 2. No gk¡ ugha
Does the school provide for the following: (if Government school)?D;k mUgsa Ldwy ls fuEufyf[kr feyrk gS % ¼vxj ljdkjh Ldwy gS rks½\
ED13a Books: 1. Yes 2. No 3. Once or twice 4. Never 5. Not applicableiqLrd gk¡ ugha ,d nks ckj dHkh&dHkh ekU; ugha
ED13b Uniform: 1. Yes 2. No 3. Once or twice 4. Never 5. Not applicableonhZ gk¡ ugha ,d nks ckj dHkh&dHkh ekU; ugha
ED14 How many girls in your family have benefi ted from Maulana Azad National Scholarship Scheme?
vkids ifjokj esa ls fdruh yM+fd;k¡ dks ekSykuk vktkn jk"Vªh; Nk=ko`fÙk ;kstuk dk ykHk feyk gS\
ED 15 Does the school in your village/locality have the school management committee?D;k vkids xk¡o@eksgYys ds Ldwy esa Ldwy izca/ku desVh gS\
1. Yes 2. No 3. Don’t know gk¡ ugha ekywe ugha
ED 16 If yes, number of Muslim members in the committee?vxj gk¡ Ldwy izca/ku dfeVh esa eqfLye lnL;ksa dh la[;k\
1. One 2. Two 3. More than two 4. None 5. Don’t know ,d nks nks ls vf/kd ,d Hkh ugha irk ugha
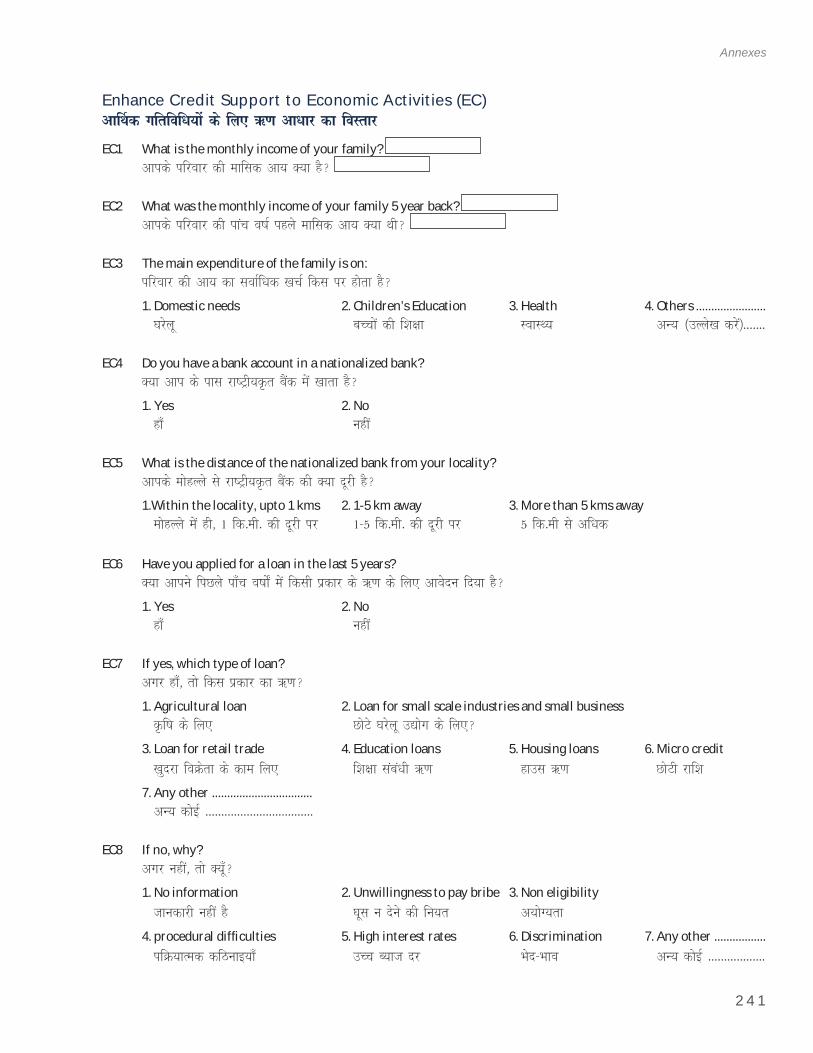
2 4 1
Annexes
Enhance Credit Support to Economic Activities (EC)vk£Fkd xfrfof/k;ksa ds fy, _.k vk/kkj dk foLrkj
EC1 What is the monthly income of your family? vkids ifjokj dh ekfld vk; D;k gS\
EC2 What was the monthly income of your family 5 year back? vkids ifjokj dh ikap o"kZ igys ekfld vk; D;k Fkh\
EC3 The main expenditure of the family is on:ifjokj dh vk; dk lokZf/kd [kpZ fdl ij gksrk gS\
1. Domestic needs 2. Children’s Education 3. Health 4. Others ....................... ?kjsyw cPpksa dh f'k{kk LokLF; vU; ¼mYys[k djsa½-------
EC4 Do you have a bank account in a nationalized bank?D;k vki ds ikl jk"Vªh;Ñr cSad esa [kkrk gS\
1. Yes 2. No gk¡ ugha
EC5 What is the distance of the nationalized bank from your locality?vkids eksgYys ls jk"Vªh;Ñr cSad dh D;k nwjh gS\
1.Within the locality, upto 1 kms 2. 1-5 km away 3. More than 5 kms away eksgYys esa gh] 1 fd-eh- dh nwjh ij 1&5 fd-eh- dh nwjh ij 5 fd-eh ls vf/kd
EC6 Have you applied for a loan in the last 5 years?D;k vkius fiNys ik¡p o"kks± esa fdlh izdkj ds _.k ds fy, vkosnu fn;k gS\
1. Yes 2. No gk¡ ugha
EC7 If yes, which type of loan?vxj gk¡] rks fdl izdkj dk _.k\
1. Agricultural loan 2. Loan for small scale industries and small business Ñf"k ds fy, NksVs ?kjsyw m|ksx ds fy,\
3. Loan for retail trade 4. Education loans 5. Housing loans 6. Micro credit [kqnjk foØsrk ds dke fy, f'k{kk laca/kh _.k gkml _.k NksVh jkf'k
7. Any other ................................. vU; dksbZ ----------------------------------
EC8 If no, why?vxj ugha] rks D;w¡\
1. No information 2. Unwillingness to pay bribe 3. Non eligibility tkudkjh ugha gS ?kwl u nsus dh fu;r v;ksX;rk
4. procedural diffi culties 5. High interest rates 6. Discrimination 7. Any other ................. ifØ;kRed dfBukb;k¡ mPp C;kt nj Hksn&Hkko vU; dksbZ ------------------
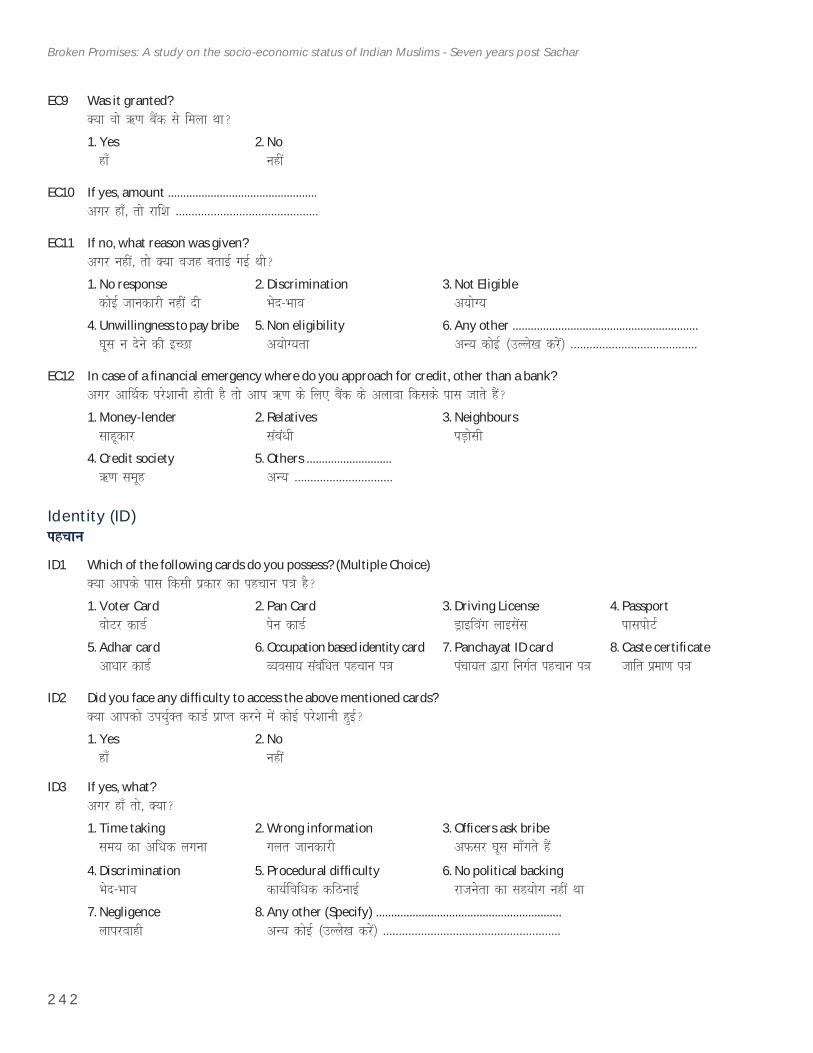
2 4 2
Broken Promises: A study on the socio-economic status of Indian Muslims - Seven years post Sachar
EC9 Was it granted?D;k oks _.k cSad ls feyk Fkk\
1. Yes 2. No gk¡ ugha
EC10 If yes, amount .................................................vxj gk¡] rks jkf'k ---------------------------------------------
EC11 If no, what reason was given?vxj ugha] rks D;k otg crkbZ xbZ Fkh\
1. No response 2. Discrimination 3. Not Eligible dksbZ tkudkjh ugha nh Hksn&Hkko v;ksX;
4. Unwillingness to pay bribe 5. Non eligibility 6. Any other ............................................................. ?kwl u nsus dh bPNk v;ksX;rk vU; dksbZ ¼mYys[k djsa½ ----------------------------------------
EC12 In case of a fi nancial emergency where do you approach for credit, other than a bank?vxj vk£Fkd ijs'kkuh gksrh gS rks vki _.k ds fy, cSad ds vykok fdlds ikl tkrs gSa\
1. Money-lender 2. Relatives 3. Neighbours lkgwdkj laca/kh iM+kslh
4. Credit society 5. Others ............................ _.k lewg vU; -------------------------------
Identity (ID)igpku
ID1 Which of the following cards do you possess? (Multiple Choice)D;k vkids ikl fdlh izdkj dk igpku i=k gS\
1. Voter Card 2. Pan Card 3. Driving License 4. Passport oksVj dkMZ isu dkMZ Mªkbfoax ykblsal ikliksVZ
5. Adhar card 6. Occupation based identity card 7. Panchayat ID card 8. Caste certifi cate vk/kkj dkMZ O;olk; lacaf/kr igpku i=k iapk;r }kjk fuxZr igpku i=k tkfr izek.k i=k
ID2 Did you face any diffi culty to access the above mentioned cards?D;k vkidks mi;qZDr dkMZ izkIr djus esa dksbZ ijs'kkuh gqbZ\
1. Yes 2. No gk¡ ugha
ID3 If yes, what?vxj gk¡ rks] D;k\
1. Time taking 2. Wrong information 3. Offi cers ask bribe le; dk vf/kd yxuk xyr tkudkjh vQlj ?kwl ek¡xrs gSa
4. Discrimination 5. Procedural diffi culty 6. No political backing Hksn&Hkko dk;Zfof/kd dfBukbZ jktusrk dk lg;ksx ugha Fkk
7. Negligence 8. Any other (Specify) ............................................................. ykijokgh vU; dksbZ ¼mYys[k djsa½ --------------------------------------------------------
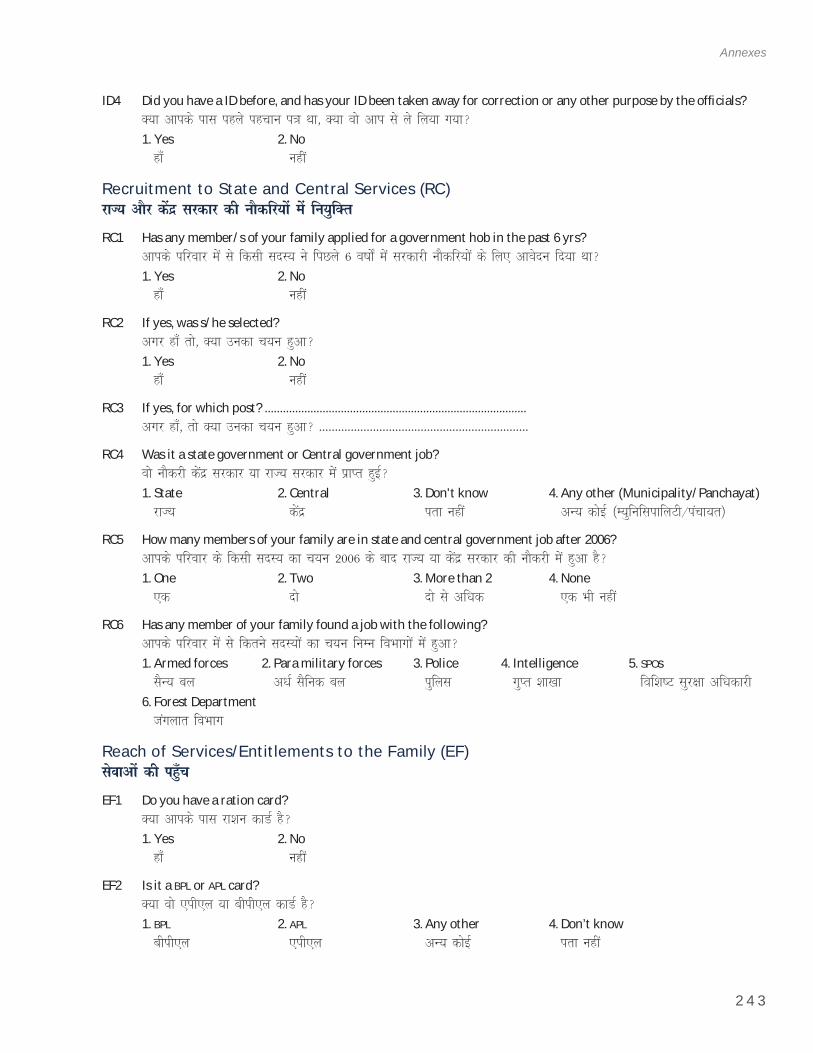
2 4 3
Annexes
ID4 Did you have a ID before, and has your ID been taken away for correction or any other purpose by the offi cials?D;k vkids ikl igys igpku i=k Fkk] D;k oks vki ls ys fy;k x;k\
1. Yes 2. No gk¡ ugha
Recruitment to State and Central Services (RC)jkT; vkSj dsanz ljdkj dh ukSdfj;ksa esa fu;qfDr
RC1 Has any member/s of your family applied for a government hob in the past 6 yrs?vkids ifjokj esa ls fdlh lnL; us fiNys 6 o"kks± esa ljdkjh ukSdfj;ksa ds fy, vkosnu fn;k Fkk\
1. Yes 2. No gk¡ ugha
RC2 If yes, was s/he selected?vxj gk¡ rks] D;k mudk p;u gqvk\
1. Yes 2. No gk¡ ugha
RC3 If yes, for which post? ......................................................................................vxj gk¡] rks D;k mudk p;u gqvk\ ------------------------------------------------------------------
RC4 Was it a state government or Central government job?oks ukSdjh dsanz ljdkj ;k jkT; ljdkj esa izkIr gqbZ\
1. State 2. Central 3. Don't know 4. Any other (Municipality/Panchayat) jkT; dsanz irk ugha vU; dksbZ ¼E;qfuflikfyVh@iapk;r½
RC5 How many members of your family are in state and central government job after 2006?vkids ifjokj ds fdlh lnL; dk p;u 2006 ds ckn jkT; ;k dsanz ljdkj dh ukSdjh esa gqvk gS\
1. One 2. Two 3. More than 2 4. None ,d nks nks ls vf/kd ,d Hkh ugha
RC6 Has any member of your family found a job with the following?vkids ifjokj esa ls fdrus lnL;ksa dk p;u fuEu foHkkxksa esa gqvk\
1. Armed forces 2. Para military forces 3. Police 4. Intelligence 5. SPOs lSU; cy v/kZ lSfud cy iqfyl xqIr 'kk[kk fof'k"V lqj{kk vf/kdkjh
6. Forest Department taxykr foHkkx
Reach of Services/Entitlements to the Family (EF)lsokvksa dh igq¡p
EF1 Do you have a ration card?D;k vkids ikl jk'ku dkMZ gS\
1. Yes 2. No gk¡ ugha
EF2 Is it a BPL or APL card?D;k oks ,ih,y ;k chih,y dkMZ gS\
1. BPL 2. APL 3. Any other 4. Don’t know chih,y ,ih,y vU; dksbZ irk ugha
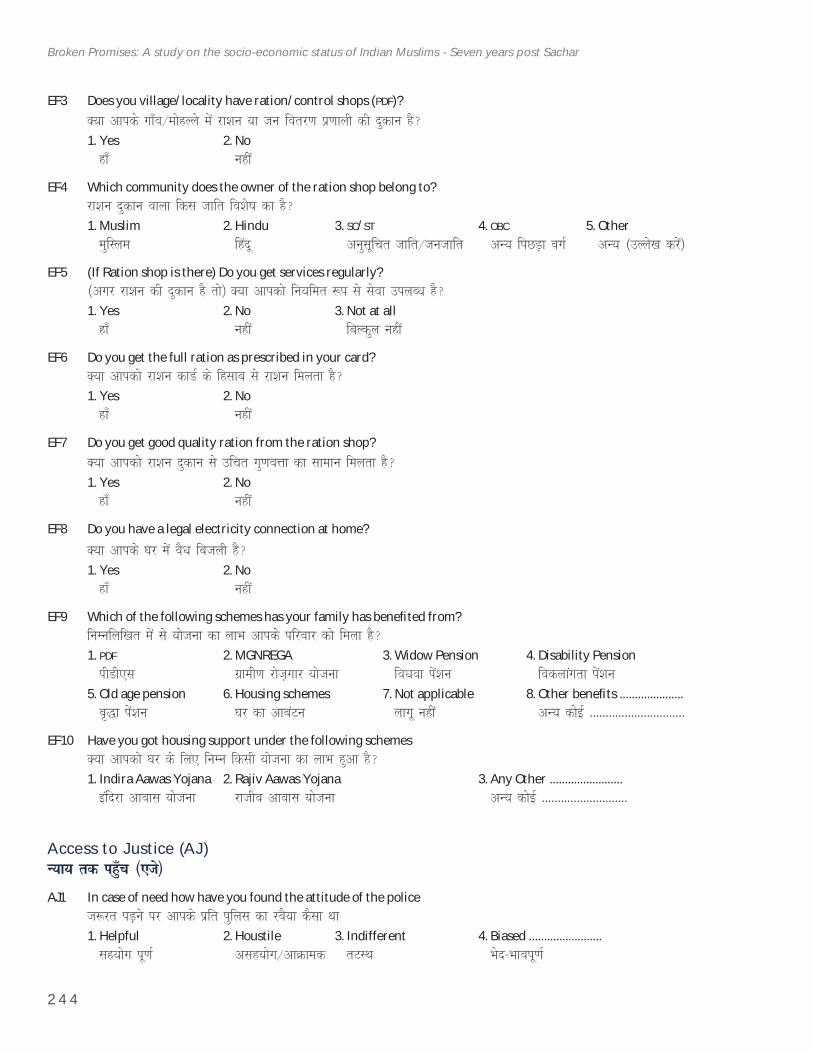
2 4 4
Broken Promises: A study on the socio-economic status of Indian Muslims - Seven years post Sachar
EF3 Does you village/locality have ration/control shops (PDF)?D;k vkids xk¡o@eksgYys esa jk'ku ;k tu forj.k iz.kkyh dh nqdku gS\
1. Yes 2. No gk¡ ugha
EF4 Which community does the owner of the ration shop belong to?jk'ku nqdku okyk fdl tkfr fo'ks"k dk gS\
1. Muslim 2. Hindu 3. SC/ST 4. OBC 5. Other eqfLye fganw vuqlwfpr tkfr@tutkfr vU; fiNM+k oxZ vU; ¼mYys[k djsa½
EF5 (If Ration shop is there) Do you get services regularly?¼vxj jk'ku dh nqdku gS rks½ D;k vkidks fu;fer :i ls lsok miyC/k gS\
1. Yes 2. No 3. Not at all gk¡ ugha fcYdqy ugha
EF6 Do you get the full ration as prescribed in your card?D;k vkidks jk'ku dkMZ ds fglkc ls jk'ku feyrk gS\
1. Yes 2. No gk¡ ugha
EF7 Do you get good quality ration from the ration shop?D;k vkidks jk'ku nqdku ls mfpr xq.koÙkk dk lkeku feyrk gS\
1. Yes 2. No gk¡ ugha
EF8 Do you have a legal electricity connection at home?D;k vkids ?kj esa oSèk fctyh gS\
1. Yes 2. No gk¡ ugha
EF9 Which of the following schemes has your family has benefi ted from?fuEufyf[kr esa ls ;kstuk dk ykHk vkids ifjokj dks feyk gS\
1. PDF 2. MGNREGA 3. Widow Pension 4. Disability Pension ihMh,l xzkeh.k jkst+xkj ;kstuk fo/kok isa'ku fodykaxrk isa'ku
5. Old age pension 6. Housing schemes 7. Not applicable 8. Other benefi ts ..................... o`)k isa'ku ?kj dk vkcaVu ykxw ugha vU; dksbZ ------------------------------
EF10 Have you got housing support under the following schemesD;k vkidks ?kj ds fy, fuEu fdlh ;kstuk dk ykHk gqvk gS\
1. Indira Aawas Yojana 2. Rajiv Aawas Yojana 3. Any Other ........................ bafnjk vkokl ;kstuk jktho vkokl ;kstuk vU; dksbZ ---------------------------
Access to Justice (AJ)U;k; rd igq¡p ¼,ts½
AJ1 In case of need how have you found the attitude of the policet:jr iM+us ij vkids izfr iqfyl dk joS;k dSlk Fkk
1. Helpful 2. Houstile 3. Indifferent 4. Biased ........................ lg;ksx iw.kZ vlg;ksx@vkØked rVLFk Hksn&Hkkoiw.kZ
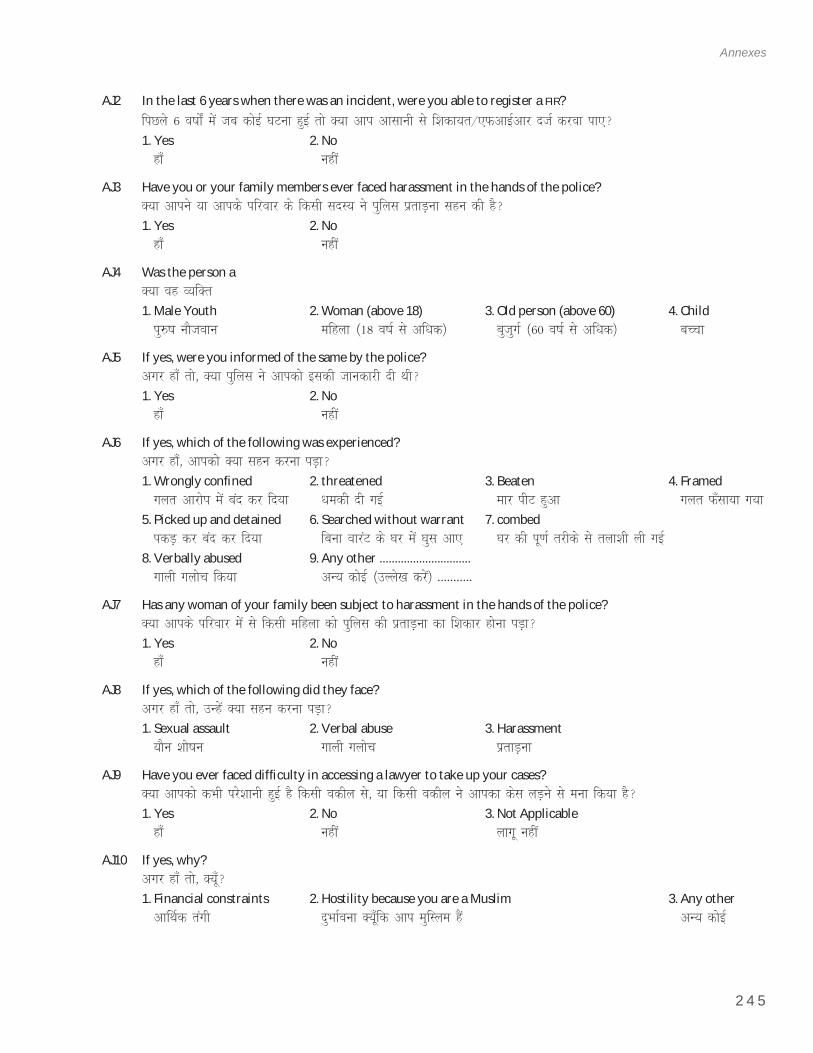
2 4 5
Annexes
AJ2 In the last 6 years when there was an incident, were you able to register a FIR?fiNys 6 o"kksZa esa tc dksbZ ?kVuk gqbZ rks D;k vki vklkuh ls f'kdk;r@,QvkbZvkj ntZ djok ik,\
1. Yes 2. No gk¡ ugha
AJ3 Have you or your family members ever faced harassment in the hands of the police?D;k vkius ;k vkids ifjokj ds fdlh lnL; us iqfyl izrkM+uk lgu dh gS\
1. Yes 2. No gk¡ ugha
AJ4 Was the person aD;k og O;fDr
1. Male Youth 2. Woman (above 18) 3. Old person (above 60) 4. Child iq#"k ukStoku efgyk ¼18 o"kZ ls vf/kd½ cqtqxZ ¼60 o"kZ ls vf/kd½ cPpk
AJ5 If yes, were you informed of the same by the police?vxj gk¡ rks] D;k iqfyl us vkidks bldh tkudkjh nh Fkh\
1. Yes 2. No gk¡ ugha
AJ6 If yes, which of the following was experienced?vxj gk¡] vkidks D;k lgu djuk iM+k\
1. Wrongly confi ned 2. threatened 3. Beaten 4. Framed xyr vkjksi esa can dj fn;k /kedh nh xbZ ekj ihV gqvk xyr Q¡lk;k x;k
5. Picked up and detained 6. Searched without warrant 7. combed idM+ dj can dj fn;k fcuk okjaV ds ?kj esa ?kql vk, ?kj dh iw.kZ rjhds ls ryk'kh yh xbZ
8. Verbally abused 9. Any other .............................. xkyh xyksp fd;k vU; dksbZ ¼mYys[k djsa½ -----------
AJ7 Has any woman of your family been subject to harassment in the hands of the police?D;k vkids ifjokj esa ls fdlh efgyk dks iqfyl dh izrkM+uk dk f'kdkj gksuk iM+k\
1. Yes 2. No gk¡ ugha
AJ8 If yes, which of the following did they face?vxj gk¡ rks] mUgsa D;k lgu djuk iM+k\
1. Sexual assault 2. Verbal abuse 3. Harassment ;kSu 'kks"ku xkyh xyksp izrkM+uk
AJ9 Have you ever faced diffi culty in accessing a lawyer to take up your cases?D;k vkidks dHkh ijs'kkuh gqbZ gS fdlh odhy ls] ;k fdlh odhy us vkidk dsl yM+us ls euk fd;k gS\
1. Yes 2. No 3. Not Applicable gk¡ ugha ykxw ugha
AJ10 If yes, why?vxj gk¡ rks] D;w¡\
1. Financial constraints 2. Hostility because you are a Muslim 3. Any other vk£Fkd raxh nqHkkZouk D;w¡fd vki eqfLye gSa vU; dksbZ
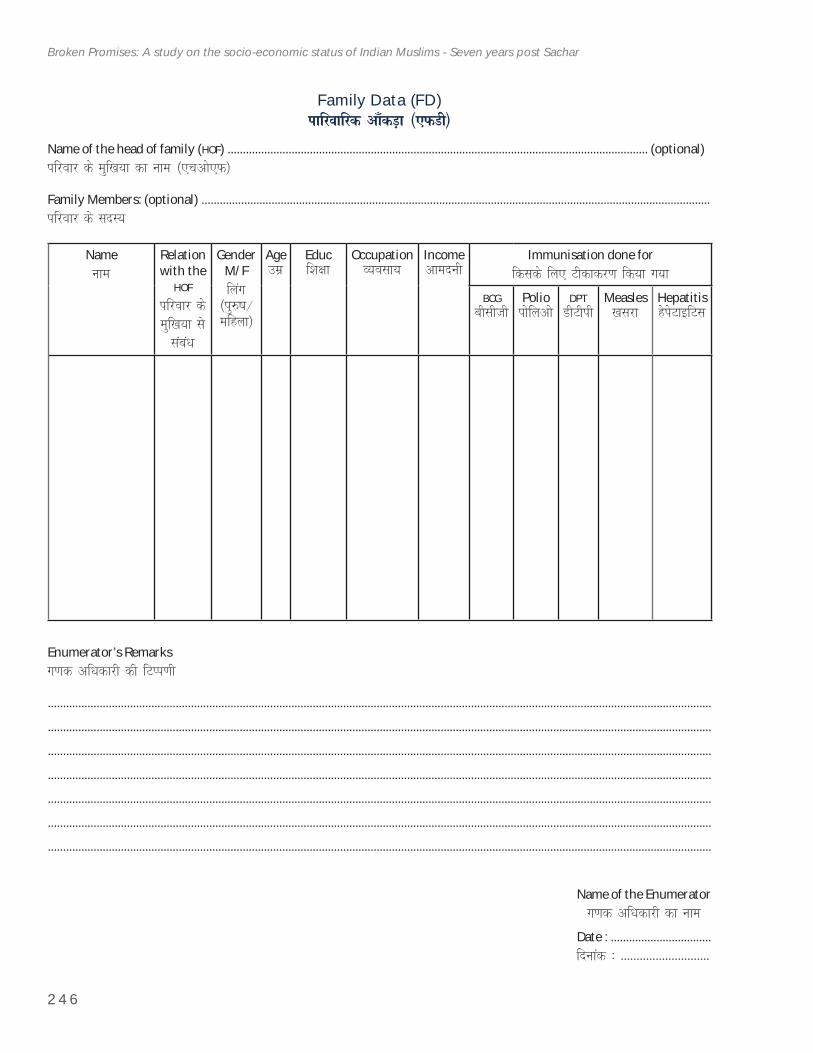
2 4 6
Broken Promises: A study on the socio-economic status of Indian Muslims - Seven years post Sachar
Family Data (FD)ikfjokfjd vk¡dM+k ¼,QMh½
Name of the head of family (HOF) .......................................................................................................................................... (optional)ifjokj ds eqf[k;k dk uke ¼,pvks,Q½
Family Members: (optional) .......................................................................................................................................................................ifjokj ds lnL;
Nameuke
Relationwith the
HOFifjokj ds eqf[k;k ls laca/k
GenderM/Ffyax
¼iq#"k@efgyk½
Agemez
Educf'k{kk
OccupationO;olk;
Incomevkenuh
Immunisation done forfdlds fy, Vhdkdj.k fd;k x;k
BCGchlhth
Polioiksfyvks
DPTMhVhih
Measles[kljk
HepatitisgsisVkbfVl
Enumerator’s Remarksx.kd vf/kdkjh dh fVIi.kh
..........................................................................................................................................................................................................................
..........................................................................................................................................................................................................................
..........................................................................................................................................................................................................................
..........................................................................................................................................................................................................................
..........................................................................................................................................................................................................................
..........................................................................................................................................................................................................................
..........................................................................................................................................................................................................................
Name of the Enumeratorx.kd vf/kdkjh dk uke
Date : .................................fnukad % ----------------------------
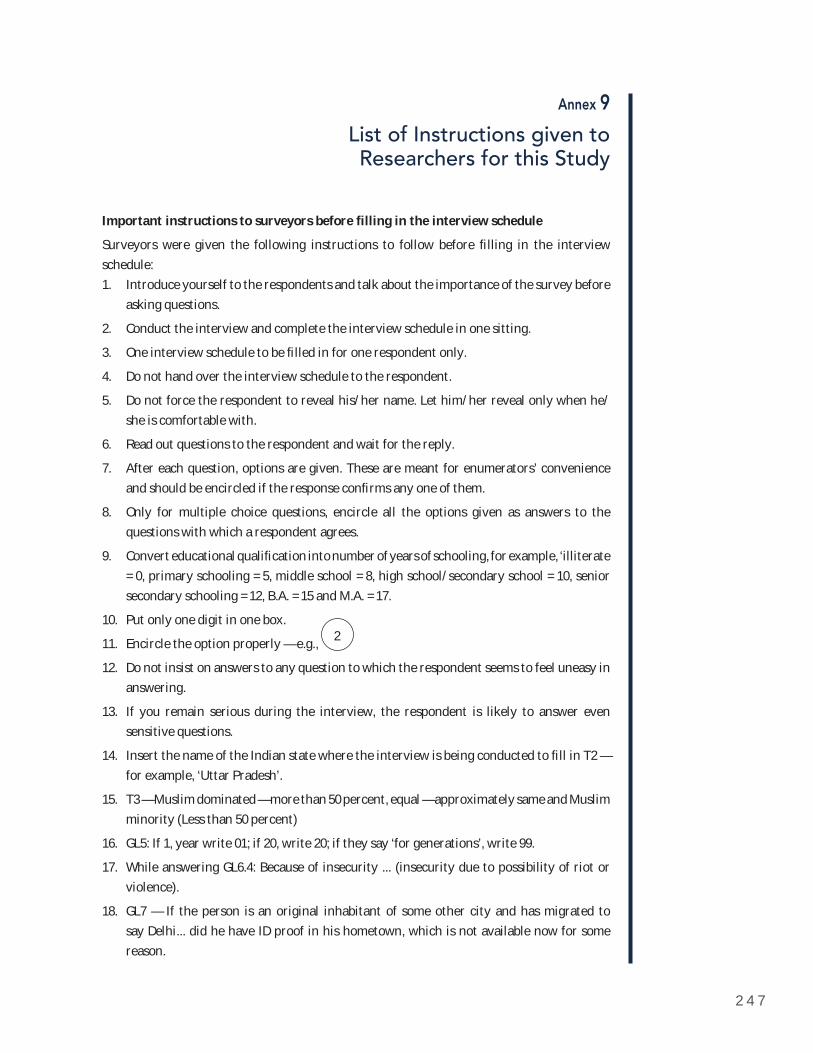
2 4 7
Annex 9
List of Instructions given to Researchers for this Study
Important instructions to surveyors before fi lling in the interview schedule
Surveyors were given the following instructions to follow before fi lling in the interview schedule:
Introduce yourself to the respondents and talk about the importance of the survey before 1.asking questions.
Conduct the interview and complete the interview schedule in one sitting.2.
One interview schedule to be fi lled in for one respondent only. 3.
Do not hand over the interview schedule to the respondent. 4.
Do not force the respondent to reveal his/her name. Let him/her reveal only when he/5.she is comfortable with.
Read out questions to the respondent and wait for the reply. 6.
After each question, options are given. These are meant for enumerators’ convenience 7.and should be encircled if the response confi rms any one of them.
Only for multiple choice questions, encircle all the options given as answers to the 8.questions with which a respondent agrees.
Convert educational qualifi cation into number of years of schooling, for example, ‘illiterate 9.= 0, primary schooling = 5, middle school = 8, high school/secondary school = 10, senior secondary schooling = 12, B.A. = 15 and M.A. = 17.
Put only one digit in one box.10.
Encircle the option properly — e.g., 11. 2
Do not insist on answers to any question to which the respondent seems to feel uneasy in 12.answering.
If you remain serious during the interview, the respondent is likely to answer even 13.sensitive questions.
Insert the name of the Indian state where the interview is being conducted to fi ll in T2 — 14.for example, ‘Uttar Pradesh’.
T3 — Muslim dominated — more than 50 percent, equal — approximately same and Muslim 15.minority (Less than 50 percent)
GL5: If 1, year write 01; if 20, write 20; if they say ‘for generations’, write 99.16.
While answering GL6.4: Because of insecurity ... (insecurity due to possibility of riot or 17.violence).
GL7 — If the person is an original inhabitant of some other city and has migrated to 18.say Delhi... did he have ID proof in his hometown, which is not available now for some reason.
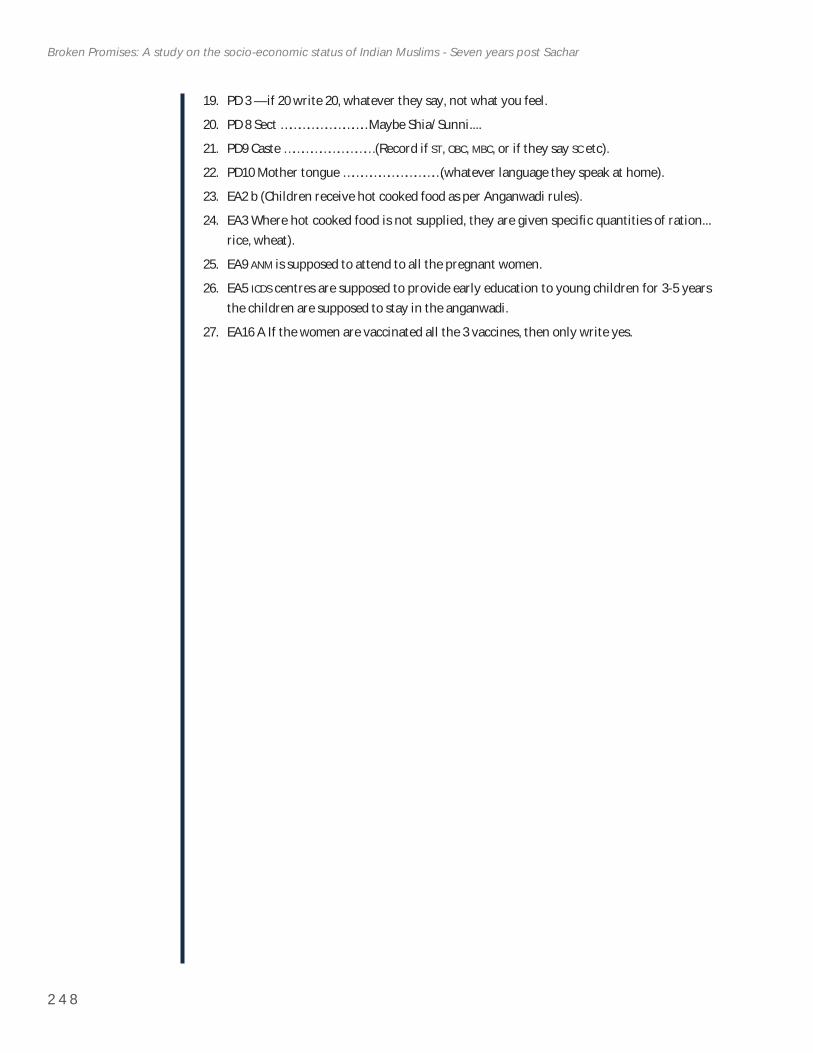
2 4 8
Broken Promises: A study on the socio-economic status of Indian Muslims - Seven years post Sachar
PD 3 — if 20 write 20, whatever they say, not what you feel.19.
PD 8 Sect …………………………Maybe Shia/Sunni....20.
PD9 Caste ………………………… (Record if 21. ST, OBC, MBC, or if they say SC etc).
PD10 Mother tongue ……………………………(whatever language they speak at home).22.
EA2 b (Children receive hot cooked food as per Anganwadi rules).23.
EA3 Where hot cooked food is not supplied, they are given specifi c quantities of ration... 24.rice, wheat).
EA925. ANM is supposed to attend to all the pregnant women.
EA526. ICDS centres are supposed to provide early education to young children for 3-5 years the children are supposed to stay in the anganwadi.
EA16 A If the women are vaccinated all the 3 vaccines, then only write yes.27.
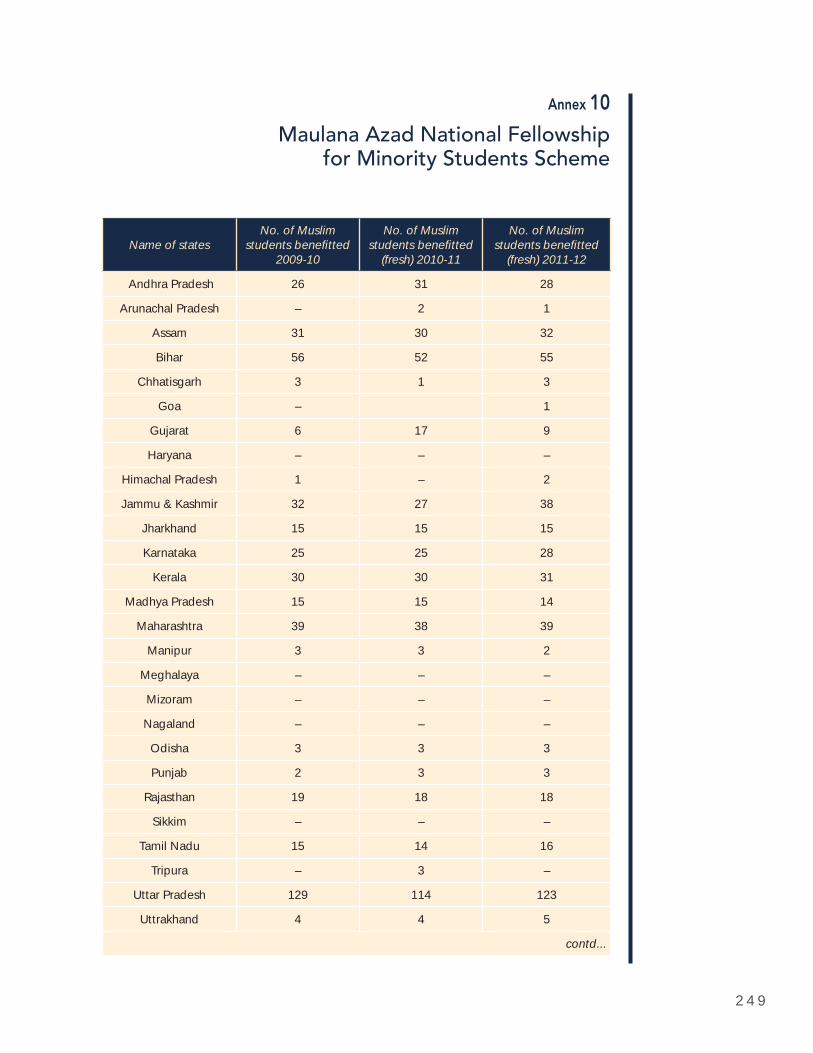
2 4 9
Annex 10
Maulana Azad National Fellowship for Minority Students Scheme
Name of statesNo. of Muslim
students benefi tted 2009-10
No. of Muslim students benefi tted
(fresh) 2010-11
No. of Muslim students benefi tted
(fresh) 2011-12
Andhra Pradesh 26 31 28
Arunachal Pradesh – 2 1
Assam 31 30 32
Bihar 56 52 55
Chhatisgarh 3 1 3
Goa – 1
Gujarat 6 17 9
Haryana – – –
Himachal Pradesh 1 – 2
Jammu & Kashmir 32 27 38
Jharkhand 15 15 15
Karnataka 25 25 28
Kerala 30 30 31
Madhya Pradesh 15 15 14
Maharashtra 39 38 39
Manipur 3 3 2
Meghalaya – – –
Mizoram – – –
Nagaland – – –
Odisha 3 3 3
Punjab 2 3 3
Rajasthan 19 18 18
Sikkim – – –
Tamil Nadu 15 14 16
Tripura – 3 –
Uttar Pradesh 129 114 123
Uttrakhand 4 4 5
contd...
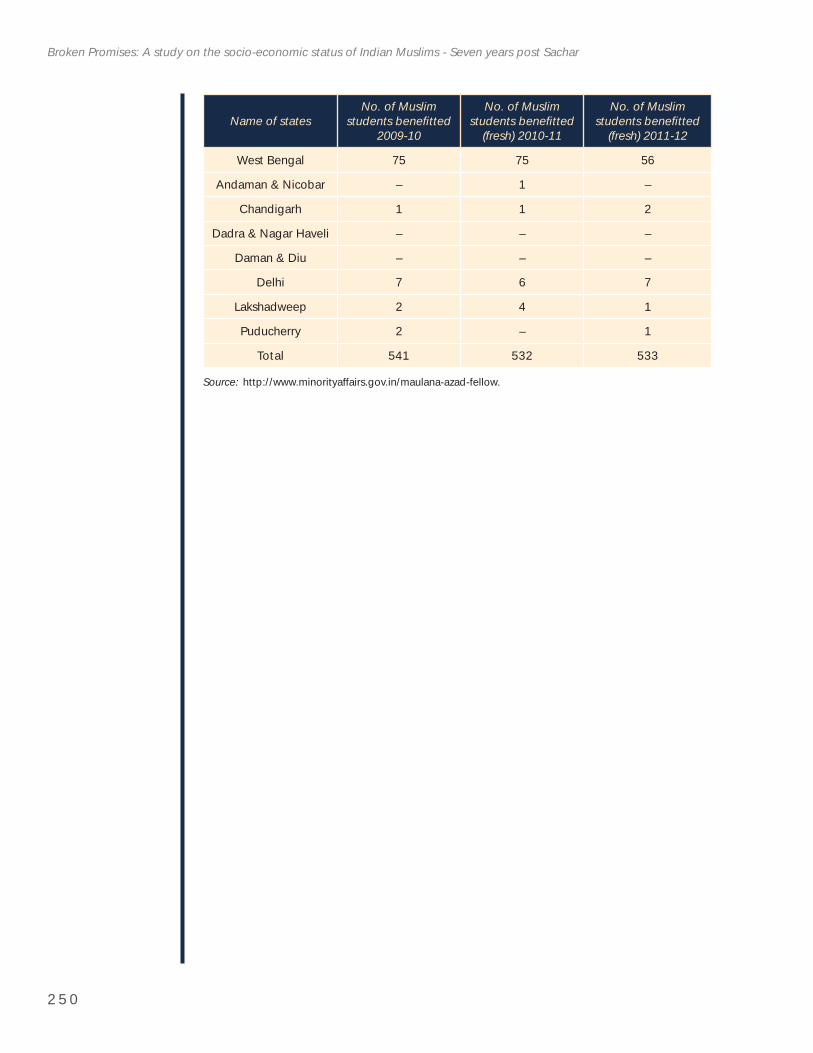
2 5 0
Broken Promises: A study on the socio-economic status of Indian Muslims - Seven years post Sachar
Name of statesNo. of Muslim
students benefi tted 2009-10
No. of Muslim students benefi tted
(fresh) 2010-11
No. of Muslim students benefi tted
(fresh) 2011-12
West Bengal 75 75 56
Andaman & Nicobar – 1 –
Chandigarh 1 1 2
Dadra & Nagar Haveli – – –
Daman & Diu – – –
Delhi 7 6 7
Lakshadweep 2 4 1
Puducherry 2 – 1
Total 541 532 533
Source: http://www.minorityaffairs.gov.in/maulana-azad-fellow.
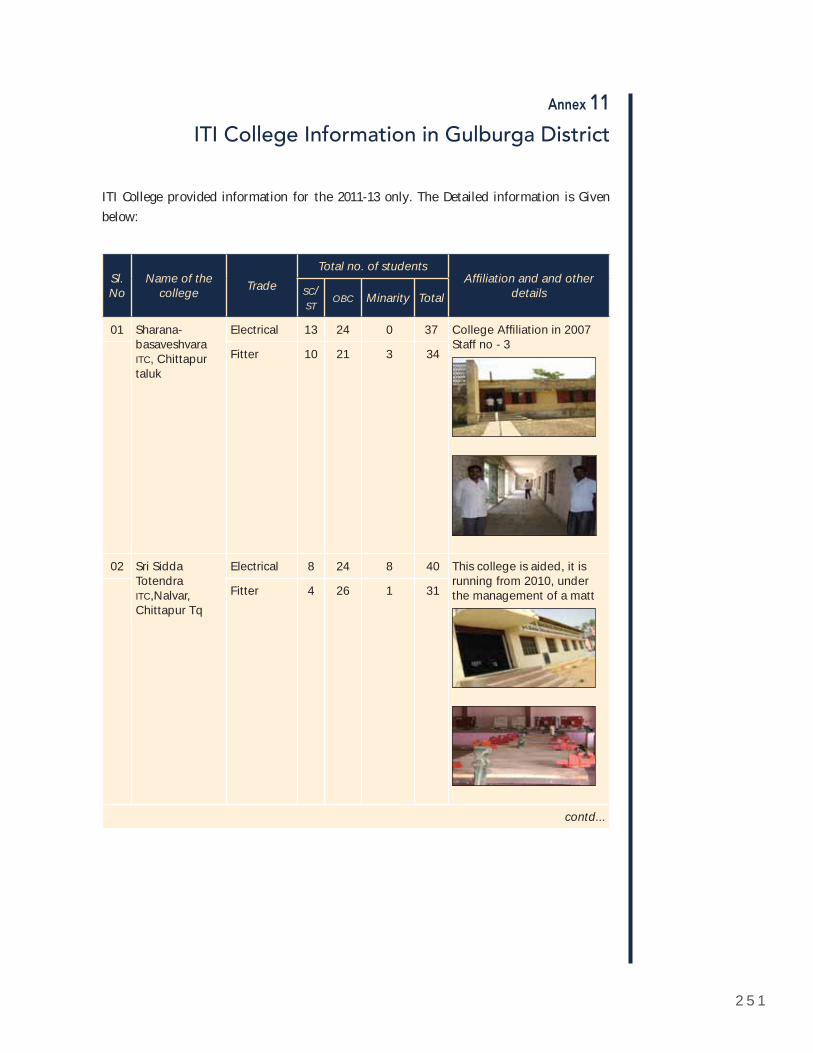
2 5 1
Annex 11
ITI College Information in Gulburga District
ITI College provided information for the 2011-13 only. The Detailed information is Given below:
Sl.No
Name of the college Trade
Total no. of studentsAffi liation and and other
detailsSC/ST
OBC Minarity Total
01 Sharana-basaveshvaraITC, Chittapur taluk
Electrical 13 24 0 37 College Affi liation in 2007Staff no - 3
Fitter 10 21 3 34
02 Sri Sidda Totendra ITC,Nalvar, Chittapur Tq
Electrical 8 24 8 40 This college is aided, it is running from 2010, under the management of a mattFitter 4 26 1 31
contd...
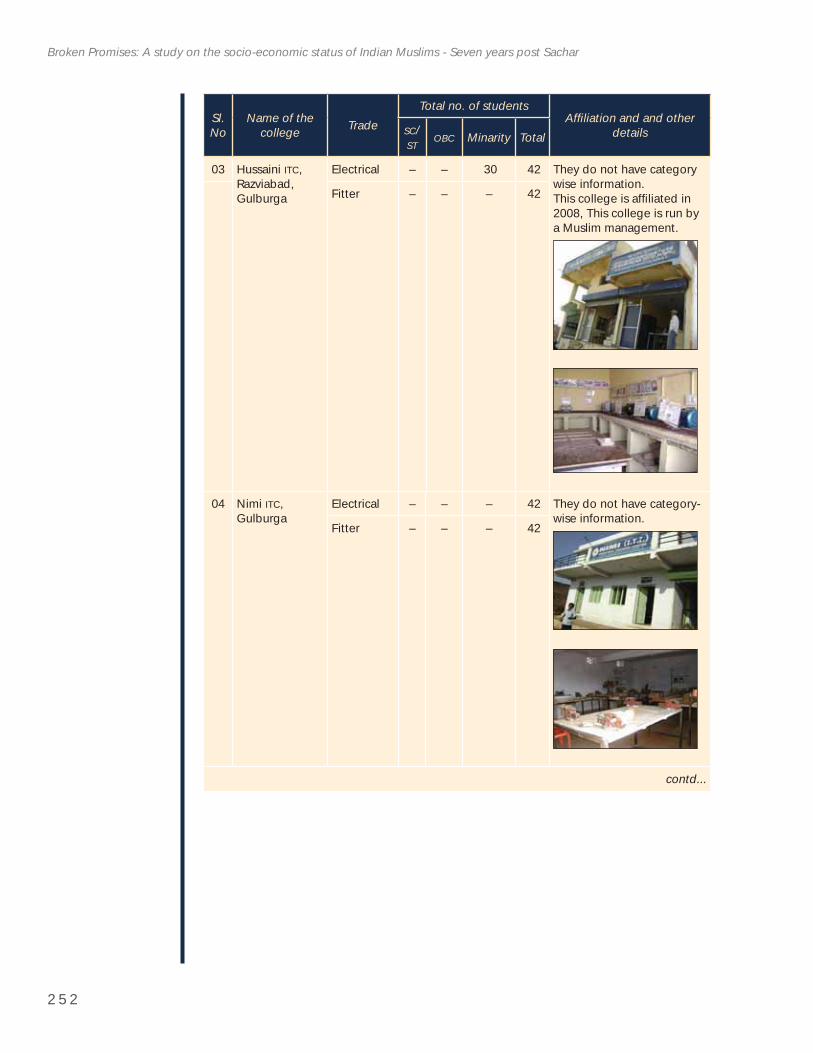
2 5 2
Broken Promises: A study on the socio-economic status of Indian Muslims - Seven years post Sachar
Sl.No
Name of the college Trade
Total no. of studentsAffi liation and and other
detailsSC/ST
OBC Minarity Total
03 Hussaini ITC,Razviabad,Gulburga
Electrical – – 30 42 They do not have category wise information. This college is affi liated in 2008, This college is run by a Muslim management.
Fitter – – – 42
04 Nimi ITC,Gulburga
Electrical – – – 42 They do not have category-wise information.
Fitter – – – 42
contd...
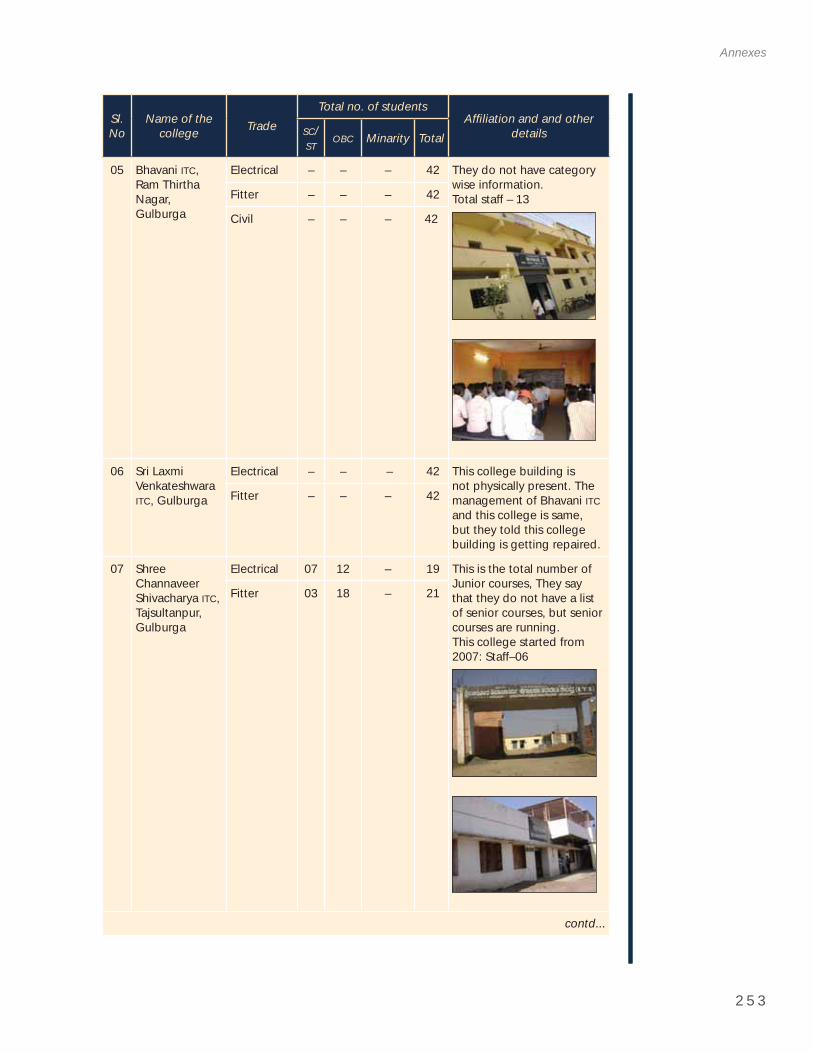
2 5 3
Annexes
Sl.No
Name of the college Trade
Total no. of studentsAffi liation and and other
detailsSC/ST
OBC Minarity Total
05 Bhavani ITC,Ram Thirtha Nagar, Gulburga
Electrical – – – 42 They do not have category wise information. Total staff – 13Fitter – – – 42
Civil – – – 42
06 Sri Laxmi Venkateshwara ITC, Gulburga
Electrical – – – 42 This college building is not physically present. The management of Bhavani ITCand this college is same, but they told this college building is getting repaired.
Fitter – – – 42
07 Shree ChannaveerShivacharya ITC,Tajsultanpur, Gulburga
Electrical 07 12 – 19 This is the total number of Junior courses, They say that they do not have a list of senior courses, but senior courses are running. This college started from 2007: Staff–06
Fitter 03 18 – 21
contd...
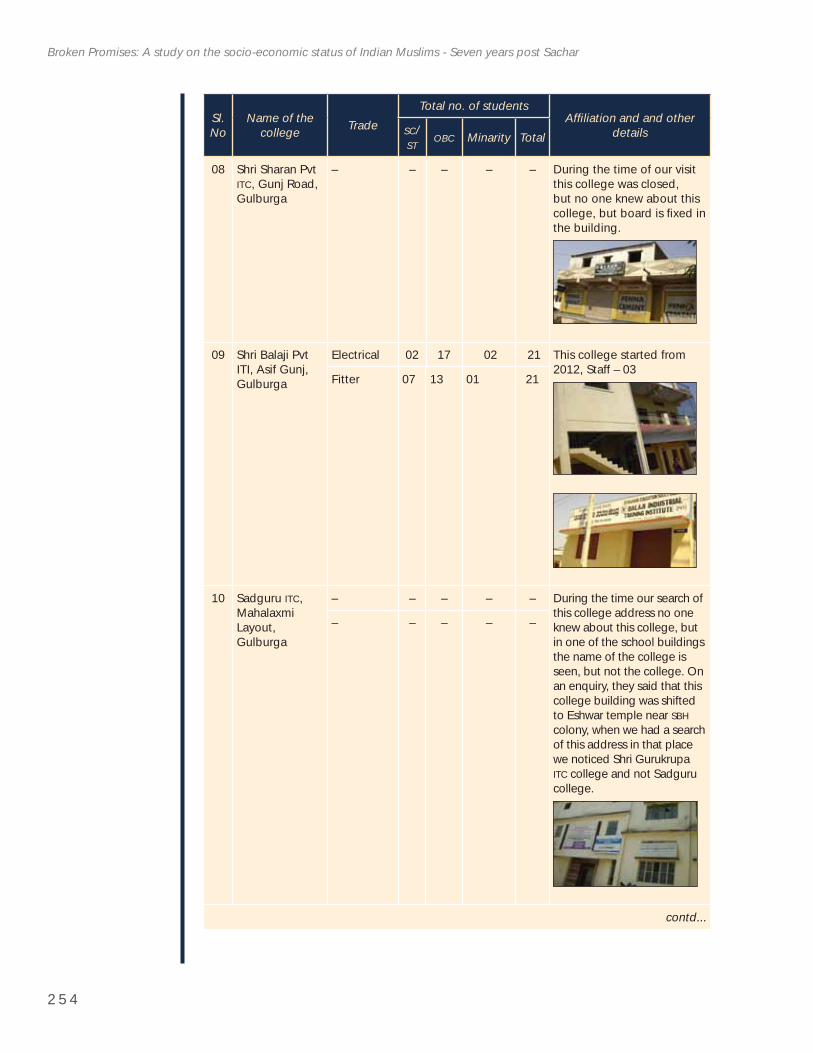
2 5 4
Broken Promises: A study on the socio-economic status of Indian Muslims - Seven years post Sachar
Sl.No
Name of the college Trade
Total no. of studentsAffi liation and and other
detailsSC/ST
OBC Minarity Total
08 Shri Sharan Pvt ITC, Gunj Road, Gulburga
– – – – – During the time of our visit this college was closed, but no one knew about this college, but board is fi xed in the building.
09 Shri Balaji Pvt ITI, Asif Gunj, Gulburga
Electrical 02 17 02 21 This college started from 2012, Staff – 03
Fitter 07 13 01 21
10 Sadguru ITC,MahalaxmiLayout,Gulburga
– – – – – During the time our search of this college address no one knew about this college, but in one of the school buildings the name of the college is seen, but not the college. On an enquiry, they said that this college building was shifted to Eshwar temple near SBHcolony, when we had a search of this address in that place we noticed Shri Gurukrupa ITC college and not Sadguru college.
– – – – –
contd...
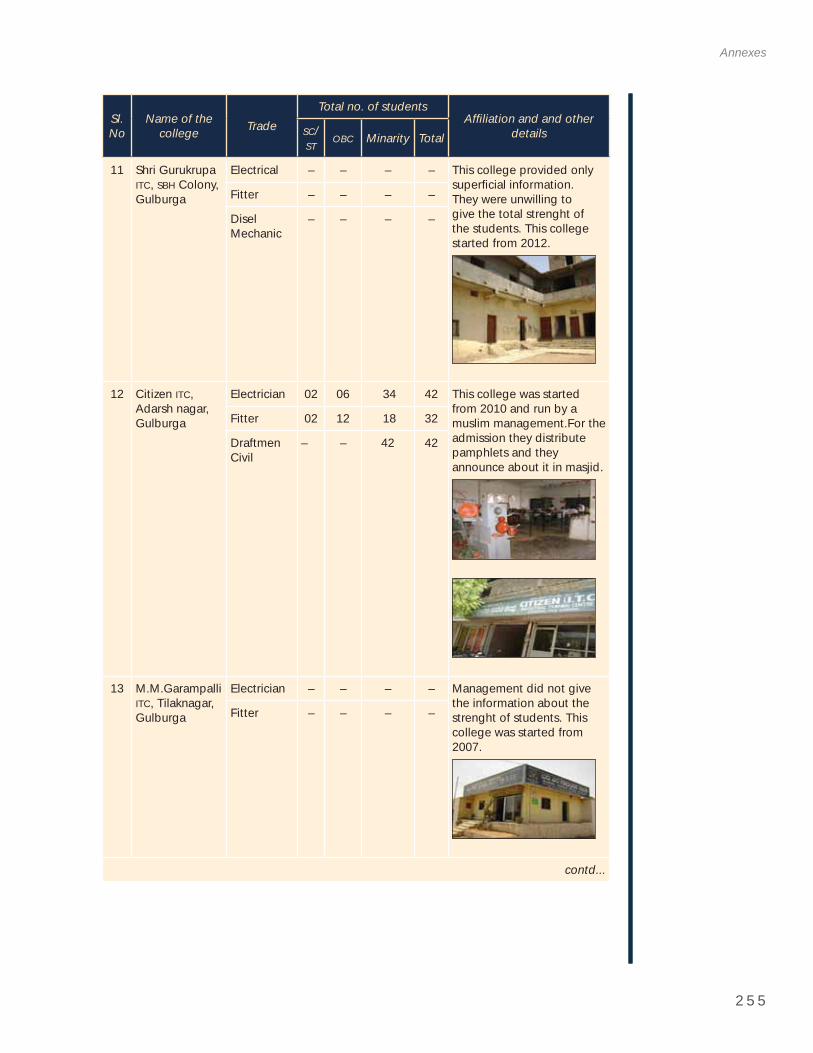
2 5 5
Annexes
Sl.No
Name of the college Trade
Total no. of studentsAffi liation and and other
detailsSC/ST
OBC Minarity Total
11 Shri Gurukrupa ITC, SBH Colony, Gulburga
Electrical – – – – This college provided only superfi cial information.They were unwilling to give the total strenght of the students. This college started from 2012.
Fitter – – – –
DiselMechanic
– – – –
12 Citizen ITC,Adarsh nagar, Gulburga
Electrician 02 06 34 42 This college was started from 2010 and run by a muslim management.For the admission they distribute pamphlets and they announce about it in masjid.
Fitter 02 12 18 32
DraftmenCivil
– – 42 42
13 M.M.Garampalli ITC, Tilaknagar, Gulburga
Electrician – – – – Management did not give the information about the strenght of students. This college was started from 2007.
Fitter – – – –
contd...
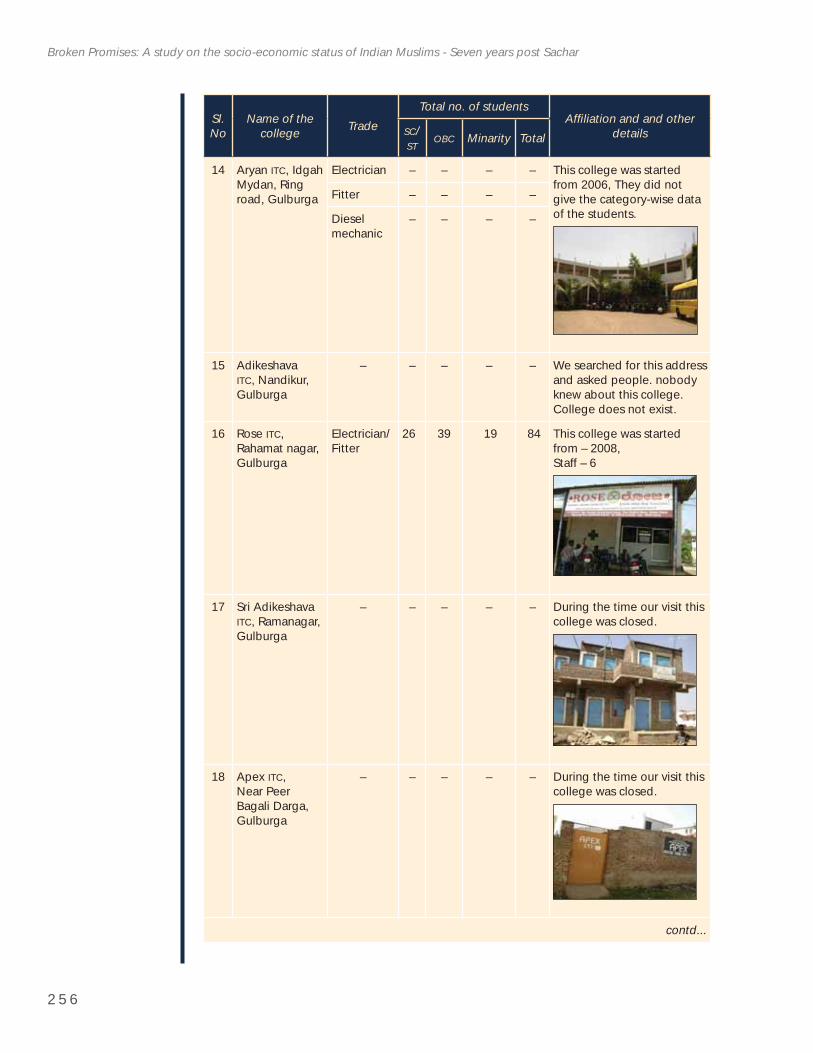
2 5 6
Broken Promises: A study on the socio-economic status of Indian Muslims - Seven years post Sachar
Sl.No
Name of the college Trade
Total no. of studentsAffi liation and and other
detailsSC/ST
OBC Minarity Total
14 Aryan ITC, Idgah Mydan, Ring road, Gulburga
Electrician – – – – This college was started from 2006, They did not give the category-wise data of the students.
Fitter – – – –
Dieselmechanic
– – – –
15 Adikeshava ITC, Nandikur, Gulburga
– – – – – We searched for this address and asked people. nobody knew about this college. College does not exist.
16 Rose ITC,Rahamat nagar, Gulburga
Electrician/Fitter
26 39 19 84 This college was started from – 2008, Staff – 6
17 Sri Adikeshava ITC, Ramanagar, Gulburga
– – – – – During the time our visit this college was closed.
18 Apex ITC,Near Peer Bagali Darga, Gulburga
– – – – – During the time our visit this college was closed.
contd...
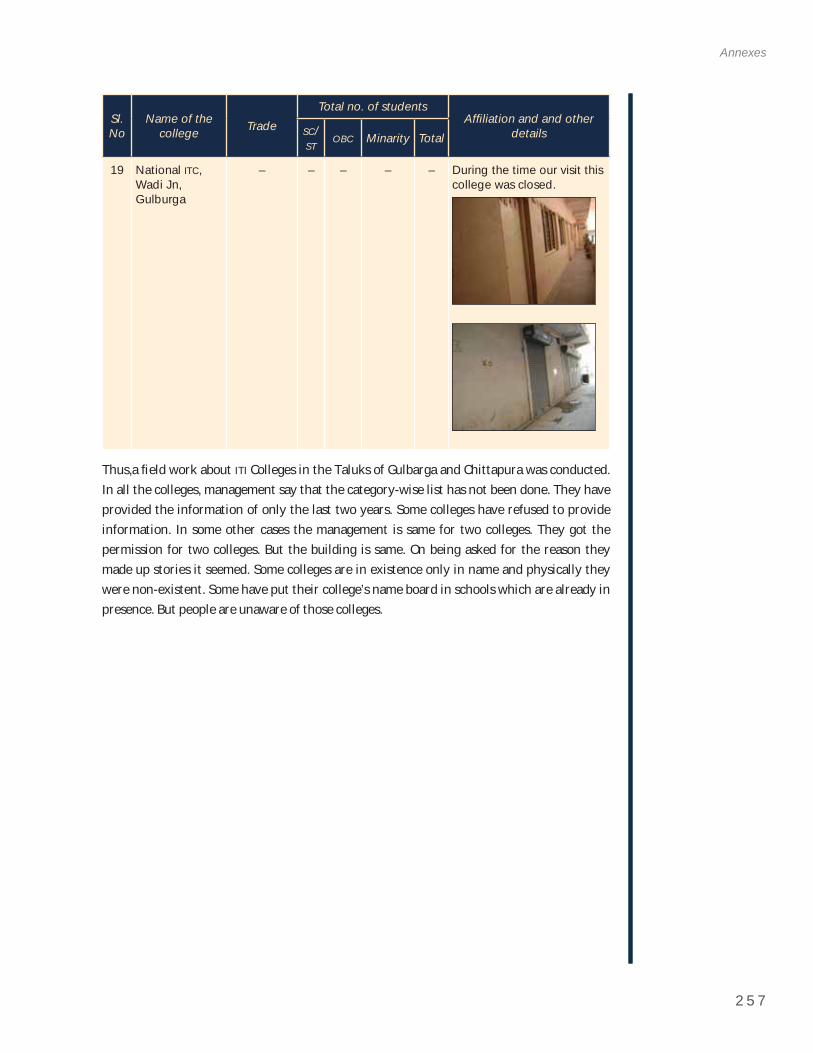
2 5 7
Annexes
Sl.No
Name of the college Trade
Total no. of studentsAffi liation and and other
detailsSC/ST
OBC Minarity Total
19 National ITC,Wadi Jn, Gulburga
– – – – – During the time our visit this college was closed.
Thus,a fi eld work about ITI Colleges in the Taluks of Gulbarga and Chittapura was conducted. In all the colleges, management say that the category-wise list has not been done. They have provided the information of only the last two years. Some colleges have refused to provide information. In some other cases the management is same for two colleges. They got the permission for two colleges. But the building is same. On being asked for the reason they made up stories it seemed. Some colleges are in existence only in name and physically they were non-existent. Some have put their college’s name board in schools which are already in presence. But people are unaware of those colleges.

2 5 9
Annex 12
List of Castes of People Met with for this Study
Rangrez/Neelgar1.
Banjara/Nat2.
Pathan3.
Ansari4.
Saifi /Lohar5.
Salmani/Nai6.
Sidiqui/Kalal7.
Syed8.
Qureshi/Chhote9.
Meo/Mewati10.
Manihar/Churiwale11.
Dhobi12.
Ghosi/Gujjar13.
Jat14.
Faquir/Shah15.
Teli/Mali16.
Abbasi/Bhisti17.
Carpenter/Barhai18.
Sheikh19.
Rajput20.
Mahagir/Machuara21.
Turk/Pasha22.
Mansoori/Dhunia23.
Mahar24.
Darji/Idrisi25.
Alvi26.
Tyagi27.
Pinarey28.
Rain29.
Pirsikar30.
Sindhi31.
Tamoli32.
Mirashi33.
Dewan/Chaudhari34.
Pinjari35.
Iraqui36.
Nadaf37.
Nagar38.
Mughal/Mirza39.
Murariyar40.
Qazi41.
Lebbe/Leppai42.
Silwari43.
Chaubdar44.
Chippa45.
Kunjra46.
Memon47.
Dodikula48.
Rayutar49.
Kayamkhani50.
Kharadi51.
Gatani52.
Ganchi53.
Lakhani54.
Arbi55.
Patel56.
Chiya57.
Rowther58.
Pathani59.
Parmar60.
Ribarchan61.
Meer62.
2 6 0
Broken Promises: A study on the socio-economic status of Indian Muslims - Seven years post Sachar
Multani63.
Beleem64.
Mochi/Chamar65.
Shershahbadi66.
Makandar67.
Jamadar68.
Paraiyar69.
Mushtiyar70.
Bohra71.
Vellal/Kamalar72.
Pakir73.
Kola74.
Venniar/Vaivakariyar75.
Inamdar76.
Wakle77.
Marrakayar78.
Thawhith79.
Nayan80.
Mohobiya81.
Tandiya82.
Niyarghah83.