Embed Size (px)
Citation preview
101
INTEGRATED REPORT& ANNUAL ACCOUNTS 2019-20
113TH YEAR
Building bridgesto the futureSINCE 1907
ABOUT THIS REPORT
Our Approach to ReportingThis is the fifth Integrated Report of Tata Steel Limited. Our Integrated Report provides quantitative and qualitative disclosures on our relationships with the stakeholders and how our leadership, culture and strategy are aligned to deliver value while managing risks and changes in the external environment. Our Report continues to evolve towards enhanced disclosures to meet the requirements of our investors and other stakeholders.
Reporting PrincipleThe financial and statutory data presented in this Report is in line with the requirements of the Companies Act, 2013 (including the rules made thereunder); Indian Accounting Standards; the Securities and Exchange Board of India (Listing Obligations and Disclosure Requirements) Regulations, 2015; and the Secretarial Standards. The Report is prepared in accordance with the Integrated Reporting <IR> framework of the International Integrated Reporting Council (IIRC) and discloses performance against the Key Performance Indicators (KPIs) relevant to Tata Steel, as per the Global Reporting Initiative (GRI), the Securities and Exchange Board of India (SEBI) and World Steel Association (worldsteel).
Reporting PeriodThe information is reported for the period April 1, 2019 to March 31, 2020. For KPIs, comparative figures for the last three to five years have been incorporated in the Report to provide a holistic view to our stakeholders.
Scope and BoundaryThe Report predominantly covers information on Tata Steel Limited, including the Tata Steel plants (at Jamshedpur, Jharkhand and Kalinganagar, Odisha), Raw Materials Division and Profit Centres. However, certain sections of the report include KPIs (financial and production) of our subsidiaries, Tata Steel BSL Limited and Tata Steel Long Products Limited.
Approach to MaterialityThe Report presents an overview of our business and associated activities that help in long-term value creation. Report content and presentation is based on issues material to Tata Steel and its stakeholders. Material issues are gathered from multiple channels and forums of engagement across the organisation and from external stakeholders. In FY 2018-19, Tata Steel updated its Environmental, Social and Governance (ESG) material issues and incorporated them in its long-term plans.
ABOUT TATA STEEL
Established in India as Asia’s first integrated private steel company in 1907, Tata Steel Limited (Tata Steel) is today one of the most profitable and low-cost producers of steel in the world, with captive iron ore mines and collieries located near our manufacturing facilities in Jamshedpur and Kalinganagar. Our comprehensive portfolio of products and brands caters to multiple industries and segments, making the steel we produce an integral part of our everyday lives.
Forward-looking StatementsCertain statements in the Report regarding our business operations may constitute forward-looking statements. These include all statements other than statements of historical facts, including those regarding the financial position, business strategy, management plans and objectives for future operations.
Forward-looking statements can be identified by words such as ‘believes’, ‘estimates’, ‘anticipates’, ‘expects’, ‘intends’, ‘may’, ‘will’, ‘plans’, ‘outlook’ and other words of similar meaning in connection with a discussion of future operational or financial performance.
Forward-looking statements are necessarily dependent on assumptions, data or methods that may be incorrect or imprecise and that may be incapable of being realised, and as such, are not intended to be a guarantee of future results, but constitute our current expectations based on reasonable assumptions. Actual results could differ materially from those projected in any forward-looking statements due to various events, risks, uncertainties and other factors. We neither assume any obligation nor intend to update or revise any forward-looking statements, whether as a result of new information, future events or otherwise.
Management ResponsibilityTo optimise governance oversight, risk management and controls, the contents of this Report have been reviewed by the senior executives of the Company, including the Chief Executive Officer and Managing Director; Executive Director and Chief Financial Officer; Vice President Safety, Health and Sustainability; and the Company Secretary and Chief Legal Officer (Corporate and Compliance).
Independent AssuranceAssurance on financial statements has been provided by independent auditors Price Waterhouse & Co. Chartered Accountants LLP and on non-financial statements by KPMG. The certificate issued by KPMG is available on our website at www.tatasteel.com or can be accessed at https://bit.ly/IRAC20192020
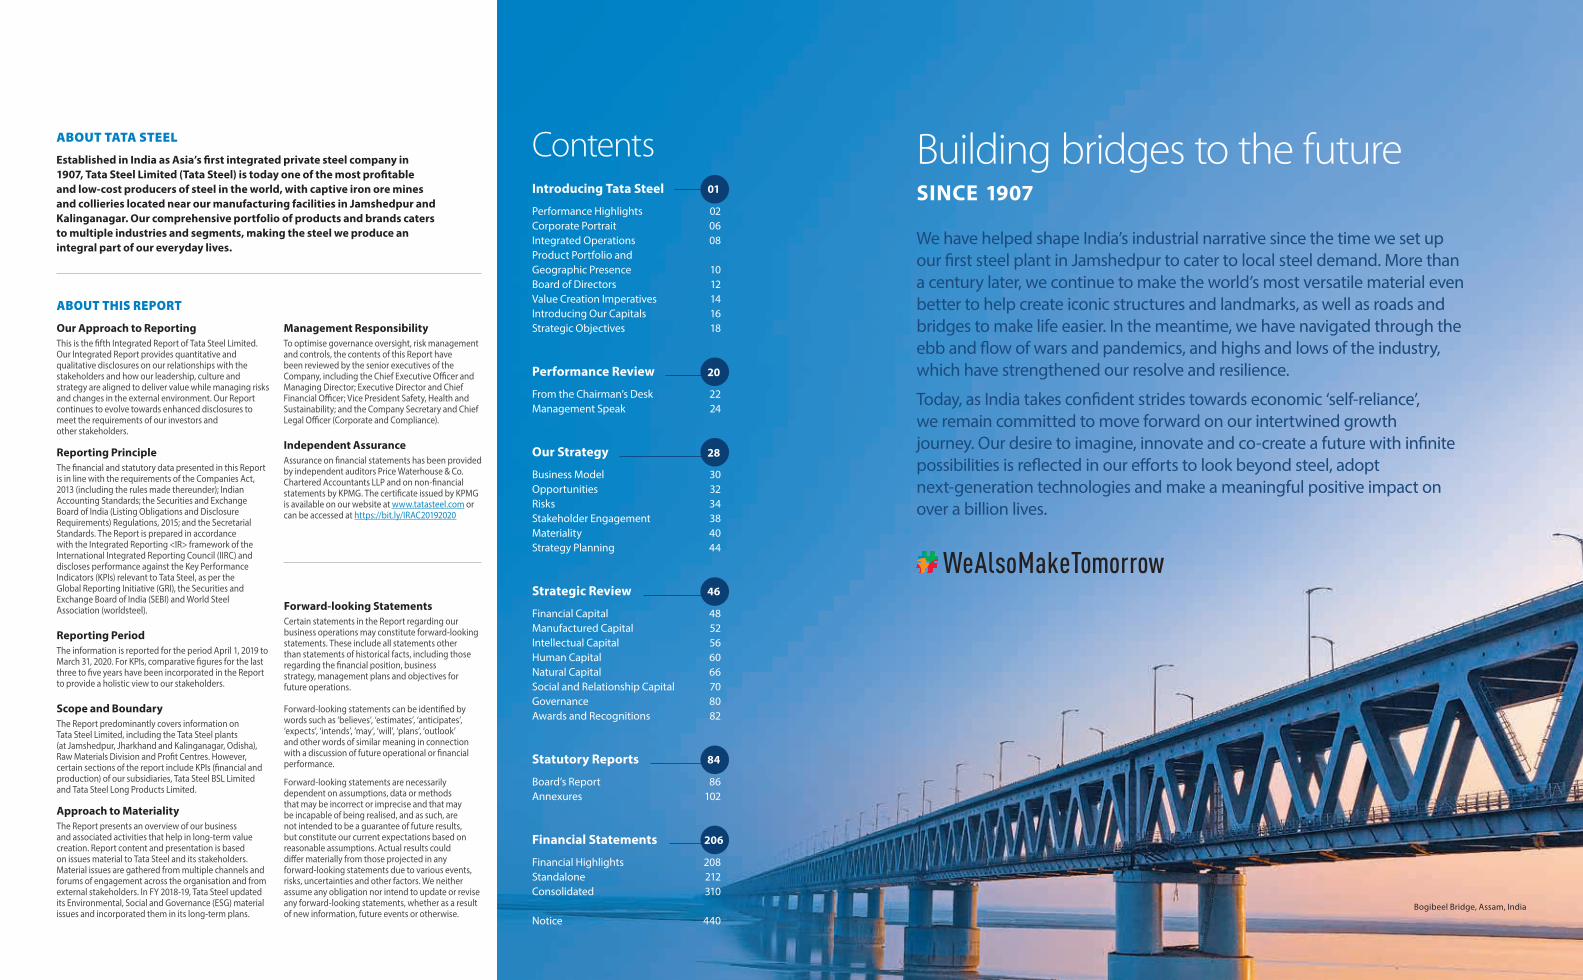
Building bridges to the future SINCE 1907
We have helped shape India’s industrial narrative since the time we set up our first steel plant in Jamshedpur to cater to local steel demand. More than a century later, we continue to make the world’s most versatile material even better to help create iconic structures and landmarks, as well as roads and bridges to make life easier. In the meantime, we have navigated through the ebb and flow of wars and pandemics, and highs and lows of the industry, which have strengthened our resolve and resilience.
Today, as India takes confident strides towards economic ‘self-reliance’, we remain committed to move forward on our intertwined growth journey. Our desire to imagine, innovate and co-create a future with infinite possibilities is reflected in our efforts to look beyond steel, adopt next-generation technologies and make a meaningful positive impact on over a billion lives.
ContentsIntroducing Tata Steel
Performance Highlights 02Corporate Portrait 06Integrated Operations 08Product Portfolio and Geographic Presence 10Board of Directors 12Value Creation Imperatives 14Introducing Our Capitals 16Strategic Objectives 18
01
Performance Review
From the Chairman’s Desk 22Management Speak 24
20
Our Strategy
Business Model 30Opportunities 32Risks 34Stakeholder Engagement 38Materiality 40Strategy Planning 44
28
Strategic Review
Financial Capital 48Manufactured Capital 52 Intellectual Capital 56Human Capital 60Natural Capital 66Social and Relationship Capital 70 Governance 80 Awards and Recognitions 82
46
Statutory Reports
Board’s Report 86Annexures 102
84
Financial Statements
Financial Highlights 208Standalone 212Consolidated 310
Notice 440
206
Bogibeel Bridge, Assam, India
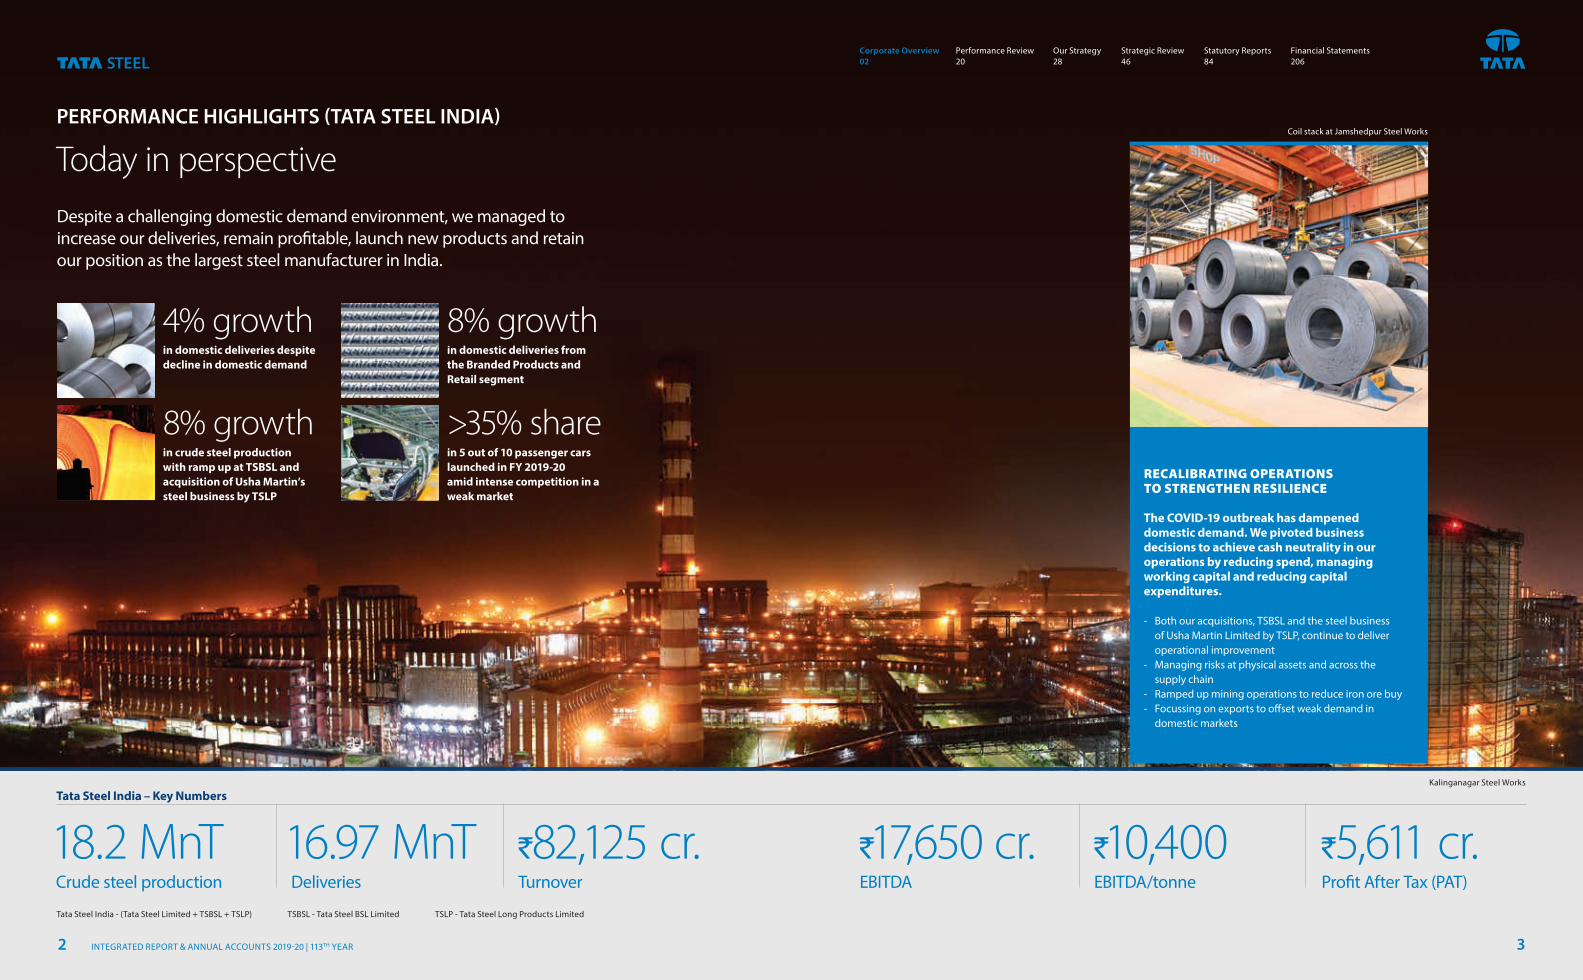
PERFORMANCE HIGHLIGHTS (TATA STEEL INDIA)
Today in perspective
Despite a challenging domestic demand environment, we managed to increase our deliveries, remain profitable, launch new products and retain our position as the largest steel manufacturer in India.
Tata Steel India – Key Numbers
4% growth
in domestic deliveries despite decline in domestic demand
8% growth in domestic deliveries from the Branded Products and Retail segment
8% growthin crude steel production with ramp up at TSBSL and acquisition of Usha Martin’s steel business by TSLP
>35% share in 5 out of 10 passenger cars launched in FY 2019-20 amid intense competition in a weak market
`82,125 cr.Turnover
1̀0,400EBITDA/tonne
1̀7,650 cr.EBITDA
18.2 MnT Crude steel production
`5,611 cr.Profit After Tax (PAT)
16.97 MnT Deliveries
RECALIBRATING OPERATIONS TO STRENGTHEN RESILIENCE
The COVID-19 outbreak has dampened domestic demand. We pivoted business decisions to achieve cash neutrality in our operations by reducing spend, managing working capital and reducing capital expenditures. ‐ Both our acquisitions, TSBSL and the steel business
of Usha Martin Limited by TSLP, continue to deliver operational improvement
‐ Managing risks at physical assets and across the supply chain
‐ Ramped up mining operations to reduce iron ore buy ‐ Focussing on exports to offset weak demand in
domestic markets
Coil stack at Jamshedpur Steel Works
Kalinganagar Steel Works
Tata Steel India - (Tata Steel Limited + TSBSL + TSLP) TSBSL - Tata Steel BSL Limited TSLP - Tata Steel Long Products Limited
INTEGRATED REPORT & ANNUAL ACCOUNTS 2019-20 | 113TH YEAR2 3
Corporate Overview 02
Strategic Review 46
Performance Review 20
Statutory Reports 84
Our Strategy 28
Financial Statements 206
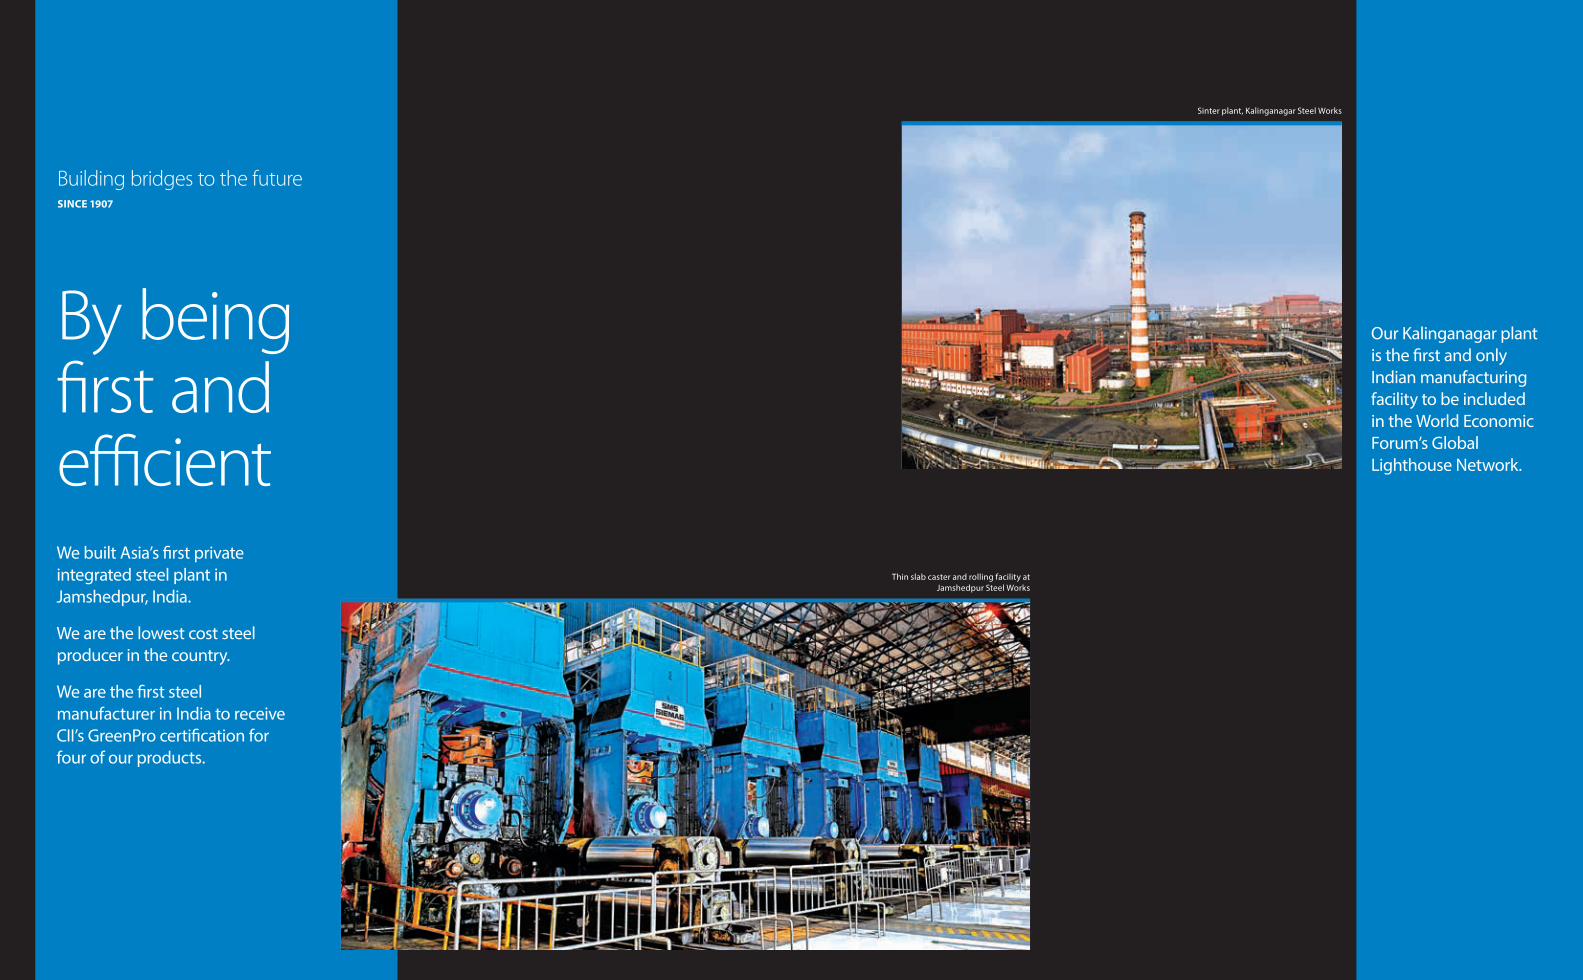
Our Kalinganagar plant is the first and only Indian manufacturing facility to be included in the World Economic Forum’s Global Lighthouse Network.
Thin slab caster and rolling facility at Jamshedpur Steel Works
By being first and efficient We built Asia’s first private integrated steel plant in Jamshedpur, India.
We are the lowest cost steel producer in the country.
We are the first steel manufacturer in India to receive CII’s GreenPro certification for four of our products.
Sinter plant, Kalinganagar Steel Works
Building bridges to the future SINCE 1907
CORPORATE PORTRAIT
Building a sustainable enterprise
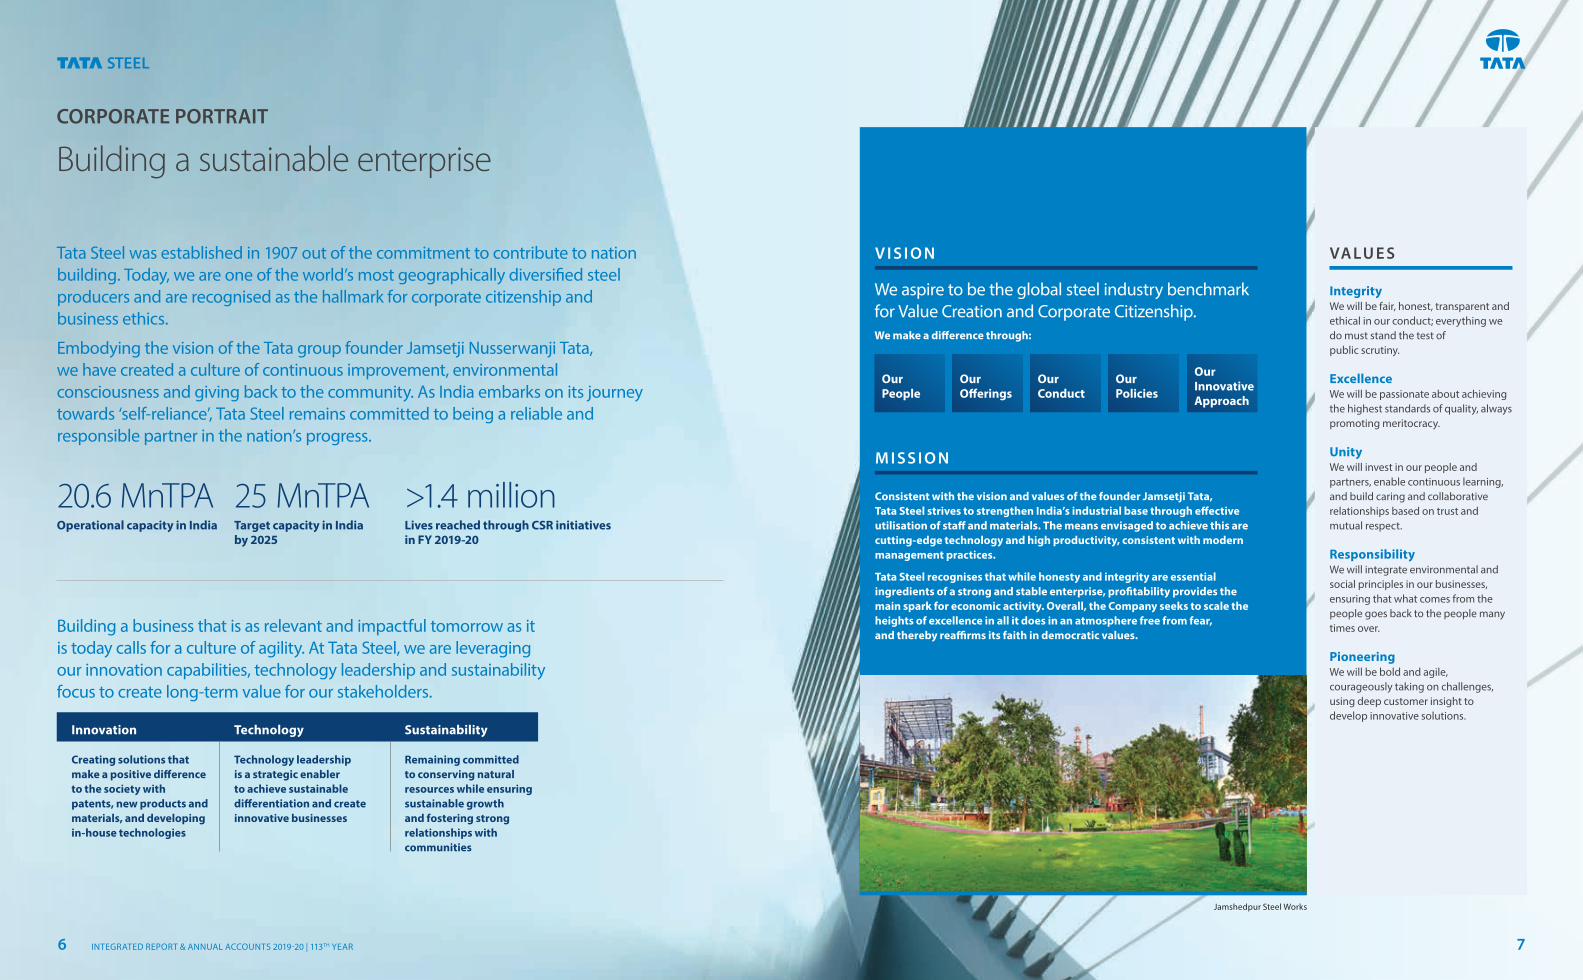
Tata Steel was established in 1907 out of the commitment to contribute to nation building. Today, we are one of the world’s most geographically diversified steel producers and are recognised as the hallmark for corporate citizenship and business ethics.
Embodying the vision of the Tata group founder Jamsetji Nusserwanji Tata, we have created a culture of continuous improvement, environmental consciousness and giving back to the community. As India embarks on its journey towards ‘self-reliance’, Tata Steel remains committed to being a reliable and responsible partner in the nation’s progress.
IntegrityWe will be fair, honest, transparent and ethical in our conduct; everything we do must stand the test of public scrutiny.
ExcellenceWe will be passionate about achieving the highest standards of quality, always promoting meritocracy.
UnityWe will invest in our people and partners, enable continuous learning, and build caring and collaborative relationships based on trust and mutual respect.
ResponsibilityWe will integrate environmental and social principles in our businesses, ensuring that what comes from the people goes back to the people many times over.
PioneeringWe will be bold and agile, courageously taking on challenges, using deep customer insight to develop innovative solutions.
Building a business that is as relevant and impactful tomorrow as it is today calls for a culture of agility. At Tata Steel, we are leveraging our innovation capabilities, technology leadership and sustainability focus to create long-term value for our stakeholders.
Creating solutions that make a positive difference to the society with patents, new products and materials, and developing in-house technologies
Technology leadership is a strategic enabler to achieve sustainable differentiation and create innovative businesses
Remaining committed to conserving natural resources while ensuring sustainable growth and fostering strong relationships with communities
We aspire to be the global steel industry benchmark for Value Creation and Corporate Citizenship.We make a difference through:
OurPeople
OurOfferings
OurConduct
OurPolicies
OurInnovative Approach
Consistent with the vision and values of the founder Jamsetji Tata, Tata Steel strives to strengthen India’s industrial base through effective utilisation of staff and materials. The means envisaged to achieve this are cutting-edge technology and high productivity, consistent with modern management practices.
Tata Steel recognises that while honesty and integrity are essential ingredients of a strong and stable enterprise, profitability provides the main spark for economic activity. Overall, the Company seeks to scale the heights of excellence in all it does in an atmosphere free from fear, and thereby reaffirms its faith in democratic values.
M I SS I O N
V I S I O N VA LU E S
Jamshedpur Steel Works
Innovation Technology Sustainability
20.6 MnTPAOperational capacity in India
25 MnTPATarget capacity in India by 2025
>1.4 millionLives reached through CSR initiatives in FY 2019-20
INTEGRATED REPORT & ANNUAL ACCOUNTS 2019-20 | 113TH YEAR6 7
INTEGRATED OPERATIONS
Designed to deliver operational excellence
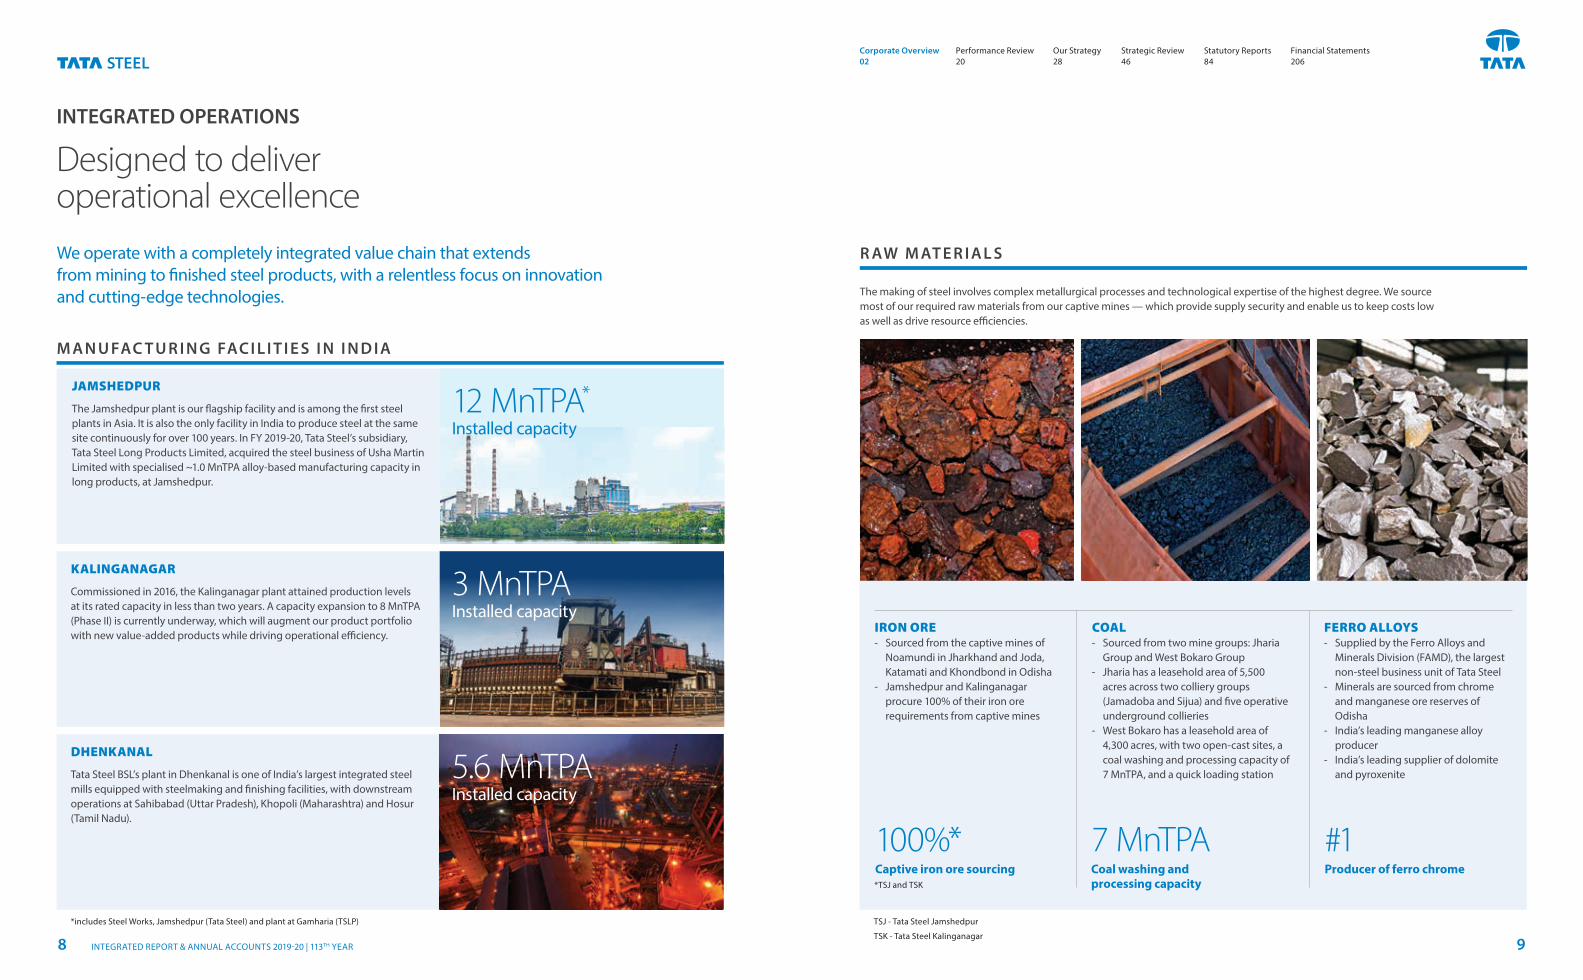
We operate with a completely integrated value chain that extends from mining to finished steel products, with a relentless focus on innovation and cutting-edge technologies.
M A N U FAC T U R I N G FAC I L I T I E S I N I N D I A
R AW M AT E R I A L S
JAMSHEDPUR
The Jamshedpur plant is our flagship facility and is among the first steel plants in Asia. It is also the only facility in India to produce steel at the same site continuously for over 100 years. In FY 2019-20, Tata Steel’s subsidiary, Tata Steel Long Products Limited, acquired the steel business of Usha Martin Limited with specialised ~1.0 MnTPA alloy-based manufacturing capacity in long products, at Jamshedpur.
The making of steel involves complex metallurgical processes and technological expertise of the highest degree. We source most of our required raw materials from our captive mines — which provide supply security and enable us to keep costs low as well as drive resource efficiencies.
KALINGANAGAR
Commissioned in 2016, the Kalinganagar plant attained production levels at its rated capacity in less than two years. A capacity expansion to 8 MnTPA (Phase II) is currently underway, which will augment our product portfolio with new value-added products while driving operational efficiency.
DHENKANAL
Tata Steel BSL’s plant in Dhenkanal is one of India’s largest integrated steel mills equipped with steelmaking and finishing facilities, with downstream operations at Sahibabad (Uttar Pradesh), Khopoli (Maharashtra) and Hosur (Tamil Nadu).
IRON ORE ‐ Sourced from the captive mines of
Noamundi in Jharkhand and Joda, Katamati and Khondbond in Odisha
‐ Jamshedpur and Kalinganagar procure 100% of their iron ore requirements from captive mines
FERRO ALLOYS ‐ Supplied by the Ferro Alloys and
Minerals Division (FAMD), the largest non-steel business unit of Tata Steel
‐ Minerals are sourced from chrome and manganese ore reserves of Odisha
‐ India’s leading manganese alloy producer
‐ India’s leading supplier of dolomite and pyroxenite
12 MnTPA*
Installed capacity
5.6 MnTPAInstalled capacity
#1Producer of ferro chrome
100%*Captive iron ore sourcing*TSJ and TSK
COAL ‐ Sourced from two mine groups: Jharia
Group and West Bokaro Group ‐ Jharia has a leasehold area of 5,500
acres across two colliery groups (Jamadoba and Sijua) and five operative underground collieries
‐ West Bokaro has a leasehold area of 4,300 acres, with two open-cast sites, a coal washing and processing capacity of 7 MnTPA, and a quick loading station
7 MnTPACoal washing and processing capacity
3 MnTPAInstalled capacity
*includes Steel Works, Jamshedpur (Tata Steel) and plant at Gamharia (TSLP) TSJ - Tata Steel Jamshedpur
TSK - Tata Steel Kalinganagar
Corporate Overview 02
Strategic Review 46
Performance Review 20
Statutory Reports 84
Our Strategy 28
Financial Statements 206
INTEGRATED REPORT & ANNUAL ACCOUNTS 2019-20 | 113TH YEAR8 9
I N D U S T R I A L A N D G E N E R A L E N G I N E E R I N G
Diversified offerings across market segments
AU TO M O T I V E AG R I C U LT U R E
CO N S T R U C T I O N
Auto OEMs*(B2B)
Agri Equipment (B2B)
Panel and Appliances, Fabrication and Capital Goods, Furnitures(B2ECA)
LPG (B2B)
Welding (B2B)
Transmission Power and Distribution (B2B)
Process Industries (Cement, Power) (B2B)
Individual House Builders (B2C)
Corporate and Government Bodies (B2B) (B2G)
Infrastructure (B2B)
Housing and Commercial(B2ECA)
Auto Ancillaries (B2B) (B2ECA)
Fencing, Farming and Irrigation (B2C)
Hot-rolled (HR), Cold-rolled (CR), Coated Coils and Sheets
Bearings
Tata Steelium (CR), Galvano (Coated), Tata Astrum (HR), Tata Structura (tubes), Tata Astrum Super (for fabrication)
Hot-rolled (HR)
Wire rods
Tata Astrum Super (for fabrication)
Tata Tiscrome (ferro chrome), Tata Ferromag (ferro manganese), boiler tubes, Tata Pipes, Tata Ferroshots, Blast Furnace (BF) slag, Metallics
Tata Tiscon (rebars), Tata Pravesh (steel doors and windows), Tata Shaktee (roofing sheets), Tata Pipes (plumbing pipes), Tata Structura (tubes)
Notes: B2B – Business to Business; B2C – Business to Consumer; B2G – Business to Government; B2ECA – Business to Emerging Corporate Account
*OEM – Original Equipment Manufacturer **LRPC – Low-relaxation Pre-stressed Concrete
Habinest (prefabricated houses), AquaNest Water Kiosks, Ezynest Modular Toilets, MobiNest (office cabins), Nestudio (rooftop houses), CanvaNest (EV charging station), Smart Easy Nest (for smart cities)
TMT rebars (higher dia rebars and corrosion-resistant steel)
Tiscon readybuild (cut and bend bars), Tata Structura (tubes), PC Strands (LRPC)**, Tata Nirman, Tata Aggreto, Ground Granulated Blast Furnace Slag (GGBS), WAMA – GC for walling
HR, CR, Coated Steel Coils and Sheets, Precision Tubes, Tyre Bead Wires, Spring Wires, Bearings
Galvanised Iron (GI), Wires, agricultural and garden tools, conveyance tubes
Market Sub-segments Market Sub-segments
Market Sub-segmentsMarket Sub-segments
Products and Brands Products and Brands
Products and BrandsProducts and Brands
PRODUCT PORTFOLIO AND GEOGRAPHIC PRESENCE
OUR FOOTPRINT (TATA STEEL LIMITED)
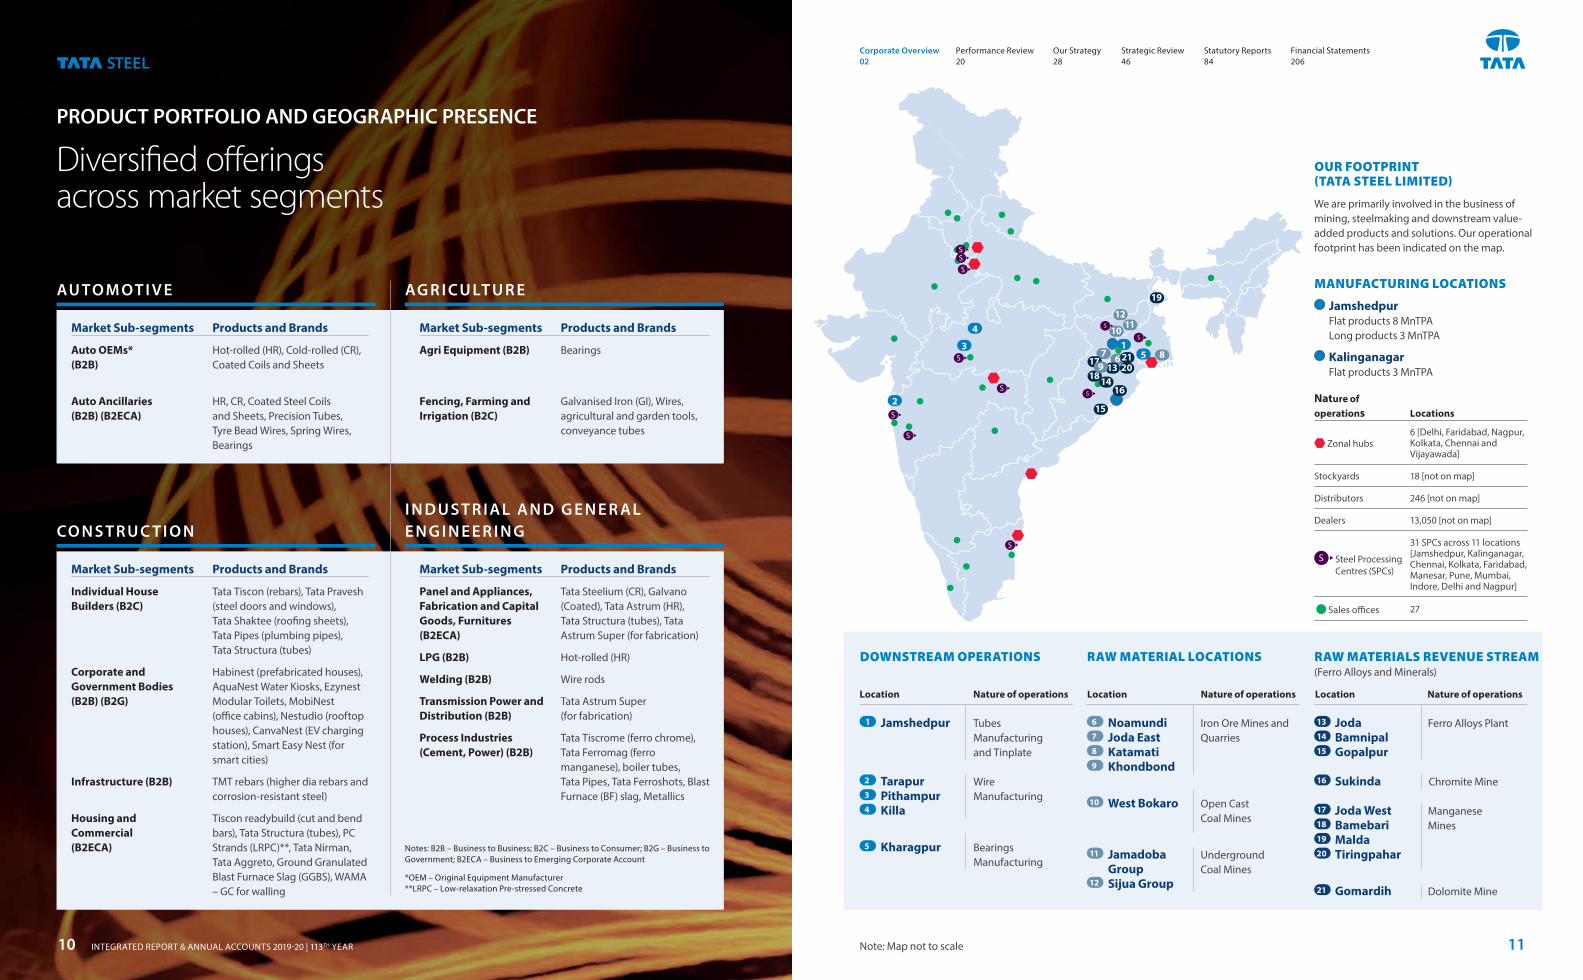
We are primarily involved in the business of mining, steelmaking and downstream value-added products and solutions. Our operational footprint has been indicated on the map.
RAW MATERIALS REVENUE STREAM(Ferro Alloys and Minerals)
Ferro Alloys Plant
Chromite Mine
Manganese Mines
Dolomite Mine
Joda BamnipalGopalpur
Sukinda
Joda WestBamebariMaldaTiringpahar
Gomardih
RAW MATERIAL LOCATIONS
Location LocationNature of operations Nature of operations
West Bokaro
Jamadoba GroupSijua Group
Iron Ore Mines and Quarries
Open Cast Coal Mines
Underground Coal Mines
Location Nature of operations
1
2
3
4
5
6 13
8 15
7 14
9
16
17
18
19
20
21
10
11
12
Jamshedpur
Kharagpur
Wire Manufacturing
Tubes Manufacturing and Tinplate
Bearings Manufacturing
TarapurPithampurKilla
NoamundiJoda EastKatamatiKhondbond
DOWNSTREAM OPERATIONS
Nature of operations Locations
Zonal hubs6 [Delhi, Faridabad, Nagpur, Kolkata, Chennai and Vijayawada]
Stockyards 18 [not on map]
Distributors 246 [not on map]
Dealers 13,050 [not on map]
S Steel Processing Centres (SPCs)
31 SPCs across 11 locations [Jamshedpur, Kalinganagar, Chennai, Kolkata, Faridabad, Manesar, Pune, Mumbai, Indore, Delhi and Nagpur]
Sales offices 27
MANUFACTURING LOCATIONS
JamshedpurFlat products 8 MnTPA Long products 3 MnTPA
Kalinganagar Flat products 3 MnTPA
Note: Map not to scale
S
S
S
S
S
S
SS
S
15
2
67
1011
12
3
4
13 202117
19
18
15
98
14
SS
16
Corporate Overview 02
Strategic Review 46
Performance Review 20
Statutory Reports 84
Our Strategy 28
Financial Statements 206
11INTEGRATED REPORT & ANNUAL ACCOUNTS 2019-20 | 113TH YEAR10
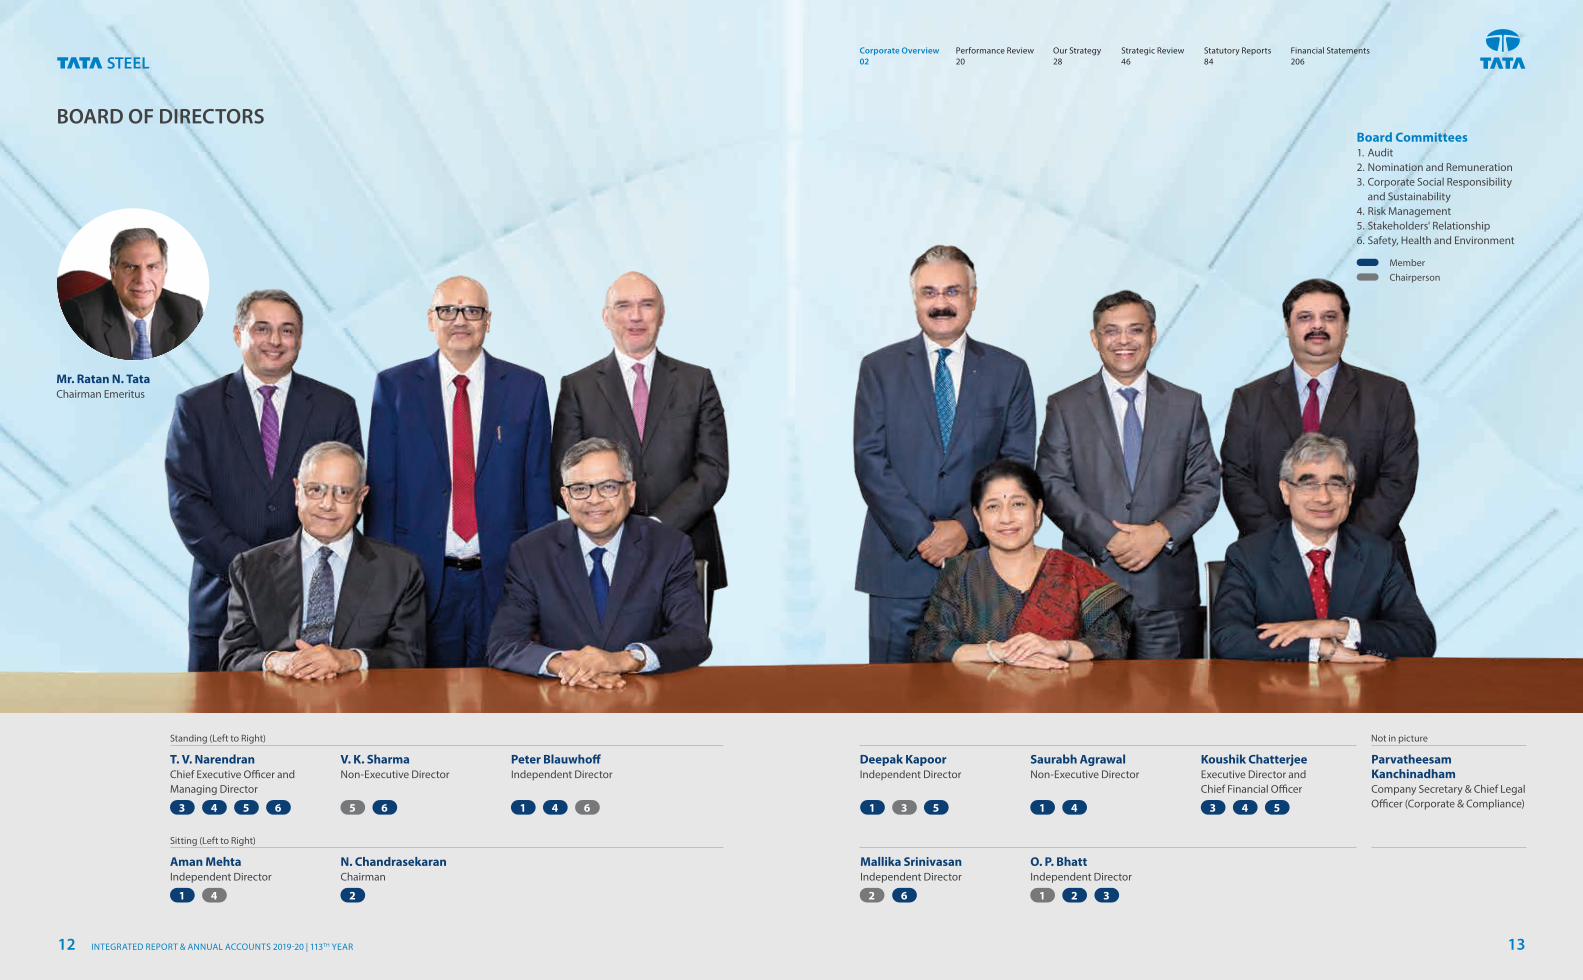
BOARD OF DIRECTORS
Mr. Ratan N. Tata Chairman Emeritus
N. Chandrasekaran Chairman
Standing (Left to Right) Not in picture
Sitting (Left to Right)
T. V. NarendranChief Executive Officer and Managing Director
V. K. SharmaNon-Executive Director
Aman MehtaIndependent Director
Peter BlauwhoffIndependent Director
MemberChairperson
Board Committees1. Audit2. Nomination and Remuneration3. Corporate Social Responsibility
and Sustainability4. Risk Management5. Stakeholders' Relationship6. Safety, Health and Environment
Parvatheesam KanchinadhamCompany Secretary & Chief Legal Officer (Corporate & Compliance)
Deepak KapoorIndependent Director
Saurabh AgrawalNon-Executive Director
Koushik ChatterjeeExecutive Director and Chief Financial Officer
O. P. BhattIndependent Director
Mallika SrinivasanIndependent Director
1
155 6 6 5 51
2 26 3
3 31
1
6
4
44 4 4
2
3
Corporate Overview 02
Strategic Review 46
Performance Review 20
Statutory Reports 84
Our Strategy 28
Financial Statements 206
INTEGRATED REPORT & ANNUAL ACCOUNTS 2019-20 | 113TH YEAR12 13
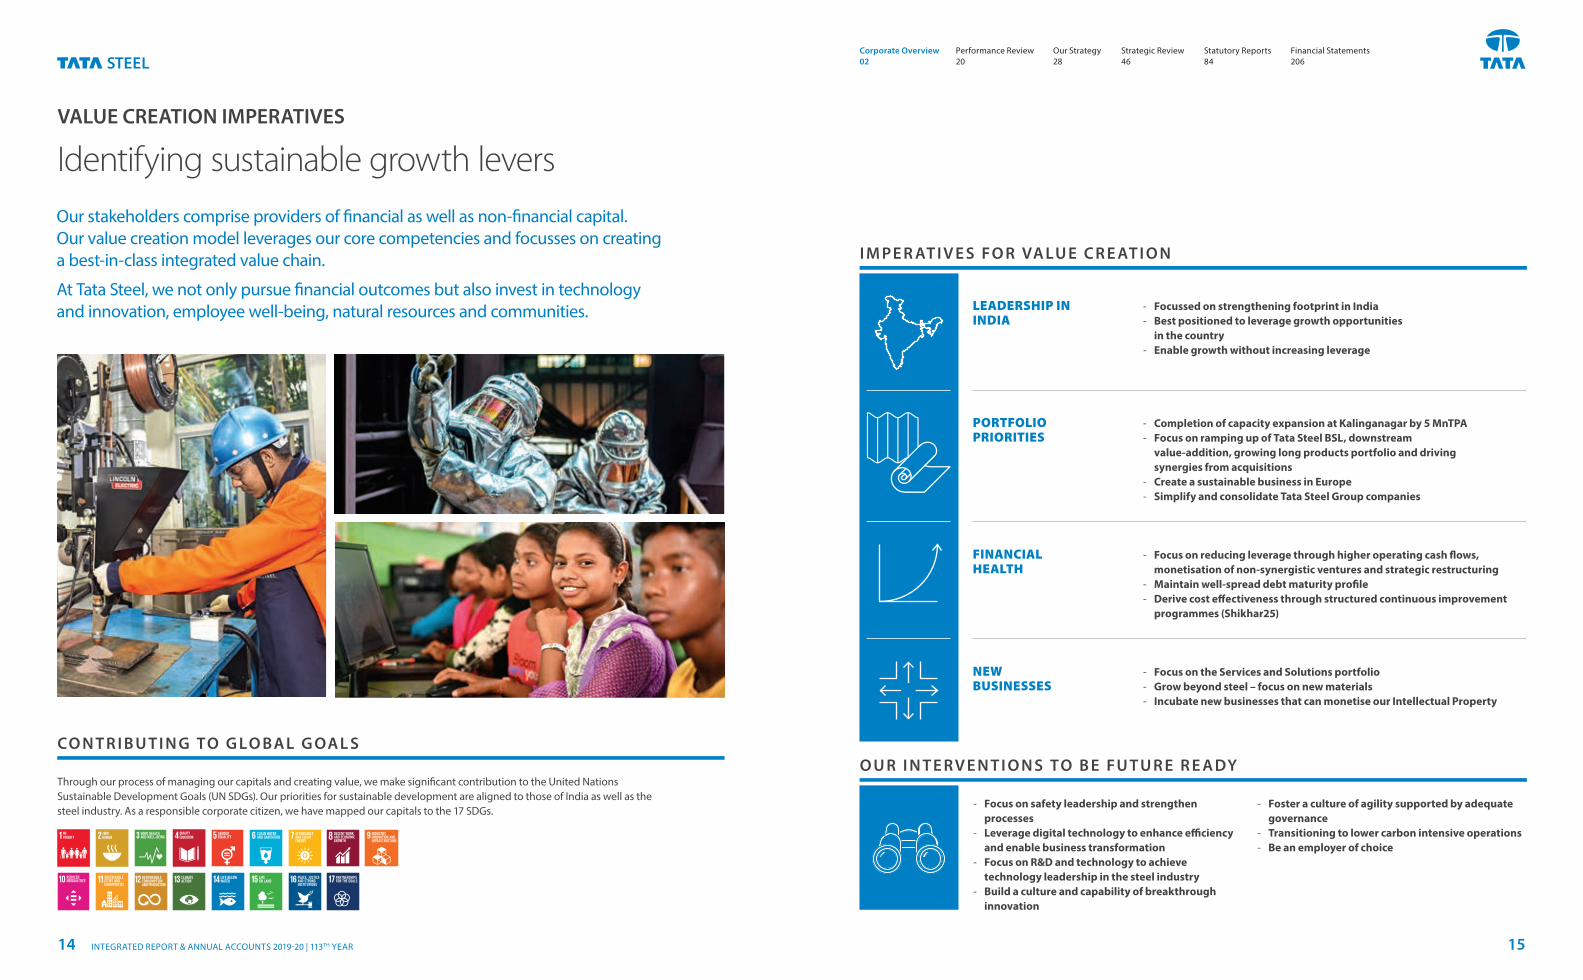
Our stakeholders comprise providers of financial as well as non-financial capital. Our value creation model leverages our core competencies and focusses on creating a best-in-class integrated value chain.
At Tata Steel, we not only pursue financial outcomes but also invest in technology and innovation, employee well-being, natural resources and communities.
Through our process of managing our capitals and creating value, we make significant contribution to the United Nations Sustainable Development Goals (UN SDGs). Our priorities for sustainable development are aligned to those of India as well as the steel industry. As a responsible corporate citizen, we have mapped our capitals to the 17 SDGs.
‐ Focussed on strengthening footprint in India ‐ Best positioned to leverage growth opportunities
in the country ‐ Enable growth without increasing leverage
‐ Completion of capacity expansion at Kalinganagar by 5 MnTPA ‐ Focus on ramping up of Tata Steel BSL, downstream
value-addition, growing long products portfolio and driving synergies from acquisitions
‐ Create a sustainable business in Europe ‐ Simplify and consolidate Tata Steel Group companies
‐ Focus on safety leadership and strengthen processes
‐ Leverage digital technology to enhance efficiency and enable business transformation
‐ Focus on R&D and technology to achieve technology leadership in the steel industry
‐ Build a culture and capability of breakthrough innovation
VALUE CREATION IMPERATIVES
Identifying sustainable growth levers
CO N T R I B U T I N G TO G LO BA L G OA L S
I M PE R AT I V E S FO R VA LU E C R E AT I O N
O U R I N T E R V E N T I O N S TO B E FU T U R E R E A DY
LEADERSHIP IN INDIA
PORTFOLIO PRIORITIES
‐ Focus on the Services and Solutions portfolio ‐ Grow beyond steel – focus on new materials ‐ Incubate new businesses that can monetise our Intellectual Property
NEW BUSINESSES
‐ Focus on reducing leverage through higher operating cash flows, monetisation of non-synergistic ventures and strategic restructuring
‐ Maintain well-spread debt maturity profile ‐ Derive cost effectiveness through structured continuous improvement
programmes (Shikhar25)
FINANCIAL HEALTH
‐ Foster a culture of agility supported by adequate governance
‐ Transitioning to lower carbon intensive operations ‐ Be an employer of choice
Corporate Overview 02
Strategic Review 46
Performance Review 20
Statutory Reports 84
Our Strategy 28
Financial Statements 206
INTEGRATED REPORT & ANNUAL ACCOUNTS 2019-20 | 113TH YEAR14 15
H U M A NC A PI TA L
M A N U FAC T U R E DC A PI TA L
FI N A N C I A L C A PI TA L
N AT U R A LC A PI TA L
I N T E L L E C T UA LC A PI TA L
S O C I A L A N D R E L AT I O N S H I P C A PI TA L
PG 48 PG 52 PG 56 PG 60 PG 66 PG 70
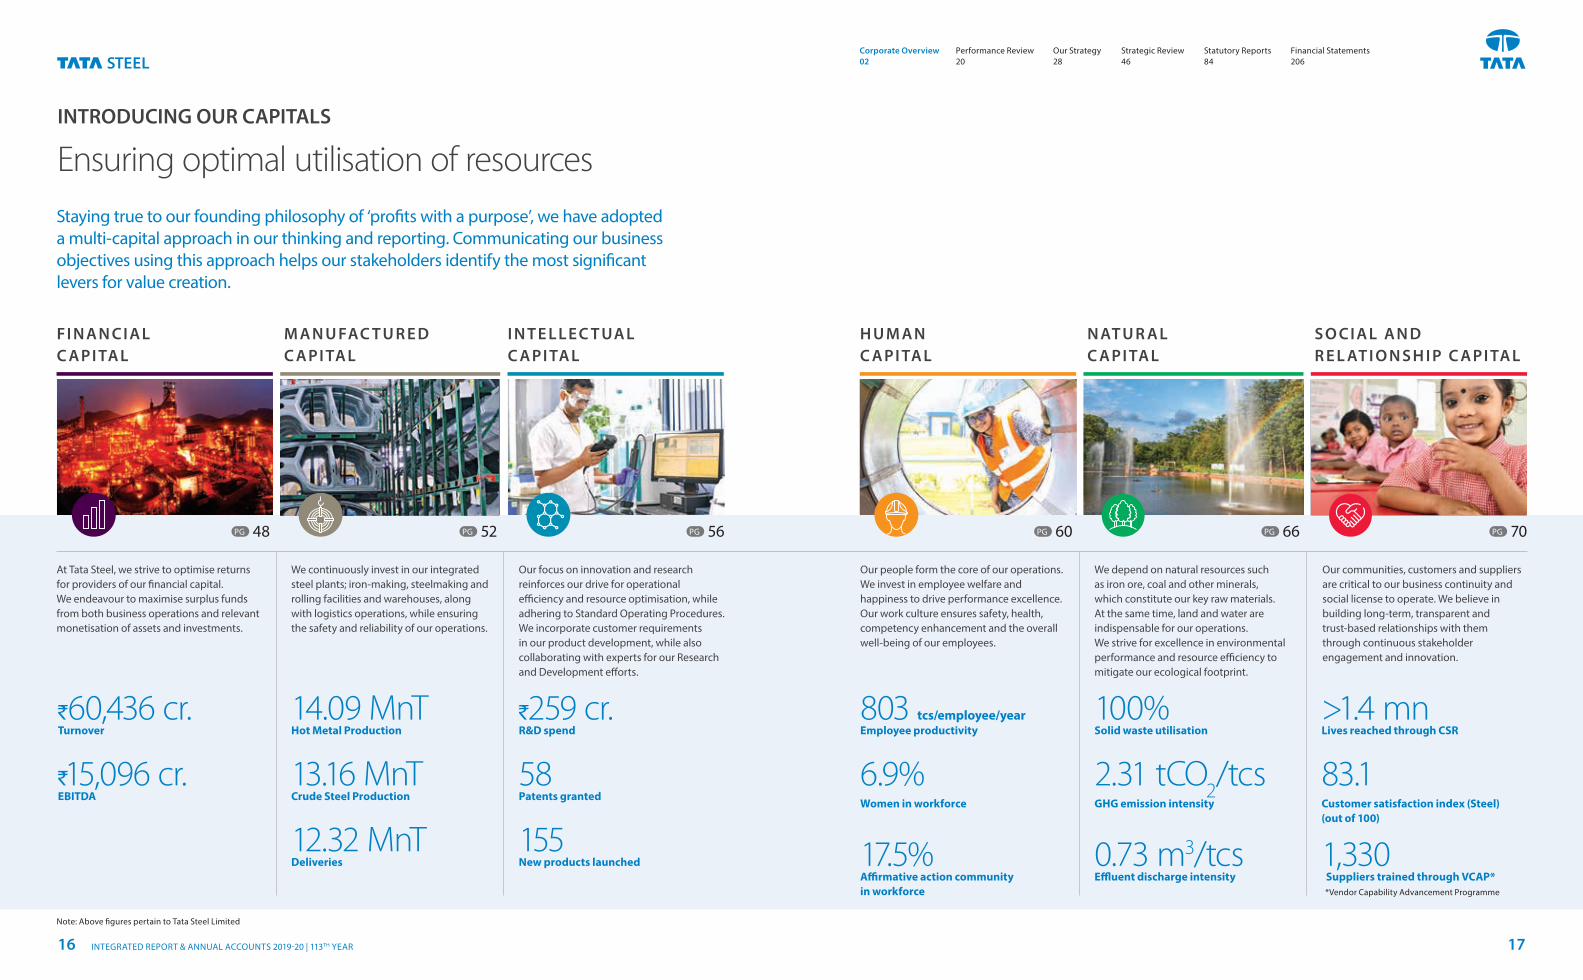
INTRODUCING OUR CAPITALS
Ensuring optimal utilisation of resources
Staying true to our founding philosophy of ‘profits with a purpose’, we have adopted a multi-capital approach in our thinking and reporting. Communicating our business objectives using this approach helps our stakeholders identify the most significant levers for value creation.
At Tata Steel, we strive to optimise returns for providers of our financial capital. We endeavour to maximise surplus funds from both business operations and relevant monetisation of assets and investments.
We continuously invest in our integrated steel plants; iron-making, steelmaking and rolling facilities and warehouses, along with logistics operations, while ensuring the safety and reliability of our operations.
Our focus on innovation and research reinforces our drive for operational efficiency and resource optimisation, while adhering to Standard Operating Procedures. We incorporate customer requirements in our product development, while also collaborating with experts for our Research and Development efforts.
Our people form the core of our operations. We invest in employee welfare and happiness to drive performance excellence. Our work culture ensures safety, health, competency enhancement and the overall well-being of our employees.
We depend on natural resources such as iron ore, coal and other minerals, which constitute our key raw materials. At the same time, land and water are indispensable for our operations. We strive for excellence in environmental performance and resource efficiency to mitigate our ecological footprint.
Our communities, customers and suppliers are critical to our business continuity and social license to operate. We believe in building long-term, transparent and trust-based relationships with them through continuous stakeholder engagement and innovation.
`60,436 cr.Turnover
14.09 MnTHot Metal Production
13.16 MnT Crude Steel Production
12.32 MnT Deliveries
100%Solid waste utilisation
2.31 tCO2/tcs
GHG emission intensity
0.73 m3/tcs Effluent discharge intensity
803 tcs/employee/yearEmployee productivity
6.9% Women in workforce
17.5% Affirmative action community in workforce
`259 cr.R&D spend
58 Patents granted
155 New products launched
>1.4 mn Lives reached through CSR
83.1 Customer satisfaction index (Steel) (out of 100)
1,330 Suppliers trained through VCAP* *Vendor Capability Advancement Programme
1̀5,096 cr.EBITDA
Note: Above figures pertain to Tata Steel Limited
Corporate Overview 02
Strategic Review 46
Performance Review 20
Statutory Reports 84
Our Strategy 28
Financial Statements 206
INTEGRATED REPORT & ANNUAL ACCOUNTS 2019-20 | 113TH YEAR16 17
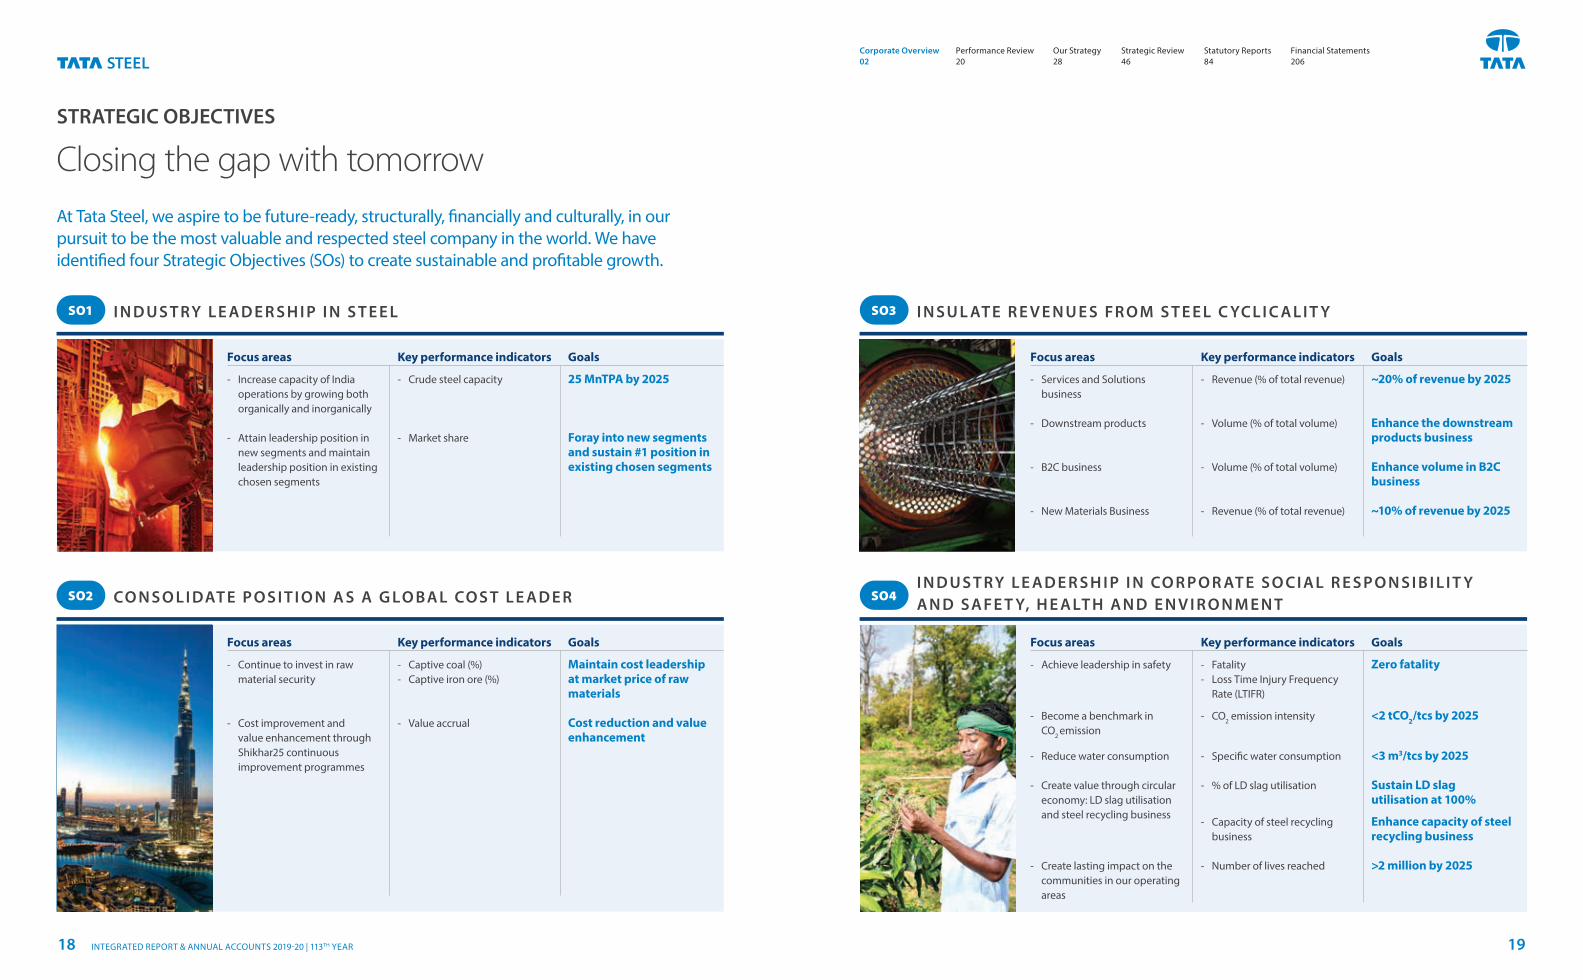
STRATEGIC OBJECTIVES
Closing the gap with tomorrow
SO1 SO3
SO2 SO4
‐ Increase capacity of India operations by growing both organically and inorganically
‐ Attain leadership position in new segments and maintain leadership position in existing chosen segments
‐ Services and Solutions business
‐ Downstream products
‐ B2C business
‐ New Materials Business
‐ Continue to invest in raw material security
‐ Cost improvement and value enhancement through Shikhar25 continuous improvement programmes
‐ Achieve leadership in safety
‐ Become a benchmark in CO2 emission
‐ Reduce water consumption
‐ Create value through circular economy: LD slag utilisation and steel recycling business
‐ Create lasting impact on the communities in our operating areas
‐ Crude steel capacity
‐ Market share
‐ Revenue (% of total revenue)
‐ Volume (% of total volume)
‐ Volume (% of total volume)
‐ Revenue (% of total revenue)
‐ Captive coal (%) ‐ Captive iron ore (%)
‐ Value accrual
‐ Fatality ‐ Loss Time Injury Frequency
Rate (LTIFR)
‐ CO2 emission intensity
‐ Specific water consumption
‐ % of LD slag utilisation
‐ Capacity of steel recycling business
‐ Number of lives reached
25 MnTPA by 2025
Foray into new segments and sustain #1 position in existing chosen segments
~20% of revenue by 2025 Enhance the downstream products business Enhance volume in B2C business ~10% of revenue by 2025
Maintain cost leadership at market price of raw materials
Cost reduction and value enhancement
Zero fatality
<2 tCO2/tcs by 2025
<3 m3/tcs by 2025
Sustain LD slag utilisation at 100%
Enhance capacity of steel recycling business
>2 million by 2025
Goals Goals
Goals Goals
Key performance indicators Key performance indicators
Key performance indicators Key performance indicators
Focus areas Focus areas
Focus areas Focus areas
I N D U S T RY L E A D E R S H I P I N S T E E L I N S U L AT E R E V E N U E S FR O M S T E E L C YC L I C A L I T Y
CO N S O L I DAT E P O S I T I O N A S A G LO BA L CO S T L E A D E RI N D U S T RY L E A D E R S H I P I N CO R P O R AT E S O C I A L R E S P O N S I B I L I T Y A N D SA FE T Y, H E A LT H A N D E N V I R O N M E N T
At Tata Steel, we aspire to be future-ready, structurally, financially and culturally, in our pursuit to be the most valuable and respected steel company in the world. We have identified four Strategic Objectives (SOs) to create sustainable and profitable growth.
Corporate Overview 02
Strategic Review 46
Performance Review 20
Statutory Reports 84
Our Strategy 28
Financial Statements 206
INTEGRATED REPORT & ANNUAL ACCOUNTS 2019-20 | 113TH YEAR18 19
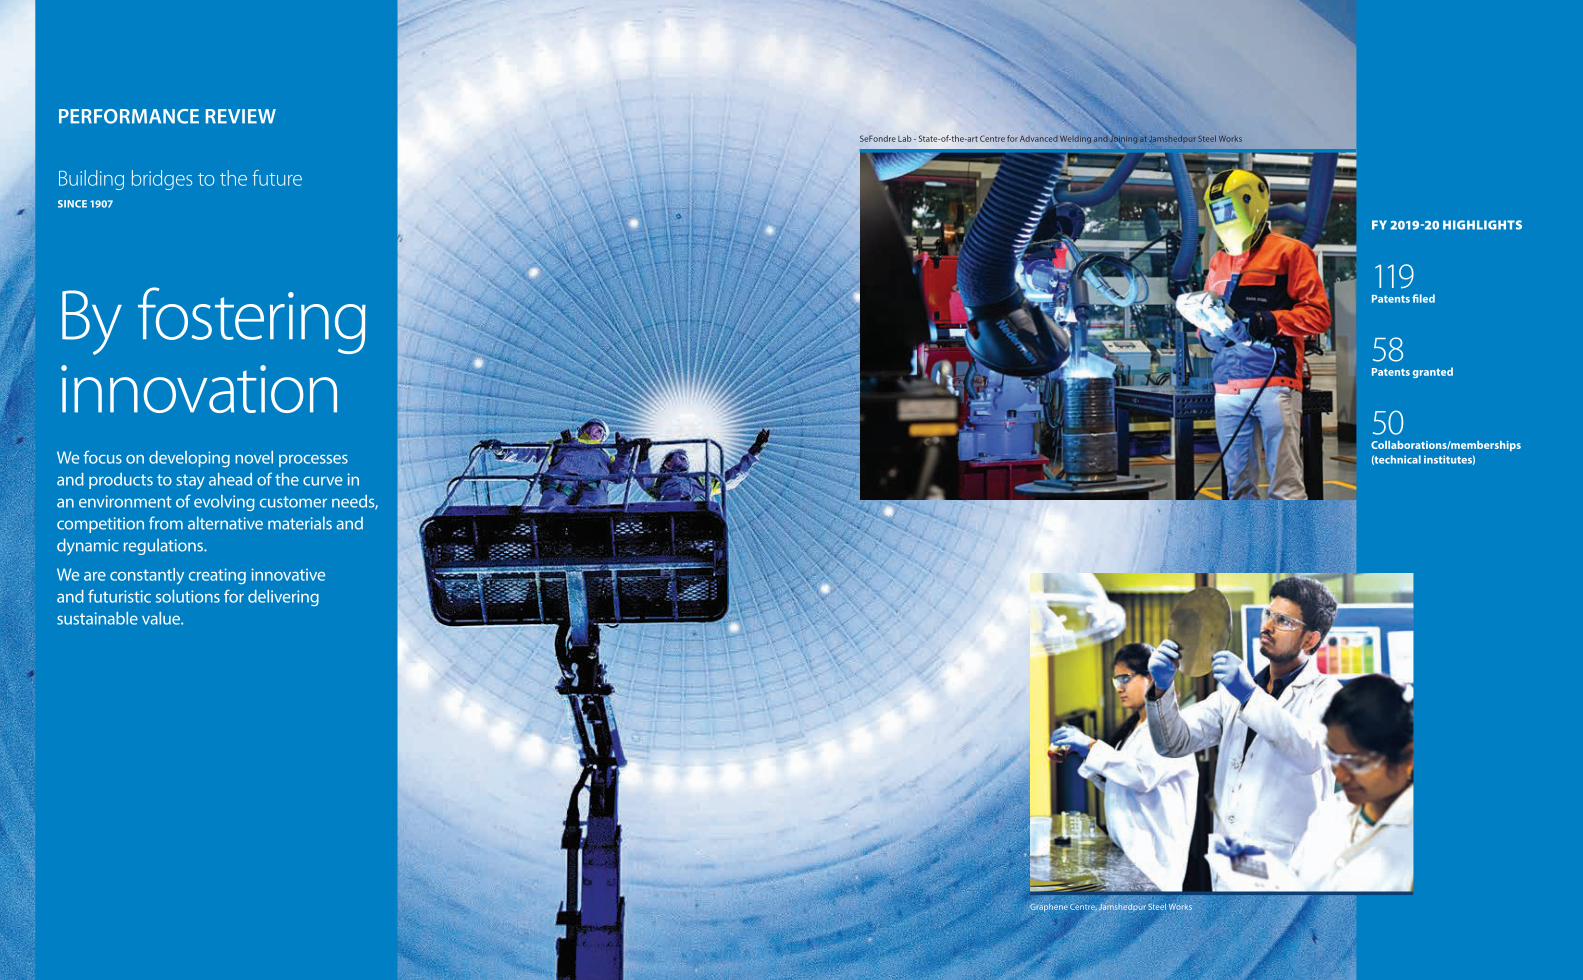
By fostering innovationWe focus on developing novel processes and products to stay ahead of the curve in an environment of evolving customer needs, competition from alternative materials and dynamic regulations.
We are constantly creating innovative and futuristic solutions for delivering sustainable value.
FY 2019-20 HIGHLIGHTS
119Patents filed
58Patents granted
50 Collaborations/memberships (technical institutes)
Building bridges to the future SINCE 1907
PERFORMANCE REVIEW
Graphene Centre, Jamshedpur Steel Works
SeFondre Lab - State-of-the-art Centre for Advanced Welding and Joining at Jamshedpur Steel Works
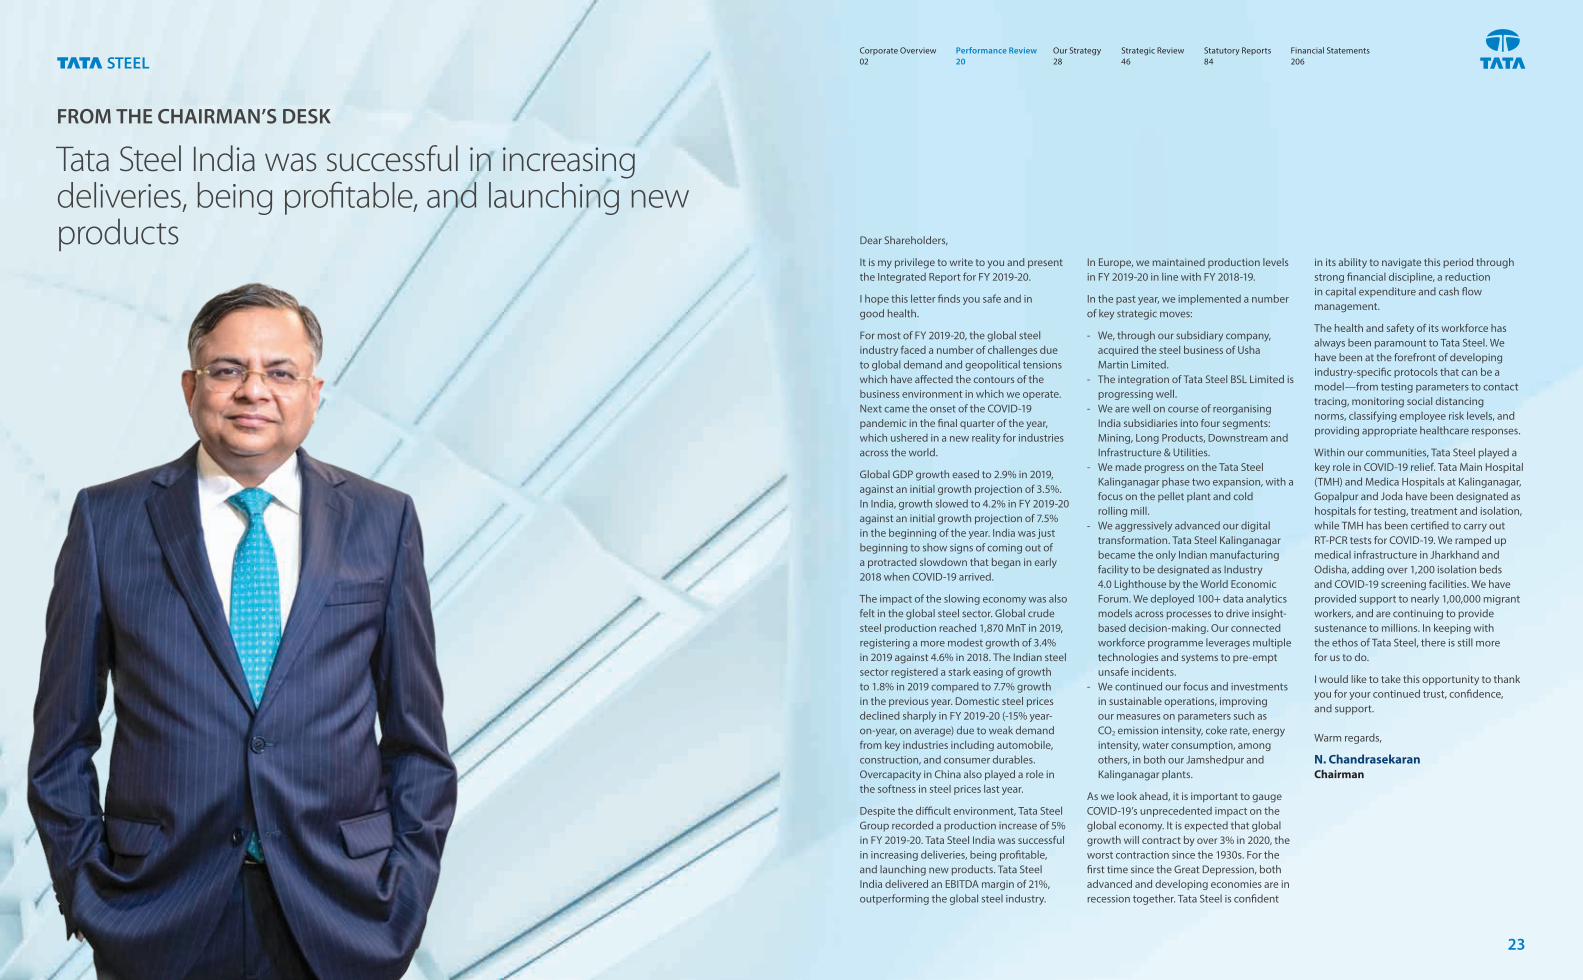
FROM THE CHAIRMAN’S DESK
Tata Steel India was successful in increasing deliveries, being profitable, and launching new products Dear Shareholders,
It is my privilege to write to you and present the Integrated Report for FY 2019-20.
I hope this letter finds you safe and in good health.
For most of FY 2019-20, the global steel industry faced a number of challenges due to global demand and geopolitical tensions which have affected the contours of the business environment in which we operate. Next came the onset of the COVID-19 pandemic in the final quarter of the year, which ushered in a new reality for industries across the world.
Global GDP growth eased to 2.9% in 2019, against an initial growth projection of 3.5%. In India, growth slowed to 4.2% in FY 2019-20 against an initial growth projection of 7.5% in the beginning of the year. India was just beginning to show signs of coming out of a protracted slowdown that began in early 2018 when COVID-19 arrived.
The impact of the slowing economy was also felt in the global steel sector. Global crude steel production reached 1,870 MnT in 2019, registering a more modest growth of 3.4% in 2019 against 4.6% in 2018. The Indian steel sector registered a stark easing of growth to 1.8% in 2019 compared to 7.7% growth in the previous year. Domestic steel prices declined sharply in FY 2019-20 (-15% year-on-year, on average) due to weak demand from key industries including automobile, construction, and consumer durables. Overcapacity in China also played a role in the softness in steel prices last year.
Despite the difficult environment, Tata Steel Group recorded a production increase of 5% in FY 2019-20. Tata Steel India was successful in increasing deliveries, being profitable, and launching new products. Tata Steel India delivered an EBITDA margin of 21%, outperforming the global steel industry.
In Europe, we maintained production levels in FY 2019-20 in line with FY 2018-19.
In the past year, we implemented a number of key strategic moves:
‐ We, through our subsidiary company, acquired the steel business of Usha Martin Limited.
‐ The integration of Tata Steel BSL Limited is progressing well.
‐ We are well on course of reorganising India subsidiaries into four segments: Mining, Long Products, Downstream and Infrastructure & Utilities.
‐ We made progress on the Tata Steel Kalinganagar phase two expansion, with a focus on the pellet plant and cold rolling mill.
‐ We aggressively advanced our digital transformation. Tata Steel Kalinganagar became the only Indian manufacturing facility to be designated as Industry 4.0 Lighthouse by the World Economic Forum. We deployed 100+ data analytics models across processes to drive insight-based decision-making. Our connected workforce programme leverages multiple technologies and systems to pre-empt unsafe incidents.
‐ We continued our focus and investments in sustainable operations, improving our measures on parameters such as CO2 emission intensity, coke rate, energy intensity, water consumption, among others, in both our Jamshedpur and Kalinganagar plants.
As we look ahead, it is important to gauge COVID-19’s unprecedented impact on the global economy. It is expected that global growth will contract by over 3% in 2020, the worst contraction since the 1930s. For the first time since the Great Depression, both advanced and developing economies are in recession together. Tata Steel is confident
in its ability to navigate this period through strong financial discipline, a reduction in capital expenditure and cash flow management.
The health and safety of its workforce has always been paramount to Tata Steel. We have been at the forefront of developing industry-specific protocols that can be a model—from testing parameters to contact tracing, monitoring social distancing norms, classifying employee risk levels, and providing appropriate healthcare responses.
Within our communities, Tata Steel played a key role in COVID-19 relief. Tata Main Hospital (TMH) and Medica Hospitals at Kalinganagar, Gopalpur and Joda have been designated as hospitals for testing, treatment and isolation, while TMH has been certified to carry out RT-PCR tests for COVID-19. We ramped up medical infrastructure in Jharkhand and Odisha, adding over 1,200 isolation beds and COVID-19 screening facilities. We have provided support to nearly 1,00,000 migrant workers, and are continuing to provide sustenance to millions. In keeping with the ethos of Tata Steel, there is still more for us to do.
I would like to take this opportunity to thank you for your continued trust, confidence, and support.
Warm regards,
N. ChandrasekaranChairman
Corporate Overview 02
Strategic Review 46
Performance Review 20
Statutory Reports 84
Our Strategy 28
Financial Statements 206
23
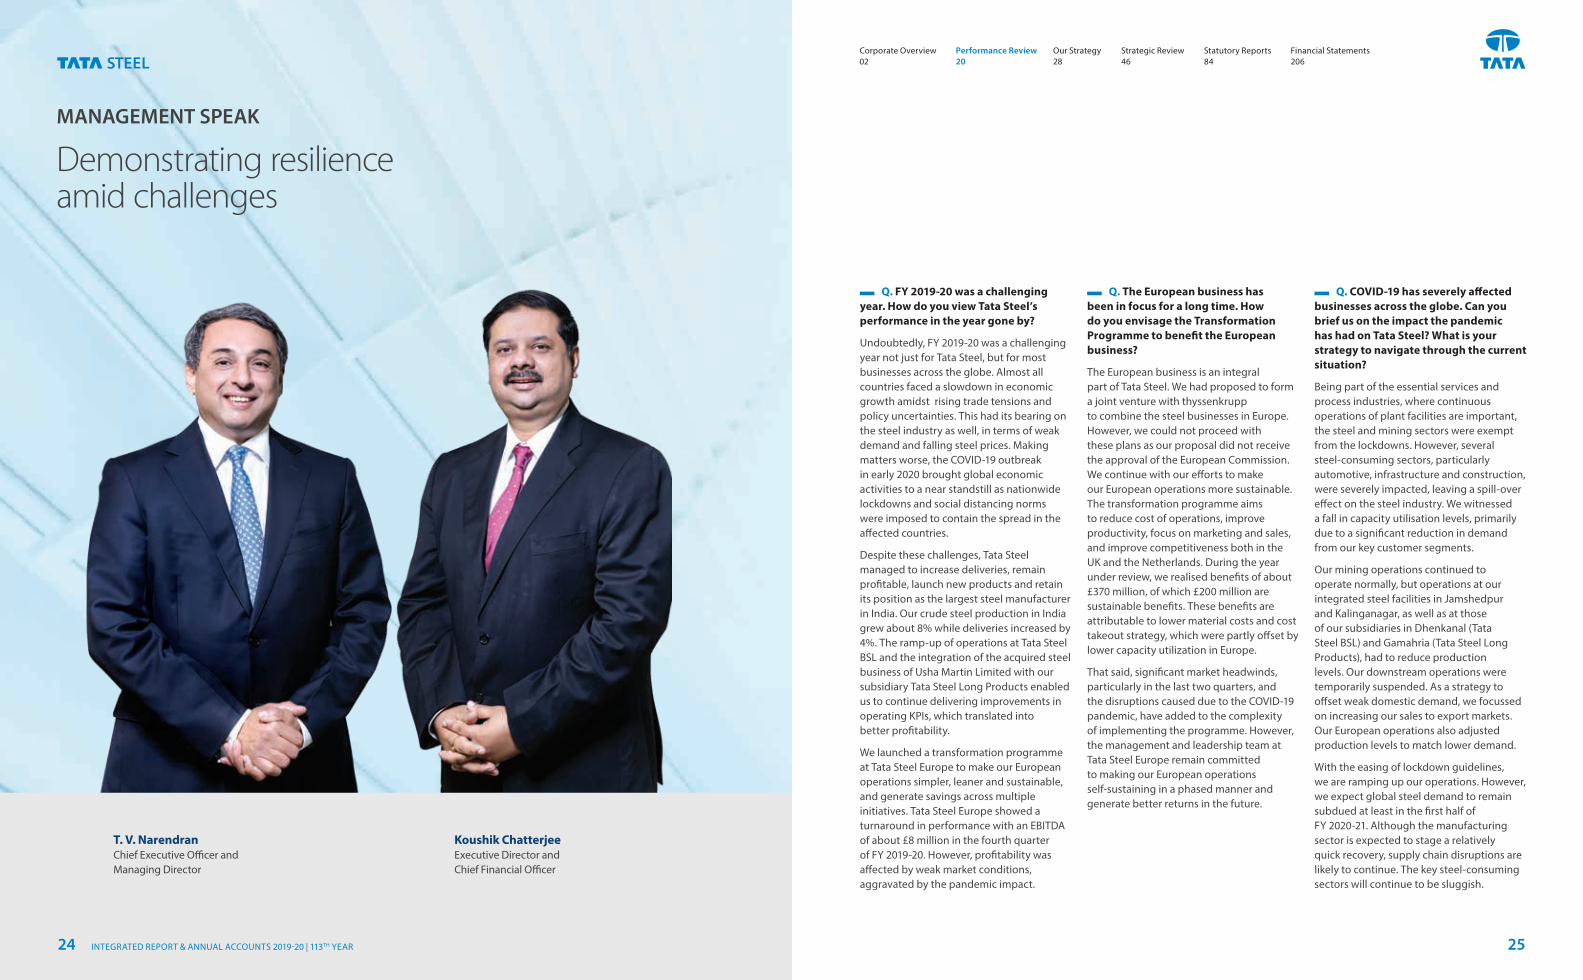
MANAGEMENT SPEAK
Demonstrating resilience amid challenges
Q. FY 2019-20 was a challenging year. How do you view Tata Steel’s performance in the year gone by?
Undoubtedly, FY 2019-20 was a challenging year not just for Tata Steel, but for most businesses across the globe. Almost all countries faced a slowdown in economic growth amidst rising trade tensions and policy uncertainties. This had its bearing on the steel industry as well, in terms of weak demand and falling steel prices. Making matters worse, the COVID-19 outbreak in early 2020 brought global economic activities to a near standstill as nationwide lockdowns and social distancing norms were imposed to contain the spread in the affected countries.
Despite these challenges, Tata Steel managed to increase deliveries, remain profitable, launch new products and retain its position as the largest steel manufacturer in India. Our crude steel production in India grew about 8% while deliveries increased by 4%. The ramp-up of operations at Tata Steel BSL and the integration of the acquired steel business of Usha Martin Limited with our subsidiary Tata Steel Long Products enabled us to continue delivering improvements in operating KPIs, which translated into better profitability.
We launched a transformation programme at Tata Steel Europe to make our European operations simpler, leaner and sustainable, and generate savings across multiple initiatives. Tata Steel Europe showed a turnaround in performance with an EBITDA of about £8 million in the fourth quarter of FY 2019-20. However, profitability was affected by weak market conditions, aggravated by the pandemic impact.
Q. The European business has been in focus for a long time. How do you envisage the Transformation Programme to benefit the European business?
The European business is an integral part of Tata Steel. We had proposed to form a joint venture with thyssenkrupp to combine the steel businesses in Europe. However, we could not proceed with these plans as our proposal did not receive the approval of the European Commission. We continue with our efforts to make our European operations more sustainable. The transformation programme aims to reduce cost of operations, improve productivity, focus on marketing and sales, and improve competitiveness both in the UK and the Netherlands. During the year under review, we realised benefits of about £370 million, of which £200 million are sustainable benefits. These benefits are attributable to lower material costs and cost takeout strategy, which were partly offset by lower capacity utilization in Europe.
That said, significant market headwinds, particularly in the last two quarters, and the disruptions caused due to the COVID-19 pandemic, have added to the complexity of implementing the programme. However, the management and leadership team at Tata Steel Europe remain committed to making our European operations self-sustaining in a phased manner and generate better returns in the future.
Q. COVID-19 has severely affected businesses across the globe. Can you brief us on the impact the pandemic has had on Tata Steel? What is your strategy to navigate through the current situation?
Being part of the essential services and process industries, where continuous operations of plant facilities are important, the steel and mining sectors were exempt from the lockdowns. However, several steel-consuming sectors, particularly automotive, infrastructure and construction, were severely impacted, leaving a spill-over effect on the steel industry. We witnessed a fall in capacity utilisation levels, primarily due to a significant reduction in demand from our key customer segments.
Our mining operations continued to operate normally, but operations at our integrated steel facilities in Jamshedpur and Kalinganagar, as well as at those of our subsidiaries in Dhenkanal (Tata Steel BSL) and Gamahria (Tata Steel Long Products), had to reduce production levels. Our downstream operations were temporarily suspended. As a strategy to offset weak domestic demand, we focussed on increasing our sales to export markets. Our European operations also adjusted production levels to match lower demand.
With the easing of lockdown guidelines, we are ramping up our operations. However, we expect global steel demand to remain subdued at least in the first half of FY 2020-21. Although the manufacturing sector is expected to stage a relatively quick recovery, supply chain disruptions are likely to continue. The key steel-consuming sectors will continue to be sluggish.
T. V. NarendranChief Executive Officer and Managing Director
Koushik ChatterjeeExecutive Director and Chief Financial Officer
Corporate Overview 02
Strategic Review 46
Performance Review 20
Statutory Reports 84
Our Strategy 28
Financial Statements 206
INTEGRATED REPORT & ANNUAL ACCOUNTS 2019-20 | 113TH YEAR24 25
MANAGEMENT SPEAK (contd)
Thus, we are focussing on conserving cash and ensuring adequate liquidity to ride out any potential disruptions. We have pivoted business decisions on cashflows and successfully driven cash neutrality in our operations by reducing spend, managing working capital and curtailing capital expenditure. Our liquidity at the end of FY 2019-20 remained robust at ₹17,745 crore, including cash and cash equivalents of ₹11,549 crore. We have also raised additional funds to build a contingency buffer.
Q. Concerted efforts to combat the pandemic are being made towards saving lives and now livelihoods. How is Tata Steel contributing to these efforts?
Our people are our biggest asset. We remain committed to ensuring their safety and well-being. Thus, our initial response was to protect our employees and immediate communities. Enhanced safety and hygiene standards were implemented at our offices and plants and social distancing norms were enforced. We formulated policies to promote safety and moved most of our essential activities to digital platforms.
A novel initiative, the ‘pod concept’, has been implemented by the health and safety team to tackle the spread of COVID-19 within the Company premises. Self-sufficient groups of people having self-contained set of skills to do an intended job have been formed and deployed at manufacturing and raw material locations as well as at profit centres. The primary objective of this initiative is to assure the health and safety of our workforce and ensure business continuity by limiting the spread of COVID-19, if any, to a single ‘pod’. In case
any suspected or confirmed case is reported within a ‘pod’, this initiative helps in the contact tracing procedure.
Staying true to the Tata philosophy of the community being a key stakeholder in business, we worked to serve the society at large. We are working with respective State Governments and District Administrations to extend support to those in need. Through the Tata Steel Foundation, we reached out to local residents in our areas of operations in Jharkhand and Odisha. Our CSR teams are working to provide food and medical assistance across the country to migrant workers. We are also working towards providing sustainable livelihoods through self-help schemes and are providing essentials and safety support to vulnerable communities. We have also stepped-up medical facilities at designated hospitals to ensure access to quality healthcare.
Q. What is your long-term plan to strengthen the business of Tata Steel?
Our growth strategyIn line with the Tata Group objective, our growth strategy is built on three pillars – simplify, synergise and scale. We continue to focus on making our India operations stronger. Tata Steel BSL is integrating well with Tata Steel. We are also in the process of amalgamating Tata Steel BSL with Tata Steel to simplify operations and derive synergies.
With the acquisition of the steel business of Usha Martin Limited through our subsidiary Tata Steel Long Products Limited, we aim to enlarge our footprint in the long products market. We are focussed on integrating and stabilising the various operating units and realising identified synergies in various areas
of operations of the newly-acquired steel business. We are optimistic that these efforts will translate into better profitability on a consolidated basis.
The Phase II expansion at Tata Steel Kalinganagar to augment the cumulative capacity of the plant from 3 MnTPA to 8 MnTPA will help us consolidate our presence in the high-end products segment.
Tata Steel Mining Limited, a wholly-owned subsidiary of Tata Steel, signed 50-year leases for Kamarda and Saruabil chromite mines. Tata Steel Mining Limited also won Sukinda chrome ore mines in the auction.
As for Europe, as mentioned earlier, we are focussed on driving the transformation programme to generate better returns from our operations.
Over the past few years, we have invested in creating a robust IT infrastructure that has helped improve our agility. It is these efforts that have enabled us to respond to the current COVID-19 situation. With the help of our digital initiatives, we have transitioned to a newer way of working wherein our workforce continues to operate from home and has adjusted well to the new normal.
Our aim is to make digital interventions across the organisation, including in operations, integrated supply chain, planning and logistics, and marketing and sales, among others. We are looking at various initiatives to drive end-to-end cost optimisation. We are also re-engineering our procurement process by introducing digital catalogue-based buying platforms, commodity price prediction-aided buying, analytics-powered negotiation tools for category managers and end-to-end contract lifecycle management and analytics.
Tata Steel has made progress towards imbibing Industry 4.0. We are happy to report that Tata Steel is the only steel company to have two of its facilities, Tata Steel Kalinganagar, India and Tata Steel IJmuiden, the Netherlands, recognised as Industry 4.0 Lighthouses by the World Economic Forum.
Focus on SustainabilityImbibing an underlying responsibility towards planet Earth in our operations, ensuring the health and safety of people at our workplaces, balancing economic prosperity and generating social benefits for the community are the norms by which Tata Steel operates. As a responsible corporate, Tata Steel supports the UN Global Compact and strives to integrate its 10 principles in all facets of business.
Climate change is recognised globally as one of the key risks in the 21st century. Tata Steel is a signatory to the Task Force on Climate Related Financial Disclosure (TCFD) and has undertaken a climate change risk assessment study in accordance with TCFD recommendations. Specific mitigation and contingency plans for each of the identified risks are being integrated with the Company’s long-term strategy.
Towards reducing our environmental footprint, we plan to achieve carbon emissions <2tCO2/tcs and specific water consumption <3 m3/tcs by 2025 and become carbon neutral in Europe by 2050. Our efforts in the steel scrap recycling business are primarily aimed at promoting sustainable steelmaking and creating a circular economy for steel.
We are making ourselves ready for a digital and more sustainable world. We have embarked on a multi-year transformation journey to become an agile and intelligent enterprise, and be the leader in digital steelmaking by 2025.
The road ahead is certainly challenging. We operate in a highly cyclical industry. However, Tata Steel has always risen to challenges and emerged stronger through downcycles, which bears testimony to its future readiness.
With regard to health and safety, we are committed to achieving ‘Zero Harm’ by 2025. We are leveraging technology to improve our safety processes and health and safety standards.
During the year under review, we reached more than 1.4 million lives through our CSR interventions in the areas of health, access to drinking water, education, livelihood, sports and infrastructure development, among others. We plan to make a meaningful difference to the lives of more than 2 million people by 2025.
Q. How do you see the road ahead for Tata Steel?
The road ahead is certainly challenging. We operate in a highly cyclical industry. However, Tata Steel has always risen to challenges and emerged stronger through downcycles, which bears testimony to its future readiness. Since 1907, the grit and determination of our people have enabled us to overcome adversities and we believe that this time too, we will learn, adapt and take Tata Steel to greater heights.
Digital transformation and Industry 4.0We are making ourselves ready for a digital and more sustainable world. We have embarked on a multi-year transformation journey to become an agile and intelligent enterprise and be the leader in digital steelmaking by 2025. In the process, we intend to achieve EBITDA improvements, enhance our digital maturity and improve our business practices.
IJmuiden Plant, The Netherlands
Tailor Welded Blanking Line (TWBL) at the Steelpark Automotive Centre, UK
Suraksha Kendra, Jamshedpur Steel Works
Corporate Overview 02
Strategic Review 46
Performance Review 20
Statutory Reports 84
Our Strategy 28
Financial Statements 206
INTEGRATED REPORT & ANNUAL ACCOUNTS 2019-20 | 113TH YEAR26 27
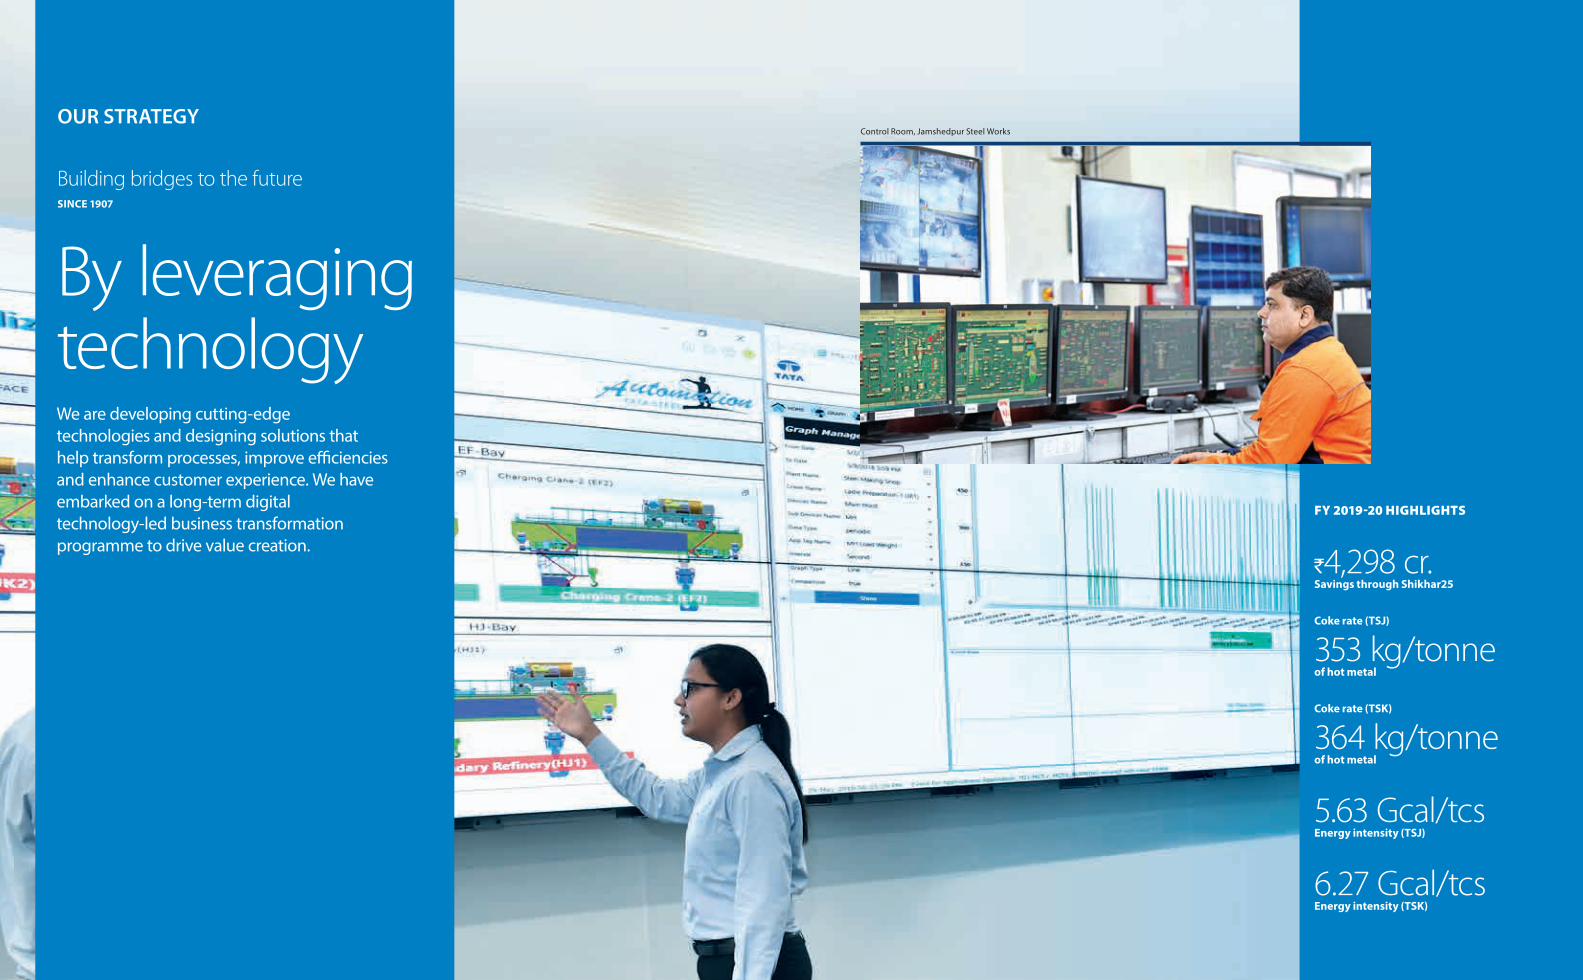
Control Room, Jamshedpur Steel Works
By leveraging technologyWe are developing cutting-edge technologies and designing solutions that help transform processes, improve efficiencies and enhance customer experience. We have embarked on a long-term digital technology-led business transformation programme to drive value creation.
FY 2019-20 HIGHLIGHTS
`4,298 cr. Savings through Shikhar25
Coke rate (TSJ)
353 kg/tonneof hot metal
Coke rate (TSK)
364 kg/tonne of hot metal
5.63 Gcal/tcs Energy intensity (TSJ)
6.27 Gcal/tcs Energy intensity (TSK)
Building bridges to the future SINCE 1907
OUR STRATEGY
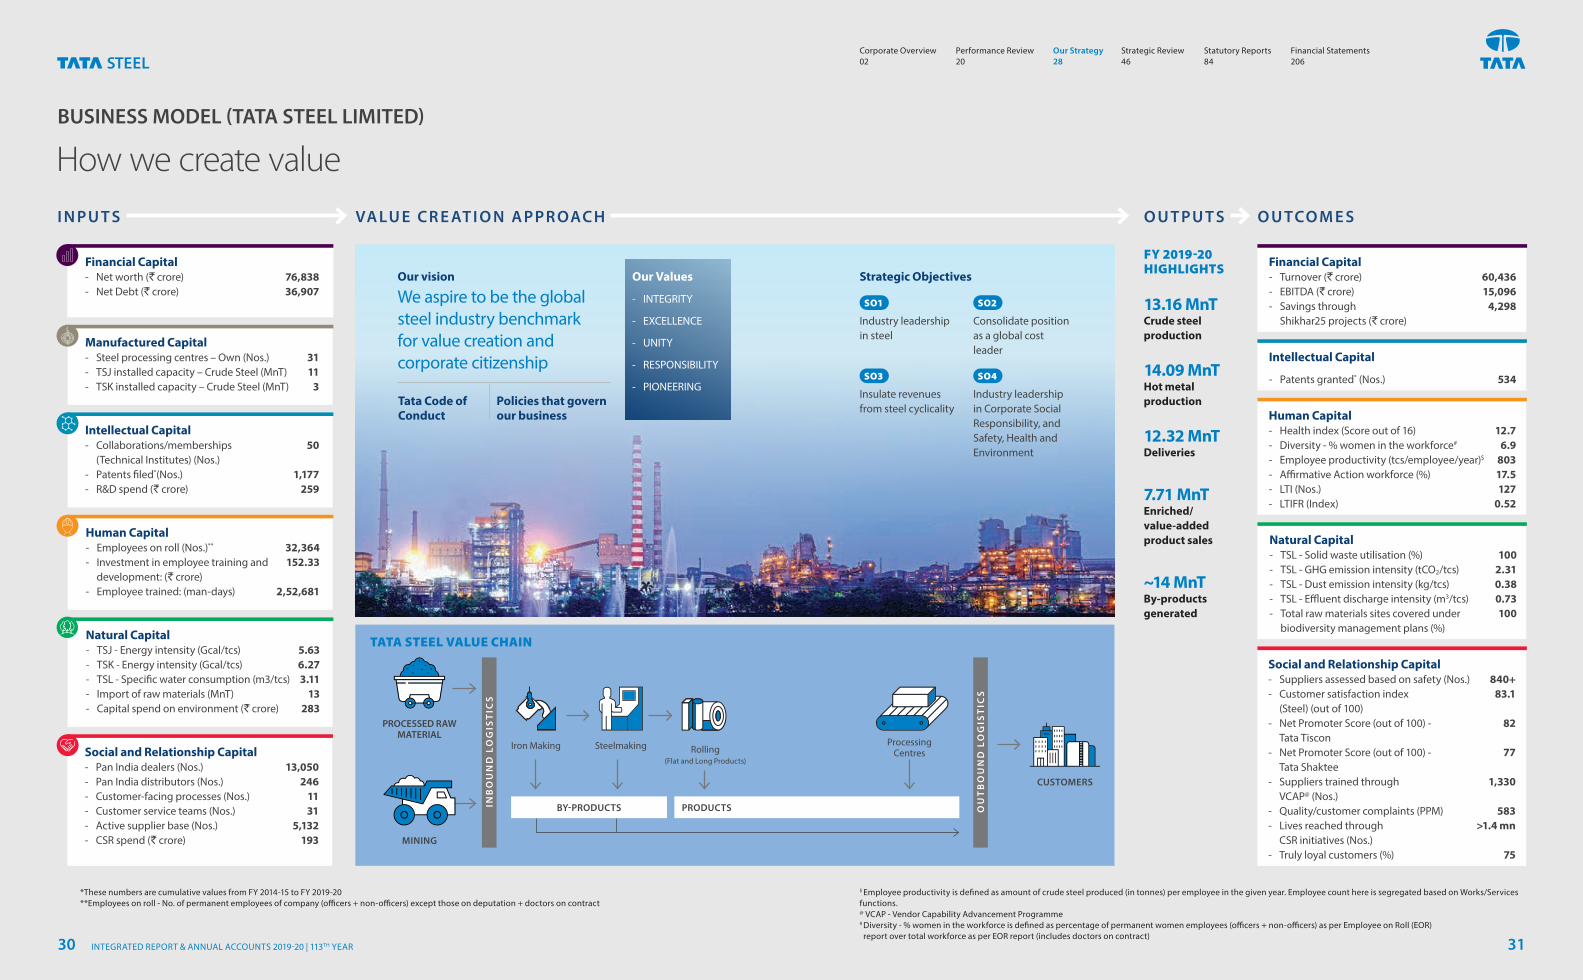
BUSINESS MODEL (TATA STEEL LIMITED)
How we create value
Financial Capital ‐ Net worth (` crore) 76,838 ‐ Net Debt (` crore) 36,907
Financial Capital ‐ Turnover (` crore) 60,436 ‐ EBITDA (` crore) 15,096 ‐ Savings through 4,298
Shikhar25 projects (` crore)
Human Capital ‐ Employees on roll (Nos.)** 32,364 ‐ Investment in employee training and 152.33
development: (` crore) ‐ Employee trained: (man-days) 2,52,681
Human Capital ‐ Health index (Score out of 16) 12.7 ‐ Diversity - % women in the workforce# 6.9 ‐ Employee productivity (tcs/employee/year)$ 803 ‐ Affirmative Action workforce (%) 17.5 ‐ LTI (Nos.) 127 ‐ LTIFR (Index) 0.52
Manufactured Capital ‐ Steel processing centres – Own (Nos.) 31 ‐ TSJ installed capacity – Crude Steel (MnT) 11 ‐ TSK installed capacity – Crude Steel (MnT) 3
Natural Capital ‐ TSJ - Energy intensity (Gcal/tcs) 5.63 ‐ TSK - Energy intensity (Gcal/tcs) 6.27 ‐ TSL - Specific water consumption (m3/tcs) 3.11 ‐ Import of raw materials (MnT) 13 ‐ Capital spend on environment (` crore) 283
Natural Capital ‐ TSL - Solid waste utilisation (%) 100 ‐ TSL - GHG emission intensity (tCO2/tcs) 2.31 ‐ TSL - Dust emission intensity (kg/tcs) 0.38 ‐ TSL - Effluent discharge intensity (m3/tcs) 0.73 ‐ Total raw materials sites covered under 100
biodiversity management plans (%)
Intellectual Capital ‐ Collaborations/memberships 50
(Technical Institutes) (Nos.) ‐ Patents filed*(Nos.) 1,177 ‐ R&D spend (` crore) 259
Intellectual Capital
‐ Patents granted* (Nos.) 534
Social and Relationship Capital ‐ Pan India dealers (Nos.) 13,050 ‐ Pan India distributors (Nos.) 246 ‐ Customer-facing processes (Nos.) 11 ‐ Customer service teams (Nos.) 31 ‐ Active supplier base (Nos.) 5,132 ‐ CSR spend (` crore) 193
Social and Relationship Capital ‐ Suppliers assessed based on safety (Nos.) 840+ ‐ Customer satisfaction index 83.1
(Steel) (out of 100) ‐ Net Promoter Score (out of 100) - 82
Tata Tiscon ‐ Net Promoter Score (out of 100) - 77
Tata Shaktee ‐ Suppliers trained through 1,330
VCAP@ (Nos.) ‐ Quality/customer complaints (PPM) 583 ‐ Lives reached through >1.4 mn
CSR initiatives (Nos.) ‐ Truly loyal customers (%) 75
$ Employee productivity is defined as amount of crude steel produced (in tonnes) per employee in the given year. Employee count here is segregated based on Works/Services functions.@ VCAP - Vendor Capability Advancement Programme# Diversity - % women in the workforce is defined as percentage of permanent women employees (officers + non-officers) as per Employee on Roll (EOR) report over total workforce as per EOR report (includes doctors on contract)
*These numbers are cumulative values from FY 2014-15 to FY 2019-20**Employees on roll - No. of permanent employees of company (officers + non-officers) except those on deputation + doctors on contract
Our vision
We aspire to be the global steel industry benchmark for value creation and corporate citizenship
Tata Code of Conduct
Policies that govern our business
Strategic Objectives
I N PU T S VA LU E C R E AT I O N A PPR OAC H O U TCO M E SO U T PU T S
FY 2019-20 HIGHLIGHTS
13.16 MnT Crude steel production
14.09 MnT Hot metal production
12.32 MnT Deliveries
7.71 MnT Enriched/ value-added product sales
~14 MnT By-products generated
TATA STEEL VALUE CHAIN
PROCESSED RAW MATERIAL
MINING
Iron Making Steelmaking
BY-PRODUCTS PRODUCTS
Rolling(Flat and Long Products)
INB
OU
ND
LO
GIS
TIC
S
CUSTOMERS
OU
TB
OU
ND
LO
GIS
TIC
S
ProcessingCentres
Industry leadership in steel
Insulate revenues from steel cyclicality
Consolidate position as a global cost leader
Industry leadership in Corporate Social Responsibility, and Safety, Health and Environment
SO1 SO2
SO3 SO4
Our Values
‐ INTEGRITY
‐ EXCELLENCE
‐ UNITY
‐ RESPONSIBILITY
‐ PIONEERING
Corporate Overview 02
Strategic Review 46
Performance Review 20
Statutory Reports 84
Our Strategy 28
Financial Statements 206
INTEGRATED REPORT & ANNUAL ACCOUNTS 2019-20 | 113TH YEAR30 31
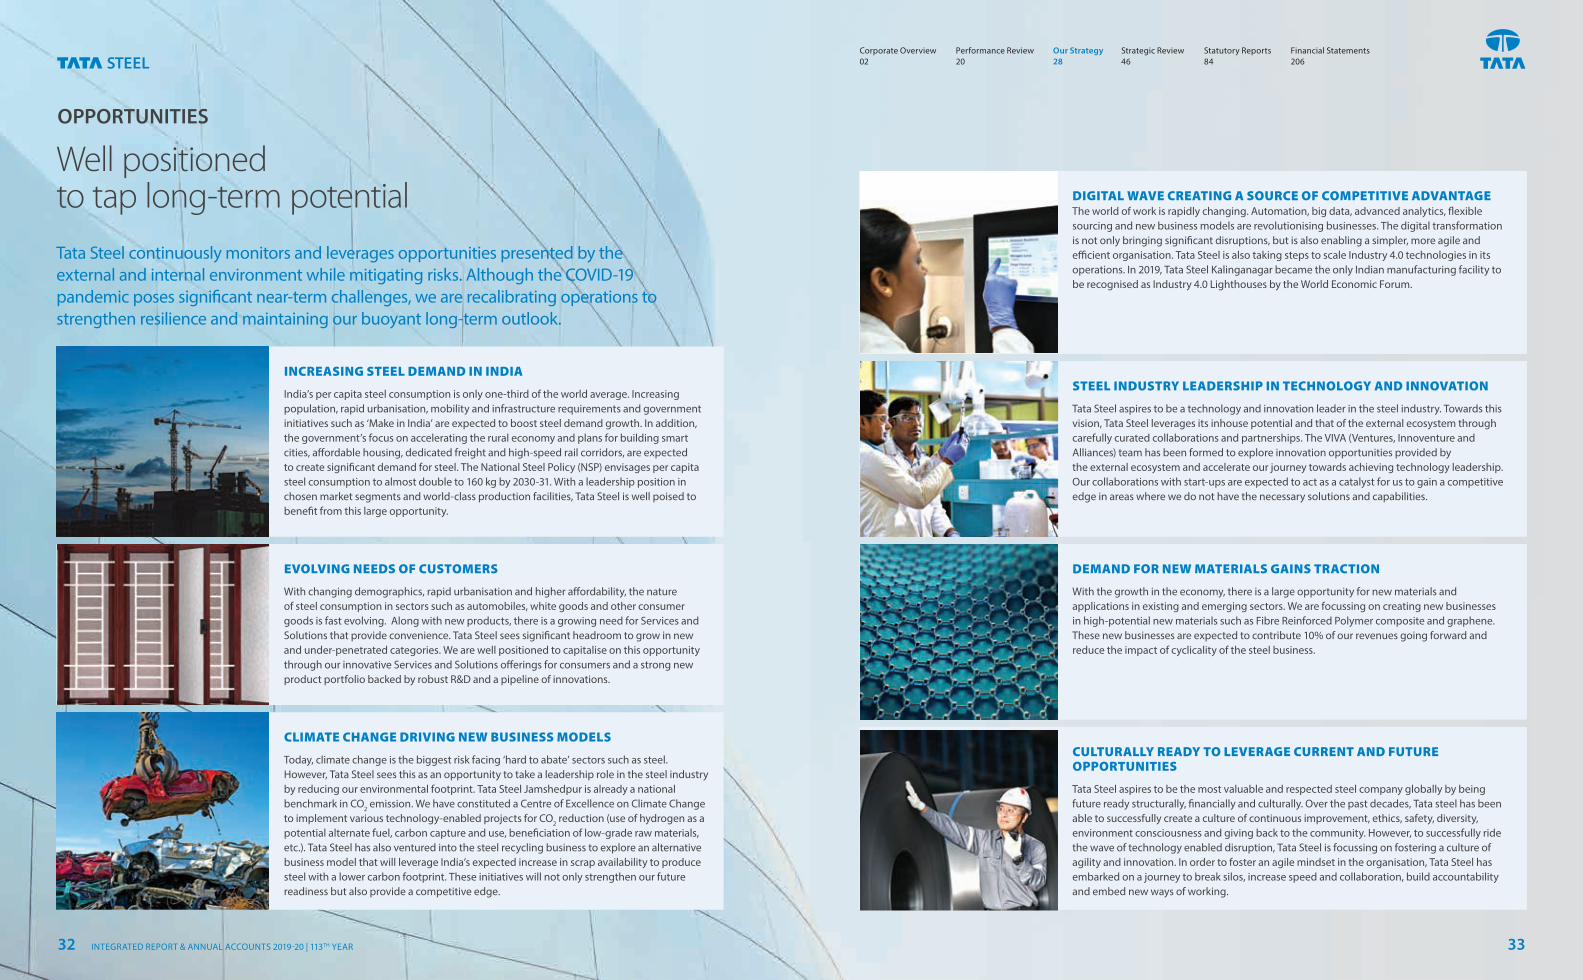
OPPORTUNITIES
Tata Steel continuously monitors and leverages opportunities presented by the external and internal environment while mitigating risks. Although the COVID-19 pandemic poses significant near-term challenges, we are recalibrating operations to strengthen resilience and maintaining our buoyant long-term outlook.
Well positioned to tap long-term potential
INCREASING STEEL DEMAND IN INDIA
India’s per capita steel consumption is only one-third of the world average. Increasing population, rapid urbanisation, mobility and infrastructure requirements and government initiatives such as ‘Make in India’ are expected to boost steel demand growth. In addition, the government’s focus on accelerating the rural economy and plans for building smart cities, affordable housing, dedicated freight and high-speed rail corridors, are expected to create significant demand for steel. The National Steel Policy (NSP) envisages per capita steel consumption to almost double to 160 kg by 2030-31. With a leadership position in chosen market segments and world-class production facilities, Tata Steel is well poised to benefit from this large opportunity.
EVOLVING NEEDS OF CUSTOMERS
With changing demographics, rapid urbanisation and higher affordability, the nature of steel consumption in sectors such as automobiles, white goods and other consumer goods is fast evolving. Along with new products, there is a growing need for Services and Solutions that provide convenience. Tata Steel sees significant headroom to grow in new and under-penetrated categories. We are well positioned to capitalise on this opportunity through our innovative Services and Solutions offerings for consumers and a strong new product portfolio backed by robust R&D and a pipeline of innovations.
CLIMATE CHANGE DRIVING NEW BUSINESS MODELS
Today, climate change is the biggest risk facing ‘hard to abate’ sectors such as steel. However, Tata Steel sees this as an opportunity to take a leadership role in the steel industry by reducing our environmental footprint. Tata Steel Jamshedpur is already a national benchmark in CO2 emission. We have constituted a Centre of Excellence on Climate Change to implement various technology-enabled projects for CO2 reduction (use of hydrogen as a potential alternate fuel, carbon capture and use, beneficiation of low-grade raw materials, etc.). Tata Steel has also ventured into the steel recycling business to explore an alternative business model that will leverage India’s expected increase in scrap availability to produce steel with a lower carbon footprint. These initiatives will not only strengthen our future readiness but also provide a competitive edge.
DIGITAL WAVE CREATING A SOURCE OF COMPETITIVE ADVANTAGE The world of work is rapidly changing. Automation, big data, advanced analytics, flexible sourcing and new business models are revolutionising businesses. The digital transformation is not only bringing significant disruptions, but is also enabling a simpler, more agile and efficient organisation. Tata Steel is also taking steps to scale Industry 4.0 technologies in its operations. In 2019, Tata Steel Kalinganagar became the only Indian manufacturing facility to be recognised as Industry 4.0 Lighthouses by the World Economic Forum.
STEEL INDUSTRY LEADERSHIP IN TECHNOLOGY AND INNOVATION
Tata Steel aspires to be a technology and innovation leader in the steel industry. Towards this vision, Tata Steel leverages its inhouse potential and that of the external ecosystem through carefully curated collaborations and partnerships. The VIVA (Ventures, Innoventure and Alliances) team has been formed to explore innovation opportunities provided by the external ecosystem and accelerate our journey towards achieving technology leadership. Our collaborations with start-ups are expected to act as a catalyst for us to gain a competitive edge in areas where we do not have the necessary solutions and capabilities.
DEMAND FOR NEW MATERIALS GAINS TRACTION
With the growth in the economy, there is a large opportunity for new materials and applications in existing and emerging sectors. We are focussing on creating new businesses in high-potential new materials such as Fibre Reinforced Polymer composite and graphene. These new businesses are expected to contribute 10% of our revenues going forward and reduce the impact of cyclicality of the steel business.
CULTURALLY READY TO LEVERAGE CURRENT AND FUTURE OPPORTUNITIES
Tata Steel aspires to be the most valuable and respected steel company globally by being future ready structurally, financially and culturally. Over the past decades, Tata steel has been able to successfully create a culture of continuous improvement, ethics, safety, diversity, environment consciousness and giving back to the community. However, to successfully ride the wave of technology enabled disruption, Tata Steel is focussing on fostering a culture of agility and innovation. In order to foster an agile mindset in the organisation, Tata Steel has embarked on a journey to break silos, increase speed and collaboration, build accountability and embed new ways of working.
Corporate Overview 02
Strategic Review 46
Performance Review 20
Statutory Reports 84
Our Strategy 28
Financial Statements 206
INTEGRATED REPORT & ANNUAL ACCOUNTS 2019-20 | 113TH YEAR32 33
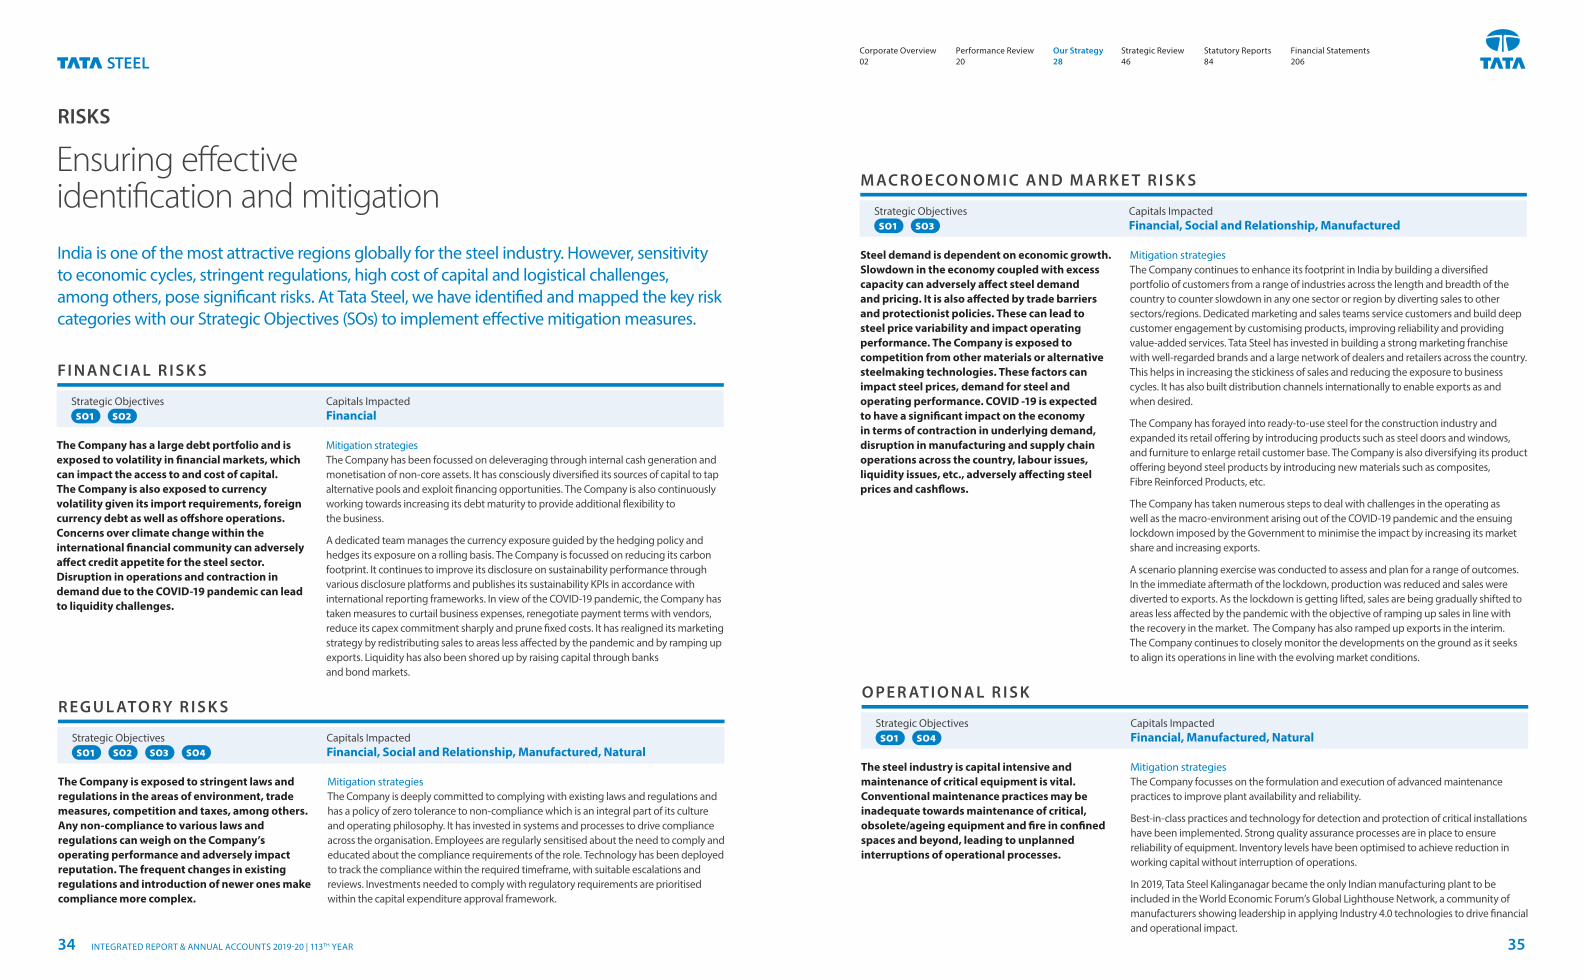
RISKS
India is one of the most attractive regions globally for the steel industry. However, sensitivity to economic cycles, stringent regulations, high cost of capital and logistical challenges, among others, pose significant risks. At Tata Steel, we have identified and mapped the key risk categories with our Strategic Objectives (SOs) to implement effective mitigation measures.
Ensuring effective identification and mitigation
FI N A N C I A L R I S K S
R E G U L ATO RY R I S K S
M AC R O E CO N O M I C A N D M A R K E T R I S K S
Capitals ImpactedFinancial
Capitals ImpactedFinancial, Social and Relationship, Manufactured, Natural
Capitals Impacted Financial, Social and Relationship, Manufactured
Strategic Objectives SO1 SO2
Strategic Objectives SO1 SO2 SO3 SO4
Strategic Objectives SO1
The Company has a large debt portfolio and is exposed to volatility in financial markets, which can impact the access to and cost of capital. The Company is also exposed to currency volatility given its import requirements, foreign currency debt as well as offshore operations. Concerns over climate change within the international financial community can adversely affect credit appetite for the steel sector. Disruption in operations and contraction in demand due to the COVID-19 pandemic can lead to liquidity challenges.
The Company is exposed to stringent laws and regulations in the areas of environment, trade measures, competition and taxes, among others. Any non-compliance to various laws and regulations can weigh on the Company’s operating performance and adversely impact reputation. The frequent changes in existing regulations and introduction of newer ones make compliance more complex.
The steel industry is capital intensive and maintenance of critical equipment is vital. Conventional maintenance practices may be inadequate towards maintenance of critical, obsolete/ageing equipment and fire in confined spaces and beyond, leading to unplanned interruptions of operational processes.
Steel demand is dependent on economic growth. Slowdown in the economy coupled with excess capacity can adversely affect steel demand and pricing. It is also affected by trade barriers and protectionist policies. These can lead to steel price variability and impact operating performance. The Company is exposed to competition from other materials or alternative steelmaking technologies. These factors can impact steel prices, demand for steel and operating performance. COVID -19 is expected to have a significant impact on the economy in terms of contraction in underlying demand, disruption in manufacturing and supply chain operations across the country, labour issues, liquidity issues, etc., adversely affecting steel prices and cashflows.
Mitigation strategies The Company has been focussed on deleveraging through internal cash generation and monetisation of non-core assets. It has consciously diversified its sources of capital to tap alternative pools and exploit financing opportunities. The Company is also continuously working towards increasing its debt maturity to provide additional flexibility to the business.
A dedicated team manages the currency exposure guided by the hedging policy and hedges its exposure on a rolling basis. The Company is focussed on reducing its carbon footprint. It continues to improve its disclosure on sustainability performance through various disclosure platforms and publishes its sustainability KPIs in accordance with international reporting frameworks. In view of the COVID-19 pandemic, the Company has taken measures to curtail business expenses, renegotiate payment terms with vendors, reduce its capex commitment sharply and prune fixed costs. It has realigned its marketing strategy by redistributing sales to areas less affected by the pandemic and by ramping up exports. Liquidity has also been shored up by raising capital through banks and bond markets.
Mitigation strategies The Company is deeply committed to complying with existing laws and regulations and has a policy of zero tolerance to non-compliance which is an integral part of its culture and operating philosophy. It has invested in systems and processes to drive compliance across the organisation. Employees are regularly sensitised about the need to comply and educated about the compliance requirements of the role. Technology has been deployed to track the compliance within the required timeframe, with suitable escalations and reviews. Investments needed to comply with regulatory requirements are prioritised within the capital expenditure approval framework.
Mitigation strategies The Company focusses on the formulation and execution of advanced maintenance practices to improve plant availability and reliability.
Best-in-class practices and technology for detection and protection of critical installations have been implemented. Strong quality assurance processes are in place to ensure reliability of equipment. Inventory levels have been optimised to achieve reduction in working capital without interruption of operations.
In 2019, Tata Steel Kalinganagar became the only Indian manufacturing plant to be included in the World Economic Forum’s Global Lighthouse Network, a community of manufacturers showing leadership in applying Industry 4.0 technologies to drive financial and operational impact.
Mitigation strategies The Company continues to enhance its footprint in India by building a diversified portfolio of customers from a range of industries across the length and breadth of the country to counter slowdown in any one sector or region by diverting sales to other sectors/regions. Dedicated marketing and sales teams service customers and build deep customer engagement by customising products, improving reliability and providing value-added services. Tata Steel has invested in building a strong marketing franchise with well-regarded brands and a large network of dealers and retailers across the country. This helps in increasing the stickiness of sales and reducing the exposure to business cycles. It has also built distribution channels internationally to enable exports as and when desired.
The Company has forayed into ready-to-use steel for the construction industry and expanded its retail offering by introducing products such as steel doors and windows, and furniture to enlarge retail customer base. The Company is also diversifying its product offering beyond steel products by introducing new materials such as composites, Fibre Reinforced Products, etc.
The Company has taken numerous steps to deal with challenges in the operating as well as the macro-environment arising out of the COVID-19 pandemic and the ensuing lockdown imposed by the Government to minimise the impact by increasing its market share and increasing exports.
A scenario planning exercise was conducted to assess and plan for a range of outcomes. In the immediate aftermath of the lockdown, production was reduced and sales were diverted to exports. As the lockdown is getting lifted, sales are being gradually shifted to areas less affected by the pandemic with the objective of ramping up sales in line with the recovery in the market. The Company has also ramped up exports in the interim. The Company continues to closely monitor the developments on the ground as it seeks to align its operations in line with the evolving market conditions.
O PE R AT I O N A L R I S K
Capitals ImpactedFinancial, Manufactured, Natural
Strategic Objectives SO1 SO4
SO3
Corporate Overview 02
Strategic Review 46
Performance Review 20
Statutory Reports 84
Our Strategy 28
Financial Statements 206
INTEGRATED REPORT & ANNUAL ACCOUNTS 2019-20 | 113TH YEAR34 35
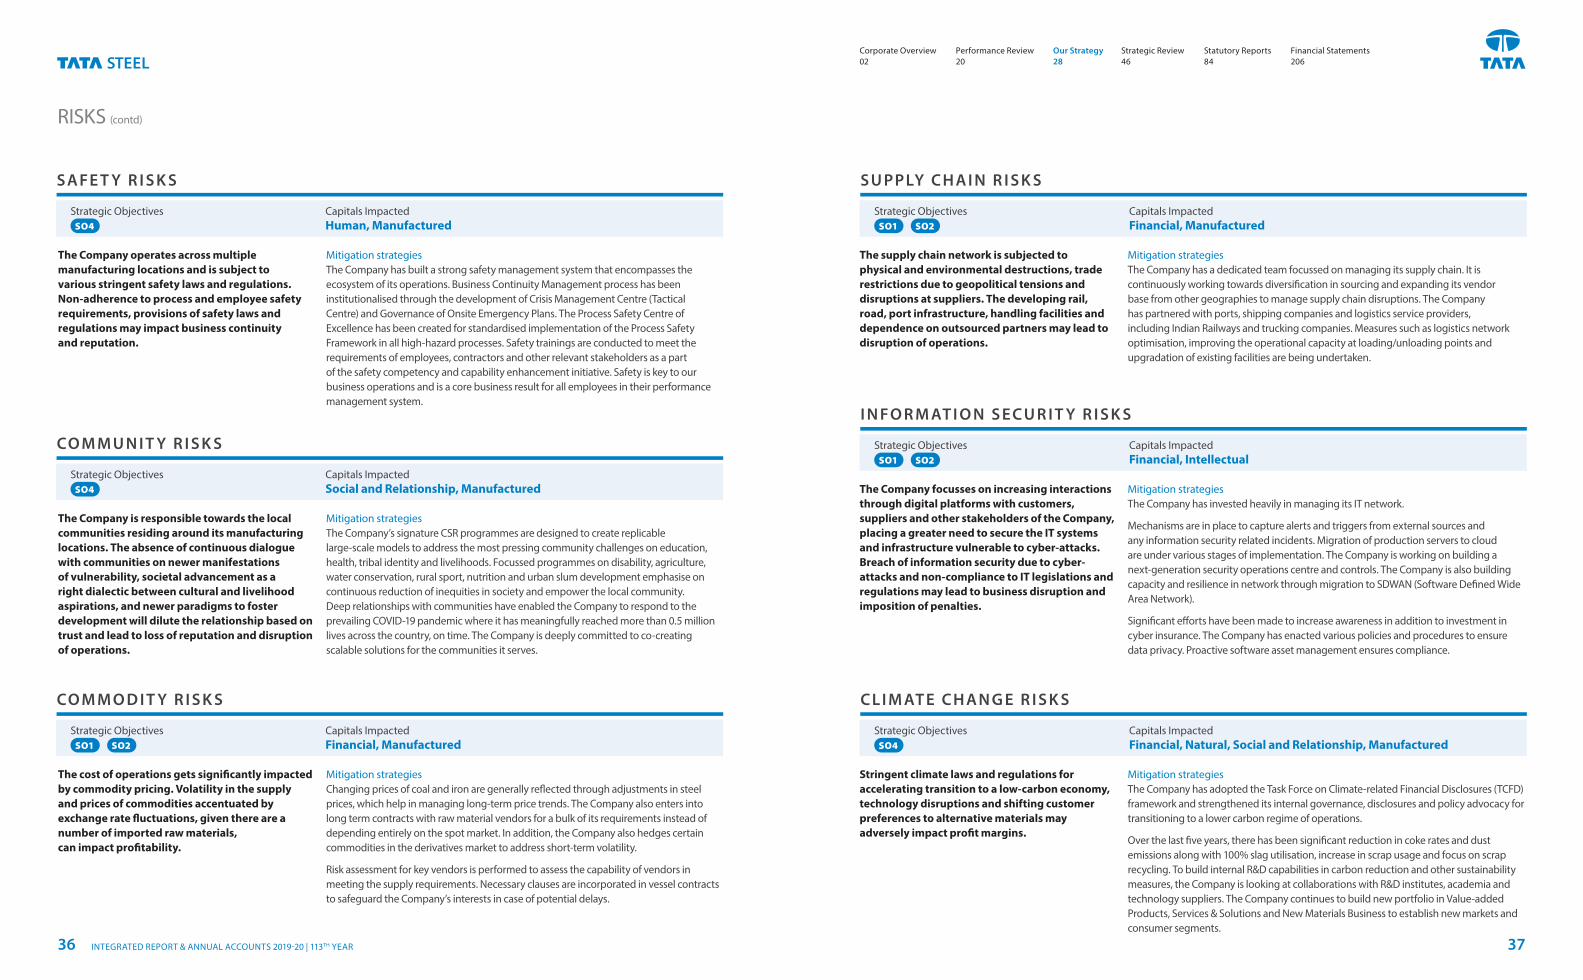
RISKS (contd)
SA FE T Y R I S K S
CO M M U N I T Y R I S K S
CO M M O D I T Y R I S K S
S U PPLY C H A I N R I S K S
I N FO R M AT I O N S E C U R I T Y R I S K S
C L I M AT E C H A N G E R I S K S
Capitals Impacted Human, Manufactured
Capitals Impacted Social and Relationship, Manufactured
Capitals Impacted Financial, Manufactured
Capitals Impacted Financial, Manufactured
Capitals Impacted Financial, Intellectual
Capitals Impacted Financial, Natural, Social and Relationship, Manufactured
Strategic ObjectivesSO4
Strategic Objectives SO4
Strategic Objectives
Strategic Objectives
SO1
SO4
Strategic Objectives SO1 SO2
Strategic Objectives SO1 SO2
SO2
The Company operates across multiple manufacturing locations and is subject to various stringent safety laws and regulations. Non-adherence to process and employee safety requirements, provisions of safety laws and regulations may impact business continuity and reputation.
The supply chain network is subjected to physical and environmental destructions, trade restrictions due to geopolitical tensions and disruptions at suppliers. The developing rail, road, port infrastructure, handling facilities and dependence on outsourced partners may lead to disruption of operations.
The Company is responsible towards the local communities residing around its manufacturing locations. The absence of continuous dialogue with communities on newer manifestations of vulnerability, societal advancement as a right dialectic between cultural and livelihood aspirations, and newer paradigms to foster development will dilute the relationship based on trust and lead to loss of reputation and disruption of operations.
The Company focusses on increasing interactions through digital platforms with customers, suppliers and other stakeholders of the Company, placing a greater need to secure the IT systems and infrastructure vulnerable to cyber-attacks. Breach of information security due to cyber-attacks and non-compliance to IT legislations and regulations may lead to business disruption and imposition of penalties.
Stringent climate laws and regulations for accelerating transition to a low-carbon economy, technology disruptions and shifting customer preferences to alternative materials may adversely impact profit margins.
The cost of operations gets significantly impacted by commodity pricing. Volatility in the supply and prices of commodities accentuated by exchange rate fluctuations, given there are a number of imported raw materials, can impact profitability.
Mitigation strategies The Company has built a strong safety management system that encompasses the ecosystem of its operations. Business Continuity Management process has been institutionalised through the development of Crisis Management Centre (Tactical Centre) and Governance of Onsite Emergency Plans. The Process Safety Centre of Excellence has been created for standardised implementation of the Process Safety Framework in all high-hazard processes. Safety trainings are conducted to meet the requirements of employees, contractors and other relevant stakeholders as a part of the safety competency and capability enhancement initiative. Safety is key to our business operations and is a core business result for all employees in their performance management system.
Mitigation strategies The Company has a dedicated team focussed on managing its supply chain. It is continuously working towards diversification in sourcing and expanding its vendor base from other geographies to manage supply chain disruptions. The Company has partnered with ports, shipping companies and logistics service providers, including Indian Railways and trucking companies. Measures such as logistics network optimisation, improving the operational capacity at loading/unloading points and upgradation of existing facilities are being undertaken.
Mitigation strategies The Company’s signature CSR programmes are designed to create replicable large-scale models to address the most pressing community challenges on education, health, tribal identity and livelihoods. Focussed programmes on disability, agriculture, water conservation, rural sport, nutrition and urban slum development emphasise on continuous reduction of inequities in society and empower the local community. Deep relationships with communities have enabled the Company to respond to the prevailing COVID-19 pandemic where it has meaningfully reached more than 0.5 million lives across the country, on time. The Company is deeply committed to co-creating scalable solutions for the communities it serves.
Mitigation strategies The Company has invested heavily in managing its IT network.
Mechanisms are in place to capture alerts and triggers from external sources and any information security related incidents. Migration of production servers to cloud are under various stages of implementation. The Company is working on building a next-generation security operations centre and controls. The Company is also building capacity and resilience in network through migration to SDWAN (Software Defined Wide Area Network).
Significant efforts have been made to increase awareness in addition to investment in cyber insurance. The Company has enacted various policies and procedures to ensure data privacy. Proactive software asset management ensures compliance.
Mitigation strategies The Company has adopted the Task Force on Climate-related Financial Disclosures (TCFD) framework and strengthened its internal governance, disclosures and policy advocacy for transitioning to a lower carbon regime of operations.
Over the last five years, there has been significant reduction in coke rates and dust emissions along with 100% slag utilisation, increase in scrap usage and focus on scrap recycling. To build internal R&D capabilities in carbon reduction and other sustainability measures, the Company is looking at collaborations with R&D institutes, academia and technology suppliers. The Company continues to build new portfolio in Value-added Products, Services & Solutions and New Materials Business to establish new markets and consumer segments.
Mitigation strategies Changing prices of coal and iron are generally reflected through adjustments in steel prices, which help in managing long-term price trends. The Company also enters into long term contracts with raw material vendors for a bulk of its requirements instead of depending entirely on the spot market. In addition, the Company also hedges certain commodities in the derivatives market to address short-term volatility.
Risk assessment for key vendors is performed to assess the capability of vendors in meeting the supply requirements. Necessary clauses are incorporated in vessel contracts to safeguard the Company’s interests in case of potential delays.
Corporate Overview 02
Strategic Review 46
Performance Review 20
Statutory Reports 84
Our Strategy 28
Financial Statements 206
INTEGRATED REPORT & ANNUAL ACCOUNTS 2019-20 | 113TH YEAR36 37
STAKEHOLDER ENGAGEMENT
Solidifying bonds with partners in progress
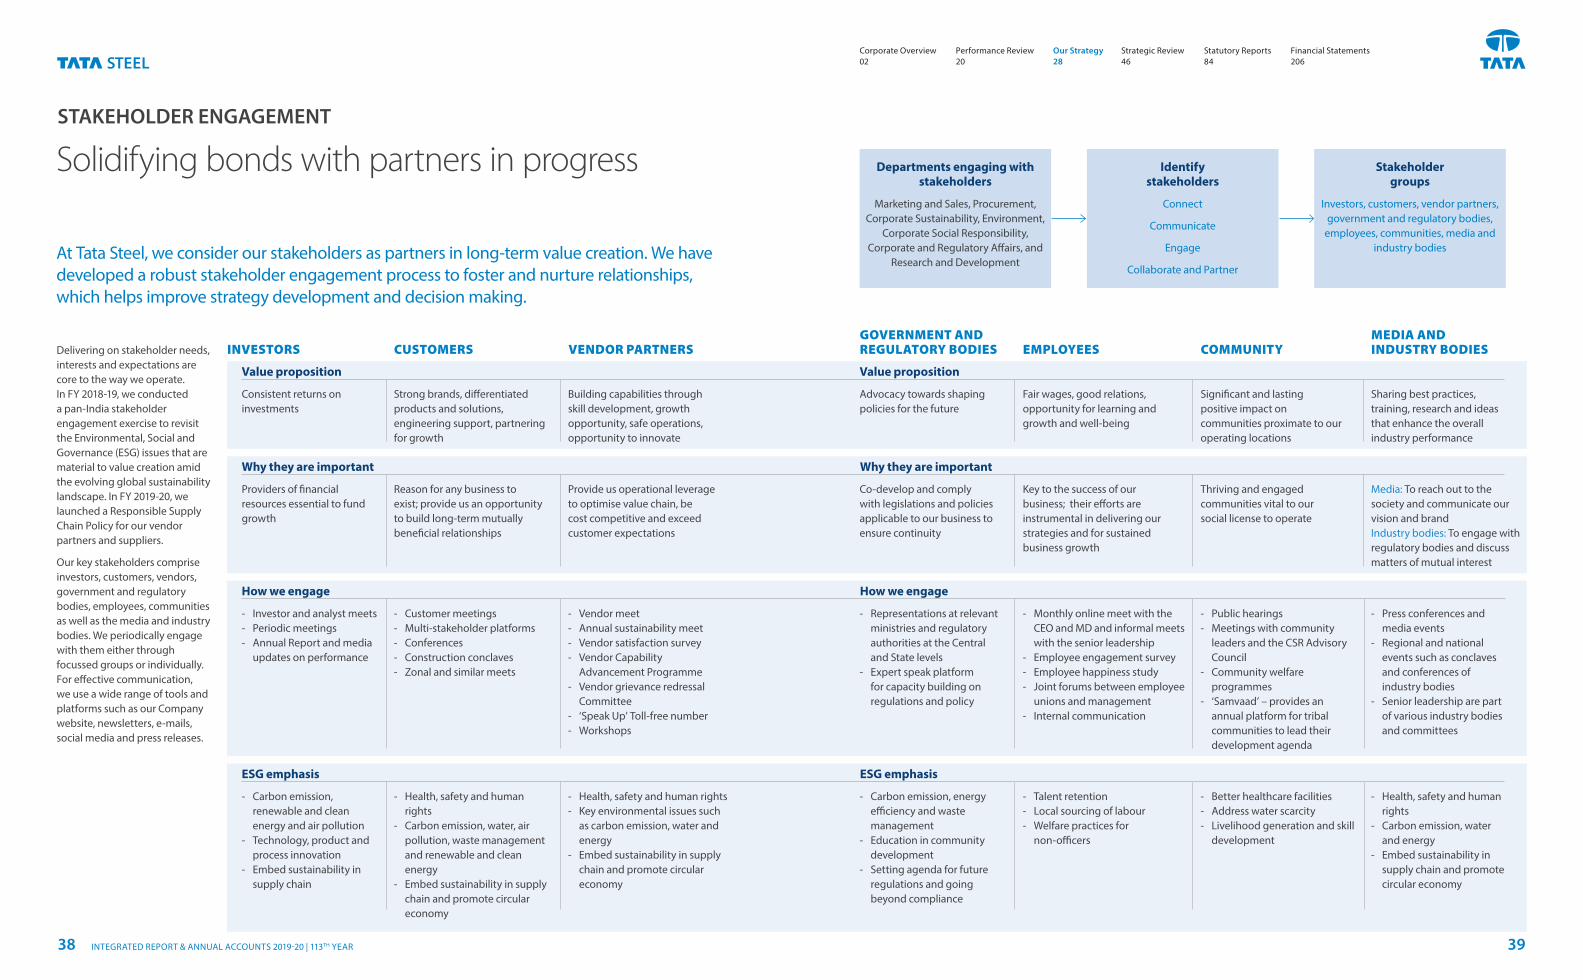
At Tata Steel, we consider our stakeholders as partners in long-term value creation. We have developed a robust stakeholder engagement process to foster and nurture relationships, which helps improve strategy development and decision making.
Delivering on stakeholder needs, interests and expectations are core to the way we operate. In FY 2018-19, we conducted a pan-India stakeholder engagement exercise to revisit the Environmental, Social and Governance (ESG) issues that are material to value creation amid the evolving global sustainability landscape. In FY 2019-20, we launched a Responsible Supply Chain Policy for our vendor partners and suppliers.
Our key stakeholders comprise investors, customers, vendors, government and regulatory bodies, employees, communities as well as the media and industry bodies. We periodically engage with them either through focussed groups or individually. For effective communication, we use a wide range of tools and platforms such as our Company website, newsletters, e-mails, social media and press releases.
CUSTOMERS VENDOR PARTNERS COMMUNITY GOVERNMENT AND REGULATORY BODIES
MEDIA AND INDUSTRY BODIESEMPLOYEESINVESTORS
Providers of financial resources essential to fund growth
‐ Investor and analyst meets ‐ Periodic meetings ‐ Annual Report and media
updates on performance
‐ Carbon emission, renewable and clean energy and air pollution
‐ Technology, product and process innovation
‐ Embed sustainability in supply chain
Co-develop and comply with legislations and policies applicable to our business to ensure continuity
‐ Representations at relevant ministries and regulatory authorities at the Central and State levels
‐ Expert speak platform for capacity building on regulations and policy
‐ Carbon emission, energy efficiency and waste management
‐ Education in community development
‐ Setting agenda for future regulations and going beyond compliance
Reason for any business to exist; provide us an opportunity to build long-term mutually beneficial relationships
‐ Customer meetings ‐ Multi-stakeholder platforms ‐ Conferences ‐ Construction conclaves ‐ Zonal and similar meets
‐ Health, safety and human rights
‐ Carbon emission, water, air pollution, waste management and renewable and clean energy
‐ Embed sustainability in supply chain and promote circular economy
Key to the success of our business; their efforts are instrumental in delivering our strategies and for sustained business growth
‐ Monthly online meet with the CEO and MD and informal meets with the senior leadership
‐ Employee engagement survey ‐ Employee happiness study ‐ Joint forums between employee
unions and management ‐ Internal communication
‐ Talent retention ‐ Local sourcing of labour ‐ Welfare practices for
non-officers
Provide us operational leverage to optimise value chain, be cost competitive and exceed customer expectations
‐ Vendor meet ‐ Annual sustainability meet ‐ Vendor satisfaction survey ‐ Vendor Capability
Advancement Programme ‐ Vendor grievance redressal
Committee ‐ ‘Speak Up’ Toll-free number ‐ Workshops
‐ Health, safety and human rights ‐ Key environmental issues such
as carbon emission, water and energy
‐ Embed sustainability in supply chain and promote circular economy
Thriving and engagedcommunities vital to oursocial license to operate
‐ Public hearings ‐ Meetings with community
leaders and the CSR Advisory Council
‐ Community welfare programmes
‐ ‘Samvaad’ – provides an annual platform for tribal communities to lead their development agenda
‐ Better healthcare facilities ‐ Address water scarcity ‐ Livelihood generation and skill
development
Media: To reach out to the society and communicate our vision and brandIndustry bodies: To engage with regulatory bodies and discuss matters of mutual interest
‐ Press conferences and media events
‐ Regional and national events such as conclaves and conferences of industry bodies
‐ Senior leadership are part of various industry bodies and committees
‐ Health, safety and human rights
‐ Carbon emission, water and energy
‐ Embed sustainability in supply chain and promote circular economy
Consistent returns on investments
Building capabilities through skill development, growth opportunity, safe operations, opportunity to innovate
Strong brands, differentiated products and solutions, engineering support, partnering for growth
Advocacy towards shaping policies for the future
Fair wages, good relations, opportunity for learning and growth and well-being
Significant and lasting positive impact on communities proximate to our operating locations
Sharing best practices, training, research and ideas that enhance the overall industry performance
How we engage How we engage
ESG emphasis ESG emphasis
Why they are important Why they are important
Value proposition Value proposition
Departments engaging with stakeholders
Marketing and Sales, Procurement, Corporate Sustainability, Environment,
Corporate Social Responsibility, Corporate and Regulatory Affairs, and
Research and Development
Identify stakeholders
Connect
Communicate
Engage
Collaborate and Partner
Stakeholder groups
Investors, customers, vendor partners, government and regulatory bodies,
employees, communities, media and industry bodies
Corporate Overview 02
Strategic Review 46
Performance Review 20
Statutory Reports 84
Our Strategy 28
Financial Statements 206
INTEGRATED REPORT & ANNUAL ACCOUNTS 2019-20 | 113TH YEAR38 39
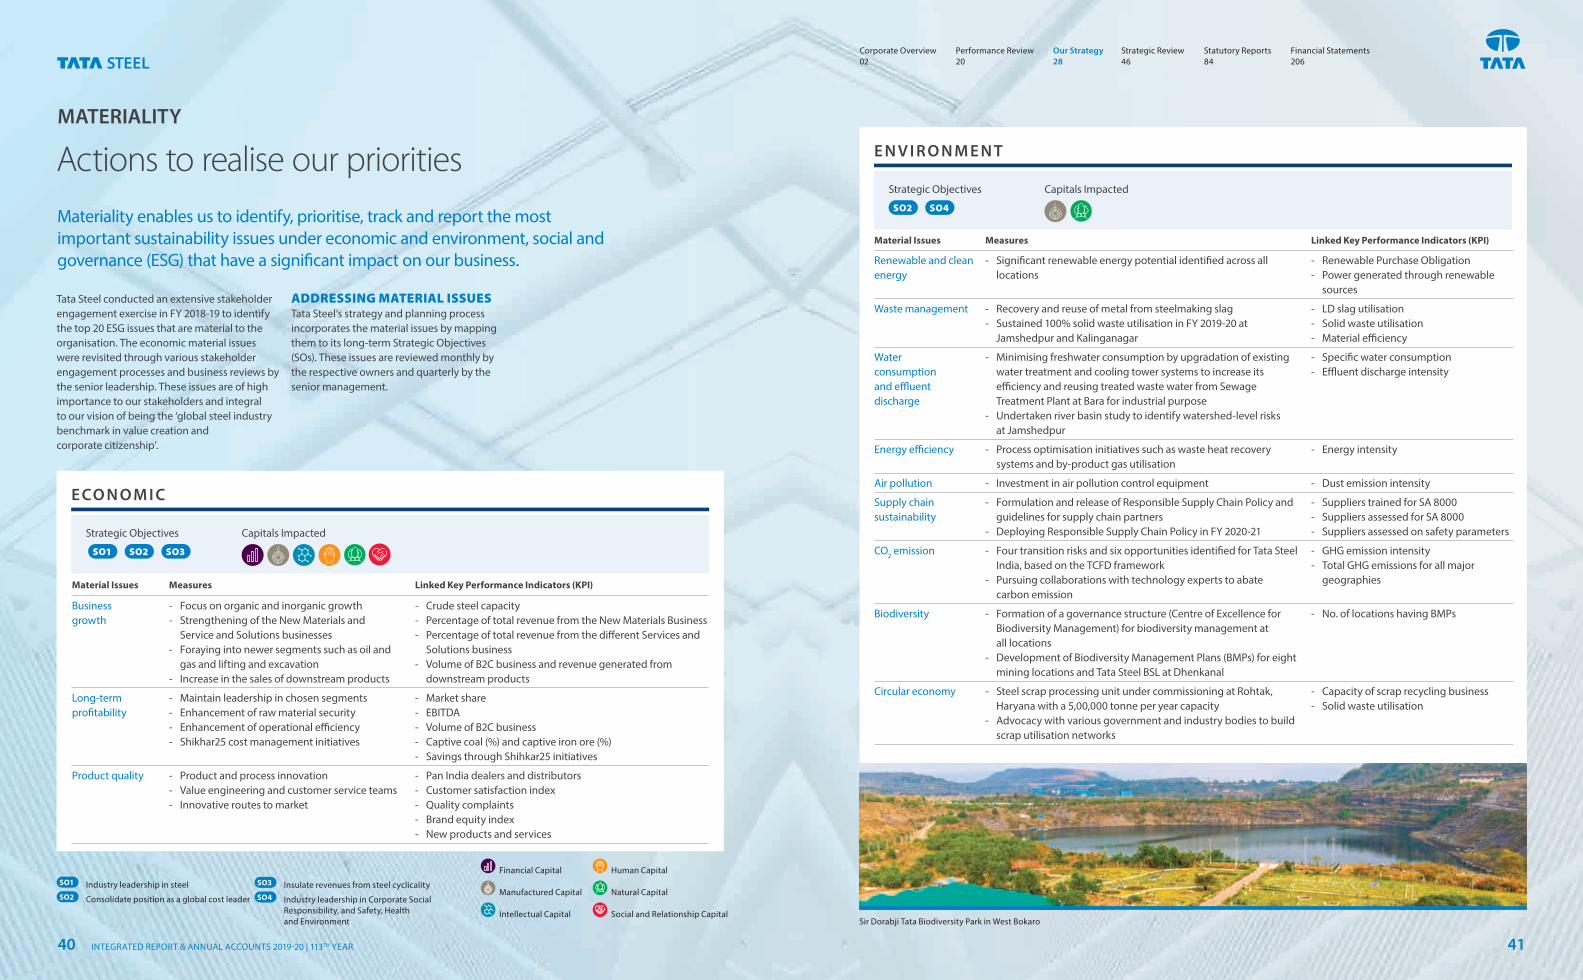
E CO N O M I C
Material Issues Measures Linked Key Performance Indicators (KPI)
Business growth
‐ Focus on organic and inorganic growth ‐ Strengthening of the New Materials and
Service and Solutions businesses ‐ Foraying into newer segments such as oil and
gas and lifting and excavation ‐ Increase in the sales of downstream products
‐ Crude steel capacity ‐ Percentage of total revenue from the New Materials Business ‐ Percentage of total revenue from the different Services and
Solutions business ‐ Volume of B2C business and revenue generated from
downstream products
Long-term profitability
‐ Maintain leadership in chosen segments ‐ Enhancement of raw material security ‐ Enhancement of operational efficiency ‐ Shikhar25 cost management initiatives
‐ Market share ‐ EBITDA ‐ Volume of B2C business ‐ Captive coal (%) and captive iron ore (%) ‐ Savings through Shihkar25 initiatives
Product quality ‐ Product and process innovation ‐ Value engineering and customer service teams ‐ Innovative routes to market
‐ Pan India dealers and distributors ‐ Customer satisfaction index ‐ Quality complaints ‐ Brand equity index ‐ New products and services
MATERIALITY
Actions to realise our priorities
Materiality enables us to identify, prioritise, track and report the most important sustainability issues under economic and environment, social and governance (ESG) that have a significant impact on our business.
E N V I R O N M E N T
Material Issues Measures Linked Key Performance Indicators (KPI)
Renewable and clean energy
‐ Significant renewable energy potential identified across all locations
‐ Renewable Purchase Obligation ‐ Power generated through renewable
sources
Waste management ‐ Recovery and reuse of metal from steelmaking slag ‐ Sustained 100% solid waste utilisation in FY 2019-20 at
Jamshedpur and Kalinganagar
‐ LD slag utilisation ‐ Solid waste utilisation ‐ Material efficiency
Water consumption and effluent discharge
‐ Minimising freshwater consumption by upgradation of existing water treatment and cooling tower systems to increase its efficiency and reusing treated waste water from Sewage Treatment Plant at Bara for industrial purpose
‐ Undertaken river basin study to identify watershed-level risks at Jamshedpur
‐ Specific water consumption ‐ Effluent discharge intensity
Energy efficiency ‐ Process optimisation initiatives such as waste heat recovery systems and by-product gas utilisation
‐ Energy intensity
Air pollution ‐ Investment in air pollution control equipment ‐ Dust emission intensity
Supply chain sustainability
‐ Formulation and release of Responsible Supply Chain Policy and guidelines for supply chain partners
‐ Deploying Responsible Supply Chain Policy in FY 2020-21
‐ Suppliers trained for SA 8000 ‐ Suppliers assessed for SA 8000 ‐ Suppliers assessed on safety parameters
CO2 emission ‐ Four transition risks and six opportunities identified for Tata Steel India, based on the TCFD framework
‐ Pursuing collaborations with technology experts to abate carbon emission
‐ GHG emission intensity ‐ Total GHG emissions for all major
geographies
Biodiversity ‐ Formation of a governance structure (Centre of Excellence for Biodiversity Management) for biodiversity management at all locations
‐ Development of Biodiversity Management Plans (BMPs) for eight mining locations and Tata Steel BSL at Dhenkanal
‐ No. of locations having BMPs
Circular economy ‐ Steel scrap processing unit under commissioning at Rohtak, Haryana with a 5,00,000 tonne per year capacity
‐ Advocacy with various government and industry bodies to build scrap utilisation networks
‐ Capacity of scrap recycling business ‐ Solid waste utilisation
Tata Steel conducted an extensive stakeholder engagement exercise in FY 2018-19 to identify the top 20 ESG issues that are material to the organisation. The economic material issues were revisited through various stakeholder engagement processes and business reviews by the senior leadership. These issues are of high importance to our stakeholders and integral to our vision of being the ‘global steel industry benchmark in value creation and corporate citizenship’.
Capitals Impacted
Capitals Impacted
Strategic Objectives
SO2 SO4
Strategic Objectives
SO1 SO2 SO3
SO1 Industry leadership in steelSO2 Consolidate position as a global cost leader
Financial Capital
Manufactured Capital
Intellectual Capital
Human Capital
Natural Capital
Social and Relationship Capital
ADDRESSING MATERIAL ISSUESTata Steel’s strategy and planning process incorporates the material issues by mapping them to its long-term Strategic Objectives (SOs). These issues are reviewed monthly by the respective owners and quarterly by the senior management.
Sir Dorabji Tata Biodiversity Park in West Bokaro
SO3 Insulate revenues from steel cyclicalitySO4 Industry leadership in Corporate Social
Responsibility, and Safety, Health and Environment
Corporate Overview 02
Strategic Review 46
Performance Review 20
Statutory Reports 84
Our Strategy 28
Financial Statements 206
INTEGRATED REPORT & ANNUAL ACCOUNTS 2019-20 | 113TH YEAR40 41
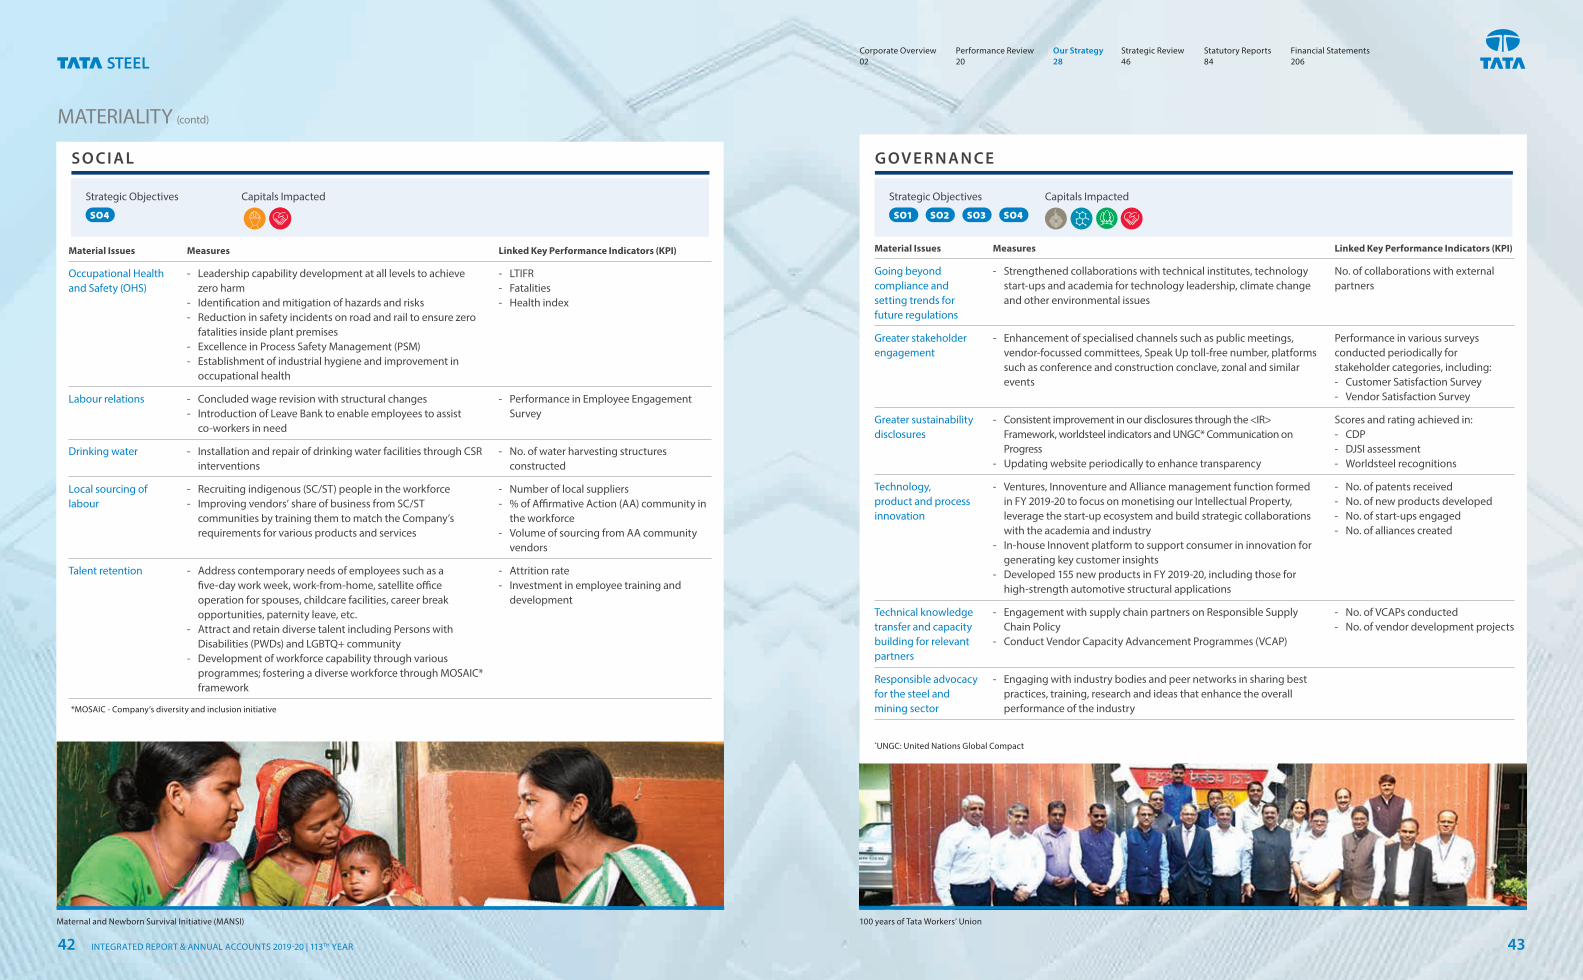
G OV E R N A N C E
Capitals ImpactedStrategic Objectives
SO1 SO2 SO3 SO4
Material Issues Measures Linked Key Performance Indicators (KPI)
Going beyond compliance and setting trends for future regulations
‐ Strengthened collaborations with technical institutes, technology start-ups and academia for technology leadership, climate change and other environmental issues
No. of collaborations with external partners
Greater stakeholder engagement
‐ Enhancement of specialised channels such as public meetings, vendor-focussed committees, Speak Up toll-free number, platforms such as conference and construction conclave, zonal and similar events
Performance in various surveys conducted periodically for stakeholder categories, including: ‐ Customer Satisfaction Survey ‐ Vendor Satisfaction Survey
Greater sustainability disclosures
‐ Consistent improvement in our disclosures through the <IR> Framework, worldsteel indicators and UNGC* Communication on Progress
‐ Updating website periodically to enhance transparency
Scores and rating achieved in: ‐ CDP ‐ DJSI assessment ‐ Worldsteel recognitions
Technology, product and process innovation
‐ Ventures, Innoventure and Alliance management function formed in FY 2019-20 to focus on monetising our Intellectual Property, leverage the start-up ecosystem and build strategic collaborations with the academia and industry
‐ In-house Innovent platform to support consumer in innovation for generating key customer insights
‐ Developed 155 new products in FY 2019-20, including those for high-strength automotive structural applications
‐ No. of patents received ‐ No. of new products developed ‐ No. of start-ups engaged ‐ No. of alliances created
Technical knowledge transfer and capacity building for relevant partners
‐ Engagement with supply chain partners on Responsible Supply Chain Policy
‐ Conduct Vendor Capacity Advancement Programmes (VCAP)
‐ No. of VCAPs conducted ‐ No. of vendor development projects
Responsible advocacy for the steel and mining sector
‐ Engaging with industry bodies and peer networks in sharing best practices, training, research and ideas that enhance the overall performance of the industry
S O C I A L
Capitals Impacted
Strategic Objectives
SO4
Material Issues Measures Linked Key Performance Indicators (KPI)
Occupational Health and Safety (OHS)
‐ Leadership capability development at all levels to achieve zero harm
‐ Identification and mitigation of hazards and risks ‐ Reduction in safety incidents on road and rail to ensure zero
fatalities inside plant premises ‐ Excellence in Process Safety Management (PSM) ‐ Establishment of industrial hygiene and improvement in
occupational health
‐ LTIFR ‐ Fatalities ‐ Health index
Labour relations ‐ Concluded wage revision with structural changes ‐ Introduction of Leave Bank to enable employees to assist
co-workers in need
‐ Performance in Employee Engagement Survey
Drinking water ‐ Installation and repair of drinking water facilities through CSR interventions
‐ No. of water harvesting structures constructed
Local sourcing of labour
‐ Recruiting indigenous (SC/ST) people in the workforce ‐ Improving vendors’ share of business from SC/ST
communities by training them to match the Company’s requirements for various products and services
‐ Number of local suppliers ‐ % of Affirmative Action (AA) community in
the workforce ‐ Volume of sourcing from AA community
vendors
Talent retention ‐ Address contemporary needs of employees such as a five-day work week, work-from-home, satellite office operation for spouses, childcare facilities, career break opportunities, paternity leave, etc.
‐ Attract and retain diverse talent including Persons with Disabilities (PWDs) and LGBTQ+ community
‐ Development of workforce capability through various programmes; fostering a diverse workforce through MOSAIC* framework
‐ Attrition rate ‐ Investment in employee training and
development
MATERIALITY (contd)
100 years of Tata Workers’ UnionMaternal and Newborn Survival Initiative (MANSI)
*UNGC: United Nations Global Compact
*MOSAIC - Company’s diversity and inclusion initiative
Corporate Overview 02
Strategic Review 46
Performance Review 20
Statutory Reports 84
Our Strategy 28
Financial Statements 206
INTEGRATED REPORT & ANNUAL ACCOUNTS 2019-20 | 113TH YEAR42 43
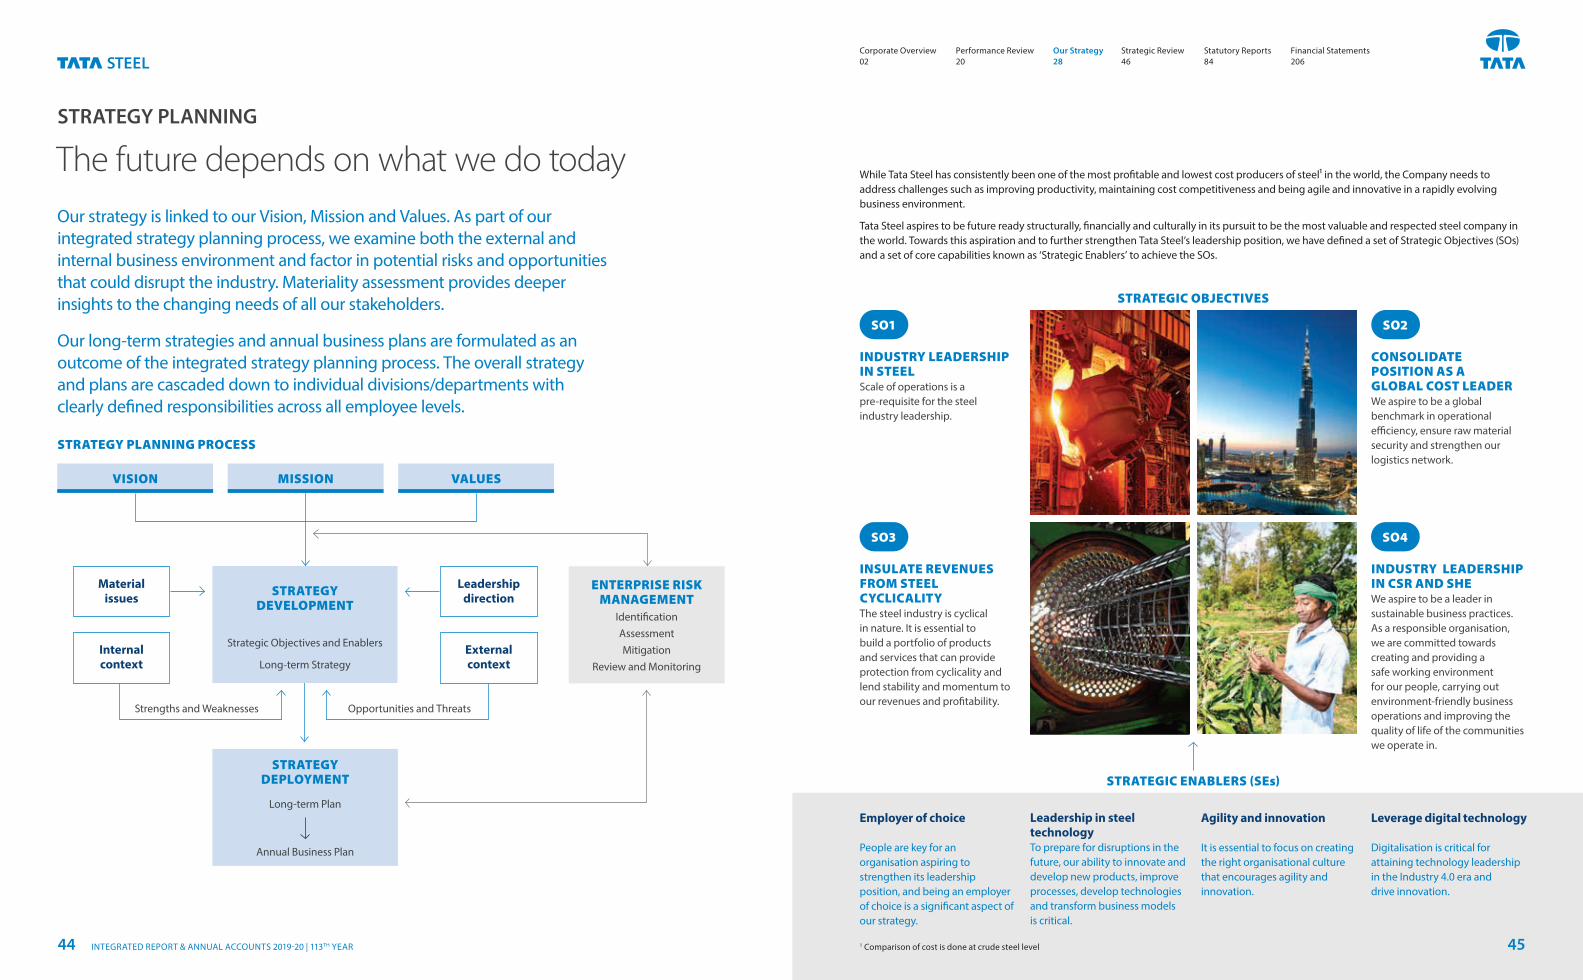
STRATEGY PLANNING
The future depends on what we do today
Our strategy is linked to our Vision, Mission and Values. As part of our integrated strategy planning process, we examine both the external and internal business environment and factor in potential risks and opportunities that could disrupt the industry. Materiality assessment provides deeper insights to the changing needs of all our stakeholders.
Our long-term strategies and annual business plans are formulated as an outcome of the integrated strategy planning process. The overall strategy and plans are cascaded down to individual divisions/departments with clearly defined responsibilities across all employee levels.
STRATEGY PLANNING PROCESS
While Tata Steel has consistently been one of the most profitable and lowest cost producers of steel1 in the world, the Company needs to address challenges such as improving productivity, maintaining cost competitiveness and being agile and innovative in a rapidly evolving business environment.
Tata Steel aspires to be future ready structurally, financially and culturally in its pursuit to be the most valuable and respected steel company in the world. Towards this aspiration and to further strengthen Tata Steel’s leadership position, we have defined a set of Strategic Objectives (SOs) and a set of core capabilities known as ‘Strategic Enablers’ to achieve the SOs.
Strengths and Weaknesses Opportunities and Threats
STRATEGY DEPLOYMENT
Long-term Plan
Annual Business Plan
Materialissues
Leadership direction
External context
Internalcontext
STRATEGY DEVELOPMENT
Strategic Objectives and Enablers
Long-term Strategy
ENTERPRISE RISK MANAGEMENT
IdentificationAssessmentMitigation
Review and Monitoring
VISION MISSION VALUES
SO1 SO2
SO3 SO4
INDUSTRY LEADERSHIP IN STEELScale of operations is a pre-requisite for the steel industry leadership.
CONSOLIDATE POSITION AS A GLOBAL COST LEADERWe aspire to be a global benchmark in operational efficiency, ensure raw material security and strengthen our logistics network.
INSULATE REVENUES FROM STEEL CYCLICALITYThe steel industry is cyclical in nature. It is essential to build a portfolio of products and services that can provide protection from cyclicality and lend stability and momentum to our revenues and profitability.
INDUSTRY LEADERSHIP IN CSR AND SHE We aspire to be a leader in sustainable business practices. As a responsible organisation, we are committed towards creating and providing a safe working environment for our people, carrying out environment-friendly business operations and improving the quality of life of the communities we operate in.
Leadership in steel technology To prepare for disruptions in the future, our ability to innovate and develop new products, improve processes, develop technologies and transform business models is critical.
Leverage digital technology
Digitalisation is critical for attaining technology leadership in the Industry 4.0 era and drive innovation.
Agility and innovation
It is essential to focus on creating the right organisational culture that encourages agility and innovation.
STRATEGIC ENABLERS (SEs)
STRATEGIC OBJECTIVES
Employer of choice
People are key for an organisation aspiring to strengthen its leadership position, and being an employer of choice is a significant aspect of our strategy.
1 Comparison of cost is done at crude steel level
Corporate Overview 02
Strategic Review 46
Performance Review 20
Statutory Reports 84
Our Strategy 28
Financial Statements 206
INTEGRATED REPORT & ANNUAL ACCOUNTS 2019-20 | 113TH YEAR44 45
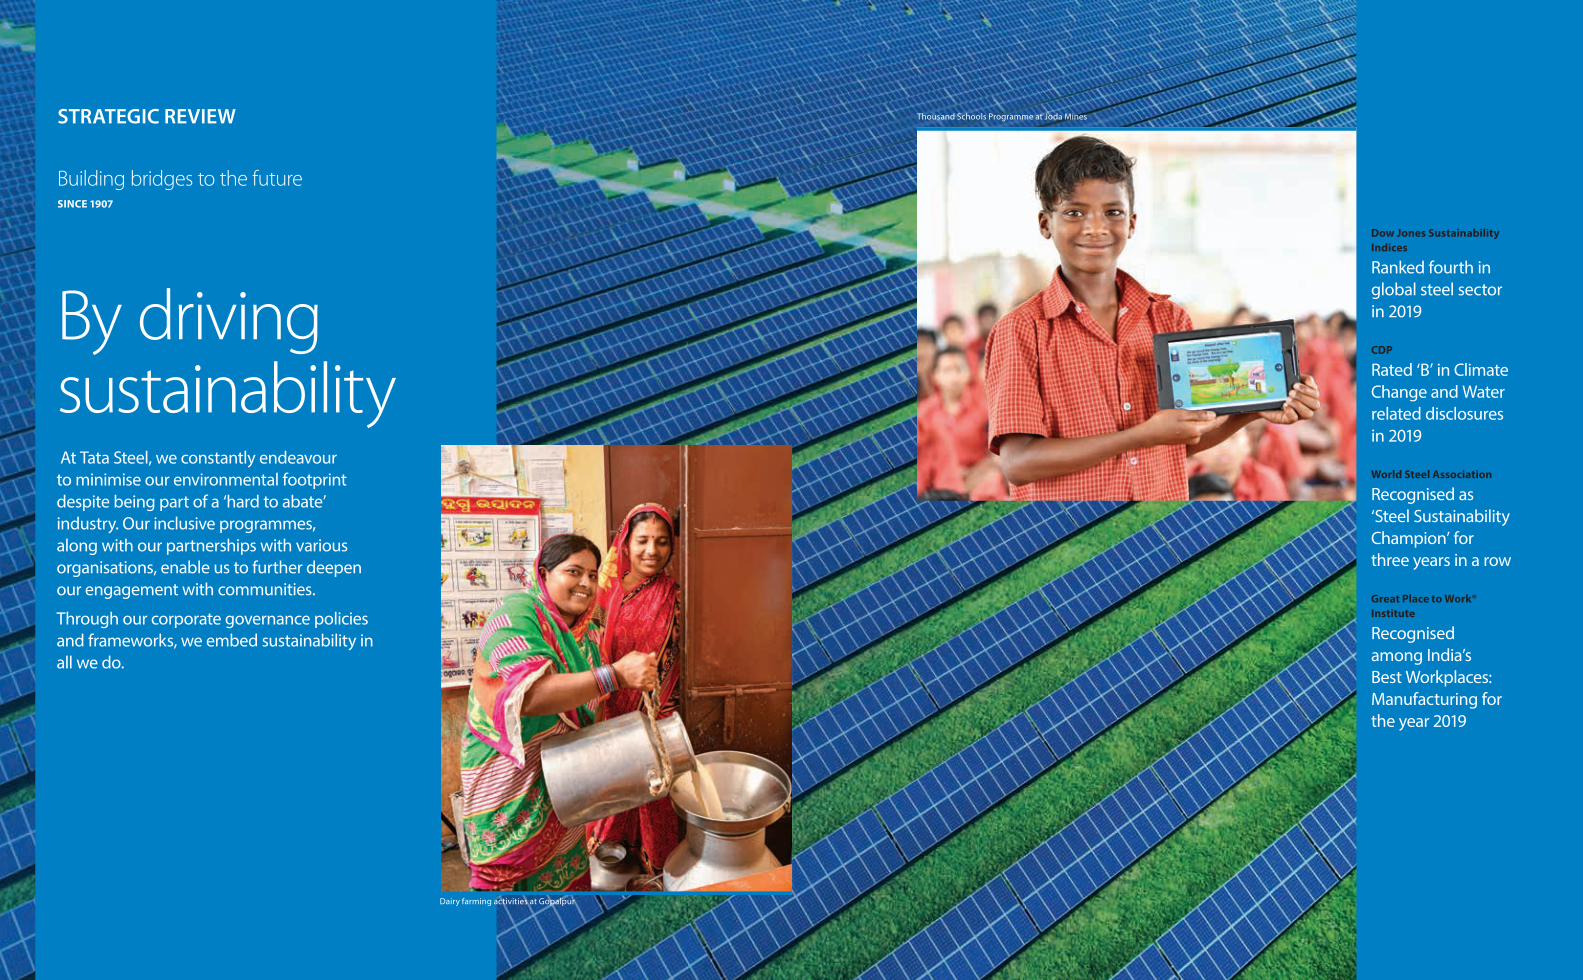
By driving sustainability At Tata Steel, we constantly endeavour to minimise our environmental footprint despite being part of a ‘hard to abate’ industry. Our inclusive programmes, along with our partnerships with various organisations, enable us to further deepen our engagement with communities.
Through our corporate governance policies and frameworks, we embed sustainability in all we do.
Dow Jones Sustainability Indices
Ranked fourth in global steel sector in 2019
CDP
Rated ‘B’ in Climate Change and Water related disclosures in 2019
World Steel Association
Recognised as ‘Steel Sustainability Champion’ for three years in a row
Great Place to Work® Institute
Recognised among India’s Best Workplaces: Manufacturing for the year 2019
Building bridges to the future SINCE 1907
STRATEGIC REVIEW Thousand Schools Programme at Joda Mines
Dairy farming activities at Gopalpur
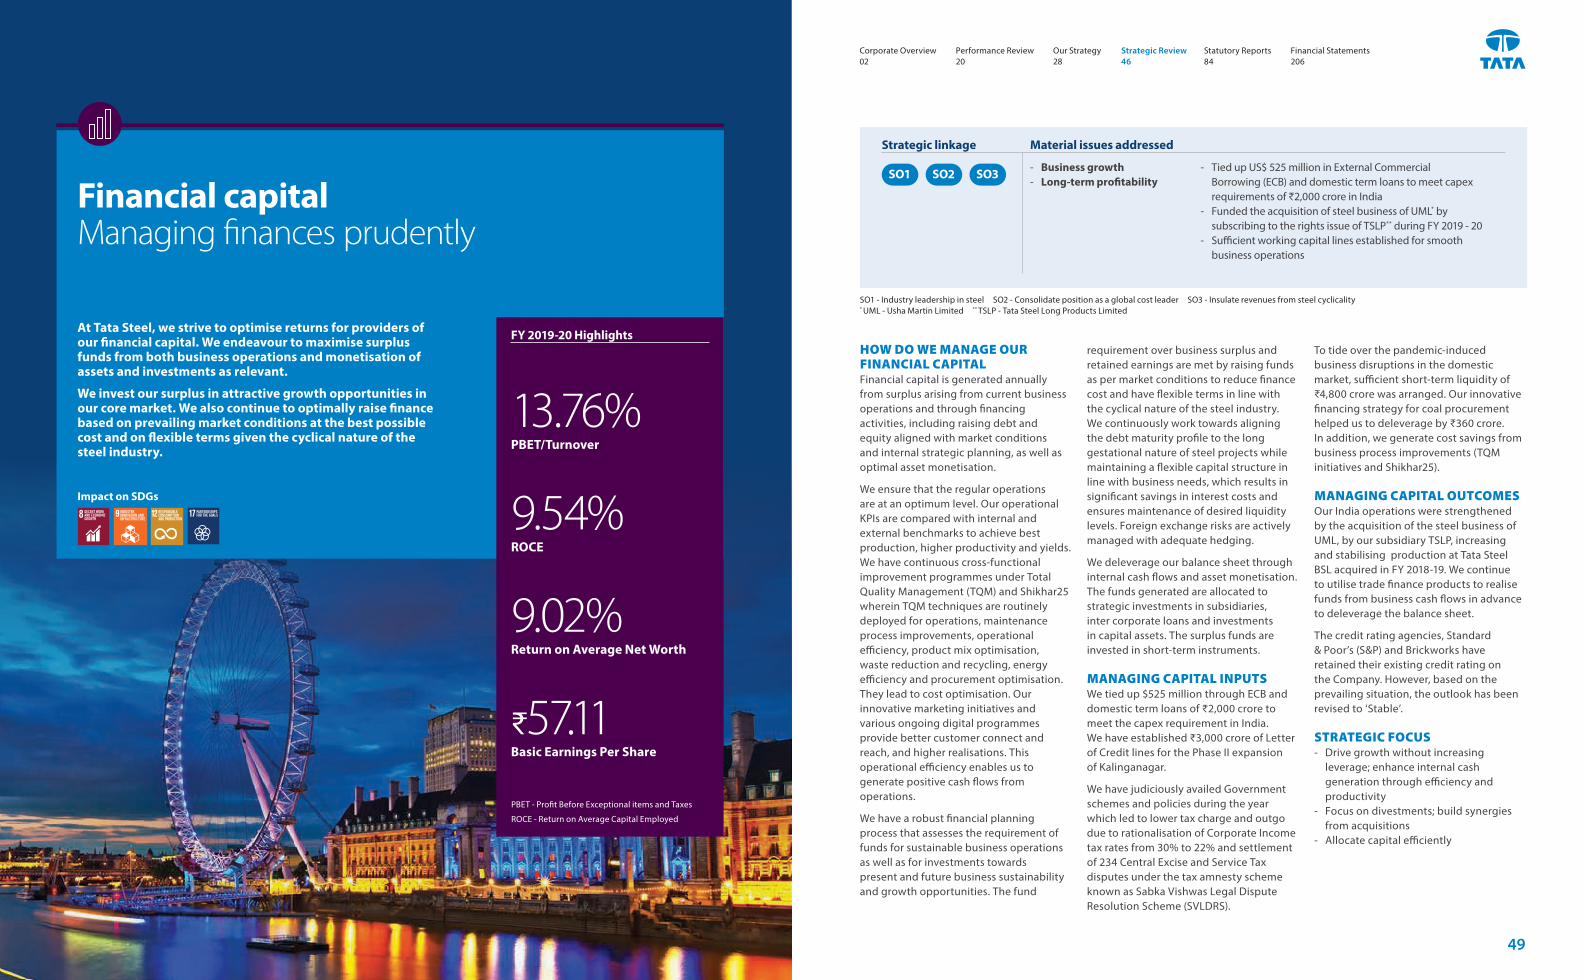
Financial capitalManaging finances prudently
At Tata Steel, we strive to optimise returns for providers of our financial capital. We endeavour to maximise surplus funds from both business operations and monetisation of assets and investments as relevant.
We invest our surplus in attractive growth opportunities in our core market. We also continue to optimally raise finance based on prevailing market conditions at the best possible cost and on flexible terms given the cyclical nature of the steel industry.
‐ Business growth ‐ Long-term profitability
‐ Tied up US$ 525 million in External Commercial Borrowing (ECB) and domestic term loans to meet capex requirements of ₹2,000 crore in India
‐ Funded the acquisition of steel business of UML* by subscribing to the rights issue of TSLP** during FY 2019 - 20
‐ Sufficient working capital lines established for smooth business operations
13.76%PBET/Turnover
9.54%ROCE
9.02%Return on Average Net Worth
₹57.11Basic Earnings Per Share
Strategic linkage Material issues addressed
SO1 SO2 SO3
HOW DO WE MANAGE OUR FINANCIAL CAPITALFinancial capital is generated annually from surplus arising from current business operations and through financing activities, including raising debt and equity aligned with market conditions and internal strategic planning, as well as optimal asset monetisation.
We ensure that the regular operations are at an optimum level. Our operational KPIs are compared with internal and external benchmarks to achieve best production, higher productivity and yields. We have continuous cross-functional improvement programmes under Total Quality Management (TQM) and Shikhar25 wherein TQM techniques are routinely deployed for operations, maintenance process improvements, operational efficiency, product mix optimisation, waste reduction and recycling, energy efficiency and procurement optimisation. They lead to cost optimisation. Our innovative marketing initiatives and various ongoing digital programmes provide better customer connect and reach, and higher realisations. This operational efficiency enables us to generate positive cash flows from operations.
We have a robust financial planning process that assesses the requirement of funds for sustainable business operations as well as for investments towards present and future business sustainability and growth opportunities. The fund
requirement over business surplus and retained earnings are met by raising funds as per market conditions to reduce finance cost and have flexible terms in line with the cyclical nature of the steel industry. We continuously work towards aligning the debt maturity profile to the long gestational nature of steel projects while maintaining a flexible capital structure in line with business needs, which results in significant savings in interest costs and ensures maintenance of desired liquidity levels. Foreign exchange risks are actively managed with adequate hedging.
We deleverage our balance sheet through internal cash flows and asset monetisation. The funds generated are allocated to strategic investments in subsidiaries, inter corporate loans and investments in capital assets. The surplus funds are invested in short-term instruments.
MANAGING CAPITAL INPUTS We tied up $525 million through ECB and domestic term loans of ₹2,000 crore to meet the capex requirement in India. We have established ₹3,000 crore of Letter of Credit lines for the Phase II expansion of Kalinganagar.
We have judiciously availed Government schemes and policies during the year which led to lower tax charge and outgo due to rationalisation of Corporate Income tax rates from 30% to 22% and settlement of 234 Central Excise and Service Tax disputes under the tax amnesty scheme known as Sabka Vishwas Legal Dispute Resolution Scheme (SVLDRS).
SO1 - Industry leadership in steel SO2 - Consolidate position as a global cost leader SO3 - Insulate revenues from steel cyclicality * UML - Usha Martin Limited ** TSLP - Tata Steel Long Products Limited
FY 2019-20 Highlights
Impact on SDGs
To tide over the pandemic-induced business disruptions in the domestic market, sufficient short-term liquidity of ₹4,800 crore was arranged. Our innovative financing strategy for coal procurement helped us to deleverage by ₹360 crore. In addition, we generate cost savings from business process improvements (TQM initiatives and Shikhar25).
MANAGING CAPITAL OUTCOMES Our India operations were strengthened by the acquisition of the steel business of UML, by our subsidiary TSLP, increasing and stabilising production at Tata Steel BSL acquired in FY 2018-19. We continue to utilise trade finance products to realise funds from business cash flows in advance to deleverage the balance sheet.
The credit rating agencies, Standard & Poor’s (S&P) and Brickworks have retained their existing credit rating on the Company. However, based on the prevailing situation, the outlook has been revised to ‘Stable’.
STRATEGIC FOCUS ‐ Drive growth without increasing
leverage; enhance internal cash generation through efficiency and productivity
‐ Focus on divestments; build synergies from acquisitions
‐ Allocate capital efficiently
PBET - Profit Before Exceptional items and Taxes
ROCE - Return on Average Capital Employed
Corporate Overview 02
Strategic Review 46
Performance Review 20
Statutory Reports 84
Our Strategy 28
Financial Statements 206
49
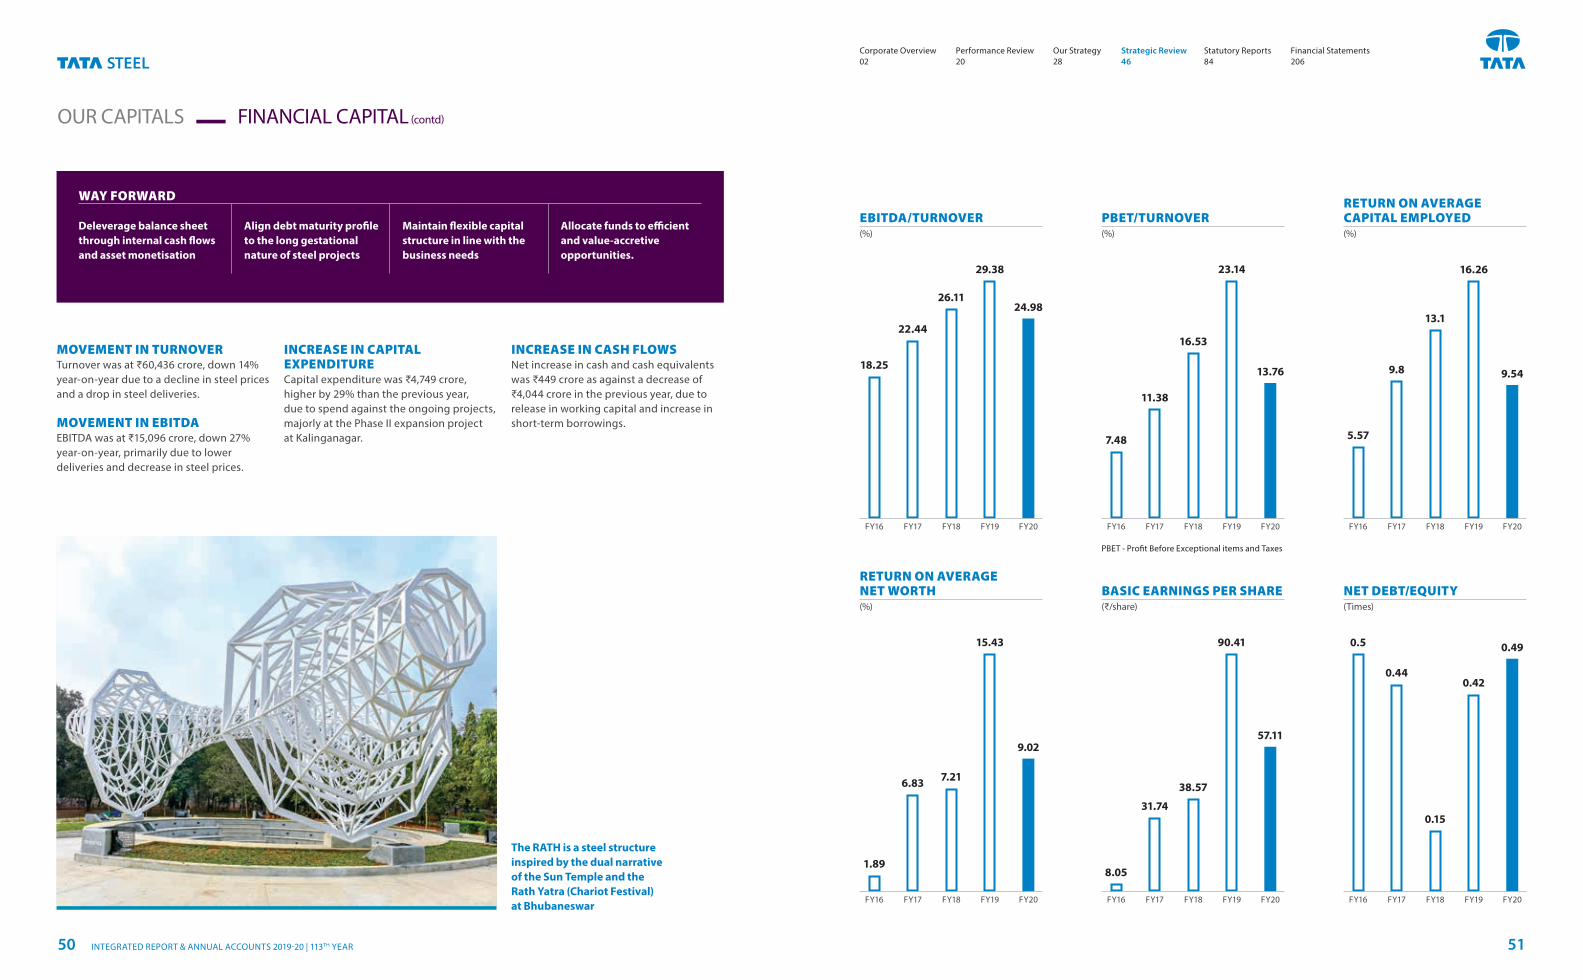
FY20 FY20
FY20
FY20
9.0257.11
9.54
0.4915.43 90.41
16.26
0.42
7.2138.57
13.1
0.15
6.83
31.74
9.8
0.44
1.898.05
5.57
0.5
FY19 FY19
FY19
FY19FY18 FY18
FY18
FY18FY17 FY17
FY17
FY17FY16 FY16
FY16
FY16
RETURN ON AVERAGE NET WORTH (%)
BASIC EARNINGS PER SHARE (₹/share)
RETURN ON AVERAGE CAPITAL EMPLOYED (%)
NET DEBT/EQUITY (Times)
FY20 FY20
24.98
13.76
29.38 23.14
26.11
16.5322.44
11.38
18.25
7.48
FY19 FY19FY18 FY18FY17 FY17FY16 FY16
EBITDA/TURNOVER (%)
PBET/TURNOVER (%)
WAY FORWARD
Deleverage balance sheet through internal cash flows and asset monetisation
Align debt maturity profile to the long gestational nature of steel projects
Maintain flexible capital structure in line with the business needs
Allocate funds to efficient and value-accretive opportunities.
MOVEMENT IN TURNOVERTurnover was at ₹60,436 crore, down 14% year-on-year due to a decline in steel prices and a drop in steel deliveries.
MOVEMENT IN EBITDAEBITDA was at ₹15,096 crore, down 27% year-on-year, primarily due to lower deliveries and decrease in steel prices.
OUR CAPITALS FINANCIAL CAPITAL (contd)
INCREASE IN CAPITAL EXPENDITURE Capital expenditure was ₹4,749 crore, higher by 29% than the previous year, due to spend against the ongoing projects, majorly at the Phase II expansion project at Kalinganagar.
INCREASE IN CASH FLOWSNet increase in cash and cash equivalents was ₹449 crore as against a decrease of ₹4,044 crore in the previous year, due to release in working capital and increase in short-term borrowings.
PBET - Profit Before Exceptional items and Taxes
The RATH is a steel structure inspired by the dual narrative of the Sun Temple and the Rath Yatra (Chariot Festival) at Bhubaneswar
Corporate Overview 02
Strategic Review 46
Performance Review 20
Statutory Reports 84
Our Strategy 28
Financial Statements 206
INTEGRATED REPORT & ANNUAL ACCOUNTS 2019-20 | 113TH YEAR50 51
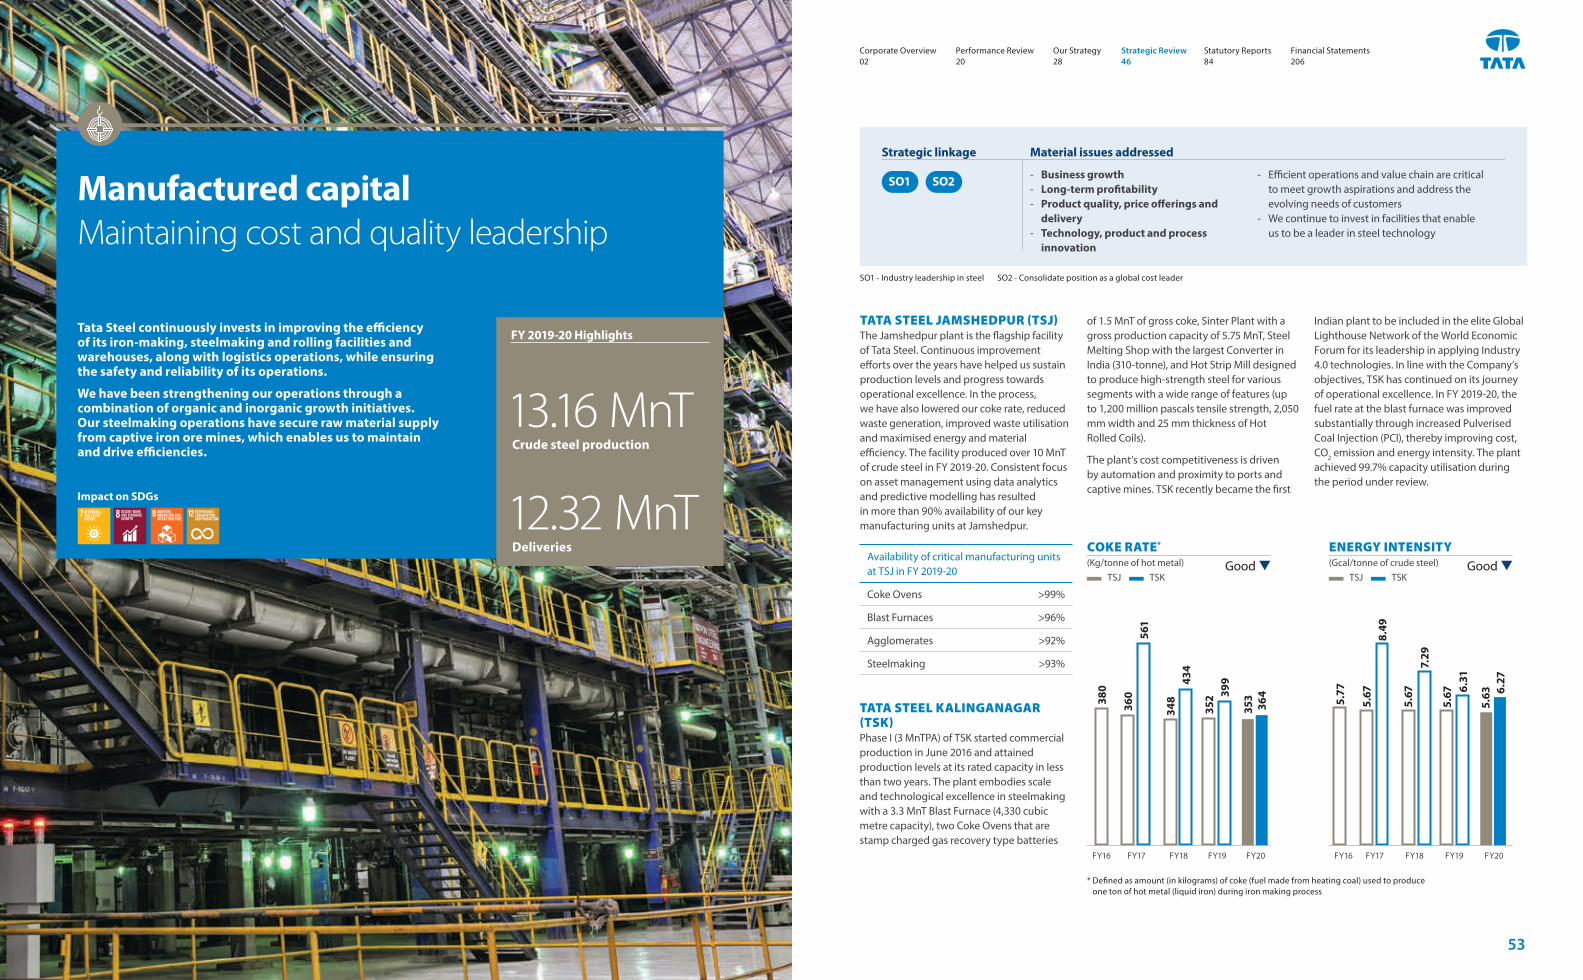
Manufactured capitalMaintaining cost and quality leadership
TATA STEEL JAMSHEDPUR (TSJ)The Jamshedpur plant is the flagship facility of Tata Steel. Continuous improvement efforts over the years have helped us sustain production levels and progress towards operational excellence. In the process, we have also lowered our coke rate, reduced waste generation, improved waste utilisation and maximised energy and material efficiency. The facility produced over 10 MnT of crude steel in FY 2019-20. Consistent focus on asset management using data analytics and predictive modelling has resulted in more than 90% availability of our key manufacturing units at Jamshedpur.
Tata Steel continuously invests in improving the efficiency of its iron-making, steelmaking and rolling facilities and warehouses, along with logistics operations, while ensuring the safety and reliability of its operations.
We have been strengthening our operations through a combination of organic and inorganic growth initiatives. Our steelmaking operations have secure raw material supply from captive iron ore mines, which enables us to maintain and drive efficiencies.
13.16 MnT Crude steel production
12.32 MnT Deliveries
FY 2019-20 Highlights
‐ Business growth ‐ Long-term profitability ‐ Product quality, price offerings and
delivery ‐ Technology, product and process
innovation
‐ Efficient operations and value chain are critical to meet growth aspirations and address the evolving needs of customers
‐ We continue to invest in facilities that enable us to be a leader in steel technology
Strategic linkage Material issues addressed
SO1 SO2
Availability of critical manufacturing units at TSJ in FY 2019-20
Coke Ovens >99%
Blast Furnaces >96%
Agglomerates >92%
Steelmaking >93%
of 1.5 MnT of gross coke, Sinter Plant with a gross production capacity of 5.75 MnT, Steel Melting Shop with the largest Converter in India (310-tonne), and Hot Strip Mill designed to produce high-strength steel for various segments with a wide range of features (up to 1,200 million pascals tensile strength, 2,050 mm width and 25 mm thickness of Hot Rolled Coils).
The plant’s cost competitiveness is driven by automation and proximity to ports and captive mines. TSK recently became the first
Indian plant to be included in the elite Global Lighthouse Network of the World Economic Forum for its leadership in applying Industry 4.0 technologies. In line with the Company’s objectives, TSK has continued on its journey of operational excellence. In FY 2019-20, the fuel rate at the blast furnace was improved substantially through increased Pulverised Coal Injection (PCI), thereby improving cost, CO2 emission and energy intensity. The plant achieved 99.7% capacity utilisation during the period under review.
SO1 - Industry leadership in steel SO2 - Consolidate position as a global cost leader
Impact on SDGs
COKE RATE* (Kg/tonne of hot metal)
TSJ TSK
ENERGY INTENSITY(Gcal/tonne of crude steel)
TSJ TSK
FY20
380
360
561
348
434
352 39
9
353
364
FY19FY18FY17FY16 FY20
5.77
5.67
8.49
5.67
7.29
5.67 6.
31
5.63 6.
27
FY19FY18FY17FY16
Good Good
TATA STEEL KALINGANAGAR (TSK)Phase I (3 MnTPA) of TSK started commercial production in June 2016 and attained production levels at its rated capacity in less than two years. The plant embodies scale and technological excellence in steelmaking with a 3.3 MnT Blast Furnace (4,330 cubic metre capacity), two Coke Ovens that are stamp charged gas recovery type batteries
* Defined as amount (in kilograms) of coke (fuel made from heating coal) used to produce one ton of hot metal (liquid iron) during iron making process
Corporate Overview 02
Strategic Review 46
Performance Review 20
Statutory Reports 84
Our Strategy 28
Financial Statements 206
53
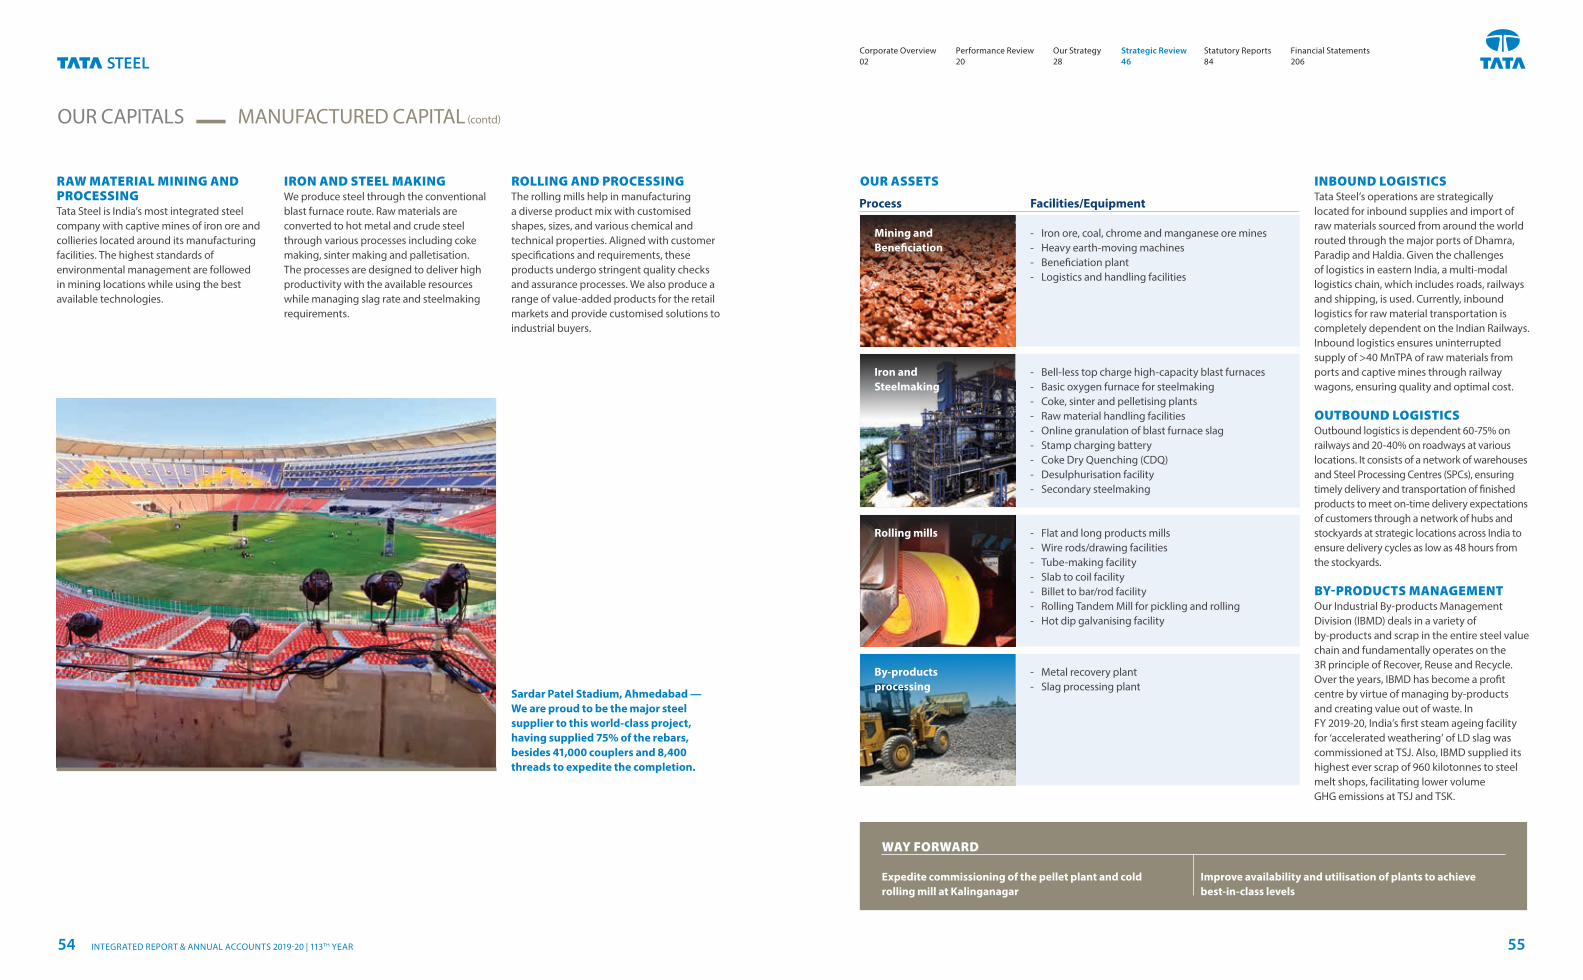
WAY FORWARD
OUR CAPITALS MANUFACTURED CAPITAL (contd)
RAW MATERIAL MINING AND PROCESSINGTata Steel is India’s most integrated steel company with captive mines of iron ore and collieries located around its manufacturing facilities. The highest standards of environmental management are followed in mining locations while using the best available technologies.
Expedite commissioning of the pellet plant and cold rolling mill at Kalinganagar
Improve availability and utilisation of plants to achieve best-in-class levels
INBOUND LOGISTICSTata Steel’s operations are strategically located for inbound supplies and import of raw materials sourced from around the world routed through the major ports of Dhamra, Paradip and Haldia. Given the challenges of logistics in eastern India, a multi-modal logistics chain, which includes roads, railways and shipping, is used. Currently, inbound logistics for raw material transportation is completely dependent on the Indian Railways. Inbound logistics ensures uninterrupted supply of >40 MnTPA of raw materials from ports and captive mines through railway wagons, ensuring quality and optimal cost.
OUTBOUND LOGISTICSOutbound logistics is dependent 60-75% on railways and 20-40% on roadways at various locations. It consists of a network of warehouses and Steel Processing Centres (SPCs), ensuring timely delivery and transportation of finished products to meet on-time delivery expectations of customers through a network of hubs and stockyards at strategic locations across India to ensure delivery cycles as low as 48 hours from the stockyards.
BY-PRODUCTS MANAGEMENTOur Industrial By-products Management Division (IBMD) deals in a variety of by-products and scrap in the entire steel value chain and fundamentally operates on the 3R principle of Recover, Reuse and Recycle. Over the years, IBMD has become a profit centre by virtue of managing by-products and creating value out of waste. In FY 2019-20, India’s first steam ageing facility for ‘accelerated weathering’ of LD slag was commissioned at TSJ. Also, IBMD supplied its highest ever scrap of 960 kilotonnes to steel melt shops, facilitating lower volume GHG emissions at TSJ and TSK.
OUR ASSETS
Process
Rolling mills
By-products processing
‐ Iron ore, coal, chrome and manganese ore mines ‐ Heavy earth-moving machines ‐ Beneficiation plant ‐ Logistics and handling facilities
‐ Bell-less top charge high-capacity blast furnaces ‐ Basic oxygen furnace for steelmaking ‐ Coke, sinter and pelletising plants ‐ Raw material handling facilities ‐ Online granulation of blast furnace slag ‐ Stamp charging battery ‐ Coke Dry Quenching (CDQ) ‐ Desulphurisation facility ‐ Secondary steelmaking
‐ Flat and long products mills ‐ Wire rods/drawing facilities ‐ Tube-making facility ‐ Slab to coil facility ‐ Billet to bar/rod facility ‐ Rolling Tandem Mill for pickling and rolling ‐ Hot dip galvanising facility
‐ Metal recovery plant ‐ Slag processing plant
Facilities/Equipment
Mining and Beneficiation
Iron and Steelmaking
Sardar Patel Stadium, Ahmedabad — We are proud to be the major steel supplier to this world-class project, having supplied 75% of the rebars, besides 41,000 couplers and 8,400 threads to expedite the completion.
IRON AND STEEL MAKINGWe produce steel through the conventional blast furnace route. Raw materials are converted to hot metal and crude steel through various processes including coke making, sinter making and palletisation. The processes are designed to deliver high productivity with the available resources while managing slag rate and steelmaking requirements.
ROLLING AND PROCESSINGThe rolling mills help in manufacturing a diverse product mix with customised shapes, sizes, and various chemical and technical properties. Aligned with customer specifications and requirements, these products undergo stringent quality checks and assurance processes. We also produce a range of value-added products for the retail markets and provide customised solutions to industrial buyers.
Corporate Overview 02
Strategic Review 46
Performance Review 20
Statutory Reports 84
Our Strategy 28
Financial Statements 206
INTEGRATED REPORT & ANNUAL ACCOUNTS 2019-20 | 113TH YEAR54 55
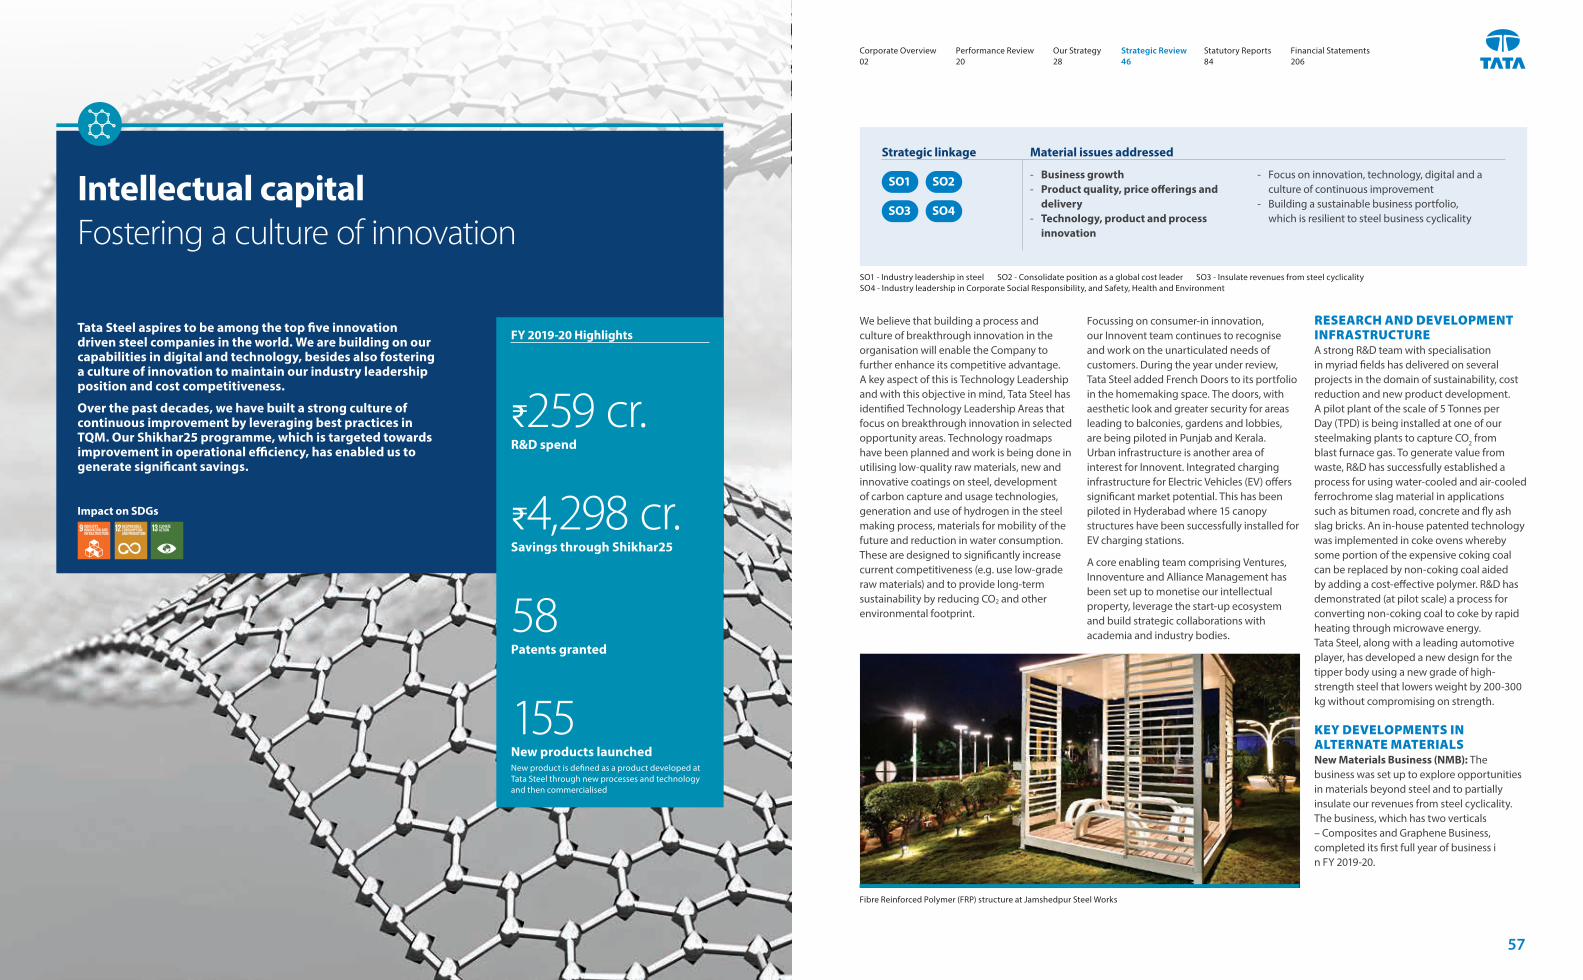
Intellectual capital Fostering a culture of innovation
Tata Steel aspires to be among the top five innovation driven steel companies in the world. We are building on our capabilities in digital and technology, besides also fostering a culture of innovation to maintain our industry leadership position and cost competitiveness.
Over the past decades, we have built a strong culture of continuous improvement by leveraging best practices in TQM. Our Shikhar25 programme, which is targeted towards improvement in operational efficiency, has enabled us to generate significant savings.
We believe that building a process and culture of breakthrough innovation in the organisation will enable the Company to further enhance its competitive advantage. A key aspect of this is Technology Leadership and with this objective in mind, Tata Steel has identified Technology Leadership Areas that focus on breakthrough innovation in selected opportunity areas. Technology roadmaps have been planned and work is being done in utilising low-quality raw materials, new and innovative coatings on steel, development of carbon capture and usage technologies, generation and use of hydrogen in the steel making process, materials for mobility of the future and reduction in water consumption. These are designed to significantly increase current competitiveness (e.g. use low-grade raw materials) and to provide long-term sustainability by reducing CO2 and other environmental footprint.
₹259 cr.R&D spend
₹4,298 cr.Savings through Shikhar25
58Patents granted
155New products launchedNew product is defined as a product developed at Tata Steel through new processes and technology and then commercialised
FY 2019-20 Highlights
‐ Business growth ‐ Product quality, price offerings and
delivery ‐ Technology, product and process
innovation
‐ Focus on innovation, technology, digital and a culture of continuous improvement
‐ Building a sustainable business portfolio, which is resilient to steel business cyclicality
Strategic linkage Material issues addressed
SO1
SO3
SO2
SO4
SO1 - Industry leadership in steel SO2 - Consolidate position as a global cost leader SO3 - Insulate revenues from steel cyclicalitySO4 - Industry leadership in Corporate Social Responsibility, and Safety, Health and Environment
Focussing on consumer-in innovation, our Innovent team continues to recognise and work on the unarticulated needs of customers. During the year under review, Tata Steel added French Doors to its portfolio in the homemaking space. The doors, with aesthetic look and greater security for areas leading to balconies, gardens and lobbies, are being piloted in Punjab and Kerala. Urban infrastructure is another area of interest for Innovent. Integrated charging infrastructure for Electric Vehicles (EV) offers significant market potential. This has been piloted in Hyderabad where 15 canopy structures have been successfully installed for EV charging stations.
A core enabling team comprising Ventures, Innoventure and Alliance Management has been set up to monetise our intellectual property, leverage the start-up ecosystem and build strategic collaborations with academia and industry bodies.
Impact on SDGs
RESEARCH AND DEVELOPMENT INFRASTRUCTUREA strong R&D team with specialisation in myriad fields has delivered on several projects in the domain of sustainability, cost reduction and new product development. A pilot plant of the scale of 5 Tonnes per Day (TPD) is being installed at one of our steelmaking plants to capture CO2 from blast furnace gas. To generate value from waste, R&D has successfully established a process for using water-cooled and air-cooled ferrochrome slag material in applications such as bitumen road, concrete and fly ash slag bricks. An in-house patented technology was implemented in coke ovens whereby some portion of the expensive coking coal can be replaced by non-coking coal aided by adding a cost-effective polymer. R&D has demonstrated (at pilot scale) a process for converting non-coking coal to coke by rapid heating through microwave energy. Tata Steel, along with a leading automotive player, has developed a new design for the tipper body using a new grade of high-strength steel that lowers weight by 200-300 kg without compromising on strength.
KEY DEVELOPMENTS IN ALTERNATE MATERIALSNew Materials Business (NMB): The business was set up to explore opportunities in materials beyond steel and to partially insulate our revenues from steel cyclicality. The business, which has two verticals – Composites and Graphene Business, completed its first full year of business i n FY 2019-20.
Fibre Reinforced Polymer (FRP) structure at Jamshedpur Steel Works
Corporate Overview 02
Strategic Review 46
Performance Review 20
Statutory Reports 84
Our Strategy 28
Financial Statements 206
57
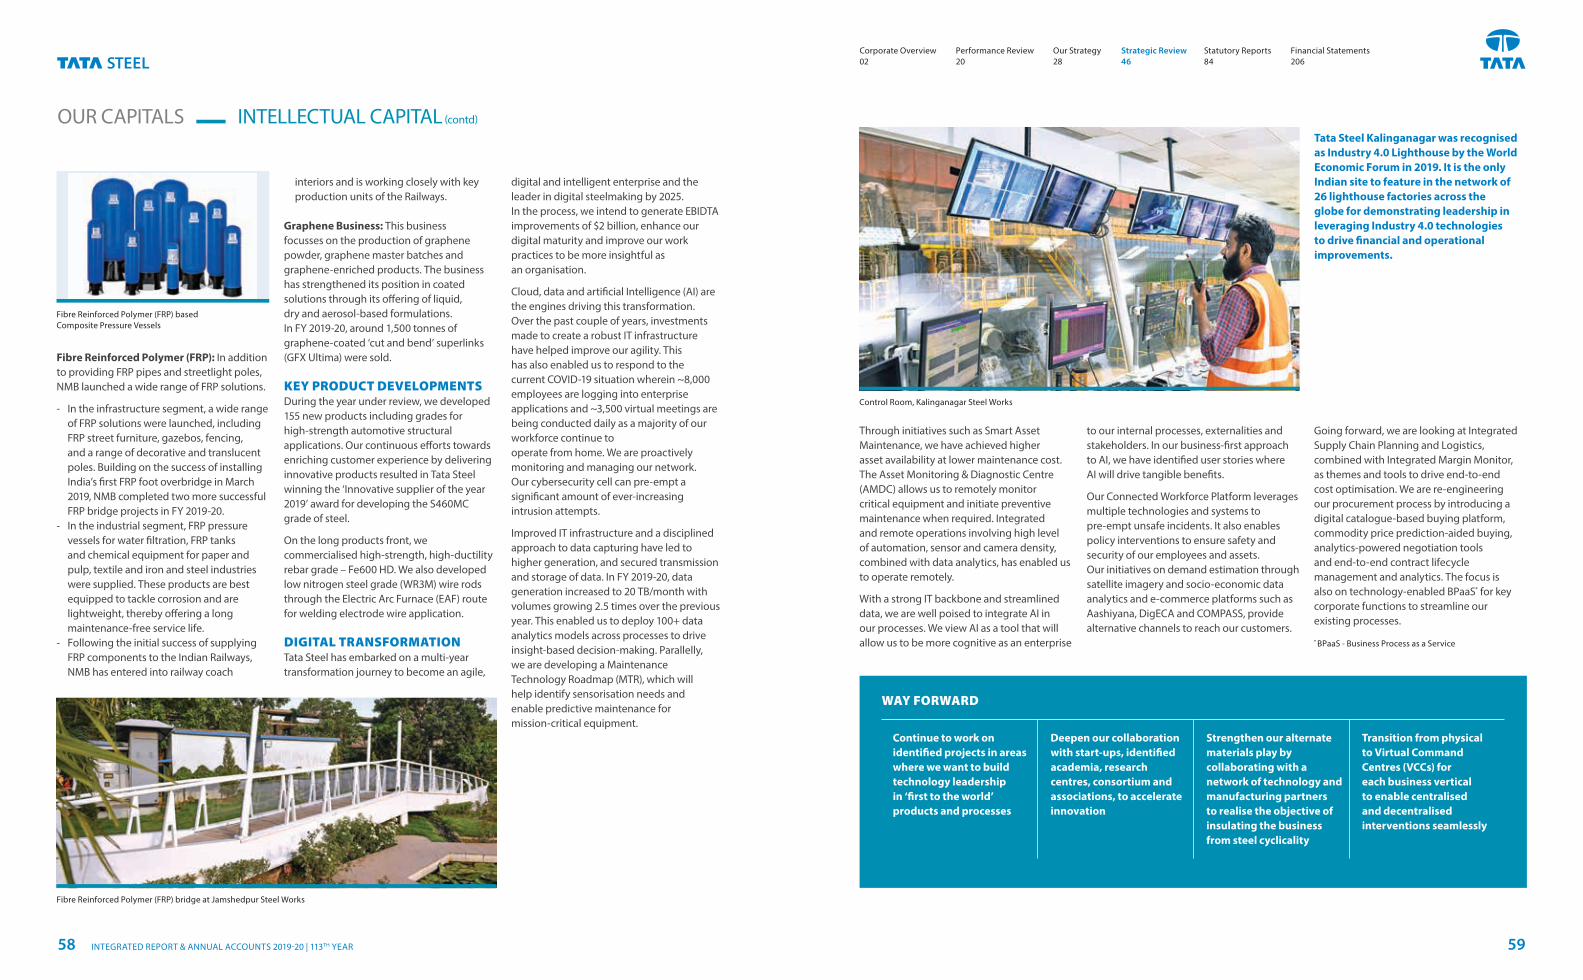
interiors and is working closely with key production units of the Railways.
Graphene Business: This business focusses on the production of graphene powder, graphene master batches and graphene-enriched products. The business has strengthened its position in coated solutions through its offering of liquid, dry and aerosol-based formulations. In FY 2019-20, around 1,500 tonnes of graphene-coated ‘cut and bend’ superlinks (GFX Ultima) were sold.
KEY PRODUCT DEVELOPMENTS During the year under review, we developed 155 new products including grades for high-strength automotive structural applications. Our continuous efforts towards enriching customer experience by delivering innovative products resulted in Tata Steel winning the ‘Innovative supplier of the year 2019’ award for developing the S460MC grade of steel.
On the long products front, we commercialised high-strength, high-ductility rebar grade – Fe600 HD. We also developed low nitrogen steel grade (WR3M) wire rods through the Electric Arc Furnace (EAF) route for welding electrode wire application.
DIGITAL TRANSFORMATIONTata Steel has embarked on a multi-year transformation journey to become an agile,
Through initiatives such as Smart Asset Maintenance, we have achieved higher asset availability at lower maintenance cost. The Asset Monitoring & Diagnostic Centre (AMDC) allows us to remotely monitor critical equipment and initiate preventive maintenance when required. Integrated and remote operations involving high level of automation, sensor and camera density, combined with data analytics, has enabled us to operate remotely.
With a strong IT backbone and streamlined data, we are well poised to integrate AI in our processes. We view AI as a tool that will allow us to be more cognitive as an enterprise
OUR CAPITALS INTELLECTUAL CAPITAL (contd)
WAY FORWARD
Continue to work on identified projects in areas where we want to build technology leadership in ‘first to the world’ products and processes
Deepen our collaboration with start-ups, identified academia, research centres, consortium and associations, to accelerate innovation
Strengthen our alternate materials play by collaborating with a network of technology and manufacturing partners to realise the objective of insulating the business from steel cyclicality
Transition from physical to Virtual Command Centres (VCCs) for each business vertical to enable centralised and decentralised interventions seamlessly
digital and intelligent enterprise and the leader in digital steelmaking by 2025. In the process, we intend to generate EBIDTA improvements of $2 billion, enhance our digital maturity and improve our work practices to be more insightful as an organisation.
Cloud, data and artificial Intelligence (AI) are the engines driving this transformation. Over the past couple of years, investments made to create a robust IT infrastructure have helped improve our agility. This has also enabled us to respond to the current COVID-19 situation wherein ~8,000 employees are logging into enterprise applications and ~3,500 virtual meetings are being conducted daily as a majority of our workforce continue to operate from home. We are proactively monitoring and managing our network. Our cybersecurity cell can pre-empt a significant amount of ever-increasing intrusion attempts.
Improved IT infrastructure and a disciplined approach to data capturing have led to higher generation, and secured transmission and storage of data. In FY 2019-20, data generation increased to 20 TB/month with volumes growing 2.5 times over the previous year. This enabled us to deploy 100+ data analytics models across processes to drive insight-based decision-making. Parallelly, we are developing a Maintenance Technology Roadmap (MTR), which will help identify sensorisation needs and enable predictive maintenance for mission-critical equipment.
to our internal processes, externalities and stakeholders. In our business-first approach to AI, we have identified user stories where AI will drive tangible benefits.
Our Connected Workforce Platform leverages multiple technologies and systems to pre-empt unsafe incidents. It also enables policy interventions to ensure safety and security of our employees and assets. Our initiatives on demand estimation through satellite imagery and socio-economic data analytics and e-commerce platforms such as Aashiyana, DigECA and COMPASS, provide alternative channels to reach our customers.
Fibre Reinforced Polymer (FRP): In addition to providing FRP pipes and streetlight poles, NMB launched a wide range of FRP solutions.
‐ In the infrastructure segment, a wide range of FRP solutions were launched, including FRP street furniture, gazebos, fencing, and a range of decorative and translucent poles. Building on the success of installing India’s first FRP foot overbridge in March 2019, NMB completed two more successful FRP bridge projects in FY 2019-20.
‐ In the industrial segment, FRP pressure vessels for water filtration, FRP tanks and chemical equipment for paper and pulp, textile and iron and steel industries were supplied. These products are best equipped to tackle corrosion and are lightweight, thereby offering a long maintenance-free service life.
‐ Following the initial success of supplying FRP components to the Indian Railways, NMB has entered into railway coach
Tata Steel Kalinganagar was recognised as Industry 4.0 Lighthouse by the World Economic Forum in 2019. It is the only Indian site to feature in the network of 26 lighthouse factories across the globe for demonstrating leadership in leveraging Industry 4.0 technologies to drive financial and operational improvements.
Going forward, we are looking at Integrated Supply Chain Planning and Logistics, combined with Integrated Margin Monitor, as themes and tools to drive end-to-end cost optimisation. We are re-engineering our procurement process by introducing a digital catalogue-based buying platform, commodity price prediction-aided buying, analytics-powered negotiation tools and end-to-end contract lifecycle management and analytics. The focus is also on technology-enabled BPaaS* for key corporate functions to streamline our existing processes.
* BPaaS - Business Process as a Service
Fibre Reinforced Polymer (FRP) bridge at Jamshedpur Steel Works
Control Room, Kalinganagar Steel Works
Fibre Reinforced Polymer (FRP) based Composite Pressure Vessels
Corporate Overview 02
Strategic Review 46
Performance Review 20
Statutory Reports 84
Our Strategy 28
Financial Statements 206
INTEGRATED REPORT & ANNUAL ACCOUNTS 2019-20 | 113TH YEAR58 59
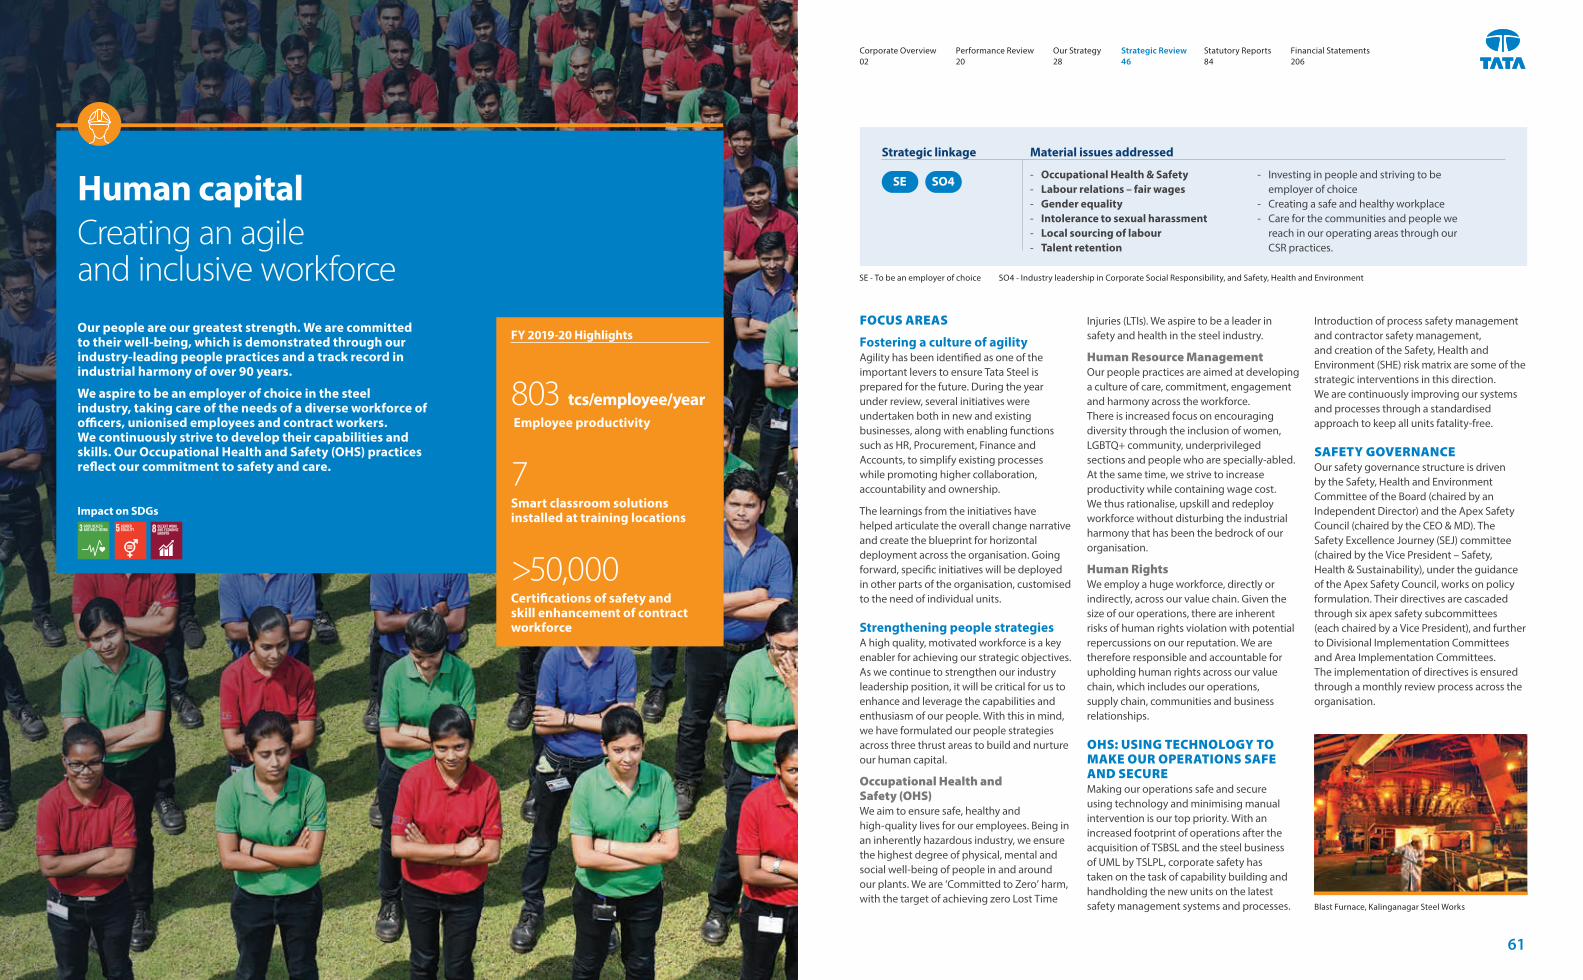
Human capital Creating an agile and inclusive workforce
Our people are our greatest strength. We are committed to their well-being, which is demonstrated through our industry-leading people practices and a track record in industrial harmony of over 90 years.
We aspire to be an employer of choice in the steel industry, taking care of the needs of a diverse workforce of officers, unionised employees and contract workers. We continuously strive to develop their capabilities and skills. Our Occupational Health and Safety (OHS) practices reflect our commitment to safety and care.
FOCUS AREAS
Fostering a culture of agility Agility has been identified as one of the important levers to ensure Tata Steel is prepared for the future. During the year under review, several initiatives were undertaken both in new and existing businesses, along with enabling functions such as HR, Procurement, Finance and Accounts, to simplify existing processes while promoting higher collaboration, accountability and ownership.
The learnings from the initiatives have helped articulate the overall change narrative and create the blueprint for horizontal deployment across the organisation. Going forward, specific initiatives will be deployed in other parts of the organisation, customised to the need of individual units.
Strengthening people strategiesA high quality, motivated workforce is a key enabler for achieving our strategic objectives. As we continue to strengthen our industry leadership position, it will be critical for us to enhance and leverage the capabilities and enthusiasm of our people. With this in mind, we have formulated our people strategies across three thrust areas to build and nurture our human capital.
Occupational Health and Safety (OHS)We aim to ensure safe, healthy and high-quality lives for our employees. Being in an inherently hazardous industry, we ensure the highest degree of physical, mental and social well-being of people in and around our plants. We are ‘Committed to Zero’ harm, with the target of achieving zero Lost Time
803 tcs/employee/year Employee productivity
7 Smart classroom solutions installed at training locations
>50,000Certifications of safety and skill enhancement of contract workforce
FY 2019-20 Highlights
‐ Occupational Health & Safety ‐ Labour relations – fair wages ‐ Gender equality ‐ Intolerance to sexual harassment ‐ Local sourcing of labour ‐ Talent retention
‐ Investing in people and striving to be employer of choice
‐ Creating a safe and healthy workplace ‐ Care for the communities and people we
reach in our operating areas through our CSR practices.
Strategic linkage Material issues addressed
SE
Injuries (LTIs). We aspire to be a leader in safety and health in the steel industry.
Human Resource ManagementOur people practices are aimed at developing a culture of care, commitment, engagement and harmony across the workforce. There is increased focus on encouraging diversity through the inclusion of women, LGBTQ+ community, underprivileged sections and people who are specially-abled. At the same time, we strive to increase productivity while containing wage cost. We thus rationalise, upskill and redeploy workforce without disturbing the industrial harmony that has been the bedrock of our organisation.
Human RightsWe employ a huge workforce, directly or indirectly, across our value chain. Given the size of our operations, there are inherent risks of human rights violation with potential repercussions on our reputation. We are therefore responsible and accountable for upholding human rights across our value chain, which includes our operations, supply chain, communities and business relationships.
OHS: USING TECHNOLOGY TO MAKE OUR OPERATIONS SAFE AND SECUREMaking our operations safe and secure using technology and minimising manual intervention is our top priority. With an increased footprint of operations after the acquisition of TSBSL and the steel business of UML by TSLPL, corporate safety has taken on the task of capability building and handholding the new units on the latest safety management systems and processes.
Introduction of process safety management and contractor safety management, and creation of the Safety, Health and Environment (SHE) risk matrix are some of the strategic interventions in this direction. We are continuously improving our systems and processes through a standardised approach to keep all units fatality-free.
SAFETY GOVERNANCEOur safety governance structure is driven by the Safety, Health and Environment Committee of the Board (chaired by an Independent Director) and the Apex Safety Council (chaired by the CEO & MD). The Safety Excellence Journey (SEJ) committee (chaired by the Vice President – Safety, Health & Sustainability), under the guidance of the Apex Safety Council, works on policy formulation. Their directives are cascaded through six apex safety subcommittees (each chaired by a Vice President), and further to Divisional Implementation Committees and Area Implementation Committees. The implementation of directives is ensured through a monthly review process across the organisation.
Impact on SDGs
SE - To be an employer of choice SO4 - Industry leadership in Corporate Social Responsibility, and Safety, Health and Environment
SO4
Blast Furnace, Kalinganagar Steel Works
Corporate Overview 02
Strategic Review 46
Performance Review 20
Statutory Reports 84
Our Strategy 28
Financial Statements 206
61
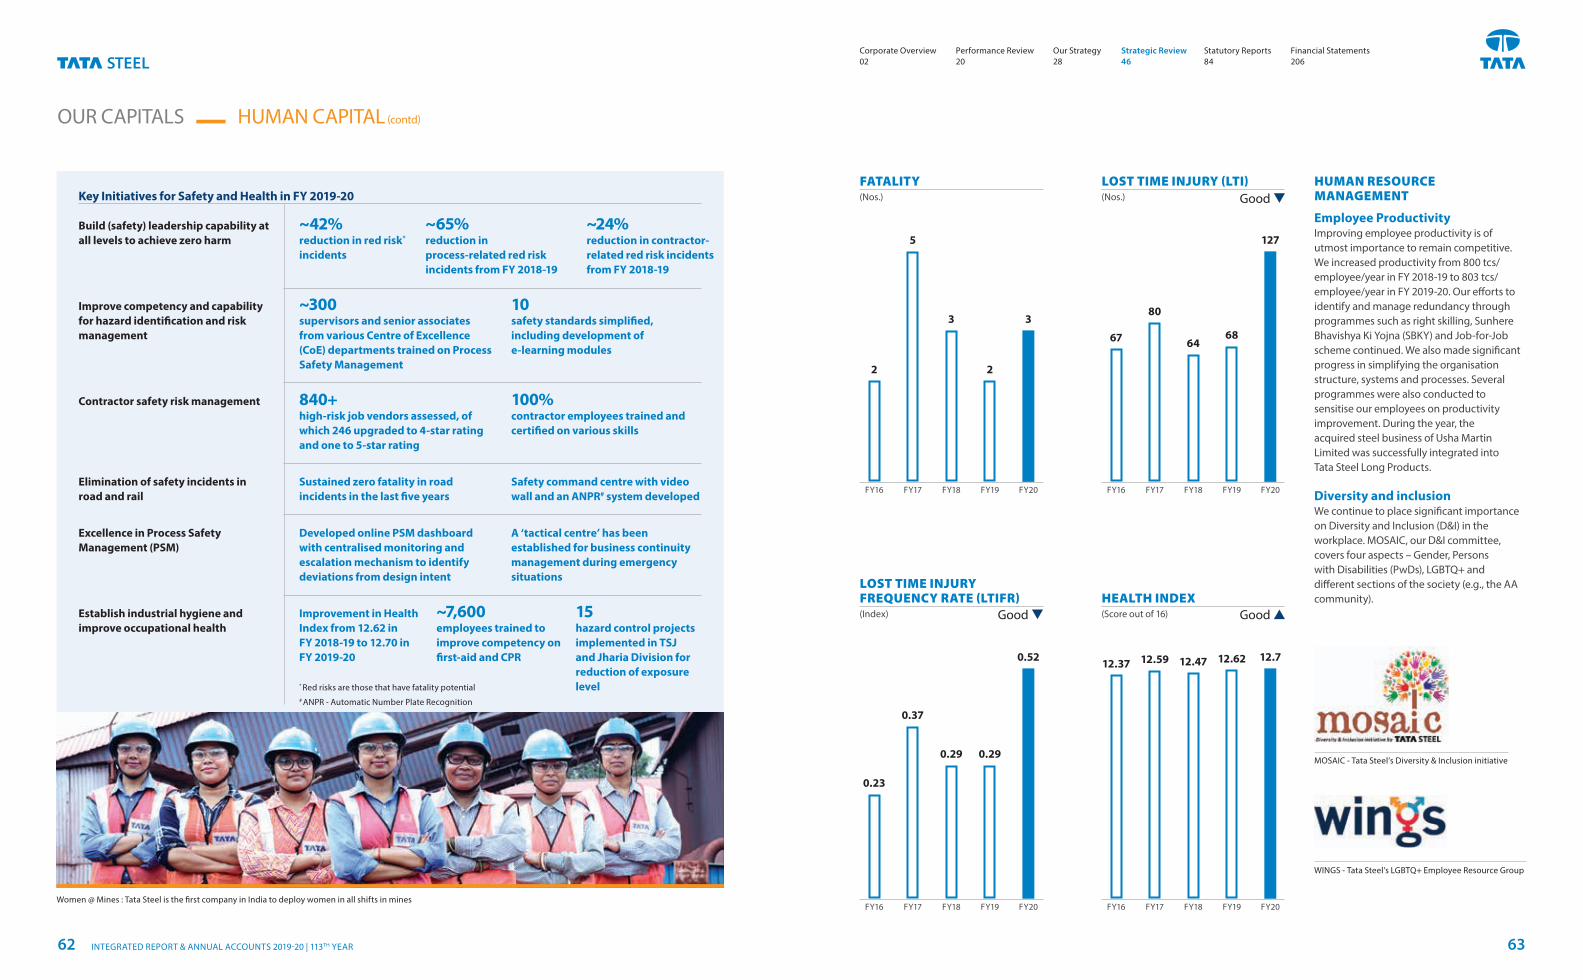
OUR CAPITALS HUMAN CAPITAL (contd)
Key Initiatives for Safety and Health in FY 2019-20
Build (safety) leadership capability at all levels to achieve zero harm
Improve competency and capability for hazard identification and risk management
Contractor safety risk management
Elimination of safety incidents in road and rail
Excellence in Process Safety Management (PSM)
Establish industrial hygiene and improve occupational health
~42% reduction in red risk* incidents
Improvement in Health Index from 12.62 in FY 2018-19 to 12.70 in FY 2019-20
~300supervisors and senior associates from various Centre of Excellence (CoE) departments trained on Process Safety Management
840+high-risk job vendors assessed, of which 246 upgraded to 4-star rating and one to 5-star rating
Sustained zero fatality in road incidents in the last five years
Developed online PSM dashboard with centralised monitoring and escalation mechanism to identify deviations from design intent
~65% reduction in process-related red risk incidents from FY 2018-19
~7,600employees trained to improve competency on first-aid and CPR
~24% reduction in contractor-related red risk incidents from FY 2018-19
15 hazard control projects implemented in TSJ and Jharia Division for reduction of exposure level
10 safety standards simplified, including development of e-learning modules
100% contractor employees trained and certified on various skills
Safety command centre with video wall and an ANPR# system developed
A ‘tactical centre’ has been established for business continuity management during emergency situations
Women @ Mines : Tata Steel is the first company in India to deploy women in all shifts in mines
HUMAN RESOURCE MANAGEMENT
Employee ProductivityImproving employee productivity is of utmost importance to remain competitive. We increased productivity from 800 tcs/employee/year in FY 2018-19 to 803 tcs/employee/year in FY 2019-20. Our efforts to identify and manage redundancy through programmes such as right skilling, Sunhere Bhavishya Ki Yojna (SBKY) and Job-for-Job scheme continued. We also made significant progress in simplifying the organisation structure, systems and processes. Several programmes were also conducted to sensitise our employees on productivity improvement. During the year, the acquired steel business of Usha Martin Limited was successfully integrated into Tata Steel Long Products.
Diversity and inclusionWe continue to place significant importance on Diversity and Inclusion (D&I) in the workplace. MOSAIC, our D&I committee, covers four aspects – Gender, Persons with Disabilities (PwDs), LGBTQ+ and different sections of the society (e.g., the AA community).
FY20
FY20
FY20
FY20
3
127
2
683
64
5
80
2
67
FY19
FY19
FY19
FY19
FY18
FY18
FY18
FY18
FY17
FY17
FY17
FY17
FY16
FY16
FY16
FY16
FATALITY (Nos.)
LOST TIME INJURY FREQUENCY RATE (LTIFR) (Index)
LOST TIME INJURY (LTI)(Nos.)
HEALTH INDEX (Score out of 16)
MOSAIC - Tata Steel’s Diversity & Inclusion initiative
WINGS - Tata Steel’s LGBTQ+ Employee Resource Group
* Red risks are those that have fatality potential# ANPR - Automatic Number Plate Recognition
Good
Good
Good
0.52
0.290.29
0.37
0.23
12.712.6212.4712.5912.37
Corporate Overview 02
Strategic Review 46
Performance Review 20
Statutory Reports 84
Our Strategy 28
Financial Statements 206
INTEGRATED REPORT & ANNUAL ACCOUNTS 2019-20 | 113TH YEAR62 63
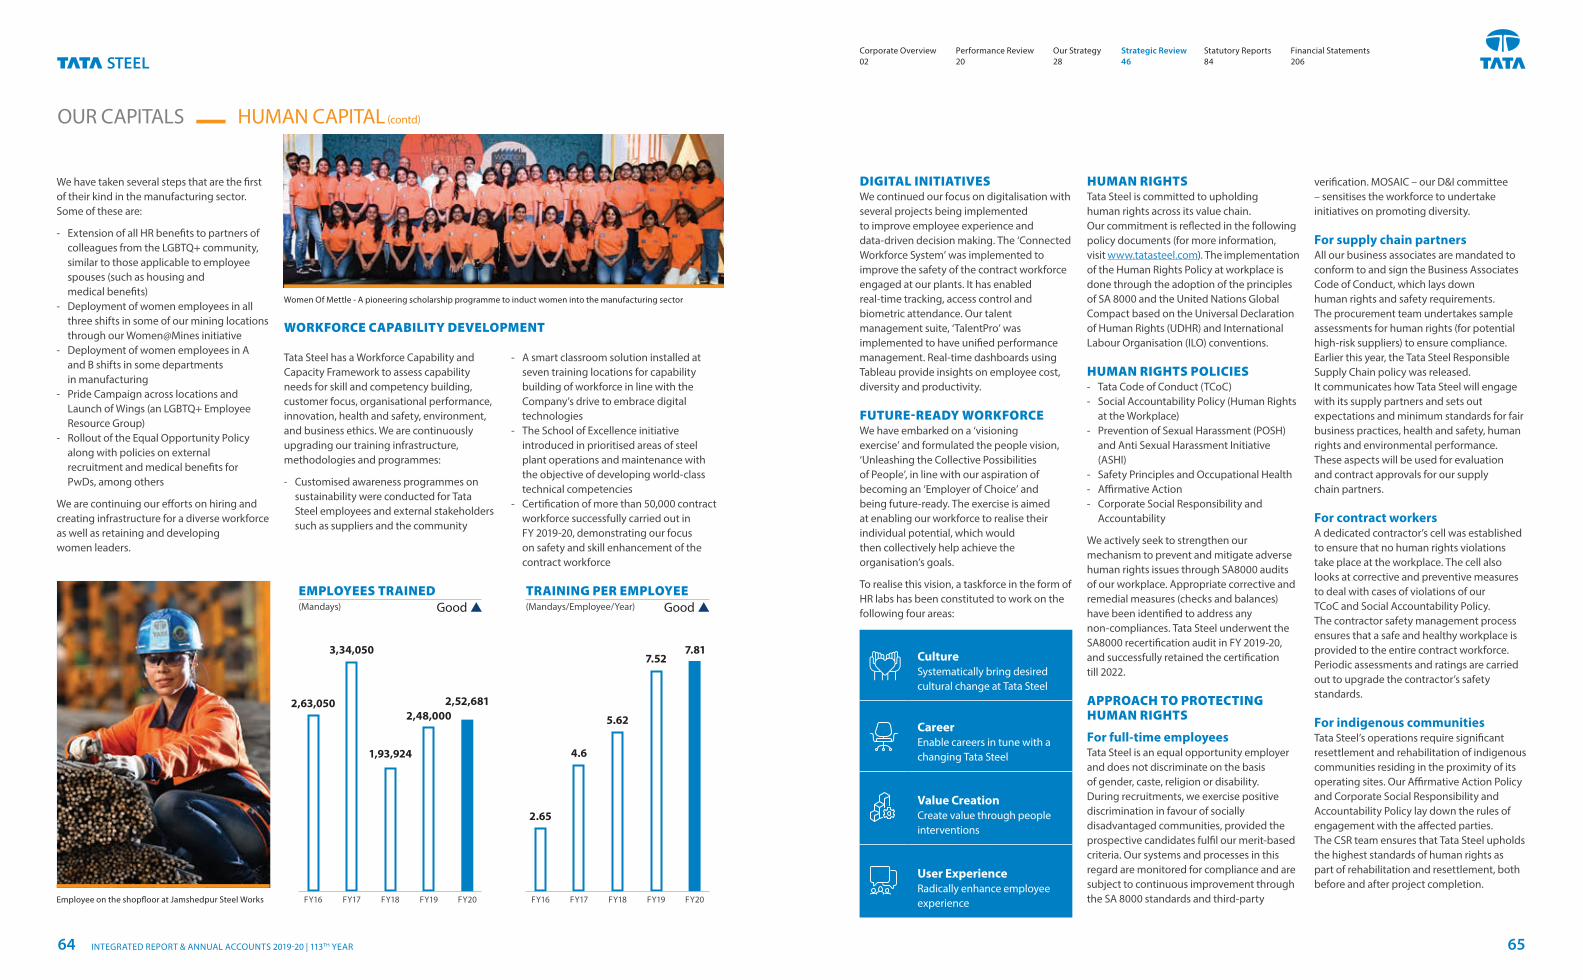
DIGITAL INITIATIVESWe continued our focus on digitalisation with several projects being implemented to improve employee experience and data-driven decision making. The ‘Connected Workforce System’ was implemented to improve the safety of the contract workforce engaged at our plants. It has enabled real-time tracking, access control and biometric attendance. Our talent management suite, ‘TalentPro’ was implemented to have unified performance management. Real-time dashboards using Tableau provide insights on employee cost, diversity and productivity.
FUTURE-READY WORKFORCEWe have embarked on a ‘visioning exercise’ and formulated the people vision, ‘Unleashing the Collective Possibilities of People’, in line with our aspiration of becoming an ‘Employer of Choice’ and being future-ready. The exercise is aimed at enabling our workforce to realise their individual potential, which would then collectively help achieve the organisation’s goals.
To realise this vision, a taskforce in the form of HR labs has been constituted to work on the following four areas:
CultureSystematically bring desired cultural change at Tata Steel
CareerEnable careers in tune with a changing Tata Steel
Value CreationCreate value through people interventions
User ExperienceRadically enhance employee experience
We have taken several steps that are the first of their kind in the manufacturing sector. Some of these are:
‐ Extension of all HR benefits to partners of colleagues from the LGBTQ+ community, similar to those applicable to employee spouses (such as housing and medical benefits)
‐ Deployment of women employees in all three shifts in some of our mining locations through our Women@Mines initiative
‐ Deployment of women employees in A and B shifts in some departments in manufacturing
‐ Pride Campaign across locations and Launch of Wings (an LGBTQ+ Employee Resource Group)
‐ Rollout of the Equal Opportunity Policy along with policies on external recruitment and medical benefits for PwDs, among others
We are continuing our efforts on hiring and creating infrastructure for a diverse workforce as well as retaining and developing women leaders.
WORKFORCE CAPABILITY DEVELOPMENT
Tata Steel has a Workforce Capability and Capacity Framework to assess capability needs for skill and competency building, customer focus, organisational performance, innovation, health and safety, environment, and business ethics. We are continuously upgrading our training infrastructure, methodologies and programmes:
‐ Customised awareness programmes on sustainability were conducted for Tata Steel employees and external stakeholders such as suppliers and the community
‐ A smart classroom solution installed at seven training locations for capability building of workforce in line with the Company’s drive to embrace digital technologies
‐ The School of Excellence initiative introduced in prioritised areas of steel plant operations and maintenance with the objective of developing world-class technical competencies
‐ Certification of more than 50,000 contract workforce successfully carried out in FY 2019-20, demonstrating our focus on safety and skill enhancement of the contract workforce
OUR CAPITALS HUMAN CAPITAL (contd)
FY20FY19FY18FY17FY16
TRAINING PER EMPLOYEE (Mandays/Employee/Year)
FY20FY19FY18FY17FY16
EMPLOYEES TRAINED (Mandays)
HUMAN RIGHTSTata Steel is committed to upholding human rights across its value chain. Our commitment is reflected in the following policy documents (for more information, visit www.tatasteel.com). The implementation of the Human Rights Policy at workplace is done through the adoption of the principles of SA 8000 and the United Nations Global Compact based on the Universal Declaration of Human Rights (UDHR) and International Labour Organisation (ILO) conventions.
HUMAN RIGHTS POLICIES ‐ Tata Code of Conduct (TCoC) ‐ Social Accountability Policy (Human Rights
at the Workplace) ‐ Prevention of Sexual Harassment (POSH)
and Anti Sexual Harassment Initiative (ASHI)
‐ Safety Principles and Occupational Health ‐ Affirmative Action ‐ Corporate Social Responsibility and
Accountability
We actively seek to strengthen our mechanism to prevent and mitigate adverse human rights issues through SA8000 audits of our workplace. Appropriate corrective and remedial measures (checks and balances) have been identified to address any non-compliances. Tata Steel underwent the SA8000 recertification audit in FY 2019-20, and successfully retained the certification till 2022.
APPROACH TO PROTECTING HUMAN RIGHTS
For full-time employeesTata Steel is an equal opportunity employer and does not discriminate on the basis of gender, caste, religion or disability. During recruitments, we exercise positive discrimination in favour of socially disadvantaged communities, provided the prospective candidates fulfil our merit-based criteria. Our systems and processes in this regard are monitored for compliance and are subject to continuous improvement through the SA 8000 standards and third-party
verification. MOSAIC – our D&I committee – sensitises the workforce to undertake initiatives on promoting diversity.
For supply chain partnersAll our business associates are mandated to conform to and sign the Business Associates Code of Conduct, which lays down human rights and safety requirements. The procurement team undertakes sample assessments for human rights (for potential high-risk suppliers) to ensure compliance. Earlier this year, the Tata Steel Responsible Supply Chain policy was released. It communicates how Tata Steel will engage with its supply partners and sets out expectations and minimum standards for fair business practices, health and safety, human rights and environmental performance. These aspects will be used for evaluation and contract approvals for our supply chain partners.
For contract workersA dedicated contractor’s cell was established to ensure that no human rights violations take place at the workplace. The cell also looks at corrective and preventive measures to deal with cases of violations of our TCoC and Social Accountability Policy. The contractor safety management process ensures that a safe and healthy workplace is provided to the entire contract workforce. Periodic assessments and ratings are carried out to upgrade the contractor’s safety standards.
For indigenous communitiesTata Steel’s operations require significant resettlement and rehabilitation of indigenous communities residing in the proximity of its operating sites. Our Affirmative Action Policy and Corporate Social Responsibility and Accountability Policy lay down the rules of engagement with the affected parties. The CSR team ensures that Tata Steel upholds the highest standards of human rights as part of rehabilitation and resettlement, both before and after project completion.
Women Of Mettle - A pioneering scholarship programme to induct women into the manufacturing sector
Employee on the shopfloor at Jamshedpur Steel Works
Good Good
7.817.52
5.62
4.6
2.65
2,52,6812,48,000
1,93,924
3,34,050
2,63,050
Corporate Overview 02
Strategic Review 46
Performance Review 20
Statutory Reports 84
Our Strategy 28
Financial Statements 206
INTEGRATED REPORT & ANNUAL ACCOUNTS 2019-20 | 113TH YEAR64 65
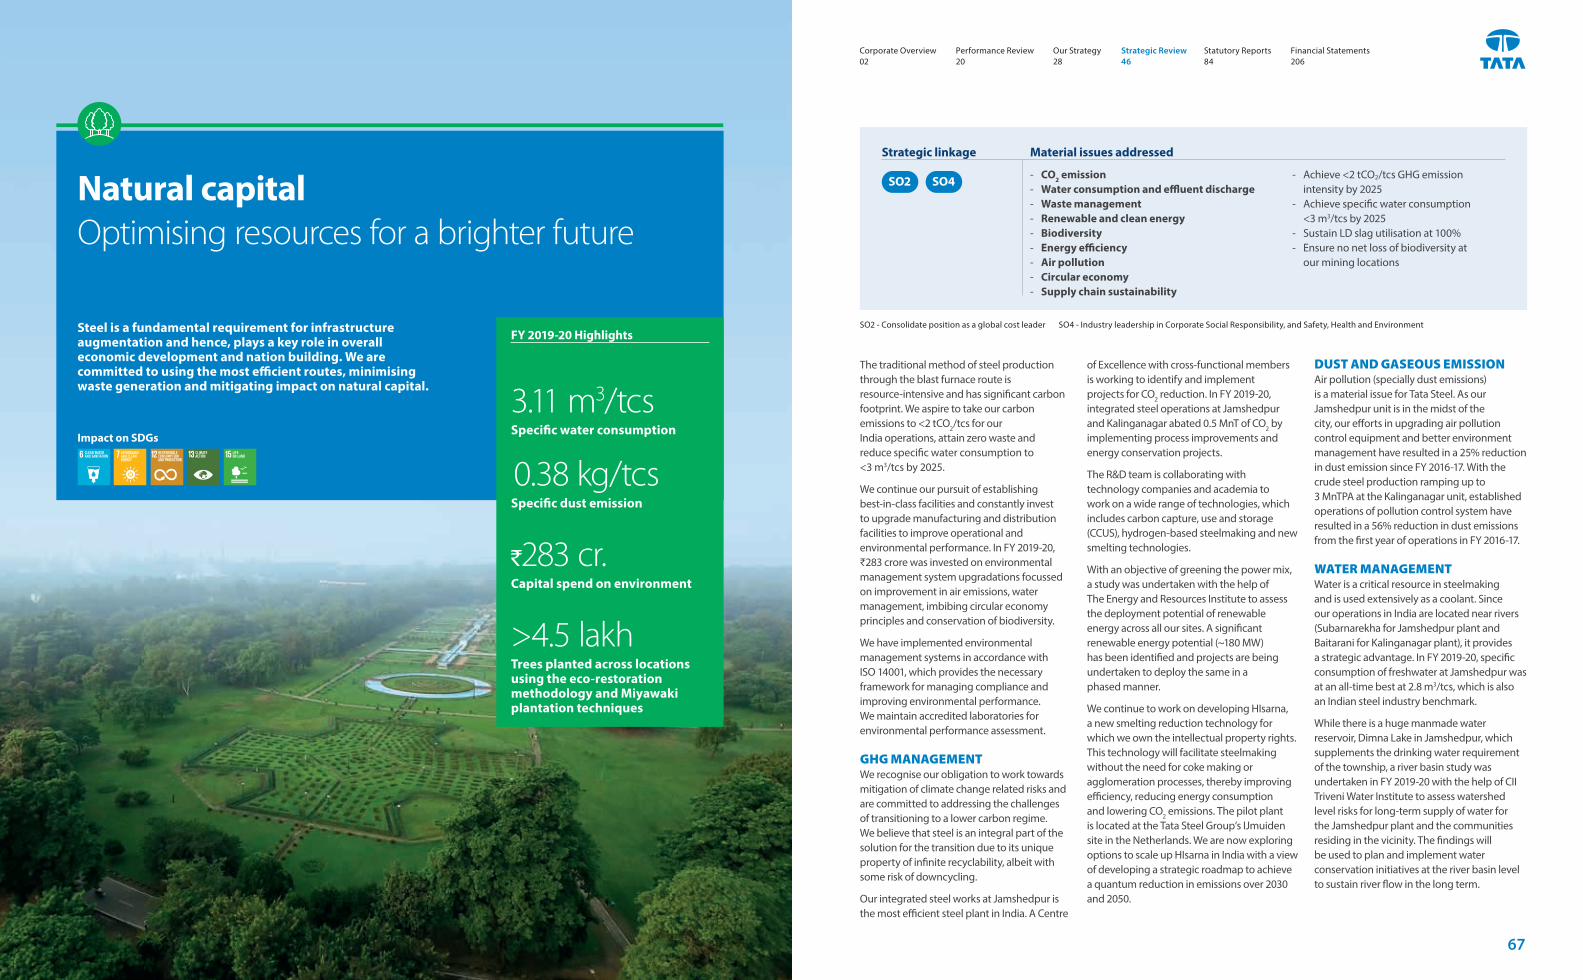
Natural capital Optimising resources for a brighter future
Steel is a fundamental requirement for infrastructure augmentation and hence, plays a key role in overall economic development and nation building. We are committed to using the most efficient routes, minimising waste generation and mitigating impact on natural capital.
The traditional method of steel production through the blast furnace route is resource-intensive and has significant carbon footprint. We aspire to take our carbon emissions to <2 tCO2/tcs for our India operations, attain zero waste and reduce specific water consumption to <3 m3/tcs by 2025.
We continue our pursuit of establishing best-in-class facilities and constantly invest to upgrade manufacturing and distribution facilities to improve operational and environmental performance. In FY 2019-20, ₹283 crore was invested on environmental management system upgradations focussed on improvement in air emissions, water management, imbibing circular economy principles and conservation of biodiversity.
We have implemented environmental management systems in accordance with ISO 14001, which provides the necessary framework for managing compliance and improving environmental performance. We maintain accredited laboratories for environmental performance assessment.
GHG MANAGEMENTWe recognise our obligation to work towards mitigation of climate change related risks and are committed to addressing the challenges of transitioning to a lower carbon regime. We believe that steel is an integral part of the solution for the transition due to its unique property of infinite recyclability, albeit with some risk of downcycling.
Our integrated steel works at Jamshedpur is the most efficient steel plant in India. A Centre
3.11 m3/tcsSpecific water consumption
0.38 kg/tcsSpecific dust emission
`283 cr.Capital spend on environment
>4.5 lakhTrees planted across locations using the eco-restoration methodology and Miyawaki plantation techniques
FY 2019-20 Highlights
of Excellence with cross-functional members is working to identify and implement projects for CO2 reduction. In FY 2019-20, integrated steel operations at Jamshedpur and Kalinganagar abated 0.5 MnT of CO2 by implementing process improvements and energy conservation projects.
The R&D team is collaborating with technology companies and academia to work on a wide range of technologies, which includes carbon capture, use and storage (CCUS), hydrogen-based steelmaking and new smelting technologies.
With an objective of greening the power mix, a study was undertaken with the help of The Energy and Resources Institute to assess the deployment potential of renewable energy across all our sites. A significant renewable energy potential (~180 MW) has been identified and projects are being undertaken to deploy the same in a phased manner.
We continue to work on developing HIsarna, a new smelting reduction technology for which we own the intellectual property rights. This technology will facilitate steelmaking without the need for coke making or agglomeration processes, thereby improving efficiency, reducing energy consumption and lowering CO2 emissions. The pilot plant is located at the Tata Steel Group’s IJmuiden site in the Netherlands. We are now exploring options to scale up HIsarna in India with a view of developing a strategic roadmap to achieve a quantum reduction in emissions over 2030 and 2050.
DUST AND GASEOUS EMISSION Air pollution (specially dust emissions) is a material issue for Tata Steel. As our Jamshedpur unit is in the midst of the city, our efforts in upgrading air pollution control equipment and better environment management have resulted in a 25% reduction in dust emission since FY 2016-17. With the crude steel production ramping up to 3 MnTPA at the Kalinganagar unit, established operations of pollution control system have resulted in a 56% reduction in dust emissions from the first year of operations in FY 2016-17.
WATER MANAGEMENT Water is a critical resource in steelmaking and is used extensively as a coolant. Since our operations in India are located near rivers (Subarnarekha for Jamshedpur plant and Baitarani for Kalinganagar plant), it provides a strategic advantage. In FY 2019-20, specific consumption of freshwater at Jamshedpur was at an all-time best at 2.8 m3/tcs, which is also an Indian steel industry benchmark.
While there is a huge manmade water reservoir, Dimna Lake in Jamshedpur, which supplements the drinking water requirement of the township, a river basin study was undertaken in FY 2019-20 with the help of CII Triveni Water Institute to assess watershed level risks for long-term supply of water for the Jamshedpur plant and the communities residing in the vicinity. The findings will be used to plan and implement water conservation initiatives at the river basin level to sustain river flow in the long term.
‐ CO2 emission ‐ Water consumption and effluent discharge ‐ Waste management ‐ Renewable and clean energy ‐ Biodiversity ‐ Energy efficiency ‐ Air pollution ‐ Circular economy ‐ Supply chain sustainability
‐ Achieve <2 tCO2/tcs GHG emission intensity by 2025
‐ Achieve specific water consumption <3 m3/tcs by 2025
‐ Sustain LD slag utilisation at 100% ‐ Ensure no net loss of biodiversity at
our mining locations
Strategic linkage Material issues addressed
SO2 SO4
SO2 - Consolidate position as a global cost leader SO4 - Industry leadership in Corporate Social Responsibility, and Safety, Health and Environment
Impact on SDGs
Corporate Overview 02
Strategic Review 46
Performance Review 20
Statutory Reports 84
Our Strategy 28
Financial Statements 206
67
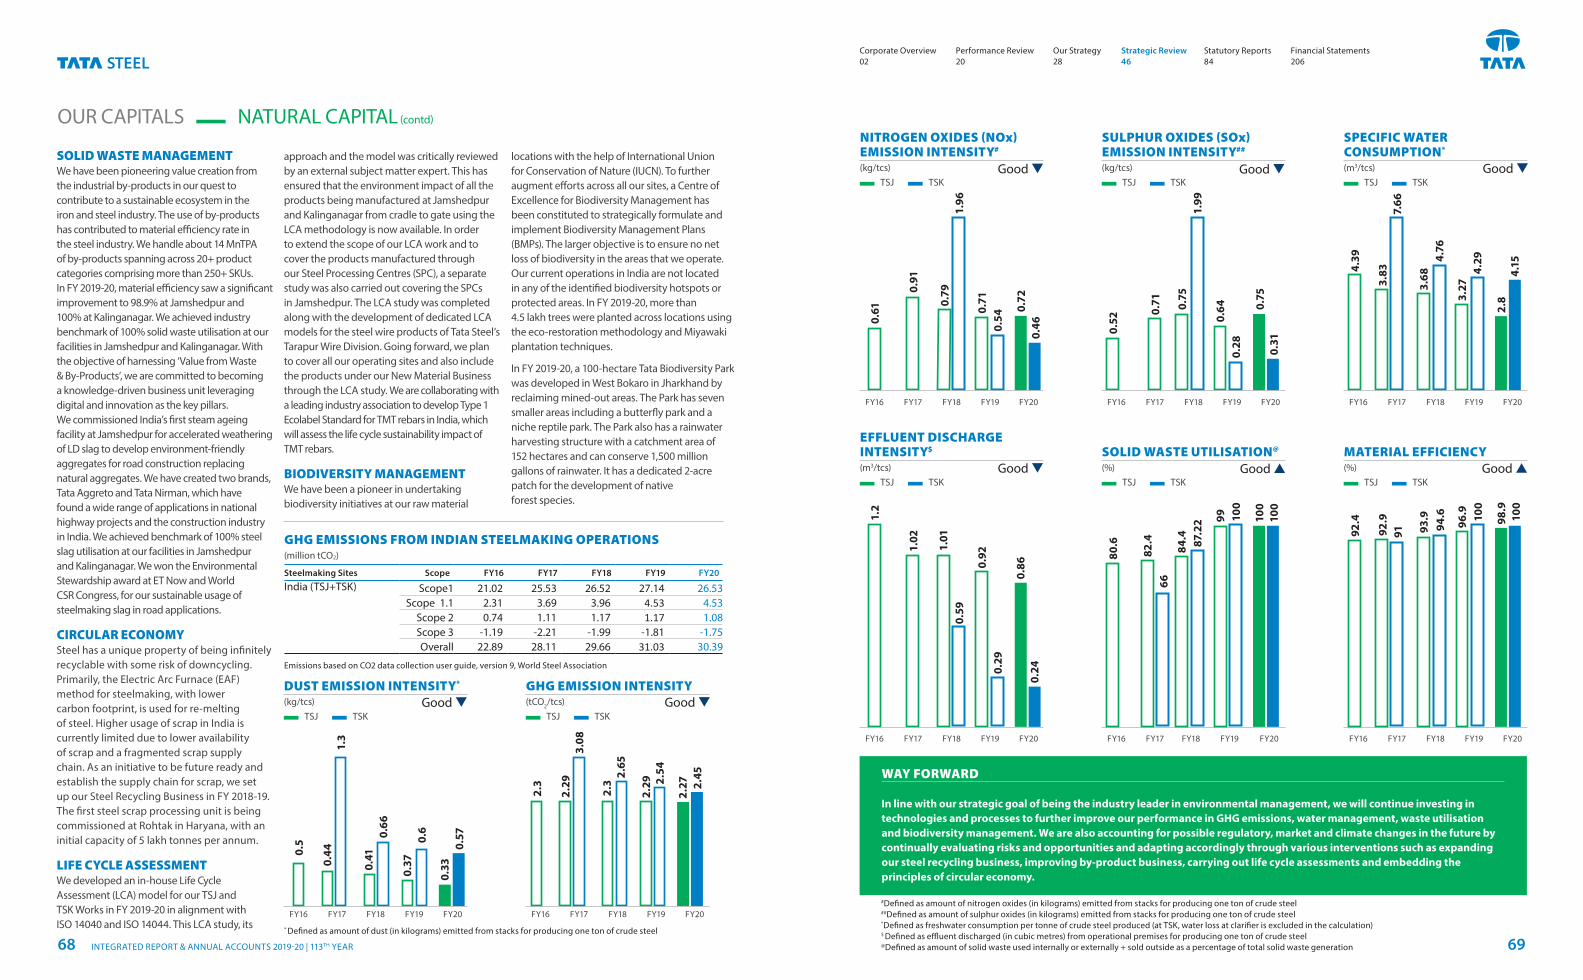
SOLID WASTE MANAGEMENTWe have been pioneering value creation from the industrial by-products in our quest to contribute to a sustainable ecosystem in the iron and steel industry. The use of by-products has contributed to material efficiency rate in the steel industry. We handle about 14 MnTPA of by-products spanning across 20+ product categories comprising more than 250+ SKUs. In FY 2019-20, material efficiency saw a significant improvement to 98.9% at Jamshedpur and 100% at Kalinganagar. We achieved industry benchmark of 100% solid waste utilisation at our facilities in Jamshedpur and Kalinganagar. With the objective of harnessing ‘Value from Waste & By-Products’, we are committed to becoming a knowledge-driven business unit leveraging digital and innovation as the key pillars. We commissioned India’s first steam ageing facility at Jamshedpur for accelerated weathering of LD slag to develop environment-friendly aggregates for road construction replacing natural aggregates. We have created two brands, Tata Aggreto and Tata Nirman, which have found a wide range of applications in national highway projects and the construction industry in India. We achieved benchmark of 100% steel slag utilisation at our facilities in Jamshedpur and Kalinganagar. We won the Environmental Stewardship award at ET Now and World CSR Congress, for our sustainable usage of steelmaking slag in road applications.
CIRCULAR ECONOMYSteel has a unique property of being infinitely recyclable with some risk of downcycling. Primarily, the Electric Arc Furnace (EAF) method for steelmaking, with lower carbon footprint, is used for re-melting of steel. Higher usage of scrap in India is currently limited due to lower availability of scrap and a fragmented scrap supply chain. As an initiative to be future ready and establish the supply chain for scrap, we set up our Steel Recycling Business in FY 2018-19. The first steel scrap processing unit is being commissioned at Rohtak in Haryana, with an initial capacity of 5 lakh tonnes per annum.
LIFE CYCLE ASSESSMENTWe developed an in-house Life Cycle Assessment (LCA) model for our TSJ and TSK Works in FY 2019-20 in alignment with ISO 14040 and ISO 14044. This LCA study, its
approach and the model was critically reviewed by an external subject matter expert. This has ensured that the environment impact of all the products being manufactured at Jamshedpur and Kalinganagar from cradle to gate using the LCA methodology is now available. In order to extend the scope of our LCA work and to cover the products manufactured through our Steel Processing Centres (SPC), a separate study was also carried out covering the SPCs in Jamshedpur. The LCA study was completed along with the development of dedicated LCA models for the steel wire products of Tata Steel’s Tarapur Wire Division. Going forward, we plan to cover all our operating sites and also include the products under our New Material Business through the LCA study. We are collaborating with a leading industry association to develop Type 1 Ecolabel Standard for TMT rebars in India, which will assess the life cycle sustainability impact of TMT rebars.
BIODIVERSITY MANAGEMENTWe have been a pioneer in undertaking biodiversity initiatives at our raw material
locations with the help of International Union for Conservation of Nature (IUCN). To further augment efforts across all our sites, a Centre of Excellence for Biodiversity Management has been constituted to strategically formulate and implement Biodiversity Management Plans (BMPs). The larger objective is to ensure no net loss of biodiversity in the areas that we operate. Our current operations in India are not located in any of the identified biodiversity hotspots or protected areas. In FY 2019-20, more than 4.5 lakh trees were planted across locations using the eco-restoration methodology and Miyawaki plantation techniques.
In FY 2019-20, a 100-hectare Tata Biodiversity Park was developed in West Bokaro in Jharkhand by reclaiming mined-out areas. The Park has seven smaller areas including a butterfly park and a niche reptile park. The Park also has a rainwater harvesting structure with a catchment area of 152 hectares and can conserve 1,500 million gallons of rainwater. It has a dedicated 2-acre patch for the development of native forest species.
OUR CAPITALS NATURAL CAPITAL (contd)
WAY FORWARD
In line with our strategic goal of being the industry leader in environmental management, we will continue investing in technologies and processes to further improve our performance in GHG emissions, water management, waste utilisation and biodiversity management. We are also accounting for possible regulatory, market and climate changes in the future by continually evaluating risks and opportunities and adapting accordingly through various interventions such as expanding our steel recycling business, improving by-product business, carrying out life cycle assessments and embedding the principles of circular economy.
NITROGEN OXIDES (NOx) EMISSION INTENSITY#
(kg/tcs) TSJ TSK
SULPHUR OXIDES (SOx) EMISSION INTENSITY##
(kg/tcs) TSJ TSK
SPECIFIC WATER CONSUMPTION*
(m3/tcs) TSJ TSK
EFFLUENT DISCHARGE INTENSITY$
(m3/tcs) TSJ TSK
SOLID WASTE UTILISATION@ (%)
TSJ TSK
MATERIAL EFFICIENCY (%)
TSJ TSK
FY20
0.61
0.91
0.79
0.71
0.54
0.72
0.46
FY19FY18FY17FY16 FY20
0.52
0.71 0.
75
0.64
0.28
0.75
0.31
FY19FY18FY17FY16 FY20
4.39
3.83
3.68
4.76
3.27
4.29
2.8
4.15
FY19FY18FY17FY16
FY20
1.2
1.02
1.01
0.59
0.92
0.29
0.86
0.24
FY19FY18FY17FY16 FY20
80.6 84
.4
66
87.2
2 99 100
100
100
FY19FY18FY17FY16 FY20
92.4
91 93.9
94.6
96.9 10
0
FY19FY18FY17FY16
92.9
82.4
98.9
100
GHG EMISSIONS FROM INDIAN STEELMAKING OPERATIONS (million tCO2)
Steelmaking Sites Scope FY16 FY17 FY18 FY19 FY20
India (TSJ+TSK) Scope1 21.02 25.53 26.52 27.14 26.53Scope 1.1 2.31 3.69 3.96 4.53 4.53
Scope 2 0.74 1.11 1.17 1.17 1.08Scope 3 -1.19 -2.21 -1.99 -1.81 -1.75Overall 22.89 28.11 29.66 31.03 30.39
Emissions based on CO2 data collection user guide, version 9, World Steel Association
FY20FY19FY18FY17FY16
DUST EMISSION INTENSITY*
(kg/tcs) TSJ TSK
Good
0.5
0.44
1.3
0.41
0.66
0.37
0.6
0.33
0.57
* Defined as amount of dust (in kilograms) emitted from stacks for producing one ton of crude steel
FY20FY19FY18FY17FY16
GHG EMISSION INTENSITY(tCO2/tcs)
TSJ TSK
2.3
2.29
3.08
2.65
2.29 2.
54
2.27 2.
45
2.3
Good
Good
Good
Good Good
Good Good
#Defined as amount of nitrogen oxides (in kilograms) emitted from stacks for producing one ton of crude steel##Defined as amount of sulphur oxides (in kilograms) emitted from stacks for producing one ton of crude steel*Defined as freshwater consumption per tonne of crude steel produced (at TSK, water loss at clarifier is excluded in the calculation)$ Defined as effluent discharged (in cubic metres) from operational premises for producing one ton of crude steel@Defined as amount of solid waste used internally or externally + sold outside as a percentage of total solid waste generation
1.96
1.99
7.66
Corporate Overview 02
Strategic Review 46
Performance Review 20
Statutory Reports 84
Our Strategy 28
Financial Statements 206
INTEGRATED REPORT & ANNUAL ACCOUNTS 2019-20 | 113TH YEAR68 69
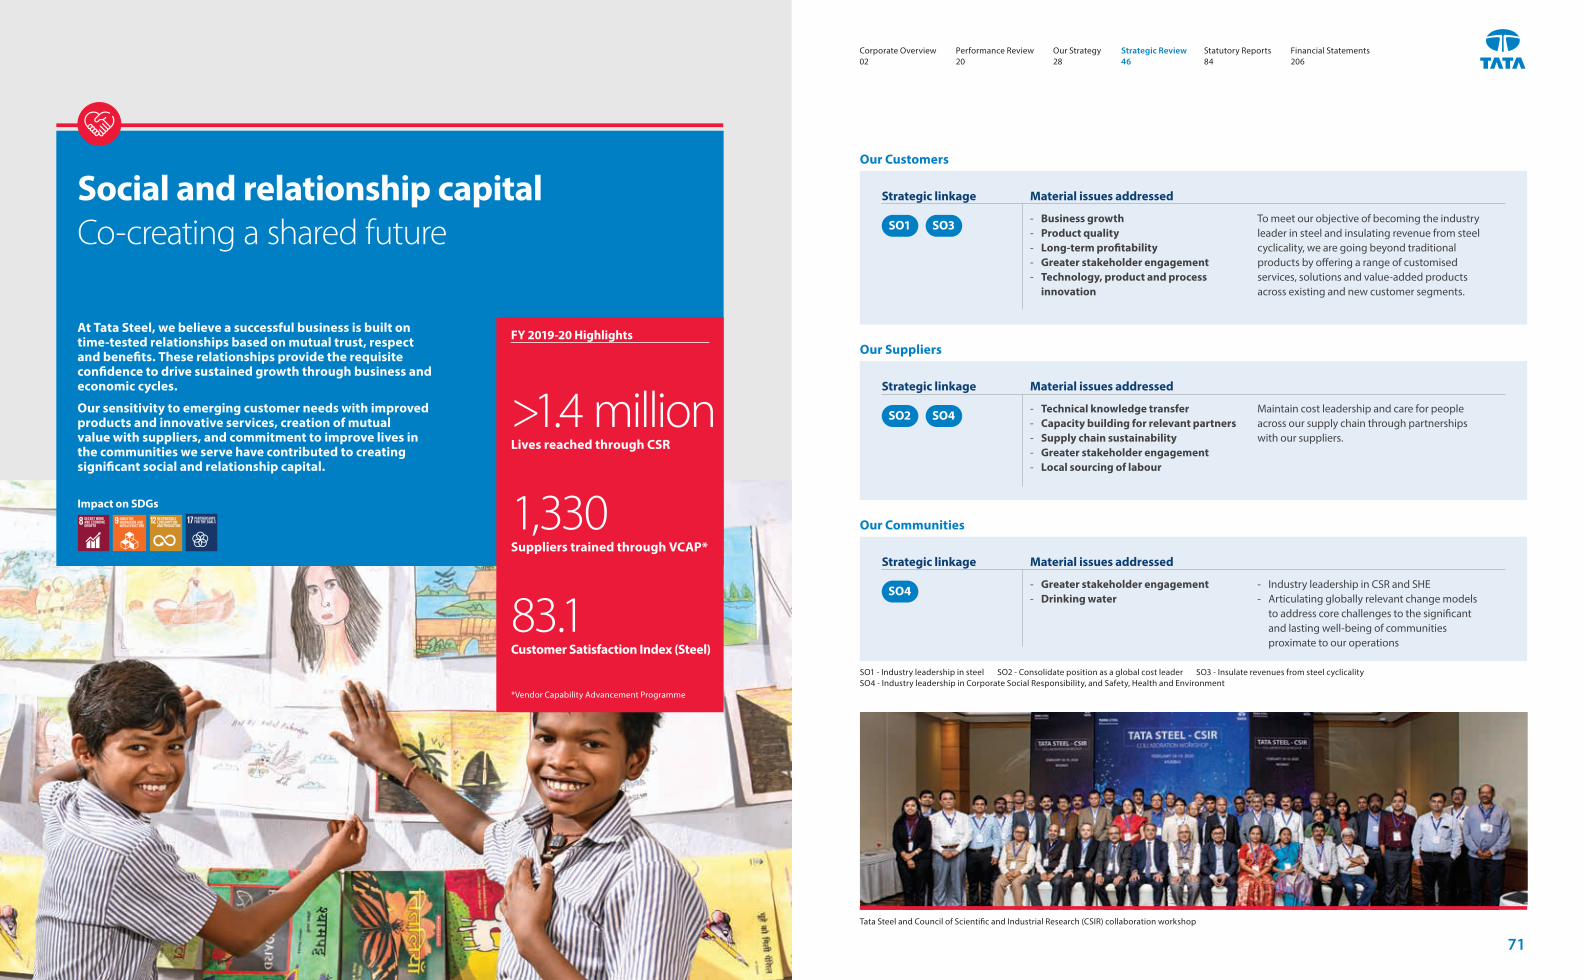
Social and relationship capital Co-creating a shared future
At Tata Steel, we believe a successful business is built on time-tested relationships based on mutual trust, respect and benefits. These relationships provide the requisite confidence to drive sustained growth through business and economic cycles.
Our sensitivity to emerging customer needs with improved products and innovative services, creation of mutual value with suppliers, and commitment to improve lives in the communities we serve have contributed to creating significant social and relationship capital.
Our Customers
Our Suppliers
Our Communities
>1.4 millionLives reached through CSR
1,330Suppliers trained through VCAP*
83.1Customer Satisfaction Index (Steel)
FY 2019-20 Highlights
‐ Business growth ‐ Product quality ‐ Long-term profitability ‐ Greater stakeholder engagement ‐ Technology, product and process
innovation
‐ Technical knowledge transfer ‐ Capacity building for relevant partners ‐ Supply chain sustainability ‐ Greater stakeholder engagement ‐ Local sourcing of labour
‐ Greater stakeholder engagement ‐ Drinking water
To meet our objective of becoming the industry leader in steel and insulating revenue from steel cyclicality, we are going beyond traditional products by offering a range of customised services, solutions and value-added products across existing and new customer segments.
Maintain cost leadership and care for people across our supply chain through partnerships with our suppliers.
‐ Industry leadership in CSR and SHE ‐ Articulating globally relevant change models
to address core challenges to the significant and lasting well-being of communities proximate to our operations
Strategic linkage
Strategic linkage
Strategic linkage
Material issues addressed
Material issues addressed
Material issues addressed
SO1
SO2
SO4
SO3
SO4
SO1 - Industry leadership in steel SO2 - Consolidate position as a global cost leader SO3 - Insulate revenues from steel cyclicalitySO4 - Industry leadership in Corporate Social Responsibility, and Safety, Health and Environment
Impact on SDGs
Tata Steel and Council of Scientific and Industrial Research (CSIR) collaboration workshop
*Vendor Capability Advancement Programme
Corporate Overview 02
Strategic Review 46
Performance Review 20
Statutory Reports 84
Our Strategy 28
Financial Statements 206
71
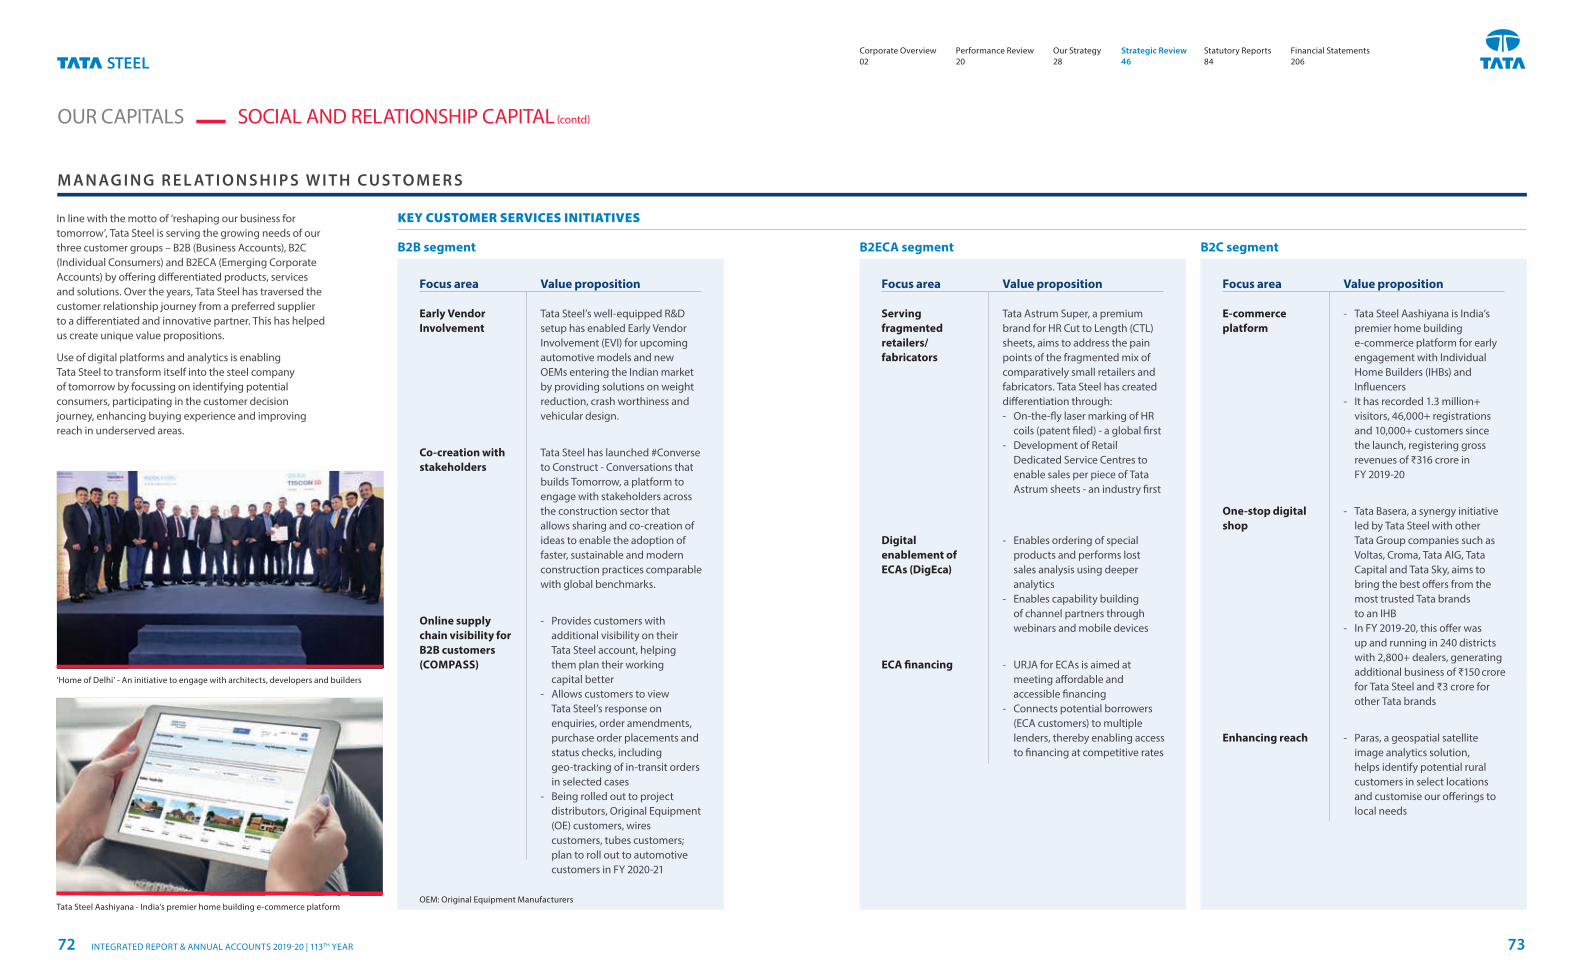
Focus area Focus area Focus areaValue proposition Value proposition Value proposition
Early Vendor Involvement
Serving fragmented retailers/fabricators
E-commerce platform
Co-creation with stakeholders
Online supply chain visibility for B2B customers (COMPASS)
Digital enablement of ECAs (DigEca)
One-stop digital shop
ECA financing
Enhancing reach
Tata Steel’s well-equipped R&D setup has enabled Early Vendor Involvement (EVI) for upcoming automotive models and new OEMs entering the Indian market by providing solutions on weight reduction, crash worthiness and vehicular design.
Tata Astrum Super, a premium brand for HR Cut to Length (CTL) sheets, aims to address the pain points of the fragmented mix of comparatively small retailers and fabricators. Tata Steel has created differentiation through: ‐ On-the-fly laser marking of HR
coils (patent filed) - a global first ‐ Development of Retail
Dedicated Service Centres to enable sales per piece of Tata Astrum sheets - an industry first
‐ Tata Steel Aashiyana is India’s premier home building e-commerce platform for early engagement with Individual Home Builders (IHBs) and Influencers
‐ It has recorded 1.3 million+ visitors, 46,000+ registrations and 10,000+ customers since the launch, registering gross revenues of ₹316 crore in FY 2019-20
Tata Steel has launched #Converse to Construct - Conversations that builds Tomorrow, a platform to engage with stakeholders across the construction sector that allows sharing and co-creation of ideas to enable the adoption of faster, sustainable and modern construction practices comparable with global benchmarks.
‐ Provides customers with additional visibility on their Tata Steel account, helping them plan their working capital better
‐ Allows customers to view Tata Steel’s response on enquiries, order amendments, purchase order placements and status checks, including geo-tracking of in-transit orders in selected cases
‐ Being rolled out to project distributors, Original Equipment (OE) customers, wires customers, tubes customers; plan to roll out to automotive customers in FY 2020-21
‐ Enables ordering of special products and performs lost sales analysis using deeper analytics
‐ Enables capability building of channel partners through webinars and mobile devices
‐ Tata Basera, a synergy initiative led by Tata Steel with other Tata Group companies such as Voltas, Croma, Tata AIG, Tata Capital and Tata Sky, aims to bring the best offers from the most trusted Tata brands to an IHB
‐ In FY 2019-20, this offer was up and running in 240 districts with 2,800+ dealers, generating additional business of ₹150 crore for Tata Steel and ₹3 crore for other Tata brands
‐ URJA for ECAs is aimed at meeting affordable and accessible financing
‐ Connects potential borrowers (ECA customers) to multiple lenders, thereby enabling access to financing at competitive rates
‐ Paras, a geospatial satellite image analytics solution, helps identify potential rural customers in select locations and customise our offerings to local needs
OUR CAPITALS SOCIAL AND RELATIONSHIP CAPITAL (contd)
KEY CUSTOMER SERVICES INITIATIVES
B2B segment B2ECA segment B2C segment
In line with the motto of ‘reshaping our business for tomorrow’, Tata Steel is serving the growing needs of our three customer groups – B2B (Business Accounts), B2C (Individual Consumers) and B2ECA (Emerging Corporate Accounts) by offering differentiated products, services and solutions. Over the years, Tata Steel has traversed the customer relationship journey from a preferred supplier to a differentiated and innovative partner. This has helped us create unique value propositions.
Use of digital platforms and analytics is enabling Tata Steel to transform itself into the steel company of tomorrow by focussing on identifying potential consumers, participating in the customer decision journey, enhancing buying experience and improving reach in underserved areas.
Tata Steel Aashiyana - India’s premier home building e-commerce platform
‘Home of Delhi’ - An initiative to engage with architects, developers and builders
M A N AG I N G R E L AT I O N S H I P S W I T H C U S TO M E R S
OEM: Original Equipment Manufacturers
Corporate Overview 02
Strategic Review 46
Performance Review 20
Statutory Reports 84
Our Strategy 28
Financial Statements 206
INTEGRATED REPORT & ANNUAL ACCOUNTS 2019-20 | 113TH YEAR72 73
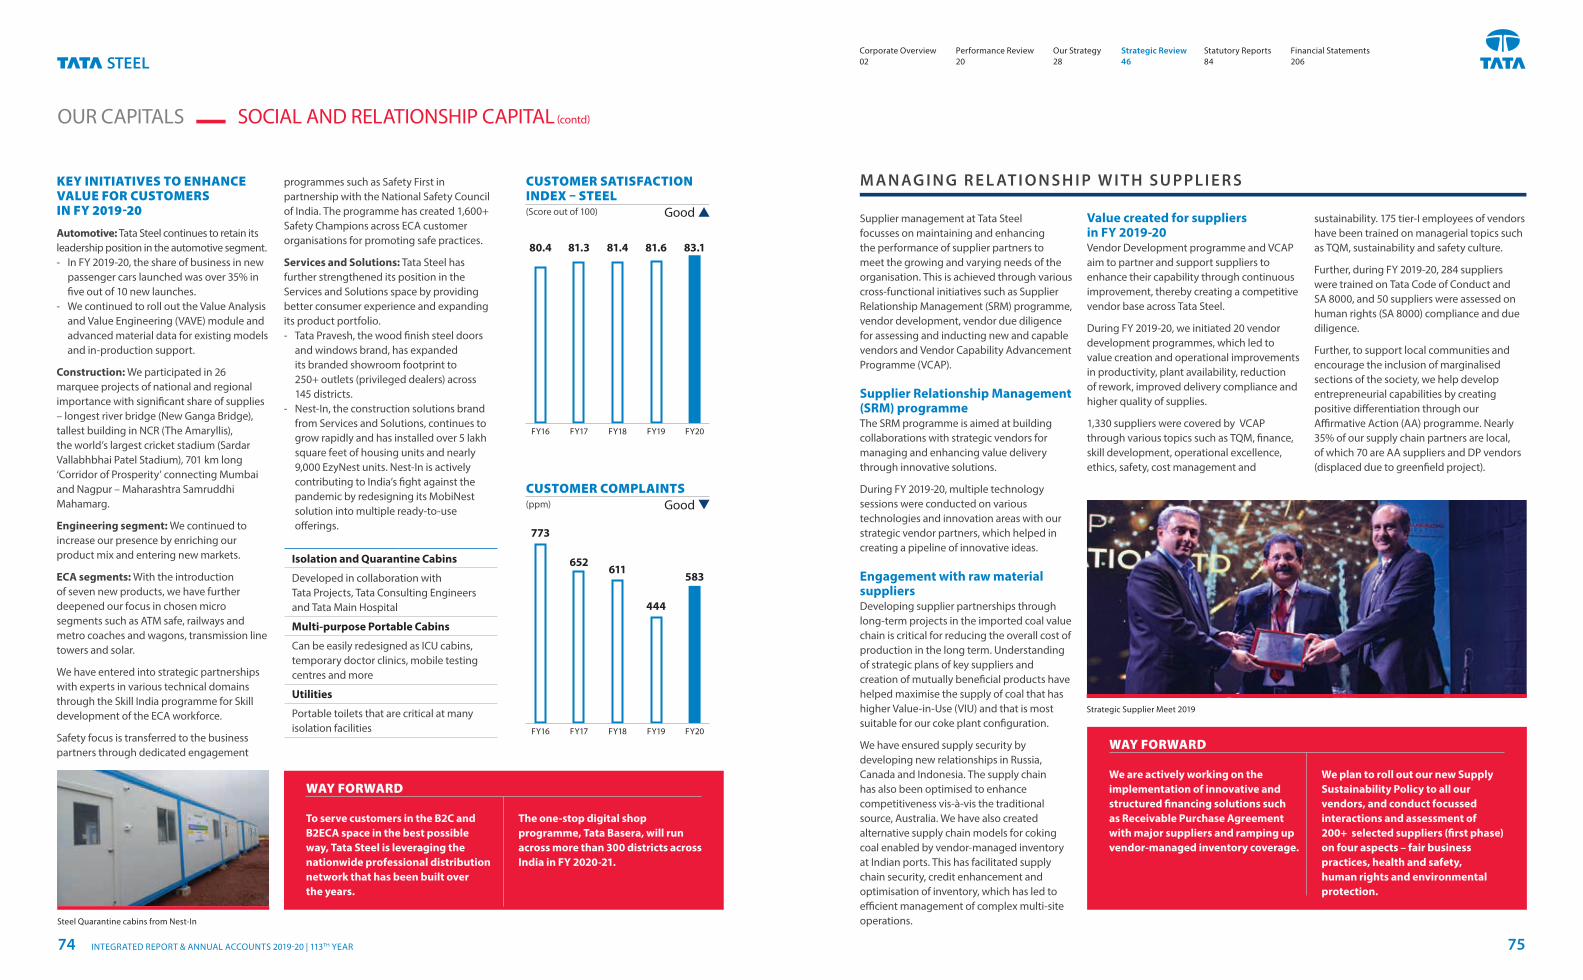
WAY FORWARD
We are actively working on the implementation of innovative and structured financing solutions such as Receivable Purchase Agreement with major suppliers and ramping up vendor-managed inventory coverage.
We plan to roll out our new Supply Sustainability Policy to all our vendors, and conduct focussed interactions and assessment of 200+ selected suppliers (first phase) on four aspects – fair business practices, health and safety, human rights and environmental protection.
Steel Quarantine cabins from Nest-In
Strategic Supplier Meet 2019
OUR CAPITALS SOCIAL AND RELATIONSHIP CAPITAL (contd)
KEY INITIATIVES TO ENHANCE VALUE FOR CUSTOMERS IN FY 2019-20
Automotive: Tata Steel continues to retain its leadership position in the automotive segment. ‐ In FY 2019-20, the share of business in new
passenger cars launched was over 35% in five out of 10 new launches.
‐ We continued to roll out the Value Analysis and Value Engineering (VAVE) module and advanced material data for existing models and in-production support.
Construction: We participated in 26 marquee projects of national and regional importance with significant share of supplies – longest river bridge (New Ganga Bridge), tallest building in NCR (The Amaryllis), the world’s largest cricket stadium (Sardar Vallabhbhai Patel Stadium), 701 km long ‘Corridor of Prosperity’ connecting Mumbai and Nagpur – Maharashtra Samruddhi Mahamarg.
Engineering segment: We continued to increase our presence by enriching our product mix and entering new markets.
ECA segments: With the introduction of seven new products, we have further deepened our focus in chosen micro segments such as ATM safe, railways and metro coaches and wagons, transmission line towers and solar.
We have entered into strategic partnerships with experts in various technical domains through the Skill India programme for Skill development of the ECA workforce.
Safety focus is transferred to the business partners through dedicated engagement
Supplier management at Tata Steel focusses on maintaining and enhancing the performance of supplier partners to meet the growing and varying needs of the organisation. This is achieved through various cross-functional initiatives such as Supplier Relationship Management (SRM) programme, vendor development, vendor due diligence for assessing and inducting new and capable vendors and Vendor Capability Advancement Programme (VCAP).
Supplier Relationship Management (SRM) programmeThe SRM programme is aimed at building collaborations with strategic vendors for managing and enhancing value delivery through innovative solutions.
During FY 2019-20, multiple technology sessions were conducted on various technologies and innovation areas with our strategic vendor partners, which helped in creating a pipeline of innovative ideas.
Engagement with raw material suppliersDeveloping supplier partnerships through long-term projects in the imported coal value chain is critical for reducing the overall cost of production in the long term. Understanding of strategic plans of key suppliers and creation of mutually beneficial products have helped maximise the supply of coal that has higher Value-in-Use (VIU) and that is most suitable for our coke plant configuration.
We have ensured supply security by developing new relationships in Russia, Canada and Indonesia. The supply chain has also been optimised to enhance competitiveness vis-à-vis the traditional source, Australia. We have also created alternative supply chain models for coking coal enabled by vendor-managed inventory at Indian ports. This has facilitated supply chain security, credit enhancement and optimisation of inventory, which has led to efficient management of complex multi-site operations.
Isolation and Quarantine Cabins
Developed in collaboration with Tata Projects, Tata Consulting Engineers and Tata Main Hospital
Multi-purpose Portable Cabins
Can be easily redesigned as ICU cabins, temporary doctor clinics, mobile testing centres and more
Utilities
Portable toilets that are critical at many isolation facilities
programmes such as Safety First in partnership with the National Safety Council of India. The programme has created 1,600+ Safety Champions across ECA customer organisations for promoting safe practices.
Services and Solutions: Tata Steel has further strengthened its position in the Services and Solutions space by providing better consumer experience and expanding its product portfolio. ‐ Tata Pravesh, the wood finish steel doors
and windows brand, has expanded its branded showroom footprint to 250+ outlets (privileged dealers) across 145 districts.
‐ Nest-In, the construction solutions brand from Services and Solutions, continues to grow rapidly and has installed over 5 lakh square feet of housing units and nearly 9,000 EzyNest units. Nest-In is actively contributing to India’s fight against the pandemic by redesigning its MobiNest solution into multiple ready-to-use offerings.
Value created for suppliers in FY 2019-20Vendor Development programme and VCAP aim to partner and support suppliers to enhance their capability through continuous improvement, thereby creating a competitive vendor base across Tata Steel.
During FY 2019-20, we initiated 20 vendor development programmes, which led to value creation and operational improvements in productivity, plant availability, reduction of rework, improved delivery compliance and higher quality of supplies.
1,330 suppliers were covered by VCAP through various topics such as TQM, finance, skill development, operational excellence, ethics, safety, cost management and
sustainability. 175 tier-I employees of vendors have been trained on managerial topics such as TQM, sustainability and safety culture.
Further, during FY 2019-20, 284 suppliers were trained on Tata Code of Conduct and SA 8000, and 50 suppliers were assessed on human rights (SA 8000) compliance and due diligence.
Further, to support local communities and encourage the inclusion of marginalised sections of the society, we help develop entrepreneurial capabilities by creating positive differentiation through our Affirmative Action (AA) programme. Nearly 35% of our supply chain partners are local, of which 70 are AA suppliers and DP vendors (displaced due to greenfield project).
M A N AG I N G R E L AT I O N S H I P W I T H S U PPL I E R S
WAY FORWARD
To serve customers in the B2C and B2ECA space in the best possible way, Tata Steel is leveraging the nationwide professional distribution network that has been built over the years.
The one-stop digital shop programme, Tata Basera, will run across more than 300 districts across India in FY 2020-21.
FY20
FY20
83.181.681.481.380.4
FY19
FY19
FY18
FY18
FY17
FY17
FY16
FY16
CUSTOMER SATISFACTION INDEX – STEEL (Score out of 100)
CUSTOMER COMPLAINTS (ppm)
Good
Good
583
444
611652
773
Corporate Overview 02
Strategic Review 46
Performance Review 20
Statutory Reports 84
Our Strategy 28
Financial Statements 206
INTEGRATED REPORT & ANNUAL ACCOUNTS 2019-20 | 113TH YEAR74 75
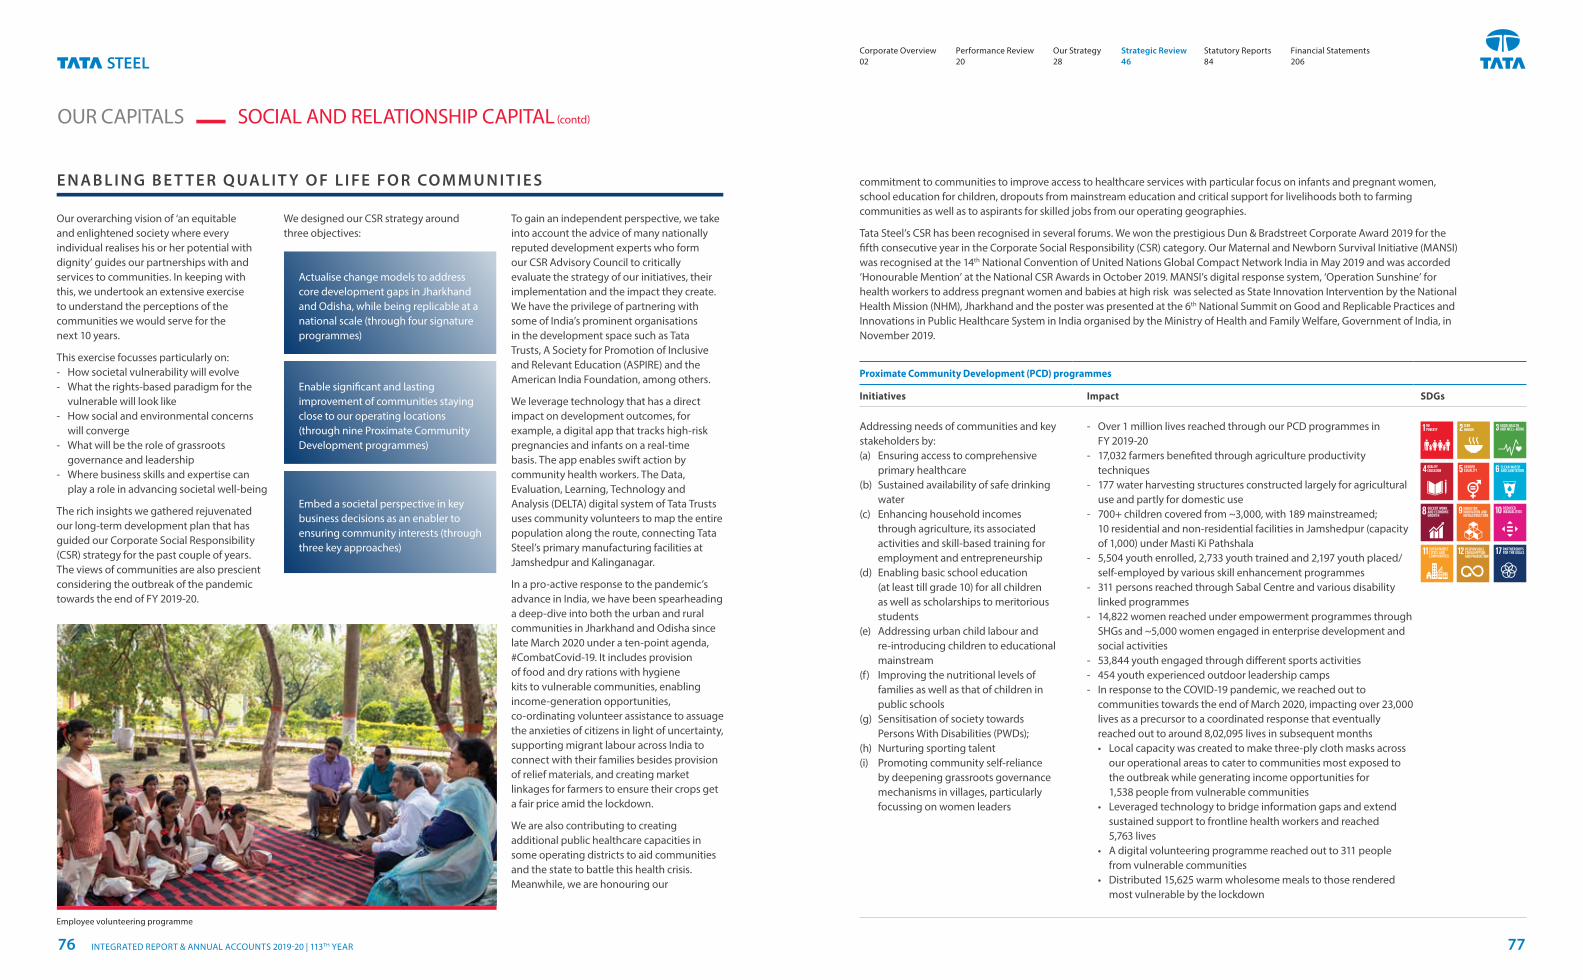
OUR CAPITALS SOCIAL AND RELATIONSHIP CAPITAL (contd)
Our overarching vision of ‘an equitable and enlightened society where every individual realises his or her potential with dignity’ guides our partnerships with and services to communities. In keeping with this, we undertook an extensive exercise to understand the perceptions of the communities we would serve for the next 10 years.
This exercise focusses particularly on: ‐ How societal vulnerability will evolve ‐ What the rights-based paradigm for the
vulnerable will look like ‐ How social and environmental concerns
will converge ‐ What will be the role of grassroots
governance and leadership ‐ Where business skills and expertise can
play a role in advancing societal well-being
The rich insights we gathered rejuvenated our long-term development plan that has guided our Corporate Social Responsibility (CSR) strategy for the past couple of years. The views of communities are also prescient considering the outbreak of the pandemic towards the end of FY 2019-20.
We designed our CSR strategy around three objectives:
Actualise change models to address core development gaps in Jharkhand and Odisha, while being replicable at a national scale (through four signature programmes)
Enable significant and lasting improvement of communities staying close to our operating locations (through nine Proximate Community Development programmes)
Embed a societal perspective in key business decisions as an enabler to ensuring community interests (through three key approaches)
To gain an independent perspective, we take into account the advice of many nationally reputed development experts who form our CSR Advisory Council to critically evaluate the strategy of our initiatives, their implementation and the impact they create. We have the privilege of partnering with some of India’s prominent organisations in the development space such as Tata Trusts, A Society for Promotion of Inclusive and Relevant Education (ASPIRE) and the American India Foundation, among others.
We leverage technology that has a direct impact on development outcomes, for example, a digital app that tracks high-risk pregnancies and infants on a real-time basis. The app enables swift action by community health workers. The Data, Evaluation, Learning, Technology and Analysis (DELTA) digital system of Tata Trusts uses community volunteers to map the entire population along the route, connecting Tata Steel’s primary manufacturing facilities at Jamshedpur and Kalinganagar.
In a pro-active response to the pandemic’s advance in India, we have been spearheading a deep-dive into both the urban and rural communities in Jharkhand and Odisha since late March 2020 under a ten-point agenda, #CombatCovid-19. It includes provision of food and dry rations with hygiene kits to vulnerable communities, enabling income-generation opportunities, co-ordinating volunteer assistance to assuage the anxieties of citizens in light of uncertainty, supporting migrant labour across India to connect with their families besides provision of relief materials, and creating market linkages for farmers to ensure their crops get a fair price amid the lockdown.
We are also contributing to creating additional public healthcare capacities in some operating districts to aid communities and the state to battle this health crisis. Meanwhile, we are honouring our
commitment to communities to improve access to healthcare services with particular focus on infants and pregnant women, school education for children, dropouts from mainstream education and critical support for livelihoods both to farming communities as well as to aspirants for skilled jobs from our operating geographies.
Tata Steel’s CSR has been recognised in several forums. We won the prestigious Dun & Bradstreet Corporate Award 2019 for the fifth consecutive year in the Corporate Social Responsibility (CSR) category. Our Maternal and Newborn Survival Initiative (MANSI) was recognised at the 14th National Convention of United Nations Global Compact Network India in May 2019 and was accorded ‘Honourable Mention’ at the National CSR Awards in October 2019. MANSI’s digital response system, ‘Operation Sunshine’ for health workers to address pregnant women and babies at high risk was selected as State Innovation Intervention by the National Health Mission (NHM), Jharkhand and the poster was presented at the 6th National Summit on Good and Replicable Practices and Innovations in Public Healthcare System in India organised by the Ministry of Health and Family Welfare, Government of India, in November 2019.
Proximate Community Development (PCD) programmes
Initiatives Impact SDGs
Addressing needs of communities and key stakeholders by: (a) Ensuring access to comprehensive
primary healthcare(b) Sustained availability of safe drinking
water (c) Enhancing household incomes
through agriculture, its associated activities and skill-based training for employment and entrepreneurship
(d) Enabling basic school education (at least till grade 10) for all children as well as scholarships to meritorious students
(e) Addressing urban child labour and re-introducing children to educational mainstream
(f) Improving the nutritional levels of families as well as that of children in public schools
(g) Sensitisation of society towards Persons With Disabilities (PWDs);
(h) Nurturing sporting talent (i) Promoting community self-reliance
by deepening grassroots governance mechanisms in villages, particularly focussing on women leaders
‐ Over 1 million lives reached through our PCD programmes in FY 2019-20
‐ 17,032 farmers benefited through agriculture productivity techniques
‐ 177 water harvesting structures constructed largely for agricultural use and partly for domestic use
‐ 700+ children covered from ~3,000, with 189 mainstreamed; 10 residential and non-residential facilities in Jamshedpur (capacity of 1,000) under Masti Ki Pathshala
‐ 5,504 youth enrolled, 2,733 youth trained and 2,197 youth placed/self-employed by various skill enhancement programmes
‐ 311 persons reached through Sabal Centre and various disability linked programmes
‐ 14,822 women reached under empowerment programmes through SHGs and ~5,000 women engaged in enterprise development and social activities
‐ 53,844 youth engaged through different sports activities ‐ 454 youth experienced outdoor leadership camps ‐ In response to the COVID-19 pandemic, we reached out to
communities towards the end of March 2020, impacting over 23,000 lives as a precursor to a coordinated response that eventually reached out to around 8,02,095 lives in subsequent months• Local capacity was created to make three-ply cloth masks across
our operational areas to cater to communities most exposed to the outbreak while generating income opportunities for 1,538 people from vulnerable communities
• Leveraged technology to bridge information gaps and extend sustained support to frontline health workers and reached 5,763 lives
• A digital volunteering programme reached out to 311 people from vulnerable communities
• Distributed 15,625 warm wholesome meals to those rendered most vulnerable by the lockdown
E N A B L I N G B E T T E R Q UA L I T Y O F L I FE FO R CO M M U N I T I E S
Employee volunteering programme
Corporate Overview 02
Strategic Review 46
Performance Review 20
Statutory Reports 84
Our Strategy 28
Financial Statements 206
INTEGRATED REPORT & ANNUAL ACCOUNTS 2019-20 | 113TH YEAR76 77
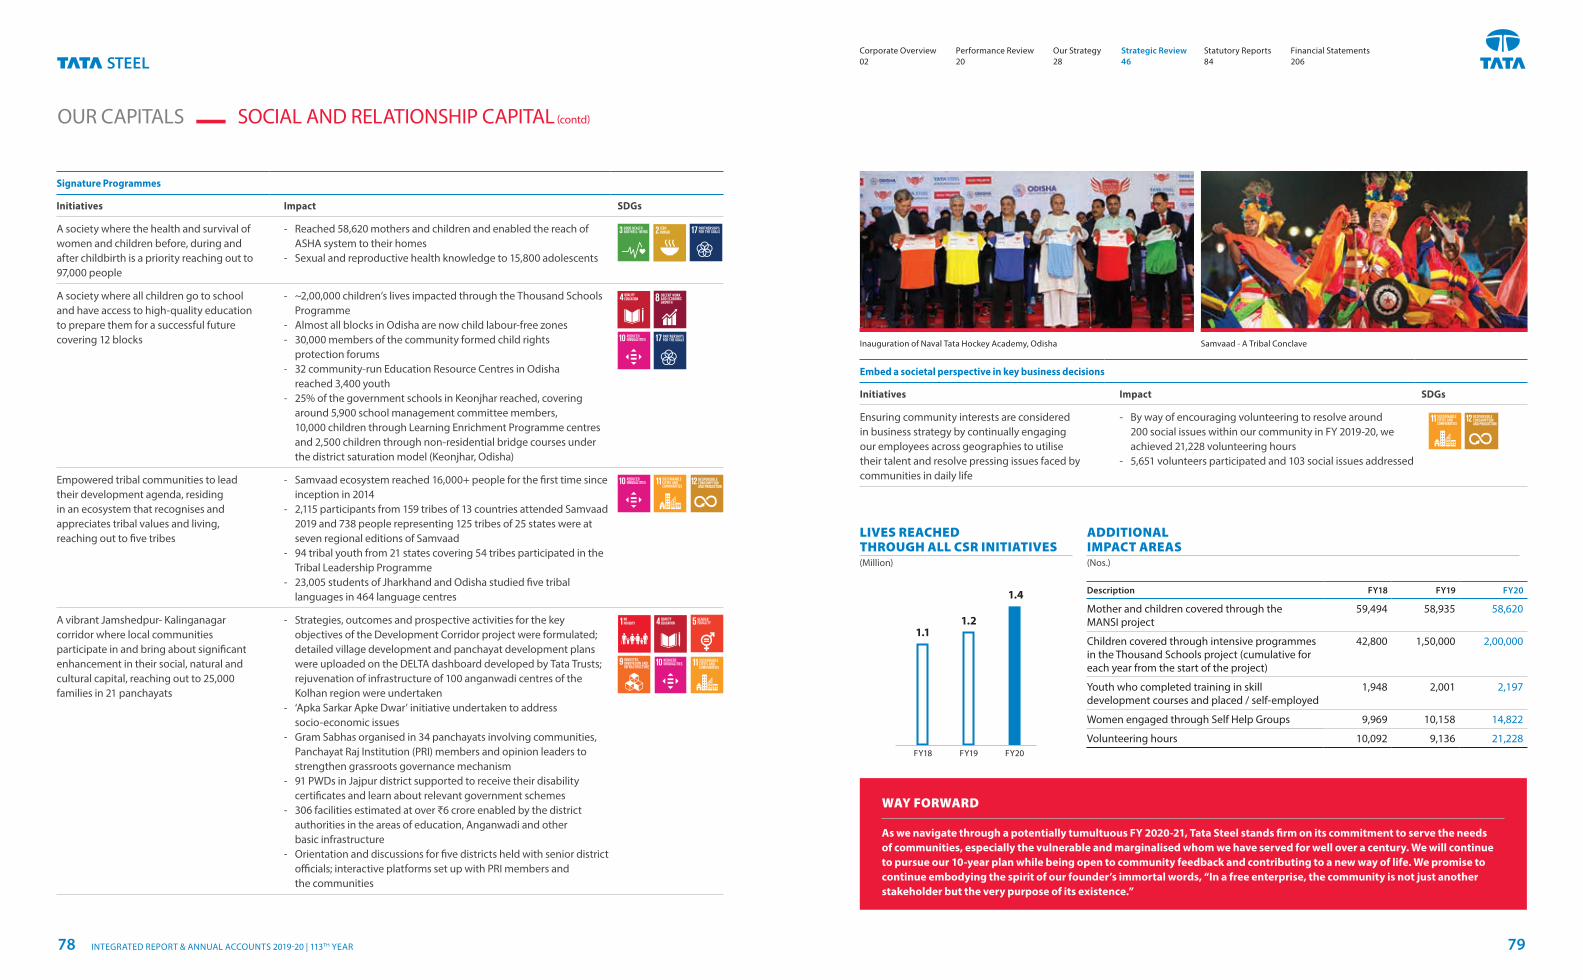
Signature Programmes
Initiatives Impact SDGs
A society where the health and survival of women and children before, during and after childbirth is a priority reaching out to 97,000 people
‐ Reached 58,620 mothers and children and enabled the reach of ASHA system to their homes
‐ Sexual and reproductive health knowledge to 15,800 adolescents
A society where all children go to school and have access to high-quality education to prepare them for a successful future covering 12 blocks
‐ ~2,00,000 children’s lives impacted through the Thousand Schools Programme
‐ Almost all blocks in Odisha are now child labour-free zones ‐ 30,000 members of the community formed child rights
protection forums ‐ 32 community-run Education Resource Centres in Odisha
reached 3,400 youth ‐ 25% of the government schools in Keonjhar reached, covering
around 5,900 school management committee members, 10,000 children through Learning Enrichment Programme centres and 2,500 children through non-residential bridge courses under the district saturation model (Keonjhar, Odisha)
Empowered tribal communities to lead their development agenda, residing in an ecosystem that recognises and appreciates tribal values and living, reaching out to five tribes
‐ Samvaad ecosystem reached 16,000+ people for the first time since inception in 2014
‐ 2,115 participants from 159 tribes of 13 countries attended Samvaad 2019 and 738 people representing 125 tribes of 25 states were at seven regional editions of Samvaad
‐ 94 tribal youth from 21 states covering 54 tribes participated in the Tribal Leadership Programme
‐ 23,005 students of Jharkhand and Odisha studied five tribal languages in 464 language centres
A vibrant Jamshedpur- Kalinganagar corridor where local communities participate in and bring about significant enhancement in their social, natural and cultural capital, reaching out to 25,000 families in 21 panchayats
‐ Strategies, outcomes and prospective activities for the key objectives of the Development Corridor project were formulated; detailed village development and panchayat development plans were uploaded on the DELTA dashboard developed by Tata Trusts; rejuvenation of infrastructure of 100 anganwadi centres of the Kolhan region were undertaken
‐ ‘Apka Sarkar Apke Dwar’ initiative undertaken to address socio-economic issues
‐ Gram Sabhas organised in 34 panchayats involving communities, Panchayat Raj Institution (PRI) members and opinion leaders to strengthen grassroots governance mechanism
‐ 91 PWDs in Jajpur district supported to receive their disability certificates and learn about relevant government schemes
‐ 306 facilities estimated at over ₹6 crore enabled by the district authorities in the areas of education, Anganwadi and other basic infrastructure
‐ Orientation and discussions for five districts held with senior district officials; interactive platforms set up with PRI members and the communities
OUR CAPITALS SOCIAL AND RELATIONSHIP CAPITAL (contd)
Embed a societal perspective in key business decisions
Initiatives Impact SDGs
Ensuring community interests are considered in business strategy by continually engaging our employees across geographies to utilise their talent and resolve pressing issues faced by communities in daily life
‐ By way of encouraging volunteering to resolve around 200 social issues within our community in FY 2019-20, we achieved 21,228 volunteering hours
‐ 5,651 volunteers participated and 103 social issues addressed
WAY FORWARD
As we navigate through a potentially tumultuous FY 2020-21, Tata Steel stands firm on its commitment to serve the needs of communities, especially the vulnerable and marginalised whom we have served for well over a century. We will continue to pursue our 10-year plan while being open to community feedback and contributing to a new way of life. We promise to continue embodying the spirit of our founder’s immortal words, “In a free enterprise, the community is not just another stakeholder but the very purpose of its existence.”
Inauguration of Naval Tata Hockey Academy, Odisha Samvaad - A Tribal Conclave
LIVES REACHED THROUGH ALL CSR INITIATIVES (Million)
ADDITIONAL IMPACT AREAS(Nos.)
FY20FY19FY18
Description FY18 FY19 FY20
Mother and children covered through the MANSI project
59,494 58,935 58,620
Children covered through intensive programmes in the Thousand Schools project (cumulative for each year from the start of the project)
42,800 1,50,000 2,00,000
Youth who completed training in skill development courses and placed / self-employed
1,948 2,001 2,197
Women engaged through Self Help Groups 9,969 10,158 14,822
Volunteering hours 10,092 9,136 21,228
1.4
1.21.1
Corporate Overview 02
Strategic Review 46
Performance Review 20
Statutory Reports 84
Our Strategy 28
Financial Statements 206
INTEGRATED REPORT & ANNUAL ACCOUNTS 2019-20 | 113TH YEAR78 79
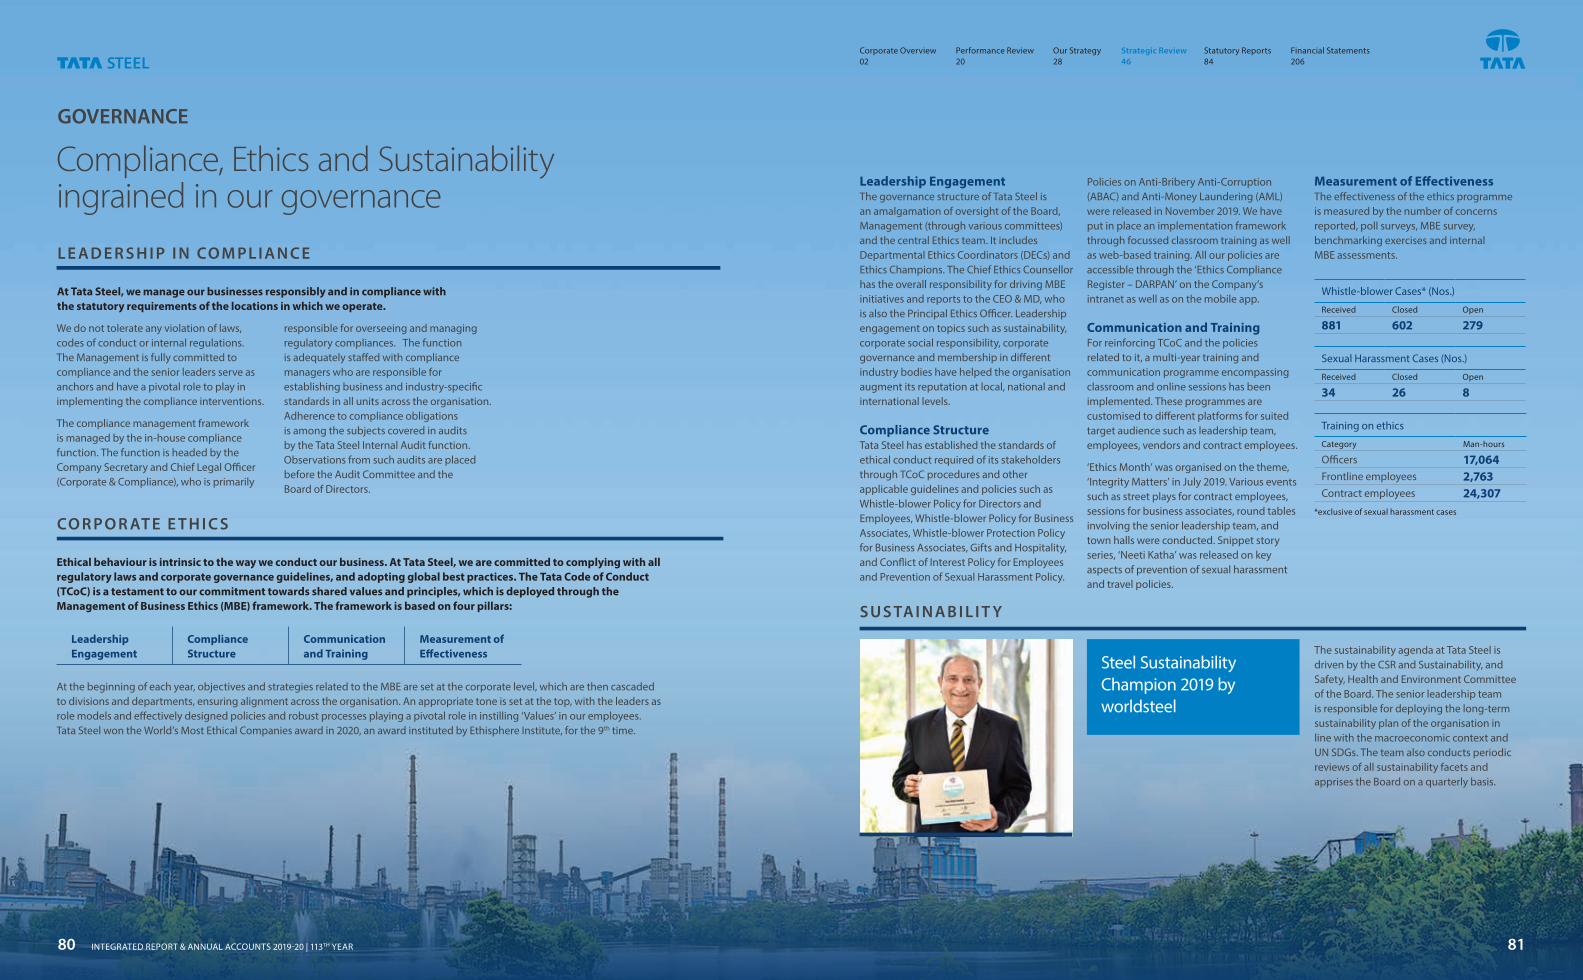
GOVERNANCE
Compliance, Ethics and Sustainability ingrained in our governance
The sustainability agenda at Tata Steel is driven by the CSR and Sustainability, and Safety, Health and Environment Committee of the Board. The senior leadership team is responsible for deploying the long-term sustainability plan of the organisation in line with the macroeconomic context and UN SDGs. The team also conducts periodic reviews of all sustainability facets and apprises the Board on a quarterly basis.
Ethical behaviour is intrinsic to the way we conduct our business. At Tata Steel, we are committed to complying with all regulatory laws and corporate governance guidelines, and adopting global best practices. The Tata Code of Conduct (TCoC) is a testament to our commitment towards shared values and principles, which is deployed through the Management of Business Ethics (MBE) framework. The framework is based on four pillars:
At Tata Steel, we manage our businesses responsibly and in compliance with the statutory requirements of the locations in which we operate.
Leadership Engagement
Compliance Structure
Communication and Training
Measurement of Effectiveness
At the beginning of each year, objectives and strategies related to the MBE are set at the corporate level, which are then cascaded to divisions and departments, ensuring alignment across the organisation. An appropriate tone is set at the top, with the leaders as role models and effectively designed policies and robust processes playing a pivotal role in instilling ‘Values’ in our employees. Tata Steel won the World’s Most Ethical Companies award in 2020, an award instituted by Ethisphere Institute, for the 9th time.
CO R P O R AT E E T H I C S
L E A D E R S H I P I N CO M PL I A N C E
Leadership Engagement The governance structure of Tata Steel is an amalgamation of oversight of the Board, Management (through various committees) and the central Ethics team. It includes Departmental Ethics Coordinators (DECs) and Ethics Champions. The Chief Ethics Counsellor has the overall responsibility for driving MBE initiatives and reports to the CEO & MD, who is also the Principal Ethics Officer. Leadership engagement on topics such as sustainability, corporate social responsibility, corporate governance and membership in different industry bodies have helped the organisation augment its reputation at local, national and international levels.
Compliance Structure Tata Steel has established the standards of ethical conduct required of its stakeholders through TCoC procedures and other applicable guidelines and policies such as Whistle-blower Policy for Directors and Employees, Whistle-blower Policy for Business Associates, Whistle-blower Protection Policy for Business Associates, Gifts and Hospitality, and Conflict of Interest Policy for Employees and Prevention of Sexual Harassment Policy.
Policies on Anti-Bribery Anti-Corruption (ABAC) and Anti-Money Laundering (AML) were released in November 2019. We have put in place an implementation framework through focussed classroom training as well as web-based training. All our policies are accessible through the ‘Ethics Compliance Register – DARPAN’ on the Company’s intranet as well as on the mobile app.
Communication and Training For reinforcing TCoC and the policies related to it, a multi-year training and communication programme encompassing classroom and online sessions has been implemented. These programmes are customised to different platforms for suited target audience such as leadership team, employees, vendors and contract employees.
‘Ethics Month’ was organised on the theme, ‘Integrity Matters’ in July 2019. Various events such as street plays for contract employees, sessions for business associates, round tables involving the senior leadership team, and town halls were conducted. Snippet story series, ‘Neeti Katha’ was released on key aspects of prevention of sexual harassment and travel policies.
Steel Sustainability Champion 2019 by worldsteel
We do not tolerate any violation of laws, codes of conduct or internal regulations. The Management is fully committed to compliance and the senior leaders serve as anchors and have a pivotal role to play in implementing the compliance interventions.
The compliance management framework is managed by the in-house compliance function. The function is headed by the Company Secretary and Chief Legal Officer (Corporate & Compliance), who is primarily
responsible for overseeing and managing regulatory compliances. The function is adequately staffed with compliance managers who are responsible for establishing business and industry-specific standards in all units across the organisation. Adherence to compliance obligations is among the subjects covered in audits by the Tata Steel Internal Audit function. Observations from such audits are placed before the Audit Committee and the Board of Directors.
Measurement of Effectiveness The effectiveness of the ethics programme is measured by the number of concerns reported, poll surveys, MBE survey, benchmarking exercises and internal MBE assessments.
Whistle-blower Cases* (Nos.)
Received Closed Open
881 602 279
Sexual Harassment Cases (Nos.)
Received Closed Open
34 26 8
Training on ethics
Category Man-hours
Officers 17,064Frontline employees 2,763Contract employees 24,307
*exclusive of sexual harassment cases
S U S TA I N A B I L I T Y
Corporate Overview 02
Strategic Review 46
Performance Review 20
Statutory Reports 84
Our Strategy 28
Financial Statements 206
81INTEGRATED REPORT & ANNUAL ACCOUNTS 2019-20 | 113TH YEAR80
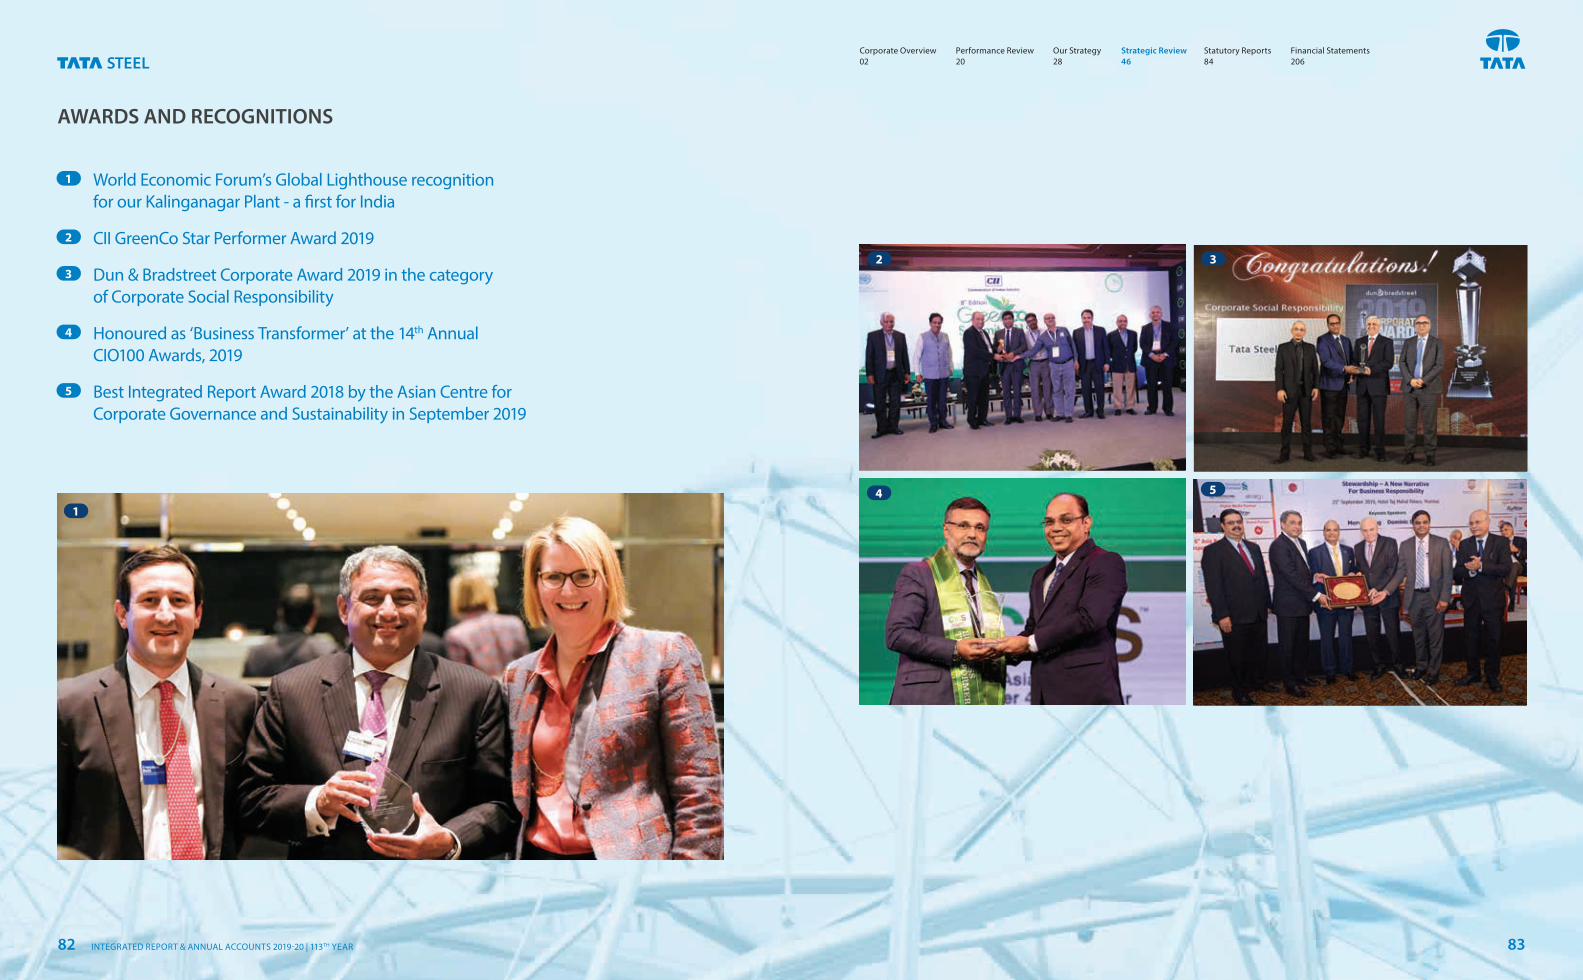
AWARDS AND RECOGNITIONS
1 World Economic Forum’s Global Lighthouse recognition for our Kalinganagar Plant - a first for India
2 CII GreenCo Star Performer Award 2019
3 Dun & Bradstreet Corporate Award 2019 in the category of Corporate Social Responsibility
4 Honoured as ‘Business Transformer’ at the 14th Annual CIO100 Awards, 2019
5 Best Integrated Report Award 2018 by the Asian Centre for Corporate Governance and Sustainability in September 2019
2
41
5
3
Corporate Overview 02
Strategic Review 46
Performance Review 20
Statutory Reports 84
Our Strategy 28
Financial Statements 206
INTEGRATED REPORT & ANNUAL ACCOUNTS 2019-20 | 113TH YEAR82 83
Board’s Report 86
Annexure 1 - Dividend Distribution Policy 102
Annexure 2 - Management Discussion Analysis 105
Annexure 3 - Annual Report on CSR Activities 131
Annexure 4 - Corporate Governance Report 134
Annexure 5 - Particulars of Remuneration 155
Annexure 6 - Financial Information of Subsidiary Companies
160
Annexure 7 - Information on Subsidiaries or Associates (including Joint Ventures)
170
Annexure 8 - Secretarial Audit Report 171
Annexure 9 - Extract of Annual Return 174
Annexure 10 - Particulars of Loans, Guarantees or Investments
197
Annexure 11 - Particulars of Energy Conservation, Technology Absorption and Foreign Exchange Earnings and Outgo
198
Statutory Reports
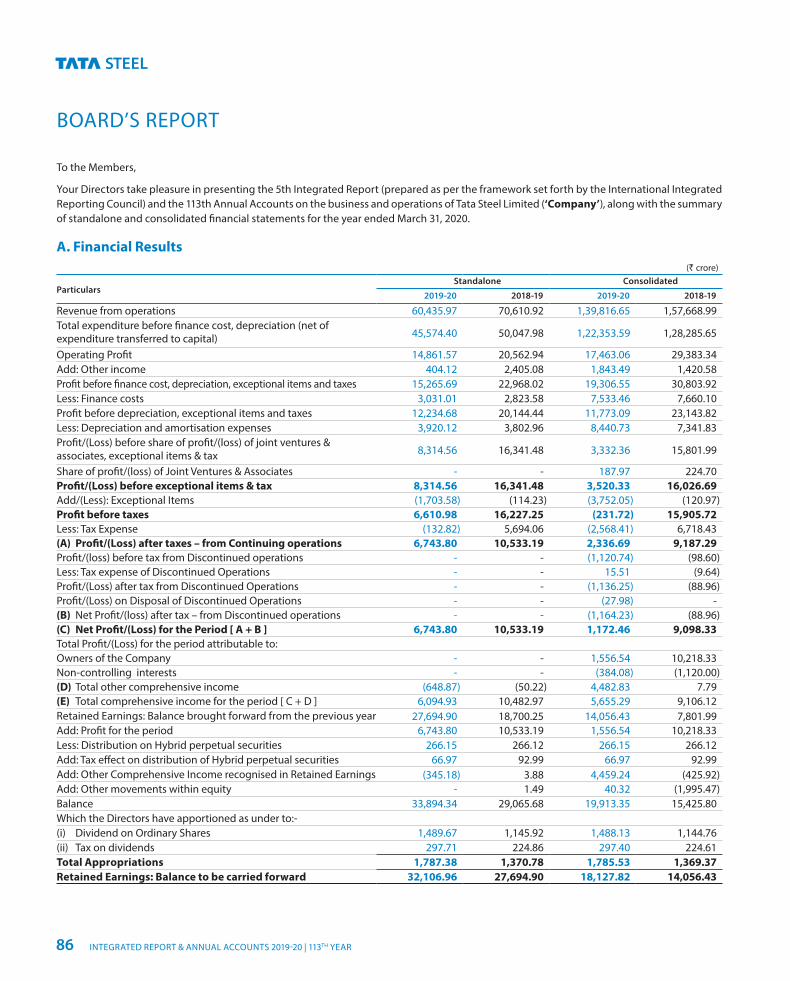
BOARD’S REPORT
To the Members,
Your Directors take pleasure in presenting the 5th Integrated Report (prepared as per the framework set forth by the International Integrated Reporting Council) and the 113th Annual Accounts on the business and operations of Tata Steel Limited (‘Company’), along with the summary of standalone and consolidated financial statements for the year ended March 31, 2020.
A. Financial Results(` crore)
Particulars Standalone Consolidated
2019-20 2018-19 2019-20 2018-19
Revenue from operations 60,435.97 70,610.92 1,39,816.65 1,57,668.99 Total expenditure before finance cost, depreciation (net of expenditure transferred to capital) 45,574.40 50,047.98 1,22,353.59 1,28,285.65
Operating Profit 14,861.57 20,562.94 17,463.06 29,383.34 Add: Other income 404.12 2,405.08 1,843.49 1,420.58 Profit before finance cost, depreciation, exceptional items and taxes 15,265.69 22,968.02 19,306.55 30,803.92 Less: Finance costs 3,031.01 2,823.58 7,533.46 7,660.10 Profit before depreciation, exceptional items and taxes 12,234.68 20,144.44 11,773.09 23,143.82 Less: Depreciation and amortisation expenses 3,920.12 3,802.96 8,440.73 7,341.83 Profit/(Loss) before share of profit/(loss) of joint ventures & associates, exceptional items & tax 8,314.56 16,341.48 3,332.36 15,801.99
Share of profit/(loss) of Joint Ventures & Associates - - 187.97 224.70 Profit/(Loss) before exceptional items & tax 8,314.56 16,341.48 3,520.33 16,026.69 Add/(Less): Exceptional Items (1,703.58) (114.23) (3,752.05) (120.97)Profit before taxes 6,610.98 16,227.25 (231.72) 15,905.72 Less: Tax Expense (132.82) 5,694.06 (2,568.41) 6,718.43 (A) Profit/(Loss) after taxes – from Continuing operations 6,743.80 10,533.19 2,336.69 9,187.29 Profit/(loss) before tax from Discontinued operations - - (1,120.74) (98.60)Less: Tax expense of Discontinued Operations - - 15.51 (9.64)Profit/(Loss) after tax from Discontinued Operations - - (1,136.25) (88.96)Profit/(Loss) on Disposal of Discontinued Operations - - (27.98) - (B) Net Profit/(loss) after tax – from Discontinued operations - - (1,164.23) (88.96)(C) Net Profit/(Loss) for the Period [ A + B ] 6,743.80 10,533.19 1,172.46 9,098.33 Total Profit/(Loss) for the period attributable to: Owners of the Company - - 1,556.54 10,218.33 Non-controlling interests - - (384.08) (1,120.00)(D) Total other comprehensive income (648.87) (50.22) 4,482.83 7.79 (E) Total comprehensive income for the period [ C + D ] 6,094.93 10,482.97 5,655.29 9,106.12 Retained Earnings: Balance brought forward from the previous year 27,694.90 18,700.25 14,056.43 7,801.99 Add: Profit for the period 6,743.80 10,533.19 1,556.54 10,218.33 Less: Distribution on Hybrid perpetual securities 266.15 266.12 266.15 266.12 Add: Tax effect on distribution of Hybrid perpetual securities 66.97 92.99 66.97 92.99 Add: Other Comprehensive Income recognised in Retained Earnings (345.18) 3.88 4,459.24 (425.92)Add: Other movements within equity - 1.49 40.32 (1,995.47)Balance 33,894.34 29,065.68 19,913.35 15,425.80 Which the Directors have apportioned as under to:- (i) Dividend on Ordinary Shares 1,489.67 1,145.92 1,488.13 1,144.76 (ii) Tax on dividends 297.71 224.86 297.40 224.61 Total Appropriations 1,787.38 1,370.78 1,785.53 1,369.37 Retained Earnings: Balance to be carried forward 32,106.96 27,694.90 18,127.82 14,056.43
INTEGRATED REPORT & ANNUAL ACCOUNTS 2019-20 | 113TH YEAR86
Notes:
(1) On January 28, 2019, T S Global Holdings Pte. Ltd. (‘TSGH’) (an indirect wholly-owned subsidiary of the Company) entered into definitive agreements with HBIS Group Co. Ltd. (‘HBIS’) to divest its entire equity stake in NatSteel Holdings Pte. Ltd. (‘NSH’) and Tata Steel (Thailand) Public Company Ltd. (‘TSTH’). During the year under review, TSGH decided not to pursue the proposed transaction with HBIS, for want of regulatory approvals.
As on March 31, 2020, active discussions and engagement with other potential buyer(s) demonstrate that the Management of the Group is committed to sell the disposal group and there is an active programme for completing the sale.
In accordance with Ind AS 105, “Non-current Assets Held for Sale and Discontinued Operations”, the assets and liabilities of businesses forming part of the disposal group have been classified as held for sale.
(2) During the year under review, exceptional items (Consolidated Accounts) primarily represent:
a) Impairment charges `3,197 crore in respect of property, plant and equipment (including capital work-in-progress and capital advances, right of use assets and intangible asset) primarily at Tata Steel Europe (‘TSE’), Global mineral entities, Tata Steel Special Economic Zone Limited, and at Tata Steel BSL Limited (‘TSBSL’) along with impairment of Goodwill at Bhubaneshwar Power Private Limited.
b) Restructuring provisions amounting to `161 crore at TSE.
c) Expenses incurred on stamp duty and registration fees for a portion of land parcels and mines acquired as part of business combination `27 crore and provision for coal block performance guarantee `134 crore at Tata Steel Long Products Limited (formerly Tata Sponge Iron Limited).
d) Provision for impairment of doubtful capital advances amounting to 4̀2 crore at TSBSL.
e) Fair valuation loss on investment in preference shares held at one of the associate companies amounting to `250 crore at Tata Steel Limited (Standalone).
f) Provision for demands and claims amounting to `196 crore relating to certain statutory demands and claims on environment and mining matters including `86 crore relating to SVLDRS - Sabka Vishwas Legal Dispute Resolution Scheme at Tata Steel Limited (Standalone).
g) Provision for Employee Separation Scheme (‘ESS’) under Sunehere Bhavishya Ki Yojana (‘SBKY’) scheme amounting to `107 crore at Tata Steel Limited (Standalone).
Partly offset by,
h) Restructuring and write back of provisions which primarily includes write-back of liabilities no longer required at Tata Steel BSL Limited `154 crore and settlement credit received at The Indian Steel & Wire Products Ltd. `18 crore.
i) Profit on sale of subsidiaries amounting to `149 crore and profit on liquidation of group companies amounting to `41 crore at TSE.
j) Gain on recovery of advances earlier provided for amounting to `1 crore at Tata Steel Limited (Standalone).
The exceptional items (Consolidated Accounts) in Financial Year 2018-19 primarily include:
a) Provision of `172 crore in respect of advances with public bodies paid under protest by Tata Steel BSL Limited.
b) Impairment charges `10 crore in respect of property, plant and equipment (including capital work-in-progress and capital advances) and intangible assets at TSBSL.
c) Provision for demands and claims amounting to `329 crore relating to certain statutory demands and claims on environment and mining matters at Tata Steel Limited (Standalone).
d) Provision for Employee Separation Scheme (‘ESS’) under Sunehere Bhavishya Ki Yojana (‘SBKY’) scheme amounting to `35 crore at Tata Steel Limited (Standalone).
Partly offset by:
e) Profit on sale of non-current investments amounting to `180 crore, primarily in TRL Krosaki Refractories Limited (an associate of the Company) and certain other subsidiaries and joint ventures.
f) Restructuring and write back of provisions amounting to
`245 crore which primarily include write-back of liabilities no longer
required at TSBSL and arbitration settlement at Tata Steel Utilities
and Infrastructure Limited (formerly Jamshedpur Utilities & Services
Company Limited), partly offset by charge at TSE.
1. Dividend Distribution Policy In terms of Regulation 43A of the Securities and Exchange Board of India (Listing Obligations and Disclosure Requirements) Regulations, 2015, (‘SEBI Listing Regulations’) the Board of Directors of the Company (‘the Board’) formulated and adopted the Dividend Distribution Policy (‘the Policy’). As per the Policy, the Company, after considering various external factors that may have an impact on the business as well as internal factors such as the long-term growth strategy of the Company and the liquidity position including working capital requirements and debt servicing obligations, will endeavour to pay dividend up to 50% of profit after tax of the Company, subject to the applicable rules and regulations.
The Policy is annexed to this report (Annexure 1) and is also available on our website at https://www.tatasteel.com/media/6086/dividend-policy-final.pdf
2. Dividend The Board has recommended a dividend of `10 per fully paid-up Ordinary (equity) Share on 112,64,90,211 fully paid-up Ordinary Shares of face value `10 each, for the year ended March 31, 2020. (Dividend for Financial Year 2018-19: `13 per fully paid-up Ordinary Share on 112,64,89,680 fully paid-up Ordinary Shares of face value `10 each).
The Board has also recommended a dividend of `2.504 per partly paid-up Ordinary (equity) Share on 7,76,36,788 partly paid-up Ordinary Shares of face value `10 (paid up `2.504 per share) each for the year ended March 31, 2020. [Dividend for Financial Year 2018-19: `3.25 per partly paid-up Ordinary Share on 7,76,36,705 partly paid-up Ordinary Shares of face value `10 each (paid-up `2.504 per share)].
The Board has recommended dividend based on the parameters laid down in the Dividend Distribution Policy and will be paid out of profits for the year.
The dividend on Ordinary Shares (fully paid-up as well as partly paid-up) is subject to the approval of the Shareholders at the Annual General Meeting (‘AGM’) scheduled to be held on Thursday, August 20, 2020.
The dividend once approved by Shareholders will be paid on and from Monday, August 24, 2020. If approved, the dividend would result in a cash outflow of `1,145.93 crore. The dividend on Ordinary
Corporate Overview 02
Strategic Review 46
Performance Review 20
Statutory Reports 84
Our Strategy 28
Financial Statements 206
87
BOARD’S REPORT (CONTD.)
Shares (fully paid-up as well as partly paid-up) is 100% of the paid-up value of each share. The total dividend pay-out works out to 16.99% (Previous Year: 17%) of the net profit of the standalone results.
Pursuant to the Finance Act, 2020, dividend income is taxable in the hands of the shareholders effective April 1, 2020 and the Company is required to deduct tax at source from dividend paid to the Members at prescribed rates as per the Income Tax Act, 1961.
The Register of Members and Share Transfer Books of the Company (for fully paid-up as well as partly paid-up shares) will remain closed from Saturday, August 8, 2020 to Thursday, August 20, 2020 (both days inclusive) for the purpose of payment of the dividend for the Financial Year ended March 31, 2020.
3. Transfer to Reserves The Board of Directors has decided to retain the entire amount of profit for Financial Year 2019-20 in the statement of profit and loss.
4. Capex and Liquidity During the year under review, the Company, on a consolidated basis spent `10,398 crore on capital projects across India, Europe and Canada largely towards on-going projects in India (Kalinganagar plant and Tata Steel BSL Limited), essential sustenance, and replacement schemes.
The Company’s liquidity position remains strong at `17,745 crore as on March 31, 2020, comprising `11,549 crore in cash and cash equivalent and balance in undrawn credit lines.
5. Management Discussion and Analysis The Management Discussion and Analysis as required in terms of the SEBI Listing Regulations is annexed to the report (Annexure 2).
B. Integrated Report In keeping with the Company’s valued tradition of “thinking about society and not just the business”, in 2016, we transitioned from compliance-based reporting to governance-based reporting by adopting the <IR> framework developed by the International Integrated Reporting Council.
We present to you our 5th Integrated Report which highlights the measures taken by the Company that contribute to long-term sustainability and value creation, while embracing different skills, continuous innovation, sustainable growth, and a better quality of life.
C. Operations and Performance1. Tata Steel Group During the year under review, the Tata Steel Group (‘the Group’) recorded total deliveries of 26.68 MnT (previous year: 26.80 MnT). The steel deliveries decreased at Tata Steel Limited by 2.9% and at Tata Steel Europe by 4%. This decrease was off-set by higher
deliveries at Tata Steel BSL Limited (‘TSBSL’) by 16%. The increase at TSBSL is due to ramp-up of operations. Further, in the previous Financial Year 2018-19, deliveries prior to the acquisition of TSBSL on May 18, 2018 under Insolvency and Bankruptcy Code were not included. Further, the acquisition of the steel business of Usha Martin Limited by Tata Steel Long Products Limited (‘TSLP’) (formerly Tata Sponge Iron Limited) on April 9, 2019, also increased the total deliveries of the Group by 0.51 MnT. The turnover for the Group was at `1,39,817 crore during the Financial Year 2019-20 (previous year: `1,57,669 crore), a decrease of 11% over the previous year due to decline in realisations across geographies along with lower deliveries. Further, the EBITDA for the Group was `17,735 crore during the Financial Year 2019-20 as compared to `29,770 crore in the previous year.
During the year under review, the Group reported a consolidated profit after tax (including discontinued operations) of `1,172 crore as against a profit of `9,098 crore in the previous year. The decrease was mainly due to lower operating profits attributable to decline in the steel prices during the year, higher exceptional charge, partly offset by lower tax expenses primarily on account of re-measurement of deferred tax liabilities based on the new lower rate of Income tax prescribed under Section 115BAA of the Income Tax Act,1961, along with creation of deferred tax assets at some of its foreign entities.
2. India During the year under review, total deliveries at Tata Steel Limited (Standalone) were at 12.32 MnT (previous year: 12.69 MnT), recording a decrease of 2.9% over the previous year. Turnover was `60,436 crore (previous year: `70,611 crore), decrease of 14.4% than that of the previous year. EBITDA from Tata Steel Limited (Standalone) was `15,096 crore (previous year: `20,744 crore), 27.2% lower than that of the previous year.
During the year under review, the crude steel production in India increased by 8% to 18.20 MnT with ramp up at TSBSL and acquisition of steel business of Usha Martin Limited by TSLP. TSBSL achieved best ever crude steel production and sales at 4.46 MnT and 4.14 MnT, respectively due to improved maintenance practices, higher capacity utilisations, and marketing synergies. TSLP which acquired steel making facility of Usha Martin Limited, during the year, achieved crude steel production of 0.58 MnT while deliveries stood at 0.51 MnT.
Total deliveries of Tata Steel from its Indian operations (including TSBSL and TSLP) stood at 16.97 MnT i.e. 4% higher than the previous year. The turnover and EBITDA (excluding inter-company eliminations and adjustments) was `82,125 crore and `17,650 crore, respectively.
During the year under review, Sukinda Chromite mine and Gomardih Dolomite mine leases expired on March 31, 2020, as per the mining regulations . Tata Steel Mining Limited (formerly T S Alloys Limited), a wholly-owned subsidiary of the Company, has won the Sukinda Chrome ore mines in the auction and the lease grant process is underway. Further, Tata Steel Mining Limited also signed 50 year
INTEGRATED REPORT & ANNUAL ACCOUNTS 2019-20 | 113TH YEAR88
leases for Kamarda and Saruabil Chrome mines. With these mines, Tata Steel Mining Limited is well placed to cater to its global customer base as well as requirements of the Group.
3. Europe During the year under review, liquid steel production from European operations was 10.26 MnT (previous year: 10.31 MnT). Deliveries from European operations decreased by 4% to 9.29 MnT primarily due to overall weakness in economic activities. Turnover from operations was `55,939 crore (previous year: `64,777 crore). The decrease in turnover was primarily due to sharp decline in European steel prices and lower deliveries, resulting in loss of ̀ 664 crore at the EBITDA level.
The Company is committed to make its European operations simpler, leaner, and sustainable. It has launched a transformation programme to generate savings across multiple initiatives.
4. Impact of COVID-19 The outbreak of COVID-19 pandemic has led to an unprecedented health crisis and has disrupted economic activities and global trade while weighing on consumer sentiments. Consequently, the global steel demand is expected to be sharply lower in 2020.
The Government of India had imposed a stringent nationwide lockdown with effect from March 25, 2020 which has severely impacted manufacturing activities. Though the Steel and Mining sectors were exempt from the lockdown measures, they were subject to certain guidelines. Steel demand was affected as key steel consuming sectors struggled to operate amidst weakening economic activities, working capital constraints, shortage of manpower, and logistical issues.
In Europe, the outbreak of COVID-19 has further accentuated the sustained weak steel demand. The share of steel imports to total consumption in the European Union continues to remain at elevated levels which is a cause of concern.
The risk-intelligent culture embedded across the Company has helped in developing and adopting a multi-pronged strategy to effectively respond to the evolving pandemic situation. The health and safety of our employees and the communities in which we operate continues to be the foremost priority of the Company. The Company is focussed on running operations safely and efficiently to service our customers. The operations have been aligned with the prevailing market conditions by reducing upstream operations while curtailing downstream operations. Cross-functional teams worked to manage supply chain and logistics issues within the constraints imposed by the lockdown to ensure that plant could operate as planned. With domestic markets closed due to the lockdown, there was a shift to export sales which were ramped up sharply. The Company is also focussed on liquidity management to face any future disruption in business conditions. Funds were raised to manage liquidity considering the heightened uncertainty over the extent of impact on underlying demand conditions.
D. Key Developments Amalgamation and Joint Venture
Amalgamation of Bamnipal Steel Limited and Tata Steel BSL Limited into and with Tata Steel Limited
During the year under review, the Board of Directors of the Company, at its meeting held on April 25, 2019, approved the amalgamation of Bamnipal Steel Limited and Tata Steel BSL Limited, into and with the Company by way of a composite scheme of amalgamation.
The Company received a ‘no objection’ to the scheme from the National Stock Exchange of India Limited and BSE Limited on August 26, 2019 and has filed an application before the National Company Law Tribunal, Mumbai Bench for necessary directions. The amalgamation is subject to approval from shareholders and other regulatory authorities.
Joint Venture between Tata Steel and thyssenkrupp AG
During the year under review, the Company and thyssenkrupp AG decided not to pursue the proposed transaction to form a joint venture to combine their steel businesses in Europe. The decision was taken after careful evaluation of the viability of the proposal in light of the feedback received from the European Commission ('EC'). Thereafter, on June 11, 2019, EC formally announced its decision to prohibit the proposed joint venture.
Acquisitions & Investments
Acquisition of Bhushan Energy Limited
During the year under review, Tata Steel BSL Limited (‘TSBSL’), an indirect subsidiary of the Company, completed the acquisition of controlling stake in Bhushan Energy Limited (now Angul Energy Limited) (‘BEL’), pursuant to the Resolution Plan as approved by the National Company Law Tribunal (Principal Bench, New Delhi) vide its Order dated May 30, 2019, under Corporate Insolvency and Resolution Process of the Insolvency and Bankruptcy Code, 2016. Consequently, BEL became a subsidiary of TSBSL effective June 1, 2019.
Investment in Tata Steel Long Products Limited
Pursuant to the Rights Issue of Tata Steel Long Products Limited (formerly Tata Sponge Iron Limited) ('TSLP'), on July 24, 2019, the Company acquired 2,58,43,967 Equity Shares of face value of `10 each of TSLP at a price of `500 per equity share (including a premium of `490 per equity share) aggregating to `1,292.20 crore. As a result of this, the Company's holding in TSLP increased from 54.50% to 75.91%. The name change of TSLP from Tata Sponge Iron Limited to Tata Steel Long Products Limited is effective August 20, 2019.
Corporate Overview 02
Strategic Review 46
Performance Review 20
Statutory Reports 84
Our Strategy 28
Financial Statements 206
89
BOARD’S REPORT (CONTD.)
Divestments
NatSteel Holdings Pte. Ltd. (‘NSH’) and Tata Steel (Thailand) Public Company Ltd. (‘TSTH’)
During the year under review, T S Global Holdings Pte. Ltd. (‘TSGH’), an indirect wholly-owned subsidiary of the Company, for want of regulatory approvals, decided not to pursue the proposed
transaction with HBIS Group Co. Ltd. (‘HBIS’), to divest its entire equity stake in NSH (100%) and TSTH (67.9%) to a company in which 70% equity stake would be held by an entity controlled by HBIS and the balance 30% by TSGH.
The Company is in discussions with other investor(s) in continuation of its strategy to find a partner for the South-East Asian business.
Financing
Issuances of Debt Securities
During the Financial Year 2019-20 and till date of the report, the Company has allotted the following Unsecured, Rated, Listed, Redeemable, Non-Convertible Debentures (‘NCDs’) of face value of `10,00,000 each to identified investors on private placement basis:
Particulars of Allotment Date of Allotment Tenure Date of Maturity
6,700 – 7.70% NCDs aggregating to `670 crore March 13, 2020 5 years March 13, 202510,250 – 7.85% NCDs aggregating to `1,025 crore April 17, 2020 3 years April 17, 20235,100 – 7.85% NCDs aggregating to `510 crore April 22, 2020 3 years April 21, 202310,000 – 7.70% NCDs (floating coupon) aggregating to `1,000 crore April 27, 2020 3 years April 27, 2023Series A: 5,000 – 7.85% NCDs (floating coupon) aggregating to `500 crore; Series B: 5,000 – 7.95% NCDs aggregating to `500 crore April 30, 2020 3 years
3 years 6 monthsApril 28, 2023
October 30, 202310,000 – 8.25% NCDs aggregating to `1,000 crore May 20, 2020 3 years May 19, 20234,000 – 8.08% NCDs (floating coupon) aggregating to `400 crore June 3, 2020 3 years June 2, 2023
Refinancing at Tata Steel Netherlands
During the year under review, Tata Steel Netherlands Holdings B.V. (‘TSNHBV’), an indirect wholly-owned subsidiary of the Company, executed agreements for the refinancing of its bank debt. TSNHBV has raised term loan facilities of EUR 1.75 billion. This represents a reduction of EUR 500 million versus the external debt outstanding in Tata Steel Europe as of March 2019, enabling the standalone European business to have a more robust balance sheet while it is also putting in significant efforts at restructuring and improving its operating performance.
Credit Rating In April 2020, S&P Global Ratings (‘S&P‘) revised the issuer credit rating of the Company as well as the long-term foreign currency issuer credit rating for ABJA Investment Co. Pte. Ltd., a wholly-owned subsidiary of the Company, from ‘BB-’/Outlook: Stable to ‘B+’/Outlook: Negative. S&P also revised the issuer credit rating of Tata Steel UK Holdings Ltd., an indirect subsidiary of the Company from ‘B+'/Outlook: Stable to ‘B'/Outlook: Negative. The revision in ratings was primarily on account of COVID-19 pandemic related disruptions and the consequent economic effects.
Similarly, in April 2020, Moody’s Investor Service (‘Moody’s’) revised the outlook for the Company’s Corporate Family Rating from Stable to Review for Downgrade and affirmed the rating ‘Ba2’. Moody’s has also revised the Corporate Family Rating of Tata Steel UK Holdings Ltd. from ‘B2'/Outlook: Stable to ‘B3'/Outlook: Review for Downgrade. The revision was also triggered in anticipation that the Company would face challenges due to the COVID-19 pandemic led economic downturn coupled with the weak credit profile of the Company.
E. Sustainability The Company is committed to steel production using the most efficient routes, minimising waste generation and mitigating impact on natural capital. The sustainability approach of the Company emphasises integrated thinking and balances the impact and outcome of six capitals viz. Financial, Manufactured, Intellectual, Human, Social and Relationship, and Natural. Aspirations of taking our carbon emissions to <2 tCO2/tcs, attaining zero waste, reducing specific water consumption to <3 m3/tcs, and doubling our CSR reach by 2025 are significant facets of this strategy.
New initiatives undertaken by the Company in the Financial Year 2019-20 find their genesis in our aspiration of minimising the carbon footprint. The Company undertook third party studies which helped in identifying a renewable energy potential of ~180 MW across locations. This will help the Company in increasing the proportion of the renewable energy in its power mix.
The Company is a signatory to the Task Force of Climate Related Financial Disclosure for climate change and is in the process of identifying transition risks to decarbonise its operations over a period. Several transition risks and opportunities have been identified as part of this assessment. Specific mitigation and contingency plans for each of the identified risks are being integrated with Company’s long-term strategy.
The Company is committed to serve its customers through a portfolio of eco-friendly products and disclosure of the impact of the products on environment by using Life Cycle Assessment (‘LCA’) methodology. In Europe, almost entire product range of the European operations is certified to be at the BES 6001 sustainable sourcing standard. During the year under review,
INTEGRATED REPORT & ANNUAL ACCOUNTS 2019-20 | 113TH YEAR90
Tata Steel Europe received a ‘Steelie’ award from World Steel Association for ‘Excellence in Life Cycle Assessment’ in recognition of its development of a sustainability development tool for use in the new product development processes in its European operations. Tata Steel Europe has also published Environmental Product Declarations (‘EPD’), setting out the environmental characteristics of products throughout their life-cycle, for a large number of its products manufactured in Europe. Further, the Company will strive to maintain its global leadership by publishing EPDs on an increased proportion of its global product offering.
The Company identified supply chain sustainability as a key material issue in the materiality exercise conducted in the Financial Year 2018-19. In order to take this forward, the Tata Steel Responsible Supply Chain Policy was adopted in February 2020. The expectations with respect to sustainability from supply chain partners, viz. vendors, Steel Processing Centres and distributors, as well as the way the Company would engage with them on the subject have been laid down in the aforesaid policy.
In order to augment the effort of the Company towards conservation of biodiversity at its operational sites, the Company constituted a Centre of Excellence for Biodiversity Management to strategically formulate and implement Biodiversity Management Plan. During the year under review, more than 4 lakh trees were planted across locations using eco-restoration methodology and Miyawaki plantation techniques.
The continued focus on ‘Sustainability’ has helped the operations of the Company, in India as well as Europe, to be recognised as two of the six Sustainability Champions by World Steel Association for three consecutive years. Also, the Jamshedpur Works was awarded the ‘GreenCo Star Performer’ award for sustained excellence in environmental management and the Global Wires division of the Company was awarded the ‘GreenCo Gold Rating’ for excellence in environmental management, by the CII Green Business Centre.
Environment The Company is committed to responsible use and protection of environment through resource conservation, pollution control, and sustainable practices for waste management. The Company focusses on operational excellence through “Prevent, Minimise, Recover, Reuse and Recycle” approach. The Company continues its pursuit of establishing best-in-class facilities and channelising its investment to upgrade manufacturing and distribution facilities to improve operational and environmental performance.
The Company has implemented environmental management systems in accordance with international standard ISO 14001, which provides the necessary framework for managing compliance and improving environmental performance. The Company maintains accredited laboratories for environmental performance assessment.
The Safety, Health, & Environment Committee of the Board provides oversight and necessary guidance on environmental matters. The Company has dedicated Environment Management teams at all its
operating locations. The Company endeavours to practice responsible advocacy on regulatory issues and actively participates in World Steel Association Environment Policy Committee, World Economic Forum, Central Pollution Control Board’s National Taskforce in India, Eurofer (the European Confederation of Iron and Steel Producers), and various other organisations. The Company engages with various organisations such as Confederation of Indian Industry-Centre of Excellence for Sustainable Development, Confederation of Indian Industry-Sohrabji Godrej Green Business Centre, the Indian Institute of Metals, The Energy and Resources Institute, The Federation of Indian Chambers of Commerce and Industry, Federation of Indian Mineral Industries, and Insolvency and Bankruptcy Board of India amongst others on diverse issues.
Climate Change Climate change is one of the most pressing issues the world faces today and the Company recognises its obligation to work towards mitigation of climate change related risks and strives to address the challenges of transitioning to a lower carbon regime. The Company firmly believes that, steel is an integral part of the solution for transitioning to lower carbon economy because of its unique property of infinite recyclability.
The Company aspires to achieve global benchmark levels of < 2 tCO2/tcs emissions by 2025 for Indian operations and to become carbon neutral by 2050 in Europe. The Company’s site in IJmuiden in the Netherlands is one of the most carbon efficient integrated steelworks in the world while, the Company’s integrated steelworks at Jamshedpur is the most efficient steel plant in India. The Company has established Energy Efficiency and Carbon Reduction programmes at all its Steel Plants in the Netherlands, UK, and India to pursue short-term energy efficiency initiative and to work on long-term decarbonisation initiatives. The Research & Development team is collaborating with technology companies and academia to work on wide range technologies which, inter alia, includes carbon capture, use and storage (‘CCUS’), hydrogen-based steelmaking and new smelting technologies. The Company has set up a Steel Recycling business in an endeavour to bring good practices in Indian scrap market and make more scrap available for conversion to steel.
The Company continues to work on developing HIsarna, a new smelting reduction technology to produce steel without the need for coke making or agglomeration processes, thereby improving efficiency, reducing energy consumption and reducing CO2 emissions. The pilot plant is located at the Company’s IJmuiden site in the Netherlands. The Company is exploring to scale up HIsarna in India to pursue the development of a strategic roadmap to achieve quantum reduction over 2030 and 2050 horizons.
Health and Safety Health and Safety Management remains the Company’s foremost priority and we are committed to achieve ‘Zero Harm’ by 2025. In pursuit of this objective, the Company has been working on six strategies viz. build safety leadership capability at all levels to achieve zero harm, achieve zero harm to contract employees
Corporate Overview 02
Strategic Review 46
Performance Review 20
Statutory Reports 84
Our Strategy 28
Financial Statements 206
91
BOARD’S REPORT (CONTD.)
by strengthening deployment of contractor safety management standard, improve competency and capability for hazard identification & risk management, improve road & rail safety across the Company, excellence in process safety management, and establish industrial hygiene and improve occupational health.
During the year under review, the Company undertook several initiatives to improve the health and safety standards of its employees, including rolling out a reward and recognition policy for Indian operations to encourage positive safety behaviour among employees, commissioning a ‘safety leadership development centre’ to enhance the competency of the workforce and provide safety induction training, and establishing ‘Tactical Centre’ for business continuity management during emergency situations. Group companies including Tata Steel Europe formed HSE Performance Improvement Teams to improve safety at workplace through learning and sharing of best practices.
A focussed effort was also made to improve the deployment of competent contract workforce in high hazard operations. For effective learning and deployment of Safety Standard across organisation, ten Safety Standards were simplified and e-learning modules were developed.
Contractor employee’s fatality remains the topmost safety concern for the Company. It is with deep regret that the Company reports three fatalities in India involving our contractor partners. During the year under review, three distinct Safety campaigns viz. ‘Zero Harm’, ECAUP (Elimination of Commonly Accepted Unsafe Practice) and ‘Fall from Height’ were launched across locations to address gaps and improve safety awareness. Monthly review of red risk incidents by the Senior Leadership helped in achieving ~44% reduction of high potential incidents vis-à-vis previous year. Further, the initiative to roll out Process Safety through ‘Centre of Excellence’ methodology gained momentum. Currently, the process safety has been rolled out to 46 departments and the balance departments will be covered in the Financial Year 2020-21. The Company has been awarded for the best practice on ‘Managing Process Safety Critical Equipment for Barrier Effectiveness’ at the World Steel Safety and Health Recognition function held at Mexico in 2019.
The Company is leveraging digital technology through usage of Smart Safety Wearable’ developed in-house, in collaboration with Tata Communications, for online tracking of health parameters of workers who are in isolated workplaces at Jamshedpur. In order to improve safe behaviour on road, a video analytic system was installed at Jamshedpur including the first Automatic Number Plate Recognition (‘ANPR’) system. Further to strengthen CCTV visualisation, local command centres were established across various locations.
Towards Occupational Health, the Company has implemented Industrial Hygiene hazard control measures to minimise the exposure level at Jamshedpur. Theme based health awareness campaigns on heat stress, hypertension, diabetes, and obesity were organised
across India covering 15,000 employees and contract employees. In order to develop competency in first-aid and Cardiopulmonary resuscitation (CPR) ~7,600 employees were trained across India. High risk cases of about 52%, relating to life style diseases, have been transformed to moderate or low risk category.
During the year under review, the Company has also undertaken other initiatives such as leadership coaching and site interventions at both integrated sites, putting in place new governance and review structures, accelerating the deployment of standards and codes of practices around coil banding, and initiative towards a more digital approach to support site health and safety teams and the development of management systems in line with ISO 45001.
At Tata Steel Europe, Health and safety continues to be of utmost priority. It is with deep regret that the Company reports two fatalities in Europe during the year. In consultation with the senior leadership, several measures including a health and safety transformation plan which focusses upon five key areas viz. transformational leadership, collaborative development and deployment, digitally enabled, company wide support, standards and integration, and workforce engagement, have been developed.
Research and Development In line with the aspiration to be amongst the top five innovation driven steel companies globally, the Company has ushered in Technology Leadership Areas (‘TLAs’). Cross-functional teams have been constituted and projects have commenced based on TLAs. During the year under review, the Research and Development (‘R&D’) conducted by the Company has demonstrated a process at lab scale for rapid heating of non-coking coal to coke, through microwave energy. The Company also targets to upscale the technology for continuous coke making. Further, with an aim to create ‘Value from Waste’, the Company established a process for using water-cooled and air-cooled ferrochrome slag material in applications such as bitumen road, concrete, and fly ash slag bricks.
Conservation of the environment and sustainability has always been an important area for the Company. Accordingly, the Company has installed a pilot plant of the scale 5 Tonnes per Day (TPD) at one of our steelmaking plants to capture CO2 from Blast Furnace gas. Further, the Company has also developed an advance oxidation process for cyanide removal and the fabrication and installation of the commercial plant of the capacity @ 100 m3/hr is under progress. Amongst the notable customer collaborations, the Company has worked jointly with a leading automotive player in designing the tipper body using a new grade of high strength steel which has resulted in reduction of the weight of the tipper body by 200 kg without compromising on its strength.
In Europe, R&D has contributed to various new products and implementation of new process control models and other process improvements. The Company has introduced the Valast range
INTEGRATED REPORT & ANNUAL ACCOUNTS 2019-20 | 113TH YEAR92
of abrasion resistant grades, the new Cr6+ free TCCT (Trivalent Chromium Coating Technology) as replacement for ECCS (Electrolytic Chrome Coated Steel) and CFPA (Chromium Free Passivation Alternative) products for packaging, and MagiZinc full finish. The Company also worked towards continuously optimising coal blending, improving safety and preventing damage by prediction of coiling through a new model CISCA (Cooling Induced Shape Change Algorithm), and automatically detecting of stickers in the casters at an early stage. Further, R&D has also been vital in getting many potential new products to reach higher Technology Readiness Levels throughout the year and to support the customer interactions on a technical level.
R&D continues to help the Company in its drive to become more sustainable and environmentally friendly. The HIsarna project has demonstrated its potential to solve certain issues faced by the steel industry in dealing with circularity and climate change. R&D will continue to support this development and be heavily involved in the technical discussions for upscaling the process in India and IJmuiden.
New Product DevelopmentDuring the year under review, the Company developed 155 new products in India, which inter alia include the JSH440WN & JSH590RN grades and S420MC for high strength automotive structural applications. The new grades of steel are targeted to be used in upcoming automotive models. The Company was awarded the “Innovative Supplier of the year 2019” for its customer centric approach and innovation in the product development.
In the long products segment, the Company commercialised high strength, high ductility rebar grade – Fe600 HD. Further, the Company also developed low N2 Steel grade [WR3M] wire rod for welding electrode wire application through Electric Arc Furnace (EAF) route.
In Europe, 22 new products were launched during the year. These launches include major developments for engineering, automotive and construction markets. A notable example of product launch includes the Valast®450, XPF ®800 Tubes and Celsius®460. Valast®450 hot rolled abrasion resistant product offers the widest strip product with superior surface quality, guaranteed impact strength and flexible length sheets at a competitive price to the yellow goods and heavy vehicles market. The XPF®800 Tubes, offers customers a cost-effective alternative for manufacturing automotive components such as twist beams. The Celsius®460 NH Tube is the strongest hot formed structural hollow section ever produced by the Company, offering customers up to 20% weight saving with no weldability penalty. Further, Packaging department has further developed and commercialised its already launched polymer laminated steel Protact® range of products.
Customer Relationship During the year under review, the Company continued to enhance its relationship with automotive manufacturers and their large value chain partners. In addition, the Company also revived its
Customer Service Team (‘CST’) approach of nurturing relationships with automotive manufacturers and continued to provide value upliftment across the Original Equipment Manufacturers (‘OEM’) supply chain ecosystem. The Company also extended its Early Vendor Involvement (‘EVI’) partnership for the upcoming models of the OEMs. The Company has offered solutions on weight reduction, crash worthiness, and vehicular design from material perspective to its customers through its equipped Research and Development setup. In addition, the Company continued to roll out its Value Analysis & Value Engineering (‘VAVE’) module and advanced material data for existing models and in-production support.
During the year under review, ‘Tata Tiscon’, the Company’s rebar brand, increased its footprint in the rural hinterland through active engagement with Mason Community under the MITR programme. The programme has over 25,000 Active Masons in the Community who contribute to more than 25% volume for the brand. The Company, through Tata Tiscon’s Innovative Discovery programme, engaged with over 7,500 architects and engineers. These engagements were aimed at enhancing the Individual House Building construction ecosystem of the country.
During the year under review, Tata Shaktee, the Company’s flagship brand in the field of galvanised corrugated sheets, completed 20 years. The Company reached out to almost 2,00,000 people across more than 4,000 villages across 16 states and 65 districts of rural India, through its on-ground bike campaign ‘Gaon Gaon Shaktee Ki Chaon’. The campaign, aimed at category conversion of ‘Kachcha House’ owners to Tata Shaktee GC Sheets, and garnered over 1,500 leads and registrations of over 55,000 people. Tata Shaktee reached out to over 5,000 farmers across 120 districts in India via 127 Kisan Meets conducted on the occasion of Kisan Diwas. This programme also helped the Company to enhance its relationship with the fabricator community via Shakteeman, the digital Fabricator Loyalty Scheme. The Company has introduced a reward based programme with the aim to increase the fabricator loyalty for Tata Shaktee.
The Company’s e-selling platform ‘Aashiyana’ which caters to multiple B2C brands crossed a turnover of `316 crore as against `100 crore in the previous year. B2ECA (Business to Emerging Corporate Accounts) consisting of brands such as Tata Astrum (HR), Tata Steelium (CRCA) and Galvano (coated) is a ~4 MnTPA business and continues to grow. During the year under review, the Company partnered with various institutions to bring together various thought leaders and ECAs to understand the upcoming technologies in the microsegments we serve. Collaborative Reform with ECA for Advanced Technical Enhancement (‘CREATE’) was conducted with over 25 ECA customers to generate cost and weight savings ideas via redesigning of components. A knowledge sharing platform ECA-Talks was conceptualised where the senior leadership team of key ECA customers shared current trends and future expectations for their respective micro-segments. Further, under the Skilling India Initiative, training programmes were organised for the workforce of
Corporate Overview 02
Strategic Review 46
Performance Review 20
Statutory Reports 84
Our Strategy 28
Financial Statements 206
93
BOARD’S REPORT (CONTD.)
ECA customers to develop technical capabilities. Fabricators were identified as key influencers to scale up Tata Astrum Super (unique laser marked Hot Rolled coils) and several fabricator meets were conducted to strengthen brand awareness. Both, COMPASS a digital supply chain visibility solution rolled for B2B and DigEca, an initiative that captures lead management for ECAs received traction from distributors & customers. DigEca has been rolled out to all ECAs to drive supply chain agility and improve visibility to customers. The Company has also completed digital analytics based projects named Paras, Amrit, and Ascend pertaining to a digital method of market demand assessment and improvement in product value realisation.
In the B2B sector, the Company has launched #Converse to Construct-Conversations that builds Tomorrow – a platform to interact and share ideas with different stakeholders of the construction sector that would enable adoption of faster, sustainable and modern construction practices in line with global benchmarks. The Company has also collaborated with the World Steel Association (through ConstructSteel forum) and Indian Steel Association to support them in their efforts to improve steel intensity in construction in India. In the Engineering Segment (Pre-Engineered Building, Lifting & Excavation, Construction & Projects and Oil & Gas), ‘Building India Together’ was rolled out to drive customer engagement initiatives such as CST, VAVE, Technology Day and Joint Milestones celebration across key customer accounts across India.
During the year under review, the Company’s “Tata Pravesh Pioneers” programme was launched to capture customer testimonials encapsulating their experiences with the products and service. The Company also launched ‘Griha Pravesh’, an Influencer Management Programme, to build a web of influencers such as architects, interior designers, civil and structural engineers and to create Tata Pravesh footprint across India.
The Company appointed dedicated Key Account Managers for Nest-in offerings, for repeat customers in order to understand and meet customised requirements, as well as receive and implement their feedback. The Company has installed over 1,800 EzyNest (modular toilets) units for repeat customers as part of their CSR initiatives across India with an AMC contract for many of them. Further, the Company has also received AquaNest (water ATMs) orders from such customers. Nest-In effectively uses demo units and open house visits to clear any customer concerns on quality and guide them on the aesthetics of Nestudio – a premium prefabricated living solution. The Company has listed all Nest-In offerings on the Government e-Marketplace portal where procurements are made by Government Officers.
In Europe, the Company partners with customers to help them excel in their market, co-creating more sustainable value throughout the entire value chain. As part of its Transformation Programme, the Company has integrated its existing initiatives on ‘Customer Excellence’ and ‘Future Value Chain’ and undertaken initiatives to optimise the mix, and identify and capture additional opportunities
in the market. ‘Commercial Excellence’ improvements have been acknowledged in the Tata Business Excellence Model assessment. The Company also has a value chain transformation programme previously known as ‘Future Value Chain’ which focusses on driving service and quality improvements. European operations are increasing its focus on business development to achieve a balanced portfolio in terms of both products and customer setup. The Company maintains its differentiation strategy, which aims to increase the proportion of high margin differentiated products. As part of the strategy, the Company has launched 22 new products in Europe during the year. These launches include major developments for the engineering, automotive, packaging, and construction markets. Along with products, the Company also offers services such as Electronic Data Interchange, Track and Trace, Early Vendor Involvement, Design and Engineering support, Building Information Modelling, Life Cycle Analysis, and Technical Support.
Corporate Social Responsibility The objective of the Company’s Corporate Social Responsibility (‘CSR’) initiatives is to improve the quality of life of communities through long-term value creation for all stakeholders. The Company has in place a CSR policy which provides guidelines to conduct CSR activities of the Company. The CSR policy is available on the website of the Company at https://www.tatasteel.com/media/11804/tata- steel-csr-policy-latest-2019.pdf
For decades, the Company has pioneered various CSR initiatives. The Company continues to remain focussed on improving the quality of life. During the year under review, the Company addressed key development challenges faced by communities we serve, thus reaching out to the lives of over 1.4 million people through innovative initiatives in health, drinking water, education, livelihood, sports, infrastructure development, amongst others. The Company’s signature CSR programmes have been recognised as models of positive change that address critical development issues at a greater scale in areas of school education, maternal and neonatal health, tribal identity, and building of a multi thematic corridor of well-being connecting its areas of operations in Jharkhand and Odisha. The Company is working closely with tribal communities in its areas of operation in India. The Company has partnered with the State Governments of Jharkhand and Odisha and with various reputed national and international development organisations in delivering its programmes.
The Company’s CSR efforts have been recognised through various awards conferred on it. The most significant achievement has been the Maternal And Newborn Survival Initiative receiving recognition in the inaugural National CSR Awards instituted by the Ministry of Corporate Affairs, Government of India at New Delhi. During the year under review, the Company spent `192.99 crore on CSR activities. The Annual Report on CSR activities, in terms of Section 135 of the
INTEGRATED REPORT & ANNUAL ACCOUNTS 2019-20 | 113TH YEAR94
Companies Act, 2013 ('the Act') and the Rules framed thereunder, is annexed to this report (Annexure 3).
Tata Steel Europe conducts regular dialogues with local communities to understand and address their concerns relating to their activities and its impact on the environment as well as our sustainability goals and improvement targets. Local communities are part of the sustainable economy, as we help each other to coexist and collaborate successfully with a good understanding of the mutual benefits that we provide to one another. The Company runs regular programmes to invite the community to see our work as well as enjoy and see the important wildlife and flora that flourish on its sites. The Company sponsors local activities and support charities. In IJmond, the Company celebrated the annual Tata Steel Chess Tournament that attracts thousands of players and spectators and boosts the local tourism economy in the off-season in January. The Company also sponsors local sports teams and children’s events, most notably in recent years the Tata Kids of Steel® triathlons that enthuse kids to be physically proactive. The Company also engages with communities as an existing and potential workforce, running programmes to involve young people, and girls in particular, so that they can discover the interesting career opportunities that our organisation offers.
F. Corporate Governance At Tata Steel, we ensure that we evolve and follow the corporate governance guidelines and best practices diligently, not just to boost long-term shareholder value, but also to respect the interests of the minority. We consider it our inherent responsibility to disclose timely and accurate information regarding the operations and performance, leadership, and governance of the Company.
In accordance with our Vision, the Group aspires to be the global steel industry benchmark for value creation and corporate citizenship. The Group expects to realise its Vision by taking such actions, as may be necessary in order to achieve its goals of value creation, safety, environment and people.
Pursuant to the SEBI Listing Regulations, the Corporate Governance Report along with the Certificate from a Practicing Company Secretary, certifying compliance with conditions of Corporate Governance, is annexed to this report (Annexure 4).
Meetings of the Board and Committees of the Board The Board met five times during the year under review. The intervening gap between the meetings was within the period prescribed under the Act and the SEBI Listing Regulations. The Committees of the Board usually meet the day before or on the day of the formal Board meeting, or whenever the need arises for transacting business. Details of composition of the Board and its Committees as well as details of Board and Committee meetings held during the year under review are given in the Corporate Governance Report.
Selection of New Directors and Board Membership Criteria
The Nomination and Remuneration Committee (‘NRC’) works with the Board to determine the appropriate characteristics, skills and experience for the Board as a whole as well as for its individual members with the objective of having a Board with diverse backgrounds and experience in business, finance, governance, and public service. Characteristics expected of all Directors include independence, integrity, high personal and professional ethics, sound business judgement, ability to participate constructively in deliberations, and willingness to exercise authority in a collective manner. The Company has in place a Policy on appointment & removal of Directors (‘Policy’).
The salient features of the Policy are:
• It acts as a guideline for matters relating to appointment and re-appointment of directors
• It contains guidelines for determining qualifications, positive attributes of directors, and independence of a Director
• It lays down the criteria for Board Membership
• It sets out the approach of the Company on board diversity
• It lays down the criteria for determining independence of a director, in case of appointment of an Independent Director
During the year under review, there has been no change to the Policy. The Policy is available on the website of the Company at https://www.tatasteel.com/media/6816/policy-on-appointment-and-removal-of-directors.pdf
Familiarisation Programme for Directors
As a practice, all new Directors (including Independent Directors) inducted to the Board go through a structured orientation programme. Presentations are made by the Senior Management giving an overview of the operations, to familiarise the new Directors with the Company’s business operations. The new Directors are given an orientation on the products of the business, group structure and subsidiaries, Board constitution and procedures, matters reserved for the Board, and the major risks and risk management strategy of the Company. Visits to plant and mining locations are organised for the new Directors to enable them to understand the business better.
During the year under review, no new Independent Directors were inducted to the Board. Details of orientation given to the existing independent directors in the areas of strategy, operations & governance, safety, health and environment, and industry trends, are available on the website of the Company at https://www.tatasteel.com/investors/corporate-governance/ compliance/
Corporate Overview 02
Strategic Review 46
Performance Review 20
Statutory Reports 84
Our Strategy 28
Financial Statements 206
95
BOARD’S REPORT (CONTD.)
Evaluation The Board evaluated the effectiveness of its functioning, that of the Committees and of individual Directors, pursuant to the provisions of the Act and SEBI Listing Regulations.
The Board sought the feedback of Directors on various parameters including:
• Degree of fulfillment of key responsibilities towards stakeholders (by way of monitoring corporate governance practices, participation in the long-term strategic planning, etc.);
• Structure, composition, and role clarity of the Board and Committees;
• Extent of co-ordination and cohesiveness between the Board and its Committees;
• Effectiveness of the deliberations and process management;
• Board/Committee culture and dynamics; and
• Quality of relationship between Board Members and the Management.
The above criteria are broadly based on the Guidance Note on Board Evaluation issued by the Securities and Exchange Board of India on January 5, 2017.
The Chairman of the Board had one-on-one meetings with each Independent Director and the Chairman of NRC had one-on-one meetings with each Executive and Non-Executive, Non-Independent Directors. These meetings were intended to obtain Directors’ inputs on effectiveness of the Board/Committee processes.
In a separate meeting of Independent Directors, performance of Non-Independent Directors, the Board as a whole, and the Chairman of the Company was evaluated, taking into account the views of Executive Directors and Non-Executive Directors.
The Nomination and Remuneration Committee reviewed the performance of the individual directors and the Board as a whole.
In the Board meeting that followed the meeting of the independent directors and the meeting of Nomination and Remuneration Committee, the performance of the Board, its committees, and individual directors was discussed.
The evaluation process endorsed the Board Members’ confidence in the ethical standards of the Company, the resilience of the Board and the Management in navigating the Company during challenging times, cohesiveness amongst the Board Members, constructive relationship between the Board and the Management, and the openness of the Management in sharing strategic information to enable Board Members to discharge their responsibilities and fiduciary duties.
In the coming year, the Board intends to enhance focus on sustainability and digital interventions.
Remuneration Policy for the Board and Senior Management Based on the recommendations of NRC, the Board has approved the Remuneration Policy for Directors, Key Managerial Personnel (‘KMPs’), and all other employees of the Company. As part of the policy, the Company strives to ensure that:
• the level and composition of remuneration is reasonable and sufficient to attract, retain, and motivate Directors of the quality required to run the Company successfully;
• relationship between remuneration and performance is clear and meets appropriate performance benchmarks; and
• remuneration to Directors, KMPs, and Senior Management involves a balance between fixed and incentive pay, reflecting short, medium, and long-term performance objectives appropriate to the working of the Company and its goals.
The salient features of the Policy are:
• It lays down the parameters based on which payment of remuneration (including sitting fees and remuneration) should be made to Independent Directors and Non-Executive Directors.
• It lays down the parameters based on which remuneration (including fixed salary, benefits and perquisites, bonus/performance linked incentive, commission, retirement benefits) should be given to whole-time directors, KMPs, and rest of the employees.
• It lays down the parameters for remuneration payable to Director for services rendered in other capacity
During the year under review, there has been no change to the Policy. The Policy is available on the website of the Company at https://www. tatasteel.com/media/6817/remuneration-policy-of-directors -etc.pdf
Particulars of Employees Disclosures pertaining to remuneration and other details as required under Section 197(12) of the Act read with Rule 5(1) of the Companies (Appointment and Remuneration of Managerial Personnel) Rules, 2014 are annexed to this report (Annexure 5).
In terms of the provisions of Section 197(12) of the Act read with Rules 5(2) and 5(3) of the Companies (Appointment and Remuneration of Managerial Personnel) Rules, 2014, a statement showing the names and other particulars of employees drawing remuneration in excess of the limits set out in the said Rules forms part of this report.
Directors
Re-appointments of Independent Directors
The shareholders of the Company at the AGM held on July 19, 2019, approved the re-appointment of Ms. Mallika Srinivasan (DIN:00037022) as Independent Director of the Company, to hold office for a second term effective August 14, 2019 through May 20, 2022. At the said AGM, the shareholders also approved the
INTEGRATED REPORT & ANNUAL ACCOUNTS 2019-20 | 113TH YEAR96
re-appointment of Mr. O. P. Bhatt (DIN:00548091) as Independent Director of the Company, to hold office for a second term effective August 14, 2019 through June 9, 2023.
Re-appointment of Director retiring by rotation
In terms of the provisions of the Act, Mr. N. Chandrasekaran (DIN:00121863), Director of the Company, retires at the ensuing AGM and being eligible, seeks re-appointment.
The necessary resolution for re-appointment of Mr. N. Chandrasekaran forms part of the Notice convening the ensuing AGM scheduled to be held on August 20, 2020.
The profile and particulars of experience, attributes, and skills that qualify Mr. Chandrasekaran for Board membership, are disclosed in the said Notice.
Independent Directors’ Declaration The Company has received the necessary declaration from each Independent Director in accordance with Section 149(7) of the Act and Regulations 16(1)(b) and 25(8) of the SEBI Listing Regulations, that he/she meets the criteria of independence as laid out in Section 149(6) of the Act and Regulations 16(1)(b) of the SEBI Listing Regulations.
In the opinion of the Board, there has been no change in the circumstances which may affect their status as independent directors of the Company and the Board is satisfied of the integrity, expertise, and experience (including proficiency in terms of Section 150(1) of the Act and applicable rules thereunder) of all Independent Directors on the Board. In terms of Section 150 read with Rule 6 of the Companies (Appointment and Qualification of Directors) Rules, 2014, Independent Directors of the Company have undertaken requisite steps towards the inclusion of their names in the data bank of Independent Directors maintained with the Indian Institute of Corporate Affairs.
Key Managerial Personnel In terms of Section 203 of the Act, the Key Managerial Personnel of the Company are Mr. T. V. Narendran, Chief Executive Officer & Managing Director, Mr. Koushik Chatterjee, Executive Director & Chief Financial Officer, and Mr. Parvatheesam Kanchinadham, Company Secretary & Chief Legal Officer (Corporate & Compliance). During the year under review, there was no change in the Key Managerial Personnel.
Audit CommitteeThe Audit Committee was constituted in the year 1986. The Committee has adopted a Charter for its functioning. The primary objective of the Committee is to monitor and provide effective supervision of the Management’s financial reporting process, to ensure accurate and timely disclosures, with the highest levels of transparency, integrity and quality of financial reporting.
The Committee comprises Mr. O. P. Bhatt (Chairman), Mr. Aman Mehta, Dr. Peter Blauwhoff, Mr. Saurabh Agrawal, and Mr. Deepak Kapoor. The Committee met 7 times during the year under review, the details of which are given in the Corporate Governance Report.
During the year under review, there were no instances when the recommendations of the Audit Committee were not accepted by the Board.
Internal Control SystemsThe Company’s internal control systems are commensurate with the nature of its business, the size, and complexity of its operations and such internal financial controls with reference to the Financial Statements are adequate.
Risk Management The Enterprise Risk Management (‘ERM’) process, which is based on international standards such as Committee of Sponsoring Organisation of the Treadway Commission (‘COSO’) and ISO 31000, is an integral part of the Company’s strategy. The ERM framework includes identification of risks and risk owners for regular tracking, mitigation, and reporting of risks to help the Company meet its business objectives. Communication and training is an essential part of the framework. The framework also requires an integrated approach towards managing risks.
Risk governance is driven by the Board of Directors through the Risk Management Committee (‘RMC’) of the Board. The RMC is responsible for reviewing and strengthening the risk management policies and processes adopted by the Company. It also reviews the potential risks facing the Company and the progress of the mitigation plans. The Company has also set up a management committee called the Group Risk Review Committee (‘GRRC’) which is responsible for the implementation of ERM process across the Company. The GRRC is focussed on enhancing the risk culture within the Company and driving the mitigation of identified risks in an optimal manner.
A dedicated ERM team has been set up to ensure deployment of the ERM process across the organisation, including Tata Steel Group Companies. The ERM team is led by Group Head – Corporate Finance & Risk Management who acts as the Chief Risk Officer (‘CRO’) of the Company. The CRO regularly reports to the RMC and the GRRC on the progress of the implementation of ERM and the status of the potential risks based on the assessment of risks and the mitigation strategies.
The Company has adopted a bottom up and top-down approach to drive enterprise risk management. The bottom-up process includes identification and regular assessment of risks by respective business units and cross-functional teams across the Company and planning of mitigation strategies in a structured manner. This is complemented by a top-down approach where the senior management identifies and assesses long-term, strategic and macro risks for the Company. Risks
Corporate Overview 02
Strategic Review 46
Performance Review 20
Statutory Reports 84
Our Strategy 28
Financial Statements 206
97
BOARD’S REPORT (CONTD.)
are consolidated under major risk themes at the organisational level to create focus areas and prioritise mitigation strategies. The ERM process is integrated with core processes such as Corporate Audit, Corporate Strategy and Planning, and Capital Allocation. Regular training and communication is carried out across the Company to develop a uniform understanding of the risk process and risk terminology. An in-house built IT system has been deployed across the organisation to enable recording and review of risks through live dashboards and real-time monitoring of data. The ERM process has matured over the years and is today embedded across the Company.
Over the years, Tata Steel has made significant progress in its journey towards risk intelligence. We are pleased to report that the Company has been adjudged ‘Firm of the Year - Metals & Mining’ at the 6th CNBC-TV18 India Risk Management Awards.
Vigil Mechanism The Company has a Vigil Mechanism that provides a formal channel for all its Directors, employees, and vendors to approach the Chairman of the Audit Committee and make protected disclosures about the unethical behaviour, actual or suspected fraud or violation of the Tata Code of Conduct (‘TCoC’). No person is denied access to the Chairman of the Audit Committee. In addition, Directors, employees, and vendors, may approach the Chief Ethics Counsellor to make any such protected disclosure.
The Vigil Mechanism includes policies viz. the Whistle-blower Policy for Directors & Employees, the Whistle-blower Policy for Business Associates, the Whistle-blower Protection Policy for Business Associates (vendors/customers), the Policy for Receipts of Gift and Hospitality, the Conflict of Interest Policy for Employees, the Anti-Bribery & Anti-Corruption (‘ABAC’) policy, and Anti-Money Laundering (‘AML’) policy.
The Whistle-blower Policies for Directors & Employees and Business Associates are an extension of the TCoC that encourage every Director, employee, and Business Associate to promptly report any actual or possible violation of the TCoC or any event that he or she becomes aware of that could affect the business or reputation of the Company. During the year under review, the Company revised the Whistle-blower policy for Directors and Employees to include ‘reporting of incidents of leak or suspected leak of Unpublished Price Sensitive Information (UPSI)’ as required in terms of the provisions of the Securities and Exchange Board of India (Prohibition of Insider Trading) Regulations, 2015, as amended.
The Whistle-blower Protection Policy for Business Associates including vendors and customers provides protection to Business Associates from any victimisation or unfair trade practices by the Company.
During the year under review, ABAC and AML policies were adopted. The key elements of the policies are risk assessment, third party due diligence, training & awareness, and audit & reporting.
The Policy for Receipts of Gift and Hospitality requires its employees to take the right decisions when they are offered gifts or hospitality while conducting business or official transactions on behalf of the Company. The Policy is in consonance with ABAC and AML policies.
The Company has also adopted a Conflict of Interest policy that requires employees to act in the best interest of the Company without any conflicts and declare conflicts, if any (real, potential or perceived).
The Whistle-blower Reward and Recognition Guidelines for employees has been implemented to encourage employees to genuinely blow the whistle on any misconduct or unethical activity taking place in the Company. The disclosures reported are addressed in the manner and within the time frames prescribed in the Whistle-blower Policy.
During the year under review, the Company undertook a series of communication and training programmes for internal stakeholders and vendors, with the aim to create awareness amongst them about the Company’s values, TCoC and other ethical practices of the Company. An e-learning module on ABAC Policy was launched by the Company in February, 2020 to sensitise the employees on the relevant laws and policies. The Company also introduced a structured yet informal platform “Stay in Touch” for its employees to interact with Chief Ethics Counsellor to understand the issues and integrate employees with the Company’s Culture through an open discussion. The Company also undertook various theme based campaigns, town hall, and departmental events. ‘Neeti Katha’ i.e. story-telling through snippet series on scenarios of ‘The ethics of travel’ and ‘Prevention of Sexual Harassment’ were mailed to employees as part of the awareness campaign. The Company also celebrates the month of July as Ethics Month with all communication and programmes centered around the theme “Integrity Matters”. This practice has helped in reinforcing employee involvement in driving the Management of Business Ethics.
The Company has developed a robust system to raise concerns on unethical behaviour, taken efforts to make stakeholders aware of such systems as well as of their responsibility to report such concerns and practice non-retaliation. The strong mechanism to address such concerns instills in our stakeholders the confidence to report ethical violations. The Company has also leveraged digitalisation for training and communication, thereby resulting in greater clarity on the subject and system amongst the stakeholders.
The Company takes pride in winning the World’s Most Ethical Companies (‘WME’) award for the 9th time.
During the year under review, the Company received 881 whistle-blower complaints of which as on March 31, 2020, 602 complaints were investigated and appropriate actions were taken and investigations were underway for the remaining 279 complaints.
INTEGRATED REPORT & ANNUAL ACCOUNTS 2019-20 | 113TH YEAR98
Disclosure as per the Sexual Harassment of Women at Workplace (Prevention, Prohibition and Redressal) Act, 2013
The Company has zero tolerance towards sexual harassment at the workplace. The Company has adopted a policy on prevention, prohibition and redressal of sexual harassment at workplace in line with the provisions of the Sexual Harassment of Women at Workplace (Prevention, Prohibition and Redressal) Act, 2013 and the Rules made thereunder.
The Company has complied with the provisions relating to the constitution of the Internal Complaints Committee as per the Sexual Harassment of Women at Workplace (Prevention, Prohibition and Redressal) Act, 2013.
During the year under review, the Company received 34 complaints of sexual harassment, of which 26 complaints have been resolved by taking appropriate actions and 8 complaints are under investigation.
Related Party Transactions
In line with the requirements of the Act and the SEBI Listing Regulations, the Company has formulated a Policy on Related Party Transactions and the same can be accessed on the Company’s website at https://www.tatasteel.com/media/5891/policy-on-related-party-transactions.pdf
During the year under review, all related party transactions entered into by the Company, were approved by the Audit Committee and were at arm’s length and in the ordinary course of business. Prior omnibus approval is obtained for related party transactions which are of repetitive nature and entered in the ordinary course of business and on an arm’s length basis. The Company did not have any contracts or arrangements with related parties in terms of Section 188(1) of the Act. Also, there were no material related party contracts entered into by the Company. Accordingly, the disclosure of related party transactions as required under Section 134(3)(h) of the Act in Form AOC-2 is not applicable to the Company for FY 2019-20 and hence does not form part of this report.
Details of related party transactions entered into by the Company, in terms of Ind AS-24 are disclosed in notes to the standalone/consolidated financial statements forming part of this Integrated Report.
Directors’ Responsibility Statement
Based on the framework of internal financial controls and compliance systems established and maintained by the Company, work performed by the internal, statutory, cost, and secretarial auditors and external agencies including audit of internal financial controls over financial reporting by the statutory auditors and the reviews performed by Management and the relevant Board Committees, including the Audit Committee, the Board is of the opinion that the Company’s internal financial controls were adequate and effective during Financial Year 2019-20.
Accordingly, pursuant to Section 134(5) of the Act, the Board of Directors, to the best of its knowledge and ability confirms that:
a) in the preparation of the annual accounts, the applicable accounting standards have been followed and that there are no material departures;
b) they have selected such accounting policies and applied them consistently and made judgements and estimates that are reasonable and prudent so as to give a true and fair view of the state of affairs of the Company at the end of the Financial Year and of the profit of the Company for that period;
c) they have taken proper and sufficient care for the maintenance of adequate accounting records in accordance with the provisions of the Companies Act, 2013 for safeguarding the assets of the Company and for preventing and detecting fraud and other irregularities;
d) they have prepared the annual accounts on a going concern basis;
e) they have laid down internal financial controls to be followed by the Company and that such internal financial controls are adequate and are operating effectively;
f) they have devised proper systems to ensure compliance with the provisions of all applicable laws and that such systems are adequate and operating effectively.
Business Responsibility Report
The Securities and Exchange Board of India (‘SEBI’) requires companies to prepare and present to stakeholders a Business Responsibility Report (‘BRR’) in the prescribed format. SEBI, however, allows companies to follow an internationally recognised framework to report on the initiatives undertaken by the Company on environmental, social, and governance perspective. Further, SEBI has on February 6, 2017, advised companies that are required to prepare BRR to transition towards an Integrated Report.
As stated earlier in the Report, the Company has followed the <IR> framework of the International Integrated Reporting Council to report on all the six capitals that are used to create long-term stakeholder value. Our Integrated Report has been assessed and KPMG has provided the required assurance. We have also provided the requisite mapping of principles between the Integrated Report, the Global Reporting Initiative (‘GRI’) and the BRR as prescribed by SEBI. The same is available on our website www.tatasteel.com
Subsidiaries, Joint Ventures and Associates
We have 220 subsidiaries and 50 associate companies (including 28 joint ventures) as on March 31, 2020. During the year under review,the Board of Directors reviewed the affairs of material subsidiaries.
Corporate Overview 02
Strategic Review 46
Performance Review 20
Statutory Reports 84
Our Strategy 28
Financial Statements 206
99
BOARD’S REPORT (CONTD.)
We have, in accordance with Section 129(3) of the Act prepared Consolidated Financial Statements of the Company and all its subsidiaries, which form part of the Integrated Report. Further, the report on the performance and financial position of each subsidiary, associate, and joint venture and salient features of their Financial Statements in the prescribed Form AOC-1 is annexed to this report (Annexure 6).
In accordance with the provisions of Section 136 of the Act and the amendments thereto, and the SEBI Listing Regulations the audited Financial Statements, including the consolidated financial statements and related information of the Company and financial statements of the subsidiary companies are available on our website www.tatasteel.com
The names of companies that have become or ceased to be subsidiaries, joint ventures and associates during the year under review are disclosed in an annexure to this report (Annexure 7).
Auditors
Statutory Auditors
Members of the Company at the AGM held on August 8, 2017, approved the appointment of Price Waterhouse & Co Chartered Accountants LLP (Registration No. 304026E/E300009), Chartered Accountants, as the statutory auditors of the Company for a period of five years commencing from the conclusion of the 110th AGM held on August 8, 2017 until the conclusion of 115th AGM of the Company to be held in the year 2022.
In terms of the provisions relating to statutory auditors forming part of the Companies Amendment Act, 2017, notified on May 7, 2018, ratification of appointment of Statutory Auditors at every AGM is no more a legal requirement. Accordingly, the Notice convening the ensuing AGM does not carry any resolution on ratification of appointment of Statutory Auditors.
The report of the Statutory Auditor forms part of the Integrated Report and Annual Accounts 2019-20. The said report does not contain any qualification, reservation, adverse remark or disclaimer. During the year under review, the Auditors did not report any matter under Section 143(12) of the Act, therefore no detail is required to be disclosed under Section 134(3)(ca) of the Act.
Cost Auditors
In terms of Section 148 of the Act, the Company is required to maintain cost records and have the audit of its cost records conducted by a Cost Accountant. Cost records are prepared and maintained by the Company as required under Section 148(1) of the Act. The Cost Audit Report of the Company for the Financial Year ended March 31, 2019 was filed by the Company in XBRL mode, on August 30, 2019.
The Board of Directors of the Company has, on the recommendation of the Audit Committee, approved the appointment of M/s. Shome & Banerjee as the cost auditors of the Company (Firm Registration No. 000001) for the year ending March 31, 2021.
M/s. Shome & Banerjee have vast experience in the field of cost audit and have been conducting the audit of the cost records of the Company for the past several years.
In accordance with the provisions of Section 148(3) of the Act read with Rule 14 of the Companies (Audit and Auditors) Rules, 2014, the remuneration payable to the Cost Auditors as recommended by the Audit Committee and approved by the Board has to be ratified by the Members of the Company. Accordingly, appropriate resolution forms part of the Notice convening the AGM. We seek your support in ratifying the proposed remuneration of `20 lakh plus applicable taxes and reimbursement of out-of-pocket expenses payable to the Cost Auditors for the Financial Year ending March 31, 2021.
Secretarial Auditors
Section 204 of the Act inter alia requires every listed company to annex to its Board’s report, a Secretarial Audit Report, given in the prescribed form, by a Company Secretary in practice.
The Board had appointed Parikh & Associates, (Registration No. P1988MH009800) Practicing Company Secretaries, as the Secretarial Auditor to conduct Secretarial Audit of the Company for the Financial Year 2019-20 and their report is annexed to this report (Annexure 8). There are no qualifications, observations, adverse remark or disclaimer in the said Report.
Extract of Annual ReturnThe extract of the Annual Return in Form MGT-9, as per provisions of the Act and Rules thereto, is annexed to this report (Annexure 9).
The extract of Annual Return in Form MGT-9 as per provisions of the Act and Rules thereto is also available on the Company’s website at https://www.tatasteel.com/media/12336/mgt-9.pdf
Significant and Material Orders passed by the Regulators or Courts There has been no significant and material order passed by the regulators or courts or tribunals impacting the going concern status and the Company’s future operations. However, Members’ attention is drawn to the statement on contingent liabilities, commitments in the notes forming part of the Financial Statements.
Particulars of Loans, Guarantees or Investments Particulars of loans, guarantees given, and investments made during the year under review in accordance with Section 186 of the Act is annexed to this report (Annexure 10).
INTEGRATED REPORT & ANNUAL ACCOUNTS 2019-20 | 113TH YEAR100
Energy Conservation, Technology Absorption and Foreign Exchange Earnings and Outgo Details of the energy conservation, technology absorption and foreign exchange earnings and outgo are annexed to this report (Annexure 11).
DepositsDuring the year under review, the Company has not accepted any deposits from public in terms of the Act. Further, no amount on account of principal or interest on deposits from public was outstanding as on the date of the balance sheet.
Secretarial Standards The Company has in place proper systems to ensure compliance with the provisions of the applicable Secretarial Standards issued by The Institute of Company Secretaries of India and such systems are adequate and operating effectively.
G. Acknowledgements We thank our customers, vendors, dealers, investors, business associates, and bankers for their continued support during the year. We place on record our appreciation of the contribution made by employees at all levels. Our resilience to meet challenges was made possible by their hard work, solidarity, co-operation and support.
We thank the Government of India, the State Governments, and the Governments in the countries where we have operations and other regulatory authorities and government agencies for their support and look forward to their continued support in the future.
On behalf of the Board of Directors
sd/-N. CHANDRASEKARAN
Mumbai ChairmanJune 29, 2020 DIN: 00121863
Corporate Overview 02
Strategic Review 46
Performance Review 20
Statutory Reports 84
Our Strategy 28
Financial Statements 206
101
BOARD’S REPORT (CONTD.)
ANNEXURE 1Dividend Distribution Policy
1. Preamble1.1 The Dividend Distribution Policy (hereinafter referred to as the
‘Policy’) has been developed in accordance with the extant provisions of the Companies Act, 2013 and SEBI regulations.
1.2 The Board of Directors (the ‘Board’) of Tata Steel Limited (the ‘Company’) has adopted the Policy of the Company as required in terms of Regulation 43A of the SEBI (Listing Obligations and Disclosure Requirements) Regulations, 2015 (the ‘Listing Regulations’) at its meeting held on April 20, 2017.
1.3 Under Section 2(35) of the Companies Act, 2013, “Dividend” includes any interim dividend. In common parlance, “dividend” means the profit of a company, which is not retained in the business and is distributed among the shareholders in proportion to the amount paid-up on the shares held by them. In case of listed companies, Section 24 of the Companies Act, 2013 confers on SEBI, the power of administration of the provisions pertaining to non-payment of dividend.
2. Effective Date The Policy shall become effective from the date of its adoption
by the Board i.e. April 20, 2017.
3. Purpose, Objectives and Scope3.1 The Securities and Exchange Board of India (“SEBI”) vide
its Gazette Notification dated July 8, 2016 has amended the Listing Regulations by inserting Regulation 43A in order to make it mandatory to have a Dividend Distribution Policy in place by the top five hundred listed companies based on their market capitalisation calculated as on the 31st day of March of every year.
3.2 As the Company is one of the top five hundred companies as on March 31, 2016, the Board has laid down a broad framework for distribution of dividend to its shareholders and/or retaining or plough back of its profits. The Policy also sets out the circumstances and different factors for consideration by the Board at the time of taking such decisions of distribution or of retention of profits, in the interest of providing transparency to the shareholders.
3.3 Declaration of dividend on the basis of parameters in addition to the elements of this Policy or resulting in amendment of any element or the Policy will be regarded as deviation. Any such deviation on elements of this Policy in extraordinary circumstances, when deemed necessary in the interests of
the Company, along with the rationale will be disclosed in the Annual Report by the Board.
3.4 The Policy reflects the intent of the Company to reward its shareholders by sharing a portion of its profits after retaining sufficient funds for growth of the Company. The Company shall pursue this Policy, to pay, subject to the circumstances and factors enlisted hereon, progressive dividend, which shall be consistent with the performance of the Company over the years.
4. Parameters to be Considered While Declaring Dividends
4.1 Financial Parameters a) Magnitude of current year’s earnings of the Company:
Since dividend is directly linked with the availability of earning over the long haul, the magnitude of earnings will significantly impact the dividend declaration decisions of the Company.
b) Operating cash flow of the Company: If the Company cannot generate adequate operating cash flow, it may need to rely on outside funding to meet its financial obligations and sometimes to run the day-to-day operations. The Board will consider the same before its decision whether to declare dividend or retain its profits.
c) Return on invested capital: The efficiency with which the Company uses its capital.
d) Cost of borrowings: The Board will analyse the requirement of necessary funds considering the long-term or short-term projects proposed to be undertaken by the Company and the viability of the raising funds from alternative sources vis-à-vis plough back its own funds.
e) Obligations to lenders: The Company should be able to repay its debt obligations without much difficulty over a reasonable period of time. Considering the volume of such obligations and time period of repayment, the decision of dividend declaration shall be taken.
f) Inadequacy of profits: If during any Financial Year, the Board determines that the profits of the Company are inadequate, the Board may decide not to declare dividends for that Financial Year.
g) Post dividend EPS: The post dividend EPS can have strong impact on the funds of the Company, thus, impacting the overall operations on day-to-day basis and therefore,
INTEGRATED REPORT & ANNUAL ACCOUNTS 2019-20 | 113TH YEAR102
affects the profits and can impact the decision for dividend declaration during a particular year.
4.2 Proposals for major capital expenditures The Board may also take into consideration the need for
replacement of capital assets, expansion and modernisation or augmentation of capital asset including any major sustenance, improvement and growth proposals.
4.3 Agreements with lending institutions/Bondholders/Debenture Trustees
The decision of dividend pay-out shall also be affected by the restrictions and covenants contained in the agreements as may be entered into with the lenders of the Company from time to time.
4.4 Statutory requirements The Company shall observe the relevant statutory requirements
including those with respect to mandatory transfer of a certain portion of profits to any specific reserve such as Debenture Redemption Reserve, Capital Redemption Reserve etc. as provided in the Companies Act, 2013, which may be applicable to the Company at the time of taking decision with regard to dividend declaration or retention of profit.
5. Factors that May Affect Dividend Payout5.1 External Factors
• Macroeconomic conditions: Considering the current and future outlook of the economy of the Country, the policy decisions that may be formulated by the Government and other similar conditions prevailing in the global market which may have a bearing on or affect the business of the Company, the management may consider retaining a larger part of the profits to have sufficient reserves to meet the exigency during unforeseen circumstances.
• Cost of raising funds from alternative sources: If the cost of raising funds to pursue its planned growth and expansion plans is significantly higher, the management may consider retaining a larger part of the profits to have sufficient funds to meet the capital expenditure plan.
• Taxation and other regulatory provisions: Dividend distribution tax or any tax deduction at source as required by applicable tax regulations in India, as may be applicable at the time of declaration of dividend. Any restrictions on payment of dividends by virtue of any regulation as may be applicable to the Company at the time of declaration of dividend.
5.2 Internal Factors• The Company’s long-term growth strategy which requires to
conserve cash in the Company to execute the growth plan.
• The liquidity position of the Company including its working capital requirements and debt servicing obligations.
• The trend of the performance/reputation of the Company that has been during the past years determine the expectation of the shareholders.
6. Target Dividend6.1 The Company has adopted a progressive dividend policy,
intending to maintain or grow the dividend each year.
6.2 The Company targets to pay dividend up to 50% of profit after tax of the Company subject to the applicable rules and regulations.
7. Circumstances Under which the Shareholders Can or Cannot Expect Dividend
7.1 The Board shall consider the factors provided above under Clause 4 and 5 above, before determination of any dividend payout after analysing the prospective opportunities and threats, viability of the options of dividend payout or retention, etc.
7.2 The decision of dividend payout shall, majorly be based on the aforesaid factors considering the balanced interest of the shareholders and the Company.
8. Manner of Dividend Payout8.1 Given below is a summary of the process of declaration and
payment of dividends, and is subject to applicable regulations
8.2 In case of final dividends
a) Recommendation, if any, shall be done by the Board, usually in the Board meeting that considers and approves the annual financial statements, subject to approval of the shareholders of the Company.
b) The dividend as recommended by the Board shall be approved/declared at the annual general meeting of the Company.
c) The payment of dividends shall be made within 30 days from the date of declaration to the shareholders entitled to receive the dividend on the record date/book closure period as per the applicable law.
8.3 In case of interim dividend
a) Interim dividend, if any, shall be declared by the Board.
b) Before declaring interim dividend, the Board shall consider the financial position of the Company that allows the payment of such dividend.
c) The payment of dividends shall be made within 30 days from the date of declaration to the shareholders entitled to receive the dividend on the record date as per the applicable laws.
Corporate Overview 02
Strategic Review 46
Performance Review 20
Statutory Reports 84
Our Strategy 28
Financial Statements 206
103
BOARD’S REPORT (CONTD.)
d) In case no final dividend is declared, interim dividend paid during the year, if any, will be regarded as final dividend in the annual general meeting.
9. Policy as to how the Retained Earnings will be Utilised
9.1 The Board may retain its earnings in order to make better use of the available funds and increase the value of the stakeholders in the long run.
9.2 The decision of utilisation of the retained earnings of the Company shall be based on the following factors:
• Long term strategic plans• Augmentation/Increase in production capacity• Market expansion plan• Product expansion plan• Modernisation plan• Diversification of business• Replacement of capital assets• Balancing the Capital Structure by de-leveraging
the Company• Other such criteria as the Board may deem fit
from time to time.
10. Provisions in Regard to Various Classes of Shares
10.1 The Company has only one class of equity shareholders and does not have any issued preference share capital. However, in case the Company issues different class of equity shares at any point in time, the factors and parameters for declaration of dividend to different class of shares of the Company shall be same as covered above.
10.2 The payment of dividend shall be based on the respective rights attached to each class of shares as per their terms of issue.
10.3 The dividends shall be paid out of the Company’s distributable profits and/or general reserves, and shall be allocated among shareholders on a pro-rata basis according to the number of each type and class of shares held.
10.4 Dividend when declared shall be first paid to the preference shareholders of the Company, if any as per the terms and conditions of their issue.
11. Applicability of the Policy11.1 The Policy shall not apply to
• Determination and declaring dividend on preference shares as the same will be as per the terms of issue approved by the shareholders;
• Distribution of dividend in kind, i.e. by issue of fully or partly paid bonus shares or other securities, subject to applicable law
• Distribution of cash as an alternative to payment of dividend by way of buyback of equity shares
12. Reporting and Disclosure As prescribed by Regulation 43A of the Listing Regulation,
this Policy shall be disclosed on the Company’s website and the Annual report.
13. Review of the Policy13.1 This Policy shall be subject to review as may be deemed
necessary as per any regulatory amendments.
13.2 Such amended Policy shall be periodically placed before the Board for adoption immediately after such changes.
14. Compliance Responsibility Compliance of this Policy shall be the responsibility of the
Company Secretary of the Company who shall have the power to ask for any information or clarifications from the management in this regard.
INTEGRATED REPORT & ANNUAL ACCOUNTS 2019-20 | 113TH YEAR104
ANNEXURE 2Management Discussion and Analysis
I. OverviewThe objective of this report is to convey the Management’s perspective on the external environment and steel industry, as well as strategy, operating and financial performance, material developments in human resources and industrial relations, risks and opportunities, and internal control systems and their adequacy in the Company during the Financial Year 2019-20. This should be read in conjunction with the Company’s financial statements, the schedules and notes thereto and other information included elsewhere in the Integrated Report. The Company’s financial statements have been prepared in accordance with Indian Accounting Standards (‘Ind AS’) complying with the requirements of the Companies Act, 2013, as amended and regulations issued by the Securities and Exchange Board of India (‘SEBI’) from time to time.
Your attention is also drawn to sections on Opportunities, Risks and Strategy Planning forming part of the Integrated Report.
II. External Environment1. Macroeconomic Condition With continued weakness in global trade and investment, global growth slumped to 2.9% in 2019, leading to varying degrees of deceleration in economies around the globe. Rising geopolitical tensions, worsening trade relations among some nations, trade policy uncertainties, and stress in key emerging market economies continued to impact global economic activity. Intensifying social unrest in several countries and weather-related disasters also contributed to declining global economic activity.
Growth in the advanced economies slowed down to 1.7% in 2019 as compared to 2.2% in 2018. The US economy slowed to 2.3% in 2019 on account of rising geopolitical tensions and policy uncertainty. Growth in the European region also slowed to 1.2% in 2019. The industrial sector in Germany struggled with lower demand from Asia and disruptions to car production. Uncertainty related to Brexit also weighed on growth in the European region. Growth in Japan was at 0.7% owing to the impact of Typhoon Hagibis, increase in value-added tax, and overall slowdown in manufacturing and exports – particularly those to China. Growth in China dropped to 6.1% in 2019 owing to lower investor sentiment and cooling domestic demand.
In India, growth slowed down to 4.2% in 2019. This economic slowdown can be attributed to weak investments and declining consumer demand. Further, several sectors such as real estate, aviation, automobile, and construction sectors suffered a consistent decline in demand. The banking sector and financial services also witnessed significant pressure of non-performing assets.
Overall, increasing trade tensions, worsening financial market sentiments, intense social unrest across many countries, and sluggish economic growth led to slowdown in global economy.
2. Economic Outlook In view of the COVID-19 pandemic, there remains considerable uncertainty around the global economic forecast for 2020. According to the International Monetary Fund (‘IMF’), global economy is projected to contract sharply by 4.9% in 2020, surpassing the decline seen during the global financial crisis a decade ago. Stark differences will be observed between impact of the pandemic on advanced economies, and emerging markets and developing economies owing to differences in governance capacity, health care systems, strength of financial institutions, and currency strength.
Growth is expected to be slower in most advanced economies. Countries in the emerging market and developing economies will also witness a slump in growth due to external demand shock, tightening in global financial conditions, and a plunge in commodity prices. In China, where recovery from the sharp contraction in the first quarter is underway, growth is projected at 1% in 2020, supported in part by policy stimulus. The IMF projects a partial recovery in 2021, however, the level of GDP growth is expected to remain below the pre-COVID-19 trend, with uncertainty about strength of the rebound.
India’s economy in the Financial Year 2020-21 is projected to grow at a slower pace following a longer period of lockdown and slower rate of recovery than anticipated. Effective policies and fiscal measures by the Government will be essential to forestall contraction of growth.
III. Steel Industry 1. Global Steel Industry Global crude steel production in 2019 saw a growth of 3.4% over 2018 to reach 1,869.69 MnT. This increase was primarily due to the growth in steel consumption in infrastructure, manufacturing, and equipment sectors. The automotive production trended down across most countries over the second half of 2019 which had an impact on the steel demand towards the end of the year.
China continued to be the world’s largest steel producer with increase in production by 8.3% to reach 996 MnT. China contributed to 53% of the global crude steel production in 2019. While steel demand remained relatively strong, the country faced significant downside risks due to broader global uncertainty and tighter environmental regulations. In United States, crude steel production went up to 88 MnT, recording an increase of 1.5% over 2018, owing to lower global automotive production and prevailing trade tensions. In Japan, steel consumption declined largely due to a slowdown in manufacturing during 2019. The country produced 99 MnT of crude
Corporate Overview 02
Strategic Review 46
Performance Review 20
Statutory Reports 84
Our Strategy 28
Financial Statements 206
105
BOARD’S REPORT (CONTD.)
steel last year, a decrease of 4.8% compared to 2018. In Europe, crude steel production slumped to 159 MnT in 2019, recording a decrease of 4.9% over 2018. The decrease was on account of challenges faced with oversupply and trade tensions.
In 2019, India became the second largest crude steel producing country in the world, with a crude steel production of 111 MnT, an increase of 1.8% over the previous year. However, the growth rate was much lower compared to the previous year. Growth in the construction sector weakened due to falling investments in fixed asset formation. Sharp fall in the private consumption led to weaker growth in automotive and consumer durables. The tighter liquidity conditions due to defaults in NBFC sector impacted credit availability. The automotive sector was also impacted by factors such as regulatory changes, rise in ownership cost, and shared economy while, the capital goods sector continued to remain weak due to the decreasing output and stagnant investment in the manufacturing sector.
2. Outlook for Steel Industry The COVID-19 pandemic has severely affected economies and industries globally and the steel industry is no exception. Therefore, outlook for the steel industry includes scenarios regarding the pandemic’s speed of propagation, possible recurrence, near-term impact of measures being taken to contain the outbreak, and the effectiveness of the stimulus announced by the Governments of various nations.
After slower than expected growth in 2019, steel demand is estimated to contract significantly in the Financial Year 2020-21. According to the World Steel Association (‘WSA’), it is possible that the impact on steel demand in relation to the expected contraction in GDP may turn out to be less severe than that seen during the erstwhile global financial crisis. In comparison with other sectors, the manufacturing sector is expected to rebound quicker though supply chain disruptions are likely to continue.
Most of the steel producing regions are expected to witness a decline in crude steel output due to production cuts amidst ongoing lockdowns. However, it is expected that compared to other countries, China will move faster towards normalisation of economic activity as it was the first country to come out of the COVID-19 crisis. Governments of different nations have announced sizeable stimulus packages which are expected to favour steel consumption through investment in infrastructure and other incentives for the steel industry.
In India, muted demand and oversupply is likely to result in suppressed steel prices and capacity utlisation in the near term. Since India depends largely on migrant labour, restarting construction and infrastructure projects will be a challenge. The demand from infrastructure, construction, and real estate sectors is likely to be subdued in the first half of the Financial Year 2020-21 due to the lockdown during the first quarter followed by the monsoons during the second quarter. Further, the demand from automobile, white goods, and capital goods sectors is likely
to reduce significantly with consumers deferring discretionary spends in the near term. Effective government stimulus and return of consumer confidence is likely to be the key driver for a gradual recovery over the second half of the Financial Year 2020-21.
IV. Strategy During the year under review, the Company continued to focus on operational and marketing excellence to counter adverse business conditions. The Company aspires to be the most valuable and respected steel company in the world for which it has taken steps to be structurally, financially, and culturally future-ready. The Company continues to place special emphasis on strengthening its financial profile to enable future growth and to achieve volume growth while remaining cost competitive. The ongoing integration and improvement initiatives undertaken at Tata Steel BSL Limited (formerly Bhushan Steel Limited) and Tata Steel Long Products Limited (formerly Tata Sponge Iron Limited) have helped to unlock synergies and improve cost competitiveness while enhancing the capacity utilisation of the production units. The focus on driving digital transformation and greater efficiency through One IT and an integrated supply chain structure continue to unlock value for the Company. The Services and Solutions portfolio and New Materials Business (Graphene & Fibre Reinforced Polymer) have put in place the requisite enablers for the Company to scale up.
Building a culture of Agility and Innovation has been identified as an important lever to make the Company fit for the future. The Company has taken many initiatives to inculcate Agility in the organisation through experiments on agile ways of working in new businesses and enabling functions in core businesses along with process simplification. The learnings from the experiments will be used to create the blueprint for organisation wide deployment over the next couple of years. During the year under review, the Innovation framework in the Company was strengthened by putting in place the required teams and governance structure.
The Company has made significant progress in Leadership in technology, a key aspect of the Company’s strategy. Several Technology Leadership Areas are being worked upon enabled by creating required knowledge partnerships and leveraging the agility and innovativeness of start-ups. The Company has made progress towards imbibing Industry 4.0 and is the only steel company to have two digital lighthouses, as recognised by World Economic Forum.
The Company aspires to further strengthen its leadership position in the industry and is pursuing the following priorities in the medium term:
Industry leadership in Steel: India is amongst the fastest growing steel markets in the world. In order to meet the increasing demand, the Company has expanded its operations organically and inorganically and is also continuing to strengthen its long products portfolio to participate in the growing market. Towards this objective, the Company through its subsidiary, Tata Steel Long Products Limited
INTEGRATED REPORT & ANNUAL ACCOUNTS 2019-20 | 113TH YEAR106
(formerly Tata Sponge Iron Limited), is focussed on ramping up the acquired steel business of Usha Martin Limited. The Company also aspires to attain a leadership position in new segments such as Lifting and Excavation, Oil and Gas, Pre-Engineered Buildings, etc. and to maintain leadership position in segments such as Automotive, Emerging Corporate Accounts (Small and Medium Enterprises), Individual House Builders, amongst others.
Consolidate position as global cost leader: The Company aims to continue to be one of the lowest cost producers of steel in the world. Over the years, the Company has improved its operating parameters to reach global benchmark levels. Post acquisition of Tata Steel BSL Limited and steel business of Usha Martin Limited, focussed synergy programmes have been put in place to ensure horizontal deployment of the Company’s process capabilities in the acquired assets. Further, during the year under review, the Company, through its Shikhar25 programme, achieved performance improvements of `4,298 crore (including `1,965 crore value protection initiatives).
Insulate revenues from steel cyclicality: Steel industry is cyclical in nature. In order to insulate revenues from steel cyclicality, the Company is focussing on the branded retail business and downstream product portfolio. The Company has embarked on building a Services & Solutions (‘S&S’) business which offers steel-based solutions for end user needs and which are seeing significant growth. Leveraging our deep knowledge of customer needs and ability to execute insight-driven innovation, we believe that this portfolio will provide a significant competitive advantage to the Company, contributing to 20% of revenue going forward. The Company is also scaling up a portfolio of offerings in materials other than steel – currently focussing on Fibre Reinforced Polymer and Graphene. S&S and new materials businesses will provide added impetus to the Company’s differentiated play and provide a unique growth opportunity.
Industry leader in Corporate Social Responsibility and Safety, Health and Environment: As one of the leading steel producers in the world, the Company also aspires to be a leader in sustainable business practices in the industry. Towards this objective, the Company is taking steps to reduce its environment footprint. The Company has entered the steel scrap recycling business to promote sustainable steel making and to create a formal circular economy for steel. The first scrap recycling unit under this initiative is being developed in Rohtak, Haryana. The Company formed Carbon Impact Centre to have a focussed intervention to drive low carbon transition and initiatives and to achieving a goal of Carbon neutrality in the long-term. Initiatives are taken to reduce dependency on fossil fuel. The Company has also completed the phase 1 of feasibility study for Renewable potential assessment at Jamshedpur, Kalinganagar and raw material locations. On the longer horizon, the Company continues to explore and invest in technologies involving sustainable
production, storage and use of Hydrogen across the steel value chain, carbon capture, use and storage and HIsarna technology to reduce its carbon footprint. The Company is also focussed on effective by-product management.
The Company also recognises the need to create a safe and healthy environment for all its employees and other stakeholders and desires to be an industry leader in the Safety, Health & Environment and Corporate Social Responsibility (‘CSR’). This will be achieved through enhanced focus on reducing unsafe incidents at the workplace as well as reducing carbon emissions and consumption of natural resources such as water. The Company will continue to deepen the engagement with communities, aiming to change many more lives through its CSR initiatives.
Strategic enablers: In order to be future-ready, the Company is focussed on creating an organisation culture which is built on a strong foundation of agility and innovation. People are the key asset for any organisation and hence, the Company continues to direct its efforts towards building a future-ready, engaged, and diverse workforce. The Company is also focussed on investing in various digital initiatives, enabling new business models, and enhancing the digital maturity of the organisation. A structure and engagement mechanism for partnering with start-ups, academia, and other R&D organisations is set up and a team to monetise existing intellectual property owned by the Company is formed.
V. Operational Performance1. Tata Steel GroupDuring the year under review, the consolidated steel production for Tata Steel group (‘the Group’) was 28.46 MnT recording a 5% increase over that of the previous year. The Group recorded total deliveries of 26.68 MnT as against 26.80 MnT in previous year. The steel deliveries decreased at Tata Steel Limited by 2.9% and at Tata Steel Europe by 4%. This decrease was off-set by higher deliveries at Tata Steel BSL Limited (‘TSBSL’) by 16%. The increase at TSBSL is due to ramp-up of operations. Further, in the previous year, deliveries prior to the acquisition of TSBSL on May 18, 2018 under the Insolvency and Bankruptcy Code were not included. Further, the acquisition of steel business of Usha Martin Limited by Tata Steel Long Products Limited (formerly Tata Sponge Iron Limited) on April 9, 2019 also increased the total deliveries of the Group by 0.51 MnT.
The turnover for the Group was at ̀ 1,39,817 crore during the Financial Year 2019-20, a decrease of 11% over the previous financial year. The decrease is due to decline in realisations across geographies along with lower deliveries.
The EBITDA of the Group was `17,735 crore during the Financial Year 2019-20 as compared to `29,770 crore in the previous year.
Corporate Overview 02
Strategic Review 46
Performance Review 20
Statutory Reports 84
Our Strategy 28
Financial Statements 206
107
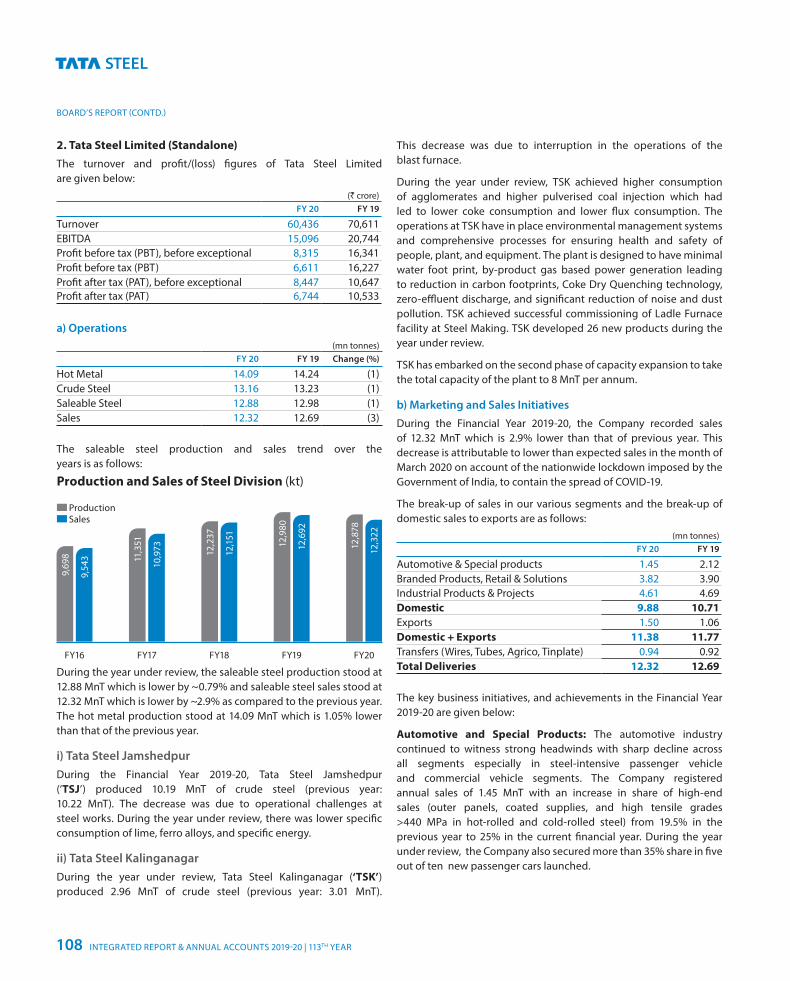
BOARD’S REPORT (CONTD.)
2. Tata Steel Limited (Standalone)The turnover and profit/(loss) figures of Tata Steel Limited are given below:
(` crore)FY 20 FY 19
Turnover 60,436 70,611EBITDA 15,096 20,744Profit before tax (PBT), before exceptional 8,315 16,341Profit before tax (PBT) 6,611 16,227Profit after tax (PAT), before exceptional 8,447 10,647Profit after tax (PAT) 6,744 10,533
a) Operations(mn tonnes)
FY 20 FY 19 Change (%)
Hot Metal 14.09 14.24 (1)Crude Steel 13.16 13.23 (1)Saleable Steel 12.88 12.98 (1)Sales 12.32 12.69 (3)
The saleable steel production and sales trend over the years is as follows:
Production and Sales of Steel Division (kt)
9,54
3
9,69
8
FY16
10,9
73
11,3
51
FY17
12,1
51
12,2
37
FY18
12,6
92
12,9
80
FY19
12,3
22
12,8
78
FY20
Production Sales
During the year under review, the saleable steel production stood at 12.88 MnT which is lower by ~0.79% and saleable steel sales stood at 12.32 MnT which is lower by ~2.9% as compared to the previous year. The hot metal production stood at 14.09 MnT which is 1.05% lower than that of the previous year.
i) Tata Steel Jamshedpur During the Financial Year 2019-20, Tata Steel Jamshedpur (‘TSJ’) produced 10.19 MnT of crude steel (previous year: 10.22 MnT). The decrease was due to operational challenges at steel works. During the year under review, there was lower specific consumption of lime, ferro alloys, and specific energy.
ii) Tata Steel Kalinganagar During the year under review, Tata Steel Kalinganagar (‘TSK’) produced 2.96 MnT of crude steel (previous year: 3.01 MnT).
This decrease was due to interruption in the operations of the blast furnace.
During the year under review, TSK achieved higher consumption of agglomerates and higher pulverised coal injection which had led to lower coke consumption and lower flux consumption. The operations at TSK have in place environmental management systems and comprehensive processes for ensuring health and safety of people, plant, and equipment. The plant is designed to have minimal water foot print, by-product gas based power generation leading to reduction in carbon footprints, Coke Dry Quenching technology, zero-effluent discharge, and significant reduction of noise and dust pollution. TSK achieved successful commissioning of Ladle Furnace facility at Steel Making. TSK developed 26 new products during the year under review.
TSK has embarked on the second phase of capacity expansion to take the total capacity of the plant to 8 MnT per annum.
b) Marketing and Sales Initiatives
During the Financial Year 2019-20, the Company recorded sales of 12.32 MnT which is 2.9% lower than that of previous year. This decrease is attributable to lower than expected sales in the month of March 2020 on account of the nationwide lockdown imposed by the Government of India, to contain the spread of COVID-19.
The break-up of sales in our various segments and the break-up of domestic sales to exports are as follows:
(mn tonnes)FY 20 FY 19
Automotive & Special products 1.45 2.12Branded Products, Retail & Solutions 3.82 3.90Industrial Products & Projects 4.61 4.69Domestic 9.88 10.71Exports 1.50 1.06Domestic + Exports 11.38 11.77Transfers (Wires, Tubes, Agrico, Tinplate) 0.94 0.92Total Deliveries 12.32 12.69
The key business initiatives, and achievements in the Financial Year 2019-20 are given below:
Automotive and Special Products: The automotive industry continued to witness strong headwinds with sharp decline across all segments especially in steel-intensive passenger vehicle and commercial vehicle segments. The Company registered annual sales of 1.45 MnT with an increase in share of high-end sales (outer panels, coated supplies, and high tensile grades >440 MPa in hot-rolled and cold-rolled steel) from 19.5% in the previous year to 25% in the current financial year. During the year under review, the Company also secured more than 35% share in five out of ten new passenger cars launched.
INTEGRATED REPORT & ANNUAL ACCOUNTS 2019-20 | 113TH YEAR108
The Company’s efforts in strengthening relationship was backed by the recognition received from automakers. Major recognition received during the year was the “Overall Performance Award” from a major passenger vehicle (PV) maker for exhibiting exemplary performance in quality, cost, delivery and development for the fifth consecutive year. During the year under review, the Company (along with Jamshedpur Continuous Annealing and Processing Company Private Limited) also received a Certificate of Appreciation from a Japanese PV manufacturer for improving process quality.
Branded Products, Retail, and Solutions: During the Financial Year 2019-20, the Company’s annual sales of Branded products was at 3.82 MnT. The B2C segment achieved sales volume of 1.63 MnT, and Tata Shaktee achieved a sales volume of 182 kt, with the launch and scale up of new products such as WAMA (wall profile) (4.3 kt) and Long Length Galvanised Corrugate Steel sheets (7.4 kt) contributing to the sales. Tata Kosh achieved its best-ever sales of 43 kt in Financial Year 2019-20. Further, through the Tata Steel channel, 15 kt of Tata Shaktee and 37 kt of Tata Kosh of TSBSL were sold during the current period.
During the current year, the B2ECA (Business to Emerging Corporate Accounts) business clocked a volume of 2.2 MnT and in the process serviced more than 9,000 customers. Value-Added Products contributed to 23% of overall ECA Volumes which grew by 17% as against that of previous year. This was achieved through development and access to key micro-segments such as ATM safe, Railways & Metro coach, Wagons, Transmission Line tower, Pre-Engineered Buildings, Solar, and introduction of segment specific seven new products. Emerging Corporate Accounts (ECA) business ventured into retail space through Tata Astrum Super Brand. The ECA business spread across 15 states with 21 distributors, has sold Tata Astrum Super Brand through 550 retailers and has reached more than 2,500 end user fabricators. ECA Brands won 14 Awards and recognitions in the Financial Year 2019-20 including CII Customer Centricity Award. Tata Steel is the first Steel company to win this award.
Industrial Products, Projects, and Exports: The year witnessed stable growth in Infrastructure, Railways, Pre-Engineered Building (‘PEB’), and Oil & Gas (‘O&G’) segments and de-growth in LPG, Real Estate, and Lifting & Excavation (‘L&E’) segments. As a result, the vertical achieved total sales of 4.61 MnT in the Financial Year 2019-20.
The Company continued to enrich its product portfolio with a focus on Engineering and Value-Added Products (VAP). Railways segment grew by 39% year-on-year from 39 kt to 54 kt. Precision Tubes segment reported sales at 107 kt reflecting a growth of 16% year-on-year. Sales of Value-Added Rebars also grew by 16% year-on-year to 56 kt. The Engineering Segment achieved best-ever sales and recorded a growth of 5% year-on-year. O&G segment recorded 3x growth in sales on account of approvals from major Oil Marketing Companies for API X60. The Company significantly increased its market share in L&E and PEB segments with an enriched product basket offering and engagement through value creation and cost saving initiatives such as Value Analysis and Value Engineering and Re-nesting exercises with key players in the industry.
As a recognition for the work on development of high strength grades, the Company was bestowed the “Innovation Award” by the market leader of earth moving equipment OEM and the “Best Supplier Award” from the market leader of mobile and tower cranes OEM.
In the Construction space, the Company maintained its focus on offering services and solutions through Cut & Bend. Tiscon Readybuild recorded sales of 138 kt in Financial Year 2019-20. India’s first Branded Welded Wire Fabric “Sm@rtFAB” achieved 1.29 kt sales thereby recording a 20% year-on-year growth in sales. The Company also supplied ~111 kt rebars (~10% of total project sales) to 26 marquee projects in India, viz. Longest River bridge – New Ganga Bridge, Tallest building in NCR – ‘The Amaryllis’, 701 km ‘Corridor of Prosperity’ connecting Mumbai and Nagpur – Maharashtra Samruddhi Mahamarg, and World’s largest Cricket Stadium: Sardar Vallabhbhai Patel Stadium, Ahmedabad.
In International market, the Company continues to expand its reach to new geographies such as Kuwait, Qatar, and Philippines, etc. while continuing to maintain its presence in Middle-East ('ME'), neighbouring countries, and South-East Asia ('SEA') markets. With success and learning from domestic PEB market, the Company also ventured in the PEB segment for the first time in ME and SEA. With enhanced focus, the Company’s VAP sales doubled in the export market (52 kt in the Financial Year 2018-19 and 110 kt in the Financial Year 2019-20).
Further, a specific drive was undertaken to optimise supply chain cost for exports between our two plants – TSK and TSJ, and three sea ports – Dhamra, Haldia, and Paradip. Container Exports have commenced from Vishakhapatnam port, thereby reducing dispatch cost and increasing options of vessel availability.
Services and Solutions: The Company has strengthened its position in the Services and Solutions space by providing better consumer experience and expanding product portfolio. During the year under review, Tata Pravesh Doors and Windows registered 30% increase in turnover as compared to the previous year. Since inception 1,00,000 Tata Pravesh units have been installed and more than 20,000 consumers have been served. Nest-In, the construction solutions brand, continued to grow rapidly. This business has executed orders worth `64 crore and achieved an order book of `91 crore in the Financial Year 2019-20. Since inception, Nest-In has installed over 5 lakh square feet of housing and nearly 9,000 EzyNest units.
Digital Initiatives: The Company’s first of its kind portal for the Individual Home Builder (IHB), Tata Steel Aashiyana, achieved a turnover of `316 crore in the Financial Year 2019-20, recording a 200% growth over that of the previous year. Tata Basera, a Tata Group level synergy initiative led by Tata Steel, has expanded its reach to more than 240 districts. The Tata Basera programme offers special benefits from five Tata Group companies to IHB who purchase Tata Tiscon/Pravesh Doors. These digital initiatives are helping reach hitherto unserved territories, allowing the Company to serve new markets and customers.
Corporate Overview 02
Strategic Review 46
Performance Review 20
Statutory Reports 84
Our Strategy 28
Financial Statements 206
109
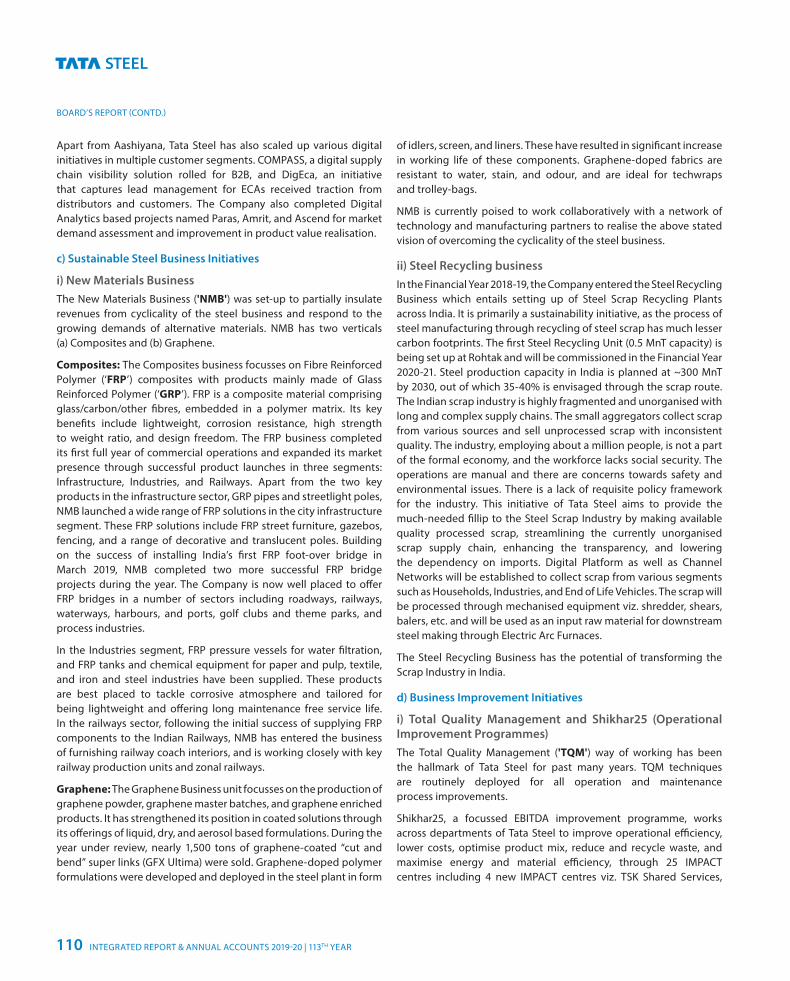
BOARD’S REPORT (CONTD.)
Apart from Aashiyana, Tata Steel has also scaled up various digital initiatives in multiple customer segments. COMPASS, a digital supply chain visibility solution rolled for B2B, and DigEca, an initiative that captures lead management for ECAs received traction from distributors and customers. The Company also completed Digital Analytics based projects named Paras, Amrit, and Ascend for market demand assessment and improvement in product value realisation.
c) Sustainable Steel Business Initiatives
i) New Materials BusinessThe New Materials Business ('NMB') was set-up to partially insulate revenues from cyclicality of the steel business and respond to the growing demands of alternative materials. NMB has two verticals (a) Composites and (b) Graphene.
Composites: The Composites business focusses on Fibre Reinforced Polymer (‘FRP’) composites with products mainly made of Glass Reinforced Polymer (‘GRP’). FRP is a composite material comprising glass/carbon/other fibres, embedded in a polymer matrix. Its key benefits include lightweight, corrosion resistance, high strength to weight ratio, and design freedom. The FRP business completed its first full year of commercial operations and expanded its market presence through successful product launches in three segments: Infrastructure, Industries, and Railways. Apart from the two key products in the infrastructure sector, GRP pipes and streetlight poles, NMB launched a wide range of FRP solutions in the city infrastructure segment. These FRP solutions include FRP street furniture, gazebos, fencing, and a range of decorative and translucent poles. Building on the success of installing India’s first FRP foot-over bridge in March 2019, NMB completed two more successful FRP bridge projects during the year. The Company is now well placed to offer FRP bridges in a number of sectors including roadways, railways, waterways, harbours, and ports, golf clubs and theme parks, and process industries.
In the Industries segment, FRP pressure vessels for water filtration, and FRP tanks and chemical equipment for paper and pulp, textile, and iron and steel industries have been supplied. These products are best placed to tackle corrosive atmosphere and tailored for being lightweight and offering long maintenance free service life. In the railways sector, following the initial success of supplying FRP components to the Indian Railways, NMB has entered the business of furnishing railway coach interiors, and is working closely with key railway production units and zonal railways.
Graphene: The Graphene Business unit focusses on the production of graphene powder, graphene master batches, and graphene enriched products. It has strengthened its position in coated solutions through its offerings of liquid, dry, and aerosol based formulations. During the year under review, nearly 1,500 tons of graphene-coated “cut and bend” super links (GFX Ultima) were sold. Graphene-doped polymer formulations were developed and deployed in the steel plant in form
of idlers, screen, and liners. These have resulted in significant increase in working life of these components. Graphene-doped fabrics are resistant to water, stain, and odour, and are ideal for techwraps and trolley-bags.
NMB is currently poised to work collaboratively with a network of technology and manufacturing partners to realise the above stated vision of overcoming the cyclicality of the steel business.
ii) Steel Recycling businessIn the Financial Year 2018-19, the Company entered the Steel Recycling Business which entails setting up of Steel Scrap Recycling Plants across India. It is primarily a sustainability initiative, as the process of steel manufacturing through recycling of steel scrap has much lesser carbon footprints. The first Steel Recycling Unit (0.5 MnT capacity) is being set up at Rohtak and will be commissioned in the Financial Year 2020-21. Steel production capacity in India is planned at ~300 MnT by 2030, out of which 35-40% is envisaged through the scrap route. The Indian scrap industry is highly fragmented and unorganised with long and complex supply chains. The small aggregators collect scrap from various sources and sell unprocessed scrap with inconsistent quality. The industry, employing about a million people, is not a part of the formal economy, and the workforce lacks social security. The operations are manual and there are concerns towards safety and environmental issues. There is a lack of requisite policy framework for the industry. This initiative of Tata Steel aims to provide the much-needed fillip to the Steel Scrap Industry by making available quality processed scrap, streamlining the currently unorganised scrap supply chain, enhancing the transparency, and lowering the dependency on imports. Digital Platform as well as Channel Networks will be established to collect scrap from various segments such as Households, Industries, and End of Life Vehicles. The scrap will be processed through mechanised equipment viz. shredder, shears, balers, etc. and will be used as an input raw material for downstream steel making through Electric Arc Furnaces.
The Steel Recycling Business has the potential of transforming the Scrap Industry in India.
d) Business Improvement Initiatives
i) Total Quality Management and Shikhar25 (Operational Improvement Programmes)The Total Quality Management ('TQM') way of working has been the hallmark of Tata Steel for past many years. TQM techniques are routinely deployed for all operation and maintenance process improvements.
Shikhar25, a focussed EBITDA improvement programme, works across departments of Tata Steel to improve operational efficiency, lower costs, optimise product mix, reduce and recycle waste, and maximise energy and material efficiency, through 25 IMPACT centres including 4 new IMPACT centres viz. TSK Shared Services,
INTEGRATED REPORT & ANNUAL ACCOUNTS 2019-20 | 113TH YEAR110
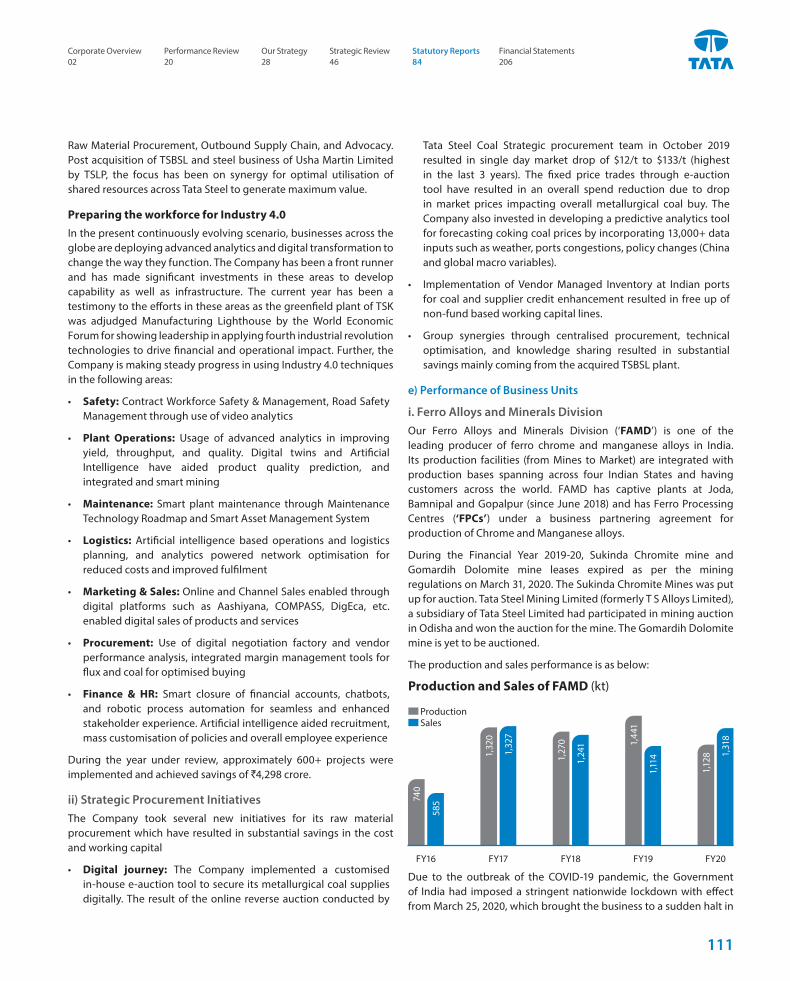
Raw Material Procurement, Outbound Supply Chain, and Advocacy. Post acquisition of TSBSL and steel business of Usha Martin Limited by TSLP, the focus has been on synergy for optimal utilisation of shared resources across Tata Steel to generate maximum value.
Preparing the workforce for Industry 4.0In the present continuously evolving scenario, businesses across the globe are deploying advanced analytics and digital transformation to change the way they function. The Company has been a front runner and has made significant investments in these areas to develop capability as well as infrastructure. The current year has been a testimony to the efforts in these areas as the greenfield plant of TSK was adjudged Manufacturing Lighthouse by the World Economic Forum for showing leadership in applying fourth industrial revolution technologies to drive financial and operational impact. Further, the Company is making steady progress in using Industry 4.0 techniques in the following areas:
• Safety: Contract Workforce Safety & Management, Road Safety Management through use of video analytics
• Plant Operations: Usage of advanced analytics in improving yield, throughput, and quality. Digital twins and Artificial Intelligence have aided product quality prediction, and integrated and smart mining
• Maintenance: Smart plant maintenance through Maintenance Technology Roadmap and Smart Asset Management System
• Logistics: Artificial intelligence based operations and logistics planning, and analytics powered network optimisation for reduced costs and improved fulfilment
• Marketing & Sales: Online and Channel Sales enabled through digital platforms such as Aashiyana, COMPASS, DigEca, etc. enabled digital sales of products and services
• Procurement: Use of digital negotiation factory and vendor performance analysis, integrated margin management tools for flux and coal for optimised buying
• Finance & HR: Smart closure of financial accounts, chatbots, and robotic process automation for seamless and enhanced stakeholder experience. Artificial intelligence aided recruitment, mass customisation of policies and overall employee experience
During the year under review, approximately 600+ projects were implemented and achieved savings of `4,298 crore.
ii) Strategic Procurement InitiativesThe Company took several new initiatives for its raw material procurement which have resulted in substantial savings in the cost and working capital
• Digital journey: The Company implemented a customised in-house e-auction tool to secure its metallurgical coal supplies digitally. The result of the online reverse auction conducted by
Tata Steel Coal Strategic procurement team in October 2019 resulted in single day market drop of $12/t to $133/t (highest in the last 3 years). The fixed price trades through e-auction tool have resulted in an overall spend reduction due to drop in market prices impacting overall metallurgical coal buy. The Company also invested in developing a predictive analytics tool for forecasting coking coal prices by incorporating 13,000+ data inputs such as weather, ports congestions, policy changes (China and global macro variables).
• Implementation of Vendor Managed Inventory at Indian ports for coal and supplier credit enhancement resulted in free up of non-fund based working capital lines.
• Group synergies through centralised procurement, technical optimisation, and knowledge sharing resulted in substantial savings mainly coming from the acquired TSBSL plant.
e) Performance of Business Units
i. Ferro Alloys and Minerals DivisionOur Ferro Alloys and Minerals Division (‘FAMD’) is one of the leading producer of ferro chrome and manganese alloys in India. Its production facilities (from Mines to Market) are integrated with production bases spanning across four Indian States and having customers across the world. FAMD has captive plants at Joda, Bamnipal and Gopalpur (since June 2018) and has Ferro Processing Centres (‘FPCs’) under a business partnering agreement for production of Chrome and Manganese alloys.
During the Financial Year 2019-20, Sukinda Chromite mine and Gomardih Dolomite mine leases expired as per the mining regulations on March 31, 2020. The Sukinda Chromite Mines was put up for auction. Tata Steel Mining Limited (formerly T S Alloys Limited), a subsidiary of Tata Steel Limited had participated in mining auction in Odisha and won the auction for the mine. The Gomardih Dolomite mine is yet to be auctioned.
The production and sales performance is as below:
Production and Sales of FAMD (kt)
58574
0
FY16
1,32
7
1,32
0
FY17
1,24
1
1,27
0
FY18
1,11
4
1,44
1
FY19
1,31
8
1,12
8
FY20
Production Sales
Due to the outbreak of the COVID-19 pandemic, the Government of India had imposed a stringent nationwide lockdown with effect from March 25, 2020, which brought the business to a sudden halt in
Corporate Overview 02
Strategic Review 46
Performance Review 20
Statutory Reports 84
Our Strategy 28
Financial Statements 206
111
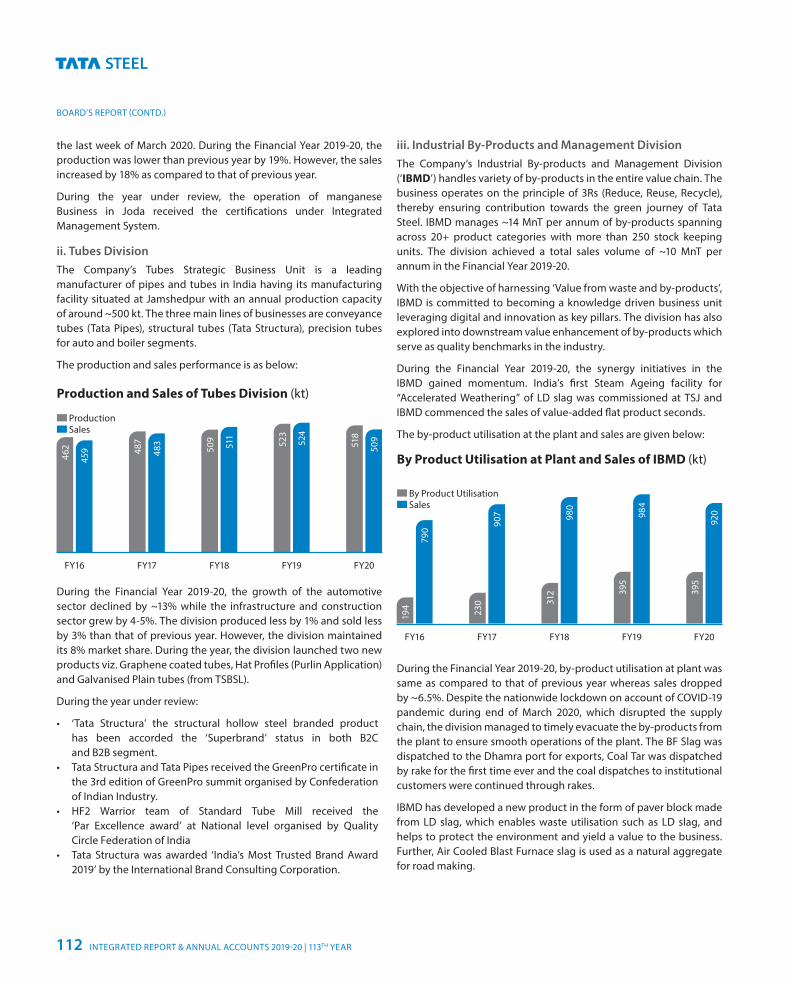
BOARD’S REPORT (CONTD.)
the last week of March 2020. During the Financial Year 2019-20, the production was lower than previous year by 19%. However, the sales increased by 18% as compared to that of previous year.
During the year under review, the operation of manganese Business in Joda received the certifications under Integrated Management System.
ii. Tubes DivisionThe Company’s Tubes Strategic Business Unit is a leading manufacturer of pipes and tubes in India having its manufacturing facility situated at Jamshedpur with an annual production capacity of around ~500 kt. The three main lines of businesses are conveyance tubes (Tata Pipes), structural tubes (Tata Structura), precision tubes for auto and boiler segments.
The production and sales performance is as below:
Production and Sales of Tubes Division (kt)
459
462
FY16
483
487
FY17
511
509
FY18
524
523
FY19
509518
FY20
Production Sales
During the Financial Year 2019-20, the growth of the automotive sector declined by ~13% while the infrastructure and construction sector grew by 4-5%. The division produced less by 1% and sold less by 3% than that of previous year. However, the division maintained its 8% market share. During the year, the division launched two new products viz. Graphene coated tubes, Hat Profiles (Purlin Application) and Galvanised Plain tubes (from TSBSL).
During the year under review:
• ‘Tata Structura’ the structural hollow steel branded product has been accorded the ‘Superbrand’ status in both B2C and B2B segment.
• Tata Structura and Tata Pipes received the GreenPro certificate in the 3rd edition of GreenPro summit organised by Confederation of Indian Industry.
• HF2 Warrior team of Standard Tube Mill received the ‘Par Excellence award’ at National level organised by Quality Circle Federation of India
• Tata Structura was awarded ‘India’s Most Trusted Brand Award 2019’ by the International Brand Consulting Corporation.
iii. Industrial By-Products and Management DivisionThe Company’s Industrial By-products and Management Division (‘IBMD’) handles variety of by-products in the entire value chain. The business operates on the principle of 3Rs (Reduce, Reuse, Recycle), thereby ensuring contribution towards the green journey of Tata Steel. IBMD manages ~14 MnT per annum of by-products spanning across 20+ product categories with more than 250 stock keeping units. The division achieved a total sales volume of ~10 MnT per annum in the Financial Year 2019-20.
With the objective of harnessing ‘Value from waste and by-products’, IBMD is committed to becoming a knowledge driven business unit leveraging digital and innovation as key pillars. The division has also explored into downstream value enhancement of by-products which serve as quality benchmarks in the industry.
During the Financial Year 2019-20, the synergy initiatives in the IBMD gained momentum. India’s first Steam Ageing facility for “Accelerated Weathering” of LD slag was commissioned at TSJ and IBMD commenced the sales of value-added flat product seconds.
The by-product utilisation at the plant and sales are given below:
By Product Utilisation at Plant and Sales of IBMD (kt)
790
194
FY16
907
230
FY17
980
312
FY1898
4
395
FY19
920
395
FY20
By Product Utilisation Sales
During the Financial Year 2019-20, by-product utilisation at plant was same as compared to that of previous year whereas sales dropped by ~6.5%. Despite the nationwide lockdown on account of COVID-19 pandemic during end of March 2020, which disrupted the supply chain, the division managed to timely evacuate the by-products from the plant to ensure smooth operations of the plant. The BF Slag was dispatched to the Dhamra port for exports, Coal Tar was dispatched by rake for the first time ever and the coal dispatches to institutional customers were continued through rakes.
IBMD has developed a new product in the form of paver block made from LD slag, which enables waste utilisation such as LD slag, and helps to protect the environment and yield a value to the business. Further, Air Cooled Blast Furnace slag is used as a natural aggregate for road making.
INTEGRATED REPORT & ANNUAL ACCOUNTS 2019-20 | 113TH YEAR112
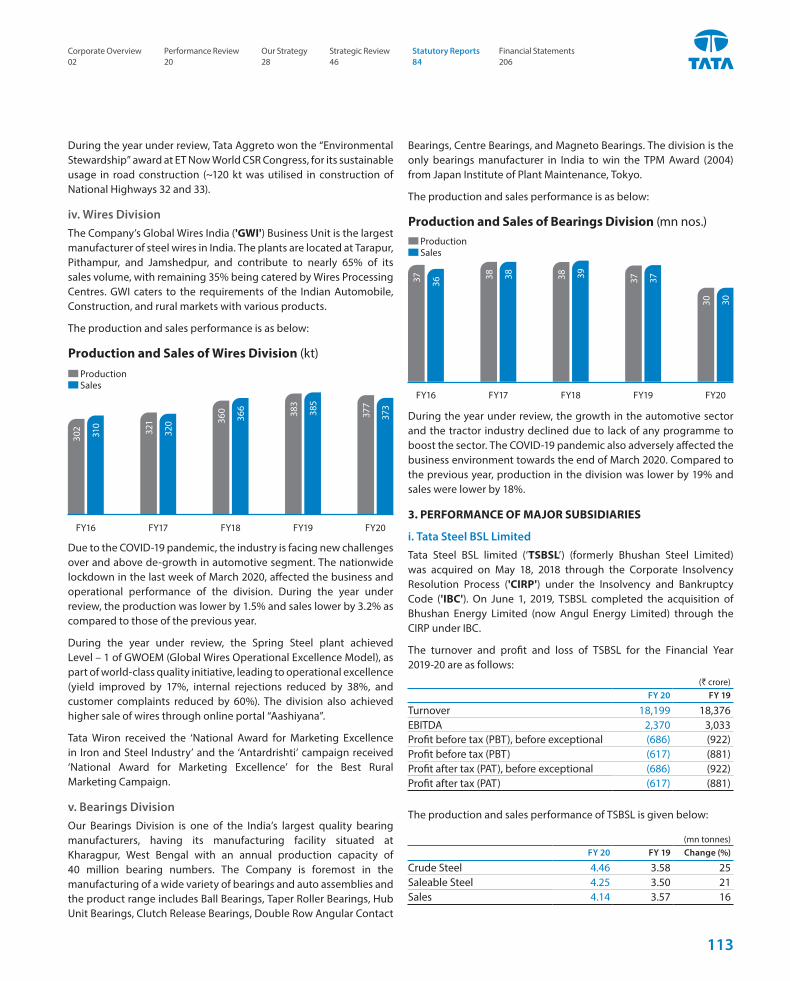
During the year under review, Tata Aggreto won the “Environmental Stewardship” award at ET Now World CSR Congress, for its sustainable usage in road construction (~120 kt was utilised in construction of National Highways 32 and 33).
iv. Wires DivisionThe Company’s Global Wires India ('GWI') Business Unit is the largest manufacturer of steel wires in India. The plants are located at Tarapur, Pithampur, and Jamshedpur, and contribute to nearly 65% of its sales volume, with remaining 35% being catered by Wires Processing Centres. GWI caters to the requirements of the Indian Automobile, Construction, and rural markets with various products.
The production and sales performance is as below:
Production and Sales of Wires Division (kt)
310
302
FY16
320
321
FY17
366
360
FY18
385
383
FY19
373
377
FY20
Production Sales
Due to the COVID-19 pandemic, the industry is facing new challenges over and above de-growth in automotive segment. The nationwide lockdown in the last week of March 2020, affected the business and operational performance of the division. During the year under review, the production was lower by 1.5% and sales lower by 3.2% as compared to those of the previous year.
During the year under review, the Spring Steel plant achieved Level – 1 of GWOEM (Global Wires Operational Excellence Model), as part of world-class quality initiative, leading to operational excellence (yield improved by 17%, internal rejections reduced by 38%, and customer complaints reduced by 60%). The division also achieved higher sale of wires through online portal “Aashiyana”.
Tata Wiron received the ‘National Award for Marketing Excellence in Iron and Steel Industry’ and the ‘Antardrishti’ campaign received ‘National Award for Marketing Excellence’ for the Best Rural Marketing Campaign.
v. Bearings DivisionOur Bearings Division is one of the India’s largest quality bearing manufacturers, having its manufacturing facility situated at Kharagpur, West Bengal with an annual production capacity of 40 million bearing numbers. The Company is foremost in the manufacturing of a wide variety of bearings and auto assemblies and the product range includes Ball Bearings, Taper Roller Bearings, Hub Unit Bearings, Clutch Release Bearings, Double Row Angular Contact
Bearings, Centre Bearings, and Magneto Bearings. The division is the only bearings manufacturer in India to win the TPM Award (2004) from Japan Institute of Plant Maintenance, Tokyo.
The production and sales performance is as below:
Production and Sales of Bearings Division (mn nos.)
3637
FY16
3838
FY17
3938
FY18
3737
FY19
3030
FY20
Production Sales
During the year under review, the growth in the automotive sector and the tractor industry declined due to lack of any programme to boost the sector. The COVID-19 pandemic also adversely affected the business environment towards the end of March 2020. Compared to the previous year, production in the division was lower by 19% and sales were lower by 18%.
3. PERFORMANCE OF MAJOR SUBSIDIARIES
i. Tata Steel BSL Limited
Tata Steel BSL limited (‘TSBSL’) (formerly Bhushan Steel Limited) was acquired on May 18, 2018 through the Corporate Insolvency Resolution Process ('CIRP') under the Insolvency and Bankruptcy Code ('IBC'). On June 1, 2019, TSBSL completed the acquisition of Bhushan Energy Limited (now Angul Energy Limited) through the CIRP under IBC.
The turnover and profit and loss of TSBSL for the Financial Year 2019-20 are as follows:
(` crore)FY 20 FY 19
Turnover 18,199 18,376EBITDA 2,370 3,033Profit before tax (PBT), before exceptional (686) (922)Profit before tax (PBT) (617) (881)Profit after tax (PAT), before exceptional (686) (922)Profit after tax (PAT) (617) (881)
The production and sales performance of TSBSL is given below:
(mn tonnes)FY 20 FY 19 Change (%)
Crude Steel 4.46 3.58 25Saleable Steel 4.25 3.50 21Sales 4.14 3.57 16
Corporate Overview 02
Strategic Review 46
Performance Review 20
Statutory Reports 84
Our Strategy 28
Financial Statements 206
113
BOARD’S REPORT (CONTD.)
During the Financial Year 2019-20, the saleable steel production stood at 4.25 MnT and crude steel production stood at 4.46 MnT recording an increase of ~21% and ~25% respectively as compared to that of the previous year. The increase at TSBSL is due to ramp-up of operations. Further, in the previous year, deliveries prior to the acquisition of TSBSL on May 18, 2018 under IBC were not included.
Post the acquisition, many improvement projects were undertaken at TSBSL. TSBSL plans to sweat all the assets and reach higher level of capacity utilisation. In order to maximise capacity utilisation, TSBSL undertook the following initiatives;
• Development of value added products – TSBSL developed new grades in Oil and Gas segment as well as adhesive coated material for auto sector for brake application (as an import substitute).
• Development of new customers & market – During the year under review, TSBSL appointed six new distributors across India. Also, new customers were added in the OEM segment to increase the market presence and secure good share of business in OEM segment.
Value creation through synergy initiative with parent organisation – TSBSL technical and quality teams are working closely with the Tata Steel teams to develop high-end HR grade operational capability for high-end segments and to increase the volumes in branded products.
Operational Excellence: Be1 ProgrammeThis is a flagship multi-dimensional excellence programme driving operational, commercial, financial, and capability excellence. These programmes enabled building a robust pipeline of improvement initiatives which will continue to deliver value over medium and long-term and strengthen TSBSL’s financial position. The pipeline was built by conducting more than 50 idea generation workshops involving employees across all levels to the shop floor. These initiatives are focussed on cost reduction, throughput debottlenecking, and value creation.
Key initiatives on cost that drove value across the organisation include – fuel rate reduction, power cost reduction, Value-in-Use driven buying of all Raw Materials, Suppliers Days for best cost, country sourcing of Refractories and Graphite Electrodes, and HR barter with other steel players for logistics cost reduction.
Key initiatives on throughput include debottlenecking across upstream and downstream units, DRI (Direct Reduced Iron) kilns operationalisation, and horizontally deploying standardised maintenance practices for critical equipment. Besides these, initiatives focussed on value creation including diversifying end customer segments (especially non-auto), creating a full potential and GTM (Geometry Technology Module) view for strengthening
export volumes, and reducing order delivery time through design of HR buffer for downstream plants.
In addition, the programme focussed on leveraging group synergies with Tata Steel to increase use of captive raw material, combined cargo planning (inbound and outbound), inter-plant synergies, and manufacture of Tata Steel branded products at TSBSL plants at arm’s length. The plant achieved multiple Business Process Developments best demonstrated performance throughout the year across both cost and throughput Key Performance Indicators.
TSBSL started using digital tools to create sustainable value. A few key highlights from digital include the Digital Twin for steel melting shop which helped debottleneck throughput, GPS tracking of all outbound trucks from gate entry to customer unloading.
The benefits achieved from these initiatives in the Financial Year 2019-20 is approximately `1,950 crore.
The turnover of TSBSL was marginally lower due to lower market realisation, partly offset by higher volumes. The loss before tax was lower due to lower interest cost as in the previous year TSBSL had Inter-Corporate Deposits to be discharged.
ii. Tata Steel Long Products Limited
Pursuant to the Business Transfer Agreement entered into between the Company and Usha Martin Limited (‘UML’) on September 22, 2018 and its subsequent novation in favour of Tata Steel Long Products Limited (‘TSLP’) (formerly Tata Sponge Iron Limited), a subsidiary of the Company, the steel business of UML was acquired by TSLP on April 9, 2019 (other than transfer of some of the assets including iron ore mines, coal mines, and certain land parcels). Further, the transfer of iron ore mines and coal mines was completed on July 3, 2019.
TSLP’s current product portfolio is unique in nature and complementary to Tata Steel product basket. It primarily deals in two products viz. DRI (Direct Reduced Iron/Sponge Iron) and Special Steel. DRI is highly commoditised in nature and used as a Raw material (substitute to the steel scrap) in the electric arc furnaces or induction furnaces. Special steel is used for high-end and critical applications such as forging, bearings, fasteners, spring, etc. This has enabled the Company to complete its offering in the Automotive sector for critical long products-based components apart from being a leader in flat products-based parts/components.
TSLP immediately after acquisition has engaged in transformation programme and launched “Shikhar” (multi-divisional, cross functional improvement initiative that aims to drive break through improvement projects) to achieve operational excellence and get the synergy benefits for long-term sustainability. The programme generated more than 1,100 ideas and TSLP successfully implemented majority of those, resulting in total savings of ~ `300 crore.
INTEGRATED REPORT & ANNUAL ACCOUNTS 2019-20 | 113TH YEAR114
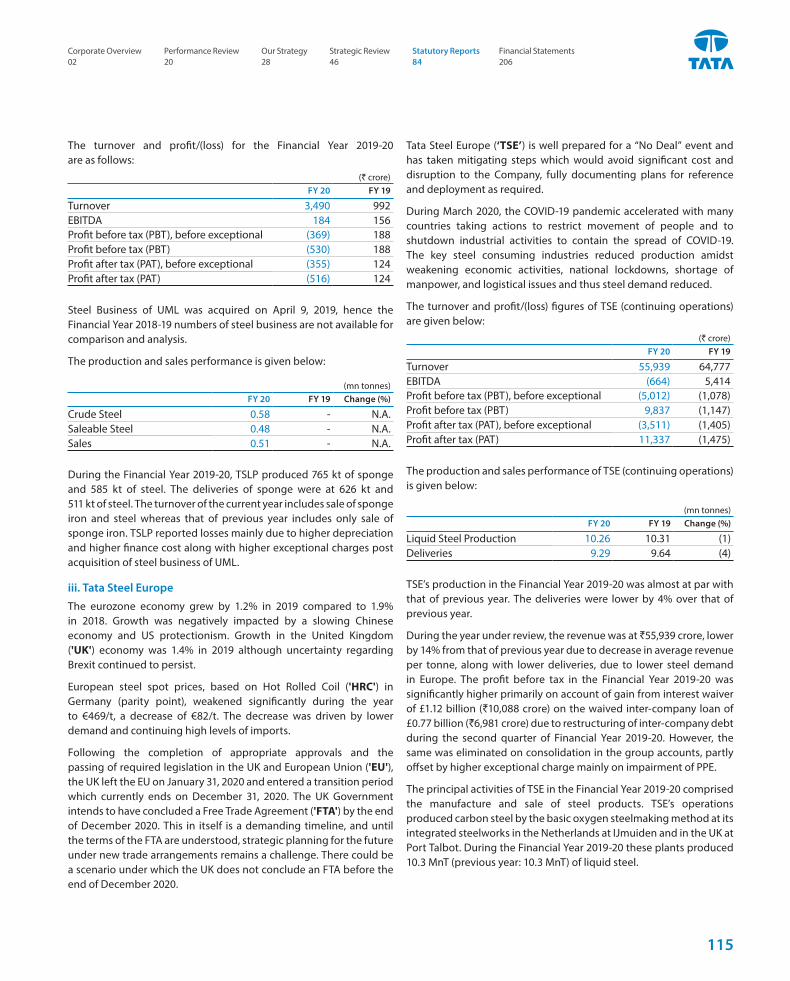
The turnover and profit/(loss) for the Financial Year 2019-20 are as follows:
(` crore)FY 20 FY 19
Turnover 3,490 992EBITDA 184 156Profit before tax (PBT), before exceptional (369) 188Profit before tax (PBT) (530) 188Profit after tax (PAT), before exceptional (355) 124Profit after tax (PAT) (516) 124
Steel Business of UML was acquired on April 9, 2019, hence the Financial Year 2018-19 numbers of steel business are not available for comparison and analysis.
The production and sales performance is given below:
(mn tonnes)FY 20 FY 19 Change (%)
Crude Steel 0.58 - N.A. Saleable Steel 0.48 - N.A. Sales 0.51 - N.A.
During the Financial Year 2019-20, TSLP produced 765 kt of sponge and 585 kt of steel. The deliveries of sponge were at 626 kt and 511 kt of steel. The turnover of the current year includes sale of sponge iron and steel whereas that of previous year includes only sale of sponge iron. TSLP reported losses mainly due to higher depreciation and higher finance cost along with higher exceptional charges post acquisition of steel business of UML.
iii. Tata Steel Europe
The eurozone economy grew by 1.2% in 2019 compared to 1.9% in 2018. Growth was negatively impacted by a slowing Chinese economy and US protectionism. Growth in the United Kingdom ('UK') economy was 1.4% in 2019 although uncertainty regarding Brexit continued to persist.
European steel spot prices, based on Hot Rolled Coil ('HRC') in Germany (parity point), weakened significantly during the year to €469/t, a decrease of €82/t. The decrease was driven by lower demand and continuing high levels of imports.
Following the completion of appropriate approvals and the passing of required legislation in the UK and European Union ('EU'), the UK left the EU on January 31, 2020 and entered a transition period which currently ends on December 31, 2020. The UK Government intends to have concluded a Free Trade Agreement ('FTA') by the end of December 2020. This in itself is a demanding timeline, and until the terms of the FTA are understood, strategic planning for the future under new trade arrangements remains a challenge. There could be a scenario under which the UK does not conclude an FTA before the end of December 2020.
Tata Steel Europe (‘TSE’) is well prepared for a “No Deal” event and has taken mitigating steps which would avoid significant cost and disruption to the Company, fully documenting plans for reference and deployment as required.
During March 2020, the COVID-19 pandemic accelerated with many countries taking actions to restrict movement of people and to shutdown industrial activities to contain the spread of COVID-19. The key steel consuming industries reduced production amidst weakening economic activities, national lockdowns, shortage of manpower, and logistical issues and thus steel demand reduced.
The turnover and profit/(loss) figures of TSE (continuing operations) are given below:
(` crore)FY 20 FY 19
Turnover 55,939 64,777EBITDA (664) 5,414Profit before tax (PBT), before exceptional (5,012) (1,078)Profit before tax (PBT) 9,837 (1,147)Profit after tax (PAT), before exceptional (3,511) (1,405)Profit after tax (PAT) 11,337 (1,475)
The production and sales performance of TSE (continuing operations) is given below:
(mn tonnes)FY 20 FY 19 Change (%)
Liquid Steel Production 10.26 10.31 (1)Deliveries 9.29 9.64 (4)
TSE’s production in the Financial Year 2019-20 was almost at par with that of previous year. The deliveries were lower by 4% over that of previous year.
During the year under review, the revenue was at `55,939 crore, lower by 14% from that of previous year due to decrease in average revenue per tonne, along with lower deliveries, due to lower steel demand in Europe. The profit before tax in the Financial Year 2019-20 was significantly higher primarily on account of gain from interest waiver of £1.12 billion (`10,088 crore) on the waived inter-company loan of £0.77 billion (`6,981 crore) due to restructuring of inter-company debt during the second quarter of Financial Year 2019-20. However, the same was eliminated on consolidation in the group accounts, partly offset by higher exceptional charge mainly on impairment of PPE.
The principal activities of TSE in the Financial Year 2019-20 comprised the manufacture and sale of steel products. TSE’s operations produced carbon steel by the basic oxygen steelmaking method at its integrated steelworks in the Netherlands at IJmuiden and in the UK at Port Talbot. During the Financial Year 2019-20 these plants produced 10.3 MnT (previous year: 10.3 MnT) of liquid steel.
Corporate Overview 02
Strategic Review 46
Performance Review 20
Statutory Reports 84
Our Strategy 28
Financial Statements 206
115
BOARD’S REPORT (CONTD.)
Whilst TSE seeks to increase its differentiated/premium business, which is less dependent on market price movements, it still retains focus in both the UK and IJmuiden on improving its operations, consistency, and taking measures to protect against unplanned interruptions and property damage.
Strip Products Mainland Europe – Liquid steel production at IJmuiden Steel Works, Netherlands during the Financial Year 2019-20 at 6.8 MnT was 0.3 MnT lower than that of previous year, reflecting the weaker market circumstances. Record annual output of 1.4 MnT was achieved at the Direct Sheet Plant. The impact of COVID-19 was still relatively limited in the Financial Year 2019-20. During the year under review, Strip Products Mainland Europe continued with the Transformation Programme which is targeting improvements to delivery and yield performance, commercial mix, and reducing operating costs and unplanned downtime. Further, progress was also achieved in its ‘Strategic Asset Roadmap’ (STAR) capital investment programme to support the strategic growth of differentiated, high value products in the automotive, lifting and excavating, and energy and power market sectors.
Implementation of the ‘Roadmap 2030’ continued, which contains a series of measures to eliminate the environmental impact (noise, dust, odour) of Strip Products Mainland Europe.
Strip Products UK – Liquid steel production at Port Talbot Steel Works, Wales during the Financial Year 2019-20 was at 3.5 MnT, 0.3 MnT higher than that of the previous year due to an outage to extend the life of Blast Furnace-5 taken in the previous year. During the Financial Year 2019-20, Strip Products UK extended the successful ‘Sustainable Operational Excellence’ programme across the hub with many areas entering the sustainable phase after achieving a significant impact on daily management activities in the first phase. Following the ‘Delivering Our Future’ improvement initiative, work began on folding the activities into the European Transformation programme. The Port Talbot Hot Strip Mill recorded its highest ever availability with inherent capability to exceed record production.
New Products TSE introduced 22 new products into the Group’s product portfolio. Major new products are:
• Valast range of abrasion resistant steel grades for the engineering sector;
• MagiZinc full finish for the automotive market;
• Chromium-6 free Trivalent Chromium Coating Technology (TCCT) as replacement for Electrolytic Chromium Coated (ECCS) and Chromium Free Passivation Alternative (CFPA) products for the packaging market.
Differentiated products accounted for 37% of TSE’s portfolio.
Strategic Activities During the year under review, the Company and thyssenkrupp AG decided not to pursue the proposed transaction to form a joint venture to combine their steel businesses in Europe. The decision was taken after careful evaluation of the viability of the proposal in light of the feedback received from the European Commission ('EC'). Thereafter, on June 11, 2019, EC formally announced its decision to prohibit the proposed joint venture.
On September 2, 2019, TSE announced that it had signed a definitive agreement with JFE Shoji Trade Corporation (JFE) for the sale of Cogent Power Inc (manufacturer of cores for electrical distribution transformers in Canada and a part of Cogent business unit). The sale of CPI to JFE completed on September 20, 2019. TSE also announced that despite exploring all options it was unable to find a viable option for Orb Electrical Steels and therefore decided to close the site. Orb Electrical Steels was a manufacturer of Grain Oriented Electrical Steel in Wales, UK and a part of Cogent business unit.
During the year under review, TSE commenced a company-wide Transformation programme to improve the performance of the business, helping it to become more sustainable and enabling investments necessary to secure its long-term future. Improvements in performance will come from productivity improvements, increased sales of higher-value steels, and employment cost savings. In the Financial Year 2019-20, the Transformation programme delivered over £200 million worth of sustainable benefits.
Awards and Accolades TSE won a Steelie Award for ‘Excellence in Life Cycle Assessment’ from the Word Steel Association. The award for developing a life cycle tool to assess the sustainability of new product recognises TSE’s leading contribution to sustainability in the steel industry.
iv. South East Asia Operations
On January 28, 2019, the Company through its subsidiary T S Global Holdings Pte. Ltd. (‘TSGH’), had entered into definitive agreements with HBIS Group Co. Ltd. (‘HBIS’) to divest its entire equity stake in NatSteel Holdings Pte. Ltd. (‘NSH’) and Tata Steel (Thailand) Public Company Ltd. (‘TSTH’).
Therefore, in accordance with Ind AS 105, “Non-current Assets Held for Sale and Discontinued Operations”, the assets and liabilities of businesses forming part of the disposal group were classified as held for sale as on March 31, 2019 and were presented separately in the Consolidated Balance Sheet as on March 31, 2019. In the results as on March 31, 2019, these companies had been disclosed within discontinued operations.
During the year under review, TSGH decided not to pursue the proposed transaction with HBIS, for want of regulatory approvals. While, the termination of definitive agreements with HBIS was
INTEGRATED REPORT & ANNUAL ACCOUNTS 2019-20 | 113TH YEAR116
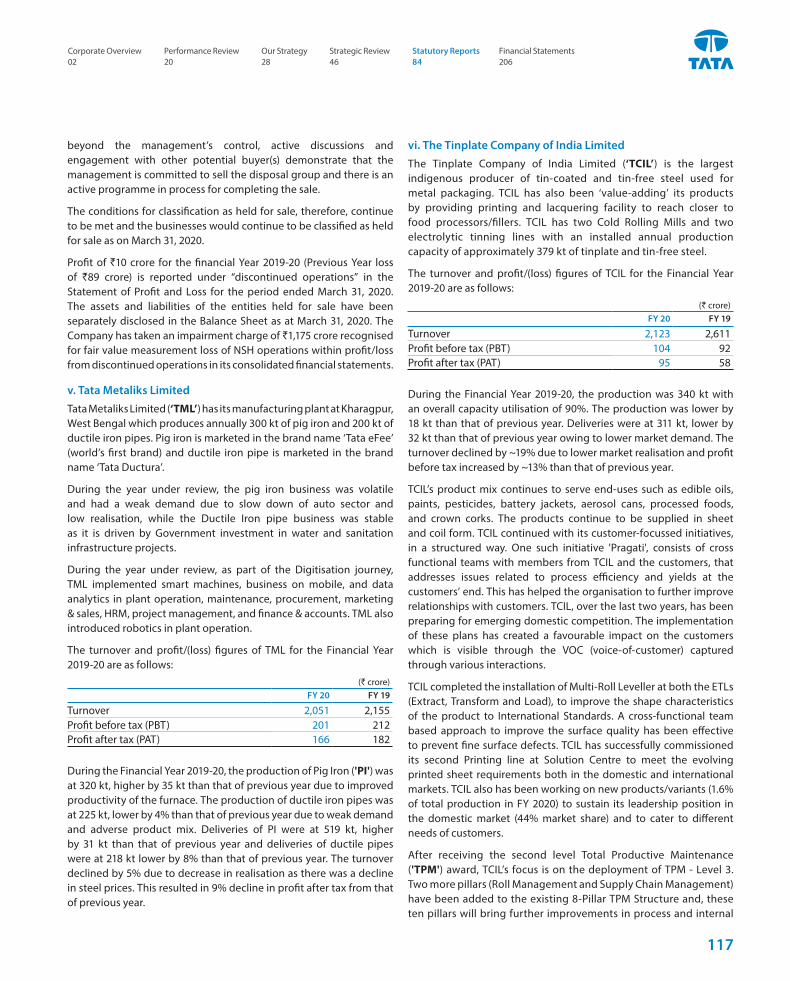
beyond the management’s control, active discussions and engagement with other potential buyer(s) demonstrate that the management is committed to sell the disposal group and there is an active programme in process for completing the sale.
The conditions for classification as held for sale, therefore, continue to be met and the businesses would continue to be classified as held for sale as on March 31, 2020.
Profit of `10 crore for the financial Year 2019-20 (Previous Year loss of `89 crore) is reported under “discontinued operations” in the Statement of Profit and Loss for the period ended March 31, 2020. The assets and liabilities of the entities held for sale have been separately disclosed in the Balance Sheet as at March 31, 2020. The Company has taken an impairment charge of `1,175 crore recognised for fair value measurement loss of NSH operations within profit/loss from discontinued operations in its consolidated financial statements.
v. Tata Metaliks Limited
Tata Metaliks Limited (‘TML’) has its manufacturing plant at Kharagpur, West Bengal which produces annually 300 kt of pig iron and 200 kt of ductile iron pipes. Pig iron is marketed in the brand name ‘Tata eFee’ (world’s first brand) and ductile iron pipe is marketed in the brand name ‘Tata Ductura’.
During the year under review, the pig iron business was volatile and had a weak demand due to slow down of auto sector and low realisation, while the Ductile Iron pipe business was stable as it is driven by Government investment in water and sanitation infrastructure projects.
During the year under review, as part of the Digitisation journey, TML implemented smart machines, business on mobile, and data analytics in plant operation, maintenance, procurement, marketing & sales, HRM, project management, and finance & accounts. TML also introduced robotics in plant operation.
The turnover and profit/(loss) figures of TML for the Financial Year 2019-20 are as follows:
(` crore)FY 20 FY 19
Turnover 2,051 2,155Profit before tax (PBT) 201 212Profit after tax (PAT) 166 182
During the Financial Year 2019-20, the production of Pig Iron ('PI') was at 320 kt, higher by 35 kt than that of previous year due to improved productivity of the furnace. The production of ductile iron pipes was at 225 kt, lower by 4% than that of previous year due to weak demand and adverse product mix. Deliveries of PI were at 519 kt, higher by 31 kt than that of previous year and deliveries of ductile pipes were at 218 kt lower by 8% than that of previous year. The turnover declined by 5% due to decrease in realisation as there was a decline in steel prices. This resulted in 9% decline in profit after tax from that of previous year.
vi. The Tinplate Company of India Limited
The Tinplate Company of India Limited (‘TCIL’) is the largest indigenous producer of tin-coated and tin-free steel used for metal packaging. TCIL has also been ‘value-adding’ its products by providing printing and lacquering facility to reach closer to food processors/fillers. TCIL has two Cold Rolling Mills and two electrolytic tinning lines with an installed annual production capacity of approximately 379 kt of tinplate and tin-free steel.
The turnover and profit/(loss) figures of TCIL for the Financial Year 2019-20 are as follows:
(` crore)FY 20 FY 19
Turnover 2,123 2,611Profit before tax (PBT) 104 92Profit after tax (PAT) 95 58
During the Financial Year 2019-20, the production was 340 kt with an overall capacity utilisation of 90%. The production was lower by 18 kt than that of previous year. Deliveries were at 311 kt, lower by 32 kt than that of previous year owing to lower market demand. The turnover declined by ~19% due to lower market realisation and profit before tax increased by ~13% than that of previous year.
TCIL’s product mix continues to serve end-uses such as edible oils, paints, pesticides, battery jackets, aerosol cans, processed foods, and crown corks. The products continue to be supplied in sheet and coil form. TCIL continued with its customer-focussed initiatives, in a structured way. One such initiative 'Pragati', consists of cross functional teams with members from TCIL and the customers, that addresses issues related to process efficiency and yields at the customers’ end. This has helped the organisation to further improve relationships with customers. TCIL, over the last two years, has been preparing for emerging domestic competition. The implementation of these plans has created a favourable impact on the customers which is visible through the VOC (voice-of-customer) captured through various interactions.
TCIL completed the installation of Multi-Roll Leveller at both the ETLs (Extract, Transform and Load), to improve the shape characteristics of the product to International Standards. A cross-functional team based approach to improve the surface quality has been effective to prevent fine surface defects. TCIL has successfully commissioned its second Printing line at Solution Centre to meet the evolving printed sheet requirements both in the domestic and international markets. TCIL also has been working on new products/variants (1.6% of total production in FY 2020) to sustain its leadership position in the domestic market (44% market share) and to cater to different needs of customers.
After receiving the second level Total Productive Maintenance ('TPM') award, TCIL’s focus is on the deployment of TPM - Level 3. Two more pillars (Roll Management and Supply Chain Management) have been added to the existing 8-Pillar TPM Structure and, these ten pillars will bring further improvements in process and internal
Corporate Overview 02
Strategic Review 46
Performance Review 20
Statutory Reports 84
Our Strategy 28
Financial Statements 206
117
BOARD’S REPORT (CONTD.)
efficiencies for sustained operations. TCIL has undertaken cost control measures such as efficient utilisation of raw materials, reduction in power consumption (Variable Frequency Drives for high power motors, LED lamps across Plant), reduction in fuel and water consumption, reduction in consumables, reduction in number of strip breakages at mills and improvement in throughput.
The focus on environment management was through on-line monitoring of effluent & stack data (being shared with Jharkhand State Pollution Control Board on-line), rain water harvesting recharging system constructed in Tinplate Hospital, General Office and in Works, Compost from Canteen food waste, Recovery of water from waste water of ETLs.
The operations of TCIL are certified to Integrated Management Systems.
vii. Tata Steel Downstream Products Limited
Tata Steel Downstream Products Limited (‘TSDPL’) (formerly Tata Steel Processing and Distribution Limited) is a leader in the organised Steel Service Centre business in India. TSDPL has a pan India presence with ten steel processing plants and thirteen distribution and sales locations. Value-added offerings of TSDPL include slitting, cut-to-length, blanking, corrugation, plate burning, fabrication, component manufacturing, and steel intensive products and applications. TSDPL’s products and services conform to world-class quality standards in meeting customers’ demand. Its entire operations including supply chain runs on a state-of-the-art ERP (Enterprise Resource Planning) system.
The key highlights on the performance during the Financial Year 2019-20 are as follows:
• TSDPL increased its processing capacity by commissioning a state of the art cut-to-length line to process high strength HR coil up to 12 mm at Kalinganagar and Pune
• Tada plant completed the expansion to handle higher volumes and more value-add services such as plate bending, blasting, and painting facility
• TSDPL Introduced several new products and service offerings which included extra high strength, scale brushed, edge trimmed, and stress relieved cut sheets and plates from Kalinganagar, processed electrical sheet and stamped components in Pantnagar region, floor and wall mounted IT racks and security safes
The turnover and profit/(loss) figures of TSDPL for the Financial Year 2019-20 are as follows:
(` crore)FY 20 FY 19
Turnover 3,108 4,281Profit before tax (PBT) 95 118Profit after tax (PAT) 61 76
During the year under review, the production from tolling business was at 1,836 kt, lower by ~12% than that of the previous year, due to lower businesses from Tata Steel and distribution business was at 627 kt, lower by ~23% than that of previous year due to lower demand in auto segment. The deliveries from tolling business was 1,799 kt which was in line with the previous year. The deliveries in distribution business was 609 kt, lower by ~24% than that of the previous year due to lower demand from auto segments. The turnover for the financial year declined by ~27% due to adverse market conditions, attributable to lower realisation and lower volumes from distribution business. The profit before tax declined by ~19%.
Awards and Accolades:National Safety Council of India awarded TSDPL’s Pune plant with a Bronze Trophy for the assessment period of CY 2016-18 and ‘Suraksha Puraskar’ and Jamshedpur plant “Prashansa Patra”.
viii. Bhubaneshwar Power Private Limited
The turnover and profit/(loss) figures of Bhubaneshwar Power Private Limited (‘BPPL’) for the Financial Year 2019-20 are as follows:
(` crore)FY 20 FY 19
Turnover 510 541Profit before tax (PBT) (9) 64Profit after tax (PAT) 25 60
Uninterrupted power supply and cost of power is a challenge for large power intensive process industries. Industries which produce 365 days per annum, continue to depend on thermal power plants for their base load requirements.
BPPL is in the business of generation of power. It owns 135 MW (2x67.5 MW) coal based power plant in Odisha. BPPL supplies 120.5 MW power to Tata Steel and Tata Steel Mining Limited (formerly T S Alloys Limited).
During the year under review, the plant operated at a load factor of 78.51%, and generated 931 million units of power, as against 924 million units in the previous year. The plant availability has come down from 94% to 87.47% attributable to operational disturbance due to cyclone FANI and adverse coal supplies.
During the Financial Year 2019-20, the turnover of BPPL was ~6% lower than that of previous year, due to lower cost of generation as the revenue model is cost plus contract. Profit before tax declined mainly as previous year included a one-time gain of ~`50 crore on fair valuation of loans. However, profit after tax increased due to an accounting credit on re-assessment of deferred tax assets and liabilities post adoption of lower tax rate which were announced during the year.
ix. Creative Port Development Private Limited
Creative Port Development Private Limited (‘CPDPL’) is in possession of a 54 years concession from the Government of Odisha
INTEGRATED REPORT & ANNUAL ACCOUNTS 2019-20 | 113TH YEAR118
for development of a Greenfield Seaport at Chaumukh Village, in Balasore District, Odisha on a “BOOST” basis (Build, Own, Operate, Share & Transfer). CPDPL is availing this concession through a Special Purpose company “Subarnarekha Port Private Limited” and is in possession of all the statutory approvals for the project. In Phase – 1, the port will have an initial capacity of 25 MnT per annum with a potential to expand to 150 MnT per annum. CPDPL is already in possession of the port land and is in the advanced stage of getting the required land for railway corridor and construction of access road.
VI. FINANCIAL PERFORMANCE1. Tata Steel Limited (Standalone)During the Financial Year 2019-20, the Company recorded a profit after tax of `6,744 crore (previous year: `10,533 crore). The decrease is primarily on account of decline in realisations, lower deliveries, lower finance income, higher finance cost, and higher exceptional charges as compared to that of the previous year. The basic and diluted earnings per share for the Financial year 2019-20 were at `57.11 per share (previous year: Basic: ̀ 90.41 per share, diluted: ̀ 90.40 per share).
The analysis of major items of the financial statements is given below:
a) Revenue from operations
(` crore)FY 20 FY 19 Change (%)
Sale of products 57,168 67,214 (15)Sale of power and water 1,648 1,709 (4)Other operating revenue 1,620 1,688 (4)Total revenue from operations 60,436 70,611 (14)
During the year under review, sale of products was lower as compared to that of the previous year, primarily due to lower realisations and decline in volumes. Ferro Alloys and Mineral Division (FAMD) registered lower revenue owing to lower sales of Ferro Chrome along with decline in prices due to depressed demand in the international markets. Wires and Tubes division registered lower revenue due to decrease in realisations and volumes.
b) Purchases of stock-in-trade
(` crore)FY 20 FY 19 Change (%)
Purchases of stock-in-trade 1,563 1,808 (14)
During the year under review, Purchases of stock-in-trade was lower as compared to that of the previous financial year due to lower purchases of wire rods, imported rebars, hot rolled coils, cold rolled coils, and slabs, owing to lower requirement.
c) Cost of materials consumed
(` crore)FY 20 FY 19 Change (%)
Cost of materials consumed 17,407 19,840 (12)
During the year under review, cost of materials consumed decreased primarily due to lower cost of imported coal, along with lower consumption of coal and purchased pellet. Moreover, cost of ferro alloys and other raw materials also declined.
d) Employee benefits expense(` crore)
FY 20 FY 19 Change (%)
Employee benefits expense 5,037 5,131 (2)
During the year under review, the employee benefits expense decreased primarily on account of reversal of excess provision post finalisation of wage agreements. The decrease was partly offset by increase due to change in the actuarial estimates owing to change in discounting rates along with normal salary revisions and its consequential impact on the retirement provisions.
e) Depreciation and amortisation expense(` crore)
FY 20 FY 19 Change (%)
Depreciation and amortisation expense 3,920 3,803 3
The increase in depreciation is due to higher charge on Right of Use assets post implementation of Ind AS 116.
f) Other expenses
(` crore)FY 20 FY 19 Change (%)
Other expenses 22,132 23,823 (7)
Other expenditure represents the following expenditure:(` crore)
FY 20 FY 19 Change (%)
Consumption of stores and spares 4,616 4,040 14Repairs to buildings 65 61 5Repairs to machinery 3,181 2,950 8Relining expenses 94 88 7Fuel oil consumed 198 211 (6)Purchase of power 2,906 2,823 3Conversion charges 2,795 2,722 3Freight and handling charges 4,047 4,320 (6)Rent 59 72 (19)Royalty 1,751 2,003 (13)Rates and taxes 832 1,201 (31)Insurance charges 147 133 11Commission, discounts and rebates 180 189 (4)Allowance for credit losses/provision for advances 2 1 50
Other expenses 2,929 3,809 (23)Less:-Expenditure (other than interest) transferred to capital & other accounts
(1,671) (800) 109
Total Other expenses 22,132 23,823 (7)
Corporate Overview 02
Strategic Review 46
Performance Review 20
Statutory Reports 84
Our Strategy 28
Financial Statements 206
119
BOARD’S REPORT (CONTD.)
Other expenses were lower as compared to those of the previous financial year primarily on account of lower freight and handling charges mainly due to favourable rates, decrease in royalty expense along with rates and taxes on reversal of excess provision, higher one time charges in previous year not present in current year, partly offset by, higher repairs to machinery mainly due to IT transformation initiatives. Consumption of stores and spares increased primarily due to charging of project expenses on account of Kalinganagar Phase-II, majorly eliminated through transfer to capital account.
g) Finance costs and net finance costs
(` crore)FY 20 FY 19 Change (%)
Finance costs 3,031 2,824 7Net Finance costs 2,861 600 377
During the year under review, finance costs increased mainly on account of issue of Non-Convertible Debentures along with higher interest cost on finance lease obligations primarily due to implementation of Ind AS 116.
Net finance charges were higher on account of lower interest income on inter-corporate deposits along with lower gain on sale of mutual funds.
h) Exceptional items
(` crore)FY 20 FY 19 Change (%)
Exceptional items (1,704) (114) N.A.
The details of exceptional items for the current year and previous year are as follows:
• Provision for Impairment of investments/doubtful advances amounting to `1,150 crore (previous year: `12 crore) relates to provision recognised for impairment of investments in subsidiaries and joint ventures, net of reversal of `1 crore on account of recovery of advances made to a joint venture.
• Provision for demands and claims amounting to `110 crore (previous year: `329 crore) relating to certain statutory demands and claims on environment and mining matters.
• Provision for demands and claims amounting to `86 crore (previous year: NIL) relating to SVLDRS Sabka Vishwas Legal Dispute Resolution Scheme.
• Provision for Employee Separation scheme (ESS) under Sunehere Bhavishya Ki Yojana (‘SBKY’) scheme amounting to `107 crore (previous year: `35 crore).
• Fair valuation loss on preference share investment held by the Company in some of its affiliates `250 crore (previous year: Nil)
• Profit on sale of non-current investments in TRL Krosaki Refractories Limited (an associate of the Company) Nil (previous year: `262 crore).
i) Property, plant and equipment (PPE) including intangibles and right of use assets
(` crore)FY 20 FY 19 Change (%)
Property, Plant and Equipment 66,392 70,417 (6)Capital work-in-progress 8,070 5,686 42Intangible assets 728 805 (10)Intangible assets under development 177 110 61
Right of use Assets 4,113 0 N.A.Total Property, plant and equipment(PPE) including intangibles & right of use assets
79,480 77,018 3
The movement in total PPE including intangible assets is higher primarily on account of increase in Right of Use Assets post implementation of Ind AS 116 along with increase in capital work-in-progress mainly at Kalinganagar Phase-II, partly offset by depreciation charge during the year.
j) Investments
(` crore)FY 20 FY 19 Change (%)
Investment in Subsidiary, JVs and Associates 26,578 4,438 499
Investments - Non-current 20,283 34,492 (41)Investments - Current 3,235 477 578Total Investments 50,096 39,407 27
The increase in investments was predominantly on account of higher investments in equity shares of subsidiaries mainly in T Steel Holdings Pte. Ltd. and in Tata Steel Long Products Limited (formerly Tata Sponge Iron Ltd.) along with increase in current investments in mutual funds. Decrease in other non-current investments is mainly in the preference shares of T Steel Holdings Pte. Ltd. on conversion to equity shares.
k) Inventories
(` crore)FY 20 FY 19 Change (%)
Finished and semi-finished goods including stock-in-trade 4,777 4,205 14
Work-in-progress 7 14 (52)Raw materials 3,586 4,496 (20)Stores and spares 2,347 2,540 (8)Total Inventories 10,717 11,255 (5)
INTEGRATED REPORT & ANNUAL ACCOUNTS 2019-20 | 113TH YEAR120
Raw material inventories decreased over that of previous year mainly due to decrease in coal inventory owing to lower rates and quantities. Inventory of stores and spares decreased mainly on account of planned reduction.
Finished and semi-finished inventory increased as compared to that of the previous year mainly due to increase in quantities, partly offset by lower rates.
l) Trade receivables
(` crore)FY 20 FY 19 Change (%)
Gross trade receivables 1,050 1,398 (25)Less: allowance for credit losses 33 35 (5)Net trade receivables 1,017 1,363 (25)
Decrease in trade receivables as compared to that of previous year is primarily due to lower month-end sales owing to nationwide lock down post outbreak of COVID-19.
m) Gross debt and Net debt
(` crore)FY 20 FY 19 Change (%)
Gross debt 41,423 29,701 39Less: Cash and Bank balances (incl. Non-current balances) 1,281 753 70
Less: Current investments 3,235 477 578Net Debt 36,907 28,471 30
Gross debt was higher due to drawal of short-term loans and other term loans, issue of non-convertible Debentures, drawal of External Commercial Borrowings (ECB) and increase in finance lease obligations post implementation of Ind AS 116, partly offset by scheduled repayments of non-convertible debentures and re-payments of ECB and term loans.
Net debt was higher as compared to that of the previous year. This is attributable to increase in Gross debt, partly offset by increase in current investments along with cash and bank balances.
n) Cash Flows
(` crore)FY 20 FY 19 Change (%)
Net Cash from/(used in)operating activities 13,454 15,193 (11)
Net Cash from/(used in) investing activities (17,635) (16,350) (8)
Net Cash from/(used in) financing activities 4,630 (2,887) 260
Net increase/(decrease) in cash and cash equivalents 449 (4,044) 111
Net cash flow from/(used in) operating activitiesDuring the year under review, the net cash generated from operating activities was `13,454 crore as compared to `15,193 crore during the previous year. The cash inflow from operating profit before working capital changes and direct taxes during the current year was `13,768 crore as compared to inflow of `19,949 crore during the previous year due to lower operating profits. Cash inflow from working capital changes in 2019-20 is mainly due to decrease in Non-current/Current financial and other assets by `1,442 crore and decrease in inventories by `533 crore, partly offset by decrease in Non-current/current financial and other liabilities/provisions by `471 crore. The income taxes paid during the current year was `1,819 crore as compared to `4,533 crore during previous financial year primarily due to change in corporate tax rates.
Net cash flow from/(used in) investing activitiesDuring the year under review, the net cash outflow from investing activities amounted to `17,635 crore as compared to `16,350 crore during the previous year. The outflow during the current year broadly represents, investments in subsidiaries ̀ 8,945 crore, capex of `4,749 crore, net purchase of current investments of `2,662 crore and inter-corporate deposits given of `1,527 crore.
Net cash flow from/(used in) financing activitiesDuring the year under review, the net cash inflow from financing activities was `4,630 crore as compared to an outflow of `2,887 crore during the previous year. The inflow during the current year broadly represents proceeds from borrowings (net of repayments) `9,772 crore, partly offset by payment of interest `3,084 crore, payment of dividend including taxes `1,787 crore.
o) Changes in Key Financial Ratios
The change in the key financial ratios as compared to previous year is stated below:
(` crore)FY 20 FY 19 Change (%)
Inventory Turnover (days) 70 60 16Debtors Turnover (days) 7 8 (14)Current Ratio (Times) 0.81 0.73 10Interest Coverage Ratio1 (Times) 4.37 9.57 (54)Debt Equity2 (Times) 0.55 0.44 27Net Debt Equity (Times) 0.49 0.42 18EBITDA Margin (%) 24.98 29.38 (15)Net Profit Margin (%)3 11.16 14.92 (25)Return on average Net worth3 (%) 9.02 15.43 (42)
1) Interest Coverage Ratio: Decreased primarily on account of lower operating profits.
2) Debt Equity Ratio: Increased primarily on account of increase in borrowings over the Financial Year 2018-19.
Corporate Overview 02
Strategic Review 46
Performance Review 20
Statutory Reports 84
Our Strategy 28
Financial Statements 206
121
BOARD’S REPORT (CONTD.)
3) Net Profit Margin and Return on average net worth: Decreased primarily on account of decrease in net profits primarily attributable to lower operating profits and higher exceptional charges during the Financial Year 2019-20.
2. Tata Steel Limited (Consolidated)The consolidated profit after tax (including discontinued operations) of the Company was `1,172 crore as against `9,098 crore in the previous year. The decrease was mainly due to lower operating profits due to falling steel prices during the year and higher exceptional charges, partly offset by lower tax expenses during the year primarily on account of re-measurement of deferred tax liabilities based on the new lower rate of Income tax prescribed under Section 115BAA of the Income Tax Act,1961 along with creation of deferred tax assets at some of the foreign entities.
The analysis of major items of the financial statements is given below.
(Note: The financials of Tata Steel Long Products Limited ('TSLP') for the Financial Year 2018-19 pertain only to the sponge business of TSLP, since the steel business of Usha Martin Limited ('UML') was acquired on April 9, 2019.)
a) Revenue from operations
(` crore)FY 20 FY 19 Change (%)
Tata Steel (Standalone) 60,436 70,611 (14)TSBSL 18,199 18,376 (1)TSE 55,939 64,777 (14)TSLP 3,490 992 252Others 41,786 45,885 (9)Eliminations & Adjustments (40,033) (42,972) 7Total revenue from operations 139,817 157,669 (11)
The consolidated revenue from operations was lower as compared to that of the previous year primarily due to decline in realisations across geographies along with lower deliveries.
Tata Steel Europe ('TSE') reported decrease mainly on account of decrease in average revenue per tonne, lower deliveries by 4% along with adverse forex impact on translation.
The revenue from Tata Steel BSL Limited ('TSBSL') marginally decreased mainly due to lower realisation, partly offset by higher volumes as the previous period was consolidated only from May 18, 2018.
Revenue from TSLP increased post of acquisition of steel business of UML reflect revenue from sponge and steel businesses.
b) Purchases of stock-in-trade
(` crore)FY 20 FY 19 Change (%)
Tata Steel (Standalone) 1,563 1,808 (14)TSBSL 3 7 (58)TSE 3,110 4,814 (35)TSLP 0 0 naOthers 4,199 6,110 (31)Eliminations & Adjustments (4,079) (6,171) 34Total purchases of stock-in-trade 4,796 6,568 (27)
Expense was lower mainly at TSE primarily on account of decrease in external steel purchases across a number of operating units, consistent with lower deliveries. At Tata Steel (Standalone), the expense was lower due to lower purchases of wire rods, imported rebars, hot rolled coils, cold rolled coils and slabs owing to lower requirement.
c) Cost of materials consumed
(` crore)FY 20 FY 19 Change (%)
Tata Steel (Standalone) 17,407 19,840 (12)TSBSL 10,816 9,840 10TSE 22,784 23,407 (3)TSLP 2,392 709 238Others 31,981 34,049 (6)Eliminations & Adjustments (32,136) (33,536) 4Total cost of materials consumed 53,244 54,309 (2)
Consumption was marginally lower mainly on account of decrease at Tata Steel (Standalone) due to lower cost of consumption of imported coal as well as other raw materials owing to decrease in prices. Tata Steel Europe reported marginal decrease in GBP terms along with favourable exchange impact on translation.
Cost at TSLP increased post acquisition of steel business of UML.
Others primarily reflects decline in transactions at T S Global Minerals Holdings Pte Ltd. due to sale of Black Ginger 461 Pty. Ltd. and lower activities at T S Global Procurement and Natsteel Asia which are majorly eliminated on consolidation.
INTEGRATED REPORT & ANNUAL ACCOUNTS 2019-20 | 113TH YEAR122
d) Employee benefits expense
(` crore)FY 20 FY 19 Change (%)
Tata Steel (Standalone) 5,037 5,131 (2)TSBSL 410 327 25TSE 11,961 12,444 (4)TSLP 192 45 328Others 934 812 15Total employee benefits expense 18,534 18,759 (1)
Decrease in expenses was mainly at TSE primarily at Strip Products Ijmuiden (driven by decrease of FTE– Full Time Equivalency) and at Cogent Power post disposal along with favourable exchange impact on translation.
Expense at Tata Steel (Standalone) decreased mainly on account of reversal of excess provisions post finalisation of wage agreements.
Expense at TSBSL reflects an increase mainly because the previous period was consolidated only from May 18, 2018. The increase is also attributable to change in the actuarial estimates owing to change in discounting rates.
Expense at TSLP increased post acquisition of steel business of UML.
e) Depreciation and amortisation expense
(` crore)FY 20 FY 19 Change (%)
Tata Steel (Standalone) 3,920 3,803 3TSBSL 1,452 1,228 18TSE 2,355 1,936 22TSLP 311 12 2,584Others 403 363 11Total depreciation and amortisation expense 8,441 7,342 15
This expense was higher than that of previous year mainly on account of higher depreciation on Right of Use assets post implementation of Ind AS 116.
The expense at TSLP increased post acquisition of steel business of UML
f) Other expenses
(` crore)FY 20 FY 19 Change (%)
Tata Steel (Standalone) 22,132 23,823 (7)TSBSL 4,875 4,661 5TSE 18,205 18,826 (3)TSLP 962 94 927Others 2,360 3,770 (37)Eliminations & Adjustments (2,189) (2,428) (10)Total other expenses 46,345 48,746 (5)
Other expenditure represents the following expenditure:(` crore)
FY 20 FY 19 Change (%)
Consumption of stores and spares 11,626 11,160 4Repairs to buildings 108 133 (19)Repairs to machinery 6,754 6,672 1Relining expenses 94 88 7Fuel oil consumed 599 451 33Purchase of power 4,720 4,865 (3)Conversion charges 2,652 2,681 (1)Freight and handling charges 8,929 8,389 6Rent 2,325 3,455 (33)Royalty 1,824 2,191 (17)Rates and taxes 1,174 1,485 (21)Insurance charges 352 272 29Commission, discounts and rebates
239 260 (8)
Allowance for credit losses/provision for advances
6 174 (97)
Other expenses 7,262 8,134 (11)Less: Expenditure (other than interest) transferred to capital & other accounts
(2,318) (1,664) 39
Total Other expenses 46,345 48,746 (5)
Expense was lower mainly at Tata Steel (Standalone) on account of decrease in freight and handling charges, decrease in royalty expense along with rates and taxes on reversal of excess provision, higher one-time charges in previous year not present in current year.
TSE reported decrease mainly on account of lower consumption of stores and spares, lower level of repairs and maintenance, power cost, lower rent due to impact of Ind AS 116, and lower other general expenses along with favourable exchange impact on translation. These decreases were partly offset by purchase of emission rights as against sale during the previous year.
Decrease in ‘Others’ was mainly at T S Global Holdings on account of favourable exchange rate movement.
Increase in other expenses at TSBSL is primarily because the previous period was consolidated only from May 18, 2018. The increase is also attributable to higher stores and spares consumption, higher repairs to machinery, offset by lower rental expenses.
Other expenses at TSLP increased post acquisition of steel business of UML.
g) Finance costs(` crore)
FY 20 FY 19 Change (%)
Tata Steel (Standalone) 3,031 2,824 7TSBSL 1,655 2,834 (42)TSE 3,249 4,631 (30)TSLP 293 3 9,591Others 4,609 7,270 (37)Eliminations & Adjustments (5,304) (9,902) (46)Finance costs 7,533 7,660 (2)
Corporate Overview 02
Strategic Review 46
Performance Review 20
Statutory Reports 84
Our Strategy 28
Financial Statements 206
123
BOARD’S REPORT (CONTD.)
h) Net Finance costs
(` crore)FY 20 FY 19 Change (%)
Tata Steel (Standalone) 2,861 600 377TSBSL 1,604 2,727 (41)TSE 2,024 4,592 (56)TSLP 242 (43) 663Others 1,069 281 280Eliminations & Adjustments (1,838) (1,531) 20Net Finance costs 5,962 6,626 (10)
Finance cost was lower mainly due to repayment of external borrowings taken by Bamnipal Steel Limited for the acquisition of TSBSL. Decrease at TSBSL mainly relates to repayment of funds provided by Bamnipal Steel Limited for the acquisition which was majorly eliminated on consolidation. Decrease at TSE was mainly due to decrease in borrowings post restructuring of debt in September 2019, majorly eliminated on consolidation.
Increase in finance cost at TSLP was post acquisition of steel business of UML.
Net finance charge was lower in line with decrease in finance cost. Expense was lower at TSE mainly due to higher finance income on refinancing of Senior Facilities Agreement (SFA). Expense was higher at Tata Steel (Standalone) mainly on account of interest income in previous year from inter-corporate deposits given to Bamnipal Steel Limited for acquisition of TSBSL, which was eliminated on consolidation.
i) Exceptional items
(` crore)FY 20 FY 19 Change (%)
Tata Steel (Standalone) (1,704) (114) N.A.TSBSL 69 41 N.A.TSE (2,221) (69) N.A.TSLP (161) 0 N.A.Others (659) 79 N.A.Eliminations & Adjustments 924 (58) N.A.Total exceptional items (3,752) (121) N.A.
Exceptional items during the Financial Year 2019-20, primarily represent:
• Provision for demands and claims amounting to `110 crore relating to certain statutory demands and claims on environment and mining matters at Tata Steel Limited (Standalone).
• Provision for demands and claims amounting to ̀ 86 crore relating to SVLDRS Sabka Vishwas Legal Dispute Resolution Scheme at Tata Steel Limited (Standalone).
• Provision for impairment of doubtful capital advances amounting to `42 crore at TSBSL.
• Impairment charges of `3,197 crore in respect of property, plant and equipment (including Capital Work-in-Progress, right of use assets, goodwill, capital advances and intangible asset) at Tata Steel Europe, Global mineral entities, Tata Steel Special Economic Zone, Tata Steel BSL Limited and Bhubaneshwar Power Private Limited.
• Restructuring provisions amounting to `161 crore at TSE.
• Provision for Employee Separation Scheme (‘ESS’) under Sunehere Bhavishya Ki Yojana (‘SBKY’) scheme amounting to `107 crore at Tata Steel Limited (Standalone).
• Expenses incurred on stamp duty and registration fees for a portion of land parcels and mines acquired as part of business combination `27 crore and provision for coal block performance guarantee `134 crore at TSLP.
• Notional fair valuation loss on preference share investment held by the Company in one of its affiliates `250 crore at Tata Steel Limited (Standalone).
Partly offset by,
• Gain on recovery of advances earlier provided for, amounting to `1 crore at Tata Steel Limited (Standalone).
• Write back of provisions amounting to `154 crore which primarily includes write-back of liabilities no longer required at TSBSL and settlement credit received at The Indian Steel & Wire Products Ltd. `18 crore.
• Profit on sale of subsidiaries `149 crore, profit on liquidation of group companies `41 crore at TSE.
The exceptional items in financial Year 2018-19 primarily include:
• Provision for demands and claims amounting to `329 crore relating to certain statutory demands and claims on environment and mining matters at Tata Steel Limited (Standalone).
• Provision of `172 crore in respect of advances with public bodies paid under protest by TSBSL.
• Provision for Employee Separation Scheme (‘ESS’) under Sunehere Bhavishya Ki Yojana (‘SBKY’) scheme amounting to `35 Crore at Tata Steel Limited (Standalone).
• Impairment charges of ̀ 10 Crore in respect of property, plant and equipment (including Capital Work-in-Progress and capital asset) and intangible asset at TSBSL.
Partly offset by,
• Profit on sale of non-current investments amounting to `180 crore, primarily in TRL Krosaki Refractories Limited (an associate of the Company).
• Restructuring and write back of provisions amounting to `245 crore which primarily includes write-back of liabilities no longer required at TSBSL and arbitration settlement at Tata Steel Utilities
INTEGRATED REPORT & ANNUAL ACCOUNTS 2019-20 | 113TH YEAR124
and Infrastructure Limited (formerly Jamshedpur Utilities & Services Company Limited), partly offset by charge at TSE.
j) Property, plant and equipment (PPE) including intangibles and right of use assets
(` crore)FY 20 FY 19 Change (%)
Tata Steel (Standalone) 79,480 77,018 3TSBSL 30,491 29,673 3TSE 24,158 21,880 10TSLP 4,646 228 1,940Others 11,488 10,441 10Eliminations & Adjustments (270) (154) (75)
Total property, plant and equipment (PPE) including intangibles & right of use assets
149,993 139,086 8
Increase in PPE and intangibles was mainly due to increase in Right of Use Assets post implementation of Ind AS 116 along with acquisition of steel business of UML. Increase at TSE was mainly on account of additions and increase in capital work in progress along with increase on account of exchange impact on translation.
k) Inventories
(` crore)FY 20 FY 19 Change (%)
Finished and semi-finished goods including stock in Trade 12,520 11,152 12
Work-in-progress 4,273 4,592 (7)Raw materials 9,513 11,425 (17)Stores and spares 4,763 4,487 6Total Inventories 31,069 31,656 (2)
(` crore)FY 20 FY 19 Change (%)
Tata Steel (Standalone) 10,717 11,255 (5)TSBSL 4,839 4,582 6TSE 12,859 13,714 (6)TSLP 797 115 591Others 1,990 2,141 (7)Eliminations & Adjustments (133) (151) 13Inventories 31,069 31,656 (2)
Decrease was primarily at Tata Steel (Standalone), mainly in raw materials and stores and spares, offset by increase in finished and semi-finished goods. Tata Steel Europe reported decrease on account of lower raw material and WIP inventory. These decreases were partly offset by acquisition of steel business of UML by TSLP. Increase at TSBSL was mainly due to higher stock of finished goods along with higher stores and spares, partly offset by decrease in raw material inventory.
l) Trade receivables(` crore)
FY 20 FY 19 Change (%)
Tata Steel (Standalone) 1,017 1,363 (25)TSBSL 702 697 1TSE 5,645 5,607 1TSLP 156 78 99Others 10,690 15,453 (31)Eliminations & Adjustments (10,325) (11,387) 9Net trade receivables 7,885 11,811 (33)
Decrease in ‘Others’ was primarily at T S Global Procurement mainly due to decline in securitisation transactions. Decrease at Tata Steel Limited (Standalone) was primarily due to lower deliveries during the month of March 2020 along with lower prices. These decreases were partly offset by acquisition of steel business of UML by TSLP.
m) Gross debt and Net debt(` crore)
FY 20 FY 19 Change (%)
Gross debt 116,328 100,816 15Less: Cash and Bankbalances (incl. Non-current balances
8,117 3,412 138
Less: Current investments 3,432 2,525 36Net debt 104,779 94,879 10
Net debt was higher by `9,900 crore over that of previous year.
Gross Debt at `1,16,328 crore was higher by `15,512 crore as compared to that of previous year. Increase in Gross Debt was mainly on account of recognition of lease obligations post transition to Ind AS 116 along with higher borrowings at TSLP due to acquisition of steel business of UML, higher proceeds from borrowings (net of repayment) mainly at Tata Steel (Standalone) along with adverse exchange impact on translation being `4,095 crore. These increases were partly offset by marginal decrease at Tata Steel Europe.
The increase in Net Debt was in line with increase in gross debt partly offset by increase in cash and bank balances mainly at T S Global Holdings (‘TSGH’) and Tata Steel (Standalone). Moreover, there was increase in current investments mainly at Tata Steel (Standalone), partly offset by decline at TSBSL.
n) Cash Flows(` crore)
FY 20 FY 19 Change (%)
Net Cash from/(used in)operating activities 20,169 25,336 (20)
Net Cash from/(used in) investing activities (14,530) (29,211) 50
Net Cash from/(used in) financing activities (1,695) (673) (152)
Net increase/(decrease) in cash and cash equivalents 3,944 (4,548) 187
Corporate Overview 02
Strategic Review 46
Performance Review 20
Statutory Reports 84
Our Strategy 28
Financial Statements 206
125
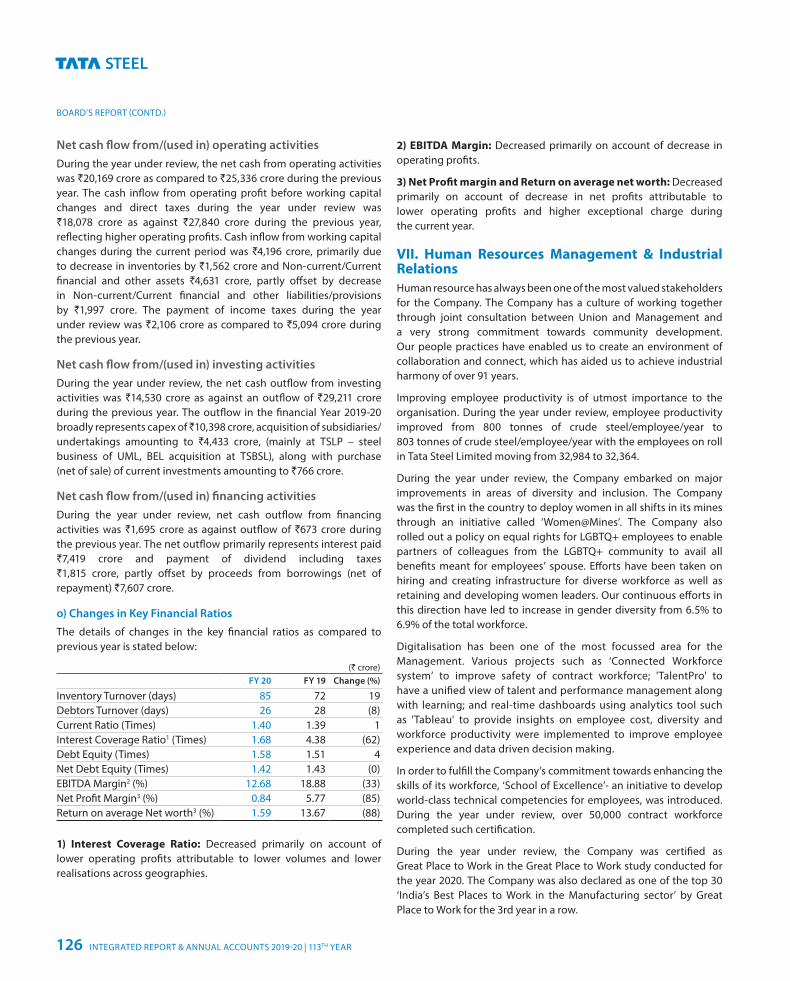
BOARD’S REPORT (CONTD.)
Net cash flow from/(used in) operating activitiesDuring the year under review, the net cash from operating activities was `20,169 crore as compared to `25,336 crore during the previous year. The cash inflow from operating profit before working capital changes and direct taxes during the year under review was `18,078 crore as against `27,840 crore during the previous year, reflecting higher operating profits. Cash inflow from working capital changes during the current period was `4,196 crore, primarily due to decrease in inventories by `1,562 crore and Non-current/Current financial and other assets `4,631 crore, partly offset by decrease in Non-current/Current financial and other liabilities/provisions by `1,997 crore. The payment of income taxes during the year under review was `2,106 crore as compared to `5,094 crore during the previous year.
Net cash flow from/(used in) investing activitiesDuring the year under review, the net cash outflow from investing activities was `14,530 crore as against an outflow of `29,211 crore during the previous year. The outflow in the financial Year 2019-20 broadly represents capex of ̀ 10,398 crore, acquisition of subsidiaries/undertakings amounting to `4,433 crore, (mainly at TSLP – steel business of UML, BEL acquisition at TSBSL), along with purchase (net of sale) of current investments amounting to `766 crore.
Net cash flow from/(used in) financing activitiesDuring the year under review, net cash outflow from financing activities was `1,695 crore as against outflow of `673 crore during the previous year. The net outflow primarily represents interest paid `7,419 crore and payment of dividend including taxes `1,815 crore, partly offset by proceeds from borrowings (net of repayment) `7,607 crore.
o) Changes in Key Financial Ratios
The details of changes in the key financial ratios as compared to previous year is stated below:
(` crore)FY 20 FY 19 Change (%)
Inventory Turnover (days) 85 72 19Debtors Turnover (days) 26 28 (8)Current Ratio (Times) 1.40 1.39 1Interest Coverage Ratio1 (Times) 1.68 4.38 (62)Debt Equity (Times) 1.58 1.51 4Net Debt Equity (Times) 1.42 1.43 (0)EBITDA Margin2 (%) 12.68 18.88 (33)Net Profit Margin3 (%) 0.84 5.77 (85)Return on average Net worth3 (%) 1.59 13.67 (88)
1) Interest Coverage Ratio: Decreased primarily on account of lower operating profits attributable to lower volumes and lower realisations across geographies.
2) EBITDA Margin: Decreased primarily on account of decrease in operating profits.
3) Net Profit margin and Return on average net worth: Decreased primarily on account of decrease in net profits attributable to lower operating profits and higher exceptional charge during the current year.
VII. Human Resources Management & Industrial Relations Human resource has always been one of the most valued stakeholders for the Company. The Company has a culture of working together through joint consultation between Union and Management and a very strong commitment towards community development. Our people practices have enabled us to create an environment of collaboration and connect, which has aided us to achieve industrial harmony of over 91 years.
Improving employee productivity is of utmost importance to the organisation. During the year under review, employee productivity improved from 800 tonnes of crude steel/employee/year to 803 tonnes of crude steel/employee/year with the employees on roll in Tata Steel Limited moving from 32,984 to 32,364.
During the year under review, the Company embarked on major improvements in areas of diversity and inclusion. The Company was the first in the country to deploy women in all shifts in its mines through an initiative called ‘Women@Mines’. The Company also rolled out a policy on equal rights for LGBTQ+ employees to enable partners of colleagues from the LGBTQ+ community to avail all benefits meant for employees’ spouse. Efforts have been taken on hiring and creating infrastructure for diverse workforce as well as retaining and developing women leaders. Our continuous efforts in this direction have led to increase in gender diversity from 6.5% to 6.9% of the total workforce.
Digitalisation has been one of the most focussed area for the Management. Various projects such as ‘Connected Workforce system’ to improve safety of contract workforce; 'TalentPro' to have a unified view of talent and performance management along with learning; and real-time dashboards using analytics tool such as 'Tableau' to provide insights on employee cost, diversity and workforce productivity were implemented to improve employee experience and data driven decision making.
In order to fulfill the Company’s commitment towards enhancing the skills of its workforce, ‘School of Excellence’- an initiative to develop world-class technical competencies for employees, was introduced. During the year under review, over 50,000 contract workforce completed such certification.
During the year under review, the Company was certified as Great Place to Work in the Great Place to Work study conducted for the year 2020. The Company was also declared as one of the top 30 ‘India’s Best Places to Work in the Manufacturing sector’ by Great Place to Work for the 3rd year in a row.
INTEGRATED REPORT & ANNUAL ACCOUNTS 2019-20 | 113TH YEAR126
In Europe, the Company is committed to provide an environment that recognises and values the differences in employee backgrounds and skills. The aim is to provide equal opportunity for all employees regardless of gender, sexual orientation, part-time or fixed term status, parental responsibilities, marital status, race, disability, colour, national or ethnic, and to maximise the benefits available from a diverse workforce.
In Europe, the Company strives to ensure that well-developed policies and procedures are in place for consulting and negotiating with trade unions, the European works council and employee representatives, so that views of employees can be considered in making decisions that are likely to affect their interests. UK Steel Enterprise Limited, a subsidiary of Tata Steel Europe, helps the economic regeneration of communities affected by changes in the UK steel industry and it has rolled out support measures to businesses across all steel sectors in the UK to help create new job opportunities for steel communities.
VIII. Digital TransformationThe Company is on a multi-year digital enabled Business Transformation journey intending to be the leader in Digital Steel making by 2025 through adoption of Digital Technologies. In the process, the Company intends to improve EBITDA, enhance digital maturity, and improve work practices to be more intelligent, insightful, and agile as an organisation.
Cloud, Data, and Artificial Intelligence (AI) are the key drivers of this transformation. The substantial investments made in Network, Cloud, and Cyber-security over the last couple of years has laid a strong foundation for a rapid and sustainable business transformation. The Company has developed a Maintenance Technology Roadmap (‘MTR’) to improve the sensor density on mission critical equipment to enable Predictive Maintenance. As a first step, an Asset Monitoring & Diagnostic Centre (‘AMDC’) has been set up for remote condition monitoring of such critical equipment. All these initiatives have accelerated data generation to ~20TB/month with data volumes growing 2.5x year-on-year. Leveraging the data, 100+ data analytics models have been deployed across processes to drive insights-based decision making.
Since the early stages of our transformation journey, the Company has acknowledged that Data Analytics and AI will have numerous applications in steel manufacturing. AI will allow the Company to be more cognitive of its internal processes, the externalities, and stakeholder expectations. A business first approach to AI helps drive this agenda through identifying user stories that drive clear tangible business benefits. The Company uses data analytics to arrive at optimum Coke, Pellet, and Sinter quality to improve the yield and throughput of the Blast Furnaces. Through Advanced Analytics the Company modelled the iron making process inside a Blast Furnace which reduces coke consumption and further yield improvement. Advanced Analytics models are guiding our operators on the optimum casting speed in the Continuous Casting process to arrive at the target properties at the lowest cost and time. Operations
Research based models are driving logistics cost optimisation and yield and throughput improvement through efficient production planning. All such initiatives are governed and monitored in order to gain cost improvements. The Company broadly classifies the Analytics solutions into three stages: 1) Smart Assistance, 2) Intelligence Augmentation, and 3) Zero Human intervention. The Company started off the journey by driving Advanced Analytics, which is the precursor to AI adoption.
As a result of early adoption and perseverance, Tata Steel Ijmuiden, Netherland (in 2018) and Tata Steel Kalinganagar, India (in 2019) have been recognised as Industry 4.0 Lighthouses by World Economic Forum.
The Company targets to be a Zero Harm organisation and ensure safety and security for our employees and assets. We have built a Connected Workforce solution that gives us end-to-end visibility of the work patterns of the contract workforce across the plants. It helps us pre-empt unsafe incidents while improving the workforce productivity through analytics. We are using Video Analytics to detect the right usage of Personal Protective Equipment on the shop-floor, to monitor traffic inside the plant premises to improve road safety.
The pioneering e-commerce initiatives such as Aashiyana (for the Individual House Builders), DigECA (for the Micro, Medium and Small Enterprises), and COMPASS (for our large industrial accounts) are well poised to be the main stay of how business will be conducted going forward – with minimal in-person interactions. Key to all such initiatives are the Company’s Channel Partners and the Sampoorna digital platform is enabling efficient distribution and enhancing customer experience through better collaboration along the distribution network. In the previous year, the Company piloted a solution that used satellite image and socio-economic data analytics for demand estimation of some of the product segments with success. This solution will prove essential in the era of social distancing where the Company can remotely identify demand hotspots and direct sales efforts towards it.
The prevalent level of sensorisation, automation, and camera density combined with data analytics allowed the Company’s managers to manage operations remotely with a skeletal workforce during the National Lockdowns. Together, these technologies form the foundation to enable truly Integrated & Remote Operations and Smart Asset Maintenance from Mines to Mills. Sensorisation, via MTR programme, and AMDC have enabled “Remote Read & Diagnose” capabilities with focus on enabling “Remote Write” capabilities going forward.
The Company is looking at Integrated Supply Chain Planning & Logistics combined with Integrated Margin Monitor as themes & tools to drive end-to-end cost optimisation. The procurement processes are being platformatised through introduction of digital catalogue-based buying, commodity price prediction aided buying, analytics powered negotiation tools and end-to-end contract lifecycle management. A Virtual Command Centre ('VCC') is envisaged to
Corporate Overview 02
Strategic Review 46
Performance Review 20
Statutory Reports 84
Our Strategy 28
Financial Statements 206
127
BOARD’S REPORT (CONTD.)
enable centralised and decentralised interventions seamlessly. This will eliminate the need for any Physical Command Centres, which are resource intensive in building and maintaining. A VCC would ideally be a device agnostic app with defined access and control as per roles, responsibilities, profiles, and decision journeys, orchestrated via AI.
IX. IMPACT OF COVID-19 PANDEMIC ON THE COMPANY The COVID-19 pandemic has posed unprecedented disruptions in business operations of companies all over the globe. At Tata Steel, the first and foremost priority is the health and safety of the employees and the communities in which the Company operates. The Company has been operating its facilities in accordance with the advisories issued from time to time, by the Central, State and local Governments, including the prescribed hygiene and safety standards and social distancing norms.
a) Impact on the operations In view of the nationwide lockdown imposed to combat the COVID-19 pandemic and the slowdown in economic activity, there has been a significant reduction in demand in key steel consuming segments such as automotive, infrastructure, construction, real estate, capital goods, consumer durables amongst others. The steel consuming industries have reduced production amidst weakening economic activities, shortage of manpower, working capital constraints, and logistical issues, thereby impacting steel demand adversely.
Being part of the essential services and process industries where the continuous operations of the facilities is important, the Company's steel and mining operations were exempt from lockdown measures, subject to certain guidelines. The Company's mining operations continued to operate normally. However, the Company operated its facilities at Jamshedpur and Kalinganagar at reduce production levels on account of lack of demand from customers. Production at downstream facilities was temporarily suspended. Operations at Strategic Business Units such as Bearings, Tubes, and Wires were also halted. Supply chain activities were affected and all despatches were stopped.
At locations where operations were continuing, the Company adopted safety & hygiene standards at shop floor and offices and implemented social distancing norms, work from home, workforce deployment plan, and staggered shift timing for safety of the employees. The Company has also put in place digital interventions to ensure smooth functioning of essential services.
With the phased removal of the lockdown restrictions in India, the Company’s upstream steel making operations have been ramped up and are currently operating at about 80% utilisation levels. The downstream units have reopened and are steadily ramping up.
In Europe, shutdown measures implemented by national governments starting from March 2020 significantly impacted
manufacturing activity and steel-using industrial sectors. The Company maintained its operations while following national government advice to protect employees, contract workers, and the communities in which it operates. The Company is managing production levels at European mills to match the lower demand levels in Europe. The Company continues to operate at about 70% utilisation level. All four blast furnaces across the two steelmaking hubs – in IJmuiden, the Netherlands, and Port Talbot, Wales are being operated at reduced levels. Liquid steel production is also aligned to lower demand levels. The Company has taken necessary steps to ensure health and safety of its workforce without affecting its business continuity plans.
b) Impact on the profitability, cash flow, liquidity and financialsThe impact on the operations of the Company on account of the COVID-19 pandemic, led to decline in steel deliveries which resulted in decline in earnings and increase in inventories. Post relaxation of the lockdown, the plant production is gradually ramping up and the inventory is being liquidated based on market demand and off-take. The Company’s digital initiatives have enabled compliance of the internal financial controls and reporting of the Company. The Company has been fulfilling its legal obligations as required for execution of the existing contracts/agreements.
The Company continues to have a strong liquidity position. In response to the COVID-19, the Company is focussed on conserving cash and liquidity and is reducing the cost base to align with the operating and market situation with strong focus on working capital management. The Company has raised funds since April 2020 through issue of Non-Convertible Debentures and Commercial Papers.
The Company has always strived to have a balanced maturity profile and a judicious mix of funding instruments which help in minimising costs while providing flexibility in managing cashflows. Taking its cashflows and liquidity position into account, the Company is in a position to service its debt and other financing arrangements. The Company has chosen not to avail the moratorium offered by RBI on interest and principal payments, demonstrating its ability to service its debt obligations.
In Europe too, cost reduction is a key focus. The Company has implemented various measures across the European operations including, aligning production to demand levels, maximising flexible working practices, liaising with governments across different territories to seek further support, and reducing all non-essential spend. The measures are expected to help the Company to minimise costs and preserve cash. The Company’s European operations have no debt repayments under its main financing facility until 2025 and therefore the focus is on conserving cash through cost reduction measures.
INTEGRATED REPORT & ANNUAL ACCOUNTS 2019-20 | 113TH YEAR128
c) Outlook of steel marketThe nationwide lockdown in India resulted in complete halt of activity across steel consuming sectors, both construction and manufacturing. While gradual resumption of business activities coupled with stimulus measures announced by government are expected to help revive the business activity, steel demand recovery is likely to be slower due to the unavailability of labour and weaker consumption growth. During H1 FY2021, most of the construction demand is expected to be driven by government infrastructure projects and rural construction. However, deferment of purchases of automotive and consumer durables coupled with weaker private investments and fragile exports is likely to keep steel consumption and consequently steel manufacturing at lower levels.
In Europe, the COVID-19 pandemic has led to a downgrading of Europe’s economic outlook and steel consumption forecasts. The situation has led to a reduction in industrial activity across Europe. While national lockdowns are now being eased in some countries, the automotive, engineering and construction sectors are showing slow signs of recovery. As a result, steel manufacturing is expected to be low in line with lesser demand. However, demand for packaging and plating steels used in food products and batteries continues to be strong through the pandemic and the outlook remains strong.
d) Corporate Social Responsibility – helping the community in the wake of COVID-19 pandemicApart from ensuring smooth operations at its facilities, the Company has also undertaken various initiatives to help combat the COVID-19 situation. Tata Steel Medical Services has established 1,200 beds and more than 100 dedicated critical care beds in Jharkhand and Odisha, to cater to those affected with COVID-19. The testing laboratory established at Jamshedpur was amongst the first to be established outside the government sector and two more laboratories are in the process of being established in Odisha. Tata Steel Medical Services has also contributed to extensive screening and testing in these regions.
The Company through Tata Steel Foundation (TSF) and with the help of district administrations has reached out to citizens in the communities where the Company operates i.e. Jharkhand and Odisha. The Company has taken steps to provide food, sustainable livelihood to the communities and migrant labourers of the region, and ration and safety support to the vulnerable communities. The Company has also augmented the medical facilities at the designated hospitals for medical treatment.
X. RISKS AND OPPORTUNITIESThe Company operates in an increasingly complex, volatile and uncertain business environment with stringent regulatory and environmental requirements. The Company aspires to create long-term value for its stakeholders by embedding risk intelligence and building resilience within the organisation.
In this journey towards risk intelligence, a robust risk governance is developed across the organisation and is driven by the Board of Directors through the Risk Management Committee (‘RMC’) of the Board. The Company has also set up a management committee called the Group Risk Review Committee (‘GRRC’) which is responsible for the implementation of ERM process across the Company.
The Company has implemented an Enterprise Risk Management (‘ERM’) framework to provide a holistic view of aggregated risk exposures as well as to facilitate more informed decision-making. The ERM framework includes identification of risks and risk owners for regular tracking, mitigation, and reporting of risks to help the Company meet its business objectives. The Company through the ERM framework has identified key risks under various categories such as financial risks, macroeconomic and market risks, operational risks, safety risks, commodity risks, supply chain risks, information security risks, regulatory risks, climate change risks, and community risks. The Company has also mapped the severity of these risks and the likely impact on the Company and has developed mitigation strategies to eliminate or minimise the impact of the risks.
The COVID-19 outbreak is an unprecedented event and has certainly posed challenges for the Company. The risk intelligent culture embedded across the Company has helped in developing and adopting a multi-pronged strategy to effectively respond to the evolving pandemic situation. Operations were aligned with the prevailing market conditions by reducing upstream operations while curtailing downstream operations. Cross functional teams worked to manage supply chain and logistics issues within the constraints imposed by the lockdown to ensure that plant could operate as planned. The Company also focussed on cash and liquidity management to face any future disruption in business conditions.
Alongside identification of risks, the Company has a continuous process of monitoring and leveraging opportunities presented by the external and internal environment. Despite the immediate challenges posed by the COVID-19 pandemic, the Company will continue to leverage opportunities provided by the near-term and long-term macro and business environment. The Company has identified various opportunities for growth and improvement and has developed strategies to leverage these opportunities. These opportunities include identifying potential for organic and inorganic growth, foraying into new lines of business to cater to evolving needs of customers as well as to make the business more sustainable, developing business models to address issues on climate change, and embarking on the path of digital transformation to be a technology leader in the industry and to gain a competitive advantage over other players.
A detailed overview on the risk landscape and mitigation strategies as well as the strategies for capitalising on opportunities in business is provided in the “Risk and Opportunities” Section forming part of the Integrated Report.
Corporate Overview 02
Strategic Review 46
Performance Review 20
Statutory Reports 84
Our Strategy 28
Financial Statements 206
129
BOARD’S REPORT (CONTD.)
XI. INTERNAL CONTROL SYSTEMS AND INTERNAL AUDIT The Company has an Internal Financial Controls (‘IFC’) framework, commensurate with the size, scale, and complexity of the Company’s operations. The framework has been designed to provide reasonable assurance with respect to recording and providing reliable financial and operational information, complying with applicable laws, safeguarding assets from unauthorised use, executing transactions with proper authorisation, and ensuring compliance with corporate policies.
The Board of Directors and the Audit Committee are responsible for ensuring that these controls are adequate and operating effectively. The Financial Statements are prepared on the basis of the Significant Accounting Policies that are carefully selected by the Management. These policies are supported by the Corporate Accounting and Systems that apply to the entity to implement the tenets of Corporate Governance and the Significant Accounting Policies uniformly across the Company. The Company has laid down Standard Operating Procedures and policies to guide the operations of the business. Business heads are responsible to ensure compliance with the policies and procedures laid down by the Management. Robust and continuous internal monitoring mechanisms ensure timely identification of risks and issues. The Company has deployed SAP Governance, Risk and Compliance (GRC) to test the effectiveness of the internal controls. The controls have been documented and embedded in the business processes.
The controls, based on the prevailing business conditions and processes have been tested during the year and no reportable material weakness in the design or effectiveness was observed. The framework on Internal Financial Controls Over Financial Reporting has been reviewed by the internal and external auditors. The Company uses various IT platforms to keep the IFC framework robust and our Information Management Policy governs these IT platforms. The systems, standard operating procedures, and controls
are implemented by the executive leadership team and are reviewed by the internal audit team whose findings and recommendations are placed before the Audit Committee.
The scope and authority of the Internal Audit function is defined in the Internal Audit Charter. To maintain its objectivity and independence, the Internal Audit function reports to the Chairman of the Audit Committee. The Internal Audit team develops an annual audit plan based on the risk profile of the business activities. The Internal Audit plan is approved by the Audit Committee, which also reviews compliance to the plan. The Internal Audit team monitors and evaluates the efficacy and adequacy of internal control systems in the Company, its compliance with operating systems, accounting procedures, and policies at all locations of the Company and its subsidiaries. Based on the report of internal audit function, process owners undertake corrective action(s) in their respective area(s) and thereby strengthen the controls.
Significant audit observations and corrective action(s) thereon are presented to the Audit Committee. The Audit Committee at its meetings reviews the reports submitted by the Internal Auditor. Also, the Audit Committee at frequent intervals has independent sessions with the statutory auditor and the Management to discuss the adequacy and effectiveness of internal financial controls.
XII. STATUTORY COMPLIANCE The Company has in place adequate systems and processes to ensure that it is in compliance with all applicable laws. The Company Secretary & Chief Legal Officer (Corporate & Compliance) is responsible for implementing the systems and processes for monitoring compliance with the applicable laws and for ensuring that the systems and processes are operating effectively. The Chief Executive Officer and Managing Director, places before the Board, at each meeting, a certificate of compliance with the applicable laws. The Company Secretary & Chief Legal Officer (Corporate & Compliance) also confirms compliance with Company law, SEBI Regulations and other corporate laws applicable to the Company.
INTEGRATED REPORT & ANNUAL ACCOUNTS 2019-20 | 113TH YEAR130
ANNEXURE 3Annual Report on Corporate Social Responsibility Activities
[Pursuant to Section 135 of the Companies Act, 2013 and the Companies (Corporate Social Responsibility Policy) Rules, 2014]
I. Overview of the Corporate Social Responsibility (‘CSR’) Policy
Our CSR initiatives are guided by our CSR Policy (‘Policy’) adopted by the Board of Directors on September 17, 2014. The Policy is available on the Company’s website at https://www.tatasteel.com/corporate/our-organisation/policies/Our CSR activities focus on initiatives in the themes of education, health, water, livelihood, rural and urban infrastructure and are in alignment with key focus areas of the Tata Group. We also undertake community-centric interventions in the areas of sports, disaster relief, environment, and ethnicity.
II. Composition of CSR and Sustainability Committee of the Board
At the helm of our CSR governance structure is the Corporate Social Responsibility and Sustainability Committee of the Board that comprises Mr. Deepak Kapoor (Chairperson), Mr. O. P. Bhatt, Mr. T. V. Narendran, and Mr. Koushik Chatterjee. During the year under review the Committee met three times.
III. CSR Advisory Council We have a CSR Advisory Council comprising eminent
personalities from academia and the development sector. The members of the Advisory Council provide macro policy-level inputs to the apex CSR and Sustainability Committee and guide the Company’s approach towards CSR.
IV. CSR Delivery Arms In terms of the Companies Act, 2013, ('Act') companies are
allowed to carry out their CSR activities through companies incorporated under Section 8 of the Act as well as through registered trusts and/or societies. We carry out our community centric interventions through a number of CSR delivery arms including the following:
Tata Steel Foundation (‘TSF’), a Section 8 Company incorporated under the Act. The main objective of the formation of TSF is to consolidate, strengthen, and broaden the CSR programme deployment as well as create a distinct brand identity for it.
Tata Steel Rural Development Society (‘TSRDS’), a registered society under Societies Registration Act, 1860. The principal aim and objective of the society is to undertake, promote, sponsor, assist or aid directly any activity/project/programme for the
promotion and growth of the rural economy, rural welfare, socio-economic development and upliftment of the people in rural areas.
Tribal Cultural Society (‘TCS’), a registered society under Societies Registration Act, 1860. The principal objective of the society is to promote and undertake cultural activities, cultural education, and training of various tribes.
Tata Steel Skill Development Society (‘TSSDS’), a registered society under Societies Registration Act, 1860. The principal aim and object of the society is to provide facilities for technical and other skill enhancement trainings within the nation.
Tata Steel Family Initiatives Foundation (‘TSFIF’), a registered trust under Indian Trusts Act, 1882. The principal objective of the trust is to undertake projects/programmes on reproductive health, prevention of drug or alcohol addiction, and empowerment of women through literacy and income generation.
Tata Steel Zoological Society (‘TSZS’), a registered society under Societies Registration Act, 1860. The principal objective of the society is to provide natural habitats to various animals suitable for their conservation and propagation. It also acts as a facilitator to spread the message of nature conservation by building awareness and conducting educational programmes.
V. Financial DetailsParticulars (` crore)
Average net profit of the Company for last three Financial Years 8,676.66
Prescribed CSR expenditure (2% of the average net profits) 173.53
Details of CSR spent during the Financial Year:
(a) Total amount to be spent for the Financial Year 173.53
(b) Amount spent 192.99(c) Amount unspent, if any Nil
The manner in which the amount is spent on CSR activities undertaken during the year review is given as an annexure to this report. Details of CSR projects undertaken during the year under review along with its impact is discussed in the Social and Relationship Capital Section of the Integrated Report.
Corporate Overview 02
Strategic Review 46
Performance Review 20
Statutory Reports 84
Our Strategy 28
Financial Statements 206
131
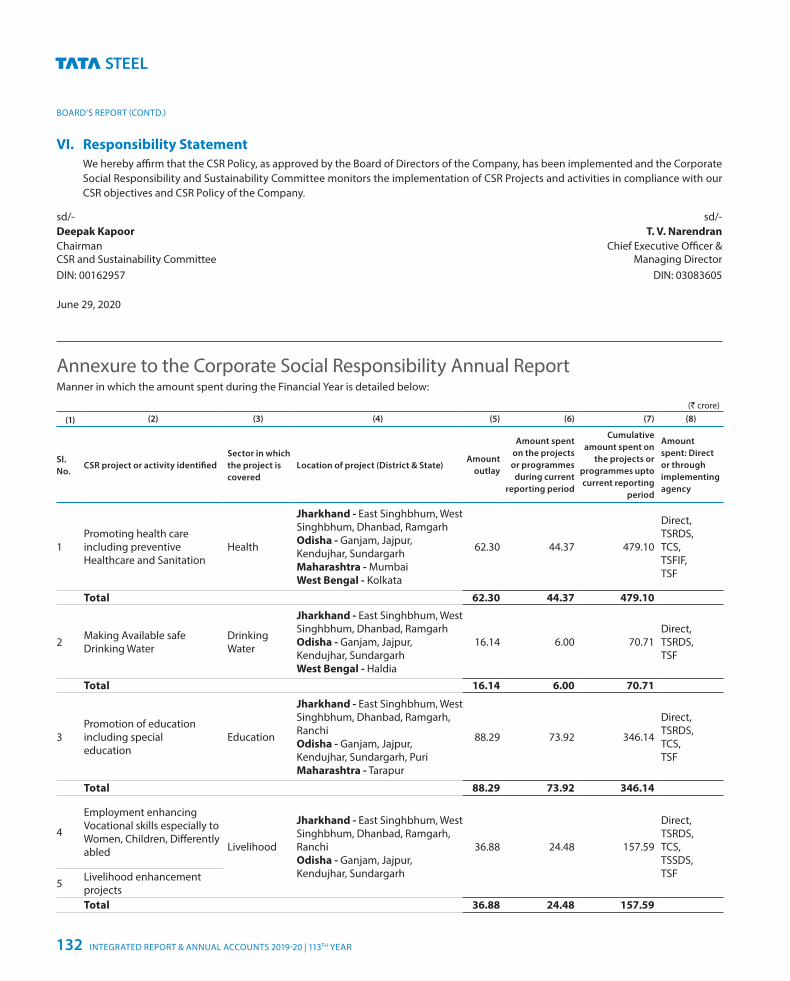
BOARD’S REPORT (CONTD.)
VI. Responsibility Statement We hereby affirm that the CSR Policy, as approved by the Board of Directors of the Company, has been implemented and the Corporate
Social Responsibility and Sustainability Committee monitors the implementation of CSR Projects and activities in compliance with our CSR objectives and CSR Policy of the Company.
sd/- sd/-Deepak Kapoor T. V. Narendran Chairman CSR and Sustainability Committee
Chief Executive Officer & Managing Director
DIN: 00162957 DIN: 03083605
June 29, 2020
Annexure to the Corporate Social Responsibility Annual ReportManner in which the amount spent during the Financial Year is detailed below:
(` crore)
(1) (2) (3) (4) (5) (6) (7) (8)
Sl. No.
CSR project or activity identifiedSector in which the project is covered
Location of project (District & State)Amount
outlay
Amount spent on the projects or programmes
during current reporting period
Cumulative amount spent on
the projects or programmes upto current reporting
period
Amount spent: Direct or through implementing agency
1Promoting health care including preventive Healthcare and Sanitation
Health
Jharkhand - East Singhbhum, West Singhbhum, Dhanbad, Ramgarh Odisha - Ganjam, Jajpur, Kendujhar, Sundargarh Maharashtra - Mumbai West Bengal - Kolkata
62.30 44.37 479.10
Direct, TSRDS, TCS, TSFIF, TSF
Total 62.30 44.37 479.10
2 Making Available safe Drinking Water
Drinking Water
Jharkhand - East Singhbhum, West Singhbhum, Dhanbad, Ramgarh Odisha - Ganjam, Jajpur, Kendujhar, Sundargarh West Bengal - Haldia
16.14 6.00 70.71 Direct, TSRDS, TSF
Total 16.14 6.00 70.71
3Promotion of education including special education
Education
Jharkhand - East Singhbhum, West Singhbhum, Dhanbad, Ramgarh, Ranchi Odisha - Ganjam, Jajpur, Kendujhar, Sundargarh, Puri Maharashtra - Tarapur
88.29 73.92 346.14
Direct, TSRDS, TCS, TSF
Total 88.29 73.92 346.14
4
Employment enhancing Vocational skills especially to Women, Children, Differently abled Livelihood
Jharkhand - East Singhbhum, West Singhbhum, Dhanbad, Ramgarh, Ranchi Odisha - Ganjam, Jajpur, Kendujhar, Sundargarh
36.88 24.48 157.59
Direct, TSRDS, TCS, TSSDS, TSF
5 Livelihood enhancement projectsTotal 36.88 24.48 157.59
INTEGRATED REPORT & ANNUAL ACCOUNTS 2019-20 | 113TH YEAR132
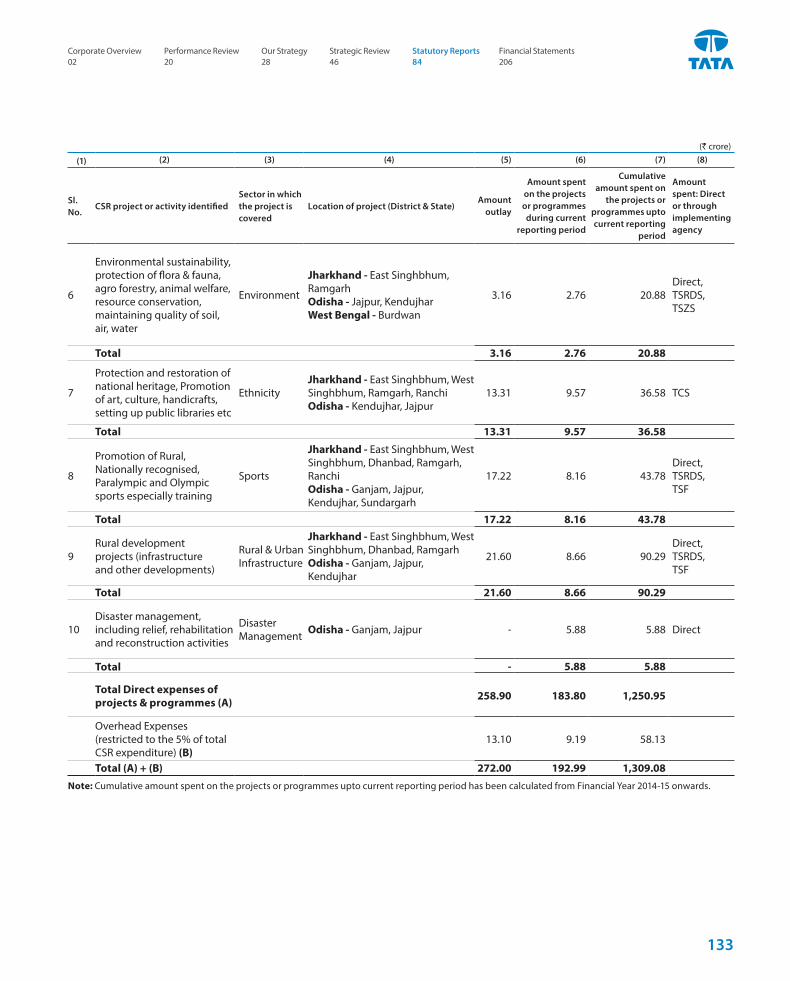
(` crore)
(1) (2) (3) (4) (5) (6) (7) (8)
Sl. No.
CSR project or activity identifiedSector in which the project is covered
Location of project (District & State)Amount
outlay
Amount spent on the projects or programmes
during current reporting period
Cumulative amount spent on
the projects or programmes upto current reporting
period
Amount spent: Direct or through implementing agency
6
Environmental sustainability, protection of flora & fauna, agro forestry, animal welfare, resource conservation, maintaining quality of soil, air, water
Environment
Jharkhand - East Singhbhum, Ramgarh Odisha - Jajpur, Kendujhar West Bengal - Burdwan
3.16 2.76 20.88 Direct, TSRDS, TSZS
Total 3.16 2.76 20.88
7
Protection and restoration of national heritage, Promotion of art, culture, handicrafts, setting up public libraries etc
EthnicityJharkhand - East Singhbhum, West Singhbhum, Ramgarh, Ranchi Odisha - Kendujhar, Jajpur
13.31 9.57 36.58 TCS
Total 13.31 9.57 36.58
8
Promotion of Rural, Nationally recognised, Paralympic and Olympic sports especially training
Sports
Jharkhand - East Singhbhum, West Singhbhum, Dhanbad, Ramgarh, Ranchi Odisha - Ganjam, Jajpur, Kendujhar, Sundargarh
17.22 8.16 43.78 Direct, TSRDS, TSF
Total 17.22 8.16 43.78
9Rural development projects (infrastructure and other developments)
Rural & Urban Infrastructure
Jharkhand - East Singhbhum, West Singhbhum, Dhanbad, Ramgarh Odisha - Ganjam, Jajpur, Kendujhar
21.60 8.66 90.29 Direct, TSRDS, TSF
Total 21.60 8.66 90.29
10Disaster management, including relief, rehabilitation and reconstruction activities
Disaster Management Odisha - Ganjam, Jajpur - 5.88 5.88 Direct
Total - 5.88 5.88
Total Direct expenses of projects & programmes (A) 258.90 183.80 1,250.95
Overhead Expenses (restricted to the 5% of total CSR expenditure) (B)
13.10 9.19 58.13
Total (A) + (B) 272.00 192.99 1,309.08 Note: Cumulative amount spent on the projects or programmes upto current reporting period has been calculated from Financial Year 2014-15 onwards.
Corporate Overview 02
Strategic Review 46
Performance Review 20
Statutory Reports 84
Our Strategy 28
Financial Statements 206
133
BOARD’S REPORT (CONTD.)
Company’s Corporate Governance PhilosophyCorporate Governance is the creation and enhancement of long-term sustainable value for our stakeholders, comprising regulators, employees, customers, vendors, investors, and the society at large, through ethically driven business practice. Effective corporate governance practices constitute the strong foundation on which successful commercial enterprises are built to last. Strong leadership and effective corporate governance practices have been the Company’s hallmark inherited from its culture and ethos. At Tata Steel, it is imperative that our Company’s affairs are managed in a fair and transparent manner.
We ensure that we evolve and follow not just the stated corporate governance guidelines, but also global best practices. We consider it our inherent responsibility to protect the rights of our shareholders and disclose timely, adequate and accurate information regarding our financials and performance, as well as the leadership and governance of the Company.
In accordance with our Vision, Tata Steel Group (‘the Group’) aspires to be the global steel industry benchmark for ‘value creation’ and ‘corporate citizenship’. The Group expects to realise its Vision by taking such actions, as may be necessary, to achieve its goals of value creation, safety, environment and people.
The Company is in compliance with the requirements stipulated under Regulations 17 to 27 read with Schedule V and clauses (b) to (i) of Regulation 46(2) of the Securities and Exchange Board of India (Listing Obligations and Disclosure Requirements) Regulations, 2015 (‘SEBI Listing Regulations’), as applicable, with regard to corporate governance.
To further strengthen our Company’s corporate governance philosophy, the Company has also adopted the Tata Business Excellence Model.
Code of conductThe Company has a strong legacy of fair, transparent and ethical governance practices.
The Company has adopted the Tata Code of Conduct (‘TCoC/Code’) for Executive Directors (‘EDs’), Senior Management Personnel and other Executives and Employees, which is available on the website of the Company www.tatasteel.com The Company has received confirmations from the EDs as well as Senior Management Personnel regarding compliance of the Code during the year under review. The Company has also adopted the Code of Conduct for Non-Executive Directors (‘NEDs’) of the Company which includes the Code of Conduct of Independent Directors (‘IDs’) which suitably incorporates the duties of Independent Directors as laid down in the
Companies Act, 2013 (‘the Act’). The same is available on the website of the Company www.tatasteel.com The Company has received confirmation from the NEDs and IDs regarding compliance of the Code, for the year under review.
Tata Code of Conduct for Prevention of Insider Trading and Code of Corporate Disclosure PracticesIn accordance with the Securities and Exchange Board of India (Prohibition of Insider Trading) Regulations, 2015 ('SEBI Insider Trading Regulations'), as amended from time to time, the Board of Directors of the Company has adopted the Tata Code of Conduct for Prevention of Insider Trading and the Code of Corporate Disclosure Practices (‘Insider Trading Code’). The Insider Trading Code was last amended by the Board of Directors on December 18, 2019, to be in compliance with the SEBI Insider Trading Regulations.
Mr. Parvatheesam Kanchinadham, Company Secretary & Chief Legal Officer (Corporate & Compliance) of the Company is the ‘Compliance Officer’ in terms of this Insider Trading Code.
Board of DirectorsThe Board of Directors ('the Board') is at the core of our corporate governance practice and oversees and ensures that the Management serves and protects the long-term interest of all our stakeholders. We believe that an active, well-informed and independent Board is necessary to ensure the highest standards of corporate governance.
Size and Composition of the BoardOur policy is to have a mix of EDs, NEDs, and IDs to maintain the Board’s independence and separate its functions of governance and management. As on March 31, 2020, the Board comprised ten members, two of whom are EDs, three are NEDs and five are IDs, including a Woman Director. The Board periodically evaluates the need for change in its composition and size. Detailed profile of our Directors is available on our website www.tatasteel.com/corporate/our-organisation/leadership/
The composition of the Board is in conformity with Regulation 17 of the SEBI Listing Regulations read with Section 149 of the Act. As on date of this report, none of our Directors serve as Director or as IDs in more than seven listed companies and none of the EDs serve as IDs on any listed company. Further, none of our IDs serve as Non-Independent Director of any company on the board of which any of our Non-Independent Director is an ID.
Independent Directors are non-executive directors as defined under Regulation 16(1)(b) of the SEBI Listing Regulations read with Section 149(6) of the Act along with rules framed thereunder. In terms of Regulation 25(8) of the SEBI Listing Regulations, they have confirmed
ANNEXURE 4Corporate Governance Report
INTEGRATED REPORT & ANNUAL ACCOUNTS 2019-20 | 113TH YEAR134
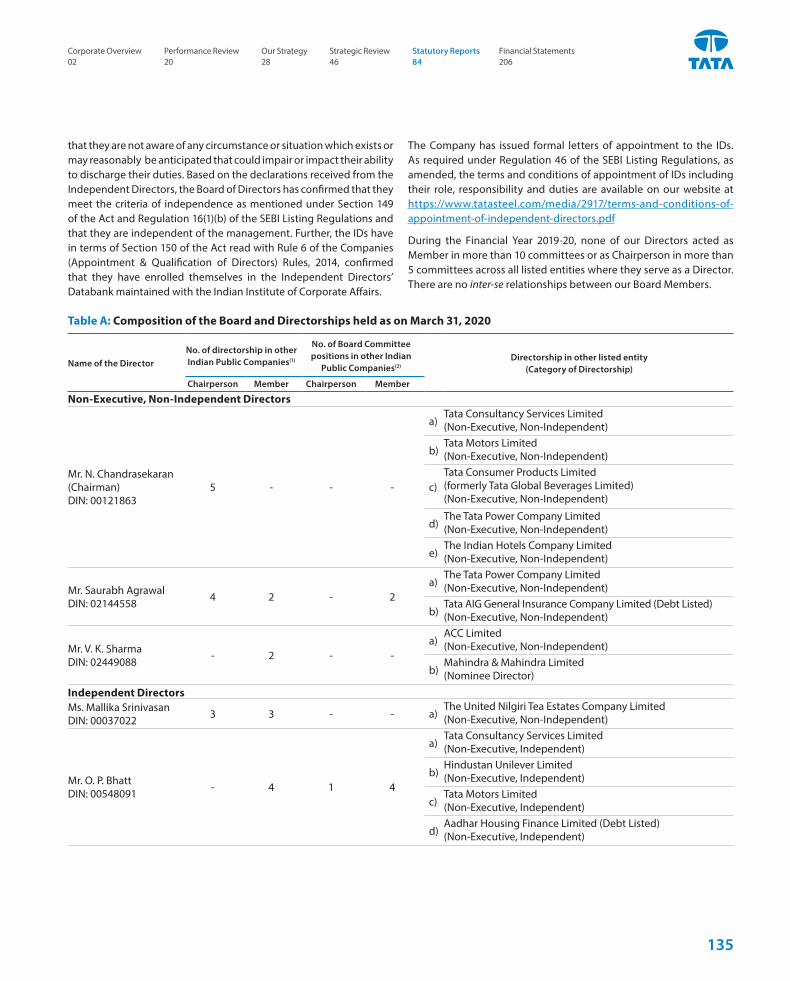
that they are not aware of any circumstance or situation which exists or may reasonably be anticipated that could impair or impact their ability to discharge their duties. Based on the declarations received from the Independent Directors, the Board of Directors has confirmed that they meet the criteria of independence as mentioned under Section 149 of the Act and Regulation 16(1)(b) of the SEBI Listing Regulations and that they are independent of the management. Further, the IDs have in terms of Section 150 of the Act read with Rule 6 of the Companies (Appointment & Qualification of Directors) Rules, 2014, confirmed that they have enrolled themselves in the Independent Directors’ Databank maintained with the Indian Institute of Corporate Affairs.
The Company has issued formal letters of appointment to the IDs. As required under Regulation 46 of the SEBI Listing Regulations, as amended, the terms and conditions of appointment of IDs including their role, responsibility and duties are available on our website at https://www.tatasteel.com/media/2917/terms-and-conditions-of- appointment-of-independent-directors.pdf
During the Financial Year 2019-20, none of our Directors acted as Member in more than 10 committees or as Chairperson in more than 5 committees across all listed entities where they serve as a Director. There are no inter-se relationships between our Board Members.
Table A: Composition of the Board and Directorships held as on March 31, 2020
Name of the DirectorNo. of directorship in other Indian Public Companies(1)
No. of Board Committee positions in other Indian
Public Companies(2)Directorship in other listed entity
(Category of Directorship)
Chairperson Member Chairperson Member
Non-Executive, Non-Independent Directors
Mr. N. Chandrasekaran(Chairman)DIN: 00121863
5 - - -
a)Tata Consultancy Services Limited (Non-Executive, Non-Independent)
b)Tata Motors Limited(Non-Executive, Non-Independent)
c)Tata Consumer Products Limited (formerly Tata Global Beverages Limited)(Non-Executive, Non-Independent)
d)The Tata Power Company Limited(Non-Executive, Non-Independent)
e)The Indian Hotels Company Limited(Non-Executive, Non-Independent)
Mr. Saurabh AgrawalDIN: 02144558 4 2 - 2
a)The Tata Power Company Limited(Non-Executive, Non-Independent)
b)Tata AIG General Insurance Company Limited (Debt Listed)(Non-Executive, Non-Independent)
Mr. V. K. SharmaDIN: 02449088 - 2 - -
a)ACC Limited(Non-Executive, Non-Independent)
b)Mahindra & Mahindra Limited(Nominee Director)
Independent DirectorsMs. Mallika SrinivasanDIN: 00037022 3 3 - - a)
The United Nilgiri Tea Estates Company Limited (Non-Executive, Non-Independent)
Mr. O. P. BhattDIN: 00548091 - 4 1 4
a)Tata Consultancy Services Limited(Non-Executive, Independent)
b)Hindustan Unilever Limited (Non-Executive, Independent)
c)Tata Motors Limited (Non-Executive, Independent)
d)Aadhar Housing Finance Limited (Debt Listed)(Non-Executive, Independent)
Corporate Overview 02
Strategic Review 46
Performance Review 20
Statutory Reports 84
Our Strategy 28
Financial Statements 206
135
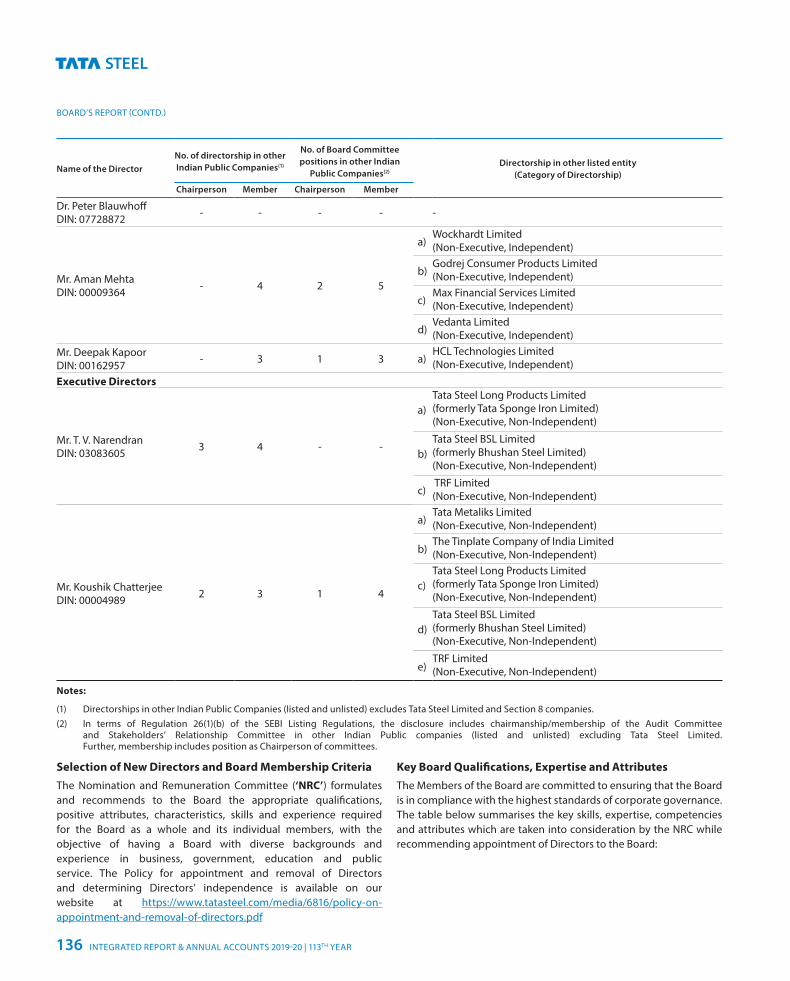
BOARD’S REPORT (CONTD.)
Name of the DirectorNo. of directorship in other Indian Public Companies(1)
No. of Board Committee positions in other Indian
Public Companies(2)Directorship in other listed entity
(Category of Directorship)
Chairperson Member Chairperson Member
Dr. Peter BlauwhoffDIN: 07728872 - - - - -
Mr. Aman MehtaDIN: 00009364 - 4 2 5
a)Wockhardt Limited (Non-Executive, Independent)
b)Godrej Consumer Products Limited (Non-Executive, Independent)
c)Max Financial Services Limited(Non-Executive, Independent)
d)Vedanta Limited (Non-Executive, Independent)
Mr. Deepak KapoorDIN: 00162957 - 3 1 3 a)
HCL Technologies Limited (Non-Executive, Independent)
Executive Directors
Mr. T. V. NarendranDIN: 03083605 3 4 - -
a)Tata Steel Long Products Limited (formerly Tata Sponge Iron Limited) (Non-Executive, Non-Independent)
b)Tata Steel BSL Limited (formerly Bhushan Steel Limited)(Non-Executive, Non-Independent)
c) TRF Limited(Non-Executive, Non-Independent)
Mr. Koushik ChatterjeeDIN: 00004989 2 3 1 4
a)Tata Metaliks Limited(Non-Executive, Non-Independent)
b)The Tinplate Company of India Limited(Non-Executive, Non-Independent)
c)Tata Steel Long Products Limited (formerly Tata Sponge Iron Limited) (Non-Executive, Non-Independent)
d)Tata Steel BSL Limited (formerly Bhushan Steel Limited)(Non-Executive, Non-Independent)
e)TRF Limited(Non-Executive, Non-Independent)
Notes:
(1) Directorships in other Indian Public Companies (listed and unlisted) excludes Tata Steel Limited and Section 8 companies.(2) In terms of Regulation 26(1)(b) of the SEBI Listing Regulations, the disclosure includes chairmanship/membership of the Audit Committee
and Stakeholders’ Relationship Committee in other Indian Public companies (listed and unlisted) excluding Tata Steel Limited. Further, membership includes position as Chairperson of committees.
Selection of New Directors and Board Membership CriteriaThe Nomination and Remuneration Committee (‘NRC’) formulates and recommends to the Board the appropriate qualifications, positive attributes, characteristics, skills and experience required for the Board as a whole and its individual members, with the objective of having a Board with diverse backgrounds and experience in business, government, education and public service. The Policy for appointment and removal of Directors and determining Directors’ independence is available on our website at https://www.tatasteel.com/media/6816/policy-on- appointment-and-removal-of-directors.pdf
Key Board Qualifications, Expertise and AttributesThe Members of the Board are committed to ensuring that the Board is in compliance with the highest standards of corporate governance. The table below summarises the key skills, expertise, competencies and attributes which are taken into consideration by the NRC while recommending appointment of Directors to the Board:
INTEGRATED REPORT & ANNUAL ACCOUNTS 2019-20 | 113TH YEAR136
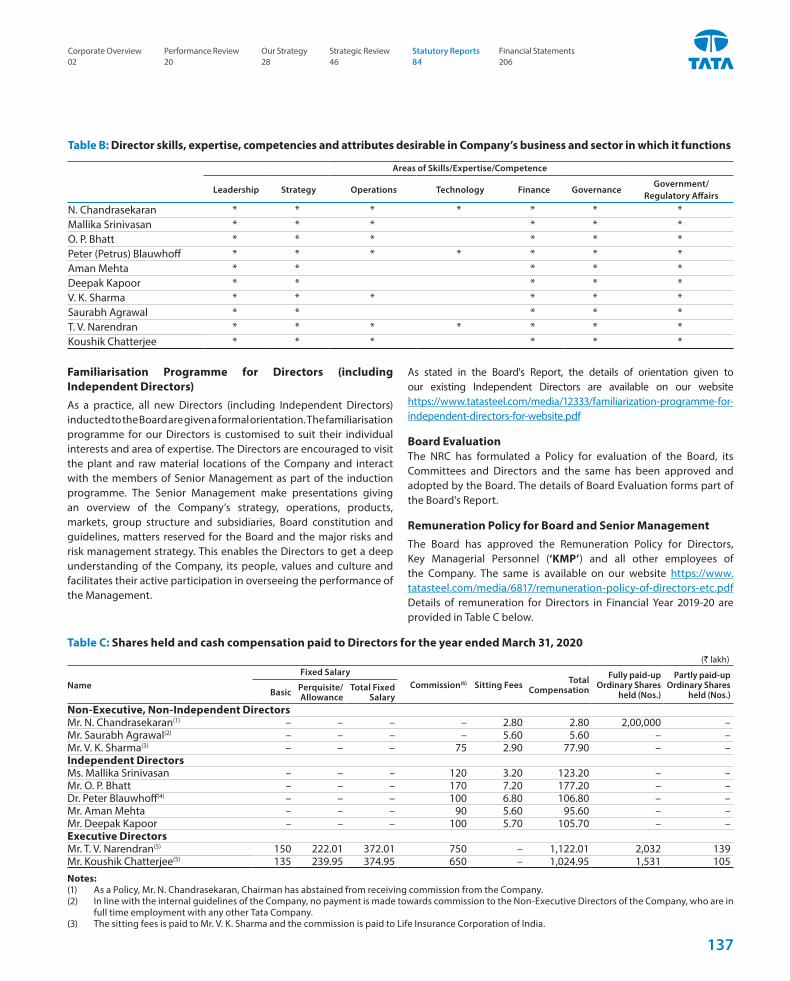
Table B: Director skills, expertise, competencies and attributes desirable in Company’s business and sector in which it functions
Areas of Skills/Expertise/Competence
Leadership Strategy Operations Technology Finance GovernanceGovernment/
Regulatory Affairs
N. Chandrasekaran * * * * * * *Mallika Srinivasan * * * * * *O. P. Bhatt * * * * * *Peter (Petrus) Blauwhoff * * * * * * *Aman Mehta * * * * *Deepak Kapoor * * * * *V. K. Sharma * * * * * *Saurabh Agrawal * * * * *T. V. Narendran * * * * * * *Koushik Chatterjee * * * * * *
Familiarisation Programme for Directors (including Independent Directors)As a practice, all new Directors (including Independent Directors) inducted to the Board are given a formal orientation. The familiarisation programme for our Directors is customised to suit their individual interests and area of expertise. The Directors are encouraged to visit the plant and raw material locations of the Company and interact with the members of Senior Management as part of the induction programme. The Senior Management make presentations giving an overview of the Company’s strategy, operations, products, markets, group structure and subsidiaries, Board constitution and guidelines, matters reserved for the Board and the major risks and risk management strategy. This enables the Directors to get a deep understanding of the Company, its people, values and culture and facilitates their active participation in overseeing the performance of the Management.
As stated in the Board's Report, the details of orientation given to our existing Independent Directors are available on our website https://www.tatasteel.com/media/12333/familiarization-programme-for-independent-directors-for-website.pdf
Board EvaluationThe NRC has formulated a Policy for evaluation of the Board, its Committees and Directors and the same has been approved and adopted by the Board. The details of Board Evaluation forms part of the Board's Report.
Remuneration Policy for Board and Senior ManagementThe Board has approved the Remuneration Policy for Directors, Key Managerial Personnel (‘KMP’) and all other employees of the Company. The same is available on our website https://www. tatasteel.com/media/6817/remuneration-policy-of-directors-etc.pdf Details of remuneration for Directors in Financial Year 2019-20 are provided in Table C below.
Table C: Shares held and cash compensation paid to Directors for the year ended March 31, 2020(` lakh)
NameFixed Salary
Commission(6) Sitting Fees Total Compensation
Fully paid-up Ordinary Shares
held (Nos.)
Partly paid-up Ordinary Shares
held (Nos.)Basic Perquisite/Allowance
Total Fixed Salary
Non-Executive, Non-Independent DirectorsMr. N. Chandrasekaran(1) – – – – 2.80 2.80 2,00,000 –Mr. Saurabh Agrawal(2) – – – – 5.60 5.60 – –Mr. V. K. Sharma(3) – – – 75 2.90 77.90 – –Independent DirectorsMs. Mallika Srinivasan – – – 120 3.20 123.20 – –Mr. O. P. Bhatt – – – 170 7.20 177.20 – –Dr. Peter Blauwhoff(4) – – – 100 6.80 106.80 – –Mr. Aman Mehta – – – 90 5.60 95.60 – –Mr. Deepak Kapoor – – – 100 5.70 105.70 – –Executive DirectorsMr. T. V. Narendran(5) 150 222.01 372.01 750 – 1,122.01 2,032 139Mr. Koushik Chatterjee(5) 135 239.95 374.95 650 – 1,024.95 1,531 105Notes:(1) As a Policy, Mr. N. Chandrasekaran, Chairman has abstained from receiving commission from the Company. (2) In line with the internal guidelines of the Company, no payment is made towards commission to the Non-Executive Directors of the Company, who are in
full time employment with any other Tata Company.(3) The sitting fees is paid to Mr. V. K. Sharma and the commission is paid to Life Insurance Corporation of India.
Corporate Overview 02
Strategic Review 46
Performance Review 20
Statutory Reports 84
Our Strategy 28
Financial Statements 206
137
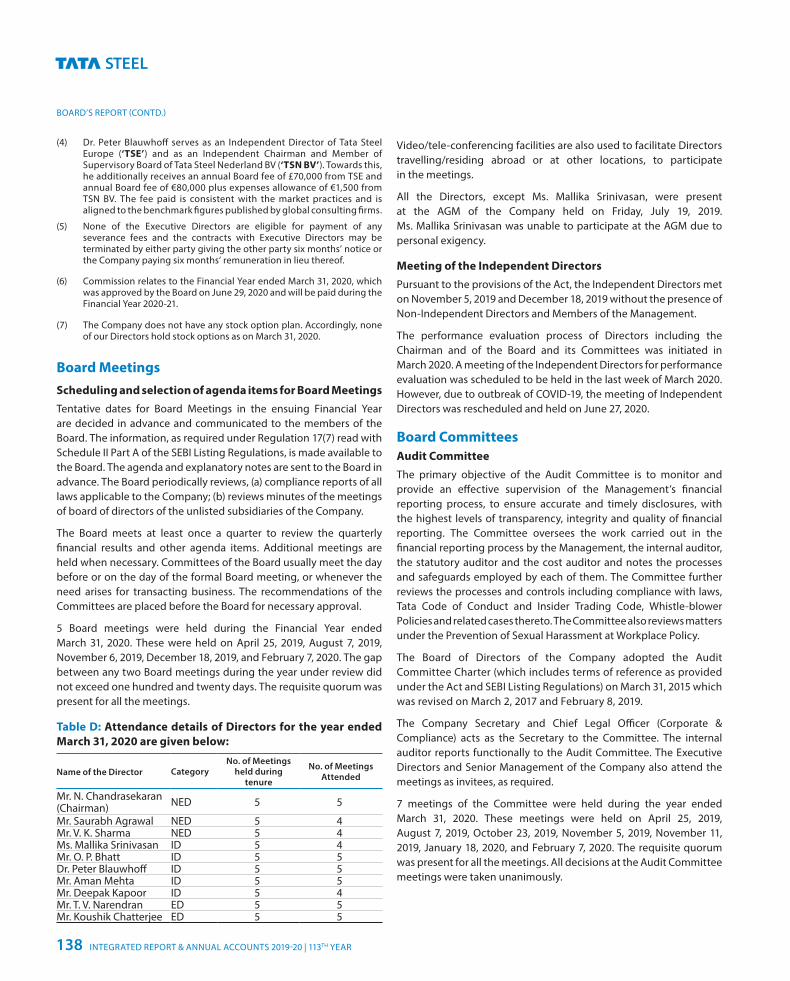
BOARD’S REPORT (CONTD.)
(4) Dr. Peter Blauwhoff serves as an Independent Director of Tata Steel Europe (‘TSE’) and as an Independent Chairman and Member of Supervisory Board of Tata Steel Nederland BV (‘TSN BV’). Towards this, he additionally receives an annual Board fee of £70,000 from TSE and annual Board fee of €80,000 plus expenses allowance of €1,500 from TSN BV. The fee paid is consistent with the market practices and is aligned to the benchmark figures published by global consulting firms.
(5) None of the Executive Directors are eligible for payment of any severance fees and the contracts with Executive Directors may be terminated by either party giving the other party six months’ notice or the Company paying six months’ remuneration in lieu thereof.
(6) Commission relates to the Financial Year ended March 31, 2020, which was approved by the Board on June 29, 2020 and will be paid during the Financial Year 2020-21.
(7) The Company does not have any stock option plan. Accordingly, none of our Directors hold stock options as on March 31, 2020.
Board MeetingsScheduling and selection of agenda items for Board MeetingsTentative dates for Board Meetings in the ensuing Financial Year are decided in advance and communicated to the members of the Board. The information, as required under Regulation 17(7) read with Schedule II Part A of the SEBI Listing Regulations, is made available to the Board. The agenda and explanatory notes are sent to the Board in advance. The Board periodically reviews, (a) compliance reports of all laws applicable to the Company; (b) reviews minutes of the meetings of board of directors of the unlisted subsidiaries of the Company.
The Board meets at least once a quarter to review the quarterly financial results and other agenda items. Additional meetings are held when necessary. Committees of the Board usually meet the day before or on the day of the formal Board meeting, or whenever the need arises for transacting business. The recommendations of the Committees are placed before the Board for necessary approval.
5 Board meetings were held during the Financial Year ended March 31, 2020. These were held on April 25, 2019, August 7, 2019, November 6, 2019, December 18, 2019, and February 7, 2020. The gap between any two Board meetings during the year under review did not exceed one hundred and twenty days. The requisite quorum was present for all the meetings.
Table D: Attendance details of Directors for the year ended March 31, 2020 are given below:
Name of the Director CategoryNo. of Meetings
held during tenure
No. of Meetings Attended
Mr. N. Chandrasekaran (Chairman) NED 5 5
Mr. Saurabh Agrawal NED 5 4Mr. V. K. Sharma NED 5 4Ms. Mallika Srinivasan ID 5 4Mr. O. P. Bhatt ID 5 5Dr. Peter Blauwhoff ID 5 5Mr. Aman Mehta ID 5 5Mr. Deepak Kapoor ID 5 4Mr. T. V. Narendran ED 5 5Mr. Koushik Chatterjee ED 5 5
Video/tele-conferencing facilities are also used to facilitate Directors travelling/residing abroad or at other locations, to participate in the meetings.
All the Directors, except Ms. Mallika Srinivasan, were present at the AGM of the Company held on Friday, July 19, 2019. Ms. Mallika Srinivasan was unable to participate at the AGM due to personal exigency.
Meeting of the Independent Directors Pursuant to the provisions of the Act, the Independent Directors met on November 5, 2019 and December 18, 2019 without the presence of Non-Independent Directors and Members of the Management.
The performance evaluation process of Directors including the Chairman and of the Board and its Committees was initiated in March 2020. A meeting of the Independent Directors for performance evaluation was scheduled to be held in the last week of March 2020.However, due to outbreak of COVID-19, the meeting of Independent Directors was rescheduled and held on June 27, 2020.
Board Committees Audit CommitteeThe primary objective of the Audit Committee is to monitor and provide an effective supervision of the Management’s financial reporting process, to ensure accurate and timely disclosures, with the highest levels of transparency, integrity and quality of financial reporting. The Committee oversees the work carried out in the financial reporting process by the Management, the internal auditor, the statutory auditor and the cost auditor and notes the processes and safeguards employed by each of them. The Committee further reviews the processes and controls including compliance with laws, Tata Code of Conduct and Insider Trading Code, Whistle-blower Policies and related cases thereto. The Committee also reviews matters under the Prevention of Sexual Harassment at Workplace Policy.
The Board of Directors of the Company adopted the Audit Committee Charter (which includes terms of reference as provided under the Act and SEBI Listing Regulations) on March 31, 2015 which was revised on March 2, 2017 and February 8, 2019.
The Company Secretary and Chief Legal Officer (Corporate & Compliance) acts as the Secretary to the Committee. The internal auditor reports functionally to the Audit Committee. The Executive Directors and Senior Management of the Company also attend the meetings as invitees, as required.
7 meetings of the Committee were held during the year ended March 31, 2020. These meetings were held on April 25, 2019, August 7, 2019, October 23, 2019, November 5, 2019, November 11, 2019, January 18, 2020, and February 7, 2020. The requisite quorum was present for all the meetings. All decisions at the Audit Committee meetings were taken unanimously.
INTEGRATED REPORT & ANNUAL ACCOUNTS 2019-20 | 113TH YEAR138
Table E: The composition of the Committee and the attendance details of the Members for the year ended March 31, 2020 are given below:
Names of Members CategoryNo. of Meetings
held during tenure
No. of meetings attended
Mr. O.P. Bhatt (Chairperson) ID 7 7
Mr. Aman Mehta ID 7 6Dr. Peter Blauwhoff ID 7 6Mr. Saurabh Agrawal NED 7 7Mr. Deepak Kapoor1 ID 6 5
1. Mr. Deepak Kapoor was appointed as Member of Audit Committee at the Board Meeting held on April 25, 2019 and was not a Member of the Audit Committee at the time of the Audit Committee meeting on April 25, 2019.
Mr. O. P. Bhatt, Chairperson of the Audit Committee was present at the AGM of the Company held on Friday, July 19, 2019.
Nomination and Remuneration CommitteeThe purpose of the Nomination and Remuneration Committee (‘NRC’) is to oversee the Company’s nomination process including succession planning for the senior management and the Board and specifically to assist the Board by identifying, screening and reviewing individuals qualified to serve as Executive Directors, Non-Executive Directors and Independent Directors consistent with the criteria as stated by the Board in its Policy on Appointment and Removal of Directors.
The Board has adopted the NRC Charter (which includes terms of reference as provided under the Act and SEBI Listing Regulations) for the functioning of the Committee on May 20, 2015 which was revised on March 29, 2019, basis the amendments in SEBI Listing Regulations.
The NRC also assists the Board in discharging its responsibilities relating to compensation of the Company’s Executive Directors and Senior Management. The Committee has formulated Remuneration Policy for Directors, KMPs and all other employees of the Company and the same is available on Company's website at https://www.tatasteel.com/media/6817/remuneration-policy-of-directors-etc.pdf. The criteria for making payments to Non-Executive Directors is available on our website at https://www.tatasteel.com/investors/corporate-governance/compliance/ The Committee has the overall responsibility of approving and evaluating the compensation plans, policies and programmes for Executive Directors and the Senior Management. The Committee reviews and recommends to the Board for its approval, the base salary, incentives/commission, other benefits, compensation or arrangements and executive employment agreements for the Executive Directors.
2 meetings of the Committee were held during the year ended March 31, 2020. These meetings were held on April 25, 2019, and November 6, 2019. The requisite quorum was present for all the meetings.
Table F: The composition of the Committee and the attendance details of the Members for the year ended March 31, 2020 are given below:
Names of Members Category No. of Meetings
held duringtenure
No. of meetings attended
Ms. Mallika Srinivasan (Chairperson) ID 2 2
Mr. O. P. Bhatt ID 2 2Mr. N. Chandrasekaran NED 2 2
Ms. Mallika Srinivasan, Chairperson of the NRC was not present at the last AGM of the Company held on Friday, July 19, 2019 due to personal exigency. Mr. O. P. Bhatt, Independent Director, was present at the AGM as authorised by the Chairperson of the NRC.
Corporate Social Responsibility and Sustainability CommitteeThe purpose of our Corporate Social Responsibility and Sustainability (‘CSR&S’) Committee is to formulate and recommend to the Board, a Corporate Social Responsibility Policy, which shall indicate the initiatives to be undertaken by the Company, recommend the amount of expenditure the Company should incur on Corporate Social Responsibility (‘CSR’) activities and to monitor from time to time the CSR activities and Policy of the Company. The Committee provides guidance in formulation of CSR strategy and its implementation and also reviews practices and principles to foster sustainable growth of the Company by creating values consistent with long-term preservation and enhancement of financial, manufacturing, natural, social, intellectual and human capital.
The Board has approved a Charter for the functioning of the Committee, on March 31, 2015, which was last revised on March 2, 2017.
The CSR policy is available on our website at https://www.tatasteel. com/media/11804/tata-steel-csr-policy-latest-2019.pdf
3 meetings of the Committee were held during the year ended March 31, 2020. These meetings were held on April 24, 2019, November 5, 2019 and February 6, 2020. The requisite quorum was present for all the meetings.
Table G: The composition of the Committee and the attendance details of the Members for the year ended March 31, 2020 are given below:
Names of Members CategoryNo. of Meetings
held duringtenure
No. of meetings attended
Mr. Deepak Kapoor (Chairperson) ID 3 3
Mr. O. P. Bhatt ID 3 3Mr. T. V. Narendran ED 3 3Mr. Koushik Chatterjee ED 3 3
Mr. Deepak Kapoor, Chairperson of CSR&S Committee was present at the AGM of the Company held on Friday, July 19, 2019.
Corporate Overview 02
Strategic Review 46
Performance Review 20
Statutory Reports 84
Our Strategy 28
Financial Statements 206
139
BOARD’S REPORT (CONTD.)
Risk Management CommitteeThe Company has constituted a Risk Management Committee (‘RMC’) for framing, implementing and monitoring the risk management policy of the Company. The Committee assists the Board in fulfilling its oversight responsibility with respect to Enterprise Risk Management (‘ERM’).
The terms of reference of the RMC are:
a) Overseeing key risks, including strategic, financial, operational, IT (including cyber security) and compliance risks.
b) Assisting the Board in framing, implementing and monitoring the risk management plan for the Company and reviewing and guiding the Risk Policy.
c) Developing risk management policy and risk management system/framework for the Company.
The Board has adopted a Charter for RMC Committee on May 20, 2015.
3 meetings of the Committee were held during the year ended March 31, 2020. These meetings were held on April 25, 2019, November 5, 2019 and February 7, 2020. The requisite quorum was present for all the meetings.
Table H: The composition of the Committee and the attendance details of the Members for the year ended March 31, 2020 are given below:
Name of the Director CategoryNo. of Meetings
held duringtenure
No. of meetings attended
Mr. Aman Mehta (Chairperson)1 ID 3 3
Mr. O. P. Bhatt1 ID 1 1Dr. Peter Blauwhoff2 ID 2 2Mr. Deepak Kapoor3 ID 1 1Mr. Saurabh Agrawal NED 3 3Mr. T. V. Narendran ED 3 3Mr. Koushik Chatterjee ED 3 3Dr. Henrik Adam4 MoM 2 2Dr. Hans Fischer4 MoM 1 1Mr. Sandip Biswas MoM 3 3Mr. Anand Sen5 MoM 1 1Mr. N. K. Misra5 MoM 3 2
MoM – Member of Management.
1. Mr. O. P. Bhatt ceased to be Chairperson and Member of the RMC effective April 25, 2019 and Mr. Aman Mehta was appointed as the Chairperson of the RMC effective April 25, 2019.
2. Dr. Peter Blauwhoff was appointed as Member of the RMC at the Board Meeting held on April 25, 2019 and was not a Member of the RMC at the time of the RMC meeting on April 25, 2019.
3. Mr. Deepak Kapoor ceased to be a Member of the RMC effective April 25, 2019.
4. Dr. Hans Fischer ceased to be a Member of Management of RMC effective April 25, 2019 and Dr. Henrik Adam was appointed as the Member of Management of the RMC effective November 5, 2019.
5. Consequent to superannuation, Mr. Anand Sen and Mr. N. K. Misra ceased to be the Members of Management of the RMC effective September 30, 2019 and December 31, 2019 respectively.
Stakeholders’ Relationship CommitteeThe Stakeholders’ Relationship Committee (‘SRC’) considers and resolves the grievances of our shareholders, debenture holders and other security holders, including complaints relating to non-receipt of annual report, transfer and transmission of securities, non-receipt of dividends/interests, issue of new/duplicate certificates, general meetings and such other grievances as may be raised by the security holders from time to time.
The Committee also reviews:
a) Measures taken for effective exercise of voting rights by Shareholders;
b) Service standards adopted by the Company in respect of services rendered by our Registrars & Transfer Agent;
c) Measures rendered and initiatives taken for reducing quantum of unclaimed dividends and ensuring timely receipt of dividend/annual report/notices and other information by Shareholders.
The Board has adopted a Charter (which includes terms of reference as provided under the Act and SEBI Listing Regulations) for the functioning of the SRC on April 11, 2014 which was revised on February 8, 2019.
1 meeting of the Committee was held during the year ended March 31, 2020 on February 6, 2020. The requisite quorum was present for the meeting.
Table I: The composition of the Committee and the attendance details of the Members for the year ended March 31, 2020 are given below:
Name of the Director CategoryNo. of Meetings
held duringtenure
No. of meetings attended
Mr. V. K. Sharma1 NED 1 1Mr. Deepak Kapoor1 ID 1 1 Mr. T. V. Narendran ED 1 1Mr. Koushik Chatterjee ED - -
1. Mr. Deepak Kapoor ceased to be the Chairperson of SRC effective April 25, 2019 and continues to be a Member of SRC. Mr. V. K. Sharma was appointed as Chairperson and Member of SRC effective even date.
Mr. V. K. Sharma, Chairperson of Committee was present at the AGM of the Company held on Friday, July 19, 2019.
In terms of Regulation 6 and Schedule V of the SEBI Listing Regulations, the Board has appointed Mr. Parvatheesam
INTEGRATED REPORT & ANNUAL ACCOUNTS 2019-20 | 113TH YEAR140
Kanchinadham, Company Secretary & Chief Legal Officer (Corporate & Compliance) as the Compliance Officer of the Company.
The details of investor complaints received and resolved during the Financial Year ended March 31, 2020 are given in Table J. The complaints relate to non-receipt of annual report, dividend, share transfers and other investor grievances.
Table J: Details of investor complaints received and resolved during the year ended March 31, 2020:
Opening as on April 1, 2019 0Received during the year 290Resolved during the year 290Closing as on March 31, 2020 0
Safety, Health and Environment CommitteeThe Safety, Health and Environment Committee (‘SH&E Committee’) of the Board oversees the policies relating to Safety, Health and Environment and their implementation across Tata Steel Group.
The Board has approved a Charter for the functioning of the Committee on October 27, 2009.
4 meetings of the Committee were held during the year ended March 31, 2020. These meetings were held on April 24, 2019,
August 6, 2019, November 5, 2019 and February 6, 2020. The requisite quorum was present for all the meetings.
Table K: The composition of the Committee and the attendance details of the Members for the year ended March 31, 2020 are given below:
Names of Members CategoryNo. of Meetings
held duringtenure
No. of meetings attended
Dr. Peter Blauwhoff (Chairperson) ID 4 4
Mr. Deepak Kapoor1 ID 1 1Ms. Mallika Srinivasan2 ID 3 2Mr. V. K. Sharma2 NED 3 3Mr. T. V. Narendran ED 4 4Dr. Hans Fischer3 MoM 1 1Dr. Henrik Adam3 MoM 3 3
MoM – Member of Management.
1. Mr. Deepak Kapoor ceased to be a member of the SH&E Committee effective April 25, 2019.
2. Ms. Mallika Srinivasan and Mr. V. K. Sharma were appointed as the members of the SH&E Committee effective April 25, 2019.
3. Dr. Hans Fischer ceased to be a Member of Management of the SH&E Committee and Dr. Henrik Adam was appointed as the Member of Management of the SH&E Committee effective August 6, 2019.
General Information for ShareholdersGeneral Body MeetingsTable L: Location and time, where last three AGMs were held:
Financial Year Ended
Date Time Venue Special Resolution(s) Passed
March 31, 2019 July 19, 2019
3:00 p.m. (IST)
Birla Matushri Sabhagar,19, Sir VithaldasThackersey Marg,Mumbai – 400 020
(i) Re-appointment of Ms. Mallika Srinivasan (DIN: 00037022) as an Independent Director of the Company.
(ii) Re-appointment of Mr. O. P. Bhatt (DIN: 00548091) as an Independent Director of the Company.
March 31, 2018 July 20, 2018 Issue of Non-Convertible Debentures on private placement basis not exceeding `12,000 crore
March 31, 2017 August 8, 2017 Issue of Non-Convertible Debentures on Private Placement basis not exceeding `10,000 crore
No extraordinary general meeting of the Company was held during the Financial Year 2019-20.
No Special Resolution was passed by the Company last year through Postal Ballot. None of the businesses proposed to be transacted at the ensuing AGM require passing a Special Resolution through Postal Ballot.
Corporate Overview 02
Strategic Review 46
Performance Review 20
Statutory Reports 84
Our Strategy 28
Financial Statements 206
141
BOARD’S REPORT (CONTD.)
Table M: Annual General Meeting 2020:
Day & Date Thursday, August 20, 2020Time 3:00 p.m. (IST)Venue In view of the continuing COVID-19 pandemic, the Ministry of Corporate Affairs has vide its circular dated
May 5, 2020 read with circulars dated April 8, 2020 and April 13, 2020 (collectively referred to as ‘MCA Circulars’) permitted the holding of the Annual General Meeting (‘AGM’) through VC/OAVM, without the physical presence of the Members at a common venue. In compliance with the provisions of the Act, SEBI Listing Regulations, and MCA Circulars, the AGM of the Company is being held through VC/OAVM. The deemed venue of the AGM shall be Bombay House, 24, Homi Mody Street, Fort, Mumbai – 400 001
Financial Year April 1 to March 31Book Closure Dates Saturday, August 8, 2020 to Thursday, August 20, 2020 (Both days inclusive)Dividend Payment Date
On and from Monday, August 24, 2020, if approved by shareholders at the AGMNote: SEBI vide its circular SEBI/HO/CFD/CMD1/CIR/P/2020/79 dated May 12, 2020 granted relaxations to the listed entities in relation to compliance with certain provisions of SEBI Listing Regulations in view of the COVID-19 situation, accordingly, where the Bank details are unavailable for electronic transfer, the Company shall dispatch the dividend warrant/Bankers’ cheque/demand draft to Members, at the earliest once the normalcy is restored.
Disclosures regarding the re-appointment of DirectorIn terms of relevant provisions of the Act, as amended, Mr. N. Chandrasekaran (DIN:00121863) is liable to retire by rotation at the ensuing AGM and being eligible, seeks re-appointment.
The Board recommends the above re-appointment for approval of the Shareholders at the ensuing AGM.
The detailed profile of Mr. Chandrasekaran and particulars of his experience, skills or attributes that qualify him for Board Membership is provided in the Notice convening the AGM.
Communication to the ShareholdersWe send quarterly, half-yearly, and yearly financial results to our Shareholders electronically. Key financial data is published in The Indian Express, Financial Express, Nav Shakti, Free Press Journal and Loksatta. The financial results along with the earnings releases are also posted on the Company’s website www.tatasteel.com
Earnings calls are held with analysts and investors and their transcripts are published on the website. Presentations made to analysts and others are also made available on the Company’s website www.tatasteel.com
All price sensitive information and matters that are material to Shareholders are disclosed to the respective Stock Exchanges where the securities of the Company are listed. All submissions to the Exchanges are made through their respective electronic online filing systems. The same are also available on the Company’s website www.tatasteel.com
The Company’s website is a comprehensive reference on it’s leadership, management, vision, mission, policies, corporate governance, sustainability, investor relations, products and processes and updates and news. The section on ‘Investors’ serves to inform the Shareholders, by giving complete financial details,
stock exchange compliances including shareholding patterns and updated credit ratings amongst others, corporate benefits, information relating to Stock Exchanges, information on unclaimed dividend of Shareholders, details of Registrars & Transfer Agent and frequently asked questions. Investors can also submit their queries by submitting ‘Shareholder Query Form’ and get feedback online. The section on ‘Media’ includes all major press reports and releases, awards and campaigns by the Company, amongst others.
Investor grievance and share transfer systemWe have a Board-level Stakeholders’ Relationship Committee to examine and redress investors’ complaints. The status on complaints and share transfers are reported to the entire Board.
During the Financial Year 2018-19, the SEBI and MCA have mandated the existing members of the Company who hold securities in physical form and intend to transfer their securities after April 1, 2019, can do so only in dematerialised form. Therefore, Members holding shares in physical form were requested to consider converting their shareholding to dematerialised form.
Share transactions in electronic form can be effected in a much simpler and faster manner. After a confirmation of a sale/purchase transaction from the broker, shareholders should approach the Depository Participant (‘DP’) with a request to debit or credit the account for the transaction. The DP will immediately arrange to complete the transaction by updating the account. There is no need for a separate communication to the Company to register these share transfers.
Shareholders should communicate with TSR Darashaw Consultants Private Limited, (formerly TSR Darashaw Limited) the Company’s Registrars and Transfer Agent (‘RTA’) quoting their folio number or Depository Participant ID (‘DP ID’) and Client ID number, for any queries to their securities.
INTEGRATED REPORT & ANNUAL ACCOUNTS 2019-20 | 113TH YEAR142
Details of non-complianceThe Company has complied with the requirements of the Stock Exchanges, SEBI and other statutory authorities on all matters relating to capital markets during the last three years and no penalties and/or strictures have been imposed on the Company in this regard. There has been no instance of non-compliance with any legal requirements particularly with any requirement of the Corporate Governance Report, during the year under review.
None of the Company’s listed securities are suspended from trading.
During the year under review, the Company did not raise any funds through preferential allotment or qualified institutions placement as specified under Regulation 32(7A) of the SEBI Listing Regulations. However, during the year under review, the Company has issued Non-Convertible Debentures ('NCDs') on private placement basis, listed on debt market segment of BSE Limited. The Company affirms that there has been no deviation or variation in utilisation of proceeds of the listed NCDs of the Company.
Certificates from Practising Company SecretariesAs required by Regulation 34(3) and Schedule V of the SEBI Listing Regulations, the certificate given under Part E by Parikh & Associates, (Firm Registration No. P1988MH009800), Practicing Company Secretaries, is annexed to this report.
As required by Clause 10 (i) of Part C under Schedule V of the SEBI Listing Regulations, the Company has received a certificate from Parikh & Associates (Firm Registration No. P1988MH009800), Practicing Company Secretaries certifying that none of our Directors have been debarred or disqualified from being appointed or continuing as Directors of the Company by SEBI or MCA or such other statutory authority.
CEO and CFO certificationAs required under Regulation 17(8) read with Schedule II Part B of the SEBI Listing Regulations, the Chief Executive Officer & Managing Director and Executive Director & Chief Financial Officer have given appropriate certifications to the Board of Directors.
Reconciliation of Share Capital AuditIn terms of Regulation 40(9) and 61(4) of the SEBI Listing Regulations, certificates, on half-yearly basis, have been issued by a Company Secretary in Practice with respect to due compliance of share and security transfer formalities by the Company.
The Company Secretary in Practice carried out a Reconciliation of Share Capital Audit to reconcile the total admitted capital with National Securities Depository Limited (‘NSDL’) and Central Depository Services (India) Limited (‘CDSL’) (collectively ‘Depositories’) and the total issued and listed capital. The Audit confirms that the total paid-up capital is in agreement with the aggregate of the total number of shares in physical form and in dematerialised form (held with Depositories). The Audit Report
is disseminated to the Stock Exchanges on quarterly basis and is also available on our website https://www.tatasteel.com/investors/stock-exchange-compliances/reconciliation-of-share-capital-audit-reports/
Related Party TransactionsAll transactions entered into with related parties as defined under the Act, and Regulation 23 of the SEBI Listing Regulations, each as amended, during the year under review were on an arm’s length price basis and in the ordinary course of business. These have been approved by the Audit Committee. Certain transactions which were repetitive in nature were approved through omnibus route by the Audit Committee. The Company has not entered into any materially significant related party transaction. The Board of Directors has approved and adopted a Policy on Related Party Transactions and the same is updated from time to time. The Policy is available on the Company’s website https://www.tatasteel.com/media/5891/policy- on-related-party-transactions.pdf
During the Financial Year 2019-20, the Company did not have any material pecuniary relationship or transactions with Non-Executive Directors apart from paying Director’s remuneration. Further, the Directors have not entered into any contracts with the Company or its subsidiaries, which will be in material conflict with the interest of the Company.
The Board has received disclosures from KMPs and Members of Senior Management relating to material, financial and commercial transactions where they and/or their relatives have personal interest.
Policy for Determining Material SubsidiariesThe Company has formulated a Policy for Determining Material Subsidiaries and the same is available on the Company’s website https://www.tatasteel.com/media/5890/policy-on-determining- material-subsidiaries.pdf The Company is in compliance with the provisions governing material subsidiaries.
Vigil MechanismThe Vigil Mechanism approved by the Board provides a formal mechanism for all Directors, employees and vendors of the Company to approach the Chairman of the Audit Committee of the Company and make protective disclosures regarding the unethical behaviour, actual or suspected fraud or violation of the Company’s Code of Conduct. Under the Policy, in addition, Directors, employees, and vendors, may approach the Chief Ethics Counsellor to make any such protected disclosure. During the year under review, no person has been denied access to the Chairman of the Audit Committee. Details of the Vigil Mechanism are given in the Board’s Report.
During the year under review, the Company revised the Whistle-blower policy for Directors and Employees to include ‘reporting of incidents of leak or suspected leak of Unpublished Price Sensitive Information (UPSI)’ as required in terms of the provisions of the SEBI Insider Trading Regulations as amended.
Corporate Overview 02
Strategic Review 46
Performance Review 20
Statutory Reports 84
Our Strategy 28
Financial Statements 206
143
BOARD’S REPORT (CONTD.)
The revised Policy is available on the Company’s website at https://www.tatasteel.com/corporate/our-organisation/policies/
Disclosures as per the Sexual Harassment of Women at Workplace (Prevention, Prohibition and Redressal) Act, 2013The disclosure regarding the complaints of sexual harassment are given in the Board’s Report.
Consolidated Fees paid to Statutory AuditorsDuring the Financial Year 2019-20, the total fees for all services paid by the Company and its subsidiaries, on a consolidated basis, to Price Waterhouse & Co Chartered Accountants LLP, Statutory Auditors (Firm Registration Number: 304026E/E-300009) of the Company is as under:
Table N: Consolidated fees paid to statutory auditors:
(` crore)
Particulars Amount
Services as statutory auditors 27.92Taxation matters and audit 2.85 Other services 9.53 Out-of-pocket expenses 1.32 Total 41.62
Dematerialisation of shares and liquidityThe Company’s Ordinary Shares are tradable compulsorily in electronic form. We have established connectivity with both the depositories, i.e. NSDL and CDSL. The International Securities Identification Number (‘ISIN’) allotted to the Fully paid-up and Partly paid-up Ordinary Shares under the Depository System are INE081A01012 and IN9081A01010 respectively.
The Company has 118,85,40,293 Ordinary Shares (including Fully paid-up and Partly paid-up Ordinary Shares) representing 98.71% of the Company’s share capital which is dematerialised as on March 31, 2020.
Further, outstanding GDR Shares 1,25,61,401 (March 31, 2019: 1,34,73,958) of face value `10 per share represent the shares underlying GDRs which were issued during 1994 and 2010. Each GDR represents one underlying Fully paid-up Ordinary Share.
Designated e-mail address for investor servicesTo serve our investors better and as required under Regulation 46(2)(j) of the SEBI Listing Regulations, the designated e-mail address for investor complaints is [email protected] The e-mail address for grievance redressal is monitored by the Company’s Compliance Officer.
Investor AwarenessAs part of good governance we have provided subscription facilities to our investors for IR alerts regarding press release, results, webcasts, analyst meets and presentations amongst others. We also provide our investors facility to write queries regarding their rights and shareholdings and have provided details of persons to be contacted for this purpose. We encourage investors to visit our website for reading the documents and for availing the above facilities at www.tatasteel.com
Legal proceedingsThere are certain pending cases related to disputes over title to shares in which the Company had been made a party. However, these cases are not material in nature.
Commodity Price Risk Commodities are critical inputs to the manufacturing of steel. Volatility in commodity prices is an inherent market risk for the Company as it impacts the profitability and cash flows. However, steel prices, over the long-term, tend to follow the trend of commodity prices which provides a natural hedge to the business.
In India, the Company has captive iron ore that meet 100% of its iron ore requirements and coal mines which meet about a quarter of its coking coal requirement. These captive mines provide a structural hedge to the price risk of these commodities.
A dedicated commodity sourcing team has been set up, which engages with key raw material producers across the globe and the commodity market at large to optimise sourcing. The team also does a regular risk assessment of the supply chain and proactively engages in diversification of vendors, geographies, development of substitutes, and value-in-use ('VIU') optimisation framework to mitigate, to the extent practical, the impact of disruptions in the supply chain.
To address the short-term price volatility, the Company also hedges certain commodities in the derivatives market. Exposure of the Company to commodity and commodity risk faced by the Company throughout the year:
1. Total exposure of the listed entity to commodities: `11,965 crore
2. Exposure of the listed entities to various commodities (based on materiality):
Commodity Name
Exposure in INR towards
the particular commodity (` crore)
Exposure in Quantity terms towards the
particular commodity(Tonnes)
% of such exposure hedged through commodity derivatives
Domestic Market International MarketTotal
OTC Exchange OTC Exchange
Coal 8,542 88,01,000 Nil Nil Nil Nil NilRefractories 900 1,05,000 Nil Nil Nil Nil Nil
INTEGRATED REPORT & ANNUAL ACCOUNTS 2019-20 | 113TH YEAR144
Compliance with discretionary requirementsAll mandatory requirements of the SEBI Listing Regulations have been complied with by the Company. The status of compliance with the discretionary requirements, as stated under Part E of Schedule II to the SEBI Listing Regulations are as under:
The Board: As on the date of the Report, the positions of the Chairman and the Chief Executive Officer are separate. Mr. N. Chandrasekaran is the Non-Executive Chairman of the Board and Mr. T. V. Narendran is the Chief Executive Officer & Managing Director of the Company.
Maintenance of Chairman’s office: The Non-Executive Chairman has a separate office which is not maintained by the Company.
Shareholder Rights: The half-yearly financial performance of the Company is sent to all the Members whose e-mail IDs are registered with the Company/Depositories. The results are also available on the Company’s website at https://www.tatasteel.com/investors/financial- performance/financial-results/
Modified opinion(s) in Audit Report: The Auditors have expressed an unmodified opinion in their report on the financial statements of the Company.
Reporting of Internal Auditor: The Internal Auditor reports to the Audit Committee.
Table O: Distribution of Shareholding of Ordinary SharesFully paid-up Ordinary Shares
Share HoldingTotal No. of Shareholders
as on March 31% to total holders
as on March 31Total No. of Shares
as on March 31% to total capital
as on March 312020 2019 2020 2019 2020 2019 2020 2019
1 28,060 23,884 3.20 3.01 28,060 23,884 0.00 0.002-10 1,40,836 1,20,513 16.07 15.18 9,44,762 8,09,676 0.09 0.0711-50 2,65,965 2,37,534 30.35 29.93 79,28,111 69,86,169 0.71 0.6251-100 1,37,982 1,24,173 15.75 15.64 1,09,44,618 96,55,582 0.97 0.86101-200 1,30,363 1,23,759 14.88 15.59 1,91,59,949 1,79,62,365 1.70 1.60201-500 1,02,596 96,515 11.71 12.16 3,21,16,622 2,98,88,109 2.85 2.65501-1,000 36,562 34,385 4.17 4.33 2,61,32,184 2,43,91,805 2.32 2.171,001-5,000 29,040 28,091 3.31 3.54 5,74,75,276 5,57,76,758 5.10 4.955,001-10,000 2,796 2,775 0.32 0.35 1,94,09,285 1,92,47,829 1.72 1.7110,001-1,00,000 1,812 1,841 0.21 0.23 4,18,34,519 4,49,56,780 3.71 3.991,00,001 and above 287 323 0.03 0.04 91,05,16,825 91,67,90,723 80.83 81.38Total 8,76,299 7,93,793 100.00 100.00 112,64,90,211 112,64,89,680 100.00 100.00
Partly paid-up Ordinary Shares
Share HoldingTotal No. of Shareholders
as on March 31% to total holders
as on March 31Total No. of Shares
as on March 31% to total capital
as on March 312020 2019 2020 2019 2020 2019 2020 2019
1 5,765 5,793 3.36 3.34 5,765 5,793 0.01 0.012-10 56,521 58,209 32.93 33.53 3,29,688 3,39,421 0.43 0.4411-50 70,096 72,068 40.83 41.52 17,21,756 17,64,981 2.22 2.2751-100 16,807 16,844 9.79 9.70 12,81,572 12,75,721 1.65 1.64101-200 9,405 9,326 5.48 5.37 14,07,722 13,88,448 1.81 1.79201-500 6,972 6,458 4.06 3.72 23,14,888 21,22,136 2.98 2.73501-1,000 2,893 2,436 1.69 1.40 21,77,708 18,15,750 2.80 2.341,001-5,000 2,493 1,899 1.45 1.09 52,71,622 40,32,985 6.79 5.195,001-10,000 362 253 0.21 0.15 25,56,671 18,11,588 3.29 2.3310,001-1,00,000 305 257 0.18 0.15 78,88,152 69,21,073 10.16 8.921,00,001 and above 41 45 0.02 0.03 5,26,81,244 5,61,58,809 67.86 72.34Total 1,71,660 1,73,588 100.00 100.00 7,76,36,788 7,76,36,705 100.00 100.00
Transfer of Unclaimed Dividend and Shares to Investor Education and Protection Fund (IEPF)
Pursuant to the provisions of the Act, read with Investor Education Protection Fund Authority (Accounting, Audit, Transfer and Refund) Rules, 2016, as amended (‘Rules’), the dividends, unclaimed for
a period of seven years from the date of transfer to the Unpaid Dividend Account of the Company are liable to be transferred to the IEPF. Accordingly, unclaimed dividends of Shareholders for FY 2012-13 lying in the unclaimed dividend account of the Company as on September 15, 2020 will be due for transfer to IEPF on the
Corporate Overview 02
Strategic Review 46
Performance Review 20
Statutory Reports 84
Our Strategy 28
Financial Statements 206
145
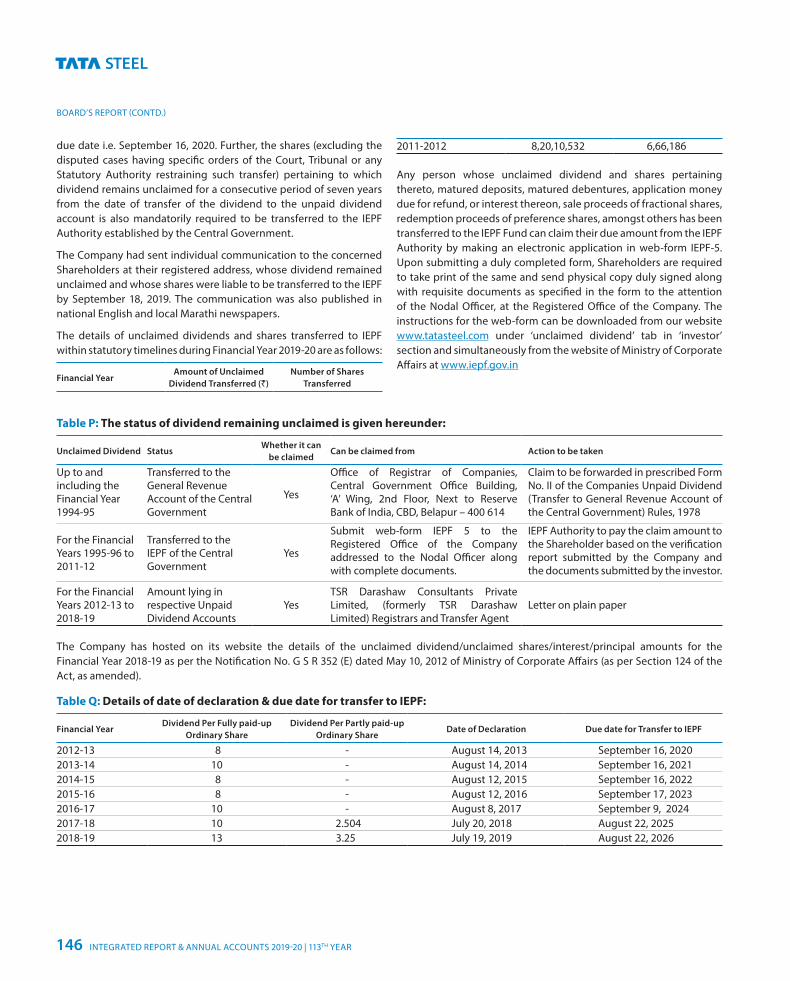
BOARD’S REPORT (CONTD.)
due date i.e. September 16, 2020. Further, the shares (excluding the disputed cases having specific orders of the Court, Tribunal or any Statutory Authority restraining such transfer) pertaining to which dividend remains unclaimed for a consecutive period of seven years from the date of transfer of the dividend to the unpaid dividend account is also mandatorily required to be transferred to the IEPF Authority established by the Central Government.
The Company had sent individual communication to the concerned Shareholders at their registered address, whose dividend remained unclaimed and whose shares were liable to be transferred to the IEPF by September 18, 2019. The communication was also published in national English and local Marathi newspapers.
The details of unclaimed dividends and shares transferred to IEPF within statutory timelines during Financial Year 2019-20 are as follows:
Financial YearAmount of Unclaimed
Dividend Transferred (`)Number of Shares
Transferred
2011-2012 8,20,10,532 6,66,186
Any person whose unclaimed dividend and shares pertaining thereto, matured deposits, matured debentures, application money due for refund, or interest thereon, sale proceeds of fractional shares, redemption proceeds of preference shares, amongst others has been transferred to the IEPF Fund can claim their due amount from the IEPF Authority by making an electronic application in web-form IEPF-5. Upon submitting a duly completed form, Shareholders are required to take print of the same and send physical copy duly signed along with requisite documents as specified in the form to the attention of the Nodal Officer, at the Registered Office of the Company. The instructions for the web-form can be downloaded from our website www.tatasteel.com under ‘unclaimed dividend’ tab in ‘investor’ section and simultaneously from the website of Ministry of Corporate Affairs at www.iepf.gov.in
Table P: The status of dividend remaining unclaimed is given hereunder:
Unclaimed Dividend StatusWhether it can
be claimedCan be claimed from Action to be taken
Up to and including the Financial Year 1994-95
Transferred to the General Revenue Account of the Central Government
Yes
Office of Registrar of Companies, Central Government Office Building, ‘A’ Wing, 2nd Floor, Next to Reserve Bank of India, CBD, Belapur – 400 614
Claim to be forwarded in prescribed Form No. II of the Companies Unpaid Dividend (Transfer to General Revenue Account of the Central Government) Rules, 1978
For the Financial Years 1995-96 to 2011-12
Transferred to the IEPF of the Central Government
Yes
Submit web-form IEPF 5 to the Registered Office of the Company addressed to the Nodal Officer along with complete documents.
IEPF Authority to pay the claim amount to the Shareholder based on the verification report submitted by the Company and the documents submitted by the investor.
For the Financial Years 2012-13 to 2018-19
Amount lying in respective Unpaid Dividend Accounts
YesTSR Darashaw Consultants Private Limited, (formerly TSR Darashaw Limited) Registrars and Transfer Agent
Letter on plain paper
The Company has hosted on its website the details of the unclaimed dividend/unclaimed shares/interest/principal amounts for the Financial Year 2018-19 as per the Notification No. G S R 352 (E) dated May 10, 2012 of Ministry of Corporate Affairs (as per Section 124 of the Act, as amended).
Table Q: Details of date of declaration & due date for transfer to IEPF:
Financial YearDividend Per Fully paid-up
Ordinary ShareDividend Per Partly paid-up
Ordinary ShareDate of Declaration Due date for Transfer to IEPF
2012-13 8 - August 14, 2013 September 16, 20202013-14 10 - August 14, 2014 September 16, 20212014-15 8 - August 12, 2015 September 16, 20222015-16 8 - August 12, 2016 September 17, 20232016-17 10 - August 8, 2017 September 9, 20242017-18 10 2.504 July 20, 2018 August 22, 20252018-19 13 3.25 July 19, 2019 August 22, 2026
INTEGRATED REPORT & ANNUAL ACCOUNTS 2019-20 | 113TH YEAR146
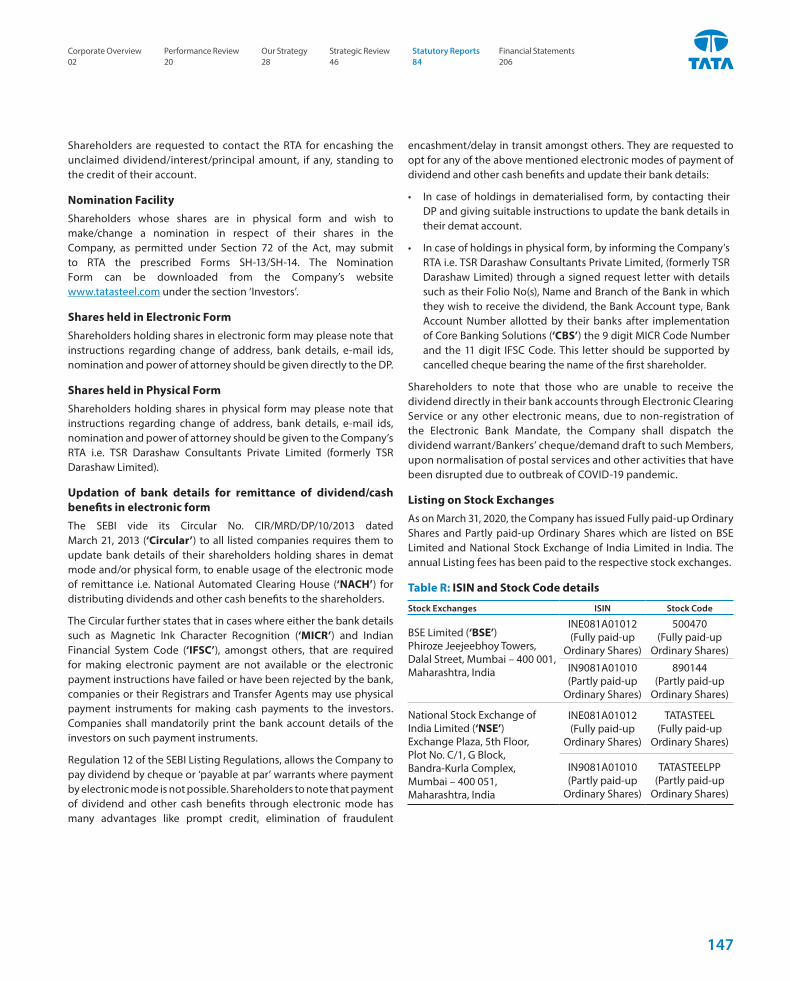
Shareholders are requested to contact the RTA for encashing the unclaimed dividend/interest/principal amount, if any, standing to the credit of their account.
Nomination FacilityShareholders whose shares are in physical form and wish to make/change a nomination in respect of their shares in the Company, as permitted under Section 72 of the Act, may submit to RTA the prescribed Forms SH-13/SH-14. The Nomination Form can be downloaded from the Company’s website www.tatasteel.com under the section ‘Investors’.
Shares held in Electronic FormShareholders holding shares in electronic form may please note that instructions regarding change of address, bank details, e-mail ids, nomination and power of attorney should be given directly to the DP.
Shares held in Physical FormShareholders holding shares in physical form may please note that instructions regarding change of address, bank details, e-mail ids, nomination and power of attorney should be given to the Company’s RTA i.e. TSR Darashaw Consultants Private Limited (formerly TSR Darashaw Limited).
Updation of bank details for remittance of dividend/cash benefits in electronic formThe SEBI vide its Circular No. CIR/MRD/DP/10/2013 dated March 21, 2013 (‘Circular’) to all listed companies requires them to update bank details of their shareholders holding shares in demat mode and/or physical form, to enable usage of the electronic mode of remittance i.e. National Automated Clearing House (‘NACH’) for distributing dividends and other cash benefits to the shareholders.
The Circular further states that in cases where either the bank details such as Magnetic Ink Character Recognition (‘MICR’) and Indian Financial System Code (‘IFSC’), amongst others, that are required for making electronic payment are not available or the electronic payment instructions have failed or have been rejected by the bank, companies or their Registrars and Transfer Agents may use physical payment instruments for making cash payments to the investors. Companies shall mandatorily print the bank account details of the investors on such payment instruments.
Regulation 12 of the SEBI Listing Regulations, allows the Company to pay dividend by cheque or ‘payable at par’ warrants where payment by electronic mode is not possible. Shareholders to note that payment of dividend and other cash benefits through electronic mode has many advantages like prompt credit, elimination of fraudulent
encashment/delay in transit amongst others. They are requested to opt for any of the above mentioned electronic modes of payment of dividend and other cash benefits and update their bank details:
• In case of holdings in dematerialised form, by contacting their DP and giving suitable instructions to update the bank details in their demat account.
• In case of holdings in physical form, by informing the Company’s RTA i.e. TSR Darashaw Consultants Private Limited, (formerly TSR Darashaw Limited) through a signed request letter with details such as their Folio No(s), Name and Branch of the Bank in which they wish to receive the dividend, the Bank Account type, Bank Account Number allotted by their banks after implementation of Core Banking Solutions (‘CBS’) the 9 digit MICR Code Number and the 11 digit IFSC Code. This letter should be supported by cancelled cheque bearing the name of the first shareholder.
Shareholders to note that those who are unable to receive the dividend directly in their bank accounts through Electronic Clearing Service or any other electronic means, due to non-registration of the Electronic Bank Mandate, the Company shall dispatch the dividend warrant/Bankers’ cheque/demand draft to such Members, upon normalisation of postal services and other activities that have been disrupted due to outbreak of COVID-19 pandemic.
Listing on Stock Exchanges As on March 31, 2020, the Company has issued Fully paid-up Ordinary Shares and Partly paid-up Ordinary Shares which are listed on BSE Limited and National Stock Exchange of India Limited in India. The annual Listing fees has been paid to the respective stock exchanges.
Table R: ISIN and Stock Code details
Stock Exchanges ISIN Stock Code
BSE Limited (‘BSE’)Phiroze Jeejeebhoy Towers,Dalal Street, Mumbai – 400 001,Maharashtra, India
INE081A01012(Fully paid-up
Ordinary Shares)
500470(Fully paid-up
Ordinary Shares)
IN9081A01010(Partly paid-up
Ordinary Shares)
890144(Partly paid-up
Ordinary Shares)
National Stock Exchange of India Limited (‘NSE’)Exchange Plaza, 5th Floor, Plot No. C/1, G Block, Bandra-Kurla Complex, Mumbai – 400 051, Maharashtra, India
INE081A01012(Fully paid-up
Ordinary Shares)
TATASTEEL (Fully paid-up
Ordinary Shares)
IN9081A01010(Partly paid-up
Ordinary Shares)
TATASTEELPP(Partly paid-up
Ordinary Shares)
Corporate Overview 02
Strategic Review 46
Performance Review 20
Statutory Reports 84
Our Strategy 28
Financial Statements 206
147
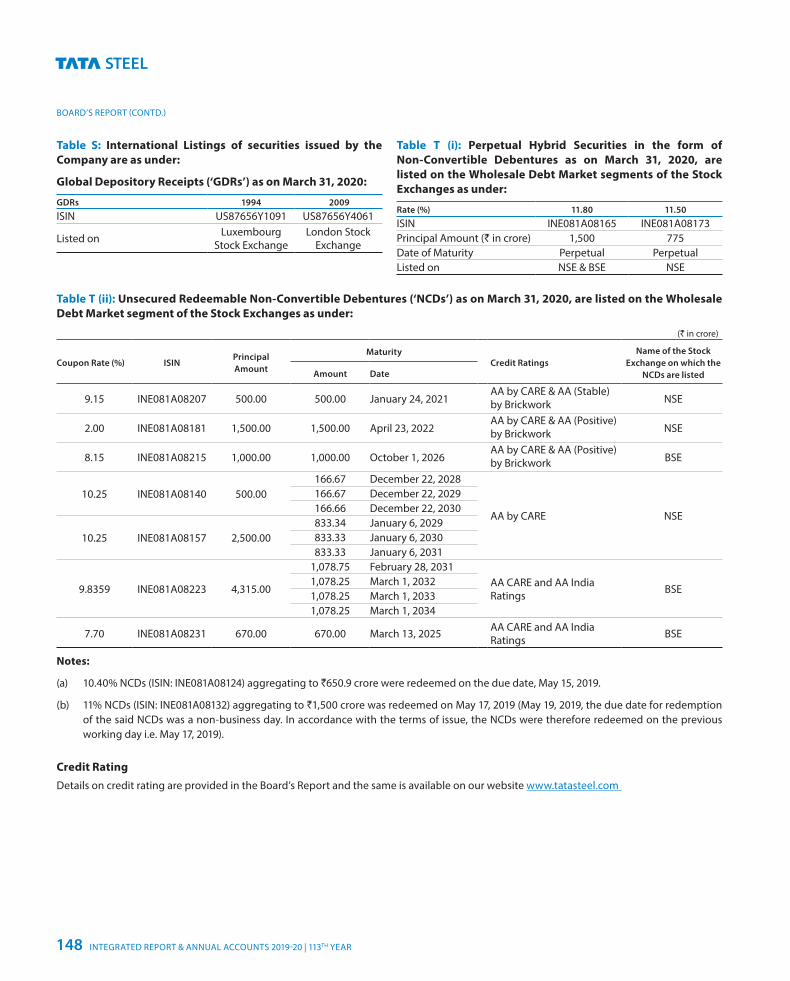
BOARD’S REPORT (CONTD.)
Table S: International Listings of securities issued by the Company are as under:
Global Depository Receipts (‘GDRs’) as on March 31, 2020:
GDRs 1994 2009
ISIN US87656Y1091 US87656Y4061
Listed on Luxembourg Stock Exchange
London Stock Exchange
Table T (i): Perpetual Hybrid Securities in the form of Non-Convertible Debentures as on March 31, 2020, are listed on the Wholesale Debt Market segments of the Stock Exchanges as under:
Rate (%) 11.80 11.50
ISIN INE081A08165 INE081A08173Principal Amount (` in crore) 1,500 775Date of Maturity Perpetual PerpetualListed on NSE & BSE NSE
Table T (ii): Unsecured Redeemable Non-Convertible Debentures (‘NCDs’) as on March 31, 2020, are listed on the Wholesale Debt Market segment of the Stock Exchanges as under:
(` in crore)
Coupon Rate (%) ISINPrincipal Amount
MaturityCredit Ratings
Name of the Stock Exchange on which the
NCDs are listedAmount Date
9.15 INE081A08207 500.00 500.00 January 24, 2021AA by CARE & AA (Stable) by Brickwork NSE
2.00 INE081A08181 1,500.00 1,500.00 April 23, 2022AA by CARE & AA (Positive) by Brickwork NSE
8.15 INE081A08215 1,000.00 1,000.00 October 1, 2026AA by CARE & AA (Positive) by Brickwork BSE
10.25 INE081A08140 500.00166.67 December 22, 2028
AA by CARE NSE
166.67 December 22, 2029166.66 December 22, 2030
10.25 INE081A08157 2,500.00833.34 January 6, 2029833.33 January 6, 2030833.33 January 6, 2031
9.8359 INE081A08223 4,315.00
1,078.75 February 28, 2031AA CARE and AA India Ratings BSE
1,078.25 March 1, 20321,078.25 March 1, 20331,078.25 March 1, 2034
7.70 INE081A08231 670.00 670.00 March 13, 2025 AA CARE and AA India Ratings BSE
Notes:
(a) 10.40% NCDs (ISIN: INE081A08124) aggregating to `650.9 crore were redeemed on the due date, May 15, 2019.
(b) 11% NCDs (ISIN: INE081A08132) aggregating to `1,500 crore was redeemed on May 17, 2019 (May 19, 2019, the due date for redemption of the said NCDs was a non-business day. In accordance with the terms of issue, the NCDs were therefore redeemed on the previous working day i.e. May 17, 2019).
Credit RatingDetails on credit rating are provided in the Board’s Report and the same is available on our website www.tatasteel.com
INTEGRATED REPORT & ANNUAL ACCOUNTS 2019-20 | 113TH YEAR148
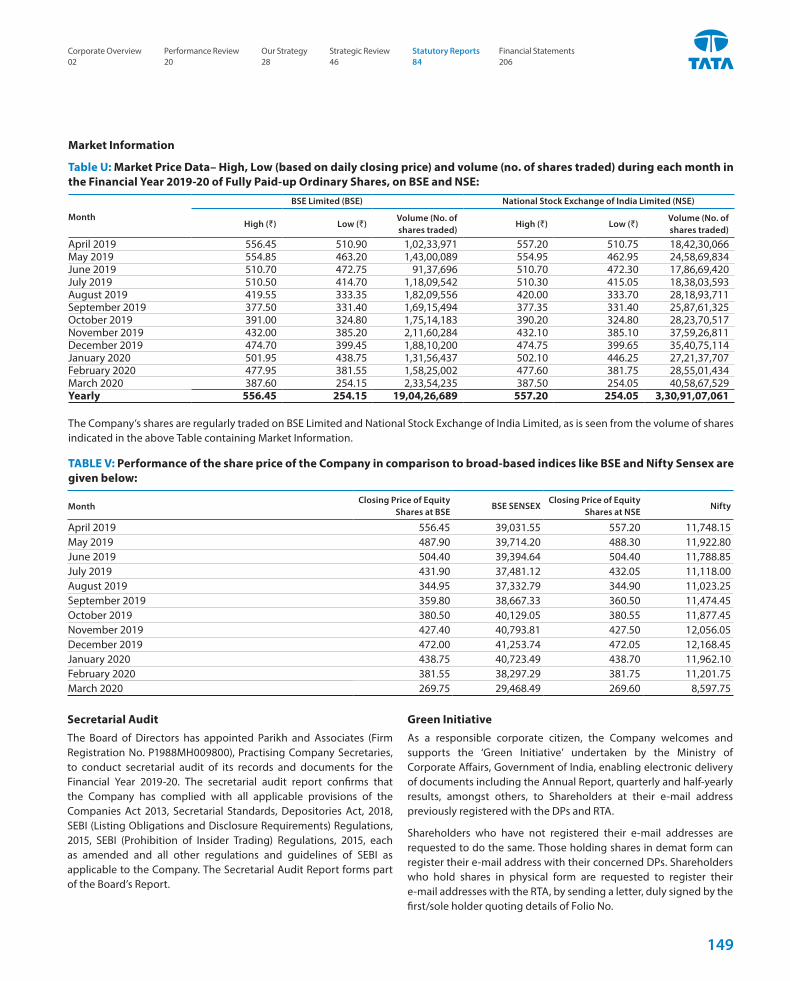
Market Information
Table U: Market Price Data– High, Low (based on daily closing price) and volume (no. of shares traded) during each month in the Financial Year 2019-20 of Fully Paid-up Ordinary Shares, on BSE and NSE:
Month
BSE Limited (BSE) National Stock Exchange of India Limited (NSE)
High (`) Low (`)Volume (No. of shares traded)
High (`) Low (`)Volume (No. of shares traded)
April 2019 556.45 510.90 1,02,33,971 557.20 510.75 18,42,30,066May 2019 554.85 463.20 1,43,00,089 554.95 462.95 24,58,69,834June 2019 510.70 472.75 91,37,696 510.70 472.30 17,86,69,420July 2019 510.50 414.70 1,18,09,542 510.30 415.05 18,38,03,593August 2019 419.55 333.35 1,82,09,556 420.00 333.70 28,18,93,711September 2019 377.50 331.40 1,69,15,494 377.35 331.40 25,87,61,325October 2019 391.00 324.80 1,75,14,183 390.20 324.80 28,23,70,517November 2019 432.00 385.20 2,11,60,284 432.10 385.10 37,59,26,811December 2019 474.70 399.45 1,88,10,200 474.75 399.65 35,40,75,114January 2020 501.95 438.75 1,31,56,437 502.10 446.25 27,21,37,707February 2020 477.95 381.55 1,58,25,002 477.60 381.75 28,55,01,434March 2020 387.60 254.15 2,33,54,235 387.50 254.05 40,58,67,529Yearly 556.45 254.15 19,04,26,689 557.20 254.05 3,30,91,07,061
The Company’s shares are regularly traded on BSE Limited and National Stock Exchange of India Limited, as is seen from the volume of shares indicated in the above Table containing Market Information.
TABLE V: Performance of the share price of the Company in comparison to broad-based indices like BSE and Nifty Sensex are given below:
Secretarial Audit The Board of Directors has appointed Parikh and Associates (Firm Registration No. P1988MH009800), Practising Company Secretaries, to conduct secretarial audit of its records and documents for the Financial Year 2019-20. The secretarial audit report confirms that the Company has complied with all applicable provisions of the Companies Act 2013, Secretarial Standards, Depositories Act, 2018, SEBI (Listing Obligations and Disclosure Requirements) Regulations, 2015, SEBI (Prohibition of Insider Trading) Regulations, 2015, each as amended and all other regulations and guidelines of SEBI as applicable to the Company. The Secretarial Audit Report forms part of the Board’s Report.
Green InitiativeAs a responsible corporate citizen, the Company welcomes and supports the ‘Green Initiative’ undertaken by the Ministry of Corporate Affairs, Government of India, enabling electronic delivery of documents including the Annual Report, quarterly and half-yearly results, amongst others, to Shareholders at their e-mail address previously registered with the DPs and RTA.
Shareholders who have not registered their e-mail addresses are requested to do the same. Those holding shares in demat form can register their e-mail address with their concerned DPs. Shareholders who hold shares in physical form are requested to register their e-mail addresses with the RTA, by sending a letter, duly signed by the first/sole holder quoting details of Folio No.
MonthClosing Price of Equity
Shares at BSEBSE SENSEX
Closing Price of Equity Shares at NSE
Nifty
April 2019 556.45 39,031.55 557.20 11,748.15 May 2019 487.90 39,714.20 488.30 11,922.80 June 2019 504.40 39,394.64 504.40 11,788.85 July 2019 431.90 37,481.12 432.05 11,118.00 August 2019 344.95 37,332.79 344.90 11,023.25 September 2019 359.80 38,667.33 360.50 11,474.45 October 2019 380.50 40,129.05 380.55 11,877.45 November 2019 427.40 40,793.81 427.50 12,056.05 December 2019 472.00 41,253.74 472.05 12,168.45 January 2020 438.75 40,723.49 438.70 11,962.10 February 2020 381.55 38,297.29 381.75 11,201.75 March 2020 269.75 29,468.49 269.60 8,597.75
Corporate Overview 02
Strategic Review 46
Performance Review 20
Statutory Reports 84
Our Strategy 28
Financial Statements 206
149
BOARD’S REPORT (CONTD.)
Major Plant Locations:Tata Steel Kalinganagar PlantTata Steel LimitedKalinganagar Industrial ComplexDuburi, Dist. JajpurOdisha – 755 026
Tata Steel Jamshedpur PlantTata Steel LimitedP.O. BistupurJamshedpur – 831 001
Cold Rolling Mill Complex, BaraTata Steel LimitedP.O. Agrico, P.S. SidhgoraBlock: Jamshedpur, Dist. Purbi SinghbhumPin – 831 009
Tata Steel Growth ShopGrowth ShopTata Steel LimitedAdityapur Industrial Estate,P.O. Gamharia, Dist. Seraikela-Kharsawan Pin – 832 108
Tata Steel Tubes DivisionTubes DivisionTata Steel LimitedP.O. Burma MinesJamshedpur – 831 007
Joda East Iron MineJoda Central OrganisationTata Steel Limited, JodaDist. Keonjhar, Odisha – 758 034
Cold Rolling Complex (West)Tata Steel LimitedPlot No. S 76, Tarapur Industrial AreaP Box 22, Tarapur Industrial Estate Post OfficeDistrict Palghar, Maharashtra – 401 506
Wire Division, TarapurTata Steel Limited - Wire DivisionPlot F8 & A6, Tarapur MIDCP.O. Boisar, Dist. Palghar – 401 506
Wire Division, IndoreIndore – Tata Steel Limited, Wire DivisionPlot 14/15/16 & 32 Industrial EstateLaxmibai Nagar, Fort IndoreMadhya Pradesh - 452 006
Wire Division, PithampurPithampur Wire DivisionPlot 158 & 158A, Sector IIIIndustrial Estate, PithampurMadhya Pradesh – 454 774
Bearings DivisionTata Steel LimitedP.O. Rakha Jungle, Nimpura Industrial EstateKharagpur, West Bengal – 721 301
Sukinda Chromite MineTata Steel LimitedP.O. Kalarangiatta, Dist. JajpurOdisha – 755 028
Noamundi Iron MineTata Steel LimitedWest Singhbhum, NoamundiJharkhand – 833 217
Ferro Alloys Plant, BamnipalTata Steel LimitedP.O. Bamnipal, Dist. KeonjharOdisha – 758 082
Joda West Iron & Manganese MineTata Steel LimitedP.O. Bichakundi, Joda, Dist. KeonjharOdisha – 758 034
Bamebari Iron & Manganese MineTata Steel LimitedP.O. Bamebari, Joda, Dist. KeonjharOdisha – 758 086
Tiringpahar Iron & Manganese MineTata Steel LimitedP.O. Bamebari, Joda, Dist. KeonjharOdisha – 758 086
Gomardih Dolomite QuarryTata Steel LimitedP.O. Tunmura, Dist. SundergarhOdisha – 770 070
Jharia DivisionTata Steel LimitedJamadoba, DhanbadJharkhand – 828 112
West Bokaro DivisionTata Steel LimitedGhatotand, Dist. RamgarhJharkhand – 825 314
Hooghly Met Coke DivisionTata Steel LimitedPatikhali, Haldia, PurbaMedinipur, West Bengal – 721 606
Ferro Alloys Plant, JodaTata Steel LimitedDist. Keonjhar, Odisha – 758 034
Ferro Chrome Plant, GopalpurTata Steel LimitedP.O. Chamakhandi, Chatrapur TahsilDist. Ganjam, Odisha – 761 020
INTEGRATED REPORT & ANNUAL ACCOUNTS 2019-20 | 113TH YEAR150
Name, designation & address of Compliance Officer:Mr. Parvatheesam Kanchinadham, Company Secretary & Chief Legal Officer (Corporate & Compliance)Bombay House, 24, Homi Mody Street, Fort, Mumbai – 400 001.Tel.: +91 22 6665 7330E-mail: [email protected]
Name, designation & address of Investor Relations Officer:Mr. Sandep Agrawal, Head - Group Investor RelationOne Forbes, 6th Floor, 1, Dr. V. B. Gandhi Marg, Fort, Mumbai – 400 001.Tel.: +91 22 6665 0530E-mail: [email protected]
Debenture Trustee:IDBI Trusteeship Services LimitedAsian Building, Ground Floor,17, R. Kamani Marg, Ballard Estate, Mumbai – 400 001.Tel.: +91 22 4080 7000; Fax: +91 22 6631 1776E-mail: [email protected] Website: www.idbitrustee.com
Stock Exchanges:BSE LimitedPhiroze Jeejeebhoy Towers,Dalal Street, Mumbai – 400 001.Tel.: +91 22 2272 1233; Fax: +91 22 2272 1919Website: www.bseindia.com
National Stock Exchange of India LimitedExchange Plaza, Plot No. C/1,G Block Bandra-Kurla Complex,Bandra (E), Mumbai-400051.Tel.: +91 22 2659 8100; Fax: +91 22 2659 8120Website: www.nseindia.com
Luxembourg Stock Exchange35A Boulevard Joseph IIL-1840 Luxembourg,Tel.: (+352) 4779361Fax: (+352) 473298Website: www.bourse.lu
London Stock Exchange10 Paternoster Square,London - EC4M 7LSTel.: (+44) 20 7797 1000Website: www.londonstockexchange.com
Depository Services:National Securities Depository LimitedTrade World, A Wing, 4th & 5th Floors,Kamala Mills Compound,Lower Parel, Mumbai – 400 013.Tel.: +91 22 2499 4200; Fax: +91 22 2497 6351 E-mail: [email protected] Investor Grievance: [email protected] Website: www.nsdl.co.in
Central Depository Services (India) LimitedMarathon Futurex, A-Wing, 25th Floor,NM Joshi Marg,Lower Parel (East), Mumbai – 400 013.Tel.: +91 22 2305 8640/8624/8639/8663E-mail: [email protected], Investor Grievance: [email protected]: www.cdslindia.com
Registrars and Transfer Agents:TSR Darashaw Consultants Private Limited (formerly TSR Darashaw Limited)CIN: U74999MH2018PTC307859Unit: Tata Steel Limited,6-10, Haji Moosa Patrawala Industrial Estate,Near Famous Studio, 20, Dr. E Moses Road,Mahalaxmi, Mumbai – 400 011.Contact Person: Ms. Mary GeorgeTel.: +91 22 6656 8484/8411/8412/8413Fax: +91 22 6656 8494Timings: Monday to Friday,10 a.m. (IST) to 3.30 p.m. (IST)E-mail: [email protected]: www.tsrdarashaw.com
Investor Contact:Registered Office:Bombay House, 24, Homi Mody Street,Fort, Mumbai – 400 001.Tel.: +91 22 6665 8282; E-mail: [email protected]: www.tatasteel.com CIN: L27100MH1907PLC000260
For the convenience of investors based in the following cities, correspondence/documents will also be accepted at the following branches/agencies of TSR Darashaw Consultants Private Limited (formerly TSR Darashaw Limited):
KolkataTata Centre, 1st Floor, 43, Jawaharlal Nehru Road, Kolkata – 700 071Contact person: Mr. Rijit Mukherjee Tel.: +91-33-2288 3087Fax: +91-33-2288 3062E-mail: [email protected]
New Delhi Plot No. 2/42, Sant Vihar, Ansari Road Daryaganj, New Delhi – 110 002Contact person: Mr. Shyamalendu ShomeTel.: +91-11-2327 1805Fax: +91-11-23271802E-mail: [email protected]
Jamshedpur Bungalow No. 1, ‘E’ Road, Northern Town Bistupur, Jamshedpur – 831 001Contact person: Mr. Subrato DasTel.: +91-657-2426 616 Fax: +91-657-2426 937E-mail: [email protected]
AhmedabadShah Consultancy Services Ltd. 3, Sumatinath Complex, Pritam Nagar Akhada Road, Ellisbridge,Ahmedabad – 380 006Contact person: Mr. Suresh ShahTel.: +91-79-2657 6038Fax: +91-79-2657-6038E-mail: [email protected]
Bengaluru503 Barton Centre, 5th Floor 84, Mahatma Gandhi Road, Bengaluru – 560 001Contact person: Mr. Jaymohan K.Tel.: +91-80-2532 0321Fax: +91-80-2558 0019E-mail: [email protected]
Corporate Overview 02
Strategic Review 46
Performance Review 20
Statutory Reports 84
Our Strategy 28
Financial Statements 206
151
BOARD’S REPORT (CONTD.)
Details of Corporate PoliciesParticulars Website Details/Links
Dividend Distribution Policy https://www.tatasteel.com/media/6086/dividend-policy-final.pdfComposition and Profile of the Board of Directors
https://www.tatasteel.com/corporate/our-organisation/leadership/
Terms and conditions of appointment of Independent Directors
https://www.tatasteel.com/media/2917/terms-and-conditions-of-appointment-of-independent-directors.pdf
Policy on Appointment and Removal of Directors
https://www.tatasteel.com/media/6816/policy-on-appointment-and-removal-of-directors.pdf
Familiarisation Programme for Independent Directors
https://www.tatasteel.com/media/12333/familiarization-programme-for-independent-directors-for-website.pdf
Remuneration Policy of Directors, KMPs & Other Employees
https://www.tatasteel.com/media/6817/remuneration-policy-of-directors-etc.pdf
Tata Code of Conduct https://www.tatasteel.com/media/1864/tcoc.pdfCriteria for Making Payments to Non-Executive Directors
https://www.tatasteel.com/media/3931/criteria-of-making-payments-to-neds.pdf
Corporate Social Responsibility Policy https://www.tatasteel.com/media/1879/csr-policy-version-20.pdfCode of Conduct for Non-Executive Directors
https://www.tatasteel.com/media/3930/tcoc-non-executive-directors.pdf
Policy on Related Party Transactions https://www.tatasteel.com/media/5891/policy-on-related-party-transactions.pdfPolicy on Determining Material Subsidiary
https://www.tatasteel.com/media/5890/policy-on-determining-material-subsidiaries.pdf
Whistle-Blower Policyhttps://www.tatasteel.com/media/9942/whistle-blower-policy-for-business-associates.pdfhttps://www.tatasteel.com/media/11322/revised-whistleblower-policy-december-18-2019.pdf
Code of Corporate Disclosure Practices https://www.tatasteel.com/media/6843/code-of-corporate-disclosure-practices.pdfPolicy on Determination of Materiality for Disclosure
https://www.tatasteel.com/media/6844/tata-steel-determination-of-materiality-policy.pdf
Document Retention and Archival Policy
https://www.tatasteel.com/media/6845/tata-steel-document-retention-policy.pdf
Prevention of Sexual Harassment (POSH) at Workplace Policy
https://www.tatasteel.com/media/7526/posh.pdf
Reconciliation of Share Capital Audit Report
https://www.tatasteel.com/investors/stock-exchange-compliances/reconciliation-of-share-capital-audit-reports/
INTEGRATED REPORT & ANNUAL ACCOUNTS 2019-20 | 113TH YEAR152
Practising Company Secretaries’ Certificate on Corporate Governance
To,The Members ofTata Steel Limited
We have examined the compliance of the conditions of Corporate Governance by Tata Steel Limited (‘the Company’) for the year ended on March 31, 2020, as stipulated under Regulations 17 to 27, clauses (b) to (i) of sub-regulation (2) of Regulation 46 and para C, D & E of Schedule V of the Securities and Exchange Board of India (Listing Obligations and Disclosure Requirements) Regulations, 2015 ('SEBI Listing Regulations').
The compliance of the conditions of Corporate Governance is the responsibility of the management. Our examination was limited to the review of procedures and implementation thereof, as adopted by the Company for ensuring compliance with conditions of Corporate Governance. It is neither an audit nor an expression of opinion on the financial statements of the Company.
In our opinion and to the best of our information and according to the explanations given to us, and the representations made by the Directors and the management and considering the relaxations granted by the Ministry of Corporate Affairs and Securities and Exchange Board of India warranted due to the spread of the COVID-19 pandemic, we certify that the Company has complied with the conditions of Corporate Governance as stipulated in the SEBI Listing Regulations for the year ended March 31, 2020.
We further state that such compliance is neither an assurance as to the future viability of the Company nor of the efficiency or effectiveness with which the management has conducted the affairs of the Company.
For Parikh & AssociatesPractising Company Secretaries
sd/-P. N. PARIKH
Mumbai FCS: 327 CP: 1228June 29, 2020 UDIN: F000327B000393588
Declaration Regarding Compliance by Board Members and Senior Management Personnel with the Code of Conduct
This is to confirm that the Company has adopted the Tata Code of Conduct for its employees including the Managing Director and the Whole-time Directors. In addition, the Company has adopted the Tata Code of Conduct for the Non-Executive Directors. Both these Codes are available on the Company’s website at www.tatasteel.com
I confirm that the Company has in respect of the Financial Year ended March 31, 2020, received from the Senior Management Team of the Company and the Members of the Board, a declaration of compliance with the Code of Conduct as applicable to them.
For the purpose of this declaration, Senior Management Team means the Members of the Management one level below the Chief Executive Officer & Managing Director as on March 31, 2020.
sd/-T. V. NARENDRAN
Chief Executive Officer & Managing Director
Mumbai DIN: 03083605June 29, 2020
Corporate Overview 02
Strategic Review 46
Performance Review 20
Statutory Reports 84
Our Strategy 28
Financial Statements 206
153
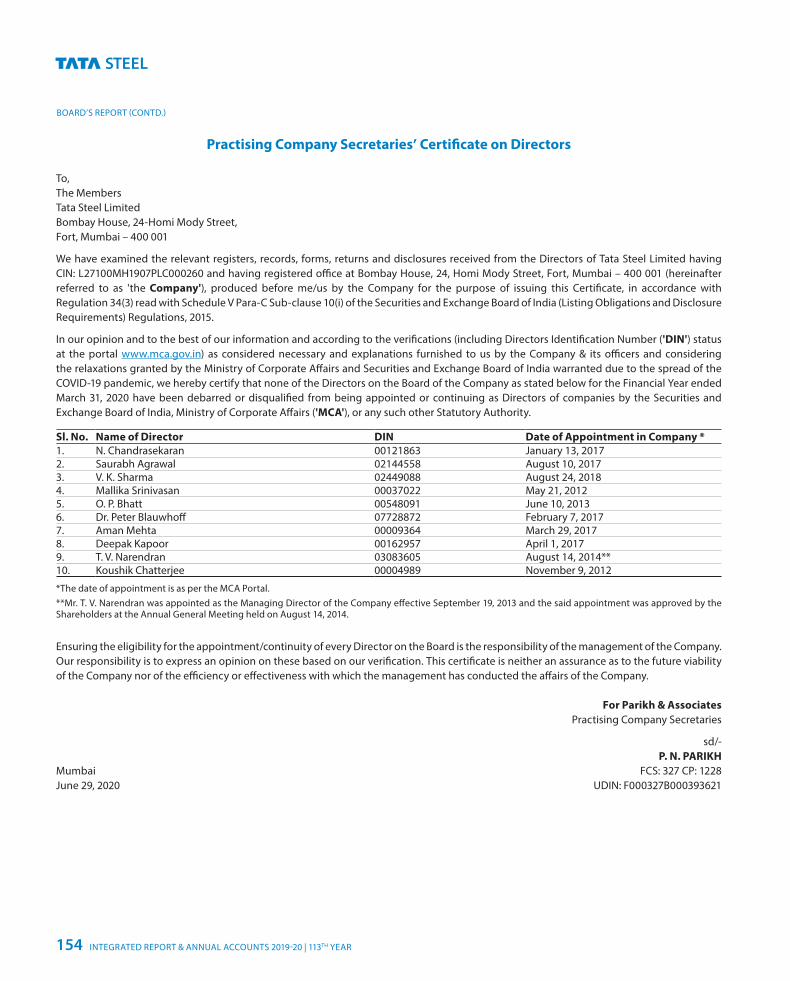
BOARD’S REPORT (CONTD.)
Practising Company Secretaries’ Certificate on Directors
To,The Members Tata Steel LimitedBombay House, 24-Homi Mody Street,Fort, Mumbai – 400 001
We have examined the relevant registers, records, forms, returns and disclosures received from the Directors of Tata Steel Limited having CIN: L27100MH1907PLC000260 and having registered office at Bombay House, 24, Homi Mody Street, Fort, Mumbai – 400 001 (hereinafter referred to as 'the Company'), produced before me/us by the Company for the purpose of issuing this Certificate, in accordance with Regulation 34(3) read with Schedule V Para-C Sub-clause 10(i) of the Securities and Exchange Board of India (Listing Obligations and Disclosure Requirements) Regulations, 2015.
In our opinion and to the best of our information and according to the verifications (including Directors Identification Number ('DIN') status at the portal www.mca.gov.in) as considered necessary and explanations furnished to us by the Company & its officers and considering the relaxations granted by the Ministry of Corporate Affairs and Securities and Exchange Board of India warranted due to the spread of the COVID-19 pandemic, we hereby certify that none of the Directors on the Board of the Company as stated below for the Financial Year ended March 31, 2020 have been debarred or disqualified from being appointed or continuing as Directors of companies by the Securities and Exchange Board of India, Ministry of Corporate Affairs ('MCA'), or any such other Statutory Authority.
Sl. No. Name of Director DIN Date of Appointment in Company *1. N. Chandrasekaran 00121863 January 13, 20172. Saurabh Agrawal 02144558 August 10, 20173. V. K. Sharma 02449088 August 24, 20184. Mallika Srinivasan 00037022 May 21, 20125. O. P. Bhatt 00548091 June 10, 20136. Dr. Peter Blauwhoff 07728872 February 7, 20177. Aman Mehta 00009364 March 29, 20178. Deepak Kapoor 00162957 April 1, 20179. T. V. Narendran 03083605 August 14, 2014**10. Koushik Chatterjee 00004989 November 9, 2012
*The date of appointment is as per the MCA Portal.**Mr. T. V. Narendran was appointed as the Managing Director of the Company effective September 19, 2013 and the said appointment was approved by the Shareholders at the Annual General Meeting held on August 14, 2014.
Ensuring the eligibility for the appointment/continuity of every Director on the Board is the responsibility of the management of the Company. Our responsibility is to express an opinion on these based on our verification. This certificate is neither an assurance as to the future viability of the Company nor of the efficiency or effectiveness with which the management has conducted the affairs of the Company.
For Parikh & AssociatesPractising Company Secretaries
sd/-P. N. PARIKH
Mumbai FCS: 327 CP: 1228June 29, 2020 UDIN: F000327B000393621
INTEGRATED REPORT & ANNUAL ACCOUNTS 2019-20 | 113TH YEAR154
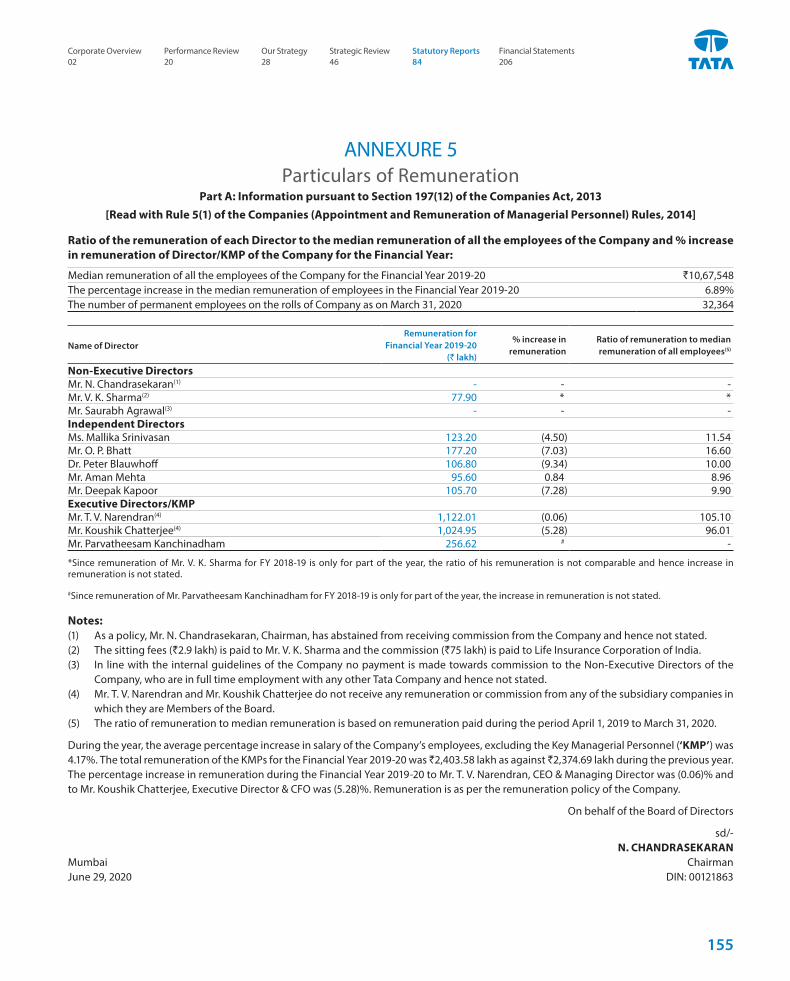
Particulars of RemunerationPart A: Information pursuant to Section 197(12) of the Companies Act, 2013
[Read with Rule 5(1) of the Companies (Appointment and Remuneration of Managerial Personnel) Rules, 2014]
ANNEXURE 5
Ratio of the remuneration of each Director to the median remuneration of all the employees of the Company and % increase in remuneration of Director/KMP of the Company for the Financial Year:
Median remuneration of all the employees of the Company for the Financial Year 2019-20 `10,67,548The percentage increase in the median remuneration of employees in the Financial Year 2019-20 6.89%The number of permanent employees on the rolls of Company as on March 31, 2020 32,364
Name of DirectorRemuneration for
Financial Year 2019-20 (` lakh)
% increase in remuneration
Ratio of remuneration to median remuneration of all employees(5)
Non-Executive DirectorsMr. N. Chandrasekaran(1) - - -Mr. V. K. Sharma(2) 77.90 * *Mr. Saurabh Agrawal(3) - - -Independent DirectorsMs. Mallika Srinivasan 123.20 (4.50) 11.54Mr. O. P. Bhatt 177.20 (7.03) 16.60Dr. Peter Blauwhoff 106.80 (9.34) 10.00Mr. Aman Mehta 95.60 0.84 8.96Mr. Deepak Kapoor 105.70 (7.28) 9.90Executive Directors/KMPMr. T. V. Narendran(4) 1,122.01 (0.06) 105.10Mr. Koushik Chatterjee(4) 1,024.95 (5.28) 96.01Mr. Parvatheesam Kanchinadham 256.62 # -
*Since remuneration of Mr. V. K. Sharma for FY 2018-19 is only for part of the year, the ratio of his remuneration is not comparable and hence increase in remuneration is not stated.
#Since remuneration of Mr. Parvatheesam Kanchinadham for FY 2018-19 is only for part of the year, the increase in remuneration is not stated.
Notes: (1) As a policy, Mr. N. Chandrasekaran, Chairman, has abstained from receiving commission from the Company and hence not stated.(2) The sitting fees (`2.9 lakh) is paid to Mr. V. K. Sharma and the commission (`75 lakh) is paid to Life Insurance Corporation of India. (3) In line with the internal guidelines of the Company no payment is made towards commission to the Non-Executive Directors of the
Company, who are in full time employment with any other Tata Company and hence not stated.(4) Mr. T. V. Narendran and Mr. Koushik Chatterjee do not receive any remuneration or commission from any of the subsidiary companies in
which they are Members of the Board.(5) The ratio of remuneration to median remuneration is based on remuneration paid during the period April 1, 2019 to March 31, 2020.
During the year, the average percentage increase in salary of the Company’s employees, excluding the Key Managerial Personnel (‘KMP’) was 4.17%. The total remuneration of the KMPs for the Financial Year 2019-20 was `2,403.58 lakh as against `2,374.69 lakh during the previous year. The percentage increase in remuneration during the Financial Year 2019-20 to Mr. T. V. Narendran, CEO & Managing Director was (0.06)% and to Mr. Koushik Chatterjee, Executive Director & CFO was (5.28)%. Remuneration is as per the remuneration policy of the Company.
On behalf of the Board of Directors
sd/-N. CHANDRASEKARAN
Mumbai ChairmanJune 29, 2020 DIN: 00121863
Corporate Overview 02
Strategic Review 46
Performance Review 20
Statutory Reports 84
Our Strategy 28
Financial Statements 206
155
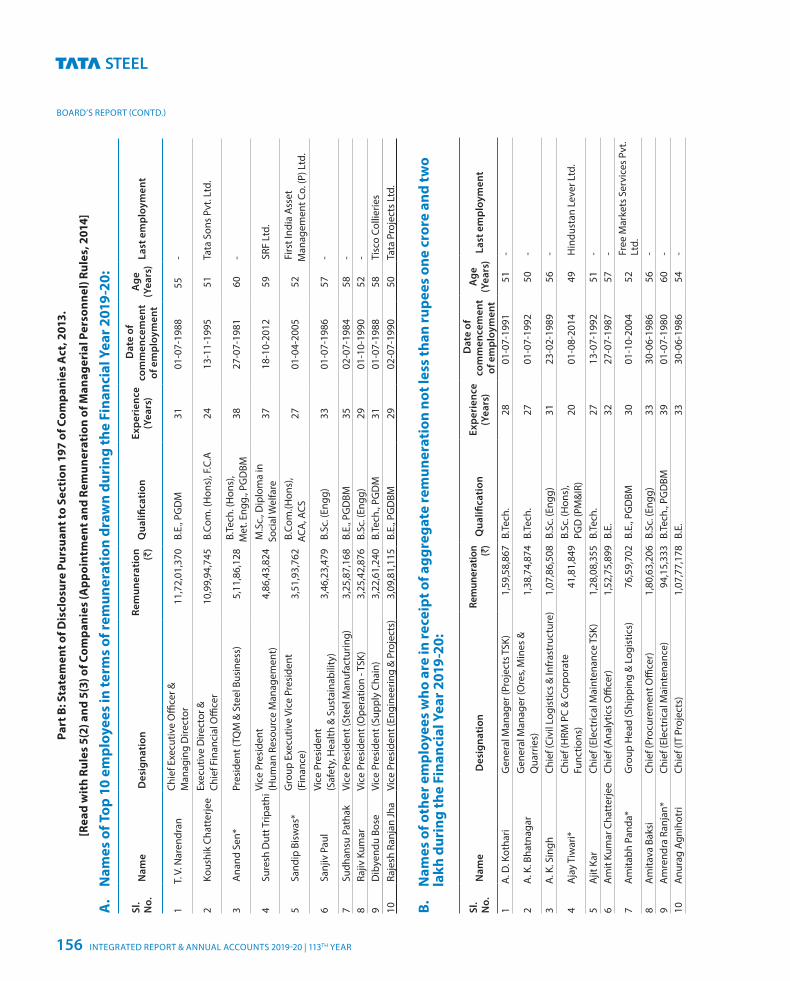
BOARD’S REPORT (CONTD.)
Part
B: S
tate
men
t of D
iscl
osur
e Pu
rsua
nt to
Sec
tion
197
of C
ompa
nies
Act
, 201
3.
[Rea
d w
ith
Rule
s 5(
2) a
nd 5
(3) o
f Com
pani
es (A
ppoi
ntm
ent a
nd R
emun
erat
ion
of M
anag
eria
l Per
sonn
el) R
ules
, 201
4]
A.
Nam
es o
f Top
10
empl
oyee
s in
term
s of
rem
uner
atio
n dr
awn
duri
ng th
e Fi
nanc
ial Y
ear 2
019-
20:
Sl.
No.
N
ame
Des
igna
tion
Re
mun
erat
ion (`)
Qua
lifica
tion
Ex
peri
ence
(Y
ears
)
Dat
e of
co
mm
ence
men
t of
em
ploy
men
t
Age
(Y
ears
) L
ast e
mpl
oym
ent
1T.
V. N
aren
dran
Chie
f Exe
cutiv
e O
ffice
r &
Man
agin
g D
irect
or
11,
72,0
1,37
0 B
.E.,
PGD
M
31
01-0
7-19
8855
-
2 K
oush
ik C
hatt
erje
e Ex
ecut
ive
Dire
ctor
&
Chie
f Fin
anci
al O
ffice
r 1
0,99
,94,
745
B.C
om. (
Hon
s), F
.C.A
2
4 13
-11-
1995
51
Tat
a So
ns P
vt. L
td.
3 A
nand
Sen
* Pr
esid
ent (
TQM
& S
teel
Bus
ines
s)
5,1
1,86
,128
B
.Tec
h. (H
ons)
, M
et. E
ngg.
, PG
DBM
3
8 27
-07-
1981
60
-
4 S
ures
h D
utt T
ripat
hi Vi
ce P
resi
dent
(H
uman
Res
ourc
e M
anag
emen
t)
4,8
6,43
,824
M
.Sc.
, Dip
lom
a in
So
cial
Wel
fare
3
7 18
-10-
2012
59
SRF
Ltd
.
5 S
andi
p Bi
swas
* G
roup
Exe
cutiv
e Vi
ce P
resi
dent
(F
inan
ce)
3,5
1,93
,762
B
.Com
.(Hon
s),
ACA
, ACS
2
7 01
-04-
2005
52
Firs
t Ind
ia A
sset
M
anag
emen
t Co.
(P) L
td.
6 S
anjiv
Pau
l Vi
ce P
resi
dent
(S
afet
y, H
ealth
& S
usta
inab
ility
) 3
,46,
23,4
79
B.S
c. (E
ngg)
3
3 01
-07-
1986
57
-
7 S
udha
nsu
Path
ak
Vice
Pre
side
nt (S
teel
Man
ufac
turin
g)
3,2
5,87
,168
B
.E.,
PGD
BM
35
02-0
7-19
84 5
8 -
8 R
ajiv
Kum
ar
Vice
Pre
side
nt (O
pera
tion
- TSK
) 3
,25,
42,8
76
B.S
c. (E
ngg)
2
9 01
-10-
1990
52
- 9
Dib
yend
u Bo
se
Vice
Pre
side
nt (S
uppl
y Ch
ain)
3
,22,
61,2
40
B.T
ech.
, PG
DM
3
1 01
-07-
1988
58
Tis
co C
ollie
ries
10 R
ajes
h Ra
njan
Jha
Vice
Pre
side
nt (E
ngin
eerin
g &
Pro
ject
s)
3,0
9,81
,115
B
.E.,
PGD
BM
29
02-0
7-19
90 5
0 T
ata
Proj
ects
Ltd
.
B.
Nam
es o
f oth
er e
mpl
oyee
s w
ho a
re in
rece
ipt o
f agg
rega
te re
mun
erat
ion
not l
ess
than
rupe
es o
ne c
rore
and
two
lakh
dur
ing
the
Fina
ncia
l Yea
r 201
9-20
:
Sl.
No.
N
ame
Des
igna
tion
Re
mun
erat
ion ()̀
Qua
lifica
tion
Ex
peri
ence
(Y
ears
)
Dat
e of
co
mm
ence
men
t of
em
ploy
men
t
Age
(Y
ears
) L
ast e
mpl
oym
ent
1A
. D. K
otha
ri G
ener
al M
anag
er (P
roje
cts T
SK)
1,5
9,58
,867
B.
Tech
. 2
8 01
-07-
1991
51
-
2A
. K. B
hatn
agar
G
ener
al M
anag
er (O
res,
Min
es &
Q
uarr
ies)
1
,38,
74,8
74
B.Te
ch.
27
01-0
7-19
92 5
0 -
3A
. K. S
ingh
Ch
ief (
Civi
l Log
istic
s &
Infr
astr
uctu
re)
1,0
7,86
,508
B.
Sc. (
Engg
) 3
1 23
-02-
1989
56
-
4A
jay
Tiw
ari*
Ch
ief (
HRM
PC
& C
orpo
rate
Fu
nctio
ns)
41,
81,8
49
B.Sc
. (H
ons)
, PG
D (P
M&
IR)
20
01-0
8-20
14 4
9 H
indu
stan
Lev
er L
td.
5A
jit K
ar
Chie
f (El
ectr
ical
Mai
nten
ance
TSK
) 1
,28,
08,3
55
B.Te
ch.
27
13-0
7-19
92 5
1 -
6A
mit
Kum
ar C
hatt
erje
e Ch
ief (
Ana
lytic
s O
ffice
r)
1,5
2,75
,899
B.
E. 3
2 27
-07-
1987
57
-
7A
mita
bh P
anda
* G
roup
Hea
d (S
hipp
ing
& L
ogis
tics)
7
6,59
,702
B.
E., P
GD
BM
30
01-1
0-20
04 5
2 Fr
ee M
arke
ts S
ervi
ces
Pvt.
Ltd.
8
Am
itava
Bak
si
Chie
f (Pr
ocur
emen
t Offi
cer)
1
,80,
63,2
06
B.Sc
. (En
gg)
33
30-0
6-19
86 5
6 -
9A
mre
ndra
Ran
jan*
Ch
ief (
Elec
tric
al M
aint
enan
ce)
94,
15,3
33
B.Te
ch.,
PGD
BM
39
01-0
7-19
80 6
0 -
10A
nura
g Ag
niho
tri
Chie
f (IT
Pro
ject
s)
1,0
7,77
,178
B.
E. 3
3 30
-06-
1986
54
-
INTEGRATED REPORT & ANNUAL ACCOUNTS 2019-20 | 113TH YEAR156
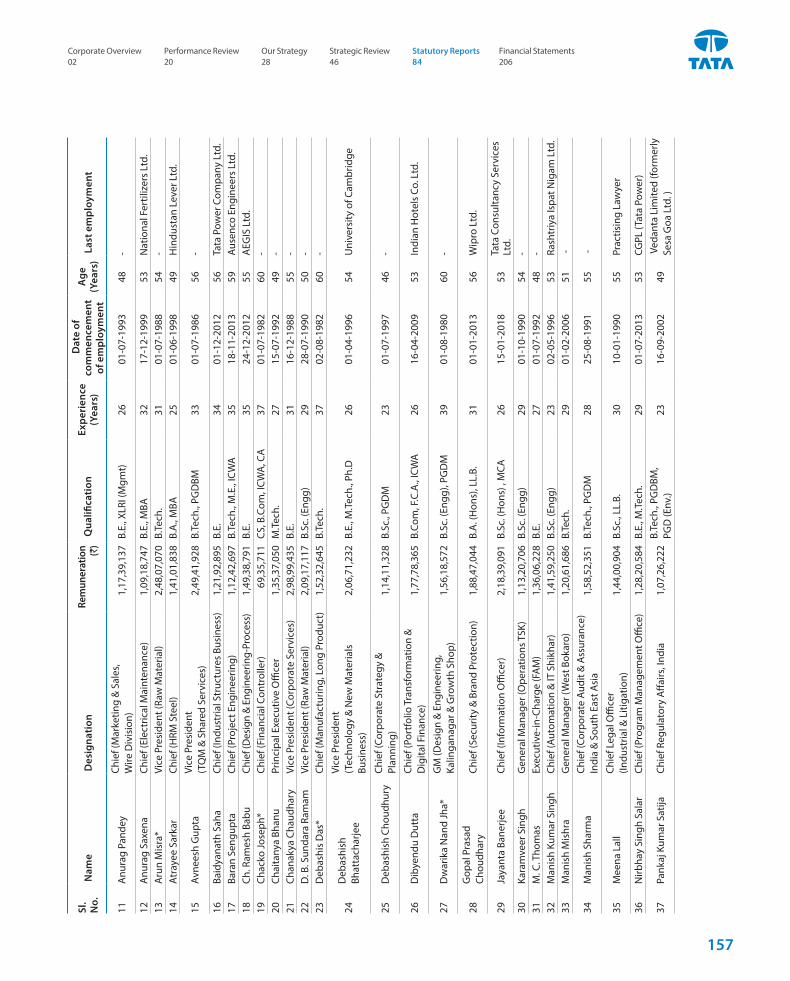
Sl.
No.
N
ame
Des
igna
tion
Re
mun
erat
ion ()̀
Qua
lifica
tion
Ex
peri
ence
(Y
ears
)
Dat
e of
co
mm
ence
men
t of
em
ploy
men
t
Age
(Y
ears
) L
ast e
mpl
oym
ent
11A
nura
g Pa
ndey
Ch
ief (
Mar
ketin
g &
Sal
es,
Wire
Div
isio
n)
1,1
7,39
,137
B.
E., X
LRI (
Mgm
t)
26
01-0
7-19
93 4
8 -
12A
nura
g Sa
xena
Ch
ief (
Elec
tric
al M
aint
enan
ce)
1,0
9,18
,747
B.
E., M
BA
32
17-1
2-19
99 5
3 N
atio
nal F
ertil
izer
s Lt
d.
13A
run
Mis
ra*
Vice
Pre
side
nt (R
aw M
ater
ial)
2,4
8,07
,070
B.
Tech
. 3
1 01
-07-
1988
54
- 14
Atr
ayee
Sar
kar
Chie
f (H
RM S
teel
) 1
,41,
01,8
38
B.A
., M
BA 2
5 01
-06-
1998
49
Hin
dust
an L
ever
Ltd
.
15Av
nees
h G
upta
Vi
ce P
resi
dent
(T
QM
& S
hare
d Se
rvic
es)
2,4
9,41
,928
B.
Tech
., PG
DBM
3
3 01
-07-
1986
56
-
16Ba
idya
nath
Sah
a Ch
ief (
Indu
stria
l Str
uctu
res
Busi
ness
) 1
,21,
92,8
95
B.E.
34
01-1
2-20
12 5
6 Ta
ta P
ower
Com
pany
Ltd
. 17
Bara
n Se
ngup
ta
Chie
f (Pr
ojec
t Eng
inee
ring)
1
,12,
42,6
97
B.Te
ch.,
M.E
., IC
WA
3
5 18
-11-
2013
59
Ause
nco
Engi
neer
s Lt
d.
18Ch
. Ram
esh
Babu
Ch
ief (
Des
ign
& En
gine
erin
g-Pr
oces
s)
1,4
9,38
,791
B.
E. 3
5 24
-12-
2012
55
AEG
IS L
td.
19Ch
acko
Jose
ph*
Chie
f (Fi
nanc
ial C
ontr
olle
r)
69,
35,7
11
CS, B
.Com
, ICW
A, C
A
37
01-0
7-19
82 6
0 -
20Ch
aita
nya
Bhan
u Pr
inci
pal E
xecu
tive
Offi
cer
1,3
5,37
,050
M
.Tec
h.
27
15-0
7-19
92 4
9 -
21Ch
anak
ya C
haud
hary
Vi
ce P
resi
dent
(Cor
pora
te S
ervi
ces)
2,9
8,99
,435
B.
E. 3
1 16
-12-
1988
55
- 22
D. B
. Sun
dara
Ram
am
Vice
Pre
side
nt (R
aw M
ater
ial)
2,0
9,17
,117
B.
Sc. (
Engg
) 2
9 28
-07-
1990
50
- 23
Deb
ashi
s D
as*
Chie
f (M
anuf
actu
ring,
Lon
g Pr
oduc
t)
1,5
2,32
,645
B.
Tech
. 3
7 02
-08-
1982
60
-
24D
ebas
hish
Bh
atta
char
jee
Vice
Pre
side
nt
(Tec
hnol
ogy
& N
ew M
ater
ials
Bu
sine
ss)
2,0
6,71
,232
B.
E., M
.Tec
h., P
h.D
2
6 01
-04-
1996
54
Uni
vers
ity o
f Cam
brid
ge
25D
ebas
hish
Cho
udhu
ry
Chie
f (Co
rpor
ate
Stra
tegy
&
Plan
ning
) 1
,14,
11,3
28
B.Sc
., PG
DM
2
3 01
-07-
1997
46
-
26D
ibye
ndu
Dut
ta
Chie
f (Po
rtfo
lio T
rans
form
atio
n &
D
igita
l Fin
ance
) 1
,77,
78,3
65
B.Co
m, F
.C.A
., IC
WA
2
6 16
-04-
2009
53
Indi
an H
otel
s Co
. Ltd
.
27D
war
ika
Nan
d Jh
a*
GM
(Des
ign
& E
ngin
eerin
g,
Kalin
gana
gar &
Gro
wth
Sho
p)
1,5
6,18
,572
B.
Sc. (
Engg
), PG
DM
3
9 01
-08-
1980
60
-
28G
opal
Pra
sad
Ch
oudh
ary
Chie
f (Se
curit
y &
Bra
nd P
rote
ctio
n)
1,8
8,47
,044
B.
A. (
Hon
s), L
L.B.
31
01-0
1-20
13 5
6 W
ipro
Ltd
.
29Ja
yant
a Ba
nerje
e Ch
ief (
Info
rmat
ion
Offi
cer)
2
,18,
39,0
91
B.Sc
. (H
ons)
, M
CA
26
15-0
1-20
18 5
3 Ta
ta C
onsu
ltanc
y Se
rvic
es
Ltd.
30
Kara
mve
er S
ingh
G
ener
al M
anag
er (O
pera
tions
TSK
) 1
,13,
20,7
06
B.Sc
. (En
gg)
29
01-1
0-19
90 5
4 -
31M
. C. T
hom
as
Exec
utiv
e-in
-Cha
rge
(FA
M)
1,3
6,06
,228
B.
E. 2
7 01
-07-
1992
48
- 32
Man
ish
Kum
ar S
ingh
Ch
ief (
Auto
mat
ion
& IT
Shi
khar
) 1
,41,
59,2
50
B.Sc
. (En
gg)
23
02-0
5-19
96 5
3 Ra
shtr
iya
Ispa
t Nig
am L
td.
33M
anis
h M
ishr
a G
ener
al M
anag
er (W
est B
okar
o)
1,2
0,61
,686
B.
Tech
. 2
9 01
-02-
2006
51
-
34M
anis
h Sh
arm
a Ch
ief (
Corp
orat
e Au
dit &
Ass
uran
ce)
Indi
a &
Sou
th E
ast A
sia
1,5
8,52
,351
B.
Tech
., PG
DM
2
8 25
-08-
1991
55
-
35M
eena
Lal
l Ch
ief L
egal
Offi
cer
(Indu
stria
l & L
itiga
tion)
1
,44,
00,9
04
B.Sc
., LL
.B.
30
10-0
1-19
90 5
5 Pr
actis
ing
Law
yer
36N
irbha
y Si
ngh
Sala
r Ch
ief (
Prog
ram
Man
agem
ent O
ffice
) 1
,28,
20,5
84
B.E.
, M.T
ech.
29
01-0
7-20
13 5
3 CG
PL (T
ata
Pow
er)
37Pa
nkaj
Kum
ar S
atija
Ch
ief R
egul
ator
y A
ffairs
, Ind
ia
1,0
7,26
,222
B.
Tech
., PG
DBM
, PG
D (E
nv.)
23
16-0
9-20
02 4
9 V
edan
ta L
imite
d (fo
rmer
ly
Sesa
Goa
Ltd
. )
Corporate Overview 02
Strategic Review 46
Performance Review 20
Statutory Reports 84
Our Strategy 28
Financial Statements 206
157
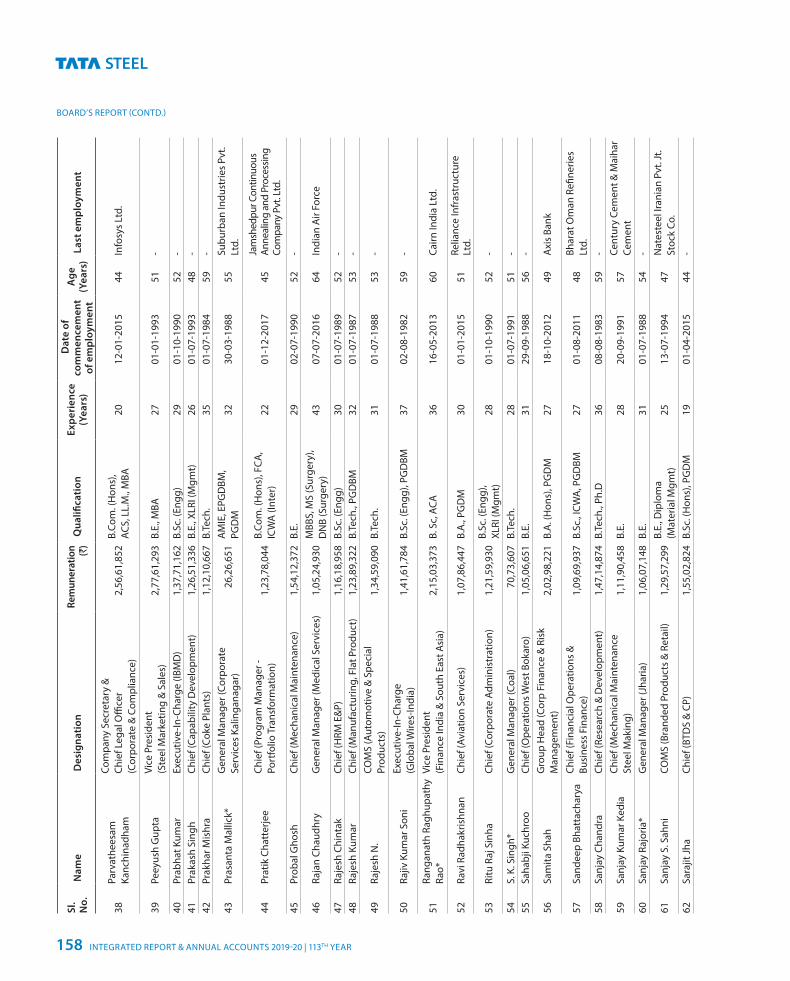
BOARD’S REPORT (CONTD.)
Sl.
No.
N
ame
Des
igna
tion
Re
mun
erat
ion ()̀
Qua
lifica
tion
Ex
peri
ence
(Y
ears
)
Dat
e of
co
mm
ence
men
t of
em
ploy
men
t
Age
(Y
ears
) L
ast e
mpl
oym
ent
38Pa
rvat
hees
am
Kanc
hina
dham
Com
pany
Sec
reta
ry &
Ch
ief L
egal
Offi
cer
(Cor
pora
te &
Com
plia
nce)
2
,56,
61,8
52
B.Co
m. (
Hon
s),
ACS,
LL.
M.,
MBA
2
0 12
-01-
2015
44
Info
sys
Ltd.
39Pe
eyus
h G
upta
Vi
ce P
resi
dent
(S
teel
Mar
ketin
g &
Sal
es)
2,7
7,61
,293
B.
E., M
BA
27
01-0
1-19
93 5
1 -
40Pr
abha
t Kum
ar
Exec
utiv
e-In
-Cha
rge
(IBM
D)
1,3
7,71
,162
B.
Sc. (
Engg
) 2
9 01
-10-
1990
52
- 41
Prak
ash
Sing
h Ch
ief (
Capa
bilit
y D
evel
opm
ent)
1
,26,
51,3
36
B.E.
, XLR
I (M
gmt)
2
6 01
-07-
1993
48
- 42
Prak
har M
ishr
a Ch
ief (
Coke
Pla
nts)
1
,12,
10,6
67
B.Te
ch.
35
01-0
7-19
84 5
9 -
43Pr
asan
ta M
allic
k*
Gen
eral
Man
ager
(Cor
pora
te
Serv
ices
Kal
inga
naga
r)
26,
26,6
51
AM
IE, E
PGD
BM,
PGD
M
32
30-0
3-19
88 5
5 Su
burb
an In
dust
ries
Pvt.
Ltd.
44Pr
atik
Cha
tter
jee
Chie
f (Pr
ogra
m M
anag
er -
Po
rtfo
lio T
rans
form
atio
n)
1,2
3,78
,044
B.
Com
. (H
ons)
, FCA
, IC
WA
(Int
er)
22
01-1
2-20
17 4
5 Ja
msh
edpu
r Con
tinuo
us
Anne
alin
g an
d Pr
oces
sing
Com
pany
Pvt
. Ltd
.
45Pr
obal
Gho
sh
Chie
f (M
echa
nica
l Mai
nten
ance
) 1
,54,
12,3
72
B.E.
29
02-0
7-19
90 5
2 -
46Ra
jan
Chau
dhry
G
ener
al M
anag
er (M
edic
al S
ervi
ces)
1
,05,
24,9
30
MBB
S, M
S (S
urge
ry),
DN
B (S
urge
ry)
43
07-0
7-20
16 6
4 In
dian
Air
Forc
e
47Ra
jesh
Chi
ntak
Ch
ief (
HRM
E&
P)
1,1
6,18
,958
B.
Sc. (
Engg
) 3
0 01
-07-
1989
52
- 48
Raje
sh K
umar
Ch
ief (
Man
ufac
turin
g, F
lat P
rodu
ct)
1,2
3,89
,322
B.
Tech
., PG
DBM
3
2 01
-07-
1987
53
-
49Ra
jesh
N.
COM
S (A
utom
otiv
e &
Spe
cial
Pr
oduc
ts)
1,3
4,59
,090
B.
Tech
. 3
1 01
-07-
1988
53
-
50Ra
jiv K
umar
Son
i Ex
ecut
ive-
In-C
harg
e
(Glo
bal W
ires-
Indi
a)
1,4
1,61
,784
B.
Sc. (
Engg
), PG
DBM
3
7 02
-08-
1982
59
-
51Ra
ngan
ath
Ragh
upat
hy
Rao*
Vi
ce P
resi
dent
(F
inan
ce In
dia
& S
outh
Eas
t Asi
a)
2,1
5,03
,373
B.
Sc,
ACA
36
16-0
5-20
13 6
0 Ca
irn In
dia
Ltd.
52Ra
vi R
adha
kris
hnan
Ch
ief (
Avia
tion
Serv
ices
) 1
,07,
86,4
47
B.A
., PG
DM
3
0 01
-01-
2015
51
Relia
nce
Infr
astr
uctu
re
Ltd.
53Ri
tu R
aj S
inha
Ch
ief (
Corp
orat
e Ad
min
istr
atio
n)
1,2
1,59
,930
B.
Sc. (
Engg
),
XLRI
(Mgm
t)
28
01-1
0-19
90 5
2 -
54S.
K. S
ingh
* G
ener
al M
anag
er (C
oal)
70,
73,6
07
B.Te
ch.
28
01-0
7-19
91 5
1 -
55Sa
habj
i Kuc
hroo
Ch
ief (
Ope
ratio
ns W
est B
okar
o)
1,0
5,06
,651
B.
E. 3
1 29
-09-
1988
56
-
56Sa
mita
Sha
h G
roup
Hea
d (C
orp
Fina
nce
& R
isk
Man
agem
ent)
2
,02,
98,2
21
B.A
. (H
ons)
, PG
DM
2
7 18
-10-
2012
49
Axi
s Ba
nk
57Sa
ndee
p Bh
atta
char
ya
Chie
f (Fi
nanc
ial O
pera
tions
&
Busi
ness
Fin
ance
) 1
,09,
69,9
37
B.Sc
., IC
WA
, PG
DBM
2
7 01
-08-
2011
48
Bhar
at O
man
Refi
nerie
s Lt
d.
58Sa
njay
Cha
ndra
Ch
ief (
Rese
arch
& D
evel
opm
ent)
1
,47,
14,8
74
B.Te
ch.,
Ph.D
3
6 08
-08-
1983
59
-
59Sa
njay
Kum
ar K
edia
Ch
ief (
Mec
hani
cal M
aint
enan
ce
Stee
l Mak
ing)
1
,11,
90,4
58
B.E.
28
20-0
9-19
91 5
7 Ce
ntur
y Ce
men
t & M
aiha
r Ce
men
t 60
Sanj
ay R
ajor
ia*
Gen
eral
Man
ager
(Jha
ria)
1,0
6,07
,148
B.
E.
31
01-0
7-19
88 5
4 -
61Sa
njay
S. S
ahni
COM
S (B
rand
ed P
rodu
cts
& R
etai
l) 1
,29,
57,2
99
B.E.
, Dip
lom
a
(Mat
eria
l Mgm
t)
25
13-0
7-19
94 4
7 N
ates
teel
Iran
ian
Pvt.
Jt.
Stoc
k Co
. 62
Sara
jit Jh
a Ch
ief (
BTD
S &
CP)
1
,55,
02,8
24
B.Sc
. (H
ons)
, PG
DM
1
9 01
-04-
2015
44
-
INTEGRATED REPORT & ANNUAL ACCOUNTS 2019-20 | 113TH YEAR158
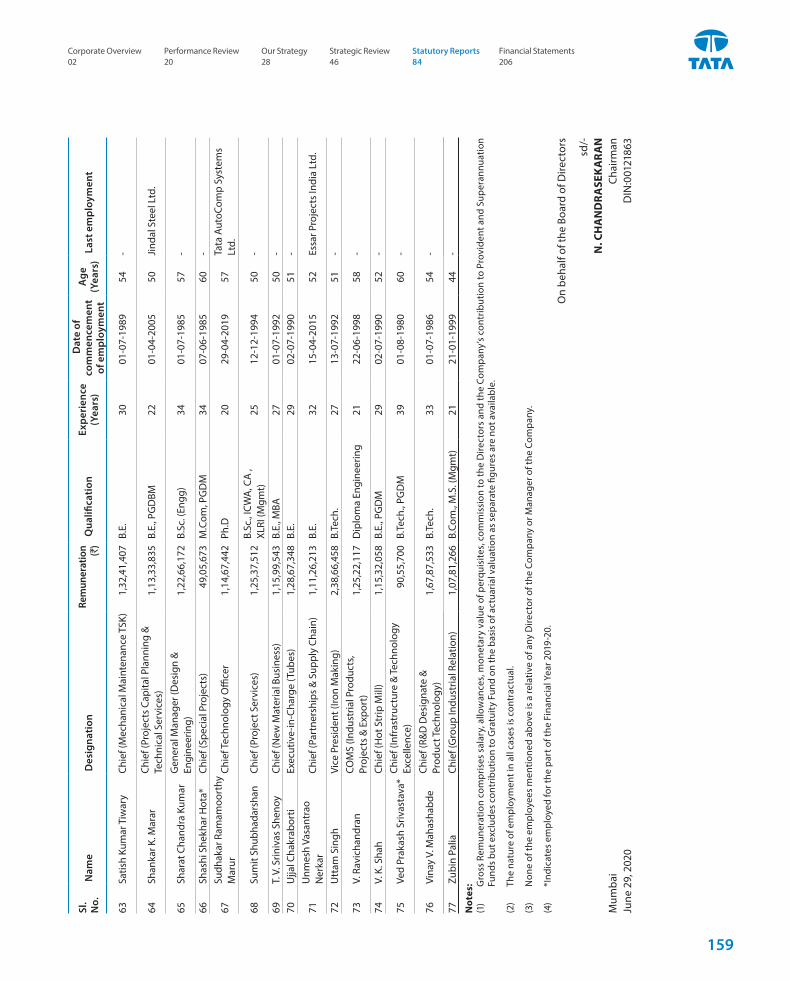
Sl.
No.
N
ame
Des
igna
tion
Re
mun
erat
ion ()̀
Qua
lifica
tion
Ex
peri
ence
(Y
ears
)
Dat
e of
co
mm
ence
men
t of
em
ploy
men
t
Age
(Y
ears
) L
ast e
mpl
oym
ent
63Sa
tish
Kum
ar T
iwar
y Ch
ief (
Mec
hani
cal M
aint
enan
ce T
SK)
1,3
2,41
,407
B.
E.
30
01-0
7-19
89 5
4 -
64Sh
anka
r K. M
arar
Ch
ief (
Proj
ects
Cap
ital P
lann
ing
&
Tech
nica
l Ser
vice
s)
1,1
3,33
,835
B.
E., P
GD
BM
22
01-0
4-20
05 5
0 Ji
ndal
Ste
el L
td.
65Sh
arat
Cha
ndra
Kum
ar
Gen
eral
Man
ager
(Des
ign
&
Engi
neer
ing)
1
,22,
66,1
72
B.Sc
. (En
gg)
34
01-0
7-19
85 5
7 -
66Sh
ashi
She
khar
Hot
a*
Chie
f (Sp
ecia
l Pro
ject
s)
49,
05,6
73
M.C
om, P
GD
M 3
4 07
-06-
1985
60
-
67Su
dhak
ar R
amam
oort
hy
Mar
ur
Chie
f Tec
hnol
ogy
Offi
cer
1,1
4,67
,442
Ph
.D 2
0 29
-04-
2019
57
Tata
Aut
oCom
p Sy
stem
s Lt
d.
68Su
mit
Shub
hada
rsha
n Ch
ief (
Proj
ect S
ervi
ces)
1
,25,
37,5
12
B.Sc
., IC
WA
, CA
,
XLRI
(Mgm
t)
25
12-1
2-19
94 5
0 -
69T.
V. S
riniv
as S
heno
yCh
ief (
New
Mat
eria
l Bus
ines
s)
1,1
5,99
,543
B.
E., M
BA
27
01-0
7-19
92 5
0 -
70U
jjal C
hakr
abor
ti Ex
ecut
ive-
in-C
harg
e (T
ubes
) 1
,28,
67,3
48
B.E.
29
02-0
7-19
90 5
1 -
71U
nmes
h Va
sant
rao
Ner
kar
Chie
f (Pa
rtne
rshi
ps &
Sup
ply
Chai
n)
1,1
1,26
,213
B.
E. 3
2 15
-04-
2015
52
Essa
r Pro
ject
s In
dia
Ltd.
72U
ttam
Sin
gh
Vice
Pre
side
nt (I
ron
Mak
ing)
2
,38,
66,4
58
B.Te
ch.
27
13-0
7-19
92 5
1 -
73V.
Rav
icha
ndra
n CO
MS
(Indu
stria
l Pro
duct
s,Pr
ojec
ts &
Exp
ort)
1,2
5,22
,117
D
iplo
ma
Engi
neer
ing
21
22-0
6-19
98 5
8 -
74V.
K. S
hah
Chie
f (H
ot S
trip
Mill
) 1
,15,
32,0
58
B.E.
, PG
DM
2
9 02
-07-
1990
52
-
75Ve
d Pr
akas
h Sr
ivas
tava
* Ch
ief (
Infr
astr
uctu
re &
Tech
nolo
gy
Exce
llenc
e)
90,
55,7
00
B.Te
ch.,
PGD
M
39
01-0
8-19
80 6
0 -
76Vi
nay
V. M
ahas
habd
e Ch
ief (
R&D
Des
igna
te &
Pr
oduc
t Tec
hnol
ogy)
1
,67,
87,5
33
B.Te
ch.
33
01-0
7-19
86 5
4 -
77Zu
bin
Palia
Ch
ief (
Gro
up In
dust
rial R
elat
ion)
1
,07,
81,2
66
B.Co
m.,
M.S
. (M
gmt)
2
1 21
-01-
1999
44
-
Not
es:
(1
) G
ross
Rem
uner
atio
n co
mpr
ises
sal
ary,
allo
wan
ces,
mon
etar
y va
lue
of p
erqu
isite
s, c
omm
issi
on to
the
Dire
ctor
s an
d th
e Co
mpa
ny’s
cont
ribut
ion
to P
rovi
dent
and
Sup
eran
nuat
ion
Fund
s bu
t exc
lude
s co
ntrib
utio
n to
Gra
tuit
y Fu
nd o
n th
e ba
sis
of a
ctua
rial v
alua
tion
as s
epar
ate
figur
es a
re n
ot a
vaila
ble.
(2)
The
natu
re o
f em
ploy
men
t in
all c
ases
is c
ontr
actu
al.
(3)
Non
e of
the
empl
oyee
s m
entio
ned
abov
e is
a re
lativ
e of
any
Dire
ctor
of t
he C
ompa
ny o
r Man
ager
of t
he C
ompa
ny.
(4)
*Ind
icat
es e
mpl
oyed
for t
he p
art o
f the
Fin
anci
al Y
ear 2
019-
20.
On
beha
lf of
the
Boar
d of
Dire
ctor
s
sd/-
N. C
HA
ND
RA
SEK
AR
AN
M
umba
i Ch
airm
an
June
29,
202
0
DIN
:001
2186
3
Corporate Overview 02
Strategic Review 46
Performance Review 20
Statutory Reports 84
Our Strategy 28
Financial Statements 206
159
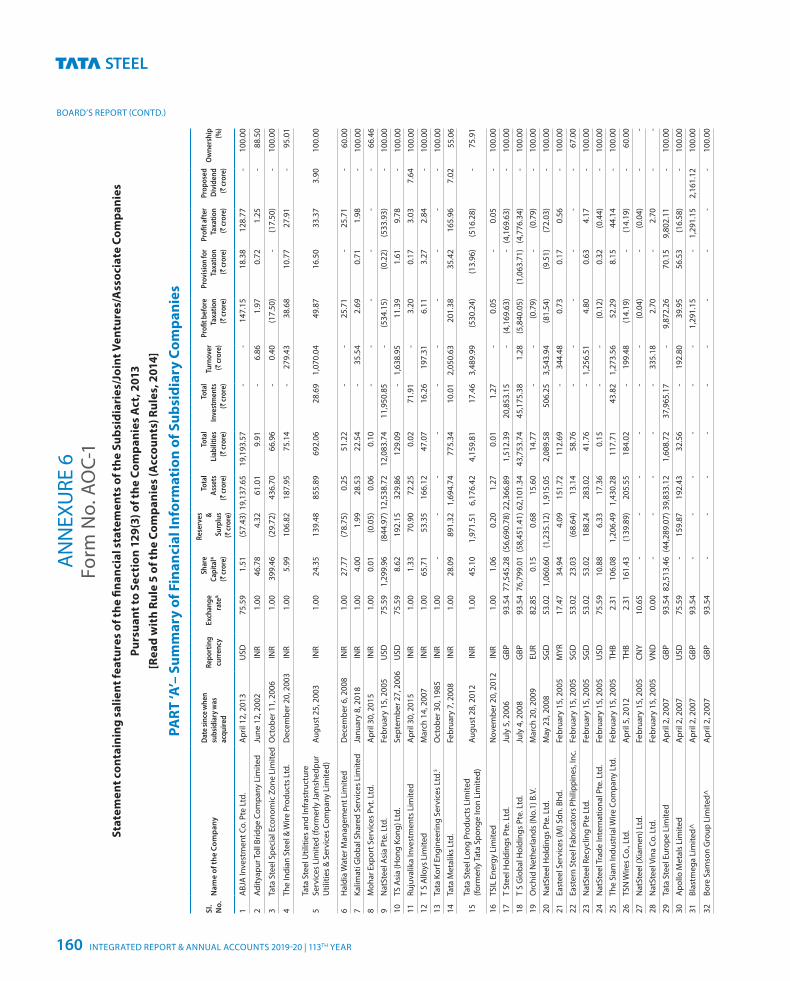
BOARD’S REPORT (CONTD.)
Form
No.
AO
C-1
Stat
emen
t con
tain
ing
salie
nt fe
atur
es o
f the
fina
ncia
l sta
tem
ents
of t
he S
ubsi
diar
ies/
Join
t Ven
ture
s/A
ssoc
iate
Com
pani
es
Purs
uant
to S
ecti
on 1
29(3
) of t
he C
ompa
nies
Act
, 201
3[R
ead
wit
h Ru
le 5
of t
he C
ompa
nies
(Acc
ount
s) R
ules
, 201
4]
PART
‘A’–
Sum
mar
y of
Fin
anci
al In
form
atio
n of
Sub
sidi
ary
Com
pani
es
ANN
EXU
RE 6
Sl.
No.
Nam
e of
the
Com
pany
Dat
e sin
ce w
hen
subs
idia
ry w
as
acqu
ired
Repo
rtin
g cu
rren
cyEx
chan
ge
rate
&
Shar
e Ca
pita
l*
(` cr
ore)
Rese
rves
& Su
rplu
s (`
cror
e)
Tota
l As
sets
(`
cror
e)
Tota
l Li
abili
ties
(` cr
ore)
Tota
l In
vest
men
ts
(` cr
ore)
Turn
over
(`
cror
e)
Profi
t bef
ore
Taxa
tion
(` cr
ore)
Prov
ision
for
Taxa
tion
(` cr
ore)
Profi
t aft
er
Taxa
tion
(` cr
ore)
Prop
osed
D
ivid
end
(` cr
ore)
Ow
ners
hip
(%)
1A
BJA
Inve
stm
ent C
o. P
te L
td.
Apr
il 12
, 201
3U
SD 7
5.59
1
.51
(57.
43) 1
9,13
7.65
1
9,19
3.57
-
- 1
47.1
5 1
8.38
1
28.7
7 -
100
.00
2Ad
ityap
ur To
ll Br
idge
Com
pany
Lim
ited
June
12,
200
2IN
R 1
.00
46.
78
4.3
2 6
1.01
9
.91
- 6
.86
1.9
7 0
.72
1.2
5 -
88.
50
3Ta
ta S
teel
Spe
cial
Eco
nom
ic Z
one
Lim
ited
Oct
ober
11,
200
6IN
R 1
.00
399
.46
(29.
72)
436
.70
66.
96
- 0
.40
(17.
50)
- (1
7.50
) -
100
.00
4Th
e In
dian
Ste
el &
Wire
Pro
duct
s Lt
d.D
ecem
ber 2
0, 2
003
INR
1.0
0 5
.99
106
.82
187
.95
75.
14
- 2
79.4
3 3
8.68
1
0.77
2
7.91
-
95.
01
5Ta
ta S
teel
Util
ities
and
Infr
astr
uctu
re
Serv
ices
Lim
ited
(form
erly
Jam
shed
pur
Util
ities
& S
ervi
ces
Com
pany
Lim
ited)
Augu
st 2
5, 2
003
INR
1.0
0 2
4.35
1
39.4
8 8
55.8
9 6
92.0
6 2
8.69
1
,070
.04
49.
87
16.
50
33.
37
3.9
0 1
00.0
0
6H
aldi
a W
ater
Man
agem
ent L
imite
dD
ecem
ber 6
, 200
8IN
R 1
.00
27.
77
(78.
75)
0.2
5 5
1.22
-
- 2
5.71
-
25.
71
- 6
0.00
7
Kalim
ati G
loba
l Sha
red
Serv
ices
Lim
ited
Janu
ary
8, 2
018
INR
1.0
0 4
.00
1.9
9 2
8.53
2
2.54
-
35.
54
2.6
9 0
.71
1.9
8 -
100
.00
8M
ohar
Exp
ort S
ervi
ces
Pvt.
Ltd.
Apr
il 30
, 201
5IN
R 1
.00
0.0
1 (0
.05)
0
.06
0.1
0 -
- -
- -
- 6
6.46
9
Nat
Stee
l Asi
a Pt
e. L
td.
Febr
uary
15,
200
5U
SD 7
5.59
1
,299
.96
(844
.97)
12,
538.
72
12,
083.
74
11,
950.
85
- (5
34.1
5)
(0.2
2)
(533
.93)
-
100
.00
10TS
Asi
a (H
ong
Kong
) Ltd
.Se
ptem
ber 2
7, 2
006
USD
75.
59
8.6
2 1
92.1
5 3
29.8
6 1
29.0
9 -
1,6
38.9
5 1
1.39
1
.61
9.7
8 -
100
.00
11Ru
juva
lika
Inve
stm
ents
Lim
ited
Apr
il 30
, 201
5IN
R 1
.00
1.3
3 7
0.90
7
2.25
0
.02
71.
91
- 3
.20
0.1
7 3
.03
7.6
4 1
00.0
0 12
T S
Allo
ys L
imite
dM
arch
14,
200
7IN
R 1
.00
65.
71
53.
35
166
.12
47.
07
16.
26
197
.31
6.1
1 3
.27
2.8
4 -
100
.00
13Ta
ta K
orf E
ngin
eerin
g Se
rvic
es L
td.$
Oct
ober
30,
198
5IN
R 1
.00
- -
- -
- -
- -
- -
100
.00
14Ta
ta M
etal
iks
Ltd.
Febr
uary
7, 2
008
INR
1.0
0 2
8.09
8
91.3
2 1
,694
.74
775
.34
10.
01
2,0
50.6
3 2
01.3
8 3
5.42
1
65.9
6 7
.02
55.
06
15Ta
ta S
teel
Lon
g Pr
oduc
ts L
imite
d (fo
rmer
ly T
ata
Spon
ge Ir
on L
imite
d)Au
gust
28,
201
2IN
R 1
.00
45.
10
1,9
71.5
1 6
,176
.42
4,1
59.8
1 1
7.46
3
,489
.99
(530
.24)
(1
3.96
) (5
16.2
8)
- 7
5.91
16TS
IL E
nerg
y Li
mite
dN
ovem
ber 2
0, 2
012
INR
1.0
0 1
.06
0.2
0 1
.27
0.0
1 1
.27
- 0
.05
- 0
.05
- 1
00.0
0
17T
Stee
l Hol
ding
s Pt
e. L
td.
July
5, 2
006
GBP
93.
54 7
7,54
5.28
(56
,690
.78)
22,
366.
89
1,5
12.3
9 2
0,85
3.15
-
(4,1
69.6
3)
- (4
,169
.63)
-
100
.00
18T
S G
loba
l Hol
ding
s Pt
e. L
td.
July
4, 2
008
GBP
93.
54 7
6,79
9.01
(58
,451
.41)
62,
101.
34
43,
753.
74
45,
175.
38
1.2
8 (5
,840
.05)
(1
,063
.71)
(4
,776
.34)
-
100
.00
19O
rchi
d N
ethe
rland
s (N
o.1)
B.V
.M
arch
20,
200
9EU
R 8
2.85
0
.15
0.6
8 1
5.60
1
4.77
-
- (0
.79)
-
(0.7
9)
- 1
00.0
0
20N
atSt
eel H
oldi
ngs
Pte.
Ltd
.M
ay 2
3, 2
008
SGD
53.
02
1,0
60.6
0 (1
,235
.12)
1
,915
.05
2,0
89.5
8 5
06.2
5 3
,543
.94
(81.
54)
(9.5
1)
(72.
03)
- 1
00.0
0
21Ea
stee
l Ser
vice
s (M
) Sdn
. Bhd
.Fe
brua
ry 1
5, 2
005
MYR
17.
47
34.
94
4.0
9 1
51.7
2 1
12.6
9 -
344
.48
0.7
3 0
.17
0.5
6 -
100
.00
22Ea
ster
n St
eel F
abric
ator
s Ph
ilipp
ines
, Inc
.Fe
brua
ry 1
5, 2
005
SGD
53.
02
23.
03
(68.
64)
13.
14
58.
76
- -
- -
- -
67.
00
23N
atSt
eel R
ecyc
ling
Pte
Ltd.
Febr
uary
15,
200
5SG
D 5
3.02
5
3.02
1
88.2
4 2
83.0
2 4
1.76
-
1,2
56.5
1 4
.80
0.6
3 4
.17
- 1
00.0
0
24N
atSt
eel T
rade
Inte
rnat
iona
l Pte
. Ltd
.Fe
brua
ry 1
5, 2
005
USD
75.
59
10.
88
6.3
3 1
7.36
0
.15
- -
(0.1
2)
0.3
2 (0
.44)
-
100
.00
25Th
e Si
am In
dust
rial W
ire C
ompa
ny L
td.
Febr
uary
15,
200
5TH
B 2
.31
106
.08
1,2
06.4
9 1
,430
.28
117
.71
43.
82
1,2
73.5
6 5
2.29
8
.15
44.
14
- 1
00.0
0
26TS
N W
ires
Co.,
Ltd.
Apr
il 5,
201
2TH
B 2
.31
161
.43
(139
.89)
2
05.5
5 1
84.0
2 -
199
.48
(14.
19)
- (1
4.19
) -
60.
00
27N
atSt
eel (
Xiam
en) L
td.
Febr
uary
15,
200
5CN
Y 1
0.65
-
- -
- -
- (0
.04)
-
(0.0
4)
- -
28N
atSt
eel V
ina
Co. L
td.
Febr
uary
15,
200
5VN
D 0
.00
- -
- -
- 3
35.1
8 2
.70
- 2
.70
- -
29Ta
ta S
teel
Eur
ope
Lim
ited
Apr
il 2,
200
7G
BP 9
3.54
82,
513.
46 (
44,2
89.0
7) 3
9,83
3.12
1
,608
.72
37,
965.
17
- 9
,872
.26
70.
15
9,8
02.1
1 -
100
.00
30A
pollo
Met
als
Lim
ited
Apr
il 2,
200
7U
SD 7
5.59
-
159
.87
192
.43
32.
56
- 1
92.8
0 3
9.95
5
6.53
(1
6.58
) -
100
.00
31Bl
astm
ega
Lim
ited^
Apr
il 2,
200
7G
BP 9
3.54
-
- -
- -
- 1
,291
.15
- 1
,291
.15
2,1
61.1
2 1
00.0
0
32Bo
re S
amso
n G
roup
Lim
ited^
Apr
il 2,
200
7G
BP 9
3.54
-
- -
- -
- -
- -
- 1
00.0
0
INTEGRATED REPORT & ANNUAL ACCOUNTS 2019-20 | 113TH YEAR160
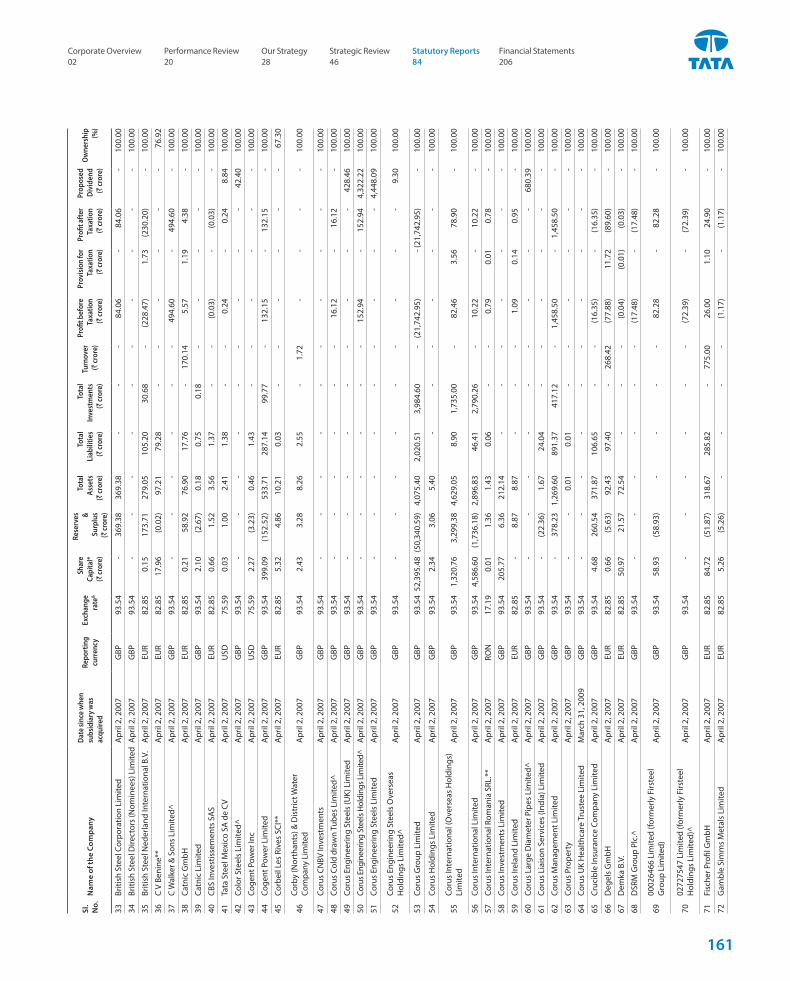
Sl.
No.
Nam
e of
the
Com
pany
Dat
e sin
ce w
hen
subs
idia
ry w
as
acqu
ired
Repo
rtin
g cu
rren
cyEx
chan
ge
rate
&
Shar
e Ca
pita
l*
(` cr
ore)
Rese
rves
& Su
rplu
s (`
cror
e)
Tota
l As
sets
(`
cror
e)
Tota
l Li
abili
ties
(` cr
ore)
Tota
l In
vest
men
ts
(` cr
ore)
Turn
over
(`
cror
e)
Profi
t bef
ore
Taxa
tion
(` cr
ore)
Prov
ision
for
Taxa
tion
(` cr
ore)
Profi
t aft
er
Taxa
tion
(` cr
ore)
Prop
osed
D
ivid
end
(` cr
ore)
Ow
ners
hip
(%)
33Br
itish
Ste
el C
orpo
ratio
n Li
mite
dA
pril
2, 2
007
GBP
93.
54
- 3
69.3
8 3
69.3
8 -
- -
84.
06
- 8
4.06
-
100
.00
34Br
itish
Ste
el D
irect
ors (
Nom
inee
s) L
imite
dA
pril
2, 2
007
GBP
93.
54
- -
- -
- -
- -
- -
100
.00
35Br
itish
Ste
el N
eder
land
Inte
rnat
iona
l B.V
.A
pril
2, 2
007
EUR
82.
85
0.1
5 1
73.7
1 2
79.0
5 1
05.2
0 3
0.68
-
(228
.47)
1
.73
(230
.20)
-
100
.00
36C
V Be
nine
**A
pril
2, 2
007
EUR
82.
85
17.
96
(0.0
2)
97.
21
79.
28
- -
- -
- -
76.
92
37C
Wal
ker &
Son
s Li
mite
d^A
pril
2, 2
007
GBP
93.
54
- -
- -
- -
494
.60
- 4
94.6
0 -
100
.00
38Ca
tnic
Gm
bHA
pril
2, 2
007
EUR
82.
85
0.2
1 5
8.92
7
6.90
1
7.76
-
170
.14
5.5
7 1
.19
4.3
8 -
100
.00
39Ca
tnic
Lim
ited
Apr
il 2,
200
7G
BP 9
3.54
2
.10
(2.6
7)
0.1
8 0
.75
0.1
8 -
- -
- -
100
.00
40CB
S In
vest
isse
men
ts S
AS
Apr
il 2,
200
7EU
R 8
2.85
0
.66
1.5
2 3
.56
1.3
7 -
- (0
.03)
-
(0.0
3)
- 1
00.0
0
41Ta
ta S
teel
Mex
ico
SA d
e CV
Apr
il 2,
200
7U
SD 7
5.59
0
.03
1.0
0 2
.41
1.3
8 -
- 0
.24
- 0
.24
8.8
4 1
00.0
0
42Co
lor S
teel
s Li
mite
d^A
pril
2, 2
007
GBP
93.
54
- -
- -
- -
- -
- 4
2.40
1
00.0
0
43Co
gent
Pow
er In
cA
pril
2, 2
007
USD
75.
59
2.2
7 (3
.23)
0
.46
1.4
3 -
- -
- -
- 1
00.0
0
44Co
gent
Pow
er L
imite
dA
pril
2, 2
007
GBP
93.
54
399
.09
(152
.52)
5
33.7
1 2
87.1
4 9
9.77
-
132
.15
- 1
32.1
5 -
100
.00
45Co
rbei
l Les
Riv
es S
CI**
Apr
il 2,
200
7EU
R 8
2.85
5
.32
4.8
6 1
0.21
0
.03
- -
- -
- -
67.
30
46Co
rby
(Nor
than
ts) &
Dis
tric
t Wat
er
Com
pany
Lim
ited
Apr
il 2,
200
7G
BP 9
3.54
2
.43
3.2
8 8
.26
2.5
5 -
1.7
2 -
- -
- 1
00.0
0
47Co
rus
CNBV
Inve
stm
ents
Apr
il 2,
200
7G
BP 9
3.54
-
- -
- -
- -
- -
- 1
00.0
0
48Co
rus
Cold
dra
wn
Tube
s Li
mite
d^A
pril
2, 2
007
GBP
93.
54
- -
- -
- -
16.
12
- 1
6.12
-
100
.00
49Co
rus
Engi
neer
ing
Stee
ls (U
K) L
imite
dA
pril
2, 2
007
GBP
93.
54
- -
- -
- -
- -
- 4
28.4
6 1
00.0
0
50Co
rus E
ngin
eerin
g St
eels
Hol
ding
s Lim
ited^
Apr
il 2,
200
7G
BP 9
3.54
-
- -
- -
- 1
52.9
4 -
152
.94
4,3
22.2
2 1
00.0
0
51Co
rus
Engi
neer
ing
Stee
ls L
imite
dA
pril
2, 2
007
GBP
93.
54
- -
- -
- -
- -
- 4
,448
.09
100
.00
52Co
rus
Engi
neer
ing
Stee
ls O
vers
eas
Hol
ding
s Li
mite
d^A
pril
2, 2
007
GBP
93.
54
- -
- -
- -
- -
- 9
.30
100
.00
53Co
rus
Gro
up L
imite
dA
pril
2, 2
007
GBP
93.
54 5
2,39
5.48
(50
,340
.59)
4
,075
.40
2,0
20.5
1 3
,984
.60
- (2
1,74
2.95
) -
(21,
742.
95)
- 1
00.0
0
54Co
rus
Hol
ding
s Li
mite
dA
pril
2, 2
007
GBP
93.
54
2.3
4 3
.06
5.40
- -
- -
- -
- 1
00.0
0
55Co
rus
Inte
rnat
iona
l (O
vers
eas
Hol
ding
s)
Lim
ited
Apr
il 2,
200
7G
BP 9
3.54
1
,320
.76
3,2
99.3
8 4
,629
.05
8.9
0 1
,735
.00
- 8
2.46
3
.56
78.
90
- 1
00.0
0
56Co
rus
Inte
rnat
iona
l Lim
ited
Apr
il 2,
200
7G
BP 9
3.54
4
,586
.60
(1,7
36.1
8)
2,8
96.8
3 4
6.41
2
,790
.26
- 1
0.22
-
10.
22
- 1
00.0
0
57Co
rus
Inte
rnat
iona
l Rom
ania
SRL
.**
Apr
il 2,
200
7RO
N 1
7.19
0
.01
1.3
6 1
.43
0.0
6 -
- 0
.79
0.0
1 0
.78
- 1
00.0
0
58Co
rus
Inve
stm
ents
Lim
ited
Apr
il 2,
200
7G
BP 9
3.54
2
05.7
7 6
.36
212
.14
- -
- -
- -
- 1
00.0
0
59Co
rus
Irela
nd L
imite
dA
pril
2, 2
007
EUR
82.
85
- 8
.87
8.8
7 -
- -
1.0
9 0
.14
0.9
5 -
100
.00
60Co
rus
Larg
e D
iam
eter
Pip
es L
imite
d^A
pril
2, 2
007
GBP
93.
54
- -
- -
- -
- -
- 6
80.3
9 1
00.0
0
61Co
rus
Liai
son
Serv
ices
(Ind
ia) L
imite
dA
pril
2, 2
007
GBP
93.
54
- (2
2.36
) 1
.67
24.
04
- -
- -
- -
100
.00
62Co
rus
Man
agem
ent L
imite
dA
pril
2, 2
007
GBP
93.
54
- 3
78.2
3 1
,269
.60
891
.37
417
.12
- 1
,458
.50
- 1
,458
.50
- 1
00.0
0
63Co
rus
Prop
erty
Apr
il 2,
200
7G
BP 9
3.54
-
- 0
.01
0.0
1 -
- -
- -
- 1
00.0
0
64Co
rus
UK
Hea
lthca
re T
rust
ee L
imite
dM
arch
31,
200
9G
BP 9
3.54
-
- -
- -
- -
- -
- 1
00.0
0
65Cr
ucib
le In
sura
nce
Com
pany
Lim
ited
Apr
il 2,
200
7G
BP 9
3.54
4
.68
260
.54
371
.87
106
.65
- -
(16.
35)
- (1
6.35
) -
100
.00
66D
egel
s G
mbH
Apr
il 2,
200
7EU
R 8
2.85
0
.66
(5.6
3)
92.
43
97.
40
- 2
68.4
2 (7
7.88
) 1
1.72
(8
9.60
) -
100
.00
67D
emka
B.V
.A
pril
2, 2
007
EUR
82.
85
50.
97
21.
57
72.
54
- -
- (0
.04)
(0
.01)
(0
.03)
-
100
.00
68D
SRM
Gro
up P
lc.^
Apr
il 2,
200
7G
BP 9
3.54
-
- -
- -
- (1
7.48
) -
(17.
48)
- 1
00.0
0
6900
0264
66 L
imite
d (fo
rmer
ly F
irste
el
Gro
up L
imite
d)A
pril
2, 2
007
GBP
93.
54
58.
93
(58.
93)
- -
- -
82.
28
- 8
2.28
-
100
.00
7002
7275
47 L
imite
d (fo
rmer
ly F
irste
el
Hol
ding
s Li
mite
d)^
Apr
il 2,
200
7G
BP 9
3.54
-
- -
- -
- (7
2.39
) -
(72.
39)
- 1
00.0
0
71Fi
sche
r Pro
fil G
mbH
Apr
il 2,
200
7EU
R 8
2.85
8
4.72
(5
1.87
) 3
18.6
7 2
85.8
2 -
775
.00
26.
00
1.1
0 2
4.90
-
100
.00
72G
ambl
e Si
mm
s M
etal
s Li
mite
dA
pril
2, 2
007
EUR
82.
85
5.2
6 (5
.26)
-
- -
- (1
.17)
-
(1.1
7)
- 1
00.0
0
Corporate Overview 02
Strategic Review 46
Performance Review 20
Statutory Reports 84
Our Strategy 28
Financial Statements 206
161
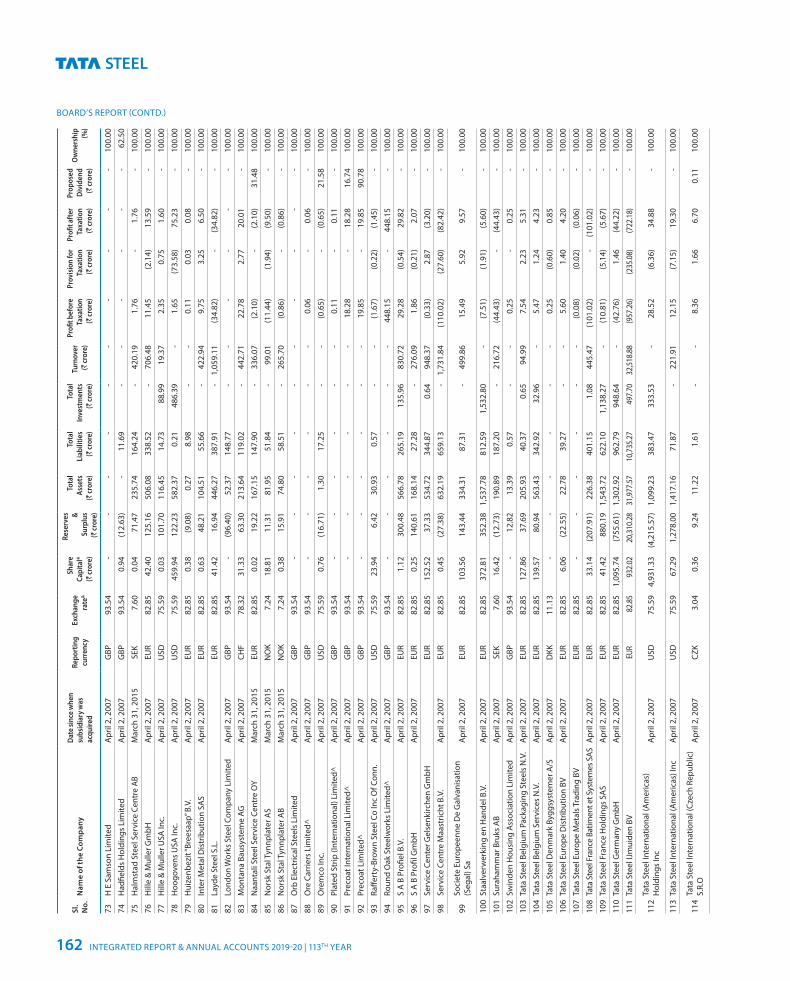
BOARD’S REPORT (CONTD.)
Sl.
No.
Nam
e of
the
Com
pany
Dat
e sin
ce w
hen
subs
idia
ry w
as
acqu
ired
Repo
rtin
g cu
rren
cyEx
chan
ge
rate
&
Shar
e Ca
pita
l*
(` cr
ore)
Rese
rves
& Su
rplu
s (`
cror
e)
Tota
l As
sets
(`
cror
e)
Tota
l Li
abili
ties
(` cr
ore)
Tota
l In
vest
men
ts
(` cr
ore)
Turn
over
(`
cror
e)
Profi
t bef
ore
Taxa
tion
(` cr
ore)
Prov
ision
for
Taxa
tion
(` cr
ore)
Profi
t aft
er
Taxa
tion
(` cr
ore)
Prop
osed
D
ivid
end
(` cr
ore)
Ow
ners
hip
(%)
73H
E S
amso
n Li
mite
dA
pril
2, 2
007
GBP
93.
54
- -
- -
- -
- -
- -
100
.00
74H
adfie
lds
Hol
ding
s Li
mite
dA
pril
2, 2
007
GBP
93.
54
0.9
4 (1
2.63
) -
11.
69
- -
- -
- -
62.
50
75H
alm
stad
Ste
el S
ervi
ce C
entr
e A
BM
arch
31,
201
5SE
K 7
.60
0.0
4 7
1.47
2
35.7
4 1
64.2
4 -
420
.19
1.7
6 -
1.7
6 -
100
.00
76H
ille
& M
ulle
r Gm
bHA
pril
2, 2
007
EUR
82.
85
42.
40
125
.16
506
.08
338
.52
- 7
06.4
8 1
1.45
(2
.14)
1
3.59
-
100
.00
77H
ille
& M
ulle
r USA
Inc.
Apr
il 2,
200
7U
SD 7
5.59
0
.03
101
.70
116
.45
14.
73
88.
99
19.
37
2.3
5 0
.75
1.6
0 -
100
.00
78H
oogo
vens
USA
Inc.
Apr
il 2,
200
7U
SD 7
5.59
4
59.9
4 1
22.2
3 5
82.3
7 0
.21
486
.39
- 1
.65
(73.
58)
75.
23
- 1
00.0
0
79H
uize
nbez
it “B
rees
aap”
B.V
.A
pril
2, 2
007
EUR
82.
85
0.3
8 (9
.08)
0
.27
8.9
8 -
- 0
.11
0.0
3 0
.08
- 1
00.0
0
80In
ter M
etal
Dis
trib
utio
n SA
SA
pril
2, 2
007
EUR
82.
85
0.6
3 4
8.21
1
04.5
1 5
5.66
-
422
.94
9.7
5 3
.25
6.5
0 -
100
.00
81La
yde
Stee
l S.L
.EU
R 8
2.85
4
1.42
1
6.94
4
46.2
7 3
87.9
1 -
1,0
59.1
1 (3
4.82
) -
(34.
82)
- 1
00.0
0
82Lo
ndon
Wor
ks S
teel
Com
pany
Lim
ited
Apr
il 2,
200
7G
BP 9
3.54
-
(96.
40)
52.
37
148
.77
- -
- -
- -
100
.00
83M
onta
na B
ausy
stem
e AG
Apr
il 2,
200
7CH
F 7
8.32
3
1.33
6
3.30
2
13.6
4 1
19.0
2 -
442
.71
22.
78
2.7
7 2
0.01
-
100
.00
84N
aant
ali S
teel
Ser
vice
Cen
tre
OY
Mar
ch 3
1, 2
015
EUR
82.
85
0.0
2 1
9.22
1
67.1
5 1
47.9
0 -
336
.07
(2.1
0)
- (2
.10)
3
1.48
1
00.0
0
85N
orsk
Sta
l Tyn
npla
ter A
SM
arch
31,
201
5N
OK
7.2
4 1
8.81
1
1.31
8
1.95
5
1.84
-
99.
01
(11.
44)
(1.9
4)
(9.5
0)
- 1
00.0
0
86N
orsk
Sta
l Tyn
npla
ter A
BM
arch
31,
201
5N
OK
7.2
4 0
.38
15.
91
74.
80
58.
51
- 2
65.7
0 (0
.86)
-
(0.8
6)
- 1
00.0
0
87O
rb E
lect
rical
Ste
els
Lim
ited
Apr
il 2,
200
7G
BP 9
3.54
-
- -
- -
- -
- -
- 1
00.0
0
88O
re C
arrie
rs L
imite
d^A
pril
2, 2
007
GBP
93.
54
- -
- -
- -
0.0
6 -
0.0
6 -
100
.00
89O
rem
co In
c.A
pril
2, 2
007
USD
75.
59
0.7
6 (1
6.71
) 1
.30
17.
25
- -
(0.6
5)
- (0
.65)
2
1.58
1
00.0
0
90Pl
ated
Str
ip (I
nter
natio
nal)
Lim
ited^
Apr
il 2,
200
7G
BP 9
3.54
-
- -
- -
- 0
.11
- 0
.11
- 1
00.0
0
91Pr
ecoa
t Int
erna
tiona
l Lim
ited^
Apr
il 2,
200
7G
BP 9
3.54
-
- -
- -
- 1
8.28
-
18.
28
16.
74
100
.00
92Pr
ecoa
t Lim
ited^
Apr
il 2,
200
7G
BP 9
3.54
-
- -
- -
- 1
9.85
-
19.
85
90.
78
100
.00
93Ra
ffert
y-Br
own
Stee
l Co
Inc
Of C
onn.
Apr
il 2,
200
7U
SD 7
5.59
2
3.94
6
.42
30.
93
0.5
7 -
- (1
.67)
(0
.22)
(1
.45)
-
100
.00
94Ro
und
Oak
Ste
elw
orks
Lim
ited^
Apr
il 2,
200
7G
BP 9
3.54
-
- -
- -
- 4
48.1
5 -
448
.15
- 1
00.0
0
95S
A B
Pro
fiel B
.V.
Apr
il 2,
200
7EU
R 8
2.85
1
.12
300
.48
566
.78
265
.19
135
.96
830
.72
29.
28
(0.5
4)
29.
82
- 1
00.0
0
96S
A B
Pro
fil G
mbH
Apr
il 2,
200
7EU
R 8
2.85
0
.25
140
.61
168
.14
27.
28
- 2
76.0
9 1
.86
(0.2
1)
2.0
7 -
100
.00
97Se
rvic
e Ce
nter
Gel
senk
irche
n G
mbH
EUR
82.
85
152
.52
37.
33
534
.72
344
.87
0.6
4 9
48.3
7 (0
.33)
2
.87
(3.2
0)
- 1
00.0
0
98Se
rvic
e Ce
ntre
Maa
stric
ht B
.V.
Apr
il 2,
200
7EU
R 8
2.85
0
.45
(27.
38)
632
.19
659
.13
- 1
,731
.84
(110
.02)
(2
7.60
) (8
2.42
) -
100
.00
99So
ciet
e Eu
rope
enne
De
Gal
vani
satio
n (S
egal
) Sa
Apr
il 2,
200
7EU
R 8
2.85
1
03.5
6 1
43.4
4 3
34.3
1 8
7.31
-
499
.86
15.
49
5.9
2 9
.57
- 1
00.0
0
100
Staa
lver
wer
king
en
Han
del B
.V.
Apr
il 2,
200
7EU
R 8
2.85
3
72.8
1 3
52.3
8 1
,537
.78
812
.59
1,5
32.8
0 -
(7.5
1)
(1.9
1)
(5.6
0)
- 1
00.0
0
101
Sura
ham
mar
Bru
ks A
BA
pril
2, 2
007
SEK
7.6
0 1
6.42
(1
2.73
) 1
90.8
9 1
87.2
0 -
216
.72
(44.
43)
- (4
4.43
) -
100
.00
102
Swin
den
Hou
sing
Ass
ocia
tion
Lim
ited
Apr
il 2,
200
7G
BP 9
3.54
-
12.
82
13.
39
0.5
7 -
- 0
.25
- 0
.25
- 1
00.0
0
103
Tata
Ste
el B
elgi
um P
acka
ging
Ste
els
N.V
.A
pril
2, 2
007
EUR
82.
85
127
.86
37.
69
205
.93
40.
37
0.6
5 9
4.99
7
.54
2.2
3 5
.31
- 1
00.0
0
104
Tata
Ste
el B
elgi
um S
ervi
ces
N.V
.A
pril
2, 2
007
EUR
82.
85
139
.57
80.
94
563
.43
342
.92
32.
96
- 5
.47
1.2
4 4
.23
- 1
00.0
0
105
Tata
Ste
el D
enm
ark
Bygg
syst
emer
A/S
Apr
il 2,
200
7D
KK 1
1.13
-
- -
- -
- 0
.25
(0.6
0)
0.8
5 -
100
.00
106
Tata
Ste
el E
urop
e D
istr
ibut
ion
BVA
pril
2, 2
007
EUR
82.
85
6.0
6 (2
2.55
) 2
2.78
3
9.27
-
- 5
.60
1.4
0 4
.20
- 1
00.0
0
107
Tata
Ste
el E
urop
e M
etal
s Tra
ding
BV
EUR
82.
85
- -
- -
- -
(0.0
8)
(0.0
2)
(0.0
6)
- 1
00.0
0
108
Tata
Ste
el F
ranc
e Ba
timen
t et S
yste
mes
SAS
Apr
il 2,
200
7EU
R 8
2.85
3
3.14
(2
07.9
1)
226
.38
401
.15
1.0
8 4
45.4
7 (1
01.0
2)
- (1
01.0
2)
- 1
00.0
0
109
Tata
Ste
el F
ranc
e H
oldi
ngs
SAS
Apr
il 2,
200
7EU
R 8
2.85
4
1.42
8
80.1
9 1
,543
.72
622
.10
1,1
38.2
7 -
(10.
81)
(5.1
4)
(5.6
7)
- 1
00.0
0
110
Tata
Ste
el G
erm
any
Gm
bHA
pril
2, 2
007
EUR
82.
85
1,0
95.7
4 (7
55.6
1)
1,3
02.9
2 9
62.7
9 9
48.6
4 -
(42.
76)
1.4
6 (4
4.22
) -
100
.00
111
Tata
Ste
el IJ
mui
den
BVEU
R 8
2.85
9
32.0
2 2
0,31
0.28
3
1,97
7.57
1
0,73
5.27
4
97.7
0 3
2,51
8.88
(9
57.2
6)
(235
.08)
(7
22.1
8)
- 1
00.0
0
112
Tata
Ste
el In
tern
atio
nal (
Am
eric
as)
Hol
ding
s In
cA
pril
2, 2
007
USD
75.
59
4,9
31.3
3 (4
,215
.57)
1
,099
.23
383
.47
333
.53
- 2
8.52
(6
.36)
3
4.88
-
100
.00
113
Tata
Ste
el In
tern
atio
nal (
Am
eric
as) I
ncA
pril
2, 2
007
USD
75.
59
67.
29
1,2
78.0
0 1
,417
.16
71.
87
- 2
21.9
1 1
2.15
(7
.15)
1
9.30
-
100
.00
114
Tata
Ste
el In
tern
atio
nal (
Czec
h Re
publ
ic)
S.R.
O
Apr
il 2,
200
7CZ
K 3
.04
0.3
6 9
.24
11.
22
1.6
1 -
- 8
.36
1.6
6 6
.70
0.1
1 1
00.0
0
INTEGRATED REPORT & ANNUAL ACCOUNTS 2019-20 | 113TH YEAR162
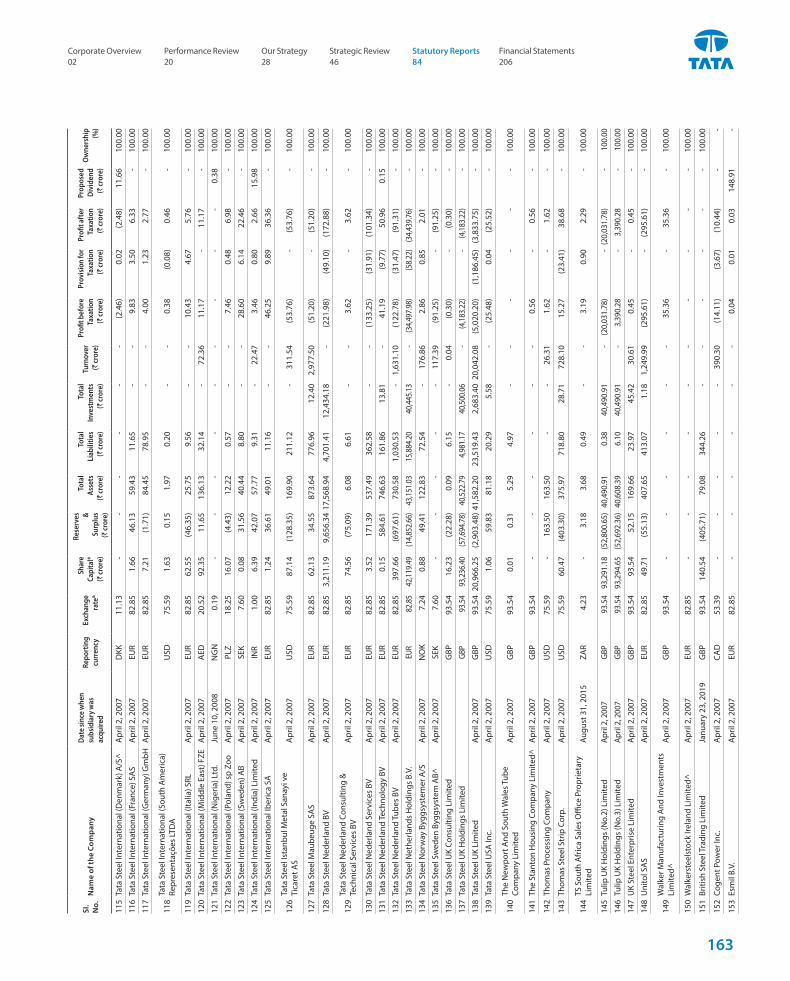
Sl.
No.
Nam
e of
the
Com
pany
Dat
e sin
ce w
hen
subs
idia
ry w
as
acqu
ired
Repo
rtin
g cu
rren
cyEx
chan
ge
rate
&
Shar
e Ca
pita
l*
(` cr
ore)
Rese
rves
& Su
rplu
s (`
cror
e)
Tota
l As
sets
(`
cror
e)
Tota
l Li
abili
ties
(` cr
ore)
Tota
l In
vest
men
ts
(` cr
ore)
Turn
over
(`
cror
e)
Profi
t bef
ore
Taxa
tion
(` cr
ore)
Prov
ision
for
Taxa
tion
(` cr
ore)
Profi
t aft
er
Taxa
tion
(` cr
ore)
Prop
osed
D
ivid
end
(` cr
ore)
Ow
ners
hip
(%)
115
Tata
Ste
el In
tern
atio
nal (
Den
mar
k) A
/S^
Apr
il 2,
200
7D
KK 1
1.13
-
- -
- -
- (2
.46)
0
.02
(2.4
8)
11.
66
100
.00
116
Tata
Ste
el In
tern
atio
nal (
Fran
ce) S
AS
Apr
il 2,
200
7EU
R 8
2.85
1
.66
46.
13
59.
43
11.
65
- -
9.8
3 3
.50
6.3
3 -
100
.00
117
Tata
Ste
el In
tern
atio
nal (
Ger
man
y) G
mbH
Apr
il 2,
200
7EU
R 8
2.85
7
.21
(1.7
1)
84.
45
78.
95
- -
4.0
0 1
.23
2.7
7 -
100
.00
118
Tata
Ste
el In
tern
atio
nal (
Sout
h A
mer
ica)
Re
pres
enta
ções
LTD
AU
SD 7
5.59
1
.63
0.1
5 1
.97
0.2
0 -
- 0
.38
(0.0
8)
0.4
6 -
100
.00
119
Tata
Ste
el In
tern
atio
nal (
Italia
) SRL
Apr
il 2,
200
7EU
R 8
2.85
6
2.55
(4
6.35
) 2
5.75
9
.56
- -
10.
43
4.6
7 5
.76
- 1
00.0
0
120
Tata
Ste
el In
tern
atio
nal (
Mid
dle
East
) FZE
Apr
il 2,
200
7A
ED 2
0.52
9
2.35
1
1.65
1
36.1
3 3
2.14
-
72.
36
11.
17
- 1
1.17
-
100
.00
121
Tata
Ste
el In
tern
atio
nal (
Nig
eria
) Ltd
.Ju
ne 1
0, 2
008
NG
N 0
.19
- -
- -
- -
- -
- 0
.38
100
.00
122
Tata
Ste
el In
tern
atio
nal (
Pola
nd) s
p Zo
oA
pril
2, 2
007
PLZ
18.
25
16.
07
(4.4
3)
12.
22
0.5
7 -
- 7
.46
0.4
8 6
.98
- 1
00.0
0
123
Tata
Ste
el In
tern
atio
nal (
Swed
en) A
BA
pril
2, 2
007
SEK
7.6
0 0
.08
31.
56
40.
44
8.8
0 -
- 2
8.60
6
.14
22.
46
- 1
00.0
0
124
Tata
Ste
el In
tern
atio
nal (
Indi
a) L
imite
dA
pril
2, 2
007
INR
1.0
0 6
.39
42.
07
57.
77
9.3
1 -
22.
47
3.4
6 0
.80
2.6
6 15
.98
100
.00
125
Tata
Ste
el In
tern
atio
nal I
beric
a SA
Apr
il 2,
200
7EU
R 8
2.85
1
.24
36.
61
49.
01
11.
16
- -
46.
25
9.8
9 3
6.36
-
100
.00
126
Tata
Ste
el Is
tanb
ul M
etal
San
ayi v
e Ti
care
t AS
Apr
il 2,
200
7U
SD 7
5.59
8
7.14
(1
28.3
5)
169
.90
211
.12
- 3
11.5
4 (5
3.76
) -
(53.
76)
- 1
00.0
0
127
Tata
Ste
el M
aube
uge
SAS
Apr
il 2,
200
7EU
R 8
2.85
6
2.13
3
4.55
8
73.6
4 7
76.9
6 1
2.40
2
,977
.50
(51.
20)
- (5
1.20
) -
100
.00
128
Tata
Ste
el N
eder
land
BV
Apr
il 2,
200
7EU
R 8
2.85
3
,211
.19
9,6
56.3
4 1
7,56
8.94
4
,701
.41
12,
434.
18
- (2
21.9
8)
(49.
10)
(172
.88)
-
100
.00
129
Tata
Ste
el N
eder
land
Con
sulti
ng &
Te
chni
cal S
ervi
ces
BVA
pril
2, 2
007
EUR
82.
85
74.
56
(75.
09)
6.0
8 6
.61
- -
3.6
2 -
3.6
2 -
100
.00
130
Tata
Ste
el N
eder
land
Ser
vice
s BV
Apr
il 2,
200
7EU
R 8
2.85
3
.52
171
.39
537
.49
362
.58
- -
(133
.25)
(3
1.91
) (1
01.3
4)
- 1
00.0
0
131
Tata
Ste
el N
eder
land
Tech
nolo
gy B
VA
pril
2, 2
007
EUR
82.
85
0.15
584.
61 7
46.6
3 1
61.8
6 1
3.81
-
41.
19
(9.7
7)
50.
96
0.1
5 1
00.0
0
132
Tata
Ste
el N
eder
land
Tub
es B
VA
pril
2, 2
007
EUR
82.
85
397
.66
(697
.61)
7
30.5
8 1
,030
.53
- 1
,631
.10
(122
.78)
(3
1.47
) (9
1.31
) -
100
.00
133
Tata
Ste
el N
ethe
rland
s H
oldi
ngs
B.V.
EUR
82.
85
42,
119.
49
(14,
852.
66)
43,
151.
03
15,
884.
20
40,
445.
13
- (3
4,49
7.98
) (5
8.22
) (3
4,43
9.76
) -
100
.00
134
Tata
Ste
el N
orw
ay B
yggs
yste
mer
A/S
Apr
il 2,
200
7N
OK
7.2
4 0
.88
49.
41
122
.83
72.
54
- 1
76.8
6 2
.86
0.8
5 2
.01
- 1
00.0
0
135
Tata
Ste
el S
wed
en B
yggs
yste
m A
B^A
pril
2, 2
007
SEK
7.6
0 -
- -
- -
117
.39
(91.
25)
- (9
1.25
) -
100
.00
136
Tata
Ste
el U
K Co
nsul
ting
Lim
ited
GBP
93.
54
16.
23
(22.
28)
0.0
9 6
.15
- 0
.04
(0.3
0)
- (0
.30)
-
100
.00
137
Tata
Ste
el U
K H
oldi
ngs
Lim
ited
GBP
93.
54
93,
236.
40
(57,
694.
78)
40,
522.
79
4,9
81.1
7 4
0,50
0.06
-
(4,1
83.2
2)
- (4
,183
.22)
-
100
.00
138
Tata
Ste
el U
K Li
mite
dA
pril
2, 2
007
GBP
93.
54 2
0,96
6.25
(2
,903
.48)
41,
582.
20
23,
519.
43
2,6
83.4
0 2
0,04
2.08
(5
,020
.20)
(1
,186
.45)
(3
,833
.75)
-
100
.00
139
Tata
Ste
el U
SA In
c.A
pril
2, 2
007
USD
75.
59
1.0
6 5
9.83
8
1.18
2
0.29
5
.58
- (2
5.48
) 0
.04
(25.
52)
- 1
00.0
0
140
The
New
port
And
Sou
th W
ales
Tub
e Co
mpa
ny L
imite
dA
pril
2, 2
007
GBP
93.
54
0.0
1 0
.31
5.2
9 4
.97
- -
- -
- -
100
.00
141
The
Stan
ton
Hou
sing
Com
pany
Lim
ited^
Apr
il 2,
200
7G
BP 9
3.54
-
- -
- -
- 0
.56
- 0
.56
- 1
00.0
0
142
Thom
as P
roce
ssin
g Co
mpa
nyA
pril
2, 2
007
USD
75.
59
- 1
63.5
0 16
3.50
- -
26.
31
1.6
2 -
1.6
2 -
100
.00
143
Thom
as S
teel
Str
ip C
orp.
Apr
il 2,
200
7U
SD 7
5.59
6
0.47
(4
03.3
0)
375
.97
718
.80
28.
71
728
.10
15.
27
(23.
41)
38.
68
- 1
00.0
0
144
TS S
outh
Afr
ica
Sale
s O
ffice
Pro
prie
tary
Li
mite
dAu
gust
31,
201
5ZA
R 4
.23
- 3
.18
3.6
8 0
.49
- -
3.1
9 0
.90
2.2
9 -
100
.00
145
Tulip
UK
Hol
ding
s (N
o.2)
Lim
ited
April
2, 2
007
GBP
93.
54
93,2
91.1
8 (5
2,80
0.65
) 4
0,49
0.91
0
.38
40,
490.
91
- (2
0,03
1.78
) -
(20,
031.
78)
- 1
00.0
0
146
Tulip
UK
Hol
ding
s (N
o.3)
Lim
ited
April
2, 2
007
GBP
93.
54
93,2
94.6
5 (5
2,69
2.36
) 4
0,60
8.39
6
.10
40,
490.
91
- 3
,390
.28
- 3
,390
.28
- 1
00.0
0
147
UK
Stee
l Ent
erpr
ise
Lim
ited
Apr
il 2,
200
7G
BP 9
3.54
9
3.54
5
2.15
1
69.6
6 2
3.97
4
5.42
3
0.61
0
.45
- 0
.45
- 1
00.0
0
148
Uni
tol S
AS
Apr
il 2,
200
7EU
R 8
2.85
4
9.71
(5
5.13
) 4
07.6
5 4
13.0
7 1
.18
1,2
49.9
9 (2
95.6
1)
- (2
95.6
1)
- 1
00.0
0
149
Wal
ker M
anuf
actu
ring
And
Inve
stm
ents
Li
mite
d^A
pril
2, 2
007
GBP
93.
54
- -
- -
- -
35.
36
- 3
5.36
-
100
.00
150
Wal
kers
teel
stoc
k Ire
land
Lim
ited^
Apr
il 2,
200
7EU
R 8
2.85
-
- -
- -
- -
- -
- 1
00.0
0
151
Briti
sh S
teel
Tra
ding
Lim
ited
Janu
ary
23, 2
019
GBP
93.
54
140
.54
(405
.71)
7
9.08
3
44.2
6 -
- -
- -
- 1
00.0
0
152
Coge
nt P
ower
Inc.
Apr
il 2,
200
7CA
D 5
3.39
-
- -
- -
390
.30
(14.
11)
(3.6
7)
(10.
44)
- -
153
Esm
il B.
V.A
pril
2, 2
007
EUR
82.
85
- -
- -
- -
0.0
4 0
.01
0.0
3 1
48.9
1 -
Corporate Overview 02
Strategic Review 46
Performance Review 20
Statutory Reports 84
Our Strategy 28
Financial Statements 206
163
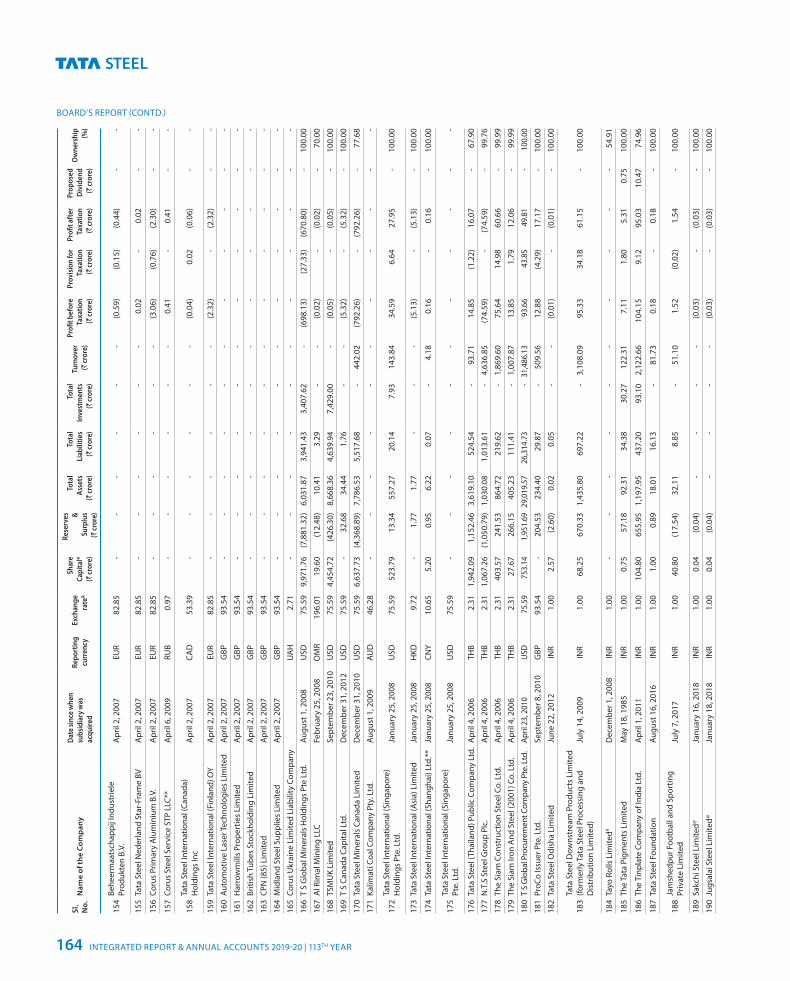
BOARD’S REPORT (CONTD.)
Sl.
No.
Nam
e of
the
Com
pany
Dat
e sin
ce w
hen
subs
idia
ry w
as
acqu
ired
Repo
rtin
g cu
rren
cyEx
chan
ge
rate
&
Shar
e Ca
pita
l*
(` cr
ore)
Rese
rves
& Su
rplu
s (`
cror
e)
Tota
l As
sets
(`
cror
e)
Tota
l Li
abili
ties
(` cr
ore)
Tota
l In
vest
men
ts
(` cr
ore)
Turn
over
(`
cror
e)
Profi
t bef
ore
Taxa
tion
(` cr
ore)
Prov
ision
for
Taxa
tion
(` cr
ore)
Profi
t aft
er
Taxa
tion
(` cr
ore)
Prop
osed
D
ivid
end
(` cr
ore)
Ow
ners
hip
(%)
154
Behe
erm
aats
chap
pij I
ndus
trie
le
Prod
ukte
n B.
V.A
pril
2, 2
007
EUR
82.
85
- -
- -
- -
(0.5
9)
(0.1
5)
(0.4
4)
- -
155
Tata
Ste
el N
eder
land
Sta
r-Fr
ame
BVA
pril
2, 2
007
EUR
82.
85
- -
- -
- -
0.0
2 -
0.0
2 -
-
156
Coru
s Pr
imar
y A
lum
iniu
m B
.V.
Apr
il 2,
200
7EU
R 8
2.85
-
- -
- -
- (3
.06)
(0
.76)
(2
.30)
-
-
157
Coru
s St
eel S
ervi
ce S
TP L
LC**
Apr
il 6,
200
9RU
B 0
.97
- -
- -
- -
0.4
1 -
0.4
1 -
-
158
Tata
Ste
el In
tern
atio
nal (
Cana
da)
Hol
ding
s In
cA
pril
2, 2
007
CAD
53.
39
- -
- -
- -
(0.0
4)
0.0
2 (0
.06)
-
-
159
Tata
Ste
el In
tern
atio
nal (
Finl
and)
OY
Apr
il 2,
200
7EU
R 8
2.85
-
- -
- -
- (2
.32)
-
(2.3
2)
- -
160
Auto
mot
ive
Lase
r Tec
hnol
ogie
s Li
mite
dA
pril
2, 2
007
GBP
93.
54
- -
- -
- -
- -
- -
-
161
Har
row
mill
s Pr
oper
ties
Lim
ited
Apr
il 2,
200
7G
BP 9
3.54
-
- -
- -
- -
- -
- -
162
Briti
sh T
ubes
Sto
ckho
ldin
g Li
mite
dA
pril
2, 2
007
GBP
93.
54
- -
- -
- -
- -
- -
-
163
CPN
(85)
Lim
ited
Apr
il 2,
200
7G
BP 9
3.54
-
- -
- -
- -
- -
- -
164
Mid
land
Ste
el S
uppl
ies
Lim
ited
Apr
il 2,
200
7G
BP 9
3.54
-
- -
- -
- -
- -
- -
165
Coru
s U
krai
ne L
imite
d Li
abili
ty C
ompa
nyU
AH
2.7
1 -
- -
- -
- -
- -
- -
166
T S
Glo
bal M
iner
als
Hol
ding
s Pt
e Lt
d.Au
gust
1, 2
008
USD
75.
59
9,9
71.7
6 (7
,881
.32)
6
,031
.87
3,9
41.4
3 3
,407
.62
- (6
98.1
3)
(27.
33)
(670
.80)
-
100
.00
167
Al R
imal
Min
ing
LLC
Febr
uary
25,
200
8O
MR
196
.01
19.
60
(12.
48)
10.
41
3.2
9 -
- (0
.02)
-
(0.0
2)
- 7
0.00
168
TSM
UK
Lim
ited
Sept
embe
r 23,
201
0U
SD 7
5.59
4
,454
.72
(426
.30)
8
,668
.36
4,6
39.9
4 7
,429
.00
- (0
.05)
-
(0.0
5)
- 1
00.0
0
169
T S
Cana
da C
apita
l Ltd
.D
ecem
ber 3
1, 2
012
USD
75.
59
- 3
2.68
3
4.44
1
.76
- -
(5.3
2)
- (5
.32)
-
100
.00
170
Tata
Ste
el M
iner
als
Cana
da L
imite
d D
ecem
ber 3
1, 2
010
USD
75.
59
6,6
37.7
3 (4
,368
.89)
7
,786
.53
5,5
17.6
8 -
442
.02
(792
.26)
-
(792
.26)
-
77.
68
171
Kalim
ati C
oal C
ompa
ny P
ty. L
td.
Augu
st 1
, 200
9AU
D 4
6.28
-
- -
- -
- -
- -
- -
172
Tata
Ste
el In
tern
atio
nal (
Sing
apor
e)
Hol
ding
s Pt
e. L
td.
Janu
ary
25, 2
008
USD
75.
59
523
.79
13.
34
557
.27
20.
14
7.9
3 1
43.8
4 3
4.59
6
.64
27.
95
- 1
00.0
0
173
Tata
Ste
el In
tern
atio
nal (
Asi
a) L
imite
dJa
nuar
y 25
, 200
8H
KD 9
.72
- 1
.77
1.7
7 -
- -
(5.1
3)
- (5
.13)
-
100
.00
174
Tata
Ste
el In
tern
atio
nal (
Shan
ghai
) Ltd
.**
Janu
ary
25, 2
008
CNY
10.
65
5.2
0 0
.95
6.2
2 0
.07
- 4
.18
0.1
6 -
0.1
6 -
100
.00
175
Tata
Ste
el In
tern
atio
nal (
Sing
apor
e)
Pte.
Ltd
.Ja
nuar
y 25
, 200
8U
SD 7
5.59
-
- -
- -
- -
- -
- -
176
Tata
Ste
el (T
haila
nd) P
ublic
Com
pany
Ltd
.A
pril
4, 2
006
THB
2.3
1 1
,942
.09
1,1
52.4
6 3
,619
.10
524
.54
- 9
3.71
1
4.85
(1
.22)
1
6.07
-
67.
90
177
N.T
.S S
teel
Gro
up P
lc.
Apr
il 4,
200
6TH
B 2
.31
1,0
67.2
6 (1
,050
.79)
1
,030
.08
1,0
13.6
1 -
4,6
36.8
5 (7
4.59
) -
(74.
59)
- 9
9.76
178
The
Siam
Con
stru
ctio
n St
eel C
o. L
td.
Apr
il 4,
200
6TH
B 2
.31
403
.57
241
.53
864
.72
219
.62
- 1
,869
.60
75.
64
14.
98
60.
66
- 9
9.99
179
The
Siam
Iron
And
Ste
el (2
001)
Co.
Ltd
.A
pril
4, 2
006
THB
2.3
1 2
7.67
2
66.1
5 4
05.2
3 1
11.4
1 -
1,0
07.8
7 1
3.85
1
.79
12.
06
- 9
9.99
180
T S
Glo
bal P
rocu
rem
ent C
ompa
ny P
te. L
td.
April
23,
201
0U
SD 7
5.59
7
53.1
4 1
,951
.69
29,
019.
57
26,
314.
73
- 3
1,48
6.13
9
3.66
4
3.85
4
9.81
-
100
.00
181
ProC
o Is
suer
Pte
. Ltd
. Se
ptem
ber 8
, 201
0G
BP 9
3.54
-
204
.53
234
.40
29.
87
- 5
09.5
6 1
2.88
(4
.29)
1
7.17
-
100
.00
182
Tata
Ste
el O
dish
a Li
mite
dJu
ne 2
2, 2
012
INR
1.0
0 2
.57
(2.6
0)
0.0
2 0
.05
- -
(0.0
1)
- (0
.01)
-
100
.00
183
Tata
Ste
el D
owns
trea
m P
rodu
cts
Lim
ited
(form
erly
Tat
a St
eel P
roce
ssin
g an
d D
istr
ibut
ion
Lim
ited)
July
14,
200
9IN
R 1
.00
68.
25
670
.33
1,4
35.8
0 6
97.2
2 -
3,1
08.0
9 9
5.33
3
4.18
6
1.15
-
100
.00
184
Tayo
Rol
ls L
imite
d#D
ecem
ber 1
, 200
8IN
R 1
.00
- -
- -
- -
- -
- -
54.
91
185
The
Tata
Pig
men
ts L
imite
dM
ay 1
8, 1
985
INR
1.0
0 0
.75
57.
18
92.
31
34.
38
30.
27
122
.31
7.1
1 1
.80
5.3
1 0
.75
100
.00
186
The
Tinp
late
Com
pany
of I
ndia
Ltd
.A
pril
1, 2
011
INR
1.0
0 1
04.8
0 6
55.9
5 1
,197
.95
437
.20
93.
10
2,1
22.6
6 1
04.1
5 9
.12
95.
03
10.
47
74.
96
187
Tata
Ste
el F
ound
atio
nAu
gust
16,
201
6IN
R 1
.00
1.0
0 0
.89
18.
01
16.
13
- 8
1.73
0
.18
- 0
.18
- 1
00.0
0
188
Jam
shed
pur F
ootb
all a
nd S
port
ing
Priv
ate
Lim
ited
July
7, 2
017
INR
1.0
0 4
0.80
(1
7.54
) 3
2.11
8
.85
- 5
1.10
1
.52
(0.0
2)
1.5
4 -
100
.00
189
Sakc
hi S
teel
Lim
ited@
Janu
ary
16, 2
018
INR
1.0
0 0
.04
(0.0
4)
- -
- -
(0.0
3)
- (0
.03)
-
100
.00
190
Jugs
alai
Ste
el L
imite
d@Ja
nuar
y 18
, 201
8IN
R 1
.00
0.0
4 (0
.04)
-
- -
- (0
.03)
-
(0.0
3)
- 1
00.0
0
INTEGRATED REPORT & ANNUAL ACCOUNTS 2019-20 | 113TH YEAR164
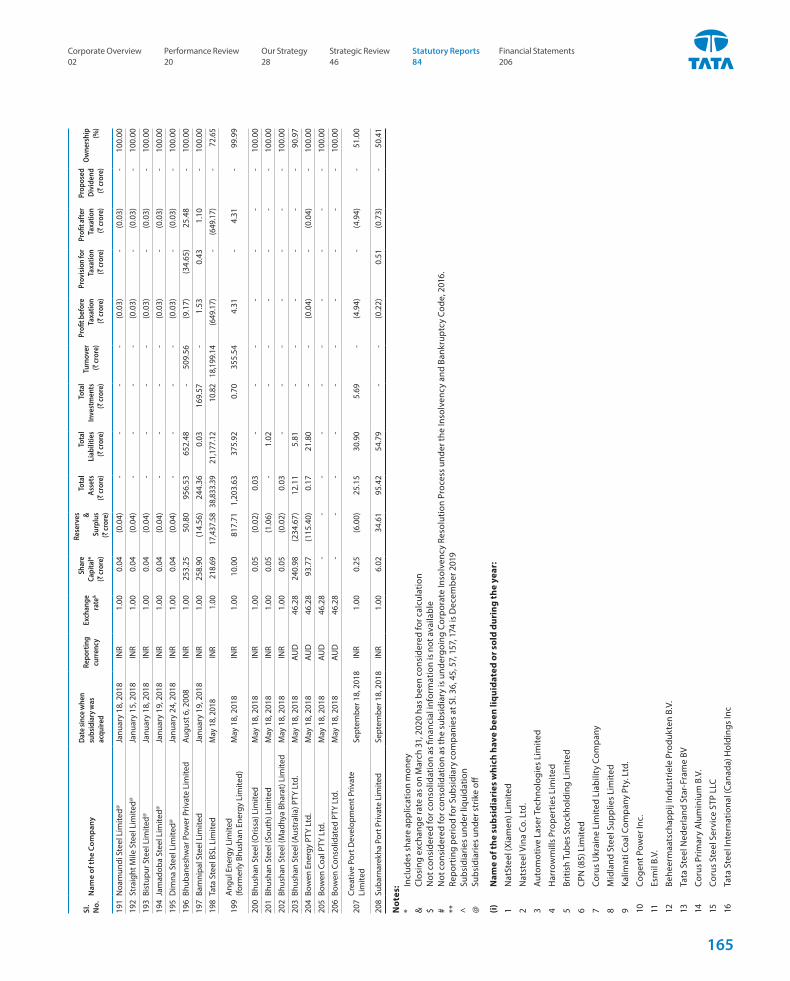
Sl.
No.
Nam
e of
the
Com
pany
Dat
e sin
ce w
hen
subs
idia
ry w
as
acqu
ired
Repo
rtin
g cu
rren
cyEx
chan
ge
rate
&
Shar
e Ca
pita
l*
(` cr
ore)
Rese
rves
& Su
rplu
s (`
cror
e)
Tota
l As
sets
(`
cror
e)
Tota
l Li
abili
ties
(` cr
ore)
Tota
l In
vest
men
ts
(` cr
ore)
Turn
over
(`
cror
e)
Profi
t bef
ore
Taxa
tion
(` cr
ore)
Prov
ision
for
Taxa
tion
(` cr
ore)
Profi
t aft
er
Taxa
tion
(` cr
ore)
Prop
osed
D
ivid
end
(` cr
ore)
Ow
ners
hip
(%)
191
Noa
mun
di S
teel
Lim
ited@
Janu
ary
18, 2
018
INR
1.0
0 0
.04
(0.0
4)
- -
- -
(0.0
3)
- (0
.03)
-
100
.00
192
Stra
ight
Mile
Ste
el L
imite
d@Ja
nuar
y 15
, 201
8IN
R 1
.00
0.0
4 (0
.04)
-
- -
- (0
.03)
-
(0.0
3)
- 1
00.0
0
193
Bist
upur
Ste
el L
imite
d@Ja
nuar
y 18
, 201
8IN
R 1
.00
0.0
4 (0
.04)
-
- -
- (0
.03)
-
(0.0
3)
- 1
00.0
0
194
Jam
adob
a St
eel L
imite
d@Ja
nuar
y 19
, 201
8IN
R 1
.00
0.0
4 (0
.04)
-
- -
- (0
.03)
-
(0.0
3)
- 1
00.0
0
195
Dim
na S
teel
Lim
ited@
Janu
ary
24, 2
018
INR
1.0
0 0
.04
(0.0
4)
- -
- -
(0.0
3)
- (0
.03)
-
100
.00
196
Bhub
anes
hwar
Pow
er P
rivat
e Li
mite
dAu
gust
6, 2
008
INR
1.0
0 2
53.2
5 5
0.80
9
56.5
3 6
52.4
8 -
509
.56
(9.1
7)
(34.
65)
25.
48
- 1
00.0
0
197
Bam
nipa
l Ste
el L
imite
dJa
nuar
y 19
, 201
8IN
R 1
.00
258
.90
(14.
56)
244
.36
0.0
3 1
69.5
7 -
1.5
3 0
.43
1.1
0 -
100
.00
198
Tata
Ste
el B
SL L
imite
dM
ay 1
8, 2
018
INR
1.0
0 2
18.6
9 1
7,43
7.58
38,
833.
39
21,
177.
12
10.
82
18,1
99.1
4 (6
49.1
7)
- (6
49.1
7)
- 7
2.65
199
Ang
ul E
nerg
y Li
mite
d
(form
erly
Bhu
shan
Ene
rgy
Lim
ited)
May
18,
201
8IN
R 1
.00
10.
00
817
.71
1,2
03.6
3 3
75.9
2 0
.70
355
.54
4.3
1 -
4.3
1 -
99.
99
200
Bhus
han
Stee
l (O
rissa
) Lim
ited
May
18,
201
8IN
R 1
.00
0.0
5 (0
.02)
0
.03
- -
- -
- -
- 1
00.0
0
201
Bhus
han
Stee
l (So
uth)
Lim
ited
May
18,
201
8IN
R 1
.00
0.0
5 (1
.06)
-
1.0
2 -
- -
- -
- 1
00.0
0
202
Bhus
han
Stee
l (M
adhy
a Bh
arat
) Lim
ited
May
18,
201
8IN
R 1
.00
0.0
5 (0
.02)
0
.03
- -
- -
- -
- 1
00.0
0
203
Bhus
han
Stee
l (Au
stra
lia) P
TY L
td.
May
18,
201
8AU
D 4
6.28
2
40.9
8 (2
34.6
7)
12.
11
5.8
1 -
- -
- -
- 9
0.97
204
Bow
en E
nerg
y PT
Y Lt
d.M
ay 1
8, 2
018
AUD
46.
28
93.
77
(115
.40)
0
.17
21.
80
- -
(0.0
4)
- (0
.04)
-
100
.00
205
Bow
en C
oal P
TY L
td.
May
18,
201
8AU
D 4
6.28
-
- -
- -
- -
- -
- 1
00.0
0
206
Bow
en C
onso
lidat
ed P
TY L
td.
May
18,
201
8AU
D 4
6.28
-
- -
- -
- -
- -
- 1
00.0
0
207
Crea
tive
Port
Dev
elop
men
t Priv
ate
Lim
ited
Sept
embe
r 18,
201
8IN
R 1
.00
0.2
5 (6
.00)
2
5.15
3
0.90
5
.69
- (4
.94)
-
(4.9
4)
- 5
1.00
208
Suba
rnar
ekha
Por
t Priv
ate
Lim
ited
Sept
embe
r 18,
201
8IN
R 1
.00
6.0
2 3
4.61
9
5.42
5
4.79
-
- (0
.22)
0
.51
(0.7
3)
- 5
0.41
Not
es:
* In
clud
es s
hare
app
licat
ion
mon
ey&
Cl
osin
g ex
chan
ge ra
te a
s on
Mar
ch 3
1, 2
020
has
been
con
side
red
for c
alcu
latio
n$
Not
con
side
red
for c
onso
lidat
ion
as fi
nanc
ial i
nfor
mat
ion
is n
ot a
vaila
ble
# N
ot c
onsi
dere
d fo
r con
solid
atio
n as
the
subs
idia
ry is
und
ergo
ing
Corp
orat
e In
solv
ency
Res
olut
ion
Proc
ess
unde
r the
Inso
lven
cy a
nd B
ankr
uptc
y Co
de, 2
016.
**
Repo
rtin
g pe
riod
for S
ubsi
diar
y co
mpa
nies
at S
l. 36
, 45,
57,
157
, 174
is D
ecem
ber 2
019
^ Su
bsid
iarie
s un
der l
iqui
datio
n@
Su
bsid
iarie
s un
der s
trik
e off
(i)
Nam
e of
the
subs
idia
ries
whi
ch h
ave
been
liqu
idat
ed o
r sol
d du
ring
the
year
:
1 N
atSt
eel (
Xiam
en) L
imite
d
2 N
atst
eel V
ina
Co. L
td.
3 A
utom
otiv
e La
ser T
echn
olog
ies
Lim
ited
4 H
arro
wm
ills
Prop
ertie
s Li
mite
d
5 Br
itish
Tub
es S
tock
hold
ing
Lim
ited
6 CP
N (8
5) L
imite
d
7 Co
rus
Ukr
aine
Lim
ited
Liab
ility
Com
pany
8 M
idla
nd S
teel
Sup
plie
s Li
mite
d
9 Ka
limat
i Coa
l Com
pany
Pty
. Ltd
.
10
Coge
nt P
ower
Inc.
11
Esm
il B.
V.
12
Behe
erm
aats
chap
pij I
ndus
trie
le P
rodu
kten
B.V
.
13
Tata
Ste
el N
eder
land
Sta
r-Fr
ame
BV
14
Coru
s Pr
imar
y A
lum
iniu
m B
.V.
15
Coru
s St
eel S
ervi
ce S
TP L
LC
16
Tata
Ste
el In
tern
atio
nal (
Cana
da) H
oldi
ngs
Inc
Corporate Overview 02
Strategic Review 46
Performance Review 20
Statutory Reports 84
Our Strategy 28
Financial Statements 206
165
BOARD’S REPORT (CONTD.)
17
Tata
Ste
el In
tern
atio
nal (
Finl
and)
OY
18
Tata
Ste
el In
tern
atio
nal (
Sing
apor
e) P
te. L
td.
(ii)
Nam
e of
the
subs
idia
ries
und
er li
quid
atio
n w
ith
no a
sset
s, li
abili
ties
and
tran
sact
ions
dur
ing
the
peri
od:
1 Be
ll &
Har
woo
d Li
mite
d
2 Bo
re S
teel
Lim
ited
3 Br
itish
Gui
de R
ails
Lim
ited
4 Br
itish
Ste
el E
ngin
eerin
g St
eels
(Exp
orts
) Lim
ited
5 Br
itish
Ste
el S
ervi
ce C
entr
es L
imite
d
6 Co
rdor
(C&
B) L
imite
d
7 Co
rus
Engi
neer
ing
Stee
ls P
ensi
on S
chem
e Tr
uste
e Li
mite
d
8 Co
rus
Serv
ice
Cent
re L
imite
d
9 Co
rus
Tube
s Po
land
Spo
lka
Z.O
.O
10
Gra
nt L
yon
Eagr
e Li
mite
d
11
Ham
mer
meg
a Li
mite
d
12
List
er T
ubes
Lim
ited
13
Nat
ionw
ide
Stee
lsto
ck L
imite
d
14
Runb
last
Lim
ited
15
Runm
ega
Lim
ited
16
Seam
less
Tub
es L
imite
d
17
Stee
l Sto
ckH
oldi
ngs
Lim
ited
18
Stee
lsto
ck L
imite
d
19
Stew
arts
& L
loyd
s O
f Ire
land
Lim
ited
20
Stew
arts
And
Llo
yds
(Ove
rsea
s) L
imite
d
21
Tata
Ste
el In
tern
atio
nal (
Schw
eiz)
AG
22
The
Tem
pleb
orou
gh R
ollin
g M
ills
Lim
ited
23
Toro
nto
Indu
stria
l Fab
ricat
ions
Lim
ited
24
U.E
.S. B
right
Bar
Lim
ited
25
UKS
E Fu
nd M
anag
ers
Lim
ited
26
Wal
kers
teel
stoc
k Li
mite
d
27
Wes
twoo
d St
eel S
ervi
ces
Lim
ited
28
Whi
tehe
ad (N
arro
w S
trip
) Lim
ited
29
Euro
pres
sing
s Li
mite
d
30
Tata
Ste
el (K
ZN) (
Pty)
Ltd
.
(iii)
Nam
e of
the
subs
idia
ries
whi
ch a
re y
et to
com
men
ce o
pera
tion
s:
1 Su
barn
arek
ha P
ort P
rivat
e Li
mite
d
2 TS
IL E
nerg
y Li
mite
d
3 Bh
usha
n St
eel (
Oris
sa) L
imite
d
4 Bh
usha
n St
eel (
Sout
h) L
imite
d
5 Bh
usha
n St
eel (
Mad
hya
Bhar
at) L
imite
d
6 Bh
usha
n St
eel (
Aus
tral
ia) P
TY L
td.
7 Bo
wen
Ene
rgy
PTY
Ltd.
8 Bo
wen
Coa
l PTY
Ltd
.
9 Bo
wen
Con
solid
ated
PTY
Ltd
.
(iv)
The
Gro
up is
und
erw
ay im
plem
enti
ng it
s co
rpor
ate
stru
ctur
e si
mpl
ifica
tion
pro
gram
me,
pur
suan
t to
whi
ch a
sig
nific
ant n
umbe
r of
ent
itie
s ha
ve b
een
volu
ntar
ily li
quid
ated
or
ente
red
into
vol
unta
ry l
iqui
dati
on d
urin
g th
e ye
ar. W
ith
an o
bjec
tive
to s
impl
ify
the
stru
ctur
e fu
rthe
r, th
e G
roup
aim
s to
dis
solv
e ad
diti
onal
ent
itie
s w
hich
are
eit
her d
orm
ant o
r ha
ve c
ease
d to
hav
e bu
sine
ss o
pera
tion
s.
INTEGRATED REPORT & ANNUAL ACCOUNTS 2019-20 | 113TH YEAR166
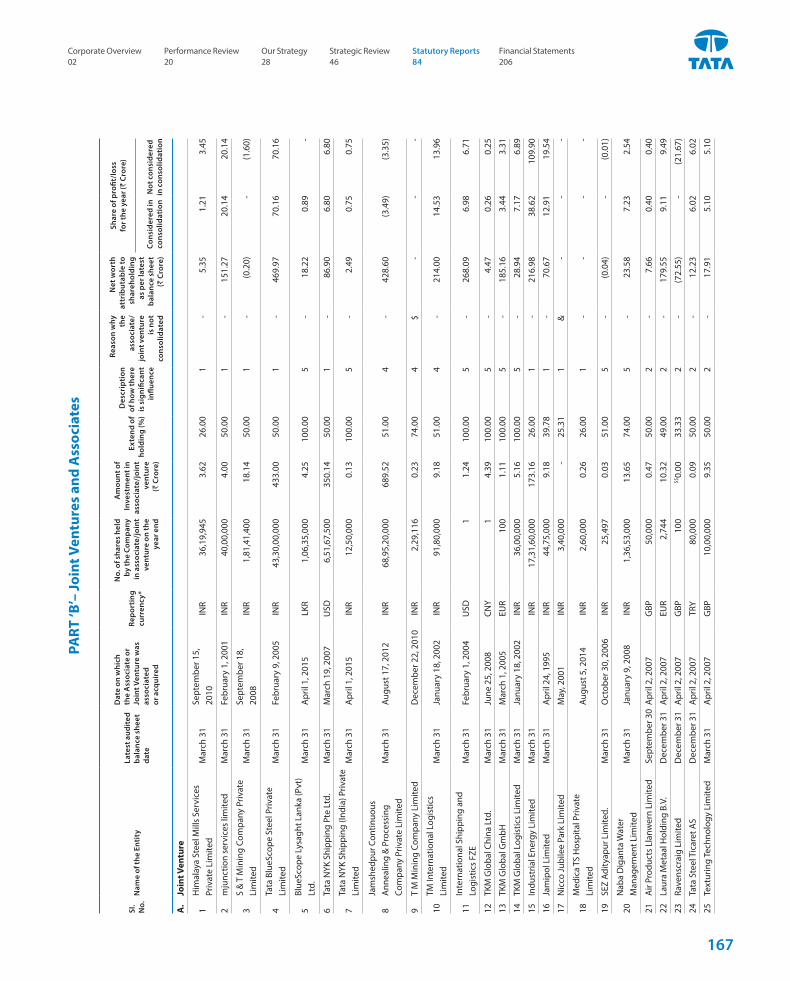
PART
‘B’–
Join
t Ven
ture
s an
d A
ssoc
iate
s
Sl.
No.
Nam
e of
the
Enti
tyLa
test
aud
ited
ba
lanc
e sh
eet
date
Dat
e on
whi
ch
the
Ass
ocia
te o
r Jo
int V
entu
re w
as
asso
ciat
ed
or a
cqui
red
Repo
rtin
g cu
rren
cy*
No.
of s
hare
s he
ld
by th
e Co
mpa
ny
in a
ssoc
iate
/joi
nt
vent
ure
on th
e ye
ar e
nd
Am
ount
of
Inve
stm
ent i
n as
soci
ate/
join
t ve
ntur
e (`
Cro
re)
Exte
nd o
f ho
ldin
g (%
)
Des
crip
tion
of
how
ther
e is
sig
nific
ant
influ
ence
Reas
on w
hy
the
asso
ciat
e/jo
int v
entu
re
is n
ot
cons
olid
ated
Net
wor
th
attr
ibut
able
to
shar
ehol
ding
as
per
late
st
bala
nce
shee
t (`
Cro
re)
Shar
e of
pro
fit/l
oss
fo
r the
yea
r (`
Cror
e)
Cons
ider
ed in
co
nsol
idat
ion
Not
con
side
red
in c
onso
lidat
ion
A.
Join
t Ven
ture
1H
imal
aya
Stee
l Mill
s Se
rvic
es
Priv
ate
Lim
ited
Mar
ch 3
1Se
ptem
ber 1
5,
2010
INR
36,
19,9
45
3.6
2 26
.00
1
- 5
.35
1.2
1 3
.45
2m
junc
tion
serv
ices
lim
ited
Mar
ch 3
1Fe
brua
ry 1
, 200
1IN
R 4
0,00
,000
4
.00
50.0
0 1
-
151
.27
20.
14
20.
14
3S
& T
Min
ing
Com
pany
Priv
ate
Lim
ited
Mar
ch 3
1Se
ptem
ber 1
8,
2008
INR
1,8
1,41
,400
1
8.14
50
.00
1
- (0
.20)
-
(1.6
0)
4Ta
ta B
lueS
cope
Ste
el P
rivat
e Li
mite
dM
arch
31
Febr
uary
9, 2
005
INR
43,
30,0
0,00
0 4
33.0
0 50
.00
1
- 4
69.9
7 7
0.16
7
0.16
5Bl
ueSc
ope
Lysa
ght L
anka
(Pvt
) Lt
d.M
arch
31
Apr
il 1,
201
5LK
R 1
,06,
35,0
00
4.2
5 10
0.00
5
- 1
8.22
0
.89
-
6Ta
ta N
YK S
hipp
ing
Pte
Ltd.
Mar
ch 3
1M
arch
19,
200
7U
SD 6
,51,
67,5
00
350
.14
50.0
0 1
-
86.
90
6.8
0 6
.80
7Ta
ta N
YK S
hipp
ing
(Indi
a) P
rivat
e Li
mite
dM
arch
31
Apr
il 1,
201
5IN
R 1
2,50
,000
0
.13
100.
00 5
-
2.4
9 0
.75
0.7
5
8Ja
msh
edpu
r Con
tinuo
us
Ann
ealin
g &
Pro
cess
ing
Com
pany
Priv
ate
Lim
ited
Mar
ch 3
1Au
gust
17,
201
2IN
R 6
8,95
,20,
000
689
.52
51.0
0 4
-
428
.60
(3.4
9)
(3.3
5)
9T
M M
inin
g Co
mpa
ny L
imite
dD
ecem
ber 2
2, 2
010
INR
2,2
9,11
6 0
.23
74.0
0 4
$
-
- -
10TM
Inte
rnat
iona
l Log
istic
s Li
mite
dM
arch
31
Janu
ary
18, 2
002
INR
91,
80,0
00
9.1
8 51
.00
4
- 2
14.0
0 1
4.53
1
3.96
11In
tern
atio
nal S
hipp
ing
and
Logi
stic
s FZ
EM
arch
31
Febr
uary
1, 2
004
USD
1
1.2
4 10
0.00
5
- 2
68.0
9 6
.98
6.7
1
12TK
M G
loba
l Chi
na L
td.
Mar
ch 3
1Ju
ne 2
5, 2
008
CNY
1
4.3
9 10
0.00
5
- 4
.47
0.2
6 0
.25
13TK
M G
loba
l Gm
bHM
arch
31
Mar
ch 1
, 200
5EU
R 1
00
1.1
1 10
0.00
5
- 1
85.1
6 3
.44
3.3
1
14TK
M G
loba
l Log
istic
s Li
mite
dM
arch
31
Janu
ary
18, 2
002
INR
36,
00,0
00
5.1
6 10
0.00
5
- 2
8.94
7
.17
6.8
9
15In
dust
rial E
nerg
y Li
mite
dM
arch
31
INR
17,
31,6
0,00
0 1
73.1
6 26
.00
1
- 2
16.9
8 3
8.62
1
09.9
0
16Ja
mip
ol L
imite
dM
arch
31
Apr
il 24
, 199
5IN
R 4
4,75
,000
9
.18
39.7
8 1
-
70.
67
12.
91
19.
54
17N
icco
Jubi
lee
Park
Lim
ited
May
, 200
1IN
R 3
,40,
000
- 25
.31
1
& -
- -
18M
edic
a TS
Hos
pita
l Priv
ate
Lim
ited
Augu
st 5
, 201
4IN
R 2
,60,
000
0.2
6 26
.00
1
- -
- -
19SE
Z Ad
ityap
ur L
imite
d.M
arch
31
Oct
ober
30,
200
6IN
R 2
5,49
7 0
.03
51.0
0 5
-
(0.0
4)
- (0
.01)
20N
aba
Dig
anta
Wat
er
Man
agem
ent L
imite
dM
arch
31
Janu
ary
9, 2
008
INR
1,3
6,53
,000
1
3.65
74
.00
5
- 2
3.58
7
.23
2.5
4
21A
ir Pr
oduc
ts L
lanw
ern
Lim
ited
Sept
embe
r 30
Apr
il 2,
200
7G
BP 5
0,00
0 0
.47
50.0
0 2
-
7.6
6 0
.40
0.4
0
22La
ura
Met
aal H
oldi
ng B
.V.
Dec
embe
r 31
Apr
il 2,
200
7EU
R 2
,744
1
0.32
49
.00
2
- 1
79.5
5 9
.11
9.4
9
23Ra
vens
crai
g Li
mite
dD
ecem
ber 3
1A
pril
2, 2
007
GBP
100
$$
0.00
33.3
3 2
-
(72.
55)
- (2
1.67
)
24Ta
ta S
teel
Tic
aret
AS
Dec
embe
r 31
Apr
il 2,
200
7TR
Y 8
0,00
0 0
.09
50.0
0 2
-
12.
23
6.0
2 6
.02
25Te
xtur
ing
Tech
nolo
gy L
imite
dM
arch
31
Apr
il 2,
200
7G
BP 1
0,00
,000
9
.35
50.0
0 2
-
17.
91
5.1
0 5
.10
Corporate Overview 02
Strategic Review 46
Performance Review 20
Statutory Reports 84
Our Strategy 28
Financial Statements 206
167
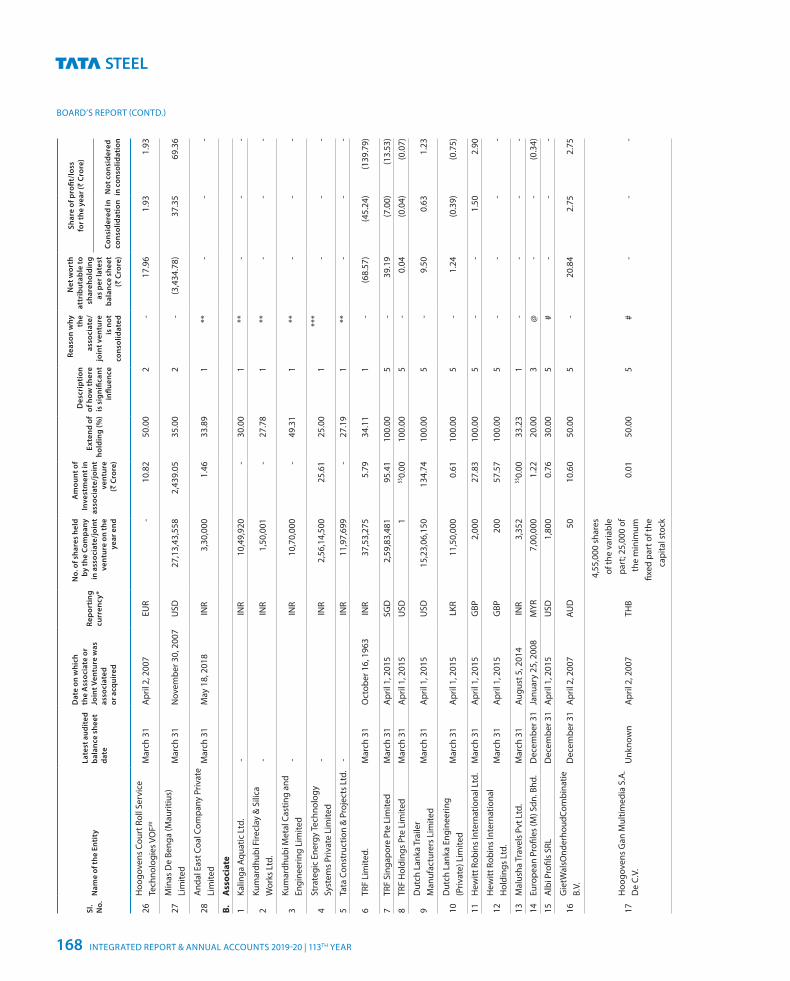
BOARD’S REPORT (CONTD.)
Sl.
No.
Nam
e of
the
Enti
tyLa
test
aud
ited
ba
lanc
e sh
eet
date
Dat
e on
whi
ch
the
Ass
ocia
te o
r Jo
int V
entu
re w
as
asso
ciat
ed
or a
cqui
red
Repo
rtin
g cu
rren
cy*
No.
of s
hare
s he
ld
by th
e Co
mpa
ny
in a
ssoc
iate
/joi
nt
vent
ure
on th
e ye
ar e
nd
Am
ount
of
Inve
stm
ent i
n as
soci
ate/
join
t ve
ntur
e (`
Cro
re)
Exte
nd o
f ho
ldin
g (%
)
Des
crip
tion
of
how
ther
e is
sig
nific
ant
influ
ence
Reas
on w
hy
the
asso
ciat
e/jo
int v
entu
re
is n
ot
cons
olid
ated
Net
wor
th
attr
ibut
able
to
shar
ehol
ding
as
per
late
st
bala
nce
shee
t (`
Cro
re)
Shar
e of
pro
fit/l
oss
fo
r the
yea
r (`
Cror
e)
Cons
ider
ed in
co
nsol
idat
ion
Not
con
side
red
in c
onso
lidat
ion
26H
oogo
vens
Cou
rt R
oll S
ervi
ce
Tech
nolo
gies
VO
F##M
arch
31
Apr
il 2,
200
7EU
R-
10.
82
50.0
0 2
-
17.
96
1.9
3 1
.93
27M
inas
De
Beng
a (M
aurit
ius)
Li
mite
dM
arch
31
Nov
embe
r 30,
200
7U
SD 2
7,13
,43,
558
2,4
39.0
5 35
.00
2
- (3
,434
.78)
3
7.35
6
9.36
28A
ndal
Eas
t Coa
l Com
pany
Priv
ate
Lim
ited
Mar
ch 3
1M
ay 1
8, 2
018
INR
3,3
0,00
0 1
.46
33.8
9 1
**
- -
-
B.A
ssoc
iate
1Ka
linga
Aqu
atic
Ltd
. -
INR
10,
49,9
20
- 30
.00
1
** -
- -
2Ku
mar
dhub
i Fire
clay
& S
ilica
W
orks
Ltd
. -
INR
1,5
0,00
1 -
27.7
8 1
**
- -
-
3Ku
mar
dhub
i Met
al C
astin
g an
d En
gine
erin
g Li
mite
d -
INR
10,
70,0
00
- 49
.31
1
** -
- -
4St
rate
gic
Ener
gy Te
chno
logy
Sy
stem
s Pr
ivat
e Li
mite
d -
INR
2,5
6,14
,500
2
5.61
25
.00
1
***
- -
-
5Ta
ta C
onst
ruct
ion
& P
roje
cts
Ltd.
- IN
R 1
1,97
,699
-
27.1
9 1
**
- -
-
6TR
F Li
mite
d.M
arch
31
Oct
ober
16,
196
3IN
R 3
7,53
,275
5
.79
34.1
1 1
-
(68.
57)
(45.
24)
(139
.79)
7TR
F Si
ngap
ore
Pte
Lim
ited
Mar
ch 3
1A
pril
1, 2
015
SGD
2,5
9,83
,481
9
5.41
10
0.00
5
- 3
9.19
(7
.00)
(1
3.53
)
8TR
F H
oldi
ngs
Pte
Lim
ited
Mar
ch 3
1A
pril
1, 2
015
USD
1
$$0.
0010
0.00
5
- 0
.04
(0.0
4)
(0.0
7)
9D
utch
Lan
ka T
raile
r M
anuf
actu
rers
Lim
ited
Mar
ch 3
1A
pril
1, 2
015
USD
15,
23,0
6,15
0 1
34.7
4 10
0.00
5
- 9
.50
0.6
3 1
.23
10D
utch
Lan
ka E
ngin
eerin
g (P
rivat
e) L
imite
dM
arch
31
Apr
il 1,
201
5LK
R 1
1,50
,000
0
.61
100.
00 5
-
1.2
4 (0
.39)
(0
.75)
11H
ewitt
Rob
ins
Inte
rnat
iona
l Ltd
.M
arch
31
Apr
il 1,
201
5G
BP 2
,000
2
7.83
10
0.00
5
- -
1.5
0 2
.90
12H
ewitt
Rob
ins
Inte
rnat
iona
l H
oldi
ngs
Ltd.
Mar
ch 3
1A
pril
1, 2
015
GBP
200
5
7.57
10
0.00
5
- -
- -
13M
alus
ha T
rave
ls P
vt L
td.
Mar
ch 3
1Au
gust
5, 2
014
INR
3,3
52
$$0.
0033
.23
1
- -
- -
14Eu
rope
an P
rofil
es (M
) Sdn
. Bhd
.D
ecem
ber 3
1Ja
nuar
y 25
, 200
8M
YR 7
,00,
000
1.2
2 20
.00
3
@
- -
(0.3
4)
15A
lbi P
rofil
s SR
L D
ecem
ber 3
1A
pril
1, 2
015
USD
1,8
00
0.7
6 30
.00
5
#
- -
-
16G
ietW
alsO
nder
houd
Com
bina
tie
B.V.
Dec
embe
r 31
Apr
il 2,
200
7AU
D 5
0 1
0.60
50
.00
5
- 2
0.84
2
.75
2.7
5
17H
oogo
vens
Gan
Mul
timed
ia S
.A.
De
C.V.
U
nkno
wn
Apr
il 2,
200
7TH
B
4,5
5,00
0 sh
ares
of
the
varia
ble
part
; 25,
000
of
the
min
imum
fix
ed p
art o
f the
ca
pita
l sto
ck
0.0
1 50
.00
5
#
- -
-
INTEGRATED REPORT & ANNUAL ACCOUNTS 2019-20 | 113TH YEAR168
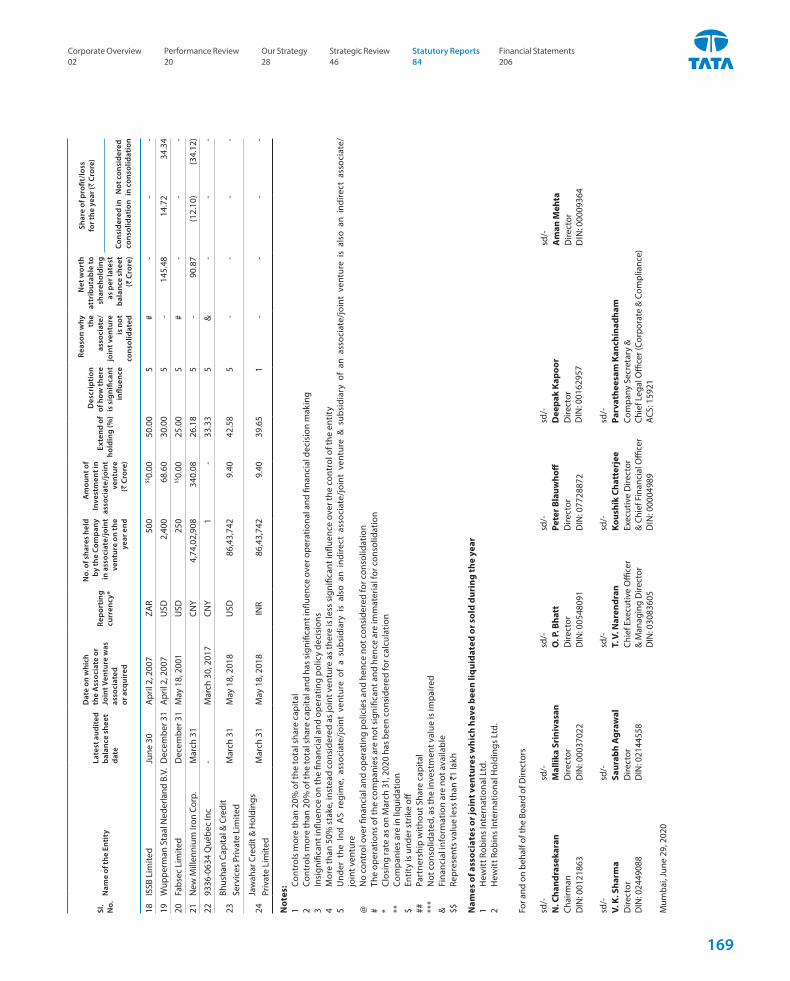
Sl.
No.
Nam
e of
the
Enti
tyLa
test
aud
ited
ba
lanc
e sh
eet
date
Dat
e on
whi
ch
the
Ass
ocia
te o
r Jo
int V
entu
re w
as
asso
ciat
ed
or a
cqui
red
Repo
rtin
g cu
rren
cy*
No.
of s
hare
s he
ld
by th
e Co
mpa
ny
in a
ssoc
iate
/joi
nt
vent
ure
on th
e ye
ar e
nd
Am
ount
of
Inve
stm
ent i
n as
soci
ate/
join
t ve
ntur
e (`
Cro
re)
Exte
nd o
f ho
ldin
g (%
)
Des
crip
tion
of
how
ther
e is
sig
nific
ant
influ
ence
Reas
on w
hy
the
asso
ciat
e/jo
int v
entu
re
is n
ot
cons
olid
ated
Net
wor
th
attr
ibut
able
to
shar
ehol
ding
as
per
late
st
bala
nce
shee
t (`
Cro
re)
Shar
e of
pro
fit/l
oss
fo
r the
yea
r (`
Cror
e)
Cons
ider
ed in
co
nsol
idat
ion
Not
con
side
red
in c
onso
lidat
ion
18IS
SB L
imite
d Ju
ne 3
0A
pril
2, 2
007
ZAR
500
$$
0.00
50.0
0 5
#
-
- -
19W
uppe
rman
Sta
al N
eder
land
B.V
.D
ecem
ber 3
1A
pril
2, 2
007
USD
2,4
00
68.
60
30.0
0 5
-
145
.48
14.
72
34.
34
20Fa
bsec
Lim
ited
Dec
embe
r 31
May
18,
200
1U
SD 2
50
$$0.
0025
.00
5
#
- -
-
21N
ew M
illen
nium
Iron
Cor
p.M
arch
31
CNY
4,7
4,02
,908
3
40.0
8 26
.18
5
- 9
0.87
(1
2.10
) (3
4.12
)
2293
36-0
634
Qué
bec
Inc
-M
arch
30,
201
7CN
Y 1
-
33.3
3 5
&
- -
-
23Bh
usha
n Ca
pita
l & C
redi
t Se
rvic
es P
rivat
e Li
mite
d M
arch
31
May
18,
201
8U
SD 8
6,43
,742
9
.40
42.5
8 5
-
- -
-
24Ja
wah
ar C
redi
t & H
oldi
ngs
Priv
ate
Lim
ited
Mar
ch 3
1M
ay 1
8, 2
018
INR
86,
43,7
42
9.4
0 39
.65
1
- -
- -
Not
es:
1 Co
ntro
ls m
ore
than
20%
of t
he to
tal s
hare
cap
ital
2 Co
ntro
ls m
ore
than
20%
of t
he to
tal s
hare
cap
ital a
nd h
as s
igni
fican
t infl
uenc
e ov
er o
pera
tiona
l and
fina
ncia
l dec
isio
n m
akin
g
3
Insi
gnifi
cant
influ
ence
on
the
finan
cial
and
ope
ratin
g po
licy
deci
sion
s
4
Mor
e th
an 5
0% s
take
, ins
tead
con
side
red
as jo
int v
entu
re a
s th
ere
is le
ss s
igni
fican
t infl
uenc
e ov
er th
e co
ntro
l of t
he e
ntit
y
5
Und
er t
he I
nd A
S re
gim
e, a
ssoc
iate
/joi
nt v
entu
re o
f a
subs
idia
ry i
s al
so a
n in
dire
ct a
ssoc
iate
/joi
nt v
entu
re &
sub
sidi
ary
of a
n as
soci
ate/
join
t ve
ntur
e is
als
o an
ind
irect
ass
ocia
te/
join
t ven
ture
@
No
cont
rol o
ver fi
nanc
ial a
nd o
pera
ting
polic
ies
and
henc
e no
t con
side
red
for c
onso
lidat
ion
# Th
e op
erat
ions
of t
he c
ompa
nies
are
not
sig
nific
ant a
nd h
ence
are
imm
ater
ial f
or c
onso
lidat
ion
*
Clos
ing
rate
as
on M
arch
31,
202
0 ha
s be
en c
onsi
dere
d fo
r cal
cula
tion
**
Com
pani
es a
re in
liqu
idat
ion
$ En
tity
is u
nder
str
ike
off##
Pa
rtne
rshi
p w
ithou
t Sha
re c
apita
l**
* N
ot c
onso
lidat
ed, a
s th
e in
vest
men
t val
ue is
impa
ired
&
Fina
ncia
l inf
orm
atio
n ar
e no
t ava
ilabl
e$$
Re
pres
ents
val
ue le
ss th
an `
1 la
kh
Nam
es o
f ass
ocia
tes
or jo
int v
entu
res
whi
ch h
ave
been
liqu
idat
ed o
r sol
d du
ring
the
year
1 H
ewit
t Rob
ins
Inte
rnat
iona
l Ltd
.
2
Hew
itt R
obin
s In
tern
atio
nal H
oldi
ngs
Ltd.
For a
nd o
n be
half
of th
e Bo
ard
of D
irect
ors
sd/-
sd/-
sd/-
sd/-
sd/-
sd
/-
N. C
hand
rase
kara
nM
allik
a Sr
iniv
asan
O. P
. Bha
ttPe
ter B
lauw
hoff
Dee
pak
Kapo
orA
man
Meh
taCh
airm
anD
irect
orD
irect
orD
irect
orD
irect
or
DIN
: 001
6295
7D
irect
or
DIN
: 000
0936
4D
IN: 0
0121
863
DIN
: 000
3702
2D
IN: 0
0548
091
DIN
: 077
2887
2
sd/-
sd/-
sd/-
sd/-
sd/-
V.
K. S
harm
aSa
urab
h A
graw
alT.
V. N
aren
dran
Kous
hik
Chat
terj
eePa
rvat
hees
am K
anch
inad
ham
Dire
ctor
D
IN: 0
2449
088
Dire
ctor
D
IN: 0
2144
558
Chie
f Exe
cutiv
e O
ffice
r &
Man
agin
g D
irect
or
DIN
: 030
8360
5
Exec
utiv
e D
irect
or
& C
hief
Fin
anci
al O
ffice
r D
IN: 0
0004
989
Com
pany
Sec
reta
ry &
Ch
ief L
egal
Offi
cer (
Corp
orat
e &
Com
plia
nce)
AC
S: 1
5921
Mum
bai,
June
29,
202
0
Corporate Overview 02
Strategic Review 46
Performance Review 20
Statutory Reports 84
Our Strategy 28
Financial Statements 206
169

BOARD’S REPORT (CONTD.)
Companies that have become/ceased to be Company’s Subsidiaries or Associate Companies (including Joint Venture Companies)
ANNEXURE 7
The name of company which has become Subsidiary during the year:
Sl. No. Name of the company
Subsidiary1. Angul Energy Limited (formerly Bhushan Energy Limited)*
The names of companies which have ceased to become Subsidiaries or Associate Companies (including Joint Venture Companies) during the year:
Sl. No. Name of the company
Subsidiary1. NatSteel (Xiamen) Limited2. Automotive Laser Technologies Limited3. Harrowmills Properties Limited4. British Tubes Stockholding Limited5. CPN (85) Limited6. Midland Steel Supplies Limited7. Kalimati Coal Company Pty. Ltd.8. Cogent Power Inc.9. NatSteel Vina Co. Ltd.10. Tata Steel International (Singapore) Pte. Ltd.11. Esmil B.V.12. Beheermaatschappij Industriele Produkten B.V.13. Tata Steel Nederland Star-Frame BV14. Corus Primary Aluminium B.V.15. Corus Steel Service STP LLC16. Corus Ukraine Limited Liability Company17. Tata Steel International (Canada) Holdings Inc18. Tata Steel International (Finland) OYAssociate1. Hewitt Robins International Ltd.2. Hewitt Robins International Holdings Ltd.3. Angul Energy Limited (formerly Bhushan Energy Limited)*
*During the year under review, the Company through its indirect subsidiary, Tata Steel BSL Limited, completed the acquisition of controlling stake in Bhushan Energy Limited (name changed to Angul Energy Limited effective February 27, 2020), pursuant to the Resolution Plan as approved by the National Company Law Tribunal (Principal Bench, New Delhi) vide its Order dated May 30, 2019, under the Corporate Insolvency and Resolution Process of the Insolvency and Bankruptcy Code, 2016. Accordingly, Angul Energy Limited has ceased to be an indirect associate company of the Company and is now an indirect subsidiary company.
Note:Dutch Lanka Trailer LLC ('DLT'), ceased to be a step down associate of the Company effective December 5, 2018, due to divestment of stake by TRF Limited (associate of the Company and indirect holding company of DLT).
On behalf of the Board of Directors
sd/- N. CHANDRASEKARAN Mumbai Chairman June 29, 2020 DIN: 00121863
INTEGRATED REPORT & ANNUAL ACCOUNTS 2019-20 | 113TH YEAR170
Form No. MR-3Secretarial Audit Report for the Financial Year Ended March 31, 2020
(Pursuant to Section 204 (1) of the Companies Act, 2013 and rule No. 9 of the Companies (Appointment and Remuneration of Managerial Personnel) Rules, 2014)
ANNEXURE 8
To,The Members,Tata Steel Limited
We have conducted the secretarial audit of the compliance of applicable statutory provisions and the adherence to good corporate practices by Tata Steel Limited (hereinafter called the Company). Secretarial Audit was conducted in a manner that provided us a reasonable basis for evaluating the corporate conducts/statutory compliances and expressing our opinion thereon.
Based on our verification of the Company’s books, papers, minute books, forms and returns filed and other records maintained by the Company, to the extent the information provided by the Company, its officers, agents and authorised representatives during the conduct of secretarial audit, the explanations and clarifications given to us and the representations made by the Management and considering the relaxations granted by the Ministry of Corporate Affairs and Securities and Exchange Board of India warranted due to the spread of the COVID-19 pandemic, we hereby report that in our opinion, the Company has, during the audit period covering the Financial Year ended on March 31, 2020, generally complied with the statutory provisions listed hereunder and also that the Company has proper Board processes and compliance mechanism in place to the extent, in the manner and subject to the reporting made hereinafter:
We have examined the books, papers, minute books, forms and returns filed and other records made available to us and maintained by the Company for the Financial Year ended on March 31, 2020 according to the provisions of:
(i) The Companies Act, 2013 (the Act) and the rules made thereunder;
(ii) The Securities Contract (Regulation) Act, 1956 (‘SCRA’) and the rules made thereunder;
(iii) The Depositories Act, 1996 and the Regulations and Bye-laws framed thereunder;
(iv) Foreign Exchange Management Act, 1999 and the rules and regulations made thereunder to the extent of Foreign Direct Investment, Overseas Direct Investment and External Commercial Borrowings;
(v) The following Regulations and Guidelines prescribed under the Securities and Exchange Board of India Act, 1992 (‘SEBI Act’):
(a) The Securities and Exchange Board of India (Substantial Acquisition of Shares and Takeovers) Regulations, 2011;
(b) The Securities and Exchange Board of India (Prohibition of Insider Trading) Regulations, 2015;
(c) The Securities and Exchange Board of India (Issue of Capital and Disclosure Requirements) Regulations, 2018 and amendments from time to time;
(d) The Securities and Exchange Board of India (Share Based Employee Benefits) Regulations, 2014; (Not applicable to the Company during the audit period)
(e) The Securities and Exchange Board of India (Issue and Listing of Debt Securities) Regulations, 2008;
(f) The Securities and Exchange Board of India (Registrars to an Issue and Share Transfer Agents) Regulations, 1993 regarding the Companies Act and dealing with client; (Not applicable to the Company during the audit period)
(g) The Securities and Exchange Board of India (Delisting of Equity Shares) Regulations, 2009; (Not applicable to the Company during the audit period) and
(h) The Securities and Exchange Board of India (Buyback of Securities) Regulations, 2018. (Not applicable to the Company during the audit period)
(vi) Other laws applicable specifically to the Company namely:
1. The Mines Act, 1952 and the rules, regulations made thereunder.
2. Mines and Minerals (Development & Regulation) Act, 1957 and the rules made thereunder.
3. Air (Prevention and Control of Pollution) Act, 1981 and the rules and standards made thereunder.
4. Water (Prevention and Control of Pollution) Act, 1974 and Water (Prevention and Control of Pollution) Rules, 1975.
Corporate Overview 02
Strategic Review 46
Performance Review 20
Statutory Reports 84
Our Strategy 28
Financial Statements 206
171
BOARD’S REPORT (CONTD.)
5. Environment Protection Act, 1986 and the rules, notifications issued thereunder.
6. Factories Act, 1948 and allied State Laws.
We have also examined compliance with the applicable clauses of the following:
(i) Secretarial Standards issued by The Institute of Company Secretaries of India with respect to board and general meetings.
(ii) The Listing Agreements entered into by the Company with BSE Limited and National Stock Exchange of India Limited read with the Securities and Exchange Board of India (Listing Obligations and Disclosure Requirements) Regulations, 2015.
During the period under review, the Company has complied with the provisions of the Act, Rules, Regulations, Guidelines, standards etc. mentioned above.
We further report that:
The Board of Directors of the Company is duly constituted with proper balance of Executive Directors, Non-Executive Directors and Independent Directors. The changes in the composition of the Board of Directors that took place during the period under review were carried out in compliance with the provisions of the Act.
Adequate notice was given to all directors to schedule the Board Meetings, agenda and detailed notes on agenda were sent at least seven days in advance for meetings other than those held at shorter notice, and a system exists for seeking and obtaining further information and clarifications on the agenda items before the meeting and for meaningful participation at the meeting.
Decisions at the Board Meetings were taken unanimously.
We further report that there are adequate systems and processes in the Company commensurate with the size and operations of the Company to monitor and ensure compliance with applicable laws, rules, regulations and guidelines.
We further report that during the audit period the Company had following events which had bearing on the Company’s affairs in pursuance of the above referred laws, rules, regulations, guidelines, standards etc.
1. The Committee of Directors of the Company vide Circular Resolution – CR No. 19 dated March 13, 2020, approved the allotment of 6,700 – 7.70% Unsecured, Rated, Listed, Redeemable, Non-Convertible Debentures ('NCDs') of face value `10,00,000 each, for cash, aggregating to `670 crore, to identified investors on private placement basis. The NCDs
(ISIN: INE081A08231) are listed and traded on WDM segment of BSE Limited.
2. The following shares, earlier kept in abeyance were allotted to the Shareholders during Fiscal 2020:
• 210 Ordinary Shares of face value `10/- per share at a premium of `290/- per share and 154 Ordinary Shares of face value `10/- per share at a premium of `590/- (in lieu of the entitlement of Cumulative Convertible Preference shares) on rights basis to one shareholder, earlier kept in abeyance, pursuant to the Rights Issue – 2007.
• 167 Ordinary Shares of face value `10/- per share at a premium of ̀ 500/- per share and 83 Partly paid-up Ordinary Shares of face value `10/- per share (paid up `2.504 per share) at a price of `615/- per share including a premium of `605/- per share, paid-up `154/- each, on rights basis to one shareholder, earlier kept in abeyance, pursuant to the Rights Issue – 2018.
3. The Company has redeemed (i) 10.40% NCDs (ISIN: INE081A08124) aggregating `650.90 crore on the due date, May 15, 2019 and (ii) 11% NCDs (ISIN: INE081A08132) aggregating `1,500 crore on the due date, May 17, 2019.
4. On August 6, 2019, T S Global Holdings Pte. Ltd. (‘TSGH’), an indirect wholly-owned subsidiary of the Company, for want of regulatory approvals, decided not to pursue the proposed transaction with HBIS Group Co. Ltd. (‘HBIS’), to divest its entire stake in NatSteel Holdings Pte. Ltd. (100%) and Tata Steel (Thailand) Public Company Ltd. (67.9%) to a company in which 70% equity stake would be held by an entity controlled by HBIS and the balance by TSGH.
5. On July 24, 2019, the Company acquired 2,58,43,967 Rights Equity Shares of Tata Steel Long Products Limited ('TSLP') (formerly Tata Sponge Iron Limited) at an issue price of `500/- per Rights Equity Share (including a premium of `490/- per Rights Equity Share) aggregating to ̀ 1,292.20 crore. As a result of this acquisition of equity shares pursuant to the rights issue, the Company's holding in TSLP increased from 54.50% to 75.91%.
6. On June 11, 2019, the European Commission formally announced its decision to prohibit the proposed European steel joint venture between Tata Steel Limited and thyssenkrupp AG. The Company and thyssenkrupp AG decided not to pursue the proposed transaction to form a joint venture to combine their steel businesses in Europe after careful evaluation of the viability of the proposal in light of the feedback received from the European Commission.
INTEGRATED REPORT & ANNUAL ACCOUNTS 2019-20 | 113TH YEAR172
7. The Company, through its indirect subsidiary - Tata Steel BSL Limited (formerly Bhushan Steel Limited), completed the acquisition of controlling stake in Bhushan Energy Limited (now Angul Energy Limited) pursuant to the National Company Law Tribunal (Principal Bench, New Delhi) (‘NCLT’) order dated May 30, 2019, approving the resolution plan submitted by the Company under the Corporate Insolvency Resolution Process of the Insolvency and Bankruptcy Code, 2016. The acquisition was completed on June 1, 2019.
8. On April 25, 2019, the Board of Directors of the Company have considered and approved a merger of Bamnipal Steel Limited and Tata Steel BSL Limited (formerly Bhushan Steel Limited) into the Company by way of a composite scheme of amalgamation and have recommended a merger ratio of 1 equity share of `10/- each fully paid-up of the Company for every 15 equity shares of `2/- each fully paid-up held by the public shareholders of Tata Steel BSL Limited. As part of the scheme, the equity shares held by Bamnipal Steel Limited and the preference shares held by the Company in Tata Steel BSL Limited shall stand cancelled. The equity shares held by the
Company in Bamnipal Steel Limited shall also stand cancelled. The Company received a ‘no objection’ to the scheme from the National Stock Exchange of India Limited and BSE Limited on August 26, 2019 and has filed an application before the National Company Law Tribunal, Mumbai Bench for necessary directions. The amalgamation is subject to approval from shareholders and other regulatory authorities.
For Parikh & AssociatesCompany Secretaries
sd/-P. N. Parikh
PartnerPlace: Mumbai FCS No.: 327 CP No.: 1228Date: June 29, 2020 UDIN: F000327B000393478
This Report is to be read with our letter of even date which is annexed as Annexure A and Forms an integral part of this report.
ANNEXURE ATo, The Members Tata Steel Limited
Our report of even date is to be read along with this letter.
1. Maintenance of secretarial record is the responsibility of the management of the Company. Our responsibility is to express an opinion on these secretarial records based on our audit.
2. We have followed the audit practices and process as were appropriate to obtain reasonable assurance about the correctness of the contents of the secretarial records. The verification was done on test basis to ensure that correct facts are reflected in secretarial records. We believe that the process and practices, we followed provide a reasonable basis for our opinion.
3. We have not verified the correctness and appropriateness of financial records and Books of Accounts of the Company.
4. Where ever required, we have obtained the Management Representation about the Compliance of laws, rules and regulations and happening of events etc.
5. The Compliance of the provisions of Corporate and other applicable laws, rules, regulations, standards is the responsibility of management. Our examination was limited to the verification of procedure on test basis.
6. The Secretarial Audit report is neither an assurance as to the future viability of the Company nor of the efficacy or effectiveness with which the management has conducted the affairs of the Company.
For Parikh & AssociatesCompany Secretaries
sd/-P. N. Parikh
PartnerPlace: Mumbai FCS No.: 327 CP No.: 1228Date: June 29, 2020 UDIN: F000327B000393478
Corporate Overview 02
Strategic Review 46
Performance Review 20
Statutory Reports 84
Our Strategy 28
Financial Statements 206
173
BOARD’S REPORT (CONTD.)
Form No. MGT-9Extract of Annual Return as on March 31, 2020
Pursuant to Section 92(3) of the Companies Act, 2013 [Read with Rule 12(1) of the Companies (Management and Administration) Rules, 2014]
ANNEXURE 9
I. REGISTRATION AND OTHER DETAILSCIN L27100MH1907PLC000260Registration Date August 26, 1907Name Tata Steel LimitedCategory/Sub-category of the Company Public listed company having share capitalRegistered office address Contact details
Bombay House, 24 Homi Mody Street, Fort, Mumbai – 400 001Phone No.: +91 22 6665 8282 E-mail: [email protected] Website: www.tatasteel.com
Whether listed company – Yes/No YesRegistrars and Transfer AgentNameAddress
Contact details
TSR Darashaw Consultants Private Limited (formerly TSR Darashaw Limited) 6-10, Haji Moosa Patrawala Industrial Estate, 20, Dr. E. Moses Road, Mahalaxmi, Mumbai – 400 011Phone No.: +91 22 6656 8484, Fax No.: +91 22 6656 8494E-mail: [email protected] Website: www.tsrdarashaw.com
II. PRINCIPAL BUSINESS ACTIVITIES OF THE COMPANY All the business activities contributing 10% or more of the total turnover of the Company shall be stated.
Sl. No. Name and Description of main products NIC Code of the Products % to total turnover of the Company
1 Manufacture of basic iron and steel 241 89.44%
III. PARTICULARS OF HOLDING, SUBSIDIARY AND ASSOCIATE COMPANIESSl. No. Name and address of the Company Holding (%)
Subsidiary Companies (Pursuant to Section 2(87)(ii) of Companies Act, 2013
1ABJA Investment Co. Pte Ltd.22 Tanjong Kling Road, Singapore 628048 100.00
2Adityapur Toll Bridge Company LimitedAiada Vikash Bhawan, Adityapur Industrial Area, Seraikela, Jamshedpur – 831 013CIN: U45201JH1996PLC007124
88.50
3Tata Steel Special Economic Zone Limited5th Floor, Zone C/2, Fortune Towers, Chandrasekharpur, Khordha, Bhubaneshwar – 751 023CIN: U45201OR2006PLC008971
100.00
4Indian Steel & Wire Products Ltd.Flat 7 D & E, 7th Floor, Everest House, 46 C Chowringhee Road, Kolkata – 700 071CIN: U27106WB1935PLC008447
95.01
5
Tata Steel Utilities and Infrastructure Services Limited (formerly Jamshedpur Utilities & Services Company Limited)Sakchi Boulevard Road, Northerntown, Bistupur, Jamshedpur – 831 001CIN: U45200JH2003PLC010315
100.00
6Haldia Water Management LimitedShakti Palace, Plot No 492 (Old) & 784 (New), 2nd Floor, Mouza, Khanjanchak Haldia – 721 602, West BengalCIN: U74140WB2008PLC126534
60.00
INTEGRATED REPORT & ANNUAL ACCOUNTS 2019-20 | 113TH YEAR174
Sl. No. Name and address of the Company Holding (%)
7Kalimati Global Shared Services Limited1st Floor, Tata Centre, 43 Jawaharlal Nehru Road, Kolkata – 700 071CIN: U74999WB2018PLC224208
100.00
8Mohar Export Services Pvt. Ltd.Army & Navy Building, 2nd Floor, 148, M G Road Opposite Kala Ghoda, Fort Mumbai – 400 001, MaharashtraCIN: U51900MH1988PTC049518
66.46
9NatSteel Asia Pte. Ltd.22 Tanjong Kling Road, Singapore 628048 100.00
10TS Asia (Hong Kong) Ltd.Room 807, 8/F, Tower 1, Enterprise Square 1, No. 9 Sheung Yuet Road, Kowloon Bay, Kowloon, Hong Kong 100.00
11Rujuvalika Investments Limited6th Floor, One Forbes No. 1, Dr. V.B. Gandhi Marg, Fort, Mumbai – 400 001CIN: U67120MH1988PLC049872
100.00
12T S Alloys LimitedN-3/24, IRC Village, Nayapalli, Bhubaneswar – 751 015, OdishaCIN: U27109OR2004PLC009683
100.00
13Tata Korf Engineering Services Ltd.Tandem Apartment, 3rd Floor, Flat No.14, 52E, Ballygunge Circular Road, Beltola, Kolkata – 700 019CIN: U74210WB1985PLC039675
100.00
14Tata Metaliks Ltd.Tata Centre, 10th Floor, 43, J L Nehru Road, Kolkata – 700 071CIN: L27310WB1990PLC050000
55.06
15Tata Steel Long Products Limited (formerly Tata Sponge Iron Limited)P.O. Joda, Dist- Keonjhar, Odisha – 758 034CIN: L27102OR1982PLC001091
75.91
16TSIL Energy LimitedTata Sponge Administrative Building, Bileipada, P.O. Baneikala, Joda, Odisha – 758 038CIN: U40109OR2012PLC016232
100.00
17Tata Steel (KZN) (Pty) Ltd.22 Bronze Bar Road, Alton North, Richards Bay-3900, South Africa 90.00
18T Steel Holdings Pte. Ltd.22 Tanjong Kling Road, Singapore 628048 100.00
19T S Global Holdings Pte. Ltd.22 Tanjong Kling Road, Singapore 628048 100.00
20Orchid Netherlands (No.1) B.V.Wenckebachstraat 1, 1951 Jz, Velsen-Noord, Netherlands 100.00
21NatSteel Holdings Pte. Ltd.22 Tanjong Kling Road, Singapore 628048 100.00
22Easteel Services (M) Sdn. Bhd.Suite 6.1A, Level 6, Menara Pelangi, Jalan Kuning, Taman Pelangi, 80400 Johor Bahru, Johor, Malaysia 100.00
23Eastern Steel Fabricators Philippines, Inc.212 Barrio Bagbaguin, Meycauayan, Bulacan, Philippines 67.00
24NatSteel Recycling Pte Ltd.22 Tanjong Kling Road, Singapore 628048 100.00
25NatSteel Trade International Pte. Ltd.22, Tanjong Kling Road, Singapore 628048 100.00
26The Siam Industrial Wire Company Ltd.14th Floor, Rasa Tower, 555 Phaholyothin Road, Kwaeng Chatuchak, Khet Chatuchak, Bangkok 10900 Thailand 100.00
27TSN Wires Co., Ltd.14th Floor, Rasa Tower, 555 Phaholyothin Road, Kwaeng Chatuchak, Khet Chatuchak, Bangkok 10900 Thailand 60.00
Corporate Overview 02
Strategic Review 46
Performance Review 20
Statutory Reports 84
Our Strategy 28
Financial Statements 206
175
BOARD’S REPORT (CONTD.)
Sl. No. Name and address of the Company Holding (%)
28Tata Steel Europe Limited30 Millbank, London, SW1P 4WY 100.00
29Apollo Metals Limited1001, 14th Avenue, Bethlehem, PA 18018-0045, USA 100.00
30Bell & Harwood Limited30 Millbank, London, SW1P 4WY 100.00
31Blastmega Limited30 Millbank, London, SW1P 4WY 100.00
32Bore Samson Group Limited30 Millbank, London, SW1P 4WY 100.00
33Bore Steel Limited30 Millbank, London, SW1P 4WY 100.00
34British Guide Rails Limited30 Millbank, London, SW1P 4WY 100.00
35British Steel Corporation Limited30 Millbank, London, SW1P 4WY 100.00
36British Steel Directors (Nominees) Limited30 Millbank, London, SW1P 4WY 100.00
37British Steel Engineering Steels (Exports) Limited30 Millbank, London, SW1P 4WY 100.00
38British Steel Nederland International B.V.Wenckebachstraat 1, 1951 JZ Velsen-Noord, Netherlands 100.00
39British Steel Service Centres Limited30 Millbank, London, SW1P 4WY 100.00
40British Steel Trading Limited30 Millbank, London, SW1P 4WY 100.00
41C V BenineWenckebachstraat 1, 1951 JZ Velsen-Noord, Netherlands 76.92
42C Walker & Sons Limited30 Millbank, London, SW1P 4WY 100.00
43Catnic GmbHAm Leitzenbach 16, 74889 Sinsheim, Germany 100.00
44Catnic Limited30 Millbank, London, SW1P 4WY 100.00
45CBS Investissements SASRue Geo Lufbery, Chauny 02301, France 100.00
46Tata Steel Mexico International SA de CVCentral Park – Corporativa 1 Armando Birlain Shaffler No 2001 – Int 16 C, Colonio Centro Sur, Queretaro, QRO Mexico
100.00
47Cogent Power Inc.59 Elm Street, Suite 400, New Haven, CT CT06510 USA 100.00
48Cogent Power LimitedOrb Works, Stephenson Street, Newport, Gwent, NP19 0RB 100.00
49Color Steels Limited30 Millbank, London, SW1P 4WY 100.00
50Corbeil Les Rives SCIRue Decauville, Corbeil Essonnes 91100, France 67.30
51Corby (Northants) & District Water Company LimitedC/o TSUK, PO Box 101, Weldon Road, Corby, Northamptonshire, NN17 5UA 100.00
52Cordor (C& B) Limited30 Millbank, London, SW1P 4WY 100.00
INTEGRATED REPORT & ANNUAL ACCOUNTS 2019-20 | 113TH YEAR176
Sl. No. Name and address of the Company Holding (%)
53Corus CNBV Investments30 Millbank, London, SW1P 4WY 100.00
54Corus Cold Drawn Tubes Limited30 Millbank, London, SW1P 4WY 100.00
55Corus Engineering Steels (UK) Limited30 Millbank, London, SW1P 4WY 100.00
56Corus Engineering Steels Holdings Limited30 Millbank, London, SW1P 4WY 100.00
57Corus Engineering Steels Limited30 Millbank, London, SW1P 4WY 100.00
58Corus Engineering Steels Overseas Holdings Limited30 Millbank, London, SW1P 4WY 100.00
59Corus Engineering Steels Pension Scheme Trustee Limited17th Floor, 125, Old Broad Street, London EC2N 1AR 100.00
60Corus Group Limited30 Millbank, London, SW1P 4WY 100.00
61Corus Holdings Limited15 Atholl Crescent, Edinburgh, EH3 8HA 100.00
62Corus International (Overseas Holdings) Limited30 Millbank, London, SW1P 4WY 100.00
63Corus International Limited30 Millbank, London, SW1P 4WY 100.00
64Corus International Romania SRL.Calea Floreasca, 169A, A Building, Fourth Floor, Campus 10, Office 2039-2044, 1st District, Bucharest 014472 Romania
100.00
65Corus Investments Limited15 Atholl Crescent, Edinburgh, EH3 8HA 100.00
66Corus Ireland Limited70 Sir John Rogerson’s Quay, Dublin 2, Ireland 100.00
67Corus Large Diameter Pipes Limited30 Millbank, London, SW1P 4WY 100.00
68Corus Liaison Services (India) Limited30 Millbank, London, SW1P 4WY 100.00
69Corus Management Limited30 Millbank, London, SW1P 4WY 100.00
70Corus Property30 Millbank, London, SW1P 4WY 100.00
71Corus Service Centre LimitedHull’s Hill, Lisburn, Antrim. BT28 2SR 100.00
72Corus Tubes Poland Spolka Z.O.OUl. Grabiszynska, Wroclaw 43-234, Poland 100.00
73Corus UK Healthcare Trustee Limited30 Millbank, London, SW1P 4WY 100.00
74Crucible Insurance Company LimitedLevel 2, Samuel Harris House, 5-11 St Georges Street, Douglas. IM1 1AJ 100.00
75Degels GmbHKönigsberger Strasse 25, 41460 Neuss, Germany 100.00
76Demka B.V.Wenckebachstraat 1, 1951 J2 Velsen-Noord, Netherlands 100.00
77DSRM Group Limited30 Millbank, London, SW1P 4WY 100.00
Corporate Overview 02
Strategic Review 46
Performance Review 20
Statutory Reports 84
Our Strategy 28
Financial Statements 206
177
BOARD’S REPORT (CONTD.)
Sl. No. Name and address of the Company Holding (%)
78Europressings LimitedHill House, 1 Little Street, London. EC4A 3TR 100.00
7900026466 Limited (formerly Firsteel Group Limited)30 Millbank, London, SW1P 4WY 100.00
8002727547 Limited (formerly Firsteel Holdings Limited)30 Millbank, London, SW1P 4WY 100.00
81Fischer Profil GmbHWaldstrasse 67, 57250 Netphen, Germany 100.00
82Gamble Simms Metals LimitedTata Steel Service Centre, Steel House, Bluebell Industrial Estate, Bluebell Avenue, Dublin 12 100.00
83Grant Lyon Eagre Limited30 Millbank, London, SW1P 4WY 100.00
84H E Samson Limited30 Millbank, London, SW1P 4WY 100.00
85Hadfields Holdings Limited30 Millbank, London, SW1P 4WY 62.50
86Halmstad Steel Service Centre ABTurbingatan 1, Halmstad, Sweden 100.00
87Hammermega Limited30 Millbank, London, SW1P 4WY 100.00
88Hille & Muller GmbHAm Trippelsberg 48, Dusseldorf 40589, Germany 100.00
89Hille & Muller USA Inc.Delaware Avenue N.W., Warren, 44485 Ohio, USA 100.00
90Hoogovens USA Inc.475 N. Martingale road, Suite 400 Schaumburg, IL 60173 USA 100.00
91Huizenbezit “Breesaap” B.V.Wenckebachstraat 1, 1951 J2 Velsen-Noord, Netherlands 100.00
92Inter Metal Distribution SAS3 Allee des Barbanniers, 92632 Gennevilliers Cedex, France 100.00
93Layde Steel S.L.Eguzkitza, 11, E-48200 Durango, Bizkaia, Spain 100.00
94Lister Tubes LimitedTata Steel Service Centre, Steel House, Bluebell Industrial Estate, Bluebell Avenue, Dublin 12 100.00
95London Works Steel Company Limited30 Millbank, London, SW1P 4WY 100.00
96Montana Bausysteme AGDurisolstrasse 11, Villmergen 5612, Switzerland 100.00
97Naantali Steel Service Centre OYRautakatu 5, Naantali 21110, Finland 100.00
98Nationwide Steelstock Limited30 Millbank, London, SW1P 4WY 100.00
99Norsk Stal Tynnplater ASHabornveien 60, 1630 Gamle Fredrikstad, 0106 Fredrikstad, Norway 100.00
100Norsk Stal Tynnplater ABÖstra Rönneholmsvägan 11, 211 47 Malmö, Sweden 100.00
101Orb Electrical Steels LimitedOrb Works, Stephenson Street, Newport, NP19 0RB 100.00
102Ore Carriers Limited30 Millbank, London, SW1P 4WY 100.00
103Oremco Inc.60 E42 Street, New York 10165, USA 100.00
INTEGRATED REPORT & ANNUAL ACCOUNTS 2019-20 | 113TH YEAR178
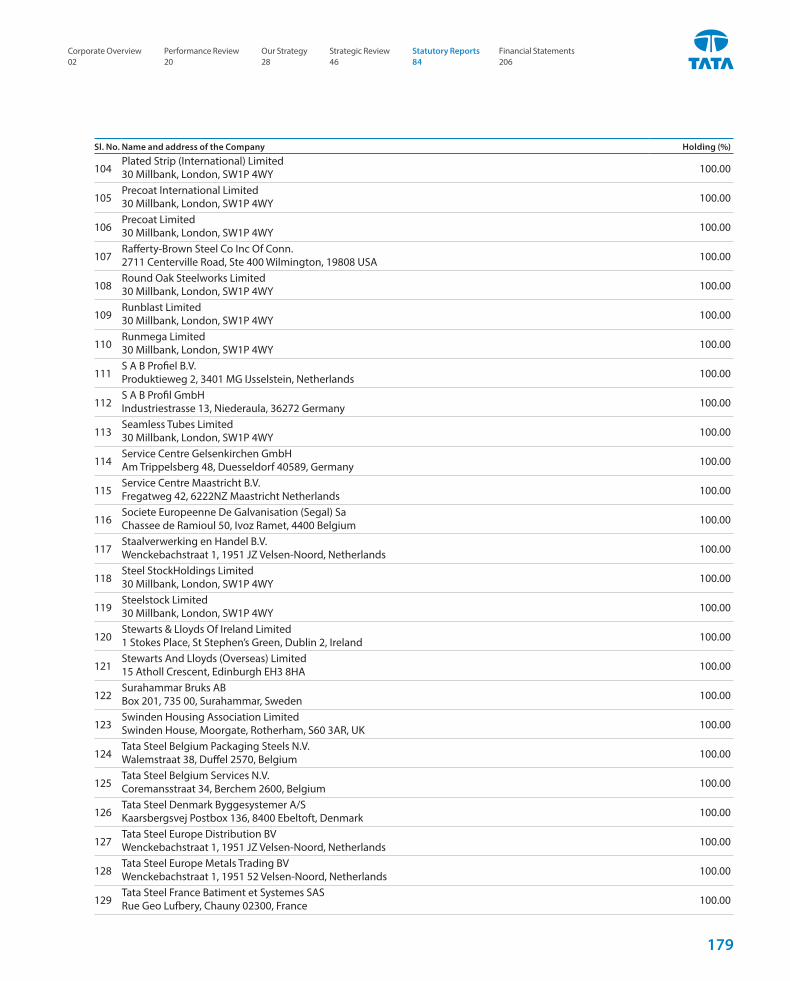
Sl. No. Name and address of the Company Holding (%)
104Plated Strip (International) Limited30 Millbank, London, SW1P 4WY 100.00
105Precoat International Limited30 Millbank, London, SW1P 4WY 100.00
106Precoat Limited30 Millbank, London, SW1P 4WY 100.00
107Rafferty-Brown Steel Co Inc Of Conn.2711 Centerville Road, Ste 400 Wilmington, 19808 USA 100.00
108Round Oak Steelworks Limited30 Millbank, London, SW1P 4WY 100.00
109Runblast Limited30 Millbank, London, SW1P 4WY 100.00
110Runmega Limited30 Millbank, London, SW1P 4WY 100.00
111S A B Profiel B.V.Produktieweg 2, 3401 MG IJsselstein, Netherlands 100.00
112S A B Profil GmbHIndustriestrasse 13, Niederaula, 36272 Germany 100.00
113Seamless Tubes Limited30 Millbank, London, SW1P 4WY 100.00
114Service Centre Gelsenkirchen GmbHAm Trippelsberg 48, Duesseldorf 40589, Germany 100.00
115Service Centre Maastricht B.V.Fregatweg 42, 6222NZ Maastricht Netherlands 100.00
116Societe Europeenne De Galvanisation (Segal) SaChassee de Ramioul 50, Ivoz Ramet, 4400 Belgium 100.00
117Staalverwerking en Handel B.V.Wenckebachstraat 1, 1951 JZ Velsen-Noord, Netherlands 100.00
118Steel StockHoldings Limited30 Millbank, London, SW1P 4WY 100.00
119Steelstock Limited30 Millbank, London, SW1P 4WY 100.00
120Stewarts & Lloyds Of Ireland Limited1 Stokes Place, St Stephen’s Green, Dublin 2, Ireland 100.00
121Stewarts And Lloyds (Overseas) Limited15 Atholl Crescent, Edinburgh EH3 8HA 100.00
122Surahammar Bruks ABBox 201, 735 00, Surahammar, Sweden 100.00
123Swinden Housing Association LimitedSwinden House, Moorgate, Rotherham, S60 3AR, UK 100.00
124Tata Steel Belgium Packaging Steels N.V.Walemstraat 38, Duffel 2570, Belgium 100.00
125Tata Steel Belgium Services N.V.Coremansstraat 34, Berchem 2600, Belgium 100.00
126Tata Steel Denmark Byggesystemer A/SKaarsbergsvej Postbox 136, 8400 Ebeltoft, Denmark 100.00
127Tata Steel Europe Distribution BVWenckebachstraat 1, 1951 JZ Velsen-Noord, Netherlands 100.00
128Tata Steel Europe Metals Trading BVWenckebachstraat 1, 1951 52 Velsen-Noord, Netherlands 100.00
129Tata Steel France Batiment et Systemes SASRue Geo Lufbery, Chauny 02300, France 100.00
Corporate Overview 02
Strategic Review 46
Performance Review 20
Statutory Reports 84
Our Strategy 28
Financial Statements 206
179
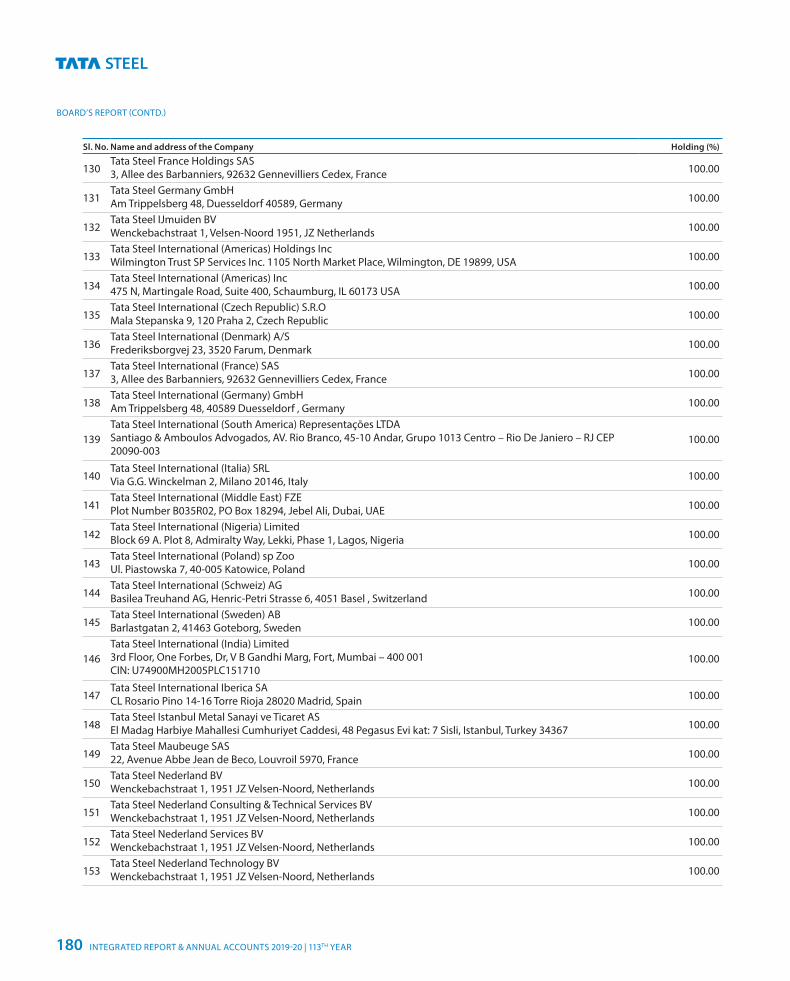
BOARD’S REPORT (CONTD.)
Sl. No. Name and address of the Company Holding (%)
130Tata Steel France Holdings SAS3, Allee des Barbanniers, 92632 Gennevilliers Cedex, France 100.00
131Tata Steel Germany GmbHAm Trippelsberg 48, Duesseldorf 40589, Germany 100.00
132Tata Steel IJmuiden BVWenckebachstraat 1, Velsen-Noord 1951, JZ Netherlands 100.00
133Tata Steel International (Americas) Holdings IncWilmington Trust SP Services Inc. 1105 North Market Place, Wilmington, DE 19899, USA 100.00
134Tata Steel International (Americas) Inc475 N, Martingale Road, Suite 400, Schaumburg, IL 60173 USA 100.00
135Tata Steel International (Czech Republic) S.R.OMala Stepanska 9, 120 Praha 2, Czech Republic 100.00
136Tata Steel International (Denmark) A/SFrederiksborgvej 23, 3520 Farum, Denmark 100.00
137Tata Steel International (France) SAS3, Allee des Barbanniers, 92632 Gennevilliers Cedex, France 100.00
138Tata Steel International (Germany) GmbHAm Trippelsberg 48, 40589 Duesseldorf , Germany 100.00
139Tata Steel International (South America) Representações LTDASantiago & Amboulos Advogados, AV. Rio Branco, 45-10 Andar, Grupo 1013 Centro – Rio De Janiero – RJ CEP 20090-003
100.00
140Tata Steel International (Italia) SRLVia G.G. Winckelman 2, Milano 20146, Italy 100.00
141Tata Steel International (Middle East) FZEPlot Number B035R02, PO Box 18294, Jebel Ali, Dubai, UAE 100.00
142Tata Steel International (Nigeria) LimitedBlock 69 A. Plot 8, Admiralty Way, Lekki, Phase 1, Lagos, Nigeria 100.00
143Tata Steel International (Poland) sp ZooUl. Piastowska 7, 40-005 Katowice, Poland 100.00
144Tata Steel International (Schweiz) AGBasilea Treuhand AG, Henric-Petri Strasse 6, 4051 Basel , Switzerland 100.00
145Tata Steel International (Sweden) ABBarlastgatan 2, 41463 Goteborg, Sweden 100.00
146Tata Steel International (India) Limited3rd Floor, One Forbes, Dr, V B Gandhi Marg, Fort, Mumbai – 400 001CIN: U74900MH2005PLC151710
100.00
147Tata Steel International Iberica SACL Rosario Pino 14-16 Torre Rioja 28020 Madrid, Spain 100.00
148Tata Steel Istanbul Metal Sanayi ve Ticaret ASEl Madag Harbiye Mahallesi Cumhuriyet Caddesi, 48 Pegasus Evi kat: 7 Sisli, Istanbul, Turkey 34367 100.00
149Tata Steel Maubeuge SAS22, Avenue Abbe Jean de Beco, Louvroil 5970, France 100.00
150Tata Steel Nederland BVWenckebachstraat 1, 1951 JZ Velsen-Noord, Netherlands 100.00
151Tata Steel Nederland Consulting & Technical Services BVWenckebachstraat 1, 1951 JZ Velsen-Noord, Netherlands 100.00
152Tata Steel Nederland Services BVWenckebachstraat 1, 1951 JZ Velsen-Noord, Netherlands 100.00
153Tata Steel Nederland Technology BVWenckebachstraat 1, 1951 JZ Velsen-Noord, Netherlands 100.00
INTEGRATED REPORT & ANNUAL ACCOUNTS 2019-20 | 113TH YEAR180
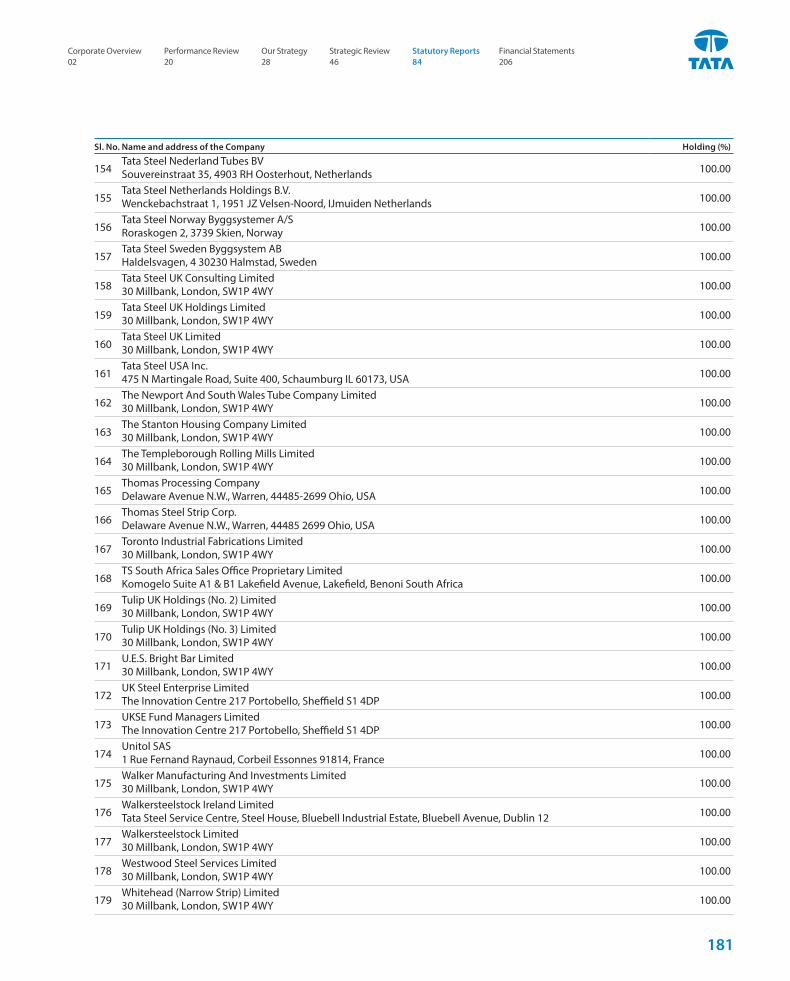
Sl. No. Name and address of the Company Holding (%)
154Tata Steel Nederland Tubes BVSouvereinstraat 35, 4903 RH Oosterhout, Netherlands 100.00
155Tata Steel Netherlands Holdings B.V.Wenckebachstraat 1, 1951 JZ Velsen-Noord, IJmuiden Netherlands 100.00
156Tata Steel Norway Byggsystemer A/SRoraskogen 2, 3739 Skien, Norway 100.00
157Tata Steel Sweden Byggsystem ABHaldelsvagen, 4 30230 Halmstad, Sweden 100.00
158Tata Steel UK Consulting Limited30 Millbank, London, SW1P 4WY 100.00
159Tata Steel UK Holdings Limited30 Millbank, London, SW1P 4WY 100.00
160Tata Steel UK Limited30 Millbank, London, SW1P 4WY 100.00
161Tata Steel USA Inc.475 N Martingale Road, Suite 400, Schaumburg IL 60173, USA 100.00
162The Newport And South Wales Tube Company Limited30 Millbank, London, SW1P 4WY 100.00
163The Stanton Housing Company Limited30 Millbank, London, SW1P 4WY 100.00
164The Templeborough Rolling Mills Limited30 Millbank, London, SW1P 4WY 100.00
165Thomas Processing CompanyDelaware Avenue N.W., Warren, 44485-2699 Ohio, USA 100.00
166Thomas Steel Strip Corp.Delaware Avenue N.W., Warren, 44485 2699 Ohio, USA 100.00
167Toronto Industrial Fabrications Limited30 Millbank, London, SW1P 4WY 100.00
168TS South Africa Sales Office Proprietary LimitedKomogelo Suite A1 & B1 Lakefield Avenue, Lakefield, Benoni South Africa 100.00
169Tulip UK Holdings (No. 2) Limited30 Millbank, London, SW1P 4WY 100.00
170Tulip UK Holdings (No. 3) Limited30 Millbank, London, SW1P 4WY 100.00
171U.E.S. Bright Bar Limited30 Millbank, London, SW1P 4WY 100.00
172UK Steel Enterprise LimitedThe Innovation Centre 217 Portobello, Sheffield S1 4DP 100.00
173UKSE Fund Managers LimitedThe Innovation Centre 217 Portobello, Sheffield S1 4DP 100.00
174Unitol SAS1 Rue Fernand Raynaud, Corbeil Essonnes 91814, France 100.00
175Walker Manufacturing And Investments Limited30 Millbank, London, SW1P 4WY 100.00
176Walkersteelstock Ireland LimitedTata Steel Service Centre, Steel House, Bluebell Industrial Estate, Bluebell Avenue, Dublin 12 100.00
177Walkersteelstock Limited30 Millbank, London, SW1P 4WY 100.00
178Westwood Steel Services Limited30 Millbank, London, SW1P 4WY 100.00
179Whitehead (Narrow Strip) Limited30 Millbank, London, SW1P 4WY 100.00
Corporate Overview 02
Strategic Review 46
Performance Review 20
Statutory Reports 84
Our Strategy 28
Financial Statements 206
181
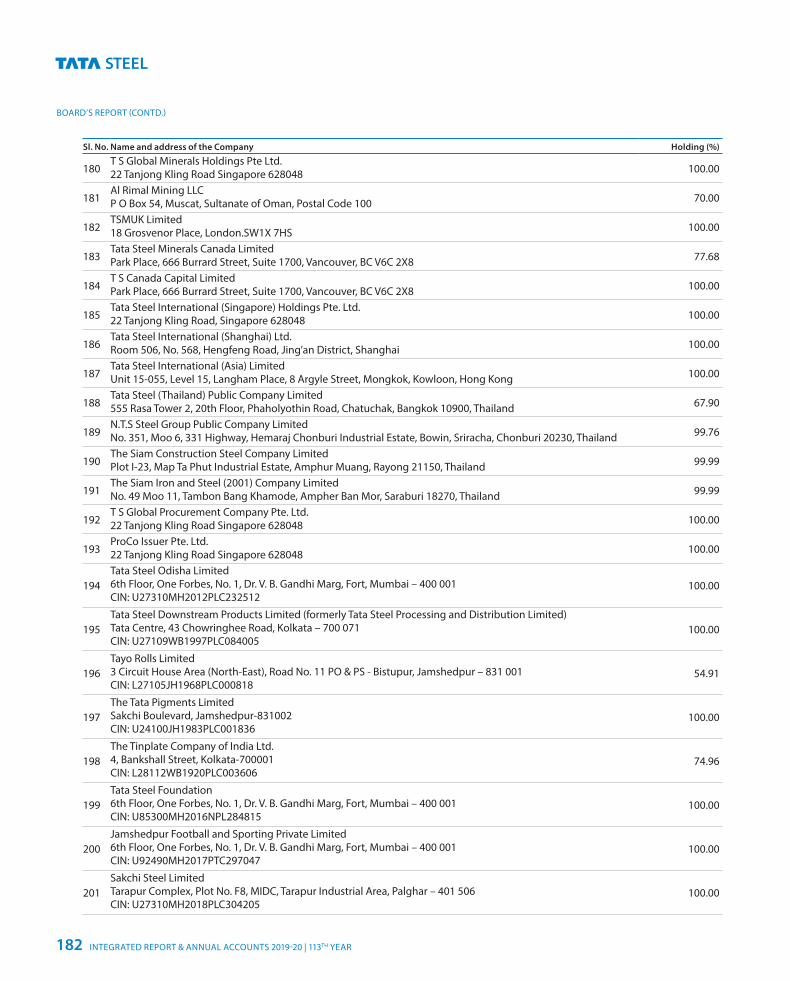
BOARD’S REPORT (CONTD.)
Sl. No. Name and address of the Company Holding (%)
180T S Global Minerals Holdings Pte Ltd.22 Tanjong Kling Road Singapore 628048 100.00
181Al Rimal Mining LLCP O Box 54, Muscat, Sultanate of Oman, Postal Code 100 70.00
182TSMUK Limited18 Grosvenor Place, London.SW1X 7HS 100.00
183Tata Steel Minerals Canada LimitedPark Place, 666 Burrard Street, Suite 1700, Vancouver, BC V6C 2X8 77.68
184T S Canada Capital LimitedPark Place, 666 Burrard Street, Suite 1700, Vancouver, BC V6C 2X8 100.00
185Tata Steel International (Singapore) Holdings Pte. Ltd.22 Tanjong Kling Road, Singapore 628048 100.00
186Tata Steel International (Shanghai) Ltd.Room 506, No. 568, Hengfeng Road, Jing’an District, Shanghai 100.00
187Tata Steel International (Asia) LimitedUnit 15-055, Level 15, Langham Place, 8 Argyle Street, Mongkok, Kowloon, Hong Kong 100.00
188Tata Steel (Thailand) Public Company Limited555 Rasa Tower 2, 20th Floor, Phaholyothin Road, Chatuchak, Bangkok 10900, Thailand 67.90
189N.T.S Steel Group Public Company LimitedNo. 351, Moo 6, 331 Highway, Hemaraj Chonburi Industrial Estate, Bowin, Sriracha, Chonburi 20230, Thailand 99.76
190The Siam Construction Steel Company LimitedPlot I-23, Map Ta Phut Industrial Estate, Amphur Muang, Rayong 21150, Thailand 99.99
191The Siam Iron and Steel (2001) Company LimitedNo. 49 Moo 11, Tambon Bang Khamode, Ampher Ban Mor, Saraburi 18270, Thailand 99.99
192T S Global Procurement Company Pte. Ltd.22 Tanjong Kling Road Singapore 628048 100.00
193ProCo Issuer Pte. Ltd.22 Tanjong Kling Road Singapore 628048 100.00
194Tata Steel Odisha Limited6th Floor, One Forbes, No. 1, Dr. V. B. Gandhi Marg, Fort, Mumbai – 400 001CIN: U27310MH2012PLC232512
100.00
195Tata Steel Downstream Products Limited (formerly Tata Steel Processing and Distribution Limited)Tata Centre, 43 Chowringhee Road, Kolkata – 700 071CIN: U27109WB1997PLC084005
100.00
196Tayo Rolls Limited3 Circuit House Area (North-East), Road No. 11 PO & PS - Bistupur, Jamshedpur – 831 001CIN: L27105JH1968PLC000818
54.91
197The Tata Pigments LimitedSakchi Boulevard, Jamshedpur-831002CIN: U24100JH1983PLC001836
100.00
198The Tinplate Company of India Ltd.4, Bankshall Street, Kolkata-700001CIN: L28112WB1920PLC003606
74.96
199Tata Steel Foundation6th Floor, One Forbes, No. 1, Dr. V. B. Gandhi Marg, Fort, Mumbai – 400 001CIN: U85300MH2016NPL284815
100.00
200Jamshedpur Football and Sporting Private Limited6th Floor, One Forbes, No. 1, Dr. V. B. Gandhi Marg, Fort, Mumbai – 400 001CIN: U92490MH2017PTC297047
100.00
201Sakchi Steel LimitedTarapur Complex, Plot No. F8, MIDC, Tarapur Industrial Area, Palghar – 401 506CIN: U27310MH2018PLC304205
100.00
INTEGRATED REPORT & ANNUAL ACCOUNTS 2019-20 | 113TH YEAR182
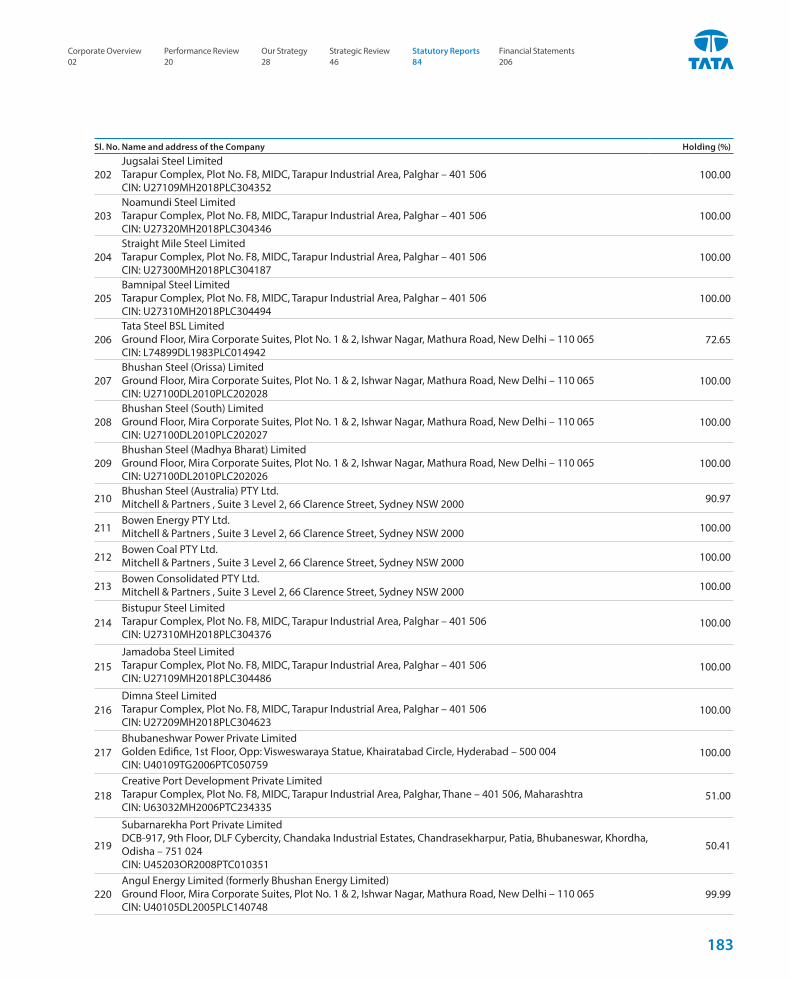
Sl. No. Name and address of the Company Holding (%)
202Jugsalai Steel LimitedTarapur Complex, Plot No. F8, MIDC, Tarapur Industrial Area, Palghar – 401 506CIN: U27109MH2018PLC304352
100.00
203Noamundi Steel LimitedTarapur Complex, Plot No. F8, MIDC, Tarapur Industrial Area, Palghar – 401 506CIN: U27320MH2018PLC304346
100.00
204Straight Mile Steel LimitedTarapur Complex, Plot No. F8, MIDC, Tarapur Industrial Area, Palghar – 401 506CIN: U27300MH2018PLC304187
100.00
205Bamnipal Steel LimitedTarapur Complex, Plot No. F8, MIDC, Tarapur Industrial Area, Palghar – 401 506CIN: U27310MH2018PLC304494
100.00
206Tata Steel BSL LimitedGround Floor, Mira Corporate Suites, Plot No. 1 & 2, Ishwar Nagar, Mathura Road, New Delhi – 110 065CIN: L74899DL1983PLC014942
72.65
207Bhushan Steel (Orissa) LimitedGround Floor, Mira Corporate Suites, Plot No. 1 & 2, Ishwar Nagar, Mathura Road, New Delhi – 110 065CIN: U27100DL2010PLC202028
100.00
208Bhushan Steel (South) LimitedGround Floor, Mira Corporate Suites, Plot No. 1 & 2, Ishwar Nagar, Mathura Road, New Delhi – 110 065CIN: U27100DL2010PLC202027
100.00
209Bhushan Steel (Madhya Bharat) LimitedGround Floor, Mira Corporate Suites, Plot No. 1 & 2, Ishwar Nagar, Mathura Road, New Delhi – 110 065CIN: U27100DL2010PLC202026
100.00
210Bhushan Steel (Australia) PTY Ltd.Mitchell & Partners , Suite 3 Level 2, 66 Clarence Street, Sydney NSW 2000 90.97
211Bowen Energy PTY Ltd.Mitchell & Partners , Suite 3 Level 2, 66 Clarence Street, Sydney NSW 2000 100.00
212Bowen Coal PTY Ltd.Mitchell & Partners , Suite 3 Level 2, 66 Clarence Street, Sydney NSW 2000 100.00
213Bowen Consolidated PTY Ltd.Mitchell & Partners , Suite 3 Level 2, 66 Clarence Street, Sydney NSW 2000 100.00
214Bistupur Steel LimitedTarapur Complex, Plot No. F8, MIDC, Tarapur Industrial Area, Palghar – 401 506CIN: U27310MH2018PLC304376
100.00
215Jamadoba Steel LimitedTarapur Complex, Plot No. F8, MIDC, Tarapur Industrial Area, Palghar – 401 506CIN: U27109MH2018PLC304486
100.00
216Dimna Steel LimitedTarapur Complex, Plot No. F8, MIDC, Tarapur Industrial Area, Palghar – 401 506CIN: U27209MH2018PLC304623
100.00
217Bhubaneshwar Power Private LimitedGolden Edifice, 1st Floor, Opp: Visweswaraya Statue, Khairatabad Circle, Hyderabad – 500 004CIN: U40109TG2006PTC050759
100.00
218Creative Port Development Private LimitedTarapur Complex, Plot No. F8, MIDC, Tarapur Industrial Area, Palghar, Thane – 401 506, MaharashtraCIN: U63032MH2006PTC234335
51.00
219
Subarnarekha Port Private LimitedDCB-917, 9th Floor, DLF Cybercity, Chandaka Industrial Estates, Chandrasekharpur, Patia, Bhubaneswar, Khordha, Odisha – 751 024CIN: U45203OR2008PTC010351
50.41
220Angul Energy Limited (formerly Bhushan Energy Limited)Ground Floor, Mira Corporate Suites, Plot No. 1 & 2, Ishwar Nagar, Mathura Road, New Delhi – 110 065CIN: U40105DL2005PLC140748
99.99
Corporate Overview 02
Strategic Review 46
Performance Review 20
Statutory Reports 84
Our Strategy 28
Financial Statements 206
183
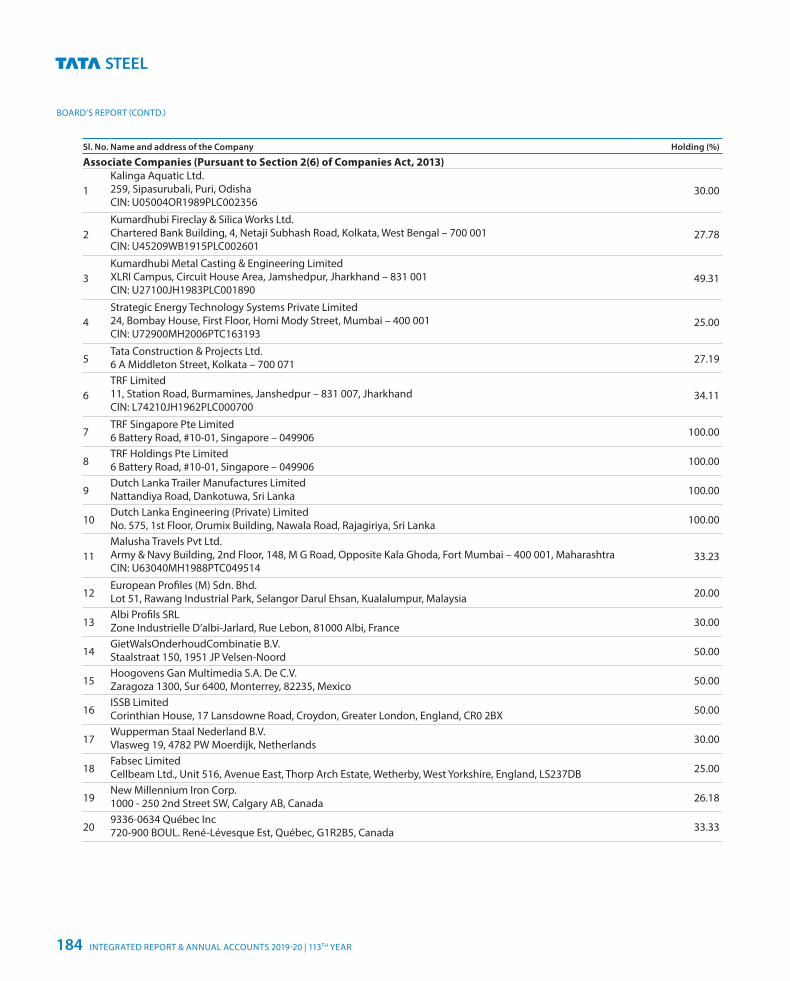
BOARD’S REPORT (CONTD.)
Sl. No. Name and address of the Company Holding (%)
Associate Companies (Pursuant to Section 2(6) of Companies Act, 2013)
1Kalinga Aquatic Ltd.259, Sipasurubali, Puri, OdishaCIN: U05004OR1989PLC002356
30.00
2Kumardhubi Fireclay & Silica Works Ltd.Chartered Bank Building, 4, Netaji Subhash Road, Kolkata, West Bengal – 700 001CIN: U45209WB1915PLC002601
27.78
3Kumardhubi Metal Casting & Engineering LimitedXLRI Campus, Circuit House Area, Jamshedpur, Jharkhand – 831 001CIN: U27100JH1983PLC001890
49.31
4Strategic Energy Technology Systems Private Limited24, Bombay House, First Floor, Homi Mody Street, Mumbai – 400 001CIN: U72900MH2006PTC163193
25.00
5Tata Construction & Projects Ltd.6 A Middleton Street, Kolkata – 700 071 27.19
6TRF Limited11, Station Road, Burmamines, Janshedpur – 831 007, JharkhandCIN: L74210JH1962PLC000700
34.11
7TRF Singapore Pte Limited6 Battery Road, #10-01, Singapore – 049906 100.00
8TRF Holdings Pte Limited6 Battery Road, #10-01, Singapore – 049906 100.00
9Dutch Lanka Trailer Manufactures LimitedNattandiya Road, Dankotuwa, Sri Lanka 100.00
10Dutch Lanka Engineering (Private) LimitedNo. 575, 1st Floor, Orumix Building, Nawala Road, Rajagiriya, Sri Lanka 100.00
11Malusha Travels Pvt Ltd.Army & Navy Building, 2nd Floor, 148, M G Road, Opposite Kala Ghoda, Fort Mumbai – 400 001, MaharashtraCIN: U63040MH1988PTC049514
33.23
12European Profiles (M) Sdn. Bhd.Lot 51, Rawang Industrial Park, Selangor Darul Ehsan, Kualalumpur, Malaysia 20.00
13Albi Profils SRL Zone Industrielle D’albi-Jarlard, Rue Lebon, 81000 Albi, France 30.00
14GietWalsOnderhoudCombinatie B.V.Staalstraat 150, 1951 JP Velsen-Noord 50.00
15Hoogovens Gan Multimedia S.A. De C.V.Zaragoza 1300, Sur 6400, Monterrey, 82235, Mexico 50.00
16ISSB LimitedCorinthian House, 17 Lansdowne Road, Croydon, Greater London, England, CR0 2BX 50.00
17Wupperman Staal Nederland B.V.Vlasweg 19, 4782 PW Moerdijk, Netherlands 30.00
18Fabsec LimitedCellbeam Ltd., Unit 516, Avenue East, Thorp Arch Estate, Wetherby, West Yorkshire, England, LS237DB 25.00
19New Millennium Iron Corp.1000 - 250 2nd Street SW, Calgary AB, Canada 26.18
209336-0634 Québec Inc720-900 BOUL. René-Lévesque Est, Québec, G1R2B5, Canada 33.33
INTEGRATED REPORT & ANNUAL ACCOUNTS 2019-20 | 113TH YEAR184
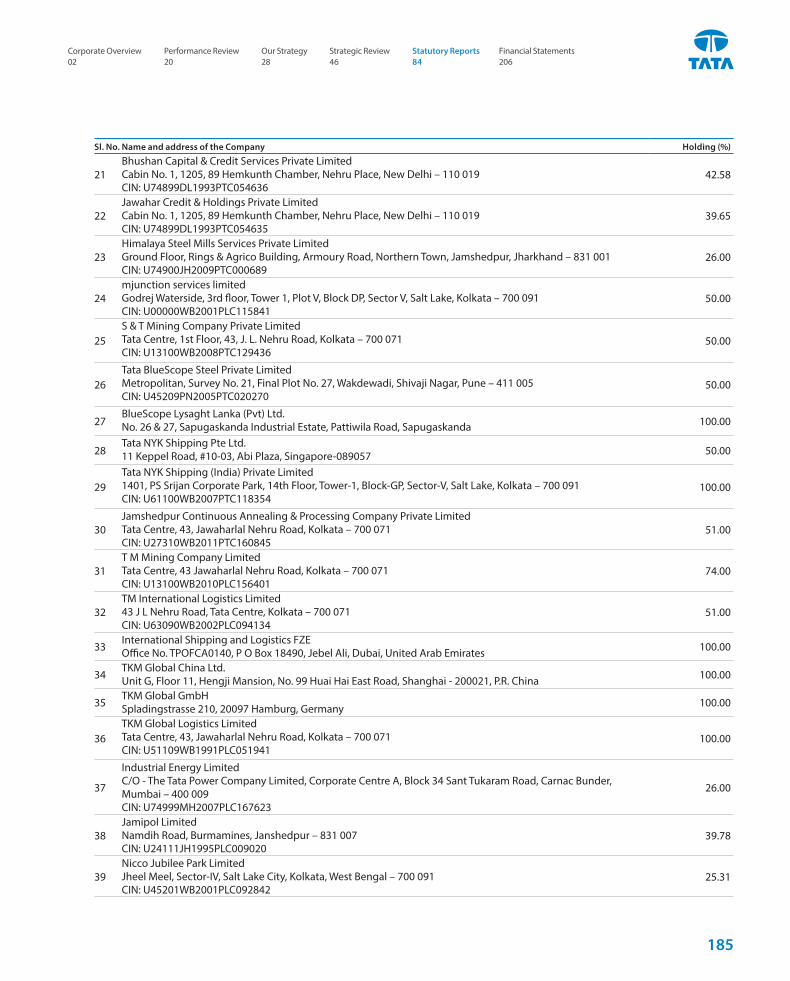
Sl. No. Name and address of the Company Holding (%)
21Bhushan Capital & Credit Services Private LimitedCabin No. 1, 1205, 89 Hemkunth Chamber, Nehru Place, New Delhi – 110 019CIN: U74899DL1993PTC054636
42.58
22Jawahar Credit & Holdings Private LimitedCabin No. 1, 1205, 89 Hemkunth Chamber, Nehru Place, New Delhi – 110 019CIN: U74899DL1993PTC054635
39.65
23Himalaya Steel Mills Services Private LimitedGround Floor, Rings & Agrico Building, Armoury Road, Northern Town, Jamshedpur, Jharkhand – 831 001CIN: U74900JH2009PTC000689
26.00
24mjunction services limitedGodrej Waterside, 3rd floor, Tower 1, Plot V, Block DP, Sector V, Salt Lake, Kolkata – 700 091CIN: U00000WB2001PLC115841
50.00
25S & T Mining Company Private LimitedTata Centre, 1st Floor, 43, J. L. Nehru Road, Kolkata – 700 071CIN: U13100WB2008PTC129436
50.00
26Tata BlueScope Steel Private LimitedMetropolitan, Survey No. 21, Final Plot No. 27, Wakdewadi, Shivaji Nagar, Pune – 411 005CIN: U45209PN2005PTC020270
50.00
27BlueScope Lysaght Lanka (Pvt) Ltd.No. 26 & 27, Sapugaskanda Industrial Estate, Pattiwila Road, Sapugaskanda 100.00
28Tata NYK Shipping Pte Ltd.11 Keppel Road, #10-03, Abi Plaza, Singapore-089057 50.00
29Tata NYK Shipping (India) Private Limited1401, PS Srijan Corporate Park, 14th Floor, Tower-1, Block-GP, Sector-V, Salt Lake, Kolkata – 700 091CIN: U61100WB2007PTC118354
100.00
30Jamshedpur Continuous Annealing & Processing Company Private Limited Tata Centre, 43, Jawaharlal Nehru Road, Kolkata – 700 071CIN: U27310WB2011PTC160845
51.00
31T M Mining Company LimitedTata Centre, 43 Jawaharlal Nehru Road, Kolkata – 700 071CIN: U13100WB2010PLC156401
74.00
32TM International Logistics Limited43 J L Nehru Road, Tata Centre, Kolkata – 700 071CIN: U63090WB2002PLC094134
51.00
33International Shipping and Logistics FZEOffice No. TPOFCA0140, P O Box 18490, Jebel Ali, Dubai, United Arab Emirates 100.00
34TKM Global China Ltd.Unit G, Floor 11, Hengji Mansion, No. 99 Huai Hai East Road, Shanghai - 200021, P.R. China 100.00
35TKM Global GmbHSpladingstrasse 210, 20097 Hamburg, Germany 100.00
36TKM Global Logistics LimitedTata Centre, 43, Jawaharlal Nehru Road, Kolkata – 700 071CIN: U51109WB1991PLC051941
100.00
37
Industrial Energy LimitedC/O - The Tata Power Company Limited, Corporate Centre A, Block 34 Sant Tukaram Road, Carnac Bunder, Mumbai – 400 009CIN: U74999MH2007PLC167623
26.00
38Jamipol LimitedNamdih Road, Burmamines, Janshedpur – 831 007CIN: U24111JH1995PLC009020
39.78
39Nicco Jubilee Park Limited Jheel Meel, Sector-IV, Salt Lake City, Kolkata, West Bengal – 700 091CIN: U45201WB2001PLC092842
25.31
Corporate Overview 02
Strategic Review 46
Performance Review 20
Statutory Reports 84
Our Strategy 28
Financial Statements 206
185
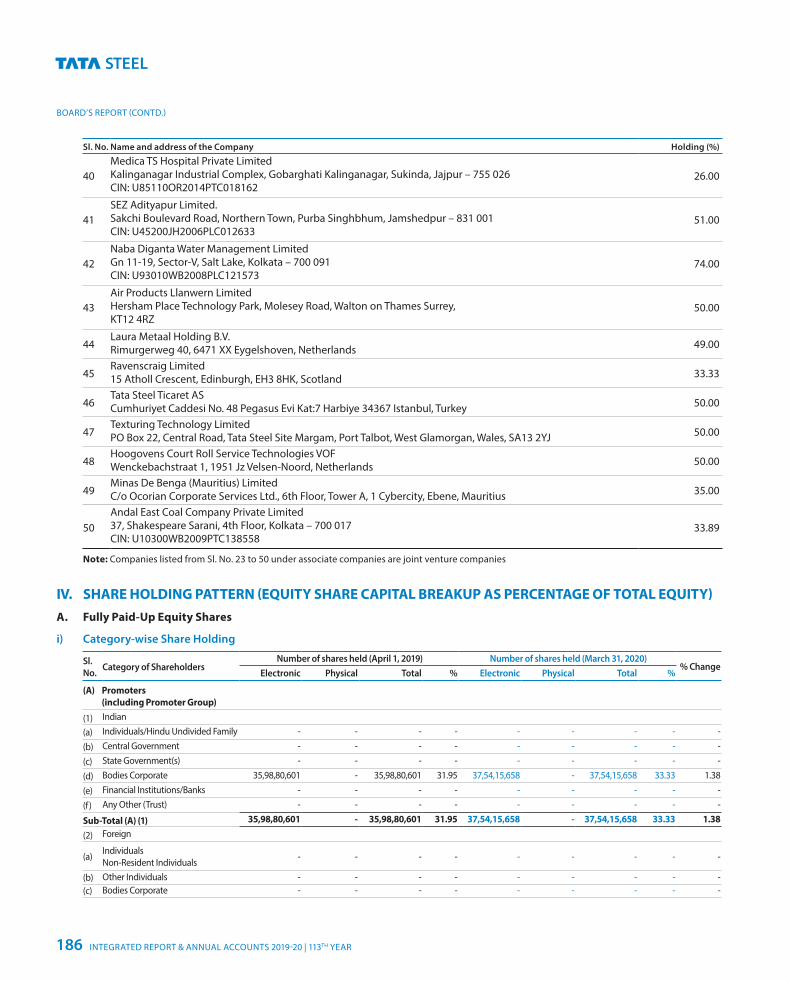
BOARD’S REPORT (CONTD.)
Sl. No. Name and address of the Company Holding (%)
40Medica TS Hospital Private Limited Kalinganagar Industrial Complex, Gobarghati Kalinganagar, Sukinda, Jajpur – 755 026CIN: U85110OR2014PTC018162
26.00
41SEZ Adityapur Limited.Sakchi Boulevard Road, Northern Town, Purba Singhbhum, Jamshedpur – 831 001CIN: U45200JH2006PLC012633
51.00
42Naba Diganta Water Management LimitedGn 11-19, Sector-V, Salt Lake, Kolkata – 700 091CIN: U93010WB2008PLC121573
74.00
43Air Products Llanwern LimitedHersham Place Technology Park, Molesey Road, Walton on Thames Surrey, KT12 4RZ
50.00
44Laura Metaal Holding B.V.Rimurgerweg 40, 6471 XX Eygelshoven, Netherlands 49.00
45Ravenscraig Limited15 Atholl Crescent, Edinburgh, EH3 8HK, Scotland 33.33
46Tata Steel Ticaret ASCumhuriyet Caddesi No. 48 Pegasus Evi Kat:7 Harbiye 34367 Istanbul, Turkey 50.00
47Texturing Technology LimitedPO Box 22, Central Road, Tata Steel Site Margam, Port Talbot, West Glamorgan, Wales, SA13 2YJ 50.00
48Hoogovens Court Roll Service Technologies VOFWenckebachstraat 1, 1951 Jz Velsen-Noord, Netherlands 50.00
49Minas De Benga (Mauritius) LimitedC/o Ocorian Corporate Services Ltd., 6th Floor, Tower A, 1 Cybercity, Ebene, Mauritius 35.00
50Andal East Coal Company Private Limited37, Shakespeare Sarani, 4th Floor, Kolkata – 700 017CIN: U10300WB2009PTC138558
33.89
Note: Companies listed from Sl. No. 23 to 50 under associate companies are joint venture companies
IV. SHARE HOLDING PATTERN (EQUITY SHARE CAPITAL BREAKUP AS PERCENTAGE OF TOTAL EQUITY)A. Fully Paid-Up Equity Shares
i) Category-wise Share Holding
Sl. No. Category of Shareholders
Number of shares held (April 1, 2019) Number of shares held (March 31, 2020)% Change
Electronic Physical Total % Electronic Physical Total %
(A) Promoters (including Promoter Group)
(1) Indian
(a) Individuals/Hindu Undivided Family - - - - - - - - -
(b) Central Government - - - - - - - - -
(c) State Government(s) - - - - - - - - -
(d) Bodies Corporate 35,98,80,601 - 35,98,80,601 31.95 37,54,15,658 - 37,54,15,658 33.33 1.38
(e) Financial Institutions/Banks - - - - - - - - -
(f) Any Other (Trust) - - - - - - - - -
Sub-Total (A) (1) 35,98,80,601 - 35,98,80,601 31.95 37,54,15,658 - 37,54,15,658 33.33 1.38
(2) Foreign
(a) Individuals Non-Resident Individuals - - - - - - - - -
(b) Other Individuals - - - - - - - - -(c) Bodies Corporate - - - - - - - - -
INTEGRATED REPORT & ANNUAL ACCOUNTS 2019-20 | 113TH YEAR186
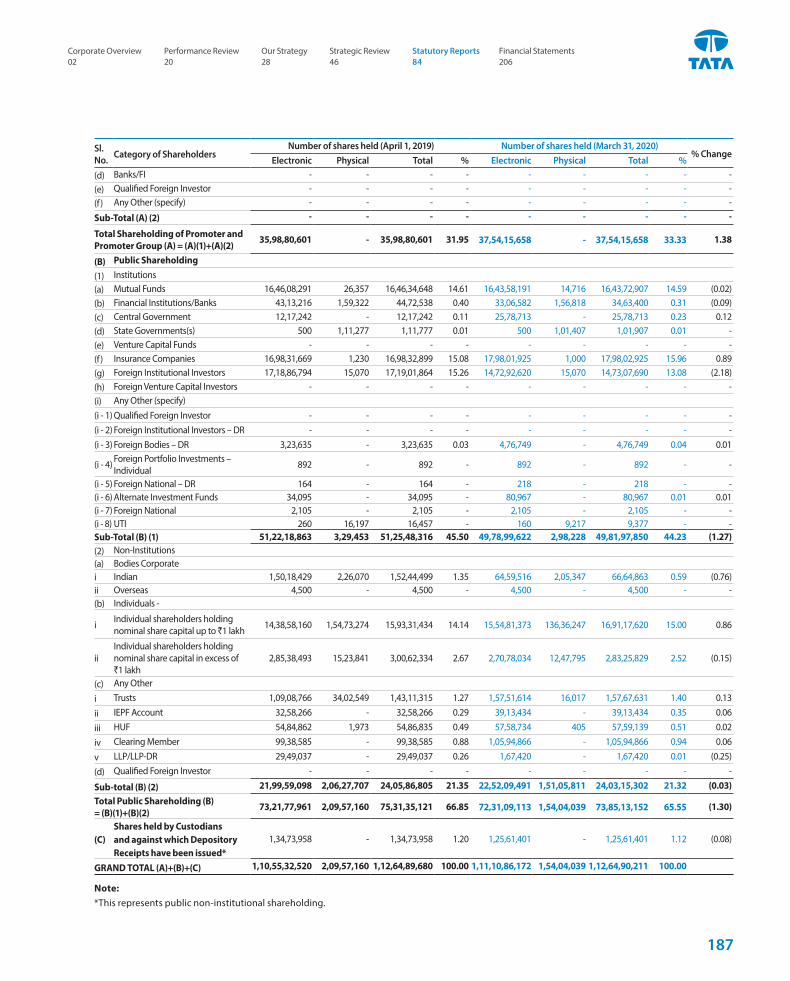
Sl. No. Category of Shareholders
Number of shares held (April 1, 2019) Number of shares held (March 31, 2020)% Change
Electronic Physical Total % Electronic Physical Total % (d) Banks/FI - - - - - - - - -(e) Qualified Foreign Investor - - - - - - - - -(f) Any Other (specify) - - - - - - - - -
Sub-Total (A) (2) - - - - - - - - -
Total Shareholding of Promoter and Promoter Group (A) = (A)(1)+(A)(2)
35,98,80,601 - 35,98,80,601 31.95 37,54,15,658 - 37,54,15,658 33.33 1.38
(B) Public Shareholding
(1) Institutions (a) Mutual Funds 16,46,08,291 26,357 16,46,34,648 14.61 16,43,58,191 14,716 16,43,72,907 14.59 (0.02)(b) Financial Institutions/Banks 43,13,216 1,59,322 44,72,538 0.40 33,06,582 1,56,818 34,63,400 0.31 (0.09)(c) Central Government 12,17,242 - 12,17,242 0.11 25,78,713 - 25,78,713 0.23 0.12(d) State Governments(s) 500 1,11,277 1,11,777 0.01 500 1,01,407 1,01,907 0.01 -(e) Venture Capital Funds - - - - - - - - -(f) Insurance Companies 16,98,31,669 1,230 16,98,32,899 15.08 17,98,01,925 1,000 17,98,02,925 15.96 0.89(g) Foreign Institutional Investors 17,18,86,794 15,070 17,19,01,864 15.26 14,72,92,620 15,070 14,73,07,690 13.08 (2.18)(h) Foreign Venture Capital Investors - - - - - - - - -(i) Any Other (specify)(i - 1) Qualified Foreign Investor - - - - - - - - -(i - 2) Foreign Institutional Investors – DR - - - - - - - - -(i - 3) Foreign Bodies – DR 3,23,635 - 3,23,635 0.03 4,76,749 - 4,76,749 0.04 0.01
(i - 4) Foreign Portfolio Investments – Individual 892 - 892 - 892 - 892 - -
(i - 5) Foreign National – DR 164 - 164 - 218 - 218 - -(i - 6) Alternate Investment Funds 34,095 - 34,095 - 80,967 - 80,967 0.01 0.01(i - 7) Foreign National 2,105 - 2,105 - 2,105 - 2,105 - -(i - 8) UTI 260 16,197 16,457 - 160 9,217 9,377 - -Sub-Total (B) (1) 51,22,18,863 3,29,453 51,25,48,316 45.50 49,78,99,622 2,98,228 49,81,97,850 44.23 (1.27)(2) Non-Institutions (a) Bodies Corporate i Indian 1,50,18,429 2,26,070 1,52,44,499 1.35 64,59,516 2,05,347 66,64,863 0.59 (0.76)ii Overseas 4,500 - 4,500 - 4,500 - 4,500 - -(b) Individuals -
i Individual shareholders holding nominal share capital up to `1 lakh 14,38,58,160 1,54,73,274 15,93,31,434 14.14 15,54,81,373 136,36,247 16,91,17,620 15.00 0.86
iiIndividual shareholders holding nominal share capital in excess of `1 lakh
2,85,38,493 15,23,841 3,00,62,334 2.67 2,70,78,034 12,47,795 2,83,25,829 2.52 (0.15)
(c) Any Other
i Trusts 1,09,08,766 34,02,549 1,43,11,315 1.27 1,57,51,614 16,017 1,57,67,631 1.40 0.13
ii IEPF Account 32,58,266 - 32,58,266 0.29 39,13,434 - 39,13,434 0.35 0.06
iii HUF 54,84,862 1,973 54,86,835 0.49 57,58,734 405 57,59,139 0.51 0.02
iv Clearing Member 99,38,585 - 99,38,585 0.88 1,05,94,866 - 1,05,94,866 0.94 0.06
v LLP/LLP-DR 29,49,037 - 29,49,037 0.26 1,67,420 - 1,67,420 0.01 (0.25)
(d) Qualified Foreign Investor - - - - - - - - -
Sub-total (B) (2) 21,99,59,098 2,06,27,707 24,05,86,805 21.35 22,52,09,491 1,51,05,811 24,03,15,302 21.32 (0.03)
Total Public Shareholding (B) = (B)(1)+(B)(2)
73,21,77,961 2,09,57,160 75,31,35,121 66.85 72,31,09,113 1,54,04,039 73,85,13,152 65.55 (1.30)
(C)Shares held by Custodians and against which Depository Receipts have been issued*
1,34,73,958 - 1,34,73,958 1.20 1,25,61,401 - 1,25,61,401 1.12 (0.08)
GRAND TOTAL (A)+(B)+(C) 1,10,55,32,520 2,09,57,160 1,12,64,89,680 100.00 1,11,10,86,172 1,54,04,039 1,12,64,90,211 100.00
Note: *This represents public non-institutional shareholding.
Corporate Overview 02
Strategic Review 46
Performance Review 20
Statutory Reports 84
Our Strategy 28
Financial Statements 206
187
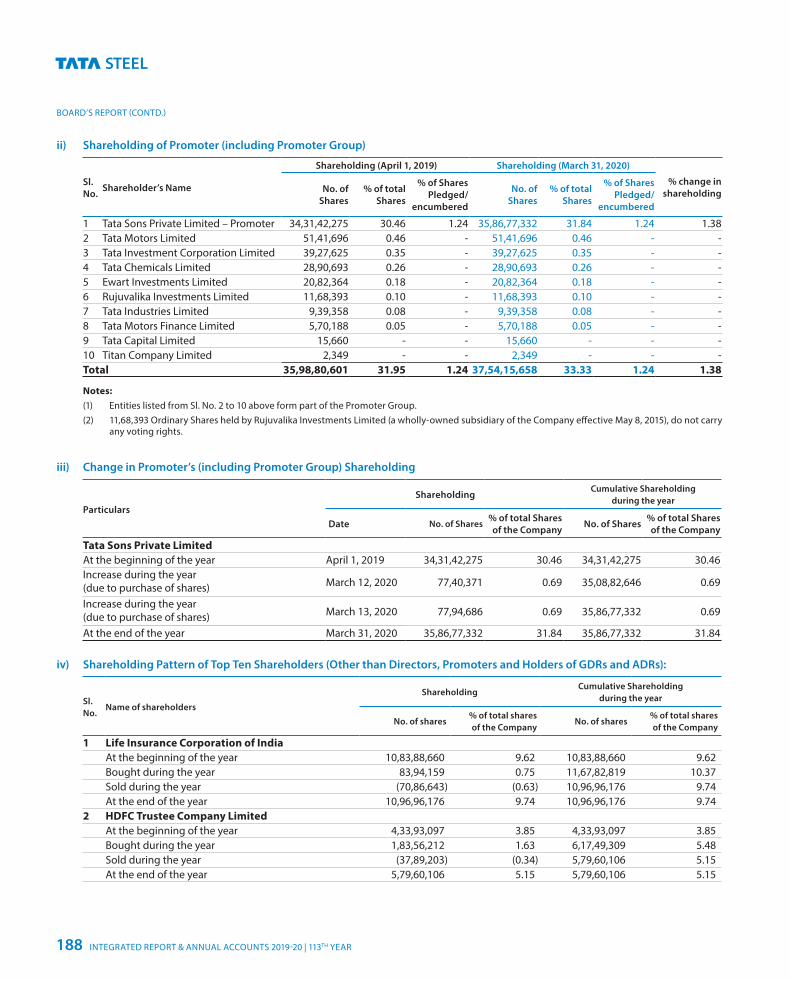
BOARD’S REPORT (CONTD.)
ii) Shareholding of Promoter (including Promoter Group)
Sl. No. Shareholder’s Name
Shareholding (April 1, 2019) Shareholding (March 31, 2020)
% change in shareholdingNo. of
Shares% of total
Shares
% of Shares Pledged/
encumbered
No. of Shares
% of total Shares
% of Shares Pledged/
encumbered
1 Tata Sons Private Limited – Promoter 34,31,42,275 30.46 1.24 35,86,77,332 31.84 1.24 1.382 Tata Motors Limited 51,41,696 0.46 - 51,41,696 0.46 - -3 Tata Investment Corporation Limited 39,27,625 0.35 - 39,27,625 0.35 - -4 Tata Chemicals Limited 28,90,693 0.26 - 28,90,693 0.26 - -5 Ewart Investments Limited 20,82,364 0.18 - 20,82,364 0.18 - -6 Rujuvalika Investments Limited 11,68,393 0.10 - 11,68,393 0.10 - -7 Tata Industries Limited 9,39,358 0.08 - 9,39,358 0.08 - -8 Tata Motors Finance Limited 5,70,188 0.05 - 5,70,188 0.05 - -9 Tata Capital Limited 15,660 - - 15,660 - - -10 Titan Company Limited 2,349 - - 2,349 - - -Total 35,98,80,601 31.95 1.24 37,54,15,658 33.33 1.24 1.38
Notes: (1) Entities listed from Sl. No. 2 to 10 above form part of the Promoter Group. (2) 11,68,393 Ordinary Shares held by Rujuvalika Investments Limited (a wholly-owned subsidiary of the Company effective May 8, 2015), do not carry
any voting rights.
iii) Change in Promoter’s (including Promoter Group) Shareholding
ParticularsShareholding
Cumulative Shareholding during the year
Date No. of Shares% of total Shares of the Company No. of Shares % of total Shares
of the Company
Tata Sons Private LimitedAt the beginning of the year April 1, 2019 34,31,42,275 30.46 34,31,42,275 30.46Increase during the year (due to purchase of shares) March 12, 2020 77,40,371 0.69 35,08,82,646 0.69
Increase during the year (due to purchase of shares) March 13, 2020 77,94,686 0.69 35,86,77,332 0.69
At the end of the year March 31, 2020 35,86,77,332 31.84 35,86,77,332 31.84
iv) Shareholding Pattern of Top Ten Shareholders (Other than Directors, Promoters and Holders of GDRs and ADRs):
Sl. No.
Name of shareholders
ShareholdingCumulative Shareholding
during the year
No. of shares% of total shares of the Company
No. of shares% of total shares of the Company
1 Life Insurance Corporation of IndiaAt the beginning of the year 10,83,88,660 9.62 10,83,88,660 9.62Bought during the year 83,94,159 0.75 11,67,82,819 10.37Sold during the year (70,86,643) (0.63) 10,96,96,176 9.74At the end of the year 10,96,96,176 9.74 10,96,96,176 9.74
2 HDFC Trustee Company LimitedAt the beginning of the year 4,33,93,097 3.85 4,33,93,097 3.85Bought during the year 1,83,56,212 1.63 6,17,49,309 5.48Sold during the year (37,89,203) (0.34) 5,79,60,106 5.15At the end of the year 5,79,60,106 5.15 5,79,60,106 5.15
INTEGRATED REPORT & ANNUAL ACCOUNTS 2019-20 | 113TH YEAR188
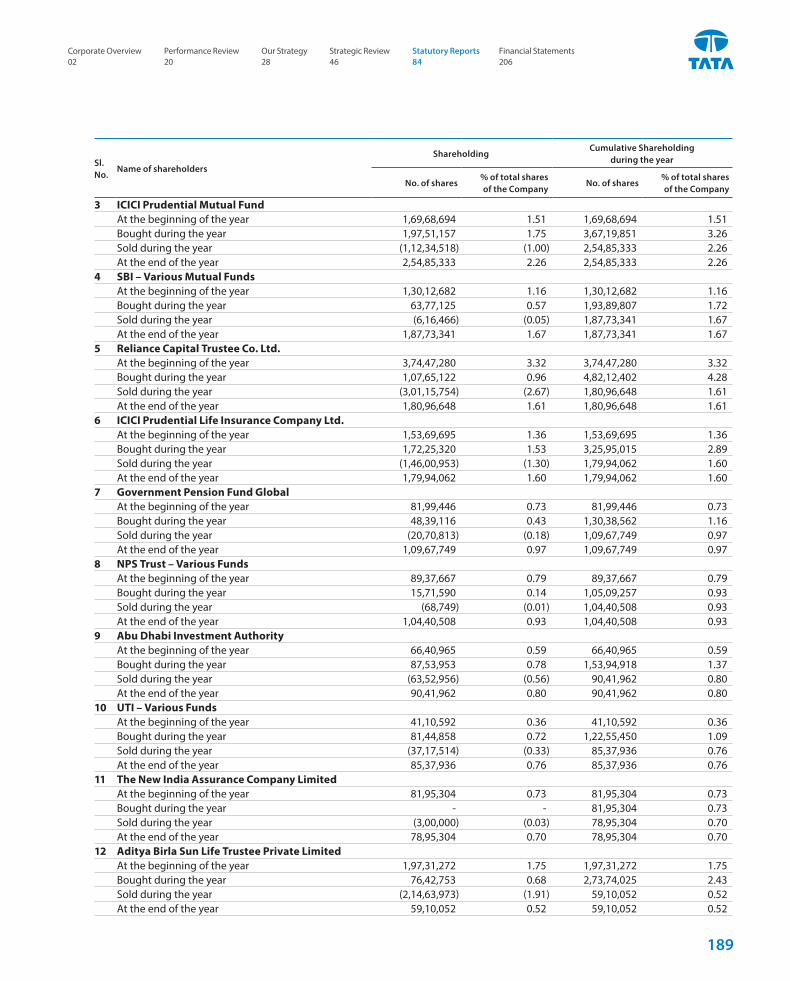
Sl. No.
Name of shareholders
ShareholdingCumulative Shareholding
during the year
No. of shares% of total shares of the Company
No. of shares% of total shares of the Company
3 ICICI Prudential Mutual FundAt the beginning of the year 1,69,68,694 1.51 1,69,68,694 1.51Bought during the year 1,97,51,157 1.75 3,67,19,851 3.26Sold during the year (1,12,34,518) (1.00) 2,54,85,333 2.26At the end of the year 2,54,85,333 2.26 2,54,85,333 2.26
4 SBI – Various Mutual Funds At the beginning of the year 1,30,12,682 1.16 1,30,12,682 1.16Bought during the year 63,77,125 0.57 1,93,89,807 1.72Sold during the year (6,16,466) (0.05) 1,87,73,341 1.67At the end of the year 1,87,73,341 1.67 1,87,73,341 1.67
5 Reliance Capital Trustee Co. Ltd. At the beginning of the year 3,74,47,280 3.32 3,74,47,280 3.32Bought during the year 1,07,65,122 0.96 4,82,12,402 4.28Sold during the year (3,01,15,754) (2.67) 1,80,96,648 1.61At the end of the year 1,80,96,648 1.61 1,80,96,648 1.61
6 ICICI Prudential Life Insurance Company Ltd. At the beginning of the year 1,53,69,695 1.36 1,53,69,695 1.36Bought during the year 1,72,25,320 1.53 3,25,95,015 2.89Sold during the year (1,46,00,953) (1.30) 1,79,94,062 1.60At the end of the year 1,79,94,062 1.60 1,79,94,062 1.60
7 Government Pension Fund Global At the beginning of the year 81,99,446 0.73 81,99,446 0.73Bought during the year 48,39,116 0.43 1,30,38,562 1.16Sold during the year (20,70,813) (0.18) 1,09,67,749 0.97At the end of the year 1,09,67,749 0.97 1,09,67,749 0.97
8 NPS Trust – Various Funds At the beginning of the year 89,37,667 0.79 89,37,667 0.79Bought during the year 15,71,590 0.14 1,05,09,257 0.93Sold during the year (68,749) (0.01) 1,04,40,508 0.93At the end of the year 1,04,40,508 0.93 1,04,40,508 0.93
9 Abu Dhabi Investment Authority At the beginning of the year 66,40,965 0.59 66,40,965 0.59Bought during the year 87,53,953 0.78 1,53,94,918 1.37Sold during the year (63,52,956) (0.56) 90,41,962 0.80At the end of the year 90,41,962 0.80 90,41,962 0.80
10 UTI – Various Funds At the beginning of the year 41,10,592 0.36 41,10,592 0.36Bought during the year 81,44,858 0.72 1,22,55,450 1.09Sold during the year (37,17,514) (0.33) 85,37,936 0.76At the end of the year 85,37,936 0.76 85,37,936 0.76
11 The New India Assurance Company Limited At the beginning of the year 81,95,304 0.73 81,95,304 0.73Bought during the year - - 81,95,304 0.73Sold during the year (3,00,000) (0.03) 78,95,304 0.70At the end of the year 78,95,304 0.70 78,95,304 0.70
12 Aditya Birla Sun Life Trustee Private LimitedAt the beginning of the year 1,97,31,272 1.75 1,97,31,272 1.75Bought during the year 76,42,753 0.68 2,73,74,025 2.43Sold during the year (2,14,63,973) (1.91) 59,10,052 0.52At the end of the year 59,10,052 0.52 59,10,052 0.52
Corporate Overview 02
Strategic Review 46
Performance Review 20
Statutory Reports 84
Our Strategy 28
Financial Statements 206
189
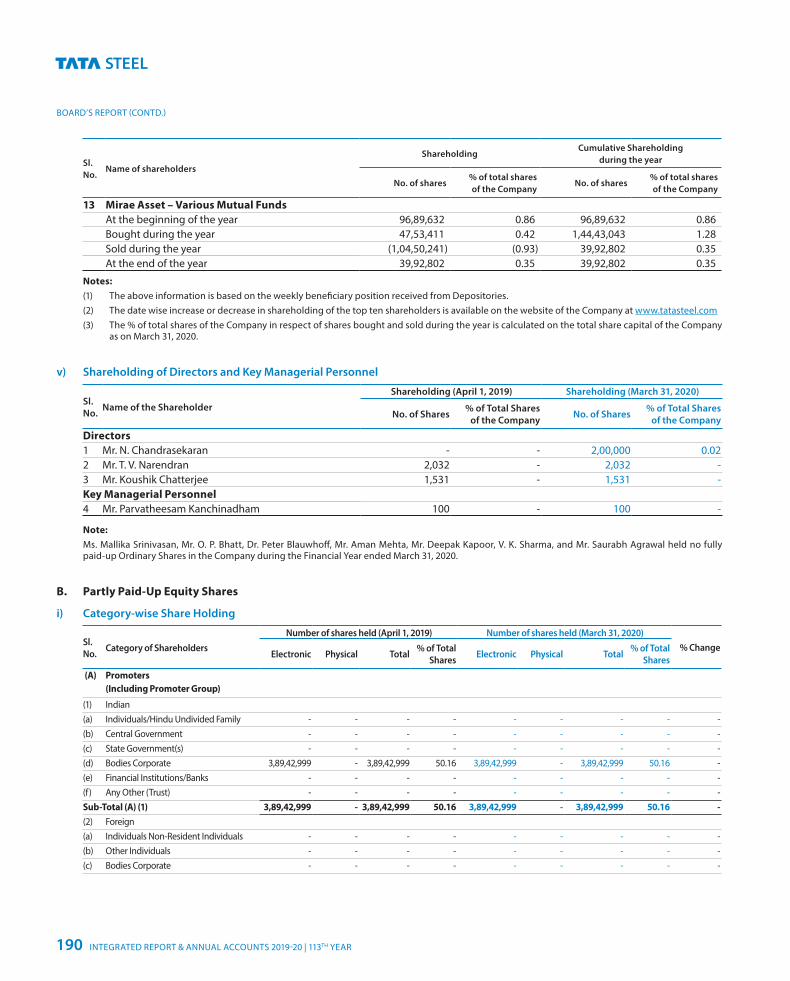
BOARD’S REPORT (CONTD.)
Sl. No.
Name of shareholders
ShareholdingCumulative Shareholding
during the year
No. of shares% of total shares of the Company
No. of shares% of total shares of the Company
13 Mirae Asset – Various Mutual FundsAt the beginning of the year 96,89,632 0.86 96,89,632 0.86Bought during the year 47,53,411 0.42 1,44,43,043 1.28Sold during the year (1,04,50,241) (0.93) 39,92,802 0.35At the end of the year 39,92,802 0.35 39,92,802 0.35
Notes: (1) The above information is based on the weekly beneficiary position received from Depositories. (2) The date wise increase or decrease in shareholding of the top ten shareholders is available on the website of the Company at www.tatasteel.com (3) The % of total shares of the Company in respect of shares bought and sold during the year is calculated on the total share capital of the Company
as on March 31, 2020.
v) Shareholding of Directors and Key Managerial Personnel
Sl. No. Name of the Shareholder
Shareholding (April 1, 2019) Shareholding (March 31, 2020)
No. of Shares % of Total Shares of the Company No. of Shares % of Total Shares
of the Company
Directors1 Mr. N. Chandrasekaran - - 2,00,000 0.022 Mr. T. V. Narendran 2,032 - 2,032 -3 Mr. Koushik Chatterjee 1,531 - 1,531 -Key Managerial Personnel4 Mr. Parvatheesam Kanchinadham 100 - 100 -
Note: Ms. Mallika Srinivasan, Mr. O. P. Bhatt, Dr. Peter Blauwhoff, Mr. Aman Mehta, Mr. Deepak Kapoor, V. K. Sharma, and Mr. Saurabh Agrawal held no fully
paid-up Ordinary Shares in the Company during the Financial Year ended March 31, 2020.
B. Partly Paid-Up Equity Shares
i) Category-wise Share Holding
Sl. No. Category of Shareholders
Number of shares held (April 1, 2019) Number of shares held (March 31, 2020)% Change
Electronic Physical Total % of Total Shares Electronic Physical Total % of Total
Shares (A) Promoters
(Including Promoter Group)
(1) Indian(a) Individuals/Hindu Undivided Family - - - - - - - - -(b) Central Government - - - - - - - - -(c) State Government(s) - - - - - - - - -(d) Bodies Corporate 3,89,42,999 - 3,89,42,999 50.16 3,89,42,999 - 3,89,42,999 50.16 -(e) Financial Institutions/Banks - - - - - - - - -(f) Any Other (Trust) - - - - - - - - -Sub-Total (A) (1) 3,89,42,999 - 3,89,42,999 50.16 3,89,42,999 - 3,89,42,999 50.16 -(2) Foreign(a) Individuals Non-Resident Individuals - - - - - - - - -(b) Other Individuals - - - - - - - - -(c) Bodies Corporate - - - - - - - - -
INTEGRATED REPORT & ANNUAL ACCOUNTS 2019-20 | 113TH YEAR190
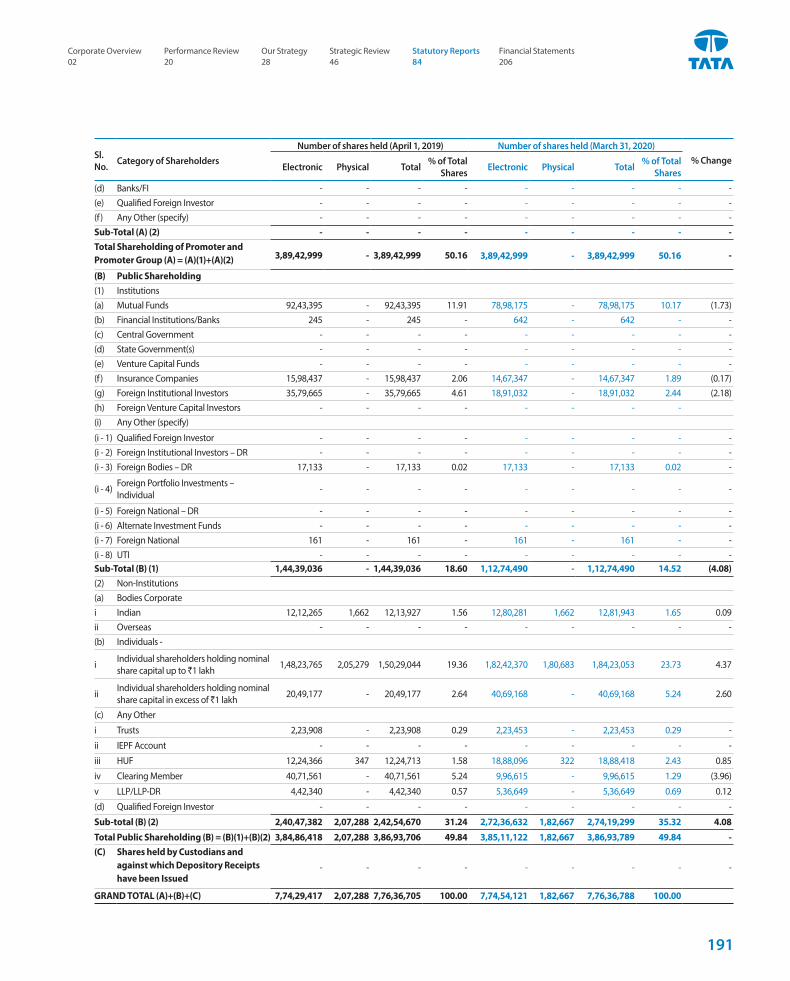
Sl. No. Category of Shareholders
Number of shares held (April 1, 2019) Number of shares held (March 31, 2020)% Change
Electronic Physical Total % of Total Shares Electronic Physical Total % of Total
Shares (d) Banks/FI - - - - - - - - -(e) Qualified Foreign Investor - - - - - - - - -(f) Any Other (specify) - - - - - - - - -Sub-Total (A) (2) - - - - - - - - -Total Shareholding of Promoter and Promoter Group (A) = (A)(1)+(A)(2) 3,89,42,999 - 3,89,42,999 50.16 3,89,42,999 - 3,89,42,999 50.16 -
(B) Public Shareholding (1) Institutions (a) Mutual Funds 92,43,395 - 92,43,395 11.91 78,98,175 - 78,98,175 10.17 (1.73)(b) Financial Institutions/Banks 245 - 245 - 642 - 642 - -(c) Central Government - - - - - - - - -(d) State Government(s) - - - - - - - - -(e) Venture Capital Funds - - - - - - - - -(f) Insurance Companies 15,98,437 - 15,98,437 2.06 14,67,347 - 14,67,347 1.89 (0.17)(g) Foreign Institutional Investors 35,79,665 - 35,79,665 4.61 18,91,032 - 18,91,032 2.44 (2.18)(h) Foreign Venture Capital Investors - - - - - - - -(i) Any Other (specify)
(i - 1) Qualified Foreign Investor - - - - - - - - -(i - 2) Foreign Institutional Investors – DR - - - - - - - - -(i - 3) Foreign Bodies – DR 17,133 - 17,133 0.02 17,133 - 17,133 0.02 -
(i - 4) Foreign Portfolio Investments – Individual - - - - - - - - -
(i - 5) Foreign National – DR - - - - - - - - -(i - 6) Alternate Investment Funds - - - - - - - - -(i - 7) Foreign National 161 - 161 - 161 - 161 - -(i - 8) UTI - - - - - - - - -Sub-Total (B) (1) 1,44,39,036 - 1,44,39,036 18.60 1,12,74,490 - 1,12,74,490 14.52 (4.08)(2) Non-Institutions (a) Bodies Corporate i Indian 12,12,265 1,662 12,13,927 1.56 12,80,281 1,662 12,81,943 1.65 0.09ii Overseas - - - - - - - - - (b) Individuals -
i Individual shareholders holding nominal share capital up to `1 lakh 1,48,23,765 2,05,279 1,50,29,044 19.36 1,82,42,370 1,80,683 1,84,23,053 23.73 4.37
ii Individual shareholders holding nominal share capital in excess of `1 lakh 20,49,177 - 20,49,177 2.64 40,69,168 - 40,69,168 5.24 2.60
(c) Any Other
i Trusts 2,23,908 - 2,23,908 0.29 2,23,453 - 2,23,453 0.29 -
ii IEPF Account - - - - - - - - -
iii HUF 12,24,366 347 12,24,713 1.58 18,88,096 322 18,88,418 2.43 0.85
iv Clearing Member 40,71,561 - 40,71,561 5.24 9,96,615 - 9,96,615 1.29 (3.96)
v LLP/LLP-DR 4,42,340 - 4,42,340 0.57 5,36,649 - 5,36,649 0.69 0.12
(d) Qualified Foreign Investor - - - - - - - - -
Sub-total (B) (2) 2,40,47,382 2,07,288 2,42,54,670 31.24 2,72,36,632 1,82,667 2,74,19,299 35.32 4.08Total Public Shareholding (B) = (B)(1)+(B)(2) 3,84,86,418 2,07,288 3,86,93,706 49.84 3,85,11,122 1,82,667 3,86,93,789 49.84 -(C) Shares held by Custodians and
against which Depository Receipts have been Issued
- - - - - - - - -
GRAND TOTAL (A)+(B)+(C) 7,74,29,417 2,07,288 7,76,36,705 100.00 7,74,54,121 1,82,667 7,76,36,788 100.00
Corporate Overview 02
Strategic Review 46
Performance Review 20
Statutory Reports 84
Our Strategy 28
Financial Statements 206
191
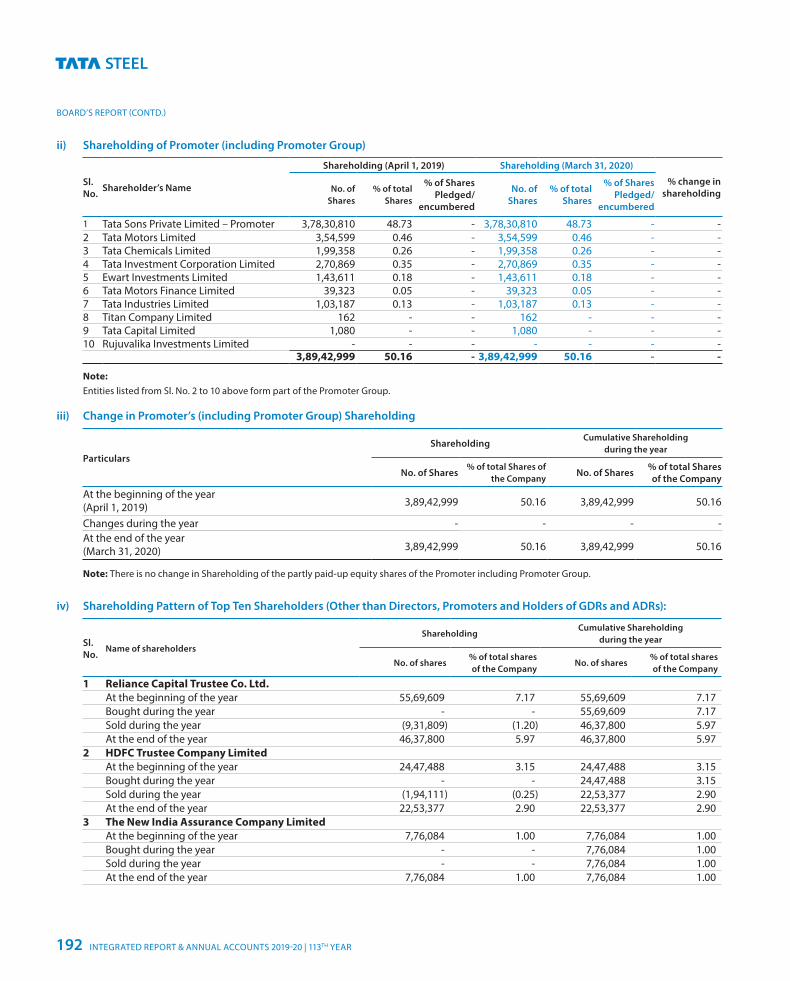
BOARD’S REPORT (CONTD.)
ii) Shareholding of Promoter (including Promoter Group)
Sl. No. Shareholder’s Name
Shareholding (April 1, 2019) Shareholding (March 31, 2020)
% change in shareholdingNo. of
Shares% of total
Shares
% of Shares Pledged/
encumbered
No. of Shares
% of total Shares
% of Shares Pledged/
encumbered
1 Tata Sons Private Limited – Promoter 3,78,30,810 48.73 - 3,78,30,810 48.73 - -2 Tata Motors Limited 3,54,599 0.46 - 3,54,599 0.46 - -3 Tata Chemicals Limited 1,99,358 0.26 - 1,99,358 0.26 - -4 Tata Investment Corporation Limited 2,70,869 0.35 - 2,70,869 0.35 - -5 Ewart Investments Limited 1,43,611 0.18 - 1,43,611 0.18 - -6 Tata Motors Finance Limited 39,323 0.05 - 39,323 0.05 - -7 Tata Industries Limited 1,03,187 0.13 - 1,03,187 0.13 - -8 Titan Company Limited 162 - - 162 - - -9 Tata Capital Limited 1,080 - - 1,080 - - -10 Rujuvalika Investments Limited - - - - - - -
3,89,42,999 50.16 - 3,89,42,999 50.16 - -
Note: Entities listed from Sl. No. 2 to 10 above form part of the Promoter Group.
iii) Change in Promoter’s (including Promoter Group) Shareholding
ParticularsShareholding
Cumulative Shareholding during the year
No. of Shares% of total Shares of
the CompanyNo. of Shares % of total Shares
of the Company
At the beginning of the year (April 1, 2019) 3,89,42,999 50.16 3,89,42,999 50.16
Changes during the year - - - -At the end of the year(March 31, 2020) 3,89,42,999 50.16 3,89,42,999 50.16
Note: There is no change in Shareholding of the partly paid-up equity shares of the Promoter including Promoter Group.
iv) Shareholding Pattern of Top Ten Shareholders (Other than Directors, Promoters and Holders of GDRs and ADRs):
Sl. No.
Name of shareholders
ShareholdingCumulative Shareholding
during the year
No. of shares% of total shares of the Company
No. of shares% of total shares of the Company
1 Reliance Capital Trustee Co. Ltd.At the beginning of the year 55,69,609 7.17 55,69,609 7.17Bought during the year - - 55,69,609 7.17Sold during the year (9,31,809) (1.20) 46,37,800 5.97At the end of the year 46,37,800 5.97 46,37,800 5.97
2 HDFC Trustee Company Limited At the beginning of the year 24,47,488 3.15 24,47,488 3.15Bought during the year - - 24,47,488 3.15Sold during the year (1,94,111) (0.25) 22,53,377 2.90At the end of the year 22,53,377 2.90 22,53,377 2.90
3 The New India Assurance Company Limited At the beginning of the year 7,76,084 1.00 7,76,084 1.00Bought during the year - - 7,76,084 1.00Sold during the year - - 7,76,084 1.00At the end of the year 7,76,084 1.00 7,76,084 1.00
INTEGRATED REPORT & ANNUAL ACCOUNTS 2019-20 | 113TH YEAR192
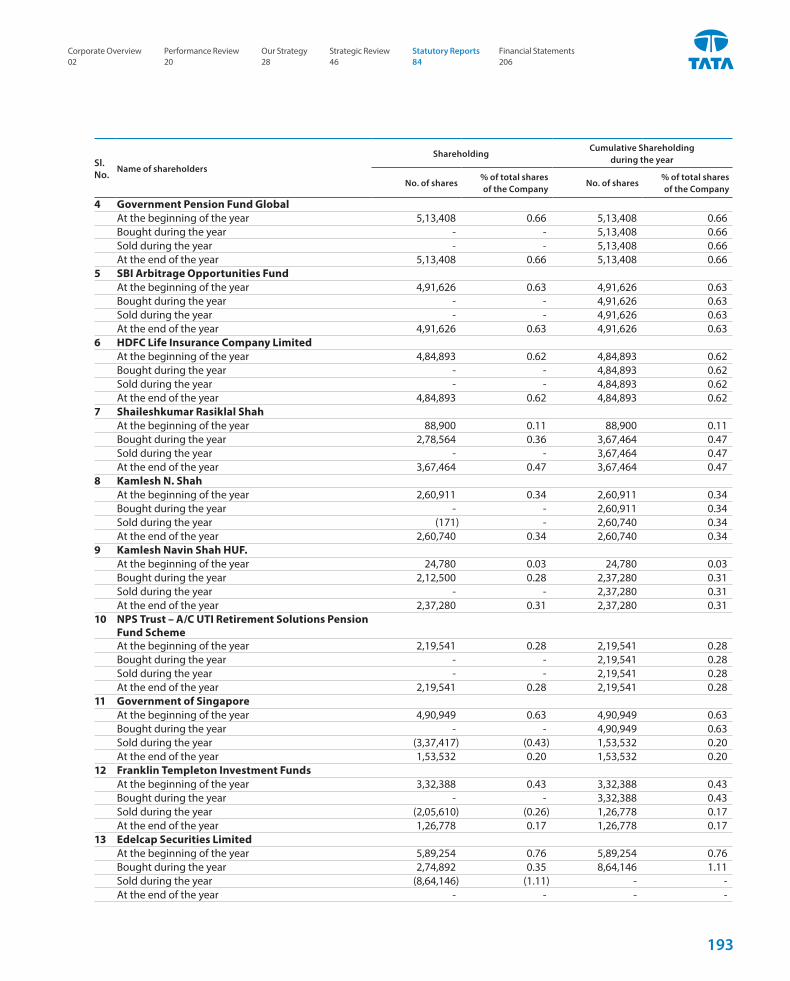
Sl. No.
Name of shareholders
ShareholdingCumulative Shareholding
during the year
No. of shares% of total shares of the Company
No. of shares% of total shares of the Company
4 Government Pension Fund Global At the beginning of the year 5,13,408 0.66 5,13,408 0.66Bought during the year - - 5,13,408 0.66Sold during the year - - 5,13,408 0.66At the end of the year 5,13,408 0.66 5,13,408 0.66
5 SBI Arbitrage Opportunities Fund At the beginning of the year 4,91,626 0.63 4,91,626 0.63Bought during the year - - 4,91,626 0.63Sold during the year - - 4,91,626 0.63At the end of the year 4,91,626 0.63 4,91,626 0.63
6 HDFC Life Insurance Company Limited At the beginning of the year 4,84,893 0.62 4,84,893 0.62Bought during the year - - 4,84,893 0.62Sold during the year - - 4,84,893 0.62At the end of the year 4,84,893 0.62 4,84,893 0.62
7 Shaileshkumar Rasiklal Shah At the beginning of the year 88,900 0.11 88,900 0.11Bought during the year 2,78,564 0.36 3,67,464 0.47Sold during the year - - 3,67,464 0.47At the end of the year 3,67,464 0.47 3,67,464 0.47
8 Kamlesh N. Shah At the beginning of the year 2,60,911 0.34 2,60,911 0.34Bought during the year - - 2,60,911 0.34Sold during the year (171) - 2,60,740 0.34At the end of the year 2,60,740 0.34 2,60,740 0.34
9 Kamlesh Navin Shah HUF. At the beginning of the year 24,780 0.03 24,780 0.03Bought during the year 2,12,500 0.28 2,37,280 0.31Sold during the year - - 2,37,280 0.31At the end of the year 2,37,280 0.31 2,37,280 0.31
10 NPS Trust – A/C UTI Retirement Solutions Pension Fund Scheme
At the beginning of the year 2,19,541 0.28 2,19,541 0.28Bought during the year - - 2,19,541 0.28Sold during the year - - 2,19,541 0.28At the end of the year 2,19,541 0.28 2,19,541 0.28
11 Government of Singapore At the beginning of the year 4,90,949 0.63 4,90,949 0.63 Bought during the year - - 4,90,949 0.63 Sold during the year (3,37,417) (0.43) 1,53,532 0.20 At the end of the year 1,53,532 0.20 1,53,532 0.2012 Franklin Templeton Investment Funds
At the beginning of the year 3,32,388 0.43 3,32,388 0.43Bought during the year - - 3,32,388 0.43Sold during the year (2,05,610) (0.26) 1,26,778 0.17At the end of the year 1,26,778 0.17 1,26,778 0.17
13 Edelcap Securities Limited At the beginning of the year 5,89,254 0.76 5,89,254 0.76 Bought during the year 2,74,892 0.35 8,64,146 1.11 Sold during the year (8,64,146) (1.11) - - At the end of the year - - - -
Corporate Overview 02
Strategic Review 46
Performance Review 20
Statutory Reports 84
Our Strategy 28
Financial Statements 206
193
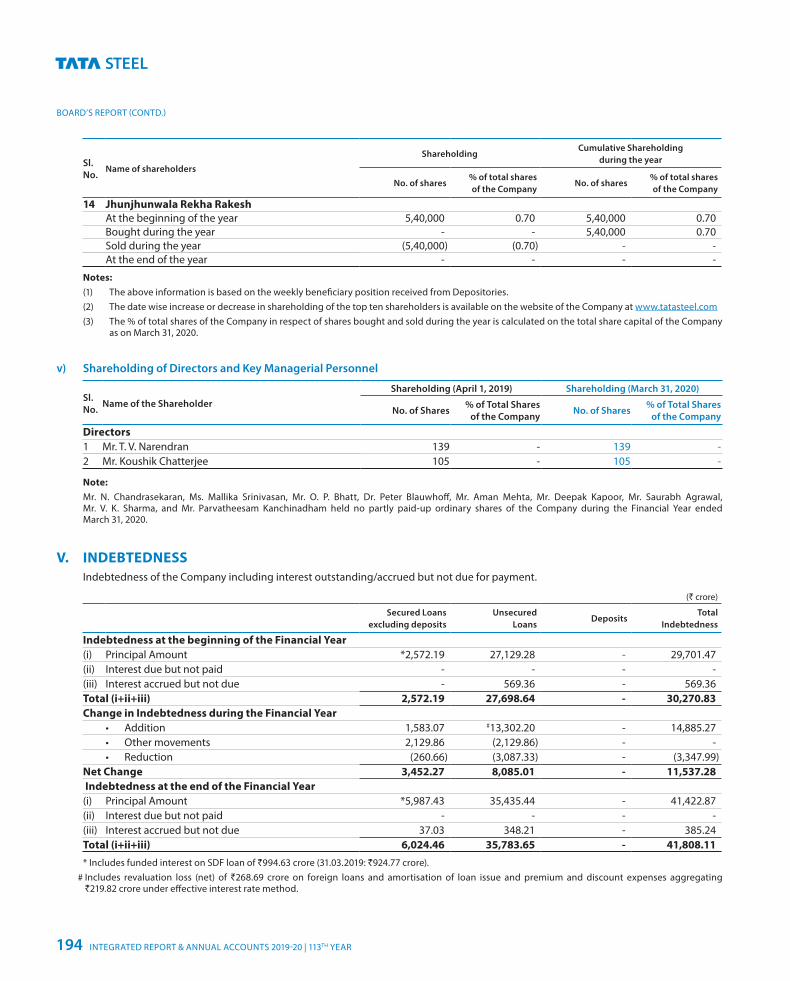
BOARD’S REPORT (CONTD.)
Sl. No.
Name of shareholders
ShareholdingCumulative Shareholding
during the year
No. of shares% of total shares of the Company
No. of shares% of total shares of the Company
14 Jhunjhunwala Rekha Rakesh At the beginning of the year 5,40,000 0.70 5,40,000 0.70 Bought during the year - - 5,40,000 0.70 Sold during the year (5,40,000) (0.70) - - At the end of the year - - - -
Notes: (1) The above information is based on the weekly beneficiary position received from Depositories. (2) The date wise increase or decrease in shareholding of the top ten shareholders is available on the website of the Company at www.tatasteel.com (3) The % of total shares of the Company in respect of shares bought and sold during the year is calculated on the total share capital of the Company
as on March 31, 2020.
v) Shareholding of Directors and Key Managerial Personnel
Sl. No. Name of the Shareholder
Shareholding (April 1, 2019) Shareholding (March 31, 2020)
No. of Shares % of Total Shares of the Company No. of Shares % of Total Shares
of the Company
Directors1 Mr. T. V. Narendran 139 - 139 -2 Mr. Koushik Chatterjee 105 - 105 -
Note: Mr. N. Chandrasekaran, Ms. Mallika Srinivasan, Mr. O. P. Bhatt, Dr. Peter Blauwhoff, Mr. Aman Mehta, Mr. Deepak Kapoor, Mr. Saurabh Agrawal,
Mr. V. K. Sharma, and Mr. Parvatheesam Kanchinadham held no partly paid-up ordinary shares of the Company during the Financial Year ended March 31, 2020.
V. INDEBTEDNESS Indebtedness of the Company including interest outstanding/accrued but not due for payment.
(` crore)
Secured Loans excluding deposits
Unsecured Loans
DepositsTotal
Indebtedness
Indebtedness at the beginning of the Financial Year(i) Principal Amount *2,572.19 27,129.28 - 29,701.47(ii) Interest due but not paid - - - -(iii) Interest accrued but not due - 569.36 - 569.36Total (i+ii+iii) 2,572.19 27,698.64 - 30,270.83Change in Indebtedness during the Financial Year
• Addition 1,583.07 #13,302.20 - 14,885.27• Other movements 2,129.86 (2,129.86) - - • Reduction (260.66) (3,087.33) - (3,347.99)
Net Change 3,452.27 8,085.01 - 11,537.28 Indebtedness at the end of the Financial Year(i) Principal Amount *5,987.43 35,435.44 - 41,422.87(ii) Interest due but not paid - - - -(iii) Interest accrued but not due 37.03 348.21 - 385.24Total (i+ii+iii) 6,024.46 35,783.65 - 41,808.11
* Includes funded interest on SDF loan of `994.63 crore (31.03.2019: `924.77 crore). # Includes revaluation loss (net) of `268.69 crore on foreign loans and amortisation of loan issue and premium and discount expenses aggregating
`219.82 crore under effective interest rate method.
INTEGRATED REPORT & ANNUAL ACCOUNTS 2019-20 | 113TH YEAR194
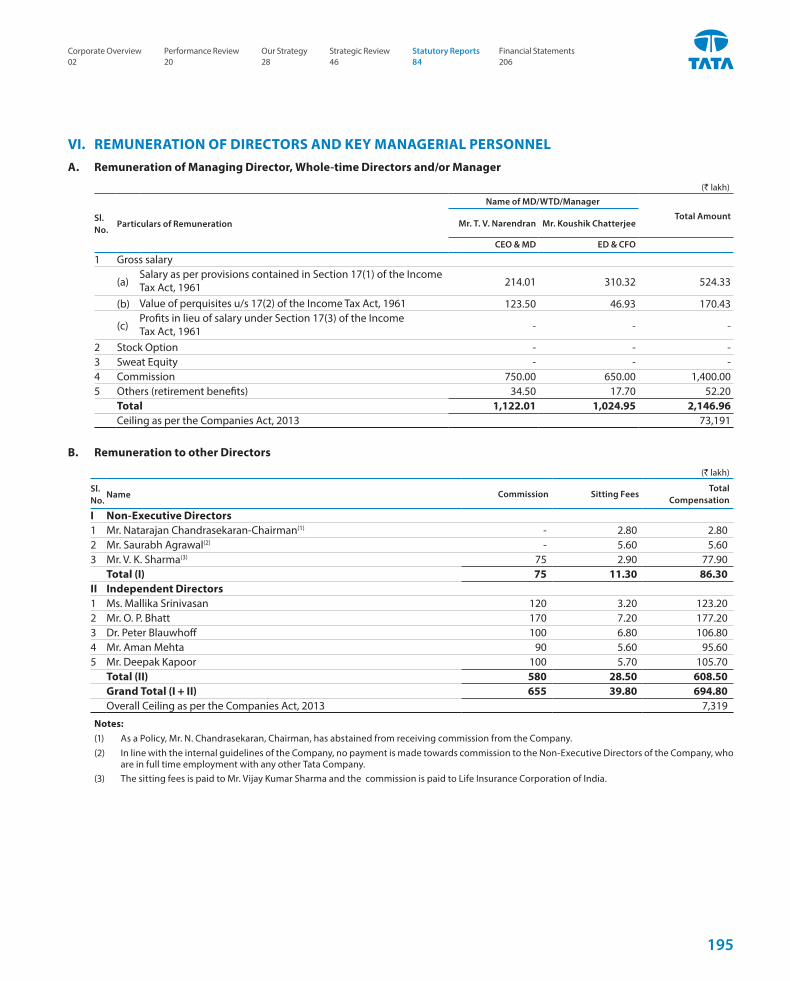
VI. REMUNERATION OF DIRECTORS AND KEY MANAGERIAL PERSONNELA. Remuneration of Managing Director, Whole-time Directors and/or Manager
(` lakh)
Sl. No.
Particulars of Remuneration
Name of MD/WTD/Manager
Total AmountMr. T. V. Narendran Mr. Koushik Chatterjee
CEO & MD ED & CFO
1 Gross salary
(a)Salary as per provisions contained in Section 17(1) of the Income Tax Act, 1961 214.01 310.32 524.33
(b) Value of perquisites u/s 17(2) of the Income Tax Act, 1961 123.50 46.93 170.43
(c)Profits in lieu of salary under Section 17(3) of the Income Tax Act, 1961 - - -
2 Stock Option - - -3 Sweat Equity - - -4 Commission 750.00 650.00 1,400.005 Others (retirement benefits) 34.50 17.70 52.20
Total 1,122.01 1,024.95 2,146.96Ceiling as per the Companies Act, 2013 73,191
B. Remuneration to other Directors
(` lakh)
Sl. No.
Name Commission Sitting FeesTotal
Compensation
I Non-Executive Directors1 Mr. Natarajan Chandrasekaran-Chairman(1) - 2.80 2.802 Mr. Saurabh Agrawal(2) - 5.60 5.603 Mr. V. K. Sharma(3) 75 2.90 77.90
Total (I) 75 11.30 86.30II Independent Directors1 Ms. Mallika Srinivasan 120 3.20 123.202 Mr. O. P. Bhatt 170 7.20 177.203 Dr. Peter Blauwhoff 100 6.80 106.804 Mr. Aman Mehta 90 5.60 95.605 Mr. Deepak Kapoor 100 5.70 105.70
Total (II) 580 28.50 608.50Grand Total (I + II) 655 39.80 694.80Overall Ceiling as per the Companies Act, 2013 7,319
Notes: (1) As a Policy, Mr. N. Chandrasekaran, Chairman, has abstained from receiving commission from the Company. (2) In line with the internal guidelines of the Company, no payment is made towards commission to the Non-Executive Directors of the Company, who
are in full time employment with any other Tata Company. (3) The sitting fees is paid to Mr. Vijay Kumar Sharma and the commission is paid to Life Insurance Corporation of India.
Corporate Overview 02
Strategic Review 46
Performance Review 20
Statutory Reports 84
Our Strategy 28
Financial Statements 206
195
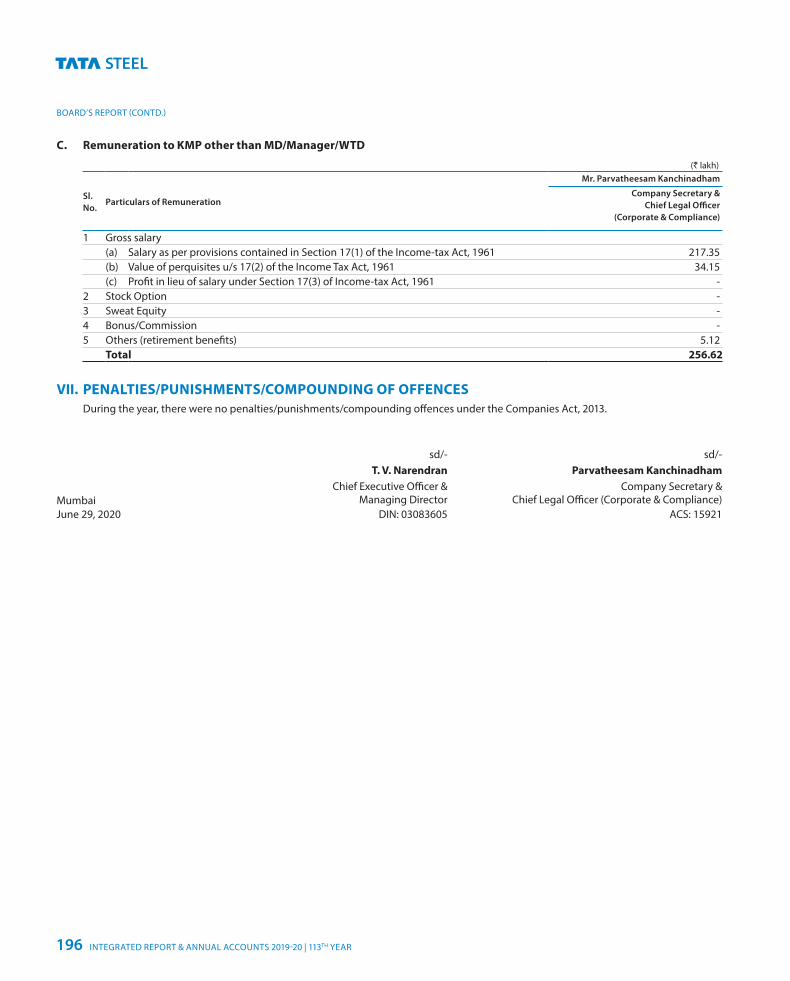
BOARD’S REPORT (CONTD.)
C. Remuneration to KMP other than MD/Manager/WTD
(` lakh)
Sl. No.
Particulars of Remuneration
Mr. Parvatheesam Kanchinadham
Company Secretary & Chief Legal Officer
(Corporate & Compliance)
1 Gross salary(a) Salary as per provisions contained in Section 17(1) of the Income-tax Act, 1961 217.35(b) Value of perquisites u/s 17(2) of the Income Tax Act, 1961 34.15(c) Profit in lieu of salary under Section 17(3) of Income-tax Act, 1961 -
2 Stock Option -3 Sweat Equity -4 Bonus/Commission -5 Others (retirement benefits) 5.12
Total 256.62
VII. PENALTIES/PUNISHMENTS/COMPOUNDING OF OFFENCES During the year, there were no penalties/punishments/compounding offences under the Companies Act, 2013.
sd/- sd/-T. V. Narendran Parvatheesam Kanchinadham
MumbaiChief Executive Officer &
Managing DirectorCompany Secretary &
Chief Legal Officer (Corporate & Compliance)June 29, 2020 DIN: 03083605 ACS: 15921
INTEGRATED REPORT & ANNUAL ACCOUNTS 2019-20 | 113TH YEAR196
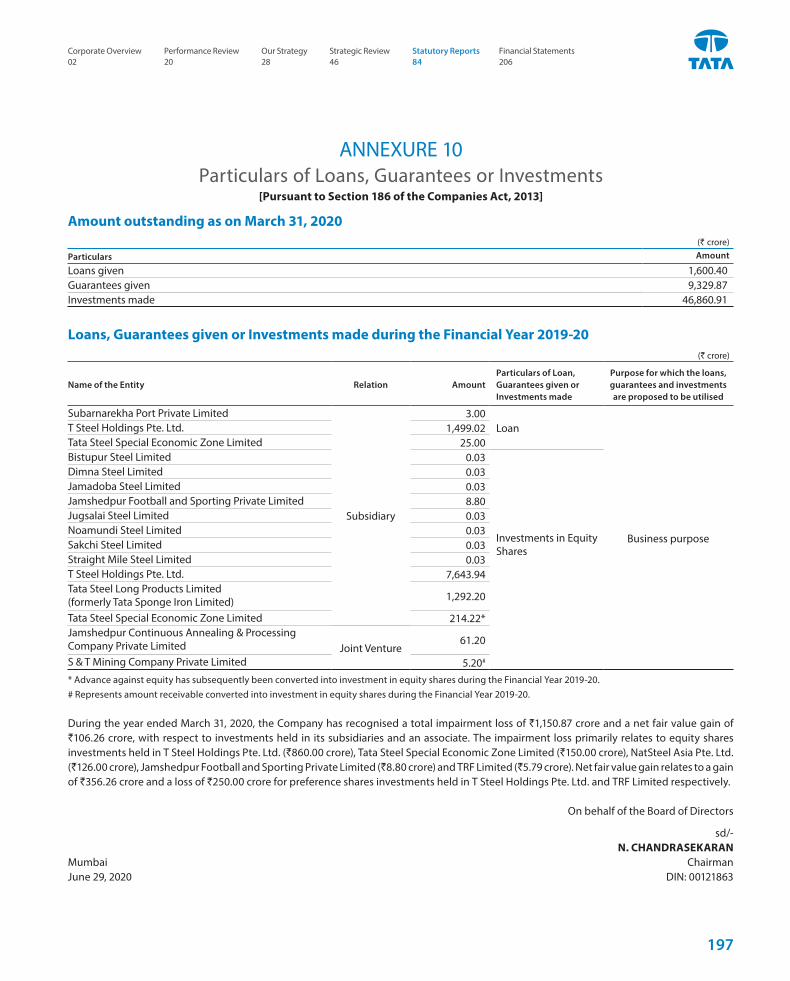
Particulars of Loans, Guarantees or Investments[Pursuant to Section 186 of the Companies Act, 2013]
ANNEXURE 10
Amount outstanding as on March 31, 2020(` crore)
Particulars Amount
Loans given 1,600.40 Guarantees given 9,329.87 Investments made 46,860.91
Loans, Guarantees given or Investments made during the Financial Year 2019-20 (` crore)
Name of the Entity Relation AmountParticulars of Loan, Guarantees given or Investments made
Purpose for which the loans, guarantees and investments are proposed to be utilised
Subarnarekha Port Private Limited
Subsidiary
3.00 Loan
Business purpose
T Steel Holdings Pte. Ltd. 1,499.02 Tata Steel Special Economic Zone Limited 25.00 Bistupur Steel Limited 0.03
Investments in Equity Shares
Dimna Steel Limited 0.03Jamadoba Steel Limited 0.03Jamshedpur Football and Sporting Private Limited 8.80Jugsalai Steel Limited 0.03Noamundi Steel Limited 0.03Sakchi Steel Limited 0.03Straight Mile Steel Limited 0.03T Steel Holdings Pte. Ltd. 7,643.94Tata Steel Long Products Limited (formerly Tata Sponge Iron Limited) 1,292.20
Tata Steel Special Economic Zone Limited 214.22*Jamshedpur Continuous Annealing & Processing Company Private Limited Joint Venture
61.20
S & T Mining Company Private Limited 5.20# * Advance against equity has subsequently been converted into investment in equity shares during the Financial Year 2019-20.# Represents amount receivable converted into investment in equity shares during the Financial Year 2019-20.
During the year ended March 31, 2020, the Company has recognised a total impairment loss of `1,150.87 crore and a net fair value gain of `106.26 crore, with respect to investments held in its subsidiaries and an associate. The impairment loss primarily relates to equity shares investments held in T Steel Holdings Pte. Ltd. (`860.00 crore), Tata Steel Special Economic Zone Limited (`150.00 crore), NatSteel Asia Pte. Ltd. (`126.00 crore), Jamshedpur Football and Sporting Private Limited (`8.80 crore) and TRF Limited (`5.79 crore). Net fair value gain relates to a gain of `356.26 crore and a loss of `250.00 crore for preference shares investments held in T Steel Holdings Pte. Ltd. and TRF Limited respectively.
On behalf of the Board of Directors
sd/-N. CHANDRASEKARAN
Mumbai ChairmanJune 29, 2020 DIN: 00121863
Corporate Overview 02
Strategic Review 46
Performance Review 20
Statutory Reports 84
Our Strategy 28
Financial Statements 206
197
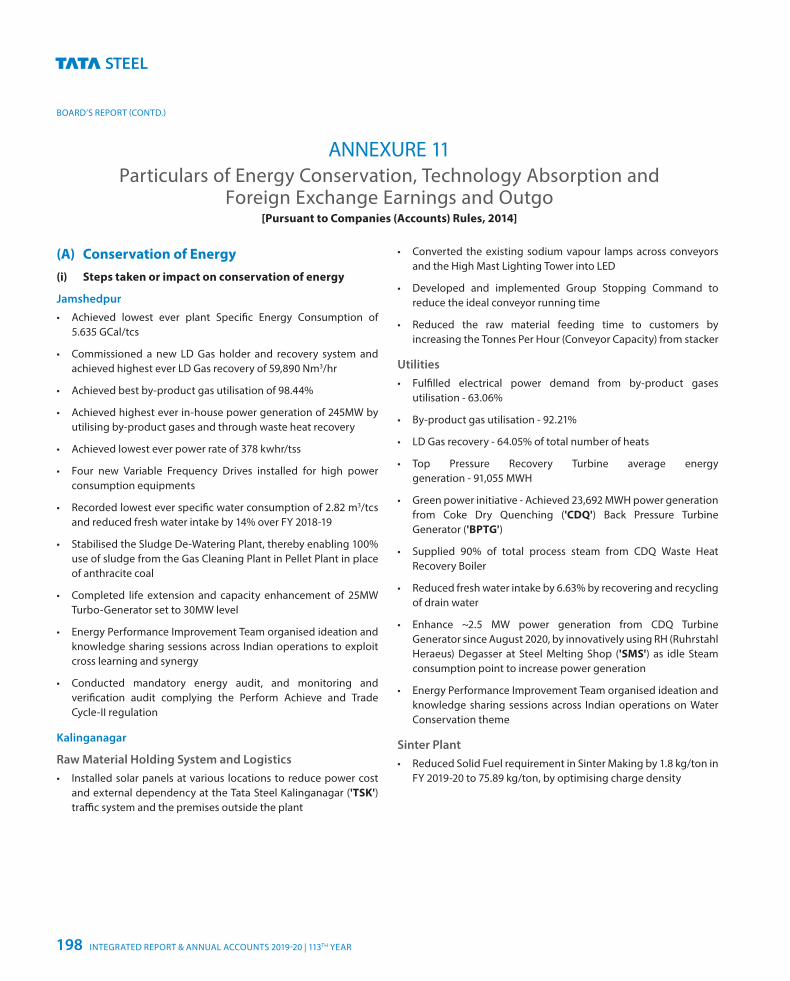
BOARD’S REPORT (CONTD.)
ANNEXURE 11Particulars of Energy Conservation, Technology Absorption and
Foreign Exchange Earnings and Outgo [Pursuant to Companies (Accounts) Rules, 2014]
(A) Conservation of Energy(i) Steps taken or impact on conservation of energy
Jamshedpur
• Achieved lowest ever plant Specific Energy Consumption of 5.635 GCal/tcs
• Commissioned a new LD Gas holder and recovery system and achieved highest ever LD Gas recovery of 59,890 Nm3/hr
• Achieved best by-product gas utilisation of 98.44%
• Achieved highest ever in-house power generation of 245MW by utilising by-product gases and through waste heat recovery
• Achieved lowest ever power rate of 378 kwhr/tss
• Four new Variable Frequency Drives installed for high power consumption equipments
• Recorded lowest ever specific water consumption of 2.82 m3/tcs and reduced fresh water intake by 14% over FY 2018-19
• Stabilised the Sludge De-Watering Plant, thereby enabling 100% use of sludge from the Gas Cleaning Plant in Pellet Plant in place of anthracite coal
• Completed life extension and capacity enhancement of 25MW Turbo-Generator set to 30MW level
• Energy Performance Improvement Team organised ideation and knowledge sharing sessions across Indian operations to exploit cross learning and synergy
• Conducted mandatory energy audit, and monitoring and verification audit complying the Perform Achieve and Trade Cycle-II regulation
Kalinganagar
Raw Material Holding System and Logistics• Installed solar panels at various locations to reduce power cost
and external dependency at the Tata Steel Kalinganagar ('TSK') traffic system and the premises outside the plant
• Converted the existing sodium vapour lamps across conveyors and the High Mast Lighting Tower into LED
• Developed and implemented Group Stopping Command to reduce the ideal conveyor running time
• Reduced the raw material feeding time to customers by increasing the Tonnes Per Hour (Conveyor Capacity) from stacker
Utilities• Fulfilled electrical power demand from by-product gases
utilisation - 63.06%
• By-product gas utilisation - 92.21%
• LD Gas recovery - 64.05% of total number of heats
• Top Pressure Recovery Turbine average energy generation - 91,055 MWH
• Green power initiative - Achieved 23,692 MWH power generation from Coke Dry Quenching ('CDQ') Back Pressure Turbine Generator ('BPTG')
• Supplied 90% of total process steam from CDQ Waste Heat Recovery Boiler
• Reduced fresh water intake by 6.63% by recovering and recycling of drain water
• Enhance ~2.5 MW power generation from CDQ Turbine Generator since August 2020, by innovatively using RH (Ruhrstahl Heraeus) Degasser at Steel Melting Shop ('SMS') as idle Steam consumption point to increase power generation
• Energy Performance Improvement Team organised ideation and knowledge sharing sessions across Indian operations on Water Conservation theme
Sinter Plant• Reduced Solid Fuel requirement in Sinter Making by 1.8 kg/ton in
FY 2019-20 to 75.89 kg/ton, by optimising charge density
INTEGRATED REPORT & ANNUAL ACCOUNTS 2019-20 | 113TH YEAR198
Coke Plant• Reduced specific water consumption to 0.90 m3/ton of gross coke
produced during FY 2019-20 (FY 2018-19: 1.02 m3/ton)
• Reduced coke moisture to 1.74% in FY 2019-20 (FY 2018-19: 2.94%). 1% reduction in coke moisture leads to reduction of about 3 Kg of fuel rate at the Blast Furnace resulting in a saving of 9,150 Tonnes of fuel at Blast Furnace
• Generated cleanest Coke Oven Gas during FY 2019-20 by achieving the lowest ever ammonia, naphthalene and tar fog at 54 mg/Nm3, 31.7 mg/Nm3 and 5.68 mg/Nm3 respectively
• Conserved Foreign Exchange by using lowest cost imported coking coals among all the coke making facilities of the Company and use of coke dust in coke making, thereby replacing valuable coking coals in the coal blend
Blast Furnace• Reduced Hot Metal Silica to 0.65% in FY 2019-20
(FY 2018-19: 0.74%)
• Reduced Total Fuel rate to 541 kg/tHm through process optimisation (FY 2018-19: 549 kg/tHm)
Steel Melting Shop (‘SMS’)• Reduced specific water consumption from 0.46 m3/tcs to
0.43 m3/tcs by changing of Gas cleaning circuit logic
Hot Strip Mill• Reduced mill specific power consumption from 122 KWH/T to
118 KWH/T through several initiatives undertaken in SHIKHAR project such as:
− planned stoppages for longer duration in place of multiple shorter durations; and
− power optimisation during idle period by switching off equipment, descaling pumps, motors amongst others
(ii) Steps taken by the Company for utilising alternate sources of Energy:
Jamshedpur
• Commissioned pilot project on ‘Energy Recovery Micro Turbine’ to recover throttling loss in pressure reducing station for de-aeration application of Boiler feed water
• Commissioned pilot project on ‘Vapor Absorption Machine’ to utilise the waste heat of Boiler blow-down water and condensate/steam from steam traps
Kalinganagar
• Increase in solid waste consumption in sinter making to 76.8 kg/ton of Net Sinter in FY 2019-20. (FY 2018-19: 73.4 kg/ton)
(iii) Capital investment on energy conservation equipments:
Particulars ` croreJamshedpurInstallation and commissioning of Energy Recovery Micro Turbine at Power House#4 1Installation and commissioning of Vapor Absorption Machine at Power House#4 1Installation of Variable Frequency Drive in High Tension ('HT') motors with variable load 2Provision for LDO firing facility in Boilers of Power House#4 4Capacity enhancement and life extension of 25MW Turbo-Generator set at Power House#4 11New LD Gas Holder 116
Corporate Overview 02
Strategic Review 46
Performance Review 20
Statutory Reports 84
Our Strategy 28
Financial Statements 206
199
BOARD’S REPORT (CONTD.)
(B) Technology Absorption1. Efforts made towards technology absorption
(i) Projects under Research and Development
Project title Benefits
Jamshedpur
Implementation of second stage hydro cyclone trials at Ores, Mines, & Quarries ('OMQ') to recover the iron values from online slime
In the absence of adequate beneficiation facility at Noamundi, ~15% of wet Run of Mine is discarded as slime having ~8% Aluminium Oxide (Al2O3) and ~55% Iron. Based on modelling and simulation results, continuous trial of 25 tons/hour capacity was carried out using modular second stage hydro cyclone plant at Noamundi for a period of 30 days. The trials have indicated a potential to recover approximately 50% iron value from slime having ~4.5% Aluminium Oxide and ~62% Iron.
Wollastonite flux trials at iron ore Pellet plant, to improve the pellet strength and productivity
Wollastonite based calcium silicate has been established as flux in iron ore pelletisation to improve the pellet strength and productivity. Trails at 6 MnTPA pelletising plant at 1.3% dosage successfully improved the pellet Cold Compressive Strength ('CCS') by 30 points.
Process for rapid heating of non-coking coal to coke through microwave energy
The process has demonstrated the technology at bench scale with 40% non-coking coal in the coal blend and the Company is planning to upscale the technology to a continuous coke making at a scale of 1 ton/hour.
CO2 Capture from BF gas 5 tons/day CO2 capture pilot plant from Blast Furnace ('BF') gas has been installed at LD#1 of the Jamshedpur Plant.
Cyanide Removal from steel industry effluents
5 m3/hour Pilot study of new advance oxidation process for Tertiary treatment for cyanide removal below 0.2 PPM (parts per million) of total cyanide has been established. The Detailed Project Report of full scale plant @100 m3/hour has also been completed. The fabrication and installation of the commercial plant is under processing.
Value from Waste
Established a process for using water-cooled and air-cooled Ferro Chrome slag material in applications such as bitumen road, concrete and fly ash slag bricks. The Company also constructed the first bitumen road of India without using any other natural aggregate (except Ferro Chrome slag) at Ferro Alloys Plant, Bamnipal premises and it is performing well under heavy traffic conditions.
Online Laser Profile Measurement at H Blast Furnace
A laser profile meter system installed at H Blast Furnace images real time top burden profile. An algorithm is developed which further processes the image data to generate critical insights for blast furnace operators such as check for non-uniformity in distribution, burden descent rate, layer profile, coke ratio distribution across the diameter of furnace across all radial points amongst others. This system does not require any safety interlocks as compared to conventional mechanical probe based profilometer because of its non-invasive nature which gives flexibility to the operator to operate it for 24 hours through 7 days for multiple times, without any down time for burden charging.
Kalinganagar
Coilability Prediction ModelThe model developed by Hot Strip Mill ('HSM') Operations team and Research & Development team predicts coiling feasibility through first principles and has been useful in development of API X-70.
Power Prediction at HSMThe predictive model for HSM power consumption developed based on the past power consumption data and rolling schedule, with an accuracy of 86%, helps in final power scheduling.
Width Extra to Order ('ETO') Reduction
Advance analytic techniques such as Gradient Boost, Random Forest, Partial dependency and Density plot are being used to determine the most influencing parameters and their boundary limits, which has helped in optimising the performance of width control model. This has resulted in reduction in ETO on account of width by 88%.
INTEGRATED REPORT & ANNUAL ACCOUNTS 2019-20 | 113TH YEAR200
(ii) Process Improvement
Jamshedpur
Mining:• An insight development on application of blast free mining
technology (Surface Miner) in hard rock (Underground Coal Study: ~80 Mpa) such as overburden material (sandstone, shale etc.) near West Bokaro has been conducted. This would be a first of its kind in the world for removing materials which creates overburden.
• The identification of Strata monitoring parameters and suitable instruments to understand strata behaviour and design suitable support system for Jharia group coal mines has been conducted. The procurement for the instruments used in this process is currently underway.
Ore Beneficiation Technology• Assessing and improving screw classifier performance at wet
plant, Noamundi Iron Ore Mines.
• Finalising 0.6 MnTPA slime beneficiation using High Gradient Magnetic Separator (‘HGMS’) plant at Noamundi
• Finalising paste thickener technology for slime disposal at OMQ
• Improving efficiency of Gomardih dolomite for production of Magnesium by TechMag process through thermodynamic feasibility study. This can yield a magnesium with grade of 99.6% purity.
Coal Beneficiation Technology• Enhancing process visibility at West Bokaro washery#3 by
installing of 6 flow meters and 6 density meters in critical locations of Washery#3 fines circuit – flotation, vacuum belt filter, reflux classifier.
• Enablers to improve flotation performance:
A. New Technology: Lab studies in Hydrophobic Hydrophilic Separation (an advanced version of oil agglomeration) at Virginia Tech. (USA) indicate possibility to achieve higher yields at a significantly lower ash (>9%) and moisture (<2%) simultaneously
B. Levers in the existing flotation process:
− Clean Coal Yield Improvement at Bhelatand Coal Preparation Plant ('BCPP'): Trial and regularisation of additional Coagulant and flocculant in effluent of Bird Centrifuge at BCPP, resulting in 0.58% yield gain on Raw Coal basis.
− Installation of Float Force - a new mixing mechanism in, 'Flotation cell' at Washery #3: 0.4% clean coal yield
improvement on raw coal basis established by replacement of conventional rotor-stator in 3 flotation cells (out of 12) with new generation mixing mechanism (Float Force) developed by Outotec. Mixing mechanism is the heart of a flotation cell which provides turbulent energy, allows suspension of coal particles in the slurry and collision of coal particles with air bubbles. Parallel deployment in 3 other flotation cells at Washery#3 is in progress
Coal Coke• Leaner blend practice at Hoogly Met Coke ('HMC') without
affecting the coke quality: Usage of prime hard coking coal reduced from 34% to 20%. This accrued benefits of `60 crore.
• Developing coal blend optimiser to have optimum distribution of coals across all sites with minimum blend cost for Tata Steel India.
Agglomeration• Developing Iron ore distribution model with the aim to optimise
overall cost (Logistics and Value in Use) across the sites.
Blast Furnaces• Utilising of 3.15 mm to 5 mm size sinter at ‘I’ blast furnace for
the first time in India, which has led to a greater proportion of agglomerates in the blast furnace burden with a consequent improvement in gas utilisation and reduction in the fuel rate.
• Deploying of the raw flux prediction system in Level 2 across F, G, H and I blast furnaces which streamlined the indiscriminate addition of raw fluxes under varying raw material chemistries thereby leading to realisation of a consistent slag chemistry regime.
• Developing an operating philosophy of a large blast furnace using two stoves. The same has enabled sustenance of stable blast furnace operations in the event of a stove outage
Ferro Alloys• Established new way of electrical power reduction in Ferro
Chrome production at Bamnipal by addition of Ferro Silicon as reducing agent through a series of lab trials.
• Developed practice for re-using Ferro Chrome fines as value added product. The plant trial will take place in FY 2020-21.
Process Visualisation & Diagnostics (‘PV & DT’)• Developed Virtual pile making model using real time data
for Noamundi iron ore pile facilitating visibility of chemical composition and material mix of every location of 100 kilo tonne pile, to identify and take corrective action in order to reduce standard deviation of iron ore fines quality.
Corporate Overview 02
Strategic Review 46
Performance Review 20
Statutory Reports 84
Our Strategy 28
Financial Statements 206
201
BOARD’S REPORT (CONTD.)
• Successful trial of image processing based foreign particle detection system in raw material conveyer belt to eliminate any breakdown due to high density material (e.g. concrete boulders mixed with coal) entering the grinding circuit of mills.
• Developing real time alert system for coke ovens to improve operational efficiency and oven health.
Process Energy & Emission• Formed CO2 impact centre to drive CO2 reduction ideas.
12 MnT of CO2 ideas were identified during FY 2019-20
• Reusing disposed Electro Static Precipitator dust in agglomeration process, washing of dust trial done in I Blast Furnace Gas Cleaning Plant. Implementation of the system in centralised sludge dewatering plant is underway which has helped sinter plants to reduce stack emission by 10-15 mg/Nm3.
• Developed CO2 intensity model for ironmaking to diagnose the deviation.
Characterisation and Specialty support• Higher value added downstream product from Coal Tar: For better
realisation from coal tar, a by-product of coke making process, the technology team and R&D team are exploring the possibility to manufacture General Purpose Carbon Fiber ('GPCF') and High-Performance Carbon Fiber ('HPCF') from it and to characterise the carbon fiber for suitable standard applications. Preparation of concept note along with development of technology road map and identification of suitable service provider for manufacturing of Carbon fiber from our by-product coal tar has been completed.
• Manufacturing of sustainable and green construction materials from LD slag: Tata Aggreto & Tata Nirman are two brands created to upcycle Steel Slag into sustainable building materials, such as different grades of Paver Blocks, Fly Ash bricks, etc. These value-added products are characterised by higher durability, lower water absorption capacity and better compressive strength as compared to traditional building materials. These ideas are being deployed horizontally at plants in Tata Steel Kalinganagar and Tata Steel BSL Limited.
• Comprehensive collaborative study on utilisation of LD slag in Portland Slag Cement ('PSC') is completed. Successful implementation of this project will lead to 100% green and sustainable evacuation of 0-6 mm fraction of LD slag. In this collaborative project with National Council of Cement and Building Materials, Faridabad, ('NCCBM'), LD slag samples from
other major integrated steel plants in India were also covered. The final report with our recommendation will be submitted to Bureau of Indian Standards for necessary approval in the due course.
Kalinganagar
Raw Material Holding System• Reduction in rail idle freight in Outbound logistics from `338/ton
in FY 2018-19 to `261/ton in FY 2019-20
• Re-routing of Freight Operation Information System connectivity without hampering commercial activities has been achieved to save time in documentation
• Installation of mechanised auto-wagon decoupling mechanism
• Inhouse modification of Single Wagon Tippler ('SWT') to handle ‘BOST’ (Bogie Open Wagon with transitional coupling) rake that has been reduced the dependency of ‘BOXN’ (Bogie open wagon pneumatic break block) wagons for material handling
• Improved throughput of Value Added Products to 391 KT in FY 2019-20 from 200 KT in FY 2018-19
• Reduction in Man Machine interface by administrative control by use of designated pathways, drop gate installations, and Reinforced Cement Concrete Toe wall at Rail siding
• Use of fall protection platform for rail and road dispatch
Sinter Plant • Improvement in Sinter Reducibility Index ('RI') from 73.9 to 76,
sustaining the Reduction Degradation Index ('RDI') average as per Memorandum of Understanding with blast furnace.
Coke Plant• Development of In-House integrated Level II system for the
operation of Coke Drying Quenching ('CDQ') using Advanced Analytics. This is the first of its kind application in the world where the CDQ operation is regulated by the Coke Oven Battery Pushing schedule.
• Development of common pushing and charging schedule for both the Coke Oven Batteries using Advanced Analytics. This is a first of its kind application custom made for the unique configuration of the TSK Coke Oven Batteries and the CDQ.
• Improvement in defects in coke strength after reaction through Coal Yard management.
INTEGRATED REPORT & ANNUAL ACCOUNTS 2019-20 | 113TH YEAR202
Blast Furnace• Improvement in Pulverised Coal Injection ('PCI') rate at Blast
Furnace at TSK from 151 Kg/Thm to 177 Kg/Thm in FY 2019-20 by improving the injection capacity
Steel Melting Shop (‘SMS’)• Improvement in usage of clean scrap from 3.1% in FY 2018-19 to
4.1% in FY 2019-20, resulting into CO2 reduction of 0.084 t/tcs
• Reduction of HM+Scrap in SMS from 1,111.8 Kg/Tcs in FY 2018-19 to 1,102.04 Kg/Tcs in FY 2019-20
• Optimisation of Metal Recovery Plant Scrap Consumption in SMS, increased usage up to 51% in FY 2019-20 as against the annual plan of 35%
• Reduction of lime consumption in SMS from 70.7 Kg/Tcs in FY 2018-19 to 67.76 Kg/Tcs in FY 2019-20
• Improvement in casting speed of SMS Caster from 1.24 Mtr/Min in FY 2018-19 to 1.28 Mtr/Min in FY 2019-20
• Reduction in caster throughput by 16.7% by reduction in planned downtime and unplanned outages due to mould failures, segment failure, breakout and slab stuck by 50 hours, in SMS
Hot Strip Mill (‘HSM’)• Improvement in gross yield from 97.98% to 98.14% through
optimisation of crop loss and sampling loss
• Improvement in tensile and toughness properties of Hot Rolled coils through intensive cooling, especially in thicker i.e. >12 mm thickness, reducing the cost of micro alloying elements
• Development of DP600 with low Silicon addition to improve surface quality by controlling Silicon scales
(iii) Product Development
Jamshedpur
• Development of BS-VI compliant Fuel Tank Coating for two-wheeler segment
• Developed 5 hot rolled grades, 1 cold rolled grade and 3 coated product grades for a specific project
• Development of cold rolled dual phase steel with 780 MPa minimum tensile strength and obtaining first phase approval from a leading automotive manufacturer
• Development of cold rolled dual phase steel with 490 MPa minimum tensile strength, which is an enabler for de-gauging. This is over the existing BH220 grade
• St52.3 grade developed to meet customer demand for Industrial rack application. This is a first-time development of ‘thin’ HR coil which is < 2 mm
• Fe 600 HD rebars to meet customer demand
• Developed high carbon wire rods for high hardness “steel shots” an import substitute
• Developed new sizes of wire rods (6.5 mm, 8.5 mm) for increased productivity at customer end
• Developed Gr-7 wire rods for high strength Steel Fibre Reinforced Concrete.
• Developed HC78B, 5.5 mm wire rods for high tensile tyre bead wire as per IS4824.
• Developed HC82B[SS], 8 mm wire rods for Gr-III springs.
Kalinganagar
• Developed API X-70 for non-sour applications in section 16 mm x 1,580 mm.
• Developed FB590/FB540 for wheels disc applications using Ferrite and Bainite.
• Developed Automotive grades such as S460MC & S420MC, DP590, JSH590R & JSH440 to meet demands of automotive customers.
• Development of UT guaranteed grades, e.g. E350 Gr.C/S355J2 for thickness >16 mm for Lifting & Excavation Equipment and wind tower applications.
Corporate Overview 02
Strategic Review 46
Performance Review 20
Statutory Reports 84
Our Strategy 28
Financial Statements 206
203
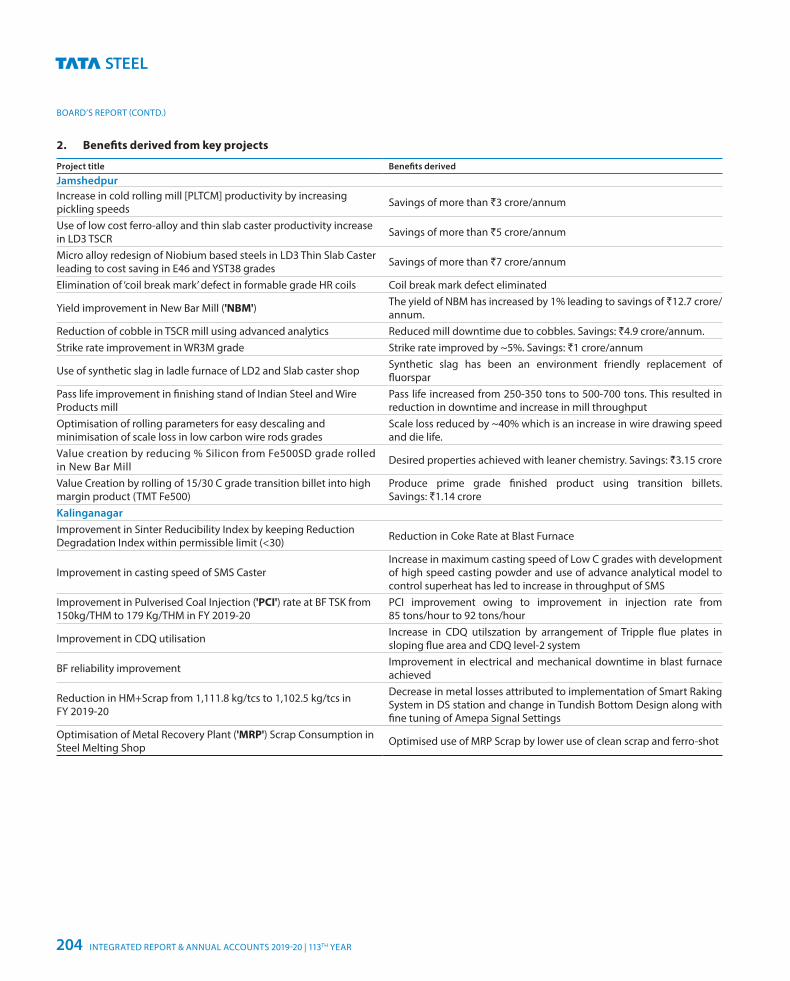
BOARD’S REPORT (CONTD.)
2. Benefits derived from key projects
Project title Benefits derived
JamshedpurIncrease in cold rolling mill [PLTCM] productivity by increasing pickling speeds Savings of more than `3 crore/annum
Use of low cost ferro-alloy and thin slab caster productivity increase in LD3 TSCR Savings of more than `5 crore/annum
Micro alloy redesign of Niobium based steels in LD3 Thin Slab Caster leading to cost saving in E46 and YST38 grades Savings of more than `7 crore/annum
Elimination of ‘coil break mark’ defect in formable grade HR coils Coil break mark defect eliminated
Yield improvement in New Bar Mill ('NBM') The yield of NBM has increased by 1% leading to savings of `12.7 crore/annum.
Reduction of cobble in TSCR mill using advanced analytics Reduced mill downtime due to cobbles. Savings: `4.9 crore/annum.Strike rate improvement in WR3M grade Strike rate improved by ~5%. Savings: `1 crore/annum
Use of synthetic slag in ladle furnace of LD2 and Slab caster shop Synthetic slag has been an environment friendly replacement of fluorspar
Pass life improvement in finishing stand of Indian Steel and Wire Products mill
Pass life increased from 250-350 tons to 500-700 tons. This resulted in reduction in downtime and increase in mill throughput
Optimisation of rolling parameters for easy descaling and minimisation of scale loss in low carbon wire rods grades
Scale loss reduced by ~40% which is an increase in wire drawing speed and die life.
Value creation by reducing % Silicon from Fe500SD grade rolled in New Bar Mill Desired properties achieved with leaner chemistry. Savings: `3.15 crore
Value Creation by rolling of 15/30 C grade transition billet into high margin product (TMT Fe500)
Produce prime grade finished product using transition billets. Savings: `1.14 crore
KalinganagarImprovement in Sinter Reducibility Index by keeping Reduction Degradation Index within permissible limit (<30) Reduction in Coke Rate at Blast Furnace
Improvement in casting speed of SMS CasterIncrease in maximum casting speed of Low C grades with development of high speed casting powder and use of advance analytical model to control superheat has led to increase in throughput of SMS
Improvement in Pulverised Coal Injection ('PCI') rate at BF TSK from 150kg/THM to 179 Kg/THM in FY 2019-20
PCI improvement owing to improvement in injection rate from 85 tons/hour to 92 tons/hour
Improvement in CDQ utilisation Increase in CDQ utilszation by arrangement of Tripple flue plates in sloping flue area and CDQ level-2 system
BF reliability improvement Improvement in electrical and mechanical downtime in blast furnace achieved
Reduction in HM+Scrap from 1,111.8 kg/tcs to 1,102.5 kg/tcs in FY 2019-20
Decrease in metal losses attributed to implementation of Smart Raking System in DS station and change in Tundish Bottom Design along with fine tuning of Amepa Signal Settings
Optimisation of Metal Recovery Plant ('MRP') Scrap Consumption in Steel Melting Shop Optimised use of MRP Scrap by lower use of clean scrap and ferro-shot
INTEGRATED REPORT & ANNUAL ACCOUNTS 2019-20 | 113TH YEAR204
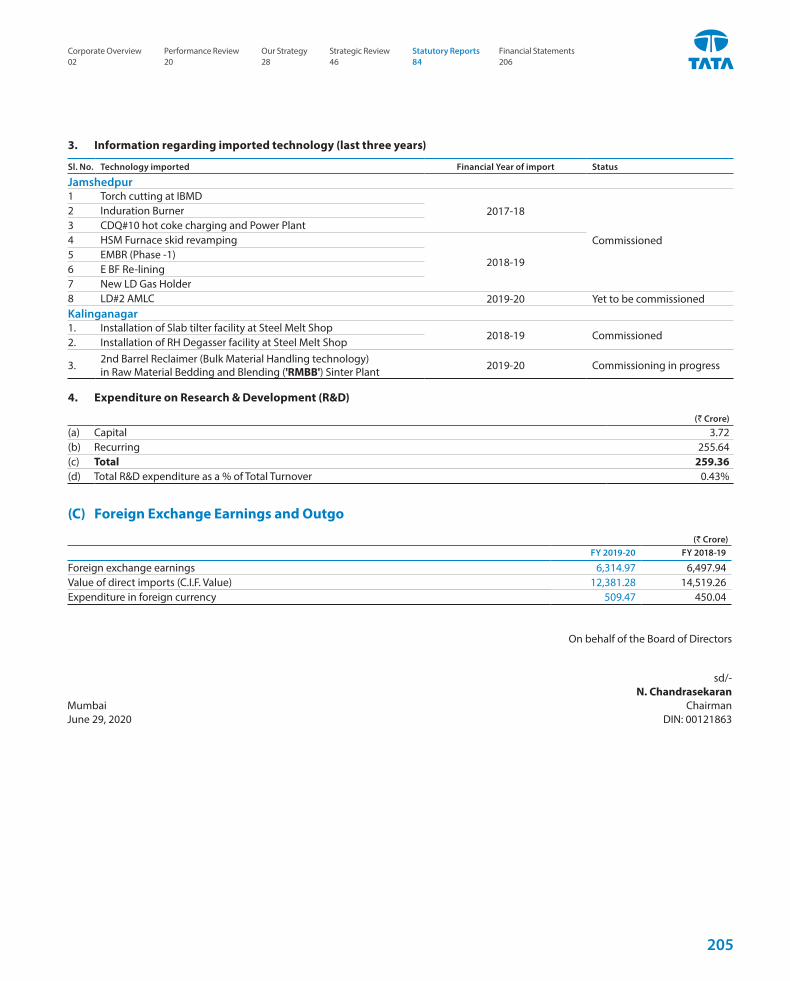
3. Information regarding imported technology (last three years)
Sl. No. Technology imported Financial Year of import Status
Jamshedpur1 Torch cutting at IBMD
2017-18
Commissioned
2 Induration Burner3 CDQ#10 hot coke charging and Power Plant4 HSM Furnace skid revamping
2018-195 EMBR (Phase -1)6 E BF Re-lining7 New LD Gas Holder8 LD#2 AMLC 2019-20 Yet to be commissionedKalinganagar1. Installation of Slab tilter facility at Steel Melt Shop
2018-19 Commissioned2. Installation of RH Degasser facility at Steel Melt Shop
3. 2nd Barrel Reclaimer (Bulk Material Handling technology) in Raw Material Bedding and Blending ('RMBB') Sinter Plant 2019-20 Commissioning in progress
4. Expenditure on Research & Development (R&D)
(` Crore)
(a) Capital 3.72(b) Recurring 255.64(c) Total 259.36(d) Total R&D expenditure as a % of Total Turnover 0.43%
(C) Foreign Exchange Earnings and Outgo
(` Crore)
FY 2019-20 FY 2018-19
Foreign exchange earnings 6,314.97 6,497.94Value of direct imports (C.I.F. Value) 12,381.28 14,519.26Expenditure in foreign currency 509.47 450.04
On behalf of the Board of Directors
sd/-N. Chandrasekaran
Mumbai ChairmanJune 29, 2020 DIN: 00121863
Corporate Overview 02
Strategic Review 46
Performance Review 20
Statutory Reports 84
Our Strategy 28
Financial Statements 206
205
Financial Statements
Highlights
Financial Highlights 208
Financial Ratios 209
Production Statistics 210
Financial Statistics 210
Dividend Statistics 211
Standalone
Independent Auditor’s Report 212
Balance Sheet 222
Statement of Profit and Loss 223
Statement of Changes in Equity 224
Statement of Cash Flows 226
Notes forming part of the Standalone Financial Statements 228
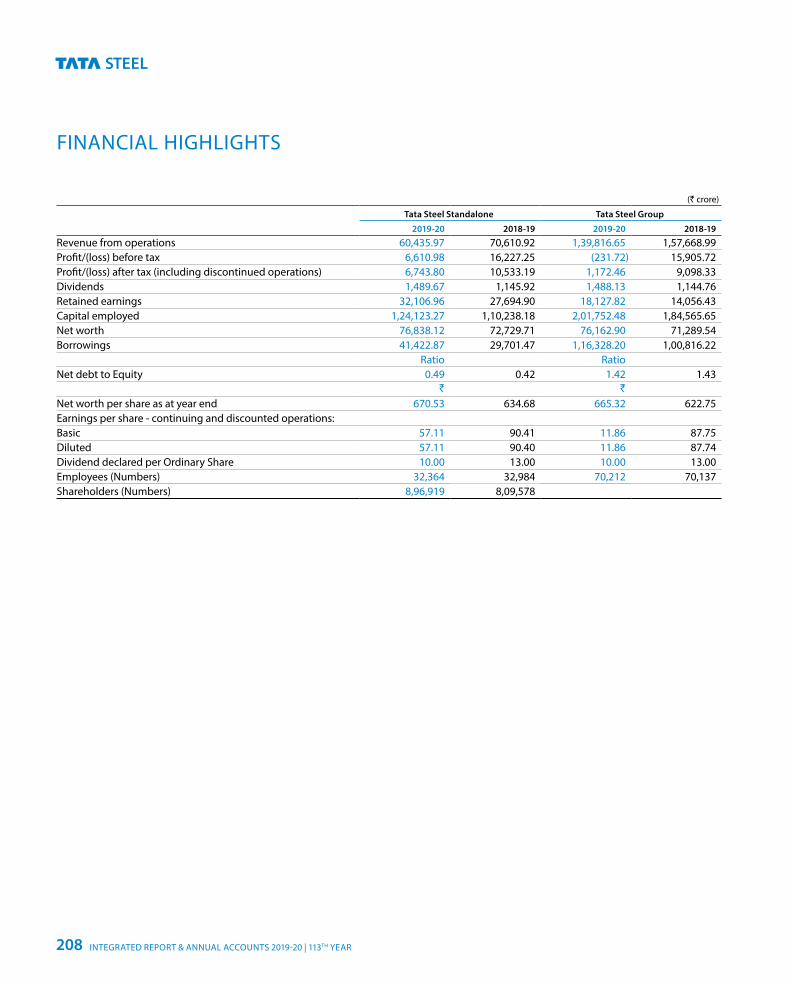
(` crore)
Tata Steel Standalone Tata Steel Group
2019-20 2018-19 2019-20 2018-19
Revenue from operations 60,435.97 70,610.92 1,39,816.65 1,57,668.99 Profit/(loss) before tax 6,610.98 16,227.25 (231.72) 15,905.72Profit/(loss) after tax (including discontinued operations) 6,743.80 10,533.19 1,172.46 9,098.33 Dividends 1,489.67 1,145.92 1,488.13 1,144.76 Retained earnings 32,106.96 27,694.90 18,127.82 14,056.43 Capital employed 1,24,123.27 1,10,238.18 2,01,752.48 1,84,565.65 Net worth 76,838.12 72,729.71 76,162.90 71,289.54 Borrowings 41,422.87 29,701.47 1,16,328.20 1,00,816.22
Ratio RatioNet debt to Equity 0.49 0.42 1.42 1.43
` `
Net worth per share as at year end 670.53 634.68 665.32 622.75 Earnings per share - continuing and discounted operations:Basic 57.11 90.41 11.86 87.75 Diluted 57.11 90.40 11.86 87.74 Dividend declared per Ordinary Share 10.00 13.00 10.00 13.00 Employees (Numbers) 32,364 32,984 70,212 70,137 Shareholders (Numbers) 8,96,919 8,09,578
FINANCIAL HIGHLIGHTS
INTEGRATED REPORT & ANNUAL ACCOUNTS 2019-20 | 113TH YEAR208
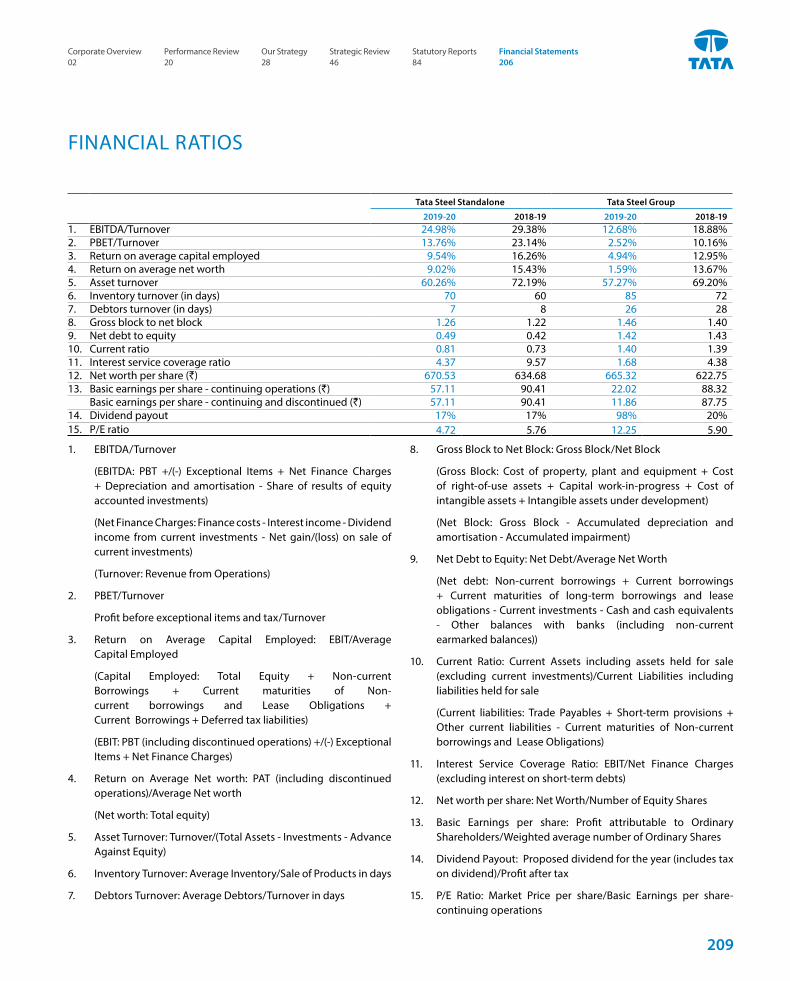
Tata Steel Standalone Tata Steel Group
2019-20 2018-19 2019-20 2018-191. EBITDA/Turnover 24.98% 29.38% 12.68% 18.88%2. PBET/Turnover 13.76% 23.14% 2.52% 10.16%3. Return on average capital employed 9.54% 16.26% 4.94% 12.95%4. Return on average net worth 9.02% 15.43% 1.59% 13.67%5. Asset turnover 60.26% 72.19% 57.27% 69.20%6. Inventory turnover (in days) 70 60 85 727. Debtors turnover (in days) 7 8 26 288. Gross block to net block 1.26 1.22 1.46 1.40 9. Net debt to equity 0.49 0.42 1.42 1.43 10. Current ratio 0.81 0.73 1.40 1.39 11. Interest service coverage ratio 4.37 9.57 1.68 4.38 12. Net worth per share (`) 670.53 634.68 665.32 622.75 13. Basic earnings per share - continuing operations (`) 57.11 90.41 22.02 88.32
Basic earnings per share - continuing and discontinued (`) 57.11 90.41 11.86 87.75 14. Dividend payout 17% 17% 98% 20%15. P/E ratio 4.72 5.76 12.25 5.90
FINANCIAL RATIOS
1. EBITDA/Turnover
(EBITDA: PBT +/(-) Exceptional Items + Net Finance Charges + Depreciation and amortisation - Share of results of equity accounted investments)
(Net Finance Charges: Finance costs - Interest income - Dividend income from current investments - Net gain/(loss) on sale of current investments)
(Turnover: Revenue from Operations)
2. PBET/Turnover
Profit before exceptional items and tax/Turnover
3. Return on Average Capital Employed: EBIT/Average Capital Employed
(Capital Employed: Total Equity + Non-current Borrowings + Current maturities of Non-current borrowings and Lease Obligations + Current Borrowings + Deferred tax liabilities)
(EBIT: PBT (including discontinued operations) +/(-) Exceptional Items + Net Finance Charges)
4. Return on Average Net worth: PAT (including discontinued operations)/Average Net worth
(Net worth: Total equity)
5. Asset Turnover: Turnover/(Total Assets - Investments - Advance Against Equity)
6. Inventory Turnover: Average Inventory/Sale of Products in days
7. Debtors Turnover: Average Debtors/Turnover in days
8. Gross Block to Net Block: Gross Block/Net Block
(Gross Block: Cost of property, plant and equipment + Cost of right-of-use assets + Capital work-in-progress + Cost of intangible assets + Intangible assets under development)
(Net Block: Gross Block - Accumulated depreciation and amortisation - Accumulated impairment)
9. Net Debt to Equity: Net Debt/Average Net Worth
(Net debt: Non-current borrowings + Current borrowings + Current maturities of long-term borrowings and lease obligations - Current investments - Cash and cash equivalents - Other balances with banks (including non-current earmarked balances))
10. Current Ratio: Current Assets including assets held for sale (excluding current investments)/Current Liabilities including liabilities held for sale
(Current liabilities: Trade Payables + Short-term provisions + Other current liabilities - Current maturities of Non-current borrowings and Lease Obligations)
11. Interest Service Coverage Ratio: EBIT/Net Finance Charges (excluding interest on short-term debts)
12. Net worth per share: Net Worth/Number of Equity Shares
13. Basic Earnings per share: Profit attributable to Ordinary Shareholders/Weighted average number of Ordinary Shares
14. Dividend Payout: Proposed dividend for the year (includes tax on dividend)/Profit after tax
15. P/E Ratio: Market Price per share/Basic Earnings per share-continuing operations
Corporate Overview 02
Strategic Review 46
Performance Review 20
Statutory Reports 84
Our Strategy 28
Financial Statements 206
209
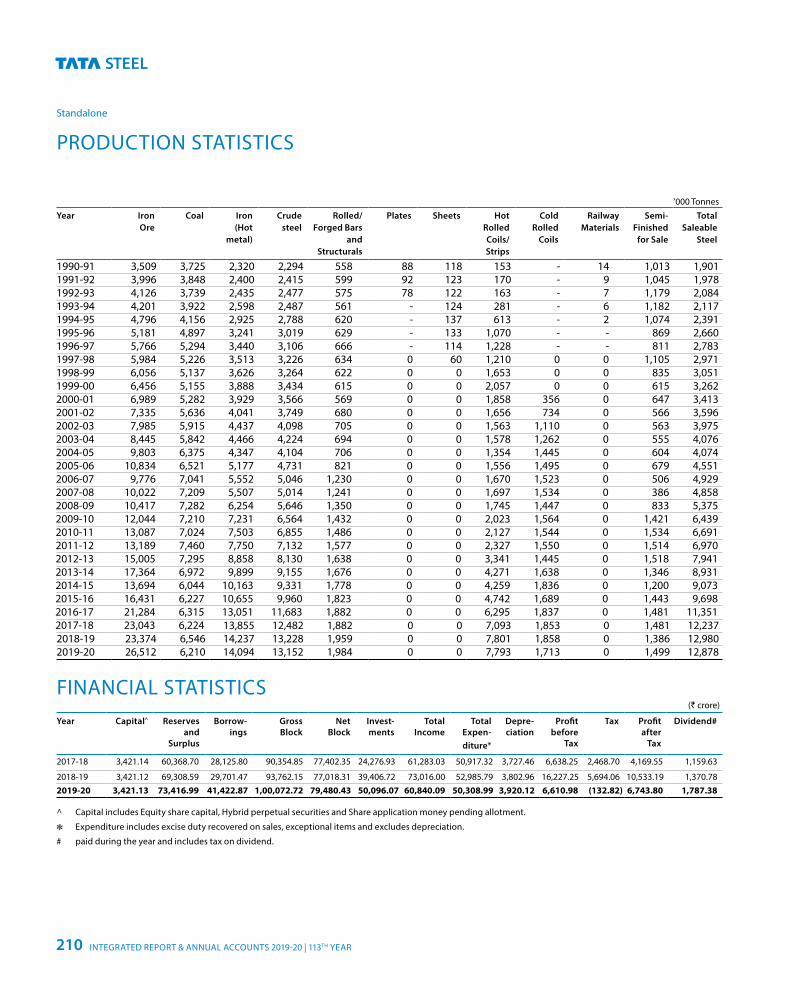
Standalone
’000 TonnesYear Iron
OreCoal Iron
(Hot metal)
Crude steel
Rolled/ Forged Bars
and Structurals
Plates Sheets Hot Rolled Coils/ Strips
Cold Rolled
Coils
Railway Materials
Semi- Finished
for Sale
Total Saleable
Steel
1990-91 3,509 3,725 2,320 2,294 558 88 118 153 - 14 1,013 1,9011991-92 3,996 3,848 2,400 2,415 599 92 123 170 - 9 1,045 1,9781992-93 4,126 3,739 2,435 2,477 575 78 122 163 - 7 1,179 2,0841993-94 4,201 3,922 2,598 2,487 561 - 124 281 - 6 1,182 2,1171994-95 4,796 4,156 2,925 2,788 620 - 137 613 - 2 1,074 2,3911995-96 5,181 4,897 3,241 3,019 629 - 133 1,070 - - 869 2,6601996-97 5,766 5,294 3,440 3,106 666 - 114 1,228 - - 811 2,7831997-98 5,984 5,226 3,513 3,226 634 0 60 1,210 0 0 1,105 2,9711998-99 6,056 5,137 3,626 3,264 622 0 0 1,653 0 0 835 3,0511999-00 6,456 5,155 3,888 3,434 615 0 0 2,057 0 0 615 3,2622000-01 6,989 5,282 3,929 3,566 569 0 0 1,858 356 0 647 3,4132001-02 7,335 5,636 4,041 3,749 680 0 0 1,656 734 0 566 3,5962002-03 7,985 5,915 4,437 4,098 705 0 0 1,563 1,110 0 563 3,9752003-04 8,445 5,842 4,466 4,224 694 0 0 1,578 1,262 0 555 4,0762004-05 9,803 6,375 4,347 4,104 706 0 0 1,354 1,445 0 604 4,0742005-06 10,834 6,521 5,177 4,731 821 0 0 1,556 1,495 0 679 4,5512006-07 9,776 7,041 5,552 5,046 1,230 0 0 1,670 1,523 0 506 4,9292007-08 10,022 7,209 5,507 5,014 1,241 0 0 1,697 1,534 0 386 4,8582008-09 10,417 7,282 6,254 5,646 1,350 0 0 1,745 1,447 0 833 5,3752009-10 12,044 7,210 7,231 6,564 1,432 0 0 2,023 1,564 0 1,421 6,4392010-11 13,087 7,024 7,503 6,855 1,486 0 0 2,127 1,544 0 1,534 6,6912011-12 13,189 7,460 7,750 7,132 1,577 0 0 2,327 1,550 0 1,514 6,9702012-13 15,005 7,295 8,858 8,130 1,638 0 0 3,341 1,445 0 1,518 7,9412013-14 17,364 6,972 9,899 9,155 1,676 0 0 4,271 1,638 0 1,346 8,9312014-15 13,694 6,044 10,163 9,331 1,778 0 0 4,259 1,836 0 1,200 9,0732015-16 16,431 6,227 10,655 9,960 1,823 0 0 4,742 1,689 0 1,443 9,6982016-17 21,284 6,315 13,051 11,683 1,882 0 0 6,295 1,837 0 1,481 11,3512017-18 23,043 6,224 13,855 12,482 1,882 0 0 7,093 1,853 0 1,481 12,2372018-19 23,374 6,546 14,237 13,228 1,959 0 0 7,801 1,858 0 1,386 12,9802019-20 26,512 6,210 14,094 13,152 1,984 0 0 7,793 1,713 0 1,499 12,878
PRODUCTION STATISTICS
FINANCIAL STATISTICS(` crore)
Year Capital^ Reserves and
Surplus
Borrow-ings
Gross Block
Net Block
Invest-ments
Total Income
Total Expen-diture*
Depre-ciation
Profit before
Tax
Tax Profit after
Tax
Dividend#
2017-18 3,421.14 60,368.70 28,125.80 90,354.85 77,402.35 24,276.93 61,283.03 50,917.32 3,727.46 6,638.25 2,468.70 4,169.55 1,159.63
2018-19 3,421.12 69,308.59 29,701.47 93,762.15 77,018.31 39,406.72 73,016.00 52,985.79 3,802.96 16,227.25 5,694.06 10,533.19 1,370.78 2019-20 3,421.13 73,416.99 41,422.87 1,00,072.72 79,480.43 50,096.07 60,840.09 50,308.99 3,920.12 6,610.98 (132.82) 6,743.80 1,787.38
^ Capital includes Equity share capital, Hybrid perpetual securities and Share application money pending allotment.
c Expenditure includes excise duty recovered on sales, exceptional items and excludes depreciation.
# paid during the year and includes tax on dividend.
INTEGRATED REPORT & ANNUAL ACCOUNTS 2019-20 | 113TH YEAR210
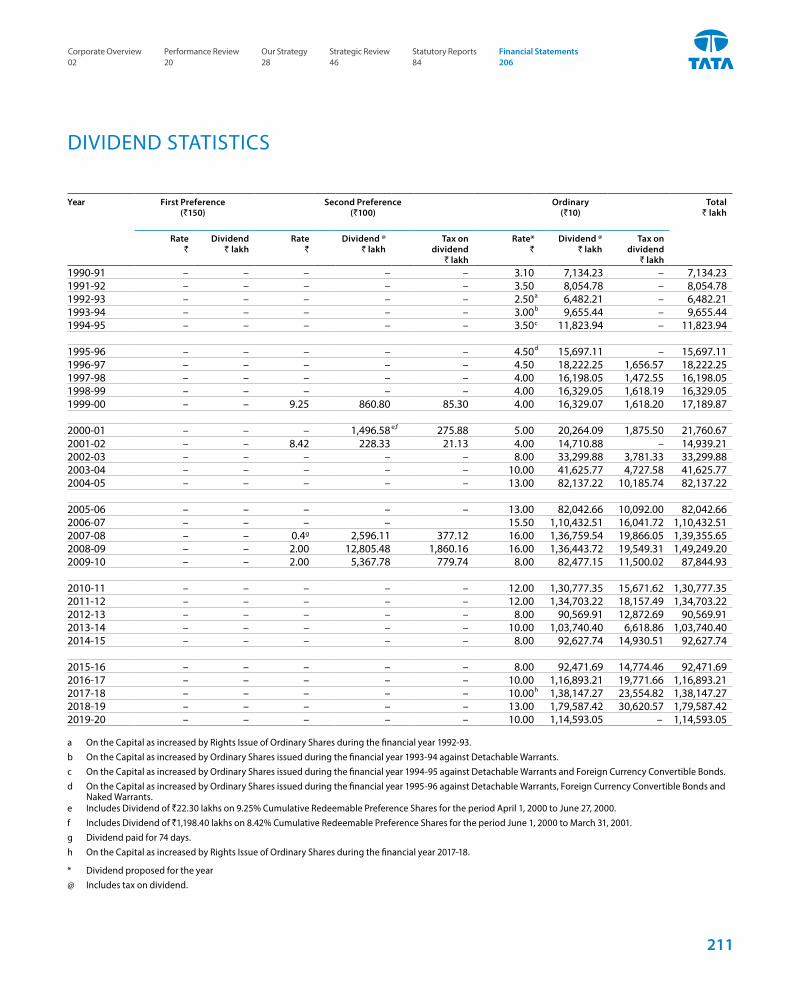
Year First Preference (`150)
Second Preference (`100)
Ordinary (`10)
Total ` lakh
Rate `
Dividend ` lakh
Rate `
Dividend @ ` lakh
Tax on dividend
` lakh
Rate* `
Dividend @ ` lakh
Tax on dividend
` lakh1990-91 – – – – – 3.10 7,134.23 – 7,134.231991-92 – – – – – 3.50 8,054.78 – 8,054.781992-93 – – – – – 2.50a 6,482.21 – 6,482.211993-94 – – – – – 3.00b 9,655.44 – 9,655.441994-95 – – – – – 3.50c 11,823.94 – 11,823.94
1995-96 – – – – – 4.50d 15,697.11 – 15,697.111996-97 – – – – – 4.50 18,222.25 1,656.57 18,222.251997-98 – – – – – 4.00 16,198.05 1,472.55 16,198.051998-99 – – – – – 4.00 16,329.05 1,618.19 16,329.051999-00 – – 9.25 860.80 85.30 4.00 16,329.07 1,618.20 17,189.87
2000-01 – – – 1,496.58 e,f 275.88 5.00 20,264.09 1,875.50 21,760.672001-02 – – 8.42 228.33 21.13 4.00 14,710.88 – 14,939.212002-03 – – – – – 8.00 33,299.88 3,781.33 33,299.882003-04 – – – – – 10.00 41,625.77 4,727.58 41,625.772004-05 – – – – – 13.00 82,137.22 10,185.74 82,137.22
2005-06 – – – – – 13.00 82,042.66 10,092.00 82,042.662006-07 – – – – 15.50 1,10,432.51 16,041.72 1,10,432.512007-08 – – 0.4g 2,596.11 377.12 16.00 1,36,759.54 19,866.05 1,39,355.652008-09 – – 2.00 12,805.48 1,860.16 16.00 1,36,443.72 19,549.31 1,49,249.202009-10 – – 2.00 5,367.78 779.74 8.00 82,477.15 11,500.02 87,844.93
2010-11 – – – – – 12.00 1,30,777.35 15,671.62 1,30,777.352011-12 – – – – – 12.00 1,34,703.22 18,157.49 1,34,703.222012-13 – – – – – 8.00 90,569.91 12,872.69 90,569.912013-14 – – – – – 10.00 1,03,740.40 6,618.86 1,03,740.402014-15 – – – – – 8.00 92,627.74 14,930.51 92,627.74
2015-16 – – – – – 8.00 92,471.69 14,774.46 92,471.692016-17 – – – – – 10.00 1,16,893.21 19,771.66 1,16,893.212017-18 – – – – – 10.00h 1,38,147.27 23,554.82 1,38,147.272018-19 – – – – – 13.00 1,79,587.42 30,620.57 1,79,587.422019-20 – – – – – 10.00 1,14,593.05 – 1,14,593.05
a On the Capital as increased by Rights Issue of Ordinary Shares during the financial year 1992-93.b On the Capital as increased by Ordinary Shares issued during the financial year 1993-94 against Detachable Warrants.c On the Capital as increased by Ordinary Shares issued during the financial year 1994-95 against Detachable Warrants and Foreign Currency Convertible Bonds.d On the Capital as increased by Ordinary Shares issued during the financial year 1995-96 against Detachable Warrants, Foreign Currency Convertible Bonds and
Naked Warrants.e Includes Dividend of `22.30 lakhs on 9.25% Cumulative Redeemable Preference Shares for the period April 1, 2000 to June 27, 2000.f Includes Dividend of `1,198.40 lakhs on 8.42% Cumulative Redeemable Preference Shares for the period June 1, 2000 to March 31, 2001.g Dividend paid for 74 days.h On the Capital as increased by Rights Issue of Ordinary Shares during the financial year 2017-18.
* Dividend proposed for the year@ Includes tax on dividend.
DIVIDEND STATISTICS
Corporate Overview 02
Strategic Review 46
Performance Review 20
Statutory Reports 84
Our Strategy 28
Financial Statements 206
211
Standalone
INDEPENDENT AUDITOR’S REPORT
To the Members of Tata Steel Limited
Report on the audit of the Standalone financial statements
Opinion1. We have audited the accompanying standalone financial
statements of Tata Steel Limited (“the Company”), which comprise the balance sheet as at March 31, 2020, and the statement of Profit and Loss (including Other Comprehensive Income), statement of changes in equity and statement of cash flows for the year then ended, and notes to the standalone financial statements, including a summary of significant accounting policies and other explanatory information (hereinafter referred to as “the Standalone Financial Statements”).
2. In our opinion and to the best of our information and according to the explanations given to us, the aforesaid standalone financial statements give the information required by the Companies Act, 2013 (“the Act”) in the manner so required and give a true and fair view in conformity with the accounting principles generally accepted in India, of the state of affairs of the Company as at March 31, 2020, and total comprehensive income (comprising profit and other comprehensive income), changes in equity and its cash flows for the year then ended.
Basis for Opinion3. We conducted our audit in accordance with the Standards
on Auditing (SAs) specified under section 143(10) of the Act. Our responsibilities under those Standards are further described in the Auditor’s Responsibilities for the Audit of the Standalone Financial Statements section of our report. We are independent of the Company in accordance with the Code of Ethics issued by the Institute of Chartered Accountants of India together with the ethical requirements that are relevant to our audit of the standalone financial statements under the provisions of the Act and the Rules thereunder, and we have fulfilled our other ethical responsibilities in accordance with these requirements and the Code of Ethics. We believe that the audit evidence we have obtained is sufficient and appropriate to provide a basis for our opinion.
Emphasis of Matter4. We draw your attention to the following matters:
(a) Note 7 (iv) to the standalone financial statements which states that the ability of the Tata Steel Europe (TSE), the step-down subsidiary of T Steel Holdings Pte Ltd (TSH), a subsidiary of the Company, to continue as a going concern is dependent on the outcome of measures taken as stated therein and the availability of future funding requirements, which could have a consequential impact on the carrying amount of investment of `20,854.89 crores (net of provision for impairment amounting to ̀ 860.00 crores) in TSH as at March 31, 2020. Further, the auditors of TSE have, without modifying the opinion, reported a Material Uncertainty Related to Going Concern vide their report dated June 24, 2020 on the financial information of TSE for the year ended March 31, 2020.
(b) Note 2(c) to the standalone financial statements which explains the uncertainties and management’s assessment of the financial impact due to lockdown / restrictions related to the COVID-19 pandemic imposed by the Governments, for which a definitive assessment of the impact is dependent upon future economic conditions.
Our opinion is not modified in respect of these matters.
INTEGRATED REPORT & ANNUAL ACCOUNTS 2019-20 | 113TH YEAR212
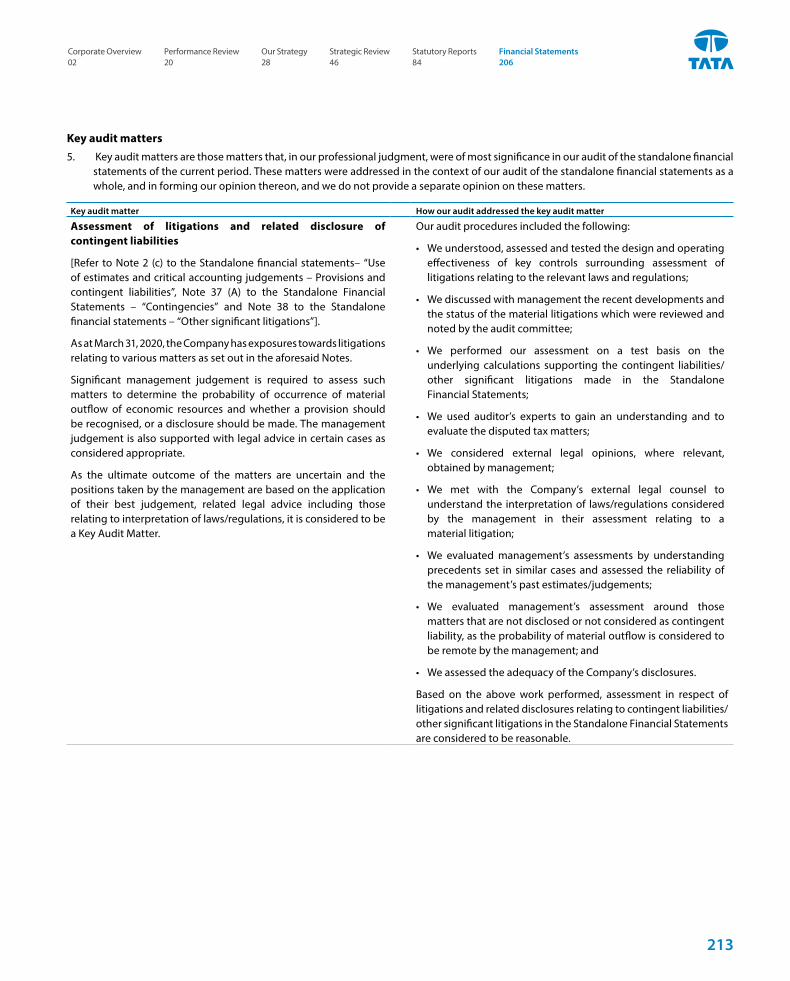
Key audit matters5. Key audit matters are those matters that, in our professional judgment, were of most significance in our audit of the standalone financial
statements of the current period. These matters were addressed in the context of our audit of the standalone financial statements as a whole, and in forming our opinion thereon, and we do not provide a separate opinion on these matters.
Key audit matter How our audit addressed the key audit matter
Assessment of litigations and related disclosure of contingent liabilities
[Refer to Note 2 (c) to the Standalone financial statements– “Use of estimates and critical accounting judgements – Provisions and contingent liabilities”, Note 37 (A) to the Standalone Financial Statements – “Contingencies” and Note 38 to the Standalone financial statements – “Other significant litigations”].
As at March 31, 2020, the Company has exposures towards litigations relating to various matters as set out in the aforesaid Notes.
Significant management judgement is required to assess such matters to determine the probability of occurrence of material outflow of economic resources and whether a provision should be recognised, or a disclosure should be made. The management judgement is also supported with legal advice in certain cases as considered appropriate.
As the ultimate outcome of the matters are uncertain and the positions taken by the management are based on the application of their best judgement, related legal advice including those relating to interpretation of laws/regulations, it is considered to be a Key Audit Matter.
Our audit procedures included the following:
• We understood, assessed and tested the design and operating effectiveness of key controls surrounding assessment of litigations relating to the relevant laws and regulations;
• We discussed with management the recent developments and the status of the material litigations which were reviewed and noted by the audit committee;
• We performed our assessment on a test basis on the underlying calculations supporting the contingent liabilities/other significant litigations made in the Standalone Financial Statements;
• We used auditor’s experts to gain an understanding and to evaluate the disputed tax matters;
• We considered external legal opinions, where relevant, obtained by management;
• We met with the Company’s external legal counsel to understand the interpretation of laws/regulations considered by the management in their assessment relating to a material litigation;
• We evaluated management’s assessments by understanding precedents set in similar cases and assessed the reliability of the management’s past estimates/judgements;
• We evaluated management’s assessment around those matters that are not disclosed or not considered as contingent liability, as the probability of material outflow is considered to be remote by the management; and
• We assessed the adequacy of the Company’s disclosures.
Based on the above work performed, assessment in respect of litigations and related disclosures relating to contingent liabilities/other significant litigations in the Standalone Financial Statements are considered to be reasonable.
Corporate Overview 02
Strategic Review 46
Performance Review 20
Statutory Reports 84
Our Strategy 28
Financial Statements 206
213
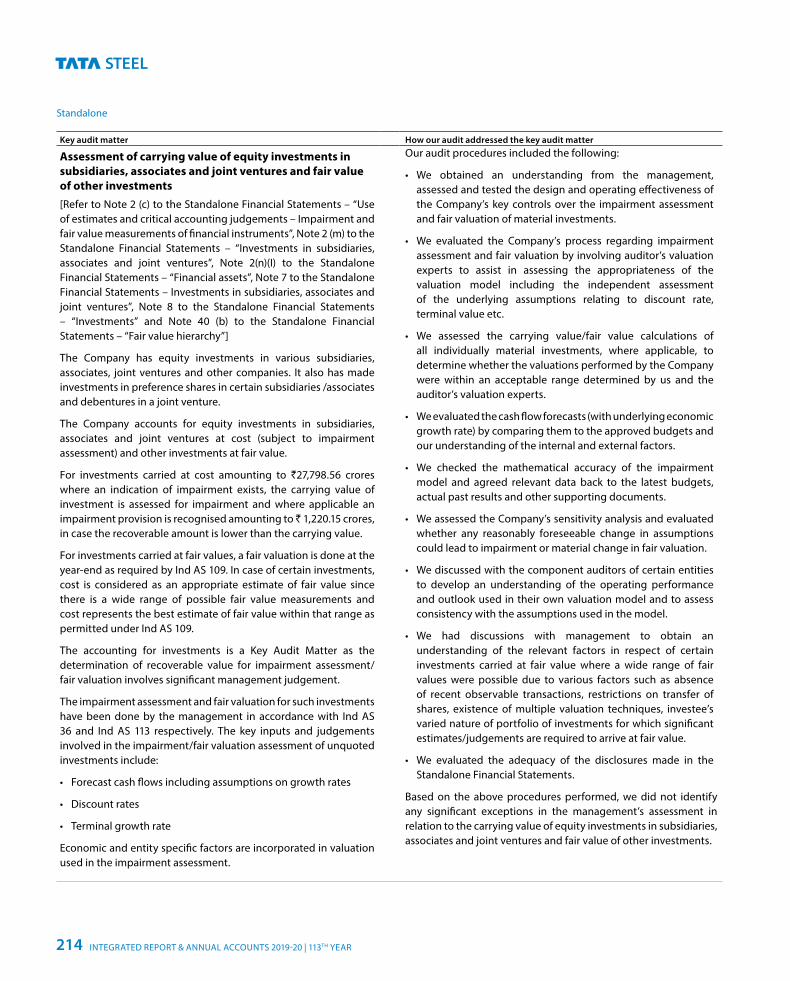
Standalone
Key audit matter How our audit addressed the key audit matter
Assessment of carrying value of equity investments in subsidiaries, associates and joint ventures and fair value of other investments[Refer to Note 2 (c) to the Standalone Financial Statements – “Use of estimates and critical accounting judgements – Impairment and fair value measurements of financial instruments”, Note 2 (m) to the Standalone Financial Statements – “Investments in subsidiaries, associates and joint ventures”, Note 2(n)(I) to the Standalone Financial Statements – “Financial assets”, Note 7 to the Standalone Financial Statements – Investments in subsidiaries, associates and joint ventures”, Note 8 to the Standalone Financial Statements – “Investments” and Note 40 (b) to the Standalone Financial Statements – “Fair value hierarchy”]
The Company has equity investments in various subsidiaries, associates, joint ventures and other companies. It also has made investments in preference shares in certain subsidiaries /associates and debentures in a joint venture.
The Company accounts for equity investments in subsidiaries, associates and joint ventures at cost (subject to impairment assessment) and other investments at fair value.
For investments carried at cost amounting to `27,798.56 crores where an indication of impairment exists, the carrying value of investment is assessed for impairment and where applicable an impairment provision is recognised amounting to ̀ 1,220.15 crores, in case the recoverable amount is lower than the carrying value.
For investments carried at fair values, a fair valuation is done at the year-end as required by Ind AS 109. In case of certain investments, cost is considered as an appropriate estimate of fair value since there is a wide range of possible fair value measurements and cost represents the best estimate of fair value within that range as permitted under Ind AS 109.
The accounting for investments is a Key Audit Matter as the determination of recoverable value for impairment assessment/fair valuation involves significant management judgement.
The impairment assessment and fair valuation for such investments have been done by the management in accordance with Ind AS 36 and Ind AS 113 respectively. The key inputs and judgements involved in the impairment/fair valuation assessment of unquoted investments include:
• Forecast cash flows including assumptions on growth rates
• Discount rates
• Terminal growth rate
Economic and entity specific factors are incorporated in valuation used in the impairment assessment.
Our audit procedures included the following:
• We obtained an understanding from the management, assessed and tested the design and operating effectiveness of the Company’s key controls over the impairment assessment and fair valuation of material investments.
• We evaluated the Company’s process regarding impairment assessment and fair valuation by involving auditor’s valuation experts to assist in assessing the appropriateness of the valuation model including the independent assessment of the underlying assumptions relating to discount rate, terminal value etc.
• We assessed the carrying value/fair value calculations of all individually material investments, where applicable, to determine whether the valuations performed by the Company were within an acceptable range determined by us and the auditor’s valuation experts.
• We evaluated the cash flow forecasts (with underlying economic growth rate) by comparing them to the approved budgets and our understanding of the internal and external factors.
• We checked the mathematical accuracy of the impairment model and agreed relevant data back to the latest budgets, actual past results and other supporting documents.
• We assessed the Company’s sensitivity analysis and evaluated whether any reasonably foreseeable change in assumptions could lead to impairment or material change in fair valuation.
• We discussed with the component auditors of certain entities to develop an understanding of the operating performance and outlook used in their own valuation model and to assess consistency with the assumptions used in the model.
• We had discussions with management to obtain an understanding of the relevant factors in respect of certain investments carried at fair value where a wide range of fair values were possible due to various factors such as absence of recent observable transactions, restrictions on transfer of shares, existence of multiple valuation techniques, investee’s varied nature of portfolio of investments for which significant estimates/judgements are required to arrive at fair value.
• We evaluated the adequacy of the disclosures made in the Standalone Financial Statements.
Based on the above procedures performed, we did not identify any significant exceptions in the management’s assessment in relation to the carrying value of equity investments in subsidiaries, associates and joint ventures and fair value of other investments.
INTEGRATED REPORT & ANNUAL ACCOUNTS 2019-20 | 113TH YEAR214
Other Information6. The Company’s Board of Directors is responsible for the other
information. The other information comprises the information included in the Integrated Report, Board’s Report along with its Annexures and Financial Highlights included in the Company’s Annual Report (titled as ‘Tata Steel Integrated Report & Annual Accounts 2019-20’) but does not include the financial statements and our auditor’s report thereon.
Our opinion on the standalone financial statements does not cover the other information and we do not express any form of assurance conclusion thereon.
In connection with our audit of the standalone financial statements, our responsibility is to read the other information and, in doing so, consider whether the other information is materially inconsistent with the standalone financial statements or our knowledge obtained in the audit or otherwise appears to be materially misstated. If, based on the work we have performed, we conclude that there is a material misstatement of this other information, we are required to report that fact.
We have nothing to report in this regard.
Responsibilities of management and those charged with governance for the standalone financial statements7. The Company’s Board of Directors is responsible for the
matters stated in section 134(5) of the Act with respect to the preparation of these standalone financial statements that give a true and fair view of the financial position, financial performance, changes in equity and cash flows of the Company in accordance with the accounting principles generally accepted in India, including the Accounting Standards specified under section 133 of the Act. This responsibility also includes maintenance of adequate accounting records in accordance with the provisions of the Act for safeguarding of the assets of the Company and for preventing and detecting frauds and other irregularities; selection and application of appropriate accounting policies; making judgments and estimates that are reasonable and prudent; and design, implementation and maintenance of adequate internal financial controls, that were operating effectively for ensuring the accuracy and completeness of the accounting records, relevant to the preparation and presentation of the standalone financial statements that give a true and fair view and are free from material misstatement, whether due to fraud or error.
8. In preparing the standalone financial statements, management is responsible for assessing the Company’s ability to continue as a going concern, disclosing, as applicable, matters related to going concern and using the going concern basis of accounting unless management either intends to liquidate the Company or to cease operations, or has no realistic alternative but to do
so. The Board of Directors are also responsible for overseeing the Company’s financial reporting process.
Auditor’s responsibilities for the audit of the standalone financial statements9. Our objectives are to obtain reasonable assurance about
whether the standalone financial statements as a whole are free from material misstatement, whether due to fraud or error, and to issue an auditor’s report that includes our opinion. Reasonable assurance is a high level of assurance, but is not a guarantee that an audit conducted in accordance with SAs will always detect a material misstatement when it exists. Misstatements can arise from fraud or error and are considered material if, individually or in the aggregate, they could reasonably be expected to influence the economic decisions of users taken on the basis of these standalone financial statements.
10. As part of an audit in accordance with SAs, we exercise professional judgment and maintain professional scepticism throughout the audit. We also:
• Identify and assess the risks of material misstatement of the standalone financial statements, whether due to fraud or error, design and perform audit procedures responsive to those risks, and obtain audit evidence that is sufficient and appropriate to provide a basis for our opinion. The risk of not detecting a material misstatement resulting from fraud is higher than for one resulting from error, as fraud may involve collusion, forgery, intentional omissions, misrepresentations, or the override of internal control.
• Obtain an understanding of internal control relevant to the audit in order to design audit procedures that are appropriate in the circumstances. Under Section 143(3) (i) of the Act, we are also responsible for expressing our opinion on whether the company has adequate internal financial controls with reference to standalone financial statements in place and the operating effectiveness of such controls.
• Evaluate the appropriateness of accounting policies used and the reasonableness of accounting estimates and related disclosures made by management.
• Conclude on the appropriateness of management’s use of the going concern basis of accounting and, based on the audit evidence obtained, whether a material uncertainty exists related to events or conditions that may cast significant doubt on the Company’s ability to continue as a going concern. If we conclude that a material uncertainty exists, we are required to draw attention in our auditor’s report to the related disclosures in the standalone financial statements or, if such disclosures are inadequate, to modify our opinion. Our conclusions are based on the audit evidence obtained up to the date of our auditor’s
Corporate Overview 02
Strategic Review 46
Performance Review 20
Statutory Reports 84
Our Strategy 28
Financial Statements 206
215
Standalone
report. However, future events or conditions may cause the Company to cease to continue as a going concern.
• Evaluate the overall presentation, structure and content of the standalone financial statements, including the disclosures, and whether the standalone financial statements represent the underlying transactions and events in a manner that achieves fair presentation.
11. We communicate with those charged with governance regarding, among other matters, the planned scope and timing of the audit and significant audit findings, including any significant deficiencies in internal control that we identify during our audit.
12. We also provide those charged with governance with a statement that we have complied with relevant ethical requirements regarding independence, and to communicate with them all relationships and other matters that may reasonably be thought to bear on our independence, and where applicable, related safeguards.
13. From the matters communicated with those charged with governance, we determine those matters that were of most significance in the audit of the standalone financial statements of the current period and are therefore the key audit matters. We describe these matters in our auditor’s report unless law or regulation precludes public disclosure about the matter or when, in extremely rare circumstances, we determine that a matter should not be communicated in our report because the adverse consequences of doing so would reasonably be expected to outweigh the public interest benefits of such communication.
Report on other legal and regulatory requirements14. As required by the Companies (Auditor’s Report) Order, 2016
(“the Order”), issued by the Central Government of India in terms of sub-section (11) of section 143 of the Act, we give in the Annexure B a statement on the matters specified in paragraphs 3 and 4 of the Order, to the extent applicable.
15. As required by Section 143(3) of the Act, we report that:
(a) We have sought and obtained all the information and explanations, which to the best of our knowledge and belief were necessary for the purposes of our audit.
(b) In our opinion, proper books of account as required by law have been kept by the Company so far as it appears from our examination of those books.
(c) The Balance Sheet, the Statement of Profit and Loss (including other comprehensive income), the Statement of Changes in Equity and Cash Flow Statement dealt with by this Report are in agreement with the books of account.
(d) In our opinion, the aforesaid standalone financial statements comply with the Accounting Standards specified under Section 133 of the Act.
(e) On the basis of the written representations received from the directors as on March 31, 2020 taken on record by the Board of Directors, none of the directors is disqualified as on March 31, 2020 from being appointed as a director in terms of Section 164 (2) of the Act.
(f) With respect to the adequacy of the internal financial controls with reference to standalone financial statements of the Company and the operating effectiveness of such controls, refer to our separate Report in “Annexure A”.
(g) With respect to the other matters to be included in the Auditor’s Report in accordance with Rule 11 of the Companies (Audit and Auditors) Rules, 2014, in our opinion and to the best of our information and according to the explanations given to us:
i. The Company has disclosed the impact of pending litigations as on March 31, 2020, on its financial position in its standalone financial statements – Refer Notes 37(A) and 38 to the standalone financial statements;
ii. The Company has long-term contracts including derivative contracts as at March 31, 2020 for which there were no material foreseeable losses.
iii. There has been no delay in transferring amounts, required to be transferred, to the Investor Education and Protection Fund by the Company during the year ended March 31, 2020 except for amounts aggregating to `5.71 crores, which according to the information and explanations provided by the management is held in abeyance due to dispute/pending legal cases.
iv. The reporting on disclosures relating to Specified Bank Notes is not applicable to the Company for the year ended March 31, 2020.
16. The Company has paid/ provided for managerial remuneration in accordance with the requisite approvals mandated by the provisions of Section 197 read with Schedule V to the Act.
For Price Waterhouse & Co Chartered Accountants LLP Firm Registration Number: 304026E/ E-300009
Chartered Accountants
Russell I Parera
Partner
Place: Mumbai Membership Number 042190
Date: June 29, 2020 UDIN: 20042190AAAABW3347
INTEGRATED REPORT & ANNUAL ACCOUNTS 2019-20 | 113TH YEAR216
ANNEXURE A TO THE INDEPENDENT AUDITOR’S REPORT
Referred to in paragraph 15(f) of the Independent Auditors’ Report of even date to the members of Tata Steel Limited on the standalone financial statements as on and for the year ended March 31, 2020
Report on the Internal Financial Controls with reference to standalone financial statements under Clause (i) of Sub-section 3 of Section 143 of the Act1. We have audited the internal financial controls with reference
to standalone financial statements of Tata Steel Limited (“the Company”) as of March 31, 2020 in conjunction with our audit of the standalone financial statements of the Company for the year ended on that date.
Management’s Responsibility for Internal Financial Controls
2. The Company’s management is responsible for establishing and maintaining internal financial controls based on the internal control over financial reporting criteria established by the Company considering the essential components of internal control stated in the Guidance Note on Audit of Internal Financial Controls Over Financial Reporting issued by the Institute of Chartered Accountants of India (ICAI). These responsibilities include the design, implementation and maintenance of adequate internal financial controls that were operating effectively for ensuring the orderly and efficient conduct of its business, including adherence to company’s policies, the safeguarding of its assets, the prevention and detection of frauds and errors, the accuracy and completeness of the accounting records, and the timely preparation of reliable financial information, as required under the Act.
Auditors’ Responsibility3. Our responsibility is to express an opinion on the Company’s
internal financial controls with reference to standalone financial statements based on our audit. We conducted our audit in accordance with the Guidance Note on Audit of Internal Financial Controls Over Financial Reporting (the “Guidance Note”) and the Standards on Auditing deemed to be prescribed under section 143(10) of the Act to the extent applicable to an audit of internal financial controls, both applicable to an audit of internal financial controls and both issued by the ICAI. Those Standards and the Guidance Note require that we comply with ethical requirements and plan and perform the audit to obtain reasonable assurance about whether adequate internal financial controls with reference to financial statements was established and maintained and if such controls operated effectively in all material respects.
4. Our audit involves performing procedures to obtain audit evidence about the adequacy of the internal financial controls system with reference to financial statements and their operating effectiveness. Our audit of internal financial controls with reference to standalone financial statements included obtaining an understanding of internal financial controls with reference to financial statements, assessing the risk that a material weakness exists, and testing and evaluating the design and operating effectiveness of internal control based on the assessed risk. The procedures selected depend on the auditor’s judgement, including the assessment of the risks of material misstatement of the standalone financial statements, whether due to fraud or error.
5. We believe that the audit evidence we have obtained is sufficient and appropriate to provide a basis for our audit opinion on the Company’s internal financial controls system with reference to standalone financial statements.
Meaning of Internal Financial Controls with reference to financial statements
6. A company’s internal financial controls with reference to financial statements is a process designed to provide reasonable assurance regarding the reliability of financial reporting and the preparation of financial statements for external purposes in accordance with generally accepted accounting principles. A company’s internal financial controls with reference to financial statements includes those policies and procedures that (1) pertain to the maintenance of records that, in reasonable detail, accurately and fairly reflect the transactions and dispositions of the assets of the company; (2) provide reasonable assurance that transactions are recorded as necessary to permit preparation of financial statements in accordance with generally accepted accounting principles, and that receipts and expenditures of the company are being made only in accordance with authorisation of management and directors of the company; and (3) provide reasonable assurance regarding prevention or timely detection of unauthorised acquisition, use, or disposition of the company’s assets that could have a material effect on the financial statements.
Inherent Limitations of Internal Financial Controls with reference to financial statements
7. Because of the inherent limitations of internal financial controls with reference to financial statements, including the possibility of collusion or improper management override of controls, material misstatements due to error or fraud may occur and not be detected. Also, projections of any evaluation of the internal
Corporate Overview 02
Strategic Review 46
Performance Review 20
Statutory Reports 84
Our Strategy 28
Financial Statements 206
217
Standalone
financial controls with reference to financial statements to future periods are subject to the risk that the internal financial controls with reference to financial statements may become inadequate because of changes in conditions, or that the degree of compliance with the policies or procedures may deteriorate.
Opinion
8. In our opinion, the Company has, in all material respects, an adequate internal financial controls system with reference to standalone financial statements and such internal financial controls with reference to standalone financial statements were operating effectively as at March 31,2020, based on the internal control over financial reporting criteria established by the Company considering the essential components of internal control stated in the Guidance Note on Audit of Internal Financial Controls Over Financial Reporting issued by the Institute of Chartered Accountants of India. Also refer paragraph 4(b) of our report.
For Price Waterhouse & Co Chartered Accountants LLP Firm Registration Number: 304026E/ E-300009
Chartered Accountants
Russell I Parera
Partner
Place: Mumbai Membership Number 042190
Date: June 29, 2020 UDIN: 20042190AAAABW3347
INTEGRATED REPORT & ANNUAL ACCOUNTS 2019-20 | 113TH YEAR218
ANNEXURE B TO THE INDEPENDENT AUDITOR’S REPORT
Referred to in paragraph 14 of the Independent Auditors’ Report of even date to the members of Tata Steel Limited on the standalone financial statements as of and for the year ended March 31, 2020i. (a) The Company is maintaining proper records showing full
particulars, including quantitative details and situation, of fixed assets.
(b) The fixed assets are physically verified by the Management according to a phased programme designed to cover all the items over a period of three years which, in our opinion, is reasonable having regard to the size of the Company and the nature of its assets. Pursuant to the programme, a portion of the fixed assets has been physically verified by the Management during the year and no material discrepancies have been noticed on such verification.
(c) According to the information and explanations given to us and the records examined by us, the title deeds of immovable properties, as disclosed in Note 3 on property, plant and equipment to the Standalone Financial Statements, are held in the name of the Company, except for:
(i) title deeds of freehold land with gross and net carrying amount of `60.44 crore and title deeds of buildings with gross carrying amount and net carrying amount of `83.48 crore and `72.24 crore respectively, which are held in the name of erstwhile companies which have subsequently been amalgamated with the Company;
(ii) title deeds of freehold land with gross and net carrying amount of `202.67 crore and title deeds of buildings with gross carrying amount and net carrying amount of `95.62 crore and `72.40 crore respectively, which are not readily available.
ii. The physical verification of inventory [excluding stocks with third parties] have been conducted at reasonable intervals by the Management during the year. In respect of inventory lying with third parties, these have substantially been confirmed by them. In respect of inventories of stores and spares, the Management has a verification programme designed to cover the items over a period of three years. The discrepancies noticed on physical verification of inventory as compared to book records were not material.
iii. The Company has not granted any loans, secured or unsecured, to companies, firms, Limited Liability Partnerships or other parties covered in the register maintained under Section 189 of the Act. Therefore, the provisions of Clause 3(iii), (iii)(a), (iii)(b) and (iii)(c) of the said Order are not applicable to the Company.
iv. In our opinion, and according to the information and explanations given to us, the Company has complied with the provisions of Section 185 and 186 of the Companies Act, 2013 in respect of the loans and investments made, and guarantees and security provided by it, as applicable.
v. The Company has not accepted any deposits from the public within the meaning of section 73, 74, 75 and 76. In our opinion, and according to the information and explanations given to us, the Company has complied with the provisions of Sections 73, 74, 75 and 76 or any other relevant provisions of the Act and the Rules framed thereunder to the extent notified, with regard to the deposits accepted from the public. According to the information and explanations given to us, no order has been passed by the Company Law Board or National Company Law Tribunal or Reserve Bank of India or any Court or any other Tribunal on the Company in respect of the aforesaid deposits.
vi. Pursuant to the rules made by the Central Government of India, the Company is required to maintain cost records as specified under Section 148(1) of the Act in respect of its products. We have broadly reviewed the same, and are of the opinion that, prima facie, the prescribed accounts and records have been made and maintained. We have not, however, made a detailed examination of the records with a view to determine whether they are accurate or complete.
vii. (a) According to the information and explanations given to us and the records of the Company examined by us, in our opinion, the Company is generally regular in depositing undisputed statutory dues in respect of income tax, though there has been a slight delay in a few cases, and is regular in depositing undisputed statutory dues, including provident fund, employees’s state insurance, sales tax, service tax, duty of customs, duty of excise , value added tax, cess, goods and services tax and other material statutory dues, as applicable, with the appropriate authorities. We are informed that the Company has applied for exemption from operations of Employee’s State Insurance Act at some locations. We are also informed that actions taken by the authorities at some locations to bring the employees of the Company under the Employees’ State Insurance Scheme has been contested by the Company and payment has not been made of the contribution demanded.
Corporate Overview 02
Strategic Review 46
Performance Review 20
Statutory Reports 84
Our Strategy 28
Financial Statements 206
219
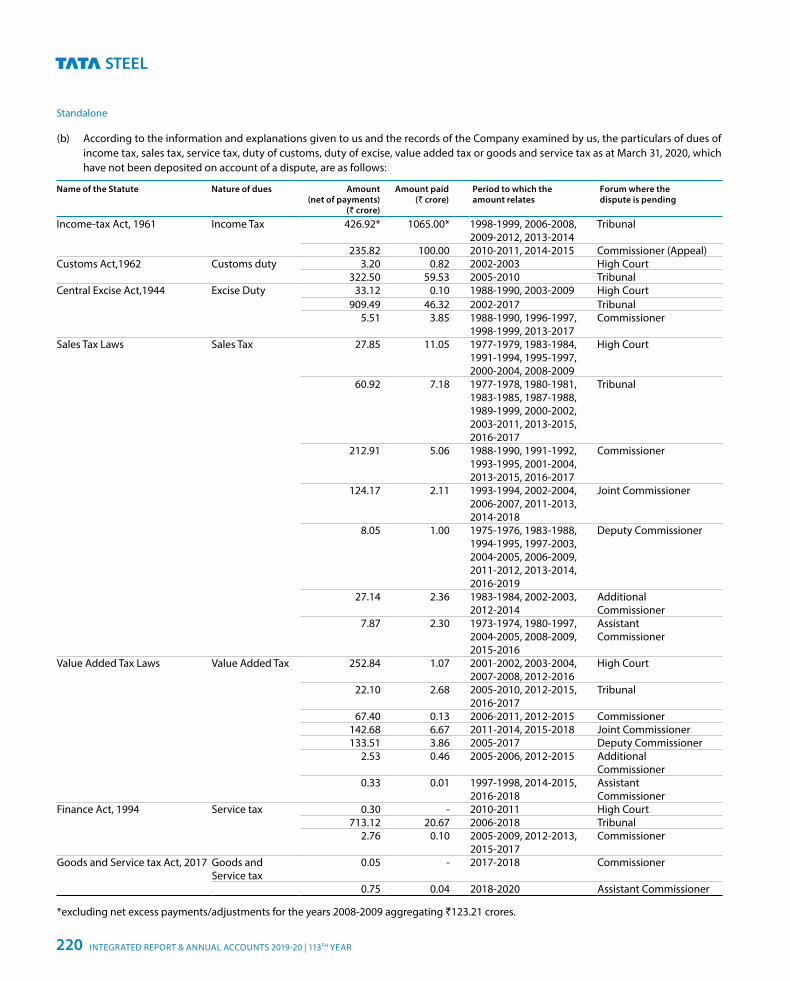
Standalone
Name of the Statute Nature of dues Amount (net of payments)
(` crore)
Amount paid (` crore)
Period to which the amount relates
Forum where the dispute is pending
Income-tax Act, 1961 Income Tax 426.92* 1065.00* 1998-1999, 2006-2008,2009-2012, 2013-2014
Tribunal
235.82 100.00 2010-2011, 2014-2015 Commissioner (Appeal)Customs Act,1962 Customs duty 3.20 0.82 2002-2003 High Court
322.50 59.53 2005-2010 TribunalCentral Excise Act,1944 Excise Duty 33.12 0.10 1988-1990, 2003-2009 High Court
909.49 46.32 2002-2017 Tribunal5.51 3.85 1988-1990, 1996-1997,
1998-1999, 2013-2017Commissioner
Sales Tax Laws Sales Tax 27.85 11.05 1977-1979, 1983-1984,1991-1994, 1995-1997,2000-2004, 2008-2009
High Court
60.92 7.18 1977-1978, 1980-1981,1983-1985, 1987-1988,1989-1999, 2000-2002,2003-2011, 2013-2015,2016-2017
Tribunal
212.91 5.06 1988-1990, 1991-1992,1993-1995, 2001-2004,2013-2015, 2016-2017
Commissioner
124.17 2.11 1993-1994, 2002-2004,2006-2007, 2011-2013,2014-2018
Joint Commissioner
8.05 1.00 1975-1976, 1983-1988,1994-1995, 1997-2003, 2004-2005, 2006-2009,2011-2012, 2013-2014,2016-2019
Deputy Commissioner
27.14 2.36 1983-1984, 2002-2003,2012-2014
AdditionalCommissioner
7.87 2.30 1973-1974, 1980-1997,2004-2005, 2008-2009,2015-2016
AssistantCommissioner
Value Added Tax Laws Value Added Tax 252.84 1.07 2001-2002, 2003-2004,2007-2008, 2012-2016
High Court
22.10 2.68 2005-2010, 2012-2015,2016-2017
Tribunal
67.40 0.13 2006-2011, 2012-2015 Commissioner142.68 6.67 2011-2014, 2015-2018 Joint Commissioner133.51 3.86 2005-2017 Deputy Commissioner
2.53 0.46 2005-2006, 2012-2015 AdditionalCommissioner
0.33 0.01 1997-1998, 2014-2015,2016-2018
AssistantCommissioner
Finance Act, 1994 Service tax 0.30 - 2010-2011 High Court713.12 20.67 2006-2018 Tribunal
2.76 0.10 2005-2009, 2012-2013,2015-2017
Commissioner
Goods and Service tax Act, 2017 Goods andService tax
0.05 - 2017-2018 Commissioner
0.75 0.04 2018-2020 Assistant Commissioner
*excluding net excess payments/adjustments for the years 2008-2009 aggregating `123.21 crores.
(b) According to the information and explanations given to us and the records of the Company examined by us, the particulars of dues of income tax, sales tax, service tax, duty of customs, duty of excise, value added tax or goods and service tax as at March 31, 2020, which have not been deposited on account of a dispute, are as follows:
INTEGRATED REPORT & ANNUAL ACCOUNTS 2019-20 | 113TH YEAR220
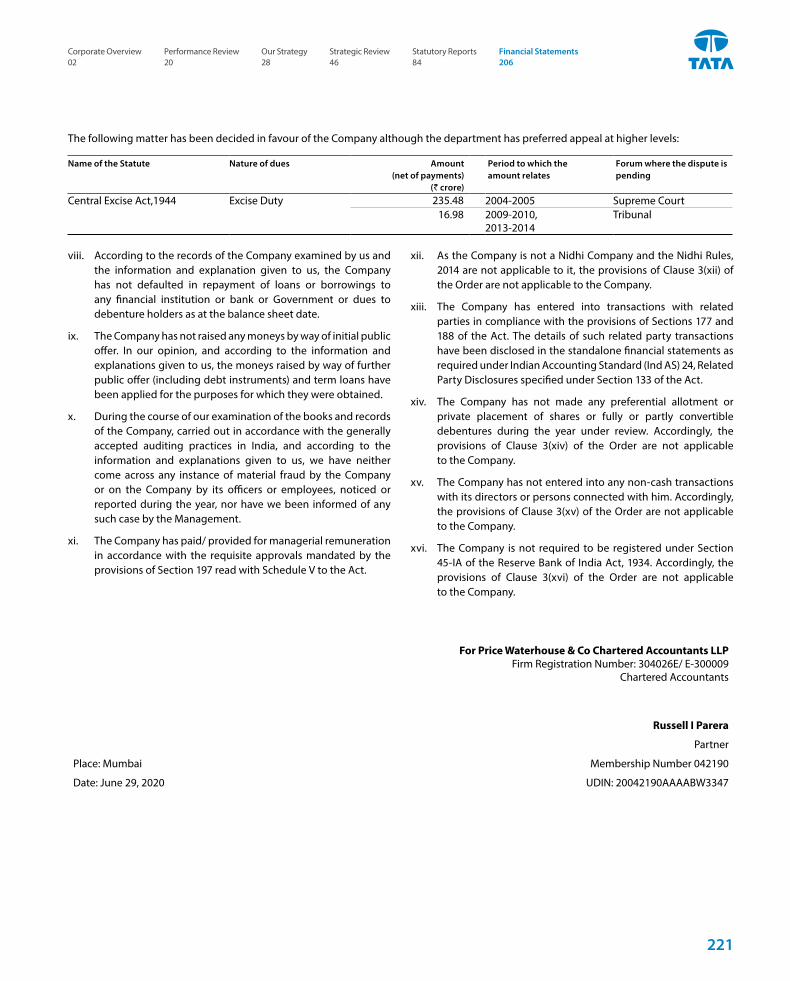
viii. According to the records of the Company examined by us and the information and explanation given to us, the Company has not defaulted in repayment of loans or borrowings to any financial institution or bank or Government or dues to debenture holders as at the balance sheet date.
ix. The Company has not raised any moneys by way of initial public offer. In our opinion, and according to the information and explanations given to us, the moneys raised by way of further public offer (including debt instruments) and term loans have been applied for the purposes for which they were obtained.
x. During the course of our examination of the books and records of the Company, carried out in accordance with the generally accepted auditing practices in India, and according to the information and explanations given to us, we have neither come across any instance of material fraud by the Company or on the Company by its officers or employees, noticed or reported during the year, nor have we been informed of any such case by the Management.
xi. The Company has paid/ provided for managerial remuneration in accordance with the requisite approvals mandated by the provisions of Section 197 read with Schedule V to the Act.
xii. As the Company is not a Nidhi Company and the Nidhi Rules, 2014 are not applicable to it, the provisions of Clause 3(xii) of the Order are not applicable to the Company.
xiii. The Company has entered into transactions with related parties in compliance with the provisions of Sections 177 and 188 of the Act. The details of such related party transactions have been disclosed in the standalone financial statements as required under Indian Accounting Standard (Ind AS) 24, Related Party Disclosures specified under Section 133 of the Act.
xiv. The Company has not made any preferential allotment or private placement of shares or fully or partly convertible debentures during the year under review. Accordingly, the provisions of Clause 3(xiv) of the Order are not applicable to the Company.
xv. The Company has not entered into any non-cash transactions with its directors or persons connected with him. Accordingly, the provisions of Clause 3(xv) of the Order are not applicable to the Company.
xvi. The Company is not required to be registered under Section 45-IA of the Reserve Bank of India Act, 1934. Accordingly, the provisions of Clause 3(xvi) of the Order are not applicable to the Company.
For Price Waterhouse & Co Chartered Accountants LLP Firm Registration Number: 304026E/ E-300009
Chartered Accountants
Russell I Parera
Partner
Place: Mumbai Membership Number 042190
Date: June 29, 2020 UDIN: 20042190AAAABW3347
The following matter has been decided in favour of the Company although the department has preferred appeal at higher levels:
Name of the Statute Nature of dues Amount (net of payments)
(` crore)
Period to which the amount relates
Forum where the dispute ispending
Central Excise Act,1944 Excise Duty 235.48 2004-2005 Supreme Court16.98 2009-2010,
2013-2014Tribunal
Corporate Overview 02
Strategic Review 46
Performance Review 20
Statutory Reports 84
Our Strategy 28
Financial Statements 206
221
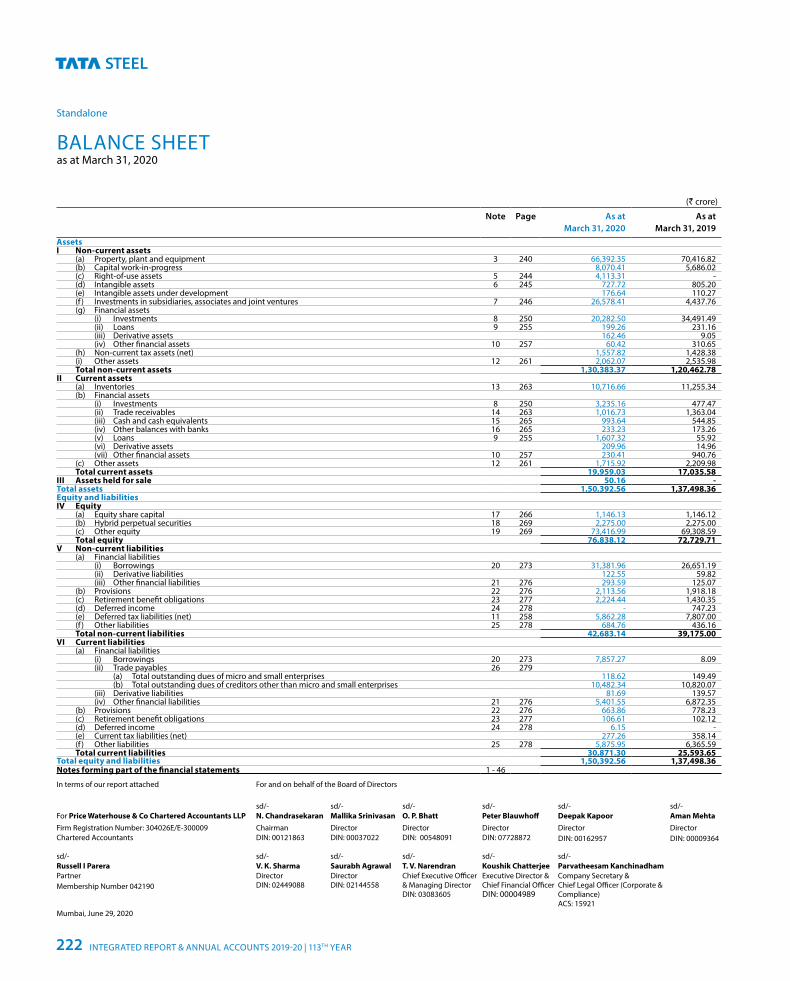
Standalone
(` crore)
Note Page As at March 31, 2020
As at March 31, 2019
AssetsI Non-current assets (a) Property, plant and equipment 3 240 66,392.35 70,416.82 (b) Capital work-in-progress 8,070.41 5,686.02 (c) Right-of-use assets 5 244 4,113.31 - (d) Intangible assets 6 245 727.72 805.20 (e) Intangible assets under development 176.64 110.27 (f ) Investments in subsidiaries, associates and joint ventures 7 246 26,578.41 4,437.76 (g) Financial assets (i) Investments 8 250 20,282.50 34,491.49 (ii) Loans 9 255 199.26 231.16 (iii) Derivative assets 162.46 9.05 (iv) Other financial assets 10 257 60.42 310.65 (h) Non-current tax assets (net) 1,557.82 1,428.38 (i) Other assets 12 261 2,062.07 2,535.98
Total non-current assets 1,30,383.37 1,20,462.78 II Current assets (a) Inventories 13 263 10,716.66 11,255.34 (b) Financial assets (i) Investments 8 250 3,235.16 477.47 (ii) Trade receivables 14 263 1,016.73 1,363.04 (iii) Cash and cash equivalents 15 265 993.64 544.85 (iv) Other balances with banks 16 265 233.23 173.26 (v) Loans 9 255 1,607.32 55.92 (vi) Derivative assets 209.96 14.96 (vii) Other financial assets 10 257 230.41 940.76 (c) Other assets 12 261 1,715.92 2,209.98
Total current assets 19,959.03 17,035.58 III Assets held for sale 50.16 -Total assets 1,50,392.56 1,37,498.36 Equity and liabilitiesIV Equity (a) Equity share capital 17 266 1,146.13 1,146.12 (b) Hybrid perpetual securities 18 269 2,275.00 2,275.00 (c) Other equity 19 269 73,416.99 69,308.59
Total equity 76,838.12 72,729.71 V Non-current liabilities (a) Financial liabilities (i) Borrowings 20 273 31,381.96 26,651.19 (ii) Derivative liabilities 122.55 59.82 (iii) Other financial liabilities 21 276 293.59 125.07 (b) Provisions 22 276 2,113.56 1,918.18 (c) Retirement benefit obligations 23 277 2,224.44 1,430.35 (d) Deferred income 24 278 - 747.23 (e) Deferred tax liabilities (net) 11 258 5,862.28 7,807.00 (f ) Other liabilities 25 278 684.76 436.16
Total non-current liabilities 42,683.14 39,175.00 VI Current liabilities (a) Financial liabilities (i) Borrowings 20 273 7,857.27 8.09 (ii) Trade payables 26 279 (a) Total outstanding dues of micro and small enterprises 118.62 149.49 (b) Total outstanding dues of creditors other than micro and small enterprises 10,482.34 10,820.07 (iii) Derivative liabilities 81.69 139.57 (iv) Other financial liabilities 21 276 5,401.55 6,872.35 (b) Provisions 22 276 663.86 778.23 (c) Retirement benefit obligations 23 277 106.61 102.12 (d) Deferred income 24 278 6.15 - (e) Current tax liabilities (net) 277.26 358.14 (f ) Other liabilities 25 278 5,875.95 6,365.59
Total current liabilities 30,871.30 25,593.65 Total equity and liabilities 1,50,392.56 1,37,498.36 Notes forming part of the financial statements 1 - 46
BALANCE SHEETas at March 31, 2020
In terms of our report attached For and on behalf of the Board of Directors
sd/- sd/- sd/- sd/- sd/- sd/- For Price Waterhouse & Co Chartered Accountants LLP N. Chandrasekaran Mallika Srinivasan O. P. Bhatt Peter Blauwhoff Deepak Kapoor Aman MehtaFirm Registration Number: 304026E/E-300009 Chairman Director Director Director Director
DIN: 00162957Director DIN: 00009364Chartered Accountants DIN: 00121863 DIN: 00037022 DIN: 00548091 DIN: 07728872
sd/- sd/- sd/- sd/- sd/- sd/- Russell I Parera V. K. Sharma Saurabh Agrawal T. V. Narendran Koushik Chatterjee Parvatheesam KanchinadhamPartner Membership Number 042190
Director DIN: 02449088
Director DIN: 02144558
Chief Executive Officer & Managing Director DIN: 03083605
Executive Director & Chief Financial Officer DIN: 00004989
Company Secretary & Chief Legal Officer (Corporate & Compliance) ACS: 15921
Mumbai, June 29, 2020
INTEGRATED REPORT & ANNUAL ACCOUNTS 2019-20 | 113TH YEAR222
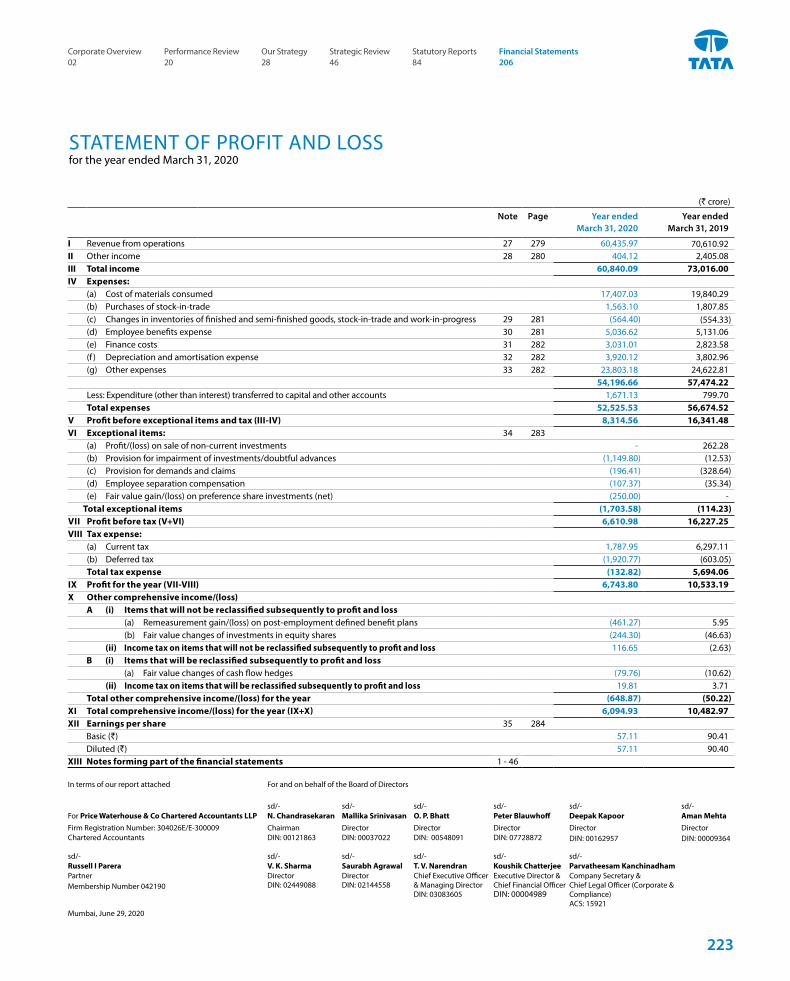
(` crore)
Note Page Year ended March 31, 2020
Year ended March 31, 2019
I Revenue from operations 27 279 60,435.97 70,610.92 II Other income 28 280 404.12 2,405.08 III Total income 60,840.09 73,016.00 IV Expenses: (a) Cost of materials consumed 17,407.03 19,840.29 (b) Purchases of stock-in-trade 1,563.10 1,807.85 (c) Changes in inventories of finished and semi-finished goods, stock-in-trade and work-in-progress 29 281 (564.40) (554.33) (d) Employee benefits expense 30 281 5,036.62 5,131.06 (e) Finance costs 31 282 3,031.01 2,823.58 (f ) Depreciation and amortisation expense 32 282 3,920.12 3,802.96 (g) Other expenses 33 282 23,803.18 24,622.81
54,196.66 57,474.22 Less: Expenditure (other than interest) transferred to capital and other accounts 1,671.13 799.70
Total expenses 52,525.53 56,674.52 V Profit before exceptional items and tax (III-IV) 8,314.56 16,341.48 VI Exceptional items: 34 283 (a) Profit/(loss) on sale of non-current investments - 262.28 (b) Provision for impairment of investments/doubtful advances (1,149.80) (12.53) (c) Provision for demands and claims (196.41) (328.64) (d) Employee separation compensation (107.37) (35.34) (e) Fair value gain/(loss) on preference share investments (net) (250.00) -
Total exceptional items (1,703.58) (114.23)VII Profit before tax (V+VI) 6,610.98 16,227.25 VIII Tax expense: (a) Current tax 1,787.95 6,297.11 (b) Deferred tax (1,920.77) (603.05) Total tax expense (132.82) 5,694.06 IX Profit for the year (VII-VIII) 6,743.80 10,533.19 X Other comprehensive income/(loss)
A (i) Items that will not be reclassified subsequently to profit and loss (a) Remeasurement gain/(loss) on post-employment defined benefit plans (461.27) 5.95 (b) Fair value changes of investments in equity shares (244.30) (46.63) (ii) Income tax on items that will not be reclassified subsequently to profit and loss 116.65 (2.63)B (i) Items that will be reclassified subsequently to profit and loss (a) Fair value changes of cash flow hedges (79.76) (10.62)
(ii) Income tax on items that will be reclassified subsequently to profit and loss 19.81 3.71 Total other comprehensive income/(loss) for the year (648.87) (50.22)
XI Total comprehensive income/(loss) for the year (IX+X) 6,094.93 10,482.97 XII Earnings per share 35 284
Basic (`) 57.11 90.41 Diluted (`) 57.11 90.40
XIII Notes forming part of the financial statements 1 - 46
STATEMENT OF PROFIT AND LOSSfor the year ended March 31, 2020
In terms of our report attached For and on behalf of the Board of Directors
sd/- sd/- sd/- sd/- sd/- sd/- For Price Waterhouse & Co Chartered Accountants LLP N. Chandrasekaran Mallika Srinivasan O. P. Bhatt Peter Blauwhoff Deepak Kapoor Aman MehtaFirm Registration Number: 304026E/E-300009 Chairman Director Director Director Director
DIN: 00162957Director DIN: 00009364Chartered Accountants DIN: 00121863 DIN: 00037022 DIN: 00548091 DIN: 07728872
sd/- sd/- sd/- sd/- sd/- sd/- Russell I Parera V. K. Sharma Saurabh Agrawal T. V. Narendran Koushik Chatterjee Parvatheesam KanchinadhamPartner Membership Number 042190
Director DIN: 02449088
Director DIN: 02144558
Chief Executive Officer & Managing Director DIN: 03083605
Executive Director & Chief Financial Officer DIN: 00004989
Company Secretary & Chief Legal Officer (Corporate & Compliance) ACS: 15921
Mumbai, June 29, 2020
Corporate Overview 02
Strategic Review 46
Performance Review 20
Statutory Reports 84
Our Strategy 28
Financial Statements 206
223
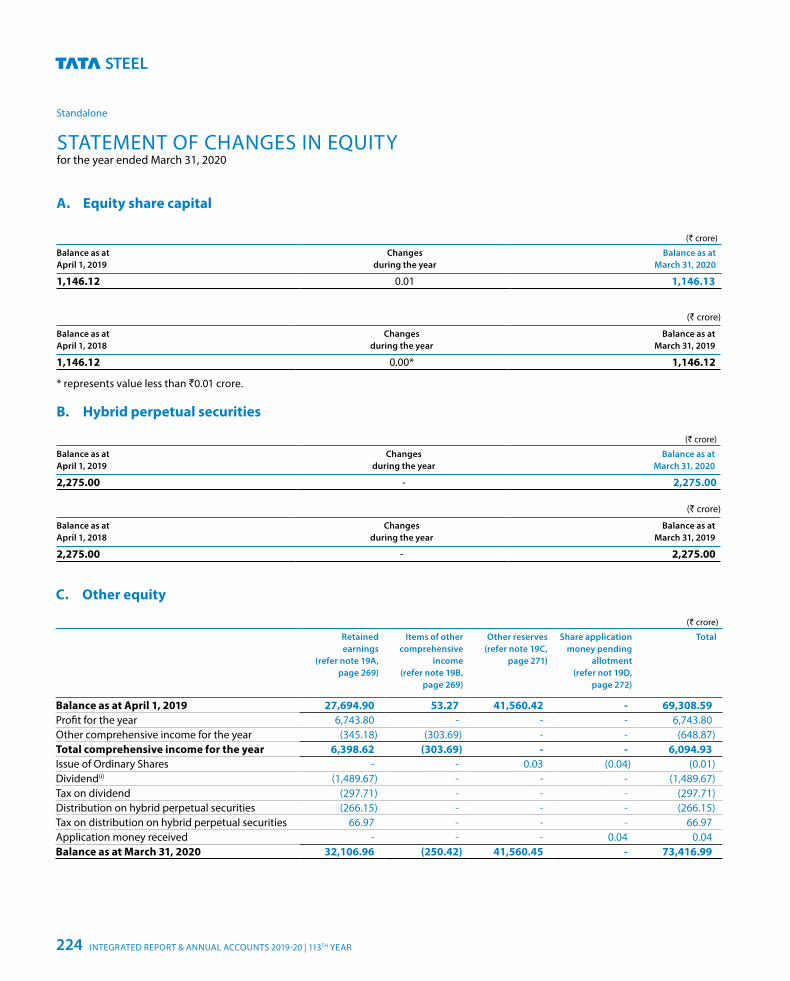
Standalone
STATEMENT OF CHANGES IN EQUITY for the year ended March 31, 2020
A. Equity share capital
(` crore)
Balance as at April 1, 2019
Changes during the year
Balance as at March 31, 2020
1,146.12 0.01 1,146.13
(` crore)
Balance as at April 1, 2018
Changes during the year
Balance as at March 31, 2019
1,146.12 0.00* 1,146.12
* represents value less than `0.01 crore.
B. Hybrid perpetual securities
(` crore)
Balance as at April 1, 2019
Changes during the year
Balance as at March 31, 2020
2,275.00 - 2,275.00
(` crore)
Balance as at April 1, 2018
Changes during the year
Balance as at March 31, 2019
2,275.00 - 2,275.00
C. Other equity
(` crore)
Retained earnings
(refer note 19A, page 269)
Items of other comprehensive
income (refer note 19B,
page 269)
Other reserves (refer note 19C,
page 271)
Share application money pending
allotment (refer not 19D,
page 272)
Total
Balance as at April 1, 2019 27,694.90 53.27 41,560.42 - 69,308.59Profit for the year 6,743.80 - - - 6,743.80Other comprehensive income for the year (345.18) (303.69) - - (648.87)Total comprehensive income for the year 6,398.62 (303.69) - - 6,094.93Issue of Ordinary Shares - - 0.03 (0.04) (0.01)Dividend(i) (1,489.67) - - - (1,489.67)Tax on dividend (297.71) - - - (297.71)Distribution on hybrid perpetual securities (266.15) - - - (266.15)Tax on distribution on hybrid perpetual securities 66.97 - - - 66.97Application money received - - - 0.04 0.04Balance as at March 31, 2020 32,106.96 (250.42) 41,560.45 - 73,416.99
INTEGRATED REPORT & ANNUAL ACCOUNTS 2019-20 | 113TH YEAR224
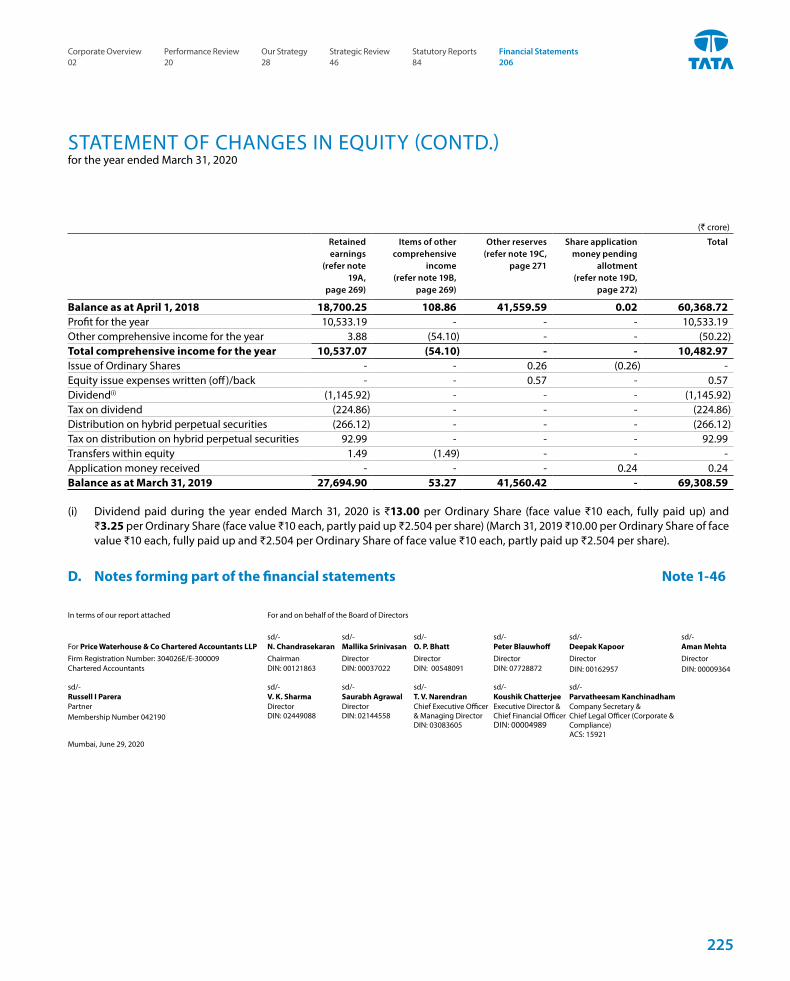
STATEMENT OF CHANGES IN EQUITY (CONTD.) for the year ended March 31, 2020
(` crore)
Retained earnings
(refer note 19A,
page 269)
Items of other comprehensive
income (refer note 19B,
page 269)
Other reserves (refer note 19C,
page 271
Share application money pending
allotment (refer note 19D,
page 272)
Total
Balance as at April 1, 2018 18,700.25 108.86 41,559.59 0.02 60,368.72 Profit for the year 10,533.19 - - - 10,533.19 Other comprehensive income for the year 3.88 (54.10) - - (50.22)Total comprehensive income for the year 10,537.07 (54.10) - - 10,482.97 Issue of Ordinary Shares - - 0.26 (0.26) -Equity issue expenses written (off)/back - - 0.57 - 0.57 Dividend(i) (1,145.92) - - - (1,145.92)Tax on dividend (224.86) - - - (224.86)Distribution on hybrid perpetual securities (266.12) - - - (266.12)Tax on distribution on hybrid perpetual securities 92.99 - - - 92.99 Transfers within equity 1.49 (1.49) - - -Application money received - - - 0.24 0.24 Balance as at March 31, 2019 27,694.90 53.27 41,560.42 - 69,308.59
(i) Dividend paid during the year ended March 31, 2020 is ₹13.00 per Ordinary Share (face value ₹10 each, fully paid up) and ₹3.25 per Ordinary Share (face value ₹10 each, partly paid up ₹2.504 per share) (March 31, 2019 ₹10.00 per Ordinary Share of face value ₹10 each, fully paid up and ₹2.504 per Ordinary Share of face value ₹10 each, partly paid up ₹2.504 per share).
D. Notes forming part of the financial statements Note 1-46
In terms of our report attached For and on behalf of the Board of Directors
sd/- sd/- sd/- sd/- sd/- sd/- For Price Waterhouse & Co Chartered Accountants LLP N. Chandrasekaran Mallika Srinivasan O. P. Bhatt Peter Blauwhoff Deepak Kapoor Aman MehtaFirm Registration Number: 304026E/E-300009 Chairman Director Director Director Director
DIN: 00162957Director DIN: 00009364Chartered Accountants DIN: 00121863 DIN: 00037022 DIN: 00548091 DIN: 07728872
sd/- sd/- sd/- sd/- sd/- sd/- Russell I Parera V. K. Sharma Saurabh Agrawal T. V. Narendran Koushik Chatterjee Parvatheesam KanchinadhamPartner Membership Number 042190
Director DIN: 02449088
Director DIN: 02144558
Chief Executive Officer & Managing Director DIN: 03083605
Executive Director & Chief Financial Officer DIN: 00004989
Company Secretary & Chief Legal Officer (Corporate & Compliance) ACS: 15921
Mumbai, June 29, 2020
Corporate Overview 02
Strategic Review 46
Performance Review 20
Statutory Reports 84
Our Strategy 28
Financial Statements 206
225
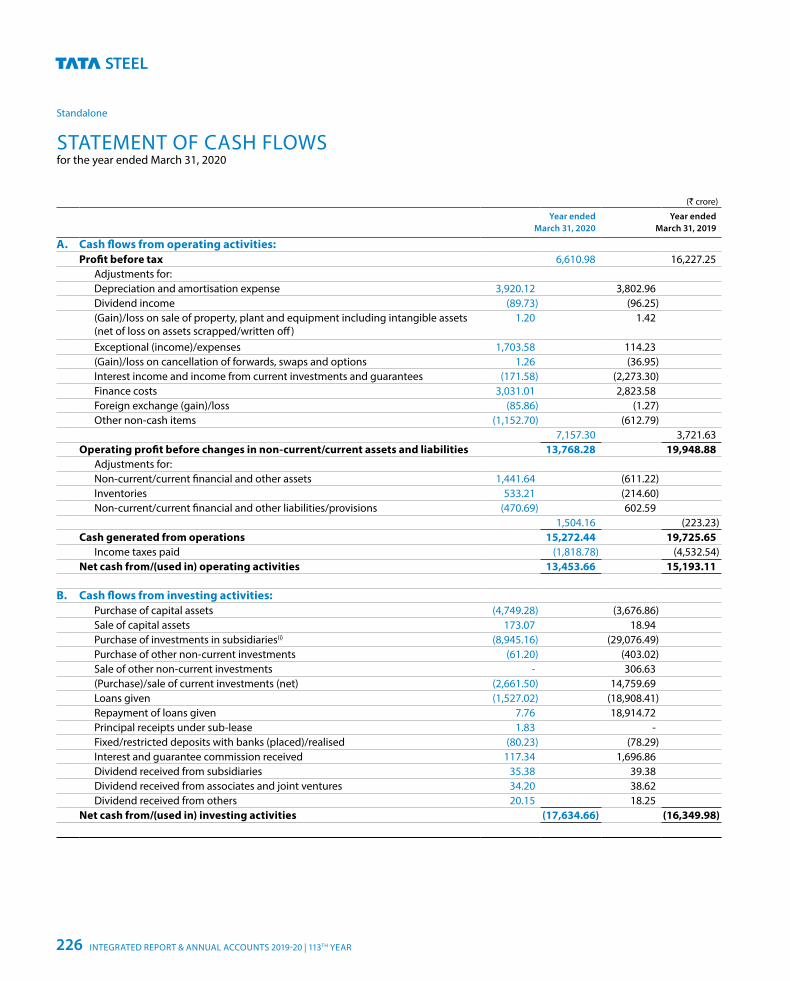
Standalone
(` crore)
Year ended March 31, 2020
Year ended March 31, 2019
A. Cash flows from operating activities:Profit before tax 6,610.98 16,227.25
Adjustments for:Depreciation and amortisation expense 3,920.12 3,802.96Dividend income (89.73) (96.25)(Gain)/loss on sale of property, plant and equipment including intangible assets (net of loss on assets scrapped/written off)
1.20 1.42
Exceptional (income)/expenses 1,703.58 114.23(Gain)/loss on cancellation of forwards, swaps and options 1.26 (36.95)Interest income and income from current investments and guarantees (171.58) (2,273.30)Finance costs 3,031.01 2,823.58Foreign exchange (gain)/loss (85.86) (1.27)Other non-cash items (1,152.70) (612.79)
7,157.30 3,721.63Operating profit before changes in non-current/current assets and liabilities 13,768.28 19,948.88
Adjustments for:Non-current/current financial and other assets 1,441.64 (611.22)Inventories 533.21 (214.60)Non-current/current financial and other liabilities/provisions (470.69) 602.59
1,504.16 (223.23) Cash generated from operations 15,272.44 19,725.65
Income taxes paid (1,818.78) (4,532.54)Net cash from/(used in) operating activities 13,453.66 15,193.11
B. Cash flows from investing activities:Purchase of capital assets (4,749.28) (3,676.86)Sale of capital assets 173.07 18.94Purchase of investments in subsidiaries(i) (8,945.16) (29,076.49)Purchase of other non-current investments (61.20) (403.02)Sale of other non-current investments - 306.63(Purchase)/sale of current investments (net) (2,661.50) 14,759.69Loans given (1,527.02) (18,908.41)Repayment of loans given 7.76 18,914.72Principal receipts under sub-lease 1.83 -Fixed/restricted deposits with banks (placed)/realised (80.23) (78.29)Interest and guarantee commission received 117.34 1,696.86Dividend received from subsidiaries 35.38 39.38Dividend received from associates and joint ventures 34.20 38.62Dividend received from others 20.15 18.25
Net cash from/(used in) investing activities (17,634.66) (16,349.98)
STATEMENT OF CASH FLOWS for the year ended March 31, 2020
INTEGRATED REPORT & ANNUAL ACCOUNTS 2019-20 | 113TH YEAR226
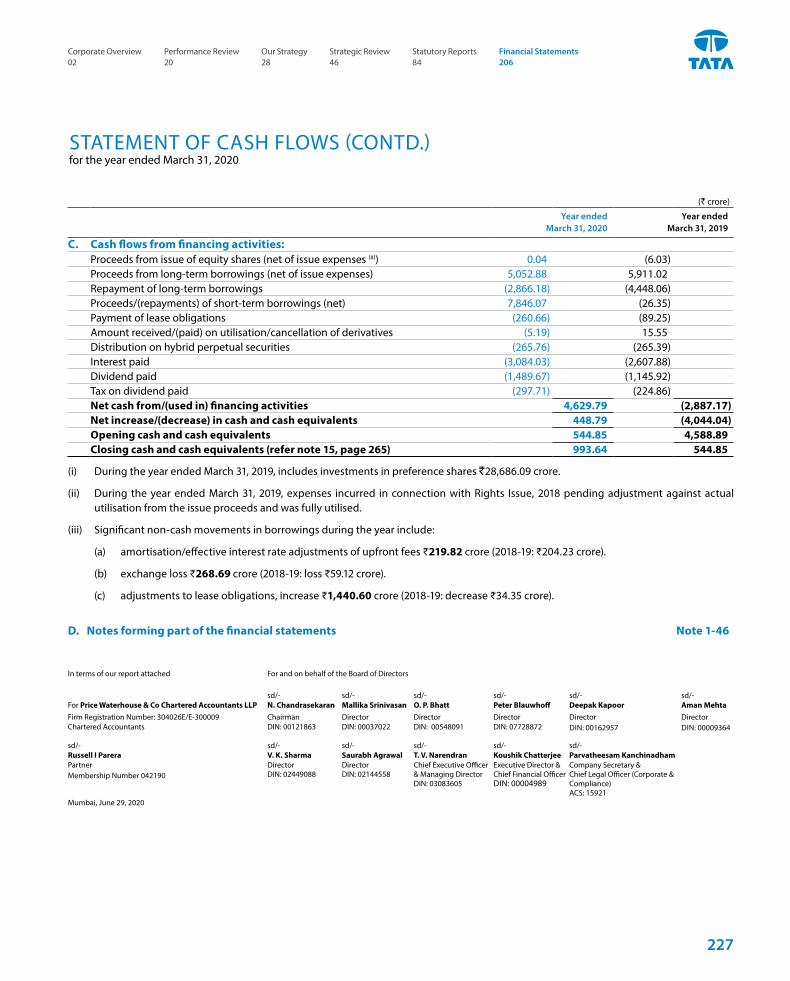
(` crore)
Year ended March 31, 2020
Year ended March 31, 2019
C. Cash flows from financing activities:Proceeds from issue of equity shares (net of issue expenses (ii)) 0.04 (6.03)Proceeds from long-term borrowings (net of issue expenses) 5,052.88 5,911.02Repayment of long-term borrowings (2,866.18) (4,448.06)Proceeds/(repayments) of short-term borrowings (net) 7,846.07 (26.35)Payment of lease obligations (260.66) (89.25)Amount received/(paid) on utilisation/cancellation of derivatives (5.19) 15.55Distribution on hybrid perpetual securities (265.76) (265.39)Interest paid (3,084.03) (2,607.88)Dividend paid (1,489.67) (1,145.92)Tax on dividend paid (297.71) (224.86)Net cash from/(used in) financing activities 4,629.79 (2,887.17)Net increase/(decrease) in cash and cash equivalents 448.79 (4,044.04)Opening cash and cash equivalents 544.85 4,588.89Closing cash and cash equivalents (refer note 15, page 265) 993.64 544.85
(i) During the year ended March 31, 2019, includes investments in preference shares `28,686.09 crore.
(ii) During the year ended March 31, 2019, expenses incurred in connection with Rights Issue, 2018 pending adjustment against actual utilisation from the issue proceeds and was fully utilised.
(iii) Significant non-cash movements in borrowings during the year include:
(a) amortisation/effective interest rate adjustments of upfront fees ₹219.82 crore (2018-19: ₹204.23 crore).
(b) exchange loss ₹268.69 crore (2018-19: loss ₹59.12 crore).
(c) adjustments to lease obligations, increase ₹1,440.60 crore (2018-19: decrease ₹34.35 crore).
D. Notes forming part of the financial statements Note 1-46
STATEMENT OF CASH FLOWS (CONTD.) for the year ended March 31, 2020
In terms of our report attached For and on behalf of the Board of Directors
sd/- sd/- sd/- sd/- sd/- sd/- For Price Waterhouse & Co Chartered Accountants LLP N. Chandrasekaran Mallika Srinivasan O. P. Bhatt Peter Blauwhoff Deepak Kapoor Aman MehtaFirm Registration Number: 304026E/E-300009 Chairman Director Director Director Director
DIN: 00162957Director DIN: 00009364Chartered Accountants DIN: 00121863 DIN: 00037022 DIN: 00548091 DIN: 07728872
sd/- sd/- sd/- sd/- sd/- sd/- Russell I Parera V. K. Sharma Saurabh Agrawal T. V. Narendran Koushik Chatterjee Parvatheesam KanchinadhamPartner Membership Number 042190
Director DIN: 02449088
Director DIN: 02144558
Chief Executive Officer & Managing Director DIN: 03083605
Executive Director & Chief Financial Officer DIN: 00004989
Company Secretary & Chief Legal Officer (Corporate & Compliance) ACS: 15921
Mumbai, June 29, 2020
Corporate Overview 02
Strategic Review 46
Performance Review 20
Statutory Reports 84
Our Strategy 28
Financial Statements 206
227
NOTESforming part of the financial statements
Standalone
1. Company information Tata Steel Limited (“the Company”) is a public limited Company
incorporated in India with its registered office in Mumbai, Maharashtra, India. The Company is listed on the BSE Limited (BSE) and the National Stock Exchange of India Limited (NSE).
The Company has presence across the entire value chain of steel manufacturing from mining and processing iron ore and coal to producing and distributing finished products. The Company offers a broad range of steel products including a portfolio of high value added downstream products such as hot rolled, cold rolled, coated steel, rebars, wire rods, tubes and wires.
The functional and presentation currency of the Company is Indian Rupee (“₹”) which is the currency of the primary economic environment in which the Company operates.
As on March 31, 2020, Tata Sons Private Limited owns 32.93 % of the Ordinary Shares of the Company, and has the ability to influence the Company’s operations.
The financial statements for the year ended March 31, 2020 were approved by the Board of Directors and authorised for issue on June 29, 2020.
2. Significant accounting policies The significant accounting policies applied by the Company
in the preparation of its financial statements are listed below. Such accounting policies have been applied consistently to all the periods presented in these financial statements, unless otherwise indicated.
(a) Statement of compliance The financial statements have been prepared in accordance
with the Indian Accounting Standards (referred to as “Ind AS”) prescribed under section 133 of the Companies Act, 2013 read with Companies (Indian Accounting Standards) Rules, as amended from time to time and other relevant provisions of the Act.
(b) Basis of preparation The financial statements have been prepared under the
historical cost convention with the exception of certain assets and liabilities that are required to be carried at fair value by Ind AS.
Fair value is the price that would be received to sell an asset or paid to transfer a liability in an orderly transaction between market participants at the measurement date.
(c) Use of estimates and critical accounting judgements
In the preparation of financial statements, the Company makes judgements, estimates and assumptions about the carrying values of assets and liabilities that are not readily apparent from other sources. The estimates and associated assumptions are based on historical experience and other factors that are considered to be relevant. Actual results may differ from these estimates.
Estimates and underlying assumptions are reviewed on an ongoing basis. Revisions to accounting estimates are recognised in the period in which the estimate is revised and future periods affected.
Key source of estimation of uncertainty at the date of financial statements, which may cause material adjustment to the carrying amounts of assets and liabilities within the next financial year, is in respect of impairment, useful lives of property, plant and equipment and intangible assets, valuation of deferred tax assets, provisions and contingent liabilities, fair value measurements of financial instruments and retirement benefit obligations as discussed below:
Impairment
The Company estimates the value in use of the cash generating unit (CGU) based on future cash flows after considering current economic conditions and trends, estimated future operating results and growth rates and anticipated future economic and regulatory conditions. The estimated cash flows are developed using internal forecasts. The cash flows are discounted using a suitable discount rate in order to calculate the present value. Further details of the Company’s impairment review and key assumptions are set out in note 3, page 240, note 5, page 244 , note 6, page 245, and note 7, page 246.
Useful lives of property, plant and equipment and intangible assets
The Company reviews the useful life of property, plant and equipment and intangible assets at the end of each reporting period. This reassessment may result in change in depreciation and amortisation expense in future periods. The policy has been detailed in note 2(i), page 231.
Valuation of deferred tax assets
The Company reviews the carrying amount of deferred tax assets at the end of each reporting period. The policy has been detailed in note 2(u), page 237 and its further information are set out in note 11, page 258.
INTEGRATED REPORT & ANNUAL ACCOUNTS 2019-20 | 113TH YEAR228
NOTESforming part of the financial statements
2. Significant accounting policies (Contd.)
Provisions and contingent liabilities
A provision is recognised when the Company has a present obligation as result of a past event and it is probable that the outflow of resources will be required to settle the obligation, in respect of which a reliable estimate can be made. These are reviewed at each balance sheet date and adjusted to reflect the current best estimates. Contingent liabilities are not recognised in the financial statements. Further details are set out in note 22, page 276 and note 37A, page 291.
Fair value measurements of financial instruments
When the fair value of financial assets and financial liabilities recorded in the balance sheet cannot be measured based on quoted prices in active markets, their fair value is measured using valuation techniques including Discounted Cash Flow Model. The inputs to these models are taken from observable markets where possible, but where this is not feasible, a degree of judgement is required in establishing fair value. Judgements include considerations of inputs such as liquidity risks, credit risks and volatility. Changes in assumptions about these factors could affect the reported fair value of financial instruments. Further details are set out in note 40, page 297.
Retirement benefit obligations The Company’s retirement benefit obligations are subject
to number of judgements including discount rates, inflation and salary growth. Significant judgements are required when setting these criteria and a change in these assumptions would have a significant impact on the amount recorded in the Company’s balance sheet and the statement of profit and loss. The Company sets these judgements based on previous experience and third party actuarial advice. Further details on the Company’s retirement benefit obligations, including key judgements are set out in note 36, page 284.
Estimation of uncertainties relating to COVID-19 Post declaration of COVID-19 as a pandemic by the World
Health Organization, the Government in India have taken significant measures to curtail the wide spread of virus, including country wide lockdown and restriction in economic activities. In view of such lockdowns, operations at the Company’s steel making facilities have been scaled down from the end week of March 2020.
In view of the impact of COVID-19, the Company has assessed the carrying amounts of property, plant and equipment, right-of-use assets, intangible assets, inventories, trade receivables,
investments and other financial assets. In assessing the recoverable value of such assets, the Company has considered various internal and external information such as existing long-term arrangements with customer and vendor partners, long-term business plan, cash flow forecasts and possible future uncertainties in economic conditions because of the pandemic including lockdowns and supply chain disruptions.
As per the Company’s current assessment of recoverability of these assets, other than the impairment recorded, no significant impact on carrying amounts of these assets is expected.
The eventual outcome of the impact of the global health pandemic may be different from those estimated as on the date of approval of these financial statements and the Company continues to closely monitor the situation including any material changes to future economic conditions and consequential impact on its financial statements.
(d) Property, plant and equipment An item of property, plant and equipment is recognised as an
asset if it is probable that future economic benefits associated with the item will flow to the Company and its cost can be measured reliably. This recognition principle is applied to costs incurred initially to acquire an item of property, plant and equipment and also to costs incurred subsequently to add to, replace part of, or service it. All other repair and maintenance costs, including regular servicing, are recognised in the statement of profit and loss as incurred. When a replacement occurs, the carrying value of the replaced part is de-recognised. Where an item of property, plant and equipment comprises major components having different useful lives, these components are accounted for as separate items.
Property, plant and equipment is stated at cost or deemed cost applied on transition to Ind AS, less accumulated depreciation and impairment. Cost includes all direct costs and expenditures incurred to bring the asset to its working condition and location for its intended use. Trial run expenses (net of revenue) are capitalised. Borrowing costs incurred during the period of construction is capitalised as part of cost of qualifying asset.
The gain or loss arising on disposal of an item of property, plant and equipment is determined as the difference between sale proceeds and carrying value of such item, and is recognised in the statement of profit and loss.
(e) Exploration for and evaluation of mineral resources Expenditures associated with search for specific mineral
resources are recognised as exploration and evaluation assets. The following expenditure comprises cost of exploration and
229
Corporate Overview 02
Strategic Review 46
Performance Review 20
Statutory Reports 84
Our Strategy 28
Financial Statements 206
NOTESforming part of the financial statements
Standalone
2. Significant accounting policies (Contd.)
evaluation assets: The following expenditure comprises cost of exploration and evaluation assets:
• obtaining of the rights to explore and evaluate mineral reserves and resources including costs directly related to this acquisition
• researching and analysing existing exploration data
• conducting geological studies, exploratory drilling and sampling
• examining and testing extraction and treatment methods
• compiling pre-feasibility and feasibility studies
• activities in relation to evaluating the technical feasibility and commercial viability of extracting a mineral resource
Administration and other overhead costs are charged to the cost of exploration and evaluation assets only if directly related to an exploration and evaluation project.
If a project does not prove viable, all irrecoverable exploration and evaluation expenditure associated with the project net of any related impairment allowances is written off to the statement of profit and loss.
The Company measures its exploration and evaluation assets at cost and classifies as property, plant and equipment or intangible assets according to the nature of the assets acquired and applies the classification consistently. To the extent that a tangible asset is consumed in developing an intangible asset, the amount reflecting that consumption is capitalised as a part of the cost of the intangible asset.
As the asset is not available for use, it is not depreciated. All exploration and evaluation assets are monitored for indications of impairment. An exploration and evaluation asset is no longer classified as such when the technical feasibility and commercial viability of extracting a mineral resource are demonstrable and the development of the deposit is sanctioned by the management. The carrying value of such exploration and evaluation asset is reclassified to mining assets.
(f) Development expenditure for mineral reserves
Development is the establishment of access to mineral reserves and other preparations for commercial production. Development activities often continue during production and include:
• sinking shafts and underground drifts (often called mine development)
• making permanent excavations
• developing passageways and rooms or galleries
• building roads and tunnels and
• advance removal of overburden and waste rock
Development (or construction) also includes the installation of infrastructure (e.g., roads, utilities and housing), machinery, equipment and facilities.
Development expenditure is capitalised and presented as part of mining assets. No depreciation is charged on the development expenditure before the start of commercial production.
(g) Provision for restoration and environmental costs The Company has liabilities related to restoration of soil and
other related works, which are due upon the closure of certain of its mining sites.
Such liabilities are estimated case-by-case based on available information, taking into account applicable local legal requirements. The estimation is made using existing technology, at current prices, and discounted using an appropriate discount rate where the effect of time value of money is material. Future restoration and environmental costs, discounted to net present value, are capitalised and the corresponding restoration liability is raised as soon as the obligation to incur such costs arises. Future restoration and environmental costs are capitalised in property, plant and equipment or mining assets as appropriate and are depreciated over the life of the related asset. The effect of time value of money on the restoration and environmental costs liability is recognised in the statement of profit and loss.
(h) Intangible assets Patents, trademarks and software costs are included in
the balance sheet as intangible assets when it is probable that associated future economic benefits would flow to the Company. In this case they are measured initially at purchase cost and then amortised on a straight-line basis over their estimated useful lives. All other costs on patents, trademarks and software are expensed in the statement of profit and loss as and when incurred.
Expenditure on research activities is recognised as an expense in the period in which it is incurred. Costs incurred on individual
INTEGRATED REPORT & ANNUAL ACCOUNTS 2019-20 | 113TH YEAR230
NOTESforming part of the financial statements
2. Significant accounting policies (Contd.)
development projects are recognised as intangible assets from the date when all of the following conditions are met:
(i) completion of the development is technically feasible.
(ii) it is the intention to complete the intangible asset and use or sell it.
(iii) ability to use or sell the intangible asset.
(iv) it is clear that the intangible asset will generate probable future economic benefits.
(v) adequate technical, financial and other resources to complete the development and to use or sell the intangible asset are available.
(vi) it is possible to reliably measure the expenditure attributable to the intangible asset during its development.
Recognition of costs as an asset is ceased when the project is complete and available for its intended use, or if these criteria are no longer applicable.
Where development activities do not meet the conditions for recognition as an asset, any associated expenditure is treated as an expense in the period in which it is incurred.
Subsequent to initial recognition, intangible assets with definite useful lives are reported at cost or deemed cost applied on transition to Ind AS, less accumulated amortisation and accumulated impairment losses.
(i) Depreciation and amortisation of property, plant and equipment, right-of-use assets and intangible assets
Depreciation or amortisation is provided so as to write off, on a staright-line basis, the cost/deemed cost of property, plant and equipment and intangible assets, including right-of-use assets to their residual value. These charges are commenced from the dates the assets are available for their intended use and are spread over their estimated useful economic lives or, in the case of right-of-use assets, over the lease period, if shorter. The estimated useful lives of assets, residual values and depreciation method are reviewed regularly and, when necessary, revised.
Depreciation on assets under construction commences only when the assets are ready for their intended use.
The estimated useful lives for main categories of property, plant and equipment and intangible assets are:
Estimated useful life (years)
Buildings upto 60 years*Roads 5 yearsPlant and machinery upto 40 years*Railway sidings upto 35 years*Vehicles and aircraft 5 to 20 yearsFurniture, fixtures and office equipments 4 to 6 yearsComputer software 5 yearsAssets covered under Electricity Act (life as prescribed under the Electricity Act)
3 to 34 years
Mining assets are amortised over the useful life of the mine or lease period whichever is lower.
Major furnace relining expenses are depreciated over a period of 10 years (average expected life).
Freehold land is not depreciated.
Assets value upto ₹25,000 are fully depreciated in the year of acquisition.
*For these class of assets, based on internal assessment and independent technical evaluation carried out by chartered engineers, the Company believes that the useful lives as given above best represents the period over which the Company expects to use these assets. Hence the useful lives for these assets are different from the useful lives as prescribed under Part C of Schedule II of the Companies Act, 2013.
(j) Impairment
At each balance sheet date, the Company reviews the carrying value of its property, plant and equipment and intangible assets to determine whether there is any indication that the carrying value of those assets may not be recoverable through continuing use. If any such indication exists, the recoverable amount of the asset is reviewed in order to determine the extent of impairment loss, if any. Where the asset does not generate cash flows that are independent from other assets, the Company estimates the recoverable amount of the cash generating unit to which the asset belongs.
Recoverable amount is the higher of fair value less costs to sell and value in use. In assessing value in use, the estimated future cash flows are discounted to their present value using a pre-tax discount rate that reflects current market assessments of the time value of money and the risks specific to the asset for which the estimates of future cash flows have not been adjusted. An
231
Corporate Overview 02
Strategic Review 46
Performance Review 20
Statutory Reports 84
Our Strategy 28
Financial Statements 206
NOTESforming part of the financial statements
Standalone
2. Significant accounting policies (Contd.)
impairment loss is recognised in the statement of profit and loss as and when the carrying value of an asset exceeds its recoverable amount.
Where an impairment loss subsequently reverses, the carrying value of the asset (or cash generating unit) is increased to the revised estimate of its recoverable amount so that the increased carrying value does not exceed the carrying value that would have been determined had no impairment loss been recognised for the asset (or cash generating unit) in prior years. A reversal of an impairment loss is recognised in the statement of profit and loss immediately.
(k) Leases Ind AS 116 “Leases” replaces Ind AS 17 “Leases” with effect
from April 1, 2019.
The adoption of this new Standard has resulted in the Company recognising a right-of-use asset and related lease liability in connection with all former operating leases except for those identified as low-value or having a remaining lease term of less than 12 months from the date of initial application.
The new Standard has been applied using the modified retrospective approach, with the right-of-use asset recognised at an amount equal to the present value of lease liability, adjusted by the amount of any prepaid or accrued lease payments relating to those leases. Prior periods have not been restated.
For contracts in place at the date of initial application, the Company has elected not to carry forward the definition of leases as per Ind AS 17 and has therefore, applied the definition of a lease as per Ind AS 116 to all such arrangements.
On transition, for leases previously accounted for as operating leases with a remaining lease term of less than 12 months and for leases of low-value assets the Company has applied the optional exemptions to not recognise right-of-use assets but to account for the lease expense on a straight-line basis over the remaining lease term.
For those leases previously classified as finance leases, the right-of-use asset and lease liability are measured at the date of initial application at the same amounts as under Ind AS 17 ‘Leases’ immediately before the date of initial application.
Refer note 2(k) - Significant accounting policies – Leases in the Annual report of the Company for the year ended March 31, 2019, page 219 for the policy as per Ind AS 17 “Leases”.
The Company as lessee
The Company accounts for each lease component within the contract as a lease separately from non-lease components of the contract and allocates the consideration in the contract to each lease component on the basis of the relative stand-alone price of the lease component and the aggregate stand-alone price of the non-lease components. The Company recognises right-of-use asset representing its right to use the underlying asset for the lease term at the lease commencement date. The cost of the right-of-use asset measured at inception comprises of the amount of initial measurement of the lease liability adjusted for any lease payments made at or before the commencement date.
Certain lease arrangements include options to extend or terminate the lease before the end of the lease term. The right-of-use assets and lease liabilities include these options when it is reasonably certain that such options would be exercised.
The right-of-use assets is subsequently measured at cost less any accumulated depreciation, accumulated impairment losses, if any and adjusted for any remeasurement of the lease liability. The right-of-use assets is depreciated using the straight-line method from the commencement date over the shorter of lease term or useful life of right-of-use asset.
Right-of-use assets are tested for impairment whenever there is any indication that their carrying amounts may not be recoverable. Impairment loss, if any, is recognised in the statement of profit and loss.
Lease liability is measured at the present value of the lease payments that are not paid at the commencement date of the lease. The lease payments are discounted using the interest rate implicit in the lease, if that rate can be readily determined. If that rate cannot be readily determined, the Company uses incremental borrowing rate. The lease liability is subsequently remeasured by increasing the carrying amount to reflect interest on the lease liability, reducing the carrying amount to reflect the lease payments made and remeasuring the carrying amount to reflect any reassessment or lease modifications. The Company recognises the amount of the remeasurement of lease liability as an adjustment to the right-of-use asset. Where the carrying amount of the right-of-use asset is reduced to zero and there is a further reduction in the measurement of the lease liability, the Company recognises any remaining amount of the remeasurement in statement of profit and loss.
Variable lease payments not included in the measurement of the lease liabilities are expensed to the statement of profit and loss in the period in which the events or conditions which trigger those payments occur.
INTEGRATED REPORT & ANNUAL ACCOUNTS 2019-20 | 113TH YEAR232
NOTESforming part of the financial statements
2. Significant accounting policies (Contd.)
The Company accounts for sale and lease back transaction, recognising right-of-use assets and lease liability, measured in the same way as other right-of-use assets and lease liability. Gain or loss on the sale transaction is recognised in statement of profit and loss.
The Company as lessor
(i) Operating lease – Rental income from operating leases is recognised in the statement of profit and loss on a straight-line basis over the term of the relevant lease unless another systematic basis is more representative of the time pattern in which economic benefits from the leased asset is diminished. Initial direct costs incurred in negotiating and arranging an operating lease are added to the carrying value of the leased asset and recognised on a straight-line basis over the lease term.
(ii) Finance lease –When assets are leased out under a finance lease, the present value of minimum lease payments is recognised as a receivable. The difference between the gross receivable and the present value of receivable is recognised as unearned finance income. Lease income is recognised over the term of the lease using the net investment method before tax, which reflects a constant periodic rate of return.
(l) Stripping costs The Company separates two different types of stripping costs
that are incurred in surface mining activity:
• developmental stripping costs and
• production stripping costs
Developmental stripping costs which are incurred in order to obtain access to quantities of mineral reserves that will be mined in future periods are capitalised as part of mining assets. Capitalisation of developmental stripping costs ends when the commercial production of the mineral reserves begins.
A mine can operate several open pits that are regarded as separate operations for the purpose of mine planning and production. In this case, stripping costs are accounted for separately, by reference to the ore extracted from each separate pit. If, however, the pits are highly integrated for the purpose of mine planning and production, stripping costs are aggregated too.
The determination of whether multiple pit mines are considered separate or integrated operations depends on each mine’s specific circumstances. The following factors normally point towards the stripping costs for the individual pits being accounted for separately:
• mining of the second and subsequent pits is conducted consecutively with that of the first pit, rather than concurrently
• separate investment decisions are made to develop each pit, rather than a single investment decision being made at the outset
• the pits are operated as separate units in terms of mine planning and the sequencing of overburden and ore mining, rather than as an integrated unit
• expenditures for additional infrastructure to support the second and subsequent pits are relatively large
• the pits extract ore from separate and distinct ore bodies, rather than from a single ore body.
The relative importance of each factor is considered by the management to determine whether, the stripping costs should be attributed to the individual pit or to the combined output from the several pits.
Production stripping costs are incurred to extract the ore in the form of inventories and/or to improve access to an additional component of an ore body or deeper levels of material. Production stripping costs are accounted for as inventories to the extent the benefit from production stripping activity is realised in the form of inventories.
The Company recognises a stripping activity asset in the production phase if, and only if, all of the following are met:
• it is probable that the future economic benefit (improved access to the ore body) associated with the stripping activity will flow to the Company
• the Company can identify the component of the ore body for which access has been improved and
• the costs relating to the improved access to that component can be measured reliably.
Such costs are presented within mining assets. After initial recognition, stripping activity assets are carried at cost/deemed cost less accumulated amortisation and impairment. The expected useful life of the identified component of the ore body is used to depreciate or amortise the stripping asset.
233
Corporate Overview 02
Strategic Review 46
Performance Review 20
Statutory Reports 84
Our Strategy 28
Financial Statements 206
NOTESforming part of the financial statements
Standalone
2. Significant accounting policies (Contd.)
(m) Investments in subsidiaries, associates and joint ventures
Investments in subsidiaries, associates and joint ventures are carried at cost/deemed cost applied on transition to Ind AS, less accumulated impairment losses, if any. Where an indication of impairment exists, the carrying amount of investment is assessed and an impairment provision is recognised, if required immediately to its recoverable amount. On disposal of such investments, difference between the net disposal proceeds and carrying amount is recognised in the statement of profit and loss.
(n) Financial instruments Financial assets and financial liabilities are recognised when
the Company becomes a party to the contractual provisions of the instrument. Financial assets and liabilities are initially measured at fair value. Transaction costs that are directly attributable to the acquisition or issue of financial assets and financial liabilities (other than financial assets and financial liabilities at fair value through profit and loss) are added to or deducted from the fair value measured on initial recognition of financial asset or financial liability. The transaction costs directly attributable to the acquisition of financial assets and financial liabilities at fair value through profit and loss are immediately recognised in the statement of profit and loss.
Effective interest method
The effective interest method is a method of calculating the amortised cost of a financial instrument and of allocating interest income or expense over the relevant period. The effective interest rate is the rate that exactly discounts future cash receipts or payments through the expected life of the financial instrument, or where appropriate, a shorter period.
(I) Financial assets
Cash and bank balances
Cash and bank balances consist of:
(i) Cash and cash equivalents - which includes cash on hand, deposits held at call with banks and other short-term deposits which are readily convertible into known amounts of cash, are subject to an insignificant risk of change in value and have original maturities of less than one year. These balances with banks are unrestricted for withdrawal and usage.
(ii) Other bank balances - which includes balances and deposits with banks that are restricted for withdrawal and usage.
Financial assets at amortised cost
Financial assets are subsequently measured at amortised cost if these financial assets are held within a business model whose objective is to hold these assets in order to collect contractual cash flows and the contractual terms of the financial asset give rise on specified dates to cash flows that are solely payments of principal and interest on the principal amount outstanding.
Financial assets measured at fair value
Financial assets are measured at fair value through other comprehensive income if such financial assets are held within a business model whose objective is to hold these assets in order to collect contractual cash flows or to sell such financial assets and the contractual terms of the financial asset give rise on specified dates to cash flows that are solely payments of principal and interest on the principal amount outstanding.
The Company in respect of equity investments (other than in subsidiaries, associates and joint ventures) which are not held for trading has made an irrevocable election to present in other comprehensive income subsequent changes in the fair value of such equity instruments. Such an election is made by the Company on an instrument by instrument basis at the time of initial recognition of such equity investments. These investments are held for medium or long-term strategic purpose. The Company has chosen to designate these investments in equity instruments as fair value through other comprehensive income as the management believes this provides a more meaningful presentation for medium or long-term strategic investments, than reflecting changes in fair value immediately in the statement of profit and loss.
Financial assets not measured at amortised cost or at fair value through other comprehensive income are carried at fair value through profit and loss.
Interest income
Interest income is accrued on a time proportion basis, by reference to the principal outstanding and effective interest rate applicable.
Dividend income
Dividend income from investments is recognised when the right to receive payment has been established.
INTEGRATED REPORT & ANNUAL ACCOUNTS 2019-20 | 113TH YEAR234
NOTESforming part of the financial statements
2. Significant accounting policies (Contd.)
Impairment of financial assets
Loss allowance for expected credit losses is recognised for financial assets measured at amortised cost and fair value through other comprehensive income.
The Company recognises life time expected credit losses for all trade receivables that do not constitute a financing transaction.
For financial assets (apart from trade receivables that do not constitute of financing transaction) whose credit risk has not significantly increased since initial recognition, loss allowance equal to twelve months expected credit losses is recognised. Loss allowance equal to the lifetime expected credit losses is recognised if the credit risk of the financial asset has significantly increased since initial recognition.
De-recognition of financial assets
The Company de-recognises a financial asset only when the contractual rights to the cash flows from the asset expire, or it transfers the financial asset and substantially all risks and rewards of ownership of the asset to another entity.
If the Company neither transfers nor retains substantially all the risks and rewards of ownership and continues to control the transferred asset, the Company recognises its retained interest in the assets and an associated liability for amounts it may have to pay.
If the Company retains substantially all the risks and rewards of ownership of a transferred financial asset, the Company continues to recognise the financial asset and also recognises a borrowing for the proceeds received.
(II) Financial liabilities and equity instruments
Classification as debt or equity
Financial liabilities and equity instruments issued by the Company are classified according to the substance of the contractual arrangements entered into and the definitions of a financial liability and an equity instrument.
Equity instruments
An equity instrument is any contract that evidences a residual interest in the assets of the Company after deducting all of its liabilities. Equity instruments are recorded at the proceeds received, net of direct issue costs.
Financial liabilities
Trade and other payables are initially measured at fair value, net of transaction costs, and are subsequently measured at amortised cost,
using the effective interest rate method where the time value of money is significant.
Interest bearing bank loans, overdrafts and issued debt are initially measured at fair value and are subsequently measured at amortised cost using the effective interest rate method. Any difference between the proceeds (net of transaction costs) and the settlement or redemption of borrowings is recognised over the term of the borrowings in the statement of profit and loss.
De-recognition of financial liabilities
The Company de-recognises financial liabilities when, and only when, the Company’s obligations are discharged, cancelled or they expire.
Derivative financial instruments and hedge accounting
In the ordinary course of business, the Company uses certain derivative financial instruments to reduce business risks which arise from its exposure to foreign exchange and interest rate fluctuations. The instruments are confined principally to forward foreign exchange contracts, cross currency swaps, interest rate swaps and collars. The instruments are employed as hedges of transactions included in the financial statements or for highly probable forecast transactions/firm contractual commitments. These derivatives contracts do not generally extend beyond six months, except for certain currency swaps and interest rate derivatives.
Derivatives are initially accounted for and measured at fair value on the date the derivative contract is entered into and are subsequently remeasured to their fair value at the end of each reporting period.
The Company adopts hedge accounting for forward foreign exchange and interest rate contracts wherever possible. At inception of each hedge, there is a formal, documented designation of the hedging relationship. This documentation includes, inter alia, items such as identification of the hedged item and transaction and nature of the risk being hedged. At inception, each hedge is expected to be highly effective in achieving an offset of changes in fair value or cash flows attributable to the hedged risk. The effectiveness of hedge instruments to reduce the risk associated with the exposure being hedged is assessed and measured at the inception and on an ongoing basis. The ineffective portion of designated hedges is recognised immediately in the statement of profit and loss.
When hedge accounting is applied:
• for fair value hedges of recognised assets and liabilities, changes in fair value of the hedged assets and liabilities attributable to the risk being hedged, are recognised in the statement of profit and loss and compensate for the effective portion of symmetrical changes in the fair value of the derivatives.
235
Corporate Overview 02
Strategic Review 46
Performance Review 20
Statutory Reports 84
Our Strategy 28
Financial Statements 206
NOTESforming part of the financial statements
Standalone
2. Significant accounting policies (Contd.)
• for cash flow hedges, the effective portion of the change in the fair value of the derivative is recognised directly in other comprehensive income and the ineffective portion is recognised in the statement of profit and loss. If the cash flow hedge of a firm commitment or forecasted transaction results in the recognition of a non-financial asset or liability, then, at the time the asset or liability is recognised, the associated gains or losses on the derivative that had previously been recognised in equity are included in the initial measurement of the asset or liability. For hedges that do not result in the recognition of a non-financial asset or a liability, amounts deferred in equity are recognised in the statement of profit and loss in the same period in which the hedged item affects the statement of profit and loss.
In cases where hedge accounting is not applied, changes in the fair value of derivatives are recognised in the statement of profit and loss as and when they arise.
Hedge accounting is discontinued when the hedging instrument expires or is sold, terminated, or exercised, or no longer qualifies for hedge accounting. At that time, any cumulative gain or loss on the hedging instrument recognised in equity is retained in equity until the forecasted transaction occurs. If a hedged transaction is no longer expected to occur, the net cumulative gain or loss recognised in equity is transferred to the statement of profit and loss for the period.
(o) Employee benefits
Defined contribution plans
Contributions under defined contribution plans are recognised as expense for the period in which the employee has rendered the service. Payments made to state managed retirement benefit schemes are dealt with as payments to defined contribution schemes where the Company’s obligations under the schemes are equivalent to those arising in a defined contribution retirement benefit scheme.
Defined benefit plans
For defined benefit retirement schemes, the cost of providing benefits is determined using the Projected Unit Credit Method, with actuarial valuation being carried out at each year-end balance sheet date. Remeasurement gains and losses of the net defined benefit liability/(asset) are recognised immediately in other comprehensive income. The service cost and net interest on the net defined benefit liability/(asset) are recognised as an expense within employee costs.
Past service cost is recognised as an expense when the plan amendment or curtailment occurs or when any related restructuring costs or termination benefits are recognised, whichever is earlier.
The retirement benefit obligations recognised in the balance sheet represents the present value of the defined benefit obligations as reduced by the fair value of plan assets.
Compensated absences
Compensated absences which are not expected to occur within twelve months after the end of the period in which the employee renders the related service are recognised based on actuarial valuation at the present value of the obligation as on the reporting date.
(p) Inventories Inventories are stated at the lower of cost and net realisable
value. Cost is ascertained on a weighted average basis. Costs comprise direct materials and, where applicable, direct labour costs and those overheads that have been incurred in bringing the inventories to their present location and condition. Net realisable value is the price at which the inventories can be realised in the normal course of business after allowing for the cost of conversion from their existing state to a finished condition and for the cost of marketing, selling and distribution.
Provisions are made to cover slow-moving and obsolete items based on historical experience of utilisation on a product category basis, which involves individual businesses considering their product lines and market conditions.
(q) Provisions Provisions are recognised in the balance sheet when the
Company has a present obligation (legal or constructive) as a result of a past event, which is expected to result in an outflow of resources embodying economic benefits which can be reliably estimated. Each provision is based on the best estimate of the expenditure required to settle the present obligation at the balance sheet date. Where the time value of money is material, provisions are measured on a discounted basis.
Constructive obligation is an obligation that derives from an entity’s actions where:
(i) by an established pattern of past practice, published policies or a sufficiently specific current statement, the entity has indicated to other parties that it will accept certain responsibilities and;
INTEGRATED REPORT & ANNUAL ACCOUNTS 2019-20 | 113TH YEAR236
NOTESforming part of the financial statements
2. Significant accounting policies (Contd.)
(ii) as a result, the entity has created a valid expectation on the part of those other parties that it will discharge such responsibilities.
(r) Onerous contracts A provision for onerous contracts is recognised when the
expected benefits to be derived by the Company from a contract are lower than the unavoidable cost of meeting its obligations under the contract. The provision is measured at the present value of the lower of the expected cost of terminating the contract and the expected net cost of continuing with the contract. Before a provision is established, the Company recognises any impairment loss on the assets associated with that contract.
(s) Government grants Government grants are recognised at its fair value, where
there is a reasonable assurance that such grants will be received and compliance with the conditions attached therewith have been met.
Government grants related to expenditure on property, plant and equipment are credited to the statement of profit and loss over the useful lives of qualifying assets or other systematic basis representative of the pattern of fulfilment of obligations associated with the grant received. Grants received less amounts credited to the statement of profit and loss at the reporting date are included in the balance sheet as deferred income.
(t) Non-current assets held for sale and discontinued operations
Non-current assets and disposal groups classified as held for sale are measured at the lower of their carrying value and fair value less costs to sell.
Assets and disposal groups are classified as held for sale if their carrying value will be recovered through a sale transaction rather than through continuing use. This condition is only met when the sale is highly probable and the asset, or disposal group, is available for immediate sale in its present condition and is marketed for sale at a price that is reasonable in relation to its current fair value. The Company must also be committed to the sale, which should be expected to qualify for recognition as a completed sale within one year from the date of classification.
Where a disposal group represents a separate major line of business or geographical area of operations, or is part of a
single co-ordinated plan to dispose of a separate major line of business or geographical area of operations, then it is treated as a discontinued operation. The post-tax profit or loss of the discontinued operation together with the gain or loss recognised on its disposal are disclosed as a single amount in the statement of profit and loss, with all prior periods being presented on this basis.
(u) Income taxes Tax expense for the year comprises current and deferred tax.
The tax currently payable is based on taxable profit for the year. Taxable profit differs from net profit as reported in the statement of profit and loss because it excludes items of income or expense that are taxable or deductible in other years and it further excludes items that are never taxable or deductible. The Company’s liability for current tax is calculated using tax rates and tax laws that have been enacted or substantively enacted by the end of the reporting period.
Deferred tax is the tax expected to be payable or recoverable on differences between the carrying value of assets and liabilities in the financial statements and the corresponding tax bases used in the computation of taxable profit and is accounted for using the balance sheet liability method. Deferred tax liabilities are generally recognised for all taxable temporary differences. In contrast, deferred tax assets are only recognised to the extent that it is probable that future taxable profits will be available against which the temporary differences can be utilised.
The carrying value of deferred tax assets is reviewed at the end of each reporting period and reduced to the extent that it is no longer probable that sufficient taxable profits will be available to allow all or part of the asset to be recovered.
Deferred tax is calculated at the tax rates that are expected to apply in the period when the liability is settled or the asset is realised based on the tax rates and tax laws that have been enacted or substantially enacted by the end of the reporting period. The measurement of deferred tax liabilities and assets reflects the tax consequences that would follow from the manner in which the Company expects, at the end of the reporting period, to recover or settle the carrying value of its assets and liabilities.
Deferred tax assets and liabilities are offset to the extent that they relate to taxes levied by the same tax authority and there are legally enforceable rights to set off current tax assets and current tax liabilities within that jurisdiction.
Current and deferred tax are recognised as an expense or income in the statement of profit and loss, except when they relate to items credited or debited either in other
237
Corporate Overview 02
Strategic Review 46
Performance Review 20
Statutory Reports 84
Our Strategy 28
Financial Statements 206
NOTESforming part of the financial statements
Standalone
2. Significant accounting policies (Contd.)
comprehensive income or directly in equity, in which case the tax is also recognised in other comprehensive income or directly in equity.
Deferred tax assets include Minimum Alternate Tax (MAT) paid in accordance with the tax laws in India, which is likely to give future economic benefits in the form of availability of set off against future income tax liability. MAT is recognised as deferred tax assets in the balance sheet when the asset can be measured reliably and it is probable that the future economic benefit associated with the asset will be realised.
(v) Revenue The Company manufactures and sells a range of steel and
other products.
Sale of products
Revenue from sale of products is recognised when control of the products has transferred, being when the products are delivered to the customer. Delivery occurs when the products have been shipped or delivered to the specific location as the case may be, the risks of loss has been transferred, and either the customer has accepted the products in accordance with the sales contract, or the Company has objective evidence that all criteria for acceptance have been satisfied. Sale of products include related ancillary services, if any.
Goods are often sold with volume discounts based on aggregate sales over a 12 months period. Revenue from these sales is recognised based on the price specified in the contract, net of the estimated volume discounts. Accumulated experience is used to estimate and provide for the discounts, using the most likely method, and revenue is only recognised to the extent that it is highly probable that a significant reversal will not occur. A liability is recognised for expected volume discounts payable to customers in relation to sales made until the end of the reporting period. No element of financing is deemed present as the sales are generally made with a credit term of 30-90 days, which is consistent with market practice. Any obligation to provide a refund is recognised as a provision. A receivable is recognised when the goods are delivered as this is the point in time that the consideration is unconditional because only the passage of time is required before the payment is due.
The Company does not have any contracts where the period between the transfer of the promised goods or services to the
customer and payment by the customer exceeds one year. As a consequence, the Company does not adjust any of the transaction prices for the time value of money.
Sale of power
Revenue from sale of power is recognised when the services are provided to the customer based on approved tariff rates established by the respective regulatory authorities. The Company doesn’t recognise revenue and an asset for cost incurred in the past that will be recovered.
(w) Foreign currency transactions and translations The financial statements of the Company are presented in Indian
Rupees (“₹”), which is the functional currency of the Company and the presentation currency for the financial statements.
In preparing the financial statements, transactions in currencies other than the Company’s functional currency are recorded at the rates of exchange prevailing on the date of the transaction. At the end of each reporting period, monetary items denominated in foreign currencies are re-translated at the rates prevailing at the end of the reporting period. Non-monetary items carried at fair value that are denominated in foreign currencies are re-translated at the rates prevailing on the date when the fair value was determined. Non-monetary items that are measured in terms of historical cost in a foreign currency are not translated.
Exchange differences arising on translation of long-term foreign currency monetary items recognised in the financial statements before the beginning of the first Ind AS financial reporting period in respect of which the Company has elected to recognise such exchange differences in equity or as part of cost of assets as allowed under Ind AS 101 “First-time adoption of Indian Accounting Standards” are added/deducted to/ from the cost of assets as the case may be. Such exchange differences recognised as part of cost of assets is recognised in the statement of profit and loss on a systematic basis.
Exchange differences arising on the re-translation or settlement of other monetary items are included in the statement of profit and loss for the period.
(x) Borrowing costs Borrowings costs directly attributable to the acquisition,
construction or production of qualifying assets, which are assets that necessarily take a substantial period of time to get ready for their intended use or sale, are added to the cost of those assets, until such time as the assets are substantially ready for the intended use or sale.
INTEGRATED REPORT & ANNUAL ACCOUNTS 2019-20 | 113TH YEAR238
NOTESforming part of the financial statements
2. Significant accounting policies (Contd.)
Investment income earned on temporary investment of specific borrowings pending their expenditure on qualifying assets is recognised in the statement of profit and loss.
Discounts or premiums and expenses on the issue of debt securities are amortised over the term of the related securities and included within borrowing costs. Premiums payable on early redemptions of debt securities, in lieu of future finance costs, are recognised as borrowing costs.
All other borrowing costs are recognised as expenses in the period in which it is incurred.
(y) Earnings per share Basic earnings per share is computed by dividing profit or loss
for the year attributable to equity holders by the weighted average number of shares outstanding during the year. Partly paid up shares are included as fully paid equivalents according to the fraction paid up.
Diluted earnings per share is computed using the weighted average number of shares and dilutive potential shares except where the result would be anti-dilutive.
(z) Recent accounting pronouncements
Amendment to Ind AS 12 “Income Tax” - Insertion of Appendix C, “Uncertainty over Income tax treatments”
The amendment intends to bring clarity to the accounting for uncertainties on income tax treatments that have yet to be accepted by tax authorities, and to reflect it in the measurement of current and deferred taxes.
The Company has applied the amendments prospectively for annual reporting periods beginning on or after April 1, 2019. There is no material impact on the Company due to the application of the above amendment.
Amendment to Ind AS 23 “Borrowing Costs” The amendment clarifies that if any specific borrowing remains
outstanding after the related asset is ready for its intended use or sale, that borrowing becomes part of the funds that an entity borrows generally when calculating the capitalisation rate on general borrowings.
The Company has applied the amendments prospectively for annual reporting periods beginning on or after April 1, 2019 There is no material impact on the Company due to the application of the above amendment.
There is no new standard or amendment to the existing standards which would have been applicable from April 1, 2020.
239
Corporate Overview 02
Strategic Review 46
Performance Review 20
Statutory Reports 84
Our Strategy 28
Financial Statements 206
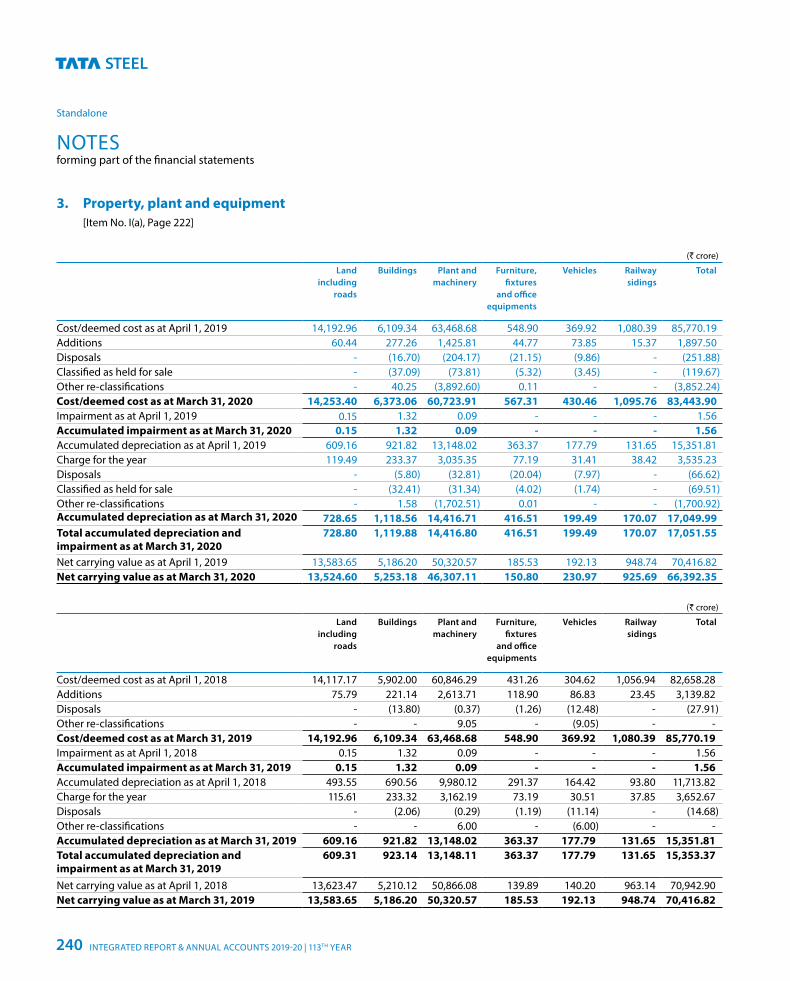
NOTESforming part of the financial statements
Standalone
3. Property, plant and equipment [Item No. I(a), Page 222]
(` crore)
Land including
roads
Buildings Plant andmachinery
Furniture,fixtures
and office equipments
Vehicles Railwaysidings
Total
Cost/deemed cost as at April 1, 2019 14,192.96 6,109.34 63,468.68 548.90 369.92 1,080.39 85,770.19Additions 60.44 277.26 1,425.81 44.77 73.85 15.37 1,897.50Disposals - (16.70) (204.17) (21.15) (9.86) - (251.88)Classified as held for sale - (37.09) (73.81) (5.32) (3.45) - (119.67)Other re-classifications - 40.25 (3,892.60) 0.11 - - (3,852.24)Cost/deemed cost as at March 31, 2020 14,253.40 6,373.06 60,723.91 567.31 430.46 1,095.76 83,443.90Impairment as at April 1, 2019 0.15 1.32 0.09 - - - 1.56Accumulated impairment as at March 31, 2020 0.15 1.32 0.09 - - - 1.56Accumulated depreciation as at April 1, 2019 609.16 921.82 13,148.02 363.37 177.79 131.65 15,351.81Charge for the year 119.49 233.37 3,035.35 77.19 31.41 38.42 3,535.23Disposals - (5.80) (32.81) (20.04) (7.97) - (66.62)Classified as held for sale - (32.41) (31.34) (4.02) (1.74) - (69.51)Other re-classifications - 1.58 (1,702.51) 0.01 - - (1,700.92)Accumulated depreciation as at March 31, 2020 728.65 1,118.56 14,416.71 416.51 199.49 170.07 17,049.99Total accumulated depreciation and impairment as at March 31, 2020
728.80 1,119.88 14,416.80 416.51 199.49 170.07 17,051.55
Net carrying value as at April 1, 2019 13,583.65 5,186.20 50,320.57 185.53 192.13 948.74 70,416.82Net carrying value as at March 31, 2020 13,524.60 5,253.18 46,307.11 150.80 230.97 925.69 66,392.35
(` crore)
Land including
roads
Buildings Plant andmachinery
Furniture,fixtures
and office equipments
Vehicles Railwaysidings
Total
Cost/deemed cost as at April 1, 2018 14,117.17 5,902.00 60,846.29 431.26 304.62 1,056.94 82,658.28 Additions 75.79 221.14 2,613.71 118.90 86.83 23.45 3,139.82 Disposals - (13.80) (0.37) (1.26) (12.48) - (27.91)Other re-classifications - - 9.05 - (9.05) - - Cost/deemed cost as at March 31, 2019 14,192.96 6,109.34 63,468.68 548.90 369.92 1,080.39 85,770.19 Impairment as at April 1, 2018 0.15 1.32 0.09 - - - 1.56 Accumulated impairment as at March 31, 2019 0.15 1.32 0.09 - - - 1.56 Accumulated depreciation as at April 1, 2018 493.55 690.56 9,980.12 291.37 164.42 93.80 11,713.82Charge for the year 115.61 233.32 3,162.19 73.19 30.51 37.85 3,652.67 Disposals - (2.06) (0.29) (1.19) (11.14) - (14.68)Other re-classifications - - 6.00 - (6.00) - - Accumulated depreciation as at March 31, 2019 609.16 921.82 13,148.02 363.37 177.79 131.65 15,351.81 Total accumulated depreciation and impairment as at March 31, 2019
609.31 923.14 13,148.11 363.37 177.79 131.65 15,353.37
Net carrying value as at April 1, 2018 13,623.47 5,210.12 50,866.08 139.89 140.20 963.14 70,942.90 Net carrying value as at March 31, 2019 13,583.65 5,186.20 50,320.57 185.53 192.13 948.74 70,416.82
INTEGRATED REPORT & ANNUAL ACCOUNTS 2019-20 | 113TH YEAR240
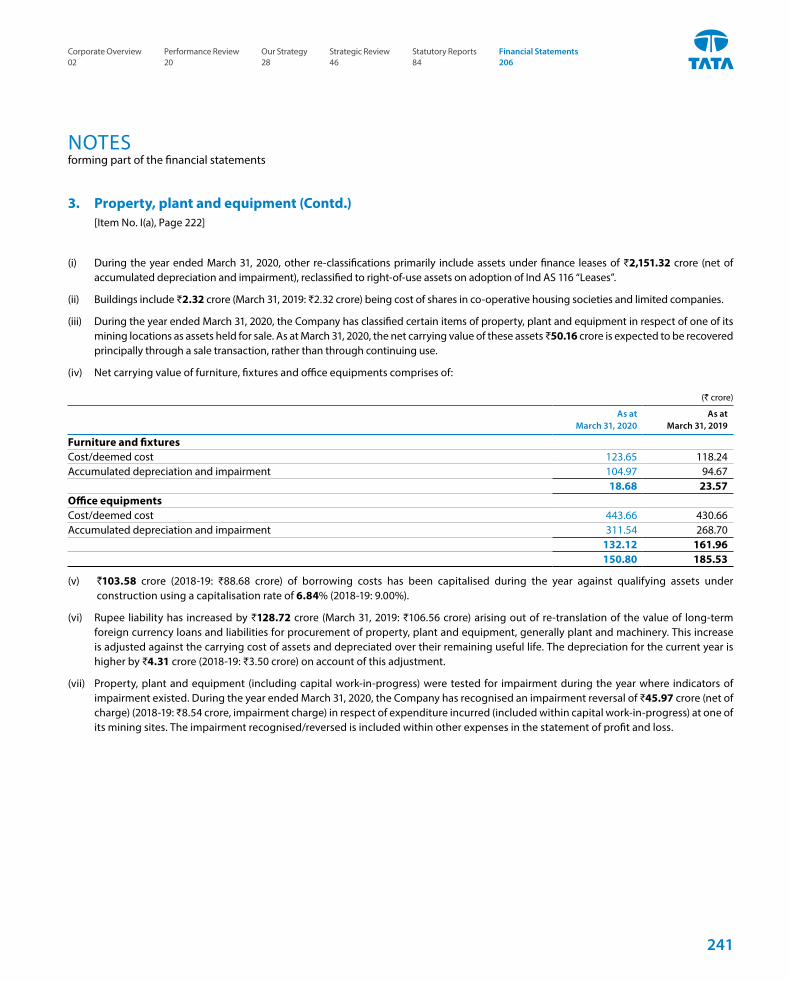
NOTESforming part of the financial statements
(i) During the year ended March 31, 2020, other re-classifications primarily include assets under finance leases of ₹2,151.32 crore (net of accumulated depreciation and impairment), reclassified to right-of-use assets on adoption of Ind AS 116 “Leases”.
(ii) Buildings include ₹2.32 crore (March 31, 2019: ₹2.32 crore) being cost of shares in co-operative housing societies and limited companies.
(iii) During the year ended March 31, 2020, the Company has classified certain items of property, plant and equipment in respect of one of its mining locations as assets held for sale. As at March 31, 2020, the net carrying value of these assets ₹50.16 crore is expected to be recovered principally through a sale transaction, rather than through continuing use.
(iv) Net carrying value of furniture, fixtures and office equipments comprises of:
(` crore)
As at March 31, 2020
As at March 31, 2019
Furniture and fixtures Cost/deemed cost 123.65 118.24Accumulated depreciation and impairment 104.97 94.67
18.68 23.57Office equipmentsCost/deemed cost 443.66 430.66Accumulated depreciation and impairment 311.54 268.70
132.12 161.96150.80 185.53
(v) ̀ 103.58 crore (2018-19: ₹88.68 crore) of borrowing costs has been capitalised during the year against qualifying assets under construction using a capitalisation rate of 6.84% (2018-19: 9.00%).
(vi) Rupee liability has increased by ₹128.72 crore (March 31, 2019: ₹106.56 crore) arising out of re-translation of the value of long-term foreign currency loans and liabilities for procurement of property, plant and equipment, generally plant and machinery. This increase is adjusted against the carrying cost of assets and depreciated over their remaining useful life. The depreciation for the current year is higher by ₹4.31 crore (2018-19: ₹3.50 crore) on account of this adjustment.
(vii) Property, plant and equipment (including capital work-in-progress) were tested for impairment during the year where indicators of impairment existed. During the year ended March 31, 2020, the Company has recognised an impairment reversal of ₹45.97 crore (net of charge) (2018-19: ₹8.54 crore, impairment charge) in respect of expenditure incurred (included within capital work-in-progress) at one of its mining sites. The impairment recognised/reversed is included within other expenses in the statement of profit and loss.
3. Property, plant and equipment (Contd.) [Item No. I(a), Page 222]
241
Corporate Overview 02
Strategic Review 46
Performance Review 20
Statutory Reports 84
Our Strategy 28
Financial Statements 206
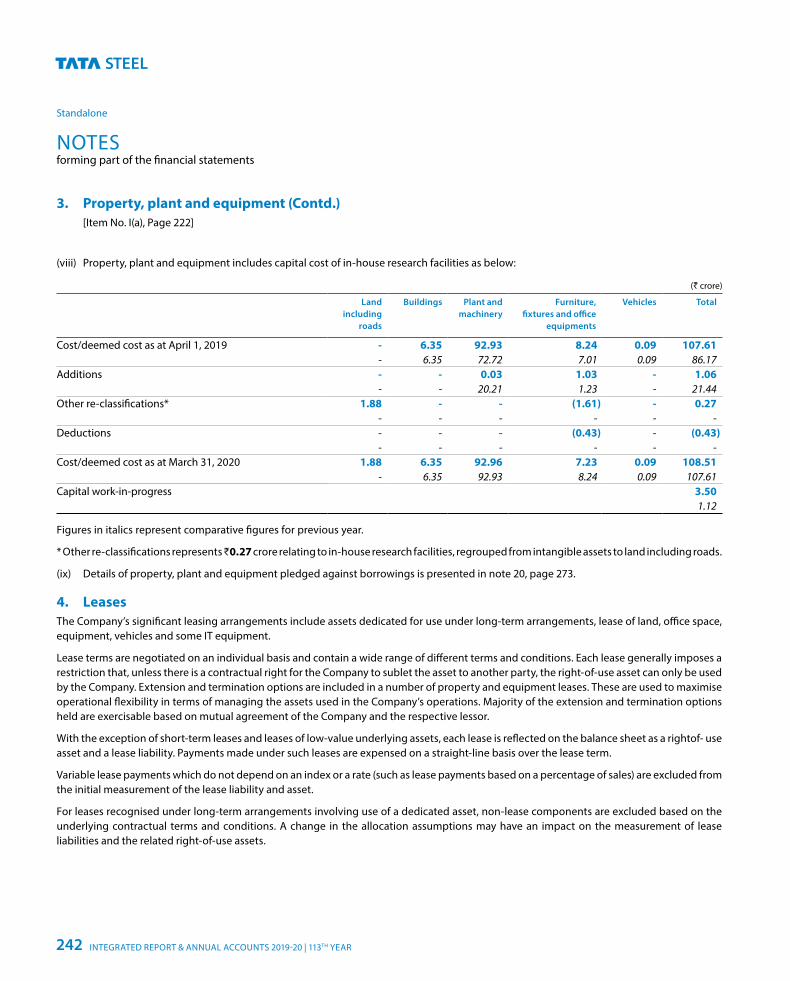
NOTESforming part of the financial statements
Standalone
(viii) Property, plant and equipment includes capital cost of in-house research facilities as below:
(` crore)
Landincluding
roads
Buildings Plant andmachinery
Furniture,fixtures and office
equipments
Vehicles Total
Cost/deemed cost as at April 1, 2019 - 6.35 92.93 8.24 0.09 107.61- 6.35 72.72 7.01 0.09 86.17
Additions - - 0.03 1.03 - 1.06- - 20.21 1.23 - 21.44
Other re-classifications* 1.88 - - (1.61) - 0.27- - - - - -
Deductions - - - (0.43) - (0.43)- - - - - -
Cost/deemed cost as at March 31, 2020 1.88 6.35 92.96 7.23 0.09 108.51- 6.35 92.93 8.24 0.09 107.61
Capital work-in-progress 3.501.12
Figures in italics represent comparative figures for previous year.
* Other re-classifications represents ₹0.27 crore relating to in-house research facilities, regrouped from intangible assets to land including roads.
(ix) Details of property, plant and equipment pledged against borrowings is presented in note 20, page 273.
4. Leases The Company’s significant leasing arrangements include assets dedicated for use under long-term arrangements, lease of land, office space, equipment, vehicles and some IT equipment.
Lease terms are negotiated on an individual basis and contain a wide range of different terms and conditions. Each lease generally imposes a restriction that, unless there is a contractual right for the Company to sublet the asset to another party, the right-of-use asset can only be used by the Company. Extension and termination options are included in a number of property and equipment leases. These are used to maximise operational flexibility in terms of managing the assets used in the Company’s operations. Majority of the extension and termination options held are exercisable based on mutual agreement of the Company and the respective lessor.
With the exception of short-term leases and leases of low-value underlying assets, each lease is reflected on the balance sheet as a rightof- use asset and a lease liability. Payments made under such leases are expensed on a straight-line basis over the lease term.
Variable lease payments which do not depend on an index or a rate (such as lease payments based on a percentage of sales) are excluded from the initial measurement of the lease liability and asset.
For leases recognised under long-term arrangements involving use of a dedicated asset, non-lease components are excluded based on the underlying contractual terms and conditions. A change in the allocation assumptions may have an impact on the measurement of lease liabilities and the related right-of-use assets.
3. Property, plant and equipment (Contd.) [Item No. I(a), Page 222]
INTEGRATED REPORT & ANNUAL ACCOUNTS 2019-20 | 113TH YEAR242
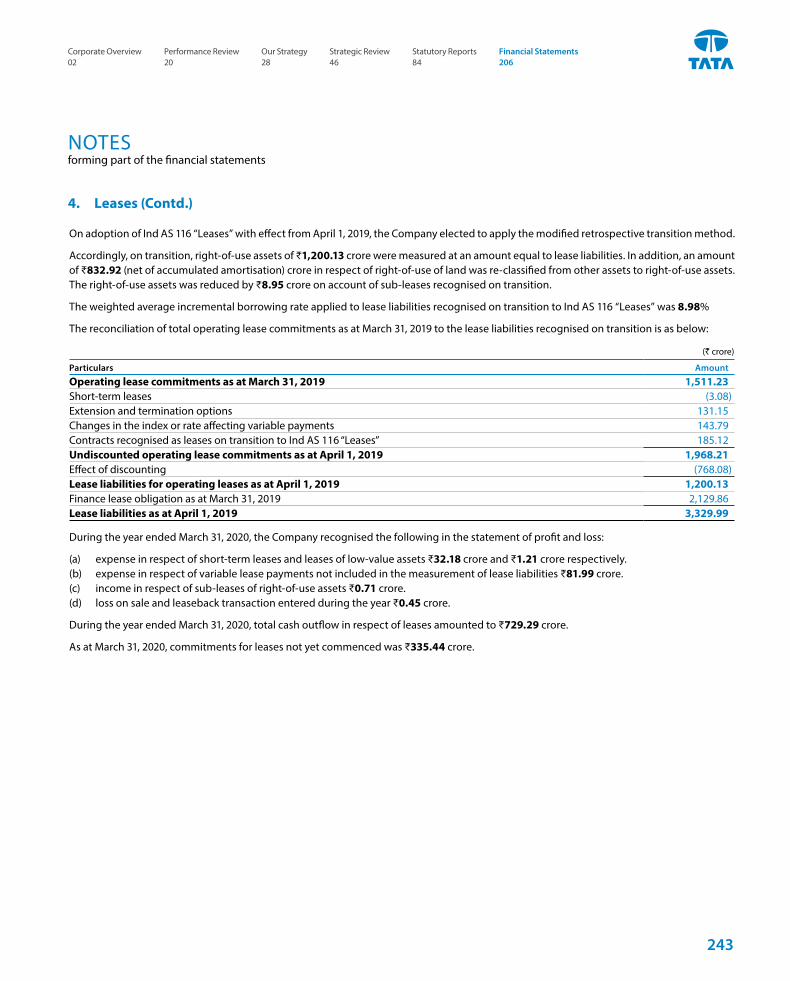
NOTESforming part of the financial statements
4. Leases (Contd.)
On adoption of Ind AS 116 “Leases” with effect from April 1, 2019, the Company elected to apply the modified retrospective transition method.
Accordingly, on transition, right-of-use assets of ₹1,200.13 crore were measured at an amount equal to lease liabilities. In addition, an amount of ₹832.92 (net of accumulated amortisation) crore in respect of right-of-use of land was re-classified from other assets to right-of-use assets.The right-of-use assets was reduced by ₹8.95 crore on account of sub-leases recognised on transition.
The weighted average incremental borrowing rate applied to lease liabilities recognised on transition to Ind AS 116 “Leases” was 8.98%
The reconciliation of total operating lease commitments as at March 31, 2019 to the lease liabilities recognised on transition is as below:
(` crore)
Particulars Amount
Operating lease commitments as at March 31, 2019 1,511.23Short-term leases (3.08)Extension and termination options 131.15Changes in the index or rate affecting variable payments 143.79Contracts recognised as leases on transition to Ind AS 116 “Leases” 185.12Undiscounted operating lease commitments as at April 1, 2019 1,968.21Effect of discounting (768.08)Lease liabilities for operating leases as at April 1, 2019 1,200.13Finance lease obligation as at March 31, 2019 2,129.86Lease liabilities as at April 1, 2019 3,329.99
During the year ended March 31, 2020, the Company recognised the following in the statement of profit and loss:
(a) expense in respect of short-term leases and leases of low-value assets ₹32.18 crore and ₹1.21 crore respectively.(b) expense in respect of variable lease payments not included in the measurement of lease liabilities ₹81.99 crore.(c) income in respect of sub-leases of right-of-use assets ₹0.71 crore.(d) loss on sale and leaseback transaction entered during the year ₹0.45 crore.
During the year ended March 31, 2020, total cash outflow in respect of leases amounted to ₹729.29 crore.
As at March 31, 2020, commitments for leases not yet commenced was ₹335.44 crore.
243
Corporate Overview 02
Strategic Review 46
Performance Review 20
Statutory Reports 84
Our Strategy 28
Financial Statements 206
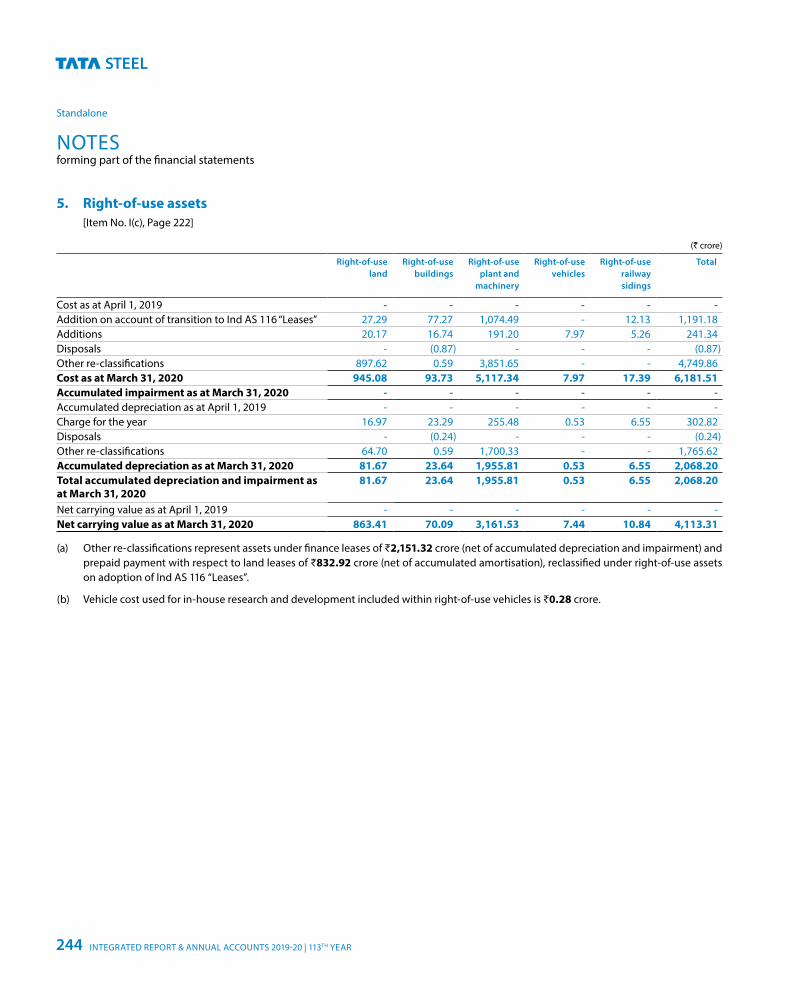
NOTESforming part of the financial statements
Standalone
5. Right-of-use assets [Item No. I(c), Page 222]
(` crore)
Right-of-useland
Right-of-usebuildings
Right-of-useplant and
machinery
Right-of-usevehicles
Right-of-userailwaysidings
Total
Cost as at April 1, 2019 - - - - - -Addition on account of transition to Ind AS 116 “Leases” 27.29 77.27 1,074.49 - 12.13 1,191.18Additions 20.17 16.74 191.20 7.97 5.26 241.34Disposals - (0.87) - - - (0.87)Other re-classifications 897.62 0.59 3,851.65 - - 4,749.86Cost as at March 31, 2020 945.08 93.73 5,117.34 7.97 17.39 6,181.51Accumulated impairment as at March 31, 2020 - - - - - -Accumulated depreciation as at April 1, 2019 - - - - - -Charge for the year 16.97 23.29 255.48 0.53 6.55 302.82Disposals - (0.24) - - - (0.24)Other re-classifications 64.70 0.59 1,700.33 - - 1,765.62Accumulated depreciation as at March 31, 2020 81.67 23.64 1,955.81 0.53 6.55 2,068.20Total accumulated depreciation and impairment as at March 31, 2020
81.67 23.64 1,955.81 0.53 6.55 2,068.20
Net carrying value as at April 1, 2019 - - - - - -Net carrying value as at March 31, 2020 863.41 70.09 3,161.53 7.44 10.84 4,113.31
(a) Other re-classifications represent assets under finance leases of ₹2,151.32 crore (net of accumulated depreciation and impairment) and prepaid payment with respect to land leases of ₹832.92 crore (net of accumulated amortisation), reclassified under right-of-use assets on adoption of Ind AS 116 “Leases”.
(b) Vehicle cost used for in-house research and development included within right-of-use vehicles is ₹0.28 crore.
INTEGRATED REPORT & ANNUAL ACCOUNTS 2019-20 | 113TH YEAR244
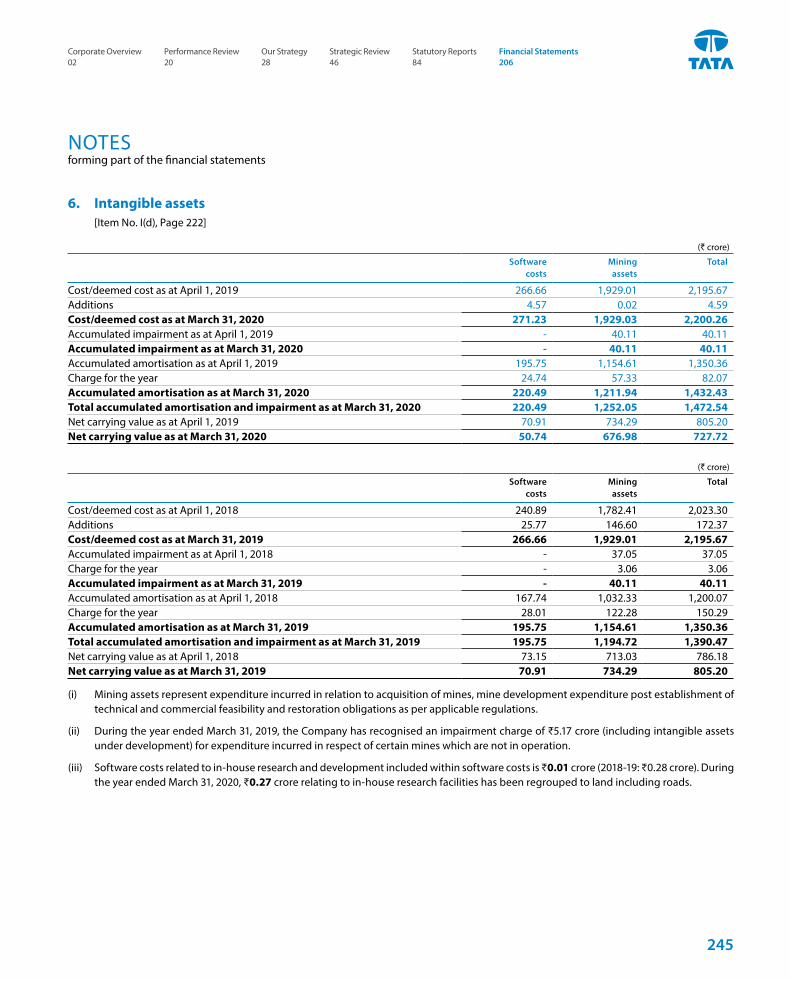
NOTESforming part of the financial statements
6. Intangible assets [Item No. I(d), Page 222]
(` crore)
Softwarecosts
Mining assets
Total
Cost/deemed cost as at April 1, 2019 266.66 1,929.01 2,195.67Additions 4.57 0.02 4.59Cost/deemed cost as at March 31, 2020 271.23 1,929.03 2,200.26Accumulated impairment as at April 1, 2019 - 40.11 40.11Accumulated impairment as at March 31, 2020 - 40.11 40.11Accumulated amortisation as at April 1, 2019 195.75 1,154.61 1,350.36Charge for the year 24.74 57.33 82.07Accumulated amortisation as at March 31, 2020 220.49 1,211.94 1,432.43Total accumulated amortisation and impairment as at March 31, 2020 220.49 1,252.05 1,472.54Net carrying value as at April 1, 2019 70.91 734.29 805.20Net carrying value as at March 31, 2020 50.74 676.98 727.72
(` crore)
Softwarecosts
Mining assets
Total
Cost/deemed cost as at April 1, 2018 240.89 1,782.41 2,023.30 Additions 25.77 146.60 172.37 Cost/deemed cost as at March 31, 2019 266.66 1,929.01 2,195.67 Accumulated impairment as at April 1, 2018 - 37.05 37.05 Charge for the year - 3.06 3.06 Accumulated impairment as at March 31, 2019 - 40.11 40.11 Accumulated amortisation as at April 1, 2018 167.74 1,032.33 1,200.07 Charge for the year 28.01 122.28 150.29 Accumulated amortisation as at March 31, 2019 195.75 1,154.61 1,350.36 Total accumulated amortisation and impairment as at March 31, 2019 195.75 1,194.72 1,390.47 Net carrying value as at April 1, 2018 73.15 713.03 786.18 Net carrying value as at March 31, 2019 70.91 734.29 805.20
(i) Mining assets represent expenditure incurred in relation to acquisition of mines, mine development expenditure post establishment of technical and commercial feasibility and restoration obligations as per applicable regulations.
(ii) During the year ended March 31, 2019, the Company has recognised an impairment charge of ₹5.17 crore (including intangible assets under development) for expenditure incurred in respect of certain mines which are not in operation.
(iii) Software costs related to in-house research and development included within software costs is ₹0.01 crore (2018-19: ₹0.28 crore). During the year ended March 31, 2020, ₹0.27 crore relating to in-house research facilities has been regrouped to land including roads.
245
Corporate Overview 02
Strategic Review 46
Performance Review 20
Statutory Reports 84
Our Strategy 28
Financial Statements 206
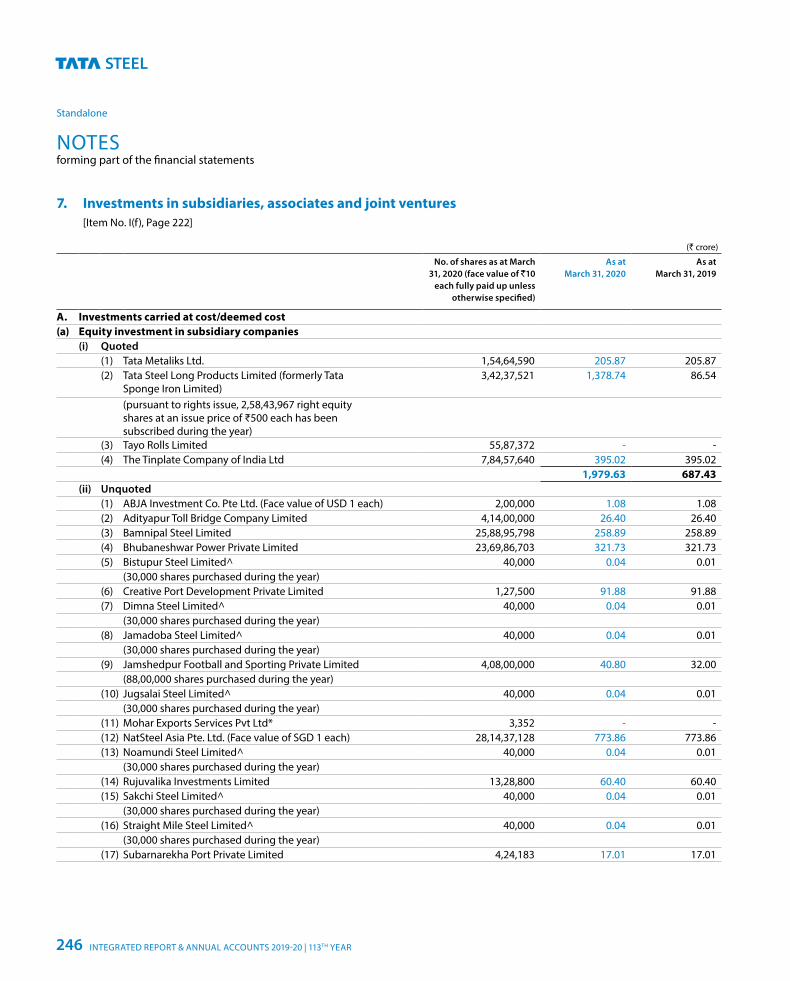
NOTESforming part of the financial statements
Standalone
7. Investments in subsidiaries, associates and joint ventures [Item No. I(f), Page 222]
(` crore)
No. of shares as at March 31, 2020 (face value of `10
each fully paid up unless otherwise specified)
As at March 31, 2020
As at March 31, 2019
A. Investments carried at cost/deemed cost(a) Equity investment in subsidiary companies
(i) Quoted(1) Tata Metaliks Ltd. 1,54,64,590 205.87 205.87 (2) Tata Steel Long Products Limited (formerly Tata
Sponge Iron Limited)3,42,37,521 1,378.74 86.54
(pursuant to rights issue, 2,58,43,967 right equityshares at an issue price of ₹500 each has beensubscribed during the year)
(3) Tayo Rolls Limited 55,87,372 - - (4) The Tinplate Company of India Ltd 7,84,57,640 395.02 395.02
1,979.63 687.43 (ii) Unquoted
(1) ABJA Investment Co. Pte Ltd. (Face value of USD 1 each) 2,00,000 1.08 1.08 (2) Adityapur Toll Bridge Company Limited 4,14,00,000 26.40 26.40 (3) Bamnipal Steel Limited 25,88,95,798 258.89 258.89 (4) Bhubaneshwar Power Private Limited 23,69,86,703 321.73 321.73 (5) Bistupur Steel Limited^ 40,000 0.04 0.01
(30,000 shares purchased during the year)(6) Creative Port Development Private Limited 1,27,500 91.88 91.88 (7) Dimna Steel Limited^ 40,000 0.04 0.01
(30,000 shares purchased during the year)(8) Jamadoba Steel Limited^ 40,000 0.04 0.01
(30,000 shares purchased during the year)(9) Jamshedpur Football and Sporting Private Limited 4,08,00,000 40.80 32.00
(88,00,000 shares purchased during the year)(10) Jugsalai Steel Limited^ 40,000 0.04 0.01
(30,000 shares purchased during the year)(11) Mohar Exports Services Pvt Ltd* 3,352 - - (12) NatSteel Asia Pte. Ltd. (Face value of SGD 1 each) 28,14,37,128 773.86 773.86 (13) Noamundi Steel Limited^ 40,000 0.04 0.01
(30,000 shares purchased during the year)(14) Rujuvalika Investments Limited 13,28,800 60.40 60.40 (15) Sakchi Steel Limited^ 40,000 0.04 0.01
(30,000 shares purchased during the year)(16) Straight Mile Steel Limited^ 40,000 0.04 0.01
(30,000 shares purchased during the year)(17) Subarnarekha Port Private Limited 4,24,183 17.01 17.01
INTEGRATED REPORT & ANNUAL ACCOUNTS 2019-20 | 113TH YEAR246
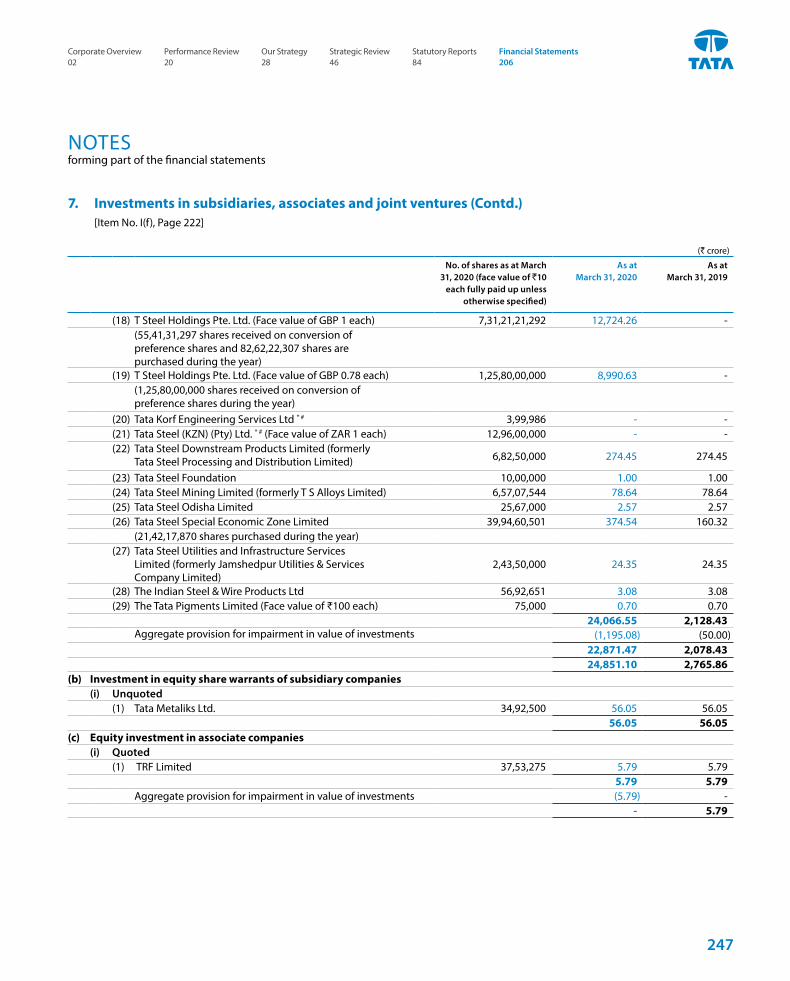
NOTESforming part of the financial statements
7. Investments in subsidiaries, associates and joint ventures (Contd.) [Item No. I(f), Page 222]
(` crore)
No. of shares as at March 31, 2020 (face value of `10
each fully paid up unless otherwise specified)
As at March 31, 2020
As at March 31, 2019
(18) T Steel Holdings Pte. Ltd. (Face value of GBP 1 each) 7,31,21,21,292 12,724.26 - (55,41,31,297 shares received on conversion ofpreference shares and 82,62,22,307 shares arepurchased during the year)
(19) T Steel Holdings Pte. Ltd. (Face value of GBP 0.78 each) 1,25,80,00,000 8,990.63 -(1,25,80,00,000 shares received on conversion ofpreference shares during the year)
(20) Tata Korf Engineering Services Ltd * # 3,99,986 - -(21) Tata Steel (KZN) (Pty) Ltd. * # (Face value of ZAR 1 each) 12,96,00,000 - -(22) Tata Steel Downstream Products Limited (formerly
Tata Steel Processing and Distribution Limited) 6,82,50,000 274.45 274.45
(23) Tata Steel Foundation 10,00,000 1.00 1.00(24) Tata Steel Mining Limited (formerly T S Alloys Limited) 6,57,07,544 78.64 78.64 (25) Tata Steel Odisha Limited 25,67,000 2.57 2.57 (26) Tata Steel Special Economic Zone Limited 39,94,60,501 374.54 160.32
(21,42,17,870 shares purchased during the year)(27) Tata Steel Utilities and Infrastructure Services
Limited (formerly Jamshedpur Utilities & ServicesCompany Limited)
2,43,50,000 24.35 24.35
(28) The Indian Steel & Wire Products Ltd 56,92,651 3.08 3.08(29) The Tata Pigments Limited (Face value of ₹100 each) 75,000 0.70 0.70
24,066.55 2,128.43Aggregate provision for impairment in value of investments (1,195.08) (50.00)
22,871.47 2,078.4324,851.10 2,765.86
(b) Investment in equity share warrants of subsidiary companies(i) Unquoted
(1) Tata Metaliks Ltd. 34,92,500 56.05 56.05 56.05 56.05
(c) Equity investment in associate companies(i) Quoted
(1) TRF Limited 37,53,275 5.79 5.79 5.79 5.79
Aggregate provision for impairment in value of investments (5.79) -- 5.79
247
Corporate Overview 02
Strategic Review 46
Performance Review 20
Statutory Reports 84
Our Strategy 28
Financial Statements 206
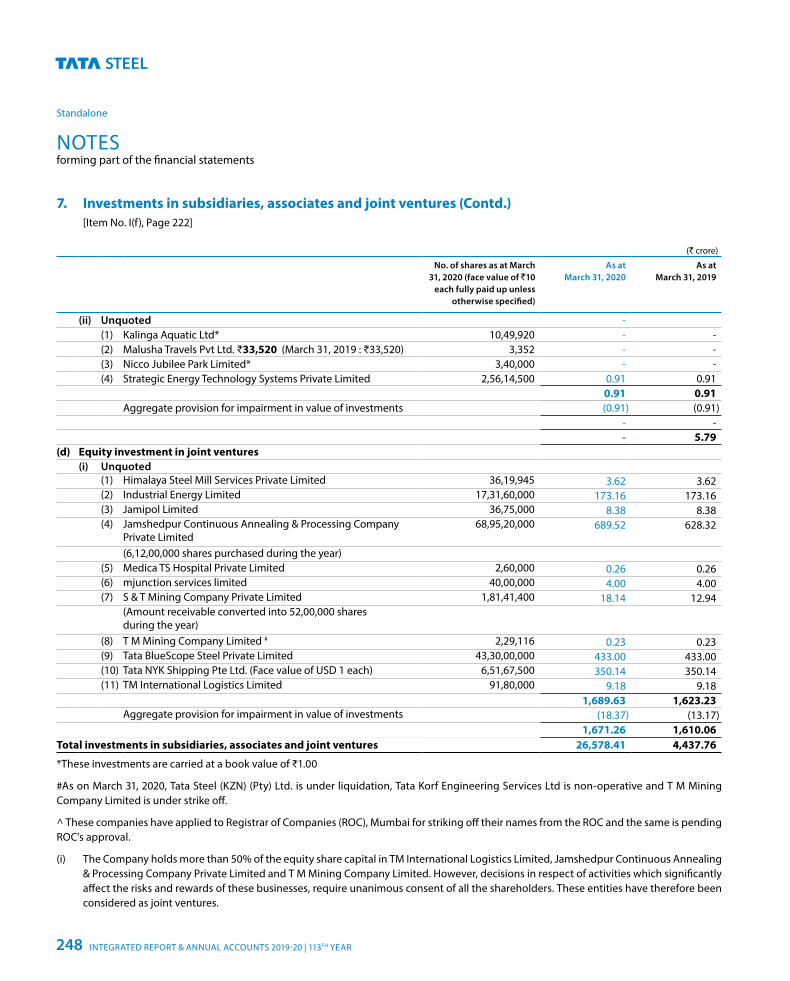
NOTESforming part of the financial statements
Standalone
7. Investments in subsidiaries, associates and joint ventures (Contd.) [Item No. I(f), Page 222]
(` crore)
No. of shares as at March 31, 2020 (face value of `10
each fully paid up unless otherwise specified)
As at March 31, 2020
As at March 31, 2019
(ii) Unquoted -(1) Kalinga Aquatic Ltd* 10,49,920 - -(2) Malusha Travels Pvt Ltd. ₹33,520 (March 31, 2019 : ₹33,520) 3,352 - -(3) Nicco Jubilee Park Limited* 3,40,000 - -(4) Strategic Energy Technology Systems Private Limited 2,56,14,500 0.91 0.91
0.91 0.91Aggregate provision for impairment in value of investments (0.91) (0.91)
- -- 5.79
(d) Equity investment in joint ventures(i) Unquoted
(1) Himalaya Steel Mill Services Private Limited 36,19,945 3.62 3.62(2) Industrial Energy Limited 17,31,60,000 173.16 173.16(3) Jamipol Limited 36,75,000 8.38 8.38(4) Jamshedpur Continuous Annealing & Processing Company
Private Limited68,95,20,000 689.52 628.32
(6,12,00,000 shares purchased during the year)(5) Medica TS Hospital Private Limited 2,60,000 0.26 0.26(6) mjunction services limited 40,00,000 4.00 4.00(7) S & T Mining Company Private Limited 1,81,41,400 18.14 12.94
(Amount receivable converted into 52,00,000 sharesduring the year)
(8) T M Mining Company Limited # 2,29,116 0.23 0.23(9) Tata BlueScope Steel Private Limited 43,30,00,000 433.00 433.00(10) Tata NYK Shipping Pte Ltd. (Face value of USD 1 each) 6,51,67,500 350.14 350.14(11) TM International Logistics Limited 91,80,000 9.18 9.18
1,689.63 1,623.23 Aggregate provision for impairment in value of investments (18.37) (13.17)
1,671.26 1,610.06 Total investments in subsidiaries, associates and joint ventures 26,578.41 4,437.76
*These investments are carried at a book value of ₹1.00
#As on March 31, 2020, Tata Steel (KZN) (Pty) Ltd. is under liquidation, Tata Korf Engineering Services Ltd is non-operative and T M Mining Company Limited is under strike off.
^ These companies have applied to Registrar of Companies (ROC), Mumbai for striking off their names from the ROC and the same is pending ROC’s approval.
(i) The Company holds more than 50% of the equity share capital in TM International Logistics Limited, Jamshedpur Continuous Annealing & Processing Company Private Limited and T M Mining Company Limited. However, decisions in respect of activities which significantly affect the risks and rewards of these businesses, require unanimous consent of all the shareholders. These entities have therefore been considered as joint ventures.
INTEGRATED REPORT & ANNUAL ACCOUNTS 2019-20 | 113TH YEAR248
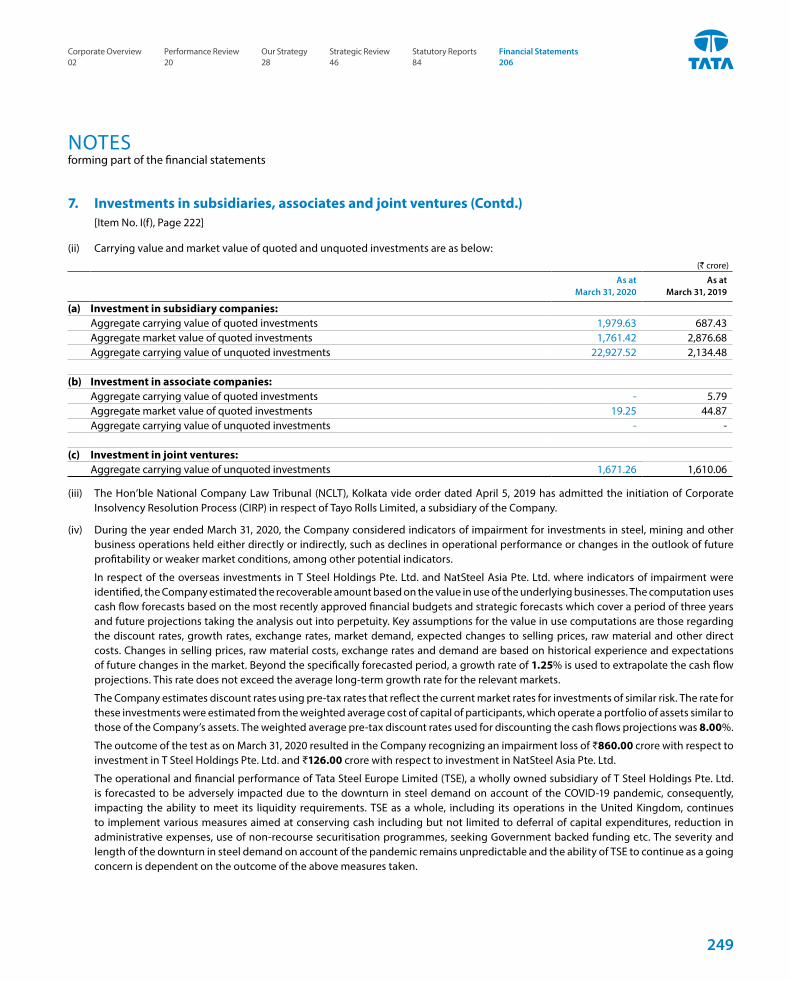
NOTESforming part of the financial statements
(ii) Carrying value and market value of quoted and unquoted investments are as below:(` crore)
As at March 31, 2020
As at March 31, 2019
(a) Investment in subsidiary companies:Aggregate carrying value of quoted investments 1,979.63 687.43Aggregate market value of quoted investments 1,761.42 2,876.68Aggregate carrying value of unquoted investments 22,927.52 2,134.48
(b) Investment in associate companies:Aggregate carrying value of quoted investments - 5.79Aggregate market value of quoted investments 19.25 44.87Aggregate carrying value of unquoted investments - -
(c) Investment in joint ventures:Aggregate carrying value of unquoted investments 1,671.26 1,610.06
(iii) The Hon’ble National Company Law Tribunal (NCLT), Kolkata vide order dated April 5, 2019 has admitted the initiation of Corporate Insolvency Resolution Process (CIRP) in respect of Tayo Rolls Limited, a subsidiary of the Company.
(iv) During the year ended March 31, 2020, the Company considered indicators of impairment for investments in steel, mining and other business operations held either directly or indirectly, such as declines in operational performance or changes in the outlook of future profitability or weaker market conditions, among other potential indicators.
In respect of the overseas investments in T Steel Holdings Pte. Ltd. and NatSteel Asia Pte. Ltd. where indicators of impairment were identified, the Company estimated the recoverable amount based on the value in use of the underlying businesses. The computation uses cash flow forecasts based on the most recently approved financial budgets and strategic forecasts which cover a period of three years and future projections taking the analysis out into perpetuity. Key assumptions for the value in use computations are those regarding the discount rates, growth rates, exchange rates, market demand, expected changes to selling prices, raw material and other direct costs. Changes in selling prices, raw material costs, exchange rates and demand are based on historical experience and expectations of future changes in the market. Beyond the specifically forecasted period, a growth rate of 1.25% is used to extrapolate the cash flow projections. This rate does not exceed the average long-term growth rate for the relevant markets.
The Company estimates discount rates using pre-tax rates that reflect the current market rates for investments of similar risk. The rate for these investments were estimated from the weighted average cost of capital of participants, which operate a portfolio of assets similar to those of the Company’s assets. The weighted average pre-tax discount rates used for discounting the cash flows projections was 8.00%.
The outcome of the test as on March 31, 2020 resulted in the Company recognizing an impairment loss of ₹860.00 crore with respect to investment in T Steel Holdings Pte. Ltd. and ₹126.00 crore with respect to investment in NatSteel Asia Pte. Ltd.
The operational and financial performance of Tata Steel Europe Limited (TSE), a wholly owned subsidiary of T Steel Holdings Pte. Ltd. is forecasted to be adversely impacted due to the downturn in steel demand on account of the COVID-19 pandemic, consequently, impacting the ability to meet its liquidity requirements. TSE as a whole, including its operations in the United Kingdom, continues to implement various measures aimed at conserving cash including but not limited to deferral of capital expenditures, reduction in administrative expenses, use of non-recourse securitisation programmes, seeking Government backed funding etc. The severity and length of the downturn in steel demand on account of the pandemic remains unpredictable and the ability of TSE to continue as a going concern is dependent on the outcome of the above measures taken.
7. Investments in subsidiaries, associates and joint ventures (Contd.) [Item No. I(f), Page 222]
249
Corporate Overview 02
Strategic Review 46
Performance Review 20
Statutory Reports 84
Our Strategy 28
Financial Statements 206
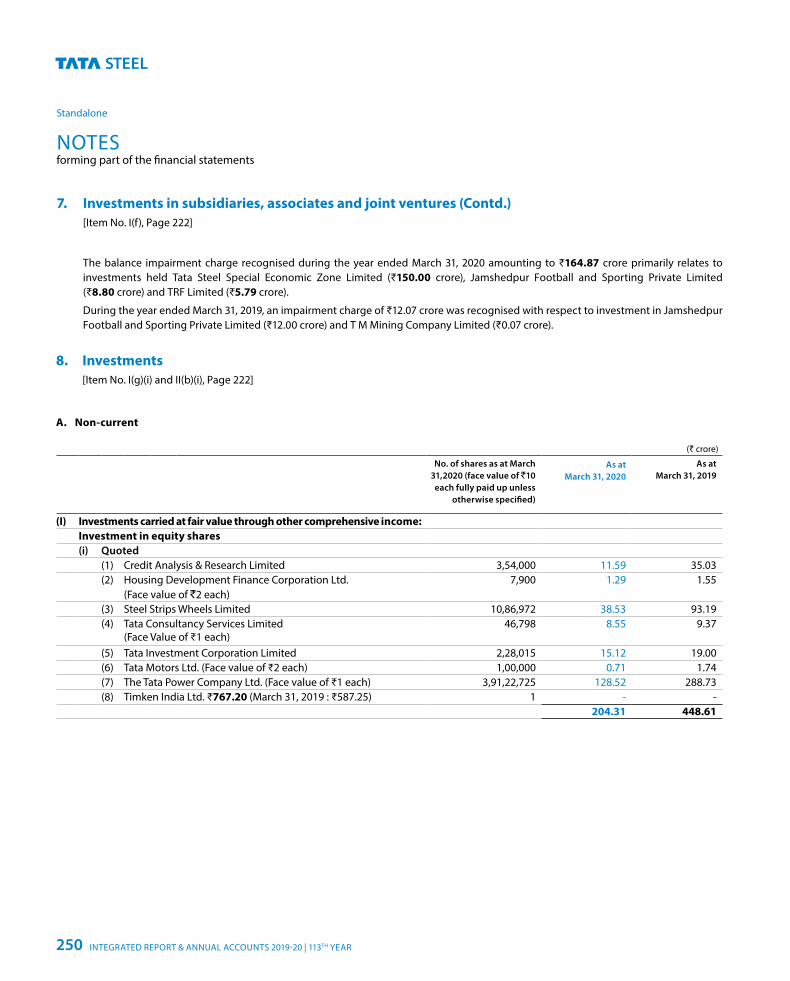
NOTESforming part of the financial statements
Standalone
7. Investments in subsidiaries, associates and joint ventures (Contd.) [Item No. I(f), Page 222]
The balance impairment charge recognised during the year ended March 31, 2020 amounting to ₹164.87 crore primarily relates to investments held Tata Steel Special Economic Zone Limited (₹150.00 crore), Jamshedpur Football and Sporting Private Limited (₹8.80 crore) and TRF Limited (₹5.79 crore).
During the year ended March 31, 2019, an impairment charge of ₹12.07 crore was recognised with respect to investment in Jamshedpur Football and Sporting Private Limited (₹12.00 crore) and T M Mining Company Limited (₹0.07 crore).
8. Investments [Item No. I(g)(i) and II(b)(i), Page 222]
A. Non-current
(` crore)
No. of shares as at March 31,2020 (face value of `10
each fully paid up unless otherwise specified)
As at March 31, 2020
As at March 31, 2019
(I) Investments carried at fair value through other comprehensive income:Investment in equity shares(i) Quoted
(1) Credit Analysis & Research Limited 3,54,000 11.59 35.03 (2) Housing Development Finance Corporation Ltd. 7,900 1.29 1.55
(Face value of `2 each)(3) Steel Strips Wheels Limited 10,86,972 38.53 93.19(4) Tata Consultancy Services Limited
(Face Value of ₹1 each)46,798 8.55 9.37
(5) Tata Investment Corporation Limited 2,28,015 15.12 19.00(6) Tata Motors Ltd. (Face value of ₹2 each) 1,00,000 0.71 1.74(7) The Tata Power Company Ltd. (Face value of ₹1 each) 3,91,22,725 128.52 288.73(8) Timken India Ltd. ₹767.20 (March 31, 2019 : ₹587.25) 1 - -
204.31 448.61
INTEGRATED REPORT & ANNUAL ACCOUNTS 2019-20 | 113TH YEAR250
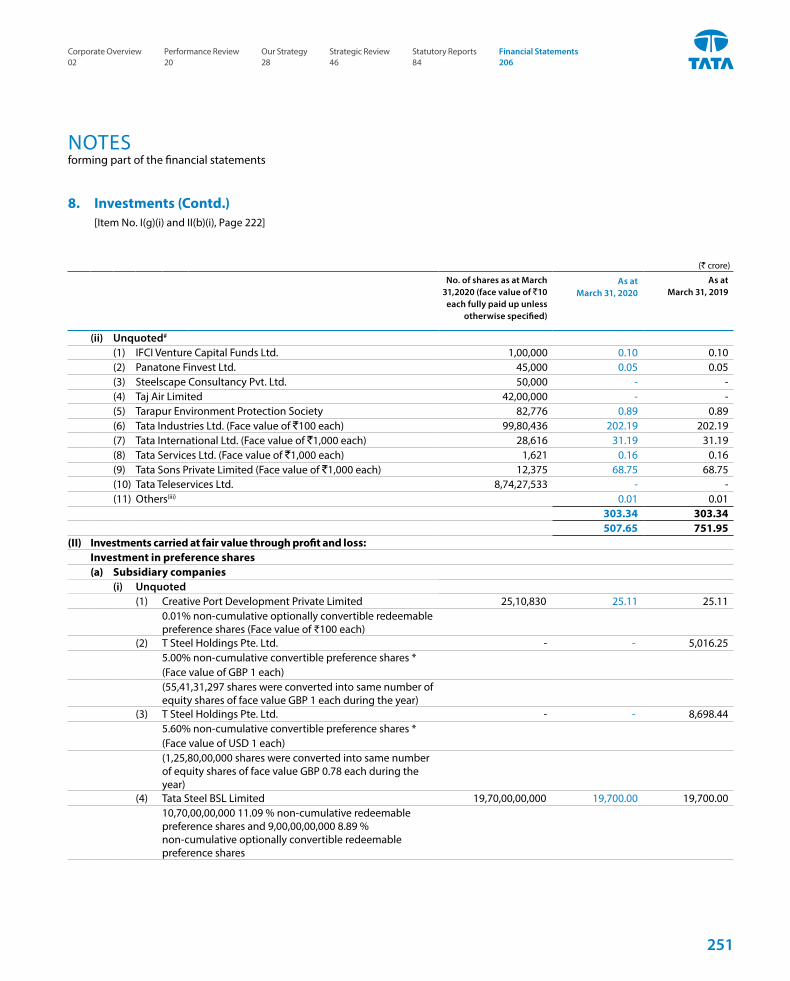
NOTESforming part of the financial statements
8. Investments (Contd.) [Item No. I(g)(i) and II(b)(i), Page 222]
(` crore)
No. of shares as at March 31,2020 (face value of `10
each fully paid up unless otherwise specified)
As at March 31, 2020
As at March 31, 2019
(ii) Unquoted#
(1) IFCI Venture Capital Funds Ltd. 1,00,000 0.10 0.10 (2) Panatone Finvest Ltd. 45,000 0.05 0.05 (3) Steelscape Consultancy Pvt. Ltd. 50,000 - - (4) Taj Air Limited 42,00,000 - - (5) Tarapur Environment Protection Society 82,776 0.89 0.89 (6) Tata Industries Ltd. (Face value of `100 each) 99,80,436 202.19 202.19 (7) Tata International Ltd. (Face value of `1,000 each) 28,616 31.19 31.19 (8) Tata Services Ltd. (Face value of `1,000 each) 1,621 0.16 0.16 (9) Tata Sons Private Limited (Face value of `1,000 each) 12,375 68.75 68.75 (10) Tata Teleservices Ltd. 8,74,27,533 - - (11) Others(iii) 0.01 0.01
303.34 303.34 507.65 751.95
(II) Investments carried at fair value through profit and loss:Investment in preference shares(a) Subsidiary companies
(i) Unquoted(1) Creative Port Development Private Limited 25,10,830 25.11 25.11
0.01% non-cumulative optionally convertible redeemablepreference shares (Face value of ₹100 each)
(2) T Steel Holdings Pte. Ltd. - - 5,016.255.00% non-cumulative convertible preference shares *(Face value of GBP 1 each)(55,41,31,297 shares were converted into same number ofequity shares of face value GBP 1 each during the year)
(3) T Steel Holdings Pte. Ltd. - - 8,698.445.60% non-cumulative convertible preference shares *(Face value of USD 1 each)(1,25,80,00,000 shares were converted into same number of equity shares of face value GBP 0.78 each during the year)
(4) Tata Steel BSL Limited 19,70,00,00,000 19,700.00 19,700.0010,70,00,00,000 11.09 % non-cumulative redeemable preference shares and 9,00,00,00,000 8.89 % non-cumulative optionally convertible redeemable preference shares
251
Corporate Overview 02
Strategic Review 46
Performance Review 20
Statutory Reports 84
Our Strategy 28
Financial Statements 206
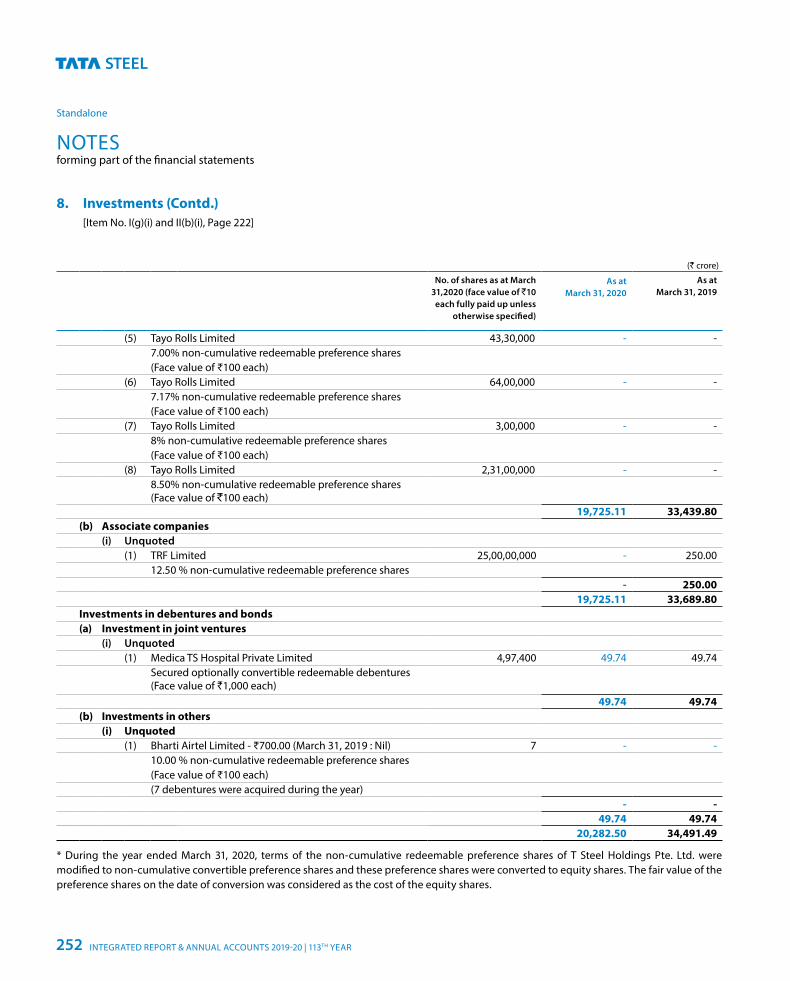
NOTESforming part of the financial statements
Standalone
8. Investments (Contd.) [Item No. I(g)(i) and II(b)(i), Page 222]
(` crore)
No. of shares as at March 31,2020 (face value of `10
each fully paid up unless otherwise specified)
As at March 31, 2020
As at March 31, 2019
(5) Tayo Rolls Limited 43,30,000 - -7.00% non-cumulative redeemable preference shares(Face value of ₹100 each)
(6) Tayo Rolls Limited 64,00,000 - -7.17% non-cumulative redeemable preference shares(Face value of ₹100 each)
(7) Tayo Rolls Limited 3,00,000 - -8% non-cumulative redeemable preference shares(Face value of ₹100 each)
(8) Tayo Rolls Limited 2,31,00,000 - -8.50% non-cumulative redeemable preference shares (Face value of `100 each)
19,725.11 33,439.80(b) Associate companies
(i) Unquoted(1) TRF Limited 25,00,00,000 - 250.00
12.50 % non-cumulative redeemable preference shares - 250.00
19,725.11 33,689.80 Investments in debentures and bonds(a) Investment in joint ventures
(i) Unquoted(1) Medica TS Hospital Private Limited 4,97,400 49.74 49.74 Secured optionally convertible redeemable debentures
(Face value of `1,000 each) 49.74 49.74
(b) Investments in others(i) Unquoted
(1) Bharti Airtel Limited - ₹700.00 (March 31, 2019 : Nil) 7 - -10.00 % non-cumulative redeemable preference shares(Face value of ₹100 each)(7 debentures were acquired during the year)
- -49.74 49.74
20,282.50 34,491.49
* During the year ended March 31, 2020, terms of the non-cumulative redeemable preference shares of T Steel Holdings Pte. Ltd. were modified to non-cumulative convertible preference shares and these preference shares were converted to equity shares. The fair value of the preference shares on the date of conversion was considered as the cost of the equity shares.
INTEGRATED REPORT & ANNUAL ACCOUNTS 2019-20 | 113TH YEAR252
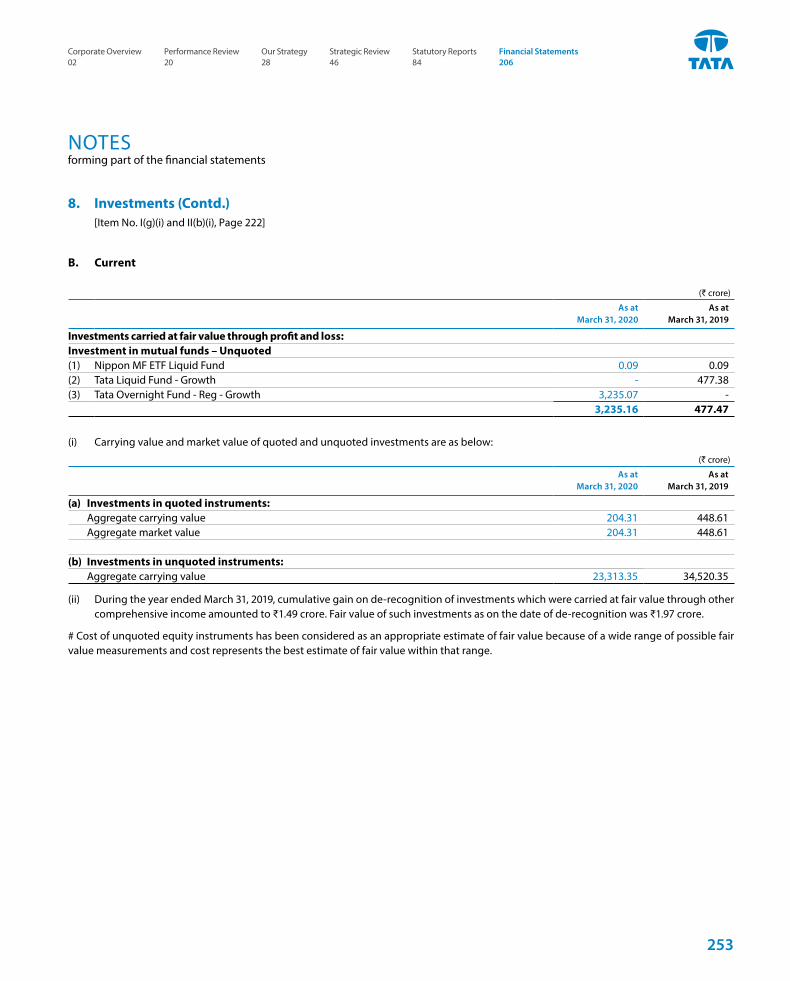
NOTESforming part of the financial statements
8. Investments (Contd.) [Item No. I(g)(i) and II(b)(i), Page 222]
B. Current
(` crore)
As at March 31, 2020
As at March 31, 2019
Investments carried at fair value through profit and loss: Investment in mutual funds – Unquoted(1) Nippon MF ETF Liquid Fund 0.09 0.09 (2) Tata Liquid Fund - Growth - 477.38 (3) Tata Overnight Fund - Reg - Growth 3,235.07 -
3,235.16 477.47
(i) Carrying value and market value of quoted and unquoted investments are as below:
(` crore)
As at March 31, 2020
As at March 31, 2019
(a) Investments in quoted instruments: Aggregate carrying value 204.31 448.61 Aggregate market value 204.31 448.61
(b) Investments in unquoted instruments: Aggregate carrying value 23,313.35 34,520.35
(ii) During the year ended March 31, 2019, cumulative gain on de-recognition of investments which were carried at fair value through other comprehensive income amounted to ₹1.49 crore. Fair value of such investments as on the date of de-recognition was ₹1.97 crore.
# Cost of unquoted equity instruments has been considered as an appropriate estimate of fair value because of a wide range of possible fair value measurements and cost represents the best estimate of fair value within that range.
253
Corporate Overview 02
Strategic Review 46
Performance Review 20
Statutory Reports 84
Our Strategy 28
Financial Statements 206
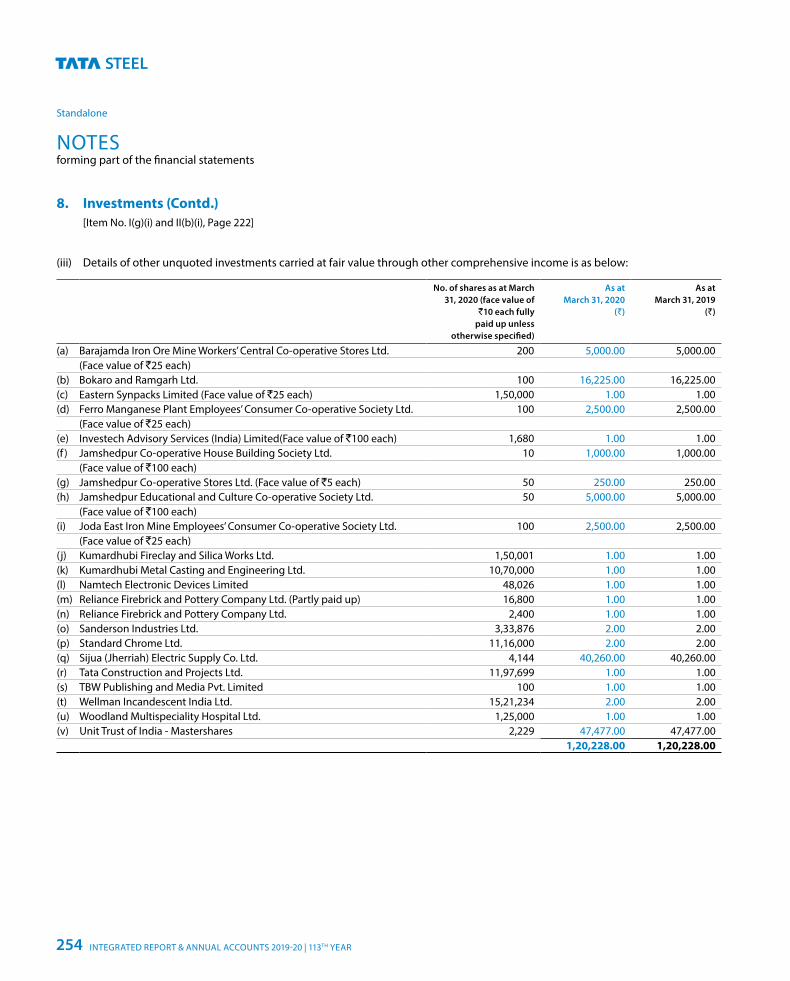
NOTESforming part of the financial statements
Standalone
8. Investments (Contd.) [Item No. I(g)(i) and II(b)(i), Page 222]
(iii) Details of other unquoted investments carried at fair value through other comprehensive income is as below:
No. of shares as at March 31, 2020 (face value of
`10 each fully paid up unless
otherwise specified)
As at March 31, 2020
(`)
As at March 31, 2019
(`)
(a) Barajamda Iron Ore Mine Workers’ Central Co-operative Stores Ltd. 200 5,000.00 5,000.00(Face value of `25 each)
(b) Bokaro and Ramgarh Ltd. 100 16,225.00 16,225.00(c) Eastern Synpacks Limited (Face value of `25 each) 1,50,000 1.00 1.00(d) Ferro Manganese Plant Employees’ Consumer Co-operative Society Ltd. 100 2,500.00 2,500.00
(Face value of `25 each)(e) Investech Advisory Services (India) Limited(Face value of `100 each) 1,680 1.00 1.00(f ) Jamshedpur Co-operative House Building Society Ltd. 10 1,000.00 1,000.00
(Face value of `100 each)(g) Jamshedpur Co-operative Stores Ltd. (Face value of `5 each) 50 250.00 250.00(h) Jamshedpur Educational and Culture Co-operative Society Ltd. 50 5,000.00 5,000.00
(Face value of `100 each)(i) Joda East Iron Mine Employees’ Consumer Co-operative Society Ltd. 100 2,500.00 2,500.00
(Face value of `25 each)(j) Kumardhubi Fireclay and Silica Works Ltd. 1,50,001 1.00 1.00(k) Kumardhubi Metal Casting and Engineering Ltd. 10,70,000 1.00 1.00(l) Namtech Electronic Devices Limited 48,026 1.00 1.00(m) Reliance Firebrick and Pottery Company Ltd. (Partly paid up) 16,800 1.00 1.00(n) Reliance Firebrick and Pottery Company Ltd. 2,400 1.00 1.00(o) Sanderson Industries Ltd. 3,33,876 2.00 2.00(p) Standard Chrome Ltd. 11,16,000 2.00 2.00(q) Sijua (Jherriah) Electric Supply Co. Ltd. 4,144 40,260.00 40,260.00(r) Tata Construction and Projects Ltd. 11,97,699 1.00 1.00(s) TBW Publishing and Media Pvt. Limited 100 1.00 1.00(t) Wellman Incandescent India Ltd. 15,21,234 2.00 2.00(u) Woodland Multispeciality Hospital Ltd. 1,25,000 1.00 1.00(v) Unit Trust of India - Mastershares 2,229 47,477.00 47,477.00
1,20,228.00 1,20,228.00
INTEGRATED REPORT & ANNUAL ACCOUNTS 2019-20 | 113TH YEAR254
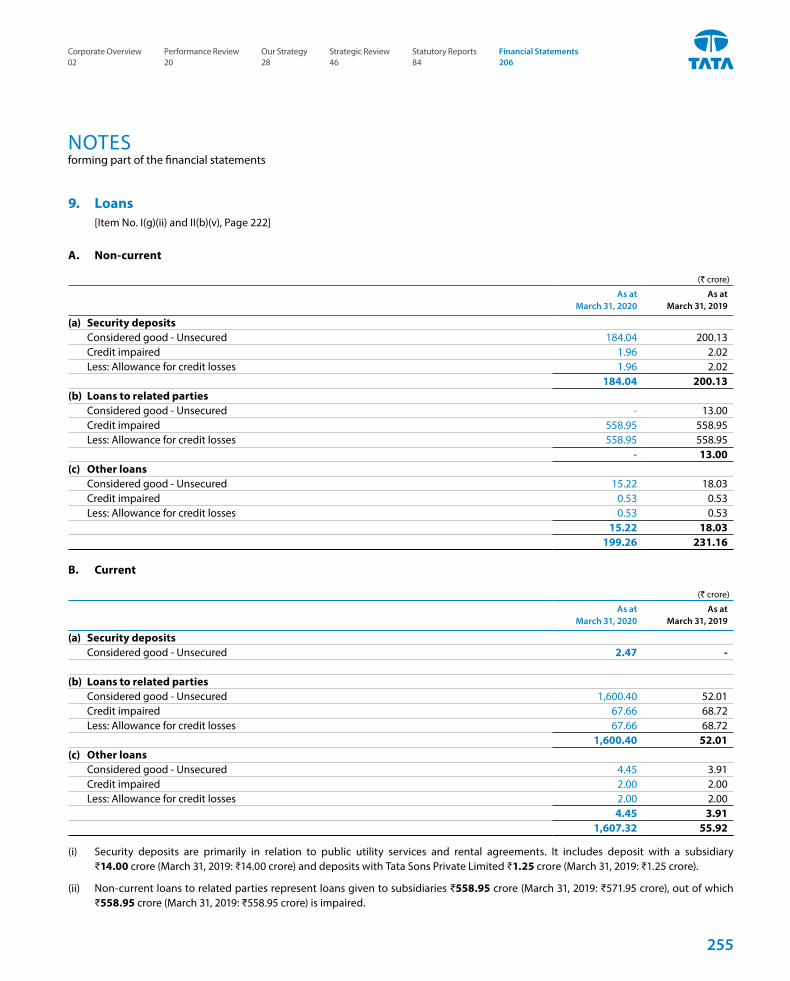
NOTESforming part of the financial statements
9. Loans [Item No. I(g)(ii) and II(b)(v), Page 222]
A. Non-current
(` crore)
As at March 31, 2020
As at March 31, 2019
(a) Security deposits Considered good - Unsecured 184.04 200.13 Credit impaired 1.96 2.02 Less: Allowance for credit losses 1.96 2.02
184.04 200.13(b) Loans to related parties Considered good - Unsecured - 13.00 Credit impaired 558.95 558.95 Less: Allowance for credit losses 558.95 558.95
- 13.00(c) Other loans Considered good - Unsecured 15.22 18.03 Credit impaired 0.53 0.53 Less: Allowance for credit losses 0.53 0.53
15.22 18.03199.26 231.16
B. Current
(` crore)
As at March 31, 2020
As at March 31, 2019
(a) Security deposits Considered good - Unsecured 2.47 -
(b) Loans to related parties Considered good - Unsecured 1,600.40 52.01 Credit impaired 67.66 68.72 Less: Allowance for credit losses 67.66 68.72
1,600.40 52.01(c) Other loans Considered good - Unsecured 4.45 3.91 Credit impaired 2.00 2.00 Less: Allowance for credit losses 2.00 2.00
4.45 3.911,607.32 55.92
(i) Security deposits are primarily in relation to public utility services and rental agreements. It includes deposit with a subsidiary ₹14.00 crore (March 31, 2019: ₹14.00 crore) and deposits with Tata Sons Private Limited ₹1.25 crore (March 31, 2019: ₹1.25 crore).
(ii) Non-current loans to related parties represent loans given to subsidiaries ₹558.95 crore (March 31, 2019: ₹571.95 crore), out of which ₹558.95 crore (March 31, 2019: ₹558.95 crore) is impaired.
255
Corporate Overview 02
Strategic Review 46
Performance Review 20
Statutory Reports 84
Our Strategy 28
Financial Statements 206
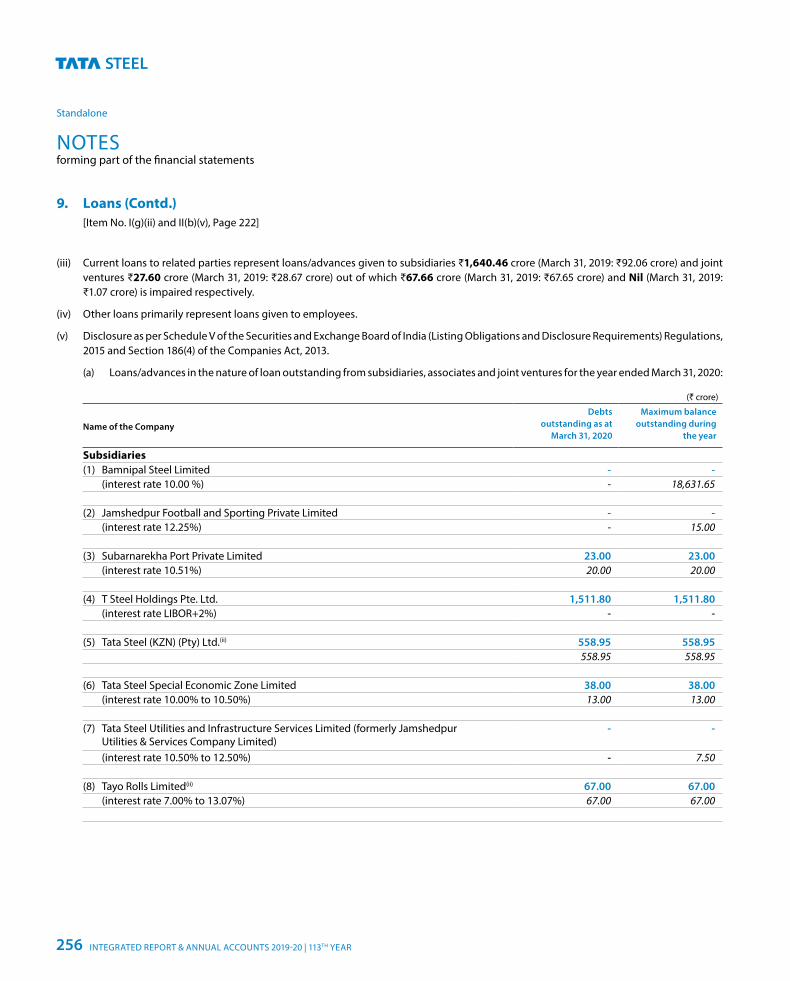
NOTESforming part of the financial statements
Standalone
(iii) Current loans to related parties represent loans/advances given to subsidiaries ₹1,640.46 crore (March 31, 2019: ₹92.06 crore) and joint ventures ₹27.60 crore (March 31, 2019: ₹28.67 crore) out of which ₹67.66 crore (March 31, 2019: ₹67.65 crore) and Nil (March 31, 2019: ₹1.07 crore) is impaired respectively.
(iv) Other loans primarily represent loans given to employees.
(v) Disclosure as per Schedule V of the Securities and Exchange Board of India (Listing Obligations and Disclosure Requirements) Regulations, 2015 and Section 186(4) of the Companies Act, 2013.
(a) Loans/advances in the nature of loan outstanding from subsidiaries, associates and joint ventures for the year ended March 31, 2020:
(` crore)
Name of the Company
Debts outstanding as at
March 31, 2020
Maximum balance outstanding during
the year
Subsidiaries(1) Bamnipal Steel Limited - - (interest rate 10.00 %) - 18,631.65
(2) Jamshedpur Football and Sporting Private Limited - - (interest rate 12.25%) - 15.00
(3) Subarnarekha Port Private Limited 23.00 23.00 (interest rate 10.51%) 20.00 20.00
(4) T Steel Holdings Pte. Ltd. 1,511.80 1,511.80 (interest rate LIBOR+2%) - -
(5) Tata Steel (KZN) (Pty) Ltd.(ii) 558.95 558.95558.95 558.95
(6) Tata Steel Special Economic Zone Limited 38.00 38.00 (interest rate 10.00% to 10.50%) 13.00 13.00
(7) Tata Steel Utilities and Infrastructure Services Limited (formerly Jamshedpur Utilities & Services Company Limited)
- -
(interest rate 10.50% to 12.50%) - 7.50
(8) Tayo Rolls Limited(ii) 67.00 67.00 (interest rate 7.00% to 13.07%) 67.00 67.00
9. Loans (Contd.) [Item No. I(g)(ii) and II(b)(v), Page 222]
INTEGRATED REPORT & ANNUAL ACCOUNTS 2019-20 | 113TH YEAR256
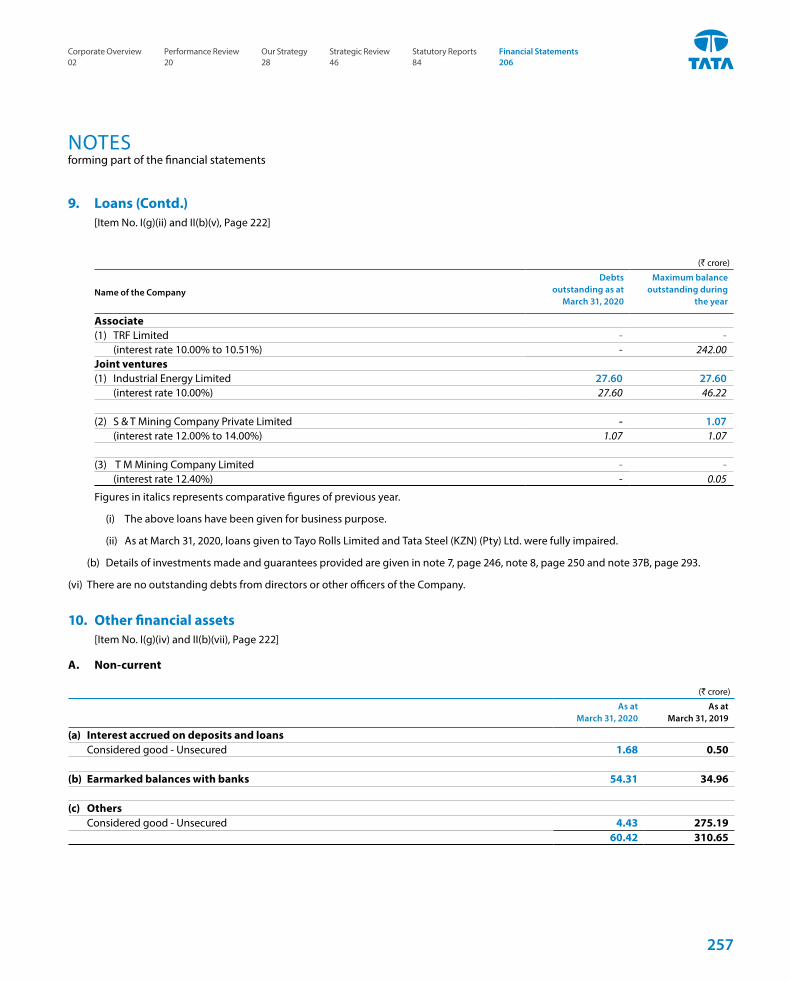
NOTESforming part of the financial statements
(` crore)
Name of the Company
Debts outstanding as at
March 31, 2020
Maximum balance outstanding during
the year
Associate(1) TRF Limited - - (interest rate 10.00% to 10.51%) - 242.00Joint ventures(1) Industrial Energy Limited 27.60 27.60 (interest rate 10.00%) 27.60 46.22
(2) S & T Mining Company Private Limited - 1.07 (interest rate 12.00% to 14.00%) 1.07 1.07
(3) T M Mining Company Limited - - (interest rate 12.40%) - 0.05
Figures in italics represents comparative figures of previous year.
(i) The above loans have been given for business purpose.
(ii) As at March 31, 2020, loans given to Tayo Rolls Limited and Tata Steel (KZN) (Pty) Ltd. were fully impaired.
(b) Details of investments made and guarantees provided are given in note 7, page 246, note 8, page 250 and note 37B, page 293.
(vi) There are no outstanding debts from directors or other officers of the Company.
10. Other financial assets [Item No. I(g)(iv) and II(b)(vii), Page 222]
A. Non-current
(` crore)
As at March 31, 2020
As at March 31, 2019
(a) Interest accrued on deposits and loans Considered good - Unsecured 1.68 0.50
(b) Earmarked balances with banks 54.31 34.96
(c) Others Considered good - Unsecured 4.43 275.19
60.42 310.65
9. Loans (Contd.) [Item No. I(g)(ii) and II(b)(v), Page 222]
257
Corporate Overview 02
Strategic Review 46
Performance Review 20
Statutory Reports 84
Our Strategy 28
Financial Statements 206
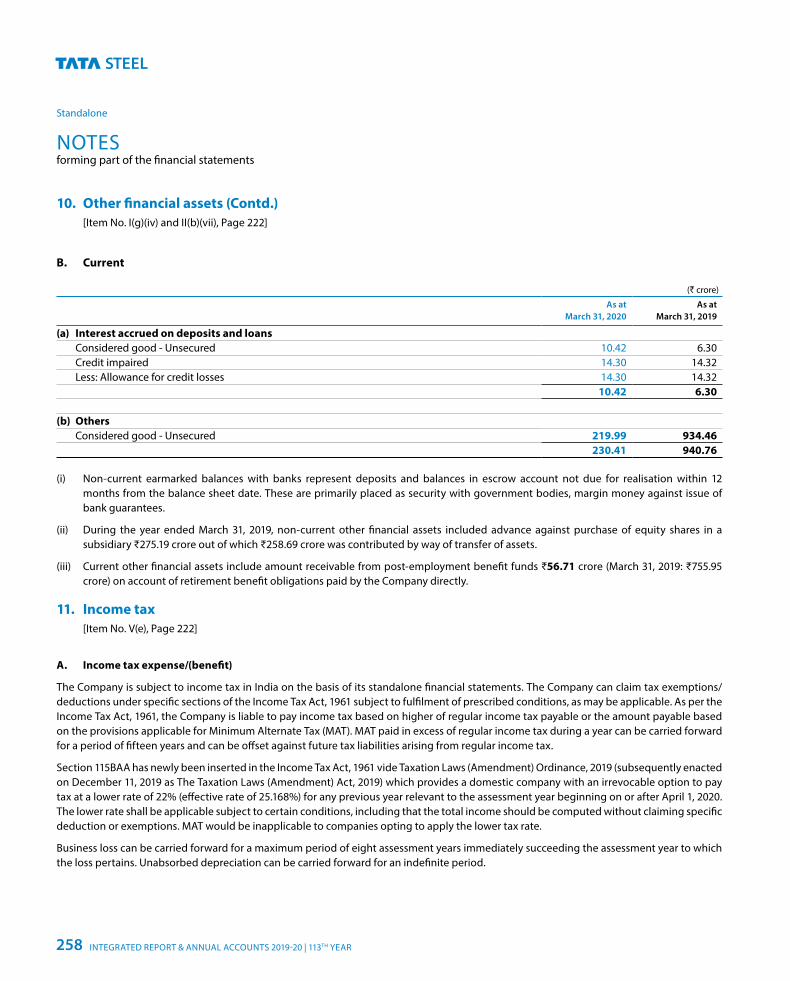
NOTESforming part of the financial statements
Standalone
B. Current
(` crore)
As at March 31, 2020
As at March 31, 2019
(a) Interest accrued on deposits and loans Considered good - Unsecured 10.42 6.30 Credit impaired 14.30 14.32 Less: Allowance for credit losses 14.30 14.32
10.42 6.30 (b) Others Considered good - Unsecured 219.99 934.46
230.41 940.76
(i) Non-current earmarked balances with banks represent deposits and balances in escrow account not due for realisation within 12 months from the balance sheet date. These are primarily placed as security with government bodies, margin money against issue of bank guarantees.
(ii) During the year ended March 31, 2019, non-current other financial assets included advance against purchase of equity shares in a subsidiary ₹275.19 crore out of which ₹258.69 crore was contributed by way of transfer of assets.
(iii) Current other financial assets include amount receivable from post-employment benefit funds ₹56.71 crore (March 31, 2019: ₹755.95 crore) on account of retirement benefit obligations paid by the Company directly.
11. Income tax [Item No. V(e), Page 222]
A. Income tax expense/(benefit)
The Company is subject to income tax in India on the basis of its standalone financial statements. The Company can claim tax exemptions/deductions under specific sections of the Income Tax Act, 1961 subject to fulfilment of prescribed conditions, as may be applicable. As per the Income Tax Act, 1961, the Company is liable to pay income tax based on higher of regular income tax payable or the amount payable based on the provisions applicable for Minimum Alternate Tax (MAT). MAT paid in excess of regular income tax during a year can be carried forward for a period of fifteen years and can be offset against future tax liabilities arising from regular income tax.
Section 115BAA has newly been inserted in the Income Tax Act, 1961 vide Taxation Laws (Amendment) Ordinance, 2019 (subsequently enacted on December 11, 2019 as The Taxation Laws (Amendment) Act, 2019) which provides a domestic company with an irrevocable option to pay tax at a lower rate of 22% (effective rate of 25.168%) for any previous year relevant to the assessment year beginning on or after April 1, 2020. The lower rate shall be applicable subject to certain conditions, including that the total income should be computed without claiming specific deduction or exemptions. MAT would be inapplicable to companies opting to apply the lower tax rate.
Business loss can be carried forward for a maximum period of eight assessment years immediately succeeding the assessment year to which the loss pertains. Unabsorbed depreciation can be carried forward for an indefinite period.
10. Other financial assets (Contd.) [Item No. I(g)(iv) and II(b)(vii), Page 222]
INTEGRATED REPORT & ANNUAL ACCOUNTS 2019-20 | 113TH YEAR258
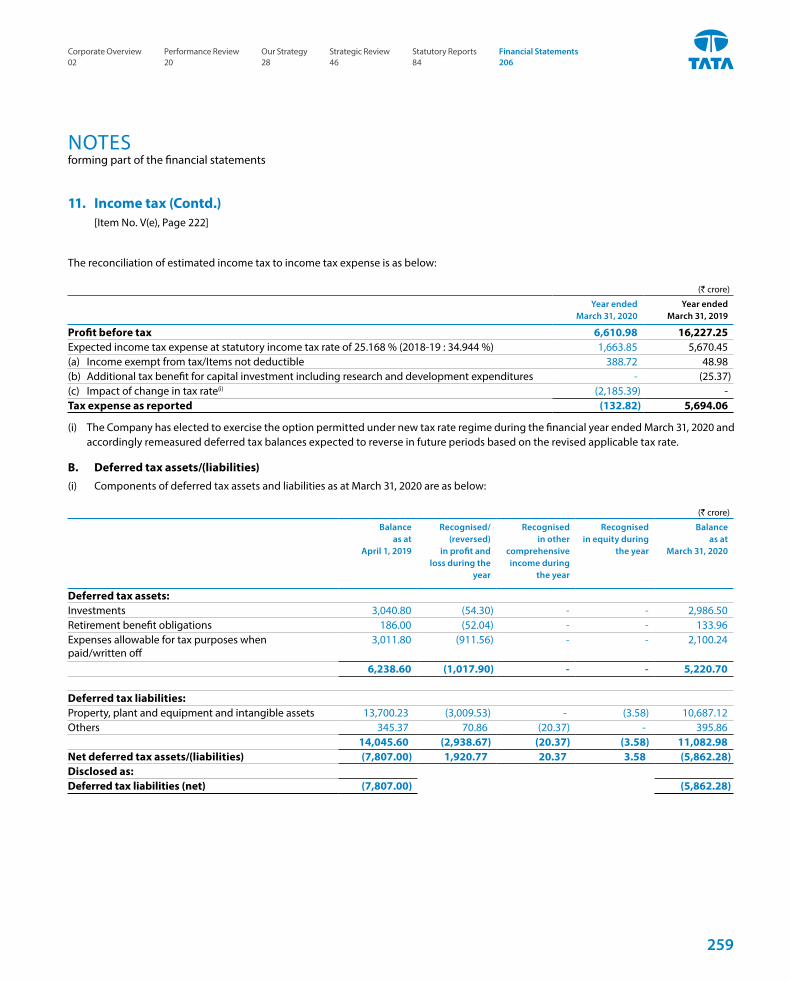
NOTESforming part of the financial statements
The reconciliation of estimated income tax to income tax expense is as below:
(` crore)
Year ended March 31, 2020
Year ended March 31, 2019
Profit before tax 6,610.98 16,227.25Expected income tax expense at statutory income tax rate of 25.168 % (2018-19 : 34.944 %) 1,663.85 5,670.45(a) Income exempt from tax/Items not deductible 388.72 48.98(b) Additional tax benefit for capital investment including research and development expenditures - (25.37)(c) Impact of change in tax rate(i) (2,185.39) -Tax expense as reported (132.82) 5,694.06
(i) The Company has elected to exercise the option permitted under new tax rate regime during the financial year ended March 31, 2020 and accordingly remeasured deferred tax balances expected to reverse in future periods based on the revised applicable tax rate.
B. Deferred tax assets/(liabilities) (i) Components of deferred tax assets and liabilities as at March 31, 2020 are as below:
(` crore)
Balance as at
April 1, 2019
Recognised/(reversed)
in profit andloss during the
year
Recognised in other
comprehensive income during
the year
Recognised in equity during
the year
Balance as at
March 31, 2020
Deferred tax assets:Investments 3,040.80 (54.30) - - 2,986.50Retirement benefit obligations 186.00 (52.04) - - 133.96Expenses allowable for tax purposes when paid/written off
3,011.80 (911.56) - - 2,100.24
6,238.60 (1,017.90) - - 5,220.70
Deferred tax liabilities:Property, plant and equipment and intangible assets 13,700.23 (3,009.53) - (3.58) 10,687.12Others 345.37 70.86 (20.37) - 395.86
14,045.60 (2,938.67) (20.37) (3.58) 11,082.98Net deferred tax assets/(liabilities) (7,807.00) 1,920.77 20.37 3.58 (5,862.28)Disclosed as:Deferred tax liabilities (net) (7,807.00) (5,862.28)
11. Income tax (Contd.) [Item No. V(e), Page 222]
259
Corporate Overview 02
Strategic Review 46
Performance Review 20
Statutory Reports 84
Our Strategy 28
Financial Statements 206
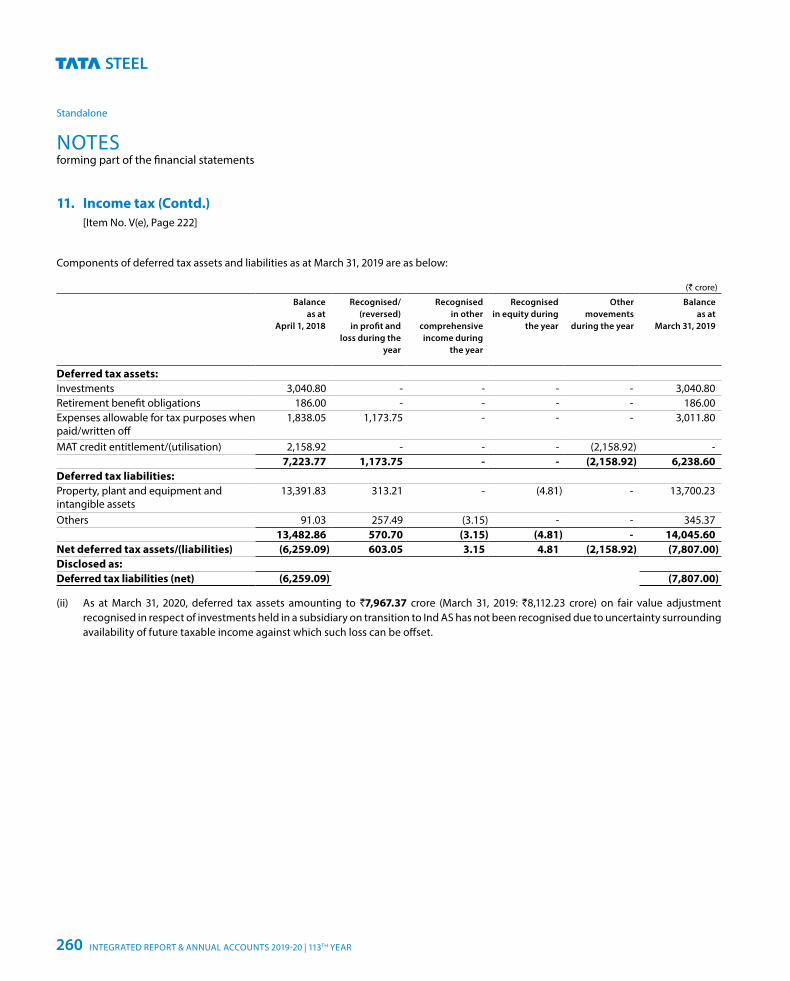
NOTESforming part of the financial statements
Standalone
11. Income tax (Contd.) [Item No. V(e), Page 222]
Components of deferred tax assets and liabilities as at March 31, 2019 are as below:
(` crore)
Balance as at
April 1, 2018
Recognised/(reversed)
in profit andloss during the
year
Recognised in other
comprehensive income during
the year
Recognised in equity during
the year
Other movements
during the year
Balance as at
March 31, 2019
Deferred tax assets:Investments 3,040.80 - - - - 3,040.80Retirement benefit obligations 186.00 - - - - 186.00Expenses allowable for tax purposes when paid/written off
1,838.05 1,173.75 - - - 3,011.80
MAT credit entitlement/(utilisation) 2,158.92 - - - (2,158.92) -7,223.77 1,173.75 - - (2,158.92) 6,238.60
Deferred tax liabilities:Property, plant and equipment and intangible assets
13,391.83 313.21 - (4.81) - 13,700.23
Others 91.03 257.49 (3.15) - - 345.3713,482.86 570.70 (3.15) (4.81) - 14,045.60
Net deferred tax assets/(liabilities) (6,259.09) 603.05 3.15 4.81 (2,158.92) (7,807.00)Disclosed as:Deferred tax liabilities (net) (6,259.09) (7,807.00)
(ii) As at March 31, 2020, deferred tax assets amounting to `7,967.37 crore (March 31, 2019: `8,112.23 crore) on fair value adjustment recognised in respect of investments held in a subsidiary on transition to Ind AS has not been recognised due to uncertainty surrounding availability of future taxable income against which such loss can be offset.
INTEGRATED REPORT & ANNUAL ACCOUNTS 2019-20 | 113TH YEAR260
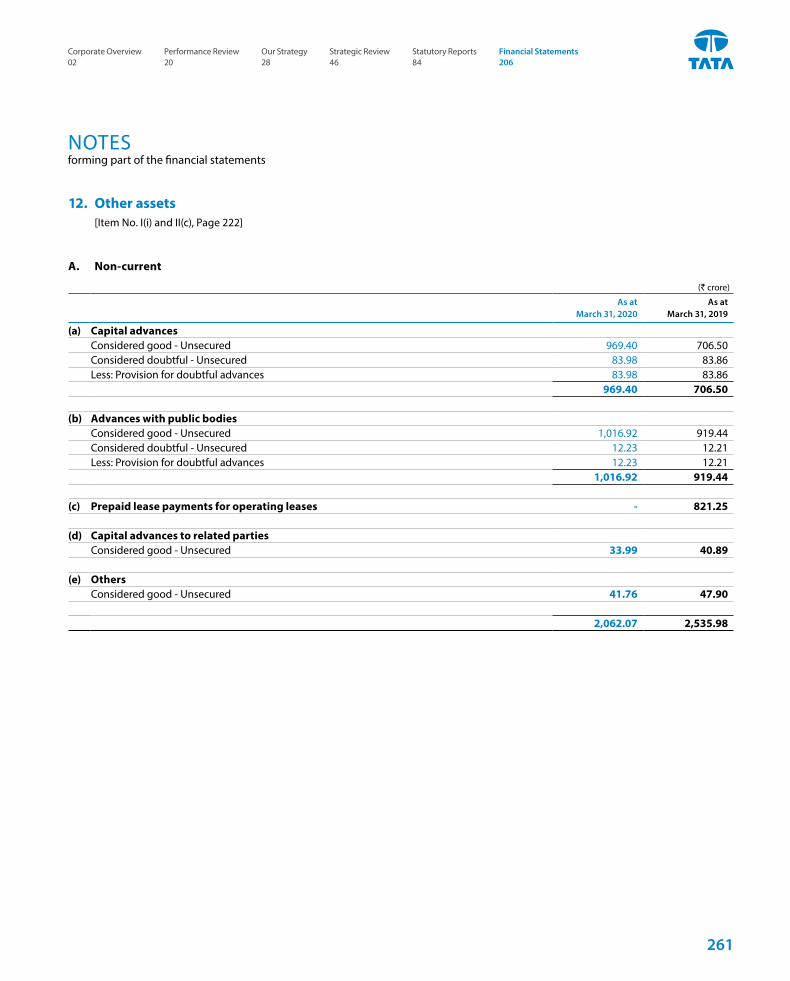
NOTESforming part of the financial statements
12. Other assets [Item No. I(i) and II(c), Page 222]
A. Non-current
(` crore)
As at March 31, 2020
As at March 31, 2019
(a) Capital advancesConsidered good - Unsecured 969.40 706.50Considered doubtful - Unsecured 83.98 83.86Less: Provision for doubtful advances 83.98 83.86
969.40 706.50
(b) Advances with public bodiesConsidered good - Unsecured 1,016.92 919.44Considered doubtful - Unsecured 12.23 12.21Less: Provision for doubtful advances 12.23 12.21
1,016.92 919.44
(c) Prepaid lease payments for operating leases - 821.25
(d) Capital advances to related partiesConsidered good - Unsecured 33.99 40.89
(e) OthersConsidered good - Unsecured 41.76 47.90
2,062.07 2,535.98
261
Corporate Overview 02
Strategic Review 46
Performance Review 20
Statutory Reports 84
Our Strategy 28
Financial Statements 206
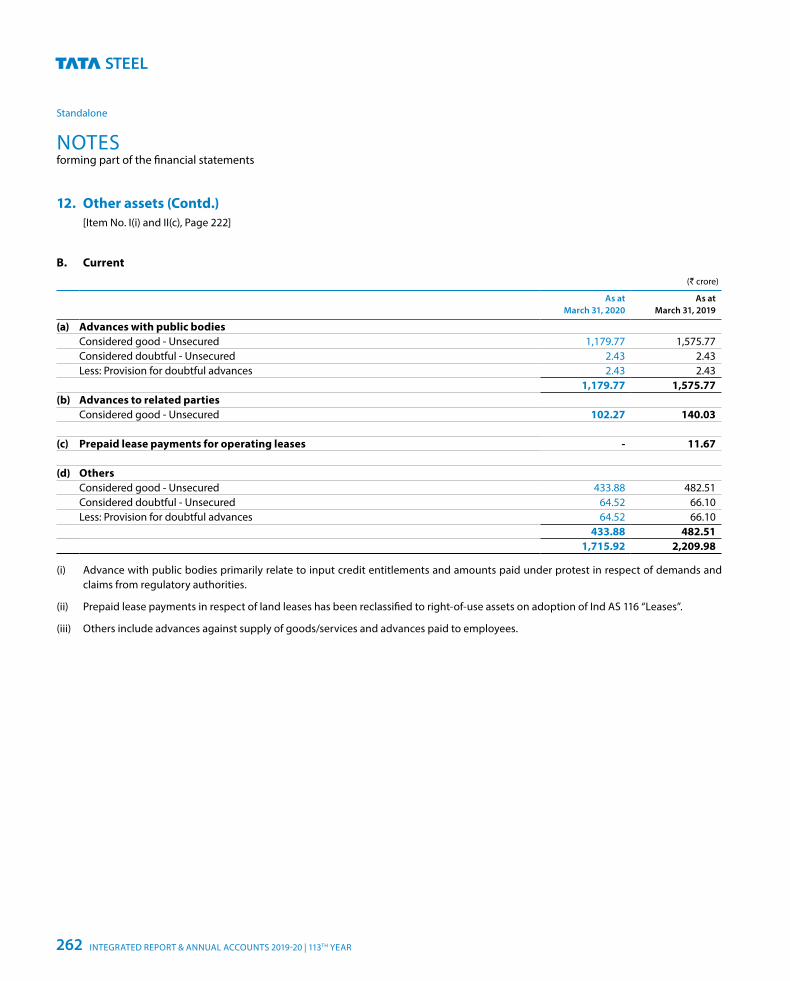
NOTESforming part of the financial statements
Standalone
B. Current (` crore)
As at March 31, 2020
As at March 31, 2019
(a) Advances with public bodiesConsidered good - Unsecured 1,179.77 1,575.77Considered doubtful - Unsecured 2.43 2.43Less: Provision for doubtful advances 2.43 2.43
1,179.77 1,575.77(b) Advances to related parties
Considered good - Unsecured 102.27 140.03
(c) Prepaid lease payments for operating leases - 11.67
(d) OthersConsidered good - Unsecured 433.88 482.51Considered doubtful - Unsecured 64.52 66.10Less: Provision for doubtful advances 64.52 66.10
433.88 482.511,715.92 2,209.98
(i) Advance with public bodies primarily relate to input credit entitlements and amounts paid under protest in respect of demands and claims from regulatory authorities.
(ii) Prepaid lease payments in respect of land leases has been reclassified to right-of-use assets on adoption of Ind AS 116 “Leases”.
(iii) Others include advances against supply of goods/services and advances paid to employees.
12. Other assets (Contd.)
[Item No. I(i) and II(c), Page 222]
INTEGRATED REPORT & ANNUAL ACCOUNTS 2019-20 | 113TH YEAR262
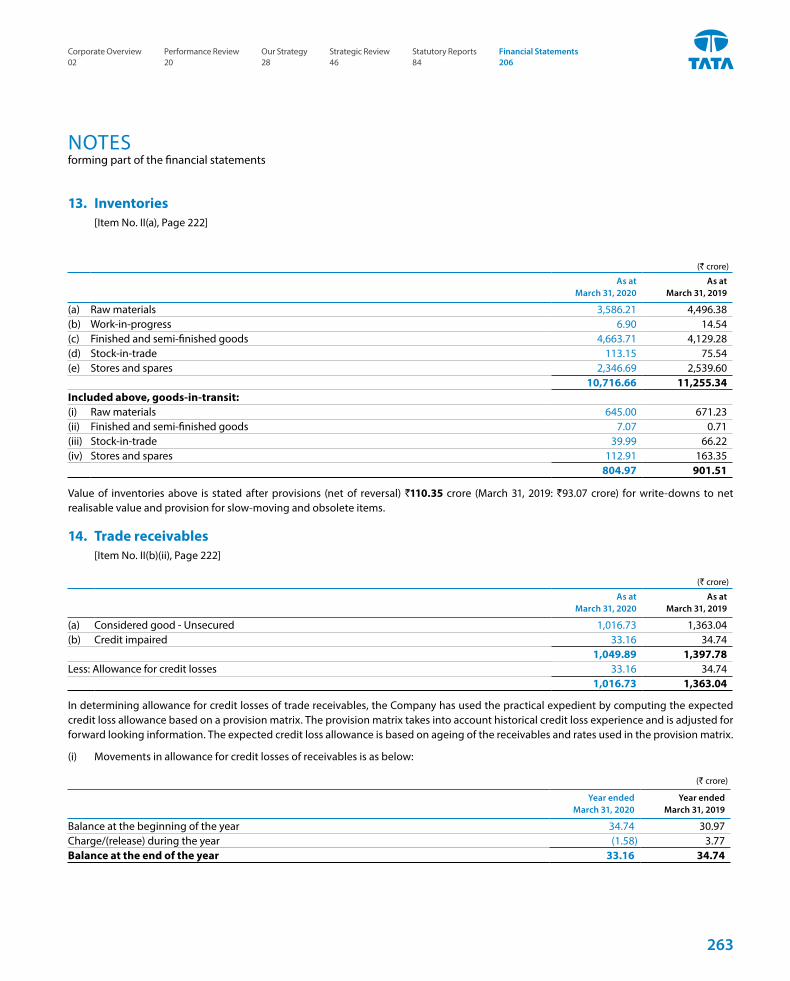
NOTESforming part of the financial statements
13. Inventories [Item No. II(a), Page 222]
(` crore)
As at March 31, 2020
As at March 31, 2019
(a) Raw materials 3,586.21 4,496.38(b) Work-in-progress 6.90 14.54(c) Finished and semi-finished goods 4,663.71 4,129.28(d) Stock-in-trade 113.15 75.54(e) Stores and spares 2,346.69 2,539.60
10,716.66 11,255.34Included above, goods-in-transit:(i) Raw materials 645.00 671.23(ii) Finished and semi-finished goods 7.07 0.71(iii) Stock-in-trade 39.99 66.22(iv) Stores and spares 112.91 163.35
804.97 901.51
Value of inventories above is stated after provisions (net of reversal) `110.35 crore (March 31, 2019: `93.07 crore) for write-downs to net realisable value and provision for slow-moving and obsolete items.
14. Trade receivables [Item No. II(b)(ii), Page 222]
(` crore)
As at March 31, 2020
As at March 31, 2019
(a) Considered good - Unsecured 1,016.73 1,363.04(b) Credit impaired 33.16 34.74
1,049.89 1,397.78Less: Allowance for credit losses 33.16 34.74
1,016.73 1,363.04
In determining allowance for credit losses of trade receivables, the Company has used the practical expedient by computing the expected credit loss allowance based on a provision matrix. The provision matrix takes into account historical credit loss experience and is adjusted for forward looking information. The expected credit loss allowance is based on ageing of the receivables and rates used in the provision matrix.
(i) Movements in allowance for credit losses of receivables is as below:
(` crore)
Year ended March 31, 2020
Year ended March 31, 2019
Balance at the beginning of the year 34.74 30.97Charge/(release) during the year (1.58) 3.77Balance at the end of the year 33.16 34.74
263
Corporate Overview 02
Strategic Review 46
Performance Review 20
Statutory Reports 84
Our Strategy 28
Financial Statements 206
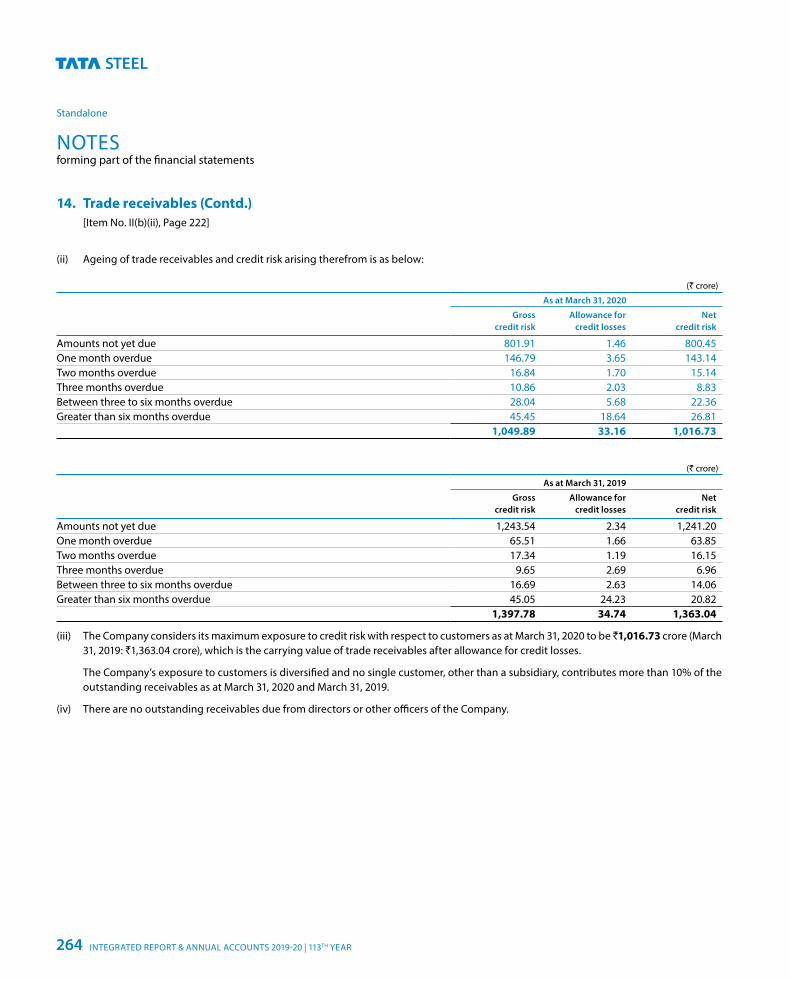
NOTESforming part of the financial statements
Standalone
(ii) Ageing of trade receivables and credit risk arising therefrom is as below:
(` crore)
As at March 31, 2020
Grosscredit risk
Allowance for credit losses
Netcredit risk
Amounts not yet due 801.91 1.46 800.45One month overdue 146.79 3.65 143.14Two months overdue 16.84 1.70 15.14Three months overdue 10.86 2.03 8.83Between three to six months overdue 28.04 5.68 22.36Greater than six months overdue 45.45 18.64 26.81
1,049.89 33.16 1,016.73
(` crore)
As at March 31, 2019
Gross credit risk
Allowance for credit losses
Net credit risk
Amounts not yet due 1,243.54 2.34 1,241.20One month overdue 65.51 1.66 63.85Two months overdue 17.34 1.19 16.15Three months overdue 9.65 2.69 6.96Between three to six months overdue 16.69 2.63 14.06Greater than six months overdue 45.05 24.23 20.82
1,397.78 34.74 1,363.04
(iii) The Company considers its maximum exposure to credit risk with respect to customers as at March 31, 2020 to be ̀ 1,016.73 crore (March 31, 2019: `1,363.04 crore), which is the carrying value of trade receivables after allowance for credit losses.
The Company’s exposure to customers is diversified and no single customer, other than a subsidiary, contributes more than 10% of the outstanding receivables as at March 31, 2020 and March 31, 2019.
(iv) There are no outstanding receivables due from directors or other officers of the Company.
14. Trade receivables (Contd.) [Item No. II(b)(ii), Page 222]
INTEGRATED REPORT & ANNUAL ACCOUNTS 2019-20 | 113TH YEAR264
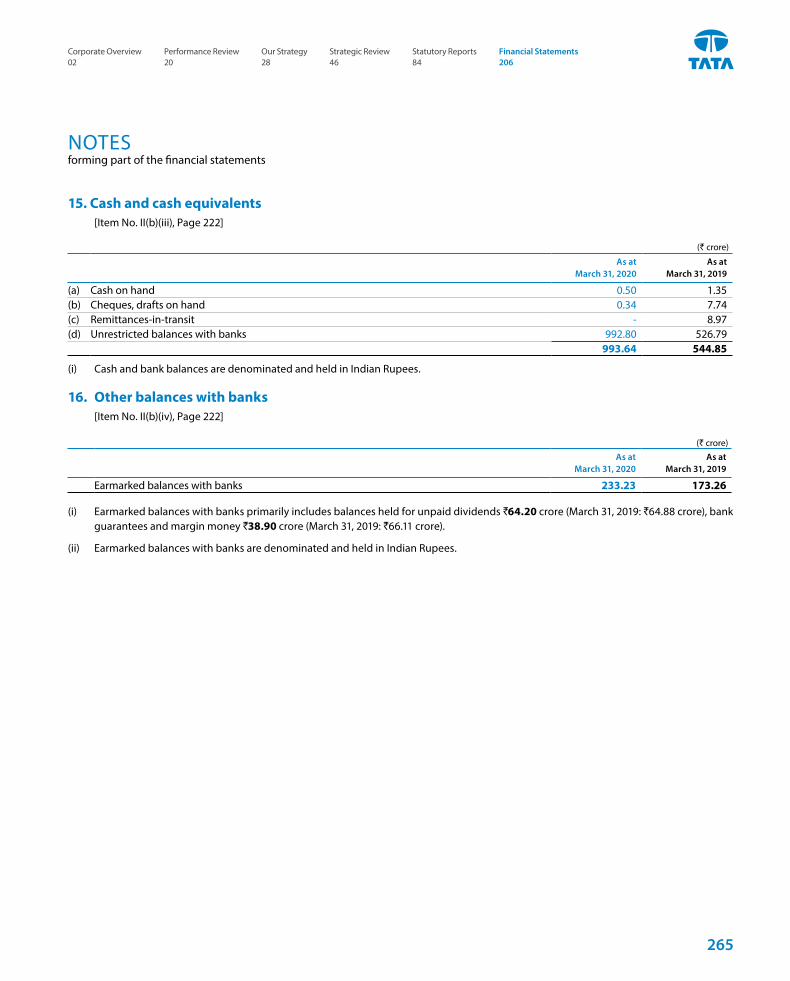
NOTESforming part of the financial statements
15. Cash and cash equivalents [Item No. II(b)(iii), Page 222]
(` crore)
As at March 31, 2020
As at March 31, 2019
(a) Cash on hand 0.50 1.35(b) Cheques, drafts on hand 0.34 7.74(c) Remittances-in-transit - 8.97(d) Unrestricted balances with banks 992.80 526.79
993.64 544.85
(i) Cash and bank balances are denominated and held in Indian Rupees.
16. Other balances with banks [Item No. II(b)(iv), Page 222]
(` crore)As at
March 31, 2020As at
March 31, 2019
Earmarked balances with banks 233.23 173.26
(i) Earmarked balances with banks primarily includes balances held for unpaid dividends `64.20 crore (March 31, 2019: `64.88 crore), bank guarantees and margin money `38.90 crore (March 31, 2019: `66.11 crore).
(ii) Earmarked balances with banks are denominated and held in Indian Rupees.
265
Corporate Overview 02
Strategic Review 46
Performance Review 20
Statutory Reports 84
Our Strategy 28
Financial Statements 206
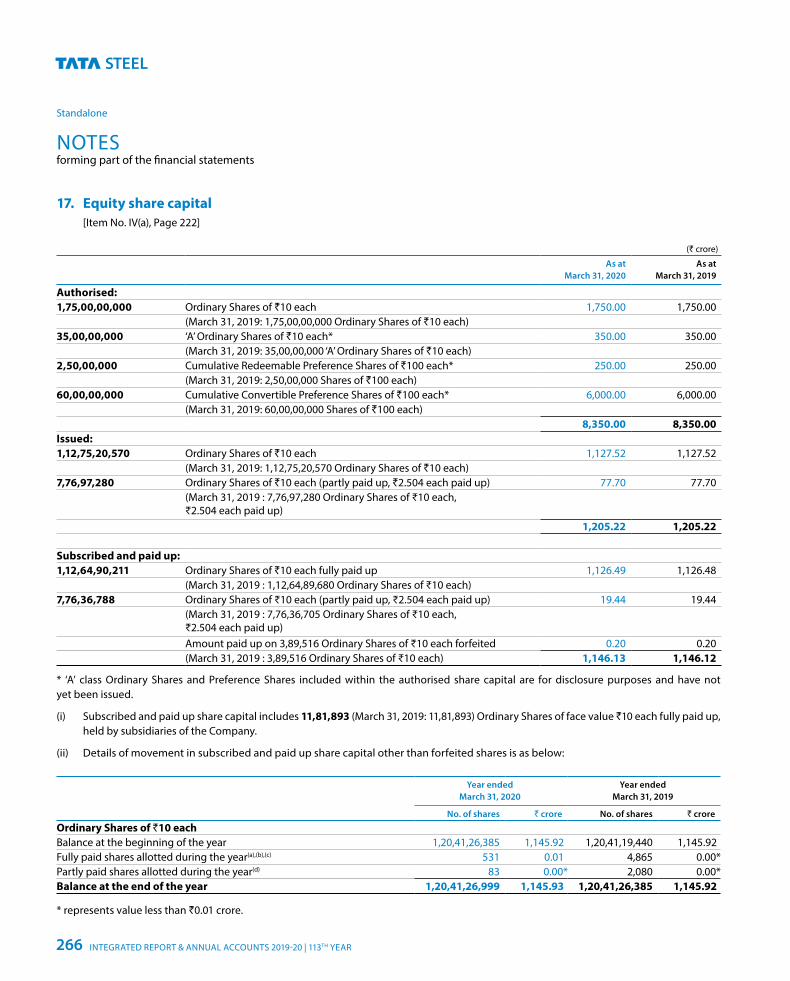
NOTESforming part of the financial statements
Standalone
17. Equity share capital [Item No. IV(a), Page 222]
(` crore)
As at March 31, 2020
As at March 31, 2019
Authorised:1,75,00,00,000 Ordinary Shares of `10 each 1,750.00 1,750.00
(March 31, 2019: 1,75,00,00,000 Ordinary Shares of `10 each)35,00,00,000 ‘A’ Ordinary Shares of `10 each* 350.00 350.00
(March 31, 2019: 35,00,00,000 ‘A’ Ordinary Shares of `10 each)2,50,00,000 Cumulative Redeemable Preference Shares of `100 each* 250.00 250.00
(March 31, 2019: 2,50,00,000 Shares of `100 each)60,00,00,000 Cumulative Convertible Preference Shares of `100 each* 6,000.00 6,000.00
(March 31, 2019: 60,00,00,000 Shares of `100 each)8,350.00 8,350.00
Issued:1,12,75,20,570 Ordinary Shares of `10 each 1,127.52 1,127.52
(March 31, 2019: 1,12,75,20,570 Ordinary Shares of `10 each)7,76,97,280 Ordinary Shares of `10 each (partly paid up, `2.504 each paid up) 77.70 77.70
(March 31, 2019 : 7,76,97,280 Ordinary Shares of ₹10 each,₹2.504 each paid up)
1,205.22 1,205.22
Subscribed and paid up:1,12,64,90,211 Ordinary Shares of `10 each fully paid up 1,126.49 1,126.48
(March 31, 2019 : 1,12,64,89,680 Ordinary Shares of ₹10 each)7,76,36,788 Ordinary Shares of ₹10 each (partly paid up, ₹2.504 each paid up) 19.44 19.44
(March 31, 2019 : 7,76,36,705 Ordinary Shares of ₹10 each,₹2.504 each paid up)Amount paid up on 3,89,516 Ordinary Shares of ₹10 each forfeited 0.20 0.20(March 31, 2019 : 3,89,516 Ordinary Shares of ₹10 each) 1,146.13 1,146.12
* ‘A’ class Ordinary Shares and Preference Shares included within the authorised share capital are for disclosure purposes and have not yet been issued.
(i) Subscribed and paid up share capital includes 11,81,893 (March 31, 2019: 11,81,893) Ordinary Shares of face value `10 each fully paid up, held by subsidiaries of the Company.
(ii) Details of movement in subscribed and paid up share capital other than forfeited shares is as below:
Year ended March 31, 2020
Year ended March 31, 2019
No. of shares ` crore No. of shares ` crore
Ordinary Shares of `10 eachBalance at the beginning of the year 1,20,41,26,385 1,145.92 1,20,41,19,440 1,145.92Fully paid shares allotted during the year(a),(b),(c) 531 0.01 4,865 0.00*Partly paid shares allotted during the year(d) 83 0.00* 2,080 0.00*Balance at the end of the year 1,20,41,26,999 1,145.93 1,20,41,26,385 1,145.92
* represents value less than `0.01 crore.
INTEGRATED REPORT & ANNUAL ACCOUNTS 2019-20 | 113TH YEAR266
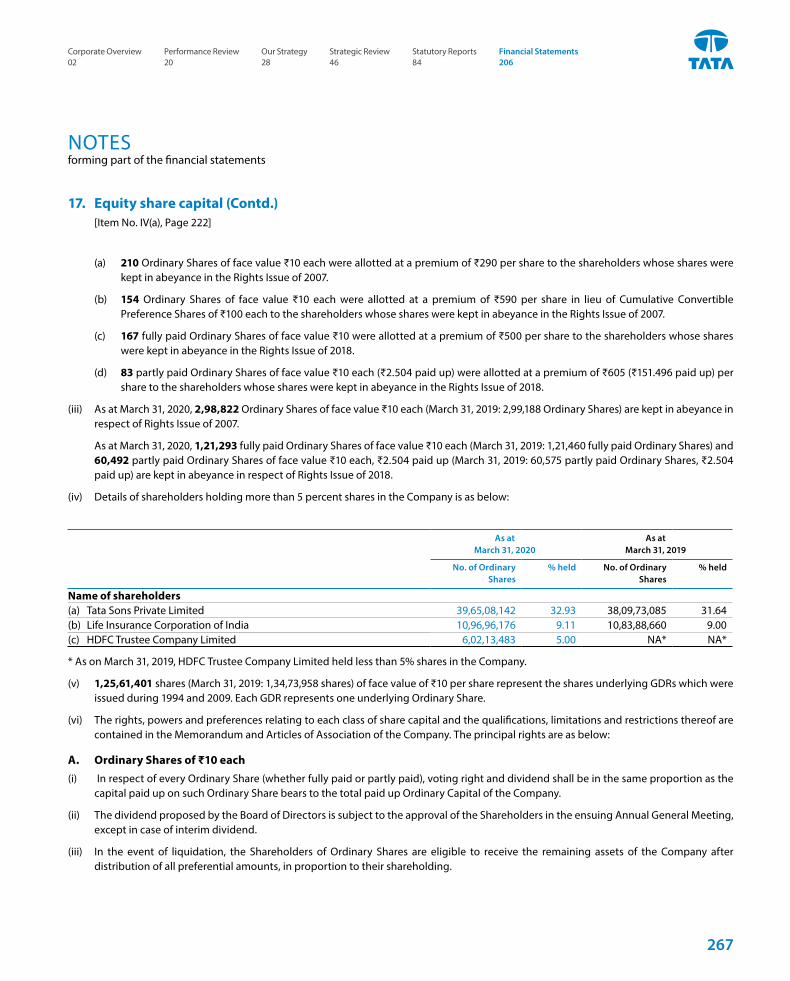
NOTESforming part of the financial statements
17. Equity share capital (Contd.) [Item No. IV(a), Page 222]
(a) 210 Ordinary Shares of face value ₹10 each were allotted at a premium of ₹290 per share to the shareholders whose shares were kept in abeyance in the Rights Issue of 2007.
(b) 154 Ordinary Shares of face value ₹10 each were allotted at a premium of ₹590 per share in lieu of Cumulative Convertible Preference Shares of ₹100 each to the shareholders whose shares were kept in abeyance in the Rights Issue of 2007.
(c) 167 fully paid Ordinary Shares of face value ₹10 were allotted at a premium of ₹500 per share to the shareholders whose shares were kept in abeyance in the Rights Issue of 2018.
(d) 83 partly paid Ordinary Shares of face value ₹10 each (₹2.504 paid up) were allotted at a premium of ₹605 (₹151.496 paid up) per share to the shareholders whose shares were kept in abeyance in the Rights Issue of 2018.
(iii) As at March 31, 2020, 2,98,822 Ordinary Shares of face value ₹10 each (March 31, 2019: 2,99,188 Ordinary Shares) are kept in abeyance in respect of Rights Issue of 2007.
As at March 31, 2020, 1,21,293 fully paid Ordinary Shares of face value ₹10 each (March 31, 2019: 1,21,460 fully paid Ordinary Shares) and 60,492 partly paid Ordinary Shares of face value ₹10 each, ₹2.504 paid up (March 31, 2019: 60,575 partly paid Ordinary Shares, ₹2.504 paid up) are kept in abeyance in respect of Rights Issue of 2018.
(iv) Details of shareholders holding more than 5 percent shares in the Company is as below:
As at March 31, 2020
As at March 31, 2019
No. of Ordinary Shares
% held No. of Ordinary Shares
% held
Name of shareholders (a) Tata Sons Private Limited 39,65,08,142 32.93 38,09,73,085 31.64(b) Life Insurance Corporation of India 10,96,96,176 9.11 10,83,88,660 9.00(c) HDFC Trustee Company Limited 6,02,13,483 5.00 NA* NA*
* As on March 31, 2019, HDFC Trustee Company Limited held less than 5% shares in the Company.
(v) 1,25,61,401 shares (March 31, 2019: 1,34,73,958 shares) of face value of ₹10 per share represent the shares underlying GDRs which were issued during 1994 and 2009. Each GDR represents one underlying Ordinary Share.
(vi) The rights, powers and preferences relating to each class of share capital and the qualifications, limitations and restrictions thereof are contained in the Memorandum and Articles of Association of the Company. The principal rights are as below:
A. Ordinary Shares of ₹10 each(i) In respect of every Ordinary Share (whether fully paid or partly paid), voting right and dividend shall be in the same proportion as the
capital paid up on such Ordinary Share bears to the total paid up Ordinary Capital of the Company.
(ii) The dividend proposed by the Board of Directors is subject to the approval of the Shareholders in the ensuing Annual General Meeting, except in case of interim dividend.
(iii) In the event of liquidation, the Shareholders of Ordinary Shares are eligible to receive the remaining assets of the Company after distribution of all preferential amounts, in proportion to their shareholding.
267
Corporate Overview 02
Strategic Review 46
Performance Review 20
Statutory Reports 84
Our Strategy 28
Financial Statements 206
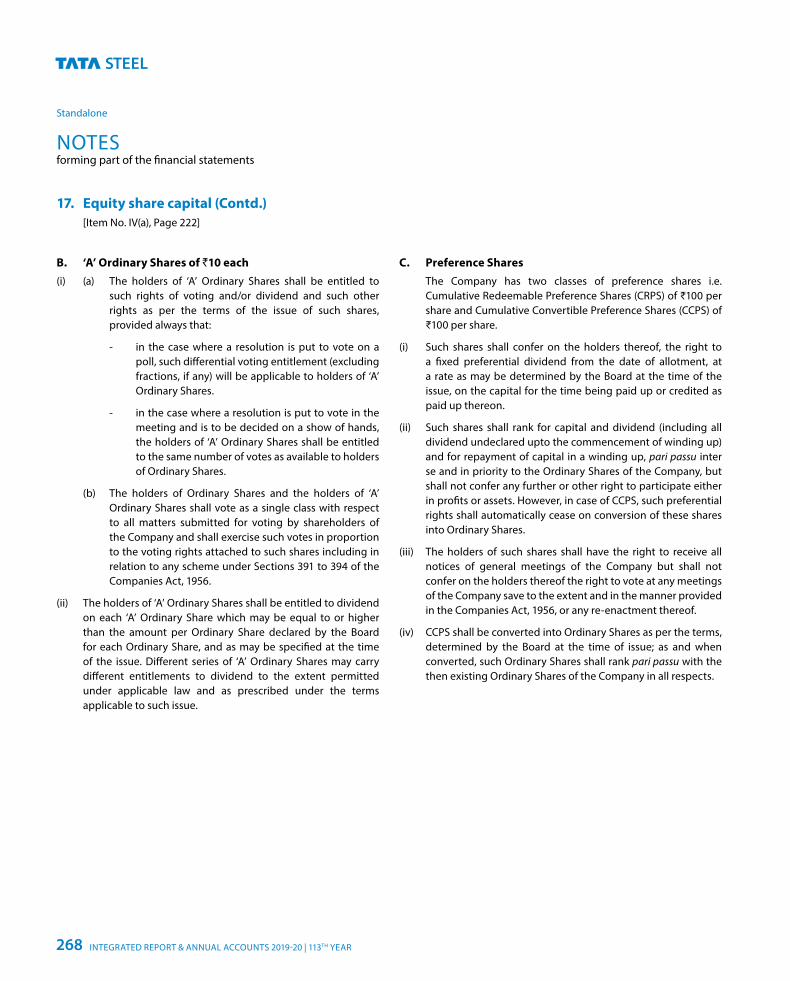
NOTESforming part of the financial statements
Standalone
17. Equity share capital (Contd.) [Item No. IV(a), Page 222]
B. ‘A’ Ordinary Shares of `10 each(i) (a) The holders of ‘A’ Ordinary Shares shall be entitled to
such rights of voting and/or dividend and such other rights as per the terms of the issue of such shares, provided always that:
- in the case where a resolution is put to vote on a poll, such differential voting entitlement (excluding fractions, if any) will be applicable to holders of ‘A’ Ordinary Shares.
- in the case where a resolution is put to vote in the meeting and is to be decided on a show of hands, the holders of ‘A’ Ordinary Shares shall be entitled to the same number of votes as available to holders of Ordinary Shares.
(b) The holders of Ordinary Shares and the holders of ‘A’ Ordinary Shares shall vote as a single class with respect to all matters submitted for voting by shareholders of the Company and shall exercise such votes in proportion to the voting rights attached to such shares including in relation to any scheme under Sections 391 to 394 of the Companies Act, 1956.
(ii) The holders of ‘A’ Ordinary Shares shall be entitled to dividend on each ‘A’ Ordinary Share which may be equal to or higher than the amount per Ordinary Share declared by the Board for each Ordinary Share, and as may be specified at the time of the issue. Different series of ‘A’ Ordinary Shares may carry different entitlements to dividend to the extent permitted under applicable law and as prescribed under the terms applicable to such issue.
C. Preference Shares The Company has two classes of preference shares i.e.
Cumulative Redeemable Preference Shares (CRPS) of ₹100 per share and Cumulative Convertible Preference Shares (CCPS) of ₹100 per share.
(i) Such shares shall confer on the holders thereof, the right to a fixed preferential dividend from the date of allotment, at a rate as may be determined by the Board at the time of the issue, on the capital for the time being paid up or credited as paid up thereon.
(ii) Such shares shall rank for capital and dividend (including all dividend undeclared upto the commencement of winding up) and for repayment of capital in a winding up, pari passu inter se and in priority to the Ordinary Shares of the Company, but shall not confer any further or other right to participate either in profits or assets. However, in case of CCPS, such preferential rights shall automatically cease on conversion of these shares into Ordinary Shares.
(iii) The holders of such shares shall have the right to receive all notices of general meetings of the Company but shall not confer on the holders thereof the right to vote at any meetings of the Company save to the extent and in the manner provided in the Companies Act, 1956, or any re-enactment thereof.
(iv) CCPS shall be converted into Ordinary Shares as per the terms, determined by the Board at the time of issue; as and when converted, such Ordinary Shares shall rank pari passu with the then existing Ordinary Shares of the Company in all respects.
INTEGRATED REPORT & ANNUAL ACCOUNTS 2019-20 | 113TH YEAR268
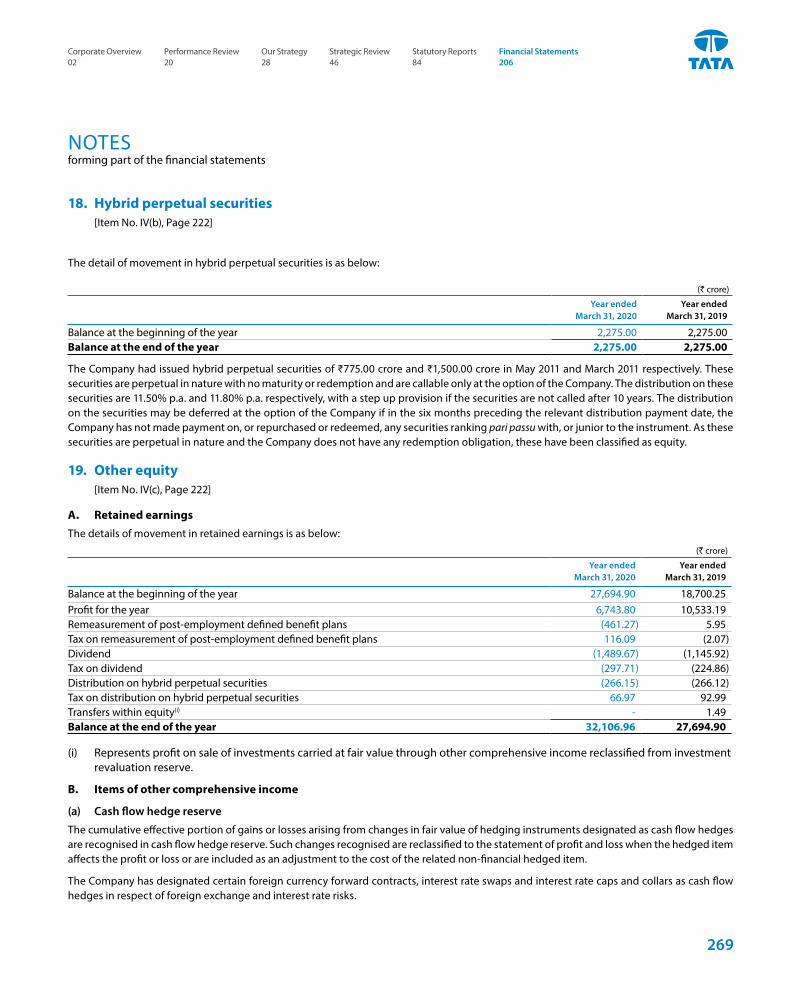
NOTESforming part of the financial statements
18. Hybrid perpetual securities [Item No. IV(b), Page 222]
The detail of movement in hybrid perpetual securities is as below:
(` crore)
Year endedMarch 31, 2020
Year endedMarch 31, 2019
Balance at the beginning of the year 2,275.00 2,275.00Balance at the end of the year 2,275.00 2,275.00
The Company had issued hybrid perpetual securities of ₹775.00 crore and ₹1,500.00 crore in May 2011 and March 2011 respectively. These securities are perpetual in nature with no maturity or redemption and are callable only at the option of the Company. The distribution on these securities are 11.50% p.a. and 11.80% p.a. respectively, with a step up provision if the securities are not called after 10 years. The distribution on the securities may be deferred at the option of the Company if in the six months preceding the relevant distribution payment date, the Company has not made payment on, or repurchased or redeemed, any securities ranking pari passu with, or junior to the instrument. As these securities are perpetual in nature and the Company does not have any redemption obligation, these have been classified as equity.
19. Other equity [Item No. IV(c), Page 222]
A. Retained earningsThe details of movement in retained earnings is as below:
(` crore)
Year endedMarch 31, 2020
Year endedMarch 31, 2019
Balance at the beginning of the year 27,694.90 18,700.25Profit for the year 6,743.80 10,533.19Remeasurement of post-employment defined benefit plans (461.27) 5.95Tax on remeasurement of post-employment defined benefit plans 116.09 (2.07)Dividend (1,489.67) (1,145.92)Tax on dividend (297.71) (224.86)Distribution on hybrid perpetual securities (266.15) (266.12)Tax on distribution on hybrid perpetual securities 66.97 92.99Transfers within equity(i) - 1.49Balance at the end of the year 32,106.96 27,694.90
(i) Represents profit on sale of investments carried at fair value through other comprehensive income reclassified from investment revaluation reserve.
B. Items of other comprehensive income
(a) Cash flow hedge reserve
The cumulative effective portion of gains or losses arising from changes in fair value of hedging instruments designated as cash flow hedges are recognised in cash flow hedge reserve. Such changes recognised are reclassified to the statement of profit and loss when the hedged item affects the profit or loss or are included as an adjustment to the cost of the related non-financial hedged item.
The Company has designated certain foreign currency forward contracts, interest rate swaps and interest rate caps and collars as cash flow hedges in respect of foreign exchange and interest rate risks.
269
Corporate Overview 02
Strategic Review 46
Performance Review 20
Statutory Reports 84
Our Strategy 28
Financial Statements 206
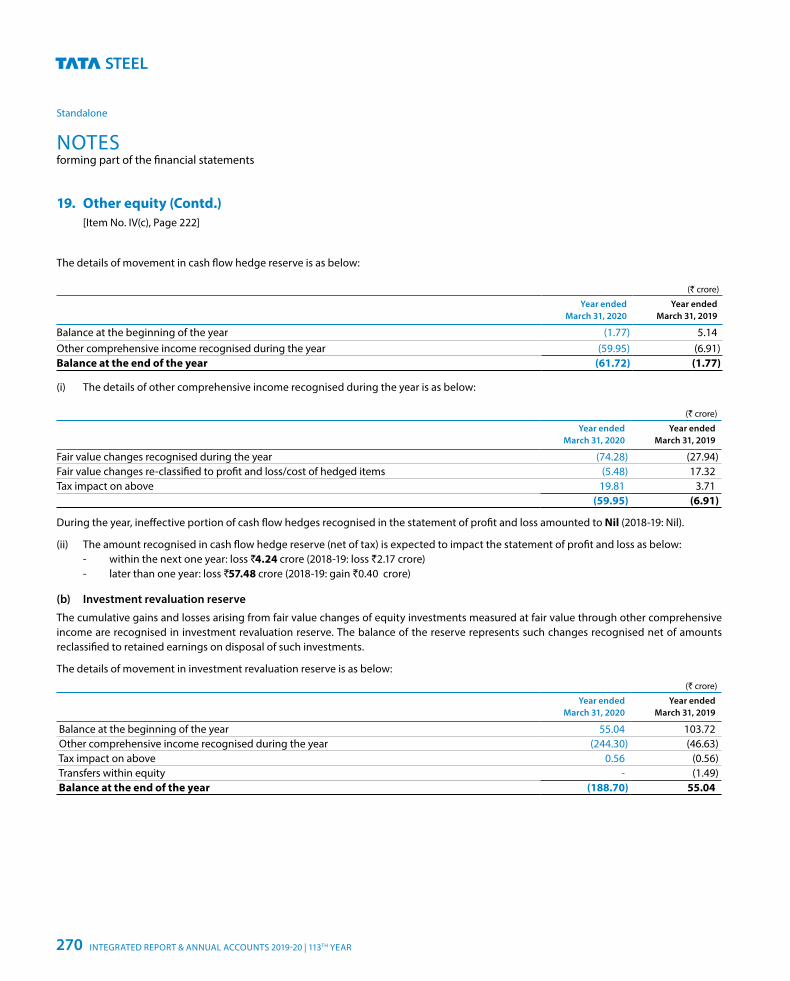
NOTESforming part of the financial statements
Standalone
The details of movement in cash flow hedge reserve is as below:
(` crore)
Year endedMarch 31, 2020
Year endedMarch 31, 2019
Balance at the beginning of the year (1.77) 5.14Other comprehensive income recognised during the year (59.95) (6.91)Balance at the end of the year (61.72) (1.77)
(i) The details of other comprehensive income recognised during the year is as below:
(` crore)
Year endedMarch 31, 2020
Year endedMarch 31, 2019
Fair value changes recognised during the year (74.28) (27.94)Fair value changes re-classified to profit and loss/cost of hedged items (5.48) 17.32Tax impact on above 19.81 3.71
(59.95) (6.91)
During the year, ineffective portion of cash flow hedges recognised in the statement of profit and loss amounted to Nil (2018-19: Nil).
(ii) The amount recognised in cash flow hedge reserve (net of tax) is expected to impact the statement of profit and loss as below: - within the next one year: loss 4̀.24 crore (2018-19: loss `2.17 crore) - later than one year: loss `57.48 crore (2018-19: gain `0.40 crore)
(b) Investment revaluation reserve
The cumulative gains and losses arising from fair value changes of equity investments measured at fair value through other comprehensive income are recognised in investment revaluation reserve. The balance of the reserve represents such changes recognised net of amounts reclassified to retained earnings on disposal of such investments.
The details of movement in investment revaluation reserve is as below:(` crore)
Year endedMarch 31, 2020
Year endedMarch 31, 2019
Balance at the beginning of the year 55.04 103.72 Other comprehensive income recognised during the year (244.30) (46.63) Tax impact on above 0.56 (0.56) Transfers within equity - (1.49) Balance at the end of the year (188.70) 55.04
19. Other equity (Contd.) [Item No. IV(c), Page 222]
INTEGRATED REPORT & ANNUAL ACCOUNTS 2019-20 | 113TH YEAR270
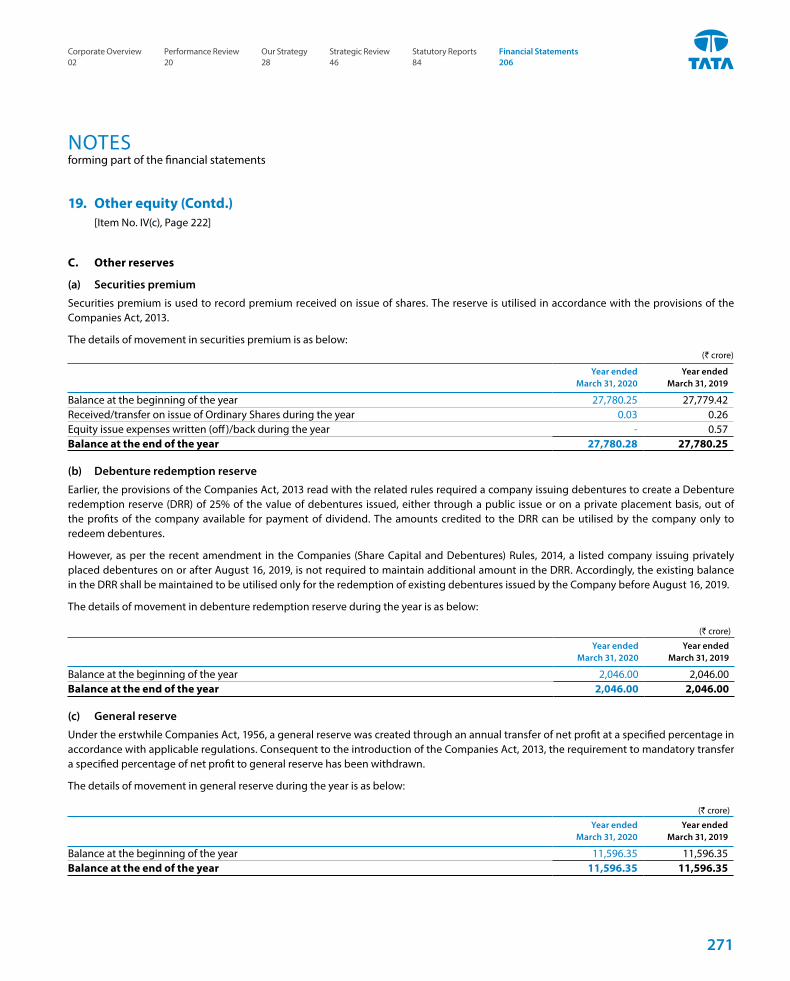
NOTESforming part of the financial statements
C. Other reserves
(a) Securities premium
Securities premium is used to record premium received on issue of shares. The reserve is utilised in accordance with the provisions of the Companies Act, 2013.
The details of movement in securities premium is as below:(` crore)
Year endedMarch 31, 2020
Year endedMarch 31, 2019
Balance at the beginning of the year 27,780.25 27,779.42Received/transfer on issue of Ordinary Shares during the year 0.03 0.26Equity issue expenses written (off)/back during the year - 0.57Balance at the end of the year 27,780.28 27,780.25
(b) Debenture redemption reserve
Earlier, the provisions of the Companies Act, 2013 read with the related rules required a company issuing debentures to create a Debenture redemption reserve (DRR) of 25% of the value of debentures issued, either through a public issue or on a private placement basis, out of the profits of the company available for payment of dividend. The amounts credited to the DRR can be utilised by the company only to redeem debentures.
However, as per the recent amendment in the Companies (Share Capital and Debentures) Rules, 2014, a listed company issuing privately placed debentures on or after August 16, 2019, is not required to maintain additional amount in the DRR. Accordingly, the existing balance in the DRR shall be maintained to be utilised only for the redemption of existing debentures issued by the Company before August 16, 2019.
The details of movement in debenture redemption reserve during the year is as below:
(` crore)
Year endedMarch 31, 2020
Year endedMarch 31, 2019
Balance at the beginning of the year 2,046.00 2,046.00Balance at the end of the year 2,046.00 2,046.00
(c) General reserve
Under the erstwhile Companies Act, 1956, a general reserve was created through an annual transfer of net profit at a specified percentage in accordance with applicable regulations. Consequent to the introduction of the Companies Act, 2013, the requirement to mandatory transfer a specified percentage of net profit to general reserve has been withdrawn.
The details of movement in general reserve during the year is as below:
(` crore)
Year endedMarch 31, 2020
Year endedMarch 31, 2019
Balance at the beginning of the year 11,596.35 11,596.35Balance at the end of the year 11,596.35 11,596.35
19. Other equity (Contd.) [Item No. IV(c), Page 222]
271
Corporate Overview 02
Strategic Review 46
Performance Review 20
Statutory Reports 84
Our Strategy 28
Financial Statements 206
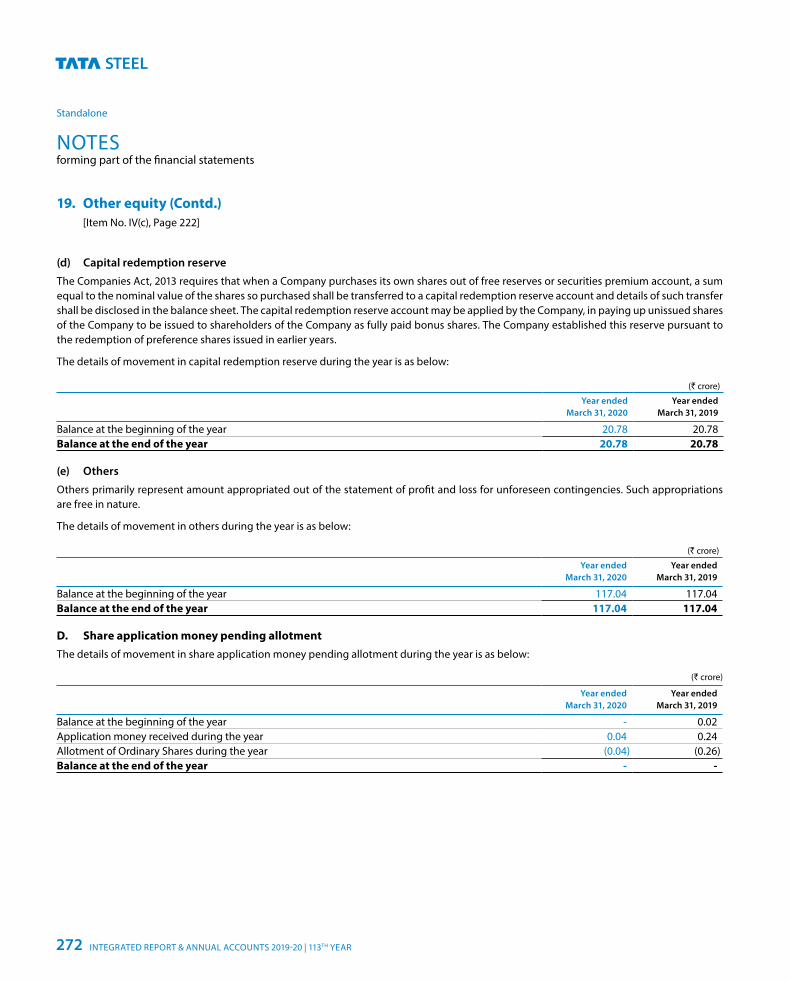
NOTESforming part of the financial statements
Standalone
(d) Capital redemption reserve
The Companies Act, 2013 requires that when a Company purchases its own shares out of free reserves or securities premium account, a sum equal to the nominal value of the shares so purchased shall be transferred to a capital redemption reserve account and details of such transfer shall be disclosed in the balance sheet. The capital redemption reserve account may be applied by the Company, in paying up unissued shares of the Company to be issued to shareholders of the Company as fully paid bonus shares. The Company established this reserve pursuant to the redemption of preference shares issued in earlier years.
The details of movement in capital redemption reserve during the year is as below:
(` crore)
Year endedMarch 31, 2020
Year endedMarch 31, 2019
Balance at the beginning of the year 20.78 20.78Balance at the end of the year 20.78 20.78
(e) Others
Others primarily represent amount appropriated out of the statement of profit and loss for unforeseen contingencies. Such appropriations are free in nature.
The details of movement in others during the year is as below:
(` crore)
Year endedMarch 31, 2020
Year endedMarch 31, 2019
Balance at the beginning of the year 117.04 117.04Balance at the end of the year 117.04 117.04
D. Share application money pending allotmentThe details of movement in share application money pending allotment during the year is as below:
(` crore)
Year endedMarch 31, 2020
Year endedMarch 31, 2019
Balance at the beginning of the year - 0.02Application money received during the year 0.04 0.24Allotment of Ordinary Shares during the year (0.04) (0.26)Balance at the end of the year - -
19. Other equity (Contd.) [Item No. IV(c), Page 222]
INTEGRATED REPORT & ANNUAL ACCOUNTS 2019-20 | 113TH YEAR272
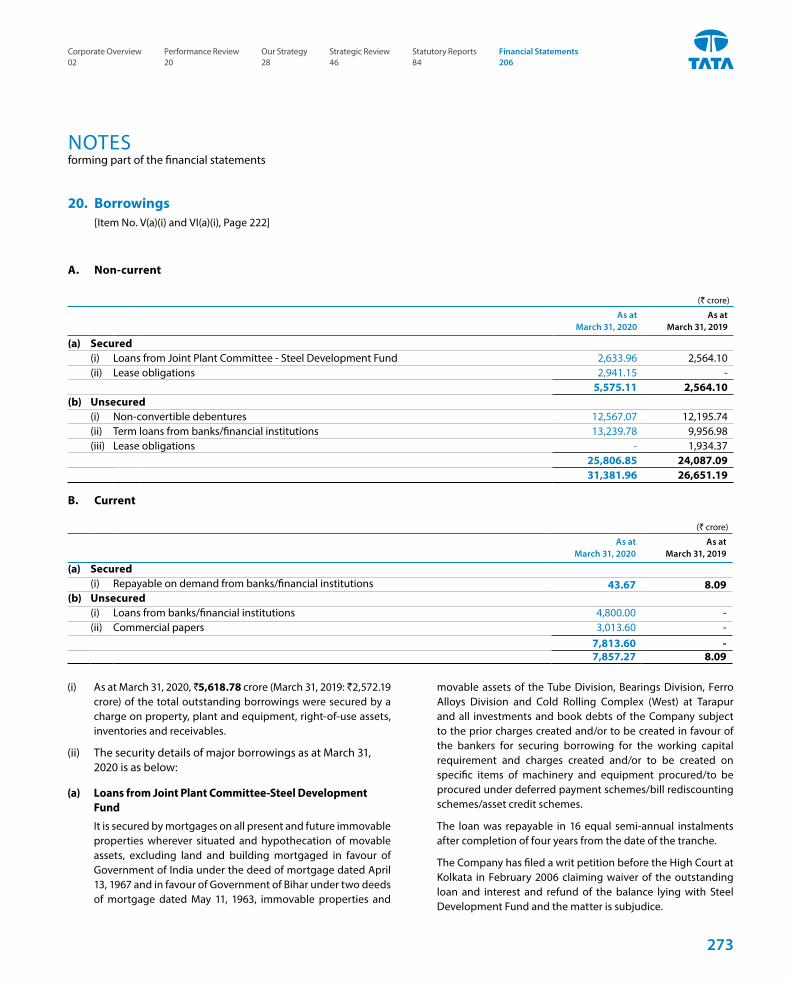
NOTESforming part of the financial statements
(i) As at March 31, 2020, `5,618.78 crore (March 31, 2019: `2,572.19 crore) of the total outstanding borrowings were secured by a charge on property, plant and equipment, right-of-use assets, inventories and receivables.
(ii) The security details of major borrowings as at March 31, 2020 is as below:
(a) Loans from Joint Plant Committee-Steel Development Fund
It is secured by mortgages on all present and future immovable properties wherever situated and hypothecation of movable assets, excluding land and building mortgaged in favour of Government of India under the deed of mortgage dated April 13, 1967 and in favour of Government of Bihar under two deeds of mortgage dated May 11, 1963, immovable properties and
20. Borrowings [Item No. V(a)(i) and VI(a)(i), Page 222]
A. Non-current
(` crore)
As at March 31, 2020
As at March 31, 2019
(a) Secured(i) Loans from Joint Plant Committee - Steel Development Fund 2,633.96 2,564.10(ii) Lease obligations 2,941.15 -
5,575.11 2,564.10(b) Unsecured
(i) Non-convertible debentures 12,567.07 12,195.74(ii) Term loans from banks/financial institutions 13,239.78 9,956.98(iii) Lease obligations - 1,934.37
25,806.85 24,087.0931,381.96 26,651.19
B. Current
(` crore)
As at March 31, 2020
As at March 31, 2019
(a) Secured(i) Repayable on demand from banks/financial institutions 43.67 8.09
(b) Unsecured(i) Loans from banks/financial institutions 4,800.00 -(ii) Commercial papers 3,013.60 -
7,813.60 -7,857.27 8.09
movable assets of the Tube Division, Bearings Division, Ferro Alloys Division and Cold Rolling Complex (West) at Tarapur and all investments and book debts of the Company subject to the prior charges created and/or to be created in favour of the bankers for securing borrowing for the working capital requirement and charges created and/or to be created on specific items of machinery and equipment procured/to be procured under deferred payment schemes/bill rediscounting schemes/asset credit schemes.
The loan was repayable in 16 equal semi-annual instalments after completion of four years from the date of the tranche.
The Company has filed a writ petition before the High Court at Kolkata in February 2006 claiming waiver of the outstanding loan and interest and refund of the balance lying with Steel Development Fund and the matter is subjudice.
273
Corporate Overview 02
Strategic Review 46
Performance Review 20
Statutory Reports 84
Our Strategy 28
Financial Statements 206
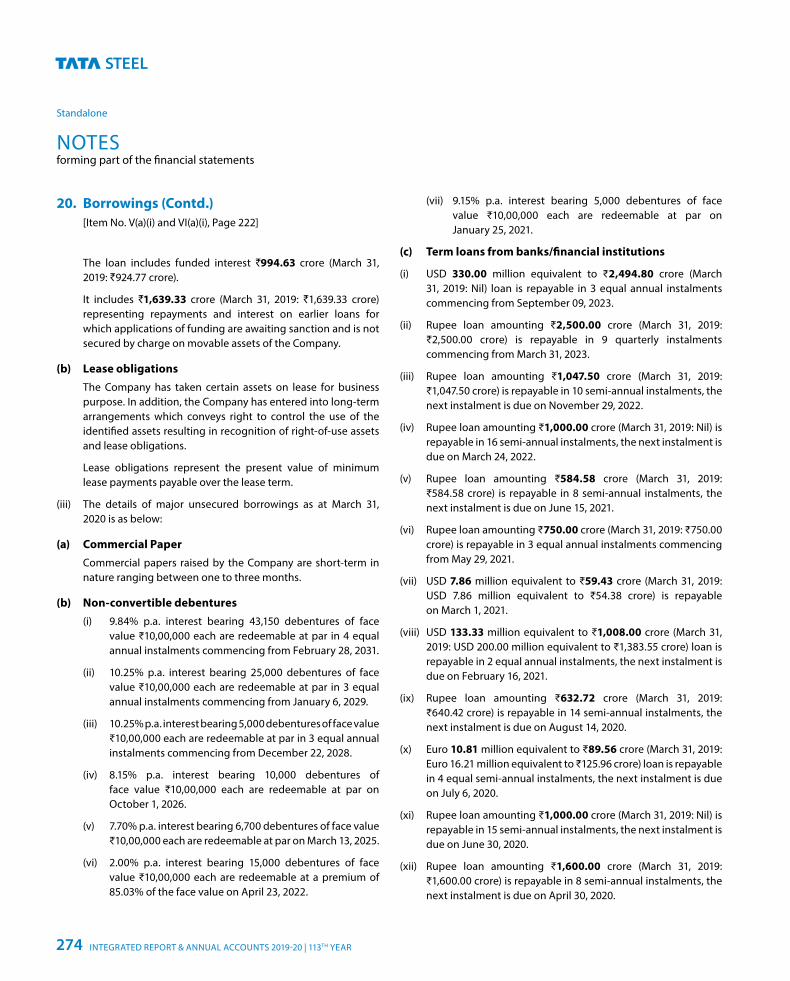
NOTESforming part of the financial statements
Standalone
The loan includes funded interest `994.63 crore (March 31, 2019: `924.77 crore).
It includes `1,639.33 crore (March 31, 2019: `1,639.33 crore) representing repayments and interest on earlier loans for which applications of funding are awaiting sanction and is not secured by charge on movable assets of the Company.
(b) Lease obligations The Company has taken certain assets on lease for business
purpose. In addition, the Company has entered into long-term arrangements which conveys right to control the use of the identified assets resulting in recognition of right-of-use assets and lease obligations.
Lease obligations represent the present value of minimum lease payments payable over the lease term.
(iii) The details of major unsecured borrowings as at March 31, 2020 is as below:
(a) Commercial Paper Commercial papers raised by the Company are short-term in
nature ranging between one to three months.
(b) Non-convertible debentures (i) 9.84% p.a. interest bearing 43,150 debentures of face
value ₹10,00,000 each are redeemable at par in 4 equal annual instalments commencing from February 28, 2031.
(ii) 10.25% p.a. interest bearing 25,000 debentures of face value ₹10,00,000 each are redeemable at par in 3 equal annual instalments commencing from January 6, 2029.
(iii) 10.25% p.a. interest bearing 5,000 debentures of face value ₹10,00,000 each are redeemable at par in 3 equal annual instalments commencing from December 22, 2028.
(iv) 8.15% p.a. interest bearing 10,000 debentures of face value ₹10,00,000 each are redeemable at par on October 1, 2026.
(v) 7.70% p.a. interest bearing 6,700 debentures of face value ₹10,00,000 each are redeemable at par on March 13, 2025.
(vi) 2.00% p.a. interest bearing 15,000 debentures of face value ₹10,00,000 each are redeemable at a premium of 85.03% of the face value on April 23, 2022.
20. Borrowings (Contd.) [Item No. V(a)(i) and VI(a)(i), Page 222]
(vii) 9.15% p.a. interest bearing 5,000 debentures of face value ₹10,00,000 each are redeemable at par on January 25, 2021.
(c) Term loans from banks/financial institutions
(i) USD 330.00 million equivalent to ₹2,494.80 crore (March 31, 2019: Nil) loan is repayable in 3 equal annual instalments commencing from September 09, 2023.
(ii) Rupee loan amounting ₹2,500.00 crore (March 31, 2019: ₹2,500.00 crore) is repayable in 9 quarterly instalments commencing from March 31, 2023.
(iii) Rupee loan amounting ₹1,047.50 crore (March 31, 2019: ₹1,047.50 crore) is repayable in 10 semi-annual instalments, the next instalment is due on November 29, 2022.
(iv) Rupee loan amounting ₹1,000.00 crore (March 31, 2019: Nil) is repayable in 16 semi-annual instalments, the next instalment is due on March 24, 2022.
(v) Rupee loan amounting ₹584.58 crore (March 31, 2019: ₹584.58 crore) is repayable in 8 semi-annual instalments, the next instalment is due on June 15, 2021.
(vi) Rupee loan amounting ₹750.00 crore (March 31, 2019: ₹750.00 crore) is repayable in 3 equal annual instalments commencing from May 29, 2021.
(vii) USD 7.86 million equivalent to ₹59.43 crore (March 31, 2019: USD 7.86 million equivalent to ₹54.38 crore) is repayable on March 1, 2021.
(viii) USD 133.33 million equivalent to ₹1,008.00 crore (March 31, 2019: USD 200.00 million equivalent to ₹1,383.55 crore) loan is repayable in 2 equal annual instalments, the next instalment is due on February 16, 2021.
(ix) Rupee loan amounting ₹632.72 crore (March 31, 2019: ₹640.42 crore) is repayable in 14 semi-annual instalments, the next instalment is due on August 14, 2020.
(x) Euro 10.81 million equivalent to ₹89.56 crore (March 31, 2019: Euro 16.21 million equivalent to ₹125.96 crore) loan is repayable in 4 equal semi-annual instalments, the next instalment is due on July 6, 2020.
(xi) Rupee loan amounting ₹1,000.00 crore (March 31, 2019: Nil) is repayable in 15 semi-annual instalments, the next instalment is due on June 30, 2020.
(xii) Rupee loan amounting ₹1,600.00 crore (March 31, 2019: ₹1,600.00 crore) is repayable in 8 semi-annual instalments, the next instalment is due on April 30, 2020.
INTEGRATED REPORT & ANNUAL ACCOUNTS 2019-20 | 113TH YEAR274
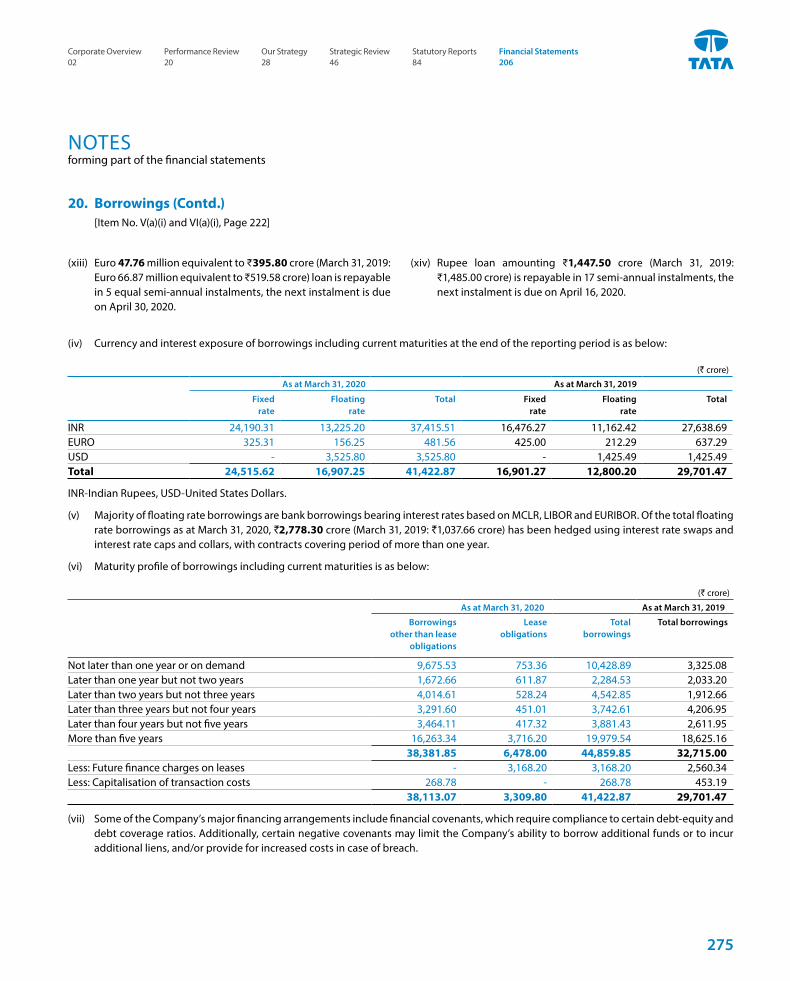
NOTESforming part of the financial statements
20. Borrowings (Contd.) [Item No. V(a)(i) and VI(a)(i), Page 222]
(iv) Currency and interest exposure of borrowings including current maturities at the end of the reporting period is as below:
(` crore)
As at March 31, 2020 As at March 31, 2019
Fixed rate
Floating rate
Total Fixed rate
Floating rate
Total
INR 24,190.31 13,225.20 37,415.51 16,476.27 11,162.42 27,638.69EURO 325.31 156.25 481.56 425.00 212.29 637.29USD - 3,525.80 3,525.80 - 1,425.49 1,425.49Total 24,515.62 16,907.25 41,422.87 16,901.27 12,800.20 29,701.47
INR-Indian Rupees, USD-United States Dollars.
(v) Majority of floating rate borrowings are bank borrowings bearing interest rates based on MCLR, LIBOR and EURIBOR. Of the total floating rate borrowings as at March 31, 2020, `2,778.30 crore (March 31, 2019: `1,037.66 crore) has been hedged using interest rate swaps and interest rate caps and collars, with contracts covering period of more than one year.
(vi) Maturity profile of borrowings including current maturities is as below:
(` crore)
As at March 31, 2020 As at March 31, 2019
Borrowingsother than lease
obligations
Leaseobligations
Totalborrowings
Total borrowings
Not later than one year or on demand 9,675.53 753.36 10,428.89 3,325.08Later than one year but not two years 1,672.66 611.87 2,284.53 2,033.20Later than two years but not three years 4,014.61 528.24 4,542.85 1,912.66Later than three years but not four years 3,291.60 451.01 3,742.61 4,206.95Later than four years but not five years 3,464.11 417.32 3,881.43 2,611.95More than five years 16,263.34 3,716.20 19,979.54 18,625.16
38,381.85 6,478.00 44,859.85 32,715.00Less: Future finance charges on leases - 3,168.20 3,168.20 2,560.34Less: Capitalisation of transaction costs 268.78 - 268.78 453.19
38,113.07 3,309.80 41,422.87 29,701.47
(vii) Some of the Company’s major financing arrangements include financial covenants, which require compliance to certain debt-equity and debt coverage ratios. Additionally, certain negative covenants may limit the Company’s ability to borrow additional funds or to incur additional liens, and/or provide for increased costs in case of breach.
(xiii) Euro 47.76 million equivalent to ₹395.80 crore (March 31, 2019: Euro 66.87 million equivalent to ₹519.58 crore) loan is repayable in 5 equal semi-annual instalments, the next instalment is due on April 30, 2020.
(xiv) Rupee loan amounting ₹1,447.50 crore (March 31, 2019: ₹1,485.00 crore) is repayable in 17 semi-annual instalments, the next instalment is due on April 16, 2020.
275
Corporate Overview 02
Strategic Review 46
Performance Review 20
Statutory Reports 84
Our Strategy 28
Financial Statements 206
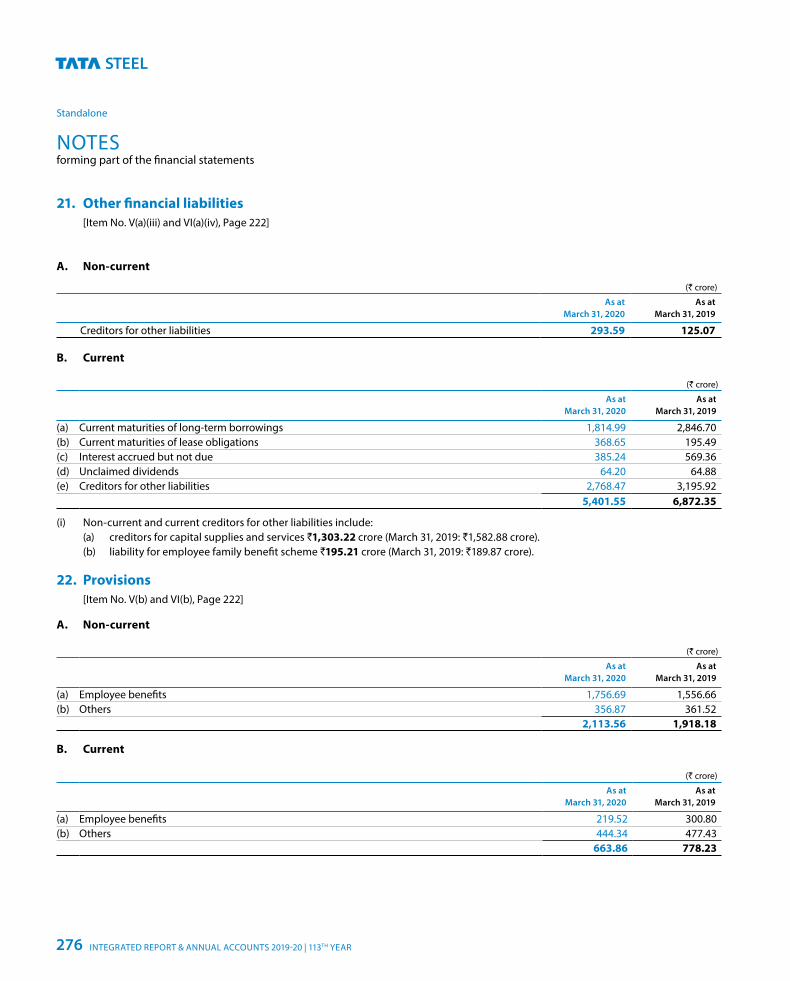
NOTESforming part of the financial statements
Standalone
21. Other financial liabilities [Item No. V(a)(iii) and VI(a)(iv), Page 222]
A. Non-current
(` crore)
As at March 31, 2020
As at March 31, 2019
Creditors for other liabilities 293.59 125.07
B. Current
(` crore)
As at March 31, 2020
As at March 31, 2019
(a) Current maturities of long-term borrowings 1,814.99 2,846.70(b) Current maturities of lease obligations 368.65 195.49(c) Interest accrued but not due 385.24 569.36(d) Unclaimed dividends 64.20 64.88(e) Creditors for other liabilities 2,768.47 3,195.92
5,401.55 6,872.35
(i) Non-current and current creditors for other liabilities include: (a) creditors for capital supplies and services `1,303.22 crore (March 31, 2019: `1,582.88 crore). (b) liability for employee family benefit scheme `195.21 crore (March 31, 2019: `189.87 crore).
22. Provisions [Item No. V(b) and VI(b), Page 222]
A. Non-current
(` crore)
As at March 31, 2020
As at March 31, 2019
(a) Employee benefits 1,756.69 1,556.66(b) Others 356.87 361.52
2,113.56 1,918.18
B. Current
(` crore)
As at March 31, 2020
As at March 31, 2019
(a) Employee benefits 219.52 300.80(b) Others 444.34 477.43
663.86 778.23
INTEGRATED REPORT & ANNUAL ACCOUNTS 2019-20 | 113TH YEAR276
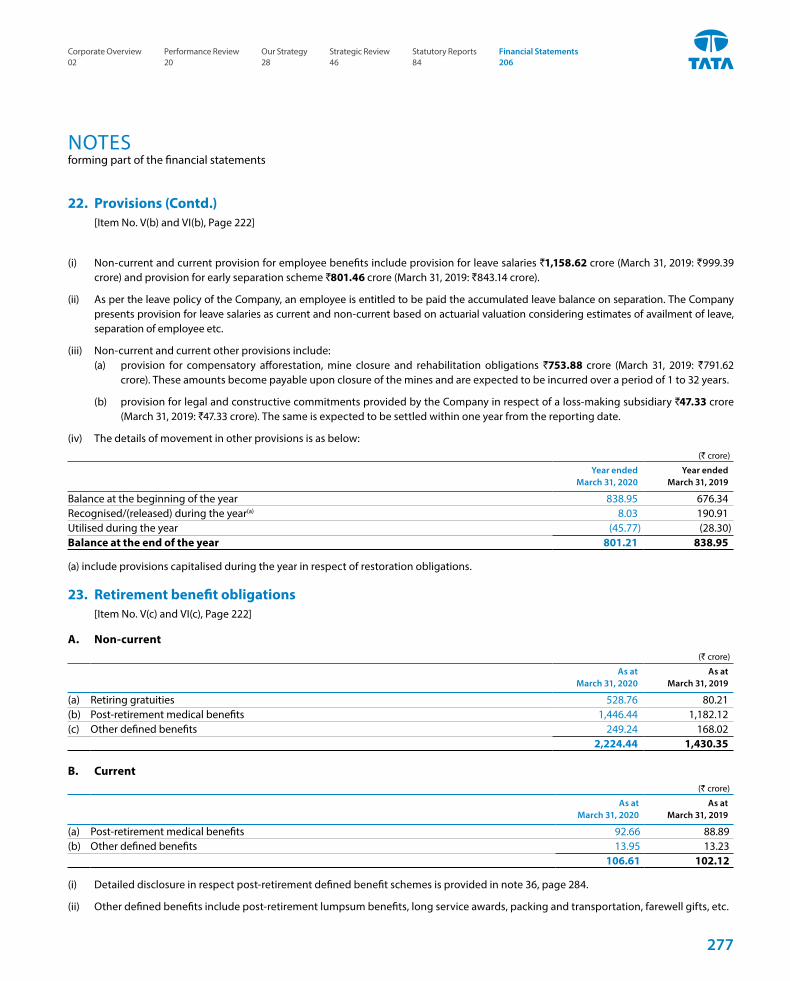
NOTESforming part of the financial statements
(i) Non-current and current provision for employee benefits include provision for leave salaries `1,158.62 crore (March 31, 2019: `999.39 crore) and provision for early separation scheme `801.46 crore (March 31, 2019: `843.14 crore).
(ii) As per the leave policy of the Company, an employee is entitled to be paid the accumulated leave balance on separation. The Company presents provision for leave salaries as current and non-current based on actuarial valuation considering estimates of availment of leave, separation of employee etc.
(iii) Non-current and current other provisions include: (a) provision for compensatory afforestation, mine closure and rehabilitation obligations `753.88 crore (March 31, 2019: `791.62
crore). These amounts become payable upon closure of the mines and are expected to be incurred over a period of 1 to 32 years.
(b) provision for legal and constructive commitments provided by the Company in respect of a loss-making subsidiary `47.33 crore (March 31, 2019: `47.33 crore). The same is expected to be settled within one year from the reporting date.
(iv) The details of movement in other provisions is as below: (` crore)
Year endedMarch 31, 2020
Year endedMarch 31, 2019
Balance at the beginning of the year 838.95 676.34Recognised/(released) during the year(a) 8.03 190.91Utilised during the year (45.77) (28.30)Balance at the end of the year 801.21 838.95
(a) include provisions capitalised during the year in respect of restoration obligations.
23. Retirement benefit obligations [Item No. V(c) and VI(c), Page 222]
A. Non-current (` crore)
As at March 31, 2020
As at March 31, 2019
(a) Retiring gratuities 528.76 80.21(b) Post-retirement medical benefits 1,446.44 1,182.12(c) Other defined benefits 249.24 168.02
2,224.44 1,430.35
B. Current (` crore)
As at March 31, 2020
As at March 31, 2019
(a) Post-retirement medical benefits 92.66 88.89(b) Other defined benefits 13.95 13.23
106.61 102.12
(i) Detailed disclosure in respect post-retirement defined benefit schemes is provided in note 36, page 284.
(ii) Other defined benefits include post-retirement lumpsum benefits, long service awards, packing and transportation, farewell gifts, etc.
22. Provisions (Contd.) [Item No. V(b) and VI(b), Page 222]
277
Corporate Overview 02
Strategic Review 46
Performance Review 20
Statutory Reports 84
Our Strategy 28
Financial Statements 206
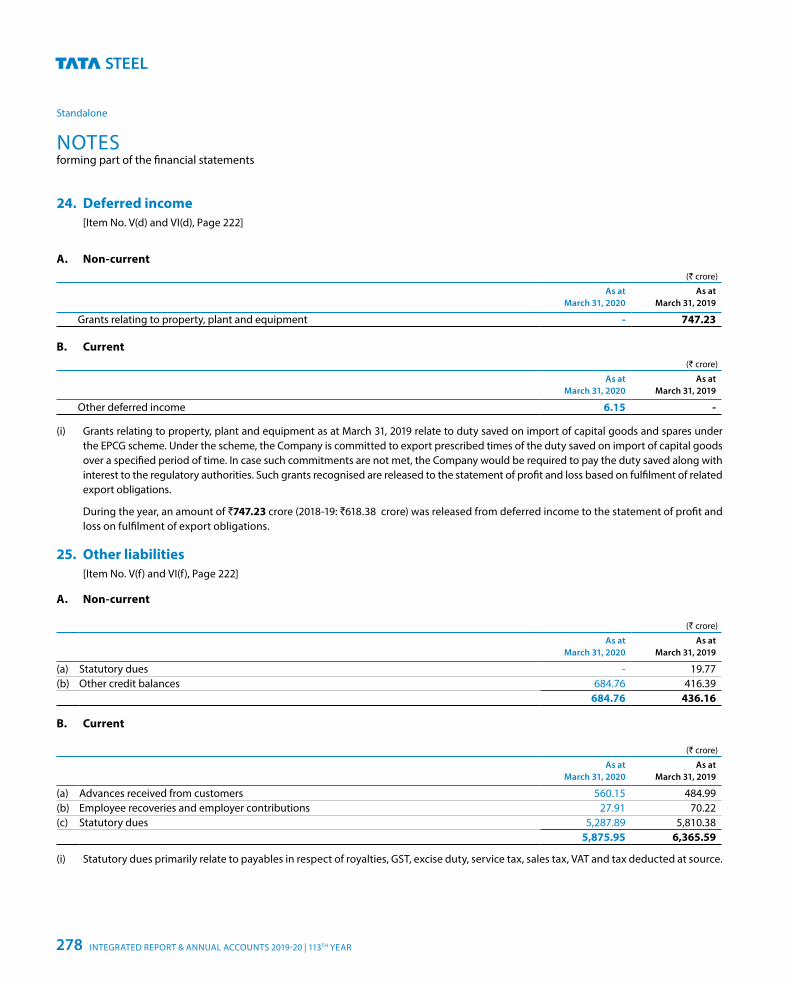
NOTESforming part of the financial statements
Standalone
24. Deferred income [Item No. V(d) and VI(d), Page 222]
A. Non-current (` crore)
As at March 31, 2020
As at March 31, 2019
Grants relating to property, plant and equipment - 747.23
B. Current (` crore)
As at March 31, 2020
As at March 31, 2019
Other deferred income 6.15 -
(i) Grants relating to property, plant and equipment as at March 31, 2019 relate to duty saved on import of capital goods and spares under the EPCG scheme. Under the scheme, the Company is committed to export prescribed times of the duty saved on import of capital goods over a specified period of time. In case such commitments are not met, the Company would be required to pay the duty saved along with interest to the regulatory authorities. Such grants recognised are released to the statement of profit and loss based on fulfilment of related export obligations.
During the year, an amount of `747.23 crore (2018-19: `618.38 crore) was released from deferred income to the statement of profit and loss on fulfilment of export obligations.
25. Other liabilities [Item No. V(f) and VI(f), Page 222]
A. Non-current
(` crore)
As at March 31, 2020
As at March 31, 2019
(a) Statutory dues - 19.77(b) Other credit balances 684.76 416.39
684.76 436.16
B. Current
(` crore)
As at March 31, 2020
As at March 31, 2019
(a) Advances received from customers 560.15 484.99(b) Employee recoveries and employer contributions 27.91 70.22(c) Statutory dues 5,287.89 5,810.38
5,875.95 6,365.59
(i) Statutory dues primarily relate to payables in respect of royalties, GST, excise duty, service tax, sales tax, VAT and tax deducted at source.
INTEGRATED REPORT & ANNUAL ACCOUNTS 2019-20 | 113TH YEAR278
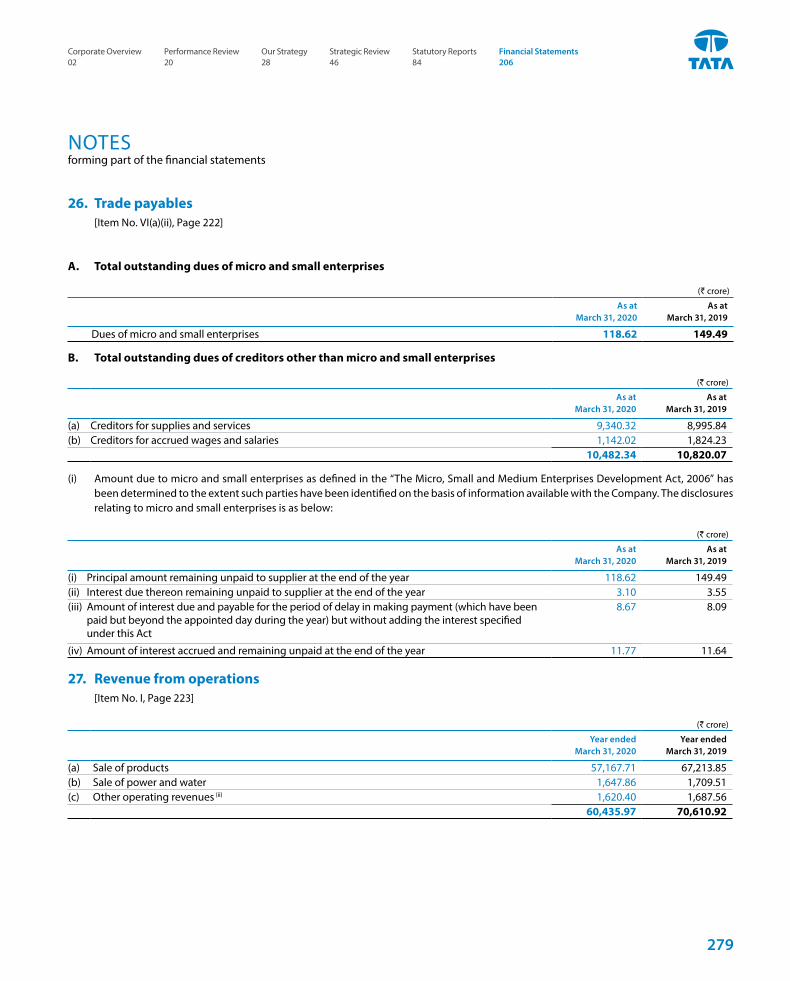
NOTESforming part of the financial statements
26. Trade payables [Item No. VI(a)(ii), Page 222]
A. Total outstanding dues of micro and small enterprises
(` crore)
As at March 31, 2020
As at March 31, 2019
Dues of micro and small enterprises 118.62 149.49
B. Total outstanding dues of creditors other than micro and small enterprises
(` crore)
As at March 31, 2020
As at March 31, 2019
(a) Creditors for supplies and services 9,340.32 8,995.84(b) Creditors for accrued wages and salaries 1,142.02 1,824.23
10,482.34 10,820.07
(i) Amount due to micro and small enterprises as defined in the “The Micro, Small and Medium Enterprises Development Act, 2006” has been determined to the extent such parties have been identified on the basis of information available with the Company. The disclosures relating to micro and small enterprises is as below:
(` crore)
As at March 31, 2020
As at March 31, 2019
(i) Principal amount remaining unpaid to supplier at the end of the year 118.62 149.49(ii) Interest due thereon remaining unpaid to supplier at the end of the year 3.10 3.55(iii) Amount of interest due and payable for the period of delay in making payment (which have been
paid but beyond the appointed day during the year) but without adding the interest specified under this Act
8.67 8.09
(iv) Amount of interest accrued and remaining unpaid at the end of the year 11.77 11.64
27. Revenue from operations [Item No. I, Page 223]
(` crore)
Year ended March 31, 2020
Year ended March 31, 2019
(a) Sale of products 57,167.71 67,213.85(b) Sale of power and water 1,647.86 1,709.51(c) Other operating revenues (ii) 1,620.40 1,687.56
60,435.97 70,610.92
279
Corporate Overview 02
Strategic Review 46
Performance Review 20
Statutory Reports 84
Our Strategy 28
Financial Statements 206
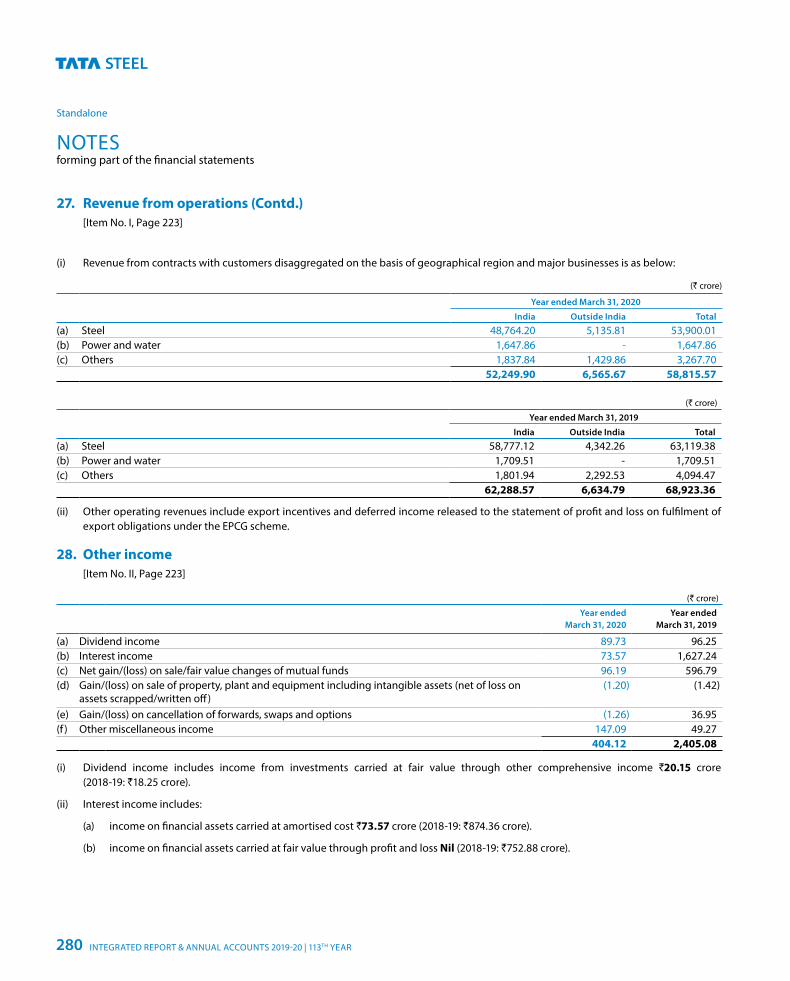
NOTESforming part of the financial statements
Standalone
(i) Revenue from contracts with customers disaggregated on the basis of geographical region and major businesses is as below:
(` crore)
Year ended March 31, 2020
India Outside India Total
(a) Steel 48,764.20 5,135.81 53,900.01(b) Power and water 1,647.86 - 1,647.86(c) Others 1,837.84 1,429.86 3,267.70
52,249.90 6,565.67 58,815.57
(` crore)
Year ended March 31, 2019
India Outside India Total
(a) Steel 58,777.12 4,342.26 63,119.38(b) Power and water 1,709.51 - 1,709.51(c) Others 1,801.94 2,292.53 4,094.47
62,288.57 6,634.79 68,923.36
(ii) Other operating revenues include export incentives and deferred income released to the statement of profit and loss on fulfilment of export obligations under the EPCG scheme.
28. Other income [Item No. II, Page 223]
(` crore)
Year ended March 31, 2020
Year ended March 31, 2019
(a) Dividend income 89.73 96.25(b) Interest income 73.57 1,627.24(c) Net gain/(loss) on sale/fair value changes of mutual funds 96.19 596.79(d) Gain/(loss) on sale of property, plant and equipment including intangible assets (net of loss on
assets scrapped/written off)(1.20) (1.42)
(e) Gain/(loss) on cancellation of forwards, swaps and options (1.26) 36.95(f ) Other miscellaneous income 147.09 49.27
404.12 2,405.08
(i) Dividend income includes income from investments carried at fair value through other comprehensive income `20.15 crore (2018-19: `18.25 crore).
(ii) Interest income includes:
(a) income on financial assets carried at amortised cost `73.57 crore (2018-19: `874.36 crore).
(b) income on financial assets carried at fair value through profit and loss Nil (2018-19: `752.88 crore).
27. Revenue from operations (Contd.) [Item No. I, Page 223]
INTEGRATED REPORT & ANNUAL ACCOUNTS 2019-20 | 113TH YEAR280
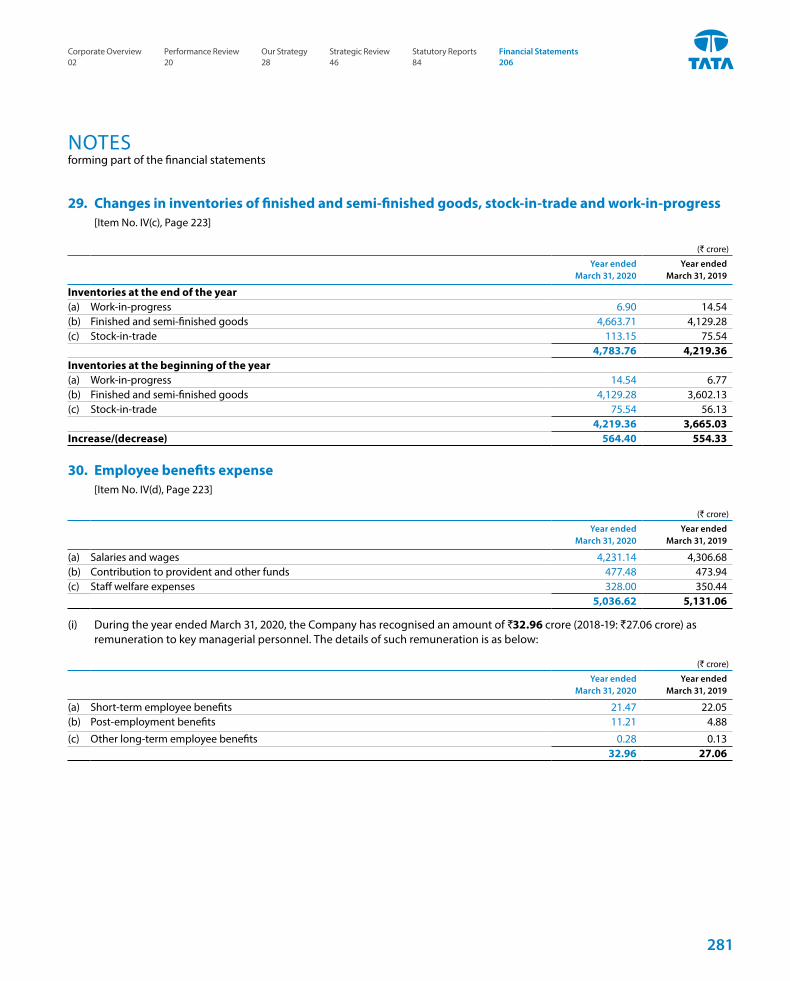
NOTESforming part of the financial statements
29. Changes in inventories of finished and semi-finished goods, stock-in-trade and work-in-progress [Item No. IV(c), Page 223]
(` crore)
Year ended March 31, 2020
Year ended March 31, 2019
Inventories at the end of the year(a) Work-in-progress 6.90 14.54(b) Finished and semi-finished goods 4,663.71 4,129.28(c) Stock-in-trade 113.15 75.54
4,783.76 4,219.36Inventories at the beginning of the year(a) Work-in-progress 14.54 6.77(b) Finished and semi-finished goods 4,129.28 3,602.13(c) Stock-in-trade 75.54 56.13
4,219.36 3,665.03Increase/(decrease) 564.40 554.33
30. Employee benefits expense [Item No. IV(d), Page 223]
(` crore)
Year ended March 31, 2020
Year ended March 31, 2019
(a) Salaries and wages 4,231.14 4,306.68(b) Contribution to provident and other funds 477.48 473.94(c) Staff welfare expenses 328.00 350.44
5,036.62 5,131.06
(i) During the year ended March 31, 2020, the Company has recognised an amount of `32.96 crore (2018-19: `27.06 crore) as remuneration to key managerial personnel. The details of such remuneration is as below:
(` crore)
Year ended March 31, 2020
Year ended March 31, 2019
(a) Short-term employee benefits 21.47 22.05(b) Post-employment benefits 11.21 4.88
(c) Other long-term employee benefits 0.28 0.1332.96 27.06
281
Corporate Overview 02
Strategic Review 46
Performance Review 20
Statutory Reports 84
Our Strategy 28
Financial Statements 206
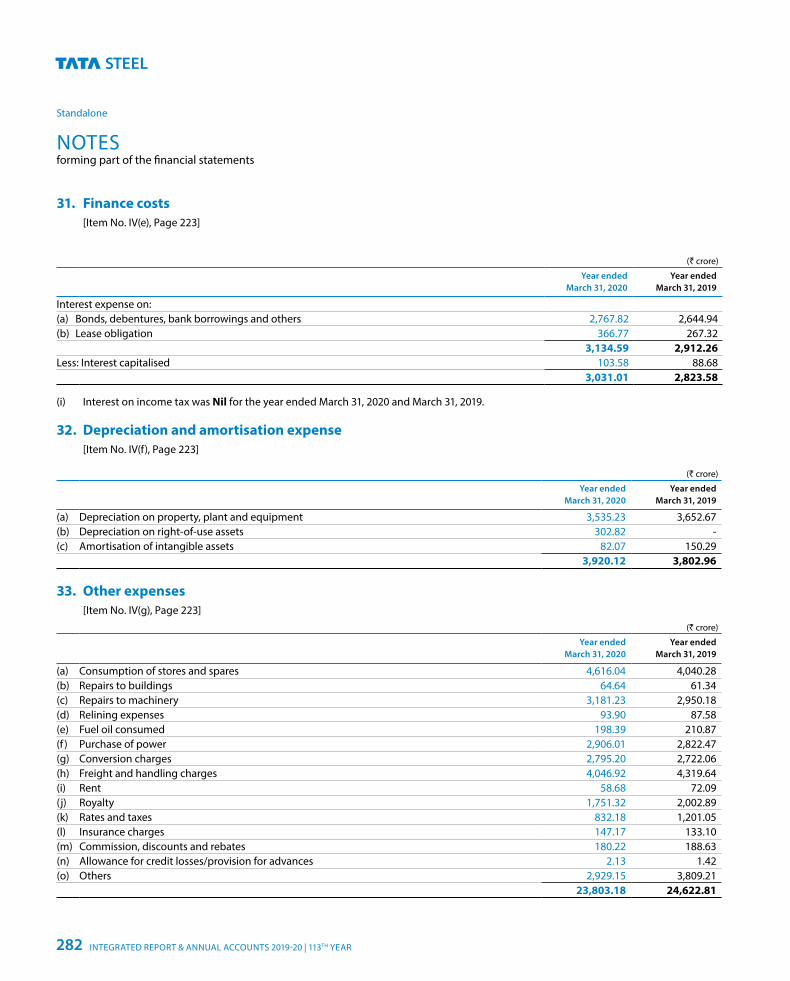
NOTESforming part of the financial statements
Standalone
31. Finance costs [Item No. IV(e), Page 223]
(` crore)
Year ended March 31, 2020
Year ended March 31, 2019
Interest expense on:(a) Bonds, debentures, bank borrowings and others 2,767.82 2,644.94(b) Lease obligation 366.77 267.32
3,134.59 2,912.26Less: Interest capitalised 103.58 88.68
3,031.01 2,823.58
(i) Interest on income tax was Nil for the year ended March 31, 2020 and March 31, 2019.
32. Depreciation and amortisation expense [Item No. IV(f), Page 223]
(` crore)
Year ended March 31, 2020
Year ended March 31, 2019
(a) Depreciation on property, plant and equipment 3,535.23 3,652.67(b) Depreciation on right-of-use assets 302.82 -(c) Amortisation of intangible assets 82.07 150.29
3,920.12 3,802.96
33. Other expenses [Item No. IV(g), Page 223]
(` crore)
Year ended March 31, 2020
Year ended March 31, 2019
(a) Consumption of stores and spares 4,616.04 4,040.28(b) Repairs to buildings 64.64 61.34(c) Repairs to machinery 3,181.23 2,950.18(d) Relining expenses 93.90 87.58(e) Fuel oil consumed 198.39 210.87(f ) Purchase of power 2,906.01 2,822.47(g) Conversion charges 2,795.20 2,722.06(h) Freight and handling charges 4,046.92 4,319.64(i) Rent 58.68 72.09(j) Royalty 1,751.32 2,002.89(k) Rates and taxes 832.18 1,201.05(l) Insurance charges 147.17 133.10(m) Commission, discounts and rebates 180.22 188.63(n) Allowance for credit losses/provision for advances 2.13 1.42(o) Others 2,929.15 3,809.21
23,803.18 24,622.81
INTEGRATED REPORT & ANNUAL ACCOUNTS 2019-20 | 113TH YEAR282
NOTESforming part of the financial statements
(i) Others include: (a) net foreign exchange gain ₹53.04 crore (2018-19: foreign exchange loss ₹134.41 crore), (b) gain on fair value changes of financial assets carried at fair value through profit and loss ₹356.26 crore (2018-19: loss of ₹111.31 crore), (c) donations to electoral trusts Nil (2018-19: ₹175.00 crore).
(ii) During the year ended March 31, 2020, the Company has recognised an amount of ₹6.95 crore (2018-19: ₹7.35 crore) towards payment to non-executive directors. The details are as below:
(` crore)
Year ended March 31, 2020
Year ended March 31, 2019
(a) Short-term benefits 6.55 6.87(b) Sitting fees 0.40 0.48
6.95 7.35
(iii) Details of auditors’ remuneration and out-of-pocket expenses is as below:(` crore)
Year ended March 31, 2020
Year ended March 31, 2019
(a) Auditors remuneration and out-of-pocket expenses(i) Statutory audit fees 6.00 6.18(ii) Tax audit fees 0.40 0.40(iii) For other services 0.69 0.74(iv) Out-of-pocket expenses 0.23 0.12
(b) Cost audit fees [including out of pocket expenses ₹58,035 (2018-19 : ₹6,936)] 0.21 0.18
(iv) As per the Companies Act, 2013, amount required to be spent by the Company on Corporate Social Responsibility (CSR) activities during the year was ₹173.53 crore (2018-19: ₹82.40 crore).
During the year ended March 31, 2020, in respect of CSR activities the Company incurred revenue expenditure which was recognised in the statement of profit and loss amounting to ₹192.99 crore [₹192.83 crore has been paid in cash and ₹0.16 crore is yet to be paid], which includes ₹0.93 crore on construction of assets [paid in cash]. During the year ended March 31, 2019, similar expense incurred was ₹314.94 crore [₹301.04 crore was paid in cash and ₹13.90 crore was unpaid], which included ₹43.32 crore on construction of assets [₹30.92 crore was paid in cash and ₹12.40 crore was unpaid].
During the year ended March 31, 2020 amount spent on CSR activities through related parties was ₹80.16 crore (2018-19: ₹45.45 crore).
(v) During the year ended March 31, 2020, revenue expenditure charged to the statement of profit and loss in respect of research and development activities undertaken was ₹255.64 crore (2018-19: ₹212.97 crore) including depreciation of ₹9.62 crore (2018-19: ₹7.80 crore). Capital expenditure incurred in respect of research and development activities during the year was ₹3.72 crore (2018-19: ₹2.82 crore).
34. Exceptional items [Item No. VI, Page 223]
Exceptional items are those which are considered for separate disclosure in the financial statements considering their size, nature or incidence. Such items included within the statement of profit and loss are detailed below:
(a) During the year ended March 31, 2019, profit/(loss) on sale of non-current investments ₹262.28 crore relates to profit recognised on sale of investments in TRL Krosaki Refractories Limited, an associate of the Company.
33. Other expenses (Contd.) [Item No. IV(g), Page 223]
283
Corporate Overview 02
Strategic Review 46
Performance Review 20
Statutory Reports 84
Our Strategy 28
Financial Statements 206
NOTESforming part of the financial statements
Standalone
(b) Provision for impairment of investments/doubtful advances ₹1,149.80 crore (2018-19: ₹12.53 crore) relates to provision recognised for impairment of investments in subsidiaries, joint ventures and associates, net of reversals of ₹1.07 crore on account of recovery of advances made to a joint venture.
(c) Provision for demands and claims ₹196.41 crore (2018-19: ₹328.64 crore) relates to provision recognised in respect of certain statutory demands and claims.
(d) Employee separation compensation `107.37 crore (2018-19: `35.34 crore) relates to provisions recognised in respect of employee separation scheme of employees.
(e) Fair value gain/(loss) on preference share investments (net) ₹250.00 crore (2018-19: Nil) represents notional fair value loss on preference share investments held by the Company in some of its affiliates.
35. Earnings per share [Item No. XII, Page 223]
The following table reflects the profit and shares data used in the computation of basic and diluted earnings per share (EPS):(` crore)
Year ended March 31, 2020
Year ended March 31, 2019
(a) Profit after tax 6,743.80 10,533.19Less: Distribution on hybrid perpetual securities (net of tax) 199.18 173.13Profit attributable to ordinary shareholders- for basic and diluted EPS 6,544.62 10,360.06
Nos. Nos.(b) Weighted average number of Ordinary Shares for basic EPS 1,14,59,30,120 1,14,59,26,020
Add: Adjustment for shares held in abeyance 89,536 1,37,496Weighted average number of Ordinary Shares and potential Ordinary Shares for diluted EPS 1,14,60,19,656 1,14,60,63,516
(c) Nominal value of Ordinary Share (`) 10.00 10.00
(d) Basic earnings per Ordinary Share (`) 57.11 90.41(e) Diluted earnings per Ordinary Share (`) 57.11 90.40
(i) As at March 31, 2020, 5,81,96,450 (March 31, 2019: 5,81,95,359) options in respect of partly paid shares and 1,21,523 (March 31, 2019: Nil) options in respect of fully paid shares were excluded from weighted average number of Ordinary Shares for the computation of diluted earnings per share as these were anti-dilutive.
36. Employee benefitsA. Defined contribution plansThe Company participates in a number of defined contribution plans on behalf of relevant personnel. Any expense recognised in relation to these schemes represents the value of contributions payable during the period by the Company at rates specified by the rules of those plans. The only amounts included in the balance sheet are those relating to the prior months contributions that were not due to be paid until after the end of the reporting period.
The major defined contribution plans operated by the Company are as below:
(a) Provident fund and pension
The Company provides provident fund benefits for eligible employees as per applicable regulations wherein both employees and the Company make monthly contributions at a specified percentage of the eligible employee’s salary. Contributions under such schemes are made either to a provident fund set up as an irrevocable trust by the Company
34. Exceptional items (Contd.) [Item No. VI, Page 223]
INTEGRATED REPORT & ANNUAL ACCOUNTS 2019-20 | 113TH YEAR284
NOTESforming part of the financial statements
36. Employee benefits (Contd.)
to manage the investments and distribute the amounts entitled to employees or to state managed funds.
Benefits provided under plans wherein contributions are made to state managed funds and the Company does not have a future obligation to make good short fall, if any, are treated as a defined contribution plan.
(b) Superannuation fund
The Company has a superannuation plan for the benefit of its employees. Employees who are members of the superannuation plan are entitled to benefits depending on the years of service and salary drawn.
Separate irrevocable trusts are maintained for employees covered and entitled to benefits. The Company contributes up to 15% of the eligible employees’ salary or ₹1,50,000, whichever is lower, to the trust every year. Such contributions are recognised as an expense as and when incurred. The Company does not have any further obligation beyond this contribution.
The contributions recognised as an expense in the statement of profit and loss during the year on account of the above defined contribution plans amounted to ₹178.78 crore (2018-19: ₹191.18 crore).
B. Defined benefit plans The defined benefit plans operated by the Company are
as below:
(a) Provident fund and pension
Provident fund benefits provided under plans wherein contributions are made to an irrevocable trust set up by the Company to manage the investments and distribute the amounts entitled to employees are treated as a defined benefit plan as the Company is obligated to provide the members a rate of return which should, at the minimum, meet the interest rate declared by Government administered provident fund. A part of the Company’s contribution is transferred to Government administered pension fund. The contributions made by the Company and the shortfall of interest, if any, are recognised as an expense in profit and loss under employee benefits expense.
In accordance with an actuarial valuation of provident fund liabilities based on guidance issued by Actuarial Society of India and based on the assumptions as mentioned below, there is no deficiency in the interest cost as the present value of the expected future earnings of the fund is greater
than the expected amount to be credited to the individual members based on the expected guaranteed rate of interest of Government administered provident fund.
Key assumptions used for actuarial valuation are as below:
As at March 31, 2020
As at March 31, 2019
Discount rate 6.50% 7.50%Guaranteed rate of return 8.50% 8.65%Expected rate of return on investment
8.40% 8.60%
(b) Retiring gratuity
The Company has an obligation towards gratuity, a defined benefit retirement plan covering eligible employees. The plan provides for a lump-sum payment to vested employees at retirement, death while in employment or on termination of employment of an amount equivalent to 15 to 30 days salary payable for each completed year of service. Vesting occurs upon completion of five years of service. The Company makes annual contributions to gratuity funds established as trusts or insurance companies. The Company accounts for the liability for gratuity benefits payable in the future based on a year-end actuarial valuation.
(c) Post-retirement medical benefits
Under this unfunded scheme, employees of the Company receive medical benefits subject to certain limits on amounts of benefits, periods after retirement and types of benefits, depending on their grade and location at the time of retirement. Employees separated from the Company under an early separation scheme, on medical grounds or due to permanent disablement are also covered under the scheme. The Company accounts for the liability for post-retirement medical scheme based on a year-end actuarial valuation.
(d) Other defined benefits
Other benefits provided under unfunded schemes include post-retirement lumpsum benefits, pension payable to directors of the Company on their retirement, farewell gifts and reimbursement of packing and transportation charges to the employees based on their last drawn salary.
The defined benefit plans expose the Company to a number of actuarial risks as below:
(i) Investment risk: The present value of the defined benefit plan liability is calculated using a discount rate determined by reference to government bond yields. If the return on plan asset is below this rate, it will create a plan deficit.
285
Corporate Overview 02
Strategic Review 46
Performance Review 20
Statutory Reports 84
Our Strategy 28
Financial Statements 206
NOTESforming part of the financial statements
Standalone
C. Details of defined benefit obligations and plan assets:
(a) Retiring gratuity:
(i) The following table sets out the amounts recognised in the financial statements in respect of retiring gratuity plan:
(` crore)
Year ended March 31, 2020
Year ended March 31, 2019
Change in defined benefit obligations:Obligation at the beginning of the year 2,839.66 2,767.69Current service cost 128.99 124.76Interest cost 180.11 186.50Remeasurement (gain)/loss 231.65 (3.93)Adjustment for arrear wage settlement 192.01 -Benefits paid (569.52) (235.36)Obligation at the end of the year 3,002.90 2,839.66
(` crore)
Year ended March 31, 2020
Year ended March 31, 2019
Change in plan assets:Fair value of plan assets at the beginning of the year 2,759.45 2,706.72Interest income 188.61 196.53Remeasurement gain/(loss) excluding amount included within employee benefits expense 15.38 28.94Employers' contribution 80.22 62.63Benefits paid (569.52) (235.37)Fair value of plan assets at the end of the year 2,474.14 2,759.45
Amounts recognised in the balance sheet consist of:
(` crore)
As at March 31, 2020
As at March 31, 2019
Fair value of plan assets 2,474.14 2,759.45Present value of obligations (3,002.90) (2,839.66)
(528.76) (80.21)Recognised as:Retirement benefit obligations - Non-current (528.76) (80.21)
36. Employee benefits (Contd.)
(ii) Interest risk: A decrease in the bond interest rate will increase the plan liability. However, this will be partially offset by an increase in the value of plan’s debt investments
(iii) Salary risk: The present value of the defined benefit plan liability is calculated by reference to the future salaries of plan participants. As such, an increase in salary of the plan participants will increase the plan’s liability.
(iv) Longevity risk: The present value of the defined benefit plan liability is calculated by reference to the best estimate of the mortality of plan participants both during and after their employment. An increase in the life expectancy of the plan participants will increase the plan’s liability.
INTEGRATED REPORT & ANNUAL ACCOUNTS 2019-20 | 113TH YEAR286
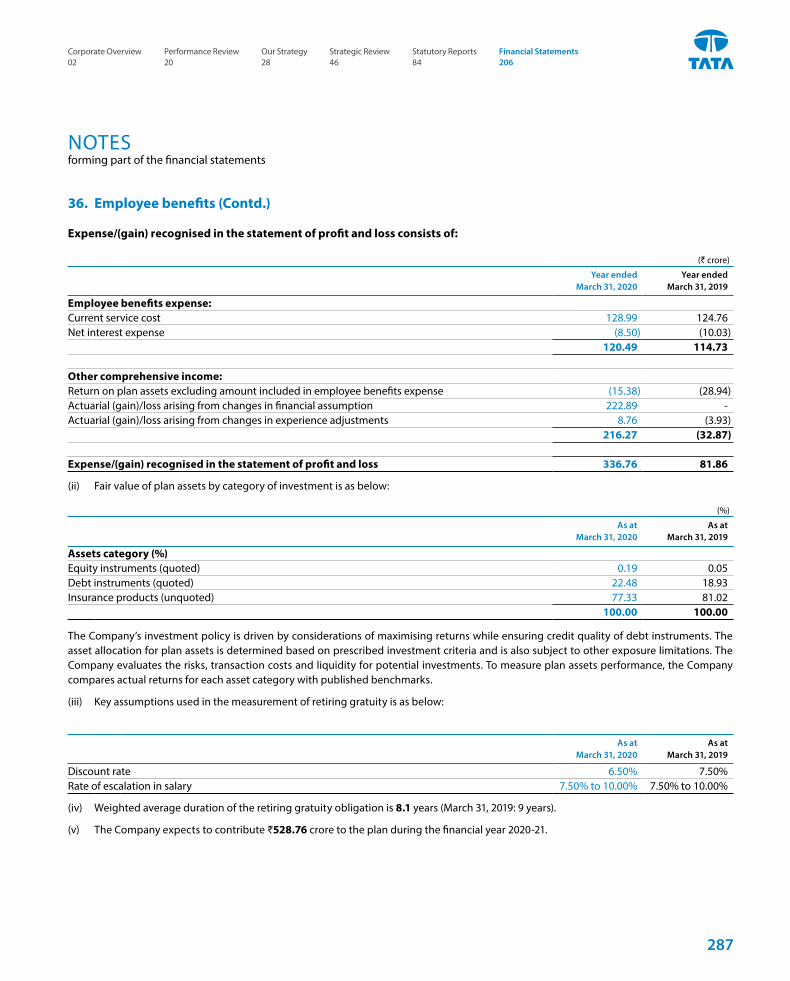
NOTESforming part of the financial statements
Expense/(gain) recognised in the statement of profit and loss consists of:
(` crore)
Year ended March 31, 2020
Year ended March 31, 2019
Employee benefits expense:Current service cost 128.99 124.76Net interest expense (8.50) (10.03)
120.49 114.73
Other comprehensive income:Return on plan assets excluding amount included in employee benefits expense (15.38) (28.94)Actuarial (gain)/loss arising from changes in financial assumption 222.89 -Actuarial (gain)/loss arising from changes in experience adjustments 8.76 (3.93)
216.27 (32.87)
Expense/(gain) recognised in the statement of profit and loss 336.76 81.86
(ii) Fair value of plan assets by category of investment is as below:
(%)
As at March 31, 2020
As at March 31, 2019
Assets category (%)Equity instruments (quoted) 0.19 0.05Debt instruments (quoted) 22.48 18.93Insurance products (unquoted) 77.33 81.02
100.00 100.00
The Company’s investment policy is driven by considerations of maximising returns while ensuring credit quality of debt instruments. The asset allocation for plan assets is determined based on prescribed investment criteria and is also subject to other exposure limitations. The Company evaluates the risks, transaction costs and liquidity for potential investments. To measure plan assets performance, the Company compares actual returns for each asset category with published benchmarks.
(iii) Key assumptions used in the measurement of retiring gratuity is as below:
As at March 31, 2020
As at March 31, 2019
Discount rate 6.50% 7.50%Rate of escalation in salary 7.50% to 10.00% 7.50% to 10.00%
(iv) Weighted average duration of the retiring gratuity obligation is 8.1 years (March 31, 2019: 9 years).
(v) The Company expects to contribute ₹528.76 crore to the plan during the financial year 2020-21.
36. Employee benefits (Contd.)
287
Corporate Overview 02
Strategic Review 46
Performance Review 20
Statutory Reports 84
Our Strategy 28
Financial Statements 206
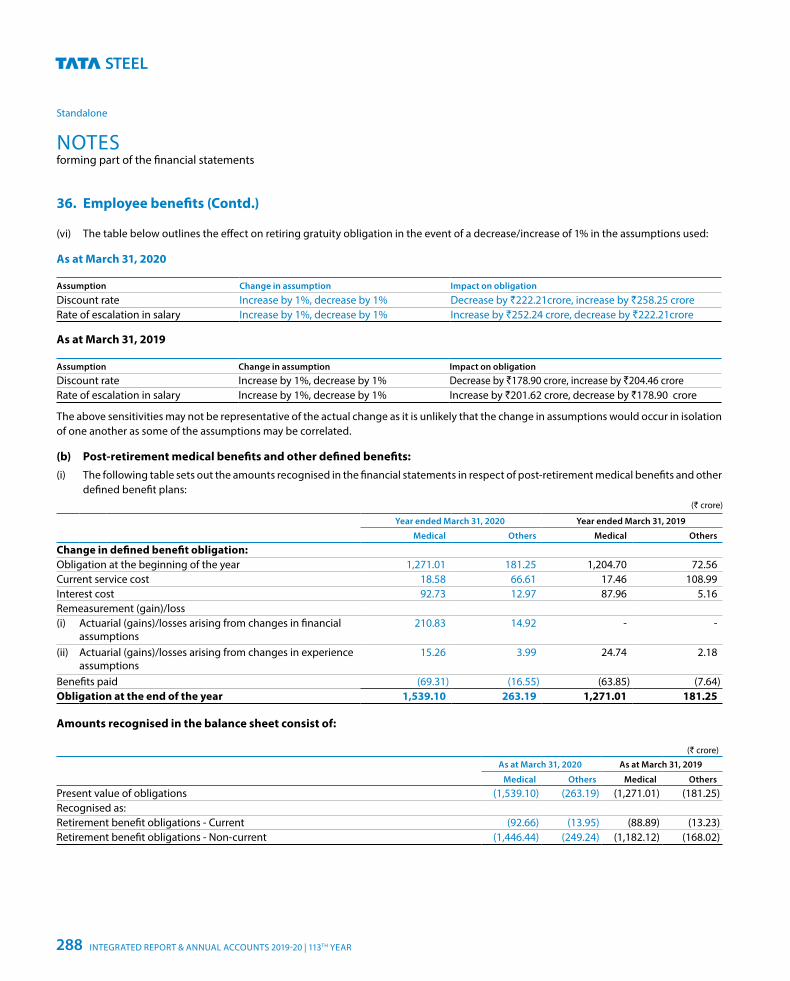
NOTESforming part of the financial statements
Standalone
(vi) The table below outlines the effect on retiring gratuity obligation in the event of a decrease/increase of 1% in the assumptions used:
As at March 31, 2020
Assumption Change in assumption Impact on obligation
Discount rate Increase by 1%, decrease by 1% Decrease by `222.21crore, increase by `258.25 crore Rate of escalation in salary Increase by 1%, decrease by 1% Increase by `252.24 crore, decrease by `222.21crore
As at March 31, 2019
Assumption Change in assumption Impact on obligation
Discount rate Increase by 1%, decrease by 1% Decrease by `178.90 crore, increase by `204.46 croreRate of escalation in salary Increase by 1%, decrease by 1% Increase by `201.62 crore, decrease by `178.90 crore
The above sensitivities may not be representative of the actual change as it is unlikely that the change in assumptions would occur in isolation of one another as some of the assumptions may be correlated.
(b) Post-retirement medical benefits and other defined benefits:(i) The following table sets out the amounts recognised in the financial statements in respect of post-retirement medical benefits and other
defined benefit plans:(` crore)
Year ended March 31, 2020 Year ended March 31, 2019
Medical Others Medical Others
Change in defined benefit obligation:Obligation at the beginning of the year 1,271.01 181.25 1,204.70 72.56Current service cost 18.58 66.61 17.46 108.99Interest cost 92.73 12.97 87.96 5.16Remeasurement (gain)/loss(i) Actuarial (gains)/losses arising from changes in financial
assumptions210.83 14.92 - -
(ii) Actuarial (gains)/losses arising from changes in experience assumptions
15.26 3.99 24.74 2.18
Benefits paid (69.31) (16.55) (63.85) (7.64)Obligation at the end of the year 1,539.10 263.19 1,271.01 181.25
Amounts recognised in the balance sheet consist of:
(` crore)
As at March 31, 2020 As at March 31, 2019
Medical Others Medical Others
Present value of obligations (1,539.10) (263.19) (1,271.01) (181.25)Recognised as:Retirement benefit obligations - Current (92.66) (13.95) (88.89) (13.23)Retirement benefit obligations - Non-current (1,446.44) (249.24) (1,182.12) (168.02)
36. Employee benefits (Contd.)
INTEGRATED REPORT & ANNUAL ACCOUNTS 2019-20 | 113TH YEAR288
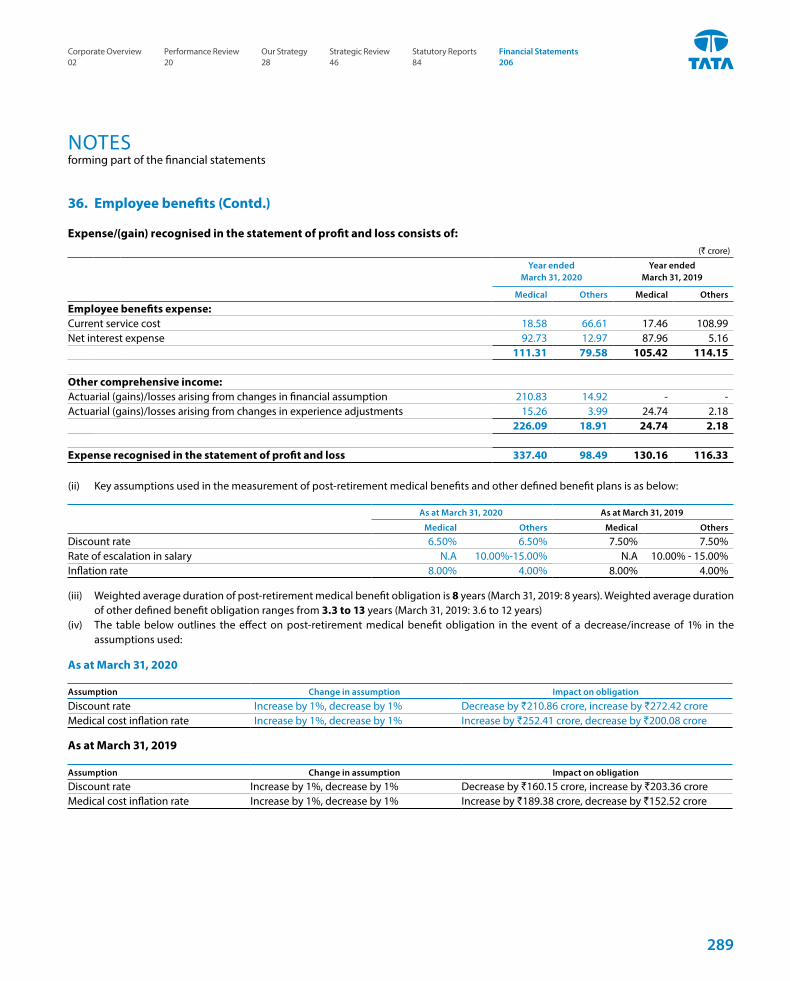
NOTESforming part of the financial statements
Expense/(gain) recognised in the statement of profit and loss consists of:(` crore)
Year ended March 31, 2020
Year ended March 31, 2019
Medical Others Medical Others
Employee benefits expense:Current service cost 18.58 66.61 17.46 108.99Net interest expense 92.73 12.97 87.96 5.16
111.31 79.58 105.42 114.15
Other comprehensive income:Actuarial (gains)/losses arising from changes in financial assumption 210.83 14.92 - -Actuarial (gains)/losses arising from changes in experience adjustments 15.26 3.99 24.74 2.18
226.09 18.91 24.74 2.18
Expense recognised in the statement of profit and loss 337.40 98.49 130.16 116.33
(ii) Key assumptions used in the measurement of post-retirement medical benefits and other defined benefit plans is as below:
As at March 31, 2020 As at March 31, 2019
Medical Others Medical Others
Discount rate 6.50% 6.50% 7.50% 7.50%Rate of escalation in salary N.A 10.00%-15.00% N.A 10.00% - 15.00%Inflation rate 8.00% 4.00% 8.00% 4.00%
(iii) Weighted average duration of post-retirement medical benefit obligation is 8 years (March 31, 2019: 8 years). Weighted average duration of other defined benefit obligation ranges from 3.3 to 13 years (March 31, 2019: 3.6 to 12 years)
(iv) The table below outlines the effect on post-retirement medical benefit obligation in the event of a decrease/increase of 1% in the assumptions used:
As at March 31, 2020
Assumption Change in assumption Impact on obligation
Discount rate Increase by 1%, decrease by 1% Decrease by `210.86 crore, increase by `272.42 crore Medical cost inflation rate Increase by 1%, decrease by 1% Increase by `252.41 crore, decrease by `200.08 crore
As at March 31, 2019
Assumption Change in assumption Impact on obligation
Discount rate Increase by 1%, decrease by 1% Decrease by `160.15 crore, increase by `203.36 crore Medical cost inflation rate Increase by 1%, decrease by 1% Increase by `189.38 crore, decrease by `152.52 crore
36. Employee benefits (Contd.)
289
Corporate Overview 02
Strategic Review 46
Performance Review 20
Statutory Reports 84
Our Strategy 28
Financial Statements 206
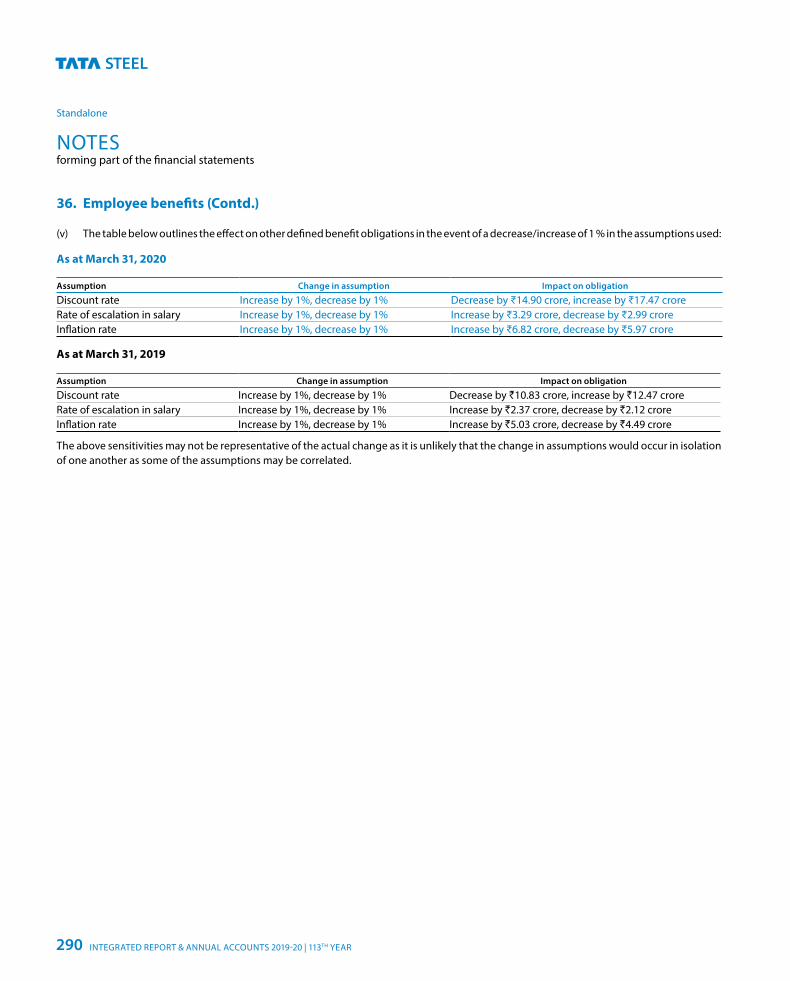
NOTESforming part of the financial statements
Standalone
(v) The table below outlines the effect on other defined benefit obligations in the event of a decrease/increase of 1 % in the assumptions used:
As at March 31, 2020
Assumption Change in assumption Impact on obligation
Discount rate Increase by 1%, decrease by 1% Decrease by ₹14.90 crore, increase by ₹17.47 croreRate of escalation in salary Increase by 1%, decrease by 1% Increase by ₹3.29 crore, decrease by ₹2.99 croreInflation rate Increase by 1%, decrease by 1% Increase by ₹6.82 crore, decrease by ₹5.97 crore
As at March 31, 2019
Assumption Change in assumption Impact on obligation
Discount rate Increase by 1%, decrease by 1% Decrease by `10.83 crore, increase by `12.47 crore Rate of escalation in salary Increase by 1%, decrease by 1% Increase by `2.37 crore, decrease by `2.12 crore Inflation rate Increase by 1%, decrease by 1% Increase by `5.03 crore, decrease by `4.49 crore
The above sensitivities may not be representative of the actual change as it is unlikely that the change in assumptions would occur in isolation of one another as some of the assumptions may be correlated.
36. Employee benefits (Contd.)
INTEGRATED REPORT & ANNUAL ACCOUNTS 2019-20 | 113TH YEAR290
NOTESforming part of the financial statements
37. Contingencies and commitmentsA. Contingencies In the ordinary course of business, the Company faces claims
and assertions by various parties. The Company assesses such claims and assertions and monitors the legal environment on an on-going basis with the assistance of external legal counsel, wherever necessary. The Company records a liability for any claims where a potential loss is probable and capable of being estimated and discloses such matters in its financial statements, if material. For potential losses that are considered possible, but not probable, the Company provides disclosure in the financial statements but does not record a liability in its accounts unless the loss becomes probable.
The following is a description of claims and assertions where a potential loss is possible, but not probable. The Company believes that none of the contingencies described below would have a material adverse effect on the Company’s financial condition, results of operations or cash flows.
It is not practicable for the Company to estimate the timings of the cash outflows, if any, pending resolution of the respective proceedings. The Company does not expect any reimbursements in respect of the same.
Litigations
The Company is involved in legal proceedings, both as plaintiff and as defendant. There are claims which the Company does not believe to be of a material nature, other than those described below:
Income tax
The Company has ongoing disputes with income tax authorities relating to tax treatment of certain items. These mainly include disallowance of expenses, tax treatment of certain expenses claimed by the Company as deduction and the computation of or eligibility of the Company’s use of certain tax incentives or allowances.
Most of these disputes and/or disallowances, being repetitive in nature, have been raised by the income tax authorities consistently in most of the years.
As at March 31, 2020, there are matters and/or disputes pending in appeal amounting to ₹2,260.36 crore (March 31, 2019: ₹3,160.64 crore).
The details of demands for more than `100 crore is as below:
(a) Interest expenditure on loans taken by the Company for acquisition of a subsidiary has been disallowed in
assessments with tax demand raised for ₹1,551.10 crore (inclusive of interest) (March 31, 2019: ₹1,791.29 crore).
(b) Interest expenditure on “Hybrid Perpetual Securities” has been disallowed in assessments with tax demand raised for ₹170.54 crore (inclusive of interest) (March 31, 2019: ₹459.13 crore)
In respect of above demands, the Company has deposited an amount of ₹1,165.00 crore (March 31, 2019: ₹1,065.00 crore) as a precondition for obtaining stay. The Company expects to sustain its position on ultimate resolution of the said appeals.
Customs, excise duty and service tax
As at March 31, 2020, there were pending litigations for various matters relating to customs, excise duty and service taxes involving demands of ₹365.43 crore (March 31, 2019: ₹682.53 crore).
Sales tax/VAT
The total sales tax demands that are being contested by the Company amounted to ₹563.30 crore (March 31, 2019: ₹717.02 crore).
The details of demands for more than `100 crore are as below:
(a) The Company stock transfers its goods manufactured at Jamshedpur works plant to its various depots/branches located outside the state of Jharkhand across the country and these goods are then sold to various customers outside the states from depots/branches. As per the Central Sales Tax Act, 1956, these transfers of goods to depots/branches were made without payment of Central sales tax and F-Form was submitted in lieu of the stock-transfers made during the period of assessment. The value of these sales was also disclosed in the periodical returns filed as per the Jharkhand Vat Act, 2005. The Commercial Tax Department has raised demand of Central Sales tax by levying tax on the differences between value of sales outside the states and value of F-Form submitted for stock transfers. The amount involved for various assessment years beginning 2011-2012 to 2015-2016 is amounting to ₹127.00 crore (March 31, 2019: ₹127.00 crore).
(b) The Commercial Tax Department of Jharkhand has rejected certain Input tax credit claimed by the Company on goods purchased from the suppliers within the State of Jharkhand. The Department has alleged that the goods have not been used in accordance with the provisions of Jharkhand VAT Act, 2005. The potential exposure on account of disputed tax and interest for the period beginning 2012-2013 to 2015-2016 as on March 31, 2020 is ₹74.00 crore (March 31, 2019: ₹104.00 crore).
291
Corporate Overview 02
Strategic Review 46
Performance Review 20
Statutory Reports 84
Our Strategy 28
Financial Statements 206
NOTESforming part of the financial statements
Standalone
Other taxes, dues and claims
Other amounts for which the Company may contingently be liable aggregate to ₹12,450.66 crore (March 31, 2019: ₹11,639.19 crore).
The details of demands for more than `100 crore are as below:
(a) Claim by a party arising out of conversion arrangement ₹195.79 crore (March 31, 2019: ₹195.79 crore). The Company has not acknowledged this claim and has instead filed a claim of ₹141.23 crore (March 31, 2019: ₹141.23 crore) on the party. The matter is pending before the Calcutta High Court.
(b) The State Government of Odisha introduced “Orissa Rural Infrastructure and Socio Economic Development Act, 2004” with effect from February 2005 levying tax on mineral bearing land computed on the basis of value of minerals produced from the mineral bearing land. The Company had filed a writ petition in the Odisha High Court challenging the validity of the Act. The High Court held in December 2005 that the State does not have authority to levy tax on minerals. The State of Odisha filed an appeal in the Supreme Court against the order of the High Court and the case is pending in Supreme Court. The potential liability, as at March 31, 2020 is ₹8,732.29 crore (March 31, 2019: ₹7,573.53 crore).
(c) The Company pays royalty on iron ore on the basis of quantity removed from the leased area at the rates based on notification issued by the Ministry of Mines, Government of India and the price published by Indian Bureau of Mines (IBM) on a monthly basis.
Demand of ₹411.08 crore has been raised by Deputy Director of Mines, Joda, claiming royalty at sized ore rates on despatches of ore fines. The Company has filed a revision petition on November 14, 2013, before the Mines Tribunal, Government of India, Ministry of Mines, New Delhi, challenging the legality and validity of the demand and to grant refund of royalty paid in excess by the Company. Mines Tribunal has granted stay on the total demand with directive to Government of Odisha not to take any coercive action for realisation of this demanded amount.
The Hon’ble High Court of Odisha in a similar matter held the circulars based on which demands were raised to be valid. The Company has challenged the judgment of the High Court by a separate petition in the Hon’ble Supreme Court on April 29, 2016.
37. Contingencies and commitments (Contd.) On July 16, 2019, the Company has filed rejoinders to the reply filed by State of Odisha against the revision petition. The State pressed for rejection of revision applications citing the judgment of the High Court. The Company represented before the authorities and explained that the judgment was passed under a particular set of ‘facts & circumstances’ which cannot have blanket application on the Company considering the case of the Company is factually different. On August 7, 2019, the Mines Tribunal decided to await the outcome of Special leave petition pending before the Hon’ble Supreme Court and adjourned the matter.
Likely demand of royalty on fines at sized ore rates as on March 31, 2020 is ₹1,965.52 crore (March 31, 2019: ₹1,630.16 crore).
(d) Demand notices were originally issued by the Deputy Director of Mines, Odisha amounting to ₹3,827.29 crore for excess production over the quantity permitted under the mining plan, environment clearance or consent to operate, pertaining to 2000-01 to 2009-10. The demand notices have been raised under Section 21(5) of the Mines & Minerals (Development and Regulations) Act, 1957 (MMDR). The Company filed revision petitions before the Mines Tribunal against all such demand notices. Initially, a stay of demands was granted, later by order dated October 12, 2017, the issue has been remanded to the state for reconsideration of the demand in the light of Supreme Court judgement passed on August 2, 2017.
The Hon’ble Supreme Court pronounced its judgement in the Common Cause case on August 2, 2017 wherein it directed that compensation equivalent to the price of mineral extracted in excess of environment clearance or without forest clearance from the forest land be paid.
In pursuance to the Judgement of Hon’ble Supreme Court, demand/show cause notices amounting to ₹3,873.35 crore have been issued during 2017-18 by the Deputy Director of Mines, Odisha and the District Mining Office, Jharkhand.
In respect of the above demands:
• as directed by the Hon’ble Supreme Court, the Company has provided and paid for iron ore and manganese ore an amount of ₹614.41 crore during 2017-18 for production in excess of environment clearance to the Deputy Director of Mines, Odisha.
• the Company has provided and paid under protest an amount of ₹56.97 crore during 2017-18 for production in excess of environment clearance to the District Mining Office, Jharkhand.
INTEGRATED REPORT & ANNUAL ACCOUNTS 2019-20 | 113TH YEAR292
NOTESforming part of the financial statements
• the Company has challenged the demands amounting to ₹132.91 crore in 2017-18 for production in excess of lower of mining plan and consent to operate limits raised by the Deputy Director of Mines, Odisha before the Mines Tribunal and obtained a stay on the matter. Mines Tribunal, Delhi vide order dated November 26, 2018 disposed of all the revision applications with a direction to remand it to the State Government to hear all such cases afresh and pass detailed order. Demand amount of ₹132.91 crore (March 31, 2019: ₹132.91 crore) is considered contingent liability.
• the Company has made a comprehensive submission before the Deputy Director of Mines, Odisha against show cause notices amounting to ₹694.02 crore received during 2017-18 for production in violation of mining plan, Environment Protection Act, 1986 and Water (Prevention & Control of Pollution) Act, 1981. A demand amounting to ₹234.74 crore has been received in April 2018 from the Deputy Director of Mines, Odisha for production in excess of the Environmental Clearance. The Company has challenged the demand and obtained a stay on the matter from the Revisionary Authority, Mines Tribunal, New Delhi. Demand of ₹234.74 crore has been provided and show cause notice of ₹694.02 crore had been considered as contingent as at March 31, 2019.
During the year ended March 31, 2020, based on the evaluation of current facts and circumstances, the Company has assessed and concluded that the said show cause notice of ₹694.02 crore no longer qualifies to be a contingent liability.
• The Company based on its internal assessment has provided an amount of ₹1,412.89 crore against demand notices amounting to ₹2,140.30 crore received from the District Mining Office, Jharkhand for producing more than environment clearance and the balance amount of ₹727.41 crore (March 31, 2019: ₹727.41 crore) has been considered contingent. The Company has however been granted a stay by the Revisional Authority, Ministry of Coal, Government of India against such demand notices.
(e) An agreement was executed between the Government of Odisha (GoO) and the Company in December, 1992 for drawal of water from Kundra Nalla for industrial consumption. In December 1993, the Tahsildar, Barbil issued a show-cause notice alleging that the Company has lifted more quantity of
37. Contingencies and commitments (Contd.) water than the sanctioned limit under the agreement and has also not installed the water meter.
While the proceedings in this regard were in progress, the Company had applied for allocation of fresh limits. Over the years, there has also been a steep increase in the water charges against which the Company filed writ petitions before Hon’ble High Court of Odisha.
In this regard, the Company has received demand of ₹156.62 crore considering the demand for period beginning from January, 1996 upto February, 2020. The potential exposure as on March 31, 2020, ₹162.96 crore (March 31, 2019: ₹125.98 crore) is considered as contingent.
The writ petition filed in August, 1997 was listed for hearing before the Full Bench of the Odisha High Court on May 17, 2019. SAIL, one of the petitioners, sought permission to withdraw its writ petition because the settlement arrived with the State Government in the matter. The High court allowed withdrawal of writ petition of SAIL and directed other parties to negotiate with the State Government. The Company has submitted its detailed representation to Principal Secretary, Water Resource Department, GoO on June 21, 2019, which is under consideration.
B. Commitments
(a) The Company has entered into various contracts with suppliers and contractors for the acquisition of plant and machinery, equipment and various civil contracts of capital nature amounting to ₹8,682.73 crore (March 31, 2019: ₹7,265.82 crore).
Other commitments as at March 31, 2020 amount to ₹0.01 crore (March 31, 2019 : ₹0.01 crore).
(b) The Company has given undertakings to:
(i) IDBI not to dispose of its investment in Wellman Incandescent India Ltd.
(ii) IDBI and ICICI Bank Ltd. (formerly ICICI) not to dispose of its investment in Standard Chrome Ltd
(c) Tata Steel Limited and Bluescope Steel Limited have given undertaking to State Bank of India not to reduce collective shareholding in Tata Bluescope Steel Private Limited (TBSPL), below 51% without prior consent of the lender. Further, the Company has given an undertaking to State Bank of India to intimate them before diluting its shareholding in TBSPL below 50%.
293
Corporate Overview 02
Strategic Review 46
Performance Review 20
Statutory Reports 84
Our Strategy 28
Financial Statements 206
NOTESforming part of the financial statements
Standalone
(d) The Company, as a promoter, has pledged 4,41,55,800 (March 31, 2019 : 4,41,55,800) equity shares of Industrial Energy Limited with Infrastructure Development Finance Corporation Limited.
(e) The Company has given guarantees aggregating ₹9,329.87 crore (March 31, 2019 : ₹12,096.24 crore) details of which are as below:
(i) in favour of Commissioner Customs for ₹1.07 crore (March 31, 2019: ₹1.07 crore) given on behalf of Timken India Limited in respect of goods imported.
(ii) in favour of Mizuho Corporate Bank Ltd., Japan Nil (March 31, 2019: ₹9.60 crore) against the loan granted to a joint venture Tata NYK Shipping Pte. Limited.
(iii) in favour of The President of India for ₹177.18 crore (March 31, 2019: ₹177.18 crore) against performance of export obligation under the various bonds executed by a joint venture Jamshedpur Continuous Annealing & Processing Company Private Limited.
(iv) in favour of the note holders against due and punctual repayment of the 100% amounts outstanding as on March 31, 2020 towards issued Guaranteed Notes by a subsidiary, ABJA Investment Co. Pte Ltd. for ₹7,560.00 crore (March 31, 2019 : ₹10,376.63 crore) and ₹1,591.47 crore (March 31, 2019 : ₹1,531.61 crore). The guarantee is capped at an amount equal to 125% of the outstanding principal amount of the Notes as detailed in “Terms and Conditions” of the Offering Memorandum.
(v) in favour of President of India for ₹0.15 crore (March 31, 2019 : ₹0.15 crore) against advance license.
38. Other significant litigations(a) Odisha Legislative Assembly issued an amendment to Indian
Stamp Act, 1889, on May 09, 2013 and inserted a new provision (Section 3A) in respect of stamp duty payable on grant/renewal of mining leases. As per the amended provision, stamp duty is levied equal to 15% of the average royalty that would accrue out of the highest annual extraction of minerals under the approved mining plan multiplied by the period of such mining lease. The Company had filed a writ petition challenging the constitutionality of the Act on July 5, 2013. The Hon’ble High Court, Cuttack passed an order on July 9, 2013 granting interim stay on the operation of the Amendment Act, 2013. Because of the stay, as on date, the Act is not enforceable and any demand
received by the Company is not liable to be proceeded with. Meanwhile, the Company received demand notices for the various mines at Odisha totalling to ₹5,579.00 crore (March 31, 2019: ₹5,579.00 crore). The Company has concluded that it is remote that the claim will sustain on ultimate resolution of the legal case by the court.
In April 2015, the Company has received an intimation from Government of Odisha, granting extension of validity period for leases under the MMDR Amendment Act, 2015 up to March 31, 2030 in respect of eight mines and up to March 31, 2020 for two mines subject to execution of supplementary lease deed. Liability has been provided in the books of accounts as on March 31, 2020 as per the existing provisions of the Stamp Act, 1899 and the Company had paid the stamp duty and registration charges totalling ₹413.72 crore for supplementary deed execution in respect of eight mines out of the above mines.
(b) Noamundi Iron Ore Mine of the Company was due for its third renewal with effect from January 01, 2012. The application for renewal was submitted by the Company within the stipulated time, but it remained pending consideration with the State and the mining operations were continued in terms of the prevailing law.
By a judgement of April 2014 in the case of Goa mines, the Supreme Court took a view that second and subsequent renewal of mining lease can be effected once the State considers the application and decides to renew the mining lease by issuing an express order. State of Jharkhand issued renewal order to the Company on December 31, 2014. The State, however, took a view on interpretation of Goa judgement that the mining carried out after expiry of the period of second renewal was ‘illegal’ and hence, issued a demand notice of ₹3,568.31 crore being the price of iron ore extracted. The said demand has been challenged by the Company before the Jharkhand High Court.
The mining operations were suspended from August 01, 2014. Upon issuance of an express order, Company paid ₹152.00 crore under protest, so that mining could be resumed.
The Mines and Minerals Development and Regulation (MMDR) Amendment Ordinance, 2015 promulgated on January 12, 2015 provides for extension of such mining leases whose applications for renewal have remained pending with the State(s). Based on the new Ordinance, Jharkhand Government revised the Express Order on February 12, 2015 for extending the period of lease up to March 31, 2030 with the following terms and conditions:
37. Contingencies and commitments (Contd.)
INTEGRATED REPORT & ANNUAL ACCOUNTS 2019-20 | 113TH YEAR294
NOTESforming part of the financial statements
• value of iron ore produced by alleged unlawful mining during the period January 1, 2012 to April 20, 2014 for ₹2,994.49 crore to be decided on the basis of disposal of our writ petition before Hon’ble High Court of Jharkhand.
• value of iron ore produced from April 21, 2014 to July 17, 2014 amounting to ₹421.83 crore to be paid in maximum 3 instalments.
• value of iron ore produced from July 18, 2014 to August 31, 2014 i.e. ₹152.00 crore to be paid immediately.
District Mining Officer Chaibasa on March 16, 2015 issued a demand notice for payment of ₹421.83 crore, in three monthly instalments. The Company on March 20, 2015 replied that since the lease has been extended by application of law till March 31, 2030, the above demand is not tenable. The Company paid ₹50.00 crore under protest on July 27, 2015, because the State had stopped issuance of transit permits.
The Company filed another writ petition before the Hon’ble High Court of Jharkhand which was heard on September 9, 2015. An interim order was given by the Hon’ble High Court of Jharkhand on September 17, 2015 wherein the Court has directed the Company to pay the amount of ₹371.83 crore in 3 equal instalments, first instalment by October 15, 2015, second instalment by November 15, 2015 and third instalment by December 15, 2015.
In view of the interim order of the Hon’ble High Court of Jharkhand ₹124.00 crore was paid on September 28, 2015, ₹124.00 crore on November 12, 2015 and ₹123.83 crore on December 14, 2015 under protest.
The case is pending before the Hon’ble High court for disposal. The State issued similar terms and conditions to other mining lessees in the State rendering the mining as illegal. Based on the Company’s assessment of the Goa mines judgement read with the Ordinance issued in the year 2015, the Company believes that it is remote that the demand of the State would sustain.
38. Other significant litigations (Contd.)
295
Corporate Overview 02
Strategic Review 46
Performance Review 20
Statutory Reports 84
Our Strategy 28
Financial Statements 206
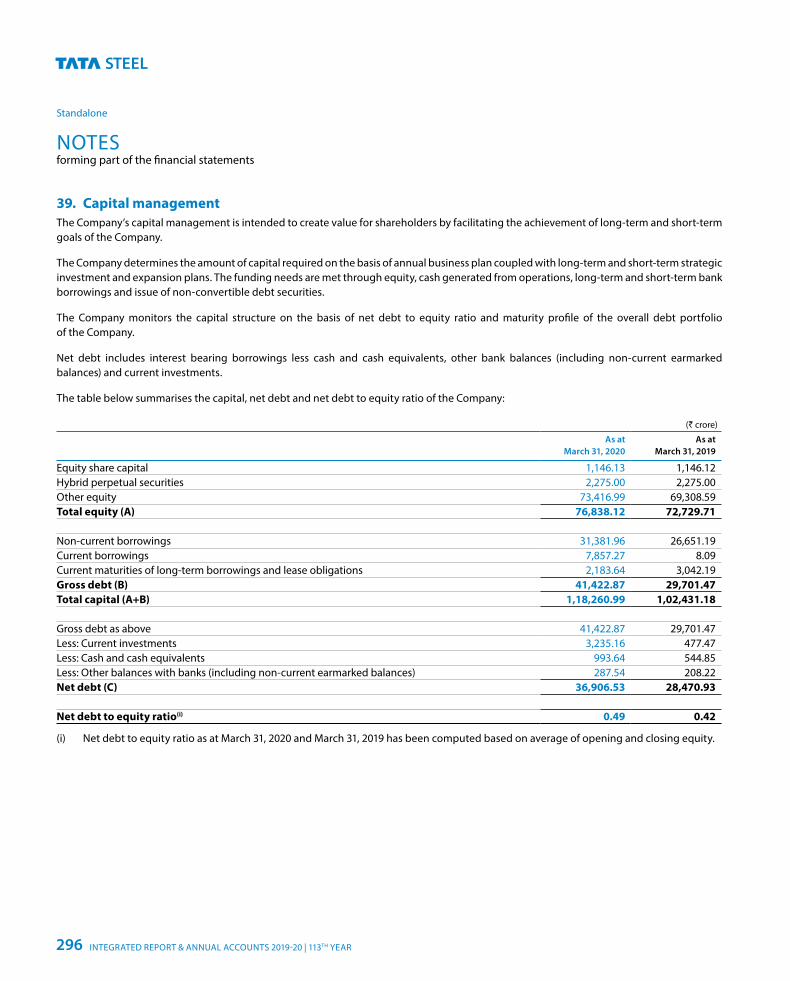
NOTESforming part of the financial statements
Standalone
39. Capital managementThe Company’s capital management is intended to create value for shareholders by facilitating the achievement of long-term and short-term goals of the Company.
The Company determines the amount of capital required on the basis of annual business plan coupled with long-term and short-term strategic investment and expansion plans. The funding needs are met through equity, cash generated from operations, long-term and short-term bank borrowings and issue of non-convertible debt securities.
The Company monitors the capital structure on the basis of net debt to equity ratio and maturity profile of the overall debt portfolio of the Company.
Net debt includes interest bearing borrowings less cash and cash equivalents, other bank balances (including non-current earmarked balances) and current investments.
The table below summarises the capital, net debt and net debt to equity ratio of the Company:
(` crore)
As at March 31, 2020
As at March 31, 2019
Equity share capital 1,146.13 1,146.12Hybrid perpetual securities 2,275.00 2,275.00Other equity 73,416.99 69,308.59Total equity (A) 76,838.12 72,729.71
Non-current borrowings 31,381.96 26,651.19Current borrowings 7,857.27 8.09Current maturities of long-term borrowings and lease obligations 2,183.64 3,042.19Gross debt (B) 41,422.87 29,701.47Total capital (A+B) 1,18,260.99 1,02,431.18
Gross debt as above 41,422.87 29,701.47Less: Current investments 3,235.16 477.47Less: Cash and cash equivalents 993.64 544.85Less: Other balances with banks (including non-current earmarked balances) 287.54 208.22Net debt (C) 36,906.53 28,470.93
Net debt to equity ratio(i) 0.49 0.42
(i) Net debt to equity ratio as at March 31, 2020 and March 31, 2019 has been computed based on average of opening and closing equity.
INTEGRATED REPORT & ANNUAL ACCOUNTS 2019-20 | 113TH YEAR296
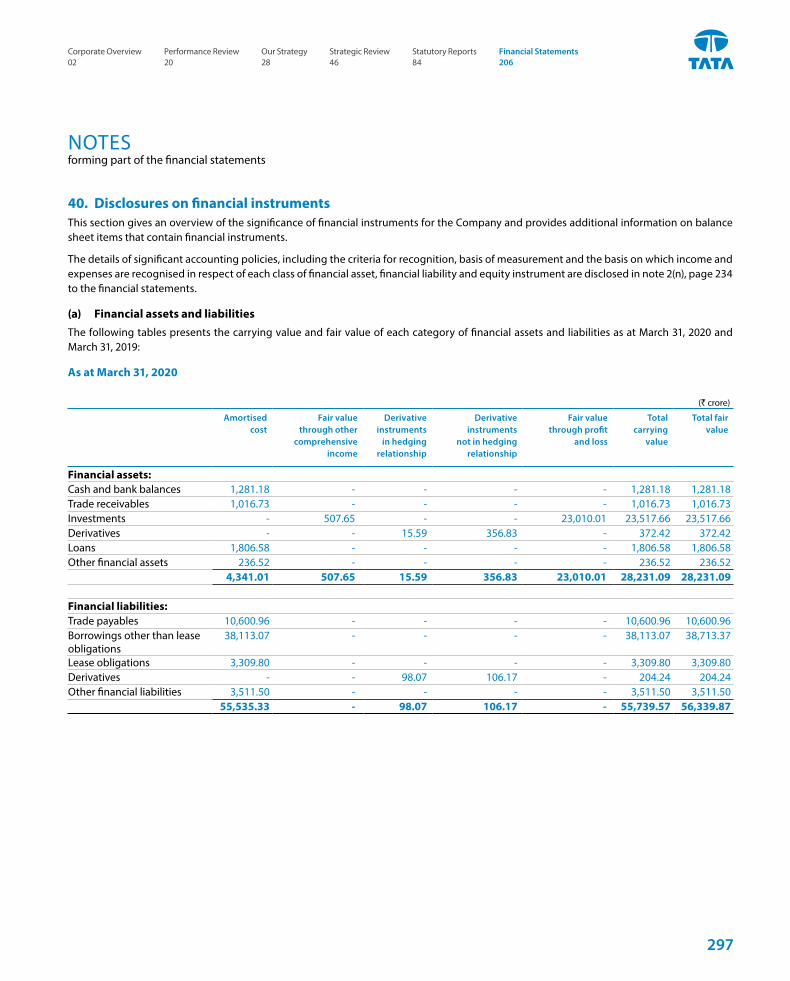
NOTESforming part of the financial statements
40. Disclosures on financial instrumentsThis section gives an overview of the significance of financial instruments for the Company and provides additional information on balance sheet items that contain financial instruments.
The details of significant accounting policies, including the criteria for recognition, basis of measurement and the basis on which income and expenses are recognised in respect of each class of financial asset, financial liability and equity instrument are disclosed in note 2(n), page 234 to the financial statements.
(a) Financial assets and liabilities The following tables presents the carrying value and fair value of each category of financial assets and liabilities as at March 31, 2020 and March 31, 2019:
As at March 31, 2020
(` crore)
Amortised cost
Fair value through other
comprehensive income
Derivative instruments
in hedging relationship
Derivative instruments
not in hedging relationship
Fair valuethrough profit
and loss
Total carrying
value
Total fair value
Financial assets:Cash and bank balances 1,281.18 - - - - 1,281.18 1,281.18Trade receivables 1,016.73 - - - - 1,016.73 1,016.73Investments - 507.65 - - 23,010.01 23,517.66 23,517.66Derivatives - - 15.59 356.83 - 372.42 372.42Loans 1,806.58 - - - - 1,806.58 1,806.58Other financial assets 236.52 - - - - 236.52 236.52
4,341.01 507.65 15.59 356.83 23,010.01 28,231.09 28,231.09
Financial liabilities:Trade payables 10,600.96 - - - - 10,600.96 10,600.96Borrowings other than lease obligations
38,113.07 - - - - 38,113.07 38,713.37
Lease obligations 3,309.80 - - - - 3,309.80 3,309.80Derivatives - - 98.07 106.17 - 204.24 204.24Other financial liabilities 3,511.50 - - - - 3,511.50 3,511.50
55,535.33 - 98.07 106.17 - 55,739.57 56,339.87
297
Corporate Overview 02
Strategic Review 46
Performance Review 20
Statutory Reports 84
Our Strategy 28
Financial Statements 206
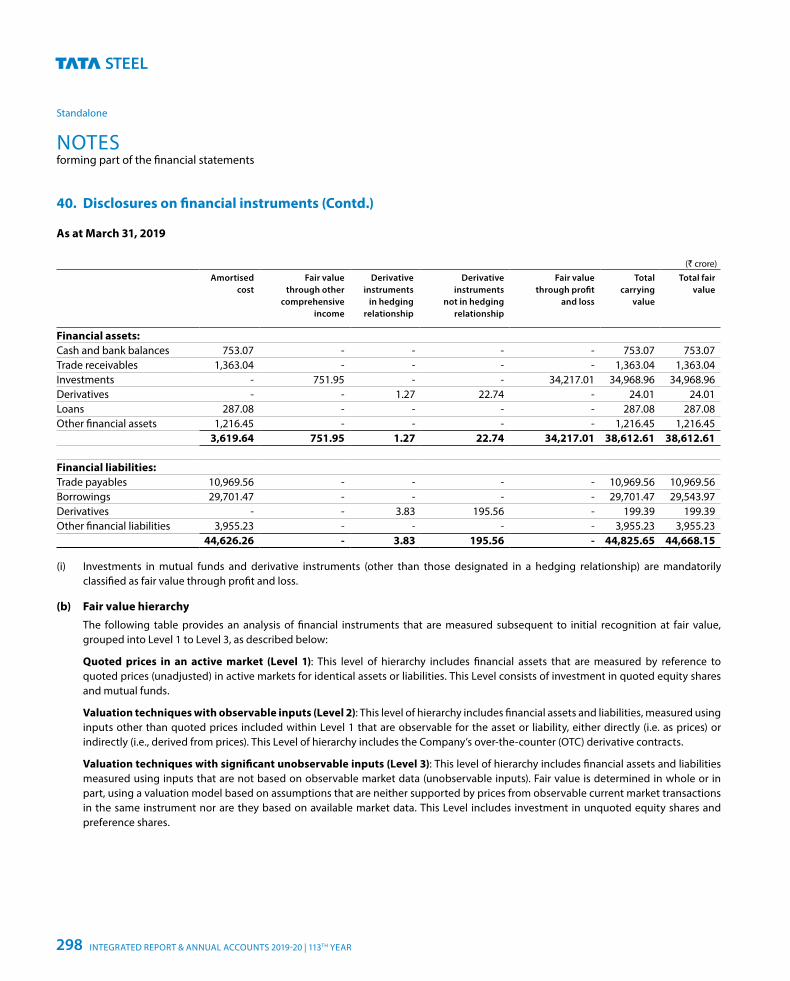
NOTESforming part of the financial statements
Standalone
As at March 31, 2019
(` crore)Amortised
costFair value
through other comprehensive
income
Derivative instruments
in hedging relationship
Derivative instruments
not in hedging relationship
Fair valuethrough profit
and loss
Total carrying
value
Total fair value
Financial assets:Cash and bank balances 753.07 - - - - 753.07 753.07Trade receivables 1,363.04 - - - - 1,363.04 1,363.04Investments - 751.95 - - 34,217.01 34,968.96 34,968.96Derivatives - - 1.27 22.74 - 24.01 24.01Loans 287.08 - - - - 287.08 287.08Other financial assets 1,216.45 - - - - 1,216.45 1,216.45
3,619.64 751.95 1.27 22.74 34,217.01 38,612.61 38,612.61
Financial liabilities:Trade payables 10,969.56 - - - - 10,969.56 10,969.56Borrowings 29,701.47 - - - - 29,701.47 29,543.97Derivatives - - 3.83 195.56 - 199.39 199.39Other financial liabilities 3,955.23 - - - - 3,955.23 3,955.23
44,626.26 - 3.83 195.56 - 44,825.65 44,668.15
(i) Investments in mutual funds and derivative instruments (other than those designated in a hedging relationship) are mandatorily classified as fair value through profit and loss.
(b) Fair value hierarchy The following table provides an analysis of financial instruments that are measured subsequent to initial recognition at fair value,
grouped into Level 1 to Level 3, as described below:
Quoted prices in an active market (Level 1): This level of hierarchy includes financial assets that are measured by reference to quoted prices (unadjusted) in active markets for identical assets or liabilities. This Level consists of investment in quoted equity shares and mutual funds.
Valuation techniques with observable inputs (Level 2): This level of hierarchy includes financial assets and liabilities, measured using inputs other than quoted prices included within Level 1 that are observable for the asset or liability, either directly (i.e. as prices) or indirectly (i.e., derived from prices). This Level of hierarchy includes the Company’s over-the-counter (OTC) derivative contracts.
Valuation techniques with significant unobservable inputs (Level 3): This level of hierarchy includes financial assets and liabilities measured using inputs that are not based on observable market data (unobservable inputs). Fair value is determined in whole or in part, using a valuation model based on assumptions that are neither supported by prices from observable current market transactions in the same instrument nor are they based on available market data. This Level includes investment in unquoted equity shares and preference shares.
40. Disclosures on financial instruments (Contd.)
INTEGRATED REPORT & ANNUAL ACCOUNTS 2019-20 | 113TH YEAR298
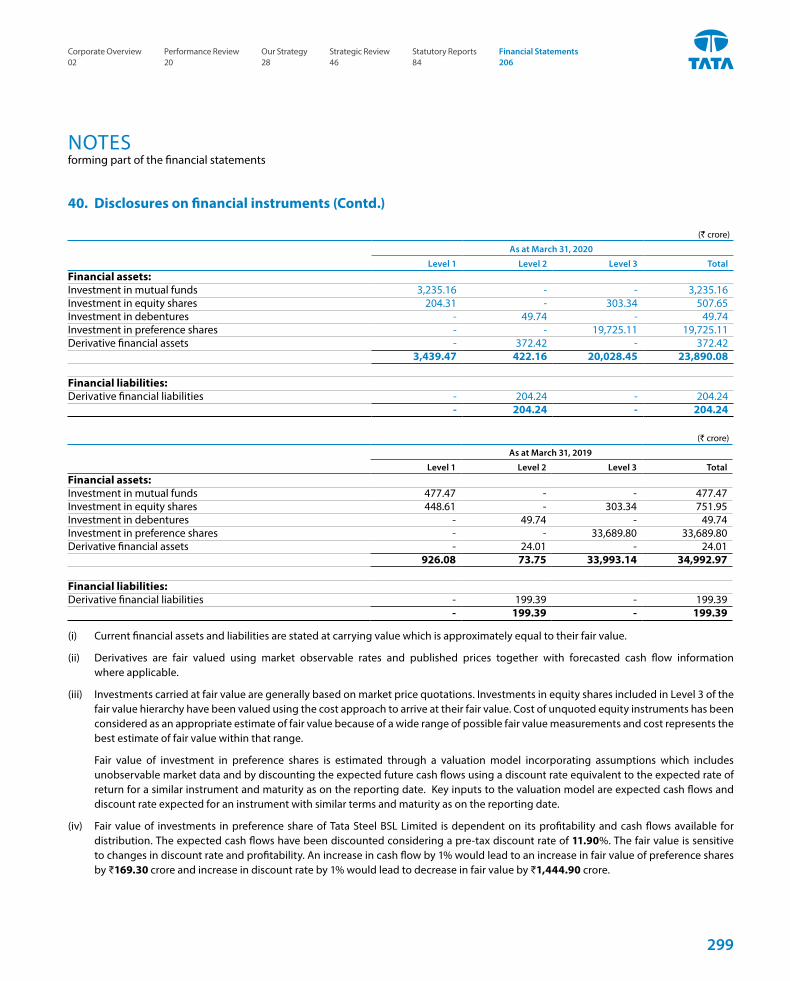
NOTESforming part of the financial statements
(` crore)
As at March 31, 2020
Level 1 Level 2 Level 3 TotalFinancial assets:Investment in mutual funds 3,235.16 - - 3,235.16Investment in equity shares 204.31 - 303.34 507.65Investment in debentures - 49.74 - 49.74Investment in preference shares - - 19,725.11 19,725.11Derivative financial assets - 372.42 - 372.42
3,439.47 422.16 20,028.45 23,890.08
Financial liabilities:Derivative financial liabilities - 204.24 - 204.24
- 204.24 - 204.24
(` crore)
As at March 31, 2019
Level 1 Level 2 Level 3 TotalFinancial assets: Investment in mutual funds 477.47 - - 477.47Investment in equity shares 448.61 - 303.34 751.95Investment in debentures - 49.74 - 49.74Investment in preference shares - - 33,689.80 33,689.80Derivative financial assets - 24.01 - 24.01
926.08 73.75 33,993.14 34,992.97
Financial liabilities:Derivative financial liabilities - 199.39 - 199.39
- 199.39 - 199.39
(i) Current financial assets and liabilities are stated at carrying value which is approximately equal to their fair value.
(ii) Derivatives are fair valued using market observable rates and published prices together with forecasted cash flow information where applicable.
(iii) Investments carried at fair value are generally based on market price quotations. Investments in equity shares included in Level 3 of the fair value hierarchy have been valued using the cost approach to arrive at their fair value. Cost of unquoted equity instruments has been considered as an appropriate estimate of fair value because of a wide range of possible fair value measurements and cost represents the best estimate of fair value within that range.
Fair value of investment in preference shares is estimated through a valuation model incorporating assumptions which includes unobservable market data and by discounting the expected future cash flows using a discount rate equivalent to the expected rate of return for a similar instrument and maturity as on the reporting date. Key inputs to the valuation model are expected cash flows and discount rate expected for an instrument with similar terms and maturity as on the reporting date.
(iv) Fair value of investments in preference share of Tata Steel BSL Limited is dependent on its profitability and cash flows available for distribution. The expected cash flows have been discounted considering a pre-tax discount rate of 11.90%. The fair value is sensitive to changes in discount rate and profitability. An increase in cash flow by 1% would lead to an increase in fair value of preference shares by ₹169.30 crore and increase in discount rate by 1% would lead to decrease in fair value by ₹1,444.90 crore.
40. Disclosures on financial instruments (Contd.)
299
Corporate Overview 02
Strategic Review 46
Performance Review 20
Statutory Reports 84
Our Strategy 28
Financial Statements 206
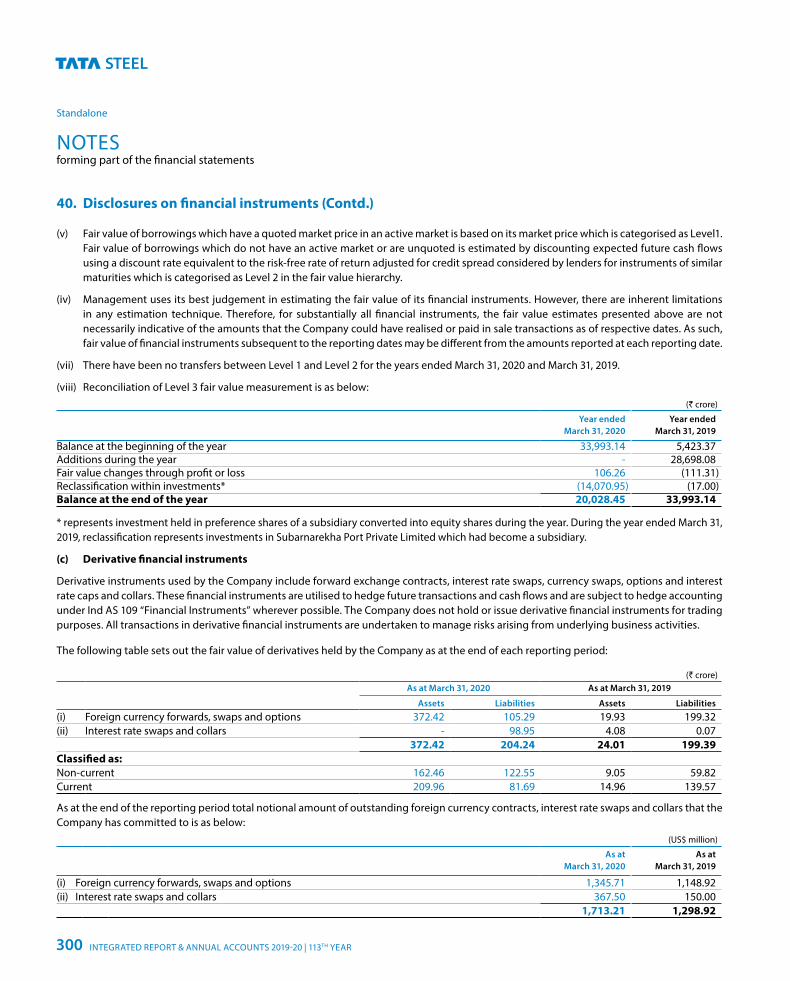
NOTESforming part of the financial statements
Standalone
(v) Fair value of borrowings which have a quoted market price in an active market is based on its market price which is categorised as Level1. Fair value of borrowings which do not have an active market or are unquoted is estimated by discounting expected future cash flows using a discount rate equivalent to the risk-free rate of return adjusted for credit spread considered by lenders for instruments of similar maturities which is categorised as Level 2 in the fair value hierarchy.
(iv) Management uses its best judgement in estimating the fair value of its financial instruments. However, there are inherent limitations in any estimation technique. Therefore, for substantially all financial instruments, the fair value estimates presented above are not necessarily indicative of the amounts that the Company could have realised or paid in sale transactions as of respective dates. As such, fair value of financial instruments subsequent to the reporting dates may be different from the amounts reported at each reporting date.
(vii) There have been no transfers between Level 1 and Level 2 for the years ended March 31, 2020 and March 31, 2019.
(viii) Reconciliation of Level 3 fair value measurement is as below:(` crore)
Year ended March 31, 2020
Year ended March 31, 2019
Balance at the beginning of the year 33,993.14 5,423.37Additions during the year - 28,698.08Fair value changes through profit or loss 106.26 (111.31)Reclassification within investments* (14,070.95) (17.00)Balance at the end of the year 20,028.45 33,993.14
* represents investment held in preference shares of a subsidiary converted into equity shares during the year. During the year ended March 31, 2019, reclassification represents investments in Subarnarekha Port Private Limited which had become a subsidiary.
(c) Derivative financial instruments
Derivative instruments used by the Company include forward exchange contracts, interest rate swaps, currency swaps, options and interest rate caps and collars. These financial instruments are utilised to hedge future transactions and cash flows and are subject to hedge accounting under Ind AS 109 “Financial Instruments” wherever possible. The Company does not hold or issue derivative financial instruments for trading purposes. All transactions in derivative financial instruments are undertaken to manage risks arising from underlying business activities.
The following table sets out the fair value of derivatives held by the Company as at the end of each reporting period:
(` crore)As at March 31, 2020 As at March 31, 2019
Assets Liabilities Assets Liabilities (i) Foreign currency forwards, swaps and options 372.42 105.29 19.93 199.32(ii) Interest rate swaps and collars - 98.95 4.08 0.07
372.42 204.24 24.01 199.39Classified as:Non-current 162.46 122.55 9.05 59.82Current 209.96 81.69 14.96 139.57
As at the end of the reporting period total notional amount of outstanding foreign currency contracts, interest rate swaps and collars that the Company has committed to is as below:
(US$ million)
As at March 31, 2020
As at March 31, 2019
(i) Foreign currency forwards, swaps and options 1,345.71 1,148.92(ii) Interest rate swaps and collars 367.50 150.00
1,713.21 1,298.92
40. Disclosures on financial instruments (Contd.)
INTEGRATED REPORT & ANNUAL ACCOUNTS 2019-20 | 113TH YEAR300
NOTESforming part of the financial statements
(d) Transfer of financial assets The Company transfers certain trade receivables under
discounting arrangements with banks/financial institutions. Some of such arrangements do not qualify for de-recognition due to recourse arrangements being in place. Consequently, the proceeds received from transfer are recorded as short-term borrowings from banks and financial institutions. As at March 31, 2020 and March 31, 2019, there has been no such transfer of trade receivables.
(e) Financial risk management
In the course of its business, the Company is exposed primarily to fluctuations in foreign currency exchange rates, interest rates, equity prices, liquidity and credit risk, which may adversely impact the fair value of its financial instruments.
The Company has a risk management policy which not only covers the foreign exchange risks but also other risks associated with the financial assets and liabilities such as interest rate risks and credit risks. The risk management policy is approved by the Board of Directors. The risk management framework aims to:
(i) create a stable business planning environment by reducing the impact of currency and interest rate fluctuations on the Company’s business plan.
(ii) achieve greater predictability to earnings by determining the financial value of the expected earnings in advance.
(i) Market risk: Market risk is the risk of any loss in future earnings, in realisable
fair values or in future cash flows that may result from a change in the price of a financial instrument. The value of a financial instrument may change as a result of changes in interest rates, foreign currency exchange rates, equity price fluctuations, liquidity and other market changes. Future specific market movements cannot be normally predicted with reasonable accuracy.
(a) Market risk - Foreign currency exchange rate risk: The fluctuation in foreign currency exchange rates may have a
potential impact on the statement of profit and loss and equity, where any transaction references more than one currency or where assets/liabilities are denominated in a currency other than the functional currency of the Company.
40. Disclosures on financial instruments (Contd.)
The Company, as per its risk management policy, uses foreign exchange and other derivative instruments primarily to hedge foreign exchange and interest rate exposure. Any weakening of the functional currency may impact the Company’s cost of imports and cost of borrowings and consequently may increase the cost of financing the Company’s capital expenditures. Such movements may also impact the fair value of preference shares investments held by the Company in its foreign subsidiaries.
A 10% appreciation/depreciation of foreign currencies with respect to functional currency of the Company would result in an increase/decrease in the Company’s net profit/equity before considering tax impacts by approximately ₹158.75 crore for the year ended March 31, 2020 (2018-19: ₹1,491.07 crore) and an increase/decrease in carrying value of property, plant and equipment (before considering depreciation) by approximately ₹109.94 crore as at March 31, 2020 (March 31, 2019: ₹145.38 crore).
The foreign exchange rate sensitivity is calculated by assuming a simultaneous parallel foreign exchange rates shift of all the currencies by 10% against the functional currency of the Company.
The sensitivity analysis has been based on the composition of the Company’s financial assets and liabilities as at March 31, 2020 and March 31, 2019 excluding trade payables, trade receivables, other derivative and non-derivative financial instruments (except investment in preference shares and loans receivable) not forming part of debt and which do not present a material exposure. The period end balances are not necessarily representative of the average balance outstanding during the period.
(b) Market risk - Interest rate risk: Interest rate risk is measured by using the cash flow sensitivity
for changes in variable interest rates. Any movement in the reference rates could have an impact on the Company’s cash flows as well as costs. The Company is subject to variable interest rates on some of its interest bearing liabilities. The Company’s interest rate exposure is mainly related to debt obligations.
Based on the composition of debt as at March 31, 2020 and March 31, 2019, a 100 basis points increase in interest rates would increase the Company’s finance costs (before considering interest eligible for capitalisation) and thereby consequently reduce net profit/equity before considering tax impacts by approximately ₹149.37 crore for the year ended March 31, 2020 (2018-19: ₹128.33 crore).
301
Corporate Overview 02
Strategic Review 46
Performance Review 20
Statutory Reports 84
Our Strategy 28
Financial Statements 206
NOTESforming part of the financial statements
Standalone
The risk estimates provided assume a parallel shift of 100 basis points interest rate across all yield curves. This calculation also assumes that the change occurs at the balance sheet date and has been calculated based on risk exposures outstanding as at that date. The period end balances are not necessarily representative of the average debt outstanding during the period.
(c) Market risk - Equity price risk: Equity price risk is related to change in market reference price
of investments in equity securities held by the Company.
The fair value of quoted investments held by the Company exposes the Company to equity price risks. In general, these investments are not held for trading purposes.
The fair value of quoted investments in equity, classified as fair value through other comprehensive income as at March 31, 2020 and March 31, 2019 was ₹204.31 crore and ₹448.61 crore, respectively.
A 10% change in equity prices of such securities held as at March 31, 2020 and March 31, 2019, would result in an impact of ₹20.43 crore and ₹44.86 crore respectively on equity before considering tax impact.
(ii) Credit risk: Credit risk is the risk of financial loss arising from counter-party
failure to repay or service debt according to the contractual terms or obligations. Credit risk encompasses both the direct risk of default and the risk of deterioration of credit worthiness as well as concentration risks.
The Company has a policy of dealing only with credit worthy counter parties and obtaining sufficient collateral, where appropriate as a means of mitigating the risk of financial loss from defaults.
Financial instruments that are subject to credit risk and concentration thereof principally consist of trade receivables, loans receivables, investments in debt securities and mutual funds, balances with bank, bank deposits, derivatives and financial guarantees provided by the Company. None of the financial instruments of the Company result in material concentration of credit risk except preference shares investments, the Company made in its subsidiary companies.
40. Disclosures on financial instruments (Contd.) The carrying value of financial assets represents the maximum credit risk. The maximum exposure to credit risk was ₹27,722.94 crore and ₹37,584.12 crore, as at March 31, 2020 and March 31, 2019 respectively, being the total carrying value of trade receivables, balances with bank, bank deposits, investments in debt securities, mutual funds, loans, derivative assets and other financial assets.
The risk relating to trade receivables is presented in note 14, page 263.
The Company’s exposure to customers is diversified and no single customer, other than a subsidiary, contributes to more than 10% of outstanding trade receivables as at March 31, 2020 and March 31, 2019.
In respect of financial guarantees provided by the Company to banks/financial institutions, the maximum exposure which the Company is exposed to is the maximum amount which the Company would have to pay if the guarantee is called upon. Based on the expectation at the end of the reporting period, the Company considers that it is more likely than not that such an amount will not be payable under the guarantees provided.
(iii) Liquidity risk: Liquidity risk refers to the risk that the Company cannot
meet its financial obligations. The objective of liquidity risk management is to maintain sufficient liquidity and ensure that funds are available for use as per requirements.
The Company has obtained fund and non-fund based working capital lines from various banks. Furthermore, the Company have access to undrawn lines of committed and uncommitted borrowing/ facilities, funds from debt markets through commercial paper programs, non-convertible debentures and other debt instruments. The Company invests its surplus funds in bank fixed deposits and in mutual funds, which carry low market risk. The Company has also invested 15% of the non-convertible debentures (issued by the Company) falling due for repayment in the next 12 months in bank deposits, to meet the regulatory norms of liquidity requirements. The Company also constantly monitors funding options available in the debt and capital markets with a view to maintaining financial flexibility.
The Company’s liquidity position remains strong at ₹8,315.34 crore as at March 31, 2020, comprising ₹4,516.34 crore in the form of current investments, cash and cash equivalents and other balances with banks (including non-current earmarked balances) and ₹3,799.00 crore in committed undrawn bank lines.
INTEGRATED REPORT & ANNUAL ACCOUNTS 2019-20 | 113TH YEAR302
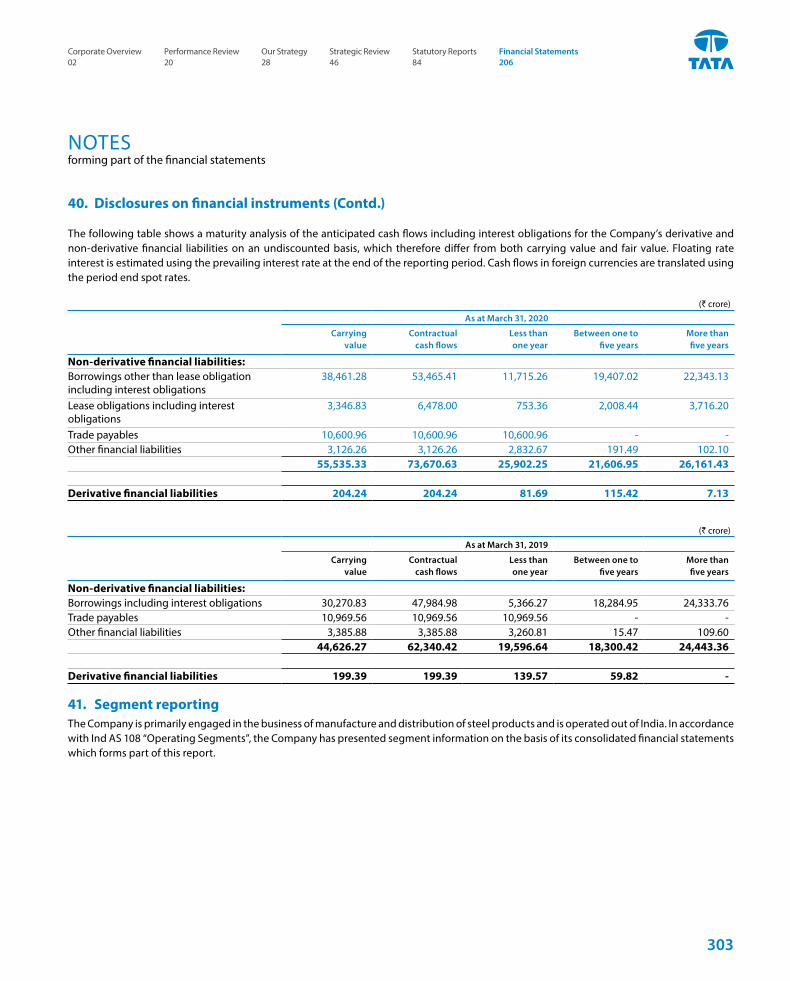
NOTESforming part of the financial statements
40. Disclosures on financial instruments (Contd.)
The following table shows a maturity analysis of the anticipated cash flows including interest obligations for the Company’s derivative and non-derivative financial liabilities on an undiscounted basis, which therefore differ from both carrying value and fair value. Floating rate interest is estimated using the prevailing interest rate at the end of the reporting period. Cash flows in foreign currencies are translated using the period end spot rates.
(` crore)
As at March 31, 2020
Carrying value
Contractual cash flows
Less than one year
Between one to five years
More than five years
Non-derivative financial liabilities:Borrowings other than lease obligationincluding interest obligations
38,461.28 53,465.41 11,715.26 19,407.02 22,343.13
Lease obligations including interestobligations
3,346.83 6,478.00 753.36 2,008.44 3,716.20
Trade payables 10,600.96 10,600.96 10,600.96 - -Other financial liabilities 3,126.26 3,126.26 2,832.67 191.49 102.10
55,535.33 73,670.63 25,902.25 21,606.95 26,161.43
Derivative financial liabilities 204.24 204.24 81.69 115.42 7.13
(` crore)
As at March 31, 2019
Carrying value
Contractual cash flows
Less than one year
Between one to five years
More than five years
Non-derivative financial liabilities:Borrowings including interest obligations 30,270.83 47,984.98 5,366.27 18,284.95 24,333.76Trade payables 10,969.56 10,969.56 10,969.56 - -Other financial liabilities 3,385.88 3,385.88 3,260.81 15.47 109.60
44,626.27 62,340.42 19,596.64 18,300.42 24,443.36
Derivative financial liabilities 199.39 199.39 139.57 59.82 -
41. Segment reportingThe Company is primarily engaged in the business of manufacture and distribution of steel products and is operated out of India. In accordance with Ind AS 108 “Operating Segments”, the Company has presented segment information on the basis of its consolidated financial statements which forms part of this report.
303
Corporate Overview 02
Strategic Review 46
Performance Review 20
Statutory Reports 84
Our Strategy 28
Financial Statements 206
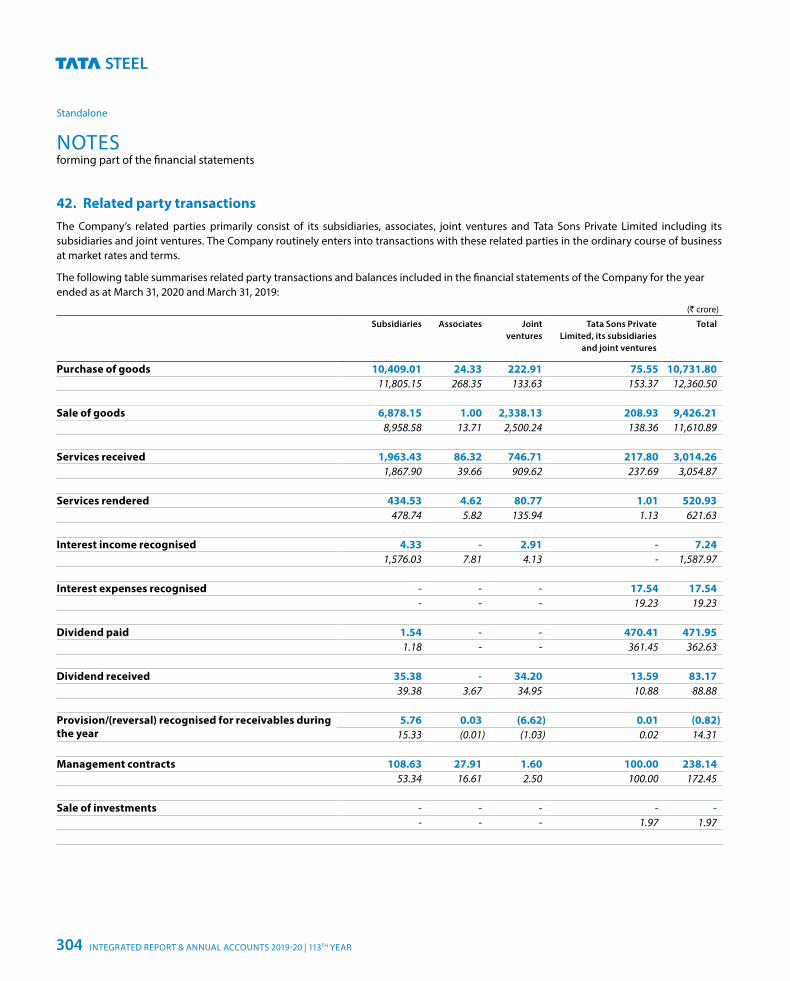
NOTESforming part of the financial statements
Standalone
42. Related party transactionsThe Company’s related parties primarily consist of its subsidiaries, associates, joint ventures and Tata Sons Private Limited including its subsidiaries and joint ventures. The Company routinely enters into transactions with these related parties in the ordinary course of business at market rates and terms.
The following table summarises related party transactions and balances included in the financial statements of the Company for the yearended as at March 31, 2020 and March 31, 2019:
(` crore)
Subsidiaries Associates Joint ventures
Tata Sons PrivateLimited, its subsidiaries
and joint ventures
Total
Purchase of goods 10,409.01 24.33 222.91 75.55 10,731.8011,805.15 268.35 133.63 153.37 12,360.50
Sale of goods 6,878.15 1.00 2,338.13 208.93 9,426.218,958.58 13.71 2,500.24 138.36 11,610.89
Services received 1,963.43 86.32 746.71 217.80 3,014.261,867.90 39.66 909.62 237.69 3,054.87
Services rendered 434.53 4.62 80.77 1.01 520.93478.74 5.82 135.94 1.13 621.63
Interest income recognised 4.33 - 2.91 - 7.241,576.03 7.81 4.13 - 1,587.97
Interest expenses recognised - - - 17.54 17.54 - - - 19.23 19.23
Dividend paid 1.54 - - 470.41 471.951.18 - - 361.45 362.63
Dividend received 35.38 - 34.20 13.59 83.1739.38 3.67 34.95 10.88 88.88
Provision/(reversal) recognised for receivables during the year
5.76 0.03 (6.62) 0.01 (0.82)15.33 (0.01) (1.03) 0.02 14.31
Management contracts 108.63 27.91 1.60 100.00 238.1453.34 16.61 2.50 100.00 172.45
Sale of investments - - - - - - - - 1.97 1.97
INTEGRATED REPORT & ANNUAL ACCOUNTS 2019-20 | 113TH YEAR304
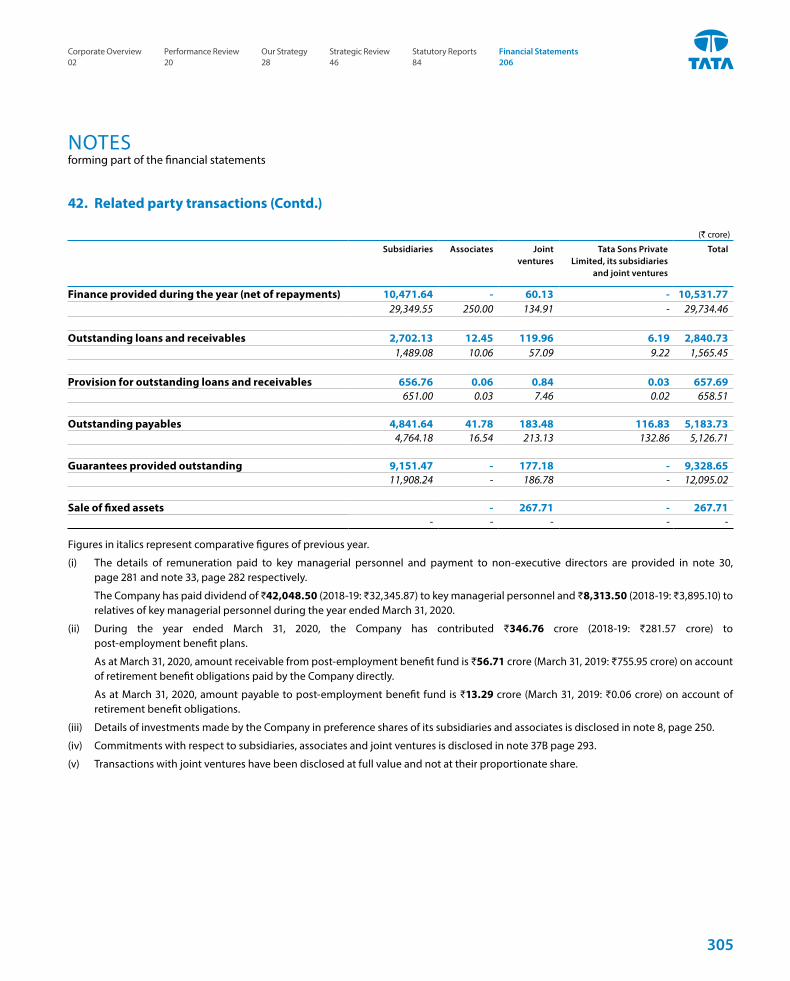
NOTESforming part of the financial statements
(` crore)
Subsidiaries Associates Joint ventures
Tata Sons PrivateLimited, its subsidiaries
and joint ventures
Total
Finance provided during the year (net of repayments) 10,471.64 - 60.13 - 10,531.7729,349.55 250.00 134.91 - 29,734.46
Outstanding loans and receivables 2,702.13 12.45 119.96 6.19 2,840.731,489.08 10.06 57.09 9.22 1,565.45
Provision for outstanding loans and receivables 656.76 0.06 0.84 0.03 657.69651.00 0.03 7.46 0.02 658.51
Outstanding payables 4,841.64 41.78 183.48 116.83 5,183.734,764.18 16.54 213.13 132.86 5,126.71
Guarantees provided outstanding 9,151.47 - 177.18 - 9,328.6511,908.24 - 186.78 - 12,095.02
Sale of fixed assets - 267.71 - 267.71 - - - - -
Figures in italics represent comparative figures of previous year.
(i) The details of remuneration paid to key managerial personnel and payment to non-executive directors are provided in note 30, page 281 and note 33, page 282 respectively.
The Company has paid dividend of ₹42,048.50 (2018-19: ₹32,345.87) to key managerial personnel and ₹8,313.50 (2018-19: ₹3,895.10) to relatives of key managerial personnel during the year ended March 31, 2020.
(ii) During the year ended March 31, 2020, the Company has contributed ₹346.76 crore (2018-19: ₹281.57 crore) to post-employment benefit plans.
As at March 31, 2020, amount receivable from post-employment benefit fund is ₹56.71 crore (March 31, 2019: ₹755.95 crore) on account of retirement benefit obligations paid by the Company directly.
As at March 31, 2020, amount payable to post-employment benefit fund is ₹13.29 crore (March 31, 2019: ₹0.06 crore) on account of retirement benefit obligations.
(iii) Details of investments made by the Company in preference shares of its subsidiaries and associates is disclosed in note 8, page 250.
(iv) Commitments with respect to subsidiaries, associates and joint ventures is disclosed in note 37B page 293.
(v) Transactions with joint ventures have been disclosed at full value and not at their proportionate share.
42. Related party transactions (Contd.)
305
Corporate Overview 02
Strategic Review 46
Performance Review 20
Statutory Reports 84
Our Strategy 28
Financial Statements 206
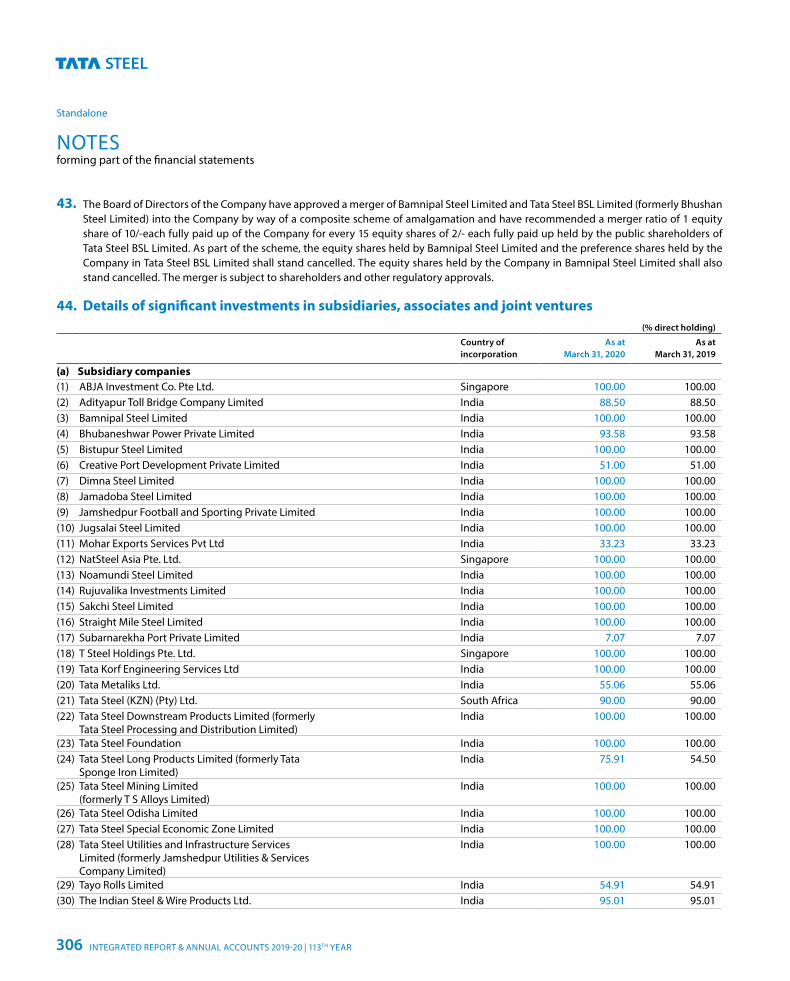
NOTESforming part of the financial statements
Standalone
43. The Board of Directors of the Company have approved a merger of Bamnipal Steel Limited and Tata Steel BSL Limited (formerly Bhushan Steel Limited) into the Company by way of a composite scheme of amalgamation and have recommended a merger ratio of 1 equity share of 10/-each fully paid up of the Company for every 15 equity shares of 2/- each fully paid up held by the public shareholders of Tata Steel BSL Limited. As part of the scheme, the equity shares held by Bamnipal Steel Limited and the preference shares held by the Company in Tata Steel BSL Limited shall stand cancelled. The equity shares held by the Company in Bamnipal Steel Limited shall also stand cancelled. The merger is subject to shareholders and other regulatory approvals.
44. Details of significant investments in subsidiaries, associates and joint ventures (% direct holding)
Country ofincorporation
As at March 31, 2020
As at March 31, 2019
(a) Subsidiary companies(1) ABJA Investment Co. Pte Ltd. Singapore 100.00 100.00(2) Adityapur Toll Bridge Company Limited India 88.50 88.50(3) Bamnipal Steel Limited India 100.00 100.00(4) Bhubaneshwar Power Private Limited India 93.58 93.58(5) Bistupur Steel Limited India 100.00 100.00(6) Creative Port Development Private Limited India 51.00 51.00(7) Dimna Steel Limited India 100.00 100.00(8) Jamadoba Steel Limited India 100.00 100.00(9) Jamshedpur Football and Sporting Private Limited India 100.00 100.00(10) Jugsalai Steel Limited India 100.00 100.00(11) Mohar Exports Services Pvt Ltd India 33.23 33.23(12) NatSteel Asia Pte. Ltd. Singapore 100.00 100.00(13) Noamundi Steel Limited India 100.00 100.00(14) Rujuvalika Investments Limited India 100.00 100.00(15) Sakchi Steel Limited India 100.00 100.00(16) Straight Mile Steel Limited India 100.00 100.00(17) Subarnarekha Port Private Limited India 7.07 7.07(18) T Steel Holdings Pte. Ltd. Singapore 100.00 100.00(19) Tata Korf Engineering Services Ltd India 100.00 100.00(20) Tata Metaliks Ltd. India 55.06 55.06(21) Tata Steel (KZN) (Pty) Ltd. South Africa 90.00 90.00(22) Tata Steel Downstream Products Limited (formerly
Tata Steel Processing and Distribution Limited)India 100.00 100.00
(23) Tata Steel Foundation India 100.00 100.00(24) Tata Steel Long Products Limited (formerly Tata
Sponge Iron Limited)India 75.91 54.50
(25) Tata Steel Mining Limited(formerly T S Alloys Limited)
India 100.00 100.00
(26) Tata Steel Odisha Limited India 100.00 100.00(27) Tata Steel Special Economic Zone Limited India 100.00 100.00(28) Tata Steel Utilities and Infrastructure Services
Limited (formerly Jamshedpur Utilities & ServicesCompany Limited)
India 100.00 100.00
(29) Tayo Rolls Limited India 54.91 54.91(30) The Indian Steel & Wire Products Ltd. India 95.01 95.01
INTEGRATED REPORT & ANNUAL ACCOUNTS 2019-20 | 113TH YEAR306
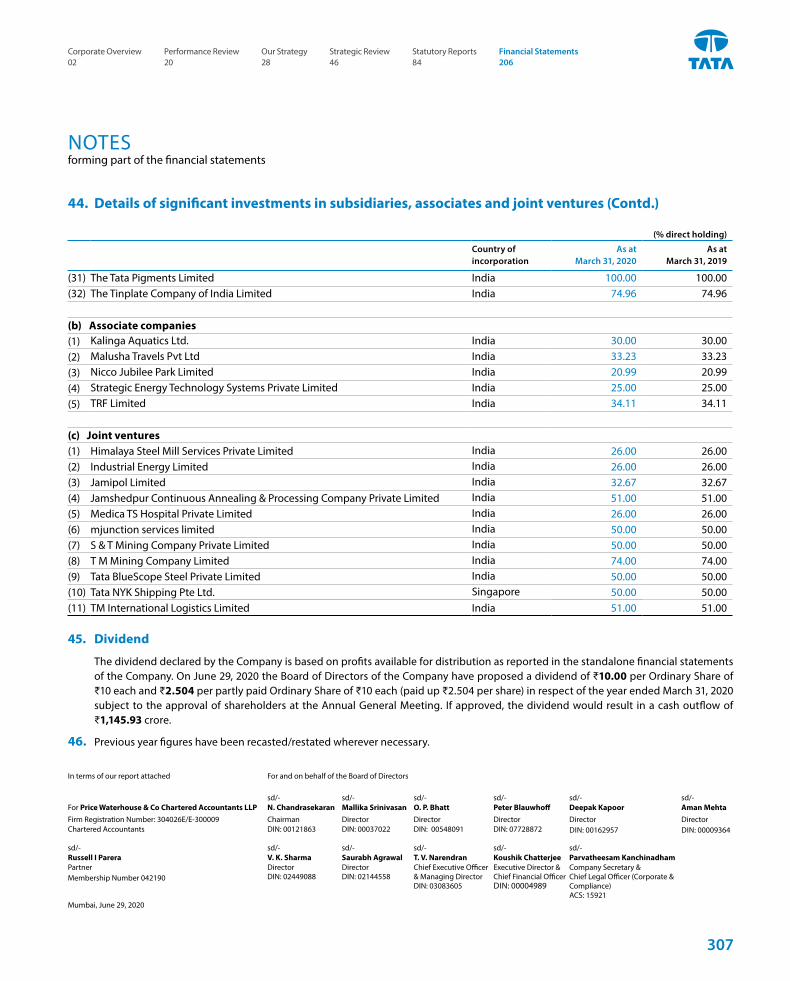
NOTESforming part of the financial statements
(% direct holding)
Country ofincorporation
As at March 31, 2020
As at March 31, 2019
(31) The Tata Pigments Limited India 100.00 100.00(32) The Tinplate Company of India Limited India 74.96 74.96
(b) Associate companies(1) Kalinga Aquatics Ltd. India 30.00 30.00(2) Malusha Travels Pvt Ltd India 33.23 33.23(3) Nicco Jubilee Park Limited India 20.99 20.99(4) Strategic Energy Technology Systems Private Limited India 25.00 25.00(5) TRF Limited India 34.11 34.11
(c) Joint ventures(1) Himalaya Steel Mill Services Private Limited India 26.00 26.00(2) Industrial Energy Limited India 26.00 26.00(3) Jamipol Limited India 32.67 32.67(4) Jamshedpur Continuous Annealing & Processing Company Private Limited India 51.00 51.00(5) Medica TS Hospital Private Limited India 26.00 26.00(6) mjunction services limited India 50.00 50.00(7) S & T Mining Company Private Limited India 50.00 50.00(8) T M Mining Company Limited India 74.00 74.00(9) Tata BlueScope Steel Private Limited India 50.00 50.00(10) Tata NYK Shipping Pte Ltd. Singapore 50.00 50.00(11) TM International Logistics Limited India 51.00 51.00
45. Dividend
The dividend declared by the Company is based on profits available for distribution as reported in the standalone financial statements of the Company. On June 29, 2020 the Board of Directors of the Company have proposed a dividend of ₹10.00 per Ordinary Share of ₹10 each and ₹2.504 per partly paid Ordinary Share of ₹10 each (paid up ₹2.504 per share) in respect of the year ended March 31, 2020 subject to the approval of shareholders at the Annual General Meeting. If approved, the dividend would result in a cash outflow of ₹1,145.93 crore.
46. Previous year figures have been recasted/restated wherever necessary.
44. Details of significant investments in subsidiaries, associates and joint ventures (Contd.)
In terms of our report attached For and on behalf of the Board of Directors
sd/- sd/- sd/- sd/- sd/- sd/- For Price Waterhouse & Co Chartered Accountants LLP N. Chandrasekaran Mallika Srinivasan O. P. Bhatt Peter Blauwhoff Deepak Kapoor Aman MehtaFirm Registration Number: 304026E/E-300009 Chairman Director Director Director Director
DIN: 00162957Director DIN: 00009364Chartered Accountants DIN: 00121863 DIN: 00037022 DIN: 00548091 DIN: 07728872
sd/- sd/- sd/- sd/- sd/- sd/- Russell I Parera V. K. Sharma Saurabh Agrawal T. V. Narendran Koushik Chatterjee Parvatheesam KanchinadhamPartner Membership Number 042190
Director DIN: 02449088
Director DIN: 02144558
Chief Executive Officer & Managing Director DIN: 03083605
Executive Director & Chief Financial Officer DIN: 00004989
Company Secretary & Chief Legal Officer (Corporate & Compliance) ACS: 15921
Mumbai, June 29, 2020
307
Corporate Overview 02
Strategic Review 46
Performance Review 20
Statutory Reports 84
Our Strategy 28
Financial Statements 206

Independent Auditor’s Report 310
Consolidated Balance Sheet 322
Consolidated Statement of Profit and Loss 324
Consolidated Statement of Changes in Equity 326
Consolidated Statement of Cash Flows 328
Notes forming part of the Consolidated Financial Statements 330
INDEPENDENT AUDITOR’S REPORT
To the Members of Tata Steel Limited
Report on the Audit of the Consolidated Financial Statements
Opinion1. We have audited the accompanying Consolidated Financial
Statements of Tata Steel Limited (hereinafter referred to as the ‘Holding Company”) and its subsidiaries (Holding Company and its subsidiaries together referred to as “the Group”), its associates and jointly controlled entities [refer note 1 to the attached Consolidated Financial Statements], which comprise the Consolidated Balance Sheet as at March 31, 2020, the Consolidated Statement of Profit and Loss (including Other Comprehensive Income), the Consolidated Statement of Changes in Equity and the Consolidated Cash Flows Statement for the year then ended, and Notes to the Consolidated Financial Statements, including a summary of significant accounting policies and other explanatory information prepared based on the relevant records. (hereinafter referred to as “the Consolidated Financial Statements”).
2. In our opinion and to the best of our information and according to the explanations given to us, the aforesaid Consolidated Financial Statements give the information required by the Companies Act, 2013 (“the Act”) in the manner so required and give a true and fair view in conformity with the accounting principles generally accepted in India, of the consolidated state of affairs of the Group, its associates and jointly controlled entities as at March 31, 2020, its consolidated total comprehensive income (comprising profit and other comprehensive income), its consolidated changes in equity and its consolidated cash flows for the year then ended.
Basis for Opinion3. We conducted our audit in accordance with the Standards
on Auditing (SAs) specified under section 143(10) of the Act. Our responsibilities under those Standards are further described in the Auditor’s Responsibilities for the Audit of the Consolidated Financial Statements section of our report. We are independent of the Group, its associates and jointly controlled entities in accordance with the ethical requirements that are relevant to our audit of the Consolidated Financial Statements in India in terms of the Code of Ethics issued by ICAI and the relevant provisions of the Act, and we have fulfilled our other ethical responsibilities in accordance with these requirements. We believe that the audit evidence we have obtained and the audit evidence obtained by the other auditors in terms of their reports referred to in paragraph 19 of the Other Matters paragraph below, other than the unaudited financial statements/ financial information as certified by the
management and referred to in paragraph 20 and financial information not available as referred to in paragraph 21 of the Other Matters paragraph below, is sufficient and appropriate to provide a basis for our opinion.
Material Uncertainty Related to Going Concern4. The following Material Uncertainty Relating to Going Concern
(as reproduced) has been communicated to us by the auditors of Tata Steel Europe Limited, a subsidiary of the Holding Company, vide their audit report dated June 24, 2020:
“Without qualifying our opinion on the special purpose financial information, we have considered the adequacy of the disclosure made in the special purpose financial information concerning Tata Steel Europe Limited’s ability to continue as a going concern. The impact of the COVID-19 global pandemic will require Tata Steel Europe Limited to access group company support in order to meet its obligations as they fall due. Tata Steel Europe Limited has received a letter from TS Global Procurement Company Pte Ltd undertaking to provide working capital and/or other cash support up to a specified amount which exceeds the amount forecast as being required by Tata Steel Europe Limited over the next twelve months. The letter states that it represents present policy, is given by way of comfort only and is not to be construed as constituting a promise as to the future conduct of TS Global Procurement Company Pte Ltd or Tata Steel Limited. Accordingly, there can be no certainty that the funds required by Tata Steel Europe Limited will in fact be made available. These conditions, along with the other matters explained in the special purpose financial information, indicate the existence of a material uncertainty which may cast significant doubt about Tata Steel Europe Limited’s ability to continue as a going concern. The special purpose financial information does not include the adjustments that would result if Tata Steel Europe Limited were unable to continue as a going concern.”
Also, refer note 49 to the consolidated financial statements in this regard.
Emphasis of Matter5. We draw your attention to Note 2(c) to the consolidated
financial statements which explains the uncertainties and management’s assessment of the financial impact due to lockdown / restrictions related to the COVID-19 pandemic imposed by the Government, for which a definitive assessment of the impact is dependent upon future economic conditions. Our opinion is not modified in respect of this matter.
Consolidated
INTEGRATED REPORT & ANNUAL ACCOUNTS 2019-20 | 113TH YEAR310
Key audit matters6. Key audit matters are those matters that, in our professional judgment, were of most significance in our audit of the consolidated financial
statements of the current year. These matters were addressed in the context of our audit of the consolidated financial statements as a whole, and in forming our opinion thereon, and we do not provide a separate opinion on these matters.
Key audit matter How our audit addressed the key audit matter
Assessment of litigations and related disclosure of contingent liabilities
[Refer to Note 2 (c) to the Consolidated financial statements– “Use of estimates and critical accounting judgements – Provisions and contingent liabilities”, Note 40 (A) to the Consolidated financial statements – “Contingencies” and Note 41 to the Consolidated financial statements – “Other significant litigations”].
As at March 31, 2020, the Holding Company has exposures towards litigations relating to various matters as set out in the aforesaid Notes.
Significant management judgement is required to assess such matters to determine the probability of occurrence of material outflow of economic resources and whether a provision should be recognised, or a disclosure should be made. The management judgement is also supported with legal advice in certain cases as considered appropriate. As the ultimate outcome of the matters are uncertain and the positions taken by the management are based on the application of their best judgement, related legal advice including those relating to interpretation of laws/regulations, it is considered to be a Key Audit Matter.
Our audit procedures included the following:
• We understood, assessed and tested the design and operating effectiveness of the Holding Company’s key controls surrounding assessment of litigations relating to the relevant laws and regulations;
• We discussed with management the recent developments and the status of the material litigations which were reviewed and noted by the Holding Company’s audit committee;
• We performed our assessment on a test basis on the underlying calculations supporting the contingent liabilities/other significant litigations made in relation to the Holding Company’s Standalone Financial Statements;
• We used auditor’s experts to gain an understanding and to evaluate the disputed tax matters;
• We considered external legal opinions, where relevant, obtained by management;
• We discussed with the Holding Company’s external legal counsel to understand the interpretation of laws/regulations considered by the management in their assessment relating to a material litigation;
• We evaluated management’s assessments by understanding precedents set in similar cases and assessed the reliability of the management’s past estimates/judgements;
• We evaluated management’s assessment around those matters that are not disclosed or not considered as contingent liability, as the probability of material outflow is considered to be remote by the management; and
• We assessed the adequacy of the disclosures.
Based on the above work performed, management’s assessment in respect of Holding Company’s litigations and related disclosures relating to contingent liabilities/other significant litigations in the Consolidated Financial Statements are considered to be reasonable.
Corporate Overview 02
Strategic Review 46
Performance Review 20
Statutory Reports 84
Our Strategy 28
Financial Statements 206
311
Key audit matter How our audit addressed the key audit matterAssessment of Purchase Price Allocation on acquisition of business in accordance with Ind AS 103, Business Combination and the appropriateness of the carrying value of the acquired Property, plant and equipment, Right-of-use assets, Other intangible assets and Goodwill as at the year end• [Refer to Note 2 (e) to the Consolidated financial statements–
“Business Combination” and Note 42. A to the Consolidated financial statements – “Acquisition of Subsidiaries”]
• On April 9, 2019, Tata Steel Long Products Limited, a subsidiary company acquired the steel division of Usha Martin Limited, pursuant to the Business Transfer Agreement (“BTA”). The subsidiary company determined the acquisition to be a business combination in accordance with Ind AS 103 ‘Business Combinations’. Ind AS 103 requires the identified assets and liabilities be recognised at fair value at the date of acquisition with the excess of the acquisition cost over the identified fair value of recognised assets and liabilities as goodwill.
• The subsidiary company appointed independent professional valuers to perform valuation of assets for the purpose of allocation of the consolidated purchase price to the respective assets and liabilities acquired (hereinafter referred to as ‘the purchase price allocation’ or ‘the PPA’). The Management of the subsidiary company determined that the fair values of the net identifiable assets acquired was `4,042.98 crores as part of the PPA and accordingly, the consideration paid in excess of the net assets acquired resulted in recognition of Goodwill of `5.66 crores.
• Significant assumptions and estimates are used as of the date of acquisition in the determination of the fair values of the identified assets acquired and liabilities assumed in the transaction.
• Further, as at the year end, significant judgements were made by the management of the subsidiary company in respect of the future projections and the discount rate used in applying the value in use method in assessing the carrying value of the acquired Property, plant and equipment, Right-of-use assets, Other intangible assets and the Goodwill.
• Accordingly, these are considered to be a key audit matter. The Management of the subsidiary company concluded that the recoverable amount is higher than their carrying values and that no impairment provision is warranted.
Our procedures included the following:
• We understood from the management of the subsidiary company, assessed the design and tested the operating effectiveness of the subsidiary company's key controls over the accounting of business combination and the impairment assessment.
• We have evaluated the competence, capabilities and objectivity of the management’s expert engaged for the PPA, obtained an understanding of the work of the expert, and evaluated the appropriateness of the expert’s work as audit evidence.
• We have traced the value of the consideration transferred with reference to the BTA.
• We have carried out our evaluation, by involving our experts (“auditor’s expert”) to:
i) review the PPA and assess the reasonableness of the underlying key assumptions used in determining the fair value of assets and liabilities as at the acquisition date.
ii) review the subsidiary company’s management's assessment / method including the key assumptions related to the projections, the discount rate used in the assessment of the carrying values as at the year end.
• We have verified the subsidiary company’s management’s computation of goodwill.
• We have also assessed the adequacy and appropriateness of the disclosures made.
Based on our procedures performed above, we noted that the PPA of the consideration is in accordance with Ind-AS 103 Business Combination and that the carrying value of the acquired Property, plant and equipment, Right-of-use assets, Other intangible assets and Goodwill as at the year end was appropriate.
Consolidated
INTEGRATED REPORT & ANNUAL ACCOUNTS 2019-20 | 113TH YEAR312
7. The following Key Audit Matters were included in the audit report dated May 25, 2020, containing an unmodified audit opinion on the consolidated special purpose financial information of Tata Steel BSL Limited, a subsidiary of the Holding Company, issued by other auditors and reproduced by us as under:
Key audit matter How our audit addressed the key audit matter
“Recoverability of amounts paid against on-going litigation
Refer Note 3 to the Consolidated Special Purpose Financial Information. Prior to the approval of the resolution plan (‘the BSL Resolution Plan’) under the Corporate Insolvency Resolution Process of the Insolvency and Bankruptcy Code, 2016 on 15 May 2018, the Holding Company was a party to certain litigations. Pursuant to the approval of the BSL Resolution Plan, it was determined that no amounts are payable in respect of those litigations as they stand extinguished.
The Holding Company had also made certain payments to the relevant authorities in respect of those litigations which were presented as recoverable under “Other non-current assets” in the Consolidated Special Purpose Financial Information.
The estimates related to expected outcome of litigations and recoverability of payments made in respect thereof have high degree of inherent uncertainty due to insufficient judicial precedents in India in respect of disposal of litigations involving companies admitted to Corporate Insolvency Resolution Process.
The application of significant judgement in the aforementioned matter required substantial involvement of senior personnel on the audit engagement including individuals with expertise in tax related matters.
We have performed the following procedures, among others, to test the recoverability of payments made by the Holding Company in relation to litigations instituted against it prior to the approval of the BSL Resolution Plan:
• Verified the underlying documents related to litigation and other correspondences with statutory authorities;
• Involved direct and indirect tax specialists to review the process used by the management to determine estimates and to test the judgements applied by management in developing the accounting estimates;
• Assessed management’s estimate of recoverability, supported by an opinion obtained by the management from a legal expert, by determining whether;
- The method of measurement used is appropriate in the circumstances; and
- The assumptions used by management are reasonable in light of the measurement principles of Ind AS.
• Determined whether the methods for making estimates have been applied consistently;
• Evaluated whether the accounting principles applied by the management fairly present the amounts recoverable from relevant authorities in Consolidated Special Purpose Financial Information in accordance with the principles of Ind AS.
Corporate Overview 02
Strategic Review 46
Performance Review 20
Statutory Reports 84
Our Strategy 28
Financial Statements 206
313
Key audit matter How our audit addressed the key audit matterAcquisition of Angul Energy Limited (formerly known as Bhushan Energy Limited)Refer Note 4 to the Consolidated Special Purpose Financial Information.
On 1 June 2019, the Holding Company acquired Angul Energy Limited (formerly known as Bhushan Energy Limited) for a purchase consideration of ̀ 10 crores and provided additional funds aggregating to `755 crores by way of Inter Corporate Deposits (‘ICD’), in accordance with the resolution plan (‘the BEL Resolution Plan’) under the Corporate Insolvency Resolution Process of the Insolvency and Bankruptcy Code, 2016.
The acquisition has been accounted for as a business combination under Ind AS 103, Business Combination and includes a number of significant and complex judgements in determination of the fair value of the identifiable assets acquired and liabilities assumed.
The acquisition resulted in recognition of capital reserve amounting to INR 804 Crores, as disclosed in the aforesaid note.
Considering the materiality of the impact on the accompanying Consolidated Special Purpose Financial Information and aforementioned significant judgements and assumptions involved, which required substantial involvement of senior personnel including experts in valuation, this has been considered as a Key Audit Matter.
We have performed the following procedures, among others, to examine whether the acquisition of Angul Energy Limited (formerly known as Bhushan Energy Limited) was appropriately accounted for and presented in the Consolidated Special Purpose Financial Information;
• Assessed and tested the design and operating effectiveness of Holding Company’s key controls over the accounting of business combination.
• Reviewed and obtained understanding of the terms of the BEL Resolution Plans to determine the assets and liabilities acquired by the Holding Company and the value of the consideration paid by the Holding Company.
• Assessed the competence, capabilities, objectivity and interdependence of management’s expert;
• Involved auditor’s valuation specialists to evaluate the reasonableness of the methodology and key assumptions used by management and its expert for determination of fair value of the identifiable assets acquired and liabilities assumed;
• Performed enquiries with the management’s experts and inspected relevant supporting documents to test the underlying data used in valuation of tangible assets;
• Evaluate the appropriateness of the accounting in accordance with Ind AS 103, including computation of the capital reserve and disclosures in the financial statements and assessed the completeness and mathematical accuracy of relevant disclosures.”
Consolidated
INTEGRATED REPORT & ANNUAL ACCOUNTS 2019-20 | 113TH YEAR314
Other Information8. The Holding Company’s Board of Directors is responsible
for the other information. The other information comprises the information in the Integrated Report, Board’s Report along with its Annexures and Financial Highlights included in the Holding Company’s Annual Report (titled as ‘Tata Steel Integrated Report & Annual Accounts 2019-20’), but does not include the Consolidated Financial Statements and our auditor’s report thereon.
9. Our opinion on the Consolidated Financial Statements does not cover the other information and we do not express any form of assurance conclusion thereon.
10. In connection with our audit of the Consolidated Financial Statements, our responsibility is to read the other information and, in doing so, consider whether the other information is materially inconsistent with the Consolidated Financial Statements or our knowledge obtained in the audit or otherwise appears to be materially misstated. If, based on the work we have performed and the reports of the other auditors as furnished to us (Refer paragraph 19 below), we conclude that there is a material misstatement of this other information, we are required to report that fact. We have nothing to report in this regard.
Responsibilities of Management and Those Charged with Governance for the Consolidated Financial Statements11. The Holding Company’s Board of Directors is responsible
for the preparation and presentation of these Consolidated Financial Statements in term of the requirements of the Act that give a true and fair view of the consolidated financial position, consolidated financial performance consolidated changes in equity and consolidated cash flows of the Group including its associates and jointly controlled entities in accordance with the accounting principles generally accepted in India, including the Accounting Standards specified under section 133 of the Act. The respective Board of Directors of the companies included in the Group and of its associates and jointly controlled entities are responsible for maintenance of adequate accounting records in accordance with the provisions of the Act for safeguarding the assets
of the Group and for preventing and detecting frauds and other irregularities; selection and application of appropriate accounting policies; making judgments and estimates that are reasonable and prudent; and the design, implementation and maintenance of adequate internal financial controls, that were operating effectively for ensuring accuracy and completeness of the accounting records, relevant to the preparation and presentation of the financial statements that give a true and fair view and are free from material misstatement, whether due to fraud or error, which have been used for the purpose of preparation of the Consolidated Financial Statements by the Directors of the Holding Company, as aforesaid.
12. In preparing the Consolidated Financial Statements, the respective Board of Directors of the companies included in the Group and of its associates and jointly controlled entities are responsible for assessing the ability of the Group and of its associates and jointly controlled entities to continue as a going concern, disclosing, as applicable, matters related to going concern and using the going concern basis of accounting unless management either intends to liquidate the Group or to cease operations, or has no realistic alternative but to do so.
13. The respective Board of Directors of the companies included in the Group and of its associates and jointly controlled entities are responsible for overseeing the financial reporting process of the Group and of its associates and jointly controlled entities.
Auditor’s Responsibilities for the Audit of the Consolidated Financial Statements14. Our objectives are to obtain reasonable assurance about
whether the Consolidated Financial Statements as a whole are free from material misstatement, whether due to fraud or error, and to issue an auditor’s report that includes our opinion. Reasonable assurance is a high level of assurance but is not a guarantee that an audit conducted in accordance with SAs will always detect a material misstatement when it exists. Misstatements can arise from fraud or error and are considered material if, individually or in the aggregate, they could reasonably be expected to influence the economic decisions of users taken on the basis of these Consolidated Financial Statements.
Corporate Overview 02
Strategic Review 46
Performance Review 20
Statutory Reports 84
Our Strategy 28
Financial Statements 206
315
15. As part of an audit in accordance with SAs, we exercise professional judgment and maintain professional skepticism throughout the audit. We also:
• Identify and assess the risks of material misstatement of the Consolidated Financial Statements, whether due to fraud or error, design and perform audit procedures responsive to those risks, and obtain audit evidence that is sufficient and appropriate to provide a basis for our opinion. The risk of not detecting a material misstatement resulting from fraud is higher than for one resulting from error, as fraud may involve collusion, forgery, intentional omissions, misrepresentations, or the override of internal control.
• Obtain an understanding of internal control relevant to the audit in order to design audit procedures that are appropriate in the circumstances. Under section 143(3)(i) of the Act, we are also responsible for expressing our opinion on whether the Holding company has adequate internal financial controls with reference to financial statements in place and the operating effectiveness of such controls.
• Evaluate the appropriateness of accounting policies used and the reasonableness of accounting estimates and related disclosures made by management.
• Conclude on the appropriateness of management’s use of the going concern basis of accounting and, based on the audit evidence obtained, whether a material uncertainty exists related to events or conditions that may cast significant doubt on the ability of the Group and its associates and jointly controlled entities to continue as a going concern. If we conclude that a material uncertainty exists, we are required to draw attention in our auditor’s report to the related disclosures in the Consolidated Financial Statements or, if such disclosures are inadequate, to modify our opinion. Our conclusions are based on the audit evidence obtained up to the date of our auditor’s report. However, future events or conditions may cause the Group and its associates and jointly controlled entities to cease to continue as a going concern.
• Evaluate the overall presentation, structure and content of the Consolidated Financial Statements, including the disclosures, and whether the Consolidated Financial
Statements represent the underlying transactions and events in a manner that achieves fair presentation.
• Obtain sufficient appropriate audit evidence regarding the financial information of the entities or business activities within the Group and its associates and jointly controlled entities to express an opinion on the Consolidated Financial Statements. We are responsible for the direction, supervision and performance of the audit of the financial statements of such entities included in the Consolidated Financial Statements of which we are the independent auditors. For the other entities included in the Consolidated Financial Statements, which have been audited by other auditors, such other auditors remain responsible for the direction, supervision and performance of the audits carried out by them. We remain solely responsible for our audit opinion.
16. We communicate with those charged with governance of the Holding Company and such other entities included in the Consolidated Financial Statements of which we are the independent auditors regarding, among other matters, the planned scope and timing of the audit and significant audit findings, including any significant deficiencies in internal control that we identify during our audit.
17. We also provide those charged with governance with a statement that we have complied with relevant ethical requirements regarding independence, and to communicate with them all relationships and other matters that may reasonably be thought to bear on our independence, and where applicable, related safeguards.
18. From the matters communicated with those charged with governance, we determine those matters that were of most significance in the audit of the Consolidated Financial Statements of the current year and are therefore the key audit matters. We describe these matters in our auditor’s report unless law or regulation precludes public disclosure about the matter or when, in extremely rare circumstances, we determine that a matter should not be communicated in our report because the adverse consequences of doing so would reasonably be expected to outweigh the public interest benefits of such communication.
Consolidated
INTEGRATED REPORT & ANNUAL ACCOUNTS 2019-20 | 113TH YEAR316
Other Matters19. We did not audit the financial statements/special purpose
financial information of twenty subsidiaries whose financial statements/special purpose financial information reflect total assets of `1,43,590.38 crores and net assets of `60,337.76 crores as at March 31, 2020, total revenue of `77,682.83 crores, total net profit after tax of `9,498.02 crores and total comprehensive income of `16,241.78 crores and net cash flows amounting to `415.69 crores for the year ended on that date, as considered in the Consolidated Financial Statements. The Consolidated Financial Statement of these subsidiaries also include their step down associates and jointly controlled entities constituting `16.27 crores and `14.99 crores of the Group’s share total comprehensive income for the year ended March 31, 2020 respectively. The consolidated financial statements also include the Group’s share of total comprehensive income (comprising profit and other comprehensive income) of `32.91 crores in respect of four jointly controlled entities whose financial statements/special purpose financial information have not been audited by us. These financial statements/special purpose financial information have been audited by other auditors/independent firm of accountants whose reports have been furnished to us by the other auditors/Management, and our opinion on the Consolidated Financial Statements insofar as it relates to the amounts and disclosures included in respect of these subsidiaries, associates and jointly controlled entities and our report in terms of sub-section (3) of Section 143 of the Act including report on Other Information insofar as it relates to the aforesaid subsidiaries, joint ventures and associates, is based solely on the reports of the other auditors/independent firm of accountants (as the case may be).
20. We did not audit the financial statements / special purpose financial information of five subsidiaries, whose financial statements/special purpose financial information reflect total assets of ̀ 8,882.39 crores and net assets of ̀ 4,149.16 crores as at March 31, 2020, total revenue of `327.81 crores, total net profit after tax of `27.08 crores and total comprehensive income of `25.96 crores and net cash flows amounting to ̀ 23.65 crores for the year ended on that date, as considered in the Consolidated Financial Statements. The Consolidated Financial Statements also include the Group’s share of net profit/(loss) after tax and total comprehensive income of ̀ Nil and ̀ Nil for the year ended
March 31, 2020 as considered in the Consolidated Financial Statements, in respect of three associates and two jointly controlled entities respectively, whose financial statements/ special purpose financial information have not been audited by us. These financial statements/special purpose financial information are unaudited and have been furnished to us by the Management, and our opinion on the Consolidated Financial Statements insofar as it relates to the amounts and disclosures included in respect of these subsidiaries, associates and jointly controlled entities and our report in terms of sub-section (3) of Section 143 of the Act including report on Other Information insofar as it relates to the aforesaid subsidiaries, associates and jointly controlled entities, is based solely on such unaudited financial statements/special purpose financial information. In our opinion and according to the information and explanations given to us by the Management, these financial statements/special purpose financial information are not material to the Group.
21. In the case of three subsidiaries, four associates and two jointly controlled entities, the financial statements/special purpose financial information for the year ended March 31, 2020 are not available. The investments in these companies are carried at Re 1 as at March 31, 2020. In absence of the aforesaid financial statements/special purpose financial information, the financial statements/special purpose financial information in respect of aforesaid subsidiaries and the Group’s share of total comprehensive income of these associates and jointly controlled entities for the year ended March 31, 2020 have not been included in the Consolidated Financial Statement. The investments in these companies are carried at Re 1 as at March 31, 2020. Accordingly, we do not report in terms of sub-section (3) of Section 143 of the Act including report on Other Information insofar to the extent these relate to the aforesaid subsidiaries, associates and jointly controlled entities.
Our opinion on the Consolidated Financial Statements, and our report on Other Legal and Regulatory Requirements below, is not modified in respect of the above matters with respect to our reliance on the work done and the reports of the other auditors, the financial statements / financial information certified by the Management and the non-availability of financial information.
Corporate Overview 02
Strategic Review 46
Performance Review 20
Statutory Reports 84
Our Strategy 28
Financial Statements 206
317
Report on Other Legal and Regulatory Requirements22. As required by Section 143(3) of the Act, we report, to the
extent applicable, that:
(a) We have sought and obtained all the information and explanations which to the best of our knowledge and belief were necessary for the purposes of our audit of the aforesaid Consolidated Financial Statements.
(b) In our opinion, proper books of account as required by law relating to preparation of the aforesaid Consolidated Financial Statements have been kept so far as it appears from our examination of those books and the reports of the other auditors.
(c) The Consolidated Balance Sheet, the Consolidated Statement of Profit and Loss (including other comprehensive income), Consolidated Statement of Changes in Equity and the Consolidated Cash Flow Statement dealt with by this Report are in agreement with the relevant books of account and records maintained for the purpose of preparation of the consolidated financial statements.
(d) In our opinion, the aforesaid Consolidated Financial Statements comply with the Accounting Standards specified under Section 133 of the Act.
(e) On the basis of the written representations received from the directors of the Holding Company as on March 31, 2020 taken on record by the Board of Directors of
the Holding Company and the reports of the statutory auditors of its subsidiary companies, associate companies and jointly controlled entities incorporated in India, none of the directors of the Group companies, its associate companies and jointly controlled entities incorporated in India is disqualified as on March 31, 2020 from being appointed as a director in terms of Section 164(2) of the Act.
(f) With respect to the adequacy of internal financial controls with reference to consolidated financial statements of the Group and the operating effectiveness of such controls, refer to our separate report in Annexure A.
(g) With respect to the other matters to be included in the Auditor’s Report in accordance with Rule 11 of the Companies (Audit and Auditor’s) Rules, 2014, in our opinion and to the best of our information and according to the explanations given to us:
i. The Consolidated Financial Statements disclose the impact of pending litigations as on March 31, 2020 on the consolidated financial position of the Group, its associates and jointly controlled entities – Refer Notes 40(A) and 41 to the Consolidated Financial Statements.
ii. The Group, its associates and jointly controlled entities had long-term contracts including derivative contracts as at March 31, 2020 for which there were no material foreseeable losses.
Consolidated
INTEGRATED REPORT & ANNUAL ACCOUNTS 2019-20 | 113TH YEAR318
For Price Waterhouse & Co Chartered Accountants LLP Firm Registration Number: 304026E/ E-300009
Chartered Accountants
Russell I Parera
Partner
Place: Mumbai Membership Number 042190
Date: June 29, 2020 UDIN: 20042190AAAABX4407
iii. There has been no delay in transferring amounts, required to be transferred, to the Investor Education and Protection Fund by the Holding Company and its subsidiary companies, associate companies and jointly controlled entities incorporated in India during the year ended March 31, 2020 except for amount aggregating to `5.71 crores, which according to the information and explanations provided by the management is held in abeyance due to dispute / pending legal cases.
iv. The reporting disclosures relating to Specified Bank Notes is not applicable to the Group for the year ended March 31, 2020.
23. The Group, its associates and jointly controlled entities incorporated as public companies in India, have paid/ provided for managerial remuneration in accordance with the requisite approvals mandated by the provisions of Section 197 read with Schedule V to the Act, except in case of one subsidiary and one associate where managerial remuneration amounting to `2.12 crore and `1.36 crore respectively, is subject to approval of the shareholders of the subsidiary and the associate respectively by way of special resolution in the ensuing Annual General Meeting.
Additionally, the following paragraph has been included in the audit report on the consolidated special purpose financial information of Tata Steel BSL Limited, a subsidiary of the Holding Company, issued by other auditor vide its report dated May 25, 2020 and reproduced by us as under:
“As required by section 197 (16) of the Act, based on our audit and on the consideration of the report of the other auditors, referred to in paragraph 12, on separate financial statements of a subsidiary, we report that the Holding Company and the subsidiary company covered under the Act paid remuneration to their respective directors during the year in accordance with the provisions of and limits laid down under section 197 read with Schedule V to the Act. Further, as stated in paragraph 13, financial information of three subsidiary companies, covered under the Act are unaudited and have been furnished to us by the management, and as certified by the management, such companies have not paid or provided for any managerial remuneration during the year.”
Corporate Overview 02
Strategic Review 46
Performance Review 20
Statutory Reports 84
Our Strategy 28
Financial Statements 206
319
ANNEXURE A TO THE INDEPENDENT AUDITOR’S REPORT
Referred to in paragraph 22(f) of the Independent Auditors’ Report of even date to the members of Tata Steel Limited on the consolidated financial statements as of and for the year ended March 31, 2020
Report on the Internal Financial Controls with reference to consolidated financial statements under Clause (i) of Sub-section 3 of Section 143 of the Act1. In conjunction with our audit of the consolidated financial
statements of the Company as of and for the year ended March 31, 2020, we have audited the internal financial controls with reference to consolidated financial statements of Tata Steel Limited (hereinafter referred to as “the Holding Company”) and its subsidiary companies, its associate companies and jointly controlled companies, which are companies incorporated in India, as of that date. Reporting under clause (i) of sub section 3 of Section 143 of the Act in respect of the adequacy of the internal financial controls with reference to financial statements is not applicable to one subsidiary and three jointly controlled companies incorporated in India namely Tata Steel Foundation and, Himalaya Steel Mills Services Private Limited, S & T Mining Company Private Limited and Tata NYK Shipping (India) Private Limited respectively, pursuant to MCA notification GSR 583(E) dated June 13, 2017.
Management’s Responsibility for Internal Financial Controls2. The respective Board of Directors of the Holding company,
its subsidiary companies, its associate companies and jointly controlled companies, to whom reporting under clause (i) of sub section 3 of Section 143 of the Act in respect of the adequacy of the internal financial controls with reference to financial statements, which are companies incorporated in India, are responsible for establishing and maintaining internal financial controls based on internal control over financial reporting criteria established by the Company considering the essential components of internal control stated in the Guidance Note on Audit of Internal Financial Controls Over Financial Reporting issued by the Institute of Chartered Accountants of India (ICAI). These responsibilities include the design, implementation and maintenance of adequate internal financial controls that were operating effectively for ensuring the orderly and efficient conduct of its business, including adherence to the respective company’s policies, the safeguarding of its assets, the prevention and detection of frauds and errors, the accuracy and completeness of the accounting records, and the timely preparation of reliable financial information, as required under the Act.
Auditor’s Responsibility3. Our responsibility is to express an opinion on the Company's
internal financial controls with reference to consolidated financial statements based on our audit. We conducted our audit in accordance with the Guidance Note on Audit of Internal Financial Controls Over Financial Reporting (the “Guidance Note”) issued by the ICAI and the Standards on Auditing deemed to be prescribed under section 143(10) of the Companies Act, 2013, to the extent applicable to an audit of internal financial controls, both applicable to an audit of internal financial controls and both issued by the ICAI. Those Standards and the Guidance Note require that we comply with ethical requirements and plan and perform the audit to obtain reasonable assurance about whether adequate internal financial controls with reference to consolidated financial statements was established and maintained and if such controls operated effectively in all material respects.
4. Our audit involves performing procedures to obtain audit evidence about the adequacy of the internal financial controls system with reference to consolidated financial statements and their operating effectiveness. Our audit of internal financial controls with reference to consolidated financial statements included obtaining an understanding of internal financial controls with reference to consolidated financial statements, assessing the risk that a material weakness exists, and testing and evaluating the design and operating effectiveness of internal control based on the assessed risk. The procedures selected depend on the auditor’s judgement, including the assessment of the risks of material misstatement of the consolidated financial statements, whether due to fraud or error.
5. We believe that the audit evidence we have obtained and the audit evidence obtained by the other auditors in terms of their reports referred to in the Other Matters paragraph below, is sufficient and appropriate to provide a basis for our audit opinion on the Company’s internal financial controls system with reference to consolidated financial statements.
Meaning of Internal Financial Controls with reference to financial statements6. A company's internal financial control with reference to
financial statements is a process designed to provide reasonable assurance regarding the reliability of financial reporting and the preparation of financial statements for external purposes in accordance with generally accepted
Consolidated
INTEGRATED REPORT & ANNUAL ACCOUNTS 2019-20 | 113TH YEAR320
accounting principles. A company's internal financial control with reference to financial statements includes those policies and procedures that (1) pertain to the maintenance of records that, in reasonable detail, accurately and fairly reflect the transactions and dispositions of the assets of the company; (2) provide reasonable assurance that transactions are recorded as necessary to permit preparation of financial statements in accordance with generally accepted accounting principles, and that receipts and expenditures of the company are being made only in accordance with authorisations of management and directors of the company; and (3) provide reasonable assurance regarding prevention or timely detection of unauthorised acquisition, use, or disposition of the company's assets that could have a material effect on the financial statements.
Inherent Limitations of Internal Financial Controls with reference to financial statements7. Because of the inherent limitations of internal financial
controls with reference to financial statements, including the possibility of collusion or improper management override of controls, material misstatements due to error or fraud may occur and not be detected. Also, projections of any evaluation of the internal financial controls with reference to financial statements to future periods are subject to the risk that the internal financial control with reference to financial statements may become inadequate because of changes in conditions, or that the degree of compliance with the policies or procedures may deteriorate.
Opinion8. In our opinion, the Holding Company, its subsidiary companies,
its associate companies and jointly controlled companies, which are companies incorporated in India, have, in all material respects, an adequate internal financial controls system with reference to financial statements and such internal financial controls with reference to financial statements were operating effectively as at March 31, 2020, based on the internal control over financial reporting criteria established by the Company considering the essential components of internal control stated in the Guidance Note on Audit of Internal Financial Controls Over Financial Reporting issued by the Institute of Chartered Accountants of India. Also refer paragraph 5 of our report.
Other Matters9. Our aforesaid reports under Section 143(3)(i) of the Act on the
adequacy and operating effectiveness of the internal financial controls with reference to financial statements insofar as it relates to thirteen subsidiary companies, which are companies incorporated in India, is based on the corresponding reports of the auditors of such companies incorporated in India. Our opinion is not qualified in respect of this matter.
For Price Waterhouse & Co Chartered Accountants LLP Firm Registration Number: 304026E/ E-300009
Chartered Accountants
Russell I Parera
Partner
Place: Mumbai Membership Number 042190
Date: June 29, 2020 UDIN: 20042190AAAABX4407
Corporate Overview 02
Strategic Review 46
Performance Review 20
Statutory Reports 84
Our Strategy 28
Financial Statements 206
321
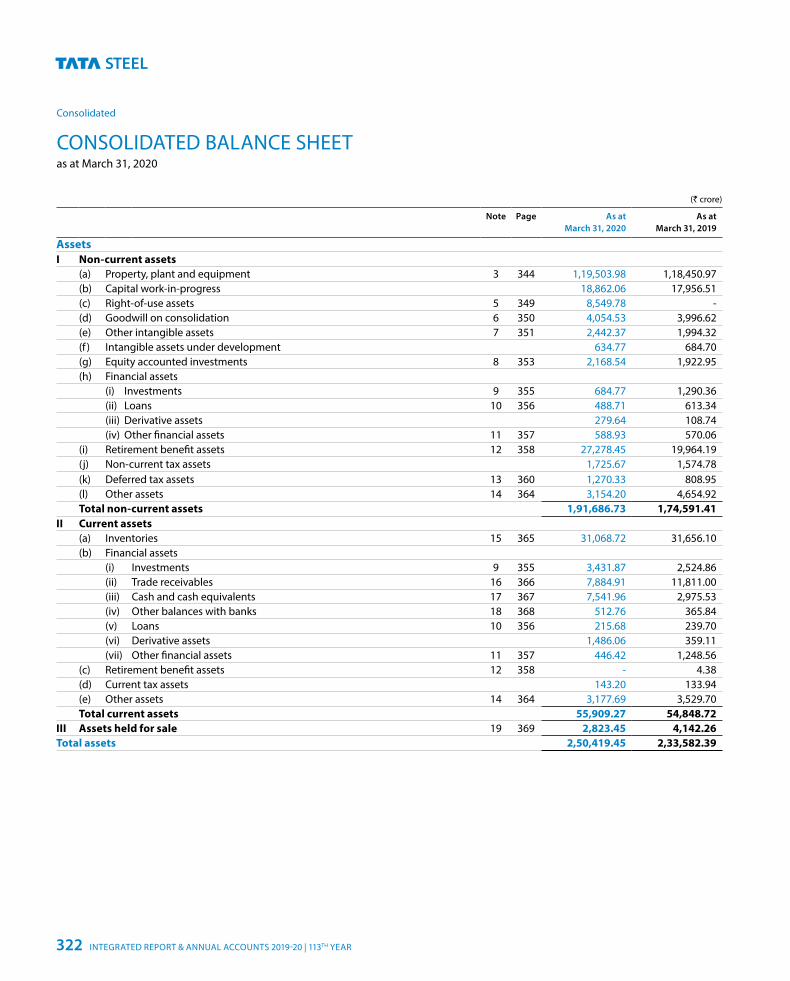
CONSOLIDATED BALANCE SHEETas at March 31, 2020
(` crore)
Note Page As at March 31, 2020
As at March 31, 2019
AssetsI Non-current assets
(a) Property, plant and equipment 3 344 1,19,503.98 1,18,450.97(b) Capital work-in-progress 18,862.06 17,956.51(c) Right-of-use assets 5 349 8,549.78 -(d) Goodwill on consolidation 6 350 4,054.53 3,996.62(e) Other intangible assets 7 351 2,442.37 1,994.32(f ) Intangible assets under development 634.77 684.70(g) Equity accounted investments 8 353 2,168.54 1,922.95(h) Financial assets
(i) Investments 9 355 684.77 1,290.36(ii) Loans 10 356 488.71 613.34(iii) Derivative assets 279.64 108.74(iv) Other financial assets 11 357 588.93 570.06
(i) Retirement benefit assets 12 358 27,278.45 19,964.19(j) Non-current tax assets 1,725.67 1,574.78(k) Deferred tax assets 13 360 1,270.33 808.95(l) Other assets 14 364 3,154.20 4,654.92Total non-current assets 1,91,686.73 1,74,591.41
II Current assets(a) Inventories 15 365 31,068.72 31,656.10(b) Financial assets
(i) Investments 9 355 3,431.87 2,524.86(ii) Trade receivables 16 366 7,884.91 11,811.00(iii) Cash and cash equivalents 17 367 7,541.96 2,975.53(iv) Other balances with banks 18 368 512.76 365.84(v) Loans 10 356 215.68 239.70(vi) Derivative assets 1,486.06 359.11(vii) Other financial assets 11 357 446.42 1,248.56
(c) Retirement benefit assets 12 358 - 4.38(d) Current tax assets 143.20 133.94(e) Other assets 14 364 3,177.69 3,529.70Total current assets 55,909.27 54,848.72
III Assets held for sale 19 369 2,823.45 4,142.26Total assets 2,50,419.45 2,33,582.39
Consolidated
INTEGRATED REPORT & ANNUAL ACCOUNTS 2019-20 | 113TH YEAR322
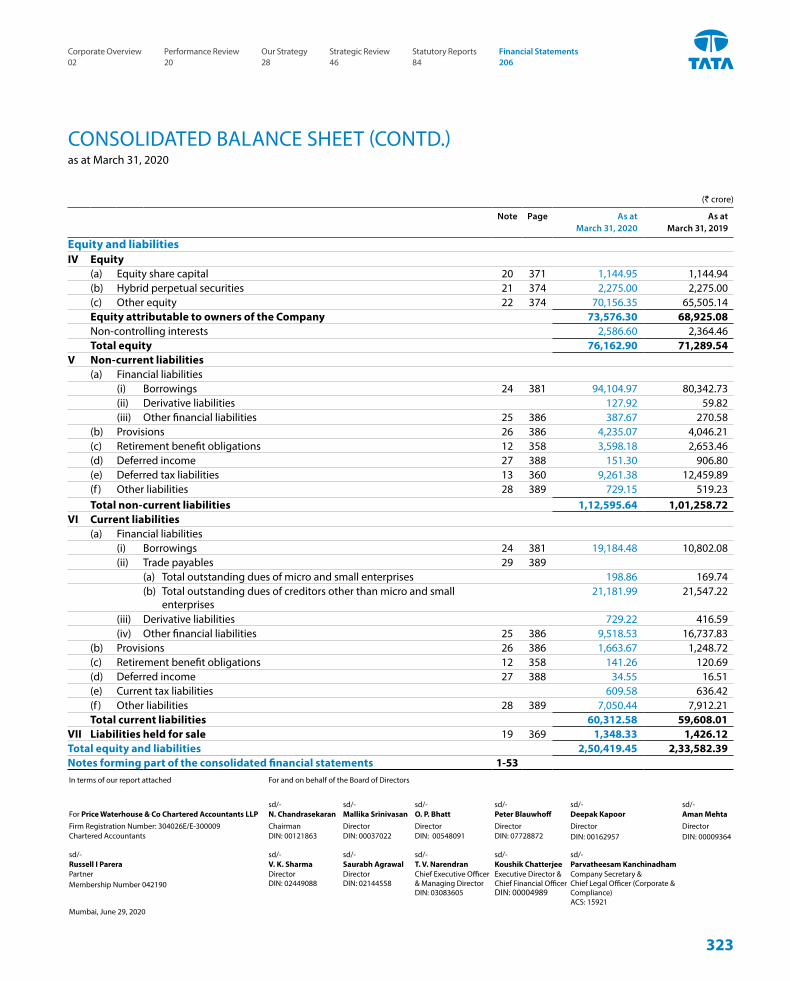
(` crore)
Note Page As at March 31, 2020
As at March 31, 2019
Equity and liabilitiesIV Equity
(a) Equity share capital 20 371 1,144.95 1,144.94(b) Hybrid perpetual securities 21 374 2,275.00 2,275.00(c) Other equity 22 374 70,156.35 65,505.14Equity attributable to owners of the Company 73,576.30 68,925.08Non-controlling interests 2,586.60 2,364.46Total equity 76,162.90 71,289.54
V Non-current liabilities(a) Financial liabilities
(i) Borrowings 24 381 94,104.97 80,342.73(ii) Derivative liabilities 127.92 59.82(iii) Other financial liabilities 25 386 387.67 270.58
(b) Provisions 26 386 4,235.07 4,046.21(c) Retirement benefit obligations 12 358 3,598.18 2,653.46(d) Deferred income 27 388 151.30 906.80(e) Deferred tax liabilities 13 360 9,261.38 12,459.89(f ) Other liabilities 28 389 729.15 519.23Total non-current liabilities 1,12,595.64 1,01,258.72
VI Current liabilities(a) Financial liabilities
(i) Borrowings 24 381 19,184.48 10,802.08(ii) Trade payables 29 389
(a) Total outstanding dues of micro and small enterprises 198.86 169.74(b) Total outstanding dues of creditors other than micro and small
enterprises21,181.99 21,547.22
(iii) Derivative liabilities 729.22 416.59(iv) Other financial liabilities 25 386 9,518.53 16,737.83
(b) Provisions 26 386 1,663.67 1,248.72(c) Retirement benefit obligations 12 358 141.26 120.69(d) Deferred income 27 388 34.55 16.51(e) Current tax liabilities 609.58 636.42(f ) Other liabilities 28 389 7,050.44 7,912.21Total current liabilities 60,312.58 59,608.01
VII Liabilities held for sale 19 369 1,348.33 1,426.12Total equity and liabilities 2,50,419.45 2,33,582.39Notes forming part of the consolidated financial statements 1-53
CONSOLIDATED BALANCE SHEET (CONTD.)as at March 31, 2020
In terms of our report attached For and on behalf of the Board of Directors
sd/- sd/- sd/- sd/- sd/- sd/- For Price Waterhouse & Co Chartered Accountants LLP N. Chandrasekaran Mallika Srinivasan O. P. Bhatt Peter Blauwhoff Deepak Kapoor Aman MehtaFirm Registration Number: 304026E/E-300009 Chairman Director Director Director Director
DIN: 00162957Director DIN: 00009364Chartered Accountants DIN: 00121863 DIN: 00037022 DIN: 00548091 DIN: 07728872
sd/- sd/- sd/- sd/- sd/- sd/- Russell I Parera V. K. Sharma Saurabh Agrawal T. V. Narendran Koushik Chatterjee Parvatheesam KanchinadhamPartner Membership Number 042190
Director DIN: 02449088
Director DIN: 02144558
Chief Executive Officer & Managing Director DIN: 03083605
Executive Director & Chief Financial Officer DIN: 00004989
Company Secretary & Chief Legal Officer (Corporate & Compliance) ACS: 15921
Mumbai, June 29, 2020
Corporate Overview 02
Strategic Review 46
Performance Review 20
Statutory Reports 84
Our Strategy 28
Financial Statements 206
323
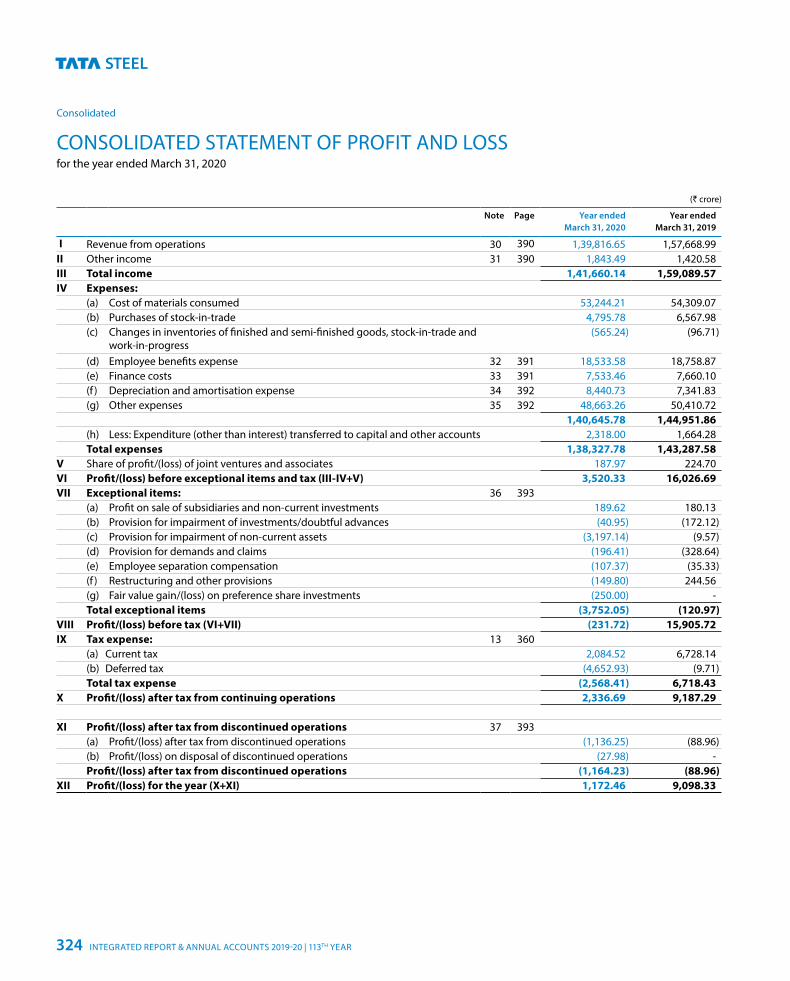
CONSOLIDATED STATEMENT OF PROFIT AND LOSSfor the year ended March 31, 2020
(` crore)
Note Page Year ended March 31, 2020
Year ended March 31, 2019
I Revenue from operations 30 390 1,39,816.65 1,57,668.99II Other income 31 390 1,843.49 1,420.58III Total income 1,41,660.14 1,59,089.57IV Expenses:
(a) Cost of materials consumed 53,244.21 54,309.07(b) Purchases of stock-in-trade 4,795.78 6,567.98(c) Changes in inventories of finished and semi-finished goods, stock-in-trade and
work-in-progress(565.24) (96.71)
(d) Employee benefits expense 32 391 18,533.58 18,758.87(e) Finance costs 33 391 7,533.46 7,660.10(f ) Depreciation and amortisation expense 34 392 8,440.73 7,341.83(g) Other expenses 35 392 48,663.26 50,410.72
1,40,645.78 1,44,951.86(h) Less: Expenditure (other than interest) transferred to capital and other accounts 2,318.00 1,664.28Total expenses 1,38,327.78 1,43,287.58
V Share of profit/(loss) of joint ventures and associates 187.97 224.70VI Profit/(loss) before exceptional items and tax (III-IV+V) 3,520.33 16,026.69VII Exceptional items: 36 393
(a) Profit on sale of subsidiaries and non-current investments 189.62 180.13(b) Provision for impairment of investments/doubtful advances (40.95) (172.12)(c) Provision for impairment of non-current assets (3,197.14) (9.57)(d) Provision for demands and claims (196.41) (328.64)(e) Employee separation compensation (107.37) (35.33)(f ) Restructuring and other provisions (149.80) 244.56(g) Fair value gain/(loss) on preference share investments (250.00) -Total exceptional items (3,752.05) (120.97)
VIII Profit/(loss) before tax (VI+VII) (231.72) 15,905.72IX Tax expense: 13 360
(a) Current tax 2,084.52 6,728.14(b) Deferred tax (4,652.93) (9.71)Total tax expense (2,568.41) 6,718.43
X Profit/(loss) after tax from continuing operations 2,336.69 9,187.29
XI Profit/(loss) after tax from discontinued operations 37 393(a) Profit/(loss) after tax from discontinued operations (1,136.25) (88.96)(b) Profit/(loss) on disposal of discontinued operations (27.98) -Profit/(loss) after tax from discontinued operations (1,164.23) (88.96)
XII Profit/(loss) for the year (X+XI) 1,172.46 9,098.33
Consolidated
INTEGRATED REPORT & ANNUAL ACCOUNTS 2019-20 | 113TH YEAR324
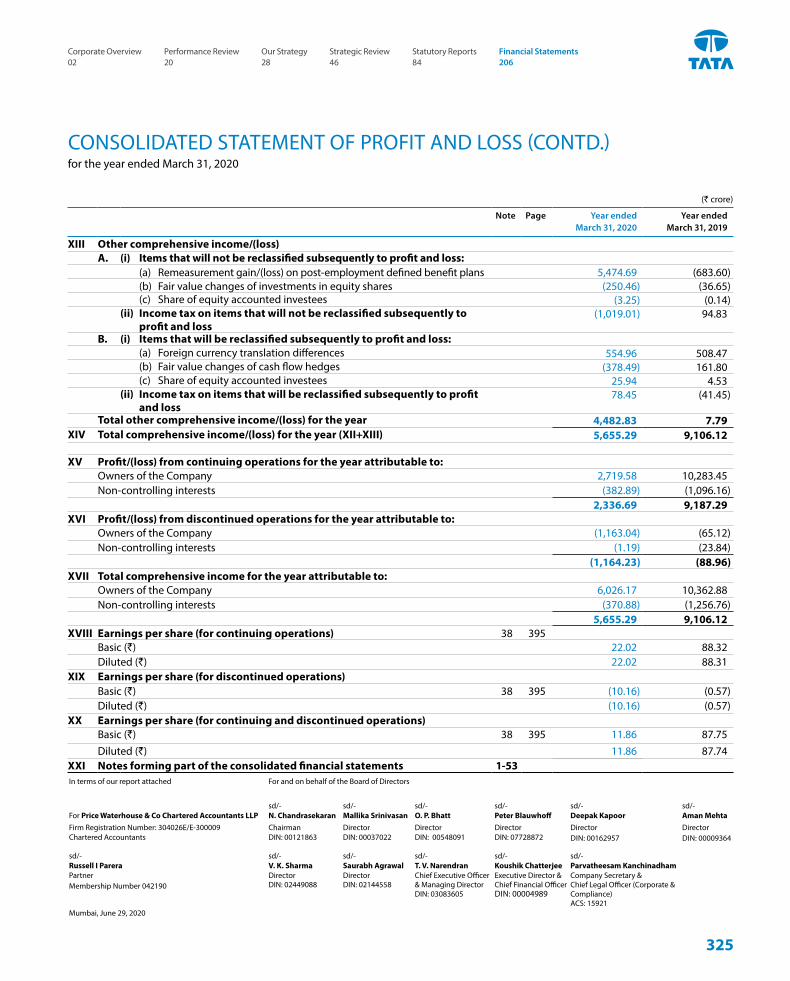
CONSOLIDATED STATEMENT OF PROFIT AND LOSS (CONTD.)for the year ended March 31, 2020
(` crore)
Note Page Year ended March 31, 2020
Year ended March 31, 2019
XIII Other comprehensive income/(loss)A. (i) Items that will not be reclassified subsequently to profit and loss:
(a) Remeasurement gain/(loss) on post-employment defined benefit plans 5,474.69 (683.60) (b) Fair value changes of investments in equity shares (250.46) (36.65) (c) Share of equity accounted investees (3.25) (0.14)(ii) Income tax on items that will not be reclassified subsequently to
profit and loss(1,019.01) 94.83
B. (i) Items that will be reclassified subsequently to profit and loss: (a) Foreign currency translation differences 554.96 508.47 (b) Fair value changes of cash flow hedges (378.49) 161.80 (c) Share of equity accounted investees 25.94 4.53(ii) Income tax on items that will be reclassified subsequently to profit
and loss78.45 (41.45)
Total other comprehensive income/(loss) for the year 4,482.83 7.79XIV Total comprehensive income/(loss) for the year (XII+XIII) 5,655.29 9,106.12
XV Profit/(loss) from continuing operations for the year attributable to:Owners of the Company 2,719.58 10,283.45Non-controlling interests (382.89) (1,096.16)
2,336.69 9,187.29XVI Profit/(loss) from discontinued operations for the year attributable to:
Owners of the Company (1,163.04) (65.12)Non-controlling interests (1.19) (23.84)
(1,164.23) (88.96)XVII Total comprehensive income for the year attributable to:
Owners of the Company 6,026.17 10,362.88Non-controlling interests (370.88) (1,256.76)
5,655.29 9,106.12XVIII Earnings per share (for continuing operations) 38 395
Basic (`) 22.02 88.32Diluted (`) 22.02 88.31
XIX Earnings per share (for discontinued operations)Basic (`) 38 395 (10.16) (0.57)Diluted (`) (10.16) (0.57)
XX Earnings per share (for continuing and discontinued operations) Basic (`) 38 395 11.86 87.75Diluted (`) 11.86 87.74
XXI Notes forming part of the consolidated financial statements 1-53In terms of our report attached For and on behalf of the Board of Directors
sd/- sd/- sd/- sd/- sd/- sd/- For Price Waterhouse & Co Chartered Accountants LLP N. Chandrasekaran Mallika Srinivasan O. P. Bhatt Peter Blauwhoff Deepak Kapoor Aman MehtaFirm Registration Number: 304026E/E-300009 Chairman Director Director Director Director
DIN: 00162957Director DIN: 00009364Chartered Accountants DIN: 00121863 DIN: 00037022 DIN: 00548091 DIN: 07728872
sd/- sd/- sd/- sd/- sd/- sd/- Russell I Parera V. K. Sharma Saurabh Agrawal T. V. Narendran Koushik Chatterjee Parvatheesam KanchinadhamPartner Membership Number 042190
Director DIN: 02449088
Director DIN: 02144558
Chief Executive Officer & Managing Director DIN: 03083605
Executive Director & Chief Financial Officer DIN: 00004989
Company Secretary & Chief Legal Officer (Corporate & Compliance) ACS: 15921
Mumbai, June 29, 2020
Corporate Overview 02
Strategic Review 46
Performance Review 20
Statutory Reports 84
Our Strategy 28
Financial Statements 206
325
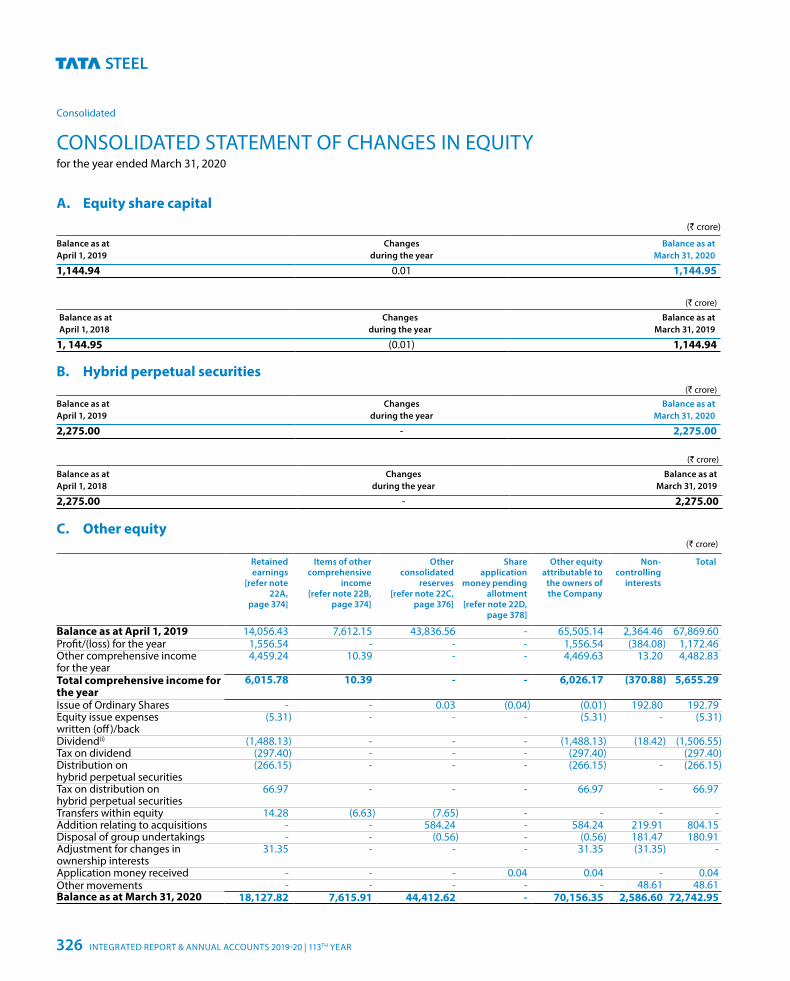
A. Equity share capital (` crore)
Balance as at April 1, 2019
Changes during the year
Balance as at March 31, 2020
1,144.94 0.01 1,144.95
(` crore)
Balance as at April 1, 2018
Changes during the year
Balance as at March 31, 2019
1, 144.95 (0.01) 1,144.94
B. Hybrid perpetual securities(` crore)
Balance as at April 1, 2019
Changes during the year
Balance as at March 31, 2020
2,275.00 - 2,275.00
(` crore)
Balance as at April 1, 2018
Changes during the year
Balance as at March 31, 2019
2,275.00 - 2,275.00
C. Other equity(` crore)
Retained earnings
[refer note 22A,
page 374]
Items of other comprehensive
income [refer note 22B,
page 374]
Other consolidated
reserves[refer note 22C,
page 376]
Shareapplication
money pending allotment
[refer note 22D, page 378]
Other equity attributable to
the owners of the Company
Non- controlling
interests
Total
Balance as at April 1, 2019 14,056.43 7,612.15 43,836.56 - 65,505.14 2,364.46 67,869.60Profit/(loss) for the year 1,556.54 - - - 1,556.54 (384.08) 1,172.46Other comprehensive income for the year
4,459.24 10.39 - - 4,469.63 13.20 4,482.83
Total comprehensive income for the year
6,015.78 10.39 - - 6,026.17 (370.88) 5,655.29
Issue of Ordinary Shares - - 0.03 (0.04) (0.01) 192.80 192.79Equity issue expenses written (off)/back
(5.31) - - - (5.31) - (5.31)
Dividend(i) (1,488.13) - - - (1,488.13) (18.42) (1,506.55)Tax on dividend (297.40) - - - (297.40) (297.40)Distribution on hybrid perpetual securities
(266.15) - - - (266.15) - (266.15)
Tax on distribution on hybrid perpetual securities
66.97 - - - 66.97 - 66.97
Transfers within equity 14.28 (6.63) (7.65) - - - -Addition relating to acquisitions - - 584.24 - 584.24 219.91 804.15Disposal of group undertakings - - (0.56) - (0.56) 181.47 180.91Adjustment for changes in ownership interests
31.35 - - - 31.35 (31.35) -
Application money received - - - 0.04 0.04 - 0.04Other movements - - - - - 48.61 48.61Balance as at March 31, 2020 18,127.82 7,615.91 44,412.62 - 70,156.35 2,586.60 72,742.95
CONSOLIDATED STATEMENT OF CHANGES IN EQUITYfor the year ended March 31, 2020
Consolidated
INTEGRATED REPORT & ANNUAL ACCOUNTS 2019-20 | 113TH YEAR326
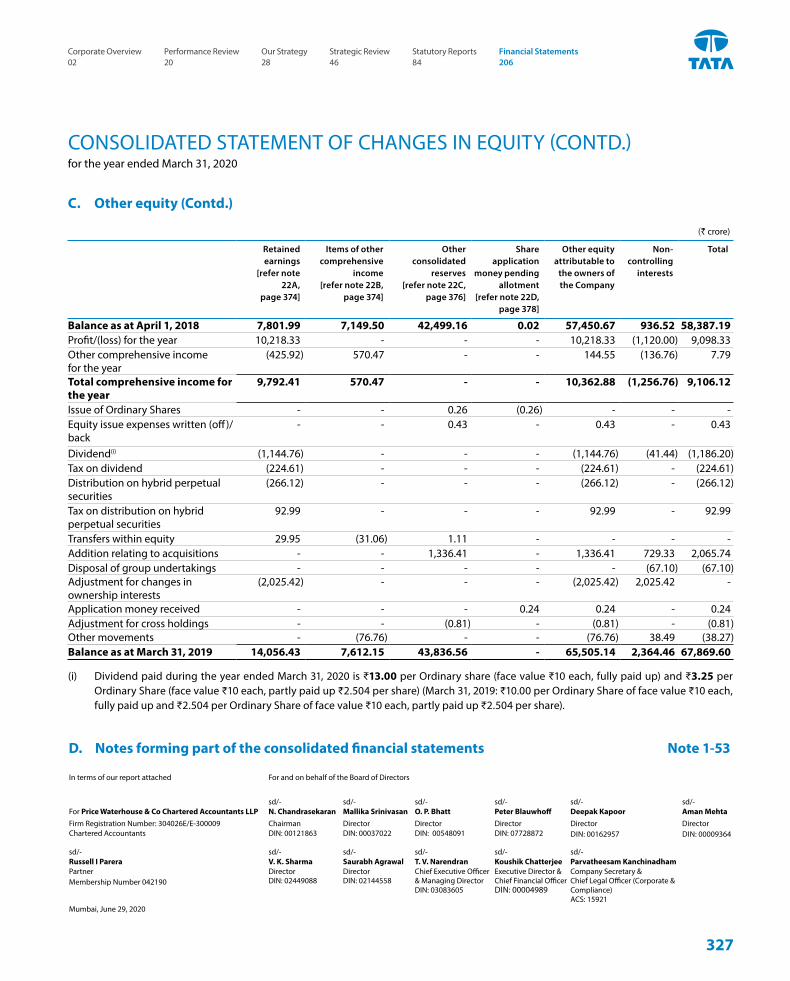
(` crore)
Retained earnings
[refer note 22A,
page 374]
Items of other comprehensive
income [refer note 22B,
page 374]
Other consolidated
reserves[refer note 22C,
page 376]
Shareapplication
money pending allotment
[refer note 22D, page 378]
Other equity attributable to
the owners of the Company
Non- controlling
interests
Total
Balance as at April 1, 2018 7,801.99 7,149.50 42,499.16 0.02 57,450.67 936.52 58,387.19Profit/(loss) for the year 10,218.33 - - - 10,218.33 (1,120.00) 9,098.33Other comprehensive income for the year
(425.92) 570.47 - - 144.55 (136.76) 7.79
Total comprehensive income for the year
9,792.41 570.47 - - 10,362.88 (1,256.76) 9,106.12
Issue of Ordinary Shares - - 0.26 (0.26) - - -Equity issue expenses written (off)/back
- - 0.43 - 0.43 - 0.43
Dividend(i) (1,144.76) - - - (1,144.76) (41.44) (1,186.20)Tax on dividend (224.61) - - - (224.61) - (224.61)Distribution on hybrid perpetual securities
(266.12) - - - (266.12) - (266.12)
Tax on distribution on hybrid perpetual securities
92.99 - - - 92.99 - 92.99
Transfers within equity 29.95 (31.06) 1.11 - - - -Addition relating to acquisitions - - 1,336.41 - 1,336.41 729.33 2,065.74Disposal of group undertakings - - - - - (67.10) (67.10)Adjustment for changes in ownership interests
(2,025.42) - - - (2,025.42) 2,025.42 -
Application money received - - - 0.24 0.24 - 0.24Adjustment for cross holdings - - (0.81) - (0.81) - (0.81)Other movements - (76.76) - - (76.76) 38.49 (38.27)Balance as at March 31, 2019 14,056.43 7,612.15 43,836.56 - 65,505.14 2,364.46 67,869.60
(i) Dividend paid during the year ended March 31, 2020 is ₹13.00 per Ordinary share (face value ₹10 each, fully paid up) and ₹3.25 per Ordinary Share (face value ₹10 each, partly paid up ₹2.504 per share) (March 31, 2019: ₹10.00 per Ordinary Share of face value ₹10 each, fully paid up and ₹2.504 per Ordinary Share of face value ₹10 each, partly paid up ₹2.504 per share).
C. Other equity (Contd.)
CONSOLIDATED STATEMENT OF CHANGES IN EQUITY (CONTD.)for the year ended March 31, 2020
D. Notes forming part of the consolidated financial statements Note 1-53
In terms of our report attached For and on behalf of the Board of Directors
sd/- sd/- sd/- sd/- sd/- sd/- For Price Waterhouse & Co Chartered Accountants LLP N. Chandrasekaran Mallika Srinivasan O. P. Bhatt Peter Blauwhoff Deepak Kapoor Aman MehtaFirm Registration Number: 304026E/E-300009 Chairman Director Director Director Director
DIN: 00162957Director DIN: 00009364Chartered Accountants DIN: 00121863 DIN: 00037022 DIN: 00548091 DIN: 07728872
sd/- sd/- sd/- sd/- sd/- sd/- Russell I Parera V. K. Sharma Saurabh Agrawal T. V. Narendran Koushik Chatterjee Parvatheesam KanchinadhamPartner Membership Number 042190
Director DIN: 02449088
Director DIN: 02144558
Chief Executive Officer & Managing Director DIN: 03083605
Executive Director & Chief Financial Officer DIN: 00004989
Company Secretary & Chief Legal Officer (Corporate & Compliance) ACS: 15921
Mumbai, June 29, 2020
Corporate Overview 02
Strategic Review 46
Performance Review 20
Statutory Reports 84
Our Strategy 28
Financial Statements 206
327
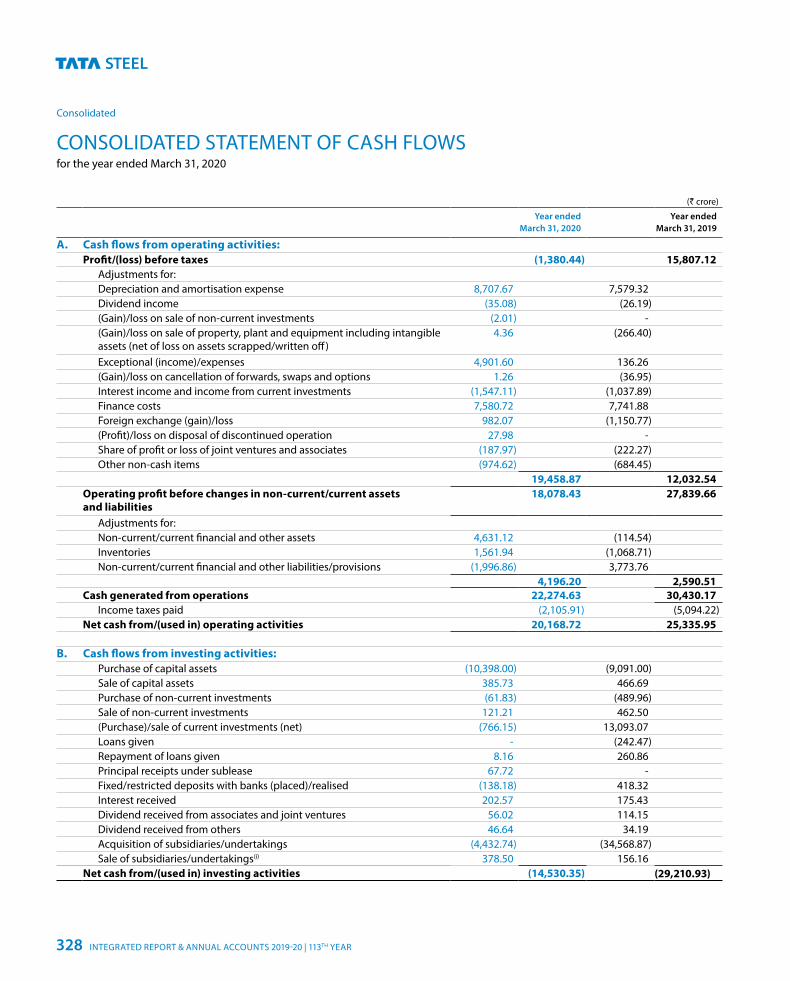
CONSOLIDATED STATEMENT OF CASH FLOWS for the year ended March 31, 2020
(` crore)
Year ended March 31, 2020
Year ended March 31, 2019
A. Cash flows from operating activities:Profit/(loss) before taxes (1,380.44) 15,807.12
Adjustments for:Depreciation and amortisation expense 8,707.67 7,579.32Dividend income (35.08) (26.19)(Gain)/loss on sale of non-current investments (2.01) - (Gain)/loss on sale of property, plant and equipment including intangible assets (net of loss on assets scrapped/written off)
4.36 (266.40)
Exceptional (income)/expenses 4,901.60 136.26(Gain)/loss on cancellation of forwards, swaps and options 1.26 (36.95)Interest income and income from current investments (1,547.11) (1,037.89)Finance costs 7,580.72 7,741.88Foreign exchange (gain)/loss 982.07 (1,150.77)(Profit)/loss on disposal of discontinued operation 27.98 -Share of profit or loss of joint ventures and associates (187.97) (222.27)Other non-cash items (974.62) (684.45)
19,458.87 12,032.54Operating profit before changes in non-current/current assetsand liabilities
18,078.43 27,839.66
Adjustments for:Non-current/current financial and other assets 4,631.12 (114.54)Inventories 1,561.94 (1,068.71)Non-current/current financial and other liabilities/provisions (1,996.86) 3,773.76
4,196.20 2,590.51Cash generated from operations 22,274.63 30,430.17
Income taxes paid (2,105.91) (5,094.22)Net cash from/(used in) operating activities 20,168.72 25,335.95
B. Cash flows from investing activities:Purchase of capital assets (10,398.00) (9,091.00)Sale of capital assets 385.73 466.69Purchase of non-current investments (61.83) (489.96)Sale of non-current investments 121.21 462.50(Purchase)/sale of current investments (net) (766.15) 13,093.07Loans given - (242.47)Repayment of loans given 8.16 260.86Principal receipts under sublease 67.72 -Fixed/restricted deposits with banks (placed)/realised (138.18) 418.32Interest received 202.57 175.43Dividend received from associates and joint ventures 56.02 114.15Dividend received from others 46.64 34.19Acquisition of subsidiaries/undertakings (4,432.74) (34,568.87)Sale of subsidiaries/undertakings(i) 378.50 156.16
Net cash from/(used in) investing activities (14,530.35) (29,210.93)
Consolidated
INTEGRATED REPORT & ANNUAL ACCOUNTS 2019-20 | 113TH YEAR328
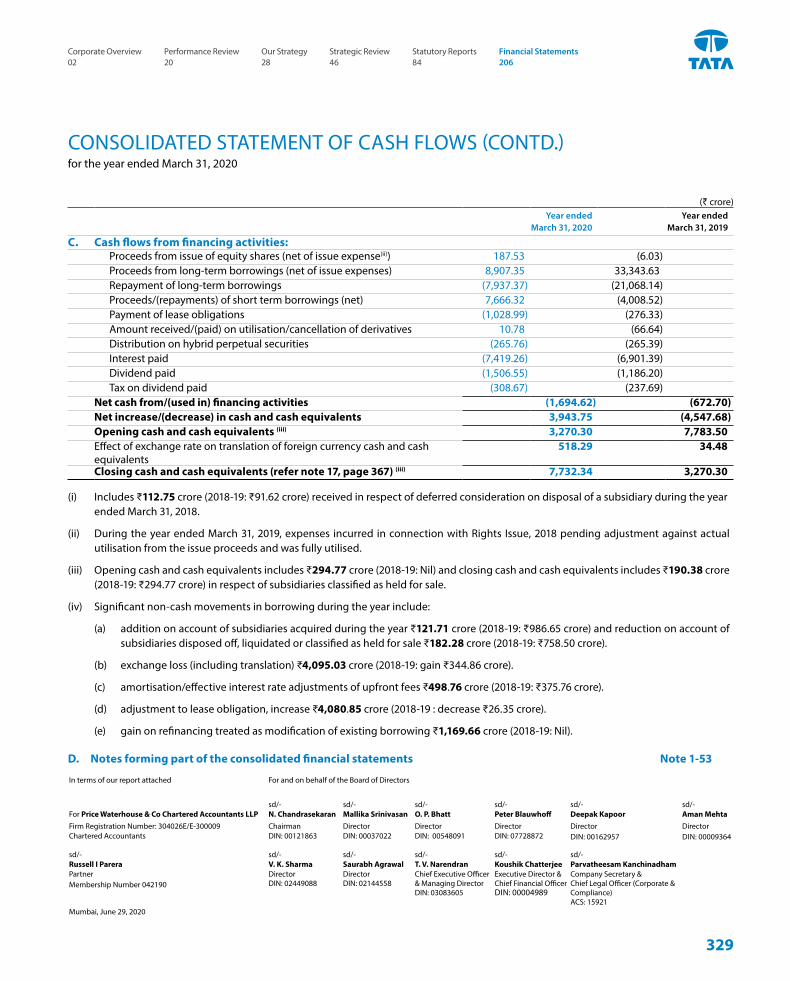
CONSOLIDATED STATEMENT OF CASH FLOWS (CONTD.) for the year ended March 31, 2020
(` crore) Year ended
March 31, 2020Year ended
March 31, 2019
C. Cash flows from financing activities:Proceeds from issue of equity shares (net of issue expense(ii)) 187.53 (6.03)Proceeds from long-term borrowings (net of issue expenses) 8,907.35 33,343.63Repayment of long-term borrowings (7,937.37) (21,068.14)Proceeds/(repayments) of short term borrowings (net) 7,666.32 (4,008.52)Payment of lease obligations (1,028.99) (276.33)Amount received/(paid) on utilisation/cancellation of derivatives 10.78 (66.64)Distribution on hybrid perpetual securities (265.76) (265.39)Interest paid (7,419.26) (6,901.39)Dividend paid (1,506.55) (1,186.20)Tax on dividend paid (308.67) (237.69)
Net cash from/(used in) financing activities (1,694.62) (672.70)Net increase/(decrease) in cash and cash equivalents 3,943.75 (4,547.68)Opening cash and cash equivalents (iii) 3,270.30 7,783.50Effect of exchange rate on translation of foreign currency cash and cash equivalents
518.29 34.48
Closing cash and cash equivalents (refer note 17, page 367) (iii) 7,732.34 3,270.30
(i) Includes ₹112.75 crore (2018-19: ₹91.62 crore) received in respect of deferred consideration on disposal of a subsidiary during the year ended March 31, 2018.
(ii) During the year ended March 31, 2019, expenses incurred in connection with Rights Issue, 2018 pending adjustment against actual utilisation from the issue proceeds and was fully utilised.
(iii) Opening cash and cash equivalents includes ₹294.77 crore (2018-19: Nil) and closing cash and cash equivalents includes ₹190.38 crore (2018-19: ₹294.77 crore) in respect of subsidiaries classified as held for sale.
(iv) Significant non-cash movements in borrowing during the year include:
(a) addition on account of subsidiaries acquired during the year ₹121.71 crore (2018-19: ₹986.65 crore) and reduction on account of subsidiaries disposed off, liquidated or classified as held for sale ₹182.28 crore (2018-19: ₹758.50 crore).
(b) exchange loss (including translation) ₹4,095.03 crore (2018-19: gain ₹344.86 crore).
(c) amortisation/effective interest rate adjustments of upfront fees ₹498.76 crore (2018-19: ₹375.76 crore).
(d) adjustment to lease obligation, increase ₹4,080.85 crore (2018-19 : decrease ₹26.35 crore).
(e) gain on refinancing treated as modification of existing borrowing ₹1,169.66 crore (2018-19: Nil).
D. Notes forming part of the consolidated financial statements Note 1-53
In terms of our report attached For and on behalf of the Board of Directors
sd/- sd/- sd/- sd/- sd/- sd/- For Price Waterhouse & Co Chartered Accountants LLP N. Chandrasekaran Mallika Srinivasan O. P. Bhatt Peter Blauwhoff Deepak Kapoor Aman MehtaFirm Registration Number: 304026E/E-300009 Chairman Director Director Director Director
DIN: 00162957Director DIN: 00009364Chartered Accountants DIN: 00121863 DIN: 00037022 DIN: 00548091 DIN: 07728872
sd/- sd/- sd/- sd/- sd/- sd/- Russell I Parera V. K. Sharma Saurabh Agrawal T. V. Narendran Koushik Chatterjee Parvatheesam KanchinadhamPartner Membership Number 042190
Director DIN: 02449088
Director DIN: 02144558
Chief Executive Officer & Managing Director DIN: 03083605
Executive Director & Chief Financial Officer DIN: 00004989
Company Secretary & Chief Legal Officer (Corporate & Compliance) ACS: 15921
Mumbai, June 29, 2020
Corporate Overview 02
Strategic Review 46
Performance Review 20
Statutory Reports 84
Our Strategy 28
Financial Statements 206
329
1. Company information Tata Steel Limited (“the Company”) is a public limited Company
incorporated in India with its registered office in Mumbai, Maharashtra, India. The Company is listed on the BSE Limited (BSE) and the National Stock Exchange of India Limited (NSE).
The Company and its subsidiaries (collectively referred to as ‘the Group’) have presence across the entire value chain of steel manufacturing from mining and processing iron ore and coal to producing and distributing finished products. The Group offers a broad range of steel products including a portfolio of high value-added downstream products such as hot rolled, cold rolled, coated steel, rebars, wire rods, tubes and wires.
The consolidated financial statements as at March 31, 2020 present the financial position of the Group as well as its interests in associate companies and joint arrangements. The list of entities consolidated is provided in note 53, page 431.
The functional and presentation currency of the Company and the presentation currency of the Group is Indian Rupee (“₹”).
As on March 31, 2020, Tata Sons Private Limited owns 32.93% of the Ordinary Shares of the Company, and has the ability to influence the Group’s operations.
The financial statements for the year ended March 31, 2020 were approved by the Board of Directors and authorised for issue on June 29, 2020.
2. Significant accounting policies The significant accounting policies applied by the Group in
the preparation of its consolidated financial statements are listed below. Such accounting policies have been applied consistently to all the periods presented in these consolidated financial statements, unless otherwise indicated.
(a) Statement of compliance The consolidated financial statements have been prepared in
accordance with the Indian Accounting Standards (referred to as “Ind AS”) prescribed under section 133 of the Companies Act, 2013 read with Companies (Indian Accounting Standards) Rules, as amended from time to time and other relevant provisions of the Act.
(b) Basis of preparation The consolidated financial statements have been prepared
under the historical cost convention with the exception of certain assets and liabilities that are required to be carried at fair values by Ind AS.
Fair value is the price that would be received to sell an asset or paid to transfer a liability in an orderly transaction between market participants at the measurement date.
(c) Use of estimates and critical accounting judgements In the preparation of the consolidated financial statements, the
Group makes judgements, estimates and assumptions about the carrying values of assets and liabilities that are not readily apparent from other sources. The estimates and associated assumptions are based on historical experience and other factors that are considered to be relevant. Actual results may differ from these estimates.
Estimates and underlying assumptions are reviewed on an ongoing basis. Revisions to accounting estimates are recognised in the period in which the estimate is revised and future periods affected.
Key source of estimation of uncertainty at the date of consolidated financial statements, which may cause material adjustment to the carrying amounts of assets and liabilities within the next financial year, is in respect of impairment, useful lives of property, plant and equipment and intangible assets, valuation of deferred tax assets, provisions and contingent liabilities, fair value measurements of financial instruments, retirement benefit obligations and non-current assets classified as held for sale as discussed below.
Impairment
The Group estimates the value in use of the cash generating unit (CGU) based on future cash flows after considering current economic conditions and trends, estimated future operating results and growth rate and anticipated future economic and regulatory conditions. The estimated cash flows are developed using internal forecasts. The cash flows are discounted using a suitable discount rate in order to calculate the present value. Further details of the Group’s impairment review and key assumptions are set out in notes 3, page 344, note 5, page 349, note 6, page 350, and note 7, page 351.
Useful lives of property, plant and equipment and intangible assets
The Group reviews the useful life of property, plant and equipment and intangible assets at the end of each reporting period. This reassessment may result in change in depreciation and amortisation expense in future periods. The policy has been detailed in note 2(n), page 335.
NOTESforming part of the consolidated financial statements
Consolidated
INTEGRATED REPORT & ANNUAL ACCOUNTS 2019-20 | 113TH YEAR330
2. Significant accounting policies (Contd.)
Valuation of deferred tax assets
The Group reviews the carrying amount of deferred tax assets at the end of each reporting period. The policy has been detailed in note 2(y), page 341 and its further information are set out in note 13, page 360.
Provisions and contingent liabilities
A provision is recognised when the Group has a present obligation as result of a past event and it is probable that the outflow of resources will be required to settle the obligation, in respect of which a reliable estimate can be made. These are reviewed at each balance sheet date and adjusted to reflect the current best estimates. Contingent liabilities are not recognised in the financial statements. Further details are set out in notes 26, page 386 and note 40(A), page 407.
Fair value measurements of financial instruments
When the fair value of financial assets and financial liabilities recorded in the balance sheet cannot be measured based on quoted prices in active markets, their fair value is measured using valuation techniques including Discounted Cash Flow Model. The inputs to these models are taken from observable markets where possible, but where this is not feasible, a degree of judgement is required in establishing fair values. Judgements include considerations of inputs such as liquidity risks, credit risks and volatility. Changes in assumptions about these factors could affect the reported fair value of financial instruments. Further details are set out in note 45, page 417.
Retirement benefit obligations and assets
The Group’s retirement benefit obligations are subject to a number of judgements including discount rates, inflation and salary growth. Significant judgements are required when setting these criteria and a change in these assumptions would have a significant impact on the amount recorded in the Group’s balance sheet and the consolidated statement of profit and loss. The Group sets these judgements based on previous experience and third party actuarial advice. Further details on the Group’s retirement benefit obligations, including key judgements are set out in note 39, page 396.
Non-current assets held for sale
The recognition of non-current assets (or disposal groups) as held for sale is dependent upon whether its carrying amount will be recovered principally through a sale transaction rather than through continuing use. Significant judgement is required
to assess whether the sale of the assets (or disposal group) is highly probable.
Estimation of uncertainties relating to COVID-19 Post declaration of COVID-19 as a pandemic by the World Health
Organization, the Government in India and across the world have taken significant measures to curtail the wide spread of virus, including country wide lockdown and restriction in economic activities.
In view of such lockdowns, operations at the Group’s steel making facilities in India have been scaled down from the end week of March 2020. The Group’s overseas operations in Europe, South East Asia and Canada have also been scaled down over various periods and are being operated as per the local guidelines, wherever permitted.
In view of the impact of COVID-19, the Group has assessed the carrying amounts of property, plant and equipment, right-of-use assets, goodwill, intangible assets, inventories, trade receivables, investments and other financial assets. In assessing the recoverable value of such assets, the Group has considered various internal and external information such as existing long-term arrangements with customer and vendor partners, long-term business plan, cash flow forecasts and possible future uncertainties in economic conditions because of the pandemic including lockdowns and supply chain disruptions across various geographies.
As per the Group’s current assessment of recoverability of these assets, other than the impairment recorded, no significant impact on carrying amounts of these assets is expected.
The eventual outcome of the impact of the global health pandemic may be different from those estimated as on the date of approval of these consolidated financial statements and the Group continues to closely monitor the situation including any material changes to future economic conditions and consequential impact on its consolidated financial statements.
(d) Basis of consolidation The consolidated financial statements incorporate the
financial statements of the Company and entities controlled by the Company i.e. its subsidiaries. It also includes the Group’s share of profits, net assets and retained post acquisition reserves of joint arrangements and associates that are consolidated using the equity or proportionate method of consolidation, as applicable.
Control is achieved when the Company is exposed to, or has rights to the variable returns of the entity and the ability to
NOTESforming part of the consolidated financial statements
331
Corporate Overview 02
Strategic Review 46
Performance Review 20
Statutory Reports 84
Our Strategy 28
Financial Statements 206
affect those returns through its power to direct the relevant activities of the entity.
The results of subsidiaries, joint arrangements and associates acquired or disposed off during the year are included in the consolidated statement of profit and loss from the effective date of acquisition or up to the effective date of disposal, as appropriate.
Wherever necessary, adjustments are made to the financial statements of subsidiaries, joint arrangements and associates to bring their accounting policies in line with those used by other members of the Group.
Intra-group transactions, balances, income and expenses are eliminated on consolidation.
Non-controlling interests in the net assets of consolidated subsidiaries are identified separately from the Group’s equity. The interest of non-controlling shareholders may be initially measured either at fair value or at the non-controlling interests’ proportionate share of the fair value of the acquiree’s identifiable net assets. The choice of measurement basis is made on an acquisition-by-acquisition basis. Subsequent to acquisition, the carrying value of non-controlling interests is the amount of those interests at initial recognition plus the non-controlling interests’ share of subsequent changes in equity. Total comprehensive income is attributed to non-controlling interests even if it results in the non-controlling interests having a deficit balance.
(e) Business combinations Acquisition of subsidiaries and businesses are accounted for
using the acquisition method. The consideration transferred in each business combination is measured at the aggregate of the acquisition date fair values of assets given, liabilities incurred by the Group to the former owners of the acquiree and equity interests issued by the Group in exchange for control of the acquiree.
Acquisition related costs are recognised in the consolidated statement of profit and loss.
Goodwill arising on acquisition is recognised as an asset and measured at cost, being the excess of the consideration transferred in the business combination over the Group’s interest in the net fair value of the identifiable assets acquired, liabilities assumed and contingent liabilities recognised. Where the fair value of the identifiable assets and liabilities exceed the
2. Significant accounting policies (Contd.) cost of acquisition, after re-assessing the fair values of the net assets and contingent liabilities, the excess is recognised as capital reserve on consolidation.
Once control has been achieved, any subsequent acquisitions where the Group does not originally hold hundred percent interest in a subsidiary are treated as an acquisition of shares from non-controlling shareholders. The identifiable net assets are not subject to further fair value adjustments and the difference between the cost of acquisition of the non-controlling interest and the net book value of the additional interest acquired is adjusted in equity.
Business combinations arising from transfer of interests in entities that are under common control are accounted for using the pooling of interest method. The difference between any consideration transferred and the aggregate historical carrying values of assets and liabilities of the acquired entity are recognised in shareholders’ equity.
(f) Goodwill Goodwill is initially recognised as an asset at cost and
is subsequently measured at cost less any accumulated impairment losses.
For the purpose of impairment testing, goodwill is allocated to each of the Group’s cash-generating units or groups of cash- generating units that are expected to benefit from the synergies of the combination. Cash-generating units to which goodwill has been allocated are tested for impairment annually, or more frequently when there is an indication that the unit’s value may be impaired. If the recoverable amount of the cash-generating unit is less than the carrying value of the unit, the impairment loss is allocated first to reduce the carrying value of any goodwill allocated to the unit and then to the other assets of the unit in proportion to the carrying value of each asset in the unit.
An impairment loss recognised for goodwill is not reversed in a subsequent period. On disposal of a subsidiary, the attributable amount of goodwill is included in the determination of profit or loss on disposal.
(g) Investment in associates
Associates are those enterprises over which the Group has significant influence, but does not have control or joint control.
Investments in associates are accounted for using the equity method and are initially recognised at cost from the date significant influence commences until the date that significant influence ceases. Subsequent changes in the carrying value
NOTESforming part of the consolidated financial statements
Consolidated
INTEGRATED REPORT & ANNUAL ACCOUNTS 2019-20 | 113TH YEAR332
2. Significant accounting policies (Contd.)
reflect the post-acquisition changes in the Group’s share of net assets of the associate and impairment charges, if any.
When the Group’s share of losses exceeds the carrying value of the associate, the carrying value is reduced to nil and recognition of further losses is discontinued, except to the extent that the Group has incurred obligations in respect of the associate.
Unrealised gains on transactions between the Group and its associates are eliminated to the extent of the Group’s interest in the associates, unrealised losses are also eliminated unless the transaction provides evidence of an impairment of the asset transferred and where material, the results of associates are modified to confirm to the Group’s accounting policies.
(h) Interest in joint arrangements A joint arrangement is a contractual arrangement whereby
the Group and other parties undertake an economic activity where the strategic financial and operating policy decisions relating to the activities of the joint arrangement require the unanimous consent of the parties sharing control.
Where Group entity undertakes its activities under joint arrangements as joint operations, the Group’s share of jointly controlled assets and any liabilities incurred jointly with other parties are recognised in its financial statements and classified according to their nature. Liabilities and expenses incurred directly in respect of interests in joint operations are accounted for on the accrual basis. Income from the sale or use of the Group’s share of the output of joint operations, and its share of joint arrangements expenses, are recognised when it is probable that the economic benefits associated with the transactions will flow to the Group and their amount can be measured reliably.
Joint arrangements that involve the establishment of a separate entity in which each venturer has an interest are referred to as joint ventures. The Group reports its interests in joint ventures using the equity method of accounting whereby an interest in joint venture is initially recorded at cost and adjusted thereafter for post-acquisition changes in the Group’s share of net assets of the joint venture. The consolidated statement of profit and loss reflects the Group’s share of the results of operations of the joint venture.
When the Group’s share of losses exceeds the carrying value of the joint venture, the carrying value is reduced to nil and recognition of further losses is discontinued, except to the
extent that the Group has incurred obligations in respect of the joint venture.
Unrealised gains on transactions between the Group and its joint ventures are eliminated to the extent of the Group’s interest in the joint venture, unrealised losses are also eliminated unless the transaction provides evidence of an impairment of the asset transferred and where material, the results of joint ventures are modified to conform to the Group’s accounting policies.
(i) Property, plant and equipment An item of property, plant and equipment is recognised as an
asset if it is probable that future economic benefits associated with the item will flow to the Group and its cost can be measured reliably. This recognition principle is applied to costs incurred initially to acquire an item of property, plant and equipment and also to costs incurred subsequently to add to, replace part of, or service it. All other repair and maintenance costs, including regular servicing, are recognised in the consolidated statement of profit and loss as incurred. When a replacement occurs, the carrying value of the replaced part is de-recognised. Where an item of property, plant and equipment comprises major components having different useful lives, these components are accounted for as separate items.
Property, plant and equipment is stated at cost or deemed cost applied on transition to Ind AS, less accumulated depreciation and impairment. Cost includes all direct costs and expenditures incurred to bring the asset to its working condition and location for its intended use. Trial run expenses (net of revenue) are capitalised. Borrowing costs incurred during the period of construction is capitalised as part of cost of qualifying asset.
The gain or loss arising on disposal of an item of property, plant and equipment is determined as the difference between sale proceeds and carrying value of such item, and is recognised in the consolidated statement of profit and loss.
(j) Exploration for and evaluation of mineral resources Expenditures associated with search for specific mineral
resources are recognised as exploration and evaluation assets. The following expenditure comprises the cost of exploration and evaluation assets:
• obtaining of the rights to explore and evaluate mineral reserves and resources including costs directly related to this acquisition
• researching and analysing existing exploration data
NOTESforming part of the consolidated financial statements
333
Corporate Overview 02
Strategic Review 46
Performance Review 20
Statutory Reports 84
Our Strategy 28
Financial Statements 206
• conducting geological studies, exploratory drilling and sampling
• examining and testing extraction and treatment methods
• compiling pre-feasibility and feasibility studies
• activities in relation to evaluating the technical feasibility and commercial viability of extracting a mineral resource.
Administration and other overhead costs are charged to the cost of exploration and evaluation assets only if directly related to an exploration and evaluation project.
If a project does not prove viable, all irrecoverable exploration and evaluation expenditure associated with the project net of any related impairment allowances is written off to the consolidated statement of profit and loss.
The Group measures its exploration and evaluation assets at cost and classifies as property, plant and equipment or intangible assets according to the nature of the assets acquired and applies the classification consistently. To the extent that a tangible asset is consumed in developing an intangible asset, the amount reflecting that consumption is capitalised as a part of the cost of the intangible asset.
As the asset is not available for use, it is not depreciated. All exploration and evaluation assets are monitored for indications of impairment. An exploration and evaluation asset is no longer classified as such when the technical feasibility and commercial viability of extracting a mineral resource are demonstrable and the development of the deposit is sanctioned by the management. The carrying value of such exploration and evaluation asset is reclassified to mining assets.
(k) Development expenditure for mineral reserves Development is the establishment of access to mineral
reserves and other preparations for commercial production. Development activities often continue during production and include:
• sinking shafts and underground drifts (often called mine development)
• making permanent excavations
• developing passageways and rooms or galleries
• building roads and tunnels and
• advance removal of overburden and waste rock.
2. Significant accounting policies (Contd.) Development (or construction) also includes the installation of infrastructure (e.g., roads, utilities and housing), machinery, equipment and facilities.
Development expenditure is capitalised and presented as part of mining assets. No depreciation is charged on the development expenditure before the start of commercial production.
(l) Provision for restoration and environmental costs The Group has liabilities related to restoration of soil and other
related works, which are due upon the closure of certain of its mining sites.
Such liabilities are estimated case-by-case based on available information, taking into account applicable local legal requirements. The estimation is made using existing technology, at current prices, and discounted using a appropriate discount rate where the effect of time value of money is material. Future restoration and environmental costs, discounted to net present value, are capitalised and the corresponding restoration liability is raised as soon as the obligation to incur such costs arises. Future restoration and environmental costs are capitalised in property, plant and equipment or mining assets as appropriate and are depreciated over the life of the related asset. The effect of time value of money on the restoration and environmental costs liability is recognised in the consolidated statement of profit and loss.
(m) Intangible assets Patents, trademarks and software costs are included in the
consolidated balance sheet as intangible assets when it is probable that associated future economic benefits would flow to the Group. In this case they are measured initially at purchase cost and then amortised on a straight-line basis over their estimated useful lives. All other costs on patents, trademarks and software are expensed in the consolidated statement of profit and loss as and when incurred.
Expenditure on research activities is recognised as an expense in the period in which it is incurred. Costs incurred on individual development projects are recognised as intangible assets from the date when all of the following conditions are met:
(i) completion of the development is technically feasible.
(ii) it is the intention to complete the intangible asset and use or sell it.
(iii) ability to use or sell the intangible asset.
(iv) it is clear that the intangible asset will generate probable future economic benefits.
NOTESforming part of the consolidated financial statements
Consolidated
INTEGRATED REPORT & ANNUAL ACCOUNTS 2019-20 | 113TH YEAR334
2. Significant accounting policies (Contd.)
(v) adequate technical, financial and other resources to complete the development and to use or sell the intangible asset are available.
(vi) it is possible to reliably measure the expenditure attributable to the intangible asset during its development.
Recognition of costs as an asset is ceased when the project is complete and available for its intended use, or if these criteria are no longer applicable.
Where development activities do not meet the conditions for recognition as an asset, any associated expenditure is treated as an expense in the period in which it is incurred.
Intangible assets acquired in a business combination are identified and recognised separately from goodwill where they satisfy the definition of an intangible asset and their fair values can be measured reliably. The cost of such intangible assets is their fair value at the acquisition date.
Subsequent to initial recognition, intangible assets with definite useful lives acquired in a business combination are reported at cost or deemed cost applied on transition to Ind AS, less accumulated amortisation and accumulated impairment losses.
(n) Depreciation and amortisation of property, plant and equipment, right-of-use assets and intangible assets
Depreciation or amortisation is provided so as to write off, on a straight-line basis, the cost/deemed cost of property, plant and equipment and intangible assets, including right-of-use assets to their residual value. These charges are commenced from the dates the assets are available for their intended use and are spread over their estimated useful economic lives or, in the case of right-of-use assets, over the lease period, if shorter. The estimated useful lives of assets, residual values and depreciation method are reviewed regularly and, when necessary, revised.
Depreciation on assets under construction commences only when the assets are ready for their intended use.
The estimated useful lives for the main categories of property, plant and equipment and other intangible assets are:
Estimated useful life (years)
Freehold and long leasehold buildings upto 60 years*Roads 5 yearsPlant and machinery upto 40 years*Furniture, fixture and office equipments 3 to 25 yearsVehicles and aircraft 4 to 20 yearsRailway sidings upto 35 years*Assets covered under the Electricity Act (lifeas prescribed under the Electricity Act)
3 to 34 years
Patents and trademarks 4 yearsProduct and process development costs 5 yearsComputer software upto 8 yearsOther assets 1 to 15 years
Mining assets are amortised over the useful life of the mine or lease period whichever is lower.
Major furnace relining expenses are depreciated over a period of 10 years (average expected life).
Freehold land is not depreciated.
* For these class of assets, based on internal assessment and independent technical evaluation carried out by chartered engineers, the Company and some of its subsidiaries believe that the useful lives as given above best represent the period over which such Company expects to use these assets. Hence the useful lives for these assets are different from the useful lives as prescribed under Part C of Schedule II of the Companies Act, 2013.
(o) Impairment At each balance sheet date, the Group reviews the carrying
value of its property, plant and equipment and intangible assets to determine whether there is any indication that the carrying value of those assets may not be recoverable through continuing use. If any such indication exists, the recoverable amount of the asset is reviewed in order to determine the extent of impairment loss, if any. Where the asset does not generate cash flows that are independent from other assets, the Group estimates the recoverable amount of the cash generating unit to which the asset belongs.
Recoverable amount is the higher of fair value less costs to sell and value in use. In assessing value in use, the estimated future cash flows are discounted to their present value using a pre-tax discount rate that reflects current market assessments of the time value of money and the risks specific to the asset for which the estimates of future cash flows have not been adjusted. An
NOTESforming part of the consolidated financial statements
335
Corporate Overview 02
Strategic Review 46
Performance Review 20
Statutory Reports 84
Our Strategy 28
Financial Statements 206
2. Significant accounting policies (Contd.)
impairment loss is recognised in the consolidated statement of profit and loss as and when the carrying value of an asset exceeds its recoverable amount.
Where an impairment loss subsequently reverses, the carrying value of the asset (or cash generating unit) is increased to the revised estimate of its recoverable amount, so that the increased carrying value does not exceed the carrying value that would have been determined had no impairment loss been recognised for the asset (or cash generating unit) in prior years. A reversal of an impairment loss is recognised in the consolidated statement of profit and loss immediately.
(p) Leases Ind AS 116 “Leases” replaces Ind AS 17 “Leases” with effect
from April 1, 2019.
The adoption of this new Standard has resulted in the Group recognising a right-of-use asset and related lease liability in connection with all former operating leases except for those identified as low-value or having a remaining lease term of less than 12 months from the date of initial application.
The new Standard has been applied using the modified retrospective approach, with the right-of-use asset recognized at an amount equal to the present value of lease liability, adjusted by the amount of any prepaid or accrued lease payments relating to those leases. Prior periods have not been restated.
For contracts in place at the date of initial application, the Group has elected not to carry forward the definition of leases as per Ind AS 17 and has therefore, applied the definition of a lease as per Ind AS 116 to all such arrangements.
Instead of performing an impairment review on the right-of-use assets at the date of initial application, the Group has relied on its historic assessment as to whether leases were onerous immediately before the date of initial application of Ind AS 116.
On transition, for leases previously accounted for as operating leases with a remaining lease term of less than 12 months and for leases of low-value assets the Group has applied the optional exemptions to not recognise right-of-use assets but to account for the lease expense on a straight-line basis over the remaining lease term.
For those leases previously classified as finance leases, the right-of-use asset and lease liability are measured at the date
of initial application at the same amounts as under Ind AS 17 “Leases” immediately before the date of initial application.
Refer note 2(p) - Significant accounting policies – Leases in the Annual Report of the Company for the year ended March 31, 2019, Page 319 for the policy as per Ind AS 17 “Leases”.
The Group as lessee
The Group accounts for each lease component within the contract as a lease separately from non-lease components of the contract and allocates the consideration in the contract to each lease component on the basis of the relative stand-alone price of the lease component and the aggregate stand-alone price of the non-lease components. The Group recognises right-of-use asset representing its right to use the underlying asset for the lease term at the lease commencement date. The cost of the right-of-use asset measured at inception comprises of the amount of initial measurement of the lease liability adjusted for any lease payments made at or before the commencement date.
Certain lease arrangements include options to extend or terminate the lease before the end of the lease term. The right-of-use assets and lease liabilities include these options when it is reasonably certain that such options would be exercised.
The right-of-use assets are subsequently measured at cost less any accumulated depreciation, accumulated impairment losses, if any, and adjusted for any remeasurement of the lease liability. The right-of-use assets are depreciated using the straight-line method from the commencement date over the shorter of lease term or useful life of right-of-use asset.
Right-of-use assets are tested for impairment whenever there is any indication that their carrying amounts may not be recoverable. Impairment loss, if any, is recognised in the consolidated statement of profit and loss.
Lease liability is measured at the present value of the lease payments that are not paid at the commencement date of the lease. The lease payments are discounted using the interest rate implicit in the lease, if that rate can be readily determined. If that rate cannot be readily determined, the Group uses incremental borrowing rate. The lease liability is subsequently remeasured by increasing the carrying amount to reflect interest on the lease liability, reducing the carrying amount to reflect the lease payments made and remeasuring the carrying amount to reflect any reassessment or lease modifications. The Group recognises the amount of the remeasurement of lease liability as an adjustment to the right-of-use asset. Where the carrying amount of the right-of-use asset is reduced to zero and there is a further reduction in the measurement of the
NOTESforming part of the consolidated financial statements
Consolidated
INTEGRATED REPORT & ANNUAL ACCOUNTS 2019-20 | 113TH YEAR336
2. Significant accounting policies (Contd.)
lease liability, the Group recognises any remaining amount of the remeasurement in the consolidated statement of profit and loss.
Variable lease payments not included in the measurement of the lease liabilities are expensed to the consolidated statement of profit and loss in the period in which the events or conditions which trigger those payments occur.
The Group accounts for sale and lease back transaction, recognising right-of-use assets and lease liability, measured in the same way as other right-of-use assets and lease liability. Gain or loss on the sale transaction is recognised in the consolidated statement of profit and loss.
The Group as lessor
(i) Operating lease – Rental income from operating leases is recognised in the consolidated statement of profit and loss on a straight-line basis over the term of the relevant lease unless another systematic basis is more representative of the time pattern in which economic benefits from the leased asset is diminished. Initial direct costs incurred in negotiating and arranging an operating lease are added to the carrying value of the leased asset and recognised on a straight-line basis over the lease term.
(ii) Finance lease – When assets are leased out under a finance lease, the present value of minimum lease payments is recognised as a receivable. The difference between the gross receivable and the present value of receivable is recognised as unearned finance income. Lease income is recognised over the term of the lease using the net investment method before tax, which reflects a constant periodic rate of return.
(q) Stripping costs The Group separates two different types of stripping costs that
are incurred in surface mining activity:
• developmental stripping costs and
• production stripping costs
Developmental stripping costs which are incurred in order to obtain access to quantities of mineral reserves that will be mined in future periods are capitalised as part of mining assets. Capitalisation of developmental stripping costs ends when the commercial production of the mineral reserves begins.
A mine can operate several open pits that are regarded as separate operations for the purpose of mine planning and production. In this case, stripping costs are accounted for separately, by reference to the ore extracted from each separate pit. If, however, the pits are highly integrated for the purpose of mine planning and production, stripping costs are aggregated too.
The determination of whether multiple pit mines are considered separate or integrated operations depends on each mine’s specific circumstances. The following factors normally point towards the stripping costs for the individual pits being accounted for separately:
• mining of the second and subsequent pits is conducted consecutively with that of the first pit, rather than concurrently
• separate investment decisions are made to develop each pit, rather than a single investment decision being made at the outset
• the pits are operated as separate units in terms of mine planning and the sequencing of overburden and ore mining, rather than as an integrated unit
• expenditure for additional infrastructure to support the second and subsequent pits are relatively large
• the pits extract ore from separate and distinct ore bodies, rather than from a single ore body.
The relative importance of each factor is considered by the management to determine whether, the stripping costs should be attributed to the individual pit or to the combined output from the several pits.
Production stripping costs are incurred to extract the ore in the form of inventories and/or to improve access to an additional component of an ore body or deeper levels of material. Production stripping costs are accounted for as inventories to the extent the benefit from production stripping activity is realised in the form of inventories.
The Group recognises a stripping activity asset in the production phase if, and only if, all of the following are met:
• it is probable that the future economic benefit (improved access to the ore body) associated with the stripping activity will flow to the Group
• the Group can identify the component of the ore body for which access has been improved and
NOTESforming part of the consolidated financial statements
337
Corporate Overview 02
Strategic Review 46
Performance Review 20
Statutory Reports 84
Our Strategy 28
Financial Statements 206
2. Significant accounting policies (Contd.)
• the costs relating to the improved access to that component can be measured reliably.
Such costs are presented within mining assets. After initial recognition, stripping activity assets are carried at cost/deemed cost, less accumulated amortisation and impairment. The expected useful life of the identified component of the ore body is used to depreciate or amortise the stripping asset.
(r) Financial instruments Financial assets and financial liabilities are recognised when
the Group becomes a party to the contractual provisions of the instrument. Financial assets and liabilities are initially measured at fair value. Transaction costs that are directly attributable to the acquisition or issue of financial assets and financial liabilities (other than financial assets and financial liabilities at fair value through profit and loss) are added to or deducted from the fair value measured on initial recognition of financial asset or financial liability. The transaction costs directly attributable to the acquisition of financial assets and financial liabilities at fair value through profit and loss are immediately recognised in the consolidated statement of profit and loss.
Effective interest method
The effective interest method is a method of calculating the amortised cost of a financial instrument and of allocating interest income or expense over the relevant period. The effective interest rate is the rate that exactly discounts future cash receipts or payments through the expected life of the financial instrument, or where appropriate, a shorter period.
(I) Financial assets
Cash and bank balances
Cash and bank balances consist of:
(i) Cash and cash equivalents - which include cash on hand, deposits held at call with banks and other short-term deposits which are readily convertible into known amounts of cash, are subject to an insignificant risk of change in value and have original maturities of less than one year. These balances with banks are unrestricted for withdrawal and usage.
(ii) Other bank balances - which include balances and deposits with banks that are restricted for withdrawal and usage.
Financial assets at amortised cost
Financial assets are subsequently measured at amortised cost if these financial assets are held within a business model whose objective is to hold these assets in order to collect contractual cash flows and the contractual terms of the financial asset give rise on specified dates to cash flows that are solely payments of principal and interest on the principal amount outstanding.
Financial assets measured at fair value
Financial assets are measured at fair value through other comprehensive income if such financial assets are held within a business model whose objective is to hold these assets in order to collect contractual cash flows or to sell these financial assets and the contractual terms of the financial asset give rise on specified dates to cash flows that are solely payments of principal and interest on the principal amount outstanding.
The Group in respect of certain equity investments (other than in associates and joint ventures) which are not held for trading has made an irrevocable election to present in other comprehensive income subsequent changes in the fair value of such equity instruments. Such an election is made by the Group on an instrument by instrument basis at the time of initial recognition of such equity investments. These investments are held for medium or long-term strategic purpose. The Group has chosen to designate these investments in equity instruments as fair value through other comprehensive income as the management believes this provides a more meaningful presentation for medium or long-term strategic investments, than reflecting changes in fair value immediately in the consolidated statement of profit and loss.
Financial assets not measured at amortised cost or at fair value through other comprehensive income are carried at fair value through profit and loss.
Interest income
Interest income is accrued on a time proportion basis, by reference to the principal outstanding and effective interest rate applicable.
Dividend income
Dividend income from investments is recognised when the right to receive payment has been established.
Impairment of financial assets
Loss allowance for expected credit losses is recognised for financial assets measured at amortised cost and fair value through other comprehensive income.
NOTESforming part of the consolidated financial statements
Consolidated
INTEGRATED REPORT & ANNUAL ACCOUNTS 2019-20 | 113TH YEAR338
2. Significant accounting policies (Contd.)
The Group recognises life time expected credit losses for all trade receivables that do not constitute a financing transaction.
For financial assets (apart from trade receivables that do not constitute a financing transaction) whose credit risk has not significantly increased since initial recognition, loss allowance equal to twelve months expected credit losses is recognised. Loss allowance equal to the lifetime expected credit losses is recognised if the credit risk of the financial asset has significantly increased since initial recognition.
De-recognition of financial assets
The Group de-recognises a financial asset only when the contractual rights to the cash flows from the asset expire, or it transfers the financial asset and substantially all risks and rewards of ownership of the asset to another entity.
If the Group neither transfers nor retains substantially all the risks and rewards of ownership and continues to control the transferred asset, the Group recognises its retained interest in the assets and an associated liability for amounts it may have to pay.
If the Group retains substantially all the risks and rewards of ownership of a transferred financial asset, the Group continues to recognise the financial asset and also recognises a borrowing for the proceeds received.
(II) Financial liabilities and equity instruments
Classification as debt or equity Financial liabilities and equity instruments issued by the Group
are classified according to the substance of the contractual arrangements entered into and the definitions of a financial liability and an equity instrument.
Equity instruments
An equity instrument is any contract that evidences a residual interest in the assets of the Group after deducting all of its liabilities. Equity instruments are recorded at the proceeds received, net of direct issue costs.
Financial liabilities
Trade and other payables are initially measured at fair value, net of transaction costs, and are subsequently measured at amortised cost, using the effective interest rate method where the time value of money is significant.
Interest bearing bank loans, overdrafts and issued debt are initially measured at fair value and are subsequently measured at amortised cost using the effective interest rate method. Any difference between the proceeds (net of transaction costs) and the settlement or redemption of borrowings is recognised over the term of the borrowings in the consolidated statement of profit and loss.
De-recognition of financial liabilities
The Group derecognises financial liabilities when, and only when, the Group’s obligations are discharged, cancelled or they expire.
Derivative financial instruments and hedge accounting
In the ordinary course of business, the Group uses certain derivative financial instruments to reduce business risks which arise from its exposure to foreign exchange, base metal prices and interest rate fluctuations. The instruments are confined principally to forward foreign exchange contracts, forward rate agreements, cross currency swaps, interest rate swaps and collar. The instruments are employed as hedges of transactions included in the financial statements or for highly probable forecast transactions/firm contractual commitments. These derivatives contracts do not generally extend beyond six months, except for certain currency swaps and interest rate derivatives.
Derivatives are initially accounted for and measured at fair value from the date the derivative contract is entered into and are subsequently remeasured to their fair value at the end of each reporting period.
The Group adopts hedge accounting for forward foreign exchange, interest rate and commodity contracts wherever possible. At the inception of each hedge, there is a formal, documented designation of the hedging relationship. This documentation includes, inter alia, items such as identification of the hedged item and transaction and nature of the risk being hedged. At inception each hedge is expected to be highly effective in achieving an offset of changes in fair value or cash flows attributable to the hedged risk. The effectiveness of hedge instruments to reduce the risk associated with the exposure being hedged is assessed and measured at the inception and on an ongoing basis. The ineffective portion of designated hedges is recognised immediately in the consolidated statement of profit and loss.
When hedge accounting is applied:
• for fair value hedges of recognised assets and liabilities, changes in fair value of the hedged assets and liabilities
NOTESforming part of the consolidated financial statements
339
Corporate Overview 02
Strategic Review 46
Performance Review 20
Statutory Reports 84
Our Strategy 28
Financial Statements 206
2. Significant accounting policies (Contd.)
attributable to the risk being hedged, are recognised in the consolidated statement of profit and loss and compensate for the effective portion of symmetrical changes in the fair value of the derivatives.
• for cash flow hedges, the effective portion of the change in the fair value of the derivative is recognised directly in other comprehensive income and the ineffective portion is recognised in the consolidated statement of profit and loss. If the cash flow hedge of a firm commitment or forecasted transaction results in the recognition of a non-financial asset or liability, then, at the time the asset or liability is recognised, the associated gains or losses on the derivative that had previously been recognised in equity are included in the initial measurement of the asset or liability. For hedges that do not result in the recognition of a non-financial asset or a liability, amounts deferred in equity are recognised in the consolidated statement of profit and loss in the same period in which the hedged item affects the consolidated statement of profit and loss.
In cases where hedge accounting is not applied, changes in the fair value of derivatives are recognised in the consolidated statement of profit and loss as and when they arise.
Hedge accounting is discontinued when the hedging instrument expires or is sold, terminated, or exercised, or no longer qualifies for hedge accounting. At that time, any cumulative gain or loss on the hedging instrument recognised in equity is retained in equity until the forecasted transaction occurs. If a hedged transaction is no longer expected to occur, the net cumulative gain or loss recognised in equity is transferred to the consolidated statement of profit and loss for the period.
(s) Employee benefits
Defined contribution plans
Contributions under defined contribution plans are recognised as an expense for the period in which the employee has rendered the service. Payments made to state managed retirement benefit schemes are dealt with as payments to defined contribution schemes where the Group’s obligations under the schemes are equivalent to those arising in a defined contribution retirement benefit scheme.
Defined benefit plans
For defined benefit retirement schemes, the cost of providing benefits is determined using the Projected Unit Credit Method, with actuarial valuation being carried out at each year-end balance sheet date. Remeasurement gains and losses of the net defined benefit liability/(asset) are recognised immediately in other comprehensive income. The service cost and net interest on the net defined benefit liability/(asset) are recognised as an expense within employee costs.
Past service cost is recognised as an expense when the plan amendment or curtailment occurs or when any related restructuring costs or termination benefits are recognised, whichever is earlier.
The retirement benefit obligations recognised in the consolidated balance sheet represents the present value of the defined benefit obligation as reduced by the fair value of plan assets.
Compensated absences
Compensated absences which are not expected to occur within twelve months after the end of the period in which the employee renders the related service are recognised based on actuarial valuation at the present value of the obligation as on the reporting date.
(t) Inventories Inventories are stated at the lower of cost and net realisable
value. Cost is ascertained on a weighted average basis. Costs comprise direct materials and, where applicable, direct labour costs and those overheads that have been incurred in bringing the inventories to their present location and condition. Net realisable value is the price at which the inventories can be realised in the normal course of business after allowing for the cost of conversion from their existing state to a finished condition and for the cost of marketing, selling and distribution.
Provisions are made to cover slow moving and obsolete items based on historical experience of utilisation on a product category basis, which involves individual businesses considering their product lines and market conditions.
(u) Provisions Provisions are recognised in the consolidated balance sheet
when the Group has a present obligation (legal or constructive) as a result of a past event, which is expected to result in an outflow of resources embodying economic benefits which can be reliably estimated. Each provision is based on the
NOTESforming part of the consolidated financial statements
Consolidated
INTEGRATED REPORT & ANNUAL ACCOUNTS 2019-20 | 113TH YEAR340
2. Significant accounting policies (Contd.)
best estimate of the expenditure required to settle the present obligation at the balance sheet date. Where the time value of money is material, provisions are measured on a discounted basis.
Constructive obligation is an obligation that derives from an entity’s actions where:
(i) by an established pattern of past practice, published policies or a sufficiently specific current statement, the entity has indicated to other parties that it will accept certain responsibilities and
(ii) as a result, the entity has created a valid expectation on the part of those other parties that it will discharge such responsibilities.
(v) Onerous contracts A provision for onerous contracts is recognised when the
expected benefits to be derived by the Group from a contract are lower than the unavoidable cost of meeting its obligations under the contract. The provision is measured at the present value of the lower of the expected cost of terminating the contract and the expected net cost of continuing with the contract. Before a provision is established, the Group recognises any impairment loss on the assets associated with that contract.
(w) Government grants
Government grants are recognised at its fair value, where there is a reasonable assurance that such grants will be received and compliance with the conditions attached therewith have been met.
Government grants related to expenditure on property, plant and equipment are credited to the consolidated statement of profit and loss over the useful lives of qualifying assets or other systematic basis representative of the pattern of fulfilment of obligations associated with the grant received. Grants received less amounts credited to the consolidated statement of profit and loss at the reporting date are included in the consolidated balance sheet as deferred income.
(x) Non-current assets held for sale and discontinued operations
Non-current assets and disposal groups classified as held for sale are measured at the lower of their carrying value and fair value less costs to sell.
Assets and disposal groups are classified as held for sale if their carrying value will be recovered through a sale transaction rather than through continuing use. This condition is only met when the sale is highly probable and the asset, or disposal group, is available for immediate sale in its present condition and is marketed for sale at a price that is reasonable in relation to its current fair value. The Group must also be committed to the sale, which should be expected to qualify for recognition as a completed sale within one year from the date of classification.
Where a disposal group represents a separate major line of business or geographical area of operations, or is part of a single coordinated plan to dispose of a separate major line of business or geographical area of operations, then it is treated as a discontinued operation. The post-tax profit or loss of the discontinued operation together with the gain or loss recognised on its disposal are disclosed as a single amount in the consolidated statement of profit and loss, with all prior periods being presented on this basis.
(y) Income taxes Tax expense for the year comprises of current and deferred
tax. The tax currently payable is based on taxable profit for the year. Taxable profit differs from net profit as reported in the consolidated statement of profit and loss because it excludes items of income or expense that are taxable or deductible in other years and it further excludes items that are never taxable or deductible. The Group’s liability for current tax is calculated using tax rates and tax laws that have been enacted or substantively enacted in countries where the Company and its subsidiaries operate by the end of the reporting period.
Deferred tax is the tax expected to be payable or recoverable on differences between the carrying value of assets and liabilities in the financial statements and the corresponding tax bases used in the computation of taxable profit, and is accounted for using the balance sheet liability method. Deferred tax liabilities are generally recognised for all taxable temporary differences. In contrast, deferred tax assets are only recognised to the extent that it is probable that future taxable profits will be available against which the temporary differences can be utilised.
Deferred tax liabilities are recognised on taxable temporary differences arising on investments in subsidiaries, joint ventures and associates, except where the Group is able to control the reversal of the temporary difference and it is probable that the temporary difference will not reverse in the foreseeable future.
The carrying value of deferred tax assets is reviewed at the end of each reporting period and reduced to the extent that it is no
NOTESforming part of the consolidated financial statements
341
Corporate Overview 02
Strategic Review 46
Performance Review 20
Statutory Reports 84
Our Strategy 28
Financial Statements 206
longer probable that sufficient taxable profits will be available to allow all or part of the asset to be recovered.
Deferred tax is calculated at the tax rates that are expected to apply in the period when the liability is settled or the asset is realised based on the tax rates and tax laws that have been enacted or substantially enacted by the end of the reporting period. The measurement of deferred tax liabilities and assets reflects the tax consequences that would follow from the manner in which the Group expects, at the end of the reporting period, to recover or settle the carrying value of its assets and liabilities.
Deferred tax assets and liabilities are offset to the extent that they relate to taxes levied by the same tax authority and they are in the same taxable entity, or a Group of taxable entities where the tax losses of one entity are used to offset the taxable profits of another and there are legally enforceable rights to set off current tax assets and current tax liabilities within that jurisdiction.
Current and deferred tax are recognised as an expense or income in the consolidated statement of profit and loss, except when they relate to items credited or debited either in other comprehensive income or directly in equity, in which case the tax is also recognised in other comprehensive income or directly in equity.
Deferred tax assets include Minimum Alternate Tax (MAT) paid in accordance with the tax laws in India, which is likely to give future economic benefits in the form of availability of set off against future income tax liability. MAT is recognised as deferred tax assets in the consolidated balance sheet when the asset can be measured reliably and it is probable that the future economic benefit associated with the asset will be realised.
(z) Revenue
The Group manufactures and sells a range of steel and other products
Sale of products
Revenue from sale of products is recognised when control of the products has transferred, being when the products are delivered to the customer. Delivery occurs when the products have been shipped or delivered to the specific location as the case may be, the risk of loss has been transferred, and either the customer has accepted the products in accordance with the sales contract, or the Group has objective evidence that
2. Significant accounting policies (Contd.) all criteria for acceptance have been satisfied. Sale of products include related ancillary services, if any.
Goods are often sold with volume discounts based on aggregate sales over a 12 months period. Revenue from these sales is recognised based on the price specified in the contract, net of the estimated volume discounts. Accumulated experience is used to estimate and provide for the discounts, using the most likely method, and revenue is only recognised to the extent that it is highly probable that a significant reversal will not occur. A liability is recognised for expected volume discounts payable to customers in relation to sales made until the end of the reporting period. No element of financing is deemed present as the sales are generally made with a credit term of 30-90 days, which is consistent with market practice. Any obligation to provide a refund is recognised as a provision. A receivable is recognised when the goods are delivered as this is the point in time that the consideration is unconditional because only the passage of time is required before the payment is due.
The Group does not have any contracts where the period between the transfer of the promised goods or services to the customer and payment by the customer exceeds one year. As a consequence, the Group does not adjust any of the transaction prices for the time value of money.
Sale of power
Revenue from sale of power is recognised when the services are provided to the customer based on approved tariff rates established by the respective regulatory authorities. The Group doesn’t recognise revenue and an asset for cost incurred in the past that will be recovered.
(aa) Foreign currency transactions and translation The consolidated financial statements of the Group are
presented in Indian Rupee (“₹”), which is the functional currency of the Company and the presentation currency for the consolidated financial statements.
In preparing the consolidated financial statements, transactions in currencies other than the entity’s functional currency are recorded at the rates of exchange prevailing on the date of the transaction. At the end of each reporting period, monetary items denominated in foreign currencies are re-translated at the rates prevailing at the end of the reporting period. Non-monetary items carried at fair value that are denominated in foreign currencies are re-translated at the rates prevailing on the date when the fair value was determined. Non-monetary
NOTESforming part of the consolidated financial statements
Consolidated
INTEGRATED REPORT & ANNUAL ACCOUNTS 2019-20 | 113TH YEAR342
2. Significant accounting policies (Contd.)
items that are measured in terms of historical cost in a foreign currency are not translated.
Exchange differences arising on translation of long-term foreign currency monetary items recognised in the consolidated financial statements before the beginning of the first Ind AS financial reporting period in respect of which the Group has elected to recognise such exchange differences in equity or as part of cost of assets as allowed under Ind As 101-“First-time adoption of Indian Accounting Standards” are recognised directly in equity or added/deducted to/from the cost of assets as the case may be. Such exchange differences recognised in equity or as part of cost of assets is recognised in the consolidated statement of profit and loss on a systematic basis.
Exchange differences arising on the retranslation or settlement of other monetary items are included in the consolidated statement of profit and loss for the period.
For the purpose of presenting the consolidated financial statements, the assets and liabilities of the Company’s foreign subsidiaries, associates and joint ventures are expressed in “₹” using exchange rates prevailing at the end of the reporting period. Income and expense items are translated at the average exchange rates for the period. Exchange differences arising, if any, are recognised in other comprehensive income and accumulated in a separate component of equity. On the disposal of a foreign operation, all of the accumulated exchange differences in respect of that operation attributable to the Company are reclassified to the consolidated statement of profit and loss.
Goodwill and fair value adjustments arising on the acquisition of a foreign operation are treated as assets and liabilities of the foreign operation and translated at the closing rate.
(ab) Borrowing costs Borrowings costs directly attributable to the acquisition,
construction or production of qualifying assets, which are assets that necessarily take a substantial period of time to get ready for their intended use or sale, are added to the cost of those assets, until such time as the assets are substantially ready for the intended use or sale.
Investment income earned on temporary investment of specific borrowings pending their expenditure on qualifying assets is recognised in the consolidated statement of profit and loss.
Discounts or premiums and expenses on the issue of debt securities are amortised over the term of the related securities and included within borrowing costs. Premiums payable on early redemptions of debt securities, in lieu of future finance costs, are recognised as borrowing costs.
All other borrowing costs are recognized as expenses in the period in which it is incurred.
(ac) Earnings per share Basic earnings per share is computed by dividing the
consolidated profit or loss for the year attributable to equity holders by the weighted average number of shares outstanding during the year. Partly paid up shares are included as fully paid equivalents according to the fraction paid up.
Diluted earnings per share is computed using the weighted average number of shares and dilutive potential shares except where the result would be anti-dilutive.
(ad) Recent accounting pronouncements
Amendment to Ind AS 12 “Income Tax” - Insertion of Appendix C, “Uncertainty over Income tax treatments”
The amendment intends to bring clarity to the accounting for uncertainties on income tax treatments that have yet to be accepted by tax authorities, and to reflect it in the measurement of current and deferred taxes.
The Group has applied the amendments prospectively for annual reporting periods beginning on or after April 1, 2019. There is no material impact on the Group due to the application of above amendment.
Amendment to Ind AS 23 “Borrowing Costs” The amendment clarifies that if any specific borrowing remains
outstanding after the related asset is ready for its intended use or sale, that borrowing becomes part of the funds that an entity borrows generally when calculating the capitalization rate on general borrowings.
The Group has applied the amendments prospectively for annual reporting periods beginning on or after April 1, 2019. There is no material impact on the Group due to the application of above amendment.
There is no new standard or amendment to the existing standards which would be effective for annual periods beginning on or after April 1, 2020.
NOTESforming part of the consolidated financial statements
343
Corporate Overview 02
Strategic Review 46
Performance Review 20
Statutory Reports 84
Our Strategy 28
Financial Statements 206
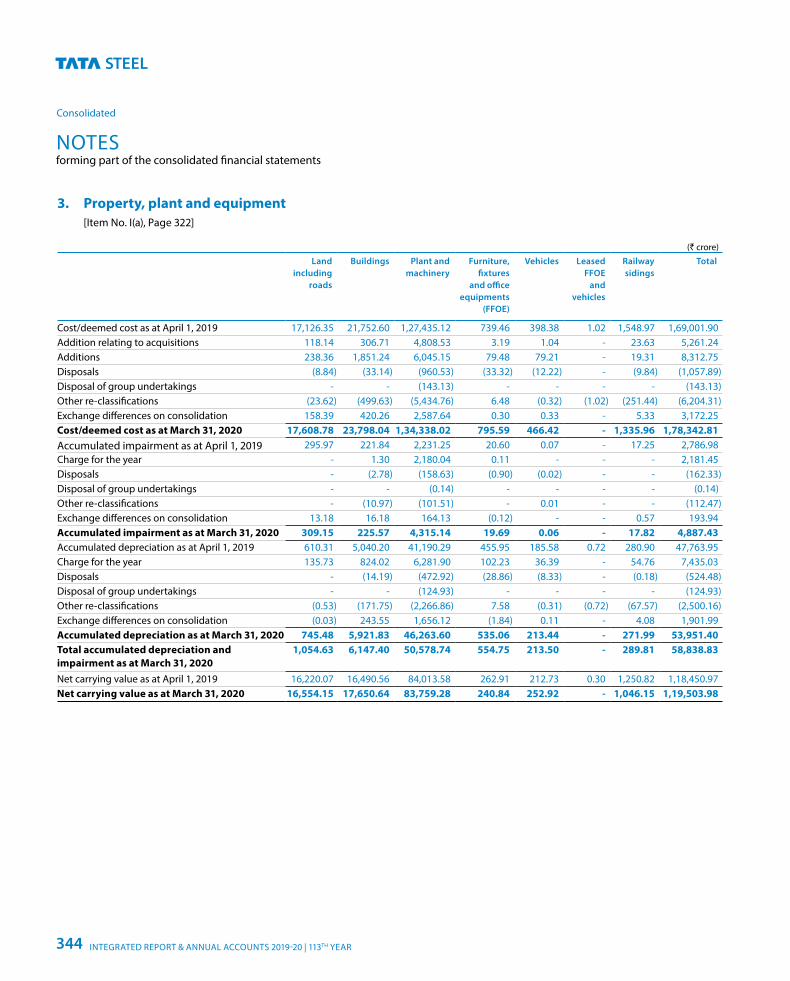
3. Property, plant and equipment [Item No. I(a), Page 322]
(` crore)Land
including roads
Buildings Plant andmachinery
Furniture, fixtures
and office equipments
(FFOE)
Vehicles LeasedFFOE
andvehicles
Railwaysidings
Total
Cost/deemed cost as at April 1, 2019 17,126.35 21,752.60 1,27,435.12 739.46 398.38 1.02 1,548.97 1,69,001.90Addition relating to acquisitions 118.14 306.71 4,808.53 3.19 1.04 - 23.63 5,261.24Additions 238.36 1,851.24 6,045.15 79.48 79.21 - 19.31 8,312.75Disposals (8.84) (33.14) (960.53) (33.32) (12.22) - (9.84) (1,057.89)Disposal of group undertakings - - (143.13) - - - - (143.13)Other re-classifications (23.62) (499.63) (5,434.76) 6.48 (0.32) (1.02) (251.44) (6,204.31)Exchange differences on consolidation 158.39 420.26 2,587.64 0.30 0.33 - 5.33 3,172.25Cost/deemed cost as at March 31, 2020 17,608.78 23,798.04 1,34,338.02 795.59 466.42 - 1,335.96 1,78,342.81Accumulated impairment as at April 1, 2019 295.97 221.84 2,231.25 20.60 0.07 - 17.25 2,786.98Charge for the year - 1.30 2,180.04 0.11 - - - 2,181.45Disposals - (2.78) (158.63) (0.90) (0.02) - - (162.33)Disposal of group undertakings - - (0.14) - - - - (0.14)Other re-classifications - (10.97) (101.51) - 0.01 - - (112.47)Exchange differences on consolidation 13.18 16.18 164.13 (0.12) - - 0.57 193.94Accumulated impairment as at March 31, 2020 309.15 225.57 4,315.14 19.69 0.06 - 17.82 4,887.43Accumulated depreciation as at April 1, 2019 610.31 5,040.20 41,190.29 455.95 185.58 0.72 280.90 47,763.95Charge for the year 135.73 824.02 6,281.90 102.23 36.39 - 54.76 7,435.03Disposals - (14.19) (472.92) (28.86) (8.33) - (0.18) (524.48)Disposal of group undertakings - - (124.93) - - - - (124.93)Other re-classifications (0.53) (171.75) (2,266.86) 7.58 (0.31) (0.72) (67.57) (2,500.16)Exchange differences on consolidation (0.03) 243.55 1,656.12 (1.84) 0.11 - 4.08 1,901.99Accumulated depreciation as at March 31, 2020 745.48 5,921.83 46,263.60 535.06 213.44 - 271.99 53,951.40Total accumulated depreciation and impairment as at March 31, 2020
1,054.63 6,147.40 50,578.74 554.75 213.50 - 289.81 58,838.83
Net carrying value as at April 1, 2019 16,220.07 16,490.56 84,013.58 262.91 212.73 0.30 1,250.82 1,18,450.97Net carrying value as at March 31, 2020 16,554.15 17,650.64 83,759.28 240.84 252.92 - 1,046.15 1,19,503.98
NOTESforming part of the consolidated financial statements
Consolidated
INTEGRATED REPORT & ANNUAL ACCOUNTS 2019-20 | 113TH YEAR344
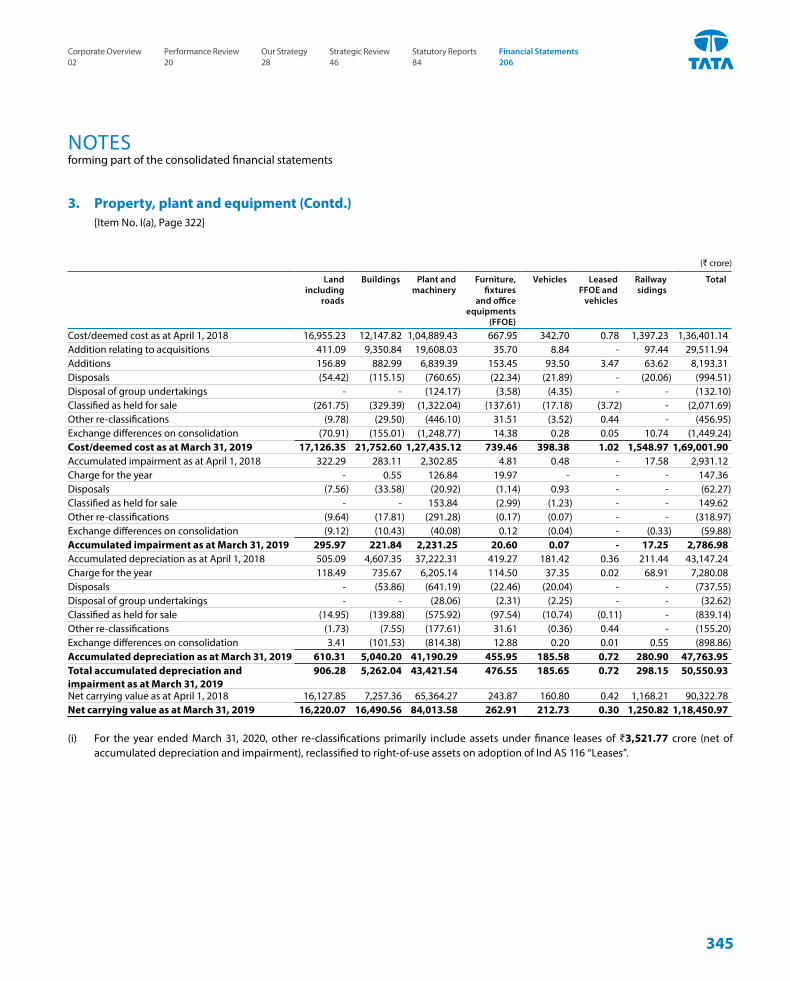
(` crore)
Land including
roads
Buildings Plant andmachinery
Furniture, fixtures
and office equipments
(FFOE)
Vehicles LeasedFFOE and
vehicles
Railwaysidings
Total
Cost/deemed cost as at April 1, 2018 16,955.23 12,147.82 1,04,889.43 667.95 342.70 0.78 1,397.23 1,36,401.14Addition relating to acquisitions 411.09 9,350.84 19,608.03 35.70 8.84 - 97.44 29,511.94Additions 156.89 882.99 6,839.39 153.45 93.50 3.47 63.62 8,193.31Disposals (54.42) (115.15) (760.65) (22.34) (21.89) - (20.06) (994.51)Disposal of group undertakings - - (124.17) (3.58) (4.35) - - (132.10)Classified as held for sale (261.75) (329.39) (1,322.04) (137.61) (17.18) (3.72) - (2,071.69)Other re-classifications (9.78) (29.50) (446.10) 31.51 (3.52) 0.44 - (456.95)Exchange differences on consolidation (70.91) (155.01) (1,248.77) 14.38 0.28 0.05 10.74 (1,449.24)Cost/deemed cost as at March 31, 2019 17,126.35 21,752.60 1,27,435.12 739.46 398.38 1.02 1,548.97 1,69,001.90Accumulated impairment as at April 1, 2018 322.29 283.11 2,302.85 4.81 0.48 - 17.58 2,931.12Charge for the year - 0.55 126.84 19.97 - - - 147.36Disposals (7.56) (33.58) (20.92) (1.14) 0.93 - - (62.27)Classified as held for sale - - 153.84 (2.99) (1.23) - - 149.62Other re-classifications (9.64) (17.81) (291.28) (0.17) (0.07) - - (318.97)Exchange differences on consolidation (9.12) (10.43) (40.08) 0.12 (0.04) - (0.33) (59.88)Accumulated impairment as at March 31, 2019 295.97 221.84 2,231.25 20.60 0.07 - 17.25 2,786.98Accumulated depreciation as at April 1, 2018 505.09 4,607.35 37,222.31 419.27 181.42 0.36 211.44 43,147.24Charge for the year 118.49 735.67 6,205.14 114.50 37.35 0.02 68.91 7,280.08Disposals - (53.86) (641.19) (22.46) (20.04) - - (737.55)Disposal of group undertakings - - (28.06) (2.31) (2.25) - - (32.62)Classified as held for sale (14.95) (139.88) (575.92) (97.54) (10.74) (0.11) - (839.14)Other re-classifications (1.73) (7.55) (177.61) 31.61 (0.36) 0.44 - (155.20)Exchange differences on consolidation 3.41 (101.53) (814.38) 12.88 0.20 0.01 0.55 (898.86)Accumulated depreciation as at March 31, 2019 610.31 5,040.20 41,190.29 455.95 185.58 0.72 280.90 47,763.95Total accumulated depreciation and impairment as at March 31, 2019
906.28 5,262.04 43,421.54 476.55 185.65 0.72 298.15 50,550.93
Net carrying value as at April 1, 2018 16,127.85 7,257.36 65,364.27 243.87 160.80 0.42 1,168.21 90,322.78Net carrying value as at March 31, 2019 16,220.07 16,490.56 84,013.58 262.91 212.73 0.30 1,250.82 1,18,450.97
(i) For the year ended March 31, 2020, other re-classifications primarily include assets under finance leases of ₹3,521.77 crore (net of accumulated depreciation and impairment), reclassified to right-of-use assets on adoption of Ind AS 116 “Leases”.
3. Property, plant and equipment (Contd.) [Item No. I(a), Page 322]
NOTESforming part of the consolidated financial statements
345
Corporate Overview 02
Strategic Review 46
Performance Review 20
Statutory Reports 84
Our Strategy 28
Financial Statements 206
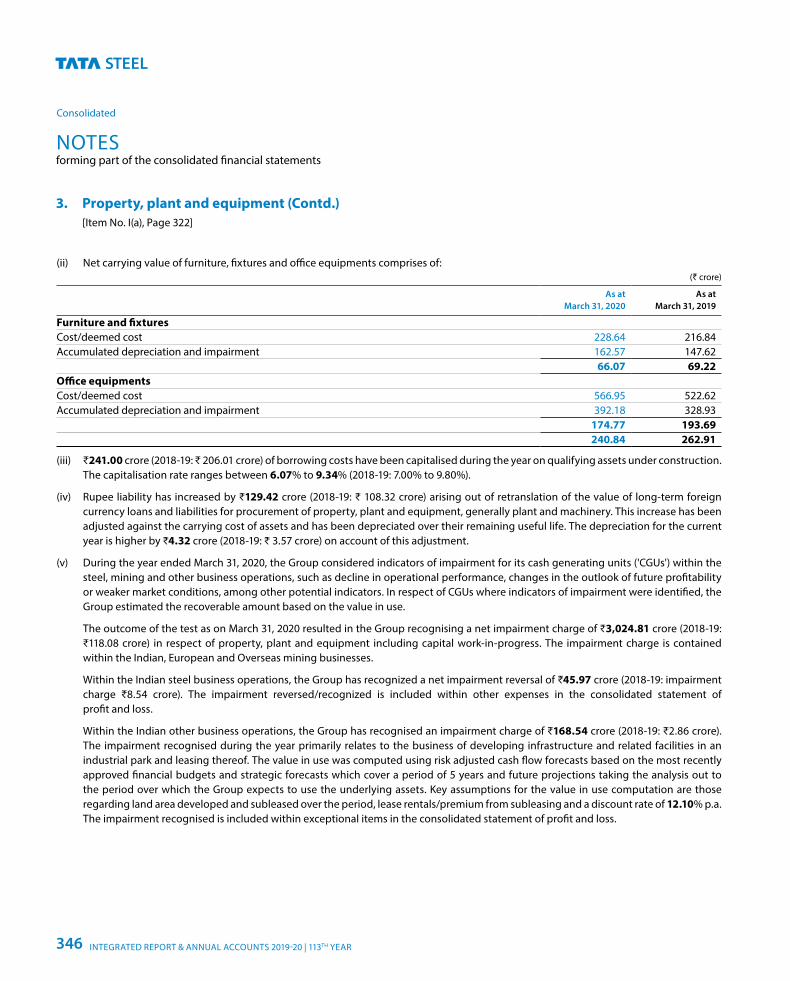
(ii) Net carrying value of furniture, fixtures and office equipments comprises of:(` crore)
As at March 31, 2020
As at March 31, 2019
Furniture and fixtures Cost/deemed cost 228.64 216.84Accumulated depreciation and impairment 162.57 147.62
66.07 69.22Office equipmentsCost/deemed cost 566.95 522.62Accumulated depreciation and impairment 392.18 328.93
174.77 193.69240.84 262.91
(iii) ₹241.00 crore (2018-19: ₹ 206.01 crore) of borrowing costs have been capitalised during the year on qualifying assets under construction. The capitalisation rate ranges between 6.07% to 9.34% (2018-19: 7.00% to 9.80%).
(iv) Rupee liability has increased by ₹129.42 crore (2018-19: ₹ 108.32 crore) arising out of retranslation of the value of long-term foreign currency loans and liabilities for procurement of property, plant and equipment, generally plant and machinery. This increase has been adjusted against the carrying cost of assets and has been depreciated over their remaining useful life. The depreciation for the current year is higher by ₹4.32 crore (2018-19: ₹ 3.57 crore) on account of this adjustment.
(v) During the year ended March 31, 2020, the Group considered indicators of impairment for its cash generating units ('CGUs') within the steel, mining and other business operations, such as decline in operational performance, changes in the outlook of future profitability or weaker market conditions, among other potential indicators. In respect of CGUs where indicators of impairment were identified, the Group estimated the recoverable amount based on the value in use.
The outcome of the test as on March 31, 2020 resulted in the Group recognising a net impairment charge of ₹3,024.81 crore (2018-19: ₹118.08 crore) in respect of property, plant and equipment including capital work-in-progress. The impairment charge is contained within the Indian, European and Overseas mining businesses.
Within the Indian steel business operations, the Group has recognized a net impairment reversal of ₹45.97 crore (2018-19: impairment charge ₹8.54 crore). The impairment reversed/recognized is included within other expenses in the consolidated statement of profit and loss.
Within the Indian other business operations, the Group has recognised an impairment charge of ₹168.54 crore (2018-19: ₹2.86 crore). The impairment recognised during the year primarily relates to the business of developing infrastructure and related facilities in an industrial park and leasing thereof. The value in use was computed using risk adjusted cash flow forecasts based on the most recently approved financial budgets and strategic forecasts which cover a period of 5 years and future projections taking the analysis out to the period over which the Group expects to use the underlying assets. Key assumptions for the value in use computation are those regarding land area developed and subleased over the period, lease rentals/premium from subleasing and a discount rate of 12.10% p.a. The impairment recognised is included within exceptional items in the consolidated statement of profit and loss.
3. Property, plant and equipment (Contd.) [Item No. I(a), Page 322]
NOTESforming part of the consolidated financial statements
Consolidated
INTEGRATED REPORT & ANNUAL ACCOUNTS 2019-20 | 113TH YEAR346
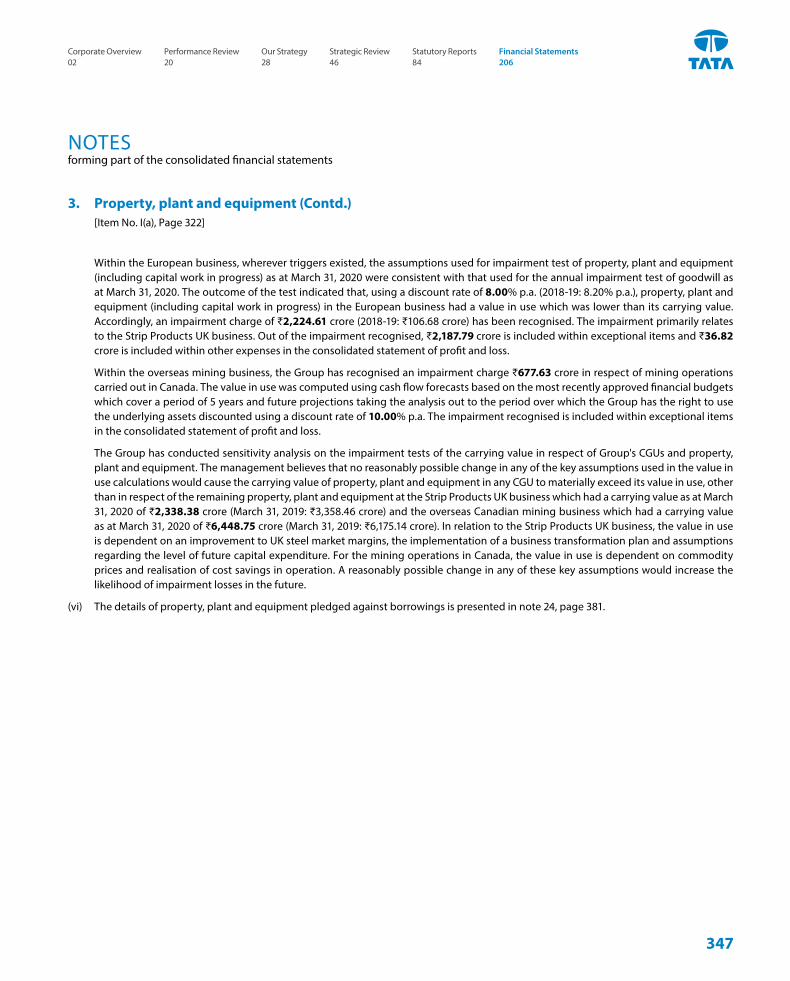
Within the European business, wherever triggers existed, the assumptions used for impairment test of property, plant and equipment (including capital work in progress) as at March 31, 2020 were consistent with that used for the annual impairment test of goodwill as at March 31, 2020. The outcome of the test indicated that, using a discount rate of 8.00% p.a. (2018-19: 8.20% p.a.), property, plant and equipment (including capital work in progress) in the European business had a value in use which was lower than its carrying value. Accordingly, an impairment charge of ₹2,224.61 crore (2018-19: ₹106.68 crore) has been recognised. The impairment primarily relates to the Strip Products UK business. Out of the impairment recognised, ₹2,187.79 crore is included within exceptional items and ₹36.82 crore is included within other expenses in the consolidated statement of profit and loss.
Within the overseas mining business, the Group has recognised an impairment charge ₹677.63 crore in respect of mining operations carried out in Canada. The value in use was computed using cash flow forecasts based on the most recently approved financial budgets which cover a period of 5 years and future projections taking the analysis out to the period over which the Group has the right to use the underlying assets discounted using a discount rate of 10.00% p.a. The impairment recognised is included within exceptional items in the consolidated statement of profit and loss.
The Group has conducted sensitivity analysis on the impairment tests of the carrying value in respect of Group's CGUs and property, plant and equipment. The management believes that no reasonably possible change in any of the key assumptions used in the value in use calculations would cause the carrying value of property, plant and equipment in any CGU to materially exceed its value in use, other than in respect of the remaining property, plant and equipment at the Strip Products UK business which had a carrying value as at March 31, 2020 of ₹2,338.38 crore (March 31, 2019: ₹3,358.46 crore) and the overseas Canadian mining business which had a carrying value as at March 31, 2020 of ₹6,448.75 crore (March 31, 2019: ₹6,175.14 crore). In relation to the Strip Products UK business, the value in use is dependent on an improvement to UK steel market margins, the implementation of a business transformation plan and assumptions regarding the level of future capital expenditure. For the mining operations in Canada, the value in use is dependent on commodity prices and realisation of cost savings in operation. A reasonably possible change in any of these key assumptions would increase the likelihood of impairment losses in the future.
(vi) The details of property, plant and equipment pledged against borrowings is presented in note 24, page 381.
3. Property, plant and equipment (Contd.) [Item No. I(a), Page 322]
NOTESforming part of the consolidated financial statements
347
Corporate Overview 02
Strategic Review 46
Performance Review 20
Statutory Reports 84
Our Strategy 28
Financial Statements 206
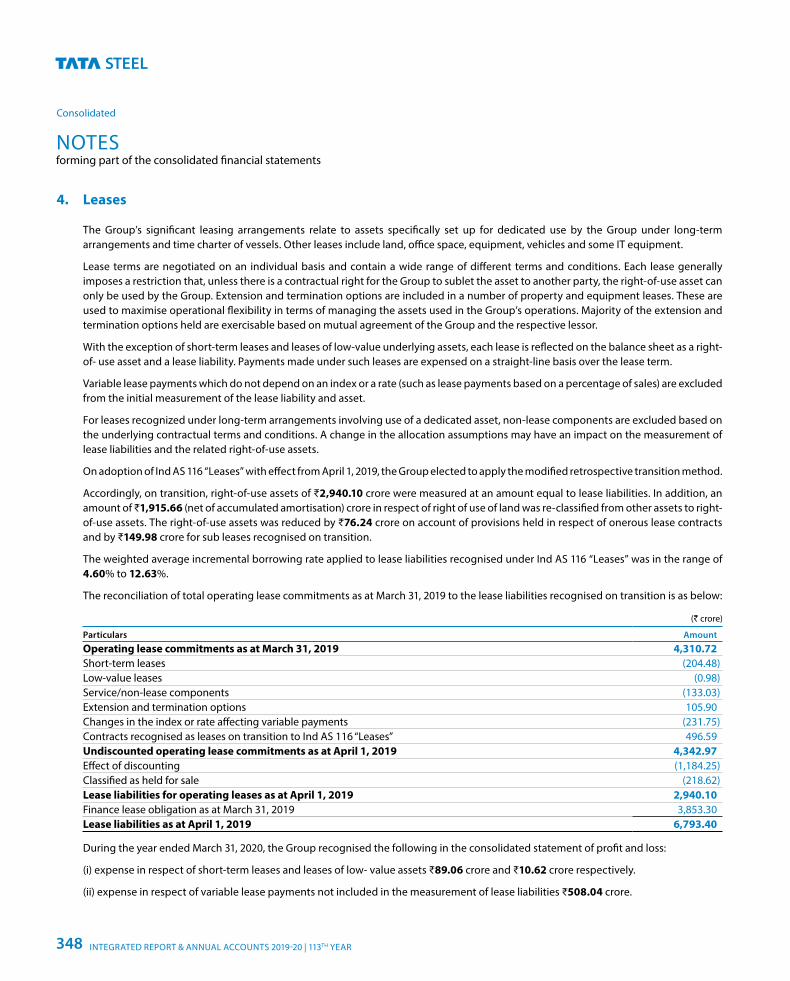
4. Leases The Group’s significant leasing arrangements relate to assets specifically set up for dedicated use by the Group under long-term
arrangements and time charter of vessels. Other leases include land, office space, equipment, vehicles and some IT equipment.
Lease terms are negotiated on an individual basis and contain a wide range of different terms and conditions. Each lease generally imposes a restriction that, unless there is a contractual right for the Group to sublet the asset to another party, the right-of-use asset can only be used by the Group. Extension and termination options are included in a number of property and equipment leases. These are used to maximise operational flexibility in terms of managing the assets used in the Group’s operations. Majority of the extension and termination options held are exercisable based on mutual agreement of the Group and the respective lessor.
With the exception of short-term leases and leases of low-value underlying assets, each lease is reflected on the balance sheet as a right-of- use asset and a lease liability. Payments made under such leases are expensed on a straight-line basis over the lease term.
Variable lease payments which do not depend on an index or a rate (such as lease payments based on a percentage of sales) are excluded from the initial measurement of the lease liability and asset.
For leases recognized under long-term arrangements involving use of a dedicated asset, non-lease components are excluded based on the underlying contractual terms and conditions. A change in the allocation assumptions may have an impact on the measurement of lease liabilities and the related right-of-use assets.
On adoption of Ind AS 116 “Leases” with effect from April 1, 2019, the Group elected to apply the modified retrospective transition method.
Accordingly, on transition, right-of-use assets of ₹2,940.10 crore were measured at an amount equal to lease liabilities. In addition, an amount of ₹1,915.66 (net of accumulated amortisation) crore in respect of right of use of land was re-classified from other assets to right-of-use assets. The right-of-use assets was reduced by ₹76.24 crore on account of provisions held in respect of onerous lease contracts and by ₹149.98 crore for sub leases recognised on transition.
The weighted average incremental borrowing rate applied to lease liabilities recognised under Ind AS 116 “Leases” was in the range of 4.60% to 12.63%.
The reconciliation of total operating lease commitments as at March 31, 2019 to the lease liabilities recognised on transition is as below:
(` crore)
Particulars Amount
Operating lease commitments as at March 31, 2019 4,310.72Short-term leases (204.48)Low-value leases (0.98)Service/non-lease components (133.03)Extension and termination options 105.90Changes in the index or rate affecting variable payments (231.75)Contracts recognised as leases on transition to Ind AS 116 “Leases” 496.59Undiscounted operating lease commitments as at April 1, 2019 4,342.97Effect of discounting (1,184.25)Classified as held for sale (218.62)Lease liabilities for operating leases as at April 1, 2019 2,940.10Finance lease obligation as at March 31, 2019 3,853.30Lease liabilities as at April 1, 2019 6,793.40
During the year ended March 31, 2020, the Group recognised the following in the consolidated statement of profit and loss:
(i) expense in respect of short-term leases and leases of low- value assets ₹89.06 crore and ₹10.62 crore respectively.
(ii) expense in respect of variable lease payments not included in the measurement of lease liabilities ₹508.04 crore.
NOTESforming part of the consolidated financial statements
Consolidated
INTEGRATED REPORT & ANNUAL ACCOUNTS 2019-20 | 113TH YEAR348
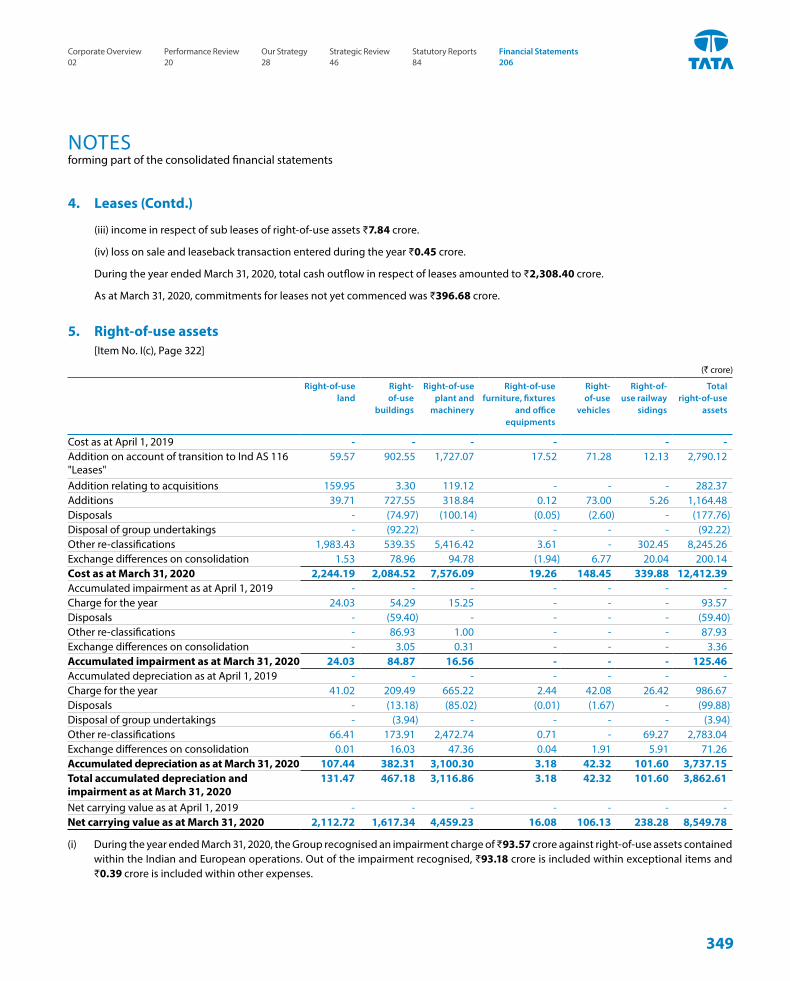
(iii) income in respect of sub leases of right-of-use assets ₹7.84 crore.
(iv) loss on sale and leaseback transaction entered during the year ₹0.45 crore.
During the year ended March 31, 2020, total cash outflow in respect of leases amounted to ₹2,308.40 crore.
As at March 31, 2020, commitments for leases not yet commenced was ₹396.68 crore.
5. Right-of-use assets [Item No. I(c), Page 322]
(` crore)
Right-of-use land
Right-of-use
buildings
Right-of-use plant and
machinery
Right-of-use furniture, fixtures
and office equipments
Right-of-use
vehicles
Right-of-use railway
sidings
Total right-of-use
assets
Cost as at April 1, 2019 - - - - - -Addition on account of transition to Ind AS 116 "Leases"
59.57 902.55 1,727.07 17.52 71.28 12.13 2,790.12
Addition relating to acquisitions 159.95 3.30 119.12 - - - 282.37Additions 39.71 727.55 318.84 0.12 73.00 5.26 1,164.48Disposals - (74.97) (100.14) (0.05) (2.60) - (177.76)Disposal of group undertakings - (92.22) - - - - (92.22)Other re-classifications 1,983.43 539.35 5,416.42 3.61 - 302.45 8,245.26Exchange differences on consolidation 1.53 78.96 94.78 (1.94) 6.77 20.04 200.14Cost as at March 31, 2020 2,244.19 2,084.52 7,576.09 19.26 148.45 339.88 12,412.39Accumulated impairment as at April 1, 2019 - - - - - - -Charge for the year 24.03 54.29 15.25 - - - 93.57Disposals - (59.40) - - - - (59.40)Other re-classifications - 86.93 1.00 - - - 87.93Exchange differences on consolidation - 3.05 0.31 - - - 3.36Accumulated impairment as at March 31, 2020 24.03 84.87 16.56 - - - 125.46Accumulated depreciation as at April 1, 2019 - - - - - - -Charge for the year 41.02 209.49 665.22 2.44 42.08 26.42 986.67Disposals - (13.18) (85.02) (0.01) (1.67) - (99.88)Disposal of group undertakings - (3.94) - - - - (3.94)Other re-classifications 66.41 173.91 2,472.74 0.71 - 69.27 2,783.04Exchange differences on consolidation 0.01 16.03 47.36 0.04 1.91 5.91 71.26Accumulated depreciation as at March 31, 2020 107.44 382.31 3,100.30 3.18 42.32 101.60 3,737.15Total accumulated depreciation and impairment as at March 31, 2020
131.47 467.18 3,116.86 3.18 42.32 101.60 3,862.61
Net carrying value as at April 1, 2019 - - - - - - -Net carrying value as at March 31, 2020 2,112.72 1,617.34 4,459.23 16.08 106.13 238.28 8,549.78
(i) During the year ended March 31, 2020, the Group recognised an impairment charge of ₹93.57 crore against right-of-use assets contained within the Indian and European operations. Out of the impairment recognised, ₹93.18 crore is included within exceptional items and ₹0.39 crore is included within other expenses.
4. Leases (Contd.)
NOTESforming part of the consolidated financial statements
349
Corporate Overview 02
Strategic Review 46
Performance Review 20
Statutory Reports 84
Our Strategy 28
Financial Statements 206
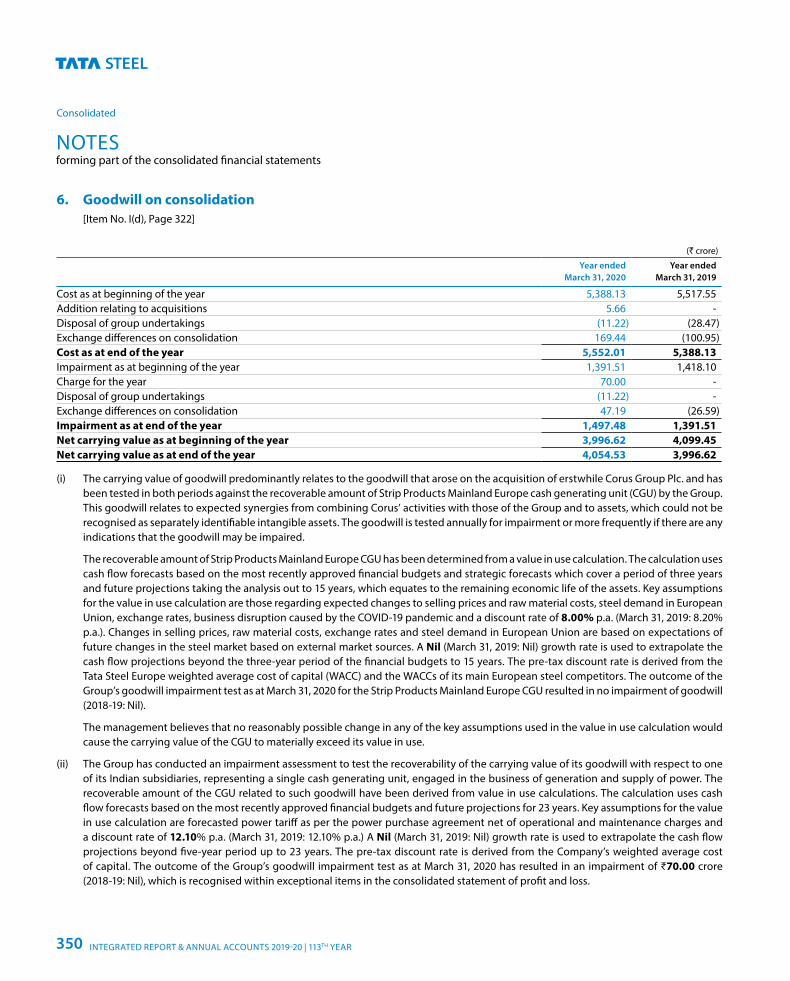
6. Goodwill on consolidation [Item No. I(d), Page 322]
(` crore)
Year ended March 31, 2020
Year ended March 31, 2019
Cost as at beginning of the year 5,388.13 5,517.55Addition relating to acquisitions 5.66 -Disposal of group undertakings (11.22) (28.47)Exchange differences on consolidation 169.44 (100.95)Cost as at end of the year 5,552.01 5,388.13Impairment as at beginning of the year 1,391.51 1,418.10Charge for the year 70.00 -Disposal of group undertakings (11.22) -Exchange differences on consolidation 47.19 (26.59)Impairment as at end of the year 1,497.48 1,391.51Net carrying value as at beginning of the year 3,996.62 4,099.45Net carrying value as at end of the year 4,054.53 3,996.62
(i) The carrying value of goodwill predominantly relates to the goodwill that arose on the acquisition of erstwhile Corus Group Plc. and has been tested in both periods against the recoverable amount of Strip Products Mainland Europe cash generating unit (CGU) by the Group. This goodwill relates to expected synergies from combining Corus’ activities with those of the Group and to assets, which could not be recognised as separately identifiable intangible assets. The goodwill is tested annually for impairment or more frequently if there are any indications that the goodwill may be impaired.
The recoverable amount of Strip Products Mainland Europe CGU has been determined from a value in use calculation. The calculation uses cash flow forecasts based on the most recently approved financial budgets and strategic forecasts which cover a period of three years and future projections taking the analysis out to 15 years, which equates to the remaining economic life of the assets. Key assumptions for the value in use calculation are those regarding expected changes to selling prices and raw material costs, steel demand in European Union, exchange rates, business disruption caused by the COVID-19 pandemic and a discount rate of 8.00% p.a. (March 31, 2019: 8.20% p.a.). Changes in selling prices, raw material costs, exchange rates and steel demand in European Union are based on expectations of future changes in the steel market based on external market sources. A Nil (March 31, 2019: Nil) growth rate is used to extrapolate the cash flow projections beyond the three-year period of the financial budgets to 15 years. The pre-tax discount rate is derived from the Tata Steel Europe weighted average cost of capital (WACC) and the WACCs of its main European steel competitors. The outcome of the Group’s goodwill impairment test as at March 31, 2020 for the Strip Products Mainland Europe CGU resulted in no impairment of goodwill (2018-19: Nil).
The management believes that no reasonably possible change in any of the key assumptions used in the value in use calculation would cause the carrying value of the CGU to materially exceed its value in use.
(ii) The Group has conducted an impairment assessment to test the recoverability of the carrying value of its goodwill with respect to one of its Indian subsidiaries, representing a single cash generating unit, engaged in the business of generation and supply of power. The recoverable amount of the CGU related to such goodwill have been derived from value in use calculations. The calculation uses cash flow forecasts based on the most recently approved financial budgets and future projections for 23 years. Key assumptions for the value in use calculation are forecasted power tariff as per the power purchase agreement net of operational and maintenance charges and a discount rate of 12.10% p.a. (March 31, 2019: 12.10% p.a.) A Nil (March 31, 2019: Nil) growth rate is used to extrapolate the cash flow projections beyond five-year period up to 23 years. The pre-tax discount rate is derived from the Company’s weighted average cost of capital. The outcome of the Group’s goodwill impairment test as at March 31, 2020 has resulted in an impairment of ₹70.00 crore (2018-19: Nil), which is recognised within exceptional items in the consolidated statement of profit and loss.
NOTESforming part of the consolidated financial statements
Consolidated
INTEGRATED REPORT & ANNUAL ACCOUNTS 2019-20 | 113TH YEAR350
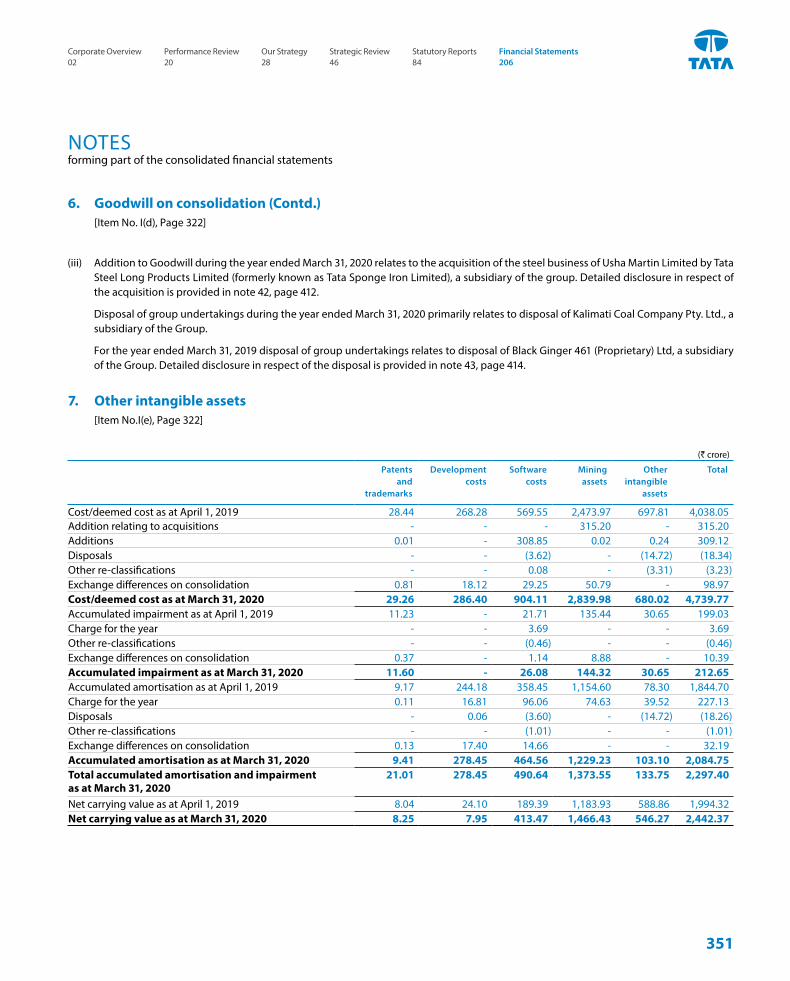
7. Other intangible assets [Item No.I(e), Page 322]
(` crore)
Patents and
trademarks
Developmentcosts
Software costs
Miningassets
Other intangible
assets
Total
Cost/deemed cost as at April 1, 2019 28.44 268.28 569.55 2,473.97 697.81 4,038.05Addition relating to acquisitions - - - 315.20 - 315.20Additions 0.01 - 308.85 0.02 0.24 309.12Disposals - - (3.62) - (14.72) (18.34)Other re-classifications - - 0.08 - (3.31) (3.23)Exchange differences on consolidation 0.81 18.12 29.25 50.79 - 98.97Cost/deemed cost as at March 31, 2020 29.26 286.40 904.11 2,839.98 680.02 4,739.77Accumulated impairment as at April 1, 2019 11.23 - 21.71 135.44 30.65 199.03Charge for the year - - 3.69 - - 3.69Other re-classifications - - (0.46) - - (0.46)Exchange differences on consolidation 0.37 - 1.14 8.88 - 10.39Accumulated impairment as at March 31, 2020 11.60 - 26.08 144.32 30.65 212.65Accumulated amortisation as at April 1, 2019 9.17 244.18 358.45 1,154.60 78.30 1,844.70Charge for the year 0.11 16.81 96.06 74.63 39.52 227.13Disposals - 0.06 (3.60) - (14.72) (18.26)Other re-classifications - - (1.01) - - (1.01)Exchange differences on consolidation 0.13 17.40 14.66 - - 32.19Accumulated amortisation as at March 31, 2020 9.41 278.45 464.56 1,229.23 103.10 2,084.75Total accumulated amortisation and impairmentas at March 31, 2020
21.01 278.45 490.64 1,373.55 133.75 2,297.40
Net carrying value as at April 1, 2019 8.04 24.10 189.39 1,183.93 588.86 1,994.32Net carrying value as at March 31, 2020 8.25 7.95 413.47 1,466.43 546.27 2,442.37
(iii) Addition to Goodwill during the year ended March 31, 2020 relates to the acquisition of the steel business of Usha Martin Limited by Tata Steel Long Products Limited (formerly known as Tata Sponge Iron Limited), a subsidiary of the group. Detailed disclosure in respect of the acquisition is provided in note 42, page 412.
Disposal of group undertakings during the year ended March 31, 2020 primarily relates to disposal of Kalimati Coal Company Pty. Ltd., a subsidiary of the Group.
For the year ended March 31, 2019 disposal of group undertakings relates to disposal of Black Ginger 461 (Proprietary) Ltd, a subsidiary of the Group. Detailed disclosure in respect of the disposal is provided in note 43, page 414.
6. Goodwill on consolidation (Contd.) [Item No. I(d), Page 322]
NOTESforming part of the consolidated financial statements
351
Corporate Overview 02
Strategic Review 46
Performance Review 20
Statutory Reports 84
Our Strategy 28
Financial Statements 206
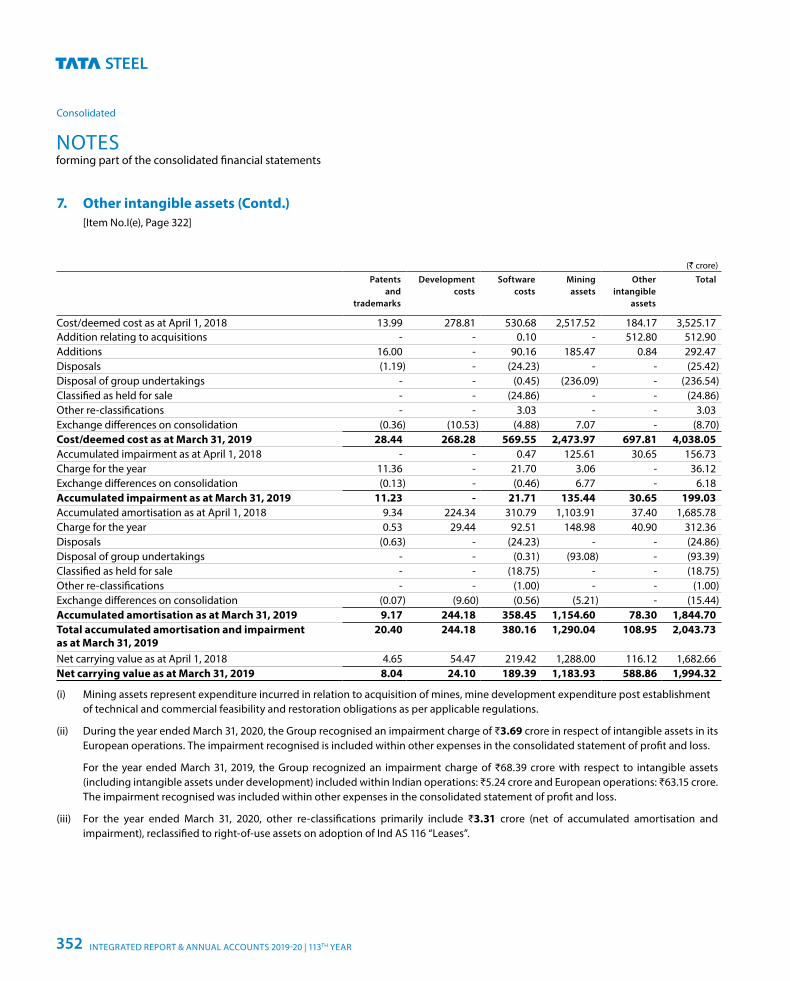
(` crore)Patents
and trademarks
Developmentcosts
Software costs
Miningassets
Other intangible
assets
Total
Cost/deemed cost as at April 1, 2018 13.99 278.81 530.68 2,517.52 184.17 3,525.17Addition relating to acquisitions - - 0.10 - 512.80 512.90Additions 16.00 - 90.16 185.47 0.84 292.47Disposals (1.19) - (24.23) - - (25.42)Disposal of group undertakings - - (0.45) (236.09) - (236.54)Classified as held for sale - - (24.86) - - (24.86)Other re-classifications - - 3.03 - - 3.03Exchange differences on consolidation (0.36) (10.53) (4.88) 7.07 - (8.70)Cost/deemed cost as at March 31, 2019 28.44 268.28 569.55 2,473.97 697.81 4,038.05Accumulated impairment as at April 1, 2018 - - 0.47 125.61 30.65 156.73Charge for the year 11.36 - 21.70 3.06 - 36.12Exchange differences on consolidation (0.13) - (0.46) 6.77 - 6.18Accumulated impairment as at March 31, 2019 11.23 - 21.71 135.44 30.65 199.03Accumulated amortisation as at April 1, 2018 9.34 224.34 310.79 1,103.91 37.40 1,685.78Charge for the year 0.53 29.44 92.51 148.98 40.90 312.36Disposals (0.63) - (24.23) - - (24.86)Disposal of group undertakings - - (0.31) (93.08) - (93.39)Classified as held for sale - - (18.75) - - (18.75)Other re-classifications - - (1.00) - - (1.00)Exchange differences on consolidation (0.07) (9.60) (0.56) (5.21) - (15.44)Accumulated amortisation as at March 31, 2019 9.17 244.18 358.45 1,154.60 78.30 1,844.70Total accumulated amortisation and impairmentas at March 31, 2019
20.40 244.18 380.16 1,290.04 108.95 2,043.73
Net carrying value as at April 1, 2018 4.65 54.47 219.42 1,288.00 116.12 1,682.66Net carrying value as at March 31, 2019 8.04 24.10 189.39 1,183.93 588.86 1,994.32
(i) Mining assets represent expenditure incurred in relation to acquisition of mines, mine development expenditure post establishment of technical and commercial feasibility and restoration obligations as per applicable regulations.
(ii) During the year ended March 31, 2020, the Group recognised an impairment charge of ₹3.69 crore in respect of intangible assets in its European operations. The impairment recognised is included within other expenses in the consolidated statement of profit and loss.
For the year ended March 31, 2019, the Group recognized an impairment charge of ₹68.39 crore with respect to intangible assets (including intangible assets under development) included within Indian operations: ₹5.24 crore and European operations: ₹63.15 crore. The impairment recognised was included within other expenses in the consolidated statement of profit and loss.
(iii) For the year ended March 31, 2020, other re-classifications primarily include ₹3.31 crore (net of accumulated amortisation and impairment), reclassified to right-of-use assets on adoption of Ind AS 116 “Leases”.
7. Other intangible assets (Contd.) [Item No.I(e), Page 322]
NOTESforming part of the consolidated financial statements
Consolidated
INTEGRATED REPORT & ANNUAL ACCOUNTS 2019-20 | 113TH YEAR352
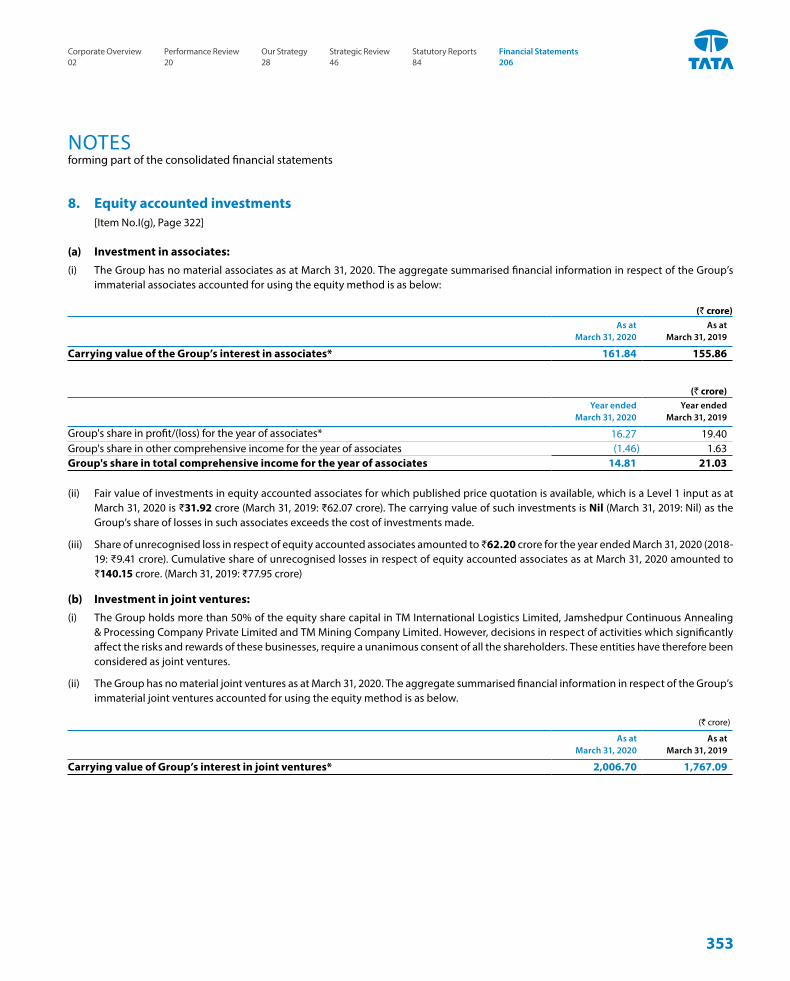
8. Equity accounted investments [Item No.I(g), Page 322]
(a) Investment in associates:(i) The Group has no material associates as at March 31, 2020. The aggregate summarised financial information in respect of the Group’s
immaterial associates accounted for using the equity method is as below:
(` crore)As at
March 31, 2020As at
March 31, 2019
Carrying value of the Group’s interest in associates* 161.84 155.86
(` crore)Year ended
March 31, 2020Year ended
March 31, 2019
Group's share in profit/(loss) for the year of associates* 16.27 19.40Group's share in other comprehensive income for the year of associates (1.46) 1.63Group's share in total comprehensive income for the year of associates 14.81 21.03
(ii) Fair value of investments in equity accounted associates for which published price quotation is available, which is a Level 1 input as at March 31, 2020 is ₹31.92 crore (March 31, 2019: ₹62.07 crore). The carrying value of such investments is Nil (March 31, 2019: Nil) as the Group’s share of losses in such associates exceeds the cost of investments made.
(iii) Share of unrecognised loss in respect of equity accounted associates amounted to ₹62.20 crore for the year ended March 31, 2020 (2018-19: ₹9.41 crore). Cumulative share of unrecognised losses in respect of equity accounted associates as at March 31, 2020 amounted to ₹140.15 crore. (March 31, 2019: ₹77.95 crore)
(b) Investment in joint ventures:(i) The Group holds more than 50% of the equity share capital in TM International Logistics Limited, Jamshedpur Continuous Annealing
& Processing Company Private Limited and TM Mining Company Limited. However, decisions in respect of activities which significantly affect the risks and rewards of these businesses, require a unanimous consent of all the shareholders. These entities have therefore been considered as joint ventures.
(ii) The Group has no material joint ventures as at March 31, 2020. The aggregate summarised financial information in respect of the Group’s immaterial joint ventures accounted for using the equity method is as below.
(` crore)
As at March 31, 2020
As at March 31, 2019
Carrying value of Group’s interest in joint ventures* 2,006.70 1,767.09
NOTESforming part of the consolidated financial statements
353
Corporate Overview 02
Strategic Review 46
Performance Review 20
Statutory Reports 84
Our Strategy 28
Financial Statements 206
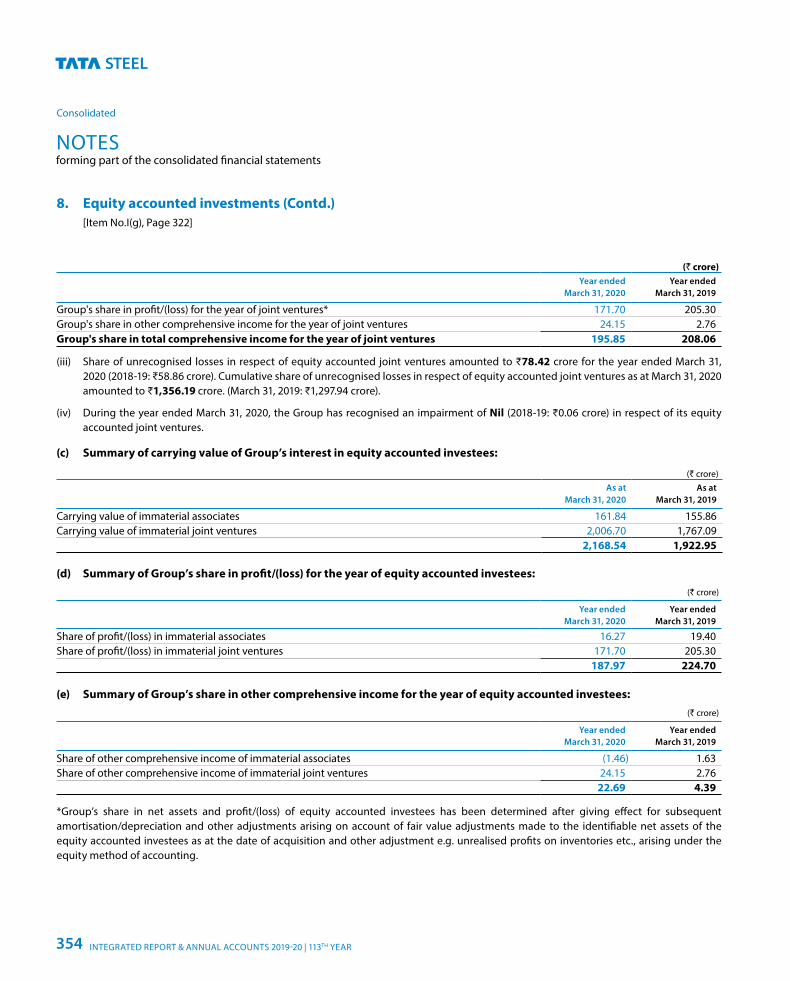
(` crore)Year ended
March 31, 2020Year ended
March 31, 2019
Group's share in profit/(loss) for the year of joint ventures* 171.70 205.30Group's share in other comprehensive income for the year of joint ventures 24.15 2.76Group's share in total comprehensive income for the year of joint ventures 195.85 208.06
(iii) Share of unrecognised losses in respect of equity accounted joint ventures amounted to ₹78.42 crore for the year ended March 31, 2020 (2018-19: ₹58.86 crore). Cumulative share of unrecognised losses in respect of equity accounted joint ventures as at March 31, 2020 amounted to ₹1,356.19 crore. (March 31, 2019: ₹1,297.94 crore).
(iv) During the year ended March 31, 2020, the Group has recognised an impairment of Nil (2018-19: ₹0.06 crore) in respect of its equity accounted joint ventures.
(c) Summary of carrying value of Group’s interest in equity accounted investees:
(` crore)As at
March 31, 2020 As at
March 31, 2019
Carrying value of immaterial associates 161.84 155.86Carrying value of immaterial joint ventures 2,006.70 1,767.09
2,168.54 1,922.95
(d) Summary of Group’s share in profit/(loss) for the year of equity accounted investees:(` crore)
Year ended March 31, 2020
Year ended March 31, 2019
Share of profit/(loss) in immaterial associates 16.27 19.40Share of profit/(loss) in immaterial joint ventures 171.70 205.30
187.97 224.70
(e) Summary of Group’s share in other comprehensive income for the year of equity accounted investees:(` crore)
Year ended March 31, 2020
Year ended March 31, 2019
Share of other comprehensive income of immaterial associates (1.46) 1.63Share of other comprehensive income of immaterial joint ventures 24.15 2.76
22.69 4.39
*Group’s share in net assets and profit/(loss) of equity accounted investees has been determined after giving effect for subsequent amortisation/depreciation and other adjustments arising on account of fair value adjustments made to the identifiable net assets of the equity accounted investees as at the date of acquisition and other adjustment e.g. unrealised profits on inventories etc., arising under the equity method of accounting.
8. Equity accounted investments (Contd.) [Item No.I(g), Page 322]
NOTESforming part of the consolidated financial statements
Consolidated
INTEGRATED REPORT & ANNUAL ACCOUNTS 2019-20 | 113TH YEAR354
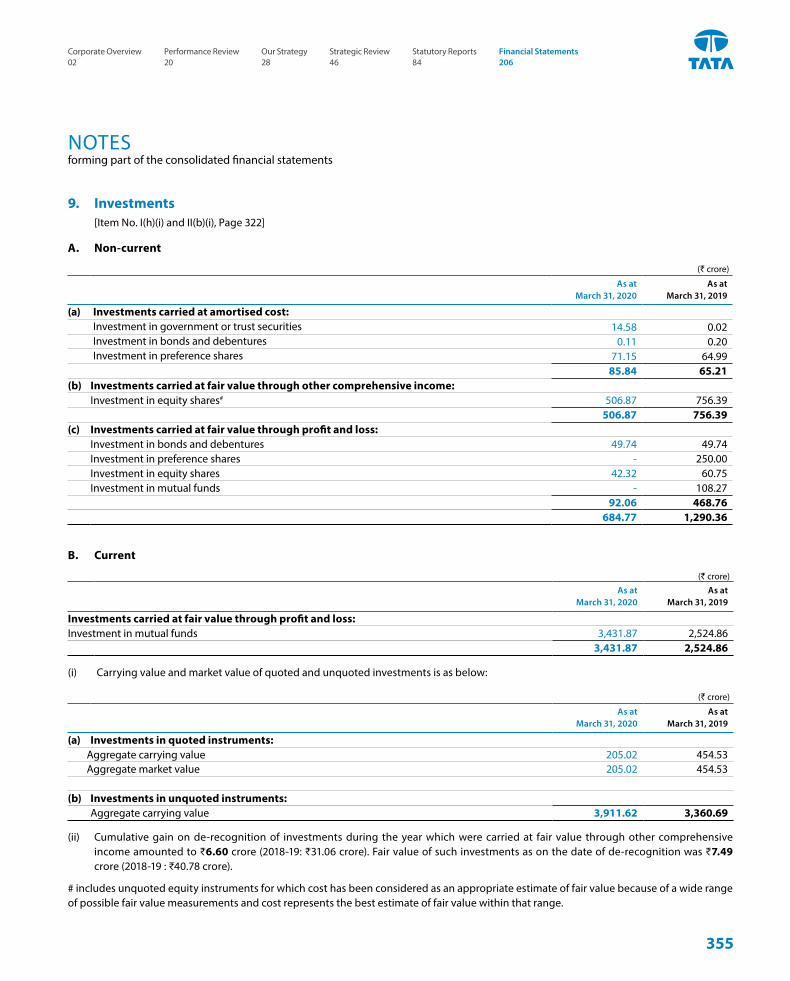
9. Investments [Item No. I(h)(i) and II(b)(i), Page 322]
A. Non-current
(` crore)
As at March 31, 2020
As at March 31, 2019
(a) Investments carried at amortised cost: Investment in government or trust securities 14.58 0.02Investment in bonds and debentures 0.11 0.20Investment in preference shares 71.15 64.99
85.84 65.21(b) Investments carried at fair value through other comprehensive income:
Investment in equity shares# 506.87 756.39506.87 756.39
(c) Investments carried at fair value through profit and loss:Investment in bonds and debentures 49.74 49.74Investment in preference shares - 250.00Investment in equity shares 42.32 60.75Investment in mutual funds - 108.27
92.06 468.76684.77 1,290.36
B. Current
(` crore)As at
March 31, 2020As at
March 31, 2019
Investments carried at fair value through profit and loss:Investment in mutual funds 3,431.87 2,524.86
3,431.87 2,524.86
(i) Carrying value and market value of quoted and unquoted investments is as below:
(` crore)
As at March 31, 2020
As at March 31, 2019
(a) Investments in quoted instruments: Aggregate carrying value 205.02 454.53 Aggregate market value 205.02 454.53
(b) Investments in unquoted instruments: Aggregate carrying value 3,911.62 3,360.69
(ii) Cumulative gain on de-recognition of investments during the year which were carried at fair value through other comprehensive income amounted to ₹6.60 crore (2018-19: ₹31.06 crore). Fair value of such investments as on the date of de-recognition was ₹7.49 crore (2018-19 : ₹40.78 crore).
# includes unquoted equity instruments for which cost has been considered as an appropriate estimate of fair value because of a wide range of possible fair value measurements and cost represents the best estimate of fair value within that range.
NOTESforming part of the consolidated financial statements
355
Corporate Overview 02
Strategic Review 46
Performance Review 20
Statutory Reports 84
Our Strategy 28
Financial Statements 206
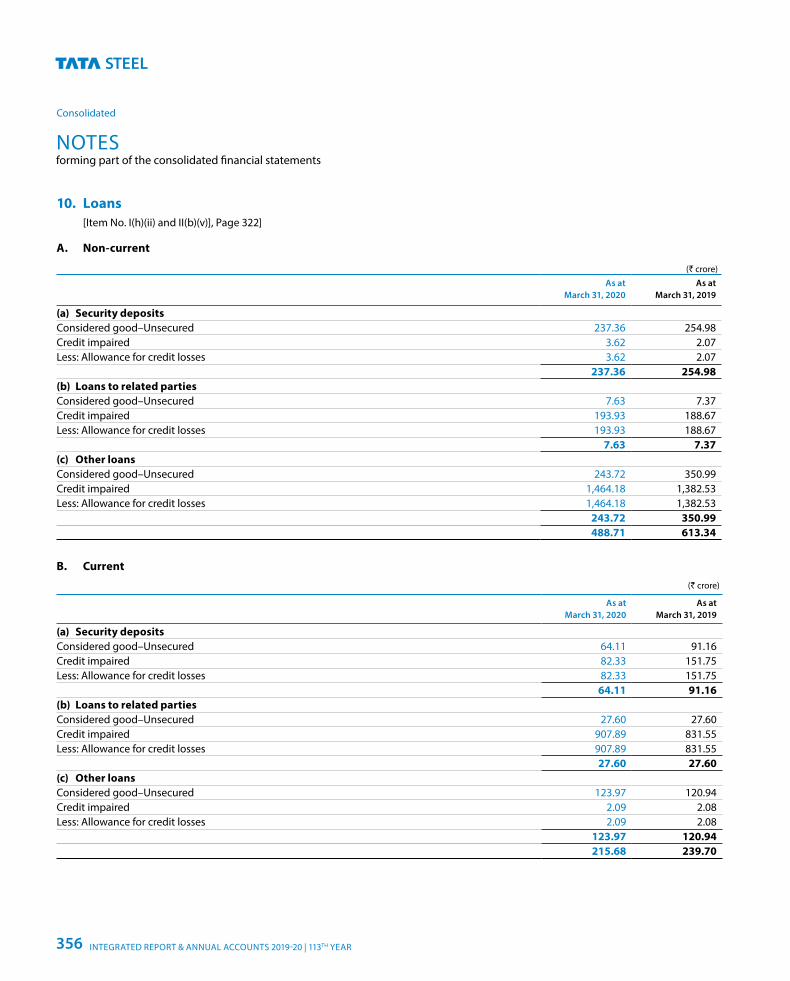
10. Loans [Item No. I(h)(ii) and II(b)(v)], Page 322]
A. Non-current
(` crore)As at
March 31, 2020As at
March 31, 2019
(a) Security depositsConsidered good–Unsecured 237.36 254.98Credit impaired 3.62 2.07Less: Allowance for credit losses 3.62 2.07
237.36 254.98(b) Loans to related partiesConsidered good–Unsecured 7.63 7.37Credit impaired 193.93 188.67Less: Allowance for credit losses 193.93 188.67
7.63 7.37(c) Other loans Considered good–Unsecured 243.72 350.99Credit impaired 1,464.18 1,382.53Less: Allowance for credit losses 1,464.18 1,382.53
243.72 350.99488.71 613.34
B. Current (` crore)
As at March 31, 2020
As at March 31, 2019
(a) Security depositsConsidered good–Unsecured 64.11 91.16Credit impaired 82.33 151.75Less: Allowance for credit losses 82.33 151.75
64.11 91.16(b) Loans to related partiesConsidered good–Unsecured 27.60 27.60Credit impaired 907.89 831.55Less: Allowance for credit losses 907.89 831.55
27.60 27.60(c) Other loansConsidered good–Unsecured 123.97 120.94Credit impaired 2.09 2.08Less: Allowance for credit losses 2.09 2.08
123.97 120.94215.68 239.70
NOTESforming part of the consolidated financial statements
Consolidated
INTEGRATED REPORT & ANNUAL ACCOUNTS 2019-20 | 113TH YEAR356
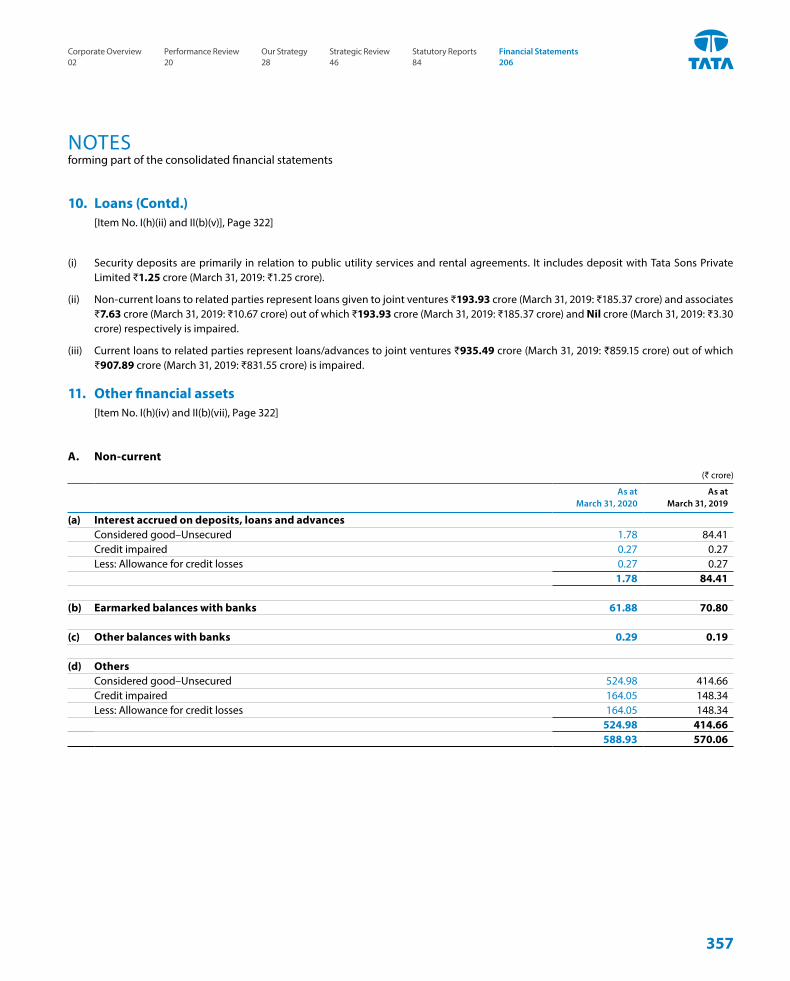
(i) Security deposits are primarily in relation to public utility services and rental agreements. It includes deposit with Tata Sons Private Limited ₹1.25 crore (March 31, 2019: ₹1.25 crore).
(ii) Non-current loans to related parties represent loans given to joint ventures ₹193.93 crore (March 31, 2019: ₹185.37 crore) and associates ₹7.63 crore (March 31, 2019: ₹10.67 crore) out of which ₹193.93 crore (March 31, 2019: ₹185.37 crore) and Nil crore (March 31, 2019: ₹3.30 crore) respectively is impaired.
(iii) Current loans to related parties represent loans/advances to joint ventures ₹935.49 crore (March 31, 2019: ₹859.15 crore) out of which ₹907.89 crore (March 31, 2019: ₹831.55 crore) is impaired.
11. Other financial assets [Item No. I(h)(iv) and II(b)(vii), Page 322]
A. Non-current(` crore)
As at March 31, 2020
As at March 31, 2019
(a) Interest accrued on deposits, loans and advancesConsidered good–Unsecured 1.78 84.41Credit impaired 0.27 0.27Less: Allowance for credit losses 0.27 0.27
1.78 84.41
(b) Earmarked balances with banks 61.88 70.80
(c) Other balances with banks 0.29 0.19
(d) OthersConsidered good–Unsecured 524.98 414.66Credit impaired 164.05 148.34Less: Allowance for credit losses 164.05 148.34
524.98 414.66588.93 570.06
10. Loans (Contd.) [Item No. I(h)(ii) and II(b)(v)], Page 322]
NOTESforming part of the consolidated financial statements
357
Corporate Overview 02
Strategic Review 46
Performance Review 20
Statutory Reports 84
Our Strategy 28
Financial Statements 206
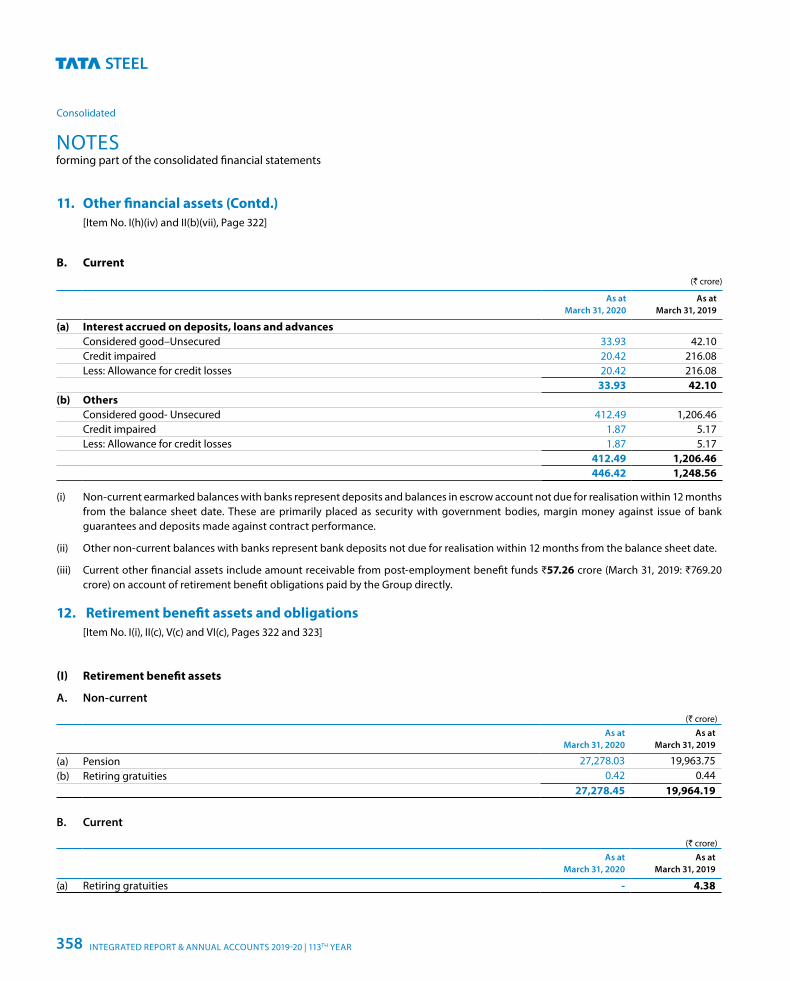
11. Other financial assets (Contd.) [Item No. I(h)(iv) and II(b)(vii), Page 322]
B. Current (` crore)
As at March 31, 2020
As at March 31, 2019
(a) Interest accrued on deposits, loans and advancesConsidered good–Unsecured 33.93 42.10Credit impaired 20.42 216.08Less: Allowance for credit losses 20.42 216.08
33.93 42.10(b) Others
Considered good- Unsecured 412.49 1,206.46Credit impaired 1.87 5.17Less: Allowance for credit losses 1.87 5.17
412.49 1,206.46446.42 1,248.56
(i) Non-current earmarked balances with banks represent deposits and balances in escrow account not due for realisation within 12 months from the balance sheet date. These are primarily placed as security with government bodies, margin money against issue of bank guarantees and deposits made against contract performance.
(ii) Other non-current balances with banks represent bank deposits not due for realisation within 12 months from the balance sheet date.
(iii) Current other financial assets include amount receivable from post-employment benefit funds ₹57.26 crore (March 31, 2019: ₹769.20 crore) on account of retirement benefit obligations paid by the Group directly.
12. Retirement benefit assets and obligations [Item No. I(i), II(c), V(c) and VI(c), Pages 322 and 323]
(I) Retirement benefit assets
A. Non-current
(` crore)As at
March 31, 2020As at
March 31, 2019
(a) Pension 27,278.03 19,963.75(b) Retiring gratuities 0.42 0.44
27,278.45 19,964.19
B. Current
(` crore)As at
March 31, 2020As at
March 31, 2019
(a) Retiring gratuities - 4.38
NOTESforming part of the consolidated financial statements
Consolidated
INTEGRATED REPORT & ANNUAL ACCOUNTS 2019-20 | 113TH YEAR358
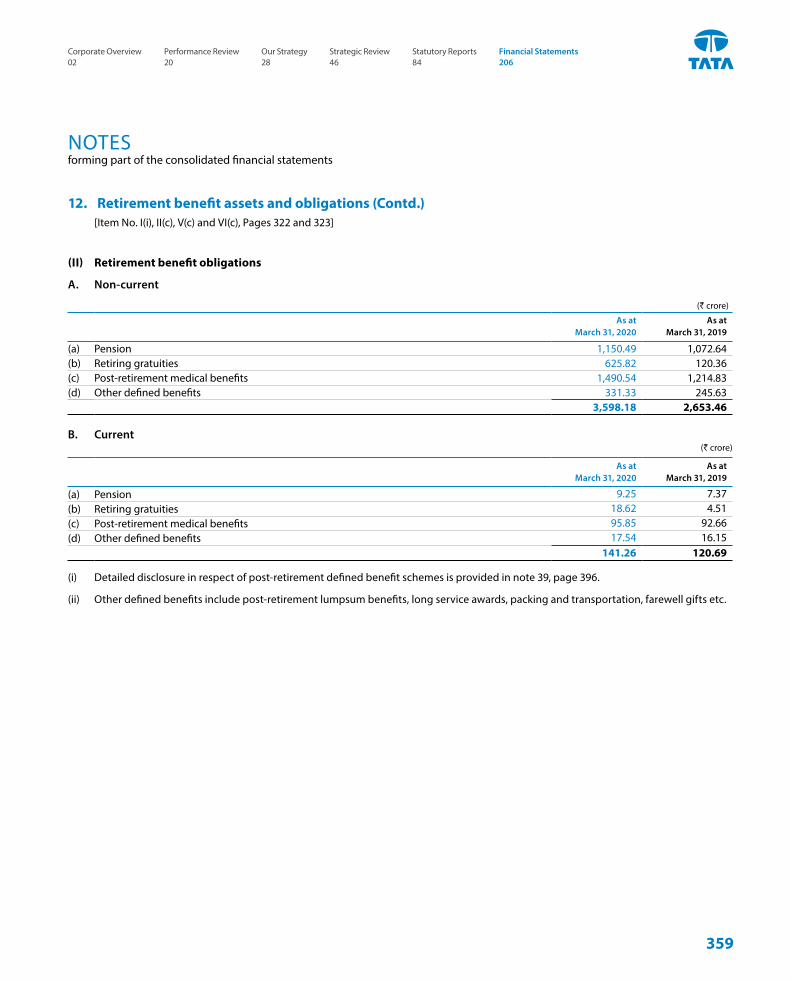
(II) Retirement benefit obligations
A. Non-current
(` crore)
As at March 31, 2020
As at March 31, 2019
(a) Pension 1,150.49 1,072.64(b) Retiring gratuities 625.82 120.36(c) Post-retirement medical benefits 1,490.54 1,214.83(d) Other defined benefits 331.33 245.63
3,598.18 2,653.46
B. Current (` crore)
As at March 31, 2020
As at March 31, 2019
(a) Pension 9.25 7.37(b) Retiring gratuities 18.62 4.51(c) Post-retirement medical benefits 95.85 92.66(d) Other defined benefits 17.54 16.15
141.26 120.69
(i) Detailed disclosure in respect of post-retirement defined benefit schemes is provided in note 39, page 396.
(ii) Other defined benefits include post-retirement lumpsum benefits, long service awards, packing and transportation, farewell gifts etc.
12. Retirement benefit assets and obligations (Contd.) [Item No. I(i), II(c), V(c) and VI(c), Pages 322 and 323]
NOTESforming part of the consolidated financial statements
359
Corporate Overview 02
Strategic Review 46
Performance Review 20
Statutory Reports 84
Our Strategy 28
Financial Statements 206
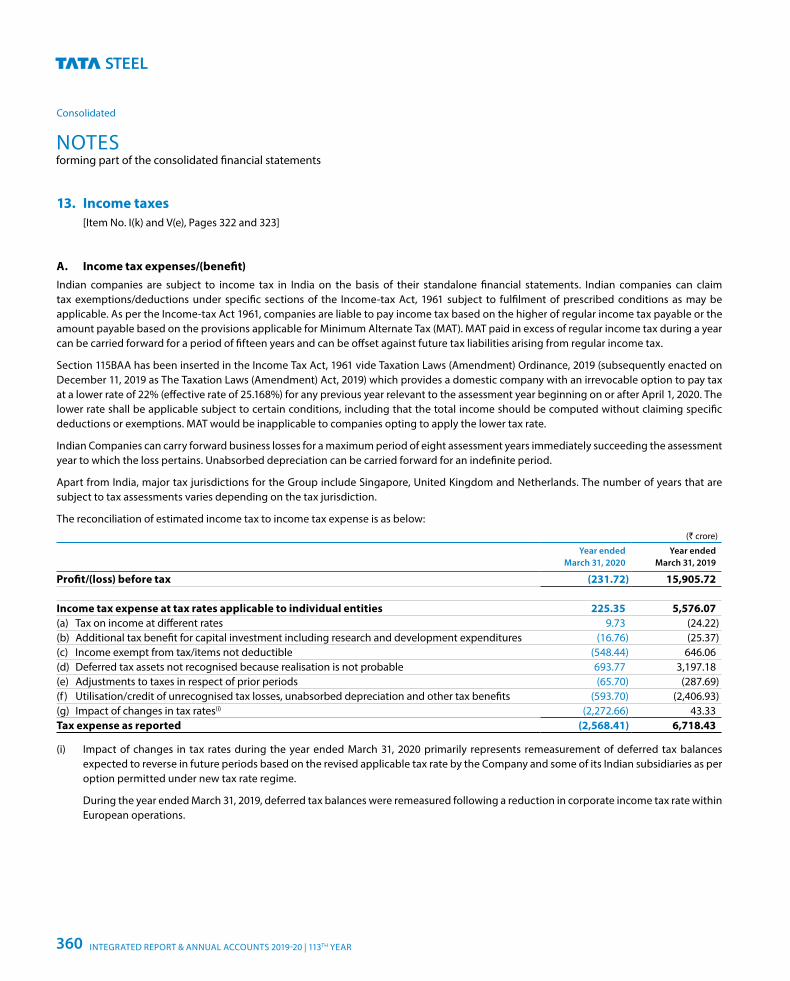
13. Income taxes [Item No. I(k) and V(e), Pages 322 and 323]
A. Income tax expenses/(benefit)Indian companies are subject to income tax in India on the basis of their standalone financial statements. Indian companies can claim tax exemptions/deductions under specific sections of the Income-tax Act, 1961 subject to fulfilment of prescribed conditions as may be applicable. As per the Income-tax Act 1961, companies are liable to pay income tax based on the higher of regular income tax payable or the amount payable based on the provisions applicable for Minimum Alternate Tax (MAT). MAT paid in excess of regular income tax during a year can be carried forward for a period of fifteen years and can be offset against future tax liabilities arising from regular income tax.
Section 115BAA has been inserted in the Income Tax Act, 1961 vide Taxation Laws (Amendment) Ordinance, 2019 (subsequently enacted on December 11, 2019 as The Taxation Laws (Amendment) Act, 2019) which provides a domestic company with an irrevocable option to pay tax at a lower rate of 22% (effective rate of 25.168%) for any previous year relevant to the assessment year beginning on or after April 1, 2020. The lower rate shall be applicable subject to certain conditions, including that the total income should be computed without claiming specific deductions or exemptions. MAT would be inapplicable to companies opting to apply the lower tax rate.
Indian Companies can carry forward business losses for a maximum period of eight assessment years immediately succeeding the assessment year to which the loss pertains. Unabsorbed depreciation can be carried forward for an indefinite period.
Apart from India, major tax jurisdictions for the Group include Singapore, United Kingdom and Netherlands. The number of years that are subject to tax assessments varies depending on the tax jurisdiction.
The reconciliation of estimated income tax to income tax expense is as below: (` crore)
Year ended March 31, 2020
Year ended March 31, 2019
Profit/(loss) before tax (231.72) 15,905.72
Income tax expense at tax rates applicable to individual entities 225.35 5,576.07(a) Tax on income at different rates 9.73 (24.22)(b) Additional tax benefit for capital investment including research and development expenditures (16.76) (25.37)(c) Income exempt from tax/items not deductible (548.44) 646.06(d) Deferred tax assets not recognised because realisation is not probable 693.77 3,197.18(e) Adjustments to taxes in respect of prior periods (65.70) (287.69)(f ) Utilisation/credit of unrecognised tax losses, unabsorbed depreciation and other tax benefits (593.70) (2,406.93)(g) Impact of changes in tax rates(i) (2,272.66) 43.33Tax expense as reported (2,568.41) 6,718.43
(i) Impact of changes in tax rates during the year ended March 31, 2020 primarily represents remeasurement of deferred tax balances expected to reverse in future periods based on the revised applicable tax rate by the Company and some of its Indian subsidiaries as per option permitted under new tax rate regime.
During the year ended March 31, 2019, deferred tax balances were remeasured following a reduction in corporate income tax rate within European operations.
NOTESforming part of the consolidated financial statements
Consolidated
INTEGRATED REPORT & ANNUAL ACCOUNTS 2019-20 | 113TH YEAR360
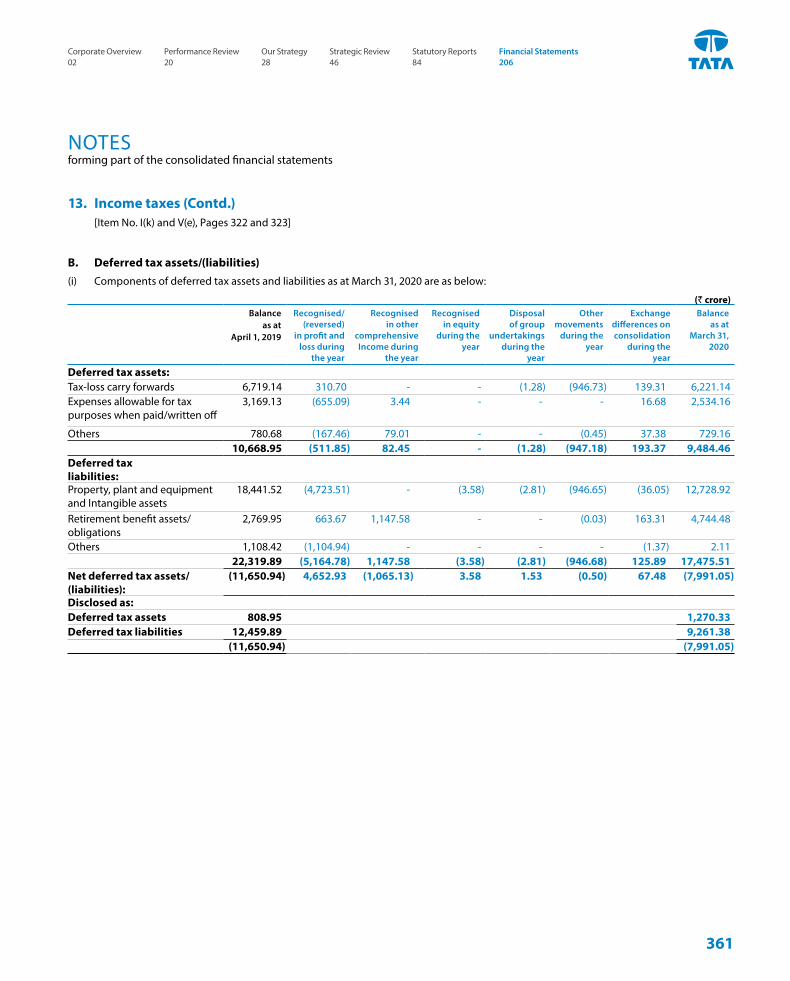
B. Deferred tax assets/(liabilities)(i) Components of deferred tax assets and liabilities as at March 31, 2020 are as below:
(` crore) Balance
as at April 1, 2019
Recognised/ (reversed)
in profit and loss during
the year
Recognised in other
comprehensive Income during
the year
Recognised in equity
during the year
Disposal of group
undertakings during the
year
Other movements
during the year
Exchange differences on consolidation
during the year
Balance as at
March 31, 2020
Deferred tax assets: Tax-loss carry forwards 6,719.14 310.70 - - (1.28) (946.73) 139.31 6,221.14Expenses allowable for tax purposes when paid/written off
3,169.13 (655.09) 3.44 - - - 16.68 2,534.16
Others 780.68 (167.46) 79.01 - - (0.45) 37.38 729.1610,668.95 (511.85) 82.45 - (1.28) (947.18) 193.37 9,484.46
Deferred tax liabilities: Property, plant and equipment and Intangible assets
18,441.52 (4,723.51) - (3.58) (2.81) (946.65) (36.05) 12,728.92
Retirement benefit assets/obligations
2,769.95 663.67 1,147.58 - - (0.03) 163.31 4,744.48
Others 1,108.42 (1,104.94) - - - - (1.37) 2.1122,319.89 (5,164.78) 1,147.58 (3.58) (2.81) (946.68) 125.89 17,475.51
Net deferred tax assets/(liabilities):
(11,650.94) 4,652.93 (1,065.13) 3.58 1.53 (0.50) 67.48 (7,991.05)
Disclosed as:Deferred tax assets 808.95 1,270.33Deferred tax liabilities 12,459.89 9,261.38
(11,650.94) (7,991.05)
13. Income taxes (Contd.) [Item No. I(k) and V(e), Pages 322 and 323]
NOTESforming part of the consolidated financial statements
361
Corporate Overview 02
Strategic Review 46
Performance Review 20
Statutory Reports 84
Our Strategy 28
Financial Statements 206
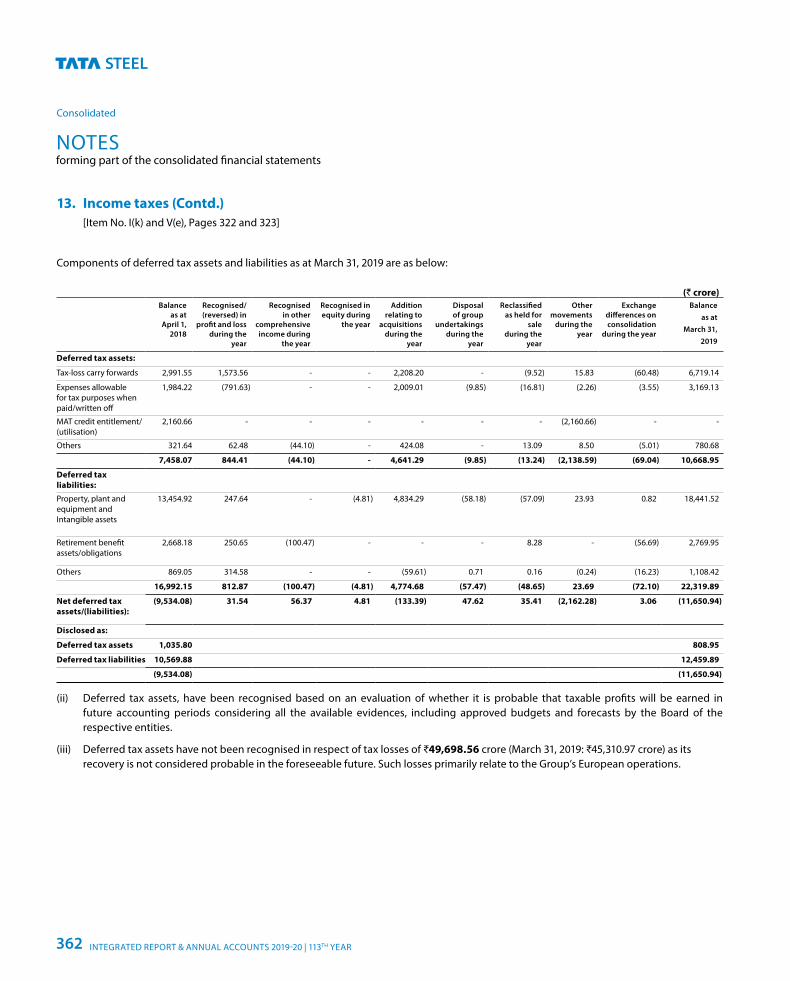
Components of deferred tax assets and liabilities as at March 31, 2019 are as below:
(` crore) Balance
as at April 1,
2018
Recognised/(reversed) in
profit and loss during the
year
Recognised in other
comprehensive income during
the year
Recognised in equity during
the year
Addition relating to
acquisitions during the
year
Disposal of group
undertakings during the
year
Reclassified as held for
sale during the
year
Other movements
during the year
Exchange differences on consolidation
during the year
Balance as at
March 31, 2019
Deferred tax assets:
Tax-loss carry forwards 2,991.55 1,573.56 - - 2,208.20 - (9.52) 15.83 (60.48) 6,719.14
Expenses allowable for tax purposes when paid/written off
1,984.22 (791.63) - - 2,009.01 (9.85) (16.81) (2.26) (3.55) 3,169.13
MAT credit entitlement/ (utilisation)
2,160.66 - - - - - - (2,160.66) - -
Others 321.64 62.48 (44.10) - 424.08 - 13.09 8.50 (5.01) 780.68
7,458.07 844.41 (44.10) - 4,641.29 (9.85) (13.24) (2,138.59) (69.04) 10,668.95
Deferred tax liabilities:
Property, plant and equipment and Intangible assets
13,454.92 247.64 - (4.81) 4,834.29 (58.18) (57.09) 23.93 0.82 18,441.52
Retirement benefit assets/obligations
2,668.18 250.65 (100.47) - - - 8.28 - (56.69) 2,769.95
Others 869.05 314.58 - - (59.61) 0.71 0.16 (0.24) (16.23) 1,108.42
16,992.15 812.87 (100.47) (4.81) 4,774.68 (57.47) (48.65) 23.69 (72.10) 22,319.89
Net deferred tax assets/(liabilities):
(9,534.08) 31.54 56.37 4.81 (133.39) 47.62 35.41 (2,162.28) 3.06 (11,650.94)
Disclosed as:
Deferred tax assets 1,035.80 808.95
Deferred tax liabilities 10,569.88 12,459.89
(9,534.08) (11,650.94)
(ii) Deferred tax assets, have been recognised based on an evaluation of whether it is probable that taxable profits will be earned in future accounting periods considering all the available evidences, including approved budgets and forecasts by the Board of the respective entities.
(iii) Deferred tax assets have not been recognised in respect of tax losses of ₹49,698.56 crore (March 31, 2019: ₹45,310.97 crore) as its recovery is not considered probable in the foreseeable future. Such losses primarily relate to the Group’s European operations.
13. Income taxes (Contd.) [Item No. I(k) and V(e), Pages 322 and 323]
NOTESforming part of the consolidated financial statements
Consolidated
INTEGRATED REPORT & ANNUAL ACCOUNTS 2019-20 | 113TH YEAR362
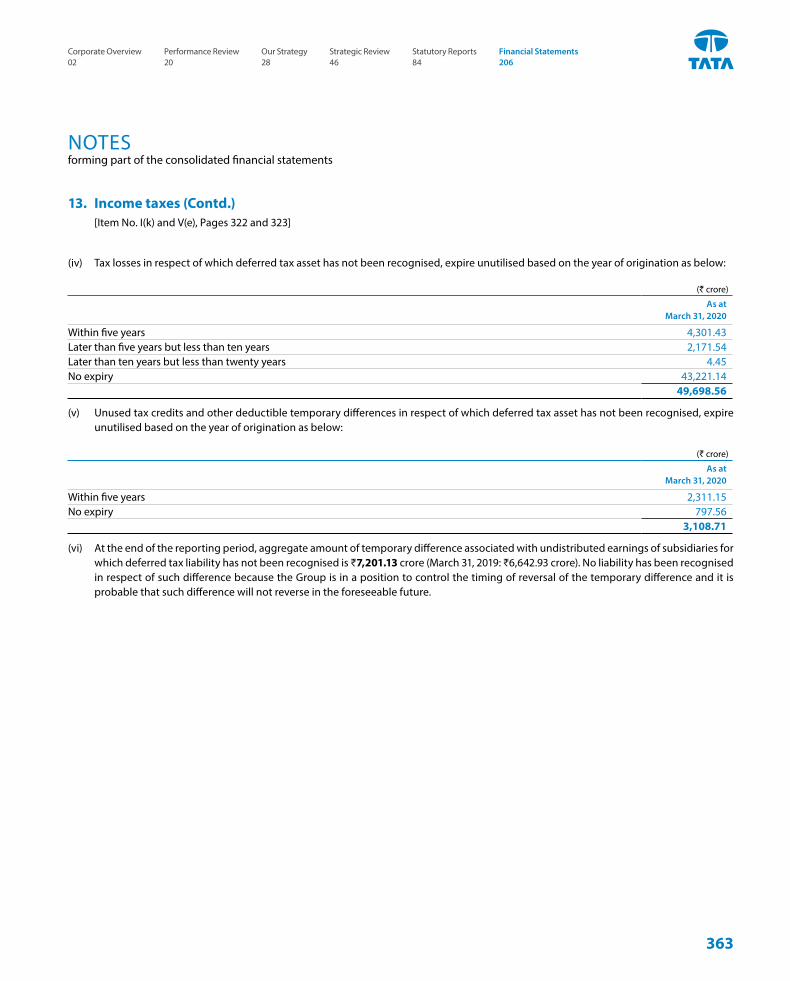
(iv) Tax losses in respect of which deferred tax asset has not been recognised, expire unutilised based on the year of origination as below:
(` crore)
As at March 31, 2020
Within five years 4,301.43Later than five years but less than ten years 2,171.54Later than ten years but less than twenty years 4.45No expiry 43,221.14
49,698.56
(v) Unused tax credits and other deductible temporary differences in respect of which deferred tax asset has not been recognised, expire unutilised based on the year of origination as below:
(` crore)
As at March 31, 2020
Within five years 2,311.15No expiry 797.56
3,108.71
(vi) At the end of the reporting period, aggregate amount of temporary difference associated with undistributed earnings of subsidiaries for which deferred tax liability has not been recognised is ₹7,201.13 crore (March 31, 2019: ₹6,642.93 crore). No liability has been recognised in respect of such difference because the Group is in a position to control the timing of reversal of the temporary difference and it is probable that such difference will not reverse in the foreseeable future.
13. Income taxes (Contd.) [Item No. I(k) and V(e), Pages 322 and 323]
NOTESforming part of the consolidated financial statements
363
Corporate Overview 02
Strategic Review 46
Performance Review 20
Statutory Reports 84
Our Strategy 28
Financial Statements 206
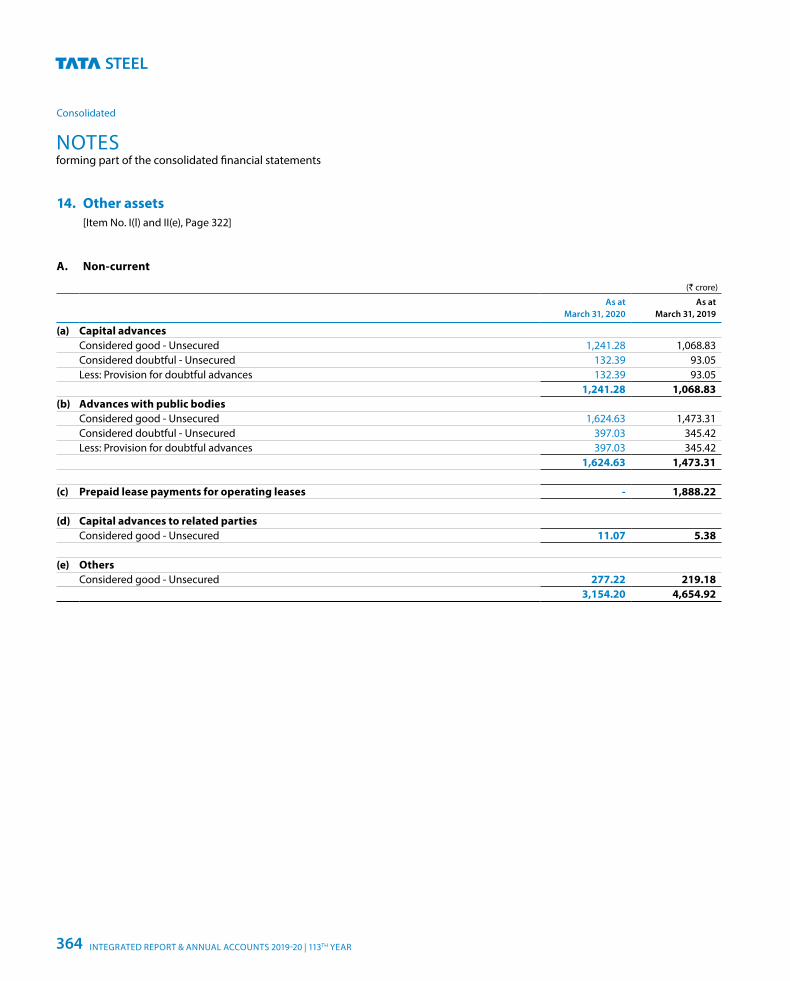
14. Other assets [Item No. I(l) and II(e), Page 322]
A. Non-current
(` crore)
As at March 31, 2020
As at March 31, 2019
(a) Capital advancesConsidered good - Unsecured 1,241.28 1,068.83Considered doubtful - Unsecured 132.39 93.05Less: Provision for doubtful advances 132.39 93.05
1,241.28 1,068.83(b) Advances with public bodies
Considered good - Unsecured 1,624.63 1,473.31Considered doubtful - Unsecured 397.03 345.42Less: Provision for doubtful advances 397.03 345.42
1,624.63 1,473.31
(c) Prepaid lease payments for operating leases - 1,888.22
(d) Capital advances to related partiesConsidered good - Unsecured 11.07 5.38
(e) OthersConsidered good - Unsecured 277.22 219.18
3,154.20 4,654.92
NOTESforming part of the consolidated financial statements
Consolidated
INTEGRATED REPORT & ANNUAL ACCOUNTS 2019-20 | 113TH YEAR364
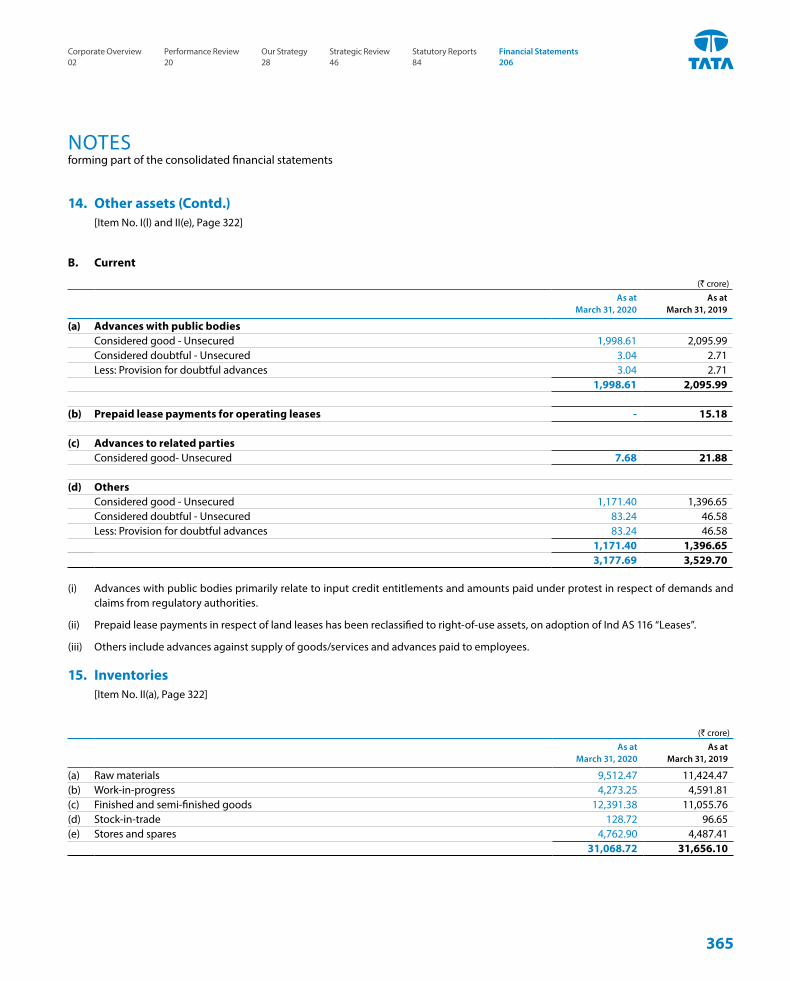
B. Current
(` crore)As at
March 31, 2020As at
March 31, 2019
(a) Advances with public bodiesConsidered good - Unsecured 1,998.61 2,095.99Considered doubtful - Unsecured 3.04 2.71Less: Provision for doubtful advances 3.04 2.71
1,998.61 2,095.99
(b) Prepaid lease payments for operating leases - 15.18
(c) Advances to related partiesConsidered good- Unsecured 7.68 21.88
(d) OthersConsidered good - Unsecured 1,171.40 1,396.65Considered doubtful - Unsecured 83.24 46.58Less: Provision for doubtful advances 83.24 46.58
1,171.40 1,396.653,177.69 3,529.70
(i) Advances with public bodies primarily relate to input credit entitlements and amounts paid under protest in respect of demands and claims from regulatory authorities.
(ii) Prepaid lease payments in respect of land leases has been reclassified to right-of-use assets, on adoption of Ind AS 116 “Leases”.
(iii) Others include advances against supply of goods/services and advances paid to employees.
15. Inventories [Item No. II(a), Page 322]
(` crore)As at
March 31, 2020As at
March 31, 2019
(a) Raw materials 9,512.47 11,424.47(b) Work-in-progress 4,273.25 4,591.81(c) Finished and semi-finished goods 12,391.38 11,055.76(d) Stock-in-trade 128.72 96.65(e) Stores and spares 4,762.90 4,487.41
31,068.72 31,656.10
14. Other assets (Contd.) [Item No. I(l) and II(e), Page 322]
NOTESforming part of the consolidated financial statements
365
Corporate Overview 02
Strategic Review 46
Performance Review 20
Statutory Reports 84
Our Strategy 28
Financial Statements 206
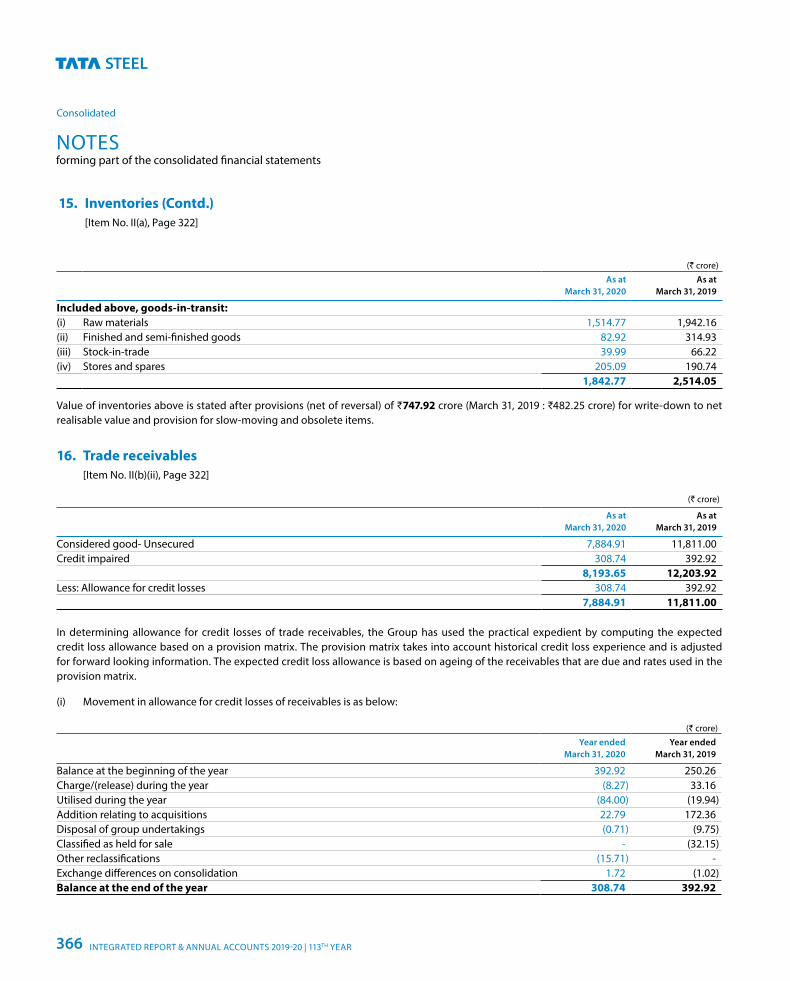
15. Inventories (Contd.) [Item No. II(a), Page 322]
(` crore)As at
March 31, 2020As at
March 31, 2019
Included above, goods-in-transit:(i) Raw materials 1,514.77 1,942.16(ii) Finished and semi-finished goods 82.92 314.93(iii) Stock-in-trade 39.99 66.22(iv) Stores and spares 205.09 190.74
1,842.77 2,514.05
Value of inventories above is stated after provisions (net of reversal) of ₹747.92 crore (March 31, 2019 : ₹482.25 crore) for write-down to net realisable value and provision for slow-moving and obsolete items.
16. Trade receivables [Item No. II(b)(ii), Page 322]
(` crore)
As at March 31, 2020
As at March 31, 2019
Considered good- Unsecured 7,884.91 11,811.00Credit impaired 308.74 392.92
8,193.65 12,203.92Less: Allowance for credit losses 308.74 392.92
7,884.91 11,811.00
In determining allowance for credit losses of trade receivables, the Group has used the practical expedient by computing the expected credit loss allowance based on a provision matrix. The provision matrix takes into account historical credit loss experience and is adjusted for forward looking information. The expected credit loss allowance is based on ageing of the receivables that are due and rates used in the provision matrix.
(i) Movement in allowance for credit losses of receivables is as below:
(` crore)Year ended
March 31, 2020Year ended
March 31, 2019
Balance at the beginning of the year 392.92 250.26Charge/(release) during the year (8.27) 33.16Utilised during the year (84.00) (19.94)Addition relating to acquisitions 22.79 172.36Disposal of group undertakings (0.71) (9.75)Classified as held for sale - (32.15)Other reclassifications (15.71) -Exchange differences on consolidation 1.72 (1.02)Balance at the end of the year 308.74 392.92
NOTESforming part of the consolidated financial statements
Consolidated
INTEGRATED REPORT & ANNUAL ACCOUNTS 2019-20 | 113TH YEAR366
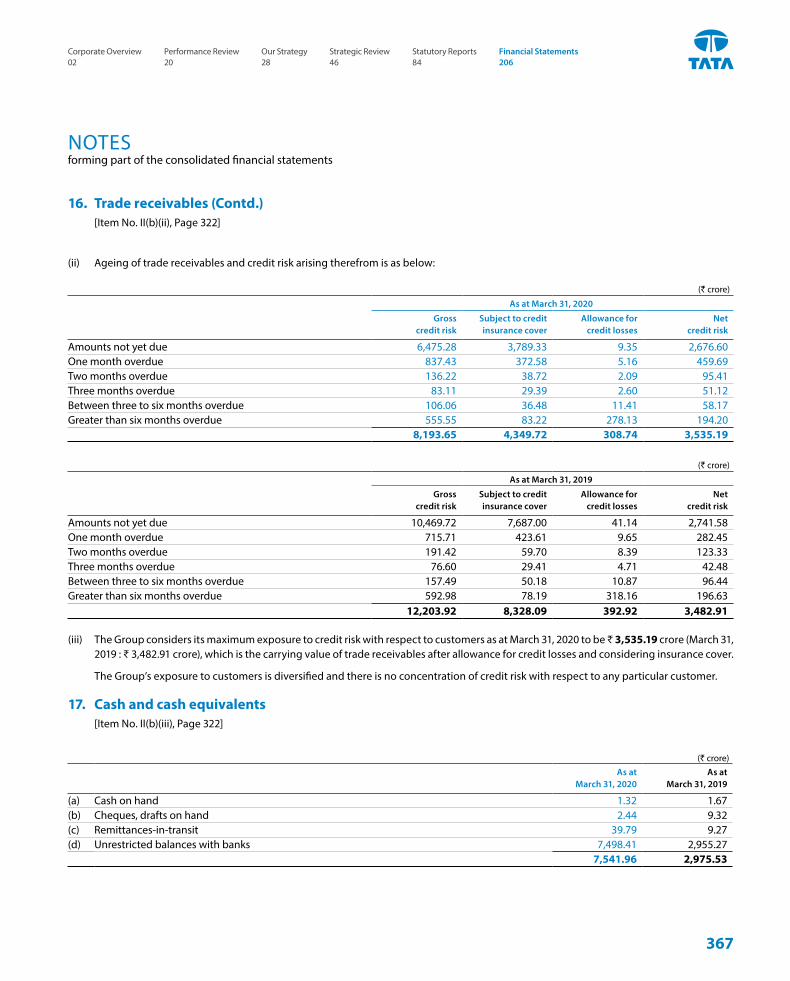
(ii) Ageing of trade receivables and credit risk arising therefrom is as below:
(` crore)
As at March 31, 2020
Gross credit risk
Subject to credit insurance cover
Allowance for credit losses
Net credit risk
Amounts not yet due 6,475.28 3,789.33 9.35 2,676.60One month overdue 837.43 372.58 5.16 459.69Two months overdue 136.22 38.72 2.09 95.41Three months overdue 83.11 29.39 2.60 51.12Between three to six months overdue 106.06 36.48 11.41 58.17Greater than six months overdue 555.55 83.22 278.13 194.20
8,193.65 4,349.72 308.74 3,535.19
(` crore)
As at March 31, 2019
Gross credit risk
Subject to credit insurance cover
Allowance for credit losses
Net credit risk
Amounts not yet due 10,469.72 7,687.00 41.14 2,741.58One month overdue 715.71 423.61 9.65 282.45Two months overdue 191.42 59.70 8.39 123.33Three months overdue 76.60 29.41 4.71 42.48Between three to six months overdue 157.49 50.18 10.87 96.44Greater than six months overdue 592.98 78.19 318.16 196.63
12,203.92 8,328.09 392.92 3,482.91
(iii) The Group considers its maximum exposure to credit risk with respect to customers as at March 31, 2020 to be ₹ 3,535.19 crore (March 31, 2019 : ₹ 3,482.91 crore), which is the carrying value of trade receivables after allowance for credit losses and considering insurance cover.
The Group’s exposure to customers is diversified and there is no concentration of credit risk with respect to any particular customer.
17. Cash and cash equivalents [Item No. II(b)(iii), Page 322]
(` crore)As at
March 31, 2020As at
March 31, 2019
(a) Cash on hand 1.32 1.67(b) Cheques, drafts on hand 2.44 9.32(c) Remittances-in-transit 39.79 9.27(d) Unrestricted balances with banks 7,498.41 2,955.27
7,541.96 2,975.53
16. Trade receivables (Contd.) [Item No. II(b)(ii), Page 322]
NOTESforming part of the consolidated financial statements
367
Corporate Overview 02
Strategic Review 46
Performance Review 20
Statutory Reports 84
Our Strategy 28
Financial Statements 206
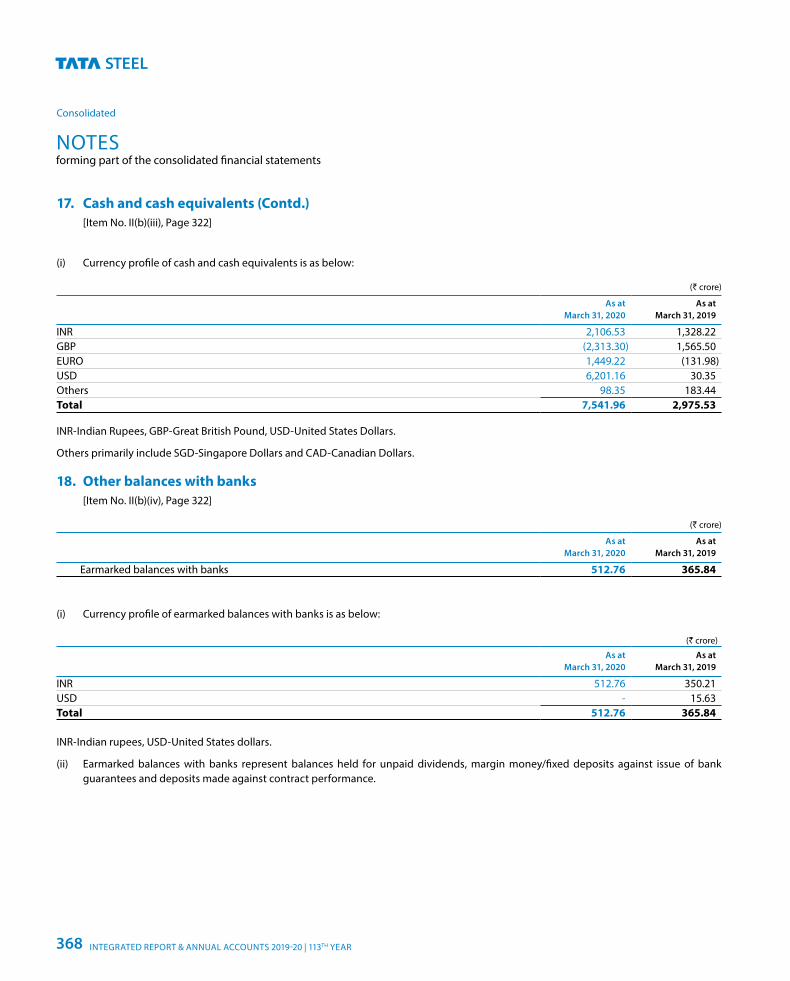
(i) Currency profile of cash and cash equivalents is as below:
(` crore)
As at March 31, 2020
As at March 31, 2019
INR 2,106.53 1,328.22GBP (2,313.30) 1,565.50EURO 1,449.22 (131.98)USD 6,201.16 30.35Others 98.35 183.44Total 7,541.96 2,975.53
INR-Indian Rupees, GBP-Great British Pound, USD-United States Dollars.
Others primarily include SGD-Singapore Dollars and CAD-Canadian Dollars.
18. Other balances with banks [Item No. II(b)(iv), Page 322]
(` crore)
As at March 31, 2020
As at March 31, 2019
Earmarked balances with banks 512.76 365.84
(i) Currency profile of earmarked balances with banks is as below:
(` crore)
As at March 31, 2020
As at March 31, 2019
INR 512.76 350.21USD - 15.63Total 512.76 365.84
INR-Indian rupees, USD-United States dollars.
(ii) Earmarked balances with banks represent balances held for unpaid dividends, margin money/fixed deposits against issue of bank guarantees and deposits made against contract performance.
17. Cash and cash equivalents (Contd.) [Item No. II(b)(iii), Page 322]
NOTESforming part of the consolidated financial statements
Consolidated
INTEGRATED REPORT & ANNUAL ACCOUNTS 2019-20 | 113TH YEAR368
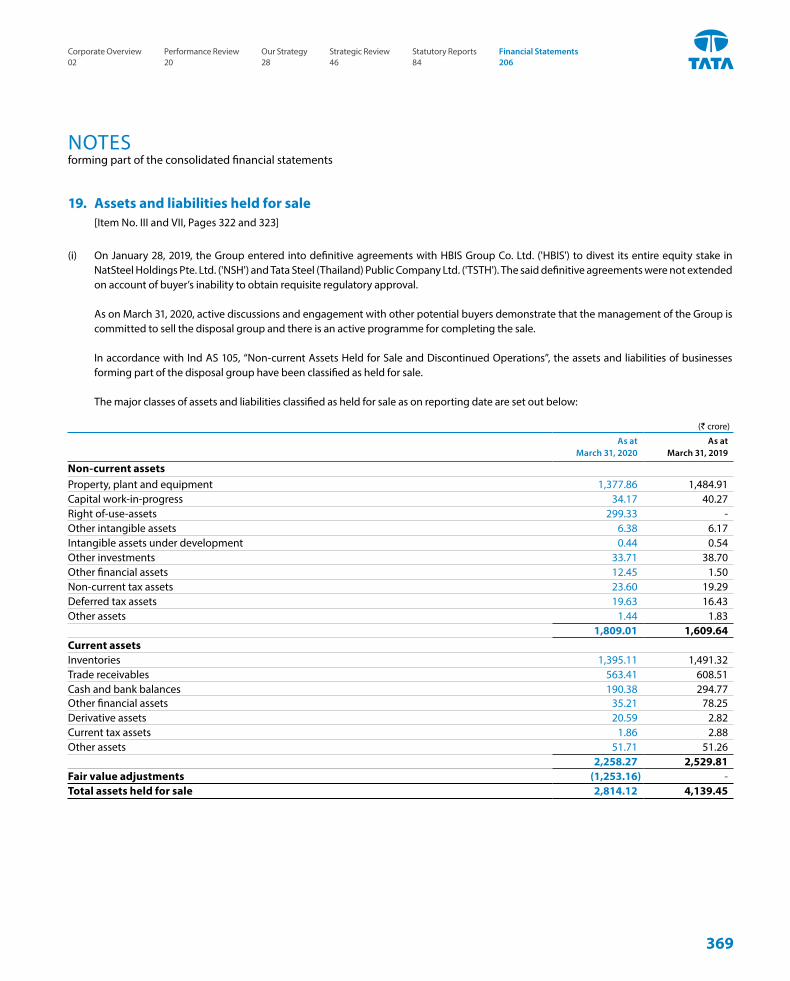
19. Assets and liabilities held for sale [Item No. III and VII, Pages 322 and 323]
(i) On January 28, 2019, the Group entered into definitive agreements with HBIS Group Co. Ltd. ('HBIS') to divest its entire equity stake in NatSteel Holdings Pte. Ltd. ('NSH') and Tata Steel (Thailand) Public Company Ltd. ('TSTH'). The said definitive agreements were not extended on account of buyer’s inability to obtain requisite regulatory approval.
As on March 31, 2020, active discussions and engagement with other potential buyers demonstrate that the management of the Group is committed to sell the disposal group and there is an active programme for completing the sale.
In accordance with Ind AS 105, “Non-current Assets Held for Sale and Discontinued Operations”, the assets and liabilities of businesses forming part of the disposal group have been classified as held for sale.
The major classes of assets and liabilities classified as held for sale as on reporting date are set out below:
(` crore)
As at March 31, 2020
As at March 31, 2019
Non-current assetsProperty, plant and equipment 1,377.86 1,484.91Capital work-in-progress 34.17 40.27Right of-use-assets 299.33 -Other intangible assets 6.38 6.17Intangible assets under development 0.44 0.54Other investments 33.71 38.70Other financial assets 12.45 1.50Non-current tax assets 23.60 19.29Deferred tax assets 19.63 16.43Other assets 1.44 1.83
1,809.01 1,609.64Current assetsInventories 1,395.11 1,491.32Trade receivables 563.41 608.51Cash and bank balances 190.38 294.77Other financial assets 35.21 78.25Derivative assets 20.59 2.82Current tax assets 1.86 2.88Other assets 51.71 51.26
2,258.27 2,529.81Fair value adjustments (1,253.16) -Total assets held for sale 2,814.12 4,139.45
NOTESforming part of the consolidated financial statements
369
Corporate Overview 02
Strategic Review 46
Performance Review 20
Statutory Reports 84
Our Strategy 28
Financial Statements 206
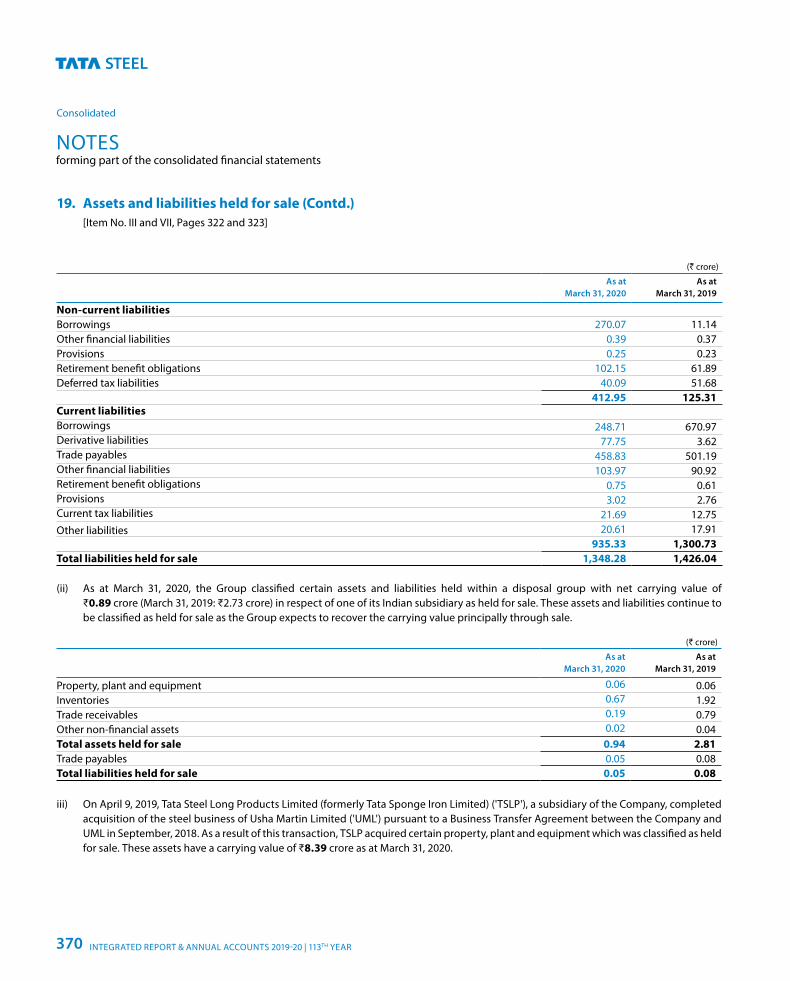
(` crore)
As at March 31, 2020
As at March 31, 2019
Non-current liabilitiesBorrowings 270.07 11.14Other financial liabilities 0.39 0.37Provisions 0.25 0.23Retirement benefit obligations 102.15 61.89Deferred tax liabilities 40.09 51.68
412.95 125.31Current liabilitiesBorrowings 248.71 670.97Derivative liabilities 77.75 3.62Trade payables 458.83 501.19Other financial liabilities 103.97 90.92Retirement benefit obligations 0.75 0.61Provisions 3.02 2.76Current tax liabilities 21.69 12.75Other liabilities 20.61 17.91
935.33 1,300.73Total liabilities held for sale 1,348.28 1,426.04
(ii) As at March 31, 2020, the Group classified certain assets and liabilities held within a disposal group with net carrying value of ₹0.89 crore (March 31, 2019: ₹2.73 crore) in respect of one of its Indian subsidiary as held for sale. These assets and liabilities continue to be classified as held for sale as the Group expects to recover the carrying value principally through sale.
(` crore)
As at March 31, 2020
As at March 31, 2019
Property, plant and equipment 0.06 0.06Inventories 0.67 1.92Trade receivables 0.19 0.79Other non-financial assets 0.02 0.04Total assets held for sale 0.94 2.81Trade payables 0.05 0.08Total liabilities held for sale 0.05 0.08
iii) On April 9, 2019, Tata Steel Long Products Limited (formerly Tata Sponge Iron Limited) ('TSLP'), a subsidiary of the Company, completed acquisition of the steel business of Usha Martin Limited ('UML') pursuant to a Business Transfer Agreement between the Company and UML in September, 2018. As a result of this transaction, TSLP acquired certain property, plant and equipment which was classified as held for sale. These assets have a carrying value of ₹8.39 crore as at March 31, 2020.
19. Assets and liabilities held for sale (Contd.) [Item No. III and VII, Pages 322 and 323]
NOTESforming part of the consolidated financial statements
Consolidated
INTEGRATED REPORT & ANNUAL ACCOUNTS 2019-20 | 113TH YEAR370
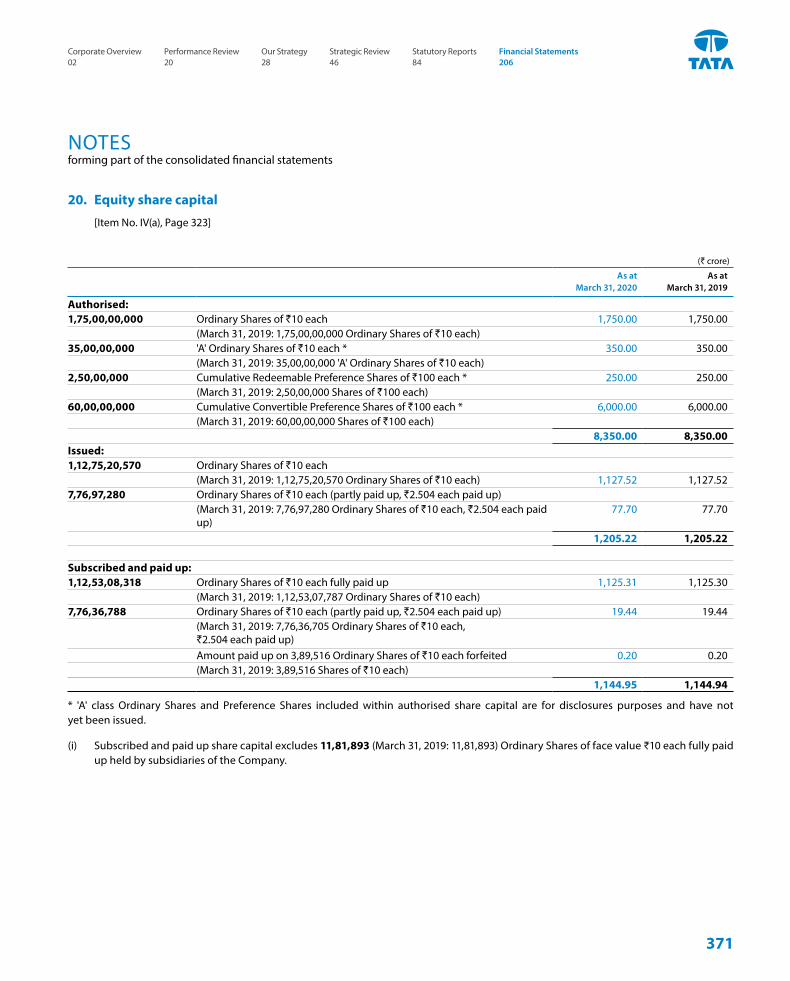
20. Equity share capital
[Item No. IV(a), Page 323]
(` crore)
As at March 31, 2020
As at March 31, 2019
Authorised:1,75,00,00,000 Ordinary Shares of `10 each 1,750.00 1,750.00
(March 31, 2019: 1,75,00,00,000 Ordinary Shares of `10 each)35,00,00,000 'A' Ordinary Shares of `10 each * 350.00 350.00
(March 31, 2019: 35,00,00,000 'A' Ordinary Shares of `10 each)2,50,00,000 Cumulative Redeemable Preference Shares of `100 each * 250.00 250.00
(March 31, 2019: 2,50,00,000 Shares of `100 each)60,00,00,000 Cumulative Convertible Preference Shares of `100 each * 6,000.00 6,000.00
(March 31, 2019: 60,00,00,000 Shares of `100 each)8,350.00 8,350.00
Issued:1,12,75,20,570 Ordinary Shares of `10 each
(March 31, 2019: 1,12,75,20,570 Ordinary Shares of `10 each) 1,127.52 1,127.527,76,97,280 Ordinary Shares of `10 each (partly paid up, `2.504 each paid up)
(March 31, 2019: 7,76,97,280 Ordinary Shares of `10 each, `2.504 each paid up)
77.70 77.70
1,205.22 1,205.22
Subscribed and paid up:1,12,53,08,318 Ordinary Shares of `10 each fully paid up 1,125.31 1,125.30
(March 31, 2019: 1,12,53,07,787 Ordinary Shares of `10 each)7,76,36,788 Ordinary Shares of `10 each (partly paid up, `2.504 each paid up) 19.44 19.44
(March 31, 2019: 7,76,36,705 Ordinary Shares of `10 each, `2.504 each paid up)Amount paid up on 3,89,516 Ordinary Shares of `10 each forfeited 0.20 0.20(March 31, 2019: 3,89,516 Shares of `10 each)
1,144.95 1,144.94
* 'A' class Ordinary Shares and Preference Shares included within authorised share capital are for disclosures purposes and have not yet been issued.
(i) Subscribed and paid up share capital excludes 11,81,893 (March 31, 2019: 11,81,893) Ordinary Shares of face value ₹10 each fully paid up held by subsidiaries of the Company.
NOTESforming part of the consolidated financial statements
371
Corporate Overview 02
Strategic Review 46
Performance Review 20
Statutory Reports 84
Our Strategy 28
Financial Statements 206
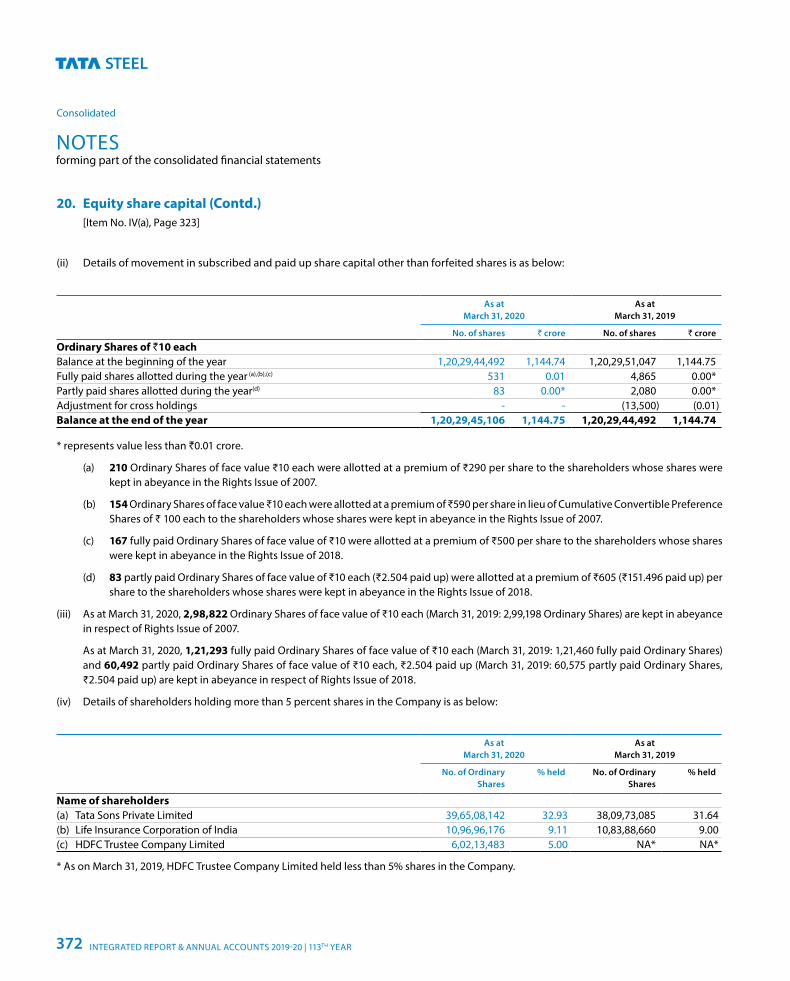
(ii) Details of movement in subscribed and paid up share capital other than forfeited shares is as below:
As at March 31, 2020
As at March 31, 2019
No. of shares ` crore No. of shares ` crore
Ordinary Shares of `10 eachBalance at the beginning of the year 1,20,29,44,492 1,144.74 1,20,29,51,047 1,144.75Fully paid shares allotted during the year (a),(b),(c) 531 0.01 4,865 0.00*Partly paid shares allotted during the year(d) 83 0.00* 2,080 0.00*Adjustment for cross holdings - - (13,500) (0.01)Balance at the end of the year 1,20,29,45,106 1,144.75 1,20,29,44,492 1,144.74
* represents value less than `0.01 crore.
(a) 210 Ordinary Shares of face value ₹10 each were allotted at a premium of ₹290 per share to the shareholders whose shares were kept in abeyance in the Rights Issue of 2007.
(b) 154 Ordinary Shares of face value ₹10 each were allotted at a premium of ₹590 per share in lieu of Cumulative Convertible Preference Shares of ₹ 100 each to the shareholders whose shares were kept in abeyance in the Rights Issue of 2007.
(c) 167 fully paid Ordinary Shares of face value of ₹10 were allotted at a premium of ₹500 per share to the shareholders whose shares were kept in abeyance in the Rights Issue of 2018.
(d) 83 partly paid Ordinary Shares of face value of ₹10 each (₹2.504 paid up) were allotted at a premium of ₹605 (₹151.496 paid up) per share to the shareholders whose shares were kept in abeyance in the Rights Issue of 2018.
(iii) As at March 31, 2020, 2,98,822 Ordinary Shares of face value of ₹10 each (March 31, 2019: 2,99,198 Ordinary Shares) are kept in abeyance in respect of Rights Issue of 2007.
As at March 31, 2020, 1,21,293 fully paid Ordinary Shares of face value of ₹10 each (March 31, 2019: 1,21,460 fully paid Ordinary Shares) and 60,492 partly paid Ordinary Shares of face value of ₹10 each, ₹2.504 paid up (March 31, 2019: 60,575 partly paid Ordinary Shares, ₹2.504 paid up) are kept in abeyance in respect of Rights Issue of 2018.
(iv) Details of shareholders holding more than 5 percent shares in the Company is as below:
As at March 31, 2020
As at March 31, 2019
No. of Ordinary Shares
% held No. of Ordinary Shares
% held
Name of shareholders (a) Tata Sons Private Limited 39,65,08,142 32.93 38,09,73,085 31.64(b) Life Insurance Corporation of India 10,96,96,176 9.11 10,83,88,660 9.00(c) HDFC Trustee Company Limited 6,02,13,483 5.00 NA* NA*
* As on March 31, 2019, HDFC Trustee Company Limited held less than 5% shares in the Company.
20. Equity share capital (Contd.) [Item No. IV(a), Page 323]
NOTESforming part of the consolidated financial statements
Consolidated
INTEGRATED REPORT & ANNUAL ACCOUNTS 2019-20 | 113TH YEAR372
20. Equity share capital (Contd.) [Item No. IV(a), Page 323]
(v) 1,25,61,401 shares (March 31, 2019: 1,34,73,958 shares) of face value of ₹10 per share represent the shares underlying GDRs which were issued during 1994 and 2009. Each GDR represents one underlying Ordinary Share.
(vi) The rights, powers and preferences relating to each class of share capital and the qualifications, limitations and restrictions thereof are contained in the Memorandum and Articles of Association of the Company. The principal rights are as below:
A. Ordinary Shares of `10 each(i) In respect of every Ordinary Share (whether fully paid or partly
paid), voting right and dividend shall be in the same proportion as the capital paid up on such Ordinary Share bears to the total paid up Ordinary Capital of the Company.
(ii) The dividend proposed by the Board of Directors is subject to the approval of the Shareholders in the ensuing Annual General Meeting, except in case of interim dividend.
(iii) In the event of liquidation, the Shareholders of Ordinary Shares are eligible to receive the remaining assets of the Company after distribution of all preferential amounts, in proportion to their shareholding.
B. ‘A’ Ordinary Shares of `10 each(i) (a) The holders of ‘A’ Ordinary Shares shall be entitled to such
rights of voting and/or dividend and such other rights as per the terms of the issue of such shares, provided always that:
- in the case where a resolution is put to vote on a poll, such differential voting entitlement (excluding fractions, if any) will be applicable to holders of ‘A’ Ordinary Shares.
- in the case where a resolution is put to vote in the meeting and is to be decided on a show of hands, the holders of ‘A’ Ordinary Shares shall be entitled to the same number of votes as available to holders of Ordinary Shares.
(b) The holders of Ordinary Shares and the holders of ‘A’ Ordinary Shares shall vote as a single class with respect to all matters submitted for voting by shareholders of the Company and shall exercise such votes in proportion
to the voting rights attached to such shares including in relation to any scheme under Sections 391 to 394 of the Companies Act, 1956.
(ii) The holders of ‘A’ Ordinary Shares shall be entitled to dividend on each ‘A’ Ordinary Share which may be equal to or higher than the amount per Ordinary Share declared by the Board for each Ordinary Share, and as may be specified at the time of the issue. Different series of ‘A’ Ordinary Shares may carry different entitlements to dividend to the extent permitted under applicable law and as prescribed under the terms applicable to such issue.
C. Preference Shares The Company has two classes of preference shares i.e.
Cumulative Redeemable Preference Shares (CRPS) of ₹ 100 per share and Cumulative Convertible Preference Shares (CCPS) of ₹100 per share.
(i) Such shares shall confer on the holders thereof, the right to a fixed preferential dividend from the date of allotment, at a rate as may be determined by the Board at the time of the issue, on the capital for the time being paid up or credited as paid up thereon.
(ii) Such shares shall rank for capital and dividend (including all dividend undeclared upto the commencement of winding up) and for repayment of capital in a winding up, pari passu inter se and in priority to the Ordinary Shares of the Company, but shall not confer any further or other right to participate either in profits or assets. However, in case of CCPS, such preferential rights shall automatically cease on conversion of these shares into Ordinary Shares.
(iii) The holders of such shares shall have the right to receive all notices of general meetings of the Company but shall not confer on the holders thereof the right to vote at any meetings of the Company save to the extent and in the manner provided in the Companies Act, 1956, or any re-enactment thereof.
(iv) CCPS shall be converted into Ordinary Shares as per the terms, determined by the Board at the time of issue; as and when converted, such Ordinary Shares shall rank pari passu with the then existing Ordinary Shares of the Company in all respects.
NOTESforming part of the consolidated financial statements
373
Corporate Overview 02
Strategic Review 46
Performance Review 20
Statutory Reports 84
Our Strategy 28
Financial Statements 206
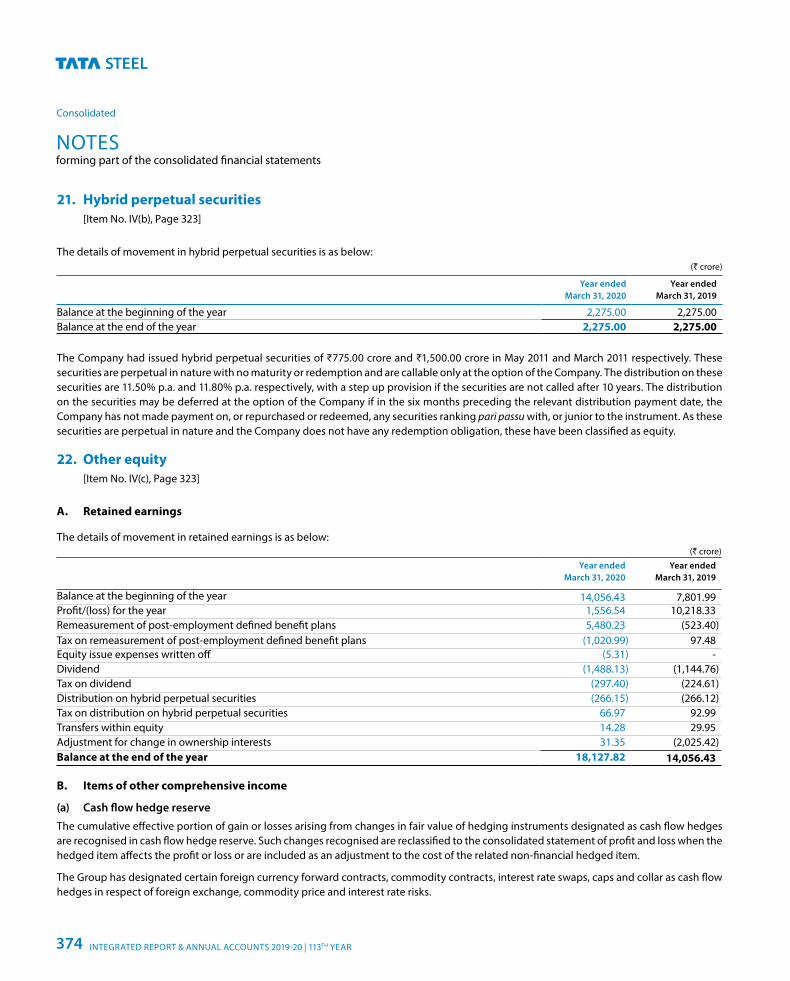
21. Hybrid perpetual securities [Item No. IV(b), Page 323]
The details of movement in hybrid perpetual securities is as below:(` crore)
Year ended March 31, 2020
Year ended March 31, 2019
Balance at the beginning of the year 2,275.00 2,275.00Balance at the end of the year 2,275.00 2,275.00
The Company had issued hybrid perpetual securities of ₹775.00 crore and ₹1,500.00 crore in May 2011 and March 2011 respectively. These securities are perpetual in nature with no maturity or redemption and are callable only at the option of the Company. The distribution on these securities are 11.50% p.a. and 11.80% p.a. respectively, with a step up provision if the securities are not called after 10 years. The distribution on the securities may be deferred at the option of the Company if in the six months preceding the relevant distribution payment date, the Company has not made payment on, or repurchased or redeemed, any securities ranking pari passu with, or junior to the instrument. As these securities are perpetual in nature and the Company does not have any redemption obligation, these have been classified as equity.
22. Other equity [Item No. IV(c), Page 323]
A. Retained earnings
The details of movement in retained earnings is as below:(` crore)
Year ended March 31, 2020
Year ended March 31, 2019
Balance at the beginning of the year 14,056.43 7,801.99Profit/(loss) for the year 1,556.54 10,218.33Remeasurement of post-employment defined benefit plans 5,480.23 (523.40)Tax on remeasurement of post-employment defined benefit plans (1,020.99) 97.48Equity issue expenses written off (5.31) -Dividend (1,488.13) (1,144.76)Tax on dividend (297.40) (224.61)Distribution on hybrid perpetual securities (266.15) (266.12)Tax on distribution on hybrid perpetual securities 66.97 92.99Transfers within equity 14.28 29.95Adjustment for change in ownership interests 31.35 (2,025.42)Balance at the end of the year 18,127.82 14,056.43
B. Items of other comprehensive income
(a) Cash flow hedge reserve
The cumulative effective portion of gain or losses arising from changes in fair value of hedging instruments designated as cash flow hedges are recognised in cash flow hedge reserve. Such changes recognised are reclassified to the consolidated statement of profit and loss when the hedged item affects the profit or loss or are included as an adjustment to the cost of the related non-financial hedged item.
The Group has designated certain foreign currency forward contracts, commodity contracts, interest rate swaps, caps and collar as cash flow hedges in respect of foreign exchange, commodity price and interest rate risks.
NOTESforming part of the consolidated financial statements
Consolidated
INTEGRATED REPORT & ANNUAL ACCOUNTS 2019-20 | 113TH YEAR374
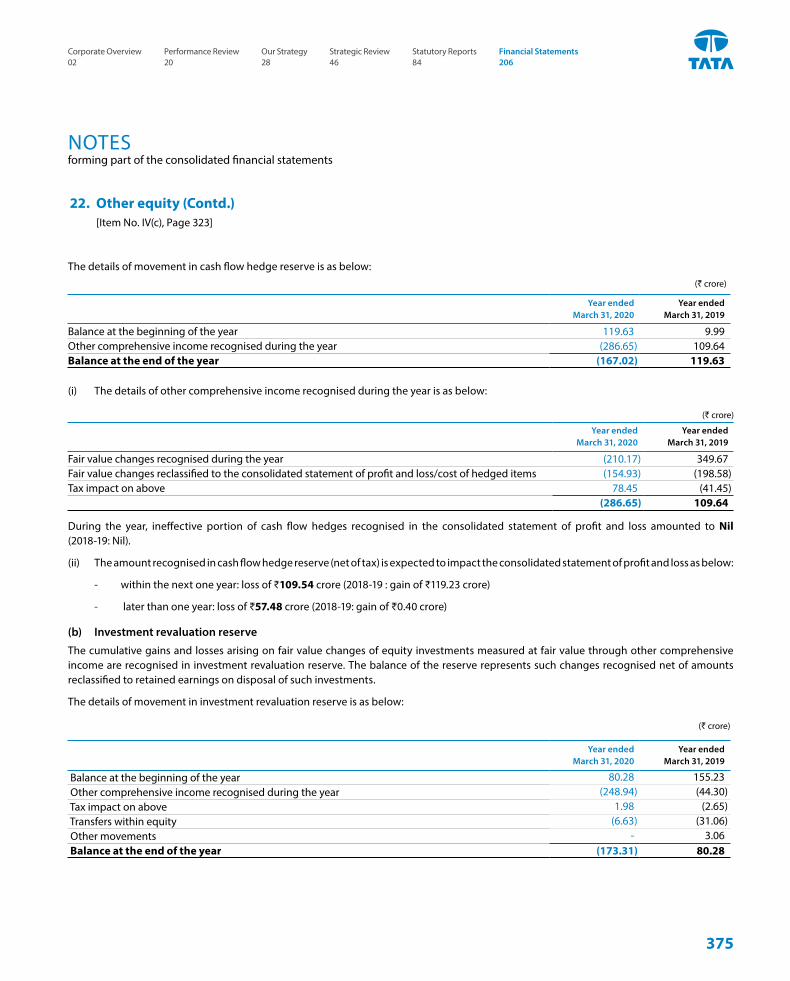
The details of movement in cash flow hedge reserve is as below:(` crore)
Year ended March 31, 2020
Year ended March 31, 2019
Balance at the beginning of the year 119.63 9.99Other comprehensive income recognised during the year (286.65) 109.64Balance at the end of the year (167.02) 119.63
(i) The details of other comprehensive income recognised during the year is as below:
(` crore)
Year ended March 31, 2020
Year ended March 31, 2019
Fair value changes recognised during the year (210.17) 349.67Fair value changes reclassified to the consolidated statement of profit and loss/cost of hedged items (154.93) (198.58)Tax impact on above 78.45 (41.45)
(286.65) 109.64
During the year, ineffective portion of cash flow hedges recognised in the consolidated statement of profit and loss amounted to Nil (2018-19: Nil).
(ii) The amount recognised in cash flow hedge reserve (net of tax) is expected to impact the consolidated statement of profit and loss as below:
- within the next one year: loss of ₹109.54 crore (2018-19 : gain of ₹119.23 crore)
- later than one year: loss of ₹57.48 crore (2018-19: gain of ₹0.40 crore)
(b) Investment revaluation reserve
The cumulative gains and losses arising on fair value changes of equity investments measured at fair value through other comprehensive income are recognised in investment revaluation reserve. The balance of the reserve represents such changes recognised net of amounts reclassified to retained earnings on disposal of such investments.
The details of movement in investment revaluation reserve is as below:
(` crore)
Year ended March 31, 2020
Year ended March 31, 2019
Balance at the beginning of the year 80.28 155.23 Other comprehensive income recognised during the year (248.94) (44.30) Tax impact on above 1.98 (2.65) Transfers within equity (6.63) (31.06) Other movements - 3.06 Balance at the end of the year (173.31) 80.28
22. Other equity (Contd.) [Item No. IV(c), Page 323]
NOTESforming part of the consolidated financial statements
375
Corporate Overview 02
Strategic Review 46
Performance Review 20
Statutory Reports 84
Our Strategy 28
Financial Statements 206
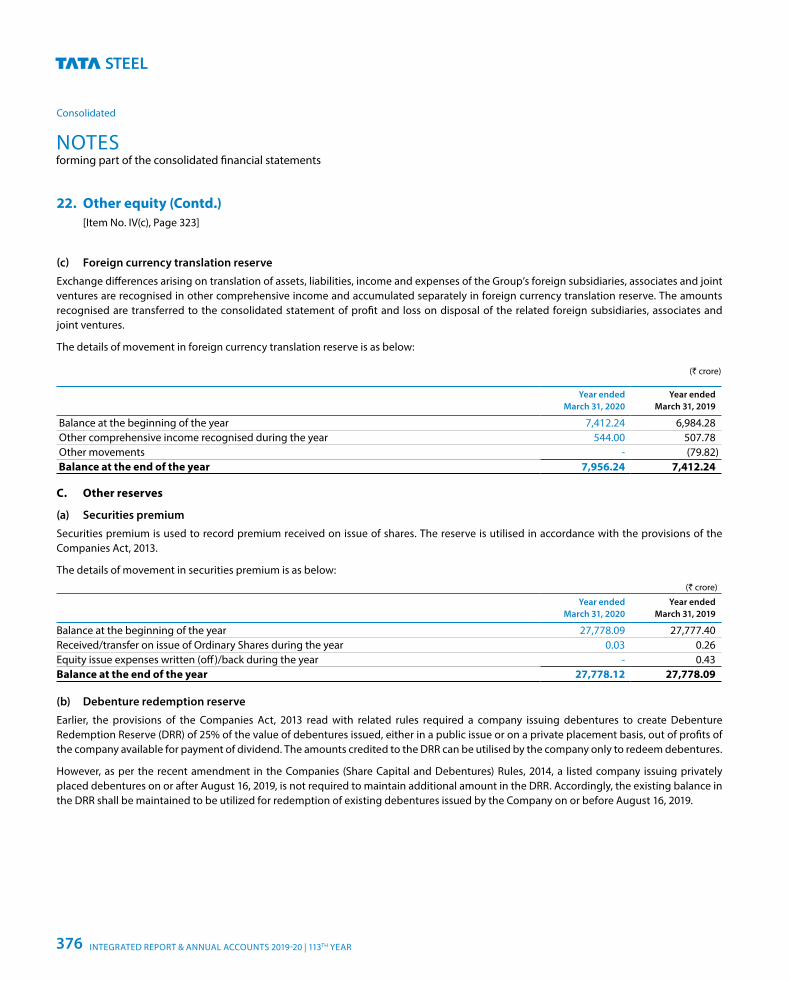
(c) Foreign currency translation reserve
Exchange differences arising on translation of assets, liabilities, income and expenses of the Group’s foreign subsidiaries, associates and joint ventures are recognised in other comprehensive income and accumulated separately in foreign currency translation reserve. The amounts recognised are transferred to the consolidated statement of profit and loss on disposal of the related foreign subsidiaries, associates and joint ventures.
The details of movement in foreign currency translation reserve is as below:
(` crore)
Year ended March 31, 2020
Year ended March 31, 2019
Balance at the beginning of the year 7,412.24 6,984.28 Other comprehensive income recognised during the year 544.00 507.78 Other movements - (79.82) Balance at the end of the year 7,956.24 7,412.24
C. Other reserves
(a) Securities premium
Securities premium is used to record premium received on issue of shares. The reserve is utilised in accordance with the provisions of the Companies Act, 2013.
The details of movement in securities premium is as below:(` crore)
Year ended March 31, 2020
Year ended March 31, 2019
Balance at the beginning of the year 27,778.09 27,777.40Received/transfer on issue of Ordinary Shares during the year 0.03 0.26Equity issue expenses written (off)/back during the year - 0.43Balance at the end of the year 27,778.12 27,778.09
(b) Debenture redemption reserve
Earlier, the provisions of the Companies Act, 2013 read with related rules required a company issuing debentures to create Debenture Redemption Reserve (DRR) of 25% of the value of debentures issued, either in a public issue or on a private placement basis, out of profits of the company available for payment of dividend. The amounts credited to the DRR can be utilised by the company only to redeem debentures.
However, as per the recent amendment in the Companies (Share Capital and Debentures) Rules, 2014, a listed company issuing privately placed debentures on or after August 16, 2019, is not required to maintain additional amount in the DRR. Accordingly, the existing balance in the DRR shall be maintained to be utilized for redemption of existing debentures issued by the Company on or before August 16, 2019.
22. Other equity (Contd.) [Item No. IV(c), Page 323]
NOTESforming part of the consolidated financial statements
Consolidated
INTEGRATED REPORT & ANNUAL ACCOUNTS 2019-20 | 113TH YEAR376
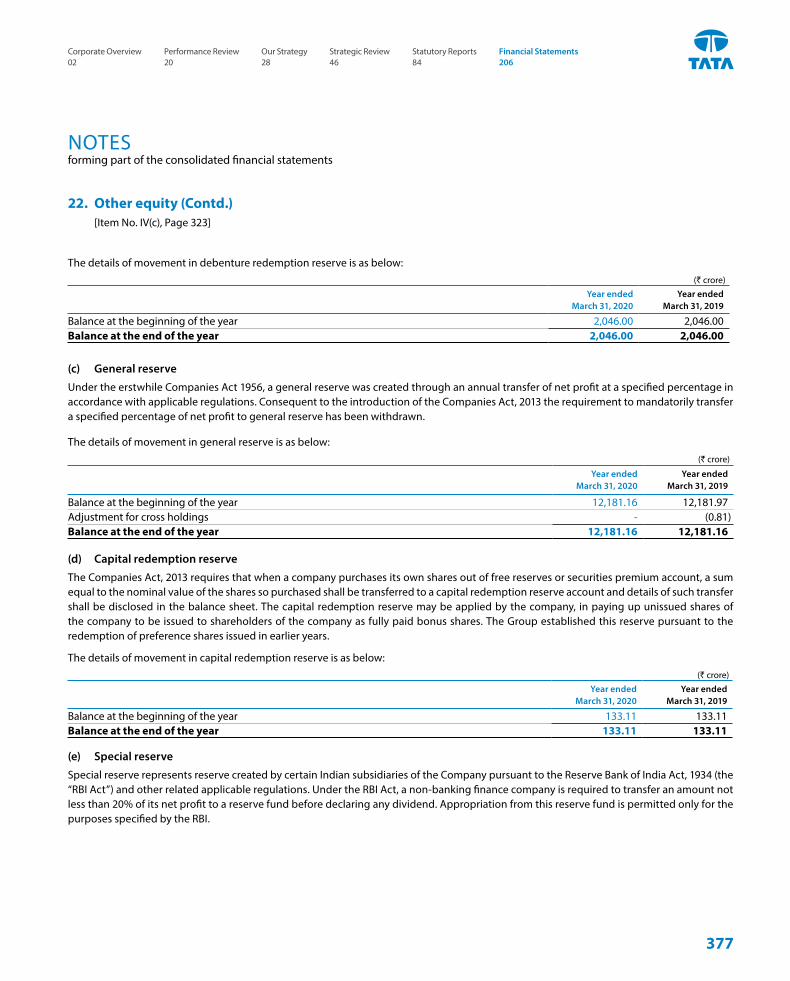
The details of movement in debenture redemption reserve is as below:(` crore)
Year ended March 31, 2020
Year ended March 31, 2019
Balance at the beginning of the year 2,046.00 2,046.00Balance at the end of the year 2,046.00 2,046.00
(c) General reserve
Under the erstwhile Companies Act 1956, a general reserve was created through an annual transfer of net profit at a specified percentage in accordance with applicable regulations. Consequent to the introduction of the Companies Act, 2013 the requirement to mandatorily transfer a specified percentage of net profit to general reserve has been withdrawn.
The details of movement in general reserve is as below:(` crore)
Year ended March 31, 2020
Year ended March 31, 2019
Balance at the beginning of the year 12,181.16 12,181.97Adjustment for cross holdings - (0.81)Balance at the end of the year 12,181.16 12,181.16
(d) Capital redemption reserve
The Companies Act, 2013 requires that when a company purchases its own shares out of free reserves or securities premium account, a sum equal to the nominal value of the shares so purchased shall be transferred to a capital redemption reserve account and details of such transfer shall be disclosed in the balance sheet. The capital redemption reserve may be applied by the company, in paying up unissued shares of the company to be issued to shareholders of the company as fully paid bonus shares. The Group established this reserve pursuant to the redemption of preference shares issued in earlier years.
The details of movement in capital redemption reserve is as below:(` crore)
Year ended March 31, 2020
Year ended March 31, 2019
Balance at the beginning of the year 133.11 133.11Balance at the end of the year 133.11 133.11
(e) Special reserve
Special reserve represents reserve created by certain Indian subsidiaries of the Company pursuant to the Reserve Bank of India Act, 1934 (the “RBI Act”) and other related applicable regulations. Under the RBI Act, a non-banking finance company is required to transfer an amount not less than 20% of its net profit to a reserve fund before declaring any dividend. Appropriation from this reserve fund is permitted only for the purposes specified by the RBI.
22. Other equity (Contd.) [Item No. IV(c), Page 323]
NOTESforming part of the consolidated financial statements
377
Corporate Overview 02
Strategic Review 46
Performance Review 20
Statutory Reports 84
Our Strategy 28
Financial Statements 206
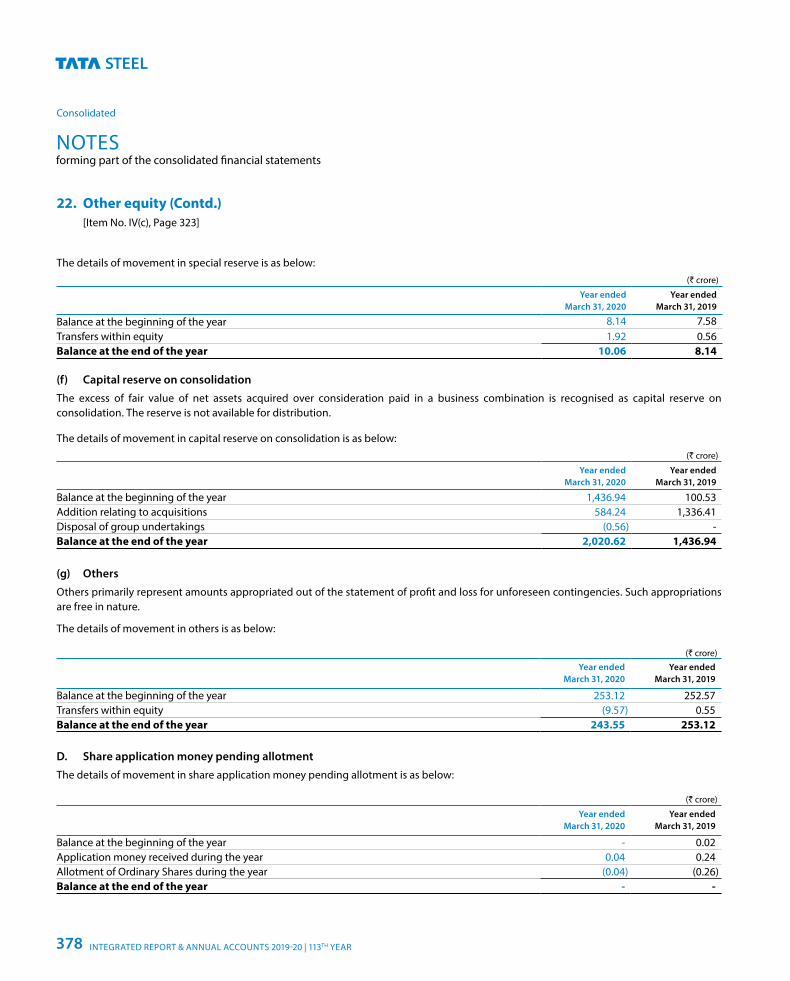
The details of movement in special reserve is as below:(` crore)
Year ended March 31, 2020
Year ended March 31, 2019
Balance at the beginning of the year 8.14 7.58Transfers within equity 1.92 0.56Balance at the end of the year 10.06 8.14
(f) Capital reserve on consolidation
The excess of fair value of net assets acquired over consideration paid in a business combination is recognised as capital reserve on consolidation. The reserve is not available for distribution.
The details of movement in capital reserve on consolidation is as below:(` crore)
Year ended March 31, 2020
Year ended March 31, 2019
Balance at the beginning of the year 1,436.94 100.53Addition relating to acquisitions 584.24 1,336.41Disposal of group undertakings (0.56) -Balance at the end of the year 2,020.62 1,436.94
(g) Others
Others primarily represent amounts appropriated out of the statement of profit and loss for unforeseen contingencies. Such appropriations are free in nature.
The details of movement in others is as below:
(` crore)Year ended
March 31, 2020Year ended
March 31, 2019
Balance at the beginning of the year 253.12 252.57Transfers within equity (9.57) 0.55Balance at the end of the year 243.55 253.12
D. Share application money pending allotment
The details of movement in share application money pending allotment is as below:
(` crore)
Year ended March 31, 2020
Year ended March 31, 2019
Balance at the beginning of the year - 0.02Application money received during the year 0.04 0.24Allotment of Ordinary Shares during the year (0.04) (0.26)Balance at the end of the year - -
22. Other equity (Contd.) [Item No. IV(c), Page 323]
NOTESforming part of the consolidated financial statements
Consolidated
INTEGRATED REPORT & ANNUAL ACCOUNTS 2019-20 | 113TH YEAR378
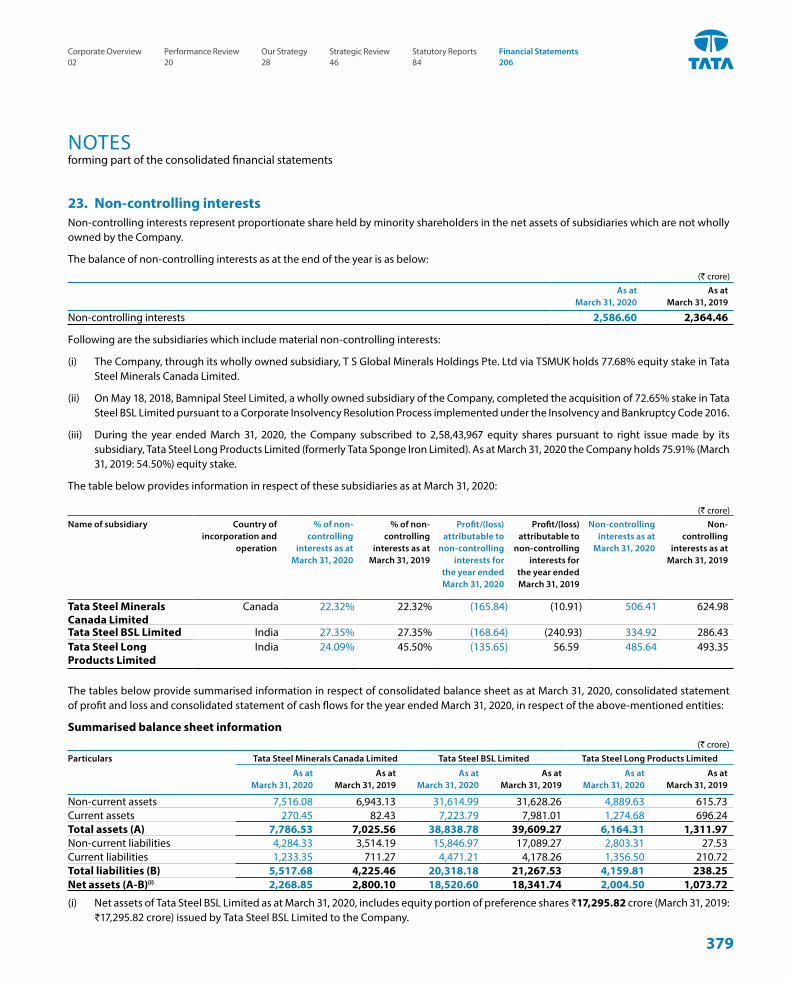
23. Non-controlling interests Non-controlling interests represent proportionate share held by minority shareholders in the net assets of subsidiaries which are not wholly owned by the Company.
The balance of non-controlling interests as at the end of the year is as below:(` crore)
As at March 31, 2020
As at March 31, 2019
Non-controlling interests 2,586.60 2,364.46
Following are the subsidiaries which include material non-controlling interests:
(i) The Company, through its wholly owned subsidiary, T S Global Minerals Holdings Pte. Ltd via TSMUK holds 77.68% equity stake in Tata Steel Minerals Canada Limited.
(ii) On May 18, 2018, Bamnipal Steel Limited, a wholly owned subsidiary of the Company, completed the acquisition of 72.65% stake in Tata Steel BSL Limited pursuant to a Corporate Insolvency Resolution Process implemented under the Insolvency and Bankruptcy Code 2016.
(iii) During the year ended March 31, 2020, the Company subscribed to 2,58,43,967 equity shares pursuant to right issue made by its subsidiary, Tata Steel Long Products Limited (formerly Tata Sponge Iron Limited). As at March 31, 2020 the Company holds 75.91% (March 31, 2019: 54.50%) equity stake.
The table below provides information in respect of these subsidiaries as at March 31, 2020:
(` crore)Name of subsidiary Country of
incorporation and operation
% of non- controlling
interests as at March 31, 2020
% of non- controlling
interests as at March 31, 2019
Profit/(loss) attributable to
non-controlling interests for
the year ended March 31, 2020
Profit/(loss) attributable to
non-controlling interests for
the year ended March 31, 2019
Non-controlling interests as at
March 31, 2020
Non-controlling
interests as at March 31, 2019
Tata Steel Minerals Canada Limited
Canada 22.32% 22.32% (165.84) (10.91) 506.41 624.98
Tata Steel BSL Limited India 27.35% 27.35% (168.64) (240.93) 334.92 286.43Tata Steel Long Products Limited
India 24.09% 45.50% (135.65) 56.59 485.64 493.35
The tables below provide summarised information in respect of consolidated balance sheet as at March 31, 2020, consolidated statement of profit and loss and consolidated statement of cash flows for the year ended March 31, 2020, in respect of the above-mentioned entities:
Summarised balance sheet information(` crore)
Particulars Tata Steel Minerals Canada Limited Tata Steel BSL Limited Tata Steel Long Products Limited
As at March 31, 2020
As at March 31, 2019
As at March 31, 2020
As at March 31, 2019
As at March 31, 2020
As at March 31, 2019
Non-current assets 7,516.08 6,943.13 31,614.99 31,628.26 4,889.63 615.73Current assets 270.45 82.43 7,223.79 7,981.01 1,274.68 696.24Total assets (A) 7,786.53 7,025.56 38,838.78 39,609.27 6,164.31 1,311.97Non-current liabilities 4,284.33 3,514.19 15,846.97 17,089.27 2,803.31 27.53Current liabilities 1,233.35 711.27 4,471.21 4,178.26 1,356.50 210.72Total liabilities (B) 5,517.68 4,225.46 20,318.18 21,267.53 4,159.81 238.25Net assets (A-B)(i) 2,268.85 2,800.10 18,520.60 18,341.74 2,004.50 1,073.72
(i) Net assets of Tata Steel BSL Limited as at March 31, 2020, includes equity portion of preference shares ₹17,295.82 crore (March 31, 2019: ₹17,295.82 crore) issued by Tata Steel BSL Limited to the Company.
NOTESforming part of the consolidated financial statements
379
Corporate Overview 02
Strategic Review 46
Performance Review 20
Statutory Reports 84
Our Strategy 28
Financial Statements 206
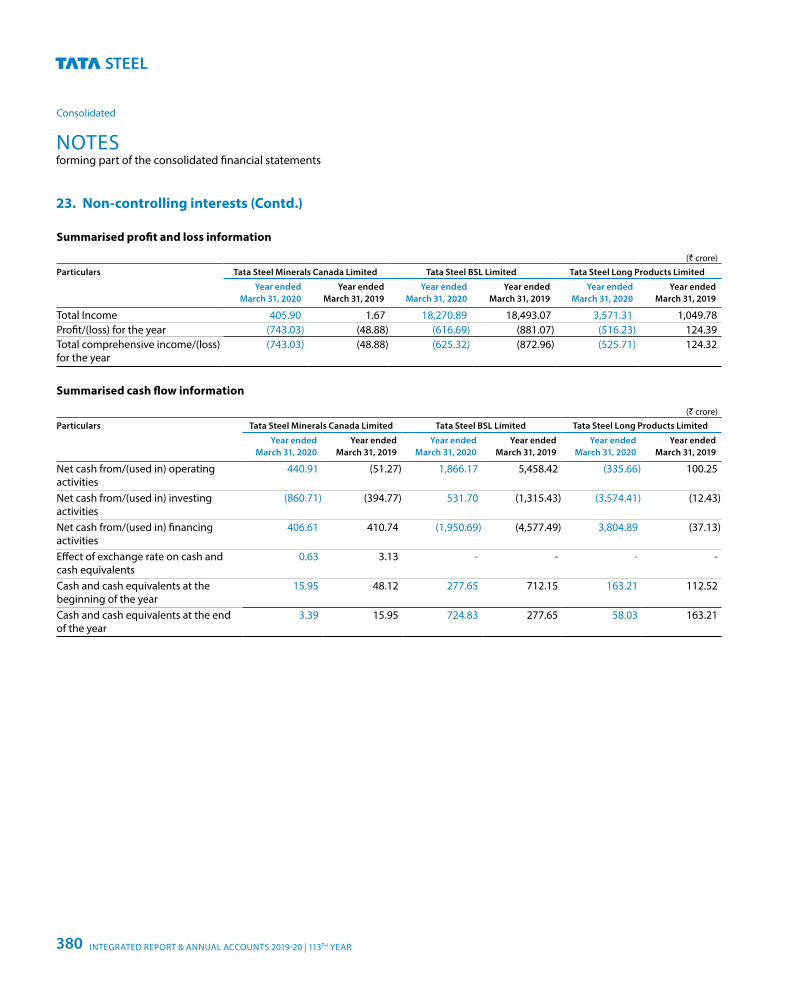
Summarised profit and loss information
(` crore)Particulars Tata Steel Minerals Canada Limited Tata Steel BSL Limited Tata Steel Long Products Limited
Year ended March 31, 2020
Year ended March 31, 2019
Year ended March 31, 2020
Year ended March 31, 2019
Year ended March 31, 2020
Year ended March 31, 2019
Total Income 405.90 1.67 18,270.89 18,493.07 3,571.31 1,049.78Profit/(loss) for the year (743.03) (48.88) (616.69) (881.07) (516.23) 124.39Total comprehensive income/(loss) for the year
(743.03) (48.88) (625.32) (872.96) (525.71) 124.32
Summarised cash flow information
(` crore)Particulars Tata Steel Minerals Canada Limited Tata Steel BSL Limited Tata Steel Long Products Limited
Year ended March 31, 2020
Year ended March 31, 2019
Year ended March 31, 2020
Year ended March 31, 2019
Year ended March 31, 2020
Year ended March 31, 2019
Net cash from/(used in) operating activities
440.91 (51.27) 1,866.17 5,458.42 (335.66) 100.25
Net cash from/(used in) investing activities
(860.71) (394.77) 531.70 (1,315.43) (3,574.41) (12.43)
Net cash from/(used in) financing activities
406.61 410.74 (1,950.69) (4,577.49) 3,804.89 (37.13)
Effect of exchange rate on cash and cash equivalents
0.63 3.13 - - - -
Cash and cash equivalents at the beginning of the year
15.95 48.12 277.65 712.15 163.21 112.52
Cash and cash equivalents at the end of the year
3.39 15.95 724.83 277.65 58.03 163.21
23. Non-controlling interests (Contd.)
NOTESforming part of the consolidated financial statements
Consolidated
INTEGRATED REPORT & ANNUAL ACCOUNTS 2019-20 | 113TH YEAR380
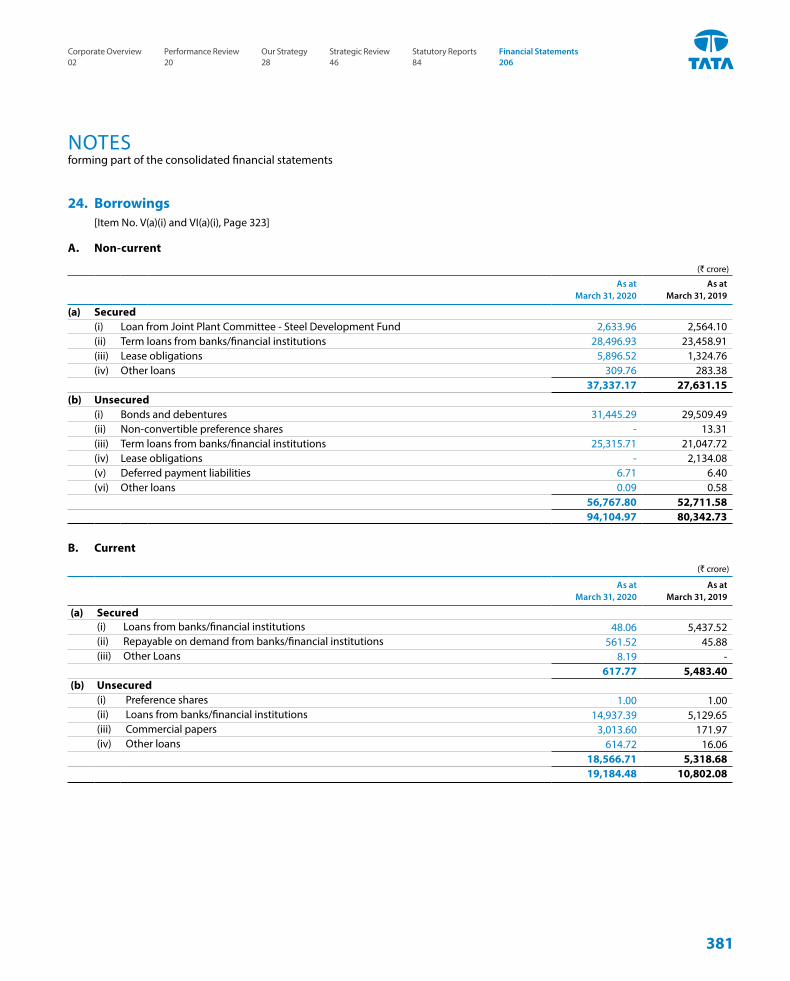
24. Borrowings [Item No. V(a)(i) and VI(a)(i), Page 323]
A. Non-current
(` crore)
As at March 31, 2020
As at March 31, 2019
(a) Secured (i) Loan from Joint Plant Committee - Steel Development Fund 2,633.96 2,564.10(ii) Term loans from banks/financial institutions 28,496.93 23,458.91(iii) Lease obligations 5,896.52 1,324.76 (iv) Other loans 309.76 283.38
37,337.17 27,631.15(b) Unsecured
(i) Bonds and debentures 31,445.29 29,509.49(ii) Non-convertible preference shares - 13.31(iii) Term loans from banks/financial institutions 25,315.71 21,047.72(iv) Lease obligations - 2,134.08(v) Deferred payment liabilities 6.71 6.40(vi) Other loans 0.09 0.58
56,767.80 52,711.58 94,104.97 80,342.73
B. Current
(` crore)
As at March 31, 2020
As at March 31, 2019
(a) Secured (i) Loans from banks/financial institutions 48.06 5,437.52(ii) Repayable on demand from banks/financial institutions 561.52 45.88(iii) Other Loans 8.19 -
617.77 5,483.40(b) Unsecured
(i) Preference shares 1.00 1.00(ii) Loans from banks/financial institutions 14,937.39 5,129.65(iii) Commercial papers 3,013.60 171.97(iv) Other loans 614.72 16.06
18,566.71 5,318.6819,184.48 10,802.08
NOTESforming part of the consolidated financial statements
381
Corporate Overview 02
Strategic Review 46
Performance Review 20
Statutory Reports 84
Our Strategy 28
Financial Statements 206
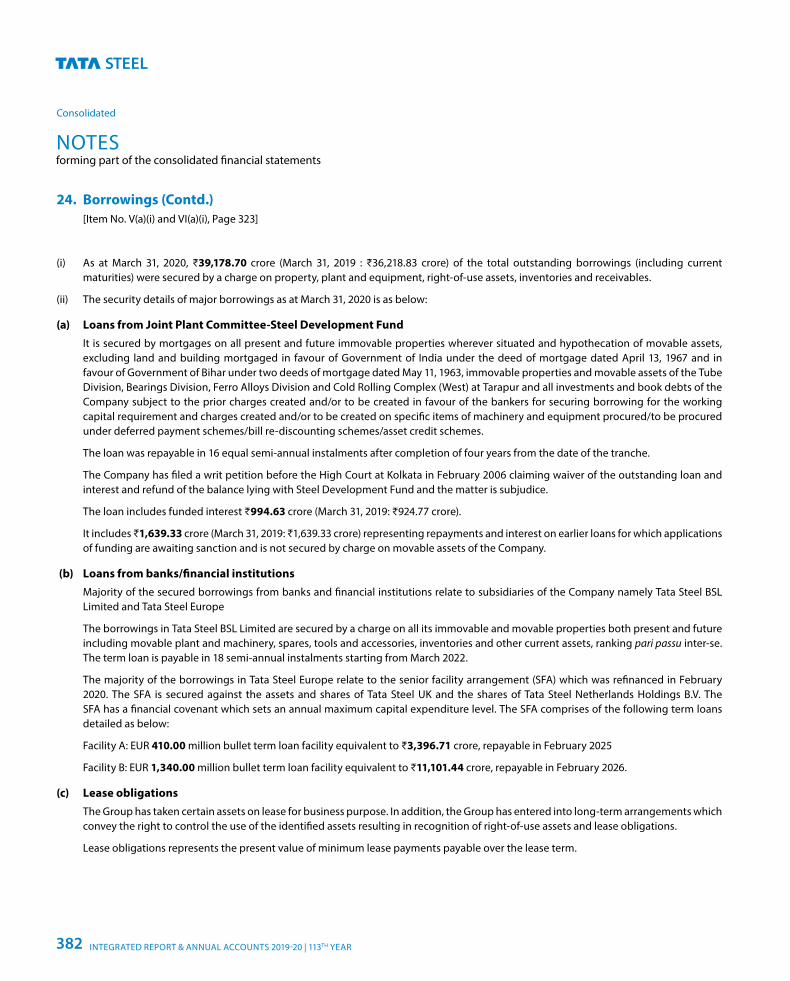
(i) As at March 31, 2020, ₹39,178.70 crore (March 31, 2019 : ₹36,218.83 crore) of the total outstanding borrowings (including current maturities) were secured by a charge on property, plant and equipment, right-of-use assets, inventories and receivables.
(ii) The security details of major borrowings as at March 31, 2020 is as below:
(a) Loans from Joint Plant Committee-Steel Development Fund It is secured by mortgages on all present and future immovable properties wherever situated and hypothecation of movable assets,
excluding land and building mortgaged in favour of Government of India under the deed of mortgage dated April 13, 1967 and in favour of Government of Bihar under two deeds of mortgage dated May 11, 1963, immovable properties and movable assets of the Tube Division, Bearings Division, Ferro Alloys Division and Cold Rolling Complex (West) at Tarapur and all investments and book debts of the Company subject to the prior charges created and/or to be created in favour of the bankers for securing borrowing for the working capital requirement and charges created and/or to be created on specific items of machinery and equipment procured/to be procured under deferred payment schemes/bill re-discounting schemes/asset credit schemes.
The loan was repayable in 16 equal semi-annual instalments after completion of four years from the date of the tranche.
The Company has filed a writ petition before the High Court at Kolkata in February 2006 claiming waiver of the outstanding loan and interest and refund of the balance lying with Steel Development Fund and the matter is subjudice.
The loan includes funded interest ₹994.63 crore (March 31, 2019: ₹924.77 crore).
It includes ₹1,639.33 crore (March 31, 2019: ₹1,639.33 crore) representing repayments and interest on earlier loans for which applications of funding are awaiting sanction and is not secured by charge on movable assets of the Company.
(b) Loans from banks/financial institutions Majority of the secured borrowings from banks and financial institutions relate to subsidiaries of the Company namely Tata Steel BSL
Limited and Tata Steel Europe
The borrowings in Tata Steel BSL Limited are secured by a charge on all its immovable and movable properties both present and future including movable plant and machinery, spares, tools and accessories, inventories and other current assets, ranking pari passu inter-se. The term loan is payable in 18 semi-annual instalments starting from March 2022.
The majority of the borrowings in Tata Steel Europe relate to the senior facility arrangement (SFA) which was refinanced in February 2020. The SFA is secured against the assets and shares of Tata Steel UK and the shares of Tata Steel Netherlands Holdings B.V. The SFA has a financial covenant which sets an annual maximum capital expenditure level. The SFA comprises of the following term loans detailed as below:
Facility A: EUR 410.00 million bullet term loan facility equivalent to ₹3,396.71 crore, repayable in February 2025
Facility B: EUR 1,340.00 million bullet term loan facility equivalent to ₹11,101.44 crore, repayable in February 2026.
(c) Lease obligations The Group has taken certain assets on lease for business purpose. In addition, the Group has entered into long-term arrangements which
convey the right to control the use of the identified assets resulting in recognition of right-of-use assets and lease obligations.
Lease obligations represents the present value of minimum lease payments payable over the lease term.
24. Borrowings (Contd.) [Item No. V(a)(i) and VI(a)(i), Page 323]
NOTESforming part of the consolidated financial statements
Consolidated
INTEGRATED REPORT & ANNUAL ACCOUNTS 2019-20 | 113TH YEAR382
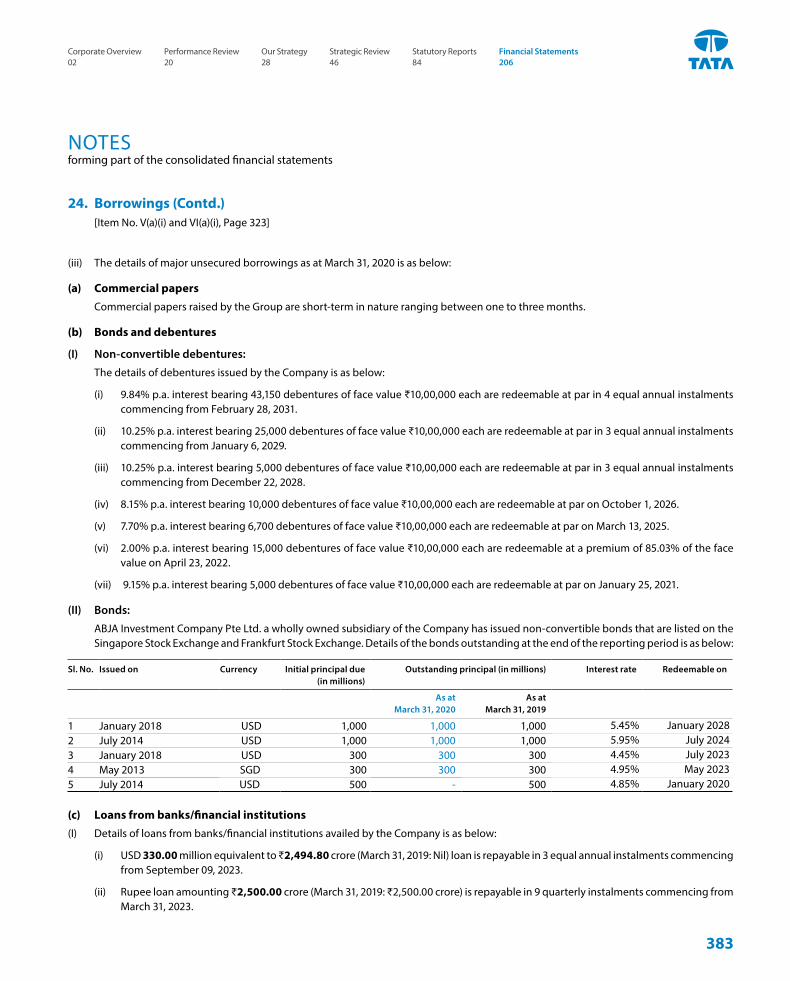
(iii) The details of major unsecured borrowings as at March 31, 2020 is as below:
(a) Commercial papers Commercial papers raised by the Group are short-term in nature ranging between one to three months.
(b) Bonds and debentures
(I) Non-convertible debentures:
The details of debentures issued by the Company is as below:
(i) 9.84% p.a. interest bearing 43,150 debentures of face value ₹10,00,000 each are redeemable at par in 4 equal annual instalments commencing from February 28, 2031.
(ii) 10.25% p.a. interest bearing 25,000 debentures of face value ₹10,00,000 each are redeemable at par in 3 equal annual instalments commencing from January 6, 2029.
(iii) 10.25% p.a. interest bearing 5,000 debentures of face value ₹10,00,000 each are redeemable at par in 3 equal annual instalments commencing from December 22, 2028.
(iv) 8.15% p.a. interest bearing 10,000 debentures of face value ₹10,00,000 each are redeemable at par on October 1, 2026.
(v) 7.70% p.a. interest bearing 6,700 debentures of face value ₹10,00,000 each are redeemable at par on March 13, 2025.
(vi) 2.00% p.a. interest bearing 15,000 debentures of face value ₹10,00,000 each are redeemable at a premium of 85.03% of the face value on April 23, 2022.
(vii) 9.15% p.a. interest bearing 5,000 debentures of face value ₹10,00,000 each are redeemable at par on January 25, 2021.
(II) Bonds:
ABJA Investment Company Pte Ltd. a wholly owned subsidiary of the Company has issued non-convertible bonds that are listed on the Singapore Stock Exchange and Frankfurt Stock Exchange. Details of the bonds outstanding at the end of the reporting period is as below:
Sl. No. Issued on Currency Initial principal due (in millions)
Outstanding principal (in millions) Interest rate Redeemable on
As at March 31, 2020
As at March 31, 2019
1 January 2018 USD 1,000 1,000 1,000 5.45% January 20282 July 2014 USD 1,000 1,000 1,000 5.95% July 20243 January 2018 USD 300 300 300 4.45% July 20234 May 2013 SGD 300 300 300 4.95% May 20235 July 2014 USD 500 - 500 4.85% January 2020
(c) Loans from banks/financial institutions(I) Details of loans from banks/financial institutions availed by the Company is as below:
(i) USD 330.00 million equivalent to ₹2,494.80 crore (March 31, 2019: Nil) loan is repayable in 3 equal annual instalments commencing from September 09, 2023.
(ii) Rupee loan amounting ₹2,500.00 crore (March 31, 2019: ₹2,500.00 crore) is repayable in 9 quarterly instalments commencing from March 31, 2023.
24. Borrowings (Contd.) [Item No. V(a)(i) and VI(a)(i), Page 323]
NOTESforming part of the consolidated financial statements
383
Corporate Overview 02
Strategic Review 46
Performance Review 20
Statutory Reports 84
Our Strategy 28
Financial Statements 206
(iii) Rupee loan amounting ₹1,047.50 crore (March 31, 2019: ₹1,047.50 crore) is repayable in 10 semi-annual instalments, the next instalment is due on November 29, 2022.
(iv) Rupee loan amounting ₹1,000.00 crore (March 31, 2019: Nil) is repayable in 16 semi-annual instalments, the next instalment is due on March 24, 2022.
(v) Rupee loan amounting ₹584.58 crore (March 31, 2019: ₹584.58 crore) is repayable in 8 semi-annual instalments, the next instalment is due on June 15, 2021.
(vi) Rupee loan amounting ₹750.00 crore (March 31, 2019: ₹750.00 crore) is repayable in 3 equal annual instalments commencing from May 29, 2021.
(vii) USD 7.86 million equivalent to ₹59.43 crore (March 31, 2019: USD 7.86 million equivalent to ₹54.38 crore) is repayable on March 1, 2021.
(viii) USD 133.33 million equivalent to ₹1,008.00 crore (March 31, 2019: USD 200.00 million equivalent to ₹1,383.55 crore) loan is repayable in 2 equal annual instalments, the next instalment is due on February 16, 2021.
(ix) Rupee loan amounting ₹632.72 crore (March 31, 2019: ₹640.42 crore) is repayable in 14 semi-annual instalments, the next instalment is due on August 14, 2020.
(x) Euro 10.81 million equivalent to ₹89.56 crore (March 31, 2019: Euro 16.21 million equivalent to ₹125.96 crore) loan is repayable in 4 equal semi-annual instalments, the next instalment is due on July 6, 2020.
(xi) Rupee loan amounting ₹1,000.00 crore (March 31, 2019: Nil) is repayable in 15 semi-annual instalments, the next instalment is due on June 30, 2020.
(xii) Rupee loan amounting ₹1,600.00 crore (March 31, 2019: ₹1,600.00 crore) is repayable in 8 semi-annual instalments, the next instalment is due on April 30, 2020.
(xiii) Euro 47.76 million equivalent to ₹395.80 crore (March 31, 2019: Euro 66.87 million equivalent to ₹519.58 crore) loan is repayable in 5 equal semi-annual instalments, the next instalment is due on April 30, 2020.
(xiv) Rupee loan amounting ₹1,447.50 crore (March 31, 2019: ₹1,485.00 crore) is repayable in 17 semi-annual instalments, the next instalment is due on April 16, 2020.
(II) Details of loans from banks/financial institutions availed by NatSteel Asia Pte Limited, a wholly owned subsidiary of the Company is as below:
(i) USD 1,151.66 million equivalent to ₹8,705.40 crore (March 31, 2019: USD 1,151.66 million equivalent to ₹7,963.15 crore) loan is repayable in 3 annual instalments, the next instalment is due on April 19, 2022.
(ii) EUR 418.27 million equivalent to ₹3,465.22 crore (March 31, 2019: EUR 418.27 million equivalent to ₹3,248.44 crore) loan is repayable in 3 annual instalments, the next instalment is due on April 19, 2022
24. Borrowings (Contd.) [Item No. V(a)(i) and VI(a)(i), Page 323]
NOTESforming part of the consolidated financial statements
Consolidated
INTEGRATED REPORT & ANNUAL ACCOUNTS 2019-20 | 113TH YEAR384
24. Borrowings (Contd.) [Item No. V(a)(i) and VI(a)(i), Page 323]
(iv) Currency and interest exposure of borrowings including current maturities at the end of the reporting period is as below:
(` crore)As at March 31, 2020 As at March 31, 2019
Fixed rate
Floating rate
Total Fixed rate
Floating rate
Total
INR 26,388.35 29,170.92 55,559.27 19,350.08 25,201.05 44,551.13GBP 1,217.99 1,827.02 3,045.01 147.48 3,514.88 3,662.36EURO 1,238.53 17,270.08 18,508.61 972.92 15,523.15 16,496.07USD 22,147.07 14,825.01 36,972.08 23,094.51 10,980.10 34,074.61Others 2,221.04 22.19 2,243.23 2,005.37 26.68 2,032.05Total 53,212.98 63,115.22 116,328.20 45,570.36 55,245.86 100,816.22
INR-Indian Rupees, GBP- Great British Pound, USD-United States Dollars.
(a) Others primarily include SGD-Singapore Dollars and CAD- Canadian Dollars.
(b) Majority of floating rate borrowings are bank borrowings bearing interest rates based on LIBOR, EURIBOR or local official rates. Of the total floating rate borrowings, as at March 31, 2020, ₹2,786.70 crore (March 31, 2019: ₹1,037.66 crore) has been hedged using interest rate swaps and interest rate caps and collars, with contracts covering a period of more than one year.
(v) Maturity profile of borrowings including current maturities is as below:(` crore)
As at March 31, 2020 As at March 31, 2019
Borrowings other than lease
obligations
Lease obligations
Total borrowings
Total borrowings
Not later than one year or on demand 21,101.09 1,721.35 22,822.44 20,877.47Later than one year but not two years 1,835.76 1,397.53 3,233.29 6,756.98Later than two years but not three years 7,316.50 1,174.58 8,491.08 8,335.28Later than three years but not four years 12,785.00 978.90 13,763.90 8,093.70Later than four years but not five years 21,116.31 968.75 22,085.06 12,011.55More than five years 47,411.03 5,160.40 52,571.43 49,261.03
111,565.69 11,401.51 122,967.20 1,05,336.01Less: Future finance charges - 4,379.45 4,379.45 3,388.73Less: Capitalisation of transaction costs 2,259.55 - 2,259.55 1,131.06
109,306.14 7,022.06 116,328.20 1,00,816.22
(vi) Some of the Group’s major financing arrangements include financial covenants, which require compliance to certain debt-equity ratios and debt coverage ratios by entities within the Group who have availed such borrowings. Additionally, certain negative covenants may limit the ability of entities within the Group to borrow additional funds or to incur additional liens, and/or provide for increased costs in case of breach.
NOTESforming part of the consolidated financial statements
385
Corporate Overview 02
Strategic Review 46
Performance Review 20
Statutory Reports 84
Our Strategy 28
Financial Statements 206
25. Other financial liabilities [Item No. V(a)(iii) and VI(a)(iv), Page 323]
A. Non-current (` crore)
As at March 31, 2020
As at March 31, 2019
(a) Interest accrued but not due - 9.57(b) Creditors for other liabilities 387.67 261.01
387.67 270.58
B. Current
(` crore)
As at March 31, 2020
As at March 31, 2019
(a) Current maturities of long-term borrowings 1,913.21 9,276.95(b) Current maturities of lease obligations 1,125.54 394.46(c) Interest accrued but not due 778.93 848.96(d) Unclaimed dividends 77.31 99.11(e) Creditors for other liabilities 5,623.54 6,118.35
9,518.53 16,737.83
(i) Non-current and current creditors for other liabilities include:
(a) creditors for capital supplies and services of ₹2,904.05 crore (March 31, 2019: ₹3,717.51 crore).
(b) liability for employee family benefit scheme ₹195.21 crore (March 31, 2019: ₹189.87 crore).
26. Provisions [Item No. V(b) and VI(b), Page 323]
A. Non-current
(` crore)As at
March 31, 2020As at
March 31, 2019
(a) Employee benefits 2,655.81 2,396.20(b) Insurance provisions 566.80 661.77(c) Others 1,012.46 988.24
4,235.07 4,046.21
B. Current
(` crore)As at
March 31, 2020As at
March 31, 2019
(a) Employee benefits 472.03 395.97(b) Others 1,191.64 852.75
1,663.67 1,248.72
NOTESforming part of the consolidated financial statements
Consolidated
INTEGRATED REPORT & ANNUAL ACCOUNTS 2019-20 | 113TH YEAR386
(i) Non-current and current provision for employee benefits include provision for leave salaries ₹1,317.48 crore (March 31, 2019: ₹1,127.69 crore) and provision for early separation, disability and other long term employee benefits ₹1,735.39 crore (March 31, 2019: ₹1,591.55 crore).
(ii) As per the leave policy of the Company and its Indian subsidiaries, an employee is entitled to be paid the accumulated leave balance on separation. The Company and its Indian subsidiaries present provision for leave salaries as current and non-current based on actuarial valuation considering estimates of availment of leave, separation of employee, etc.
(iii) Insurance provisions currently held by Tata Steel Europe, a wholly owned indirect subsidiary of the Company, cover its historical liability risks, including those covered by its captive insurance company, Crucible Insurance Company Limited, in respect of its retrospective hearing impairment policy and those for which it is now responsible for under its current insurance arrangements. The provisions include a suitable amount in respect of its known outstanding claims and an appropriate amount in respect of liabilities that have been incurred but not yet reported. The provisions are subject to regular review and are adjusted as appropriate. The value of the final insurance settlements is uncertain and so is the timing of the expenditure.
(iv) Non-current and current other provisions primarily include:
(a) provision for compensatory afforestation, mine closure and rehabilitation obligations and other environmental remediation obligations ₹1,438.86 crore (March 31, 2019: ₹1,046.50 crore). These amounts become payable upon closure of the mines/sites and are expected to be incurred over a period of 1 to 32 years.
(b) provision in respect of onerous contracts amounting to ₹173.79 crore (March 31, 2019: ₹249.65 crore).
(v) The details of movement in provision balances is as below:
Year ended March 31, 2020 (` crore)
Insurance Provisions
Others Total
Balance at the beginning of the year 661.77 1,840.99 2,502.76Recognised/(released) during the year(i) (73.53) 591.19 517.66Addition relating to acquisitions - 27.42 27.42Disposal of group undertakings - (9.91) (9.91)Utilised during the year (39.41) (238.61) (278.02)Other re-classifications(ii) - (76.24) (76.24)Exchange differences on consolidation 17.97 69.26 87.23Balance at the end of the year 566.80 2,204.10 2,770.90
26. Provisions (Contd.) [Item No. V(b) and VI(b), Page 323]
NOTESforming part of the consolidated financial statements
387
Corporate Overview 02
Strategic Review 46
Performance Review 20
Statutory Reports 84
Our Strategy 28
Financial Statements 206
Year ended March 31, 2019 (` crore)
Insurance Provisions
Others Total
Balance at the beginning of the year 858.44 1,828.10 2,686.54Recognised/(released) during the year(i) (131.98) 290.48 158.50Disposal of group undertakings - (12.26) (12.26)Utilised during the year (50.83) (233.47) (284.30)Classified as held for sale - (0.23) (0.23)Exchange differences on consolidation (13.86) (31.63) (45.49)Balance at the end of the year 661.77 1,840.99 2,502.76
(i) Includes provisions capitalised during the year in respect of restoration obligations.
(ii) Represents provision for onerous leases reclassified to right-of-use assets.
27. Deferred income [Item No. V(d) and VI(d), Page 323]
A. Non-current
(` crore)
As at March 31, 2020
As at March 31, 2019
(a) Grants relating to property, plant and equipment 45.47 804.37(b) Revenue grants 18.25 32.14(c) Others 87.58 70.29
151.30 906.80
B. Current
(` crore)As at
March 31, 2020As at
March 31, 2019
(a) Grants relating to property, plant and equipment 20.75 10.48(b) Others 13.80 6.03
34.55 16.51
Grants relating to property, plant and equipment relates to duty saved on import of capital goods and spares under the EPCG scheme. Under the scheme, certain entities within the Group are committed to export prescribed times of the duty saved on import of capital goods over a specified period of time. In case such commitments are not met, the entities would be required to pay the duty saved along with interest to the regulatory authorities. Such grants recognised are released to the consolidated statement of profit and loss based on fulfilment of related export obligations.
During the year, an amount of ₹764.35 crore (2018-19: ₹635.76 crore) was released from deferred income to the consolidated statement of profit and loss on fulfilment of export obligations.
26. Provisions (Contd.) [Item No. V(b) and VI(b), Page 323]
NOTESforming part of the consolidated financial statements
Consolidated
INTEGRATED REPORT & ANNUAL ACCOUNTS 2019-20 | 113TH YEAR388
28. Other liabilities [Item No. V(f) and VI(f), Page 323]
A. Non-current
(` crore)
As at March 31, 2020
As at March 31, 2019
(a) Advances received from customers 2.73 -(b) Statutory dues - 19.77(c) Other credit balances 726.42 499.46
729.15 519.23
B. Current
(` crore)As at
March 31, 2020As at
March 31, 2019
(a) Advances received from customers 810.06 769.60(b) Employee recoveries and employer contributions 135.04 161.08(c) Statutory dues 6,046.67 6,931.75(d) Other credit balances 58.67 49.78
7,050.44 7,912.21
(i) Statutory dues primarily relate to payables in respect of royalties, GST, excise duties, service tax, sales tax, VAT and tax deducted at source.
29. Trade payables [Item No. VI(a)(ii), Page 323]
A. Total outstanding dues of micro and small enterprises(` crore)
As at March 31, 2020
As at March 31, 2019
Dues of micro and small enterprises 198.86 169.74198.86 169.74
B. Total outstanding dues of creditors other than micro and small enterprises(` crore)
As at March 31, 2020
As at March 31, 2019
(a) Creditors for supplies and services 17,618.35 17,100.42(b) Creditors for accrued wages and salaries 3,563.64 4,446.80
21,181.99 21,547.22
NOTESforming part of the consolidated financial statements
389
Corporate Overview 02
Strategic Review 46
Performance Review 20
Statutory Reports 84
Our Strategy 28
Financial Statements 206
30. Revenue from operations [Item No. I, Page 324]
(` crore)Year ended
March 31, 2020Year ended
March 31, 2019
(a) Sale of products 1,35,167.06 1,52,843.66(b) Sale of power and water 1,659.46 1,727.58(c) Income from services 150.24 120.60(d) Other operating revenues(ii) 2,839.89 2,977.15
1,39,816.65 1,57,668.99
(i) Revenue from contracts with customers disaggregated on the basis of geographical regions and major businesses is as below:(` crore)
Year endedMarch 31, 2020
Year endedMarch 31, 2019
(a) India 70,121.42 79,605.15(b) Outside India 66,855.34 75,086.69
136,976.76 1,54,691.84
(` crore)Year ended
March 31, 2020Year ended
March 31, 2019
(a) Steel 1,25,991.59 1,40,002.34(b) Power and water 1,659.46 1,727.58(c) Others 9,325.71 12,961.92
136,976.76 154,691.84
Revenue outside India includes Asia excluding India ₹9,935.98 crore (2018-19: ₹8,895.30 crore), UK ₹12,606.68 crore (2018-19: ₹14,767.65 crore) and other European countries ₹35,783.63 crore (2018-19: ₹41,123.35 crore).
(ii) Other operating revenues include export incentives and deferred income released to consolidated statement of profit and loss on fulfilment of export obligations under the EPCG scheme.
31. Other income [Item No. II, Page 324]
(` crore)
Year endedMarch 31, 2020
Year ended March 31, 2019
(a) Dividend income 43.35 34.19(b) Interest income 1,419.09 316.64(c) Net gain/(loss) on sale/fair value changes of mutual funds 140.86 708.96(d) Net gain/(loss) on sale of non-current investments 2.01 -(e) Gain/(loss) on sale of property, plant and equipment including intangible assets
(net of loss on assets scrapped/written off)(4.14) 266.50
(f ) Gain/(loss) on cancellation of forwards, swaps and options (1.26) 36.95(g) Other miscellaneous income 243.58 57.34
1,843.49 1,420.58
NOTESforming part of the consolidated financial statements
Consolidated
INTEGRATED REPORT & ANNUAL ACCOUNTS 2019-20 | 113TH YEAR390
(i) Dividend income includes income from investments carried at fair value through other comprehensive income of ₹20.29 crore (2018-19: ₹19.58 crore)
(ii) Interest income includes:
(a) income from financial assets carried at amortised cost of ₹241.36 crore (2018-19: ₹315.24 crore).
(b) income from financial assets carried at fair value through profit and loss ₹8.07 crore (2018-19: ₹1.40 crore).
(iii) Interest income during the year also includes gain of ₹1,169.66 crore on senior facility arrangement refinancing in February 2020 within Tata Steel Europe, treated as a debt modification in accordance with Ind AS 109 "Financial Instruments". The gain arises as the effective interest rate used to discount the cashflows is higher than the actual interest rate charged on the facility.
32. Employee benefits expense [Item No. IV(d), Page 324]
(` crore)Year ended
March 31, 2020Year ended
March 31, 2019
(a) Salaries and wages 15,212.59 15,382.93(b) Contribution to provident and other funds 2,687.36 2,719.49(c) Staff welfare expenses 633.63 656.45
18,533.58 18,758.87
During the year ended March 31, 2020, the Company has recognised an amount of ₹32.96 crore (2018-19: ₹27.06 crore) as remuneration to key managerial personnel. The details of such remuneration is as below:
(` crore)
Year ended March 31, 2020
Year ended March 31, 2019
(a) Short-term employee benefits 21.47 22.05(b) Post-employment benefits 11.21 4.88
(c) Other long-term employee benefits 0.28 0.1332.96 27.06
33. Finance costs [Item No. IV(e), Page 324]
(` crore)
Year ended March 31, 2020
Year ended March 31, 2019
Interest expense on:(a) Bonds, debentures, bank borrowings and others 7,100.94 7,537.44(b) Lease obligations 673.52 328.67
7,774.46 7,866.11Less: Interest capitalised 241.00 206.01
7,533.46 7,660.10
31. Other income (Contd.) [Item No. II, Page 324]
NOTESforming part of the consolidated financial statements
391
Corporate Overview 02
Strategic Review 46
Performance Review 20
Statutory Reports 84
Our Strategy 28
Financial Statements 206
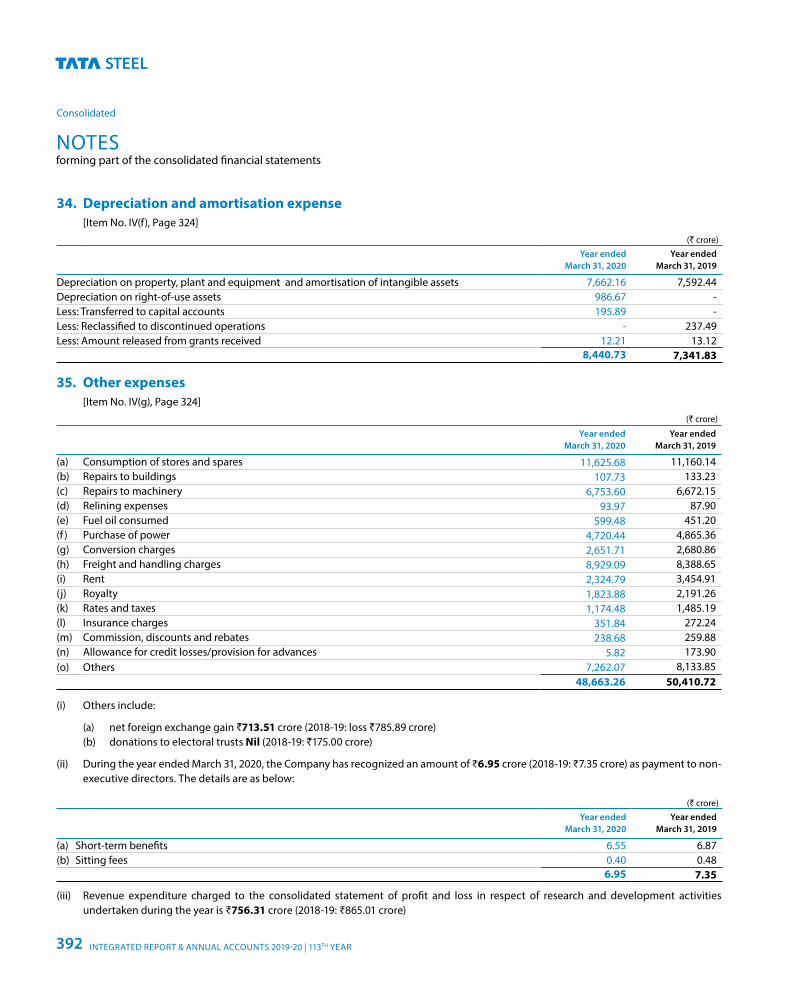
34. Depreciation and amortisation expense [Item No. IV(f), Page 324]
(` crore)Year ended
March 31, 2020Year ended
March 31, 2019
Depreciation on property, plant and equipment and amortisation of intangible assets 7,662.16 7,592.44Depreciation on right-of-use assets 986.67 -Less: Transferred to capital accounts 195.89 -Less: Reclassified to discontinued operations - 237.49Less: Amount released from grants received 12.21 13.12
8,440.73 7,341.83
35. Other expenses [Item No. IV(g), Page 324]
(` crore)
Year ended March 31, 2020
Year ended March 31, 2019
(a) Consumption of stores and spares 11,625.68 11,160.14(b) Repairs to buildings 107.73 133.23(c) Repairs to machinery 6,753.60 6,672.15(d) Relining expenses 93.97 87.90(e) Fuel oil consumed 599.48 451.20(f ) Purchase of power 4,720.44 4,865.36(g) Conversion charges 2,651.71 2,680.86(h) Freight and handling charges 8,929.09 8,388.65(i) Rent 2,324.79 3,454.91(j) Royalty 1,823.88 2,191.26(k) Rates and taxes 1,174.48 1,485.19(l) Insurance charges 351.84 272.24(m) Commission, discounts and rebates 238.68 259.88(n) Allowance for credit losses/provision for advances 5.82 173.90(o) Others 7,262.07 8,133.85
48,663.26 50,410.72
(i) Others include:
(a) net foreign exchange gain `713.51 crore (2018-19: loss `785.89 crore) (b) donations to electoral trusts Nil (2018-19: `175.00 crore)
(ii) During the year ended March 31, 2020, the Company has recognized an amount of ₹6.95 crore (2018-19: ₹7.35 crore) as payment to non-executive directors. The details are as below:
(` crore)Year ended
March 31, 2020Year ended
March 31, 2019
(a) Short-term benefits 6.55 6.87(b) Sitting fees 0.40 0.48
6.95 7.35
(iii) Revenue expenditure charged to the consolidated statement of profit and loss in respect of research and development activities undertaken during the year is ₹756.31 crore (2018-19: ₹865.01 crore)
NOTESforming part of the consolidated financial statements
Consolidated
INTEGRATED REPORT & ANNUAL ACCOUNTS 2019-20 | 113TH YEAR392
36. Exceptional items [Item No. VII, Page 324]
Exceptional items are those which are considered for separate disclosure in the financial statements considering their size, nature or incidence. Such items included within the consolidated statement of profit and loss are detailed below:
(a) Profit on sale of subsidiaries and non-current investments includes profit of ₹148.99 crore on sale and ₹40.63 crore on liquidation of subsidiaries within the European Operations (2018-19: ₹180.13 crore primarily includes profit on sale of investment in TRL Krosaki Refractories Limited, an associate of the Company).
(b) Provision for impairment of investments/doubtful advances ₹40.95 crore (2018-19: ₹172.12 crore) primarily relates to capital and other advances.
(c) Provision for impairment of non-current assets relates to impairment recognised in respect of property, plant and equipment (including capital work-in-progress), right-of-use assets and goodwill ₹3,197.14 crore (2018-19: ₹9.57 crore). The impairment recognized is contained within Tata Steel Europe, Rest of the world, Other Indian operations and Bamnipal Steel (including Tata Steel BSL) segment (2018-19: Bamnipal Steel (including Tata Steel BSL) segment). The impairment recognized is shown as an exceptional item in segment reporting and does not form part of segment result.
(d) Provision for demands and claims ₹196.41 crore (2018-19: ₹328.64 crore) is in respect of certain statutory demands and claims.
(e) Employee separation compensation ₹107.37 crore (2018-19: ₹35.33 crore) relates to provisions recognised in respect of early separation of employee within Indian operations.
(f) Restructuring and other provisions ₹149.80 crore primarily includes provision relating to performance obligation towards development of a coal block within Tata Steel Long Products Limited (formerly Tata Sponge Iron Limited), restructuring provisions within European Operations and write-back of liabilities no longer required (2018-19: ₹244.56 crore primarily include write-back of liabilities no longer required).
(g) Fair value gain/(loss) on preference share investment ₹250.00 crore (2018-19: Nil) represents notional fair value loss on preference share investments held in an associate of the Company.
37. Discontinued operations
[Item No. XI, Page 324]
On January 28, 2019, the Group entered into definitive agreements with HBIS Group Co. Ltd. ('HBIS') to divest its entire equity stake in NatSteel Holdings Pte. Ltd. ('NSH') and Tata Steel (Thailand) Public Company Ltd. ('TSTH'). The definitive agreements were not extended since HBIS was not able to procure the requisite regulatory approval.
As on March 31, 2020, active discussions and engagement with other potential buyers demonstrate that the management of the Group is committed to sell the disposal group and there is an active programme for completing the sale.
In accordance with Ind AS 105, “Non-current Assets Held for Sale and Discontinued Operations”, the businesses forming part of the disposal group have been classified as discontinued operations.
NOTESforming part of the consolidated financial statements
393
Corporate Overview 02
Strategic Review 46
Performance Review 20
Statutory Reports 84
Our Strategy 28
Financial Statements 206
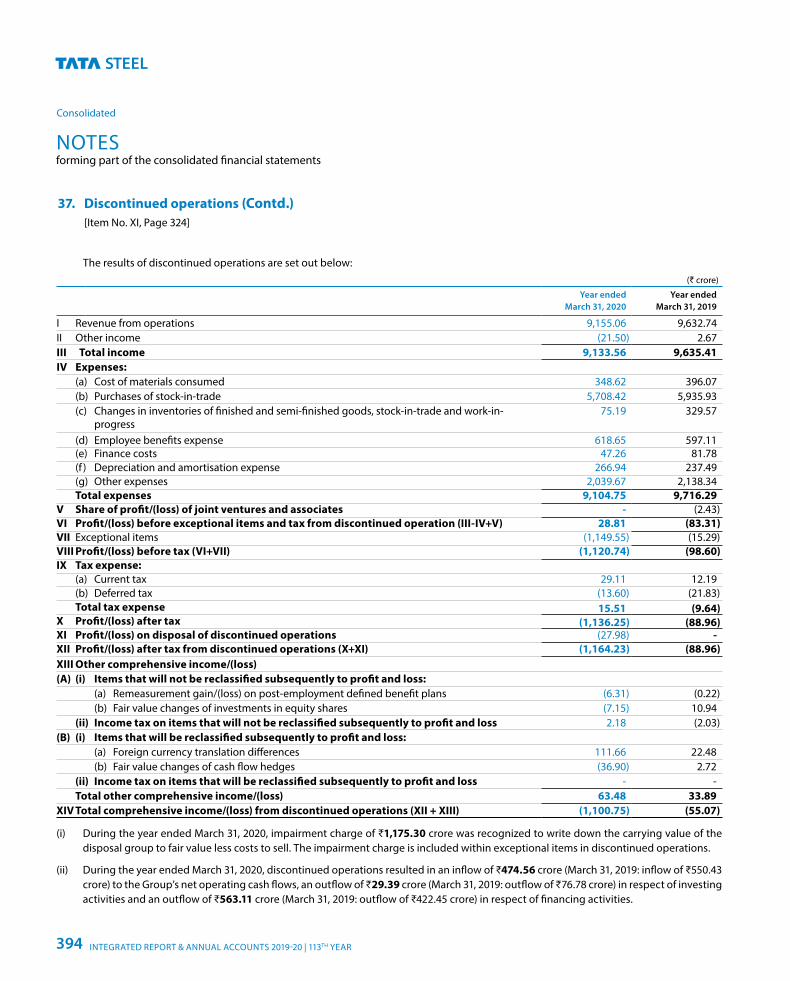
The results of discontinued operations are set out below:(` crore)
Year ended March 31, 2020
Year ended March 31, 2019
I Revenue from operations 9,155.06 9,632.74II Other income (21.50) 2.67III Total income 9,133.56 9,635.41IV Expenses: (a) Cost of materials consumed 348.62 396.07 (b) Purchases of stock-in-trade 5,708.42 5,935.93 (c) Changes in inventories of finished and semi-finished goods, stock-in-trade and work-in-
progress75.19 329.57
(d) Employee benefits expense 618.65 597.11 (e) Finance costs 47.26 81.78 (f ) Depreciation and amortisation expense 266.94 237.49 (g) Other expenses 2,039.67 2,138.34 Total expenses 9,104.75 9,716.29V Share of profit/(loss) of joint ventures and associates - (2.43)VI Profit/(loss) before exceptional items and tax from discontinued operation (III-IV+V) 28.81 (83.31)VII Exceptional items (1,149.55) (15.29)VIII Profit/(loss) before tax (VI+VII) (1,120.74) (98.60)IX Tax expense: (a) Current tax 29.11 12.19 (b) Deferred tax (13.60) (21.83) Total tax expense 15.51 (9.64)X Profit/(loss) after tax (1,136.25) (88.96)XI Profit/(loss) on disposal of discontinued operations (27.98) -XII Profit/(loss) after tax from discontinued operations (X+XI) (1,164.23) (88.96)XIII Other comprehensive income/(loss) (A) (i) Items that will not be reclassified subsequently to profit and loss: (a) Remeasurement gain/(loss) on post-employment defined benefit plans (6.31) (0.22) (b) Fair value changes of investments in equity shares (7.15) 10.94 (ii) Income tax on items that will not be reclassified subsequently to profit and loss 2.18 (2.03)(B) (i) Items that will be reclassified subsequently to profit and loss: (a) Foreign currency translation differences 111.66 22.48 (b) Fair value changes of cash flow hedges (36.90) 2.72 (ii) Income tax on items that will be reclassified subsequently to profit and loss - - Total other comprehensive income/(loss) 63.48 33.89XIV Total comprehensive income/(loss) from discontinued operations (XII + XIII) (1,100.75) (55.07)
(i) During the year ended March 31, 2020, impairment charge of ₹1,175.30 crore was recognized to write down the carrying value of the disposal group to fair value less costs to sell. The impairment charge is included within exceptional items in discontinued operations.
(ii) During the year ended March 31, 2020, discontinued operations resulted in an inflow of ₹474.56 crore (March 31, 2019: inflow of ₹550.43 crore) to the Group’s net operating cash flows, an outflow of ₹29.39 crore (March 31, 2019: outflow of ₹76.78 crore) in respect of investing activities and an outflow of ₹563.11 crore (March 31, 2019: outflow of ₹422.45 crore) in respect of financing activities.
37. Discontinued operations (Contd.) [Item No. XI, Page 324]
NOTESforming part of the consolidated financial statements
Consolidated
INTEGRATED REPORT & ANNUAL ACCOUNTS 2019-20 | 113TH YEAR394
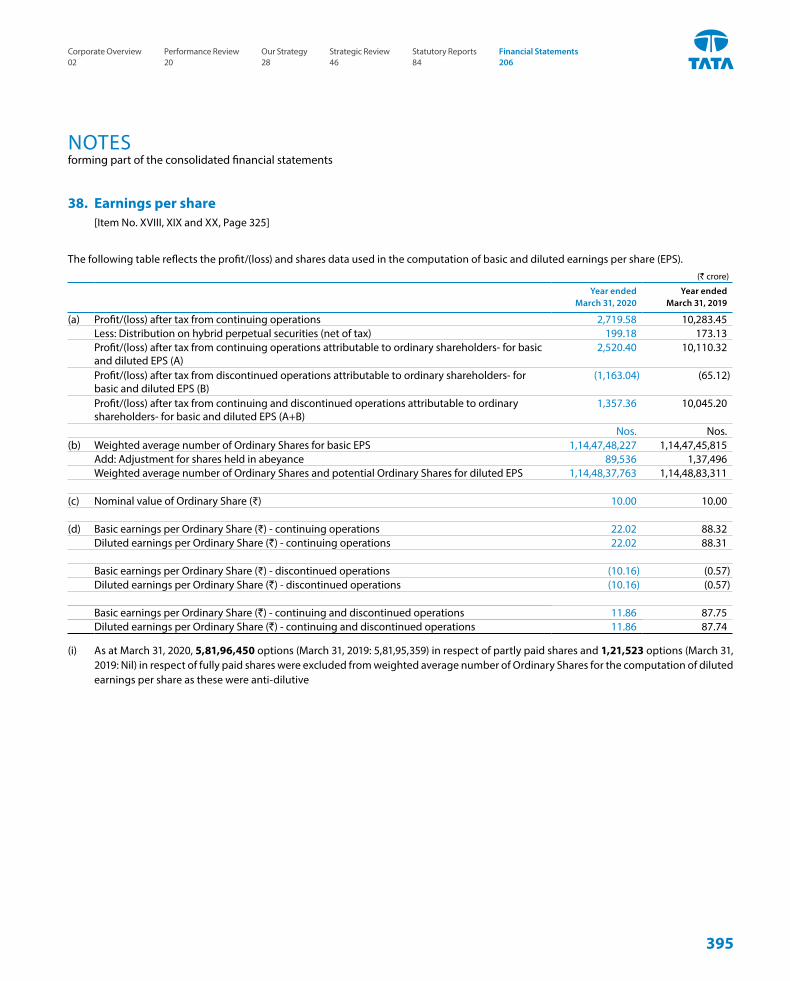
38. Earnings per share [Item No. XVIII, XIX and XX, Page 325]
The following table reflects the profit/(loss) and shares data used in the computation of basic and diluted earnings per share (EPS).(` crore)
Year ended March 31, 2020
Year ended March 31, 2019
(a) Profit/(loss) after tax from continuing operations 2,719.58 10,283.45Less: Distribution on hybrid perpetual securities (net of tax) 199.18 173.13Profit/(loss) after tax from continuing operations attributable to ordinary shareholders- for basic and diluted EPS (A)
2,520.40 10,110.32
Profit/(loss) after tax from discontinued operations attributable to ordinary shareholders- for basic and diluted EPS (B)
(1,163.04) (65.12)
Profit/(loss) after tax from continuing and discontinued operations attributable to ordinary shareholders- for basic and diluted EPS (A+B)
1,357.36 10,045.20
Nos. Nos.(b) Weighted average number of Ordinary Shares for basic EPS 1,14,47,48,227 1,14,47,45,815
Add: Adjustment for shares held in abeyance 89,536 1,37,496Weighted average number of Ordinary Shares and potential Ordinary Shares for diluted EPS 1,14,48,37,763 1,14,48,83,311
(c) Nominal value of Ordinary Share (₹) 10.00 10.00
(d) Basic earnings per Ordinary Share (₹) - continuing operations 22.02 88.32Diluted earnings per Ordinary Share (`) - continuing operations 22.02 88.31
Basic earnings per Ordinary Share (₹) - discontinued operations (10.16) (0.57)Diluted earnings per Ordinary Share (`) - discontinued operations (10.16) (0.57)
Basic earnings per Ordinary Share (`) - continuing and discontinued operations 11.86 87.75Diluted earnings per Ordinary Share (`) - continuing and discontinued operations 11.86 87.74
(i) As at March 31, 2020, 5,81,96,450 options (March 31, 2019: 5,81,95,359) in respect of partly paid shares and 1,21,523 options (March 31, 2019: Nil) in respect of fully paid shares were excluded from weighted average number of Ordinary Shares for the computation of diluted earnings per share as these were anti-dilutive
NOTESforming part of the consolidated financial statements
395
Corporate Overview 02
Strategic Review 46
Performance Review 20
Statutory Reports 84
Our Strategy 28
Financial Statements 206
39. Employee benefitsA. Defined contribution plansThe Group participates in a number of defined contribution plans on behalf of relevant personnel. Any expense recognised in relation to these schemes represents the value of contributions payable during the period by the Group at rates specified by the rules of those plans.The only amounts included in the consolidated balance sheet are those relating to the prior months contributions that were not due to be paid until after the end of the reporting period.
The major defined contribution plans operated by the Group are as below:
(a) Provident fund and pension
The Company and its Indian subsidiaries provide provident fund benefits for eligible employees as per applicable regulations wherein both employees and the Company/Indian subsidiaries make monthly contributions at a specified percentage of the eligible employees’ salary. Contributions under such schemes are made either to a provident fund set up as an irrevocable trust by the Company/Indian subsidiaries to manage the investments and distribute the amounts entitled to employees or to state managed funds.
Benefits provided under plans wherein contributions are made to state managed funds and the Company/Indian subsidiaries do not have a future obligation to make good short fall if any, are treated as a defined contribution plan.
(b) Superannuation fund
The Company and some of its Indian subsidiaries have a superannuation plan for the benefit of its employees. Employees who are members of the superannuation plan are entitled to benefits depending on the years of service and salary drawn.
Separate irrevocable trusts are generally maintained for employees covered and entitled to benefits. The Company and its Indian subsidiaries contribute up to 15% of the eligible employees’ salary or ₹1,50,000, whichever is lower, to the trust every year. Such contributions are recognised as an expense as and when incurred. The Company and its Indian subsidiaries does not have any further obligations beyond this contribution.
The contributions recognised as an expense in the consolidated statement of profit and loss during the year on account of the above defined contribution plans amounted to ₹1,419.38 crore (2018-19: ₹1,369.81 crore).
B. Defined benefit plansThe defined benefit plans operated by the Group are as below:
(a) Provident fund and pension Provident fund benefits provided under plans wherein
contributions are made to an irrevocable trust set up by the Company/Indian subsidiaries to manage the investments and distribute the amounts entitled to employees are treated as a defined benefit plan as the Company/Indian subsidiaries are obligated to provide the members a rate of return which should, at the minimum, meet the interest rate declared by Government administered provident fund. A part of the Company’s/Indian subsidiaries’ contribution is transferred to Government administered pension fund. The contributions made by the Company/Indian subsidiaries and the shortfall of interest, if any, are recognised as an expense in the consolidated statement of profit and loss under employee benefits expense.
In accordance with an actuarial valuation of provident fund liabilities of Company and its Indian subsidiaries based on guidance issued by Actuarial Society of India and based on the assumptions as mentioned below, there is no deficiency in the interest cost as the present value of the expected future earnings of the fund is greater than the expected amount to be credited to the individual members based on the expected guaranteed rate of interest of Government administered provident fund.
Key assumptions used for actuarial valuation are as below:
As at March 31, 2020
As at March 31, 2019
Discount rate 6.20% - 6.70% 7.50%Guaranteed rate of return 8.00% - 8.50% 8.60% - 8.65%Expected rate of return on investment
8.00% - 8.50% 8.60% - 8.75%
(b) Retiring gratuity
The Company and its Indian subsidiaries have an obligation towards gratuity, a defined benefit retirement plan covering eligible employees. The plan provides for a lump-sum payment to vested employees at retirement, death while in employment or on termination of employment of an amount equivalent to 15 to 30 days salary payable for each completed year of service. Vesting occurs upon completion of five years of service. The Company and its Indian subsidiaries make annual contributions to gratuity funds established as trusts or insurance companies. The Company and its Indian subsidiaries accounts for the liability for gratuity benefits payable in the future based on an actuarial valuation.
NOTESforming part of the consolidated financial statements
Consolidated
INTEGRATED REPORT & ANNUAL ACCOUNTS 2019-20 | 113TH YEAR396
(c) Post-retirement medical benefits
Under this unfunded scheme, employees of the Company and some of its subsidiaries receive medical benefits subject to certain limits on amounts of benefits, periods after retirement and types of benefits, depending on their grade and location at the time of retirement. Employees separated from the Company and its subsidiaries under an early separation scheme, on medical grounds or due to permanent disablement are also covered under the scheme. The Company and such subsidiaries account for the liability for post-retirement medical scheme based on year-end actuarial valuation.
(d) Tata Steel Europe’s pension plan
Tata Steel Europe, a wholly owned indirect subsidiary of the Company, operates a number of defined benefit pension and post-retirement schemes. The benefits offered by these schemes are largely based on pensionable pay and years of service at retirement. With the exception of certain unfunded arrangements, the assets of these schemes are held in administered funds that are legally separated from Tata Steel Europe. For those pension schemes set up under a trust, the trustees are required by law to act in the best interests of the schemes beneficiaries in accordance with the scheme rules and relevant pension legislation. The trustees are generally responsible for the investment policy with regard to the assets of the fund, after consulting with the sponsoring employer.
Tata Steel Europe accounts for all pension and post-retirement defined benefit arrangements using Ind AS 19 ‘Employee Benefits’, with independent actuaries being used to calculate the costs, assets and liabilities to be recognised in relation to these schemes. The present value of the defined benefit obligation, the current service cost and past service costs are calculated by these actuaries using the Projected unit credit method. However, the ongoing funding arrangements of each scheme, in place to meet their long-term pension liabilities, are governed by the individual scheme documentation and national legislation. The accounting and disclosure requirements of Ind AS 19 "Employee benefits" do not affect these funding arrangements.
The British Steel Pension Scheme (BSPS) is the legacy defined benefit pension scheme in the UK and is closed to future accrual. The current Scheme is the successor to the old BSPS which, in accordance with a Regulated Apportionment Arrangement (‘RAA’), entered a Pension Protection Fund (PPF) assessment period in March 2018. At that time approximately
39. Employee benefits (Contd.)
80,000 electing members of the BSPS, out of a total of more than 120,000, were transferred to the new Scheme (which retains the title ‘British Steel Pension Scheme’). The BSPS is sponsored by Tata Steel UK Limited (TSUK). Although TSUK has a legal obligation to fund any future deficit, a key condition of the new BSPS going forward was that it was sufficiently well funded to meet the scheme’s modified liabilities on a self-sufficiency basis with a buffer to cover residual risks. With the assets that it holds, the new scheme is therefore well positioned to pay benefits securely on a low risk basis without recourse to TSUK. This risk includes economic risks (such as interest rate risk and inflation risk), demographic risks (for example members living longer than expected), and legal risks (for example changes in legislation that may increase liabilities). TSUK has worked with the Trustee to develop and implement an Integrated Risk Management (‘IRM’) framework to manage these risks. The framework provides ongoing monitoring of the key investment, funding and covenant risks facing the scheme and tracks progress against the scheme’s journey plan and target. Measures taken by the Trustee to manage risk include the use of asset-liability matching techniques to reduce interest rate risk, and investment in assets that are expected to be correlated to future inflation in the longer term to mitigate inflation risk. In particular, the scheme’s investment policy has regard for the maturity and nature of the scheme’s liabilities and seeks to match a large part of the scheme’s liabilities with secure bonds, whilst achieving a higher long-term return on a small proportion of equity and other investments. However, the scheme’s interest rate risk is hedged on a long-term funding basis linked to gilts whereas AA corporate bonds are implicit in the Ind AS 19 “Employee Benefits” discount rate and so there is some mismatching risk to the financial statements, should yields on gilts and corporate bonds diverge.
The BSPS and Open Trustee Limited (‘OTL’), acting on behalf of the members of the old Scheme, hold an anti-embarrassment interest in TSUK agreed as part of the RAA. The anti-embarrassment interest was initially 33.33% at the time of the RAA but has since been diluted to less than 1% due to successive equity issuances by TSUK to its parent company Corus Group Limited. No value has been included in the BSPS’s assets at March 31, 2020 (March 31, 2019: Nil) for its interest in TSUK.
At March 31, 2020 the new scheme had a surplus of ₹26,067.36 crore (March 31, 2019: ₹18,833.17 crore). The company has recognised 100% (March 31, 2019: 100%) of the surplus as it has an unconditional right to a refund of the
NOTESforming part of the consolidated financial statements
397
Corporate Overview 02
Strategic Review 46
Performance Review 20
Statutory Reports 84
Our Strategy 28
Financial Statements 206
surplus. The new scheme is fully funded on a low-risk technical provisions (‘TP’) basis and TSUK is working with the Trustee to explore options to increase security for members and to work towards an ultimate winding up of the scheme in which all benefits are fully secured with one or more insurance companies. The March 31, 2018 valuation was agreed between TSUK and the BSPS Trustee on April 11, 2019. This was a surplus of ₹6,008.56 crore on a TP (more prudent) basis equating to a funding ratio of 106.3%. The agreed Schedule of Contributions confirmed that neither ordinary nor deficit recovery contributions are due from Tata Steel Europe.
On October 26, 2018 the High Court ruled that UK pension schemes would be required to equalise guaranteed minimum pensions ('GMP'). The ruling also provided guidance on how this equalisation should be undertaken. Following this ruling, in the prior year an increase to the BSPS liabilities in respect of the estimated impact of this equalisation with the related charge in other comprehensive income was recognised. This reserve has been retained at the same value in the March 31, 2020 Ind AS 19 position.
(e) Other defined benefits
Other benefits provided under unfunded schemes include pension payable to directors on their retirement, farewell gifts, post-retirement lumpsum benefit and reimbursement of packing and transportation charges to the employees based on their last drawn salary.
39. Employee benefits (Contd.)
The defined benefit plans expose the Group to a number of actuarial risks as below:
(i) Investment risk: The present value of the defined benefit plan liability is calculated using a discount rate determined by reference to government/high quality bond yields. If the return on plan asset is below this rate, it will create a plan deficit.
(ii) Interest risk: A decrease in the bond interest rate will increase the plan liability. However, this will be partially offset by an increase in the value of plan’s debt investments.
(iii) Salary risk: The present value of the defined benefit plan liability is calculated by reference to the future salaries of plan participants. As such, an increase in salary of the plan participants will increase the plan’s liability.
(iv) Longevity risk: The present value of the defined benefit plan liability is calculated by reference to the best estimate of the mortality of plan participants both during and after their employment. An increase in the life expectancy of the plan participants will increase the plan’s liability.
(v) Inflation risk: Some of the Group’s Pension obligations are linked to inflation, and higher inflation will lead to higher liabilities although, in most cases, caps on the level of inflationary increases are in place to protect the plan against extreme inflation.
NOTESforming part of the consolidated financial statements
Consolidated
INTEGRATED REPORT & ANNUAL ACCOUNTS 2019-20 | 113TH YEAR398
C. Details of defined benefit obligations and plan assets:
(a) Retiring gratuity:
(i) The following table sets out the amounts recognised in the consolidated financial statements in respect of retiring gratuity:
(` crore)
Year endedMarch 31, 2020
Year endedMarch 31, 2019
Change in defined benefit obligations:Obligation at the beginning of the year 3,096.99 2,966.47Addition relating to acquisitions 24.77 56.67Current service cost 150.73 143.63Interest cost 200.10 205.38Benefits paid (597.47) (257.31)Remeasurement (gain)/loss 269.36 (17.85)Adjustment for arrear wage settlement 192.01 -Obligations of companies disposed (5.45) -Obligation at the end of the year 3,331.04 3,096.99
(` crore)
Year endedMarch 31, 2020
Year endedMarch 31, 2019
Change in plan assets:Fair value of plan assets at the beginning of the year 2,976.94 2,898.34Addition relating to acquisitions - 22.55Interest income 204.18 211.58Remeasurement gain/(loss) excluding amount included within employee benefits expense 16.11 29.73Employers' contribution 86.94 72.05Benefits paid (592.51) (257.31)Assets of companies disposed (4.64) -Fair value of plan assets at the end of the year 2,687.02 2,976.94
Amounts recognised in the consolidated balance sheet consist of:
(` crore)As at
March 31, 2020As at
March 31, 2019
Fair value of plan assets 2,687.02 2,976.94Present value of obligations 3,331.04 3,096.99
(644.02) (120.05)Recognised as:Retirement benefit assets - Non-current 0.42 0.44Retirement benefit assets - Current - 4.38Retirement benefit obligations - Non-current (625.82) (120.36)Retirement benefit obligations - Current (18.62) (4.51)
(644.02) (120.05)
39. Employee benefits (Contd.)
NOTESforming part of the consolidated financial statements
399
Corporate Overview 02
Strategic Review 46
Performance Review 20
Statutory Reports 84
Our Strategy 28
Financial Statements 206
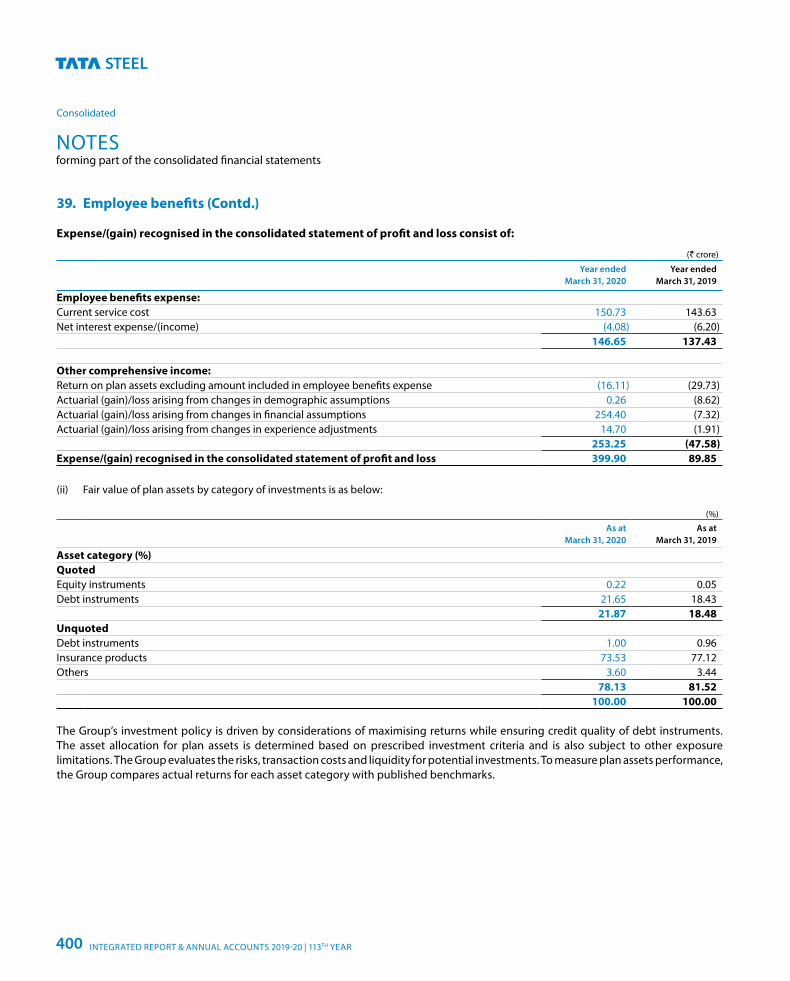
Expense/(gain) recognised in the consolidated statement of profit and loss consist of:
(` crore)
Year endedMarch 31, 2020
Year ended March 31, 2019
Employee benefits expense:Current service cost 150.73 143.63Net interest expense/(income) (4.08) (6.20)
146.65 137.43
Other comprehensive income:Return on plan assets excluding amount included in employee benefits expense (16.11) (29.73)Actuarial (gain)/loss arising from changes in demographic assumptions 0.26 (8.62)Actuarial (gain)/loss arising from changes in financial assumptions 254.40 (7.32)Actuarial (gain)/loss arising from changes in experience adjustments 14.70 (1.91)
253.25 (47.58)Expense/(gain) recognised in the consolidated statement of profit and loss 399.90 89.85
(ii) Fair value of plan assets by category of investments is as below:
(%)As at
March 31, 2020As at
March 31, 2019
Asset category (%)QuotedEquity instruments 0.22 0.05Debt instruments 21.65 18.43
21.87 18.48UnquotedDebt instruments 1.00 0.96Insurance products 73.53 77.12Others 3.60 3.44
78.13 81.52100.00 100.00
The Group’s investment policy is driven by considerations of maximising returns while ensuring credit quality of debt instruments. The asset allocation for plan assets is determined based on prescribed investment criteria and is also subject to other exposure limitations. The Group evaluates the risks, transaction costs and liquidity for potential investments. To measure plan assets performance, the Group compares actual returns for each asset category with published benchmarks.
39. Employee benefits (Contd.)
NOTESforming part of the consolidated financial statements
Consolidated
INTEGRATED REPORT & ANNUAL ACCOUNTS 2019-20 | 113TH YEAR400
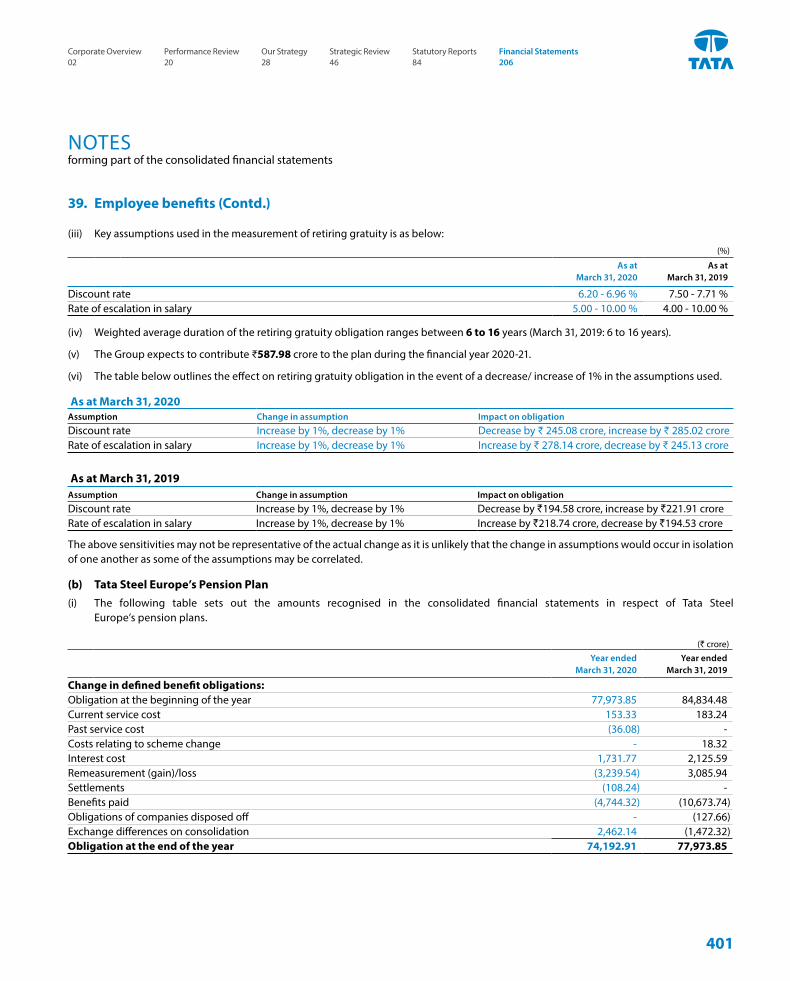
(iii) Key assumptions used in the measurement of retiring gratuity is as below:(%)
As at March 31, 2020
As at March 31, 2019
Discount rate 6.20 - 6.96 % 7.50 - 7.71 % Rate of escalation in salary 5.00 - 10.00 % 4.00 - 10.00 %
(iv) Weighted average duration of the retiring gratuity obligation ranges between 6 to 16 years (March 31, 2019: 6 to 16 years).
(v) The Group expects to contribute ₹587.98 crore to the plan during the financial year 2020-21.
(vi) The table below outlines the effect on retiring gratuity obligation in the event of a decrease/ increase of 1% in the assumptions used.
As at March 31, 2020Assumption Change in assumption Impact on obligation
Discount rate Increase by 1%, decrease by 1% Decrease by ₹ 245.08 crore, increase by ₹ 285.02 croreRate of escalation in salary Increase by 1%, decrease by 1% Increase by ₹ 278.14 crore, decrease by ₹ 245.13 crore
As at March 31, 2019Assumption Change in assumption Impact on obligation
Discount rate Increase by 1%, decrease by 1% Decrease by `194.58 crore, increase by `221.91 crore Rate of escalation in salary Increase by 1%, decrease by 1% Increase by `218.74 crore, decrease by `194.53 crore
The above sensitivities may not be representative of the actual change as it is unlikely that the change in assumptions would occur in isolation of one another as some of the assumptions may be correlated.
(b) Tata Steel Europe’s Pension Plan(i) The following table sets out the amounts recognised in the consolidated financial statements in respect of Tata Steel
Europe’s pension plans.
(` crore)Year ended
March 31, 2020Year ended
March 31, 2019
Change in defined benefit obligations:Obligation at the beginning of the year 77,973.85 84,834.48Current service cost 153.33 183.24Past service cost (36.08) -Costs relating to scheme change - 18.32Interest cost 1,731.77 2,125.59Remeasurement (gain)/loss (3,239.54) 3,085.94Settlements (108.24) -Benefits paid (4,744.32) (10,673.74)Obligations of companies disposed off - (127.66)Exchange differences on consolidation 2,462.14 (1,472.32)Obligation at the end of the year 74,192.91 77,973.85
39. Employee benefits (Contd.)
NOTESforming part of the consolidated financial statements
401
Corporate Overview 02
Strategic Review 46
Performance Review 20
Statutory Reports 84
Our Strategy 28
Financial Statements 206
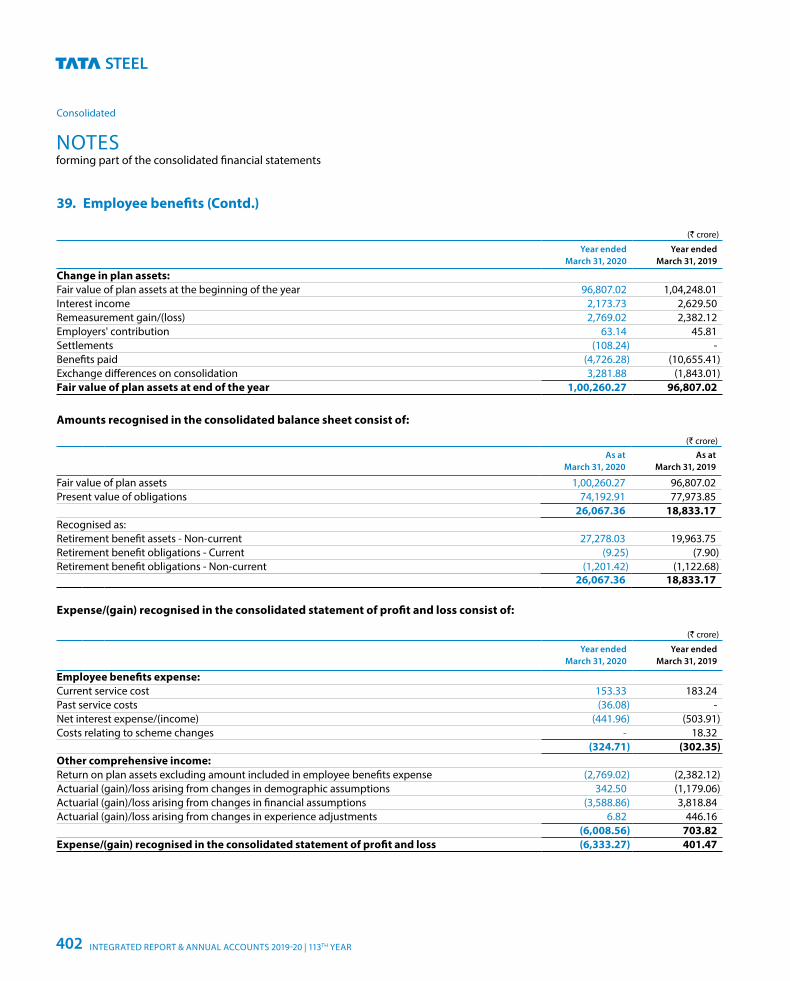
(` crore)
Year endedMarch 31, 2020
Year endedMarch 31, 2019
Change in plan assets:Fair value of plan assets at the beginning of the year 96,807.02 1,04,248.01Interest income 2,173.73 2,629.50Remeasurement gain/(loss) 2,769.02 2,382.12Employers' contribution 63.14 45.81Settlements (108.24) -Benefits paid (4,726.28) (10,655.41)Exchange differences on consolidation 3,281.88 (1,843.01)Fair value of plan assets at end of the year 1,00,260.27 96,807.02
Amounts recognised in the consolidated balance sheet consist of:
(` crore)As at
March 31, 2020As at
March 31, 2019
Fair value of plan assets 1,00,260.27 96,807.02Present value of obligations 74,192.91 77,973.85
26,067.36 18,833.17Recognised as:Retirement benefit assets - Non-current 27,278.03 19,963.75Retirement benefit obligations - Current (9.25) (7.90)Retirement benefit obligations - Non-current (1,201.42) (1,122.68)
26,067.36 18,833.17
Expense/(gain) recognised in the consolidated statement of profit and loss consist of:
(` crore)
Year ended March 31, 2020
Year ended March 31, 2019
Employee benefits expense:Current service cost 153.33 183.24Past service costs (36.08) -Net interest expense/(income) (441.96) (503.91)Costs relating to scheme changes - 18.32
(324.71) (302.35)Other comprehensive income:Return on plan assets excluding amount included in employee benefits expense (2,769.02) (2,382.12)Actuarial (gain)/loss arising from changes in demographic assumptions 342.50 (1,179.06)Actuarial (gain)/loss arising from changes in financial assumptions (3,588.86) 3,818.84Actuarial (gain)/loss arising from changes in experience adjustments 6.82 446.16
(6,008.56) 703.82Expense/(gain) recognised in the consolidated statement of profit and loss (6,333.27) 401.47
39. Employee benefits (Contd.)
NOTESforming part of the consolidated financial statements
Consolidated
INTEGRATED REPORT & ANNUAL ACCOUNTS 2019-20 | 113TH YEAR402
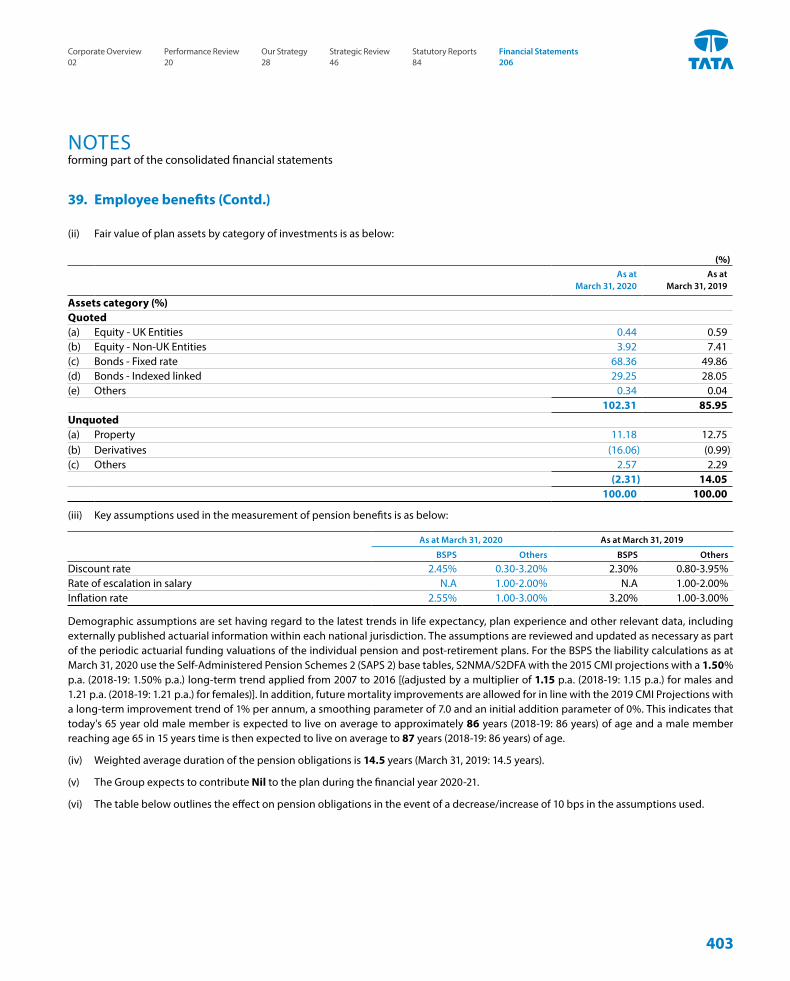
(ii) Fair value of plan assets by category of investments is as below:
(%)As at
March 31, 2020As at
March 31, 2019
Assets category (%)Quoted (a) Equity - UK Entities 0.44 0.59(b) Equity - Non-UK Entities 3.92 7.41(c) Bonds - Fixed rate 68.36 49.86(d) Bonds - Indexed linked 29.25 28.05(e) Others 0.34 0.04
102.31 85.95Unquoted (a) Property 11.18 12.75(b) Derivatives (16.06) (0.99)(c) Others 2.57 2.29
(2.31) 14.05100.00 100.00
(iii) Key assumptions used in the measurement of pension benefits is as below:
As at March 31, 2020 As at March 31, 2019
BSPS Others BSPS Others
Discount rate 2.45% 0.30-3.20% 2.30% 0.80-3.95%Rate of escalation in salary N.A 1.00-2.00% N.A 1.00-2.00%Inflation rate 2.55% 1.00-3.00% 3.20% 1.00-3.00%
Demographic assumptions are set having regard to the latest trends in life expectancy, plan experience and other relevant data, including externally published actuarial information within each national jurisdiction. The assumptions are reviewed and updated as necessary as part of the periodic actuarial funding valuations of the individual pension and post-retirement plans. For the BSPS the liability calculations as at March 31, 2020 use the Self-Administered Pension Schemes 2 (SAPS 2) base tables, S2NMA/S2DFA with the 2015 CMI projections with a 1.50% p.a. (2018-19: 1.50% p.a.) long-term trend applied from 2007 to 2016 [(adjusted by a multiplier of 1.15 p.a. (2018-19: 1.15 p.a.) for males and 1.21 p.a. (2018-19: 1.21 p.a.) for females)]. In addition, future mortality improvements are allowed for in line with the 2019 CMI Projections with a long-term improvement trend of 1% per annum, a smoothing parameter of 7.0 and an initial addition parameter of 0%. This indicates that today's 65 year old male member is expected to live on average to approximately 86 years (2018-19: 86 years) of age and a male member reaching age 65 in 15 years time is then expected to live on average to 87 years (2018-19: 86 years) of age.
(iv) Weighted average duration of the pension obligations is 14.5 years (March 31, 2019: 14.5 years).
(v) The Group expects to contribute Nil to the plan during the financial year 2020-21.
(vi) The table below outlines the effect on pension obligations in the event of a decrease/increase of 10 bps in the assumptions used.
39. Employee benefits (Contd.)
NOTESforming part of the consolidated financial statements
403
Corporate Overview 02
Strategic Review 46
Performance Review 20
Statutory Reports 84
Our Strategy 28
Financial Statements 206
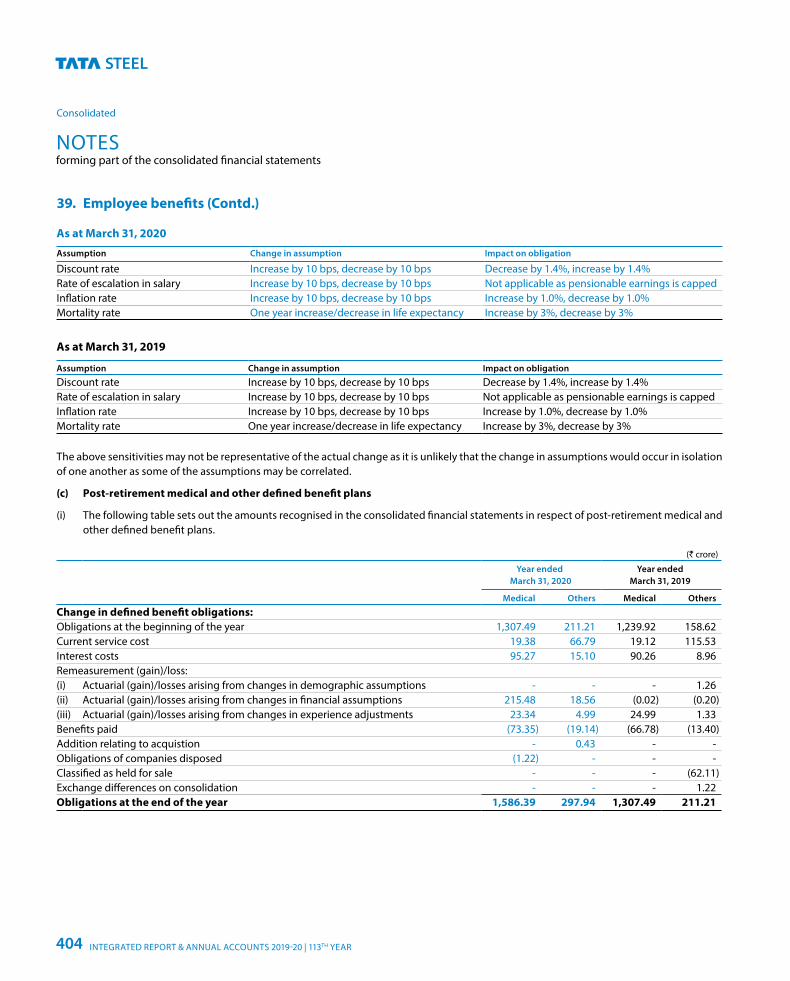
As at March 31, 2020
Assumption Change in assumption Impact on obligation
Discount rate Increase by 10 bps, decrease by 10 bps Decrease by 1.4%, increase by 1.4%Rate of escalation in salary Increase by 10 bps, decrease by 10 bps Not applicable as pensionable earnings is cappedInflation rate Increase by 10 bps, decrease by 10 bps Increase by 1.0%, decrease by 1.0%Mortality rate One year increase/decrease in life expectancy Increase by 3%, decrease by 3%
As at March 31, 2019
Assumption Change in assumption Impact on obligation
Discount rate Increase by 10 bps, decrease by 10 bps Decrease by 1.4%, increase by 1.4% Rate of escalation in salary Increase by 10 bps, decrease by 10 bps Not applicable as pensionable earnings is capped Inflation rate Increase by 10 bps, decrease by 10 bps Increase by 1.0%, decrease by 1.0% Mortality rate One year increase/decrease in life expectancy Increase by 3%, decrease by 3%
The above sensitivities may not be representative of the actual change as it is unlikely that the change in assumptions would occur in isolation of one another as some of the assumptions may be correlated.
(c) Post-retirement medical and other defined benefit plans
(i) The following table sets out the amounts recognised in the consolidated financial statements in respect of post-retirement medical and other defined benefit plans.
(` crore)
Year ended March 31, 2020
Year ended March 31, 2019
Medical Others Medical Others
Change in defined benefit obligations:Obligations at the beginning of the year 1,307.49 211.21 1,239.92 158.62Current service cost 19.38 66.79 19.12 115.53Interest costs 95.27 15.10 90.26 8.96Remeasurement (gain)/loss:(i) Actuarial (gain)/losses arising from changes in demographic assumptions - - - 1.26(ii) Actuarial (gain)/losses arising from changes in financial assumptions 215.48 18.56 (0.02) (0.20)(iii) Actuarial (gain)/losses arising from changes in experience adjustments 23.34 4.99 24.99 1.33Benefits paid (73.35) (19.14) (66.78) (13.40)Addition relating to acquistion - 0.43 - -Obligations of companies disposed (1.22) - - -Classified as held for sale - - - (62.11)Exchange differences on consolidation - - - 1.22Obligations at the end of the year 1,586.39 297.94 1,307.49 211.21
39. Employee benefits (Contd.)
NOTESforming part of the consolidated financial statements
Consolidated
INTEGRATED REPORT & ANNUAL ACCOUNTS 2019-20 | 113TH YEAR404
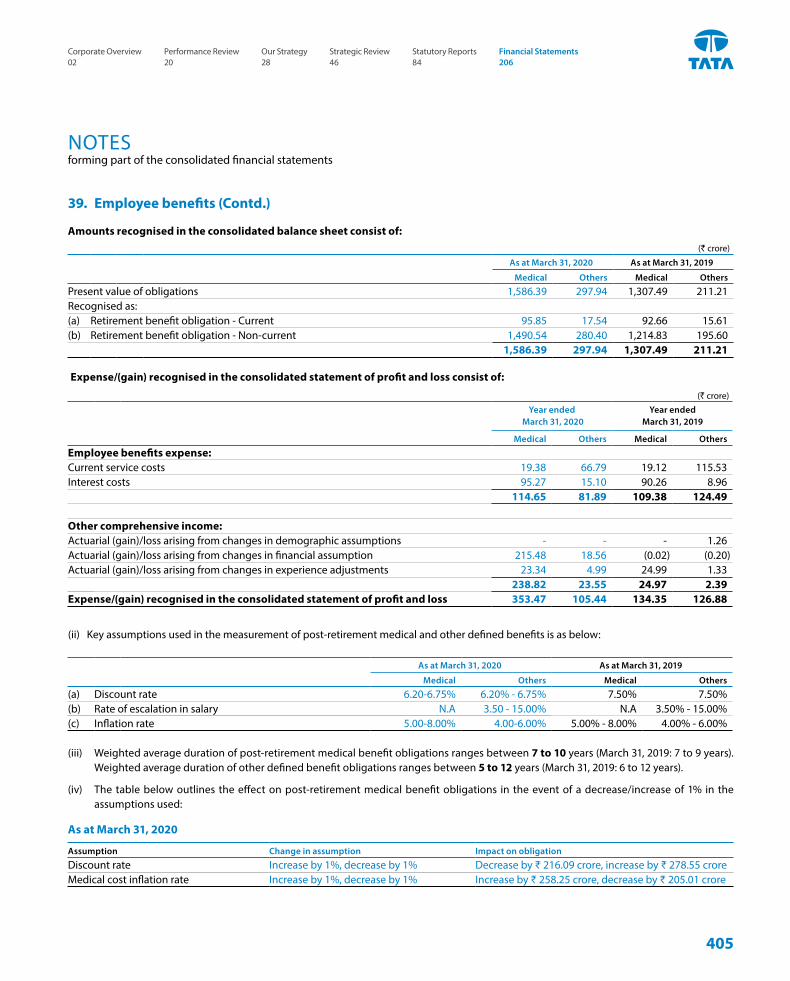
39. Employee benefits (Contd.)
Amounts recognised in the consolidated balance sheet consist of:(` crore)
As at March 31, 2020 As at March 31, 2019
Medical Others Medical Others
Present value of obligations 1,586.39 297.94 1,307.49 211.21Recognised as:(a) Retirement benefit obligation - Current 95.85 17.54 92.66 15.61(b) Retirement benefit obligation - Non-current 1,490.54 280.40 1,214.83 195.60
1,586.39 297.94 1,307.49 211.21
Expense/(gain) recognised in the consolidated statement of profit and loss consist of:
(` crore)Year ended
March 31, 2020 Year ended
March 31, 2019
Medical Others Medical Others
Employee benefits expense:Current service costs 19.38 66.79 19.12 115.53Interest costs 95.27 15.10 90.26 8.96
114.65 81.89 109.38 124.49
Other comprehensive income:Actuarial (gain)/loss arising from changes in demographic assumptions - - - 1.26Actuarial (gain)/loss arising from changes in financial assumption 215.48 18.56 (0.02) (0.20)Actuarial (gain)/loss arising from changes in experience adjustments 23.34 4.99 24.99 1.33
238.82 23.55 24.97 2.39Expense/(gain) recognised in the consolidated statement of profit and loss 353.47 105.44 134.35 126.88
(ii) Key assumptions used in the measurement of post-retirement medical and other defined benefits is as below:
As at March 31, 2020 As at March 31, 2019
Medical Others Medical Others
(a) Discount rate 6.20-6.75% 6.20% - 6.75% 7.50% 7.50%(b) Rate of escalation in salary N.A 3.50 - 15.00% N.A 3.50% - 15.00%(c) Inflation rate 5.00-8.00% 4.00-6.00% 5.00% - 8.00% 4.00% - 6.00%
(iii) Weighted average duration of post-retirement medical benefit obligations ranges between 7 to 10 years (March 31, 2019: 7 to 9 years). Weighted average duration of other defined benefit obligations ranges between 5 to 12 years (March 31, 2019: 6 to 12 years).
(iv) The table below outlines the effect on post-retirement medical benefit obligations in the event of a decrease/increase of 1% in the assumptions used:
As at March 31, 2020
Assumption Change in assumption Impact on obligation
Discount rate Increase by 1%, decrease by 1% Decrease by ₹ 216.09 crore, increase by ₹ 278.55 croreMedical cost inflation rate Increase by 1%, decrease by 1% Increase by ₹ 258.25 crore, decrease by ₹ 205.01 crore
NOTESforming part of the consolidated financial statements
405
Corporate Overview 02
Strategic Review 46
Performance Review 20
Statutory Reports 84
Our Strategy 28
Financial Statements 206
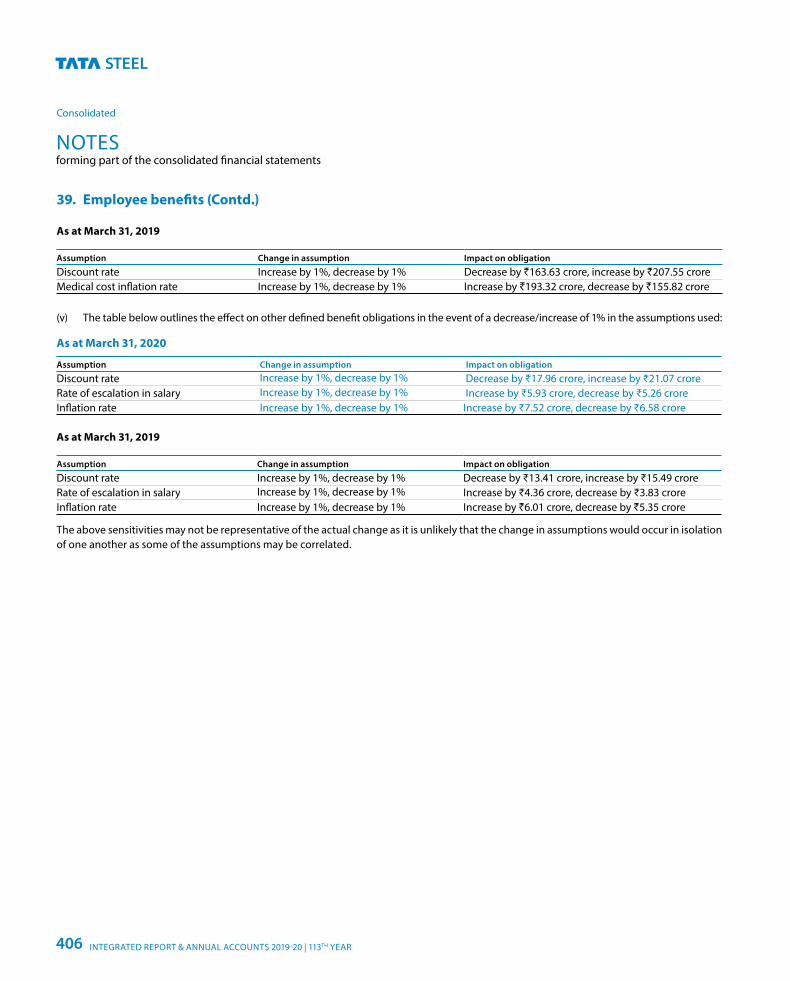
As at March 31, 2019
Assumption Change in assumption Impact on obligation
Discount rate Increase by 1%, decrease by 1% Decrease by `163.63 crore, increase by `207.55 crore Medical cost inflation rate Increase by 1%, decrease by 1% Increase by `193.32 crore, decrease by `155.82 crore
(v) The table below outlines the effect on other defined benefit obligations in the event of a decrease/increase of 1% in the assumptions used:
As at March 31, 2020
Assumption Change in assumption Impact on obligation
Discount rate Increase by 1%, decrease by 1% Decrease by ₹17.96 crore, increase by ₹21.07 crore Rate of escalation in salary Increase by 1%, decrease by 1% Increase by ₹5.93 crore, decrease by ₹5.26 croreInflation rate Increase by 1%, decrease by 1% Increase by ₹7.52 crore, decrease by ₹6.58 crore
As at March 31, 2019
Assumption Change in assumption Impact on obligation
Discount rate Increase by 1%, decrease by 1% Decrease by ₹13.41 crore, increase by ₹15.49 croreRate of escalation in salary Increase by 1%, decrease by 1% Increase by ₹4.36 crore, decrease by ₹3.83 croreInflation rate Increase by 1%, decrease by 1% Increase by `6.01 crore, decrease by `5.35 crore
The above sensitivities may not be representative of the actual change as it is unlikely that the change in assumptions would occur in isolation of one another as some of the assumptions may be correlated.
39. Employee benefits (Contd.)
NOTESforming part of the consolidated financial statements
Consolidated
INTEGRATED REPORT & ANNUAL ACCOUNTS 2019-20 | 113TH YEAR406
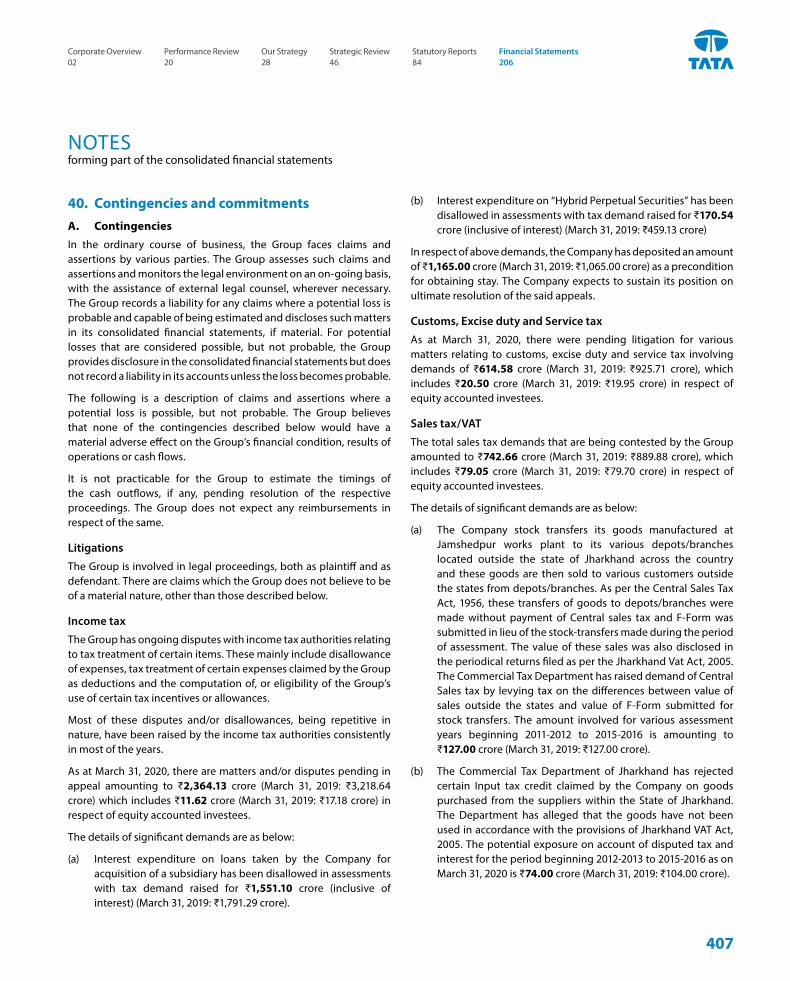
40. Contingencies and commitmentsA. ContingenciesIn the ordinary course of business, the Group faces claims and assertions by various parties. The Group assesses such claims and assertions and monitors the legal environment on an on-going basis, with the assistance of external legal counsel, wherever necessary. The Group records a liability for any claims where a potential loss is probable and capable of being estimated and discloses such matters in its consolidated financial statements, if material. For potential losses that are considered possible, but not probable, the Group provides disclosure in the consolidated financial statements but does not record a liability in its accounts unless the loss becomes probable.
The following is a description of claims and assertions where a potential loss is possible, but not probable. The Group believes that none of the contingencies described below would have a material adverse effect on the Group’s financial condition, results of operations or cash flows.
It is not practicable for the Group to estimate the timings of the cash outflows, if any, pending resolution of the respective proceedings. The Group does not expect any reimbursements in respect of the same.
Litigations
The Group is involved in legal proceedings, both as plaintiff and as defendant. There are claims which the Group does not believe to be of a material nature, other than those described below.
Income tax
The Group has ongoing disputes with income tax authorities relating to tax treatment of certain items. These mainly include disallowance of expenses, tax treatment of certain expenses claimed by the Group as deductions and the computation of, or eligibility of the Group’s use of certain tax incentives or allowances.
Most of these disputes and/or disallowances, being repetitive in nature, have been raised by the income tax authorities consistently in most of the years.
As at March 31, 2020, there are matters and/or disputes pending in appeal amounting to ₹2,364.13 crore (March 31, 2019: ₹3,218.64 crore) which includes ₹11.62 crore (March 31, 2019: ₹17.18 crore) in respect of equity accounted investees.
The details of significant demands are as below:
(a) Interest expenditure on loans taken by the Company for acquisition of a subsidiary has been disallowed in assessments with tax demand raised for ₹1,551.10 crore (inclusive of interest) (March 31, 2019: ₹1,791.29 crore).
(b) Interest expenditure on “Hybrid Perpetual Securities” has been disallowed in assessments with tax demand raised for ₹170.54 crore (inclusive of interest) (March 31, 2019: ₹459.13 crore)
In respect of above demands, the Company has deposited an amount of ₹1,165.00 crore (March 31, 2019: ₹1,065.00 crore) as a precondition for obtaining stay. The Company expects to sustain its position on ultimate resolution of the said appeals.
Customs, Excise duty and Service tax
As at March 31, 2020, there were pending litigation for various matters relating to customs, excise duty and service tax involving demands of ₹614.58 crore (March 31, 2019: ₹925.71 crore), which includes ₹20.50 crore (March 31, 2019: ₹19.95 crore) in respect of equity accounted investees.
Sales tax/VAT
The total sales tax demands that are being contested by the Group amounted to ₹742.66 crore (March 31, 2019: ₹889.88 crore), which includes ₹79.05 crore (March 31, 2019: ₹79.70 crore) in respect of equity accounted investees.
The details of significant demands are as below:
(a) The Company stock transfers its goods manufactured at Jamshedpur works plant to its various depots/branches located outside the state of Jharkhand across the country and these goods are then sold to various customers outside the states from depots/branches. As per the Central Sales Tax Act, 1956, these transfers of goods to depots/branches were made without payment of Central sales tax and F-Form was submitted in lieu of the stock-transfers made during the period of assessment. The value of these sales was also disclosed in the periodical returns filed as per the Jharkhand Vat Act, 2005. The Commercial Tax Department has raised demand of Central Sales tax by levying tax on the differences between value of sales outside the states and value of F-Form submitted for stock transfers. The amount involved for various assessment years beginning 2011-2012 to 2015-2016 is amounting to ₹127.00 crore (March 31, 2019: ₹127.00 crore).
(b) The Commercial Tax Department of Jharkhand has rejected certain Input tax credit claimed by the Company on goods purchased from the suppliers within the State of Jharkhand. The Department has alleged that the goods have not been used in accordance with the provisions of Jharkhand VAT Act, 2005. The potential exposure on account of disputed tax and interest for the period beginning 2012-2013 to 2015-2016 as on March 31, 2020 is ₹74.00 crore (March 31, 2019: ₹104.00 crore).
NOTESforming part of the consolidated financial statements
407
Corporate Overview 02
Strategic Review 46
Performance Review 20
Statutory Reports 84
Our Strategy 28
Financial Statements 206
40. Contingencies and commitments (Contd.)
Other taxes, dues and claims
Other amounts for which the Group may contingently be liable aggregate to ₹13,044.46 crore (March 31, 2019: ₹12,578.82 crore), which includes ₹90.53 crore (March 31, 2019: ₹75.22 crore) in respect of equity accounted investees.
The details of significant demands are as below:
(a) Claim by a party arising out of conversion arrangement ₹195.79 crore (March 31, 2019: ₹195.79 crore). The Company has not acknowledged this claim and has instead filed a claim of ₹141.23 crore (March 31, 2019: ₹141.23 crore) on the party. The matter is pending before the Calcutta High Court.
(b) The State Government of Odisha introduced “Orissa Rural Infrastructure and Socio Economic Development Act, 2004” with effect from February 2005 levying tax on mineral bearing land computed on the basis of value of minerals produced from the mineral bearing land. The Company had filed a writ petition in the Orissa High Court challenging the validity of the Act. The High Court held in December 2005 that the State does not have authority to levy tax on minerals.The State of Odisha filed an appeal in the Supreme Court against the order of the High Court and the case is pending in Supreme Court. The potential liability, as at March 31, 2020 is ₹8,732.29 crore (March 31, 2019: ₹7,573.53 crore).
(c) The Company pays royalty on iron ore on the basis of quantity removed from the leased area at the rates based on notification issued by the Ministry of Mines, Government of India and the price published by India Bureau of Mines (IBM) on a monthly basis.
Demand of ₹411.08 crore has been raised by Deputy Director of Mines, Joda, claiming royalty at sized ore rates on despatches of ore fines. The Company has filed a revision petition on November 14, 2013 before the Mines Tribunal, Government of India, Ministry of Mines, New Delhi, challenging the legality and validity of the demand and to grant refund of royalty paid in excess by the Company. Mines Tribunal has granted stay on the total demand with directive to Government of Odisha not to take any coercive action for realisation of this demanded amount.
The Hon’ble High Court of Odisha, in a similar matter held the circulars based on which demands were raised to be valid. The Company has challenged the judgement of the High Court by a separate petition in the Hon’ble Supreme Court on April 29, 2016.
On July 16, 2019, the Company has filed rejoinders to the reply filed by State of Odisha against the revision petition. The State pressed for rejection of revision applications citing the judgment of the High Court. The Company represented before the authorities and explained that the judgment was passed under a particular set of ‘facts & circumstances’ which cannot have blanket application on the Company considering the case of the Company is factually different. On August 7, 2019, the Mines Tribunal decided to await the outcome of Special leave petition pending before the Hon’ble Supreme Court and adjourned the matter.
Likely demand of royalty on fines at sized ore rates as on March 31, 2020 is ₹1,965.52 crore (March 31, 2019: ₹1,630.16 crore).
(d) Demand notices were originally issued by the Deputy Director of Mines, Odisha amounting to ₹3,827.29 crore for excess production over the quantity permitted under the mining plan, environment clearance or consent to operate, pertaining to 2000-01 to 2009-10. The demand notices have been raised under Section 21(5) of the Mines & Minerals (Development and Regulations) Act, 1957 (MMDR). The Company filed revision petitions before the Mines Tribunal against all such demand notices. Initially, a stay of demands was granted, later by order dated October 12, 2017, the issue has been remanded to the state for reconsideration of the demand in the light of Supreme Court judgement passed on August 2, 2017.
The Hon’ble Supreme Court pronounced its judgement in the Common Cause case on August 2, 2017 wherein it directed that compensation equivalent to the price of mineral extracted in excess of environment clearance or without forest clearance from the forest land be paid.
In pursuance to the Judgement of Hon’ble Supreme Court, demand/show cause notices amounting to ₹3,873.35 crore have been issued during 2017-18 by the Deputy Director of Mines, Odisha and the District Mining Office, Jharkhand.
In respect of the above demands:
• as directed by the Hon’ble Supreme Court, the Company has provided and paid for iron ore and manganese ore an amount of ₹614.41 crore during 2017-18 for production in excess of environment clearance to the Deputy Director of Mines, Odisha.
• the Company has provided and paid under protest an amount of ₹56.97 crore during 2017-18 for production in excess of environment clearance to the District Mining Office, Jharkhand.
NOTESforming part of the consolidated financial statements
Consolidated
INTEGRATED REPORT & ANNUAL ACCOUNTS 2019-20 | 113TH YEAR408
• the Company has challenged the demands amounting to ₹132.91 crore in 2017-18 for production in excess of lower of mining plan and consent to operate limits raised by the Deputy Director of Mines, Odisha before the Mines Tribunal and obtained a stay on the matter. Mines Tribunal, Delhi vide order dated November 26, 2018 disposed of all the revision applications with a direction to remand it to the State Government to hear all such cases afresh and pass detailed order. Demand amount of ₹132.91 crore (March 31, 2019: ₹132.91 crore) is considered contingent.
• the Company has made a comprehensive submission before the Deputy Director of Mines, Odisha against show cause notices amounting to ₹ 694.02 crore received during 2017-18 for production in violation of mining plan, Environment Protection Act, 1986 and Water (Prevention & Control of Pollution) Act, 1981. A demand amounting to ₹234.74 crore has been received in April, 2018 from the Deputy Director of Mines, Odisha for production in excess of the Environmental Clearance. The Company has challenged the demand and obtained a stay on the matter from the Revisionary Authority, Mines Tribunal, New Delhi. Demand of ₹234.74 crore has been provided and show cause notice of ₹694.02 crore had been considered as contingent as at March 31, 2019.
During the year ended March 31, 2020, based on the evaluation of current facts and circumstances, the Company has assessed and concluded that the said show cause notice of ₹694.02 crore no longer qualifies to be a contingent liability.
• the Company based on its internal assessment has provided an amount of ₹1,412.89 crore against demand notices amounting to ₹2,140.30 crore received from the District Mining Office, Jharkhand for producing more than environment clearance and the balance amount of ₹727.41 crore (March 31, 2019: ₹727.41 crore) has been considered as contingent. The Company has however been granted a stay by the Revisional Authority, Ministry of Coal, Government of India against such demand notices.
(e) An agreement was executed between the Government of Odisha (GoO) and the Company in December, 1992 for drawal of water from Kundra Nalla for industrial consumption. In
40. Contingencies and commitments (Contd.) December 1993, the Tahsildar, Barbil issued a show-cause notice alleging that the Company has lifted more quantity of water than the sanctioned limit under the agreement and has also not installed the water meter.
While the proceedings in this regard were in progress, the Company had applied for allocation of fresh limits. Over the years, there has also been a steep increase in water charges against which the Company filed writ petitions before the Hon’ble High Court of Odisha.
In this regard, the Company has received demand of ₹156.62 crore for the period beginning January 1996 to February 2020. The potential exposure as on March 31, 2020 is ₹162.96 crore (March 31, 2019: ₹125.98 crore) is considered as contingent.
The writ petition filed in August 1997 was listed for hearing before the Full Bench of High Court of Odisha on May 17, 2019. SAIL, one of the petitioners, sought permission to withdraw its writ petition because a settlement arrived with the State Government on the matter. The High Court allowed withdrawal of writ petition of SAIL and directed other parties to negotiate with the State Government. The Company has submitted its detailed representation to Principal Secretary, Water Resource Department, GoO on June 21, 2019, which is under consideration.
B. Commitments(a) The Group has entered into various contracts with suppliers
and contractors for acquisition of plant and machinery, equipment and various civil contracts of capital nature amounting to ₹11,128.64 crore, which includes ₹91.89 crore in respect of equity accounted investees (March 31, 2019: ₹10,205.20 crore which includes ₹30.30 crore in respect of equity accounted investees).
Other commitment as at March 31, 2020 amounts to ₹0.01 crore which includes Nil in respect of equity accounted investees (March 31, 2019: ₹ 0.01 crore which includes Nil in respect of equity accounted investees).
(b) The Company has given undertakings to:
(i) IDBI not to dispose of its investment in Wellman Incandescent India Ltd.,
(ii) IDBI and ICICI Bank Ltd. (formerly ICICI) not to dispose of its investment in Standard Chrome Ltd.
NOTESforming part of the consolidated financial statements
409
Corporate Overview 02
Strategic Review 46
Performance Review 20
Statutory Reports 84
Our Strategy 28
Financial Statements 206
(c) The Company and Bluescope Steel Limited have given undertaking to State Bank of India not to reduce collective shareholding in Tata Bluescope Steel Private Limited (TBSPL), below 51% without prior consent of the lender. Further, the Company has given an undertaking to State bank of India to intimate them before diluting its shareholding in TBSPL below 50%.
(d) The Company, as a promoter, has pledged 4,41,55,800 (March 31, 2019: 4,41,55,800) equity shares of Industrial Energy Limited with Infrastructure Development Finance Corporation Limited.
(e) The Group has given guarantees aggregating ₹178.40 crore (March 31, 2019: ₹188.00 crore) details of which are as below:
(i) in favour of Commissioner of Customs for ₹1.07 crore (March 31, 2019: ₹1.07 crore) given on behalf of Timken India Limited in respect of goods imported.
(ii) in favour of Mizuho Corporate Bank Ltd., Japan for Nil (March 31, 2019: ₹9.60 crore) against the loan granted to a joint venture Tata NYK Shipping Pte. Limited.
(iii) in favour of The President of India for ₹177.18 crore (March 31, 2019: ₹177.18 crore) against performance of export obligations under various bonds executed by a joint venture Jamshedpur Continuous Annealing and Processing Company Private Limited.
(iv) in favour of President of India for ₹0.15 crore (March 31, 2019: ₹ 0.15 crore) against advance license.
41. Other significant litigations
(a) Odisha Legislative Assembly issued an amendment to Indian Stamp Act, 1889, on May 9, 2013 and inserted a new provision (Section 3A) in respect of stamp duty payable on grant/ renewal of mining leases. As per the amended provision, stamp duty is levied equal to 15% of the average royalty that would accrue out of the highest annual extraction of minerals under the approved mining plan multiplied by the period of such mining lease. The Company had filed a writ petition challenging the constitutionality of the Act on July 5, 2013. The Hon’ble High Court, Cuttack passed an order on July 9, 2013 granting interim stay on the operation of the Amendment Act, 2013. Because of the stay, as on date, the Act is not enforceable and any demand received by the Company is not liable to be proceeded with. Meanwhile, the Company received demand notices for various
mines in Odisha totalling to ₹5,579.00 crore (March 31, 2019: ₹5,579 crore). The Company has concluded that it is remote that the claim will sustain on ultimate resolution of the legal case by the court.
In April, 2015, the Company has received an intimation from Government of Odisha, granting extension of validity period for leases under the MMDR Amendment Act, 2015 up to March 31, 2030 in respect of eight mines and up to March 31, 2020 for two mines subject to execution of supplementary lease deed. Liability has been provided in the books of accounts as on March 31, 2020 as per the existing provisions of the Stamp Act, 1899 and the Company had paid the stamp duty and registration charges totalling ₹413.72 crore for supplementary deed execution in respect of eight mines out of the above mines.
b) Noamundi Iron Ore Mine of the Company was due for its third renewal with effect from January 01, 2012. The application for renewal was submitted by the company within the stipulated time, but it remained pending consideration with the State and the mining operations were continued in terms of the prevailing law.
By a judgement of April 2014 in the case of Goa mines, the Supreme Court took a view that second and subsequent renewal of mining lease can be effected once the State considers the application and decides to renew the mining lease by issuing an express order. State of Jharkhand issued renewal order to the Company on December 31, 2014. The State, however, took a view on an interpretation of Goa judgment that the mining carried out after expiry of the period of second renewal was ‘illegal’ and hence, issued a demand notice of ₹3,568.31 crore being the price of iron ore extracted. The said demand has been challenged by the Company before the Jharkhand High Court.
The mining operations were suspended from August 1, 2014. Upon issuance of an express order, Company paid ₹152.00 crore under protest, so that mining could be resumed.
The Mines and Minerals Development and Regulation (MMDR) Amendment Ordinance 2015 promulgated on January 12, 2015 provides for extension of such mining leases whose applications for renewal have remained pending with the State(s). Based on the new Ordinance, Jharkhand Government revised the Express Order on February 12, 2015 for extending the period of lease upto March 31, 2030 with the following terms and conditions:
40. Contingencies and commitments (Contd.)
NOTESforming part of the consolidated financial statements
Consolidated
INTEGRATED REPORT & ANNUAL ACCOUNTS 2019-20 | 113TH YEAR410
41. Other significant litigations (Contd.)
• value of iron ore produced by alleged unlawful mining during the period January 1, 2012 to April 20, 2014 for ₹2,994.49 crore to be decided on the basis of disposal of our writ petition before Hon’ble High Court of Jharkhand.
• value of iron ore produced from April 21, 2014 to July 17, 2014 amounting to ₹421.83 crore to be paid in maximum 3 instalments.
• value of iron ore produced from July 18, 2014 to August 31, 2014 ₹152.00 crore to be paid immediately.
District Mining Officer Chaibasa on March 16, 2015 issued a demand notice for payment of ₹421.83 crore in three monthly installments. The Company on March 20, 2015 replied that since the lease has been extended by application of law till March 31, 2030, the above demand is not tenable. The Company, paid ₹50.00 crore under protest on July 27, 2015, because the State had stopped issuance of transit permits.
The Company filed another writ petition before the Hon’ble High Court of Jharkhand which was heard on September 9, 2015. An interim order was given by the Hon’ble High Court of Jharkhand on September 17, 2015, wherein the Court has directed the Company to pay the amount of ₹371.83 crore in 3 equal instalments, first instalment by October 15, 2015, second instalment by November 15, 2015 and third instalment by December 15, 2015.
In view of the interim order of the Hon’ble High Court of Jharkhand ₹124.00 crore was paid on September 28, 2015, ₹124.00 crore on November 12, 2015 and ₹123.83 crore on December 14, 2015 under protest.
The case is pending before the Hon’ble High court for disposal. The State issued similar terms and conditions to other mining lessees in the State rendering the mining as illegal. Based on the Company’s assessment of the Goa mines judgement read with the Ordinance issued in the year 2015, the Company believes that it is remote that the demand of the State would sustain.
NOTESforming part of the consolidated financial statements
411
Corporate Overview 02
Strategic Review 46
Performance Review 20
Statutory Reports 84
Our Strategy 28
Financial Statements 206
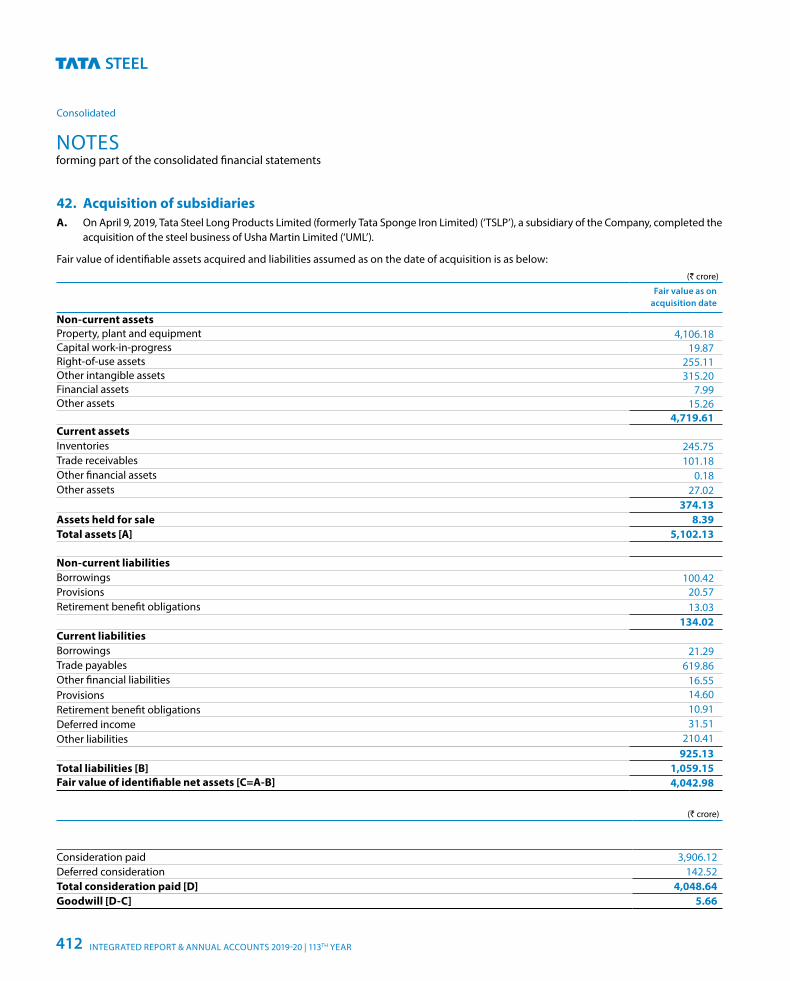
42. Acquisition of subsidiariesA. On April 9, 2019, Tata Steel Long Products Limited (formerly Tata Sponge Iron Limited) (‘TSLP’), a subsidiary of the Company, completed the
acquisition of the steel business of Usha Martin Limited (‘UML’).
Fair value of identifiable assets acquired and liabilities assumed as on the date of acquisition is as below: (` crore)
Fair value as on acquisition date
Non-current assetsProperty, plant and equipment 4,106.18Capital work-in-progress 19.87Right-of-use assets 255.11Other intangible assets 315.20Financial assets 7.99Other assets 15.26
4,719.61Current assetsInventories 245.75Trade receivables 101.18Other financial assets 0.18Other assets 27.02
374.13Assets held for sale 8.39Total assets [A] 5,102.13
Non-current liabilitiesBorrowings 100.42Provisions 20.57Retirement benefit obligations 13.03
134.02Current liabilitiesBorrowings 21.29Trade payables 619.86Other financial liabilities 16.55Provisions 14.60Retirement benefit obligations 10.91Deferred income 31.51Other liabilities 210.41
925.13Total liabilities [B] 1,059.15Fair value of identifiable net assets [C=A-B] 4,042.98
(` crore)
Consideration paid 3,906.12Deferred consideration 142.52Total consideration paid [D] 4,048.64Goodwill [D-C] 5.66
NOTESforming part of the consolidated financial statements
Consolidated
INTEGRATED REPORT & ANNUAL ACCOUNTS 2019-20 | 113TH YEAR412
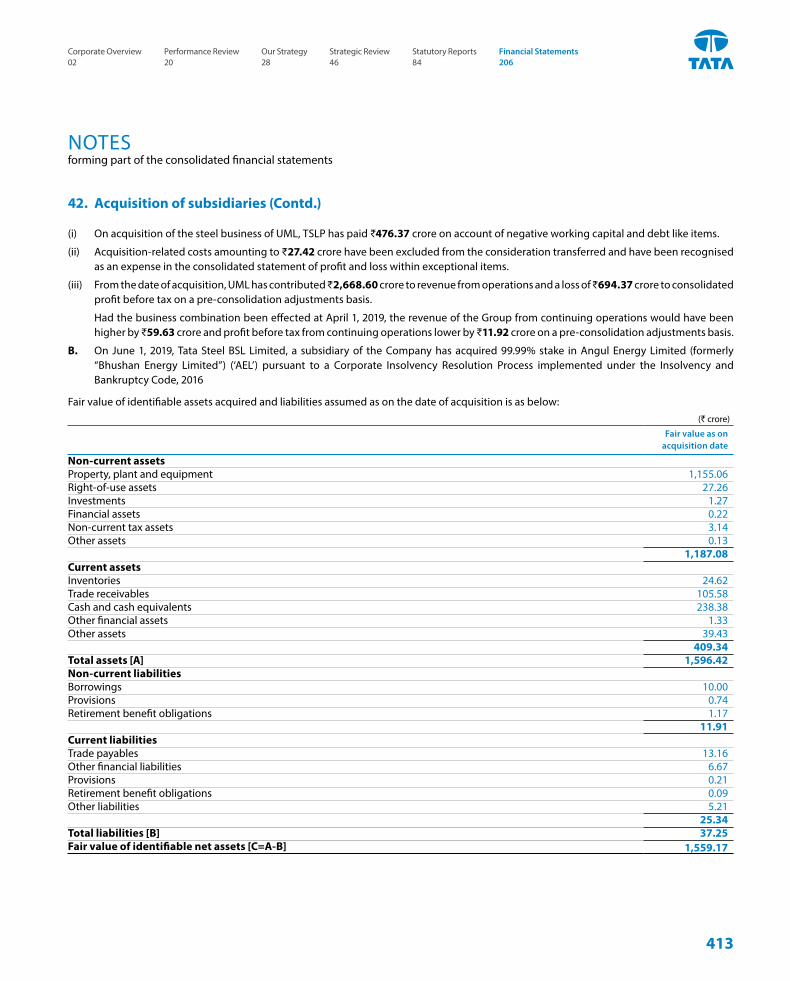
(i) On acquisition of the steel business of UML, TSLP has paid ₹476.37 crore on account of negative working capital and debt like items.
(ii) Acquisition-related costs amounting to ₹27.42 crore have been excluded from the consideration transferred and have been recognised as an expense in the consolidated statement of profit and loss within exceptional items.
(iii) From the date of acquisition, UML has contributed ₹2,668.60 crore to revenue from operations and a loss of ₹694.37 crore to consolidated profit before tax on a pre-consolidation adjustments basis.
Had the business combination been effected at April 1, 2019, the revenue of the Group from continuing operations would have been higher by ₹59.63 crore and profit before tax from continuing operations lower by ₹11.92 crore on a pre-consolidation adjustments basis.
B. On June 1, 2019, Tata Steel BSL Limited, a subsidiary of the Company has acquired 99.99% stake in Angul Energy Limited (formerly “Bhushan Energy Limited”) (‘AEL’) pursuant to a Corporate Insolvency Resolution Process implemented under the Insolvency and Bankruptcy Code, 2016
Fair value of identifiable assets acquired and liabilities assumed as on the date of acquisition is as below: (` crore)
Fair value as on acquisition date
Non-current assetsProperty, plant and equipment 1,155.06Right-of-use assets 27.26Investments 1.27Financial assets 0.22Non-current tax assets 3.14Other assets 0.13
1,187.08Current assetsInventories 24.62Trade receivables 105.58Cash and cash equivalents 238.38Other financial assets 1.33Other assets 39.43
409.34Total assets [A] 1,596.42Non-current liabilitiesBorrowings 10.00Provisions 0.74Retirement benefit obligations 1.17
11.91Current liabilitiesTrade payables 13.16Other financial liabilities 6.67Provisions 0.21Retirement benefit obligations 0.09Other liabilities 5.21
25.34Total liabilities [B] 37.25Fair value of identifiable net assets [C=A-B] 1,559.17
42. Acquisition of subsidiaries (Contd.)
NOTESforming part of the consolidated financial statements
413
Corporate Overview 02
Strategic Review 46
Performance Review 20
Statutory Reports 84
Our Strategy 28
Financial Statements 206
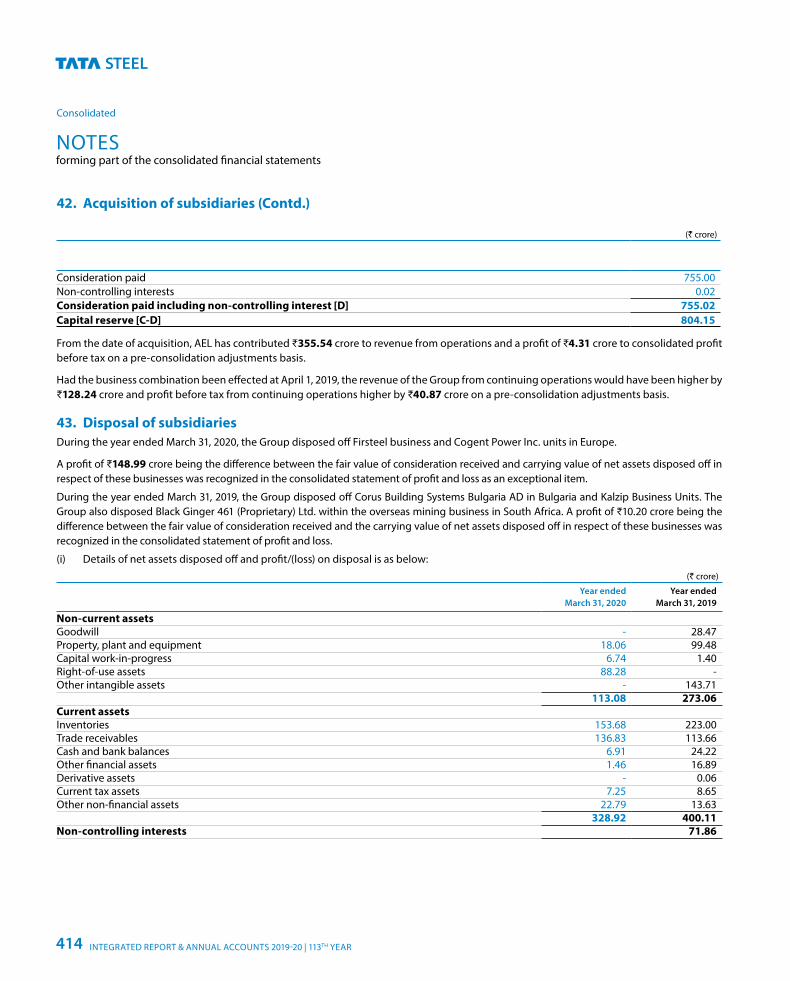
(` crore)
Consideration paid 755.00Non-controlling interests 0.02Consideration paid including non-controlling interest [D] 755.02Capital reserve [C-D] 804.15
From the date of acquisition, AEL has contributed ₹355.54 crore to revenue from operations and a profit of ₹4.31 crore to consolidated profit before tax on a pre-consolidation adjustments basis.
Had the business combination been effected at April 1, 2019, the revenue of the Group from continuing operations would have been higher by ₹128.24 crore and profit before tax from continuing operations higher by ₹40.87 crore on a pre-consolidation adjustments basis.
43. Disposal of subsidiariesDuring the year ended March 31, 2020, the Group disposed off Firsteel business and Cogent Power Inc. units in Europe.
A profit of ₹148.99 crore being the difference between the fair value of consideration received and carrying value of net assets disposed off in respect of these businesses was recognized in the consolidated statement of profit and loss as an exceptional item.
During the year ended March 31, 2019, the Group disposed off Corus Building Systems Bulgaria AD in Bulgaria and Kalzip Business Units. The Group also disposed Black Ginger 461 (Proprietary) Ltd. within the overseas mining business in South Africa. A profit of ₹10.20 crore being the difference between the fair value of consideration received and the carrying value of net assets disposed off in respect of these businesses was recognized in the consolidated statement of profit and loss.
(i) Details of net assets disposed off and profit/(loss) on disposal is as below: (` crore)
Year ended March 31, 2020
Year ended March 31, 2019
Non-current assetsGoodwill - 28.47Property, plant and equipment 18.06 99.48Capital work-in-progress 6.74 1.40Right-of-use assets 88.28 -Other intangible assets - 143.71
113.08 273.06Current assetsInventories 153.68 223.00Trade receivables 136.83 113.66Cash and bank balances 6.91 24.22Other financial assets 1.46 16.89Derivative assets - 0.06Current tax assets 7.25 8.65Other non-financial assets 22.79 13.63
328.92 400.11Non-controlling interests 71.86
42. Acquisition of subsidiaries (Contd.)
NOTESforming part of the consolidated financial statements
Consolidated
INTEGRATED REPORT & ANNUAL ACCOUNTS 2019-20 | 113TH YEAR414
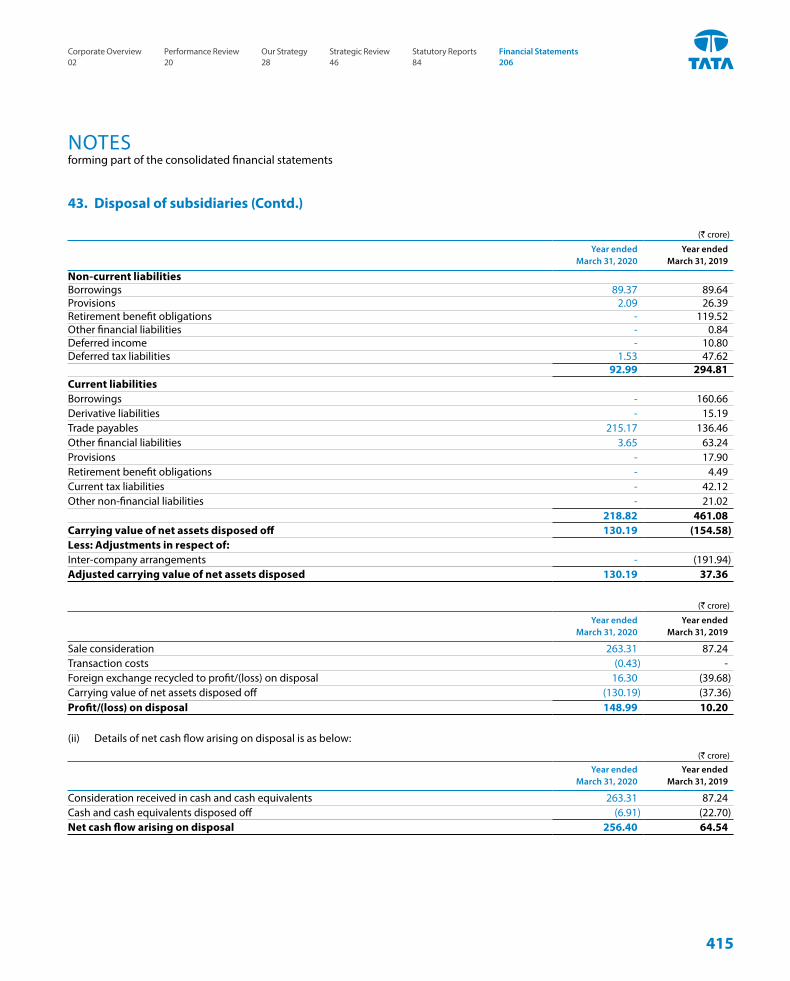
(` crore)
Year ended March 31, 2020
Year ended March 31, 2019
Non-current liabilitiesBorrowings 89.37 89.64Provisions 2.09 26.39Retirement benefit obligations - 119.52Other financial liabilities - 0.84Deferred income - 10.80Deferred tax liabilities 1.53 47.62
92.99 294.81Current liabilitiesBorrowings - 160.66Derivative liabilities - 15.19Trade payables 215.17 136.46Other financial liabilities 3.65 63.24Provisions - 17.90Retirement benefit obligations - 4.49Current tax liabilities - 42.12Other non-financial liabilities - 21.02
218.82 461.08Carrying value of net assets disposed off 130.19 (154.58)Less: Adjustments in respect of:Inter-company arrangements - (191.94)Adjusted carrying value of net assets disposed 130.19 37.36
(` crore)
Year ended March 31, 2020
Year ended March 31, 2019
Sale consideration 263.31 87.24Transaction costs (0.43) -Foreign exchange recycled to profit/(loss) on disposal 16.30 (39.68)Carrying value of net assets disposed off (130.19) (37.36)Profit/(loss) on disposal 148.99 10.20
(ii) Details of net cash flow arising on disposal is as below:(` crore)
Year ended March 31, 2020
Year ended March 31, 2019
Consideration received in cash and cash equivalents 263.31 87.24Cash and cash equivalents disposed off (6.91) (22.70)Net cash flow arising on disposal 256.40 64.54
43. Disposal of subsidiaries (Contd.)
NOTESforming part of the consolidated financial statements
415
Corporate Overview 02
Strategic Review 46
Performance Review 20
Statutory Reports 84
Our Strategy 28
Financial Statements 206
44. Capital ManagementThe Group’s capital management is intended to create value for shareholders by facilitating the achievement of long-term and short-term goals of the Group.
The Group determines the amount of capital required on the basis of annual business plan of entities within the Group coupled with long-term and short-term strategic investment and expansion plans. The funding needs are met through equity, cash generated from operations, long and short-term bank borrowings and issue of non-convertible debt securities.
The Group monitors the capital structure on the basis of net debt to equity ratio and maturity profile of the overall debt portfolio of the Group.
Net debt includes interest bearing borrowings less cash and cash equivalents, other bank balances (including non-current and earmarked balances) and current investments.
The table below summarises the capital, net debt and net debt to equity ratio of the Group.
(` crore)As at
March 31, 2020 As at
March 31, 2019
Equity share capital 1,144.95 1,144.94Hybrid perpetual securities 2,275.00 2,275.00Other equity 70,156.35 65,505.14Equity attributable to shareholders of the Company 73,576.30 68,925.08Non-controlling interests 2,586.60 2,364.46Total equity (A) 76,162.90 71,289.54
Non-current borrowings 94,104.97 80,342.73Current borrowings 19,184.48 10,802.08Current maturities of long-term borrowings and lease obligations 3,038.75 9,671.41Gross debt (B) 1,16,328.20 1,00,816.22Total capital (A+B) 1,92,491.10 1,72,105.76
Gross debt as above 1,16,328.20 1,00,816.22Less: Current investments 3,431.87 2,524.86Less: Cash and cash equivalents 7,541.96 2,975.53Less: Other balances with banks (including non-current earmarked balances) 574.93 436.83Net debt (C) 1,04,779.44 94,879.00
Net debt to equity ratio(i) 1.42 1.43
(i) Net debt to equity ratio as at March 31, 2020 and March 31, 2019 has been computed based on the average of opening and closing equity.
NOTESforming part of the consolidated financial statements
Consolidated
INTEGRATED REPORT & ANNUAL ACCOUNTS 2019-20 | 113TH YEAR416
45. Disclosures on financial instruments
This section gives an overview of the significance of financial instruments for the Group and provides additional information on balance sheet items that contain financial instruments.
The details of significant accounting policies, including the criteria for recognition, the basis of measurement and the basis on which income and expenses are recognised in respect of each class of financial asset, financial liability and equity instrument are disclosed in note 2(r) page 338 to the consolidated financial statements.
(a) Financial assets and liabilities The following tables present the carrying value and fair value of each category of financial assets and liabilities as at March 31, 2020 and March 31, 2019.
As at March 31, 2020 (` crore)
Amortised cost
Fair value through other
comprehensive income
Derivative instruments
in hedging relationship
Derivative instruments
not in hedging relationship
Fair value through profit
and loss
Total carrying
value
Total fair value
Financial assets:Cash and bank balances 8,116.89 - - - - 8,116.89 8,116.89Trade receivables 7,884.91 - - - - 7,884.91 7,884.91Investments 85.84 506.87 - - 3,523.93 4,116.64 4,116.64Derivatives - - 684.23 1,081.47 - 1,765.70 1,765.70Loans 704.39 - - - - 704.39 704.39Other financial assets 973.18 - - - - 973.18 973.18
17,765.21 506.87 684.23 1,081.47 3,523.93 23,561.71 23,561.71Financial liabilities:Trade payables 21,380.85 - - - - 21,380.85 21,380.85Borrowings other than lease obligations
1,09,306.14 - - - - 1,09,306.14 1,08,728.40
Lease obligations 7,022.06 - - - - 7,022.06 7,022.06Derivatives - - 513.76 343.38 - 857.14 857.14Other financial liabilities 6,867.45 - - - - 6,867.45 6,867.45
1,44,576.50 - 513.76 343.38 - 1,45,433.64 1,44,855.90
NOTESforming part of the consolidated financial statements
417
Corporate Overview 02
Strategic Review 46
Performance Review 20
Statutory Reports 84
Our Strategy 28
Financial Statements 206
As at March 31, 2019 (` crore)
Amortised cost
Fair value through other
comprehensive income
Derivative instruments
in hedging relationship
Derivative instruments
not in hedging relationship
Fair value through profit
and loss
Total carrying
value
Total fair value
Financial assets:Cash and bank balances 3,412.36 - - - - 3,412.36 3,412.36Trade receivables 11,811.00 - - - - 11,811.00 11,811.00Investments 65.21 756.39 - - 2,993.62 3,815.22 3,815.22Derivatives - - 184.44 283.41 - 467.85 467.85Loans 853.04 - - - - 853.04 853.04Other financial assets 1,747.63 - - - - 1,747.63 1,747.63
17,889.24 756.39 184.44 283.41 2,993.62 22,107.10 22,107.10Financial liabilities:Trade payables 21,716.96 - - - - 21,716.96 21,716.96Borrowings 1,00,816.22 - - - - 1,00,816.22 99,893.42Derivatives - - 216.35 260.06 - 476.41 476.41Other financial liabilities 7,337.00 - - - - 7,337.00 7,337.00
1,29,870.18 - 216.35 260.06 - 1,30,346.59 1,29,423.79
(i) Investments in mutual funds and derivative instruments (other than those designated in a hedging relationship) are mandatorily classified as fair value through profit and loss.
(b) Fair value hierarchy The following table provides an analysis of financial instruments that are measured subsequent to initial recognition at fair value,
grouped into Level 1 to Level 3, as described below.
Quoted prices in an active market (Level 1): This Level of hierarchy includes financial assets and liabilities, that are measured by reference to quoted prices (unadjusted) in active markets for identical assets or liabilities. This Level consists of investments in quoted equity shares and mutual funds.
Valuation techniques with observable inputs (Level 2): This Level of hierarchy includes financial assets and liabilities, measured using inputs other than quoted prices included within Level 1 that are observable for the asset or liability, either directly (i.e., as prices) or indirectly (i.e., derived from prices). This Level of hierarchy includes the Group’s over-the-counter (OTC) derivative contracts.
Valuation techniques with significant unobservable inputs (Level 3): This Level of hierarchy includes financial assets and liabilities measured using inputs that are not based on observable market data (unobservable inputs). Fair values are determined in whole or in part, using a valuation model based on assumptions that are neither supported by prices from observable current market transactions in the same instrument nor are they based on available market data. This Level includes investment in unquoted equity shares and preference shares.
45. Disclosures on financial instruments (Contd.)
NOTESforming part of the consolidated financial statements
Consolidated
INTEGRATED REPORT & ANNUAL ACCOUNTS 2019-20 | 113TH YEAR418
(` crore)
As at March 31, 2020
Level 1 Level 2 Level 3 TotalFinancial assets: Investments in mutual funds 3,431.87 - - 3,431.87Investments in equity shares 205.02 - 344.17 549.19Investments in bonds and debentures - 49.74 - 49.74Derivative financial assets - 1,765.70 - 1,765.70
3,636.89 1,815.44 344.17 5,796.50Financial liabilities:Derivative financial liabilities - 857.14 - 857.14
- 857.14 - 857.14
(` crore)
As at March 31, 2019
Level 1 Level 2 Level 3 TotalFinancial assets: Investments in mutual funds 2,633.13 - - 2,633.13Investments in equity shares 454.53 - 362.61 817.14Investments in bonds and debentures - 49.74 - 49.74Investments in preference shares - - 250.00 250.00Derivative financial assets - 467.85 - 467.85
3,087.66 517.59 612.61 4,217.86Financial liabilities:Derivative financial liabilities - 476.41 - 476.41
- 476.41 - 476.41
Notes:
(i) Current financial assets and liabilities are stated at carrying value which is approximately equal to their fair value.
(ii) Derivatives are fair valued using market observable rates and published prices together with forecasted cash flow information where applicable.
(iii) Investments carried at fair value are generally based on market price quotations. Investments in equity shares included in Level 3 of the fair value hierarchy have been valued using the cost approach to arrive at their fair value. Cost of unquoted equity instruments has been considered as an appropriate estimate of fair value because of a wide range of possible fair value measurements and cost represents the best estimate of fair value within that range. Fair value of investment in preference shares is estimated by discounting the expected future cash flows using a discount rate equivalent to the expected rate of return for a similar instrument and maturity as on the reporting date.
(iv) Fair value of borrowings which have a quoted market price in an active market is based on its market price which is categorised as Level 1. Fair value of borrowings which do not have an active market or are unquoted is estimated by discounting the expected future cash flows using a discount rate equivalent to the risk-free rate of return adjusted for credit spread considered by lenders for instruments of similar maturities which is categorised as Level 2 in the fair value hierarchy.
(v) Management uses its best judgement in estimating the fair value of its financial instruments. However, there are inherent limitations in any estimation technique. Therefore, for substantially all financial instruments, the fair value estimates presented above are not necessarily indicative of the amounts that the Group could have realised or paid in sale transactions as of respective dates. As such, fair value of financial instruments subsequent to the reporting dates may be different from the amounts reported at each reporting date.
(vi) There have been no transfers between Level 1 and Level 2 for the years ended March 31, 2020 and March 31, 2019.
45. Disclosures on financial instruments (Contd.)
NOTESforming part of the consolidated financial statements
419
Corporate Overview 02
Strategic Review 46
Performance Review 20
Statutory Reports 84
Our Strategy 28
Financial Statements 206
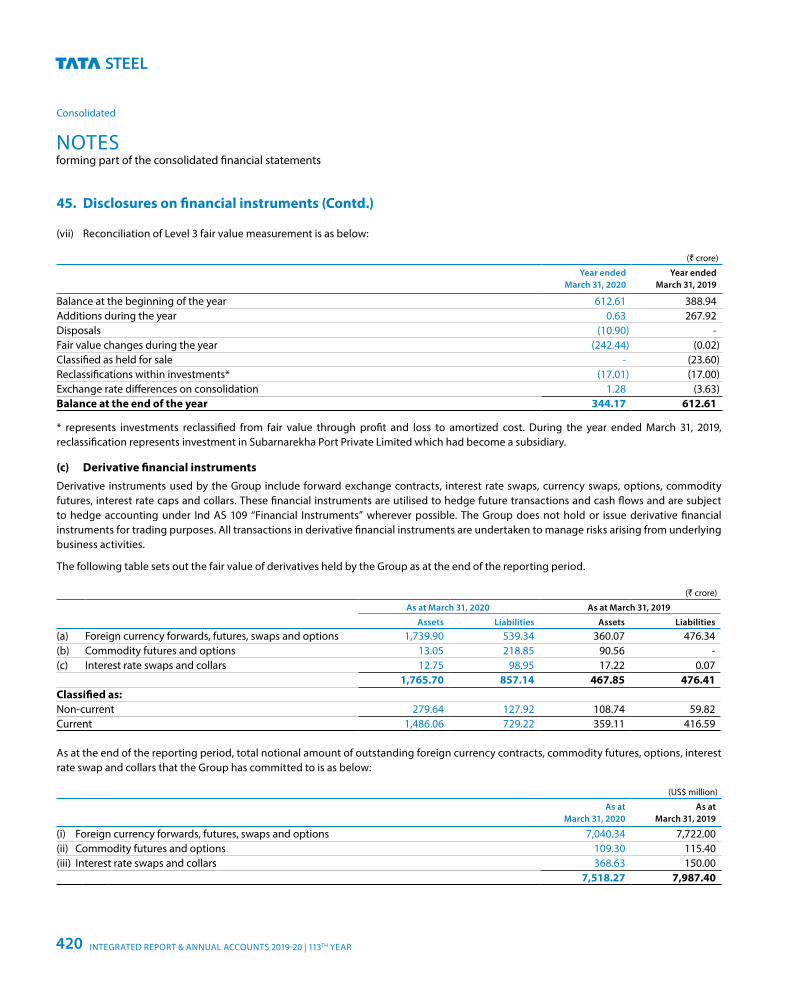
(vii) Reconciliation of Level 3 fair value measurement is as below:
(` crore)
Year ended March 31, 2020
Year ended March 31, 2019
Balance at the beginning of the year 612.61 388.94Additions during the year 0.63 267.92Disposals (10.90) -Fair value changes during the year (242.44) (0.02)Classified as held for sale - (23.60)Reclassifications within investments* (17.01) (17.00)Exchange rate differences on consolidation 1.28 (3.63)Balance at the end of the year 344.17 612.61
* represents investments reclassified from fair value through profit and loss to amortized cost. During the year ended March 31, 2019, reclassification represents investment in Subarnarekha Port Private Limited which had become a subsidiary.
(c) Derivative financial instrumentsDerivative instruments used by the Group include forward exchange contracts, interest rate swaps, currency swaps, options, commodity futures, interest rate caps and collars. These financial instruments are utilised to hedge future transactions and cash flows and are subject to hedge accounting under Ind AS 109 “Financial Instruments” wherever possible. The Group does not hold or issue derivative financial instruments for trading purposes. All transactions in derivative financial instruments are undertaken to manage risks arising from underlying business activities.
The following table sets out the fair value of derivatives held by the Group as at the end of the reporting period.
(` crore)
As at March 31, 2020 As at March 31, 2019
Assets Liabilities Assets Liabilities
(a) Foreign currency forwards, futures, swaps and options 1,739.90 539.34 360.07 476.34(b) Commodity futures and options 13.05 218.85 90.56 -(c) Interest rate swaps and collars 12.75 98.95 17.22 0.07
1,765.70 857.14 467.85 476.41Classified as:Non-current 279.64 127.92 108.74 59.82Current 1,486.06 729.22 359.11 416.59 As at the end of the reporting period, total notional amount of outstanding foreign currency contracts, commodity futures, options, interest rate swap and collars that the Group has committed to is as below:
(US$ million)
As at March 31, 2020
As at March 31, 2019
(i) Foreign currency forwards, futures, swaps and options 7,040.34 7,722.00(ii) Commodity futures and options 109.30 115.40(iii) Interest rate swaps and collars 368.63 150.00
7,518.27 7,987.40
45. Disclosures on financial instruments (Contd.)
NOTESforming part of the consolidated financial statements
Consolidated
INTEGRATED REPORT & ANNUAL ACCOUNTS 2019-20 | 113TH YEAR420
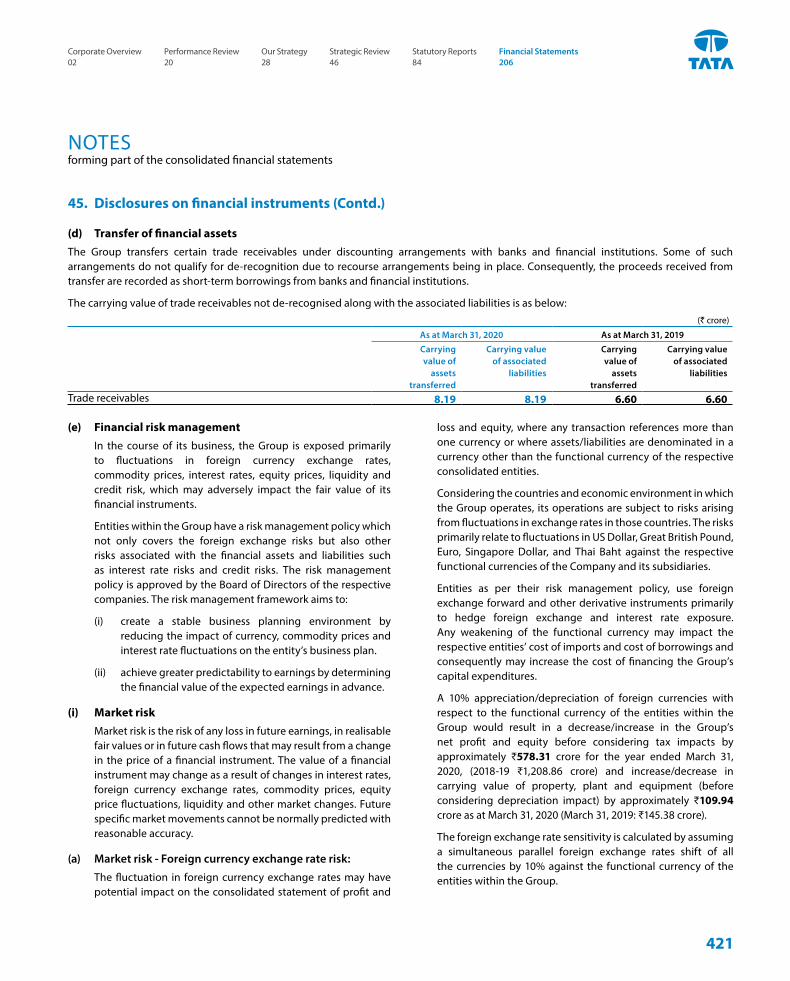
(e) Financial risk management In the course of its business, the Group is exposed primarily
to fluctuations in foreign currency exchange rates, commodity prices, interest rates, equity prices, liquidity and credit risk, which may adversely impact the fair value of its financial instruments.
Entities within the Group have a risk management policy which not only covers the foreign exchange risks but also other risks associated with the financial assets and liabilities such as interest rate risks and credit risks. The risk management policy is approved by the Board of Directors of the respective companies. The risk management framework aims to:
(i) create a stable business planning environment by reducing the impact of currency, commodity prices and interest rate fluctuations on the entity’s business plan.
(ii) achieve greater predictability to earnings by determining the financial value of the expected earnings in advance.
(i) Market risk Market risk is the risk of any loss in future earnings, in realisable
fair values or in future cash flows that may result from a change in the price of a financial instrument. The value of a financial instrument may change as a result of changes in interest rates, foreign currency exchange rates, commodity prices, equity price fluctuations, liquidity and other market changes. Future specific market movements cannot be normally predicted with reasonable accuracy.
(a) Market risk - Foreign currency exchange rate risk:
The fluctuation in foreign currency exchange rates may have potential impact on the consolidated statement of profit and
45. Disclosures on financial instruments (Contd.)
(d) Transfer of financial assetsThe Group transfers certain trade receivables under discounting arrangements with banks and financial institutions. Some of such arrangements do not qualify for de-recognition due to recourse arrangements being in place. Consequently, the proceeds received from transfer are recorded as short-term borrowings from banks and financial institutions.
The carrying value of trade receivables not de-recognised along with the associated liabilities is as below: (` crore)
As at March 31, 2020 As at March 31, 2019
Carrying value of
assets transferred
Carrying value of associated
liabilities
Carrying value of
assets transferred
Carrying value of associated
liabilities
Trade receivables 8.19 8.19 6.60 6.60
loss and equity, where any transaction references more than one currency or where assets/liabilities are denominated in a currency other than the functional currency of the respective consolidated entities.
Considering the countries and economic environment in which the Group operates, its operations are subject to risks arising from fluctuations in exchange rates in those countries. The risks primarily relate to fluctuations in US Dollar, Great British Pound, Euro, Singapore Dollar, and Thai Baht against the respective functional currencies of the Company and its subsidiaries.
Entities as per their risk management policy, use foreign exchange forward and other derivative instruments primarily to hedge foreign exchange and interest rate exposure. Any weakening of the functional currency may impact the respective entities’ cost of imports and cost of borrowings and consequently may increase the cost of financing the Group’s capital expenditures.
A 10% appreciation/depreciation of foreign currencies with respect to the functional currency of the entities within the Group would result in a decrease/increase in the Group’s net profit and equity before considering tax impacts by approximately ₹578.31 crore for the year ended March 31, 2020, (2018-19 ₹1,208.86 crore) and increase/decrease in carrying value of property, plant and equipment (before considering depreciation impact) by approximately ₹109.94 crore as at March 31, 2020 (March 31, 2019: ₹145.38 crore).
The foreign exchange rate sensitivity is calculated by assuming a simultaneous parallel foreign exchange rates shift of all the currencies by 10% against the functional currency of the entities within the Group.
NOTESforming part of the consolidated financial statements
421
Corporate Overview 02
Strategic Review 46
Performance Review 20
Statutory Reports 84
Our Strategy 28
Financial Statements 206
45. Disclosures on financial instruments (Contd.)
The sensitivity analysis has been based on the composition of the Group’s financial assets and liabilities as at March 31, 2020 and March 31, 2019 excluding trade payables, trade receivables, other derivative and non-derivative financial instruments not forming part of debt and which do not present a material exposure. The period end balances are not necessarily representative of the average debt outstanding during the period.
(b) Market risk - Interest rate risk:
Interest rate risk is measured by using the cash flow sensitivity for changes in variable interest rates. Any movement in the reference rates could have an impact on the Group’s cash flows as well as costs.
The Group is subject to variable interest rates on some of its interest bearing liabilities. The Group’s interest rate exposure is mainly related to debt obligations.
Based on the composition of debt as at March 31, 2020 and March 31, 2019 a 100 basis points increase in interest rates would increase the Group’s finance costs (before considering interest eligible for capitalization) and thereby consequently reduce net profit and equity before considering tax impacts by approximately ₹629.81 crore for the year ended March 31, 2020 (2018-19 : ₹555.11 crore).
The risk estimates provided assume a parallel shift of 100 basis points interest rate across all yield curves. This calculation also assumes that the change occurs at the balance sheet date and has been calculated based on risk exposures outstanding as at that date. The period end balances are not necessarily representative of the average debt outstanding during the period.
(c) Market risk - Equity price risk:
Equity price risk is related to the change in market reference price of investments in equity securities held by the Group.
The fair value of quoted investments held by the Group exposes the Group to equity price risks. In general, these investments are not held for trading purposes.
The fair value of quoted investments in equity classified as fair value through other comprehensive income/profit and loss as at March 31, 2020 and March 31, 2019 was ₹205.02 crore and ₹454.53 crore respectively.
A 10% change in equity prices of such securities held as at March 31, 2020 and March 31, 2019 would result in an impact of ₹20.50 crore and ₹45.45 crore respectively on equity before considering tax impact.
(ii) Commodity risk The Group makes use of commodity futures contracts
and options to manage its purchase price risk for certain commodities. Across the Group, forward purchases are also made of zinc, tin and nickel to cover sales contracts with fixed metal prices.
There was no significant market risk relating to the consolidated statement of profit and loss since the majority of commodity derivatives are treated as cash flow hedges with movements being reflected in equity and the timing and recognition in the consolidated statement of profit and loss would depend on the point at which the underlying hedged transactions are recognised
(iii) Credit risk Credit risk is the risk of financial loss arising from counter-party
failure to repay or service debt according to the contractual terms or obligations. Credit risk encompasses both the direct risk of default and the risk of deterioration of credit worthiness as well as concentration risks.
Entities within the Group have a policy of dealing only with credit worthy counter parties and obtaining sufficient collateral, where appropriate as a means of mitigating the risk of financial loss from defaults.
Financial instruments that are subject to credit risk and concentration thereof principally consist of trade receivables, loans receivables, investments in debt securities and mutual funds, balances with banks, bank deposits, derivatives and financial guarantees provided by the Group. None of the financial instruments of the Group result in material concentration of credit risk.
The carrying value of financial assets represents the maximum credit risk. The maximum exposure to credit risk was ₹18,661.48 crore and ₹12,960.20 crore as at March 31, 2020 and March 31, 2019 respectively, being the total carrying value of trade receivables, balances with bank, bank deposits, investments in debt securities and mutual funds, loans, derivative assets and other financial assets net of insurance cover, where applicable.
The risk relating to trade receivables is presented in note 16, page 366.
NOTESforming part of the consolidated financial statements
Consolidated
INTEGRATED REPORT & ANNUAL ACCOUNTS 2019-20 | 113TH YEAR422
45. Disclosures on financial instruments (Contd.)
The Group’s exposure to customers is diversified and there is no concentration of credit risk with respect to any particular customer as at March 31, 2020 and March 31, 2019.
In respect of financial guarantees provided by the Group to banks and financial institutions, the maximum exposure which the Group is exposed to is the maximum amount which the Group would have to pay if the guarantee is called upon. Based on the expectation at the end of the reporting period, the Group considers that it is more likely than not that such an amount will not be payable under the guarantees provided.
(iv) Liquidity risk Liquidity risk refers to the risk that the Group cannot meet
its financial obligations. The objective of liquidity risk management is to maintain sufficient liquidity and ensure that funds are available for use as per requirements.
The Group has obtained fund and non-fund based working capital lines from various banks. Furthermore, the entities within the Group have access to undrawn lines of committed and uncommitted borrowing/facilities, funds from debt markets through commercial paper programs, non-convertible debentures and other debt instruments. The Group invests its surplus funds in bank fixed deposits and mutual funds, which carry no or low mark to market risk. The Company and entities within the Group, wherever applicable, have also invested 15% of the non-convertible debentures (issued by the Company/entities) falling due for repayment in the next 12 months in bank deposits, to meet the regulatory norms of liquidity requirements. The Group also constantly monitors funding options available in the debt and capital markets with a view of maintaining financial flexibility.
The Group’s liquidity position remains strong as at March 31, 2020, comprising of current investments, cash and cash equivalents and other balances with banks, in addition to committed undrawn bank lines.
NOTESforming part of the consolidated financial statements
423
Corporate Overview 02
Strategic Review 46
Performance Review 20
Statutory Reports 84
Our Strategy 28
Financial Statements 206
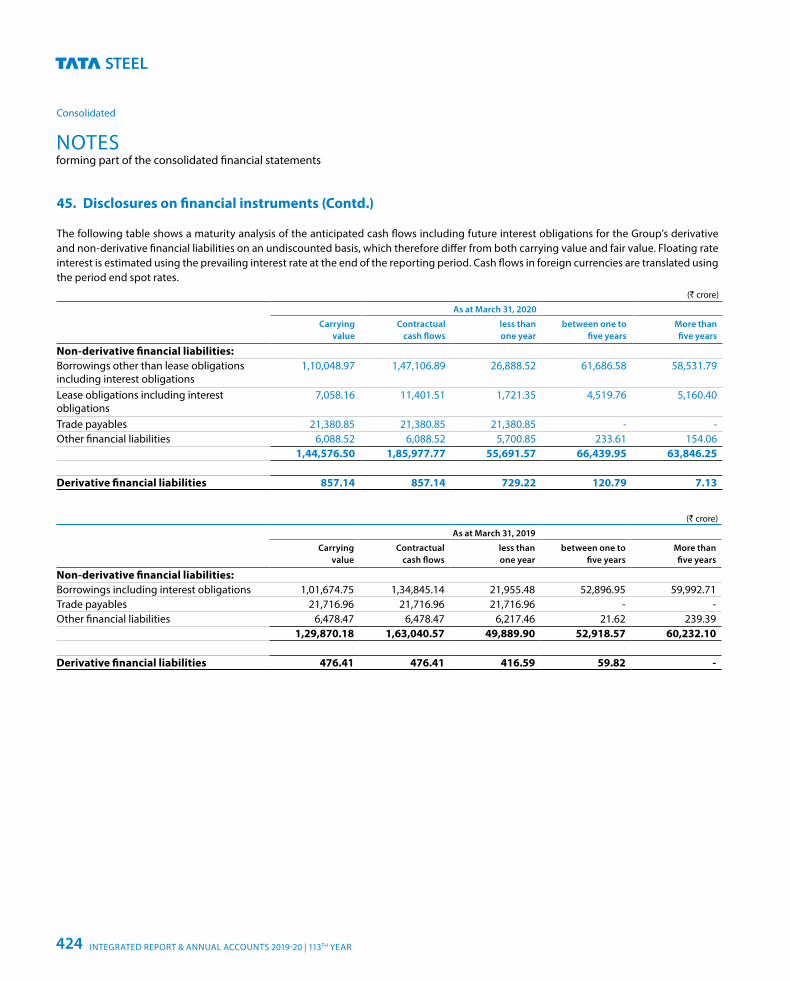
The following table shows a maturity analysis of the anticipated cash flows including future interest obligations for the Group’s derivative and non-derivative financial liabilities on an undiscounted basis, which therefore differ from both carrying value and fair value. Floating rate interest is estimated using the prevailing interest rate at the end of the reporting period. Cash flows in foreign currencies are translated using the period end spot rates.
(` crore)
As at March 31, 2020
Carrying value
Contractual cash flows
less than one year
between one to five years
More than five years
Non-derivative financial liabilities:Borrowings other than lease obligations including interest obligations
1,10,048.97 1,47,106.89 26,888.52 61,686.58 58,531.79
Lease obligations including interest obligations
7,058.16 11,401.51 1,721.35 4,519.76 5,160.40
Trade payables 21,380.85 21,380.85 21,380.85 - -Other financial liabilities 6,088.52 6,088.52 5,700.85 233.61 154.06
1,44,576.50 1,85,977.77 55,691.57 66,439.95 63,846.25
Derivative financial liabilities 857.14 857.14 729.22 120.79 7.13
(` crore)
As at March 31, 2019
Carrying value
Contractual cash flows
less than one year
between one to five years
More than five years
Non-derivative financial liabilities:Borrowings including interest obligations 1,01,674.75 1,34,845.14 21,955.48 52,896.95 59,992.71Trade payables 21,716.96 21,716.96 21,716.96 - -Other financial liabilities 6,478.47 6,478.47 6,217.46 21.62 239.39
1,29,870.18 1,63,040.57 49,889.90 52,918.57 60,232.10
Derivative financial liabilities 476.41 476.41 416.59 59.82 -
45. Disclosures on financial instruments (Contd.)
NOTESforming part of the consolidated financial statements
Consolidated
INTEGRATED REPORT & ANNUAL ACCOUNTS 2019-20 | 113TH YEAR424
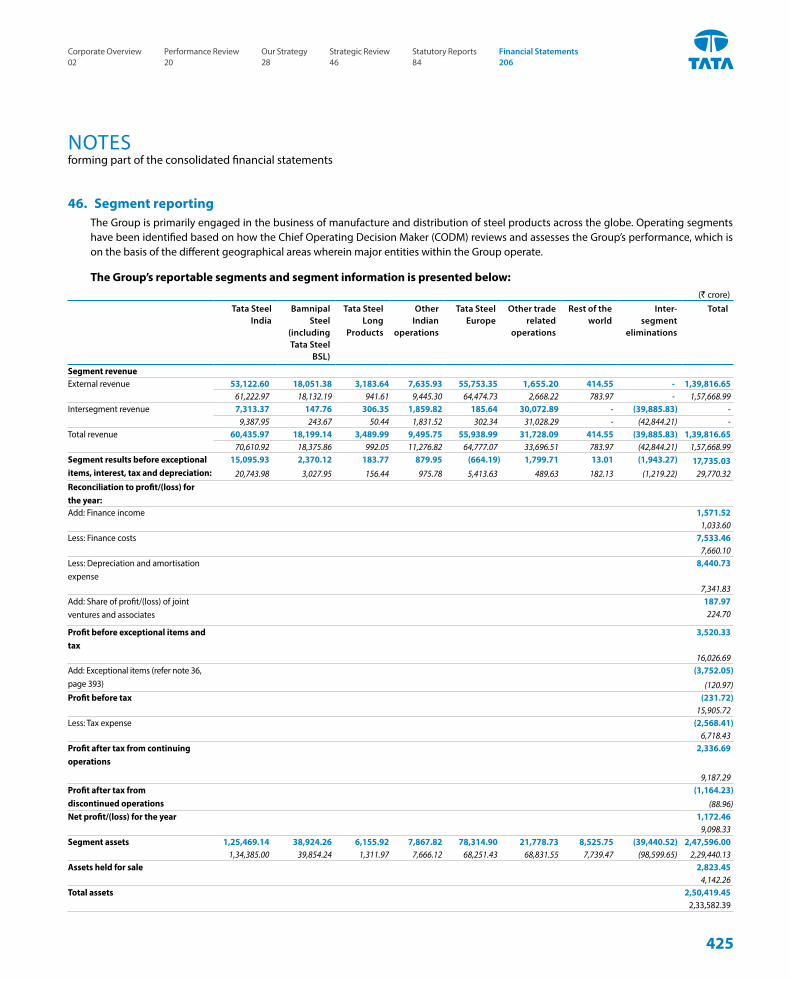
46. Segment reporting The Group is primarily engaged in the business of manufacture and distribution of steel products across the globe. Operating segments
have been identified based on how the Chief Operating Decision Maker (CODM) reviews and assesses the Group’s performance, which is on the basis of the different geographical areas wherein major entities within the Group operate.
The Group’s reportable segments and segment information is presented below: (` crore)
Tata Steel India
Bamnipal Steel
(including Tata Steel
BSL)
Tata Steel Long
Products
OtherIndian
operations
Tata SteelEurope
Other trade related
operations
Rest of the world
Inter-segment
eliminations
Total
Segment revenueExternal revenue 53,122.60 18,051.38 3,183.64 7,635.93 55,753.35 1,655.20 414.55 - 1,39,816.65
61,222.97 18,132.19 941.61 9,445.30 64,474.73 2,668.22 783.97 - 1,57,668.99Intersegment revenue 7,313.37 147.76 306.35 1,859.82 185.64 30,072.89 - (39,885.83) -
9,387.95 243.67 50.44 1,831.52 302.34 31,028.29 - (42,844.21) -Total revenue 60,435.97 18,199.14 3,489.99 9,495.75 55,938.99 31,728.09 414.55 (39,885.83) 1,39,816.65
70,610.92 18,375.86 992.05 11,276.82 64,777.07 33,696.51 783.97 (42,844.21) 1,57,668.99Segment results before exceptional items, interest, tax and depreciation:
15,095.93 2,370.12 183.77 879.95 (664.19) 1,799.71 13.01 (1,943.27) 17,735.0320,743.98 3,027.95 156.44 975.78 5,413.63 489.63 182.13 (1,219.22) 29,770.32
Reconciliation to profit/(loss) for the year:Add: Finance income 1,571.52
1,033.60Less: Finance costs 7,533.46
7,660.10Less: Depreciation and amortisation expense
8,440.73
7,341.83Add: Share of profit/(loss) of joint ventures and associates
187.97224.70
Profit before exceptional items and tax
3,520.33
16,026.69Add: Exceptional items (refer note 36, page 393)
(3,752.05)
(120.97)Profit before tax (231.72)
15,905.72Less: Tax expense (2,568.41)
6,718.43Profit after tax from continuing operations
2,336.69
9,187.29Profit after tax from discontinued operations
(1,164.23)(88.96)
Net profit/(loss) for the year 1,172.469,098.33
Segment assets 1,25,469.14 38,924.26 6,155.92 7,867.82 78,314.90 21,778.73 8,525.75 (39,440.52) 2,47,596.001,34,385.00 39,854.24 1,311.97 7,666.12 68,251.43 68,831.55 7,739.47 (98,599.65) 2,29,440.13
Assets held for sale 2,823.454,142.26
Total assets 2,50,419.452,33,582.39
NOTESforming part of the consolidated financial statements
425
Corporate Overview 02
Strategic Review 46
Performance Review 20
Statutory Reports 84
Our Strategy 28
Financial Statements 206
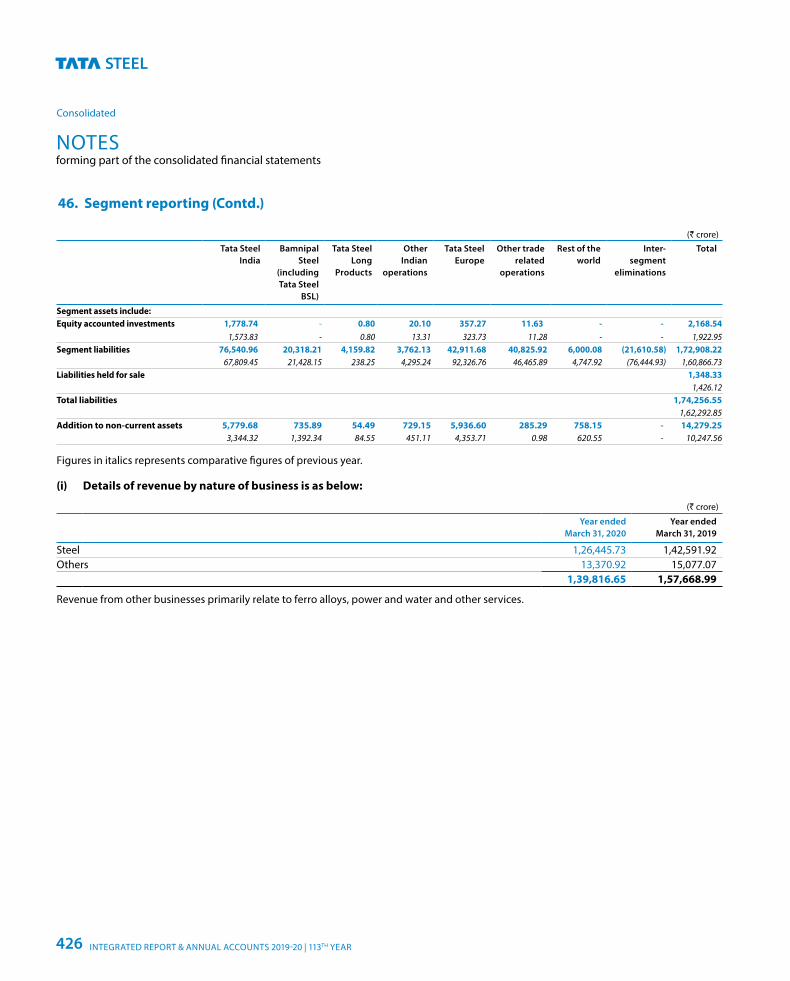
46. Segment reporting (Contd.)
(` crore)Tata Steel
IndiaBamnipal
Steel (including Tata Steel
BSL)
Tata Steel Long
Products
OtherIndian
operations
Tata SteelEurope
Other trade related
operations
Rest of the world
Inter-segment
eliminations
Total
Segment assets include:Equity accounted investments 1,778.74 - 0.80 20.10 357.27 11.63 - - 2,168.54
1,573.83 - 0.80 13.31 323.73 11.28 - - 1,922.95Segment liabilities 76,540.96 20,318.21 4,159.82 3,762.13 42,911.68 40,825.92 6,000.08 (21,610.58) 1,72,908.22
67,809.45 21,428.15 238.25 4,295.24 92,326.76 46,465.89 4,747.92 (76,444.93) 1,60,866.73Liabilities held for sale 1,348.33
1,426.12Total liabilities 1,74,256.55
1,62,292.85Addition to non-current assets 5,779.68 735.89 54.49 729.15 5,936.60 285.29 758.15 - 14,279.25
3,344.32 1,392.34 84.55 451.11 4,353.71 0.98 620.55 - 10,247.56
Figures in italics represents comparative figures of previous year.
(i) Details of revenue by nature of business is as below:
(` crore)
Year ended March 31, 2020
Year ended March 31, 2019
Steel 1,26,445.73 1,42,591.92Others 13,370.92 15,077.07
1,39,816.65 1,57,668.99
Revenue from other businesses primarily relate to ferro alloys, power and water and other services.
NOTESforming part of the consolidated financial statements
Consolidated
INTEGRATED REPORT & ANNUAL ACCOUNTS 2019-20 | 113TH YEAR426
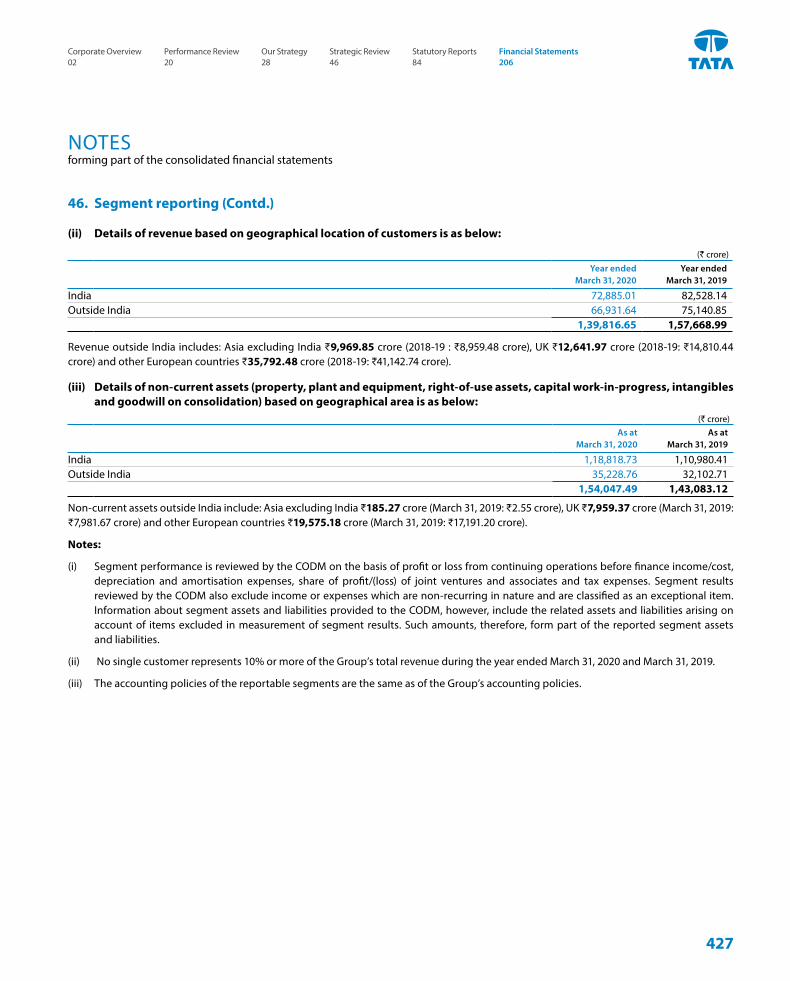
46. Segment reporting (Contd.)
(ii) Details of revenue based on geographical location of customers is as below:
(` crore)Year ended
March 31, 2020Year ended
March 31, 2019
India 72,885.01 82,528.14Outside India 66,931.64 75,140.85
1,39,816.65 1,57,668.99
Revenue outside India includes: Asia excluding India ₹9,969.85 crore (2018-19 : ₹8,959.48 crore), UK ₹12,641.97 crore (2018-19: ₹14,810.44 crore) and other European countries ₹35,792.48 crore (2018-19: ₹41,142.74 crore).
(iii) Details of non-current assets (property, plant and equipment, right-of-use assets, capital work-in-progress, intangibles and goodwill on consolidation) based on geographical area is as below:
(` crore)As at
March 31, 2020As at
March 31, 2019
India 1,18,818.73 1,10,980.41Outside India 35,228.76 32,102.71
1,54,047.49 1,43,083.12
Non-current assets outside India include: Asia excluding India ₹185.27 crore (March 31, 2019: ₹2.55 crore), UK ₹7,959.37 crore (March 31, 2019: ₹7,981.67 crore) and other European countries ₹19,575.18 crore (March 31, 2019: ₹17,191.20 crore).
Notes:
(i) Segment performance is reviewed by the CODM on the basis of profit or loss from continuing operations before finance income/cost, depreciation and amortisation expenses, share of profit/(loss) of joint ventures and associates and tax expenses. Segment results reviewed by the CODM also exclude income or expenses which are non-recurring in nature and are classified as an exceptional item. Information about segment assets and liabilities provided to the CODM, however, include the related assets and liabilities arising on account of items excluded in measurement of segment results. Such amounts, therefore, form part of the reported segment assets and liabilities.
(ii) No single customer represents 10% or more of the Group’s total revenue during the year ended March 31, 2020 and March 31, 2019.
(iii) The accounting policies of the reportable segments are the same as of the Group’s accounting policies.
NOTESforming part of the consolidated financial statements
427
Corporate Overview 02
Strategic Review 46
Performance Review 20
Statutory Reports 84
Our Strategy 28
Financial Statements 206
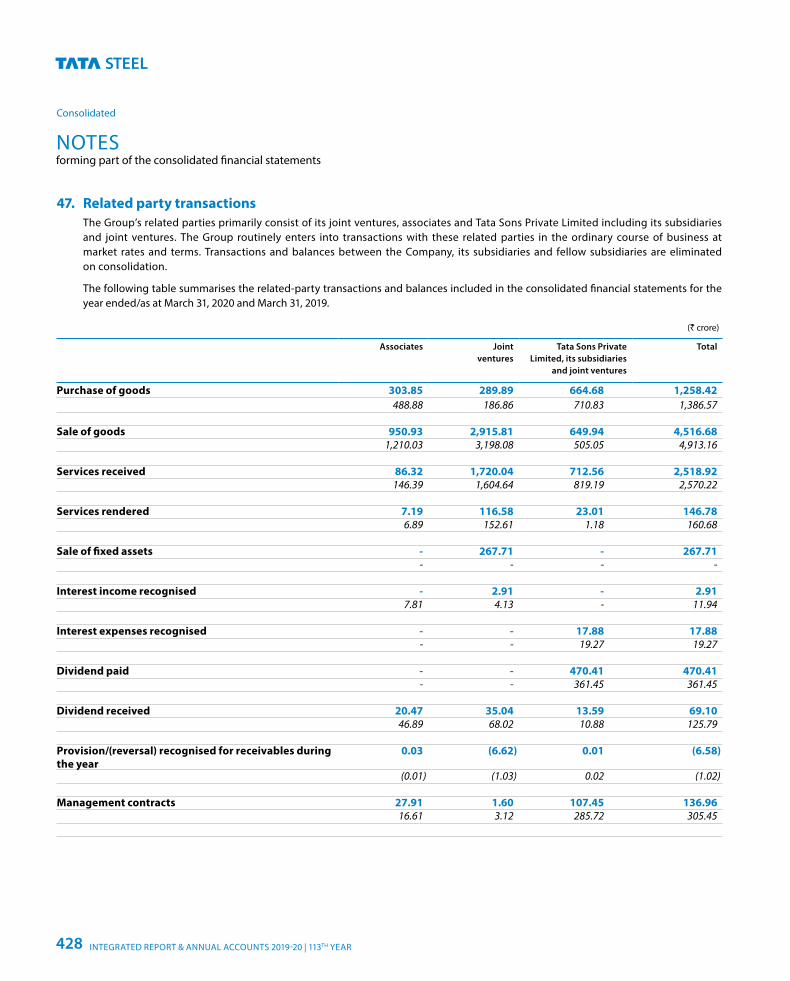
47. Related party transactions The Group’s related parties primarily consist of its joint ventures, associates and Tata Sons Private Limited including its subsidiaries
and joint ventures. The Group routinely enters into transactions with these related parties in the ordinary course of business at market rates and terms. Transactions and balances between the Company, its subsidiaries and fellow subsidiaries are eliminated on consolidation.
The following table summarises the related-party transactions and balances included in the consolidated financial statements for the year ended/as at March 31, 2020 and March 31, 2019.
(` crore)
Associates Joint ventures
Tata Sons Private Limited, its subsidiaries
and joint ventures
Total
Purchase of goods 303.85 289.89 664.68 1,258.42488.88 186.86 710.83 1,386.57
Sale of goods 950.93 2,915.81 649.94 4,516.681,210.03 3,198.08 505.05 4,913.16
Services received 86.32 1,720.04 712.56 2,518.92146.39 1,604.64 819.19 2,570.22
Services rendered 7.19 116.58 23.01 146.786.89 152.61 1.18 160.68
Sale of fixed assets - 267.71 - 267.71- - - -
Interest income recognised - 2.91 - 2.917.81 4.13 - 11.94
Interest expenses recognised - - 17.88 17.88- - 19.27 19.27
Dividend paid - - 470.41 470.41- - 361.45 361.45
Dividend received 20.47 35.04 13.59 69.1046.89 68.02 10.88 125.79
Provision/(reversal) recognised for receivables during the year
0.03 (6.62) 0.01 (6.58)
(0.01) (1.03) 0.02 (1.02)
Management contracts 27.91 1.60 107.45 136.9616.61 3.12 285.72 305.45
NOTESforming part of the consolidated financial statements
Consolidated
INTEGRATED REPORT & ANNUAL ACCOUNTS 2019-20 | 113TH YEAR428
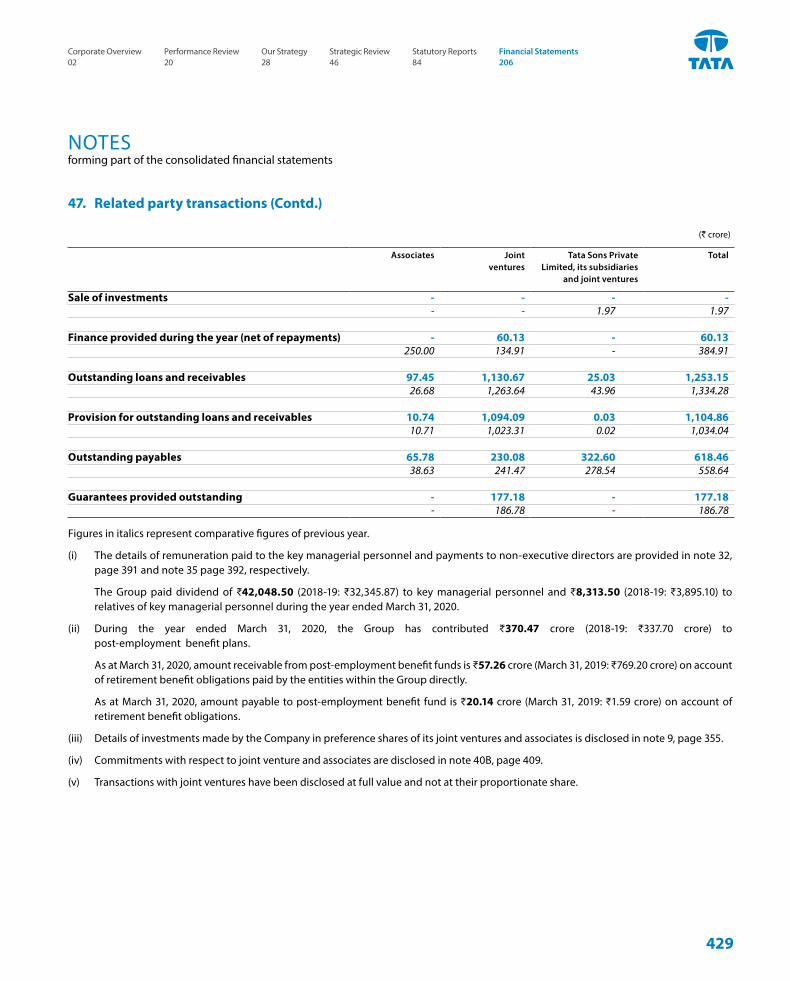
47. Related party transactions (Contd.)
(` crore)
Associates Joint ventures
Tata Sons Private Limited, its subsidiaries
and joint ventures
Total
Sale of investments - - - -- - 1.97 1.97
Finance provided during the year (net of repayments) - 60.13 - 60.13250.00 134.91 - 384.91
Outstanding loans and receivables 97.45 1,130.67 25.03 1,253.1526.68 1,263.64 43.96 1,334.28
Provision for outstanding loans and receivables 10.74 1,094.09 0.03 1,104.8610.71 1,023.31 0.02 1,034.04
Outstanding payables 65.78 230.08 322.60 618.4638.63 241.47 278.54 558.64
Guarantees provided outstanding - 177.18 - 177.18- 186.78 - 186.78
Figures in italics represent comparative figures of previous year.
(i) The details of remuneration paid to the key managerial personnel and payments to non-executive directors are provided in note 32, page 391 and note 35 page 392, respectively.
The Group paid dividend of ₹42,048.50 (2018-19: ₹32,345.87) to key managerial personnel and ₹8,313.50 (2018-19: ₹3,895.10) to relatives of key managerial personnel during the year ended March 31, 2020.
(ii) During the year ended March 31, 2020, the Group has contributed ₹370.47 crore (2018-19: ₹337.70 crore) to post-employment benefit plans.
As at March 31, 2020, amount receivable from post-employment benefit funds is ₹57.26 crore (March 31, 2019: ₹769.20 crore) on account of retirement benefit obligations paid by the entities within the Group directly.
As at March 31, 2020, amount payable to post-employment benefit fund is ₹20.14 crore (March 31, 2019: ₹1.59 crore) on account of retirement benefit obligations.
(iii) Details of investments made by the Company in preference shares of its joint ventures and associates is disclosed in note 9, page 355.
(iv) Commitments with respect to joint venture and associates are disclosed in note 40B, page 409.
(v) Transactions with joint ventures have been disclosed at full value and not at their proportionate share.
NOTESforming part of the consolidated financial statements
429
Corporate Overview 02
Strategic Review 46
Performance Review 20
Statutory Reports 84
Our Strategy 28
Financial Statements 206
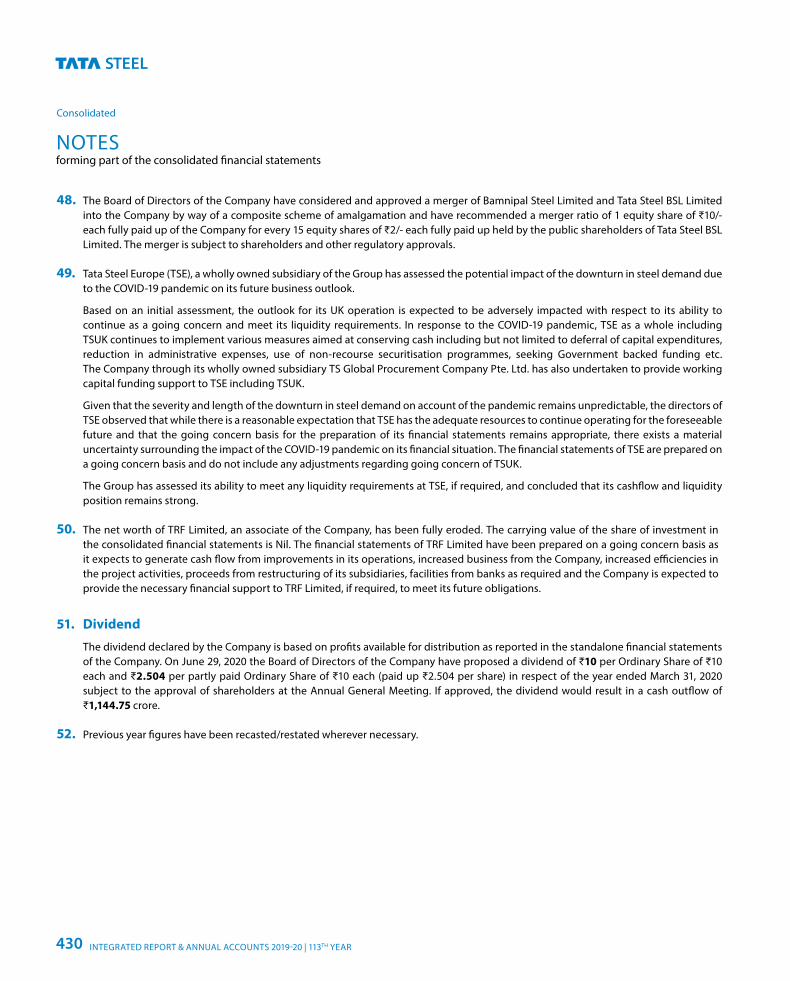
48. The Board of Directors of the Company have considered and approved a merger of Bamnipal Steel Limited and Tata Steel BSL Limited into the Company by way of a composite scheme of amalgamation and have recommended a merger ratio of 1 equity share of ₹10/-each fully paid up of the Company for every 15 equity shares of ₹2/- each fully paid up held by the public shareholders of Tata Steel BSL Limited. The merger is subject to shareholders and other regulatory approvals.
49. Tata Steel Europe (TSE), a wholly owned subsidiary of the Group has assessed the potential impact of the downturn in steel demand due to the COVID-19 pandemic on its future business outlook.
Based on an initial assessment, the outlook for its UK operation is expected to be adversely impacted with respect to its ability to continue as a going concern and meet its liquidity requirements. In response to the COVID-19 pandemic, TSE as a whole including TSUK continues to implement various measures aimed at conserving cash including but not limited to deferral of capital expenditures, reduction in administrative expenses, use of non-recourse securitisation programmes, seeking Government backed funding etc. The Company through its wholly owned subsidiary TS Global Procurement Company Pte. Ltd. has also undertaken to provide working capital funding support to TSE including TSUK.
Given that the severity and length of the downturn in steel demand on account of the pandemic remains unpredictable, the directors of TSE observed that while there is a reasonable expectation that TSE has the adequate resources to continue operating for the foreseeable future and that the going concern basis for the preparation of its financial statements remains appropriate, there exists a material uncertainty surrounding the impact of the COVID-19 pandemic on its financial situation. The financial statements of TSE are prepared on a going concern basis and do not include any adjustments regarding going concern of TSUK.
The Group has assessed its ability to meet any liquidity requirements at TSE, if required, and concluded that its cashflow and liquidity position remains strong.
50. The net worth of TRF Limited, an associate of the Company, has been fully eroded. The carrying value of the share of investment in the consolidated financial statements is Nil. The financial statements of TRF Limited have been prepared on a going concern basis as it expects to generate cash flow from improvements in its operations, increased business from the Company, increased efficiencies in the project activities, proceeds from restructuring of its subsidiaries, facilities from banks as required and the Company is expected to provide the necessary financial support to TRF Limited, if required, to meet its future obligations.
51. Dividend
The dividend declared by the Company is based on profits available for distribution as reported in the standalone financial statements of the Company. On June 29, 2020 the Board of Directors of the Company have proposed a dividend of ₹10 per Ordinary Share of ₹10 each and ₹2.504 per partly paid Ordinary Share of ₹10 each (paid up ₹2.504 per share) in respect of the year ended March 31, 2020 subject to the approval of shareholders at the Annual General Meeting. If approved, the dividend would result in a cash outflow of ₹1,144.75 crore.
52. Previous year figures have been recasted/restated wherever necessary.
NOTESforming part of the consolidated financial statements
Consolidated
INTEGRATED REPORT & ANNUAL ACCOUNTS 2019-20 | 113TH YEAR430
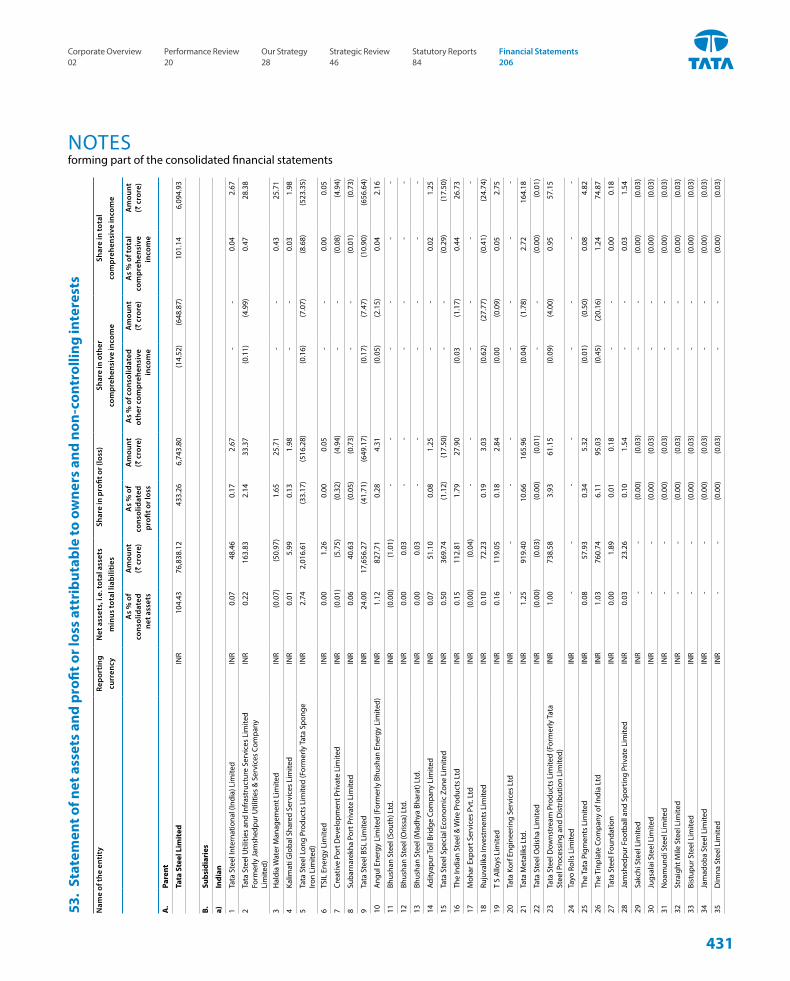
53.
Stat
emen
t of n
et a
sset
s an
d pr
ofit o
r los
s at
trib
utab
le to
ow
ners
and
non
-con
trol
ling
inte
rest
s
Nam
e of
the
enti
tyRe
port
ing
curr
ency
Net
ass
ets,
i.e.
tota
l ass
ets
min
us to
tal l
iabi
litie
sSh
are
in p
rofit
or (
loss
)Sh
are
in o
ther
co
mpr
ehen
sive
inco
me
Shar
e in
tota
l co
mpr
ehen
sive
inco
me
As
% o
f co
nsol
idat
ed
net a
sset
s
Am
ount
(`
cro
re)
As
% o
f co
nsol
idat
ed
profi
t or l
oss
Am
ount
(`
cro
re)
As
% o
f con
solid
ated
ot
her c
ompr
ehen
sive
in
com
e
Am
ount
(`
cro
re)
As
% o
f tot
al
com
preh
ensi
ve
inco
me
Am
ount
(`
cro
re)
A.
Pare
nt
Tata
Ste
el L
imit
ed IN
R 1
04.4
3 7
6,83
8.12
4
33.2
6 6
,743
.80
(14.
52)
(648
.87)
1
01.1
4 6
,094
.93
B.Su
bsid
iari
es
a)
Indi
an
1Ta
ta S
teel
Inte
rnat
iona
l (In
dia)
Lim
ited
INR
0.0
7 4
8.46
0
.17
2.6
7 -
-
0
.04
2.6
7
2Ta
ta S
teel
Util
ities
and
Infr
astr
uctu
re S
ervi
ces
Lim
ited
Form
erly
Jam
shed
pur U
tiliti
es &
Ser
vice
s Co
mpa
ny
Lim
ited)
INR
0.2
2 1
63.8
3 2
.14
33.
37
(0.1
1)
(4.9
9)
0.4
7 2
8.38
3H
aldi
a W
ater
Man
agem
ent L
imite
d IN
R (0
.07)
(5
0.97
) 1
.65
25.
71
-
-
0.4
3 2
5.71
4Ka
limat
i Glo
bal S
hare
d Se
rvic
es L
imite
d IN
R 0
.01
5.9
9 0
.13
1.9
8 -
-
0
.03
1.9
8
5Ta
ta S
teel
Lon
g Pr
oduc
ts L
imite
d (F
orm
erly
Tat
a Sp
onge
Iro
n Li
mite
d) IN
R 2
.74
2,0
16.6
1 (3
3.17
) (5
16.2
8)
(0.1
6)
(7.0
7)
(8.6
8)
(523
.35)
6TS
IL E
nerg
y Li
mite
d IN
R 0
.00
1.2
6 0
.00
0.0
5 -
-
0
.00
0.0
5
7Cr
eativ
e Po
rt D
evel
opm
ent P
rivat
e Li
mite
d IN
R (0
.01)
(5
.75)
(0
.32)
(4
.94)
-
-
(0
.08)
(4
.94)
8Su
barn
arek
ha P
ort P
rivat
e Li
mite
d IN
R 0
.06
40.
63
(0.0
5)
(0.7
3)
-
-
(0.0
1)
(0.7
3)
9Ta
ta S
teel
BSL
Lim
ited
INR
24.
00
17,
656.
27
(41.
71)
(649
.17)
(0
.17)
(7
.47)
(1
0.90
) (6
56.6
4)
10A
ngul
Ene
rgy
Lim
ited
(For
mer
ly B
hush
an E
nerg
y Li
mite
d) IN
R 1
.12
827
.71
0.2
8 4
.31
(0.0
5)
(2.1
5)
0.0
4 2
.16
11Bh
usha
n St
eel (
Sout
h) L
td.
INR
(0.0
0)
(1.0
1)
-
-
-
-
-
-
12Bh
usha
n St
eel (
Oris
sa) L
td.
INR
0.0
0 0
.03
-
-
-
-
-
-
13Bh
usha
n St
eel (
Mad
hya
Bhar
at) L
td.
INR
0.0
0 0
.03
-
-
-
-
-
-
14Ad
ityap
ur To
ll Br
idge
Com
pany
Lim
ited
INR
0.0
7 5
1.10
0
.08
1.2
5 -
-
0
.02
1.2
5
15Ta
ta S
teel
Spe
cial
Eco
nom
ic Z
one
Lim
ited
INR
0.5
0 3
69.7
4 (1
.12)
(1
7.50
) -
-
(0
.29)
(1
7.50
)
16Th
e In
dian
Ste
el &
Wire
Pro
duct
s Lt
d IN
R 0
.15
112
.81
1.7
9 2
7.90
(0
.03
(1.1
7)
0.4
4 2
6.73
17M
ohar
Exp
ort S
ervi
ces
Pvt.
Ltd
INR
(0.0
0)
(0.0
4)
-
-
-
-
-
-
18Ru
juva
lika
Inve
stm
ents
Lim
ited
INR
0.1
0 7
2.23
0
.19
3.0
3 (0
.62)
(2
7.77
) (0
.41)
(2
4.74
)
19T
S A
lloys
Lim
ited
INR
0.1
6 1
19.0
5 0
.18
2.8
4 (0
.00
(0.0
9)
0.0
5 2
.75
20Ta
ta K
orf E
ngin
eerin
g Se
rvic
es L
td IN
R -
-
-
-
-
-
-
-
21Ta
ta M
etal
iks
Ltd.
INR
1.2
5 9
19.4
0 1
0.66
1
65.9
6 (0
.04)
(1
.78)
2
.72
164
.18
22Ta
ta S
teel
Odi
sha
Lim
ited
INR
(0.0
0)
(0.0
3)
(0.0
0) (0
.01)
-
-
(0
.00)
(0
.01)
23Ta
ta S
teel
Dow
nstr
eam
Pro
duct
s Li
mite
d (F
orm
erly
Tat
a St
eel P
roce
ssin
g an
d D
istr
ibut
ion
Lim
ited)
INR
1.0
0 7
38.5
8 3
.93
61.
15
(0.0
9)
(4.0
0)
0.9
5 5
7.15
24Ta
yo R
olls
Lim
ited
INR
-
-
-
-
-
-
-
-
25Th
e Ta
ta P
igm
ents
Lim
ited
INR
0.0
8 5
7.93
0
.34
5.3
2 (0
.01)
(0
.50)
0
.08
4.8
2
26Th
e Ti
npla
te C
ompa
ny o
f Ind
ia L
td IN
R 1
.03
760
.74
6.1
1 9
5.03
(0
.45)
(2
0.16
) 1
.24
74.
87
27Ta
ta S
teel
Fou
ndat
ion
INR
0.0
0 1
.89
0.0
1 0
.18
-
-
0.0
0 0
.18
28Ja
msh
edpu
r Foo
tbal
l and
Spo
rtin
g Pr
ivat
e Li
mite
d IN
R 0
.03
23.
26
0.1
0 1
.54
-
-
0.0
3 1
.54
29Sa
kchi
Ste
el L
imite
d IN
R -
-
(0
.00)
(0
.03)
-
-
(0
.00)
(0
.03)
30Ju
gsal
ai S
teel
Lim
ited
INR
-
-
(0.0
0)
(0.0
3)
-
-
(0.0
0)
(0.0
3)
31N
oam
undi
Ste
el L
imite
d IN
R -
-
(0
.00)
(0
.03)
-
-
(0
.00)
(0
.03)
32St
raig
ht M
ile S
teel
Lim
ited
INR
-
-
(0.0
0)
(0.0
3)
-
-
(0.0
0)
(0.0
3)
33Bi
stup
ur S
teel
Lim
ited
INR
-
-
(0.0
0)
(0.0
3)
-
-
(0.0
0)
(0.0
3)
34Ja
mad
oba
Stee
l Lim
ited
INR
-
-
(0.0
0)
(0.0
3)
-
-
(0.0
0)
(0.0
3)
35D
imna
Ste
el L
imite
d IN
R -
-
(0
.00)
(0
.03)
-
-
(0
.00)
(0.0
3)
NOTESforming part of the consolidated financial statements
431
Corporate Overview 02
Strategic Review 46
Performance Review 20
Statutory Reports 84
Our Strategy 28
Financial Statements 206
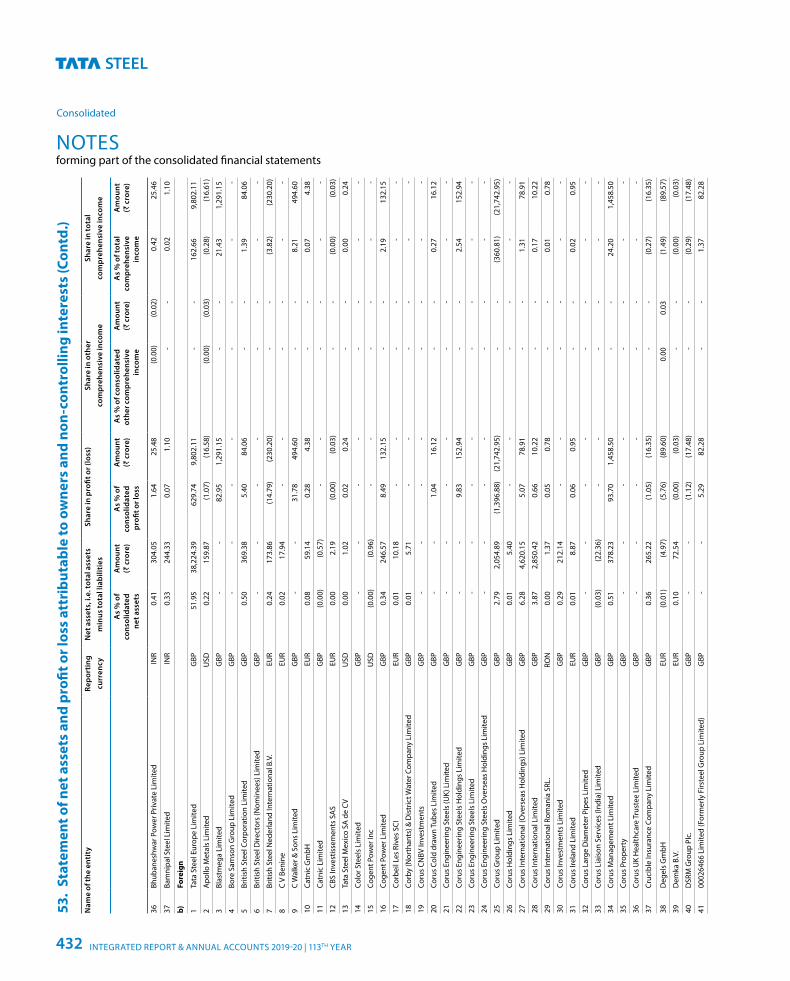
53.
Stat
emen
t of n
et a
sset
s an
d pr
ofit o
r los
s at
trib
utab
le to
ow
ners
and
non
-con
trol
ling
inte
rest
s (C
ontd
.)
Nam
e of
the
enti
tyRe
port
ing
curr
ency
Net
ass
ets,
i.e.
tota
l ass
ets
min
us to
tal l
iabi
litie
sSh
are
in p
rofit
or (
loss
)Sh
are
in o
ther
co
mpr
ehen
sive
inco
me
Shar
e in
tota
l co
mpr
ehen
sive
inco
me
As
% o
f co
nsol
idat
ed
net a
sset
s
Am
ount
(`
cro
re)
As
% o
f co
nsol
idat
ed
profi
t or l
oss
Am
ount
(`
cro
re)
As
% o
f con
solid
ated
ot
her c
ompr
ehen
sive
in
com
e
Am
ount
(`
cro
re)
As
% o
f tot
al
com
preh
ensi
ve
inco
me
Am
ount
(`
cro
re)
36Bh
uban
eshw
ar P
ower
Priv
ate
Lim
ited
INR
0.4
1 3
04.0
5 1
.64
25.
48
(0.0
0)
(0.0
2)
0.4
2 2
5.46
37Ba
mni
pal S
teel
Lim
ited
INR
0.3
3 2
44.3
3 0
.07
1.1
0 -
-
0
.02
1.1
0
b)Fo
reig
n
1Ta
ta S
teel
Eur
ope
Lim
ited
GBP
5
1.95
3
8,22
4.39
6
29.7
4 9
,802
.11
-
-
162
.66
9,8
02.1
1
2A
pollo
Met
als
Lim
ited
USD
0
.22
159
.87
(1.0
7)
(16.
58)
(0.0
0)
(0.0
3)
(0.2
8)
(16.
61)
3Bl
astm
ega
Lim
ited
GBP
-
-
8
2.95
1
,291
.15
-
-
21.
43
1,2
91.1
5
4Bo
re S
amso
n G
roup
Lim
ited
GBP
-
-
-
-
-
-
-
-
5Br
itish
Ste
el C
orpo
ratio
n Li
mite
d G
BP
0.5
0 3
69.3
8 5
.40
84.
06
-
-
1.3
9 8
4.06
6Br
itish
Ste
el D
irect
ors
(Nom
inee
s) L
imite
d G
BP
-
-
-
-
-
-
-
-
7Br
itish
Ste
el N
eder
land
Inte
rnat
iona
l B.V
. E
UR
0.2
4 1
73.8
6 (1
4.79
) (2
30.2
0)
-
-
(3.8
2)
(230
.20)
8C
V Be
nine
EU
R 0
.02
17.
94
-
-
-
-
-
-
9C
Wal
ker &
Son
s Li
mite
d G
BP
-
-
31.
78
494
.60
-
-
8.2
1 4
94.6
0
10Ca
tnic
Gm
bH E
UR
0.0
8 5
9.14
0
.28
4.3
8 -
-
0
.07
4.3
8
11Ca
tnic
Lim
ited
GBP
(0
.00)
(0
.57)
-
-
-
-
-
-
12CB
S In
vest
isse
men
ts S
AS
EU
R 0
.00
2.1
9 (0
.00)
(0
.03)
-
-
(0
.00)
(0
.03)
13Ta
ta S
teel
Mex
ico
SA d
e CV
USD
0
.00
1.0
2 0
.02
0.2
4 -
-
0
.00
0.2
4
14Co
lor S
teel
s Li
mite
d G
BP
-
-
-
-
-
-
-
-
15Co
gent
Pow
er In
c U
SD
(0.0
0)
(0.9
6)
-
-
-
-
-
-
16Co
gent
Pow
er L
imite
d G
BP
0.3
4 2
46.5
7 8
.49
132
.15
-
-
2.1
9 1
32.1
5
17Co
rbei
l Les
Riv
es S
CI E
UR
0.0
1 1
0.18
-
-
-
-
-
-
18Co
rby
(Nor
than
ts) &
Dis
tric
t Wat
er C
ompa
ny L
imite
d G
BP
0.0
1 5
.71
-
-
-
-
-
-
19Co
rus
CNBV
Inve
stm
ents
GBP
-
-
-
-
-
-
-
-
20Co
rus
Cold
dra
wn
Tube
s Li
mite
d G
BP
-
-
1.0
4 1
6.12
-
-
0
.27
16.
12
21Co
rus
Engi
neer
ing
Stee
ls (U
K) L
imite
d G
BP
-
-
-
-
-
-
-
-
22Co
rus
Engi
neer
ing
Stee
ls H
oldi
ngs
Lim
ited
GBP
-
-
9
.83
152
.94
-
-
2.5
4 1
52.9
4
23Co
rus
Engi
neer
ing
Stee
ls L
imite
d G
BP
-
-
-
-
-
-
-
-
24Co
rus
Engi
neer
ing
Stee
ls O
vers
eas
Hol
ding
s Li
mite
d G
BP
-
-
-
-
-
-
-
-
25Co
rus
Gro
up L
imite
d G
BP
2.7
9 2
,054
.89
(1,3
96.8
8)
(21,
742.
95)
-
-
(360
.81)
(2
1,74
2.95
)
26Co
rus
Hol
ding
s Li
mite
d G
BP
0.0
1 5
.40
-
-
-
-
-
-
27Co
rus
Inte
rnat
iona
l (O
vers
eas
Hol
ding
s) L
imite
d G
BP
6.2
8 4
,620
.15
5.0
7 7
8.91
-
-
1
.31
78.
91
28Co
rus
Inte
rnat
iona
l Lim
ited
GBP
3
.87
2,8
50.4
2 0
.66
10.
22
-
-
0.1
7 1
0.22
29Co
rus
Inte
rnat
iona
l Rom
ania
SRL
. R
ON
0
.00
1.3
7 0
.05
0.7
8 -
-
0
.01
0.7
8
30Co
rus
Inve
stm
ents
Lim
ited
GBP
0
.29
212
.14
-
-
-
-
-
-
31Co
rus
Irela
nd L
imite
d E
UR
0.0
1 8
.87
0.0
6 0
.95
-
-
0.0
2 0
.95
32Co
rus
Larg
e D
iam
eter
Pip
es L
imite
d G
BP
-
-
-
-
-
-
-
-
33Co
rus
Liai
son
Serv
ices
(Ind
ia) L
imite
d G
BP
(0.0
3)
(22.
36)
-
-
-
-
-
-
34Co
rus
Man
agem
ent L
imite
d G
BP
0.5
1 3
78.2
3 9
3.70
1
,458
.50
-
-
24.
20
1,4
58.5
0
35Co
rus
Prop
erty
GBP
-
-
-
-
-
-
-
-
36Co
rus
UK
Hea
lthca
re T
rust
ee L
imite
d G
BP
-
-
-
-
-
-
-
-
37Cr
ucib
le In
sura
nce
Com
pany
Lim
ited
GBP
0
.36
265
.22
(1.0
5)
(16.
35)
-
-
(0.2
7)
(16.
35)
38D
egel
s G
mbH
EU
R (0
.01)
(4
.97)
(5
.76)
(8
9.60
) 0
.00
0.0
3 (1
.49)
(8
9.57
)
39D
emka
B.V
. E
UR
0
.10
72.
54
(0.0
0)
(0.0
3)
-
-
(0.0
0)
(0.0
3)
40D
SRM
Gro
up P
lc.
GBP
-
-
(1
.12)
(1
7.48
) -
-
(0
.29)
(1
7.48
)
4100
0264
66 L
imite
d (F
orm
erly
Firs
teel
Gro
up L
imite
d) G
BP
-
-
5.2
9 8
2.28
-
-
1
.37
82.
28
NOTESforming part of the consolidated financial statements
Consolidated
INTEGRATED REPORT & ANNUAL ACCOUNTS 2019-20 | 113TH YEAR432
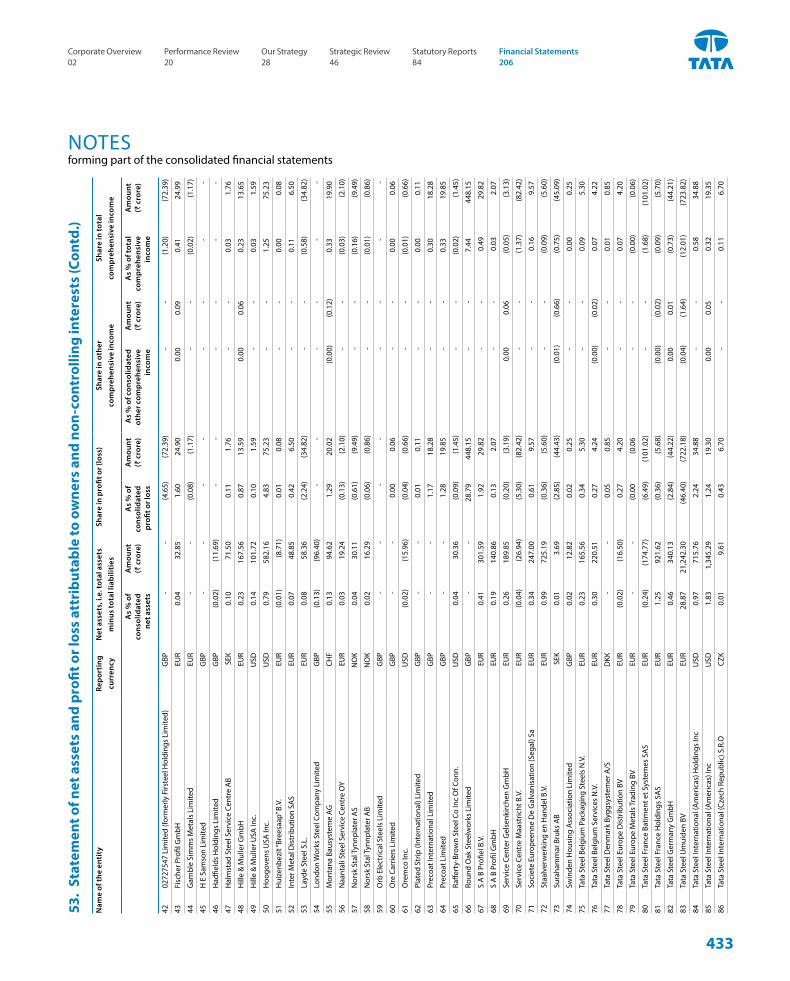
53.
Stat
emen
t of n
et a
sset
s an
d pr
ofit o
r los
s at
trib
utab
le to
ow
ners
and
non
-con
trol
ling
inte
rest
s (C
ontd
.)
Nam
e of
the
enti
tyRe
port
ing
curr
ency
Net
ass
ets,
i.e.
tota
l ass
ets
min
us to
tal l
iabi
litie
sSh
are
in p
rofit
or (
loss
)Sh
are
in o
ther
co
mpr
ehen
sive
inco
me
Shar
e in
tota
l co
mpr
ehen
sive
inco
me
As
% o
f co
nsol
idat
ed
net a
sset
s
Am
ount
(`
cro
re)
As
% o
f co
nsol
idat
ed
profi
t or l
oss
Am
ount
(`
cro
re)
As
% o
f con
solid
ated
ot
her c
ompr
ehen
sive
in
com
e
Am
ount
(`
cro
re)
As
% o
f tot
al
com
preh
ensi
ve
inco
me
Am
ount
(`
cro
re)
4202
7275
47 L
imite
d (fo
rmer
ly F
irste
el H
oldi
ngs
Lim
ited)
GBP
-
-
(4
.65)
(7
2.39
) -
-
(1
.20)
(7
2.39
)
43Fi
sche
r Pro
fil G
mbH
EU
R 0
.04
32.
85
1.6
0 2
4.90
0
.00
0.0
9 0
.41
24.
99
44G
ambl
e Si
mm
s M
etal
s Li
mite
d E
UR
-
-
(0.0
8)
(1.1
7)
-
-
(0.0
2)
(1.1
7)
45H
E S
amso
n Li
mite
d G
BP
-
-
-
-
-
-
-
-
46H
adfie
lds
Hol
ding
s Li
mite
d G
BP
(0.0
2)
(11.
69)
-
-
-
-
-
-
47H
alm
stad
Ste
el S
ervi
ce C
entr
e A
B S
EK
0.1
0 7
1.50
0
.11
1.7
6 -
-
0
.03
1.7
6
48H
ille
& M
ulle
r Gm
bH E
UR
0.2
3 1
67.5
6 0
.87
13.
59
0.0
0 0
.06
0.2
3 1
3.65
49H
ille
& M
ulle
r USA
Inc.
USD
0
.14
101
.72
0.1
0 1
.59
-
-
0.0
3 1
.59
50H
oogo
vens
USA
Inc.
USD
0
.79
582
.16
4.8
3 7
5.23
-
-
1
.25
75.
23
51H
uize
nbez
it “B
rees
aap”
B.V
. E
UR
(0.0
1)
(8.7
1)
0.0
1 0
.08
-
-
0.0
0 0
.08
52In
ter M
etal
Dis
trib
utio
n SA
S E
UR
0.0
7 4
8.85
0
.42
6.5
0 -
-
0
.11
6.5
0
53La
yde
Stee
l S.L
. E
UR
0.0
8 5
8.36
(2
.24)
(3
4.82
) -
-
(0
.58)
(3
4.82
)
54Lo
ndon
Wor
ks S
teel
Com
pany
Lim
ited
GBP
(0
.13)
(9
6.40
) -
-
-
-
-
-
55M
onta
na B
ausy
stem
e AG
CH
F 0
.13
94.
62
1.2
9 2
0.02
(0
.00)
(0
.12)
0
.33
19.
90
56N
aant
ali S
teel
Ser
vice
Cen
tre
OY
EU
R 0
.03
19.
24
(0.1
3)
(2.1
0)
-
-
(0.0
3)
(2.1
0)
57N
orsk
Sta
l Tyn
npla
ter A
S N
OK
0.0
4 3
0.11
(0
.61)
(9
.49)
-
-
(0
.16)
(9
.49)
58N
orsk
Sta
l Tyn
npla
ter A
B N
OK
0.0
2 1
6.29
(0
.06)
(0
.86)
-
-
(0
.01)
(0
.86)
59O
rb E
lect
rical
Ste
els
Lim
ited
GBP
-
-
-
-
-
-
-
-
60O
re C
arrie
rs L
imite
d G
BP
-
-
0.0
0 0
.06
-
-
0.0
0 0
.06
61O
rem
co In
c. U
SD
(0.0
2)
(15.
96)
(0.0
4)
(0.6
6)
-
-
(0.0
1)
(0.6
6)
62Pl
ated
Str
ip (I
nter
natio
nal)
Lim
ited
GBP
-
-
0
.01
0.1
1 -
-
0
.00
0.1
1
63Pr
ecoa
t Int
erna
tiona
l Lim
ited
GBP
-
-
1
.17
18.
28
-
-
0.3
0 1
8.28
64Pr
ecoa
t Lim
ited
GBP
-
-
1
.28
19.
85
-
-
0.3
3 1
9.85
65Ra
ffert
y-Br
own
Stee
l Co
Inc
Of C
onn.
USD
0
.04
30.
36
(0.0
9)
(1.4
5)
-
-
(0.0
2)
(1.4
5)
66Ro
und
Oak
Ste
elw
orks
Lim
ited
GBP
-
-
2
8.79
4
48.1
5 -
-
7
.44
448
.15
67S
A B
Pro
fiel B
.V.
EU
R 0
.41
301
.59
1.9
2 2
9.82
-
-
0
.49
29.
82
68S
A B
Pro
fil G
mbH
EU
R 0
.19
140
.86
0.1
3 2
.07
-
-
0.0
3 2
.07
69Se
rvic
e Ce
nter
Gel
senk
irche
n G
mbH
EU
R 0
.26
189
.85
(0.2
0)
(3.1
9)
0.0
0 0
.06
(0.0
5)
(3.1
3)
70Se
rvic
e Ce
ntre
Maa
stric
ht B
.V.
EU
R (0
.04)
(2
6.94
) (5
.30)
(8
2.42
) -
-
(1
.37)
(8
2.42
)
71So
ciet
e Eu
rope
enne
De
Gal
vani
satio
n (S
egal
) Sa
EU
R 0
.34
247
.00
0.6
1 9
.57
-
-
0.1
6 9
.57
72St
aalv
erw
erki
ng e
n H
ande
l B.V
. E
UR
0.9
9 7
25.1
9 (0
.36)
(5
.60)
-
-
(0
.09)
(5
.60)
73Su
raha
mm
ar B
ruks
AB
SEK
0
.01
3.6
9 (2
.85)
(4
4.43
) (0
.01)
(0
.66)
(0
.75)
(4
5.09
)
74Sw
inde
n H
ousi
ng A
ssoc
iatio
n Li
mite
d G
BP
0.0
2 1
2.82
0
.02
0.2
5 -
-
0
.00
0.2
5
75Ta
ta S
teel
Bel
gium
Pac
kagi
ng S
teel
s N
.V.
EU
R 0
.23
165
.56
0.3
4 5
.30
-
-
0.0
9 5
.30
76Ta
ta S
teel
Bel
gium
Ser
vice
s N
.V.
EU
R 0
.30
220
.51
0.2
7 4
.24
(0.0
0)
(0.0
2)
0.0
7 4
.22
77Ta
ta S
teel
Den
mar
k By
ggsy
stem
er A
/S D
KK
-
-
0.0
5 0
.85
-
-
0.0
1 0
.85
78Ta
ta S
teel
Eur
ope
Dis
trib
utio
n BV
EU
R (0
.02)
(1
6.50
) 0
.27
4.2
0 -
-
0
.07
4.2
0
79Ta
ta S
teel
Eur
ope
Met
als T
radi
ng B
V E
UR
-
-
(0.0
0 (0
.06
-
-
(0.0
0)
(0.0
6)
80Ta
ta S
teel
Fra
nce
Batim
ent e
t Sys
tem
es S
AS
EU
R (0
.24)
(1
74.7
7)
(6.4
9)
(101
.02)
-
-
(1
.68)
(1
01.0
2)
81Ta
ta S
teel
Fra
nce
Hol
ding
s SA
S E
UR
1.2
5 9
21.6
2 (0
.36)
(5
.68)
(0
.00)
(0
.02)
(0
.09)
(5
.70)
82Ta
ta S
teel
Ger
man
y G
mbH
EU
R 0
.46
340
.13
(2.8
4)
(44.
22)
0.0
0 0
.01
(0.7
3)
(44.
21)
83Ta
ta S
teel
IJm
uide
n BV
EU
R 2
8.87
2
1,24
2.30
(4
6.40
) (7
22.1
8)
(0.0
4)
(1.6
4)
(12.
01)
(723
.82)
84Ta
ta S
teel
Inte
rnat
iona
l (A
mer
icas
) Hol
ding
s In
c U
SD
0.9
7 7
15.7
6 2
.24
34.
88
-
-
0.5
8 3
4.88
85Ta
ta S
teel
Inte
rnat
iona
l (A
mer
icas
) Inc
USD
1
.83
1,3
45.2
9 1
.24
19.
30
0.0
0 0
.05
0.3
2 1
9.35
86Ta
ta S
teel
Inte
rnat
iona
l (Cz
ech
Repu
blic
) S.R
.O
CZK
0
.01
9.6
1 0
.43
6.7
0 -
-
0
.11
6.7
0
NOTESforming part of the consolidated financial statements
433
Corporate Overview 02
Strategic Review 46
Performance Review 20
Statutory Reports 84
Our Strategy 28
Financial Statements 206
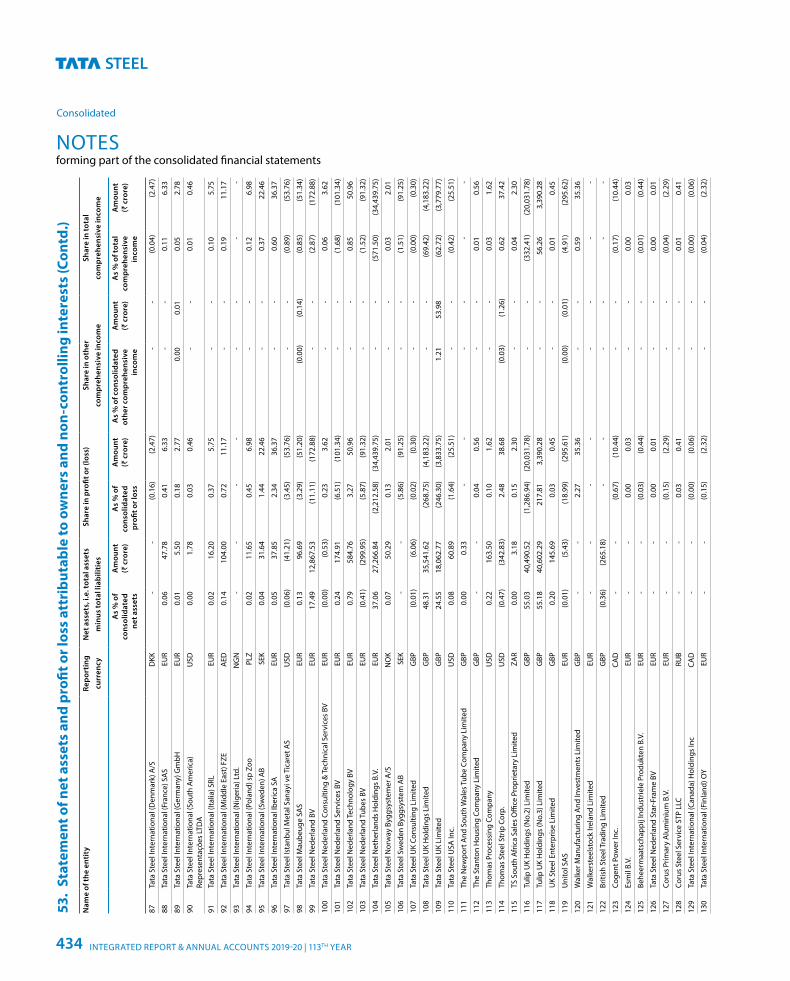
53.
Stat
emen
t of n
et a
sset
s an
d pr
ofit o
r los
s at
trib
utab
le to
ow
ners
and
non
-con
trol
ling
inte
rest
s (C
ontd
.)N
ame
of th
e en
tity
Repo
rtin
g cu
rren
cyN
et a
sset
s, i.
e. to
tal a
sset
s m
inus
tota
l lia
bilit
ies
Shar
e in
pro
fit o
r (lo
ss)
Shar
e in
oth
er
com
preh
ensi
ve in
com
eSh
are
in to
tal
com
preh
ensi
ve in
com
e
As
% o
f co
nsol
idat
ed
net a
sset
s
Am
ount
(`
cro
re)
As
% o
f co
nsol
idat
ed
profi
t or l
oss
Am
ount
(`
cro
re)
As
% o
f con
solid
ated
ot
her c
ompr
ehen
sive
in
com
e
Am
ount
(`
cro
re)
As
% o
f tot
al
com
preh
ensi
ve
inco
me
Am
ount
(`
cro
re)
87Ta
ta S
teel
Inte
rnat
iona
l (D
enm
ark)
A/S
DKK
-
-
(0
.16)
(2
.47)
-
-
(0
.04)
(2
.47)
88Ta
ta S
teel
Inte
rnat
iona
l (Fr
ance
) SA
S E
UR
0.0
6 4
7.78
0
.41
6.3
3 -
-
0
.11
6.3
3
89Ta
ta S
teel
Inte
rnat
iona
l (G
erm
any)
Gm
bH E
UR
0.0
1 5
.50
0.1
8 2
.77
0.0
0 0
.01
0.0
5 2
.78
90Ta
ta S
teel
Inte
rnat
iona
l (So
uth
Am
eric
a)
Repr
esen
taçõ
es LT
DA
USD
0
.00
1.7
8 0
.03
0.4
6 -
-
0
.01
0.4
6
91Ta
ta S
teel
Inte
rnat
iona
l (Ita
lia) S
RL E
UR
0.0
2 1
6.20
0
.37
5.7
5 -
-
0
.10
5.7
5
92Ta
ta S
teel
Inte
rnat
iona
l (M
iddl
e Ea
st) F
ZE A
ED
0.1
4 1
04.0
0 0
.72
11.
17
-
-
0.1
9 1
1.17
93Ta
ta S
teel
Inte
rnat
iona
l (N
iger
ia) L
td.
NG
N
-
-
-
-
-
-
-
-
94Ta
ta S
teel
Inte
rnat
iona
l (Po
land
) sp
Zoo
PLZ
0
.02
11.
65
0.4
5 6
.98
-
-
0.1
2 6
.98
95Ta
ta S
teel
Inte
rnat
iona
l (Sw
eden
) AB
SEK
0
.04
31.
64
1.4
4 2
2.46
-
-
0
.37
22.
46
96Ta
ta S
teel
Inte
rnat
iona
l Ibe
rica
SA E
UR
0.0
5 3
7.85
2
.34
36.
37
-
-
0.6
0 3
6.37
97Ta
ta S
teel
Ista
nbul
Met
al S
anay
i ve
Tica
ret A
S U
SD
(0.0
6)
(41.
21)
(3.4
5)
(53.
76)
-
-
(0.8
9)
(53.
76)
98Ta
ta S
teel
Mau
beug
e SA
S E
UR
0.1
3 9
6.69
(3
.29)
(5
1.20
) (0
.00)
(0
.14)
(0
.85)
(5
1.34
)
99Ta
ta S
teel
Ned
erla
nd B
V E
UR
17.
49
12,
867.
53
(11.
11)
(172
.88)
-
-
(2
.87)
(1
72.8
8)
100
Tata
Ste
el N
eder
land
Con
sulti
ng &
Tech
nica
l Ser
vice
s BV
EU
R (0
.00)
(0
.53)
0
.23
3.6
2 -
-
0
.06
3.6
2
101
Tata
Ste
el N
eder
land
Ser
vice
s BV
EU
R 0
.24
174
.91
(6.5
1)
(101
.34)
-
-
(1
.68)
(1
01.3
4)
102
Tata
Ste
el N
eder
land
Tech
nolo
gy B
V E
UR
0.7
9 5
84.7
6 3
.27
50.
96
-
-
0.8
5 5
0.96
103
Tata
Ste
el N
eder
land
Tub
es B
V E
UR
(0.4
1)
(299
.95)
(5
.87)
(9
1.32
) -
-
(1
.52)
(9
1.32
)
104
Tata
Ste
el N
ethe
rland
s H
oldi
ngs
B.V.
EU
R 3
7.06
2
7,26
6.84
(2
,212
.58)
(3
4,43
9.75
) -
-
(5
71.5
0)
(34,
439.
75)
105
Tata
Ste
el N
orw
ay B
yggs
yste
mer
A/S
NO
K 0
.07
50.
29
0.1
3 2
.01
-
-
0.0
3 2
.01
106
Tata
Ste
el S
wed
en B
yggs
yste
m A
B S
EK
-
-
(5.8
6)
(91.
25)
-
-
(1.5
1)
(91.
25)
107
Tata
Ste
el U
K Co
nsul
ting
Lim
ited
GBP
(0
.01)
(6
.06)
(0
.02)
(0
.30)
-
-
(0
.00)
(0
.30)
108
Tata
Ste
el U
K H
oldi
ngs
Lim
ited
GBP
4
8.31
3
5,54
1.62
(2
68.7
5)
(4,1
83.2
2)
-
-
(69.
42)
(4,1
83.2
2)
109
Tata
Ste
el U
K Li
mite
d G
BP
24.
55
18,
062.
77
(246
.30)
(3
,833
.75)
1
.21
53.
98
(62.
72)
(3,7
79.7
7)
110
Tata
Ste
el U
SA In
c. U
SD
0.0
8 6
0.89
(1
.64)
(2
5.51
) -
-
(0
.42)
(2
5.51
)
111
The
New
port
And
Sou
th W
ales
Tub
e Co
mpa
ny L
imite
d G
BP
0.0
0 0
.33
-
-
-
-
-
-
112
The
Stan
ton
Hou
sing
Com
pany
Lim
ited
GBP
-
-
0
.04
0.5
6 -
-
0
.01
0.5
6
113
Thom
as P
roce
ssin
g Co
mpa
ny U
SD
0.2
2 1
63.5
0 0
.10
1.6
2 -
-
0
.03
1.6
2
114
Thom
as S
teel
Str
ip C
orp.
USD
(0
.47)
(3
42.8
3)
2.4
8 3
8.68
(0
.03)
(1
.26)
0
.62
37.
42
115
TS S
outh
Afr
ica
Sale
s O
ffice
Pro
prie
tary
Lim
ited
ZA
R 0
.00
3.1
8 0
.15
2.3
0 -
-
0
.04
2.3
0
116
Tulip
UK
Hol
ding
s (N
o.2)
Lim
ited
GBP
5
5.03
4
0,49
0.52
(1
,286
.94)
(2
0,03
1.78
) -
-
(3
32.4
1)
(20,
031.
78)
117
Tulip
UK
Hol
ding
s (N
o.3)
Lim
ited
GBP
5
5.18
4
0,60
2.29
2
17.8
1 3
,390
.28
-
-
56.
26
3,3
90.2
8
118
UK
Stee
l Ent
erpr
ise
Lim
ited
GBP
0
.20
145
.69
0.0
3 0
.45
-
-
0.0
1 0
.45
119
Uni
tol S
AS
EU
R (0
.01)
(5
.43)
(1
8.99
) (2
95.6
1)
(0.0
0)
(0.0
1)
(4.9
1)
(295
.62)
120
Wal
ker M
anuf
actu
ring
And
Inve
stm
ents
Lim
ited
GBP
-
-
2
.27
35.
36
-
-
0.5
9 3
5.36
121
Wal
kers
teel
stoc
k Ire
land
Lim
ited
EU
R -
-
-
-
-
-
-
-
122
Briti
sh S
teel
Tra
ding
Lim
ited
GBP
(0
.36)
(2
65.1
8)
-
-
-
-
-
-
123
Coge
nt P
ower
Inc.
CA
D
-
-
(0.6
7)
(10.
44)
-
-
(0.1
7)
(10.
44)
124
Esm
il B.
V. E
UR
-
-
0.0
0 0
.03
-
-
0.0
0 0
.03
125
Behe
erm
aats
chap
pij I
ndus
trie
le P
rodu
kten
B.V
. E
UR
-
-
(0.0
3)
(0.4
4)
-
-
(0.0
1)
(0.4
4)
126
Tata
Ste
el N
eder
land
Sta
r-Fr
ame
BV E
UR
-
-
0.0
0 0
.01
-
-
0.0
0 0
.01
127
Coru
s Pr
imar
y A
lum
iniu
m B
.V.
EU
R -
-
(0
.15)
(2
.29)
-
-
(0
.04)
(2
.29)
128
Coru
s St
eel S
ervi
ce S
TP L
LC R
UB
-
-
0.0
3 0
.41
-
-
0.0
1 0
.41
129
Tata
Ste
el In
tern
atio
nal (
Cana
da) H
oldi
ngs
Inc
CA
D
-
-
(0.0
0)
(0.0
6)
-
-
(0.0
0)
(0.0
6)
130
Tata
Ste
el In
tern
atio
nal (
Finl
and)
OY
EU
R -
-
(0
.15)
(2
.32)
-
-
(0
.04)
(2
.32)
NOTESforming part of the consolidated financial statements
Consolidated
INTEGRATED REPORT & ANNUAL ACCOUNTS 2019-20 | 113TH YEAR434
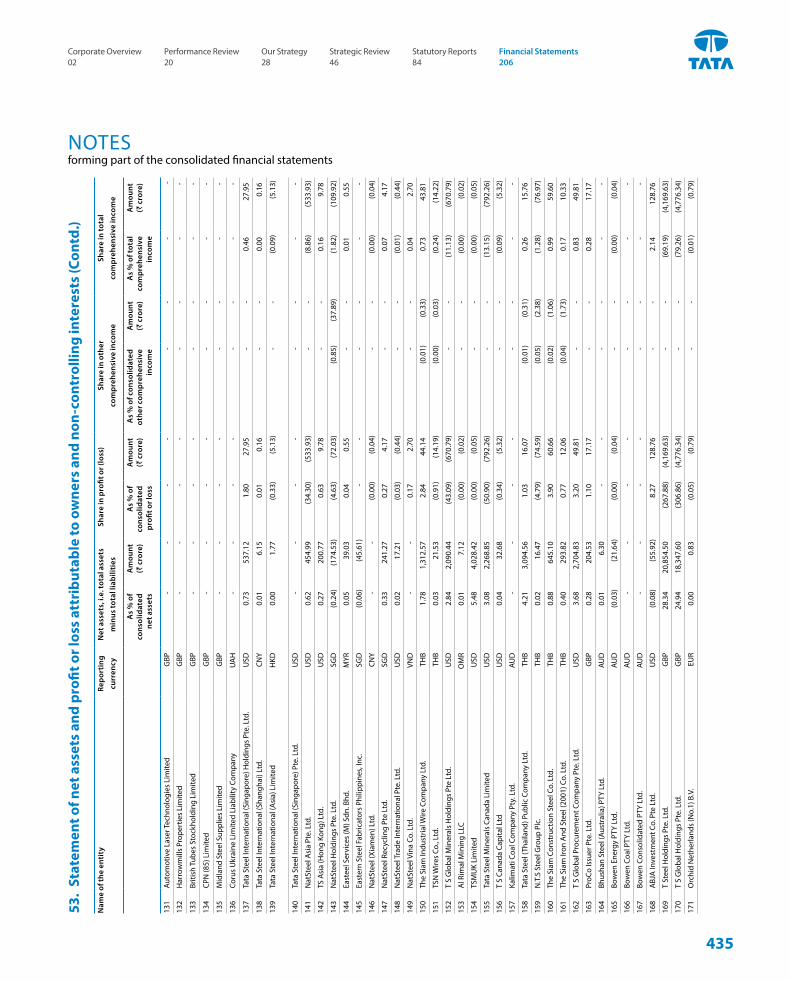
53.
Stat
emen
t of n
et a
sset
s an
d pr
ofit o
r los
s at
trib
utab
le to
ow
ners
and
non
-con
trol
ling
inte
rest
s (C
ontd
.)
Nam
e of
the
enti
tyRe
port
ing
curr
ency
Net
ass
ets,
i.e.
tota
l ass
ets
min
us to
tal l
iabi
litie
sSh
are
in p
rofit
or (
loss
)Sh
are
in o
ther
co
mpr
ehen
sive
inco
me
Shar
e in
tota
l co
mpr
ehen
sive
inco
me
As
% o
f co
nsol
idat
ed
net a
sset
s
Am
ount
(`
cro
re)
As
% o
f co
nsol
idat
ed
profi
t or l
oss
Am
ount
(`
cro
re)
As
% o
f con
solid
ated
ot
her c
ompr
ehen
sive
in
com
e
Am
ount
(`
cro
re)
As
% o
f tot
al
com
preh
ensi
ve
inco
me
Am
ount
(`
cro
re)
131
Auto
mot
ive
Lase
r Tec
hnol
ogie
s Li
mite
d G
BP
-
-
-
-
-
-
-
-
132
Har
row
mill
s Pr
oper
ties
Lim
ited
GBP
-
-
-
-
-
-
-
-
133
Briti
sh T
ubes
Sto
ckho
ldin
g Li
mite
d G
BP
-
-
-
-
-
-
-
-
134
CPN
(85)
Lim
ited
GBP
-
-
-
-
-
-
-
-
135
Mid
land
Ste
el S
uppl
ies
Lim
ited
GBP
-
-
-
-
-
-
-
-
136
Coru
s U
krai
ne L
imite
d Li
abili
ty C
ompa
ny U
AH
-
-
-
-
-
-
-
-
137
Tata
Ste
el In
tern
atio
nal (
Sing
apor
e) H
oldi
ngs
Pte.
Ltd
. U
SD
0.7
3 5
37.1
2 1
.80
27.
95
-
-
0.4
6 2
7.95
138
Tata
Ste
el In
tern
atio
nal (
Shan
ghai
) Ltd
. C
NY
0.0
1 6
.15
0.0
1 0
.16
-
-
0.0
0 0
.16
139
Tata
Ste
el In
tern
atio
nal (
Asi
a) L
imite
d H
KD
0.0
0 1
.77
(0.3
3)
(5.1
3)
-
-
(0.0
9)
(5.1
3)
140
Tata
Ste
el In
tern
atio
nal (
Sing
apor
e) P
te. L
td.
USD
-
-
-
-
-
-
-
-
141
Nat
Stee
l Asi
a Pt
e. L
td.
USD
0
.62
454
.99
(34.
30)
(533
.93)
-
-
(8
.86)
(5
33.9
3)
142
TS A
sia
(Hon
g Ko
ng) L
td.
USD
0
.27
200
.77
0.6
3 9
.78
-
-
0.1
6 9
.78
143
Nat
Stee
l Hol
ding
s Pt
e. L
td.
SG
D
(0.2
4)
(174
.53)
(4
.63)
(7
2.03
) (0
.85)
(3
7.89
) (1
.82)
(1
09.9
2)
144
East
eel S
ervi
ces
(M) S
dn. B
hd.
MYR
0
.05
39.
03
0.0
4 0
.55
-
-
0.0
1 0
.55
145
East
ern
Stee
l Fab
ricat
ors
Phili
ppin
es, I
nc.
SG
D
(0.0
6)
(45.
61)
-
-
-
-
-
-
146
Nat
Stee
l (Xi
amen
) Ltd
. C
NY
-
-
(0.0
0)
(0.0
4)
-
-
(0.0
0)
(0.0
4)
147
Nat
Stee
l Rec
yclin
g Pt
e Lt
d. S
GD
0
.33
241
.27
0.2
7 4
.17
-
-
0.0
7 4
.17
148
Nat
Stee
l Tra
de In
tern
atio
nal P
te. L
td.
USD
0
.02
17.
21
(0.0
3)
(0.4
4)
-
-
(0.0
1)
(0.4
4)
149
Nat
Stee
l Vin
a Co
. Ltd
. V
ND
-
-
0
.17
2.7
0 -
-
0
.04
2.7
0
150
The
Siam
Indu
stria
l Wire
Com
pany
Ltd
. T
HB
1.7
8 1
,312
.57
2.8
4 4
4.14
(0
.01)
(0
.33)
0
.73
43.
81
151
TSN
Wire
s Co
., Lt
d. T
HB
0.0
3 2
1.53
(0
.91)
(1
4.19
) (0
.00)
(0
.03)
(0
.24)
(1
4.22
)
152
T S
Glo
bal M
iner
als
Hol
ding
s Pt
e Lt
d. U
SD
2.8
4 2
,090
.44
(43.
09)
(670
.79)
-
-
(1
1.13
) (6
70.7
9)
153
Al R
imal
Min
ing
LLC
OM
R 0
.01
7.1
2 (0
.00)
(0
.02)
-
-
(0
.00)
(0
.02)
154
TSM
UK
Lim
ited
USD
5
.48
4,0
28.4
2 (0
.00)
(0
.05)
-
-
(0
.00)
(0
.05)
155
Tata
Ste
el M
iner
als
Cana
da L
imite
d U
SD
3.0
8 2
,268
.85
(50.
90)
(792
.26)
-
-
(1
3.15
) (7
92.2
6)
156
T S
Cana
da C
apita
l Ltd
USD
0
.04
32.
68
(0.3
4)
(5.3
2)
-
-
(0.0
9)
(5.3
2)
157
Kalim
ati C
oal C
ompa
ny P
ty. L
td.
AU
D
-
-
-
-
-
-
-
-
158
Tata
Ste
el (T
haila
nd) P
ublic
Com
pany
Ltd
. T
HB
4.2
1 3
,094
.56
1.0
3 1
6.07
(0
.01)
(0
.31)
0
.26
15.
76
159
N.T
.S S
teel
Gro
up P
lc.
TH
B 0
.02
16.
47
(4.7
9)
(74.
59)
(0.0
5)
(2.3
8)
(1.2
8)
(76.
97)
160
The
Siam
Con
stru
ctio
n St
eel C
o. L
td.
TH
B 0
.88
645
.10
3.9
0 6
0.66
(0
.02)
(1
.06)
0
.99
59.
60
161
The
Siam
Iron
And
Ste
el (2
001)
Co.
Ltd
. T
HB
0.4
0 2
93.8
2 0
.77
12.
06
(0.0
4)
(1.7
3)
0.1
7 1
0.33
162
T S
Glo
bal P
rocu
rem
ent C
ompa
ny P
te. L
td.
USD
3
.68
2,7
04.8
3 3
.20
49.
81
-
-
0.8
3 4
9.81
163
ProC
o Is
suer
Pte
. Ltd
. G
BP
0.2
8 2
04.5
3 1
.10
17.
17
-
-
0.2
8 1
7.17
164
Bhus
han
Stee
l (Au
stra
lia) P
TY L
td.
AU
D
0.0
1 6
.30
-
-
-
-
-
-
165
Bow
en E
nerg
y PT
Y Lt
d. A
UD
(0
.03)
(2
1.64
) (0
.00)
(0
.04)
-
-
(0
.00)
(0
.04)
166
Bow
en C
oal P
TY L
td.
AU
D
-
-
-
-
-
-
-
-
167
Bow
en C
onso
lidat
ed P
TY L
td.
AU
D
-
-
-
-
-
-
-
-
168
ABJ
A In
vest
men
t Co.
Pte
Ltd
. U
SD
(0.0
8)
(55.
92)
8.2
7 1
28.7
6 -
-
2
.14
128
.76
169
T St
eel H
oldi
ngs
Pte.
Ltd
. G
BP
28.
34
20,
854.
50
(267
.88)
(4
,169
.63)
-
-
(6
9.19
) (4
,169
.63)
170
T S
Glo
bal H
oldi
ngs
Pte.
Ltd
. G
BP
24.
94
18,
347.
60
(306
.86)
(4
,776
.34)
-
-
(7
9.26
) (4
,776
.34)
171
Orc
hid
Net
herla
nds
(No.
1) B
.V.
EU
R 0
.00
0.8
3 (0
.05)
(0
.79)
-
-
(0
.01)
(0
.79)
NOTESforming part of the consolidated financial statements
435
Corporate Overview 02
Strategic Review 46
Performance Review 20
Statutory Reports 84
Our Strategy 28
Financial Statements 206
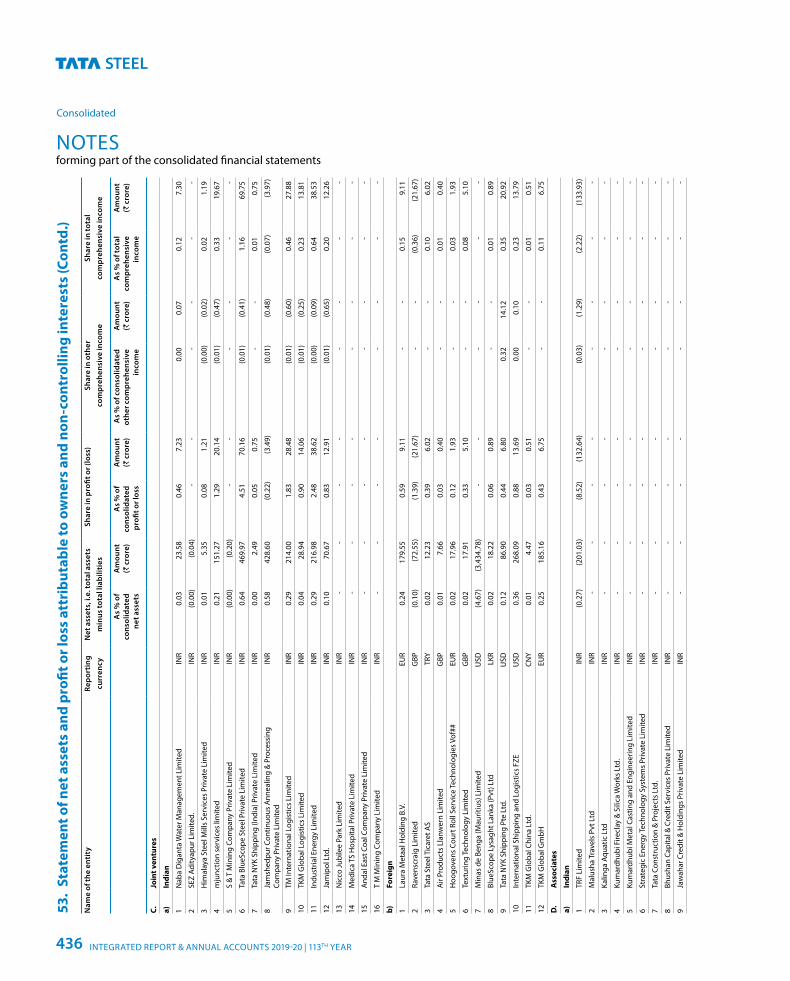
53.
Stat
emen
t of n
et a
sset
s an
d pr
ofit o
r los
s at
trib
utab
le to
ow
ners
and
non
-con
trol
ling
inte
rest
s (C
ontd
.)N
ame
of th
e en
tity
Repo
rtin
g cu
rren
cyN
et a
sset
s, i.
e. to
tal a
sset
s m
inus
tota
l lia
bilit
ies
Shar
e in
pro
fit o
r (lo
ss)
Shar
e in
oth
er
com
preh
ensi
ve in
com
eSh
are
in to
tal
com
preh
ensi
ve in
com
e
As
% o
f co
nsol
idat
ed
net a
sset
s
Am
ount
(`
cro
re)
As
% o
f co
nsol
idat
ed
profi
t or l
oss
Am
ount
(`
cro
re)
As
% o
f con
solid
ated
ot
her c
ompr
ehen
sive
in
com
e
Am
ount
(`
cro
re)
As
% o
f tot
al
com
preh
ensi
ve
inco
me
Am
ount
(`
cro
re)
C.Jo
int v
entu
res
a)In
dian
1N
aba
Dig
anta
Wat
er M
anag
emen
t Lim
ited
INR
0.0
3 2
3.58
0
.46
7.2
3 0
.00
0.0
7 0
.12
7.3
0
2SE
Z Ad
ityap
ur L
imite
d. IN
R (0
.00)
(0
.04)
-
-
-
-
-
-
3H
imal
aya
Stee
l Mill
s Se
rvic
es P
rivat
e Li
mite
d IN
R 0
.01
5.3
5 0
.08
1.2
1 (0
.00)
(0
.02)
0
.02
1.1
9
4m
junc
tion
serv
ices
lim
ited
INR
0.2
1 1
51.2
7 1
.29
20.
14
(0.0
1)
(0.4
7)
0.3
3 1
9.67
5S
& T
Min
ing
Com
pany
Priv
ate
Lim
ited
INR
(0.0
0)
(0.2
0)
-
-
-
-
-
-
6Ta
ta B
lueS
cope
Ste
el P
rivat
e Li
mite
d IN
R 0
.64
469
.97
4.5
1 7
0.16
(0
.01)
(0
.41)
1
.16
69.
75
7Ta
ta N
YK S
hipp
ing
(Indi
a) P
rivat
e Li
mite
d IN
R 0
.00
2.4
9 0
.05
0.7
5 -
-
0
.01
0.7
5
8Ja
msh
edpu
r Con
tinuo
us A
nnea
ling
& P
roce
ssin
g Co
mpa
ny P
rivat
e Li
mite
d IN
R 0
.58
428
.60
(0.2
2)
(3.4
9)
(0.0
1)
(0.4
8)
(0.0
7)
(3.9
7)
9TM
Inte
rnat
iona
l Log
istic
s Li
mite
d IN
R 0
.29
214
.00
1.8
3 2
8.48
(0
.01)
(0
.60)
0
.46
27.
88
10TK
M G
loba
l Log
istic
s Li
mite
d IN
R 0
.04
28.
94
0.9
0 1
4.06
(0
.01)
(0
.25)
0
.23
13.
81
11In
dust
rial E
nerg
y Li
mite
d IN
R 0
.29
216
.98
2.4
8 3
8.62
(0
.00)
(0
.09)
0
.64
38.
53
12Ja
mip
ol L
td.
INR
0.1
0 7
0.67
0
.83
12.
91
(0.0
1)
(0.6
5)
0.2
0 1
2.26
13N
icco
Jubi
lee
Park
Lim
ited
INR
-
-
-
-
-
-
-
-
14M
edic
a TS
Hos
pita
l Priv
ate
Lim
ited
INR
-
-
-
-
-
-
-
-
15A
ndal
Eas
t Coa
l Com
pany
Priv
ate
Lim
ited
INR
-
-
-
-
-
-
-
-
16T
M M
inin
g Co
mpa
ny L
imite
d IN
R -
-
-
-
-
-
-
-
b)Fo
reig
n
1La
ura
Met
aal H
oldi
ng B
.V.
EU
R 0
.24
179
.55
0.5
9 9
.11
-
-
0.1
5 9
.11
2Ra
vens
crai
g Li
mite
d G
BP
(0.1
0)
(72.
55)
(1.3
9)
(21.
67)
-
-
(0.3
6)
(21.
67)
3Ta
ta S
teel
Tic
aret
AS
TRY
0
.02
12.
23
0.3
9 6
.02
-
-
0.1
0 6
.02
4A
ir Pr
oduc
ts L
lanw
ern
Lim
ited
GBP
0
.01
7.6
6 0
.03
0.4
0 -
-
0
.01
0.4
0
5H
oogo
vens
Cou
rt R
oll S
ervi
ce Te
chno
logi
es V
of##
EU
R 0
.02
17.
96
0.1
2 1
.93
-
-
0.0
3 1
.93
6Te
xtur
ing
Tech
nolo
gy L
imite
d G
BP
0.0
2 1
7.91
0
.33
5.1
0 -
-
0
.08
5.1
0
7M
inas
de
Beng
a (M
aurit
ius)
Lim
ited
USD
(4
.67)
(3
,434
.78)
-
-
-
-
-
-
8Bl
ueSc
ope
Lysa
ght L
anka
(Pvt
) Ltd
LKR
0
.02
18.
22
0.0
6 0
.89
-
-
0.0
1 0
.89
9Ta
ta N
YK S
hipp
ing
Pte
Ltd.
USD
0
.12
86.
90
0.4
4 6
.80
0.3
2 1
4.12
0
.35
20.
92
10In
tern
atio
nal S
hipp
ing
and
Logi
stic
s FZ
E U
SD
0.3
6 2
68.0
9 0
.88
13.
69
0.0
0 0
.10
0.2
3 1
3.79
11TK
M G
loba
l Chi
na L
td.
CN
Y 0
.01
4.4
7 0
.03
0.5
1 -
-
0
.01
0.5
1
12TK
M G
loba
l Gm
bH E
UR
0.2
5 1
85.1
6 0
.43
6.7
5 -
-
0
.11
6.7
5
D.
Ass
ocia
tes
a)In
dian
1TR
F Li
mite
d IN
R (0
.27)
(2
01.0
3)
(8.5
2)
(132
.64)
(0
.03)
(1
.29)
(2
.22)
(1
33.9
3)
2M
alus
ha T
rave
ls P
vt L
td IN
R -
-
-
-
-
-
-
-
3Ka
linga
Aqu
atic
Ltd
INR
-
-
-
-
-
-
-
-
4Ku
mar
dhub
i Fire
clay
& S
ilica
Wor
ks L
td.
INR
-
-
-
-
-
-
-
-
5Ku
mar
dhub
i Met
al C
astin
g an
d En
gine
erin
g Li
mite
d IN
R -
-
-
-
-
-
-
-
6St
rate
gic
Ener
gy Te
chno
logy
Sys
tem
s Pr
ivat
e Li
mite
d IN
R -
-
-
-
-
-
-
-
7Ta
ta C
onst
ruct
ion
& P
roje
cts
Ltd.
INR
-
-
-
-
-
-
-
-
8Bh
usha
n Ca
pita
l & C
redi
t Ser
vice
s Pr
ivat
e Li
mite
d IN
R -
-
-
-
-
-
-
-
9Ja
wah
ar C
redi
t & H
oldi
ngs
Priv
ate
Lim
ited
INR
-
-
-
-
-
-
-
-
NOTESforming part of the consolidated financial statements
Consolidated
INTEGRATED REPORT & ANNUAL ACCOUNTS 2019-20 | 113TH YEAR436
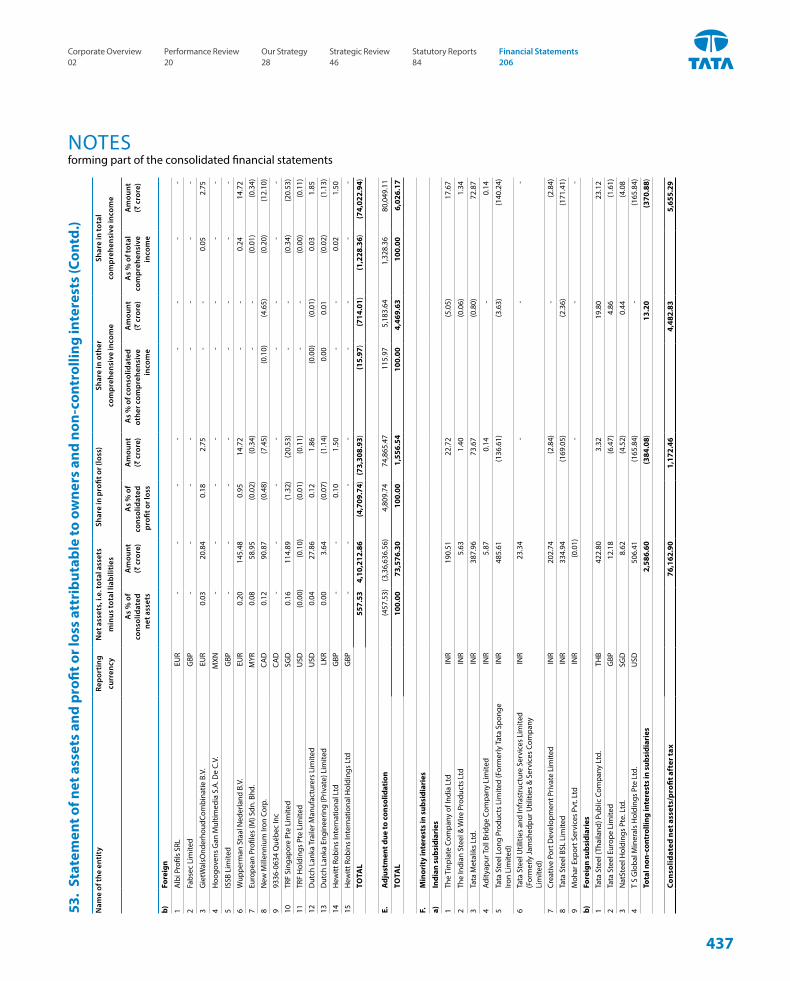
53.
Stat
emen
t of n
et a
sset
s an
d pr
ofit o
r los
s at
trib
utab
le to
ow
ners
and
non
-con
trol
ling
inte
rest
s (C
ontd
.)N
ame
of th
e en
tity
Repo
rtin
g cu
rren
cyN
et a
sset
s, i.
e. to
tal a
sset
s m
inus
tota
l lia
bilit
ies
Shar
e in
pro
fit o
r (lo
ss)
Shar
e in
oth
er
com
preh
ensi
ve in
com
eSh
are
in to
tal
com
preh
ensi
ve in
com
e
As
% o
f co
nsol
idat
ed
net a
sset
s
Am
ount
(`
cro
re)
As
% o
f co
nsol
idat
ed
profi
t or l
oss
Am
ount
(`
cro
re)
As
% o
f con
solid
ated
ot
her c
ompr
ehen
sive
in
com
e
Am
ount
(`
cro
re)
As
% o
f tot
al
com
preh
ensi
ve
inco
me
Am
ount
(`
cro
re)
b)Fo
reig
n
1A
lbi P
rofil
s SR
L E
UR
-
-
-
-
-
-
-
-
2Fa
bsec
Lim
ited
GBP
-
-
-
-
-
-
-
-
3G
ietW
alsO
nder
houd
Com
bina
tie B
.V.
EU
R 0
.03
20.
84
0.1
8 2
.75
-
-
0.0
5 2
.75
4H
oogo
vens
Gan
Mul
timed
ia S
.A. D
e C.
V.
MXN
-
-
-
-
-
-
-
-
5IS
SB L
imite
d G
BP
-
-
-
-
-
-
-
-
6W
uppe
rman
Sta
al N
eder
land
B.V
. E
UR
0.2
0 1
45.4
8 0
.95
14.
72
-
-
0.2
4 1
4.72
7
Euro
pean
Pro
files
(M) S
dn. B
hd.
MYR
0
.08
58.
95
(0.0
2)
(0.3
4)
-
-
(0.0
1)
(0.3
4)
8N
ew M
illen
nium
Iron
Cor
p. C
AD
0
.12
90.
87
(0.4
8)
(7.4
5)
(0.1
0)
(4.6
5)
(0.2
0)
(12.
10)
993
36-0
634
Qué
bec
Inc
CA
D
-
-
-
-
-
-
-
-
10TR
F Si
ngap
ore
Pte
Lim
ited
SG
D
0.1
6 1
14.8
9 (1
.32)
(2
0.53
) -
-
(0
.34)
(2
0.53
) 11
TRF
Hol
ding
s Pt
e Li
mite
d U
SD
(0.0
0)
(0.1
0)
(0.0
1)
(0.1
1)
-
-
(0.0
0)
(0.1
1)
12D
utch
Lan
ka T
raile
r Man
ufac
ture
rs L
imite
d U
SD
0.0
4 2
7.86
0
.12
1.8
6 (0
.00)
(0
.01)
0
.03
1.8
5 13
Dut
ch L
anka
Eng
inee
ring
(Priv
ate)
Lim
ited
LKR
0
.00
3.6
4 (0
.07)
(1
.14)
0
.00
0.0
1 (0
.02)
(1
.13)
14
Hew
itt R
obin
s In
tern
atio
nal L
td G
BP
-
-
0.1
0 1
.50
-
-
0.0
2 1
.50
15H
ewitt
Rob
ins
Inte
rnat
iona
l Hol
ding
s Lt
d G
BP
-
-
-
-
-
-
-
-
TOTA
L 5
57.5
3 4
,10,
212.
86
(4,7
09.7
4)
(73,
308.
93)
(15.
97)
(714
.01)
(1
,228
.36)
(7
4,02
2.94
)
E.A
djus
tmen
t due
to c
onso
lidat
ion
(457
.53)
(3
,36,
636.
56)
4,8
09.7
4 7
4,86
5.47
1
15.9
7 5
,183
.64
1,3
28.3
6 8
0,04
9.11
TOTA
L 1
00.0
0 7
3,57
6.30
1
00.0
0 1
,556
.54
100
.00
4,4
69.6
3 1
00.0
0 6
,026
.17
F.M
inor
ity
inte
rest
s in
sub
sidi
arie
s
a)In
dian
sub
sidi
arie
s
1Th
e Ti
npla
te C
ompa
ny o
f Ind
ia L
td IN
R 1
90.5
1 2
2.72
(5
.05)
1
7.67
2Th
e In
dian
Ste
el &
Wire
Pro
duct
s Lt
d IN
R 5
.63
1.4
0 (0
.06)
1
.34
3Ta
ta M
etal
iks
Ltd.
INR
387
.96
73.
67
(0.8
0)
72.
87
4Ad
ityap
ur To
ll Br
idge
Com
pany
Lim
ited
INR
5.8
7 0
.14
-
0.1
4
5Ta
ta S
teel
Lon
g Pr
oduc
ts L
imite
d (F
orm
erly
Tat
a Sp
onge
Iro
n Li
mite
d) IN
R 4
85.6
1 (1
36.6
1)
(3.6
3)
(140
.24)
6Ta
ta S
teel
Util
ities
and
Infr
astr
uctu
re S
ervi
ces
Lim
ited
(For
mer
ly Ja
msh
edpu
r Util
ities
& S
ervi
ces
Com
pany
Li
mite
d)
INR
23.
34
-
-
-
7Cr
eativ
e Po
rt D
evel
opm
ent P
rivat
e Li
mite
d IN
R 2
02.7
4 (2
.84)
-
(2
.84)
8
Tata
Ste
el B
SL L
imite
d IN
R 3
34.9
4 (1
69.0
5)
(2.3
6)
(171
.41)
9
Moh
ar E
xpor
t Ser
vice
s Pv
t. Lt
d IN
R (0
.01)
-
-
-
b)
Fore
ign
subs
idia
ries
1Ta
ta S
teel
(Tha
iland
) Pub
lic C
ompa
ny L
td.
TH
B 4
22.8
0 3
.32
19.
80
23.
12
2Ta
ta S
teel
Eur
ope
Lim
ited
GBP
1
2.18
(6
.47)
4
.86
(1.6
1)
3N
atSt
eel H
oldi
ngs
Pte.
Ltd
. S
GD
8
.62
(4.5
2)
0.4
4 (4
.08
4T
S G
loba
l Min
eral
s H
oldi
ngs
Pte
Ltd.
USD
5
06.4
1 (1
65.8
4)
-
(165
.84)
To
tal n
on-c
ontr
ollin
g in
tere
sts
in s
ubsi
diar
ies
2,5
86.6
0 (3
84.0
8)
13.
20
(370
.88)
Cons
olid
ated
net
ass
ets/
pro
fit a
fter
tax
76,
162.
90
1,1
72.4
6 4
,482
.83
5,6
55.2
9
NOTESforming part of the consolidated financial statements
437
Corporate Overview 02
Strategic Review 46
Performance Review 20
Statutory Reports 84
Our Strategy 28
Financial Statements 206
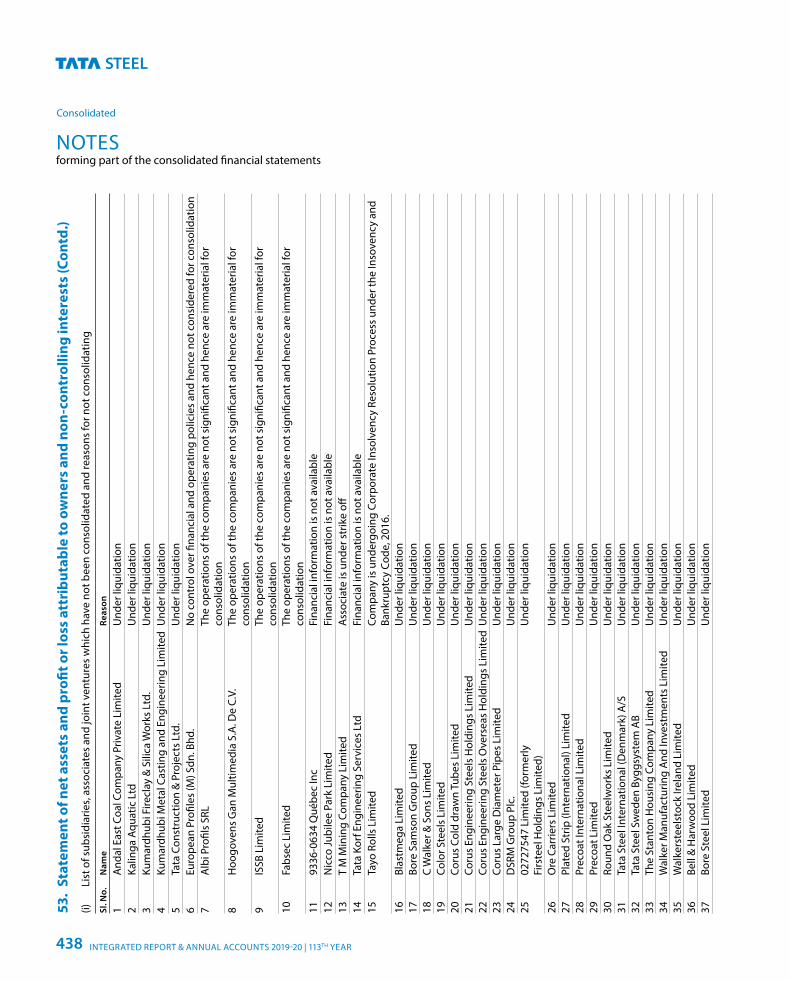
53.
Stat
emen
t of n
et a
sset
s an
d pr
ofit o
r los
s at
trib
utab
le to
ow
ners
and
non
-con
trol
ling
inte
rest
s (C
ontd
.)(i)
Li
st o
f sub
sidi
arie
s, a
ssoc
iate
s an
d jo
int v
entu
res
whi
ch h
ave
not b
een
cons
olid
ated
and
reas
ons
for n
ot c
onso
lidat
ing
Sl. N
o.N
ame
Reas
on
1A
ndal
Eas
t Coa
l Com
pany
Priv
ate
Lim
ited
Und
er li
quid
atio
n 2
Kalin
ga A
quat
ic L
tdU
nder
liqu
idat
ion
3Ku
mar
dhub
i Fire
clay
& S
ilica
Wor
ks L
td.
Und
er li
quid
atio
n 4
Kum
ardh
ubi M
etal
Cas
ting
and
Engi
neer
ing
Lim
ited
Und
er li
quid
atio
n 5
Tata
Con
stru
ctio
n &
Pro
ject
s Lt
d.U
nder
liqu
idat
ion
6Eu
rope
an P
rofil
es (M
) Sdn
. Bhd
.N
o co
ntro
l ove
r fina
ncia
l and
ope
ratin
g po
licie
s an
d he
nce
not c
onsi
dere
d fo
r con
solid
atio
n 7
Alb
i Pro
fils
SRL
The
oper
atio
ns o
f the
com
pani
es a
re n
ot s
igni
fican
t and
hen
ce a
re im
mat
eria
l for
co
nsol
idat
ion
8H
oogo
vens
Gan
Mul
timed
ia S
.A. D
e C.
V.
The
oper
atio
ns o
f the
com
pani
es a
re n
ot s
igni
fican
t and
hen
ce a
re im
mat
eria
l for
co
nsol
idat
ion
9IS
SB L
imite
d Th
e op
erat
ions
of t
he c
ompa
nies
are
not
sig
nific
ant a
nd h
ence
are
imm
ater
ial f
or
cons
olid
atio
n 10
Fabs
ec L
imite
dTh
e op
erat
ions
of t
he c
ompa
nies
are
not
sig
nific
ant a
nd h
ence
are
imm
ater
ial f
or
cons
olid
atio
n 11
9336
-063
4 Q
uébe
c In
cFi
nanc
ial i
nfor
mat
ion
is n
ot a
vaila
ble
12N
icco
Jubi
lee
Park
Lim
ited
Fina
ncia
l inf
orm
atio
n is
not
ava
ilabl
e13
T M
Min
ing
Com
pany
Lim
ited
Ass
ocia
te is
und
er s
trik
e off
14
Tata
Kor
f Eng
inee
ring
Serv
ices
Ltd
Fina
ncia
l inf
orm
atio
n is
not
ava
ilabl
e 15
Tayo
Rol
ls L
imite
dCo
mpa
ny is
und
ergo
ing
Corp
orat
e In
solv
ency
Res
olut
ion
Proc
ess
unde
r the
Inso
venc
y an
d Ba
nkru
ptcy
Cod
e, 2
016.
16
Blas
tmeg
a Li
mite
dU
nder
liqu
idat
ion
17Bo
re S
amso
n G
roup
Lim
ited
Und
er li
quid
atio
n 18
C W
alke
r & S
ons
Lim
ited
Und
er li
quid
atio
n 19
Colo
r Ste
els
Lim
ited
Und
er li
quid
atio
n 20
Coru
s Co
ld d
raw
n Tu
bes
Lim
ited
Und
er li
quid
atio
n 21
Coru
s En
gine
erin
g St
eels
Hol
ding
s Li
mite
dU
nder
liqu
idat
ion
22Co
rus
Engi
neer
ing
Stee
ls O
vers
eas
Hol
ding
s Li
mite
dU
nder
liqu
idat
ion
23Co
rus
Larg
e D
iam
eter
Pip
es L
imite
dU
nder
liqu
idat
ion
24D
SRM
Gro
up P
lc.
Und
er li
quid
atio
n 25
0272
7547
Lim
ited
(form
erly
Fi
rste
el H
oldi
ngs
Lim
ited)
Und
er li
quid
atio
n
26O
re C
arrie
rs L
imite
dU
nder
liqu
idat
ion
27Pl
ated
Str
ip (I
nter
natio
nal)
Lim
ited
Und
er li
quid
atio
n 28
Prec
oat I
nter
natio
nal L
imite
dU
nder
liqu
idat
ion
29Pr
ecoa
t Lim
ited
Und
er li
quid
atio
n 30
Roun
d O
ak S
teel
wor
ks L
imite
dU
nder
liqu
idat
ion
31Ta
ta S
teel
Inte
rnat
iona
l (D
enm
ark)
A/S
Und
er li
quid
atio
n 32
Tata
Ste
el S
wed
en B
yggs
yste
m A
BU
nder
liqu
idat
ion
33Th
e St
anto
n H
ousi
ng C
ompa
ny L
imite
dU
nder
liqu
idat
ion
34W
alke
r Man
ufac
turin
g A
nd In
vest
men
ts L
imite
dU
nder
liqu
idat
ion
35W
alke
rste
elst
ock
Irela
nd L
imite
dU
nder
liqu
idat
ion
36Be
ll &
Har
woo
d Li
mite
dU
nder
liqu
idat
ion
37Bo
re S
teel
Lim
ited
Und
er li
quid
atio
n
NOTESforming part of the consolidated financial statements
Consolidated
INTEGRATED REPORT & ANNUAL ACCOUNTS 2019-20 | 113TH YEAR438
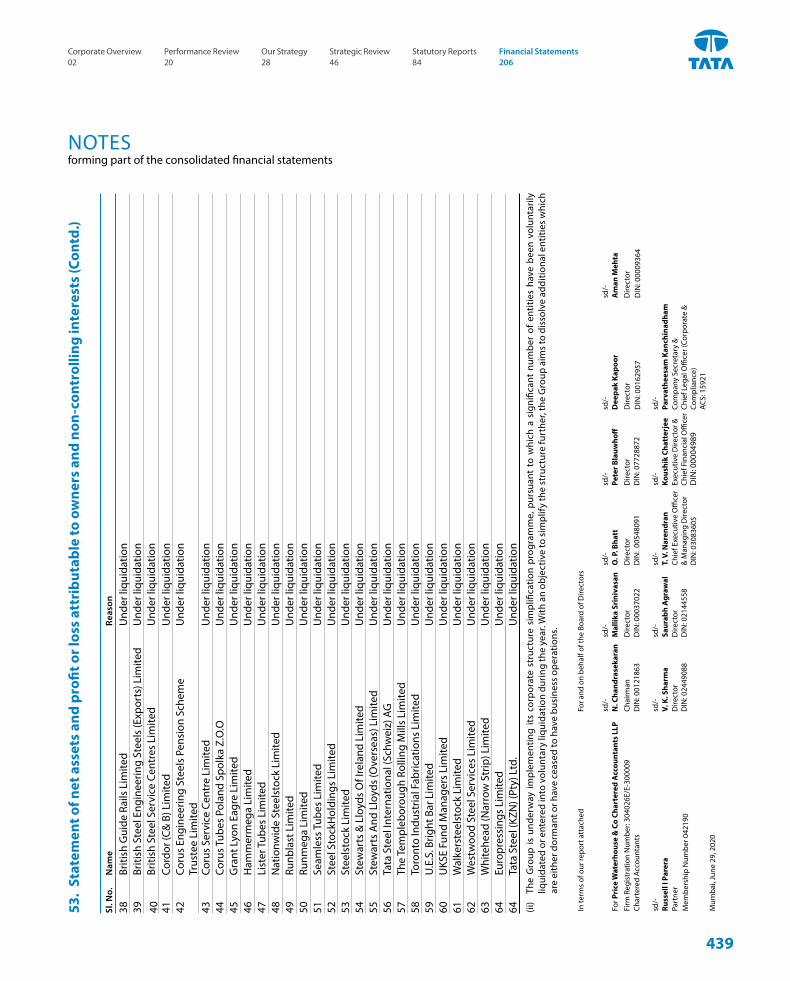
53.
Stat
emen
t of n
et a
sset
s an
d pr
ofit o
r los
s at
trib
utab
le to
ow
ners
and
non
-con
trol
ling
inte
rest
s (C
ontd
.)
Sl. N
o.N
ame
Reas
on
38Br
itish
Gui
de R
ails
Lim
ited
Und
er li
quid
atio
n 39
Briti
sh S
teel
Eng
inee
ring
Stee
ls (E
xpor
ts) L
imite
dU
nder
liqu
idat
ion
40Br
itish
Ste
el S
ervi
ce C
entr
es L
imite
dU
nder
liqu
idat
ion
41Co
rdor
(C&
B) L
imite
dU
nder
liqu
idat
ion
42Co
rus
Engi
neer
ing
Stee
ls P
ensi
on S
chem
e Tr
uste
e Li
mite
dU
nder
liqu
idat
ion
43Co
rus
Serv
ice
Cent
re L
imite
dU
nder
liqu
idat
ion
44Co
rus T
ubes
Pol
and
Spol
ka Z
.O.O
Und
er li
quid
atio
n 45
Gra
nt L
yon
Eagr
e Li
mite
dU
nder
liqu
idat
ion
46H
amm
erm
ega
Lim
ited
Und
er li
quid
atio
n 47
List
er T
ubes
Lim
ited
Und
er li
quid
atio
n 48
Nat
ionw
ide
Stee
lsto
ck L
imite
dU
nder
liqu
idat
ion
49Ru
nbla
st L
imite
dU
nder
liqu
idat
ion
50Ru
nmeg
a Li
mite
dU
nder
liqu
idat
ion
51Se
amle
ss T
ubes
Lim
ited
Und
er li
quid
atio
n 52
Stee
l Sto
ckH
oldi
ngs
Lim
ited
Und
er li
quid
atio
n 53
Stee
lsto
ck L
imite
dU
nder
liqu
idat
ion
54St
ewar
ts &
Llo
yds
Of I
rela
nd L
imite
dU
nder
liqu
idat
ion
55St
ewar
ts A
nd L
loyd
s (O
vers
eas)
Lim
ited
Und
er li
quid
atio
n 56
Tata
Ste
el In
tern
atio
nal (
Schw
eiz)
AG
Und
er li
quid
atio
n 57
The
Tem
pleb
orou
gh R
ollin
g M
ills
Lim
ited
Und
er li
quid
atio
n 58
Toro
nto
Indu
stria
l Fab
ricat
ions
Lim
ited
Und
er li
quid
atio
n 59
U.E
.S. B
right
Bar
Lim
ited
Und
er li
quid
atio
n 60
UKS
E Fu
nd M
anag
ers
Lim
ited
Und
er li
quid
atio
n 61
Wal
kers
teel
stoc
k Li
mite
dU
nder
liqu
idat
ion
62W
estw
ood
Stee
l Ser
vice
s Li
mite
dU
nder
liqu
idat
ion
63W
hite
head
(Nar
row
Str
ip) L
imite
dU
nder
liqu
idat
ion
64Eu
ropr
essi
ngs
Lim
ited
Und
er li
quid
atio
n 64
Tata
Ste
el (K
ZN) (
Pty)
Ltd
.U
nder
liqu
idat
ion
(ii)
The
Gro
up is
und
erw
ay im
plem
entin
g its
cor
pora
te s
truc
ture
sim
plifi
catio
n pr
ogra
mm
e, p
ursu
ant
to w
hich
a s
igni
fican
t nu
mbe
r of
ent
ities
hav
e be
en v
olun
taril
y liq
uida
ted
or e
nter
ed in
to v
olun
tary
liqu
idat
ion
durin
g th
e ye
ar. W
ith a
n ob
ject
ive
to s
impl
ify th
e st
ruct
ure
furt
her,
the
Gro
up a
ims
to d
isso
lve
addi
tiona
l ent
ities
whi
ch
are
eith
er d
orm
ant o
r hav
e ce
ased
to h
ave
busi
ness
ope
ratio
ns.
In te
rms
of o
ur re
port
att
ache
dFo
r and
on
beha
lf of
the
Boar
d of
Dire
ctor
s
sd/-
sd/-
sd/-
sd/-
sd/-
sd
/-
For P
rice
Wat
erho
use
& C
o Ch
arte
red
Acc
ount
ants
LLP
N. C
hand
rase
kara
nM
allik
a Sr
iniv
asan
O. P
. Bha
ttPe
ter B
lauw
hoff
Dee
pak
Kapo
orA
man
Meh
taFi
rm R
egis
trat
ion
Num
ber:
3040
26E/
E-30
0009
Chai
rman
Dire
ctor
Dire
ctor
Dire
ctor
Dire
ctor
D
IN: 0
0162
957
Dire
ctor
D
IN: 0
0009
364
Char
tere
d Ac
coun
tant
sD
IN: 0
0121
863
DIN
: 000
3702
2D
IN:
0054
8091
DIN
: 077
2887
2
sd/-
sd/-
sd/-
sd/-
sd/-
sd/-
Ru
ssel
l I P
arer
aV.
K. S
harm
aSa
urab
h A
graw
alT.
V. N
aren
dran
Kous
hik
Chat
terj
eePa
rvat
hees
am K
anch
inad
ham
Part
ner
Mem
bers
hip
Num
ber 0
4219
0D
irect
or
DIN
: 024
4908
8D
irect
or
DIN
: 021
4455
8Ch
ief E
xecu
tive
Offi
cer
& M
anag
ing
Dire
ctor
D
IN: 0
3083
605
Exec
utiv
e D
irect
or &
Ch
ief F
inan
cial
Offi
cer
DIN
: 000
0498
9
Com
pany
Sec
reta
ry &
Ch
ief L
egal
Offi
cer (
Corp
orat
e &
Co
mpl
ianc
e)
ACS:
159
21M
umba
i, Ju
ne 2
9, 2
020
NOTESforming part of the consolidated financial statements
439
Corporate Overview 02
Strategic Review 46
Performance Review 20
Statutory Reports 84
Our Strategy 28
Financial Statements 206
INTEGRATED REPORT & ANNUAL ACCOUNTS 2019-20 | 113TH YEAR440
NOTICE
Notice is hereby given that the 113th Annual General Meeting of the Members of Tata Steel Limited will be held on Thursday, August 20, 2020, at 3.00 p.m. (IST) through Video Conferencing (‘VC’)/Other Audio-Visual Means (‘OAVM’), to transact the following business:
Ordinary Business:Item No. 1 – Adoption of Audited Standalone Financial StatementsTo receive, consider and adopt the Audited Standalone Financial Statements of the Company for the Financial Year ended March 31, 2020 together with the Reports of the Board of Directors and the Auditors thereon.
Item No. 2 – Adoption of Audited Consolidated Financial StatementsTo receive, consider and adopt the Audited Consolidated Financial Statements of the Company for the Financial Year ended March 31, 2020 together with the Report of the Auditors thereon.
Item No. 3 – Declaration of DividendTo declare dividend of:
• ₹10/- per fully paid-up Ordinary (equity) Share of face value ₹10/- each for the Financial Year 2019-20.
• ₹2.504 per partly paid-up Ordinary (equity) Share of face value ₹10/- each (paid-up ₹2.504 per share) for the Financial Year 2019-20.
Item No. 4 – Re-appointment of a Director To appoint a Director in the place of Mr. N. Chandrasekaran (DIN:00121863), who retires by rotation in terms of Section 152(6) of the Companies Act, 2013 and, being eligible, seeks re-appointment.
Special Business:Item No. 5 – Ratification of Remuneration of Cost AuditorsTo consider, and if thought fit, to pass the following Resolution as an Ordinary Resolution:
“RESOLVED THAT pursuant to the provisions of Section 148(3) and other applicable provisions, if any, of the Companies Act, 2013 read with the Companies (Audit and Auditors) Rules, 2014, (including any statutory modification or re-enactment thereof for the time being in force), the Company hereby ratifies the remuneration of ₹20 lakh plus applicable taxes and reimbursement of out-of-pocket expenses payable to Messrs Shome & Banerjee, Cost Accountants (Firm Registration Number - 000001), who have been appointed by the Board of Directors on the recommendation of the Audit Committee,
as the Cost Auditors of the Company, to conduct the audit of the cost records maintained by the Company, for the Financial Year ending March 31, 2021.”
Item No. 6 – Commission to Non-Executive Directors of the CompanyTo consider, and if thought fit, to pass the following Resolution as an Ordinary Resolution:
“RESOLVED THAT pursuant to the provisions of Section 197 and other applicable provisions, if any, of the Companies Act, 2013 (‘Act’) and the Rules made thereunder, as amended from time to time and Regulation 17(6) of the Securities and Exchange Board of India (Listing Obligations and Disclosure Requirements) Regulations, 2015, as amended from time to time, consent of the Members be and is hereby accorded for payment of a sum not exceeding 1% of the net profits of the Company per annum, calculated in accordance with the provisions of Section 198 of the Act, as commission and the same be paid to and distributed amongst the Directors of the Company or some or any of them (other than the Managing Director and Whole-time Directors) in such amounts or proportions and in such manner and in all respects as may be decided by the Board of Directors of the Company and such payments shall be made with respect to the profits of the Company for each year, commencing April 1, 2021.”
NOTES:(a) The Statement, pursuant to Section 102 of the Companies
Act, 2013, as amended (‘Act’) with respect to Item Nos. 5 and 6 forms part of this Notice. Additional information, pursuant to Regulations 26(4) and 36(3) of the Securities and Exchange Board of India (Listing Obligations and Disclosure Requirements) Regulations, 2015, (‘SEBI Listing Regulations’) and Secretarial Standard on General Meetings issued by the Institute of Company Secretaries of India, in respect of Director retiring by rotation seeking re-appointment at this Annual General Meeting (‘Meeting’ or ‘AGM’) is furnished as an annexure to the Notice.
(b) In view of the global outbreak of the COVID-19 pandemic, the Ministry of Corporate Affairs (‘MCA’) has vide its General Circular No. 20/2020 dated May 5, 2020 in relation to ‘Clarification on holding of annual general meeting (AGM) through video conferencing (VC) or other audio visual means (OAVM) read with General Circular No. 14/2020 dated April 8, 2020 and the General Circular No. 17/2020 dated April 13, 2020 in relation to ‘Clarification on passing of ordinary and special resolutions by companies under the Companies Act, 2013 and the rules made thereunder on account of the threat posed by COVID-19’ (collectively referred to as ‘MCA
441
Circulars’) and the Securities and Exchange Board of India (‘SEBI’) vide its circular dated May 12, 2020 in relation to ‘Additional relaxation in relation to compliance with certain provisions of the SEBI (Listing Obligations and Disclosure Requirements) Regulations, 2015 – COVID-19 pandemic’ (‘SEBI Circular’) permitted the holding of the AGM through VC or OAVM, without the physical presence of the Members at a common venue. In compliance with the provisions of the Act, SEBI Listing Regulations and MCA Circulars & SEBI Circular, the 113th AGM of the Company is being held through VC/OAVM on Thursday, August 20, 2020 at 3.00 p.m. (IST). The deemed venue for the 113th AGM will be Bombay House, 24 Homi Mody Street, Fort, Mumbai – 400 001.
(c) PURSUANT TO PROVISIONS OF THE ACT, A MEMBER ENTITLED TO ATTEND AND VOTE AT THE AGM IS ENTITLED TO APPOINT A PROXY TO ATTEND AND VOTE AT THE MEETING ON HIS/HER BEHALF AND THE PROXY NEED NOT BE A MEMBER OF THE COMPANY. SINCE THIS AGM IS BEING HELD PURSUANT TO THE MCA CIRCULARS AND SEBI CIRCULAR THROUGH VC/OAVM, THE REQUIREMENT OF PHYSICAL ATTENDANCE OF MEMBERS HAS BEEN DISPENSED WITH. ACCORDINGLY, IN TERMS OF THE MCA CIRCULARS AND SEBI CIRCULAR, THE FACILITY FOR APPOINTMENT OF PROXIES BY THE MEMBERS WILL NOT BE AVAILABLE FOR THIS AGM AND HENCE THE PROXY FORM, ROUTE MAP AND ATTENDANCE SLIP ARE NOT ANNEXED TO THIS NOTICE.
(d) The Members can join the AGM in the VC/OAVM mode 30 minutes before and 15 minutes after the scheduled time of the commencement of the Meeting by following the procedure mentioned in the Notice. The Members will be able to view the proceedings on the National Securities Depository Limited’s (‘NSDL’) website at www.evoting.nsdl.com The facility of participation at the AGM through VC/OAVM will be made available to at least 1,000 Members on a first come first served basis as per the MCA Circulars.
(e) Institutional Investors, who are Members of the Company, are encouraged to attend the 113th AGM through VC/OAVM mode and vote electronically. Pursuant to the provisions of the Act, the Institutional/Corporate Shareholders (i.e. other than individuals / HUF, NRI, etc.) are required to send a scanned copy (PDF/JPG Format) of its Board or governing body Resolution/Authorisation etc., authorising its representative to attend the AGM through VC/OAVM on its behalf and to vote through remote e-voting. The said Resolution/Authorisation shall be sent to the Scrutinizer at [email protected] with a copy marked to [email protected]
(f) The attendance of the Members attending the AGM through VC/OAVM will be counted for the purpose of reckoning the quorum under Section 103 of the Act.
(g) In case of joint holders, the Member whose name appears as the first holder in the order of the names as per the Register of Members of the Company will be entitled to vote at the meeting.
(h) In line with the MCA Circular dated May 5, 2020 and SEBI Circular dated May 12, 2020, the Notice of the AGM along with the Integrated Report & Annual Accounts 2019-20 is being sent only through electronic mode to those Members whose e-mail addresses are registered with the Company/Depositories. The Notice convening the 113th AGM has been uploaded on the website of the Company at www.tatasteel.com and may also be accessed from the relevant section of the websites of the Stock Exchanges i.e. BSE Limited and the National Stock Exchange of India Limited at www.bseindia.com and www.nseindia.com respectively. The Notice is also available on the website of NSDL at www.evoting.nsdl.com
(i) Book Closure and Dividend The Register of Members and Share Transfer Books of the
Company (for both, fully paid-up and partly paid-up Ordinary (equity) Shares) will be closed from Saturday, August 8, 2020 to Thursday, August 20, 2020 (both days inclusive) for the purpose of payment of dividend for Financial Year 2019-20. The dividend of ₹10/- per fully paid-up Ordinary (equity) Share of ₹10/- each (100%) and ₹2.504 per partly paid-up Ordinary (equity) Share of ₹10/- each (paid-up ₹2.504 per share) (100%), if declared by the Members at the AGM, will be paid subject to deduction of income-tax at source (‘TDS’) on and from Monday, August 24, 2020 as under:
• In respect of Ordinary Shares held in physical form: To all the Members, after giving effect to valid transmission and transposition in respect of valid requests lodged with the Company as on close of business hours on Friday, August 7, 2020.
• In respect of Ordinary Shares held in electronic form: To all beneficial owners of the shares, as on the close of business hours on Friday, August 7, 2020, as per details furnished by the Depositories for this purpose.
Pursuant to Finance Act, 2020, dividend income is taxable in the hands of Shareholders w.e.f. April 1, 2020 and the Company is required to deduct tax at source from dividend paid to the Members at the prescribed rates in the Income Tax Act, 1961 (‘IT Act’). In general, to enable compliance with TDS requirements, Members are requested to complete and/or update their Residential status, PAN, Category as per the IT Act with their depository participants (‘DPs’) or in case shares are held in physical form, with the Company/ Registrars and Transfer Agent (‘RTA’) by sending documents through e-mail on or before Friday, July 31, 2020. For the detailed process, please click here: ‘Communication on Tax Deduction on Dividend’.
Notice
INTEGRATED REPORT & ANNUAL ACCOUNTS 2019-20 | 113TH YEAR442
Updation of mandate for receiving dividend directly in bank account through Electronic Clearing System or any other means in a timely manner:
Shares held in physical form: Members are requested to send hard copies of the following details/documents to the Company’s Registrars and Transfer Agent (RTA), viz. TSR Darashaw Consultants Private Limited (TSR), (formerly TSR Darashaw Limited) at 6-10, Haji Moosa Patrawala Industrial Estate (Near Famous Studio), 20, Dr. E. Moses Road, Mahalaxmi, Mumbai – 400 011, latest by Friday, July 31, 2020:
a. a signed request letter mentioning your name, folio number(s), complete address and following details relating to bank account in which the dividend is to be received:
i) Name & Branch of Bank and Bank Account type;
ii) Bank Account Number & Type allotted by your Bank after implementation of Core Banking Solutions;
iii) 11 digit IFSC Code.
b. Cancelled cheque in original, bearing the name of the Member or first holder, in case shares are held jointly;
c. self-attested copy of the PAN Card; and
d. self-attested copy of any document (such as Aadhaar Card, Driving License, Election Identity Card, Passport) in support of the address of the Member as registered with the Company.
Shares held in electronic form: Members may please note that their bank details as furnished by the respective DPs to the Company will be considered for remittance of dividend as per the applicable regulations of the DPs and the Company will not entertain any direct request from such Members for change/addition/deletion in such bank details. Accordingly, the Members holding shares in demat form are requested to update their Electronic Bank Mandate with their respective DPs.
Further, please note that instructions, if any, already given by Members in respect of shares held in physical form, will not be automatically applicable to the dividend paid on shares held in electronic form.
The Members who are unable to receive the dividend directly in their bank accounts through Electronic Clearing Service or any other means, due to non-registration of the Electronic Bank Mandate, the Company shall dispatch the dividend warrant/ Bankers’ cheque/demand draft to such Members, upon normalisation of postal services and other activities.
(j) Nomination facility: As per the provisions of Section 72 of the Act, the facility for making nomination is available to the Members in respect of the shares held by them. Members who have not yet registered their nomination are requested to register the same by submitting Form No. SH-13. If a Member desires to cancel the earlier nomination and record a fresh nomination, may submit the same in Form SH-14. The said forms can be downloaded from the Company’s website at
www.tatasteel.com Members are requested to submit the said form to their DP in case the shares are held in electronic form and to the RTA at [email protected] in case the shares are held in physical form, quoting their folio no(s).
(k) Consolidation of Physical Share Certificates: Members holding shares in physical form, in identical order of names, in more than one folio are requested to send to the Company or RTA, the details of such folios together with the share certificates for consolidating their holdings in one folio. A consolidated share certificate will be issued to such Members after making requisite changes.
(l) The attention of the Members is particularly drawn to the Corporate Governance Report forming part of the Board’s Report in respect of unclaimed dividends and transfer of dividends/shares to the Investor Education & Protection Fund.
(m) In compliance with the aforesaid MCA Circulars and SEBI Circular, Notice of the AGM along with the Integrated Report & Annual Accounts 2019-20 is being sent only through electronic mode to those Members whose e-mail addresses are registered with the Company/RTA/Depositories. Members may note that the Notice and Integrated Report & Annual Accounts 2019-20 will also be available on the Company’s website www.tatasteel.com, relevant section of the websites of the Stock Exchanges i.e. BSE Limited and National Stock Exchange of India Limited at www.bseindia.com and www.nseindia.com respectively, and on the website of NSDL https://www.evoting.nsdl.com
(n) As per Regulation 40 of the SEBI Listing Regulations, as amended, securities of the listed companies can be transferred only in dematerialised form with effect from April 1, 2019, except in case of request received for transmission or transposition of securities. In view of this and to eliminate all risks associated with physical shares and for ease of portfolio management, Members holding shares in physical form are requested to consider converting their holdings to dematerialised form. Members may contact the Company’s RTA, TSR Darashaw Consultants Private Limited at [email protected] for assistance in this regard. Members may also refer to Frequently Asked Questions (‘FAQs’) on the Company’s website. For details click here: FAQs
(o) To prevent fraudulent transactions, Members are advised to exercise due diligence and notify the Company of any change in address or demise of any Member as soon as possible. Members are also advised to not leave their demat account(s) dormant for long. Periodic statement of holdings should be obtained from the concerned Depository Participant and holdings should be verified from time to time.
PROCESS FOR REGISTERING E-MAIL ADDRESS:i. One time registration of e-mail address with RTA for
receiving the Integrated Report & Annual Accounts 2019-20 and cast votes electronically: The Company has
443
made special arrangements with RTA for registration of e-mail address of those Members (holding shares either in electronic or physical form) who wish to receive this Integrated Report and Annual Accounts for FY 2019-20 and cast votes electronically. Eligible Members whose e-mail addresses are not registered with the Company/DPs are required to provide the same to RTA on or before 5.00 p.m. (IST) on Thursday, August 13, 2020.
Process to be followed for one time registration of e-mail address is as follows:
I. For Members who hold shares in Electronic form:
a) Visit the link: https://green.tsrdarashaw.com/green/events/login/ti
b) Enter the DP ID & Client ID, PAN details and captcha code.
c) System will verify the Client ID and PAN details.
d) On successful verification, system will allow you to enter your e-mail address and mobile number.
e) Enter your e-mail address and mobile number.
f) The system will then confirm the e-mail address for the limited purpose of service of this AGM Notice & Integrated Report & Annual Accounts 2019-20.
II. For Members who hold shares in Physical form:
a) Visit the link: https://green.tsrdarashaw.com/green/events/login/ti
b) Enter the physical Folio Number, PAN details and captcha code.
c) In the event the PAN details are not available on record, Member to enter one of the share certificate number.
d) System will verify the Folio Number and PAN details or the share certificate number.
e) On successful verification, system will allow you to enter your e-mail address and mobile number.
f) Enter your e-mail address and mobile number.
g) If PAN details are not available, the system will prompt the Member to upload a self-attested copy of the PAN card.
h) The system will then confirm the e-mail address for the purpose of service of this AGM Notice & Integrated Report and Annual Accounts for FY 2019-20.
After successful submission of the e-mail address, NSDL will e-mail a copy of this AGM Notice and Integrated Report for FY 2019-20 along with the e-voting user ID and password. In case of any queries, Members may write to [email protected] or [email protected]
ii. Registration of e-mail address permanently with Company/DP: Members are requested to register the e-mail address with their concerned DPs, in respect of electronic
holding and with RTA, in respect of physical holding, by writing to them at [email protected] Further, those Members who have already registered their e-mail addresses are requested to keep their e-mail addresses validated/updated with their DPs/RTA to enable servicing of notices/documents/Integrated Reports and other communications electronically to their e-mail address in future.
iii. Alternatively, Members may also send an e-mail request to [email protected] along with the following documents for procuring user id and password and registration of e-mail addresses for remote e-voting for the resolutions set out in this Notice:
• In case shares are held in physical form, please provide Folio No., Name of Shareholder, scanned copy of the share certificate (front and back), self-attested scanned copy of PAN card, and self-attested scanned copy of Aadhaar Card.
• In case shares are held in demat form, please provide DP ID-Client ID (8 digit DP ID + 8 digit Client ID or 16 digit Beneficiary ID), Name, client master or copy of Consolidated Account statement, self-attested scanned copy of PAN card, and self-attested scanned copy of Aadhaar Card.
INSTRUCTIONS FOR E-VOTING AND JOINING THE AGM ARE AS FOLLOWS:
A. PROCESS AND MANNER FOR VOTING THROUGH ELECTRONIC MEANS:
1. Pursuant to the provisions of Section 108 of the Act read with Rule 20 of the Companies (Management and Administration) Rules, 2014 (as amended) and Regulation 44 of the SEBI Listing Regulations (as amended) and the MCA Circulars, the Company is providing facility of remote e-voting to its Members in respect of the business to be transacted at the AGM. For this purpose, the Company has entered into an agreement with NSDL for facilitating voting through electronic means, as the authorised agency. The facility of casting votes by a Member using remote e-voting system as well as remote e-voting during the AGM will be provided by NSDL.
2. Members of the Company holding shares either in physical form or in electronic form as on the cut-off date of Thursday, August 13, 2020 may cast their vote by remote e-voting. A person who is not a Member as on the cut-off date should treat this Notice for information purpose only. A person whose name is recorded in the Register of Members or in the Register of Beneficial Owners maintained by the depositories as on the cut-off date only shall be entitled to avail the facility of remote e-voting before the AGM as well as remote e-voting during the AGM. Any person who acquires shares of the Company and becomes a Member of the Company after the dispatch of the Notice and holding shares as on the cut-off date i.e. Thursday, August 13, 2020, may obtain the User ID and Password by sending a request at [email protected]
Notice
INTEGRATED REPORT & ANNUAL ACCOUNTS 2019-20 | 113TH YEAR444
3. The remote e-voting period commences on Sunday, August 16, 2020 at 9.00 a.m. (IST) and ends on Wednesday, August 19, 2020 at 5.00 p.m. (IST). The remote e-voting module shall be disabled by NSDL for voting thereafter. Once the vote on a resolution is cast by the Member, the Member shall not be allowed to change it subsequently. The voting rights of the Members shall be in proportion to their share of the paid-up equity share capital of the Company as on the cut-off date i.e. Thursday, August 13, 2020.
4. Members will be provided with the facility for voting through electronic voting system during the VC/OAVM proceedings at the AGM and Members participating at the AGM, who have not already cast their vote on the resolution(s) by remote e-voting, will be eligible to exercise their right to vote on such resolution(s) upon announcement by the Chairman. Members who have cast their vote on resolution(s) by remote e-voting prior to the AGM will also be eligible to participate at the AGM through VC/OAVM but shall not be entitled to cast their vote on such resolution(s) again.
5. The remote e-voting module on the day of the AGM shall be disabled by NSDL for voting 15 minutes after the conclusion of the Meeting.
INSTRUCTIONS FOR MEMBERS FOR ATTENDING THE AGM THROUGH VC/OAVM AND REMOTE E-VOTING (BEFORE AND DURING THE AGM) ARE AS UNDER:1. The Members will be provided with a facility to attend
the AGM through VC/OAVM through the NSDL e-voting system and they may access the same at https://www.evoting.nsdl.com under the Shareholders/Members login by using the remote e-voting credentials, where the EVEN of the Company i.e. 113138 (for fully paid-up Ordinary Shares) & 113139 (for partly paid-up Ordinary Shares) will be displayed. On clicking this link, the Members will be able to attend and participate in the proceedings of the AGM. Please note that the Members who do not have the User ID and Password for e-voting or have forgotten the User ID/Password may retrieve the same by following the remote e-voting instructions mentioned below to avoid last minute rush. Further, Members may also use the OTP-based login for logging into the e-voting system of NSDL.
2. Members may join the Meeting through Laptops, Smartphones, Tablets and iPads for better experience. Further, Members will be required to use Internet with a good speed to avoid any disturbance during the Meeting. Members will need the latest version of Chrome, Safari, Internet Explorer 11, MS Edge or Firefox. Please note that participants connecting from Mobile Devices or Tablets or through Laptops connecting via mobile hotspot may experience Audio/Video loss due to fluctuation in their respective network. It is therefore
recommended to use stable Wi-Fi or LAN connection to mitigate any glitches.
3. Members are encouraged to submit their questions in advance with respect to the Accounts or the business to be transacted at the AGM. These queries may be submitted from their registered e-mail address, mentioning their name, DP ID and Client ID/folio number and mobile number, to reach the Company’s e-mail address at [email protected] before 3.00 p.m. (IST) on Thursday, August 13, 2020.
4. Members who would like to express their views or ask questions during the AGM may pre-register themselves as a speaker by sending their request from their registered e-mail address mentioning their name, DP ID and Client ID/folio number, PAN, mobile number at [email protected] between August 14, 2020 (9:00 a.m. IST) through August 16, 2020 (5:00 p.m. IST). Those Members who have registered themselves as a speaker will only be allowed to express their views/ask questions during the AGM. The Company reserves the right to restrict the number of speakers depending on the availability of time for the AGM.
5. Members who need assistance before or during the AGM, can contact NSDL on [email protected] /1800-222-990 or contact Mr. Amit Vishal, Senior Manager – NSDL at [email protected]/ 022-24994360 or Mr. Sanjeev Yadav, Assistant Manager – NSDL at [email protected]/022-24994553.
THE INSTRUCTIONS FOR REMOTE E-VOTING BEFORE/DURING THE AGM
The instructions for remote e-voting before the AGM are as under:The way to vote electronically on NSDL e-voting system consists of ‘Two Steps’ which are mentioned below:
Step 1: Log-in to NSDL e-voting system at https://www.evoting.nsdl.com/
How to Log-in to NSDL e-voting website?
1. Visit the e-voting website of NSDL. Open web browser by typing the following URL: https://www.evoting.nsdl.com/ either on a Personal Computer or on a mobile.
2. Once the home page of e-voting system is launched, click on the icon ‘Login’ which is available under ‘Shareholder’ section.
3. A new screen will open. You will have to enter your User ID, your Password and a Verification Code as shown on the screen.
Alternatively, if you are registered for NSDL eservices i.e. IDEAS, you can log-in at https://eservices.nsdl.com/ with your existing IDEAS login. Once you log-in to NSDL eservices after using your log-in credentials, click on e-voting and you can proceed to Step 2 i.e. Cast your vote electronically.
445
4. Your User ID details are given below:
Manner of holding shares i.e. Demat (NSDL or CDSL) or Physical
Your User ID is:
a) For Members who hold shares in demat account with NSDL. 8 Character DP ID followed by 8 Digit Client ID For example, if your DP ID is IN300*** and Client ID is 12****** then your user ID is IN300***12******.
b) For Members who hold shares in demat account with CDSL. 16 Digit Beneficiary ID For example, if your Beneficiary ID is 12************** then your user ID is 12**************
c) For Members holding shares in Physical Form. EVEN Number followed by Folio Number registered with the Company For example, if folio number is S1******** and EVEN is113138 fully paid-up Ordinary Shares) then user ID is 113138S1******** and, If, EVEN is 113139 (partly paid-up Ordinary Shares) then user ID is 113139PV*********
5. Your password details are given below:
(a) If you are already registered for e-voting, then you can use your existing password to login and cast your vote.
(b) If you are using NSDL e-voting system for the first time, you will need to retrieve the ‘initial password’ which was communicated to you. Once you retrieve your ‘initial password’, you need to enter the ‘initial password’ and the system will force you to change your password.
(c) How to retrieve your ‘initial password’?
(i) If your e-mail ID is registered in your demat account or with the Company, your ‘initial password’ is communicated to you on your e-mail ID. Open the e-mail sent to you by NSDL and open the attachment i.e. a .pdf file. The password to open the .pdf file is your 8 digit client ID for NSDL account, last 8 digits of client ID for CDSL account or folio number for shares held in physical form. The .pdf file contains your ‘User ID’ and your ‘initial password’.
(ii) If your e-mail ID is not registered, please follow steps mentioned in process for those shareholders whose e-mail ids are not registered.
6. If you are unable to retrieve or have not received the ‘Initial password’ or have forgotten your password:
(a) Click on ‘Forgot User Details/Password?’ (If you are holding shares in your demat account with NSDL or CDSL) option available on www.evoting.nsdl.com
(b) Click on ‘Physical User Reset Password?’ (If you are holding shares in physical mode) option available on www.evoting.nsdl.com
(c) If you are still unable to get the password by aforesaid two options, you can send a request at [email protected] mentioning your demat account number/folio number, your PAN, your name and your registered address.
(d) Members can also use the OTP (One Time Password) based login for casting the votes on the e-voting system of NSDL.
7. After entering your password, tick on Agree to ‘Terms and Conditions’ by selecting on the check box.
8. Now, you will have to click on ‘Login’ button.
9. After you click on the ‘Login’ button, Home page of e-voting will open.
Step 2: Cast your vote electronically on NSDL e-voting system.
How to cast your vote electronically on NSDL e-voting system?
1. After successful login at Step 1, you will be able to see the Home page of e-voting. Click on e-Voting. Then, click on Active Voting Cycles.
2. After clicking on Active Voting Cycles, you will be able to see all the companies ‘EVEN’ in which you are holding shares and whose voting cycle is in active status.
3. Select ‘EVEN’ of the Company.
4. Now you are ready for e-voting as the Voting page opens.
5. Cast your vote by selecting appropriate options i.e. assent or dissent, verify/modify the number of shares for which you wish to cast your vote and click on ‘Submit’ and also ‘Confirm’ when prompted.
6. Upon confirmation, the message ‘Vote cast successfully’ will be displayed.
7. You can also take the printout of the votes cast by you by clicking on the print option on the confirmation page.
8. Once you confirm your vote on the resolution, you will not be allowed to modify your vote.
Notice
INTEGRATED REPORT & ANNUAL ACCOUNTS 2019-20 | 113TH YEAR446
The instructions for e-voting during the AGM are as under:
1. The procedure for remote e-voting during the AGM is same as the instructions mentioned above for remote e-voting, since the Meeting is being held through VC/OAVM.
2. Only those Members/Shareholders, who will be present in the AGM through VC/OAVM facility and have not cast their vote on the Resolutions through remote e-voting and are otherwise not barred from doing so, shall be eligible to vote on such resolution(s) through e-voting system during the AGM.
General Guidelines for Shareholders:
1. It is strongly recommended not to share your password with any other person and take utmost care to keep your password confidential. Login to the e-voting website will be disabled upon five unsuccessful attempts to key-in the correct password. In such an event, you will need to go through the ‘Forgot User Details/Password?’ or ‘Physical User Reset Password?’ option available on www.evoting.nsdl.com to reset the password.
2. In case of any queries/grievances pertaining to remote e-voting (before the AGM and during the AGM), you may refer to the Frequently Asked Questions (‘FAQs’) for Shareholders and e-voting user manual for Shareholders available in the download section of www.evoting.nsdl.com or call on the toll-free number: 1800-222-990 or send a request at [email protected] or contact Mr. Amit Vishal or Ms. Pallavi Mhatre or Mr. Pratik Bhatt from NSDL at the designated e-mail IDs: [email protected] or [email protected] or [email protected] or at telephone nos.: +91 22 2499 4360/ 4545/4738.
Other Instructions:
i. The Board of Directors has appointed Mr. P. N. Parikh (Membership No. FCS 327) or failing him, Ms. Jigyasa Ved (Membership No. FCS 6488) and failing her, Mr. Mitesh Dhabliwala (Membership No. FCS 8331) of M/s. Parikh & Associates, Practising Company Secretaries, as the Scrutinizer to scrutinize the remote e-voting process before and during the AGM in a fair and transparent manner.
ii. The Scrutinizer shall immediately after the conclusion of voting at the AGM, unblock and count the votes cast during the AGM, and votes cast through remote e-voting and make, not later than 48 hours of conclusion of the AGM, a consolidated Scrutinizer’s Report of the total votes cast in favor or against, if any, to the Chairman or a person authorised by him in writing who shall countersign the same.
iii. The results declared along with the Scrutinizer’s Report shall be placed on the website of the Company www.tatasteel.com and on the website of NSDL www.evoting.nsdl.com immediately after the result is declared by the Chairman or any other person authorised by the Chairman and the same shall be communicated to BSE Limited and National Stock Exchange of India Limited, where the shares of the Company are listed.
By Order of the Board of Directors
Sd/-Parvatheesam Kanchinadham
Company Secretary &Chief Legal Officer (Corporate & Compliance)
ACS: 15921
MumbaiJune 29, 2020
Registered Office:Bombay House, 24, Homi Mody Street, Fort, Mumbai – 400 001Tel: +91 22 6665 8282 CIN: L27100MH1907PLC000260Website: www.tatasteel.com E-mail: [email protected]
447
Statement pursuant to Section 102(1) of the Companies Act, 2013, as amended (‘Act’)The following Statement sets out all material facts relating to Item Nos. 5 and 6 mentioned in the accompanying Notice.
Item No. 5:The Company is required under Section 148 of the Act read with the Companies (Cost Records and Audit) Rules, 2014, as amended from time to time, to have the audit of its cost records for products covered under the Companies (Cost Records and Audit) Rules, 2014 conducted by a Cost Accountant in practice. Based on the documents made available and the discussions held at the meeting of the Audit Committee, it considered and recommended the appointment and remuneration of the Cost Auditor to the Board of Directors (the ‘Board’). The Board has, on the recommendation of the Audit Committee, approved the appointment and remuneration of Messrs Shome & Banerjee, Cost Accountants (Firm Registration Number - 000001) as the Cost Auditor of the Company for the Financial Year 2020-21.
In accordance with the provisions of Section 148(3) of the Act read with Rule 14 of the Companies (Audit and Auditors) Rules, 2014, the remuneration payable to the Cost Auditors as recommended by the Audit Committee and approved by the Board of Directors has to be ratified by the Members of the Company. The Board of Directors has fixed the remuneration payable to the Cost Auditors for Financial Year 2020-21 at ₹20 lakh plus applicable taxes and reimbursement of out of pocket expenses, to cover the cost audit of different divisions including Tubes, Bearings, Ferro Alloys and Minerals Division, Steel Products, Growth Shop, health services, and Kalinganagar plant. Accordingly, the consent of the Members is sought for passing an Ordinary Resolution as set out at Item No. 5 of the Notice for ratification of the remuneration payable to the Cost Auditor of the Company for the Financial Year ending March 31, 2021.
None of the Directors and Key Managerial Personnel of the Company or their respective relatives is concerned or interested in the Resolution mentioned at Item No. 5 of the Notice.
The Board recommends the Resolution set forth in Item No. 5 for the approval of the Members.
Item No. 6:The Members at the 108th AGM of the Company held on August 12, 2015, approved payment of remuneration by way of commission to Non-Executive Directors (‘NEDs’) of the Company, of a sum not exceeding 1% of the net profits of the Company per annum, calculated in accordance with the provisions of Section 198 of the Act, for a period of five years commencing from April 1, 2016 till March 31, 2021. This commission will be distributed amongst all or some of the Non-Executive Directors, taking into consideration parameters such as overall performance of the Company, attendance at Board and Committee meetings, contribution at or other than at meetings etc. in accordance with the directions given by the Board as prescribed under the
Remuneration Policy of Directors, KMPs and Other Employees of the Company.
Further, Regulation 17(6)(a) of the SEBI Listing Regulations authorises the Board of Directors to recommend all fees and compensation (excluding sitting fees), if any, to NEDs, including Independent Directors and the same would require approval of Members at general meeting.
Considering the rich experience, expertise, and insights brought to the Board by the NEDs, it is proposed that, remuneration by way of commission not exceeding 1% of the net profits of the Company per annum, calculated in accordance with provisions of the Act, be continued to be paid and distributed amongst the NEDs of the Company in accordance with the recommendations of the Nomination and Remuneration Committee of the Board and approval by the Board of Directors of the Company, for each financial year commencing April 1, 2021 onwards. The above commission shall be in addition to sitting fees payable to the Director(s) for attending meetings of the Board/Committees or for any other purpose whatsoever as may be decided by the Board.
Details of commission and sitting fees paid to NEDs during the Financial Year 2019-20 is provided in Annexure 5 to the Board’s Report and the Corporate Governance Report.
Since the validity of the earlier resolution passed by the Members at the AGM held on August 12, 2015, expires in the ensuing financial year i.e. 2020-21, approval is sought from Members for paying commission to NEDs as mentioned above.
None of the Directors and Key Managerial Personnel of the Company or their respective relatives, except the NEDs of the Company to the extent of remuneration that may be received by such Directors, is concerned or interested in the Resolution mentioned at Item No. 6 of the Notice.
The Board recommends the Resolution set forth in Item No. 6 for the approval of the Members.
By Order of the Board of Directors
Sd/-Parvatheesam Kanchinadham
Company Secretary &Chief Legal Officer (Corporate & Compliance)
ACS: 15921
MumbaiJune 29, 2020
Registered Office:Bombay House, 24, Homi Mody Street, Fort, Mumbai – 400 001Tel: +91 22 6665 8282 CIN: L27100MH1907PLC000260Website: www.tatasteel.com E-mail: [email protected]
Notice
INTEGRATED REPORT & ANNUAL ACCOUNTS 2019-20 | 113TH YEAR448
Annexure to the NoticeDetails of the Director seeking re-appointment in
the forthcoming Annual General Meeting[Pursuant to Regulations 26(4) and 36(3) of the SEBI (Listing Obligations and Disclosure Requirements) Regulations, 2015,
and Secretarial Standard on General Meeting]
Profile of Mr. Natarajan Chandrasekaran
Mr. Natarajan Chandrasekaran (DIN:00121863) (aged 57 years) was appointed as a Member of the Board effective January 13, 2017 and as Chairman of the Board effective February 7, 2017.
Mr. Chandrasekaran is Chairman of the Board at Tata Sons Private Limited, the holding company and promoter of all Tata Group companies. The Tata Group companies, across 10 business verticals, have aggregate annual
revenues over US $110 billion and a market capitalisation of over US$ 165 billion.
Mr. Chandrasekaran joined the Board of Tata Sons in October 2016 and was appointed Chairman in January 2017. He also chairs the Boards of several group operating companies, including Tata Motors, Tata Power, Indian Hotels and Tata Consultancy Services (TCS) – of which he was Chief Executive from 2009-17.
In addition to his professional career with the Tata Group, he serves as a Director on the Board of India’s central bank, the Reserve Bank of India, since 2016. Mr. Chandrasekaran also serves on the International Advisory Council of Singapore’s Economic Development Board.
Mr. Chandrasekaran is the Chairman of Indian Institute of Management Lucknow as well as the President of the Court at Indian Institute of Science Bengaluru. He is the member of Bocconi’s International Advisory Council and the Co-Chair of India US CEO Forum.
Mr. Chandrasekaran has been awarded several honorary doctorates by leading Universities in India and internationally, including an honorary Doctor of Letters from Macquarie University, Australia,
Doctor of Letters from the Regional Engineering College, Trichy, Tamil Nadu. He is also the author of Bridgital Nation, a ground breaking book on harnessing technological disruptions to bring Indians closer to their dreams.
Mr. Chandrasekaran holds a Bachelor’s degree in Applied Science. He also holds a Master’s degree in Computer Applications from Regional Engineering College, Trichy, Tamil Nadu, India.
Particulars of experience, attributes or skills that qualify the candidate for Board membershipUnder the leadership of Mr. Chandrasekaran, TCS became one of the largest private sector employer in India with the highest retention rate in a globally competitive industry. He shaped TCS’s strong positioning in the emerging digital economy with a suite of innovative digital products and platforms for enterprises, some of which have since scaled into sizeable new businesses.
Mr. Chandrasekaran having been the CEO of TCS and currently serving as the Chairman of Tata Sons Private Limited, brings with him valuable experience in managing the issues faced by large and complex organisations. The Company and the Board will immensely benefit by leveraging his demonstrated leadership capability, general business acumen and knowledge of complex financial and operational issues faced by the Company.
Mr. Chandrasekaran also brings rich experience in various areas of business, technology, operations, societal and governance matters.
Board Meeting Attendance and RemunerationDetails regarding the attendance at the Board Meeting and remuneration paid to Mr. Natarajan Chandrasekaran are provided in the Board’s Report and in the Corporate Governance Report forming part of the Board’s Report.
Shareholding in the CompanyMr. Natarajan Chandrasekaran holds 2,00,000 fully paid-up Ordinary (Equity) Shares of the Company.
449
Directorships in other public limited companies (excluding foreign companies, private companies and Section 8 companies)
Directorships Tata Consultancy Services Limited
Tata Motors Limited
The Indian Hotels Company Limited
The Tata Power Company Limited
Tata Consumer Products Limited (formerly Tata Global Beverages Limited)
Chairman/Member of Committees in other public limited companies (Committees include the statutory committees)
Corporate Social Responsibility CommitteeChairman
Tata Consultancy Services Limited
Nomination and Remuneration CommitteeMember
Tata Consultancy Services Limited
Tata Motors Limited
The Indian Hotels Company Limited
The Tata Power Company Limited
Tata Consumer Products Limited (formerly Tata Global Beverages Limited)
Notice

NOTES

NOTES

NOTES
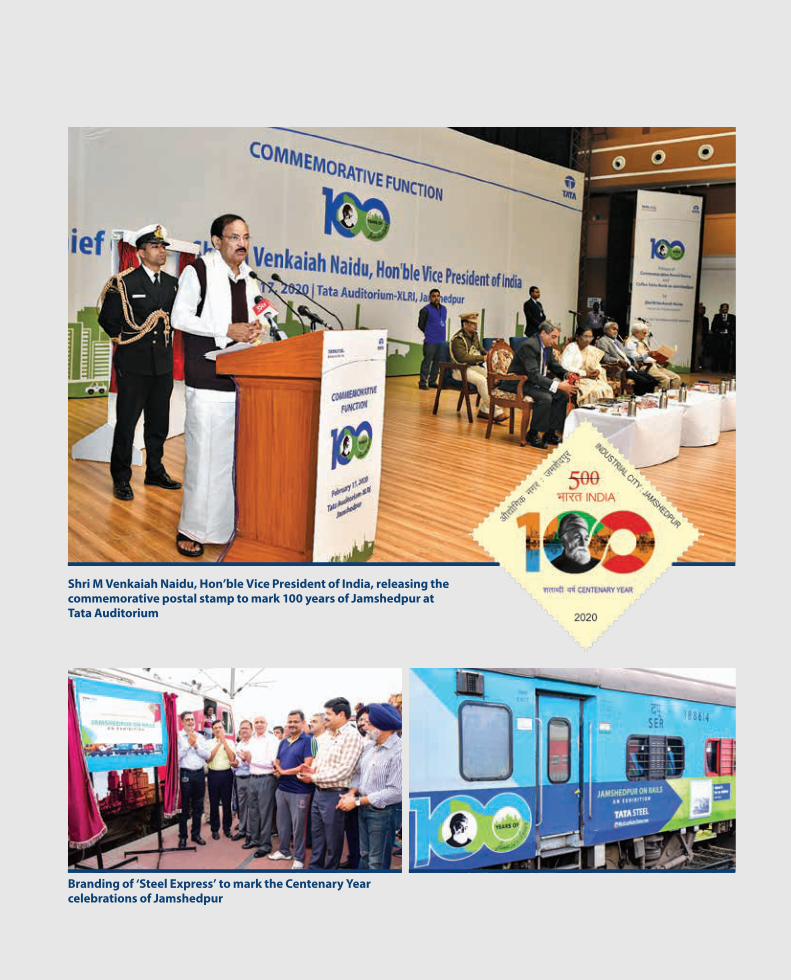
Branding of ‘Steel Express’ to mark the Centenary Year celebrations of Jamshedpur
Shri M Venkaiah Naidu, Hon’ble Vice President of India, releasing the commemorative postal stamp to mark 100 years of Jamshedpur at Tata Auditorium
Tata Steel LimitedBombay House, 24 Homi Mody Street, Fort, Mumbai - 400 001 www.tatasteel.com
/TataSteelLtd
/Tatasteelltd
/tatasteelltd/
/user/Thetatasteel/
/company/tatasteelltd/


