Embed Size (px)
Citation preview

A N N UA L R E P O R T
2020

Salesforce Tower, San Francisco, CA

1
Boston Properties, Inc. (NYSE: BXP) is the largest publicly-traded developer, owner and manager
of Class A office properties in the United States, concentrated in five regions—Boston, Los
Angeles, New York, San Francisco and Washington, DC. The Company is a fully integrated real
estate company, organized as a REIT, that develops, manages and operates a diverse portfolio
of primarily Class A office space. The Company’s portfolio totals 51.2 million square feet and 196
properties, including six properties under construction/redevelopment.
Boston Properties is well known for its development expertise, in-house building management
and responsiveness to tenants’ needs. The Company holds a superior track record of developing
premium Central Business District (CBD) office buildings, successful mixed-use complexes and
build-to-suit projects for a diverse array of creditworthy tenants.
Boston Properties actively works to promote its growth and operations in a sustainable and
responsible manner. The Company has earned nine consecutive Global Real Estate Sustainability
Benchmark (GRESB) Green Stars and the highest GRESB 5-star Rating.
The Company was founded in 1970 and became a public company in 1997.
This Annual Report contains “forward-looking statements” within the meaning of the federal securities laws. See the discussion under “Forward-Looking Statements” in the Form 10-K for matters to be consid-ered in this regard. This Annual Report also contains certain non-GAAP financial measures within the meaning of Regulation G. The calculations of these non-GAAP financial measures may differ from those used by other REITs. The reasons for their use and reconciliations to the most directly comparable GAAP measures are included in the Form 10-K and on the pages immediately following the Form 10-K titled “Disclosures Relating to Non-GAAP Financial Measures.” All data as of 12/31/20 unless noted.
About Boston Properties
In 2020, we demonstrated the resilience and stability of our business during an unexpectedly challenging year due to the COVID-19 pandemic, while at the same time we reinforced our unwavering commitment to serving our clients.
In March 2020, many cities throughout the United States initiated a fulllockdown to mitigate the spread of the virus, resulting in a precipitous dropin economic activity. In addition to tragic human loss, the pandemic signifi-cantly impacted the built environment, causing a halt in construction and development, a pause in leasing activity, and, most devastating , a sudden loss of employment for millions of Americans. In the face of the shutdowns, BXP and many of our clients were required to move to a remote work structure seemingly overnight.
BXP remained resilient through the crisis. We continued our strong rentcollection throughout the year, collecting over 99% of office rents billed. Weexperienced limited rollover of our office clients, demonstrating the attrac-tiveness of our portfolio. Although many of our retail clients experienced hardship due to the shutdowns, we worked with them to provide financialrelief, investing in their future recovery and ultimate success.
One of the most significant achievements for BXP was our ability to lead the industry in health security. Leveraging our property management expertise and consistent with our “tenant first” priorities, we quickly imple-mented additional processes and protocols to ensure the safety and health security of our clients and employees and prepared our buildings for thenew normal. We immediately formed an internal, cross-regional HealthSecurity Task Force comprised of internal and external health security experts and developed a comprehensive Health Security Plan. This was effectively implemented across our portfolio thanks to the hard work anddedication of our property management team. We are proud that, through-out the pandemic, our buildings remained open to our clients.
In addition to our pandemic-focused activities, BXP also accomplishedsignificant business objectives in 2020, including:
• Completed 184 leases comprising 3.7 million square feet with a weighted-average lease term of 8.3 years1,2,
• Delivered 1.8 million square feet of new developments representing $909 million of investment3,
• Continued the construction of properties in our active developmentpipeline, which consists of six properties, totaling 3.7 million square feet2. These projects are 87% pre-leased1,4 and are projected to deliverincremental FFO growth in 2021 and beyond,
To our shareholders
2
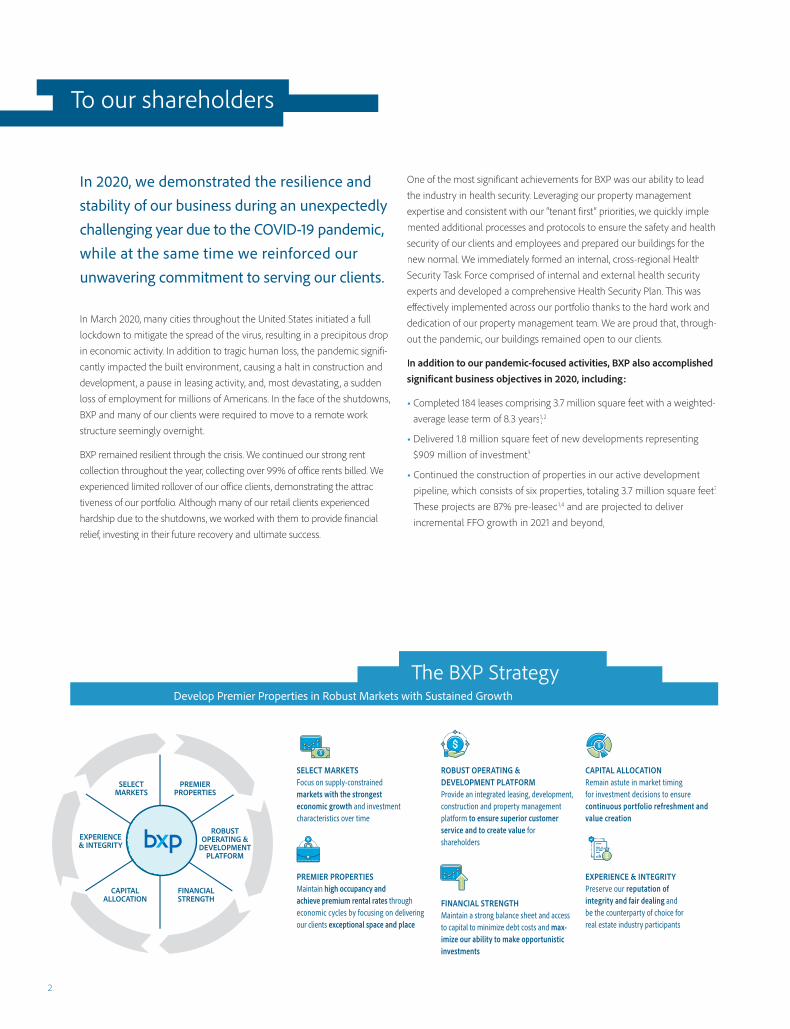
The BXP StrategyDevelop Premier Properties in Robust Markets with Sustained Growth
PREMIERPROPERTIES
SELECTMARKETS
EXPERIENCE& INTEGRITY
ROBUST OPERATING &
DEVELOPMENTPLATFORM
FINANCIALSTRENGTH
CAPITALALLOCATION
SELECT MARKETS Focus on supply-constrained markets with the strongest economic growth and investment characteristics over time
PREMIER PROPERTIES Maintain high occupancy and achieve premium rental rates through economic cycles by focusing on delivering our clients exceptional space and place
ROBUST OPERATING & DEVELOPMENT PLATFORM Provide an integrated leasing, development, construction and property management platform to ensure superior customer service and to create value for shareholders
FINANCIAL STRENGTH Maintain a strong balance sheet and access to capital to minimize debt costs and max-imize our ability to make opportunistic investments
CAPITAL ALLOCATION Remain astute in market timing for investment decisions to ensure continuous portfolio refreshment and value creation
EXPERIENCE & INTEGRITY Preserve our reputation of integrity and fair dealing and be the counterparty of choice for real estate industry participants

“We take great pride in the quality of our work, the customers we serve, the communities we support, the assets we nurture and the trust we develop withinvestors and industry professionals.”
INNOVATIONCOLLABORATION =
Douglas T. Linde, President Owen D. Thomas, Chief Executive Officer
3

The Hub on Causeway Rendering, Boston, MA
BXP MarketsDiversified Across U.S. Markets
27% New York, NY21% San Francisco, CA
8% Reston, VA**
4% Los Angeles, CA5% Washington, DC
Boston, MA35%
4
BXP’s Share of NOI*
BXP Tenant Base Broad Portfolio Balanced Across Sectors
Industry Diversification***
* Percentage of Net Operating Income (NOI) which includes our share of NOI from our consolidated and unconsolidated joint ventures, excluding termination income, for the three months ended December 31, 2020. Refer to disclosures relating to non-GAAP Financial Measures on the pages immediately following the Annual Report on Form 10-K.
** Reston, Virginia is part of BXP’s Washington, DC Region.*** Represents industry diversification percentages based on BXP’s Share of Annualized Rental Obligations as of December 31, 2020. Refer to disclosures relating to non-GAAP Financial Measures
on the pages immediately following the Form 10-K.
26% Media, Technology & Life Sciences
21% Legal Services
16% Financial Services other
8% Other Professional Services
7% Real Estate & Insurance
8% Commercial & Investment Banking
6% Retail
4% Manufacturing
2% Government/Public Administration
2% Other
Reston Gateway Rendering, Reston VA 1
• Acquired a 50% interest in an existing joint venture at Beach Cities Media Center, a 6.4-acre site in El Segundo, California that will support a future development project of approximately 275,000 square feet,
• Added to our growing life sciences practice by forming a joint venture for the future development of a life sciences campus in South San Francisco; expanding our future development opportunities in Waltham, Massachusetts; and continuing our lab conversion redevelopment of 200 West Street inWaltham, Massachusetts that is now 100% leased1 to a biotechnologytenant. Our life sciences practice consists of more than three million square feet2 of existing properties and more than five million square feet2 of potentialnear-term future redevelopment and development opportunities for clientsin the life sciences sector,
• Completed $557 million of non-core asset sales,
• Were recognized as the highest-ranked office real estate company onNewsweek’s America’s Most Responsible Companies 2021 list, and kk
• Earned a top ESG rating in the 2020 Global Real Estate Sustainability Benchmark (GRESB®) assessment. BXP earned a ninth consecutive “GreenStar” recognition and the highest GRESB 5-star Rating , as well as an “A” disclosure score.
Leasing
Despite slower market conditions due to the COVID-19 pandemic, our leasing teams had a productive year in 2020, most notably in our Boston, Massachusetts region and with our Reston, Virginia properties.
We executed 184 leases representing 3.7 million square feet of space in 2020with a weighted-average lease term of 8.3 years1. While this is approximately1,2
60% of our typical annual leasing averages, our teams outperformed office
leasing activity in our markets. Our activity included several large, long-termleases across our portfolio, including 612,000 square feet of leases withMicrosoft and 196,000 square feet with Volkswagen at Reston Town Center in Reston, Virginia and 138,000 square feet with Translate Bio at 200 WestStreet , the new life science redevelopment in Waltham, Massachusetts.
Leasing activity continues to recover slowly across virtually all our markets, and many tenants are signaling a near-term end to their remote work structure as the COVID-19 vaccines allow a safe returnto in-person work.
Development
We continue to support our long-term growth strategy and create value for shareholders through development. During 2020, we fully placed in-service five developments including:
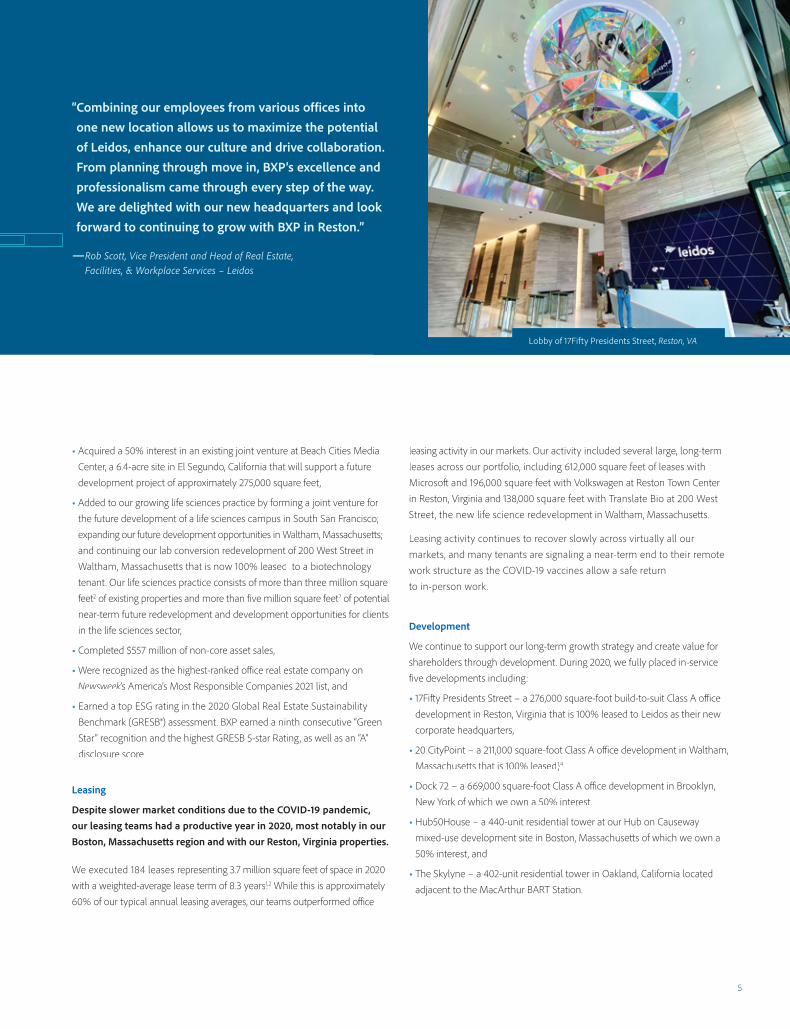
• 17Fifty Presidents Street – a 276,000 square-foot build-to-suit Class A office development in Reston, Virginia that is 100% leased to Leidos as their new corporate headquarters,
• 20 CityPoint – a 211,000 square-foot Class A office development in Waltham, Massachusetts that is 100% leased1,4,
• Dock 72 – a 669,000 square-foot Class A office development in Brooklyn, New York of which we own a 50% interest.
• Hub50House – a 440-unit residential tower at our Hub on Causewaymixed-use development site in Boston, Massachusetts of which we own a50% interest, and
• The Skylyne – a 402-unit residential tower in Oakland, California located adjacent to the MacArthur BART Station.
“ Combining our employees from various offices into one new location allows us to maximize the potential of Leidos, enhance our culture and drive collaboration. From planning through move in, BXP’s excellence and professionalism came through every step of the way. We are delighted with our new headquarters and look forward to continuing to grow with BXP in Reston.”
— Rob Scott, Vice President and Head of Real Estate, Facilities, & Workplace Services – Leidos
Lobby of 17Fifty Presidents Street, Reston, VA
5
$2.6B BXP’s Share of Revenue FY 202010
4.1% Dividend Yield
7.8 Years WeightedAverage Lease Term2,9
90.1% Leased2,8
$978.2M Funds from Operations (FFO) FY 2020651.2M Square Feet
Owned2
196 Properties2
2020 Quick Facts
6
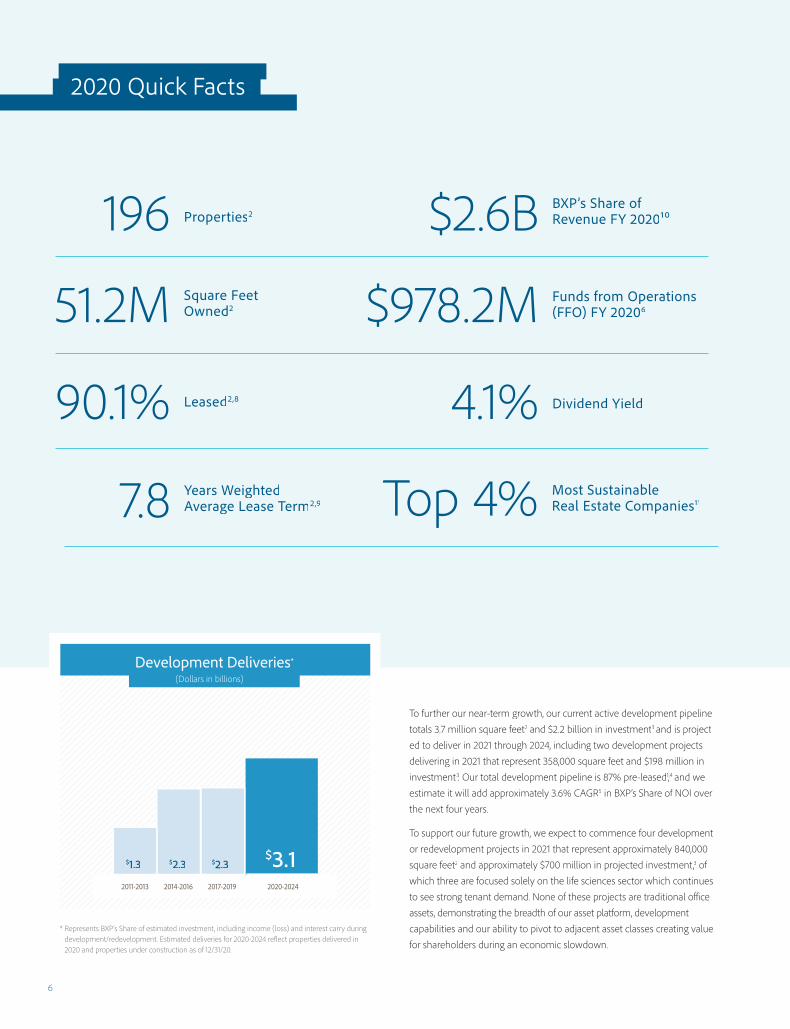
To further our near-term growth, our current active development pipeline totals 3.7 million square feet2 and $2.2 billion in investment3 and is project-ed to deliver in 2021 through 2024, including two development projects delivering in 2021 that represent 358,000 square feet and $198 million ininvestment3. Our total development pipeline is 87% pre-leased3 1, and we1,4
estimate it will add approximately 3.6% CAGR5 in BXP’s Share of NOI over the next four years.
To support our future growth, we expect to commence four developmentor redevelopment projects in 2021 that represent approximately 840,000square feet2 and approximately $700 million in projected investment,3 of which three are focused solely on the life sciences sector which continues to see strong tenant demand. None of these projects are traditional officeassets, demonstrating the breadth of our asset platform, developmentcapabilities and our ability to pivot to adjacent asset classes creating valuefor shareholders during an economic slowdown.
Development Deliveries*
Õ
2020-20242017-20192014-20162011-2013
$3.1$2.3$2.3$1.3
* Represents BXP’s Share of estimated investment, including income (loss) and interest carry during development/redevelopment. Estimated deliveries for 2020-2024 reflect properties delivered in 2020 and properties under construction as of 12/31/20.
(Dollars in billions)
Top 4% Most Sustainable Real Estate Companies11

Hub50House Rendering, Boston, MA
Colorado Center, Santa Monica, CA
7

Acquisitions
During 2020, we acquired a 50% interest in Beach Cities Media Campus,a 6.4-acre site on the Rosecrans Corridor in the El Segundo submarketof Los Angeles, California in partnership with Continental Development Corporation (CDC), a leading El Segundo owner and developer. The site isfully entitled to support the future development of approximately 275,000square feet of Class A creative office space, and this acquisition underlinesour commitment to grow our portfolio in the Los Angeles Region and our relationship with CDC.
We also formed a joint venture with a neighboring operator in SouthSan Francisco, California by contributing the three existing office propertiesin our Gateway Commons portfolio and developable land. Our partnercontributed existing lab, office and amenity buildings, and additional land.
With the opportunity for future development, the joint venture willultimately control a well-located life sciences campus with approximately twomillion square feet upon completion of the master development plan. Weexpect to commence our first development project at the portfolio in 2021.
Finally, we entered into an agreement with an existing joint venture partner for the future development of a 1.2 million-square-foot, multi-phase site inWaltham, Massachusetts, a popular market in the Boston area for leading and emerging companies in the life sciences, biotechnology, and technologysectors. The agreement allows for the phased development of office and lab properties across 41-acres and builds on BXP’s current footprint of 4.3million square feet of Class A Office and lab properties in this submarket.We anticipate additional developments starts in 2021 targeted at the life sciences sector, utilizing our land and properties in suburban Boston, Massachusetts and South San Francisco, California.
m understands the complexities of oure space needs as a growing biotech, and
pressed by their professional, forward-roach. We are excited to call 200 West
eadquarters as we continue our mission new class of potentially transformative
cine to treat or prevent debilitating oring diseases.”
hief Executive Officer –r Translate Bio
200 West Street Rendering, Waltham, MA
751 Gateway Rendering, South San Francisco, CA
“The BBXP teamlab annd officewe weere impthinkiing appStreett our heto devvelop amRNAA mediclilife-thhrhreaten
—Ron RRRenaud, Ch
8

Salesforce Tower, San Francisco, CA
“The workplace continues to play an important role in the future of work. Ouremployees have been telling us that they do want to return to the office withmore flexibility for key meetings, collaboration and events. When it’s safe to do so, we’re looking forward to proudly reopening our doors.”
—Michele Schneider, SVP of Global Workplace Services – Salesforce.
9
Dispositions
We continuously upgrade our portfolio and raise additional capital by sell-ing non-core or stabilized assets at attractive prices. In 2020 we completed a significant number of asset sales focused in our suburban portfolios and Washington, DC market. More specifically, we sold 455,000 square-feet of Capital Gallery in Washington, DC CBD to the Smithsonian Institution and sold New Dominion Technology Park in Herndon, Virginia. Additionally,we completed the sale of our 50% interest in Annapolis Junction Building8 and two land parcels at the Annapolis Junction office park in suburbanMaryland, and sold a land parcel in Marlborough, Massachusetts.
Overall, our asset sales totaled $538 million in aggregate net proceeds. As we move into the new year, we anticipate a similar level of disposition activity.
Balance Sheet
Our balance sheet remains strong with $3.2 billion of liquidity as of year-end 2020.7 During the year, we focused on capital raising to further 7
strengthen our balance sheet. Also in 2020, we completed a $1.25 billionbond offering of 3.250% unsecured senior notes due in 2031.
In early 2021, we completed the redemption of our 4.125% unsecuredbonds maturing in May 2021 and completed an $850 million green bondoffering of 2.550% senior unsecured notes maturing in 2032. This markedour third green bond offering.
We have significant liquidity and access in size, at attractive terms, to theunsecured and secured debt markets if needed to fund our existing devel-opment pipeline. Also, we are formalizing relationships with large-scale private equity partners to help us fund additional acquisition opportunitiesas they become available.
We maintain the highest investment grade ratings in our sector withStandard & Poor’s of BBB+ and Moody’s of Baa1.

Atlantic Wharf, 290 Congress Street, Boston, MA
—Scott Couto, Head of North AmericaColumbia Threadneedle Investments
888 Boylston Street, Boston, MA
0 4
Environmental, Social and Governance (ESG) Leadership
Environmental
BXP’s sustainability strategy is to conduct our business in a manner thatcontributes to positive economic, social, and environmental outcomes for our customers, shareholders, employees, and the communities we serve. To that end, we deliver efficient, healthy, and productive workspaces while simultaneously mitigating operational costs and potential external impacts of energy, water, waste, and greenhouse gas emissions.
BXP continues to be recognized as an industry leader in sustainability. In 2020, we earned a top ESG rating in the 2020 Global Real Estate Sustain-ability Benchmark (GRESB) assessment. BXP earned a ninth consecutive “Green Star” recognition and the highest GRESB 5-star Rating , as well as an “A” disclosure score.
BXP was also recognized as the highest ranked office REIT on Newsweek’s kk2021 America’s Most Responsible Companies list. We ranked second among all property companies and 56th overall out of the 400 companies included on this year’s list.
With the emergence of health security as a key focus in 2020, we continued to demonstrate our leadership in this area as we implemented our Health Security Plan and adopted measures to address the public health crisisbrought on by COVID-19.
Social
Boston Properties is widely recognized for our entrepreneurial spiritcoupled with a focus on creating long-term value. We have an established reputation for excellence and integrity, and these core values are inherent in our culture and our strategy and contribute to achieving our business
10
Environmental, Social and Governance (ESG)
“Our new office at 290 Congress Street will provide “our employees and our business with the kind of modern, engaging and efficient space that will allow us to develop the optimal work environment for the future. We’re excited to welcome employees to this dynamic new space and are delighted to rein-force our engagement with, and commitment to, this world-class city.”
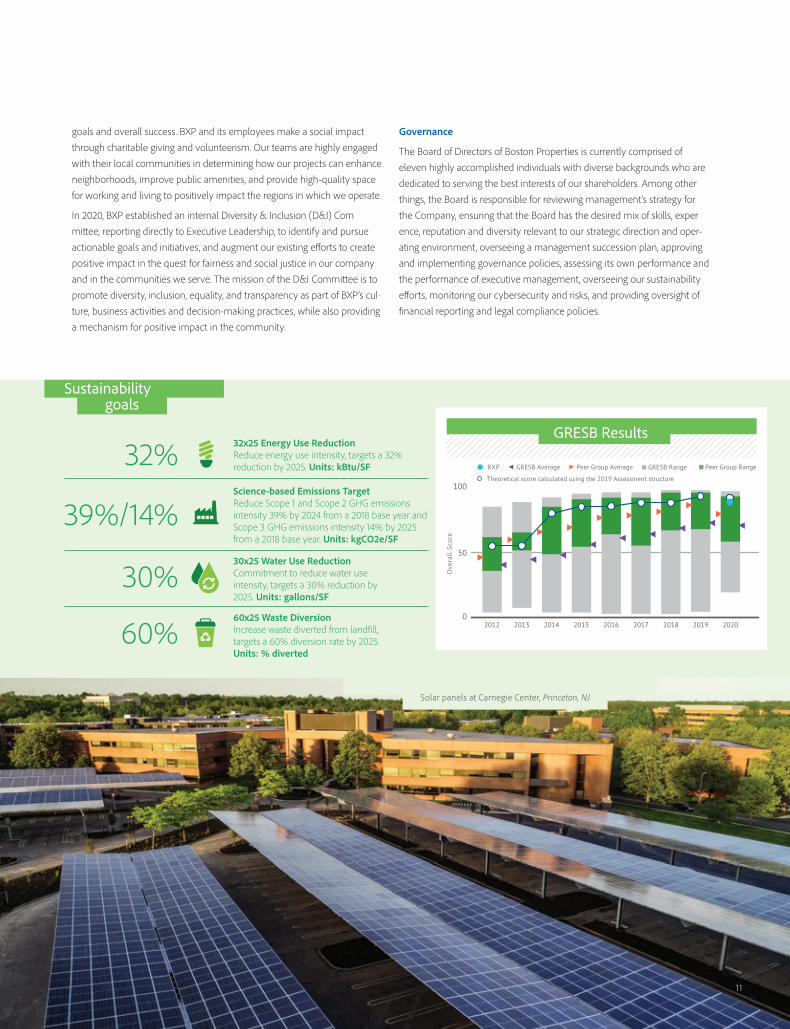
Solar panels at Carnegie Center, Princeton, NJ
GRESB Results
Theoretical score calculated using the 2019 Assessment structure
BXP GRESB Average Peer Group Average GRESB Range Peer Group Range
Ove
rall
Sco
re
100
50
02012 2013 2014 2015 2016 2017 2018 20202019
Science-based Emissions TargetReduce Scope 1 and Scope 2 GHG emissions intensity 39% by 2024 from a 2018 base year and Scope 3 GHG emissions intensity 14% by 2025 from a 2018 base year. Units: kgCO2e/SF
39%/14%
30%30x25 Water Use ReductionCommitment to reduce water use intensity, targets a 30% reduction by 2025. Units: gallons/SF
32% 32x25 Energy Use ReductionReduce energy use intensity, targets a 32% reduction by 2025. Units: kBtu/SF
60x25 Waste DiversionIncrease waste diverted from landfill, targets a 60% diversion rate by 2025. Units: % diverted
60%
Sustainability goals
goals and overall success. BXP and its employees make a social impact through charitable giving and volunteerism. Our teams are highly engaged with their local communities in determining how our projects can enhance neighborhoods, improve public amenities, and provide high-quality spacefor working and living to positively impact the regions in which we operate.
In 2020, BXP established an internal Diversity & Inclusion (D&I) Com-mittee, reporting directly to Executive Leadership, to identify and pursue actionable goals and initiatives, and augment our existing efforts to create positive impact in the quest for fairness and social justice in our company and in the communities we serve. The mission of the D&I Committee is to promote diversity, inclusion, equality, and transparency as part of BXP’s cul-ture, business activities and decision-making practices, while also providinga mechanism for positive impact in the community.
Governance
The Board of Directors of Boston Properties is currently comprised of eleven highly accomplished individuals with diverse backgrounds who are dedicated to serving the best interests of our shareholders. Among other things, the Board is responsible for reviewing management’s strategy for the Company, ensuring that the Board has the desired mix of skills, experi-ence, reputation and diversity relevant to our strategic direction and oper-ating environment, overseeing a management succession plan, approving and implementing governance policies, assessing its own performance andthe performance of executive management, overseeing our sustainabilityefforts, monitoring our cybersecurity and risks, and providing oversight of financial reporting and legal compliance policies.
1 1
2019 A/R BXP
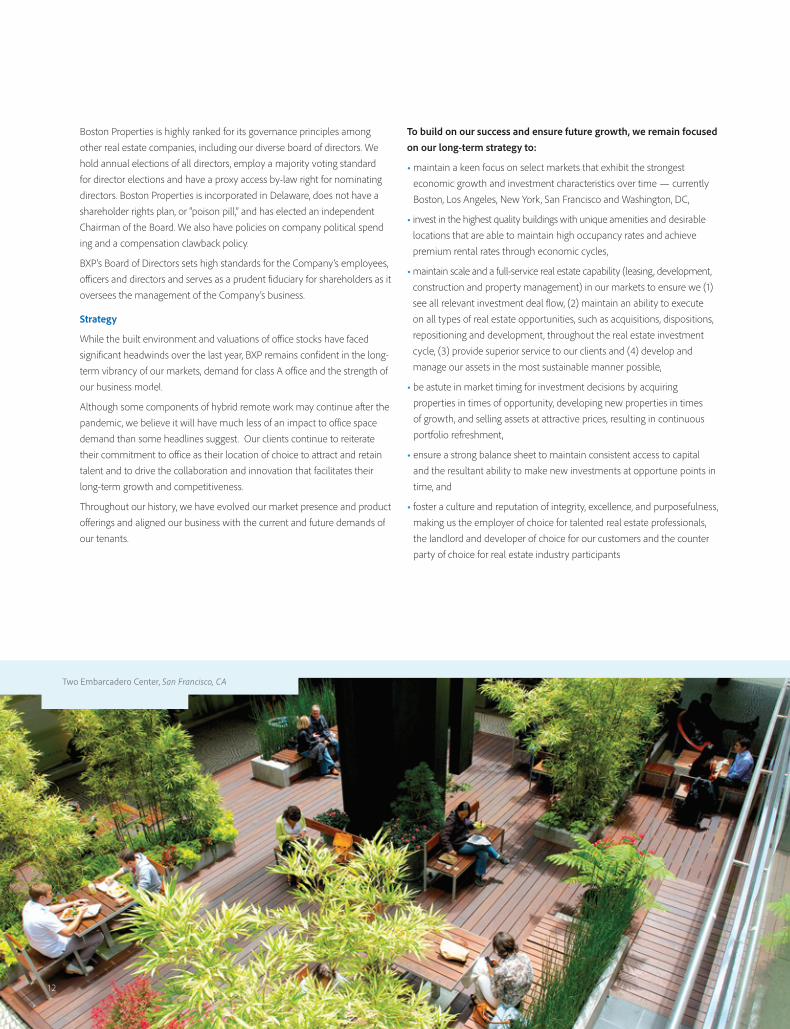
Two Embarcadero Center, San Francisco, CA
Boston Properties is highly ranked for its governance principles among other real estate companies, including our diverse board of directors. We hold annual elections of all directors, employ a majority voting standard for director elections and have a proxy access by-law right for nominating directors. Boston Properties is incorporated in Delaware, does not have a shareholder rights plan, or “poison pill,” and has elected an independent Chairman of the Board. We also have policies on company political spend-ing and a compensation clawback policy.
BXP’s Board of Directors sets high standards for the Company’s employees,officers and directors and serves as a prudent fiduciary for shareholders as itoversees the management of the Company’s business.
Strategy
While the built environment and valuations of office stocks have faced significant headwinds over the last year, BXP remains confident in the long-term vibrancy of our markets, demand for class A office and the strength of our business model.
Although some components of hybrid remote work may continue after the pandemic, we believe it will have much less of an impact to office space demand than some headlines suggest. Our clients continue to reiterate their commitment to office as their location of choice to attract and retaintalent and to drive the collaboration and innovation that facilitates their long-term growth and competitiveness.
Throughout our history, we have evolved our market presence and productofferings and aligned our business with the current and future demands of our tenants.
To build on our success and ensure future growth, we remain focusedon our long-term strategy to:
• maintain a keen focus on select markets that exhibit the strongest economic growth and investment characteristics over time — currently Boston, Los Angeles, New York, San Francisco and Washington, DC,
• invest in the highest quality buildings with unique amenities and desirablelocations that are able to maintain high occupancy rates and achievepremium rental rates through economic cycles,
• maintain scale and a full-service real estate capability (leasing, development, construction and property management) in our markets to ensure we (1)see all relevant investment deal flow, (2) maintain an ability to execute on all types of real estate opportunities, such as acquisitions, dispositions, repositioning and development, throughout the real estate investmentcycle, (3) provide superior service to our clients and (4) develop andmanage our assets in the most sustainable manner possible,
• be astute in market timing for investment decisions by acquiringproperties in times of opportunity, developing new properties in timesof growth, and selling assets at attractive prices, resulting in continuous portfolio refreshment,
• ensure a strong balance sheet to maintain consistent access to capital and the resultant ability to make new investments at opportune points in time, and
• foster a culture and reputation of integrity, excellence, and purposefulness, making us the employer of choice for talented real estate professionals, the landlord and developer of choice for our customers and the counter-party of choice for real estate industry participants.
1 2
Looking Ahead
By maintaining our focus on the execution of this strategy, we are confident in BXP’s future prospects and enthusiastic about the Company’s growthpotential at this unique point in time.
• Income Growth
BXP’s potential for income growth in both the short- and long-term isreadily apparent. While our office revenues remained resilient in 2020, our ancillary income streams from our parking, hotel and retail clients, all of which were devastated by the lockdowns, contributed to a 10% decline in FFO year-over-year. As we enter 2021, we expect to see a clear path to the 6
recovery of our variable income streams as the vaccine rollout continues,the economy begins to reopen and individuals return to offices, restaurants, shops, theaters and travel.
Additionally, BXP has a stable office portfolio. We have collected over 99%of office rents billed throughout the pandemic, demonstrating the quality of our buildings and office clients. Only 7% of our leases roll over in 2021, andwe experienced 20% positive mark-to-market in rental rates on average,the last five years providing a cushion for potential decreases in market rent caused by the pandemic. We have also signed over 600,000 square feet of leases on space vacant that will experience rent commencement in 2021.
Finally, we have significant external growth drivers which are readily quantifiable, most notably in our current development and redevelopment pipeline which represents $2.2 billion of investment3 and is projected to add3.6% CAGR5 in BXP’s Share of NOI10 over the next four years. We anticipate
additional development starts in 2021 to align with strong demand from life sciences tenants in our markets. We will also experience substantial income growth in our recently delivered urban apartment complexes that are not fully leased.
• Business Model
The core strategic principal for BXP is to build, acquire, own and manage high-quality properties. Our portfolio is dominated by Class A urbanassets, many among the leading buildings in their respective markets suchas Salesforce Tower, 767 Fifth Avenue, 200 Clarendon Street and Kendall Center. High-quality assets like ours perform better than lower class properties in times of recession, as certain customers look to upgrade their space. We are already seeing a higher market share of leasing tour activity in many of our premier assets.
Another hallmark of our strategy is market selection as we believe in the long-term health and attractiveness of U. S. coastal gateway markets. Though the pandemic has created challenging economic conditions for these large cities, we remain confident in the attractiveness of our target markets due to the clustering of knowledge workers and increased barriers to new supply. The cities where we currently and aspire to operate, Boston, New York, San Francisco, Los Angeles, Washington, DC and Seattle, have unmatched educational, cultural and civic resources which attract the leading clusters of knowledge workers in the U.S., particularly in computer science and life sciences. Future job growth and office demand is going to be driven in the technology and life sciences fields where our target markets have a distinct clustering advantage. Creating value in office real estate as
13
Reston Gateway Rendering, Reston VA 1
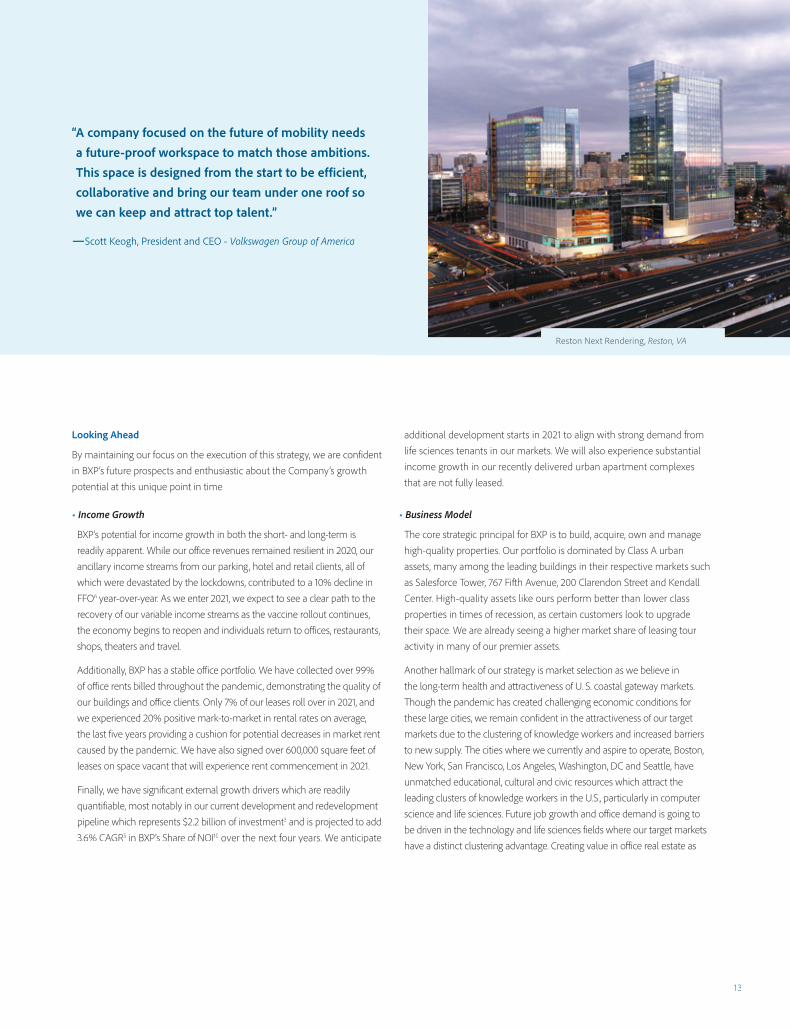
“A company focused on the future of mobility needs “a future-proof workspace to match those ambitions. This space is designed from the start to be efficient, collaborative and bring our team under one roof so we can keep and attract top talent.”
—Scott Keogh, President and CEO - Volkswagen Group of America
Reston Next Rendering, Reston, VA
an owner requires a combination of favorable demand, rental growth and barriers to supply. In addition to favorable demand trends, our markets havebuilt-in obstacles to new development including a dearth of available sites, difficulty in permitting, anti-development local ordinances and cost andcomplexity in construction. This combination has led to favorable rental rate growth over time.
Finally, BXP has a fully integrated operating capability and proven quality of execution in each of our regions that continues to be a hallmark of our business model. Our leasing in 2020 outperformed market averages. We are an industry leader in ESG performance. We continue to have the advantagesof scale in accessing new investment opportunities and attracting and retaining talent.
• Value Creation
BXP has the balance sheet and access to capital to take advantage of opportunities to create additional shareholder value. We have a pipeline of potential new opportunities in our core markets and in Seattle and continue to look for investments that require leasing and/or redevelop-ment to take advantage of our operating skills and create higher returns.We also intend to invest more aggressively into life sciences. In early 2021,we announced three new life sciences development projects totaling approximately 800,000 square feet and $520 million of investment3 with a projected initial unleveraged cash yield of approximately 8%.2 Lastly, weown or control land aggregating over 16 million2 square feet of potentialoffice, lab, and residential developments, which we will commence as dictated by market conditions.
Organization
At Boston Properties we are fortunate to have a very stable, talented,and dedicated team of professionals. We take great pride in the qualityof our work, the customers we serve, the communities we support, theassets we nurture and the trust we develop with investors and industryprofessionals. Many of our professionals are recognized leaders in thereal estate industry and their local communities, and many of BostonProperties’ activities have earned industry accolades. We are deeplyappreciative of our team’s expertise, loyalty, and commitment; withoutwhich we could not accomplish all that we do.
In 2021, our Executive Vice President and head of the Washington, DCRegion, Peter Johnston, will retire after 33 years with BXP. We would like tothank Peter for his significant contributions and dedication to the Companythroughout his tenure and wish him the best in his well-earned retirement.
We would like to thank all of our colleagues at Boston Properties, as well asour Board of Directors, for all of their contributions in 2020, and importantly,we would also like to thank you, our shareholders, for your continued trustand support.
We are confident BXP will emerge from the COVID-19 pandemic withstrength and momentum given our portfolio quality, income stability,growth potential, access to capital and highly engaged management team.
We look forward to an exciting year of recovery, accomplishments andgrowth in 2021.
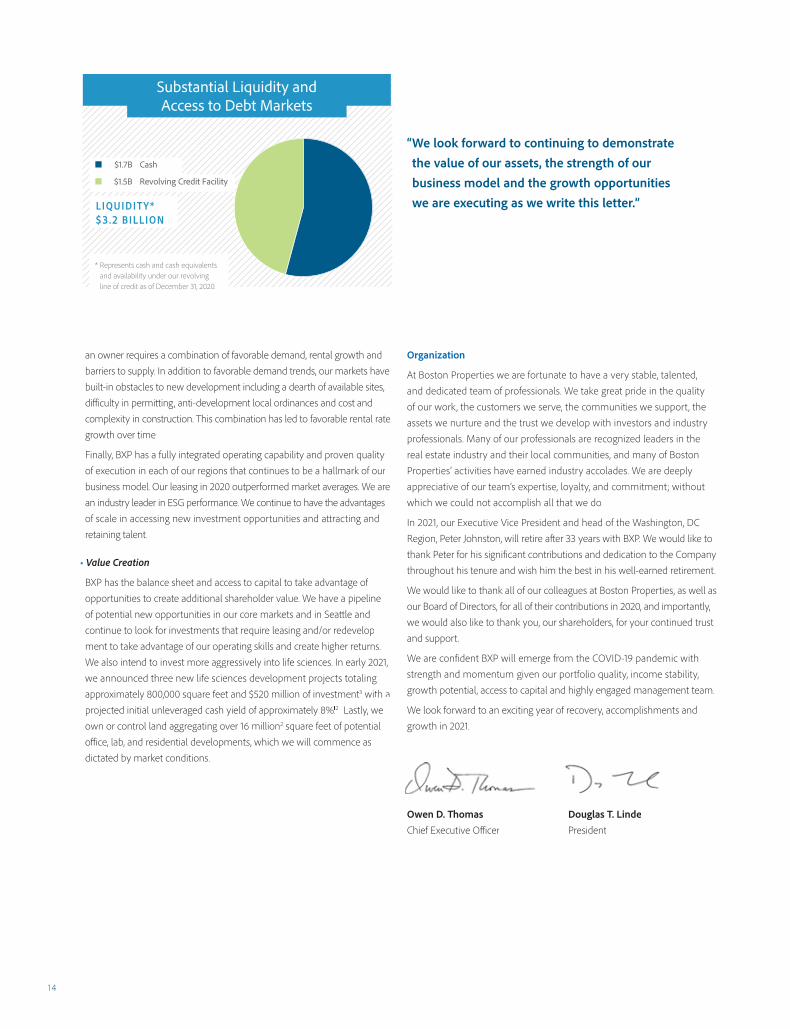
Substantial Liquidity and Access to Debt Markets
LIQUIDITY* $3.2 BILLION
$1.7B Cash
$1.5B Revolving Credit Facility
Owen D. ThomasChief Executive Officer
Douglas T. LindePresident
14
* Represents cash and cash equivalents and availability under our revolving line of credit as of December 31, 2020.
“ We look forward to continuing to demonstrate the value of our assets, the strength of our business model and the growth opportunities we are executing as we write this letter.”
2019 B XP B O STON PROPERTIE S
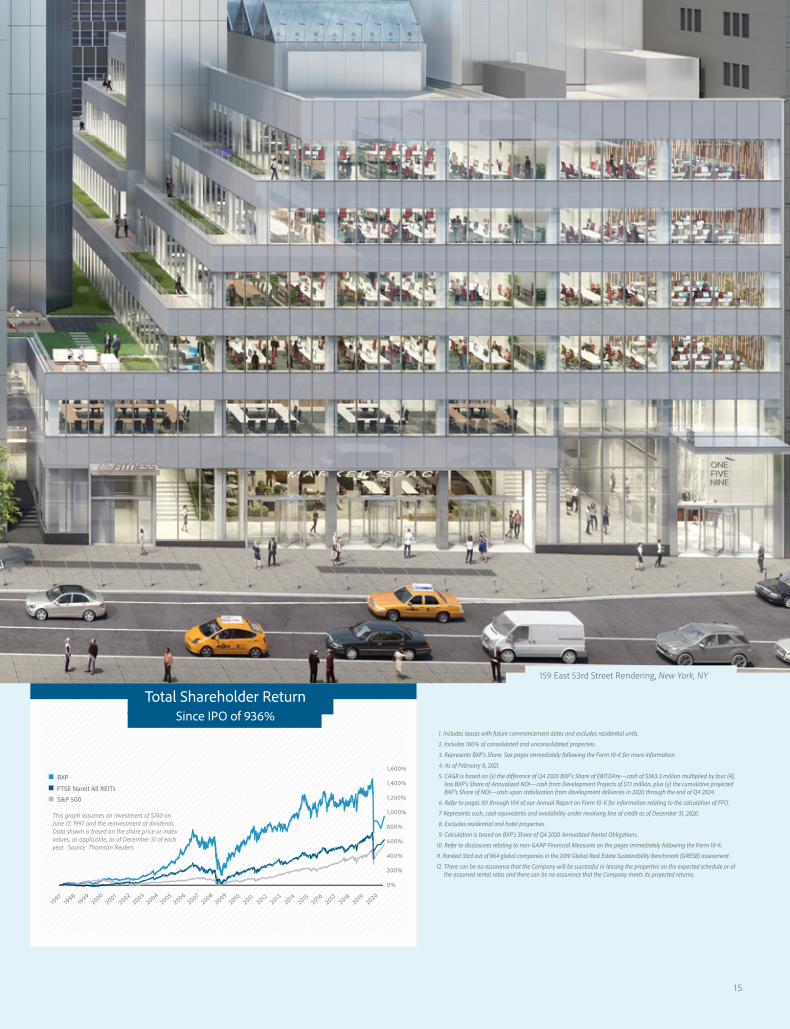
159 East 53rd Street Rendering, New York, NY
1,600%
1,400%
1,200%
1,000%
800%
600%
400%
200%
0%
1997
1998
1999
20002001
20022003
20042005
20062007
20082009
20102011
20122013
20142015
20162017
20182020
2019
BXP
S&P 500
FTSE Nareit All REITs
This graph assumes an investment of $100 on June 17, 1997 and the reinvestment of dividends. Data shown is based on the share price or index values, as applicable, as of December 31 of each year. Source: Thomson Reuters
1. Includes leases with future commencement dates and excludes residential units.
2. Includes 100% of consolidated and unconsolidated properties.
3. Represents BXP’s Share. See pages immediately following the Form 10-K for more information.
4. As of February 8, 2021.
5. CAGR is based on (x) the difference of Q4 2020 BXP’s Share of EBITDAre—cash of $363.3 million multiplied by four (4), less BXP’s Share of Annualized NOI—cash from Development Projects of $7.1 million, plus (y) the cumulative projected BXP’s Share of NOI—cash upon stabilization from development deliveries in 2020 through the end of Q4 2024.
6. Refer to pages 101 through 104 of our Annual Report on Form 10-K for information relating to the calculation of FFO.
7. Represents cash, cash equivalents and availability under revolving line of credit as of December 31, 2020.
8. Excludes residential and hotel properties.
9. Calculation is based on BXP’s Share of Q4 2020 Annualized Rental Obligations.
10. Refer to disclosures relating to non-GAAP Financial Measures on the pages immediately following the Form 10-K.
11. Ranked 33rd out of 964 global companies in the 2019 Global Real Estate Sustainability Benchmark (GRESB) assessment.
12. There can be no assurance that the Company will be successful in leasing the properties on the expected schedule or at the assumed rental rates and there can be no assurance that the Company meets its projected returns.
Total Shareholder Return Since IPO of 936%
15

BOSTON PROPERTIES
Officers
16
BOSTON PROPERTIES
Board of Directors
Owen D. ThomasChief Executive Officer andDirector
Douglas T. LindePresident and Director
Kelly A. AyotteDirector and Chair ofCompensation Committee
Bruce W. DuncanDirector
Karen E. DykstraDirector
Joel I. KleinChairman of the Board
William H. Walton, IIIDirector
Matthew J. LustigDirector and Chair of Nominating and CorporateGovernance Committee
David A. TwardockDirector and Chair of Audit Committee
Diane J. HoskinsDirector and Chair of theSustainability Committee
Carol B. EinigerDirector
Executive Officers
Owen D. ThomasChief Executive Officer
Douglas T. LindePresident
Raymond A. RitcheySenior ExecutiveVice President
Michael E. LaBelleExecutive VicePresident, ChiefFinancial Officerand Treasurer
Peter D. JohnstonExecutive Vice President, —Washington, DC Region
Bryan J. KoopExecutive Vice President,—Boston Region
Robert E. PesterExecutive Vice President, —San Francisco Region
John F. PowersExecutive Vice President,—New York Region
Senior Officers
Peter BackSenior Vice President Construction—San Francisco, CA
John K. BrandberghSenior Vice President Leasing—New York, NY
Frank D. BurtSenior Vice President, Chief Legal Officer and Secretary
Steven R. ColvinSenior Vice PresidentProperty Management—San Francisco, CA
Frederick J. DeAngelis Senior Vice Presidentand Senior Counsel—Boston, MA
Rodney C. Diehl Senior Vice President Leasing—San Francisco, CA
Donna D. Garesché Senior Vice President and Chief Human Resources Officer
Amy C. Gindel Senior Vice President Finance and Planning
Thomas L. Hill Senior Vice President Property Management—New York, NY
Karen D. HoldridgeSenior Vice PresidentRegional General Counsel—New York, NY
Eric G. KevorkianSenior Vice Presidentand Senior Corporate Counsel
Jonathan LangeSenior Vice President—Los Angeles Region
Andrew D. LevinSenior Vice President Leasing—New York, NY
James J. MagaldiSenior Vice PresidentFinance and Capital Markets
Yuchong C. McDonoughSenior Vice President, Regional General Counsel—Washington, DC
Laura D. McNultySenior Vice PresidentProperty Management—Washington, DC
David MillerSenior Vice PresidentConstruction—Washington, DC
Richard T. MonopoliSenior Vice PresidentDevelopment—New York, NY
Patrick MulvihillSenior Vice PresidentLeasing—Boston, MA
Peter OtteniSenior Vice President Development—Washington, DC
David C. ProvostSenior Vice PresidentDevelopment—Boston, MA
Jonathan S. RandallSenior Vice PresidentConstruction—Boston, MA
Robert A. SchubertSenior Vice PresidentConstruction—New York, NY
Peter V. SeeSenior Vice PresidentProperty Management—Boston, MA
Christine M. ShenSenior Vice Presidentand Regional GeneralCounsel—San Francisco, CA
Kenneth F. SimmonsSenior Vice President Development —Washington, DC
Jake StromanSenior Vice President Leasing—Washington, DC
Madeleine C. TiminSenior Vice President and Regional General Counsel —Boston, MA
Michael R. WalshSenior Vice Presidentand Chief Accounting Officer
James J. Whalen, Jr.Senior Vice Presidentand Chief InformationTechnology Officer

UNITED STATESSECURITIES AND EXCHANGE COMMISSION
Washington, D.C. 20549
FORM 10-K☒ ANNUAL REPORT PURSUANT TO SECTION 13 OR 15(d) OF THE SECURITIES EXCHANGE ACT OF 1934
For the fiscal year ended December 31, 2020OR
☐ TRANSITION REPORT PURSUANT TO SECTION 13 OR 15(d) OF THE SECURITIES EXCHANGE ACT OF 1934For the transition period from to
Commission File Number: 1-13087 (Boston Properties, Inc.)Commission File Number: 0-50209 (Boston Properties Limited Partnership)
BOSTON PROPERTIES, INC.BOSTON PROPERTIES LIMITED PARTNERSHIP
(Exact name of Registrants as specified in its charter)
Boston Properties, Inc. Delaware 04-2473675(State or other jurisdiction of incorporation or
organization)(I.R.S. Employer Identification
Number)
Boston Properties Limited Partnership Delaware 04-3372948
(State or other jurisdiction of incorporation ororganization)
(I.R.S. Employer IdentificationNumber)
Prudential Center, 800 Boylston Street, Suite 1900, Boston, Massachusetts 02199-8103(Address of principal executive offices) (Zip Code)
(617) 236-3300(Registrants’ telephone number, including area code)
Securities registered pursuant to Section 12(b) of the Act:
Registrant Title of each class Trading Symbol(s)Name of each
exchange on which registered
Boston Properties, Inc. Common Stock, par value $.01 per share BXP New York Stock Exchange
Boston Properties, Inc.
Depository Shares Each Representing1/100th of a share
BXP PRB New York Stock Exchangeof 5.25% Series B CumulativeRedeemable Preferred Stock, par value
$0.01 per share
Securities registered pursuant to Section 12(g) of the Act:Registrant Title of each class
Boston Properties Limited Partnership Units of Limited Partnership
Indicate by check mark if the registrant is a well-known seasoned issuer, as defined in Rule 405 of the Securities Act.
Boston Properties, Inc.: Yes ☒ No ☐ Boston Properties Limited Partnership: Yes ☒ No ☐
Indicate by check mark if the registrant is not required to file reports pursuant to Section 13 or Section 15(d) of the Act.
Boston Properties, Inc.: Yes ☐ No ☒ Boston Properties Limited Partnership: Yes ☐ No ☒
Indicate by check mark whether the registrant (1) has filed all reports required to be filed by Section 13 or 15(d) of the SecuritiesExchange Act of 1934 during the preceding 12 months (or for such shorter period that the registrant was required to file such reports), and(2) has been subject to such filing requirements for the past 90 days.
Boston Properties, Inc.: Yes ☒ No ☐ Boston Properties Limited Partnership: Yes ☒ No ☐
Indicate by check mark whether the registrant has submitted electronically every Interactive Data File required to be submitted pursuantto Rule 405 of Regulation S-T (§232.405 of this chapter) during the preceding 12 months (or for such shorter period that the registrant wasrequired to submit such files).
Boston Properties, Inc.: Yes ☒ No ☐ Boston Properties Limited Partnership: Yes ☒ No ☐
Indicate by check mark whether the registrant is a large accelerated filer, an accelerated filer, a non-accelerated filer, a smaller reportingcompany or an emerging growth company. See the definitions of “large accelerated filer,” “accelerated filer,” “smaller reporting company,”and “emerging growth company” in Rule 12b-2 of the Exchange Act.
Boston Properties, Inc.:Large Accelerated Filer ☒ Accelerated Filer ☐ Non-accelerated Filer ☐ Smaller Reporting Company ☐Emerging Growth Company ☐
Boston Properties Limited Partnership:Large Accelerated Filer ☐ Accelerated Filer ☐ Non-accelerated Filer ☒ Smaller Reporting Company ☐Emerging Growth Company ☐
If an emerging growth company, indicate by check mark if the registrant has elected not to use the extended transition period forcomplying with any new or revised financial accounting standards pursuant to Section 13(a) of the Exchange Act.
Boston Properties, Inc. ☐ Boston Properties Limited Partnership ☐
Indicate by check mark whether the registrant has filed a report on and attestation to its management’s assessment of the effectivenessof its internal control over financial reporting under Section 404(b) of the Sarbanes-Oxley Act (15 U.S.C. 7262(b)) by the registered publicaccounting firm that prepared or issued its audit report.
Boston Properties, Inc. ☒ Boston Properties Limited Partnership ☒
Indicate by check mark whether the registrant is a shell company (as defined in Rule 12b-2 of the Act).
Boston Properties, Inc.: Yes ☐ No ☒ Boston Properties Limited Partnership: Yes ☐ No ☒
As of June 30, 2020, the aggregate market value of the 155,311,291 shares of Common Stock held by non-affiliates of BostonProperties, Inc. was $14,037,034,481 based upon the last reported sale price of $90.38 per share on the New York Stock Exchange on June30, 2020. (For this computation, Boston Properties, Inc. has excluded the market value of all shares of Common Stock reported asbeneficially owned by executive officers and directors of Boston Properties, Inc.; such exclusion shall not be deemed to constitute anadmission that any such person is an affiliate of Boston Properties, Inc.).
As of February 22, 2021, there were 155,805,646 shares of Common Stock of Boston Properties, Inc. outstanding.
Because no established market for common units of limited partnership of Boston Properties Limited Partnership exists, there is nomarket value for such units.
Certain information contained in Boston Properties Inc.’s Proxy Statement relating to its Annual Meeting of Stockholders to be heldMay 20, 2021 is incorporated by reference in Items 10, 11, 12, 13 and 14 of Part III. Boston Properties, Inc. intends to file such ProxyStatement with the Securities and Exchange Commission not later than 120 days after the end of its fiscal year ended December 31, 2020.
EXPLANATORY NOTEThis report combines the Annual Reports on Form 10-K for the fiscal year ended December 31, 2020 of Boston
Properties, Inc. and Boston Properties Limited Partnership. Unless stated otherwise or the context otherwiserequires, references to “BXP” mean Boston Properties, Inc., a Delaware corporation and real estate investment trust(“REIT”), and references to “BPLP” and the “Operating Partnership” mean Boston Properties Limited Partnership, aDelaware limited partnership. BPLP is the entity through which BXP conducts substantially all of its business andowns, either directly or through subsidiaries, substantially all of its assets. BXP is the sole general partner and alsoa limited partner of BPLP. As the sole general partner of BPLP, BXP has exclusive control of BPLP’s day-to-daymanagement. Therefore, unless stated otherwise or the context requires, references to the “Company,” “we,” “us”and “our” mean collectively BXP, BPLP and those entities/subsidiaries consolidated by BXP.
As of December 31, 2020, BXP owned an approximate 90.0% ownership interest in BPLP. The remainingapproximate 10.0% interest was owned by limited partners. The other limited partners of BPLP are (1) persons whocontributed their direct or indirect interests in properties to BPLP in exchange for common units or preferred units oflimited partnership interest in BPLP and/or (2) recipients of long-term incentive plan units of BPLP pursuant toBXP’s Stock Option and Incentive Plans. Under the limited partnership agreement of BPLP, unitholders maypresent their common units of BPLP for redemption at any time (subject to restrictions agreed upon at the time ofissuance of the units that may restrict such right for a period of time, generally one year from issuance). Uponpresentation of a common unit for redemption, BPLP must redeem the unit for cash equal to the then value of ashare of BXP’s common stock. In lieu of a cash redemption by BPLP, however, BXP may elect to acquire anycommon units so tendered by issuing shares of BXP common stock in exchange for the common units. If BXP soelects, its common stock will be exchanged for common units on a one-for-one basis. This one-for-one exchangeratio is subject to specified adjustments to prevent dilution. BXP generally expects that it will elect to issue itscommon stock in connection with each such presentation for redemption rather than having BPLP pay cash. Witheach such exchange or redemption, BXP’s percentage ownership in BPLP will increase. In addition, whenever BXPissues shares of its common stock other than to acquire common units of BPLP, BXP must contribute any netproceeds it receives to BPLP and BPLP must issue to BXP an equivalent number of common units of BPLP. Thisstructure is commonly referred to as an umbrella partnership REIT, or UPREIT.
The Company believes that combining the Annual Reports on Form 10-K of BXP and BPLP into this singlereport provides the following benefits:
• enhances investors’ understanding of BXP and BPLP by enabling investors to view the business as awhole in the same manner as management views and operates the business;
• eliminates duplicative disclosure and provides a more concise and readable presentation because asubstantial portion of the disclosure applies to both BXP and BPLP; and
• creates time and cost efficiencies through the preparation of one combined report instead of two separatereports.
The Company believes it is important to understand the few differences between BXP and BPLP in the contextof how BXP and BPLP operate as a consolidated company. The financial results of BPLP are consolidated into thefinancial statements of BXP. BXP does not have any other significant assets, liabilities or operations, other than itsinvestment in BPLP, nor does it have employees of its own. BPLP, not BXP, generally executes all significantbusiness relationships other than transactions involving the securities of BXP. BPLP holds substantially all of theassets of BXP, including ownership interests in joint ventures. BPLP conducts the operations of the business and isstructured as a partnership with no publicly traded equity. Except for the net proceeds from equity offerings by BXP,which are contributed to the capital of BPLP in exchange for common or preferred units of partnership in BPLP, asapplicable, BPLP generates all remaining capital required by the Company’s business. These sources includeworking capital, net cash provided by operating activities, borrowings under its credit facilities, the issuance ofsecured and unsecured debt and equity securities and proceeds received from the disposition of certain propertiesand interests in joint ventures.
Shareholders’ equity, partners’ capital and noncontrolling interests are the main areas of difference betweenthe consolidated financial statements of BXP and BPLP. The limited partners of BPLP are accounted for aspartners’ capital in BPLP’s financial statements and as noncontrolling interests in BXP’s financial statements. Thenoncontrolling interests in BPLP’s financial statements include the interests of unaffiliated partners in variousconsolidated partnerships. The noncontrolling interests in BXP’s financial statements include the same
noncontrolling interests at BPLP’s level and limited partners of BPLP. The differences between shareholders’ equityand partners’ capital result from differences in the equity issued at BXP and BPLP levels.
In addition, the consolidated financial statements of BXP and BPLP differ in total real estate assets resultingfrom previously applied acquisition accounting by BXP for the issuance of common stock in connection with non-sponsor redemptions of common units of BPLP. This accounting resulted in a step-up of the real estate assets atBXP. This resulted in a difference between the net real estate of BXP as compared to BPLP of approximately$271.3 million, or 1.5% at December 31, 2020, and a corresponding difference in depreciation expense, impairmentlosses and gains on sales of real estate upon the sale of certain properties having an allocation of the real estatestep-up. The acquisition accounting was nullified on a prospective basis beginning in 2009 as a result of theCompany’s adoption of a new accounting standard requiring any future redemptions to be accounted for solely asan equity transaction.
To help investors better understand the key differences between BXP and BPLP, certain information for BXPand BPLP in this report has been separated, as set forth below:
• Item 5. Market for Registrant’s Common Equity, Related Stockholder Matters and Issuer Purchasesof Equity Securities;
• Item 6. Selected Financial Data;
• Item 7. Management’s Discussion and Analysis of Financial Condition and Results of Operationsincludes information specific to each entity, where applicable;
• Item 7. Liquidity and Capital Resources includes separate reconciliations of amounts to eachentity’s financial statements, where applicable;
• Item 8. Financial Statements and Supplementary Data which includes the following specificdisclosures for BXP and BPLP:
• Note 2. Summary of Significant Accounting Policies;
• Note 3. Real Estate;
• Note 12. Stockholders’ Equity / Partners’ Capital;
• Note 13. Segment Information; and
• Note 14. Earnings Per Share / Common Unit; and
• Item 15. Financial Statement Schedule—Schedule 3.
This report also includes the following separate items for each of BXP and BPLP: Part II, Item 9A. Controlsand Procedures, consents of the independent registered public accounting firm (Exhibits 23.1 and 23.2), andcertifications (Exhibits 31.1, 31.2, 31.3, 31.4, 32.1, 32.2, 32.3 and 32.4).
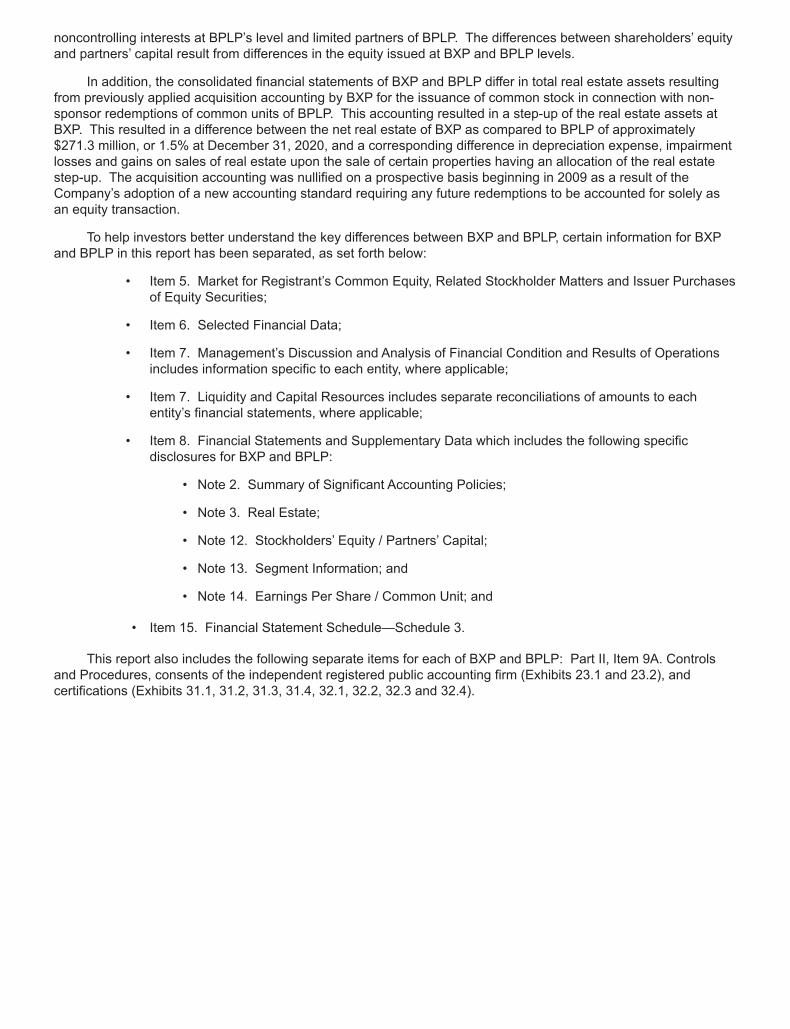
TABLE OF CONTENTS
ITEM NO. DESCRIPTION PAGE NO.
PART I 21. BUSINESS 21A. RISK FACTORS 191B. UNRESOLVED STAFF COMMENTS 42
2. PROPERTIES 43
3. LEGAL PROCEEDINGS 49
4. MINE SAFETY DISCLOSURES 49
PART II 505. MARKET FOR REGISTRANT’S COMMON EQUITY, RELATED STOCKHOLDER
MATTERS AND ISSUER PURCHASES OF EQUITY SECURITIES50
6. SELECTED FINANCIAL DATA 52
7. MANAGEMENT’S DISCUSSION AND ANALYSIS OF FINANCIAL CONDITION ANDRESULTS OF OPERATIONS
57
7A. QUANTITATIVE AND QUALITATIVE DISCLOSURES ABOUT MARKET RISK 110
8. FINANCIAL STATEMENTS AND SUPPLEMENTARY DATA 111
9. CHANGES IN AND DISAGREEMENTS WITH ACCOUNTANTS ON ACCOUNTING ANDFINANCIAL DISCLOSURE
182
9A. CONTROLS AND PROCEDURES 182
9B. OTHER INFORMATION 182
PART III 183
10. DIRECTORS, EXECUTIVE OFFICERS AND CORPORATE GOVERNANCE 183
11. EXECUTIVE COMPENSATION 183
12. SECURITY OWNERSHIP OF CERTAIN BENEFICIAL OWNERS AND MANAGEMENTAND RELATED STOCKHOLDER MATTERS
183
13. CERTAIN RELATIONSHIPS AND RELATED TRANSACTIONS, AND DIRECTORINDEPENDENCE
184
14. PRINCIPALACCOUNTANT FEES AND SERVICES 184
PART IV 185
15. EXHIBITS AND FINANCIAL STATEMENT SCHEDULES 185
16. FORM 10-K SUMMARY 199

Summary of Risk FactorsThe risk factors detailed in Item 1A titled “Risk Factors” in this Annual Report on Form 10-K are the risks that
we believe are material to our investors and a reader should carefully consider them. Those risks are not all of therisks we face and other factors not presently known to us or that we currently believe are immaterial may also affectour business if they occur. The following is a summary of the risk factors detailed in Item 1A:
• The COVID-19 pandemic has caused severe disruptions in the United States and global economies andwe expect it will continue to materially and adversely affect our financial condition, results of operations,cash flows, liquidity and performance and that of our tenants.
• Our performance depends upon the economic climates of our markets—Boston, Los Angeles, New York,San Francisco and Washington, DC.
• Adverse economic and geopolitical conditions, health crises and dislocations in the credit markets couldhave a material adverse effect on our results of operations, financial condition and ability to pay dividendsand/or distributions.
• Our success depends on key personnel whose continued service is not guaranteed.
• Our performance and value are subject to risks associated with our real estate assets and with the realestate industry, including, without limitation:◦ potential difficulties or delays renewing leases or re-leasing space; and
◦ potential adverse effects from major tenants’ bankruptcies or insolvencies.
• Our actual costs to develop properties may exceed our budgeted costs.
• Our use of joint ventures may limit our flexibility with respect to the assets they own and other assets wemay wish to acquire.
• Some potential losses are not covered by insurance.
• We face risks associated with the physical effects of climate change.
• Potential liability for environmental contamination could result in substantial costs.
• An increase in interest rates would increase our interest costs on variable rate debt and could adverselyimpact our ability to re-finance existing debt or sell assets on favorable terms or at all.
• Covenants in our debt agreements could adversely affect our financial condition.
• We face risks associated with the use of debt to fund acquisitions and developments, includingrefinancing risk.
• Our degree of leverage could limit our ability to obtain additional financing or affect the market price of ourequity and debt securities.
• We face risks associated with BXP’s status as a real estate investment trust (REIT), including, withoutlimitation:◦ failure to qualify as a REIT would cause BXP to be taxed as a corporation, which would
substantially reduce funds available for payment of dividends;◦ possible adverse state and local tax audits and changes in state and local tax laws could result in
increased tax costs that could adversely affect our financial condition and results of operations andthe amount of cash available for the payment of dividends and distributions to our securityholders;and
◦ in order to maintain BXP’s REIT status, we may be forced to borrow funds during unfavorablemarket conditions.
• Litigation could have a material adverse effect.
• We face risks associated with security breaches through cyber attacks, cyber intrusions or otherwise, aswell as other significant disruptions of our information technology (IT) networks and related systems.
• Changes in accounting pronouncements could adversely affect our operating results, in addition to thereported financial performance of our tenants.
This section contains forward-looking statements. You should refer to the explanation of the qualifications andlimitations on forward-looking statements beginning on page 57.
1
PART IItem 1. Business
GeneralBXP, a Delaware corporation organized in 1997, is a fully integrated, self-administered and self-managed
REIT, and is one of the largest publicly-traded office REITs (based on total market capitalization as of December 31,2020) in the United States that develops, owns and manages primarily Class A office properties.
Our properties are concentrated in five markets—Boston, Los Angeles, New York, San Francisco andWashington, DC. At December 31, 2020, we owned or had joint venture interests in a portfolio of 196 commercialreal estate properties, aggregating approximately 51.2 million net rentable square feet of primarily Class A officeproperties, including six properties under construction/redevelopment totaling approximately 3.7 million net rentablesquare feet. As of December 31, 2020, our properties consisted of:
• 177 office properties (including six properties under construction/redevelopment);• 12 retail properties;• six residential properties; and• one hotel.
We consider Class A office properties to be well-located buildings that are modern structures or have beenmodernized to compete with newer buildings and professionally managed and maintained. As such, theseproperties attract high-quality tenants and command upper-tier rental rates. Our definition of Class A officeproperties may be different than those used by other companies.
We are a full-service real estate company, with substantial in-house expertise and resources in acquisitions,development, financing, capital markets, construction management, property management, marketing, leasing,accounting, risk management, tax and legal services. BXP manages BPLP as its sole general partner. Ourprincipal executive office and Boston regional office are located at The Prudential Center, 800 Boylston Street, Suite1900, Boston, Massachusetts 02199 and our telephone number is (617) 236-3300. In addition, we have regionaloffices at 3250 Ocean Park Boulevard, Suite 300, Santa Monica, California 90405, 599 Lexington Avenue, NewYork, New York 10022, Four Embarcadero Center, San Francisco, California 94111 and 2200 Pennsylvania AvenueNW, Washington, DC 20037.
Our internet address is http://www.bxp.com. On our website, you can obtain free copies of our Annual Reportson Form 10-K, quarterly reports on Form 10-Q, current reports on Form 8-K, and amendments to those reports filedor furnished pursuant to Section 13(a) or 15(d) of the Securities Exchange Act of 1934, as amended, as soon asreasonably practicable after we electronically file such material with, or furnish it to, the Securities and ExchangeCommission, or the SEC. You may also obtain BXP’s and BPLP’s reports by accessing the EDGAR database at theSEC’s website at http://www.sec.gov, or we will furnish an electronic or paper copy of these reports free of chargeupon written request to: Investor Relations, Boston Properties, Inc., Prudential Center, 800 Boylston Street, Suite1900, Boston, Massachusetts 02199. “Boston Properties” is a registered trademark and the “bxp” logo is atrademark, in both cases, owned by BPLP.
Boston Properties Limited PartnershipBPLP is a Delaware limited partnership organized in 1997, and the entity through which BXP conducts
substantially all of its business and owns, either directly or through subsidiaries, substantially all of its assets. BXPis the sole general partner of BPLP and, as of February 22, 2021, the owner of approximately 89.8% of theeconomic interests in BPLP. Economic interest was calculated as the number of common partnership units of BPLPowned by BXP as a percentage of the sum of (1) the actual aggregate number of outstanding common partnershipunits of BPLP and (2) the number of common units issuable upon conversion of all outstanding long term incentiveplan units of BPLP, or LTIP Units, for which all performance conditions have been satisfied for such conversion. Weexclude from (1) and (2) above other LTIP Units issued in the form of Multi-Year Long-Term Incentive Plan Awards in2019 or later (“MYLTIP Awards”), which remain subject to performance conditions. An LTIP Unit is generally theeconomic equivalent of a share of BXP’s restricted common stock, although LTIP Units issued in the form ofMYLTIP Awards are only entitled to receive one-tenth (1/10th) of the regular quarterly distributions (and no specialdistributions) prior to being earned.
Preferred units of BPLP have the rights, preferences and other privileges set forth in an amendment to thelimited partnership agreement of BPLP. As of December 31, 2020 and February 22, 2021, BPLP had one series of
2
Preferred Units outstanding consisting of 80,000 Series B Preferred Units. The Series B Preferred Units have aliquidation preference of $2,500 per share (or an aggregate of approximately $193.6 million at December 31, 2020and February 22, 2021, after deducting the underwriting discount and transaction expenses). The Series BPreferred Units were issued by BPLP on March 27, 2013 in connection with BXP’s issuance of 80,000 shares(8,000,000 depositary shares each representing 1/100th of a share) of 5.25% Series B Cumulative RedeemablePreferred Stock (the “Series B Preferred Stock”). BXP contributed the net proceeds from the offering to BPLP inexchange for Series B Preferred Units having rights, performance and privileges generally mirroring those of theSeries B Preferred Stock. BXP will pay cumulative cash dividends on the Series B Preferred Stock at a rate of5.25% per annum of the $2,500 liquidation preference per share. On and after March 27, 2018, BXP, at its option,may redeem the Series B Preferred Stock for a cash redemption price of $2,500 per share, plus all accrued andunpaid dividends. The Series B Preferred Stock is not redeemable by the holders, has no maturity date and is notconvertible into any other security of ours or our affiliates.
Transactions During 2020
Dispositions
For information explaining why BXP and BPLP may report different gains on sales of real estate, see theExplanatory Note that follows the cover page of this Annual Report on Form 10-K.
On January 28, 2020, we entered into a joint venture with a third party to own, operate and develop propertiesat our Gateway Commons complex located in South San Francisco, California. We contributed our 601, 611 and651 Gateway properties and development rights with an agreed upon value aggregating approximately $350.0million for our 50% interest in the joint venture. 601, 611 and 651 Gateway consist of three Class A office propertiesaggregating approximately 768,000 net rentable square feet. The partner contributed three properties anddevelopment rights with an agreed upon value aggregating approximately $280.8 million at closing and willcontribute cash totaling approximately $69.2 million in the future for its 50% ownership interest in the joint venture.As a result of the partner’s deferred contribution, we have an initial approximately 55% interest in the joint venture.Future development projects will be owned 49% by us and 51% by our partner. Upon the partner’s contribution, weceased accounting for the joint venture entity on a consolidated basis and are accounting for the joint venture entityon an unconsolidated basis using the equity method of accounting, as we have reduced our ownership interest inthe joint venture entity and no longer have a controlling financial or operating interest in the joint venture entity (SeeNote 6). We recognized a gain on the retained and sold interest in the real estate contributed to the joint venturetotaling approximately $217.7 million for BXP and $222.4 million for BPLP during the year ended December 31,2020 within Gains on Sales of Real Estate on the respective Consolidated Statements of Operations, as the fairvalue of the real estate exceeded its carrying value (See “Investments in Unconsolidated Joint Ventures” below).
On February 20, 2020, we completed the sale of New Dominion Technology Park located in Herndon, Virginiafor a gross sale price of $256.0 million. Net cash proceeds totaled approximately $254.0 million, resulting in a gainon sale of real estate totaling approximately $192.3 million for BXP and approximately $197.1 million for BPLP. NewDominion Technology Park is comprised of two Class A office properties aggregating approximately 493,000 netrentable square feet.
On June 25, 2020, we completed the sale of a portion of our Capital Gallery property located in Washington,DC for a gross sale price of approximately $253.7 million. Net cash proceeds totaled approximately $246.6 million,resulting in a gain on sale of real estate totaling approximately $203.5 million for BXP and approximately$207.0 million for BPLP. Capital Gallery is an approximately 631,000 net rentable square foot Class A officeproperty. The portion sold was comprised of approximately 455,000 net rentable square feet of commercial officespace. We continue to own the land, underground parking garage and remaining commercial office and retail spacecontaining approximately 176,000 net rentable square feet at the property.
On December 16, 2020, we completed the sale of a parcel of land located in Marlborough, Massachusetts fora gross sale price of approximately $14.3 million. Net cash proceeds totaled approximately $14.2 million, resultingin a gain on sale of real estate totaling approximately $5.2 million.
Developments/Redevelopments
As of December 31, 2020, we had six office properties under construction/redevelopment, which we expectwill total approximately 3.7 million net rentable square feet. We estimate our share of the total investment tocomplete these projects, in the aggregate, is approximately $2.2 billion, of which approximately $848.7 million
3
remains to be invested as of December 31, 2020. Approximately 87% of the commercial space in thesedevelopment projects was pre-leased as of February 22, 2021. For a detailed list of the properties underconstruction/redevelopment see “Liquidity and Capital Resources” within “Item 7—Management’s Discussion andAnalysis of Financial Condition and Results of Operations.”
On March 26, 2020, we completed and fully placed in-service 17Fifty Presidents Street located in Reston,Virginia. 17Fifty Presidents Street is a build-to-suit project with approximately 276,000 net rentable square feet ofClass A office space that is 100% leased.
On June 1, 2020, we completed and fully placed in-service 20 CityPoint, a Class A office project withapproximately 211,000 net rentable square feet located in Waltham, Massachusetts. As of December 31, 2020, theoffice portion of the property was 100% leased, including a lease with a future commencement.
On June 26, 2020, we completed the acquisition of real property at 777 Harrison Street (known as Fourth +Harrison and formerly known as 425 Fourth Street) located in San Francisco, California for a gross purchase price,including entitlements, totaling approximately $140.1 million. On July 31, 2020 and December 16, 2020, weacquired real property at 759 Harrison Street located in San Francisco, California, which is expected to be includedin the Fourth + Harrison development project, for an aggregate purchase price totaling approximately $4.5 million.759 Harrison Street and Fourth + Harrison are expected to support the development of approximately 850,000square feet of primarily commercial office space.
On August 15, 2020, we completed and fully placed in-service The Skylyne, an approximately 331,000 squarefoot project comprised of 402 residential units and retail space located in Oakland, California.
On November 3, 2020, we signed an approximately 138,000 square-foot, 10-year lease with a new tenant at200 West Street in Waltham, Massachusetts. We are currently redeveloping a portion of 200 West Street into lifesciences space with expected completion in 2021. With this lease, the property is 100% leased.
Ground Lease
On July 29, 2020, we entered into a 99-year ground lease with a third-party hotel developer for land at ourReston Next property located in Reston, Virginia, which will support the development of a 270-room, approximately241,000 square foot hotel property. The lease commenced on October 21, 2020 and, upon commencement, weperformed classification testing. The ground lease is subject to termination rights with respect to the hoteldeveloper’s ability to obtain construction financing for the property and, as of the lease commencement date, wewere not reasonably certain that those termination rights would not be exercised and as such we have accountedfor this as an operating lease that will expire on August 28, 2022.
Unsecured Debt
On May 5, 2020, BPLP completed a public offering of $1.25 billion in aggregate principal amount of its 3.250%unsecured senior notes due 2031. The notes were priced at 99.850% of the principal amount to yield an effectiverate (including financing fees) of approximately 3.343% per annum to maturity. The notes will mature on January30, 2031, unless earlier redeemed. The aggregate net proceeds from the offering were approximately $1.24 billion,after deducting underwriting discounts and transaction expenses.
Equity Transactions
During the year ended December 31, 2020, BXP acquired an aggregate of 856,811 common units of limitedpartnership interest, including 88,168 common units issued upon the conversion of LTIP Units, 2012 OPP Units,2013 MYLTIP Units, 2014 MYLTIP Units, 2015 MYLTIP Units, 2016 MYLTIP Units and 2017 MYLTIP Unitspresented by the holders for redemption, in exchange for an equal number of shares of BXP common stock.
Investments in Unconsolidated Joint Ventures
On January 28, 2020, we entered into a joint venture with a third party to own, operate and develop propertiesat our Gateway Commons complex located in South San Francisco, California. We contributed our 601, 611 and651 Gateway properties and development rights with an agreed upon value aggregating approximately $350.0million for our 50% interest in the joint venture (See Note 3). 601, 611 and 651 Gateway consist of three Class Aoffice properties aggregating approximately 768,000 net rentable square feet. The partner contributed threeproperties and development rights with an agreed upon value aggregating approximately $280.8 million at closingand will contribute cash totaling approximately $69.2 million in the future for its 50% ownership interest in the joint
4
venture. As a result of the partner’s deferred contribution, we had an initial approximately 55% interest in the jointventure. Future development projects will be owned 49% by us and 51% by our partner (See “Dispositions” above).
On February 20, 2020, a joint venture in which we have a 55% interest acquired the land underlying theground lease at its Platform 16 property located in San Jose, California for a purchase price totaling approximately$134.8 million. The joint venture had previously made a deposit totaling $15.0 million, which was credited againstthe purchase price. Platform 16 consists of a parcel of land totaling approximately 5.6 acres that is expected tosupport the development of approximately 1.1 million square feet of commercial office space.
On June 9, 2020, a joint venture in which we have a 20% interest refinanced with a new lender the mortgageloan collateralized by its Metropolitan Square property located in Washington, DC. The outstanding balance of theloan totaled approximately $155.9 million, bore interest at a fixed rate of 5.75% per annum and was scheduled tomature on August 5, 2020. The new mortgage loan totaling $325.0 million, of which $288.0 million was advanced atclosing, bears interest at a variable rate equal to (1) the greater of (x) LIBOR or (y) 0.65%, plus (2) 4.75% perannum, and matures on July 7, 2022, with two, one-year extension options, subject to certain conditions. The jointventure entered into an interest rate cap agreement with a financial institution to limit its exposure to increases inthe LIBOR rate at a cap of 3.00% per annum on a notional amount of $325.0 million through July 7, 2022. The jointventure distributed excess loan proceeds from the new mortgage loan totaling approximately $112.7 million, ofwhich our share totaled approximately $22.5 million. Metropolitan Square is a Class A office property withapproximately 654,000 net rentable square feet.
On June 25, 2020, a joint venture in which we have a 50% interest completed the sale of Annapolis JunctionBuilding Eight and two land parcels located in Annapolis, Maryland for a gross sale price of $47.0 million. Net cashproceeds totaled approximately $45.8 million after the payment of transaction costs. We recognized a gain on saleof real estate totaling approximately $5.8 million, which is included in Income (Loss) from Unconsolidated JointVentures in the accompanying Consolidated Statements of Operations. The joint venture distributed approximately$36.8 million of available cash and the net proceeds from the sale after the pay down of the mortgage loan, of whichour share totaled approximately $18.4 million. Annapolis Junction Building Eight is an approximately 126,000 netrentable square foot Class A office property, which is vacant. The two land parcels will support the development ofapproximately 300,000 square feet of commercial office space with one parcel currently containing surface parkingfor approximately 511 vehicles.
On June 25, 2020, in conjunction with the joint venture’s sale of Annapolis Junction Building Eight, the jointventure in which we have a 50% interest modified the mortgage loan collateralized by Annapolis Junction BuildingSeven and Building Eight with the release of Annapolis Junction Building Eight as collateral under the loan inexchange for a principal pay down of approximately $16.1 million using a portion of the net proceeds from the saleof the property. At the time of the modification, the outstanding balance of the loan totaled approximately$34.5 million, bore interest at a variable rate equal to LIBOR plus 2.35% per annum and was scheduled to matureon June 30, 2020. The modified mortgage loan totaling approximately $18.4 million is collateralized by AnnapolisJunction Building Seven, continues to bear interest at a variable rate equal to LIBOR plus 2.35% per annum andmatures on March 25, 2021. Annapolis Junction Building Seven is a Class A office property with approximately127,000 net rentable square feet located in Annapolis, Maryland.
On July 23, 2020, we acquired a 50% interest in a joint venture entity that owns Beach Cities Media Campus,a 6.4-acre parcel of land located in El Segundo, California, for a purchase price of approximately $21.2 million.Beach Cities Media Campus is expected to support the development of approximately 275,000 square feet of ClassA office space.
On July 24, 2020, a joint venture in which we have a 50% interest completed and fully placed in-serviceHub50House, an approximately 320,000 square foot project comprised of 440 residential units located in Boston,Massachusetts.
On September 1, 2020, we entered into an agreement with our partner in the joint venture that owns 1265Main Street located in Waltham, Massachusetts to (1) form additional joint ventures to own and develop a mixed-use property containing approximately 1.2 million square feet to be developed in phases on an approximately 41-acre site adjacent to 1265 Main Street and (2) share the costs of certain offsite infrastructure improvements with ourjoint venture partner and other third-party abutting land owners. We will serve as the development manager andexpect to own a 50% interest in each of the joint ventures.
5
On September 30, 2020, a joint venture in which we have a 50% interest extended the mortgage loancollateralized by its Market Square North property. At the time of the extension, the outstanding balance of the loantotaled approximately $114.2 million, bore interest at a fixed rate of 4.85% per annum and was scheduled to matureon October 1, 2020. The extended loan was scheduled to mature on November 1, 2020. On October 30, 2020, thejoint venture refinanced the mortgage loan. The outstanding balance of the loan totaled approximately$114.2 million, bore interest at a fixed rate of 4.85% per annum and was scheduled to mature on November 1,2020. The new mortgage loan totals $125.0 million, bears interest at a variable rate equal to (1) the greater of (x)LIBOR or (y) 0.50%, plus (2) 2.30% per annum, and matures on November 10, 2025, with one, one-year extensionoption, subject to certain conditions. Market Square North is a Class A office property with approximately 418,000net rentable square feet.
On October 1, 2020, a joint venture in which we have a 50% interest completed and fully placed in-serviceDock 72, a Class A office project with approximately 669,000 net rentable square feet located in Brooklyn, New Yorkthat is 33% leased. During December 2020, we recognized a non-cash impairment charge totaling approximately$60.5 million, which represented the other-than temporary decline in the fair value below the carrying value of ourinvestment in the unconsolidated joint venture that owns Dock 72. The non-cash impairment charge was the resultof an increase in costs and an extension of the projected period to fully lease the property and lower projected rentalrates due to the COVID-19 pandemic, resulting in a current fair value that was less than the carrying value of ourinvestment. We assessed the impairment and concluded that it was other than temporary. We determined that ourvaluation of the investment was categorized within Level 3 of the fair value hierarchy, as it utilized significantunobservable inputs in its assessment including an exit capitalization rate of 5.25%, a discount rate on our equityinvestment (the property is encumbered by mortgage debt) of 8.0% and an average lease commencement oncurrently vacant space of mid-2023. In addition, on December 14, 2020, the joint venture extended the mortgageloan collateralized by the property. At the time of the extension, the outstanding balance of the loan totaledapproximately $198.6 million, bore interest at a variable rate equal to LIBOR plus 2.25% per annum and wasscheduled to mature on December 18, 2020. The extended mortgage loan has a total commitment amount of$250.0 million, bears interest at an initial variable rate equal to (1) the greater of (x) LIBOR or (y) 0.25%, plus (2)2.85% per annum and matures on December 18, 2023.
On November 13, 2020, a joint venture in which we have a 50% interest extended the mortgage loancollateralized by its Annapolis Junction Building Six property located in Annapolis, Maryland. At the time of theextension, the outstanding balance of the loan totaled approximately $12.0 million, bore interest at a variable rateequal to LIBOR plus 2.00% per annum and was scheduled to mature on November 17, 2020. The extendedmortgage loan has a total commitment amount of approximately $13.2 million, bears interest at a variable rate equalto (1) the greater of (x) LIBOR or (y) 0.50%, plus (2) 2.50% per annum and matures on November 16, 2021.Annapolis Junction Building Six is a Class A office property with approximately 119,000 net rentable square feet.
Stock Option and Incentive Plan
On February 4, 2020, BXP’s Compensation Committee approved a new equity-based, multi-year, long-termincentive program (the “2020 MYLTIP”) as a performance-based component of our overall compensation program.Under the Financial Accounting Standards Board’s Accounting Standards Codification (“ASC”) 718 “Compensation -Stock Compensation,” the 2020 MYLTIP has an aggregate value of approximately $13.7 million, which amount willgenerally be amortized into earnings over the four-year plan period under the graded vesting method (See Note 16to the Consolidated Financial Statements).
On February 6, 2020, the measurement period for our 2017 MYLTIP awards ended and, based on BXP’srelative TSR performance, the final awards were determined to be 83.8% of target or an aggregate of approximately$17.6 million (after giving effect to employee separations). As a result, an aggregate of 270,942 2017 MYLTIP Unitsthat had been previously granted were automatically forfeited.
Business and Growth Strategies
Business StrategiesOur primary business objective is to maximize return on investment to provide our investors with the greatest
possible total return in all points of the economic cycle. Our strategies to achieve this objective are:
• to target a few carefully selected geographic markets—Boston, Los Angeles, New York, San Francisco andWashington, DC—and to be one of the leading, if not the leading, developers, owners and managers in
6
each of those markets with a full-service office in each market providing property management, leasing,development, construction and legal expertise. We select markets and submarkets with a diverseeconomic base and a deep pool of prospective tenants in various industries and where tenants havedemonstrated a preference for high-quality office buildings and other facilities. Additionally, our marketshave historically been able to recruit new talent to them and as such created job growth that results ingrowth in rental rates and occupancy over time. We have explored, and may continue to explore for futureinvestment, select domestic and international markets that exhibit these same traits, including specificallySeattle;
• to emphasize markets and submarkets within those markets where the difficulty of receiving the necessaryapprovals for development and the necessary financing constitute high barriers to the creation of newsupply, and where skill, financial strength and diligence are required to successfully develop, finance andmanage high-quality office and life sciences space, as well as selected retail and residential space;
• to take on complex, technically challenging development projects, leveraging the skills of our managementteam to successfully develop, acquire or reposition properties that other organizations may not have thecapacity or resources to pursue;
• to own and develop high-quality real estate designed to meet the demands of today’s tenants who requiresophisticated telecommunications and related infrastructure, support services, sustainable features andamenities, and to manage those facilities so as to become the landlord of choice for both existing andprospective clients;
• to opportunistically acquire assets that increase our market share in the markets in which we have chosento concentrate, as well as potential new markets, which exhibit an opportunity to improve returns throughrepositioning (through a combination of capital improvements and shift in marketing strategy), changes inmanagement focus and leasing;
• to explore joint venture opportunities with (1) existing property owners located in desirable locations, whoseek to benefit from the depth of development and management expertise we are able to provide and ouraccess to capital and (2) strategic institutional partners, leveraging our skills as developers, owners andmanagers of Class A office space and mixed-use complexes;
• to pursue on a selective basis the sale of properties or interests therein, including core properties, to either(1) take advantage of the demand for our premier properties and realize the value we have created or (2)pare from our portfolio properties that we believe have slower future growth potential;
• to seek third-party development contracts to enable us to retain and utilize our existing development andconstruction management staff, especially when our internal development is less active or when newdevelopment is less-warranted due to market conditions; and
• to enhance our capital structure through our access to a variety of sources of capital and proactivelymanage our debt expirations. In the current economic climate with relatively low interest rates we haveand will continue to attempt to lower the cost of our debt capital and seek opportunities to lock in such lowrates through early debt repayment, refinancings and interest rate hedges.
Growth StrategiesExternal Growth Strategies
We believe that our development experience, our organizational depth and our balance sheet position us tocontinue to selectively develop a range of property types, including high-rise urban developments, mixed-usedevelopments (including office, residential and retail), low-rise suburban office properties and life sciences space,within budget and on schedule. We believe we are also well-positioned to achieve external growth throughacquisitions. Other factors that contribute to our competitive position include:
• our control of sites (including sites under contract or option to acquire) in our markets that could supportapproximately 16.7 million additional square feet of new office, life sciences, retail and residentialdevelopment;
• our reputation gained through 51 years of successful operations and the stability and strength of ourexisting portfolio of properties;
7
• our relationships with leading national corporations, universities and public institutions, includinggovernment agencies, seeking new facilities and development services;
• our relationships with nationally recognized financial institutions that provide capital to the real estateindustry;
• our track record and reputation for executing acquisitions efficiently provide comfort to domestic andforeign institutions, private investors and corporations who seek to sell commercial real estate in ourmarket areas;
• our ability to act quickly on due diligence and financing;
• our relationships with institutional buyers and sellers of high-quality real estate assets;
• our ability to procure entitlements from multiple municipalities to develop sites and attract land owners tosell or partner with us; and
• our relationship with domestic and foreign investors who seek to partner with companies like ours.
Opportunities to execute our external growth strategy fall into three categories:
• Development in selected submarkets.We believe the selected development of well-positioned office, lifesciences and residential buildings and mixed-use complexes may be justified in our markets. We believein acquiring land after taking into consideration timing factors relating to economic cycles and in responseto market conditions that allow for its development at the appropriate time. While we purposelyconcentrate in markets with high barriers-to-entry, we have demonstrated throughout our 51-year history,an ability to make carefully timed land acquisitions in submarkets where we can become one of the marketleaders in establishing rent and other business terms. We believe that there are opportunities at keylocations in our existing and other markets for a well-capitalized developer to acquire land withdevelopment potential.
In the past, we have been particularly successful at acquiring sites or options to purchase sites that needgovernmental approvals for development. Because of our development expertise, knowledge of thegovernmental approval process and reputation for quality development with local government regulatorybodies, we generally have been able to secure the permits necessary to allow development and to profitfrom the resulting increase in land value. We seek complex projects where we can add value through theefforts of our experienced and skilled management team leading to attractive returns on investment.
Our strong regional relationships and recognized development expertise have enabled us to capitalize onunique build-to-suit opportunities. We intend to seek and expect to continue to be presented with suchopportunities in the near term allowing us to earn relatively significant returns on these developmentopportunities through multiple business cycles.
• Acquisition of assets and portfolios of assets from institutions or individuals.We believe that due to oursize, management strength and reputation, we are well positioned to acquire portfolios of assets orindividual properties from institutions or individuals if valuations meet our criteria. In addition, we believethat our market knowledge and our liquidity and access to capital may provide us with a competitiveadvantage when pursuing acquisitions. Opportunities to acquire properties may also come through thepurchase of first mortgage or mezzanine debt. We are also able to appeal to sellers wishing to contributeon a tax-deferred basis their ownership of property for equity in a diversified real estate operating companythat offers liquidity through access to the public equity markets in addition to a quarterly distribution. Ourability to offer common and preferred units of limited partnership in BPLP to sellers who would otherwiserecognize a taxable gain upon a sale of assets for cash or BXP’s common stock may facilitate this type oftransaction on a tax-efficient basis. Recent Treasury regulations may limit certain of the tax benefitspreviously available to sellers in these transactions.
• Acquisition of underperforming assets and portfolios of assets. We believe that because of our in-depthmarket knowledge and development experience in each of our markets, our national reputation withbrokers, financial institutions, owners of real estate and others involved in the real estate market and ouraccess to competitively-priced capital, we are well-positioned to identify and acquire existing,underperforming properties for competitive prices and to add significant additional value to such properties
8
through our effective marketing strategies, repositioning/redevelopment expertise and a responsiveproperty management program.
Internal Growth Strategies
We believe that opportunities will exist to increase cash flow from our existing properties through an increasein occupancy and rental rates because they are of high quality and in desirable locations. Additionally, our marketshave diversified economies that have historically experienced job growth and increased use of office space,resulting in growth in rental rates and occupancy over time. Our strategy for maximizing the benefits from theseopportunities is three-fold: (1) to provide high-quality property management services using our employees in orderto encourage tenants to renew, expand and relocate in our properties, (2) to achieve speed and transaction costefficiency in replacing departing tenants through the use of in-house services for marketing, lease negotiation andconstruction of tenant and capital improvements and (3) to work with new or existing tenants with space expansionor contraction needs, leveraging our expertise and clustering of assets to maximize the cash flow from our assets.We expect to continue our internal growth as a result of our ability to:
• Cultivate existing submarkets and long-term relationships with credit tenants. In choosing locations for ourproperties, we have paid particular attention to transportation and commuting patterns, physicalenvironment, adjacency to established business centers and amenities, proximity to sources of businessgrowth and other local factors.
The weighted-average lease term of our in-place leases, including leases signed by our unconsolidatedjoint ventures, was approximately 7.4 years at December 31, 2020, and we continue to cultivate long-termleasing relationships with a diverse base of high-quality, financially stable tenants. Based on leases inplace at December 31, 2020, leases with respect to approximately 8.1% of the total square feet in ourportfolio, including unconsolidated joint ventures, will expire in calendar year 2021.
• Directly manage our office properties to maximize the potential for tenant retention.We provide propertymanagement services ourselves, rather than contracting for this service, to maintain awareness of andresponsiveness to tenant needs. We and our properties also benefit from cost efficiencies produced by anexperienced work force attentive to preventive maintenance and energy management and from ourcontinuing programs to assure that our property management personnel at all levels remain aware of theirimportant role in tenant relations. In addition, we reinvest in our properties by adding new services andamenities that are desirable to our tenants.
• Replace tenants quickly at best available market terms and lowest possible transaction costs. We believethat we are well-positioned to attract new tenants and achieve relatively high rental and occupancy ratesas a result of our well-located, well-designed and well-maintained properties, our reputation for high-qualitybuilding services and responsiveness to tenants, and our ability to offer expansion and relocationalternatives within our submarkets.
• Extend terms of existing leases to existing tenants prior to expiration. We have also successfully structuredearly tenant renewals, which have reduced the cost associated with lease downtime while securing thetenancy of our highest quality credit-worthy tenants on a long-term basis and enhancing relationships.
• Re-development of existing assets. We believe the select re-development of assets within our portfolio,where through the ability to increase the building size and/or to increase cash flow and generateappropriate returns on incremental investment after consideration of the asset’s current and future cashflows, may be desirable. This generally occurs in situations in which we are able to increase the building’ssize, improve building systems, including conversion to higher yielding life sciences uses, andsustainability features, and/or add tenant amenities, thereby increasing tenant demand, generatingacceptable returns on incremental investment and enhancing the long-term value of the property and thecompany. In the past, we have been particularly successful at gaining local government approval forincreased density at several of our assets, providing the opportunity to enhance value at a particularlocation. Our strong regional relationships and recognized re-development expertise have enabled us tocapitalize on unique build-to-suit opportunities. We intend to seek and expect to continue to be presentedwith such opportunities in the near term allowing us to earn attractive returns on these developmentopportunities through multiple business cycles.
9
SustainabilityOur Sustainability Strategy
We actively work to promote our growth and operations in a sustainable and responsible manner across ourfive regions. The BXP sustainability strategy is to conduct our business, the development and operation of new andexisting buildings, in a manner that contributes to positive economic, social and environmental outcomes for ourcustomers, shareholders, employees and the communities we serve. Our investment philosophy is shaped by ourcore strategy of long-term ownership and our commitment to our communities and the centers of commerce andcivic life that make them thrive. We are focused on developing and maintaining healthy, high-performancebuildings, while simultaneously mitigating operational costs and the potential external impacts of energy, water,waste, greenhouse gas emissions and climate change. To that end, we have publicly adopted long-term energy,emissions, water and waste goals that establish aggressive reduction targets and have been aligned with the UnitedNations Sustainable Development Goals. BXP is a corporate member of the U.S. Green Building Council®(“USGBC”) and has a long history of owning, developing and operating properties that are certified under USGBC’sLeadership in Energy and Environmental Design™ (LEED®) rating system. In 2018, we announced a partnershipwith a leading healthy building certification system, Fitwel, to support healthy building design and operationalpractices across our portfolio, becoming a Fitwel Champion. We completed our Fitwel Champion commitments in2019, adding 12.4 million square feet of Fitwel certified buildings.
In addition, we have been an active participant in the green bond market since 2018, which provides access tosustainability-focused investors interested in the positive environmental externalities of our business activities. BXPand its employees also make a social impact through charitable giving, volunteerism, public realm investments anddiversity and inclusion. Through these efforts, we demonstrate that operating and developing commercial realestate can be conducted with a conscious regard for the environment and wider society while mutually benefitingour stakeholders.
Industry Leadership in Sustainability
We continue to be recognized as an industry leader in sustainability. In 2020, BXP ranked among the top realestate companies in the Global Real Estate Sustainability Benchmark (“GRESB”) assessment, earning a fifthconsecutive 5 Star rating, the highest rating and recognition for being an industry leader. It was the ninthconsecutive year that BXP earned the GRESB “Green Star” designation, achieving the highest scores in severalcategories, including: Data Monitoring & Review, Targets, Policies, Reporting and Leadership. BXP was also namedone of America’s Most Responsible Companies by Newsweek magazine in 2020. BXP ranked 56th overall out of400 companies included. It was the second highest ranking of all property companies and the highest ranking of anyoffice REIT. In 2014, 2015, 2017, 2018 and 2019, BXP was selected by the National Association of Real EstateInvestment Trusts (“Nareit”) as a Leader in the Light Award winner. Nareit's annual Leader in the Light Awards honorNareit member companies that have demonstrated superior and sustained sustainability practices.
BXP has adopted sustainable development and operational practices across its portfolio. BXP became a proudsignatory of the We Are Still In pledge after the U.S. withdrawal from the Paris Agreement, and has alignedemissions reduction targets with climate science. The SBTi Target Validation Team has classified BXP’s emissionsreduction target ambition and has determined that it is in line with a 1.5°C trajectory, currently the most ambitiousdesignation available. As of the end of 2020, BXP is one of six North American Real Estate companies with thisdistinction and the only North American office company in that group. We have LEED certified 28.8 million squarefeet of our portfolio, of which 96% is certified at the highest Gold and Platinum levels. BXP’s master lease formincludes green lease clauses that support a more sustainable tenant-landlord relationship. In 2020, BXP wasnamed a Green Lease Leader at the highest Gold level by the Institute for Market Transformation and the U.S.Department of Energy for exhibiting a strong commitment to high performance and sustainability in buildings andbest practices in leasing. Through active asset management and tenant engagement, BXP has been a leader inenergy efficiency and healthy building practices. In 2020 BXP was recognized by the Environmental PerformanceAgency (“EPA”) as an ENERGY STAR Partner of the Year for Sustained Excellence. This award is reserved forENERGY STAR partners demonstrating outstanding leadership, year over year. Partners must perform at asuperior level of energy management, demonstrate best practices across the organization and prove organization-wide energy savings. BXP was named a 2020 Best in Building Health award winner. We completed the first FitwelDesign Certified project in the world in 2019 and executed more Fitwel certifications by count and building area thanany other company in 2019. BXP has 11 Fitwel Ambassadors among our Sustainability, Development and PropertyManagement teams.
10
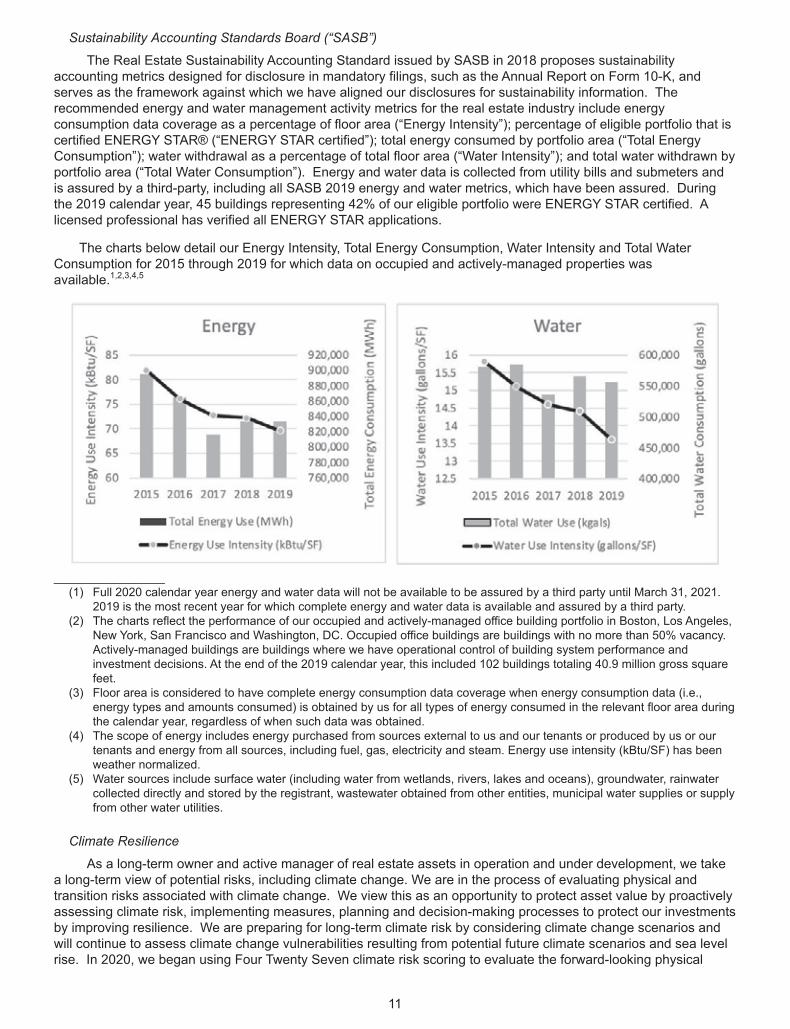
Sustainability Accounting Standards Board (“SASB”)
The Real Estate Sustainability Accounting Standard issued by SASB in 2018 proposes sustainabilityaccounting metrics designed for disclosure in mandatory filings, such as the Annual Report on Form 10-K, andserves as the framework against which we have aligned our disclosures for sustainability information. Therecommended energy and water management activity metrics for the real estate industry include energyconsumption data coverage as a percentage of floor area (“Energy Intensity”); percentage of eligible portfolio that iscertified ENERGY STAR® (“ENERGY STAR certified”); total energy consumed by portfolio area (“Total EnergyConsumption”); water withdrawal as a percentage of total floor area (“Water Intensity”); and total water withdrawn byportfolio area (“Total Water Consumption”). Energy and water data is collected from utility bills and submeters andis assured by a third-party, including all SASB 2019 energy and water metrics, which have been assured. Duringthe 2019 calendar year, 45 buildings representing 42% of our eligible portfolio were ENERGY STAR certified. Alicensed professional has verified all ENERGY STAR applications.
The charts below detail our Energy Intensity, Total Energy Consumption, Water Intensity and Total WaterConsumption for 2015 through 2019 for which data on occupied and actively-managed properties wasavailable.1,2,3,4,5
_______________(1) Full 2020 calendar year energy and water data will not be available to be assured by a third party until March 31, 2021.
2019 is the most recent year for which complete energy and water data is available and assured by a third party.(2) The charts reflect the performance of our occupied and actively-managed office building portfolio in Boston, Los Angeles,
New York, San Francisco and Washington, DC. Occupied office buildings are buildings with no more than 50% vacancy.Actively-managed buildings are buildings where we have operational control of building system performance andinvestment decisions. At the end of the 2019 calendar year, this included 102 buildings totaling 40.9 million gross squarefeet.
(3) Floor area is considered to have complete energy consumption data coverage when energy consumption data (i.e.,energy types and amounts consumed) is obtained by us for all types of energy consumed in the relevant floor area duringthe calendar year, regardless of when such data was obtained.
(4) The scope of energy includes energy purchased from sources external to us and our tenants or produced by us or ourtenants and energy from all sources, including fuel, gas, electricity and steam. Energy use intensity (kBtu/SF) has beenweather normalized.
(5) Water sources include surface water (including water from wetlands, rivers, lakes and oceans), groundwater, rainwatercollected directly and stored by the registrant, wastewater obtained from other entities, municipal water supplies or supplyfrom other water utilities.
Climate Resilience
As a long-term owner and active manager of real estate assets in operation and under development, we takea long-term view of potential risks, including climate change. We are in the process of evaluating physical andtransition risks associated with climate change. We view this as an opportunity to protect asset value by proactivelyassessing climate risk, implementing measures, planning and decision-making processes to protect our investmentsby improving resilience. We are preparing for long-term climate risk by considering climate change scenarios andwill continue to assess climate change vulnerabilities resulting from potential future climate scenarios and sea levelrise. In 2020, we began using Four Twenty Seven climate risk scoring to evaluate the forward-looking physical
11
climate risk exposure of our entire portfolio. Event-driven (acute) and longer-term (chronic) physical risks that mayresult from climate change could have a material adverse effect on our properties, operations and business.Management’s role in assessing and managing these climate-related risks and initiatives is spread across multipleteams across our organization, including our executive leadership and our Sustainability, Risk Management,Development, Construction and Property Management departments. Climate resilience measures include trainingand implementation of emergency response plans and the engagement of our executives and BXP’s Board ofDirectors on climate change and other environmental, social and governance (“ESG”) aspects.
Reporting
A notable part of our commitment to sustainable development and operations is our commitment totransparent reporting of ESG performance indicators, as we recognize the importance of this information toinvestors, lenders and others in understanding how BXP assesses sustainability information and evaluates risksand opportunities. We publish an annual sustainability report that is aligned with the Global Reporting Initiativereporting framework, United Nations Sustainable Development Goals and the SASB framework and includes ourstrategy, key performance indicators, annual like-for-like comparisons, achievements and historical sustainabilityreports, which is available on our website at http://www.bxp.com under the heading “Sustainability.” In addition, wecontinue to work to further align our reporting with the recommendations of the Financial Stability Board’s TaskForce on Climate-related Financial Disclosures (“TCFD”) to disclose climate-related financial risks andopportunities.
In 2018 and 2019, BPLP issued an aggregate of $1.85 billion of green bonds. The terms of the green bondshave use of proceeds restrictions limiting its allocation to “eligible green projects.” We published our first GreenBond Allocation Report in June 2019, disclosing the full allocation of approximately $988 million in net proceedsfrom BPLP’s inaugural green bond offering to the eligible green project at our Salesforce Tower property in SanFrancisco, California. We recently published our September 30, 2020 Green Bond Allocation Report disclosing thefull allocation of approximately $841 million in net proceeds from BPLP’s green bond offering in June 2019. TheGreen Bond Allocation Reports are available on our website at http://www.bxp.com under the heading“Sustainability.”
Except for the documents specifically incorporated by reference into this Annual Report on Form 10-K,information contained on our website or that can be accessed through our website is not incorporated by referenceinto this Annual Report on Form 10-K.
Human Capital ManagementOur company culture supports and nurtures our employees and provides a unique competitive advantage. We
believe our employees are a significant distinguishing factor that sets BXP apart. As of December 31, 2020, we hadapproximately 750 employees. Our operational and financial performance depends on their talents, energy,experience and well-being. Our ability to attract and retain talented people depends on a number of factors,including work environment, career development and professional training, compensation and benefits, and thehealth, safety and wellness of our employees. We have an established reputation for excellence and integrity andthese core values are inherent in our culture and play a critical role in achieving our goals and overall success.
Diversity & Inclusion
We strive to create a diverse and inclusive workplace. It has been, and will continue to be, our policy to recruit,hire, assign, promote and train in all job titles without regard to race, national origin, religion, age, color, sex, sexualorientation, gender identity, disability, or protected veteran status, or any other characteristic protected by local,state, or federal laws, rules, or regulations. By implementing this policy, we aim to ensure that all employees havethe opportunity to make their maximum contribution to us and to their own career goals.
In 2020, we took concrete steps to formalize and elevate our focus on diversity and equity within our companyand in the communities we serve. We launched the Diversity & Inclusion Committee in early 2020 with the missionof promoting diversity, inclusion, equality and transparency as part of our culture, business activities and decision-making practices, while also providing an additional mechanism through which we can make a positive impact in thecommunities in which we operate. Areas of priority include recruiting, retention and professional development,review and assessment of our policies with a focus on business partner diversity and other relationships, andcommunity outreach. In addition, our Chief Executive Officer is a signatory to the CEO Action for Diversitycampaign, which is the largest CEO-driven business commitment to advance diversity and inclusion in theworkplace.
12
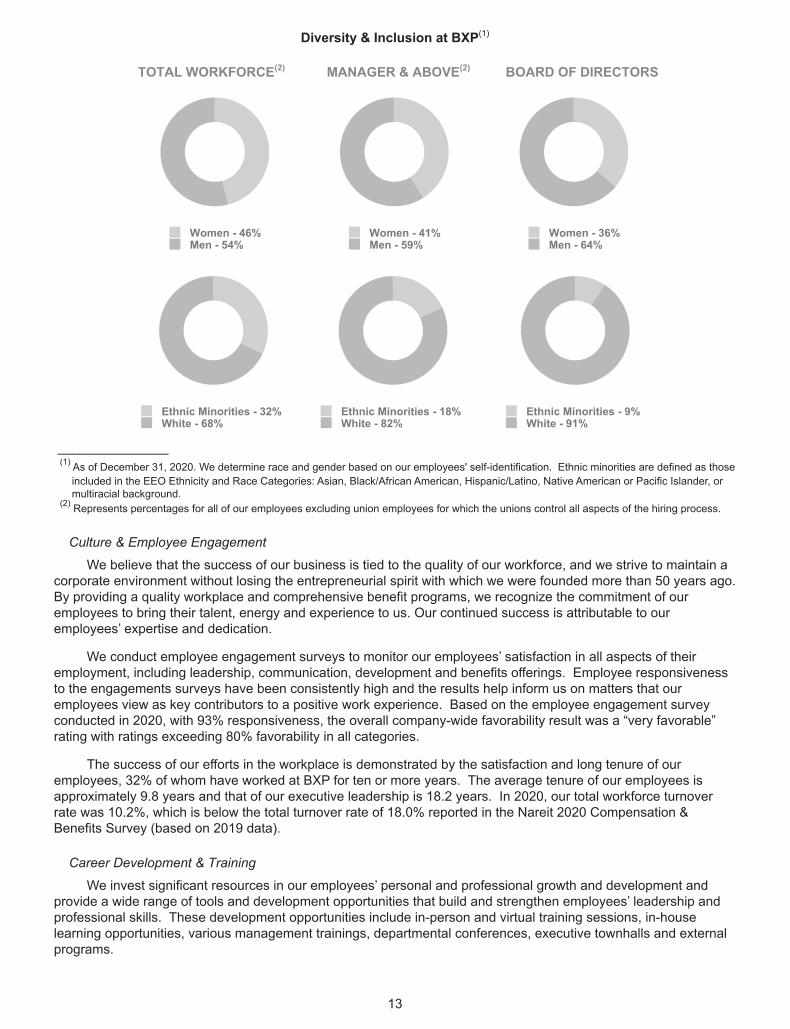
Diversity & Inclusion at BXP(1)
TOTAL WORKFORCE(2) MANAGER & ABOVE(2) BOARD OF DIRECTORS
Women - 46%Men - 54%
Women - 41%Men - 59%
Women - 36%Men - 64%
Ethnic Minorities - 32%White - 68%
Ethnic Minorities - 18%White - 82%
Ethnic Minorities - 9%White - 91%
_______________(1) As of December 31, 2020. We determine race and gender based on our employees' self-identification. Ethnic minorities are defined as thoseincluded in the EEO Ethnicity and Race Categories: Asian, Black/African American, Hispanic/Latino, Native American or Pacific Islander, ormultiracial background.
(2) Represents percentages for all of our employees excluding union employees for which the unions control all aspects of the hiring process.
Culture & Employee Engagement
We believe that the success of our business is tied to the quality of our workforce, and we strive to maintain acorporate environment without losing the entrepreneurial spirit with which we were founded more than 50 years ago.By providing a quality workplace and comprehensive benefit programs, we recognize the commitment of ouremployees to bring their talent, energy and experience to us. Our continued success is attributable to ouremployees’ expertise and dedication.
We conduct employee engagement surveys to monitor our employees’ satisfaction in all aspects of theiremployment, including leadership, communication, development and benefits offerings. Employee responsivenessto the engagements surveys have been consistently high and the results help inform us on matters that ouremployees view as key contributors to a positive work experience. Based on the employee engagement surveyconducted in 2020, with 93% responsiveness, the overall company-wide favorability result was a “very favorable”rating with ratings exceeding 80% favorability in all categories.
The success of our efforts in the workplace is demonstrated by the satisfaction and long tenure of ouremployees, 32% of whom have worked at BXP for ten or more years. The average tenure of our employees isapproximately 9.8 years and that of our executive leadership is 18.2 years. In 2020, our total workforce turnoverrate was 10.2%, which is below the total turnover rate of 18.0% reported in the Nareit 2020 Compensation &Benefits Survey (based on 2019 data).
Career Development & Training
We invest significant resources in our employees’ personal and professional growth and development andprovide a wide range of tools and development opportunities that build and strengthen employees’ leadership andprofessional skills. These development opportunities include in-person and virtual training sessions, in-houselearning opportunities, various management trainings, departmental conferences, executive townhalls and externalprograms.
13

One particularly relevant training that was offered to all employees in 2020 was Unconscious/Implicit Biastraining. We offered this training as part of our commitment to recognize that we all have a role to play to mitigateunconscious bias in the work environment and support an inclusive workforce. We strive for a truly inclusiveenvironment where all employees feel valued and provided the opportunity to succeed. This training, coupled withother trainings and initiatives, aims to enhance awareness, knowledge, collaboration and teamwork and overallenrich our culture.
Compensation & Benefits
Our employee benefit programs are designed to meet the needs of our diverse workforce, support ouremployees and their families by offering comprehensive programs that provide flexibility and choice in coverage,make available valuable resources to protect and enhance financial security and help balance work and personallife. Some of the benefits that we offer our employees include:
• health, telehealth, dental and vision insurance,• a 401(k) plan with a generous matching contribution,• an employee stock purchase plan,• health care and dependent care reimbursement accounts,• income protection through our sick pay, salary continuation and long-term disability policies,• a scholarship program for the children of non-officer employees,• a commuter subsidy to support the use of public transportation,• tuition reimbursement, and• paid vacation, holiday, personal and volunteer days to balance work and personal life.
Health, Safety & Wellness
As one of the largest publicly-traded office REITs (based on total market capitalization as of December 31,2020) in the United States, we are keenly aware of the influence of buildings on human health and its importance toour tenants and employees. In light of the COVID-19 pandemic, our focus on healthy buildings has become evenmore important. The health, safety and security of our employees, tenants, contractors and others is our highestpriority. In early 2020, we convened a Health Security Task Force of subject matter experts from both inside andoutside BXP to develop the BXP Health Security Plan, which we published in May of 2020. The BXP HealthSecurity Plan is a comprehensive set of building operational measures, including cleaning and disinfection, air andwater quality, physical distancing, screening and personal protective equipment and health security communication.We conduct health and security quality audits to ensure implementation and effectiveness of the plan at ourproperties.
We believe the success of our employees is dependent upon their overall well-being, including their physicalhealth, mental health, work-life balance and financial well-being. In addition to the benefits outlined above, we alsooffer our employees an Employee Wellness Program and an Employee Assistance Program. The EmployeeWellness Program was established in 2016 to encourage employees to improve their health and well-being byoffering activities facilitated through an engaging and personalized approach. Program participants receive areduction in their health insurance deduction cost. The Employee Assistance Program includes services forchildcare, eldercare, personal relationship information, financial planning assistance, stress management, mentalillness and general wellness and self-help.
Policies with Respect to Certain ActivitiesThe discussion below sets forth certain additional information regarding our investment, financing and other
policies. These policies have been determined by BXP’s Board of Directors and, in general, may be amended orrevised from time to time by the Board of Directors.
Investment PoliciesInvestments in Real Estate or Interests in Real Estate
Our investment objectives are to provide quarterly cash dividends/distributions to our securityholders and toachieve long-term capital appreciation through increases in our value. We have not established a specific policyregarding the relative priority of these investment objectives.
14
We expect to continue to pursue our investment objectives primarily through the ownership of our currentproperties, development projects and other acquired properties. We currently intend to continue to invest primarilyin developments of properties and acquisitions of existing improved properties or properties in need ofredevelopment, and acquisitions of land that we believe have development potential, primarily in our existingmarkets of Boston, Los Angeles, New York, San Francisco and Washington, DC and the target market of Seattle.We have explored and may continue to explore for future investment select domestic and international markets thatexhibit these same traits. Future investment or development activities will not be limited to a specified percentageof our assets. We intend to engage in such future investment or development activities in a manner that isconsistent with the maintenance of BXP’s status as a REIT for federal income tax purposes. In addition, we maypurchase or lease income-producing commercial and other types of properties for long-term investment, expandand improve the real estate presently owned or other properties purchased, or sell such real estate properties, inwhole or in part, when circumstances warrant. We do not have a policy that restricts the amount or percentage ofassets that will be invested in any specific property, however, our investments may be restricted by our debtcovenants.
We may also continue to participate with third parties in property ownership, through joint ventures or othertypes of co-ownership. These investments may permit us to own interests in larger assets without unduly restrictingdiversification and, therefore, add flexibility in structuring our portfolio.
Equity investments may be subject to existing mortgage financing and other indebtedness or such financing orindebtedness as may be incurred in connection with acquiring or refinancing these investments. Debt service onsuch financing or indebtedness will have a priority over any distributions with respect to BXP’s common stock.Investments are also subject to our policy not to be treated as an investment company under the InvestmentCompany Act of 1940, as amended (the “1940 Act”).
Investments in Real Estate Mortgages
While our current portfolio consists primarily of, and our business objectives emphasize, equity investments incommercial real estate, we may, at the discretion of the Board of Directors of BXP, invest in mortgages and othertypes of real estate interests consistent with BXP’s qualification as a REIT. Investments in real estate mortgagesrun the risk that one or more borrowers may default under such mortgages and that the collateral securing suchmortgages may not be sufficient to enable us to recoup our full investment. We may invest in participating,convertible or traditional mortgages if we conclude that we may benefit from the cash flow, or any appreciation invalue of the property or as an entrance to the fee ownership. As of December 31, 2020, we had three notereceivables outstanding, which aggregated approximately $96.3 million.
Securities of or Interests in Entities Primarily Engaged in Real Estate Activities
Subject to the percentage of ownership limitations and gross income and asset tests necessary for BXP’sREIT qualification, we also may invest in securities of other REITs, other entities engaged in real estate activities orsecurities of other issuers, including for the purpose of exercising control over such entities.
DispositionsWe decide to dispose or partially dispose of properties based upon the periodic review of our portfolio and the
determination by the Board of Directors of BXP that doing so is in our best interests. Any decision to dispose of aproperty will be authorized by the Board of Directors of BXP or a committee thereof. Some holders of limitedpartnership interests in BPLP could incur adverse tax consequences upon the sale of certain of our properties thatdiffer from the tax consequences to BXP. Consequently, holders of limited partnership interests in BPLP may havedifferent objectives regarding the appropriate pricing and timing of any such sale. Such different tax treatmentderives in most cases from the fact that we acquired these properties in exchange for partnership interests incontribution transactions structured to allow the prior owners to defer taxable gain. Generally, this deferralcontinues so long as we do not dispose of the properties in a taxable transaction. Unless a sale by us of theseproperties is structured as a like-kind exchange under Section 1031 of the Internal Revenue Code of 1986, asamended (the “Code”), or in a manner that otherwise allows deferral to continue, recognition of the deferred tax gainallocable to these prior owners is generally triggered by a sale. As of December 31, 2020, we had no propertiesthat were subject to a tax protection agreement.
15
Financing PoliciesThe agreement of limited partnership of BPLP and BXP’s certificate of incorporation and bylaws do not limit
the amount or percentage of indebtedness that we may incur. Further, we do not have a policy limiting the amountof indebtedness that we may incur, nor have we established any limit on the number or amount of mortgages thatmay be placed on any single property or on our portfolio as a whole. However, our mortgages, credit facilities, jointventure agreements and unsecured debt securities contain customary restrictions, requirements and otherlimitations on our ability to incur indebtedness. In addition, we evaluate the impact of incremental leverage on ourdebt metrics and the credit ratings of BPLP’s publicly traded debt. A reduction in BPLP’s credit ratings could resultin us borrowing money at higher interest rates.
The Board of Directors of BXP will consider a number of factors when evaluating our level of indebtednessand when making decisions regarding the incurrence of indebtedness, including the purchase price of properties tobe acquired with debt financing, the estimated market value of our properties upon refinancing, the entering intoagreements such as interest rate swaps, caps, floors and other interest rate hedging contracts and the ability ofparticular properties and us as a whole to generate cash flow to cover expected debt service.
Policies with Respect to Other ActivitiesAs the sole general partner of BPLP, BXP has the authority to issue additional common and preferred units of
limited partnership interest of BPLP. BXP has issued, and may in the future issue, common or preferred units oflimited partnership interest to persons who contribute their direct or indirect interests in properties to us in exchangefor such common or preferred units. We have not engaged in trading, underwriting or agency distribution or sale ofsecurities of issuers other than BXP and BPLP does not intend to do so. At all times, we intend to makeinvestments in such a manner as to enable BXP to maintain its qualification as a REIT, unless, due to changes incircumstances or to the Code, the Board of Directors of BXP determines that it is no longer in the best interest ofBXP to qualify as a REIT. We may make loans to third parties, including, without limitation, to joint ventures in whichwe participate or in connection with the disposition of a property. We intend to make investments in such a way thatwe will not be treated as an investment company under the 1940 Act. Our policies with respect to these and otheractivities may be reviewed and modified or amended from time to time by the Board of Directors of BXP.
Governmental RegulationsGeneral
Compliance with various governmental regulations has an impact on our business, including our capitalexpenditures, earnings and competitive position, which can be material. We incur costs to monitor and take actionsto comply with governmental regulations that are applicable to our business, which include, among others, (1)federal securities laws and regulations, (2) applicable stock exchange requirements, and (3) federal, state and locallaws and regulations related to (a) our status as a REIT and other tax laws and regulations, and (b) real property,the improvements thereon and the operation thereof, such as laws and regulations relating to the environment,health and safety, zoning, usage, building, fire and life safety codes, (4) the requirements of the Office of ForeignAssets Control of the United States Department of the Treasury and (5) the Americans with Disabilities Act of 1990.In addition to the discussion below, see “Item 1A – Risk Factors” for a discussion of these governmental regulationsand other material risks to us, including, to the extent material, to our competitive position, and see “Item 7.Management’s Discussion and Analysis of Financial Condition and Results of Operations” together with ourconsolidated financial statements, including the related notes included therein, for a discussion of materialinformation relevant to an assessment of our financial condition and results of operations, including, to the extentmaterial, the effects that compliance with governmental regulations may have upon our capital expenditures andearnings.
Environmental Matters
It is our policy to retain independent environmental consultants to conduct or update Phase I environmentalassessments (which generally do not involve invasive techniques such as soil or ground water sampling) andasbestos surveys in connection with our acquisition of properties. These pre-purchase environmental assessmentshave not revealed environmental conditions that we believe will have a material adverse effect on our business,assets, financial condition, results of operations or liquidity, and we are not otherwise aware of environmentalconditions with respect to our properties that we believe would have such a material adverse effect. However, fromtime to time environmental conditions at our properties have required and may in the future require environmentaltesting and/or regulatory filings, as well as remedial action.
16
For example, in February 1999, we (through a joint venture) acquired from Exxon Corporation a property inMassachusetts that was formerly used as a petroleum bulk storage and distribution facility and was known by thestate regulatory authority to contain soil and groundwater contamination. We developed an office park on theproperty. We engaged a specially licensed environmental consultant to oversee the management of contaminatedsoil and groundwater that was disturbed in the course of construction. Under the property acquisition agreement,Exxon agreed to (1) bear the liability arising from releases or discharges of oil and hazardous substances whichoccurred at the site prior to our ownership, (2) continue monitoring and/or remediating such releases anddischarges as necessary and appropriate to comply with applicable requirements, and (3) indemnify us for certainlosses arising from preexisting site conditions. Any indemnity claim may be subject to various defenses andcontractual limitations, including time limits, and there can be no assurance that the amounts paid under theindemnity, if any, would be sufficient to cover the liabilities arising from any such releases and discharges.
Environmental investigations at some of our properties and certain properties owned by our affiliates haveidentified groundwater contamination migrating from off-site source properties. In each case we engaged a licensedenvironmental consultant to perform the necessary investigations and assessments, and to prepare any requiredsubmittals to the regulatory authorities. In each case the environmental consultant concluded that the propertiesqualify under the regulatory program or the regulatory practice for a status which eliminates certain deadlines forconducting response actions at a site. We also believe that these properties qualify for liability relief under certainstatutory provisions or regulatory practices regarding upgradient releases. Although we believe that the current orformer owners of the upgradient source properties may bear responsibility for some or all of the costs of addressingthe identified groundwater contamination, we will take such further response actions (if any) that we deemnecessary or advisable. Other than periodic testing at some of these properties, no such additional responseactions are anticipated at this time.
Some of our properties and certain properties owned by our affiliates are located in urban, industrial and otherpreviously developed areas where fill or current or historical use of the areas have caused site contamination.Accordingly, it is sometimes necessary to institute special soil and/or groundwater handling procedures and/orinclude particular building design features in connection with development, construction and other propertyoperations in order to achieve regulatory closure and/or ensure that contaminated materials are addressed in anappropriate manner. In these situations, it is our practice to investigate the nature and extent of detectedcontamination, including potential issues associated with vapor intrusion concerns and/or potential contaminantmigration to or from the subject property in ground water, assess potential liability risks and estimate the costs ofrequired response actions and special handling procedures. We then use this information as part of our decision-making process with respect to the acquisition, deal structure and/or development of the property. For example, weown a parcel in Massachusetts which was formerly used as a quarry/asphalt batching facility. Pre-purchase testingindicated that the site contained relatively low levels of certain contaminants. We have developed an office park onthis property. Prior to and during redevelopment activities, we engaged a specially licensed environmentalconsultant to monitor environmental conditions at the site and prepare necessary regulatory submittals based on theresults of an environmental risk characterization. A submittal has been made to the regulatory authorities in orderto achieve regulatory closure at this site. The submittal included an environmental deed restriction that mandatescompliance with certain protective measures in a portion of the site where low levels of residual soil contaminationhave been left in place in accordance with applicable laws.
We expect that resolution of the environmental matters described above will not have a material impact on ourbusiness, assets, financial condition, results of operations or liquidity. However, we cannot assure you that we haveidentified all environmental liabilities at our properties, that all necessary remediation actions have been or will beundertaken at our properties, that we will be indemnified, in full or at all, or that we will have insurance coverage inthe event that such environmental liabilities arise.
Corporate Governance
BXP is currently governed by an eleven-member Board of Directors. The current members of the Board ofDirectors of BXP are Kelly A. Ayotte, Bruce W. Duncan, Karen E. Dykstra, Carol B. Einiger, Diane J. Hoskins, Joel I.Klein, Douglas T. Linde, Matthew J. Lustig, Owen D. Thomas, David A. Twardock and William H. Walton III. Alldirectors of BXP stand for election for one-year terms expiring at the next succeeding annual meeting ofstockholders.
17
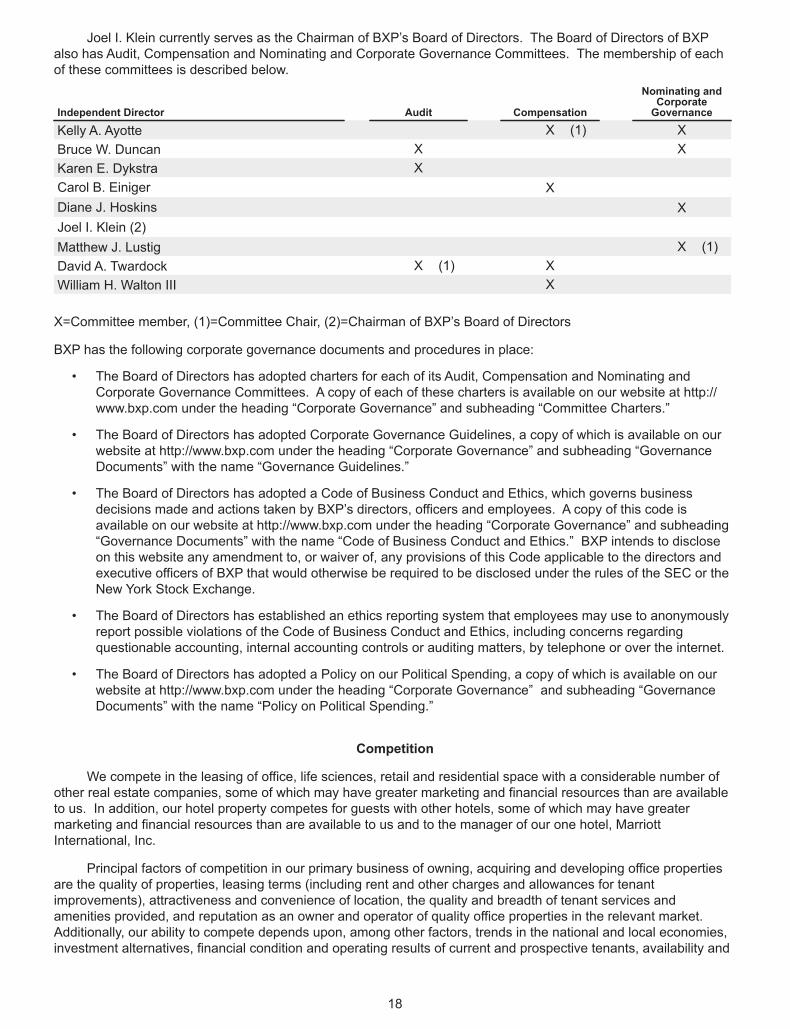
Joel I. Klein currently serves as the Chairman of BXP’s Board of Directors. The Board of Directors of BXPalso has Audit, Compensation and Nominating and Corporate Governance Committees. The membership of eachof these committees is described below.
Independent Director Audit Compensation
Nominating andCorporateGovernance
Kelly A. Ayotte X (1) XBruce W. Duncan X XKaren E. Dykstra XCarol B. Einiger XDiane J. Hoskins XJoel I. Klein (2)Matthew J. Lustig X (1)David A. Twardock X (1) XWilliam H. Walton III X
X=Committee member, (1)=Committee Chair, (2)=Chairman of BXP’s Board of Directors
BXP has the following corporate governance documents and procedures in place:
• The Board of Directors has adopted charters for each of its Audit, Compensation and Nominating andCorporate Governance Committees. A copy of each of these charters is available on our website at http://www.bxp.com under the heading “Corporate Governance” and subheading “Committee Charters.”
• The Board of Directors has adopted Corporate Governance Guidelines, a copy of which is available on ourwebsite at http://www.bxp.com under the heading “Corporate Governance” and subheading “GovernanceDocuments” with the name “Governance Guidelines.”
• The Board of Directors has adopted a Code of Business Conduct and Ethics, which governs businessdecisions made and actions taken by BXP’s directors, officers and employees. A copy of this code isavailable on our website at http://www.bxp.com under the heading “Corporate Governance” and subheading“Governance Documents” with the name “Code of Business Conduct and Ethics.” BXP intends to discloseon this website any amendment to, or waiver of, any provisions of this Code applicable to the directors andexecutive officers of BXP that would otherwise be required to be disclosed under the rules of the SEC or theNew York Stock Exchange.
• The Board of Directors has established an ethics reporting system that employees may use to anonymouslyreport possible violations of the Code of Business Conduct and Ethics, including concerns regardingquestionable accounting, internal accounting controls or auditing matters, by telephone or over the internet.
• The Board of Directors has adopted a Policy on our Political Spending, a copy of which is available on ourwebsite at http://www.bxp.com under the heading “Corporate Governance” and subheading “GovernanceDocuments” with the name “Policy on Political Spending.”
Competition
We compete in the leasing of office, life sciences, retail and residential space with a considerable number ofother real estate companies, some of which may have greater marketing and financial resources than are availableto us. In addition, our hotel property competes for guests with other hotels, some of which may have greatermarketing and financial resources than are available to us and to the manager of our one hotel, MarriottInternational, Inc.
Principal factors of competition in our primary business of owning, acquiring and developing office propertiesare the quality of properties, leasing terms (including rent and other charges and allowances for tenantimprovements), attractiveness and convenience of location, the quality and breadth of tenant services andamenities provided, and reputation as an owner and operator of quality office properties in the relevant market.Additionally, our ability to compete depends upon, among other factors, trends in the national and local economies,investment alternatives, financial condition and operating results of current and prospective tenants, availability and
18
cost of capital, construction and renovation costs, taxes, utilities, governmental regulations, legislation andpopulation trends.
In addition, we currently have six residential properties and may in the future decide to acquire or developadditional residential properties. As an owner, we will also face competition for prospective residents from otheroperators/owners whose properties may be perceived to offer a better location or better amenities or whose rentmay be perceived as a better value given the quality, location and amenities that the resident seeks. We will alsocompete against condominiums and single-family homes that are for sale or rent. Because the scale of ourresidential portfolio is relatively small, we expect to continue to retain third parties to manage our residentialproperties.
Our Hotel Property
We operate our hotel property through a taxable REIT subsidiary. The taxable REIT subsidiary, a wholly-owned subsidiary of BPLP, is the lessee pursuant to a lease for the hotel property. As lessor, BPLP is entitled to apercentage of gross receipts from the hotel property. The hotel lease is intended to provide the economic benefitsof ownership of the underlying real estate to flow to us as rental income, while our taxable REIT subsidiary earnsthe profit from operating the property as a hotel. Marriott International, Inc. continues to manage the hotel propertyunder the Marriott name and under terms of the existing management agreements. Marriott has been engagedunder a separate long-term incentive management agreement to operate and manage the hotel on behalf of thetaxable REIT subsidiary.
Item 1A. Risk Factors.Set forth below are the risks that we believe are material to our investors and they should be carefully
considered. Throughout this section, we refer to the equity and debt securities of both BXP and BPLP as our“securities,” and the investors who own securities of BXP, BPLP or both, as our “securityholders.” These risks arenot all of the risks we face and other factors not presently known to us or that we currently believe are immaterialmay also affect our business if they occur. This section contains forward-looking statements. You should refer tothe explanation of the qualifications and limitations on forward-looking statements beginning on page 57.
Risks Related to Our Business and Operations
The COVID-19 pandemic has caused severe disruptions in the United States and global economies and weexpect it will continue to materially and adversely affect our financial condition, results of operations, cashflows, liquidity and performance and that of our tenants.
The global impact of the COVID-19 pandemic continues to evolve and public health officials and governmentalauthorities, including those in all of the markets in which we operate, continue to implement measures restrictingtravel, issuing “stay-at-home” orders, restricting the types of businesses that may continue to operate (including thetypes of construction projects that may proceed) and the capacity at which businesses may operate. Most of theserestrictions began in earnest in March 2020 and they quickly had a material adverse impact on economic andmarket conditions around the world, including the United States and the markets in which our properties are located,and on us. It is likely that the restrictions and measures of public health officials and governmental authorities willcontinue through the end of 2021 and possibly longer. There remains uncertainty regarding the duration andbreadth of the COVID-19 pandemic. The degree to which the COVID-19 pandemic will continue to adverselyimpact our business, financial condition, results of operation, cash flows, liquidity and performance, and that of ourtenants, will be driven primarily by the speed, effectiveness and distribution of vaccines, the duration of indirecteconomic impacts such as recession, dislocation in capital markets, and job loss, potential longer term changes inconsumer and tenant behavior, as well as possible future governmental responses, which makes it impossible for usto predict with certainty the overall impact that COVID-19 will have on us and our tenants at this time. Factorsrelated to COVID-19 that have had, or could have, a material adverse effect on our results of operations andfinancial condition, include:
• a complete or partial closure of, or other operational issues at, one or more of our properties resulting fromgovernment or tenant action, including delays in re-opening or subsequent closures of previously re-opened properties, which could adversely affect our operations and those of our tenants;
19
• reduced economic activity impacting the businesses, financial condition and liquidity of our tenants hascaused, and is expected to continue to cause, one or more of our tenants to be unable to meet theirobligations to us, including their ability to make rental payments, in full or at all, or to otherwise seekmodifications of such obligations, including rent concessions, deferrals or abatements, or to declarebankruptcy;
• the failure of our tenants to properly implement or deploy their business continuity plans, or if those plansare ineffective, could have a material adverse effect on our tenants’ businesses and their ability to pay rent;
• the impact of new or continued complete or partial shutdowns of the operations of one or more of ourtenants’ businesses, including office, life sciences, hotel and retail tenants, and parking operators,temporary or long-term disruptions in our tenants’ supply chains from local, national and internationalsuppliers or delays in the delivery of products, services or other materials necessary for our tenants’operations, could force our tenants to reduce, delay or eliminate offerings of their products and services,which could result in less revenue, income and cash flow, and possibly their bankruptcy or insolvency,which in turn could:
• reduce our cash flows,
• adversely impact our ability to finance, refinance or sell a property,
• adversely impact our ability to continue paying dividends to our stockholders at current levels, orat all, and
• result in additional legal and other costs to enforce our rights, collect rent and/or re-lease thespace occupied by the distressed tenant;
• the duration and scope of the mandatory business closures and “stay-at-home” orders have had, and areexpected to continue to have, a severe negative impact on our retail, fitness and entertainment tenantsthat depend on in-person interactions with their customers to generate revenues and have resulted, andare expected to continue to result, in most retail, fitness and entertainment tenants being unable to maketimely rental payments in full or at all;
• the extent to which COVID-19 decreases customers’ willingness to frequent, or prevents customers fromfrequenting, our tenants’ businesses in the future, may result in our retail tenants’ continued inability tomake timely rental payments to us under their leases;
• many of our retail and select office tenants have approached us seeking either rent concessions, deferralsor abatements, and the extent to which we grant these requests or instead seek to enforce our legalremedies could have a material adverse effect on our results of operations, liquidity and cash flows;
• the degree to which our tenants’ businesses have been, and continue to be, negatively impacted hasrequired, and may continue to require, us to write-off a tenant’s accrued rent balance and this could have amaterial adverse effect on our results of operations and liquidity;
• if new or existing actions or measures implemented to prevent the spread of COVID-19 continue to resultin increasing unemployment, it may negatively affect the leasing of residential units as well as the ability ofour existing residential tenants to generate sufficient income to pay, or make them unwilling to pay rent, infull or at all, in a timely manner;
• the impact of prolonged restrictions on freedom of movement and business operations, such as travelbans, business closures and “stay-at-home” orders have had, and are expected to continue to have, amaterial adverse effect on the operators of our parking garages and our hotel property, which negativelyimpacts our revenues and may also result in a decrease in demand for hotel stays even after the travelbans and other restrictions are lifted;
• our failure, or the failure of any of our joint venture partners, to meet our or their, as applicable,responsibilities or obligations to the other or to third parties, such as lenders, including a failure tocontribute additional capital needed by the ventures or a default by a party under a joint venture agreementor other agreement relating to a joint venture, each of which, in our case, could result in dilution of ourinterest or a loss of our management and other rights relating to our joint ventures, and in the case of ajoint venture partner, could result in our payment of the partner’s share of the additional capital;
20
• the impact of COVID-19 could result in an event or change in circumstances that results in an impairmentin the value of our properties or our investments in unconsolidated joint ventures, and any such impairmentcould have a material adverse effect on our results of operations in the periods in which the charge istaken;
• we may be unable to restructure or amend leases with certain of our tenants on terms favorable to us or atall;
• the impact and validity of interpretations of lease provisions and applicable laws related to claims bytenants regarding their obligations to pay rent as a result of COVID-19, and any adverse court rulings ordecisions interpreting these provisions and laws, could have a material adverse effect on our results ofoperations and liquidity;
• restrictions intended to prevent the spread of COVID-19 have limited, and are expected to continue to limit,our leasing activities, such as property tours, and may have a material adverse effect on our ability torenew leases, lease vacant space, including vacant space from tenant bankruptcies and defaults, or re-lease available space as leases expire in our properties on favorable terms, or at all;
• COVID-19 has caused a material decline in general business activity and demand for real estatetransactions, and if this persists, it would adversely affect our ability or desire to make strategic acquisitionsor dispositions;
• the impact of recent and future efforts by state, local, federal and industry groups to enact laws andregulations have restricted, and may further restrict, the ability of landlords, such as us, to collect rent,enforce remedies for the failure to pay rent, or otherwise enforce the terms of the lease agreements, suchas a rent freeze for tenants or a suspension of a landlord’s ability to enforce evictions;
• the extent of construction delays on our development/redevelopment projects due to work-stoppageorders, disruptions in the supply of materials, delays in permitting or inspections, or other factors couldresult in our failure to meet the development milestones set forth in any applicable lease agreement, whichcould provide the tenant the right to terminate its lease or entitle the tenant to monetary damages, delaythe commencement or completion of construction and our anticipated lease-up plans for a development/redevelopment project or our overall development pipeline, including recognizing revenue for new leases,that may cause returns on investment to be less than projected, and/or increase the costs of constructionof new or existing projects, any of which could adversely affect our investment returns, profitability and/orour future growth;
• we may be unable to access debt and equity capital on attractive terms, or at all, and a further disruptionand instability in the global financial markets or deteriorations in credit and financing conditions may affectour tenants’ and our access to capital and other sources of funding necessary to fund our respectiveoperations or address maturing liabilities on a timely basis;
• the financial effects of the COVID-19 pandemic on our future financial results, cash flows and financialcondition could adversely impact our compliance with the financial covenants of our credit facility and otherdebt agreements and could result in an event of default and the acceleration of indebtedness, which couldnegatively impact our financial condition, results of operations and our ability to make additionalborrowings and pay dividends;
• adaptions made by companies in response to “stay-at-home” orders and future limitations on in-personwork environments could lead to a sustained shift away from collective in-person work environments orrelocations away from the cities in which we operate, either of which could adversely affect the overalldemand for office space across our portfolio over the long term;
• the effectiveness or lack of effectiveness of governmental relief in providing assistance to large and smallbusinesses, including some of our tenants, that have suffered significant declines in revenues as a resultof mandatory business shut-downs, “stay-at-home” orders and social distancing practices, and thepotential for a prolonged, severe recession, could have a material adverse impact on our financialcondition and results of operations;
• increased vulnerability to cyber-security threats and potential breaches, including phishing attacks,malware and impersonation tactics, resulting from the increase in numbers of individuals working fromhome;
21
• the potential that business interruption, loss of rental income and/or other associated expenses related toour operations will not be covered in whole or in part by our insurance policies, which may increaseunreimbursed liabilities;
• if the health of our employees, particularly our key personnel and property management teams, arenegatively impacted, we may be unable to ensure business continuity and be exposed to lawsuits fromtenants;
• we may, in managing our liquidity depending on business conditions, choose to pay dividends in our stockinstead of cash, which may cause our stockholders to pay income taxes on the dividends without receivinga corresponding amount of cash;
• uncertainty as to the conditions that must be satisfied as government authorities continue to lift “stay-at-home” orders and public health officials continue the process of gradually returning Americans to work andwhether government authorities will impose (or suggest) requirements on landlords, such as us, to protectthe health and safety of tenants and visitors to our buildings could result in increased operating costs anddemands on our property management teams to ensure compliance with any such requirements, as wellas increased costs associated with protecting against potential liability arising from these measures, suchas claims by tenants that the measures violate their leases and claims by visitors that the measurescaused them damages; and
• limited access to our facilities, management, tenants, support staff and professional advisors coulddecrease the effectiveness of our disclosure controls and procedures, internal controls over financialreporting and other risk mitigation strategies, increase our susceptibility to security breaches, hamper ourability to comply with regulatory obligations and prevent us from conducting our business as efficiently andeffectively as we otherwise would have.
The full extent to which the COVID-19 pandemic impacts our operations and those of our tenants will dependon future developments, which remain highly uncertain and cannot be predicted with confidence at this time. Thefluidity of the situation presents material uncertainty and risk with respect to our financial condition, results ofoperations, cash flows, liquidity and overall performance. Moreover, many risk factors detailed in this Item 1A titled“Risk Factors” are heightened risks as a result of the impact of the COVID-19 pandemic.
Our performance depends upon the economic climates of our markets—Boston, Los Angeles, New York,San Francisco and Washington, DC.
Substantially all of our revenue is derived from properties located in five markets: Boston, Los Angeles, NewYork, San Francisco and Washington, DC. A downturn in the economies of these markets, or the impact that adownturn in the overall national economy may have upon these economies, could result in reduced demand foroffice space and/or a reduction in rents. Because our portfolio consists primarily of office buildings (as compared toa more diversified real estate portfolio), a decrease in demand for office space in turn could adversely affect ourresults of operations. Additionally, there are submarkets within our markets that are dependent upon a limitednumber of industries. For example, in our Washington, DC market, we focus on leasing office properties togovernmental agencies and contractors, as well as legal firms. A reduction in spending by the Federal Governmentcould result in reduced demand for office space and adversely affect our results of operations. In addition, in ourNew York market, we have historically leased properties to financial, legal and other professional firms. A significantdownturn in one or more of these sectors could adversely affect our results of operations.
In addition, a significant economic downturn over a period of time could result in an event or change incircumstances that results in an impairment in the value of our properties or our investments in unconsolidated jointventures. An impairment loss is recognized if the carrying amount of the asset (1) is not recoverable over itsexpected holding period and (2) exceeds its fair value. There can be no assurance that we will not take charges inthe future related to the impairment of our assets or investments. Any future impairment could have a materialadverse effect on our results of operations in the period in which the charge is taken.
Adverse economic and geopolitical conditions, health crises and dislocations in the credit markets couldhave a material adverse effect on our results of operations, financial condition and ability to pay dividendsand/or distributions.
Our business may be affected by market and economic challenges experienced by the U.S. and globaleconomies or real estate industry as a whole, by the local economic conditions in the markets in which our
22
properties are located, including the impact of high unemployment, volatility in the public equity and debt markets,and international economic and other conditions, including pandemics. These current conditions, or similarconditions existing in the future, may adversely affect our results of operations, financial condition and ability to paydividends and/or distributions as a result of the following, among other potential consequences:
• the financial condition of our tenants may be adversely affected, which may result in tenant defaults underleases due to bankruptcy, lack of liquidity, lack of funding, operational failures or for other reasons;
• significant job losses may occur, which may decrease demand for our office space, causing market rentalrates and property values to be negatively impacted;
• our ability to borrow on terms and conditions that we find acceptable, or at all, may be limited, which couldreduce our ability to pursue acquisition and development opportunities and refinance existing debt, reduceour returns from our acquisition and development activities and increase our future interest expense;
• reduced values of our properties may limit our ability to dispose of assets at attractive prices or to obtaindebt financing secured by our properties and may reduce the availability of unsecured loans;
• the value and liquidity of our short-term investments and cash deposits could be reduced as a result of adeterioration of the financial condition of the institutions that hold our cash deposits or the institutions orassets in which we have made short-term investments, a dislocation of the markets for our short-terminvestments, increased volatility in market rates for such investments or other factors;
• one or more lenders under our line of credit could refuse to fund their financing commitment to us or couldfail and we may not be able to replace the financing commitment of any such lenders on favorable terms,or at all; and
• to the extent we enter into derivative financial instruments, one or more counterparties to our derivativefinancial instruments could default on their obligations to us, or could fail, increasing the risk that we maynot realize the benefits of these instruments.
Our success depends on key personnel whose continued service is not guaranteed.We depend on the efforts of key personnel, particularly Owen D. Thomas, Chief Executive Officer, Douglas T.
Linde, President, and Raymond A. Ritchey, Senior Executive Vice President. Among the reasons that Messrs.Thomas, Linde and Ritchey are important to our success is that each has a national reputation, which attractsbusiness and investment opportunities and assists us in negotiations with lenders, joint venture partners and otherinvestors. If we lost their services, our relationships with lenders, potential tenants and industry personnel coulddiminish.
Our Chief Financial Officer and Regional Managers also have strong reputations. Their reputations aid us inidentifying opportunities, having opportunities brought to us, and negotiating with tenants and build-to-suitprospects. While we believe that we could find replacements for these key personnel, the loss of their servicescould materially and adversely affect our operations because of diminished relationships with lenders, prospectivetenants and industry personnel.
Risks Related to Real Estate
Our performance and value are subject to risks associated with our real estate assets and with the realestate industry.
Our economic performance and the value of our real estate assets, and consequently the value of oursecurities, are subject to the risk that if our properties do not generate revenues sufficient to meet our operatingexpenses, including debt service and capital expenditures, our cash flow and ability to pay distributions to oursecurityholders will be adversely affected. The following factors, among others, may adversely affect the incomegenerated by our properties:
• downturns in the national, regional and local economic conditions (particularly increases inunemployment);
• competition from other office, life sciences, hotel, retail and residential buildings;
23
• local real estate market conditions, such as oversupply or reduction in demand for office, life sciences,hotel, retail or residential space;
• changes in interest rates and availability of financing;
• vacancies, changes in market rental rates and the need to periodically repair, renovate and re-let space;
• changes in space utilization by our tenants due to technology, economic conditions and business culture;
• increased operating costs, including insurance expense, utilities, real estate taxes, state and local taxesand heightened security costs;
• civil disturbances, earthquakes and other natural disasters or terrorist acts or acts of war which may resultin uninsured or underinsured losses or decrease the desirability to our tenants in impacted locations;
• significant expenditures associated with each investment, such as debt service payments, real estatetaxes (including reassessments and changes in tax laws), insurance and maintenance costs which aregenerally not reduced when circumstances cause a reduction in revenues from a property;
• declines in the financial condition of our tenants and our ability to collect rents from our tenants; and
• decreases in the underlying value of our real estate.
Our properties face significant competition.We face significant competition from developers, owners and managers of office, life sciences and residential
properties and other commercial real estate, including sublease space available from our tenants. Substantially allof our properties face competition from similar properties in the same market. This competition may affect our abilityto attract and retain tenants and may reduce the rents we are able to charge. These competing properties mayhave vacancy rates higher than our properties, which may result in their owners being willing to lease availablespace at lower rates than the space in our properties.
We face potential difficulties or delays renewing leases or re-leasing space.We derive most of our income from rent received from our tenants. If a tenant experiences a downturn in its
business or other types of financial distress, including as a result of the COVID-19 pandemic or due to the costs ofadditional federal, state or local tax burdens, it may be unable to make timely rental payments. Also, when ourtenants decide not to renew their leases or terminate early, we may not be able to re-let the space or there could bea substantial delay in re-letting the space. Even if tenants decide to renew or lease new space, the terms ofrenewals or new leases, including the cost of required renovations or concessions to tenants, may be less favorableto us than current lease terms. As a result, our cash flow could decrease and our ability to make distributions to oursecurityholders could be adversely affected.
Changes in rent control or rent stabilization and eviction laws and regulations in our markets could have amaterial adverse effect on our residential portfolio’s results of operations and residential property values.
Various state and local governments have enacted, and may continue to enact, rent control or rentstabilization laws and regulations or take other actions that could limit our ability to raise rents or charge certainfees, such as pet fees or application fees. We have seen a recent increase in governments considering, or beingurged by advocacy groups to consider, rent control or rent stabilization laws and regulations, including as a result ofthe COVID-19 pandemic. Depending on the extent and terms of future enactments of rent control or rentstabilization laws and regulations, as well as any lawsuits against us arising from such issues, such futureenactments could have a material adverse effect on our residential portfolio’s results of operations and the value ofour residential properties.
State and local governments may also make changes to eviction and other tenants’ rights laws andregulations that could have a material adverse effect on our residential portfolio’s results of operations and the valueof our residential properties. If we are restricted from re-leasing apartment units due to the inability to evictdelinquent residents, our results of operations and property values for our residential properties may be adverselyeffected.
24
We face potential adverse effects from major tenants’ bankruptcies or insolvencies.The bankruptcy or insolvency of a major tenant may adversely affect the income produced by our properties.
Our tenants could file for bankruptcy protection or become insolvent in the future. We cannot evict a tenant solelybecause of its bankruptcy. On the other hand, a bankrupt tenant may reject and terminate its lease with us. In suchcase, our claim against the bankrupt tenant for unpaid and future rent would be subject to a statutory cap that mightbe substantially less than the remaining rent actually owed under the lease, and, even so, our claim for unpaid rentwould likely not be paid in full. This shortfall could adversely affect our cash flow and results of operations.
Our actual costs to develop properties may exceed our budgeted costs.We intend to continue to develop and substantially renovate office, life sciences, retail and residential
properties. Our current and future development and construction activities may be exposed to the following risks:
• we may be unable to proceed with the development of properties because we cannot obtain financing onfavorable terms or at all;
• we may incur construction costs for a development project that exceed our original estimates due toincreases in interest rates and increased materials, labor, leasing or other costs, which could makecompletion of the project less profitable because market rents may not increase sufficiently to compensatefor the increase in construction costs;
• we may be unable to obtain, or face delays in obtaining, required zoning, land-use, building, occupancy,and other governmental permits and authorizations, which could result in increased costs and couldrequire us to abandon our activities entirely with respect to a project;
• we may abandon development opportunities after we begin to explore them and as a result we may losedeposits or fail to recover expenses already incurred;
• we may expend funds on and devote management’s time to projects that we do not complete;
• we may be unable to complete construction and/or leasing of a property on schedule or at all; and
• we may suspend development projects after construction has begun due to changes in economicconditions or other factors, and this may result in the write-off of costs, payment of additional costs orincreases in overall costs when the development project is restarted.
Investment returns from our developed properties may be less than anticipated.Our developed properties may be exposed to the following risks:
• we may lease developed properties at rental rates that are less than projected, or at a slower pace thenprojected, at the time we decide to undertake the development;
• operating expenses and construction costs may be greater than projected at the time of development,resulting in our investment being less profitable than we expected; and
• occupancy rates and rents at newly developed properties may fluctuate depending on a number of factors,including market and economic conditions, and may result in our investments being less profitable than weexpected or not profitable at all.
We face risks associated with the development of mixed-use commercial properties.We operate, are currently developing, and may in the future develop, properties either alone or through joint
ventures with other persons that are known as “mixed-use” developments. This means that in addition to thedevelopment of office space, the project may also include space for residential, retail, hotel or other commercialpurposes. We have less experience in developing and managing non-office and non-retail real estate than we dowith office real estate. As a result, if a development project includes a non-office or non-retail use, we may seek todevelop that component ourselves, sell the rights to that component to a third-party developer with experience inthat use or we may seek to partner with such a developer. If we do not sell the rights or partner with such adeveloper, or if we choose to develop the other component ourselves, we would be exposed not only to those riskstypically associated with the development of commercial real estate generally, but also to specific risks associatedwith the development and ownership of non-office and non-retail real estate. In addition, even if we sell the rights todevelop the other component or elect to participate in the development through a joint venture, we may be exposed
25
to the risks associated with the failure of the other party to complete the development as expected. These includethe risk that the other party would default on its obligations necessitating that we complete the other componentourselves (including providing any necessary financing). In the case of residential properties, these risks includecompetition for prospective residents from other operators whose properties may be perceived to offer a betterlocation or better amenities or whose rent may be perceived as a better value given the quality, location andamenities that the resident seeks. We will also compete against condominiums and single-family homes that are forsale or rent. Because we have less experience with residential properties than with office and retail properties, weexpect to retain third parties to manage our residential properties. If we decide to not sell or participate in a jointventure and instead hire a third party manager, we would be dependent on them and their key personnel whoprovide services to us and we may not find a suitable replacement if the management agreement is terminated, or ifkey personnel leave or otherwise become unavailable to us.
Failure to comply with Federal Government contractor requirements could result in substantial costs andloss of substantial revenue.
As of December 31, 2020, the U.S. Government was one of our largest tenants by square feet. We aresubject to compliance with a wide variety of complex legal requirements because we are a Federal Governmentcontractor. These laws regulate how we conduct business, require us to administer various compliance programsand require us to impose compliance responsibilities on some of our contractors. Our failure to comply with theselaws could subject us to fines, penalties and damages, cause us to be in default of our leases and other contractswith the Federal Government and bar us from entering into future leases and other contracts with the FederalGovernment. There can be no assurance that these costs and loss of revenue will not have a material adverseeffect on our properties, operations or business.
Our use of joint ventures limits our flexibility with respect to the assets they own and other assets we maywish to acquire.
In appropriate circumstances, we intend to develop, acquire and recapitalize properties in joint ventures withother persons or entities. We currently have joint ventures that are and are not consolidated within our financialstatements. Our participation in joint ventures subjects us to risks, including but not limited to, the following risksthat:
• we could become engaged in a dispute with any of our joint venture partners that might affect our ability todevelop, finance or operate a property and could lead to the sale of either parties’ ownership interest or theproperty;
• some of our joint ventures are subject to debt and in the current credit markets the refinancing of such debtmay require equity capital calls;
• our joint venture partners may default on their obligations necessitating that we fulfill their obligationourselves;
• our joint venture partners may have different objectives than we have regarding the appropriate timing andterms of any sale or refinancing of properties or the commencement of development activities;
• our joint venture partners may be structured differently than us for tax purposes and this could createconflicts of interest;
• our joint venture partners may have competing interests in our markets that could create conflicts ofinterest;
• our joint ventures may be unable to repay any amounts that we may loan to them; and
• our joint venture agreements may contain provisions limiting the liquidity of our interest for sale or sale ofthe entire asset.
We face the risk that third parties will not be able to service or repay loans we make to them.From time to time, we have loaned and in the future may loan funds to (1) a third-party buyer to facilitate the
sale of an asset by us to such third party, or (2) a third party in connection with the formation of a joint venture toacquire and/or develop a property. Making these loans subjects us to the following risks, each of which could havea material adverse effect on our cash flow, results of operations and/or financial condition:
26
• the third party may be unable to make full and timely payments of interest and principal on the loan whendue;
• if the third-party buyer to whom we provide seller financing and utilizes the assets as collateral does notmanage the property well, or the property otherwise fails to meet financial projections, performs poorly ordeclines in value, then the buyer may not have the funds or ability to raise new debt with which to makerequired payments of interest and principal to us;
• if we loan funds to a joint venture, and the joint venture is unable to make required payments of interest orprincipal, or both, or there are disagreements with respect to the repayment of the loan or other matters,then we could have a resulting dispute with our partner(s), and such a dispute could harm ourrelationship(s) with our partner(s) and cause delays in developing or selling the property or the failure toproperly manage the property; and
• if we loan funds to a joint venture and the joint venture is unable to make required payments of interest andprincipal, or both, then we may exercise remedies available to us in the joint venture agreement that couldallow us to increase our ownership interest or our control over major decisions, or both, which could resultin an unconsolidated joint venture becoming consolidated with our financial statement; doing so couldrequire us to reallocate the purchase price among the various asset and liability components and this couldresult in material changes to our reported results of operations and financial condition.
We face risks associated with property acquisitions.We have acquired in the past and intend to continue to pursue the acquisition of properties and portfolios of
properties, including large portfolios that could increase our size and result in alterations to our capital structure.Our acquisition activities and their success are subject to the following risks:
• even if we enter into an acquisition agreement for a property, we may be unable to complete thatacquisition after making a non-refundable deposit and incurring certain other acquisition-related costs;
• we may be unable to obtain or assume financing for acquisitions on favorable terms or at all;
• acquired properties may fail to perform as expected;
• the actual costs of repositioning, redeveloping or maintaining acquired properties may be greater than ourestimates;
• the acquisition agreement will likely contain conditions to closing, including completion of due diligenceinvestigations to our satisfaction or other conditions that are not within our control, which may not besatisfied;
• acquired properties may be located in new markets, either within or outside the United States, where wemay face risks associated with a lack of market knowledge or understanding of the local economy, lack ofbusiness relationships in the area, costs associated with opening a new regional office and unfamiliaritywith local governmental and permitting procedures;
• we may acquire real estate through the acquisition of the ownership entity subjecting us to the risks of thatentity; and
• we may be unable to quickly and efficiently integrate new acquisitions, particularly acquisitions of portfoliosof properties, into our existing operations, and this could have an adverse effect on our results ofoperations and financial condition.
We have acquired in the past and in the future may acquire properties through the acquisition of first mortgageor mezzanine debt. Investments in these loans must be carefully structured to ensure that BXP continues to satisfythe various asset and income requirements applicable to REITs. If we fail to structure any such acquisition properly,BXP could fail to qualify as a REIT. In addition, acquisitions of first mortgage or mezzanine loans subject us to therisks associated with the borrower’s default, including potential bankruptcy, and there may be significant delays andcosts associated with the process of foreclosure on collateral securing or supporting these investments. There canbe no assurance that we would recover any or all of our investment in the event of such a default or bankruptcy.
27
We have acquired in the past and in the future may acquire properties or portfolios of properties through taxdeferred contribution transactions in exchange for partnership interests in BPLP. This acquisition structure has theeffect, among others, of reducing the amount of tax depreciation we can deduct over the tax life of the acquiredproperties, and typically requires that we agree to protect the contributors’ ability to defer recognition of taxable gainthrough restrictions on our ability to dispose of the acquired properties and/or the allocation of partnership debt tothe contributors to maintain their tax bases. These restrictions could limit our ability to sell an asset at a time, or onterms, that would be favorable absent such restrictions.
Acquired properties may expose us to unknown liability.We may acquire properties or invest in joint ventures that own properties subject to liabilities and without any
recourse, or with only limited recourse, against the prior owners or other third parties with respect to unknownliabilities. As a result, if a liability were asserted against us based upon ownership of those properties, we mighthave to pay substantial sums to settle or contest it, which could adversely affect our results of operations and cashflow. Unknown liabilities with respect to acquired properties might include:
• liabilities for clean-up of undisclosed environmental contamination;
• claims by tenants, vendors or other persons against the former owners of the properties;
• liabilities incurred in the ordinary course of business; and
• claims for indemnification by general partners, directors, officers and others indemnified by the formerowners of the properties.
Competition for acquisitions may result in increased prices for properties.We plan to continue to acquire properties as we are presented with attractive opportunities. We may face
competition for acquisition opportunities with other investors, and this competition may adversely affect us bysubjecting us to the following risks:
• we may be unable to acquire a desired property because of competition from other well-capitalized realestate investors, including publicly traded and private REITs, institutional investment funds and other realestate investors; and
• even if we are able to acquire a desired property, competition from other real estate investors maysignificantly increase the purchase price.
We may have difficulty selling our properties, which may limit our flexibility.Properties like the ones that we own could be difficult to sell. This may limit our ability to change our portfolio
promptly in response to changes in economic or other conditions. In addition, federal tax laws limit our ability to sellproperties and this may affect our ability to sell properties without adversely affecting returns to our securityholders.These restrictions reduce our ability to respond to changes in the performance of our investments and couldadversely affect our financial condition and results of operations.
Our ability to dispose of some of our properties is constrained by their tax attributes. Properties which wedeveloped and have owned for a significant period of time or which we acquired through tax deferred contributiontransactions in exchange for partnership interests in BPLP often have low tax bases. Furthermore, as a REIT, BXPmay be subject to a 100% “prohibited transactions” tax on the gain from dispositions of property if BXP is deemed tohold the property primarily for sale to customers in the ordinary course of business, unless the disposition qualifiesunder a safe harbor exception for properties that have been held for at least two years and with respect to whichcertain other requirements are met. The potential application of the prohibited transactions tax could cause us toforego potential dispositions of property or other opportunities that might otherwise be attractive to us, or toundertake such dispositions or other opportunities through a taxable REIT subsidiary, which would generally resultin income taxes being incurred. If we dispose of these properties outright in taxable transactions, we may berequired to distribute a significant amount of the taxable gain to our securityholders under the requirements of theCode applicable to REITs, which in turn would impact our future cash flow and may increase our leverage. In somecases, without incurring additional costs we may be restricted from disposing of properties contributed in exchangefor our partnership interests under tax protection agreements with contributors. To dispose of low basis or tax-protected properties efficiently we from time to time use like-kind exchanges, which are intended to qualify for non-
28
recognition of taxable gain, but can be difficult to consummate and result in the property for which the disposedassets are exchanged inheriting their low tax bases and other tax attributes (including tax protection covenants).
Because we own a hotel property, we face the risks associated with the hospitality industry.The following factors, among others, are common to the hotel industry, and may reduce the receipts generated
by our hotel property:
• our hotel property competes for guests with other hotels, a number of which may have greater marketingand financial resources than our hotel-operating business partners;
• if there is an increase in operating costs resulting from inflation and other factors, our hotel-operatingbusiness partners may not be able to offset such increase by increasing room rates;
• our hotel property is subject to the fluctuating and seasonal demands of business travelers and tourism;and
• our hotel property is subject to general and local economic and social conditions that may affect demandfor travel in general, including war and terrorism.
In addition, because our hotel property is located in Cambridge, Massachusetts, it is subject to the Cambridgemarket’s fluctuations in demand, increases in operating costs and increased competition from additions in supply.
Due to the COVID-19 pandemic, our hotel closed in March 2020 and did not re-open until October 2020. As aresult of the pandemic, the hotel has been operating at a diminished occupancy and generating minimal revenue.The closing of the hotel for more than two fiscal quarters, weak demand and low occupancy since its re-opening,have had, and are expected to continue to have, a material adverse effect on the hotel’s operations. We expecthotel occupancy to remain low until a sufficient number of people have been vaccinated and the demand for traveland leisure returns to historical levels.
We did not obtain new owner’s title insurance policies in connection with properties acquired duringBXP’s initial public offering.
We acquired many of our properties from our predecessors at the completion of BXP’s initial public offering inJune 1997. Before we acquired these properties, each of them was insured by a title insurance policy. We did notobtain new owner’s title insurance policies in connection with the acquisition of these properties. To the extent wehave financed properties after acquiring them in connection with the initial public offering, we have obtained newtitle insurance policies, however, the amount of these policies may be less than the current or future value of theapplicable properties. Nevertheless, because in many instances we acquired these properties indirectly byacquiring ownership of the entity that owned the property and those owners remain in existence as our subsidiaries,some of these title insurance policies may continue to benefit us. Many of these title insurance policies may be foramounts less than the current or future values of the applicable properties. If there was a title defect related to anyof these properties, or to any of the properties acquired at the time of the initial public offering of BXP, that is nolonger covered by a title insurance policy, we could lose both our capital invested in and our anticipated profits fromsuch property. We have obtained title insurance policies for all properties that we have acquired after the initialpublic offering of BXP, however, these policies may be for amounts less than the current or future values of theapplicable properties.
Some potential losses are not covered by insurance.Our property insurance program per occurrence limits are $1.0 billion for its portfolio insurance program,
including coverage for acts of terrorism other than nuclear, biological, chemical or radiological terrorism (“TerrorismCoverage”). We also carry $250 million of Terrorism Coverage for 601 Lexington Avenue, New York, New York(“601 Lexington Avenue”) in excess of the $1.0 billion of coverage in our property insurance program. Certainproperties, including the General Motors Building located at 767 Fifth Avenue in New York, New York (“767 FifthAvenue”), are currently insured in separate insurance programs. The property insurance program per occurrencelimits for 767 Fifth Avenue are $1.625 billion, including Terrorism Coverage. We also currently carry nuclear,biological, chemical and radiological terrorism insurance coverage for acts of terrorism certified under the FederalTerrorism Risk Insurance Act (as amended, “TRIA”) (“NBCR Coverage”), which is provided by IXP as a directinsurer, for the properties in our portfolio, including 767 Fifth Avenue, but excluding certain other properties owned injoint ventures with third parties or which we manage. The per occurrence limit for NBCR Coverage is $1.0 billion.Under TRIA, after the payment of the required deductible and coinsurance, the NBCR Coverage provided by IXP is
29
backstopped by the Federal Government if the aggregate industry insured losses resulting from a certified act ofterrorism exceed a “program trigger.” The program trigger is $200 million, the coinsurance is 20% and thedeductible is 20% of the premiums earned by the insurer for the year prior to a claim. If the Federal Governmentpays out for a loss under TRIA, it is mandatory that the Federal Government recoup the full amount of the loss frominsurers offering TRIA coverage after the payment of the loss pursuant to a formula in TRIA. We may elect toterminate the NBCR Coverage if the Federal Government seeks recoupment for losses paid under TRIA, if TRIA isnot extended after its expiration on December 31, 2027, if there is a change in our portfolio or for any other reason.We intend to continue to monitor the scope, nature and cost of available terrorism insurance.
We also currently carry earthquake insurance on our properties located in areas known to be subject toearthquakes. In addition, this insurance is subject to a deductible in the amount of 3% of the value of the affectedproperty. Specifically, we currently carry earthquake insurance which covers our San Francisco and Los Angelesregions with a $240 million per occurrence limit and a $240 million annual aggregate limit, $20 million of which isprovided by IXP, as a direct insurer. The amount of our earthquake insurance coverage may not be sufficient tocover losses from earthquakes. In addition, the amount of earthquake coverage could impact our ability to financeproperties subject to earthquake risk. We may discontinue earthquake insurance or change the structure of ourearthquake insurance program on some or all of our properties in the future if the premiums exceed our estimationof the value of the coverage.
IXP, a captive insurance company which is a wholly-owned subsidiary, acts as a direct insurer with respect toa portion of our earthquake insurance coverage for our Greater San Francisco and Los Angeles properties and ourNBCR Coverage. Insofar as we own IXP, we are responsible for its liquidity and capital resources, and theaccounts of IXP are part of our consolidated financial statements. In particular, if a loss occurs which is covered byour NBCR Coverage but is less than the applicable program trigger under TRIA, IXP would be responsible for thefull amount of the loss without any backstop by the Federal Government. IXP would also be responsible for anyrecoupment charges by the Federal Government in the event losses are paid out and its insurance policy ismaintained after the payout by the Federal Government. If we experience a loss and IXP is required to pay underits insurance policy, we would ultimately record the loss to the extent of the required payment. Therefore, insurancecoverage provided by IXP should not be considered as the equivalent of third-party insurance, but rather as amodified form of self-insurance. In addition, BPLP has issued a guarantee to cover liabilities of IXP in the amount of$20.0 million.
Due to the current COVID-19 pandemic, we anticipate the possibility of business interruption, loss of leaserevenue and/or other associated expenses related to our operations across our portfolio. Because this is an ongoingsituation it is not yet possible to quantify our losses and expenses, which continue to develop. Because of thecomplexity of our insurance policies and limited precedent for claims being made related to pandemics, it is not yetpossible to determine if such losses and expenses will be covered by our insurance policies. Therefore, at this time,we are providing notice to the applicable insurers of the potential for claims in order to protect our rights under ourpolicies.
We continue to monitor the state of the insurance market in general, and the scope and costs of coverage foracts of terrorism, California earthquake risk and pandemics, in particular, but we cannot anticipate what coveragewill be available on commercially reasonable terms in future policy years. There are other types of losses, such asfrom wars, for which we cannot obtain insurance at all or at a reasonable cost. With respect to such losses andlosses from acts of terrorism, earthquakes or other catastrophic events, if we experience a loss that is uninsured orthat exceeds policy limits, we could lose the capital invested in the damaged properties, as well as the anticipatedfuture revenues from those properties. Depending on the specific circumstances of each affected property, it ispossible that we could be liable for mortgage indebtedness or other obligations related to the property. Any suchloss could materially and adversely affect our business and financial condition and results of operations.
Actual or threatened terrorist attacks may adversely affect our ability to generate revenues and the value ofour properties.
We have significant investments in large metropolitan markets that have been or may be in the future thetargets of actual or threatened terrorism attacks, including Boston, Los Angeles, New York, San Francisco andWashington, DC. As a result, some tenants in these markets may choose to relocate their businesses to othermarkets or to lower-profile office buildings within these markets that may be perceived to be less likely targets offuture terrorist activity. This could result in an overall decrease in the demand for office space in these marketsgenerally or in our properties in particular, which could increase vacancies in our properties or necessitate that welease our properties on less favorable terms or both. In addition, future terrorist attacks in these markets could
30
directly or indirectly damage our properties, both physically and financially, or cause losses that materially exceedour insurance coverage. As a result of the foregoing, our ability to generate revenues and the value of ourproperties could decline materially. See also “—Some potential losses are not covered by insurance.”
We face risks associated with our tenants and contractual counterparties being designated “ProhibitedPersons” by the Office of Foreign Assets Control.
Pursuant to Executive Order 13224 and other laws, the Office of Foreign Assets Control of the United StatesDepartment of the Treasury (“OFAC”) maintains a list of persons designated as terrorists or who are otherwiseblocked or banned (“Prohibited Persons”). OFAC regulations and other laws prohibit conducting business orengaging in transactions with Prohibited Persons (the “OFAC Requirements”). Certain of our loan and otheragreements require us to comply with OFAC Requirements. We have established a compliance program wherebytenants and others with whom we conduct business are checked against the OFAC list of Prohibited Persons priorto entering into any agreement and on a periodic basis thereafter. Our leases and other agreements, in general,require the other party to comply with OFAC Requirements. If a tenant or other party with whom we contract isplaced on the OFAC list we may be required by the OFAC Requirements to terminate the lease or other agreement.Any such termination could result in a loss of revenue or a damage claim by the other party that the termination waswrongful.
We face risks associated with the physical effects of climate change.The physical effects of climate change could have a material adverse effect on our properties, operations and
business. For example, many of our properties are located along the East and West coasts, particularly those in thecentral business districts of Boston, Los Angeles, New York, San Francisco and Washington, DC. To the extentclimate change causes changes in weather patterns, our markets could experience increases in storm intensity,extreme temperatures, rising sea-levels and/or drought. Over time, these conditions could result in decliningdemand for office space in our buildings or costs associated with infrastructure-related remediation projects.Climate change may also have indirect effects on our business by making property insurance unavailable or byincreasing the cost of (i) property insurance on terms we find acceptable, (ii) real estate taxes or other assessments,(iii) energy and (iv) property maintenance. There can be no assurance that climate change will not have a materialadverse effect on our properties, operations or business.
For additional discussion regarding our approach to climate resiliency and our continued commitment totransparent reporting of ESG performance indicators, see “Item 1. Business—Business and Growth Strategies—Policies with Respect to Certain Activities—Sustainability” and our annual sustainability report available on ourwebsite at http://www.bxp.com under the heading “Sustainability.”
Potential liability for environmental contamination could result in substantial costs.Under federal, state and local environmental laws, ordinances and regulations, we may be required to
investigate and clean up the effects of releases of hazardous or toxic substances or petroleum products at ormigrating from our properties simply because of our current or past ownership or operation of the real estate. Ifunidentified environmental problems arise, we may have to make substantial payments, which could adverselyaffect our cash flow and our ability to make distributions to our securityholders, because: as owner or operator wemay have to pay for property damage and for investigation and clean-up costs incurred in connection with thecontamination; the law typically imposes clean-up responsibility and liability regardless of whether the owner oroperator knew of or caused the contamination; even if more than one person may be responsible for thecontamination, each person who shares legal liability under the environmental laws may be held responsible for allof the clean-up costs; and governmental entities and third parties may sue the owner or operator of a contaminatedsite for damages and costs.
These costs could be substantial and in extreme cases could exceed the amount of our insurance or the valueof the contaminated property. We currently carry environmental insurance in an amount and subject to deductiblesthat we believe are commercially reasonable. Specifically, we carry a pollution legal liability policy with a $20 millionlimit per incident and a policy aggregate limit of $40 million. The presence or migration of hazardous or toxicsubstances or petroleum products or the failure to properly remediate contamination may give rise to third-partyclaims for bodily injury, property damage and/or response costs and may materially and adversely affect our abilityto borrow against, sell or rent an affected property. In addition, applicable environmental laws create liens oncontaminated sites in favor of the government for damages and costs it incurs in connection with contamination.Changes in laws, regulations and practices and their implementation increasing the potential liability for
31
environmental conditions existing at our properties, or increasing the restrictions on the handling, storage ordischarge of hazardous or toxic substances or petroleum products or other actions may result in significantunanticipated expenditures.
Environmental laws also govern the presence, maintenance and removal of asbestos and other buildingmaterials. For example, laws require that owners or operators of buildings containing asbestos:
• properly manage and maintain the asbestos;
• notify and train those who may come into contact with asbestos; and
• undertake special precautions, including removal or other abatement, if asbestos would be disturbedduring renovation or demolition of a building.
Such laws may impose fines and penalties on building owners or operators who fail to comply with theserequirements and may allow third parties to seek recovery from owners or operators for personal injury associatedwith exposure to asbestos fibers.
Some of our properties are located in urban and previously developed areas where fill or current or historicindustrial uses of the areas have caused site contamination. It is our policy to retain independent environmentalconsultants to conduct or update Phase I environmental site assessments and asbestos surveys with respect to ouracquisition of properties. These assessments generally include a visual inspection of the properties and thesurrounding areas, an examination of current and historical uses of the properties and the surrounding areas and areview of relevant state, federal and historical documents, but do not involve invasive techniques such as soil andground water sampling. Where appropriate, on a property-by-property basis, our practice is to have theseconsultants conduct additional testing, including sampling for asbestos, for lead and other contaminants in drinkingwater and, for soil and/or groundwater contamination where underground storage tanks are or were located orwhere other past site usage creates a potential environmental problem. Even though these environmentalassessments are conducted, there is still the risk that:
• the environmental assessments and updates did not identify or properly address all potentialenvironmental liabilities;
• a prior owner created a material environmental condition that is not known to us or the independentconsultants preparing the assessments;
• new environmental liabilities have developed since the environmental assessments were conducted; and
• future uses or conditions such as changes in applicable environmental laws and regulations could result inenvironmental liability for us.
Inquiries about indoor air quality may necessitate special investigation and, depending on the results,remediation beyond our regular indoor air quality testing and maintenance programs. Indoor air quality issues canstem from inadequate ventilation, chemical contaminants from indoor or outdoor sources, and biologicalcontaminants such as molds, pollen, viruses and bacteria. Indoor exposure to chemical or biological contaminantscan be alleged to be connected to allergic reactions or other adverse health effects. If these conditions were tooccur at one of our properties, we may be subject to third-party claims for personal injury, or may need to undertakea targeted remediation program, including without limitation, special cleaning measures and steps to increaseindoor ventilation rates and eliminate sources of contaminants. Such remediation programs could be costly,necessitate the temporary relocation of some or all of the property’s tenants or require rehabilitation of the affectedproperty.
Compliance or failure to comply with the Americans with Disabilities Act or other safety regulations andrequirements could result in substantial costs.
The Americans with Disabilities Act generally requires that certain buildings, including office buildings,residential buildings and hotels, be made accessible to disabled persons. Noncompliance could result in theimposition of fines by the federal government or the award of damages to private litigants. If, under the Americanswith Disabilities Act, we are required to make substantial alterations and capital expenditures in one or more of ourproperties, including the removal of access barriers, it could adversely affect our financial condition and results ofoperations, as well as the amount of cash available for distribution to our securityholders.
32
Our properties are subject to various federal, state and local regulatory requirements, such as state and localfire and life safety requirements. If we fail to comply with these requirements, we could incur fines or privatedamage awards. We do not know whether existing requirements will change or whether compliance with futurerequirements will require significant unanticipated expenditures that will affect our cash flow and results ofoperations.
Any future international activities will be subject to special risks and we may not be able to effectivelymanage our international business.
We have underwritten, and in the future may acquire, properties, portfolios of properties or interests in realestate-related entities on a strategic or selective basis in international markets that are new to us. If we acquireproperties or platforms located in these markets, we will face risks associated with a lack of market knowledge andunderstanding of the local economy, forging new business relationships in the area and unfamiliarity with local lawsand government and permitting procedures. In addition, our international operations will be subject to the usualrisks of doing business abroad such as possible revisions in tax treaties or other laws and regulations, includingthose governing the taxation of our international income, restrictions on the transfer of funds and uncertainty overterrorist activities. We cannot predict the likelihood that any of these developments may occur. Further, we may inthe future enter into agreements with non-U.S. entities that are governed by the laws of, and are subject to disputeresolution in the courts of, another country or region. We cannot accurately predict whether such a forum wouldprovide us with an effective and efficient means of resolving disputes that may arise.
Investments in international markets may also subject us to risks associated with funding increasingheadcount, integrating new offices, and establishing effective controls and procedures to regulate the operations ofnew offices and to monitor compliance with U.S. laws and regulations such as the Foreign Corrupt Practices Actand similar foreign laws and regulations, such as the U.K. Bribery Act.
We may be subject to risks from potential fluctuations in exchange rates between the U.S. dollar and thecurrencies of the other countries in which we invest.
If we invest in countries where the U.S. dollar is not the national currency, we will be subject to internationalcurrency risks from the potential fluctuations in exchange rates between the U.S. dollar and the currencies of thoseother countries. A significant depreciation in the value of the currency of one or more countries where we have asignificant investment may materially affect our results of operations. We may attempt to mitigate any such effectsby borrowing in the currency of the country in which we are investing and, under certain circumstances, by hedgingexchange rate fluctuations; however, access to capital may be more restricted, or unavailable on favorable terms orat all, in certain locations. For leases denominated in international currencies, we may use derivative financialinstruments to manage the international currency exchange risk. We cannot assure you, however, that our effortswill successfully neutralize all international currency risks.
Risks Related to Our Indebtedness and Financing
An increase in interest rates would increase our interest costs on variable rate debt and could adverselyimpact our ability to refinance existing debt or sell assets on favorable terms or at all.
As of February 22, 2021, we had approximately $500 million of outstanding indebtedness, excluding ourunconsolidated joint ventures, that bears interest at variable rates, and we may incur more indebtedness in thefuture. If interest rates increase, then so would the interest costs on our unhedged variable rate debt, which couldadversely affect our cash flow and our ability to pay principal and interest on our debt and our ability to makedistributions to our securityholders. Further, rising interest rates could limit our ability to refinance existing debtwhen it matures or significantly increase our future interest expense. From time to time, we enter into interest rateswap agreements and other interest rate hedging contracts, including swaps, caps and floors. While theseagreements are intended to lessen the impact of rising interest rates on us, they also expose us to the risk that theother parties to the agreements will not perform, we could incur significant costs associated with the settlement ofthe agreements, the agreements will be unenforceable and the underlying transactions will fail to qualify as highly-effective cash flow hedges under guidance included in ASC 815 “Derivatives and Hedging.” In addition, an increasein interest rates could decrease the amounts third-parties are willing to pay for our assets, thereby limiting our abilityto change our portfolio promptly in response to changes in economic or other conditions.
33
Covenants in our debt agreements could adversely affect our financial condition.The mortgages on our properties contain customary covenants such as those that limit our ability, without the
prior consent of the lender, to further mortgage the applicable property or to modify or discontinue insurancecoverage. Our unsecured credit facility, unsecured debt securities and certain secured loans contain customaryrestrictions, requirements and other limitations on our ability to incur indebtedness, including total debt to assetratios, secured debt to total asset ratios, debt service coverage ratios and minimum ratios of unencumbered assetsto unsecured debt, which we must maintain. Our continued ability to borrow under our credit facilities is subject tocompliance with our financial and other covenants. In addition, our failure to comply with such covenants couldcause a default under the applicable debt agreement, and we may then be required to repay such debt with capitalfrom other sources. Under those circumstances, other sources of capital may not be available to us, or be availableonly on unattractive terms. Additionally, in the future our ability to satisfy current or prospective lenders’ insurancerequirements may be adversely affected if lenders generally insist upon greater insurance coverage against acts ofterrorism or losses resulting from earthquakes than is available to us in the marketplace or on commerciallyreasonable terms.
We rely on debt financing, including borrowings under our unsecured credit facility, issuances of unsecureddebt securities and debt secured by individual properties, to finance our existing portfolio, our acquisition anddevelopment activities and for working capital. If we are unable to obtain debt financing from these or othersources, or to refinance existing indebtedness upon maturity, our financial condition and results of operations wouldlikely be adversely affected. If we breach covenants in our debt agreements, the lenders can declare a default and,if the debt is secured, can take possession of the property securing the defaulted loan. In addition, our unsecureddebt agreements contain specific cross-default provisions with respect to specified other indebtedness, giving theunsecured lenders the right to declare a default if we are in default under other loans in some circumstances.Defaults under our debt agreements could materially and adversely affect our financial condition and results ofoperations.
We face risks associated with the use of debt to fund acquisitions and developments, including refinancingrisk.
We are subject to the risks normally associated with debt financing, including the risk that our cash flow will beinsufficient to meet required payments of principal and interest. We anticipate that only a small portion of theprincipal of our debt will be repaid prior to maturity. Therefore, we are likely to need to refinance at least a portion ofour outstanding debt as it matures. There is a risk that we may not be able to refinance existing debt or that theterms of any refinancing will not be as favorable as the terms of our existing debt. If principal payments due atmaturity cannot be refinanced, extended or repaid with proceeds from other sources, such as new equity capital,our cash flow may not be sufficient to repay all maturing debt in years when significant “balloon” payments comedue. In addition, we may rely on debt to fund a portion of our new investments such as our acquisition anddevelopment activity. There is a risk that we may be unable to finance these activities on favorable terms or at all.These conditions, which increase the cost and reduce the availability of debt, may continue or worsen in the future.
We have had and may have in the future agreements with a number of limited partners of BPLP whocontributed properties in exchange for partnership interests that require BPLP to maintain for specified periods oftime secured debt on certain of our assets and/or allocate partnership debt to such limited partners to enable themto continue to defer recognition of their taxable gain with respect to the contributed property. These tax protectionand debt allocation agreements may restrict our ability to repay or refinance debt. As of December 31, 2020, wehad no tax protection or debt allocation agreement requirements that could restrict our ability to repay or financedebt.
Our degree of leverage could limit our ability to obtain additional financing or affect the market price of ourequity and debt securities.
As of February 22, 2021, our Consolidated Debt was approximately $12.2 billion (excluding unconsolidatedjoint venture debt).
The following table presents Consolidated Market Capitalization as well as the corresponding ratios ofConsolidated Debt to Consolidated Market Capitalization (dollars and shares / units in thousands):
34
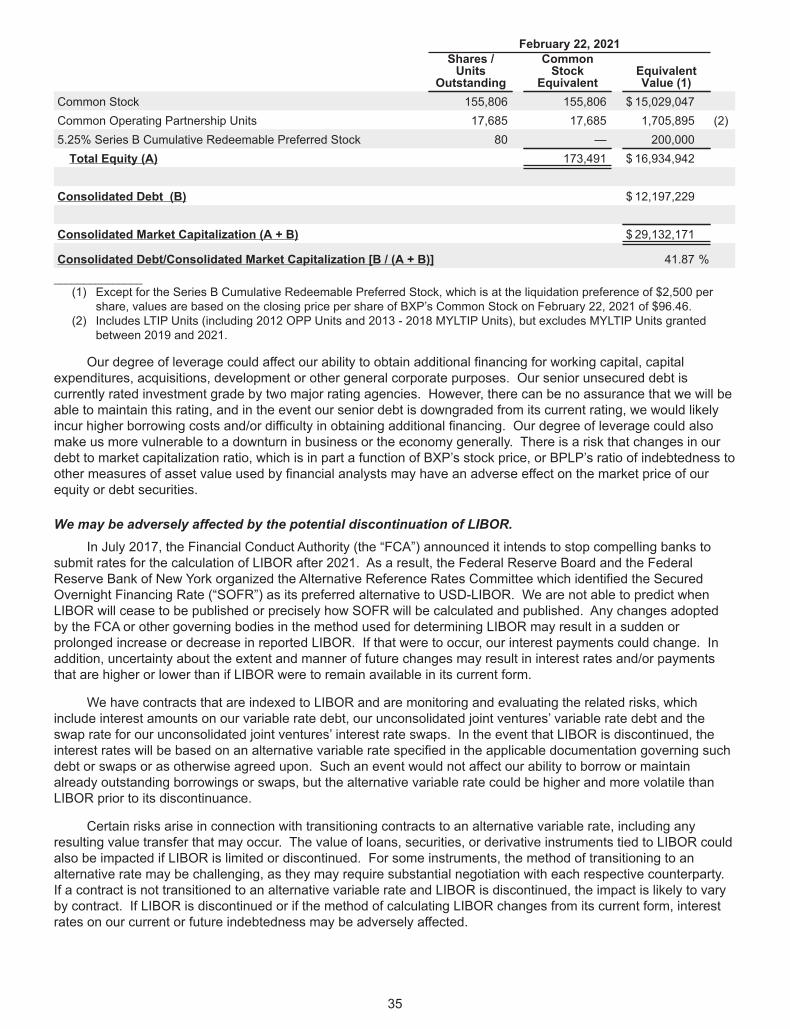
February 22, 2021Shares /Units
Outstanding
CommonStock
EquivalentEquivalentValue (1)
Common Stock 155,806 155,806 $ 15,029,047Common Operating Partnership Units 17,685 17,685 1,705,895 (2)5.25% Series B Cumulative Redeemable Preferred Stock 80 — 200,000Total Equity (A) 173,491 $ 16,934,942
Consolidated Debt (B) $ 12,197,229
Consolidated Market Capitalization (A + B) $ 29,132,171
Consolidated Debt/Consolidated Market Capitalization [B / (A + B)] 41.87 %_______________(1) Except for the Series B Cumulative Redeemable Preferred Stock, which is at the liquidation preference of $2,500 per
share, values are based on the closing price per share of BXP’s Common Stock on February 22, 2021 of $96.46.(2) Includes LTIP Units (including 2012 OPP Units and 2013 - 2018 MYLTIP Units), but excludes MYLTIP Units granted
between 2019 and 2021.
Our degree of leverage could affect our ability to obtain additional financing for working capital, capitalexpenditures, acquisitions, development or other general corporate purposes. Our senior unsecured debt iscurrently rated investment grade by two major rating agencies. However, there can be no assurance that we will beable to maintain this rating, and in the event our senior debt is downgraded from its current rating, we would likelyincur higher borrowing costs and/or difficulty in obtaining additional financing. Our degree of leverage could alsomake us more vulnerable to a downturn in business or the economy generally. There is a risk that changes in ourdebt to market capitalization ratio, which is in part a function of BXP’s stock price, or BPLP’s ratio of indebtedness toother measures of asset value used by financial analysts may have an adverse effect on the market price of ourequity or debt securities.
We may be adversely affected by the potential discontinuation of LIBOR.In July 2017, the Financial Conduct Authority (the “FCA”) announced it intends to stop compelling banks to
submit rates for the calculation of LIBOR after 2021. As a result, the Federal Reserve Board and the FederalReserve Bank of New York organized the Alternative Reference Rates Committee which identified the SecuredOvernight Financing Rate (“SOFR”) as its preferred alternative to USD-LIBOR. We are not able to predict whenLIBOR will cease to be published or precisely how SOFR will be calculated and published. Any changes adoptedby the FCA or other governing bodies in the method used for determining LIBOR may result in a sudden orprolonged increase or decrease in reported LIBOR. If that were to occur, our interest payments could change. Inaddition, uncertainty about the extent and manner of future changes may result in interest rates and/or paymentsthat are higher or lower than if LIBOR were to remain available in its current form.
We have contracts that are indexed to LIBOR and are monitoring and evaluating the related risks, whichinclude interest amounts on our variable rate debt, our unconsolidated joint ventures’ variable rate debt and theswap rate for our unconsolidated joint ventures’ interest rate swaps. In the event that LIBOR is discontinued, theinterest rates will be based on an alternative variable rate specified in the applicable documentation governing suchdebt or swaps or as otherwise agreed upon. Such an event would not affect our ability to borrow or maintainalready outstanding borrowings or swaps, but the alternative variable rate could be higher and more volatile thanLIBOR prior to its discontinuance.
Certain risks arise in connection with transitioning contracts to an alternative variable rate, including anyresulting value transfer that may occur. The value of loans, securities, or derivative instruments tied to LIBOR couldalso be impacted if LIBOR is limited or discontinued. For some instruments, the method of transitioning to analternative rate may be challenging, as they may require substantial negotiation with each respective counterparty.If a contract is not transitioned to an alternative variable rate and LIBOR is discontinued, the impact is likely to varyby contract. If LIBOR is discontinued or if the method of calculating LIBOR changes from its current form, interestrates on our current or future indebtedness may be adversely affected.
35
While we expect LIBOR to be available in substantially its current form until the end of 2021, it is possible thatLIBOR will become unavailable prior to that point. This could result, for example, if sufficient banks decline to makesubmissions to the LIBOR administrator. In that case, the risks associated with the transition to an alternativevariable rate will be accelerated and magnified.
We face risks associated with short-term liquid investments.We may invest cash balances in a variety of short-term investments that are intended to preserve principal
value and maintain a high degree of liquidity while providing current income. From time to time, these investmentsmay include (either directly or indirectly):
• direct obligations issued by the U.S. Treasury;
• obligations issued or guaranteed by the U.S. Government or its agencies;
• taxable municipal securities;
• obligations (including certificates of deposit) of banks and thrifts;
• commercial paper and other instruments consisting of short-term U.S. dollar denominated obligationsissued by corporations and banks;
• repurchase agreements collateralized by corporate and asset-backed obligations;
• both registered and unregistered money market funds; and
• other highly rated short-term securities.
Investments in these securities and funds are not insured against loss of principal. Under certaincircumstances we may be required to redeem all or part of our investment, and our right to redeem some or all ofour investment may be delayed or suspended. In addition, there is no guarantee that our investments in thesesecurities or funds will be redeemable at par value. A decline in the value of our investment or a delay orsuspension of our right to redeem may have a material adverse effect on our results of operations or financialcondition.
Risks Related to Our Organization and Structure
Conflicts of interest exist with holders of interests in BPLP.Sales of properties and repayment of related indebtedness will have different effects on holders of interests inBPLP than on BXP’s stockholders.
Some holders of interests in BPLP could incur adverse tax consequences upon the sale of certain of ourproperties and on the repayment of related debt which differ from the tax consequences to BXP and itsstockholders. Consequently, such holders of partnership interests in BPLP may have different objectives regardingthe appropriate pricing and timing of any such sale or repayment of debt. While BXP has exclusive authority underthe limited partnership agreement of BPLP to determine when to refinance or repay debt or whether, when, and onwhat terms to sell a property, subject, in the case of certain properties, to the contractual commitments describedbelow, any such decision would require the approval of BXP’s Board of Directors. While the Board of Directors hasa policy with respect to these matters directors and executive officers could exercise their influence in a mannerinconsistent with the interests of some, or a majority, of BXP’s stockholders, including in a manner which couldprevent completion of a sale of a property or the repayment of indebtedness.
Agreement not to sell some properties.
We have had and may have in the future agreements with the contributors of some properties that we haveacquired in exchange for partnership interests in BPLP pursuant to which we have agreed not to sell or otherwisetransfer the properties, prior to specified dates, in any transaction that would trigger taxable income to thecontributor. In addition, we are responsible for the reimbursement of certain tax-related costs to the prior owners ifthe subject properties are sold in a taxable sale. In general, our obligations to the prior owners are limited in timeand only apply to actual damages suffered.
36
Also, BPLP has had and may have in the future agreements providing prior owners of properties with the rightto guarantee specific amounts of indebtedness and, in the event that the specific indebtedness they guarantee isrepaid or reduced, additional and/or substitute indebtedness. These agreements may hinder actions that BPLP mayotherwise desire to take to repay or refinance guaranteed indebtedness because BPLP would be required to makepayments to the beneficiaries of such agreements if it violates these agreements.
Limits on changes in control may discourage takeover attempts beneficial to stockholders.Provisions in BXP’s charter and bylaws, BXP’s shareholder rights agreement and the limited partnership
agreement of BPLP, as well as provisions of the Internal Revenue Code and Delaware corporate law, may:
• delay or prevent a change of control over BXP or a tender offer, even if such action might be beneficial toBXP’s stockholders; and
• limit BXP’s stockholders’ opportunity to receive a potential premium for their shares of common stock overthen-prevailing market prices.
Stock Ownership Limit
To facilitate maintenance of BXP’s qualification as a REIT and to otherwise address concerns relating toconcentration of stock ownership, BXP’s charter generally prohibits ownership, directly, indirectly or beneficially, byany single stockholder of more than 6.6% of the number of outstanding shares of any class or series of its commonstock. We refer to this limitation as the “ownership limit.” BXP’s Board of Directors may waive, in its sole discretion,or modify the ownership limit with respect to one or more persons if it is satisfied that ownership in excess of thislimit will not jeopardize BXP’s status as a REIT for federal income tax purposes. In addition, under BXP’s charter,each of Mortimer B. Zuckerman and the respective families and affiliates of Mortimer B. Zuckerman and Edward H.Linde, as well as, in general, pension plans and mutual funds, may actually and beneficially own up to 15% of thenumber of outstanding shares of any class or series of BXP’s equity common stock. Shares owned in violation ofthe ownership limit will be subject to the loss of rights to distributions and voting and other penalties. The ownershiplimit may have the effect of inhibiting or impeding a change in control.
BPLP’s Partnership Agreement
BXP has agreed in the limited partnership agreement of BPLP not to engage in specified extraordinarytransactions, including, among others, business combinations, unless limited partners of BPLP other than BXPreceives, or have the opportunity to receive, either (1) the same consideration for their partnership interests asholders of BXP common stock in the transaction or (2) limited partnership units that, among other things, wouldentitle the holders, upon redemption of these units, to receive shares of common equity of a publicly tradedcompany or the same consideration as holders of BXP common stock received in the transaction. If these limitedpartners would not receive such consideration, we cannot engage in the transaction unless limited partners holdingat least 75% of the common units of limited partnership interest, other than those held by BXP or its affiliates,consent to the transaction. In addition, BXP has agreed in the limited partnership agreement of BPLP that it will notcomplete specified extraordinary transactions, including among others, business combinations, in which BXPreceive the approval of its common stockholders unless (1) limited partners holding at least 75% of the commonunits of limited partnership interest, other than those held by BXP or its affiliates, consent to the transaction or (2)the limited partners of BPLP are also allowed to vote and the transaction would have been approved had theselimited partners been able to vote as common stockholders on the transaction. Therefore, if BXP’s commonstockholders approve a specified extraordinary transaction, the partnership agreement requires the following beforeit can complete the transaction:
• holders of partnership interests in BPLP, including BXP, must vote on the matter;
• BXP must vote its partnership interests in the same proportion as its stockholders voted on the transaction;and
• the result of the vote of holders of partnership interests in BPLP must be such that had such vote been avote of stockholders, the business combination would have been approved.
37
With respect to specified extraordinary transactions, BXP has agreed in BPLP’s partnership agreement to useits commercially reasonable efforts to structure such a transaction to avoid causing its limited partners to recognizegain for federal income tax purposes by virtue of the occurrence of or their participation in such a transaction.
As a result of these provisions, a potential acquirer may be deterred from making an acquisition proposal, andBXP may be prohibited by contract from engaging in a proposed extraordinary transaction, including a proposedbusiness combination, even though BXP stockholders approve of the transaction.
We may change our policies without obtaining the approval of our stockholders.Our operating and financial policies, including our policies with respect to acquisitions of real estate, growth,
operations, indebtedness, capitalization and dividends, are exclusively determined by BXP’s Board of Directors.Accordingly, our securityholders do not control these policies.
Risks Related to BXP’s Status as a REIT
Failure to qualify as a REIT would cause BXP to be taxed as a corporation, which would substantiallyreduce funds available for payment of dividends.
If BXP fails to qualify as a REIT for federal income tax purposes, it will be taxed as a corporation unlesscertain relief provisions apply. We believe that BXP is organized and qualified as a REIT and intends to operate in amanner that will allow BXP to continue to qualify as a REIT. However, we cannot assure you that BXP is qualifiedas such, or that it will remain qualified as such in the future. This is because qualification as a REIT involves theapplication of highly technical and complex provisions of the Internal Revenue Code as to which there are onlylimited judicial and administrative interpretations and involves the determination of facts and circumstances notentirely within our control. Future legislation, new regulations, administrative interpretations or court decisions maysignificantly change the tax laws or the application of the tax laws with respect to qualification as a REIT for federalincome tax purposes or the federal income tax consequences of such qualification.
In addition, we currently hold certain of our properties through subsidiaries that have elected to be taxed asREITs and we may in the future determine that it is in our best interests to hold one or more of our other propertiesthrough one or more subsidiaries that elect to be taxed as REITs. If any of these subsidiaries fails to qualify as aREIT for federal income tax purposes, then BXP may also fail to qualify as a REIT for federal income tax purposes.
If BXP or any of its subsidiaries that are REITs fails to qualify as a REIT then, unless certain relief provisionsapply, it will face serious tax consequences that will substantially reduce the funds available for payment ofdividends for each of the years involved because:
• BXP would not be allowed a deduction for dividends paid to stockholders in computing its taxable incomeand would be subject to federal income tax at regular corporate rates;
• BXP also could be subject to the federal alternative minimum tax for tax years ending before January 1,2018 and possibly increased state and local taxes; and
• unless BXP is entitled to relief under statutory provisions, BXP could not elect to be subject to tax as aREIT for four taxable years following the year during which it was disqualified.
In addition, if BXP fails to qualify as a REIT and the relief provisions do not apply, it will no longer be requiredto pay dividends. As a result of all these factors, BXP’s failure to qualify as a REIT could impair our ability to raisecapital and expand our business, and it would adversely affect the value of BXP’s common stock. If BXP or any ofits subsidiaries that are REITs fails to qualify as a REIT but is eligible for certain relief provisions, then it may retainits status as a REIT, but may be required to pay a penalty tax, which could be substantial.
In order to maintain BXP’s REIT status, we may be forced to borrow funds during unfavorable marketconditions.
In order to maintain BXP’s REIT status, we may need to borrow funds on a short-term basis to meet the REITdistribution requirements, even if the then-prevailing market conditions are not favorable for these borrowings. Toqualify as a REIT, BXP generally must distribute to its stockholders at least 90% of its taxable income each year,excluding capital gains and with certain other adjustments. In addition, BXP will be subject to a 4% nondeductibleexcise tax on the amount, if any, by which dividends paid in any calendar year are less than the sum of 85% ofordinary income, 95% of capital gain net income and 100% of undistributed income from prior years. We may need
38
short-term debt or long-term debt or proceeds from asset sales, creation of joint ventures or sales of common stockto fund required distributions as a result of differences in timing between the actual receipt of income and therecognition of income for federal income tax purposes, or the effect of non-deductible capital expenditures, thecreation of reserves or required debt or amortization payments. Any inability of our cash flows to cover ourdistribution requirements could have an adverse impact on our ability to raise short- and long-term debt or sellequity securities in order to fund distributions required to maintain BXP’s REIT status.
We may be subject to adverse legislative or regulatory tax changes that could negatively impact ourfinancial condition.
At any time, the U.S. federal income tax laws governing REITs or the administrative interpretations of thoselaws may be amended, including with respect to our hotel ownership structure. We cannot predict if or when anynew U.S. federal income tax law, regulation, or administrative interpretation, or any amendment to any existing U.S.federal income tax law, Treasury regulation or administrative interpretation, will be adopted, promulgated or becomeeffective and any such law, regulation, or interpretation may take effect retroactively. BXP, its taxable REITsubsidiaries, and our securityholders could be adversely affected by any such change in, or any new, U.S. federalincome tax law, Treasury regulation or administrative interpretation.
We face possible adverse state and local tax audits and changes in state and local tax laws.Because BXP is organized and qualifies as a REIT, it is generally not subject to federal income taxes, but we
are subject to certain state and local taxes. In the normal course of business, certain entities through which we ownreal estate either have undergone, or are currently undergoing, tax audits. Although we believe that we havesubstantial arguments in favor of our positions in the ongoing audits, in some instances there is no controllingprecedent or interpretive guidance on the specific point at issue. Collectively, tax deficiency notices received to datefrom the jurisdictions conducting the ongoing audits have not been material. However, there can be no assurancethat future audits will not occur with increased frequency or that the ultimate result of such audits will not have amaterial adverse effect on our results of operations.
From time to time changes in state and local tax laws or regulations are enacted, which may result in anincrease in our tax liability. A shortfall in tax revenues for states and municipalities in which we operate may lead toan increase in the frequency and size of such changes. If such changes occur, we may be required to payadditional taxes on our assets or income. These increased tax costs could adversely affect our financial conditionand results of operations and the amount of cash available for the payment of dividends and distributions to oursecurityholders.
General Risk Factors
Changes in market conditions could adversely affect the market price of BXP’s common stock.As with other publicly traded equity securities, the value of BXP’s common stock depends on various market
conditions that may change from time to time. Among the market conditions that may affect the value of BXP’scommon stock are the following:
• the extent of investor interest in our securities;
• the general reputation of REITs and the attractiveness of our equity securities in comparison to other equitysecurities, including securities issued by other real estate-based companies;
• our underlying asset value;
• investor confidence in the stock and bond markets, generally;
• national economic conditions;
• changes in tax laws;
• our financial performance;
• changes in our credit ratings; and
• general stock and bond market conditions, including changes in interest rates.
39
The market value of BXP’s common stock is based primarily upon the market’s perception of our growthpotential and our current and potential future earnings and cash dividends. Consequently, BXP’s common stockmay trade at prices that are greater or less than BXP’s net asset value per share of common stock. If our futureearnings or cash dividends are less than expected, it is likely that the market price of BXP’s common stock willdiminish.
Further issuances of equity securities may be dilutive to current securityholders.The interests of our existing securityholders could be diluted if additional equity securities are issued to
finance future developments, acquisitions or repay indebtedness. Our ability to execute our business strategydepends on our access to an appropriate blend of debt financing, including unsecured lines of credit and otherforms of secured and unsecured debt, and equity financing, including common and preferred equity.
The number of shares available for future sale could adversely affect the market price of BXP’s stock.In connection with and subsequent to BXP’s initial public offering, we have completed many private placement
transactions in which shares of stock of BXP or partnership interests in BPLP were issued to owners of propertieswe acquired or to institutional investors. This common stock, or common stock issuable in exchange for suchpartnership interests in BPLP, may be sold in the public securities markets over time under registration rights wegranted to these investors. Additional common stock issuable under our employee benefit and other incentiveplans, including as a result of the grant of stock options and restricted equity securities, may also be sold in themarket at some time in the future. Future sales of BXP common stock in the market could adversely affect the priceof its common stock. We cannot predict the effect the perception in the market that such sales may occur will haveon the market price of BXP’s common stock.
Litigation could have a material adverse effect.From time to time, we are involved in legal proceedings and other claims. We may also be named as
defendants in lawsuits allegedly arising out of our actions or the actions of our vendors, contractors, tenants or othercontractual parties in which such parties have agreed to indemnify, defend and hold us harmless from and againstvarious claims, litigation and liabilities arising in connection with their respective businesses and/or added as anadditional insured under certain insurance policies. An unfavorable resolution of any legal proceeding or other claimcould have a material adverse effect on our financial condition or results from operations. Regardless of itsoutcome, legal proceedings and other claims may result in substantial costs and expenses and significantly divertthe attention of our management. With respect to any legal proceeding or other claim, there can be no assurancethat we will be able to prevail, or achieve a favorable settlement or outcome, or that our insurance or the insuranceand/or any contractual indemnities of our vendors, contractors, tenants or other contractual parties will be enough tocover all of our defense costs or any resulting liabilities.
We face risks associated with security breaches through cyber attacks, cyber intrusions or otherwise, aswell as other significant disruptions of our information technology (IT) networks and related systems.
We face risks associated with security breaches, whether through cyber attacks or cyber intrusions over theInternet, malware, computer viruses, attachments to e-mails, persons inside our organization or persons withaccess to systems inside our organization, and other significant disruptions of our IT networks and related systems.The risk of a security breach or disruption, particularly through cyber attack or cyber intrusion, including by computerhackers, foreign governments and cyber terrorists, has generally increased as the number, intensity andsophistication of attempted attacks and intrusions from around the world have increased. Our IT networks andrelated systems are essential to the operation of our business and our ability to perform day-to-day operations(including managing our building systems) and, in some cases, may be critical to the operations of certain of ourtenants.
The Audit Committee of BXP’s Board of Directors oversees our risk management processes related tocybersecurity. It meets no less frequently than annually with our IT personnel and senior management to discussrecent trends in cyber risks and our strategy to defend our IT networks, business systems and information againstcyber attacks and intrusions. Under the oversight of the Audit Committee, we implemented our cybersecuritystandards and overall program by reference to the National Institute of Standards and Technology (“NIST”) CyberSecurity Framework. As part of our overall cybersecurity program:
40
• we have implemented a continuous improvement methodology including, but not limited to, ongoingenhancements to processes and controls, quarterly control reviews, annual policy reviews, biannualpenetration tests and annual investments in our security infrastructure;
• we annually assess our cybersecurity program against the NIST framework and periodically engage anoutside consulting firm to conduct the assessment; and
• we conduct cybersecurity awareness training at least three times per year for our employees and primaryon-site providers, and we conduct ongoing phishing simulations to raise awareness of spoofed ormanipulated electronic communications and other critical security threats.
Although we make efforts to maintain the security and integrity of our IT networks and related systems, and wehave implemented various measures to manage the risk of a security breach or disruption, there can be noassurance that our security efforts and measures will be effective or that attempted security breaches or disruptionswould not be successful or damaging. Even the most well-protected information, networks, systems and facilitiesremain potentially vulnerable because the techniques used in such attempted security breaches evolve andgenerally are not recognized until launched against a target, and in some cases, are designed not be detected and,in fact, may not be detected. Accordingly, we may be unable to anticipate these techniques or to implementadequate security barriers or other preventative measures, and thus it is impossible for us to entirely mitigate thisrisk.
Like other businesses, we have been, and expect to continue to be, subject to attempts at unauthorizedaccess, mishandling or misuse, computer viruses or malware, cyber attacks and intrusions and other events ofvarying degrees. To date, these events have not adversely affected our operations or business and have not beenmaterial, either individually or in the aggregate. However, a security breach or other significant disruption involvingour IT networks and related systems could:
• disrupt the proper functioning of our networks and systems and therefore our operations and/or those ofcertain of our tenants;
• result in misstated financial reports, violations of loan covenants, missed reporting deadlines and/ormissed permitting deadlines;
• result in our inability to properly monitor our compliance with the rules and regulations regarding BXP’squalification as a REIT;
• result in the unauthorized access to, and destruction, loss, theft, misappropriation or release of, proprietary,confidential, sensitive or otherwise valuable information of ours or others, which others could use tocompete against us or which could expose us to damage claims by third-parties for disruptive, destructiveor otherwise harmful purposes and outcomes;
• result in our inability to maintain the building systems relied upon by our tenants for the efficient use of theirleased space;
• require significant management attention and resources to remedy any damages that result;
• subject us to claims for breach of contract, damages, credits, penalties or termination of leases or otheragreements; and
• damage our reputation among our tenants and investors generally.
Any one or more of the foregoing could have a material adverse effect on our results of operations, financialcondition and cash flows.
Changes in accounting pronouncements could adversely affect our operating results, in addition to thereported financial performance of our tenants.
Accounting policies and methods are fundamental to how we record and report our financial condition andresults of operations. Uncertainties posed by various initiatives of accounting standard-setting by the FinancialAccounting Standards Board and the Securities and Exchange Commission, which create and interpret applicableaccounting standards for U.S. companies, may change the financial accounting and reporting standards or theirinterpretation and application of these standards that govern the preparation of our financial statements. Changes
41

include, but are not limited to, changes in revenue recognition, lease accounting and the adoption of accountingstandards likely to require the increased use of “fair-value” measures.
These changes could have a material impact on our reported financial condition and results of operations. Insome cases, we could be required to apply a new or revised standard retroactively, resulting in potentially materialrestatements of prior period financial statements. Similarly, these changes could have a material impact on ourtenants’ reported financial condition or results of operations or could affect our tenants’ preferences regardingleasing real estate.
Item 1B. Unresolved Staff Comments.None.
42
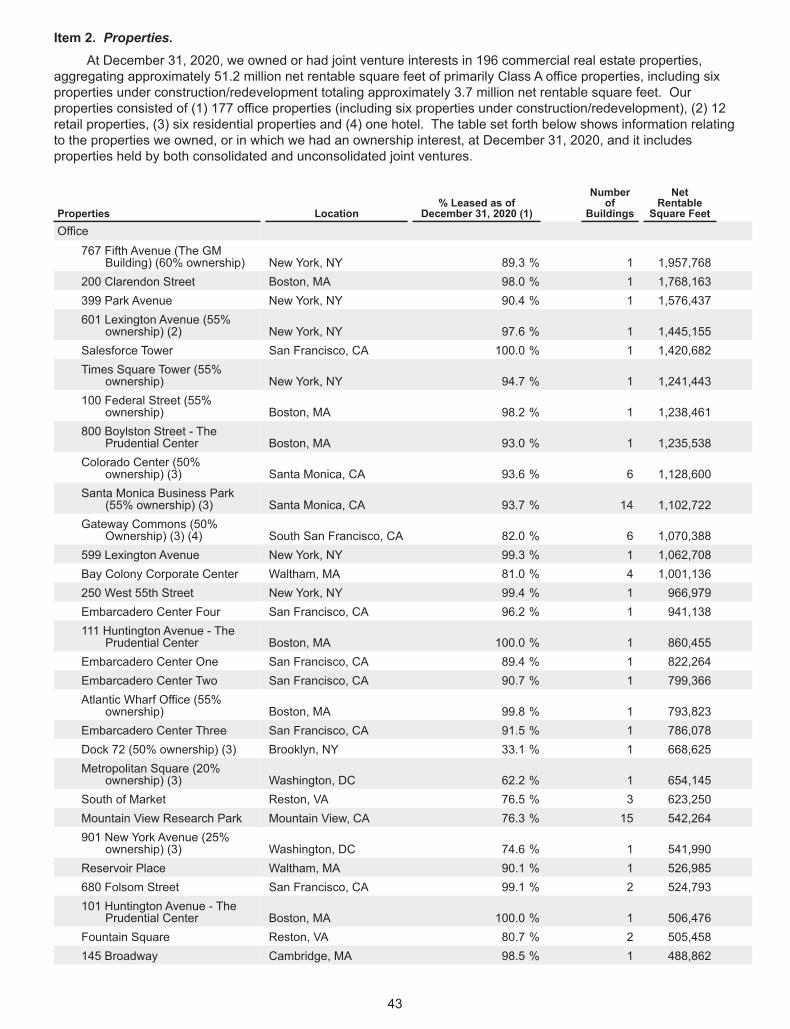
Item 2. Properties.At December 31, 2020, we owned or had joint venture interests in 196 commercial real estate properties,
aggregating approximately 51.2 million net rentable square feet of primarily Class A office properties, including sixproperties under construction/redevelopment totaling approximately 3.7 million net rentable square feet. Ourproperties consisted of (1) 177 office properties (including six properties under construction/redevelopment), (2) 12retail properties, (3) six residential properties and (4) one hotel. The table set forth below shows information relatingto the properties we owned, or in which we had an ownership interest, at December 31, 2020, and it includesproperties held by both consolidated and unconsolidated joint ventures.
Properties Location% Leased as of
December 31, 2020 (1)
Numberof
Buildings
NetRentableSquare Feet
Office767 Fifth Avenue (The GM
Building) (60% ownership) New York, NY 89.3 % 1 1,957,768200 Clarendon Street Boston, MA 98.0 % 1 1,768,163399 Park Avenue New York, NY 90.4 % 1 1,576,437601 Lexington Avenue (55%
ownership) (2) New York, NY 97.6 % 1 1,445,155Salesforce Tower San Francisco, CA 100.0 % 1 1,420,682Times Square Tower (55%
ownership) New York, NY 94.7 % 1 1,241,443100 Federal Street (55%
ownership) Boston, MA 98.2 % 1 1,238,461800 Boylston Street - The
Prudential Center Boston, MA 93.0 % 1 1,235,538Colorado Center (50%
ownership) (3) Santa Monica, CA 93.6 % 6 1,128,600Santa Monica Business Park
(55% ownership) (3) Santa Monica, CA 93.7 % 14 1,102,722Gateway Commons (50%
Ownership) (3) (4) South San Francisco, CA 82.0 % 6 1,070,388599 Lexington Avenue New York, NY 99.3 % 1 1,062,708Bay Colony Corporate Center Waltham, MA 81.0 % 4 1,001,136250 West 55th Street New York, NY 99.4 % 1 966,979Embarcadero Center Four San Francisco, CA 96.2 % 1 941,138111 Huntington Avenue - The
Prudential Center Boston, MA 100.0 % 1 860,455Embarcadero Center One San Francisco, CA 89.4 % 1 822,264Embarcadero Center Two San Francisco, CA 90.7 % 1 799,366Atlantic Wharf Office (55%
ownership) Boston, MA 99.8 % 1 793,823Embarcadero Center Three San Francisco, CA 91.5 % 1 786,078Dock 72 (50% ownership) (3) Brooklyn, NY 33.1 % 1 668,625Metropolitan Square (20%
ownership) (3) Washington, DC 62.2 % 1 654,145South of Market Reston, VA 76.5 % 3 623,250Mountain View Research Park Mountain View, CA 76.3 % 15 542,264901 New York Avenue (25%
ownership) (3) Washington, DC 74.6 % 1 541,990Reservoir Place Waltham, MA 90.1 % 1 526,985680 Folsom Street San Francisco, CA 99.1 % 2 524,793101 Huntington Avenue - The
Prudential Center Boston, MA 100.0 % 1 506,476Fountain Square Reston, VA 80.7 % 2 505,458145 Broadway Cambridge, MA 98.5 % 1 488,862
43
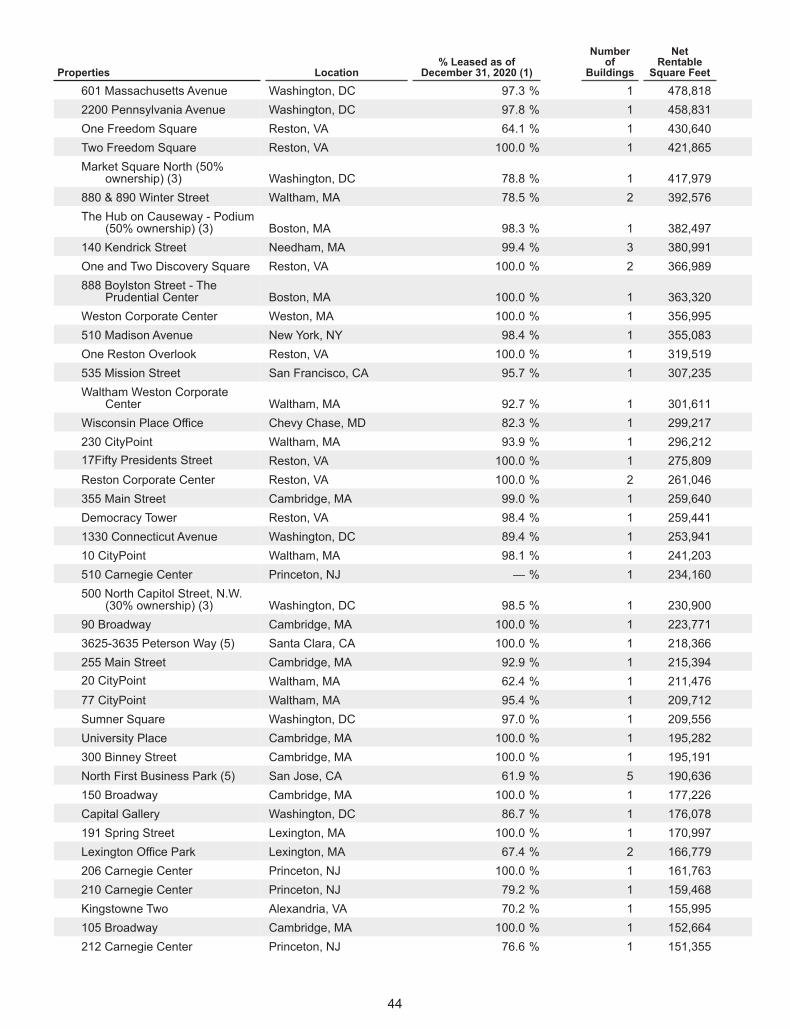
Properties Location% Leased as of
December 31, 2020 (1)
Numberof
Buildings
NetRentableSquare Feet
601 Massachusetts Avenue Washington, DC 97.3 % 1 478,8182200 Pennsylvania Avenue Washington, DC 97.8 % 1 458,831One Freedom Square Reston, VA 64.1 % 1 430,640Two Freedom Square Reston, VA 100.0 % 1 421,865Market Square North (50%
ownership) (3) Washington, DC 78.8 % 1 417,979880 & 890 Winter Street Waltham, MA 78.5 % 2 392,576The Hub on Causeway - Podium
(50% ownership) (3) Boston, MA 98.3 % 1 382,497140 Kendrick Street Needham, MA 99.4 % 3 380,991One and Two Discovery Square Reston, VA 100.0 % 2 366,989888 Boylston Street - The
Prudential Center Boston, MA 100.0 % 1 363,320Weston Corporate Center Weston, MA 100.0 % 1 356,995510 Madison Avenue New York, NY 98.4 % 1 355,083One Reston Overlook Reston, VA 100.0 % 1 319,519535 Mission Street San Francisco, CA 95.7 % 1 307,235Waltham Weston Corporate
Center Waltham, MA 92.7 % 1 301,611Wisconsin Place Office Chevy Chase, MD 82.3 % 1 299,217230 CityPoint Waltham, MA 93.9 % 1 296,21217Fifty Presidents Street Reston, VA 100.0 % 1 275,809Reston Corporate Center Reston, VA 100.0 % 2 261,046355 Main Street Cambridge, MA 99.0 % 1 259,640Democracy Tower Reston, VA 98.4 % 1 259,4411330 Connecticut Avenue Washington, DC 89.4 % 1 253,94110 CityPoint Waltham, MA 98.1 % 1 241,203510 Carnegie Center Princeton, NJ — % 1 234,160500 North Capitol Street, N.W.
(30% ownership) (3) Washington, DC 98.5 % 1 230,90090 Broadway Cambridge, MA 100.0 % 1 223,7713625-3635 Peterson Way (5) Santa Clara, CA 100.0 % 1 218,366255 Main Street Cambridge, MA 92.9 % 1 215,39420 CityPoint Waltham, MA 62.4 % 1 211,47677 CityPoint Waltham, MA 95.4 % 1 209,712Sumner Square Washington, DC 97.0 % 1 209,556University Place Cambridge, MA 100.0 % 1 195,282300 Binney Street Cambridge, MA 100.0 % 1 195,191North First Business Park (5) San Jose, CA 61.9 % 5 190,636150 Broadway Cambridge, MA 100.0 % 1 177,226Capital Gallery Washington, DC 86.7 % 1 176,078191 Spring Street Lexington, MA 100.0 % 1 170,997Lexington Office Park Lexington, MA 67.4 % 2 166,779206 Carnegie Center Princeton, NJ 100.0 % 1 161,763210 Carnegie Center Princeton, NJ 79.2 % 1 159,468Kingstowne Two Alexandria, VA 70.2 % 1 155,995105 Broadway Cambridge, MA 100.0 % 1 152,664212 Carnegie Center Princeton, NJ 76.6 % 1 151,355
44
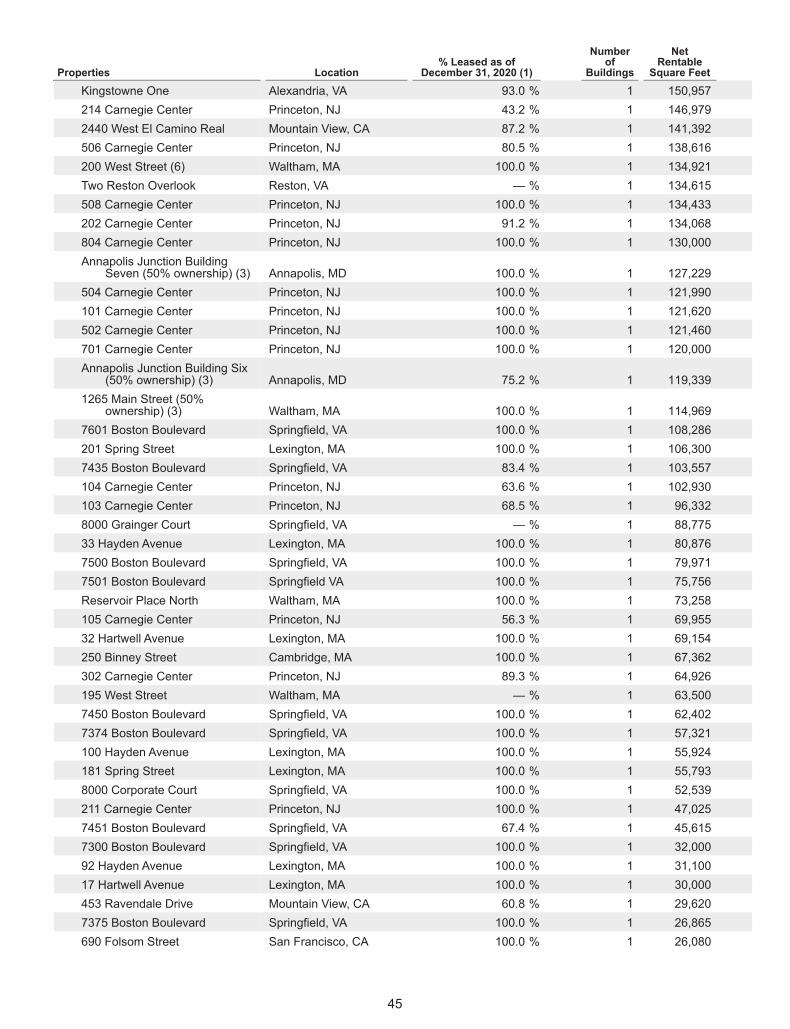
Properties Location% Leased as of
December 31, 2020 (1)
Numberof
Buildings
NetRentableSquare Feet
Kingstowne One Alexandria, VA 93.0 % 1 150,957214 Carnegie Center Princeton, NJ 43.2 % 1 146,9792440 West El Camino Real Mountain View, CA 87.2 % 1 141,392506 Carnegie Center Princeton, NJ 80.5 % 1 138,616200 West Street (6) Waltham, MA 100.0 % 1 134,921Two Reston Overlook Reston, VA — % 1 134,615508 Carnegie Center Princeton, NJ 100.0 % 1 134,433202 Carnegie Center Princeton, NJ 91.2 % 1 134,068804 Carnegie Center Princeton, NJ 100.0 % 1 130,000Annapolis Junction Building
Seven (50% ownership) (3) Annapolis, MD 100.0 % 1 127,229504 Carnegie Center Princeton, NJ 100.0 % 1 121,990101 Carnegie Center Princeton, NJ 100.0 % 1 121,620502 Carnegie Center Princeton, NJ 100.0 % 1 121,460701 Carnegie Center Princeton, NJ 100.0 % 1 120,000Annapolis Junction Building Six
(50% ownership) (3) Annapolis, MD 75.2 % 1 119,3391265 Main Street (50%
ownership) (3) Waltham, MA 100.0 % 1 114,9697601 Boston Boulevard Springfield, VA 100.0 % 1 108,286201 Spring Street Lexington, MA 100.0 % 1 106,3007435 Boston Boulevard Springfield, VA 83.4 % 1 103,557104 Carnegie Center Princeton, NJ 63.6 % 1 102,930103 Carnegie Center Princeton, NJ 68.5 % 1 96,3328000 Grainger Court Springfield, VA — % 1 88,77533 Hayden Avenue Lexington, MA 100.0 % 1 80,8767500 Boston Boulevard Springfield, VA 100.0 % 1 79,9717501 Boston Boulevard Springfield VA 100.0 % 1 75,756Reservoir Place North Waltham, MA 100.0 % 1 73,258105 Carnegie Center Princeton, NJ 56.3 % 1 69,95532 Hartwell Avenue Lexington, MA 100.0 % 1 69,154250 Binney Street Cambridge, MA 100.0 % 1 67,362302 Carnegie Center Princeton, NJ 89.3 % 1 64,926195 West Street Waltham, MA — % 1 63,5007450 Boston Boulevard Springfield, VA 100.0 % 1 62,4027374 Boston Boulevard Springfield, VA 100.0 % 1 57,321100 Hayden Avenue Lexington, MA 100.0 % 1 55,924181 Spring Street Lexington, MA 100.0 % 1 55,7938000 Corporate Court Springfield, VA 100.0 % 1 52,539211 Carnegie Center Princeton, NJ 100.0 % 1 47,0257451 Boston Boulevard Springfield, VA 67.4 % 1 45,6157300 Boston Boulevard Springfield, VA 100.0 % 1 32,00092 Hayden Avenue Lexington, MA 100.0 % 1 31,10017 Hartwell Avenue Lexington, MA 100.0 % 1 30,000453 Ravendale Drive Mountain View, CA 60.8 % 1 29,6207375 Boston Boulevard Springfield, VA 100.0 % 1 26,865690 Folsom Street San Francisco, CA 100.0 % 1 26,080
45
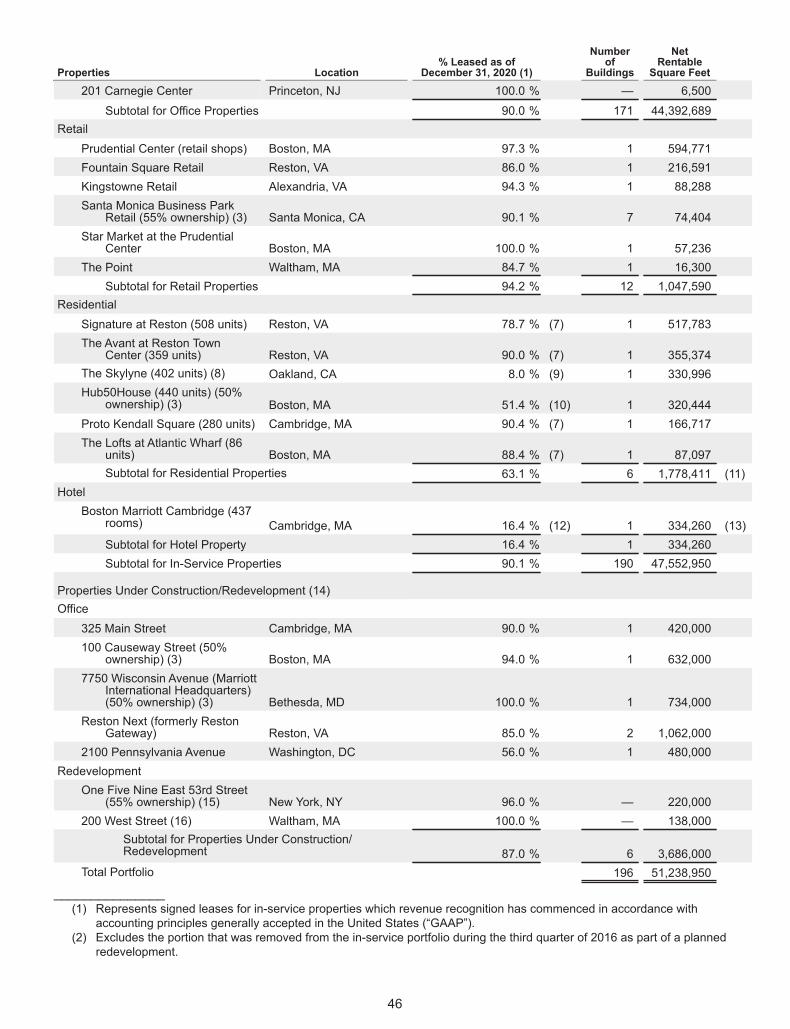
Properties Location% Leased as of
December 31, 2020 (1)
Numberof
Buildings
NetRentableSquare Feet
201 Carnegie Center Princeton, NJ 100.0 % — 6,500
Subtotal for Office Properties 90.0 % 171 44,392,689Retail
Prudential Center (retail shops) Boston, MA 97.3 % 1 594,771Fountain Square Retail Reston, VA 86.0 % 1 216,591Kingstowne Retail Alexandria, VA 94.3 % 1 88,288Santa Monica Business Park
Retail (55% ownership) (3) Santa Monica, CA 90.1 % 7 74,404Star Market at the Prudential
Center Boston, MA 100.0 % 1 57,236The Point Waltham, MA 84.7 % 1 16,300
Subtotal for Retail Properties 94.2 % 12 1,047,590Residential
Signature at Reston (508 units) Reston, VA 78.7 % (7) 1 517,783The Avant at Reston Town
Center (359 units) Reston, VA 90.0 % (7) 1 355,374The Skylyne (402 units) (8) Oakland, CA 8.0 % (9) 1 330,996Hub50House (440 units) (50%
ownership) (3) Boston, MA 51.4 % (10) 1 320,444Proto Kendall Square (280 units) Cambridge, MA 90.4 % (7) 1 166,717The Lofts at Atlantic Wharf (86
units) Boston, MA 88.4 % (7) 1 87,097Subtotal for Residential Properties 63.1 % 6 1,778,411 (11)
HotelBoston Marriott Cambridge (437
rooms) Cambridge, MA 16.4 % (12) 1 334,260 (13)Subtotal for Hotel Property 16.4 % 1 334,260Subtotal for In-Service Properties 90.1 % 190 47,552,950
Properties Under Construction/Redevelopment (14)Office
325 Main Street Cambridge, MA 90.0 % 1 420,000100 Causeway Street (50%
ownership) (3) Boston, MA 94.0 % 1 632,0007750 Wisconsin Avenue (Marriott
International Headquarters)(50% ownership) (3) Bethesda, MD 100.0 % 1 734,000
Reston Next (formerly RestonGateway) Reston, VA 85.0 % 2 1,062,000
2100 Pennsylvania Avenue Washington, DC 56.0 % 1 480,000Redevelopment
One Five Nine East 53rd Street(55% ownership) (15) New York, NY 96.0 % — 220,000
200 West Street (16) Waltham, MA 100.0 % — 138,000Subtotal for Properties Under Construction/Redevelopment 87.0 % 6 3,686,000
Total Portfolio 196 51,238,950
_______________(1) Represents signed leases for in-service properties which revenue recognition has commenced in accordance with
accounting principles generally accepted in the United States (“GAAP”).(2) Excludes the portion that was removed from the in-service portfolio during the third quarter of 2016 as part of a planned
redevelopment.
46
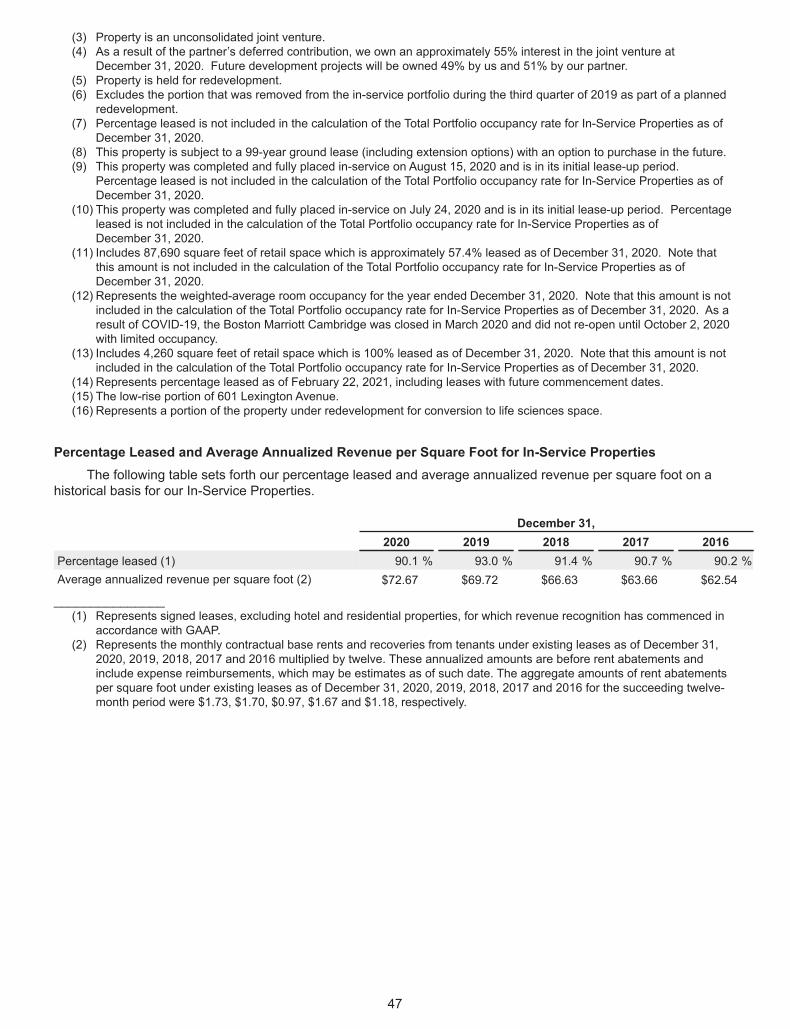
(3) Property is an unconsolidated joint venture.(4) As a result of the partner’s deferred contribution, we own an approximately 55% interest in the joint venture at
December 31, 2020. Future development projects will be owned 49% by us and 51% by our partner.(5) Property is held for redevelopment.(6) Excludes the portion that was removed from the in-service portfolio during the third quarter of 2019 as part of a planned
redevelopment.(7) Percentage leased is not included in the calculation of the Total Portfolio occupancy rate for In-Service Properties as of
December 31, 2020.(8) This property is subject to a 99-year ground lease (including extension options) with an option to purchase in the future.(9) This property was completed and fully placed in-service on August 15, 2020 and is in its initial lease-up period.
Percentage leased is not included in the calculation of the Total Portfolio occupancy rate for In-Service Properties as ofDecember 31, 2020.
(10) This property was completed and fully placed in-service on July 24, 2020 and is in its initial lease-up period. Percentageleased is not included in the calculation of the Total Portfolio occupancy rate for In-Service Properties as ofDecember 31, 2020.
(11) Includes 87,690 square feet of retail space which is approximately 57.4% leased as of December 31, 2020. Note thatthis amount is not included in the calculation of the Total Portfolio occupancy rate for In-Service Properties as ofDecember 31, 2020.
(12) Represents the weighted-average room occupancy for the year ended December 31, 2020. Note that this amount is notincluded in the calculation of the Total Portfolio occupancy rate for In-Service Properties as of December 31, 2020. As aresult of COVID-19, the Boston Marriott Cambridge was closed in March 2020 and did not re-open until October 2, 2020with limited occupancy.
(13) Includes 4,260 square feet of retail space which is 100% leased as of December 31, 2020. Note that this amount is notincluded in the calculation of the Total Portfolio occupancy rate for In-Service Properties as of December 31, 2020.
(14) Represents percentage leased as of February 22, 2021, including leases with future commencement dates.(15) The low-rise portion of 601 Lexington Avenue.(16) Represents a portion of the property under redevelopment for conversion to life sciences space.
Percentage Leased and Average Annualized Revenue per Square Foot for In-Service PropertiesThe following table sets forth our percentage leased and average annualized revenue per square foot on a
historical basis for our In-Service Properties.
December 31,2020 2019 2018 2017 2016
Percentage leased (1) 90.1 % 93.0 % 91.4 % 90.7 % 90.2 %Average annualized revenue per square foot (2) $72.67 $69.72 $66.63 $63.66 $62.54
_______________(1) Represents signed leases, excluding hotel and residential properties, for which revenue recognition has commenced in
accordance with GAAP.(2) Represents the monthly contractual base rents and recoveries from tenants under existing leases as of December 31,
2020, 2019, 2018, 2017 and 2016 multiplied by twelve. These annualized amounts are before rent abatements andinclude expense reimbursements, which may be estimates as of such date. The aggregate amounts of rent abatementsper square foot under existing leases as of December 31, 2020, 2019, 2018, 2017 and 2016 for the succeeding twelve-month period were $1.73, $1.70, $0.97, $1.67 and $1.18, respectively.
47
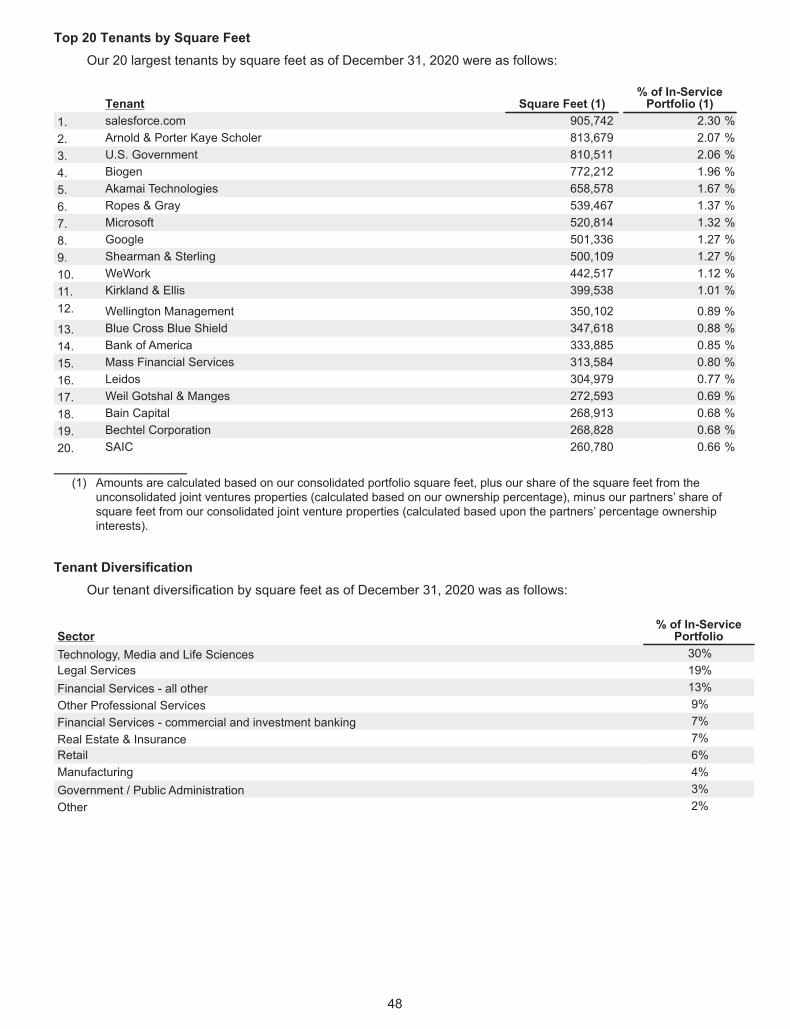
Top 20 Tenants by Square FeetOur 20 largest tenants by square feet as of December 31, 2020 were as follows:
Tenant Square Feet (1)% of In-ServicePortfolio (1)
1. salesforce.com 905,742 2.30 %2. Arnold & Porter Kaye Scholer 813,679 2.07 %3. U.S. Government 810,511 2.06 %4. Biogen 772,212 1.96 %5. Akamai Technologies 658,578 1.67 %6. Ropes & Gray 539,467 1.37 %7. Microsoft 520,814 1.32 %8. Google 501,336 1.27 %9. Shearman & Sterling 500,109 1.27 %10. WeWork 442,517 1.12 %11. Kirkland & Ellis 399,538 1.01 %12. Wellington Management 350,102 0.89 %13. Blue Cross Blue Shield 347,618 0.88 %14. Bank of America 333,885 0.85 %15. Mass Financial Services 313,584 0.80 %16. Leidos 304,979 0.77 %17. Weil Gotshal & Manges 272,593 0.69 %18. Bain Capital 268,913 0.68 %19. Bechtel Corporation 268,828 0.68 %20. SAIC 260,780 0.66 %
__________________(1) Amounts are calculated based on our consolidated portfolio square feet, plus our share of the square feet from the
unconsolidated joint ventures properties (calculated based on our ownership percentage), minus our partners’ share ofsquare feet from our consolidated joint venture properties (calculated based upon the partners’ percentage ownershipinterests).
Tenant DiversificationOur tenant diversification by square feet as of December 31, 2020 was as follows:
Sector% of In-Service
PortfolioTechnology, Media and Life Sciences 30%Legal Services 19%Financial Services - all other 13%Other Professional Services 9%Financial Services - commercial and investment banking 7%Real Estate & Insurance 7%Retail 6%Manufacturing 4%Government / Public Administration 3%Other 2%
48
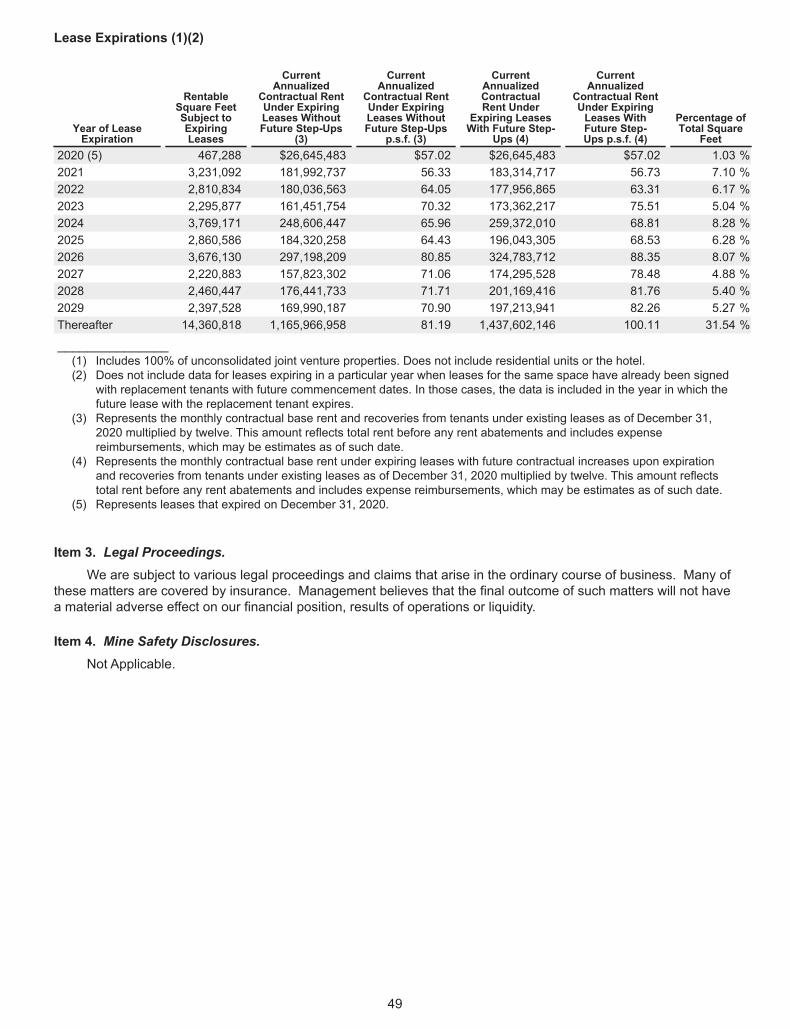
Lease Expirations (1)(2)
Year of LeaseExpiration
RentableSquare FeetSubject toExpiringLeases
CurrentAnnualized
Contractual RentUnder ExpiringLeases WithoutFuture Step-Ups
(3)
CurrentAnnualized
Contractual RentUnder ExpiringLeases WithoutFuture Step-Ups
p.s.f. (3)
CurrentAnnualizedContractualRent Under
Expiring LeasesWith Future Step-
Ups (4)
CurrentAnnualized
Contractual RentUnder ExpiringLeases WithFuture Step-Ups p.s.f. (4)
Percentage ofTotal Square
Feet2020 (5) 467,288 $26,645,483 $57.02 $26,645,483 $57.02 1.03 %2021 3,231,092 181,992,737 56.33 183,314,717 56.73 7.10 %2022 2,810,834 180,036,563 64.05 177,956,865 63.31 6.17 %2023 2,295,877 161,451,754 70.32 173,362,217 75.51 5.04 %2024 3,769,171 248,606,447 65.96 259,372,010 68.81 8.28 %2025 2,860,586 184,320,258 64.43 196,043,305 68.53 6.28 %2026 3,676,130 297,198,209 80.85 324,783,712 88.35 8.07 %2027 2,220,883 157,823,302 71.06 174,295,528 78.48 4.88 %2028 2,460,447 176,441,733 71.71 201,169,416 81.76 5.40 %2029 2,397,528 169,990,187 70.90 197,213,941 82.26 5.27 %Thereafter 14,360,818 1,165,966,958 81.19 1,437,602,146 100.11 31.54 %
_______________(1) Includes 100% of unconsolidated joint venture properties. Does not include residential units or the hotel.(2) Does not include data for leases expiring in a particular year when leases for the same space have already been signed
with replacement tenants with future commencement dates. In those cases, the data is included in the year in which thefuture lease with the replacement tenant expires.
(3) Represents the monthly contractual base rent and recoveries from tenants under existing leases as of December 31,2020 multiplied by twelve. This amount reflects total rent before any rent abatements and includes expensereimbursements, which may be estimates as of such date.
(4) Represents the monthly contractual base rent under expiring leases with future contractual increases upon expirationand recoveries from tenants under existing leases as of December 31, 2020 multiplied by twelve. This amount reflectstotal rent before any rent abatements and includes expense reimbursements, which may be estimates as of such date.
(5) Represents leases that expired on December 31, 2020.
Item 3. Legal Proceedings.We are subject to various legal proceedings and claims that arise in the ordinary course of business. Many of
these matters are covered by insurance. Management believes that the final outcome of such matters will not havea material adverse effect on our financial position, results of operations or liquidity.
Item 4. Mine Safety Disclosures.Not Applicable.
49
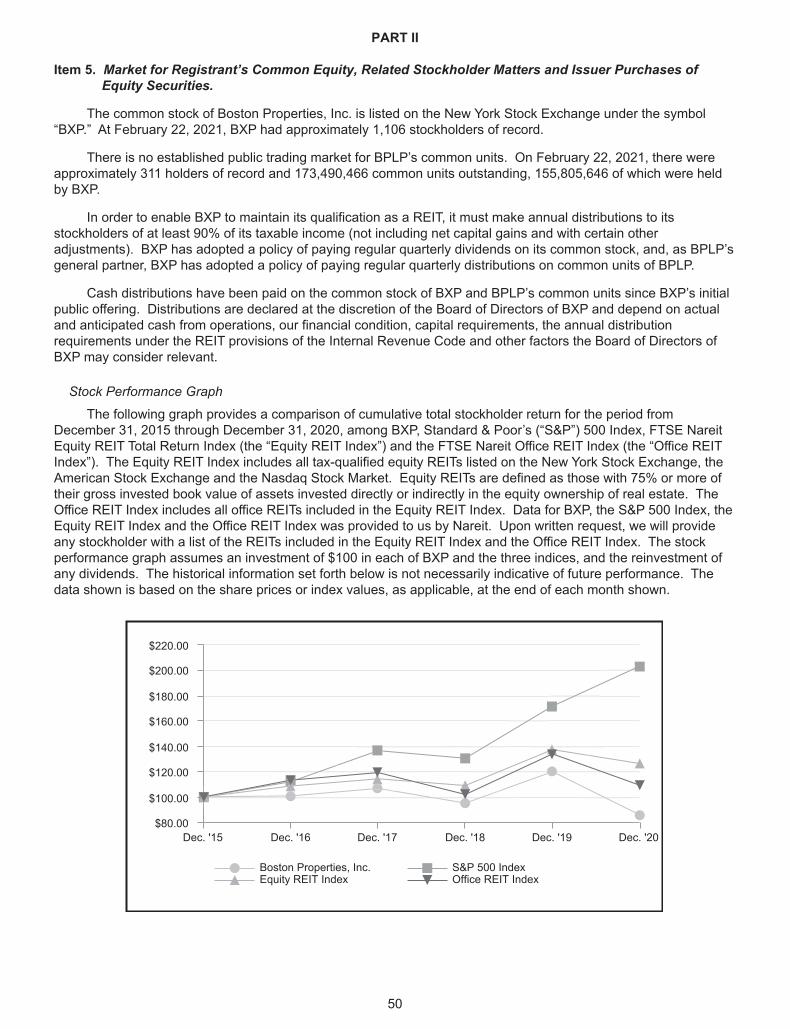
PART II
Item 5. Market for Registrant’s Common Equity, Related Stockholder Matters and Issuer Purchases ofEquity Securities.
The common stock of Boston Properties, Inc. is listed on the New York Stock Exchange under the symbol“BXP.” At February 22, 2021, BXP had approximately 1,106 stockholders of record.
There is no established public trading market for BPLP’s common units. On February 22, 2021, there wereapproximately 311 holders of record and 173,490,466 common units outstanding, 155,805,646 of which were heldby BXP.
In order to enable BXP to maintain its qualification as a REIT, it must make annual distributions to itsstockholders of at least 90% of its taxable income (not including net capital gains and with certain otheradjustments). BXP has adopted a policy of paying regular quarterly dividends on its common stock, and, as BPLP’sgeneral partner, BXP has adopted a policy of paying regular quarterly distributions on common units of BPLP.
Cash distributions have been paid on the common stock of BXP and BPLP’s common units since BXP’s initialpublic offering. Distributions are declared at the discretion of the Board of Directors of BXP and depend on actualand anticipated cash from operations, our financial condition, capital requirements, the annual distributionrequirements under the REIT provisions of the Internal Revenue Code and other factors the Board of Directors ofBXP may consider relevant.
Stock Performance Graph
The following graph provides a comparison of cumulative total stockholder return for the period fromDecember 31, 2015 through December 31, 2020, among BXP, Standard & Poor’s (“S&P”) 500 Index, FTSE NareitEquity REIT Total Return Index (the “Equity REIT Index”) and the FTSE Nareit Office REIT Index (the “Office REITIndex”). The Equity REIT Index includes all tax-qualified equity REITs listed on the New York Stock Exchange, theAmerican Stock Exchange and the Nasdaq Stock Market. Equity REITs are defined as those with 75% or more oftheir gross invested book value of assets invested directly or indirectly in the equity ownership of real estate. TheOffice REIT Index includes all office REITs included in the Equity REIT Index. Data for BXP, the S&P 500 Index, theEquity REIT Index and the Office REIT Index was provided to us by Nareit. Upon written request, we will provideany stockholder with a list of the REITs included in the Equity REIT Index and the Office REIT Index. The stockperformance graph assumes an investment of $100 in each of BXP and the three indices, and the reinvestment ofany dividends. The historical information set forth below is not necessarily indicative of future performance. Thedata shown is based on the share prices or index values, as applicable, at the end of each month shown.
Boston Properties, Inc. S&P 500 IndexEquity REIT Index Office REIT Index
Dec. '15 Dec. '16 Dec. '17 Dec. '18 Dec. '19 Dec. '20$80.00
$100.00
$120.00
$140.00
$160.00
$180.00
$200.00
$220.00
50
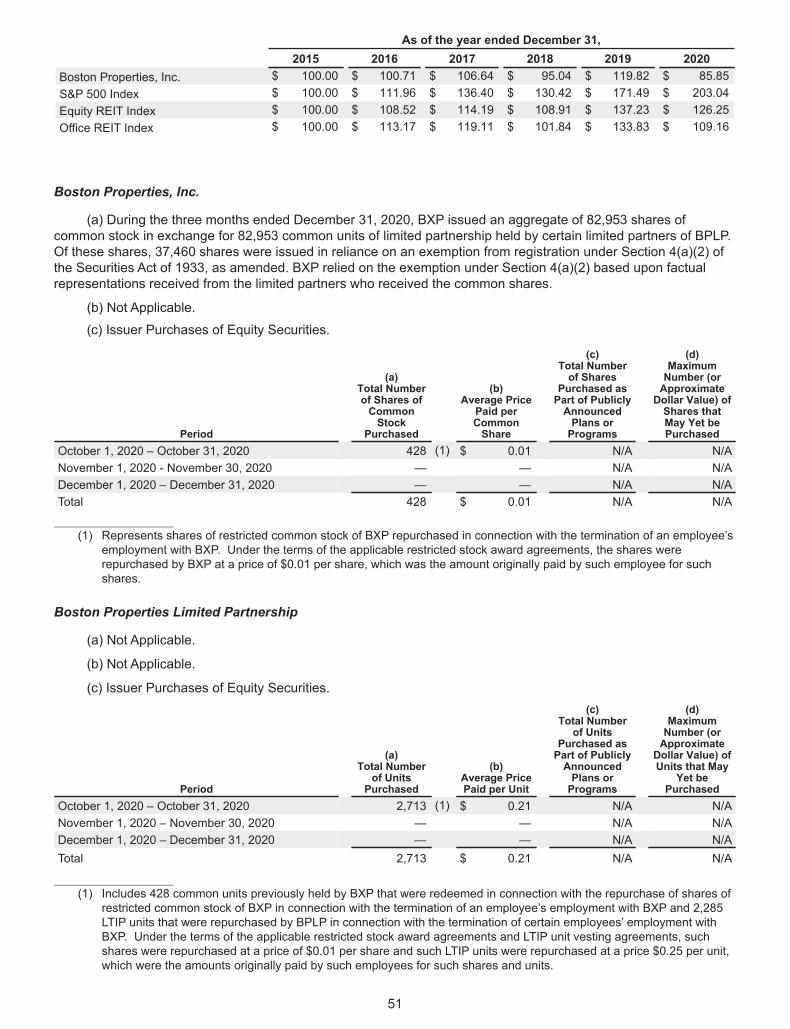
As of the year ended December 31,2015 2016 2017 2018 2019 2020
Boston Properties, Inc. $ 100.00 $ 100.71 $ 106.64 $ 95.04 $ 119.82 $ 85.85S&P 500 Index $ 100.00 $ 111.96 $ 136.40 $ 130.42 $ 171.49 $ 203.04Equity REIT Index $ 100.00 $ 108.52 $ 114.19 $ 108.91 $ 137.23 $ 126.25Office REIT Index $ 100.00 $ 113.17 $ 119.11 $ 101.84 $ 133.83 $ 109.16
Boston Properties, Inc.
(a) During the three months ended December 31, 2020, BXP issued an aggregate of 82,953 shares ofcommon stock in exchange for 82,953 common units of limited partnership held by certain limited partners of BPLP.Of these shares, 37,460 shares were issued in reliance on an exemption from registration under Section 4(a)(2) ofthe Securities Act of 1933, as amended. BXP relied on the exemption under Section 4(a)(2) based upon factualrepresentations received from the limited partners who received the common shares.
(b) Not Applicable.
(c) Issuer Purchases of Equity Securities.
Period
(a)Total Numberof Shares ofCommonStock
Purchased
(b)Average PricePaid perCommonShare
(c)Total Numberof Shares
Purchased asPart of PubliclyAnnouncedPlans orPrograms
(d)MaximumNumber (orApproximateDollar Value) ofShares thatMay Yet bePurchased
October 1, 2020 – October 31, 2020 428 (1) $ 0.01 N/A N/ANovember 1, 2020 - November 30, 2020 — — N/A N/ADecember 1, 2020 – December 31, 2020 — — N/A N/ATotal 428 $ 0.01 N/A N/A____________________
(1) Represents shares of restricted common stock of BXP repurchased in connection with the termination of an employee’semployment with BXP. Under the terms of the applicable restricted stock award agreements, the shares wererepurchased by BXP at a price of $0.01 per share, which was the amount originally paid by such employee for suchshares.
Boston Properties Limited Partnership
(a) Not Applicable.
(b) Not Applicable.
(c) Issuer Purchases of Equity Securities.
Period
(a)Total Numberof UnitsPurchased
(b)Average PricePaid per Unit
(c)Total Numberof Units
Purchased asPart of PubliclyAnnouncedPlans orPrograms
(d)MaximumNumber (orApproximateDollar Value) ofUnits that May
Yet bePurchased
October 1, 2020 – October 31, 2020 2,713 (1) $ 0.21 N/A N/ANovember 1, 2020 – November 30, 2020 — — N/A N/ADecember 1, 2020 – December 31, 2020 — — N/A N/ATotal 2,713 $ 0.21 N/A N/A
____________________(1) Includes 428 common units previously held by BXP that were redeemed in connection with the repurchase of shares of
restricted common stock of BXP in connection with the termination of an employee’s employment with BXP and 2,285LTIP units that were repurchased by BPLP in connection with the termination of certain employees’ employment withBXP. Under the terms of the applicable restricted stock award agreements and LTIP unit vesting agreements, suchshares were repurchased at a price of $0.01 per share and such LTIP units were repurchased at a price $0.25 per unit,which were the amounts originally paid by such employees for such shares and units.
51
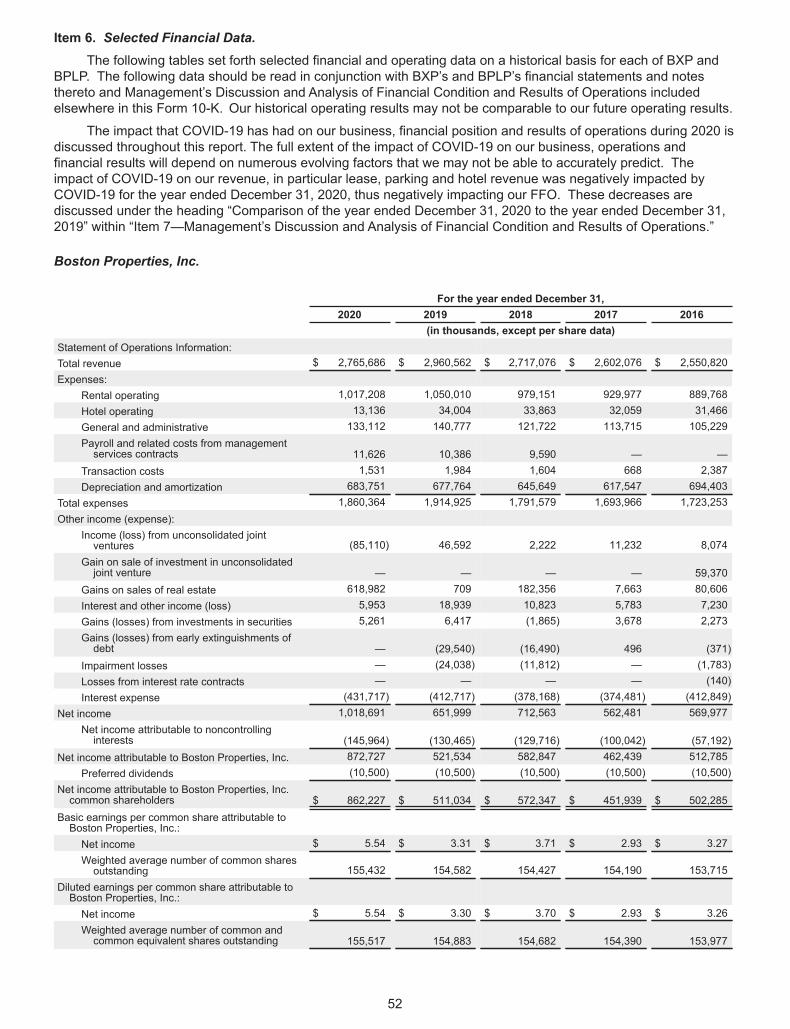
Item 6. Selected Financial Data.The following tables set forth selected financial and operating data on a historical basis for each of BXP and
BPLP. The following data should be read in conjunction with BXP’s and BPLP’s financial statements and notesthereto and Management’s Discussion and Analysis of Financial Condition and Results of Operations includedelsewhere in this Form 10-K. Our historical operating results may not be comparable to our future operating results.
The impact that COVID-19 has had on our business, financial position and results of operations during 2020 isdiscussed throughout this report. The full extent of the impact of COVID-19 on our business, operations andfinancial results will depend on numerous evolving factors that we may not be able to accurately predict. Theimpact of COVID-19 on our revenue, in particular lease, parking and hotel revenue was negatively impacted byCOVID-19 for the year ended December 31, 2020, thus negatively impacting our FFO. These decreases arediscussed under the heading “Comparison of the year ended December 31, 2020 to the year ended December 31,2019” within “Item 7—Management’s Discussion and Analysis of Financial Condition and Results of Operations.”
Boston Properties, Inc.
For the year ended December 31,2020 2019 2018 2017 2016
(in thousands, except per share data)Statement of Operations Information:Total revenue $ 2,765,686 $ 2,960,562 $ 2,717,076 $ 2,602,076 $ 2,550,820Expenses:
Rental operating 1,017,208 1,050,010 979,151 929,977 889,768Hotel operating 13,136 34,004 33,863 32,059 31,466General and administrative 133,112 140,777 121,722 113,715 105,229Payroll and related costs from managementservices contracts 11,626 10,386 9,590 — —
Transaction costs 1,531 1,984 1,604 668 2,387Depreciation and amortization 683,751 677,764 645,649 617,547 694,403
Total expenses 1,860,364 1,914,925 1,791,579 1,693,966 1,723,253Other income (expense):
Income (loss) from unconsolidated jointventures (85,110) 46,592 2,222 11,232 8,074
Gain on sale of investment in unconsolidatedjoint venture — — — — 59,370
Gains on sales of real estate 618,982 709 182,356 7,663 80,606Interest and other income (loss) 5,953 18,939 10,823 5,783 7,230Gains (losses) from investments in securities 5,261 6,417 (1,865) 3,678 2,273Gains (losses) from early extinguishments ofdebt — (29,540) (16,490) 496 (371)
Impairment losses — (24,038) (11,812) — (1,783)Losses from interest rate contracts — — — — (140)Interest expense (431,717) (412,717) (378,168) (374,481) (412,849)
Net income 1,018,691 651,999 712,563 562,481 569,977Net income attributable to noncontrollinginterests (145,964) (130,465) (129,716) (100,042) (57,192)
Net income attributable to Boston Properties, Inc. 872,727 521,534 582,847 462,439 512,785Preferred dividends (10,500) (10,500) (10,500) (10,500) (10,500)
Net income attributable to Boston Properties, Inc.common shareholders $ 862,227 $ 511,034 $ 572,347 $ 451,939 $ 502,285
Basic earnings per common share attributable toBoston Properties, Inc.:Net income $ 5.54 $ 3.31 $ 3.71 $ 2.93 $ 3.27Weighted average number of common sharesoutstanding 155,432 154,582 154,427 154,190 153,715
Diluted earnings per common share attributable toBoston Properties, Inc.:Net income $ 5.54 $ 3.30 $ 3.70 $ 2.93 $ 3.26Weighted average number of common andcommon equivalent shares outstanding 155,517 154,883 154,682 154,390 153,977
52

December 31,2020 2019 2018 2017 2016
(in thousands)Balance Sheet information:
Real estate, gross $ 23,352,909 $ 22,889,010 $ 21,649,896 $ 21,096,642 $ 20,147,263Real estate, net 17,818,807 17,622,212 16,752,119 16,507,008 15,925,028Cash and cash equivalents 1,668,742 644,950 543,359 434,767 356,914Total assets 22,858,190 21,284,905 20,256,477 19,372,233 18,851,643Total indebtedness 13,047,758 11,811,806 11,007,757 10,271,611 9,796,133Redeemable deferred stock units 6,897 8,365 — — —Stockholders’ equity attributable to BostonProperties, Inc. 5,996,083 5,684,687 5,883,171 5,813,957 5,786,295
Equity noncontrolling interests 2,343,529 2,329,549 2,330,797 2,288,499 2,145,629
For the year ended December 31,2020 2019 2018 2017 2016
(in thousands, except per share and percentage data)Other Information:
Funds from Operations attributable to BostonProperties, Inc. common shareholders (1) $ 978,191 $ 1,085,844 $ 974,489 $ 959,412 $ 927,747
Dividends declared per share 3.92 3.83 3.50 3.05 2.70Cash flows provided by operating activities (2) 1,156,840 1,181,165 1,150,245 911,979 1,034,548Cash flows used in investing activities (2) (613,719) (1,015,091) (1,098,876) (882,044) (1,337,347)Cash flows provided by (used in) financingactivities (2) 484,322 (113,379) 82,453 55,346 (74,621)
Total square feet at end of year (includingdevelopment projects) 51,239 51,969 51,586 50,339 47,704
In-service percentage leased at end of year 90.1 % 93.0 % 91.4 % 90.7 % 90.2 %
_______________(1) Pursuant to the revised definition of Funds from Operations adopted by the Board of Governors of Nareit, we calculate
Funds from Operations, or “FFO,” for BXP by adjusting net income attributable to Boston Properties, Inc. commonshareholders (computed in accordance with GAAP) for gains (or losses) from sales of properties, impairment losses ondepreciable real estate consolidated on BXP’s balance sheet, impairment losses on our investments in unconsolidatedjoint ventures driven by a measurable decrease in the fair value of depreciable real estate held by the unconsolidated jointventures and our share of real estate-related depreciation and amortization. FFO is a non-GAAP financial measure. Webelieve the presentation of FFO, combined with the presentation of required GAAP financial measures, improves theunderstanding of operating results of REITs among the investing public and helps make comparisons of REIT operatingresults more meaningful. Management generally considers FFO to be a useful measure for understanding and comparingBXP’s operating results because, by excluding gains and losses related to sales of previously depreciated operating realestate assets, impairment losses and real estate asset depreciation and amortization (which can differ across owners ofsimilar assets in similar condition based on historical cost accounting and useful life estimates), FFO can help investorscompare the operating performance of a company’s real estate across reporting periods and to the operating performanceof other companies. Amount represents BXP’s share, which was 90.03%, 89.77%, 89.83%, 89.82% and 89.70% for theyears ended December 31, 2020, 2019, 2018, 2017 and 2016, respectively, after allocation to the noncontrolling interests.
Our computation of FFO may not be comparable to FFO reported by other REITs or real estate companies that do notdefine the term in accordance with the current Nareit definition or that interpret the current Nareit definition differently. Webelieve that in order to facilitate a clear understanding of our operating results, FFO should be examined in conjunctionwith net income attributable to Boston Properties, Inc. common shareholders as presented in BXP’s ConsolidatedFinancial Statements. FFO should not be considered as a substitute for net income attributable to Boston Properties, Inc.common shareholders (determined in accordance with GAAP) or any other GAAP financial measures and should only beconsidered together with and as a supplement to BXP’s financial information prepared in accordance with GAAP.
A reconciliation of FFO attributable to Boston Properties, Inc. common shareholders to net income attributable to BostonProperties, Inc. common shareholders computed in accordance with GAAP is provided under the heading “Management’sDiscussion and Analysis of Financial Condition and Results of Operations—Funds from Operations.”
(2) On January 1, 2018, we adopted Accounting Standards Update (“ASU”) ASU 2016-15 and ASU 2016-18 andretrospectively applied the guidance to our Consolidated Statements of Cash Flows for all periods presented. Theadoption of ASU 2016-15 and ASU 2016-18 required us to include Cash Held in Escrows with Cash and Cash Equivalentswhen reconciling the beginning-of-period and end-of-period total amounts shown on the Consolidated Statements of CashFlows and required us to classify debt prepayment and extinguishment costs as a component of financing activities insteadof as a component of operating activities in our Consolidated Statements of Cash Flows resulting in changes to thereported amounts of cash flows provided by (used in) operating, investing and financing activities.
53
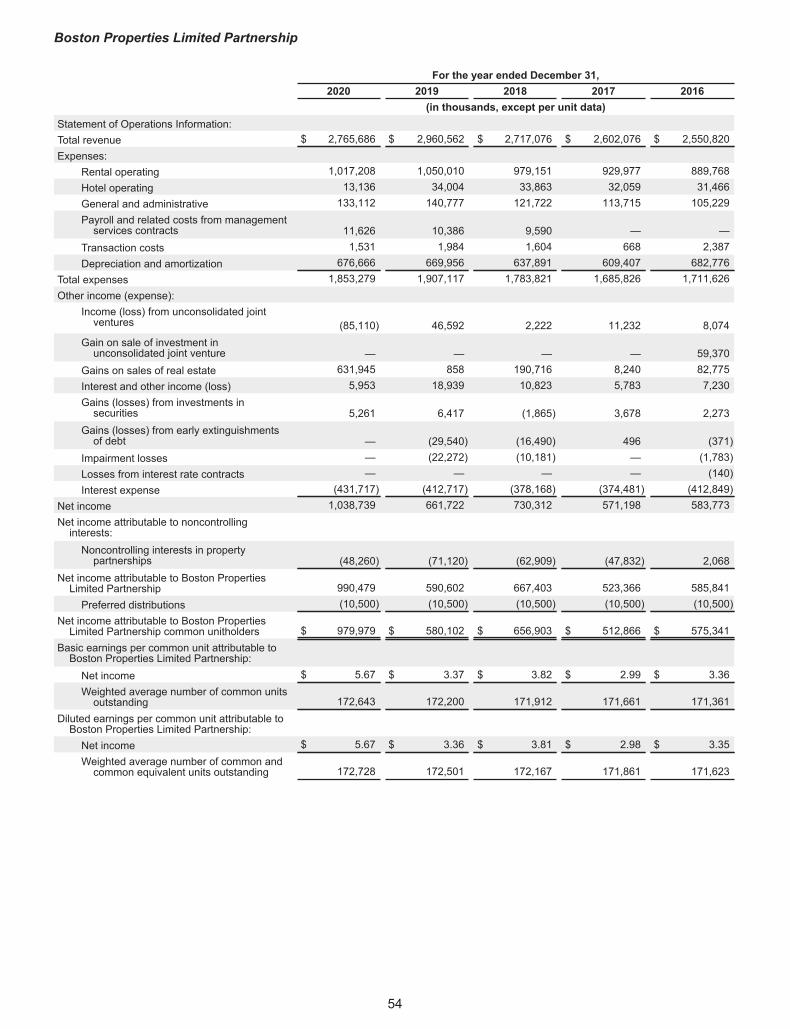
Boston Properties Limited Partnership
For the year ended December 31,2020 2019 2018 2017 2016
(in thousands, except per unit data)Statement of Operations Information:Total revenue $ 2,765,686 $ 2,960,562 $ 2,717,076 $ 2,602,076 $ 2,550,820Expenses:
Rental operating 1,017,208 1,050,010 979,151 929,977 889,768Hotel operating 13,136 34,004 33,863 32,059 31,466General and administrative 133,112 140,777 121,722 113,715 105,229Payroll and related costs from managementservices contracts 11,626 10,386 9,590 — —
Transaction costs 1,531 1,984 1,604 668 2,387Depreciation and amortization 676,666 669,956 637,891 609,407 682,776
Total expenses 1,853,279 1,907,117 1,783,821 1,685,826 1,711,626Other income (expense):
Income (loss) from unconsolidated jointventures (85,110) 46,592 2,222 11,232 8,074
Gain on sale of investment inunconsolidated joint venture — — — — 59,370
Gains on sales of real estate 631,945 858 190,716 8,240 82,775Interest and other income (loss) 5,953 18,939 10,823 5,783 7,230Gains (losses) from investments insecurities 5,261 6,417 (1,865) 3,678 2,273
Gains (losses) from early extinguishmentsof debt — (29,540) (16,490) 496 (371)
Impairment losses — (22,272) (10,181) — (1,783)Losses from interest rate contracts — — — — (140)Interest expense (431,717) (412,717) (378,168) (374,481) (412,849)
Net income 1,038,739 661,722 730,312 571,198 583,773Net income attributable to noncontrollinginterests:Noncontrolling interests in propertypartnerships (48,260) (71,120) (62,909) (47,832) 2,068
Net income attributable to Boston PropertiesLimited Partnership 990,479 590,602 667,403 523,366 585,841Preferred distributions (10,500) (10,500) (10,500) (10,500) (10,500)
Net income attributable to Boston PropertiesLimited Partnership common unitholders $ 979,979 $ 580,102 $ 656,903 $ 512,866 $ 575,341
Basic earnings per common unit attributable toBoston Properties Limited Partnership:Net income $ 5.67 $ 3.37 $ 3.82 $ 2.99 $ 3.36Weighted average number of common unitsoutstanding 172,643 172,200 171,912 171,661 171,361
Diluted earnings per common unit attributable toBoston Properties Limited Partnership:Net income $ 5.67 $ 3.36 $ 3.81 $ 2.98 $ 3.35Weighted average number of common andcommon equivalent units outstanding 172,728 172,501 172,167 171,861 171,623
54
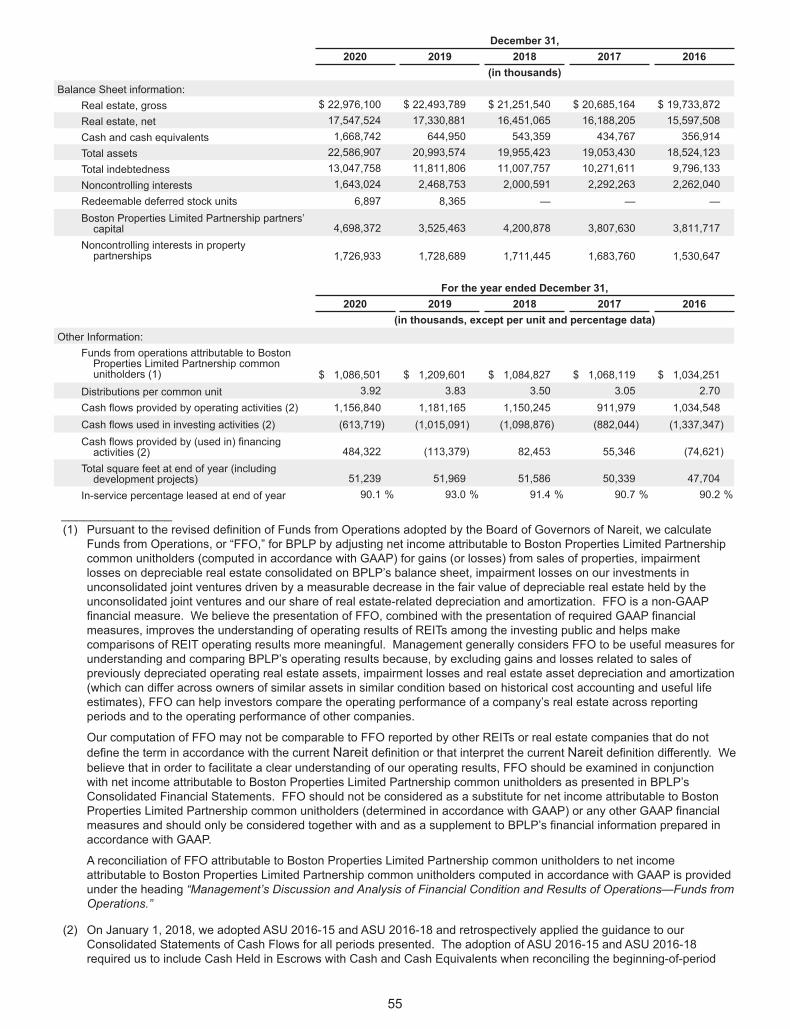
December 31,2020 2019 2018 2017 2016
(in thousands)Balance Sheet information:
Real estate, gross $ 22,976,100 $ 22,493,789 $ 21,251,540 $ 20,685,164 $ 19,733,872Real estate, net 17,547,524 17,330,881 16,451,065 16,188,205 15,597,508Cash and cash equivalents 1,668,742 644,950 543,359 434,767 356,914Total assets 22,586,907 20,993,574 19,955,423 19,053,430 18,524,123Total indebtedness 13,047,758 11,811,806 11,007,757 10,271,611 9,796,133Noncontrolling interests 1,643,024 2,468,753 2,000,591 2,292,263 2,262,040Redeemable deferred stock units 6,897 8,365 — — —Boston Properties Limited Partnership partners’capital 4,698,372 3,525,463 4,200,878 3,807,630 3,811,717
Noncontrolling interests in propertypartnerships 1,726,933 1,728,689 1,711,445 1,683,760 1,530,647
For the year ended December 31,2020 2019 2018 2017 2016
(in thousands, except per unit and percentage data)Other Information:
Funds from operations attributable to BostonProperties Limited Partnership commonunitholders (1) $ 1,086,501 $ 1,209,601 $ 1,084,827 $ 1,068,119 $ 1,034,251
Distributions per common unit 3.92 3.83 3.50 3.05 2.70Cash flows provided by operating activities (2) 1,156,840 1,181,165 1,150,245 911,979 1,034,548Cash flows used in investing activities (2) (613,719) (1,015,091) (1,098,876) (882,044) (1,337,347)Cash flows provided by (used in) financingactivities (2) 484,322 (113,379) 82,453 55,346 (74,621)
Total square feet at end of year (includingdevelopment projects) 51,239 51,969 51,586 50,339 47,704
In-service percentage leased at end of year 90.1 % 93.0 % 91.4 % 90.7 % 90.2 %
_______________(1) Pursuant to the revised definition of Funds from Operations adopted by the Board of Governors of Nareit, we calculate
Funds from Operations, or “FFO,” for BPLP by adjusting net income attributable to Boston Properties Limited Partnershipcommon unitholders (computed in accordance with GAAP) for gains (or losses) from sales of properties, impairmentlosses on depreciable real estate consolidated on BPLP’s balance sheet, impairment losses on our investments inunconsolidated joint ventures driven by a measurable decrease in the fair value of depreciable real estate held by theunconsolidated joint ventures and our share of real estate-related depreciation and amortization. FFO is a non-GAAPfinancial measure. We believe the presentation of FFO, combined with the presentation of required GAAP financialmeasures, improves the understanding of operating results of REITs among the investing public and helps makecomparisons of REIT operating results more meaningful. Management generally considers FFO to be useful measures forunderstanding and comparing BPLP’s operating results because, by excluding gains and losses related to sales ofpreviously depreciated operating real estate assets, impairment losses and real estate asset depreciation and amortization(which can differ across owners of similar assets in similar condition based on historical cost accounting and useful lifeestimates), FFO can help investors compare the operating performance of a company’s real estate across reportingperiods and to the operating performance of other companies.
Our computation of FFO may not be comparable to FFO reported by other REITs or real estate companies that do notdefine the term in accordance with the current Nareit definition or that interpret the current Nareit definition differently. Webelieve that in order to facilitate a clear understanding of our operating results, FFO should be examined in conjunctionwith net income attributable to Boston Properties Limited Partnership common unitholders as presented in BPLP’sConsolidated Financial Statements. FFO should not be considered as a substitute for net income attributable to BostonProperties Limited Partnership common unitholders (determined in accordance with GAAP) or any other GAAP financialmeasures and should only be considered together with and as a supplement to BPLP’s financial information prepared inaccordance with GAAP.
A reconciliation of FFO attributable to Boston Properties Limited Partnership common unitholders to net incomeattributable to Boston Properties Limited Partnership common unitholders computed in accordance with GAAP is providedunder the heading “Management’s Discussion and Analysis of Financial Condition and Results of Operations—Funds fromOperations.”
(2) On January 1, 2018, we adopted ASU 2016-15 and ASU 2016-18 and retrospectively applied the guidance to ourConsolidated Statements of Cash Flows for all periods presented. The adoption of ASU 2016-15 and ASU 2016-18required us to include Cash Held in Escrows with Cash and Cash Equivalents when reconciling the beginning-of-period
55

and end-of-period total amounts shown on the Consolidated Statements of Cash Flows and required us to classify debtprepayment and extinguishment costs as a component of financing activities instead of as a component of operatingactivities in our Consolidated Statements of Cash Flows resulting in changes to the reported amounts of cash flowsprovided by (used in) operating, investing and financing activities.
56
Item 7—Management’s Discussion and Analysis of Financial Condition and Results of OperationsThe following discussion should be read in conjunction with the financial statements and notes thereto
appearing elsewhere in this report.
Forward-Looking StatementsThis Annual Report on Form 10-K, including the documents incorporated by reference, contain forward-looking
statements within the meaning of the federal securities laws, Section 27A of the Securities Act of 1933, asamended, and Section 21E of the Securities Exchange Act of 1934, as amended. We intend these forward-lookingstatements to be covered by the safe harbor provisions for forward-looking statements contained in the PrivateSecurities Litigation Reform Act of 1995 and are including this statement for purposes of complying with those safeharbor provisions, in each case, to the extent applicable. Such statements are contained principally, but not only,under the captions “Business—Business and Growth Strategies,” “Risk Factors” and “Management’s Discussionand Analysis of Financial Condition and Results of Operations.” We caution investors that any such forward-lookingstatements are based on current beliefs or expectations of future events and on assumptions made by, andinformation currently available to, our management. When used, the words “anticipate,” “believe,” “budget,”“estimate,” “expect,” “intend,” “may,” “might,” “plan,” “project,” “should,” “will” and similar expressions that do notrelate solely to historical matters are intended to identify forward-looking statements. Such statements are subjectto risks, uncertainties and assumptions and are not guarantees of future performance or occurrences, which may beaffected by known and unknown risks, trends, uncertainties and factors that are, in some cases, beyond our control.Should one or more of these known or unknown risks or uncertainties materialize, or should underlying assumptionsprove incorrect, actual results may vary materially from those expressed or implied by the forward-lookingstatements. We caution you that, while forward-looking statements reflect our good-faith beliefs when we makethem, they are not guarantees of future performance or occurrences and are impacted by actual events when theyoccur after we make such statements. Accordingly, investors should use caution in relying on forward-lookingstatements, which are based on results and trends at the time they are made, to anticipate future results or trends.
One of the most significant factors that may cause actual results to differ materially from those expressed orimplied by the forward-looking statements is the ongoing impact of the global COVID-19 pandemic on the U.S. andglobal economies, which has impacted, and is likely to continue to impact, us and, directly or indirectly, many of theother important factors below and the risks set forth in this Form 10-K in Part I, Item 1A.
Some of the risks and uncertainties that may cause our actual results, performance or achievements to differmaterially from those expressed or implied by forward-looking statements include, among others, the following:
• the risks and uncertainties related to the impact of the COVID-19 global pandemic, including theduration, scope and severity of the pandemic domestically and internationally; federal, state andlocal government actions or restrictive measures implemented in response to COVID-19, theeffectiveness of such measures, as well as the effect of any relaxation of current restrictions, andthe direct and indirect impact of such measures on our and our tenants' businesses, financialcondition, results of operations, cash flows, liquidity and performance, and the U.S. andinternational economy and economic activity generally; the speed, effectiveness and distribution ofvaccines, whether new or existing actions and measures continue to result in increasingunemployment that impacts the ability of our residential tenants to generate sufficient income topay, or make them unwilling to pay rent in a timely manner, in full or at all; the health, continuedservice and availability of our personnel, including our key personnel and property managementteams; and the effectiveness or lack of effectiveness of governmental relief in providing assistanceto individuals and large and small businesses, including our tenants, that have suffered significantadverse effects from COVID-19;
• volatile or adverse global economic and political conditions, health crises and dislocations in thecredit markets could adversely affect our access to cost-effective capital and have a resultingmaterial adverse effect on our business opportunities, results of operations and financial condition;
• general risks affecting the real estate industry (including, without limitation, the inability to enter intoor renew leases, tenant space utilization, dependence on tenants’ financial condition, andcompetition from other developers, owners and operators of real estate);
• failure to manage effectively our growth and expansion into new markets and sub-markets or tointegrate acquisitions and developments successfully;
• the ability of our joint venture partners to satisfy their obligations;
57
• risks and uncertainties affecting property development and construction (including, withoutlimitation, construction delays, increased construction costs, cost overruns, inability to obtainnecessary permits, tenant accounting considerations that may result in negotiated lease provisionsthat limit a tenant’s liability during construction, and public opposition to such activities);
• risks associated with the availability and terms of financing and the use of debt to fund acquisitionsand developments or refinance existing indebtedness, including the impact of higher interest rateson the cost and/or availability of financing;
• risks associated with forward interest rate contracts and the effectiveness of such arrangements;
• risks associated with downturns in the national and local economies, increases in interest rates,and volatility in the securities markets;
• risks associated with actual or threatened terrorist attacks;
• costs of compliance with the Americans with Disabilities Act and other similar laws;
• potential liability for uninsured losses and environmental contamination;
• risks associated with the physical effects of climate change;
• risks associated with security breaches through cyber attacks, cyber intrusions or otherwise, as wellas other significant disruptions of our information technology (IT) networks and related systems,which support our operations and our buildings;
• risks associated with BXP’s potential failure to qualify as a REIT under the Internal Revenue Codeof 1986, as amended;
• possible adverse changes in tax and environmental laws;
• the impact of newly adopted accounting principles on our accounting policies and on period-to-period comparisons of financial results;
• risks associated with possible state and local tax audits; and
• risks associated with our dependence on key personnel whose continued service is not guaranteed.
The risks set forth above are not exhaustive. Other sections of this report, including “Part I, Item 1A—RiskFactors,” include additional factors that could adversely affect our business and financial performance. Moreover,we operate in a very competitive and rapidly changing environment, particularly in light of the circumstances relatingto COVID-19. New risk factors emerge from time to time and it is not possible for management to predict all riskfactors, nor can we assess the impact of all risk factors on our business or the extent to which any factor, orcombination of factors, may cause actual results to differ materially from those contained in any forward-lookingstatements. Given these risks and uncertainties, investors should not place undue reliance on forward-lookingstatements as a prediction of actual results. Investors should also refer to our Quarterly Reports on Form 10-Q forfuture periods and Current Reports on Form 8-K as we file them with the SEC, and to other materials we mayfurnish to the public from time to time through Current Reports on Form 8-K or otherwise, for a discussion of risksand uncertainties that may cause actual results, performance or achievements to differ materially from thoseexpressed or implied by forward-looking statements. We expressly disclaim any responsibility to update anyforward-looking statements to reflect changes in underlying assumptions or factors, new information, future events,or otherwise, and you should not rely upon these forward-looking statements after the date of this report.
OverviewBXP is one of the largest publicly-traded office real estate investment trusts (REITs) (based on total market
capitalization as of December 31, 2020) in the United States that develops, owns and manages primarily Class Aoffice properties. Our properties are concentrated in five markets in the United States - Boston, Los Angeles, NewYork, San Francisco and Washington, DC. BPLP is the entity through which BXP conducts substantially all of itsbusiness and owns (either directly or through subsidiaries) substantially all of its assets. We generate revenue andcash primarily by leasing Class A office space to our tenants. When making leasing decisions, we consider, amongother things, the creditworthiness of the tenant and the industry in which it conducts business, the length of thelease, the rental rate to be paid at inception and throughout the lease term, the costs of tenant improvements, freerent period and other landlord concessions, anticipated operating expenses and real estate taxes, current andanticipated vacancy in our properties and the market overall (including sublease space), current and expectedfuture demand for the space, the impact of any expansion rights and general economic factors.
58
Our core strategy has always been to develop, acquire and manage high-quality properties in supply-constrained markets with high barriers-to-entry and to focus on executing long-term leases with financially strongtenants. Our tenant base is diverse across market sectors and the weighted-average lease term for our in-placeleases, excluding residential units, was approximately 7.4 years, as of December 31, 2020, including leases signedby our unconsolidated joint ventures. The weighted-average lease term for our top 20 office tenants wasapproximately 10.4 years as of December 31, 2020. Historically, these factors have minimized our exposure inweaker economic cycles and enhanced revenues as market conditions improve. To be successful in any leasingenvironment, we believe we must consider all aspects of the tenant-landlord relationship. In this regard, we believethat our competitive advantage is based on the following attributes:
• our understanding of tenants’ short- and long-term space utilization and amenity needs in the local markets;
• our reputation as a premier developer, owner and manager of primarily Class A office properties;
• our financial strength and our ability to maintain high building standards;
• our focus on developing and operating in a sustainable and responsible manner; and
• our relationships with local brokers.
Outlook
Starting in March 2020, the COVID-19 pandemic negatively impacted global macroeconomic conditions.Following a drop in U.S. GDP of 31% in the second quarter of 2020, GDP growth in each of the third and fourthquarters of 2020 showed sequential quarterly improvements after the enactment of federal stimulus programs.While initial estimates indicate that GDP grew 4% in the fourth quarter of 2020, this was a decline from the thirdquarter as many of the stimulus programs began to expire toward the end of the year. U.S. stocks rose inNovember of 2020 as news about vaccine efficacy provided optimism. As we begin 2021, the U.S. economicrecovery remains slow and operating conditions for several sectors, including commercial real estate, continue to benegatively impacted by the pandemic. The health of the overall economy and employment trends amongprofessional workers have been, and we expect will continue to be, important drivers of office market conditions asvaccine distribution and efficacy drives a return to normal.
Late in the first quarter of 2020, public health officials and governmental authorities, including those in all ofthe markets in which we operate, reacted to the spread of the COVID-19 pandemic by imposing various regulatorymeasures, including quarantines, travel restrictions, issuing “stay-at-home” orders, restricting the types ofbusinesses that could continue to operate (including the types of construction projects that could proceed), closingschools and otherwise limiting the size of gatherings. Although the state and local authorities in many of our regionseased those regulations in the second half of 2020 to allow for the return to work, the physical occupancy of ourproperties remained well below capacity for the remainder of 2020 as infection rates increased and most employerscontinued their COVID-19 response protocols and encouraged employees to work from home when possible.
The future impact of the pandemic on the demand for office space is unclear as companies consider therecessionary impact on their business and their demand for labor while, at the same time, evaluate their spacerequirements in light of their current and projected headcounts and the continued focus on social distancing andemployees’ desire for more flexibility to work from home. Real estate is by nature a long-term business and we donot believe these considerations and ultimate decisions by tenants will evidence a clear trend in the short term. Inthe meantime, we believe our strategically located, high quality office properties will continue to be a component oftoday’s forward-thinking organizations that desire collaboration, innovation, productivity and culture, and we expecttenants will take advantage of the availability of Class A space and upgrade.
In the fourth quarter of 2020, we signed approximately 1.2 million square feet of new leases and renewals witha weighted-average lease term of approximately eight years, indicating that, despite headwinds, many prospectiveand existing tenants continue to commit to the long-term use of space and view our properties as their preferredchoice for a premium Class A office environment. Included in our fourth quarter 2020 leasing activity were (1) anapproximately 196,000 square foot, 20-year lease for the U.S. headquarters of a multinational automotive companyat our Reston Next development in Reston, Virginia; (2) an approximately 138,000 square-foot, 10-year lease with abiotechnology company at 200 West Street in Waltham, Massachusetts and (3) an approximately 75,000 square-foot, seven-year lease with a leading healthcare technology company at 20 CityPoint, a development in Waltham,Massachusetts that we fully placed-in service in June 2020.
59
While the volume of leasing in the fourth quarter of 2020 was an improvement of approximately 350,000square feet of leasing from the third quarter of 2020, new leasing activity in the fourth quarter of 2020 remainedlower than it was prior to the COVID-19 pandemic as many existing and prospective tenants deferred decisions ontheir office space needs as they focused on their employees’ safety and managing their businesses through therecession and economic recovery.
The development of primarily pre-leased properties in supply-constrained markets with the strongesteconomic growth over time continues to be a cornerstone of our long-term growth strategy. As of December 31,2020, we had approximately 3.7 million square feet of active developments and redevelopments in our pipeline,which are 87% pre-leased, as of February 22, 2021, to predominately credit-strong tenants with long-lease terms.Our development projects are projected to meet required delivery milestones as defined in our leases.
The health and safety of our employees, tenants, service providers and visitors continue to be our highestpriorities. In the fourth quarter of 2020, we continued to operate in accordance with our health safety protocols in allin-service properties across our portfolio to provide a healthy and safe environment in accordance with the policiesand applicable legal requirements in our regions.
Rent Collections
Cash rent payments for a particular month are generally due on the first day of that month (although tenantshave varying grace periods). Our reported rent collection amounts are based on the total amount of rent billed byus, including all amounts from consolidated operations and all unconsolidated joint ventures, other than GatewayCommons, our residential properties and one hotel for which we do not handle billing.
During the fourth quarter of 2020, our rent collections as a percentage of the total amounts billed to all tenantswere 99.1%.
• Approximately 96.2% of the total amounts billed were made to office tenants. Our fourth quarter rentcollections from office tenants continued to be strong at 99.7%. Approximately 91.4% of our lease revenuein the fourth quarter of 2020 was generated by our office portfolio. Our office portfolio has long-term leasecontracts and modest rollover exposure over the next few years.
• Approximately 3.8% of the total amounts billed related to retail leases. Our fourth quarter rent collectionsfrom retail tenants were 84.6%.
Revenue
As a result of the impact of the COVID-19 pandemic on the current economic environment and on thecommercial real estate sector in particular, our fourth quarter 2020 revenues, when compared to fourth quarter2019, continued to be adversely affected due to (1) write-offs of accrued rent balances, (2) declines in revenue fromour retail tenants, parking and our single hotel, and (3) a decline in occupancy in our in-service office and retailproperties due to a slowdown in new leasing activity for vacant and expiring space.
When evaluating the collectability of a tenant’s accrued rent and accounts receivable balances, managementanalyzes the tenant’s creditworthiness, current economic trends, including the impact of COVID-19 on a tenant’sbusiness, and changes in the tenant’s payment patterns on a lease-by-lease basis. In the fourth quarter of 2020,we recorded write-offs totaling approximately $40.1 million, of which approximately $39.8 million were primarilyassociated with the write-off of accrued rent of all tenants in the co-working sector and approximately $0.3 millionwere associated with accounts receivable. These amounts represent the write-offs in our consolidated portfolio,plus our share of the write-offs from the unconsolidated joint ventures (calculated based on our ownershippercentage), minus our partners’ share of write-offs from our consolidated joint ventures (calculated based upon thepartners’ percentage ownership interests). We will recognize lease revenue from tenants in the co-working sectoron a cash basis commencing in the first quarter of 2021.
Our retail tenants were materially and adversely affected by the COVID-19 pandemic in 2020. Lease revenuefrom our retail leases was approximately $46.7 million in the fourth quarter of 2020, a $6.3 million, or 12.0%,decrease compared to $53.0 million during the fourth quarter of 2019.
60
In the fourth quarter of 2020, our parking and other revenue was approximately $15.9 million, representing asmall decrease compared to $16.3 million of parking and other revenue in the third quarter of 2020, but a decreaseof approximately $10.8 million, or 40%, compared to the fourth quarter of 2019. The year-over-year decline waslargely due to the decline in transient parking revenue as employees continue to work from home amid safetyconcerns during the pandemic.
Our hotel property, the Boston Marriott Cambridge, re-opened in October 2020 but operated at diminishedoccupancy and generated only $0.5 million in revenue in the fourth quarter of 2020. Although this was animprovement from the third quarter of 2020 when the hotel was closed, our hotel revenue in the fourth quarter of2020 decreased $11.3 million as compared to the fourth quarter of 2019. We expect hotel occupancy to remain lowuntil a sufficient number of people have been vaccinated and the demand for travel and leisure returns to historicallevels.
The overall occupancy of our in-service office and retail properties was 90.1% at December 31, 2020, adecrease of 290 basis points compared to 93.0% at December 31, 2019. The decrease was primarily due to fullyplacing in-service Dock 72, an approximately 669,000 square foot office property located in Brooklyn, New York inwhich we have a 50% ownership interest, which was only 33% leased, as of December 31, 2020, and a slowdownof leasing activity for available space.
Despite the concerns of the COVID-19 pandemic and the negative impact on economic conditions in ourmarkets, we continue to be optimistic for our industry generally and our company in particular, given low interestrates, the high quality of our properties, the supply demand characteristics of our markets and the success of ourdevelopment efforts. In addition, we anticipate our revenue from retail, parking and our hotel to improve as thepandemic subsides.
As a leading developer, owner and manager of marquee Class A office properties in the United States, ourpriorities remain focused on the following:
• ensuring tenant health, safety and satisfaction;
• leasing available space in our in-service and development properties, as well as proactively focusing onfuture lease expirations;
• completing the construction of our development properties;
• continuing and completing the redevelopment and repositioning of several key properties to increase future
revenue and asset values over the long-term;
• maintaining discipline in our underwriting of investment opportunities;
• managing our near-term debt maturities and maintaining our conservative balance sheet; and
• actively managing our operations in a sustainable and responsible manner.
The following is an overview of portfolio activity and leasing activity in the fourth quarter and full year 2020.
During the fourth quarter of 2020, we signed leases across our portfolio totaling approximately 1.2 millionsquare feet and we commenced revenue recognition on approximately 935,000 square feet of leases in secondgeneration space, including lease renewals. Of these second generation leases, approximately 869,000 squarefeet had been vacant for less than one year and, in the aggregate, they represent an increase in net rentalobligations (gross rent less operating expenses) of approximately 11% over the prior leases.
Consistent with our long-term investment strategy to invest in high-yielding development opportunities, in2020, we completed and fully placed in-service approximately 1.8 million square feet of new development, includingtwo office development properties that are each approximately 100% leased, including leases with futurecommencement dates: 17Fifty Presidents Street, an approximately 276,000 square foot property in Reston, Virginia,and 20 CityPoint, an approximately 211,000 square foot property in Waltham, Massachusetts. We also fully placedin-service Dock 72, an approximately 669,000 square foot office property located in Brooklyn, New York in which wehave a 50% ownership interest, which was 33% leased as of December 31, 2020. In addition, during 2020 we fullyplaced in-service two residential properties: Hub50House, a 440 unit residential property in Boston, Massachusettsin which we have a 50% ownership interest, and The Skylyne, a 402 unit residential property in Oakland, California.
61
As of December 31, 2020, our construction/redevelopment pipeline consisted of six properties that, whencompleted, we expect will total approximately 3.7 million net rentable square feet. Three of these development/redevelopment projects are owned by joint ventures. Our share of the estimated total cost for these projects isapproximately $2.2 billion, of which approximately $849 million remains to be invested as of December 31, 2020.Approximately 87% of the commercial space in these development projects was pre-leased as of February 22,2021.
As we continue to focus on the development and acquisition of assets to enhance our long-term growth, wealso continually review our portfolio to identify properties as potential sales candidates that either no longer fit withinour portfolio strategy or could attract premium pricing in the current market environment. For example, during 2020,we completed the sale of several properties and land parcels for aggregate net proceeds of $537.7 million (ourshare), including New Dominion Technology Park in Herndon, Virginia; approximately 455,000 square feet of CapitalGallery in Washington, DC; Annapolis Junction Building Eight and two parcels of land at Annapolis JunctionBusiness Park in Annapolis, Maryland and a land parcel in Marlborough, Massachusetts. We expect to continue tosell select assets from time to time, subject to market conditions.
A brief overview of each of our markets follows.
Boston
Our Boston central business district (“CBD”) in-service portfolio was approximately 98% leased as ofDecember 31, 2020. This includes approximately 225,000 square feet of retail leases, representing 2.3% of ourBoston CBD portfolio, that we terminated due to the nonpayment of rent, but where the tenants have yet to vacate.During the fourth quarter of 2020, we executed approximately 451,000 square feet of leases and had approximately171,000 square feet of leases commenced in the Boston region. Approximately 163,000 square feet of the leasesthat commenced had been vacant for less than one year and represent an increase in net rental obligations ofapproximately 54% over the prior leases.
Our approximately 2.0 million square foot in-service office portfolio in Cambridge was approximately 99%leased as of December 31, 2020. During the fourth quarter of 2020, we continued our development of 325 MainStreet at Kendall Center in Cambridge, Massachusetts, which is 90% pre-leased to an office tenant for a term of 15years and we expect to deliver into service in 2022.
Waltham and the area surrounding the Route 128-Mass Turnpike interchange continue to comprise a popularsubmarket of Boston for leading and emerging companies in the life sciences, biotechnology and technologysectors. In our suburban portfolio, we continued the redevelopment of 200 West Street, an approximately 273,000square feet Class A office property in Waltham, Massachusetts. The redevelopment is a conversion ofapproximately 138,000 square feet into life sciences space to meet growing demand in the life sciences sector. Inthe fourth quarter of 2020, we signed a 10-year lease with a new tenant for this life sciences space with occupancyexpected by year-end 2021. With this lease, the property, including the office space, is approximately 100% leased.During the fourth quarter of 2020, we also signed a new 75,000 square-foot, seven-year lease with a leadinghealthcare technology company at 20 CityPoint, a Class A office property that was fully placed in-service in 2020.With this lease, the office portion of the property is 100% leased. Additionally, in the third quarter of 2020, weentered into an agreement with an existing joint venture partner for the future development of a 1.2 million squarefoot site in Waltham. The agreement allows for the phased development of office and life sciences propertiesacross 41-acres and builds on our current footprint of approximately 4.3 million square feet of office and lifesciences properties in this submarket.
Los Angeles
Our Los Angeles (“LA”) in-service portfolio of approximately 2.3 million square feet is currently focused onWest LA and includes Colorado Center, a 1.1 million square foot property of which we own 50%, and Santa MonicaBusiness Park, a 21-building, approximately 1.2 million square foot property of which we own 55%. As of December31, 2020, our LA in-service properties were approximately 94% leased.
We continue to explore opportunities to increase our presence by seeking investments where our financial,operational, redevelopment and development expertise provide the opportunity, either alone or with partners, toachieve accretive returns. In the third quarter of 2020, we acquired a 50% ownership interest in Beach Cities MediaCampus, a 6.4-acre land site on the Rosecrans Corridor of the El Segundo submarket of Los Angeles. The site isfully entitled to support the future development of approximately 275,000 square feet of Class A creative office
62
space and is located in the South Bay of Los Angeles, a creative cluster where several Fortune 500 and emergingoffice tenants in the technology, entertainment and financial sectors are located.
New York
As of December 31, 2020, our New York CBD in-service portfolio was approximately 90% leased. In addition,we executed approximately 93,000 square feet of leases and approximately 264,000 square feet of leasescommenced in the fourth quarter of 2020. Of these leases, approximately 239,000 square feet had been vacant forless than one year and represent an increase in net rental obligations of approximately 12% over the prior leases.
In the fourth quarter of 2020, we fully placed in-service Dock 72, an unconsolidated joint venture developmentlocated in Brooklyn, New York in which we own a 50% interest. The property consists of approximately 669,000square feet of Class A office space and was 33% leased as of December 31, 2020. Excluding Dock 72, theremainder of the New York CBD in-service portfolio is approximately 94% leased. We recognized a $60.5 millionnon-cash impairment charge related to our investment in Dock 72 due to an increase in construction costs and anextension of the projected period to fully lease the property due to the COVID-19 pandemic, resulting in a lowercurrent fair value.
San Francisco
In the fourth quarter of 2020, governmental authorities in San Francisco extended travel quarantines, stay-at-home orders and restrictions on the types of businesses that could continue to operate, including offices, except fornon-essential workers, which impacted the pace of new leasing activity.
Our San Francisco CBD in-service properties were approximately 95% leased as of December 31, 2020.During the fourth quarter of 2020, we executed approximately 67,000 square feet of leases and we commencedapproximately 50,000 square feet of leases in the San Francisco region. Of these leases, approximately 39,000square feet had been vacant for less than one year and represent an increase in net rental obligations ofapproximately 22% over the prior leases.
Washington, DC
In the Washington, DC region, we remain focused on (1) expanding our development potential in Reston,Virginia, where demand from technology and cybersecurity tenants remains strong, (2) divesting of certain assets inWashington, DC and select suburban markets and (3) matching development sites with tenants to begindevelopment with significant pre-leasing commitments. During the fourth quarter of 2020, we executedapproximately 547,000 square feet of leases and we commenced approximately 229,000 square feet of leases inthe Washington, DC region. Of these leases, approximately 207,000 square feet had been vacant for less than oneyear.
Our Washington, DC CBD in-service properties were approximately 84% leased, as of December 31, 2020,with modest near-term exposure, and we have reduced our exposure in the Washington, DC CBD marketsignificantly over the past few years through the dispositions of assets.
Our Washington, DC suburban properties, which includes our significant presence in Reston, Virginia, wereapproximately 85% leased as of December 31, 2020. During the fourth quarter of 2020, we signed anapproximately 196,000 square foot, 20-year lease with a tenant at Reston Next, our approximately 1.1 millionsquare foot development, the new phase of Reston Town Center in Reston, Virginia. With this lease, the RestonNext development is 85% pre-leased, as of February 22, 2021, and we expect to place this property in-service in2022.
63
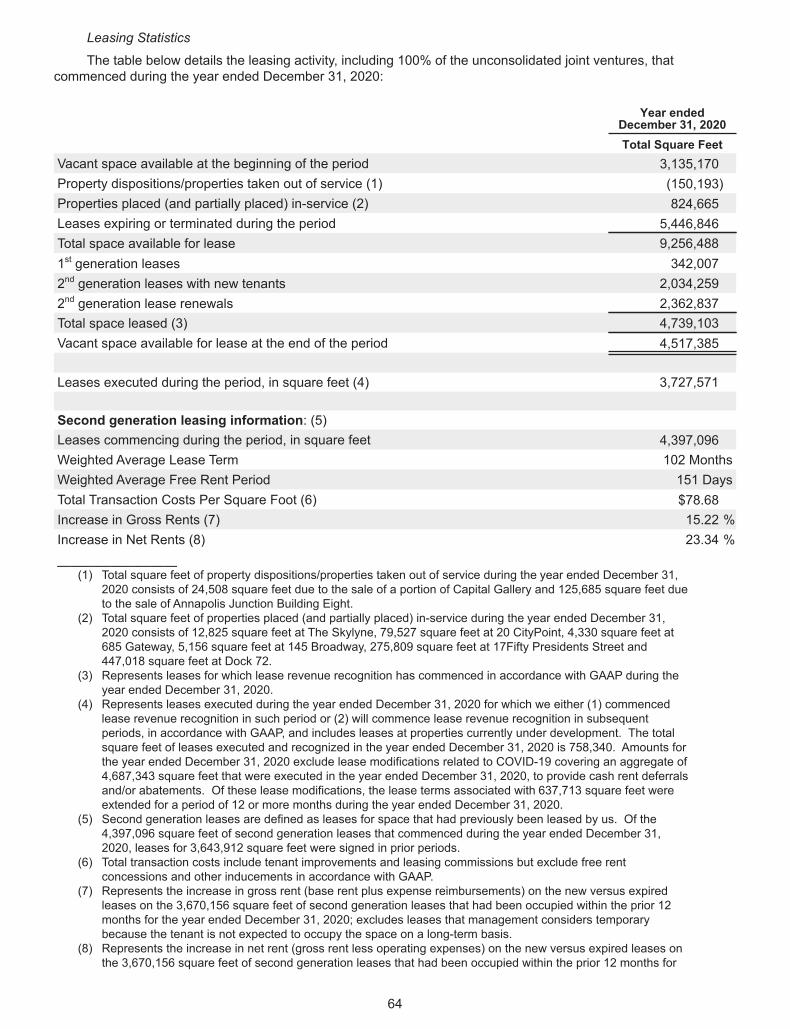
Leasing Statistics
The table below details the leasing activity, including 100% of the unconsolidated joint ventures, thatcommenced during the year ended December 31, 2020:
Year endedDecember 31, 2020Total Square Feet
Vacant space available at the beginning of the period 3,135,170Property dispositions/properties taken out of service (1) (150,193)Properties placed (and partially placed) in-service (2) 824,665Leases expiring or terminated during the period 5,446,846Total space available for lease 9,256,4881st generation leases 342,0072nd generation leases with new tenants 2,034,2592nd generation lease renewals 2,362,837Total space leased (3) 4,739,103Vacant space available for lease at the end of the period 4,517,385
Leases executed during the period, in square feet (4) 3,727,571
Second generation leasing information: (5)Leases commencing during the period, in square feet 4,397,096Weighted Average Lease Term 102 MonthsWeighted Average Free Rent Period 151 DaysTotal Transaction Costs Per Square Foot (6) $78.68Increase in Gross Rents (7) 15.22 %Increase in Net Rents (8) 23.34 %__________________
(1) Total square feet of property dispositions/properties taken out of service during the year ended December 31,2020 consists of 24,508 square feet due to the sale of a portion of Capital Gallery and 125,685 square feet dueto the sale of Annapolis Junction Building Eight.
(2) Total square feet of properties placed (and partially placed) in-service during the year ended December 31,2020 consists of 12,825 square feet at The Skylyne, 79,527 square feet at 20 CityPoint, 4,330 square feet at685 Gateway, 5,156 square feet at 145 Broadway, 275,809 square feet at 17Fifty Presidents Street and447,018 square feet at Dock 72.
(3) Represents leases for which lease revenue recognition has commenced in accordance with GAAP during theyear ended December 31, 2020.
(4) Represents leases executed during the year ended December 31, 2020 for which we either (1) commencedlease revenue recognition in such period or (2) will commence lease revenue recognition in subsequentperiods, in accordance with GAAP, and includes leases at properties currently under development. The totalsquare feet of leases executed and recognized in the year ended December 31, 2020 is 758,340. Amounts forthe year ended December 31, 2020 exclude lease modifications related to COVID-19 covering an aggregate of4,687,343 square feet that were executed in the year ended December 31, 2020, to provide cash rent deferralsand/or abatements. Of these lease modifications, the lease terms associated with 637,713 square feet wereextended for a period of 12 or more months during the year ended December 31, 2020.
(5) Second generation leases are defined as leases for space that had previously been leased by us. Of the4,397,096 square feet of second generation leases that commenced during the year ended December 31,2020, leases for 3,643,912 square feet were signed in prior periods.
(6) Total transaction costs include tenant improvements and leasing commissions but exclude free rentconcessions and other inducements in accordance with GAAP.
(7) Represents the increase in gross rent (base rent plus expense reimbursements) on the new versus expiredleases on the 3,670,156 square feet of second generation leases that had been occupied within the prior 12months for the year ended December 31, 2020; excludes leases that management considers temporarybecause the tenant is not expected to occupy the space on a long-term basis.
(8) Represents the increase in net rent (gross rent less operating expenses) on the new versus expired leases onthe 3,670,156 square feet of second generation leases that had been occupied within the prior 12 months for
64
the year ended December 31, 2020; excludes leases that management considers temporary because thetenant is not expected to occupy the space on a long-term basis.
For descriptions of significant transactions that we completed during 2020, see “Item 1. Business—Transactions During 2020.”
Critical Accounting PoliciesThe preparation of financial statements in conformity with accounting principles generally accepted in the
United States of America, or GAAP, requires management to use judgment in the application of accounting policies,including making estimates and assumptions. We base our estimates on historical experience and on various otherassumptions believed to be reasonable under the circumstances. These judgments affect the reported amounts ofassets and liabilities and disclosure of contingent assets and liabilities at the dates of the financial statements andthe reported amounts of revenue and expenses during the reporting periods. If our judgment or interpretation of thefacts and circumstances relating to various transactions had been different, it is possible that different accountingpolicies would have been applied resulting in a different presentation of our financial statements. From time to time,we evaluate our estimates and assumptions. In the event estimates or assumptions prove to be different fromactual results, adjustments are made in subsequent periods to reflect more current information. Below is adiscussion of accounting policies that we consider critical in that they may require complex judgment in theirapplication or require estimates about matters that are inherently uncertain.
Real EstateUpon acquisitions of real estate, we assess whether the transaction should be accounted for as an asset
acquisition or as a business combination by applying a screen to determine whether the integrated set of assets andactivities acquired meets the definition of a business. Acquisitions of integrated sets of assets and activities that donot meet the definition of a business are accounted for as asset acquisitions. Our acquisitions of real estate or in-substance real estate generally will not meet the definition of a business because substantially all of the fair value isconcentrated in a single identifiable asset or group of similar identifiable assets (i.e. land, buildings, and relatedintangible assets) or because the acquisition does not include a substantive process in the form of an acquiredworkforce or an acquired contract that cannot be replaced without significant cost, effort or delay.
We assess the fair value of acquired tangible and intangible assets (including land, buildings, tenantimprovements, “above-” and “below-market” leases, leasing and assumed financing origination costs, acquired in-place leases, other identified intangible assets and assumed liabilities) and allocate the purchase price to theacquired assets and assumed liabilities, including land and buildings as if vacant. We assess fair value based onestimated cash flow projections that utilize discount and/or capitalization rates that we deem appropriate, as well asavailable market information. Estimates of future cash flows are based on a number of factors including thehistorical operating results, known and anticipated trends, and market and economic conditions.
The fair value of the tangible assets of an acquired property considers the value of the property as if it werevacant. We also consider an allocation of purchase price of other acquired intangibles, including acquired in-placeleases that may have a customer relationship intangible value, including (but not limited to) the nature and extent ofthe existing relationship with the tenants, the tenants’ credit quality and expectations of lease renewals. Based onour acquisitions to date, our allocation to customer relationship intangible assets has been immaterial.
We record acquired “above-” and “below-market” leases at their fair values (using a discount rate whichreflects the risks associated with the leases acquired) equal to the difference between (1) the contractual amountsto be paid pursuant to each in-place lease and (2) management’s estimate of fair market lease rates for eachcorresponding in-place lease, measured over a period equal to the remaining term of the lease for above-marketleases and the initial term plus the term of any below-market fixed rate renewal options for below-market leases.Acquired “above-” and “below-market” lease values have been reflected within Prepaid Expenses and Other Assetsand Other Liabilities, respectively, in our Consolidated Balance Sheets. Other intangible assets acquired includeamounts for in-place lease values that are based on our evaluation of the specific characteristics of each tenant’slease. Factors to be considered include estimates of carrying costs during hypothetical expected lease-up periodsconsidering current market conditions, and costs to execute similar leases. In estimating carrying costs, we includereal estate taxes, insurance and other operating expenses and estimates of lost rentals at market rates during theexpected lease-up periods, depending on local market conditions. In estimating costs to execute similar leases, weconsider leasing commissions, legal and other related expenses.
65
Management reviews its long-lived assets for indicators of impairment following the end of each quarter andwhen events or changes in circumstances indicate that the carrying amount of the asset may not be recoverable.This evaluation of long-lived assets is dependent on a number of factors, including when there is an event oradverse change in the operating performance of the long-lived asset or a current expectation that, more likely thannot, a long-lived asset will be sold or otherwise disposed of significantly before the end of its previously estimateduseful life or hold period. An impairment loss is recognized if the carrying amount of an asset is not recoverable andexceeds its fair value. The evaluation of anticipated cash flows is subjective and is based in part on assumptionsregarding anticipated hold periods, future occupancy, future rental rates, future capital requirements, discount ratesand capitalization rates that could differ materially from actual results in future periods. Because cash flows onproperties considered to be “long-lived assets to be held and used” are considered on an undiscounted basis todetermine whether an asset may be impaired, our established strategy of holding properties over the long termdirectly decreases the likelihood of recording an impairment loss. If our hold strategy changes or market conditionsotherwise dictate an earlier sale date, an impairment loss may be recognized and such loss could be material. If wedetermine that an impairment has occurred, the affected assets must be reduced to their fair value.
Guidance in Accounting Standards Codification (“ASC”) 360 “Property Plant and Equipment” requires thatqualifying assets and liabilities and the results of operations that have been sold, or otherwise qualify as “held forsale,” be presented as discontinued operations in all periods presented if the property operations are expected to beeliminated and we will not have significant continuing involvement following the sale. Discontinued operationspresentation applies only to disposals representing a strategic shift that has (or will have) a major effect on anentity’s operations and financial results (e.g., a disposal of a major geographical area, a major line of business, amajor equity method investment or other major parts of an entity). The components of the property’s net incomethat are reflected as discontinued operations include the net gain (or loss) upon the disposition of the property heldfor sale, operating results, depreciation and interest expense (if the property is subject to a secured loan). Wegenerally consider assets to be “held for sale” when the transaction has been approved by BXP’s Board ofDirectors, or a committee thereof, and there are no known significant contingencies relating to the sale, such that asale of the property within one year is considered probable. Following the classification of a property as “held forsale,” no further depreciation is recorded on the assets, and the asset is written down to the lower of carrying valueor fair market value, less cost to sell.
Real estate is stated at depreciated cost. A variety of costs are incurred in the acquisition, development andleasing of properties. The cost of buildings and improvements includes the purchase price of property, legal feesand other acquisition costs. We capitalize acquisition costs that we incur to effect an asset acquisition and expenseacquisition costs that we incur to effect a business combination, including legal, due diligence and other closingrelated costs. Costs directly related to the development of properties are capitalized. Capitalized developmentcosts include interest, internal wages, property taxes, insurance, and other project costs incurred during the periodof development. After the determination is made to capitalize a cost, it is allocated to the specific component of theproject that benefited from the investment. Determination of when a development project commences andcapitalization begins, and when a development project is substantially complete and held available for occupancyand capitalization must cease, involves a degree of judgment. Our capitalization policy on development propertiesfollows the guidance in ASC 835-20 “Capitalization of Interest” and ASC 970 “Real Estate-General.” The costs ofland and buildings under development include specifically identifiable costs.
Capitalized costs include pre-construction costs necessary to the development of the property, developmentcosts, construction costs, interest costs, real estate taxes, salaries and related costs and other costs incurred duringthe period of development. We begin the capitalization of costs during the pre-construction period, which we defineas activities that are necessary for the development of the property. We consider a construction project assubstantially complete and held available for occupancy upon the completion of tenant improvements, but no laterthan one year from cessation of major construction activity. We cease capitalization on the portion (1) substantiallycompleted, (2) occupied or held available for occupancy, and capitalize only those costs associated with the portionunder construction or (3) if activities necessary for the development of the property have been suspended.
Investments in Unconsolidated Joint VenturesWe consolidate variable interest entities (“VIEs”) in which we are considered to be the primary beneficiary.
VIEs are entities in which the equity investors do not have sufficient equity at risk to finance their endeavors withoutadditional financial support or that the holders of the equity investment at risk do not have substantive participatingrights. The primary beneficiary is defined by the entity having both of the following characteristics: (1) the power todirect the activities that, when taken together, most significantly impact the variable interest entity’s performance,and (2) the obligation to absorb losses and the right to receive the returns from the variable interest entity that could
66
potentially be significant to the VIE. For ventures that are not VIEs, we consolidate entities for which we havesignificant decision making control over the ventures’ operations. Our judgment with respect to our level ofinfluence or control of an entity involves the consideration of various factors including the form of our ownershipinterest, our representation in the entity’s governance, the size of our investment (including loans), estimates offuture cash flows, our ability to participate in policy making decisions and the rights of the other investors toparticipate in the decision making process and to replace us as manager and/or liquidate the venture, if applicable.Our assessment of our influence or control over an entity affects the presentation of these investments in ourconsolidated financial statements. In addition to evaluating control rights, we consolidate entities in which theoutside partner has no substantive kick-out rights to remove us as the managing member.
Accounts of the consolidated entity are included in our accounts and the noncontrolling interest is reflected onthe Consolidated Balance Sheets as a component of equity or in temporary equity between liabilities and equity.Investments in unconsolidated joint ventures are recorded initially at cost, and subsequently adjusted for equity inearnings and cash contributions and distributions. Any difference between the carrying amount of theseinvestments on the balance sheet and the underlying equity in net assets is amortized as an adjustment to equity inearnings of unconsolidated joint ventures over the life of the related asset. Under the equity method of accounting,our net equity investment is reflected within the Consolidated Balance Sheets, and our share of net income or lossfrom the joint ventures is included within the Consolidated Statements of Operations. The joint venture agreementsmay designate different percentage allocations among investors for profits and losses; however, our recognition ofjoint venture income or loss generally follows the joint venture’s distribution priorities, which may change upon theachievement of certain investment return thresholds. We may account for cash distributions in excess of ourinvestment in an unconsolidated joint venture as income when we are not the general partner in a limitedpartnership and when we have neither the requirement nor the intent to provide financial support to the jointventure. We classify distributions received from equity method investees within our Consolidated Statements ofCash Flows using the nature of the distribution approach, which classifies the distributions received on the basis ofthe nature of the activity or activities of the investee that generated the distribution as either a return on investment(classified as cash inflows from operating activities) or a return of investment (classified as cash inflows frominvesting activities). Our investments in unconsolidated joint ventures are reviewed for indicators of impairment ona quarterly basis and we record impairment charges when events or circumstances change indicating that a declinein the fair values below the carrying amounts has occurred and such decline is other-than-temporary. Thisevaluation of the investments in unconsolidated joint ventures is dependent on a number of factors, including theperformance of each investment and market conditions. We will record an impairment charge if we determine that adecline in the fair value below the carrying amount of an investment in an unconsolidated joint venture is other-than-temporary. The fair value is calculated using discounted cash flows which is subjective and considers assumptionsregarding future occupancy, future rental rates, future capital requirements, discount rates and capitalization ratesthat could differ materially from actual results in future periods.
To the extent that we contribute assets to a joint venture, our investment in the joint venture is recorded at ourcost basis in the assets that were contributed to the joint venture. To the extent that our cost basis is different thanthe basis reflected at the joint venture level, the basis difference is amortized over the life of the related asset andincluded in our share of equity in net income of the joint venture. In accordance with the provisions of ASC 610-20“Gains and Losses from the Derecognition of Nonfinancial Assets” (“ASC 610-20”), we will recognize a full gain onboth the retained and sold portions of real estate contributed or sold to a joint venture by recognizing our new equitymethod investment interest at fair value.
The combined summarized financial information of the unconsolidated joint ventures is disclosed in Note 6 tothe Consolidated Financial Statements.
Revenue RecognitionIn general, we commence lease/rental revenue recognition when the tenant takes possession of the leased
space and the leased space is substantially ready for its intended use. Contractual lease/rental revenue is reportedon a straight-line basis over the terms of the respective leases. We recognize acquired in-place “above-” and“below-market” leases at their fair values as lease/rental revenue over the original term of the respective leases.Accrued rental income as reported on the Consolidated Balance Sheets represents cumulative lease/rental incomeearned in excess of rent payments received pursuant to the terms of the individual lease agreements.
For the year ended December 31, 2020, the impact of the net adjustments of rents from “above-” and “below-market” leases increased lease revenue by approximately $6.5 million. For the year ended December 31, 2020, theimpact of the straight-line rent adjustment increased lease revenue by approximately $104.9 million. Those
67
amounts exclude the adjustment of rents from “above-” and “below-market” leases and straight-line income fromunconsolidated joint ventures, which are disclosed in Note 6 to the Consolidated Financial Statements.
Our leasing strategy is generally to secure creditworthy tenants that meet our underwriting guidelines.Furthermore, following the initiation of a lease, we continue to actively monitor the tenant’s creditworthiness toensure that all tenant related assets are recorded at their realizable value. When assessing tenant credit quality,we:
• review relevant financial information, including:• financial ratios;• net worth;• revenue;• cash flows;• leverage; and• liquidity;
• evaluate the depth and experience of the tenant’s management team; and• assess the strength/growth of the tenant’s industry.
As a result of the underwriting process, tenants are then categorized into one of three categories:(1) acceptable-risk tenants;(2) the tenant’s credit is such that we may require collateral, in which case we:
• may require a security deposit; and/or• may reduce upfront tenant improvement investments; or
(3) the tenant’s credit is below our acceptable parameters.
We must make estimates as to the collectability of our accrued rent and accounts receivable related to leaserevenue. Management analyzes accrued rent and accounts receivable by considering tenant creditworthiness,current economic trends, including the impact of the novel coronavirus (“COVID-19”) pandemic on tenants’businesses, and changes in tenants’ payment patterns when evaluating the collectability of the tenant’s receivablebalance, including the accrued rent receivable, on a lease-by-lease basis. We write-off the tenant’s receivablebalance, including the accrued rent receivable, if we consider the balances no longer probable of collection. Inaddition, tenants in bankruptcy are analyzed and considerations are made in connection with the expected recoveryof pre-petition and post-petition claims If the balances are considered no longer probable of collection andtherefore written off, we will cease to recognize lease income, including straight-line rent, unless cash is received. Ifwe subsequently determine that we are probable we will collect substantially all the remaining lessee’s leasepayments under the lease term, we will then reinstate the straight-line balance, adjusting for the amount related tothe period when the lease payments were considered not probable. If our estimate of collectability differ from thecash received, then the timing and amount of our reported revenue could be impacted. The credit risk is mitigatedby the high quality of our existing tenant base, reviews of prospective tenants’ risk profiles prior to lease executionand consistent monitoring of our portfolio to identify potential problem tenants.
The weighted-average term of our in-place leases, excluding residential units, was approximately 7.4 years,as of December 31, 2020, including leases signed by our unconsolidated joint ventures. The credit risk is mitigatedby the high quality of our existing tenant base, reviews of prospective tenants’ risk profiles prior to lease executionand consistent monitoring of our portfolio to identify potential problem tenants.
Recoveries from tenants, consisting of amounts due from tenants for common area maintenance, real estatetaxes and other recoverable costs, are recognized as revenue in the period during which the expenses are incurred(See “Leases” ). We recognize these reimbursements on a gross basis, as we obtain control of the goods andservices before they are transferred to the tenant. We also receive reimbursements of payroll and payroll relatedcosts from unconsolidated joint venture entities and third party property owners in connection with managementservices contracts which we reflect on a gross basis instead of on a net basis as we have determined that we arethe principal and not the agent under these arrangements in accordance with the guidance in ASC 606 “Revenuefrom Contracts with Customers” (“ASC 606”).
68
Our parking revenue is derived primarily from monthly and transient daily parking. In addition, we have certainlease arrangements for parking accounted for under the guidance in ASC 842 “Leases” (“ASC 842”). The monthlyand transient daily parking revenue falls within the scope of ASC 606 and is accounted for at the point in time whencontrol of the goods or services transfers to the customer and our performance obligation is satisfied.
Our hotel revenue is derived from room rentals and other sources such as charges to guests for telephoneservice, movie and vending commissions, meeting and banquet room revenue and laundry services. Hotel revenueis recognized as the hotel rooms are occupied and the services are rendered to the hotel customers.
We earn management and development fees. Development and management services revenue is earnedfrom unconsolidated joint venture entities and third-party property owners. We determined that the performanceobligations associated with our development services contracts are satisfied over time and that we would recognizeour development services revenue under the output method evenly over time from the developmentcommencement date through the substantial completion date of the development management services project dueto the stand-ready nature of the contracts. Significant judgments impacting the amount and timing of revenuerecognized from our development services contracts include estimates of total development project costs fromwhich the fees are typically derived and estimates of the period of time until substantial completion of thedevelopment project, the period of time over which the development services are required to be performed. Werecognize development fees earned from unconsolidated joint venture projects equal to its cost plus profit to theextent of the third party partners’ ownership interest. Property management fees are recorded and earned based ona percentage of collected rents at the properties under management, and not on a straight-line basis, because suchfees are contingent upon the collection of rents.
Gains on sales of real estate are recognized pursuant to the provisions included in ASC 610-20. Under ASC610-20, we must first determine whether the transaction is a sale to a customer or non-customer. We typically sellreal estate on a selective basis and not within the ordinary course of our business and therefore expects that oursale transactions will not be contracts with customers. We next determine whether we have a controlling financialinterest in the property after the sale, consistent with the consolidation model in ASC 810 “Consolidation” (“ASC810”). If we determine that we do not have a controlling financial interest in the real estate, we evaluate whether acontract exists under ASC 606 and whether the buyer has obtained control of the asset that was sold. Werecognize a full gain on sale of real estate when the derecognition criteria under ASC 610-20 have been met.
Leases
Lessee
For leases in which we are the lessee (generally ground leases), in accordance with ASC 842 we recognize aright-of-use asset and a lease liability. We made the policy election to not apply the revenue recognitionrequirements of ASC 842 to short-term leases. This policy election is made by class of underlying assets and asdescribed below, we consider real estate to be a class of underlying assets, and will not be further delineating it intospecific uses of the real estate asset as the risk profiles are similar in nature. We will recognize the lease paymentsin net income on a straight-line basis over the lease term.
The lease liability is equal to the present value of the minimum lease payments in accordance with ASC 842.We will use our incremental borrowing rate (“IBR”) to determine the net present value of the minimum leasepayments. In order to determine the IBR, we utilized a market-based approach to estimate the incrementalborrowing rate for each individual lease. The approach required significant judgment. Therefore, we utilizeddifferent data sets to estimate base IBRs via an analysis of the following weighted-components:
• the interpolated rates from yields on outstanding U.S. Treasury issuances for up to 30 years and for years31 and beyond, longer-term publicly traded educational institution debt issued by high credit qualityeducational institutions with maturity dates exceeding 31 years,
• observable mortgage rates spread over U.S. Treasury issuances, and
• unlevered property yields and discount rates.
We then applied adjustments to account for considerations related to term and interpolated the IBR.
69
Lessor
We lease primarily Class A office, life sciences, retail and residential space to tenants. These leases maycontain extension and termination options that are predominately at the sole discretion of the tenant, providedcertain conditions are satisfied. In a few instances, the leases also contain purchase options, which would beexercisable at fair market value. Also, certain of our leases include rental payments that are based on a percentageof the tenant sales in excess of contractual amounts.
Per ASC 842, lessors do not need to separate nonlease components from the associated lease component ifcertain criteria stated above are met for each class of underlying assets. The guidance in ASC 842 defines“underlying asset” as “an asset that is the subject of a lease for which a right to use that asset has been conveyedto a lessee. The underlying asset could be a physically distinct portion of a single asset.” Based on the aboveguidance, we consider real estate assets as a class of underlying assets and will not be further delineating it intospecific uses of the real estate asset as the risk profiles are similar in nature.
Lease components are elements of an arrangement that provide the customer with the right to use anidentified asset. Nonlease components are distinct elements of a contract that are not related to securing the use ofthe leased asset and revenue is recognized in accordance with ASC 606. We consider common area maintenance(CAM) and service income associated with tenant work orders to be nonlease components because they representdelivery of a separate service but are not considered a cost of securing the identified asset. In the case of ourbusiness, the identified asset would be the leased real estate (office, life sciences, retail or residential).
We assessed and concluded that the timing and pattern of transfer for nonlease components and theassociated lease component are the same. We determined that the predominant component was the leasecomponent and as such our leases will continue to qualify as operating leases and we have made a policy electionto account for and present the lease component and the nonlease component as a single component in the revenuesection of the Consolidated Statements of Operations labeled Lease. Prior to the January 1, 2019 adoption of ASC842, nonlease components had been included within Recoveries from Tenants Revenue, Parking and OtherRevenue and Development and Management Services Revenue on our Consolidated Statements of Operations.
Recoveries from tenants, consisting of amounts due from tenants for common area maintenance, real estatetaxes and other recoverable costs, are recognized as revenue in the period during which the expenses are incurred.
In addition, in accordance with ASC 842, lessors will only capitalize incremental direct leasing costs. As aresult, upon adoption of ASC 842 on January 1, 2019, we no longer capitalizes non-incremental legal costs andinternal leasing wages. These costs are expensed as incurred. The expensing of these items is included withinGeneral and Administrative Expense on the Consolidated Statements of Operations.
Depreciation and AmortizationWe compute depreciation and amortization on our properties using the straight-line method based on
estimated useful asset lives. We allocate the acquisition cost of real estate to its components and depreciate oramortize these assets (or liabilities) over their useful lives. The amortization of acquired “above-” and “below-market” leases and acquired in-place leases is recorded as an adjustment to revenue and depreciation andamortization, respectively, in the Consolidated Statements of Operations.
Fair Value of Financial InstrumentsThe carrying values of cash and cash equivalents, marketable securities, escrows, receivables, accounts
payable, accrued expenses and other assets and liabilities are reasonable estimates of their fair values because ofthe short maturities of these instruments.
We follow the authoritative guidance for fair value measurements when valuing our financial instruments fordisclosure purposes The table below presents the financial instruments that are being valued for disclosurepurposes as well as the Level at which they are categorized as defined in ASC 820 “Fair Value Measurements andDisclosures”.
70
Financial Instrument LevelUnsecured senior notes (1) Level 1Related party note receivable Level 3Notes receivable Level 3Mortgage notes payable Level 3Unsecured term loan / line of credit Level 3_______________(1) If trading volume for the period is low, the valuation could be categorized as Level 2.
Because our valuations of our financial instruments are based on the above Levels and involve the use ofestimates, the actual fair values of our financial instruments may differ materially from those estimates.
Derivative Instruments and Hedging ActivitiesDerivative instruments and hedging activities require management to make judgments on the nature of its
derivatives and their effectiveness as hedges. These judgments determine if the changes in fair value of thederivative instruments are reported in the Consolidated Statements of Operations as a component of net income oras a component of comprehensive income and as a component of equity on the Consolidated Balance Sheets.While management believes its judgments are reasonable, a change in a derivative’s effectiveness as a hedgecould materially affect expenses, net income and equity. We account for both the effective and ineffective portionsof changes in the fair value of a derivative in other comprehensive income (loss) and subsequently reclassify the fairvalue of the derivative to earnings over the term that the hedged transaction affects earnings and in the same lineitem as the hedged transaction within the statements of operations
Income Taxes
Boston Properties Inc.BXP has elected to be treated as a REIT under Sections 856 through 860 of the Internal Revenue Code of
1986, as amended (the “Code”), commencing with its taxable year ended December 31, 1997. As a result, itgenerally will not be subject to federal corporate income tax on its taxable income that is distributed to itsstockholders. A REIT is subject to a number of organizational and operational requirements, including arequirement that it currently distribute at least 90% of its annual taxable income (with certain adjustments). BXP’spolicy is to distribute at least 100% of its taxable income. Accordingly, the only provision for federal income taxes inthe accompanying consolidated financial statements relates to BXP’s consolidated taxable REIT subsidiaries. BXP’staxable REIT subsidiaries did not have significant tax provisions or deferred income tax items. BXP had nouncertain tax positions recognized as of December 31, 2020 and 2019. At December 31, 2020, BXP’s tax returnsfor the years 2017 forward remain subject to examination by the major tax jurisdictions under the statute oflimitations.
We own a hotel property that we lease to one of our taxable REIT subsidiaries and that is managed by MarriottInternational, Inc. The hotel taxable REIT subsidiary, a wholly owned subsidiary of BPLP, is the lessee pursuant tothe lease for the hotel property. As lessor, BPLP is entitled to a percentage of gross receipts from the hotel property.Marriott International, Inc. continues to manage the hotel property under the Marriott name and under terms of amanagement agreement. The hotel taxable REIT subsidiary is subject to tax at the federal and state level and,accordingly, BXP has recorded a tax provision in its Consolidated Statements of Operations for the years endedDecember 31, 2020, 2019 and 2018.
The net difference between the tax basis and the reported amounts of BXP’s assets and liabilities wasapproximately $2.0 billion and $1.7 billion as of December 31, 2020 and 2019, respectively, which was primarilyrelated to the difference in basis of contributed property and accrued rental income.
Certain entities included in BXP’s Consolidated Financial Statements are subject to certain state and localtaxes. These taxes are recorded as operating expenses in the accompanying consolidated financial statements.
71
The following table reconciles GAAP net income attributable to Boston Properties, Inc. to taxable income(unaudited):
For the year ended December 31,2020 2019 2018
(in thousands)Net income attributable to Boston Properties, Inc. $ 872,727 $ 521,534 $ 582,847Straight-line rent and net “above-” and “below-market” rentadjustments (90,144) (65,111) (53,080)
Book/Tax differences from depreciation and amortization 106,203 125,281 109,756Book/Tax differences from interest expense — — (18,190)Book/Tax differences on gains/(losses) from capital transactions (345,854) 51,555 (26,428)Book/Tax differences from stock-based compensation 42,576 49,123 48,817Tangible Property Regulations (144,981) (148,157) (128,639)Other book/tax differences, net 117,166 (15,221) 56,870Taxable income $ 557,693 $ 519,004 $ 571,953
Boston Properties Limited PartnershipThe partners are required to report their respective share of BPLP’s taxable income or loss on their respective
tax returns and are liable for any related taxes thereon. Accordingly, the only provision for federal income taxes inthe accompanying consolidated financial statements relates to BPLP’s consolidated taxable REIT subsidiaries.BPLP’s taxable REIT subsidiaries did not have significant tax provisions or deferred income tax items. BPLP hadno uncertain tax positions recognized as of December 31, 2020 and 2019.
We own a hotel property which is managed through a taxable REIT subsidiary. The hotel taxable REITsubsidiary, a wholly owned subsidiary BPLP, is the lessee pursuant to the lease for the hotel property. As lessor,BPLP is entitled to a percentage of gross receipts from the hotel property. Marriott International, Inc. continues tomanage the hotel property under the Marriott name and under terms of a management agreement. The hoteltaxable REIT subsidiary is subject to tax at the federal and state level and, accordingly, BPLP had recorded a taxprovision in its Consolidated Statements of Operations for the years ended December 31, 2020, 2019 and 2018.
The net difference between the tax basis and the reported amounts of BPLP’s assets and liabilities wasapproximately $2.9 billion and $2.7 billion as of December 31, 2020 and 2019, respectively, which was primarilyrelated to the difference in basis of contributed property and accrued rental income.
Certain entities included in BPLP’s consolidated financial statements are subject to certain state and localtaxes. These taxes are recorded as operating expenses in the accompanying consolidated financial statements.
The following table reconciles GAAP net income attributable to Boston Properties Limited Partnership totaxable income (unaudited):
For the year ended December 31,2020 2019 2018
(in thousands)Net income attributable to Boston Properties Limited Partnership $ 990,479 $ 590,602 $ 667,403Straight-line rent and net “above-” and “below-market” rentadjustments (100,375) (72,687) (59,199)
Book/Tax differences from depreciation and amortization 101,470 124,108 109,673Book/Tax differences from interest expense — — (20,287)Book/Tax differences on gains/(losses) from capital transactions (359,497) 56,955 5,762Book/Tax differences from stock-based compensation 47,408 54,838 54,445Tangible Property Regulations (161,435) (165,395) (143,468)Other book/tax differences, net 121,397 (20,177) 70,003Taxable income $ 639,447 $ 568,244 $ 684,332
72
Recent Accounting PronouncementsFor a discussion concerning new accounting pronouncements that may have an effect on our Consolidated
Financial Statements, see Note 2 to the Consolidated Financial Statements.
Results of Operations for the Years Ended December 31, 2020 and 2019This section of this Form 10-K generally discusses 2020 and 2019 items and year-to-year comparisons
between 2020 and 2019. Discussions of 2018 items and year-to-year comparisons between 2019 and 2018 thatare not included in this Form 10-K can be found in “Management’s Discussion and Analysis of Financial Conditionand Results of Operations” in Part II, Item 7 of our Annual Report on Form 10-K for the year ended December 31,2019, which was filed with the SEC on March 2, 2020.
The impact that COVID-19 has had on our business, financial position and results of operations during theyear ended December 31, 2020 is discussed throughout this Annual Report on Form 10-K. The full extent of theimpact of COVID-19 on our business, operations and financial results will depend on numerous evolving factors thatwe may not be able to accurately predict. In addition, we cannot predict the impact that COVID-19 will have on ourtenants, employees, contractors, lenders, suppliers, vendors and joint venture partners and any material adverseeffect on these parties could also have a material adverse effect on us. The situation surrounding COVID-19remains fluid, and we are actively managing our response in collaboration with tenants, government officials andjoint venture partners and assessing potential impacts to our financial position and operating results, as well aspotential adverse developments in our business. See Item 1A: “Risk Factors” for additional details.
Net income attributable to Boston Properties, Inc. common shareholders and net income attributable to BostonProperties Limited Partnership common unitholders increased approximately $351.2 million and $399.9 million forthe year ended December 31, 2020 compared to 2019, respectively, as set forth in the following tables and for thereasons discussed below under the heading “Comparison of the year ended December 31, 2020 to the year endedDecember 31, 2019” within “Item 7—Management’s Discussion and Analysis of Financial Condition and Results ofOperations.”
The following are reconciliations of Net Income Attributable to Boston Properties, Inc. Common Shareholdersto Net Operating Income and Net Income Attributable to Boston Properties Limited Partnership CommonUnitholders to Net Operating Income for the years ended December 31, 2020 and 2019 (in thousands):
73
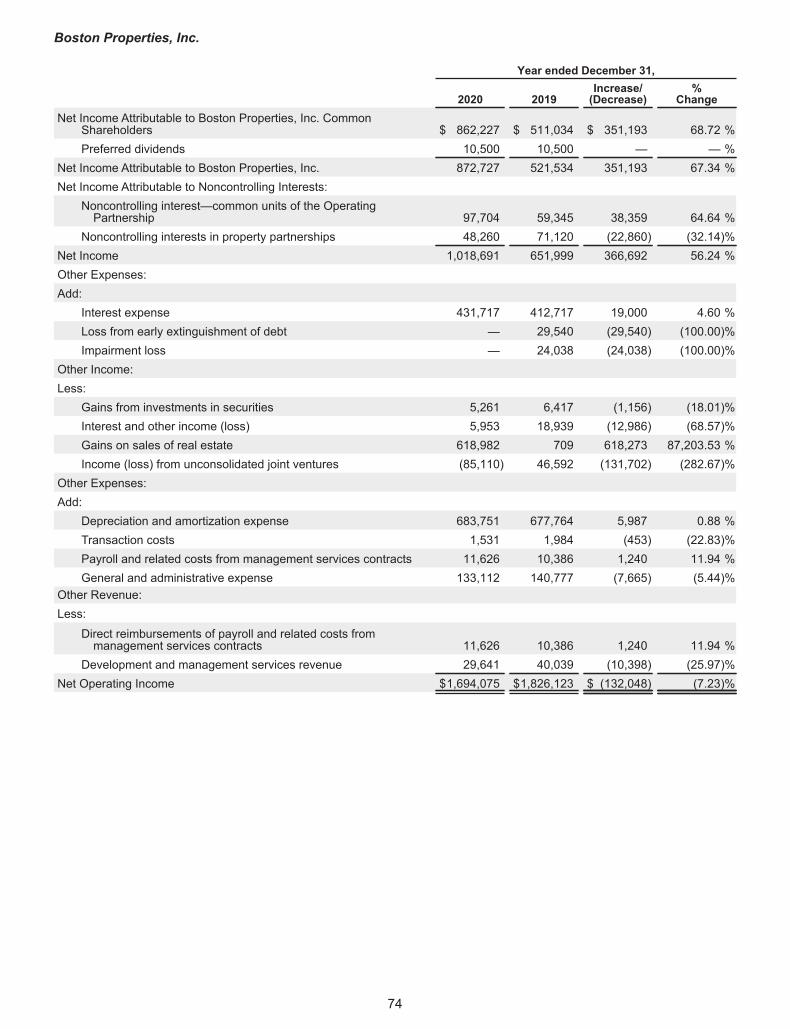
Boston Properties, Inc.
Year ended December 31,
2020 2019Increase/(Decrease)
%Change
Net Income Attributable to Boston Properties, Inc. CommonShareholders $ 862,227 $ 511,034 $ 351,193 68.72 %Preferred dividends 10,500 10,500 — — %
Net Income Attributable to Boston Properties, Inc. 872,727 521,534 351,193 67.34 %Net Income Attributable to Noncontrolling Interests:
Noncontrolling interest—common units of the OperatingPartnership 97,704 59,345 38,359 64.64 %
Noncontrolling interests in property partnerships 48,260 71,120 (22,860) (32.14)%Net Income 1,018,691 651,999 366,692 56.24 %Other Expenses:Add:
Interest expense 431,717 412,717 19,000 4.60 %Loss from early extinguishment of debt — 29,540 (29,540) (100.00)%Impairment loss — 24,038 (24,038) (100.00)%
Other Income:Less:
Gains from investments in securities 5,261 6,417 (1,156) (18.01)%Interest and other income (loss) 5,953 18,939 (12,986) (68.57)%Gains on sales of real estate 618,982 709 618,273 87,203.53 %Income (loss) from unconsolidated joint ventures (85,110) 46,592 (131,702) (282.67)%
Other Expenses:Add:
Depreciation and amortization expense 683,751 677,764 5,987 0.88 %Transaction costs 1,531 1,984 (453) (22.83)%Payroll and related costs from management services contracts 11,626 10,386 1,240 11.94 %General and administrative expense 133,112 140,777 (7,665) (5.44)%
Other Revenue:Less:
Direct reimbursements of payroll and related costs frommanagement services contracts 11,626 10,386 1,240 11.94 %
Development and management services revenue 29,641 40,039 (10,398) (25.97)%Net Operating Income $1,694,075 $1,826,123 $ (132,048) (7.23)%
74
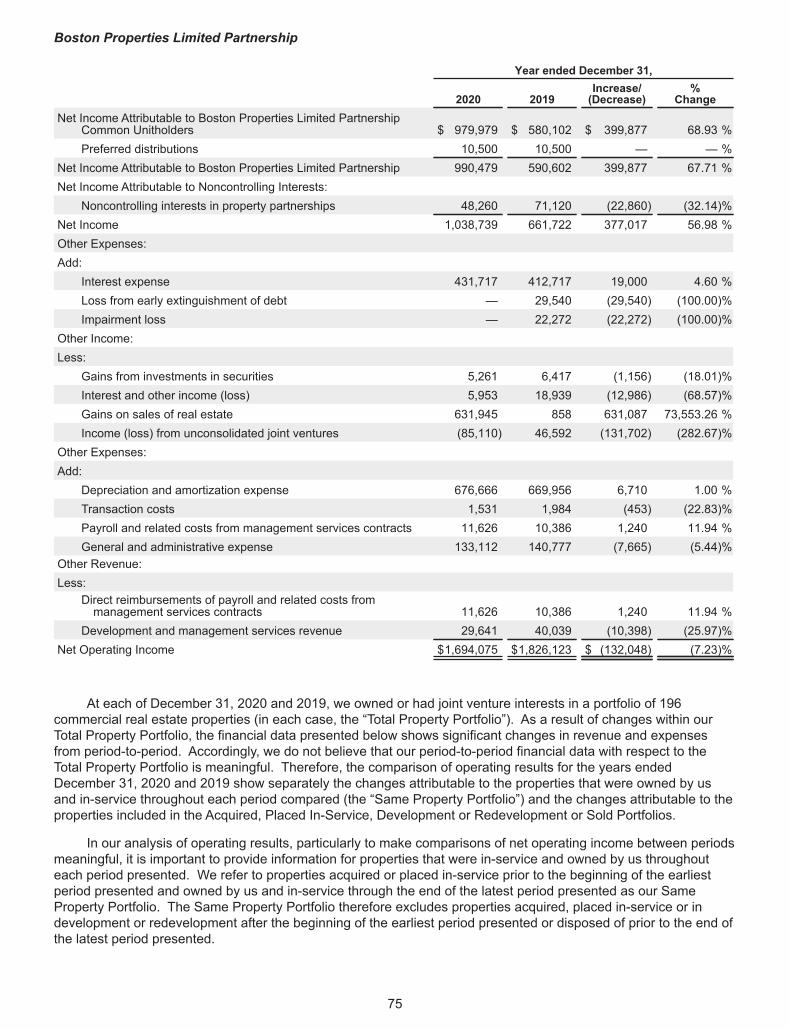
Boston Properties Limited Partnership
Year ended December 31,
2020 2019Increase/(Decrease)
%Change
Net Income Attributable to Boston Properties Limited PartnershipCommon Unitholders $ 979,979 $ 580,102 $ 399,877 68.93 %Preferred distributions 10,500 10,500 — — %
Net Income Attributable to Boston Properties Limited Partnership 990,479 590,602 399,877 67.71 %Net Income Attributable to Noncontrolling Interests:
Noncontrolling interests in property partnerships 48,260 71,120 (22,860) (32.14)%Net Income 1,038,739 661,722 377,017 56.98 %Other Expenses:Add:
Interest expense 431,717 412,717 19,000 4.60 %Loss from early extinguishment of debt — 29,540 (29,540) (100.00)%Impairment loss — 22,272 (22,272) (100.00)%
Other Income:Less:
Gains from investments in securities 5,261 6,417 (1,156) (18.01)%Interest and other income (loss) 5,953 18,939 (12,986) (68.57)%Gains on sales of real estate 631,945 858 631,087 73,553.26 %Income (loss) from unconsolidated joint ventures (85,110) 46,592 (131,702) (282.67)%
Other Expenses:Add:
Depreciation and amortization expense 676,666 669,956 6,710 1.00 %Transaction costs 1,531 1,984 (453) (22.83)%Payroll and related costs from management services contracts 11,626 10,386 1,240 11.94 %General and administrative expense 133,112 140,777 (7,665) (5.44)%
Other Revenue:Less:
Direct reimbursements of payroll and related costs frommanagement services contracts 11,626 10,386 1,240 11.94 %
Development and management services revenue 29,641 40,039 (10,398) (25.97)%Net Operating Income $1,694,075 $1,826,123 $ (132,048) (7.23)%
At each of December 31, 2020 and 2019, we owned or had joint venture interests in a portfolio of 196commercial real estate properties (in each case, the “Total Property Portfolio”). As a result of changes within ourTotal Property Portfolio, the financial data presented below shows significant changes in revenue and expensesfrom period-to-period. Accordingly, we do not believe that our period-to-period financial data with respect to theTotal Property Portfolio is meaningful. Therefore, the comparison of operating results for the years endedDecember 31, 2020 and 2019 show separately the changes attributable to the properties that were owned by usand in-service throughout each period compared (the “Same Property Portfolio”) and the changes attributable to theproperties included in the Acquired, Placed In-Service, Development or Redevelopment or Sold Portfolios.
In our analysis of operating results, particularly to make comparisons of net operating income between periodsmeaningful, it is important to provide information for properties that were in-service and owned by us throughouteach period presented. We refer to properties acquired or placed in-service prior to the beginning of the earliestperiod presented and owned by us and in-service through the end of the latest period presented as our SameProperty Portfolio. The Same Property Portfolio therefore excludes properties acquired, placed in-service or indevelopment or redevelopment after the beginning of the earliest period presented or disposed of prior to the end ofthe latest period presented.
75
Net operating income (“NOI”) is a non-GAAP financial measure equal to net income attributable to BostonProperties, Inc. common shareholders and net income attributable to Boston Properties Limited Partnershipcommon unitholders, as applicable, the most directly comparable GAAP financial measures, plus (1) preferreddividends/distributions, net income attributable to noncontrolling interests, interest expense, loss from earlyextinguishment of debt, impairment loss, depreciation and amortization expense, transaction costs, payroll andrelated costs from management services contracts and corporate general and administrative expense less (2) gainsfrom investments in securities, interest and other income (loss), gains on sales of real estate, income (loss) fromunconsolidated joint ventures, direct reimbursements of payroll and related costs from management servicescontracts and development and management services revenue. We use NOI internally as a performance measureand believe it provides useful information to investors regarding our results of operations and financial conditionbecause, when compared across periods, it reflects the impact on operations from trends in occupancy rates, rentalrates, operating costs and acquisition and development activity on an unleveraged basis, providing perspective notimmediately apparent from net income attributable to Boston Properties, Inc. common shareholders and net incomeattributable to Boston Properties Limited Partnership common unitholders. For example, interest expense is notnecessarily linked to the operating performance of a real estate asset and is often incurred at the corporate level asopposed to the property level. Similarly, interest expense may be incurred at the property level even though thefinancing proceeds may be used at the corporate level (e.g., used for other investment activity). In addition,depreciation and amortization expense, because of historical cost accounting and useful life estimates, may distortoperating performance measures at the property level. NOI presented by us may not be comparable to NOIreported by other REITs or real estate companies that define NOI differently.
We believe that, in order to facilitate a clear understanding of our operating results, NOI should be examinedin conjunction with net income attributable to Boston Properties, Inc. common shareholders and net incomeattributable to Boston Properties Limited Partnership common unitholders as presented in our ConsolidatedFinancial Statements. NOI should not be considered as a substitute for net income attributable to BostonProperties, Inc. common shareholders or net income attributable to Boston Properties Limited Partnership commonunitholders (determined in accordance with GAAP) or any other GAAP financial measures and should only beconsidered together with and as a supplement to our financial information prepared in accordance with GAAP.
The gains on sales of real estate, depreciation expense and impairment losses may differ between BXP andBPLP as a result of previously applied acquisition accounting by BXP for the issuance of common stock inconnection with non-sponsor OP Unit redemptions by BPLP. This accounting resulted in a step-up of the real estateassets at BXP that was allocated to certain properties. The difference between the real estate assets of BXP ascompared to BPLP for certain properties having an allocation of the real estate step-up will result in a correspondingdifference in gains on sales of real estate, depreciation expense and impairment losses, when those properties aresold. For additional information see the Explanatory Note that follows the cover page of this Annual Report on Form10-K.
Comparison of the year ended December 31, 2020 to the year ended December 31, 2019The table below shows selected operating information for the Same Property Portfolio and the Total Property
Portfolio. The Same Property Portfolio consists of 139 properties totaling approximately 38.6 million net rentablesquare feet, excluding unconsolidated joint ventures. The Same Property Portfolio includes properties acquired orplaced in-service on or prior to January 1, 2019 and owned and in service through December 31, 2020. The TotalProperty Portfolio includes the effects of the other properties either acquired, placed in-service, in development orredevelopment after January 1, 2019 or disposed of on or prior to December 31, 2020. This table includes areconciliation from the Same Property Portfolio to the Total Property Portfolio by also providing information for theyears ended December 31, 2020 and 2019 with respect to the properties that were acquired, placed in-service, indevelopment or redevelopment or sold.
76
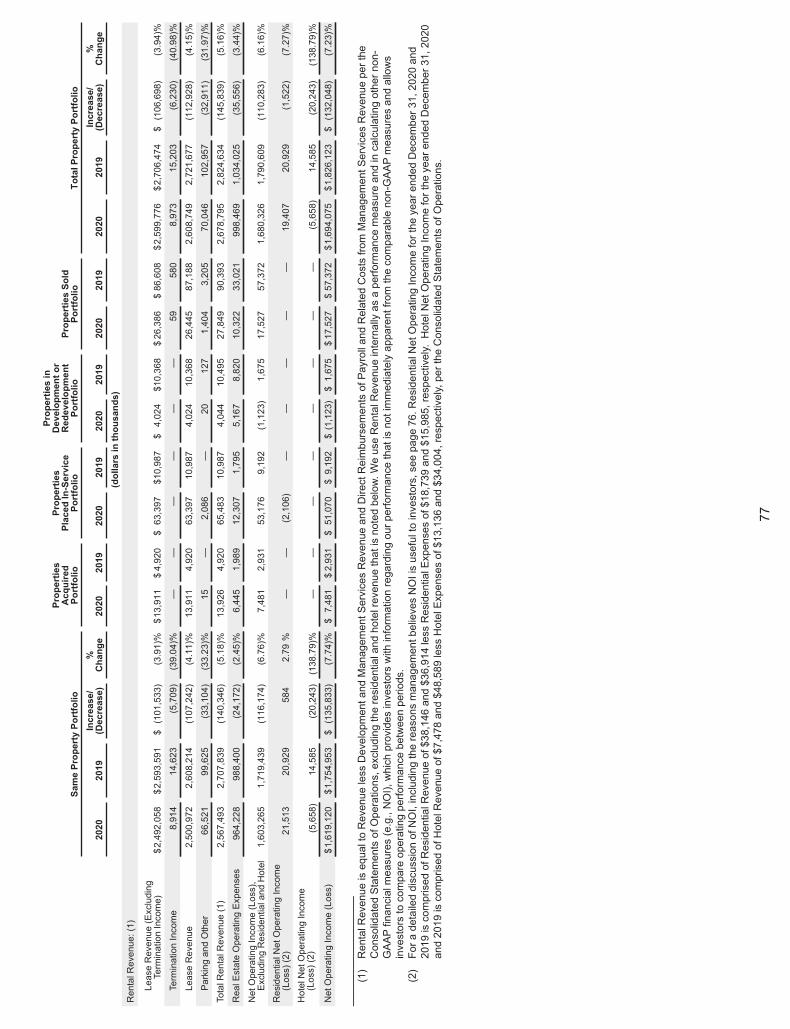
SamePropertyPortfolio
Properties
Acquired
Portfolio
Properties
PlacedIn-Service
Portfolio
Propertiesin
Developmentor
Redevelopment
Portfolio
PropertiesSold
Portfolio
TotalPropertyPortfolio
2020
2019
Increase/
(Decrease)
%Change
2020
2019
2020
2019
2020
2019
2020
2019
2020
2019
Increase/
(Decrease)
%Change
(dollarsinthousands)
RentalRevenue:(1)
LeaseRevenue(Excluding
TerminationIncome)
$2,492,058
$2,593,591
$(101,533)
(3.91)%
$13,911
$4,920
$63,397
$10,987
$4,024
$10,368
$26,386
$86,608
$2,599,776
$2,706,474
$(106,698)
(3.94)%
TerminationIncome
8,914
14,623
(5,709)
(39.04)%
——
——
——
59580
8,973
15,203
(6,230)
(40.98)%
LeaseRevenue
2,500,972
2,608,214
(107,242)
(4.11)%
13,911
4,920
63,397
10,987
4,024
10,368
26,445
87,188
2,608,749
2,721,677
(112,928)
(4.15)%
ParkingandOther
66,521
99,625
(33,104)
(33.23)%
15—
2,086
—20
127
1,404
3,205
70,046
102,957
(32,911)
(31.97)%
TotalRentalRevenue(1)
2,567,493
2,707,839
(140,346)
(5.18)%
13,926
4,920
65,483
10,987
4,044
10,495
27,849
90,393
2,678,795
2,824,634
(145,839)
(5.16)%
RealEstateOperatingExpenses
964,228
988,400
(24,172)
(2.45)%
6,445
1,989
12,307
1,795
5,167
8,820
10,322
33,021
998,469
1,034,025
(35,556)
(3.44)%
NetOperatingIncome(Loss),
ExcludingResidentialandHotel
1,603,265
1,719,439
(116,174)
(6.76)%
7,481
2,931
53,176
9,192
(1,123)
1,675
17,527
57,372
1,680,326
1,790,609
(110,283)
(6.16)%
ResidentialNetOperatingIncome
(Loss)(2)
21,513
20,929
584
2.79%
——
(2,106)
——
——
—19,407
20,929
(1,522)
(7.27)%
HotelNetOperatingIncome
(Loss)(2)
(5,658)
14,585
(20,243)
(138.79)%
——
——
——
——
(5,658)
14,585
(20,243)
(138.79)%
NetOperatingIncome(Loss)
$1,619,120
$1,754,953
$(135,833)
(7.74)%
$7,481
$2,931
$51,070
$9,192
$(1,123)$1,675
$17,527
$57,372
$1,694,075
$1,826,123
$(132,048)
(7.23)%
_______________
(1)RentalRevenueisequaltoRevenuelessDevelopmentandManagementServicesRevenueandDirectReimbursementsofPayrollandRelatedCostsfromManagementServicesRevenueperthe
ConsolidatedStatementsofOperations,excludingtheresidentialandhotelrevenuethatisnotedbelow.WeuseRentalRevenueinternallyasaperformancemeasureandincalculatingothernon-
GAAPfinancialmeasures(e.g.,NOI),whichprovidesinvestorswithinformationregardingourperformancethatisnotimmediatelyapparentfromthecomparablenon-GAAPmeasuresandallows
investorstocompareoperatingperformancebetweenperiods.
(2)ForadetaileddiscussionofNOI,includingthereasonsmanagementbelievesNOIisusefultoinvestors,seepage76.ResidentialNetOperatingIncomefortheyearendedDecember31,2020and
2019iscomprisedofResidentialRevenueof$38,146and$36,914lessResidentialExpensesof$18,739and$15,985,respectively.HotelNetOperatingIncomefortheyearendedDecember31,2020
and2019iscomprisedofHotelRevenueof$7,478and$48,589lessHotelExpensesof$13,136and$34,004,respectively,pertheConsolidatedStatementsofOperations.
77
Same Property Portfolio
Lease Revenue (Excluding Termination Income)Lease revenue from the Same Property Portfolio decreased by approximately $101.5 million for the year
ended December 31, 2020 compared to 2019. Approximately $87.3 million of the decrease was related to write-offs, which are discussed below. In addition to the impact of the write-offs, we experienced an approximately $14.2million decrease due to our average occupancy decreasing from 93.9% to 93.2%. Average revenue per square footwas approximately the same for both years.
Under ASC 842, the write-off for bad debt, including accrued rent, is recorded as a reduction to lease revenue.As a result, during the year ended December 31, 2020, for our Same Property Portfolio, we wrote off approximately$65.4 million and $21.9 million of accrued rent and accounts receivable balances, respectively. These write-offsrelated to tenants, primarily in the retail, entertainment and co-working sectors, that either terminated their leases orfor which we determined that substantially all of their amount owed, related to accrued rent and/or accountsreceivable balances, were no longer probable of collection.
In addition, as a result of COVID-19, for the Same Property Portfolio, during 2020, we executed leasemodification agreements for approximately 3.5 million square feet and granted approximately $63.9 million of cashrent abatements and deferrals, of which approximately $50.0 million related to rental charges for 2020. Althoughsome of the lease modifications were deferrals under which we expect the tenant will pay us in full primarily in 2021,the majority of the lease modifications involved extending the lease term (in some cases for a year or more) orproviding for a period of time where the tenant will only pay percentage rent. As a result of the lease modificationagreements that extended the lease term, we expect to see an increase in the cash rent we will receive in thefuture.
In April 2020, the Financial Accounting Standards Board (“FASB”) staff issued a question and answerdocument (“Lease Modification Q & A”) related to the application of lease accounting guidance for leaseconcessions, in accordance with ASC 842, as a result of COVID-19. We did not utilize the guidance provided in theLease Modification Q & A and instead elected to continue to account for the COVID-19 lease concessions on alease-by-lease basis in accordance with the existing lease modification accounting framework (See Note 4 to theConsolidated Financial Statements). As such, our accrued rent balances, which are a component of lease revenue,include the accounting impact (adjusted for write-offs) from the rent abatements, deferrals and extensions that wereexecuted during 2020.
We expect the volume of lease modifications as a result of COVID-19 to decrease as vaccines are rolled outand the pandemic subsides. However, the degree to which our tenants’ businesses are negatively impacted byCOVID-19 may leave some tenants still unable to meet their rental payment obligations and result in a reduction inour cash flows. We may write off additional accrued rent or accounts receivable balances and this could have amaterial adverse effect on lease revenue. See Item 1A: “Risk Factors” for additional details.
Termination IncomeTermination income decreased by approximately $5.7 million for the year ended December 31, 2020
compared to 2019.
Termination income for the year ended December 31, 2020 related to 38 tenants across the Same PropertyPortfolio and totaled approximately $8.9 million, which was primarily related to tenants that terminated leases earlyin the New York region.
Termination income for the year ended December 31, 2019 related to 39 tenants across the Same PropertyPortfolio and totaled approximately $14.6 million, of which approximately $8.2 million is from two tenants thatterminated leases early at 399 Park Avenue in New York City.
Parking and Other RevenueParking and other revenue decreased by approximately $33.1 million for the year ended December 31, 2020
compared to 2019. Parking revenue decreased by approximately $34.7 million while other revenue increased byapproximately $1.6 million. The decrease in parking revenue was primarily due to a decrease in transient andmonthly parking.
78
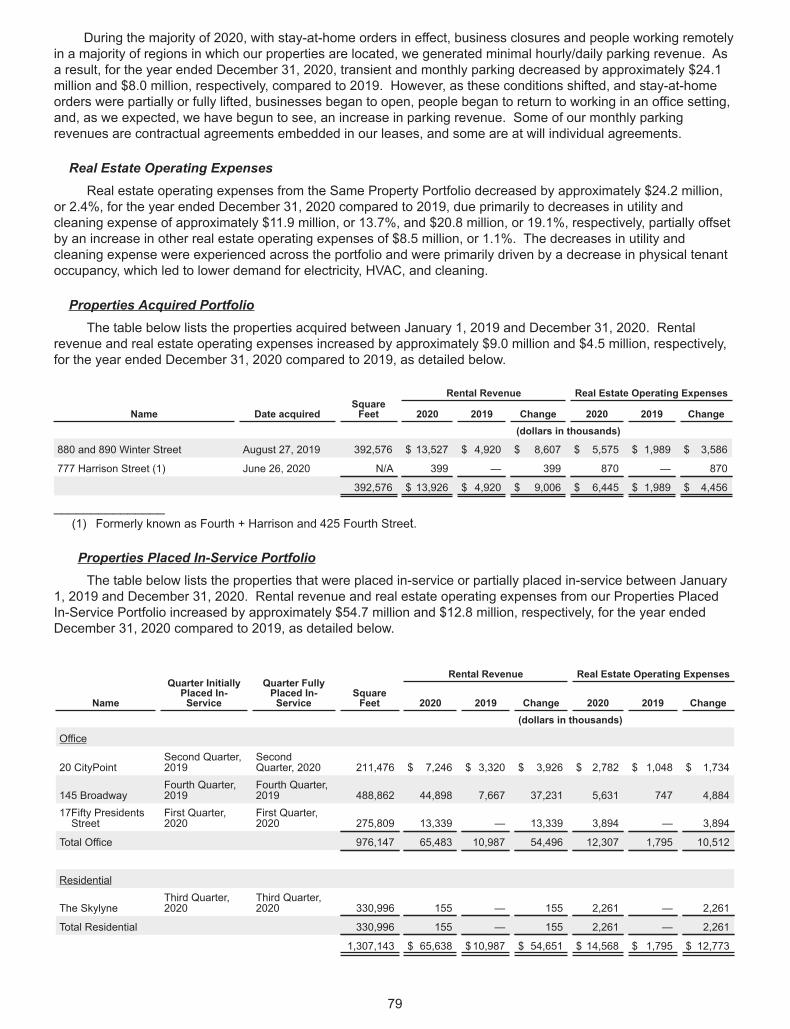
During the majority of 2020, with stay-at-home orders in effect, business closures and people working remotelyin a majority of regions in which our properties are located, we generated minimal hourly/daily parking revenue. Asa result, for the year ended December 31, 2020, transient and monthly parking decreased by approximately $24.1million and $8.0 million, respectively, compared to 2019. However, as these conditions shifted, and stay-at-homeorders were partially or fully lifted, businesses began to open, people began to return to working in an office setting,and, as we expected, we have begun to see, an increase in parking revenue. Some of our monthly parkingrevenues are contractual agreements embedded in our leases, and some are at will individual agreements.
Real Estate Operating ExpensesReal estate operating expenses from the Same Property Portfolio decreased by approximately $24.2 million,
or 2.4%, for the year ended December 31, 2020 compared to 2019, due primarily to decreases in utility andcleaning expense of approximately $11.9 million, or 13.7%, and $20.8 million, or 19.1%, respectively, partially offsetby an increase in other real estate operating expenses of $8.5 million, or 1.1%. The decreases in utility andcleaning expense were experienced across the portfolio and were primarily driven by a decrease in physical tenantoccupancy, which led to lower demand for electricity, HVAC, and cleaning.
Properties Acquired PortfolioThe table below lists the properties acquired between January 1, 2019 and December 31, 2020. Rental
revenue and real estate operating expenses increased by approximately $9.0 million and $4.5 million, respectively,for the year ended December 31, 2020 compared to 2019, as detailed below.
SquareFeet
Rental Revenue Real Estate Operating Expenses
Name Date acquired 2020 2019 Change 2020 2019 Change(dollars in thousands)
880 and 890 Winter Street August 27, 2019 392,576 $ 13,527 $ 4,920 $ 8,607 $ 5,575 $ 1,989 $ 3,586
777 Harrison Street (1) June 26, 2020 N/A 399 — 399 870 — 870
392,576 $ 13,926 $ 4,920 $ 9,006 $ 6,445 $ 1,989 $ 4,456
_______________(1) Formerly known as Fourth + Harrison and 425 Fourth Street.
Properties Placed In-Service PortfolioThe table below lists the properties that were placed in-service or partially placed in-service between January
1, 2019 and December 31, 2020. Rental revenue and real estate operating expenses from our Properties PlacedIn-Service Portfolio increased by approximately $54.7 million and $12.8 million, respectively, for the year endedDecember 31, 2020 compared to 2019, as detailed below.
Quarter InitiallyPlaced In-Service
Quarter FullyPlaced In-Service
Rental Revenue Real Estate Operating Expenses
NameSquareFeet 2020 2019 Change 2020 2019 Change
(dollars in thousands)
Office
20 CityPointSecond Quarter,2019
SecondQuarter, 2020 211,476 $ 7,246 $ 3,320 $ 3,926 $ 2,782 $ 1,048 $ 1,734
145 BroadwayFourth Quarter,2019
Fourth Quarter,2019 488,862 44,898 7,667 37,231 5,631 747 4,884
17Fifty PresidentsStreet
First Quarter,2020
First Quarter,2020 275,809 13,339 — 13,339 3,894 — 3,894
Total Office 976,147 65,483 10,987 54,496 12,307 1,795 10,512
Residential
The SkylyneThird Quarter,2020
Third Quarter,2020 330,996 155 — 155 2,261 — 2,261
Total Residential 330,996 155 — 155 2,261 — 2,261
1,307,143 $ 65,638 $10,987 $ 54,651 $ 14,568 $ 1,795 $ 12,773
79
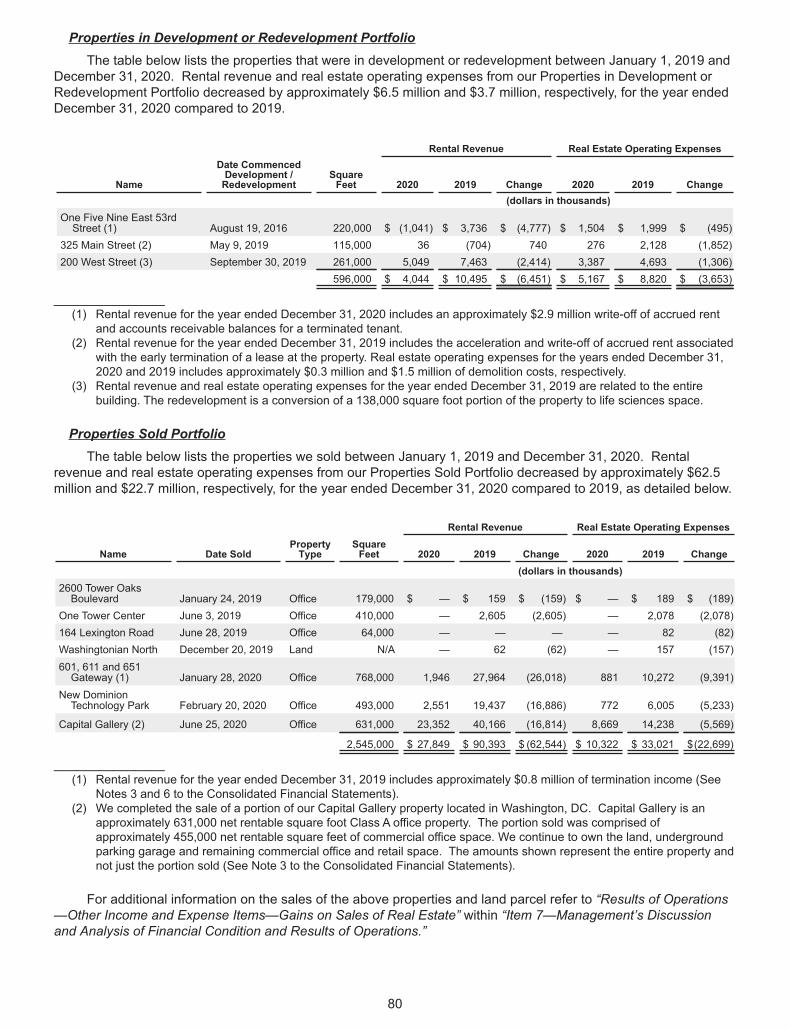
Properties in Development or Redevelopment PortfolioThe table below lists the properties that were in development or redevelopment between January 1, 2019 and
December 31, 2020. Rental revenue and real estate operating expenses from our Properties in Development orRedevelopment Portfolio decreased by approximately $6.5 million and $3.7 million, respectively, for the year endedDecember 31, 2020 compared to 2019.
Rental Revenue Real Estate Operating Expenses
Name
Date CommencedDevelopment /Redevelopment
SquareFeet 2020 2019 Change 2020 2019 Change
(dollars in thousands)One Five Nine East 53rdStreet (1) August 19, 2016 220,000 $ (1,041) $ 3,736 $ (4,777) $ 1,504 $ 1,999 $ (495)
325 Main Street (2) May 9, 2019 115,000 36 (704) 740 276 2,128 (1,852)200 West Street (3) September 30, 2019 261,000 5,049 7,463 (2,414) 3,387 4,693 (1,306)
596,000 $ 4,044 $ 10,495 $ (6,451) $ 5,167 $ 8,820 $ (3,653)
_______________(1) Rental revenue for the year ended December 31, 2020 includes an approximately $2.9 million write-off of accrued rent
and accounts receivable balances for a terminated tenant.(2) Rental revenue for the year ended December 31, 2019 includes the acceleration and write-off of accrued rent associated
with the early termination of a lease at the property. Real estate operating expenses for the years ended December 31,2020 and 2019 includes approximately $0.3 million and $1.5 million of demolition costs, respectively.
(3) Rental revenue and real estate operating expenses for the year ended December 31, 2019 are related to the entirebuilding. The redevelopment is a conversion of a 138,000 square foot portion of the property to life sciences space.
Properties Sold PortfolioThe table below lists the properties we sold between January 1, 2019 and December 31, 2020. Rental
revenue and real estate operating expenses from our Properties Sold Portfolio decreased by approximately $62.5million and $22.7 million, respectively, for the year ended December 31, 2020 compared to 2019, as detailed below.
Rental Revenue Real Estate Operating Expenses
Name Date SoldPropertyType
SquareFeet 2020 2019 Change 2020 2019 Change
(dollars in thousands)2600 Tower OaksBoulevard January 24, 2019 Office 179,000 $ — $ 159 $ (159) $ — $ 189 $ (189)
One Tower Center June 3, 2019 Office 410,000 — 2,605 (2,605) — 2,078 (2,078)164 Lexington Road June 28, 2019 Office 64,000 — — — — 82 (82)Washingtonian North December 20, 2019 Land N/A — 62 (62) — 157 (157)601, 611 and 651Gateway (1) January 28, 2020 Office 768,000 1,946 27,964 (26,018) 881 10,272 (9,391)
New DominionTechnology Park February 20, 2020 Office 493,000 2,551 19,437 (16,886) 772 6,005 (5,233)
Capital Gallery (2) June 25, 2020 Office 631,000 23,352 40,166 (16,814) 8,669 14,238 (5,569)
2,545,000 $ 27,849 $ 90,393 $ (62,544) $ 10,322 $ 33,021 $(22,699)
_______________(1) Rental revenue for the year ended December 31, 2019 includes approximately $0.8 million of termination income (See
Notes 3 and 6 to the Consolidated Financial Statements).(2) We completed the sale of a portion of our Capital Gallery property located in Washington, DC. Capital Gallery is an
approximately 631,000 net rentable square foot Class A office property. The portion sold was comprised ofapproximately 455,000 net rentable square feet of commercial office space. We continue to own the land, undergroundparking garage and remaining commercial office and retail space. The amounts shown represent the entire property andnot just the portion sold (See Note 3 to the Consolidated Financial Statements).
For additional information on the sales of the above properties and land parcel refer to “Results of Operations—Other Income and Expense Items—Gains on Sales of Real Estate” within “Item 7—Management’s Discussionand Analysis of Financial Condition and Results of Operations.”
80
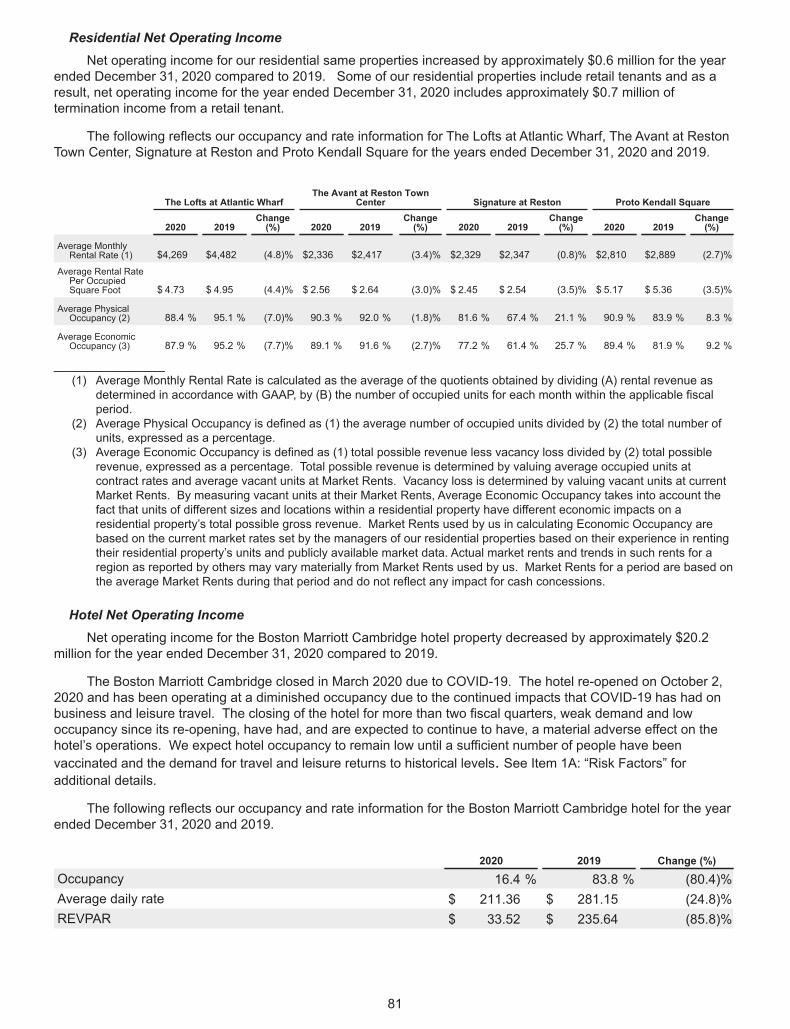
Residential Net Operating IncomeNet operating income for our residential same properties increased by approximately $0.6 million for the year
ended December 31, 2020 compared to 2019. Some of our residential properties include retail tenants and as aresult, net operating income for the year ended December 31, 2020 includes approximately $0.7 million oftermination income from a retail tenant.
The following reflects our occupancy and rate information for The Lofts at Atlantic Wharf, The Avant at RestonTown Center, Signature at Reston and Proto Kendall Square for the years ended December 31, 2020 and 2019.
The Lofts at Atlantic WharfThe Avant at Reston Town
Center Signature at Reston Proto Kendall Square
2020 2019Change(%) 2020 2019
Change(%) 2020 2019
Change(%) 2020 2019
Change(%)
Average MonthlyRental Rate (1) $4,269 $4,482 (4.8)% $2,336 $2,417 (3.4)% $2,329 $2,347 (0.8)% $2,810 $2,889 (2.7)%
Average Rental RatePer OccupiedSquare Foot $ 4.73 $ 4.95 (4.4)% $ 2.56 $ 2.64 (3.0)% $ 2.45 $ 2.54 (3.5)% $ 5.17 $ 5.36 (3.5)%
Average PhysicalOccupancy (2) 88.4 % 95.1 % (7.0)% 90.3 % 92.0 % (1.8)% 81.6 % 67.4 % 21.1 % 90.9 % 83.9 % 8.3 %
Average EconomicOccupancy (3) 87.9 % 95.2 % (7.7)% 89.1 % 91.6 % (2.7)% 77.2 % 61.4 % 25.7 % 89.4 % 81.9 % 9.2 %
_______________(1) Average Monthly Rental Rate is calculated as the average of the quotients obtained by dividing (A) rental revenue as
determined in accordance with GAAP, by (B) the number of occupied units for each month within the applicable fiscalperiod.
(2) Average Physical Occupancy is defined as (1) the average number of occupied units divided by (2) the total number ofunits, expressed as a percentage.
(3) Average Economic Occupancy is defined as (1) total possible revenue less vacancy loss divided by (2) total possiblerevenue, expressed as a percentage. Total possible revenue is determined by valuing average occupied units atcontract rates and average vacant units at Market Rents. Vacancy loss is determined by valuing vacant units at currentMarket Rents. By measuring vacant units at their Market Rents, Average Economic Occupancy takes into account thefact that units of different sizes and locations within a residential property have different economic impacts on aresidential property’s total possible gross revenue. Market Rents used by us in calculating Economic Occupancy arebased on the current market rates set by the managers of our residential properties based on their experience in rentingtheir residential property’s units and publicly available market data. Actual market rents and trends in such rents for aregion as reported by others may vary materially from Market Rents used by us. Market Rents for a period are based onthe average Market Rents during that period and do not reflect any impact for cash concessions.
Hotel Net Operating IncomeNet operating income for the Boston Marriott Cambridge hotel property decreased by approximately $20.2
million for the year ended December 31, 2020 compared to 2019.
The Boston Marriott Cambridge closed in March 2020 due to COVID-19. The hotel re-opened on October 2,2020 and has been operating at a diminished occupancy due to the continued impacts that COVID-19 has had onbusiness and leisure travel. The closing of the hotel for more than two fiscal quarters, weak demand and lowoccupancy since its re-opening, have had, and are expected to continue to have, a material adverse effect on thehotel’s operations. We expect hotel occupancy to remain low until a sufficient number of people have beenvaccinated and the demand for travel and leisure returns to historical levels. See Item 1A: “Risk Factors” foradditional details.
The following reflects our occupancy and rate information for the Boston Marriott Cambridge hotel for the yearended December 31, 2020 and 2019.
2020 2019 Change (%)
Occupancy 16.4 % 83.8 % (80.4)%Average daily rate $ 211.36 $ 281.15 (24.8)%REVPAR $ 33.52 $ 235.64 (85.8)%
81
Other Operating Revenue and Expense Items
Development and Management Services RevenueDevelopment and management services revenue decreased by approximately $10.4 million for the year
ended December 31, 2020 compared to 2019. Development and management services revenue decreased byapproximately $10.0 million and $0.4 million, respectively. The decrease in development services revenue wasprimarily related to a decrease of approximately $10.7 million in development fees from the completion ofdevelopment projects in the Boston and Washington, DC regions and fees associated with tenant improvementprojects earned in the Boston region, partially offset by an increase of approximately $0.7 million in fees associatedwith tenant improvement projects earned in the Washington, DC region. The decrease in management servicesrevenue was primarily related to a decrease in leasing commissions earned from our unconsolidated joint venturesin the Boston region, partially offset by property management fees earned from third-party owned buildings in theWashington, DC region and our Gateway Commons unconsolidated joint venture, which was deconsolidated onJanuary 28, 2020.
General and Administrative ExpenseGeneral and administrative expense decreased by approximately $7.7 million for the year ended
December 31, 2020 compared to 2019 primarily due to a decrease in compensation expense of approximately $7.4million and an approximately $0.3 million decrease in other general and administrative expenses. The decrease incompensation expense was related to (1) an approximately $2.5 million increase in capitalized wages, whichdecreases general and administrative expenses, (2) an approximately $1.1 million decrease in the value of ourdeferred compensation plan, (3) an approximately $0.6 million decrease in health care costs and (3) anapproximately $3.2 million decrease in other compensation-related expenses. The increase in capitalized wages isshown as an decrease to general and administrative expense as some of these costs were capitalized and includedin real estate assets on our Consolidated Balance Sheets (see below).
Wages directly related to the development of rental properties are capitalized and included in real estateassets on our Consolidated Balance Sheets and amortized over the useful lives of the applicable asset or leaseterm. Capitalized wages for the year ended December 31, 2020 and 2019 were approximately $12.9 million and$10.4 million, respectively. These costs are not included in the general and administrative expenses discussedabove.
Transaction CostsTransaction costs decreased by approximately $0.5 million for the year ended December 31, 2020 compared
to 2019 due primarily to costs incurred in connection with the pursuit and formation of new joint ventures. Ingeneral, transaction costs relating to the formation of new and pending joint ventures and the pursuit of othertransactions are expensed as incurred.
Depreciation and Amortization ExpenseDepreciation expense may differ between BXP and BPLP as a result of previously applied acquisition
accounting by BXP for the issuance of common stock in connection with non-sponsor OP Unit redemptions byBPLP. This accounting resulted in a step-up of the real estate assets at BXP that was allocated to certainproperties. The difference between the real estate assets of BXP as compared to BPLP for certain propertieshaving an allocation of the real estate step-up will result in a corresponding difference in depreciation expense. Foradditional information see the Explanatory Note that follows the cover page of this Annual Report on Form 10-K.
82
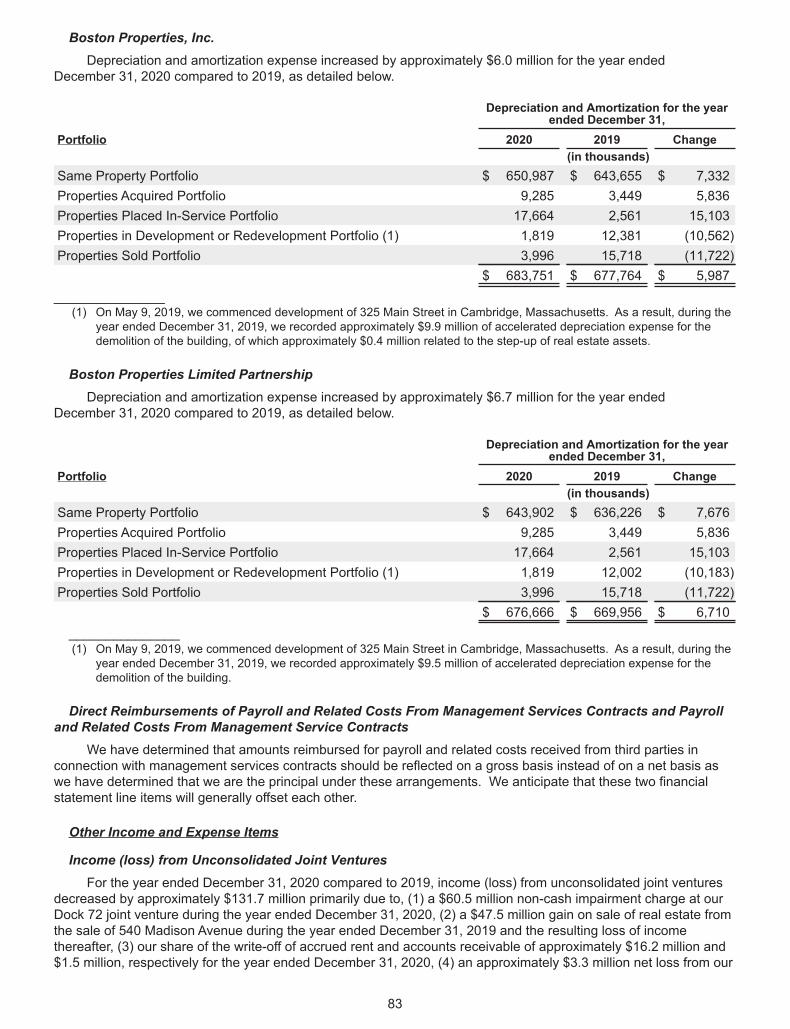
Boston Properties, Inc.Depreciation and amortization expense increased by approximately $6.0 million for the year ended
December 31, 2020 compared to 2019, as detailed below.
Portfolio
Depreciation and Amortization for the yearended December 31,
2020 2019 Change(in thousands)
Same Property Portfolio $ 650,987 $ 643,655 $ 7,332Properties Acquired Portfolio 9,285 3,449 5,836Properties Placed In-Service Portfolio 17,664 2,561 15,103Properties in Development or Redevelopment Portfolio (1) 1,819 12,381 (10,562)Properties Sold Portfolio 3,996 15,718 (11,722)
$ 683,751 $ 677,764 $ 5,987_______________(1) On May 9, 2019, we commenced development of 325 Main Street in Cambridge, Massachusetts. As a result, during the
year ended December 31, 2019, we recorded approximately $9.9 million of accelerated depreciation expense for thedemolition of the building, of which approximately $0.4 million related to the step-up of real estate assets.
Boston Properties Limited PartnershipDepreciation and amortization expense increased by approximately $6.7 million for the year ended
December 31, 2020 compared to 2019, as detailed below.
Portfolio
Depreciation and Amortization for the yearended December 31,
2020 2019 Change(in thousands)
Same Property Portfolio $ 643,902 $ 636,226 $ 7,676Properties Acquired Portfolio 9,285 3,449 5,836Properties Placed In-Service Portfolio 17,664 2,561 15,103Properties in Development or Redevelopment Portfolio (1) 1,819 12,002 (10,183)Properties Sold Portfolio 3,996 15,718 (11,722)
$ 676,666 $ 669,956 $ 6,710_______________(1) On May 9, 2019, we commenced development of 325 Main Street in Cambridge, Massachusetts. As a result, during the
year ended December 31, 2019, we recorded approximately $9.5 million of accelerated depreciation expense for thedemolition of the building.
Direct Reimbursements of Payroll and Related Costs From Management Services Contracts and Payrolland Related Costs From Management Service Contracts
We have determined that amounts reimbursed for payroll and related costs received from third parties inconnection with management services contracts should be reflected on a gross basis instead of on a net basis aswe have determined that we are the principal under these arrangements. We anticipate that these two financialstatement line items will generally offset each other.
Other Income and Expense Items
Income (loss) from Unconsolidated Joint VenturesFor the year ended December 31, 2020 compared to 2019, income (loss) from unconsolidated joint ventures
decreased by approximately $131.7 million primarily due to, (1) a $60.5 million non-cash impairment charge at ourDock 72 joint venture during the year ended December 31, 2020, (2) a $47.5 million gain on sale of real estate fromthe sale of 540 Madison Avenue during the year ended December 31, 2019 and the resulting loss of incomethereafter, (3) our share of the write-off of accrued rent and accounts receivable of approximately $16.2 million and$1.5 million, respectively for the year ended December 31, 2020, (4) an approximately $3.3 million net loss from our
83
Gateway Commons joint venture, primarily due to depreciation and amortization expense and (5) the fully placingin-service of the Hub50House residential property, which is not expected to be stabilized until the first quarter of2022, decreased our net income by approximately $3.4 million. These decreases were partially offset by anapproximately $5.8 million gain on sale of real estate from the sale of Annapolis Junction Building Eight and twoundeveloped land parcels during the year ended December 31, 2020.
Under ASC 842, the write-off for bad debt, including accrued rent, is recorded as a reduction to lease revenue.As a result, during the year ended December 31, 2020, for our unconsolidated joint ventures, we wrote off our shareof the accrued rent and accounts receivable balances of approximately $16.2 million and $1.5 million, respectively.These write-offs related to tenants that either terminated their leases or for which we determined that their accruedrent and/or accounts receivable balances were no longer probable of collection.
In addition, as a result of COVID-19, for properties owned by our unconsolidated joint ventures, during 2020,the joint ventures executed lease modification agreements for approximately 1.1 million square feet. As a result ofthese lease modification agreements, our share of the total cash rent abatements and deferrals granted wasapproximately $9.5 million, of which approximately $7.5 million was related to rental charges for 2020. Althoughsome of the lease modifications were deferrals where we expect the tenant will pay the joint venture in full primarilyin 2021, the majority of the lease modifications involved extending the lease term (in some cases for longer than ayear). As a result of the lease modification agreements that extended the lease term, we expect to see an increasein the cash rent we will receive in the future.
In April 2020, the FASB staff issued the Lease Modification Q & A related to the application of lease accountingguidance for lease concessions, in accordance with ASC 842, as a result of COVID-19. We did not utilize theguidance provided in the Lease Modification Q & A and instead elected to continue to account for the COVID-19lease concessions on a lease-by-lease basis in accordance with the existing lease modification accountingframework (See Note 4 to the Consolidated Financial Statements). As such, the accrued rent balances, which are acomponent of lease revenue, include the accounting impact (adjusted for write-offs) from the rent abatements,deferrals and extensions that were executed during 2020.
The joint ventures expect the volume of lease modifications as a result of COVID-19 to start to decrease.However, the degree to which tenants’ businesses are negatively impacted by COVID-19 could leave some tenantsstill unable to meet their rental payment obligations and result in a reduction in cash flows. Our unconsolidated jointventures may write-off additional accrued rent or accounts receivable balances and this could have a materialadverse effect on lease revenue. See Item 1A: “Risk Factors” for additional details.
Gains on Sales of Real EstateGains on sales of real estate may differ between BXP and BPLP as a result of previously applied acquisition
accounting by BXP for the issuance of common stock in connection with non-sponsor OP Unit redemptions byBPLP. This accounting resulted in a step-up of the real estate assets at BXP that was allocated to certainproperties. The difference between the real estate assets of BXP as compared to BPLP for certain propertieshaving an allocation of the real estate step-up will result in a corresponding difference in the gains on sales of realestate when those properties are sold. For additional information, see the Explanatory Note that follows the coverpage of this Annual Report on Form 10-K.
84
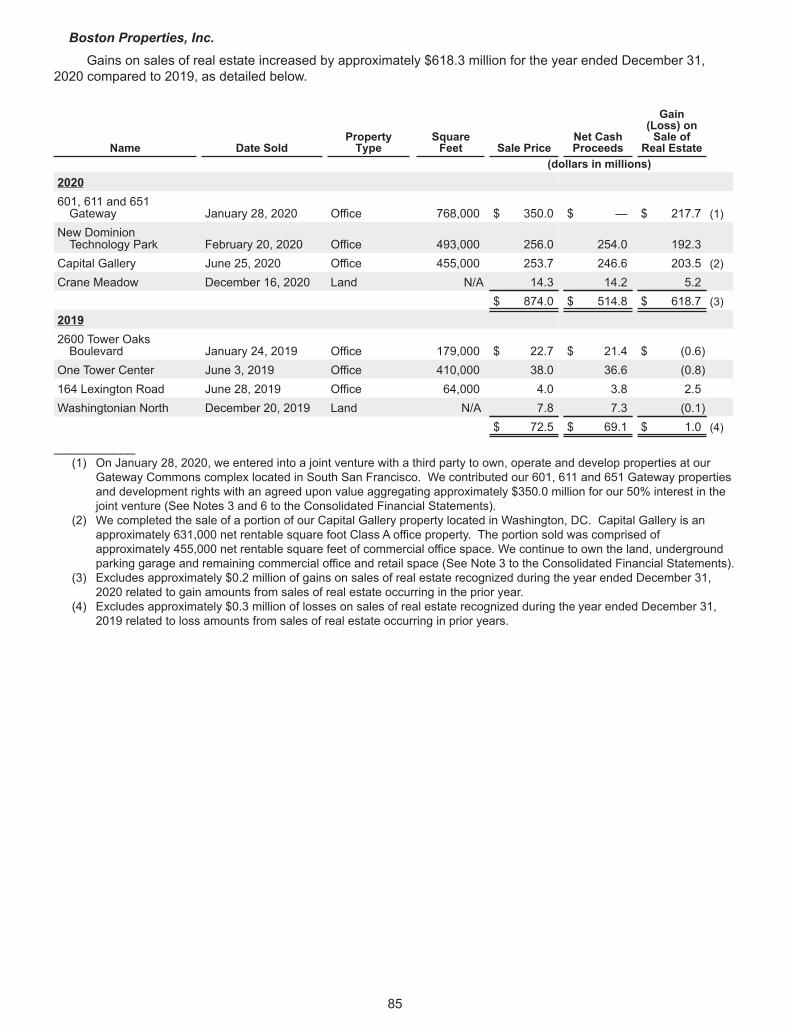
Boston Properties, Inc.Gains on sales of real estate increased by approximately $618.3 million for the year ended December 31,
2020 compared to 2019, as detailed below.
Name Date SoldPropertyType
SquareFeet Sale Price
Net CashProceeds
Gain(Loss) onSale of
Real Estate(dollars in millions)
2020601, 611 and 651Gateway January 28, 2020 Office 768,000 $ 350.0 $ — $ 217.7 (1)
New DominionTechnology Park February 20, 2020 Office 493,000 256.0 254.0 192.3
Capital Gallery June 25, 2020 Office 455,000 253.7 246.6 203.5 (2)Crane Meadow December 16, 2020 Land N/A 14.3 14.2 5.2
$ 874.0 $ 514.8 $ 618.7 (3)20192600 Tower OaksBoulevard January 24, 2019 Office 179,000 $ 22.7 $ 21.4 $ (0.6)
One Tower Center June 3, 2019 Office 410,000 38.0 36.6 (0.8)164 Lexington Road June 28, 2019 Office 64,000 4.0 3.8 2.5Washingtonian North December 20, 2019 Land N/A 7.8 7.3 (0.1)
$ 72.5 $ 69.1 $ 1.0 (4)
___________(1) On January 28, 2020, we entered into a joint venture with a third party to own, operate and develop properties at our
Gateway Commons complex located in South San Francisco. We contributed our 601, 611 and 651 Gateway propertiesand development rights with an agreed upon value aggregating approximately $350.0 million for our 50% interest in thejoint venture (See Notes 3 and 6 to the Consolidated Financial Statements).
(2) We completed the sale of a portion of our Capital Gallery property located in Washington, DC. Capital Gallery is anapproximately 631,000 net rentable square foot Class A office property. The portion sold was comprised ofapproximately 455,000 net rentable square feet of commercial office space. We continue to own the land, undergroundparking garage and remaining commercial office and retail space (See Note 3 to the Consolidated Financial Statements).
(3) Excludes approximately $0.2 million of gains on sales of real estate recognized during the year ended December 31,2020 related to gain amounts from sales of real estate occurring in the prior year.
(4) Excludes approximately $0.3 million of losses on sales of real estate recognized during the year ended December 31,2019 related to loss amounts from sales of real estate occurring in prior years.
85
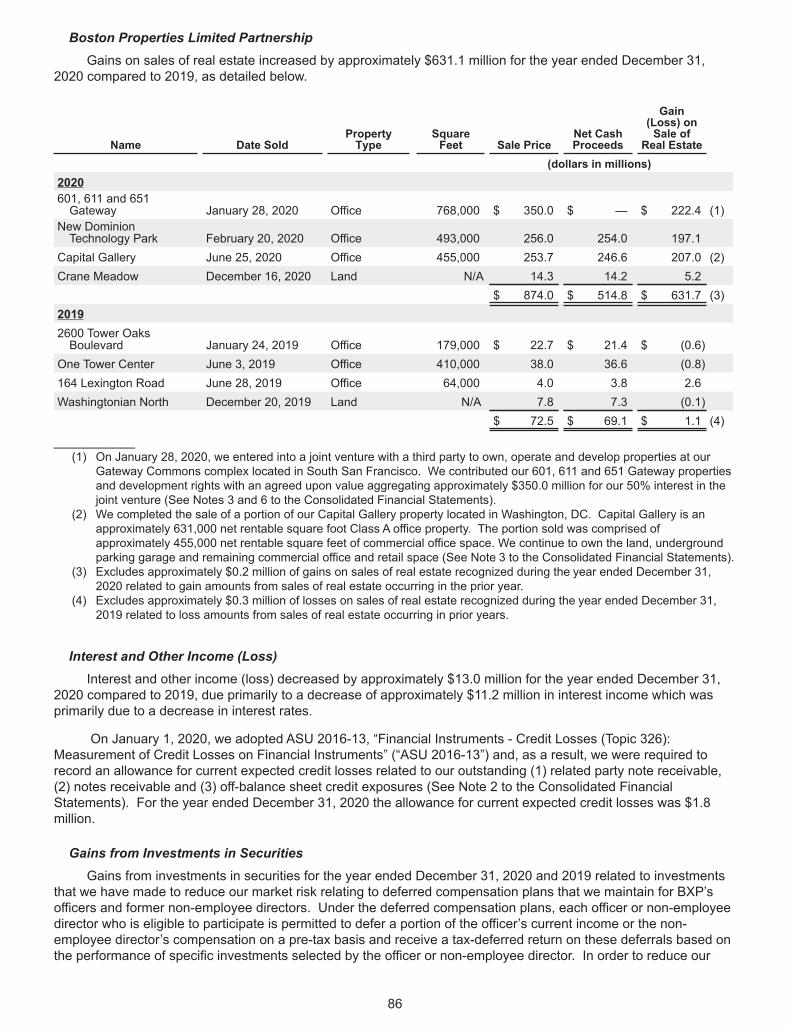
Boston Properties Limited PartnershipGains on sales of real estate increased by approximately $631.1 million for the year ended December 31,
2020 compared to 2019, as detailed below.
Name Date SoldPropertyType
SquareFeet Sale Price
Net CashProceeds
Gain(Loss) onSale of
Real Estate(dollars in millions)
2020601, 611 and 651Gateway January 28, 2020 Office 768,000 $ 350.0 $ — $ 222.4 (1)
New DominionTechnology Park February 20, 2020 Office 493,000 256.0 254.0 197.1
Capital Gallery June 25, 2020 Office 455,000 253.7 246.6 207.0 (2)Crane Meadow December 16, 2020 Land N/A 14.3 14.2 5.2
$ 874.0 $ 514.8 $ 631.7 (3)20192600 Tower OaksBoulevard January 24, 2019 Office 179,000 $ 22.7 $ 21.4 $ (0.6)
One Tower Center June 3, 2019 Office 410,000 38.0 36.6 (0.8)164 Lexington Road June 28, 2019 Office 64,000 4.0 3.8 2.6Washingtonian North December 20, 2019 Land N/A 7.8 7.3 (0.1)
$ 72.5 $ 69.1 $ 1.1 (4)
___________(1) On January 28, 2020, we entered into a joint venture with a third party to own, operate and develop properties at our
Gateway Commons complex located in South San Francisco. We contributed our 601, 611 and 651 Gateway propertiesand development rights with an agreed upon value aggregating approximately $350.0 million for our 50% interest in thejoint venture (See Notes 3 and 6 to the Consolidated Financial Statements).
(2) We completed the sale of a portion of our Capital Gallery property located in Washington, DC. Capital Gallery is anapproximately 631,000 net rentable square foot Class A office property. The portion sold was comprised ofapproximately 455,000 net rentable square feet of commercial office space. We continue to own the land, undergroundparking garage and remaining commercial office and retail space (See Note 3 to the Consolidated Financial Statements).
(3) Excludes approximately $0.2 million of gains on sales of real estate recognized during the year ended December 31,2020 related to gain amounts from sales of real estate occurring in the prior year.
(4) Excludes approximately $0.3 million of losses on sales of real estate recognized during the year ended December 31,2019 related to loss amounts from sales of real estate occurring in prior years.
Interest and Other Income (Loss)Interest and other income (loss) decreased by approximately $13.0 million for the year ended December 31,
2020 compared to 2019, due primarily to a decrease of approximately $11.2 million in interest income which wasprimarily due to a decrease in interest rates.
On January 1, 2020, we adopted ASU 2016-13, “Financial Instruments - Credit Losses (Topic 326):Measurement of Credit Losses on Financial Instruments” (“ASU 2016-13”) and, as a result, we were required torecord an allowance for current expected credit losses related to our outstanding (1) related party note receivable,(2) notes receivable and (3) off-balance sheet credit exposures (See Note 2 to the Consolidated FinancialStatements). For the year ended December 31, 2020 the allowance for current expected credit losses was $1.8million.
Gains from Investments in SecuritiesGains from investments in securities for the year ended December 31, 2020 and 2019 related to investments
that we have made to reduce our market risk relating to deferred compensation plans that we maintain for BXP’sofficers and former non-employee directors. Under the deferred compensation plans, each officer or non-employeedirector who is eligible to participate is permitted to defer a portion of the officer’s current income or the non-employee director’s compensation on a pre-tax basis and receive a tax-deferred return on these deferrals based onthe performance of specific investments selected by the officer or non-employee director. In order to reduce our
86
market risk relating to these plans, we typically acquire, in a separate account that is not restricted as to its use,similar or identical investments as those selected by each officer or non-employee director. This enables us togenerally match our liabilities to BXP’s officers or former non-employee directors under our deferred compensationplans with equivalent assets and thereby limit our market risk. The performance of these investments is recordedas gains from investments in securities. During the year ended December 31, 2020 and 2019, we recognized gainsof approximately $5.3 million and $6.4 million, respectively, on these investments. By comparison, our general andadministrative expense increased by approximately $5.3 million and $6.4 million during the year endedDecember 31, 2020 and 2019, respectively, as a result of increases in our liability under our deferred compensationplans that was associated with the performance of the specific investments selected by officers and former non-employee directors of BXP participating in the plans.
Impairment LossImpairment loss may differ between BXP and BPLP as a result of previously applied acquisition accounting by
BXP for the issuance of common stock in connection with non-sponsor OP Unit redemptions by BPLP. Thisaccounting resulted in a step-up of the real estate assets at BXP that was allocated to certain properties. Thedifference between the real estate assets of BXP as compared to BPLP for certain properties having an allocation ofthe real estate step-up will result in a corresponding difference in depreciation expense. For additional informationsee the Explanatory Note that follows the cover page of this Annual Report on Form 10-K.
At March 31, 2019, we evaluated the expected hold period of our One Tower Center property located in EastBrunswick, New Jersey and, based on a shorter-than-expected hold period, we reduced the carrying value of theproperty to its estimated fair value at March 31, 2019 and recognized an impairment loss totaling approximately$24.0 million for BXP and approximately $22.3 million for BPLP. Our estimated fair value was based on a pendingoffer from a third party to acquire the property and the subsequent execution of a purchase and sale agreement onApril 18, 2019 for a gross sale price of approximately $38.0 million. On June 3, 2019, we completed the sale of theproperty. One Tower Center is an approximately 410,000 net rentable square foot Class A office property. We didnot have any impairments during the year ended December 31, 2020.
Loss From Early Extinguishment of DebtOn September 18, 2019, BPLP completed the redemption of $700.0 million in aggregate principal amount of
its 5.625% senior notes due November 15, 2020. The redemption price was approximately $740.7 million. Theredemption price included approximately $13.5 million of accrued and unpaid interest to, but not including, theredemption date. Excluding the accrued and unpaid interest, the redemption price was approximately 103.90% ofthe principal amount being redeemed. We recognized a loss from early extinguishment of debt totalingapproximately $28.0 million, which amount included the payment of the redemption premium totaling approximately$27.3 million.
On December 19, 2019, we used available cash to repay the bond financing collateralized by our NewDominion Technology Park, Building One property totaling approximately $26.5 million. The bond financing boreinterest at a weighted-average fixed rate of approximately 7.69% per annum and was scheduled to mature onJanuary 15, 2021. We recognized a loss from early extinguishment of debt totaling approximately $1.5 million,which amount included the payment of a prepayment penalty totaling approximately $1.4 million. New DominionTechnology Park, Building One is an approximately 235,000 net rentable square foot Class A office property locatedin Herndon, Virginia.
87
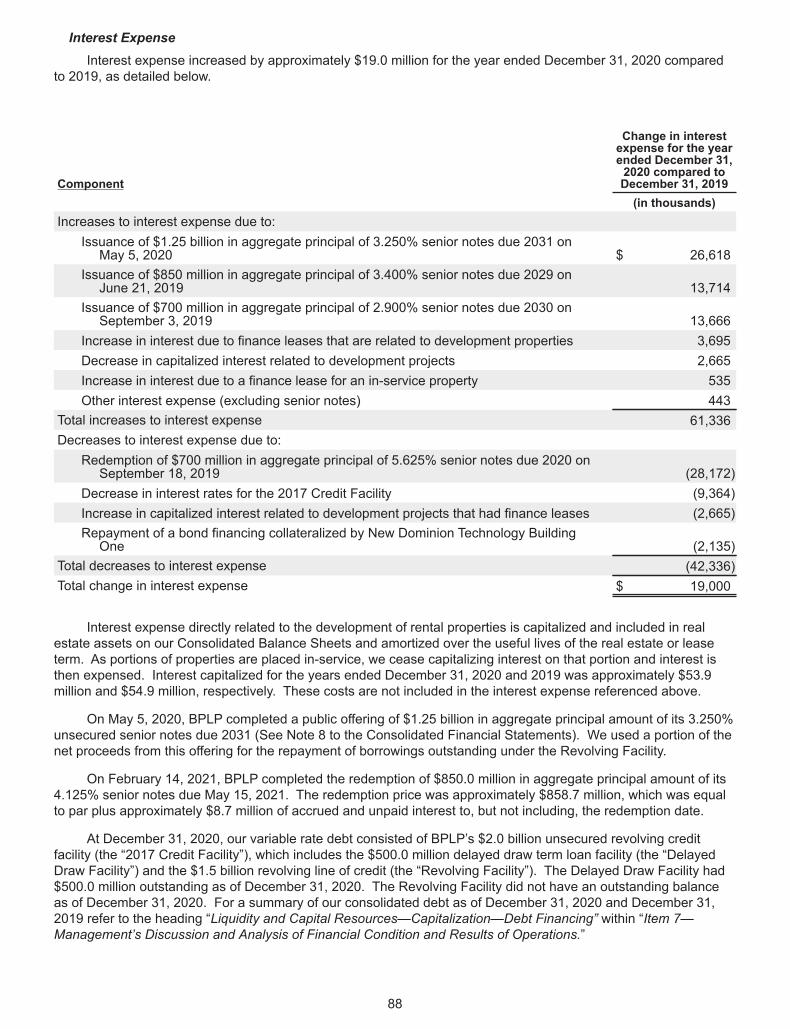
Interest ExpenseInterest expense increased by approximately $19.0 million for the year ended December 31, 2020 compared
to 2019, as detailed below.
Component
Change in interestexpense for the yearended December 31,2020 compared toDecember 31, 2019(in thousands)
Increases to interest expense due to:Issuance of $1.25 billion in aggregate principal of 3.250% senior notes due 2031 onMay 5, 2020 $ 26,618
Issuance of $850 million in aggregate principal of 3.400% senior notes due 2029 onJune 21, 2019 13,714
Issuance of $700 million in aggregate principal of 2.900% senior notes due 2030 onSeptember 3, 2019 13,666
Increase in interest due to finance leases that are related to development properties 3,695Decrease in capitalized interest related to development projects 2,665Increase in interest due to a finance lease for an in-service property 535Other interest expense (excluding senior notes) 443
Total increases to interest expense 61,336Decreases to interest expense due to:
Redemption of $700 million in aggregate principal of 5.625% senior notes due 2020 onSeptember 18, 2019 (28,172)
Decrease in interest rates for the 2017 Credit Facility (9,364)Increase in capitalized interest related to development projects that had finance leases (2,665)Repayment of a bond financing collateralized by New Dominion Technology BuildingOne (2,135)
Total decreases to interest expense (42,336)Total change in interest expense $ 19,000
Interest expense directly related to the development of rental properties is capitalized and included in realestate assets on our Consolidated Balance Sheets and amortized over the useful lives of the real estate or leaseterm. As portions of properties are placed in-service, we cease capitalizing interest on that portion and interest isthen expensed. Interest capitalized for the years ended December 31, 2020 and 2019 was approximately $53.9million and $54.9 million, respectively. These costs are not included in the interest expense referenced above.
On May 5, 2020, BPLP completed a public offering of $1.25 billion in aggregate principal amount of its 3.250%unsecured senior notes due 2031 (See Note 8 to the Consolidated Financial Statements). We used a portion of thenet proceeds from this offering for the repayment of borrowings outstanding under the Revolving Facility.
On February 14, 2021, BPLP completed the redemption of $850.0 million in aggregate principal amount of its4.125% senior notes due May 15, 2021. The redemption price was approximately $858.7 million, which was equalto par plus approximately $8.7 million of accrued and unpaid interest to, but not including, the redemption date.
At December 31, 2020, our variable rate debt consisted of BPLP’s $2.0 billion unsecured revolving creditfacility (the “2017 Credit Facility”), which includes the $500.0 million delayed draw term loan facility (the “DelayedDraw Facility”) and the $1.5 billion revolving line of credit (the “Revolving Facility”). The Delayed Draw Facility had$500.0 million outstanding as of December 31, 2020. The Revolving Facility did not have an outstanding balanceas of December 31, 2020. For a summary of our consolidated debt as of December 31, 2020 and December 31,2019 refer to the heading “Liquidity and Capital Resources—Capitalization—Debt Financing” within “Item 7—Management’s Discussion and Analysis of Financial Condition and Results of Operations.”
88
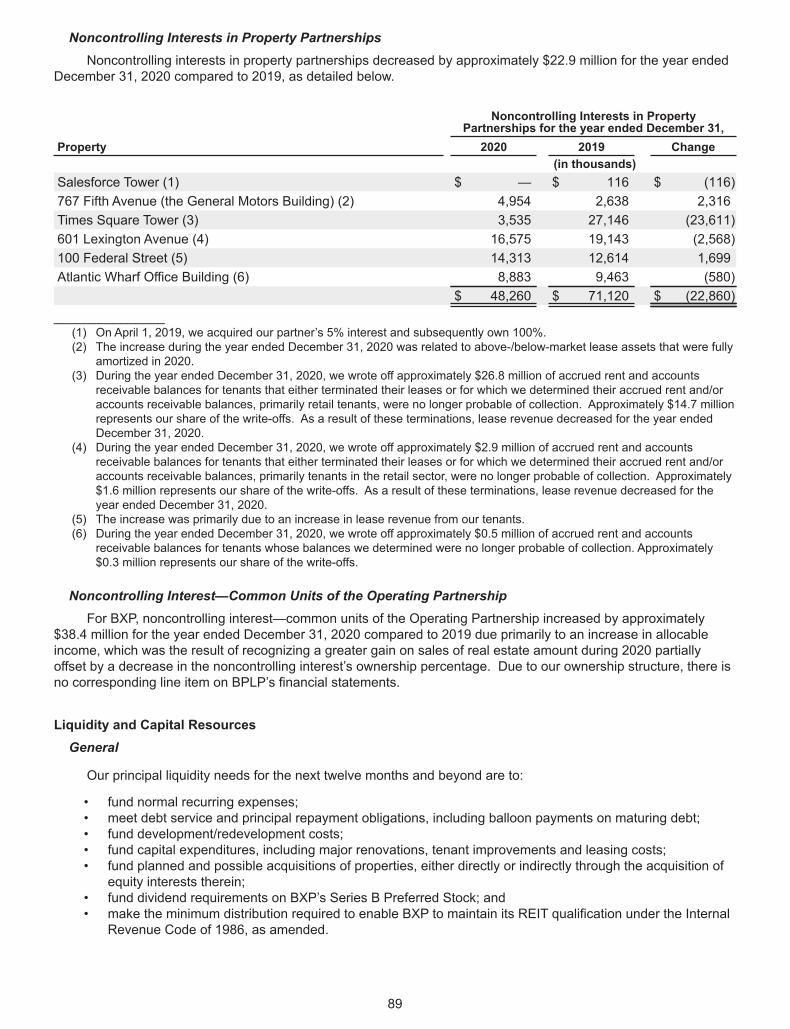
Noncontrolling Interests in Property PartnershipsNoncontrolling interests in property partnerships decreased by approximately $22.9 million for the year ended
December 31, 2020 compared to 2019, as detailed below.
Property
Noncontrolling Interests in PropertyPartnerships for the year ended December 31,2020 2019 Change
(in thousands)Salesforce Tower (1) $ — $ 116 $ (116)767 Fifth Avenue (the General Motors Building) (2) 4,954 2,638 2,316Times Square Tower (3) 3,535 27,146 (23,611)601 Lexington Avenue (4) 16,575 19,143 (2,568)100 Federal Street (5) 14,313 12,614 1,699Atlantic Wharf Office Building (6) 8,883 9,463 (580)
$ 48,260 $ 71,120 $ (22,860)_______________(1) On April 1, 2019, we acquired our partner’s 5% interest and subsequently own 100%.(2) The increase during the year ended December 31, 2020 was related to above-/below-market lease assets that were fully
amortized in 2020.(3) During the year ended December 31, 2020, we wrote off approximately $26.8 million of accrued rent and accounts
receivable balances for tenants that either terminated their leases or for which we determined their accrued rent and/oraccounts receivable balances, primarily retail tenants, were no longer probable of collection. Approximately $14.7 millionrepresents our share of the write-offs. As a result of these terminations, lease revenue decreased for the year endedDecember 31, 2020.
(4) During the year ended December 31, 2020, we wrote off approximately $2.9 million of accrued rent and accountsreceivable balances for tenants that either terminated their leases or for which we determined their accrued rent and/oraccounts receivable balances, primarily tenants in the retail sector, were no longer probable of collection. Approximately$1.6 million represents our share of the write-offs. As a result of these terminations, lease revenue decreased for theyear ended December 31, 2020.
(5) The increase was primarily due to an increase in lease revenue from our tenants.(6) During the year ended December 31, 2020, we wrote off approximately $0.5 million of accrued rent and accounts
receivable balances for tenants whose balances we determined were no longer probable of collection. Approximately$0.3 million represents our share of the write-offs.
Noncontrolling Interest—Common Units of the Operating PartnershipFor BXP, noncontrolling interest—common units of the Operating Partnership increased by approximately
$38.4 million for the year ended December 31, 2020 compared to 2019 due primarily to an increase in allocableincome, which was the result of recognizing a greater gain on sales of real estate amount during 2020 partiallyoffset by a decrease in the noncontrolling interest’s ownership percentage. Due to our ownership structure, there isno corresponding line item on BPLP’s financial statements.
Liquidity and Capital ResourcesGeneral
Our principal liquidity needs for the next twelve months and beyond are to:
• fund normal recurring expenses;• meet debt service and principal repayment obligations, including balloon payments on maturing debt;• fund development/redevelopment costs;• fund capital expenditures, including major renovations, tenant improvements and leasing costs;• fund planned and possible acquisitions of properties, either directly or indirectly through the acquisition of
equity interests therein;• fund dividend requirements on BXP’s Series B Preferred Stock; and• make the minimum distribution required to enable BXP to maintain its REIT qualification under the Internal
Revenue Code of 1986, as amended.
89
We expect to satisfy these needs using one or more of the following:
• cash flow from operations;• distribution of cash flows from joint ventures;• cash and cash equivalent balances;• BPLP’s 2017 Credit Facility;• short-term bridge facilities;• construction loans;• long-term secured and unsecured indebtedness (including unsecured exchangeable indebtedness);• sales of real estate; and• issuances of BXP equity securities and/or additional preferred or common units of partnership interest in
BPLP.
We draw on multiple financing sources to fund our long-term capital needs. Our current developmentproperties are expected to be primarily funded with our available cash balances, construction loans and BPLP’sRevolving Facility. We use BPLP’s Revolving Facility primarily as a bridge facility to fund acquisition opportunities,refinance outstanding indebtedness and meet short-term development and working capital needs. Although wemay seek to fund our development projects with construction loans, which may require guarantees by BPLP, thefinancing for each particular project ultimately depends on several factors, including, among others, the project’ssize and duration, the extent of pre-leasing and our available cash and access to cost effective capital at the giventime.
90
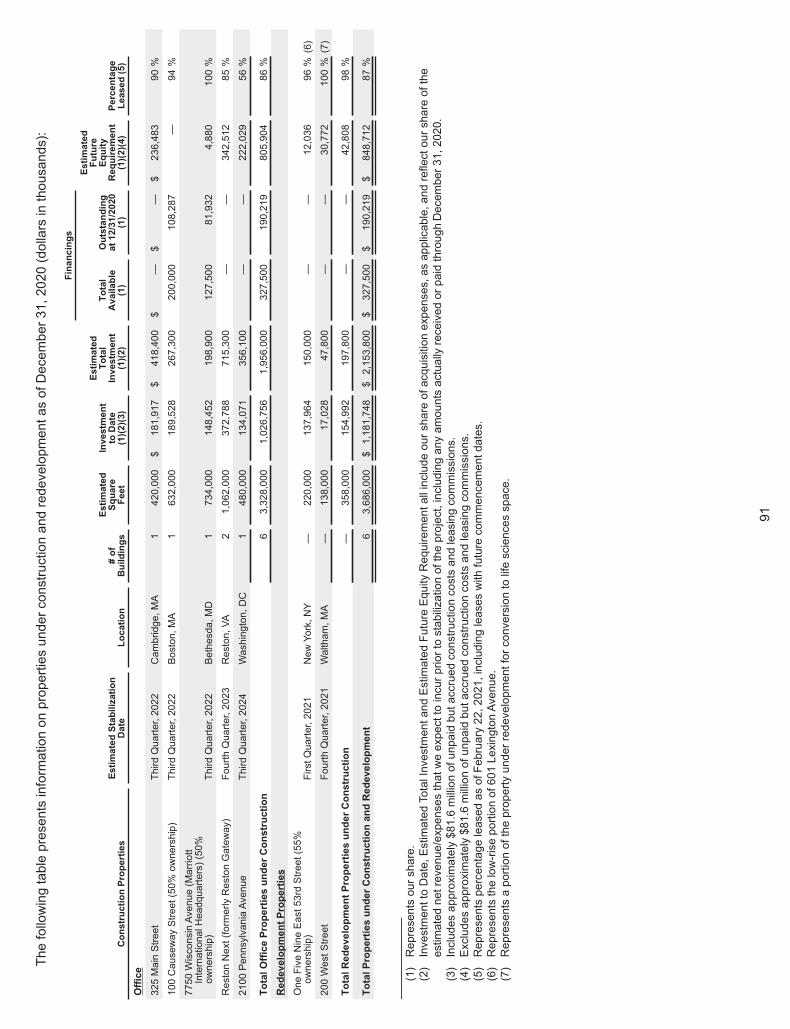
ThefollowingtablepresentsinformationonpropertiesunderconstructionandredevelopmentasofDecember31,2020(dollarsinthousands):
Financings
ConstructionProperties
EstimatedStabilization
Date
Location
#of
Buildings
Estimated
Square
Feet
Investment
toDate
(1)(2)(3)
Estimated
Total
Investment
(1)(2)
Total
Available
(1)
Outstanding
at12/31/2020
(1)
Estimated
Future
Equity
Requirement
(1)(2)(4)
Percentage
Leased(5)
Office
325MainStreet
ThirdQuarter,2022
Cambridge,MA
1420,000
$181,917
$418,400
$—
$—
$236,483
90%
100CausewayStreet(50%
ownership)
ThirdQuarter,2022
Boston,MA
1632,000
189,528
267,300
200,000
108,287
—94%
7750WisconsinAvenue(Marriott
InternationalHeadquarters)(50%
ownership)
ThirdQuarter,2022
Bethesda,MD
1734,000
148,452
198,900
127,500
81,932
4,880
100%
RestonNext(formerlyRestonGateway)
FourthQuarter,2023
Reston,VA
21,062,000
372,788
715,300
——
342,512
85%
2100PennsylvaniaAvenue
ThirdQuarter,2024
Washington,DC
1480,000
134,071
356,100
——
222,029
56%
TotalOfficePropertiesunderConstruction
63,328,000
1,026,756
1,956,000
327,500
190,219
805,904
86%
RedevelopmentProperties
OneFiveNineEast53rdStreet(55%
ownership)
FirstQuarter,2021
New
York,NY
—220,000
137,964
150,000
——
12,036
96%(6)
200WestStreet
FourthQuarter,2021
Waltham,MA
—138,000
17,028
47,800
——
30,772
100%(7)
TotalRedevelopmentPropertiesunderConstruction
—358,000
154,992
197,800
——
42,808
98%
TotalPropertiesunderConstructionandRedevelopment
63,686,000
$1,181,748
$2,153,800
$327,500
$190,219
$848,712
87%
___________
(1)Representsourshare.
(2)InvestmenttoDate,EstimatedTotalInvestmentandEstimatedFutureEquityRequirementallincludeourshareofacquisitionexpenses,asapplicable,andreflectourshareofthe
estimatednetrevenue/expensesthatweexpecttoincurpriortostabilizationoftheproject,includinganyamountsactuallyreceivedorpaidthroughDecember31,2020.
(3)Includesapproximately$81.6millionofunpaidbutaccruedconstructioncostsandleasingcommissions.
(4)Excludesapproximately$81.6millionofunpaidbutaccruedconstructioncostsandleasingcommissions.
(5)RepresentspercentageleasedasofFebruary22,2021,includingleaseswithfuturecommencementdates.
(6)Representsthelow-riseportionof601LexingtonAvenue.
(7)Representsaportionofthepropertyunderredevelopmentforconversiontolifesciencesspace.
91
Lease revenue (which includes recoveries from tenants), other income from operations, available cashbalances, mortgage financings, unsecured indebtedness and draws on BPLP’s Revolving Facility are the principalsources of capital that we use to fund operating expenses, debt service, maintenance and repositioning capitalexpenditures, tenant improvements and the minimum distribution required to enable BXP to maintain its REITqualification. We seek to maximize income from our existing properties by maintaining quality standards for ourproperties that promote high occupancy rates and permit increases in rental rates while reducing tenant turnoverand controlling operating expenses. Our sources of revenue also include third-party fees generated by our propertymanagement, leasing and development and construction businesses, as well as the sale of assets from time totime. We believe these sources of capital will continue to provide the funds necessary for our short-term liquidityneeds, including our properties under development and redevelopment.
Material adverse changes in one or more sources of capital, including from the impacts of COVID-19, mayadversely affect our net cash flows. During the fourth quarter of 2020, our rent collections remained strong as wecollected 99.7% of rents from our office tenants and 99.1% of rents from all tenants, including retail tenants.However, COVID-19 resulted in the write-off of accrued rent balances for all remaining co-working tenants.Decreases in parking and other revenue and the continued disruption in operations for our hotel reduced ourrevenue for the fourth quarter of 2020.
Cash rent abatements and deferrals primarily related to COVID-19 were approximately $19.2 million in thefourth quarter. This amount represents our consolidated cash rent abatements and deferrals plus our share of thecash rent abatements and deferrals from the unconsolidated joint ventures (calculated based on our ownershippercentage) minus our partners’ share of cash rent abatements and deferrals from our consolidated joint ventures(calculated based upon the partners’ percentage ownership interests).
To date, these impacts have not adversely affected our ability to fund operating expenses, dividends anddistributions, debt service payments, maintenance and repositioning capital expenditures and tenant improvements.Any future material adverse change in the cash provided by our operations may affect our ability to comply with thefinancial covenants under BPLP’s 2017 Credit Facility or its unsecured senior notes.
Our primary uses of capital over the next twelve months will be the completion of our current and committeddevelopment and redevelopment projects. Following the redemption of the $850 million aggregate principal amountof BPLP’s 4.125% senior unsecured notes on February 14, 2021, we have no further 2021 debt maturities, otherthan three loans borrowed by our unconsolidated joint ventures of which our share is approximately $102 million.As of December 31, 2020, our share of the remaining development and redevelopment costs that we expect to fundthrough 2024 was approximately $849 million. In addition, we anticipate development/redevelopment starts in 2021of over $700 million, the majority of which are new life sciences developments and conversions.
To satisfy these capital needs, as of February 22, 2021, we had approximately $517 million of cash and cashequivalents, of which approximately $155 million is attributable to our consolidated joint venture partners.
Although the full impact of COVID-19 on our liquidity and capital resources, as well as the duration of suchimpact, will depend on a wide range of factors, all of which are highly uncertain and cannot be predicted withconfidence at this time, we believe that our strong liquidity, including the approximately $1.5 billion available underthe Revolving Facility and available cash, as of February 22, 2021, is sufficient to fund our remaining capitalrequirements on existing development and redevelopment projects, repay our maturing indebtedness when due,satisfy our REIT distribution requirements and still allow us to act opportunistically on attractive investmentopportunities.
We have not sold any shares under BXP’s $600.0 million “at the market” equity offering program.
During 2020 we continued to access various sources of capital, including the sale of more than $920 million ofassets generating approximately $538 million of proceeds, the issuance by BPLP in May 2020 of $1.25 billion inaggregate principal amount of its 3.25% senior unsecured notes due 2031 and the completion of $731.6 million ofsecured debt transactions to refinance maturing debt, of which our share of the aggregate principal is $268.3million. The refinancing transactions included the following:
• A $250.0 million mortgage loan collateralized by Dock 72, a 669,000 square-foot Class A office property inBrooklyn, New York in which we have a 50% interest. The new loan matures on December 18, 2023.
92
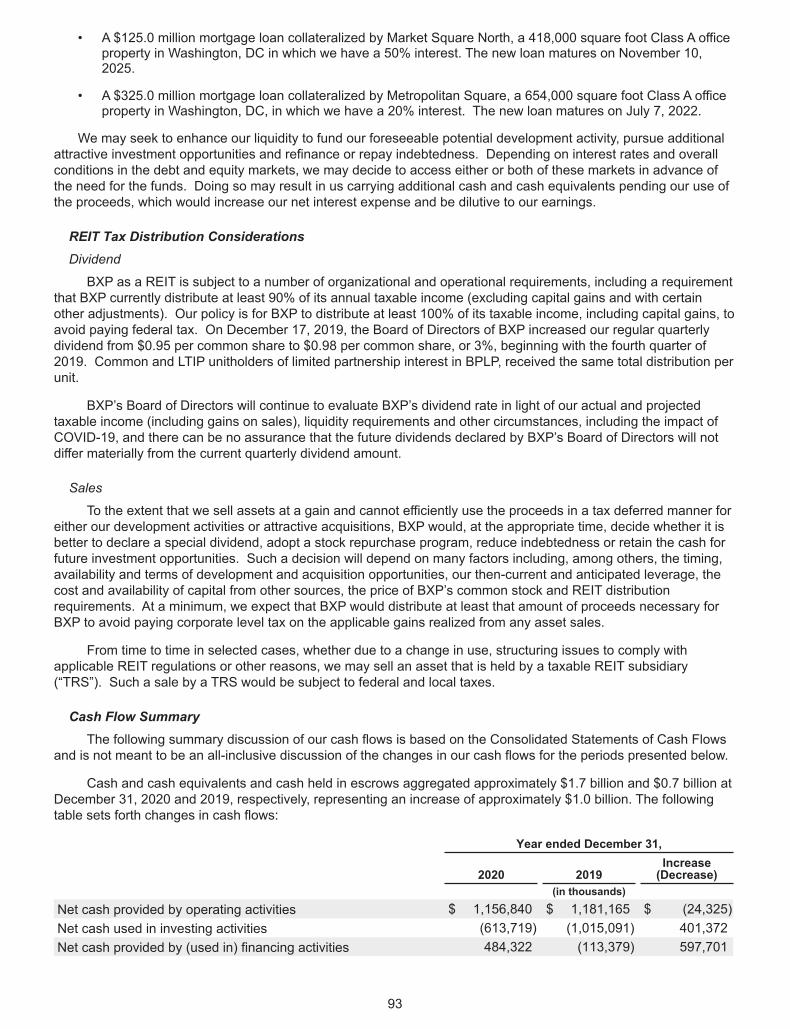
• A $125.0 million mortgage loan collateralized by Market Square North, a 418,000 square foot Class A officeproperty in Washington, DC in which we have a 50% interest. The new loan matures on November 10,2025.
• A $325.0 million mortgage loan collateralized by Metropolitan Square, a 654,000 square foot Class A officeproperty in Washington, DC, in which we have a 20% interest. The new loan matures on July 7, 2022.
We may seek to enhance our liquidity to fund our foreseeable potential development activity, pursue additionalattractive investment opportunities and refinance or repay indebtedness. Depending on interest rates and overallconditions in the debt and equity markets, we may decide to access either or both of these markets in advance ofthe need for the funds. Doing so may result in us carrying additional cash and cash equivalents pending our use ofthe proceeds, which would increase our net interest expense and be dilutive to our earnings.
REIT Tax Distribution ConsiderationsDividend
BXP as a REIT is subject to a number of organizational and operational requirements, including a requirementthat BXP currently distribute at least 90% of its annual taxable income (excluding capital gains and with certainother adjustments). Our policy is for BXP to distribute at least 100% of its taxable income, including capital gains, toavoid paying federal tax. On December 17, 2019, the Board of Directors of BXP increased our regular quarterlydividend from $0.95 per common share to $0.98 per common share, or 3%, beginning with the fourth quarter of2019. Common and LTIP unitholders of limited partnership interest in BPLP, received the same total distribution perunit.
BXP’s Board of Directors will continue to evaluate BXP’s dividend rate in light of our actual and projectedtaxable income (including gains on sales), liquidity requirements and other circumstances, including the impact ofCOVID-19, and there can be no assurance that the future dividends declared by BXP’s Board of Directors will notdiffer materially from the current quarterly dividend amount.
Sales
To the extent that we sell assets at a gain and cannot efficiently use the proceeds in a tax deferred manner foreither our development activities or attractive acquisitions, BXP would, at the appropriate time, decide whether it isbetter to declare a special dividend, adopt a stock repurchase program, reduce indebtedness or retain the cash forfuture investment opportunities. Such a decision will depend on many factors including, among others, the timing,availability and terms of development and acquisition opportunities, our then-current and anticipated leverage, thecost and availability of capital from other sources, the price of BXP’s common stock and REIT distributionrequirements. At a minimum, we expect that BXP would distribute at least that amount of proceeds necessary forBXP to avoid paying corporate level tax on the applicable gains realized from any asset sales.
From time to time in selected cases, whether due to a change in use, structuring issues to comply withapplicable REIT regulations or other reasons, we may sell an asset that is held by a taxable REIT subsidiary(“TRS”). Such a sale by a TRS would be subject to federal and local taxes.
Cash Flow SummaryThe following summary discussion of our cash flows is based on the Consolidated Statements of Cash Flows
and is not meant to be an all-inclusive discussion of the changes in our cash flows for the periods presented below.
Cash and cash equivalents and cash held in escrows aggregated approximately $1.7 billion and $0.7 billion atDecember 31, 2020 and 2019, respectively, representing an increase of approximately $1.0 billion. The followingtable sets forth changes in cash flows:
Year ended December 31,
2020 2019Increase(Decrease)
(in thousands)
Net cash provided by operating activities $ 1,156,840 $ 1,181,165 $ (24,325)Net cash used in investing activities (613,719) (1,015,091) 401,372Net cash provided by (used in) financing activities 484,322 (113,379) 597,701
93
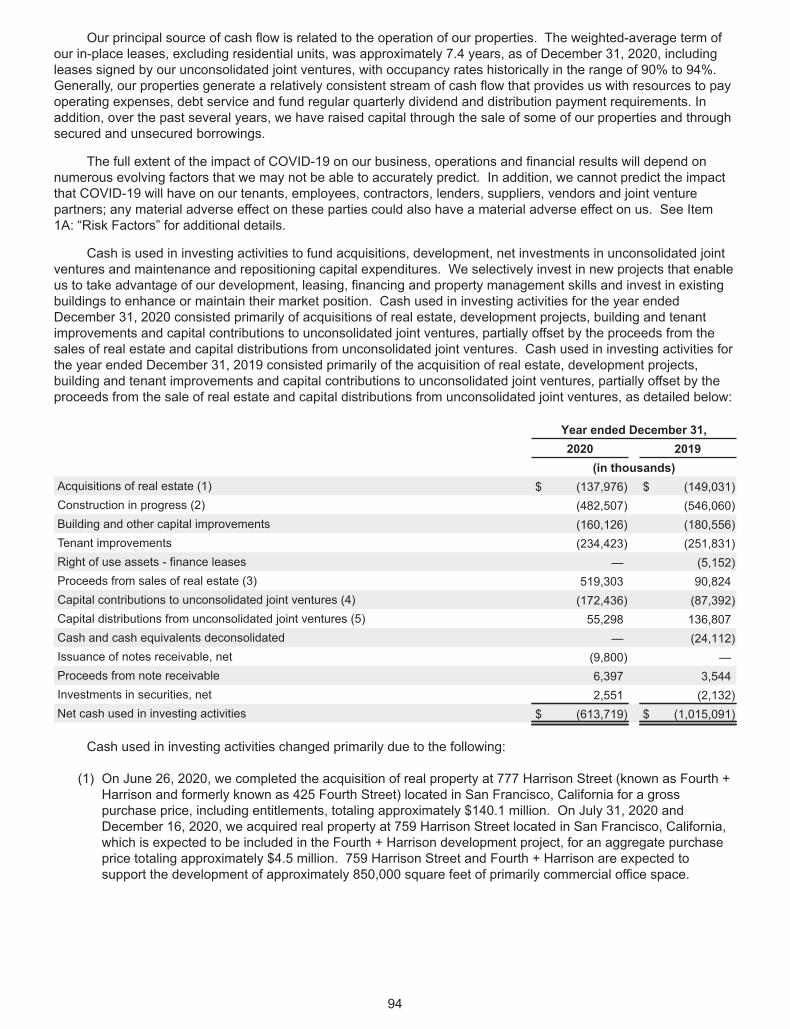
Our principal source of cash flow is related to the operation of our properties. The weighted-average term ofour in-place leases, excluding residential units, was approximately 7.4 years, as of December 31, 2020, includingleases signed by our unconsolidated joint ventures, with occupancy rates historically in the range of 90% to 94%.Generally, our properties generate a relatively consistent stream of cash flow that provides us with resources to payoperating expenses, debt service and fund regular quarterly dividend and distribution payment requirements. Inaddition, over the past several years, we have raised capital through the sale of some of our properties and throughsecured and unsecured borrowings.
The full extent of the impact of COVID-19 on our business, operations and financial results will depend onnumerous evolving factors that we may not be able to accurately predict. In addition, we cannot predict the impactthat COVID-19 will have on our tenants, employees, contractors, lenders, suppliers, vendors and joint venturepartners; any material adverse effect on these parties could also have a material adverse effect on us. See Item1A: “Risk Factors” for additional details.
Cash is used in investing activities to fund acquisitions, development, net investments in unconsolidated jointventures and maintenance and repositioning capital expenditures. We selectively invest in new projects that enableus to take advantage of our development, leasing, financing and property management skills and invest in existingbuildings to enhance or maintain their market position. Cash used in investing activities for the year endedDecember 31, 2020 consisted primarily of acquisitions of real estate, development projects, building and tenantimprovements and capital contributions to unconsolidated joint ventures, partially offset by the proceeds from thesales of real estate and capital distributions from unconsolidated joint ventures. Cash used in investing activities forthe year ended December 31, 2019 consisted primarily of the acquisition of real estate, development projects,building and tenant improvements and capital contributions to unconsolidated joint ventures, partially offset by theproceeds from the sale of real estate and capital distributions from unconsolidated joint ventures, as detailed below:
Year ended December 31,2020 2019
(in thousands)Acquisitions of real estate (1) $ (137,976) $ (149,031)Construction in progress (2) (482,507) (546,060)Building and other capital improvements (160,126) (180,556)Tenant improvements (234,423) (251,831)Right of use assets - finance leases — (5,152)Proceeds from sales of real estate (3) 519,303 90,824Capital contributions to unconsolidated joint ventures (4) (172,436) (87,392)Capital distributions from unconsolidated joint ventures (5) 55,298 136,807Cash and cash equivalents deconsolidated — (24,112)Issuance of notes receivable, net (9,800) —Proceeds from note receivable 6,397 3,544Investments in securities, net 2,551 (2,132)Net cash used in investing activities $ (613,719) $ (1,015,091)
Cash used in investing activities changed primarily due to the following:
(1) On June 26, 2020, we completed the acquisition of real property at 777 Harrison Street (known as Fourth +Harrison and formerly known as 425 Fourth Street) located in San Francisco, California for a grosspurchase price, including entitlements, totaling approximately $140.1 million. On July 31, 2020 andDecember 16, 2020, we acquired real property at 759 Harrison Street located in San Francisco, California,which is expected to be included in the Fourth + Harrison development project, for an aggregate purchaseprice totaling approximately $4.5 million. 759 Harrison Street and Fourth + Harrison are expected tosupport the development of approximately 850,000 square feet of primarily commercial office space.
94
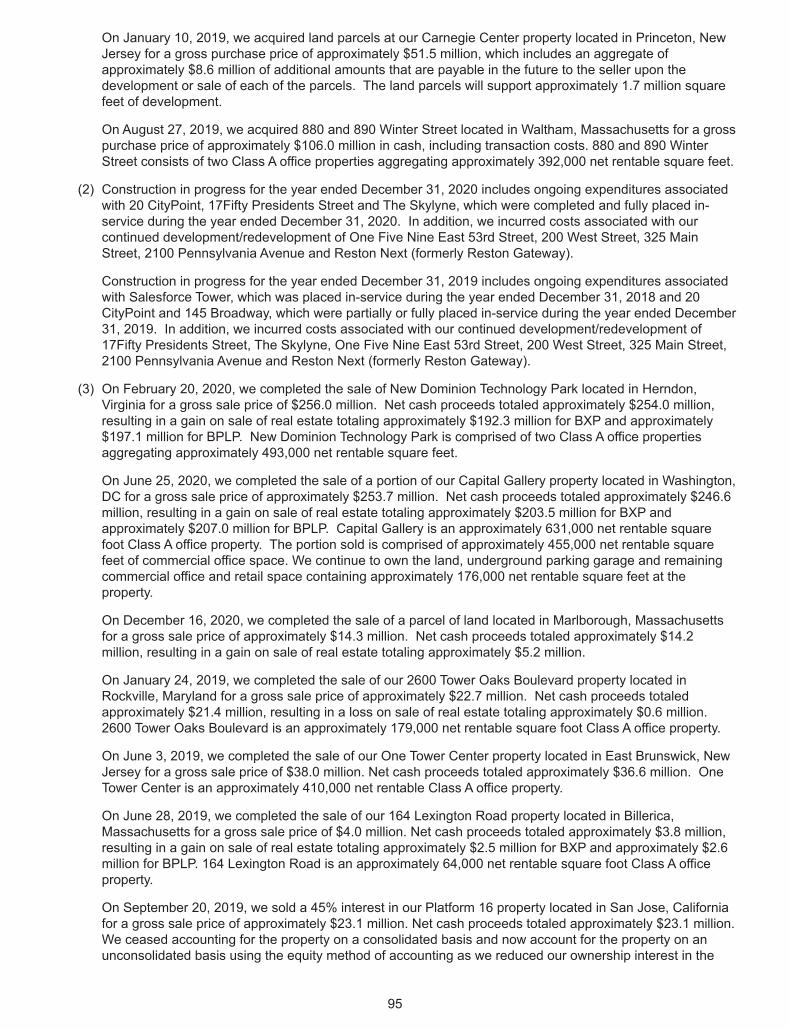
On January 10, 2019, we acquired land parcels at our Carnegie Center property located in Princeton, NewJersey for a gross purchase price of approximately $51.5 million, which includes an aggregate ofapproximately $8.6 million of additional amounts that are payable in the future to the seller upon thedevelopment or sale of each of the parcels. The land parcels will support approximately 1.7 million squarefeet of development.
On August 27, 2019, we acquired 880 and 890 Winter Street located in Waltham, Massachusetts for a grosspurchase price of approximately $106.0 million in cash, including transaction costs. 880 and 890 WinterStreet consists of two Class A office properties aggregating approximately 392,000 net rentable square feet.
(2) Construction in progress for the year ended December 31, 2020 includes ongoing expenditures associatedwith 20 CityPoint, 17Fifty Presidents Street and The Skylyne, which were completed and fully placed in-service during the year ended December 31, 2020. In addition, we incurred costs associated with ourcontinued development/redevelopment of One Five Nine East 53rd Street, 200 West Street, 325 MainStreet, 2100 Pennsylvania Avenue and Reston Next (formerly Reston Gateway).
Construction in progress for the year ended December 31, 2019 includes ongoing expenditures associatedwith Salesforce Tower, which was placed in-service during the year ended December 31, 2018 and 20CityPoint and 145 Broadway, which were partially or fully placed in-service during the year ended December31, 2019. In addition, we incurred costs associated with our continued development/redevelopment of17Fifty Presidents Street, The Skylyne, One Five Nine East 53rd Street, 200 West Street, 325 Main Street,2100 Pennsylvania Avenue and Reston Next (formerly Reston Gateway).
(3) On February 20, 2020, we completed the sale of New Dominion Technology Park located in Herndon,Virginia for a gross sale price of $256.0 million. Net cash proceeds totaled approximately $254.0 million,resulting in a gain on sale of real estate totaling approximately $192.3 million for BXP and approximately$197.1 million for BPLP. New Dominion Technology Park is comprised of two Class A office propertiesaggregating approximately 493,000 net rentable square feet.
On June 25, 2020, we completed the sale of a portion of our Capital Gallery property located in Washington,DC for a gross sale price of approximately $253.7 million. Net cash proceeds totaled approximately $246.6million, resulting in a gain on sale of real estate totaling approximately $203.5 million for BXP andapproximately $207.0 million for BPLP. Capital Gallery is an approximately 631,000 net rentable squarefoot Class A office property. The portion sold is comprised of approximately 455,000 net rentable squarefeet of commercial office space. We continue to own the land, underground parking garage and remainingcommercial office and retail space containing approximately 176,000 net rentable square feet at theproperty.
On December 16, 2020, we completed the sale of a parcel of land located in Marlborough, Massachusettsfor a gross sale price of approximately $14.3 million. Net cash proceeds totaled approximately $14.2million, resulting in a gain on sale of real estate totaling approximately $5.2 million.
On January 24, 2019, we completed the sale of our 2600 Tower Oaks Boulevard property located inRockville, Maryland for a gross sale price of approximately $22.7 million. Net cash proceeds totaledapproximately $21.4 million, resulting in a loss on sale of real estate totaling approximately $0.6 million.2600 Tower Oaks Boulevard is an approximately 179,000 net rentable square foot Class A office property.
On June 3, 2019, we completed the sale of our One Tower Center property located in East Brunswick, NewJersey for a gross sale price of $38.0 million. Net cash proceeds totaled approximately $36.6 million. OneTower Center is an approximately 410,000 net rentable Class A office property.
On June 28, 2019, we completed the sale of our 164 Lexington Road property located in Billerica,Massachusetts for a gross sale price of $4.0 million. Net cash proceeds totaled approximately $3.8 million,resulting in a gain on sale of real estate totaling approximately $2.5 million for BXP and approximately $2.6million for BPLP. 164 Lexington Road is an approximately 64,000 net rentable square foot Class A officeproperty.
On September 20, 2019, we sold a 45% interest in our Platform 16 property located in San Jose, Californiafor a gross sale price of approximately $23.1 million. Net cash proceeds totaled approximately $23.1 million.We ceased accounting for the property on a consolidated basis and now account for the property on anunconsolidated basis using the equity method of accounting as we reduced our ownership interest in the
95
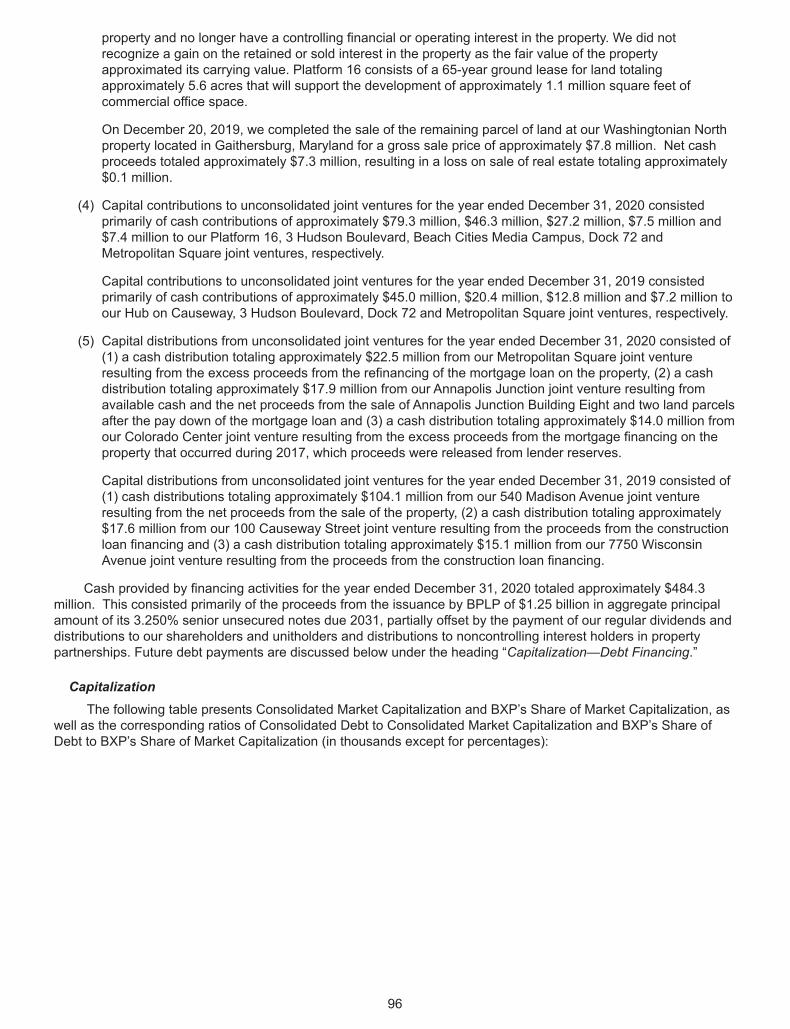
property and no longer have a controlling financial or operating interest in the property. We did notrecognize a gain on the retained or sold interest in the property as the fair value of the propertyapproximated its carrying value. Platform 16 consists of a 65-year ground lease for land totalingapproximately 5.6 acres that will support the development of approximately 1.1 million square feet ofcommercial office space.
On December 20, 2019, we completed the sale of the remaining parcel of land at our Washingtonian Northproperty located in Gaithersburg, Maryland for a gross sale price of approximately $7.8 million. Net cashproceeds totaled approximately $7.3 million, resulting in a loss on sale of real estate totaling approximately$0.1 million.
(4) Capital contributions to unconsolidated joint ventures for the year ended December 31, 2020 consistedprimarily of cash contributions of approximately $79.3 million, $46.3 million, $27.2 million, $7.5 million and$7.4 million to our Platform 16, 3 Hudson Boulevard, Beach Cities Media Campus, Dock 72 andMetropolitan Square joint ventures, respectively.
Capital contributions to unconsolidated joint ventures for the year ended December 31, 2019 consistedprimarily of cash contributions of approximately $45.0 million, $20.4 million, $12.8 million and $7.2 million toour Hub on Causeway, 3 Hudson Boulevard, Dock 72 and Metropolitan Square joint ventures, respectively.
(5) Capital distributions from unconsolidated joint ventures for the year ended December 31, 2020 consisted of(1) a cash distribution totaling approximately $22.5 million from our Metropolitan Square joint ventureresulting from the excess proceeds from the refinancing of the mortgage loan on the property, (2) a cashdistribution totaling approximately $17.9 million from our Annapolis Junction joint venture resulting fromavailable cash and the net proceeds from the sale of Annapolis Junction Building Eight and two land parcelsafter the pay down of the mortgage loan and (3) a cash distribution totaling approximately $14.0 million fromour Colorado Center joint venture resulting from the excess proceeds from the mortgage financing on theproperty that occurred during 2017, which proceeds were released from lender reserves.
Capital distributions from unconsolidated joint ventures for the year ended December 31, 2019 consisted of(1) cash distributions totaling approximately $104.1 million from our 540 Madison Avenue joint ventureresulting from the net proceeds from the sale of the property, (2) a cash distribution totaling approximately$17.6 million from our 100 Causeway Street joint venture resulting from the proceeds from the constructionloan financing and (3) a cash distribution totaling approximately $15.1 million from our 7750 WisconsinAvenue joint venture resulting from the proceeds from the construction loan financing.
Cash provided by financing activities for the year ended December 31, 2020 totaled approximately $484.3million. This consisted primarily of the proceeds from the issuance by BPLP of $1.25 billion in aggregate principalamount of its 3.250% senior unsecured notes due 2031, partially offset by the payment of our regular dividends anddistributions to our shareholders and unitholders and distributions to noncontrolling interest holders in propertypartnerships. Future debt payments are discussed below under the heading “Capitalization—Debt Financing.”
CapitalizationThe following table presents Consolidated Market Capitalization and BXP’s Share of Market Capitalization, as
well as the corresponding ratios of Consolidated Debt to Consolidated Market Capitalization and BXP’s Share ofDebt to BXP’s Share of Market Capitalization (in thousands except for percentages):
96
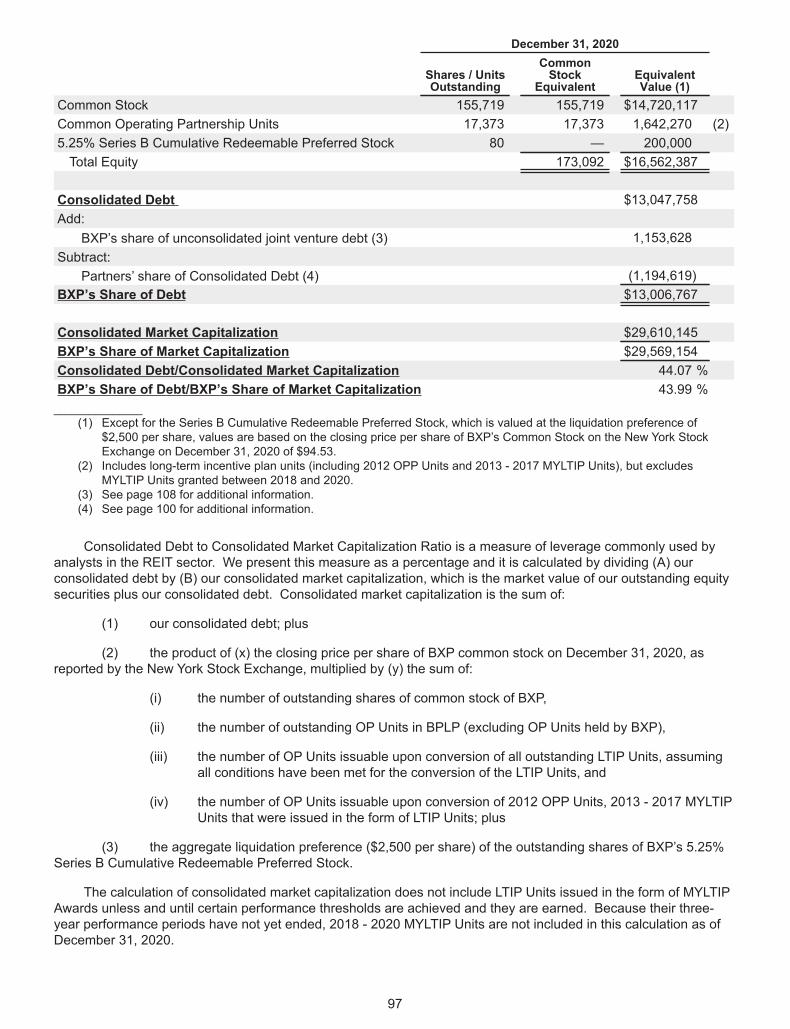
December 31, 2020
Shares / UnitsOutstanding
CommonStock
EquivalentEquivalentValue (1)
Common Stock 155,719 155,719 $14,720,117Common Operating Partnership Units 17,373 17,373 1,642,270 (2)5.25% Series B Cumulative Redeemable Preferred Stock 80 — 200,000Total Equity 173,092 $16,562,387
Consolidated Debt $13,047,758Add:
BXP’s share of unconsolidated joint venture debt (3) 1,153,628Subtract:
Partners’ share of Consolidated Debt (4) (1,194,619)BXP’s Share of Debt $13,006,767
Consolidated Market Capitalization $29,610,145BXP’s Share of Market Capitalization $29,569,154Consolidated Debt/Consolidated Market Capitalization 44.07 %BXP’s Share of Debt/BXP’s Share of Market Capitalization 43.99 %_______________
(1) Except for the Series B Cumulative Redeemable Preferred Stock, which is valued at the liquidation preference of$2,500 per share, values are based on the closing price per share of BXP’s Common Stock on the New York StockExchange on December 31, 2020 of $94.53.
(2) Includes long-term incentive plan units (including 2012 OPP Units and 2013 - 2017 MYLTIP Units), but excludesMYLTIP Units granted between 2018 and 2020.
(3) See page 108 for additional information.(4) See page 100 for additional information.
Consolidated Debt to Consolidated Market Capitalization Ratio is a measure of leverage commonly used byanalysts in the REIT sector. We present this measure as a percentage and it is calculated by dividing (A) ourconsolidated debt by (B) our consolidated market capitalization, which is the market value of our outstanding equitysecurities plus our consolidated debt. Consolidated market capitalization is the sum of:
(1) our consolidated debt; plus
(2) the product of (x) the closing price per share of BXP common stock on December 31, 2020, asreported by the New York Stock Exchange, multiplied by (y) the sum of:
(i) the number of outstanding shares of common stock of BXP,
(ii) the number of outstanding OP Units in BPLP (excluding OP Units held by BXP),
(iii) the number of OP Units issuable upon conversion of all outstanding LTIP Units, assumingall conditions have been met for the conversion of the LTIP Units, and
(iv) the number of OP Units issuable upon conversion of 2012 OPP Units, 2013 - 2017 MYLTIPUnits that were issued in the form of LTIP Units; plus
(3) the aggregate liquidation preference ($2,500 per share) of the outstanding shares of BXP’s 5.25%Series B Cumulative Redeemable Preferred Stock.
The calculation of consolidated market capitalization does not include LTIP Units issued in the form of MYLTIPAwards unless and until certain performance thresholds are achieved and they are earned. Because their three-year performance periods have not yet ended, 2018 - 2020 MYLTIP Units are not included in this calculation as ofDecember 31, 2020.
97
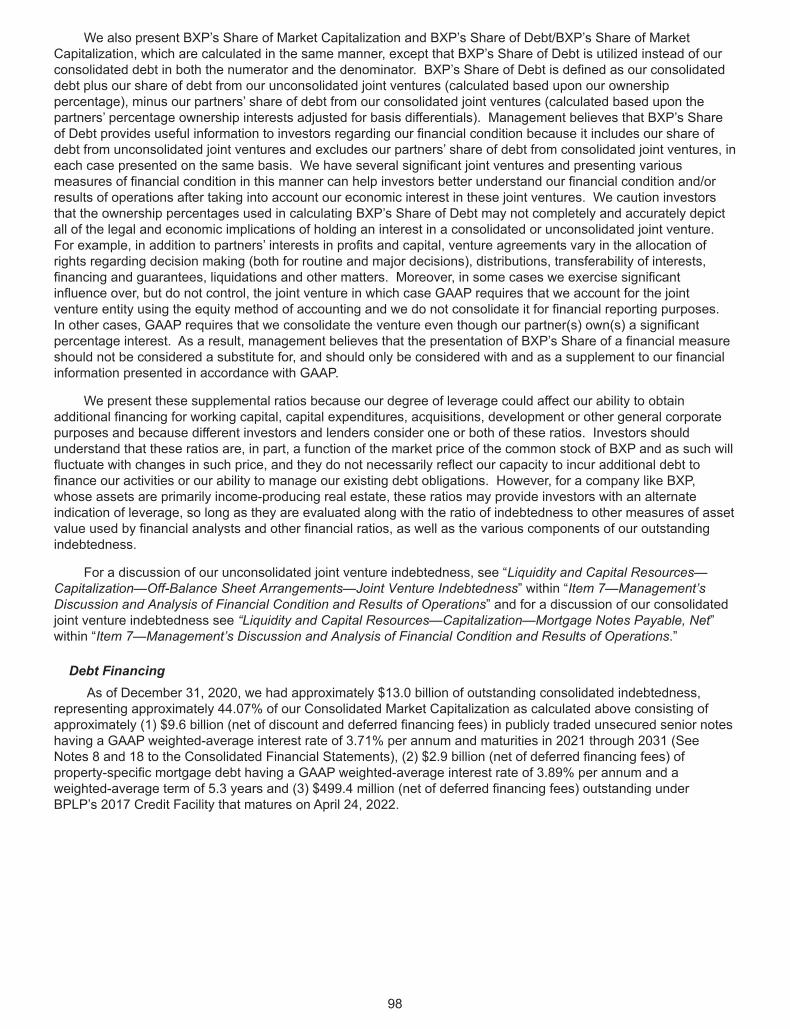
We also present BXP’s Share of Market Capitalization and BXP’s Share of Debt/BXP’s Share of MarketCapitalization, which are calculated in the same manner, except that BXP’s Share of Debt is utilized instead of ourconsolidated debt in both the numerator and the denominator. BXP’s Share of Debt is defined as our consolidateddebt plus our share of debt from our unconsolidated joint ventures (calculated based upon our ownershippercentage), minus our partners’ share of debt from our consolidated joint ventures (calculated based upon thepartners’ percentage ownership interests adjusted for basis differentials). Management believes that BXP’s Shareof Debt provides useful information to investors regarding our financial condition because it includes our share ofdebt from unconsolidated joint ventures and excludes our partners’ share of debt from consolidated joint ventures, ineach case presented on the same basis. We have several significant joint ventures and presenting variousmeasures of financial condition in this manner can help investors better understand our financial condition and/orresults of operations after taking into account our economic interest in these joint ventures. We caution investorsthat the ownership percentages used in calculating BXP’s Share of Debt may not completely and accurately depictall of the legal and economic implications of holding an interest in a consolidated or unconsolidated joint venture.For example, in addition to partners’ interests in profits and capital, venture agreements vary in the allocation ofrights regarding decision making (both for routine and major decisions), distributions, transferability of interests,financing and guarantees, liquidations and other matters. Moreover, in some cases we exercise significantinfluence over, but do not control, the joint venture in which case GAAP requires that we account for the jointventure entity using the equity method of accounting and we do not consolidate it for financial reporting purposes.In other cases, GAAP requires that we consolidate the venture even though our partner(s) own(s) a significantpercentage interest. As a result, management believes that the presentation of BXP’s Share of a financial measureshould not be considered a substitute for, and should only be considered with and as a supplement to our financialinformation presented in accordance with GAAP.
We present these supplemental ratios because our degree of leverage could affect our ability to obtainadditional financing for working capital, capital expenditures, acquisitions, development or other general corporatepurposes and because different investors and lenders consider one or both of these ratios. Investors shouldunderstand that these ratios are, in part, a function of the market price of the common stock of BXP and as such willfluctuate with changes in such price, and they do not necessarily reflect our capacity to incur additional debt tofinance our activities or our ability to manage our existing debt obligations. However, for a company like BXP,whose assets are primarily income-producing real estate, these ratios may provide investors with an alternateindication of leverage, so long as they are evaluated along with the ratio of indebtedness to other measures of assetvalue used by financial analysts and other financial ratios, as well as the various components of our outstandingindebtedness.
For a discussion of our unconsolidated joint venture indebtedness, see “Liquidity and Capital Resources—Capitalization—Off-Balance Sheet Arrangements—Joint Venture Indebtedness” within “Item 7—Management’sDiscussion and Analysis of Financial Condition and Results of Operations” and for a discussion of our consolidatedjoint venture indebtedness see “Liquidity and Capital Resources—Capitalization—Mortgage Notes Payable, Net”within “Item 7—Management’s Discussion and Analysis of Financial Condition and Results of Operations.”
Debt FinancingAs of December 31, 2020, we had approximately $13.0 billion of outstanding consolidated indebtedness,
representing approximately 44.07% of our Consolidated Market Capitalization as calculated above consisting ofapproximately (1) $9.6 billion (net of discount and deferred financing fees) in publicly traded unsecured senior noteshaving a GAAP weighted-average interest rate of 3.71% per annum and maturities in 2021 through 2031 (SeeNotes 8 and 18 to the Consolidated Financial Statements), (2) $2.9 billion (net of deferred financing fees) ofproperty-specific mortgage debt having a GAAP weighted-average interest rate of 3.89% per annum and aweighted-average term of 5.3 years and (3) $499.4 million (net of deferred financing fees) outstanding underBPLP’s 2017 Credit Facility that matures on April 24, 2022.
98
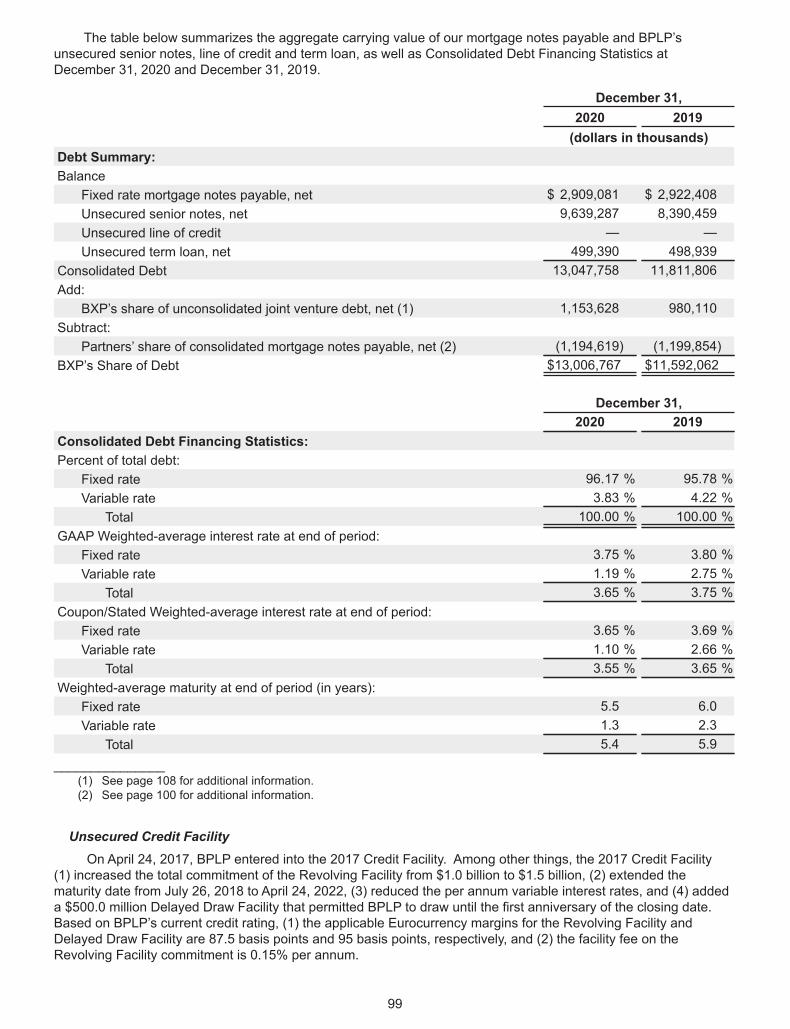
The table below summarizes the aggregate carrying value of our mortgage notes payable and BPLP’sunsecured senior notes, line of credit and term loan, as well as Consolidated Debt Financing Statistics atDecember 31, 2020 and December 31, 2019.
December 31,2020 2019(dollars in thousands)
Debt Summary:Balance
Fixed rate mortgage notes payable, net $ 2,909,081 $ 2,922,408Unsecured senior notes, net 9,639,287 8,390,459Unsecured line of credit — —Unsecured term loan, net 499,390 498,939
Consolidated Debt 13,047,758 11,811,806Add:
BXP’s share of unconsolidated joint venture debt, net (1) 1,153,628 980,110Subtract:
Partners’ share of consolidated mortgage notes payable, net (2) (1,194,619) (1,199,854)BXP’s Share of Debt $13,006,767 $11,592,062
December 31,2020 2019
Consolidated Debt Financing Statistics:Percent of total debt:
Fixed rate 96.17 % 95.78 %Variable rate 3.83 % 4.22 %
Total 100.00 % 100.00 %GAAP Weighted-average interest rate at end of period:
Fixed rate 3.75 % 3.80 %Variable rate 1.19 % 2.75 %
Total 3.65 % 3.75 %Coupon/Stated Weighted-average interest rate at end of period:
Fixed rate 3.65 % 3.69 %Variable rate 1.10 % 2.66 %
Total 3.55 % 3.65 %Weighted-average maturity at end of period (in years):
Fixed rate 5.5 6.0Variable rate 1.3 2.3
Total 5.4 5.9_______________
(1) See page 108 for additional information.(2) See page 100 for additional information.
Unsecured Credit FacilityOn April 24, 2017, BPLP entered into the 2017 Credit Facility. Among other things, the 2017 Credit Facility
(1) increased the total commitment of the Revolving Facility from $1.0 billion to $1.5 billion, (2) extended thematurity date from July 26, 2018 to April 24, 2022, (3) reduced the per annum variable interest rates, and (4) addeda $500.0 million Delayed Draw Facility that permitted BPLP to draw until the first anniversary of the closing date.Based on BPLP’s current credit rating, (1) the applicable Eurocurrency margins for the Revolving Facility andDelayed Draw Facility are 87.5 basis points and 95 basis points, respectively, and (2) the facility fee on theRevolving Facility commitment is 0.15% per annum.
99
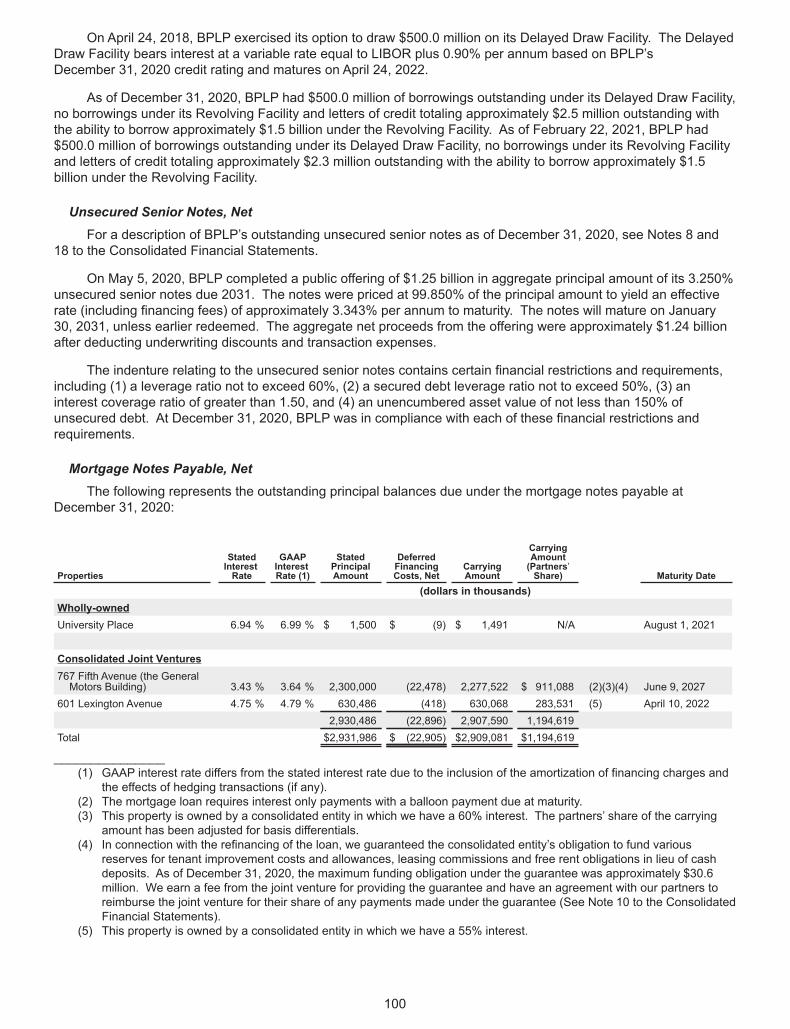
On April 24, 2018, BPLP exercised its option to draw $500.0 million on its Delayed Draw Facility. The DelayedDraw Facility bears interest at a variable rate equal to LIBOR plus 0.90% per annum based on BPLP’sDecember 31, 2020 credit rating and matures on April 24, 2022.
As of December 31, 2020, BPLP had $500.0 million of borrowings outstanding under its Delayed Draw Facility,no borrowings under its Revolving Facility and letters of credit totaling approximately $2.5 million outstanding withthe ability to borrow approximately $1.5 billion under the Revolving Facility. As of February 22, 2021, BPLP had$500.0 million of borrowings outstanding under its Delayed Draw Facility, no borrowings under its Revolving Facilityand letters of credit totaling approximately $2.3 million outstanding with the ability to borrow approximately $1.5billion under the Revolving Facility.
Unsecured Senior Notes, NetFor a description of BPLP’s outstanding unsecured senior notes as of December 31, 2020, see Notes 8 and
18 to the Consolidated Financial Statements.
On May 5, 2020, BPLP completed a public offering of $1.25 billion in aggregate principal amount of its 3.250%unsecured senior notes due 2031. The notes were priced at 99.850% of the principal amount to yield an effectiverate (including financing fees) of approximately 3.343% per annum to maturity. The notes will mature on January30, 2031, unless earlier redeemed. The aggregate net proceeds from the offering were approximately $1.24 billionafter deducting underwriting discounts and transaction expenses.
The indenture relating to the unsecured senior notes contains certain financial restrictions and requirements,including (1) a leverage ratio not to exceed 60%, (2) a secured debt leverage ratio not to exceed 50%, (3) aninterest coverage ratio of greater than 1.50, and (4) an unencumbered asset value of not less than 150% ofunsecured debt. At December 31, 2020, BPLP was in compliance with each of these financial restrictions andrequirements.
Mortgage Notes Payable, NetThe following represents the outstanding principal balances due under the mortgage notes payable at
December 31, 2020:
Properties
StatedInterestRate
GAAPInterestRate (1)
StatedPrincipalAmount
DeferredFinancingCosts, Net
CarryingAmount
CarryingAmount(Partners’Share) Maturity Date
(dollars in thousands)Wholly-ownedUniversity Place 6.94 % 6.99 % $ 1,500 $ (9) $ 1,491 N/A August 1, 2021
Consolidated Joint Ventures767 Fifth Avenue (the GeneralMotors Building) 3.43 % 3.64 % 2,300,000 (22,478) 2,277,522 $ 911,088 (2)(3)(4) June 9, 2027
601 Lexington Avenue 4.75 % 4.79 % 630,486 (418) 630,068 283,531 (5) April 10, 20222,930,486 (22,896) 2,907,590 1,194,619
Total $2,931,986 $ (22,905) $2,909,081 $1,194,619
_______________(1) GAAP interest rate differs from the stated interest rate due to the inclusion of the amortization of financing charges and
the effects of hedging transactions (if any).(2) The mortgage loan requires interest only payments with a balloon payment due at maturity.(3) This property is owned by a consolidated entity in which we have a 60% interest. The partners’ share of the carrying
amount has been adjusted for basis differentials.(4) In connection with the refinancing of the loan, we guaranteed the consolidated entity’s obligation to fund various
reserves for tenant improvement costs and allowances, leasing commissions and free rent obligations in lieu of cashdeposits. As of December 31, 2020, the maximum funding obligation under the guarantee was approximately $30.6million. We earn a fee from the joint venture for providing the guarantee and have an agreement with our partners toreimburse the joint venture for their share of any payments made under the guarantee (See Note 10 to the ConsolidatedFinancial Statements).
(5) This property is owned by a consolidated entity in which we have a 55% interest.
100
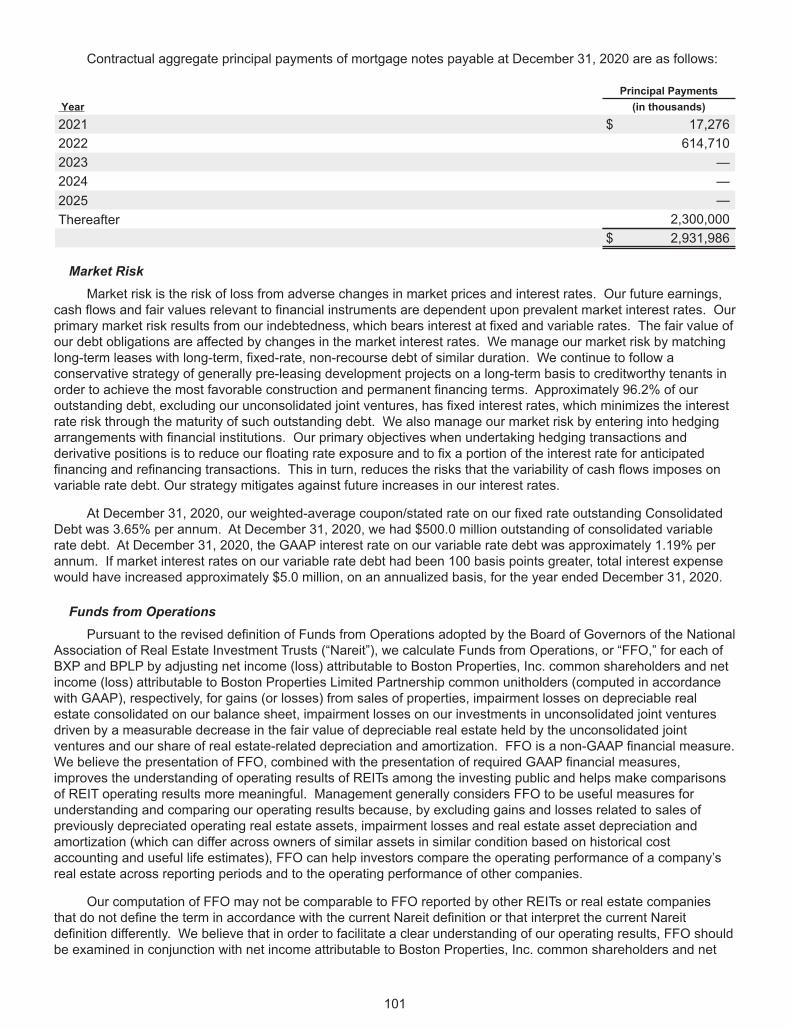
Contractual aggregate principal payments of mortgage notes payable at December 31, 2020 are as follows:
Principal PaymentsYear (in thousands)2021 $ 17,2762022 614,7102023 —2024 —2025 —Thereafter 2,300,000
$ 2,931,986
Market RiskMarket risk is the risk of loss from adverse changes in market prices and interest rates. Our future earnings,
cash flows and fair values relevant to financial instruments are dependent upon prevalent market interest rates. Ourprimary market risk results from our indebtedness, which bears interest at fixed and variable rates. The fair value ofour debt obligations are affected by changes in the market interest rates. We manage our market risk by matchinglong-term leases with long-term, fixed-rate, non-recourse debt of similar duration. We continue to follow aconservative strategy of generally pre-leasing development projects on a long-term basis to creditworthy tenants inorder to achieve the most favorable construction and permanent financing terms. Approximately 96.2% of ouroutstanding debt, excluding our unconsolidated joint ventures, has fixed interest rates, which minimizes the interestrate risk through the maturity of such outstanding debt. We also manage our market risk by entering into hedgingarrangements with financial institutions. Our primary objectives when undertaking hedging transactions andderivative positions is to reduce our floating rate exposure and to fix a portion of the interest rate for anticipatedfinancing and refinancing transactions. This in turn, reduces the risks that the variability of cash flows imposes onvariable rate debt. Our strategy mitigates against future increases in our interest rates.
At December 31, 2020, our weighted-average coupon/stated rate on our fixed rate outstanding ConsolidatedDebt was 3.65% per annum. At December 31, 2020, we had $500.0 million outstanding of consolidated variablerate debt. At December 31, 2020, the GAAP interest rate on our variable rate debt was approximately 1.19% perannum. If market interest rates on our variable rate debt had been 100 basis points greater, total interest expensewould have increased approximately $5.0 million, on an annualized basis, for the year ended December 31, 2020.
Funds from OperationsPursuant to the revised definition of Funds from Operations adopted by the Board of Governors of the National
Association of Real Estate Investment Trusts (“Nareit”), we calculate Funds from Operations, or “FFO,” for each ofBXP and BPLP by adjusting net income (loss) attributable to Boston Properties, Inc. common shareholders and netincome (loss) attributable to Boston Properties Limited Partnership common unitholders (computed in accordancewith GAAP), respectively, for gains (or losses) from sales of properties, impairment losses on depreciable realestate consolidated on our balance sheet, impairment losses on our investments in unconsolidated joint venturesdriven by a measurable decrease in the fair value of depreciable real estate held by the unconsolidated jointventures and our share of real estate-related depreciation and amortization. FFO is a non-GAAP financial measure.We believe the presentation of FFO, combined with the presentation of required GAAP financial measures,improves the understanding of operating results of REITs among the investing public and helps make comparisonsof REIT operating results more meaningful. Management generally considers FFO to be useful measures forunderstanding and comparing our operating results because, by excluding gains and losses related to sales ofpreviously depreciated operating real estate assets, impairment losses and real estate asset depreciation andamortization (which can differ across owners of similar assets in similar condition based on historical costaccounting and useful life estimates), FFO can help investors compare the operating performance of a company’sreal estate across reporting periods and to the operating performance of other companies.
Our computation of FFO may not be comparable to FFO reported by other REITs or real estate companiesthat do not define the term in accordance with the current Nareit definition or that interpret the current Nareitdefinition differently. We believe that in order to facilitate a clear understanding of our operating results, FFO shouldbe examined in conjunction with net income attributable to Boston Properties, Inc. common shareholders and net
101

income attributable to Boston Properties Limited Partnership as presented in our Consolidated FinancialStatements. FFO should not be considered as a substitute for net income attributable to Boston Properties, Inc.common shareholders or net income attributable to Boston Properties Limited Partnership common unitholders(determined in accordance with GAAP) or any other GAAP financial measures and should only be consideredtogether with and as a supplement to our financial information prepared in accordance with GAAP.
The impact that COVID-19 has had on our business, financial position and results of operations during 2020 isdiscussed throughout this report. The full extent of the impact of COVID-19 on our business, operations andfinancial results will depend on numerous evolving factors that we may not be able to accurately predict. Theimpact of COVID-19 on our revenue, in particular lease, parking and hotel revenue was negatively impacted byCOVID-19 for the year ended December 31, 2020, thus negatively impacting our FFO. These decreases arediscussed under the heading “Comparison of the year ended December 31, 2020 to the year ended December 31,2019” within “Item 7—Management’s Discussion and Analysis of Financial Condition and Results of Operations.”
102
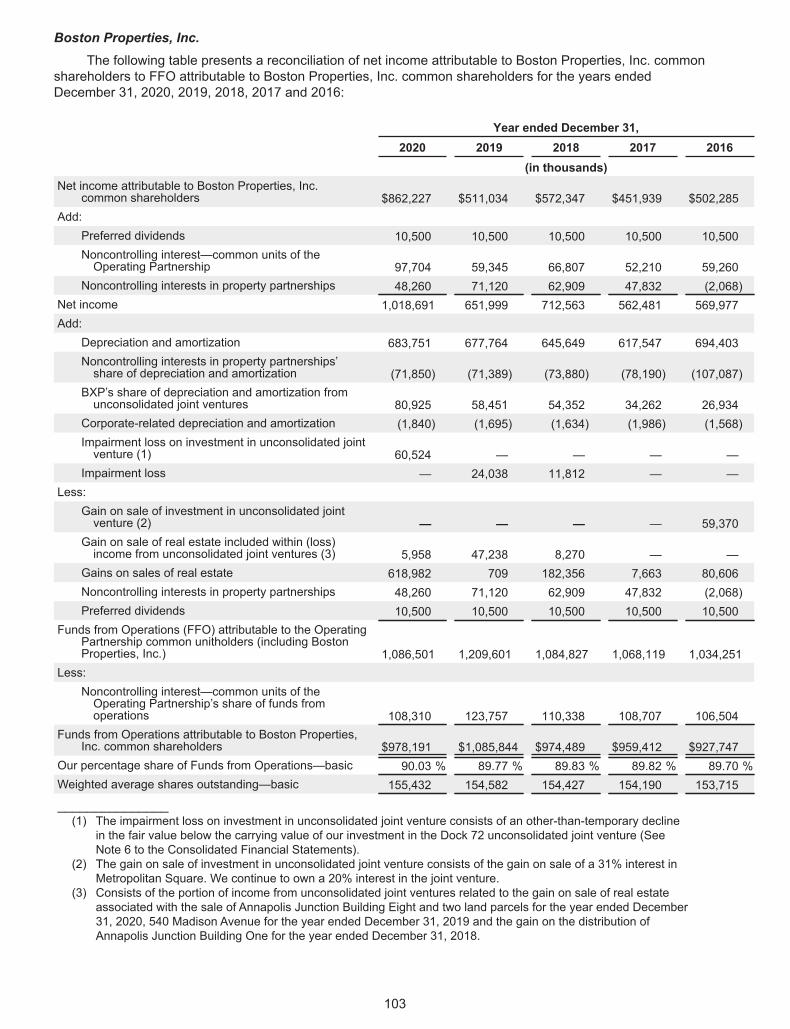
Boston Properties, Inc.The following table presents a reconciliation of net income attributable to Boston Properties, Inc. common
shareholders to FFO attributable to Boston Properties, Inc. common shareholders for the years endedDecember 31, 2020, 2019, 2018, 2017 and 2016:
Year ended December 31,2020 2019 2018 2017 2016
(in thousands)Net income attributable to Boston Properties, Inc.
common shareholders $862,227 $511,034 $572,347 $451,939 $502,285Add:
Preferred dividends 10,500 10,500 10,500 10,500 10,500Noncontrolling interest—common units of theOperating Partnership 97,704 59,345 66,807 52,210 59,260
Noncontrolling interests in property partnerships 48,260 71,120 62,909 47,832 (2,068)Net income 1,018,691 651,999 712,563 562,481 569,977Add:
Depreciation and amortization 683,751 677,764 645,649 617,547 694,403Noncontrolling interests in property partnerships’share of depreciation and amortization (71,850) (71,389) (73,880) (78,190) (107,087)
BXP’s share of depreciation and amortization fromunconsolidated joint ventures 80,925 58,451 54,352 34,262 26,934
Corporate-related depreciation and amortization (1,840) (1,695) (1,634) (1,986) (1,568)Impairment loss on investment in unconsolidated jointventure (1) 60,524 — — — —
Impairment loss — 24,038 11,812 — —Less:
Gain on sale of investment in unconsolidated jointventure (2) — — — — 59,370
Gain on sale of real estate included within (loss)income from unconsolidated joint ventures (3) 5,958 47,238 8,270 — —
Gains on sales of real estate 618,982 709 182,356 7,663 80,606Noncontrolling interests in property partnerships 48,260 71,120 62,909 47,832 (2,068)Preferred dividends 10,500 10,500 10,500 10,500 10,500
Funds from Operations (FFO) attributable to the OperatingPartnership common unitholders (including BostonProperties, Inc.) 1,086,501 1,209,601 1,084,827 1,068,119 1,034,251
Less:Noncontrolling interest—common units of theOperating Partnership’s share of funds fromoperations 108,310 123,757 110,338 108,707 106,504
Funds from Operations attributable to Boston Properties,Inc. common shareholders $978,191 $1,085,844 $974,489 $959,412 $927,747
Our percentage share of Funds from Operations—basic 90.03 % 89.77 % 89.83 % 89.82 % 89.70 %Weighted average shares outstanding—basic 155,432 154,582 154,427 154,190 153,715
_______________(1) The impairment loss on investment in unconsolidated joint venture consists of an other-than-temporary decline
in the fair value below the carrying value of our investment in the Dock 72 unconsolidated joint venture (SeeNote 6 to the Consolidated Financial Statements).
(2) The gain on sale of investment in unconsolidated joint venture consists of the gain on sale of a 31% interest inMetropolitan Square. We continue to own a 20% interest in the joint venture.
(3) Consists of the portion of income from unconsolidated joint ventures related to the gain on sale of real estateassociated with the sale of Annapolis Junction Building Eight and two land parcels for the year ended December31, 2020, 540 Madison Avenue for the year ended December 31, 2019 and the gain on the distribution ofAnnapolis Junction Building One for the year ended December 31, 2018.
103
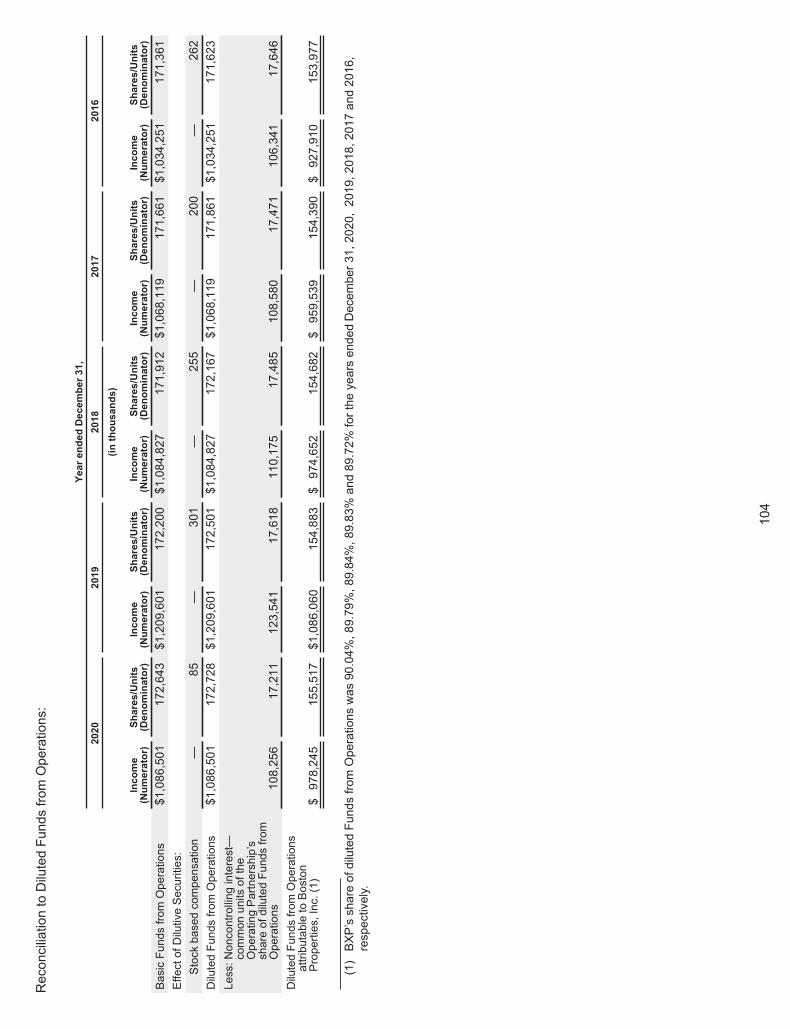
ReconciliationtoDilutedFundsfromOperations:
YearendedDecember31,
2020
2019
2018
2017
2016
(inthousands)
Income
(Numerator)
Shares/Units
(Denominator)
Income
(Numerator)
Shares/Units
(Denominator)
Income
(Numerator)
Shares/Units
(Denominator)
Income
(Numerator)
Shares/Units
(Denominator)
Income
(Numerator)
Shares/Units
(Denominator)
BasicFundsfromOperations
$1,086,501
172,643
$1,209,601
172,200
$1,084,827
171,912
$1,068,119
171,661
$1,034,251
171,361
EffectofDilutiveSecurities:
Stockbasedcompensation
—85
—301
—255
—200
—262
DilutedFundsfromOperations
$1,086,501
172,728
$1,209,601
172,501
$1,084,827
172,167
$1,068,119
171,861
$1,034,251
171,623
Less:Noncontrollinginterest—
commonunitsofthe
OperatingPartnership’s
shareofdilutedFundsfrom
Operations
108,256
17,211
123,541
17,618
110,175
17,485
108,580
17,471
106,341
17,646
DilutedFundsfromOperations
attributabletoBoston
Properties,Inc.(1)
$978,245
155,517
$1,086,060
154,883
$974,652
154,682
$959,539
154,390
$927,910
153,977
_______________
(1)BXP’sshareofdilutedFundsfromOperationswas90.04%,89.79%,89.84%,89.83%and89.72%
fortheyearsendedDecember31,2020,2019,2018,2017and2016,
respectively.
104
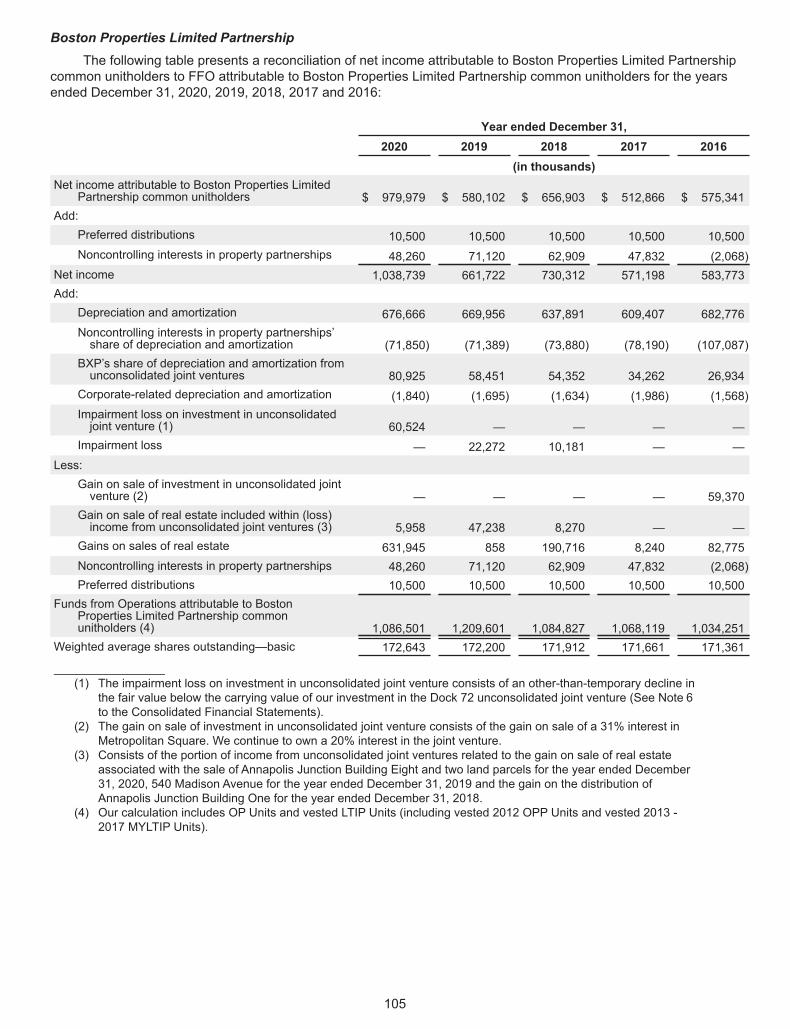
Boston Properties Limited PartnershipThe following table presents a reconciliation of net income attributable to Boston Properties Limited Partnership
common unitholders to FFO attributable to Boston Properties Limited Partnership common unitholders for the yearsended December 31, 2020, 2019, 2018, 2017 and 2016:
Year ended December 31,2020 2019 2018 2017 2016
(in thousands)Net income attributable to Boston Properties Limited
Partnership common unitholders $ 979,979 $ 580,102 $ 656,903 $ 512,866 $ 575,341Add:
Preferred distributions 10,500 10,500 10,500 10,500 10,500Noncontrolling interests in property partnerships 48,260 71,120 62,909 47,832 (2,068)
Net income 1,038,739 661,722 730,312 571,198 583,773Add:
Depreciation and amortization 676,666 669,956 637,891 609,407 682,776Noncontrolling interests in property partnerships’share of depreciation and amortization (71,850) (71,389) (73,880) (78,190) (107,087)
BXP’s share of depreciation and amortization fromunconsolidated joint ventures 80,925 58,451 54,352 34,262 26,934
Corporate-related depreciation and amortization (1,840) (1,695) (1,634) (1,986) (1,568)Impairment loss on investment in unconsolidatedjoint venture (1) 60,524 — — — —
Impairment loss — 22,272 10,181 — —Less:
Gain on sale of investment in unconsolidated jointventure (2) — — — — 59,370
Gain on sale of real estate included within (loss)income from unconsolidated joint ventures (3) 5,958 47,238 8,270 — —
Gains on sales of real estate 631,945 858 190,716 8,240 82,775Noncontrolling interests in property partnerships 48,260 71,120 62,909 47,832 (2,068)Preferred distributions 10,500 10,500 10,500 10,500 10,500
Funds from Operations attributable to BostonProperties Limited Partnership commonunitholders (4) 1,086,501 1,209,601 1,084,827 1,068,119 1,034,251
Weighted average shares outstanding—basic 172,643 172,200 171,912 171,661 171,361
_______________(1) The impairment loss on investment in unconsolidated joint venture consists of an other-than-temporary decline in
the fair value below the carrying value of our investment in the Dock 72 unconsolidated joint venture (See Note 6to the Consolidated Financial Statements).
(2) The gain on sale of investment in unconsolidated joint venture consists of the gain on sale of a 31% interest inMetropolitan Square. We continue to own a 20% interest in the joint venture.
(3) Consists of the portion of income from unconsolidated joint ventures related to the gain on sale of real estateassociated with the sale of Annapolis Junction Building Eight and two land parcels for the year ended December31, 2020, 540 Madison Avenue for the year ended December 31, 2019 and the gain on the distribution ofAnnapolis Junction Building One for the year ended December 31, 2018.
(4) Our calculation includes OP Units and vested LTIP Units (including vested 2012 OPP Units and vested 2013 -2017 MYLTIP Units).
105
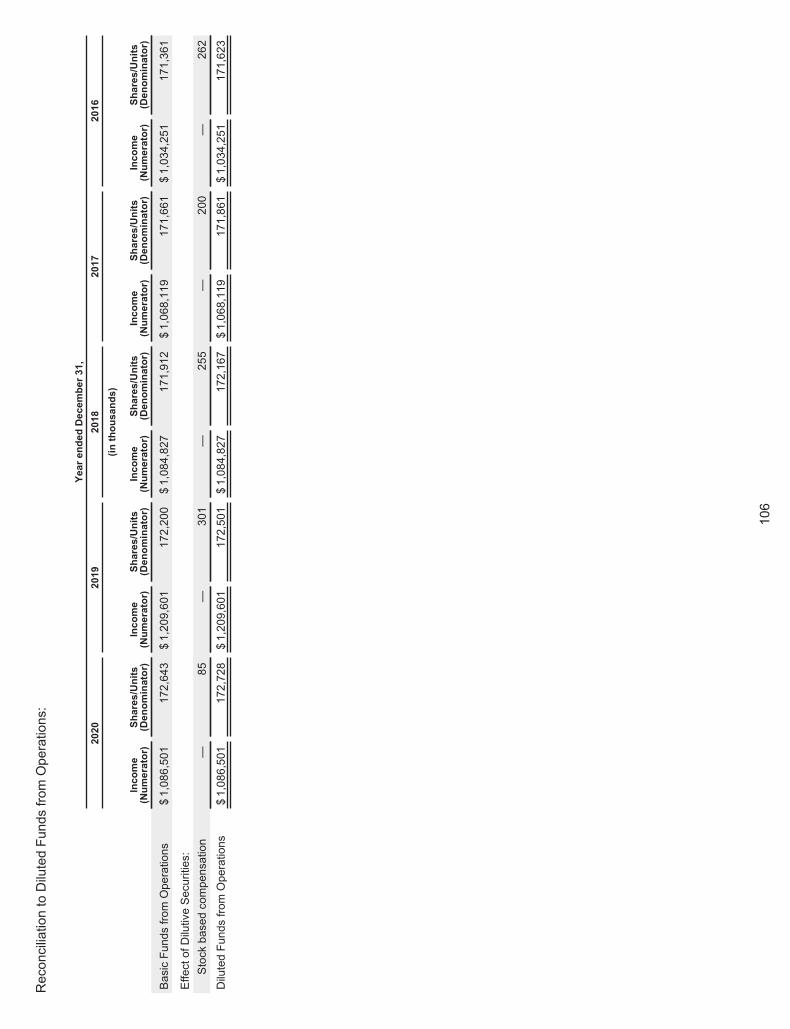
ReconciliationtoDilutedFundsfromOperations:
YearendedDecember31,
2020
2019
2018
2017
2016
(inthousands)
Income
(Numerator)
Shares/Units
(Denominator)
Income
(Numerator)
Shares/Units
(Denominator)
Income
(Numerator)
Shares/Units
(Denominator)
Income
(Numerator)
Shares/Units
(Denominator)
Income
(Numerator)
Shares/Units
(Denominator)
BasicFundsfromOperations
$1,086,501
172,643
$1,209,601
172,200
$1,084,827
171,912
$1,068,119
171,661
$1,034,251
171,361
EffectofDilutiveSecurities:
Stockbasedcompensation
—85
—301
—255
—200
—262
DilutedFundsfromOperations
$1,086,501
172,728
$1,209,601
172,501
$1,084,827
172,167
$1,068,119
171,861
$1,034,251
171,623
106
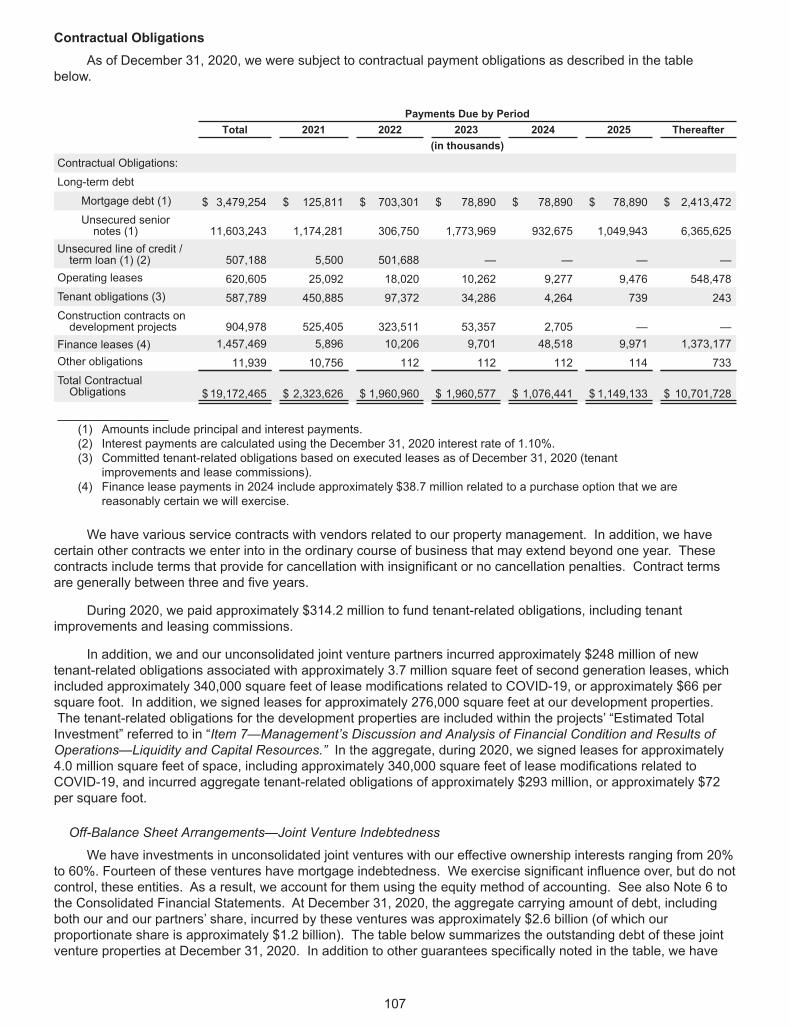
Contractual ObligationsAs of December 31, 2020, we were subject to contractual payment obligations as described in the table
below.
Payments Due by PeriodTotal 2021 2022 2023 2024 2025 Thereafter
(in thousands)Contractual Obligations:
Long-term debt
Mortgage debt (1) $ 3,479,254 $ 125,811 $ 703,301 $ 78,890 $ 78,890 $ 78,890 $ 2,413,472Unsecured seniornotes (1) 11,603,243 1,174,281 306,750 1,773,969 932,675 1,049,943 6,365,625
Unsecured line of credit /term loan (1) (2) 507,188 5,500 501,688 — — — —
Operating leases 620,605 25,092 18,020 10,262 9,277 9,476 548,478Tenant obligations (3) 587,789 450,885 97,372 34,286 4,264 739 243Construction contracts ondevelopment projects 904,978 525,405 323,511 53,357 2,705 — —
Finance leases (4) 1,457,469 5,896 10,206 9,701 48,518 9,971 1,373,177Other obligations 11,939 10,756 112 112 112 114 733Total ContractualObligations $19,172,465 $ 2,323,626 $ 1,960,960 $ 1,960,577 $ 1,076,441 $ 1,149,133 $ 10,701,728
_______________(1) Amounts include principal and interest payments.(2) Interest payments are calculated using the December 31, 2020 interest rate of 1.10%.(3) Committed tenant-related obligations based on executed leases as of December 31, 2020 (tenant
improvements and lease commissions).(4) Finance lease payments in 2024 include approximately $38.7 million related to a purchase option that we are
reasonably certain we will exercise.
We have various service contracts with vendors related to our property management. In addition, we havecertain other contracts we enter into in the ordinary course of business that may extend beyond one year. Thesecontracts include terms that provide for cancellation with insignificant or no cancellation penalties. Contract termsare generally between three and five years.
During 2020, we paid approximately $314.2 million to fund tenant-related obligations, including tenantimprovements and leasing commissions.
In addition, we and our unconsolidated joint venture partners incurred approximately $248 million of newtenant-related obligations associated with approximately 3.7 million square feet of second generation leases, whichincluded approximately 340,000 square feet of lease modifications related to COVID-19, or approximately $66 persquare foot. In addition, we signed leases for approximately 276,000 square feet at our development properties.The tenant-related obligations for the development properties are included within the projects’ “Estimated TotalInvestment” referred to in “Item 7—Management’s Discussion and Analysis of Financial Condition and Results ofOperations—Liquidity and Capital Resources.” In the aggregate, during 2020, we signed leases for approximately4.0 million square feet of space, including approximately 340,000 square feet of lease modifications related toCOVID-19, and incurred aggregate tenant-related obligations of approximately $293 million, or approximately $72per square foot.
Off-Balance Sheet Arrangements—Joint Venture Indebtedness
We have investments in unconsolidated joint ventures with our effective ownership interests ranging from 20%to 60%. Fourteen of these ventures have mortgage indebtedness. We exercise significant influence over, but do notcontrol, these entities. As a result, we account for them using the equity method of accounting. See also Note 6 tothe Consolidated Financial Statements. At December 31, 2020, the aggregate carrying amount of debt, includingboth our and our partners’ share, incurred by these ventures was approximately $2.6 billion (of which ourproportionate share is approximately $1.2 billion). The table below summarizes the outstanding debt of these jointventure properties at December 31, 2020. In addition to other guarantees specifically noted in the table, we have
107
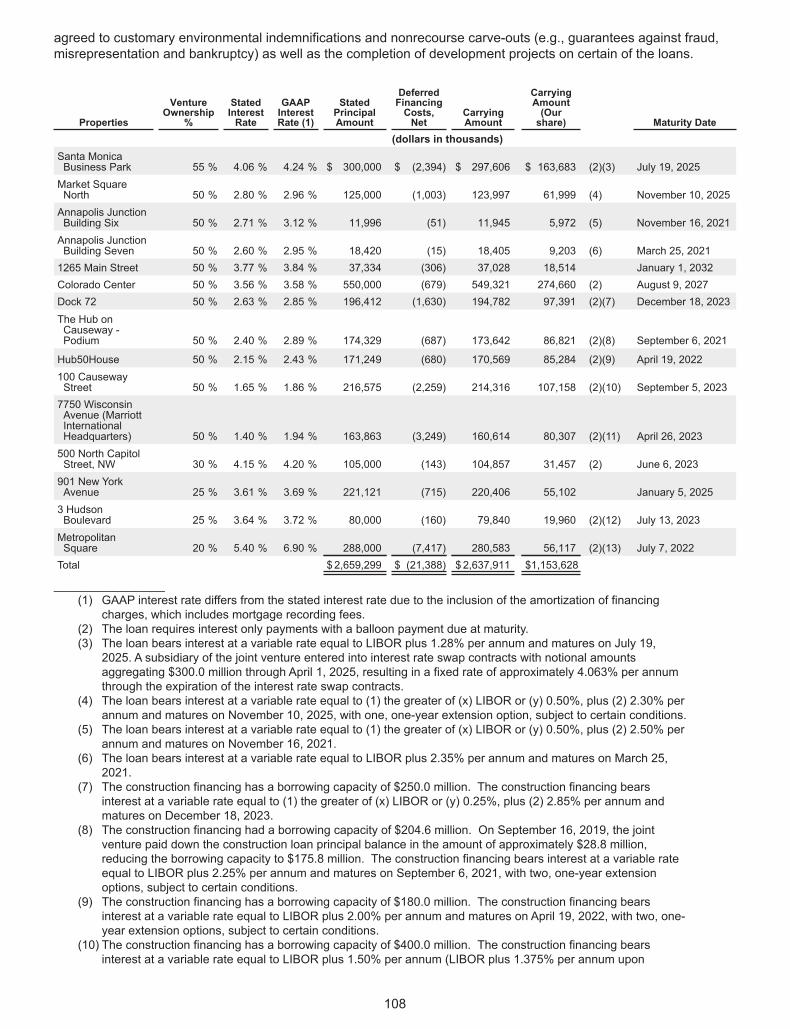
agreed to customary environmental indemnifications and nonrecourse carve-outs (e.g., guarantees against fraud,misrepresentation and bankruptcy) as well as the completion of development projects on certain of the loans.
Properties
VentureOwnership
%
StatedInterestRate
GAAPInterestRate (1)
StatedPrincipalAmount
DeferredFinancingCosts,Net
CarryingAmount
CarryingAmount(Ourshare) Maturity Date
(dollars in thousands)Santa MonicaBusiness Park 55 % 4.06 % 4.24 % $ 300,000 $ (2,394) $ 297,606 $ 163,683 (2)(3) July 19, 2025Market SquareNorth 50 % 2.80 % 2.96 % 125,000 (1,003) 123,997 61,999 (4) November 10, 2025Annapolis JunctionBuilding Six 50 % 2.71 % 3.12 % 11,996 (51) 11,945 5,972 (5) November 16, 2021Annapolis JunctionBuilding Seven 50 % 2.60 % 2.95 % 18,420 (15) 18,405 9,203 (6) March 25, 20211265 Main Street 50 % 3.77 % 3.84 % 37,334 (306) 37,028 18,514 January 1, 2032Colorado Center 50 % 3.56 % 3.58 % 550,000 (679) 549,321 274,660 (2) August 9, 2027Dock 72 50 % 2.63 % 2.85 % 196,412 (1,630) 194,782 97,391 (2)(7) December 18, 2023The Hub onCauseway -Podium 50 % 2.40 % 2.89 % 174,329 (687) 173,642 86,821 (2)(8) September 6, 2021
Hub50House 50 % 2.15 % 2.43 % 171,249 (680) 170,569 85,284 (2)(9) April 19, 2022100 CausewayStreet 50 % 1.65 % 1.86 % 216,575 (2,259) 214,316 107,158 (2)(10) September 5, 20237750 WisconsinAvenue (MarriottInternationalHeadquarters) 50 % 1.40 % 1.94 % 163,863 (3,249) 160,614 80,307 (2)(11) April 26, 2023500 North CapitolStreet, NW 30 % 4.15 % 4.20 % 105,000 (143) 104,857 31,457 (2) June 6, 2023901 New YorkAvenue 25 % 3.61 % 3.69 % 221,121 (715) 220,406 55,102 January 5, 20253 HudsonBoulevard 25 % 3.64 % 3.72 % 80,000 (160) 79,840 19,960 (2)(12) July 13, 2023MetropolitanSquare 20 % 5.40 % 6.90 % 288,000 (7,417) 280,583 56,117 (2)(13) July 7, 2022Total $ 2,659,299 $ (21,388) $2,637,911 $1,153,628
_______________(1) GAAP interest rate differs from the stated interest rate due to the inclusion of the amortization of financing
charges, which includes mortgage recording fees.(2) The loan requires interest only payments with a balloon payment due at maturity.(3) The loan bears interest at a variable rate equal to LIBOR plus 1.28% per annum and matures on July 19,
2025. A subsidiary of the joint venture entered into interest rate swap contracts with notional amountsaggregating $300.0 million through April 1, 2025, resulting in a fixed rate of approximately 4.063% per annumthrough the expiration of the interest rate swap contracts.
(4) The loan bears interest at a variable rate equal to (1) the greater of (x) LIBOR or (y) 0.50%, plus (2) 2.30% perannum and matures on November 10, 2025, with one, one-year extension option, subject to certain conditions.
(5) The loan bears interest at a variable rate equal to (1) the greater of (x) LIBOR or (y) 0.50%, plus (2) 2.50% perannum and matures on November 16, 2021.
(6) The loan bears interest at a variable rate equal to LIBOR plus 2.35% per annum and matures on March 25,2021.
(7) The construction financing has a borrowing capacity of $250.0 million. The construction financing bearsinterest at a variable rate equal to (1) the greater of (x) LIBOR or (y) 0.25%, plus (2) 2.85% per annum andmatures on December 18, 2023.
(8) The construction financing had a borrowing capacity of $204.6 million. On September 16, 2019, the jointventure paid down the construction loan principal balance in the amount of approximately $28.8 million,reducing the borrowing capacity to $175.8 million. The construction financing bears interest at a variable rateequal to LIBOR plus 2.25% per annum and matures on September 6, 2021, with two, one-year extensionoptions, subject to certain conditions.
(9) The construction financing has a borrowing capacity of $180.0 million. The construction financing bearsinterest at a variable rate equal to LIBOR plus 2.00% per annum and matures on April 19, 2022, with two, one-year extension options, subject to certain conditions.
(10) The construction financing has a borrowing capacity of $400.0 million. The construction financing bearsinterest at a variable rate equal to LIBOR plus 1.50% per annum (LIBOR plus 1.375% per annum upon
108
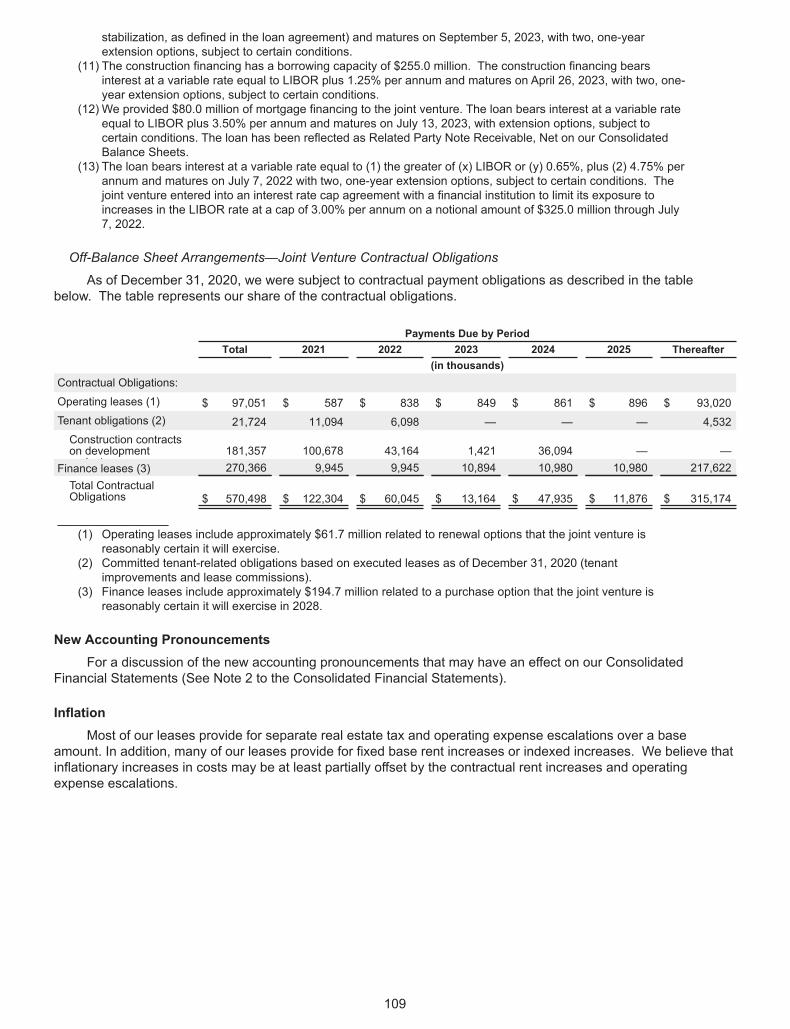
stabilization, as defined in the loan agreement) and matures on September 5, 2023, with two, one-yearextension options, subject to certain conditions.
(11) The construction financing has a borrowing capacity of $255.0 million. The construction financing bearsinterest at a variable rate equal to LIBOR plus 1.25% per annum and matures on April 26, 2023, with two, one-year extension options, subject to certain conditions.
(12) We provided $80.0 million of mortgage financing to the joint venture. The loan bears interest at a variable rateequal to LIBOR plus 3.50% per annum and matures on July 13, 2023, with extension options, subject tocertain conditions. The loan has been reflected as Related Party Note Receivable, Net on our ConsolidatedBalance Sheets.
(13) The loan bears interest at a variable rate equal to (1) the greater of (x) LIBOR or (y) 0.65%, plus (2) 4.75% perannum and matures on July 7, 2022 with two, one-year extension options, subject to certain conditions. Thejoint venture entered into an interest rate cap agreement with a financial institution to limit its exposure toincreases in the LIBOR rate at a cap of 3.00% per annum on a notional amount of $325.0 million through July7, 2022.
Off-Balance Sheet Arrangements—Joint Venture Contractual Obligations
As of December 31, 2020, we were subject to contractual payment obligations as described in the tablebelow. The table represents our share of the contractual obligations.
Payments Due by PeriodTotal 2021 2022 2023 2024 2025 Thereafter
(in thousands)Contractual Obligations:
Operating leases (1) $ 97,051 $ 587 $ 838 $ 849 $ 861 $ 896 $ 93,020Tenant obligations (2) 21,724 11,094 6,098 — — — 4,532Construction contractson developmentj t
181,357 100,678 43,164 1,421 36,094 — —Finance leases (3) 270,366 9,945 9,945 10,894 10,980 10,980 217,622Total ContractualObligations $ 570,498 $ 122,304 $ 60,045 $ 13,164 $ 47,935 $ 11,876 $ 315,174
_______________(1) Operating leases include approximately $61.7 million related to renewal options that the joint venture is
reasonably certain it will exercise.(2) Committed tenant-related obligations based on executed leases as of December 31, 2020 (tenant
improvements and lease commissions).(3) Finance leases include approximately $194.7 million related to a purchase option that the joint venture is
reasonably certain it will exercise in 2028.
New Accounting PronouncementsFor a discussion of the new accounting pronouncements that may have an effect on our Consolidated
Financial Statements (See Note 2 to the Consolidated Financial Statements).
InflationMost of our leases provide for separate real estate tax and operating expense escalations over a base
amount. In addition, many of our leases provide for fixed base rent increases or indexed increases. We believe thatinflationary increases in costs may be at least partially offset by the contractual rent increases and operatingexpense escalations.
109
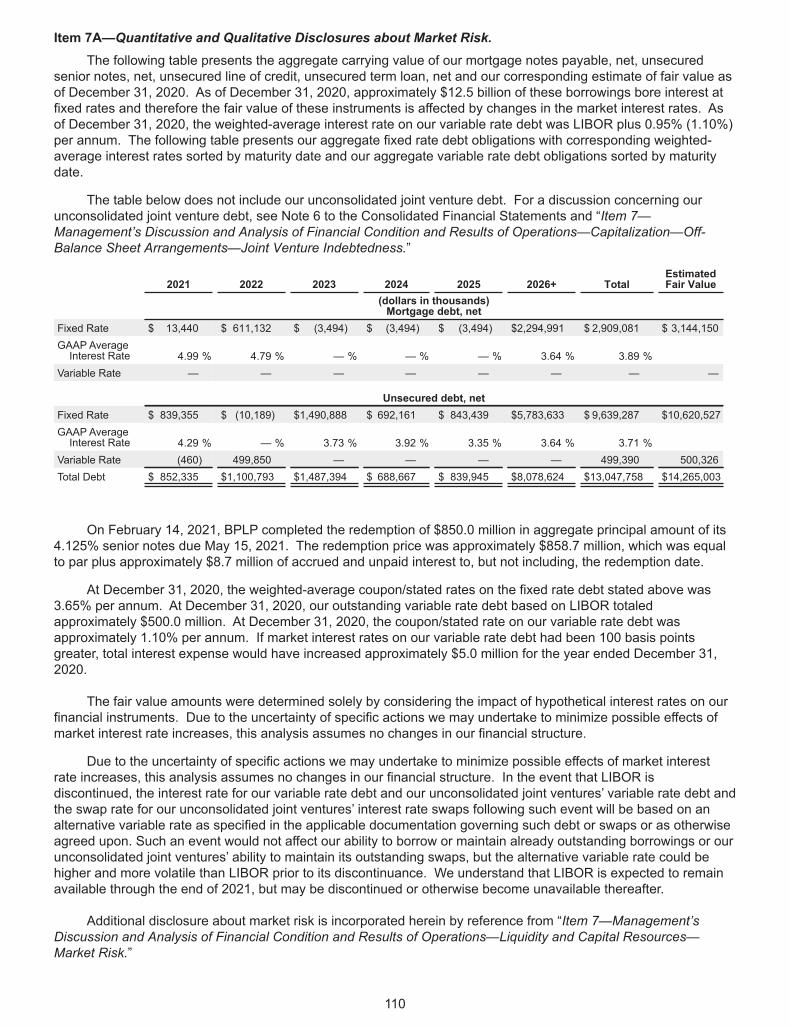
Item 7A—Quantitative and Qualitative Disclosures about Market Risk.The following table presents the aggregate carrying value of our mortgage notes payable, net, unsecured
senior notes, net, unsecured line of credit, unsecured term loan, net and our corresponding estimate of fair value asof December 31, 2020. As of December 31, 2020, approximately $12.5 billion of these borrowings bore interest atfixed rates and therefore the fair value of these instruments is affected by changes in the market interest rates. Asof December 31, 2020, the weighted-average interest rate on our variable rate debt was LIBOR plus 0.95% (1.10%)per annum. The following table presents our aggregate fixed rate debt obligations with corresponding weighted-average interest rates sorted by maturity date and our aggregate variable rate debt obligations sorted by maturitydate.
The table below does not include our unconsolidated joint venture debt. For a discussion concerning ourunconsolidated joint venture debt, see Note 6 to the Consolidated Financial Statements and “Item 7—Management’s Discussion and Analysis of Financial Condition and Results of Operations—Capitalization—Off-Balance Sheet Arrangements—Joint Venture Indebtedness.”
2021 2022 2023 2024 2025 2026+ TotalEstimatedFair Value
(dollars in thousands)Mortgage debt, net
Fixed Rate $ 13,440 $ 611,132 $ (3,494) $ (3,494) $ (3,494) $2,294,991 $ 2,909,081 $ 3,144,150GAAP AverageInterest Rate 4.99 % 4.79 % — % — % — % 3.64 % 3.89 %
Variable Rate — — — — — — — —
Unsecured debt, netFixed Rate $ 839,355 $ (10,189) $1,490,888 $ 692,161 $ 843,439 $5,783,633 $ 9,639,287 $10,620,527GAAP AverageInterest Rate 4.29 % — % 3.73 % 3.92 % 3.35 % 3.64 % 3.71 %
Variable Rate (460) 499,850 — — — — 499,390 500,326Total Debt $ 852,335 $1,100,793 $1,487,394 $ 688,667 $ 839,945 $8,078,624 $13,047,758 $14,265,003
On February 14, 2021, BPLP completed the redemption of $850.0 million in aggregate principal amount of its4.125% senior notes due May 15, 2021. The redemption price was approximately $858.7 million, which was equalto par plus approximately $8.7 million of accrued and unpaid interest to, but not including, the redemption date.
At December 31, 2020, the weighted-average coupon/stated rates on the fixed rate debt stated above was3.65% per annum. At December 31, 2020, our outstanding variable rate debt based on LIBOR totaledapproximately $500.0 million. At December 31, 2020, the coupon/stated rate on our variable rate debt wasapproximately 1.10% per annum. If market interest rates on our variable rate debt had been 100 basis pointsgreater, total interest expense would have increased approximately $5.0 million for the year ended December 31,2020.
The fair value amounts were determined solely by considering the impact of hypothetical interest rates on ourfinancial instruments. Due to the uncertainty of specific actions we may undertake to minimize possible effects ofmarket interest rate increases, this analysis assumes no changes in our financial structure.
Due to the uncertainty of specific actions we may undertake to minimize possible effects of market interestrate increases, this analysis assumes no changes in our financial structure. In the event that LIBOR isdiscontinued, the interest rate for our variable rate debt and our unconsolidated joint ventures’ variable rate debt andthe swap rate for our unconsolidated joint ventures’ interest rate swaps following such event will be based on analternative variable rate as specified in the applicable documentation governing such debt or swaps or as otherwiseagreed upon. Such an event would not affect our ability to borrow or maintain already outstanding borrowings or ourunconsolidated joint ventures’ ability to maintain its outstanding swaps, but the alternative variable rate could behigher and more volatile than LIBOR prior to its discontinuance. We understand that LIBOR is expected to remainavailable through the end of 2021, but may be discontinued or otherwise become unavailable thereafter.
Additional disclosure about market risk is incorporated herein by reference from “Item 7—Management’sDiscussion and Analysis of Financial Condition and Results of Operations—Liquidity and Capital Resources—Market Risk.”
110
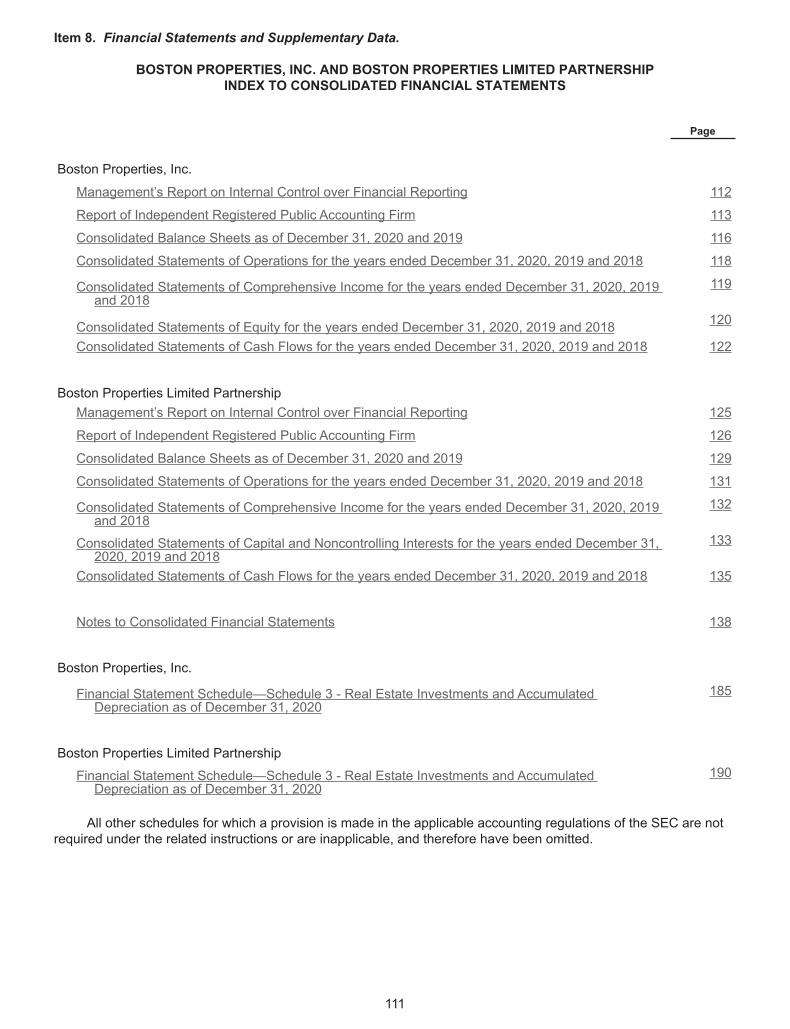
Item 8. Financial Statements and Supplementary Data.
BOSTON PROPERTIES, INC. AND BOSTON PROPERTIES LIMITED PARTNERSHIPINDEX TO CONSOLIDATED FINANCIAL STATEMENTS
Page
Boston Properties, Inc.
Management’s Report on Internal Control over Financial Reporting 112
Report of Independent Registered Public Accounting Firm 113
Consolidated Balance Sheets as of December 31, 2020 and 2019 116
Consolidated Statements of Operations for the years ended December 31, 2020, 2019 and 2018 118
Consolidated Statements of Comprehensive Income for the years ended December 31, 2020, 2019and 2018
119
Consolidated Statements of Equity for the years ended December 31, 2020, 2019 and 2018 120
Consolidated Statements of Cash Flows for the years ended December 31, 2020, 2019 and 2018 122
Boston Properties Limited PartnershipManagement’s Report on Internal Control over Financial Reporting 125
Report of Independent Registered Public Accounting Firm 126
Consolidated Balance Sheets as of December 31, 2020 and 2019 129
Consolidated Statements of Operations for the years ended December 31, 2020, 2019 and 2018 131
Consolidated Statements of Comprehensive Income for the years ended December 31, 2020, 2019and 2018
132
Consolidated Statements of Capital and Noncontrolling Interests for the years ended December 31,2020, 2019 and 2018
133
Consolidated Statements of Cash Flows for the years ended December 31, 2020, 2019 and 2018 135
Notes to Consolidated Financial Statements 138
Boston Properties, Inc.
Financial Statement Schedule—Schedule 3 - Real Estate Investments and AccumulatedDepreciation as of December 31, 2020
185
Boston Properties Limited Partnership
Financial Statement Schedule—Schedule 3 - Real Estate Investments and AccumulatedDepreciation as of December 31, 2020
190
All other schedules for which a provision is made in the applicable accounting regulations of the SEC are notrequired under the related instructions or are inapplicable, and therefore have been omitted.
111
Management’s Report on Internal Control overFinancial Reporting
Management of Boston Properties, Inc. is responsible for establishing and maintaining adequate internalcontrol over financial reporting for Boston Properties, Inc. Boston Properties, Inc.’s internal control over financialreporting is a process designed under the supervision of its principal executive officer and principal financial officerto provide reasonable assurance regarding the reliability of financial reporting and the preparation of BostonProperties, Inc.’s financial statements for external reporting purposes in accordance with U.S. generally acceptedaccounting principles.
As of the end of Boston Properties, Inc.’s 2020 fiscal year, management conducted assessments of theeffectiveness of Boston Properties, Inc.’s internal control over financial reporting based on the frameworkestablished in Internal Control—Integrated Framework (2013) issued by the Committee of SponsoringOrganizations of the Treadway Commission (COSO). Based on these assessments, management has determinedthat Boston Properties, Inc.’s internal control over financial reporting as of December 31, 2020 was effective.
Our internal control over financial reporting includes policies and procedures that (1) pertain to themaintenance of records that, in reasonable detail, accurately and fairly reflect transactions and dispositions of ourassets; (2) provide reasonable assurance that transactions are recorded as necessary to permit preparation offinancial statements in accordance with U.S. generally accepted accounting principles, and that receipts andexpenditures are being made only in accordance with authorizations of management and the directors of BostonProperties, Inc.; and (3) provide reasonable assurance regarding prevention or timely detection of unauthorizedacquisition, use or disposition of Boston Properties, Inc.’s assets that could have a material effect on its financialstatements.
The effectiveness of Boston Properties, Inc.’s internal control over financial reporting as of December 31, 2020has been audited by PricewaterhouseCoopers LLP, an independent registered public accounting firm, as stated inits report appearing on page 113, which expresses an unqualified opinion on the effectiveness of Boston Properties,Inc.’s internal control over financial reporting as of December 31, 2020.
112
Report of Independent Registered Public Accounting Firm
To the Board of Directors and Stockholders of Boston Properties, Inc.
Opinions on the Financial Statements and Internal Control over Financial Reporting
We have audited the accompanying consolidated balance sheets of Boston Properties, Inc. and its subsidiaries (the“Company”) as of December 31, 2020 and 2019, and the related consolidated statements of operations, ofcomprehensive income, of equity and of cash flows for each of the three years in the period ended December 31,2020, including the related notes and financial statement schedule listed in the accompanying index (collectivelyreferred to as the “consolidated financial statements”). We also have audited the Company's internal control overfinancial reporting as of December 31, 2020, based on criteria established in Internal Control - IntegratedFramework (2013) issued by the Committee of Sponsoring Organizations of the Treadway Commission (COSO).
In our opinion, the consolidated financial statements referred to above present fairly, in all material respects, thefinancial position of the Company as of December 31, 2020 and 2019, and the results of its operations and its cashflows for each of the three years in the period ended December 31, 2020 in conformity with accounting principlesgenerally accepted in the United States of America. Also in our opinion, the Company maintained, in all materialrespects, effective internal control over financial reporting as of December 31, 2020, based on criteria established inInternal Control - Integrated Framework (2013) issued by the COSO.
Basis for Opinions
The Company's management is responsible for these consolidated financial statements, for maintaining effectiveinternal control over financial reporting, and for its assessment of the effectiveness of internal control over financialreporting, included in the accompanying Management’s Report on Internal Control over Financial Reporting. Ourresponsibility is to express opinions on the Company’s consolidated financial statements and on the Company'sinternal control over financial reporting based on our audits. We are a public accounting firm registered with thePublic Company Accounting Oversight Board (United States) (PCAOB) and are required to be independent withrespect to the Company in accordance with the U.S. federal securities laws and the applicable rules and regulationsof the Securities and Exchange Commission and the PCAOB.
We conducted our audits in accordance with the standards of the PCAOB. Those standards require that we planand perform the audits to obtain reasonable assurance about whether the consolidated financial statements are freeof material misstatement, whether due to error or fraud, and whether effective internal control over financialreporting was maintained in all material respects.
Our audits of the consolidated financial statements included performing procedures to assess the risks of materialmisstatement of the consolidated financial statements, whether due to error or fraud, and performing proceduresthat respond to those risks. Such procedures included examining, on a test basis, evidence regarding the amountsand disclosures in the consolidated financial statements. Our audits also included evaluating the accountingprinciples used and significant estimates made by management, as well as evaluating the overall presentation ofthe consolidated financial statements. Our audit of internal control over financial reporting included obtaining anunderstanding of internal control over financial reporting, assessing the risk that a material weakness exists, andtesting and evaluating the design and operating effectiveness of internal control based on the assessed risk. Ouraudits also included performing such other procedures as we considered necessary in the circumstances. Webelieve that our audits provide a reasonable basis for our opinions.
Definition and Limitations of Internal Control over Financial Reporting
A company’s internal control over financial reporting is a process designed to provide reasonable assuranceregarding the reliability of financial reporting and the preparation of financial statements for external purposes inaccordance with generally accepted accounting principles. A company’s internal control over financial reportingincludes those policies and procedures that (i) pertain to the maintenance of records that, in reasonable detail,accurately and fairly reflect the transactions and dispositions of the assets of the company; (ii) provide reasonableassurance that transactions are recorded as necessary to permit preparation of financial statements in accordancewith generally accepted accounting principles, and that receipts and expenditures of the company are being madeonly in accordance with authorizations of management and directors of the company; and (iii) provide reasonableassurance regarding prevention or timely detection of unauthorized acquisition, use, or disposition of the company’sassets that could have a material effect on the financial statements.
113
Because of its inherent limitations, internal control over financial reporting may not prevent or detect misstatements.Also, projections of any evaluation of effectiveness to future periods are subject to the risk that controls maybecome inadequate because of changes in conditions, or that the degree of compliance with the policies orprocedures may deteriorate.
Critical Audit Matters
The critical audit matter communicated below is a matter arising from the current period audit of the consolidatedfinancial statements that was communicated or required to be communicated to the audit committee and that (i)relates to accounts or disclosures that are material to the consolidated financial statements and (ii) involved ourespecially challenging, subjective, or complex judgments. The communication of critical audit matters does not alterin any way our opinion on the consolidated financial statements, taken as a whole, and we are not, bycommunicating the critical audit matter below, providing a separate opinion on the critical audit matter or on theaccounts or disclosures to which it relates.
Impairment Assessments of Long-Lived Assets and Investments in Unconsolidated Joint Ventures
As described in Notes 2, 3 and 6 to the consolidated financial statements, the Company’s total real estate balancewas $17,818.8 million and its investments in unconsolidated joint ventures was $1,273.9 million as of December 31,2020. During 2020, the Company did not recognize an impairment loss related to its long-lived assets andrecognized a $60.5 million other-than-temporary-impairment loss related to an investment in unconsolidated jointventure. Management reviews its long-lived assets for indicators of impairment following the end of each quarterand when events or changes in circumstances indicate that the carrying amount of the asset may not berecoverable. This evaluation of long-lived assets is dependent on a number of factors, including when there is anevent or adverse change in the operating performance of the long-lived asset or a current expectation that, morelikely than not, a long-lived asset will be sold or otherwise disposed of significantly before the end of its previouslyestimated useful life or hold period. Management reviews its unconsolidated joint ventures for indicators ofimpairment on a quarterly basis and records impairment charges when events or circumstances change indicatingthat a decline in the fair values below the carrying amounts has occurred and such decline is other-than-temporary.This evaluation of the investments in unconsolidated joint ventures is dependent on a number of factors, includingthe performance of each investment and market conditions. The Company will record an impairment charge if itdetermines that a decline in the fair value below the carrying amount of an investment in an unconsolidated jointventure is other-than-temporary. The fair value is calculated using discounted cash flows which is subjective andconsiders assumptions regarding future occupancy, future rental rates, future capital requirements, discount ratesand capitalization rates.
The principal considerations for our determination that performing procedures relating to the impairmentassessments of long-lived assets and investments in unconsolidated joint ventures is a critical audit matter are (i)the significant judgment by management in identifying the indicators of impairment for long lived assets, which inturn led to a high degree of auditor judgment, subjectivity and effort in performing procedures and evaluatingevidence related to identifying the indicators of impairment for long-lived assets; (ii) the significant judgment bymanagement in identifying the indicators of impairment for investments in unconsolidated joint ventures, which inturn led to a high degree of auditor judgment, subjectivity and effort in performing procedures and evaluatingevidence related to the indicators of impairment for investments in unconsolidated joint ventures; (iii) the significantjudgment by management when developing the fair value measurement of the investments in unconsolidated jointventures relating to potential other-than-temporary impairments, which in turn led to a high degree of auditorjudgment, subjectivity and effort in performing procedures and evaluating management’s assumptions related tofuture occupancy, future rental rates, future capital requirements, discount rate and capitalization rate; and, (iv) theaudit effort involved the use of professionals with specialized skill and knowledge.
Addressing the matter involved performing procedures and evaluating audit evidence in connection with forming ouroverall opinion on the consolidated financial statements. These procedures included testing the effectiveness ofcontrols relating to (i) the identification of the indicators of impairment for long-lived assets, (ii) the identification ofthe indicators of impairment for investments in unconsolidated joint ventures, and (iii) developing the fair valuemeasurement of the investments in unconsolidated joint ventures in the evaluation of potential other-than-temporaryimpairments. For the long-lived assets, the procedures included, among others, evaluating the reasonableness ofmanagement’s assessment of the indicators of impairment for long lived assets by considering the anticipated holdperiod, market economic conditions, operating performance of the asset, or evidence obtained in other areas of theaudit that may be indicative of an indicator of impairment of the long-lived assets. For the investments inunconsolidated joint ventures, the procedures, included, among others, (i) evaluating the reasonableness of
114
management’s identification of changes in the performance of each investment and market conditions indicatingthat there may be a decline in the fair values of the investments in unconsolidated joint ventures below the carryingamounts has occurred and such decline is other-than-temporary by considering changes in the performance of theinvestments and market conditions, or evidence obtained in other areas of the audit and (ii) evaluating thereasonableness of aforementioned assumptions, by consideration of the past performance of the investment inunconsolidated joint ventures and whether the assumptions were consistent with evidence obtained in other areasof the audit. Professionals with specialized skill and knowledge were used to assist in the evaluation theappropriateness of the discounted cash flow model and reasonableness of the assumptions.
/s/ PricewaterhouseCoopers LLPBoston, MassachusettsFebruary 26, 2021
We have served as the Company’s auditor since 1997.
115
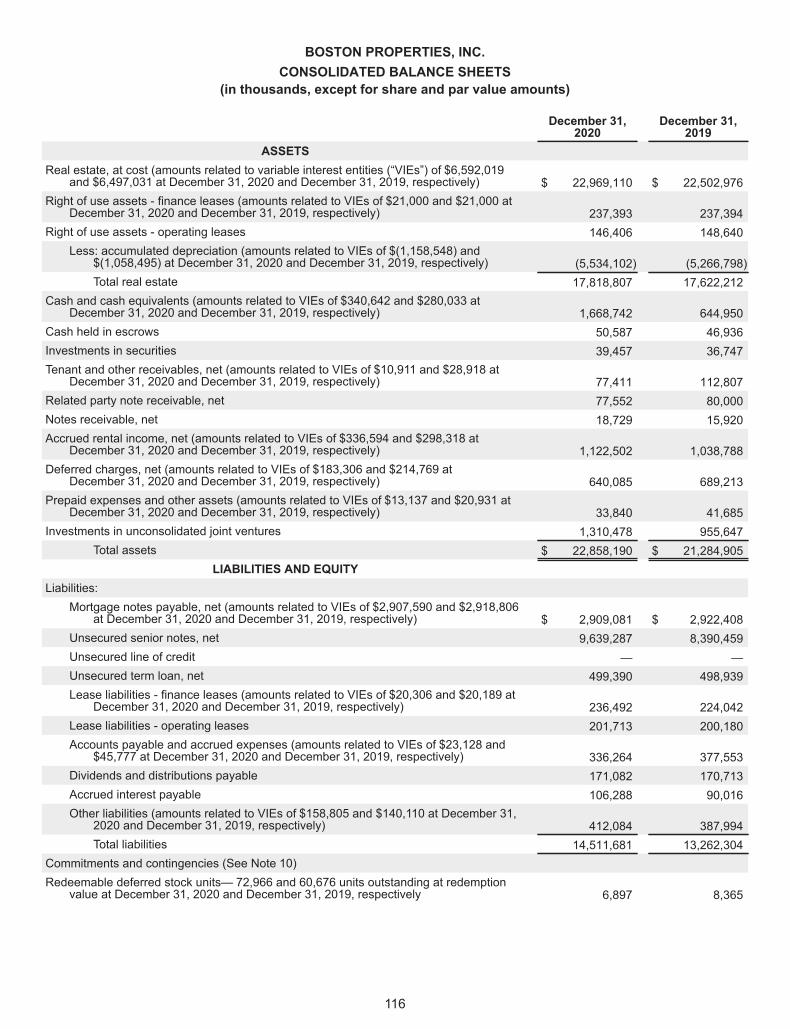
BOSTON PROPERTIES, INC.CONSOLIDATED BALANCE SHEETS
(in thousands, except for share and par value amounts)
December 31,2020
December 31,2019
ASSETSReal estate, at cost (amounts related to variable interest entities (“VIEs”) of $6,592,019
and $6,497,031 at December 31, 2020 and December 31, 2019, respectively) $ 22,969,110 $ 22,502,976Right of use assets - finance leases (amounts related to VIEs of $21,000 and $21,000 at
December 31, 2020 and December 31, 2019, respectively) 237,393 237,394Right of use assets - operating leases 146,406 148,640
Less: accumulated depreciation (amounts related to VIEs of $(1,158,548) and$(1,058,495) at December 31, 2020 and December 31, 2019, respectively) (5,534,102) (5,266,798)Total real estate 17,818,807 17,622,212
Cash and cash equivalents (amounts related to VIEs of $340,642 and $280,033 atDecember 31, 2020 and December 31, 2019, respectively) 1,668,742 644,950
Cash held in escrows 50,587 46,936Investments in securities 39,457 36,747Tenant and other receivables, net (amounts related to VIEs of $10,911 and $28,918 at
December 31, 2020 and December 31, 2019, respectively) 77,411 112,807Related party note receivable, net 77,552 80,000Notes receivable, net 18,729 15,920Accrued rental income, net (amounts related to VIEs of $336,594 and $298,318 at
December 31, 2020 and December 31, 2019, respectively) 1,122,502 1,038,788Deferred charges, net (amounts related to VIEs of $183,306 and $214,769 at
December 31, 2020 and December 31, 2019, respectively) 640,085 689,213Prepaid expenses and other assets (amounts related to VIEs of $13,137 and $20,931 at
December 31, 2020 and December 31, 2019, respectively) 33,840 41,685Investments in unconsolidated joint ventures 1,310,478 955,647
Total assets $ 22,858,190 $ 21,284,905LIABILITIES AND EQUITY
Liabilities:Mortgage notes payable, net (amounts related to VIEs of $2,907,590 and $2,918,806
at December 31, 2020 and December 31, 2019, respectively) $ 2,909,081 $ 2,922,408Unsecured senior notes, net 9,639,287 8,390,459Unsecured line of credit — —Unsecured term loan, net 499,390 498,939Lease liabilities - finance leases (amounts related to VIEs of $20,306 and $20,189 at
December 31, 2020 and December 31, 2019, respectively) 236,492 224,042Lease liabilities - operating leases 201,713 200,180Accounts payable and accrued expenses (amounts related to VIEs of $23,128 and
$45,777 at December 31, 2020 and December 31, 2019, respectively) 336,264 377,553Dividends and distributions payable 171,082 170,713Accrued interest payable 106,288 90,016Other liabilities (amounts related to VIEs of $158,805 and $140,110 at December 31,
2020 and December 31, 2019, respectively) 412,084 387,994Total liabilities 14,511,681 13,262,304
Commitments and contingencies (See Note 10)Redeemable deferred stock units— 72,966 and 60,676 units outstanding at redemption
value at December 31, 2020 and December 31, 2019, respectively 6,897 8,365
116
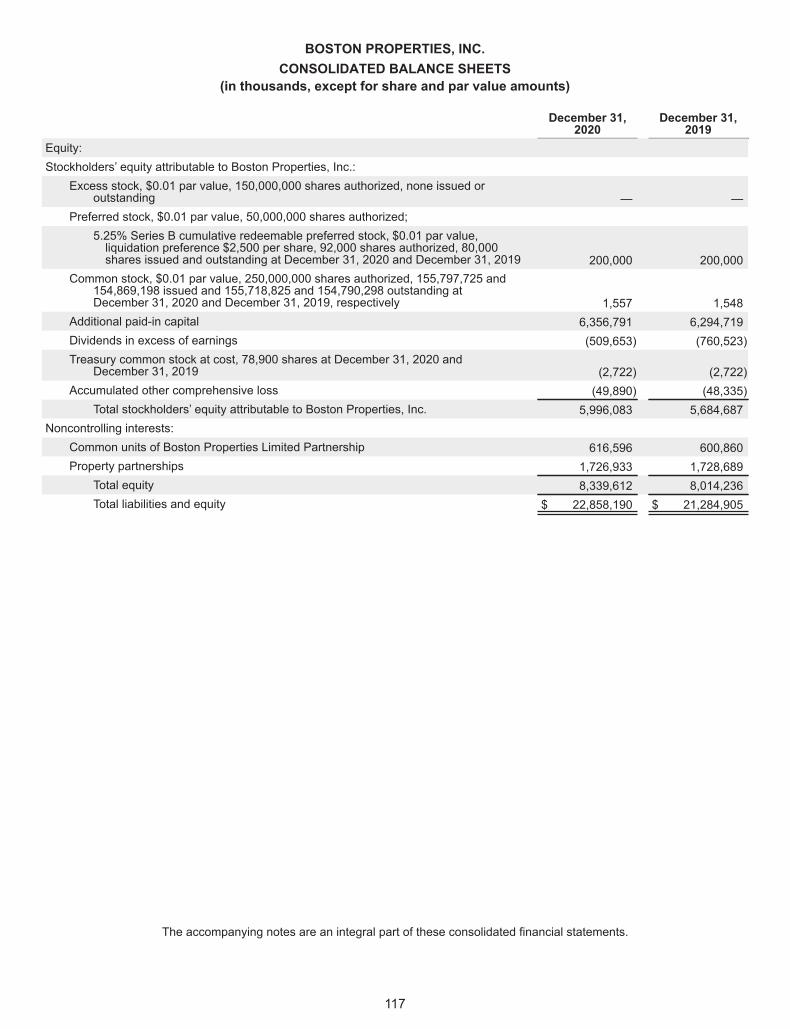
BOSTON PROPERTIES, INC.CONSOLIDATED BALANCE SHEETS
(in thousands, except for share and par value amounts)
December 31,2020
December 31,2019
Equity:Stockholders’ equity attributable to Boston Properties, Inc.:
Excess stock, $0.01 par value, 150,000,000 shares authorized, none issued oroutstanding — —
Preferred stock, $0.01 par value, 50,000,000 shares authorized;5.25% Series B cumulative redeemable preferred stock, $0.01 par value,liquidation preference $2,500 per share, 92,000 shares authorized, 80,000shares issued and outstanding at December 31, 2020 and December 31, 2019 200,000 200,000
Common stock, $0.01 par value, 250,000,000 shares authorized, 155,797,725 and154,869,198 issued and 155,718,825 and 154,790,298 outstanding atDecember 31, 2020 and December 31, 2019, respectively 1,557 1,548
Additional paid-in capital 6,356,791 6,294,719Dividends in excess of earnings (509,653) (760,523)Treasury common stock at cost, 78,900 shares at December 31, 2020 and
December 31, 2019 (2,722) (2,722)Accumulated other comprehensive loss (49,890) (48,335)
Total stockholders’ equity attributable to Boston Properties, Inc. 5,996,083 5,684,687Noncontrolling interests:
Common units of Boston Properties Limited Partnership 616,596 600,860Property partnerships 1,726,933 1,728,689
Total equity 8,339,612 8,014,236Total liabilities and equity $ 22,858,190 $ 21,284,905
The accompanying notes are an integral part of these consolidated financial statements.
117
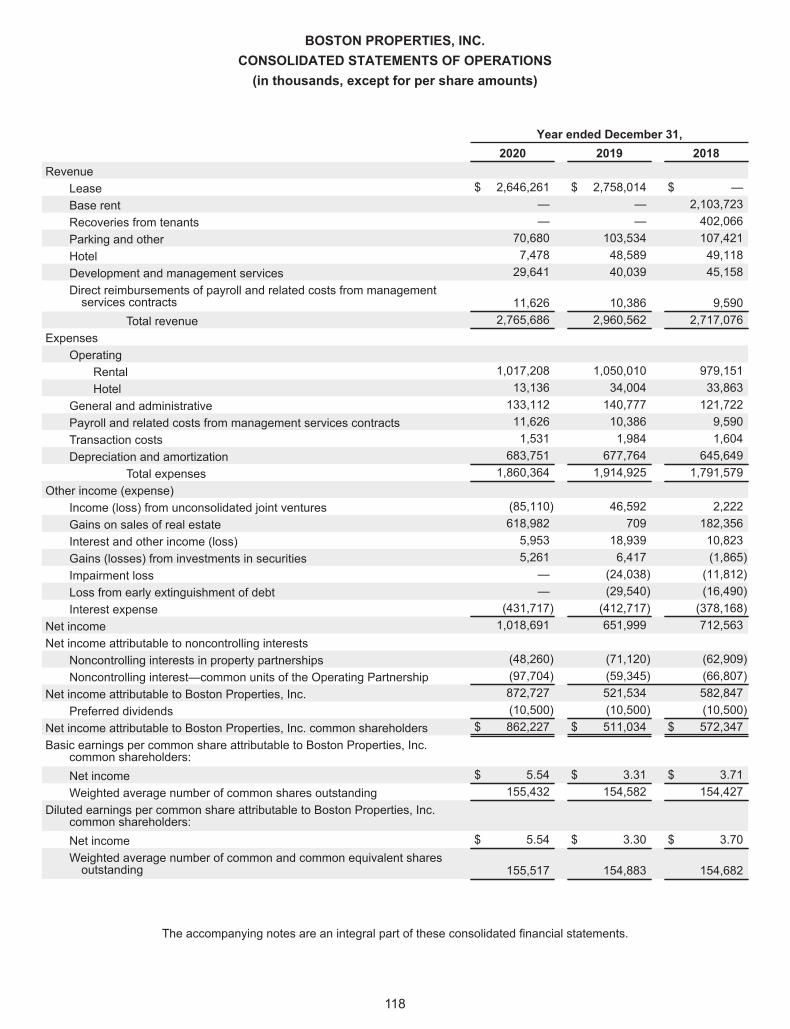
BOSTON PROPERTIES, INC.CONSOLIDATED STATEMENTS OF OPERATIONS(in thousands, except for per share amounts)
Year ended December 31,2020 2019 2018
RevenueLease $ 2,646,261 $ 2,758,014 $ —Base rent — — 2,103,723Recoveries from tenants — — 402,066Parking and other 70,680 103,534 107,421Hotel 7,478 48,589 49,118Development and management services 29,641 40,039 45,158Direct reimbursements of payroll and related costs from managementservices contracts 11,626 10,386 9,590
Total revenue 2,765,686 2,960,562 2,717,076Expenses
OperatingRental 1,017,208 1,050,010 979,151Hotel 13,136 34,004 33,863
General and administrative 133,112 140,777 121,722Payroll and related costs from management services contracts 11,626 10,386 9,590Transaction costs 1,531 1,984 1,604Depreciation and amortization 683,751 677,764 645,649
Total expenses 1,860,364 1,914,925 1,791,579Other income (expense)
Income (loss) from unconsolidated joint ventures (85,110) 46,592 2,222Gains on sales of real estate 618,982 709 182,356Interest and other income (loss) 5,953 18,939 10,823Gains (losses) from investments in securities 5,261 6,417 (1,865)Impairment loss — (24,038) (11,812)Loss from early extinguishment of debt — (29,540) (16,490)Interest expense (431,717) (412,717) (378,168)
Net income 1,018,691 651,999 712,563Net income attributable to noncontrolling interests
Noncontrolling interests in property partnerships (48,260) (71,120) (62,909)Noncontrolling interest—common units of the Operating Partnership (97,704) (59,345) (66,807)
Net income attributable to Boston Properties, Inc. 872,727 521,534 582,847Preferred dividends (10,500) (10,500) (10,500)
Net income attributable to Boston Properties, Inc. common shareholders $ 862,227 $ 511,034 $ 572,347Basic earnings per common share attributable to Boston Properties, Inc.
common shareholders:Net income $ 5.54 $ 3.31 $ 3.71Weighted average number of common shares outstanding 155,432 154,582 154,427
Diluted earnings per common share attributable to Boston Properties, Inc.common shareholders:Net income $ 5.54 $ 3.30 $ 3.70Weighted average number of common and common equivalent sharesoutstanding 155,517 154,883 154,682
The accompanying notes are an integral part of these consolidated financial statements.
118
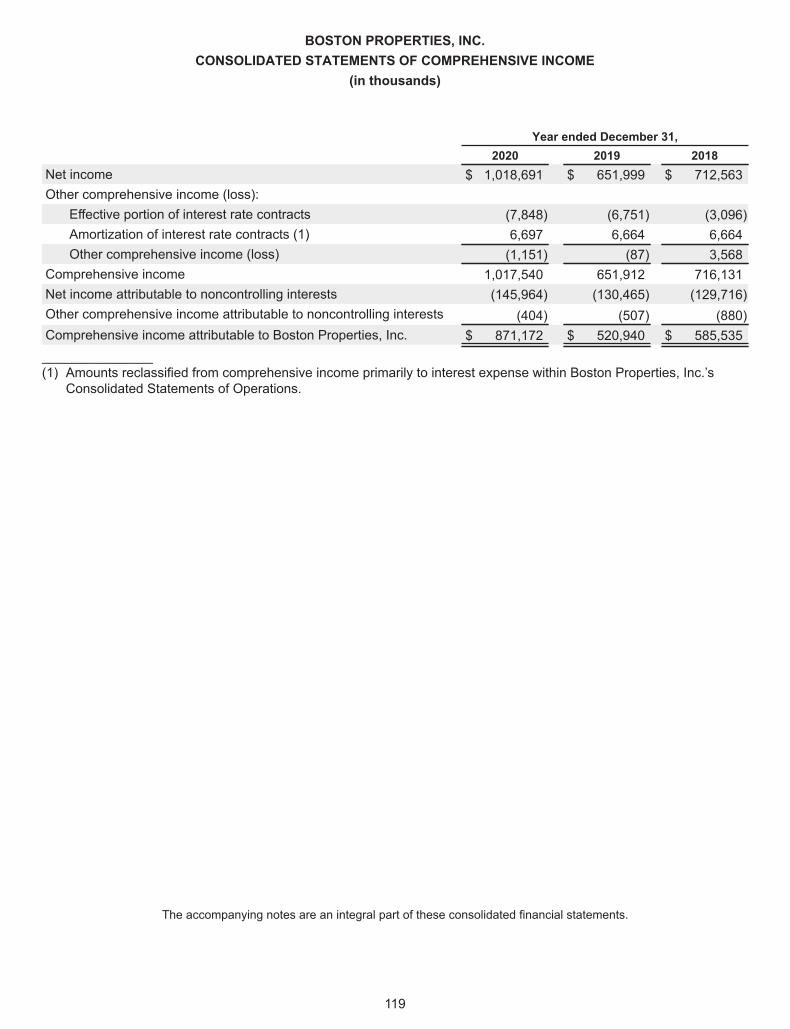
BOSTON PROPERTIES, INC.CONSOLIDATED STATEMENTS OF COMPREHENSIVE INCOME
(in thousands)
Year ended December 31,2020 2019 2018
Net income $ 1,018,691 $ 651,999 $ 712,563Other comprehensive income (loss):
Effective portion of interest rate contracts (7,848) (6,751) (3,096)Amortization of interest rate contracts (1) 6,697 6,664 6,664Other comprehensive income (loss) (1,151) (87) 3,568
Comprehensive income 1,017,540 651,912 716,131Net income attributable to noncontrolling interests (145,964) (130,465) (129,716)Other comprehensive income attributable to noncontrolling interests (404) (507) (880)Comprehensive income attributable to Boston Properties, Inc. $ 871,172 $ 520,940 $ 585,535_______________(1) Amounts reclassified from comprehensive income primarily to interest expense within Boston Properties, Inc.’s
Consolidated Statements of Operations.
The accompanying notes are an integral part of these consolidated financial statements.
119
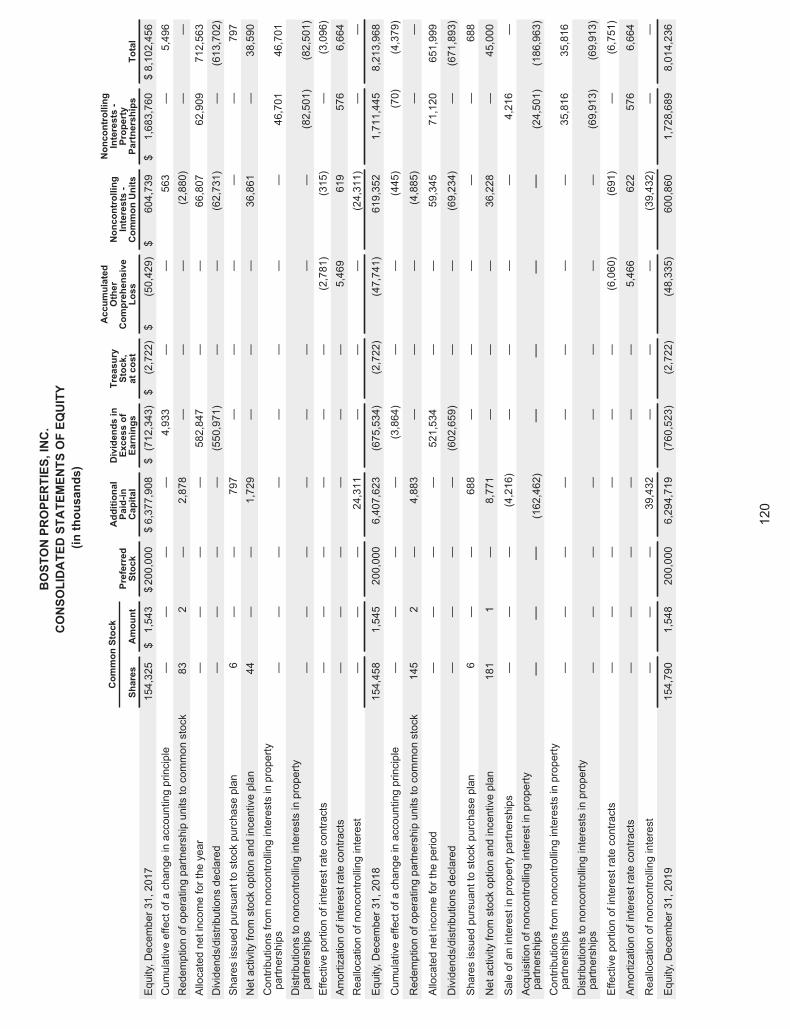
BOSTONPROPERTIES,INC.
CONSOLIDATEDSTATEMENTS
OFEQUITY
(inthousands)
Common
Stock
Preferred
Stock
Additional
Paid-in
Capital
Dividendsin
Excessof
Earnings
Treasury
Stock,
atcost
Accumulated
Other
Comprehensive
Loss
Noncontrolling
Interests-
CommonUnits
Noncontrolling
Interests-
Property
Partnerships
Total
Shares
Amount
Equity,December31,2017
154,325
$1,543
$200,000
$6,377,908
$(712,343)$
(2,722)$
(50,429)
$604,739
$1,683,760
$8,102,456
Cumulativeeffectofachangeinaccountingprinciple
——
——
4,933
——
563
—5,496
Redemptionofoperatingpartnershipunitstocommonstock
832
—2,878
——
—(2,880)
——
Allocatednetincomefortheyear
——
——
582,847
——
66,807
62,909
712,563
Dividends/distributionsdeclared
——
——
(550,971)
——
(62,731)
—(613,702)
Sharesissuedpursuanttostockpurchaseplan
6—
—797
——
——
—797
Netactivityfromstockoptionandincentiveplan
44—
—1,729
——
—36,861
—38,590
Contributionsfromnoncontrollinginterestsinproperty
partnerships
——
——
——
——
46,701
46,701
Distributionstononcontrollinginterestsinproperty
partnerships
——
——
——
——
(82,501)
(82,501)
Effectiveportionofinterestratecontracts
——
——
——
(2,781)
(315)
—(3,096)
Amortizationofinterestratecontracts
——
——
——
5,469
619
576
6,664
Reallocationofnoncontrollinginterest
——
—24,311
——
—(24,311)
——
Equity,December31,2018
154,458
1,545
200,000
6,407,623
(675,534)
(2,722)
(47,741)
619,352
1,711,445
8,213,968
Cumulativeeffectofachangeinaccountingprinciple
——
——
(3,864)
——
(445)
(70)
(4,379)
Redemptionofoperatingpartnershipunitstocommonstock
145
2—
4,883
——
—(4,885)
——
Allocatednetincomefortheperiod
——
——
521,534
——
59,345
71,120
651,999
Dividends/distributionsdeclared
——
——
(602,659)
——
(69,234)
—(671,893)
Sharesissuedpursuanttostockpurchaseplan
6—
—688
——
——
—688
Netactivityfromstockoptionandincentiveplan
181
1—
8,771
——
—36,228
—45,000
Saleofaninterestinpropertypartnerships
——
—(4,216)
——
——
4,216
—Acquisitionofnoncontrollinginterestinproperty
partnerships
——
—(162,462)
——
——
(24,501)
(186,963)
Contributionsfromnoncontrollinginterestsinproperty
partnerships
——
——
——
——
35,816
35,816
Distributionstononcontrollinginterestsinproperty
partnerships
——
——
——
——
(69,913)
(69,913)
Effectiveportionofinterestratecontracts
——
——
——
(6,060)
(691)
—(6,751)
Amortizationofinterestratecontracts
——
——
——
5,466
622
576
6,664
Reallocationofnoncontrollinginterest
——
—39,432
——
—(39,432)
——
Equity,December31,2019
154,790
1,548
200,000
6,294,719
(760,523)
(2,722)
(48,335)
600,860
1,728,689
8,014,236
120
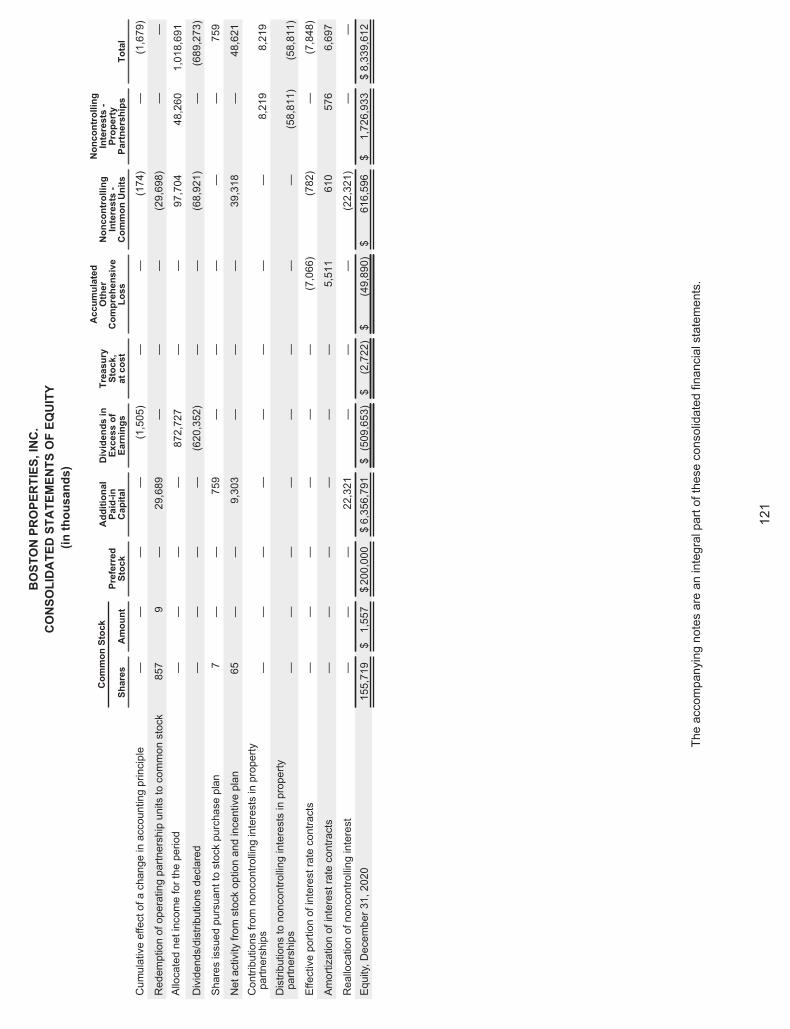
BOSTONPROPERTIES,INC.
CONSOLIDATEDSTATEMENTS
OFEQUITY
(inthousands)
Common
Stock
Preferred
Stock
Additional
Paid-in
Capital
Dividendsin
Excessof
Earnings
Treasury
Stock,
atcost
Accumulated
Other
Comprehensive
Loss
Noncontrolling
Interests-
CommonUnits
Noncontrolling
Interests-
Property
Partnerships
Total
Shares
Amount
Cumulativeeffectofachangeinaccountingprinciple
——
——
(1,505)
——
(174)
—(1,679)
Redemptionofoperatingpartnershipunitstocommonstock
857
9—
29,689
——
—(29,698)
——
Allocatednetincomefortheperiod
——
——
872,727
——
97,704
48,260
1,018,691
Dividends/distributionsdeclared
——
——
(620,352)
——
(68,921)
—(689,273)
Sharesissuedpursuanttostockpurchaseplan
7—
—759
——
——
—759
Netactivityfromstockoptionandincentiveplan
65—
—9,303
——
—39,318
—48,621
Contributionsfromnoncontrollinginterestsinproperty
partnerships
——
——
——
——
8,219
8,219
Distributionstononcontrollinginterestsinproperty
partnerships
——
——
——
——
(58,811)
(58,811)
Effectiveportionofinterestratecontracts
——
——
——
(7,066)
(782)
—(7,848)
Amortizationofinterestratecontracts
——
——
——
5,511
610
576
6,697
Reallocationofnoncontrollinginterest
——
—22,321
——
—(22,321)
——
Equity,December31,2020
155,719
$1,557
$200,000
$6,356,791
$(509,653)$
(2,722)$
(49,890)
$616,596
$1,726,933
$8,339,612
Theaccompanyingnotesareanintegralpartoftheseconsolidatedfinancialstatements.
121
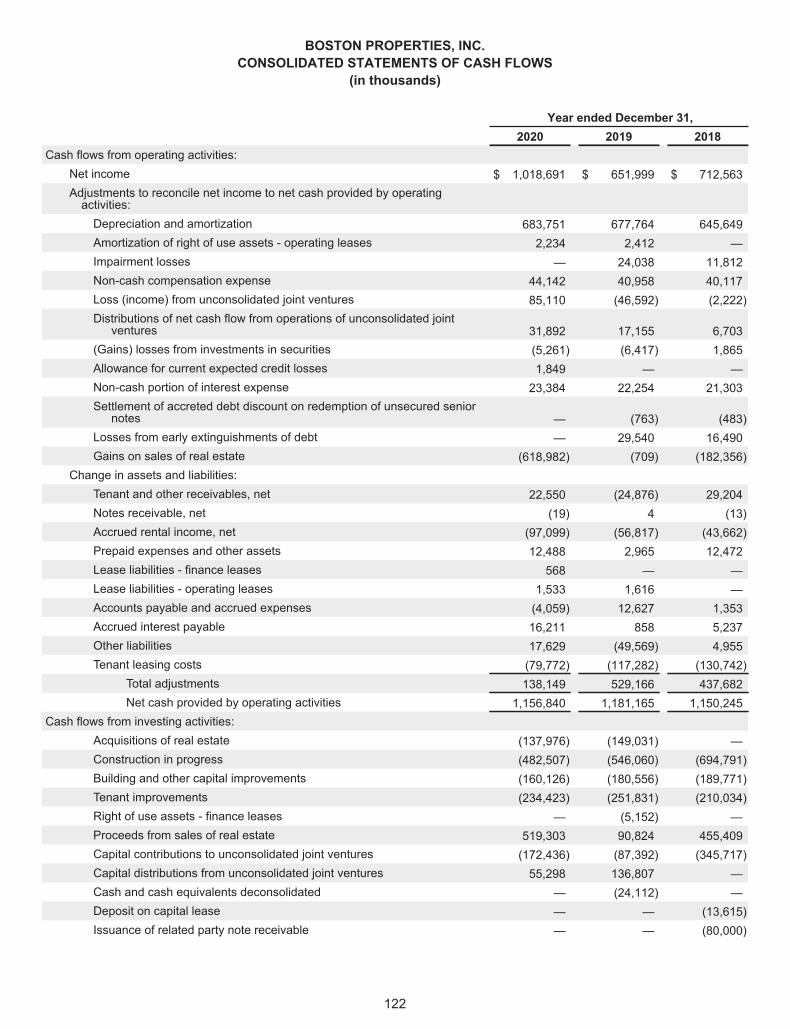
BOSTON PROPERTIES, INC.CONSOLIDATED STATEMENTS OF CASH FLOWS
(in thousands)
Year ended December 31,2020 2019 2018
Cash flows from operating activities:Net income $ 1,018,691 $ 651,999 $ 712,563Adjustments to reconcile net income to net cash provided by operatingactivities:Depreciation and amortization 683,751 677,764 645,649Amortization of right of use assets - operating leases 2,234 2,412 —Impairment losses — 24,038 11,812Non-cash compensation expense 44,142 40,958 40,117Loss (income) from unconsolidated joint ventures 85,110 (46,592) (2,222)Distributions of net cash flow from operations of unconsolidated jointventures 31,892 17,155 6,703
(Gains) losses from investments in securities (5,261) (6,417) 1,865Allowance for current expected credit losses 1,849 — —Non-cash portion of interest expense 23,384 22,254 21,303Settlement of accreted debt discount on redemption of unsecured senior
notes — (763) (483)Losses from early extinguishments of debt — 29,540 16,490Gains on sales of real estate (618,982) (709) (182,356)
Change in assets and liabilities:Tenant and other receivables, net 22,550 (24,876) 29,204Notes receivable, net (19) 4 (13)Accrued rental income, net (97,099) (56,817) (43,662)Prepaid expenses and other assets 12,488 2,965 12,472Lease liabilities - finance leases 568 — —Lease liabilities - operating leases 1,533 1,616 —Accounts payable and accrued expenses (4,059) 12,627 1,353Accrued interest payable 16,211 858 5,237Other liabilities 17,629 (49,569) 4,955Tenant leasing costs (79,772) (117,282) (130,742)
Total adjustments 138,149 529,166 437,682Net cash provided by operating activities 1,156,840 1,181,165 1,150,245
Cash flows from investing activities:Acquisitions of real estate (137,976) (149,031) —Construction in progress (482,507) (546,060) (694,791)Building and other capital improvements (160,126) (180,556) (189,771)Tenant improvements (234,423) (251,831) (210,034)Right of use assets - finance leases — (5,152) —Proceeds from sales of real estate 519,303 90,824 455,409Capital contributions to unconsolidated joint ventures (172,436) (87,392) (345,717)Capital distributions from unconsolidated joint ventures 55,298 136,807 —Cash and cash equivalents deconsolidated — (24,112) —Deposit on capital lease — — (13,615)Issuance of related party note receivable — — (80,000)
122
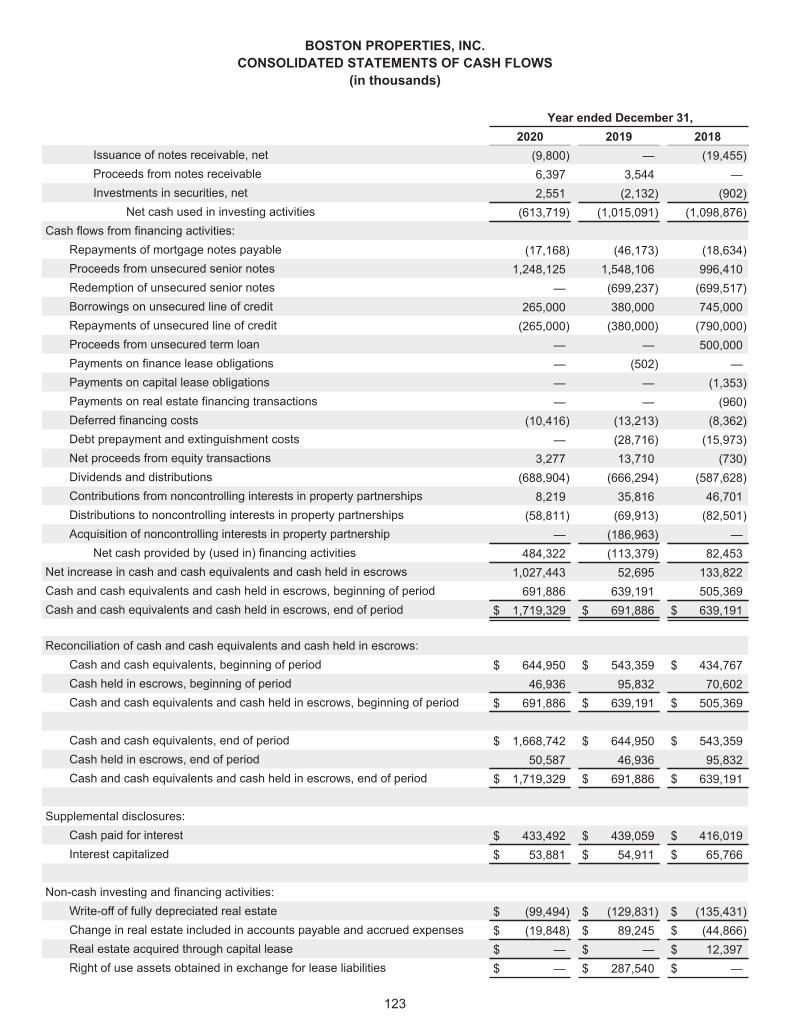
BOSTON PROPERTIES, INC.CONSOLIDATED STATEMENTS OF CASH FLOWS
(in thousands)
Year ended December 31,2020 2019 2018
Issuance of notes receivable, net (9,800) — (19,455)Proceeds from notes receivable 6,397 3,544 —Investments in securities, net 2,551 (2,132) (902)
Net cash used in investing activities (613,719) (1,015,091) (1,098,876)Cash flows from financing activities:
Repayments of mortgage notes payable (17,168) (46,173) (18,634)Proceeds from unsecured senior notes 1,248,125 1,548,106 996,410Redemption of unsecured senior notes — (699,237) (699,517)Borrowings on unsecured line of credit 265,000 380,000 745,000Repayments of unsecured line of credit (265,000) (380,000) (790,000)Proceeds from unsecured term loan — — 500,000Payments on finance lease obligations — (502) —Payments on capital lease obligations — — (1,353)Payments on real estate financing transactions — — (960)Deferred financing costs (10,416) (13,213) (8,362)Debt prepayment and extinguishment costs — (28,716) (15,973)Net proceeds from equity transactions 3,277 13,710 (730)Dividends and distributions (688,904) (666,294) (587,628)Contributions from noncontrolling interests in property partnerships 8,219 35,816 46,701Distributions to noncontrolling interests in property partnerships (58,811) (69,913) (82,501)Acquisition of noncontrolling interests in property partnership — (186,963) —
Net cash provided by (used in) financing activities 484,322 (113,379) 82,453Net increase in cash and cash equivalents and cash held in escrows 1,027,443 52,695 133,822Cash and cash equivalents and cash held in escrows, beginning of period 691,886 639,191 505,369Cash and cash equivalents and cash held in escrows, end of period $ 1,719,329 $ 691,886 $ 639,191
Reconciliation of cash and cash equivalents and cash held in escrows:Cash and cash equivalents, beginning of period $ 644,950 $ 543,359 $ 434,767Cash held in escrows, beginning of period 46,936 95,832 70,602Cash and cash equivalents and cash held in escrows, beginning of period $ 691,886 $ 639,191 $ 505,369
Cash and cash equivalents, end of period $ 1,668,742 $ 644,950 $ 543,359Cash held in escrows, end of period 50,587 46,936 95,832Cash and cash equivalents and cash held in escrows, end of period $ 1,719,329 $ 691,886 $ 639,191
Supplemental disclosures:Cash paid for interest $ 433,492 $ 439,059 $ 416,019Interest capitalized $ 53,881 $ 54,911 $ 65,766
Non-cash investing and financing activities:Write-off of fully depreciated real estate $ (99,494) $ (129,831) $ (135,431)Change in real estate included in accounts payable and accrued expenses $ (19,848) $ 89,245 $ (44,866)Real estate acquired through capital lease $ — $ — $ 12,397Right of use assets obtained in exchange for lease liabilities $ — $ 287,540 $ —
123
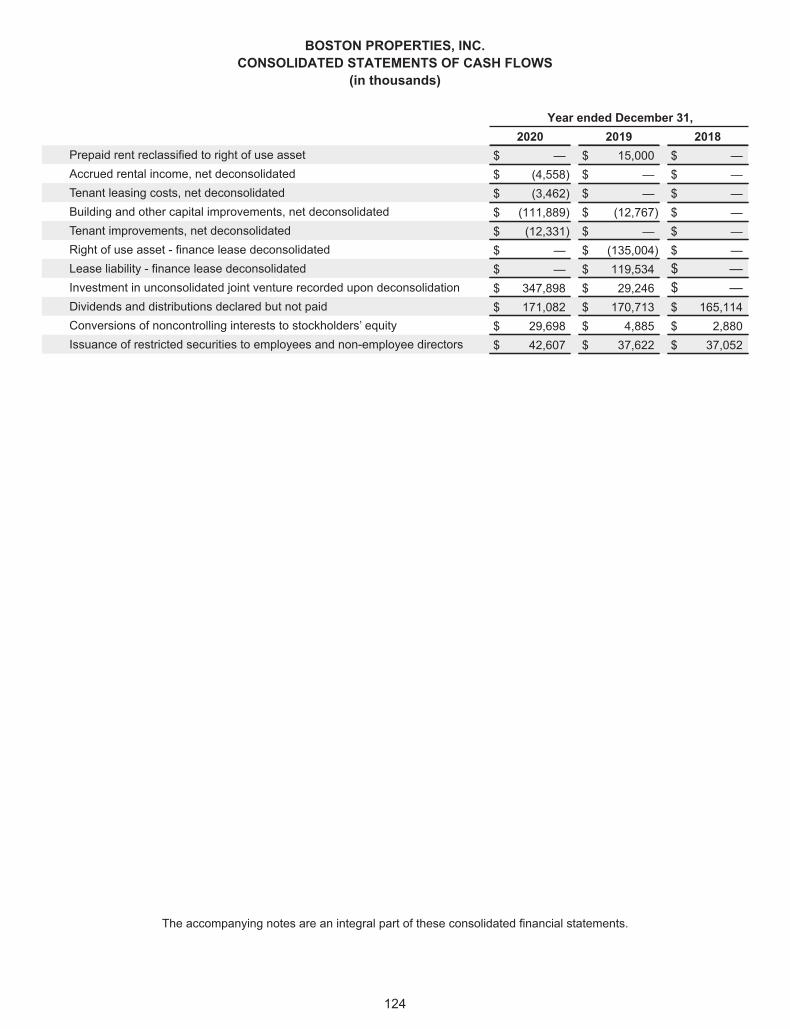
BOSTON PROPERTIES, INC.CONSOLIDATED STATEMENTS OF CASH FLOWS
(in thousands)
Year ended December 31,2020 2019 2018
Prepaid rent reclassified to right of use asset $ — $ 15,000 $ —Accrued rental income, net deconsolidated $ (4,558) $ — $ —Tenant leasing costs, net deconsolidated $ (3,462) $ — $ —Building and other capital improvements, net deconsolidated $ (111,889) $ (12,767) $ —Tenant improvements, net deconsolidated $ (12,331) $ — $ —Right of use asset - finance lease deconsolidated $ — $ (135,004) $ —Lease liability - finance lease deconsolidated $ — $ 119,534 $ —Investment in unconsolidated joint venture recorded upon deconsolidation $ 347,898 $ 29,246 $ —Dividends and distributions declared but not paid $ 171,082 $ 170,713 $ 165,114Conversions of noncontrolling interests to stockholders’ equity $ 29,698 $ 4,885 $ 2,880Issuance of restricted securities to employees and non-employee directors $ 42,607 $ 37,622 $ 37,052
The accompanying notes are an integral part of these consolidated financial statements.
124
Management’s Report on Internal Control overFinancial Reporting
Management of Boston Properties, Inc., the sole general partner of Boston Properties Limited Partnership, isresponsible for establishing and maintaining adequate internal control over financial reporting for Boston PropertiesLimited Partnership. Boston Properties Limited Partnership’s internal control over financial reporting is a processdesigned under the supervision of the principal executive officer and principal financial officer of Boston Properties,Inc. to provide reasonable assurance regarding the reliability of financial reporting and the preparation of BostonProperties Limited Partnership’s financial statements for external reporting purposes in accordance withU.S. generally accepted accounting principles.
As of the end of Boston Properties Limited Partnership’s 2020 fiscal year, management conductedassessments of the effectiveness of Boston Properties Limited Partnership’s internal control over financial reportingbased on the framework established in Internal Control—Integrated Framework (2013) issued by the Committee ofSponsoring Organizations of the Treadway Commission (COSO). Based on these assessments, management hasdetermined that Boston Properties Limited Partnership’s internal control over financial reporting as of December 31,2020 was effective.
Boston Properties Limited Partnership’s internal control over financial reporting includes policies andprocedures that (1) pertain to the maintenance of records that, in reasonable detail, accurately and fairly reflecttransactions and dispositions of our assets; (2) provide reasonable assurance that transactions are recorded asnecessary to permit preparation of financial statements in accordance with U.S. generally accepted accountingprinciples, and that receipts and expenditures are being made only in accordance with authorizations ofmanagement and the directors of Boston Properties, Inc.; and (3) provide reasonable assurance regardingprevention or timely detection of unauthorized acquisition, use or disposition of Boston Properties LimitedPartnership’s assets that could have a material effect on our financial statements.
The effectiveness of Boston Properties Limited Partnership’s internal control over financial reporting as ofDecember 31, 2020 has been audited by PricewaterhouseCoopers LLP, an independent registered publicaccounting firm, as stated in its report appearing on page 126, which expresses an unqualified opinion on theeffectiveness of Boston Properties Limited Partnership’s internal control over financial reporting as of December 31,2020.
125
Report of Independent Registered Public Accounting Firm
To the Partners of Boston Properties Limited Partnership
Opinions on the Financial Statements and Internal Control over Financial Reporting
We have audited the accompanying consolidated balance sheets of Boston Properties Limited Partnership and itssubsidiaries (the “Partnership”) as of December 31, 2020 and 2019, and the related consolidated statements ofoperations, of comprehensive income, of capital and noncontrolling interests and of cash flows for each of the threeyears in the period ended December 31, 2020, including the related notes and financial statement schedule listed inthe accompanying index (collectively referred to as the “consolidated financial statements”). We also have auditedthe Partnership's internal control over financial reporting as of December 31, 2020, based on criteria established inInternal Control - Integrated Framework (2013) issued by the Committee of Sponsoring Organizations of theTreadway Commission (COSO).
In our opinion, the consolidated financial statements referred to above present fairly, in all material respects, thefinancial position of the Partnership as of December 31, 2020 and 2019, and the results of its operations and itscash flows for each of the three years in the period ended December 31, 2020 in conformity with accountingprinciples generally accepted in the United States of America. Also in our opinion, the Partnership maintained, in allmaterial respects, effective internal control over financial reporting as of December 31, 2020, based on criteriaestablished in Internal Control - Integrated Framework (2013) issued by the COSO.
Basis for Opinions
The Partnership's management is responsible for these consolidated financial statements, for maintaining effectiveinternal control over financial reporting, and for its assessment of the effectiveness of internal control over financialreporting, included in the accompanying Management’s Report on Internal Control over Financial Reporting. Ourresponsibility is to express opinions on the Partnership’s consolidated financial statements and on the Partnership'sinternal control over financial reporting based on our audits. We are a public accounting firm registered with thePublic Company Accounting Oversight Board (United States) (PCAOB) and are required to be independent withrespect to the Partnership in accordance with the U.S. federal securities laws and the applicable rules andregulations of the Securities and Exchange Commission and the PCAOB.
We conducted our audits in accordance with the standards of the PCAOB. Those standards require that we planand perform the audits to obtain reasonable assurance about whether the consolidated financial statements are freeof material misstatement, whether due to error or fraud, and whether effective internal control over financialreporting was maintained in all material respects.
Our audits of the consolidated financial statements included performing procedures to assess the risks of materialmisstatement of the consolidated financial statements, whether due to error or fraud, and performing proceduresthat respond to those risks. Such procedures included examining, on a test basis, evidence regarding the amountsand disclosures in the consolidated financial statements. Our audits also included evaluating the accountingprinciples used and significant estimates made by management, as well as evaluating the overall presentation ofthe consolidated financial statements. Our audit of internal control over financial reporting included obtaining anunderstanding of internal control over financial reporting, assessing the risk that a material weakness exists, andtesting and evaluating the design and operating effectiveness of internal control based on the assessed risk. Ouraudits also included performing such other procedures as we considered necessary in the circumstances. Webelieve that our audits provide a reasonable basis for our opinions.
Definition and Limitations of Internal Control over Financial Reporting
A company’s internal control over financial reporting is a process designed to provide reasonable assuranceregarding the reliability of financial reporting and the preparation of financial statements for external purposes inaccordance with generally accepted accounting principles. A company’s internal control over financial reportingincludes those policies and procedures that (i) pertain to the maintenance of records that, in reasonable detail,accurately and fairly reflect the transactions and dispositions of the assets of the company; (ii) provide reasonableassurance that transactions are recorded as necessary to permit preparation of financial statements in accordancewith generally accepted accounting principles, and that receipts and expenditures of the company are being madeonly in accordance with authorizations of management and directors of the company; and (iii) provide reasonable
126
assurance regarding prevention or timely detection of unauthorized acquisition, use, or disposition of the company’sassets that could have a material effect on the financial statements.
Because of its inherent limitations, internal control over financial reporting may not prevent or detect misstatements.Also, projections of any evaluation of effectiveness to future periods are subject to the risk that controls maybecome inadequate because of changes in conditions, or that the degree of compliance with the policies orprocedures may deteriorate.
Critical Audit Matters
The critical audit matter communicated below is a matter arising from the current period audit of the consolidatedfinancial statements that was communicated or required to be communicated to the audit committee and that (i)relates to accounts or disclosures that are material to the consolidated financial statements and (ii) involved ourespecially challenging, subjective, or complex judgments. The communication of critical audit matters does not alterin any way our opinion on the consolidated financial statements, taken as a whole, and we are not, bycommunicating the critical audit matter below, providing a separate opinion on the critical audit matter or on theaccounts or disclosures to which it relates.
Impairment Assessments of Long-Lived Assets and Investments in Unconsolidated Joint Ventures
As described in Notes 2, 3 and 6 to the consolidated financial statements, the Partnership’s total real estate balancewas $17,547.5 million and its investments in unconsolidated joint ventures was $1,273.9 million as of December 31,2020. During 2020, the Partnership did not recognize an impairment loss related to its long-lived assets andrecognized a $60.5 million other-than-temporary-impairment loss related to an investment in unconsolidated jointventure. Management reviews its long-lived assets for indicators of impairment following the end of each quarterand when events or changes in circumstances indicate that the carrying amount of the asset may not berecoverable. This evaluation of long-lived assets is dependent on a number of factors, including when there is anevent or adverse change in the operating performance of the long-lived asset or a current expectation that, morelikely than not, a long-lived asset will be sold or otherwise disposed of significantly before the end of its previouslyestimated useful life or hold period. Management reviews its unconsolidated joint ventures for indicators ofimpairment on a quarterly basis and records impairment charges when events or circumstances change indicatingthat a decline in the fair values below the carrying amounts has occurred and such decline is other-than-temporary.This evaluation of the investments in unconsolidated joint ventures is dependent on a number of factors, includingthe performance of each investment and market conditions. The Partnership will record an impairment charge if itdetermines that a decline in the fair value below the carrying amount of an investment in an unconsolidated jointventure is other-than-temporary. The fair value is calculated using discounted cash flows which is subjective andconsiders assumptions regarding future occupancy, future rental rates, future capital requirements, discount ratesand capitalization rates.
The principal considerations for our determination that performing procedures relating to the impairmentassessments of long-lived assets and investments in unconsolidated joint ventures is a critical audit matter are (i)the significant judgment by management in identifying the indicators of impairment for long lived assets, which inturn led to a high degree of auditor judgment, subjectivity and effort in performing procedures and evaluatingevidence related to identifying the indicators of impairment for long-lived assets; (ii) the significant judgment bymanagement in identifying the indicators of impairment for investments in unconsolidated joint ventures, which inturn led to a high degree of auditor judgment, subjectivity and effort in performing procedures and evaluatingevidence related to the indicators of impairment for investments in unconsolidated joint ventures; (iii) the significantjudgment by management when developing the fair value measurement of the investments in unconsolidated jointventures relating to potential other-than-temporary impairments, which in turn led to a high degree of auditorjudgment, subjectivity and effort in performing procedures and evaluating management’s assumptions related tofuture occupancy, future rental rates, future capital requirements, discount rate and capitalization rate; and, (iv) theaudit effort involved the use of professionals with specialized skill and knowledge.
Addressing the matter involved performing procedures and evaluating audit evidence in connection with forming ouroverall opinion on the consolidated financial statements. These procedures included testing the effectiveness ofcontrols relating to (i) the identification of the indicators of impairment for long-lived assets, (ii) the identification ofthe indicators of impairment for investments in unconsolidated joint ventures, and (iii) developing the fair valuemeasurement of the investments in unconsolidated joint ventures in the evaluation of potential other-than-temporaryimpairments. For the long-lived assets, the procedures included, among others, evaluating the reasonableness ofmanagement’s assessment of the indicators of impairment for long lived assets by considering the anticipated hold
127
period, market economic conditions, operating performance of the asset, or evidence obtained in other areas of theaudit that may be indicative of an indicator of impairment of the long-lived assets. For the investments inunconsolidated joint ventures, the procedures, included, among others, (i) evaluating the reasonableness ofmanagement’s identification of changes in the performance of each investment and market conditions indicatingthat there may be a decline in the fair values of the investments in unconsolidated joint ventures below the carryingamounts has occurred and such decline is other-than-temporary by considering changes in the performance of theinvestments and market conditions, or evidence obtained in other areas of the audit and (ii) evaluating thereasonableness of aforementioned assumptions, by consideration of the past performance of the investment inunconsolidated joint ventures and whether the assumptions were consistent with evidence obtained in other areasof the audit. Professionals with specialized skill and knowledge were used to assist in the evaluation theappropriateness of the discounted cash flow model and reasonableness of the assumptions.
/s/ PricewaterhouseCoopers LLPBoston, MassachusettsFebruary 26, 2021
We have served as the Partnership’s auditor since 1997.
128
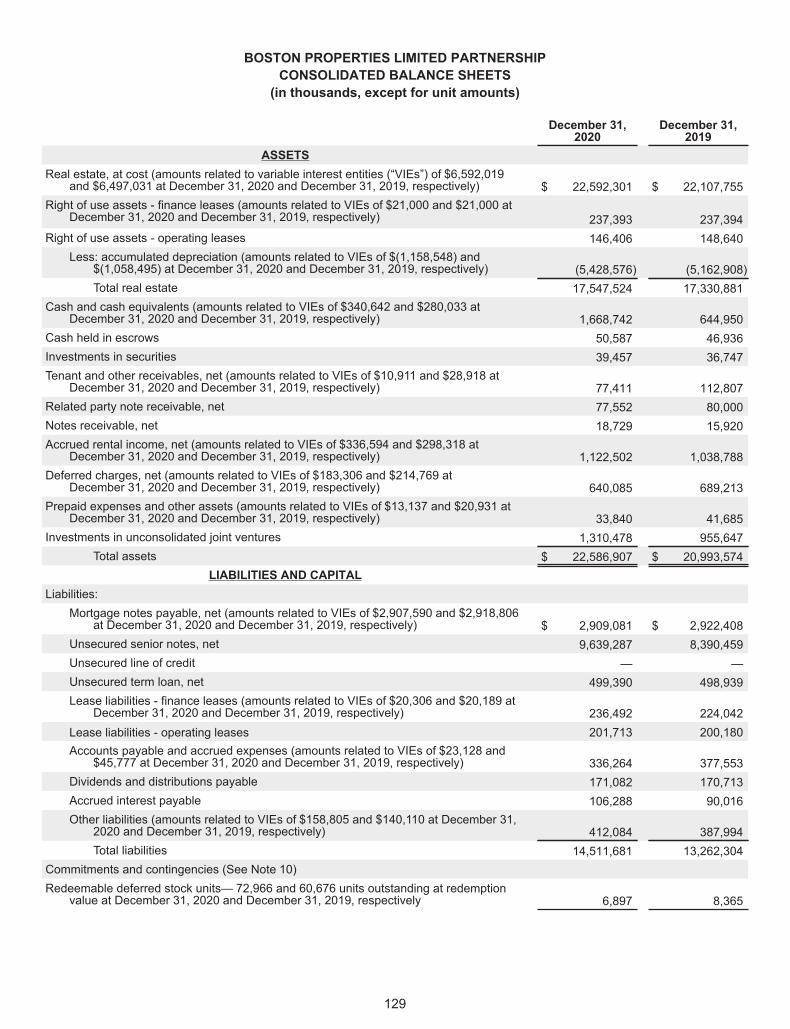
BOSTON PROPERTIES LIMITED PARTNERSHIPCONSOLIDATED BALANCE SHEETS(in thousands, except for unit amounts)
December 31,2020
December 31,2019
ASSETSReal estate, at cost (amounts related to variable interest entities (“VIEs”) of $6,592,019
and $6,497,031 at December 31, 2020 and December 31, 2019, respectively) $ 22,592,301 $ 22,107,755Right of use assets - finance leases (amounts related to VIEs of $21,000 and $21,000 at
December 31, 2020 and December 31, 2019, respectively) 237,393 237,394Right of use assets - operating leases 146,406 148,640
Less: accumulated depreciation (amounts related to VIEs of $(1,158,548) and$(1,058,495) at December 31, 2020 and December 31, 2019, respectively) (5,428,576) (5,162,908)Total real estate 17,547,524 17,330,881
Cash and cash equivalents (amounts related to VIEs of $340,642 and $280,033 atDecember 31, 2020 and December 31, 2019, respectively) 1,668,742 644,950
Cash held in escrows 50,587 46,936Investments in securities 39,457 36,747Tenant and other receivables, net (amounts related to VIEs of $10,911 and $28,918 at
December 31, 2020 and December 31, 2019, respectively) 77,411 112,807Related party note receivable, net 77,552 80,000Notes receivable, net 18,729 15,920Accrued rental income, net (amounts related to VIEs of $336,594 and $298,318 at
December 31, 2020 and December 31, 2019, respectively) 1,122,502 1,038,788Deferred charges, net (amounts related to VIEs of $183,306 and $214,769 at
December 31, 2020 and December 31, 2019, respectively) 640,085 689,213Prepaid expenses and other assets (amounts related to VIEs of $13,137 and $20,931 at
December 31, 2020 and December 31, 2019, respectively) 33,840 41,685Investments in unconsolidated joint ventures 1,310,478 955,647
Total assets $ 22,586,907 $ 20,993,574LIABILITIES AND CAPITAL
Liabilities:Mortgage notes payable, net (amounts related to VIEs of $2,907,590 and $2,918,806
at December 31, 2020 and December 31, 2019, respectively) $ 2,909,081 $ 2,922,408Unsecured senior notes, net 9,639,287 8,390,459Unsecured line of credit — —Unsecured term loan, net 499,390 498,939Lease liabilities - finance leases (amounts related to VIEs of $20,306 and $20,189 at
December 31, 2020 and December 31, 2019, respectively) 236,492 224,042Lease liabilities - operating leases 201,713 200,180Accounts payable and accrued expenses (amounts related to VIEs of $23,128 and
$45,777 at December 31, 2020 and December 31, 2019, respectively) 336,264 377,553Dividends and distributions payable 171,082 170,713Accrued interest payable 106,288 90,016Other liabilities (amounts related to VIEs of $158,805 and $140,110 at December 31,
2020 and December 31, 2019, respectively) 412,084 387,994Total liabilities 14,511,681 13,262,304
Commitments and contingencies (See Note 10)Redeemable deferred stock units— 72,966 and 60,676 units outstanding at redemption
value at December 31, 2020 and December 31, 2019, respectively 6,897 8,365
129
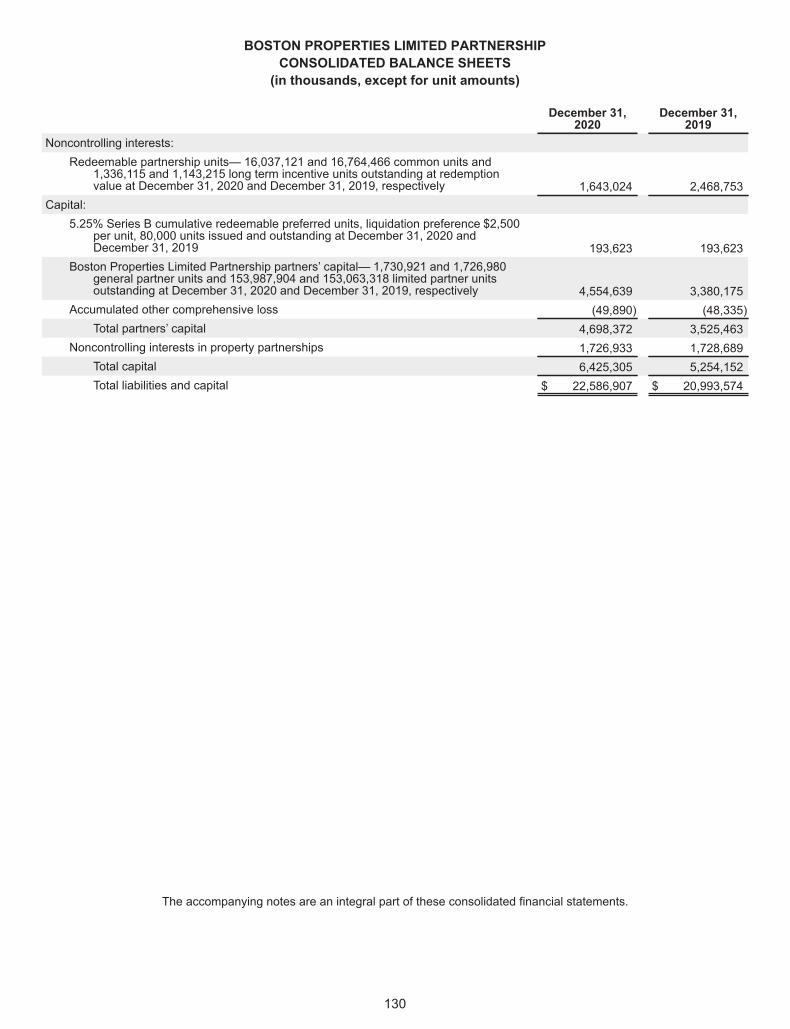
BOSTON PROPERTIES LIMITED PARTNERSHIPCONSOLIDATED BALANCE SHEETS(in thousands, except for unit amounts)
December 31,2020
December 31,2019
Noncontrolling interests:Redeemable partnership units— 16,037,121 and 16,764,466 common units and
1,336,115 and 1,143,215 long term incentive units outstanding at redemptionvalue at December 31, 2020 and December 31, 2019, respectively 1,643,024 2,468,753
Capital:5.25% Series B cumulative redeemable preferred units, liquidation preference $2,500
per unit, 80,000 units issued and outstanding at December 31, 2020 andDecember 31, 2019 193,623 193,623
Boston Properties Limited Partnership partners’ capital— 1,730,921 and 1,726,980general partner units and 153,987,904 and 153,063,318 limited partner unitsoutstanding at December 31, 2020 and December 31, 2019, respectively 4,554,639 3,380,175
Accumulated other comprehensive loss (49,890) (48,335)Total partners’ capital 4,698,372 3,525,463
Noncontrolling interests in property partnerships 1,726,933 1,728,689Total capital 6,425,305 5,254,152Total liabilities and capital $ 22,586,907 $ 20,993,574
The accompanying notes are an integral part of these consolidated financial statements.
130
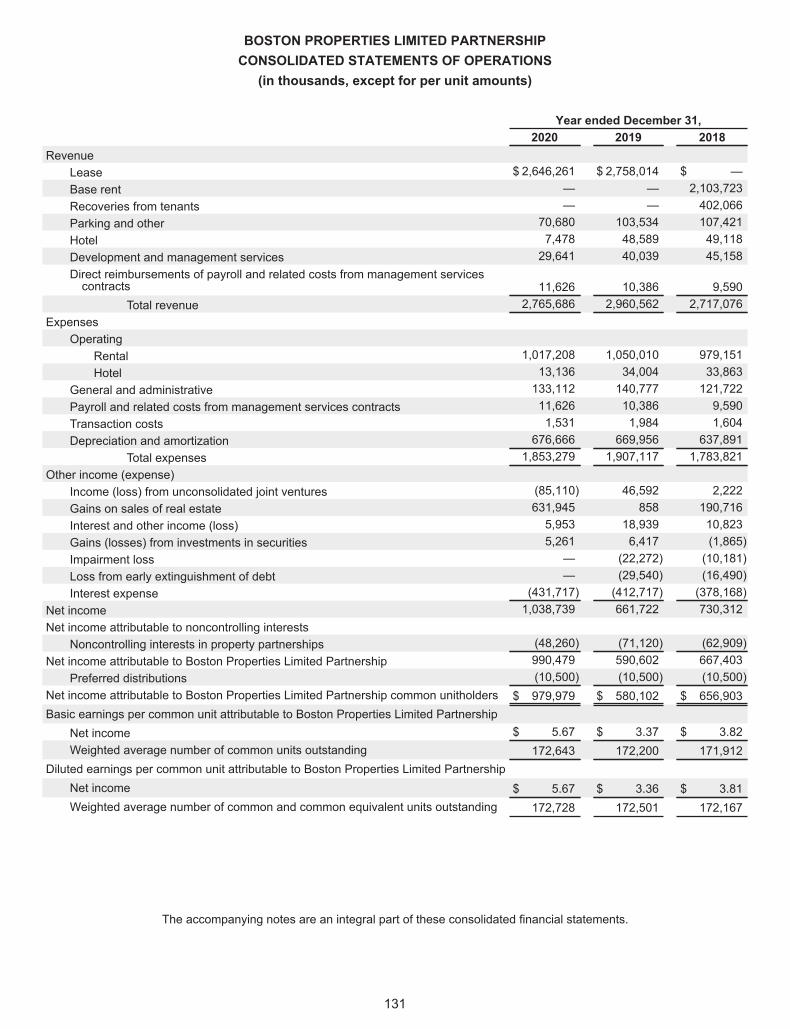
BOSTON PROPERTIES LIMITED PARTNERSHIPCONSOLIDATED STATEMENTS OF OPERATIONS(in thousands, except for per unit amounts)
Year ended December 31,2020 2019 2018
RevenueLease $ 2,646,261 $ 2,758,014 $ —Base rent — — 2,103,723Recoveries from tenants — — 402,066Parking and other 70,680 103,534 107,421Hotel 7,478 48,589 49,118Development and management services 29,641 40,039 45,158Direct reimbursements of payroll and related costs from management servicescontracts 11,626 10,386 9,590
Total revenue 2,765,686 2,960,562 2,717,076Expenses
OperatingRental 1,017,208 1,050,010 979,151Hotel 13,136 34,004 33,863
General and administrative 133,112 140,777 121,722Payroll and related costs from management services contracts 11,626 10,386 9,590Transaction costs 1,531 1,984 1,604Depreciation and amortization 676,666 669,956 637,891
Total expenses 1,853,279 1,907,117 1,783,821Other income (expense)
Income (loss) from unconsolidated joint ventures (85,110) 46,592 2,222Gains on sales of real estate 631,945 858 190,716Interest and other income (loss) 5,953 18,939 10,823Gains (losses) from investments in securities 5,261 6,417 (1,865)Impairment loss — (22,272) (10,181)Loss from early extinguishment of debt — (29,540) (16,490)Interest expense (431,717) (412,717) (378,168)
Net income 1,038,739 661,722 730,312Net income attributable to noncontrolling interests
Noncontrolling interests in property partnerships (48,260) (71,120) (62,909)Net income attributable to Boston Properties Limited Partnership 990,479 590,602 667,403
Preferred distributions (10,500) (10,500) (10,500)Net income attributable to Boston Properties Limited Partnership common unitholders $ 979,979 $ 580,102 $ 656,903Basic earnings per common unit attributable to Boston Properties Limited Partnership
Net income $ 5.67 $ 3.37 $ 3.82Weighted average number of common units outstanding 172,643 172,200 171,912
Diluted earnings per common unit attributable to Boston Properties Limited PartnershipNet income $ 5.67 $ 3.36 $ 3.81Weighted average number of common and common equivalent units outstanding 172,728 172,501 172,167
The accompanying notes are an integral part of these consolidated financial statements.
131
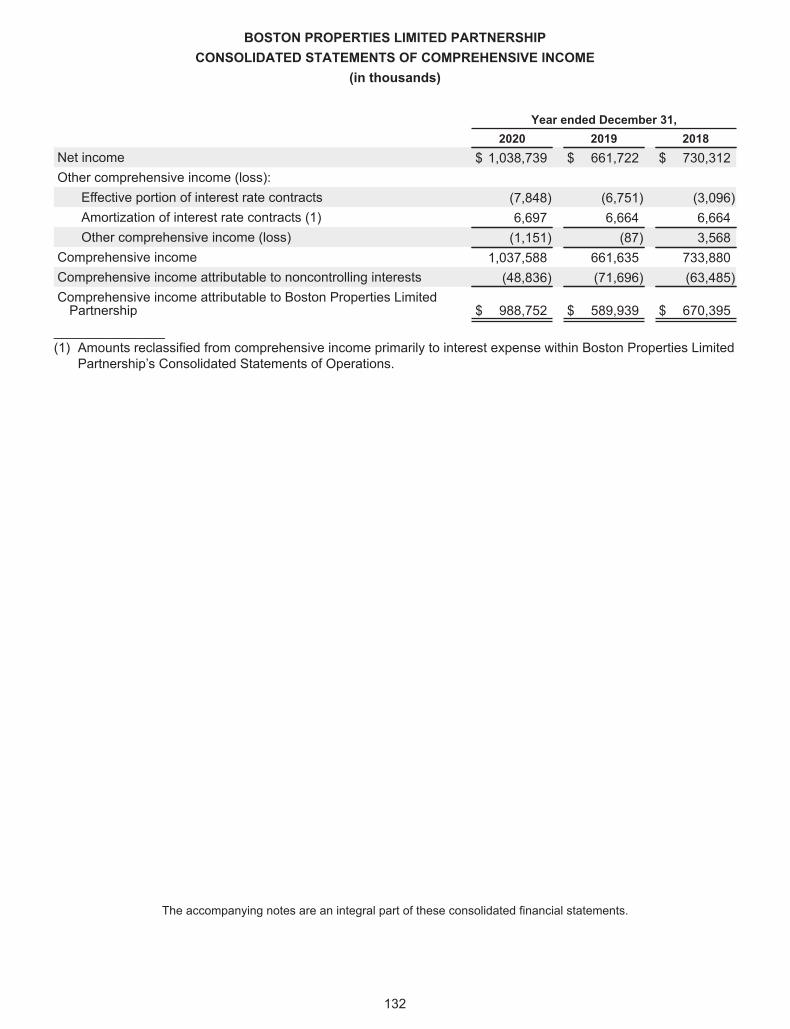
BOSTON PROPERTIES LIMITED PARTNERSHIPCONSOLIDATED STATEMENTS OF COMPREHENSIVE INCOME
(in thousands)
Year ended December 31,2020 2019 2018
Net income $ 1,038,739 $ 661,722 $ 730,312Other comprehensive income (loss):
Effective portion of interest rate contracts (7,848) (6,751) (3,096)Amortization of interest rate contracts (1) 6,697 6,664 6,664Other comprehensive income (loss) (1,151) (87) 3,568
Comprehensive income 1,037,588 661,635 733,880Comprehensive income attributable to noncontrolling interests (48,836) (71,696) (63,485)Comprehensive income attributable to Boston Properties LimitedPartnership $ 988,752 $ 589,939 $ 670,395
_______________(1) Amounts reclassified from comprehensive income primarily to interest expense within Boston Properties Limited
Partnership’s Consolidated Statements of Operations.
The accompanying notes are an integral part of these consolidated financial statements.
132
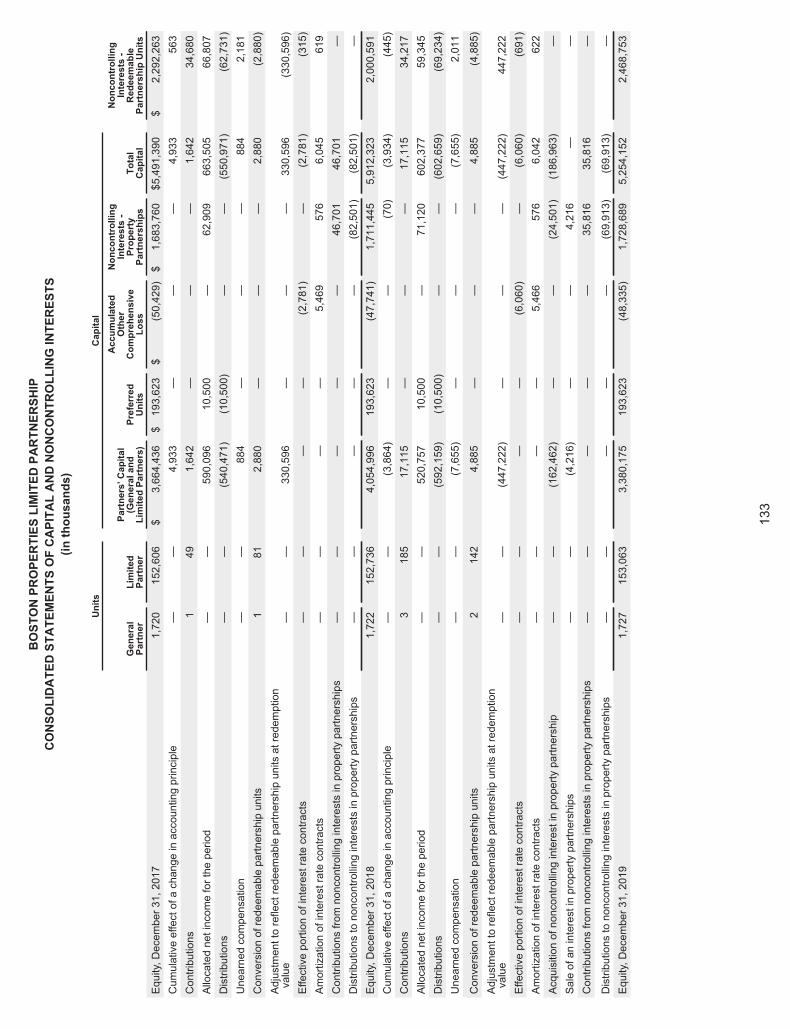
BOSTONPROPERTIES
LIMITED
PARTNERSHIP
CONSOLIDATEDSTATEMENTS
OFCAPITALANDNONCONTROLLINGINTERESTS
(inthousands)
Units
Capital
General
Partner
Limited
Partner
Partners’Capital
(Generaland
LimitedPartners)
Preferred
Units
Accumulated
Other
Com
prehensive
Loss
Noncontrolling
Interests-
Property
Partnerships
Total
Capital
Noncontrolling
Interests-
Redeemable
PartnershipUnits
Equity,December31,2017
1,720
152,606
$3,664,436
$193,623
$(50,429)
$1,683,760
$5,491,390
$2,292,263
Cumulativeeffectofachangeinaccountingprinciple
——
4,933
——
—4,933
563
Contributions
149
1,642
——
—1,642
34,680
Allocatednetincomefortheperiod
——
590,096
10,500
—62,909
663,505
66,807
Distributions
——
(540,471)
(10,500)
——
(550,971)
(62,731)
Unearnedcompensation
——
884
——
—884
2,181
Conversionofredeemablepartnershipunits
181
2,880
——
—2,880
(2,880)
Adjustmenttoreflectredeemablepartnershipunitsatredemption
value
——
330,596
——
—330,596
(330,596)
Effectiveportionofinterestratecontracts
——
——
(2,781)
—(2,781)
(315)
Amortizationofinterestratecontracts
——
——
5,469
576
6,045
619
Contributionsfromnoncontrollinginterestsinpropertypartnerships
——
——
—46,701
46,701
—Distributionstononcontrollinginterestsinpropertypartnerships
——
——
—(82,501)
(82,501)
—Equity,December31,2018
1,722
152,736
4,054,996
193,623
(47,741)
1,711,445
5,912,323
2,000,591
Cumulativeeffectofachangeinaccountingprinciple
——
(3,864)
——
(70)
(3,934)
(445)
Contributions
3185
17,115
——
—17,115
34,217
Allocatednetincomefortheperiod
——
520,757
10,500
—71,120
602,377
59,345
Distributions
——
(592,159)
(10,500)
——
(602,659)
(69,234)
Unearnedcompensation
——
(7,655)
——
—(7,655)
2,011
Conversionofredeemablepartnershipunits
2142
4,885
——
—4,885
(4,885)
Adjustmenttoreflectredeemablepartnershipunitsatredemption
value
——
(447,222)
——
—(447,222)
447,222
Effectiveportionofinterestratecontracts
——
——
(6,060)
—(6,060)
(691)
Amortizationofinterestratecontracts
——
——
5,466
576
6,042
622
Acquisitionofnoncontrollinginterestinpropertypartnership
——
(162,462)
——
(24,501)
(186,963)
—Saleofaninterestinpropertypartnerships
——
(4,216)
——
4,216
——
Contributionsfromnoncontrollinginterestsinpropertypartnerships
——
——
—35,816
35,816
—
Distributionstononcontrollinginterestsinpropertypartnerships
——
——
—(69,913)
(69,913)
—Equity,December31,2019
1,727
153,063
3,380,175
193,623
(48,335)
1,728,689
5,254,152
2,468,753
133
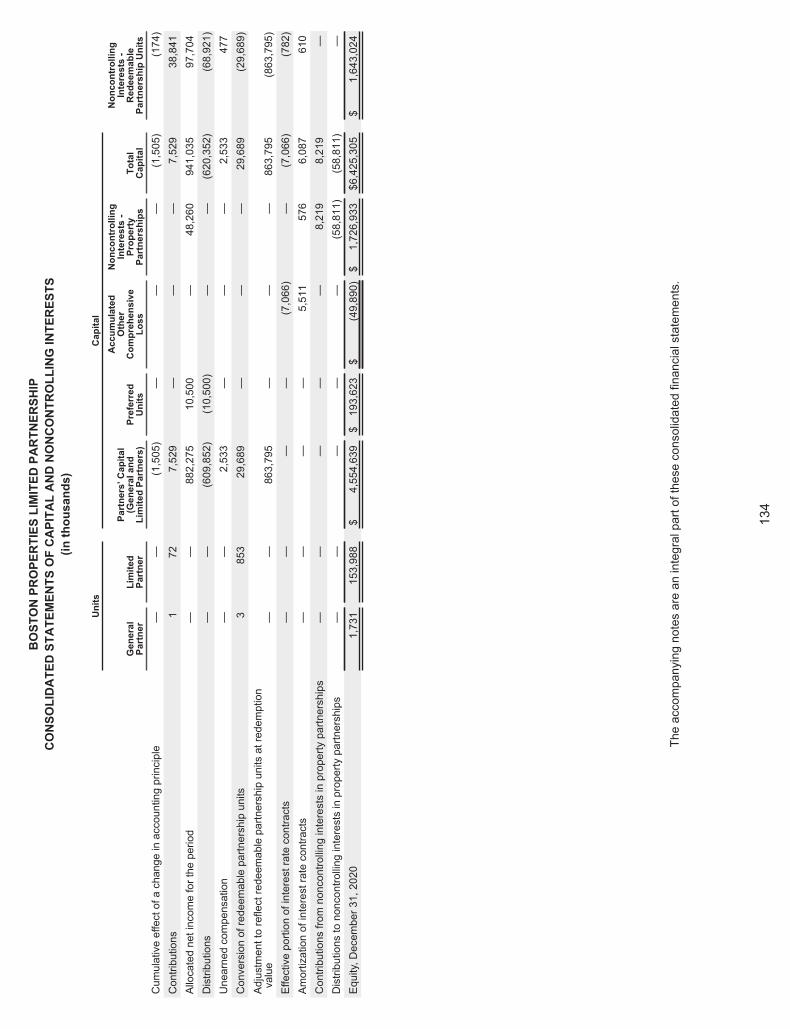
BOSTONPROPERTIES
LIMITED
PARTNERSHIP
CONSOLIDATEDSTATEMENTS
OFCAPITALANDNONCONTROLLINGINTERESTS
(inthousands)
Units
Capital
General
Partner
Limited
Partner
Partners’Capital
(Generaland
LimitedPartners)
Preferred
Units
Accumulated
Other
Com
prehensive
Loss
Noncontrolling
Interests-
Property
Partnerships
Total
Capital
Noncontrolling
Interests-
Redeemable
PartnershipUnits
Cumulativeeffectofachangeinaccountingprinciple
——
(1,505)
——
—(1,505)
(174)
Contributions
172
7,529
——
—7,529
38,841
Allocatednetincomefortheperiod
——
882,275
10,500
—48,260
941,035
97,704
Distributions
——
(609,852)
(10,500)
——
(620,352)
(68,921)
Unearnedcompensation
——
2,533
——
—2,533
477
Conversionofredeemablepartnershipunits
3853
29,689
——
—29,689
(29,689)
Adjustmenttoreflectredeemablepartnershipunitsatredemption
value
——
863,795
——
—863,795
(863,795)
Effectiveportionofinterestratecontracts
——
——
(7,066)
—(7,066)
(782)
Amortizationofinterestratecontracts
——
——
5,511
576
6,087
610
Contributionsfromnoncontrollinginterestsinpropertypartnerships
——
——
—8,219
8,219
—Distributionstononcontrollinginterestsinpropertypartnerships
——
——
—(58,811)
(58,811)
—Equity,December31,2020
1,731
153,988
$4,554,639
$193,623
$(49,890)
$1,726,933
$6,425,305
$1,643,024
Theaccompanyingnotesareanintegralpartoftheseconsolidatedfinancialstatements.
134
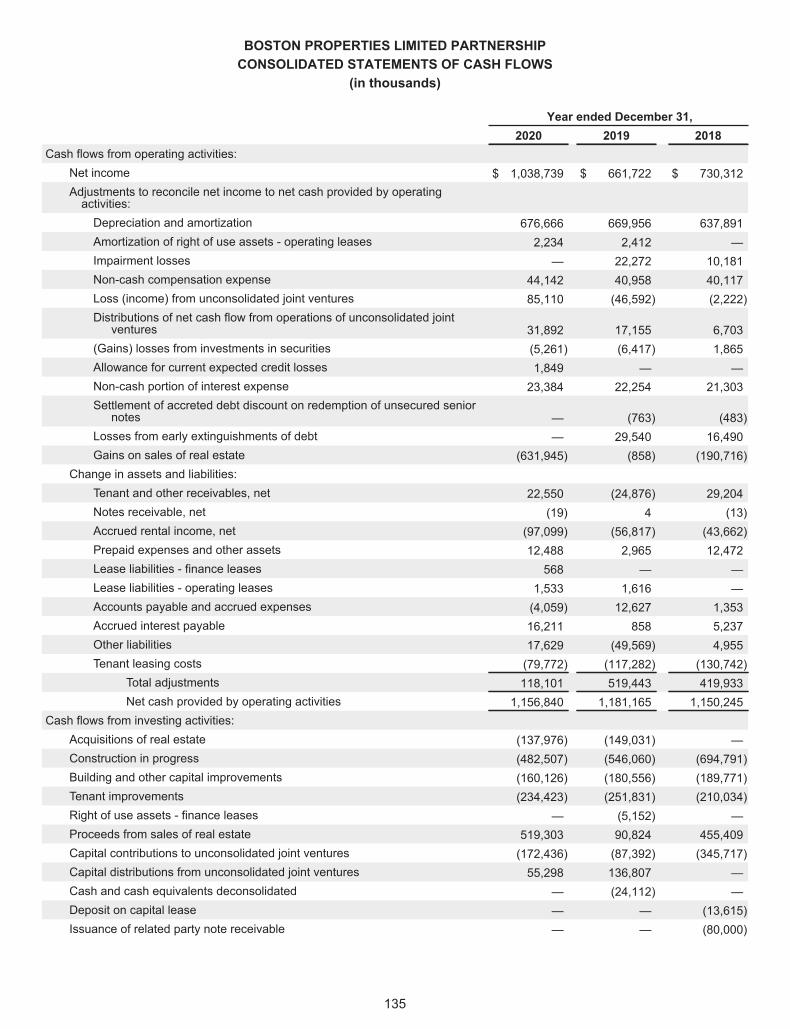
BOSTON PROPERTIES LIMITED PARTNERSHIPCONSOLIDATED STATEMENTS OF CASH FLOWS
(in thousands)
Year ended December 31,2020 2019 2018
Cash flows from operating activities:Net income $ 1,038,739 $ 661,722 $ 730,312Adjustments to reconcile net income to net cash provided by operatingactivities:Depreciation and amortization 676,666 669,956 637,891Amortization of right of use assets - operating leases 2,234 2,412 —Impairment losses — 22,272 10,181Non-cash compensation expense 44,142 40,958 40,117Loss (income) from unconsolidated joint ventures 85,110 (46,592) (2,222)Distributions of net cash flow from operations of unconsolidated joint
ventures 31,892 17,155 6,703(Gains) losses from investments in securities (5,261) (6,417) 1,865Allowance for current expected credit losses 1,849 — —Non-cash portion of interest expense 23,384 22,254 21,303Settlement of accreted debt discount on redemption of unsecured senior
notes — (763) (483)Losses from early extinguishments of debt — 29,540 16,490Gains on sales of real estate (631,945) (858) (190,716)
Change in assets and liabilities:Tenant and other receivables, net 22,550 (24,876) 29,204Notes receivable, net (19) 4 (13)Accrued rental income, net (97,099) (56,817) (43,662)Prepaid expenses and other assets 12,488 2,965 12,472Lease liabilities - finance leases 568 — —Lease liabilities - operating leases 1,533 1,616 —Accounts payable and accrued expenses (4,059) 12,627 1,353Accrued interest payable 16,211 858 5,237Other liabilities 17,629 (49,569) 4,955Tenant leasing costs (79,772) (117,282) (130,742)
Total adjustments 118,101 519,443 419,933Net cash provided by operating activities 1,156,840 1,181,165 1,150,245
Cash flows from investing activities:Acquisitions of real estate (137,976) (149,031) —Construction in progress (482,507) (546,060) (694,791)Building and other capital improvements (160,126) (180,556) (189,771)Tenant improvements (234,423) (251,831) (210,034)Right of use assets - finance leases — (5,152) —Proceeds from sales of real estate 519,303 90,824 455,409Capital contributions to unconsolidated joint ventures (172,436) (87,392) (345,717)Capital distributions from unconsolidated joint ventures 55,298 136,807 —Cash and cash equivalents deconsolidated — (24,112) —Deposit on capital lease — — (13,615)Issuance of related party note receivable — — (80,000)
135
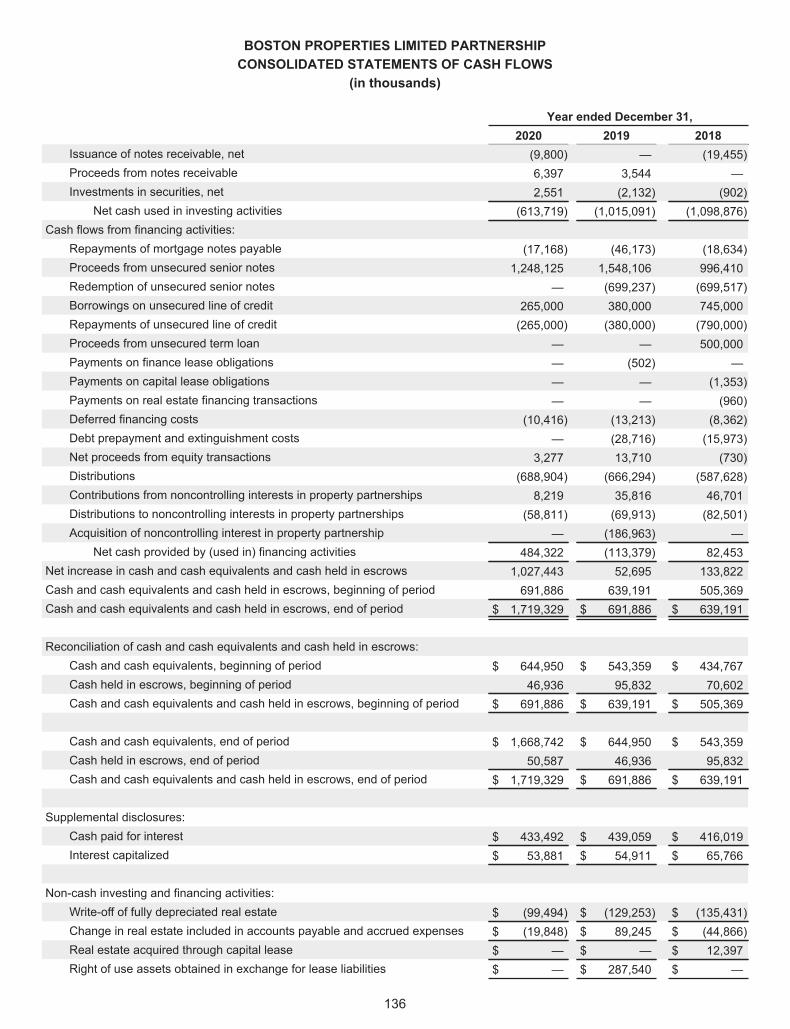
BOSTON PROPERTIES LIMITED PARTNERSHIPCONSOLIDATED STATEMENTS OF CASH FLOWS
(in thousands)
Year ended December 31,2020 2019 2018
Issuance of notes receivable, net (9,800) — (19,455)Proceeds from notes receivable 6,397 3,544 —Investments in securities, net 2,551 (2,132) (902)
Net cash used in investing activities (613,719) (1,015,091) (1,098,876)Cash flows from financing activities:
Repayments of mortgage notes payable (17,168) (46,173) (18,634)Proceeds from unsecured senior notes 1,248,125 1,548,106 996,410Redemption of unsecured senior notes — (699,237) (699,517)Borrowings on unsecured line of credit 265,000 380,000 745,000Repayments of unsecured line of credit (265,000) (380,000) (790,000)Proceeds from unsecured term loan — — 500,000Payments on finance lease obligations — (502) —Payments on capital lease obligations — — (1,353)Payments on real estate financing transactions — — (960)Deferred financing costs (10,416) (13,213) (8,362)Debt prepayment and extinguishment costs — (28,716) (15,973)Net proceeds from equity transactions 3,277 13,710 (730)Distributions (688,904) (666,294) (587,628)Contributions from noncontrolling interests in property partnerships 8,219 35,816 46,701Distributions to noncontrolling interests in property partnerships (58,811) (69,913) (82,501)Acquisition of noncontrolling interest in property partnership — (186,963) —
Net cash provided by (used in) financing activities 484,322 (113,379) 82,453Net increase in cash and cash equivalents and cash held in escrows 1,027,443 52,695 133,822Cash and cash equivalents and cash held in escrows, beginning of period 691,886 639,191 505,369Cash and cash equivalents and cash held in escrows, end of period $ 1,719,329 $ 691,886 $ 639,191
Reconciliation of cash and cash equivalents and cash held in escrows:Cash and cash equivalents, beginning of period $ 644,950 $ 543,359 $ 434,767Cash held in escrows, beginning of period 46,936 95,832 70,602Cash and cash equivalents and cash held in escrows, beginning of period $ 691,886 $ 639,191 $ 505,369
Cash and cash equivalents, end of period $ 1,668,742 $ 644,950 $ 543,359Cash held in escrows, end of period 50,587 46,936 95,832Cash and cash equivalents and cash held in escrows, end of period $ 1,719,329 $ 691,886 $ 639,191
Supplemental disclosures:Cash paid for interest $ 433,492 $ 439,059 $ 416,019Interest capitalized $ 53,881 $ 54,911 $ 65,766
Non-cash investing and financing activities:Write-off of fully depreciated real estate $ (99,494) $ (129,253) $ (135,431)Change in real estate included in accounts payable and accrued expenses $ (19,848) $ 89,245 $ (44,866)Real estate acquired through capital lease $ — $ — $ 12,397Right of use assets obtained in exchange for lease liabilities $ — $ 287,540 $ —
136
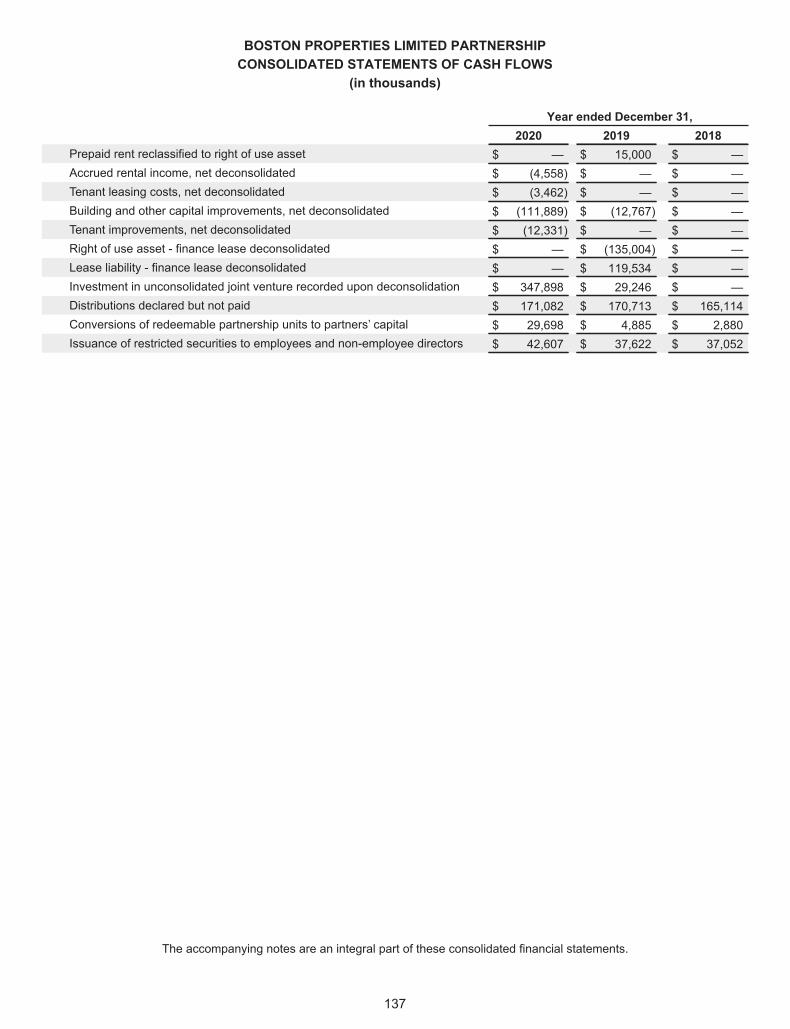
BOSTON PROPERTIES LIMITED PARTNERSHIPCONSOLIDATED STATEMENTS OF CASH FLOWS
(in thousands)
Year ended December 31,2020 2019 2018
Prepaid rent reclassified to right of use asset $ — $ 15,000 $ —Accrued rental income, net deconsolidated $ (4,558) $ — $ —Tenant leasing costs, net deconsolidated $ (3,462) $ — $ —Building and other capital improvements, net deconsolidated $ (111,889) $ (12,767) $ —Tenant improvements, net deconsolidated $ (12,331) $ — $ —Right of use asset - finance lease deconsolidated $ — $ (135,004) $ —Lease liability - finance lease deconsolidated $ — $ 119,534 $ —Investment in unconsolidated joint venture recorded upon deconsolidation $ 347,898 $ 29,246 $ —Distributions declared but not paid $ 171,082 $ 170,713 $ 165,114Conversions of redeemable partnership units to partners’ capital $ 29,698 $ 4,885 $ 2,880Issuance of restricted securities to employees and non-employee directors $ 42,607 $ 37,622 $ 37,052
The accompanying notes are an integral part of these consolidated financial statements.
137
BOSTON PROPERTIES, INC. AND BOSTON PROPERTIES LIMITED PARTNERSHIPNOTES TO THE CONSOLIDATED FINANCIAL STATEMENTS
1. OrganizationBoston Properties, Inc., a Delaware corporation, is a fully integrated, self-administered and self-managed real
estate investment trust (“REIT”). Boston Properties, Inc. is the sole general partner of Boston Properties LimitedPartnership, its operating partnership, and at December 31, 2020 owned an approximate 90.0% (89.6% atDecember 31, 2019) general and limited partnership interest in Boston Properties Limited Partnership. Unlessstated otherwise or the context requires, the “Company” refers to Boston Properties, Inc. and its subsidiaries,including Boston Properties Limited Partnership and its consolidated subsidiaries. Partnership interests in BostonProperties Limited Partnership include:
• common units of partnership interest (also referred to as “OP Units”),
• long term incentive units of partnership interest (also referred to as “LTIP Units”), and
• preferred units of partnership interest (also referred to as “Preferred Units”).
Unless specifically noted otherwise, all references to OP Units exclude units held by Boston Properties, Inc. Aholder of an OP Unit may present such OP Unit to Boston Properties Limited Partnership for redemption at any time(subject to restrictions agreed upon at the time of issuance of OP Units to particular holders that may restrict suchredemption right for a period of time, generally one year from issuance). Upon presentation of an OP Unit forredemption, Boston Properties Limited Partnership is obligated to redeem the OP Unit for cash equal to the value ofa share of common stock of Boston Properties, Inc. (“Common Stock”). In lieu of a cash redemption, BostonProperties, Inc. may elect to acquire the OP Unit for one share of Common Stock. Because the number of shares ofCommon Stock outstanding at all times equals the number of OP Units that Boston Properties, Inc. owns, one shareof Common Stock is generally the economic equivalent of one OP Unit, and the quarterly distribution that may bepaid to the holder of an OP Unit equals the quarterly dividend that may be paid to the holder of a share of CommonStock.
The Company uses LTIP Units as a form of equity-based award for annual long term incentive equitycompensation. The Company has also issued LTIP Units to employees in the form of (1) 2012 outperformance planawards (“2012 OPP Units”) and (2) 2013 - 2020 multi-year, long-term incentive program awards (also referred to as“MYLTIP Units”), each of which, upon the satisfaction of certain performance and vesting conditions, is convertibleinto one OP Unit. The three-year measurement periods for the 2012 OPP Units and the 2013 - 2017 MYLTIP Unitshave ended and Boston Properties, Inc.’s total stockholder return (“TSR”) was sufficient for employees to earn andtherefore become eligible to vest in a portion of the awards. Unless and until they are earned, the rights,preferences and privileges of the 2018 - 2020 MYLTIP Units differ from other LTIP Units granted to employees(including the 2012 OPP Units and the 2013 - 2017 MYLTIP Units, which have been earned). Therefore, unlessspecifically noted otherwise, all references to LTIP Units exclude the 2018 - 2020 MYLTIP Units. LTIP Units(including the earned 2012 OPP Units and the earned 2013 - 2017 MYLTIP Units), whether vested or not, willreceive the same quarterly per unit distributions as OP Units, which equal per share dividends on Common Stock(See Notes 11, 16 and 18).
At December 31, 2020 and 2019, there was one series of Preferred Units outstanding (i.e., Series B PreferredUnits). The Series B Preferred Units were issued to Boston Properties, Inc. on March 27, 2013 in connection withthe issuance of 80,000 shares (8,000,000 depositary shares each representing 1/100th of a share) of 5.25% SeriesB Cumulative Redeemable Preferred Stock (the “Series B Preferred Stock”). Boston Properties, Inc. contributed thenet proceeds from the offering to Boston Properties Limited Partnership in exchange for 80,000 Series B PreferredUnits having terms and preferences generally mirroring those of the Series B Preferred Stock (See Note 12).
Properties
At December 31, 2020, the Company owned or had joint venture interests in a portfolio of 196 commercial realestate properties (the “Properties”) aggregating approximately 51.2 million net rentable square feet (unaudited) ofprimarily Class A office properties, including six properties under construction/redevelopment totaling approximately3.7 million net rentable square feet (unaudited). At December 31, 2020, the Properties consisted of:
• 177 office properties (including six properties under construction/redevelopment);• 12 retail properties;• six residential properties; and
138
• one hotel.
The Company considers Class A office properties to be well-located buildings that are modern structures orhave been modernized to compete with newer buildings and professionally managed and maintained. As such,these properties attract high-quality tenants and command upper-tier rental rates.
Basis of PresentationThe accompanying consolidated financial statements are presented using the accrual basis of accounting in
conformity with accounting principles generally accepted in the United States of America. Boston Properties, Inc.does not have any other significant assets, liabilities or operations, other than its investment in Boston PropertiesLimited Partnership, nor does it have employees of its own. Boston Properties Limited Partnership, not BostonProperties, Inc., generally executes all significant business relationships other than transactions involving securitiesof Boston Properties, Inc. All majority-owned subsidiaries and joint ventures over which the Company has financialand operating control and variable interest entities (“VIEs”) in which the Company has determined it is the primarybeneficiary are included in the consolidated financial statements. All significant intercompany balances andtransactions have been eliminated in consolidation. The Company accounts for all other unconsolidated jointventures using the equity method of accounting. Accordingly, the Company’s share of the earnings of these jointventures and companies is included in consolidated net income.
Variable Interest Entities (VIEs)Consolidated VIEs are those for which the Company is considered to be the primary beneficiary of a VIE. The
primary beneficiary is the entity that has a controlling financial interest in the VIE, which is defined by the entityhaving both of the following characteristics: (1) the power to direct the activities that, when taken together, mostsignificantly impact the VIE’s performance and (2) the obligation to absorb losses or the right to receive the returnsfrom the VIE that could potentially be significant to the VIE. The Company has determined that it is the primarybeneficiary for six of the seven entities that are VIEs as of December 31, 2020.
Consolidated Variable Interest Entities
As of December 31, 2020, Boston Properties, Inc. has identified six consolidated VIEs, including BostonProperties Limited Partnership. Excluding Boston Properties Limited Partnership, the VIEs consisted of thefollowing five in-service properties: 767 Fifth Avenue (the General Motors Building), Times Square Tower, 601Lexington Avenue, Atlantic Wharf Office Building and 100 Federal Street.
The Company consolidates these VIEs because it is the primary beneficiary. The third parties’ interests inthese consolidated entities (excluding Boston Properties Limited Partnership’s interest) are reflected asnoncontrolling interests in property partnerships in the accompanying consolidated financial statements (See Note11).
In addition, Boston Properties, Inc.’s only significant asset is its investment in Boston Properties LimitedPartnership and, consequently, substantially all of Boston Properties, Inc.’s assets and liabilities are the assets andliabilities of Boston Properties Limited Partnership.
Variable Interest Entities Not Consolidated
As of December 31, 2020, the Company has determined that the Platform 16 Holdings LP joint venture is aVIE. The Company does not consolidate this entity as the Company does not have the power to direct the activitiesthat, when taken together, most significantly impact the VIE’s performance and, therefore, the Company is notconsidered to be the primary beneficiary.
2. Summary of Significant Accounting PoliciesReal Estate
Upon acquisitions of real estate, the Company assesses whether the transaction should be accounted for asan asset acquisition or as a business combination by applying a screen to determine whether the integrated set ofassets and activities acquired meets the definition of a business. Acquisitions of integrated sets of assets andactivities that do not meet the definition of a business are accounted for as asset acquisitions. The Company’sacquisitions of real estate or in-substance real estate generally will not meet the definition of a business becausesubstantially all of the fair value is concentrated in a single identifiable asset or group of similar identifiable assets
139
(i.e. land, buildings, and related intangible assets) or because the acquisition does not include a substantiveprocess in the form of an acquired workforce or an acquired contract that cannot be replaced without significantcost, effort or delay.
The Company assesses the fair value of acquired tangible and intangible assets (including land, buildings,tenant improvements, “above-” and “below-market” leases, leasing and assumed financing origination costs,acquired in-place leases, other identified intangible assets and assumed liabilities) and allocates the purchase priceto the acquired assets and assumed liabilities, including land and buildings as if vacant. The Company assessesfair value based on estimated cash flow projections that utilize discount and/or capitalization rates that it deemsappropriate, as well as available market information. Estimates of future cash flows are based on a number offactors including the historical operating results, known and anticipated trends, and market and economicconditions.
The fair value of the tangible assets of an acquired property considers the value of the property as if it werevacant. The Company also considers an allocation of purchase price of other acquired intangibles, includingacquired in-place leases that may have a customer relationship intangible value, including (but not limited to) thenature and extent of the existing relationship with the tenants, the tenants’ credit quality and expectations of leaserenewals. Based on its acquisitions to date, the Company’s allocation to customer relationship intangible assetshas been immaterial.
The Company records acquired “above-” and “below-market” leases at their fair values (using a discount ratewhich reflects the risks associated with the leases acquired) equal to the difference between (1) the contractualamounts to be paid pursuant to each in-place lease and (2) management’s estimate of fair market lease rates foreach corresponding in-place lease, measured over a period equal to the remaining term of the lease for above-market leases and the initial term plus the term of any below-market fixed rate renewal options for below-marketleases. Acquired “above-” and “below-market” lease values have been reflected within Prepaid Expenses andOther Assets and Other Liabilities, respectively, in the Company’s Consolidated Balance Sheets. Other intangibleassets acquired include amounts for in-place lease values that are based on the Company’s evaluation of thespecific characteristics of each tenant’s lease. Factors to be considered include estimates of carrying costs duringhypothetical expected lease-up periods considering current market conditions, and costs to execute similar leases.In estimating carrying costs, the Company includes real estate taxes, insurance and other operating expenses andestimates of lost rentals at market rates during the expected lease-up periods, depending on local marketconditions. In estimating costs to execute similar leases, the Company considers leasing commissions, legal andother related expenses.
Management reviews its long-lived assets for indicators of impairment following the end of each quarter andwhen events or changes in circumstances indicate that the carrying amount of the asset may not be recoverable.This evaluation of long-lived assets is dependent on a number of factors, including when there is an event oradverse change in the operating performance of the long-lived asset or a current expectation that, more likely thannot, a long-lived asset will be sold or otherwise disposed of significantly before the end of its previously estimateduseful life or hold period. An impairment loss is recognized if the carrying amount of an asset is not recoverable andexceeds its fair value. The evaluation of anticipated cash flows is subjective and is based in part on assumptionsregarding anticipated hold periods, future occupancy, future rental rates, future capital requirements, discount ratesand capitalization rates that could differ materially from actual results in future periods. Because cash flows onproperties considered to be “long-lived assets to be held and used” are considered on an undiscounted basis todetermine whether an asset may be impaired, the Company’s established strategy of holding properties over thelong term directly decreases the likelihood of recording an impairment loss. If the Company’s hold strategy changesor market conditions otherwise dictate an earlier sale date, an impairment loss may be recognized, and such losscould be material. If the Company determines that an impairment has occurred, the affected assets must bereduced to their fair value.
Guidance in Accounting Standards Codification (“ASC”) 360 “Property Plant and Equipment” requires thatqualifying assets and liabilities and the results of operations that have been sold, or otherwise qualify as “held forsale,” be presented as discontinued operations in all periods presented if the property operations are expected to beeliminated and the Company will not have significant continuing involvement following the sale. Discontinuedoperations presentation applies only to disposals representing a strategic shift that has (or will have) a major effecton an entity’s operations and financial results (e.g., a disposal of a major geographical area, a major line ofbusiness, a major equity method investment or other major parts of an entity). The components of the property’snet income that are reflected as discontinued operations include the net gain (or loss) upon the disposition of theproperty held for sale, operating results, depreciation and interest expense (if the property is subject to a secured
140
loan). The Company generally considers assets to be “held for sale” when the transaction has been approved byBoston Properties, Inc.’s Board of Directors, or a committee thereof, and there are no known significantcontingencies relating to the sale, such that a sale of the property within one year is considered probable. Followingthe classification of a property as “held for sale,” no further depreciation is recorded on the assets, and the asset iswritten down to the lower of carrying value or fair market value, less cost to sell.
Real estate is stated at depreciated cost. A variety of costs are incurred in the acquisition, development andleasing of properties. The cost of buildings and improvements includes the purchase price of property, legal feesand other acquisition costs. The Company capitalizes acquisition costs that it incurs to effect an asset acquisitionand expenses acquisition costs that it incurs to effect a business combination, including legal, due diligence andother closing related costs. Costs directly related to the development of properties are capitalized. Capitalizeddevelopment costs include interest, internal wages, property taxes, insurance, and other project costs incurredduring the period of development. After the determination is made to capitalize a cost, it is allocated to the specificcomponent of the project that benefited from the investment. Determination of when a development projectcommences and capitalization begins, and when a development project is substantially complete and held availablefor occupancy and capitalization must cease, involves a degree of judgment. The Company’s capitalization policyon development properties follows the guidance in ASC 835-20 “Capitalization of Interest” and ASC 970 “RealEstate-General.” The costs of land and buildings under development include specifically identifiable costs.
Capitalized costs include pre-construction costs necessary to the development of the property, developmentcosts, construction costs, interest costs, real estate taxes, salaries and related costs and other costs incurred duringthe period of development. The Company begins the capitalization of costs during the pre-construction period,which it defines as activities that are necessary for the development of the property. The Company considers aconstruction project as substantially complete and held available for occupancy upon the completion of tenantimprovements, but no later than one year from cessation of major construction activity. The Company ceasescapitalization on the portion (1) substantially completed, (2) occupied or held available for occupancy, andcapitalizes only those costs associated with the portion under construction or (3) if activities necessary for thedevelopment of the property have been suspended. Interest costs capitalized for the years ended December 31,2020, 2019 and 2018 were approximately $53.9 million, $54.9 million and $65.8 million, respectively. Salaries andrelated costs capitalized for the years ended December 31, 2020, 2019 and 2018 were approximately $12.9 million,$10.4 million and $12.5 million, respectively.
Expenditures for repairs and maintenance are charged to operations as incurred. Significant betterments arecapitalized. When assets are sold or retired, their costs and related accumulated depreciation are removed fromthe accounts with the resulting gains or losses reflected in net income or loss for the period.
The Company computes depreciation and amortization on properties using the straight-line method based onestimated useful asset lives. The Company allocates the acquisition cost of real estate to its components anddepreciates or amortizes these assets (or liabilities) over their useful lives. The amortization of acquired “above-”and “below-market” leases and acquired in-place leases is recorded as an adjustment to revenue and depreciationand amortization, respectively, in the Consolidated Statements of Operations.
Depreciation is computed on a straight-line basis over the estimated useful lives of the assets as follows:
Land improvements 25 to 40 yearsBuildings and improvements 10 to 40 yearsTenant improvements Shorter of useful life or terms of related leaseFurniture, fixtures, and equipment 3 to 7 years
Cash and Cash Equivalents
Cash and cash equivalents consist of cash on hand and investments with maturities of three months or lessfrom the date of purchase. The majority of the Company’s cash and cash equivalents are held at major commercialbanks which may at times exceed the Federal Deposit Insurance Corporation limit of $250,000.
Cash Held in Escrows
Escrows include amounts established pursuant to various agreements for security deposits, property taxes,insurance and other costs. Escrows also include cash held by qualified intermediaries for possible investments in
141
like-kind exchanges in accordance with Section 1031 of the Internal Revenue Code, as amended (the “Code”), inconnection with sales of the Company’s properties.
Investments in Securities
The Company accounts for investments in equity securities at fair value, with gains or losses resulting fromchanges in fair value recognized currently in earnings. The Company maintains deferred compensation plans thatare designed to allow officers and non-employee directors of Boston Properties, Inc. to defer a portion of theofficer’s current income or the non-employee director’s current compensation on a pre-tax basis and receive a tax-deferred return on these deferrals based on the performance of specific investments selected by the officer or non-employee director. The Company’s obligation under the plans is that of an unsecured promise to pay the deferredcompensation to the plan participants in the future. At December 31, 2020 and 2019, the Company had maintainedapproximately $39.5 million and $36.7 million, respectively, in separate accounts, which are not restricted as to theiruse. The Company recognized gains (losses) of approximately $5.3 million, $6.4 million and $(1.9) million on itsinvestments in the accounts associated with the Company’s deferred compensation plans during the years endedDecember 31, 2020, 2019 and 2018, respectively.
Tenant and Other Receivables
Tenant and other accounts receivable, other than accrued rents receivable, are expected to be collected withinone year.
Notes Receivable
The Company accounts for notes receivable at their unamortized cost, net of any unamortized deferred feesor costs, premiums or discounts and an allowance for loan losses (see “New Accounting Pronouncements Adopted—Financial Instruments - Credit Losses”). Loan fees and direct costs associated with loans originated by theCompany are deferred and amortized over the term of the note as interest income.
Deferred Charges
Deferred charges include leasing costs and certain financing fees. Leasing costs include acquired intangiblein-place lease values and direct and incremental fees and costs incurred in the successful negotiation of leases,including brokerage and other costs which have been deferred and are being amortized on a straight-line basis overthe terms of the respective leases. Unamortized leasing costs are charged to expense upon the early termination ofthe lease. Fully amortized deferred leasing costs are removed from the books upon the expiration of the lease. TheCompany did not capitalize any external legal costs and internal leasing salaries and related costs for the yearsended December 31, 2020 and 2019 (see “Leases”). Internal leasing salaries and related costs capitalized for theyear ended December 31, 2018 were approximately $5.4 million. Financing fees included in deferred chargesconsist of external fees and costs incurred to obtain the Company’s revolving facility and if applicable, the delayeddraw facility and construction financing arrangements where there are not sufficient amounts outstanding. Suchfinancing costs have been deferred and are being amortized over the terms of the respective financing and includedwithin interest expense. Unamortized financing costs are charged to expense upon the early repayment orsignificant modification of the financing. Fully amortized deferred financing costs are removed from the books uponthe maturity of the debt.
External fees and costs incurred to obtain mortgage financings and unsecured senior notes have beendeferred and are presented as direct deductions from the carrying amounts of the corresponding debt liability. Suchfinancing costs are being amortized over the terms of the respective financing and included within interest expense.Unamortized financing costs are charged to expense upon the early repayment or significant modification of thefinancing.
Investments in Unconsolidated Joint Ventures
The Company consolidates VIEs in which it is considered to be the primary beneficiary. VIEs are entities inwhich the equity investors do not have sufficient equity at risk to finance their endeavors without additional financialsupport or that the holders of the equity investment at risk do not have substantive participating rights. The primarybeneficiary is defined by the entity having both of the following characteristics: (1) the power to direct the activitiesthat, when taken together, most significantly impact the variable interest entity’s performance, and (2) the obligationto absorb losses and the right to receive the returns from the variable interest entity that could potentially besignificant to the VIE. For ventures that are not VIEs, the Company consolidates entities for which it has significant
142
decision making control over the ventures’ operations. The Company’s judgment with respect to its level ofinfluence or control of an entity involves the consideration of various factors including the form of the Company’sownership interest, its representation in the entity’s governance, the size of its investment (including loans),estimates of future cash flows, its ability to participate in policy making decisions and the rights of the otherinvestors to participate in the decision making process and to replace the Company as manager and/or liquidate theventure, if applicable. The Company’s assessment of its influence or control over an entity affects the presentationof these investments in the Company’s consolidated financial statements. In addition to evaluating control rights,the Company consolidates entities in which the outside partner has no substantive kick-out rights to remove theCompany as the managing member.
Accounts of the consolidated entity are included in the accounts of the Company and the noncontrollinginterest is reflected on the Consolidated Balance Sheets as a component of equity or in temporary equity betweenliabilities and equity. Investments in unconsolidated joint ventures are recorded initially at cost, and subsequentlyadjusted for equity in earnings and cash contributions and distributions. Any difference between the carryingamount of these investments on the balance sheet and the underlying equity in net assets is amortized as anadjustment to equity in earnings of unconsolidated joint ventures over the life of the related asset. Under the equitymethod of accounting, the net equity investment of the Company is reflected within the Consolidated BalanceSheets, and the Company’s share of net income or loss from the joint ventures is included within the ConsolidatedStatements of Operations. The joint venture agreements may designate different percentage allocations amonginvestors for profits and losses; however, the Company’s recognition of joint venture income or loss generallyfollows the joint venture’s distribution priorities, which may change upon the achievement of certain investmentreturn thresholds. The Company may account for cash distributions in excess of its investment in anunconsolidated joint venture as income when the Company is not the general partner in a limited partnership andwhen the Company has neither the requirement nor the intent to provide financial support to the joint venture. TheCompany classifies distributions received from equity method investees within its Consolidated Statements of CashFlows using the nature of the distribution approach, which classifies the distributions received on the basis of thenature of the activity or activities of the investee that generated the distribution as either a return on investment(classified as cash inflows from operating activities) or a return of investment (classified as cash inflows frominvesting activities). The Company’s investments in unconsolidated joint ventures are reviewed for indicators ofimpairment on a quarterly basis and the Company records impairment charges when events or circumstanceschange indicating that a decline in the fair values below the carrying amounts has occurred and such decline isother-than-temporary. This evaluation of the investments in unconsolidated joint ventures is dependent on anumber of factors, including the performance of each investment and market conditions. The Company will recordan impairment charge if it determines that a decline in the fair value below the carrying amount of an investment inan unconsolidated joint venture is other-than-temporary. The fair value is calculated using discounted cash flowswhich is subjective and considers assumptions regarding future occupancy, future rental rates, future capitalrequirements, discount rates and capitalization rates that could differ materially from actual results in future periods.
To the extent that the Company contributed assets to a joint venture, the Company’s investment in the jointventure was recorded at the Company’s cost basis in the assets that were contributed to the joint venture. To theextent that the Company’s cost basis is different than the basis reflected at the joint venture level, the basisdifference is amortized over the life of the related asset and included in the Company’s share of equity in net incomeof the joint venture. In accordance with the provisions of ASC 610-20 “Gains and Losses from the Derecognition ofNonfinancial Assets” (“ASC 610-20”), the Company will recognize a full gain on both the retained and sold portionsof real estate contributed or sold to a joint venture by recognizing its new equity method investment interest at fairvalue.
The combined summarized financial information of the unconsolidated joint ventures is disclosed in Note 6.
Revenue Recognition
In general, the Company commences lease/rental revenue recognition when the tenant takes possession ofthe leased space and the leased space is substantially ready for its intended use. Contractual lease/rental revenueis reported on a straight-line basis over the terms of the respective leases. The impact of the straight-line rentadjustment increased revenue by approximately $104.9 million, $58.4 million and $51.9 million for the years endedDecember 31, 2020, 2019 and 2018, respectively, as the revenue recorded exceeded amounts billed. Accruedrental income, as reported on the Consolidated Balance Sheets, represents cumulative lease/rental income earnedin excess of rent payments received pursuant to the terms of the individual lease agreements.
143
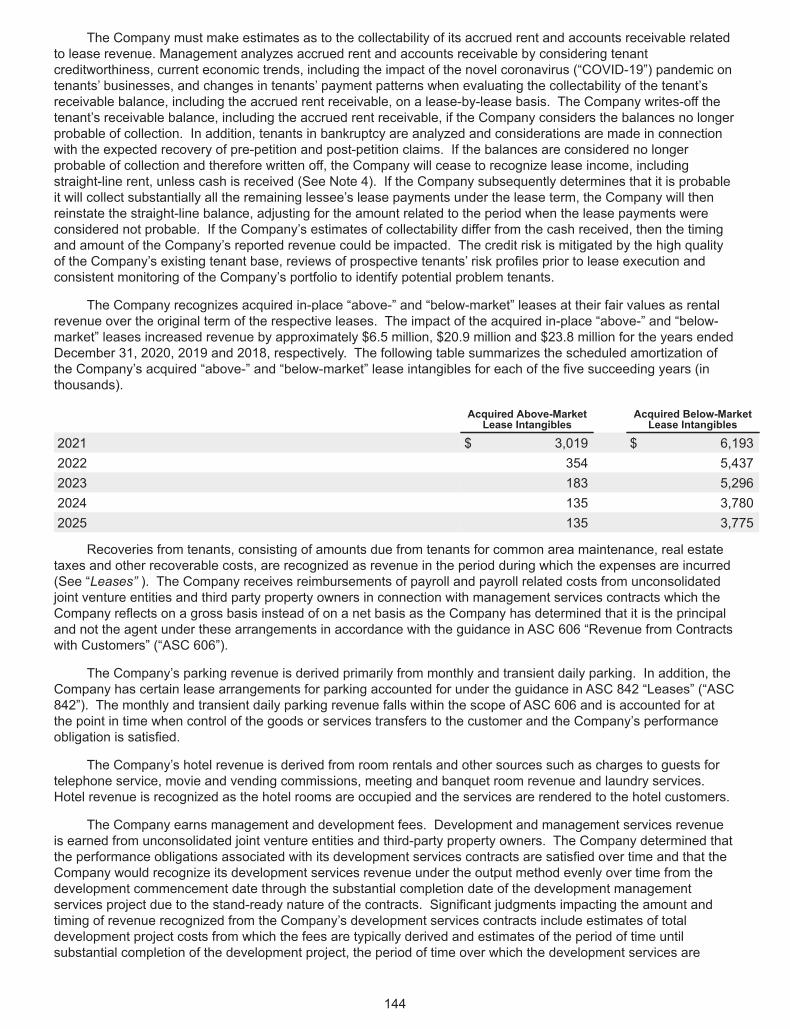
The Company must make estimates as to the collectability of its accrued rent and accounts receivable relatedto lease revenue. Management analyzes accrued rent and accounts receivable by considering tenantcreditworthiness, current economic trends, including the impact of the novel coronavirus (“COVID-19”) pandemic ontenants’ businesses, and changes in tenants’ payment patterns when evaluating the collectability of the tenant’sreceivable balance, including the accrued rent receivable, on a lease-by-lease basis. The Company writes-off thetenant’s receivable balance, including the accrued rent receivable, if the Company considers the balances no longerprobable of collection. In addition, tenants in bankruptcy are analyzed and considerations are made in connectionwith the expected recovery of pre-petition and post-petition claims. If the balances are considered no longerprobable of collection and therefore written off, the Company will cease to recognize lease income, includingstraight-line rent, unless cash is received (See Note 4). If the Company subsequently determines that it is probableit will collect substantially all the remaining lessee’s lease payments under the lease term, the Company will thenreinstate the straight-line balance, adjusting for the amount related to the period when the lease payments wereconsidered not probable. If the Company’s estimates of collectability differ from the cash received, then the timingand amount of the Company’s reported revenue could be impacted. The credit risk is mitigated by the high qualityof the Company’s existing tenant base, reviews of prospective tenants’ risk profiles prior to lease execution andconsistent monitoring of the Company’s portfolio to identify potential problem tenants.
The Company recognizes acquired in-place “above-” and “below-market” leases at their fair values as rentalrevenue over the original term of the respective leases. The impact of the acquired in-place “above-” and “below-market” leases increased revenue by approximately $6.5 million, $20.9 million and $23.8 million for the years endedDecember 31, 2020, 2019 and 2018, respectively. The following table summarizes the scheduled amortization ofthe Company’s acquired “above-” and “below-market” lease intangibles for each of the five succeeding years (inthousands).
Acquired Above-MarketLease Intangibles
Acquired Below-MarketLease Intangibles
2021 $ 3,019 $ 6,1932022 354 5,4372023 183 5,2962024 135 3,7802025 135 3,775
Recoveries from tenants, consisting of amounts due from tenants for common area maintenance, real estatetaxes and other recoverable costs, are recognized as revenue in the period during which the expenses are incurred(See “Leases” ). The Company receives reimbursements of payroll and payroll related costs from unconsolidatedjoint venture entities and third party property owners in connection with management services contracts which theCompany reflects on a gross basis instead of on a net basis as the Company has determined that it is the principaland not the agent under these arrangements in accordance with the guidance in ASC 606 “Revenue from Contractswith Customers” (“ASC 606”).
The Company’s parking revenue is derived primarily from monthly and transient daily parking. In addition, theCompany has certain lease arrangements for parking accounted for under the guidance in ASC 842 “Leases” (“ASC842”). The monthly and transient daily parking revenue falls within the scope of ASC 606 and is accounted for atthe point in time when control of the goods or services transfers to the customer and the Company’s performanceobligation is satisfied.
The Company’s hotel revenue is derived from room rentals and other sources such as charges to guests fortelephone service, movie and vending commissions, meeting and banquet room revenue and laundry services.Hotel revenue is recognized as the hotel rooms are occupied and the services are rendered to the hotel customers.
The Company earns management and development fees. Development and management services revenueis earned from unconsolidated joint venture entities and third-party property owners. The Company determined thatthe performance obligations associated with its development services contracts are satisfied over time and that theCompany would recognize its development services revenue under the output method evenly over time from thedevelopment commencement date through the substantial completion date of the development managementservices project due to the stand-ready nature of the contracts. Significant judgments impacting the amount andtiming of revenue recognized from the Company’s development services contracts include estimates of totaldevelopment project costs from which the fees are typically derived and estimates of the period of time untilsubstantial completion of the development project, the period of time over which the development services are
144
required to be performed. The Company recognizes development fees earned from unconsolidated joint ventureprojects equal to its cost plus profit to the extent of the third party partners’ ownership interest. Propertymanagement fees are recorded and earned based on a percentage of collected rents at the properties undermanagement, and not on a straight-line basis, because such fees are contingent upon the collection of rents.
Gains on sales of real estate are recognized pursuant to the provisions included in ASC 610-20. Under ASC610-20, the Company must first determine whether the transaction is a sale to a customer or non-customer. TheCompany typically sells real estate on a selective basis and not within the ordinary course of its business andtherefore expects that its sale transactions will not be contracts with customers. The Company next determineswhether it has a controlling financial interest in the property after the sale, consistent with the consolidation model inASC 810 “Consolidation” (“ASC 810”). If the Company determines that it does not have a controlling financialinterest in the real estate, it evaluates whether a contract exists under ASC 606 and whether the buyer has obtainedcontrol of the asset that was sold. The Company recognizes a full gain on sale of real estate when thederecognition criteria under ASC 610-20 have been met.
Leases
Lessee
For leases in which the Company is the lessee (generally ground leases), in accordance with ASC 842 theCompany recognizes a right-of-use asset and a lease liability. The Company made the policy election to not applythe revenue recognition requirements of ASC 842 to short-term leases. This policy election is made by class ofunderlying assets and as described below, the Company considers real estate to be a class of underlying assets,and will not be further delineating it into specific uses of the real estate asset as the risk profiles are similar innature. The Company will recognize the lease payments in net income on a straight-line basis over the lease term.
The lease liability is equal to the present value of the minimum lease payments in accordance with ASC 842.The Company will use its incremental borrowing rate (“IBR”) to determine the net present value of the minimumlease payments. In order to determine the IBR, the Company utilized a market-based approach to estimate theincremental borrowing rate for each individual lease. The approach required significant judgment. Therefore, theCompany utilized different data sets to estimate base IBRs via an analysis of the following weighted-components:
• the interpolated rates from yields on outstanding U.S. Treasury issuances for up to 30 years and for years31 and beyond, longer-term publicly traded educational institution debt issued by high credit qualityeducational institutions with maturity dates exceeding 31 years,
• observable mortgage rates spread over U.S. Treasury issuances, and
• unlevered property yields and discount rates.
The Company then applied adjustments to account for considerations related to term and interpolated the IBR.
Lessor
The Company leases primarily Class A office, life sciences, retail and residential space to tenants. Theseleases may contain extension and termination options that are predominately at the sole discretion of the tenant,provided certain conditions are satisfied. In a few instances, the leases also contain purchase options, which wouldbe exercisable at fair market value. Also, certain of the Company’s leases include rental payments that are basedon a percentage of the tenant sales in excess of contractual amounts.
Per ASC 842, lessors do not need to separate nonlease components from the associated lease component ifcertain criteria stated above are met for each class of underlying assets. The guidance in ASC 842 defines“underlying asset” as “an asset that is the subject of a lease for which a right to use that asset has been conveyedto a lessee. The underlying asset could be a physically distinct portion of a single asset.” Based on the aboveguidance, the Company considers real estate assets as a class of underlying assets and will not be furtherdelineating it into specific uses of the real estate asset as the risk profiles are similar in nature.
Lease components are elements of an arrangement that provide the customer with the right to use anidentified asset. Nonlease components are distinct elements of a contract that are not related to securing the use ofthe leased asset and revenue is recognized in accordance with ASC 606. The Company considers common areamaintenance (CAM) and service income associated with tenant work orders to be nonlease components becausethey represent delivery of a separate service but are not considered a cost of securing the identified asset. In the
145
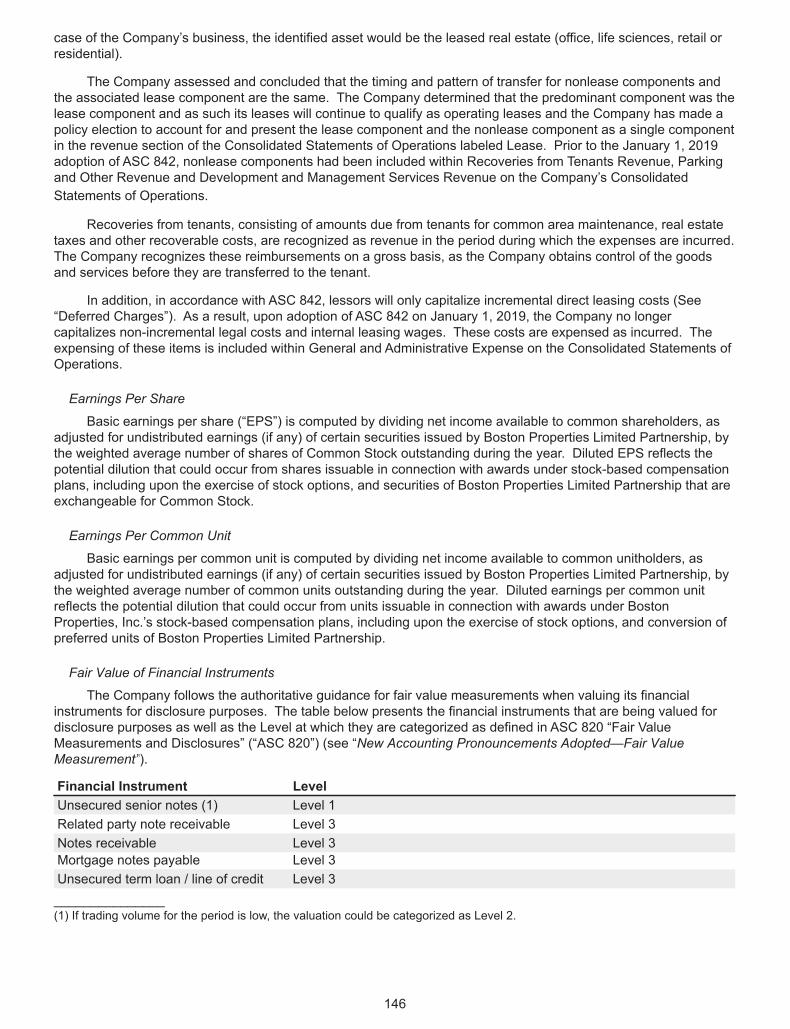
case of the Company’s business, the identified asset would be the leased real estate (office, life sciences, retail orresidential).
The Company assessed and concluded that the timing and pattern of transfer for nonlease components andthe associated lease component are the same. The Company determined that the predominant component was thelease component and as such its leases will continue to qualify as operating leases and the Company has made apolicy election to account for and present the lease component and the nonlease component as a single componentin the revenue section of the Consolidated Statements of Operations labeled Lease. Prior to the January 1, 2019adoption of ASC 842, nonlease components had been included within Recoveries from Tenants Revenue, Parkingand Other Revenue and Development and Management Services Revenue on the Company’s ConsolidatedStatements of Operations.
Recoveries from tenants, consisting of amounts due from tenants for common area maintenance, real estatetaxes and other recoverable costs, are recognized as revenue in the period during which the expenses are incurred.The Company recognizes these reimbursements on a gross basis, as the Company obtains control of the goodsand services before they are transferred to the tenant.
In addition, in accordance with ASC 842, lessors will only capitalize incremental direct leasing costs (See“Deferred Charges”). As a result, upon adoption of ASC 842 on January 1, 2019, the Company no longercapitalizes non-incremental legal costs and internal leasing wages. These costs are expensed as incurred. Theexpensing of these items is included within General and Administrative Expense on the Consolidated Statements ofOperations.
Earnings Per Share
Basic earnings per share (“EPS”) is computed by dividing net income available to common shareholders, asadjusted for undistributed earnings (if any) of certain securities issued by Boston Properties Limited Partnership, bythe weighted average number of shares of Common Stock outstanding during the year. Diluted EPS reflects thepotential dilution that could occur from shares issuable in connection with awards under stock-based compensationplans, including upon the exercise of stock options, and securities of Boston Properties Limited Partnership that areexchangeable for Common Stock.
Earnings Per Common Unit
Basic earnings per common unit is computed by dividing net income available to common unitholders, asadjusted for undistributed earnings (if any) of certain securities issued by Boston Properties Limited Partnership, bythe weighted average number of common units outstanding during the year. Diluted earnings per common unitreflects the potential dilution that could occur from units issuable in connection with awards under BostonProperties, Inc.’s stock-based compensation plans, including upon the exercise of stock options, and conversion ofpreferred units of Boston Properties Limited Partnership.
Fair Value of Financial Instruments
The Company follows the authoritative guidance for fair value measurements when valuing its financialinstruments for disclosure purposes. The table below presents the financial instruments that are being valued fordisclosure purposes as well as the Level at which they are categorized as defined in ASC 820 “Fair ValueMeasurements and Disclosures” (“ASC 820”) (see “New Accounting Pronouncements Adopted—Fair ValueMeasurement”).
Financial Instrument LevelUnsecured senior notes (1) Level 1Related party note receivable Level 3Notes receivable Level 3Mortgage notes payable Level 3Unsecured term loan / line of credit Level 3_______________(1) If trading volume for the period is low, the valuation could be categorized as Level 2.
146
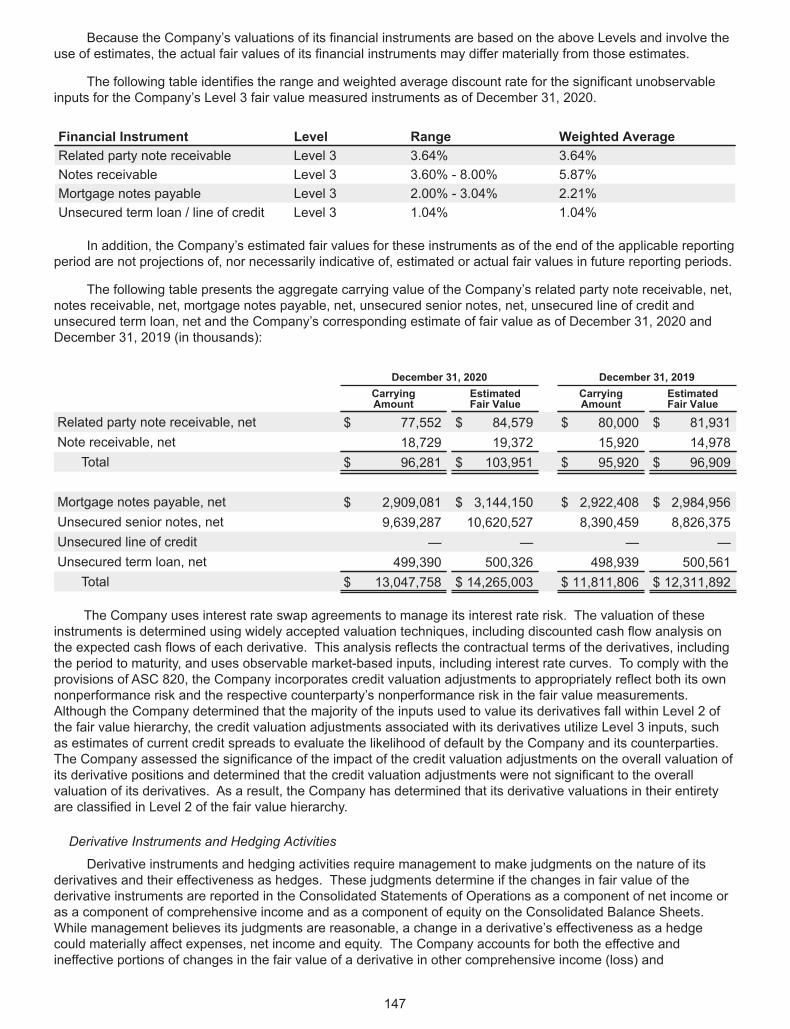
Because the Company’s valuations of its financial instruments are based on the above Levels and involve theuse of estimates, the actual fair values of its financial instruments may differ materially from those estimates.
The following table identifies the range and weighted average discount rate for the significant unobservableinputs for the Company’s Level 3 fair value measured instruments as of December 31, 2020.
Financial Instrument Level Range Weighted AverageRelated party note receivable Level 3 3.64% 3.64%Notes receivable Level 3 3.60% - 8.00% 5.87%Mortgage notes payable Level 3 2.00% - 3.04% 2.21%Unsecured term loan / line of credit Level 3 1.04% 1.04%
In addition, the Company’s estimated fair values for these instruments as of the end of the applicable reportingperiod are not projections of, nor necessarily indicative of, estimated or actual fair values in future reporting periods.
The following table presents the aggregate carrying value of the Company’s related party note receivable, net,notes receivable, net, mortgage notes payable, net, unsecured senior notes, net, unsecured line of credit andunsecured term loan, net and the Company’s corresponding estimate of fair value as of December 31, 2020 andDecember 31, 2019 (in thousands):
December 31, 2020 December 31, 2019CarryingAmount
EstimatedFair Value
CarryingAmount
EstimatedFair Value
Related party note receivable, net $ 77,552 $ 84,579 $ 80,000 $ 81,931Note receivable, net 18,729 19,372 15,920 14,978
Total $ 96,281 $ 103,951 $ 95,920 $ 96,909
Mortgage notes payable, net $ 2,909,081 $ 3,144,150 $ 2,922,408 $ 2,984,956Unsecured senior notes, net 9,639,287 10,620,527 8,390,459 8,826,375Unsecured line of credit — — — —Unsecured term loan, net 499,390 500,326 498,939 500,561
Total $ 13,047,758 $ 14,265,003 $ 11,811,806 $ 12,311,892
The Company uses interest rate swap agreements to manage its interest rate risk. The valuation of theseinstruments is determined using widely accepted valuation techniques, including discounted cash flow analysis onthe expected cash flows of each derivative. This analysis reflects the contractual terms of the derivatives, includingthe period to maturity, and uses observable market-based inputs, including interest rate curves. To comply with theprovisions of ASC 820, the Company incorporates credit valuation adjustments to appropriately reflect both its ownnonperformance risk and the respective counterparty’s nonperformance risk in the fair value measurements.Although the Company determined that the majority of the inputs used to value its derivatives fall within Level 2 ofthe fair value hierarchy, the credit valuation adjustments associated with its derivatives utilize Level 3 inputs, suchas estimates of current credit spreads to evaluate the likelihood of default by the Company and its counterparties.The Company assessed the significance of the impact of the credit valuation adjustments on the overall valuation ofits derivative positions and determined that the credit valuation adjustments were not significant to the overallvaluation of its derivatives. As a result, the Company has determined that its derivative valuations in their entiretyare classified in Level 2 of the fair value hierarchy.
Derivative Instruments and Hedging Activities
Derivative instruments and hedging activities require management to make judgments on the nature of itsderivatives and their effectiveness as hedges. These judgments determine if the changes in fair value of thederivative instruments are reported in the Consolidated Statements of Operations as a component of net income oras a component of comprehensive income and as a component of equity on the Consolidated Balance Sheets.While management believes its judgments are reasonable, a change in a derivative’s effectiveness as a hedgecould materially affect expenses, net income and equity. The Company accounts for both the effective andineffective portions of changes in the fair value of a derivative in other comprehensive income (loss) and
147
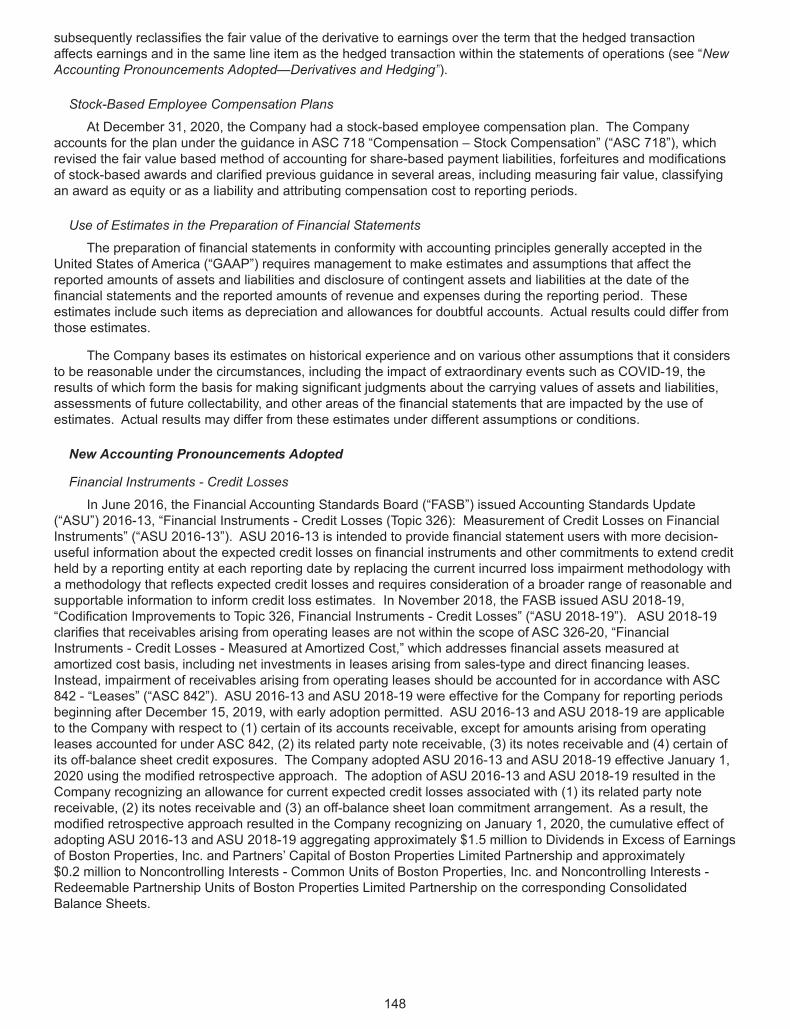
subsequently reclassifies the fair value of the derivative to earnings over the term that the hedged transactionaffects earnings and in the same line item as the hedged transaction within the statements of operations (see “NewAccounting Pronouncements Adopted—Derivatives and Hedging”).
Stock-Based Employee Compensation Plans
At December 31, 2020, the Company had a stock-based employee compensation plan. The Companyaccounts for the plan under the guidance in ASC 718 “Compensation – Stock Compensation” (“ASC 718”), whichrevised the fair value based method of accounting for share-based payment liabilities, forfeitures and modificationsof stock-based awards and clarified previous guidance in several areas, including measuring fair value, classifyingan award as equity or as a liability and attributing compensation cost to reporting periods.
Use of Estimates in the Preparation of Financial Statements
The preparation of financial statements in conformity with accounting principles generally accepted in theUnited States of America (“GAAP”) requires management to make estimates and assumptions that affect thereported amounts of assets and liabilities and disclosure of contingent assets and liabilities at the date of thefinancial statements and the reported amounts of revenue and expenses during the reporting period. Theseestimates include such items as depreciation and allowances for doubtful accounts. Actual results could differ fromthose estimates.
The Company bases its estimates on historical experience and on various other assumptions that it considersto be reasonable under the circumstances, including the impact of extraordinary events such as COVID-19, theresults of which form the basis for making significant judgments about the carrying values of assets and liabilities,assessments of future collectability, and other areas of the financial statements that are impacted by the use ofestimates. Actual results may differ from these estimates under different assumptions or conditions.
New Accounting Pronouncements Adopted
Financial Instruments - Credit Losses
In June 2016, the Financial Accounting Standards Board (“FASB”) issued Accounting Standards Update(“ASU”) 2016-13, “Financial Instruments - Credit Losses (Topic 326): Measurement of Credit Losses on FinancialInstruments” (“ASU 2016-13”). ASU 2016-13 is intended to provide financial statement users with more decision-useful information about the expected credit losses on financial instruments and other commitments to extend creditheld by a reporting entity at each reporting date by replacing the current incurred loss impairment methodology witha methodology that reflects expected credit losses and requires consideration of a broader range of reasonable andsupportable information to inform credit loss estimates. In November 2018, the FASB issued ASU 2018-19,“Codification Improvements to Topic 326, Financial Instruments - Credit Losses” (“ASU 2018-19”). ASU 2018-19clarifies that receivables arising from operating leases are not within the scope of ASC 326-20, “FinancialInstruments - Credit Losses - Measured at Amortized Cost,” which addresses financial assets measured atamortized cost basis, including net investments in leases arising from sales-type and direct financing leases.Instead, impairment of receivables arising from operating leases should be accounted for in accordance with ASC842 - “Leases” (“ASC 842”). ASU 2016-13 and ASU 2018-19 were effective for the Company for reporting periodsbeginning after December 15, 2019, with early adoption permitted. ASU 2016-13 and ASU 2018-19 are applicableto the Company with respect to (1) certain of its accounts receivable, except for amounts arising from operatingleases accounted for under ASC 842, (2) its related party note receivable, (3) its notes receivable and (4) certain ofits off-balance sheet credit exposures. The Company adopted ASU 2016-13 and ASU 2018-19 effective January 1,2020 using the modified retrospective approach. The adoption of ASU 2016-13 and ASU 2018-19 resulted in theCompany recognizing an allowance for current expected credit losses associated with (1) its related party notereceivable, (2) its notes receivable and (3) an off-balance sheet loan commitment arrangement. As a result, themodified retrospective approach resulted in the Company recognizing on January 1, 2020, the cumulative effect ofadopting ASU 2016-13 and ASU 2018-19 aggregating approximately $1.5 million to Dividends in Excess of Earningsof Boston Properties, Inc. and Partners’ Capital of Boston Properties Limited Partnership and approximately$0.2 million to Noncontrolling Interests - Common Units of Boston Properties, Inc. and Noncontrolling Interests -Redeemable Partnership Units of Boston Properties Limited Partnership on the corresponding ConsolidatedBalance Sheets.
148
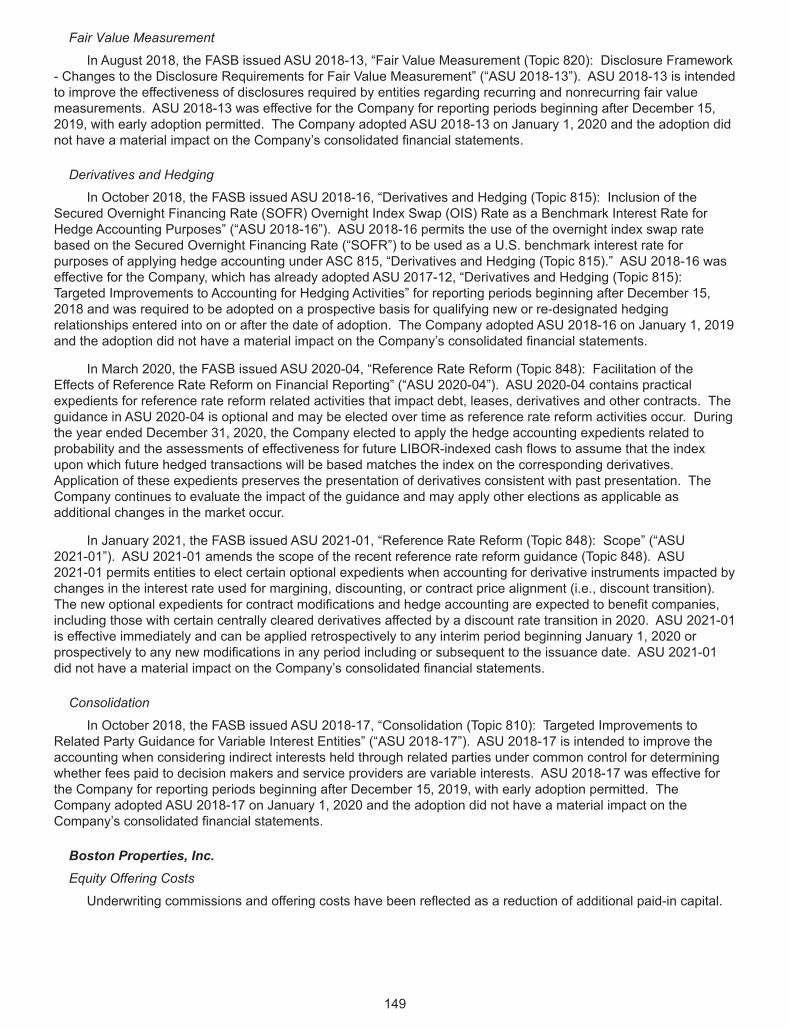
Fair Value Measurement
In August 2018, the FASB issued ASU 2018-13, “Fair Value Measurement (Topic 820): Disclosure Framework- Changes to the Disclosure Requirements for Fair Value Measurement” (“ASU 2018-13”). ASU 2018-13 is intendedto improve the effectiveness of disclosures required by entities regarding recurring and nonrecurring fair valuemeasurements. ASU 2018-13 was effective for the Company for reporting periods beginning after December 15,2019, with early adoption permitted. The Company adopted ASU 2018-13 on January 1, 2020 and the adoption didnot have a material impact on the Company’s consolidated financial statements.
Derivatives and Hedging
In October 2018, the FASB issued ASU 2018-16, “Derivatives and Hedging (Topic 815): Inclusion of theSecured Overnight Financing Rate (SOFR) Overnight Index Swap (OIS) Rate as a Benchmark Interest Rate forHedge Accounting Purposes” (“ASU 2018-16”). ASU 2018-16 permits the use of the overnight index swap ratebased on the Secured Overnight Financing Rate (“SOFR”) to be used as a U.S. benchmark interest rate forpurposes of applying hedge accounting under ASC 815, “Derivatives and Hedging (Topic 815).” ASU 2018-16 waseffective for the Company, which has already adopted ASU 2017-12, “Derivatives and Hedging (Topic 815):Targeted Improvements to Accounting for Hedging Activities” for reporting periods beginning after December 15,2018 and was required to be adopted on a prospective basis for qualifying new or re-designated hedgingrelationships entered into on or after the date of adoption. The Company adopted ASU 2018-16 on January 1, 2019and the adoption did not have a material impact on the Company’s consolidated financial statements.
In March 2020, the FASB issued ASU 2020-04, “Reference Rate Reform (Topic 848): Facilitation of theEffects of Reference Rate Reform on Financial Reporting” (“ASU 2020-04”). ASU 2020-04 contains practicalexpedients for reference rate reform related activities that impact debt, leases, derivatives and other contracts. Theguidance in ASU 2020-04 is optional and may be elected over time as reference rate reform activities occur. Duringthe year ended December 31, 2020, the Company elected to apply the hedge accounting expedients related toprobability and the assessments of effectiveness for future LIBOR-indexed cash flows to assume that the indexupon which future hedged transactions will be based matches the index on the corresponding derivatives.Application of these expedients preserves the presentation of derivatives consistent with past presentation. TheCompany continues to evaluate the impact of the guidance and may apply other elections as applicable asadditional changes in the market occur.
In January 2021, the FASB issued ASU 2021-01, “Reference Rate Reform (Topic 848): Scope” (“ASU2021-01”). ASU 2021-01 amends the scope of the recent reference rate reform guidance (Topic 848). ASU2021-01 permits entities to elect certain optional expedients when accounting for derivative instruments impacted bychanges in the interest rate used for margining, discounting, or contract price alignment (i.e., discount transition).The new optional expedients for contract modifications and hedge accounting are expected to benefit companies,including those with certain centrally cleared derivatives affected by a discount rate transition in 2020. ASU 2021-01is effective immediately and can be applied retrospectively to any interim period beginning January 1, 2020 orprospectively to any new modifications in any period including or subsequent to the issuance date. ASU 2021-01did not have a material impact on the Company’s consolidated financial statements.
Consolidation
In October 2018, the FASB issued ASU 2018-17, “Consolidation (Topic 810): Targeted Improvements toRelated Party Guidance for Variable Interest Entities” (“ASU 2018-17”). ASU 2018-17 is intended to improve theaccounting when considering indirect interests held through related parties under common control for determiningwhether fees paid to decision makers and service providers are variable interests. ASU 2018-17 was effective forthe Company for reporting periods beginning after December 15, 2019, with early adoption permitted. TheCompany adopted ASU 2018-17 on January 1, 2020 and the adoption did not have a material impact on theCompany’s consolidated financial statements.
Boston Properties, Inc.Equity Offering Costs
Underwriting commissions and offering costs have been reflected as a reduction of additional paid-in capital.
149
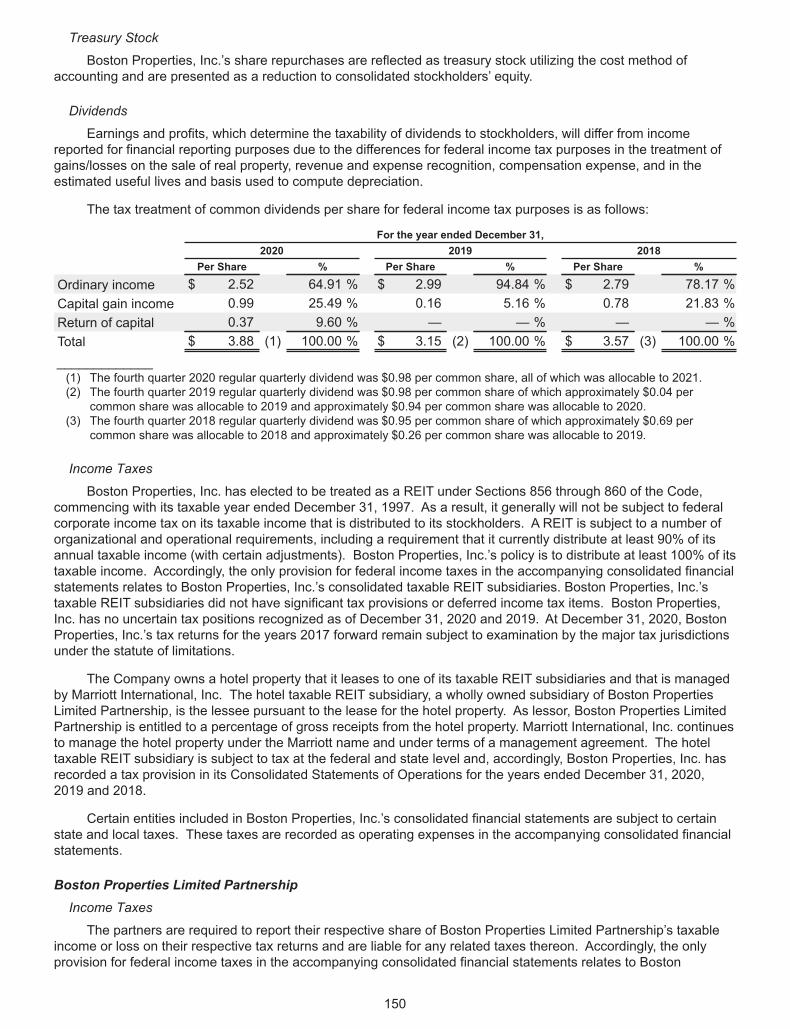
Treasury Stock
Boston Properties, Inc.’s share repurchases are reflected as treasury stock utilizing the cost method ofaccounting and are presented as a reduction to consolidated stockholders’ equity.
Dividends
Earnings and profits, which determine the taxability of dividends to stockholders, will differ from incomereported for financial reporting purposes due to the differences for federal income tax purposes in the treatment ofgains/losses on the sale of real property, revenue and expense recognition, compensation expense, and in theestimated useful lives and basis used to compute depreciation.
The tax treatment of common dividends per share for federal income tax purposes is as follows:
For the year ended December 31,2020 2019 2018
Per Share % Per Share % Per Share %
Ordinary income $ 2.52 64.91 % $ 2.99 94.84 % $ 2.79 78.17 %Capital gain income 0.99 25.49 % 0.16 5.16 % 0.78 21.83 %Return of capital 0.37 9.60 % — — % — — %Total $ 3.88 (1) 100.00 % $ 3.15 (2) 100.00 % $ 3.57 (3) 100.00 %_____________(1) The fourth quarter 2020 regular quarterly dividend was $0.98 per common share, all of which was allocable to 2021.(2) The fourth quarter 2019 regular quarterly dividend was $0.98 per common share of which approximately $0.04 per
common share was allocable to 2019 and approximately $0.94 per common share was allocable to 2020.(3) The fourth quarter 2018 regular quarterly dividend was $0.95 per common share of which approximately $0.69 per
common share was allocable to 2018 and approximately $0.26 per common share was allocable to 2019.
Income Taxes
Boston Properties, Inc. has elected to be treated as a REIT under Sections 856 through 860 of the Code,commencing with its taxable year ended December 31, 1997. As a result, it generally will not be subject to federalcorporate income tax on its taxable income that is distributed to its stockholders. A REIT is subject to a number oforganizational and operational requirements, including a requirement that it currently distribute at least 90% of itsannual taxable income (with certain adjustments). Boston Properties, Inc.’s policy is to distribute at least 100% of itstaxable income. Accordingly, the only provision for federal income taxes in the accompanying consolidated financialstatements relates to Boston Properties, Inc.’s consolidated taxable REIT subsidiaries. Boston Properties, Inc.’staxable REIT subsidiaries did not have significant tax provisions or deferred income tax items. Boston Properties,Inc. has no uncertain tax positions recognized as of December 31, 2020 and 2019. At December 31, 2020, BostonProperties, Inc.’s tax returns for the years 2017 forward remain subject to examination by the major tax jurisdictionsunder the statute of limitations.
The Company owns a hotel property that it leases to one of its taxable REIT subsidiaries and that is managedby Marriott International, Inc. The hotel taxable REIT subsidiary, a wholly owned subsidiary of Boston PropertiesLimited Partnership, is the lessee pursuant to the lease for the hotel property. As lessor, Boston Properties LimitedPartnership is entitled to a percentage of gross receipts from the hotel property. Marriott International, Inc. continuesto manage the hotel property under the Marriott name and under terms of a management agreement. The hoteltaxable REIT subsidiary is subject to tax at the federal and state level and, accordingly, Boston Properties, Inc. hasrecorded a tax provision in its Consolidated Statements of Operations for the years ended December 31, 2020,2019 and 2018.
Certain entities included in Boston Properties, Inc.’s consolidated financial statements are subject to certainstate and local taxes. These taxes are recorded as operating expenses in the accompanying consolidated financialstatements.
Boston Properties Limited PartnershipIncome Taxes
The partners are required to report their respective share of Boston Properties Limited Partnership’s taxableincome or loss on their respective tax returns and are liable for any related taxes thereon. Accordingly, the onlyprovision for federal income taxes in the accompanying consolidated financial statements relates to Boston
150
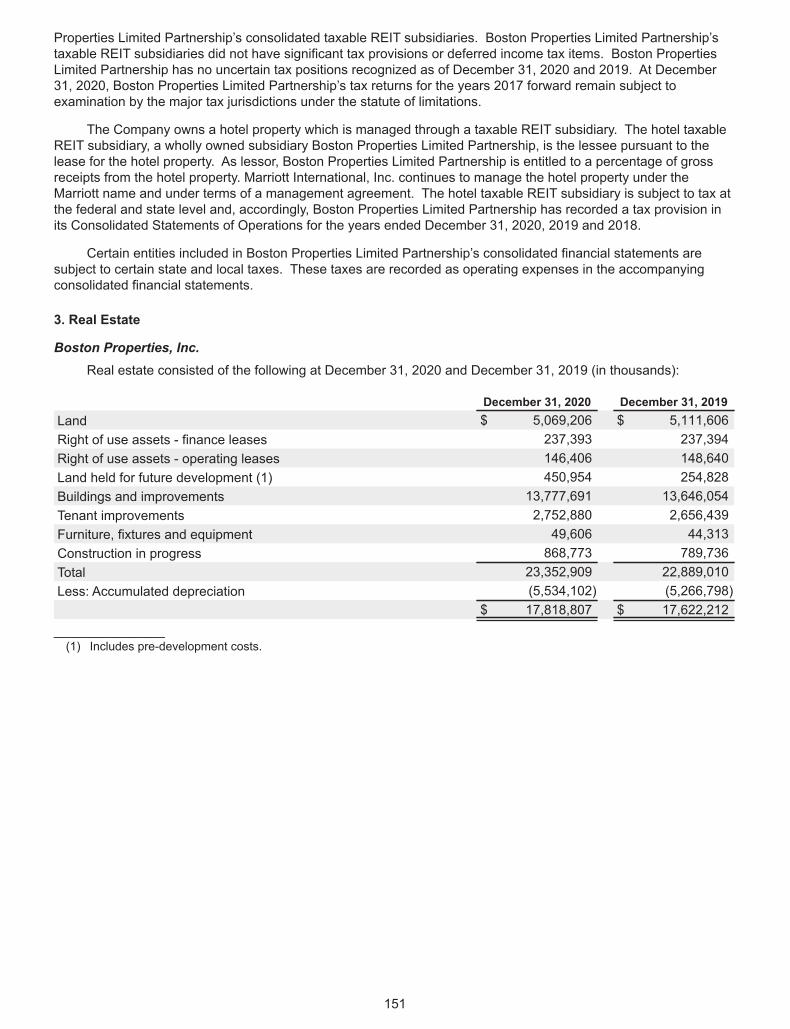
Properties Limited Partnership’s consolidated taxable REIT subsidiaries. Boston Properties Limited Partnership’staxable REIT subsidiaries did not have significant tax provisions or deferred income tax items. Boston PropertiesLimited Partnership has no uncertain tax positions recognized as of December 31, 2020 and 2019. At December31, 2020, Boston Properties Limited Partnership’s tax returns for the years 2017 forward remain subject toexamination by the major tax jurisdictions under the statute of limitations.
The Company owns a hotel property which is managed through a taxable REIT subsidiary. The hotel taxableREIT subsidiary, a wholly owned subsidiary Boston Properties Limited Partnership, is the lessee pursuant to thelease for the hotel property. As lessor, Boston Properties Limited Partnership is entitled to a percentage of grossreceipts from the hotel property. Marriott International, Inc. continues to manage the hotel property under theMarriott name and under terms of a management agreement. The hotel taxable REIT subsidiary is subject to tax atthe federal and state level and, accordingly, Boston Properties Limited Partnership has recorded a tax provision inits Consolidated Statements of Operations for the years ended December 31, 2020, 2019 and 2018.
Certain entities included in Boston Properties Limited Partnership’s consolidated financial statements aresubject to certain state and local taxes. These taxes are recorded as operating expenses in the accompanyingconsolidated financial statements.
3. Real Estate
Boston Properties, Inc.Real estate consisted of the following at December 31, 2020 and December 31, 2019 (in thousands):
December 31, 2020 December 31, 2019Land $ 5,069,206 $ 5,111,606Right of use assets - finance leases 237,393 237,394Right of use assets - operating leases 146,406 148,640Land held for future development (1) 450,954 254,828Buildings and improvements 13,777,691 13,646,054Tenant improvements 2,752,880 2,656,439Furniture, fixtures and equipment 49,606 44,313Construction in progress 868,773 789,736Total 23,352,909 22,889,010Less: Accumulated depreciation (5,534,102) (5,266,798)
$ 17,818,807 $ 17,622,212_______________(1) Includes pre-development costs.
151
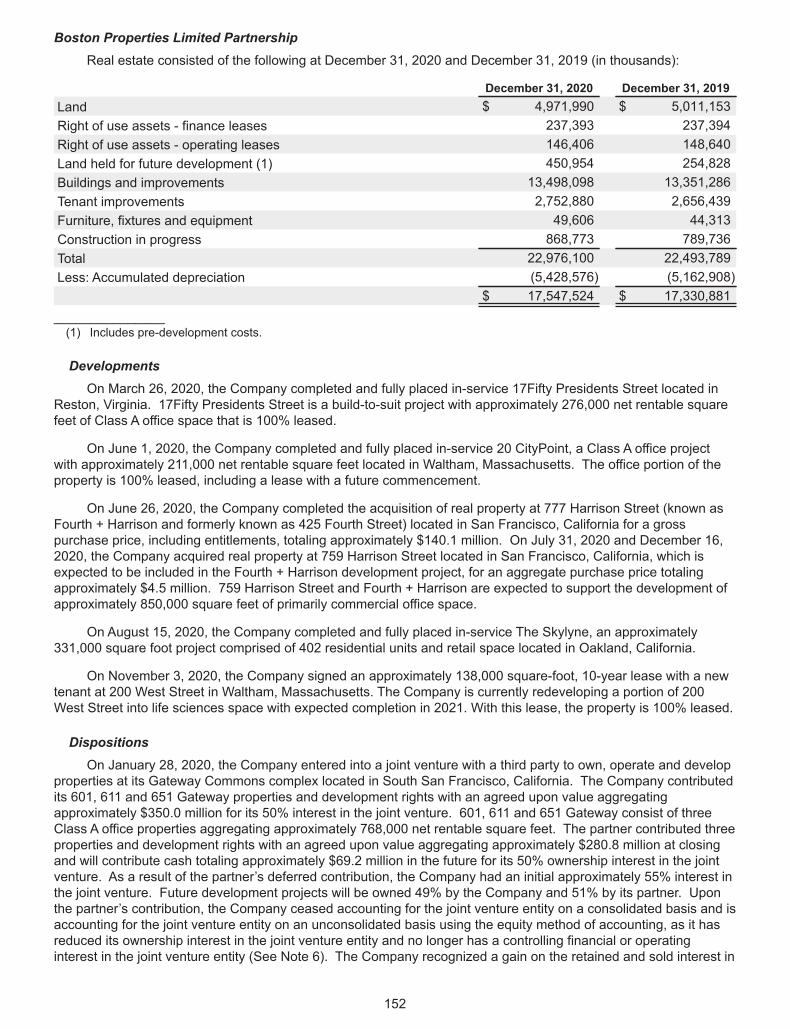
Boston Properties Limited PartnershipReal estate consisted of the following at December 31, 2020 and December 31, 2019 (in thousands):
December 31, 2020 December 31, 2019Land $ 4,971,990 $ 5,011,153Right of use assets - finance leases 237,393 237,394Right of use assets - operating leases 146,406 148,640Land held for future development (1) 450,954 254,828Buildings and improvements 13,498,098 13,351,286Tenant improvements 2,752,880 2,656,439Furniture, fixtures and equipment 49,606 44,313Construction in progress 868,773 789,736Total 22,976,100 22,493,789Less: Accumulated depreciation (5,428,576) (5,162,908)
$ 17,547,524 $ 17,330,881_______________(1) Includes pre-development costs.
DevelopmentsOn March 26, 2020, the Company completed and fully placed in-service 17Fifty Presidents Street located in
Reston, Virginia. 17Fifty Presidents Street is a build-to-suit project with approximately 276,000 net rentable squarefeet of Class A office space that is 100% leased.
On June 1, 2020, the Company completed and fully placed in-service 20 CityPoint, a Class A office projectwith approximately 211,000 net rentable square feet located in Waltham, Massachusetts. The office portion of theproperty is 100% leased, including a lease with a future commencement.
On June 26, 2020, the Company completed the acquisition of real property at 777 Harrison Street (known asFourth + Harrison and formerly known as 425 Fourth Street) located in San Francisco, California for a grosspurchase price, including entitlements, totaling approximately $140.1 million. On July 31, 2020 and December 16,2020, the Company acquired real property at 759 Harrison Street located in San Francisco, California, which isexpected to be included in the Fourth + Harrison development project, for an aggregate purchase price totalingapproximately $4.5 million. 759 Harrison Street and Fourth + Harrison are expected to support the development ofapproximately 850,000 square feet of primarily commercial office space.
On August 15, 2020, the Company completed and fully placed in-service The Skylyne, an approximately331,000 square foot project comprised of 402 residential units and retail space located in Oakland, California.
On November 3, 2020, the Company signed an approximately 138,000 square-foot, 10-year lease with a newtenant at 200 West Street in Waltham, Massachusetts. The Company is currently redeveloping a portion of 200West Street into life sciences space with expected completion in 2021. With this lease, the property is 100% leased.
DispositionsOn January 28, 2020, the Company entered into a joint venture with a third party to own, operate and develop
properties at its Gateway Commons complex located in South San Francisco, California. The Company contributedits 601, 611 and 651 Gateway properties and development rights with an agreed upon value aggregatingapproximately $350.0 million for its 50% interest in the joint venture. 601, 611 and 651 Gateway consist of threeClass A office properties aggregating approximately 768,000 net rentable square feet. The partner contributed threeproperties and development rights with an agreed upon value aggregating approximately $280.8 million at closingand will contribute cash totaling approximately $69.2 million in the future for its 50% ownership interest in the jointventure. As a result of the partner’s deferred contribution, the Company had an initial approximately 55% interest inthe joint venture. Future development projects will be owned 49% by the Company and 51% by its partner. Uponthe partner’s contribution, the Company ceased accounting for the joint venture entity on a consolidated basis and isaccounting for the joint venture entity on an unconsolidated basis using the equity method of accounting, as it hasreduced its ownership interest in the joint venture entity and no longer has a controlling financial or operatinginterest in the joint venture entity (See Note 6). The Company recognized a gain on the retained and sold interest in
152
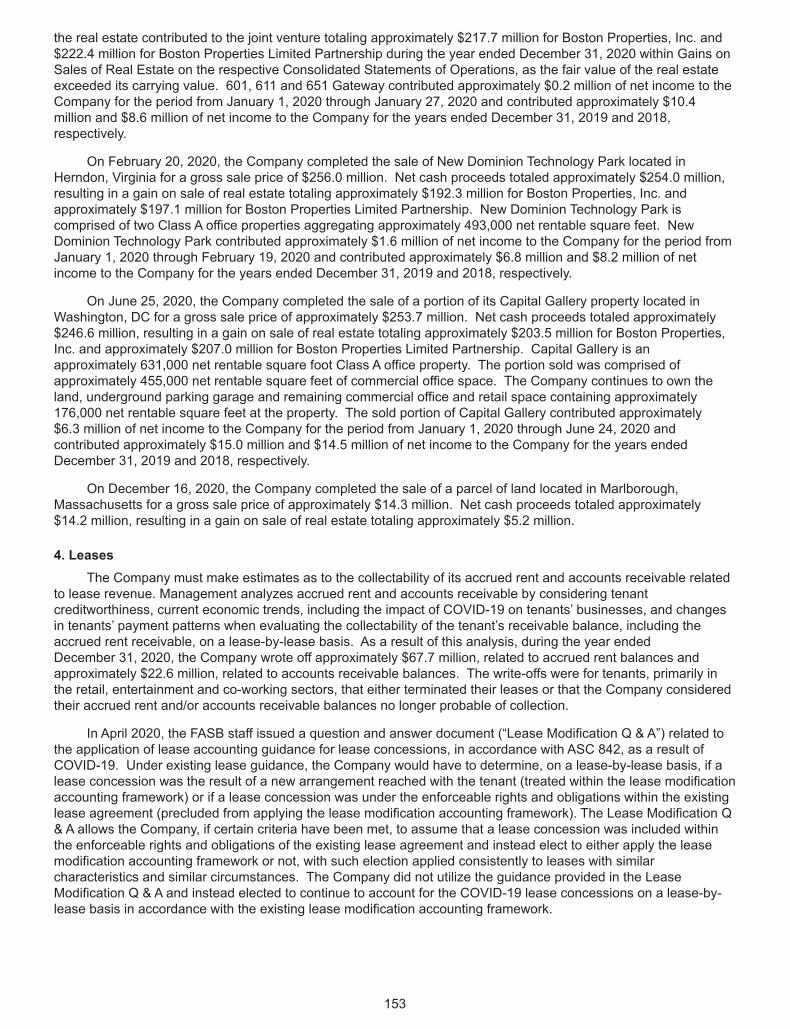
the real estate contributed to the joint venture totaling approximately $217.7 million for Boston Properties, Inc. and$222.4 million for Boston Properties Limited Partnership during the year ended December 31, 2020 within Gains onSales of Real Estate on the respective Consolidated Statements of Operations, as the fair value of the real estateexceeded its carrying value. 601, 611 and 651 Gateway contributed approximately $0.2 million of net income to theCompany for the period from January 1, 2020 through January 27, 2020 and contributed approximately $10.4million and $8.6 million of net income to the Company for the years ended December 31, 2019 and 2018,respectively.
On February 20, 2020, the Company completed the sale of New Dominion Technology Park located inHerndon, Virginia for a gross sale price of $256.0 million. Net cash proceeds totaled approximately $254.0 million,resulting in a gain on sale of real estate totaling approximately $192.3 million for Boston Properties, Inc. andapproximately $197.1 million for Boston Properties Limited Partnership. New Dominion Technology Park iscomprised of two Class A office properties aggregating approximately 493,000 net rentable square feet. NewDominion Technology Park contributed approximately $1.6 million of net income to the Company for the period fromJanuary 1, 2020 through February 19, 2020 and contributed approximately $6.8 million and $8.2 million of netincome to the Company for the years ended December 31, 2019 and 2018, respectively.
On June 25, 2020, the Company completed the sale of a portion of its Capital Gallery property located inWashington, DC for a gross sale price of approximately $253.7 million. Net cash proceeds totaled approximately$246.6 million, resulting in a gain on sale of real estate totaling approximately $203.5 million for Boston Properties,Inc. and approximately $207.0 million for Boston Properties Limited Partnership. Capital Gallery is anapproximately 631,000 net rentable square foot Class A office property. The portion sold was comprised ofapproximately 455,000 net rentable square feet of commercial office space. The Company continues to own theland, underground parking garage and remaining commercial office and retail space containing approximately176,000 net rentable square feet at the property. The sold portion of Capital Gallery contributed approximately$6.3 million of net income to the Company for the period from January 1, 2020 through June 24, 2020 andcontributed approximately $15.0 million and $14.5 million of net income to the Company for the years endedDecember 31, 2019 and 2018, respectively.
On December 16, 2020, the Company completed the sale of a parcel of land located in Marlborough,Massachusetts for a gross sale price of approximately $14.3 million. Net cash proceeds totaled approximately$14.2 million, resulting in a gain on sale of real estate totaling approximately $5.2 million.
4. LeasesThe Company must make estimates as to the collectability of its accrued rent and accounts receivable related
to lease revenue. Management analyzes accrued rent and accounts receivable by considering tenantcreditworthiness, current economic trends, including the impact of COVID-19 on tenants’ businesses, and changesin tenants’ payment patterns when evaluating the collectability of the tenant’s receivable balance, including theaccrued rent receivable, on a lease-by-lease basis. As a result of this analysis, during the year endedDecember 31, 2020, the Company wrote off approximately $67.7 million, related to accrued rent balances andapproximately $22.6 million, related to accounts receivable balances. The write-offs were for tenants, primarily inthe retail, entertainment and co-working sectors, that either terminated their leases or that the Company consideredtheir accrued rent and/or accounts receivable balances no longer probable of collection.
In April 2020, the FASB staff issued a question and answer document (“Lease Modification Q & A”) related tothe application of lease accounting guidance for lease concessions, in accordance with ASC 842, as a result ofCOVID-19. Under existing lease guidance, the Company would have to determine, on a lease-by-lease basis, if alease concession was the result of a new arrangement reached with the tenant (treated within the lease modificationaccounting framework) or if a lease concession was under the enforceable rights and obligations within the existinglease agreement (precluded from applying the lease modification accounting framework). The Lease Modification Q& A allows the Company, if certain criteria have been met, to assume that a lease concession was included withinthe enforceable rights and obligations of the existing lease agreement and instead elect to either apply the leasemodification accounting framework or not, with such election applied consistently to leases with similarcharacteristics and similar circumstances. The Company did not utilize the guidance provided in the LeaseModification Q & A and instead elected to continue to account for the COVID-19 lease concessions on a lease-by-lease basis in accordance with the existing lease modification accounting framework.
153
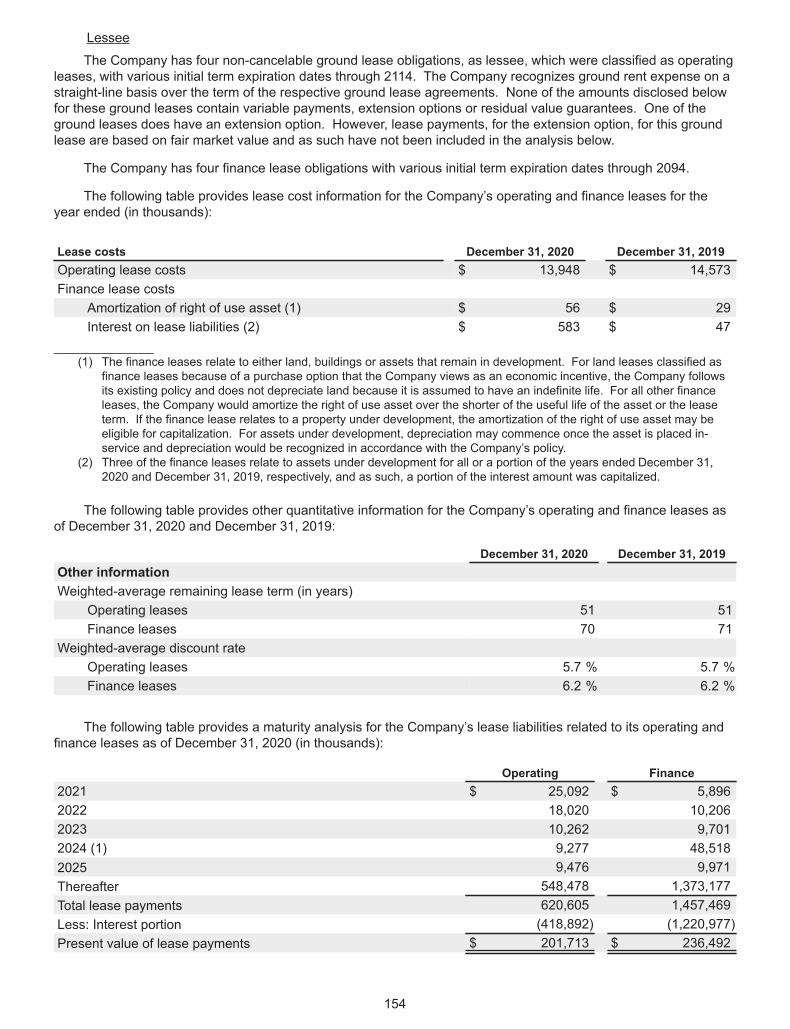
Lessee
The Company has four non-cancelable ground lease obligations, as lessee, which were classified as operatingleases, with various initial term expiration dates through 2114. The Company recognizes ground rent expense on astraight-line basis over the term of the respective ground lease agreements. None of the amounts disclosed belowfor these ground leases contain variable payments, extension options or residual value guarantees. One of theground leases does have an extension option. However, lease payments, for the extension option, for this groundlease are based on fair market value and as such have not been included in the analysis below.
The Company has four finance lease obligations with various initial term expiration dates through 2094.
The following table provides lease cost information for the Company’s operating and finance leases for theyear ended (in thousands):
Lease costs December 31, 2020 December 31, 2019Operating lease costs $ 13,948 $ 14,573Finance lease costs
Amortization of right of use asset (1) $ 56 $ 29Interest on lease liabilities (2) $ 583 $ 47
_______________(1) The finance leases relate to either land, buildings or assets that remain in development. For land leases classified as
finance leases because of a purchase option that the Company views as an economic incentive, the Company followsits existing policy and does not depreciate land because it is assumed to have an indefinite life. For all other financeleases, the Company would amortize the right of use asset over the shorter of the useful life of the asset or the leaseterm. If the finance lease relates to a property under development, the amortization of the right of use asset may beeligible for capitalization. For assets under development, depreciation may commence once the asset is placed in-service and depreciation would be recognized in accordance with the Company’s policy.
(2) Three of the finance leases relate to assets under development for all or a portion of the years ended December 31,2020 and December 31, 2019, respectively, and as such, a portion of the interest amount was capitalized.
The following table provides other quantitative information for the Company’s operating and finance leases asof December 31, 2020 and December 31, 2019:
December 31, 2020 December 31, 2019Other informationWeighted-average remaining lease term (in years)
Operating leases 51 51Finance leases 70 71
Weighted-average discount rateOperating leases 5.7 % 5.7 %Finance leases 6.2 % 6.2 %
The following table provides a maturity analysis for the Company’s lease liabilities related to its operating andfinance leases as of December 31, 2020 (in thousands):
Operating Finance2021 $ 25,092 $ 5,8962022 18,020 10,2062023 10,262 9,7012024 (1) 9,277 48,5182025 9,476 9,971Thereafter 548,478 1,373,177Total lease payments 620,605 1,457,469Less: Interest portion (418,892) (1,220,977)Present value of lease payments $ 201,713 $ 236,492
154
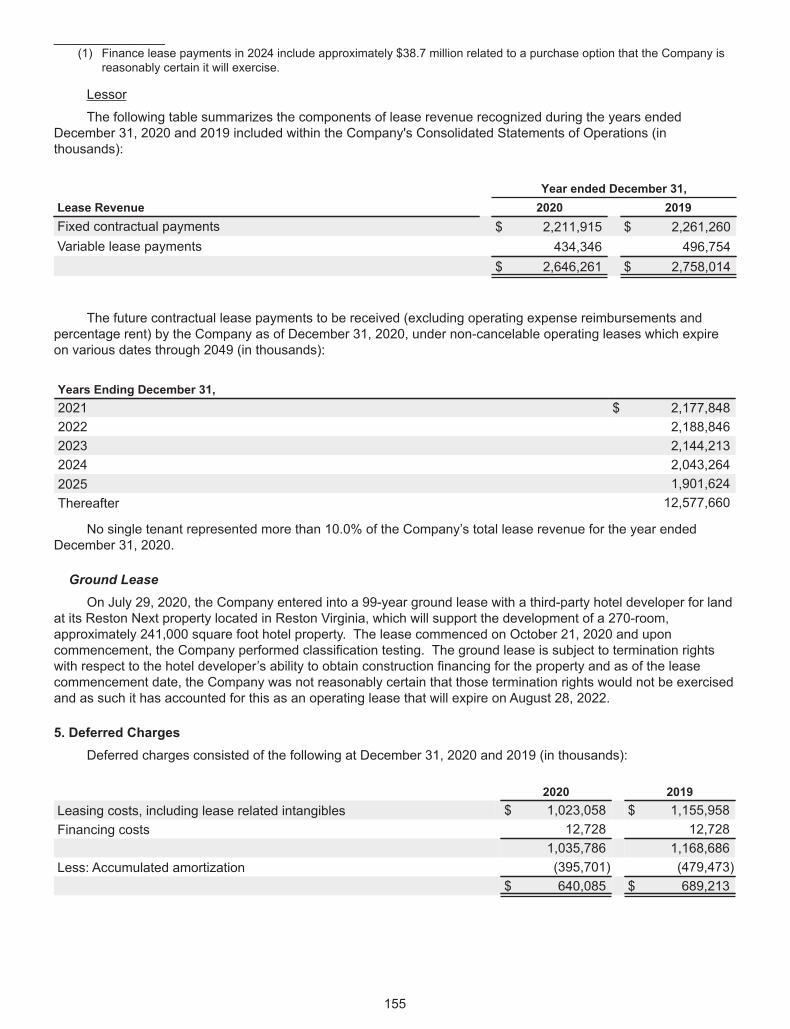
_______________(1) Finance lease payments in 2024 include approximately $38.7 million related to a purchase option that the Company is
reasonably certain it will exercise.
Lessor
The following table summarizes the components of lease revenue recognized during the years endedDecember 31, 2020 and 2019 included within the Company's Consolidated Statements of Operations (inthousands):
Year ended December 31,Lease Revenue 2020 2019Fixed contractual payments $ 2,211,915 $ 2,261,260Variable lease payments 434,346 496,754
$ 2,646,261 $ 2,758,014
The future contractual lease payments to be received (excluding operating expense reimbursements andpercentage rent) by the Company as of December 31, 2020, under non-cancelable operating leases which expireon various dates through 2049 (in thousands):
Years Ending December 31,2021 $ 2,177,8482022 2,188,8462023 2,144,2132024 2,043,2642025 1,901,624Thereafter 12,577,660
No single tenant represented more than 10.0% of the Company’s total lease revenue for the year endedDecember 31, 2020.
Ground LeaseOn July 29, 2020, the Company entered into a 99-year ground lease with a third-party hotel developer for land
at its Reston Next property located in Reston Virginia, which will support the development of a 270-room,approximately 241,000 square foot hotel property. The lease commenced on October 21, 2020 and uponcommencement, the Company performed classification testing. The ground lease is subject to termination rightswith respect to the hotel developer’s ability to obtain construction financing for the property and as of the leasecommencement date, the Company was not reasonably certain that those termination rights would not be exercisedand as such it has accounted for this as an operating lease that will expire on August 28, 2022.
5. Deferred ChargesDeferred charges consisted of the following at December 31, 2020 and 2019 (in thousands):
2020 2019Leasing costs, including lease related intangibles $ 1,023,058 $ 1,155,958Financing costs 12,728 12,728
1,035,786 1,168,686Less: Accumulated amortization (395,701) (479,473)
$ 640,085 $ 689,213
155
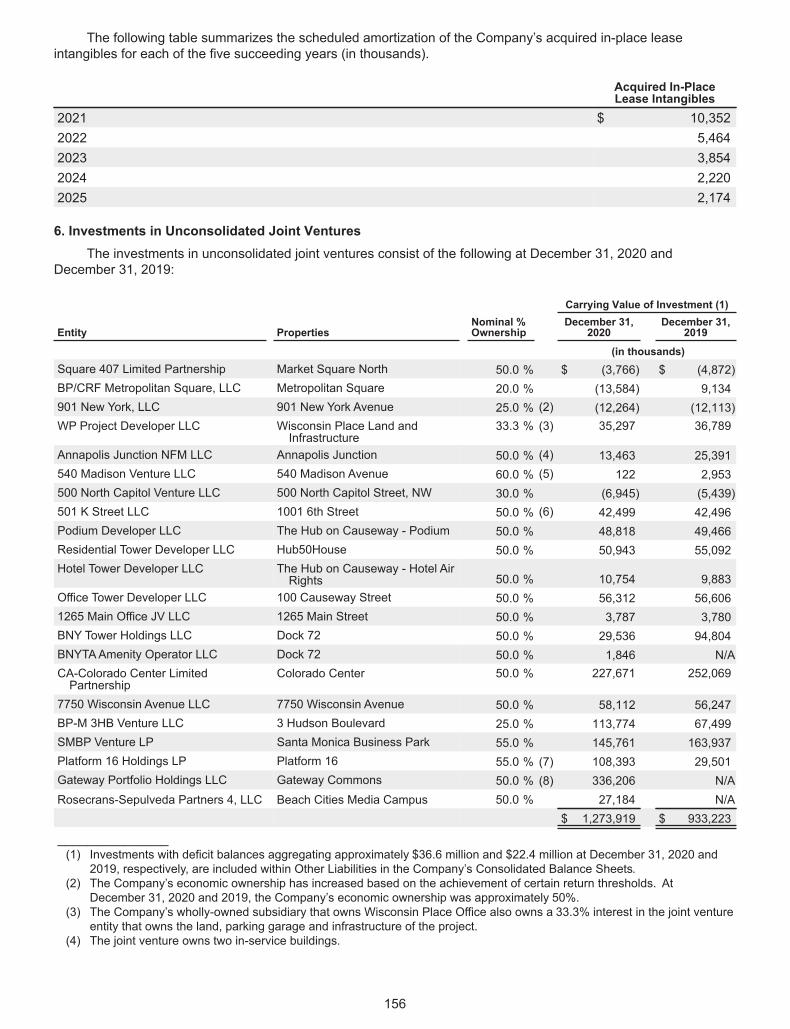
The following table summarizes the scheduled amortization of the Company’s acquired in-place leaseintangibles for each of the five succeeding years (in thousands).
Acquired In-PlaceLease Intangibles
2021 $ 10,3522022 5,4642023 3,8542024 2,2202025 2,174
6. Investments in Unconsolidated Joint VenturesThe investments in unconsolidated joint ventures consist of the following at December 31, 2020 and
December 31, 2019:
Carrying Value of Investment (1)
Entity PropertiesNominal %Ownership
December 31,2020
December 31,2019
(in thousands)Square 407 Limited Partnership Market Square North 50.0 % $ (3,766) $ (4,872)BP/CRF Metropolitan Square, LLC Metropolitan Square 20.0 % (13,584) 9,134901 New York, LLC 901 New York Avenue 25.0 % (2) (12,264) (12,113)WP Project Developer LLC Wisconsin Place Land and
Infrastructure33.3 % (3) 35,297 36,789
Annapolis Junction NFM LLC Annapolis Junction 50.0 % (4) 13,463 25,391540 Madison Venture LLC 540 Madison Avenue 60.0 % (5) 122 2,953500 North Capitol Venture LLC 500 North Capitol Street, NW 30.0 % (6,945) (5,439)501 K Street LLC 1001 6th Street 50.0 % (6) 42,499 42,496Podium Developer LLC The Hub on Causeway - Podium 50.0 % 48,818 49,466Residential Tower Developer LLC Hub50House 50.0 % 50,943 55,092Hotel Tower Developer LLC The Hub on Causeway - Hotel Air
Rights 50.0 % 10,754 9,883Office Tower Developer LLC 100 Causeway Street 50.0 % 56,312 56,6061265 Main Office JV LLC 1265 Main Street 50.0 % 3,787 3,780BNY Tower Holdings LLC Dock 72 50.0 % 29,536 94,804BNYTAAmenity Operator LLC Dock 72 50.0 % 1,846 N/ACA-Colorado Center LimitedPartnership
Colorado Center 50.0 % 227,671 252,069
7750 Wisconsin Avenue LLC 7750 Wisconsin Avenue 50.0 % 58,112 56,247BP-M 3HB Venture LLC 3 Hudson Boulevard 25.0 % 113,774 67,499SMBP Venture LP Santa Monica Business Park 55.0 % 145,761 163,937Platform 16 Holdings LP Platform 16 55.0 % (7) 108,393 29,501Gateway Portfolio Holdings LLC Gateway Commons 50.0 % (8) 336,206 N/ARosecrans-Sepulveda Partners 4, LLC Beach Cities Media Campus 50.0 % 27,184 N/A
$ 1,273,919 $ 933,223
_______________(1) Investments with deficit balances aggregating approximately $36.6 million and $22.4 million at December 31, 2020 and
2019, respectively, are included within Other Liabilities in the Company’s Consolidated Balance Sheets.(2) The Company’s economic ownership has increased based on the achievement of certain return thresholds. At
December 31, 2020 and 2019, the Company’s economic ownership was approximately 50%.(3) The Company’s wholly-owned subsidiary that owns Wisconsin Place Office also owns a 33.3% interest in the joint venture
entity that owns the land, parking garage and infrastructure of the project.(4) The joint venture owns two in-service buildings.
156
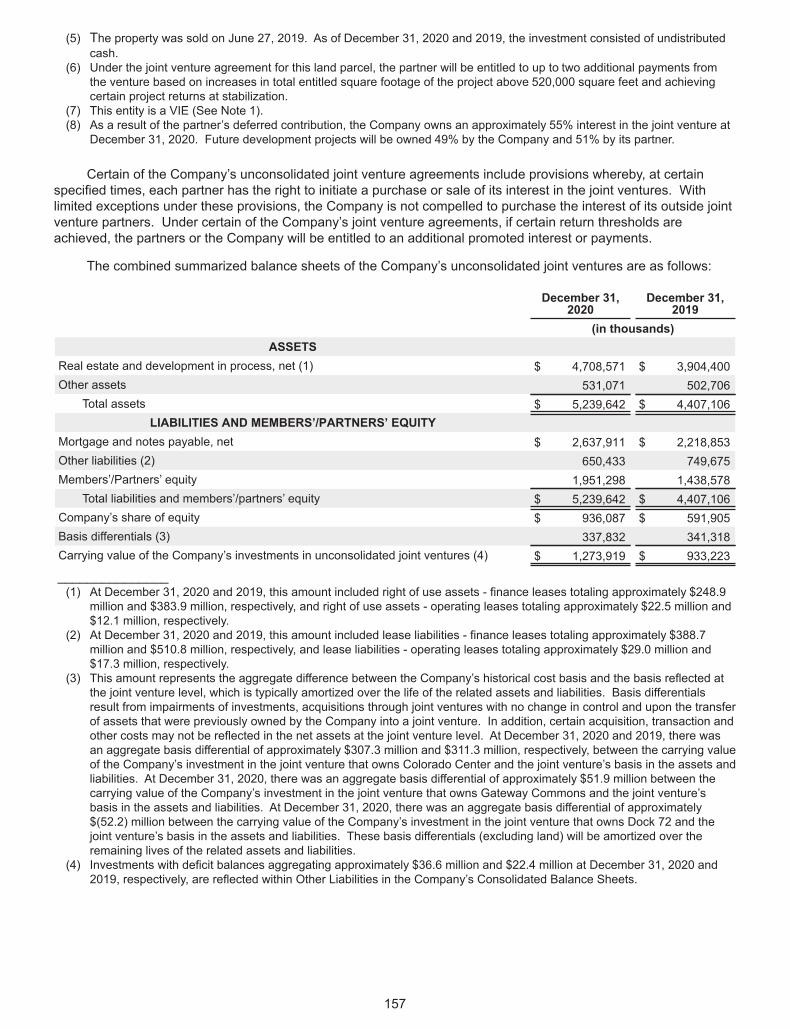
(5) The property was sold on June 27, 2019. As of December 31, 2020 and 2019, the investment consisted of undistributedcash.
(6) Under the joint venture agreement for this land parcel, the partner will be entitled to up to two additional payments fromthe venture based on increases in total entitled square footage of the project above 520,000 square feet and achievingcertain project returns at stabilization.
(7) This entity is a VIE (See Note 1).(8) As a result of the partner’s deferred contribution, the Company owns an approximately 55% interest in the joint venture at
December 31, 2020. Future development projects will be owned 49% by the Company and 51% by its partner.
Certain of the Company’s unconsolidated joint venture agreements include provisions whereby, at certainspecified times, each partner has the right to initiate a purchase or sale of its interest in the joint ventures. Withlimited exceptions under these provisions, the Company is not compelled to purchase the interest of its outside jointventure partners. Under certain of the Company’s joint venture agreements, if certain return thresholds areachieved, the partners or the Company will be entitled to an additional promoted interest or payments.
The combined summarized balance sheets of the Company’s unconsolidated joint ventures are as follows:
December 31,2020
December 31,2019
(in thousands)ASSETS
Real estate and development in process, net (1) $ 4,708,571 $ 3,904,400Other assets 531,071 502,706
Total assets $ 5,239,642 $ 4,407,106LIABILITIES AND MEMBERS’/PARTNERS’ EQUITY
Mortgage and notes payable, net $ 2,637,911 $ 2,218,853Other liabilities (2) 650,433 749,675Members’/Partners’ equity 1,951,298 1,438,578
Total liabilities and members’/partners’ equity $ 5,239,642 $ 4,407,106Company’s share of equity $ 936,087 $ 591,905Basis differentials (3) 337,832 341,318Carrying value of the Company’s investments in unconsolidated joint ventures (4) $ 1,273,919 $ 933,223
_______________(1) At December 31, 2020 and 2019, this amount included right of use assets - finance leases totaling approximately $248.9
million and $383.9 million, respectively, and right of use assets - operating leases totaling approximately $22.5 million and$12.1 million, respectively.
(2) At December 31, 2020 and 2019, this amount included lease liabilities - finance leases totaling approximately $388.7million and $510.8 million, respectively, and lease liabilities - operating leases totaling approximately $29.0 million and$17.3 million, respectively.
(3) This amount represents the aggregate difference between the Company’s historical cost basis and the basis reflected atthe joint venture level, which is typically amortized over the life of the related assets and liabilities. Basis differentialsresult from impairments of investments, acquisitions through joint ventures with no change in control and upon the transferof assets that were previously owned by the Company into a joint venture. In addition, certain acquisition, transaction andother costs may not be reflected in the net assets at the joint venture level. At December 31, 2020 and 2019, there wasan aggregate basis differential of approximately $307.3 million and $311.3 million, respectively, between the carrying valueof the Company’s investment in the joint venture that owns Colorado Center and the joint venture’s basis in the assets andliabilities. At December 31, 2020, there was an aggregate basis differential of approximately $51.9 million between thecarrying value of the Company’s investment in the joint venture that owns Gateway Commons and the joint venture’sbasis in the assets and liabilities. At December 31, 2020, there was an aggregate basis differential of approximately$(52.2) million between the carrying value of the Company’s investment in the joint venture that owns Dock 72 and thejoint venture’s basis in the assets and liabilities. These basis differentials (excluding land) will be amortized over theremaining lives of the related assets and liabilities.
(4) Investments with deficit balances aggregating approximately $36.6 million and $22.4 million at December 31, 2020 and2019, respectively, are reflected within Other Liabilities in the Company’s Consolidated Balance Sheets.
157
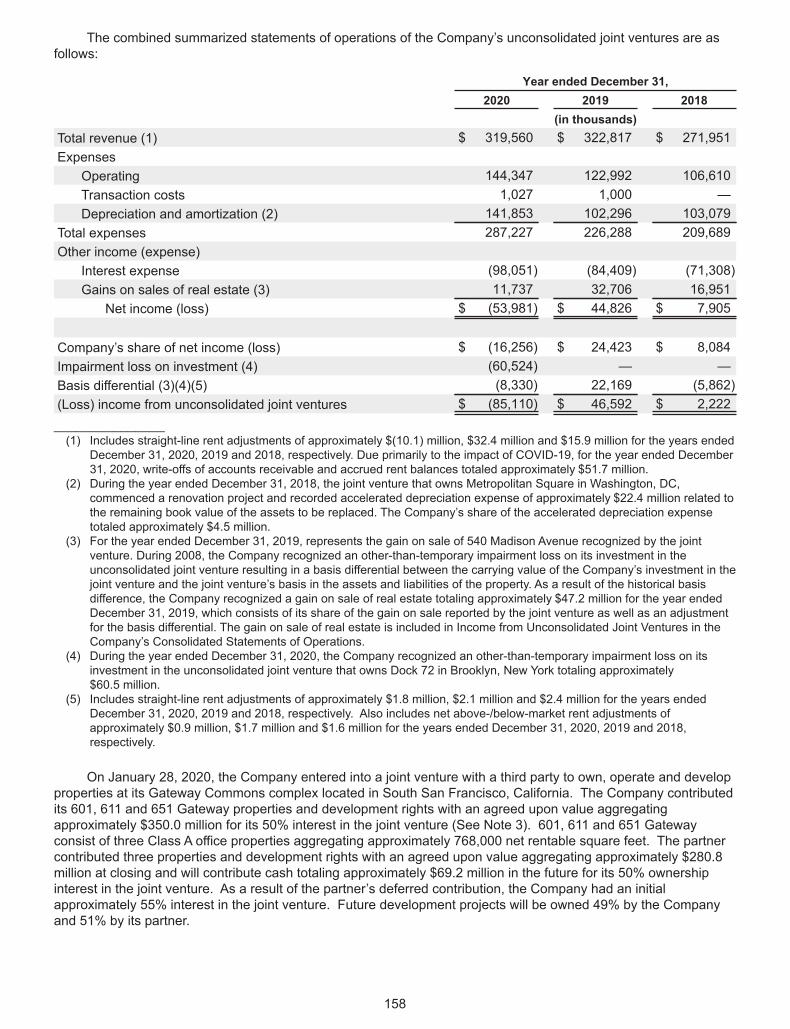
The combined summarized statements of operations of the Company’s unconsolidated joint ventures are asfollows:
Year ended December 31,2020 2019 2018
(in thousands)Total revenue (1) $ 319,560 $ 322,817 $ 271,951Expenses
Operating 144,347 122,992 106,610Transaction costs 1,027 1,000 —Depreciation and amortization (2) 141,853 102,296 103,079
Total expenses 287,227 226,288 209,689Other income (expense)
Interest expense (98,051) (84,409) (71,308)Gains on sales of real estate (3) 11,737 32,706 16,951
Net income (loss) $ (53,981) $ 44,826 $ 7,905
Company’s share of net income (loss) $ (16,256) $ 24,423 $ 8,084Impairment loss on investment (4) (60,524) — —Basis differential (3)(4)(5) (8,330) 22,169 (5,862)(Loss) income from unconsolidated joint ventures $ (85,110) $ 46,592 $ 2,222_______________(1) Includes straight-line rent adjustments of approximately $(10.1) million, $32.4 million and $15.9 million for the years ended
December 31, 2020, 2019 and 2018, respectively. Due primarily to the impact of COVID-19, for the year ended December31, 2020, write-offs of accounts receivable and accrued rent balances totaled approximately $51.7 million.
(2) During the year ended December 31, 2018, the joint venture that owns Metropolitan Square in Washington, DC,commenced a renovation project and recorded accelerated depreciation expense of approximately $22.4 million related tothe remaining book value of the assets to be replaced. The Company’s share of the accelerated depreciation expensetotaled approximately $4.5 million.
(3) For the year ended December 31, 2019, represents the gain on sale of 540 Madison Avenue recognized by the jointventure. During 2008, the Company recognized an other-than-temporary impairment loss on its investment in theunconsolidated joint venture resulting in a basis differential between the carrying value of the Company’s investment in thejoint venture and the joint venture’s basis in the assets and liabilities of the property. As a result of the historical basisdifference, the Company recognized a gain on sale of real estate totaling approximately $47.2 million for the year endedDecember 31, 2019, which consists of its share of the gain on sale reported by the joint venture as well as an adjustmentfor the basis differential. The gain on sale of real estate is included in Income from Unconsolidated Joint Ventures in theCompany’s Consolidated Statements of Operations.
(4) During the year ended December 31, 2020, the Company recognized an other-than-temporary impairment loss on itsinvestment in the unconsolidated joint venture that owns Dock 72 in Brooklyn, New York totaling approximately$60.5 million.
(5) Includes straight-line rent adjustments of approximately $1.8 million, $2.1 million and $2.4 million for the years endedDecember 31, 2020, 2019 and 2018, respectively. Also includes net above-/below-market rent adjustments ofapproximately $0.9 million, $1.7 million and $1.6 million for the years ended December 31, 2020, 2019 and 2018,respectively.
On January 28, 2020, the Company entered into a joint venture with a third party to own, operate and developproperties at its Gateway Commons complex located in South San Francisco, California. The Company contributedits 601, 611 and 651 Gateway properties and development rights with an agreed upon value aggregatingapproximately $350.0 million for its 50% interest in the joint venture (See Note 3). 601, 611 and 651 Gatewayconsist of three Class A office properties aggregating approximately 768,000 net rentable square feet. The partnercontributed three properties and development rights with an agreed upon value aggregating approximately $280.8million at closing and will contribute cash totaling approximately $69.2 million in the future for its 50% ownershipinterest in the joint venture. As a result of the partner’s deferred contribution, the Company had an initialapproximately 55% interest in the joint venture. Future development projects will be owned 49% by the Companyand 51% by its partner.
158
On February 20, 2020, a joint venture in which the Company has a 55% interest acquired the land underlyingthe ground lease at its Platform 16 property located in San Jose, California for a purchase price totalingapproximately $134.8 million. The joint venture had previously made a deposit totaling $15.0 million, which wascredited against the purchase price. Platform 16 consists of a parcel of land totaling approximately 5.6 acres that isexpected to support the development of approximately 1.1 million square feet of commercial office space.
On June 9, 2020, a joint venture in which the Company has a 20% interest refinanced with a new lender themortgage loan collateralized by its Metropolitan Square property located in Washington, DC. The outstandingbalance of the loan totaled approximately $155.9 million, bore interest at a fixed rate of 5.75% per annum and wasscheduled to mature on August 5, 2020. The new mortgage loan totaling $325.0 million, of which $288.0 millionwas advanced at closing, bears interest at a variable rate equal to (1) the greater of (x) LIBOR or (y) 0.65%, plus (2)4.75% per annum, and matures on July 7, 2022, with two, one-year extension options, subject to certain conditions.The joint venture entered into an interest rate cap agreement with a financial institution to limit its exposure toincreases in the LIBOR at a cap of 3.00% per annum on a notional amount of $325.0 million through July 7, 2022.The joint venture distributed excess loan proceeds from the new mortgage loan totaling approximately$112.7 million, of which the Company’s share totaled approximately $22.5 million. Metropolitan Square is a Class Aoffice property with approximately 654,000 net rentable square feet.
On June 25, 2020, a joint venture in which the Company has a 50% interest completed the sale of AnnapolisJunction Building Eight and two land parcels located in Annapolis, Maryland for a gross sale price of $47.0 million.Net cash proceeds totaled approximately $45.8 million after the payment of transaction costs. The Companyrecognized a gain on sale of real estate totaling approximately $5.8 million, which is included in Income (Loss) fromUnconsolidated Joint Ventures in the accompanying Consolidated Statements of Operations. The joint venturedistributed approximately $36.8 million of available cash and the net proceeds from the sale after the pay down ofthe mortgage loan, of which the Company’s share totaled approximately $18.4 million. Annapolis Junction BuildingEight is an approximately 126,000 net rentable square foot Class A office property, which is vacant. The two landparcels will support the development of approximately 300,000 square feet of commercial office space with oneparcel currently containing surface parking for approximately 511 vehicles.
On June 25, 2020, in conjunction with the joint venture’s sale of Annapolis Junction Building Eight, the jointventure in which the Company has a 50% interest modified the mortgage loan collateralized by Annapolis JunctionBuilding Seven and Building Eight with the release of Annapolis Junction Building Eight as collateral under the loanin exchange for a principal pay down of approximately $16.1 million using a portion of the net proceeds from thesale of the property. At the time of the modification, the outstanding balance of the loan totaled approximately$34.5 million, bore interest at a variable rate equal to LIBOR plus 2.35% per annum and was scheduled to matureon June 30, 2020. The modified mortgage loan totaling approximately $18.4 million is collateralized by AnnapolisJunction Building Seven, continues to bear interest at a variable rate equal to LIBOR plus 2.35% per annum andmatures on March 25, 2021. Annapolis Junction Building Seven is a Class A office property with approximately127,000 net rentable square feet located in Annapolis, Maryland.
On July 23, 2020, the Company acquired a 50% interest in a joint venture entity that owns Beach Cities MediaCampus, a 6.4-acre parcel of land located in El Segundo, California, for a purchase price of approximately$21.2 million. Beach Cities Media Campus is expected to support the development of approximately 275,000square feet of Class A office space.
On July 24, 2020, a joint venture in which the Company has a 50% interest completed and fully placed in-service Hub50House, an approximately 320,000 square foot project comprised of 440 residential units located inBoston, Massachusetts.
On September 1, 2020, the Company entered into an agreement with its partner in the joint venture that owns1265 Main Street located in Waltham, Massachusetts to (1) form additional joint ventures to own and develop amixed-use property containing approximately 1,200,000 square feet to be developed in phases on an approximately41-acre site adjacent to 1265 Main Street and (2) share the costs of certain offsite infrastructure improvements withits joint venture partner and other third-party abutting land owners. The Company will serve as the developmentmanager and expects to own a 50% interest in each of the joint ventures.
On September 30, 2020, a joint venture in which the Company has a 50% interest extended the mortgageloan collateralized by its Market Square North property. At the time of the extension, the outstanding balance of theloan totaled approximately $114.2 million, bore interest at a fixed rate of 4.85% per annum and was scheduled tomature on October 1, 2020. The extended loan was scheduled to mature on November 1, 2020. On October 30,
159
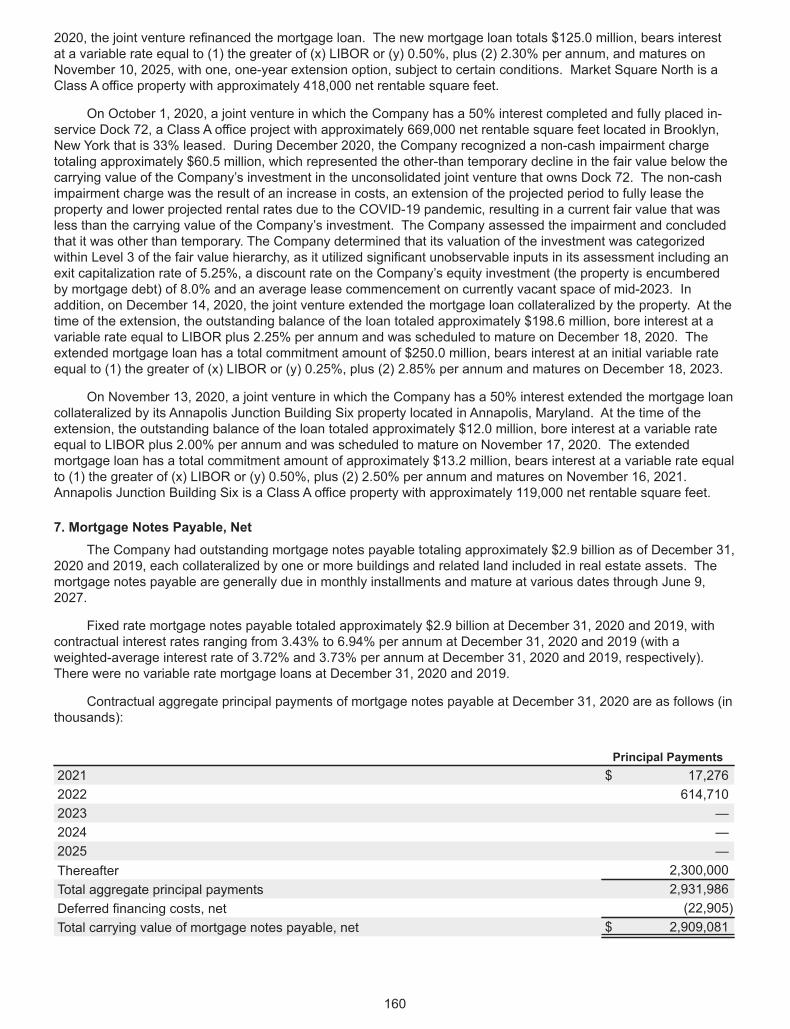
2020, the joint venture refinanced the mortgage loan. The new mortgage loan totals $125.0 million, bears interestat a variable rate equal to (1) the greater of (x) LIBOR or (y) 0.50%, plus (2) 2.30% per annum, and matures onNovember 10, 2025, with one, one-year extension option, subject to certain conditions. Market Square North is aClass A office property with approximately 418,000 net rentable square feet.
On October 1, 2020, a joint venture in which the Company has a 50% interest completed and fully placed in-service Dock 72, a Class A office project with approximately 669,000 net rentable square feet located in Brooklyn,New York that is 33% leased. During December 2020, the Company recognized a non-cash impairment chargetotaling approximately $60.5 million, which represented the other-than temporary decline in the fair value below thecarrying value of the Company’s investment in the unconsolidated joint venture that owns Dock 72. The non-cashimpairment charge was the result of an increase in costs, an extension of the projected period to fully lease theproperty and lower projected rental rates due to the COVID-19 pandemic, resulting in a current fair value that wasless than the carrying value of the Company’s investment. The Company assessed the impairment and concludedthat it was other than temporary. The Company determined that its valuation of the investment was categorizedwithin Level 3 of the fair value hierarchy, as it utilized significant unobservable inputs in its assessment including anexit capitalization rate of 5.25%, a discount rate on the Company’s equity investment (the property is encumberedby mortgage debt) of 8.0% and an average lease commencement on currently vacant space of mid-2023. Inaddition, on December 14, 2020, the joint venture extended the mortgage loan collateralized by the property. At thetime of the extension, the outstanding balance of the loan totaled approximately $198.6 million, bore interest at avariable rate equal to LIBOR plus 2.25% per annum and was scheduled to mature on December 18, 2020. Theextended mortgage loan has a total commitment amount of $250.0 million, bears interest at an initial variable rateequal to (1) the greater of (x) LIBOR or (y) 0.25%, plus (2) 2.85% per annum and matures on December 18, 2023.
On November 13, 2020, a joint venture in which the Company has a 50% interest extended the mortgage loancollateralized by its Annapolis Junction Building Six property located in Annapolis, Maryland. At the time of theextension, the outstanding balance of the loan totaled approximately $12.0 million, bore interest at a variable rateequal to LIBOR plus 2.00% per annum and was scheduled to mature on November 17, 2020. The extendedmortgage loan has a total commitment amount of approximately $13.2 million, bears interest at a variable rate equalto (1) the greater of (x) LIBOR or (y) 0.50%, plus (2) 2.50% per annum and matures on November 16, 2021.Annapolis Junction Building Six is a Class A office property with approximately 119,000 net rentable square feet.
7. Mortgage Notes Payable, NetThe Company had outstanding mortgage notes payable totaling approximately $2.9 billion as of December 31,
2020 and 2019, each collateralized by one or more buildings and related land included in real estate assets. Themortgage notes payable are generally due in monthly installments and mature at various dates through June 9,2027.
Fixed rate mortgage notes payable totaled approximately $2.9 billion at December 31, 2020 and 2019, withcontractual interest rates ranging from 3.43% to 6.94% per annum at December 31, 2020 and 2019 (with aweighted-average interest rate of 3.72% and 3.73% per annum at December 31, 2020 and 2019, respectively).There were no variable rate mortgage loans at December 31, 2020 and 2019.
Contractual aggregate principal payments of mortgage notes payable at December 31, 2020 are as follows (inthousands):
Principal Payments2021 $ 17,2762022 614,7102023 —2024 —2025 —Thereafter 2,300,000Total aggregate principal payments 2,931,986Deferred financing costs, net (22,905)Total carrying value of mortgage notes payable, net $ 2,909,081
160
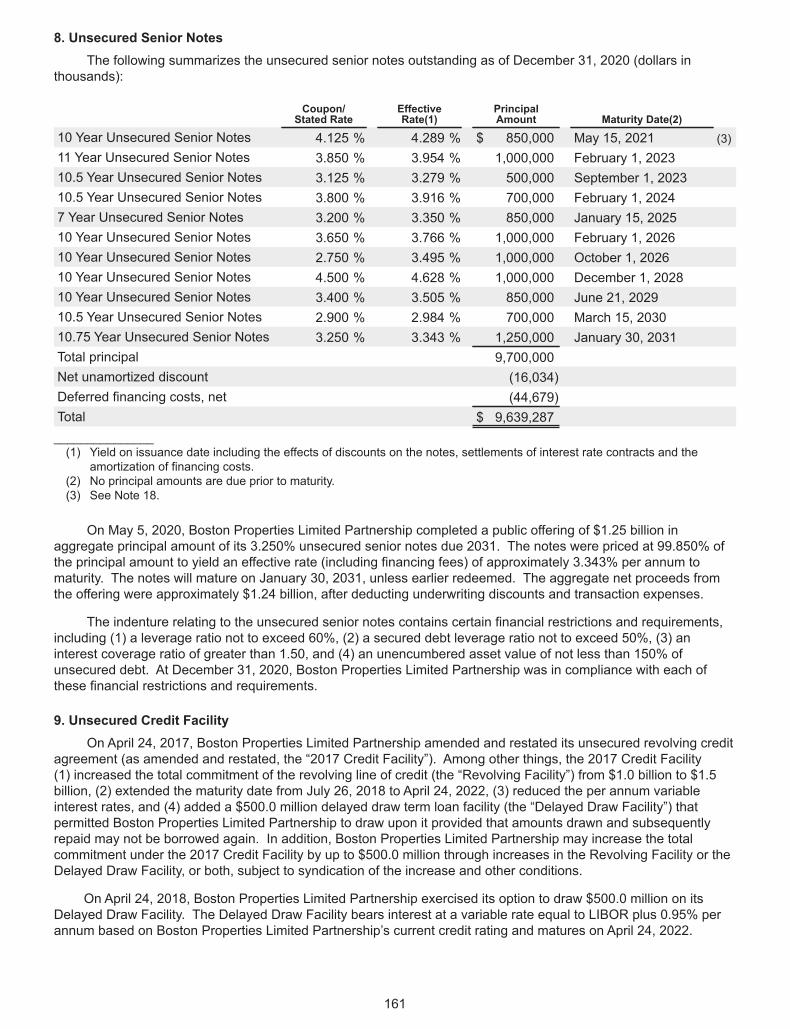
8. Unsecured Senior NotesThe following summarizes the unsecured senior notes outstanding as of December 31, 2020 (dollars in
thousands):
Coupon/Stated Rate
EffectiveRate(1)
PrincipalAmount Maturity Date(2)
10 Year Unsecured Senior Notes 4.125 % 4.289 % $ 850,000 May 15, 2021 (3)11 Year Unsecured Senior Notes 3.850 % 3.954 % 1,000,000 February 1, 202310.5 Year Unsecured Senior Notes 3.125 % 3.279 % 500,000 September 1, 202310.5 Year Unsecured Senior Notes 3.800 % 3.916 % 700,000 February 1, 20247 Year Unsecured Senior Notes 3.200 % 3.350 % 850,000 January 15, 202510 Year Unsecured Senior Notes 3.650 % 3.766 % 1,000,000 February 1, 202610 Year Unsecured Senior Notes 2.750 % 3.495 % 1,000,000 October 1, 202610 Year Unsecured Senior Notes 4.500 % 4.628 % 1,000,000 December 1, 202810 Year Unsecured Senior Notes 3.400 % 3.505 % 850,000 June 21, 202910.5 Year Unsecured Senior Notes 2.900 % 2.984 % 700,000 March 15, 203010.75 Year Unsecured Senior Notes 3.250 % 3.343 % 1,250,000 January 30, 2031Total principal 9,700,000Net unamortized discount (16,034)Deferred financing costs, net (44,679)Total $ 9,639,287_______________(1) Yield on issuance date including the effects of discounts on the notes, settlements of interest rate contracts and the
amortization of financing costs.(2) No principal amounts are due prior to maturity.(3) See Note 18.
On May 5, 2020, Boston Properties Limited Partnership completed a public offering of $1.25 billion inaggregate principal amount of its 3.250% unsecured senior notes due 2031. The notes were priced at 99.850% ofthe principal amount to yield an effective rate (including financing fees) of approximately 3.343% per annum tomaturity. The notes will mature on January 30, 2031, unless earlier redeemed. The aggregate net proceeds fromthe offering were approximately $1.24 billion, after deducting underwriting discounts and transaction expenses.
The indenture relating to the unsecured senior notes contains certain financial restrictions and requirements,including (1) a leverage ratio not to exceed 60%, (2) a secured debt leverage ratio not to exceed 50%, (3) aninterest coverage ratio of greater than 1.50, and (4) an unencumbered asset value of not less than 150% ofunsecured debt. At December 31, 2020, Boston Properties Limited Partnership was in compliance with each ofthese financial restrictions and requirements.
9. Unsecured Credit FacilityOn April 24, 2017, Boston Properties Limited Partnership amended and restated its unsecured revolving credit
agreement (as amended and restated, the “2017 Credit Facility”). Among other things, the 2017 Credit Facility(1) increased the total commitment of the revolving line of credit (the “Revolving Facility”) from $1.0 billion to $1.5billion, (2) extended the maturity date from July 26, 2018 to April 24, 2022, (3) reduced the per annum variableinterest rates, and (4) added a $500.0 million delayed draw term loan facility (the “Delayed Draw Facility”) thatpermitted Boston Properties Limited Partnership to draw upon it provided that amounts drawn and subsequentlyrepaid may not be borrowed again. In addition, Boston Properties Limited Partnership may increase the totalcommitment under the 2017 Credit Facility by up to $500.0 million through increases in the Revolving Facility or theDelayed Draw Facility, or both, subject to syndication of the increase and other conditions.
On April 24, 2018, Boston Properties Limited Partnership exercised its option to draw $500.0 million on itsDelayed Draw Facility. The Delayed Draw Facility bears interest at a variable rate equal to LIBOR plus 0.95% perannum based on Boston Properties Limited Partnership’s current credit rating and matures on April 24, 2022.
161
At Boston Properties Limited Partnership’s option, loans under the Revolving Facility and Delayed DrawFacility will bear interest at a rate per annum equal to (1) (a) in the case of loans denominated in Dollars, Euro orSterling, LIBOR, and (b) in the case of loans denominated in Canadian Dollars, CDOR, in each case, plus a marginranging from 77.5 to 155 basis points for the Revolving Commitment and 85 to 175 basis points for the DelayedDraw Facility, based on Boston Properties Limited Partnership’s credit rating or (2) an alternate base rate equal tothe greatest of (x) the Administrative Agent’s prime rate, (y) the Federal Funds rate plus 0.50% or (z) LIBOR for aone-month period plus 1.00%, in each case, plus a margin ranging from 0 to 55 basis points for the RevolvingFacility and 0 to 75 basis points for the Delayed Draw Facility, based on Boston Properties Limited Partnership’scredit rating. The 2017 Credit Facility also contains a competitive bid option for up to 65% of the Revolving Facilitythat allows banks that are part of the lender consortium to bid to make loan advances to Boston Properties LimitedPartnership at a reduced interest rate.
In addition, Boston Properties Limited Partnership is obligated to pay (1) in quarterly installments a facility feeon the total commitment under the Revolving Facility at a rate per annum ranging from 0.10% to 0.30% based onBoston Properties Limited Partnership’s credit rating, (2) an annual fee on the undrawn amount of each letter ofcredit equal to the LIBOR margin on the Revolving Facility and (3) a fee on the unused commitments under theDelayed Draw Facility equal to 0.15% per annum. Based on Boston Properties Limited Partnership’s December 31,2020 credit rating, (1) the applicable Eurocurrency margins for the Revolving Facility and Delayed Draw Facility are0.875% and 0.95% per annum, respectively, (2) the alternate base rate margin is zero basis points for each of theRevolving Facility and Delayed Draw Facility and (3) the facility fee on the Revolving Facility commitment is 0.15%per annum.
At December 31, 2020 and 2019, Boston Properties Limited Partnership had $500.0 million of borrowingsoutstanding under its Delayed Draw Facility and no amounts outstanding under its Revolving Facility.
The 2017 Credit Facility contains customary representations and warranties, affirmative and negativecovenants and events of default provisions, including failure to pay indebtedness, breaches of covenants, andbankruptcy and other insolvency events, which could result in the acceleration of all amounts and cancellation of allcommitments outstanding under the Credit Agreement. Among other covenants, the 2017 Credit Facility requiresthat Boston Properties Limited Partnership maintain on an ongoing basis: (1) a leverage ratio not to exceed 60%,however, the leverage ratio may increase to no greater than 65% provided that it is reduced back to 60% within oneyear, (2) a secured debt leverage ratio not to exceed 55%, (3) a fixed charge coverage ratio of at least 1.40, (4) anunsecured debt leverage ratio not to exceed 60%, however, the unsecured debt leverage ratio may increase to nogreater than 65% provided that it is reduced to 60% within one year, (5) an unsecured debt interest coverage ratioof at least 1.75 and (6) limitations on permitted investments. At December 31, 2020, Boston Properties LimitedPartnership was in compliance with each of these financial and other covenant requirements.
10. Commitments and ContingenciesGeneral
In the normal course of business, the Company guarantees its performance of services or indemnifies thirdparties against its negligence. In addition, in the normal course of business, the Company guarantees to certaintenants the obligations of its subsidiaries for the payment of tenant improvement allowances and brokeragecommissions in connection with their leases and limited costs arising from delays in delivery of their premises.
The Company has letter of credit and performance obligations related to lender and developmentrequirements that total approximately $20.0 million at December 31, 2020.
Certain of the Company’s joint venture agreements include provisions whereby, at certain specified times,each partner has the right to initiate a purchase or sale of its interest in the joint ventures. With limited exception,under these provisions, the Company is not compelled to purchase the interest of its outside joint venture partners.From time to time, under certain of the Company’s joint venture agreements, if certain return thresholds areachieved, either the Company or its partners may be entitled to an additional promoted interest or payments.
From time to time, the Company (or ventures in which the Company has an ownership interest) has agreed,and may in the future agree, to (1) guarantee portions of the principal, interest and other amounts in connection withtheir borrowings, (2) provide customary environmental indemnifications and nonrecourse carve-outs (e.g.,guarantees against fraud, misrepresentation and bankruptcy) in connection with their borrowings and (3) provideguarantees to lenders, tenants and other third parties for the completion of development projects. The Companyhas agreements with its outside partners whereby the partners agree to reimburse the joint venture for their share of
162
any payments made under the guarantee. In some cases, the Company earns a fee from the applicable jointventure for providing the guarantee.
In connection with the refinancing of 767 Fifth Avenue’s (the General Motors Building) secured loan by theCompany’s consolidated joint venture entity, 767 Venture, LLC, the Company guaranteed the consolidated entity’sobligation to fund various reserves for tenant improvement costs and allowances, leasing commissions and free rentobligations in lieu of cash deposits. As of December 31, 2020, the maximum funding obligation under the guaranteewas approximately $30.6 million. The Company earns a fee from the joint venture for providing the guarantee andhas an agreement with the outside partners to reimburse the joint venture for their share of any payments madeunder the guarantee. As of December 31, 2020, no amounts related to the guarantee are recorded as liabilities inthe Company’s consolidated financial statements.
Pursuant to the lease agreement with Marriott, the Company has guaranteed the completion of the officebuilding and parking garage on behalf of its 7750 Wisconsin Avenue joint venture and has also provided a financingguaranty as required with respect to the third-party construction financing. The Company earns fees from the jointventure for providing the guarantees and any amounts the Company pays under the guarantee(s) will be deemed tobe capital contributions by the Company to the joint venture. The Company has also agreed to fund constructioncosts through capital contributions to the joint venture in the event of insufficiency of third-party constructionfinancing. In addition, the Company has guaranteed to Marriott, as hotel manager, the completion of a hotel beingdeveloped by an affiliate of The Bernstein Companies (the Company’s partner in the 7750 Wisconsin Avenue jointventure) adjacent to the office property, for which the Company earns a fee from the affiliate of The BernsteinCompanies. In addition, the Company entered into agreements with affiliates of The Bernstein Companies wherebythe Company could be required to act as a mezzanine and/or mortgage lender and finance the construction of thehotel property. An affiliate of The Bernstein Companies exercised its option to borrow $10.0 million from theCompany under such agreements, which financing was provided by the Company on June 1, 2020. The financingbears interest at a fixed rate of 8.00% per annum, compounded monthly, and matures on the fifth anniversary of thedate on which the base building of the affiliate of The Bernstein Companies’ hotel property is substantiallycompleted. The financing is collateralized by a pledge of the partner’s equity interest in the joint venture that ownsand is developing 7750 Wisconsin Avenue. To secure such financing arrangements, affiliates of The BernsteinCompanies are required to provide certain security, which varies depending on the specific loan, by pledges of theirequity interest in the office property, a fee mortgage on the hotel property, or both. As of December 31, 2020, noamounts related to the contingent aspect of any of the guarantees are recorded as liabilities in the Company’sconsolidated financial statements.
In connection with the sale and development of the Company’s 6595 Springfield Center Drive developmentproject, the Company has guaranteed the completion of the project and the payment of certain cost overruns inaccordance with the development management agreement with the buyer. Although the project has been sold andthe lease with the Federal Government tenant has been assigned to the buyer, pursuant to the terms of the FederalGovernment lease, the Federal Government tenant is not obligated to release the prior owner/landlord from suchlandlord’s obligations under the lease until completion of the construction. As a result, the entity which previouslyowned the land remains liable to the Federal Government tenant for the completion of the construction obligationsunder the lease. The buyer is obligated to fund the balance of the costs to meet such construction obligations,subject to the Company’s obligation to fund cost overruns (if any), as noted above. An affiliate of the buyer hasprovided a guaranty of the obligations of the buyer to fund such construction costs and the buyer has agreed to usecommercially reasonable efforts to require the construction lender to provide certain remedies to the Company inthe event the buyer does not fund such construction obligations. As of December 31, 2020, no amounts related tothe contingent aspect of the guarantee are recorded as a liability in the Company’s consolidated financialstatements.
In connection with the redevelopment of the Company’s 325 Main Street property located in Cambridge,Massachusetts, the Company is required, pursuant to the local zoning ordinance, to commence construction of aresidential building of at least 200,000 square feet with 25% of the project designated as income-restricted (with aminimum of 20% of the square footage devoted to home ownership units) prior to the occupancy of the 325 MainStreet property, which is expected to occur during the third quarter of 2022. 325 Main Street consisted of anapproximately 115,000 net rentable square foot Class A office property that was demolished and is being developedinto an approximately 420,000 net rentable square foot Class A office property, including approximately 41,000 netrentable square feet of retail space.
163
In 2009, the Company filed a general unsecured creditor’s claim against Lehman Brothers, Inc. forapproximately $45.3 million related to its rejection of a lease at 399 Park Avenue in New York City. On January 10,2014, the trustee for the liquidation of the business of Lehman Brothers allowed the Company’s claim in the amountof approximately $45.2 million. During 2020, the Company received a distribution totaling approximately$0.1 million. During the years 2014 through 2018, the Company received distributions aggregating approximately$18.0 million, leaving a remaining claim of approximately $27.1 million. The Company will continue to evaluatewhether to attempt to sell the remaining claim or wait until the trustee distributes proceeds from the LehmanBrothers estate. Given the inherent uncertainties in bankruptcy proceedings, there can be no assurance as to thetiming or amount of additional proceeds, if any, that the Company may ultimately realize on the remaining claim,whether by sale to a third party or by one or more distributions from the trustee. Accordingly, the Company has notrecorded any estimated recoveries associated with this gain contingency within its Consolidated FinancialStatements at December 31, 2020.
Concentrations of Credit Risk
Management of the Company performs ongoing credit evaluations of tenants and may require tenants toprovide some form of credit support such as corporate guarantees and/or other financial guarantees. Although theCompany’s properties are geographically diverse and the tenants operate in a variety of industries, to the extent theCompany has a significant concentration of rental revenue from any single tenant, the inability of that tenant tomake its lease payments could have an adverse effect on the Company.
Insurance
The Company’s property insurance program per occurrence limits are $1.0 billion for its portfolio insuranceprogram, including coverage for acts of terrorism other than nuclear, biological, chemical or radiological terrorism(“Terrorism Coverage”). The Company also carries $250 million of Terrorism Coverage for 601 Lexington Avenue,New York, New York (“601 Lexington Avenue”) in excess of the $1.0 billion of coverage in the Company’s propertyinsurance program. Certain properties, including the General Motors Building located at 767 Fifth Avenue in NewYork, New York (“767 Fifth Avenue”), are currently insured in separate insurance programs. The property insuranceprogram per occurrence limits for 767 Fifth Avenue are $1.625 billion, including Terrorism Coverage. The Companyalso currently carries nuclear, biological, chemical and radiological terrorism insurance coverage for acts ofterrorism certified under the Federal Terrorism Risk Insurance Act (as amended, “TRIA”) (“NBCR Coverage”), whichis provided by IXP as a direct insurer, for the properties in the Company’s portfolio, including 767 Fifth Avenue, butexcluding certain other properties owned in joint ventures with third parties or which the Company manages. Theper occurrence limit for NBCR Coverage is $1.0 billion. Under TRIA, after the payment of the required deductibleand coinsurance, the NBCR Coverage provided by IXP is backstopped by the Federal Government if the aggregateindustry insured losses resulting from a certified act of terrorism exceed a “program trigger.” The program trigger is$200 million, the coinsurance is 20% and the deductible is 20% of the premiums earned by the insurer for the yearprior to a claim. If the Federal Government pays out for a loss under TRIA, it is mandatory that the FederalGovernment recoup the full amount of the loss from insurers offering TRIA coverage after the payment of the losspursuant to a formula in TRIA. The Company may elect to terminate the NBCR Coverage if the FederalGovernment seeks recoupment for losses paid under TRIA, if TRIA is not extended after its expiration on December31, 2027, if there is a change in its portfolio or for any other reason. The Company intends to continue to monitorthe scope, nature and cost of available terrorism insurance.
The Company also currently carries earthquake insurance on its properties located in areas known to besubject to earthquakes. In addition, this insurance is subject to a deductible in the amount of 3% of the value of theaffected property. Specifically, the Company currently carries earthquake insurance which covers its San Franciscoand Los Angeles regions with a $240 million per occurrence limit, and a $240 million annual aggregate limit, $20million of which is provided by IXP, as a direct insurer. The amount of the Company’s earthquake insurancecoverage may not be sufficient to cover losses from earthquakes. In addition, the amount of earthquake coveragecould impact the Company’s ability to finance properties subject to earthquake risk. The Company may discontinueearthquake insurance or change the structure of its earthquake insurance program on some or all of its properties inthe future if the premiums exceed the Company’s estimation of the value of the coverage.
IXP, a captive insurance company which is a wholly-owned subsidiary of the Company, acts as a direct insurerwith respect to a portion of the Company’s earthquake insurance coverage for its Greater San Francisco and LosAngeles properties and the Company’s NBCR Coverage. Insofar as the Company owns IXP, it is responsible for itsliquidity and capital resources, and the accounts of IXP are part of the Company’s consolidated financial statements.In particular, if a loss occurs which is covered by the Company’s NBCR Coverage but is less than the applicable
164
program trigger under TRIA, IXP would be responsible for the full amount of the loss without any backstop by theFederal Government. IXP would also be responsible for any recoupment charges by the Federal Government in theevent losses are paid out and its insurance policy is maintained after the payout by the Federal Government. If theCompany experiences a loss and IXP is required to pay under its insurance policy, the Company would ultimatelyrecord the loss to the extent of the required payment. Therefore, insurance coverage provided by IXP should not beconsidered as the equivalent of third-party insurance, but rather as a modified form of self-insurance. In addition,Boston Properties Limited Partnership has issued a guarantee to cover liabilities of IXP in the amount of $20.0million.
Due to the current COVID-19 pandemic, the Company anticipates the possibility of business interruption, lossof lease revenue and/or other associated expenses related to the Company’s operations across its portfolio.Because this is an ongoing situation it is not yet possible to quantify the Company’s losses and expenses, whichcontinue to develop. Because of the complexity of the Company’s insurance policies and limited precedent forclaims being made related to pandemics, it is not yet possible to determine if such losses and expenses will becovered by the Company’s insurance policies. Therefore, at this time, the Company is providing notice to theapplicable insurers of the potential for claims in order to protect the Company’s rights under its policies.
The Company continues to monitor the state of the insurance market in general, and the scope and costs ofcoverage for acts of terrorism, California earthquake risk and pandemics, in particular, but the Company cannotanticipate what coverage will be available on commercially reasonable terms in future policy years. There are othertypes of losses, such as from wars, for which the Company cannot obtain insurance at all or at a reasonable cost.With respect to such losses and losses from acts of terrorism, earthquakes or other catastrophic events, if theCompany experiences a loss that is uninsured or that exceeds policy limits, the Company could lose the capitalinvested in the damaged properties, as well as the anticipated future revenues from those properties. Dependingon the specific circumstances of each affected property, it is possible that the Company could be liable for mortgageindebtedness or other obligations related to the property. Any such loss could materially and adversely affect theCompany’s business and financial condition and results of operations.
Legal Matters
The Company is subject to various legal proceedings and claims that arise in the ordinary course of business.These matters are generally covered by insurance. Management believes that the final outcome of such matterswill not have a material adverse effect on the financial position, results of operations or liquidity of the Company.
State and Local Tax Matters
Because Boston Properties, Inc. is organized and qualifies as a REIT, it is generally not subject to federalincome taxes, but is subject to certain state and local taxes. In the normal course of business, certain entitiesthrough which the Company owns real estate either have undergone, or are currently undergoing, tax audits.Although the Company believes that it has substantial arguments in favor of its positions in the ongoing audits, insome instances there is no controlling precedent or interpretive guidance on the specific point at issue. Collectively,tax deficiency notices received to date from the jurisdictions conducting the ongoing audits have not been material.However, there can be no assurance that future audits will not occur with increased frequency or that the ultimateresult of such audits will not have a material adverse effect on the Company’s results of operations.
Environmental Matters
It is the Company’s policy to retain independent environmental consultants to conduct or update Phase Ienvironmental assessments (which generally do not involve invasive techniques such as soil or ground watersampling) and asbestos surveys in connection with the Company’s acquisition of properties. These pre-purchaseenvironmental assessments have not revealed environmental conditions that the Company believes will have amaterial adverse effect on its business, assets, financial condition, results of operations or liquidity, and theCompany is not otherwise aware of environmental conditions with respect to its properties that the Companybelieves would have such a material adverse effect. However, from time to time environmental conditions at theCompany’s properties have required and may in the future require environmental testing and/or regulatory filings, aswell as remedial action.
For example, in February 1999, the Company (through a joint venture) acquired from Exxon Corporation aproperty in Massachusetts that was formerly used as a petroleum bulk storage and distribution facility and wasknown by the state regulatory authority to contain soil and groundwater contamination. The Company developed anoffice park on the property. The Company engaged a specially licensed environmental consultant to oversee the
165
management of contaminated soil and groundwater that was disturbed in the course of construction. Under theproperty acquisition agreement, Exxon agreed to (1) bear the liability arising from releases or discharges of oil andhazardous substances which occurred at the site prior to the Company’s ownership, (2) continue monitoring and/orremediating such releases and discharges as necessary and appropriate to comply with applicable requirements,and (3) indemnify the Company for certain losses arising from preexisting site conditions. Any indemnity claim maybe subject to various defenses and contractual limitations, including time limits, and there can be no assurance thatthe amounts paid under the indemnity, if any, would be sufficient to cover the liabilities arising from any suchreleases and discharges.
Environmental investigations at some of the Company’s properties and certain properties owned by affiliatesof the Company have identified groundwater contamination migrating from off-site source properties. In each casethe Company engaged a licensed environmental consultant to perform the necessary investigations andassessments and to prepare any required submittals to the regulatory authorities. In each case the environmentalconsultant concluded that the properties qualify under the regulatory program or the regulatory practice for a statuswhich eliminates certain deadlines for conducting response actions at a site. The Company also believes that theseproperties qualify for liability relief under certain statutory provisions or regulatory practices regarding upgradientreleases. Although the Company believes that the current or former owners of the upgradient source propertiesmay bear responsibility for some or all of the costs of addressing the identified groundwater contamination, theCompany will take such further response actions (if any) that it deems necessary or advisable. Other than periodictesting at some of these properties, no such additional response actions are anticipated at this time.
Some of the Company’s properties and certain properties owned by the Company’s affiliates are located inurban, industrial and other previously developed areas where fill or current or historical uses of the areas havecaused site contamination. Accordingly, it is sometimes necessary to institute special soil and/or groundwaterhandling procedures and/or include particular building design features in connection with development, constructionand other property operations in order to achieve regulatory closure and/or ensure that contaminated materials areaddressed in an appropriate manner. In these situations, it is the Company’s practice to investigate the nature andextent of detected contamination, including potential issues associated with vapor intrusion concerns and/orpotential contaminant migration to or from the subject property in groundwater, assess potential liability risks andestimate the costs of required response actions and special handling procedures contaminant migration, assesspotential liability risks and estimate the costs of required response actions and special handling procedures. TheCompany then uses this information as part of its decision-making process with respect to the acquisition, dealstructure and/or development of the property. For example, the Company owns a parcel in Massachusetts whichwas formerly used as a quarry/asphalt batching facility. Pre-purchase testing indicated that the site containedrelatively low levels of certain contaminants. The Company has developed an office park on this property. Prior toand during redevelopment activities, the Company engaged a specially licensed environmental consultant tomonitor environmental conditions at the site and prepare necessary regulatory submittals based on the results of anenvironmental risk characterization. A submittal has been made to the regulatory authorities in order to achieveregulatory closure at this site. The submittal included an environmental deed restriction that mandates compliancewith certain protective measures in a portion of the site where low levels of residual soil contamination have beenleft in place in accordance with applicable laws.
The Company expects that resolution of the environmental matters relating to the above will not have amaterial impact on its business, assets, financial condition, results of operations or liquidity. However, the Companycannot assure you that it has identified all environmental liabilities at its properties, that all necessary remediationactions have been or will be undertaken at the Company’s properties or that the Company will be indemnified, in fullor at all, in the event that such environmental liabilities arise.
11. Noncontrolling InterestsNoncontrolling interests relate to the interests in Boston Properties Limited Partnership not owned by Boston
Properties, Inc. and interests in consolidated property partnerships not wholly-owned by the Company. As ofDecember 31, 2020, the noncontrolling interests in Boston Properties Limited Partnership consisted of 16,037,121OP Units, 1,336,115 LTIP Units (including 105,080 2012 OPP Units, 64,468 2013 MYLTIP Units, 23,100 2014MYLTIP Units, 24,966 2015 MYLTIP Units, 89,791 2016 MYLTIP Units and 116,078 2017 MYLTIP Units), 336,1952018 MYLTIP Units, 219,916 2019 MYLTIP Units and 203,278 2020 MYLTIP Units held by parties other than BostonProperties, Inc.
166
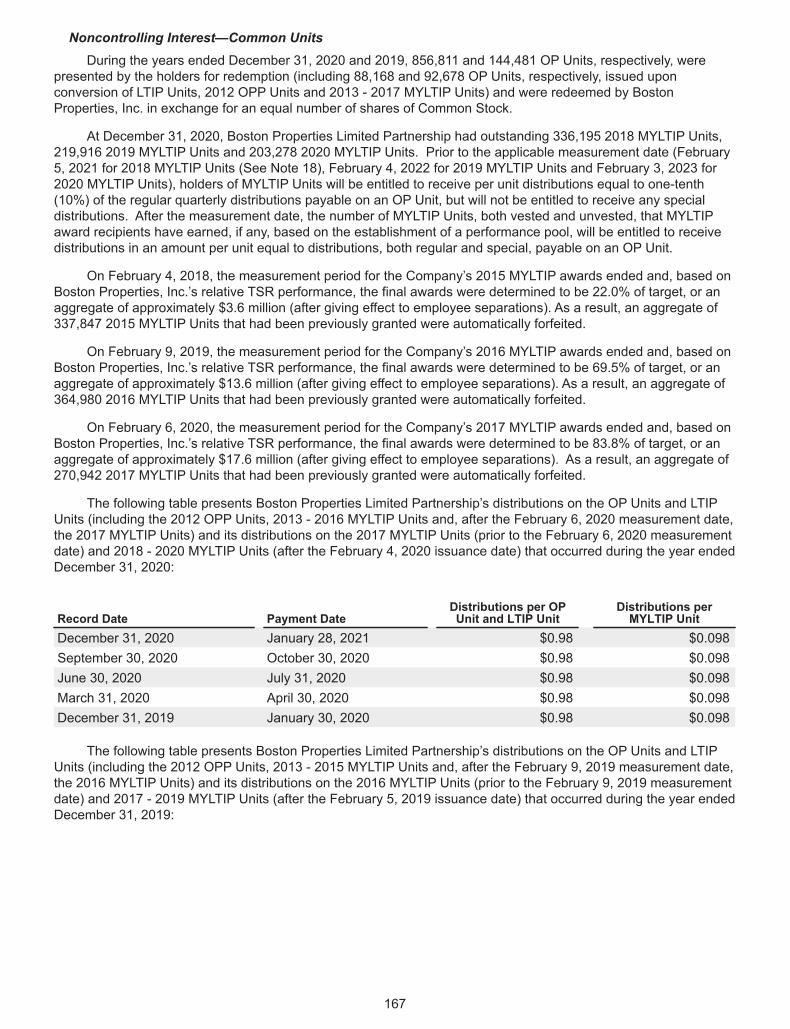
Noncontrolling Interest—Common UnitsDuring the years ended December 31, 2020 and 2019, 856,811 and 144,481 OP Units, respectively, were
presented by the holders for redemption (including 88,168 and 92,678 OP Units, respectively, issued uponconversion of LTIP Units, 2012 OPP Units and 2013 - 2017 MYLTIP Units) and were redeemed by BostonProperties, Inc. in exchange for an equal number of shares of Common Stock.
At December 31, 2020, Boston Properties Limited Partnership had outstanding 336,195 2018 MYLTIP Units,219,916 2019 MYLTIP Units and 203,278 2020 MYLTIP Units. Prior to the applicable measurement date (February5, 2021 for 2018 MYLTIP Units (See Note 18), February 4, 2022 for 2019 MYLTIP Units and February 3, 2023 for2020 MYLTIP Units), holders of MYLTIP Units will be entitled to receive per unit distributions equal to one-tenth(10%) of the regular quarterly distributions payable on an OP Unit, but will not be entitled to receive any specialdistributions. After the measurement date, the number of MYLTIP Units, both vested and unvested, that MYLTIPaward recipients have earned, if any, based on the establishment of a performance pool, will be entitled to receivedistributions in an amount per unit equal to distributions, both regular and special, payable on an OP Unit.
On February 4, 2018, the measurement period for the Company’s 2015 MYLTIP awards ended and, based onBoston Properties, Inc.’s relative TSR performance, the final awards were determined to be 22.0% of target, or anaggregate of approximately $3.6 million (after giving effect to employee separations). As a result, an aggregate of337,847 2015 MYLTIP Units that had been previously granted were automatically forfeited.
On February 9, 2019, the measurement period for the Company’s 2016 MYLTIP awards ended and, based onBoston Properties, Inc.’s relative TSR performance, the final awards were determined to be 69.5% of target, or anaggregate of approximately $13.6 million (after giving effect to employee separations). As a result, an aggregate of364,980 2016 MYLTIP Units that had been previously granted were automatically forfeited.
On February 6, 2020, the measurement period for the Company’s 2017 MYLTIP awards ended and, based onBoston Properties, Inc.’s relative TSR performance, the final awards were determined to be 83.8% of target, or anaggregate of approximately $17.6 million (after giving effect to employee separations). As a result, an aggregate of270,942 2017 MYLTIP Units that had been previously granted were automatically forfeited.
The following table presents Boston Properties Limited Partnership’s distributions on the OP Units and LTIPUnits (including the 2012 OPP Units, 2013 - 2016 MYLTIP Units and, after the February 6, 2020 measurement date,the 2017 MYLTIP Units) and its distributions on the 2017 MYLTIP Units (prior to the February 6, 2020 measurementdate) and 2018 - 2020 MYLTIP Units (after the February 4, 2020 issuance date) that occurred during the year endedDecember 31, 2020:
Record Date Payment DateDistributions per OPUnit and LTIP Unit
Distributions perMYLTIP Unit
December 31, 2020 January 28, 2021 $0.98 $0.098September 30, 2020 October 30, 2020 $0.98 $0.098June 30, 2020 July 31, 2020 $0.98 $0.098March 31, 2020 April 30, 2020 $0.98 $0.098December 31, 2019 January 30, 2020 $0.98 $0.098
The following table presents Boston Properties Limited Partnership’s distributions on the OP Units and LTIPUnits (including the 2012 OPP Units, 2013 - 2015 MYLTIP Units and, after the February 9, 2019 measurement date,the 2016 MYLTIP Units) and its distributions on the 2016 MYLTIP Units (prior to the February 9, 2019 measurementdate) and 2017 - 2019 MYLTIP Units (after the February 5, 2019 issuance date) that occurred during the year endedDecember 31, 2019:
167
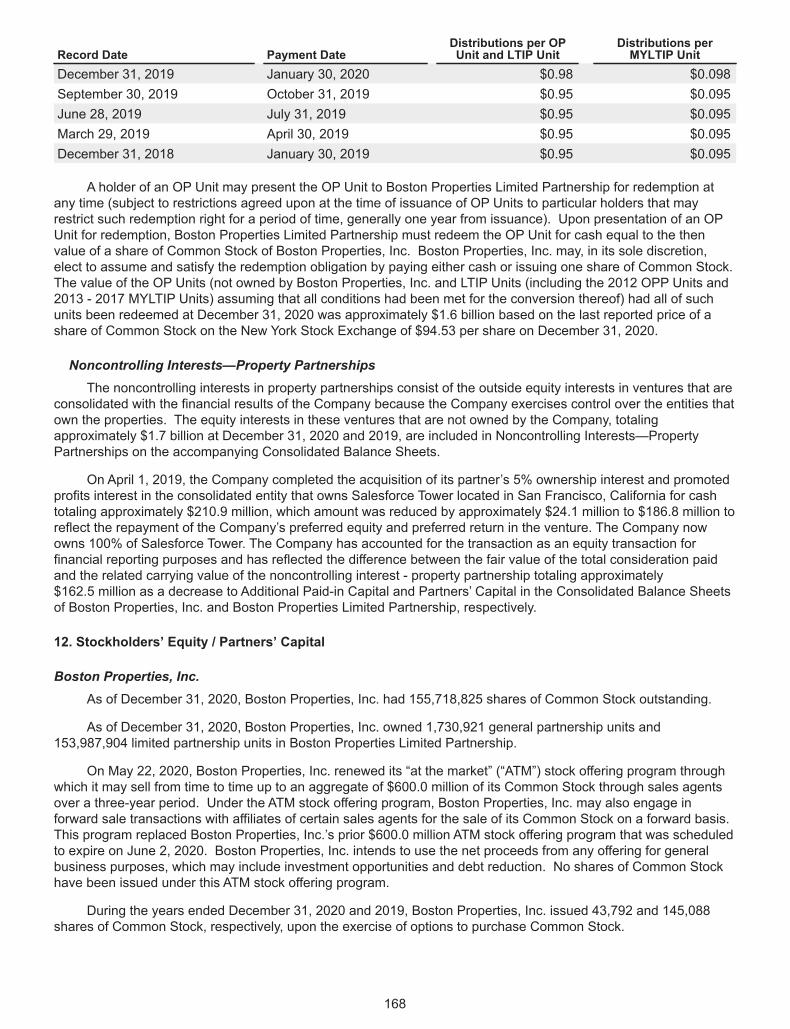
Record Date Payment DateDistributions per OPUnit and LTIP Unit
Distributions perMYLTIP Unit
December 31, 2019 January 30, 2020 $0.98 $0.098September 30, 2019 October 31, 2019 $0.95 $0.095June 28, 2019 July 31, 2019 $0.95 $0.095March 29, 2019 April 30, 2019 $0.95 $0.095December 31, 2018 January 30, 2019 $0.95 $0.095
A holder of an OP Unit may present the OP Unit to Boston Properties Limited Partnership for redemption atany time (subject to restrictions agreed upon at the time of issuance of OP Units to particular holders that mayrestrict such redemption right for a period of time, generally one year from issuance). Upon presentation of an OPUnit for redemption, Boston Properties Limited Partnership must redeem the OP Unit for cash equal to the thenvalue of a share of Common Stock of Boston Properties, Inc. Boston Properties, Inc. may, in its sole discretion,elect to assume and satisfy the redemption obligation by paying either cash or issuing one share of Common Stock.The value of the OP Units (not owned by Boston Properties, Inc. and LTIP Units (including the 2012 OPP Units and2013 - 2017 MYLTIP Units) assuming that all conditions had been met for the conversion thereof) had all of suchunits been redeemed at December 31, 2020 was approximately $1.6 billion based on the last reported price of ashare of Common Stock on the New York Stock Exchange of $94.53 per share on December 31, 2020.
Noncontrolling Interests—Property PartnershipsThe noncontrolling interests in property partnerships consist of the outside equity interests in ventures that are
consolidated with the financial results of the Company because the Company exercises control over the entities thatown the properties. The equity interests in these ventures that are not owned by the Company, totalingapproximately $1.7 billion at December 31, 2020 and 2019, are included in Noncontrolling Interests—PropertyPartnerships on the accompanying Consolidated Balance Sheets.
On April 1, 2019, the Company completed the acquisition of its partner’s 5% ownership interest and promotedprofits interest in the consolidated entity that owns Salesforce Tower located in San Francisco, California for cashtotaling approximately $210.9 million, which amount was reduced by approximately $24.1 million to $186.8 million toreflect the repayment of the Company’s preferred equity and preferred return in the venture. The Company nowowns 100% of Salesforce Tower. The Company has accounted for the transaction as an equity transaction forfinancial reporting purposes and has reflected the difference between the fair value of the total consideration paidand the related carrying value of the noncontrolling interest - property partnership totaling approximately$162.5 million as a decrease to Additional Paid-in Capital and Partners’ Capital in the Consolidated Balance Sheetsof Boston Properties, Inc. and Boston Properties Limited Partnership, respectively.
12. Stockholders’ Equity / Partners’ Capital
Boston Properties, Inc.As of December 31, 2020, Boston Properties, Inc. had 155,718,825 shares of Common Stock outstanding.
As of December 31, 2020, Boston Properties, Inc. owned 1,730,921 general partnership units and153,987,904 limited partnership units in Boston Properties Limited Partnership.
On May 22, 2020, Boston Properties, Inc. renewed its “at the market” (“ATM”) stock offering program throughwhich it may sell from time to time up to an aggregate of $600.0 million of its Common Stock through sales agentsover a three-year period. Under the ATM stock offering program, Boston Properties, Inc. may also engage inforward sale transactions with affiliates of certain sales agents for the sale of its Common Stock on a forward basis.This program replaced Boston Properties, Inc.’s prior $600.0 million ATM stock offering program that was scheduledto expire on June 2, 2020. Boston Properties, Inc. intends to use the net proceeds from any offering for generalbusiness purposes, which may include investment opportunities and debt reduction. No shares of Common Stockhave been issued under this ATM stock offering program.
During the years ended December 31, 2020 and 2019, Boston Properties, Inc. issued 43,792 and 145,088shares of Common Stock, respectively, upon the exercise of options to purchase Common Stock.
168
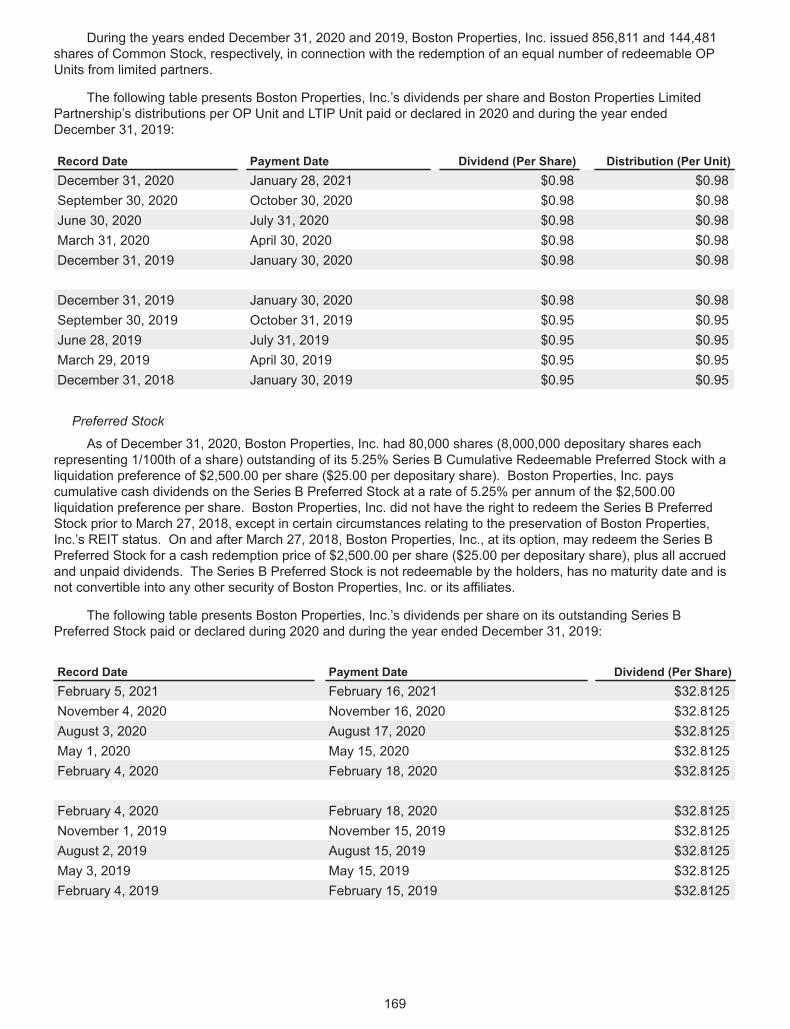
During the years ended December 31, 2020 and 2019, Boston Properties, Inc. issued 856,811 and 144,481shares of Common Stock, respectively, in connection with the redemption of an equal number of redeemable OPUnits from limited partners.
The following table presents Boston Properties, Inc.’s dividends per share and Boston Properties LimitedPartnership’s distributions per OP Unit and LTIP Unit paid or declared in 2020 and during the year endedDecember 31, 2019:
Record Date Payment Date Dividend (Per Share) Distribution (Per Unit)December 31, 2020 January 28, 2021 $0.98 $0.98September 30, 2020 October 30, 2020 $0.98 $0.98June 30, 2020 July 31, 2020 $0.98 $0.98March 31, 2020 April 30, 2020 $0.98 $0.98December 31, 2019 January 30, 2020 $0.98 $0.98
December 31, 2019 January 30, 2020 $0.98 $0.98September 30, 2019 October 31, 2019 $0.95 $0.95June 28, 2019 July 31, 2019 $0.95 $0.95March 29, 2019 April 30, 2019 $0.95 $0.95December 31, 2018 January 30, 2019 $0.95 $0.95
Preferred Stock
As of December 31, 2020, Boston Properties, Inc. had 80,000 shares (8,000,000 depositary shares eachrepresenting 1/100th of a share) outstanding of its 5.25% Series B Cumulative Redeemable Preferred Stock with aliquidation preference of $2,500.00 per share ($25.00 per depositary share). Boston Properties, Inc. payscumulative cash dividends on the Series B Preferred Stock at a rate of 5.25% per annum of the $2,500.00liquidation preference per share. Boston Properties, Inc. did not have the right to redeem the Series B PreferredStock prior to March 27, 2018, except in certain circumstances relating to the preservation of Boston Properties,Inc.’s REIT status. On and after March 27, 2018, Boston Properties, Inc., at its option, may redeem the Series BPreferred Stock for a cash redemption price of $2,500.00 per share ($25.00 per depositary share), plus all accruedand unpaid dividends. The Series B Preferred Stock is not redeemable by the holders, has no maturity date and isnot convertible into any other security of Boston Properties, Inc. or its affiliates.
The following table presents Boston Properties, Inc.’s dividends per share on its outstanding Series BPreferred Stock paid or declared during 2020 and during the year ended December 31, 2019:
Record Date Payment Date Dividend (Per Share)February 5, 2021 February 16, 2021 $32.8125November 4, 2020 November 16, 2020 $32.8125August 3, 2020 August 17, 2020 $32.8125May 1, 2020 May 15, 2020 $32.8125February 4, 2020 February 18, 2020 $32.8125
February 4, 2020 February 18, 2020 $32.8125November 1, 2019 November 15, 2019 $32.8125August 2, 2019 August 15, 2019 $32.8125May 3, 2019 May 15, 2019 $32.8125February 4, 2019 February 15, 2019 $32.8125
169
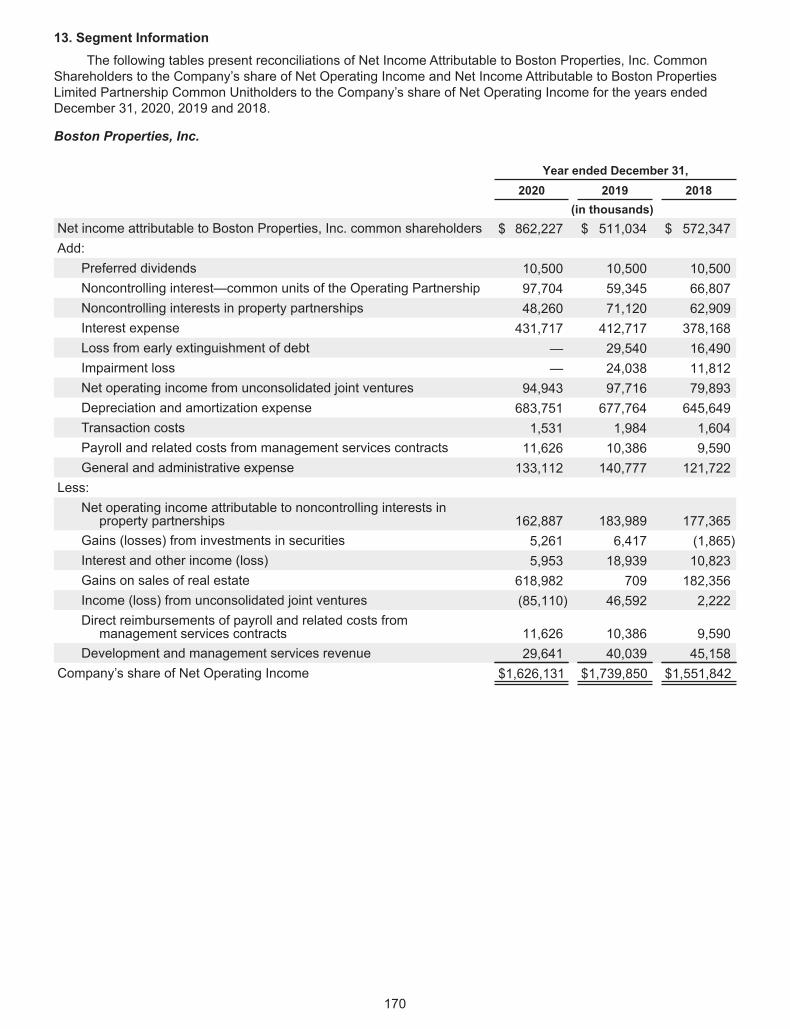
13. Segment InformationThe following tables present reconciliations of Net Income Attributable to Boston Properties, Inc. Common
Shareholders to the Company’s share of Net Operating Income and Net Income Attributable to Boston PropertiesLimited Partnership Common Unitholders to the Company’s share of Net Operating Income for the years endedDecember 31, 2020, 2019 and 2018.
Boston Properties, Inc.
Year ended December 31,2020 2019 2018
(in thousands)Net income attributable to Boston Properties, Inc. common shareholders $ 862,227 $ 511,034 $ 572,347Add:
Preferred dividends 10,500 10,500 10,500Noncontrolling interest—common units of the Operating Partnership 97,704 59,345 66,807Noncontrolling interests in property partnerships 48,260 71,120 62,909Interest expense 431,717 412,717 378,168Loss from early extinguishment of debt — 29,540 16,490Impairment loss — 24,038 11,812Net operating income from unconsolidated joint ventures 94,943 97,716 79,893Depreciation and amortization expense 683,751 677,764 645,649Transaction costs 1,531 1,984 1,604Payroll and related costs from management services contracts 11,626 10,386 9,590General and administrative expense 133,112 140,777 121,722
Less:Net operating income attributable to noncontrolling interests inproperty partnerships 162,887 183,989 177,365
Gains (losses) from investments in securities 5,261 6,417 (1,865)Interest and other income (loss) 5,953 18,939 10,823Gains on sales of real estate 618,982 709 182,356Income (loss) from unconsolidated joint ventures (85,110) 46,592 2,222Direct reimbursements of payroll and related costs frommanagement services contracts 11,626 10,386 9,590
Development and management services revenue 29,641 40,039 45,158Company’s share of Net Operating Income $1,626,131 $1,739,850 $1,551,842
170
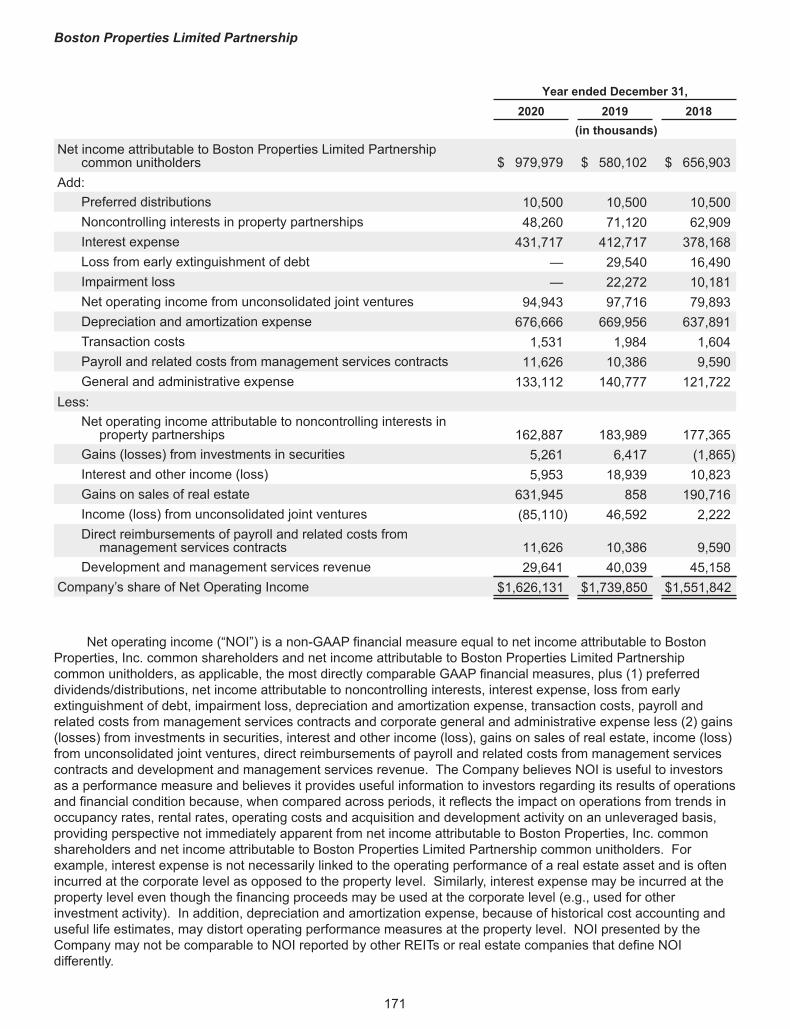
Boston Properties Limited Partnership
Year ended December 31,2020 2019 2018
(in thousands)Net income attributable to Boston Properties Limited Partnership
common unitholders $ 979,979 $ 580,102 $ 656,903Add:
Preferred distributions 10,500 10,500 10,500Noncontrolling interests in property partnerships 48,260 71,120 62,909Interest expense 431,717 412,717 378,168Loss from early extinguishment of debt — 29,540 16,490Impairment loss — 22,272 10,181Net operating income from unconsolidated joint ventures 94,943 97,716 79,893Depreciation and amortization expense 676,666 669,956 637,891Transaction costs 1,531 1,984 1,604Payroll and related costs from management services contracts 11,626 10,386 9,590General and administrative expense 133,112 140,777 121,722
Less:Net operating income attributable to noncontrolling interests inproperty partnerships 162,887 183,989 177,365
Gains (losses) from investments in securities 5,261 6,417 (1,865)Interest and other income (loss) 5,953 18,939 10,823Gains on sales of real estate 631,945 858 190,716Income (loss) from unconsolidated joint ventures (85,110) 46,592 2,222Direct reimbursements of payroll and related costs frommanagement services contracts 11,626 10,386 9,590
Development and management services revenue 29,641 40,039 45,158Company’s share of Net Operating Income $1,626,131 $1,739,850 $1,551,842
Net operating income (“NOI”) is a non-GAAP financial measure equal to net income attributable to BostonProperties, Inc. common shareholders and net income attributable to Boston Properties Limited Partnershipcommon unitholders, as applicable, the most directly comparable GAAP financial measures, plus (1) preferreddividends/distributions, net income attributable to noncontrolling interests, interest expense, loss from earlyextinguishment of debt, impairment loss, depreciation and amortization expense, transaction costs, payroll andrelated costs from management services contracts and corporate general and administrative expense less (2) gains(losses) from investments in securities, interest and other income (loss), gains on sales of real estate, income (loss)from unconsolidated joint ventures, direct reimbursements of payroll and related costs from management servicescontracts and development and management services revenue. The Company believes NOI is useful to investorsas a performance measure and believes it provides useful information to investors regarding its results of operationsand financial condition because, when compared across periods, it reflects the impact on operations from trends inoccupancy rates, rental rates, operating costs and acquisition and development activity on an unleveraged basis,providing perspective not immediately apparent from net income attributable to Boston Properties, Inc. commonshareholders and net income attributable to Boston Properties Limited Partnership common unitholders. Forexample, interest expense is not necessarily linked to the operating performance of a real estate asset and is oftenincurred at the corporate level as opposed to the property level. Similarly, interest expense may be incurred at theproperty level even though the financing proceeds may be used at the corporate level (e.g., used for otherinvestment activity). In addition, depreciation and amortization expense, because of historical cost accounting anduseful life estimates, may distort operating performance measures at the property level. NOI presented by theCompany may not be comparable to NOI reported by other REITs or real estate companies that define NOIdifferently.
171
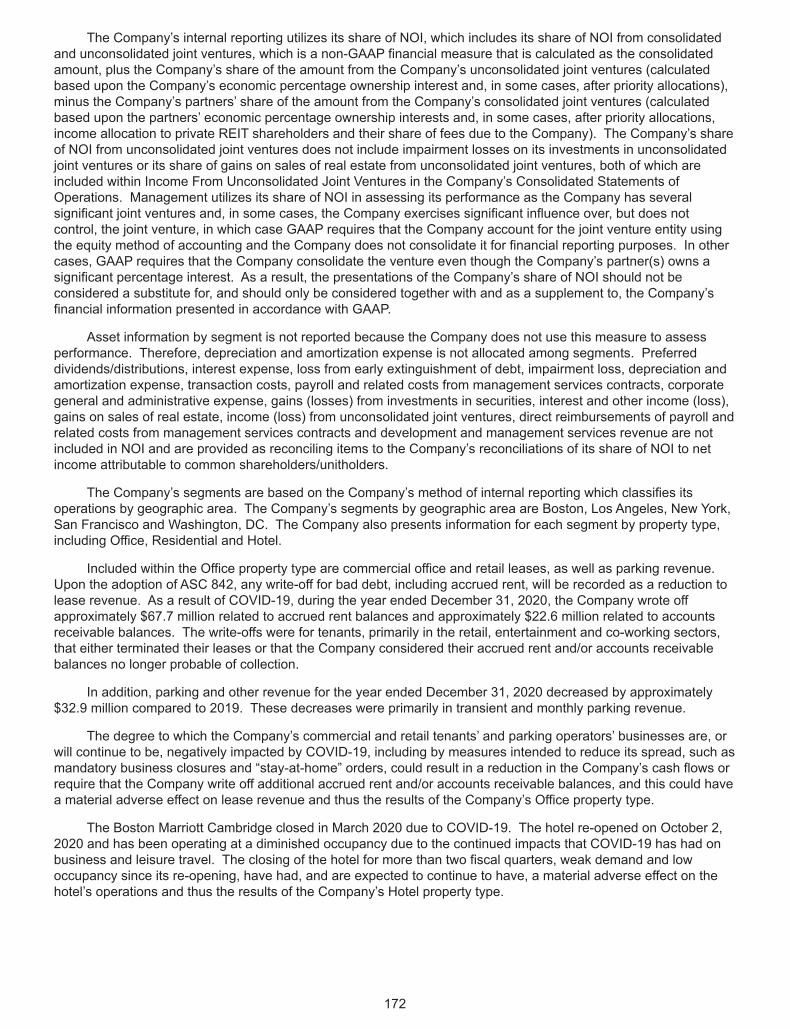
The Company’s internal reporting utilizes its share of NOI, which includes its share of NOI from consolidatedand unconsolidated joint ventures, which is a non-GAAP financial measure that is calculated as the consolidatedamount, plus the Company’s share of the amount from the Company’s unconsolidated joint ventures (calculatedbased upon the Company’s economic percentage ownership interest and, in some cases, after priority allocations),minus the Company’s partners’ share of the amount from the Company’s consolidated joint ventures (calculatedbased upon the partners’ economic percentage ownership interests and, in some cases, after priority allocations,income allocation to private REIT shareholders and their share of fees due to the Company). The Company’s shareof NOI from unconsolidated joint ventures does not include impairment losses on its investments in unconsolidatedjoint ventures or its share of gains on sales of real estate from unconsolidated joint ventures, both of which areincluded within Income From Unconsolidated Joint Ventures in the Company’s Consolidated Statements ofOperations. Management utilizes its share of NOI in assessing its performance as the Company has severalsignificant joint ventures and, in some cases, the Company exercises significant influence over, but does notcontrol, the joint venture, in which case GAAP requires that the Company account for the joint venture entity usingthe equity method of accounting and the Company does not consolidate it for financial reporting purposes. In othercases, GAAP requires that the Company consolidate the venture even though the Company’s partner(s) owns asignificant percentage interest. As a result, the presentations of the Company’s share of NOI should not beconsidered a substitute for, and should only be considered together with and as a supplement to, the Company’sfinancial information presented in accordance with GAAP.
Asset information by segment is not reported because the Company does not use this measure to assessperformance. Therefore, depreciation and amortization expense is not allocated among segments. Preferreddividends/distributions, interest expense, loss from early extinguishment of debt, impairment loss, depreciation andamortization expense, transaction costs, payroll and related costs from management services contracts, corporategeneral and administrative expense, gains (losses) from investments in securities, interest and other income (loss),gains on sales of real estate, income (loss) from unconsolidated joint ventures, direct reimbursements of payroll andrelated costs from management services contracts and development and management services revenue are notincluded in NOI and are provided as reconciling items to the Company’s reconciliations of its share of NOI to netincome attributable to common shareholders/unitholders.
The Company’s segments are based on the Company’s method of internal reporting which classifies itsoperations by geographic area. The Company’s segments by geographic area are Boston, Los Angeles, New York,San Francisco and Washington, DC. The Company also presents information for each segment by property type,including Office, Residential and Hotel.
Included within the Office property type are commercial office and retail leases, as well as parking revenue.Upon the adoption of ASC 842, any write-off for bad debt, including accrued rent, will be recorded as a reduction tolease revenue. As a result of COVID-19, during the year ended December 31, 2020, the Company wrote offapproximately $67.7 million related to accrued rent balances and approximately $22.6 million related to accountsreceivable balances. The write-offs were for tenants, primarily in the retail, entertainment and co-working sectors,that either terminated their leases or that the Company considered their accrued rent and/or accounts receivablebalances no longer probable of collection.
In addition, parking and other revenue for the year ended December 31, 2020 decreased by approximately$32.9 million compared to 2019. These decreases were primarily in transient and monthly parking revenue.
The degree to which the Company’s commercial and retail tenants’ and parking operators’ businesses are, orwill continue to be, negatively impacted by COVID-19, including by measures intended to reduce its spread, such asmandatory business closures and “stay-at-home” orders, could result in a reduction in the Company’s cash flows orrequire that the Company write off additional accrued rent and/or accounts receivable balances, and this could havea material adverse effect on lease revenue and thus the results of the Company’s Office property type.
The Boston Marriott Cambridge closed in March 2020 due to COVID-19. The hotel re-opened on October 2,2020 and has been operating at a diminished occupancy due to the continued impacts that COVID-19 has had onbusiness and leisure travel. The closing of the hotel for more than two fiscal quarters, weak demand and lowoccupancy since its re-opening, have had, and are expected to continue to have, a material adverse effect on thehotel’s operations and thus the results of the Company’s Hotel property type.
172
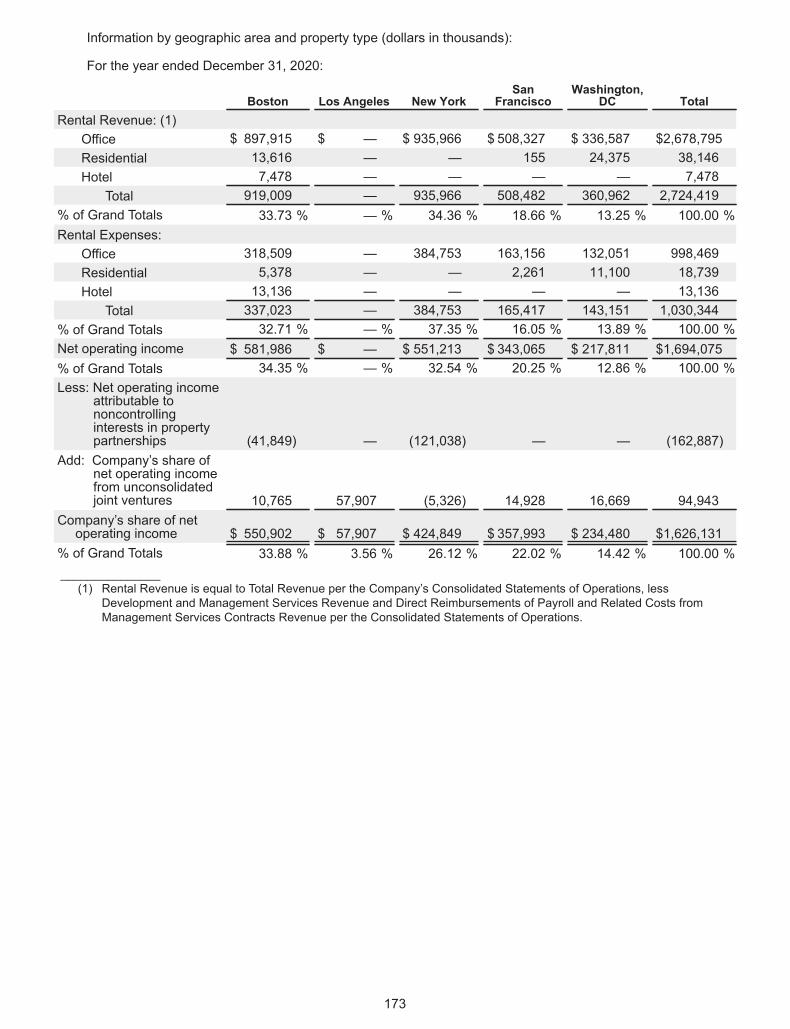
Information by geographic area and property type (dollars in thousands):
For the year ended December 31, 2020:
Boston Los Angeles New YorkSan
FranciscoWashington,
DC TotalRental Revenue: (1)
Office $ 897,915 $ — $ 935,966 $ 508,327 $ 336,587 $2,678,795Residential 13,616 — — 155 24,375 38,146Hotel 7,478 — — — — 7,478
Total 919,009 — 935,966 508,482 360,962 2,724,419% of Grand Totals 33.73 % — % 34.36 % 18.66 % 13.25 % 100.00 %Rental Expenses:
Office 318,509 — 384,753 163,156 132,051 998,469Residential 5,378 — — 2,261 11,100 18,739Hotel 13,136 — — — — 13,136
Total 337,023 — 384,753 165,417 143,151 1,030,344% of Grand Totals 32.71 % — % 37.35 % 16.05 % 13.89 % 100.00 %Net operating income $ 581,986 $ — $ 551,213 $ 343,065 $ 217,811 $1,694,075% of Grand Totals 34.35 % — % 32.54 % 20.25 % 12.86 % 100.00 %Less: Net operating income
attributable tononcontrollinginterests in propertypartnerships (41,849) — (121,038) — — (162,887)
Add: Company’s share ofnet operating incomefrom unconsolidatedjoint ventures 10,765 57,907 (5,326) 14,928 16,669 94,943
Company’s share of netoperating income $ 550,902 $ 57,907 $ 424,849 $ 357,993 $ 234,480 $1,626,131
% of Grand Totals 33.88 % 3.56 % 26.12 % 22.02 % 14.42 % 100.00 %_______________(1) Rental Revenue is equal to Total Revenue per the Company’s Consolidated Statements of Operations, less
Development and Management Services Revenue and Direct Reimbursements of Payroll and Related Costs fromManagement Services Contracts Revenue per the Consolidated Statements of Operations.
173
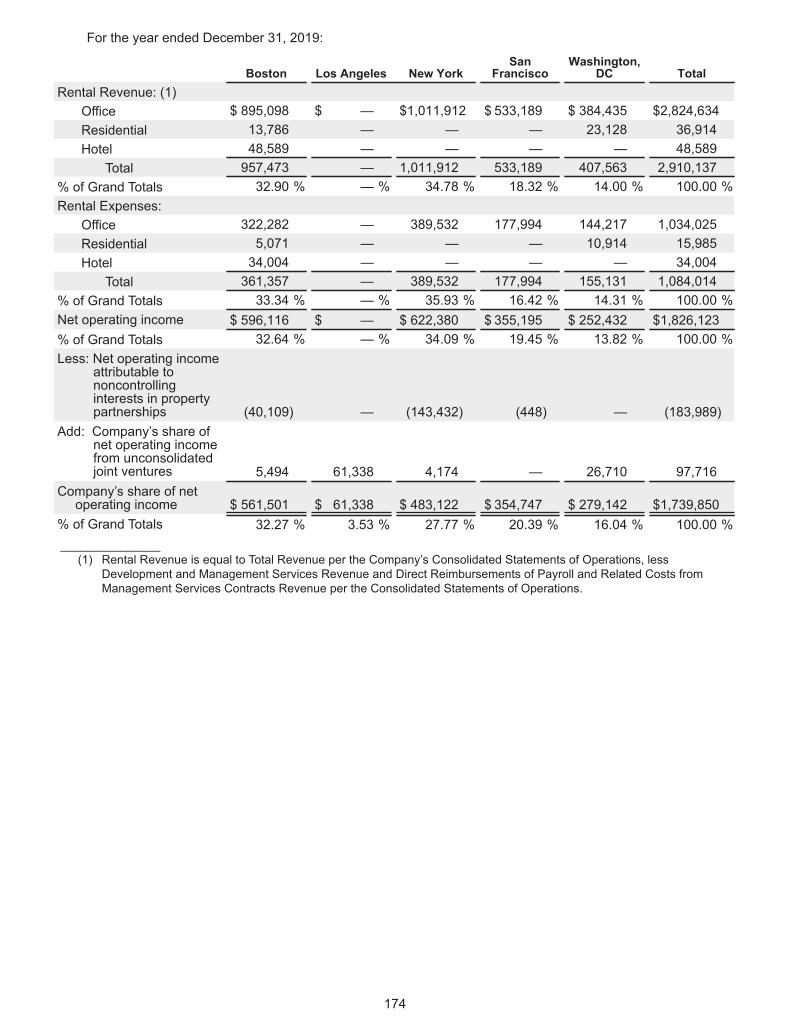
For the year ended December 31, 2019:
Boston Los Angeles New YorkSan
FranciscoWashington,
DC TotalRental Revenue: (1)
Office $ 895,098 $ — $1,011,912 $ 533,189 $ 384,435 $2,824,634Residential 13,786 — — — 23,128 36,914Hotel 48,589 — — — — 48,589
Total 957,473 — 1,011,912 533,189 407,563 2,910,137% of Grand Totals 32.90 % — % 34.78 % 18.32 % 14.00 % 100.00 %Rental Expenses:
Office 322,282 — 389,532 177,994 144,217 1,034,025Residential 5,071 — — — 10,914 15,985Hotel 34,004 — — — — 34,004
Total 361,357 — 389,532 177,994 155,131 1,084,014% of Grand Totals 33.34 % — % 35.93 % 16.42 % 14.31 % 100.00 %Net operating income $ 596,116 $ — $ 622,380 $ 355,195 $ 252,432 $1,826,123% of Grand Totals 32.64 % — % 34.09 % 19.45 % 13.82 % 100.00 %Less: Net operating income
attributable tononcontrollinginterests in propertypartnerships (40,109) — (143,432) (448) — (183,989)
Add: Company’s share ofnet operating incomefrom unconsolidatedjoint ventures 5,494 61,338 4,174 — 26,710 97,716
Company’s share of netoperating income $ 561,501 $ 61,338 $ 483,122 $ 354,747 $ 279,142 $1,739,850
% of Grand Totals 32.27 % 3.53 % 27.77 % 20.39 % 16.04 % 100.00 %_______________(1) Rental Revenue is equal to Total Revenue per the Company’s Consolidated Statements of Operations, less
Development and Management Services Revenue and Direct Reimbursements of Payroll and Related Costs fromManagement Services Contracts Revenue per the Consolidated Statements of Operations.
174
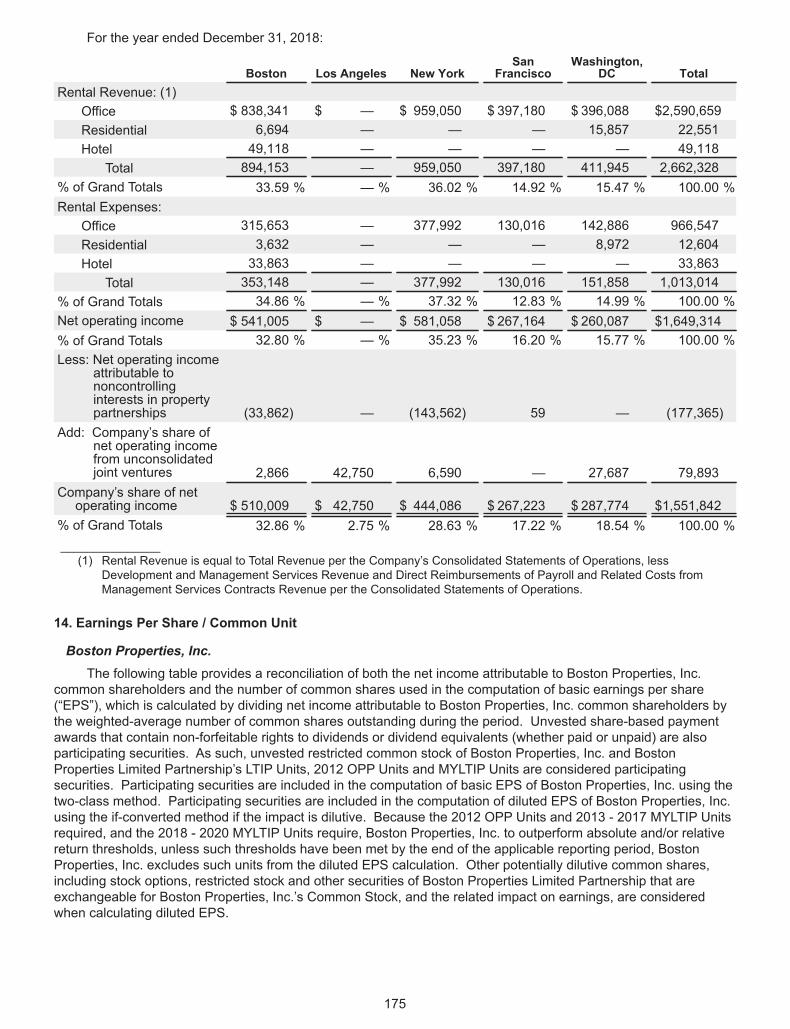
For the year ended December 31, 2018:
Boston Los Angeles New YorkSan
FranciscoWashington,
DC TotalRental Revenue: (1)
Office $ 838,341 $ — $ 959,050 $ 397,180 $ 396,088 $2,590,659Residential 6,694 — — — 15,857 22,551Hotel 49,118 — — — — 49,118
Total 894,153 — 959,050 397,180 411,945 2,662,328% of Grand Totals 33.59 % — % 36.02 % 14.92 % 15.47 % 100.00 %Rental Expenses:
Office 315,653 — 377,992 130,016 142,886 966,547Residential 3,632 — — — 8,972 12,604Hotel 33,863 — — — — 33,863
Total 353,148 — 377,992 130,016 151,858 1,013,014% of Grand Totals 34.86 % — % 37.32 % 12.83 % 14.99 % 100.00 %Net operating income $ 541,005 $ — $ 581,058 $ 267,164 $ 260,087 $1,649,314% of Grand Totals 32.80 % — % 35.23 % 16.20 % 15.77 % 100.00 %Less: Net operating income
attributable tononcontrollinginterests in propertypartnerships (33,862) — (143,562) 59 — (177,365)
Add: Company’s share ofnet operating incomefrom unconsolidatedjoint ventures 2,866 42,750 6,590 — 27,687 79,893
Company’s share of netoperating income $ 510,009 $ 42,750 $ 444,086 $ 267,223 $ 287,774 $1,551,842
% of Grand Totals 32.86 % 2.75 % 28.63 % 17.22 % 18.54 % 100.00 %_______________(1) Rental Revenue is equal to Total Revenue per the Company’s Consolidated Statements of Operations, less
Development and Management Services Revenue and Direct Reimbursements of Payroll and Related Costs fromManagement Services Contracts Revenue per the Consolidated Statements of Operations.
14. Earnings Per Share / Common Unit
Boston Properties, Inc.The following table provides a reconciliation of both the net income attributable to Boston Properties, Inc.
common shareholders and the number of common shares used in the computation of basic earnings per share(“EPS”), which is calculated by dividing net income attributable to Boston Properties, Inc. common shareholders bythe weighted-average number of common shares outstanding during the period. Unvested share-based paymentawards that contain non-forfeitable rights to dividends or dividend equivalents (whether paid or unpaid) are alsoparticipating securities. As such, unvested restricted common stock of Boston Properties, Inc. and BostonProperties Limited Partnership’s LTIP Units, 2012 OPP Units and MYLTIP Units are considered participatingsecurities. Participating securities are included in the computation of basic EPS of Boston Properties, Inc. using thetwo-class method. Participating securities are included in the computation of diluted EPS of Boston Properties, Inc.using the if-converted method if the impact is dilutive. Because the 2012 OPP Units and 2013 - 2017 MYLTIP Unitsrequired, and the 2018 - 2020 MYLTIP Units require, Boston Properties, Inc. to outperform absolute and/or relativereturn thresholds, unless such thresholds have been met by the end of the applicable reporting period, BostonProperties, Inc. excludes such units from the diluted EPS calculation. Other potentially dilutive common shares,including stock options, restricted stock and other securities of Boston Properties Limited Partnership that areexchangeable for Boston Properties, Inc.’s Common Stock, and the related impact on earnings, are consideredwhen calculating diluted EPS.
175
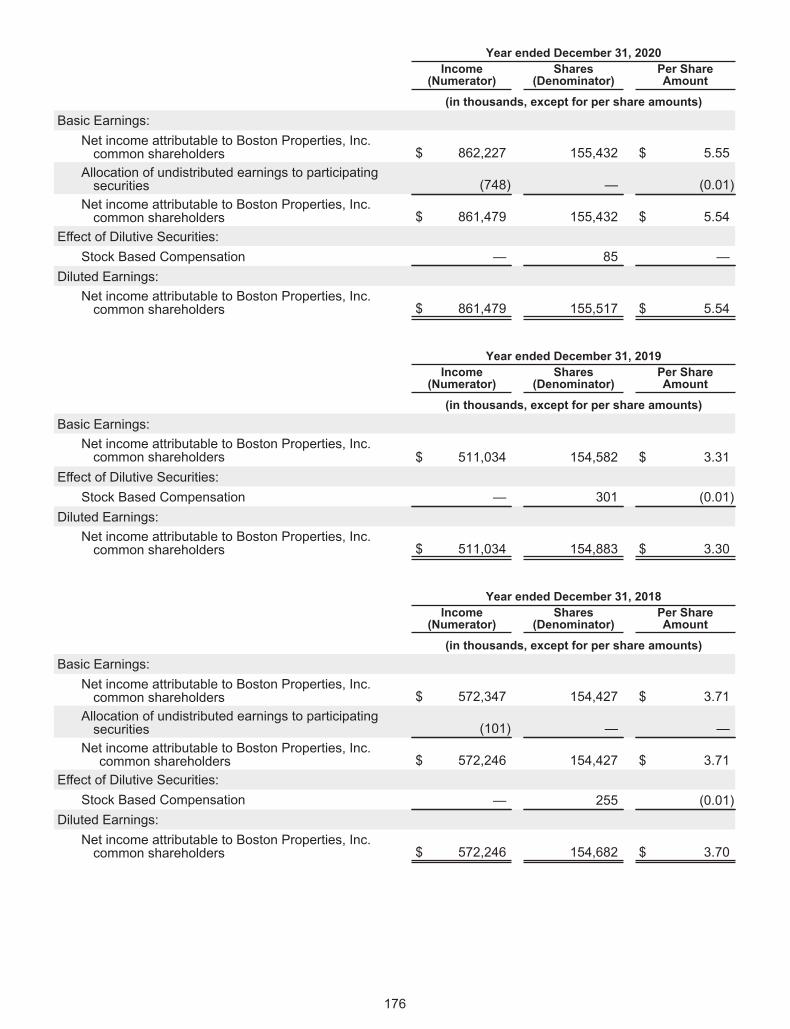
Year ended December 31, 2020Income
(Numerator)Shares
(Denominator)Per ShareAmount
(in thousands, except for per share amounts)Basic Earnings:
Net income attributable to Boston Properties, Inc.common shareholders $ 862,227 155,432 $ 5.55
Allocation of undistributed earnings to participatingsecurities (748) — (0.01)
Net income attributable to Boston Properties, Inc.common shareholders $ 861,479 155,432 $ 5.54
Effect of Dilutive Securities:Stock Based Compensation — 85 —
Diluted Earnings:Net income attributable to Boston Properties, Inc.common shareholders $ 861,479 155,517 $ 5.54
Year ended December 31, 2019Income
(Numerator)Shares
(Denominator)Per ShareAmount
(in thousands, except for per share amounts)Basic Earnings:
Net income attributable to Boston Properties, Inc.common shareholders $ 511,034 154,582 $ 3.31
Effect of Dilutive Securities:Stock Based Compensation — 301 (0.01)
Diluted Earnings:Net income attributable to Boston Properties, Inc.common shareholders $ 511,034 154,883 $ 3.30
Year ended December 31, 2018Income
(Numerator)Shares
(Denominator)Per ShareAmount
(in thousands, except for per share amounts)Basic Earnings:
Net income attributable to Boston Properties, Inc.common shareholders $ 572,347 154,427 $ 3.71
Allocation of undistributed earnings to participatingsecurities (101) — —
Net income attributable to Boston Properties, Inc.common shareholders $ 572,246 154,427 $ 3.71
Effect of Dilutive Securities:Stock Based Compensation — 255 (0.01)
Diluted Earnings:Net income attributable to Boston Properties, Inc.common shareholders $ 572,246 154,682 $ 3.70
176
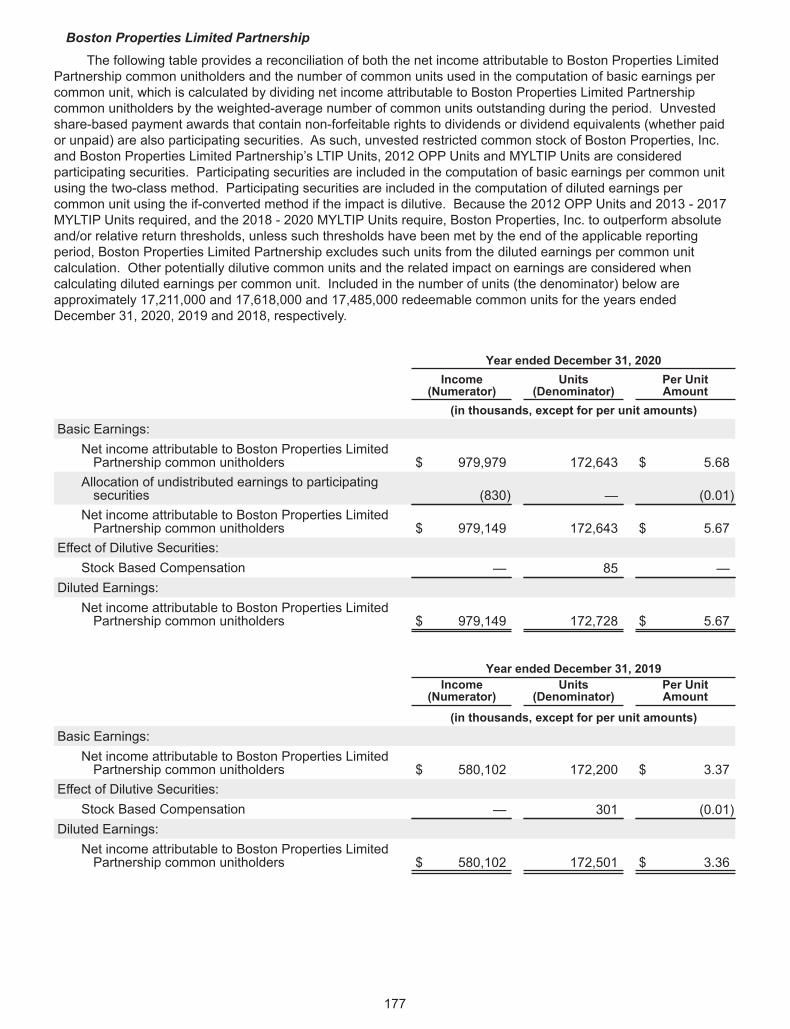
Boston Properties Limited PartnershipThe following table provides a reconciliation of both the net income attributable to Boston Properties Limited
Partnership common unitholders and the number of common units used in the computation of basic earnings percommon unit, which is calculated by dividing net income attributable to Boston Properties Limited Partnershipcommon unitholders by the weighted-average number of common units outstanding during the period. Unvestedshare-based payment awards that contain non-forfeitable rights to dividends or dividend equivalents (whether paidor unpaid) are also participating securities. As such, unvested restricted common stock of Boston Properties, Inc.and Boston Properties Limited Partnership’s LTIP Units, 2012 OPP Units and MYLTIP Units are consideredparticipating securities. Participating securities are included in the computation of basic earnings per common unitusing the two-class method. Participating securities are included in the computation of diluted earnings percommon unit using the if-converted method if the impact is dilutive. Because the 2012 OPP Units and 2013 - 2017MYLTIP Units required, and the 2018 - 2020 MYLTIP Units require, Boston Properties, Inc. to outperform absoluteand/or relative return thresholds, unless such thresholds have been met by the end of the applicable reportingperiod, Boston Properties Limited Partnership excludes such units from the diluted earnings per common unitcalculation. Other potentially dilutive common units and the related impact on earnings are considered whencalculating diluted earnings per common unit. Included in the number of units (the denominator) below areapproximately 17,211,000 and 17,618,000 and 17,485,000 redeemable common units for the years endedDecember 31, 2020, 2019 and 2018, respectively.
Year ended December 31, 2020Income
(Numerator)Units
(Denominator)Per UnitAmount
(in thousands, except for per unit amounts)Basic Earnings:
Net income attributable to Boston Properties LimitedPartnership common unitholders $ 979,979 172,643 $ 5.68
Allocation of undistributed earnings to participatingsecurities (830) — (0.01)
Net income attributable to Boston Properties LimitedPartnership common unitholders $ 979,149 172,643 $ 5.67
Effect of Dilutive Securities:Stock Based Compensation — 85 —
Diluted Earnings:Net income attributable to Boston Properties LimitedPartnership common unitholders $ 979,149 172,728 $ 5.67
Year ended December 31, 2019Income
(Numerator)Units
(Denominator)Per UnitAmount
(in thousands, except for per unit amounts)Basic Earnings:
Net income attributable to Boston Properties LimitedPartnership common unitholders $ 580,102 172,200 $ 3.37
Effect of Dilutive Securities:Stock Based Compensation — 301 (0.01)
Diluted Earnings:Net income attributable to Boston Properties LimitedPartnership common unitholders $ 580,102 172,501 $ 3.36
177
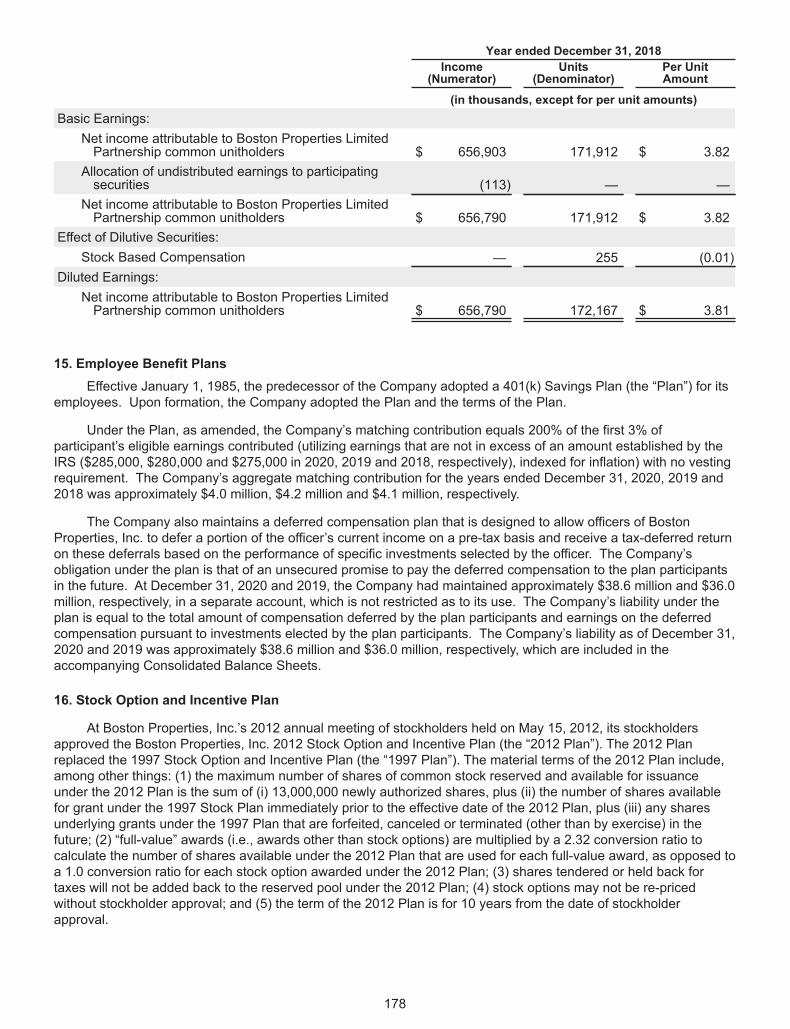
Year ended December 31, 2018Income
(Numerator)Units
(Denominator)Per UnitAmount
(in thousands, except for per unit amounts)Basic Earnings:
Net income attributable to Boston Properties LimitedPartnership common unitholders $ 656,903 171,912 $ 3.82
Allocation of undistributed earnings to participatingsecurities (113) — —
Net income attributable to Boston Properties LimitedPartnership common unitholders $ 656,790 171,912 $ 3.82
Effect of Dilutive Securities:Stock Based Compensation — 255 (0.01)
Diluted Earnings:Net income attributable to Boston Properties LimitedPartnership common unitholders $ 656,790 172,167 $ 3.81
15. Employee Benefit PlansEffective January 1, 1985, the predecessor of the Company adopted a 401(k) Savings Plan (the “Plan”) for its
employees. Upon formation, the Company adopted the Plan and the terms of the Plan.
Under the Plan, as amended, the Company’s matching contribution equals 200% of the first 3% ofparticipant’s eligible earnings contributed (utilizing earnings that are not in excess of an amount established by theIRS ($285,000, $280,000 and $275,000 in 2020, 2019 and 2018, respectively), indexed for inflation) with no vestingrequirement. The Company’s aggregate matching contribution for the years ended December 31, 2020, 2019 and2018 was approximately $4.0 million, $4.2 million and $4.1 million, respectively.
The Company also maintains a deferred compensation plan that is designed to allow officers of BostonProperties, Inc. to defer a portion of the officer’s current income on a pre-tax basis and receive a tax-deferred returnon these deferrals based on the performance of specific investments selected by the officer. The Company’sobligation under the plan is that of an unsecured promise to pay the deferred compensation to the plan participantsin the future. At December 31, 2020 and 2019, the Company had maintained approximately $38.6 million and $36.0million, respectively, in a separate account, which is not restricted as to its use. The Company’s liability under theplan is equal to the total amount of compensation deferred by the plan participants and earnings on the deferredcompensation pursuant to investments elected by the plan participants. The Company’s liability as of December 31,2020 and 2019 was approximately $38.6 million and $36.0 million, respectively, which are included in theaccompanying Consolidated Balance Sheets.
16. Stock Option and Incentive Plan
At Boston Properties, Inc.’s 2012 annual meeting of stockholders held on May 15, 2012, its stockholdersapproved the Boston Properties, Inc. 2012 Stock Option and Incentive Plan (the “2012 Plan”). The 2012 Planreplaced the 1997 Stock Option and Incentive Plan (the “1997 Plan”). The material terms of the 2012 Plan include,among other things: (1) the maximum number of shares of common stock reserved and available for issuanceunder the 2012 Plan is the sum of (i) 13,000,000 newly authorized shares, plus (ii) the number of shares availablefor grant under the 1997 Stock Plan immediately prior to the effective date of the 2012 Plan, plus (iii) any sharesunderlying grants under the 1997 Plan that are forfeited, canceled or terminated (other than by exercise) in thefuture; (2) “full-value” awards (i.e., awards other than stock options) are multiplied by a 2.32 conversion ratio tocalculate the number of shares available under the 2012 Plan that are used for each full-value award, as opposed toa 1.0 conversion ratio for each stock option awarded under the 2012 Plan; (3) shares tendered or held back fortaxes will not be added back to the reserved pool under the 2012 Plan; (4) stock options may not be re-pricedwithout stockholder approval; and (5) the term of the 2012 Plan is for 10 years from the date of stockholderapproval.
178
On February 4, 2020, Boston Properties, Inc.’s Compensation Committee granted the 2020 MYLTIP awardsunder the Boston Properties, Inc.’s 2012 Stock Option and Incentive Plan (the “2012 Plan”) to certain officers andemployees of Boston Properties, Inc. The 2020 MYLTIP awards utilize Boston Properties, Inc.’s TSR over a three-year measurement period, on an annualized, compounded basis, as the performance metric. Earned awards willrange from zero to a maximum of 203,278 LTIP Units depending on Boston Properties, Inc.’s TSR relative to theFTSE Russell Nareit Office Index, adjusted to include Vornado Realty Trust, with a target of approximately 101,638LTIP Units and linear interpolation between zero and maximum. Earned awards (if any) will vest 50% onFebruary 3, 2023 and 50% on February 3, 2024, based on continued employment. Vesting will be accelerated inthe event of a change in control, termination of employment by Boston Properties, Inc. without cause, or terminationof employment by the award recipient for good reason, death, disability or retirement. If there is a change of controlprior to February 3, 2023, earned awards will be calculated based on TSR performance up to the date of the changeof control. The 2020 MYLTIP awards are in the form of LTIP Units issued on the grant date which (i) are subject toforfeiture to the extent awards are not earned and (ii) prior to the performance measurement date are only entitledto one-tenth (10%) of the regular quarterly distributions payable on common partnership units. Under ASC 718, the2020 MYLTIP awards have an aggregate value of approximately $13.7 million, which amount will generally beamortized into earnings under the graded vesting method.
On February 6, 2020, the measurement period for the Company’s 2017 MYLTIP awards ended and, based onBoston Properties, Inc.’s relative TSR performance, the final awards were determined to be 83.8% of target, or anaggregate of approximately $17.6 million (after giving effect to employee separations). As a result, an aggregate of270,942 2017 MYLTIP Units that had been previously granted were automatically forfeited.
On February 9, 2019, the measurement period for the Company’s 2016 MYLTIP awards ended and, based onBoston Properties, Inc.’s relative TSR performance, the final awards were determined to be 69.5% of target, or anaggregate of approximately $13.6 million (after giving effect to employee separations). As a result, an aggregate of364,980 2016 MYLTIP Units that had been previously granted were automatically forfeited.
On February 4, 2018, the measurement period for the Company’s 2015 MYLTIP awards ended and, based onBoston Properties, Inc.’s relative TSR performance, the final awards were determined to be 22.0% of target, or anaggregate of approximately $3.6 million (after giving effect to employee separations). As a result, an aggregate of337,847 2015 MYLTIP Units that had been previously granted were automatically forfeited.
Boston Properties, Inc. issued 29,630, 26,503 and 20,320 shares of restricted common stock and BostonProperties Limited Partnership issued 207,181, 181,919 and 205,838 LTIP Units to employees and non-employeedirectors under the 2012 Plan during the years ended December 31, 2020, 2019 and 2018, respectively. BostonProperties, Inc. did not issue any non-qualified stock options under the 2012 Plan during the years ended December31, 2020, 2019 and 2018. Boston Properties Limited Partnership issued 203,278 2020 MYLTIP Units, 220,7342019 MYLTIP Units and 342,659 2018 MYLTIP Units to employees under the 2012 Plan during the years endedDecember 31, 2020, 2019 and 2018, respectively. Employees and non-employee directors paid $0.01 per share ofrestricted common stock and $0.25 per LTIP Unit and MYLTIP Unit. When issued, LTIP Units are not economicallyequivalent in value to a share of Common Stock, but over time can increase in value to one-for-one parity withCommon Stock if there is sufficient appreciation in the value of the Company’s assets. The aggregate value of theLTIP Units is included in noncontrolling interests in the Consolidated Balance Sheets of Boston Properties, Inc. andBoston Properties Limited Partnership. A majority of the grants of restricted common stock and LTIP Units toemployees vest in 4 equal annual installments. Restricted common stock is measured at fair value on the date ofgrant based on the number of shares granted and the closing price of Boston Properties, Inc.’s Common Stock onthe date of grant as quoted on the New York Stock Exchange. Such value is recognized as an expense ratably overthe corresponding employee service period. Because the 2012 OPP Units and 2013 - 2020 MYLTIP Units aresubject to both a service condition and a market condition, the Company recognizes the related compensationexpense under the graded vesting attribution method. Under the graded vesting attribution method, each portion ofthe award that vests at a different date is accounted for as a separate award and recognized over the periodappropriate to that portion so that the compensation cost for each portion should be recognized in full by the timethat portion vests. The Company recognizes forfeitures as they occur on its awards of stock-based compensation.Dividends paid on both vested and unvested shares of restricted stock are charged directly to Dividends in Excessof Earnings in Boston Properties, Inc.’s Consolidated Balance Sheets and Partners’ Capital in Boston PropertiesLimited Partnership’s Consolidated Balance Sheets. Aggregate stock-based compensation expense associatedwith restricted stock, LTIP Units and 2015 - 2020 MYLTIP Units was approximately $43.0 million, $39.8 million and$38.0 million for the years ended December 31, 2020, 2019 and 2018, respectively. At December 31, 2020, therewas (1) an aggregate of approximately $25.4 million of unrecognized compensation expense related to unvested
179
restricted stock and LTIP Units and (2) an aggregate of approximately $10.3 million of unrecognized compensationexpense related to unvested 2018 - 2020 MYLTIP Units that is expected to be recognized over a weighted-averageperiod of approximately 2.1 years.
The shares of restricted stock were valued at approximately $4.0 million ($133.81 per share weighted-average), $3.5 million ($131.27 per share weighted-average) and $2.4 million ($119.27 per share weighted-average) for the years ended December 31, 2020, 2019 and 2018, respectively.
LTIP Units were valued using a Monte Carlo simulation method model in accordance with the provisions ofASC 718. LTIP Units issued during the years ended December 31, 2020, 2019 and 2018 were valued atapproximately $26.3 million, $22.1 million and $22.7 million, respectively. The weighted-average per unit fair valueof LTIP Unit grants in 2020, 2019 and 2018 was $127.14, $121.50 and $110.29, respectively. The per unit fair valueof each LTIP Unit granted in 2020, 2019 and 2018 was estimated on the date of grant using the followingassumptions; an expected life of 5.7 years, 5.7 years and 5.7 years, a risk-free interest rate of 1.47%, 2.68% and2.63% and an expected price volatility of 18.0%, 27.0% and 27.0%, respectively.
There were no non-qualified stock options granted during the years ended December 31, 2020, 2019 and2018.
A summary of the status of Boston Properties, Inc.’s stock options as of December 31, 2020, 2019 and 2018and changes during the years then ended are presented below:
SharesWeighted-AverageExercise Price
Outstanding at December 31, 2017 540,441 $ 96.35Exercised — $ —Outstanding at December 31, 2018 540,441 $ 96.35Exercised (145,088) $ 96.27Outstanding at December 31, 2019 395,353 $ 96.37Exercised (43,792) $ 91.60Outstanding at December 31, 2020 351,561 $ 96.97
The following table summarizes information about Boston Properties, Inc.’s stock options outstanding atDecember 31, 2020:
Options Outstanding Options ExercisableNumber
Outstanding at12/31/20
Weighted-AverageRemaining
Contractual Life Exercise PriceNumber Exercisable
at 12/31/20 Exercise Price54,003 0.1 years $ 86.86 54,003 $ 86.8654,282 2.3 years $ 95.69 54,282 $ 95.69133,834 2.1 years $ 98.46 133,834 $ 98.46109,442 1.1 years $ 100.77 109,442 $ 100.77
The total intrinsic value of the outstanding and exercisable stock options as of December 31, 2020 wasapproximately $0.4 million. In addition, Boston Properties, Inc. had 395,353 and 540,441 options exercisable at aweighted-average exercise price of $96.37 and $96.35 at December 31, 2019 and 2018, respectively.
Boston Properties, Inc. adopted the 1999 Non-Qualified Employee Stock Purchase Plan (the “Stock PurchasePlan”) to encourage the ownership of Common Stock by eligible employees. The Stock Purchase Plan becameeffective on January 1, 1999 with an aggregate maximum of 250,000 shares of Common Stock available forissuance. The Stock Purchase Plan provides for eligible employees to purchase on the business day immediatelyfollowing the end of the biannual purchase periods (i.e., January 1-June 30 and July 1-December 31) shares ofCommon Stock at a purchase price equal to 85% of the average closing prices of the Common Stock during the lastten business days of the purchase period. Boston Properties, Inc. issued 7,195, 5,862 and 6,268 shares with theweighted-average purchase price equal to $90.53 per share, $104.11 per share and $107.20 per share under theStock Purchase Plan during the years ended December 31, 2020, 2019 and 2018, respectively.
180
17. Related Party TransactionsA firm controlled by Mr. Raymond A. Ritchey’s brother was paid aggregate leasing commissions of
approximately $914,000, $21,000 and $921,000 during the years ended December 31, 2020, 2019 and 2018,respectively, related to certain exclusive leasing arrangements for certain Northern Virginia properties. In addition,Mr. Ritchey’s brother is employed by a real estate brokerage firm and participated in brokerage activities for whichthe Company paid the firm approximately $3.4 million and $2.6 million for the years ended December 31, 2020 and2019, respectively. Mr. Ritchey’s brother did not participate in brokerage activities related to such arrangementduring the year ended December 31, 2018. Mr. Ritchey is a Senior Executive Vice President of Boston Properties,Inc.
In accordance with Boston Properties, Inc.’s 2012 Plan, and as approved by its Board of Directors, seven non-employee directors made elections to receive deferred stock units in lieu of cash fees for 2020. As a result of theseelections, the aggregate cash fees otherwise payable to a non-employee director during a fiscal quarter areconverted into a number of deferred stock units equal to the aggregate cash fees divided by the last reported salesprice of a share of Boston Properties, Inc.’s Common Stock on the last trading of the applicable fiscal quarter. Thedeferred stock units are also credited with dividend equivalents as dividends are paid by Boston Properties, Inc.The deferred stock units may be settled in shares of Common Stock upon the cessation of such director’s serviceon the Board of Directors of Boston Properties, Inc. The non-employee director compensation program provides,subject to certain conditions, the non-employee directors holding deferred stock units with the ability to elect,following cessation of their service on the Company’s Board of Directors, to diversify their investment elections intonon-employer securities on a pre-tax basis and receive tax-deferred returns on such deferrals, which will ultimatelybe settled in cash. The Company’s obligation under the plan is that of an unsecured promise to pay the deferredcompensation to the non-employee director in the future. At December 31, 2020 and 2019, the Company hadmaintained approximately $0.8 million and $0.7 million, respectively, in a separate account, which is not restrictedas to its use. The Company’s liability under the plan is equal to the total amount of compensation deferred by thenon-employee director and earnings on the deferred compensation pursuant to investments elected by the non-employee director. The Company’s liability as of December 31, 2020 and 2019 was approximately $0.8 million and$0.7 million, respectively, which is included in the accompanying Consolidated Balance Sheets. The terms of thenon-employee director compensation program require the classification of these deferred stock units as temporaryequity on the Consolidated Balance Sheets of Boston Properties, Inc. and Boston Properties Limited Partnershipwithin Redeemable Deferred Stock Units. On May 21, 2019, in connection with the cessation of a director’s serviceon the Board of Directors of Boston Properties, Inc., Boston Properties, Inc. issued 17,949 shares of Common Stockin settlement of a portion of the director’s outstanding deferred stock units. In addition, on September 3, 2019, theCompany converted 4,917 of such director’s deferred stock units as a result of such director’s election to diversifytheir investment elections into non-employer securities. At December 31, 2020 and 2019, Boston Properties, Inc.had outstanding 72,966 and 60,676 deferred stock units, respectively.
18. Subsequent EventsOn January 29, 2021 and February 2, 2021, Boston Properties, Inc. issued an aggregate of 33,449 shares of
restricted Common Stock and Boston Properties Limited Partnership issued an aggregate of 263,527 LTIP Unitsunder the 2012 Plan to certain employees of Boston Properties, Inc.
On February 2, 2021, Boston Properties, Inc.’s Compensation Committee approved the 2021 Multi-Year Long-Term Incentive Program (the “2021 MYLTIP”) awards under Boston Properties, Inc.’s 2012 Plan to certain officersand employees of Boston Properties, Inc. Earned awards will range from zero to a maximum of 352,021 LTIP Unitsdepending on Boston Properties, Inc.’s relative and absolute TSR performance with a target of approximately176,009 LTIP Units. Under ASC 718, the 2021 MYLTIP awards have an aggregate value of approximately$15.3 million.
On February 5, 2021, the measurement period for the Company’s 2018 MYLTIP awards ended and, based onBoston Properties, Inc.’s relative TSR performance, the final awards were determined to be 29.2% of target, or anaggregate of approximately $4.6 million (after giving effect to employee separations). As a result, an aggregate of285,925 2018 MYLTIP Units that had been previously granted were automatically forfeited.
On February 14, 2021, Boston Properties Limited Partnership used available cash to complete the redemptionof $850.0 million in aggregate principal amount of its 4.125% senior notes due May 15, 2021. The redemption pricewas approximately $858.7 million, which was equal to par plus approximately $8.7 million of accrued and unpaidinterest to, but not including, the redemption date.
181
Item 9. Changes in and Disagreements with Accountants on Accounting and Financial Disclosures.None.
Item 9A. Controls and Procedures.
Boston Properties, Inc.As of the end of the period covered by this report, an evaluation was carried out by our management, with the
participation of Boston Properties, Inc.’s Chief Executive Officer (Principal Executive Officer) and Chief FinancialOfficer (Principal Financial Officer), of the effectiveness of its disclosure controls and procedures (as defined inRule 13a-15(e) under the Securities Exchange Act of 1934). Based upon that evaluation, Boston Properties, Inc.’sChief Executive Officer and Chief Financial Officer concluded that these disclosure controls and procedures wereeffective as of the end of the period covered by this report. In addition, no change in Boston Properties, Inc.’sinternal control over financial reporting (as defined in Rule 13a-15(f) under the Securities Exchange Act of 1934)occurred during the fourth quarter of Boston Properties, Inc.’s fiscal year ended December 31, 2020 that hasmaterially affected, or is reasonably likely to materially affect, Boston Properties, Inc.’s internal control over financialreporting.
Management’s Report on Internal Control over Financial Reporting is set forth on page 112 of this AnnualReport on Form 10-K and is incorporated herein by reference.
Boston Properties Limited PartnershipAs of the end of the period covered by this report, an evaluation was carried out by the management of Boston
Properties, Inc., the sole general partner of Boston Properties Limited Partnership, with the participation of its ChiefExecutive Officer (Principal Executive Officer) and Chief Financial Officer (Principal Financial Officer), of theeffectiveness of its disclosure controls and procedures (as defined in Rule 13a-15(e) under the Securities ExchangeAct of 1934). Based upon that evaluation, the Chief Executive Officer and Chief Financial Officer of BostonProperties, Inc. concluded that these disclosure controls and procedures were effective as of the end of the periodcovered by this report. In addition, no change in its internal control over financial reporting (as defined inRule 13a-15(f) under the Securities Exchange Act of 1934) occurred during the fourth quarter of its fiscal year endedDecember 31, 2020 that has materially affected, or is reasonably likely to materially affect, its internal control overfinancial reporting.
Management’s Report on Internal Control over Financial Reporting is set forth on page 125 of this AnnualReport on Form 10-K and is incorporated herein by reference.
Item 9B. Other Information.None.
182
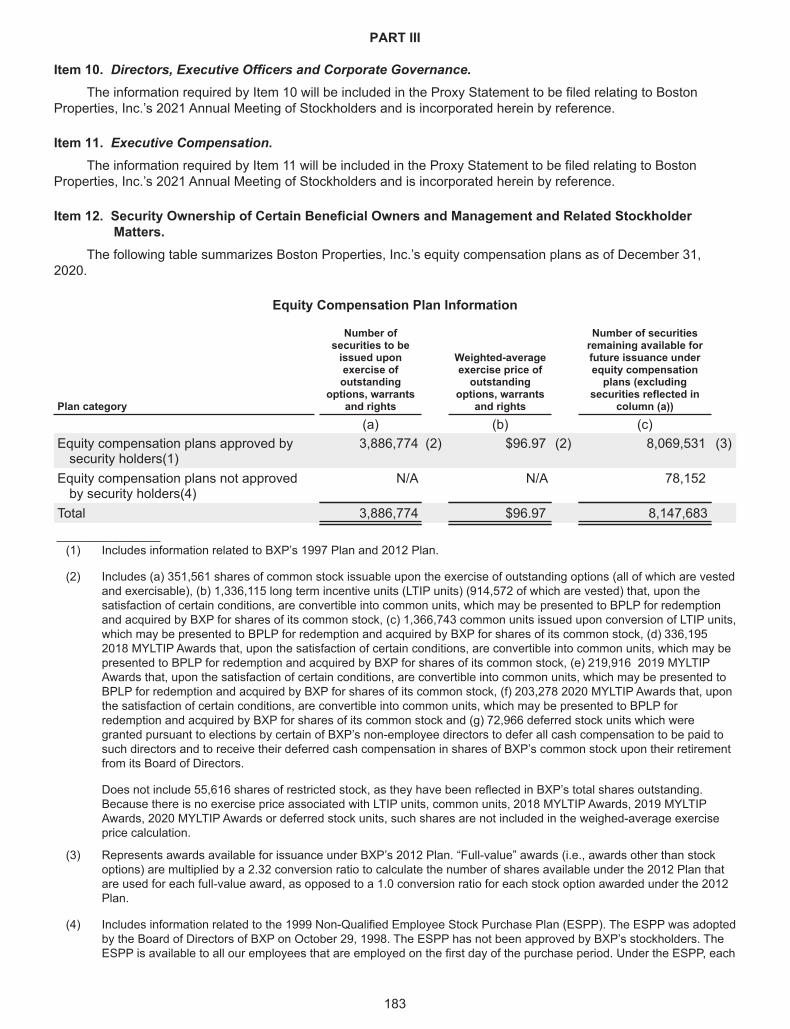
PART III
Item 10. Directors, Executive Officers and Corporate Governance.The information required by Item 10 will be included in the Proxy Statement to be filed relating to Boston
Properties, Inc.’s 2021 Annual Meeting of Stockholders and is incorporated herein by reference.
Item 11. Executive Compensation.The information required by Item 11 will be included in the Proxy Statement to be filed relating to Boston
Properties, Inc.’s 2021 Annual Meeting of Stockholders and is incorporated herein by reference.
Item 12. Security Ownership of Certain Beneficial Owners and Management and Related StockholderMatters.
The following table summarizes Boston Properties, Inc.’s equity compensation plans as of December 31,2020.
Equity Compensation Plan Information
Plan category
Number ofsecurities to beissued uponexercise ofoutstanding
options, warrantsand rights
Weighted-averageexercise price ofoutstanding
options, warrantsand rights
Number of securitiesremaining available forfuture issuance underequity compensationplans (excluding
securities reflected incolumn (a))
(a) (b) (c)Equity compensation plans approved bysecurity holders(1)
3,886,774 (2) $96.97 (2) 8,069,531 (3)
Equity compensation plans not approvedby security holders(4)
N/A N/A 78,152
Total 3,886,774 $96.97 8,147,683______________(1) Includes information related to BXP’s 1997 Plan and 2012 Plan.
(2) Includes (a) 351,561 shares of common stock issuable upon the exercise of outstanding options (all of which are vestedand exercisable), (b) 1,336,115 long term incentive units (LTIP units) (914,572 of which are vested) that, upon thesatisfaction of certain conditions, are convertible into common units, which may be presented to BPLP for redemptionand acquired by BXP for shares of its common stock, (c) 1,366,743 common units issued upon conversion of LTIP units,which may be presented to BPLP for redemption and acquired by BXP for shares of its common stock, (d) 336,1952018 MYLTIP Awards that, upon the satisfaction of certain conditions, are convertible into common units, which may bepresented to BPLP for redemption and acquired by BXP for shares of its common stock, (e) 219,916 2019 MYLTIPAwards that, upon the satisfaction of certain conditions, are convertible into common units, which may be presented toBPLP for redemption and acquired by BXP for shares of its common stock, (f) 203,278 2020 MYLTIP Awards that, uponthe satisfaction of certain conditions, are convertible into common units, which may be presented to BPLP forredemption and acquired by BXP for shares of its common stock and (g) 72,966 deferred stock units which weregranted pursuant to elections by certain of BXP’s non-employee directors to defer all cash compensation to be paid tosuch directors and to receive their deferred cash compensation in shares of BXP’s common stock upon their retirementfrom its Board of Directors.
Does not include 55,616 shares of restricted stock, as they have been reflected in BXP’s total shares outstanding.Because there is no exercise price associated with LTIP units, common units, 2018 MYLTIP Awards, 2019 MYLTIPAwards, 2020 MYLTIP Awards or deferred stock units, such shares are not included in the weighed-average exerciseprice calculation.
(3) Represents awards available for issuance under BXP’s 2012 Plan. “Full-value” awards (i.e., awards other than stockoptions) are multiplied by a 2.32 conversion ratio to calculate the number of shares available under the 2012 Plan thatare used for each full-value award, as opposed to a 1.0 conversion ratio for each stock option awarded under the 2012Plan.
(4) Includes information related to the 1999 Non-Qualified Employee Stock Purchase Plan (ESPP). The ESPP was adoptedby the Board of Directors of BXP on October 29, 1998. The ESPP has not been approved by BXP’s stockholders. TheESPP is available to all our employees that are employed on the first day of the purchase period. Under the ESPP, each
183

eligible employee may purchase shares of our common stock at semi-annual intervals each year at a purchase priceequal to 85% of the average closing prices of our common stock on the New York Stock Exchange during the last tenbusiness days of the purchase period. Each eligible employee may contribute no more than $10,000 per year topurchase our common stock under the ESPP.
Additional information concerning security ownership of certain beneficial owners and managementrequired by Item 12 will be included in the Proxy Statement to be filed relating to Boston Properties, Inc.’s 2021Annual Meeting of Stockholders and is incorporated herein by reference.
Item 13. Certain Relationships and Related Transactions, and Director Independence.The information required by Item 13 will be included in the Proxy Statement to be filed relating to Boston
Properties, Inc.’s 2021 Annual Meeting of Stockholders and is incorporated herein by reference.
Item 14. Principal Accountant Fees and Services.The information required by Item 14 will be included in the Proxy Statement to be filed relating to Boston
Properties, Inc.’s 2021 Annual Meeting of Stockholders and is incorporated herein by reference.
184
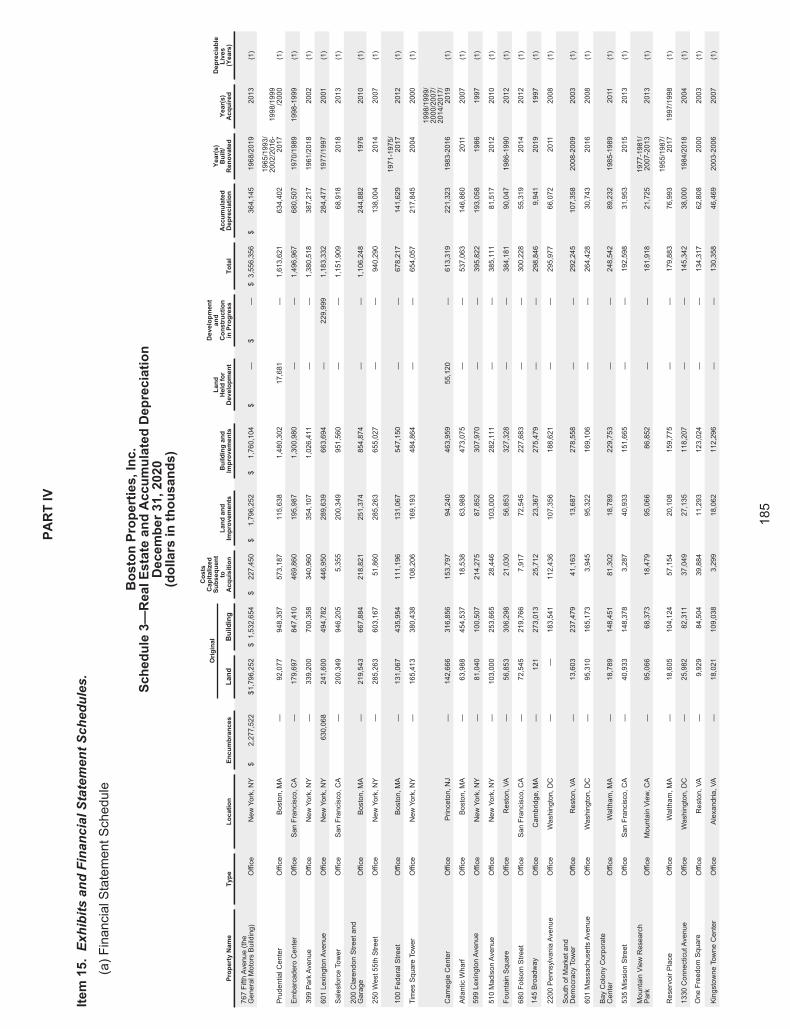
PARTIV
Item15.ExhibitsandFinancialStatementSchedules.
(a)FinancialStatementSchedule
BostonProperties,Inc.
Schedule3—
RealEstateandAccumulatedDepreciation
December31,2020
(dollarsinthousands)
PropertyName
Type
Location
Encumbrances
Original
Costs
Capitalized
Subsequent
toAcquisition
Landand
Improvements
Buildingand
Improvements
Land
Heldfor
Development
Development
and
Construction
inProgress
Total
Accumulated
Depreciation
Year(s)
Built/
Renovated
Year(s)
Acquired
Depreciable
Lives
(Years)
Land
Building
767FifthAvenue(the
GeneralMotorsBuilding)
Office
New
York,NY
$2,277,522
$1,796,252
$1,532,654
$227,450
$1,796,252
$1,760,104
$—
$—
$3,556,356
$364,145
1968/2019
2013
(1)
PrudentialCenter
Office
Boston,MA
—92,077
948,357
573,187
115,638
1,480,302
17,681
—1,613,621
634,402
1965/1993/
2002/2016-
2017
1998/1999
/2000
(1)
EmbarcaderoCenter
Office
SanFrancisco,CA
—179,697
847,410
469,860
195,987
1,300,980
——
1,496,967
680,507
1970/1989
1998-1999
(1)
399ParkAvenue
Office
New
York,NY
—339,200
700,358
340,960
354,107
1,026,411
——
1,380,518
387,217
1961/2018
2002
(1)
601LexingtonAvenue
Office
New
York,NY
630,068
241,600
494,782
446,950
289,639
663,694
—229,999
1,183,332
284,477
1977/1997
2001
(1)
SalesforceTower
Office
SanFrancisco,CA
—200,349
946,205
5,355
200,349
951,560
——
1,151,909
68,918
2018
2013
(1)
200ClarendonStreetand
Garage
Office
Boston,MA
—219,543
667,884
218,821
251,374
854,874
——
1,106,248
244,882
1976
2010
(1)
250West55thStreet
Office
New
York,NY
—285,263
603,167
51,860
285,263
655,027
——
940,290
138,004
2014
2007
(1)
100FederalStreet
Office
Boston,MA
—131,067
435,954
111,196
131,067
547,150
——
678,217
141,629
1971-1975/
2017
2012
(1)
TimesSquareTower
Office
New
York,NY
—165,413
380,438
108,206
169,193
484,864
——
654,057
217,845
2004
2000
(1)
CarnegieCenter
Office
Princeton,NJ
—142,666
316,856
153,797
94,240
463,959
55,120
—613,319
221,323
1983-2016
1998/1999/
2000/2007/
2014/2017/
2019
(1)
AtlanticWharf
Office
Boston,MA
—63,988
454,537
18,538
63,988
473,075
——
537,063
146,860
2011
2007
(1)
599LexingtonAvenue
Office
New
York,NY
—81,040
100,507
214,275
87,852
307,970
——
395,822
193,058
1986
1997
(1)
510MadisonAvenue
Office
New
York,NY
—103,000
253,665
28,446
103,000
282,111
——
385,111
81,517
2012
2010
(1)
FountainSquare
Office
Reston,VA
—56,853
306,298
21,030
56,853
327,328
——
384,181
90,047
1986-1990
2012
(1)
680Folsom
Street
Office
SanFrancisco,CA
—72,545
219,766
7,917
72,545
227,683
——
300,228
55,319
2014
2012
(1)
145Broadway
Office
Cambridge,MA
—121
273,013
25,712
23,367
275,479
——
298,846
9,941
2019
1997
(1)
2200PennsylvaniaAvenue
Office
Washington,DC
——
183,541
112,436
107,356
188,621
——
295,977
66,072
2011
2008
(1)
SouthofMarketand
DemocracyTower
Office
Reston,VA
—13,603
237,479
41,163
13,687
278,558
——
292,245
107,358
2008-2009
2003
(1)
601MassachusettsAvenue
Office
Washington,DC
—95,310
165,173
3,945
95,322
169,106
——
264,428
30,743
2016
2008
(1)
BayColonyCorporate
Center
Office
Waltham,MA
—18,789
148,451
81,302
18,789
229,753
——
248,542
89,232
1985-1989
2011
(1)
535MissionStreet
Office
SanFrancisco,CA
—40,933
148,378
3,287
40,933
151,665
——
192,598
31,953
2015
2013
(1)
MountainView
Research
Park
Office
MountainView,CA
—95,066
68,373
18,479
95,066
86,852
——
181,918
21,725
1977-1981/
2007-2013
2013
(1)
ReservoirPlace
Office
Waltham,MA
—18,605
104,124
57,154
20,108
159,775
——
179,883
76,993
1955/1987/
2017
1997/1998
(1)
1330ConnecticutAvenue
Office
Washington,DC
—25,982
82,311
37,049
27,135
118,207
——
145,342
38,000
1984/2018
2004
(1)
OneFreedomSquare
Office
Reston,VA
—9,929
84,504
39,884
11,293
123,024
——
134,317
62,808
2000
2003
(1)
KingstowneTowneCenter
Office
Alexandria,VA
—18,021
109,038
3,299
18,062
112,296
——
130,358
46,469
2003-2006
2007
(1)
185
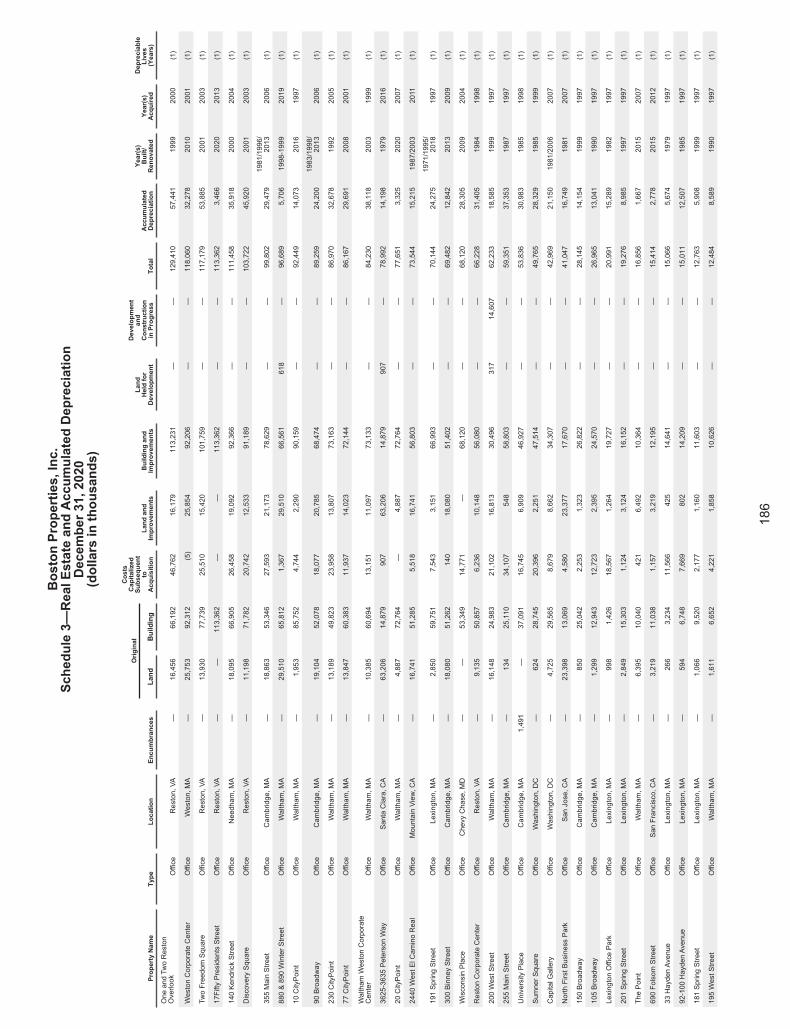
BostonProperties,Inc.
Schedule3—
RealEstateandAccumulatedDepreciation
December31,2020
(dollarsinthousands)
PropertyName
Type
Location
Encumbrances
Original
Costs
Capitalized
Subsequent
toAcquisition
Landand
Improvements
Buildingand
Improvements
Land
Heldfor
Development
Development
and
Construction
inProgress
Total
Accumulated
Depreciation
Year(s)
Built/
Renovated
Year(s)
Acquired
Depreciable
Lives
(Years)
Land
Building
OneandTwoReston
Overlook
Office
Reston,VA
—16,456
66,192
46,762
16,179
113,231
——
129,410
57,441
1999
2000
(1)
WestonCorporateCenter
Office
Weston,MA
—25,753
92,312
(5)
25,854
92,206
——
118,060
32,278
2010
2001
(1)
TwoFreedomSquare
Office
Reston,VA
—13,930
77,739
25,510
15,420
101,759
——
117,179
53,885
2001
2003
(1)
17FiftyPresidentsStreet
Office
Reston,VA
——
113,362
——
113,362
——
113,362
3,466
2020
2013
(1)
140KendrickStreet
Office
Needham,MA
—18,095
66,905
26,458
19,092
92,366
——
111,458
35,918
2000
2004
(1)
DiscoverySquare
Office
Reston,VA
—11,198
71,782
20,742
12,533
91,189
——
103,722
45,920
2001
2003
(1)
355MainStreet
Office
Cambridge,MA
—18,863
53,346
27,593
21,173
78,629
——
99,802
29,479
1981/1996/
2013
2006
(1)
880&890WinterStreet
Office
Waltham,MA
—29,510
65,812
1,367
29,510
66,561
618
—96,689
5,706
1998-1999
2019
(1)
10CityPoint
Office
Waltham,MA
—1,953
85,752
4,744
2,290
90,159
——
92,449
14,073
2016
1997
(1)
90Broadway
Office
Cambridge,MA
—19,104
52,078
18,077
20,785
68,474
——
89,259
24,200
1983/1998/
2013
2006
(1)
230CityPoint
Office
Waltham,MA
—13,189
49,823
23,958
13,807
73,163
——
86,970
32,678
1992
2005
(1)
77CityPoint
Office
Waltham,MA
—13,847
60,383
11,937
14,023
72,144
——
86,167
29,691
2008
2001
(1)
Waltham
WestonCorporate
Center
Office
Waltham,MA
—10,385
60,694
13,151
11,097
73,133
——
84,230
38,118
2003
1999
(1)
3625-3635PetersonWay
Office
SantaClara,CA
—63,206
14,879
907
63,206
14,879
907
—78,992
14,198
1979
2016
(1)
20CityPoint
Office
Waltham,MA
—4,887
72,764
—4,887
72,764
——
77,651
3,325
2020
2007
(1)
2440WestElCaminoReal
Office
MountainView,CA
—16,741
51,285
5,518
16,741
56,803
——
73,544
15,215
1987/2003
2011
(1)
191SpringStreet
Office
Lexington,MA
—2,850
59,751
7,543
3,151
66,993
——
70,144
24,275
1971/1995/
2018
1997
(1)
300BinneyStreet
Office
Cambridge,MA
—18,080
51,262
140
18,080
51,402
——
69,482
12,842
2013
2009
(1)
WisconsinPlace
Office
ChevyChase,MD
——
53,349
14,771
—68,120
——
68,120
28,305
2009
2004
(1)
RestonCorporateCenter
Office
Reston,VA
—9,135
50,857
6,236
10,148
56,080
——
66,228
31,405
1984
1998
(1)
200WestStreet
Office
Waltham,MA
—16,148
24,983
21,102
16,813
30,496
317
14,607
62,233
18,585
1999
1997
(1)
255MainStreet
Office
Cambridge,MA
—134
25,110
34,107
548
58,803
——
59,351
37,353
1987
1997
(1)
UniversityPlace
Office
Cambridge,MA
1,491
—37,091
16,745
6,909
46,927
——
53,836
30,983
1985
1998
(1)
SumnerSquare
Office
Washington,DC
—624
28,745
20,396
2,251
47,514
——
49,765
28,329
1985
1999
(1)
CapitalGallery
Office
Washington,DC
—4,725
29,565
8,679
8,662
34,307
——
42,969
21,150
1981/2006
2007
(1)
NorthFirstBusinessPark
Office
SanJose,CA
—23,398
13,069
4,580
23,377
17,670
——
41,047
16,749
1981
2007
(1)
150Broadway
Office
Cambridge,MA
—850
25,042
2,253
1,323
26,822
——
28,145
14,154
1999
1997
(1)
105Broadway
Office
Cambridge,MA
—1,299
12,943
12,723
2,395
24,570
——
26,965
13,041
1990
1997
(1)
LexingtonOfficePark
Office
Lexington,MA
—998
1,426
18,567
1,264
19,727
——
20,991
15,289
1982
1997
(1)
201SpringStreet
Office
Lexington,MA
—2,849
15,303
1,124
3,124
16,152
——
19,276
8,985
1997
1997
(1)
ThePoint
Office
Waltham,MA
—6,395
10,040
421
6,492
10,364
——
16,856
1,667
2015
2007
(1)
690Folsom
Street
Office
SanFrancisco,CA
—3,219
11,038
1,157
3,219
12,195
——
15,414
2,778
2015
2012
(1)
33HaydenAvenue
Office
Lexington,MA
—266
3,234
11,566
425
14,641
——
15,066
5,674
1979
1997
(1)
92-100HaydenAvenue
Office
Lexington,MA
—594
6,748
7,669
802
14,209
——
15,011
12,507
1985
1997
(1)
181SpringStreet
Office
Lexington,MA
—1,066
9,520
2,177
1,160
11,603
——
12,763
5,908
1999
1997
(1)
195WestStreet
Office
Waltham,MA
—1,611
6,652
4,221
1,858
10,626
——
12,484
8,589
1990
1997
(1)
186
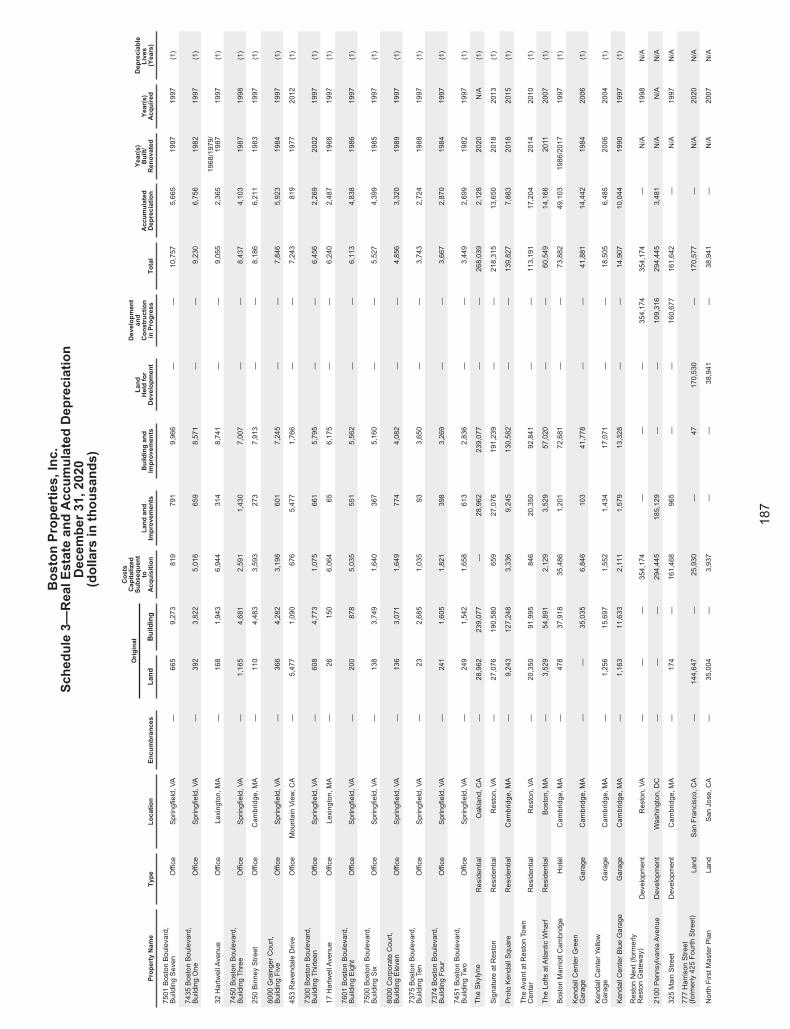
BostonProperties,Inc.
Schedule3—
RealEstateandAccumulatedDepreciation
December31,2020
(dollarsinthousands)
PropertyName
Type
Location
Encumbrances
Original
Costs
Capitalized
Subsequent
toAcquisition
Landand
Improvements
Buildingand
Improvements
Land
Heldfor
Development
Development
and
Construction
inProgress
Total
Accumulated
Depreciation
Year(s)
Built/
Renovated
Year(s)
Acquired
Depreciable
Lives
(Years)
Land
Building
7501BostonBoulevard,
BuildingSeven
Office
Springfield,VA
—665
9,273
819
791
9,966
——
10,757
5,665
1997
1997
(1)
7435BostonBoulevard,
BuildingOne
Office
Springfield,VA
—392
3,822
5,016
659
8,571
——
9,230
6,756
1982
1997
(1)
32HartwellAvenue
Office
Lexington,MA
—168
1,943
6,944
314
8,741
——
9,055
2,365
1968/1979/
1987
1997
(1)
7450BostonBoulevard,
BuildingThree
Office
Springfield,VA
—1,165
4,681
2,591
1,430
7,007
——
8,437
4,103
1987
1998
(1)
250BinneyStreet
Office
Cambridge,MA
—110
4,483
3,593
273
7,913
——
8,186
6,211
1983
1997
(1)
8000GraingerCourt,
BuildingFive
Office
Springfield,VA
—366
4,282
3,198
601
7,245
——
7,846
5,923
1984
1997
(1)
453RavendaleDrive
Office
MountainView,CA
—5,477
1,090
676
5,477
1,766
——
7,243
819
1977
2012
(1)
7300BostonBoulevard,
BuildingThirteen
Office
Springfield,VA
—608
4,773
1,075
661
5,795
——
6,456
2,269
2002
1997
(1)
17HartwellAvenue
Office
Lexington,MA
—26
150
6,064
656,175
——
6,240
2,487
1968
1997
(1)
7601BostonBoulevard,
BuildingEight
Office
Springfield,VA
—200
878
5,035
551
5,562
——
6,113
4,838
1986
1997
(1)
7500BostonBoulevard,
BuildingSix
Office
Springfield,VA
—138
3,749
1,640
367
5,160
——
5,527
4,399
1985
1997
(1)
8000CorporateCourt,
BuildingEleven
Office
Springfield,VA
—136
3,071
1,649
774
4,082
——
4,856
3,320
1989
1997
(1)
7375BostonBoulevard,
BuildingTen
Office
Springfield,VA
—23
2,685
1,035
933,650
——
3,743
2,724
1988
1997
(1)
7374BostonBoulevard,
BuildingFour
Office
Springfield,VA
—241
1,605
1,821
398
3,269
——
3,667
2,870
1984
1997
(1)
7451BostonBoulevard,
BuildingTwo
Office
Springfield,VA
—249
1,542
1,658
613
2,836
——
3,449
2,699
1982
1997
(1)
TheSkylyne
Residential
Oakland,CA
—28,962
239,077
—28,962
239,077
——
268,039
2,128
2020
N/A
(1)
SignatureatReston
Residential
Reston,VA
—27,076
190,580
659
27,076
191,239
——
218,315
13,650
2018
2013
(1)
ProtoKendallSquare
Residential
Cambridge,MA
—9,243
127,248
3,336
9,245
130,582
——
139,827
7,883
2018
2015
(1)
TheAvantatRestonTown
Center
Residential
Reston,VA
—20,350
91,995
846
20,350
92,841
——
113,191
17,204
2014
2010
(1)
TheLoftsatAtlanticWharf
Residential
Boston,MA
—3,529
54,891
2,129
3,529
57,020
——
60,549
14,166
2011
2007
(1)
BostonMarriottCambridge
Hotel
Cambridge,MA
—478
37,918
35,486
1,201
72,681
——
73,882
49,103
1986/2017
1997
(1)
KendallCenterGreen
Garage
Garage
Cambridge,MA
——
35,035
6,846
103
41,778
——
41,881
14,442
1984
2006
(1)
KendallCenterYellow
Garage
Garage
Cambridge,MA
—1,256
15,697
1,552
1,434
17,071
——
18,505
6,485
2006
2004
(1)
KendallCenterBlueGarage
Garage
Cambridge,MA
—1,163
11,633
2,111
1,579
13,328
——
14,907
10,044
1990
1997
(1)
RestonNext(formerly
RestonGateway)
Development
Reston,VA
——
—354,174
——
—354,174
354,174
—N/A
1998
N/A
2100PennsylvaniaAvenue
Development
Washington,DC
——
—294,445
185,129
——
109,316
294,445
3,481
N/A
N/A
N/A
325MainStreet
Development
Cambridge,MA
—174
—161,468
965
——
160,677
161,642
—N/A
1997
N/A
777HarrisonStreet
(formerly425FourthStreet)
Land
SanFrancisco,CA
—144,647
—25,930
—47
170,530
—170,577
—N/A
2020
N/A
NorthFirstMasterPlan
Land
SanJose,CA
—35,004
—3,937
——
38,941
—38,941
—N/A
2007
N/A
187
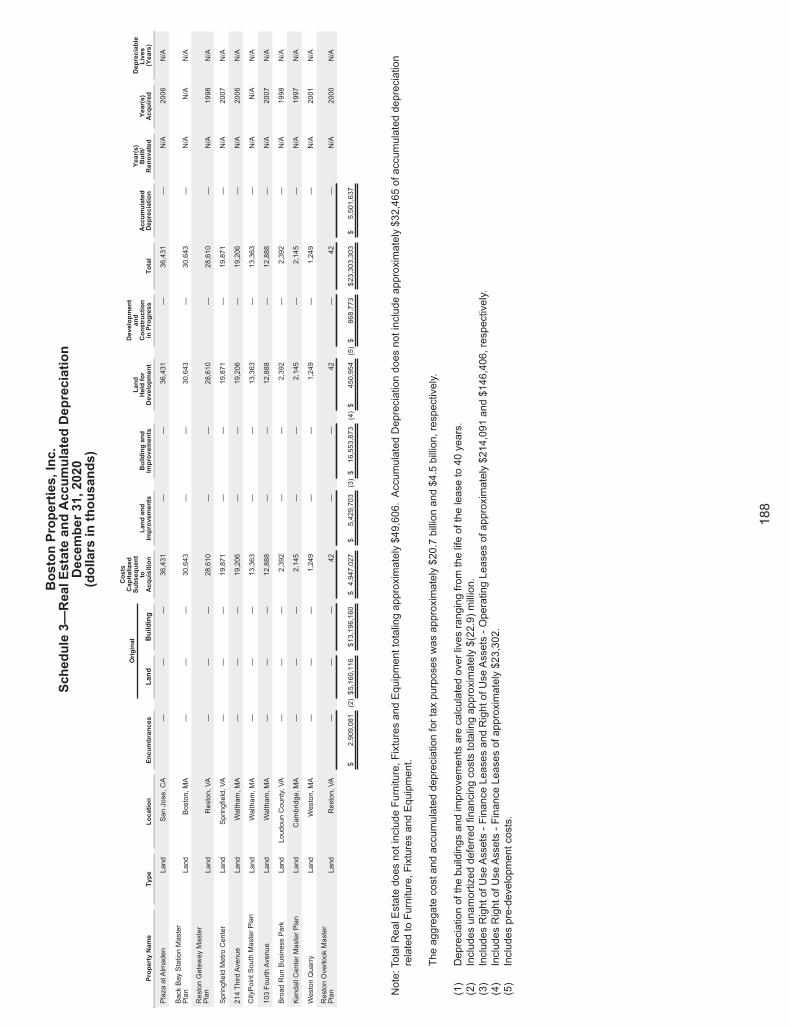
BostonProperties,Inc.
Schedule3—
RealEstateandAccumulatedDepreciation
December31,2020
(dollarsinthousands)
PropertyName
Type
Location
Encumbrances
Original
Costs
Capitalized
Subsequent
toAcquisition
Landand
Improvements
Buildingand
Improvements
Land
Heldfor
Development
Development
and
Construction
inProgress
Total
Accumulated
Depreciation
Year(s)
Built/
Renovated
Year(s)
Acquired
Depreciable
Lives
(Years)
Land
Building
PlazaatAlmaden
Land
SanJose,CA
——
—36,431
——
36,431
—36,431
—N/A
2006
N/A
BackBayStationMaster
Plan
Land
Boston,MA
——
—30,643
——
30,643
—30,643
—N/A
N/A
N/A
RestonGatewayMaster
Plan
Land
Reston,VA
——
—28,610
——
28,610
—28,610
—N/A
1998
N/A
SpringfieldMetroCenter
Land
Springfield,VA
——
—19,871
——
19,871
—19,871
—N/A
2007
N/A
214ThirdAvenue
Land
Waltham,MA
——
—19,206
——
19,206
—19,206
—N/A
2006
N/A
CityPointSouthMasterPlan
Land
Waltham,MA
——
—13,363
——
13,363
—13,363
—N/A
N/A
N/A
103FourthAvenue
Land
Waltham,MA
——
—12,888
——
12,888
—12,888
—N/A
2007
N/A
BroadRunBusinessPark
Land
LoudounCounty,VA
——
—2,392
——
2,392
—2,392
—N/A
1998
N/A
KendallCenterMasterPlan
Land
Cambridge,MA
——
—2,145
——
2,145
—2,145
—N/A
1997
N/A
WestonQuarry
Land
Weston,MA
——
—1,249
——
1,249
—1,249
—N/A
2001
N/A
RestonOverlookMaster
Plan
Land
Reston,VA
——
—42
——
42—
42—
N/A
2000
N/A
$2,909,081(2)$5,160,116
$13,196,160
$4,947,027
$5,429,703(3)$
16,553,873
(4)$
450,954(5)$
868,773
$23,303,303
$5,501,637
Note:TotalRealEstatedoesnotincludeFurniture,FixturesandEquipmenttotalingapproximately$49,606.AccumulatedDepreciationdoesnotincludeapproximately$32,465ofaccumulateddepreciation
relatedtoFurniture,FixturesandEquipment.
Theaggregatecostandaccumulateddepreciationfortaxpurposeswasapproximately$20.7billionand$4.5billion,respectively.
(1)
Depreciationofthebuildingsandimprovementsarecalculatedoverlivesrangingfromthelifeoftheleaseto40years.
(2)
Includesunamortizeddeferredfinancingcoststotalingapproximately$(22.9)million.
(3)
IncludesRightofUseAssets-FinanceLeasesandRightofUseAssets-OperatingLeasesofapproximately$214,091and$146,406,respectively.
(4)
IncludesRightofUseAssets-FinanceLeasesofapproximately$23,302.
(5)
Includespre-developmentcosts.
188
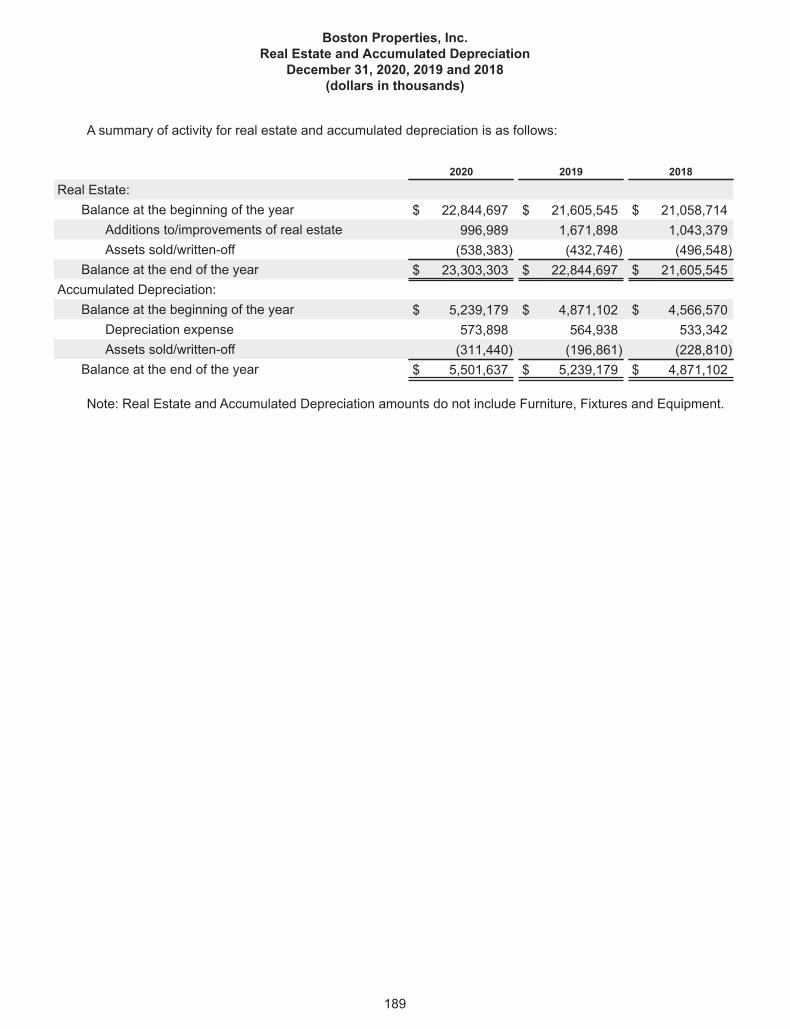
Boston Properties, Inc.Real Estate and Accumulated Depreciation
December 31, 2020, 2019 and 2018(dollars in thousands)
A summary of activity for real estate and accumulated depreciation is as follows:
2020 2019 2018
Real Estate:Balance at the beginning of the year $ 22,844,697 $ 21,605,545 $ 21,058,714
Additions to/improvements of real estate 996,989 1,671,898 1,043,379Assets sold/written-off (538,383) (432,746) (496,548)
Balance at the end of the year $ 23,303,303 $ 22,844,697 $ 21,605,545Accumulated Depreciation:
Balance at the beginning of the year $ 5,239,179 $ 4,871,102 $ 4,566,570Depreciation expense 573,898 564,938 533,342Assets sold/written-off (311,440) (196,861) (228,810)
Balance at the end of the year $ 5,501,637 $ 5,239,179 $ 4,871,102
Note: Real Estate and Accumulated Depreciation amounts do not include Furniture, Fixtures and Equipment.
189
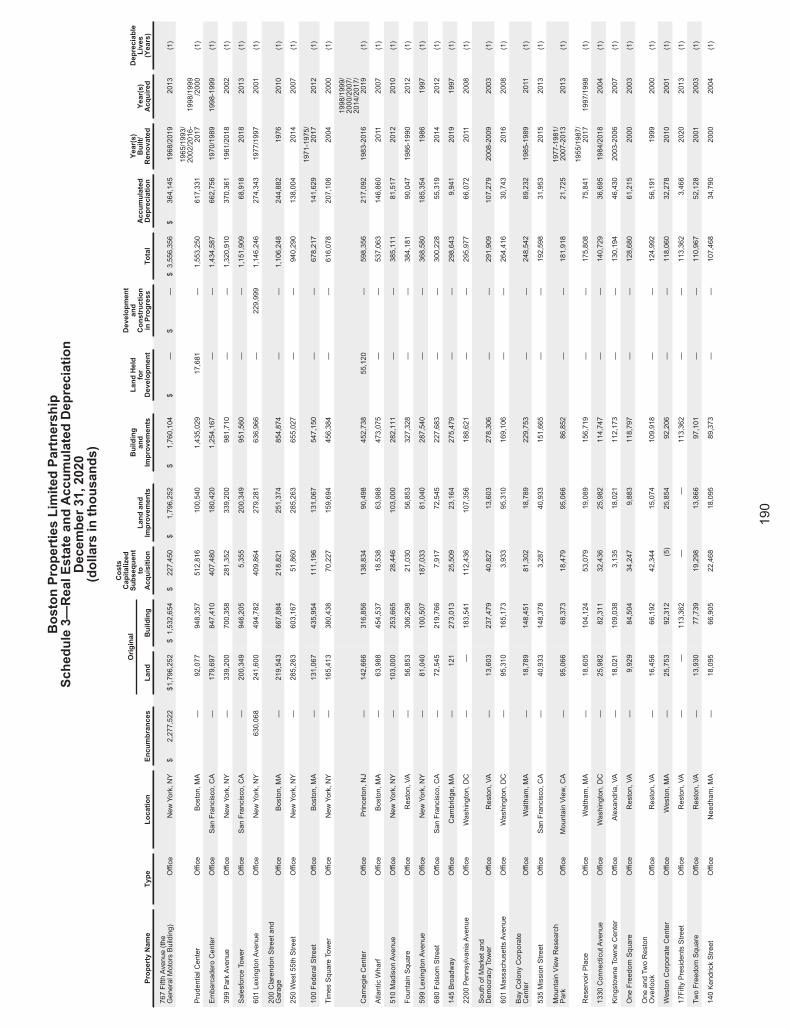
BostonPropertiesLimitedPartnership
Schedule3—
RealEstateandAccumulatedDepreciation
December31,2020
(dollarsinthousands)
Original
Costs
Capitalized
Subsequent
toAcquisition
Landand
Improvements
Building
and
Improvements
LandHeld
for
Development
Development
and
Construction
inProgress
Total
Accumulated
Depreciation
Year(s)
Built/
Renovated
Year(s)
Acquired
Depreciable
Lives
(Years)
PropertyName
Type
Location
Encumbrances
Land
Building
767FifthAvenue(the
GeneralMotorsBuilding)
Office
New
York,NY
$2,277,522
$1,796,252
$1,532,654
$227,450
$1,796,252
$1,760,104
$—
$—
$3,556,356
$364,145
1968/2019
2013
(1)
PrudentialCenter
Office
Boston,MA
—92,077
948,357
512,816
100,540
1,435,029
17,681
—1,553,250
617,331
1965/1993/
2002/2016-
2017
1998/1999
/2000
(1)
EmbarcaderoCenter
Office
SanFrancisco,CA
—179,697
847,410
407,480
180,420
1,254,167
——
1,434,587
662,756
1970/1989
1998-1999
(1)
399ParkAvenue
Office
New
York,NY
—339,200
700,358
281,352
339,200
981,710
——
1,320,910
370,361
1961/2018
2002
(1)
SalesforceTower
Office
SanFrancisco,CA
—200,349
946,205
5,355
200,349
951,560
——
1,151,909
68,918
2018
2013
(1)
601LexingtonAvenue
Office
New
York,NY
630,068
241,600
494,782
409,864
279,281
636,966
—229,999
1,146,246
274,343
1977/1997
2001
(1)
200ClarendonStreetand
Garage
Office
Boston,MA
—219,543
667,884
218,821
251,374
854,874
——
1,106,248
244,882
1976
2010
(1)
250West55thStreet
Office
New
York,NY
—285,263
603,167
51,860
285,263
655,027
——
940,290
138,004
2014
2007
(1)
100FederalStreet
Office
Boston,MA
—131,067
435,954
111,196
131,067
547,150
——
678,217
141,629
1971-1975/
2017
2012
(1)
TimesSquareTower
Office
New
York,NY
—165,413
380,438
70,227
159,694
456,384
——
616,078
207,106
2004
2000
(1)
CarnegieCenter
Office
Princeton,NJ
—142,666
316,856
138,834
90,498
452,738
55,120
—598,356
217,092
1983-2016
1998/1999/
2000/2007/
2014/2017/
2019
(1)
AtlanticWharf
Office
Boston,MA
—63,988
454,537
18,538
63,988
473,075
——
537,063
146,860
2011
2007
(1)
510MadisonAvenue
Office
New
York,NY
—103,000
253,665
28,446
103,000
282,111
——
385,111
81,517
2012
2010
(1)
FountainSquare
Office
Reston,VA
—56,853
306,298
21,030
56,853
327,328
——
384,181
90,047
1986-1990
2012
(1)
599LexingtonAvenue
Office
New
York,NY
—81,040
100,507
187,033
81,040
287,540
——
368,580
185,354
1986
1997
(1)
680Folsom
Street
Office
SanFrancisco,CA
—72,545
219,766
7,917
72,545
227,683
——
300,228
55,319
2014
2012
(1)
145Broadway
Office
Cambridge,MA
—121
273,013
25,509
23,164
275,479
——
298,643
9,941
2019
1997
(1)
2200PennsylvaniaAvenue
Office
Washington,DC
——
183,541
112,436
107,356
188,621
——
295,977
66,072
2011
2008
(1)
SouthofMarketand
DemocracyTower
Office
Reston,VA
—13,603
237,479
40,827
13,603
278,306
——
291,909
107,279
2008-2009
2003
(1)
601MassachusettsAvenue
Office
Washington,DC
—95,310
165,173
3,933
95,310
169,106
——
264,416
30,743
2016
2008
(1)
BayColonyCorporate
Center
Office
Waltham,MA
—18,789
148,451
81,302
18,789
229,753
——
248,542
89,232
1985-1989
2011
(1)
535MissionStreet
Office
SanFrancisco,CA
—40,933
148,378
3,287
40,933
151,665
——
192,598
31,953
2015
2013
(1)
MountainView
Research
Park
Office
MountainView,CA
—95,066
68,373
18,479
95,066
86,852
——
181,918
21,725
1977-1981/
2007-2013
2013
(1)
ReservoirPlace
Office
Waltham,MA
—18,605
104,124
53,079
19,089
156,719
——
175,808
75,841
1955/1987/
2017
1997/1998
(1)
1330ConnecticutAvenue
Office
Washington,DC
—25,982
82,311
32,436
25,982
114,747
——
140,729
36,695
1984/2018
2004
(1)
KingstowneTowneCenter
Office
Alexandria,VA
—18,021
109,038
3,135
18,021
112,173
——
130,194
46,430
2003-2006
2007
(1)
OneFreedomSquare
Office
Reston,VA
—9,929
84,504
34,247
9,883
118,797
——
128,680
61,215
2000
2003
(1)
OneandTwoReston
Overlook
Office
Reston,VA
—16,456
66,192
42,344
15,074
109,918
——
124,992
56,191
1999
2000
(1)
WestonCorporateCenter
Office
Weston,MA
—25,753
92,312
(5)
25,854
92,206
——
118,060
32,278
2010
2001
(1)
17FiftyPresidentsStreet
Office
Reston,VA
——
113,362
——
113,362
——
113,362
3,466
2020
2013
(1)
TwoFreedomSquare
Office
Reston,VA
—13,930
77,739
19,298
13,866
97,101
——
110,967
52,128
2001
2003
(1)
140KendrickStreet
Office
Needham,MA
—18,095
66,905
22,468
18,095
89,373
——
107,468
34,790
2000
2004
(1)
190
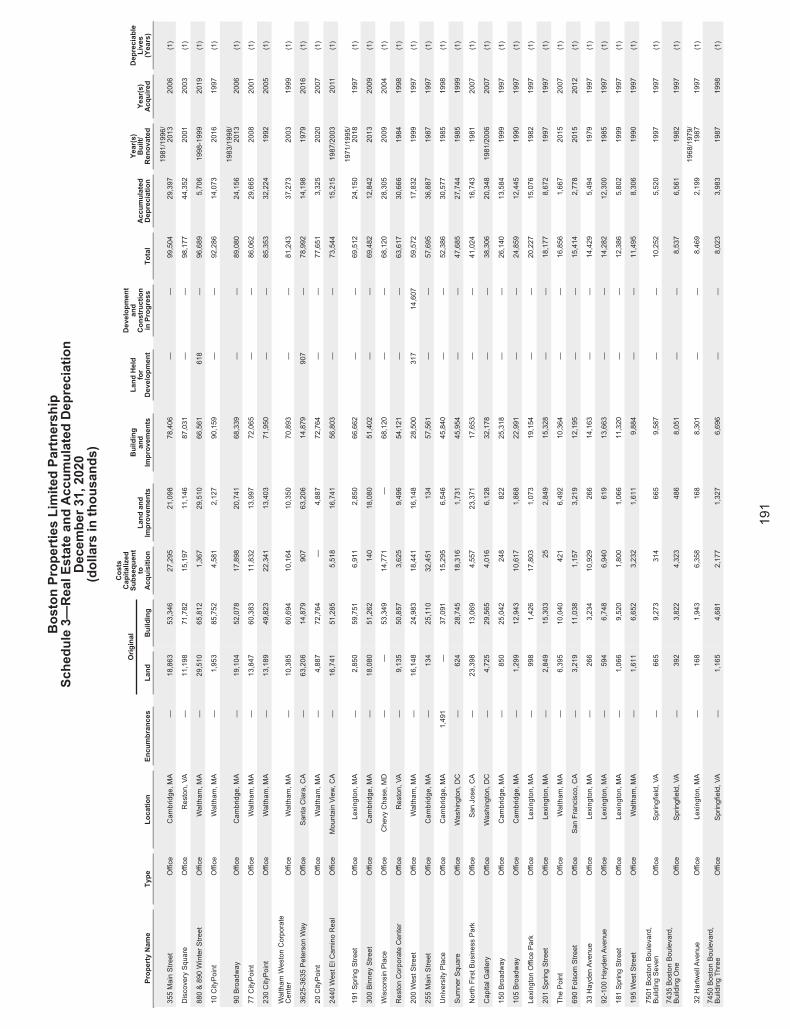
BostonPropertiesLimitedPartnership
Schedule3—
RealEstateandAccumulatedDepreciation
December31,2020
(dollarsinthousands)
Original
Costs
Capitalized
Subsequent
toAcquisition
Landand
Improvements
Building
and
Improvements
LandHeld
for
Development
Development
and
Construction
inProgress
Total
Accumulated
Depreciation
Year(s)
Built/
Renovated
Year(s)
Acquired
Depreciable
Lives
(Years)
PropertyName
Type
Location
Encumbrances
Land
Building
355MainStreet
Office
Cambridge,MA
—18,863
53,346
27,295
21,098
78,406
——
99,504
29,397
1981/1996/
2013
2006
(1)
DiscoverySquare
Office
Reston,VA
—11,198
71,782
15,197
11,146
87,031
——
98,177
44,352
2001
2003
(1)
880&890WinterStreet
Office
Waltham,MA
—29,510
65,812
1,367
29,510
66,561
618
—96,689
5,706
1998-1999
2019
(1)
10CityPoint
Office
Waltham,MA
—1,953
85,752
4,581
2,127
90,159
——
92,286
14,073
2016
1997
(1)
90Broadway
Office
Cambridge,MA
—19,104
52,078
17,898
20,741
68,339
——
89,080
24,156
1983/1998/
2013
2006
(1)
77CityPoint
Office
Waltham,MA
—13,847
60,383
11,832
13,997
72,065
——
86,062
29,665
2008
2001
(1)
230CityPoint
Office
Waltham,MA
—13,189
49,823
22,341
13,403
71,950
——
85,353
32,224
1992
2005
(1)
Waltham
WestonCorporate
Center
Office
Waltham,MA
—10,385
60,694
10,164
10,350
70,893
——
81,243
37,273
2003
1999
(1)
3625-3635PetersonWay
Office
SantaClara,CA
—63,206
14,879
907
63,206
14,879
907
—78,992
14,198
1979
2016
(1)
20CityPoint
Office
Waltham,MA
—4,887
72,764
—4,887
72,764
——
77,651
3,325
2020
2007
(1)
2440WestElCaminoReal
Office
MountainView,CA
—16,741
51,285
5,518
16,741
56,803
——
73,544
15,215
1987/2003
2011
(1)
191SpringStreet
Office
Lexington,MA
—2,850
59,751
6,911
2,850
66,662
——
69,512
24,150
1971/1995/
2018
1997
(1)
300BinneyStreet
Office
Cambridge,MA
—18,080
51,262
140
18,080
51,402
——
69,482
12,842
2013
2009
(1)
WisconsinPlace
Office
ChevyChase,MD
——
53,349
14,771
—68,120
——
68,120
28,305
2009
2004
(1)
RestonCorporateCenter
Office
Reston,VA
—9,135
50,857
3,625
9,496
54,121
——
63,617
30,666
1984
1998
(1)
200WestStreet
Office
Waltham,MA
—16,148
24,983
18,441
16,148
28,500
317
14,607
59,572
17,832
1999
1997
(1)
255MainStreet
Office
Cambridge,MA
—134
25,110
32,451
134
57,561
——
57,695
36,887
1987
1997
(1)
UniversityPlace
Office
Cambridge,MA
1,491
—37,091
15,295
6,546
45,840
——
52,386
30,577
1985
1998
(1)
SumnerSquare
Office
Washington,DC
—624
28,745
18,316
1,731
45,954
——
47,685
27,744
1985
1999
(1)
NorthFirstBusinessPark
Office
SanJose,CA
—23,398
13,069
4,557
23,371
17,653
——
41,024
16,743
1981
2007
(1)
CapitalGallery
Office
Washington,DC
—4,725
29,565
4,016
6,128
32,178
——
38,306
20,348
1981/2006
2007
(1)
150Broadway
Office
Cambridge,MA
—850
25,042
248
822
25,318
——
26,140
13,584
1999
1997
(1)
105Broadway
Office
Cambridge,MA
—1,299
12,943
10,617
1,868
22,991
——
24,859
12,445
1990
1997
(1)
LexingtonOfficePark
Office
Lexington,MA
—998
1,426
17,803
1,073
19,154
——
20,227
15,076
1982
1997
(1)
201SpringStreet
Office
Lexington,MA
—2,849
15,303
252,849
15,328
——
18,177
8,672
1997
1997
(1)
ThePoint
Office
Waltham,MA
—6,395
10,040
421
6,492
10,364
——
16,856
1,667
2015
2007
(1)
690Folsom
Street
Office
SanFrancisco,CA
—3,219
11,038
1,157
3,219
12,195
——
15,414
2,778
2015
2012
(1)
33HaydenAvenue
Office
Lexington,MA
—266
3,234
10,929
266
14,163
——
14,429
5,494
1979
1997
(1)
92-100HaydenAvenue
Office
Lexington,MA
—594
6,748
6,940
619
13,663
——
14,282
12,300
1985
1997
(1)
181SpringStreet
Office
Lexington,MA
—1,066
9,520
1,800
1,066
11,320
——
12,386
5,802
1999
1997
(1)
195WestStreet
Office
Waltham,MA
—1,611
6,652
3,232
1,611
9,884
——
11,495
8,306
1990
1997
(1)
7501BostonBoulevard,
BuildingSeven
Office
Springfield,VA
—665
9,273
314
665
9,587
——
10,252
5,520
1997
1997
(1)
7435BostonBoulevard,
BuildingOne
Office
Springfield,VA
—392
3,822
4,323
486
8,051
——
8,537
6,561
1982
1997
(1)
32HartwellAvenue
Office
Lexington,MA
—168
1,943
6,358
168
8,301
——
8,469
2,199
1968/1979/
1987
1997
(1)
7450BostonBoulevard,
BuildingThree
Office
Springfield,VA
—1,165
4,681
2,177
1,327
6,696
——
8,023
3,983
1987
1998
(1)
191
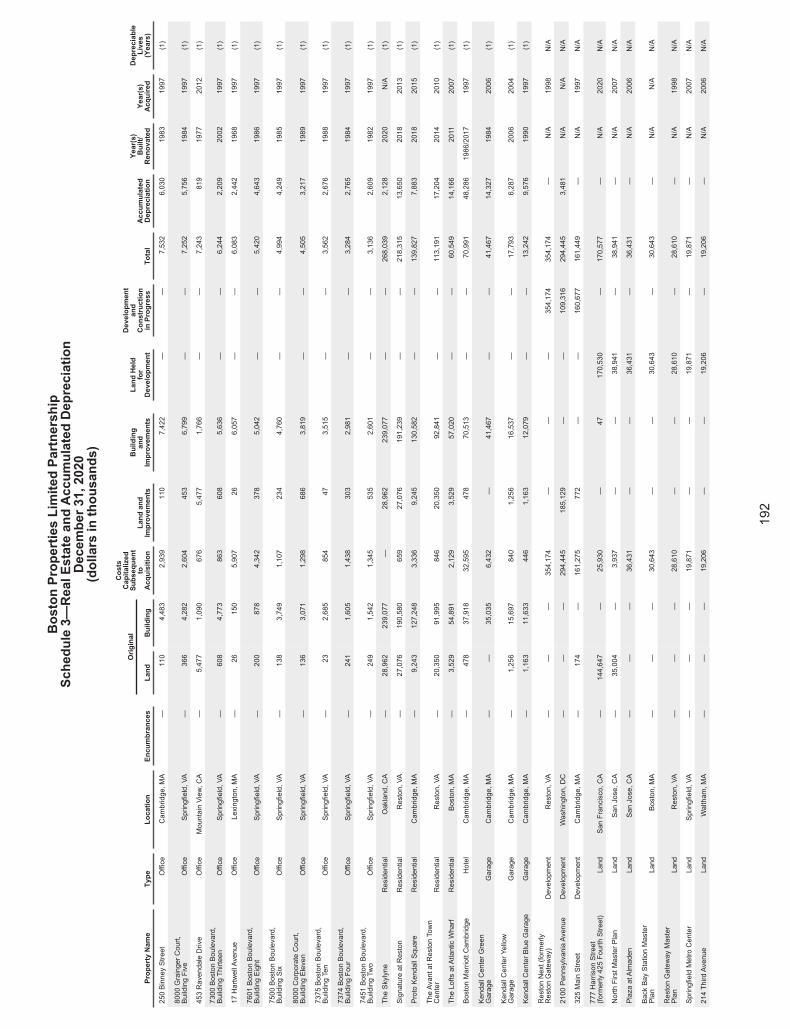
BostonPropertiesLimitedPartnership
Schedule3—
RealEstateandAccumulatedDepreciation
December31,2020
(dollarsinthousands)
Original
Costs
Capitalized
Subsequent
toAcquisition
Landand
Improvements
Building
and
Improvements
LandHeld
for
Development
Development
and
Construction
inProgress
Total
Accumulated
Depreciation
Year(s)
Built/
Renovated
Year(s)
Acquired
Depreciable
Lives
(Years)
PropertyName
Type
Location
Encumbrances
Land
Building
250BinneyStreet
Office
Cambridge,MA
—110
4,483
2,939
110
7,422
——
7,532
6,030
1983
1997
(1)
8000GraingerCourt,
BuildingFive
Office
Springfield,VA
—366
4,282
2,604
453
6,799
——
7,252
5,756
1984
1997
(1)
453RavendaleDrive
Office
MountainView,CA
—5,477
1,090
676
5,477
1,766
——
7,243
819
1977
2012
(1)
7300BostonBoulevard,
BuildingThirteen
Office
Springfield,VA
—608
4,773
863
608
5,636
——
6,244
2,209
2002
1997
(1)
17HartwellAvenue
Office
Lexington,MA
—26
150
5,907
266,057
——
6,083
2,442
1968
1997
(1)
7601BostonBoulevard,
BuildingEight
Office
Springfield,VA
—200
878
4,342
378
5,042
——
5,420
4,643
1986
1997
(1)
7500BostonBoulevard,
BuildingSix
Office
Springfield,VA
—138
3,749
1,107
234
4,760
——
4,994
4,249
1985
1997
(1)
8000CorporateCourt,
BuildingEleven
Office
Springfield,VA
—136
3,071
1,298
686
3,819
——
4,505
3,217
1989
1997
(1)
7375BostonBoulevard,
BuildingTen
Office
Springfield,VA
—23
2,685
854
473,515
——
3,562
2,676
1988
1997
(1)
7374BostonBoulevard,
BuildingFour
Office
Springfield,VA
—241
1,605
1,438
303
2,981
——
3,284
2,765
1984
1997
(1)
7451BostonBoulevard,
BuildingTwo
Office
Springfield,VA
—249
1,542
1,345
535
2,601
——
3,136
2,609
1982
1997
(1)
TheSkylyne
Residential
Oakland,CA
—28,962
239,077
—28,962
239,077
——
268,039
2,128
2020
N/A
(1)
SignatureatReston
Residential
Reston,VA
—27,076
190,580
659
27,076
191,239
——
218,315
13,650
2018
2013
(1)
ProtoKendallSquare
Residential
Cambridge,MA
—9,243
127,248
3,336
9,245
130,582
——
139,827
7,883
2018
2015
(1)
TheAvantatRestonTown
Center
Residential
Reston,VA
—20,350
91,995
846
20,350
92,841
——
113,191
17,204
2014
2010
(1)
TheLoftsatAtlanticWharf
Residential
Boston,MA
—3,529
54,891
2,129
3,529
57,020
——
60,549
14,166
2011
2007
(1)
BostonMarriottCambridge
Hotel
Cambridge,MA
—478
37,918
32,595
478
70,513
——
70,991
48,286
1986/2017
1997
(1)
KendallCenterGreen
Garage
Garage
Cambridge,MA
——
35,035
6,432
—41,467
——
41,467
14,327
1984
2006
(1)
KendallCenterYellow
Garage
Garage
Cambridge,MA
—1,256
15,697
840
1,256
16,537
——
17,793
6,287
2006
2004
(1)
KendallCenterBlueGarage
Garage
Cambridge,MA
—1,163
11,633
446
1,163
12,079
——
13,242
9,576
1990
1997
(1)
RestonNext(formerly
RestonGateway)
Development
Reston,VA
——
—354,174
——
—354,174
354,174
—N/A
1998
N/A
2100PennsylvaniaAvenue
Development
Washington,DC
——
—294,445
185,129
——
109,316
294,445
3,481
N/A
N/A
N/A
325MainStreet
Development
Cambridge,MA
—174
—161,275
772
——
160,677
161,449
—N/A
1997
N/A
777HarrisonStreet
(formerly425FourthStreet)
Land
SanFrancisco,CA
—144,647
—25,930
—47
170,530
—170,577
—N/A
2020
N/A
NorthFirstMasterPlan
Land
SanJose,CA
—35,004
—3,937
——
38,941
—38,941
—N/A
2007
N/A
PlazaatAlmaden
Land
SanJose,CA
——
—36,431
——
36,431
—36,431
—N/A
2006
N/A
BackBayStationMaster
Plan
Land
Boston,MA
——
—30,643
——
30,643
—30,643
—N/A
N/A
N/A
RestonGatewayMaster
Plan
Land
Reston,VA
——
—28,610
——
28,610
—28,610
—N/A
1998
N/A
SpringfieldMetroCenter
Land
Springfield,VA
——
—19,871
——
19,871
—19,871
—N/A
2007
N/A
214ThirdAvenue
Land
Waltham,MA
——
—19,206
——
19,206
—19,206
—N/A
2006
N/A
192
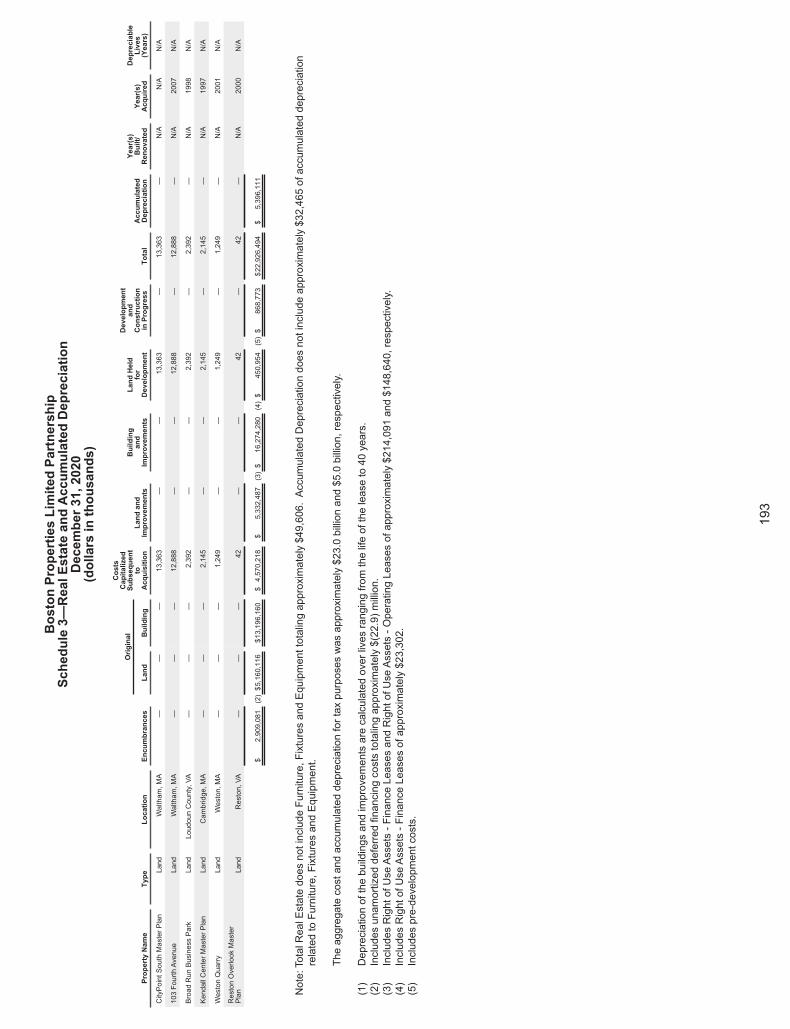
BostonPropertiesLimitedPartnership
Schedule3—
RealEstateandAccumulatedDepreciation
December31,2020
(dollarsinthousands)
Original
Costs
Capitalized
Subsequent
toAcquisition
Landand
Improvements
Building
and
Improvements
LandHeld
for
Development
Development
and
Construction
inProgress
Total
Accumulated
Depreciation
Year(s)
Built/
Renovated
Year(s)
Acquired
Depreciable
Lives
(Years)
PropertyName
Type
Location
Encumbrances
Land
Building
CityPointSouthMasterPlan
Land
Waltham,MA
——
—13,363
——
13,363
—13,363
—N/A
N/A
N/A
103FourthAvenue
Land
Waltham,MA
——
—12,888
——
12,888
—12,888
—N/A
2007
N/A
BroadRunBusinessPark
Land
LoudounCounty,VA
——
—2,392
——
2,392
—2,392
—N/A
1998
N/A
KendallCenterMasterPlan
Land
Cambridge,MA
——
—2,145
——
2,145
—2,145
—N/A
1997
N/A
WestonQuarry
Land
Weston,MA
——
—1,249
——
1,249
—1,249
—N/A
2001
N/A
RestonOverlookMaster
Plan
Land
Reston,VA
——
—42
——
42—
42—
N/A
2000
N/A
$2,909,081(2)$5,160,116
$13,196,160
$4,570,218
$5,332,487(3)$
16,274,280
(4)$
450,954(5)$
868,773
$22,926,494
$5,396,111
Note:TotalRealEstatedoesnotincludeFurniture,FixturesandEquipmenttotalingapproximately$49,606.AccumulatedDepreciationdoesnotincludeapproximately$32,465ofaccumulateddepreciation
relatedtoFurniture,FixturesandEquipment.
Theaggregatecostandaccumulateddepreciationfortaxpurposeswasapproximately$23.0billionand$5.0billion,respectively.
(1)
Depreciationofthebuildingsandimprovementsarecalculatedoverlivesrangingfromthelifeoftheleaseto40years.
(2)
Includesunamortizeddeferredfinancingcoststotalingapproximately$(22.9)million.
(3)
IncludesRightofUseAssets-FinanceLeasesandRightofUseAssets-OperatingLeasesofapproximately$214,091and$148,640,respectively.
(4)
IncludesRightofUseAssets-FinanceLeasesofapproximately$23,302.
(5)
Includespre-developmentcosts.
193
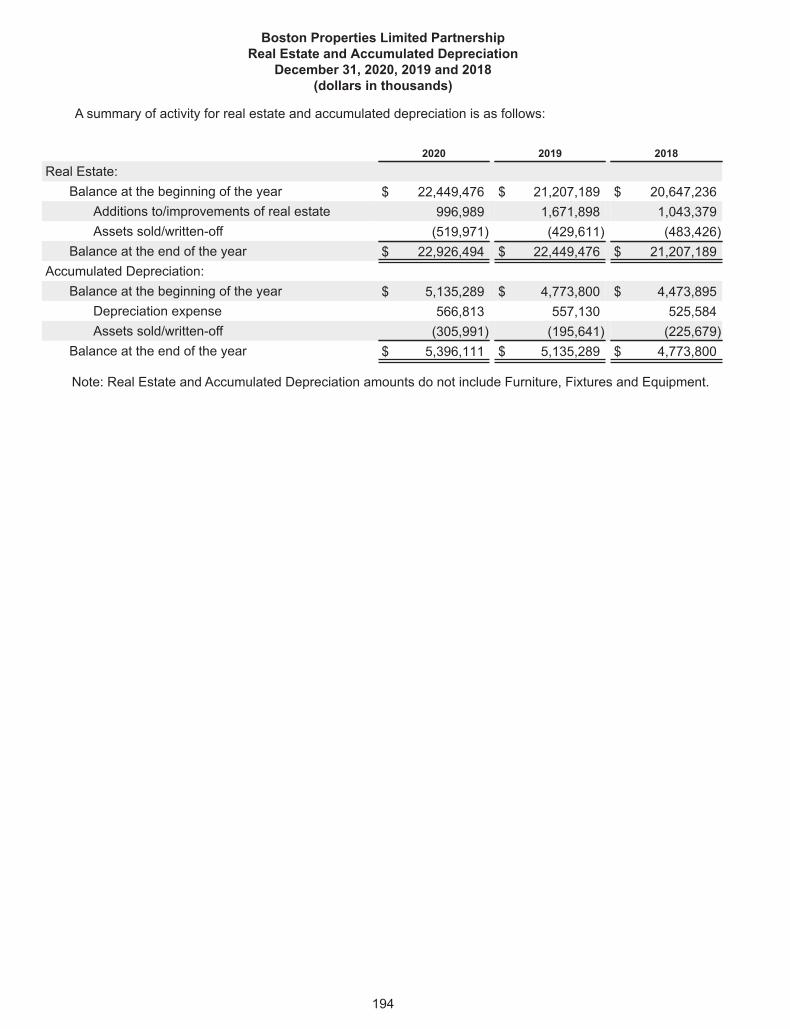
Boston Properties Limited PartnershipReal Estate and Accumulated Depreciation
December 31, 2020, 2019 and 2018(dollars in thousands)
A summary of activity for real estate and accumulated depreciation is as follows:
2020 2019 2018
Real Estate:Balance at the beginning of the year $ 22,449,476 $ 21,207,189 $ 20,647,236
Additions to/improvements of real estate 996,989 1,671,898 1,043,379Assets sold/written-off (519,971) (429,611) (483,426)
Balance at the end of the year $ 22,926,494 $ 22,449,476 $ 21,207,189Accumulated Depreciation:
Balance at the beginning of the year $ 5,135,289 $ 4,773,800 $ 4,473,895Depreciation expense 566,813 557,130 525,584Assets sold/written-off (305,991) (195,641) (225,679)
Balance at the end of the year $ 5,396,111 $ 5,135,289 $ 4,773,800
Note: Real Estate and Accumulated Depreciation amounts do not include Furniture, Fixtures and Equipment.
194
(b) Exhibits
2.1 — Transfer Agreement, dated May 31, 2013, by and among BP 767 Fifth LLC, Sungate Fifth AvenueLLC, 767 LLC and BP/DC 767 Fifth LLC. (Incorporated by reference to Exhibit 2.1 to the CurrentReport on Form 8-K of Boston Properties, Inc. filed on June 3, 2013.)
2.2 — Purchase and Sale Agreement by and among NBIM Walker 601 LEX NYC LLC, NBIM Walker 100FED BOS LLC, NBIM Walker ATW BOS LLC and Boston Properties Limited Partnership, datedSeptember 16, 2014. (Incorporated by reference to Exhibit 2.1 to the Current Report on Form 8-Kof Boston Properties Limited Partnership filed on September 18, 2014.)
3.1 — Form of Amended and Restated Certificate of Incorporation of Boston Properties, Inc.(Incorporated by reference to Exhibit 3.1 to Boston Properties, Inc.’s Registration Statement onForm S-11, File No. 333-25279.)
3.2 — Amended and Restated Certificate of Designations of Series E Junior Participating CumulativePreferred Stock of Boston Properties, Inc. (Incorporated by reference to Exhibit 3.1 to BostonProperties, Inc.’s Current Report on Form 8-K filed on June 18, 2007.)
3.3 — Certificate of Amendment of Amended and Restated Certificate of Incorporation of BostonProperties, Inc. (Incorporated by reference to Exhibit 3.1 to Boston Properties, Inc.’s CurrentReport on Form 8-K filed on May 20, 2010.)
3.4 — Certificate of Designations of 92,000 shares of 5.25% Series B Cumulative Redeemable PreferredStock of Boston Properties, Inc. (Incorporated by reference to Exhibit 3.3 to the RegistrationStatement on Form 8-A of Boston Properties, Inc. filed on March 22, 2013.)
3.5 — Third Amended and Restated By-laws of Boston Properties, Inc. (Incorporated by reference toExhibit 3.1 to the Current Report on Form 8-K of Boston Properties, Inc. filed on May 19, 2016.)
3.6 — Amendment No. 1 to Third Amended and Restated By-laws of Boston Properties, Inc.(Incorporated by reference to Exhibit 3.1 to the Current Report on Form 8-K of Boston Properties,Inc. and Boston Properties Limited Partnership filed on March 24, 2020.)
3.7 — Form of Certificate of Designations for Series A Preferred Stock. (Incorporated by reference toExhibit 99.26 to Boston Properties, Inc.’s Current Report on Form 8-K filed on November 25,1998.)
4.1 — Form of Common Stock Certificate. (Incorporated by reference to Exhibit 4.3 to Boston Properties,Inc.’s Registration Statement on Form S-11, File No. 333-25279.)
4.2 — Description of the Securities of Boston Properties, Inc. and Boston Properties Limited Partnership(Incorporated by reference to Exhibit 4.2 to the Annual Report on Form 10-K of Boston Properties,Inc. and Boston Properties Limited Partnership filed on March 2, 2020.)
4.3 — Master Deposit Agreement among Boston Properties, Inc., Computershare Inc. andComputershare Trust Company, N.A., collectively, as depositary, and the holders from time to timeof depositary shares as described therein, dated March 22, 2013. (Incorporated by reference toExhibit 4.1 to the Registration Statement on Form 8-A of Boston Properties, Inc. filed on March 22,2013.)
4.4 — Indenture, dated as of December 13, 2002, by and between Boston Properties Limited Partnershipand The Bank of New York, as Trustee. (Incorporated by reference to Exhibit 4.1 to BostonProperties, Inc.’s Current Report on Form 8-K/A filed on December 13, 2002.)
4.5 — Supplemental Indenture No. 12, dated as of June 11, 2012, between Boston Properties LimitedPartnership and The Bank of New York Mellon Trust Company, N.A., as Trustee, including a formof the 3.85% Senior Note due 2023. (Incorporated by reference to Exhibit 4.1 to the Current Reporton Form 8-K of Boston Properties Limited Partnership filed on June 11, 2012.)
4.6 — Supplemental Indenture No. 13, dated as of April 11, 2013, between Boston Properties LimitedPartnership and The Bank of New York Mellon Trust Company, N.A., as Trustee, including a formof the 3.125% Senior Note due 2023. (Incorporated by reference to Exhibit 4.1 to the CurrentReport on Form 8-K of Boston Properties Limited Partnership filed on April 11, 2013.)
4.7 — Supplemental Indenture No. 14, dated as of June 27, 2013, between Boston Properties LimitedPartnership and The Bank of New York Mellon Trust Company, N.A., as Trustee, including a formof the 3.800% Senior Note due 2024. (Incorporated by reference to Exhibit 4.1 to the CurrentReport on Form 8-K of Boston Properties Limited Partnership filed on July 1, 2013.)
195
4.8 — Supplemental Indenture No. 15, dated as of January 20, 2016, between Boston Properties LimitedPartnership and The Bank of New York Mellon Trust Company, N.A., as Trustee, including a formof the 3.650% Senior Note due 2026. (Incorporated by reference to Exhibit 4.1 to the CurrentReport on Form 8-K of Boston Properties Limited Partnership filed on January 20, 2016.)
4.9 — Supplemental Indenture No. 16, dated as of August 17, 2016, between Boston Properties LimitedPartnership and The Bank of New York Mellon Trust Company, N.A., as Trustee; including a formof the 2.750% Senior Note due 2026. (Incorporated by reference to Exhibit 4.1 to the CurrentReport on Form 8-K of Boston Properties Limited Partnership and Boston Properties, Inc. filed onAugust 17, 2016.)
4.10 — Supplemental Indenture No. 17, dated as of December 4, 2017, between Boston PropertiesLimited Partnership and The Bank of New York Mellon Trust Company, N.A., as Trustee; includinga form of the 3.200% Senior Note due 2025. (Incorporated by reference to Exhibit 4.1 to theCurrent Report on Form 8-K of Boston Properties Limited Partnership and Boston Properties, Inc.filed on December 4, 2017.)
4.11 — Supplemental Indenture No. 18, dated as of November 28, 2018, between Boston PropertiesLimited Partnership and The Bank of New York Mellon Trust Company, N.A., as Trustee; includinga form of the 4.500% Senior Note due 2028. (Incorporated by reference to Exhibit 4.1 to theCurrent Report on Form 8-K of Boston Properties Limited Partnership and Boston Properties, Inc.filed on November 28, 2018.)
4.12 — Supplemental Indenture No. 19, dated as of June 21, 2019, between Boston Properties LimitedPartnership and The Bank of New York Mellon Trust Company, N.A., as Trustee; including a formof the 3.400% Senior Note due 2029. (Incorporated by reference to Exhibit 4.1 to the CurrentReport on Form 8-K of Boston Properties Limited Partnership and Boston Properties, Inc. filed onJune 21, 2019.)
4.13 — Supplemental Indenture No. 20, dated as of September 3, 2019, between Boston PropertiesLimited Partnership and The Bank of New York Mellon Trust Company, N.A., as Trustee; includinga form of the 2.900% Senior Note due 2030. (Incorporated by reference to Exhibit 4.1 to theCurrent Report on Form 8-K of Boston Properties Limited Partnership and Boston Properties, Inc.filed on September 3, 2019.)
4.14 — Supplemental Indenture No. 21, dated as of May 5, 2020, between Boston Properties LimitedPartnership and The Bank of New York Mellon Trust Company, N.A., as Trustee; including a formof the 3.250% Senior Note due 2031. (Incorporated by reference to Exhibit 4.1 to the CurrentReport on Form 8-K of Boston Properties, Inc. and Boston Properties Limited Partnership filed onMay 5, 2020.)
10.1 — Second Amended and Restated Agreement of Limited Partnership of Boston Properties LimitedPartnership, dated as of June 29, 1998. (Incorporated by reference to Exhibit 99.1 to BostonProperties, Inc.’s Current Report on Form 8-K filed on July 15, 1998.)
10.2 — Certificate of Designations for the Series Four Preferred Units, dated as of August 29, 2012,constituting an amendment to the Second Amended and Restated Agreement of LimitedPartnership of Boston Properties Limited Partnership. (Incorporated by reference to Exhibit 10.1 tothe Quarterly Report on Form 10-Q of Boston Properties, Inc. filed on November 8, 2012.)
10.3 — Certificate of Designations for the 5.25% Series B Cumulative Redeemable Preferred Units, datedas of March 20, 2013, constituting an amendment to the Second Amended and RestatedAgreement of Limited Partnership of Boston Properties Limited Partnership. (Incorporated byreference to Exhibit 10.1 to the Current Report on Form 8-K of Boston Properties, Inc. filed onMarch 22, 2013.)
10.4 — Forty-Seventh Amendment to the Second Amended and Restated Agreement of LimitedPartnership of Boston Properties Limited Partnership, dated as of April 11, 2003, by BostonProperties, Inc., as general partner. (Incorporated by reference to Exhibit 10.1 to BostonProperties, Inc.’s Quarterly Report on Form 10-Q filed on August 14, 2003.)
10.5 — Seventy-Seventh Amendment to the Second Amended and Restated Agreement of LimitedPartnership of Boston Properties Limited Partnership, dated as of January 24, 2008, by BostonProperties, Inc., as general partner. (Incorporated by reference to Exhibit 10.3 to BostonProperties, Inc.’s Current Report on Form 8-K filed on January 29, 2008.)
10.6 — Ninety-Eighth Amendment to the Second Amended and Restated Agreement of LimitedPartnership of Boston Properties Limited Partnership, dated as of October 21, 2010. (Incorporatedby reference to Exhibit 10.1 to Boston Properties, Inc.’s Quarterly Report on Form 10-Q filed onNovember 5, 2010.)
196
10.7 — One Hundred Forty-Ninth Amendment to the Second Amended and Restated Agreement of LimitedPartnership of Boston Properties Limited Partnership, dated as of December 15, 2017.(Incorporated by reference to Exhibit 10.7 to Boston Properties, Inc.’s Annual Report on Form 10-Kfiled on February 28, 2018.)
10.8* — Second Amendment and Restatement of Boston Properties, Inc. 1997 Stock Option and IncentivePlan. (Incorporated by reference to Exhibit A to Boston Properties, Inc.’s Proxy Statement onSchedule 14A filed on April 6, 2007.)
10.9* — Boston Properties, Inc. 2012 Stock Option and Incentive Plan. (Incorporated by reference toExhibit A to Boston Properties, Inc.’s Proxy Statement on Schedule 14A filed on March 30, 2012.)
10.10* — Boston Properties, Inc. 1999 Non-Qualified Employee Stock Purchase Plan. (Incorporated byreference to Exhibit 10.59 to Boston Properties, Inc.’s Annual Report on Form 10-K filed on March15, 2005.)
10.11* — First Amendment to the Boston Properties, Inc. 1999 Non-Qualified Employee Stock PurchasePlan. (Incorporated by reference to Exhibit 10.60 to Boston Properties, Inc.’s Annual Report onForm 10-K filed on March 15, 2005.)
10.12* — Second Amendment to the Boston Properties, Inc. 1999 Non-Qualified Employee Stock PurchasePlan. (Incorporated by reference to Exhibit 10.61 to Boston Properties, Inc.’s Annual Report onForm 10-K filed on March 15, 2005.)
10.13* — Boston Properties Deferred Compensation Plan, Amended and Restated Effective as of January 1,2009. (Incorporated by reference to Exhibit 10.10 to Boston Properties, Inc.’s Annual Report onForm 10-K filed on March 2, 2009.)
10.14* — Employment Agreement by and between Douglas T. Linde and Boston Properties, Inc. dated as ofNovember 29, 2002. (Incorporated by reference to Exhibit 10.12 to Boston Properties, Inc.’sAnnual Report on Form 10-K filed on February 27, 2003.)
10.15* — First Amendment to Employment Agreement, dated as of November 1, 2007, by and betweenBoston Properties, Inc. and Douglas T. Linde. (Incorporated by reference to Exhibit 10.3 to BostonProperties, Inc.’s Quarterly Report on Form 10-Q filed on November 9, 2007.)
10.16* — Second Amendment to Employment Agreement, dated as of December 15, 2008, by and betweenBoston Properties, Inc. and Douglas T. Linde. (Incorporated by reference to Exhibit 10.19 toBoston Properties, Inc.’s Annual Report on Form 10-K filed on March 2, 2009.)
10.17* — Amended and Restated Employment Agreement by and between Raymond A. Ritchey and BostonProperties, Inc. dated as of November 29, 2002. (Incorporated by reference to Exhibit 10.15 toBoston Properties, Inc.’s Annual Report on Form 10-K filed on February 27, 2003.)
10.18* — First Amendment to Amended and Restated Employment Agreement, dated as of November 1,2007, by and between Boston Properties, Inc. and Raymond A. Ritchey. (Incorporated byreference to Exhibit 10.4 to Boston Properties, Inc.’s Quarterly Report on Form 10-Q filed onNovember 9, 2007.)
10.19* — Second Amendment to Amended and Restated Employment Agreement, dated as of December15, 2008, by and between Boston Properties, Inc. and Raymond A. Ritchey. (Incorporated byreference to Exhibit 10.22 to Boston Properties, Inc.’s Annual Report on Form 10-K filed on March2, 2009.)
10.20* — Employment Agreement by and between Michael E. LaBelle and Boston Properties, Inc. dated asof January 24, 2008. (Incorporated by reference to Exhibit 10.2 to Boston Properties, Inc.’s CurrentReport on Form 8-K filed on January 29, 2008.)
10.21* — First Amendment to Employment Agreement, dated as of December 15, 2008, by and betweenBoston Properties, Inc. and Michael E. LaBelle. (Incorporated by reference to Exhibit 10.27 toBoston Properties, Inc.’s Annual Report on Form 10-K filed on March 2, 2009.)
10.22* — Employment Agreement by and between Peter D. Johnston and Boston Properties, Inc. dated asof August 25, 2005. (Incorporated by reference to Exhibit 10.2 to Boston Properties, Inc.’sQuarterly Report on Form 10-Q filed on November 9, 2005.)
10.23* — First Amendment to Employment Agreement, dated as of November 1, 2007, by and betweenBoston Properties, Inc. and Peter D. Johnston. (Incorporated by reference to Exhibit 10.6 toBoston Properties, Inc.’s Quarterly Report on Form 10-Q filed on November 9, 2007.)
10.24* — Second Amendment to Employment Agreement, dated as of December 15, 2008, by and betweenBoston Properties, Inc. and Peter D. Johnston. (Incorporated by reference to Exhibit 10.30 toBoston Properties, Inc.’s Annual Report on Form 10-K filed on March 2, 2009.)
197
10.25* — Employment Agreement by and between Bryan J. Koop and Boston Properties, Inc. dated as ofNovember 29, 2002. (Incorporated by reference to Exhibit 10.10 to Boston Properties, Inc.’sAnnual Report on Form 10-K filed on February 27, 2003.)
10.26* — First Amendment to Employment Agreement, dated as of November 1, 2007, by and betweenBoston Properties, Inc. and Bryan J. Koop. (Incorporated by reference to Exhibit 10.7 to BostonProperties, Inc.’s Quarterly Report on Form 10-Q filed on November 9, 2007.)
10.27* — Second Amendment to Employment Agreement, dated as of December 15, 2008, by and betweenBoston Properties, Inc. and Bryan J. Koop. (Incorporated by reference to Exhibit 10.33 to BostonProperties, Inc.’s Annual Report on Form 10-K filed on March 2, 2009.)
10.28* — Employment Agreement by and between Robert E. Pester and Boston Properties, Inc. dated as ofDecember 16, 2002. (Incorporated by reference to Exhibit 10.14 to Boston Properties, Inc.’sAnnual Report on Form 10-K filed on February 27, 2003.)
10.29* — First Amendment to Employment Agreement, dated as of November 1, 2007, by and betweenBoston Properties, Inc. and Robert E. Pester. (Incorporated by reference to Exhibit 10.9 to BostonProperties, Inc.’s Quarterly Report on Form 10-Q filed on November 9, 2007.)
10.30* — Second Amendment to Employment Agreement, dated as of December 15, 2008, by and betweenBoston Properties, Inc. and Robert E. Pester. (Incorporated by reference to Exhibit 10.40 to BostonProperties, Inc.’s Annual Report on Form 10-K filed on March 2, 2009.)
10.31* — Employment Agreement by and between John F. Powers and Boston Properties, Inc. dated as ofJanuary 2, 2018. (Incorporated by reference to Exhibit 10.32 to Boston Properties, Inc.'s AnnualReport on Form 10-K filed on February 28, 2018.)
10.32* — Employment Agreement by and between Owen D. Thomas and Boston Properties, Inc. dated as ofApril 2, 2018. (Incorporated by reference to Exhibit 10.2 to Boston Properties, Inc.'s QuarterlyReport on Form 10-Q filed on May 8, 2018.)
10.33* — Boston Properties, Inc. Senior Executive Severance Plan. (Incorporated by reference to Exhibit10.19 to Boston Properties, Inc.’s Annual Report on Form 10-K filed on February 27, 2003.)
10.34* — First Amendment to the Boston Properties, Inc. Senior Executive Severance Plan, dated as ofOctober 18, 2007. (Incorporated by reference to Exhibit 10.13 to Boston Properties, Inc.’sQuarterly Report on Form 10-Q filed on November 9, 2007.)
10.35* — Second Amendment to the Boston Properties, Inc. Senior Executive Severance Plan, dated as ofDecember 15, 2008. (Incorporated by reference to Exhibit 10.52 to Boston Properties, Inc.’sAnnual Report on Form 10-K filed on March 2, 2009.)
10.36* — Third Amendment to the Boston Properties, Inc. Senior Executive Severance Plan, dated as ofJanuary 8, 2014. (Incorporated by reference to Exhibit 10.48 to Boston Properties, Inc.’s AnnualReport on Form 10-K filed on February 28, 2014.)
10.37* — Boston Properties, Inc. Executive Severance Plan, dated as of July 30, 1998. (Incorporated byreference to Exhibit 10.20 to Boston Properties, Inc.’s Annual Report on Form 10-K filed onFebruary 27, 2003.)
10.38* — First Amendment to the Boston Properties, Inc. Executive Severance Plan, dated as of October 18,2007. (Incorporated by reference to Exhibit 10.14 to Boston Properties, Inc.’s Quarterly Report onForm 10-Q filed on November 9, 2007.)
10.39* — Second Amendment to the Boston Properties, Inc. Executive Severance Plan, dated as of January8, 2014. (Incorporated by reference to Exhibit 10.51 to Boston Properties, Inc.’s Annual Report onForm 10-K filed on February 28, 2014.)
10.40* — Boston Properties, Inc. Officer Severance Plan, dated as of July 30, 1998. (Incorporated byreference to Exhibit 10.15 to Boston Properties, Inc.’s Quarterly Report on Form 10-Q filed onNovember 9, 2007.)
10.41* — First Amendment to the Boston Properties, Inc. Officer Severance Plan, dated as of October 18,2007. (Incorporated by reference to Exhibit 10.16 to Boston Properties, Inc.’s Quarterly Report onForm 10-Q filed on November 9, 2007.)
10.42* — Second Amendment to the Boston Properties, Inc. Officer Severance Plan, dated as of December15, 2008. (Incorporated by reference to Exhibit 10.57 to Boston Properties, Inc.’s Annual Report onForm 10-K filed on March 2, 2009.)
10.43* — Form of Indemnification Agreement by and among Boston Properties, Inc., Boston PropertiesLimited Partnership and certain officers and directors of the Company. (Incorporated by referenceto Exhibit 10.43 to Boston Properties, Inc.’s Annual Report on Form 10-K filed on March 2, 2020.)
198
10.44* — Director Appointment Agreement, dated as of January 20, 2011, by and between Matthew J. Lustigand Boston Properties, Inc. (Incorporated by reference to Exhibit 10.55 to Boston Properties, Inc.’sAnnual Report on Form 10-K filed on February 25, 2011.)
10.45* — Boston Properties, Inc. Non-Employee Director Compensation Plan. (Incorporated by reference toAppendix B to Boston Properties, Inc.’s Proxy Statement on Schedule 14A filed on April 5, 2019.)
10.46 — Eighth Amended and Restated Credit Agreement, dated as of April 24, 2017, among BostonProperties Limited Partnership and the lenders identified therein. (Incorporated by reference toExhibit 10.1 to the Current Report on Form 8-K of Boston Properties Limited Partnership filed onApril 25, 2017.)
21.1 — Subsidiaries of Boston Properties, Inc. and Boston Properties Limited Partnership (Filed herewith.)
23.1 — Consent of PricewaterhouseCoopers LLP, Independent Registered Public Accounting firm forBoston Properties, Inc. (Filed herewith.)
23.2 — Consent of PricewaterhouseCoopers LLP, Independent Registered Public Accounting firm forBoston Properties Limited Partnership. (Filed herewith.)
31.1 — Rule 13a-14(a)/15d-14(a) Certification of Chief Executive Officer of Boston Properties, Inc.pursuant to Section 302 of the Sarbanes-Oxley Act of 2002. (Filed herewith.)
31.2 — Rule 13a-14(a)/15d-14(a) Certification of Chief Financial Officer of Boston Properties, Inc. pursuantto Section 302 of the Sarbanes-Oxley Act of 2002. (Filed herewith.)
31.3 — Rule 13a-14(a)/15d-14(a) Certification of Chief Executive Officer of Boston Properties LimitedPartnership pursuant to Section 302 of the Sarbanes-Oxley Act of 2002. (Filed herewith.)
31.4 — Rule 13a-14(a)/15d-14(a) Certification of Chief Financial Officer of Boston Properties LimitedPartnership pursuant to Section 302 of the Sarbanes-Oxley Act of 2002. (Filed herewith.)
32.1 — Section 1350 Certification of Chief Executive Officer of Boston Properties, Inc. pursuant to Section906 of the Sarbanes-Oxley Act of 2002. (Furnished herewith.)
32.2 — Section 1350 Certification of Chief Financial Officer of Boston Properties, Inc. pursuant to Section906 of the Sarbanes-Oxley Act of 2002. (Furnished herewith.)
32.3 — Section 1350 Certification of Chief Executive Officer of Boston Properties Limited Partnershippursuant to Section 906 of the Sarbanes-Oxley Act of 2002. (Furnished herewith.)
32.4 — Section 1350 Certification of Chief Financial Officer of Boston Properties Limited Partnershippursuant to Section 906 of the Sarbanes-Oxley Act of 2002. (Furnished herewith.)
101.SCH — Inline XBRL Taxonomy Extension Schema Document. (Filed herewith.)101.CAL — Inline XBRL Taxonomy Extension Calculation Linkbase Document. (Filed herewith.)101.LAB — Inline XBRL Taxonomy Extension Label Linkbase Document. (Filed herewith.)101.PRE — Inline XBRL Taxonomy Extension Presentation Linkbase Document. (Filed herewith.)101.DEF — Inline XBRL Taxonomy Extension Definition Linkbase Document. (Filed herewith.)
104 — Cover Page Interactive Data File (formatted as Inline XBRL with applicable taxonomy extensioninformation contained in Exhibits 101.*). (Filed herewith.)
* Indicates management contract or compensatory plan or arrangement required to be filed or incorporated byreference as an exhibit to this Form 10-K pursuant to Item 15(b) of Form 10-K.
Item 16. Form 10-K Summary.Not Applicable.
199
SIGNATURES
Pursuant to the requirements of the Securities Exchange Act of 1934, Boston Properties, Inc. has duly causedthis report to be signed on its behalf by the undersigned thereunto duly authorized.
BOSTON PROPERTIES, INC.
February 26, 2021 /s/ MICHAEL E. LABELLEMichael E. LaBelle
Chief Financial Officer(duly authorized officer and principal financial officer)
Pursuant to the requirements of the Securities Exchange Act of 1934, this report has been signed below bythe following persons on behalf of Boston Properties, Inc., and in the capacities and on the dates indicated.
February 26, 2021
By: /s/ OWEN D. THOMASOwen D. Thomas
Director, Chief Executive Officer and Principal ExecutiveOfficer
By: /s/ DOUGLAS T. LINDEDouglas T. Linde
Director and President
By: /s/ KELLY A. AYOTTEKelly A. Ayotte
Director
By: /s/ BRUCEW. DUNCANBruce W. Duncan
Director
By: /s/ KAREN E. DYKSTRAKaren E. Dykstra
Director
By: /s/ CAROL B. EINIGERCarol B. Einiger
Director
By: /s/ DIANE J. HOSKINSDiane J. Hoskins
Director
By: /s/ JOEL I. KLEINJoel I. Klein
Chairman of the Board
200
By: /s/ MATTHEW J. LUSTIGMatthew J. Lustig
Director
By: /s/ DAVID A. TWARDOCKDavid A. Twardock
Director
By: /s/ WILLIAM H. WALTON, IIIWilliam H. Walton, III
Director
By: /s/ MICHAEL E. LABELLEMichael E. LaBelle
Executive Vice President, Chief Financial Officer andPrincipal Financial Officer
By: /s/ MICHAEL R. WALSHMichael R. Walsh
Senior Vice President, Chief Accounting Officer andPrincipal Accounting Officer
201
SIGNATURES
Pursuant to the requirements of the Securities Exchange Act of 1934, Boston Properties Limited Partnershiphas duly caused this report to be signed on its behalf by the undersigned thereunto duly authorized.
BOSTON PROPERTIES LIMITED PARTNERSHIPBy: Boston Properties, Inc., its General Partner
February 26, 2021 /s/ MICHAEL E. LABELLEMichael E. LaBelle
Chief Financial Officer(duly authorized officer and principal financial officer)
Pursuant to the requirements of the Securities Exchange Act of 1934, this report has been signed below bythe following persons on behalf of Boston Properties, Inc., as general partner of Boston Properties LimitedPartnership, and in the capacities and on the dates indicated.
February 26, 2021
By: /s/ OWEN D. THOMASOwen D. Thomas
Director, Chief Executive Officer and Principal ExecutiveOfficer
By: /s/ DOUGLAS T. LINDEDouglas T. Linde
Director and President
By: /s/ KELLY A. AYOTTEKelly A. Ayotte
Director
By: /s/ BRUCEW. DUNCANBruce W. Duncan
Director
By: /s/ KAREN E. DYKSTRAKaren E. Dykstra
Director
By: /s/ CAROL B. EINIGERCarol B. Einiger
Director
By: /s/ DIANE J. HOSKINSDiane J. Hoskins
Director
By: /s/ JOEL I. KLEINJoel I. Klein
Chairman of the Board
202
By: /s/ MATTHEW J. LUSTIGMatthew J. Lustig
Director
By: /s/ DAVID A. TWARDOCKDavid A. Twardock
Director
By: /s/ WILLIAM H. WALTON, IIIWilliam H. Walton, III
Director
By: /s/ MICHAEL E. LABELLEMichael E. LaBelle
Executive Vice President, Chief Financial Officer andPrincipal Financial Officer
By: /s/ MICHAEL R. WALSHMichael R. Walsh
Senior Vice President, Chief Accounting Officer andPrincipal Accounting Officer
203
Exhibit 31.1
CERTIFICATION
I, Owen D. Thomas, certify that:1. I have reviewed this Annual Report on Form 10-K of Boston Properties, Inc.;2. Based on my knowledge, this report does not contain any untrue statement of a material fact or omit to state a
material fact necessary to make the statements made, in light of the circumstances under which suchstatements were made, not misleading with respect to the period covered by this report;
3. Based on my knowledge, the financial statements, and other financial information included in this report, fairlypresent in all material respects the financial condition, results of operations and cash flows of the registrant asof, and for, the periods presented in this report;
4. The registrant's other certifying officer(s) and I are responsible for establishing and maintaining disclosurecontrols and procedures (as defined in Exchange Act Rules 13a-15(e) and 15d-15(e)) and internal control overfinancial reporting (as defined in Exchange Act Rules 13a-15(f) and 15d-15(f)) for the registrant and have:(a) Designed such disclosure controls and procedures, or caused such disclosure controls and procedures
to be designed under our supervision, to ensure that material information relating to the registrant,including its consolidated subsidiaries, is made known to us by others within those entities, particularlyduring the period in which this report is being prepared;
(b) Designed such internal control over financial reporting, or caused such internal control over financialreporting to be designed under our supervision, to provide reasonable assurance regarding the reliabilityof financial reporting and the preparation of financial statements for external purposes in accordance withgenerally accepted accounting principles;
(c) Evaluated the effectiveness of the registrant's disclosure controls and procedures and presented in thisreport our conclusions about the effectiveness of the disclosure controls and procedures, as of the end ofthe period covered by this report based on such evaluation; and
(d) Disclosed in this report any change in the registrant's internal control over financial reporting thatoccurred during the registrant's most recent fiscal quarter (the registrant's fourth fiscal quarter in the caseof an annual report) that has materially affected, or is reasonably likely to materially affect, the registrant'sinternal control over financial reporting; and
5. The registrant's other certifying officer(s) and I have disclosed, based on our most recent evaluation of internalcontrol over financial reporting, to the registrant's auditors and the audit committee of the registrant's board ofdirectors (or persons performing the equivalent functions):(a) All significant deficiencies and material weaknesses in the design or operation of internal control over
financial reporting which are reasonably likely to adversely affect the registrant's ability to record,process, summarize and report financial information; and
(b) Any fraud, whether or not material, that involves management or other employees who have a significantrole in the registrant's internal control over financial reporting.
Date: February 26, 2021
/s/ OWEN D. THOMASOwen D. Thomas
Chief Executive Officer
Exhibit 31.2
CERTIFICATION
I, Michael E. LaBelle, certify that:1. I have reviewed this Annual Report on Form 10-K of Boston Properties, Inc.;2. Based on my knowledge, this report does not contain any untrue statement of a material fact or omit to state a
material fact necessary to make the statements made, in light of the circumstances under which suchstatements were made, not misleading with respect to the period covered by this report;
3. Based on my knowledge, the financial statements, and other financial information included in this report, fairlypresent in all material respects the financial condition, results of operations and cash flows of the registrant asof, and for, the periods presented in this report;
4. The registrant's other certifying officer(s) and I are responsible for establishing and maintaining disclosurecontrols and procedures (as defined in Exchange Act Rules 13a-15(e) and 15d-15(e)) and internal control overfinancial reporting (as defined in Exchange Act Rules 13a-15(f) and 15d-15(f)) for the registrant and have:(a) Designed such disclosure controls and procedures, or caused such disclosure controls and procedures
to be designed under our supervision, to ensure that material information relating to the registrant,including its consolidated subsidiaries, is made known to us by others within those entities, particularlyduring the period in which this report is being prepared;
(b) Designed such internal control over financial reporting, or caused such internal control over financialreporting to be designed under our supervision, to provide reasonable assurance regarding the reliabilityof financial reporting and the preparation of financial statements for external purposes in accordance withgenerally accepted accounting principles;
(c) Evaluated the effectiveness of the registrant's disclosure controls and procedures and presented in thisreport our conclusions about the effectiveness of the disclosure controls and procedures, as of the end ofthe period covered by this report based on such evaluation; and
(d) Disclosed in this report any change in the registrant's internal control over financial reporting thatoccurred during the registrant's most recent fiscal quarter (the registrant's fourth fiscal quarter in the caseof an annual report) that has materially affected, or is reasonably likely to materially affect, the registrant'sinternal control over financial reporting; and
5. The registrant's other certifying officer(s) and I have disclosed, based on our most recent evaluation of internalcontrol over financial reporting, to the registrant's auditors and the audit committee of the registrant's board ofdirectors (or persons performing the equivalent functions):(a) All significant deficiencies and material weaknesses in the design or operation of internal control over
financial reporting which are reasonably likely to adversely affect the registrant's ability to record,process, summarize and report financial information; and
(b) Any fraud, whether or not material, that involves management or other employees who have a significantrole in the registrant's internal control over financial reporting.
Date: February 26, 2021
/s/ MICHAEL E. LABELLEMichael E. LaBelle
Chief Financial Officer
Exhibit 31.3
CERTIFICATION
I, Owen D. Thomas, certify that:1. I have reviewed this Annual Report on Form 10-K of Boston Properties Limited Partnership;2. Based on my knowledge, this report does not contain any untrue statement of a material fact or omit to state a
material fact necessary to make the statements made, in light of the circumstances under which suchstatements were made, not misleading with respect to the period covered by this report;
3. Based on my knowledge, the financial statements, and other financial information included in this report, fairlypresent in all material respects the financial condition, results of operations and cash flows of the registrant asof, and for, the periods presented in this report;
4. The registrant's other certifying officer(s) and I are responsible for establishing and maintaining disclosurecontrols and procedures (as defined in Exchange Act Rules 13a-15(e) and 15d-15(e)) and internal control overfinancial reporting (as defined in Exchange Act Rules 13a-15(f) and 15d-15(f)) for the registrant and have:(a) Designed such disclosure controls and procedures, or caused such disclosure controls and procedures
to be designed under our supervision, to ensure that material information relating to the registrant,including its consolidated subsidiaries, is made known to us by others within those entities, particularlyduring the period in which this report is being prepared;
(b) Designed such internal control over financial reporting, or caused such internal control over financialreporting to be designed under our supervision, to provide reasonable assurance regarding the reliabilityof financial reporting and the preparation of financial statements for external purposes in accordance withgenerally accepted accounting principles;
(c) Evaluated the effectiveness of the registrant's disclosure controls and procedures and presented in thisreport our conclusions about the effectiveness of the disclosure controls and procedures, as of the end ofthe period covered by this report based on such evaluation; and
(d) Disclosed in this report any change in the registrant's internal control over financial reporting thatoccurred during the registrant's most recent fiscal quarter (the registrant's fourth fiscal quarter in the caseof an annual report) that has materially affected, or is reasonably likely to materially affect, the registrant'sinternal control over financial reporting; and
5. The registrant's other certifying officer(s) and I have disclosed, based on our most recent evaluation of internalcontrol over financial reporting, to the registrant's auditors and the audit committee of the registrant's board ofdirectors (or persons performing the equivalent functions):(a) All significant deficiencies and material weaknesses in the design or operation of internal control over
financial reporting which are reasonably likely to adversely affect the registrant's ability to record,process, summarize and report financial information; and
(b) Any fraud, whether or not material, that involves management or other employees who have a significantrole in the registrant's internal control over financial reporting.
Date: February 26, 2021
/s/ OWEN D. THOMASOwen D. Thomas
Chief Executive Officer of Boston Properties, Inc.General Partner of Boston Properties Limited
Partnership
Exhibit 31.4
CERTIFICATION
I, Michael E. LaBelle, certify that:1. I have reviewed this Annual Report on Form 10-K of Boston Properties Limited Partnership;2. Based on my knowledge, this report does not contain any untrue statement of a material fact or omit to state a
material fact necessary to make the statements made, in light of the circumstances under which suchstatements were made, not misleading with respect to the period covered by this report;
3. Based on my knowledge, the financial statements, and other financial information included in this report, fairlypresent in all material respects the financial condition, results of operations and cash flows of the registrant asof, and for, the periods presented in this report;
4. The registrant's other certifying officer(s) and I are responsible for establishing and maintaining disclosurecontrols and procedures (as defined in Exchange Act Rules 13a-15(e) and 15d-15(e)) and internal control overfinancial reporting (as defined in Exchange Act Rules 13a-15(f) and 15d-15(f)) for the registrant and have:(a) Designed such disclosure controls and procedures, or caused such disclosure controls and procedures
to be designed under our supervision, to ensure that material information relating to the registrant,including its consolidated subsidiaries, is made known to us by others within those entities, particularlyduring the period in which this report is being prepared;
(b) Designed such internal control over financial reporting, or caused such internal control over financialreporting to be designed under our supervision, to provide reasonable assurance regarding the reliabilityof financial reporting and the preparation of financial statements for external purposes in accordance withgenerally accepted accounting principles;
(c) Evaluated the effectiveness of the registrant's disclosure controls and procedures and presented in thisreport our conclusions about the effectiveness of the disclosure controls and procedures, as of the end ofthe period covered by this report based on such evaluation; and
(d) Disclosed in this report any change in the registrant's internal control over financial reporting thatoccurred during the registrant's most recent fiscal quarter (the registrant's fourth fiscal quarter in the caseof an annual report) that has materially affected, or is reasonably likely to materially affect, the registrant'sinternal control over financial reporting; and
5. The registrant's other certifying officer(s) and I have disclosed, based on our most recent evaluation of internalcontrol over financial reporting, to the registrant's auditors and the audit committee of the registrant's board ofdirectors (or persons performing the equivalent functions):(a) All significant deficiencies and material weaknesses in the design or operation of internal control over
financial reporting which are reasonably likely to adversely affect the registrant's ability to record,process, summarize and report financial information; and
(b) Any fraud, whether or not material, that involves management or other employees who have a significantrole in the registrant's internal control over financial reporting.
Date: February 26, 2021
/s/ MICHAEL E. LABELLEMichael E. LaBelle
Chief Financial Officer of Boston Properties, Inc.General Partner of Boston Properties Limited
Partnership
Exhibit 32.1
CERTIFICATION PURSUANT TO 18 U.S.C. SECTION 1350, AS ADOPTED PURSUANT TOSECTION 906 OF THE SARBANES-OXLEY ACT OF 2002
The undersigned officer of Boston Properties, Inc. (the “Company”) hereby certifies to his knowledge that theCompany's Annual Report on Form 10-K for the period ended December 31, 2020 (the “Report”), as filed with theSecurities and Exchange Commission on the date hereof, fully complies with the requirements of Section 13(a) or15(d), as applicable, of the Securities Exchange Act of 1934, as amended, and that the information contained in theReport fairly presents, in all material respects, the financial condition and results of operations of the Company. Thiscertification shall not be deemed “filed” for any purpose, nor shall it be deemed to be incorporated by reference intoany filing under the Securities Act of 1933 or the Securities Exchange Act of 1934 regardless of any generalincorporation language in such filing.
Date: February 26, 2021
/s/ OWEN D. THOMASOwen D. Thomas
Chief Executive Officer
Exhibit 32.2
CERTIFICATION PURSUANT TO 18 U.S.C. SECTION 1350, AS ADOPTED PURSUANT TOSECTION 906 OF THE SARBANES-OXLEY ACT OF 2002
The undersigned officer of Boston Properties, Inc. (the “Company”) hereby certifies to his knowledge that theCompany's Annual Report on Form 10-K for the period ended December 31, 2020 (the “Report”), as filed with theSecurities and Exchange Commission on the date hereof, fully complies with the requirements of Section 13(a) or15(d), as applicable, of the Securities Exchange Act of 1934, as amended, and that the information contained in theReport fairly presents, in all material respects, the financial condition and results of operations of the Company. Thiscertification shall not be deemed “filed” for any purpose, nor shall it be deemed to be incorporated by reference intoany filing under the Securities Act of 1933 or the Securities Exchange Act of 1934 regardless of any generalincorporation language in such filing.
Date: February 26, 2021
/s/ MICHAEL E. LABELLEMichael E. LaBelle
Chief Financial Officer

Exhibit 32.3
CERTIFICATION PURSUANT TO 18 U.S.C. SECTION 1350, AS ADOPTED PURSUANT TOSECTION 906 OF THE SARBANES-OXLEY ACT OF 2002
The undersigned officer of Boston Properties, Inc., the sole general partner of Boston Properties LimitedPartnership (the “Operating Partnership”), hereby certifies to his knowledge that the Operating Partnership's AnnualReport on Form 10-K for the period ended December 31, 2020 (the “Report”), as filed with the Securities andExchange Commission on the date hereof, fully complies with the requirements of Section 13(a) or 15(d), asapplicable, of the Securities Exchange Act of 1934, as amended, and that the information contained in the Reportfairly presents, in all material respects, the financial condition and results of operations of the Operating Partnership.This certification shall not be deemed “filed” for any purpose, nor shall it be deemed to be incorporated by referenceinto any filing under the Securities Act of 1933 or the Securities Exchange Act of 1934 regardless of any generalincorporation language in such filing.
Date: February 26, 2021
/s/ OWEN D. THOMASOwen D. Thomas
Chief Executive Officer of Boston Properties, Inc.General Partner of Boston Properties Limited
Partnership
Exhibit 32.4
CERTIFICATION PURSUANT TO 18 U.S.C. SECTION 1350, AS ADOPTED PURSUANT TOSECTION 906 OF THE SARBANES-OXLEY ACT OF 2002
The undersigned officer of Boston Properties, Inc., the sole general partner of Boston Properties LimitedPartnership (the “Operating Partnership”), hereby certifies to his knowledge that the Operating Partnership's AnnualReport on Form 10-K for the period ended December 31, 2020 (the “Report”), as filed with the Securities andExchange Commission on the date hereof, fully complies with the requirements of Section 13(a) or 15(d), asapplicable, of the Securities Exchange Act of 1934, as amended, and that the information contained in the Reportfairly presents, in all material respects, the financial condition and results of operations of the Operating Partnership.This certification shall not be deemed “filed” for any purpose, nor shall it be deemed to be incorporated by referenceinto any filing under the Securities Act of 1933 or the Securities Exchange Act of 1934 regardless of any generalincorporation language in such filing.
Date: February 26, 2021
/s/ MICHAEL E. LABELLEMichael E. LaBelle
Chief Financial Officer of Boston Properties, Inc.General Partner of Boston Properties Limited
Partnership
Disclosures Related to Non-GAAP Financial Measures
This section contains certain non-GAAP financial measures within the meaning of Regulation G and otherterms that the Company uses in this Annual Report and, if applicable, the reasons why management believes thesenon-GAAP financial measures provide useful information to investors about the Company’s financial condition andresults of operations and the other purposes for which management uses the measures. The Company’s definitionsmay differ from those used by other companies and, therefore, may not be comparable.
The Company presents “BXP’s Share” of certain of these measures, which are non-GAAP financialmeasures that are calculated as the consolidated amount calculated in accordance with GAAP, plus the Company’sshare of the amount from the Company’s unconsolidated joint ventures (calculated based upon the Company’spercentage ownership interest and, in some cases, after priority allocations), minus the Company’s partners’ shareof the amount from the Company’s consolidated joint ventures (calculated based upon the partners’ percentageownership interests and, in some cases, after income allocation to private REIT shareholders and their share of feesdue to the Company). Management believes that presenting “BXP’s Share” of these measures provides usefulinformation to investors regarding the Company’s financial condition and/or results of operations because theCompany has several significant joint ventures and, in some cases, the Company exercises significant influenceover, but does not control, the joint venture, in which case GAAP requires that the Company account for the jointventure entity using the equity method of accounting and the Company does not consolidate it for financial reportingpurposes. In other cases, GAAP requires that the Company consolidate the venture even though the Company’spartner(s) owns a significant percentage interest. As a result, management believes that presenting BXP Share ofvarious financial measures in this manner can help investors better understand the Company’s financial conditionand/or results of operations after taking into account its true economic interest in these joint ventures. TheCompany cautions investors that the ownership percentages used in calculating “BXP’s Share” of these measuresmay not completely and accurately depict all of the legal and economic implications of holding an interest in aconsolidated or unconsolidated joint venture. For example, in addition to partners’ interests in profits and capital,venture agreements vary in the allocation of rights regarding decision making (both routine and major decisions),distributions, transferability of interests, financings and guarantees, liquidations and other matters. As a result,presentations of “BXP’s Share” of a financial measure should not be considered a substitute for, and should only beconsidered together with and as a supplement to, the Company’s financial information presented in accordance withGAAP.
Annualized Rental ObligationsMonthly contractual base rents (excluding percentage rent) and budgeted reimbursements from tenants underexisting leases, as of the last day of the reporting period, multiplied by twelve (12). These amounts exclude rentabatements.
Earnings Before Interest, Taxes, Depreciation and Amortization for Real Estate (EBITDAre)Pursuant to the definition of Earnings Before Interest, Taxes, Depreciation and Amortization for Real Estate adoptedby the Board of Governors of the National Association of Real Estate Investment Trusts (“Nareit”), the Companycalculates EBITDAre as net income (loss) attributable to Boston Properties, Inc. common shareholders, the mostdirectly comparable GAAP financial measure, plus net income attributable to noncontrolling interests, interestexpense, losses (gains) from early extinguishments of debt, depreciation and amortization expense, impairmentloss and adjustments to reflect the Company’s share of EBITDAre from unconsolidated joint ventures less gains(losses) on sales of real estate. EBITDAre is a non-GAAP financial measure. The Company uses EBITDAreinternally as a performance measure and believes EBITDAre provides useful information to investors regarding itsfinancial condition and results of operations at the corporate level because, when compared across periods,EBITDAre reflects the impact on operations from trends in occupancy rates, rental rates, operating costs, generaland administrative expenses and acquisition and development activities on an unleveraged basis, providingperspective not immediately apparent from net (loss) income attributable to Boston Properties, Inc. commonshareholders.
In some cases the Company also presents BXP’s Share of EBITDAre – cash, which is BXP’s Share of EBITDAreafter eliminating the effects of straight-line rent, fair value lease revenue and non-cash termination incomeadjustment (fair value lease amounts) and adding straight-line ground rent expense, stock-based compensationexpense and lease transaction costs that qualify as rent inducements. Presenting BXP’s Share of EBITDAre – cashallows investors to compare EBITDAre across periods without taking into account the effect of certain non-cashrental revenues, ground rent expense and stock based compensation expense. Similar to depreciation andamortization, because of historical cost accounting, fair value lease revenue may distort operating performancemeasures at the property level. Additionally, presenting EBITDAre excluding the impact of straight-line rent providesinvestors with an alternative view of operating performance at the property level that more closely reflects rentalrevenue generated at the property level without regard to future contractual increases in rental rates.
The Company’s computation of EBITDAre may not be comparable to EBITDAre reported by other REITs or realestate companies that do not define the term in accordance with the current Nareit definition or that interpret thecurrent Nareit definition differently. The Company believes that in order to facilitate a clear understanding of itsoperating results, EBITDAre should be examined in conjunction with net income attributable to Boston Properties,Inc. common shareholders as presented in the Company’s consolidated financial statements. EBITDAre should notbe considered a substitute to net income attributable to Boston Properties, Inc. common shareholders inaccordance with GAAP or any other GAAP financial measures and should only be considered together with and asa supplement to the Company’s financial information prepared in accordance with GAAP.
Net Operating Income (NOI)Refer to page 76 within the Form 10-K for an explanation of Net Operating Income (NOI) and the reasons whymanagement believes NOI provides useful information to investors about the Company’s financial condition andresults of operations and the other purposes for which management uses this measure.
In some cases, the Company also presents (1) NOI – cash, which is NOI after eliminating the effects of straight-linerent, fair value lease revenue, straight-line ground rent expense adjustment and lease transaction costs that qualifyas rent inducements in accordance with GAAP, and (2) NOI – cash, excluding termination income
Presenting NOI – cash allows investors to compare NOI performance across periods without taking into account theeffect of certain non-cash rental revenues and ground rent expenses. Similar to depreciation and amortizationexpense, fair value lease revenues, because of historical cost accounting, may distort operating performancemeasures at the property level. Additionally, presenting NOI excluding the impact of the straight-lining of rentprovides investors with an alternative view of operating performance at the property level that more closely reflectsnet cash generated at the property level on an unleveraged basis. Presenting NOI measures that excludetermination income provides investors with additional information regarding operating performance at a propertylevel that allows them to compare operating performance between periods without taking into account terminationincome, which can distort the results for any given period because they generally represent multiple months oryears of a tenant’s rental obligations that are paid in a lump sum in connection with a negotiated early termination ofthe tenant’s lease and are not reflective of the core ongoing operating performance of the Company’s properties.
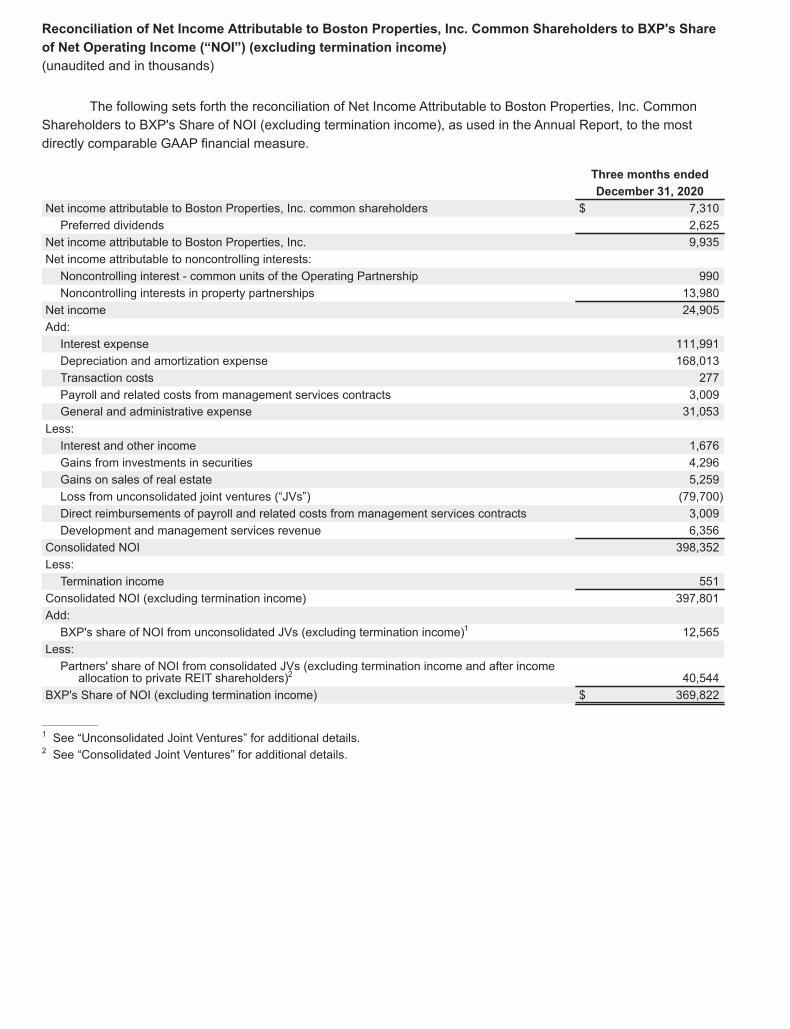
Reconciliation of Net Income Attributable to Boston Properties, Inc. Common Shareholders to BXP's Shareof Net Operating Income (“NOI”) (excluding termination income)(unaudited and in thousands)
The following sets forth the reconciliation of Net Income Attributable to Boston Properties, Inc. CommonShareholders to BXP's Share of NOI (excluding termination income), as used in the Annual Report, to the mostdirectly comparable GAAP financial measure.
Three months endedDecember 31, 2020
Net income attributable to Boston Properties, Inc. common shareholders $ 7,310Preferred dividends 2,625
Net income attributable to Boston Properties, Inc. 9,935Net income attributable to noncontrolling interests:Noncontrolling interest - common units of the Operating Partnership 990Noncontrolling interests in property partnerships 13,980
Net income 24,905Add:Interest expense 111,991Depreciation and amortization expense 168,013Transaction costs 277Payroll and related costs from management services contracts 3,009General and administrative expense 31,053
Less:Interest and other income 1,676Gains from investments in securities 4,296Gains on sales of real estate 5,259Loss from unconsolidated joint ventures (“JVs”) (79,700)Direct reimbursements of payroll and related costs from management services contracts 3,009Development and management services revenue 6,356
Consolidated NOI 398,352Less:Termination income 551
Consolidated NOI (excluding termination income) 397,801Add:BXP's share of NOI from unconsolidated JVs (excluding termination income)1 12,565
Less:Partners' share of NOI from consolidated JVs (excluding termination income and after incomeallocation to private REIT shareholders)2 40,544
BXP's Share of NOI (excluding termination income) $ 369,822
______________1 See “Unconsolidated Joint Ventures” for additional details.2 See “Consolidated Joint Ventures” for additional details.
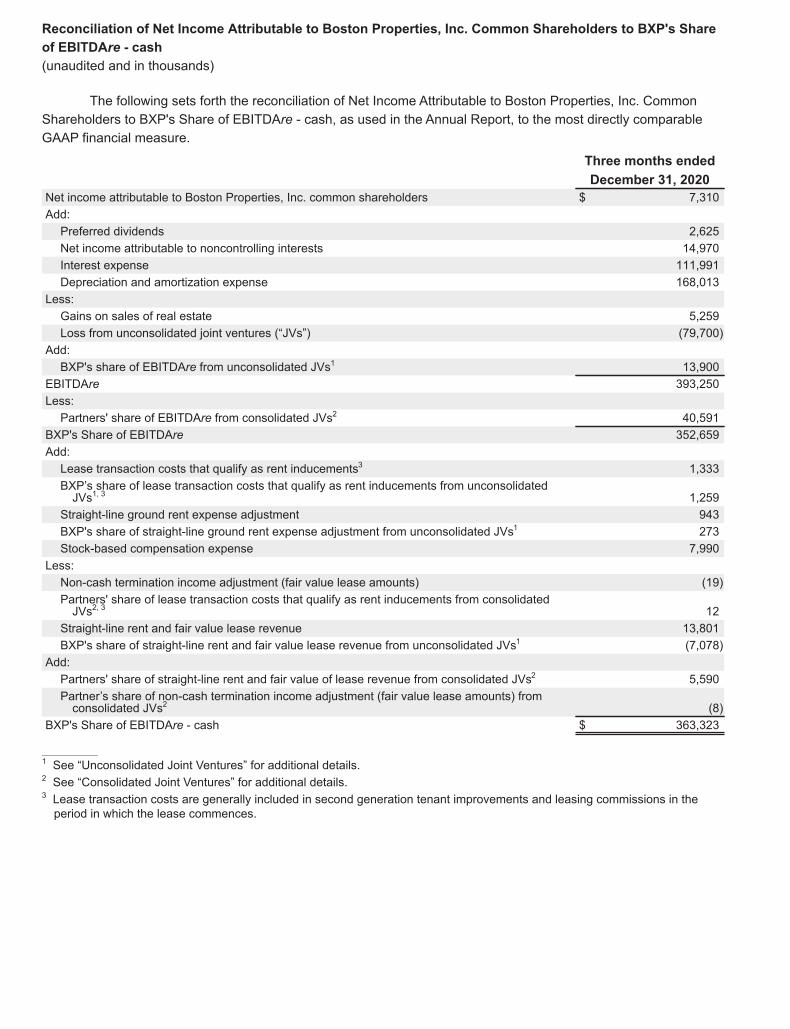
Reconciliation of Net Income Attributable to Boston Properties, Inc. Common Shareholders to BXP's Shareof EBITDAre - cash(unaudited and in thousands)
The following sets forth the reconciliation of Net Income Attributable to Boston Properties, Inc. CommonShareholders to BXP's Share of EBITDAre - cash, as used in the Annual Report, to the most directly comparableGAAP financial measure.
Three months endedDecember 31, 2020
Net income attributable to Boston Properties, Inc. common shareholders $ 7,310Add:Preferred dividends 2,625Net income attributable to noncontrolling interests 14,970Interest expense 111,991Depreciation and amortization expense 168,013
Less:Gains on sales of real estate 5,259Loss from unconsolidated joint ventures (“JVs”) (79,700)
Add:BXP's share of EBITDAre from unconsolidated JVs1 13,900
EBITDAre 393,250Less:Partners' share of EBITDAre from consolidated JVs2 40,591
BXP's Share of EBITDAre 352,659Add:Lease transaction costs that qualify as rent inducements3 1,333BXP’s share of lease transaction costs that qualify as rent inducements from unconsolidatedJVs1, 3 1,259
Straight-line ground rent expense adjustment 943BXP's share of straight-line ground rent expense adjustment from unconsolidated JVs1 273Stock-based compensation expense 7,990
Less:Non-cash termination income adjustment (fair value lease amounts) (19)Partners' share of lease transaction costs that qualify as rent inducements from consolidatedJVs2, 3 12
Straight-line rent and fair value lease revenue 13,801BXP's share of straight-line rent and fair value lease revenue from unconsolidated JVs1 (7,078)
Add:Partners' share of straight-line rent and fair value of lease revenue from consolidated JVs2 5,590Partner’s share of non-cash termination income adjustment (fair value lease amounts) fromconsolidated JVs2 (8)
BXP's Share of EBITDAre - cash $ 363,323
______________1 See “Unconsolidated Joint Ventures” for additional details.2 See “Consolidated Joint Ventures” for additional details.3 Lease transaction costs are generally included in second generation tenant improvements and leasing commissions in theperiod in which the lease commences.
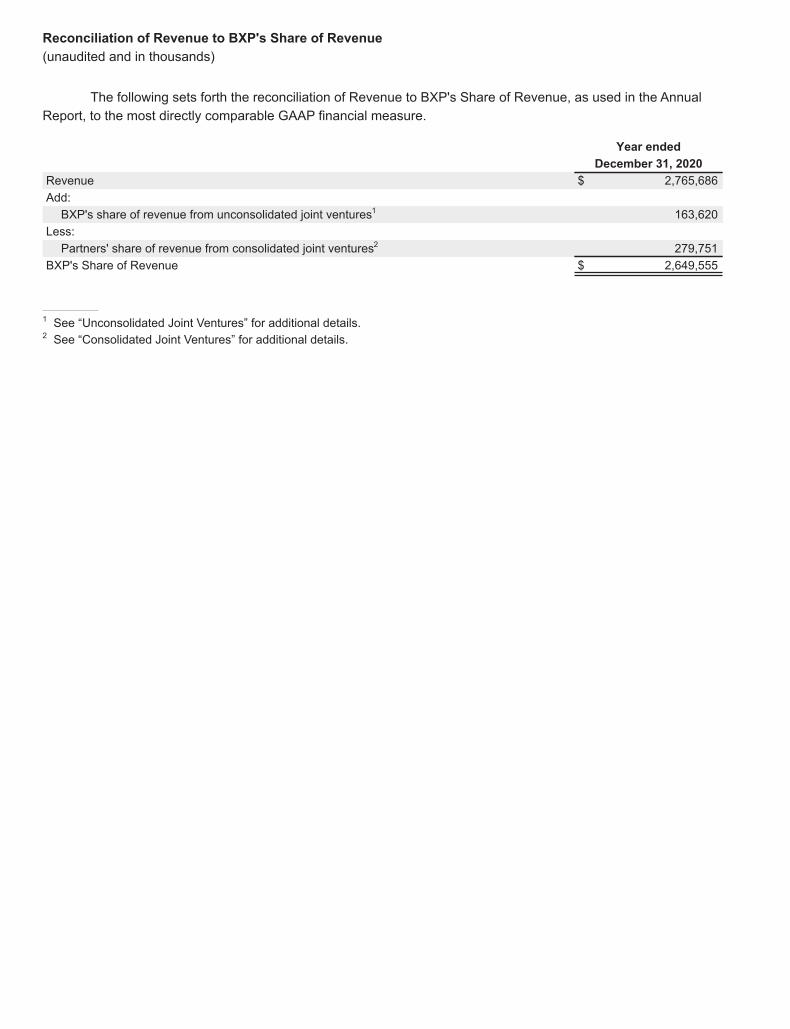
Reconciliation of Revenue to BXP's Share of Revenue(unaudited and in thousands)
The following sets forth the reconciliation of Revenue to BXP's Share of Revenue, as used in the AnnualReport, to the most directly comparable GAAP financial measure.
Year endedDecember 31, 2020
Revenue $ 2,765,686Add:BXP's share of revenue from unconsolidated joint ventures1 163,620
Less:Partners' share of revenue from consolidated joint ventures2 279,751
BXP's Share of Revenue $ 2,649,555
______________1 See “Unconsolidated Joint Ventures” for additional details.2 See “Consolidated Joint Ventures” for additional details.
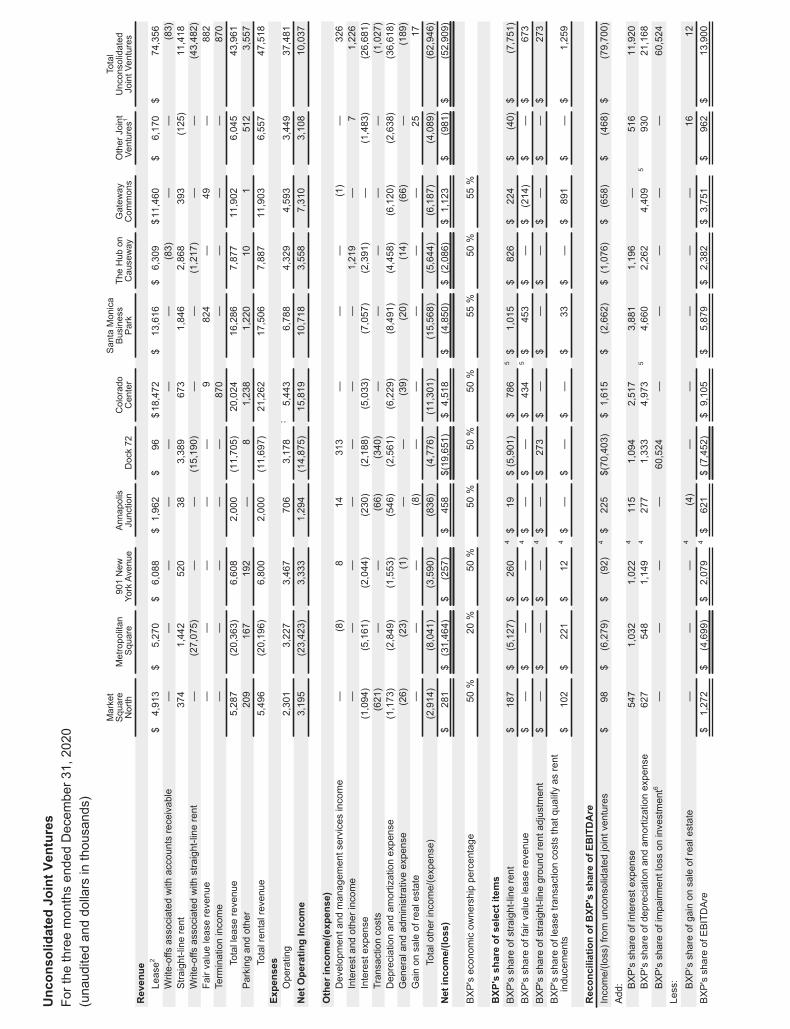
UnconsolidatedJointVentures
ForthethreemonthsendedDecember31,2020
(unauditedanddollarsinthousands)
Market
Square
North
Metropolitan
Square
901New
YorkAvenue
Annapolis
Junction
Dock72
Colorado
Center
SantaMonica
Business
Park
TheHubon
Causeway
Gateway
Commons
OtherJoint
Ventures
1
Total
Unconsolidated
JointVentures
Revenue
Lease2
$4,913
$5,270
$6,088
$1,962
$96
$18,472
$13,616
$6,309
$11,460
$6,170
$74,356
Write-offsassociatedwithaccountsreceivable
——
——
——
—(83)
——
(83)
Straight-linerent
374
1,442
520
383,389
673
1,846
2,868
393
(125)
11,418
Write-offsassociatedwithstraight-linerent
—(27,075)
——
(15,190)
——
(1,217)
——
(43,482)
Fairvalueleaserevenue
——
——
—9
824
—49
—882
Terminationincome
——
——
—870
——
——
870
Totalleaserevenue
5,287
(20,363)
6,608
2,000
(11,705)
20,024
16,286
7,877
11,902
6,045
43,961
Parkingandother
209
167
192
—8
1,238
1,220
101
512
3,557
Totalrentalrevenue
5,496
(20,196)
6,800
2,000
(11,697)
21,262
17,506
7,887
11,903
6,557
47,518
Expenses
Operating
2,301
3,227
3,467
706
3,178
35,443
6,788
4,329
4,593
3,449
37,481
NetOperatingIncome
3,195
(23,423)
3,333
1,294
(14,875)
15,819
10,718
3,558
7,310
3,108
10,037
Otherincome/(expense)
Developmentandmanagementservicesincome
—(8)
814
313
——
—(1)
—326
Interestandotherincome
——
——
——
—1,219
—7
1,226
Interestexpense
(1,094)
(5,161)
(2,044)
(230)
(2,188)
(5,033)
(7,057)
(2,391)
—(1,483)
(26,681)
Transactioncosts
(621)
——
(66)
(340)
——
——
—(1,027)
Depreciationandamortizationexpense
(1,173)
(2,849)
(1,553)
(546)
(2,561)
(6,229)
(8,491)
(4,458)
(6,120)
(2,638)
(36,618)
Generalandadministrativeexpense
(26)
(23)
(1)
——
(39)
(20)
(14)
(66)
—(189)
Gainonsaleofrealestate
——
—(8)
——
——
—25
17Totalotherincome/(expense)
(2,914)
(8,041)
(3,590)
(836)
(4,776)
(11,301)
(15,568)
(5,644)
(6,187)
(4,089)
(62,946)
Netincome/(loss)
$281
$(31,464)
$(257)
$458
$(19,651)
$4,518
$(4,850)
$(2,086)
$1,123
$(981)$
(52,909)
BXP'seconomicownershippercentage
50%
20%
50%
50%
50%
50%
55%
50%
55%
BXP'sshareofselectitems
BXP'sshareofstraight-linerent
$187
$(5,127)
$260
4$
19$(5,901)
$786
5$
1,015
$826
$224
$(40)
$(7,751)
BXP'sshareoffairvalueleaserevenue
$—
$—
$—
4$
—$
—$
434
5$
453
$—
$(214)
$—
$673
BXP'sshareofstraight-linegroundrentadjustment
$—
$—
$—
4$
—$
273
$—
$—
$—
$—
$—
$273
BXP'sshareofleasetransactioncoststhatqualifyasrent
inducements
$102
$221
$12
4$
—$
—$
—$
33$
—$
891
$—
$1,259
ReconciliationofBXP'sshareofEBITDAre
Income/(loss)fromunconsolidatedjointventures
$98
$(6,279)
$(92)
4$
225
$(70,403)
$1,615
$(2,662)
$(1,076)
$(658)
$(468)$
(79,700)
Add: BXP'sshareofinterestexpense
547
1,032
1,022
4115
1,094
2,517
3,881
1,196
—516
11,920
BXP'sshareofdepreciationandamortizationexpense
627
548
1,149
4277
1,333
4,973
54,660
2,262
4,409
5930
21,168
BXP'sshareofimpairmentlossoninvestment6
——
——
60,524
——
——
—60,524
Less: BXP’sshareofgainonsaleofrealestate
——
—4
(4)
——
——
—16
12BXP'sshareofEBITDAre
$1,272
$(4,699)
$2,079
4$
621
$(7,452)
$9,105
$5,879
$2,382
$3,751
$962
$13,900
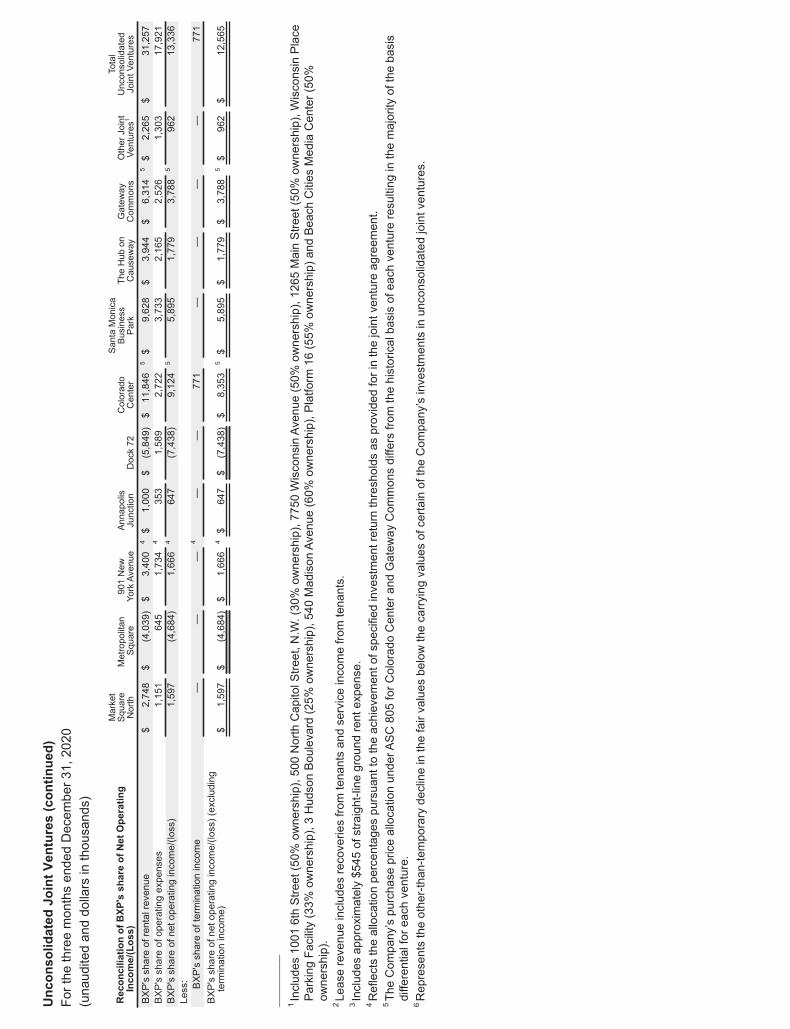
UnconsolidatedJointVentures(continued)
ForthethreemonthsendedDecember31,2020
(unauditedanddollarsinthousands)
ReconciliationofBXP'sshareofNetOperating
Income/(Loss)
Market
Square
North
Metropolitan
Square
901New
YorkAvenue
Annapolis
Junction
Dock72
Colorado
Center
SantaMonica
Business
Park
TheHubon
Causeway
Gateway
Commons
OtherJoint
Ventures
1
Total
Unconsolidated
JointVentures
BXP'sshareofrentalrevenue
$2,748
$(4,039)$
3,400
4$
1,000
$(5,849)$
11,846
5$
9,628
$3,944
$6,314
5$
2,265
$31,257
BXP'sshareofoperatingexpenses
1,151
645
1,734
4353
1,589
2,722
3,733
2,165
2,526
1,303
17,921
BXP'sshareofnetoperatingincome/(loss)
1,597
(4,684)
1,666
4647
(7,438)
9,124
55,895
1,779
3,788
5962
13,336
Less: BXP'sshareofterminationincome
——
—4
——
771
——
——
771
BXP'sshareofnetoperatingincome/(loss)(excluding
terminationincome)
$1,597
$(4,684)$
1,666
4$
647
$(7,438)$
8,353
5$
5,895
$1,779
$3,788
5$
962
$12,565
________
1Includes10016thStreet(50%
ownership),500NorthCapitolStreet,N.W.(30%ownership),7750WisconsinAvenue(50%
ownership),1265MainStreet(50%
ownership),WisconsinPlace
ParkingFacility(33%
ownership),3HudsonBoulevard(25%
ownership),540MadisonAvenue(60%
ownership),Platform16(55%
ownership)andBeachCitiesMediaCenter(50%
ownership).
2Leaserevenueincludesrecoveriesfromtenantsandserviceincomefromtenants.
3Includesapproximately$545ofstraight-linegroundrentexpense.
4Reflectstheallocationpercentagespursuanttotheachievementofspecifiedinvestmentreturnthresholdsasprovidedforinthejointventureagreement.
5TheCompany’spurchasepriceallocationunderASC805forColoradoCenterandGatewayCommonsdiffersfromthehistoricalbasisofeachventureresultinginthemajorityofthebasis
differentialforeachventure.
6Representstheother-than-temporarydeclineinthefairvaluesbelowthecarryingvaluesofcertainoftheCompany’sinvestmentsinunconsolidatedjointventures.
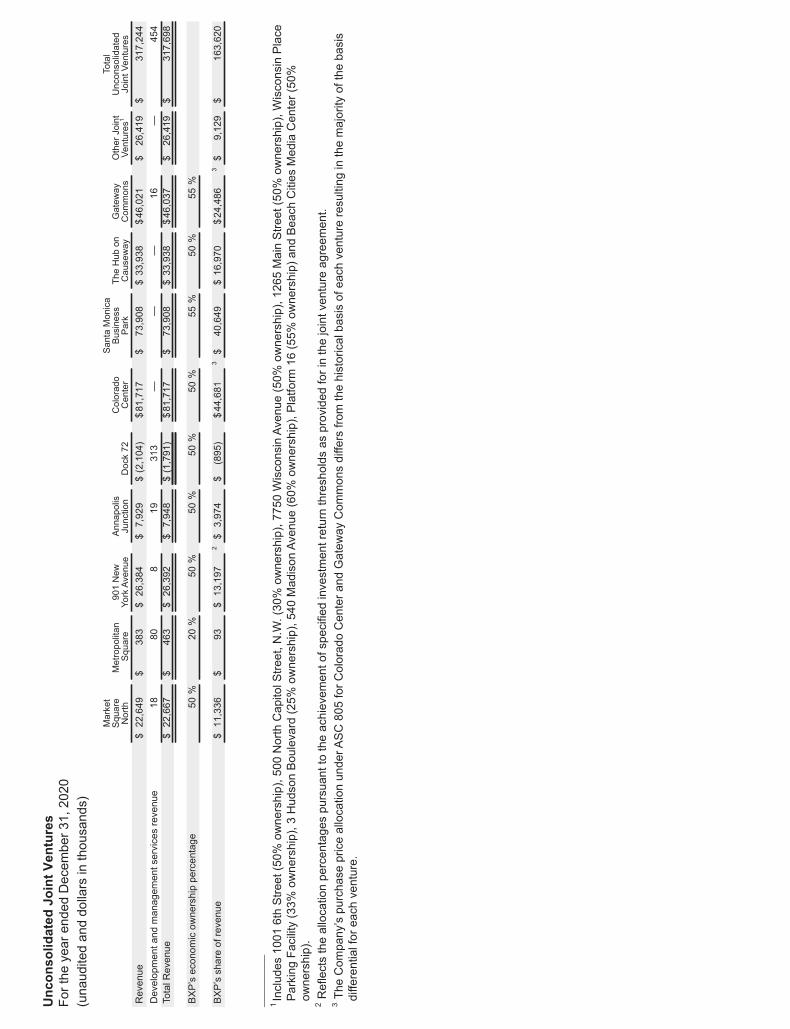
UnconsolidatedJointVentures
FortheyearendedDecember31,2020
(unauditedanddollarsinthousands)
Market
Square
North
Metropolitan
Square
901New
YorkAvenue
Annapolis
Junction
Dock72
Colorado
Center
SantaMonica
Business
Park
TheHubon
Causeway
Gateway
Commons
OtherJoint
Ventures
1
Total
Unconsolidated
JointVentures
Revenue
$22,649
$383
$26,384
$7,929
$(2,104)
$81,717
$73,908
$33,938
$46,021
$26,419
$317,244
Developmentandmanagementservicesrevenue
1880
819
313
——
—16
—454
TotalRevenue
$22,667
$463
$26,392
$7,948
$(1,791)
$81,717
$73,908
$33,938
$46,037
$26,419
$317,698
BXP’seconomicownershippercentage
50%
20%
50%
50%
50%
50%
55%
50%
55%
BXP’sshareofrevenue
$11,336
$93
$13,197
2$3,974
$(895)
$44,681
3$
40,649
$16,970
$24,486
3$
9,129
$163,620
________
1Includes10016thStreet(50%
ownership),500NorthCapitolStreet,N.W.(30%ownership),7750WisconsinAvenue(50%
ownership),1265MainStreet(50%
ownership),WisconsinPlace
ParkingFacility(33%
ownership),3HudsonBoulevard(25%
ownership),540MadisonAvenue(60%
ownership),Platform16(55%
ownership)andBeachCitiesMediaCenter(50%
ownership).
2Reflectstheallocationpercentagespursuanttotheachievementofspecifiedinvestmentreturnthresholdsasprovidedforinthejointventureagreement.
3TheCompany’spurchasepriceallocationunderASC805forColoradoCenterandGatewayCommonsdiffersfromthehistoricalbasisofeachventureresultinginthemajorityofthebasis
differentialforeachventure.
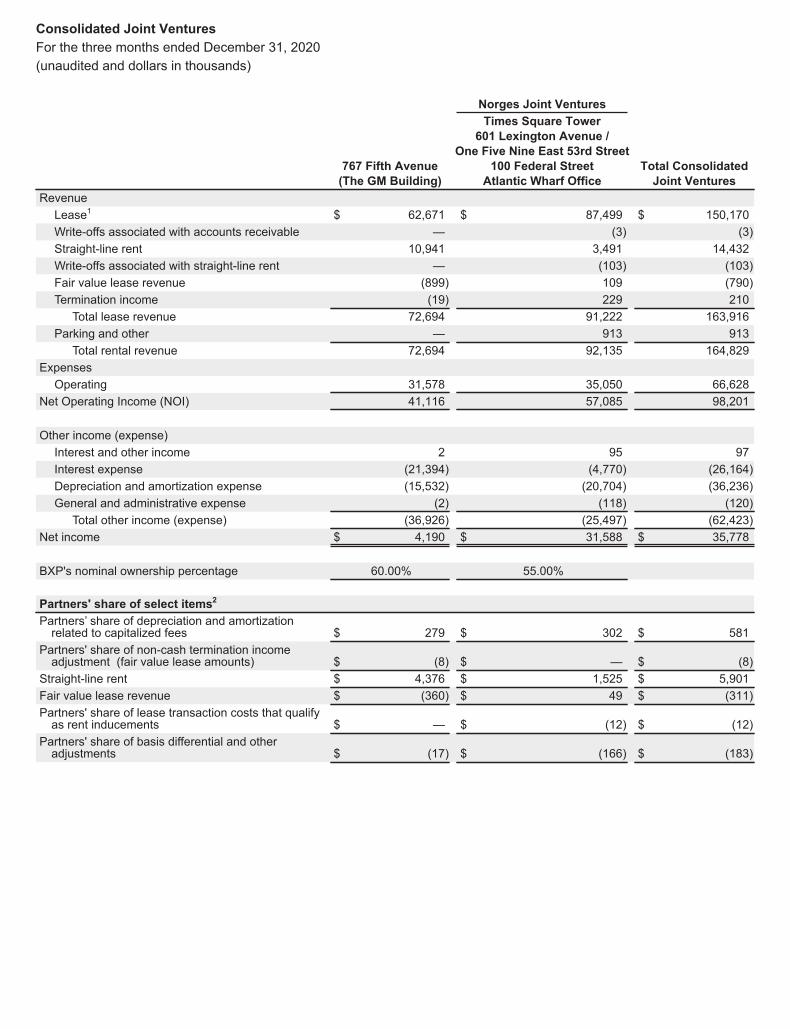
Consolidated Joint VenturesFor the three months ended December 31, 2020(unaudited and dollars in thousands)
Norges Joint VenturesTimes Square Tower601 Lexington Avenue /
One Five Nine East 53rd Street767 Fifth Avenue 100 Federal Street Total Consolidated(The GM Building) Atlantic Wharf Office Joint Ventures
RevenueLease1 $ 62,671 $ 87,499 $ 150,170Write-offs associated with accounts receivable — (3) (3)Straight-line rent 10,941 3,491 14,432Write-offs associated with straight-line rent — (103) (103)Fair value lease revenue (899) 109 (790)Termination income (19) 229 210Total lease revenue 72,694 91,222 163,916
Parking and other — 913 913Total rental revenue 72,694 92,135 164,829
ExpensesOperating 31,578 35,050 66,628
Net Operating Income (NOI) 41,116 57,085 98,201
Other income (expense)Interest and other income 2 95 97Interest expense (21,394) (4,770) (26,164)Depreciation and amortization expense (15,532) (20,704) (36,236)General and administrative expense (2) (118) (120)Total other income (expense) (36,926) (25,497) (62,423)
Net income $ 4,190 $ 31,588 $ 35,778
BXP's nominal ownership percentage 60.00% 55.00%
Partners' share of select items2
Partners’ share of depreciation and amortizationrelated to capitalized fees $ 279 $ 302 $ 581
Partners' share of non-cash termination incomeadjustment (fair value lease amounts) $ (8) $ — $ (8)
Straight-line rent $ 4,376 $ 1,525 $ 5,901Fair value lease revenue $ (360) $ 49 $ (311)Partners' share of lease transaction costs that qualifyas rent inducements $ — $ (12) $ (12)
Partners' share of basis differential and otheradjustments $ (17) $ (166) $ (183)
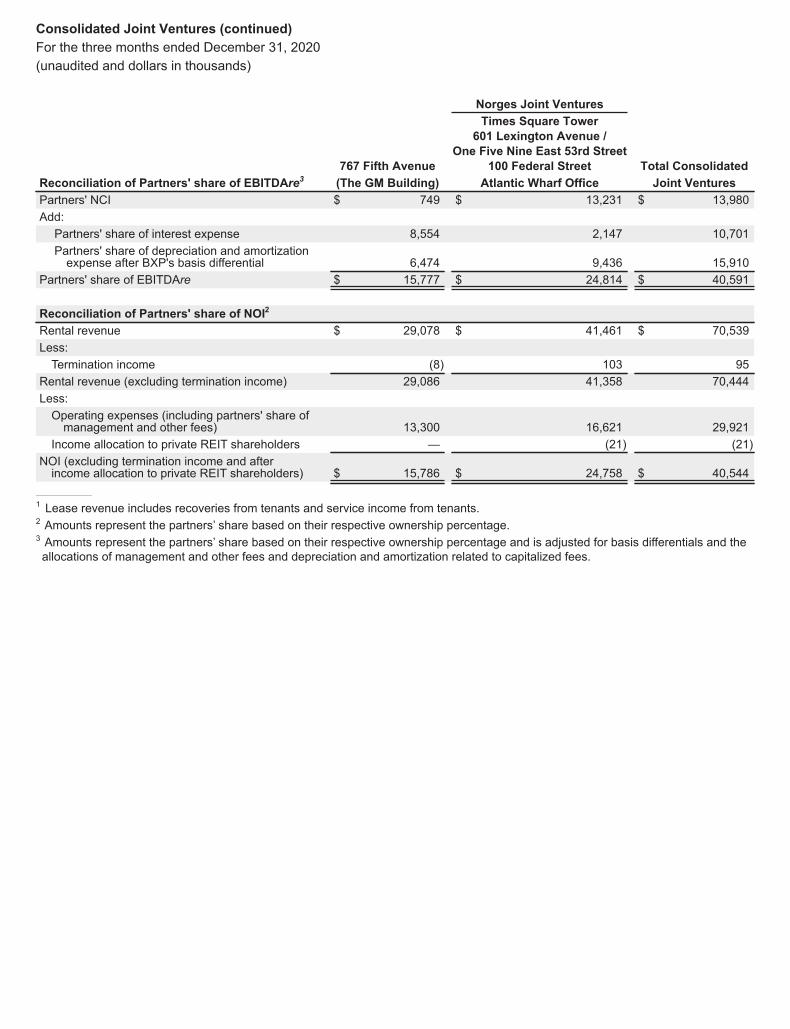
Consolidated Joint Ventures (continued)For the three months ended December 31, 2020(unaudited and dollars in thousands)
Norges Joint VenturesTimes Square Tower601 Lexington Avenue /
One Five Nine East 53rd Street767 Fifth Avenue 100 Federal Street Total Consolidated
Reconciliation of Partners' share of EBITDAre3 (The GM Building) Atlantic Wharf Office Joint VenturesPartners' NCI $ 749 $ 13,231 $ 13,980Add:Partners' share of interest expense 8,554 2,147 10,701Partners' share of depreciation and amortizationexpense after BXP's basis differential 6,474 9,436 15,910
Partners' share of EBITDAre $ 15,777 $ 24,814 $ 40,591
Reconciliation of Partners' share of NOI2
Rental revenue $ 29,078 $ 41,461 $ 70,539Less:Termination income (8) 103 95
Rental revenue (excluding termination income) 29,086 41,358 70,444Less:Operating expenses (including partners' share ofmanagement and other fees) 13,300 16,621 29,921
Income allocation to private REIT shareholders — (21) (21)NOI (excluding termination income and afterincome allocation to private REIT shareholders) $ 15,786 $ 24,758 $ 40,544
______________1 Lease revenue includes recoveries from tenants and service income from tenants.2 Amounts represent the partners’ share based on their respective ownership percentage.3 Amounts represent the partners’ share based on their respective ownership percentage and is adjusted for basis differentials and theallocations of management and other fees and depreciation and amortization related to capitalized fees.
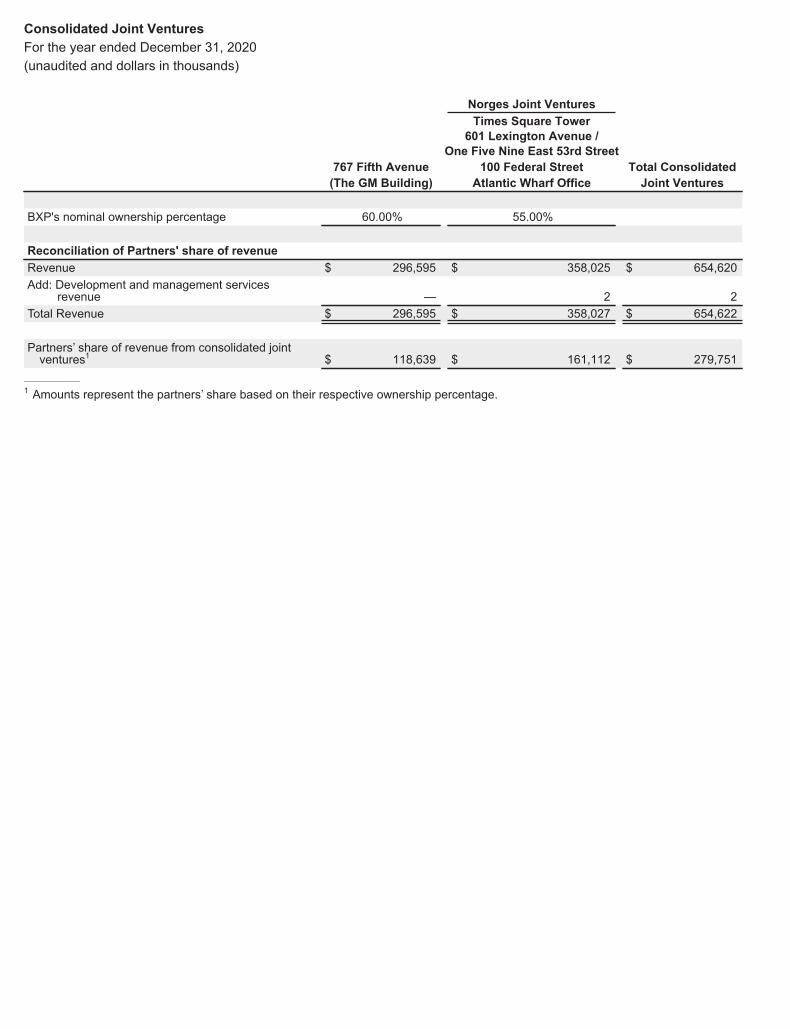
Consolidated Joint VenturesFor the year ended December 31, 2020(unaudited and dollars in thousands)
Norges Joint VenturesTimes Square Tower601 Lexington Avenue /
One Five Nine East 53rd Street767 Fifth Avenue 100 Federal Street Total Consolidated(The GM Building) Atlantic Wharf Office Joint Ventures
BXP's nominal ownership percentage 60.00% 55.00%
Reconciliation of Partners' share of revenueRevenue $ 296,595 $ 358,025 $ 654,620Add: Development and management services
revenue — 2 2Total Revenue $ 296,595 $ 358,027 $ 654,622
Partners’ share of revenue from consolidated jointventures1 $ 118,639 $ 161,112 $ 279,751
______________1 Amounts represent the partners’ share based on their respective ownership percentage.
B O STON PROPERTIE S
Corporate Information
Corporate Counsel
Goodwin Procter LLP100 Northern AvenueBoston, MA 02210
Independent Registered Public Accounting Firm
PricewaterhouseCoopers LLP101 Seaport BoulevardBoston, MA 02210
Transfer Agent and Registrar
Registered shareholders with questionsabout their account or inquiries related to our Dividend Reinvestment and Stock Purchase Plan should contact:
Computershare Trust Company, N.A.P.O. Box 505000Louisville, KY 40233(888) 485-2389www.computershare.com
Stock Information
Our common stock is listed on the New York Stock Exchange (NYSE) under the ticker symbol “BXP.” On January 31, 2021, the closing sale price per common share on the NYSE was $91.27 and there were approximately 1,108 common shareholders of record. This does not include the number of persons whose shares are held in nominee or “street name” accounts through banks or brokers. The table below sets forth the quarterly high and low sales prices and distributions per common share for fiscal year 2020.
Boston Properties is a registered trademark, and the “bxp” logo is a trademark of Boston Properties Limited Partnership.
Design: Curran & Connors, Inc. www.curran-connors.com
2020 Quarter Ended High Low Distributions
December 31 $105.98 $69.69 $0.98
September 30 $94.63 $78.41 $0.98
June 30 $107.90 $71.57 $0.98
March 31 $147.83 $77.21 $0.98
Investor Relations
Investor inquiries may be directed to:
Investor RelationsBoston Properties, Inc.800 Boylston Street, Suite 1900Boston, MA 02199(617) [email protected]
You may also contact us through ourwebsite at www.bxp.com.
The Annual Meeting of Shareholders
The annual meeting of shareholders will be heldon May 20, 2021 at 9:00 a.m. Eastern Time. TheCompany will hold the meeting via live audio web-cast. The link can be found on the investor relations section of our website at investors.bxp.comor can be joined through the following link: www.virtualshareholdermeeting.com/BXP2021. TheAnnual Meeting can be accessed by stockholdersbeginning at 8:45 a.m. Eastern Time using the16-digit control number on their proxy card, votinginstruction form or notice of internet availability.
Form 10-K
Boston Properties’ Form 10-K is incorporatedherein and has been filed with the Securitiesand Exchange Commission. Additional copies of the Annual Report and Form 10-K may beobtained from the Company free of charge bycalling Investor Relations at (617) 236-3429; or bysubmitting a request through the Contact featureon the Company’s website at www.bxp.com.
Boston800 Boylston Streetat The Prudential CenterBoston, MA 02199(617) 236-3300
Los Angeles3250 Ocean Park Blvd. Suite 300Santa Monica, CA 90405(424) 330-3200
New York599 Lexington AvenueNew York, NY 10022(212) 326-4000
San FranciscoFour Embarcadero CenterSan Francisco, CA 94111(415) 772-0700
Washington, DC2200 Pennsylvania Avenue, NWWashington, DC 20037(202) 585-0800
800 Boylston Streetat The Prudential Center Boston, MA 02199(617) 236-3300www.bxp.com