Embed Size (px)
Citation preview

H Original Research Paper 349
Chemometrics und Intelligent L.uboratov Systems, 10 (1991) 349-358
Elsevier Science Publishers B.V.. Amsterdam
Building decision rules by chemometric analysis: application to olive oil
R. Aparicio * and L. Ferreiro
Department of Expert Systems, Instituto de la Grass, Au. P. Garcia Tejero, 41012 Sevilla (Spain)
R. Leardi and M. Forina
Istituto di Analisi e Tecnologie Farmaceutiche ed Alimentari, Via Srigata Salerno, I-16147 Genova (Itab)
(Received 10 August 1990; accepted 7 November 1990)
Aparicio, R., Ferreiro, L., Leardi, R. and Forma, M., 1991. Building decision rules by chemometric analysis: application to olive oil.
Chemometrics and Intelligent Laboratory Systems, 10: 349-358.
A data set of 97 samples of olive oil characterized by 36 chemical compounds, collected in Jaen (Spain), was used to investigate
whether the information obtained by chemometric analysis of all of the variables, considered as a whole, could also be achieved by
independent and parallel studies of its subsets. Each one of the subsets introduced independent and uncorrelated information, which
can be used to build decision rules which may be implemented in expert systems.
The analytical chemist tends to use ever in- creasing numbers of chemical compounds to char- acterize or identify foods, partly due to the fact that modem analytical instrumentation can de- liver a large amount of information and partly due to the presumption that many good variables can characterize better than only a few. However, a large set of variables might be very expensive, and it would be unnecessary if, for instance, some of the variables do not bring useful information, or if there are groups of highly correlated variables.
would be a strong limitation, as compared with the possibility of building an independent decision rule for each of the subsets (here, groups of chem- ical variables) into which the whole set can be divided. The latter strategy would anyway be con- venient, though some of the decision rules may produce useful information only about a limited number of categories, or it may have a low possi- bility. Moreover, this last method allows the inclu- sion of new chemical subsets (also called frac- tions) without any alteration to the decision rules already built and the application of artificial intel- ligence (AI) tools to the set of rules [l].
From the expert systems point of view, the use Several studies have shown that the geographic of the complete set of variables as a unity will origin of olive oil can be revealed using either eventually produce a single decision rule. This chemometrics [2,3] or possibility theory [4,5]. A
0169-7439/91,‘$03.50 0 1991 - Elsevier Science Publishers B.V.

350 Chemometrics and Intelligent Laboratory Systems n
previous paper, analyzing olive oil samples of Jaen using factor analysis [S], demonstrated that there is a strong correlation between the chemical com- position and the geological structural units of Jaen province, i.e. the Guadalquivir river depression and two groups of mountain ranges (Betica and Morena) that flank its southern and northern sides on two divergent lines.
ples were collected from different cooperatives throu~out the province of Jaen and each one is the average representation of the olive oil pro- duced by that cooperative in the 1988 crop.
In this study, the authors use a chemomet~c approach to investigate whether the global infor- mation represented by the total data set can be reproduced by summing the information pre- sented by different subsets of variables. As al- ready stated, this could lead to several decision rules, with the great advantage that even samples which lack one or more subsets could be subjected to the classification process.
Every sample is described by 36 chemical varia- bles, grouped into five series of chemical com- pounds (fatty acids, methylsterols, sterols, aliphatic alcohols and triterpenic alcohols), plus squalene, oleanic aldehyde, phytol and eritrodiol (Table 1).
This hypothesis is applied to the samples of extra virgin olive oil collected in the province of Jaen (Andalusia) from 97 different cooperatives. This province has been selected because in it the various factors influencing the characteristics of the oil (e.g. olive variety, climate, soil etc.) are supposed to be highly homogeneous. With those conditions, no fraction has an initial weight which is greater than the other ones, which presumably would not occur if there were more than one variety, or quite different soils and climates [S].
All of the chemical parameters were measured by gas chromatography using a variety of proce- dures [5]. Thus, fatty acids have been measured as their methyl esters produced by inter-esterification, neutralization and subsequent methylation using a solution of HCl in methanol. A solution of water saturated with NaCl was then added and the final solution was extracted with hexane. The organic phase was analyzed by a Perkin-Elmer Sigma2 gas chromatograph (EGS 2.5%, Chromosorb W 80- 100, 2 m X 2 mm). An equal response factor was considered for the whole set of fatty acids.
According to this situation of general homo- geneity, the province of Jaen is supposed to be a good test to verify the proposed hypothesis without having to deal with cross-dependences among dif- ferent series of chemical compounds (fractions), due to the influence of various combinations of different factors on each sample.
The other variables were determined by saponification of the oils, fractionation by pre- parative thin-layer chromatography (TLC) on a silica gel layer (0.5 mm) of the unsaponifiable matter using n-hexane/ethyl acetate (85 : 15, v/v) as developer. Three large bands were removed from the TLC plate, the first one containing tri- terpenic alcohols and a part of the phytol and aliphatic alcohols, the second one contai~ng the rest of the phytol and aliphatic alcohols, methyl- sterols and hydroxyaldehyde-triterpene, and the third one containing sterols and erythrodiol.
Of course, on such a basis, no spectacular re- sults can be attained, but the satisfying findings already obtained easily allow us to suppose that in a less difficult situation the combination of several decision rules based on subsets of variables could lead to very satisfying conclusions.
The three separated bands and the fractions recovered from them were extracted separately with isopropyl ether; the solutions were silanized with a mixture of pyridine, hexamethyldisilane and trimethylchlorosilane (9 : 3 : 1) and indepen- dently analyzed by two Hewlett-Packard 5670 gas chromatographs (methylphenylsilicone HP-5, cap- illary column 25 m X 0.3 mm).
EXPERIMENTAL
Data
The phytol and aliphatic alcohol contents were determined by adding the data of the first and second portions, using the cholestane peak as weight, and quantifying the results with heneico- sane.
A data set obtained from 97 samples of Spanish Triterpenic alcohols, methylsterols and hy- extra virgin olive oil was examined. The sam- droxyaldehyde-triterpene were also quantified with

n Original Research Paper 351
TABLE 1
Chemical variables and reference numbers
Fatty acids:
Palmitic acid (1)
Palmitoleic acid (2)
Margaric acid (3)
Margaroleic acid (4)
Stearic acid (5)
Oleic acid (6)
Linoleic acid (7)
Linolenic acid (8)
Arachidic acid (9)
Gadoleic acid (10)
Behenic acid (11)
Terpenic hydrocarbons:
Squalene (12)
Methylsterols:
Obtusifoliol(l3)
Unknown (14)
Gramisterol (IS)
Cycloeucalenol(16)
2CEthyllophenol(17)
Citrostadienol(18)
Triterpenic hydroxyaldehydes:
Oleanic aldehyde (19)
Diterpenic alcohols:
Phytol(20)
Triterpenic dialcohols:
Erythrodiol(21)
Aliphatic alcohols:
Docosanol(22)
Tetracosanol(23)
Hexacosanol(24)
Octacosanol(25)
Sterols: Campesterol(26)
6-5-Avenasterol(27)
/3Sitosterol(28)
Stigmasterol(29)
Triterpenic alcohols:
Taraxerol(30)
Dammaradienol(31)
~-A~~ne (32)
Butyrrospermol(33)
24-Methylene-24dihydrolanosterol(34)
Cycloartenol(35)
2~methylene-cyclo~t~ol(36)
heneicosane, whilst sterols and erythrodiol were quantified with betuline.
Besides the chemical data, in order to obtain a better interpretation of the results, other variables from the SEXIA database have also been taken into account, such as altitude, soils and olive varieties.
RESULTS AND DISCUSSION
The data processing was performed by the PARVUS package [6]; the graphical output was obtained using AUTOCAD [7].
All the variables have an almost normal distri- bution, so that no transformation had to be ap- plied to the data.
After normalization by autoscaling (column centering and column standardization), the eigen- vectors of the covariance generalized matrix have been computed (Table 2 shows the variance ex- plained by each eigenvector). Cross-validation 181, repeated three times with different cancellation matrices, always detected five significant compo- nents, explai~ng 68.6% of the total variance.
A cluster analysis has been performed in order to determine whether the objects of the data set could be divided into subgroups. Due to the high correlations present among some of the variables, the original data were considered to be unsuitable for the production of unbiased results, and the scores of the five significant eigenvectors were then taken into account.
TABLE 2
Variance explained by the first eigenvectors
Eigenvector Variance 1%) Cumulative variance (S)
1 26.3 26.3 2 16.4 42.7 3 12.9 55.5 4 7.7 63.2 5 5.4 68.6 6 4.0 72.6

352 Chemometrics and Intelligent Laboratory Systems w
0.0
0.1
0.2
0.6
0.7
0.8
r-
i
Fig. 1. Dendrogram of the 97 samples performed on the scores of the 5 significant eigenvectors (Euclidean distance, average distance,
unweighted).
A hierarchical clustering technique was used [9]; the similarity matrix was computed on the basis of the Euclidean distance between the scores of the objects in the five-dimensional space spanned by the significant eigenvectors, and the
0% q o “,@I
%O G3 a
,- ,-
m
_. . i
Fig. 2. Scores of the objects on eigenvector I-eigenvector 2 plane (42.7% of total variance). The symbol shows the cluster
to which the object belongs.
objects were clustered by the average linkage method (unweighted pair group).
The dendrogram of Fig. 1 shows that, at a similarity level of 0.55, five clusters are detected. Fig. 2 shows the scores of the objects in the plane of the two first eigenvectors (42.6% of total vari-
Fig. 3. Loading plot on eigenvector I-eigenvector 2 plane
(variables have the number reported in Table 1).

n Original Research Paper 353
Fig. 4. Map of the province of Jaen according to the cluster analysis. The colour of the zone shows the cluster to
belongs.
which the
ante), whose plot of loadings is reported in Fig. 3; from these plots it is evident that the two main clusters are well separated on eigenvector 1, com- posed almost exclusively of the fatty acids.
To understand whether this division is some- how correlated with the geographical location of the samples, a map of the province was obtained, on which the producing zones were marked. From it (Fig. 4), one can see that the objects of the different clusters follow a quite ‘logical’ pattern, with the zones of the two main clusters placed in quite well-defined areas.
The raw varimax rotation of loadings per- formed on the five significant eigenvectors pro- duced quite an interesting result, since each of the varivectors obtained is made up almost exclusively of the variables of a single chemical group: vari- vector 1 by fatty acids, varivector 2 by erythrodiol and saturated aliphatic alcohols, varivector 3 by
triterpenic alcohols, varivector 4 by methylsterols, and varivector 5 by sterols (Fig. 5).
This is very important for the goal of the pres- ent work, since, as the varivectors are uncorre- lated, it means that several independent classifica- tion rules could be prepared.
Principal components analysis was then per- formed on each of these five groups of variables separately; for every subset only one significant eigenvector has been detected, and the scores on it have been reported on the map of the province, according to a chromatic scale going from blue to red [3]. This method also allows one to determine, by observing whether the scores follow a well-de- fined pattern or are randomly distributed, the groups of variables which are really meaningful in order to reach a good classification.
Fig. 6 (fatty acids) displays two large zones: the first one, at the western side of the province, close

354 Chemometrics and Intelligent Laboratory Systems I

n Original Research Paper 355
Fig. 6. Scores on eigenvector 1 after principal components analysis on fatty acids: pure blue = low content c
red = high content of oleic acid. If oleic acid, pure
to the border with Cordoba, is characterized by low content of oleic acid, while the other one, corresponding to a central-eastern zone called La Loma plus a small area of Cazorla and Condado, has a high content of oleic acid.
To explain the difference between the two areas, it can be said that in the western zone the ratio between oleic and linoleic acids is close to that characterizing the oils from Cordoba, in which there is a mixture of varieties, including picual. This hypothesis of varietal dishomogeneity would also explain the presence of an area with low content of oleic acid in the north of the province, near Albacete province, where the mix of tree varieties is not quite the same as the rest of the province.
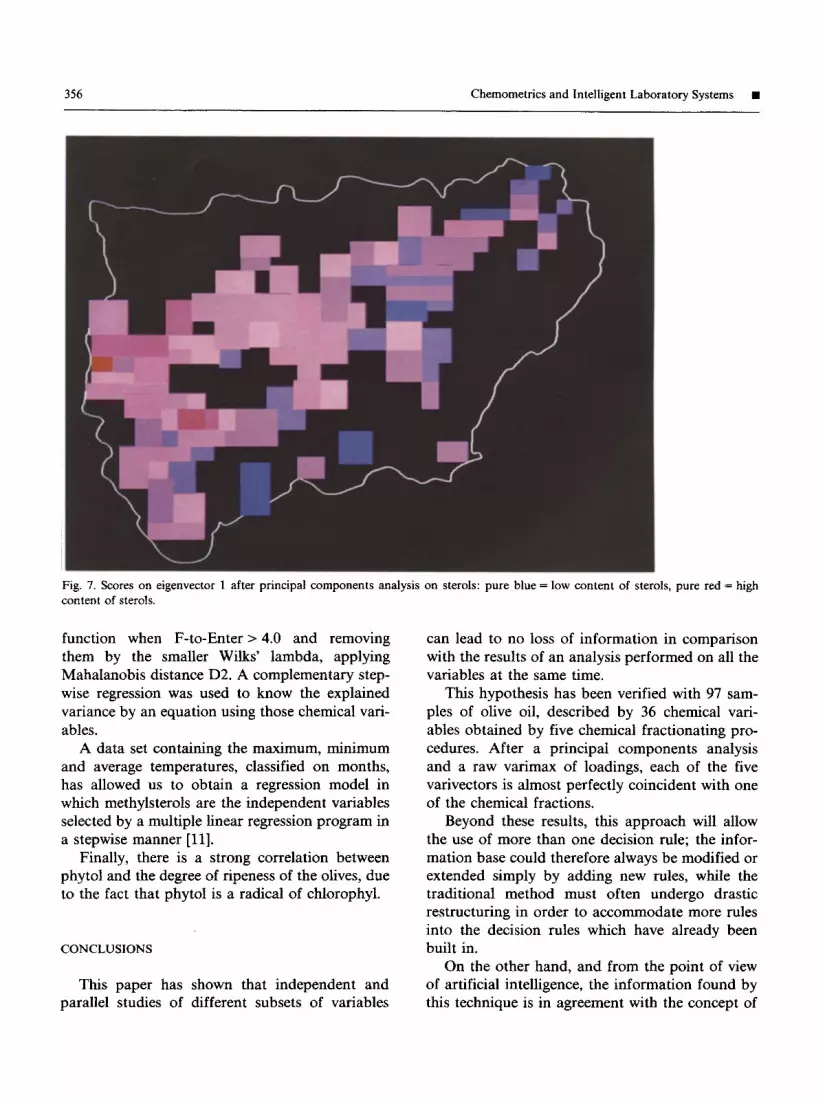
Fig. 7 shows that sterols are highly correlated with the relief of the province, since the highest content of sterols can be found in the samples obtained from the lowest zones. So it can be seen
that the samples collected in the hills, the Betica and Calderon mountain ranges, have a lower con- tent of sterols than those from the plateau or from zones near the Guadalquivir river.
To support this impression, a map of the pro- vince has been prepared in which the altitude is the variable which is taken into account (Fig. 8). From the comparison of the two maps, the corre- lation between sterols and altitude appears very evident.
Other kinds of information can be introduced by the other series [5]. Aliphatic alcohols are strongly correlated with the system used to obtain olive oil (oil mill or centrifugation). There was a correct prediction of 79.2% of the production sys- tems (jackknife method) by a canonical equation whose variables are tetracosanol and hexacosanol [lo]. The equation was indicated by a stepwise discriminant analysis program with the following options: entering variables into the classification
356 Chemometrics and Intelligent Laboratory Systems H
Fig. 7. Scores on eigenvector 1 after principal components analysis on sterols: pure blue = low content of sterc
content of sterols.
)ls, pure 1 .ed =
function when F-to-Enter > 4.0 and removing them by the smaller Wilks’ lambda, applying ~ahal~obis distance D2. A complements step- wise regression was used to know the explained variance by an equation using those chemical vari- ables.
A data set containing the maximum, minimum and average temperatures, classified on months, has allowed us to obtain a regression model in which methylsterols are the independent variables selected by a multiple linear regression program in a stepwise manner [ll].
Finally, there is a strong correlation between phytol and the degree of ripeness of the olives, due to the fact that phytol is a radical of chlorophyl.
CONCLUSIONS
This paper has shown that independent and parallel studies of different subsets of variables
can lead to no loss of information in comparison with the results of an analysis performed on all the variables at the same time.
This hypothesis has been verified with 97 sam- ples of olive oil, described by 36 chemical vari- ables obtained by five chemical fractionating pro- cedures. After a principal components analysis and a raw varimax of loadings, each of the five varivectors is almost perfectly coincident with one of the chemical fractions.
Beyond these results, this approach will allow the use of more than one decision rule; the infor- mation base could therefore always be modified or extended simply by adding new rules, while the traditional method must often undergo drastic restructuring in order to accommodate more rules into the decision rules which have already been built in.
On the other hand, and from the point of view of artificial intelligence, the information found by this technique is in agreement with the concept of

n Original Research Paper 35-l
Fig. 8. Altimetric map: pure blue = highest zones, pure red = lowest zones.
elemental information cells (distributed informa- tion) on which the new expert systems work. This is the case with SEXIA, an expert system that operates with the information deduced from this kind of decision rules.
ACKNOWLEDGEMENTS
This research was supported in part by Anda- lusia grant OF.A6-871, CICYT-SPAIN ALI88- 0187CO202 and CSIC-SPAIN/CNR-ITALY Commission.
REFERENCES
1 E. Char&k and D. McDermott, Introduction to Artificial Intelligence, Addison-Wesley, Reading, 1985.
2 M. Forma and E. Tiscomia, Pattern recognition methods in
the prediction of Italian olive oil origin by their fatty acid
content, Annaii di Chimica, 72 (1982) 143-155. 3 C. Armanino, R. Leardi, S. Lanteri and G. Modi, Chem-
ometric analysis of Tuscan olive oils, Chemometrics and
Intel&gent Laboratoty Systems, 5 (1989) 342-354. 4 R. Aparicio, Characterization of foods by inexact rules: the
SEXIA expert system, Journal of Chemometrics, 3 (1988) 175-192.
5 R. Aparicio, L. Ferreiro and J.L. Rodriguez, Characteriza-
tion of Andalusian virgin olive oils, Agficulture Ministry of
Andalusia, Sevilla, 1990 (in Spanish).
6 M. Forma, R. Leardi, C. Armanino and S. Lanteri,
PARVUS: An Extendable Package of Programs for Data Expioration, Ciassification and Correlation, Elsevier Scien-
tific Software, Amsterdam, 1988.
7 AUTOCAD, Autodesk AG, Version 2.6.44 IBM PC, Ad-
vanced Drafting Extension 3. 8 S. Wold, Cross validatoty estimation of the number of
components in factor and principal components models,
Technometrics, 20 (1978) 397406. 9 D.L. Massart and L. Kaufman, Hierarchical clustering
methods, in J.D. Winefordner (Editor), The Interpretation

358 Chemometrics and Intelligent Laboratory Systems m
of Analytical Chemical Data by the Use of Cluster Analysis, Wiley, New York, 1983, pp. 75-99.
10 R. Aparicio, M. Sncha and M. Ferreiro, A statistical study of the influence of the extraction methods on the chemical composition of virgin olive oil, Grams y Aceites, 42, No. 5 (1991) in press.
11 L. Ferreiro and R. Aparicio, Influence of attitude on the chemical composition of virgin olive oil, Grasas y Aceites, 43 (1992) in press.


