Embed Size (px)
Citation preview

UNIVERSITY OF CALIFORNIA, SAN DIEGO
Building Futures Markets: Infrastructure and Outcome on the Chicago Board of Trade
and New Orleans Cotton Exchange, 1856-1916
A dissertation submitted in partial satisfaction of the
requirements for the degree Doctor of Philosophy
in
Sociology
by
David L. Pinzur
Committee in Charge:
Professor Akos Rona-Tas, Chair
Professor Isaac W. Martin, Co-Chair
Professor Richard Biernacki
Professor Martha Lampland
Professor Juan Pablo Pardo-Guerra
Professor Krislert Samphantharak
2017


iii
The Dissertation of David L. Pinzur is approved, and it is acceptable in quality and
form for publication on microfilm and electronically:
Co-chair
Chair
University of California, San Diego
2017

iv
DEDICATION
To my parents, with love and gratitude.

v
TABLE OF CONTENTS
Signature Page………………………………………………………………................. iii
Dedication…………………………………………………………………………….... iv
Table of Contents……………………………………………………………………….. v
List of Abbreviations…………………………………………………………………... vi
List of Figures…………………………………………………………………………. vii
List of Tables…………………………………………………………………………. viii
Acknowledgements……………………………………………………………….......... ix
Vita…………………………………………………………………………………..…. xii
Abstract of the Dissertation………………………………………………………….... xiii
Introduction- Building Futures Markets………………………………………………... 1
Chapter 1 – CBOT, NOCE, and the Birth of Futures……………………….……….... 19
Chapter 2 – Information and Infrastructure…………………………………………… 46
Chapter 3 – Constructing Grades………………………………………..…………….. 68
Chapter 4- Moving Information………………………………..…………………….. 107
Chapter 5 – Valuing Futures ……….………………………………………………... 148
Conclusion- Infrastructure and Outcome ………..…………………………………... 177
Appendix A- Glossary of Economic Terms …..……………………………………... 190
Appendix B – Monthly high and low prices of wheat and cotton on CBOT &
NOCE………………………………………………………………………………… 194
References……………………………………………………………………………. 208
vi
LIST OF ABBREVIATIONS
CBOT Chicago Board of Trade
NCE National Cotton Exchange
NOCE New Orleans Cotton Exchange
RWC Illinois Railroad and Warehouse Commission

vii
LIST OF FIGURES
Figure 1. Intra-month commodity price volatility, September 1870 – August 1913…….. 7
Figure 2. Intra-month price volatility, total months (N=516)……………………………. 7
viii
LIST OF TABLES
Table 1. Orientation and infrastructural needs of hedging and speculation……………. 12
Table 2. Variation in standards for white winter wheat (1905-1906)…………………... 83
ix
ACKNOWLEDGEMENTS
I have leaned on many people over the past eight years, and it has been their
support that brought me to this point. Akos Rona-Tas has been a kind and patient Chair,
whether regularly meeting for coffee to check in on the progress of my work or pushing
me to think big when I am more comfortable inhabiting a cozy intellectual nook. Juan
Pablo Pardo-Guerra has offered invaluable guidance over the past year, and has given me
the confidence to sharpen my arguments and get into the fray. Isaac Martin has always
been curious, supportive, and skeptical—an admirable trio if ever there was one. Martha
Lampland has displayed boundless enthusiasm for my work and was instrumental in its
earliest formulation. Rick Biernacki has served as a model of how to combine rigorous
analytical thinking with academic humility, a rare combination which I can only strive
toward. Finally, Krislert Samphantharak has provided another rare combination –
economic expertise and appreciation for sociological analyses of markets.
Other faculty have given generously of their time and knowledge. I could not
have asked for a better mentor for teaching Classical Sociological Theory than Harvey
Goldman. Jeff Haydu gladly met to discuss this dissertation when it was only in
embryonic form, too slight to even be brought to my Chair. Amy Binder helped to hold
me accountable for producing work in this final year, for which I am forever in her debt.
Heidi Keller-Lapp shared with me her expertise in teaching and has gone beyond the call
of duty in supporting my own work in the classroom.
It has been my friends and fellow graduate students, though, who have offered
the bulk of the intellectual and personal support I needed to complete this research. Greg
x
and Ruth Lestikow made the move to San Diego easy, as did Dan Brown, Mia Calamia,
and Zev Arnold in New Orleans (and any list of roommates would not be complete
without my writing buddy of the past five years, my cat Sadie). Waqas Butt, Andrew
Somerville, Gary Lee, and Tad Skotnicki proved the most stimulating pizza-eating
companions one could ever hope for. Aaron Marquette, Jennifer Nations, Kelly Nielsen,
Tad Skotnicki, Rachel Soper, Alexandra Vinson and Stacy Williams offered both
friendship and critical comments on my written work. Equally importantly, April Huff,
Jon Shafran, Norissa Gastelum, and Kris Jorgensen never required me to send them a
single paper! Kelly Nielsen and Joan Donovan were my first good friends in San Diego.
They, along with their spouses and children, have been a constant and valued part of my
life here.
Eileen Levinson has been a non-stop cheerleader for me over the past year and a
half. She never fails to bring a smile to my face. Her support and understanding during
this time when I have been busy, distracted, and overloaded have picked me up when I
was down many times. Emily Pinzur has always been my closest confidante and the past
eight years have been no exception. I count myself lucky to have had her support my
whole life, and to have had her as a San Diego pal for the last five years. Finally, my
parents Mark and Maxine have provided boundless love and support. They always
encouraged me to be myself and saw value in my decisions. I would not be where I am
today without them.
Chapter 3, in part, is a reprint of the material as it appears in: Pinzur, David. 2016.
“Making the Grade: Infratructural Semiotics and Derivative Market Outcomes on the
Chicago Board of Trade and New Orleans Cotton Exchange, 1856-1909.” Economy &

xi
Society, 45(3-4): 431-453. The dissertation author was the sole researcher and author on
this paper.

xii
VITA
2002 Bachelor of Arts, Washington University, Saint Louis
2011 Master of Arts, University of California, San Diego
2017 Doctor of Philosophy, University of California, San Diego

xiii
ABSTRACT OF THE DISSERTATION
Building Futures Markets: Infrastructure and Outcome on the Chicago Board of Trade
and New Orleans Cotton Exchange, 1856-1916
by
David L. Pinzur
Doctor of Philosophy in Sociology
University of California, San Diego, 2017
Professor Akos Rona-Tas, Chair
Professor Isaac Martin, Co-Chair
Derivative financial instruments figure prominently in the modern global
economy, but their modern origins date back to the use of agricultural futures contracts in
the mid-19th century. This dissertation analyzes the construction of markets in futures
contracts during this period on two exchanges—the Chicago Board of Trade and New

xiv
Orleans Cotton Exchange. Building these markets posed a unique problem. Unlike extant
markets, which could operate autonomously, futures markets had to be constitutively
linked with a second underlying market in order to work (e.g., a market in cotton futures
linked with an underlying market in cotton itself). Making this linkage required creating
infrastructural connections—with institutional, material, and cognitive components—that
would allow the two markets to work in concert. Infrastructures had to support an
environment in which traders on the futures market could incorporate spot market
information into intentionally rational decisions.
The Chicago Board of Trade and New Orleans Cotton Exchange built their
infrastructures differently. This dissertation asks two questions about this divergence:
What factors caused the infrastructure on each exchange to take the shape it did? And,
what consequences did these infrastructures have for market behavior? I answer these
questions through analyzing the construction and impact of three critical infrastructural
features: (1) the classification schemes by which spot commodities were assigned grades;
(2) the material means of gathering and disseminating data, both statistics on the growth
and movement of the spot crop, as well as price quotations from global markets; (3) the
economic and cultural theories by which traders understood the nature of speculation in
futures and its effect on spot markets. I find that the characteristics of these infrastructural
elements were shaped less by any uniform concern with efficiency or fairness and more
by the distinct economic, cultural, political, and organizational environments on each
exchange. Additionally, I suggest that these distinct infrastructures promoted different
types of trading on each market—high-risk speculation in Chicago and low-risk hedging

xv
in New Orleans—which contributed to the divergent price volatility on these markets
during the period of my research.
1
Introduction – Building Futures Markets
In the period of American history between the Civil War and the First World War,
markets in agricultural futures contracts became integral to the global commodity trade
(Hieronymus 1977; Hoffman 1932). Futures contracts are fairly simple derivative
instruments that bind two parties to a transaction for a particular class of goods, at a
designated future date and price—e.g., a contract made in mid-March might specify the
sale of 500 bushels of #1 spring wheat at a price of $1 per bushel at some time in June.1
These contractual obligations were then traded on the futures markets. The trader above
who bought a contract for spring wheat could easily transfer his obligation by simply
selling a contract for the same commodity in the same amount. Standardization of
commodities and contractual terms enabled an active, year-round market of people
trading obligations to buy or sell agricultural commodities at a future date.
Futures markets solved two major problems that had previously plagued the
marketing of agricultural commodities (Santos 2002; Working 1953). First, they evened
out cyclical fluctuations in supply and, thus, price. Before the advent of futures markets,
spot market prices would rise and fall dramatically in concert with the seasons: at
harvest time, a burst of supply would drive prices down, and the opposite occurred during
the planting and growing seasons. With futures markets, farmers and middlemen had a
year-round market of speculators ready to commit to buying the commodities, often even
before they were out of the ground. Second, futures market removed much of the risk
1 Economic terms in bold are defined in the Glossary, Appendix A.

2
associated with storing commodities. Prior to futures markets, middlemen faced the
possibility that market prices would drop between the time at which they bought and
when they sold. Futures markets solved this problem, allowing them to reliably find
buyers quickly after coming into possession of their goods. While storage still had certain
other costs, the risk of a significant price drop was mitigated.
In these ways, futures markets revolutionized the worldwide marketing of
agricultural commodities. But, critically, they did not do so simply by establishing a new
market that operated as a more efficient, independent entity for buying and selling goods,
but by tethering the new market to an existing one to create a more efficient system. Spot
markets trade commodities, while futures markets trade promises to exchange those
commodities. Together, they create a powerful system for mobilizing capital and
marketing commodities. I describe this relation as a constitutive linkage between markets.
This linkage did not emerge naturally or simply; it required the active construction of
institutional, material, and cognitive connections between spot and futures markets.
Tasked with making this connection, two of the earliest exchanges in the United States to
create futures markets for agricultural goods—the Chicago Board of Trade (CBOT) and
the New Orleans Cotton Exchange (NOCE)—took different paths. This divergence, its
causes and its effects, are the topics of this dissertation.
In this dissertation I conceptualize the connection between spot and futures
markets as an infrastructure enabling their co-functioning. Infrastructure is a concept with
roots in science and technology studies that is beginning to be applied in sociological
studies of markets. It refers to the systems, technologies, standards, and protocols that

3
underlie market action and allow interchange across multiple parties (Bowker & Star
1999; Lampland & Star 2009; Pardo-Guerra 2014; Star & Ruhleder 1996). To conceive
of the connection between markets as an infrastructure is to understand it as a politically
contentious and practically consequential object that broadly shapes market behaviors. It
was these infrastructural connections that enabled futures traders to make intentionally
rational buying and selling decisions and made futures markets viable.
An infrastructural perspective on the roots of futures markets synthesizes
material from the literature on market creation on one hand, and derivatives on the other.
On the topic of market construction, scholars have identified fundamental problems that
markets must solve in order to operate successfully. Jens Beckert (2009; 2012) argues
that markets face fundamental coordination problems stemming from the uncertainty of
economic action, which they must solve by socio-structural, institutional and cultural
means in order to operate at all. Rona-Tas & Guseva (2014) add data to this theoretical
framework, studying the particular problems of value and cooperation that arose in the
creation of credit card markets in post-communist countries. They also highlight the
deceptively difficult problem of recruiting actors into the market, often against the
backdrop of unstable institutions or extant social divisions (see also Yenkey 2011, 2015).
The literature on derivatives focuses directly on the social foundations of the linked
relation between derivatives and their underlying commodities. Scholars identify that this
connection is constituted by the overlapping actions of diverse individuals and
organizational actors (Millo 2007), and that the seeming abstractness of derivatives in
fact comes from particular material actions (MacKenzie 2007; Maurer 2002). Others
4
examine the consequences of the practices by which derivatives are created. Pryke &
Allen (2000) demonstrate how the calculative, risk management practices at the heart of
derivative trading alter understandings of what money is capable of doing.
By analyzing futures markets in terms of their infrastructural connection with
spot markets I aim to combine useful features of both of these approaches. An
infrastructural approach highlights the theoretical and practical puzzles facing market
creation, while also focusing on the unique constitutive linkage between derivative and
underlying markets. This perspective allows for a market-wide perspective on the
connection between derivatives and their underlying entities. Particularly, I focus on the
infrastructural features that created the information traders needed in order to make
intentionally rational decisions on the futures market—what I call their information
infrastructure.
This dissertation focuses on three features of these information infrastructures.
Each of these linked the futures market and spot market in some way, made futures
markets possible, and enabled futures traders to make intentionally rational decisions:
(1) The classification schemes by which spot commodities were assigned abstract
grades: Futures contracts did not specify the exchange of particular bushels of wheat
or bales of cotton, but for a certain general class of goods (e.g., strict middling Upland
cotton or #1 spring wheat). Both exchanges needed to create systems that delineated
the categorical types available and sorted spot commodities into a particular grade. It
was through the operation of these systems that the trading of futures contracts was

5
made possible. They linked the commodity as a physical good with the commodity
classifications traded on the futures market.
(2) The material means of gathering and disseminating data on both the growth and
movement of the spot crop and the states of worldwide markets: These socio-technical
systems expanded traders’ perspectives on the market beyond the exchange floor.
They brought into the exchange data on the growth and movement of the agricultural
commodity, as well as price quotations from spot and futures markets around the
world. Traders used this information to discern trends in worldwide supply and
demand, or track price trends in other important markets. These systems provided
material by which traders could orient themselves and attempt to discern future short-
or long-term trends in futures or spot markets.
(3) The economic and cultural theories by which traders understood the nature of
speculation in futures and its effect on spot markets: With the introduction of futures
markets came a new type of trading: speculation in futures contracts. In order for
speculative trades to be seen as legitimate features of the market, members of the
exchanges needed to justify their economic and cultural value. Making this evaluation
required detailing futures speculation’s relation to the spot market. But more than
simply bringing legitimacy, these understandings allowed traders to understand states
of the market, the relation between spots and futures, and the impact of their own
actions. It provided reasons for engaging in speculation, as well as lines between
legitimate and illegitimate trades.

6
All three of these infrastructural elements had to be created form scratch. All features of
how they would work were up for debate, and could be solved in several ways. The
decisions these exchanges made with regard to these three features would influence the
character and operation of their futures markets for decades to come.
This dissertation asks two main sets of questions about these infrastructures. The
first relates to the social factors that caused the infrastructures to take the shape they did.
Why did these exchanges link spot and futures markets they ways they did? What social,
cultural, organizational, technical, or economic factors influenced the construction of
their linking infrastructures? The second set of questions asks how differences in the
exchanges’ infrastructures may have affected behavior on their markets. Did the systems
promote, or make more feasible, distinct styles of trading with differing levels of
volatility? This question has the potential to illuminate the puzzling long-term divergence
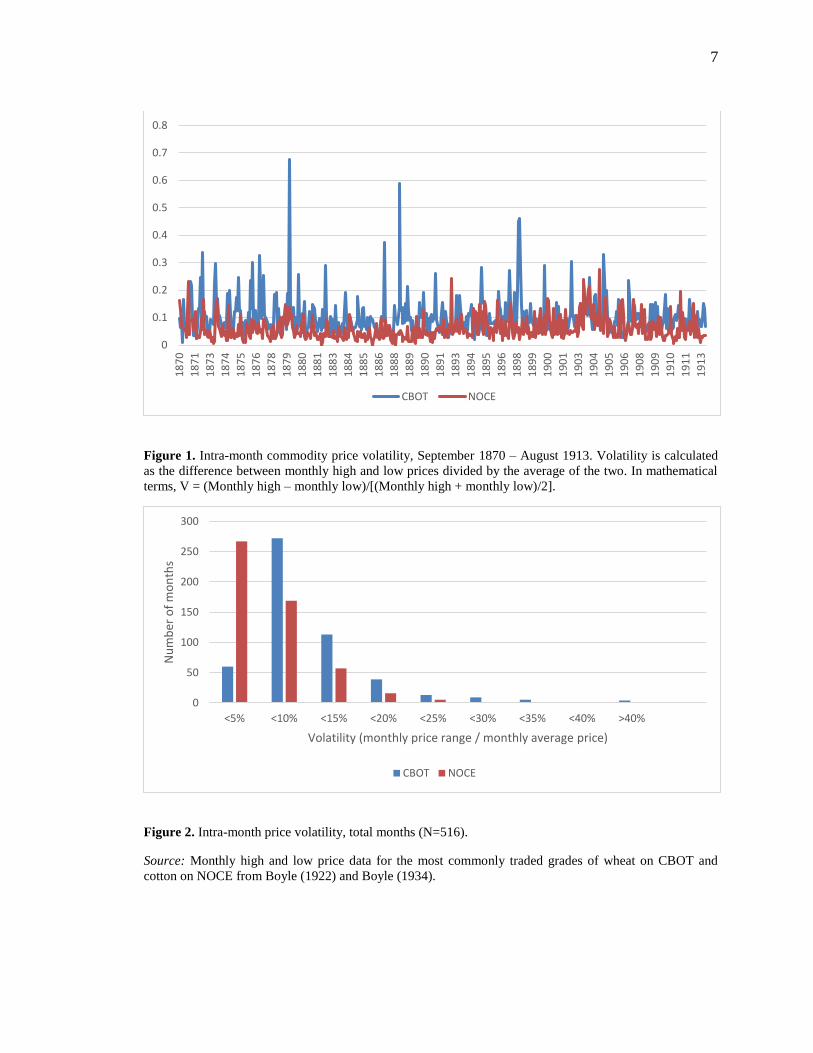
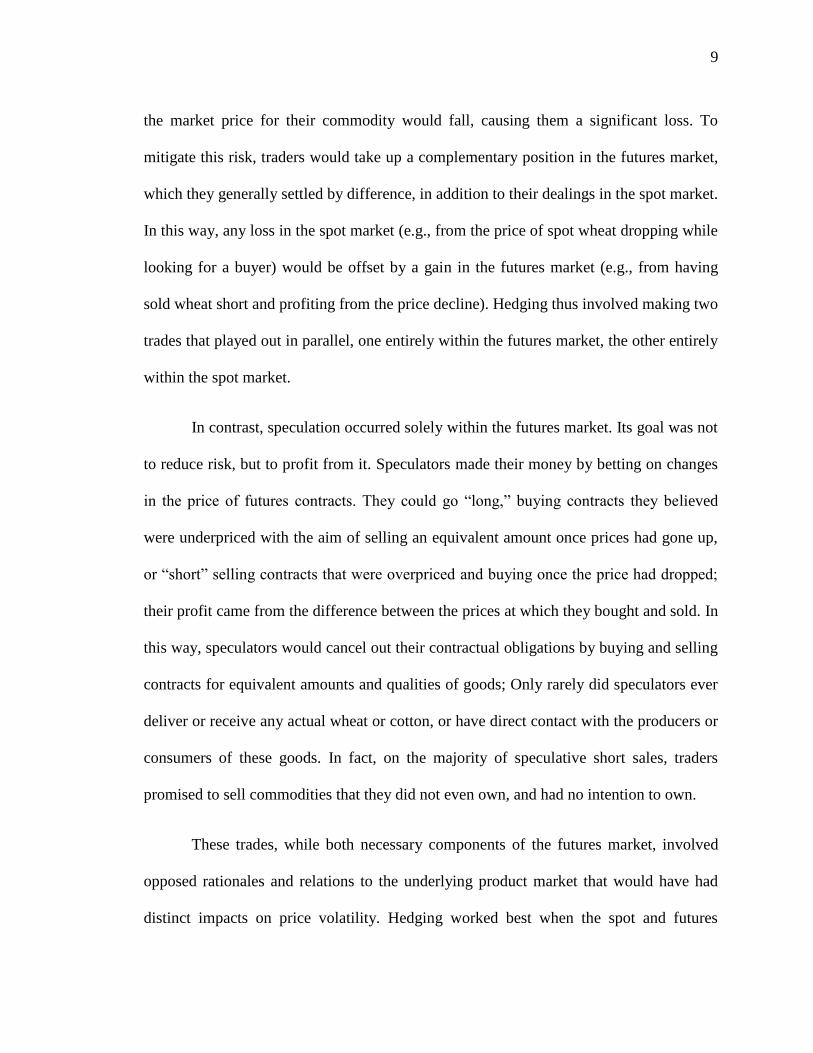
in price volatility found on these exchanges over the period of my research (see Figures
1 and 2; also, more generally, Bouilly 1976; Cronon 1991; Lurie 1979; Markham 2002)?
To summarize my answers to these questions, which I develop over the course of
this dissertation: The infrastructures built on CBOT and NOCE differed significantly in
how they constructed, gathered, disseminated, and interpreted information about the
market. These differences were the outcome of struggles between diverse organizational
and political actors, who drew on distinct economic, cultural, and technical logics in their
attempts to make the market suit their own needs. The effects of these infrastructural
differences were significant. The infrastructure on NOCE led to a futures market that
7
Figure 1. Intra-month commodity price volatility, September 1870 – August 1913. Volatility is calculated
as the difference between monthly high and low prices divided by the average of the two. In mathematical
terms, V = (Monthly high – monthly low)/[(Monthly high + monthly low)/2].
Figure 2. Intra-month price volatility, total months (N=516).
Source: Monthly high and low price data for the most commonly traded grades of wheat on CBOT and
cotton on NOCE from Boyle (1922) and Boyle (1934).
0
0.1
0.2
0.3
0.4
0.5
0.6
0.7
0.8
18
70
18
71
18
73
18
74
18
75
18
76
18
78
18
79
18
80
18
81
18
83
18
84
18
85
18
86
18
88
18
89
18
90
18
91
18
93
18
94
18
95
18
96
18
98
18
99
19
00
19
01
19
03
19
04
19
05
19
06
19
08
19
09
19
10
19
11
19
13
CBOT NOCE
0
50
100
150
200
250
300
<5% <10% <15% <20% <25% <30% <35% <40% >40%
Nu
mb
er o
f m
on
ths
Volatility (monthly price range / monthly average price)
CBOT NOCE

8
featured a large amount of low-volatility hedging and a close connection with spot
markets, while the infrastructure on CBOT promoted excessive, high-risk speculation and
a rift between futures and spot markets.
Hedging and speculation on futures markets
The method by which I make this last claim regarding the effects of infrastructure
on price volatility differs enough from a standard sociological style that it warrants
further explanation. The argument hinges on an analysis of the different types of trades
that could be made on futures markets—speculative and hedging—and the infrastructural
features that made one or the other more feasible or rational. Speculation and hedging
had a symbiotic relation: speculation made the constant market upon which hedging
relied, while hedging gave legitimacy to speculative trading by offering direct benefits in
the spot market. Both types of trades were present on both exchanges. Yet, the ratio of
speculation to hedging could vary widely, variation that would impact the level of price
volatility seen on the market. My analysis hinges on highlighting the infrastructural
features one ach exchange that might have impacted this ration of speculation to hedging.
To understand this argument, it is necessary to have a basic understanding of how
hedging and speculation on futures markets work. Hedging is a way of using the futures
market to insure against adverse price movements in the spot market. Middlemen
connecting buyers and sellers in the spot market would often have to buy and store
commodities to sell at a later date. Until these goods were sold traders faced the risk that
9
the market price for their commodity would fall, causing them a significant loss. To
mitigate this risk, traders would take up a complementary position in the futures market,
which they generally settled by difference, in addition to their dealings in the spot market.
In this way, any loss in the spot market (e.g., from the price of spot wheat dropping while
looking for a buyer) would be offset by a gain in the futures market (e.g., from having
sold wheat short and profiting from the price decline). Hedging thus involved making two
trades that played out in parallel, one entirely within the futures market, the other entirely
within the spot market.
In contrast, speculation occurred solely within the futures market. Its goal was not
to reduce risk, but to profit from it. Speculators made their money by betting on changes
in the price of futures contracts. They could go “long,” buying contracts they believed
were underpriced with the aim of selling an equivalent amount once prices had gone up,
or “short” selling contracts that were overpriced and buying once the price had dropped;
their profit came from the difference between the prices at which they bought and sold. In
this way, speculators would cancel out their contractual obligations by buying and selling
contracts for equivalent amounts and qualities of goods; Only rarely did speculators ever
deliver or receive any actual wheat or cotton, or have direct contact with the producers or
consumers of these goods. In fact, on the majority of speculative short sales, traders
promised to sell commodities that they did not even own, and had no intention to own.
These trades, while both necessary components of the futures market, involved
opposed rationales and relations to the underlying product market that would have had
distinct impacts on price volatility. Hedging worked best when the spot and futures

10
markets were relatively stable and stayed roughly in step with each other, since this most
effectively enabled the insurance function of the hedge. Speculation, however, was
stimulated by an active market with a great deal of movement in prices, which increased
the uncertainty under which speculation thrives. Hedging also had a built-in limit on the
amount traded in futures, since traders would hedge only the amount of the underlying
commodity they were actually moving, and end their engagement in the futures market as
soon as their spot dealings were through. Speculators had no such limits. They
maintained ongoing portfolios of contracts and could pump up the volume of trade as
high as would benefit them.2 Additionally, greater levels of speculation, ceteris paribus,
increased the likelihood of manipulative actions such as cornering the market. Corners
worked by trapping traders who had built up sizeable speculative positions. Corners were
highly disruptive events, causing massive fluctuations in price and often scaring traders
out of the market for long stretches of time. We can conclude from these differences in
trading that a market that featured far more speculation than hedging would be more
likely to see price fluctuations than one with a greater proportion of hedging.
Unfortunately, it is impossible to empirically determine what percentage of trades
in the futures market were made as hedges versus speculation, since formally they were
exactly the same. But I argue that by analyzing the infrastructural connections between
product and futures markets, we can determine whether a particular exchange would
make one or the other type of trading more or less feasible. This is because speculation
and hedging have distinct information infrastructures under which they would thrive.
2 Marx’s (1976) two circuits of capital, C-M-C and M-C-M’, describe this difference quite well.

11
Hedging, since it involved parallel trades in the spot and futures markets required
conditions where information was useful in both markets. Also, since hedging is a longer-
term strategy, it did not require that information travel especially quickly, only that it be
accurate. For speculation, the needs were opposite. Since traders were constantly looking
to adjust their portfolio towards greater profit, the speed of information was critical.
Additionally, since speculation almost always occurred entirely within the futures market,
with no actual delivery of commodities, the accuracy of information was secondary—all
that mattered was that everyone was working with the same information, good or bad.
The distinct orientations and infrastructural needs of hedging and speculation are
summarized in Table 1.
Over the course of the dissertation, I demonstrate that CBOT’s infrastructure
offered more support for speculation than hedging, while NOCE’s infrastructure did the
opposite. As a result, I argue, CBOT would have seen a higher proportion of speculation,
as hedging trades moved to other markets better suited to their needs; conversely, NOCE
would have encouraged hedging, while making speculation difficult. These differences
would have created different baseline levels of volatility in their futures markets, offering
a partial explanation for the divergence in price volatility across markets.

12
Table 1. Orientation and infrastructural needs of hedging and speculation.
Hedging Speculation O
rien
tati
on
Relation to markets Acted in both markets Acted only in futures market
Market goal Price insurance Bet on price movements
Orientation to risk Reducing risk Assuming risk
Orientation to price Favor price stability Favor price fluctuation
Infr
ast
ruc-
tura
l n
eed
s
Classification needs Index physical qualities Create stable symbols
Information needs Long-term crop data Fast price updates
Theoretical needs Show spot market
value Distinguish from gambling
Data sources
The data for this dissertation comes from three primary sources. The first, and
largest, source of data for this dissertation was the archives of the exchanges. The CBOT
archive is held at the University of Illinois – Chicago. Sources included annual reports,
official rules and regulations, meeting minutes, and statistical data displayed on the
Board. I additionally reviewed materials and reports from several important standing
committees: Arbitration and Appeals; Grain; Warehouse; Market Reports; Membership;
and Transportation. I also consulted books and pamphlets from the period— both those
published by CBOT and those simply related to topics of interest—that were included in
the Board’s library. Finally, I rounded out the data with the records of the Education
Department, the Secretary’s correspondence, and the reports of the Annual Meetings of
the CBOT affiliate, Council of North American Grain Exchanges. While CBOT was
founded in 1848, the Board did not begin to keep records until ten years later. Most of
these records, however, were destroyed in the Great Chicago Fire of October 1871. Thus
13
almost all of the material is from 1872 onward. Data for from prior to this point were
gathered through secondary sources.
The NOCE archive is housed at Tulane University, and includes copious records
from the time of the Exchange’s founding. These include annual reports, official rules and
regulations, and meeting minutes. Reports from several standing committees provided
material for my analysis, including the Committees on Supervision; Membership;
Information and Statistics; Arbitration & Appeals; Futures; Exchange Quotations; and
Telegraph. Books and pamphlets published by the Exchange were also included, as well
as several issues of Cotton World, the periodical produced by NOCE Secretary Henry
Hester. In addition to the materials at Tulane, the New Orleans Public Library also has a
number of additional books and pamphlets, as well as miscellaneous documents related to
the New Orleans cotton trade that filled out the collection of documents.
A second source of data was exchange members' testimonies before state and
federal legislators. On a number of occasions, representatives from CBOT and NOCE
were asked to publicly defend the desirability and safety of commodity exchanges,
futures markets, or speculation. The transcripts of these public hearings provide evidence
of the exchanges’ workings, as well as traders’ orientations to speculation and its role in
the economy. Representatives from CBOT spoke before Illinois legislators in 1870 during
the Illinois constitutional convention, and again in 1883, before a special committee
charged with investigating speculative trading. They also appeared before the U.S.
Congress in 1914 to comment on proposed legislation. NOCE representatives testified
before the New York state senate in 1882 regarding speculation in the cotton market, and

14
before the House Committee on Agriculture in 1895 and 1914 to comment on several
proposed pieces of legislation. Members of both CBOT and NOCE gave testimony at the
House Committee on Agriculture’s 1892 hearing on “fictitious dealings in agricultural
products,” undertaken in connection with the pending Hatch Bill, which sought to
regulate futures markets.
The final source of data for the dissertation was articles from the New Orleans
Daily Picayune (later Times-Picayune), the Chicago Tribune, and the New York Times.
These papers both reported on and editorialized the actions of the exchanges and attitudes
of traders. They offer context and a non-exchange-centered perspective. Newspaper data
was used selectively to flesh out areas of interest and noteworthy events from other
sources.
Outline of the dissertation
The first chapter of the dissertation sketches the foundings of the CBOT and
NOCE and the creation of their futures markets. CBOT was founded prior to the Civil
War, amid a technologically-fueled growth spurt that turned Chicago into a commercial
hub of the North. Futures trading was introduced during the Civil War. The uncertainty
and volatility produced by the War created ample opportunities for speculation in the
price of commodities, and futures provided a less capital-intensive way to engage in it.
By contrast, NOCE was founded after the war, in an effort to regain New Orleans’ once-
dominant position as the country’s cotton export capital. Focused largely on revitalizing
the spot trade, NOCE adopted futures trading only reluctantly, once the volume of the

15
business grew too big to pass up. I also discuss the regulations put in place by the federal
government beginning in 1916, which ended the period of associational and state-level
regulation. Finally, I justify my case selection, arguing that CBOT and NOCE allow me
to investigate both the causes that shaped infrastructures in particular ways and the
effects those infrastructures had on market action.
Chapter 2 develops the concept of market infrastructure, which I use to
understand the production, dissemination, and interpretation of information on spot and
futures markets. I begin by highlighting three broad perspectives on information within
markets, taken by information economists and some sociological network theorists,
institutional sociologists, and science and technology scholars. I bring together these
three approaches through a discussion of “information infrastructures”—the institutional,
material, and cultural means by which information is created, disseminated, and
interpreted. This broad perspective enables us to consider all three of the areas
highlighted above, while additionally analyzing the character of information on markets
and the uses to which it can be put. According to the nature of the infrastructure involved,
information may take on wholly different properties, constructing vastly different market
information environments. This is seen in the cases in my dissertation, were the distinct
infrastructures in place on CBOT and NOCE created information environments that
promoted very different types of trading on the futures markets. The conceptual
framework of “information infrastructure” thus seeks to encompass the established
literature on how market devices and institutions impose a relation to information and

16
also to determine how market infrastructures give particular qualities to information, and
how these qualities come to matter in market situations.
The next three chapters examine different components of the infrastructures that
linked spot and futures markets and enabled futures trading on each exchange. Chapter 3
studies the grading systems that transformed concrete commodities into abstract grades
that could be embedded in futures contracts. On CBOT, the grading system developed
contemporaneously with the futures market and was shaped by the (not always honest)
opportunities for profit available to powerful elevator owners and speculators within that
system. Even when the state took over grading, political pressure on the regulatory board
resulted in continued inaccurate grades. On NOCE, grading was created for the benefit of
spot traders long before futures trading arose. For much of my period of research the
system was based on antagonistic negotiation between buyer and seller, which resulted in
grades that closely indexed the physical qualities of cotton. This was supplemented by a
top-notch system of supervision and inspection that watched over cotton as it was
processed and loaded onto ships. Even once NOCE centralized grading in an official
body, powerful spot traders worked to ensure its continued fidelity. Finally, I argue that
these differences in the ability of grades to accurately index the commodities’ physical
qualities resulted in a higher proportion of speculation to hedging on CBOT than on
NOCE.
Chapter 4 discusses the systems for gathering and disseminating price quotations
and crop statistics on each exchange. The former type of information changed from
minute to minute and linked each exchange to other worldwide markets; the latter came

17
on a longer time scale and connected exchanges to the worlds of agriculture and
transportation. CBOT and NOCE differed in the value they assigned to each type of
information and their methods for gathering them. CBOT fought hard to ensure control
over the dissemination of their own quotations and speedy telegraphic service with other
exchanges, making credible threats that forced Western Union to meet their demands on a
number of issues. But this focus on quotations came at the expense of developing an
accurate system of crop statistics. On NOCE, the situation was reversed. From its
inception, NOCE gathered vast amounts of statistical data on the growth and movement
of the crop. But their telegraphic facilities continually lagged behind those of rival
markets, particularly the Cotton Exchange in New York. I claim that these differences in
the type of information gathered and the speed of its dissemination also contributed to
CBOT having a higher proportion of speculative trading than NOCE.
Chapter 5 addresses the theoretical orientations that traders brought to the futures
market. Traders on CBOT and NOCE differently assigned different economic and
cultural value to speculation and futures trading. On CBOT, the cultural defense of
speculation was made overwhelmingly in response to threatened legislation and thus
focused on its distinction with gambling. But among Board members, a speculative
market was contrasted economically to a dull market: speculation created action and
opportunities for profit, which was good for the market as a whole. These arguments
converged in the rejection of options trading, a close relative of futures that took on both
a negative economic and cultural character. On NOCE, the value of futures came from
being tools by which traders could push for higher cotton prices in the spot market.

18
Higher prices, in addition to their economic value, would help bring autonomy to the
South, freeing it from reliance on Northern and foreign capital. I suggest that these
infrastructural differences, unlike those in the previous two chapters, would have had
only minor impacts on market behavior. Both encouraged speculation, only for different
reasons. Still, the distinct understandings of futures speculation adds richness to our
accounts of the evolution and institutionalization of futures markets in this period.
In the concluding chapter, I summarize the argument of the dissertation, reviewing
the infrastructural differences on these two early futures markets, their causes, and their
consequences. I also discuss two general contributions of the dissertation and their
potential to guide further research. The first is demonstrating the necessity of studying
derivative markets in terms of their constitutive, infrastructural linkages with underlying
markets. I suggest that this perspective challenges and supplements the literature on
market creation by noting the distinct challenges present in the creation of derivative
markets. Second, I highlight infrastructural analysis as a useful analytical approach to
studying the regulation of financial markets. This extends recent arguments about how to
influence market-level outcomes not by imposing regulatory strictures, but by reshaping
market architectures.

19
Chapter 1 – CBOT, NOCE, and the Birth of Futures
The middle of the 19th century saw the rise of a new type of organization, which
transformed the marketing of agricultural commodities: the exchange. Though exchanges
for trading stocks had existed in the Unites States since 1792, commodity exchanges took
longer to arrive. Commodity exchanges were corporations that brought together a range
of businessmen—including merchants, warehousemen, millers, spinners, shipping agents,
insurance agents, and others—for the promotion and regulation of trade. Some exchanges
hosted markets in a large number of commodities, while others focused on particular
commodities such as cotton, coffee, butter, eggs, leather, or petroleum.
Commodity exchanges served two broad functions. First, they regulated and
oversaw a city’s commodity trade. Exchanges set rules of competition and cooperation,
and promoted uniformity in trade practices such as delivery, giving of margins, and
setting commission or storage rates. Many exchanges established standards for assigning
grades to commodities, facilitating large-scale, institutionalized trading. They also served
as sites for the speedy and fair settlement of business disputes. This private arbitration
process kept business from getting mired in protracted court battles and ensured that
well-qualified peers would judge the cases. Beyond this regulatory function, exchanges
also acted as aggregators of information and sites of markets. Prior to the founding of
exchanges, commodity trading occurred scattered throughout the offices, street corners,

20
and saloons of a city. Information traveled through private channels and varied from one
locale to the next. Exchanges centralized this information and, with it, trading. The result
was a lively market, with a large common pool of information.
CBOT and NOCE were major exchanges both founded in this mid-19th century
wave, CBOT in 1848 and NOCE in 1871. Soon after their foundings, both also became
the sites of large markets in agricultural futures contracts. The exchanges, as
organizations, were central to developing the infrastructures of these new markets in
derivative financial products. This chapter outlines the histories of these exchanges,
beginning with the developments that spawned the formation of the exchanges, then
following on to their subsequent institutionalization of futures trading. The chapter also
provides broader context on the exchanges’ defining characteristics as well as their
positions within the global commodity trade. This historical background provides context
for the in-depth infrastructural analysis that follows in chapters three to five. I also
explore why these cases are especially well-suited to an infrastructural analysis; this
provides a methodological justification for the dissertation as a whole.
CBOT: The ascendance of Chicago & the founding of the Board
The city of Chicago grew rapidly in the 1830s and 1840s. What was, at the start of
the period, a forgettable local trading post for Native tribes and English and French
settlers was, by the end of it, a booming city attracting massive investment form
breathless capitalists. Chicago’s population increased twenty-fold and the value of its

21
land grew by a factor of three thousand in just a few years of this initial growth (Cronon
1991). Along with the flood of capital came a spate of growth in shipping and storing
technology. By the end of the 1840s, the growth of railroads, grain elevators, and lake
transportation had made Chicago the central transit point for wheat, corn, oats, barley,
rye, and others agricultural commodities from the expanding hinterland, “the
intermediary between small and large lots, between box cars and lake boats, between
small seller and large buyer” (Lee 1938: 63). Railroads connected to northwest Illinois
and southwestern Wisconsin, enticing farmers to send their wheat in by rail, rather than
haul it in on wagons. Steam-powered elevators, built with train tracks on one side and a
waterway on the other, stored grain and transferred it from rail to lake vessels. Once grain
was loaded onto ships, the newly opened Illinois & Michigan Canal allowed shipment
along either the Great Lakes or the Mississippi River, leading to the two largest ports in
America. The increasing flow of goods and capital into the city led the Cleveland Plain
Dealer, in 1858, to perceptively quip: “Chicago is a bustling city. It was formerly in
Illinois, but now Illinois is in it” (Cited in Lee 1938: 95).
Alongside this growth in transportation infrastructure, a number of specialized
functions emerged within the growing market, including storage, shipment, forwarding,
and commission buying or selling (Lee 1938). The chain by which grain went from
farmer to miller was long. Commonly a farmer sold grain to a local buyer, who would
then consign the grain to a commission merchant in Chicago. Grain was shipped to
Chicago by rail, almost always entering an elevator aligned with the railroad. The
elevator proprietor issued receipts for this grain to the commission broker, who, seeking

22
to limit his exposure to price changes, sold these receipts, usually to a speculator. The
receipt would then often be exchanged among speculators multiple times before
eventually ending up with a shipper who would go to the warehouse and get grain that
matched his receipts, which was then shipped to the mill (Lee 1938).
This complex marketing system was growing at an astonishing rate and handling
increasingly large sums of both commodities and money. By the mid-1850s, more grain
was moving through the city than ever before. From 1852-1857 receipts and shipments of
wheat grew more than ten-fold (Taylor 1917: 141).1 This was matched by an increase in
the storage capacity of the city’s elevators, which grew from 700,000 bushels in 1848 to
5,000,000 bushels in 1860. During this period, fully half of the wheat shipped to the
eastern seaboard went through Chicago (Lee 1938). Unsurprisingly, members of the trade
sought to establish some level of order and stability amid this growth. In March 1848,
thirteen firms and individuals organized to establish a Board of Trade that would settle
disputes, establish regulations, share information, and generally serve as a center for
Chicago businessmen. In the first year eighty-two people joined the organization,
representing all areas of the commodity trade (Taylor 1917). The Board drafted a
constitution and by-laws, which provided for an elected Board of Directors and a handful
of standing committees dedicated to critical issues in the grain trade, such as Shipping,
1 Information about the early years of the Board is scant. They did not print an annual report until 1858, and
newspapers took little interest in reporting on the activities or composition of the Board in its earliest years.
More seriously, their records were destroyed in the Great Chicago Fire of 1871. As a result, figures from
the time before 1871 are imprecise. Nevertheless, they give a proper sense of the market’s enormous
growth.

23
Warehousing, and Arbitration.
In these early years, the Board of Trade served primarily as a voluntary
association for administering and supporting agricultural trade. But it was not until the
Board’s transformation into a marketplace that the organization truly caught on.
Merchants had discovered that gathering together at a single trading place offered them
constant opportunities for speculative dealing. These were especially frequent from 1853-
1856, as the Crimean War made European markets highly volatile, offering multiple
chances to try to take advantage of price movements.
The speculation of the Crimean War period was done with spot commodities;
traders would buy low with hopes to sell high. This spot speculation was soon largely
replaced with speculation in futures contracts. Following the creation of a set of
standardized grades in 1856, traders began making and exchanging contracts to buy or
sell a particular grade at some future point. The use of standardized grades and soon
thereafter standardized contracts allowed futures trading to happen en masse. This system
of futures trading required far less capital and thus enabled a larger amount of
speculation. The Civil War provided—as the Crimean War had before it—a large supply
of external jolts that resulted in sudden price movements (Taylor 1917). Battles
represented not only advances and setbacks in the war, but opportunities to make large
sums of money. The famous warehouse owner P.D. Armour, for example, made some $2
million after selling pork short in anticipation of the peace at Appomattox—a peace
which sent the price of pork tumbling from $40 to $28 a barrel (Markham 2002: 269).
In the spot trade as well, the Board’s reach continued to grow throughout the Civil

24
War. Chicago took on extra rail traffic as southern routes became inaccessible. Between
1859 and 1866, the quantity of grain handled in the city more than tripled (Kendall 1956).
Nine new grain warehouses, providing seven million bushels of space were built in the
first half of the 1860s (Lee 1938: 109). CBOT also gained new, expansive legal powers
when, in March 1859, the state of Illinois granted them a special charter bestowing the
ability to appoint weighers, inspectors, and measurers whose judgments would be binding
upon both buyer and seller, as well as quasi-judicial powers to decide cases of arbitration,
issue subpoenas, and administer oaths (Lurie 1979). Between 1859 and 1863, the Board’s
membership rolls had swelled from 520 to 980 (CBOT, Annual reports). By the end of
the war, the Board was established as a central player in worldwide agricultural trade.
Illinois’s regulation of the grain trade
Following the war, dropping prices and high demand for agricultural commodities
created an environment ripe for corners. CBOT suffered a large corner in wheat in 1866
and, two years later, saw three corners on wheat, two on corn, one on oats, and one
attempted on rye (Cronon 1991). On top of these disruptions to the market, elevators and
railroads were cementing collusive agreements that limited competition and consumer
choice. These injustices, foregrounded through the agitation of Illinois’s strong agrarian
bloc, led to the state’s regulation of the grain trade. Through the Illinois Constitution of
1870 and the Warehouse Act of 1871 the state assumed authority to regulate railroads and
warehouses. As part of this regulation, it also created the Illinois State Railroad and
Warehouse Commission (RWC). A central duty of this commission was the inspection,

25
grading, and issuance of receipts for all grain changing hands in the Chicago market,
tasks which had previously been handled by the Board itself. This involved the state to an
unprecedented degree at a very early point in the history of the derivative market. 2
CBOT’s relation with the state was to color the development of their market over the next
forty years.
By the time of the RWC’s founding in 1871, Chicago’s rapid rise from “frontier
town” to “world’s greatest market” (Chicago Daily Journal, April 22, 1919) was almost
complete. Not even October’s Great Fire slowed the commercial progress of the city.
Though a number of other Midwestern cities (e.g., Duluth, Minneapolis, Kansas City, St.
Louis) formed boards of trade that competed for grain forwarding business, no other
primary market received even half as much grain as Chicago in any year between 1860
and 1890 (Goldstein 1928; Lee 1938). By 1880, elevator storage space had grown to over
19 million bushels (Lee 1938), and Chicago exported 153 million bushels of wheat, a
new record high (Shannon 1945). Chicago was the clear center of the grain trade in the
country, a position they held throughout the period studied in this dissertation.
NOCE: Impact of the Civil War on the New Orleans cotton trade
The commercial history of New Orleans was quite different than that of Chicago.
In the pre-railroad era New Orleans’s geographical position made them a natural cotton
2 This was the first instance in the country of a state assuming responsibility for grading commodities. After
the RWC’s constitutional authority was established in the 1876 U.S. Supreme Court case Munn v. Illinois
several other states, including as Minnesota, Kansas and Missouri, established similar grading authorities.

26
market. The city stood at the mouth of the Mississippi and within close range of the lands
where the majority of American cotton was grown. New Orleans was the central port for
cotton, the primary export crop of the US (Rothstein 1966). In the six crop years prior to
the Civil War, New Orleans merchants sold, on average, just over 47% of all the
country’s cotton (Bouilly 1976). As cotton accounted for over half of all American
exports, this made New Orleans the commercial center of the South, and cotton the
leading source of business.
The central figure in the marketing of the cotton crop during this period was the
factor, an all-purpose commission merchant who connected the otherwise disparate
groups of planters, financial interests, shipping companies, and merchants (Stone 1915).
Factors were the sole link between planters in the country and all city, northern and
international interests. For this reason, as compared to commission merchants in Chicago,
the factor’s work had a far broader scope. Factors were closely intertwined with planters’
every economic action. They would lend money to planters at the start of the season, and
advance them up to two-thirds or three-fourths of the market value of the produce
consigned to them after the harvest (Jones 1937). They acted with great latitude to market
the cotton consigned to them, based on their superior knowledge of the market and the
close, trusting relationships established with clients (Woodman 1963). In fact, Stone
(1915) states that relations between factors and their clients “were of the most intimate
and confidential character, as close probably as was ever the case between business
associates;” their associations “frequently were life-long” (Stone 1915: 559). This is not
to say that factors did not exact a sizeable toll for their services. Planters were forced to

27
buy supplies for the farm and the homestead through factors, at greatly inflated prices,
which amounted to an effective interest charge of from 40 to 110% (Shannon 1945). If
the total receipts of a farmer’s crop was not enough to wipe out his indebtedness for the
year, his obligation to the merchant rolled over into the next year (Hammond 1897). This
effectively created a system of debt peonage for many small farmers, giving Stone’s
previous comment about “life-long” relations a far dimmer interpretation.
But after years of prosperity, the New Orleans cotton market entered into a
protracted decline, beginning in the mid-1850s and lasting for twenty years. The advance
of the railroad turned New Orleans’s geographic position from an asset into a liability.
Railroads offered planters an attractive alternative to sending their goods down the river.
This was especially true as rates dropped and improvements in cotton presses at interior
towns made it possible to pack over twice as much cotton into the same car space
(Hammond 1897; Shannon 1945). Once cotton arrived at the east coast, the ports of New
York, Charleston, and Savannah offered better facilities and lower prices than New
Orleans (Caldwell 1980). From 1860 to 1870, the number of bales shipped eastward by
rail grew from 109,000 bales to 381,000. Between 1868-1871, New Orleans merchants
sold an average of only 37% of the total crop, down from the ante-bellum figure of 47%
(Bouilly 1976). The Civil War also led to a significant loss of business. Crop returns were
remarkably low during the war years. In 1861, the South’s cotton crop totaled 4 million
bales; in the years 1862-1865, the combined total did not reach 3 million (Shannon 1945).
Of the little cotton that was produced, even less brought money to the South. Many bales
went to waste for lack of adequate storage, were thrown up on the lines of fortifications

28
to impede cannon balls, or were burned by the Confederates to prevent capture by the
Union (Shannon 1945). Once New Orleans was occupied, northern merchants assumed
control of large quantities of cotton, either through outright theft or by trading with
Southern businessmen who preferred the relative security of Northern greenbacks to their
almost worthless Confederate dollars (Shannon 1945).
This decline in business spelled the end of the factorage system that had reigned
prior to the war. Concentrating multiple functions in the single person of the factor
created an inefficient system that required large margins to cover the extensive risk being
born by the factor. In times of flush production, the inefficiencies of the system caused
little concern, but this period of sustained decline put increased pressure on the system.
Buyers began to bypass factors, using new communication facilities to strike deals with
planters in the interior directly, and shipping the cotton on through bills of lading that
seamlessly moved goods across varieties of transport (Ellis 1973; Woodman 1963). Store
merchants in the interior went from being adjuncts of seaport factors to being key players
in the marketing of cotton in their own right (Woodman 1963). Each of the major
functions of the factor—salesman, buyer and supplier of credit—was gradually being
replaced by other, more efficient agencies (Woodman 1963).
Founding & development of the NOCE
In 1871, in the midst of this decline and transformation of the cotton trade, the
New Orleans Cotton Exchange was founded. The organization was proposed in January

29
by thirty-six local cotton firms. Within two weeks it had over 100 members and by
September had secured a charter from the state (Boyle 1934). Unlike CBOT, there was
sustained interest and membership in the Exchange from the start, and a year after its
founding the Exchange’s had more than doubled to 225 regular members. The formal
organization of the Exchange was quite similar to that found on CBOT. Government was
vested in a board of directors, subject to a charter, constitution, by-laws and rules;
standing and special committees were formed, dedicated to issues such as Information &
Statistics, Membership, Arbitration and Appeals, Futures, Supervision, Deliveries and
Finance; the membership committee and Board of Directors were given disciplinary
power, and Arbitration and Appeals committees settled commercial disputes.
NOCE was a stable organization. Antebellum trade in New Orleans had been
organized through elites; following the war, the occupations of the elites changed, but the
reliance on tight-knit networks did not. There were several instances of well-entrenched
families whose influence in the Exchange spanned decades. The Glenny family is
particularly telling. J.E. Glenny served for three years on the committee on classification
and quotations, twice as chair; I.E. Glenny served for four years on the board of directors,
and multiple committees, including one chairmanship; E.J. Glenny served practically
every year from 1898 to 1915 on the board of directors, including two stints apiece as
president and vice-president; and J.W. Glenny served twice on the arbitration committee.
During the period of my research, the office of NOCE president was held by three
different father-son pairs – R.M. Walmsley and S.P. Walmsley; Andrew Stewart and
W.P. Stewart; and John F. Clark and Russell Clark (Boyle 1934).

30
NOCE was founded one year after the creation of the New York Cotton
Exchange; both New York and New Orleans followed the Liverpool Cotton Brokers’
Association, which had formed in 1841.3 Together, these three exchanges dominated the
global cotton trade. New York and Liverpool were large and had sizeable speculative
markets; New Orleans was third in size and remained more involved in the spot trade, at
first (Bouilly 1976: 39). In New York, especially, spot trading was quite low by the time
the Cotton Exchange was founded. The New York exchange was developed not to build
up the trade in commodities, but to standardize futures contracts, and promote futures
trading, fact which kept NOCE members wary (Bouilly 1976). While NOCE did what it
could to promote business across the exchanges, adopting similar rules and working to
align their classifications and practices, it remained suspicious of the other markets.
While members saw the revival of the spot trade as the primary objective of the
Exchange, this did not mean that traders in New Orleans were unfamiliar with, or
unamenable to, futures trading. Traders had sold commodities “to arrive” in antebellum
times, and during the war futures contracts were used to keep a steady supply of cotton to
Southern mills. In fact, NOCE, upon its founding in 1871, featured futures trading. But it
remained quite rare at this time. Using the large, established futures market in New York
was more appealing to traders than building their own in New Orleans. In the first month
of trading on the Exchange, there were only three transactions in futures. From this
inauspicious beginning, the trade managed to shrink even further, with only a smattering
of futures trades in the Exchange’s first three years. Between 1873 and 1879 no futures
3 This group spawned the Liverpool Cotton Exchange in 1888.

31
transactions took place on the Exchange (Ellis 1973).
NOCE finally established its own futures market in 1879, once it became clear
that futures were becoming a central feature of the global agricultural marketplace, which
NOCE did not want to cede entirely (Bouilly 1976). Once established, futures trading
found fertile soil. While the volume of futures never matched that seen in Liverpool or
New York, New Orleans maintained a sizeable volume that attracted orders from clients
around the world. The city’s spot trade also leveled off at this time, stemming the decline
of the previous years. While spot sales had plateaued at a level approximately 20% below
their high-water mark of the 1850s, they remained steady throughout the remainder of the
19th century (Bouilly 1976). New Orleans, though less dominant than before the war,
remained important to world trade as a viable market for futures and the largest cotton
port in the United States.
Federal regulation of commodity exchanges
The period of time covered in this dissertation spans from the introduction of
futures on CBOT to the beginnings of federal regulation of the futures market. 4 Up until
1916, futures trading took place on CBOT and NOCE free from constraints at either the
4 The federal government’s one brief foray into this arena during the period of my research, the Anti-Gold
Futures Act, was a disaster. Passed in the midst of the Civil War, it was designed to suppress speculation in
gold in order to build up the value of Union-issued greenback currency. Its effect was the exact opposite.
The price of gold shot up more than 50% in two weeks and Congress quickly repealed the act. Following
this, another piece of legislation regulating the futures trade was not passed for fifty years.

32
state or the federal level.5 Though, this lack of regulation was not for lack of trying. An
1874 bill in the Illinois legislature sought to limit speculation by prohibiting the sale of
grain that was not owned by the trader. In 1883, the state appointed a special House
committee to investigate the Board’s practices; the committee issued a scathing report
urging the suppression of futures trading. The Louisiana legislature, in 1888, debated a
bill aiming to affix a prohibitively large tax to speculative trades in futures. The federal
government was also busy with proposed legislation. Between 1880 and 1920 some 200
bills were introduced in Congress to regulate futures and options trading; the 60th
Congress (1907-1909) alone, introduced 25 bills designed to prohibit futures trading
(Markham 1987). While the vast majority never made it out of committee, some were
able to do so and a few, in fact, came close to passing: the Hatch Bill in 1892 and Scott
Bill in 1910 both required significant lobbying from the exchanges to be defeated.
The first pieces of legislation providing for federal regulation of the commodity
trade were the Cotton Futures Act and Grain Standards Act, both found in the same bill
from 1916.6 These first acts were tentative. The federal government mirrored the steps
taken by individual states, regulating commodities (whether traded on spot or futures
markets) rather than the futures markets themselves. Both acts established, and mandated
the use of, federal grading standards for cotton and grain (Markham 1987). But the
Cotton Futures Act did dip a toe into regulation of the futures market. It mandated a
5 While Illinois did oversee the grading of commodities via the RWC, it did not directly regulate futures
trading or speculation in any way.
6 The 1916 version of the Cotton Futures Act was a second version of a bill Congress had passed two years
earlier. The prior act was ruled unconstitutional on a technicality shortly after becoming a law: the bill had
originated in the Senate, when, as a revenue measure, it should have been drafted in the House.

33
single method for setting premiums and discounts on future delivery and required
separate grade certificates for each bale delivered on contract rather than one for the lot
(Garside 1935). While mild in their effect, these laws established the federal
government’s involvement in commodity exchanges.
While not regulatory in nature, the federal government did temporarily disrupt the
workings of the futures market in wheat following the entry of the United States into
World War I. In an effort to provision the Allied forces, the Food and Fuel Control Act of
August 1917 gave the federal government the power to set the price of wheat by fiat. The
Wheat Price Guarantee Act, passed in February 1919, extended the President’s authority
to regulate speculation and other practices on exchanges. Under these extraordinary
circumstances, CBOT had little choice but to suspend their wheat from August 1917 to
July 1920 (Markham 1987). Though not regulation, this interference from the state
clearly makes these years unsuitable for a comparison.
Finally, following World War I, the federal government firmly established
oversight over the futures trade with the passage of the Grain Futures Act of 1922.7 The
law required exchanges to act to prevent price manipulation and the dissemination of
false and misleading crop or market information. It forced exchanges to maintain records
of their transactions, which were made open to the Department of Justice and Department
7 The Grain Futures Act, like the Cotton Futures Act before it, had two iterations. It was first passed in
December 1921, and was soon thereafter found unconstitutional by the U.S. Supreme Court. After this
rejection by the courts, Congress quickly went back to drafting a new law. Ironically, in order to craft a bill
that would not run afoul of the Court’s logic, the new bill had to make stronger claims about futures trading
than the original, including that it damaged the national public interest and often caused obstructions in
interstate commerce.

34
of Agriculture. The law also caused the establishment of the Grain Futures
Administration, a predecessor to the present-day Commodity Futures Trading
Commission. This administration was tasked with holding exchanges to these rules. To
ensure compliance with the law, they had the ability to impose a prohibitive tax of 20
cents per bushel on contracts executed on exchanges that failed to meet these
requirements (Markham 1987). This fully established the federal government’s regulatory
role in relation to commodity futures markets, a role it has continued playing to this day.
In sum, between 1916 and 1922 the federal government significantly reshaped the
operation of both spot and future markets in wheat and cotton, putting an end to the
period of decentralized, private and state-level regulation. But in the sixty years prior to
1916, futures markets developed in an open environment of experimentation and local
regulation. This dissertation traces CBOT and NOCE through their development and
institutionalization during this period. The unique paths taken on these exchanges
exemplify the variety of meanings and practices attached to futures trading at this
formative time. They illustrate how futures markets grew out of, an in interaction with,
extant spot markets in agricultural commodities. To understand futures markets, this
dissertation argues, we must consider their myriad points of connection with these
underlying spot markets.
Case selection

35
CBOT and NOCE both developed futures markets in the sixty years prior to federal
regulation. But they were not alone in doing so. Grain futures were traded on boards of
trade in New York, St. Louis, Minneapolis, and Duluth; cotton futures were traded in
New York and Liverpool. So why choose CBOT and NOCE for study? Answering this
question requires considering this dissertation’s dual analytic goals, as described in the
Introduction. The primary goal of my analysis is to reveal through an empirical argument
how material and social factors directly impacted the creation of information
infrastructures linking spot and futures markets. Thus, the first task of this section is to
discuss what features of these markets make them useful cases with which to investigate
this topic. The secondary analytic goal of the dissertation is to examine how these
divergent infrastructures established unique conditions of possibility that indirectly
impacted behavior on these markets. This is necessarily a theoretical argument. The
second task of this section, then, is two-fold: first, to establish how these cases serve as
illustrations of this theoretical argument; second, to parse the relation between this
indirect cause of behavior and traditional, direct causes.
Empirical analysis
Since the object of my empirical analysis is the infrastructural linkage created
between spot and derivative markets, it is useful for my two cases to have spot markets
whose histories differ up to the point of initiating the futures trade. As shown in the
above history, NOCE and CBOT meet this requirement. CBOT developed out of the need

36
to control the Chicago spot market’s rapid, technologically-fueled growth. The Board
attempted to balance the interests of several powerful market actors—including railroads,
elevators, and merchants—as they jockeyed for advantage in the young market. NOCE,
by contrast, developed out of a more stable and established spot cotton trade in New
Orleans. NOCE was formed, not to control the market, but to rebuild it after the setbacks
of the Civil War. When the time came to build futures markets on these exchanges, their
distinct histories with and relations to the spot market would likely push them to privilege
different aspects of trade, support different groups, and develop different understandings
of the economy, all of which would be reflected in their market infrastructures. These
cases thus offer a chance to explore how distinct spot market backgrounds influence the
creation of derivative markets and their constitutive, infrastructural linkages to the
underlying spot market.
These cases are also useful because they feature markets built upon different
underlying spot commodities. This difference creates space between the cases that allows
for a more thorough analysis of the social and material influences on the infrastructure
that emerges. If the underlying markets dealt in the same commodity both would likely
implement quite similar infrastructures, since they would be dealing with the same
material features of production, transportation, storage and manufacture. Additionally, we
would expect to see a process of isomorphism among such markets whereby their
infrastructures would converge into a single model. In the course of doing business, the
exchanges would adopt the same sets of classifications, use the same statistics on the
crop, and even develop similar ways of theorizing the market through exposure to shared

37
sources of information, such as those presented at national conferences. Having markets
with distinct commodities at their bases therefore allows for their infrastructures to
evolve along separate paths, enabling a clearer analysis.
A final worthwhile feature of these cases is the differing role of the state in the
construction and enactment of their infrastructures. NOCE developed their infrastructure
free from any direct state interference. CBOT, in contrast, was forced early on to
cooperate with the state via the RWC. Through this agency, the state established control
over an important component of the market infrastructure, the system for grading and
creating receipts for spot wheat. This distinction provides an opportunity to explore the
origins and challenges of state involvement in the construction of market infrastructures.
How did the state’s involvement affect the quality of infrastructure created? Did state
involvement in this one area of infrastructure impact the form and operation of other
areas? How did infrastructure become a source of power for the state? These questions
are critical for understanding efforts at state regulation of financial markets from an
infrastructural perspective.
Theoretical analysis
The secondary goal of my analysis is to understand how infrastructure affected
behavior on these markets. Here, NOCE and CBOT are useful cases because they
exhibited a striking difference in behavior—a long-term divergence in price volatility
(see Figures 1 and 2, p. 7 in introduction)—which I use as a focal point for my theoretical

38
argument. I argue that it is possible to trace this difference in volatility back to the
distinct infrastructures on each market. But this claim is limited in its scope. I claim not
that infrastructure directly caused market volatility, but rather that it created an
environment that made volatility-producing behaviors, such as heavy speculation and
running corners, more plausible and rational on CBOT, and less so on NOCE.
This is necessarily a theoretical claim. I argue that infrastructure acted as a
“limiting cause” of volatility, a factor that sets the conditions of possibility, or establishes
a range of possible outcomes, within which certain events actually occur (Wright, Levine
& Sober 1992). Limiting causes are contrasted with “selective causes,” the familiar
causes of economic sociological analysis, such as network geometry, institutional
environment, status distinction, culture, and more. There were undoubtedly several
selective causes of volatility, discussed below, at work in my cases, including network
position, institutional environment, and market culture. One could assume that until the
influence of these factors are definitively disproven, any analysis that proffers another
possible cause (e.g., infrastructure) is worth little—it simply adds one more hypothesis to
the bunch. But I argue that this is not the case. The presence of selective causes, such as
differences in networks, institutions and culture, does not invalidate a study of limiting
causes; these causes are complementary, not exclusive.
Still, in order to place my own infrastructural analysis in context, it is necessary to
briefly review the major economic and social structural factors that might have been
selective causes of price volatility on these markets. I discuss four: (1) predictability of
supply; (2) network structure; (3) institutional environment; and (4) culture. I do not

39
discount that these features might have impacted volatility. I do, however, offer evidence
that suggests their impact in these cases was likely smaller, and more mixed, than theory
might at first lead us to believe. My goal in presenting this contrary evidence is to suggest
that these factors do not inevitably, entirely account for the difference in volatility seen
on these markets.8
Possible selective causes of volatility
One partial source of the volatility on these markets was simply a difference in the
consistency of supply. Central here is the fact that wheat rots far more easily than cotton.
Wheat was therefore more likely to go bad while in storage or in transit. The sudden
drops in supply that would accompany this spoilage would cause prices to spike. This
suggests that the greater volatility in the price of wheat was, in part, a function of its
particular physical qualities.
But it seems unlikely that this mechanism could account for the market’s
persistently higher volatility over fifty years. Instances of mass spoilage were rare.
Taylor’s (1917) history of the Chicago Board, which includes detailed yearly accounts of
8 The inability to precisely pin down the sources of volatility on these markets is partly due to a mismatch
of scale between the phenomenon and the data. Volatility occurs on a micro time scale—it depends on
judgments occurring from minute to minute, or second to second. This is why ethnography is so well suited
to studies of market decision-making (e.g., Beunza, Hardie & MacKenzie 2006; Beunza & Stark 2005;
Smith 2011; Zaloom 2006). Historical documents capture a longer time frame, and so miss many of the
immediate causes of volatility. But what historical data do capture well are differences in infrastructure that
set the conditions within which these micro-level phenomena occur.
40
the markets for several commodities, only notes six years with significant instances of
heating, four of which were for stocks of corn, not wheat.9 He makes only one mention of
spoilage in stored wheat, which occurred in 1870—unfortunate timing for warehousemen
who were just then facing scrutiny from Illinois’s Constitutional convention. In addition
to its infrequency, the revelation of spoilage, at least as a statement of supply used in
rational calculations, would be reflected in prices fairly quickly, preventing long-term,
multi-month effects. Though, if we were to imagine that instances of spoilage had
broader effects—say, as rumors about further spoilage continued to circulate—volatility
might last longer, as speculators wagered over the extent of the damage. But, though the
evidence does show instances of uncertainty over the status of the crop, the infrequency
of these moments tends to make any long-term effect less plausible.
A second influence on volatility might have been the network structures of the
two exchanges. Trade networks in New Orleans were more tightly-knit than in Chicago.
As discussed above, many NOCE leadership positions were filled by a rotating cast of
prominent members. These small, elite-driven trading networks were a legacy of the
factorage system, which had severely limited the number of middlemen in the cotton
trade. We can assume that volatility within such a market might have been dampened by
a number of different forces, including more rigidly enforced social norms against
excessive speculation or market manipulation, the individual need to repeatedly trade
with the same people, and personal friendships (Biggart 2001; Burt 1992; Rauch &
9 These mentions were found by searching the PDF file for the terms “spoilage,” “heating,” and “rotten,”
along with their alternates, e.g., spoil, spoiled, spoiling, etc.
41
Casella 2001; Sabel 1992). CBOT, by contrast, developed out of a far more specialized
and differentiated marketing system. This social distance between traders could have
weakened the norms of behavior on CBOT, allowing opportunistic and manipulative
behavior to become more prominent. In fact, CBOT did have some trouble getting
members to follow the rules, as discussed more extensively below.
However, there is also evidence that these dense network connections did not
always serve to keep markets orderly and stable. Dense networks can breed rivalry as
well as trust (Dalton 1959), and in 1825, 1839 and 1842, years when the elite-based
factorage system was at its peak, New Orleans saw large corners in the spot market for
cotton (Bouilly 1976).10 The first of these left many of the largest firms in the world
insolvent and disrupted trading for months after. For fourteen weeks after the corner, the
New Orleans Price Current magazine posted no prices because there was simply no
trading to report, stating that “cotton at present is in as little demand as if there never had
been such an article in the market” (cited in Boyle 1934: 24). The presence of these
speculative manipulations on the antebellum New Orleans market casts doubt on the
notion that the Exchange’s close ties would have necessarily lowered volatility.
Another network-related influence on volatility might have been the size of the
markets. It is probable that the group of traders in the wheat pit at CBOT was larger than
its counterpart at NOCE. Unfortunately, the size of these groups is difficult to discern.
Records list the number of overall members in each exchange, not the number of traders
10 This is especially noteworthy because this took place in the spot market, which requires far more capital
to corner than does the futures market (Bouilly 1976). This suggests that traders, in fact, were willing to
expend a great effort to fleece associates in their tightly-knit network.

42
in the pits. In terms of overall numbers, CBOT’s membership during the majority of the
period under study hovered around 1,800, while NOCE averaged about 400, making the
Board four and a half times larger; but, of course CBOT hosted large markets in multiple
commodities (including the biggest corn market in the world), while NOCE hosted only
one market in cotton. Thus it is difficult to compare the number of traders who populated
the two pits. This difficulty is compounded by the fact that some traders engaged with
multiple commodities, while others specialized in one.
But if the CBOT wheat pits were larger, this might have been a selective cause of
volatility. Large size has been shown to promote distinct cliques of traders, which
impedes the flow of information and thus increases volatility (Baker 1984; Carruthers
1996). Without data on the number of traders occupying each market, however, it is
impossible to even speculate as to whether in these cases size had any effect on volatility.
Another possible influence on volatility might have been the institutional settings,
understood as the governance structures and rules, both official and unofficial, of the
exchanges. For the most part, though, CBOT and NOCE were quite similar
institutionally. Both were state chartered organizations which set and enforced their own
rules. Individuals bought a membership in each, and new applications were screened by a
standing committee and put to a vote. Both organizations had similar rules regarding the
types of trades that were allowed (e.g., futures trades of all kinds, as well as corners) and
those that were not allowed (e.g., trades executed outside of exchange hours or off the
trading floor and trading in options). One distinction, however, was that CBOT was less
willing to hand down harsh punishments for engaging in prohibited trades. This
43
reluctance might have lowered the cost of—and increased the presence of—volatility-
inducing behavior on their exchange (Abolafia 1996; Greif 1989; Williamson 1981). But,
in fact, in the specific case of CBOT, this effect would likely be negligible, since the
prohibited trades had countervailing affects on market volatility: trading away from the
floor and at off hours tended to increase volatility, while trading options dampened it.
Thus, the laxity of rules did not uniformly make CBOT more volatile.
A final influence on volatility might have been differences in cultural beliefs about
how a trader should make money, or how commodity markets should operate. On this
topic, there is some evidence to suggest that Chicago simply had a more permissive
attitude to speculation than New Orleans—after all, the city itself was born in a
speculative boom. Big-time speculators such as Benjamin P. Hutchinson—“Old Hutch,”
as he was known—were mythologized in popular newspaper accounts. As Chicago
gained a reputation as wild market, traders with a taste for speculation were drawn to it,
creating a feedback cycle (Ferris 1988; Markham 2002). At the same time, in New
Orleans, many old-guard factors decried speculation as creating a “spirit of gambling”
(New Orleans Daily Picayune, Dec. 27, 1879). The ethos of NOCE in its early years was
focused largely on the revival of the Southern spot trade in the aftermath of the Civil
War, not on speculative trading (Ellis 1973). This difference in the legitimacy of
speculation as a commercial activity could certainly have created a more volatile market
on CBOT (cf., deGoede 2005; Fabian 1990). Yet, to say that speculation was absent or
generally discouraged in New Orleans is mistaken. As noted above, the antebellum cotton
market was “replete with speculative attempts to manipulate the price or corner the spot

44
market” (Bouilly 1976: 13). Additionally, NOCE members defended speculation using
the same language of increased efficiency and risk management as did members of
CBOT. Traders in both cities embraced and defended speculation and short selling in
their quest to make a profit.
These possibilities thus remain neither proven nor disproven. While
countervailing evidence and alternative explanations suggest that their influence might
have been small, or mixed, the impact of differences in supply, networks, institutions and
culture has by no means been disproved. Because of this I cannot argue that the
divergence in volatility on these markets was caused by a difference in infrastructure and
nothing else. It is, in fact, difficult to imagine two cases where all selective causes are
controlled for, leaving only the influence of infrastructure present.
This inability to definitively pronounce on the relation of infrastructure to
volatility may appear to be a weakness. But a symmetrical weakness exists in traditional
economic and sociological analyses, which ignore market infrastructures. Both economic
and sociological approaches to volatility invoke an ideal version of “the market” in their
analyses (cf. Krippner’s (2001) critique of “embeddedness”). Neoclassical economists
use this idealized form as is, combined with reductive assumptions about individual
behavior. Institutional economists and sociologists embed this ideal of a market in myriad
social relations, which they then understand to shape actors’ behaviors. Yet neither
approach recognizes that markets are complex, socio-technical settings, which require
extensive infrastructure to function, nor that these infrastructures themselves underlie and
shape market behavior. For instance, Abolafia (1996) fails to control for the underlying

45
assets (futures, stocks, and bonds) in his study. The assumption he makes is that any
difference in the instrument being traded and its connection to an underlying asset is of
no consequence to market behavior. Baker (1984), though he studies only stock options,
glides past the fact that different classes of options were traded in each of the networks he
studies. There is no thought that differences at the infrastructural level (e.g., that the
classes are composed of differing numbers of options) might impact volatility at all.
These analyses look to social factors within the market, but fail to analyze the
infrastructural features at their base. Thus they give only a partial explanation of market
phenomena.
Infrastructures must be incorporated into sociological analyses of markets.
Infrastructure is an imminently social object, shaped by competing interests and
attachments. It is a battleground upon which social actors create frameworks that set
fundamental limits to action. The fact that these social influences tend to disappear into
the technical functionality of a complex system over time is all the more reason to bring
them to light. But the general lack of work on the subject means that any such research
must first address the issues of infrastructures’ boundaries and characteristics, as well as
how best to integrate it into our studies of markets. These are the topics of the next
chapter.

46
Chapter Two – Information and Infrastructure
In many popular and even academic perspectives on markets, information is held
to be a—or the—critical feature. Traders gather, withhold, share, and act on information;
information is good or bad, truthful or misleading; it both gives context to and is
conveyed in prices; it enables judgments of the future and actions in the present. In this
chapter, I examine how exactly information as a feature of markets has been
conceptualized in sociological or sociologically-informed accounts. The goal is to
discover which features of information can be drawn from these diverse perspectives and
to consider how to integrate these elements into a single conceptual framework.
I highlight three broad perspectives on information within markets. The first
approach, taken by information economists and some sociological network theorists,
focuses on the movement of information through markets and among economic actors.
By highlighting the unequal dissemination of economic information, and thus, the
unequal distribution of economic resources, these scholars draw a sharp contrast with the
information-related postulates of neoclassical economics. The second approach discussed
notes that, in addition to receiving information through network channels, actors must be
able to interpret and use this information in their everyday environments. The processes
of meaning-making, judgment, and calculation this entails are not simple, nor are they
individualistic; significant institutional and material means are put to work in the service
of these ends. The final approach conceives of information as a product of socio-material
construction. It focuses on the systems by which the information at the heart of the

47
market is created, the power relations inscribed therein, and the qualities it takes on as a
result of its origins.
I bring together these three approaches through a discussion of “information
infrastructures”—the institutional, material, and cultural means by which information is
created, disseminated, and interpreted. This broad perspective enables us to consider all
three of the areas highlighted above, while additionally analyzing the character of
information on markets and the uses to which it can be put. According to the nature of the
infrastructure involved, information may take on wholly different properties, constructing
vastly different market information environments. This is seen in the cases in my
dissertation, were the distinct infrastructures in place on CBOT and NOCE created
information environments that promoted very different types of trading on the futures
markets. The conceptual framework of “information infrastructure” thus seeks to
encompass the established literature on how market devices and institutions impose a
relation to information and also to determine how market infrastructures give particular
qualities to information, and how these qualities come to matter in market situations.
Disseminating information in markets
Some of the earliest work on information in markets was concerned with its
dissemination. Neoclassical economics centrally features postulates regarding the
movement of information within and across markets: all available information was held
to be reflected in prices; information was understood to move costlessly through the

48
market and be held in common by all participants (Fama 1970). In response to the
proliferation of quantitative models based on these neoclassical assumptions, mid-century
economists sought to more carefully study the flow of information in markets. Hayek’s
(1945) early efforts did little more than more explicitly draw out the mechanisms
assumed by neoclassical economics. Hayek claimed that the price mechanism in a free
market could efficiently disseminate local knowledge to distant parties, a feat that could
not be accomplished through central planning. Though each actor has only a limited view
of the economy, the whole is efficiently coordinated by the price mechanism—to Hayek,
this is the “marvel of the market.”
Subsequent economists, however, have questioned just how marvelously markets
actually do distribute information. They note that market transactions are often marked by
asymmetric knowledge and a strong incentive not to reveal information to others, due
either to the nature of the transaction (e.g., buying a used car, Akerlof 1970) or to the
costs associated with gathering information (Stigler 1961). Under such conditions, price
ceases to be an effective conveyor of information, and market order collapses. Further
work among economists developed a distinct perspective that treated information as a
scarce good, the acquisition of which involved a cost—information became a commodity,
similar in many ways to any other commodity. The dissemination of information
throughout a market then itself became an economic problem, and unequal distributions
were understood as the outcome of market imbalances.
The work of information economists formed a baseline from which to consider
the uneven distribution of information within markets. Sociologists built on these initial

49
economic analyses through a number of network-based studies. One style of network
analysis studies the differential patterning and movement of information within networks.
The size and density of networks are critical in this regard: information moves more
uniformly through small networks, while in larger networks it breaks up among cliques
(Baker 1994); it travels quickly through dense networks, but becomes more varied and
useful in sparse networks (Granovetter 1973, 1974, 1985; Mizruchi & Stearns 2001; Uzzi
1997). Another type of network analysis focuses on the distribution of control over
information based on an actor’s network position. Being in a position to control
information or broker the connection of two groups—a “structural hole” (Burt 1992) or
tertius gaudens (Simmel 1950)—makes an actor powerful within a market. Thus, the
small handful of executives that serve on the boards of multiple companies exert
significant influence thanks to their ability to connect otherwise distinct parties (Mizruchi
1996; Palmer & Barber 2001; Useem 1984). Similarly, in the realm of politics, Padgett &
Ansell (1993) show that the Medici’s power in pre-Renaissance Florence came from
spanning network disjunctures within the elite. This geometric approach to understanding
network dynamics suggests that two actors who occupy similar positions within a
network are “structurally equivalent” and will have roughly equivalent amounts of power
in those networks (White, Boorman & Breiger 1974; Lorraine & White 1971).
This work demonstrates decisively that information travels uneven and unequal
paths through the market. However, this approach fails to consider what happens once
actors get ahold of this information. Implicit in this lack of attention is the idea that
information is a self-evident signal, which must only be received to be understood; the

50
processes of interpretation and cognition remain unstudied, and tacitly understood to be
individualistic cognitive acts rather than social ones. As such, this work still relies on a
model of action that presupposes a rational actor involved in individual calculation. The
second approach to information in markets, discussed below, critiques these assumptions,
showing that information, in fact, requires a multi-faceted social setting to become
meaningful. The approach thus moves beyond a focus simply on the socially patterned
movement of information to scrutinize processes of judgment, meaning-making and
calculation as social acts.
Interpretation & calculation
The theoretical ground for the critique of the information economics and network
sociology perspective is the uncertainty of economic action. Even if we accept the
notions—explicitly stated within information economics and implicit in network
geometry approaches—that individuals will act in rational, calculative pursuit of their
goals whenever possible, there are a number of environments in which this is impossible.
In an uncertain environment, rational calculation is impossible because there is no way to
meaningfully assess the probability of future events, whether because the causes are too
numerous, too unpredictable, or too interdependent (Knight 1921). In an important sense,
this is a problem of information. If we assume uncertainty, it is impossible for even the
most rational economic actor to individually interpret and calculate from information.
Under such circumstances, economic actors must create and rely on a multitude of social

51
and technical aides to narrow the possible interpretations, calculations, and actions that
actors may take in an economic setting. These include “social devices” (Beckert 1996)
that narrow the range of possible actions, “judgment devices” (Karpik 2010) that
legitimate and validate information, and “calculative tools” (Callon 1998a) that routinize
and constrain the practices of calculation. In all of these perspectives, we see that
interpreting the economic environment and engaging in economic action is not an
individual task, but an irreducibly social one.
Institutions and culture constitute economic actors’ cognitive experiences of the
market. Institutions fundamentally construct understandings of the economic
environment (DiMaggio 1994) and establish the framework of “the market” such that
individual actors can then engage in creative activity (Beckert 2009; Krippner 2001).
Institutions provide schemas, classifications, scripts, and routines that structure
interpretation and cognition of market information (Powell & DiMaggio 1991). These
interpretations of information often come to market actors readymade and determined by
other economic actors. For instance, the shared cognitive schemas that provide a common
frame for evaluating and interpreting events, behaviors, and actions are often constructed
at the organizational field level (DiMaggio & Powell 1983; Powell & DiMaggio 1991).
This is seen in the fact that CEOs drawn from different divisions within a firm view the
same business environment in fundamentally different ways, interpreting the same
evidence via different cognitive schemes (Fligstein 1990). These socially-constructed
frameworks for interpretation are found also in other areas of the economy. For instance,
in the world of art, the interpretation of market information is fundamentally shaped by

52
cultural beliefs about the value of art. Works of art are priced not according to the
principles of supply and demand but according to gallery owners' roles as advocates for
the artists they feature in their shows and the symbolic meaning of the prices they post
(Velthuis 2003). In all cases, cultural meanings and institutionalized behaviors
dialectically reinforce one another and mold social life into recognizable patterns (Zucker
1983).
Often, these broadly shared interpretations of the economy become embedded in
economic theoretical models. These theories then expand in scope and taken-for-granted
status, providing common guides for interpreting, and acting in, the market (Callon
1998a; MacKenzie, Muniesa & Siu 2007). These generally accepted ways of measuring
and understanding the world can be considered components of an economic style of
reasoning, a general perspective on how and why economic action occurs the way it does
(Hacking 1992; Hirschman & Popp-Berman 2013). These are foundational, paradigmatic
features of theoretical approaches to the economy. As such, they become deeply
embedded in the ways of thinking within a given environment, and built into more
elaborate theories as fundamental truths (Fleck 1979; Kuhn 1962). These act as
calculative tools that push market actors to interpret and act upon information in similar
ways (Callon 1998a). These elements also work their way more visibly into the
calculative tools by which traders make sense of, and act in, the market, including sheets
of stock option prices (MacKenzie 2006), tables of figures (Didier 2007), or the portfolio
(Smith 2011), a process that can have performative effects on the market, as discussed at
length later in this chapter.

53
Information also is made meaningful through the interpolation of “judgment
devices” that flag differences in the qualities of products and the status of producers
(Aspers & Beckert 2011; Karpik 2010). These provide mechanisms by which information
is made credible, enabling actors to have faith that their information accurately represents
the qualities of the commodities—or, at least, that most people will act as if it does. They
include diverse features such as personal networks of close friends and associates that
vouch for information’s accuracy, as well as a number of devices that give validity to
third-party judgments, such as those form critics, guidebooks, the state, or independent
certification boards (Karpik 2010). Judgment devices exist in a mutually supportive
relationship with broad cultural understandings, and similarly work to eliminate
uncertainty and promote coordination between market actors.
In addition to taking shape through the institutionalized intervention of actors
outside an economic actor’s immediate circle, information is also interpreted in situ, by
materially embedded actors on the market. Meaning-making is pragmatic and guided by
the particular goals and capacities of the actors, as well as the affordances of the material
environment. This pragmatic process is affected by a set of influences distinct from those
impacting the creation and use of elements in the institutional environment.
One particular pragmatic challenge is that traders must constantly construct
interpretations of unique and rapidly changing market situations. This involves creating
frames that distinguish between those relations actors will take into account and those
that will be thrown out of the calculation (Callon 1998b). These more specific, temporary
framings of a market environment enable traders to spot particular profit-making

54
opportunities (Beunza & Garud 2007; Beunza, Hardie & MacKenzie 2006; Stark 2009).
The construction of these frames is shaped by both social and material features of the
environment. A company’s organizational structure may come to play a significant role,
in terms of how strictly they control how frames get made or used, and the flexibility of
these frames in practice (Beunza, Hardie & MacKenzie 2006). Additionally, the physical
layout of an office can encourage or discourage conflict between frames among different
actors (Stark 2009). These frames are designed to be constantly revised and edited as they
are “overflowed,” as flexible, moment-to-moment calculative and interpretive tools.
Also, the material configurations of information displays have been shown to shape
the methods of cognition and interpretation among economic actors. The stock ticker, for
example, introduced a smooth temporal structure to the market, which enabled actors to
make price variations objects of symbolic interpretation (Preda 2006). Prices written on
white boards, rather than spoken between traders, made network and interpersonal
relations forged on the floor of the exchange less critical than previously (Pardo-Guerra
2010). Screens function as “reflexive mechanisms of observation and projection” or
“scopes” that project the reality of the market to traders (Knorr-Cetina 2003: 8). These
enable traders to conceptualize the market in new ways, e.g., as intrinsically dynamic and
processual (Knorr-Cetina & Grimpe 2008) or as autonomous from the individuals who
comprise it (Zaloom 2004).
The connection between the macro-level institutional and micro-level pragmatic
environments is revealed in the case of performativity. The theory of performativity
argues that economic theories, thought only to describe the market as an external reality,

55
in fact craft actors and the economy as a whole so as to bring their actions more in line
with the predictions of economic theory (MacKenzie 2007). But performativity is not
simply a new version of the self-fulfilling prophecy, whereby economic agents
collectively will into existence a new reality (Merton 1948). The efficacy of economic
theory in a performative situation rather comes from its incorporation into material
objects and processes “beyond human minds" (Callon 2007: 323; but see also Duhem
1996 [1894]); these range from calculative aids (MacKenzie & Millo 2003; Preda 2009)
to market procedures (Garcia-Parpet 2007; Guala 2007). These objects come together in a
mutually attuned assemblage of human actors, discursive elements, procedures, and
technical devices—an agencement—that transports the theoretical perspective into a
material realm (Callon 2007). Garcia-Parpet (2007), for example, documents how the
physical layout and carefully controlled procedures established in the strawberry market
in Fontaines-en-Sologne, France—ranging from the style of auction used to the rigorous
physical separation of buyers and sellers—amounted to the “practical realization of the
model of perfect competition” (Garcia-Parpet 2007: 20). The agencement serves as both
the substance of the performance and the object that shapes economic behavior into the
form proposed by economic theory. This is seen especially clearly when formulas move
from one world to another. A formula may find the proper felicity conditions within the
university, but when it moves to another field it may find that the sociotechnical
arrangements that would have enabled it to survive in this new world are either not
present or are difficult to put into place (Callon 2007).

56
The preceding research demonstrates that the processes of interpretation and
calculation rely on a multitude of social factors. Institutions serve to provide an
authoritative, yet general, orientation to information, which actors must then further
interpret within meso-level organizational or market settings. The particular material
tools with which they engage in cognition often serve to draw these two environments
into close connection. Actors use “social devices” (Beckert 1996), “judgment devices”
(Karpik 2010) and “calculation tools” (Callon 1998a) to make sense of and act upon
information within economic environments.
But while this scholarship is a useful counter-position to the individualist
cognitive approaches that analyzed only the movement, and not the interpretation, of
information, this perspective fails to consider the socio-technical influences of the
construction of information for the market. These approaches tend to think of
information, prior to the social actions that enable interpretation and cognition, as under-
determined and wholly without qualities. The final approach to information concerns
itself with precisely the issue of information’s origins and pedigree. Scholars of sociology
and science and technology studies analyze the processes by which information is
constructed to discover the qualities that it brings to the market irrespective of the
institutions, culture, and material tools within which it is embedded.
Construction

57
Central to this approach is to study information in relation to the infrastructures
that support its creation, gathering, and dissemination. Infrastructure, a term drawn from
science and technology studies, is defined as linked, interdependent, socio-technical
systems—sets of standards and classifications, technological devices and protocols
(Pardo-Guerra 2014)— that both support action locally and enable coordination globally
(Bowker 1994; Star & Ruhleder 1996). Infrastructures tend to sink into other aspects of
the environment, invisibly supporting mundane tasks and becoming visible only when
they break down (Star & Ruhleder 1996). Infrastructures also are linked together through
shared sets of standards, giving them scope over long distances and spans of time. They
are able to undergird large-scale technical systems (Hughes 1987) by harmonizing
multiple, independent technologies and communities of practice around a single, common
standard (Barry 2001; Bijker, Hughes & Pinch 1987; Edwards, Bowker, Jackson &
Williams 2009).
Economic sociologists are finding infrastructure to be a useful concept as they
begin to conceptualize markets more as material objects (Pardo-Guerra 2014; Pinch &
Swedberg 2008). The focus on infrastructure shows the socio-technical underpinnings of
markets and offers another site for sociological analysis. Infrastructures are politically
contested objects, the details of which affect the lives of the individuals who use them
every day. Classifications and metrics discard information and elide distinctions that are
critical to actors on the ground (Bowker & Star 1999; Cronon 1991; Espeland & Stevens
1998); they impose particular ways of seeing and governing that empowers certain
groups while subjugating others (Foucault 1982; Lampland & Star 2009; Miller &

58
O'Leary 1987; Miller & Rose 1990). Processes favor the goals of some groups while
hindering others (Barry 2001; Millerand & Bowker 2009). The actors most closely
connected with the creation of classes, standards, calculations, or processes wield great
power to define encounters, while those farthest away often find that their own practices
fit poorly within the system provided (Barry 2001; Latour 1987; Star & Lampland 2009;
Thevenot 1984). The mode of construction suffuses market information with power
relations, circumscribing the modes of thinking and talking available to economic actors
downstream as a result. Even prior to its dissemination or interpretation, then,
information is the subject of a highly contested process of construction, which has
significant effects on market action.
Infrastructural analyses have tended to focus on three discrete topics: (1) the
creation of new objects and ways of understanding; (2) the creation of new market-
related processes; (3) the creation of information to be communicated, interpreted and
acted upon. The final focus is the one to which this dissertation contributes, but also the
least developed in the literature. Below, I briefly review research done in the first two
areas, before developing the need for and possibilities of research in the third.
Infrastructures enable or deny particular ways of acting and understanding by
creating new objects, which in turn promote new ways of understanding, as well as by
simply making possible new actions. In creating meaningful objects, infrastructures
provide the underlying categories by which individuals understand and experience an
environment (Bowker & Star 1999; Espeland & Stevens 1998). The effects of this can be

59
mundane, as when law schools come to understand the strengths and weaknesses of their
programs through the classifications used to produce national rankings (Espeland &
Sauder 2007), or when scientific research sites create new organizational structures,
identities, and collaborative forms of work in response to the implementation of a new
metadata standard (Millerand & Bowker 2009). But they can also have a vast
significance, such as with the de-categorization of homosexuality as a mental disorder
within the DSM (Kirk & Kutchins 1992).
This significance comes from the new ways of acting that are established by
infrastructures, actions which often rely upon the new categories they create. By
classifying commodities (Cronon 1991) or people (Fourcade & Healy 2013) we create the
infrastructure to incorporate them into entirely new market processes. Poon (2009) and
Rona-Tas & Hiss (2011), for example, note how grading consumers with a credit score
allows them to be embedded within a suite of new practices from banks, landlords, and
employers. Of course, other infrastructural changes do not rely on creating new objects,
but simply enable new processes that differently fulfill an established function. This is the
case with innovations in the execution and clearing of trades, which enabled the markets
to take on vastly different characters (Millo, Muniesa, Panourgias & Scott 2005; Pardo-
Guerra 2014).
In several respects, these points about the construction of new ways of seeing and
acting are similar to those made above regarding the material and calculative tools
present on markets. But one must be careful not to conflate infrastructure with technology
or material tools more generally (Pardo-Guerra 2014). Infrastructures have several
60
particular features that distinguish them from material technologies more generally,
including invisibly supporting tasks, linking communities of practice, and being
understood as natural within a community of practice. Many market technologies do not
meet these criteria: calculative aids such as charts of long-term price movements (Preda
2009), sheets of stock option prices (MacKenzie 2006), or tables of figures (Didier 2007),
while influential technologies of economic decision-making, are all highly visible, local,
and often actively contested (Pardo-Guerra 2014). These material tools are utilized
differently than infrastructures, are embedded within different social settings, and have
different consequences for action: infrastructures remain hidden while displays are put
center stage; infrastructures last over long periods of time, while representations must
continually be legitimated; infrastructures, once in place, operate largely shielded from
the influence of social factors with which market devices must interact.
Additionally, the definition and examples of infrastructure given above need
qualification. The above set of features gives us the sense that we can identify a system as
“infrastructural,” once and for all. But infrastructure is a relational concept: what is
infrastructure to one person may be structure to another, what is infrastructural at one
time may become structural as conditions change (Bowker 1994; Bowker & Star 1999;
Star & Ruhleder 1996). To an office worker, the servers working in the building’s
basement and the cables running through its walls are infrastructures that enable their
day-to-day action to proceed without a second thought; however, to the company’s IT
team, they are objects of intense daily focus. Thus, it makes less sense to ask what makes
something an infrastructure than to ask when it is infrastructure (Star & Lampland 2009).

61
Infrastructure must always be situated in relation to a set of practices, never located
simply in material properties. Just as with our thinking about what is “information,” our
ideas about what is “infrastructure” must be in relation to practice.
While scholars have most carefully considered how infrastructures produce new
objects, ways of understanding, and modes of action, infrastructures also create new
information. Scholars have recognized this function of infrastructure, but have tended to
collapse it together with the creation of new objects and ways of understanding. This can
be seen in the arguments that infrastructures work in part because they facilitate
communication among the groups that use them. Star (2002: 109), for example, calls
infrastructures ‘communicative tools’; Bowker & Star (1999: 286) argue that
classification systems allow people to ‘communicate across the boundaries of disparate
communities’; and Edwards (2010: 18) notes that a classification infrastructure is, among
other things, a ‘communication … web with both social and technical dimensions’. These
scholars have tended to assume that communication occurs unproblematically once two
infrastructures have been ‘plugged into’ one another via a common set of standards
(Bowker & Star 1999: 35; see also Star & Lampland 2009; Star & Ruhleder 1996). A
single, shared classification scheme or set of standards establishes a shared ontology
across settings, which serves as a common language allowing actors to reference the
same types of objects, processes, and relations (Espeland & Stevens 1998).
Classifications, standards, and grades become information that conveys meaning to
market actors.

62
Yet, while a shared ontology may make communication possible, it tells us
nothing about the quality of communication that takes place. The issue of ‘work arounds’
serves to illustrate this point. Much research has shown that shared classifications and
standards fail to create uniformity of practice across environments (Barry 2001; Bowker
& Star 1999; Edwards, et al. 2009; Millerand & Bowker 2009). Familiar ways of working
are retained without change, and simply labeled in accordance with a new classification
scheme, for either bureaucratic or symbolic reasons (Meyer & Rowan 1977). The
prevalence of work arounds suggests that a shared classificatory language does not
guarantee uniform or reliable communication. Rather, understanding classification
infrastructures as ‘communicative tools’ requires explicitly theorizing their character as
producers of information.
The primary example of linking infrastructure with the information it produces
comes from Muniesa’s (2007) study of price-setting mechanisms on the Paris Bourse and
the Bolsa de Madrid. Concentrating on the issue of how prices communicate, Muniesa
demonstrates that different infrastructural procedures created prices that differed in their
primary semiotic mode. Simply using the last trade of the day produced a good index, but
failed symbolically; making an average of trades in the last five minutes produced a good
icon, but a poor index; utilizing an algorithmic auction produced a fairly good index,
combined with a strong symbol. These different semiotic modes in turn promoted
divergent behaviors on the market, particularly with regard to manipulation of price.
Thanks to the character of the sign produced in this final configuration, market
manipulation was ‘pragmatically calibrated’ and ‘rendered costly’ (Muniesa 2007: 388).

63
The semiotic capacity of other infrastructures has also been noted. Lampland
(2010) notes that bookkeeping practices among farmers in Stalinist Hungary used ‘false
numbers’ that acted not as indexes, but as icons symbolizing the implementation of
rational, written management practices. Similarly, Lea & Pholeros (2010) show how
conditions of work led government contractors building houses in Australia to carelessly
complete government checklists and forms, producing documents that served as icons of
work practice rather than indexes of building quality as intended. Pinzur (2016) has
linked differences in the semiotic qualities of commodity grades to market-level
divergence in price volatility over a period of decades. In each case, the quality of the
information produced by market infrastructure impacted their incorporation into the
environment.
Thinking about the qualities of information requires a shift in focus from the
construction of infrastructures (Star 2002) to their implementation in practice (Hatherly,
Leung & MacKenzie 2008). Prior research has treated the former as critical: it is the
moment when partisans battle to establish the contours of the system and set into place an
ontology with far-reaching political consequences (Cronon 1991; Espeland & Sauder
2007; Foucault 1982; Miller & O’Leary 1987; Miller & Rose 1990). But it is in the latter
moment that information acquires its qualities. By classifying a good, transmitting a
price, or creating a statistic in one way and not another, infrastructural actors construct
information with distinct properties. For example, Hatherly, Leung & MacKenzie (2008)
demonstrate that the meaning of the figures produced by accountants, including the basic
categories of profit and loss, can vary dramatically in response to changes in classifying

64
practice. As the processes by which infrastructures operate change, so too are the
qualities of the information they produce altered (Barnes 1983; Bloor 1997; Wittgenstein
1967).
The preceding makes clear that there is room within an infrastructural approach to
consider the qualities that information has as a result of the circumstances of its creation.
This is a generally understudied topic, and a critical area for study. As seen above,
information, even prior to being embedded within multiple social environments in the
market, has qualities that stem from the infrastructures that produce, distribute, and
support it. These qualities may importantly shape the ways in which the information may
be embedded or the types of actions they enable. While these informational qualities in
no way determine the response of market actors, but they do establish limiting conditions
on their action (Wright, Levine & Sober 1992) and make particular actions more feasible
and rational. By studying the social features that lead infrastructures to be implemented in
particular ways, we can uncover a distinct layer of social influence on markets that often
goes unanalyzed.
Information infrastructure
The perspective on “information infrastructures” developed in this dissertation
encompasses our thinking about creation, dissemination, and interpretation of
information. All three are shaped by information infrastructures, and the qualities of
information are shaped by the processes underlying each. We must analyze the life cycle
of information, the social and technical environments through which it moves and

65
operates. By examining each of these components in action, it is possible to discover the
resulting qualities given to information. Other sociological approaches fail to recognize
the presence of these qualities and the constraints and affordances they present to actors.
Even when the same actions are made possible by an infrastructure (e.g., classification of
agricultural commodities enables futures trading) the quality of information being
produced can make certain actions (e.g., speculation, hedging, manipulation) more or less
likely.
In this dissertation, I study the divergent implementations of information
infrastructures on the Chicago Board of Trade and New Orleans Cotton Exchange, and
make an effort to broadly trace the full range of qualities of the information they
produced. I trace out the processes by which infrastructures operated, the qualities of the
information they produced, and consequences of those qualities on the behavior of
market actors. Each of the following three empirical chapters primarily addresses the
creation and impact of a different infrastructural aspect of the futures markets on these
exchanges.
Chapter 3 examines the systems of classification, grading and valuation, by which
physical wheat and cotton were repackaged as standardized grades. The grading
infrastructures on each exchange reflected material differences between wheat and cotton,
as well as the power of various groups within each market. While both systems assigned
grades to commodities, the differences in when they were assigned, in what fashion, and
with which material tools, meant that they operated in distinct ways. The grades, as
information, had divergent semiotic and legal qualities, which undergirded different

66
behaviors. On CBOT, the character of the grades made speculative trading more feasible
and rational, while on NOCE stable hedging trades were promoted.
Chapter 4 looks at the means of gathering and transmitting information about the
supply and demand for both futures contracts and for their underlying agricultural
commodities. This information took two forms: crop statistics and price quotations. This
chapter shows how the infrastructures for both forms of information were built on each
exchange, and why they were built differently. CBOT built up their price quotation
infrastructure as part of their political and economic battles against Western Union and
illegal gambling dens known as bucket shops, while doing little for the politically and
economically unimportant crop statistics infrastructure. NOCE, by contrast, built on
established connection with other US cotton centers to build a statistical system that
restored control and respect to the South, while their efforts to build up telegraphic price
systems floundered due to their poor technologies and lack of bargaining power. These
differences enabled different processes of valuation on the exchanges: while traders on
CBOT were encouraged to ride short-term shifts in price and seize on minute advantages
and misalignments, traders on NOCE were moved toward longer-term perspectives and
calculation.
Finally, chapter 5 pulls back to look at how market information was situated
within a framework on the connection between spot and derivative markets and finance
more generally. The distinct political challenges facing the exchanges led to several
significant differences in their understanding of the economic function and cultural
legitimacy of futures trading. CBOT, as part of its response to the federal government’s

67
attempts to tax speculation, drew a sharp line between futures contracts and options
contracts, arguing for the legitimacy of the former and danger of the latter. The
distinction proved a powerful component of the argument that both saved futures trading
and eliminated significant regional economic rivals. On NOCE, exchange leaders had
little to gain from making this distinction. For them, the critical concept was the close
linkage between spot and futures markets and the ability of the latter to build up Southern
autonomy in the cotton trade. In reflecting the political imperatives in their local regions,
the two exchanges created distinct economic theoretical perspectives on the functioning
and legitimacy of derivative markets.
Taken as a whole, this offers a perspective on what I call the “information
infrastructures” of these markets: the systems by which information was constructed,
disseminated, and interpreted on each exchange. These systems then serve as the basis for
an infrastructural analysis that spotlights the unique conditions of possibility created on
each market.

68
Chapter 3 – Constructing Grades
The systems for grading, or classifying, primary commodities stood at the heart of
the transition of wheat or cotton from a physical good to a certificate, or receipt,
providing information about a physical good.1 Using these grading systems, exchanges
would assign a particular classification (e.g., “#2 Hard Winter Wheat,” or “Strict Good
Middling Upland cotton”) to each rail carload of wheat or bale of cotton. Traders would
then contract to buy or sell a particular class of commodity. This deal could be made
months ahead of time. This ability to make deals in a standardized product months ahead
of time is the critical feature of a futures market. Before grading systems, individuals
could of course still contract to deliver goods at some future point, but assurances of
quality would be based on business or friendship ties, or a knowledge of the particular
farmland and climate where goods came from. This interpersonal basis could never
support a constant market where contracts achieve liquidity. Standardized grading
systems enabled the high volume of trade needed to enable widespread speculation and
hedging, the most characteristic features of modern futures markets. In short, the
development of futures trading over the past 150 years is premised on sorting
commodities into standardized grades.
CBOT and NOCE utilized different systems for grading primary commodities that
reflected the divergent circumstances of their creation. Chicago’s system developed
1 I use the terms “grading” and “classifying” interchangeably. But it is worthwhile to note that this does not
fit with the usage on the two markets themselves. On CBOT, wheat was “graded,” while on NOCE, cotton
was “classed;” adding to the complication, cotton was assigned a “grade” based on the purity of the lint, as
part of the broader process of being “classed.” For the sake of simplicity, I ignore these distinctions in
usage.
69
contemporaneously with the trade in futures and thus was shaped by the opportunities for
profit it provided. These opportunities, in combination with the dominant position of
grain elevator operators, made manipulation of wheat and fraudulent receipting viable
practices. As a result, information produced in the Chicago market regarding the quality
and quantity of wheat present in the city was suspect. Even involving the state of Illinois
in a regulatory capacity failed to solve these problems. In contrast, New Orleans relied on
a system of classing that was created entirely in isolation from the futures market, wholly
for the benefit of spot traders. Classing was adversarial and small-scale, preventing any
systemic manipulation of commodities or information. The powerful position of spot
traders within the NOCE guaranteed that maintaining the fidelity of classing, even at the
expense of efficiency, was a foremost concern.
These grading systems, in addition to being shaped by the market relations
surrounding their creation, made particular behaviors more feasible and rational. The
infrastructure established on CBOT made for an uncertain relation between the
warehouse receipts that represented wheat and the quantity and quality of physical wheat
located in elevators. Yet, though receipts failed to accurately index the wheat they
represented, these receipts could still be used automatically, without any danger of traders
being held responsible for wheat being of inferior quality. This created an environment
where speculation in futures could thrive in a highly uncertain environment, and where
hedging would be discouraged. Conversely, NOCE created a system where the quantity
and quality of cotton was well accounted for. The grading system also passed costs onto
buyers and sellers by making grading a private negotiation. This meant that grades served

70
as accurate indexes of quality and that speculation had a potentially significant cost
attached to it. Both of these features made the market more useful for spot dealing and
hedging and kept speculation more narrowly confined.
The Chicago Board of Trade: Warehouse grading & CBOT inspection
The creation of a grain grading system in Chicago in the 1860s took place in an
atmosphere of rapid growth. In the decade prior to the introduction of grading, railroads
laid 2,500 miles of new track into the city, and fifteen new grain elevators were
constructed, increasing the storage space in the city from 700,000 to 5,000,000 bushels.
By 1860, Chicago was the clear grain shipping center of the country, bringing in more
than twice the grain of the next largest market for the next three decades (Lee 1938).
Most significant to the grading of wheat at this early point were the grain
elevators.2 Elevators’ power came largely from their position as a bridge between
distinct parties in the grain trade (Cronon 1991). First, elevators served as a meeting place
for buyers and sellers in the spot market. Sellers could store their wheat at elevators until
they found a suitable buyer. They could also settle transactions by handing over receipts
issued by elevator companies, rather than delivering the wheat itself. Second, and more
critically, elevators facilitated the transfer of grain from railroad cars to ships on the lake.
Elevators were built with railroad tracks on one side, from which grain would be
unloaded into the warehouse, and the water on the other, where chutes would pour grain
2 Grain warehouses were known as elevators because of the process by which they raised grain on conveyor
belts before sifting it into bins.

71
into waiting ships. Nearly all the wheat entering Chicago made this switch, which
elevators made happen much faster than previously possible.
Elevator owners solidified this positional advantage through maintaining a non-
competitive oligopoly in the city. By 1870, 93% of the total storage space in the city was
controlled by just five partnerships, representing ten individuals. Each of these
partnerships was allied with one or two preferred rail lines, which served their
warehouses exclusively. This arrangement benefited both elevator owners, who took a
steady stream of grain into store, and railroads, which did not have to go to the expense
of delivering to multiple locations. This combination of indispensable position,
oligopolistic ownership, and alliance with railroads made elevator owners powerful
figures within CBOT, despite their relatively small numbers (Lee 1938).
From this dominant position, elevator owners introduced a system for grading
wheat in 1856. The scheme they developed, with CBOT’s help, delineated three kinds of
wheat—white winter wheat, red winter wheat, and spring wheat—and four gradations of
quality—club, No. 1, No. 2, and rejected (Taylor 1917). The primary impetus behind this
system was to increase the efficiency of grain storage (Cronon 1991). Prior to this point,
elevators needed to store each shipment of grain separately so as to maintain its unique
identity, which left enormous amounts of bin space within warehouses unused. Many
elevators could store 500,000 bushels or more, yet often shipments from farmers totaled
only a few thousand bushels (Lee 1938). A system of grades allowed elevators to
combine grain of the same grade from different sources, maintaining the aggregate
quality while more efficiently using the space within their warehouse bins. Buyers would

72
be issued receipts entitling them not to a particular shipment of wheat, but to wheat of a
certain class and grade.
It is worthwhile to pause here and consider precisely what changes wheat went
through in being processed at an elevator. Grain processed at an elevator was twice
transformed. First, it was physically transformed, as shipments from numerous farms
were combined according to grade. If grain was miscategorized or combined improperly,
the quality of the mixture would be degraded, and mills would receive an inferior
product. The second transformation was not physical, but semiotic. When wheat was
taken into store, the elevator produced receipts representing that grain for its owners.
These receipts could then be traded or used as collateral for loans, with all parties secure
in the knowledge that the holder could redeem them at will for a particular amount of
wheat. Receipts informed market actors of the quantity of wheat present in the city’s
elevators. These two transformations anchor the analysis that follows.
The idea of a grading system was well received, as it benefited several classes of
CBOT members in addition to warehousemen. Commission merchants benefited from
lower handling charges once different shipments of wheat did not have to be kept
separate. Also, the grading system enabled the futures market to arise. The presence of a
futures market gave commission merchants a place where they could hedge their spot
positions, as well as a place where speculators could bet on price movements.
In practice, though, there were problems. CBOT traders complained that the
classifications were too broad, mixing together wheat of substantially different kinds.
They also complained that warehouse operators graded on a lax standard in order to

73
attract grain into store. But, most seriously, the system made manipulation simple. This
feature hinged on the permissive grading rules that elevator owners had shepherded into
existence. These rules allowed elevator owners to buy and sell wheat on their own
account, in addition to storing wheat for others. This made it profitable to mix wheat
from different grades. Elevator operators would dilute grain of a higher grade (e.g., #1
wheat) with a lower quality grade (e.g., #2 wheat) just up to the threshold at which that
mixture would move into the lower class. By doing so, the elevator could create an
instant profit: by mixing 500 bushels of average quality #1 hard winter wheat with 200
bushels of #2 hard winter wheat, elevators could create 700 bushels of low quality #1
hard winter wheat. Of course, when creating receipts or selling this wheat on the market,
its classification was still #1 grade – the fact that this wheat was actually of a very poor
quality was only discovered once shipments had been made. The practice of mixing
ruined the reputation of Chicago wheat.
Information regarding the quantity of wheat in the city was similarly uncertain
because of elevator operators’ production of receipts. Elevators would issue counterfeit
receipts as a way of turning a quick profit in the speculative market. They would sell
these forged receipts on the market when the price for wheat was momentarily high (such
as during a corner or other speculative mania), then buy them back once the price had
dropped. Elevator operators would profit on the price differential, at the expense of
destabilizing information about the supply of wheat within the city (Taylor 1917). The
charge that warehousemen were misrepresenting the quantity of grain in store and
profiting from issuing fraudulent receipts was brought in the wake of corners in 1866,

74
1868, 1869 and 1870 (Lee 1938). These charges were verified in 1872, when two major
elevators were discovered to have outstanding receipts far exceeding the quantity of grain
they actually held in store (Taylor 1917).3
In 1859, CBOT created an independent inspection force that looked to crack
down on these practices. Most significantly it took over grading duties from the
warehouse owners. This change was meant to remove the conflict of interest present
when warehouse owners did their own grading (Taylor 1917). But despite CBOT’s
oversight, grading continued to be plagued by mixing and fraudulent receipts. Why? One
significant reason was that Board of Trade inspectors were allowed to act without
restriction in spot and futures markets while at the same time being part of the grading
apparatus. Thus, they faced the same temptation to manipulate receipts and disseminate
misinformation as did elevator owners. In this sense, the antagonistic relation between
elevators and inspectors was an illusion.
The grading system established by warehouses, even when supervised by CBOT,
failed to produce accurate information about either the quality or the quantity of wheat
found in the city. This uncertainty depressed the spot trade, bringing lower prices for
wheat coming through Chicago (Taylor 1917).4 It also created conditions where
speculation could thrive. The lack of solid data regarding the supply of grain in the city
3 These frauds were only discovered through extraordinary circumstances. In the first case, the Iowa
elevator burned to the ground and an examination of the remains revealed the shortage in grain. In the
second, Munn & Scott elevators went bankrupt and in the sale of their holdings to Armour & Co., the
shortfall of wheat in store had to be revealed.
4 Chicago wheat brought four to five cents less per bushel than similar grades from other cities. Chicago
grain was so bad that it was being rebranded with other locations in the name, e.g., Milwaukee Club,
Amber Iowa, and Northwestern Club (Taylor 1917).

75
promoted diverse interpretations of the market environment and the future of prices, and
an environment thick with rumors. Speculators could also be bold, knowing that elevator
owners stood ready to flood the market with fraudulent receipts in the event of the market
being cornered. Further, the ease with which elevators created fraudulent receipts made it
possible to engage in manipulations in the futures market with minimal involvement in
spots. These are conditions under which speculation becomes profitable.
State intervention: the Railroad & Warehouse Commission
The failure of the private grading system to produce accurate information
galvanized support for state regulation of the grain trade. Through provisions in the 1870
Constitution and four separate statutes from 1871, the state created a significant
regulatory apparatus to protect the quality of Chicago grades and ensure the fidelity of
elevator receipts. At the heart of the regulatory system was the Illinois Railroad and
Warehouse Commission (RWC), created in 1871. This commission was headed by three
men, appointed by the governor for two-year terms. As their name suggests, the
Commission was tasked with the massive job of regulating the transportation, grading,
and storage of grain in the state.
The RWC had two jobs in relation to grading. First, it took over inspection duties
from CBOT. State inspectors were stationed outside of all public elevators to sample and
grade grain entering by rail car.5 State inspection ensured that graders of wheat would be
5 The distinction between public and private elevators was introduced in the 1870 Constitution. The key
distinction was that public elevators could combine shipments of grain, while private elevators could not.
Since the need to combine grain of the same grade to economize on storage space was the impetus for
76
entirely separated from the trade in wheat, eliminating potential conflicts of interest and
opportunities for inside trading. Second, the Commission established an office for
registering and tracking grain receipts to prevent fraud. All receipts had to pass through
this office at the time of their creation and again when they were canceled through
delivery; fraudulent receipts would have no corresponding entry with the state registrar.
Ideally, this system of state regulation would guarantee the fidelity of information about
the quantity and quality of grain passing through Chicago. In reality, political and
economic conditions were such that the Commission achieved only some of its goals.
The goal of establishing a registrar for elevator receipts initially failed. Elevators
were required to give a bond and acquire a license to operate, both of which could be
forfeited through engaging in any prohibited activity or interfering in the discharge of the
Commission’s duties (Lurie 1979). Though the state had the power to revoke the license
of any elevator not complying with its requirements, the elevators had a simple strategy
for evading this penalty: they simply refused to take out licenses or give bonds in the first
place. As with their earlier negotiations with CBOT, elevator operators recognized the
strength of their position when they presented a uniform front. Elevators were eventually
forced into compliance with the law only through financial pressure. Banks, which lent
money on the security of warehouse receipts, were becoming increasingly nervous about
fraudulent receipts. Accordingly, they charged higher interest rates on their loans to
balance this increased risk. Warehouses quickly discovered that the simplest way to allay
introducing grading in the first place, it is unsurprising that nearly all of the warehouse space in Chicago
was public (Lurie 1979).

77
these fears and reduce the interest on their loans was to register receipts with the state
(Lee 1938).
CBOT paired this registrar’s office with its own system of supervision. They kept
a list of “regular” elevators, whose receipts were tenderable on trade. Only bonded
warehouses in good standing with the RWC were declared regular. Another requirement
of regularity was that elevators always post accurate reports of the grain they had in
stock, allow Board of Trade certifiers yearly access to their warehouses for inspection,
and accept grain arriving along any railroad line, not just a single, favored line. In this
way, the Board attempted to put pressure on the elevators with the threat of making their
receipts, and thus the grain they held in store, worthless on the Chicago market.
This technique had some success in promoting accurate information on the
quantity of wheat in the city. The Board used the pressure of regularity to force
warehouses into accepting a twice-yearly examination of the interior of their warehouses.
In 1895, the Board stripped two elevators of their regular status when they would not
allow inspectors access to the grain in store.6 Five years later, the Board made irregular
all Armour Elevator Company receipts, following the discovery that the company had
outstanding receipts for wheat that was not in store.7
The complementary systems of registration and regularity, once adopted, did
solve several earlier problems with the previous system of grading. They made
information on the quantity of wheat in the city’s elevators more accurate. Since all
shipments in and out were supervised and registered through the state, statistics were
6 Board of Directors Records, Box 32, Folder 25, March 12, 1895. 7 OR, Box 9, Folder 10, May 25, 1900.

78
carefully kept and disseminated. Also, registration of receipts eliminated the mixing of
grades that had plagued the grain trade previously. Grain leaving the elevator needed to
be matched to receipts held by the registrar. Thus, attempts to mix lower grades of wheat
into a higher grade would produce wheat without receipts on record, which could not be
shipped.
Like registration, RWC’s efforts to control inspection and grading got off to a
rocky start. Not two years into the RWC’s supervision, CBOT was arguing that
inspectors lacked the necessary expertise for the job and that inspection should be
returned to the Board.8 But, unlike registration, the problems with inaccurate grading
only grew worse as time went on. By 1900, state inspection was so unreliable that many
eastern buyers would accept the delivery of wheat from Chicago only after having their
own private inspectors ensure its quality.9 State inspection had become so discredited
that, according to Board president W.S. Warren, Chicago certificates “were not worth the
paper they were printed on.”10 RWC inspectors were giving higher grades than merited,
allowing mixed wheat in grades that should have been pure, and ignoring the minimum
weight requirements for bushels by grade.11 By 1908, CBOT was receiving significant
complaints from abroad. Both the American Consulate in Germany and the Liverpool
Corn Association complained that orders of hard winter wheat were arriving instead as
soft wheat, making them entirely unusable for the purposes of buyers.12 Liverpool
8 BDR, Box 1, Folder 5, Jan. 20, 1873 9 OR, Minutes of the Annual Meeting, Box 9, Folder 4, 1901 10 OR, MAM, Box 9, Folder 4, 1901: unnumbered page 11 Committee Records, Box 320, Folder 1, Aug. 12, 1907 12 CR, Box 319, Folder 4, Oct. 19, 1908
79
threatened to stop accepting Chicago inspection certificates altogether if the problems
were not solved.13
In addition to inaccurate grading, the RWC’s distance—both physical and
practical—from the grain trade also led it to make poor decisions. In one such instance,
they altered the standards for #2 spring wheat in the middle of the trading season, which
threw existing contracts into disorder. Traders, who could not be sure that buyers would
get the quality of product they needed, were paralyzed: “So long as there remains an
unknown quantity of this mixed wheat, which may be delivered out as 2 spring on any
receipts, there is no safety in loading even a single car – nor can any samples be sent out
with safety until this stock is exhausted.”14
CBOT pinned these problems on two sources: first, the appointment of
inexperienced graders; second, the Commission’s unfamiliarity with the necessities of
everyday trade. On the first point, inspectors were not required to pass an examination or
show any special familiarity with the grain trade. The Commission even employed female
inspectors, which the Board took as confirmation of their disregard for hiring inspectors
with the proper experience and familiarity with the trade.15 CBOT charged that this lack
of standards made grain inspection part of the “political machine” of Illinois.16 CBOT
leaders took special umbrage at regulation of the grain trade being handed out as
patronage, with President William T. Baker caustically noting that “zeal in partisan
13 Executive office records, Box 437, Folder 3, Nov. 3, 1909 14 BDR, Box 22, Folder 5, Jan. 24, 1890 15 CR, Box 320, Folder 4, Oct. 24, 1911 16 OR, MAM, Box 9, Folder 4, 1900: np
80
campaign work does not qualify men” for work as inspectors.17 To the second point,
CBOT argued that a three-person commission, located 160 miles away in Springfield,
could never hope to develop familiarity with the reality of trade from moment to
moment.18
After over thirty years of complaint and uncertain state inspection, and
immediately following the sharp criticism in the early 1900s, CBOT took steps to
guarantee the accuracy of grades and the legitimacy of their contracts. In 1905, it
established their own unofficial inspection service, parallel to that offered by the state.
This Department of Grain Sampling and Seed Inspection was a response to the “very
general demand … for a more efficient, disinterested and official system of resampling
grain consigned to and being shipped from this market.”19 Though the decisions of this
inspection service were not official and could not be used to compel any change in grade,
they offered an alternative grading process for those merchants frustrated with state
inspection. CBOT recommended that disgruntled buyers should stipulate that their orders
were to be shipped subject to approval of the Board’s Department of Grain Sampling and
Seed Inspection.20 This parallel system of inspection would offer quality assurances that
were sorely lacking under the state system.
But this was not a systemic fix. Permanent change needed to come from a reform
of the RWC, particularly the procedure for assigning inspectors. To this end, CBOT
lobbied for close to twenty years to have grain inspector positions placed under Civil
17 OR, MAM, Box 7, Folder 9, 1895: np 18 OR, Report of the Trade and Commerce of Chicago, Box 86, 1873 19 OR, MAM, Box 10, Folder 25, 1905: np 20 CR, Box 319, Folder 6, Mar. 8, 1905

81
Service rules in order to ensure that positions were awarded on merit.21 They also pushed
for increased accountability and centralization of supervision, so that inspectors’ decision
could be subjected to review. CBOT’s Grain Committee communicated to the RWC their
desire to have samples of grain sent every morning to the office of the Chief Inspector in
Springfield, so that he could check up on the work of inspectors in the field. The Board
maintained that this would help to reduce the number of careless and improperly drawn
samples, which were leading to improperly graded shipments of wheat.22 The RWC
resisted any major changes for many years. It was not until 1912—forty years after their
inception—that the RWC adopted Civil Service rules for appointing inspectors.23
The greater difficulty in establishing the classification system as compared to the
registrar is unsurprising, given the interpretive nature of grain grading. Whereas the
registrar’s job was merely clerical—collecting, compiling, and disseminating
information—inspectors had to be familiar with the conventions of the grain trade and
expert enough to make distinctions of grade under sometimes difficult conditions.24 They
were required to create information that would serve as the basis of large economic
transactions. This is a difficult task for the state to step into, especially given the lack of
uniformity across states. This heterogeneity of standards is addressed in the next section.
Opposition to standardized grades
21 OR, MAM, Box 7, Folder 9, 1895; OR, MAM, Box 9, Folder 4, 1901 22 CR, Box 319, Folder 10, Jul. 16, 1907 23 OR, MAM, Box 13, Folder 8, 1912 24 Grading happened outside, rain or shine. Inspectors often had to work quickly to accommodate the many
carloads of wheat waiting to get to an elevator.

82
The previous sections show that CBOT did take steps to ensure the quality of
grading whether done privately or by the state, however feeble or ineffectual those steps
might have been. Yet, as the following section reveals, it remained entirely unwilling to
cooperate with other markets on the same issue. This unwillingness to work with other
exchanges was most prominent in efforts to harmonize grading standards used across
exchanges. CBOT showed a general disinclination to give up control over any aspect of
its trade, whether to a state agency or a supra-organizational association of grain
exchanges.
By the early 1900s, the classification of wheat into grades had spread to grain
exchanges around the world. The problem was that each exchange had its own classes
and standards, with no guarantee of parity between them. As an example, the grading
standards from 1905-1906 for white winter wheat show a great deal of variety.25 Some
exchanges divided the wheat into four grades, some three; some factor in the weight of
the bushel in their determination while others don't, and even those that do use weights
have different cut-off points; the qualitative descriptions of the grades also vary, with
certain exchanges holding higher or lower standards than others. Table 3, below,
illustrates this variety in grading standards across the Chicago Board of Trade (1906),
New York Produce Exchange (1905) and Toledo Board of Trade (1906). Key differences
existed in the minimum weights per bushel for each grade and the amount of cheaper red
winter wheat that could be permissibly mixed into a bushel.26
25 CR, Box 319, Folder 5, various dates 26 Hill (1990: 19) notes that even if the markets had instituted identical standards, the tools used for
inspection were crude and varied greatly from place to place. This variation would have made equivalent

83
Table 2. Variation in standards for white winter wheat (1905-1906).
Grade of wheat Chicago Toledo New York
#1 white winter No min. weight or percentage
Min. 58 lb/bu; min. 95% white wheat
Min. 60 lb/bu; no min. percentage
#2 white winter No min. weight or percentage
Min. 56 lb/bu; min. 90% white wheat
Min. 58 lb/bu; min. 95% white wheat
#3 white winter Min. 54 lb/bu; no min. percentage
Min. 53 lb/bu; min. 90% white wheat
Min. 56 ½ lb/bu; min. 95% white wheat
#4 white winter No min. weight or percentage
Min. 50 lb/bu; no min. percentage
Min. 52 lb/bu; no min. percentage
In instances where no quantitative guidelines were given, grading relied on the
expertise and discrimination of inspectors. All of the descriptors used to measure wheat,
e.g., “clean,” “dry,” “plump,” and “sound,” required interpretation. Making things even
less precise, some of the classification guidelines bordered on tautology: in Chicago, #3
white winter wheat was described as “not clean & plump enough for #2 white winter
wheat,” a description that offers little in the way of concrete guidelines for inspectors.
This is not to suggest that these qualitative guidelines could not produce uniformity
within a market or even across markets, but this uniformity depended on inspectors
sharing similar backgrounds and knowledge. As was seen in the previous section, the
ability and expertise of Chicago inspectors was doubted by many in the grain trade. The
questionable skill of state grain inspectors made uniformity on qualitative dimensions
difficult to achieve.
processing impossible. “The major obstacle to creating uniformity in grades and grading among markets
was the lack of objective, standard measures and instrumentation.”

84
This variation in grading practice across exchanges led to numerous problems.
First, since the quality of wheat was not strictly comparable, neither were prices.
Merchants thus needed to perform acts of translation when comparing prices, recognizing
that #2 Hard Winter Wheat from Kansas City was different from the same grade of wheat
in Chicago, which was different from the same grade in Minneapolis.27 This impeded
trade between cities. Further, without any cooperation between exchanges, changes on
one exchange would wreak havoc in others. When Minnesota’s state inspection
department eliminated the grade of Velvet Chaff wheat, which was still in use on CBOT,
Chicago merchants received shipments of mixed wheat the quality of which was
essentially in between two grades on their market.28 Variation in grades also made
figuring the regional supply of a given grade difficult.
By 1906, these problems were causing such trouble to the trade that multiple
groups, including the USDA and the Grain Dealers National Association, began to push
for uniform grading standards. Grain Dealers National Association held a “Uniform
Grade Congress” in 1906. Addressing this Congress, a representative from the USDA
pinned the problems of grain inspection squarely on the lack of standards:
Conditions in the cloth trade would be similar if there was no standard
yard-stick or measure, or there would be an added cause for dissatisfaction
even in the grain trade if a pound was legally 16 ounces in Chicago, 14
ounces in New York, and every city or community was allowed to make
its own standard of weights.29
27 OR, MAM, Box 15, Folder 3, 1920 28 BDR, Box 77, Folder 14, Feb. 20, 1915 29 CR, Box 319, Folder 7, Dec. 11, 1906

85
The problem of inconsistent inspection was felt particularly in European markets, which
had little redress for the receipt of incorrectly graded or spoiled grain. European boards of
trade thus added their voices to the chorus calling for uniform standards for grading
American grain.30
But CBOT resisted attempts to create uniform standards. Its leaders judged them
to be desirable in the abstract, but impracticable, because of the organic nature of
agricultural goods.31 Reframing the above comment from a USDA representative about
the lack of a standard “yard stick,” President C.H. Canby, argued that “products of the
soil cannot be graded with the same exactness as is the case with manufactured products,
and a certain degree of variation will unavoidably at times result.”32 Wheat grown in
different parts of the country had unique properties, which could be accounted for by
local grading systems, but would be lost in a national or international system. But, in
addition to these product-based impracticalities, there is evidence that CBOT simply
objected to any system that would hurt their market. CBOT rejected the uniform grading
standards put forward by the Grain Dealers National Association in 1907, for the reason
that the new regulations would result in much of their hard wheat being re-graded as
mixed wheat or red wheat, which would bring a lower price. Other proposed changes,
such as new minimum test weights for grades and addition of new grades, were also
rejected outright, with no explanation other than that they conflicted with current
practice.33
30 CR, Box 319, Folder 10, Jan. 24, 1907 31 CR, Box 319, Folder 4, Feb. 9, 1906 32 OR, MAM, Box 14, Folder 7, 1915: 4 33 CR, Box 319, Folder 10, Mar. 19, 1907

86
CBOT’s resistance to uniform grading standards contributed to the character of
the spot-futures system. Lack of uniformity caused major problems for spot dealers, and
they pushed for greater alignment with other exchanges. That their call was so easily
dismissed demonstrates the weak position of spot dealers. Non-spot interests dominated
among CBOT members, who were able to resist external pressure to change their grades
because of Chicago’s position as the world’s foremost grain market. The grading system
that resulted thus lacked uniformity across markets, a significant impediment to spot
trading on CBOT.
As a whole, CBOT’s grading system failed to incorporate features that would
promote a sound spot market environment. The constant uncertainty surrounding the
reliability of grades introduced unnecessary risk into the merchandising of wheat. The
grading infrastructure thus promoted speculation in the Chicago market at the expense of
a stable spot market. We turn next to New Orleans, where the creation of market
infrastructure took a different path.
The New Orleans Cotton Exchange: Tradition of shared standards
While in Chicago the spot and futures markets developed together, New Orleans
had a long history as a major spot market long before futures were adopted (Sherman
1934). The practice of classifying cotton on dimensions such as staple length, color and
purity of the lint originated in this early environment (Garside 1935). When NOCE was
established in 1871, eight different grades of cotton quality—ranging from good middling

87
to inferior—and twelve staple lengths were commonly used in the trade (Boyle 1934).34
These classifications were developed to serve parties within the spot market, with no
influence from the futures market. They were used to simplify and regulate the trade, so
that spinners could be assured of getting the particular quality they needed. All cotton
exchanged in the New Orleans market was judged according to a single common
standard.
Though classification was well-established, it still faced certain persistent
problems. First, grading standards across markets were far from uniform. Each market
created and relied on its own set of “types”—samples of cotton from each grade and
color—to guide classers’ judgments and provide a standard for arbitration. But these
local methods did nothing to harmonize standards across markets. Second, even within a
local setting, variation in grading was not unusual. This variation was due to the fact that
cotton classification remained private. At every sale, buyer and seller would employ an
expert cotton classer to sample the bales and pronounce a judgment as to its grade. Since
cotton would often change hands multiple times between the producer and the spinner,
this meant the same bale would be classed multiple times, often with different results
(Garside 1935). NOCE addressed the first of these issues almost immediately upon its
founding; the latter was not addressed until the turn of the century.
34 NOCE futures contracts did not demand the exclusive delivery of a single grade of cotton. Rather, all
contracts were made for “middling” grade cotton, and, if delivery was required, a range of grades could be
tendered to satisfy the contract. Parties were compensated for any difference in quality between middling
and the grade of cotton that was delivered through receiving an appropriate premium or discount on the
contract price. The amount of these were determined based on market prices at the end of each day by the
NOCE Committee on Quotations.

88
In 1872, a year after NOCE’s founding, the board of directors set to work to
address the problem of uniformity across markets. They began by distributing 118 sets of
official NOCE types to exchanges, mills, factors and other members of the trade around
the world. They requested similar type samples from all major cotton markets in return,
with the hope of ironing out any discrepancies in grading standards.35 NOCE leaders also
pursued uniform classification standards through the National Cotton Exchange, an
association comprised of representatives from major exchanges around the country. In
1874, the National Cotton Exchange created the first American standard for cotton, which
soon became the de facto world standard when Liverpool, the largest European cotton
market, signed on in 1877. NOCE’s flexibility when producing this standard speaks to its
desire for uniformity: leaders were willing to make changes to their own local
classifications in order to fall in line with the common standard, a stark contrast to
Chicago’s intransigence in such matters.36
When this international harmony broke down in 1883, NOCE battled for several
years to restore uniformity.37 The standard grading system fell apart when the New York
Cotton Exchange (NYCE) decided to adopt a new standard that would benefit their
futures trade by making more cotton available for delivery on contracts. NOCE
immediately complained to the National Cotton Exchange about this defection from the
international standard. The next year, in protest over New York’s refusal to negotiate,
they refused to attend the National Cotton Exchange meeting.38 When it became clear
35 Annual report, 1872 36 AR, 1874 37 AR, 1883 38 AR, 1884

89
that NYCE was reluctant to return the established standard, NOCE accused them of
enriching their own futures market at the expense of Southern spot markets. Longtime
NOCE secretary, Henry Hester, writing in Cotton World magazine took NYCE to task,
arguing that, “A little less of local prejudice and a more general disposition to work for
the common good” would produce an international standard that would benefit all parties
to the cotton trade.39
When private coordination between exchanges failed to work, NOCE turned to
the federal government to implement standards. In 1899, a full fifteen years before
federal involvement in the grain trade, NOCE was pressuring the Commissioners of
Agriculture of the cotton states to “use earnest and energetic efforts” to pass legislation
establishing standard weights and classifications.40 The Board of Directors, advocating
for government intervention, expressed the position of NOCE clearly: “We can
understand why separate types should be made for Gulf and Upland cottons, but not why
Low Middling should not be Low Middling and Middling be Middling, calling for the
same cotton, barring differences that have nothing to do with grade, all the world over
and at all times during the season.”41 This willingness to engage with state supervision
continued unabated. In 1910, NOCE president W.B. Thompson pledged that NOCE
would adopt state or federal standards, if and when they were introduced (Thompson
1910). This was borne out by NOCE’s support for the Cotton Futures Act of 1914, which
39 Cotton World, Sep. 17, 1887, p. 37 40 AR, 1899: 8 41 AR, 1899: 10

90
standardized forms of contract, grades and modes of settlement nationwide.42 The law,
they argued, boosted investor confidence and made futures contracts better for hedging
purposes.43 In 1910, even before the passage of this federal law, NOCE voluntarily
aligned their own type standards with those promulgated by the USDA, arguing that this
alignment made their system not only smoothly connected to other exchanges, but fair
and upright, with transactions “beyond dispute or misconception.”44 This alignment was
so thorough that NOCE had only a few minor changes to make following the enactments
of the 1914 Cotton Futures Act and the 1923 Cotton Standards Act (Boyle 1934).
NOCE leaders showed a desire for uniform classification standards from the
founding of the Exchange. It is particularly telling that these Southern businessmen
desired uniformity so much that they supported federal intervention and control over the
South’s staple crop. NOCE was motivated in this desire by the needs of the spot market,
as evidenced by the fact that much of their campaigning for uniformity took place before
futures trading even gained a foothold in the New Orleans market (Bouilly 1979).
Protecting the crop
Beyond setting standards, NOCE also sought at this early point to guarantee the
quality and quantity of cotton remained constant throughout the process of sampling
bales, removing damaged bits and moving them from the presses to the docks. At the
42The original Cotton Futures Act, making federal grading compulsory for cotton delivered on futures
contracts, was passed in 1914. NOCE supported the law except for two features: first, a clause restricting
foreign trade; second, the too strict limitation of grades tenderable on contract. Both objectionable features
were removed in 1916 amendments to the law. 43 AR, 1914 44 AR, 1910: 8

91
time of NOCE’s founding, a number of well-known problems existed in all of these areas.
Under pressure to move cotton quickly, workers often handled bales carelessly, rolling
them through mud or water, diminishing their quality. Also, press operators were known
to skim small amounts of cotton off of bales as they were processed, and petty thieves
similarly stole small amounts from bales awaiting loading on the docks. As a result,
buyers often found their cotton coming in far under weight requirements.45 In 1874,
NOCE sought to curtail these abuses through the establishment of two departments—
Supervision and Inspection—tasked with preventing fraud and protecting the quality of
the cotton from the time it arrived at warehouses, through its storage on the docks, and
finally as it was packed onto ships.
The supervision department’s job was to oversee the preparation of bales in cotton
presses and warehouses. This involved overseeing the sampling of the bales and the
removal of damaged bits, so as to put the bale into merchantable condition. The goal of
this department was to ensure bales were processed with a minimum of waste, or “loose.”
They recorded the amount of loose cotton stored at each press as well as the weight of the
samples taken by each party’s classers and furnished certificates of these weights if
desired by the parties to the trade.46 The inspection department then protected the cotton
as it sat on the docks and ensured proper handling as it was loaded onto ships. Inspectors
also kept books for the Exchange giving the number of bales of cotton received by every
vessel, as well as the condition of the cotton received and the character of the weather
45 AR, 1876 46 Volumes, Box 275, Folder 5, Feb. 19, 1905

92
morning, noon, and night.47 Inspectors noted whether cotton was taken on board a ship in
wet or dry condition, and if wet, whether the cotton was received wet or became so by
being exposed to rain on the levee or being rolled through the mud.48 They also noted if a
ship stored cotton on its deck, exposed to the elements, a practice which had become
common among shippers looking to haul as much cotton as possible on each trip. This
information was available to all Exchange members and was regularly consulted when
determining responsibility for cotton arriving out of condition.49
The Exchange also provided the resources to make these new departments viable.
The supervision department was well-staffed from the start: a chief supervisor, twenty-six
assistants, fifty or more laborers, and a team of clerks for record-keeping were employed
to oversee the cotton in the city’s twenty-four compresses and two rail depots.50 The
Exchange also acted quickly and decisively against those parties who, protesting the
mandatory fees attached to each service, attempted to refuse supervision and inspection.
Members who denied supervisors access to their presses were threatened with expulsion
from the Exchange51; shipping lines that refused inspection had their names posted on the
exchange to discourage others from dealing with them.52 But, as with receipt registration
in Chicago, the most convincing way to get their system off the ground was making
registration profitable. Within a few years of its introduction, most shippers and press
operators had come to recognize that the system raised the value of cotton abroad and
47 AR, 1875 48 V, Box 285, Folder 8, Feb. 19, 1905 49 AR, 1882 50 AR, 1876; AR, 1877. The exact number of laborers employed varied depending on the amount of cotton
being processed, with extra help hired during busy times. 51 V, Box 127, Folder 42, Nov. 9, 1874 52 V, Box 127, Folder 58, Oct. 20, 1875

93
thus provided them ample recompense for the extra fees.53
Both systems worked as intended. An early review of the supervision system
claimed that it “has added more to the reputation of New Orleans for care and attention to
the produce intrusted [sic] to her merchants than any other measure ever before
adopted.”54 The inspection department was similarly feted. It oversaw and brought
certainty to a period during transportation where cotton had formerly been unprotected
and vulnerable. By 1877, the amount of cotton lost to careless handling and petty theft
was the lowest ever seen in New Orleans or any other market for which statistics
existed.55 Through the two systems, NOCE kept an eye on cotton during its entire tenure
in the city.
At no other place that we know of, however, is such a thorough system of
supervision maintained, where the cotton is guarded from the time it
reaches the port until it is finally placed in the hold of the outgoing vessel;
where every bundle of samples is weighed to see that its contents are not
over the regulation weight, where the making of unnecessary loose is
prevented by close and strict watchfulness, and where pilfering is rendered
almost impossible. In a word, these are the objects of the New Orleans
system of supervision and inspection, under which not a pound of the
planters’ or country shippers’ cotton confided to the care of our merchants
is unnecessarily wasted.56
The general sentiment among NOCE officials was that the system of protecting the crop
established in New Orleans had no equal at any other cotton port in the world (Boyle
1934).
As further evidence of the success of the NOCE system, supervision and
53 AR, 1876; AR, 1877 54 AR,1881: 3 55 AR, 1877 56 AR,1902: 22

94
inspection departments soon spread to other exchanges. The New York Cotton Exchange
adopted NOCE’s system of supervision in 1876, with the Liverpool Cotton Exchange
following suit shortly thereafter, in 1877.57 In addition to its adoption in other markets,
the reach of the system was expanded within the New Orleans market. In 1889, the
Exchange extended its system of supervision to more thoroughly cover railroad depots,
bringing under its control many bales that had previously escaped supervision.58
Inspection was extended even to bales of cotton that circumvented the one-cent
inspection fee.59 They decided that protecting the reputation of their port for safe and
efficient handling was worth the financial loss and the risk of encouraging free-riding.60
NOCE paid close attention to the physical crop moving through their port.
Because bales of cotton retained their identity throughout the process, the challenge was
to maintain the quality of the bale throughout its processing and handling. The need to
account for the quality and weight of the cotton in their care led NOCE to build a security
system that guaranteed the fidelity of the grades agreed on by buyer and seller. Parties in
the spot trade could be confident that cotton would be handled well or that any cases
where it was not would be carefully documented.
Centralized grading
Both the system of coordinating grading standards across exchanges and the
57 AR, 1876; AR, 1877 58 AR, 1889 59 These bales had not been supervised or inspected previously because they never entered cotton presses
where supervisors were stationed. They could skip the presses altogether because they were shipped on
through bills of lading, meaning that they could be immediately moved from rail to ship without any need
for storage. 60 AR, 1883

95
departments of supervision and inspection aimed to ensure the quality of cotton across
exchanges. The goal was to help cotton and information about cotton travel well from one
market to the next. But this focus on inter-market uniformity came at the expense of
intra-market reliability. As mentioned in earlier section, cotton classification was a local
and variable process. Cotton was re-classed at every sale, with the possibility that a single
bale of cotton might be assigned multiple grades during its movement through the city’s
marketing machinery (Garside 1935).
This system had a number of drawbacks. First, arbitration was time consuming,
labor-intensive and not uncommon. In 1883, the Arbitration Committee reported that they
judged 93,300 bales over the course of the year, with 12,762 of these being further
appealed.61 Second, private grading enabled buyers and sellers to bypass the Exchange
altogether. Private deals could be struck in small towns in the interior of the state, after
which cotton would be shipped on through bills of lading, passing directly from rail to
ship. The practice of private classification, in combination with increased rail service to
interior points, enabled this diffuse buying and selling, lessening the commercial activity
on NOCE.62 This diffuse and private practice had financial ramifications. Without the
imprimatur of an organizationally sanctioned grade, banks did not lend as much money
on cotton certificates as the underlying commodity would warrant. As Exchange
President W.B. Thompson explained in 1908:
The cotton itself is as good as gold, but the piece of paper which is
supposed to represent the cotton, and upon which the money is loaned,
may be worthless. If the warehouse receipt was known to the world to be
perfectly good, there would be no doubt about money seeking such
61 AR, 1883 62 AR, 1898

96
collateral.63
The lack of a universally recognized certificate limited the potential of cotton as a source
of capital.
A final problem with the system of private classification has already been
mentioned: the re-classification of cotton each time it changed hands. This practice
created the possibility that cotton could be purchased as one class and sold as another.
This was made more likely by virtue of the delicate nature of cotton classing, where
subtle distinctions were made through multiple senses. The purity of the lint and color of
the cotton was determined by visual inspection, which was sensitive to changes in light.
In addition to their eyes, classers relied on their fingers and ears in judging the quality of
cotton. Determining the staple length and strength of the fiber was accomplished by
pulling apart a sample of cotton, feeling for slight differences in resistance and listening
for the “cry” of the cotton as it was separated. Classers needed dexterity and sensitivity,
in addition to long experience, in order to become experts.64 Given the delicacy of this
process, it was not uncommon for a bale to be re-classed as a higher or lower type on
resale than on purchase. This fluctuation in grade promoted a divide between futures and
spot markets. Speculators in futures had little interest in taking on this risk. Accordingly,
they often would try to sell any contracts they held in the days just prior to delivery to
avoid having to handle any actual cotton. This practice would create an over-supply of
63 Thompson, William B. 1908. Address of W.B. Thompson, President New Orleans Cotton
Exchange. The Central Warehouse Plan, p.7
64 The sensitivity required for cotton classification is clearly demonstrated by the lengths USDA officials
eventually went when they took over classification duties in 1916. Cotton was classed in special humidity-
controlled rooms with north-facing skylights and black and grey interiors designed to produce an even
character of light throughout the day. Classing was a subtle art. As one merchant claimed, “The hands of a
cotton classer should be as soft as a debutante’s and as supple as a violinist’s” (Garside 1935: 77).

97
contract cotton for sale, depressing prices (Garside 1935). The variability of grading
produced a system where futures traders were discouraged from handling actual cotton.
A centralized system for classing and certifying cotton run by NOCE officials
would resolve these problems. In 1887, following the introduction of such a system on
the New York Cotton Exchange, NOCE began discussing its feasibility in their own
market. The special committee appointed to investigate the system reported that while it
favored the certificate system upon its merits they recognized that, “under existing
conditions for handling spot cotton in New Orleans, its success might prove doubtful.”65
Dealers in spot cotton were loathe to relinquish their role in classification, which they
used to their own benefit. While there was not the same opportunity for outright
manipulation as with grain elevators in Chicago, cotton dealers did enjoy certain benefits
from being at the center of the grading process. For instance, many believed that by
skillfully displaying their goods they could influence the grade assigned and thus the
value of their cotton (Garside 1935). Spot dealers also benefited from buying cotton in
small towns, where markets were smaller and less competitive. New Orleans dealers were
also far better informed than small-town producers and middlemen about the state of
markets in the city and around the world, giving them an advantage (Boyle 1934).
Handing over classification to NOCE would eliminate both advantages.
As a result of this opposition from spot dealers, centralized grading made little
headway for decades. The initial push made in 1887, as well as a second try coming from
NOCE’s Futures Committee in 1897, were both handily defeated.66 Since NOCE could
65 AR, 1887: 15 66 Cotton World, Apr. 28, 1888; AR, 1898

98
not institute an Exchange-wide central classification system over the objections of spot
dealers, they initially required certification only for cotton delivered on futures contracts.
In 1909, they placed grading of contract cotton under the care of a salaried Board of
Classers, cotton experts employed by the Exchange who would class cotton tendered on
contract. The certificates of grade they issued were fully guaranteed by the Exchange.67
Classers were required to work solely in this capacity and were forbidden from having
any interest whatever in the cotton business.68
The system immediately brought the futures and spot markets into closer contact,
to the immediate benefit of speculators. They no longer needed to hire an expert in cotton
classing to move cotton in the spot market.
Under this system receivers may separate for shipment any bale or number
of bales in a contract (as each bale has its own tag number and class) for
use on various orders requiring particular grades of cotton. Thus every
possible facility is given to both deliverers and receivers of cotton on
contracts, bringing the contract and spot business into the closest possible
accord and simplifying the business so that the advantages to deliverer and
receiver are equal. In a word, the business has been so simplified that it
does not require expert knowledge to either receive or deliver cotton on
contract.69
Speculators now had two convenient, reliable choices in the event they received cotton on
their contract: sell it on the open market, knowing that the grade was certified and backed
by the Exchange, or redeliver it on a contract that they had sold. This movement of cotton
between spot and futures markets was aided by the enormous amount of practical
information featured on certificates, including the name of the press or warehouse where
67 Thompson, William B. 1909. The New Future Rules of the New Orleans Cotton Exchange. New Orleans:
J.G. Hauser. 68 Thompson, William B. 1910. Analysis and Exposition of the Scott Anti-Cotton-Future Bill. 69 AR 1910: 27

99
it was stored, the number or letter of the warehouse receipt, the marks of bales, the lot or
tag number or numbers, whether compressed or uncompressed and the number of bales in
each grade.70 This ample information—in conjunction with the Exchange’s guarantee of
quality—made it possible for speculators to move easily between futures and spot
markets.
Reviewing the first year of the system, the Exchange claimed that certification
created, “a medium through which buyers and sellers of contracts can, with implicit
confidence in the result and at a minimum cost, settle their obligations with actual
cotton.”71 This linkage was not only strong theoretically; in practice, the NOCE
certification system enabled fast processing. In one particularly heavy trading month in
1917, NOCE successfully processed over 21,000 bales delivered on futures contracts in
the last 6 days of the month.72 It also achieved the desired goal of substantially lowering
the number of appeals on grade.73
The success of NOCE’s certification system was so convincing that spot dealers
began to recognize its value to them as well. Within two years of the inspection bureau’s
inception spot traders were bringing their non-contract cotton to be graded, even though
they were not required to do so.74 These dealers found the NOCE certification smoothed
their transactions, saved them the time (and possible expense) of arbitration, and made
cotton better collateral for loans.75 This voluntary involvement by spot dealers paved the
70 AR, 1910 71 AR, 1910: 8 72 AR, 1917 73 AR, 1910 74 AR, 1911 75 Only the party whose judgment was overturned needed to pay arbitration fees.

100
way for NOCE to take another step towards integrating the spot and futures markets. In
1915, NOCE took over the duty of sampling—but still not classing—spot cotton. NOCE
experts would draw a sample of every bale and store this sample for examination by
interested buyers. If a seller so desired, this sample could thus be transferred to the board
of classers for grading. The assigned certificates of grade would then be officially
guaranteed by the exchange, and valid for delivery in the futures market. With a
minimum of expense, traders could easily move cotton from the spot to the futures
market.76 In the crop year ending July 31, 1917, this movement from spot to futures
markets occurred in 19% of the samples taken.77 This meant that spot cotton could now
move into the futures market just as easily as futures deliveries could be handled in the
spot market.
Following the pattern described in the previous sections, actors in the spot market
exerted a significant impact on the actual process of classification. Spot dealers delayed
the introduction of a centralized certification system. But at least part of their opposition
was misplaced. Even though NOCE acted against spot dealers wishes, they did so with
the spot market’s interest in mind. By centralizing grading, spots and futures were
brought into closer contact, strengthening both.
As a whole, NOCE’s system of classification reflected the importance of the spot
cotton market in New Orleans. The needs of spot traders for consistency and uniformity
informed their decisions regarding classification, certification and connection with other
76 AR, 1915 77 AR, 1917
101
markets. The infrastructure that resulted supported a robust spot market with close ties to
the trade in futures. These features kept speculation and commodity trade in a healthy
balance up until federal regulation of the futures market in 1914.
Conclusion
This chapter has described the development of two distinct grading systems on
CBOT and NOCE. Each system was created within an economic, organizational, and
institutional environment that shaped its workings. NOCE’s system reflects an
overarching concern with the spot trade. Decisions regarding classifications were made
for the good of the spot market primarily, if not wholly. This orientation resulted in a
market infrastructure that promoted hedging and a close relation between spot and futures
markets. By contrast, CBOT’s system was the product of an organization with little
investment in the spot market. Spot dealers’ need for accurate grading was constantly
pushed off in favor of maintaining an uncertain status quo. This uncertainty made CBOT
better suited to speculation in the futures market than to the actual trade of primary
commodities.
These findings offer an interesting critique of current sociological theories about
the classification. Most scholarship on classifications, and infrastructures generally, is
most concerned with how infrastructures delineate the types of actors, things, and
processes that can exist in a given setting (Foucault 1982). Analyses from this approach
tend to have two features: first, they highlight the process of constructing an
infrastructure as the critical moment for study. This is the moment when partisans battle

102
to enshrine the ontology that best suits their particular needs (Cronon 1991; Espeland &
Sauder 2007; Foucault 1982; Miller & O’Leary 1987; Miller & Rose 1990). Second, they
study the consequences of these infrastructures for the people who use them. They
examine how people adapt their work practices so as to be in harmony with an
infrastructure, whether by sincerely adopting it or by cynically engaging in ‘work
arounds’ that allow them to continue the same practices, only labeled according to a new
scheme (Barry 2001; Bowker & Star 1999; Edwards, et al. 2009; Millerand & Bowker
2009). We can think of this research as taking an ontological approach to the topic.
In opposition to this dominant ontological approach, my findings show the
importance of taking a semiotic approach to classification. Theorizing classifications as
semiotic entities requires a shift in focus from the moment of constructing classification
schemes (Star 2002) to the practice of classifying itself (Hatherly, Leung & MacKenzie
2008). This latter, practical moment is when classifications acquire their semiotic content.
As this process changes, so too the meaning of classifications is altered (Barnes 1983;
Bloor 1997; Wittgenstein 1967). The significance of even the most basic economic
classifications, such as ‘profit’ and ‘loss’, are constantly reshaped by the evolution of
classifying practices (Hatherly, Leung & MacKenzie 2008). The meaning of a market’s
closing prices differs according to the algorithmic processes by which it is produced
(Muniesa 2007). A semiotic approach to infrastructure also is less concerned with the
constraints imposed by an infrastructure and more interested in how individuals engage
creatively with infrastructures as meaningful objects.

103
A semiotic approach is more useful than an ontological approach for
understanding the significance of classifications in these cases. Different types of trades
had different semiotic requirements for classifications. For instance, for speculation that
did not end in delivery, the grade was only required to specify which commodity’s
market price was the object of the speculative bet. For the purposes of this type of trade, a
futures contract for Colorado Red Wheat was essentially a bet on the price of the
commodity being marketed as ‘Colorado Red Wheat’—the physical qualities represented
by this label could be entirely arbitrary. Hedging, by contrast, required grades to work in
both futures and spot markets. For a grade to function well in the spot market the content
of classifications was paramount: the grading system had to provide a fair recompense to
farmers based on the quality of their product and an accurate guide to manufacturers, who
required their raw materials to meet certain physical standards. If grades did not
accurately index these physical dimensions, the spot market component of the hedge
would be unsatisfactory.
To put this in explicitly semiotic language, speculation only required the
classification system to produce viable symbols, or to act as a symbolic infrastructure,
i.e., a logically coherent classification systems within which signs are meaningfully
related.78 Hedging, in addition to this symbolic infrastructure, also required a
classification system that produced signs indexed to the physical qualities of
78 I rely here on Peirce’s (1931-1958) trichotomy of signs: icons, indexes, and symbols. Icons signify
through their resemblance to their object (e.g., a picture of a cigarette with a slash through it indicating, ‘No
Smoking’); indices signify through pointing to their object (e.g., dark clouds and strong winds as a sign of
impending rain); symbols signify through their connection to other symbols and their associations (e.g.
words, which are meaningful primarily through their connection with other words in a language). Any sign
can signify in any combination of one or all of these modes.

104
commodities, i.e., an indexical infrastructure.79 For indexical infrastructures, issues of
practice—i.e., how grading was accomplished and integrated into the market—were
critical. Recognizing these different semiotic infrastructures also makes possible an
analysis of their interchange. How did grades move from acting as symbols to acting as
indexes? This was a critical question on the occasions when the commodities specified on
a futures contract were actually delivered in fulfillment of that contract. The exchanges’
distinct arrangements for translating between these semiotic functions acted as border
objects or gateways (Star & Griesemer 1989; Edwards 2010), shaping behaviors on the
market.
The key difference in how the two exchanges mediated this translation from
symbol to index was the presence of a warehouse receipt on CBOT, and the lack of one
on NOCE. On CBOT, the receipt and the legal apparatus in which it was embedded,
automatically linked the grade as a symbolic entity and tool of speculation to the grade as
an indexical guide to the material commodity. This established what we might call
“indexicality by fiat.” Traders who needed to settle a contract through delivery could
simply buy receipts for the proper grade of wheat, and rest assured that these would
satisfy their obligations. The receipt served to isolate speculators on the futures market
from any cost related to handling and classifying wheat, even on the occasions when they
79 Though not featured in either of these case, iconic infrastructures also exist. The clearest example of an
iconic infrastructure is a field guide, a pictorial system for classifying species of birds or plants. Iconic
infrastructures are unique among the three types in that their status as infra-structural is most likely to
fluctuate. While in routine cases of classification these icons are used passively as a background guide for
everyday practice, they are also actively reference in more difficult cases: birders carry field guides in their
packs and refer to them when they spot an unfamiliar species. Iconic infrastructures thus move fluidly
between being infrastructures that invisibly support tasks and being highly visible tools.

105
were forced to deliver it. By contrast, in NOCE’s system, speculators who were forced to
deliver cotton had to confront cotton as a physical object, in a process of “indexicality by
negotiation.” This introduced a potentially substantial cost to settling by delivery. Parties
had to hire expert classers to negotiate a grade, and even then risked losing money on the
deal due to changes in grade from one transaction to another. The difference in how
grades were incorporated into practice on each exchange—as permanent inscriptions on
warehouse receipts on CBOT and as negotiated agreements between private parties on
NOCE—thus shaped traders’ orientation to settling contracts through the delivery of
goods.
This difference, in turn, was highly consequential for market stability. On
NOCE, the possible cost of converting futures contracts to actual commodities placed a
check on speculation in the futures market. Speculators were wary of the risks and costs
associated with physical delivery, and would attempt to rid themselves of any contract
they suspected might require it, even to the point of selling at below market price
(Garside 1935). CBOT’s system of ‘indexicality by fiat’ removed this brake. Speculators
could be confident that they could, quickly and at no extra cost, secure warehouse
receipts which would satisfy their contracts. The differences in the semiotic character of
grades produced on CBOT and NOCE thus promoted contrasting behaviors on their
derivative markets. The low spot market fidelity of CBOT’s grade made hedging
difficult, while the permanent relation between its symbolic and indexical functions
enabled unfettered speculation. NOCE’s grade, by contrast, had high spot market fidelity,
106
allowing for safe hedging, and an uncertain, costly method of linking symbolic and
indexical functions, which tamped down speculation.
The grading systems analyzed above were critical infrastructural components;
they constructed information about physical commodities that enabled their inclusion as
abstract goods in standardized futures contracts. Each exchange needed its own grading
system as a prerequisite to its own futures market. But of course, markets were not
islands. Each market needed to be able to bring in for the use of its members information
about the growth and movement of spot crops, as well as price quotations from world
markets. They also needed to disseminate the price data produced on their own market to
other exchanges and trading offices. Achieving these goals required building
infrastructures, such as telegraph systems and crop reports, that moved information from
city to city, and between the city and country. It is to these information-moving
infrastructural components that I turn next.
Chapter 3, in part, is a reprint of the material as it appears in: Pinzur, David. 2016.
“Making the Grade: Infratructural Semiotics and Derivative Market Outcomes on the
Chicago Board of Trade and New Orleans Cotton Exchange, 1856-1909.” Economy &
Society, 45(3-4): 431-453. The dissertation author was the sole researcher and author on
this paper.

107
Chapter 4 – Moving Information
While creating a system of grades was a critical prerequisite to futures trading, it
did not encompass the entirety of infrastructure needed by these global futures markets.
Grades and standards were a categorical infrastructure, which gave each market a
language with which to operate.1 In this chapter, I focus on the transmission
infrastructures by which each market connected to its surroundings. I analyze both the
social forces that influenced the formation of these information-moving infrastructures
and the consequences of those infrastructures for each market.
I look specifically at the gathering and dissemination of two types of market-
related information: price quotations and crop statistics. Quotations were the prices at
which commodities and futures were bought and sold on exchanges. In high-volume
auction markets, this information was being constantly produced, and was the primary
way in which traders came to know the state of the market. Quotations were relayed to
other exchanges via telegraph, to be displayed—and continuously updated—on
blackboards for the use of traders. Gathering this information from other markets was
obviously a goal of this infrastructure. But just as important was the widespread
distribution of a market’s own quotations: the more widely a market’s quotations were
considered, the more influence it had to move the market itself. Crop statistics provided a
different type of information, not about the price of futures but about the growth,
movement, and consumption of the underlying crop. Whereas price quotations arrived in
1 Though, of course, in the previous chapter we also saw that grades were constructed in concert with other
exchanges, meaning that they are not entirely internal.

108
seconds or minutes, crop statistics came weekly or monthly. They allowed traders to
understand the current market situation holistically and historically, discern trends in
supply and demand, and estimate probable future states of the market—i.e., to adopt a
rational, calculative approach to trading. Price quotations and crop statistics thus provide
the short-term and long-term information by which traders make their decisions in the
futures market.
CBOT and NOCE, as organizations, assigned different values to each type of
information and had distinct methods for gathering them. Their perspectives were shaped
by the social and economic environments on each exchange. CBOT’s policies on price
quotations varied over the years in relation to the actions of two powerful nemeses: the
Western Union telegraph company and bucket shops.2 The Board battled these two
groups for control over and access to the valuable price quotations on the exchange floor.
Regarding crop statistics, CBOT publicized the data compiled by other sources, including
the United States Department of Agriculture and private crop experts, but did not produce
any information themselves. The information they publicized was widely recognized to
be unreliable, and CBOT did not take steps to improve this situation. Influenced by their
battle with Western Union and the bucket shops, CBOT treated information as private
property, which the Board need not be involved with vetting or equally distributing.
NOCE’s policies on both price quotations and crop statistics were motivated by the
economic and cultural desire to be independent of northern and foreign markets. Long-
2 Bucket shops were gambling parlors where the public could bet on fluctuations in the price of
commodities being traded on CBOT. Price quotations were transmitted from the Board’s floor to the shops
by telegraph.
109
time Exchange Secretary Henry Hester built a statistical system that gained worldwide
acclaim, making New Orleans a worldwide center for cotton statistics and earning Hester
renown as the “Father of Cotton Statistics.”3 But while NOCE was successful in creating
the infrastructure for gathering crop statistics, its efforts at building a reliable telegraphic
infrastructure for transmitting price quotations faltered. NOCE, beginning from a
dilapidated physical infrastructure, simply did not have the economic leverage to pressure
Western Union and the New York Cotton Exchange into making the changes that would
have sped up service.
These policies on collecting crop statistics and price quotations resulted in
markets with distinct information milieus that promoted divergent economic behaviors.
On CBOT, the lack of Board-verified information created a two-tiered system: traders
with better information, faster telegraphic service, or superior ability to sift out nuggets of
truth from the sea of dubious claims had an advantage over other members—rightfully
so, according to the Board. This inequality and unreliability both made long-term market
projection difficult and did little to lower uncertainty in the short-term, making
speculation on short-term price fluctuations a profitable strategy. NOCE, on the contrary,
produced a wealth of reliable statistics on the growth, movement and consumption of
cotton for the benefit of members. Crop statistics allowed traders to understand the
current market situation historically and holistically, to discern trends in supply and
demand, and to estimate probable future states—i.e., to adopt a rational, calculative
3 Frost, Meigs. 1926. “Hester Says”: An Intimate Personal Sketch of the World’s Greatest Cotton
Authority, Theo. H. Harvey Press, New Orleans.
110
approach to trading. Additionally, the lack of speedy telegraphic services made
speculation in futures, which required quickly spotting market opportunities, more
difficult. Thus, traders on NOCE worked with much information about the long-term
state of the cotton spot market, but little that could serve as fodder for short-term
speculative trades. The systems by which the exchanges gathered and disseminated
information in the form of price quotations and crop statistics, thus affected the types of
trading prominent on each market.
Chicago Board of Trade
CBOT’s policy on price quotations was determined in large part by their fear of
two outcomes: a Western Union monopoly over telegraph services, and the unchecked
growth of bucket shops. Since Western Union was a prime provider of CBOT’s price
quotations to bucket shops around the country, these dangers were interconnected: the
more inescapable Western Union became, the less CBOT could do to keep quotations
away from bucket shops; the larger bucket shops grew, the more incentive Western
Union had to seek their continued business. The three-way battle that took place was
fought largely through the courts, and extant histories have featured this legal component
prominently. My analysis builds on this scholarship by situating these court battles in
relation to CBOT’s concurrent attempts to circumvent Western Union altogether and to
leverage the value of their price quotations in their negotiations. These economic

111
maneuvers were critical to the information infrastructure that was eventually built on
CBOT with respect to price quotations.
Building alternatives to the Western Union monopoly
By the early 1870s, CBOT and other exchanges were becoming wary of Western
Union’s growing control of the telegraph market, with good reason. Western Union
acquired several major competitors during the 1860s and 1870s (John 2010). In 1866,
they swallowed up the United States Telegraph Company and the American Telegraph
Company, the latter being one of its principle rivals. They further expanded in 1877,
acquiring the Atlantic & Pacific Telegraph Company, which ran a competing line on the
important Chicago-New York corridor. In 1881, they essentially acquired the American
Union Telegraph Company by hiring its majority owner, Jay Gould, as their new
president. CBOT and other exchanges noted that the mergers had led to price increases,
as well as refusals to take complaints seriously or make necessary technical upgrades.
Higher prices, the exchanges argued, were not going to improvements of service, but
rather to paying dividends on Western Union’s highly inflated stock.4
CBOT’s concern over monopoly led them to endorse federal regulation of the
telegraph in the early 1870s, and also to support the establishment of a state-run system
of telegraphy. But they also sought to exert their own power directly. The Board’s
4 BDR, Box 7, Folder 5, Feb. 8, 1881

112
relationship with the telegraph company was symbiotic: exchanges relied on the
telegraph to facilitate modern worldwide trade, and telegraph companies needed the
volume provided by exchanges in order to be profitable. In the latter half of the 19th
century, financial news and quotations traveling between the world’s exchanges made up
the bulk of the information being sent by telegraph. CBOT used this need to their
advantage, leveraging their status as the world’s leading grain market to exert significant
pressure on Western Union.
The first instance of CBOT pushing back against Western Union came in 1880,
when several members, in conjunction with several Milwaukee businessmen, formed a
new telegraph company that directly linked the grain exchanges in both cities,
circumventing Western Union’s wires. The company—named the Chicago & Milwaukee
Telegraph—was an unqualified success. The company’s Board of Directors was
comprised entirely of Milwaukee and Chicago grain men; stock was non-transferable
except by consent of this board, a fail-safe designed to keep Western Union from gaining
financial control of the company, as they had with many other competitors. The cost of
constructing the line was recouped within two years of operation, and the company
earned 50% and 60% dividends in its first two years.5 Additionally, the competition they
offered drove down Western Union’s prices. In 1880, at the time of the Chicago &
Milwaukee’s founding, Western Union charged twenty-five cents for a ten word message
between the cities; in the coming years, upon losing a good portion of their business,
5 “Cheap Telegraphing Pays,” Chicago Tribune, May 26, 1886, p.9

113
Western Union reduced their rates between the two cities first to fifteen, then to five cents
per ten words.6
Following the success of this maneuver in Milwaukee, the Board attempted to make
the same direct connection with the Merchant’s Exchange in St. Louis. Members of the
Chicago and St. Louis exchanges, claiming that consolidation of telegraph companies had
eliminated all competition along the route between their cities, chartered the Board of
Trade Telegraph Company in December 1881 to directly link their buildings.7 By the end
of November 1882, construction of the line was nearly complete: poles had been planted
and wires hung from Chicago to East St. Louis, from which point the Company planned
to lease space on the Baltimore & Ohio Company’s poles running into St. Louis proper.
But Western Union, having learned the lesson of the Chicago & Milwaukee
Telegraph Company, put up significant resistance to this final stage. They sent out gangs
of armed men on several occasions to cut down the Board of Trade Company’s wires,
finally having them camp at the site to prevent any repairs.8 When the Board of Trade
telegraph sought redress in court, Western Union argued that the lines were cut because
they were in violation of an agreement between the Baltimore & Ohio Company and the
belt railroad that encircled St. Louis.9 Western Union impressed upon the Wiggins Ferry
Company and Illinois & St. Louis Railroad Company, which together owned much of the
land in the area, to take out injunctions against the Board of Trade Telegraph Company,
6 “New Line of Telegraph,” CT, Apr. 19, 1890, p.3 7 “Telegraph War,” CT, Nov. 29, 1882, p.3 8 “Judge Wall Hearing the Case of the Board of Trade vs. Western Union at East St. Louis,” CT, Jan. 15,
1883, p. 8 9 “Telegraph War,” CT, Nov. 29, 1882, p.3

114
preventing them from running wires across their property.10 At this point, the fate of the
Company moved to the courts. It suffered an early defeat when, in March 1883, a judge
in St. Clair County Circuit Court declined to dissolve the injunction filed by the Illinois &
St. Louis railroad.11 Adding to this, Western Union succeeded in having a suit moved
from state to the Federal Court, lengthening the process for resolving the case.12 In
February 1884, facing these legal setbacks and losing between $500 and $1,000 every
day as their wires sat idle, the stockholders of the Board of Trade Telegraph Company
conceded defeat—partially. While they did give up their plan to create an independent
telegraph company, they still gave a long-term lease of their line to a new rival of
Western Union, the Bankers’ & Merchants’ Telegraph Company of New York.13
In the midst of this battle over the Board of Trade Telegraph Company, CBOT
engaged Western Union on another front: the dissemination of quotations to bucket
shops. On December 16, 1882, CBOT notified Western Union that they must cease
furnishing quotations to bucket shops within two weeks or they would be kicked off of
the floor of the Board and deprived of quotations altogether.14 This was CBOT’s first
attempt to leverage the value of their quotations to influence Western Union’s policies on
dissemination of information. Western Union rejected the proposed change, stating that
its execution would be impracticable and would cost both them and the Board of Trade
10 “Judge Wall Hearing the Case of the Board of Trade vs. Western Union at East St. Louis,” CT, Jan. 15,
1883, p. 8 11 “The Board of Trade Telegraph Company’s Woes,” CT, Mar. 15, 1883, p.8 12 “The Board of Trade Telegraph Company,” CT, Feb. 10, 1883, p.12 13 “Telegraph’s Consolidation,” CT, Feb. 12, 1884, p.8 14 BDR, Box 8, Folder 10, Feb. 28, 1882; BDR, Box 8, Folder 47, Nov. 21, 1882

115
business.15 When the two week mark came, CBOT did not follow through on their threat,
but continued to used the possibility of cutting off quotations as a bargaining chip.
However, their ability to use this chip was curtailed by an 1883 court ruling that forbid
the Baltimore and Ohio Telegraph Company from withholding quotations from any
paying customer, even a bucket shop. Western Union pointed to the injunction to claim
that they faced legal reprisal for discriminating among recipients, as CBOT asked. Given
the unfavorable legal environment, CBOT backed away from this position. But, as will be
seen later in this chapter, it would return in a more favorable environment twenty years
later.
The final attempt to fight Western Union at this early period was the effort to
create an exchange-owned line between Chicago and New York. Linking the two major
financial centers of the United States, this would be the Holy Grail of telegraphic
independence. In January 1881—at the same time as the Board of Trade Telegraph
Company was attempting to link Chicago and St. Louis—two different groups, one
centered in New York, the other in Chicago, began planning a telegraph that would
connect their cities. The effort had the support of the most important exchanges in New
York City. The presidents of the New York Produce Exchange, Cotton Exchange and
Petroleum Exchange wrote a joint letter to several major exchanges across the country
urging them to support this effort. The planned company would follow the template of
the Chicago & Milwaukee Company, vesting voting power on over one-half of the stock
in a Board of Trustees, a majority of whom would be presidents of commercial
15 BDR, Box 10, Folder 2, Dec. 29, 1883

116
exchanges.16 CBOT responded positively to this letter, appointing a committee to confer
with committees from other exchanges on the matter. By October 1883, the New York
Produce Exchange was ready to move forward on a plan to incorporate. It had discovered
extant lines that ran from Weehawken, NJ, to 8 miles outside of Chicago, which the
proposed company could appropriate for their own use. The cost of additional
construction and operation were outlined, as well as the projected revenues. CBOT,
however, declined to get involved. They offered little explanation, other than citing “the
result of previous attempts of a like character,” likely a reference to the Board of Trade
Telegraph Company, which, at the time, was losing money and mired in a prolonged
legal battle with Western Union.17
The history of CBOT’s early efforts to form independent telegraph companies or
dictate policy to Western Union was thus mixed. The Chicago & Milwaukee Telegraph
Company was an early success, but later efforts were stymied by lengthy legal battles and
adverse court decisions. Despite this checkered history, the Board clearly established that
they could credibly resist Western Union: the Chicago & Milwaukee Telegraph forced
down prices; the sale of the Board of Trade Telegraph Company built up a new
competitor. The threats of establishing independent telegraph lines and imposing
restrictions on quotations remained viable negotiating strategies, to which CBOT would
return in later years.
16 BDR, Box 7, Folder 10, Mar. 22, 1881 17 BDR, Box 9, Folder 34, Nov. 10, 1883

117
William T. Baker and the telegraphic blackout
The early years of the Board’s fight for control of their quotations was against
Western Union. The next phase took on the bucket shops directly. There were two
components of the Board’s antipathy to bucket shops. One was economic: bucket shops
drew away business that might otherwise have gone to the exchange. This diffusion of
trading meant that Board prices aggregated less information, which decreased their
authoritativeness. The second, more significant, piece of their opposition was that bucket
shops impaired the legitimacy of the Board itself. Many bucket shop patrons thought that
the shops and Board of Trade were affiliated, and thus blamed the Board when bucket
shops acted unscrupulously. Others in the public hit upon the similarities between the two
establishments to impugn the activities of the Board as nothing but gambling. Bucket
shops precipitated and featured prominently in federal anti-futures legislation aimed at
exchanges throughout the period of my research.
The fight against bucket shops from 1883 to 1889 took place in a highly litigious
and uncertain environment (Lurie 1979). Bucket shops sought out injunctions against the
telegraph companies and the Board of Trade, seeking to preserve the flow of quotations,
while the Board countered that their quotations were private property and could be
disseminated in any way they saw fit. The lower courts were inconsistent in their
decisions on these injunctions, and CBOT was not willing to make any substantial moves
until a test case had been decided by a higher court. This case came in 1889 and the result
was not favorable to the Board. The Illinois Supreme Court ruled in the case of New York
and Chicago Grain and Stock Exchange v. Chicago Board of Trade that the Board’s

118
price quotations were vested with a public interest, and thus could not be withheld from
any groups without first proving the illegality of their business. Subsequent court
decisions even struck down the Board’s attempts to impose more minor restrictions, such
as distributing quotations only to Board members or replacing continuous quotations with
transmissions at fifteen minute intervals. By the end of the 1880s, nearly a decade into
the fight over price quotations, CBOT found themselves constrained by legal setbacks
and with few options for controlling quotations.
In January 1890, faced with this conundrum, the Board elected William Baker as
president on a platform of all-out attack on bucket shops. Baker argued that the Board
needed to keep continuous quotations from bucket shops at all costs. If the courts would
not allow the board to supply quotations to legitimate traders while weeding out the
bucket shops, then the only option was to cut off quotations to all parties. Baker’s
“blackout” policy was enacted a few months later. On March 31, 1890, CBOT eliminated
the department of market reports and ended the dissemination of continuous price
quotations from the floor of the exchange. This policy excluded telegraph companies
from the floor and restricted the timing of members’ private telegraphic correspondence,
so that instantaneous and continuous quotations could not be made.18 It cut off the flow of
quotations not only to bucket shops, but also to commission houses and exchanges
around the world. It was a drastic policy, but one which the Board believed was made
necessary by the danger of bucket shops and the unfavorable rulings of the court.
18 OR, MAM Box 5, Folder 18, 1891

119
Baker’s policy faced numerous difficulties. Members, unable to speedily furnish
their clients with information, were put at a disadvantage compared to traders on other
exchanges.19 The policy also gave a significant advantage in speculation to traders from
large commission houses that were equipped with a private telegraph wire. These traders
could still receive continuous quotations from other markets, while those relying on the
public wire received only periodic updates. Their constant updates allowed them to act on
information that had not yet reached members by the public wire. Finally, most galling to
Board members, continuous quotations were still making their way off the floor and to
outside parties despite the ban. Board members went to extreme lengths to get quotations
out: members formed pools to collect and disseminate quotations20; commission houses
ran secret wires to bucket shops; traders stood by the windows and used hand signals to
communicate with correspondents outside the building (Taylor 1917). Several Chicago
bucket shops actually grew during the first year of the policy, and even bucket shops in
Minneapolis and St. Louis were posting quotations.21 Board member Robert Lindblom,
an outspoken critic of the plan who sued the Board for restricting his access to the
telegraph, argued that the policy was a failure:
It is well known that in New York, in Minneapolis, in St. Louis, in
Chicago, any man who wishes to pay $1.00 a week can get every shade of
quotation that is made on the Board of Trade. My own correspondents in
New York who are not members of this Board have had these quotations
for a years and a half, and have had this advantage over a member, that
while he has had them I have been prohibited from receiving or
19 OR, MAM, Box 6, Folder 2, 1892 20 OR, , Box 5, Folder 3, Mar. 31, 1890 21 OR, Box 5, Folder 14, Nov. 9, 1891; OR, Box 5, Folder 14, Nov. 12, 1891

120
disseminating them.22
The blackout policy was failing to achieve its aim, disadvantaging Board members and
failing to achieve its primary goal. After two years, Baker was voted out of office and
continuous quotations restored. For the remainder of the 1890s, the Board made no
headway in their legal right to control quotations: private telegraph companies collected
the quotations at their own expense, and distributed them freely for own their benefit.
Control over quotations
In 1899, the Board hired a new attorney, a young Wisconsin Law School graduate
named Henry S. Robbins. Unlike his predecessor, who, for the previous eight years had
“ever striven to keep the Board out of litigation” (Lurie 1979: 165), Robbins believed the
time was right for the Board to take the offensive in litigation against bucket shops. He
soon had the opportunity, when in February 1900 a prominent bucket shop, the Christie-
Street Commission Company, filed an injunction against the Board of Trade to prevent
any cessation of market quotations. In arguing the case, Robbins actively sought to prove
that the Christie company was doing an illegitimate business, a strategy that the Board’s
prior attorney had thought unwise.
As part of their new offensive strategy, in May 1900, while awaiting judgment in
the Christie case, the Board announced that it would resume collecting quotations from
the floor of the exchange, taking that task away from the telegraph companies (Lurie
22 OR, Box 5, Folder 14, Nov. 12, 1891

121
1979). This was largely understood as a first step toward exerting greater control over
quotations by inserting CBOT’s own agents in between the trading on the floor and the
Western Union company.23 This step paid dividends when, on June 20th, the Christie case
was decided in the Board’s favor, stating that the bucket shop did an illegal business and
thus had no right to quotations from the Board of Trade. The following day, the Board
notified Western Union that they would turn over price quotations for transmission only if
the telegraph company agreed to limit their dissemination to approved recipients. As they
had nearly twenty years before, Western Union rejected this proposal. But this time, in
the more encouraging legal environment, CBOT actually followed through on their threat
and, on August 1, stopped providing continuous quotations to Western Union. Instead
they provided updates every five minutes, a significant decrease in business.24
Over the next eight months, as Western Union continued to only get periodic
price quotations, CBOT increased the pressure. They did this not through additional court
victories, but by an older strategy: threatening to circumvent the company with exchange-
controlled competitors. In September 1900, CBOT signed with the Cleveland Telegraph
Company to provide continuous ticker service in the city of Chicago. Their contract gave
CBOT full control over who received their quotations: Cleveland submitted a statement
to the Board every sixty days listing the names of persons who received continuous
quotations, and the Board was given authority to cut off transmissions to any recipient
they deemed illegitimate.25 In addition to contracting with the Cleveland Company for
23 “Aimed at Bucket Shops,” CT, May 26, 1900, p. 13 24 “Plan Lines For Their Own Use,” CT, Jul. 31, 1900, p.5 25 “Want Market Wires Cut,” CT, Sep. 9, 1900, p.7
122
local ticker distribution, CBOT revived the plan to build an independent line linking
Chicago and New York. The Board, working through a group of New York businessmen,
incorporated the Exchange Telegraph Company in October 1900, with the goal of linking
Chicago not only to New York but also Peoria, Indianapolis, St. Louis, Omaha, Sioux
City, Kansas City, Minneapolis, Duluth, Milwaukee, Toledo, Cincinnati, Detroit,
Philadelphia, Baltimore, Boston, and Buffalo.26 The company projected that wires could
be up and running in just over four years.
While these projections may have been overly optimistic in their details, the
threat to Western Union was still meaningful. They were already losing money from the
lack of continuous quotations and confronting the possibility of further pro-CBOT court
rulings, and now faced the possibility of a significant, exchange-controlled competitor. As
a result, Western Union signed a contract that made serious concessions to the Board.
Prior to CBOT taking control of collecting quotations in August, Western Union had paid
$6,000 a year for continuous quotations, with no restrictions on their distribution,
servicing offices in Chicago and beyond. In March, when they finally signed a new
contract for continuous distribution, they were paying $30,000 a year, had agreed to
furnish quotations only to Board-approved recipients27, and given Cleveland Telegraph
Company exclusive rights to distribute quotations inside the city of Chicago.28 When
Western Union returned to the floor of the exchange on April 1, it was under conditions
26 “Vote For a New Telegraph Line,” CT, Sep. 15, 1900, p.3; “Enters Telegraphic Field,” CT, Oct. 7, 1900,
p.8 27 Each approved recipient of quotations had their own set of requirements to meet, which ensured that
quotations were not then used for gambling purposes (BDR, Box 43, Folder 5, Oct. 23, 1900). 28 “Quotation War May Be Ended,” CT, Nov. 11, 1900, p.8; “Quotation War to Continue,” CT, Nov. 20,
1900, p.4

123
crafted by the Board to ensure their complete control over price quotations.29
The 1905 U.S. Supreme Court ruling on the appeal of Christie, which upheld
CBOT’s right to control its quotations, settled all quotation-related legal questions in
favor of the Board. Following this ruling, CBOT kept its quotations under close control.
Primarily, this meant cutting off quotations from bucket shops, which withered away. By
1917, for the first time in nearly forty years, there were no bucket shops in operation
anywhere in the country.30 But the Board also used its newly established property right to
keep quotations away from a second less noxious, but still problematic, group: small
speculators in country towns. Experience with proposed federal legislation in 1890 and
1891 had shown the Board that speculative losses by farmers and country traders
provided ample fodder for denunciations of the Board of Trade. Seeking to head of
hostile legislation, the Board, in March 1911, cut off quotations to recipients in towns
with less than 10,000 inhabitants; in 1918, the cut-off was raised to 25,000.31 Parties in
cities that did not meet this mark could apply for an exemption to the rule, but had to
guarantee that quotations would not be made public, and would only be for private use.32
This policy aimed not only to forestall anti-futures legislation, but also to maintain the
credibility of the Board’s past legal arguments. President Frank Bunch, in his 1912
address to the Board made this connection:
It took ten years or more of ceaseless work in the courts and the
expenditure of many thousands of dollars to obtain our present position,
29 OR, MAM, Box 9, Folder 27, 1902 30 OR, MAM, Box 14, Folder 13, 1917 31 OR, MAM, Box 13, Folder 1, 1911; OR, MAM, Box 14, Folder 15, 1918 32 BDR, Box 68, Folder 12, Mar. 14, 1911

124
where we have absolute and unlimited control of our quotations. The
strength and justice of our claims were only realized by the courts when
we showed that the quotations were not distributed indiscriminately
among the public but were at all times subject to our control. It therefore
behooves all of us to guard with the greatest care the dissemination of
these quotations in order that, if legal complications shall arise again in the
future, we can sustain our identical position, as we did in the past and are
doing at the present time.33
Since CBOT had won the right to control its quotations, they bore responsibility for the
dissemination of those quotations. The legal path that they took to defeating bucket shops
pushed them toward an even broader conservatism in disseminating quotations than they
had initially pursued.
CBOT’s varying policies on price quotations were responses to the needs of their
battles against the monopoly of Western Union and growth of bucket shops. Their power
in fighting both came not just from victories in the courts, but from their ability to
effectively pressure Western Union using both the threat of creating alternate, exchange-
controlled telegraph companies and the value of their quotations as bargaining chips. The
animating argument behind these policies was the belief that price quotations were
private goods that could be controlled or withheld as desired. Below, we will see how this
belief pervaded CBOT’s perspective on information more generally, including their ideas
about crop statistics.
Conflicting and unreliable crop statistics
33 OR, MAM, Box 13, Folder 8, 1912: np

125
CBOT did not give much attention to the task of providing members with statistics
on the growth, movement and consumption of grain. The Board did not gather any
statistics itself, and simply passed on statistics from government and private sources with
no effort to vet them for accuracy. Information was often highly general or unreliable.
This is, of course, not to say that no one on the Board operated with good information.
But CBOT as an organization did nothing to encourage the creation or gathering of this
information. Good crop statistics—like price quotations—were private goods to be
acquired and utilized by individual members, rather than public goods provided by the
Board. This created an environment where the statistics provided to members could not
serve as the basis for any rational, long-term prognoses of the market. As the Chicago
Tribune, echoing a refrain among traders, stated: on CBOT, “the man who trades on
statistics is on the highway to ruin.”34
CBOT began producing weekly statements on the movement of grain through the
city in the 1860s. But these statistics were too general to tell traders anything about the
supply of wheat in the city. The report gave total amounts of wheat, corn, soybeans, and
other commodities going into and out of warehouses, but did not distinguish these
amounts by grade.35 Since contracts were made for one particular grade only, this general
information was of limited use. Similarly, in records of the movement of wheat, no
distinction was made between wheat that was actually warehoused in the city and that
which simply passed through the city, or was sold in the city but shipped from another
location, such as Milwaukee (Taylor 1917). This made it difficult to know how much
34 “Article 4 – No Title,” CT, Feb. 21, 1891, p.4 35 Publications, Box 64, Folder 21, Apr. 19, 1862

126
wheat was actually in the city’s warehouses. It was not until 1886 that the Board moved
from this omnibus method of keeping accounts to a “more enlightening system of book-
keeping” that included these relevant distinctions.36
Comparative, multi-city data on the movement and price of wheat came even
more slowly. In 1909, the Federal Department of Commerce’s Bureau of Statistics
complained that they were unable to make accurate national monthly reports of grain
receipts and shipments because there was no uniformity in the book-keeping methods
utilized by the country’s exchanges.37 In 1910, the Council of North American Grain
Exchanges complained that the trade lacked a daily market report that would compare
price information across multiple exchanges.38 Traders on CBOT, and others in the wheat
trade, were unable to gain a complete picture of the movement, consumption, or price of
wheat across the country.
While statistics on the extent of the growing crop were more plentiful than those
tracking its movement, they were still of dubious value (Pietruska 2012). The United
States Department of Agriculture’s Division of Statistics began publishing monthly crop
reports in 1863. The USDA compiled their statistics using reports from hundreds of
thousands of correspondents submitting from across the country.39 Each correspondent
reported on the area planted, the condition of the crop, and its yield per acre for a
particular assigned area. These reports were not numerical measurements, but rather
36 OR, Box 2, Folder 10, Feb. 26, 1886 37 EOR, Box 437, Folder 2, May 8, 1909 38 CBOT Affiliates, Box 77, Folder 7, Feb. 8, 1910 39 Willis (1902) puts the number at “perhaps two hundred and fifty thousand,” almost all of whom were
unpaid volunteers.

127
estimates of the forthcoming crop in relation to the previous year’s crop. Correspondents
reported their estimate as a percentage: taking the previous year’s crop as equal to 100,
they would assess whether the crop was, for example, 10% less (reported as “90”), 10%
more (reported as “110”), or any other value. These returns were then weighted and
converted into a statewide percentage.
Though one could certainly find fault in this method of estimation, the real source of
error came in how the USDA converted these percentages into quantities. To do so,
USDA statisticians made calculations using crop data from the most recent decennial
census. The problem with this method was that figures became progressively less
accurate the further one moved from the date of the census. Any errors in estimation were
compounded when they served as the basis for the following year’s estimates, and so on
(Willis 1902). The USDA’s chief crop statistician admitted in September 1886 that, as a
result of this system, their current estimates of the growing crop were probably about
10% too,” low.40 Despite this awareness, and pledges to fix these shortcomings,
government crop reporting remained inaccurate for decades.41 In 1912, according to
CBOT’s board of directors, government crop reports were still prone to “significant
error” and “radical correction.”42
Further complicating the value of the USDA’s data was the fact that their figures
did not always match those produced by other government agencies. Many state
Agriculture Boards made up their own statistics, which could diverge remarkably from
40 “Crop Statistics,” CT, Sep. 22, 1886, p.6 41 “Improved Crop Statistics, CT, Sep. 23, 1895, p. 6 42 OR, Box 2, Folder 10, Aug. 23, 1912

128
the USDA’s.43 For example, in May 1888, the USDA reported that about 776,300 acres
of winter wheat was growing in Kansas, while the Kansas Board of Agriculture put the
figure at 1,210,500 acres, over 50% higher.44 Additionally, USDA’s figures did not
always match those provided by the Census Bureau. In 1902, the two departments
entered into a protracted debate over the significant divergence in their numbers, leading
a contemporary observer to remark in The Journal of Political Economy that the USDA’s
numbers “[were] and perhaps under existing circumstances must necessarily be, so wide
of the real facts of the case as to be practically worthless as a guide to traders and
speculators” (Willis 1902).
In addition, correspondents were known to underreport their harvests or refuse to
return forms. This was often done on the advice of local organizations which taught that
publicizing crop figures depressed prices in foreign markets.45 This attitude was not just
found among farmers. An 1886 CBOT committee appointed to examine the financial
state of the Board expressed a desire to keep production statistics close to the vest, stating
that “the benefits derived from this constant advertising of our stocks are considered by
some members doubtful.”46 This skepticism was even found in high federal offices. In
May 1894, Secretary of Agriculture J. Sterling Morton claimed that crop statistics exerted
a depressing influence in foreign markets by building up the expectation of great crops,
and should thus be eliminated.47
43 “National Crop Reporting,” CT, May 4, 1894, p.6 44 “Misleading Crop Statistics,” CT, May 17, 1888, p. 4 45 “Inaccurate Crop Statistics,” CT, May 29, 1893, p.4 46 OR, Box 2, Folder 10, Feb. 26, 1886: np, emphasis added 47 “National Crop Reporting,” CT, May 4, 1894, p.6

129
All of these features made government figures poor guides to the crop situation.
This information void created a demand for data that was met by independent statisticians
and market prognosticators, who publicized their findings in circulars distributed by
private commission houses. These reports mixed scattered statistical information with a
healthy dose of gut feeling and estimation; unsurprisingly, they varied greatly. The
Chicago Tribune, as early as 1887, was denouncing the reports of these “private-wire
oracles,” saying that, “No two of them ever agree upon a prophecy—indeed they rarely
agree upon statements of fact—and again no one of them yet was ever known to advise
his Chicago correspondents and their customers to keep quiet and await events.”48
Despite their inaccuracies, these reports continued to have a central role in the grain
trade. A 1918 letter from commission merchant and prominent Board member C.H.
Canby expressed frustration with the very same problem mentioned by the Tribune
twenty years earlier:
I would also call attention to the situation surrounding some of our
commercial news reporters who make a specialty of so weaving together
different disconnected threads in the situation covering all kinds of
theories in regard to car supply, the crop position, and movement, as to
bring about exactly the kind of speculative excitement, or undue unrest, in
the minds of the trade which, when apparently supported by the reputation
of a leading newspaper, gives it an importance unwarranted, and in many
instances totally misleading. It would occur to me that our commercial
reporters should be limited strictly and entirely to the collection of
commercial statistics, including receipts, shipments and prices, and be
entirely prohibited from indulging in theoretical forecasts and opinions
which are put together for the sole purpose of attempting to forecast the
future action of the market. One missing link in these alleged statements
48 “Private New York Wires,” CT, Jan. 30, 1887, p.14

130
of fact destroys their entire argument and renders these articles not only
inaccurate, but misleading and harmful.49
Board members agreed with Canby, and, a few days after receiving the above letter,
adopted a measure stating that the Board would only publicize reports from crop experts
who had registered with the Board of Trade.50 But for the first fifty years of futures
trading on CBOT, this effort to exert any organizational authority over crop reports was
entirely absent.
CBOT members thus lacked a reliable, shared body of information about growing
crops and world markets. In place of accurate statistics, CBOT members had unreliable
forecasts, hearsay, and misinformation. Statistics from independent commission houses
produced more heat than light; attempts by the federal government and umbrella
organizations such as the North American Grain Dealer's Association were plagued by
inconsistent reporting and suspect methodologies. Information was a resource to be
acquired independently and used for personal gain, not a public good for the benefit of
the Board. Thus, rather than serving as a stabilizing point for the market, crop statistics
simply became fodder for additional speculation.
The New Orleans Cotton Exchange
NOCE’s position on gathering and dissemination of information stood in stark
contrast to CBOT’s. This was seen, in part, in the previous chapter’s discussion of the
49 BDR, Box 84, Folder 37, Jun. 15, 1918 50 BDR, Box 84, Folder 37, Jun. 19, 1918

131
departments of Supervision and Inspection, which produced vast amounts of information
regarding the minutest details of daily cotton receipts, shipments and stocks during its
tenure in the city.51 This same hunger for information was found in the Exchange’s
policies on crop statistics and price quotations. The organization sought independence
and stature by becoming an informational hub and providing members the data needed to
make extensive market calculations.
Information and the founding of the Exchange
When telling the story of information gathering on NOCE, one must begin with the
person of Henry Hester. Hester was the first Secretary of the Exchange, a position he held
continuously for sixty-one years, practically up to his death in 1934. He exerted a
foundational influence on NOCE. At the Exchange’s founding, Hester was a 24-year old
journalist covering cotton and financial markets for the New Orleans Price Current. He
was offered the job of secretary directly by E.H. Summers, one of the eighteen founders
of the Exchange and its first president, on the strength of his reporting on world cotton
markets. Hester accepted on the condition that he would be given a wide berth in
planning the workings of the Exchange.
With this broad authority, he set out “to make the South the authority for facts
concerning the growth and distribution of its great staple, cotton.”52 Hester’s work began
51 See, e.g., AR, 1876; 1877; 1879; 1881 52 “Hester Says,” 1926: np
132
immediately. At its first meeting, the Exchange accomplished two things: found quarters
to rent and appointed a Committee on Information and Statistics (CIS). In 1871 and 1872,
the first two years of the Exchange, “market information” made up half of the budget
(Boyle 1934). Prior to this time, information on stocks of cotton in the U.S. and around
the world, as well as quotations from foreign markets, came to New Orleans from sources
in New York and Liverpool. Traders feared that these reports were manipulated by those
seeking lower prices, and kept New Orleans a second-tier market (Bouilly 1976). Hester
argued that NOCE could protect itself from manipulation and empower members to form
their own opinions on the market by building up their own statistical infrastructure rather
than simply following New York’s lead. The CIS, writing in 1890, spoke to this point:
The custom of awaiting the effect of important events upon the New York
market, and following in the wake of the latter, is false, both in principle
and in fact; but, unless we are as well, if not better, posted than New York
upon current events, there is no alternative but for this market to remain in
leading strings.53
Expanding the scope of general information in order not to be in thrall to New York and
foreign market centers was a general theme and goal of NOCE, particularly the CIS.54
The thought among members of the CIS was that greater quantities of information
would help members to “act more intelligently.”55 This hope of instilling rational,
intelligent, and independent analysis of the market was a persistent feature of Hester’s
tenure. There is some evidence that this rational orientation took among the membership.
Soon after the Exchange’s founding, CIS committee chair Harrison Watts found that
53 AR, 1890: 32 54 See AR, 1892; 1893; 1894 55 AR, 1889: 26
133
early data-gathering efforts had awakened among NOCE members “a thirst for
information heretofore considered valueless,” and fostered “more enlightened relations
between the producer and consumer.”56 This faith in the ability of statistical analysis to
sway traders remained central to the Exchange as an organization, exemplified by two
cases, from 1920 and 1926, when Hester was asked to prepare statements on the cotton
markets in response to rapidly declining prices.57 For these purposes he produced detailed
statistical pictures drawing on a wide variety of figures—including carryover from the
past year, government estimate of the growing crop, miscellaneous other sources of
cotton (linter crop and city crop), probable takings of American mills, probable future
carryover, comparisons to past years totals and prices, past years’ consumption totals,
historical price trends, and prices of cotton from other regions—to show that the panics
lacked any grounding in the facts. In both cases, Hester’s statistically-based assurances
stemmed the fall of prices and restored confidence among sellers.58
Crop statistics
NOCE’s most significant infrastructure-building project was the creation of a
system for gathering statistics on the growth and movement of the U.S. cotton crop.59
Prior to the founding of the Exchange in 1871, this information had been provided by
estimates from country presses and travelers. The new system created by the CIS sought
56 AR, 1874: 106 57 Hester, Henry G. 1926. Cotton Situation, New Orleans. 58 “Hester Says,” 1926 59 V, Box 72, Folder 8, May 24, 1871

134
to gather this information systematically by sending monthly surveys to informants in
different cotton-producing regions. Members sent circulars to their correspondents who
were responsible for reporting on acreage planted, weather conditions, and progress of
the growing crop for carefully demarcated regions (Ellis 1973). The CIS noted that the
first full year of crop reporting saw “a fair degree of success.” While the system could
undoubtedly be improved, it was at least gathering information that had previously been
uncollected.60
The qualified success of the crop reports in their first two years led the National
Cotton Exchange (NCE), in September 1874, to take over the production of reports and
scale up the practice to the country as a whole. Under the control of the National
Exchange, the process continued largely as it had in New Orleans: NCE split the cotton-
growing regions of the U.S. into multiple sections, which they then allotted to each of
their member exchanges. Each exchange was in charge of sending their correspondents
each month during the growing season a “uniform series of interrogatories … relative to
planting, the condition, cultivation and gathering of the cotton crops.”61 These reports
were then sent on for compilation by NOCE’s CIS, acting as the Central Committee on
Information and Statistics for the NCE and keeping Hester in a central position at the
national organization.62 NOCE, working now as a functionary of the National Exchange,
continued to make progress in their methods of gathering information. In their 1876
annual report, the CIS claimed that they were receiving more replies covering a larger
60 AR, 1872: 4 61 “The Cotton Exchange Convention,” New Orleans Daily-Picayune, Jun. 12, 1874, p. 1 62 AR, 1884

135
area every month; in 1877, they established and disseminated to other exchanges a
uniform series of questions for use in obtaining information for monthly crop reports.63
But the crop reporting system was not without its flaws. NCE member bodies
were having difficulty getting accurate and commensurable data for their crop and
acreage reports. For some years, each exchange produced its own questionnaire, which
made comparisons difficult. Even once questionnaires were standardized, NCE found that
correspondents still interpreted questions differently. This problem was compounded by
NCE’s requirement that member exchanges merely compile responses as received,
exercising no discretion as to acceptance or rejection of answers.64 In addition to
commensurability problems, NCE’s system suffered the same problem as the USDA’s in
using the decennial census as a baseline for estimating later years’ figures. The further it
got from 1870, the less accurate the estimates.65 By 1879, even getting data from about
400 respondents for its region, NOCE claimed that it could not make any “predictions”
about the cotton crop but only present “an intelligent general view of the crop
prospects.”66 In 1882, citing persistent inaccuracies, NCE discontinued compiling
monthly reports of crop and acreage.67
But this cancellation did not last long. The experience of the previous years’
reports, even with their problems, had awakened cotton dealers to the potential value of
detailed crop statistics, and in 1884, after two years of advocacy from NOCE, the
63 AR, 1877 64 AR, 1881 65 AR, 1878 66 AR, 1879: 304 67 AR, 1882
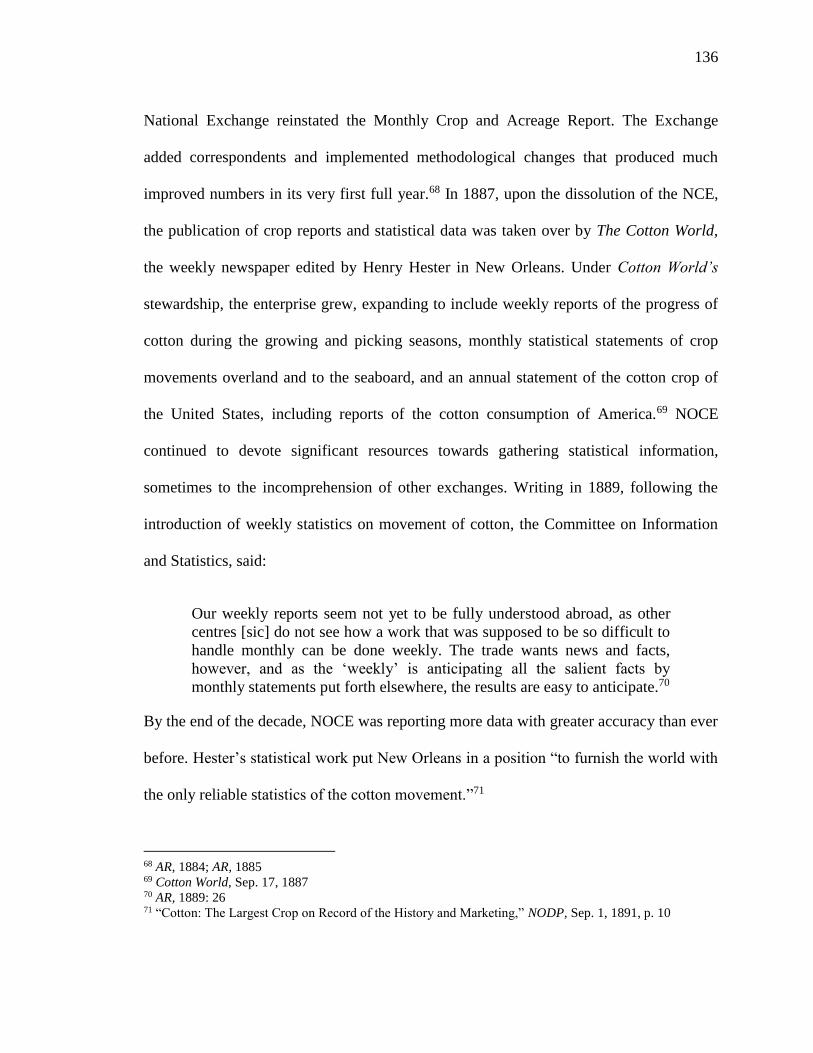
136
National Exchange reinstated the Monthly Crop and Acreage Report. The Exchange
added correspondents and implemented methodological changes that produced much
improved numbers in its very first full year.68 In 1887, upon the dissolution of the NCE,
the publication of crop reports and statistical data was taken over by The Cotton World,
the weekly newspaper edited by Henry Hester in New Orleans. Under Cotton World’s
stewardship, the enterprise grew, expanding to include weekly reports of the progress of
cotton during the growing and picking seasons, monthly statistical statements of crop
movements overland and to the seaboard, and an annual statement of the cotton crop of
the United States, including reports of the cotton consumption of America.69 NOCE
continued to devote significant resources towards gathering statistical information,
sometimes to the incomprehension of other exchanges. Writing in 1889, following the
introduction of weekly statistics on movement of cotton, the Committee on Information
and Statistics, said:
Our weekly reports seem not yet to be fully understood abroad, as other
centres [sic] do not see how a work that was supposed to be so difficult to
handle monthly can be done weekly. The trade wants news and facts,
however, and as the ‘weekly’ is anticipating all the salient facts by
monthly statements put forth elsewhere, the results are easy to anticipate.70
By the end of the decade, NOCE was reporting more data with greater accuracy than ever
before. Hester’s statistical work put New Orleans in a position “to furnish the world with
the only reliable statistics of the cotton movement.”71
68 AR, 1884; AR, 1885 69 Cotton World, Sep. 17, 1887 70 AR, 1889: 26 71 “Cotton: The Largest Crop on Record of the History and Marketing,” NODP, Sep. 1, 1891, p. 10

137
By 1890, Hester’s system was comprehensive. Each week, his report presented a
massive amount of information: the movement of cotton at 102 interior towns, as well as
historical statistics (listing figures for this week, this year, and last year) on movement
into sight, visible cotton, spinner's takings, exports, stocks, and prices, as well as
statements of mill takings, receipts, and stocks from Liverpool and Bremen.72 Hester’s
annual statement in 1890 also was a milestone. His team of statisticians gathered reliable
data from every delivery point, each point of crossing on the Ohio, Mississippi and
Potomac rivers, and from all the mills in the South, obviating the need to guess or
estimate a single detail of the entire statement.73 The report won praise and respect from
the world’s cotton markets. By the turn of the century, no man in the cotton world would
think of doing business without a weekly Hester’s Report, “any more than the captain of
a ship would think of sailing from port without chart and compass and sextant.”74
NOCE, through the construction of this impressive statistical machinery, had
achieved the autonomy it sought thirty years before. President A. Brittin, speaking in
1903, expressed the new powerful position their market occupied:
Last year’s business shows beyond question that New Orleans is no longer
in leading strings, and that while the changes and variations in other great
market have more or less influence with us as ours have with them, it has
come to pass that where conditions justify, this market takes the lead and
acts independently upon its own views of the legitimate effects of supply
and demand, or other causes which may affect values. In brief, the people
72 AR, 1890 73 AR, 1891 74 “Hester Says,” 1926: np

138
of the Cotton States have learned to appreciate the commanding position
they hold in the cotton world and at last to think and act for themselves.75
NOCE became, through the labor of Henry Hester, a center of calculation producing
invaluable information for cotton traders (Latour 1987). While exchanges on New York
and Liverpool remained larger in terms of the volume of trading, New Orleans
maintained its market share as well as its status through the provision of crop statistics
that allowed for wide-ranging and far-seeing calculation.
The flow of telegraphic information
Though NOCE created an impressive infrastructure for gathering and
disseminating crop statistics, their efforts at securing reliable, speedy telegraph service
was less successful. In large part, this was due to the poor state of telegraphy in the South
following the Civil War (Thompson 1972). At the onset of war, lines extending from
north to south across the Mason-Dixon line had been cut, and as the war continued much
of telegraphic property in the South was destroyed. Companies serving the South barely
had enough business during the war to stay afloat, and certainly not enough to repair
damaged lines or expand coverage. After the war, the American Telegraph Company,
which offered the main route to the north seemed to be making a recovery. They
absorbed two other companies serving New Orleans—the Southwestern Telegraph
Company and the Washington & New Orleans Telegraph Company—and made plans to
75 AR, 1903: 8

139
invest half a million dollars in repairs of their lines. These plans, however, were scrapped
in 1866, when the American was absorbed by Western Union. Having won a monopoly
over the north-south route, Western Union subsequently did little to rebuild or expand
southern lines.
As a result, telegraph service in the South lagged behind that in the north.
Particularly critical for traders was the discrepancy in speed of transmission. As NOCE’s
Telegraph Committee recognized, “modern methods of transacting business count
minutes and even seconds where hours and half hours only were formerly considered.”76
Shaving off these minutes and seconds remained a challenge for NOCE for over forty
years. The most persistent problem related to the telegraph was the presence of “beats,”
instances where messages and price quotations reached commission houses along private
wires faster than the same information came to the Exchange over public lines. As a
result of this time differential, members associated with private houses had a chance to
act on information before it became common knowledge, giving them a significant
advantage in the market. Beats were noted in NOCE’s annual report as early as 1883, but
became a persistent concern starting a few years later.77 In 1888 and 1889 there were
complaints of multiple beats on fluctuations coming from New York.78 These complaints
were made, with some variation from year to year, throughout the next decade: in 1906,
the Telegraph Committee of NOCE complained that beats were “a matter of daily, almost
76 AR, 1903: 9 77 AR, 1883 78 AR, 1888; AR, 1889

140
hourly, occurrence”; in 1910, they were still bemoaning the “wretched quotations
service” with New York and Liverpool.79
The primary source of beats was the technical limitations of the public telegraph
system itself.80 During busy times messages would take longer to transmit. This led to
serious delays at the opening of the market and at periods of large fluctuations, precisely
when speedy service was most needed.81 One possible solution to the problem of beats
would have been to create a direct line between the New Orleans and New York
exchanges, as CBOT had done with the Milwaukee Exchange. NOCE and NYCE both
expressed interest in this idea and discussed its feasibility in 1904.82 But, as with CBOT’s
efforts to connect directly to New York, NOCE determined that the cost of a direct line
was too great. The Board of Directors resigned itself to the fact that NOCE simply could
not compete with private commission houses that spent hundreds of thousands of dollars
on telegraphing each year.83 Once they had given up on creating a new line, all NOCE
could do was harangue Western Union and hope for improvements in service. These
efforts did little but frustrate Exchange leaders. Writing in 1908, after two decades of
pushing Western Union for improvements, the CIS admitted that their arguments had,
“been gone over so often with the telegraph officials with no appreciable result, that [they
were] at loss what further to do.”84
79 AR, 1906: 9; AR, 1910: 35 80 AR, 1896 81 AR, 1911 82 AR, 1904 83 AR, 1905. NOCE’s total budget for telegraphing in the same year was only $13,850. 84 AR, 1908: 31

141
Another source of beats was not technical, but procedural, and regarded the rules
governing transmission between NYCE and NOCE. Some of these rules gave a
significant advantage to private wire houses. One such rule, which NOCE first became
aware of in 1896, was NYCE’s so-called “ten-minute rule.” This rule allowed a member
to withhold reporting a trade in futures to the Exchange for ten minutes. During this time,
they would privately wire news of the trade to their constituents in New Orleans, who
would get the jump on other members.85 A second procedural problem was that NYCE
only transmitted sales—not offers and bids—to NOCE over the public wire. Private
commission houses, though, did receive offers and bids. This let them see the movements
of the market at a finer grain, sussing out trends early. A trader who relied on the public
wire, complaining of this arrangement, gave the following example:
Some days since a certain month was quoted at 10:30 A.M. in New York,
11 cents; by 10:31, it was offered at 10.99; then at ’98, ’97, ’96, and ‘95
successively; but because there were no sales we did not get a quotation
until 10:33, when a transaction was made at 10.95. The successive offers
of ’99 to ’95 were known through private resources, but the Exchange was
without information because it had to wait until an actual sale.86
Thus, it was not just the technical relation with Western Union that influenced the speedy
gathering of price quotations. Even when telegraph wires were in perfect working order
the organizational relations with NYCE posed another obstacle.
Addressing these problems with NYCE, while not as intractable as the technical
issues with Western Union, involved their own challenges. Convincing New York to alter
their rules for the benefit of New Orleans took work, and changes only happened slowly.
85 AR, 1896 86 AR, 1903: 31-32
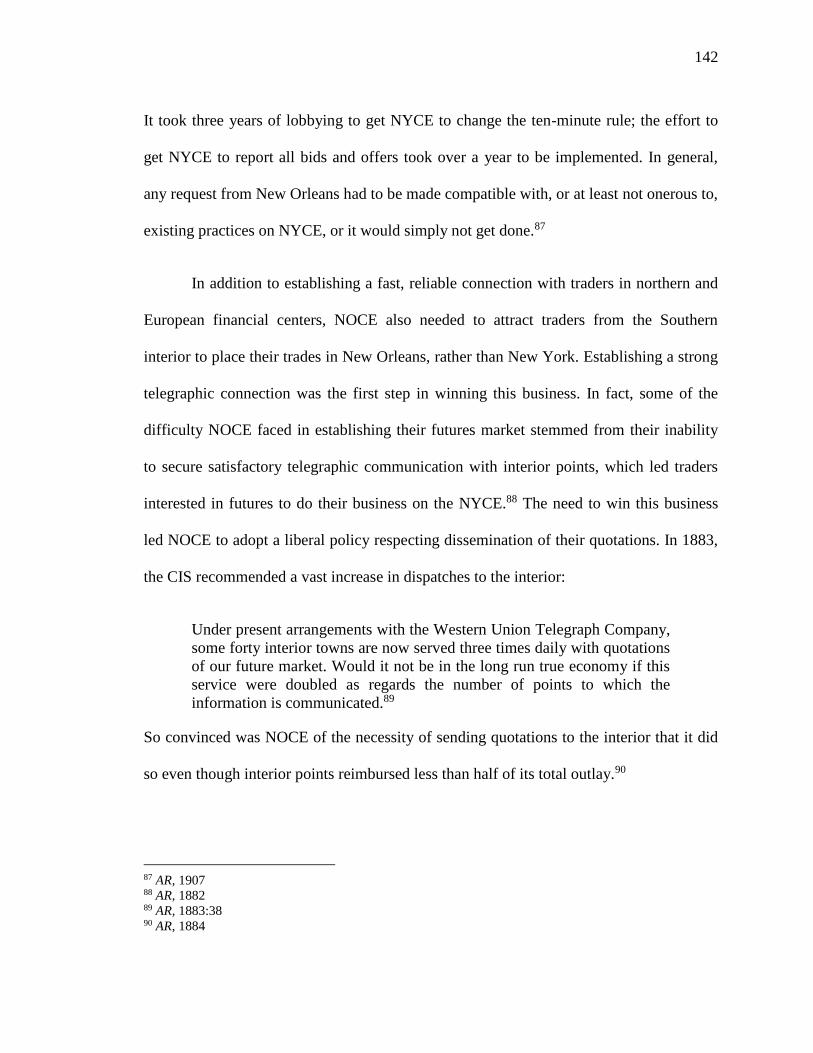
142
It took three years of lobbying to get NYCE to change the ten-minute rule; the effort to
get NYCE to report all bids and offers took over a year to be implemented. In general,
any request from New Orleans had to be made compatible with, or at least not onerous to,
existing practices on NYCE, or it would simply not get done.87
In addition to establishing a fast, reliable connection with traders in northern and
European financial centers, NOCE also needed to attract traders from the Southern
interior to place their trades in New Orleans, rather than New York. Establishing a strong
telegraphic connection was the first step in winning this business. In fact, some of the
difficulty NOCE faced in establishing their futures market stemmed from their inability
to secure satisfactory telegraphic communication with interior points, which led traders
interested in futures to do their business on the NYCE.88 The need to win this business
led NOCE to adopt a liberal policy respecting dissemination of their quotations. In 1883,
the CIS recommended a vast increase in dispatches to the interior:
Under present arrangements with the Western Union Telegraph Company,
some forty interior towns are now served three times daily with quotations
of our future market. Would it not be in the long run true economy if this
service were doubled as regards the number of points to which the
information is communicated.89
So convinced was NOCE of the necessity of sending quotations to the interior that it did
so even though interior points reimbursed less than half of its total outlay.90
87 AR, 1907 88 AR, 1882 89 AR, 1883:38 90 AR, 1884

143
Despite connecting with interior points through wide dissemination of their
quotations, NOCE still found that their antiquated telegraph facilities were driving away
business.91 New York simply offered a faster connection, and thus, a safer market. The
CIS noted in 1904 that from many points in the South, it took fifteen minutes for a
message to travel to and from New York, whereas the time to and from New Orleans was
three or four-fold greater.92 Six years later, the discrepancy in speed was exactly the
same.93 Not only did this mean that New Orleans saw hedges and speculative trades
going to New York, but it also precluded an entire class of trades from taking place on
the New Orleans market. If telegraph service were faster, the Committee claimed, it
would open up the opportunity for a “straddle” business, where traders could arbitrage
price discrepancies with New York.94
NOCE continually struggled to obtain fast, reliable telegraph service. While they
were able to build an impressive statistical infrastructure, their position as a secondary
market to New York had a significant effect on their telegraphic infrastructure. They
simply did not have the stature to force the hand of the New York Cotton Exchange or
the various telegraph companies. As a result, they were never able to attract orders from a
broad enough area to compete with NYCE in terms of volume. These telegraphic issues
served to circumscribe the New Orleans market, particularly hurting the speculative
business that thrived on the speedy transmission of information.
91 AR, 1901; AR, 1903 92 AR, 1904 93 AR, 1910 94 AR, 1904
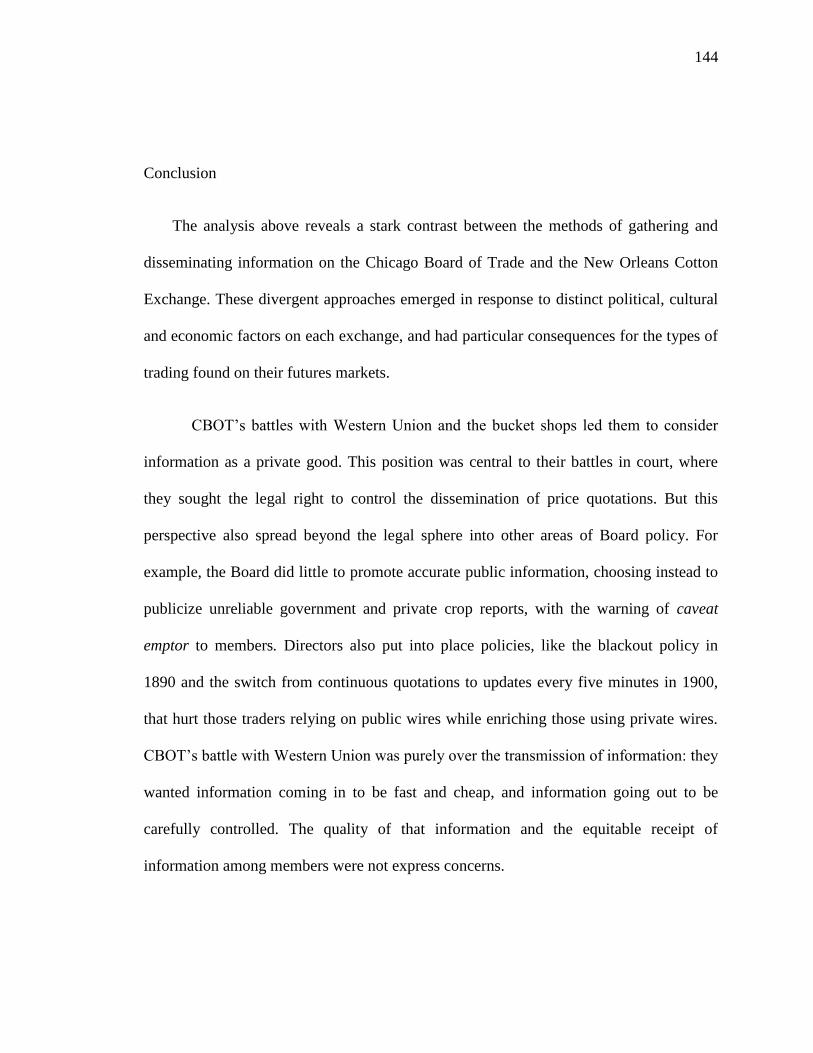
144
Conclusion
The analysis above reveals a stark contrast between the methods of gathering and
disseminating information on the Chicago Board of Trade and the New Orleans Cotton
Exchange. These divergent approaches emerged in response to distinct political, cultural
and economic factors on each exchange, and had particular consequences for the types of
trading found on their futures markets.
CBOT’s battles with Western Union and the bucket shops led them to consider
information as a private good. This position was central to their battles in court, where
they sought the legal right to control the dissemination of price quotations. But this
perspective also spread beyond the legal sphere into other areas of Board policy. For
example, the Board did little to promote accurate public information, choosing instead to
publicize unreliable government and private crop reports, with the warning of caveat
emptor to members. Directors also put into place policies, like the blackout policy in
1890 and the switch from continuous quotations to updates every five minutes in 1900,
that hurt those traders relying on public wires while enriching those using private wires.
CBOT’s battle with Western Union was purely over the transmission of information: they
wanted information coming in to be fast and cheap, and information going out to be
carefully controlled. The quality of that information and the equitable receipt of
information among members were not express concerns.

145
On NOCE, information was conceived of as a public good. From its founding,
NOCE sought to make available for its members vast quantities of information, with the
goal of making New Orleans the world’s authority on the cotton trade. This policy drew
upon the significance of cotton as an economic and cultural product, and the perceived
indignity of relying on northern and foreign financial centers for crop statistics. Henry
Hester’s skill as a statistician, and NOCE’s active cooperation with other exchanges,
mills, and railroads made NOCE an informational hub and center of calculation for the
cotton trade. While the public character of information was realized in the collection of
crop statistics, it was undercut by poor telegraphic service, where slow transmission times
to NOCE divided traders based on their access to private wires. NOCE, being the smaller
of the two main American cotton exchanges, lacked the power to force the telegraph
companies to make technical changes that would have ameliorated these problems.
These differences created divergent information environments on the two
markets. In terms of crop statistics, NOCE clearly had a more reliable system in place. It
devoted significant resources to gathering crop information and forming partnerships
with other cotton exchanges across the United States. CBOT, on the other hand, was not
involved in the collection of crop data, nor did it make efforts to harmonize with other
centers of the grain trade. The picture on price quotations was less clear cut, particularly
for CBOT. The Board was eventually able to exert control over its quotations, which
increased their value and their ability to authoritatively convey information about short-
term trends. It also was able to force Western Union into providing reliable, fast
telegraphic service. However, it achieved both of these ends using drastic measures

146
which at least temporarily exacerbated differences between traders with access to private
wires and those who relied on the public transmission. The situation on NOCE was more
straightforward. Telegraphic service was always poor, leading to a significant division
based on access to private wires. Also the Exchange’s price quotations remained less
important than New York’s for traders around the country.
These differences provided the conditions of possibility within which divergent
types of trades and strategies could arise. On CBOT, the lack of accurate, shared
information made long-term planning and statistical analysis difficult. Given this
difficulty and the volume of trading enabled by the reliable—if occasionally lessened or
eliminated—telegraphic service to CBOT, short-term trends were more visible and a
better source of information for traders. The information being gathered and disseminated
on CBOT thus encouraged speculation based on the minute-to-minute movement of
prices. On NOCE, the combination of widely disseminated, highly regarded statistical
information and slow, two-tiered telegraphic service pushed traders in the opposite
direction. Trading on momentary price misalignments was difficult, as the speed of the
telegraph meant that members were often running just behind other traders. Yet, the mass
of statistical data commonly disseminated to all members enabled and promoted clear-
eyed analyses of long-term market trends. Traders on NOCE would thus be more likely
to engage in long-term calculation than short-term speculation.

147
The differences in the methods of gathering and disseminating information explored
in this chapter created distinctions in the raw information with which traders worked on
these markets. But this raw information still needed to be situated within a framework for
understanding what effect futures trading had in the economy. Information would allow
traders to act, but would not give their actions value, purpose, or legitimacy. This
required a separate process of economic and cultural meaning-making on each exchange.
This is the topic to which we now turn.

148
Chapter 5 – Theorizing Futures
Both exchanges faced challenges regarding economic and cultural value of
speculation. To the public and many elected representatives, the vast speculative business
seemed to be little more than gambling, utterly disconnected from the production and
consumption of physical goods. Detractors pointed to the discrepancy between actual
commodities marketed and futures traded as evidence of this disconnect. For instance, in
1875, the Chicago Tribune estimated trades in grain futures to be ten times greater than
the cash business, a chasm that seemed inexplicable to many.1 Additionally, many found
the practice of short selling—where a speculator contracted to sell a commodity in the
future, hoping to profit from a decline in prices below the contracted level—to be
particularly objectionable. Many viewed “bears” with suspicion, believing them to be
engaged in machinations to keep prices artificially low. The downward pressure that
shorts exerted on the market was particularly odious because they almost never
exchanged actual physical goods as a result of their contract: sellers almost always
entered into contracts to sell commodities that they did not own and never intended to
own. To critics, this was just another way in which futures speculation transformed the
reality of staple crops into mere fictions in a speculative game (Fabian 1990).
CBOT and NOCE defended speculation in futures and short selling in terms that
were similar in several respects. Both broadly defined speculation as taking on a risk
stemming from the uncertainty of price movements. Such uncertainty could not be
1 “Grain: Statistics Concerning Chicago’s Chief Interest,” CT, April 17, 1875:7

149
eliminated from the market entirely, but it could be borne by different parties.
Speculators took on the burden of risk, in exchange for the opportunity to profit from that
risk.2 Speculation was a specialized way of efficiently managing natural market risk.
Both exchanges also argued that futures markets benefited producers and consumers in
spot markets. Speculation on futures markets created a constant demand for goods, a
high-volume, year-round market which enabled agriculturalists to sell commodities
independent of a “strictly consumptive demand.”3 This eliminated the disruptive seasonal
price cycles that had characterized agricultural marketing up to that point.4 Futures
markets also could be used to insure a spot market position, by hedging. This enabled the
marketing of grain with less expense and a smaller intervening margin of profit than
under previous marketing systems.5 Futures markets, and the system of speculation, were
defended by CBOT president Hiram Sager as a “natural and legitimate outgrowth of the
great system that has been perfected for the marketing of our crops.”6 These defenses of
futures markets and speculation, as well as their relation to agrarian movements and court
cases, have been covered in a great deal of scholarly work (Cowing 1965; Cronon 1991;
de Goede 2005; Fabian 1999; Ferris 1988; Goldstein 1928; Levy 2006).7
But beyond these similarities, there were several significant differences in how
the exchanges understood the economic function and cultural legitimacy of futures
trading. Futures were not simply understood to be valuable because they generated
2 OR, MAM, Box 14, Folder 15, 1918 3 OR, MAM, Box 6, Folder 10, 1893: np 4 Sager, Hiram. 1908. Prosperity and the Exchange: Why the Great Trade Marts of the Country are
Essential to the Conduct of its Legitimate Business. Harper & Brothers; NOCE, AR, 1898 5 OR, MAM, Box 14, Folder 15, 1918 6 Sager 1908: 12 7 All of this work, however, has taken CBOT as the paradigmatic 19th century futures market. As I argue
below, this single case method has led to a narrow understanding of the topic.

150
demand and evened out price fluctuations: both exchanges made other arguments
uniquely shaped by the local and state-level economic, political, and cultural
environment.
The argument of the chapter, in brief, is this: On CBOT, the legitimacy of futures
were constructed largely in opposition to the non-legitimacy of a closely related
derivative instrument, options (also known as “privileges” or “puts and calls”). This
served two purposes. First, it was politically valuable as a method for distinguishing the
Board from both bucket shops and the rival Chicago Open Board of Trade. Both
distinctions were critical to forestalling proposed state and federal anti-futures regulation.
Second, it served to establish the economic value of speculation among Board members.
Members argued that options created dull markets, while futures stimulated speculation
and market vitality. On NOCE, the legitimacy of futures derived from their ability to
impact the spot market and their capacity to increase Southern autonomy. The distinct
socio-economic environment in New Orleans at the adoption of futures trading, the
cultural significance of cotton, and federal efforts to impose cotton-specific regulations
all contributed to this particular understanding. These differences between major 19th
century markets illustrate that theorization of futures was a contingent, local process with
wide variability. It was only later, through the institutional alignment imposed by the
Supreme Court and federal government, that these differences began to disappear.
The Chicago Board of Trade: The problem of options
In Chapter 3, we saw that futures trading developed in tandem with the spot

151
market on CBOT. This chapter examines another key simultaneous development: the
growth of trading in options alongside of futures. Options, also known as privileges or
puts and calls, were similar to futures in that they were contracts for a future transaction,
at a particular price for a particular good. But there was a significant difference between
the two instruments. While futures contracts compelled the contracting parties to
exchange goods or warehouse receipts at a particular date, options gave one party—either
the buyer or seller—the ability to decide whether or not to make the transaction at the
contract’s call date. If that party stood to lose money by consummating the deal, they
would simply not exercise the option, calling off the transaction. For instance, a trader
who, at the end of the day, saw #2 wheat trading at $1.25/bushel might secure an option
to sell the very next day at $1.23/bushel; for this privilege he would pay to his
counterparty a small fee, traditionally $1 per 1,000 bushels (Lurie 1979). Having
purchased this privilege, the trader would then take one of two courses the next day: (1) if
prices dropped below $1.23/bushel, he would invoke his option, buy low in the spot
market and sell at the higher, prearranged rate, making money on the deal; (2) if prices
had not dropped below this mark, he would forego the option, make no sale, and lose out
only on the small fee he had paid. Thus, options were inexpensive ways of making
money on short-term price movements.
From the outset, the trade in options was generally condemned. The Board
prohibited them in their first set of official rules for futures trading in 1865, and the state
of Illinois made them illegal in 1874. Yet, despite this general disapproval and the
regulations it spawned, all of CBOT’s efforts, for close to fifty years, to eliminate these

152
trades from its pits failed. In 1888, a CBOT special committee investigated more than 80
Board members over the course of a month for engaging in puts and calls. But, following
the investigation, the committee revoked punishments and softened new rules in the face
of member anger, e.g., by rewording them so that a punishment “should” or “ought” to
follow discovery of option trading, rather than “shall” follow it (Lurie 1979). In 1892,
Directors again passed a resolution barring trading in options, but found the resolution
impossible to enforce and rescinded it a few months later. In 1895, William T. Baker was
elected President on a platform that prominently called for the prohibition of options
trading. But the resolutions he proposed to that end shortly after his election were
soundly beaten back. In 1900, the Board passed a rule calling for the expulsion of
members who traded in puts and calls, but it was not generally enforced, and was
repealed five years later. In 1911, the Board passed a resolution attempting to rein in
options trading among members on venues outside of the Board. But this final effort, like
those before it, had little impact. Two years later, the Illinois legislature gave up the fight
against options, passing a bill allowing puts and calls under certain restrictions. The
Board gave up soon thereafter, passing a resolution allowing puts and calls on the floor of
the exchange (Taylor 1917).
I ask two questions related to this history: first, why did options trading persist on the
Board despite their continual efforts at regulation; second, how did the continued salience
of options shape traders’ understandings of futures contracts? In answering these
questions I highlight several factors. Regarding the first question, the fact that there were
multiple local sites where options trading took place made it difficult to eliminate the

153
practice. As to the second question, the political environment established by proposed
anti-futures legislation, and the powerful position of speculators within the Board, meant
that options became a moral and economic scapegoat, allowing speculation in futures to
remain an unvarnished good.
Outlets for options
The Board of Trade was not the only place where Chicago speculators could go to
trade in options. Operating alongside CBOT were two other local venues that could fill
this need: the competing Open Board of Trade and the myriad bucket shops that
populated the city. Both allowed speculators to trade in options—or, in the case of bucket
shops, engage in a reasonable facsimile of trading options—any time the Board attempted
to crack down on the practice in its own pits.8 These alternative venues made it difficult
to stamp out options trading, and kept the practice of option trading a lively topic of
debate into the 1910s.
The Open Board of Trade was established in 1879 as a smaller exchange offering
a less expensive alternative to the “Big Board.” The Open Board had a lower membership
fee and permitted trading in far smaller lots. In 1882, for example, CBOT’s membership
fee was $10,000 and the minimum lot that could be traded was 5,000 bushels (Lurie
1979); the Open Board, by contrast had a fee of $1,000 and permitted trading in 1,000
bushel lots (Taylor 1917). Soon after its establishment, the Open Board developed into a
smaller, yet significant site of trade. By March, 1883, it had 180 members, and had raised
8 OR, MAM, Box 9, Folder 27, 1902

154
the membership limit to 400 to accommodate growing interest.9 Like the regular Board,
the Open Board featured both spot and future markets, and speculators on the Open
Board, like those on the regular Board, entered into binding legal contracts.
The relationship between the Open Board and the Big Board was, at the best of
times, one of uneasy cooperation. The exchanges did each get something from the other:
CBOT provided market quotations to the Open Board; the Open Board provided a site for
trading by call auctions, a form preferred by many members, yet not found on the regular
Board. This cooperation was often punctuated by periods of animosity and competition,
usually related to the state of options trading on each exchange. The Open Board did not
have the same qualms about allowing options trading on their exchange. In fact, they had
found that they could attract a sizeable business by offering a convenient outlet for
displaced traders whenever CBOT would take actions to quash options trading on its own
exchange. For instance, in 1887, when the Board of Trade passed a resolution prohibiting
trade in puts and calls, the Open Board continued to allow it, and that week saw its
transactions jump to incredible new heights (Taylor 1917).
CBOT directors recognized this problem and took steps to punish both members
who circumvented their rules and the Open Board as an organization. In 1883, the Board
passed a resolution prohibiting members from belonging to the Open Board.10 This
blanket prohibition was scaled back following member anger, but new members were still
forced to pledge that they would not to use the Open Board to trade in puts and calls.11
9 For comparison, CBOT had 1,936 members in 1883 (Annual Report, 1883). 10 BDR, Box 9, Folder 13, Apr. 2, 1883 11 BDR, Box 21, Folder 6, Apr. 8, 1889

155
Additionally, CBOT cut of the supply of price quotations to the Open Board on multiple
occasions—in 1883, 1887, 1904 and 1911—each time citing trade in puts and calls as the
offending reason.12 But the Open Board was not helpless in these fights with CBOT, and
was often able to negotiate a settlement that entailed keeping the right to trade in puts and
calls. Two weapons in their arsenal were extending trading hours and lowering
commission rates. Both practices had the effect of drawing traders away from the Big
Board and thus decreasing the value of their market’s information. The Open Board used
these tactics in both 1883 and 1904 to force the Board into restoring quotations.13 In 1887
they took a more direct route: when the Board cut off their official supply of quotations,
the Open Board simply gathered the same quotations from other markets (Taylor 1917).
Thus, the Open Board was able to maintain its autonomy and reject the attempts of
CBOT to enforce rules against trading options.
In addition to the Open Board, members could execute options trades in bucket
shops. These small gambling shops rose to prominence shortly after the Open Board. At
their peak, in 1895, there were 80 distinct bucket shops operating in the city.14 CBOT
tried to prevent members from using bucket shops, but this proved even more difficult
than keeping them off the Open Board. Unlike the Open Board, CBOT had no direct
relationship with bucket shops and thus, cutting off quotations was far more difficult., as
seen in the Chapter 4. As a result they had to rely on disciplining their membership. In
1883, the Board prohibited members from using bucket shops, a rule that had weak
member support and lax enforcement. Bucket shops were also spread around the city,
12 BDR, Box 9, Folder 13, Apr. 2, 1883; P, Box 2, Folder 3, Dec. 3, 1911 13 BDR, Box 9, Folder 13, Apr. 2, 1883 14 OR, MAM, Box 8, Folder 15, 1899

156
making it harder to surveil members’ use of them. Directors briefly hired private
investigators to stake out bucket shops across the city, but this was discontinued after
member outrage over the practice (Lurie 1979).
These alternative local venues undercut CBOT’s efforts at banning privileges.
Option trading thus continued, despite its prohibitions in Illinois state law and the Board’s
own rules. The continued presence of these disfavored trades became a central focus of
proposed federal regulations. This legislation only served to further the importance of
defining futures in relation to options. The following section demonstrates this relational
definition, and how its construction was influenced by features of the proposed laws.
The response to regulation
The Board’s inability to enforce the law and their own regulations prohibiting
options trading provided fodder for public criticism of the Board, and featured
prominently in proposed federal regulations of trading, including the Butterworth bill of
1890 and the Hatch bill of 1892, which struck at both futures and options trading with the
same penalties. As a result, distinguishing between the two types of derivatives became a
key point of CBOT’s defense of their methods as a whole. The Board hammered on the
distinction between options and futures, a distinction that was often minimized or
overlooked entirely in the bills. They drew distinctions between futures and options along
two lines. First, they defended speculation in futures as a way to handle naturally existing
risk in the marketing process, while painting options as unnecessary, parasitic, gambling
contracts. Second, they argued that futures contracts, at their termination, necessitated the

157
delivery of real goods, whereas options contracts did not. In these two critical ways,
CBOT’s economic and cultural valuation of futures was shaped by the political
imperative to distinguish the two types of derivative trading found on their exchange.
As we have seen, the Board argued that futures trading and speculation were vital
components of modern agricultural marketing. Options trading, on the other hand, was,
according to President Charles D. Hamill in 1892, “a pure bet that the market will be
either higher or lower the next day.”15 CBOT leaders pointed to several features of
options when making this claim. Options usually covered only very short periods of
time—generally one day—and they could be entered into for very little money (Lurie
1979). Such short-term contracts, they argued, could not possibly offer any of the
legitimate hedging or risk allocation purposes of futures. The small amount of money
required to trade options was also significant. In futures trading, there was no limit as to
how much money one could gain or lose in the market, while in options losses were
limited to the small amount already paid as a fee. CBOT leaders, such as the anti-bucket
shop crusader John H. Hill, maintained that this limitation on losses “[tended] to cause
speculation to degenerate into gambling.”16 The relative ease and low cost of trading
options meant they could be traded without the same careful consideration as futures and
by non-expert people of small means.
Additionally, CBOT claimed that options lacked legitimacy because of their
characteristic feature: the transaction specified in the contract was optional. Futures
15 Quoted in Grain Exchanges Hearing Before the Committee on Rules, House of Representatives, 63rd
Congress, Mar. 3-7, 1914: 84 16 Hill, John H., Jr. 1921. The Octopus and Lesser Evils. p. 15, emphasis added

158
contracts bound the holder to a transaction, in one form or another, at the contract’s call
date. This made it, at its core, similar to any contract used in the spot market. Options
contracts, on the other hand, could be exited by one party with no exchange being made.
This seemed to pervert the very notion of contract, and placed options at a greater
distance from the actual physical exchange of wheat. For this reason, Board member and
commission merchant, Samuel H. Greeley, could claim that, as opposed to futures, which
played a vital part in the marketing of agricultural commodities, “a put or call never in
the history of the trade marketed a bushel of grain.”17 John H. Hill made this same
accusation more colorfully, saying: “‘Puts’ and ‘calls’ have no more relation to commerce
than a deck of cards or a box of dice. Horse-race gambling at least inspires the breeding
of fine horses; ‘puts and calls’ breed embezzlers and financial wrecks.”18
CBOT also drew on the distinction between futures and options when establishing
themselves as the sole group with the economic knowledge to competently regulate trade
in futures. Legislators and agrarian activists often conflated the two terms, referring to
their stance against non-spot trading broadly as “anti-option” (Lurie 1979). Board
members used this confusion to paint their critics as ignorant of the true marketing
processes at work. While this may not have been entirely untrue, it failed to acknowledge
that confusion over the terms ‘futures’ and ‘options’ was also found among Board
members. In the 1883 investigation of the Board of Trade by a special committee of the
Illinois House of Representatives, witnesses in the same line of work, trading on the same
Board, offered contradictory definitions of options, one defining them in relation to
17 Grain Exchanges Hearing Before the Committee on Rules, House of Representatives, 63rd Congress,
Mar. 3-7, 1914: 86 18 Ibid.

159
privileges, the other to futures.19 This confusion still existed up to the first efforts at
federal regulation. In 1891, right in between the debates over the 1890 Butterworth and
1892 Hatch bills, prominent Board member W.S. Crosby published a popular pamphlet
which referred to futures as “options” throughout.20 At the root of this confusion were
two different understandings of the term. When futures were referred to as options, the
“option” referred to was the choice given to sellers, of determining on what date during
the month they wanted to make delivery or settle by differences. The “option” referred to
in privileges, or puts and calls, was the choice whether to execute the transaction at all.
The use of the term “option” to describe both instruments caused not a small amount of
trouble, spawning two cases in the Illinois Supreme Court in 1875 and 1877, and a third
in the Illinois Court of Appeals in 1879 (Lurie 1979).
19 “Report of the Special House Committee to Investigate Concerning the Mode of Conducting Certain
Stock Speculations on the Chicago Boards of Trade, Together with the Testimony Taken Before the
Committee.” May 11, 1883.
Excerpts from these testimonies are given below. They are dialogues between legislators and two
different commission merchants who had been called before the committee. The first merchant draws a
clear distinction between futures and options, and claims that options are synonymous with privileges:
Q: One of the purposes of this investigation is to see whether a means can be devised without prejudicing
or injuring the legitimate deals in real property by circumscribing what is commonly called this option
business. You call it futures, on the Board of Trade. It used to be called options.
A: There is quite a difference between options and futures.
Q: […] What is the difference between an option and a future?
A: An option is merely a privilege of buying and selling. If I sell for future delivery I have made a
contract—I buy for the future.
The second commission merchant offers a different definition, using the term “option” to refer to a
futures contract, which he distinguishes from a privilege, or puts and calls.
Q: What is understood by the term option dealing, or option contract?
A: Well, the option just gives the man that sells the option of the day. For instance, you sell for the month
of July; you can have any day you see fit in the month to deliver it.
Q: Is that what is ordinarily meant by the term option?
A: Yes, sir.
Q: Isn’t there another meaning to it?
A: I don’t know how there can be.
Q: That is, the option to sell or buy on a privileged contract?
A: Those are puts and calls; those are privileges.
Thus, even at the same point in time, in the same city, among men in the same line of business, the
meaning of an “option” was unsettled. 20 Crosby, W.S. 1891. The Chicago Board of Trade and Its Policy, Knight, Leonard & Co: Chicago.

160
Having made these arguments to the state, drawing the distinction between
legitimate futures speculation and illegitimate puts and calls, CBOT recognized ever
more urgently the need to suppress options trading on its floor. The state had been kept at
bay with a particular line of argument and CBOT was now committed to keep to that
tack. John H. Hill complained that:
With a degenerate board of trade, such as would result from this
legislation [to legalize the trade in privileges], Congress would have very
little patience. That plank of the Democratic platform upon which
President Wilson was elected which denounced gambling in food products
would be easily justified into an act that would destroy the great grain
market in Chicago.21
President Edward Andrew also made a point of exhorting the membership to good
behavior with regard to puts and calls, given that the eyes of the nation were watching. In
his Presidential address of 1913, Andrew called upon members to “avoid in any way
giving offense to public opinion” by engaging in the controversial practice.22 Three years
later, President Joseph Griffin reported that efforts to cut down on illegal privilege
trading were having a positive effect on federal legislative bodies, noting that, “The
Chairman of the Agricultural Committee assures me that the apparently earnest efforts of
the Exchanges to eliminate abuses and maintain a high degree of business integrity and
efficiency meets with his cordial approval.”23 Practically speaking, the distinction
between futures and options thus became a tool for forestalling federal regulation.
Options became the scapegoat derivative—linked to gambling and decried as unrelated to
the underlying trade—enabling futures to be framed as entirely legitimate.
21 Grain Exchanges Hearing Before the Committee on Rules, House of Representatives, 63rd Congress,
Mar. 3-7, 1914: 85 22 OR, MAM, Box 13, Folder 25, 1913: 12 23 OR, MAM, Box 14, Folder 10, 1916: 2

161
Options and speculation
In addition to these moral distinctions based on the relation to the underlying spot
trade, CBOT directors also highlighted the significant economic differences between
futures and options. As we have seen, directors were unified in their defense of
speculation as economically beneficial; many would be inclined to agree with Board
President William S. Warren’s effusive claim that speculation was “the very life-blood of
the grain market.”24 This defense of speculation provided the framework for the
economic devaluation of options.
Traders objected to options because they “cooper[ed] prices within a narrow limit
day after day.”25 They argued that options dampened fluctuations in markets to the point
that opportunities for speculation in futures were significantly diminished.26 This sapped
the market of the energy needed to continue along at a high volume. Without using the
term, the traders were arguing for the benefits of volatility. In fact, even those who
supported options trading did so not by arguing that less volatility was good for the
market, but by disputing options’ purported dampening effect. In a 1905 resolution
seeking to have privileges legalized in the state of Illinois, members noted the symbiotic
relation of speculation and option trading, writing that options trading had become, “so
necessary to the speculative trading in Grain that it has become almost co-extensive with
it.”27 Thus, on both sides of the debate, the economic value of options was judged in
24 OR, MAM, Box 9, Folder 4, 1900: np 25 OR, MAM, Box 7, Folder 9, 1895: np 26 OR, MAM, Box 9, Folder 4, 1900 27 OR, MAM, Box 10, Folder 25, 1905: np

162
relation to their relation to market volatility and the opportunities for speculation. The
unquestioned value of speculation was central to these exercises in economic theory, as it
was to debates over the value of futures.
The above shows us that the Chicago Board of Trade understood futures primarily
in contrast to another financial instrument, the options contract. The co-evolution of
futures and options during the Civil War, combined with the multiple local settings for
engaging in trades, allowed options to be traded at a high level despite Board regulations
and Illinois law. The importance of distinguishing futures and options for the purposes of
combating federal legislation and producing economic theory kept this contrast salient.
By smearing options trading as economically unproductive and immoral gambling,
CBOT leaders could offer its prohibition as a concession to those pushing legislation,
while still holding onto the more widely utilized futures trade.
New Orleans: Adopting futures
As opposed to Chicago, the New Orleans futures market was established within
the context of a long-running, major spot market. Prior to the War, New Orleans was the
largest cotton port in the United States, with a well-entrenched system for financing the
cotton crop known as factorage. In this system individuals called factors would finance
the production of a farmer’s entire crop, as well as advance him money for supplies
throughout the year. In exchange, he would have exclusive rights to merchandise the
entirety of that crop, as well as a claim to future harvests if, as often happened, the farmer
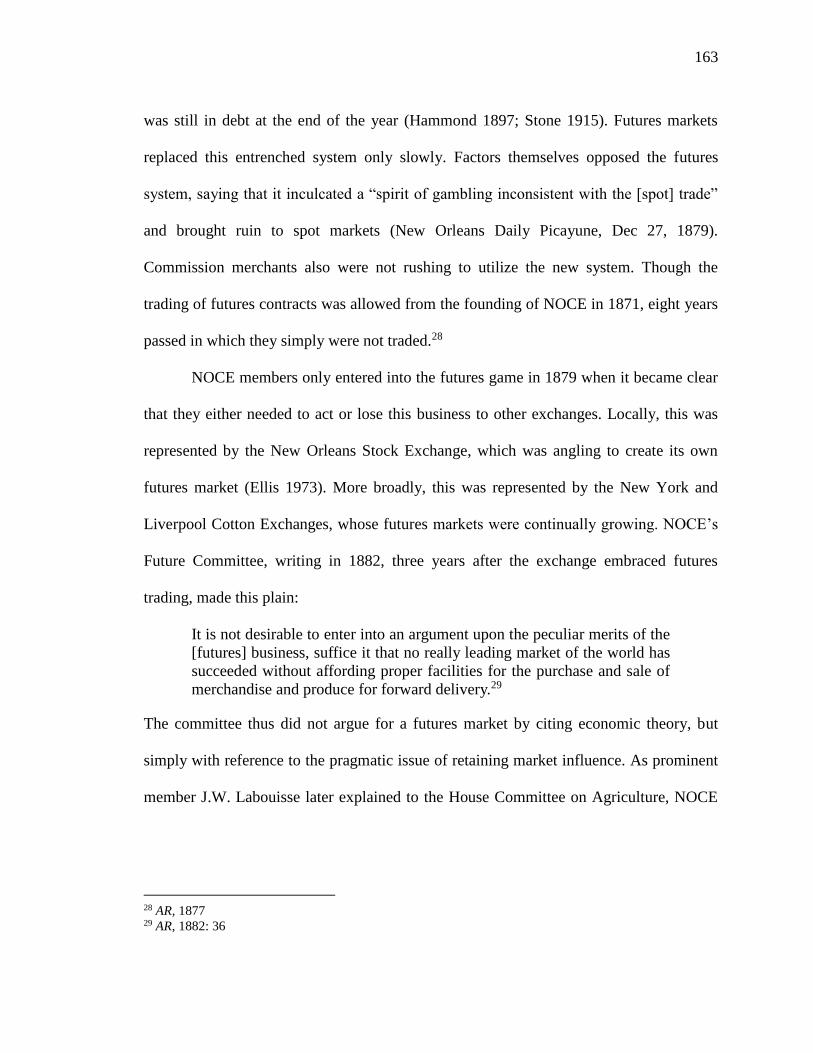
163
was still in debt at the end of the year (Hammond 1897; Stone 1915). Futures markets
replaced this entrenched system only slowly. Factors themselves opposed the futures
system, saying that it inculcated a “spirit of gambling inconsistent with the [spot] trade”
and brought ruin to spot markets (New Orleans Daily Picayune, Dec 27, 1879).
Commission merchants also were not rushing to utilize the new system. Though the
trading of futures contracts was allowed from the founding of NOCE in 1871, eight years
passed in which they simply were not traded.28
NOCE members only entered into the futures game in 1879 when it became clear
that they either needed to act or lose this business to other exchanges. Locally, this was
represented by the New Orleans Stock Exchange, which was angling to create its own
futures market (Ellis 1973). More broadly, this was represented by the New York and
Liverpool Cotton Exchanges, whose futures markets were continually growing. NOCE’s
Future Committee, writing in 1882, three years after the exchange embraced futures
trading, made this plain:
It is not desirable to enter into an argument upon the peculiar merits of the
[futures] business, suffice it that no really leading market of the world has
succeeded without affording proper facilities for the purchase and sale of
merchandise and produce for forward delivery.29
The committee thus did not argue for a futures market by citing economic theory, but
simply with reference to the pragmatic issue of retaining market influence. As prominent
member J.W. Labouisse later explained to the House Committee on Agriculture, NOCE
28 AR, 1877 29 AR, 1882: 36

164
had adopted futures trading when it did simply because “it found it necessary to fall into
line with everybody else.”30
The nature of speculation
Given the pre-eminence of the spot market on NOCE, it is unsurprising that the value
of futures trading was tied to its ability to promote the spot trade. Reflecting on the first
two full years of futures trading, the Board noted approvingly that receipts of actual
cotton had increased since the introduction of futures trading.31 Cotton continued to be
the acknowledged mainstay of the market and futures merely “an adjunct to the spot
trade.”32 The futures trade was conceptualized primarily as a form of insurance which
allowed NOCE greater control over the spot business.33 This orientation toward the spot
market continued long after the futures market had grown large and influential. Nearly
thirty years after futures trading began in earnest, President William B. Thompson could
still claim that, “The spot business is the most valuable division of the cotton trade to the
city of New Orleans, and the spot market is the basis of the existence of the Cotton
Exchange and the foundation upon which the Future contract business stands.”34
Traders claimed that this relation to the spot market made their futures market
particularly sound and legitimate, and claimed that the speculative abuses found on other
exchanges stemmed from the lack of a robust spot market. Looking back on the first three
years of futures trading on the Exchange, Henry Leopold, Chairman of the Future
30 “Fictitious Dealing in Agricultural Products,” Committee on Agriculture, 1892: 94 31 AR, 1881 32 AR, 1888:15 33 AR, 1888 34 AR, 1908: 10

165
Committee explained that the large spot market was, “ a guarantee of the soundness and
stability of the [futures] business.”35 To President Abraham Brittin, in 1903, the spot
trade made the futures market, “by nature beyond the attempts of speculators to sway it
without respect to supply and demand36; to President William B. Thompson, six years
later, it ensured “the security of the trader and the accuracy of the quotations.”37 One year
later, Thompson discussed at length the importance of the connection between markets:
Furthermore, I am of the opinion that a responsive future contract cannot
be maintained in independence of an actual spot market, or in isolation
therefrom; that the effort to maintain the same away from and independent
of a spot market, necessitates arbitrary and artificial methods of fixing the
relative value of the several contract grades; that such arbitrary and
artificial devices cannot result in other than fictitious values and discounts;
and finally, that the power to control such valuation, in the hands of a few
men, and subject to manipulation by these, as their interest may dictate,
makes such a market, so controlled, the breeding grounds of the evils of
which complaint is made. Or to phrase the conclusion differently, the
existence and activity of such an artificial future market as I have outlined,
logically accounts for the abuses which have attracted general attention
and condemnation.38
The abuses found in other futures markets stem from their distance from the spot market,
which necessitates “artificial” and “arbitrary” connections. NOCE, being a “natural
cotton market” and at no such distance from the market in spot cotton, was naturally free
from the attendant evils.39
Additionally, there was a strong belief that the interests of Southern markets like
35 AR, 1882: 35 36 AR, 1903: 8; 37 Thompson, William B. 1909. The New Future Rules of the New Orleans Cotton Exchange, Press of J.G.
Hauser: New Orleans, p. 6. 38 Thompson, William B. 1910. Letter to Georgia Industrial Association, p.3-4. 39 AR, 1901; AR, 1902

166
NOCE were “naturally in sympathy with Southern producers.”40 This alliance with the
producer translated into a natural tendency to push for higher prices. NOCE’s futures
market was thus seen as a necessary counter-balance to those in New York and Liverpool,
both of which were “affiliated with the spinning interests” and “almost always do believe
that prices will be lower, and to that end direct their efforts.”41 NOCE’s futures market
was thus predicated not only on economic interest, but also the duty to resist surrendering
control of the market for the South’s staple crop. Were New Orleans to abdicate its
market position, New York and Liverpool would be empowered “to dictate to the South
and to the entire world.”42
Such arguments offered a distinct perspective on the relation between price-setting
on futures and futures markets. Rather than framing price as an function of worldwide
supply and demand—as was standard practice on CBOT—NOCE highlighted the power
of regionally-massed buyers or sellers. In a pamphlet opposing the 1908 Scott Anti-future
Act, the Exchange made the following argument:
Because Liverpool is the great market patronized by consumers, the
predominant influence there is bearish, more men being interested in a
declining market than in an advancing market. Because New Orleans is
the great market patronized by producers, cotton bankers and merchants
and by exporters, who purchase future deliveries and hedges as a
protection against loss on the cotton of specific grade they contract to
deliver to spinner during months to come, the predominant influence here
is naturally bullish, more men being interested in an advancing market
40 AR, 1908: 12 41 Thompson, William B. 1908. Address Before the Joint Committee on Agriculture of the Senate and
House of Representatives: Contracts for Future Delivery, and Effects of Adverse Legislation, L. Graham
Company, New Orleans, p.19 42 The New Orleans Cotton Exchange: Its Functions and Method of Transacting Business in Contracts for
the Future Delivery of Cotton. c. 1908. L. Graham Co., New Orleans, p.6

167
than in a declining market.43
This argument, that price was linked to traders’ “interests,” is at odds with the notion that
prices are set by the balance of supply and demand. In fact, according to the theory of
supply and demand the argument is backwards: the greater number of buyers in Liverpool
would tend to increase prices, while the number of sellers in New Orleans would lower
them. Thompson’s position amounts to arguing that groups of bulls and bears colluded, at
least tacitly, to push prices in a direction favorable to their market position.
Arguments about traders’ interests in cotton were also expressed in terms that
evoked the desire for Southern autonomy, and which must have resonated with men who
had been youths during the Civil War and matured during Reconstruction. This is found
in the rhetoric used to convince members on a number of topics. President William B.
Thompson made such appeals while campaigning in support of the construction of public
warehouses meant to lower costs and attract more cotton to New Orleans. He claimed the
warehouse would “liberate the cotton trade and the commercial South from the financial
domination of alien interests” and allow the South to achieve “financial and industrial
enfranchisement.”44 He reminded listeners that, “We cannot be great so long as we are
supplicants, and we shall be supplicants no longer, when we shall have placed ourselves
in a position to hold that which is ours and to reap what we have sown.”45 On other
issues, the rhetoric was just as hot, if not more so. At the 1905 conference of the Southern
43 The New Orleans Cotton Exchange: Its Functions and Method of Transacting Business in Contracts for
the Future Delivery of Cotton. c. 1908. L. Graham Co., New Orleans, p.24 44 Thompson, William B. 1908. Address of W.B. Thompson, President New Orleans Cotton Exchange. The
Central Warehouse Plan, p. 8-9. 45 Ibid.

168
Cotton Growers Association, which met in New Orleans and hosted several powerful
Exchange members, Tom Watson of Georgia directly drew the link between the freedom
won through control of capital and the freedom won at the barrel of a gun. Speaking on
the seemingly innocuous topic of acreage reductions, he rallied the various state
delegations by likening the task at hand to the military battles that their forefathers had
fought in the past—North Carolinians were reminded of “the last charge of Appomattox,”
Texans of the Alamo, South Carolinians of Fort Moultrie, and so on (Saloutos 1960). The
battle for control of the cotton crop, Watson argued to great cheers, would require similar
bravery and resolve.
NOCE thus offered both unorthodox economic arguments and distinct cultural
arguments in an effort to legitimate futures speculation. Futures markets were
conceptualized as valuable tools by which to ensure the vitality of the spot market and the
autonomy of Southern producers and traders. Futures contracts were figurative weapons
with which to fight for the full prices and full control that had been denied to Southern
traders in the past.
Bucket shops, regulation, and delivery on contracts
We have seen above that a key feature of CBOT’s defense of futures was the fact
that all futures contracts, as opposed to options, legally bound their parties to an actual
delivery of goods or receipts. This legal obligation was critical to their defense of the
non-delivery that occurred in the vast majority of cases: practices such as offsetting
settlement or ring settlements were conceptualized as simplified methods that were

169
equivalent to what would otherwise occur via a long string of deliveries. In this way, non-
delivery was reframed as delivery by other means. This perspective was forged in
response to the challenges from bucket shops, which threatened the Board’s economic
success and cultural legitimacy, and proposed federal legislation that conflated futures
and options. For CBOT, stressing delivery was a useful way of dealing with both issues
at one time.
The political context in which NOCE defended speculation was different. It did
not face nearly the same problem with bucket shops as did CBOT. While bucket
shopping was enough of a concern for the Exchange to form a special committee
dedicated to the problem in 1901, the committee often had little to report.46 Their 1903
report noted that only one member had been investigated for suspected bucket shopping,
and no positive proof of illegal practices was found. Compared with the same year in
Chicago, where CBOT initiated nine separate lawsuits aimed at keeping quotations from
bucket shops, and obtained injunctions against 70 bucket shops in Chicago, Milwaukee
and Kansas City, the relative lack of urgency is clear.47
NOCE was also responding to two pieces of cotton-specific legislation that
presented different challenges than the earlier Hatch and Washburn bills that CBOT had
fought off. The first of these was the 1910 bill introduced by Representative Charles
Scott of Kansas. The Scott Bill proposed to tax out of existence any speculative dealing
in futures contracts that did not culminate in delivery. The bill would require that parties
to a trade sign an affidavit stating that they intended to actually deliver or receive cotton
46 AR, 1901 47 OR, MAM, Box 10, Folder 1, 1903; NOCE, AR, 1903

170
on the contracts entered into, and failure to do so would be prima facie evidence of
gambling. The second threat was a 1913 amendment to a tariff bill, introduced by Senator
Clarke of Arkansas, which imposed a 1/10 of one cent tax upon sales of cotton for future
delivery, refunding the tax when cotton was actually delivered by the seller to the buyer.
Critically, neither conflated futures and options as had earlier legislative attempts to
eliminate speculation.
In the face of these legislative threats, and not under pressure to make any clear-
cut distinction between the Exchange and bucket shops, leaders made a more
sophisticated argument about the nature of delivery. As opposed to CBOT, which focused
on the delivery that came at the end of every speculative futures contract, NOCE
highlighted the delivery that occurred in the spot market as one half of a hedge.48 Traders
who sell futures contracts as a hedge do, in fact, deliver cotton—but it is spot cotton, not
the cotton specified in a futures contract. Hedging worked by allowing parallel trades in
spot and futures markets—having those markets intersect through forced delivery would
ruin the system, by requiring traders to acquire and deliver extra cotton.
NOCE president William B. Thompson argued, in opposition to the 1913 Clarke
amendment, that hedgers quite legitimately entered into futures markets with no intention
to deliver or receive the commodities specified on their contract. Further, Thompson
argued that, oftentimes, the nature of delivery was the exact opposite of what Congress
48 Recall that hedging involved simultaneous operations in the spot market and the futures market: hedgers
would buy or sell actual cotton in the spot market, while insuring their spot cotton against adverse price
movements in the futures market.
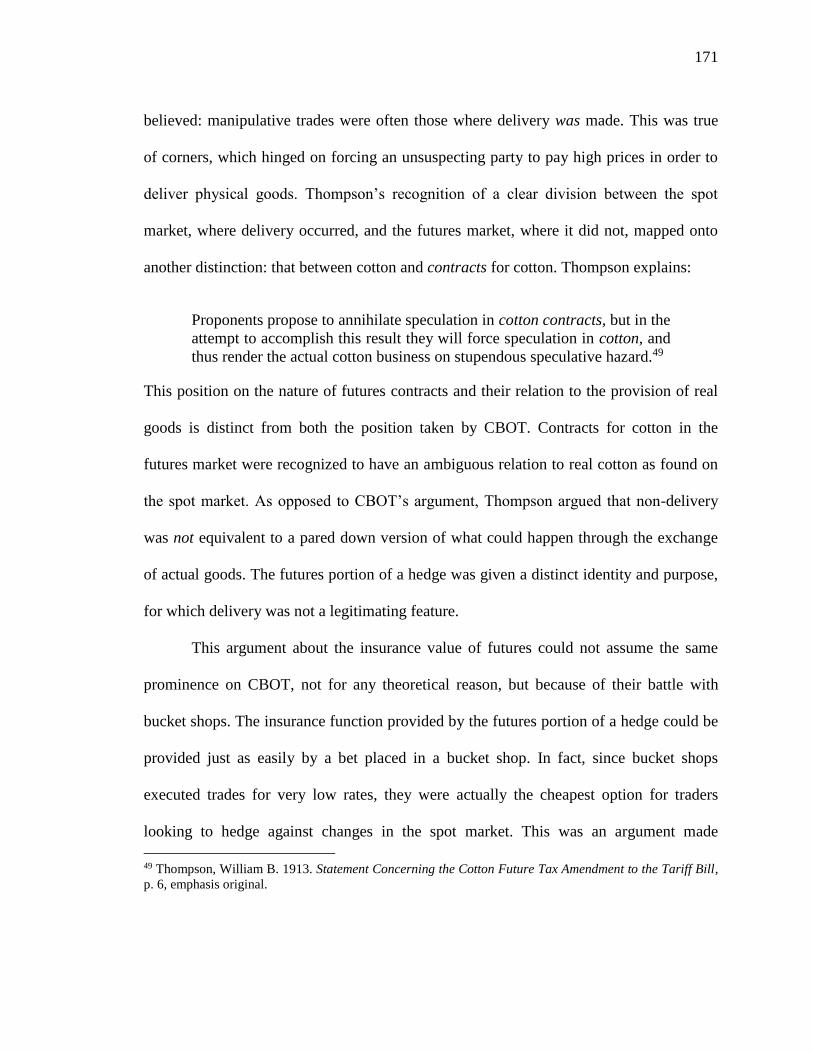
171
believed: manipulative trades were often those where delivery was made. This was true
of corners, which hinged on forcing an unsuspecting party to pay high prices in order to
deliver physical goods. Thompson’s recognition of a clear division between the spot
market, where delivery occurred, and the futures market, where it did not, mapped onto
another distinction: that between cotton and contracts for cotton. Thompson explains:
Proponents propose to annihilate speculation in cotton contracts, but in the
attempt to accomplish this result they will force speculation in cotton, and
thus render the actual cotton business on stupendous speculative hazard.49
This position on the nature of futures contracts and their relation to the provision of real
goods is distinct from both the position taken by CBOT. Contracts for cotton in the
futures market were recognized to have an ambiguous relation to real cotton as found on
the spot market. As opposed to CBOT’s argument, Thompson argued that non-delivery
was not equivalent to a pared down version of what could happen through the exchange
of actual goods. The futures portion of a hedge was given a distinct identity and purpose,
for which delivery was not a legitimating feature.
This argument about the insurance value of futures could not assume the same
prominence on CBOT, not for any theoretical reason, but because of their battle with
bucket shops. The insurance function provided by the futures portion of a hedge could be
provided just as easily by a bet placed in a bucket shop. In fact, since bucket shops
executed trades for very low rates, they were actually the cheapest option for traders
looking to hedge against changes in the spot market. This was an argument made
49 Thompson, William B. 1913. Statement Concerning the Cotton Future Tax Amendment to the Tariff Bill,
p. 6, emphasis original.

172
forcefully by bucket shop owners and supporters, who saw the Board’s opposition as
based less in moral scruples and more in the desire to maintain a monopoly over certain
types of trades (Cronon 1991). The relative lack of bucket shops in New Orleans
compared to Chicago opened up a distinct line of argument by which to establish the
economic value of futures speculation.
NOCE thus presents an interesting comparison to CBOT. The futures market
emerged slowly and was conceived of as ancillary to the extant spot market. The
presence of a vibrant spot trade was additionally thought of as a safeguard against the
excesses of the financial market, protecting NOCE traders from the manipulation found
in other financial centers. Maintaining control of the cotton crop was also a framed as a
duty to the people of the South, a way to retain autonomy from foreign interests. This
position toward the spot market, combined with proposed legislation aimed only at cotton
markets, led NOCE to articulate a unique perspective on futures trading and the
legitimacy of delivery. These features led futures contracts to be understood differently
on NOCE than on CBOT. Their economic value lay in their ability to boost cotton prices
for consumers, while their cultural legitimacy came from the autonomy and control they
brought to the South.
Conclusion
In this chapter, we have seen that CBOT and NOCE understood futures contracts
and markets in different ways. On CBOT, futures contracts were understood as positive

173
economic and moral devices. Futures enabled speculation but involved large enough
sums of money and long enough periods of time to distance themselves from mere
gambling. They were enforceable contracts, which legally bound a party to close a deal,
through the delivery or receipt of warehouse receipts or physical goods. Non-delivery of
goods was conceptualized as, in fact, a simplified process equivalent to a long string of
deliveries and re-deliveries. Both of these features were constructed in contrast to
options, which was scapegoated for both the moral and economic failings of the market.
This perspective was shaped by the CBOT’s needs to fight off competition from the Open
Board of Trade and bucket shops, while simultaneously forestalling legislation that
lumped together all kinds of speculative trades in derivatives. On NOCE, futures
contracts had value for a different set of reasons. Futures bolstered the spot market, lifting
prices and providing insurance by means of hedging. They also promoted Southern
interests and autonomy from foreign control. The status of delivery, and particularly non-
delivery, on contracts was more ambiguous than that presented on CBOT. Non-delivery
on contracts was not equated to a string of deliveries, but rather was conceptualized as a
distinct part of a hedge, one that was entirely legitimate even though, or precisely
because, delivery was never intended. NOCE’s position was made possible by the distinct
cultural value of cotton as a Southern emblem, their lack of local competitors, and the
details of the particular, cotton-specific legislation proposed in Congress.
By drawing out these distinctions, the chapter demonstrates the local economic,
cultural, and political factors contributing to the processes of theorizing and legitimating
speculation in futures. Creating ideas about the economic worth of speculation and the

174
cultural legitimacy of speculation were not two separate processes, but two components
of a single process. On CBOT, the needs to distinguish the Board from bucket shops and
also to fight off indiscriminate legislation both influenced the form taken by the
economic claims of speculation’s value. Similarly, on NOCE, the justifications of
speculation as a hedge that could raise spot market prices and also increase Southern
autonomy were formed in response to local desires and the particulars of cotton-specific
legislation. The economic and cultural content of justifications for controversial new
products reflects local political struggles (Espeland 1998). It is through the political
legitimation work that had to occur, and the context in which it occurred, that futures
contracts came to take on particular cultural and economic characteristics (Callon,
Meadel & Rabeharisoa 2005).
A correlate of this argument is that previous studies that focused solely on CBOT
may have offered too narrow a perspective on the development of futures markets in the
United States. Within economic sociology, CBOT has become the paradigmatic case for
discussing the development of futures markets or the construction of standardized
grading systems. This is not without reason. Chicago was the first and largest market for
agricultural futures, and has continued to grow even until this day. CBOT was also
involved in significant court cases that defined the legal environment in which futures
markets flourished. But my findings from New Orleans suggest that the lack of
comparative case studies may have promoted over-generalizations on the topic of
attitudes toward and legitimation of speculation in futures.

175
For instance, scholars have highlighted the issue of delivery as central to the
legitimation of futures trading (Levy 2006). It is indeed true that the “contemplation of
delivery” was central to Justice Holmes’ 1905 Supreme Court decision affirming the
legality of CBOT traders’ practice of settling futures trades by difference. This decision
regarding delivery subsequently became an important touchstone for exchanges whose
methods were called into question. But the case of NOCE shows that delivery, in and of
itself, was not a universal concern, nor a universal good. The President of NOCE made
multiple public addresses, even after Holmes’ ruling, denying the importance of an intent
to deliver on futures contracts, highlighting instead the ability for futures contracts to
offer insurance on spot trades. To focus on delivery and its significance in the Supreme
Court’s logic is to ignore other ways of legitimating speculation in futures that co-existed
with those coming from Chicago.
As a second example, the distinction between speculation and gambling was
central to CBOT’s legitimation efforts. But this matter was far less prominent on NOCE,
opening the possibility that the salience of this issue might have varied across exchanges.
The findings of this chapter suggest that this lack of salience was largely economic and
political. The distinction between speculation and gambling was simply less useful in
proving the value of the futures trade in New Orleans. CBOT’s statements about
speculation in relation to gambling were not simply responses to public criticism, but also
strategic claims that usefully mapped onto the distinctions CBOT sought to draw between
futures and options trading on one hand, and the Board and bucket shops on the other.
NOCE had no incentive to draw on this same distinction. It is also possible that this

176
moral distinction may not have had the same power in New Orleans as it did in Chicago.
After all, Louisiana had a popular state lottery from 1868-1893, which suggests that
Louisianans may have held more liberal ideas about gambling than other people around
the country. While my two-case design cannot speak to this possibility authoritatively, it
does show that attitudes towards gambling across the country were not homogenous. The
distinction between speculation and gambling was critical to CBOT’s efforts to attain
legitimacy, but cannot unproblematically be applied to all 19th century American futures
markets.
This chapter thus uncovers the variety of ways in which futures trading was deemed
useful and legitimate. It shows that, in contrast to scholarship which has focused
exclusively on the case of Chicago, futures were conceptualized in a number of ways, and
that no one set of features was central to their legitimacy. The orthodox conception of
what futures are and what they are good for could well have been quite different had a
legal challenge from another exchange made it to the Supreme Court first, or if CBOT
had been able to reach consensus with their competitors. The particular understanding of
speculation as “the self-adjustment of society to the probable” and the “contemplation of
delivery” need not have been the centerpieces around which futures trading was
legitimated. Alternative formulations existed and gave rise to unique market
environments throughout the formative decades of futures markets.

177
Conclusion- Infrastructure and Outcome
This dissertation has studied the information infrastructures that linked extant
spot markets in agricultural commodities to newly-developed futures markets, and
enabled their co-functioning. Chapter 1 served as an introduction to the cases and a
methodological justification for their selection. Chapter 2 outlined the meaning of
infrastructure as a feature of, and approach to studying, markets. Chapters 3-5 offered
empirical analyses of three features of these infrastructures: (1) the classification schemes
by which spot commodities were assigned grades; (2) the material means of gathering
and disseminating data, both statistics on the growth and movement of the spot crop, as
well as price quotations from global markets; (3) the economic and cultural theories by
which traders understood the nature of speculation in futures and its effect on spot
markets. These infrastructural connections made futures markets viable by enabling
futures traders to make intentionally rational buying and selling decisions based on a real
or perceived relation with the underlying spot market.
The dissertation asked two questions about these infrastructures: What factors
caused each feature to take the shape it did? And, what consequences did these
infrastructures have for market behavior? I begin this chapter by reviewing the answers to
these questions given over the course of this dissertation. Following this, I discuss the
larger lessons of the dissertation and directions for future research.

178
What factors caused each infrastructural feature to take the shape it did?
Chapter 3 demonstrated that, on CBOT, powerful grain elevator owners shaped
the grading system to their own ends. Despite supervision from CBOT inspectors,
warehouse owners gamed the system by diluting wheat and forging elevator receipts.
These actions produced uncertainty over both the quality and quantity of wheat in the
city. State-run grading had its own problems. The politicized Railroad & Warehouse
Commission did not require that appointees have any prior knowledge of the grain trade,
and officials remained unresponsive to traders’ day-to-day needs. Finally, CBOT itself
influenced the classification system by refusing to negotiate grading standards with other
exchanges, a stance enabled by their dominant market position. The grading system that
emerged from this context often failed to index wheat’s physical qualities and had an
uncertain relation to other markets’ systems.
NOCE’s system, by contrast, was developed for the spot trade, and was in use
long before futures markets emerged. Spot market traders and merchants thus exerted a
great deal of influence on the workings of the system. They ensured that grading on
NOCE remained an antagonistic negotiation between buyer and seller, rather than a
centralized process. NOCE also built a significant supervisory apparatus in response to
spot traders’ concerns about the maintenance of grades as cotton moved through the city.
Finally, NOCE directors worked to align standards with other exchanges and promote
harmony within the spot trade. These features led to a grading system that accurately
indexed the physical qualities of cotton and promoted uniformity in trading across
markets.

179
Chapter 4 showed that CBOT’s methods for gathering and disseminating
information were shaped by the larger conflicts they had with Western Union and bucket
shops. CBOT exerted pressure on Western Union to tighten control over the
dissemination of price data and keep price quotations away from illegitimate recipients.
They leveraged the value of their quotations as the world’s leading commodity market,
and made credible threats to create their own telegraph companies that would circumvent
Western Union. In this fight to control their quotations, CBOT argued that market
information was a private good, a perspective which they brought to their policies on
crop reports as well. CBOT made no effort to authenticate reports from outside sources or
to gather statistics on their own. As a result, multiple reports circulated at any given time,
creating uncertainty and rumor around the growth and movement of wheat.
NOCE developed a crop reporting system that was spurred on by their Board of
Directors’ desire to free themselves from reliance on Northern sources of information.
Their mistrust of this information, combined with the subordinate position in which it
placed NOCE, led the Exchange to build a sophisticated statistical network that traced the
growth and movement of the cotton crop. Long-serving Exchange Secretary Henry
Hester used his positions on the National Cotton Exchange and the editorial board of
Cotton World magazine to expand this network across the nation, and the system he built
gained renown worldwide. However, NOCE’s weak position relative to Western Union
and the New York Cotton Exchange made it difficult to improve the technical capacity of
telegraphs and amend prejudicial rules of information sharing. Though their commitment
to providing information as a public good for their members made problems with “beats”

180
by private wires a hotly debated topic, the Exchange was unable to force any significant
improvements. This created an environment where spot market statistics were plentiful,
but up-to-the-minute market quotations were not.
Chapter 5 established that CBOT evaluated futures speculation largely in contrast
to a closely related type of derivative, options contracts. This was done in response to two
different challenges. First, alternative local venues for trading—bucket shops and the
Open Board of Trade—made options trading impossible to eliminate. The continued
presence of options despite their illegality hurt the Board’s legitimacy. Second, options
trading featured in two proposed pieces of federal legislation that aimed to bar
speculation in futures. CBOT seized upon the distinction between options and futures as a
way to fight both their local rivals and the proposed legislation. On the one hand, they
linked the differences between futures and options contracts to the distinction between
speculation and gambling. On the other, they capitalized on confusion over these terms
within legislation to delegitimate federal efforts at regulation. Options also served as a
useful foil when evaluating the economic value of speculation. Speculators contrasted the
lively market that resulted from futures speculation with the dullness which accompanied
options trading, arguing that the use of options contracts killed beneficial fluctuations in
price.
On NOCE, the economic and cultural importance of the spot trade shaped the
valuation of speculation in futures. NOCE’s leaders argued that their robust spot market
guaranteed the value of futures trading on their exchange, in contrast to markets that
needed to rely on artificial means for establishing value. They also claimed that a

181
significant component of the futures market’s worth was that it gave New Orleans traders
a tool with which to boost spot market prices. This perspective was further enabled by
cotton-specific legislation proposed at the federal level. Unlike the bills which CBOT
faced two decades before, these made no distinction between futures and options, but
rather focused narrowly on ensuring the delivery of goods on contract. NOCE justified
non-delivery on contracts through a full-throated defense of hedging. As opposed to
CBOT, which attempted to cast non-delivery as equivalent to delivery by other means,
NOCE argued that non-delivery on futures contracts was critical to preserving the value
of actual spot goods.
What consequences did these infrastructures have for market behavior?
Chapters 3 and 4 also explore the consequences of these infrastructural features
on market behavior. On CBOT, the information conveyed by grades was more likely to
misrepresent the physical quality of wheat and the quantities being stored in the city. The
Board’s policy of treating information as a private good created a two-tiered system,
where traders with better information or faster telegraphic service had an advantage over
other members. Warehouse receipts that automatically called forth particular grades of
wheat enabled speculation to grow quite large, as traders could be assured that they could
satisfy contracts with little cost simply through the purchase of a standardized contract.
These systems would have made long-term market projection difficult, while doing little
to lower uncertainty in the short-term. As a result, we would expect to see increased
speculation on short-term price fluctuations and the loss of hedging to other markets.

182
Conversely, NOCE created a system where grades closely indexed the quality of
cotton, and quantities were ensured by the careful supervision of bales as they moved
through the city. The Exchange produced a wealth of reliable statistics on the growth,
movement and consumption of cotton, which gave members a detailed perspective on the
spot market. Also, the lack of speedy telegraphic services made speculation in futures,
which required quickly spotting market opportunities, more difficult. Finally, the cost of
negotiating grade every time delivery was involved served as a potential cost that
speculators were keen to avoid. These features combined to create a market that would
promote relatively more spot market-related hedging and less pure speculation.
These infrastructural differences established distinct, limiting conditions for
action on the two exchanges. Irrespective of the influence of social structural factors such
as network ties, regulative institutions, or cultural attitudes toward speculation, the
infrastructure of CBOT would promote a higher proportion of speculative trades than that
of NOCE. I argue that these infrastructural differences were a significant reason why
CBOT saw such greater price volatility than NOCE over the period of my research.
In the remainder of this chapter I note two general lessons we can draw from the
questions and answers presented in this dissertation. First: Market infrastructure, broadly
understood, is a particularly useful concept for studying market creation, particularly for
derivative markets. Second: An infrastructural approach enables meaningful new
analyses of system-level outcomes, market volatility being an example. I discuss each
and propose areas for future exploration below.

183
Infrastructure and derivative market creation
Infrastructures offer practical solutions to some of the theoretical problems posed
by the creation of a new market (Beckert 2009, 2012; Callon 2008; Preda 2009; Rona-
Tas & Guseva 2014). Infrastructures are critical components by which new markets give
commodities the proper characteristics (Callon 1998b; Healy 2010; Zelizer 1979), equip
traders with appropriate interests, capacities, and orientations (Caliskan & Callon 2010;
Callon 2008; Crouch & Streeck 1997; Hollingsworth & Boyer 1997; Polanyi 1957), and
enable actors to make rational decisions despite the fundamental uncertainty of the
market (Beckert 1996; 2009; Knight 1921; Millo, Muniesa, Panourgias & Scott 2005).
Established at the genesis of markets, infrastructures both solve these problems and
establish conditions that influence behavior on the market long into the future. The same
is true of infrastructures on derivative markets: they also help define actors and
commodities, and make possible action under uncertainty. But, in solving these problems,
they face the additional challenge of doing so in ways that are compatible with the
solutions in place on the underlying spot market. If actors in the derived market are acting
in ways that are illegitimate in the underlying market there will be conflict between them;
if derived commodities are being handled in ways that clash with established
understandings and practices in the underlying market, this will be contested; if derived
and underlying markets require different levels of uncertainty, their conflicting needs will
cause strife. Establishing a compatible relation can be difficult, as underlying and derived
markets have different aims and may benefit from quite different infrastructural features.

184
Several findings from the dissertation illustrate this tension. Futures markets
created a new economic actor in the speculator, and a new commodity in the futures
contract. Defining the character of both was a contentious process, largely because the
cultural orientations present in the underlying market constrained action in the derivative
market. Futures, for instance, challenged the traditional spot market-based understanding
of contracts. While futures ostensibly bound two parties to a transaction of physical
goods, traders realized early on that the physical delivery of goods—the raison d’etre of
spot markets—was an unnecessary drag on speculation in the futures market. They
created new processes, such as standardizing contracts and offsetting trades, that allowed
settlement of deals without delivery. To actors in the spot market, this appeared to pervert
the meaning of contracts in a morally questionable sleight-of-hand. Speculators also
strained the accepted orientations to exchange by selling short items that they did not own
and often never intended to own. To them, this behavior was market-making, but to many
in the product market accustomed to exchanging physical goods it was gambling. The
orientations in place on the spot market were challenged by new futures market practices,
and compromise was only reached through decades of court battles and legislation.
Aligning the methods for managing uncertainty across underlying and derived
markets also was difficult. The challenge was seen most clearly on the topic of grading
the spot commodity. On both markets, spot and futures traders clashed over the
acceptable level of uncertainty of grades in relation to contracts. On CBOT, the
uncertainty created by a shoddy grading system caused problems for traders in the spot
market, as the quality of wheat failed to meet their customers’ expectations. But futures

185
traders could accept this uncertainty, given their general non-involvement with the
physical commodity. On NOCE, the situation was reversed. Uncertainty over grading
was worrisome to speculators because of the potential cost it imposed. This was why
speculators lobbied for, and eventually convinced NOCE to create, a centralized grading
service for contract cotton. Spot dealers, however, used the grading system to their
advantage, mobilizing their own expertise to profit from the uncertainty present in
transactions. In both cases a single infrastructure struggled to solve the problem of
uncertainty in a manner satisfactory to parties in both markets.1
Studying derivative markets in terms of their infrastructures offers a way to
examine these challenges inherent in their construction. It focuses on the constitutive
linkage that material tools, information networks, and cultural evaluations produce
between derivative and underlying markets, and how this connection entangles the
markets in a complex, two-market system. More research on these market systems and
their infrastructures is needed to address some of the particular questions suggested by
this dissertation. How does the form of an extant underlying market influence the creation
of its derived market? Conversely, once a derived market has been built, how does it
redound infrastructurally on the underlying market from which it grew? What factors—
organizational, political, cultural, or economic—impact the nature of this relationship?
Under what circumstances do these linking infrastructures change over time? These
1 Interestingly, as these examples show, there is not a pre-established relation between the type of market
and the level of uncertainty traders optimally desire: on NOCE, spot traders had a higher tolerance for
uncertainty, while on CBOT, spot traders had less. The significance of uncertainty in the market is filtered
through the institutional environment.

186
questions are critical for understanding the modern economy. One need only recall the
2008 housing crash and financial crisis to recognize that the links between derivative and
underlying markets fundamentally shape the workings of the economy. Developing a
sociological understanding of linked underlying-derivative market systems thus remains
an important task for economic sociologists.
Infrastructural analysis & market regulation
The second broad contribution of this dissertation is demonstrating the ability of
an infrastructural analysis to explain market-wide dynamics and outcomes. By comparing
the information required for two different types of trades—speculation and hedging—
with the information created by infrastructures on CBOT and NOCE, I demonstrate that
the two markets would see divergent baseline levels of each type of trade. This analysis is
unique in that it focuses on the infrastructures that set limiting conditions for market
action, rather than the social structures that constrained it. Since these infrastructural
differences persist over long stretches of time, they are well-suited to explain long-term
divergences in behavior such as those seen in price volatility on the two exchanges. This
provides a non-deterministic method for linking foundational infrastructures with system-
level outcomes and dynamics. That is, it helps us to see how infrastructures shape
behavior, without reducing those behaviors to mechanical effects of the infrastructures in
which they occur.

187
This connection between infrastructure and systemic market behaviors is useful
for thinking about the regulation of financial markets. It echoes the argument made by
Schneiberg & Bartley (2010), who use the tools of organizational sociology to analyze
market architectures. Modern financial markets, they claim, combine incredible
complexity with tight coupling, an arrangement that makes them prone to “normal
accidents” (Perrow 1984). Rather than attempting to regulate such markets, a difficult and
resource-intensive fix, they suggest that we might make markets more stable by re-
shaping their architectures, i.e., by re-segmenting and decentralizing markets, and
building in redundancies. These changes in market architectures would weaken
interconnections between markets and prevent failures or errors from cascading through
large sectors of the economy. In this way, their argument expands the claim made in this
dissertation. Both Schneiberg & Bartley’s (2010) article and this dissertation make
similar claims about how the form of markets can impact behavior, irrespective of any
additional coercive regulation.
Combining the “infrastructural” approach outlined in this dissertation with
Schneiberg & Bartley’s (2010) “architectural” approach has promise. But the connection
between these approaches still requires theoretical elaboration and empirical testing.
What exactly is the distinction between market infrastructures and architectures? How, if
at all, are they related to each other? Do infrastructures and architectures correspond to
particular types of market behaviors, e.g., price volatility versus cascading of errors?
Most broadly, how does each relate to, and interconnect, flows of information and flows

188
of capital? Answering these questions will go a long way toward understanding the
relation between a market’s foundations and its outcomes.
The value of infrastructure
Economic sociologists have amassed a vast body of knowledge about the social
structural influences that shape behavior on individual markets. But this dissertation
suggests that it is also critical to direct attention away from the social structural factors
that directly influence market behavior and onto the infrastructural features that indirectly
shape the conditions of possibility on the market. Market infrastructures are created to
solve fundamental problems of economic action; they set limiting conditions on behavior
within markets. This dissertation has highlighted these elements in the case of 19th
century futures markets. There, infrastructures were created to construct, disseminate, and
evaluate information on futures markets, making those markets viable spaces of rational
calculation. The particulars of their construction had a significant impact on behavior,
making particular types of trading more feasible, or rational, on each exchange.
As a whole, the dissertation pushes toward a deeper, systemic, sociological
analysis of markets, both on their own and in combination with markets to which they are
constitutively linked. It offers a fresh line of thought in economic sociologists' broad
move away from the traditional orienting metaphor of social structural “embeddedness”
(Beckert 2003, 2007, 2009; Callon 2008; Krippner 2001; Krippner & Alvarez 2007). By
shifting analysis from the market’s social context to the fabric of the market itself, this

189
approach draws from science and technology studies, information studies, and
anthropology to create a perspective on markets as socio-technically constructed objects.
This multi-disciplinary, socio-material approach is necessary in order to understand the
continual processes of evolution, diversification, and inter-connection that sit at the heart
of modern markets.

190
Appendix A. – Glossary of Economic Terms
Bucket shop – Shops that allowed patrons to place bets on the movement of commodity
prices without actually entering into legally binding contracts. Prices from a legitimate
exchange (e.g., CBOT) were relayed to the shop by telegraph. At bucket shops, patrons
could deal in small quantities, far below the minimums set by exchanges. They could also
deal in options, which were, by and large, prohibited on legitimate exchanges.
Corner – A gambit wherein a trader simultaneously buys up both futures contracts and
the underlying spot commodity called for in these contracts. By doing so, he hopes to
own a significant portion of that commodity by the time his contracts come due. At the
contract’s call date, he would then demand that his counterparties meet the contract by
physical delivery of commodities. Since he controlled the majority of the supply, his
counterparties would be forced to come to him to buy, at which point he could charge a
highly inflated price. This would earn the trader a large profit. Corners required large
sums of capital and were often the work of secret syndicates of traders. They could
impact prices on an exchange for weeks or months. A less severe version of the same
price increased cause by a shortage of supply was known as a squeeze.
Derivative – Any financial instrument the value of which is a function of a separate,
underlying entity. This underlying entity can be any asset, an index, or an interest rate.
During the time period covered in this research the underlying entities were concrete
physical commodities, such as agricultural products or gold.

191
Factors – An all-purpose commission merchant who connected Southern planters to
financial interests, shipping companies, and merchants. Factors would lend money to
planters at the start of the season, advance them money after the harvest, sell cotton on
consignment, and buy goods needed on the farm and homestead. Factors served as the
central node in the ante-bellum marketing of the South’s cotton crop.
Futures contract – A contract for the purchase or sale of a specified quantity of a
commodity at a specified price and future date. Futures contracts on CBOT specified the
grade of wheat that was to be exchanged; contracts on NOCE did not. Contracts matured
in a particular month, and could be settled at any time during that month.
Futures market – A secondary market for the purchase and sale of futures contracts.
These markets were enabled by the standardization of commodity grades and futures
contracts. This allowed contracts to be exchanged at a high volume and for traders to
easily maintain portfolios of speculative trades.
Hedging – The act of buying or selling in the futures market in order to insure against
adverse price movements in the spot market. Hedging was done by individuals who were
involved in the spot trade of commodities in order to reduce the inherent risk of adverse
price movements. In a hedge, a trader balances a purchase or sale in the spot market with
the opposite action in the futures market. That is, a buyer of spot goods would sell the
same amount of goods in the futures market, and a seller of spot goods would buy in the
futures market. The futures market portion of a hedge was generally offset; the spot
market portion was delivered.

192
Long / short position – A long position is taken when a trader buys futures anticipating a
rise in their price; a short position is taken when a trader sells futures anticipating a drop
in their price. Often, these positions were taken by traders with no desire to own the
commodities promised in the contracts, nor any desire to.
Offsetting settlement – A method of cancelling one’s obligation in the futures market
through assuming an opposite position. A trader who had bought a futures contract for
500 bales of basis middling cotton could offset his position by selling a contract for the
same amount. His two contractual obligations would then cancel each other out. Traders
could then simply pay whatever difference existed in the price at which the contract was
bought and sold. This chain of offsetting transactions often extended to several traders
who would need to meet and settle their respective positions. These were known as ring
settlements, as they involved a circle of trades (e.g., A to B, B to C, C to D, D back to
A). Clearinghouses were developed in the late 19th and early 20th centuries to keep track
of the long trails of deals and simplify the clearing process at the end of each month.
Options – Options, also known as privileges or puts and calls, were contracts for a future
transaction, at a particular price for a particular good. But, unlike futures contracts,
options gave one party—either the buyer or seller—the ability to decide whether or not to
make the transaction at the contract’s call date. Securing an option to either buy or sell
required paying a counter-party a small fee, traditionally $1 per 1,000 bushels. When the
option came due, the trader could decide either to execute the deal as specified, or to
decline to do so, in which case he would forfeit the fee he had paid.
Ring settlement – See offsetting positions.

193
Speculation – Buying or selling in the futures market in order to profit from price
fluctuations. As opposed to hedging, speculation does not involve a counter-position in
the spot market. Speculators bet on price movements in the spot market, which would in
turn affect the value of their contracts. Speculators generally avoided any actual
involvement in the spot market, and did not come into contact with primary commodities.
Spot market – A market for the purchase and sale of physical commodities (e.g., wheat
or cotton), where buyers pay money and receive goods from sellers on the spot.

194
Appendix B. – Monthly high and low prices of wheat and cotton on CBOT & NOCE
Monthly high and low price data come from Boyle (1922) and Boyle (1934).
Cotton prices from NOCE are for middling cotton; this was the basis grade for all futures
contracts. On CBOT, prices are for “that grade of wheat in which the most transactions
were had” (Boyle 1922: 9). This grade changed over the period of time measured. The
following type of wheat was used in each year: 1870: No. 1 spring; 1871-1897: No. 2
spring; 1898-1904: “Regular” wheat; 1905-1913: No. 2 red winter wheat.
I created the intra-month volatility statistic to compare the movement of prices
across markets. It is calculated as the difference between monthly high and low prices
divided by the average of the two; in mathematical terms, V = (Monthly high – monthly
low)/[(Monthly high + monthly low)/2]. Intra-month volatility is a particularly useful
measure of volatility in futures markets. Contracts came due each month in succession
and would have converged with spot prices. Thus large spot price changes within a
month suggest significant volatility in futures markets.

195
Month CBOT Wheat Prices NOCE Cotton Prices
Low High Volatility Low High Volatility
September 1870 97 107 0.098039216 18 1/4 15 1/2 0.162962963 October 1870 104 111 0.065116279 16 1/2 14 1/2 0.129032258
November 1870 95 103 0.080808081 16 1/4 15 1/8 0.071713147 December 1870 105 106 0.009478673 15 1/8 14 1/4 0.059574468
January 1871 110 130 0.166666667 15 1/8 14 1/4 0.059574468 February 1871 122 132 0.078740157 15 14 1/4 0.051282051
March 1871 123 131 0.062992126 14 3/4 13 7/8 0.061135371
April 1871 124 134 0.07751938 14 3/4 14 3/8 0.025751073 May 1871 125 133 0.062015504 16 3/8 14 1/2 0.12145749 June 1871 127 132 0.038610039 21 16 5/8 0.23255814 July 1871 109 129 0.168067227 20 3/4 20 0.036809816
August 1871 99 125 0.232142857 Missing Missing September 1871 106 132 0.218487395 20 1/4 18 1/2 0.090322581
October 1871 112 124 0.101694915 19 7/8 18 1/8 0.092105263 November 1871 118 122 0.033333333 18 7/8 17 7/8 0.054421769 December 1871 117 121 0.033613445 19 3/4 18 1/2 0.065359477
January 1872 120 125 0.040816327 22 19 1/2 0.120481928 February 1872 123 126 0.024096386 22 3/8 21 7/8 0.02259887
March 1872 118 126 0.06557377 22 1/2 21 3/4 0.033898305
April 1872 119 136 0.133333333 23 1/8 22 1/2 0.02739726 May 1872 135 154 0.131487889 23 1/2 22 7/8 0.026954178 June 1872 121 155 0.246376812 25 1/4 24 0.050761421 July 1872 120 132 0.095238095 24 1/2 22 1/4 0.096256684
August 1872 111 156 0.337078652 20 3/4 19 5/8 0.055727554
September 1872 117 129 0.097560976 21 1/4 18 0.165605096 October 1872 107 121 0.122807018 19 1/2 18 3/4 0.039215686
November 1872 101 111 0.094339623 19 3/8 18 3/8 0.052980132 December 1872 109 121 0.104347826 19 7/8 18 7/8 0.051612903
January 1873 119 126 0.057142857 20 19 3/8 0.031746032 February 1873 120 126 0.048780488 19 7/8 19 3/8 0.025477707
March 1873 118 123 0.041493776 19 1/2 18 1/2 0.052631579 April 1873 114 125 0.092050209 19 1/4 18 1/2 0.039735099 May 1873 123 134 0.085603113 18 3/8 18 1/8 0.01369863 June 1873 117 128 0.089795918 18 3/4 18 1/4 0.027027027 July 1873 114 123 0.075949367 18 3/4 18 5/8 0.006688963
August 1873 117 146 0.220532319 18 3/4 18 1/2 0.013422819

196
September 1873 89 120 0.296650718 19 17 0.111111111 October 1873 93 109 0.158415842 18 3/4 15 7/8 0.166064982
November 1873 92 109 0.169154229 16 5/8 14 3/8 0.14516129 December 1873 106 117 0.098654709 16 7/8 15 3/4 0.068965517
January 1874 114 127 0.107883817 16 3/4 15 3/4 0.061538462 February 1874 115 124 0.075313808 16 1/4 15 3/4 0.03125
March 1874 117 123 0.05 16 5/8 15 1/2 0.070038911 April 1874 119 128 0.072874494 17 1/2 16 3/8 0.066420664 May 1874 117 127 0.081967213 18 17 3/8 0.035335689 June 1874 116 123 0.058577406 17 3/4 16 7/8 0.050541516 July 1874 108 117 0.08 17 16 3/4 0.014814815
August 1874 91 110 0.189054726 16 7/8 16 5/8 0.014925373
September 1874 93 102 0.092307692 16 7/8 14 5/8 0.142857143 October 1874 81 99 0.2 14 3/4 14 1/8 0.043290043
November 1874 83 93 0.113636364 14 1/2 14 1/8 0.026200873 December 1874 87 93 0.066666667 14 1/4 13 7/8 0.026666667
January 1875 88 91 0.033519553 14 7/8 14 0.060606061 February 1875 83 88 0.058479532 15 3/4 14 7/8 0.057142857
March 1875 85 96 0.121546961 16 15 5/8 0.023715415 April 1875 93 105 0.121212121 16 1/8 15 5/8 0.031496063 May 1875 89 106 0.174358974 15 3/4 15 1/8 0.04048583 June 1875 90 102 0.125 15 1/2 15 0.032786885 July 1875 100 128 0.245614035 15 3/8 14 1/4 0.075949367
August 1875 115 130 0.12244898 14 5/8 14 1/8 0.034782609 September 1875 105 119 0.125 14 3/8 12 7/8 0.110091743
October 1875 108 113 0.045248869 13 1/2 12 3/4 0.057142857 November 1875 104 113 0.082949309 12 3/4 12 1/2 0.01980198 December 1875 94 97 0.031413613 12 5/8 12 1/2 0.009950249
January 1876 95 102 0.07106599 12 1/2 12 1/4 0.02020202 February 1876 97 106 0.088669951 12 3/8 12 1/4 0.010152284
March 1876 97 105 0.079207921 13 1/4 12 1/4 0.078431373 April 1876 99 105 0.058823529 12 7/8 12 0.070351759 May 1876 96 108 0.117647059 12 11 3/8 0.053475936 June 1876 102 108 0.057142857 11 3/4 11 3/8 0.032432432 July 1876 83 105 0.234042553 11 3/8 11 1/8 0.022222222
August 1876 84 96 0.133333333 11 1/8 10 1/8 0.094117647 September 1876 82 111 0.300518135 11 10 1/2 0.046511628
October 1876 105 116 0.099547511 11 10 1/4 0.070588235 November 1876 107 114 0.063348416 12 11 0.086956522 December 1876 112 127 0.125523013 12 1/8 11 3/8 0.063829787
January 1877 125 131 0.046875 12 7/8 12 1/4 0.049751244

197
February 1877 121 133 0.094488189 12 1/4 11 3/4 0.041666667 March 1877 121 129 0.064 11 7/8 11 0.076502732
April 1877 126 175 0.325581395 11 1/2 10 7/8 0.055865922 May 1877 141 176 0.220820189 11 10 1/2 0.046511628 June 1877 141 155 0.094594595 11 3/8 10 3/4 0.056497175 July 1877 127 148 0.152727273 11 3/8 11 1/8 0.022222222
August 1877 100 129 0.253275109 11 1/8 10 1/8 0.094117647 September 1877 106 118 0.107142857 11 1/8 10 1/8 0.094117647
October 1877 104 114 0.091743119 11 3/8 10 3/4 0.056497175 November 1877 105 114 0.082191781 10 7/8 10 1/2 0.035087719 December 1877 106 112 0.055045872 11 1/8 10 3/4 0.034285714
January 1878 102 109 0.066350711 10 7/8 10 5/8 0.023255814
February 1878 101 109 0.076190476 10 5/8 10 1/2 0.01183432 March 1878 108 112 0.036363636 10 3/4 10 1/8 0.05988024
April 1878 106 114 0.072727273 10 1/4 10 0.024691358 May 1878 105 113 0.073394495 11 10 1/4 0.070588235 June 1878 88 106 0.18556701 11 1/4 11 0.02247191 July 1878 89 105 0.164948454 11 1/4 11 0.02247191
August 1878 89 108 0.192893401 11 3/8 11 0.033519553 September 1878 85 89 0.045977011 11 10 3/8 0.058479532
October 1878 77 88 0.133333333 10 1/4 9 3/8 0.089171975 November 1878 79 85 0.073170732 9 1/2 8 7/8 0.068027211 December 1878 81 84 0.036363636 9 1/4 8 3/8 0.09929078
January 1879 82 87 0.059171598 9 3/8 9 1/8 0.027027027 February 1879 85 94 0.100558659 9 5/8 9 1/4 0.039735099
March 1879 89 96 0.075675676 10 1/8 9 1/8 0.103896104 April 1879 84 93 0.101694915 11 3/8 10 1/4 0.104046243 May 1879 89 103 0.145833333 13 1/8 11 3/8 0.142857143 June 1879 101 107 0.057692308 12 3/4 11 7/8 0.07106599 July 1879 91 110 0.189054726 12 11 1/8 0.075675676
August 1879 84 92 0.090909091 11 1/2 10 1/2 0.090909091 September 1879 52 105 0.675159236 11 5/8 10 1/8 0.137931034
October 1879 103 120 0.152466368 10 3/4 9 3/4 0.097560976 November 1879 110 122 0.103448276 11 3/4 10 1/2 0.112359551 December 1879 122 133 0.08627451 12 1/4 11 1/2 0.063157895
January 1880 115 132 0.137651822 12 1/2 11 7/8 0.051282051 February 1880 118 125 0.057613169 13 12 5/8 0.029268293
March 1880 114 126 0.1 13 12 1/2 0.039215686 April 1880 107 115 0.072072072 12 5/8 11 3/4 0.071794872 May 1880 112 119 0.060606061 11 3/4 11 1/4 0.043478261 June 1880 88 114 0.257425743 11 3/4 11 1/4 0.043478261

198
July 1880 87 96 0.098360656 11 3/4 11 1/4 0.043478261 August 1880 86 92 0.06741573 11 3/4 11 3/8 0.032432432
September 1880 86 95 0.099447514 11 3/4 10 7/8 0.077348066 October 1880 91 102 0.113989637 11 3/8 10 7/8 0.04494382
November 1880 101 112 0.103286385 12 10 3/4 0.10989011 December 1880 94 110 0.156862745 11 3/4 11 3/8 0.032432432
January 1881 95 100 0.051282051 11 5/8 11 3/8 0.02173913 February 1881 96 100 0.040816327 11 3/8 11 1/8 0.022222222
March 1881 98 104 0.059405941 11 10 1/2 0.046511628 April 1881 100 107 0.06763285 10 5/8 10 1/4 0.035928144 May 1881 100 113 0.122065728 10 1/2 10 1/8 0.036363636 June 1881 107 114 0.063348416 10 3/4 10 1/2 0.023529412
July 1881 108 121 0.113537118 11 7/8 10 3/4 0.099447514 August 1881 119 138 0.147859922 12 1/4 11 0.107526882
September 1881 121 138 0.131274131 11 3/8 11 0.033519553 October 1881 131 143 0.087591241 11 3/8 10 7/8 0.04494382
November 1881 124 132 0.0625 11 1/2 11 1/8 0.033149171 December 1881 123 129 0.047619048 11 5/8 11 3/8 0.02173913
January 1882 126 136 0.076335878 11 5/8 11 3/8 0.02173913 February 1882 120 132 0.095238095 11 5/8 11 1/4 0.032786885
March 1882 124 135 0.084942085 12 11 1/2 0.042553191 April 1882 133 140 0.051282051 12 12 0 May 1882 123 140 0.129277567 12 1/8 12 0.010362694
June 1882 125 133 0.062015504 12 1/2 12 0.040816327 July 1882 125 135 0.076923077 12 7/8 12 1/2 0.02955665
August 1882 101 135 0.288135593 12 3/4 12 3/8 0.029850746 September 1882 97 108 0.107317073 12 1/2 11 3/8 0.094240838
October 1882 92 97 0.052910053 11 1/4 10 3/8 0.080924855 November 1882 91 94 0.032432432 10 1/4 9 3/4 0.05 December 1882 91 95 0.043010753 10 9 11/16 0.031746032
January 1883 93 103 0.102040816 9 7/8 9 9/16 0.032154341 February 1883 101 111 0.094339623 9 15/16 9 5/8 0.031948882
March 1883 105 109 0.037383178 9 3/4 9 1/2 0.025974026 April 1883 102 112 0.093457944 9 7/8 9 3/8 0.051948052 May 1883 108 113 0.045248869 10 1/4 10 0.024691358
June 1883 98 113 0.142180095 10 1/8 9 13/16 0.031347962 July 1883 97 103 0.06 9 13/16 9 9/16 0.025806452
August 1883 100 103 0.02955665 9 3/4 9 5/8 0.012903226 September 1883 93 101 0.082474227 10 5/16 9 5/8 0.068965517
October 1883 90 96 0.064516129 10 11/16 10 3/16 0.047904192 November 1883 92 98 0.063157895 10 5/16 10 0.030769231

199
December 1883 95 99 0.041237113 10 3/16 9 7/8 0.031152648 January 1884 88 95 0.076502732 10 1/2 10 1/4 0.024096386
February 1884 91 96 0.053475936 10 1/2 10 5/16 0.018018018 March 1884 83 94 0.124293785 11 1/8 10 7/16 0.063768116
April 1884 76 92 0.19047619 11 3/4 11 1/8 0.054644809 May 1884 85 95 0.111111111 11 5/8 11 3/8 0.02173913 June 1884 85 90 0.057142857 11 3/8 11 0.033519553 July 1884 80 85 0.060606061 11 10 11/16 0.028818444
August 1884 76 84 0.1 11 3/4 10 1/2 0.112359551 September 1884 73 80 0.091503268 10 3/4 9 3/4 0.097560976
October 1884 73 79 0.078947368 9 15/16 9 7/16 0.051612903 November 1884 71 75 0.054794521 10 1/8 9 1/2 0.063694268
December 1884 70 74 0.055555556 10 1/2 10 1/16 0.042553191 January 1885 76 81 0.063694268 10 5/8 10 5/16 0.029850746
February 1885 74 79 0.065359477 10 11/16 10 1/2 0.017699115 March 1885 73 80 0.091503268 10 5/8 10 1/2 0.01183432
April 1885 77 92 0.177514793 10 5/8 10 1/8 0.048192771 May 1885 85 91 0.068181818 10 1/2 10 3/16 0.03021148 June 1885 84 90 0.068965517 10 7/16 9 15/16 0.049079755 July 1885 85 90 0.057142857 10 9 3/4 0.025316456
August 1885 78 89 0.131736527 9 3/4 9 1/2 0.025974026 September 1885 76 87 0.134969325 9 1/2 9 1/8 0.040268456
October 1885 85 91 0.068181818 9 3/8 9 0.040816327
November 1885 84 91 0.08 9 8 7/8 0.013986014 December 1885 84 89 0.057803468 8 7/8 8 5/8 0.028571429
January 1886 77 85 0.098765432 8 3/4 8 9/16 0.02166065 February 1886 78 81 0.037735849 8 11/16 8 3/16 0.059259259
March 1886 76 81 0.063694268 8 3/4 8 1/4 0.058823529 April 1886 72 80 0.105263158 8 15/16 8 11/16 0.028368794 May 1886 72 79 0.092715232 9 8 13/16 0.021052632 June 1886 71 78 0.093959732 8 7/8 8 7/8 0 July 1886 73 79 0.078947368 9 3/16 9 0.020618557
August 1886 74 79 0.065359477 9 3/16 8 15/16 0.027586207 September 1886 72 77 0.067114094 9 3/8 8 7/8 0.054794521
October 1886 70 75 0.068965517 9 1/4 8 9/16 0.077192982
November 1886 73 76 0.040268456 8 3/4 8 1/2 0.028985507 December 1886 75 79 0.051948052 9 1/8 8 11/16 0.049122807
January 1887 77 80 0.038216561 9 1/16 8 7/8 0.020905923 February 1887 72 78 0.08 9 1/8 8 7/8 0.027777778
March 1887 72 80 0.105263158 10 1/16 9 1/8 0.09771987 April 1887 77 84 0.086956522 10 3/8 10 1/16 0.03058104

200
May 1887 81 89 0.094117647 10 5/8 10 3/8 0.023809524 June 1887 65 95 0.375 10 3/4 10 7/16 0.029498525 July 1887 68 71 0.043165468 10 7/16 9 1/2 0.094043887
August 1887 66 70 0.058823529 9 1/2 9 3/16 0.033444816 September 1887 67 72 0.071942446 9 1/8 8 13/16 0.034843206
October 1887 69 72 0.042553191 9 1/8 8 3/4 0.041958042 November 1887 72 77 0.067114094 9 13/16 9 1/8 0.072607261 December 1887 75 79 0.051948052 9 7/8 9 11/16 0.019169329
January 1888 75 78 0.039215686 9 7/8 9 3/4 0.012738854 February 1888 75 76 0.013245033 9 7/8 9 13/16 0.006349206
March 1888 72 76 0.054054054 9 7/8 9 3/8 0.051948052 April 1888 71 82 0.14379085 9 1/2 9 3/8 0.013245033
May 1888 81 89 0.094117647 9 1/2 9 1/2 0 June 1888 78 86 0.097560976 9 3/4 9 3/8 0.039215686 July 1888 79 85 0.073170732 10 1/8 9 3/4 0.037735849
August 1888 81 93 0.137931034 10 1/8 9 5/8 0.050632911 September 1888 90 165 0.588235294 10 9 5/8 0.038216561
October 1888 103 117 0.127272727 9 3/4 9 1/4 0.052631579 November 1888 102 117 0.136986301 9 5/8 9 1/3 0.0330033 December 1888 97 105 0.079207921 9 1/2 9 3/8 0.013245033
January 1889 94 102 0.081632653 9 5/8 9 3/8 0.026315789 February 1889 93 108 0.149253731 9 3/4 9 1/2 0.025974026
March 1889 96 105 0.089552239 9 15/16 9 3/4 0.019047619
April 1889 79 98 0.214689266 10 5/8 9 15/16 0.066869301 May 1889 77 87 0.12195122 10 3/4 10 5/8 0.011695906 June 1889 75 82 0.089171975 10 7/8 10 3/4 0.011560694 July 1889 77 85 0.098765432 11 10 7/8 0.011428571
August 1889 75 79 0.051948052 11 1/8 11 0.011299435 September 1889 76 83 0.088050314 10 7/8 10 1/4 0.059171598
October 1889 78 83 0.062111801 10 1/16 9 7/16 0.064102564 November 1889 79 81 0.025 9 11/16 9 9/16 0.012987013 December 1889 77 80 0.038216561 9 11/16 9 5/8 0.006472492
January 1890 74 78 0.052631579 10 11/16 9 5/8 0.104615385 February 1890 74 76 0.026666667 10 11/16 10 3/8 0.029673591
March 1890 76 80 0.051282051 11 10 11/16 0.028818444
April 1890 77 90 0.155688623 11 11/16 11 0.060606061 May 1890 90 100 0.105263158 11 7/8 11 9/16 0.026666667 June 1890 84 93 0.101694915 11 7/8 11 7/16 0.037533512 July 1890 85 94 0.100558659 11 3/4 11 7/16 0.026954178
August 1890 89 108 0.192893401 11 3/4 10 3/8 0.124293785 September 1890 95 105 0.1 10 1/4 9 3/4 0.05

201
October 1890 96 103 0.070351759 10 1/16 9 11/16 0.037974684 November 1890 91 102 0.113989637 9 9/16 9 1/16 0.053691275 December 1890 88 93 0.055248619 9 1/8 8 13/16 0.034843206
January 1891 87 96 0.098360656 9 5/16 8 15/16 0.04109589 February 1891 93 97 0.042105263 9 1/16 8 3/4 0.035087719
March 1891 94 104 0.101010101 8 3/4 8 5/8 0.014388489 April 1891 102 114 0.111111111 8 11/16 8 5/16 0.044117647 May 1891 99 108 0.086956522 8 3/8 8 5/16 0.007490637 June 1891 92 101 0.093264249 8 1/4 7 7/8 0.046511628 July 1891 85 95 0.111111111 7 15/16 7 3/4 0.023904382
August 1891 87 113 0.26 8 7 5/8 0.048 September 1891 91 100 0.094240838 8 1/2 8 0.060606061
October 1891 92 99 0.073298429 8 3/8 7 15/16 0.053639847 November 1891 91 97 0.063829787 7 7/8 7 3/8 0.06557377 December 1891 89 93 0.043956044 7 1/2 7 0.068965517
January 1892 84 90 0.068965517 7 3/16 6 13/16 0.053571429 February 1892 82 92 0.114942529 6 7/8 6 1/2 0.056074766
March 1892 77 90 0.155688623 6 1/2 6 1/4 0.039215686 April 1892 77 85 0.098765432 7 6 3/8 0.093457944 May 1892 80 86 0.072289157 7 3/16 7 0.026431718 June 1892 78 88 0.120481928 7 1/2 7 1/16 0.060085837 July 1892 76 80 0.051282051 7 3/16 7 0.026431718
August 1892 74 80 0.077922078 7 3/16 6 15/16 0.03539823
September 1892 72 74 0.02739726 7 7/16 6 15/16 0.069565217 October 1892 69 74 0.06993007 7 13/16 7 7/16 0.049180328
November 1892 70 73 0.041958042 9 7/8 7 11/15 0.243256034 December 1892 69 72 0.042553191 9 11/16 9 5/16 0.039473684
January 1893 72 77 0.067114094 9 5/8 9 3/16 0.046511628 February 1893 72 76 0.054054054 9 1/4 8 13/16 0.048442907
March 1893 73 78 0.066225166 9 8 5/16 0.079422383 April 1893 71 85 0.179487179 8 3/16 7 7/16 0.096 May 1893 68 76 0.111111111 7 5/8 7 1/4 0.050420168 June 1893 64 69 0.07518797 7 7/8 7 5/16 0.074074074 July 1893 55 66 0.181818182 7 3/4 7 7/16 0.041152263
August 1893 56 64 0.133333333 7 5/8 6 13/16 0.112554113
September 1893 63 69 0.090909091 8 3/16 7 5/16 0.112903226 October 1893 61 66 0.078740157 8 1/8 7 5/8 0.063492063
November 1893 59 62 0.049586777 7 3/4 7 7/16 0.041152263 December 1893 59 64 0.081300813 7 9/16 7 1/8 0.059574468
January 1894 59 63 0.06557377 7 3/4 7 5/16 0.058091286 February 1894 54 60 0.105263158 7 7/16 7 1/16 0.051724138

202
March 1894 56 59 0.052173913 7 5/16 7 1/8 0.025974026 April 1894 57 64 0.115702479 7 5/16 7 0.043668122 May 1894 53 59 0.107142857 7 1/16 6 13/16 0.036036036 June 1894 53 60 0.123893805 7 1/8 6 7/8 0.035714286 July 1894 50 58 0.148148148 6 7/8 6 5/8 0.037037037
August 1894 52 55 0.056074766 6 5/8 6 7/16 0.028708134 September 1894 51 55 0.075471698 6 1/2 5 11/16 0.133333333
October 1894 51 52 0.019417476 5 3/4 5 3/16 0.102857143 November 1894 51 56 0.093457944 5 1/2 4 7/8 0.120481928 December 1894 53 57 0.072727273 5 5/16 5 1/16 0.048192771
January 1895 49 55 0.115384615 5 3/16 5 0.036809816 February 1895 50 52 0.039215686 5 3/16 5 0.036809816
March 1895 52 55 0.056074766 5 7/8 5 1/16 0.148571429 April 1895 54 63 0.153846154 6 3/8 5 3/4 0.103092784 May 1895 61 81 0.281690141 7 6 3/16 0.123222749 June 1895 69 81 0.16 7 6 5/8 0.055045872 July 1895 61 71 0.151515152 6 3/4 6 1/2 0.037735849
August 1895 59 69 0.15625 7 11/16 6 9/16 0.157894737 September 1895 55 62 0.11965812 8 3/4 7 9/16 0.14559387
October 1895 59 61 0.033333333 9 3/16 8 5/16 0.1 November 1895 56 58 0.035087719 8 5/8 8 1/16 0.06741573 December 1895 54 59 0.088495575 8 3/16 7 3/4 0.054901961
January 1896 57 64 0.115702479 8 7 13/16 0.023715415
February 1896 62 67 0.07751938 8 7 1/2 0.064516129 March 1896 61 66 0.078740157 7 13/16 7 3/8 0.057613169
April 1896 62 67 0.07751938 7 3/4 7 5/8 0.016260163 May 1896 58 63 0.082644628 7 3/4 7 3/8 0.049586777 June 1896 54 59 0.088495575 7 3/8 6 13/16 0.079295154 July 1896 54 59 0.088495575 6 13/16 6 1/2 0.046948357
August 1896 54 59 0.088495575 8 6 13/16 0.160337553 September 1896 55 67 0.196721311 8 1/8 7 5/8 0.063492063
October 1896 67 77 0.138888889 7 5/8 7 1/8 0.06779661 November 1896 72 82 0.12987013 7 1/2 7 3/16 0.042553191 December 1896 76 81 0.063694268 7 3/8 6 11/16 0.097777778
January 1897 73 81 0.103896104 7 6 7/8 0.018018018
February 1897 72 76 0.054054054 7 3/16 6 11/16 0.072072072 March 1897 71 76 0.068027211 7 3/16 6 15/16 0.03539823
April 1897 66 77 0.153846154 7 9/16 6 15/16 0.086206897 May 1897 69 76 0.096551724 7 9/16 7 5/16 0.033613445 June 1897 67 73 0.085714286 7 5/8 7 3/8 0.033333333 July 1897 68 78 0.136986301 7 13/16 7 5/8 0.024291498

203
August 1897 76 100 0.272727273 7 11/16 7 1/16 0.084745763 September 1897 85 100 0.162162162 7 1/16 6 1/16 0.152380952
October 1897 83 90 0.080924855 6 1/8 5 1/2 0.107526882 November 1897 86 91 0.056497175 5 1/2 5 1/4 0.046511628 December 1897 86 91 0.056497175 5 3/8 5 1/4 0.023529412
January 1898 89 108 0.192893401 5 3/8 5 3/16 0.035502959 February 1898 95 108 0.128078818 5 11/16 5 1/4 0.08
March 1898 100 107 0.06763285 5 3/4 5 7/16 0.055865922 April 1898 101 123 0.196428571 5 13/16 5 9/16 0.043956044 May 1898 117 185 0.450331126 6 1/16 5 11/16 0.063829787 June 1898 75 120 0.461538462 6 1/16 5 15/16 0.020833333 July 1898 66 88 0.285714286 5 7/8 5 5/8 0.043478261
August 1898 65 75 0.142857143 5 11/16 5 3/8 0.056497175 September 1898 63 68 0.076335878 5 3/8 4 7/8 0.097560976
October 1898 62 70 0.121212121 5 4 13/16 0.038216561 November 1898 65 69 0.059701493 5 1/16 4 3/4 0.063694268 December 1898 63 70 0.105263158 5 1/4 5 0.048780488
January 1899 67 76 0.125874126 5 3/4 5 3/16 0.102857143 February 1899 70 74 0.055555556 6 5 3/4 0.042553191
March 1899 67 74 0.09929078 6 1/16 5 11/16 0.063829787 April 1899 70 76 0.082191781 5 3/4 5 5/8 0.021978022 May 1899 68 79 0.149659864 5 7/8 5 11/16 0.032432432 June 1899 72 79 0.092715232 5 3/4 5 1/2 0.044444444
July 1899 69 75 0.083333333 5 13/16 5 5/8 0.032786885 August 1899 69 74 0.06993007 5 15/16 5 3/4 0.032085561
September 1899 69 75 0.083333333 6 1/2 5 3/4 0.12244898 October 1899 68 75 0.097902098 6 15/16 6 3/4 0.02739726
November 1899 65 71 0.088235294 7 7/16 6 7/8 0.07860262 December 1899 64 69 0.07518797 7 1/2 7 3/16 0.042553191
January 1900 61 67 0.09375 7 3/4 7 1/4 0.066666667 February 1900 64 67 0.045801527 9 7 7/8 0.133333333
March 1900 64 67 0.045801527 9 7/16 9 0.047457627 April 1900 65 68 0.045112782 9 1/2 9 1/8 0.040268456 May 1900 64 67 0.045801527 9 1/2 8 13/16 0.075085324 June 1900 65 87 0.289473684 9 13/16 8 13/16 0.10738255
July 1900 74 80 0.077922078 10 1/4 9 7/8 0.037267081 August 1900 72 76 0.054054054 10 1/4 9 3/8 0.089171975
September 1900 72 79 0.092715232 11 1/8 9 3/8 0.170731707 October 1900 72 77 0.067114094 10 3/8 8 13/16 0.16286645
November 1900 70 74 0.055555556 9 7/8 9 0.092715232 December 1900 69 75 0.083333333 9 13/16 9 1/4 0.059016393
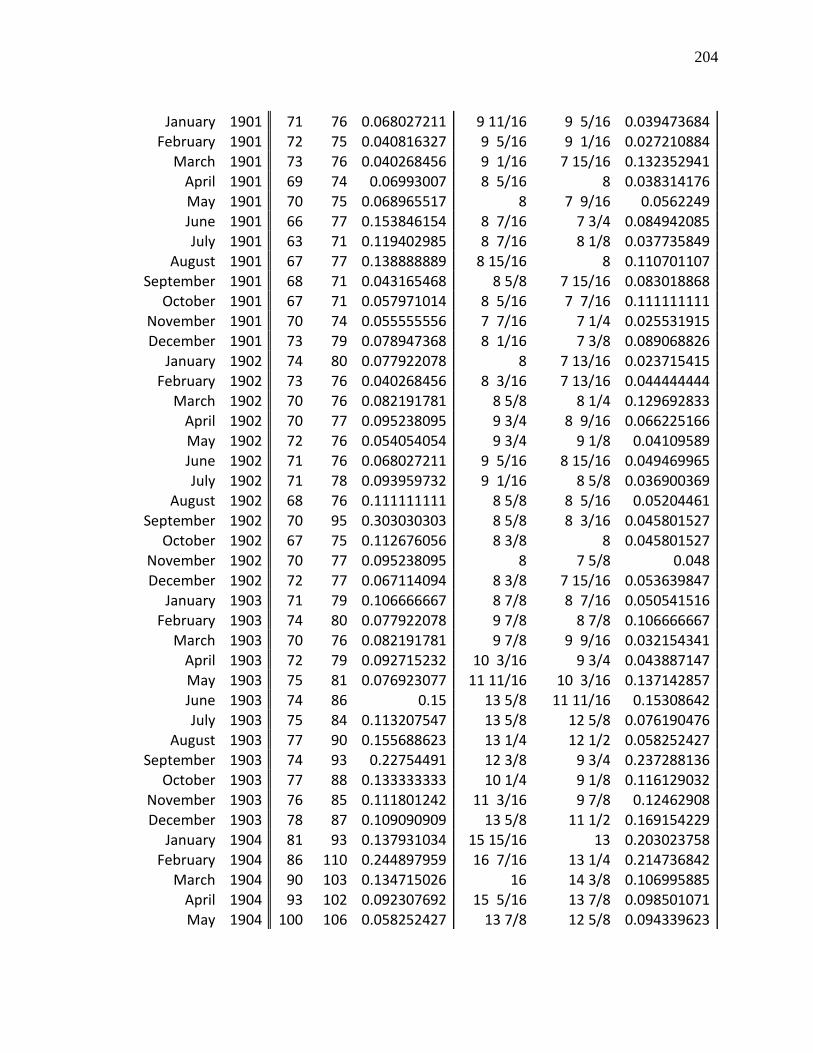
204
January 1901 71 76 0.068027211 9 11/16 9 5/16 0.039473684 February 1901 72 75 0.040816327 9 5/16 9 1/16 0.027210884
March 1901 73 76 0.040268456 9 1/16 7 15/16 0.132352941 April 1901 69 74 0.06993007 8 5/16 8 0.038314176 May 1901 70 75 0.068965517 8 7 9/16 0.0562249 June 1901 66 77 0.153846154 8 7/16 7 3/4 0.084942085 July 1901 63 71 0.119402985 8 7/16 8 1/8 0.037735849
August 1901 67 77 0.138888889 8 15/16 8 0.110701107 September 1901 68 71 0.043165468 8 5/8 7 15/16 0.083018868
October 1901 67 71 0.057971014 8 5/16 7 7/16 0.111111111 November 1901 70 74 0.055555556 7 7/16 7 1/4 0.025531915 December 1901 73 79 0.078947368 8 1/16 7 3/8 0.089068826
January 1902 74 80 0.077922078 8 7 13/16 0.023715415 February 1902 73 76 0.040268456 8 3/16 7 13/16 0.044444444
March 1902 70 76 0.082191781 8 5/8 8 1/4 0.129692833 April 1902 70 77 0.095238095 9 3/4 8 9/16 0.066225166 May 1902 72 76 0.054054054 9 3/4 9 1/8 0.04109589 June 1902 71 76 0.068027211 9 5/16 8 15/16 0.049469965 July 1902 71 78 0.093959732 9 1/16 8 5/8 0.036900369
August 1902 68 76 0.111111111 8 5/8 8 5/16 0.05204461 September 1902 70 95 0.303030303 8 5/8 8 3/16 0.045801527
October 1902 67 75 0.112676056 8 3/8 8 0.045801527 November 1902 70 77 0.095238095 8 7 5/8 0.048
December 1902 72 77 0.067114094 8 3/8 7 15/16 0.053639847 January 1903 71 79 0.106666667 8 7/8 8 7/16 0.050541516
February 1903 74 80 0.077922078 9 7/8 8 7/8 0.106666667 March 1903 70 76 0.082191781 9 7/8 9 9/16 0.032154341
April 1903 72 79 0.092715232 10 3/16 9 3/4 0.043887147 May 1903 75 81 0.076923077 11 11/16 10 3/16 0.137142857 June 1903 74 86 0.15 13 5/8 11 11/16 0.15308642 July 1903 75 84 0.113207547 13 5/8 12 5/8 0.076190476
August 1903 77 90 0.155688623 13 1/4 12 1/2 0.058252427 September 1903 74 93 0.22754491 12 3/8 9 3/4 0.237288136
October 1903 77 88 0.133333333 10 1/4 9 1/8 0.116129032 November 1903 76 85 0.111801242 11 3/16 9 7/8 0.12462908
December 1903 78 87 0.109090909 13 5/8 11 1/2 0.169154229 January 1904 81 93 0.137931034 15 15/16 13 0.203023758
February 1904 86 110 0.244897959 16 7/16 13 1/4 0.214736842 March 1904 90 103 0.134715026 16 14 3/8 0.106995885
April 1904 93 102 0.092307692 15 5/16 13 7/8 0.098501071 May 1904 100 106 0.058252427 13 7/8 12 5/8 0.094339623

205
June 1904 98 106 0.078431373 12 3/8 10 11/16 0.146341463 July 1904 94 112 0.174757282 11 1/8 10 1/2 0.057803468
August 1904 94 113 0.183574879 11 3/8 10 1/4 0.104046243 September 1904 105 119 0.125 11 3/16 10 0.112094395
October 1904 110 119 0.07860262 10 3/16 9 1/2 0.06984127 November 1904 110 118 0.070175439 9 3/4 8 7/8 0.093959732 December 1904 109 119 0.087719298 8 9/16 6 1/2 0.273858921
January 1905 115 121 0.050847458 7 6 5/8 0.055045872 February 1905 113 123 0.084745763 7 3/4 7 0.101694915
March 1905 111 118 0.061135371 7 11/16 7 3/16 0.067226891 April 1905 86 120 0.330097087 7 1/2 7 3/16 0.042553191 May 1905 87 111 0.242424242 8 3/4 7 7/16 0.162162162
June 1905 94 107 0.129353234 9 3/4 8 3/16 0.174216028 July 1905 86 105 0.19895288 11 1/8 9 3/4 0.131736527
August 1905 78 87 0.109090909 10 5/8 10 5/16 0.029850746 September 1905 79 86 0.084848485 10 1/2 10 1/16 0.042553191
October 1905 83 91 0.091954023 10 11/16 9 3/4 0.091743119 November 1905 83 90 0.080924855 11 5/8 10 3/4 0.078212291 December 1905 85 89 0.045977011 12 1/8 11 3/8 0.063829787
January 1906 85 90 0.057142857 11 3/4 11 3/16 0.049046322 February 1906 83 87 0.047058824 10 7/8 10 9/16 0.029154519
March 1906 78 85 0.085889571 11 1/4 10 1/2 0.068965517 April 1906 84 91 0.08 11 7/16 11 1/8 0.027700831
May 1906 86 97 0.120218579 11 7/16 11 0.038997214 June 1906 83 89 0.069767442 11 1/8 10 13/16 0.028490028 July 1906 72 85 0.165605096 11 1/8 10 5/8 0.045977011
August 1906 69 73 0.056338028 10 5/8 9 3/16 0.14511041 September 1906 69 74 0.06993007 9 3/8 9 1/8 0.027027027
October 1906 71 74 0.04137931 11 3/8 9 11/16 0.160237389 November 1906 72 74 0.02739726 11 3/8 9 5/8 0.166666667 December 1906 73 75 0.027027027 11 3/8 10 1/8 0.11627907
January 1907 71 75 0.054794521 10 9/16 10 1/4 0.03003003 February 1907 73 77 0.053333333 10 5/8 10 7/16 0.017804154
March 1907 72 76 0.054054054 11 1/16 10 5/8 0.040345821 April 1907 74 81 0.090322581 11 3/8 10 1/2 0.08
May 1907 79 100 0.234636872 12 1/2 11 1/2 0.083333333 June 1907 87 98 0.118918919 13 12 1/2 0.039215686 July 1907 89 97 0.086021505 13 1/8 12 5/8 0.038834951
August 1907 82 92 0.114942529 13 9/16 12 3/4 0.06175772 September 1907 91 98 0.074074074 13 9/16 11 1/2 0.164588529
October 1907 91 105 0.142857143 11 5/8 10 5/16 0.11965812

206
November 1907 88 97 0.097297297 11 3/8 10 5/8 0.068181818 December 1907 92 101 0.093264249 11 7/8 11 1/8 0.065217391
January 1908 91 102 0.113989637 12 1/4 11 3/8 0.074074074 February 1908 89 100 0.116402116 11 7/8 11 3/8 0.043010753
March 1908 92 101 0.093264249 11 3/8 10 1/2 0.08 April 1908 89 100 0.116402116 10 1/2 9 13/16 0.067692308 May 1908 99 111 0.114285714 11 1/2 9 15/16 0.145772595 June 1908 89 100 0.116402116 11 7/8 11 3/8 0.043010753 July 1908 84 92 0.090909091 11 3/8 10 3/8 0.091954023
August 1908 90 96 0.064516129 10 3/8 9 1/8 0.128205128 September 1908 95 102 0.07106599 9 3/16 9 0.020618557
October 1908 97 102 0.050251256 9 8 3/4 0.028169014
November 1908 99 106 0.068292683 9 1/16 8 7/8 0.020905923 December 1908 99 107 0.077669903 8 15/16 8 11/16 0.028368794
January 1909 103 108 0.047393365 9 5/8 8 7/8 0.081081081 February 1909 107 124 0.147186147 9 1/2 9 5/16 0.019933555
March 1909 117 126 0.074074074 9 1/2 9 1/4 0.026666667 April 1909 125 145 0.148148148 10 5/16 9 7/16 0.088607595 May 1909 142 154 0.081081081 11 10 3/16 0.076696165 June 1909 150 160 0.064516129 11 1/2 10 7/8 0.055865922 July 1909 106 124 0.156521739 12 3/8 11 1/2 0.073298429
August 1909 99 106 0.068292683 12 1/2 12 1/8 0.030456853 September 1909 100 115 0.139534884 13 3/16 12 3/16 0.078817734
October 1909 116 121 0.042194093 14 7/16 13 0.104783599 November 1909 115 121 0.050847458 14 11/16 14 1/8 0.039045553 December 1909 116 128 0.098360656 15 3/4 14 1/4 0.1
January 1910 121 127 0.048387097 15 3/4 14 7/8 0.057142857 February 1910 118 127 0.073469388 15 1/16 14 5/8 0.029473684
March 1910 115 125 0.083333333 14 13/16 14 9/16 0.017021277 April 1910 106 121 0.13215859 14 13/16 14 9/16 0.017021277 May 1910 98 118 0.185185185 15 1/8 14 5/8 0.033613445 June 1910 98 104 0.059405941 15 14 1/2 0.033898305 July 1910 98 112 0.133333333 15 3/16 14 5/8 0.037735849
August 1910 99 104 0.049261084 15 1/4 14 5/8 0.041841004 September 1910 95 101 0.06122449 14 1/4 13 1/4 0.072727273
October 1910 91 99 0.084210526 15 5/8 13 9/16 0.141327623 November 1910 89 94 0.054644809 14 3/4 14 3/16 0.03887689 December 1910 90 96 0.064516129 14 15/16 14 11/16 0.016877637
January 1911 92 101 0.093264249 15 14 15/16 0.004175365 February 1911 86 96 0.10989011 14 15/16 14 1/2 0.029723992
March 1911 84 92 0.090909091 14 5/8 14 3/8 0.017241379

207
April 1911 83 92 0.102857143 15 1/4 14 3/8 0.05907173 May 1911 90 104 0.144329897 15 11/16 15 1/4 0.028282828 June 1911 86 96 0.10989011 15 7/16 15 0.028747433 July 1911 83 91 0.091954023 15 1/16 12 3/8 0.195899772
August 1911 87 92 0.055865922 12 1/8 11 1/2 0.052910053 September 1911 89 97 0.086021505 11 7/8 10 9/16 0.116991643
October 1911 94 103 0.091370558 10 3/16 9 3/8 0.083067093 November 1911 90 99 0.095238095 9 1/2 9 1/4 0.026666667 December 1911 91 98 0.074074074 9 1/4 9 1/16 0.020477816
January 1912 93 102 0.092307692 9 13/16 9 3/16 0.065789474 February 1912 95 103 0.080808081 10 1/2 9 7/8 0.061349693
March 1912 98 105 0.068965517 10 15/16 10 3/8 0.052785924
April 1912 99 117 0.166666667 12 11 0.086956522 May 1912 105 120 0.133333333 11 15/16 11 1/2 0.037333333 June 1912 106 113 0.063926941 12 1/4 11 5/8 0.052356021 July 1912 97 110 0.125603865 13 1/4 12 3/8 0.068292683
August 1912 100 108 0.076923077 13 11 3/16 0.149870801 September 1912 101 107 0.057692308 11 1/2 11 3/16 0.027548209
October 1912 102 111 0.084507042 11 7/16 10 11/16 0.06779661 November 1912 99 107 0.077669903 12 3/4 11 7/16 0.108527132 December 1912 99 112 0.123222749 13 12 5/8 0.029268293
January 1913 107 115 0.072072072 13 12 1/4 0.059405941 February 1913 102 112 0.093457944 12 3/4 12 3/8 0.029850746
March 1913 101 108 0.066985646 12 1/2 12 3/8 0.010050251 April 1913 102 109 0.066350711 12 9/16 12 3/16 0.03030303 May 1913 99 109 0.096153846 12 7/16 12 1/8 0.025445293 June 1913 93 108 0.149253731 12 5/8 12 3/16 0.035264484 July 1913 84 96 0.133333333 12 5/8 12 3/16 0.035264484
August 1913 84 90 0.068965517 12 5/16 11 7/8 0.036175711

208
References
New Orleans Cotton Exchange Records, Manuscripts Collection 652, Louisiana Research
Collection, Howard-Tilton Memorial Library, Tulane University, New Orleans, LA
70118.
Chicago Board of Trade collection, Special Collections & University Archives,
University of Illinois at Chicago Library, Chicago, IL 60607.
Abolafia, M. 1996. Making Markets: Opportunism and Restraint on Wall Street.
Cambridge, MA: London.
Akerlof, G. A. 1970. “The market for" lemons": Quality uncertainty and the market
mechanism.” The Quarterly Journal of Economics, 488-500.
Appadurai, A. 1986. The Social Life of Things: Commodities in Cultural Perspective.
Aspers, P. 2009. “Knowledge and Valuation in Markets.” Theory and Society 38 (2):
111–31.
Aspers, P. and J. Beckert. 2011. “Value in Markets.” In J. Beckert & P. Aspers (eds) The
Worth of Goods: Valuation and Pricing in the Economy, Oxford, Oxford University
Press.
Baker, W. E. 1984. “The Social Structure of a National Securities Market.” American
Journal of Sociology, 89(4), 775–811.
Barnes, B. 1983 “Social Life as Bootstrapped Induction.” Sociology 17(4): 524-545.
Baron, J.N. 2004. “Employing Identities in Organizational Ecology.” Industrial and
Corporate Change 13 (1): 3–32.
Barry, A. 2001. Political Machines: Governing a Technological Society. London, UK:
The Athlone Press.
Beckert, J. 1996. “What Is Sociological about Economic Sociology? Uncertainty and the
Embeddedness of Economic Action.” Theory and Society 25 (6): 803–40.
Beckert, J. 2003. “Economic Sociology and Embeddedness: How Shall We
Conceptualize Economic Action?” Journal of Economic Issues 37 (3): 769–87.
Beckert, J. 2007. “The Great Transformation of Embeddedness: Karl Polanyi and the
New Economic Sociology.” MPIfG Discussion Paper 07/1. Max Planck Institute for
the Study of Societies, Cologne.
Beckert, J. 2009. “The Social Order of Markets.” Theory and Society 38 (3): 245–69.

209
Beunza, D. and D. Stark. 2004. “Tools of the Trade: The Socio-technology of Arbitrage
in a Wall Street Trading Room.” Industrial and Corporate Change 13 (2): 369–400.
Beunza, D. and R. Garud. 2007. “Calculators, Lemmings or Frame-makers? The
Intermediary Role of Securities Analysts.” The Sociological Review 55: 13–39.
Beunza, D., I. Hardie, and D. MacKenzie. 2006. “A Price is a Social Thing: Towards a
Material Sociology of Arbitrage.” Organization Studies 27 (5): 721–45.
Biernacki, R. 1995. The Fabrication of Labor: Germany and Britain, 1640-1914.
Berkeley: University of California Press.
Bijker, W.E., T.P. Hughes and T.J. Pinch. 1987. The Social Construction of
Technological Systems: New Directions in the Sociology and History of Technology.
Cambridge, MA: MIT Press.
Bloor, D. 1997. Wittgenstein, Rules and Institutions. New York: Routledge Press.
Boltanski, L. and L. Thévenot. [1991] 2006. On Justification: Economies of Worth.
Princeton, NJ: Princeton University Press.
Bouilly, R. 1975. “The Development of American Cotton Exchanges, 1870-1916.”
(Unpublished doctoral dissertation). University of Missouri, Columbia, MO.
Bowker, G. 1994. “Information Mythology and Infrastructure.” In L. Bud-Frierman (ed.)
Information Acumen: The Understanding and Use of Knowledge in Modern
Business, London, UK: Routledge.
Bowker, G. and S.L. Star. 1999. Sorting Things out: Classification and Its Consequences.
Cambridge, MA: MIT Press.
Boyle, J. 1922. Chicago Wheat Prices for Eighty-One Years: Daily, Monthly and Yearly
Fluctuations and Their Causes. Ithaca, NY: Cornell University Press.
Boyle, J. 1934. Cotton and the New Orleans Cotton Exchange: A Century of Commercial
Evolution. Garden City, NY: Country Life Press.
Burt, R. 1992. Structural Holes: The Social Structure of Competition. Harvard University
Press.
Busch, L. 2000. “The Moral Economy of Grades and Standards.” Journal of Rural
Studies 16 (3): 273–83.
Caldwell, S.A. 1980. A Banking History of Louisiana. Baton Rouge, LA: Ayer
Publishing.
Çalışkan, K. and M. Callon. 2010. “Economization, Part 2: A Research Programme for
the Study of Markets.” Economy and Society 39 (1): 1–32.

210
Callon, M. 1986. “Some Elements of a Sociology of Translation.” In J. Law (ed.) Power,
Action and Belief: A New Sociology of Knowledge, London: Routledge.
Callon, M. 1998a. “The Embeddedness of Economic Markets in Economics.” In M.
Callon (ed.) The Laws of the Markets, Oxford: Blackwell.
Callon, M. 1998b. “An Essay on Framing and Overflowing: Economic Externalities
Revisited by Sociology.” In M. Callon (ed.) The Laws of the Markets, Oxford:
Blackwell.
Callon, M. 2007. "What Does It Mean to Say That Economics Is Performative?" In Do
Economists Make Markets?: On the Performativity of Economics. MacKenzie, D.A., F.
Muniesa, and L. Siu, eds. Princeton University Press.
Callon, M. 2008. “Economic Markets and the Rise of Interactive Agencements: From
Prosthetic Agencies to Habilitated Agencies.” In T.J. Pinch and R. Swedberg (eds)
Living in a Material World: Economic Sociology Meets Science and Technology
Studies, Boston: MIT Press.
Callon, M., and B. Latour. 1992. “Don’t Throw the Baby out with the Bath School! A
Reply to Collins and Yearley.” In S. Pickering (ed.) Science as Practice and
Culture, Chicago: University of Chicago Press.
Callon, M., C. Méadel, and V. Rabeharisoa. 2002. “The Economy of Qualities.”
Economy and Society 31 (2): 194–217.
Carruthers, B.G., and S. Babb. 1996. “The Color of Money and the Nature of Value:
Greenbacks and Gold in Postbellum America.” American Journal of Sociology,
1556–91.
Carruthers, Bruce G. 1996. City of Capital. Princeton, NJ: Princeton University Press.
Cowing, C.B. 1965. Populists, Plungers, and Progressives: A Social History of Stock and
Commodity Speculation, 1890-1936. Princeton, NJ: Princeton University Press.
Cronon, W. 1992. Nature’s Metropolis: Chicago and the Great West. New York: WW
Norton & Company.
DeGoede, M. 2005. Virtue, Fortune, and Faith: A Genealogy of Finance. Minneapolis,
MN: University of Minnesota Press.
Didier, E. 2007. “Do Statistics ‘perform’ the Economy?” In D. MacKenzie, F. Muniesa
and L. Siu (eds) Do Economists Make Markets, Princeton, NJ: Princeton University
Press.
DiMaggio, P. 1994. “Economy and Culture.” In N.J. Smelser and R. Swedberg (eds)
Handbook of Economic Sociology, Princeton, NJ: Princeton University Press.

211
DiMaggio, P. and W.W. Powell. 1983. “The Iron Cage Revisited: Institutional
Isomorphism and Collective Rationality in Organizational Fields.” American
Sociological Review, 147–60.
Duhem, P. [1894] 1996. “Some Reflections on the Subject of Experimental Physics.”
In Pierre Duhem: Essays in History and Philosophy of Science. Trans. Roger Ariew
and Peter Barker. Hackett Pub Co Inc.
Edwards, P. 2010. A Vast Machine: Computer Models, Climate Data, and the Politics of
Global Warming. Cambridge: MIT Press.
Edwards, P.N., G.C. Bowker, S.J. Jackson, and R. Williams 2009. “Introduction: An
Agenda for Infrastructure Studies.” Journal of the Association for Information
Systems, 10(5): 364-374.
Ellis, L.T. 1973. “The New Orleans Cotton Exchange: The Formative Years, 1871-
1880.” The Journal of Southern History 39 (4): 545–64.
Espeland, W.N. 1998. The Struggle for Water: Politics, Rationality and Identity in the
American Southwest. Chicago: University of Chicago Press.
Espeland, W.N. and M. Sauder. 2007. “Rankings and Reactivity: How Public Measures
Recreate Social Worlds.” American Journal of Sociology 113(1): 1-40.
Espeland, W.N., and M.L. Stevens. 1998. “Commensuration as a Social Process.” Annual
Review of Sociology, 313–43.
Fabian, A. 1990. Card Sharps, Dream Books, and Bucket Shops: Gambling in 19th-
century America. Ithaca, NY: Cornell University Press.
Fama, E.F. 1970. "Efficient capital markets: A review of theory and empirical work." The
Journal of Finance 25(2): 383-417.
Ferris, W. 1988. The Grain Traders. East Lansing: Michigan State University Press.
Fleck, L. 1979. Genesis and Development of a Scientific Fact. Chicago: University of
Chicago Press.
Fligstein, Neil. 1990. The Transformation of Corporate Control. Cambridge: Harvard
University Press.
———. 2001. The Architecture of Markets: An Economic Sociology of Twenty-First-
Century Capitalist Societies. Princeton, NJ: Princeton University Press.
Foucault, M. 1970. The Order Of Things: An Archaeology Of the Human Sciences.
London: Tavistock.
Foucault, M. 1982. The Archaeology of Knowledge. New York: Pantheon Books.

212
Fourcade, M. 2011. “Price and Prejudice: On Economics, and the
Enchantment/Disenchantment of Nature.” In J. Beckert & P. Aspers (eds) The Worth
of Goods: Valuation and Pricing in the Economy, Oxford, Oxford University Press.
Fourcade, M. and K. Healy. 2013. “Classification Situations: Life-chances in the
Neoliberal Era.” Accounting, Organizations and Society 38 (8): 559–72.
Fourcade, M., and K. Healy. 2007. “Moral Views of Market Society.” Annual Review of
Sociology. 33: 285–311.
Garcia-Parpet, M-F. 2007. “The Social Construction of a Perfect Market: The Strawberry
Auction at Fontaines-En-Sologne.” In D. MacKenzie, F. Muniesa and L. Siu (eds)
Do Economists Make Markets, Princeton, NJ: Princeton University Press.
Garside, A. 1935. Cotton Goes to Market: a Graphic Description of a Great Industry.
New York: Frederick A. Stokes Co.
Goldstein, B. 1928. Marketing: A Farmer’s Problem. New York: Macmillan.
Granovetter, M. 1985. “Economic Action and Social Structure: The Problem of
Embeddedness.” American Journal of Sociology, 481–510.
Granovetter, M.S. 1973. “The Strength of Weak Ties.” American Journal of Sociology,
1360–80.
———. 1974. Getting a Job: A Study of Contacts and Careers. Chicago: University of
Chicago Press.
Greif, A. 1989. “Reputation and Coalitions in Medieval Trade: Evidence on the Maghribi
Traders.” The Journal of Economic History, 49 (4): 857-882.
Guala, F. 2001. “Building Economic Machines: The FCC Auctions.” Studies in History
and Philosophy of Science Part A 32 (3): 453–77.
———. 2007. “How to Do Things with Experimental Economics.” In D. MacKenzie, F.
Muniesa and L. Siu (eds) Do Economists Make Markets, Princeton, NJ: Princeton
University Press.
Guseva, A., and A. Rona-Tas. 2001. “Uncertainty, Risk, and Trust: Russian and
American Credit Card Markets Compared.” American Sociological Review, 623–46.
Hacking, I. 1992. “‘Style’ for Historians and Philosophers.” Studies in History and
Philosophy of Science Part A 23 (1): 1–20.
Hammond, M.B. 1897. “The Cotton Industry: An Essay in American Economic History.”
Publications of the American Economic Association, New Series, No.1. Ithaca, NY.

213
Hatherley, D., D. Leung and D. MacKenzie. 2008. “The Finitist Accountant:
Classifications, Rules and the Construction of Profits.” In Pinch, T. and Swedberg,
R. (eds) Living in a Material World, Cambridge, MA: MIT Press.
Hayek, F. A. 1945. “The Use of Knowledge in Society.” The American Economic
Review, 35(4): 519-530.
Healy, K. 2006. Last Best Gifts: Altruism and the Market for Human Blood and Organs.
Chicago: University of Chicago Press.
Hieronymus, T.A. 1977. Economics of Futures Trading for Commercial and Personal
Profit. New York: Commodity Research Bureau, Inc.
Hill, L.D. 1990. Grain Grades and Standards: Historical Issues Shaping the Future.
Urbana, IL: University of Illinois Press.
Hirschman, A.O. 1977. The Passions and the Interests. Princeton, NJ: Princeton
University Press.
Hirschman, D. and E. Popp Berman. 2014. “Do Economists Make Policies? On the
Political Effects of Economics.” Socio-Economic Review 12(4):779-811.
Hoffman, G.W. 1932. Futures Trading Upon Organized Commodity Markets in the
United States. Philadelphia: University of Pennsylvania Press.
Hollingsworth, J.R. and R. Boyer, eds. 1999. Contemporary Capitalism: The
Embeddedness of Institutions. Cambridge: Cambridge University Press.
Hughes, T.P. 1987. “The Evolution of Large Technological Systems.” In W.E Bijker,
T.P. Hughes, and T.J. Pinch (eds) The Social Construction of Technological
Systems: New Directions in the Sociology and History of Technology, Cambridge,
MA: MIT Press.
John, R.R. 2010. Network Nation. Cambridge: Harvard University Press.
Jones, F.M. 1935. “Middlemen in the Domestic Trade of the United States, 1800-1860.”
Illinois Studies in the Social Sciences. Vol. xxi, no. 3.
Karpik, L. 2010. Valuing the Unique: The Economics of Singularities. Princeton, NJ:
Princeton University Press.
Kendall, L.T. 1956. “Chicago Board of Trade and the Federal Government.”
(Unpublished doctoral dissertation). Indiana University, Bloomington, IN.
Kirk, S.A. and H. Kutchins. 1992. The Selling of DSM: The Rhetoric of Science in
Psychiatry. Livingston, NJ: Transaction Publishers.
Knight, F.H. 1921. Risk, Uncertainty and Profit. New York: Hart, Schaffner and Marx.

214
Knorr Cetina, K. 2003. “From Pipes to Scopes: The Flow Architecture of Financial
Markets.” Distinktion: Scandinavian Journal of Social Theory 4 (2): 7–23.
Knorr Cetina, K. and B. Grimpe. 2008. “Global Financial Technologies: Scoping
Systems That Raise the World.” In Pinch, T.J. and Swedberg, R. (eds) Living in a
Material World, Cambridge, MA: MIT Press.
Knorr Cetina, K. and U. Bruegger. 2002. “Global Microstructures: The Virtual Societies
of Financial markets1.” American Journal of Sociology 107 (4): 905–50.
Krippner, G.R. 2001. “The Elusive Market: Embeddedness and the Paradigm of
Economic Sociology.” Theory and Society 30 (6): 775–810.
Krippner, G.R., and A.S. Alvarez. 2007. “Embeddedness and the Intellectual Projects of
Economic Sociology.” Annual Review of Sociology. 33: 219–40.
Kuhn, T.S. 1962. The Structure of Scientific Revolutions. Chicago: University Of
Chicago Press.
Lampland, M. (2010) ‘False numbers as formalizing practices’, Social Studies of Science
40 (3): 377–404.
Lampland, M. and S.L. Star. 2009. Standards and Their Stories: How Quantifying,
Classifying, and Formalizing Practices Shape Everyday Life. Ithaca, NY: Cornell
University Press.
Latour, B. 1987. Science in Action: How to Follow Scientists and Engineers Through
Society. Cambridge: Harvard University Press.
Latour, B. 2005. Reassembling the Social: An Introduction to Actor-Network-Theory.
Oxford: Oxford University Press.
Lawrence, T.B., and N. Phillips. 2004. “From Moby Dick to Free Willy: Macro-Cultural
Discourse and Institutional Entrepreneurship in Emerging Institutional Fields.”
Organization 11 (5): 689–711.
Lea, T. and Pholeros, P. (2010) ‘This is not a pipe: the treacheries of indigenous
housing’, Public Culture 22(1): 187-209.
Lee, G. 1938. “History of the Chicago Grain Elevator Industry, 1840-1890.”
(Unpublished doctoral dissertation). Harvard University, Cambridge, MA.
Levy, J.I. 2006. “Contemplating Delivery: Futures Trading and the Problem of
Commodity Exchange in the United States, 1875–1905.” The American Historical
Review 111 (2): 307–35.
Lorrain, F. and H.C. White. 1971. “Structural Equivalence of Individuals in Social
Networks.” The Journal of Mathematical Sociology 1 (1): 49–80.

215
Lurie, J. 1979. The Chicago Board of Trade, 1859-1905: The Dynamics of Self-
Regulation. Chicago: University of Illinois Press.
MacKenzie, D. 2006. An Engine, Not a Camera: How Financial Models Shape Markets.
Boston: The MIT Press.
MacKenzie, D. 2007. “The Material Production of Virtuality: Innovation, Cultural
Geography and Facticity in Derivatives Markets.” Economy and Society, 36(3),
355–376.
MacKenzie, D. and Y. Millo. 2003. “Constructing a Market, Performing Theory: The
Historical Sociology of a Financial Derivatives Exchange.” American Journal of
Sociology 109 (1): 107–45.
MacKenzie, D., F. Muniesa, and L. Siu. 2007. Do Economists Make Markets?: On the
Performativity of Economics. Princeton, NJ: Princeton University Press.
Markham, J.W. 1987. The History of Commodity Futures Trading and Its Regulation.
Westport, CT: Praeger.
Markham, J.W. 2002. A Financial History of the United States: From Christopher
Columbus to the Robber Barons (1492-1900). Armonk, NY: ME Sharpe.
Marx, K. 1976. Capital: Volume 1: A Critique of Political Economy. New York: Penguin
Classics.
Maurer, B. 2002. “Repressed Futures: Financial Derivatives’ Theological Unconscious.”
Economy and Society, 31(1), 15–36.
Merton, R. K. 1948. The Sociology of Science: Theoretical and Empirical Investigations.
Chicago: University Of Chicago Press.
Meyer, J.W., and B. Rowan. 1977. “Institutionalized Organizations: Formal Structure as
Myth and Ceremony.” American Journal of Sociology, 340–63.
Miller, D. 2005. Materiality. Durham, NC: Duke University Press.
Miller, P. 2008. “Calculating Economic Life.” Journal of Cultural Economy 1 (1): 51–64.
Miller, P. and T. O’Leary. 1987. “Accounting and the Construction of the Governable
Person.” Accounting, Organizations and Society 12 (3): 235–65.
Miller, P., and N. Rose. 1990. “Governing Economic Life.” Economy and Society 19 (1):
1–31.
Millerand, F. and G. Bowker. 2009. “Metadata Standards: Trajectories and Enactment in
the Life of an Ontology.” In Lampland, M. and Star, L. (eds) Standards and Their

216
Stories: How Quantifying, Classifying, and Formalizing Practices Shape Everyday
Life, Ithaca, NY: Cornell University Press.
Millo, Y. 2007. “Making Things Deliverable: The Origins of Index-based Derivatives.”
In Callon, M., Millo, Y. and Muniesa, F. (eds) Market Devices, Oxford, UK:
Blackwell Publishing
Millo, Y., F. Muniesa, N.S. Panourgias and S.V. Scott. 2005. “Organised Detachment:
Clearinghouse Mechanisms in Financial Markets.” Information and Organization 15
(3): 229–46.
Mirowski, P. and E. Nik-Khah. 2007. “Performativity, and a Problem in Science Studies,
Augmented With Consideration of the FCC Auctions.” In D. MacKenzie, F.
Muniesa and L. Siu (eds) Do Economists Make Markets, Princeton, NJ: Princeton
University Press.
Mizruchi, M. S. 1996. “What Do Interlocks Do? An Analysis, Critique, and Assessment
of Research on Interlocking Directorates.” Annual review of sociology, 22(1): 271-
298.
Mizruchi, M.S. and L.B. Stearns. 2001. “Getting Deals Done: The Use of Social
Networks in Bank Decision-Making.” American Sociological Review 66(5):647–71.
Muniesa, F. 2007. “Market Technologies and the Pragmatics of Prices.” Economy and
Society 36 (3): 377–95.
Muniesa, F. and M. Callon. 2007. “Economic Experiments and the Construction of
Markets.” In D. MacKenzie, F. Muniesa and L. Siu (eds) Do Economists Make
Markets, Princeton, NJ: Princeton University Press.
O’Malley, M. 1994. “Specie and Species: Race and the Money Question in Nineteenth-
Century America.” The American Historical Review 99 (2): 369–95.
Padgett, J.F. and C.K. Ansell. 1993. “Robust Action and the Rise of the Medici, 1400-
1434.” American Journal of Sociology, 1259–1319.
Palmer, D. and B.M. Barber. 2001. “Challengers, Elites, and Owning Families: A Social
Class Theory of Corporate Acquisitions in the 1960s.” Administrative Science
Quarterly 46 (1): 87–120.
Pardo-Guerra, J.P. 2010. “Creating Flows of Interpersonal Bits: The Automation of the
London Stock Exchange, c. 1955–90.” Economy and Society 39 (1): 84–109.
Pardo-Guerra, J.P. 2014. “Making Markets: Infrastructures, Engineers and the Moral
Technologies of Finance.” (Unpublished paper), London School of Economics and
Political Science, London.

217
Peirce, C.S. 1931-1958. Collected Papers of Charles Sanders Peirce. (Eds) C.
Hartshorne, P. Weiss and A.W. Burks, Cambridge: Harvard University Press.
Perrow, C. 1984. Normal Accidents: Living with High Risk Systems. New York: Basic
Books.
Pietruska, J.L. 2012. “‘Cotton Guessers’: Crop Forecasters and the Rationalizing of
Uncertainty in American Cotton Markets, 1890–1905.” In H. Berghoff, P. Scranton
and U. Spiekermann (eds) The Rise of Marketing and Market Research, London:
Palgrave Macmillan.
Pinch, T. and R. Swedberg. 2008. Living in a Material World: Economic Sociology Meets
Science and Technology Studies. Boston, MA: MIT Press.
Pinzur, D. 2016. “Making the Grade: Infrastructural Semiotics and Derivative Market
Outcomes on the Chicago Board of Trade and New Orleans Cotton Exchange,
1856-1909.” Economy & Society 45 (3-4): 431-453.
Podolny, J.M. 2001. “Networks as the Pipes and Prisms of the Market.” American
Journal of Sociology 107 (1): 33–60.
Polanyi, K. 1957. The Great Transformation: The Political and Economic Origins of Our
Time. Boston: Beacon Press.
Poon, M. 2009. “From New Deal Institutions to Capital Markets: Commercial Consumer
Risk Scores and the Making of Subprime Mortgage Finance.” Accounting,
Organizations and Society 34 (5): 654–74.
Powell, W.W., and P.J. DiMaggio. 1991. “Introduction.” In P.J. DiMaggio and W.W.
Powell (eds) The New Institutionalism in Organizational Analysis, Chicago:
University Of Chicago Press.
Preda, A. 2006. “Socio-technical Agency in Financial Markets.” Social Studies of Science
36 (5): 753–82.
Preda, A. 2009. Framing Finance: The Boundaries of Markets and Modern Capitalism.
Chicago: University of Chicago Press.
Pryke, M. and J. Allen. 2000. “Monetized Time-space: Derivatives–money’s ‘New
Imaginary’?” Economy and Society, 29(2), 264–284.
Rona-Tas, A. 2014. “The Off-label Use of Consumer Credit Ratings.” Paper presented at
the Annual Conference of the Society for the Advancement of Socio-Economics,
Chicago, IL.
Rona-Tas, A. & Hiss, S. 2011. “Forecasting as Valuation: The Role of Ratings and
Predictions in the Subprime Mortgage Crisis in the United States.” In Beckert, J. and
Aspers, P. (eds) The Worth of Goods, Oxford, UK: Oxford University Press.

218
Rothstein, M. 1966. “Antebellum Wheat and Cotton Exports: A Contrast in Marketing
Organization and Economic Development.” Agricultural History 40 (2): 91–100.
Saloutos, T. 1960. Farmer Movements in the South, 1865-1933. Berkeley: University of
California Press.
Santos, J. 2002. “Did Futures Markets Stabilise US Grain Prices?” Journal of
Agricultural Economics 53 (1): 25–36.
Shannon, F.A. 1945. “The Farmer’s Last Frontier.” Soil Science 60 (3): 263.
Sherman, A. 1934. The History of the New Orleans Cotton Exchange, 1871-1914.
(Unpublished masters thesis). Tulane University, New Orleans, LA.
Simmel, G. 1950. The Sociology of Georg Simmel. K. Wolff (ed.) Glencoe, IL: Free
Press.
Smith, C. 2011. “Coping With Contingencies in Equity Option Markets: The
‘Rationality’ of Pricing.” In Beckert, J. and Aspers, P. (eds) The Worth of Goods,
Oxford, UK: Oxford University Press.
Smith-Doerr, L., and W.W. Powell. 2005. “Networks and Economic Life.” In N.J.
Smelser and R. Swedberg (eds) Handbook of Economic Sociology, Princeton, NJ:
Princeton University Press.
Star, S. 2002. “Infrastructure and Ethnographic Practice.” Scandinavian Journal of
Information Systems, 14(2): 107-122.
Star, S. and J. Griesemer. 1989. “Institutional Ecology, Translations and Boundary
Objects: Amateurs and Professionals in Berkeley’s Museum of Vertebrate Zoology,
1907-39’, Social Studies of Science 19 (3): 387–420.
Star, S. and K. Ruhleder. 1996. “Steps Toward an Ecology of Infrastructure: Design and
Access for Large Information Spaces.” Information Systems Research 7 (1): 111–34.
Stark, D. 2009. The Sense of Dissonance: Accounts of Worth in Economic Life. Princeton,
NJ: Princeton University Press.
Stigler, G. J. 1961. “The Economics of Information.” Journal of Political Economy
69(3): 213-225.
Stone, A.H. 1915. “The Cotton Factorage System of the Southern States.” The American
Historical Review 20 (3): 557–65.
Taylor, C. 1917. History of the Board of Trade of the City of Chicago. Chicago: RO Law.
Thévenot, L. 1984. “Rules and Implements: Investment in Forms.” Social Science
Information 23 (1): 1–45.

219
Thévenot, L. M. Moody and C. Lafaye. 2000. “Forms of Valuing Nature: Arguments and
Modes of Justification in French and American Environmental Disputes.” In M.
Lamont and L. Thévenot (eds) Rethinking Comparative Cultural Sociology:
Repertoires of Evaluation in France and the United States, Cambridge: Cambridge
University Press.
Thompson, R.L. 1972. Wiring a Continent: The History of the Telegraph Industry in the
United States, 1832-1866. New York: Arno Press.
Useem, M. 1984. The Inner Circle: Large Corporations and the Rise of Business
Political Activity in the US and UK. New York: Oxford University Press.
Uzzi, B. 1997. “Social Structure and Competition in Interfirm Networks: The Paradox of
Embeddedness.” Administrative Science Quarterly, 35–67.
Velthuis, O. 2003. “Symbolic Meanings of Prices: Constructing the Value of
Contemporary Art in Amsterdam and New York Galleries.” Theory and Society 32
(2): 181–215.
White, H. C., Boorman, S. A., & Breiger, R. L. 1976. “Social Structure from Multiple
Networks. Blockmodels of roles and positions.” American Journal of
Sociology 81(4): 730-780.
Williamson, O.E. 1981. “The Economics of Organization: The Transaction Cost
Approach’, American Journal of Sociology, 548-577.
Willis, H.P. 1902. “The Adjustment of Crop Statistics.” Journal of Political Economy,
11(1):1-54.
Wittgenstein, L. 1967. Philosophical Investigations. New York: Blackwell.
Woodman, H.D. 1963. King Cotton and His Retainers: Financing and Marketing the
Cotton Crop of the South, 1800-1925. Lexington, KY: University of Kentucky
Press.
Working, H. 1953. “Futures Trading and Hedging.” The American Economic Review.
43(3): 314-343.
Wright, E.O., A. Levine, and E. Sober. 1992. Reconstructing Marxism: Essays on
Explanation and the Theory of History. London: Verso.
Yenkey, C.B. 2011. “Selling Value in Kenya’s Nairobi Stock Exchange.” In J. Beckert &
P. Aspers (eds) The Worth of Goods: Valuation and Pricing in the Economy,
Oxford, Oxford University Press.
Yenkey, C.B. 2015. “Mobilizing a Market Ethnic Segmentation and Investor Recruitment
into the Nairobi Securities Exchange.” Administrative Science Quarterly, 60(4):561-
595.

220
Zaloom, C. 2004. “Time, Space, and Technology in Financial Networks.” In Castells, M
(ed.) The Network Society: A Cross-cultural Perspective, Northampton, MA: Edgar
Elgar Publishing, Inc.
Zaloom, C. 2006. Out of the Pits: Traders and Technology from Chicago to London.
Chicago: University of Chicago Press.
Zelizer, V.A. 1979. Morals and Markets: The Development of Life Insurance in the
United States. Livingston, NJ: Transaction Publishers.
Zelizer, V.A. 1985. Pricing the Priceless Child: The Changing Social Value of Children.
Princeton, NJ: Princeton University Press.
———. 1997. The Social Meaning of Money: Pin Money, Paychecks, Poor Relief, and
Other Currencies. Princeton, NJ: Princeton University Press.
Zilber, T.B. 2002. “Institutionalization as an Interplay between Actions, Meanings, and
Actors: The Case of a Rape Crisis Center in Israel.” Academy of Management
Journal 45 (1): 234–54.
Zucker, L.G. 1983. “Organizations as Institutions.” Research in the Sociology of
Organizations 2 (1): 1–47.


