Embed Size (px)
Citation preview
25Business Student Perceptions of a Preferred Employer:A Study Identifying Determinants of Employer Branding© 2011 IUP. All Rights Reserved.
Business Student Perceptions of a PreferredEmployer: A Study Identifying Determinants
of Employer Branding
Bhadra J H Arachchige* and Alan Robertson**
There is an increasing evidence that employers need to give greater emphasis to attract the rightemployees to meet their goals of maximizing organizational value and success. The concept of theemployer brand, adapted from marketing theory, has increasingly become the focus of organizationstowards developing their image as an employer of choice, thereby enabling the recruitment andretention of the best possible workforce. An antecedent to the development of an effective employerbrand is the concept of employer attractiveness, the perceived benefits that a potential employeeidentifies with an organization. The paper identifies the significant factors which attract SriLankan university graduates to potential employees, both on a general basis and for specific studentsegments. Drawing on the research results, eight dimensions of employer attractiveness are posited.These would enable organizations to gain a meaningful understanding as to how to strategicallydevelop their employer brand. The paper also discusses the implications of the findings, identifiesthe limitations and suggests the directions for future research.
* Senior Lecturer, Department of Human Resource Management, Faculty of Management Studies andCommerce, University of Sri Jayawardenepura, Sri Lanka. E-mail: [email protected]
** Australian Programs Director, American National College, Sri Lanka. E-mail: [email protected]
IntroductionAlthough a graduate unemployment problem exists in Sri Lanka, there are many fields inwhich graduates are eagerly sought by employers. Even where graduate availability isplentiful, employers in many cases compete actively to attract the higher quality potentialjob applicants. As Collins (2001) in his ‘Good to Great’ study stresses, it’s not just a matterof getting people on the bus before you figure out where to drive it. Of greater importanceis getting the ‘right people’.
It is known that firms with better reputations attract more as well as higher qualityapplicants (Turban and Cable, 2003). Available research on the factors that affect jobseekers’ reputation perceptions of employers is, however, sparse. Of the studies availablemany are inconclusive, often conflicting significantly with each other (Cable and Graham,2000). If employers are to be successful in recruiting the best available talent, it isimportant that they understand their current reputation among job seekers and locate anyincorrect beliefs that may be held (Fombrun, 1996). This process is going to be moreeffective if managers are aware of the factors that are most important in determining theperceptions of job applicants. The principal objective of this study is therefore to identifythese factors.
The IUP Journal of Brand Management, Vol. VIII, No. 3, 201126
Overview of Past ResearchChambers et al. (1998) in “The War for Talent” explore the difficulty faced by large UScompanies in attracting the most suitable executive employees. Reasons for this includethe aging population which is resulting in a reduction of the proportion of working agepeople, no increase in the percentage of female workers, a flattening of workforceproductivity improvements, stable immigration levels and executives not prolonging theircareers. These quantitative factors are further exacerbated by three qualitative challengeswhich Chambers et al. (1998) identify as:
1. The need of a more complex economy for more sophisticated talent with globalbusiness skills, multicultural fluency, technological and entrepreneurial skills,
2. The rise of many small and medium size companies that are increasinglytargeting the same people sought by large companies, and
3. The increase in job mobility.
While Chambers et al. (1998) published these findings more than a decade ago, theirrelevance is nonetheless still current. Konig (2008) acknowledges the existence of a“talent crisis” which he believes will worsen in the years ahead.
“For every person entering the job market by 2012, four will exit. By 2016 theratio will be one to six” (Konig, 2008, p. 46).
In addressing this issue he suggests that businesses should be continually asking thefollowing:
a. Are we attracting the right people at all levels of the organization?
b. Does our corporate culture enable the identification and development of theright talent?
c. Do we offer the incentives which create opportunities for talent to rise withinthe organization?
To bring the right people on board is not simply a matter of placing an advertisementin the newspaper and expecting to be inundated with applications. While advertising andpublicity have a role in the recruitment process, many companies now realize that findingpeople capable of creating organizational success requires the same level of organizationalresearch and planning as does, for example, product development or project management(Kaliprasad, 2006).
Organizational success can be measured in a variety of ways; however there is evidenceto demonstrate that measuring profit per employee is the key to understanding corporatewealth in the present day. Bryan (2007, p. 60) states that:
The real engines of wealth creation today are the knowledge, relationships,reputations and other tangibles created by talented people and represented byinvestments in such activities as R&D, marketing and training.
27Business Student Perceptions of a Preferred Employer:A Study Identifying Determinants of Employer Branding
Bryan advocates that measuring corporate performance by financial indexes alone(balance sheets, cash flows, ROIC) does not truly reflect real wealth generation. He pointsout that from 1995 to 2005 the world’s leading corporations increased their profitabilityfivefold, this being largely generated by a doubling of both profit per employee and thenumber of employees. Hornung (2010) adds weight to this argument in showing thatFortune magazine’s “100 Best Companies to Work for in the US” consistently show higherprofit per employee than firms not on the list.
Over the last decade, companies across the globe have been developing theirreputation image through systematic application of marketing principles to therecruitment and retention of employees. Employer branding, as it is known, has beendescribed as “the sum of a company’s efforts to communicate to existing and prospectivestaff that it is a desirable place to work” (Lloyd, 2002).
The 2008-10 global financial crisis, with its impact on all aspects of economic life,made many companies eager to cut costs across the board. The resulting mergers,acquisitions, hiring freezes and layoffs have undoubtedly dented the image of manycompanies as employers. In arguing that employer branding offers the best way to redefine,and improve the way a company recruits, Johnson and Roberts (2006) cited a study thatindicated 40% of job seekers ranked treatment of employees highest in their perceptionsof organizations as a place to work (29% ranked quality of products or services as mostimportant). Research by the Chartered Institute of Personnel and Development (CIPD)shows that approximately 75% of companies that use employer branding as a tool forrecruitment find it effective (Dyer, 2007).
Sri Lankan organizations have similar demands as do their developed nationcounterparts in attracting and retaining top talent, especially in the light of a growingpost-internal war economy, a shortage of graduate applicants in a number of occupationsectors, and the availability of competitive overseas employment opportunities particularlyin the Middle East. A total of 266,450 Sri Lankans were registered by the ForeignEmployment Bureau as leaving for overseas work in 2010 out of a total workforce ofapproximately 8 million. An additional factor affecting the business sector is the localperception that the security, flexibility and less-pressured work environment of the publicservice offers a more attractive employment proposition. The official unemployment ratein December 2010 stood at 4.9%.
Given the importance of attracting the right people to an organization, Lievens andHighhouse (2003) have explored the most important factors in this process. Theyconcluded that a brand symbolic image model, drawn from the marketing literature,provides a company with a framework for auditing their image as an employer and forbenchmarking their image to competitors. It can also serve to set it apart from othercompanies, more so than job and organizational attributes. They also identify the need forfurther research into how prospective applicants form a global impression of a company,how they make trait inferences and which traits might be more attractive in differenttypes of organizations and industries. Subsequent research supported the importance of
The IUP Journal of Brand Management, Vol. VIII, No. 3, 201128
symbolic beliefs as a recruiting tool but was of limited application as it looked at only oneorganization (Lievens, 2007). There are, however, examples of symbolic traits having apositive impact on recruitment. Greening and Turban (2000) used an experimentalapproach in which they manipulated the Corporate Social Performance (CSP) image oforganizations. They found that prospective job applicants are more likely to pursue jobsfrom socially responsible firms than from firms with poor social performance reputations.
Hieronimus et al. (2005) emphasize the need for companies to determine whichattributes are most important to specific types of potential employees. They mention thattraditional job recruitment focuses on functional employment benefits rather thanintangible and emotional benefits. Moroko and Uncles (2008) also point out that jobseekers can be segmented into a range of groups based on demographic, geographic,psychographic and behavioral characteristics and, as with consumer branding, theseshould be acknowledged in the recruitment process.
Having identified the need for effective recruitment practices and the factors that areimportant to potential recruits, it is also essential to recognize the role played by employerbranding in this process.
There is little doubt that employer branding is increasingly used to attract employees(Business Day, 2004). It should ideally present a picture of the instrumental and symbolictraits of an organization which permit job seekers to differentiate the organization fromits competitors in the recruitment market. During the recruitment process the employerbrand messages indicate the nature of the employment, career opportunities, challengesand the unique features of the organization. They may clarify misconceptions and reducereliance on prior notions (Rousseau, 2001). Backhaus and Tikoo (2004) stress theimportance of accuracy of perceptions about the organization. This is supported by Cableet al. (2000) who warn that providing only positive and desirable value-based informationcan lead to unrealistic expectations on the part of recruits with subsequent disappointmentat a later date, in effect representing a violation of the psychological contract which couldlead to increased intentions to quit, reduced job satisfaction and trust, and decreased jobperformance. A more realistic presentation which provides input on both sides of theemployment opportunity is considered preferable (Meglino amd Ravlin, 1999) and ispurported to reduce unreal expectations which leads to lower employee turnover, increasestrust and perceptions of honesty and reduces role ambiguity (Backhaus and Tikoo, 2004).
The employer brand is, like the consumer brand, all about perception, as Knox andFreeman (2006) indicate in their recruitment process model which is adapted fromDukerich and Carter (2000). One of the key aspects of this model, also highlighted byDavies et al. (2004), is the significance of internal marketing within an organization.An integrated approach needs to be taken for both internal and external marketing forthe recruitment market. Additionally, employer branding strategies should be aligned witha company’s overall corporate brand and customer brand strategy (Hieronimus et al., 2005;Wheeler et al., 2006; and Mark and Toelken, 2009). The messages that firms send out topotential recruits should be reinforced by its own employees. An interesting finding of
29Business Student Perceptions of a Preferred Employer:A Study Identifying Determinants of Employer Branding
Knox and Freeman’s research is that recruiters and potential recruits have statisticallydifferent perceptions of an organization’s image. Recruiters, it is claimed, have a muchrosier picture of how potential recruits see the organization.
Perception is closely aligned to the reputation of an organization. Drawing fromorganizational behavior studies, there is a useful body of research to assist inunderstanding the role of employer branding in the recruitment process as reputation isformed from the image which in turn is a reflection of the brand.
Some research studies have identified a relationship between an organization’sreputation and its success in attracting quality applicants (Fombrun, 1996; and Cable andTurban, 2001), with Highhouse et al. (1999) suggesting overall perceptions of reputationare in fact the most significant factor influencing the choice by recruits. Factors thatcontribute to an organization’s reputation include financial performance, company size,media exposure, advertising expenditures and type of industry (Cable and Graham, 2000).
Turban and Cable’s (2003) study of the impact of a firm’s reputation on thecharacteristics of job applicants can possibly shed some light on the contribution of theemployer brand to job recruitment. They conducted two studies which both supported thebelief that firms with better reputations attract more applicants as well as higher qualityapplicants. They did not, however, identify why this occurs but suggested that the socialidentity and signaling theories may provide an avenue for investigating the causes of therelationship. Subsequent findings by Collins and Han (2004) may indicate that Turban andCable’s study was too simplistic in isolating a single factor, reputation, as a major contributorto recruitment attraction, and that applicant pool quantity and quality are the result of aninteraction between numerous practices. The Collins and Han study examined the influenceof low-involvement and high-involvement recruitment practices, corporate advertising andfirm reputation. While all had some impact, they were nonetheless surprised that firmreputation showed a low level of relationship with applicant pool quantity and quality,although they did find that corporate advertising together with firm reputation did correlatewith recruitment outcomes. This tends to suggest that for employer branding to succeed inits aim of making the organization more attractive to potential recruits, any specificinformation that presents the organization’s employment offering is required to be closelylinked with a general increase in corporate advertising (Edwards, 2010).
Whether it is linked with other factors or not, research has shown that reputation isa significant factor in the recruitment process. Organizations need to recognize the typeof image they present to potential employees and endeavour to present themselves clearlyto the labor market in order to attract the best match of applicant. As to the nature ofthe image there is little agreement. In the earlier discussion on brand identity andorganizational identity, a range of character dimensions were identified from the availableliterature.
A popular approach has been the personification of the organization, in essence givingit human qualities in order for those both in and outside to understand the corporate
The IUP Journal of Brand Management, Vol. VIII, No. 3, 201130
character. This approach does have some criticisms. Firstly, personification essentially isa metaphor. If taken too seriously it can be deceptive as it tends to simplify the complexphenomenon of corporate reputation (Hunt and Menon, 1995). Secondly, organizationsare not human beings and do not share their characteristics (Morgeson and Hofmann,1999). Finally, difficulties arise in comparing the reputations of organizations and inexplaining why one firm has a better reputation than another. One example of a corporatecharacter scale which attempts to overcome these deficiencies has been developed byDavies et al. (2004).
Some generic scales (scales that can be applied to a wide range of organizations) areused to compare firms in more detail. Fortune’s America’s Most Admired Companiesannual survey evaluates companies on eight criteria: quality of management, quality ofproducts and services, innovativeness, long-term investment value, financial soundness,employee talent, use of corporate assets, social responsibility and overall company results(Davies et al., 2004). Similar measures are used in Europe and Asia. A Sri Lankanequivalent is that of the Nielsen Company’s survey of the most respected entities in SriLanka (Lanka Monthly Digest, 2010) which selects the top 100 businesses on the basis offinancial performance, quality consciousness, management profile, work environment,corporate social responsibility, honesty, innovation, dynamism, vision and nation-mindedness.
One particularly relevant example of the value of reputation in attracting staff isreported by Cafolla (2008) and relates to the difficulty experienced by mainland Chineseretailers of luxury goods to attract qualified staff capable of providing the high level ofservice required for the demanding customers in their stores. While salary was once themain incentive, it has been replaced by the lure of working for a well-branded company,that which offers training, especially overseas, career growth, an attractive workenvironment and social status.
Another approach to how a company should brand itself as an employer with the goalof attracting new staff is proposed by Moroko and Uncles (2008) who draw on the productbranding strategy of segmentation. They propose that the market for potential employeesshould be segmented, just as it is done for consumer groups, and outline a strategy forcarrying out this based on the five major ways in which marketers think about consumers.Their differences are centered on the profitability consumers bring to a company, theproduct features they prize, the reference groups they turn to for advice and approval, theability of consumers to negotiate attractive prices, and the barriers that may prevent themfrom making purchases. It is suggested that these five segmentation approaches also applyin the context of the employer-employee relationship and can be used as a basis fordeveloping the employer brand as a recruitment tool.
As the previous discussion has shown, the employer brand has a range of dimensionsand is the product of a variety of influencing factors. Its strength and value, the brandequity, is closely related to the level of ‘employer attractiveness’, defined as “theenvisioned benefits that a potential employee sees in working for a specific organization”
31Business Student Perceptions of a Preferred Employer:A Study Identifying Determinants of Employer Branding
(Berthon et al., 2005). The attractiveness of the employer brand and the organizationalreputation will therefore relate to the degree to which the employer brand attracts thenumber and quality of job applicants. As a result, the dimensions of attractiveness needto be identified if organizations wish to maximize the effectiveness of their recruitingprocess. It should be noted however that ‘attractiveness’ is a perception and, as such, willvary between segments of the market for new employees (Moroko and Uncles, 2008).
ObjectivesThe objectives of the study are threefold. Firstly, it is aimed to identify the attributes oforganizations that are most significant in attracting Sri Lankan graduate students to seekemployment, a valuable tool to assist organizational recruitment practices. Students,as with all elements of a population, differ in a variety of ways. Secondly, therefore, theresearch differentiates the perception factors on the basis of student gender, course ofstudy and academic performance. It is considered important to recognize variations in theperceptions of different student segments. This information can give a more specific focusto the efforts of human resource managers to attract the most suitable recruits for theirorganizations. Finally, in order to provide a framework for organizational recruitmentplanning, the research results will be analyzed to identify the key dimensions oforganizational attractiveness within the Sri Lankan context.
MethodologyIn order to obtain the information required to meet the objectives of the study, a sampleof 221 final year business course students from a Sri Lankan university were surveyed. Thestudents were drawn from the following course streams: human resource management(81 students), marketing management (62 students) and finance (78 students). Thesestudents were less than four months away from completing their undergraduate degreesand, as such, actively contemplating their employment prospects. In addition, they hadmostly been working for the previous six months as full-time interns in businessorganizations as a course requirement. This had given them some exposure to work andthe characteristics of different types of employers. It is believed that this was an ideal groupfrom which to gain an understanding of the attributes that will attract graduates to seekemployment in organizations.
Data was gathered from the students through a self-completion questionnaire whichwas divided into two sections. Part A consisted of 32 items representing factors that therespondents may consider important when considering potential employers. Of theseitems, 25 were drawn from an Employer Attractiveness (EmpAt) scale developed byBerthon et al. (2005) as a result of focus groups using final year students at a largeAustralian university. Of the original 32 factors, or employer attributes, that wereidentified by the focus groups, seven were eliminated as a result of a two-stage purificationusing Cronbach’s Alpha. The alpha for the final 25 item EmpAt scale was 0.96. In thereview of literature on this topic, the authors identified further seven factors which werenot included in Berthon et al.’s scale. These were: profitability, company size, awareness
The IUP Journal of Brand Management, Vol. VIII, No. 3, 201132
of the company through advertising and media exposure, type of product and/or serviceproduced, quality of management, honesty and fairness of the organization, and providinggreater respect from family and friends. The seven factors were added to the EmpAt scaleand tested for consistency before being considered in the overall analysis. Respondentswere asked to rate each of the items on a 7-point Likert scale.
Part B of the questionnaire contained five questions which enabled segmentation ofthe students on the basis of gender, course of study and academic success level as reflectedby their GPA.
Data analysis for the first objective, identification of attributes which attract graduateapplicants, was carried out by computing the mean of respondents’ values for each of theitems in Part A of the questionnaire. Once an overall value was obtained, it was furtherextended by calculating the mean for each of the segmented groups in order to providethe information required for objective two.
As a refinement of the information obtained, it was also decided to use PrincipalComponent Analysis (PCA) to attempt to identify the broader dimensions of employerattractiveness.
Analysis and ResultsOverall Preferred Attributes
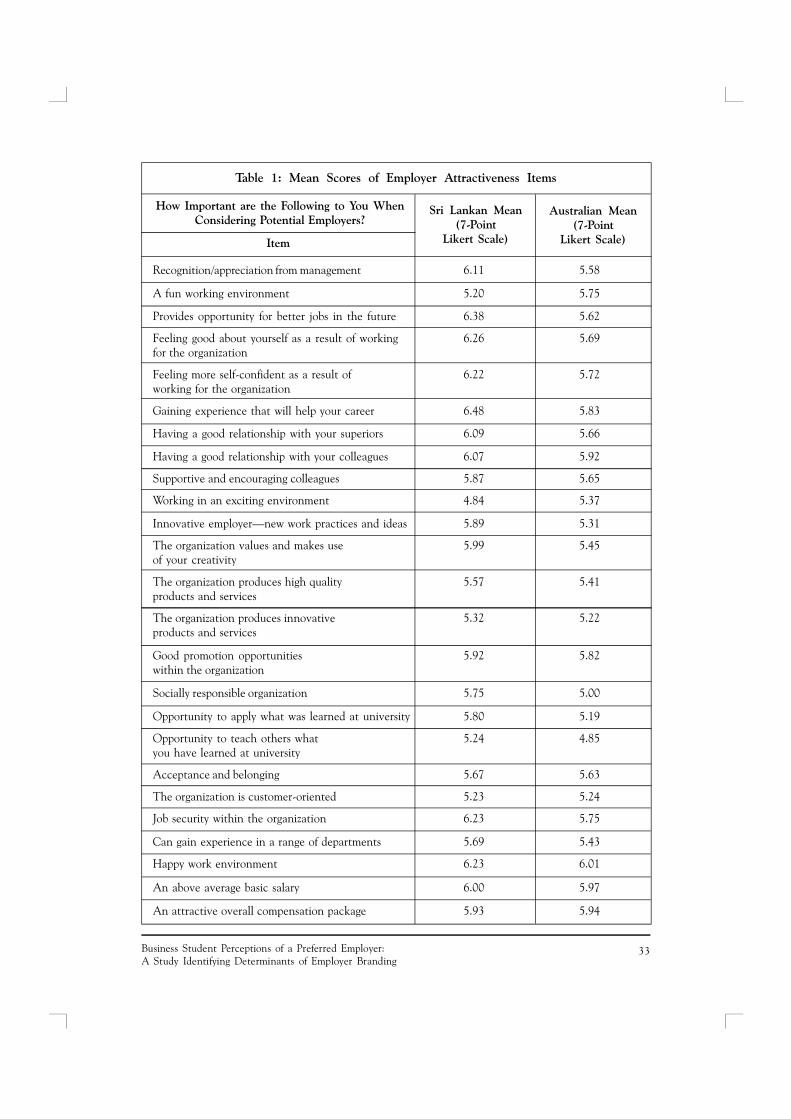
Table 1 indicates the mean scores for the 32 items which were rated on a 7-point Likertscale by the respondents in relation to their importance as an attractor for employment.The first 25 items were used in a trial of the EmpAt scale administered to the final yearbusiness students at an Australian university and the results are included as a comparison.It should be noted that the terminology of some questions was changed to make themmore easily understood by Sri Lankan university students, many of whom come from abackground where English is not used in everyday parlance. The final seven items were,as indicated previously, drawn from the relevant literature and added to the questionnaireas these factors were not included in the EmpAt instrument.
The correlation between the two groups on the 25 common items is 0.577. On thet-test this is not recognized as a significant difference.
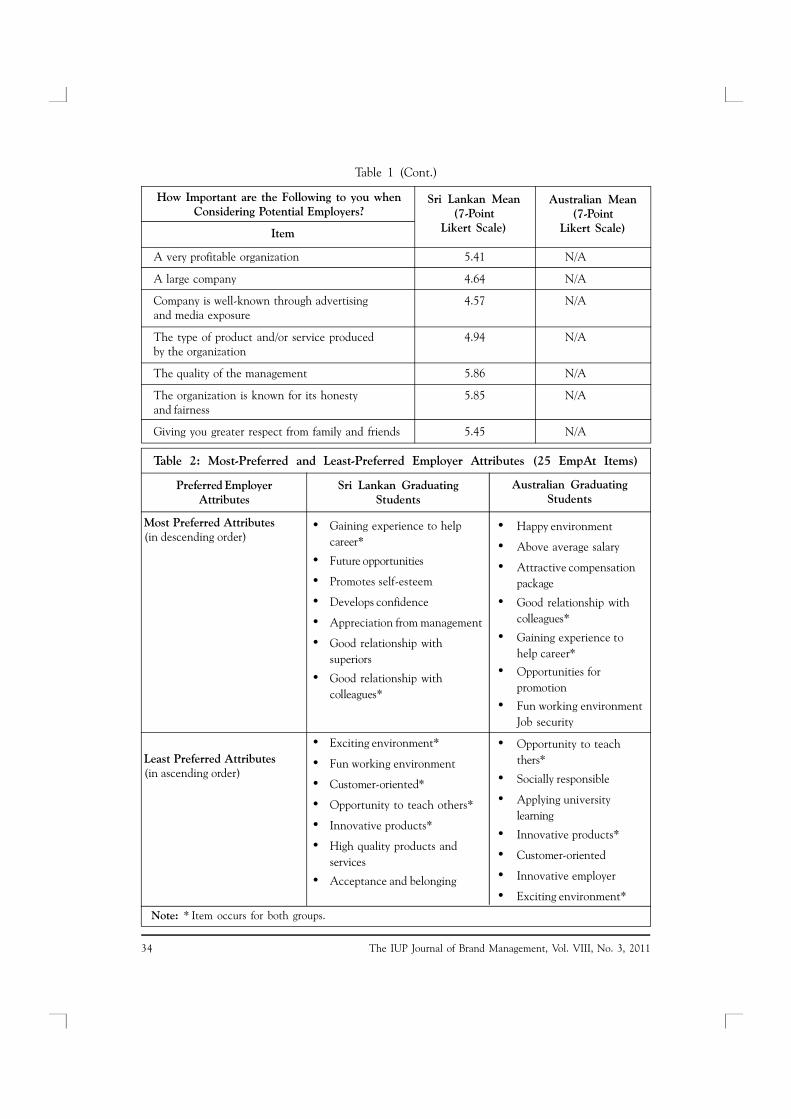
A comparison between the most and least preferred attributes of the two groups basedon the common 25 items is summarized in Table 2.
There is a greater level of commonality between the least preferred employer attributes(57.14%) than the most preferred (28.57%). In relation to the latter, Sri Lankan studentsplace greatest value on the opportunities for self development and relationship withmanagement and superiors. The greater availability of job opportunities together with aless formal working environment and organizational hierarchical relationship structure isreflected in the Australian students’ greater interest in socializing (happiness, fun,
33Business Student Perceptions of a Preferred Employer:A Study Identifying Determinants of Employer Branding
Recognition/appreciation from management 6.11 5.58
A fun working environment 5.20 5.75
Provides opportunity for better jobs in the future 6.38 5.62
Feeling good about yourself as a result of working 6.26 5.69for the organization
Feeling more self-confident as a result of 6.22 5.72working for the organization
Gaining experience that will help your career 6.48 5.83
Having a good relationship with your superiors 6.09 5.66
Having a good relationship with your colleagues 6.07 5.92
Supportive and encouraging colleagues 5.87 5.65
Working in an exciting environment 4.84 5.37
Innovative employer—new work practices and ideas 5.89 5.31
The organization values and makes use 5.99 5.45of your creativity
The organization produces high quality 5.57 5.41products and services
The organization produces innovative 5.32 5.22products and services
Good promotion opportunities 5.92 5.82within the organization
Socially responsible organization 5.75 5.00
Opportunity to apply what was learned at university 5.80 5.19
Opportunity to teach others what 5.24 4.85you have learned at university
Acceptance and belonging 5.67 5.63
The organization is customer-oriented 5.23 5.24
Job security within the organization 6.23 5.75
Can gain experience in a range of departments 5.69 5.43
Happy work environment 6.23 6.01
An above average basic salary 6.00 5.97
An attractive overall compensation package 5.93 5.94
Table 1: Mean Scores of Employer Attractiveness Items
How Important are the Following to You WhenConsidering Potential Employers?
Item
Sri Lankan Mean(7-Point
Likert Scale)
Australian Mean(7-Point
Likert Scale)
The IUP Journal of Brand Management, Vol. VIII, No. 3, 201134
Table 1 (Cont.)
How Important are the Following to you whenConsidering Potential Employers?
Item
Sri Lankan Mean(7-Point
Likert Scale)
Australian Mean(7-Point
Likert Scale)
A very profitable organization 5.41 N/A
A large company 4.64 N/A
Company is well-known through advertising 4.57 N/Aand media exposure
The type of product and/or service produced 4.94 N/Aby the organization
The quality of the management 5.86 N/A
The organization is known for its honesty 5.85 N/Aand fairness
Giving you greater respect from family and friends 5.45 N/A
Table 2: Most-Preferred and Least-Preferred Employer Attributes (25 EmpAt Items)
Sri Lankan GraduatingStudents
Australian GraduatingStudents
Most Preferred Attributes(in descending order)
Least Preferred Attributes(in ascending order)
• Gaining experience to helpcareer*
• Future opportunities
• Promotes self-esteem
• Develops confidence
• Appreciation from management
• Good relationship withsuperiors
• Good relationship withcolleagues*
• Exciting environment*
• Fun working environment
• Customer-oriented*
• Opportunity to teach others*
• Innovative products*
• High quality products andservices
• Acceptance and belonging
• Happy environment
• Above average salary
• Attractive compensationpackage
• Good relationship withcolleagues*
• Gaining experience tohelp career*
• Opportunities forpromotion
• Fun working environmentJob security
• Opportunity to teachthers*
• Socially responsible
• Applying universitylearning
• Innovative products*
• Customer-oriented
• Innovative employer
• Exciting environment*
Note: * Item occurs for both groups.
Preferred EmployerAttributes
35Business Student Perceptions of a Preferred Employer:A Study Identifying Determinants of Employer Branding
collegial relationships) and compensation factors. The cultural and economic differencesbetween the two cohorts are less evident in the least preferred attributes. However, bothgroups tend to display lack of interest in the actual products and services of the organizationsthey wish to work for. This observation needs to be further investigated but it shouldnonetheless be of concern to recruitment personnel if they are to select the type of newlygraduated employees who will most effectively deliver the outcomes required to maximize theirorganization’s success.
Inclusion of the additional seven items on the questionnaire administered to theSri Lankan graduating students was prompted by the results of studies including Cable andGraham (2000), Davies et al. (2004) and Edwards (2010). Three of these items (companysize, exposure and type of product/service) were in fact rated as the lowest of the employerattributes appealing to Sri Lankan graduating business students which contradict thefindings of the overseas studies. As with the Sri Lankan/Australian student comparison,cultural and economic factors may be significant in explaining this result. The most andleast preferred of the 32 items on the extended list is summarized in Table 3.
It is also noteworthy that while the alpha for the original 25 items used in theAustralian survey was reported to be 0.95, it was a lower 0.888 on the same items in theSri Lankan study. This is still well above the minimal acceptable level of 0.7. With theadditional seven items added, the alpha coefficient was 0.903.
Table 3: Most-Preferred and Least-Preferred Employer Attributes (32 Items)
Sri Lankan Graduating Students
Most Preferred Attributes(in descending order)
Least Preferred Attributes(in ascending order)
• Gaining experience to help career
• Future opportunities
• Promotes self-esteem
• Develops confidence
• Appreciation from management
• Good relationship with superiors
• Good relationship with colleagues
• Well-known company
• Size of company
• Exciting environment
• Type of product or service
• Fun working environment
• Customer-oriented
• Opportunity to teach others
• Innovative products
• High quality products and services
Preferred Employer Attributes
The IUP Journal of Brand Management, Vol. VIII, No. 3, 201136
Instrumental and Symbolic AttributesThere is a considerable amount of research demonstrating that applicants are attracted toorganizations on the basis of instrumental dimensions (for example, Highhouse et al.,1999; and Cable and Graham, 2000). Instrumental factors include job and organizationalcharacteristics such as salary, promotional opportunities, career development andorganizational structure. Further studies have, however, revealed that while instrumentalfactors are important in attracting applicants to a particular category of organization, itis the symbolic perspective that differentiates a company from its competitors (Lievensand Highhouse, 2003). The symbolic dimension is related to perceived traits such asinnovativeness, excitement, sincerity and competence. In terms of employer attributespreferred by the Sri Lankan students it can be seen that although instrumental factorspredominate (career experience, future opportunities, recognition from management andinternal relationships), symbolic attributes also influence student perceptions (esteem,confidence and happiness). Where competition for particular types of graduate employeesis tight, HR managers may find that these are the attributes which can prove mosteffective in attracting the applicants they require.
Preferred Attributes of Student SegmentsThe need to recognize that newly graduated applicants vary in terms of personal andacademic attributes and employment interests has been emphasized by Moroko and Uncles(2008). Recruitment practices, therefore, need to be tailored to the specific requirementsof the employees that are sought rather than the ‘one-size-fits-all’ approach. For thisreason the factors affecting graduate perceptions need to be considered for differentstudent segments. In this respect, we have examined the variations in preferred attributeson the basis of gender, academic course and level of academic achievement. The meansof the responses for each of the 32 test items of the groupings were measured forcorrelation in order to identify whether any significant differences could be identified. Theresults are summarized in Tables 4, 5 and 6.
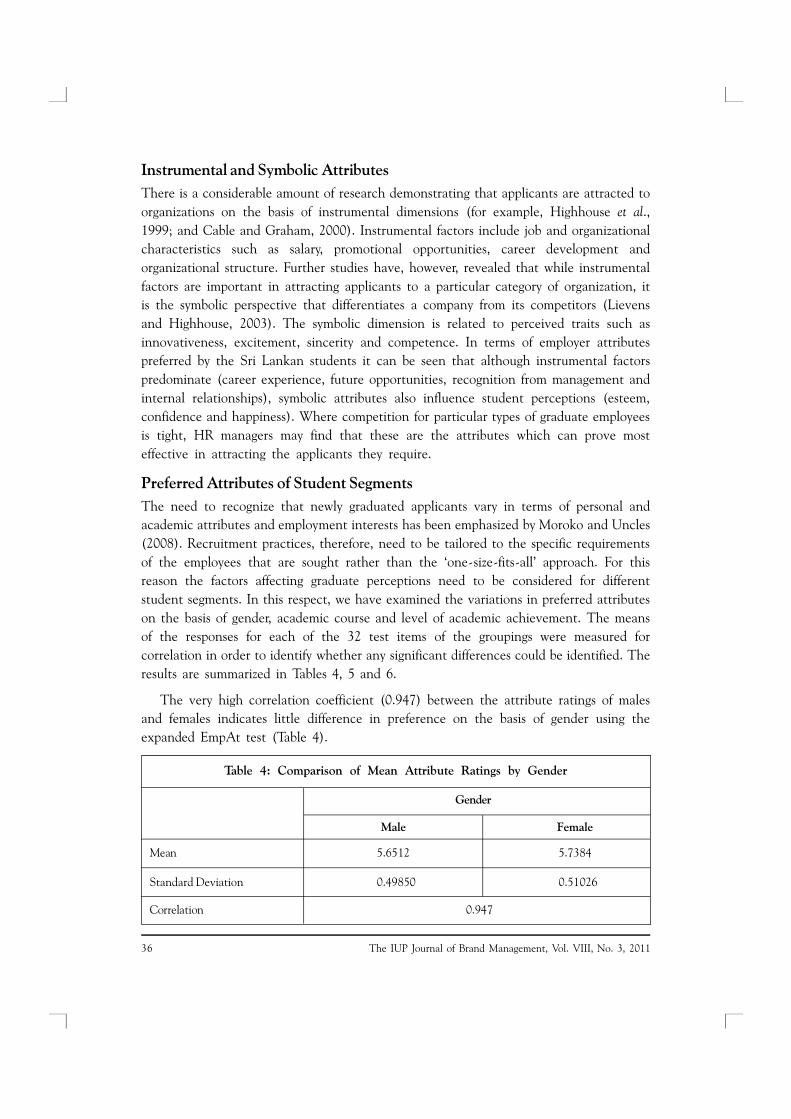
The very high correlation coefficient (0.947) between the attribute ratings of malesand females indicates little difference in preference on the basis of gender using theexpanded EmpAt test (Table 4).
Male Female
Mean 5.6512 5.7384
Standard Deviation 0.49850 0.51026
Correlation 0.947
Table 4: Comparison of Mean Attribute Ratings by Gender
Gender
37Business Student Perceptions of a Preferred Employer:A Study Identifying Determinants of Employer Branding
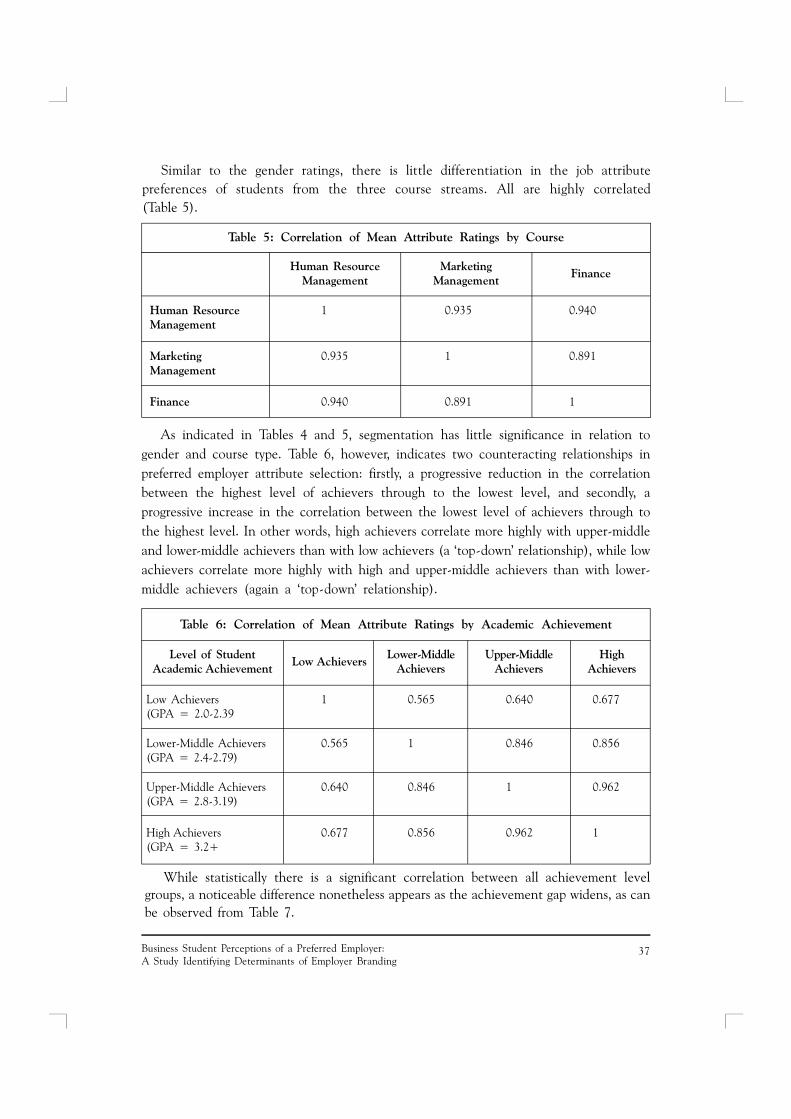
Human Resource 1 0.935 0.940Management
Marketing 0.935 1 0.891Management
Finance 0.940 0.891 1
Table 5: Correlation of Mean Attribute Ratings by Course
Human ResourceManagement
MarketingManagement
Finance
Similar to the gender ratings, there is little differentiation in the job attributepreferences of students from the three course streams. All are highly correlated(Table 5).
As indicated in Tables 4 and 5, segmentation has little significance in relation togender and course type. Table 6, however, indicates two counteracting relationships inpreferred employer attribute selection: firstly, a progressive reduction in the correlationbetween the highest level of achievers through to the lowest level, and secondly, aprogressive increase in the correlation between the lowest level of achievers through tothe highest level. In other words, high achievers correlate more highly with upper-middleand lower-middle achievers than with low achievers (a ‘top-down’ relationship), while lowachievers correlate more highly with high and upper-middle achievers than with lower-middle achievers (again a ‘top-down’ relationship).
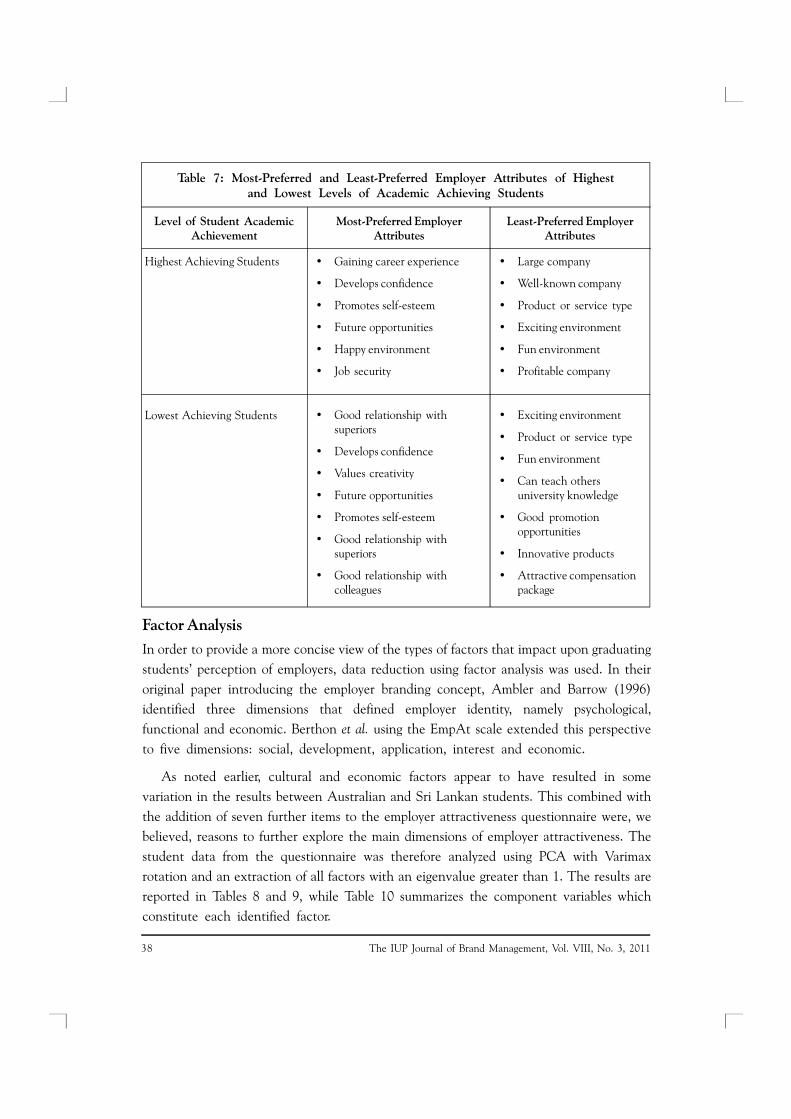
While statistically there is a significant correlation between all achievement levelgroups, a noticeable difference nonetheless appears as the achievement gap widens, as canbe observed from Table 7.
Low Achievers 1 0.565 0.640 0.677(GPA = 2.0-2.39
Lower-Middle Achievers 0.565 1 0.846 0.856(GPA = 2.4-2.79)
Upper-Middle Achievers 0.640 0.846 1 0.962(GPA = 2.8-3.19)
High Achievers 0.677 0.856 0.962 1(GPA = 3.2+
Table 6: Correlation of Mean Attribute Ratings by Academic Achievement
Low AchieversLower-Middle
AchieversUpper-Middle
AchieversHigh
AchieversLevel of Student
Academic Achievement
The IUP Journal of Brand Management, Vol. VIII, No. 3, 201138
Factor AnalysisIn order to provide a more concise view of the types of factors that impact upon graduatingstudents’ perception of employers, data reduction using factor analysis was used. In theiroriginal paper introducing the employer branding concept, Ambler and Barrow (1996)identified three dimensions that defined employer identity, namely psychological,functional and economic. Berthon et al. using the EmpAt scale extended this perspectiveto five dimensions: social, development, application, interest and economic.
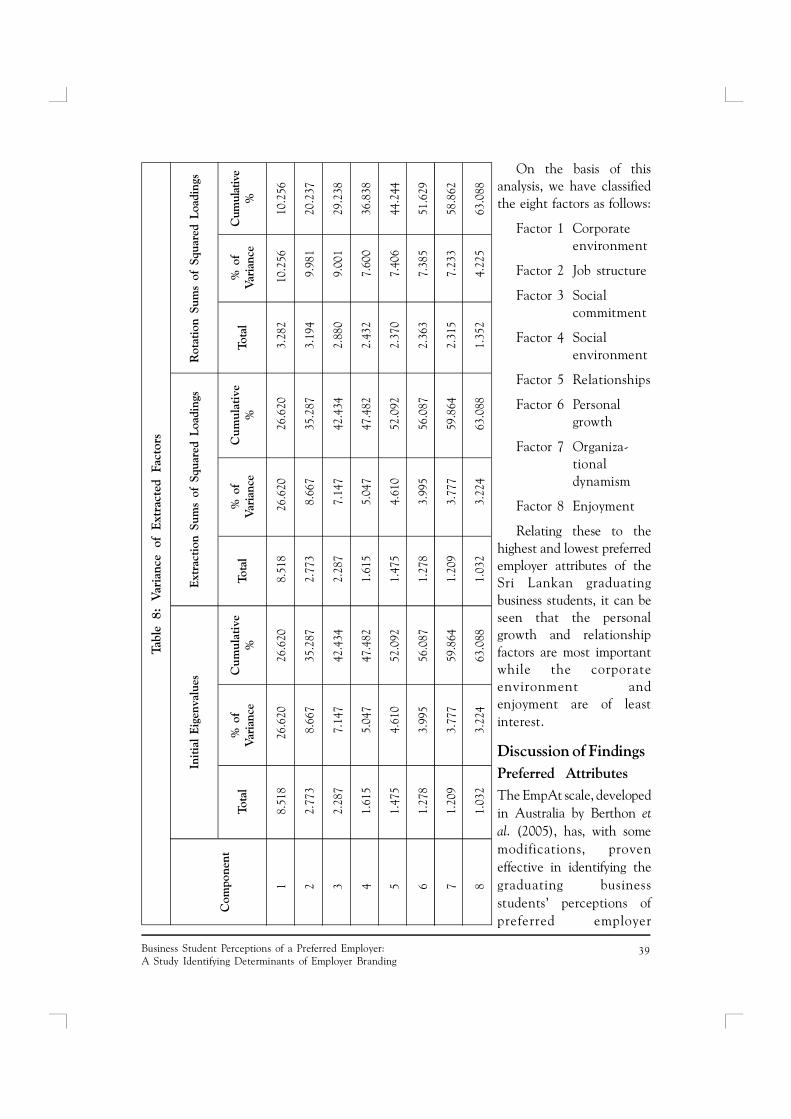
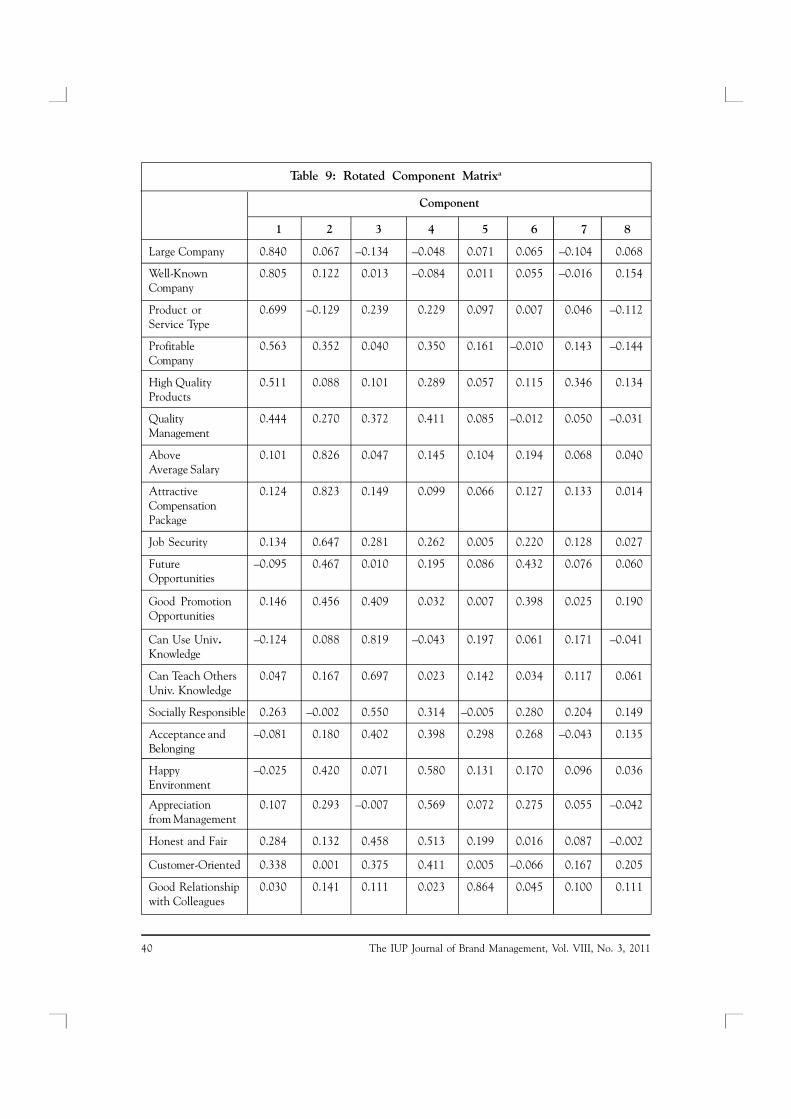
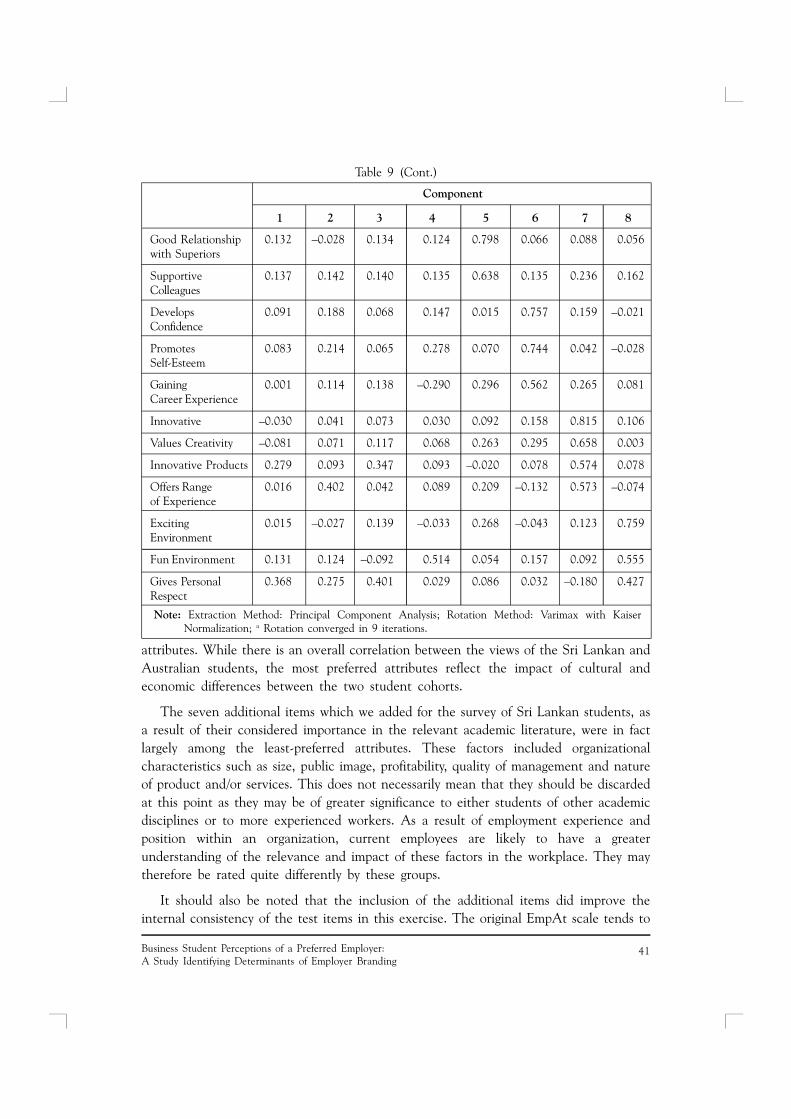
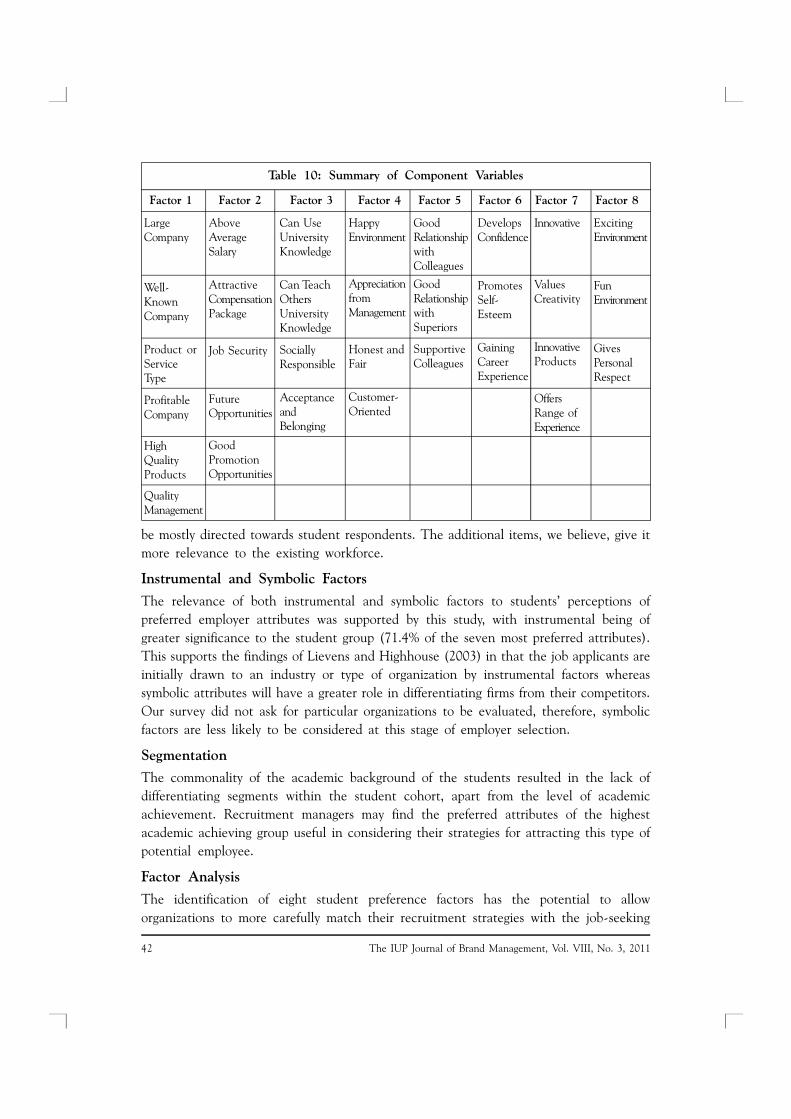
As noted earlier, cultural and economic factors appear to have resulted in somevariation in the results between Australian and Sri Lankan students. This combined withthe addition of seven further items to the employer attractiveness questionnaire were, webelieved, reasons to further explore the main dimensions of employer attractiveness. Thestudent data from the questionnaire was therefore analyzed using PCA with Varimaxrotation and an extraction of all factors with an eigenvalue greater than 1. The results arereported in Tables 8 and 9, while Table 10 summarizes the component variables whichconstitute each identified factor.
Table 7: Most-Preferred and Least-Preferred Employer Attributes of Highestand Lowest Levels of Academic Achieving Students
Most-Preferred EmployerAttributes
Least-Preferred EmployerAttributes
Highest Achieving Students
Lowest Achieving Students
• Gaining career experience
• Develops confidence
• Promotes self-esteem
• Future opportunities
• Happy environment
• Job security
• Good relationship withsuperiors
• Develops confidence
• Values creativity
• Future opportunities
• Promotes self-esteem
• Good relationship withsuperiors
• Good relationship withcolleagues
• Large company
• Well-known company
• Product or service type
• Exciting environment
• Fun environment
• Profitable company
• Exciting environment
• Product or service type
• Fun environment
• Can teach othersuniversity knowledge
• Good promotionopportunities
• Innovative products
• Attractive compensationpackage
Level of Student AcademicAchievement
39Business Student Perceptions of a Preferred Employer:A Study Identifying Determinants of Employer Branding
On the basis of thisanalysis, we have classifiedthe eight factors as follows:
Factor 1 Corporateenvironment
Factor 2 Job structure
Factor 3 Socialcommitment
Factor 4 Socialenvironment
Factor 5 Relationships
Factor 6 Personalgrowth
Factor 7 Organiza-tionaldynamism
Factor 8 Enjoyment
Relating these to thehighest and lowest preferredemployer attributes of theSri Lankan graduatingbusiness students, it can beseen that the personalgrowth and relationshipfactors are most importantwhile the corporateenvironment andenjoyment are of leastinterest.
Discussion of FindingsPreferred AttributesThe EmpAt scale, developedin Australia by Berthon etal. (2005), has, with somemodifications, proveneffective in identifying thegraduating businessstudents’ perceptions ofpreferred employer
Tabl
e 8:
Var
ianc
e of
Ext
ract
ed F
acto
rs
Init
ial
Eige
nval
ues
Extr
acti
on S
ums
of S
quar
ed L
oadi
ngs
Rot
atio
n Su
ms
of S
quar
ed L
oadi
ngs
Tota
l%
of
Var
ianc
eC
umul
ativ
e%
Tota
l%
of
Var
ianc
eC
umul
ativ
e%
Tota
l%
of
Var
ianc
eC
umul
ativ
e%
Com
pone
nt
18.
518
26.6
2026
.620
8.51
826
.620
26.6
203.
282
10.2
5610
.256
22.
773
8.66
735
.287
2.77
38.
667
35.2
873.
194
9.98
120
.237
32.
287
7.14
742
.434
2.28
77.
147
42.4
342.
880
9.00
129
.238
41.
615
5.04
747
.482
1.61
55.
047
47.4
822.
432
7.60
036
.838
51.
475
4.61
052
.092
1.47
54.
610
52.0
922.
370
7.40
644
.244
61.
278
3.99
556
.087
1.27
83.
995
56.0
872.
363
7.38
551
.629
71.
209
3.77
759
.864
1.20
93.
777
59.8
642.
315
7.23
358
.862
81.
032
3.22
463
.088
1.03
23.
224
63.0
881.
352
4.22
563
.088
The IUP Journal of Brand Management, Vol. VIII, No. 3, 201140
Table 9: Rotated Component Matrixa
Component
Large Company 0.840 0.067 –0.134 –0.048 0.071 0.065 –0.104 0.068
Well-Known 0.805 0.122 0.013 –0.084 0.011 0.055 –0.016 0.154Company
Product or 0.699 –0.129 0.239 0.229 0.097 0.007 0.046 –0.112Service Type
Profitable 0.563 0.352 0.040 0.350 0.161 –0.010 0.143 –0.144Company
High Quality 0.511 0.088 0.101 0.289 0.057 0.115 0.346 0.134Products
Quality 0.444 0.270 0.372 0.411 0.085 –0.012 0.050 –0.031Management
Above 0.101 0.826 0.047 0.145 0.104 0.194 0.068 0.040Average Salary
Attractive 0.124 0.823 0.149 0.099 0.066 0.127 0.133 0.014CompensationPackage
Job Security 0.134 0.647 0.281 0.262 0.005 0.220 0.128 0.027
Future –0.095 0.467 0.010 0.195 0.086 0.432 0.076 0.060Opportunities
Good Promotion 0.146 0.456 0.409 0.032 0.007 0.398 0.025 0.190Opportunities
Can Use Univ. –0.124 0.088 0.819 –0.043 0.197 0.061 0.171 –0.041Knowledge
Can Teach Others 0.047 0.167 0.697 0.023 0.142 0.034 0.117 0.061Univ. Knowledge
Socially Responsible 0.263 –0.002 0.550 0.314 –0.005 0.280 0.204 0.149
Acceptance and –0.081 0.180 0.402 0.398 0.298 0.268 –0.043 0.135Belonging
Happy –0.025 0.420 0.071 0.580 0.131 0.170 0.096 0.036Environment
Appreciation 0.107 0.293 –0.007 0.569 0.072 0.275 0.055 –0.042from Management
Honest and Fair 0.284 0.132 0.458 0.513 0.199 0.016 0.087 –0.002
Customer-Oriented 0.338 0.001 0.375 0.411 0.005 –0.066 0.167 0.205
Good Relationship 0.030 0.141 0.111 0.023 0.864 0.045 0.100 0.111with Colleagues
1 2 3 4 5 6 7 8
41Business Student Perceptions of a Preferred Employer:A Study Identifying Determinants of Employer Branding
attributes. While there is an overall correlation between the views of the Sri Lankan andAustralian students, the most preferred attributes reflect the impact of cultural andeconomic differences between the two student cohorts.
The seven additional items which we added for the survey of Sri Lankan students, asa result of their considered importance in the relevant academic literature, were in factlargely among the least-preferred attributes. These factors included organizationalcharacteristics such as size, public image, profitability, quality of management and natureof product and/or services. This does not necessarily mean that they should be discardedat this point as they may be of greater significance to either students of other academicdisciplines or to more experienced workers. As a result of employment experience andposition within an organization, current employees are likely to have a greaterunderstanding of the relevance and impact of these factors in the workplace. They maytherefore be rated quite differently by these groups.
It should also be noted that the inclusion of the additional items did improve theinternal consistency of the test items in this exercise. The original EmpAt scale tends to
Table 9 (Cont.)
Component
1 2 3 4 5 6 7 8
Note: Extraction Method: Principal Component Analysis; Rotation Method: Varimax with KaiserNormalization; a Rotation converged in 9 iterations.
Good Relationship 0.132 –0.028 0.134 0.124 0.798 0.066 0.088 0.056with Superiors
Supportive 0.137 0.142 0.140 0.135 0.638 0.135 0.236 0.162Colleagues
Develops 0.091 0.188 0.068 0.147 0.015 0.757 0.159 –0.021Confidence
Promotes 0.083 0.214 0.065 0.278 0.070 0.744 0.042 –0.028Self-Esteem
Gaining 0.001 0.114 0.138 –0.290 0.296 0.562 0.265 0.081Career Experience
Innovative –0.030 0.041 0.073 0.030 0.092 0.158 0.815 0.106
Values Creativity –0.081 0.071 0.117 0.068 0.263 0.295 0.658 0.003
Innovative Products 0.279 0.093 0.347 0.093 –0.020 0.078 0.574 0.078
Offers Range 0.016 0.402 0.042 0.089 0.209 –0.132 0.573 –0.074of Experience
Exciting 0.015 –0.027 0.139 –0.033 0.268 –0.043 0.123 0.759Environment
Fun Environment 0.131 0.124 –0.092 0.514 0.054 0.157 0.092 0.555
Gives Personal 0.368 0.275 0.401 0.029 0.086 0.032 –0.180 0.427Respect
The IUP Journal of Brand Management, Vol. VIII, No. 3, 201142
be mostly directed towards student respondents. The additional items, we believe, give itmore relevance to the existing workforce.
Instrumental and Symbolic Factors
The relevance of both instrumental and symbolic factors to students’ perceptions ofpreferred employer attributes was supported by this study, with instrumental being ofgreater significance to the student group (71.4% of the seven most preferred attributes).This supports the findings of Lievens and Highhouse (2003) in that the job applicants areinitially drawn to an industry or type of organization by instrumental factors whereassymbolic attributes will have a greater role in differentiating firms from their competitors.Our survey did not ask for particular organizations to be evaluated, therefore, symbolicfactors are less likely to be considered at this stage of employer selection.
Segmentation
The commonality of the academic background of the students resulted in the lack ofdifferentiating segments within the student cohort, apart from the level of academicachievement. Recruitment managers may find the preferred attributes of the highestacademic achieving group useful in considering their strategies for attracting this type ofpotential employee.
Factor Analysis
The identification of eight student preference factors has the potential to alloworganizations to more carefully match their recruitment strategies with the job-seeking
Table 10: Summary of Component Variables
Factor 1 Factor 2 Factor 3 Factor 4 Factor 5 Factor 6 Factor 7 Factor 8
LargeCompany
Well-KnownCompany
Product orServiceType
ProfitableCompany
HighQualityProducts
QualityManagement
AboveAverageSalary
AttractiveCompensationPackage
Job Security
FutureOpportunities
GoodPromotionOpportunities
Can UseUniversityKnowledge
Can TeachOthersUniversityKnowledge
SociallyResponsible
AcceptanceandBelonging
HappyEnvironment
AppreciationfromManagement
Honest andFair
Customer-Oriented
GoodRelationshipwithColleagues
GoodRelationshipwithSuperiors
SupportiveColleagues
DevelopsConfidence
PromotesSelf-Esteem
GainingCareerExperience
Innovative
ValuesCreativity
InnovativeProducts
OffersRange ofExperience
ExcitingEnvironment
FunEnvironment
GivesPersonalRespect
43Business Student Perceptions of a Preferred Employer:A Study Identifying Determinants of Employer Branding
motives and preferences of graduate students. Business students, for example, haveindicated personal growth and relationship factors as being most important while thecorporate environment and enjoyment are of least interest. Higher achieving students aremore concerned with personal growth and job structure.
The range of factors is of sufficient breadth to be applied to many types of employeecategories.
ConclusionThis study has thrown light on the preferred employer attributes of graduating businessdegree students within the Sri Lankan context through the use of a modified version ofthe Australian-developed EmpAt scale. In addition, factors that may influence the jobseekers’ perceptions such as reputation variables, personal characteristics and academicbackground have been considered. Finally, analysis of the survey results has indicated eightdimensions of employer attractiveness. These can enable organizations to gain ameaningful understanding of how to strategically develop their employer brand both forthe recruitment and retention of employees.
Increasingly, organizational wealth is being generated by converting the intangibleproducts created by talented employees into “institutional skills, patents, brands, software,customer bases, intellectual capital and networks that raise profit per employee and returnon invested capital” (Bryan, 2007). The imperative to understand the motives ofjob-seekers is becoming increasingly evident if companies wish to gain a competitiveadvantage through attracting the best available human capital.
Limitations of the Study: As this is an exploratory study, it was confined to the studentsof one academic faculty at one university, although students were drawn from threedifferent specializations. Generalizing from these findings in relation to students fromother disciplines could be misleading as other factors such as academic and employmentskills, job opportunities and employer characteristics may vary from those relevant tobusiness studies. The influence of cultural and economic factors on Sri Lankan businessstudents was also observed when comparing the results with those of Australian businessstudents. Care would therefore be required in relating the results to other nationalentities.
A majority of job seekers are current or former employees who, as pointed outpreviously, are likely to have quite different perceptions of employer attributes.The student outcomes may therefore not be applicable to more experienced workers.
Implications and Further Research: Demographic changes in many countries togetherwith an ever-increasing competitive business environment will necessitate greaterattention by companies of all types towards attracting the most suitable employeesrequired for organizational success. A greater understanding of what factors influencethe employment preferences of job applicants is a fundamental and necessaryprerequisite for both a recruitment strategy and the development of an employer
The IUP Journal of Brand Management, Vol. VIII, No. 3, 201144
brand. There is little academic research to support either function at a global levelor within Sri Lanka.
This study has presented a profile of the employer attributes that attract businessgraduate students from a Sri Lankan university. A viable measurement mechanism hasbeen identified and tested, and relevant influencing factors and segmentation variablesinvestigated. The development of an eight-component structure to explain the broaddimensions of employer attractiveness can enable human resource managementdepartments to find a focus for recruitment strategies by gaining an awareness of thefactors that influence graduating students’ choice of employers.
From this basis, it should now be possible to extend the research based on the followingfour sectors:
1. Students from a wider range of courses and universities;
2. Experienced employees;
3. Middle- and upper-level managers and executives; and
4. Human resource management personnel, in relation to what attributes theybelieve their organization has, to attract new employees. This could be comparedwith the perceptions of job seekers.
In all instances some modification to the questionnaire items would be required.A longitudinal study of changing perceptions of job seekers in relation to their preferredemployer attributes, both general and related to specific industries and organizations, mayalso reveal trends at both a macro and micro level.
References1. Ambler T and Barrow S (1996), “The Employer Brand”, The Journal of Brand
Management, Vol. 4, No. 3, pp. 185-206.
2. Backhaus K and Tikoo S (2004), “Conceptualising and Researching EmployerBranding”, Career Development International, Vol. 4, No. 5, pp. 501-517.
3. Berthon P, Ewing M and Hah L L (2005), “Captivating Company: Dimensions ofAttractiveness in Employer Branding”, International Journal of Advertising, Vol. 24,No. 2, pp. 151-172.
4. Bryan L (2007), “The New Metrics of Corporate Performance: Profit per Employee”,McKinsey Quarterly, No. 1, pp. 56-65.
5. Cable D B and Turban D M (2001), “Establishing the Dimensions, Sources and Valueof Job Seekers’ Employer Knowledge During Recruitment”, Research in Personnel andHuman Resource Management, Vol. 20, pp. 115-163.
6. Cable D M and Graham M (2000), “The Determinants of Organizational Reputation:A Job Search Perspective”, Journal of Organisational Behaviour, Vol. 21, No. 8,pp. 929-947.
45Business Student Perceptions of a Preferred Employer:A Study Identifying Determinants of Employer Branding
7. Cable D M, Aiman-Smith L, Mulvey P W and Edwards J R (2000), “The Sources andAccuracy of Job Applicants’ Beliefs About Organizational Culture”, Academy ofManagement Journal, Vol. 43, No. 6, pp. 1076-1085.
8. Cafolla L (2008), “How to Build an Effective Employer Brand”, China Staff, Vol. 14,No. 9, pp. 23-26.
9. Chambers E G, Foulon M Handfield-Jones H, Hankin S M and Michaels E G (1998),“The War for Talent”, McKinsey Quarterly, No. 3, pp. 44-57.
10. Collins J (2001), Good to Great, Random House, London.
11. Collins C J and Han J (2004), “Exploring Applicant Pool Quantity and Quality: TheEffects of Early Recruitment Practice, Strategies, Corporate Advertising and FirmReputation”, Personnel Psychology, Vol. 57, pp. 685-717.
12. Davies G J (2008), “Employer Branding and Its Influence on Managers”, EuropeanJournal of Marketing, Vol. 42, Nos. 5 & 6, pp. 667-681.
13. Davies G J, Chun R, Da Silva R and Roper R (2004), Corporate Reputation andCompetitiveness, Routledge, London.
14. Dukerich J M and Carter S M (2000), “Distorted Images and Reputation Repair” inM Schultz, M J Hatch and M H Larsen (Eds.), The Expressive Organisation: LinkingIdentity, Reputation and the Corporate Brand, pp. 97-112, Oxford University Press,Oxford.
15. Dyer K (2007), “Employer Branding: A Vital Tool for Success”,Strategic Communication Management, Vol. 12, No. 1, p. 2.
16. Edwards M R (2010), “An Integrative Review of Employer Branding and OB Theory”,Personnel Review, Vol. 39, No. 1, pp. 5-23.
17. Fombrun C (1996), Reputation: Realizing Value from the Corporate Image, HarvardBusiness School Press, Boston, MA.
18. Greening D W and Turban D B (2000), “Corporate Social Performance as aCompetitive Advantage in Attracting a Quality Workforce”, Business and Society,Vol. 39, No. 3, pp. 254-280.
19. Hieronimus F, Schaefer K and Schroder J (2005), “Using Branding to Attract Talent”,McKinsey Quarterly, No. 3, pp. 12-14.
20. Highhouse S, Zickar M J, Thorsteinson T J, Stierwalk S L and Slaughter J E (1999),“Assessing Company Employment Image: An Example in the Fast Food Industry”,Personnel Psychology, Vol. 52, pp. 151-172.
21. Hornung D M (2010), “How to Measure Your Employer Brand”, available atwww.iabc.com. Accessed on December 12, 2010.
22. Hunt S D and Menon A (1995), “Metaphor and Competitive Advantage: Evaluatingthe Use of Metaphor in Theories of Competitive Strategy”, Journal of BusinessResearch, Vol. 33, No. 2, pp. 81-90.
The IUP Journal of Brand Management, Vol. VIII, No. 3, 201146
Reference # 25J-2011-09-02-01
23. Johnson M and Roberts P (2006), “Rules of Attraction: Recruit and Retain the BestStaff with Employer Branding”, Marketing Health Services, Vol. 26, No. 1, pp. 38-40.
24. Kaliprasad M (2006), “The Human Factor I: Attracting, Retaining and MotivatingCapable People”, Cost Engineering, Vol. 48, No. 6, pp. 20-26.
25. Knox S and Freeman C (2006), “Measuring and Managing Employer Brand Image inthe Service Industry”, Journal of Marketing Management, Vol. 22, Nos. 7 & 6,pp. 695-716.
26. Konig C (2008), “Employer Branding: Management Crunch”, Brand Strategy,December, p. 46.
27. Lanka Monthly Digest (LMD) (2010), “Most Respected Entities in Sri Lanka”, August.
28. Lievens F (2007), “Employer Branding in the Belgian Army: The Importance ofInstrumental and Symbolic Beliefs for Potential Applicants, Actual Applicants andMilitary Employees”, Human Resource Management, Vol. 46, No. 1, pp. 51-69.
29. Lievens F and Highhouse S (2003), “The Relation of Instrumental and SymbolicAttributes to a Company’s Attractiveness as an Employer”, Personnel Psychology,Vol. 56, No. 1, pp. 75-102.
30. Lloyd S (2002), “Branding from the Inside Out”, BRW, Vol. 24, No. 10, pp. 23-31.
31. Mark P and Toelken K (2009), “Poisoned by a Toxic Brand: A Worst Case Scenarioof Employer Branding – A Case of a Fortune 100 Technology Firm”, OrganisationDevelopment Journal, Vol. 27, No. 4, pp. 21-29.
32. Meglino B M and Ravlin E (1999), When are Realistic Job Previews Most Effective,Academy of Management, Chicago, Illinois.
33. Morgeson F P and Hofmann D A (1999), “The Structure and Function of CollectiveConstructs; Implications for Multilevel Research and Theory Development”,Academy of Management Review, Vol. 24, No. 2, pp. 249-265.
34. Moroko L and Uncles M D (2009), “Employer Branding and Market Segmentation”,Journal of Brand Management, Vol. 17, No. 3, pp. 181-196.
35. Rousseau D M (2001), “Schema, Promise and Mutuality: The Building Blocks of thePsychological Contract”, Journal of Occupational and Organisational Psychology,Vol. 74, pp. 511-541.
36. Turban D B and Cable D M (2003), “Firm Reputation and Applicant PoolCharacteristics”, Journal of Organisational Behaviour, Vol. 24, No. 6, pp. 733-751.
37. Wheeler A R, Richey R G, Tokkman M and Sablynski C J (2006), “RetainingEmployees for Service Competency: The Role of Corporate Brand Identity”, Journalof Brand Management, Vol. 14, Nos. 1 & 2, pp. 96-113.

Copyright of IUP Journal of Brand Management is the property of IUP Publications and its content may not be
copied or emailed to multiple sites or posted to a listserv without the copyright holder's express written
permission. However, users may print, download, or email articles for individual use.