Embed Size (px)
Citation preview
A monthly newsletter from the EBRI Education and Research Fund © 2011 Employee Benefit Research Institute
Employer and Employee Reactions to Health Reform: Findings From the 2010 EBRI/MGA Consumer Engagement in Health Care Survey and the 2010 SHRM Organizations’ Response to Health Care Reform Poll, p. 2
Self-reported Benefit Accrual Rates of Defined Benefit Plans: An Analysis of the 2004 and 2007 Survey of Consumer Finances, p. 9
E X E C U T I V E S U M M A R Y
Employer and Employee Reactions to Health Reform: Findings From the 2010 EBRI/MGA Consumer Engagement in Health Care Survey and the 2010 SHRM Organizations’ Response to Health Care Reform Poll
SURVEY DATA: This paper presents data from the 2010 EBRI/MGA Consumer Engagement in Health Care Survey and the Society for Human Resource Management’s 2010 SHRM Organizations’ Response to Health Care Reform Poll to examine how employers might respond to health reform and employees expectations of changes to health coverage.
RESPONSE TO EXPECTED COST INCREASES: Employers are uncertain regarding changing benefits in response to health reform, but they are likely to pass along any cost increases to workers. Workers are mostly expecting such cost increases.
FUTURE OF COVERAGE: Employers are evenly split as to whether they will change health coverage as a result of health reform while workers are split between thinking their benefits will remain the same or erode. While few workers expect employers to drop coverage after 2014, and very few employers plan to drop coverage, employers are evenly split between having decided to continue to offer coverage and being undecided about the future of employment-based health coverage.
Self-Reported Benefit Accrual Rates of Defined Benefit Plans: An Analysis of the 2004 and 2007 Survey of Consumer Finances
PENSION ACCRUAL RATES AND THE SCF: The Survey of Consumer Finances (SCF) measures respondents’ self-reported expected benefits from defined benefit (DB) pension plans. As a percentage of final pay, the mean annual benefit accrual rates in 2004 and 2007 are estimated to have been 2.06 percent and 2.48 percent, respectively. These rates are higher than the average annual accrual rate of 1.59 percent reported by the U.S. Department of Labor’s 2005 National Compensation Survey (NCS), which is based on official plan documents. This suggests that the 2004 and 2007 SCF respondents overestimated their expected pension benefits at retirement, unless they had more generous accrual formulas than plan participants in the 2005 NCS.
YOUNG PARTICIPANTS EXPECTING LESS GENEROUS BENEFITS: Despite the likely measurement error in self-reported expected benefits, young DB plan participants reported having less generous benefit formulas than older participants, the SCF finds. Respondents to the 2007 SCF who expected to work 25 or more years before retirement estimate their mean annual benefit accrual rate to be 1.68 percent, compared with 2.60 percent for those who expected to work less than five years before retirement.
January 2011 • Vol. 32, No. 1
ebri.org Notes • January 2011 • Vol. 32, No. 1 2
Employer and Employee Reactions to Health Reform: Findings From the 2010 EBRI/MGA Consumer Engagement in Health Care Survey and the 2010 SHRM Organizations' Response to Health Care Reform Poll by Paul Fronstin, Employee Benefit Research Institute
Introduction This report presents data from the 2010 EBRI/MGA Consumer Engagement in Health Care Survey and the Society for Human Resource Management’s (SHRM) 2010 SHRM Organizations’ Response to Health Care Reform Poll to examine how employers might respond to health reform and employees’ expectations of changes to health coverage. It was found that there is still a large lack of understanding of the health reform legislation among both workers and employers. Despite employers’ uncertainty regarding how they will change benefits in response to health reform, they are likely to pass along any cost increases to workers—and, mostly, workers are expecting such cost increases. Employers are evenly split as to whether they will change health coverage as a result of health reform while workers are split between thinking their benefits will remain the same or will erode. And while few workers expect employers to drop coverage after 2014, and very few employers say they plan to drop coverage, employers are evenly split between having decided to continue to offer coverage and being undecided about the future of employment-based health coverage.
About the Surveys 2010 EBRI/MGA Consumer Engagement in Health Care Survey The 2010 EBRI/MGA Consumer Engagement in Health Care Survey is an online survey of 4,508 privately insured adults ages 21−64 fielded in August 2010. The survey was conducted to provide nationally representative data regarding the growth of consumer-driven health plans (CDHPs) and high-deductible health plans (HDHPs), and the impact of these plans and consumer engagement more generally on the behavior and attitudes of adults with private health insurance coverage. The sample was randomly drawn from Synovate’s online panel of more than 2 million Internet users who have agreed to participate in research surveys. This survey used a base sample of 2,007 and a random oversample of individuals with CDHPs and HDHPs. High deductibles were defined as individual deductibles of at least $1,000 and family deductibles of at least $2,000. Those with a high deductible and either a health reimbursement arrangement (HRA) or a health savings account (HSA) comprise the CDHP sample, and those with deductibles that are generally high enough to meet the qualifying threshold to make tax-preferred contributions to an HSA but without an account comprise the HDHP sample. More information about the 2010 EBRI/MGA Consumer Engagement in Health Care Survey can be found in (Fronstin 2010).
2010 SHRM Organizations’ Response to Health Care Reform Poll The 2010 SHRM Organizations’ Response to Health Care Reform Poll is a survey of 1,095 randomly selected human resource (HR) professionals with the job title of manager and above, as well as HR professionals in the compensation and benefits area. All analyses were based on respondents working at organizations with 50 or more employees. The survey was fielded July 22–August 3, 2010, and had a response rate of 15 percent and a margin of error of +/- 3 per-cent. More information about the 2010 SHRM Organizations’ Response to Health Care Reform Poll can be found at www.shrm.org/surveys
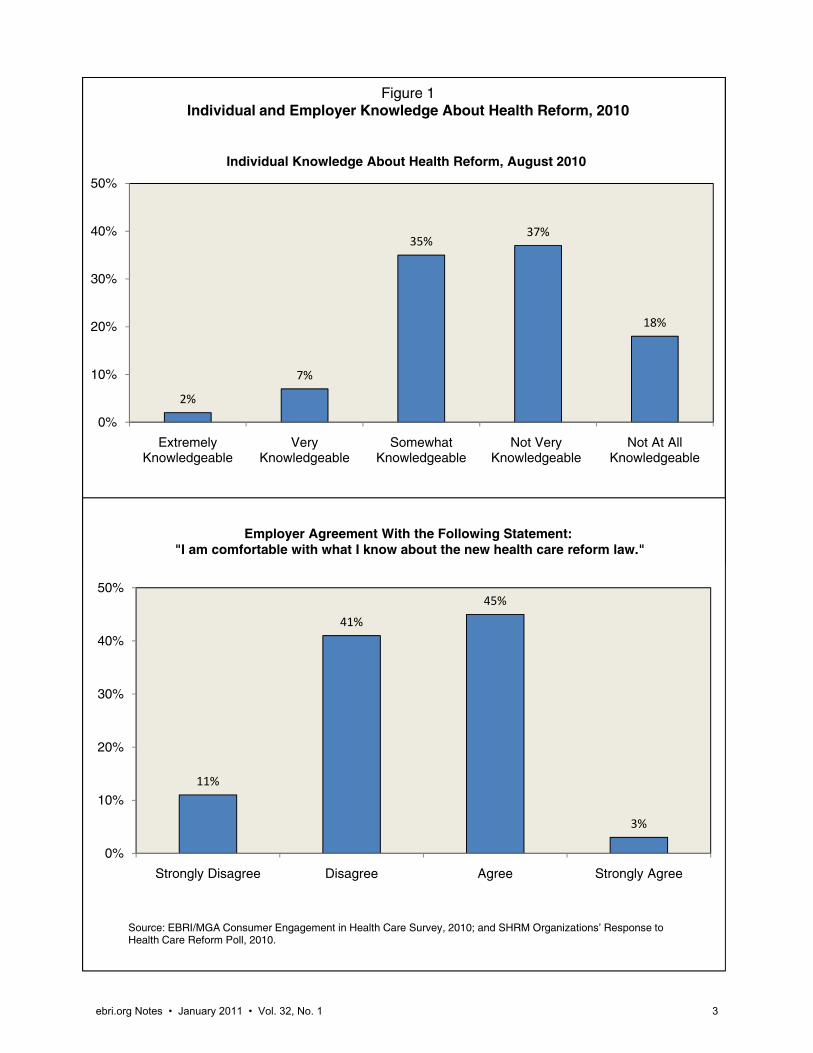
Knowledge About Health Reform Both individuals and employers admit that they are not very knowledgeable about health reform. Two percent of adults with private insurance report that they are extremely knowledgeable about the legislation, and only 7 percent report
2%
7%
35%37%
18%
0%
10%
20%
30%
40%
50%
Extremely Knowledgeable
Very Knowledgeable
Somewhat Knowledgeable
Not Very Knowledgeable
Not At All Knowledgeable
Individual Knowledge About Health Reform, August 2010
Employer Agreement With the Following Statement:"I am comfortable with what I know about the new health care reform law."
Figure 1Individual and Employer Knowledge About Health Reform, 2010
Source: EBRI/MGA Consumer Engagement in Health Care Survey, 2010.; and SHRM Organizations’ Response to Health Care Reform Poll, 2010.
2%
7%
35%37%
18%
0%
10%
20%
30%
40%
50%
Extremely Knowledgeable
Very Knowledgeable
Somewhat Knowledgeable
Not Very Knowledgeable
Not At All Knowledgeable
Individual Knowledge About Health Reform, August 2010
11%
41%
45%
3%
0%
10%
20%
30%
40%
50%
Strongly Disagree Disagree Agree Strongly Agree
Employer Agreement With the Following Statement:"I am comfortable with what I know about the new health care reform law."
Figure 1Individual and Employer Knowledge About Health Reform, 2010
Source: EBRI/MGA Consumer Engagement in Health Care Survey, 2010; and SHRM Organizations’ Response to Health Care Reform Poll, 2010.
ebri.org Notes • January 2011 • Vol. 32, No. 1 3
ebri.org Notes • January 2011 • Vol. 32, No. 1 4
that they are very knowledgeable (Figure 1). Most report that they are somewhat knowledgeable (35 percent) or not very knowledgeable (37 percent). Nearly 1 in 5 (18 percent) report that they are not at all knowledgeable about the health reform law. When employers were asked if they were comfortable with what they knew about the law, 45 per-cent agreed that they were comfortable, 41 percent disagreed, and 11 percent strongly disagreed.
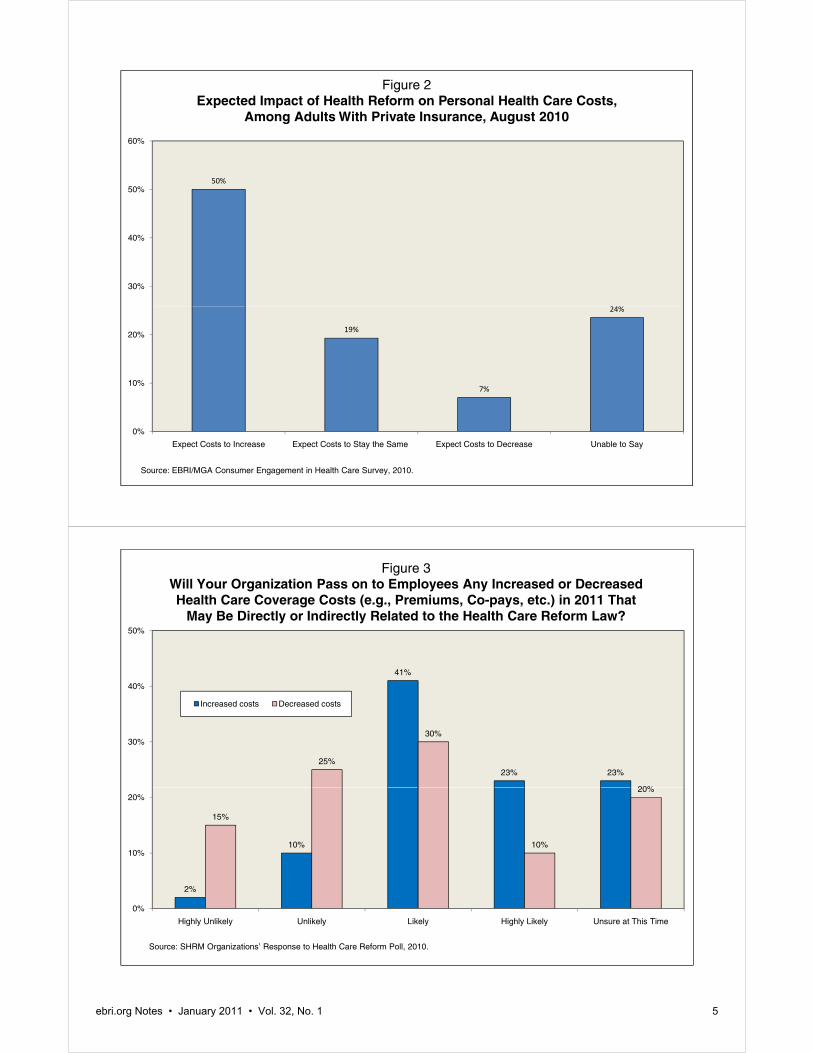
Impact on Health Care Costs About one-half of individuals expect their health care costs to increase as a result of the health reform law (Figure 2). Similarly, many employers expect to pass along any increases in costs, whether directly or indirectly related to health reform. Slightly more than 40 percent of employers report that they are likely to pass along cost increases, and another 23 percent are highly likely to pass the cost increases along to workers (Figure 3). Few are unlikely (10 per-cent) or highly unlikely (2 percent) to pass along cost increases. Almost one-quarter (23 percent) were unsure at the time of the study whether cost increases would be passed along to workers.
It is also worth noting that employers are more likely to pass along cost increases than cost decreases. While 41 per-cent were likely to pass along cost increases, only 30 percent were likely to pass along any cost decreases that were directly or indirectly related to health reform. And while 23 percent were highly likely to pass along cost increases, only 10 percent were highly likely to pass along cost decreases.
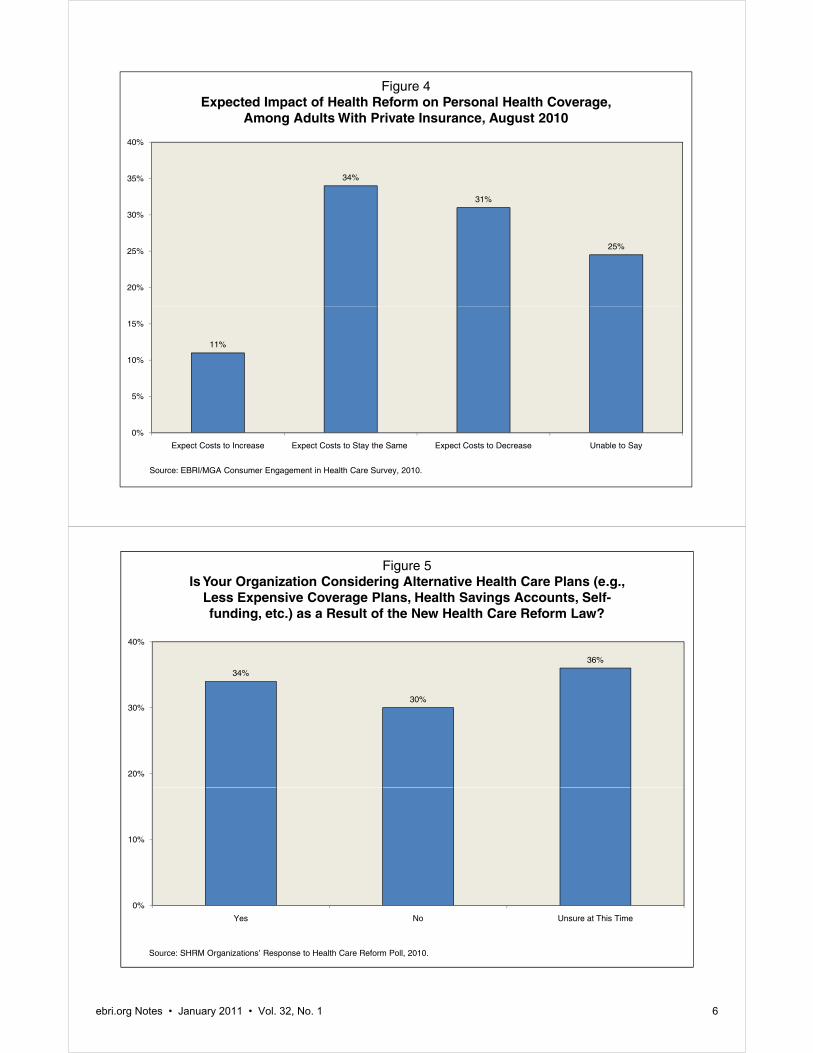
Impact on Health Coverage Much like the findings on health care costs, more individuals expect their health care benefits to decrease than to stay the same or increase as a result of health reform. Three out of 10 (31 percent) adults with private insurance expect their health coverage to decline as a result of the health reform law, and one-third (34 percent) expect their benefits to be unchanged (Figure 4).
Many employers are considering changing their health plans as a result of health reform. There is a fairly even split between those that are considering changing their plans (34 percent), those that are not considering (30 percent), and those that have not yet decided (36 percent) (Figure 5). The changes that employers are considering may reduce the comprehensiveness of coverage for workers.
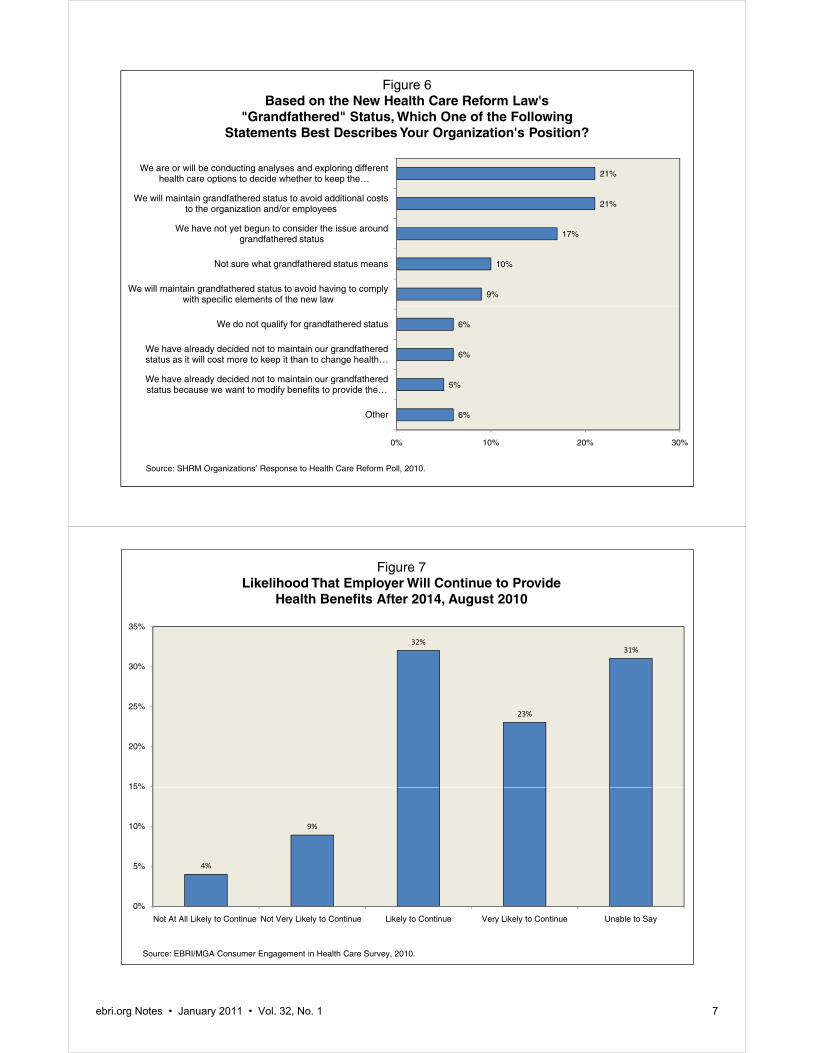
Many employers are also considering whether they will try to keep their grandfathered status. Grandfathered plans do not need to comply with certain aspects of health reform, such as the provision of preventive services with no cost sharing. Overall, 30 percent of employers report that they will attempt to maintain their grandfathered status, either to avoid additional costs (21 percent) or to avoid complying with specific elements of health reform (9 percent) (Figure 6). Only 1 in 10 (11 percent) report that they have decided not to maintain grandfathered status either because the costs would be higher (6 percent) or in order to modify benefits (5 percent). Many employers are either conducting analyses or about to conduct them to decide whether to keep grandfathered status (21 percent) or have not yet begun to think about grandfathered status (17 percent).
Impact on Employment-Based Coverage When it comes to the future of employment-based coverage, few individuals think their employer will not continue to provide health benefits after 2014. Four percent think their employer is not at all likely to continue providing health benefits, and another 9 percent think their employer is not very likely to provide them (Figure 7). Thirty-two percent think that their employer is likely to continue offering health benefits after 2014, and another 23 percent think their employer is very likely to continue offering them. Almost one-third (31 percent) were unable to say if their employer was likely to continue providing health benefits after 2014.
50%
24%
30%
40%
50%
60%
Figure 2Expected Impact of Health Reform on Personal Health Care Costs,
Among Adults With Private Insurance, August 2010
19%
7%
24%
0%
10%
20%
Expect Costs to Increase Expect Costs to Stay the Same Expect Costs to Decrease Unable to Say
Source: EBRI/MGA Consumer Engagement in Health Care Survey, 2010.
41%
23% 23%25%
30%
20%
30%
40%
50%
Increased costs Decreased costs
Figure 3Will Your Organization Pass on to Employees Any Increased or Decreased Health Care Coverage Costs (e.g., Premiums, Co-pays, etc.) in 2011 That
May Be Directly or Indirectly Related to the Health Care Reform Law?
2%
10%
15%
10%
20%
0%
10%
20%
Highly Unlikely Unlikely Likely Highly Likely Unsure at This Time
Source: SHRM Organizations’ Response to Health Care Reform Poll, 2010.
ebri.org Notes • January 2011 • Vol. 32, No. 1 5
34%
31%
25%
20%
25%
30%
35%
40%
Figure 4Expected Impact of Health Reform on Personal Health Coverage,
Among Adults With Private Insurance, August 2010
11%
0%
5%
10%
15%
Expect Costs to Increase Expect Costs to Stay the Same Expect Costs to Decrease Unable to Say
Source: EBRI/MGA Consumer Engagement in Health Care Survey, 2010.
34%
30%
36%
20%
30%
40%
Figure 5Is Your Organization Considering Alternative Health Care Plans (e.g.,
Less Expensive Coverage Plans, Health Savings Accounts, Self-funding, etc.) as a Result of the New Health Care Reform Law?
0%
10%
Yes No Unsure at This Time
Source: SHRM Organizations’ Response to Health Care Reform Poll, 2010.
ebri.org Notes • January 2011 • Vol. 32, No. 1 6
9%
10%
17%
21%
21%
We will maintain grandfathered status to avoid having to comply with specific elements of the new law
Not sure what grandfathered status means
We have not yet begun to consider the issue around grandfathered status
We will maintain grandfathered status to avoid additional costs to the organization and/or employees
We are or will be conducting analyses and exploring different health care options to decide whether to keep the …
Figure 6Based on the New Health Care Reform Law's
"Grandfathered" Status, Which One of the Following Statements Best Describes Your Organization's Position?
6%
5%
6%
6%
0% 10% 20% 30%
Other
We have already decided not to maintain our grandfathered status because we want to modify benefits to provide the …
We have already decided not to maintain our grandfathered status as it will cost more to keep it than to change health …
We do not qualify for grandfathered status
Source: SHRM Organizations’ Response to Health Care Reform Poll, 2010.
32%
23%
31%
15%
20%
25%
30%
35%
Figure 7Likelihood That Employer Will Continue to Provide
Health Benefits After 2014, August 2010
4%
9%
0%
5%
10%
15%
Not At All Likely to Continue Not Very Likely to Continue Likely to Continue Very Likely to Continue Unable to Say
Source: EBRI/MGA Consumer Engagement in Health Care Survey, 2010.
ebri.org Notes • January 2011 • Vol. 32, No. 1 7
ebri.org Notes • January 2011 • Vol. 32, No. 1 8
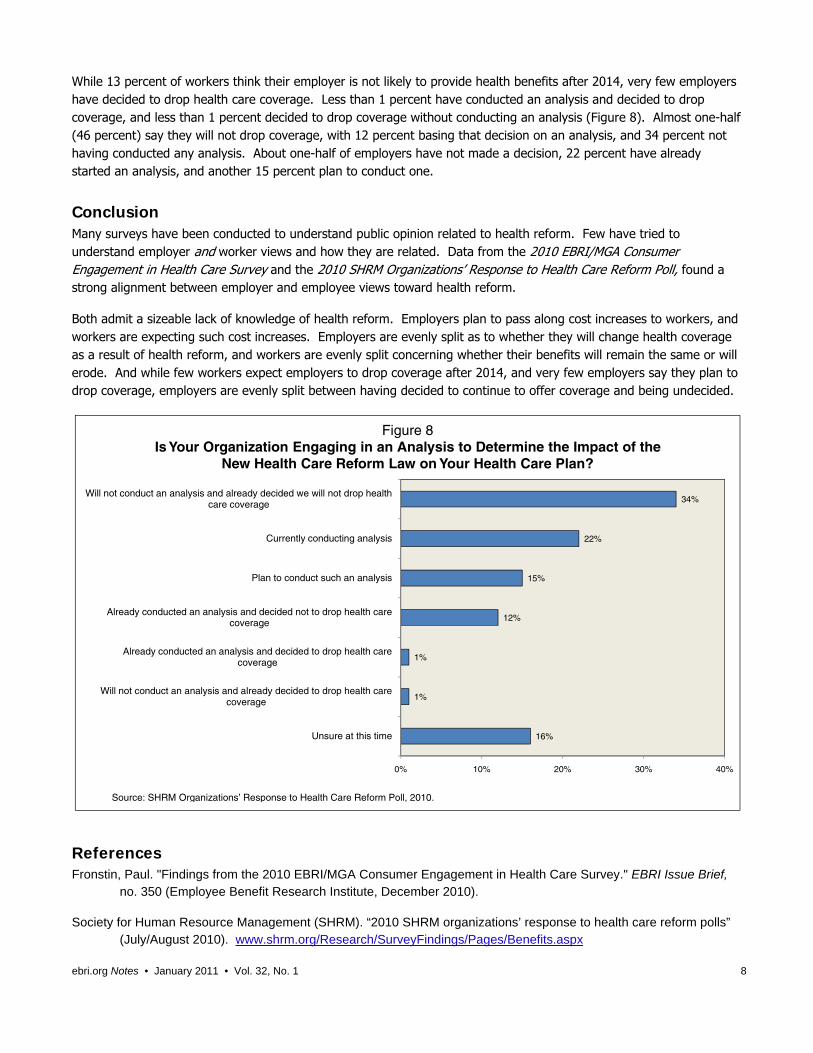
While 13 percent of workers think their employer is not likely to provide health benefits after 2014, very few employers have decided to drop health care coverage. Less than 1 percent have conducted an analysis and decided to drop coverage, and less than 1 percent decided to drop coverage without conducting an analysis (Figure 8). Almost one-half (46 percent) say they will not drop coverage, with 12 percent basing that decision on an analysis, and 34 percent not having conducted any analysis. About one-half of employers have not made a decision, 22 percent have already started an analysis, and another 15 percent plan to conduct one.
Conclusion Many surveys have been conducted to understand public opinion related to health reform. Few have tried to understand employer and worker views and how they are related. Data from the 2010 EBRI/MGA Consumer Engagement in Health Care Survey and the 2010 SHRM Organizations’ Response to Health Care Reform Poll, found a strong alignment between employer and employee views toward health reform.
Both admit a sizeable lack of knowledge of health reform. Employers plan to pass along cost increases to workers, and workers are expecting such cost increases. Employers are evenly split as to whether they will change health coverage as a result of health reform, and workers are evenly split concerning whether their benefits will remain the same or will erode. And while few workers expect employers to drop coverage after 2014, and very few employers say they plan to drop coverage, employers are evenly split between having decided to continue to offer coverage and being undecided.
16%
1%
1%
12%
15%
22%
34%
0% 10% 20% 30% 40%
Unsure at this time
Will not conduct an analysis and already decided to drop health care coverage
Already conducted an analysis and decided to drop health care coverage
Already conducted an analysis and decided not to drop health care coverage
Plan to conduct such an analysis
Currently conducting analysis
Will not conduct an analysis and already decided we will not drop health care coverage
Figure 8Is Your Organization Engaging in an Analysis to Determine the Impact of the
New Health Care Reform Law on Your Health Care Plan?
Source: SHRM Organizations’ Response to Health Care Reform Poll, 2010.
References Fronstin, Paul. "Findings from the 2010 EBRI/MGA Consumer Engagement in Health Care Survey." EBRI Issue Brief,
no. 350 (Employee Benefit Research Institute, December 2010).
Society for Human Resource Management (SHRM). “2010 SHRM organizations’ response to health care reform polls” (July/August 2010). www.shrm.org/Research/SurveyFindings/Pages/Benefits.aspx
ebri.org Notes • January 2011 • Vol. 32, No. 1 9
Self-Reported Benefit Accrual Rates of Defined Benefit Plans: An Analysis of the 2004 and 2007 Survey of Consumer Finances by Youngkyun Park, Employee Benefit Research Institute
Introduction The Federal Reserve Board’s Survey of Consumer Finances (SCF) provides valuable information on defined benefit (DB) pension plans, such as participants’ self-reported expected benefits as a percentage of pay at retirement, or as regular dollar amounts. The information is usually used when computing the expected present value of DB benefits in research literature (e.g., Gale and Pence, 2006; Wolff, 2007).1
However, as several studies have documented, workers often are not well informed about their pension benefits. For example, using the 1992 Health and Retirement Study, Gustman and Steinmeier (1989 and 2004) and Engelhardt (2001) documented significant discrepancies between self- and firm-reported pension information.2 In particular, Kennickell (2009) pointed out that the SCF responses were likely to have a relatively high degree of uncertainty about pension benefits.3
This article examines whether self-reported SCF respondents accurately estimated their expected benefits from DB plans in comparison with the 2005 National Compensation Survey (NCS). To do this, the distribution of annual benefit accrual rates of the 2004 and 2007 SCF respondents who reported their expected benefits as a percentage of final pay are compared with the distribution of “flat percent per year of service” reported by the 2005 NCS (the most recent available information on flat percentage per year of service).
In contrast to the SCF, the NCS provides DB pension benefit information based on actual plan documents. The NCS data are collected by the U.S. Department of Labor’s Bureau of Labor Statistics (BLS) field economists who visit sampled establishments or contact them by phone to collect data for the survey.4 For DB pensions, in particular, BLS field economists also asked respondents to provide Summary Plan Provision documents. Therefore, compared with the self-reported benefits of the SCF respondents, the NCS data based on plan documents are much less likely to have measurement error concerning benefit formulas.
The SCF respondents report their expected benefits in terms of regular payments or as a percentage of final pay. This article compares benefit formulas of two different types of self-reported benefits:
By benefit formulas, which are estimated based on the 2004 and 2007 SCF.
By expected years to retirement and age of the respondents, to see whether young DB plan participants expect to have less generous benefit formulas than older participants.
Different Types of Expected Benefits From DB Plans For DB participants, the SCF asks families when they expect to start receiving benefits and how much they expect to receive.5 Respondents report their expected benefits as a percentage of final pay or regular payments (e.g., monthly or yearly).6
Figure 1 shows different responses of expected benefits at retirement by 2004 and 2007 SCF respondents. These percentages are calculated for respondents and their spouse/partner who reported DB plans as the most important plan.7 More than 29 percent of the 2004 SCF respondents who had DB plans reported their expected benefits as a percentage of final pay, while about 71 percent reported as regular payments.8 Similarly, in 2007, about 34 percent of the respondents reported their expected benefits as a percentage of final pay, while more than 66 percent reported as regular payments.
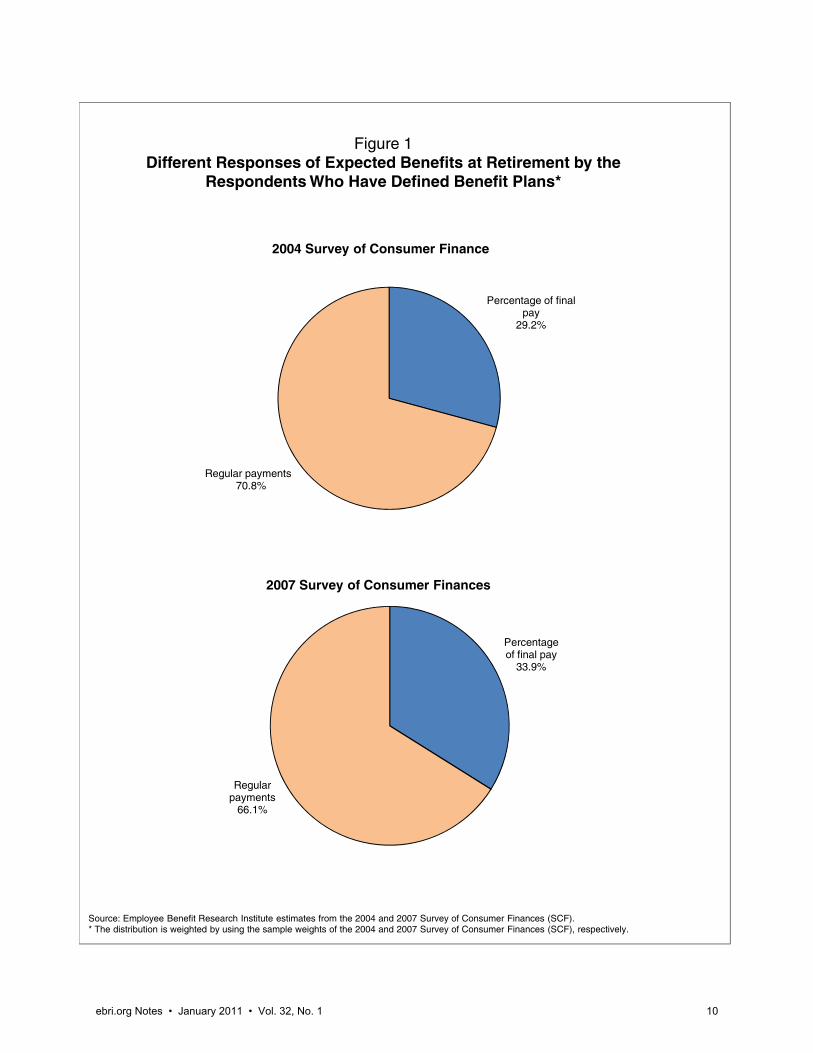
Figure 1Different Responses of Expected Benefits at Retirement by the
Respondents Who Have Defined Benefit Plans*
2004 Survey of Consumer Finance
2007 Survey of Consumer Finances
Percentage of final pay
29.2%
Regular payments70.8%
Percentage of final pay
33.9%
Regular payments
66.1%
Figure 1Different Responses of Expected Benefits at Retirement by the
Respondents Who Have Defined Benefit Plans*
2004 Survey of Consumer Finance
Source: Employee Benefit Research Institute estimates from the 2004 and 2007 Survey of Consumer Finances (SCF).* The distribution is weighted by using the sample weights of the 2004 and 2007 Survey of Consumer Finances (SCF), respectively.
2007 Survey of Consumer Finances
Percentage of final pay
29.2%
Regular payments70.8%
ebri.org Notes • January 2011 • Vol. 32, No. 1 10
ebri.org Notes • January 2011 • Vol. 32, No. 1 11
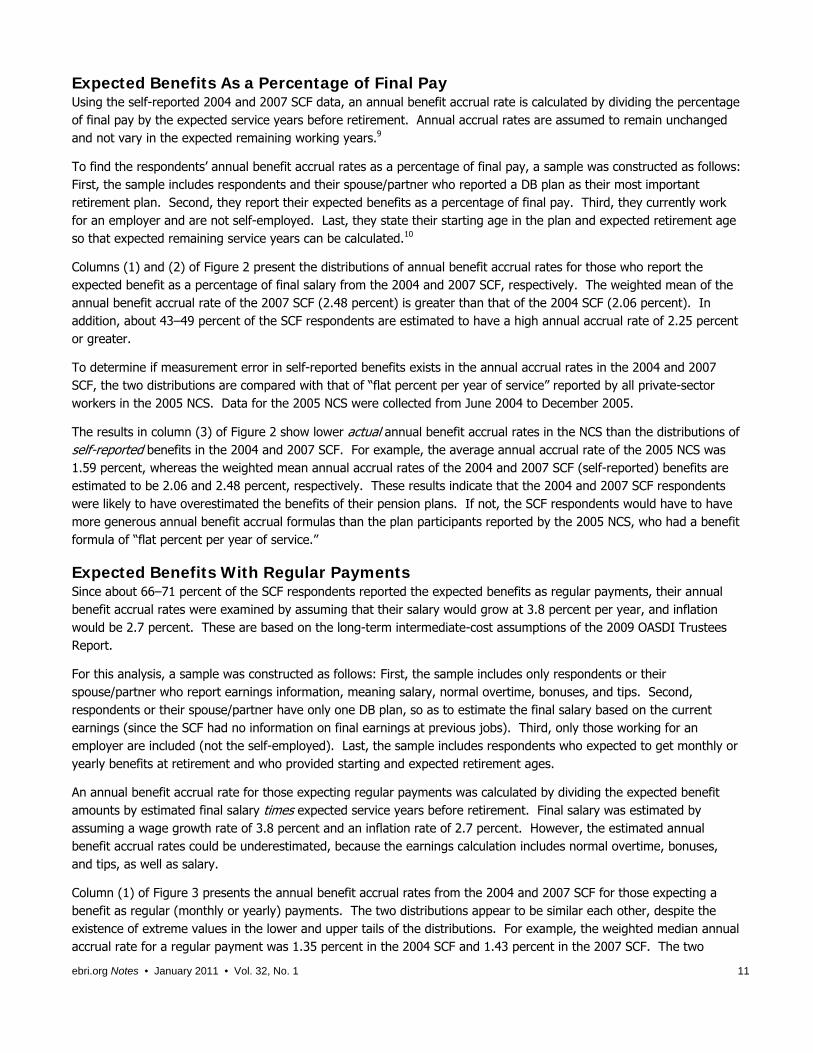
Expected Benefits As a Percentage of Final Pay Using the self-reported 2004 and 2007 SCF data, an annual benefit accrual rate is calculated by dividing the percentage of final pay by the expected service years before retirement. Annual accrual rates are assumed to remain unchanged and not vary in the expected remaining working years.9
To find the respondents’ annual benefit accrual rates as a percentage of final pay, a sample was constructed as follows: First, the sample includes respondents and their spouse/partner who reported a DB plan as their most important retirement plan. Second, they report their expected benefits as a percentage of final pay. Third, they currently work for an employer and are not self-employed. Last, they state their starting age in the plan and expected retirement age so that expected remaining service years can be calculated.10
Columns (1) and (2) of Figure 2 present the distributions of annual benefit accrual rates for those who report the expected benefit as a percentage of final salary from the 2004 and 2007 SCF, respectively. The weighted mean of the annual benefit accrual rate of the 2007 SCF (2.48 percent) is greater than that of the 2004 SCF (2.06 percent). In addition, about 43–49 percent of the SCF respondents are estimated to have a high annual accrual rate of 2.25 percent or greater.
To determine if measurement error in self-reported benefits exists in the annual accrual rates in the 2004 and 2007 SCF, the two distributions are compared with that of “flat percent per year of service” reported by all private-sector workers in the 2005 NCS. Data for the 2005 NCS were collected from June 2004 to December 2005.
The results in column (3) of Figure 2 show lower actual annual benefit accrual rates in the NCS than the distributions of self-reported benefits in the 2004 and 2007 SCF. For example, the average annual accrual rate of the 2005 NCS was 1.59 percent, whereas the weighted mean annual accrual rates of the 2004 and 2007 SCF (self-reported) benefits are estimated to be 2.06 and 2.48 percent, respectively. These results indicate that the 2004 and 2007 SCF respondents were likely to have overestimated the benefits of their pension plans. If not, the SCF respondents would have to have more generous annual benefit accrual formulas than the plan participants reported by the 2005 NCS, who had a benefit formula of “flat percent per year of service.”
Expected Benefits With Regular Payments Since about 66–71 percent of the SCF respondents reported the expected benefits as regular payments, their annual benefit accrual rates were examined by assuming that their salary would grow at 3.8 percent per year, and inflation would be 2.7 percent. These are based on the long-term intermediate-cost assumptions of the 2009 OASDI Trustees Report.
For this analysis, a sample was constructed as follows: First, the sample includes only respondents or their spouse/partner who report earnings information, meaning salary, normal overtime, bonuses, and tips. Second, respondents or their spouse/partner have only one DB plan, so as to estimate the final salary based on the current earnings (since the SCF had no information on final earnings at previous jobs). Third, only those working for an employer are included (not the self-employed). Last, the sample includes respondents who expected to get monthly or yearly benefits at retirement and who provided starting and expected retirement ages.
An annual benefit accrual rate for those expecting regular payments was calculated by dividing the expected benefit amounts by estimated final salary times expected service years before retirement. Final salary was estimated by assuming a wage growth rate of 3.8 percent and an inflation rate of 2.7 percent. However, the estimated annual benefit accrual rates could be underestimated, because the earnings calculation includes normal overtime, bonuses, and tips, as well as salary.
Column (1) of Figure 3 presents the annual benefit accrual rates from the 2004 and 2007 SCF for those expecting a benefit as regular (monthly or yearly) payments. The two distributions appear to be similar each other, despite the existence of extreme values in the lower and upper tails of the distributions. For example, the weighted median annual accrual rate for a regular payment was 1.35 percent in the 2004 SCF and 1.43 percent in the 2007 SCF. The two
2004
SC
F*
2007
SC
F*
2005
NC
S**
Per
cent
age
of fi
nal p
ayP
erce
ntag
e of
fina
l pay
Fla
t per
cent
per
yea
r
of
ser
vice
Ann
ual B
enef
it A
ccru
al R
ate
(1)
(2)
(3)
Less
than
1.0
0 pe
rcen
t19
.5%
4.4%
2.3%
1.00
–1.2
4 pe
rcen
t6.
87.
313
.61.
25–1
.49
perc
ent
10.9
6.8
9.1
1.50
–1.7
4 pe
rcen
t8.
77.
238
.61.
75–1
.99
perc
ent
9.7
8.7
27.3
2.00
–2.2
4 pe
rcen
t7.
316
.66.
82.
25 p
erce
nt o
r gr
eate
r43
.149
.12.
3A
vera
ge a
nnua
l acc
rual
rat
e2.
062.
481.
59S
ourc
e: N
atio
nal C
ompe
nsat
ion
Sur
vey:
Em
ploy
ee B
enef
its in
Priv
ate
Indu
stry
in th
e U
nite
d S
tate
s, 2
005,
U.S
. Bur
eau
of L
abor
Sta
tistic
s (M
ay 2
007)
and
Em
ploy
ee B
enef
it R
esea
rch
Inst
itute
est
imat
es fr
om th
e 20
04 a
nd 2
007
Sur
vey
of C
onsu
mer
Fin
ance
s.*
Wei
ghte
d by
usi
ng th
e sa
mpl
e w
eigh
ts o
f the
200
4 an
d 20
07 S
urve
y of
Con
sum
er F
inan
ces
(SC
F),
res
pect
ivel
y.P
erce
ntag
es m
ay n
ot a
dd to
100
due
to r
ound
ing
erro
r.**
The
dis
trib
utio
n of
acc
rual
rat
es is
obt
aine
d fo
r al
l priv
ate
indu
stry
wor
kers
from
the
2005
Nat
iona
l Com
pens
atio
n S
urve
y (N
CS
).
Fig
ure
2D
istr
ibu
tio
n o
f A
nn
ual
Ben
efit
Acc
rual
Rat
es f
or
Def
ined
Ben
efit
Pla
n P
arti
cip
ants
(3)
Expecte
d B
enefit
s R
eport
ed a
s
Reg
ula
r P
aym
en
tsE
xpecte
d B
enefit
s R
eport
ed a
s
a P
erc
en
tag
e o
f F
inal P
ay
Dis
trib
uti
on
of
An
nu
al
Ben
efi
t A
ccru
al
Rate
s b
y D
iffe
ren
t T
yp
es o
f th
e E
xp
ecte
d B
en
efi
tsF
igure
3
Tota
l
(2)
(1)
2004 S
CF
*2007 S
CF
*2004 S
CF
*2007 S
CF
*2004 S
CF
*2007 S
CF
*Less than 1
.00 p
erc
ent
34.9
%28.8
%19.5
%4.4
%29.4
%17.3
%1.0
0–1.2
4 p
erc
ent
9.7
12.2
6.8
7.3
8.4
9.5
1.2
5–1.4
9 p
erc
ent
9.1
13.4
10.9
6.8
9.5
10.4
1.5
0–1.7
4 p
erc
ent
6.1
11.2
8.7
7.2
7.2
9.5
1.7
5–1.9
9 p
erc
ent
10.5
8.4
9.7
8.7
10.0
8.8
2.0
0–2.2
4 p
erc
ent
5.0
4.4
7.3
16.6
6.1
10.2
2.2
5–2.4
9 p
erc
ent
2.8
5.2
9.2
10.7
5.3
7.7
2.5
0–2.7
4 p
erc
ent
4.4
2.3
6.6
12.6
5.4
7.2
2.7
5–2.9
9 p
erc
ent
1.5
3.4
3.8
5.9
2.5
4.6
3.0
0 p
erc
ent or
gre
ate
r16.0
10.6
17.5
19.9
16.3
14.9
Media
n1.3
51.4
31.8
32.2
21.5
81.8
0M
ean
2.5
61.7
12.0
62.4
82.3
72.0
7
Souce: E
mplo
yee B
enefit
Researc
h Instit
ute
estim
ate
s fro
m the 2
004 a
nd 2
007 S
urv
ey o
f C
onsum
er
Fin
ances.
* W
eig
hte
d b
y u
sin
g the s
am
ple
weig
hts
of th
e 2
004 a
nd 2
007 S
urv
ey o
f C
onsum
er
Fin
ances (
SC
F),
respectiv
ely
.P
erc
enta
ges m
ay n
ot add to 1
00 d
ue to r
oundin
g e
rror.
(3)
Expecte
d B
enefit
s R
eport
ed a
s
Reg
ula
r P
aym
en
tsE
xpecte
d B
enefit
s R
eport
ed a
s
a P
erc
en
tag
e o
f F
inal P
ay
Dis
trib
uti
on
of
An
nu
al
Ben
efi
t A
ccru
al
Rate
s b
y D
iffe
ren
t T
yp
es o
f th
e E
xp
ecte
d B
en
efi
tsF
igure
3
Annual B
enefit
Accru
al R
ate
Tota
l
(2)
(1)
ebri.org Notes • January 2011 • Vol. 32, No. 1 12
ebri.org Notes • January 2011 • Vol. 32, No. 1 13
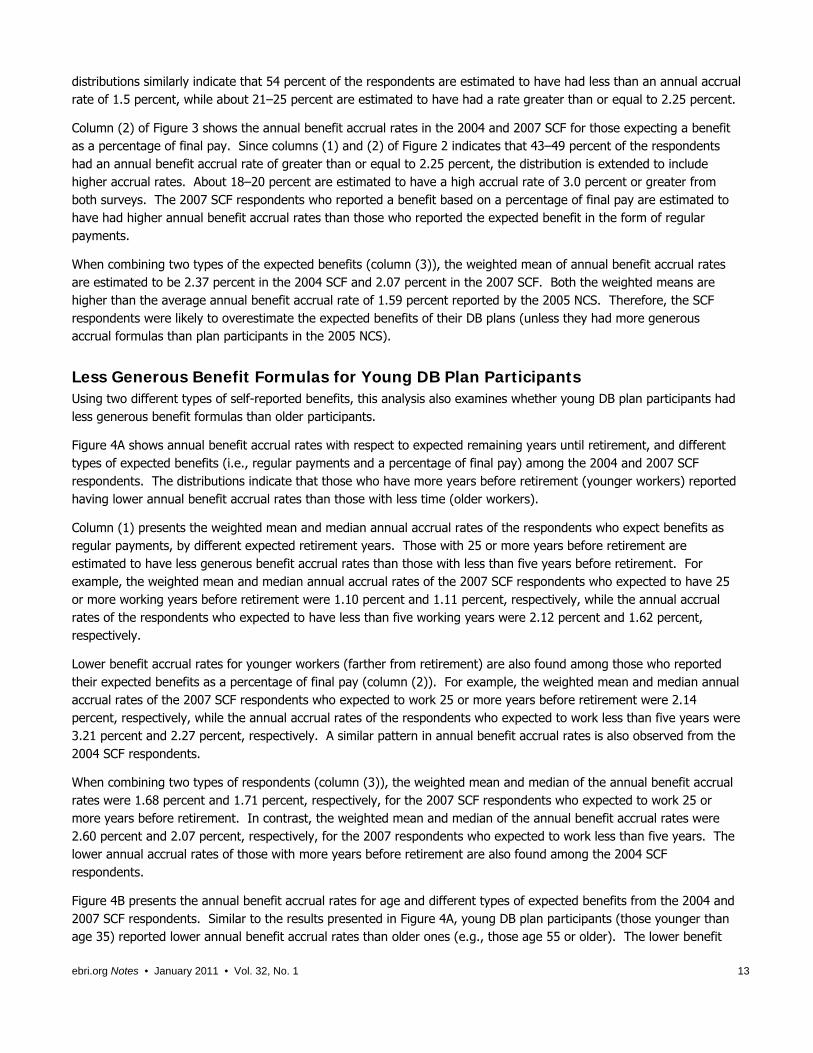
distributions similarly indicate that 54 percent of the respondents are estimated to have had less than an annual accrual rate of 1.5 percent, while about 21–25 percent are estimated to have had a rate greater than or equal to 2.25 percent.
Column (2) of Figure 3 shows the annual benefit accrual rates in the 2004 and 2007 SCF for those expecting a benefit as a percentage of final pay. Since columns (1) and (2) of Figure 2 indicates that 43–49 percent of the respondents had an annual benefit accrual rate of greater than or equal to 2.25 percent, the distribution is extended to include higher accrual rates. About 18–20 percent are estimated to have a high accrual rate of 3.0 percent or greater from both surveys. The 2007 SCF respondents who reported a benefit based on a percentage of final pay are estimated to have had higher annual benefit accrual rates than those who reported the expected benefit in the form of regular payments.
When combining two types of the expected benefits (column (3)), the weighted mean of annual benefit accrual rates are estimated to be 2.37 percent in the 2004 SCF and 2.07 percent in the 2007 SCF. Both the weighted means are higher than the average annual benefit accrual rate of 1.59 percent reported by the 2005 NCS. Therefore, the SCF respondents were likely to overestimate the expected benefits of their DB plans (unless they had more generous accrual formulas than plan participants in the 2005 NCS).
Less Generous Benefit Formulas for Young DB Plan Participants Using two different types of self-reported benefits, this analysis also examines whether young DB plan participants had less generous benefit formulas than older participants.
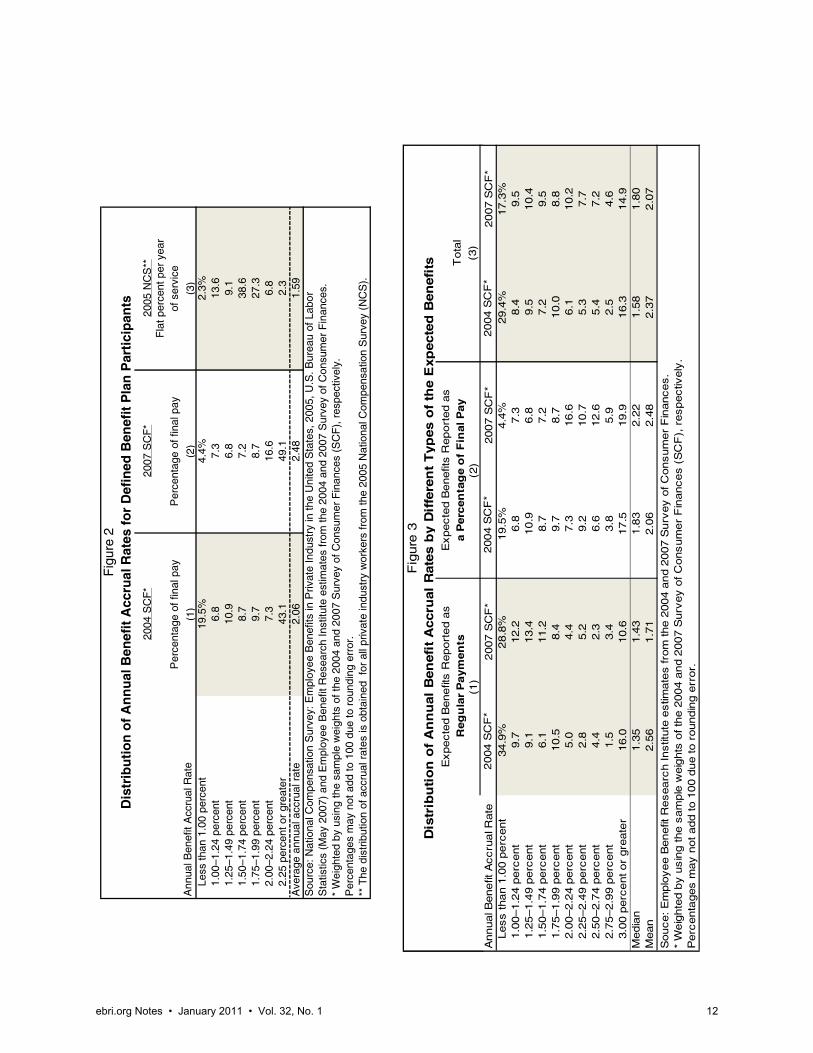
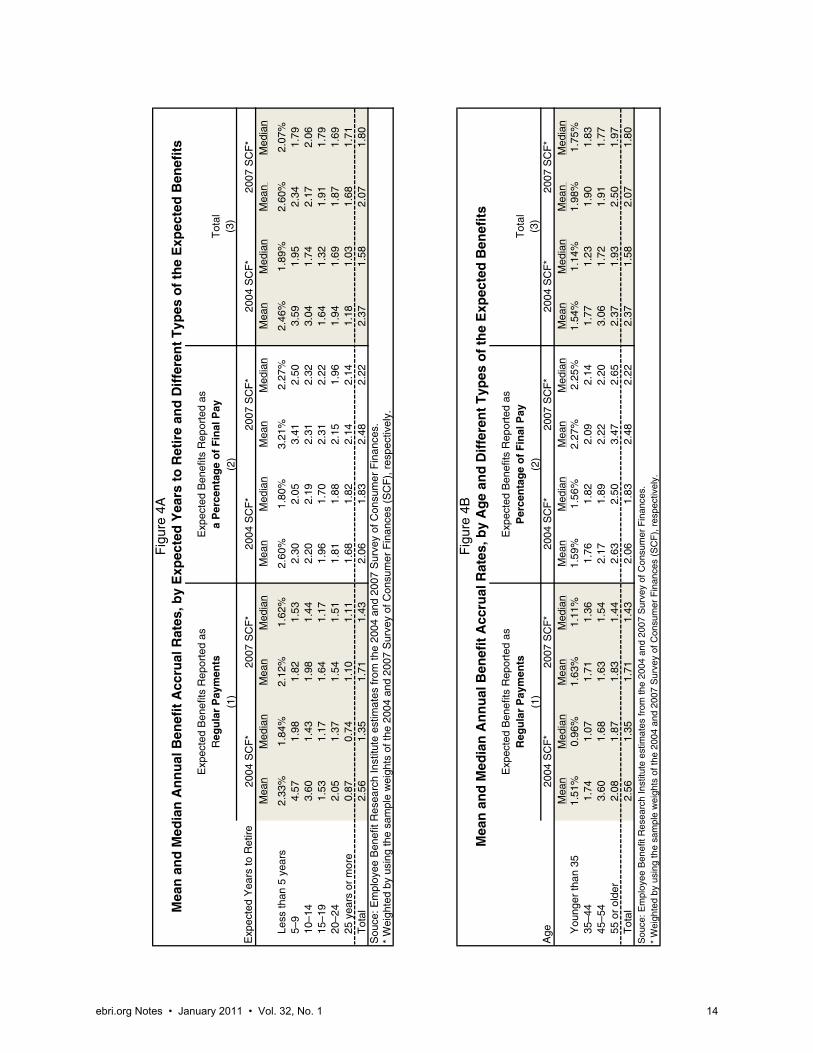
Figure 4A shows annual benefit accrual rates with respect to expected remaining years until retirement, and different types of expected benefits (i.e., regular payments and a percentage of final pay) among the 2004 and 2007 SCF respondents. The distributions indicate that those who have more years before retirement (younger workers) reported having lower annual benefit accrual rates than those with less time (older workers).
Column (1) presents the weighted mean and median annual accrual rates of the respondents who expect benefits as regular payments, by different expected retirement years. Those with 25 or more years before retirement are estimated to have less generous benefit accrual rates than those with less than five years before retirement. For example, the weighted mean and median annual accrual rates of the 2007 SCF respondents who expected to have 25 or more working years before retirement were 1.10 percent and 1.11 percent, respectively, while the annual accrual rates of the respondents who expected to have less than five working years were 2.12 percent and 1.62 percent, respectively.
Lower benefit accrual rates for younger workers (farther from retirement) are also found among those who reported their expected benefits as a percentage of final pay (column (2)). For example, the weighted mean and median annual accrual rates of the 2007 SCF respondents who expected to work 25 or more years before retirement were 2.14 percent, respectively, while the annual accrual rates of the respondents who expected to work less than five years were 3.21 percent and 2.27 percent, respectively. A similar pattern in annual benefit accrual rates is also observed from the 2004 SCF respondents.
When combining two types of respondents (column (3)), the weighted mean and median of the annual benefit accrual rates were 1.68 percent and 1.71 percent, respectively, for the 2007 SCF respondents who expected to work 25 or more years before retirement. In contrast, the weighted mean and median of the annual benefit accrual rates were 2.60 percent and 2.07 percent, respectively, for the 2007 respondents who expected to work less than five years. The lower annual accrual rates of those with more years before retirement are also found among the 2004 SCF respondents.
Figure 4B presents the annual benefit accrual rates for age and different types of expected benefits from the 2004 and 2007 SCF respondents. Similar to the results presented in Figure 4A, young DB plan participants (those younger than age 35) reported lower annual benefit accrual rates than older ones (e.g., those age 55 or older). The lower benefit
Mea
nM
edia
nM
ean
Med
ian
Mea
nM
edia
nM
ean
Med
ian
Mea
nM
edia
nM
ean
Med
ian
Less
than
5 y
ears
2.33
%1.
84%
2.12
%1.
62%
2.60
%1.
80%
3.21
%2.
27%
2.46
%1.
89%
2.60
%2.
07%
5–9
4.57
1.98
1.82
1.53
2.30
2.05
3.41
2.50
3.59
1.95
2.34
1.79
10–1
43.
601.
431.
981.
442.
202.
192.
312.
323.
041.
742.
172.
0615
–19
1.53
1.17
1.64
1.17
1.96
1.70
2.31
2.22
1.64
1.32
1.91
1.79
20–2
42.
051.
371.
541.
511.
811.
882.
151.
961.
941.
691.
871.
6925
yea
rs o
r m
ore
0.87
0.74
1.10
1.11
1.68
1.82
2.14
2.14
1.18
1.03
1.68
1.71
Tot
al2.
561.
351.
711.
432.
061.
832.
482.
222.
371.
582.
071.
80S
ouce
: Em
ploy
ee B
enef
it R
esea
rch
Inst
itute
est
imat
es fr
om th
e 20
04 a
nd 2
007
Sur
vey
of C
onsu
mer
Fin
ance
s.*
Wei
ghte
d by
usi
ng th
e sa
mpl
e w
eigh
ts o
f the
200
4 an
d 20
07 S
urve
y of
Con
sum
er F
inan
ces
(SC
F),
res
pect
ivel
y.
Mea
nM
edia
nM
ean
Med
ian
Mea
nM
edia
nM
ean
Med
ian
Mea
nM
edia
nM
ean
Med
ian
You
nger
than
35
1.51
%0.
96%
1.63
%1.
11%
1.59
%1.
56%
2.27
%2.
25%
1.54
%1.
14%
1.98
%1.
75%
35–4
41.
741.
071.
711.
361.
761.
822.
092.
141.
771.
231.
901.
8345
–54
3.60
1.68
1.63
1.54
2.17
1.89
2.22
2.20
3.06
1.72
1.91
1.77
55 o
r ol
der
2.08
1.87
1.83
1.44
2.63
2.50
3.47
2.65
2.37
1.93
2.50
1.97
Tot
al2.
561.
351.
711.
432.
061.
832.
482.
222.
371.
582.
071.
80S
ouce
: Em
ploy
ee B
enef
it R
esea
rch
Inst
itute
est
imat
es fr
om th
e 20
04 a
nd 2
007
Sur
vey
of C
onsu
mer
Fin
ance
s.*
Wei
ghte
d by
usi
ng th
e sa
mpl
e w
eigh
ts o
f the
200
4 an
d 20
07 S
urve
y of
Con
sum
er F
inan
ces
(SC
F),
res
pect
ivel
y.
Fig
ure
4A
Fig
ure
4B
Mea
n a
nd
Med
ian
An
nu
al B
enef
it A
ccru
al R
ates
, by
Exp
ecte
d Y
ears
to
Ret
ire
and
Dif
fere
nt
Typ
es o
f th
e E
xpec
ted
Ben
efit
s
Mea
n a
nd
Med
ian
An
nu
al B
enef
it A
ccru
al R
ates
, by
Ag
e an
d D
iffe
ren
t T
ypes
of
the
Exp
ecte
d B
enef
its
Exp
ecte
d Y
ears
to R
etire
2004
SC
F*
Exp
ecte
d B
enef
its R
epor
ted
as
R
egu
lar
Pay
men
tsE
xpec
ted
Ben
efits
Rep
orte
d as
a P
erce
nta
ge
of
Fin
al P
ayT
otal
(1)
(2)
(3)
2007
SC
F*
2004
SC
F*
2007
SC
F*
2004
SC
F*
2007
SC
F*
Age
Exp
ecte
d B
enef
its R
epor
ted
as
R
egu
lar
Pay
men
tsE
xpec
ted
Ben
efits
Rep
orte
d as
Per
cen
tag
e o
f F
inal
Pay
Tot
al(1
)(2
)(3
)20
04 S
CF
*20
07 S
CF
*20
04 S
CF
*20
07 S
CF
*20
04 S
CF
*20
07 S
CF
*
ebri.org Notes • January 2011 • Vol. 32, No. 1 14
ebri.org Notes • January 2011 • Vol. 32, No. 1 15
accrual rates for young participants are found for two different types of the expected benefits, although some variation in the accrual rates exists between the two types (columns (1) and (2)).
The results presented in Figure 4A and 4B indicate that young DB plan participants (with more years before retirement) tend to believe they have less generous benefit formulas than older participants (those closer to retirement).
Conclusion This article examined whether the SCF respondents accurately estimated their expected benefits of DB plans, by comparing the distributions of annual benefit accrual rates of the 2004 and 2007 SCF respondents who reported their expected benefits as a percentage of final pay with the distribution of flat percent per year of service reported by the 2005 NCS. The results indicate that the 2004 and 2007 SCF respondents appear to overestimate their expected benefits of their pension plans (unless they had more generous formulas of annual benefit accrual rates than the plan participants reported by the 2005 NCS).This indicates that the 2004 and 2007 SCF data about the expected pension benefits have some measurement errors due to the self-reporting of the respondents. This is consistent with the findings of the financial literacy literature (e.g., Gustman and Steinmeier, 1989 and 2004; Engelhardt, 2001).
Also, despite the potential measurement errors in the self-reported expected benefits of the SCF respondents, this analysis finds that young DB plan participants were likely to have less generous benefit formulas than older ones—a finding that is consistent with the 2004 and 2007 SCF. Lower benefit accrual rates for young participants were also found among those who reported retirement benefits as a percentage of final pay or regular payments.
Endnotes 1 See Gale, William G., and Karen M. Pence. “Are successive generations getting wealthier, and if so, why? Evidence from the 1990s.”
Brookings Papers on Economic Activity, 2006, pp. 155–234.
2 See Gustman, Alan, and Thomas Steinmeier. “An Analysis of Pension Benefit Formulas, Pension Wealth, and Incentives from Pensions.”
Research in Labor Economics, Vol. 10, 1989, pp. 53–106; Gustman, Alan, and Thomas Steinmeier. “What People Don’t Know about Their
Pensions and Social Security,” in Private Pensions and Public Policies, edited by William G. Gale, John B. Shoven, and Mark J. Warshawsky.
Brookings Institution (2004); Engelhardt, Gary V. “Have 401(k) Raised Household Saving? Evidence from the Health and Retirement Study.”
Syracuse University, Center for Policy Research Aging Studies Program Paper No. 24, 2001.
3 See Kennickell, Arthur B. “Ponds and Streams: Wealth and Income in the U.S., 1989 to 2007.” Finance and Economics Discussion Series,
2009-13 (Washington, DC: Federal Reserve Board). Available at www.federalreserve.gov/pubs/feds/2009/200913/200913pap.pdf
4 For more details on survey methodology, see Appendix of National Compensation Survey: Employee Benefits in Private Industry in the
United States, 2005, www.bls.gov/ncs/ebs/sp/ebbl0022.pdf
5 This Notes article focuses on private defined benefit plans. As a proxy for this control, the SCF respondents who worked in the industry of
public administration are dropped from the samples.
6 Very few respondents (about 0.5 percent of the respondents) reported their expected benefits at retirement as lump- sum payments. This
article does not include those respondents in the analysis.
7 The SCF allows respondents and their spouse/partner to report up to three pension plans, respectively. If a respondent had more than on
plan, he/she was asked to list a plan considered the most important one first.
8 The distribution of different types of the expected benefits is weighted by using the sample weights. When either respondents or their
spouse/partner reported DB plans, a full sample weight is used. However, if both respondents and their spouse/partner reported DB plans, half
of a sample weight is employed.
9 Different annual accrual rates may apply to different service years.
10 In order to control for outliers of the expected service years, the observations with the expected service years having more than 40 years
are dropped from the sample.
EBRI Employee Benefit Research Institute Notes (ISSN 10854452) is published monthly by the Employee Benefit Research Institute, 1100 13th St. NW, Suite 878, Washington, DC 20005-4051, at $300 per year or is included as part of a membership subscription. Periodicals postage rate paid in Washington, DC, and additional mailing offices. POSTMASTER: Send address changes to: EBRI Notes, 1100 13th St. NW, Suite 878, Washington, DC 20005-4051. Copyright 2011 by Employee Benefit Research Institute. All rights reserved, Vol. 32, no.1.
The Employee Benefit Research Institute (EBRI) was founded in 1978. Its mission is to contribute to, to encourage, and to enhance the development of sound employee benefit programs and sound public policy through objective research and education. EBRI is the only private, nonprofit, nonpartisan, Washington, DC-based organization committed exclusively to public policy research and education on economic security and employee benefit issues. EBRI’s membership includes a cross-section of pension funds; businesses; trade associations; labor unions; health care providers and insurers; government organizations; and service firms.
EBRI’s work advances knowledge and understanding of employee benefits and their importance to the nation’s economy among policymakers, the news media, and the public. It does this by conducting and publishing policy research, analysis, and special reports on employee benefits issues; holding educational briefings for EBRI members, congressional and federal agency staff, and the news media; and sponsoring public opinion surveys on employee benefit issues. EBRI’s Education and Research Fund (EBRI-ERF) performs the charitable, educational, and scientific functions of the Institute. EBRI-ERF is a tax-exempt organization supported by contributions and grants.
EBRI Issue Briefs are periodicals providing expert evaluations of employee benefit issues and trends, as well as critical analyses of employee benefit policies and proposals. EBRI Notes is a monthly periodical providing current information on a variety of employee benefit topics. EBRI’s Pension Investment Report provides detailed financial information on the universe of defined benefit, defined contribution, and 401(k) plans. EBRI Fundamentals of Employee Benefit Programs offers a straightforward, basic explanation of employee benefit programs in the private and public sectors. The EBRI Databook on Employee Benefits is a statistical reference work on employee benefit programs and work force-related issues.
Contact EBRI Publications, (202) 659-0670; fax publication orders to (202) 775-6312. Subscriptions to EBRI Issue Briefs are included as part of EBRI membership, or as part of a $199 annual subscription to EBRI Notes and EBRI Issue Briefs. Individual copies are available with prepayment for $25 each (for printed copies). Change of Address: EBRI, 1100 13th St. NW, Suite 878, Washington, DC, 20005-4051, (202) 659-0670; fax number, (202) 775-6312; e-mail: [email protected] Membership Information: Inquiries regarding EBRI membership and/or contributions to EBRI-ERF should be directed to EBRI President/ASEC Chairman Dallas Salisbury at the above address, (202) 659-0670; e-mail: [email protected]
Editorial Board: Dallas L. Salisbury, publisher; Stephen Blakely, editor. Any views expressed in this publication and those of the authors should not be ascribed to the officers, trustees, members, or other sponsors of the Employee Benefit Research Institute, the EBRI Education and Research Fund, or their staffs. Nothing herein is to be construed as an attempt to aid or hinder the adoption of any pending legislation, regulation, or interpretative rule, or as legal, accounting, actuarial, or other such professional advice.
EBRI Notes is registered in the U.S. Patent and Trademark Office. ISSN: 10854452 10854452/90 $ .50+.50
© 2011, Employee Benefit Research InstituteEducation and Research Fund. All rights reserved.
Who we are
What we do
Our publications
Orders/ Subscriptions


