Embed Size (px)
Citation preview
Deutsche Bank Markets Research
Rating
Buy Asia
China
Technology
Software & Services
Company
Alibaba
Date
5 December 2015
Company Update
e-Commerce outside, ad tech inside
Reuters Bloomberg Exchange Ticker BABA.N BABA US NYS BABA
Forecasts And Ratios
Year End Mar 31 2014A 2015A 2016E 2017E 2018E
Sales (CNYm) 52,504.0 76,204.0 97,965.4 131,731.9 175,517.9
EBITDA (CNYm) 26,303.0 25,636.0 32,925.9 50,574.7 75,192.2
Reported NPAT (CNYm) 23,076.0 24,149.0 69,738.5 41,226.4 62,110.1
Reported EPS FD(CNY) 9.90 9.58 26.82 15.58 23.20
DB EPS FD(CNY) 11.80 12.96 16.80 22.69 30.34
OLD DB EPS FD(CNY) 11.80 12.96 16.80 22.47 30.07
% Change 0.0% 0.0% 0.0% 1.0% 0.9%
DB EPS growth (%) 105.0 9.8 29.6 35.0 33.7
PER (x) – 46.0 31.5 23.3 17.4
EV/EBITDA (x) – 52.5 32.6 20.0 12.4
DPS (net) (CNY) 0.00 0.00 0.00 0.00 0.00
Yield (net) (%) – 0.0 0.0 0.0 0.0
Source: Deutsche Bank estimates, company data 1 DB EPS is fully diluted and excludes non-recurring items 2 Multiples and yields calculations use average historical prices for past years and spot prices for current and future years, except P/B which uses
the year end close
Super-ID roll-out, improved mobile major catalysts to further growth
________________________________________________________________________________________________________________
Deutsche Bank AG/Hong Kong
Deutsche Bank does and seeks to do business with companies covered in its research reports. Thus, investors should be aware that the firm may have a conflict of interest that could affect the objectivity of this report. Investors should consider this report as only a single factor in making their investment decision. DISCLOSURES AND ANALYST CERTIFICATIONS ARE LOCATED IN APPENDIX 1. MCI (P) 124/04/2015.
Price at 3 Dec 2015 (USD) 82.59
Price target - 12mth (USD) 99.00
52-week range (USD) 110.65 - 57.39
NASDAQ 100 4,607
Alan Hellawell III
Research Analyst
(+852) 2203 6240
Ross Sandler
Research Analyst
(+1) 415 262-2028
Key changes
Price target 98.00 to 99.00 ↑ 1.0%
Source: Deutsche Bank
Price/price relative
45
60
75
90
105
120
9/14 3/15 9/15
Alibaba
NASDAQ 100 (Rebased)
Performance (%) 1m 3m 12m
Absolute -1.0 24.3 -25.4
NASDAQ 100 -2.4 8.8 6.8
Source: Deutsche Bank
The Alimama Ad Network is China's first and most advanced exchange. Improved support of mobile ads placement, better connectivity to partner properties and the roll-out of "Super-ID" user tracking should underpin distinct upside to the company's advertising take-rate. Maintain Buy on the possibility of better-than-expected monetization rate from Alibaba "Marketing Services" ad revenues.
The industry’s most robust advertising exchange We expect the Alimama Ad Network to continue to dominate China’s programmatic advertising landscape. As the first mover in the space, and with unrivaled commercial user data and connectivity to millions of advertisers, we expect Alibaba to be able to broaden its appeal with “long tail” accounts. SME’s and smaller merchants should drive the next leg of ads growth in China.
Alibaba’s aggressive shift to mobile: GMV leads, ad exchange follows While Alibaba’s mobile monetization rate has consistently beaten our expectations (largely on stronger than anticipated mobile ad sales) the tighter incorporation of properties such as UCWeb and Youku Mobile should bolster mobile “Marketing Services” even further going forward. The cultivation of a “Super-ID” user tracking system meanwhile should translate into improved audience targeting for its estimated 1m+ advertisers. We note however that a revenue share to partner-publishers of 50-70% from Alibaba’s “TANX” public exchange could weigh on BABA GM’s should growth recover in that business.
Lifting TP to US$99; maintain Buy in expectations of strong ads growth Our TP is based on a weighted average of: 1) CY16E non-GAAP PER (50% weighting), 2) CY16E EV/EBITDA (30% weighting), and 3) a 20% DCF value. Our current TP of US$99 implies 29.7x CY16E P/E and 22.2x CY16E EV/EBITDA. Key risks: lower mobile/PC take rate, lower GMV growth.
5 December 2015
Software & Services
Alibaba
Page 2 Deutsche Bank AG/Hong Kong
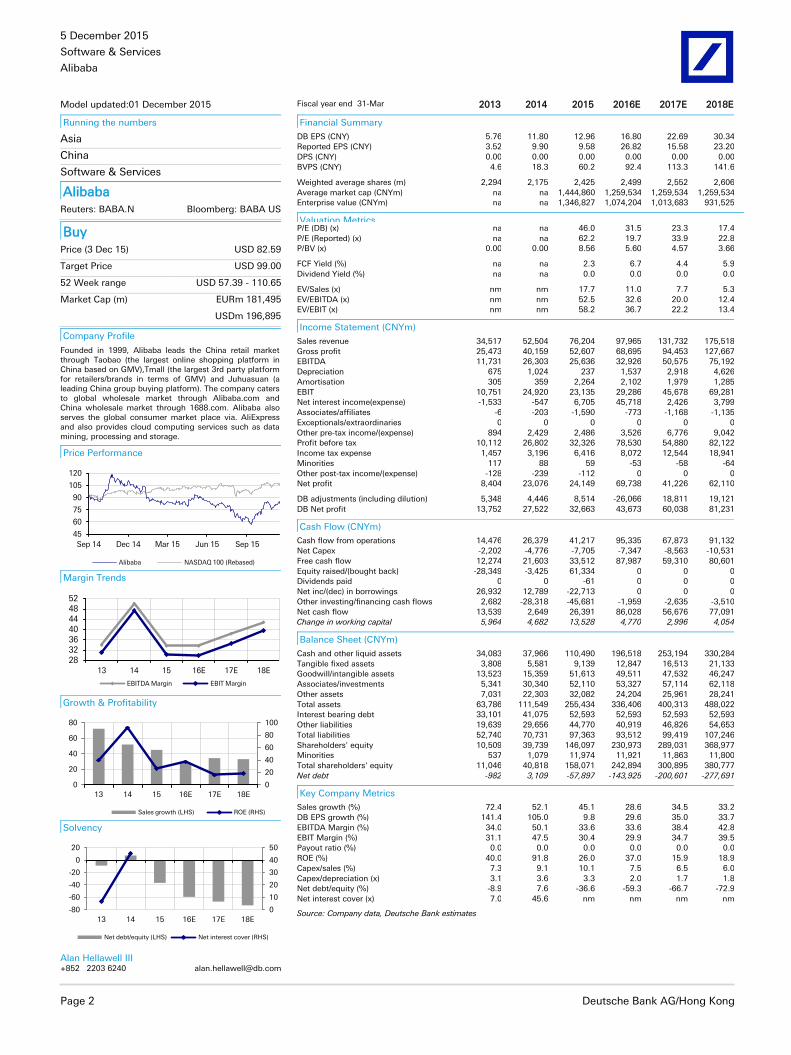
Model updated:01 December 2015
Running the numbers
Asia
China
Software & Services
Alibaba Reuters: BABA.N Bloomberg: BABA US
Buy Price (3 Dec 15) USD 82.59
Target Price USD 99.00
52 Week range USD 57.39 - 110.65
Market Cap (m) EURm 181,495
USDm 196,895
Company Profile
Founded in 1999, Alibaba leads the China retail market through Taobao (the largest online shopping platform in China based on GMV),Tmall (the largest 3rd party platform for retailers/brands in terms of GMV) and Juhuasuan (a leading China group buying platform). The company caters to global wholesale market through Alibaba.com and China wholesale market through 1688.com. Alibaba also serves the global consumer market place via. AliExpress and also provides cloud computing services such as data mining, processing and storage.
Price Performance
45
60
75
90
105
120
Sep 14 Dec 14 Mar 15 Jun 15 Sep 15
Alibaba NASDAQ 100 (Rebased)
Margin Trends
28323640444852
13 14 15 16E 17E 18E
EBITDA Margin EBIT Margin
Growth & Profitability
0
20
40
60
80
100
0
20
40
60
80
13 14 15 16E 17E 18E
Sales growth (LHS) ROE (RHS)
Solvency
0
10
20
30
40
50
-80
-60
-40
-20
0
20
13 14 15 16E 17E 18E
Net debt/equity (LHS) Net interest cover (RHS)
Alan Hellawell III
+852 2203 6240 [email protected]
Fiscal year end 31-Mar 2013 2014 2015 2016E 2017E 2018E
Financial Summary
DB EPS (CNY) 5.76 11.80 12.96 16.80 22.69 30.34
Reported EPS (CNY) 3.52 9.90 9.58 26.82 15.58 23.20
DPS (CNY) 0.00 0.00 0.00 0.00 0.00 0.00
BVPS (CNY) 4.6 18.3 60.2 92.4 113.3 141.6
Weighted average shares (m) 2,294 2,175 2,425 2,499 2,552 2,606
Average market cap (CNYm) na na 1,444,860 1,259,534 1,259,534 1,259,534
Enterprise value (CNYm) na na 1,346,827 1,074,204 1,013,683 931,525
Valuation Metrics P/E (DB) (x) na na 46.0 31.5 23.3 17.4
P/E (Reported) (x) na na 62.2 19.7 33.9 22.8
P/BV (x) 0.00 0.00 8.56 5.60 4.57 3.66
FCF Yield (%) na na 2.3 6.7 4.4 5.9
Dividend Yield (%) na na 0.0 0.0 0.0 0.0
EV/Sales (x) nm nm 17.7 11.0 7.7 5.3
EV/EBITDA (x) nm nm 52.5 32.6 20.0 12.4
EV/EBIT (x) nm nm 58.2 36.7 22.2 13.4
Income Statement (CNYm)
Sales revenue 34,517 52,504 76,204 97,965 131,732 175,518
Gross profit 25,473 40,159 52,607 68,695 94,453 127,667
EBITDA 11,731 26,303 25,636 32,926 50,575 75,192
Depreciation 675 1,024 237 1,537 2,918 4,626
Amortisation 305 359 2,264 2,102 1,979 1,285
EBIT 10,751 24,920 23,135 29,286 45,678 69,281
Net interest income(expense) -1,533 -547 6,705 45,718 2,426 3,799
Associates/affiliates -6 -203 -1,590 -773 -1,168 -1,135
Exceptionals/extraordinaries 0 0 0 0 0 0
Other pre-tax income/(expense) 894 2,429 2,486 3,526 6,776 9,042
Profit before tax 10,112 26,802 32,326 78,530 54,880 82,122
Income tax expense 1,457 3,196 6,416 8,072 12,544 18,941
Minorities 117 88 59 -53 -58 -64
Other post-tax income/(expense) -128 -239 -112 0 0 0
Net profit 8,404 23,076 24,149 69,738 41,226 62,110
DB adjustments (including dilution) 5,348 4,446 8,514 -26,066 18,811 19,121
DB Net profit 13,752 27,522 32,663 43,673 60,038 81,231
Cash Flow (CNYm)
Cash flow from operations 14,476 26,379 41,217 95,335 67,873 91,132
Net Capex -2,202 -4,776 -7,705 -7,347 -8,563 -10,531
Free cash flow 12,274 21,603 33,512 87,987 59,310 80,601
Equity raised/(bought back) -28,349 -3,425 61,334 0 0 0
Dividends paid 0 0 -61 0 0 0
Net inc/(dec) in borrowings 26,932 12,789 -22,713 0 0 0
Other investing/financing cash flows 2,682 -28,318 -45,681 -1,959 -2,635 -3,510
Net cash flow 13,539 2,649 26,391 86,028 56,676 77,091
Change in working capital 5,964 4,682 13,528 4,770 2,996 4,054
Balance Sheet (CNYm)
Cash and other liquid assets 34,083 37,966 110,490 196,518 253,194 330,284
Tangible fixed assets 3,808 5,581 9,139 12,847 16,513 21,133
Goodwill/intangible assets 13,523 15,359 51,613 49,511 47,532 46,247
Associates/investments 5,341 30,340 52,110 53,327 57,114 62,118
Other assets 7,031 22,303 32,082 24,204 25,961 28,241
Total assets 63,786 111,549 255,434 336,406 400,313 488,022
Interest bearing debt 33,101 41,075 52,593 52,593 52,593 52,593
Other liabilities 19,639 29,656 44,770 40,919 46,826 54,653
Total liabilities 52,740 70,731 97,363 93,512 99,419 107,246
Shareholders' equity 10,509 39,739 146,097 230,973 289,031 368,977
Minorities 537 1,079 11,974 11,921 11,863 11,800
Total shareholders' equity 11,046 40,818 158,071 242,894 300,895 380,777
Net debt -982 3,109 -57,897 -143,925 -200,601 -277,691
Key Company Metrics
Sales growth (%) 72.4 52.1 45.1 28.6 34.5 33.2
DB EPS growth (%) 141.4 105.0 9.8 29.6 35.0 33.7
EBITDA Margin (%) 34.0 50.1 33.6 33.6 38.4 42.8
EBIT Margin (%) 31.1 47.5 30.4 29.9 34.7 39.5
Payout ratio (%) 0.0 0.0 0.0 0.0 0.0 0.0
ROE (%) 40.0 91.8 26.0 37.0 15.9 18.9
Capex/sales (%) 7.3 9.1 10.1 7.5 6.5 6.0
Capex/depreciation (x) 3.1 3.6 3.3 2.0 1.7 1.8
Net debt/equity (%) -8.9 7.6 -36.6 -59.3 -66.7 -72.9
Net interest cover (x) 7.0 45.6 nm nm nm nm
Source: Company data, Deutsche Bank estimates
5 December 2015
Software & Services
Alibaba
Deutsche Bank AG/Hong Kong Page 3
The Alimama Ad Network
China’s most dominant exchange, leveraging unrivaled big data capabilities
(This note has been issued in parallel today with a more expansive Deutsche
Bank FITT report titled “Digital ad exchanges: quietly promoting industry
winners”. Please refer to this report for an explanation of the ad exchange, and
deeper analysis of industry trends.)
Please join us for a global Deutsche Bank investor call Monday, December 7th
Please join us at 10am ET, 3pm GMT, 11pm HK time for a global investor call,
when we review the findings contained both in this note and our larger FITT
report.
Dial-in details are (800) 309-8606 for US, 08000288438 for UK, 8008700169 for
China Domestic, 800966253 for HK, and (706) 679-0645 ROW. Conference
code is 98067737.
China’s widest spanning exchange with e-commerce characteristics
Our accompanying study of China’s three main digital ad exchanges reveals
that Alibaba has achieved clear dominance across several fronts of ad
technology. The Alimama Advertising Network serves to place ads both on
Alibaba’s internal properties on the one hand, and on third party publishers
through the TANX exchange on the other. We view the greatest strategic
advantages of the Alimama Advertising Network as the following:
Between helping merchants place ads within China’s largest e-
commerce platform, and additionally offering connectivity to a
growing number of external publishers, Alimama Advertising
Network aggregates the greatest ads volume (impressions) of any
solution in China on our estimates. We believe that Alimama
Advertising Network as of 1H 2015 managed over 15bn
impressions per day; over 10b daily page views (PVs) on PC and
more than 5b daily PVs on mobile, representing both resources
inside and outside of Taobao.
With its origins as China’s leading e-commerce platform, Alibaba
is renowned for its targeted advertising capabilities. Much of this
ever-improving targeting is based on China’s largest collection of
consumer transaction data and purchasing behaviors. Alibaba’s
customer base clearly has high purchase intent, and thus Alimama
Advertising Network can offer ad products with unrivaled
commerciality. Through its “Dharma Sword” effort (detailed
below), Alibaba can assign “Super-ID’s” to users and track them
across a wide range of properties.
Alibaba, according to many of the advertisers whom we
interviewed, offers the market the most comprehensive family of
digital ad tools and properties, ranging from its TANX and TANX
Mobile exchanges, to some of the market’s most robust DSP,
SSP, and DMP-related products; along with connectivity to several
ad networks.
Alimama Ad Network
managed 15bn
impressions per day.
5 December 2015
Software & Services
Alibaba
Page 4 Deutsche Bank AG/Hong Kong
Expecting improved ads connectivity to Youku, UCWeb, etc from FY17 onward
From a merchant or brand owner perspective, Alimama enables three major
forms of advertising:
Tier 1 properties: internal advertising within Alibaba’s own
marketplace (eg – search results and banner ads presented when one
browses Taobao or Tmall.)
Tier 2 resources: advertisement onto investee properties, such as
UCWeb, Weibo and Youku.
Tier 3 resources: broader external third party publishers/websites.
Mobile ads opportunity: much more where that came from
Alibaba’s advertising business (also known as “Marketing Services”) has
heretofore relied heavily on Taobao and Tmall merchants buying advertising
slots on the Taobao/Tmall marketplaces alone. As Alibaba continues to release
inventory on Taobao and Tmall desktop and mobile, these revenues should
grow appreciably over time. Alibaba’s success in opening up ad inventory on
its mobile properties has been particularly impressive, with March, June and
September quarter mobile take-rates of 1.73%, 2.16% and 2.39% beating DBe
by 4bps, 46bps and 6bps, respectively. Mobile monetization at Alibaba has
largely been driven by the paid listings that appear in search results. Currently,
only slots #1, #7, and #13 are paid results. As management has communicated
on numerous occasions, the company has purposefully chosen to “under-
monetize” its services. We moreover would expect the conversion of an ever-
growing number of results slots into paid ads to prove a straightforward
manner, in contrast to the monetization of general search, in which a user may
not have commercial intent when searching.
In the case of Alibaba, an outright majority of buyers are mobile, and nearly all
new users join through mobile devices. Mobile users moreover exhibit higher
engagement, and their usage creates richer data sets, two characteristics
which would suggest significant advertising potential going forward.
Exploiting mobile ad apps with Ali group properties UCWeb and Youku Mobile
We have discovered a new source of potential upside to Alibaba’s advertising
business, particularly from FY2017 onward, being advertising on recently
integrated properties such as UCWeb, Youku and Weibo. As the app usage
rankings below indicate, if successful, Alibaba can open up a significant
amount of new mobile inventory by more tightly integrating the third and fifth
most popular mobile apps in China, offering ad slots both to its own merchants
and those third party advertisers seeking to place ads through Alibaba’s TANX
public exchange.
5 December 2015
Software & Services
Alibaba
Deutsche Bank AG/Hong Kong Page 5
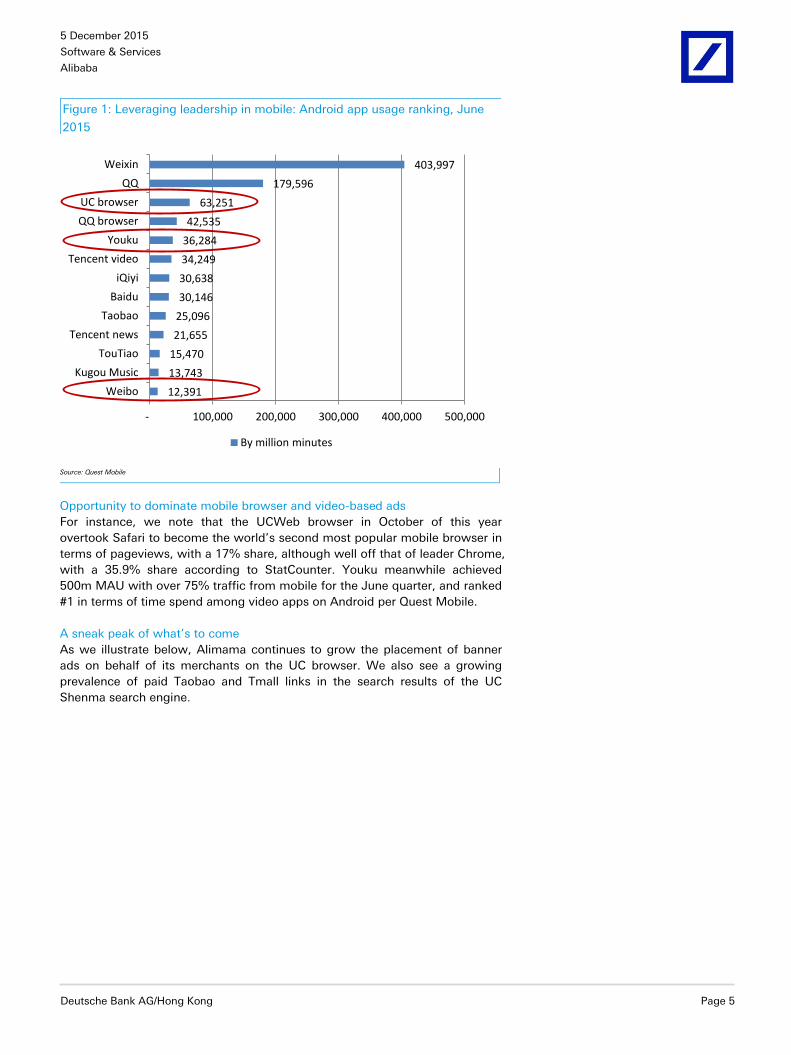
Figure 1: Leveraging leadership in mobile: Android app usage ranking, June
2015
12,391
13,743
15,470
21,655
25,096
30,146
30,638
34,249
36,284
42,535
63,251
179,596
403,997
- 100,000 200,000 300,000 400,000 500,000
Kugou Music
TouTiao
Tencent news
Taobao
Baidu
iQiyi
Tencent video
Youku
QQ browser
UC browser
Weixin
By million minutes
Source: Quest Mobile
Opportunity to dominate mobile browser and video-based ads
For instance, we note that the UCWeb browser in October of this year
overtook Safari to become the world’s second most popular mobile browser in
terms of pageviews, with a 17% share, although well off that of leader Chrome,
with a 35.9% share according to StatCounter. Youku meanwhile achieved
500m MAU with over 75% traffic from mobile for the June quarter, and ranked
#1 in terms of time spend among video apps on Android per Quest Mobile.
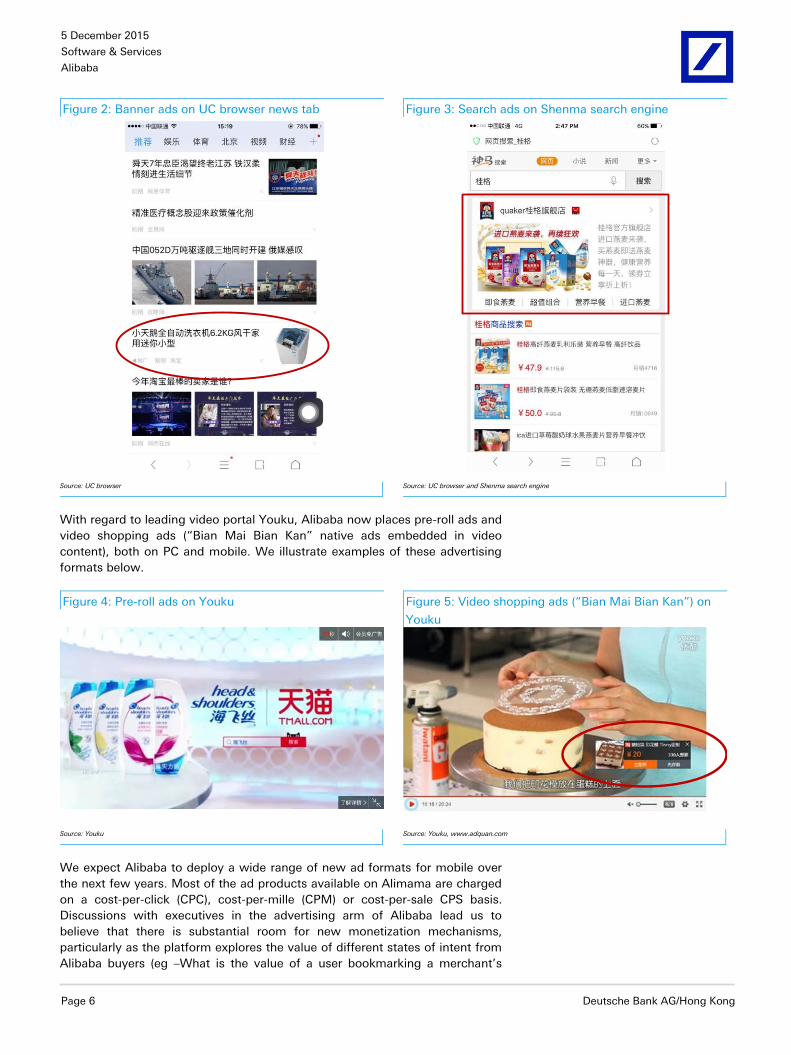
A sneak peak of what’s to come
As we illustrate below, Alimama continues to grow the placement of banner
ads on behalf of its merchants on the UC browser. We also see a growing
prevalence of paid Taobao and Tmall links in the search results of the UC
Shenma search engine.
5 December 2015
Software & Services
Alibaba
Page 6 Deutsche Bank AG/Hong Kong
Figure 2: Banner ads on UC browser news tab Figure 3: Search ads on Shenma search engine
Source: UC browser
Source: UC browser and Shenma search engine
With regard to leading video portal Youku, Alibaba now places pre-roll ads and
video shopping ads (“Bian Mai Bian Kan” native ads embedded in video
content), both on PC and mobile. We illustrate examples of these advertising
formats below.
Figure 4: Pre-roll ads on Youku Figure 5: Video shopping ads (“Bian Mai Bian Kan”) on
Youku
Source: Youku
Source: Youku, www.adquan.com
We expect Alibaba to deploy a wide range of new ad formats for mobile over
the next few years. Most of the ad products available on Alimama are charged
on a cost-per-click (CPC), cost-per-mille (CPM) or cost-per-sale CPS basis.
Discussions with executives in the advertising arm of Alibaba lead us to
believe that there is substantial room for new monetization mechanisms,
particularly as the platform explores the value of different states of intent from
Alibaba buyers (eg –What is the value of a user bookmarking a merchant’s
5 December 2015
Software & Services
Alibaba
Deutsche Bank AG/Hong Kong Page 7
website for future purchase? What is the value of moving a storefront’s
product into one’s shopping cart, etc.)
Average dollar spend per advertiser also to drive growth
We estimate that Alibaba sees roughly 1 million active advertisers per quarter.
A vast majority of these advertiser-storefronts would be SMEs merchants on
Taobao and a smaller number would be Tmall storefronts (although delivering
outsized revenues.) In turn a much smaller percentage of Alibaba customers
are external advertisers placing ads through TANX.
The collective number of Alibaba advertisers is measurably higher than Baidu’s
roughly 623,000 active advertisers as of 3Q15. With Alibaba recently having
increased efforts around promoting advertising solutions to the larger brands
on its Tmall platform, and with the average merchant increasing total spend as
he moves ad budget from PC to mobile, we expect an increase in average
dollar spend per advertiser to be a major driver going forward, and less any
increase in the number of advertisers.
The TANX public exchange: Alibaba’s third party solution
TANX-based ad revenues involve high revenue share, low gross margin
While a significant majority of Alibaba Marketing Services revenues is derived
internally from Taobao and Tmall merchants advertising on the Alibaba
marketplaces, Alimama also has TANX, which is a “public exchange” devoted
to allowing both Taobao and Tmall merchants, in addition to third party brand
owners, to advertise on external third party publishers.
We refer to the third party websites that allow TANX to place ads on their
properties as “Taobao Affiliates.” As we reveal below, Alibaba’s Taobao
Affiliate revenues (conducted largely through the TANX exchange) reached as
much as 11% of total company ad revenues in FY2014, only to fall back to 6%
in FY2015. We attribute the decline in Tao Affiliates revenues to three major
factors:
We believe that TANX mobile ad exchange technology innovations
were unable to keep pace with the ongoing and rapid shift toward
mobile advertising of the rest of the business.
We believe that the company has shifted increasing resource and
emphasis toward improved and expanded use of its own properties,
and particularly the tighter integration of properties such as UCWeb
and Youku Mobile.
As we illustrate below, TANX-derived revenues carry a hefty revenue
share for Tao Affiliates (50-70%), and thus are of a far lower gross
margin profile than other Marketing Services revenues. While we
expect Alibaba’s TANX exchange to remain China’s leading public
exchange, we expect this business to grow broadly in-line with the
rest of Alibaba revenues going forward.
We furnish estimates around Alibaba’s TANX-derived Taobao Affilaites
business below:
5 December 2015
Software & Services
Alibaba
Page 8 Deutsche Bank AG/Hong Kong
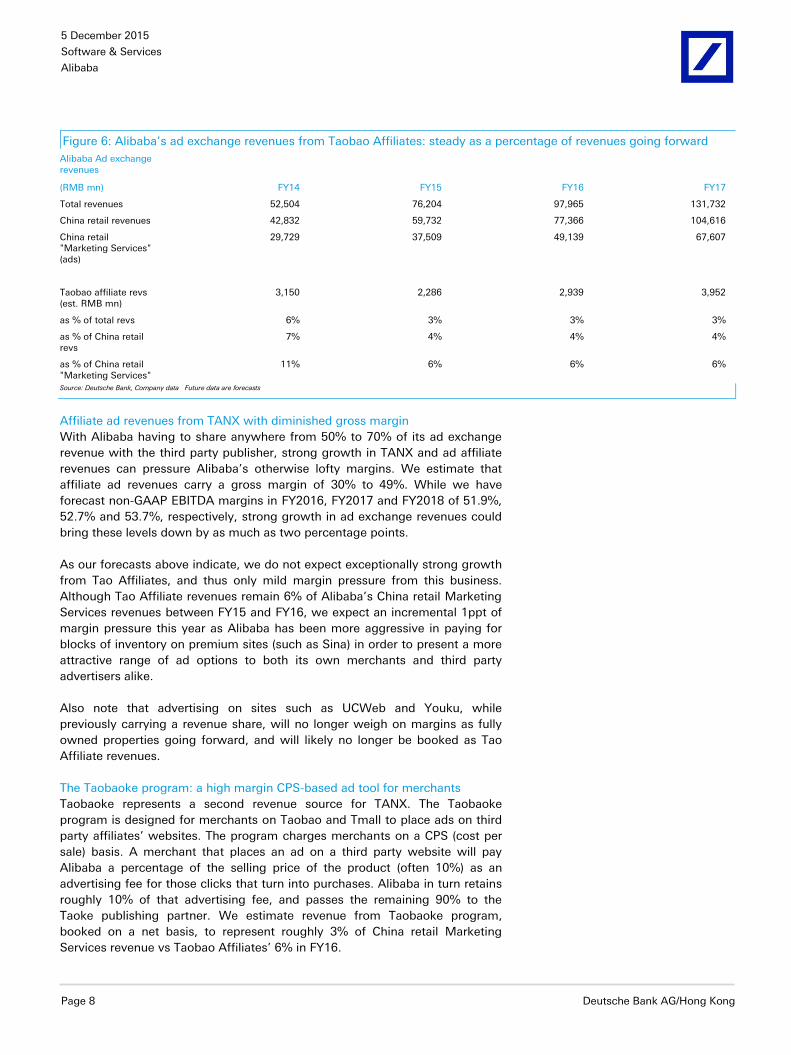
Figure 6: Alibaba’s ad exchange revenues from Taobao Affiliates: steady as a percentage of revenues going forward
Alibaba Ad exchange revenues
(RMB mn) FY14 FY15 FY16 FY17
Total revenues 52,504 76,204 97,965 131,732
China retail revenues 42,832 59,732 77,366 104,616
China retail "Marketing Services" (ads)
29,729 37,509 49,139 67,607
Taobao affiliate revs (est. RMB mn)
3,150 2,286 2,939 3,952
as % of total revs 6% 3% 3% 3%
as % of China retail revs
7% 4% 4% 4%
as % of China retail "Marketing Services"
11% 6% 6% 6%
Source: Deutsche Bank, Company data Future data are forecasts
Affiliate ad revenues from TANX with diminished gross margin
With Alibaba having to share anywhere from 50% to 70% of its ad exchange
revenue with the third party publisher, strong growth in TANX and ad affiliate
revenues can pressure Alibaba’s otherwise lofty margins. We estimate that
affiliate ad revenues carry a gross margin of 30% to 49%. While we have
forecast non-GAAP EBITDA margins in FY2016, FY2017 and FY2018 of 51.9%,
52.7% and 53.7%, respectively, strong growth in ad exchange revenues could
bring these levels down by as much as two percentage points.
As our forecasts above indicate, we do not expect exceptionally strong growth
from Tao Affiliates, and thus only mild margin pressure from this business.
Although Tao Affiliate revenues remain 6% of Alibaba’s China retail Marketing
Services revenues between FY15 and FY16, we expect an incremental 1ppt of
margin pressure this year as Alibaba has been more aggressive in paying for
blocks of inventory on premium sites (such as Sina) in order to present a more
attractive range of ad options to both its own merchants and third party
advertisers alike.
Also note that advertising on sites such as UCWeb and Youku, while
previously carrying a revenue share, will no longer weigh on margins as fully
owned properties going forward, and will likely no longer be booked as Tao
Affiliate revenues.
The Taobaoke program: a high margin CPS-based ad tool for merchants
Taobaoke represents a second revenue source for TANX. The Taobaoke
program is designed for merchants on Taobao and Tmall to place ads on third
party affiliates’ websites. The program charges merchants on a CPS (cost per
sale) basis. A merchant that places an ad on a third party website will pay
Alibaba a percentage of the selling price of the product (often 10%) as an
advertising fee for those clicks that turn into purchases. Alibaba in turn retains
roughly 10% of that advertising fee, and passes the remaining 90% to the
Taoke publishing partner. We estimate revenue from Taobaoke program,
booked on a net basis, to represent roughly 3% of China retail Marketing
Services revenue vs Taobao Affiliates’ 6% in FY16.
5 December 2015
Software & Services
Alibaba
Deutsche Bank AG/Hong Kong Page 9
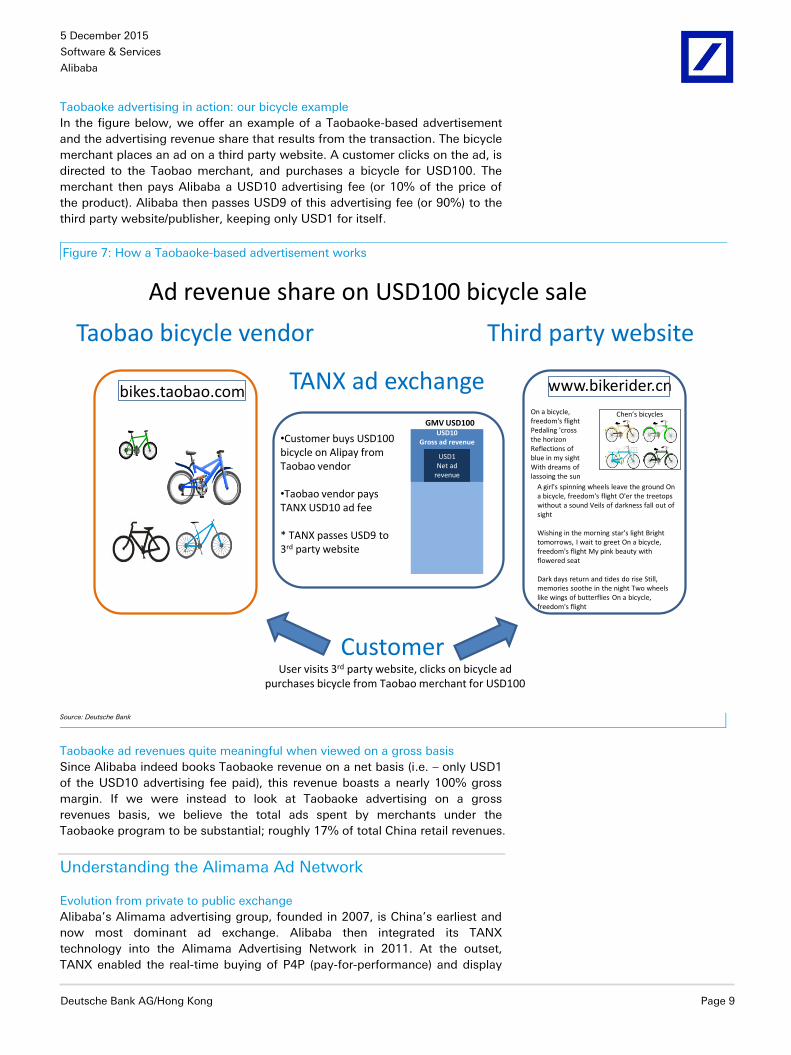
Taobaoke advertising in action: our bicycle example
In the figure below, we offer an example of a Taobaoke-based advertisement
and the advertising revenue share that results from the transaction. The bicycle
merchant places an ad on a third party website. A customer clicks on the ad, is
directed to the Taobao merchant, and purchases a bicycle for USD100. The
merchant then pays Alibaba a USD10 advertising fee (or 10% of the price of
the product). Alibaba then passes USD9 of this advertising fee (or 90%) to the
third party website/publisher, keeping only USD1 for itself.
Figure 7: How a Taobaoke-based advertisement works
USD10Gross ad revenue
www.bikerider.cn
Chen’s bicycles
A girl's spinning wheels leave the ground On a bicycle, freedom's flight O'er the treetops without a sound Veils of darkness fall out of sight
Wishing in the morning star's light Bright tomorrows, I wait to greet On a bicycle, freedom's flight My pink beauty with flowered seat
Dark days return and tides do rise Still, memories soothe in the night Two wheels like wings of butterflies On a bicycle, freedom's flight
On a bicycle, freedom's flightPedaling 'cross the horizonReflections of blue in my sightWith dreams of lassoing the sun
Third party website
Ad revenue share on USD100 bicycle sale
TANX ad exchange
User visits 3rd party website, clicks on bicycle adpurchases bicycle from Taobao merchant for USD100
Customer
bikes.taobao.com
Taobao bicycle vendor
•Customer buys USD100 bicycle on Alipay from Taobao vendor
•Taobao vendor pays TANX USD10 ad fee
* TANX passes USD9 to 3rd party website
GMV USD100
USD1Net ad
revenue
Source: Deutsche Bank
Taobaoke ad revenues quite meaningful when viewed on a gross basis
Since Alibaba indeed books Taobaoke revenue on a net basis (i.e. – only USD1
of the USD10 advertising fee paid), this revenue boasts a nearly 100% gross
margin. If we were instead to look at Taobaoke advertising on a gross
revenues basis, we believe the total ads spent by merchants under the
Taobaoke program to be substantial; roughly 17% of total China retail revenues.
Understanding the Alimama Ad Network
Evolution from private to public exchange
Alibaba’s Alimama advertising group, founded in 2007, is China’s earliest and
now most dominant ad exchange. Alibaba then integrated its TANX
technology into the Alimama Advertising Network in 2011. At the outset,
TANX enabled the real-time buying of P4P (pay-for-performance) and display
5 December 2015
Software & Services
Alibaba
Page 10 Deutsche Bank AG/Hong Kong
ad products for Alibaba’s own Taobao and Tmall merchants across Alibaba
properties only. More recently TANX has extended its ad exchange services to
both third party advertisers and third party websites (publishers).
Alimama thus serves as both an internal and external exchange
With the earlier broadening in its scope, Alimama now acts as both:
an internal exchange (allowing Taobao and Tmall merchants to
advertise by buying P4P and display ads on Alibaba’s two internal
e-commerce platforms)
an external public exchange, TANX, which connects both:
o its millions of Taobao and Tmall merchants and
o interested external advertisers
…to external publishers.
We attempt to illustrate these two types of business below.
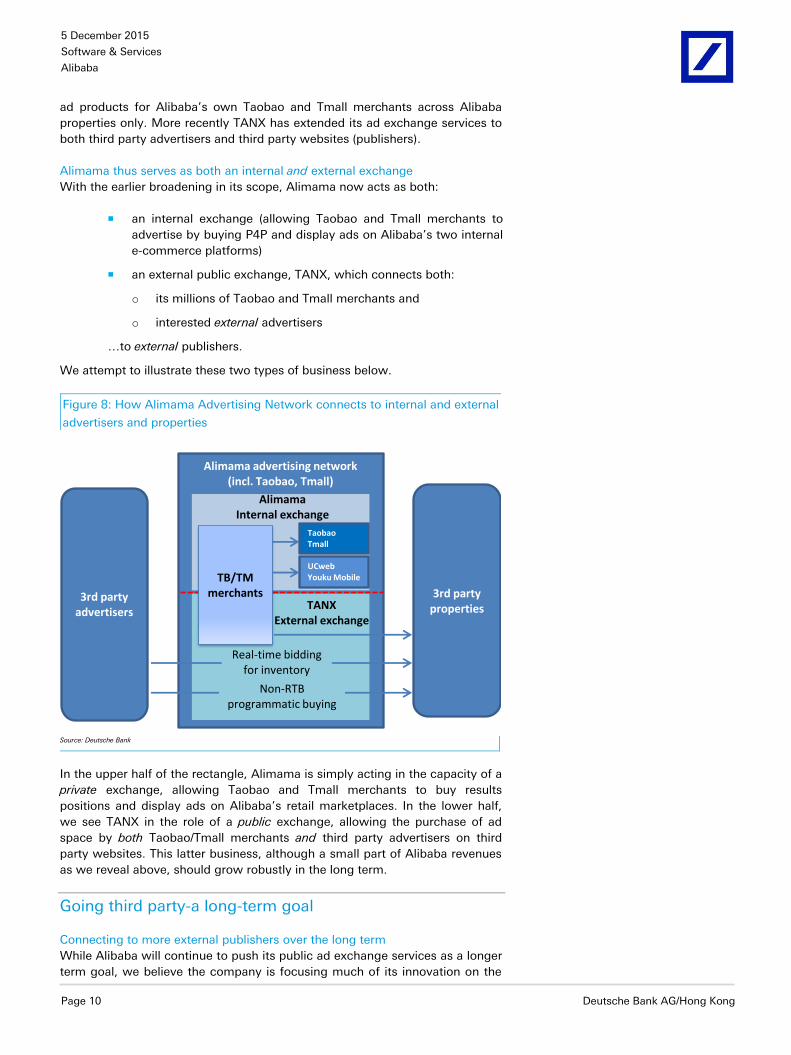
Figure 8: How Alimama Advertising Network connects to internal and external
advertisers and properties
Alimama advertising network(incl. Taobao, Tmall)
3rd party advertisers
3rd party properties
TaobaoTmall
Real-time bidding for inventory
Non-RTB programmatic buying
TB/TMmerchants
TANXExternal exchange
AlimamaInternal exchange
UCwebYouku Mobile
Source: Deutsche Bank
In the upper half of the rectangle, Alimama is simply acting in the capacity of a
private exchange, allowing Taobao and Tmall merchants to buy results
positions and display ads on Alibaba’s retail marketplaces. In the lower half,
we see TANX in the role of a public exchange, allowing the purchase of ad
space by both Taobao/Tmall merchants and third party advertisers on third
party websites. This latter business, although a small part of Alibaba revenues
as we reveal above, should grow robustly in the long term.
Going third party-a long-term goal
Connecting to more external publishers over the long term
While Alibaba will continue to push its public ad exchange services as a longer
term goal, we believe the company is focusing much of its innovation on the
5 December 2015
Software & Services
Alibaba
Deutsche Bank AG/Hong Kong Page 11
inclusion of investee properties UCWeb and Youku. The company is thus
reaching out aggressively both to new publisher affiliates and external third
party advertisers. Some might argue that TANX, by virtue of its lineage being
an Alibaba group asset, is overly focused on e-commerce advertisers. We
believe that Alibaba has sought to diversify the advertiser mix using TANX well
beyond its mainstay of small merchants and e-commerce types to include
larger accounts, brand advertisers and the like.
Complementary acquisitions to the ad ecosystem
Alibaba indeed continues to broaden the span of its advertising offerings in a
bid to remain China’s busiest digital ads marketplace. The acquisition of
AdChina, Umeng, CNZZ.com and others has helped advance this strategy of
exploring resources outside Taobao/Tmall, and increasing its exposure to brand
advertisers and the utilization of data.
Going omni-channel
High log-in rates and connectivity to range of group properties aid BABA’s
omni-channel strategy
As we explain in detail in our broader industry piece, we believe that Alibaba is
uniquely qualified to meet ever-rising expectations amongst advertisers to
follow, and better target, their prospective customers across multiple devices
and properties. Not only is the Taobao and Tmall shopper identifiable across
devices, Alibaba has over the past few years connected to a growing eco-
system of leading partner platforms. Alibaba has in fact created a “Super-ID”
by identifying and tracking the same user across a widening range of these
properties.
Big data and the “Dharma Sword”
Alibaba is indeed continuously widening and deepening available user data on
its TANX exchange. Its Dharma Sword initiative, launched in mid-August by
incorporating technology from its AdChina acquisition, incorporates much
wider data sets in order to offer brand advertisers big data marketing services
covering all digital media. Dharma Sword has grown to hold data on 630m
users (as per Huanqiu.com) by inter-connecting user accounts across Taobao,
Tmall, Alipay, Sina Weibo, Autonavi and other partner properties. TANX thus
now claims to cover 98% of China internet users.
Alibaba claims that Dharma Sword has the ability to categorize consumers
with increasing detail. Our discussions with advertisers in various industries,
such as those in home furnishings, healthcare, and mother & baby, reveal a
consistent effort to better target audiences across ever-finer sub-categories. In
addition to commonly used demographic attributes (such as age, education,
salary, marital status, location, etc), Dharma Sword for instance claims to be
able to analyze finer elements, such as a user’s mood and even imminent
change of status (e.g.-plans to move, start a family etc) based on recent
behaviors, and display the appropriate ad accordingly. These customer insights
are based on the combination of pre-existing user identity data mixed with
user activities from browsing (cookies), transactions, social interactions,
payment behaviors, shopping cart changes, searches executed, videos viewed
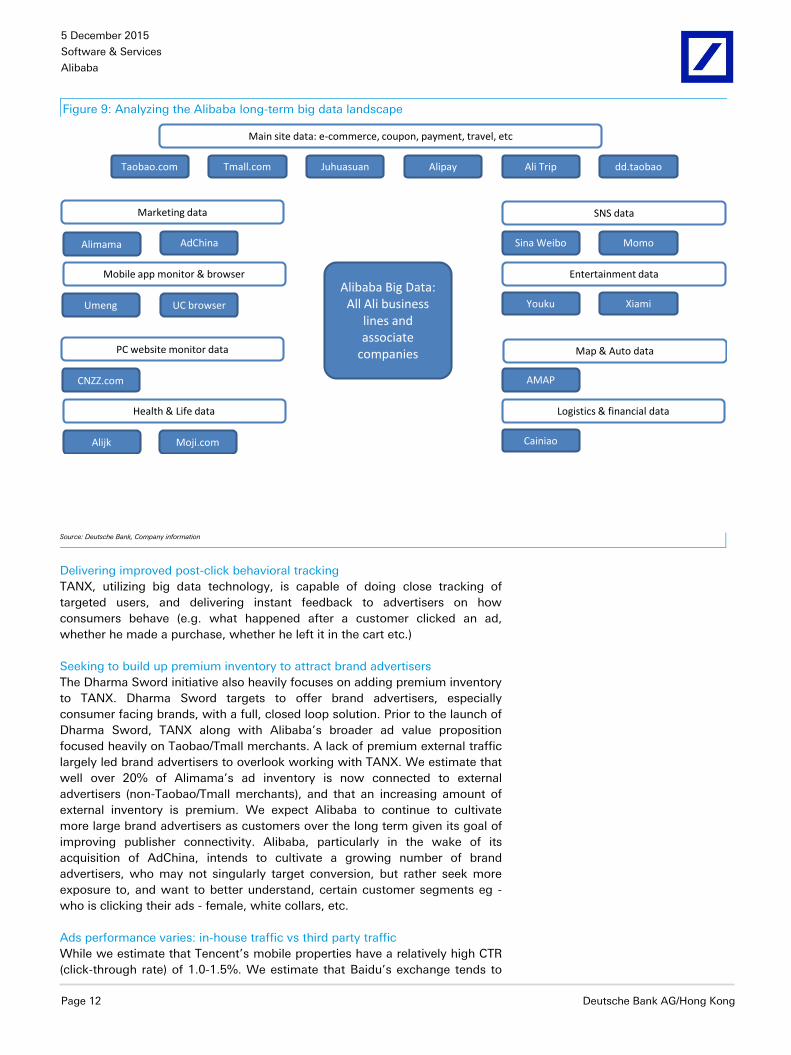
and mobile map usage. Below we present the massive eco-system of
properties across which Alibaba can track a user’s Super-ID.
5 December 2015
Software & Services
Alibaba
Page 12 Deutsche Bank AG/Hong Kong
Figure 9: Analyzing the Alibaba long-term big data landscape
Marketing data
Mobile app monitor & browser
PC website monitor data
Health & Life data
Alijk Moji.com
CNZZ.com
Umeng UC browser
Alimama AdChina
Taobao.com Tmall.com Juhuasuan Alipay Ali Trip dd.taobao
Main site data: e-commerce, coupon, payment, travel, etc
SNS data
Entertainment data
Map & Auto data
Logistics & financial data
Sina Weibo Momo
Youku Xiami
AMAP
Cainiao
Alibaba Big Data:All Ali business
lines and associate
companies
Source: Deutsche Bank, Company information
Delivering improved post-click behavioral tracking
TANX, utilizing big data technology, is capable of doing close tracking of
targeted users, and delivering instant feedback to advertisers on how
consumers behave (e.g. what happened after a customer clicked an ad,
whether he made a purchase, whether he left it in the cart etc.)
Seeking to build up premium inventory to attract brand advertisers
The Dharma Sword initiative also heavily focuses on adding premium inventory
to TANX. Dharma Sword targets to offer brand advertisers, especially
consumer facing brands, with a full, closed loop solution. Prior to the launch of
Dharma Sword, TANX along with Alibaba’s broader ad value proposition
focused heavily on Taobao/Tmall merchants. A lack of premium external traffic
largely led brand advertisers to overlook working with TANX. We estimate that
well over 20% of Alimama’s ad inventory is now connected to external
advertisers (non-Taobao/Tmall merchants), and that an increasing amount of
external inventory is premium. We expect Alibaba to continue to cultivate
more large brand advertisers as customers over the long term given its goal of
improving publisher connectivity. Alibaba, particularly in the wake of its
acquisition of AdChina, intends to cultivate a growing number of brand
advertisers, who may not singularly target conversion, but rather seek more
exposure to, and want to better understand, certain customer segments eg -
who is clicking their ads - female, white collars, etc.
Ads performance varies: in-house traffic vs third party traffic
While we estimate that Tencent’s mobile properties have a relatively high CTR
(click-through rate) of 1.0-1.5%. We estimate that Baidu’s exchange tends to
5 December 2015
Software & Services
Alibaba
Deutsche Bank AG/Hong Kong Page 13
see a CTR of less than 0.5%. We believe that the CTR through the TANX
exchange is somewhere in between these levels.
We meanwhile regard Alibaba’s internal Taobao and Tmall traffic as premium
in nature. We believe it has similar or superior CTR to Tencent, at 1.0-1.5%. We
believe that third party publisher traffic on the other hand has a lesser CTR of
0.5-1.0%.
Important constituent Alimama technologies
The RTB and non-RTB models
TANX adopts both RTB (real-time bidding) and non-RTB models in the
placement of ads. The RTB system (Zuanshi/Zhitongche program) allows
merchants to bid for ad slots on Taobao/Tmall or on a third party website, and
charges on a CPM/CPC basis. The Taobaoke program, detailed above, is a non-
RTB model. It generally places ads on third party websites by matching
displayed ads with the sought-after user behavior patterns. The Taobaoke
program tends to charge merchants on a cost-per-sales (CPS) basis.
The TANX DSP: evolving to service third party advertisers
As we discuss in our broader industry report, a demand-side platform (DSP) is
an interface which allows advertisers, ad agencies, etc to connect to the TANX
ad exchange. In addition to being connected to external DSPs, TANX operates
its own DSP as well. As aforementioned, the TANX DSP grew from originally
having limited its services only to Taobao and Tmall advertisers, to include
other e-commerce advertisers, before then fully expanding its scope to cover
all advertisers at large. We estimate that TANX has progressively opened
>80% of Alimama’s traffic to the public, ensuring a steady supply of ad
inventory.
The TANX SSP
The TANX supply-side platform (SSP) effectively acts as a DSP to publishers
and partner websites. (Again, kindly refer to our detailed explanation of the SP
in our industry report.) The TANX SSP came about through the integration of
Alimama’s previous ad platform and TANX. We estimate that it processes
~4bn PVs per day. The SSP facilitates the utilization of remnant ad inventories
of publishers and thereby assists them in maximizing their revenues. It
specifically allows publishers to specify the customers, ad networks, and ad
formats that are eligible to take part in the bidding process.
The DMP
Alibaba’s data management platform DMP facilitates the analysis of consumer
behavioral data uploaded by the advertisers, as well as Alibaba’s own data on
the consumers’ historical shopping records and browsing patterns, enabling
the participants to evaluate the available ad inventory more accurately and
select the most appropriate ad space. The TANX DMP moreover has become
increasingly enriched subsequent to the roll-out of the Dharma Sword initiative
and introduction of Super-ID’s. The system allows analysis of data from
various dimensions such as unique visitors, clicks, CTRs, amount of display,
duration, revenue, etc. This further enhances audience targeting capabilities for
advertisers, helping them to achieve higher ROI.
5 December 2015
Software & Services
Alibaba
Page 14 Deutsche Bank AG/Hong Kong
Confident around our ahead-of-consensus numbers
Lifting FY17, FY18 revenues on better ad monetization outlook
Evidence of the continuing improvement in Alibaba ads monetization has led
us to lift both PC and mobile take rates by 4bps from FY2017 onwards. We
therefore revise up FY17/18 net revenue forecasts by 1%/1%, and increase
non-GAAP net profit by 1%/1% respectively.
Our findings over the past several months of analyzing Alibaba’s ads business
reinforce confidence in our ahead-of-consensus numbers. With our latest
revisions, we are 3%/9% ahead of Bloomberg in terms of net revenues for
FY17/18, and 1%/12% ahead on non-GAAP net profit for FY17/18.
One parting blue-sky thought…
We believe that Alibaba’s ads business could end up growing far faster than
we have assumed in our longer term model. If indeed the company can
continuously deliver high RoI ad products across an ever-growing range of
group properties, we could envision Marketing Services growing so fast as to
significantly outpace the other major component of Alibaba’s domestic retail
ecommerce revenues, namely Commissions. With a singular focus on ramping
up its ads business, we believe that Marketing Services could grow to become
as much as 75-80% of domestic revenues (Commissions being the balance) by
FY2020, compared to our current assumption of 72%.
Valuation and risks
Our interactive Alibaba model
Recall that we recently made available interactive scenario analysis for Alibaba,
enabling investors to model business drivers and assumptions on their own in
order to determine how varying inputs such as GMV and take-rate might
impact earnings and valuation. Please click here to see our scenario analysis
and test your own assumptions. We include in this report screenshots in order
to illustrate how our new interactive offering works.
Valuation
Our TP is based on a weighted average of: 1) CY16E non-GAAP PER (50%
weighting), 2) CY16E EV/EBITDA (30% weighting), and 3) a 20% DCF value.
Our current TP of US$99 implies 29.5x CY16E P/E and 22x CY16E EV/EBITDA.
Risks
Key downside risks include:
Mounting competitive pressures from global/local e-commerce
platforms and off-line players
Failure to maintain sound relationships with participants in the
ecosystem
Inability to develop efficient technological platforms.
Failure to monitor fraudulent transactions on the platform which can
result in a slowdown in user base growth and activity.
Inability to efficiently monetize mobile e-commerce opportunities
Inability to correctly monitor 3rd-party service providers which can
result in growing user dissatisfaction.

5 December 2015
Software & Services
Alibaba
Deutsche Bank AG/Hong Kong Page 15
Inability to successfully integrate invested entities into Alibaba's
ecosystem.
Regulatory concerns surrounding Ant Financial Services.
5 December 2015
Software & Services
Alibaba
Page 16 Deutsche Bank AG/Hong Kong
Appendix 1
Important Disclosures
Additional information available upon request
Disclosure checklist
Company Ticker Recent price* Disclosure
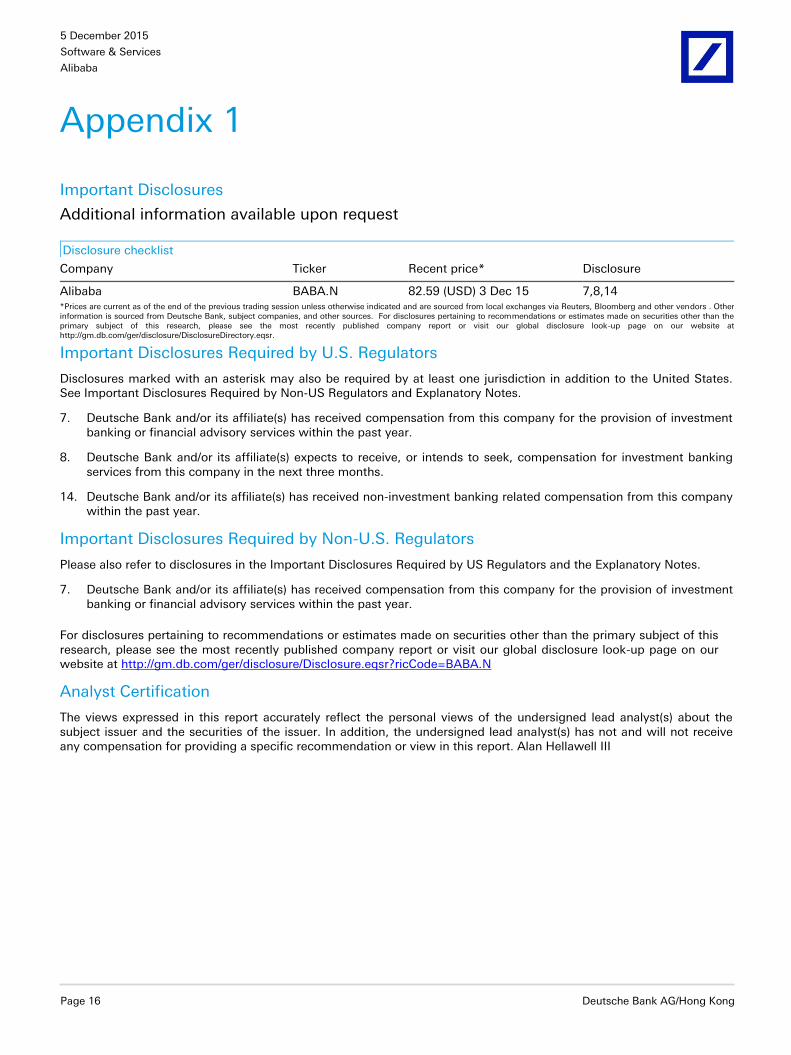
Alibaba BABA.N 82.59 (USD) 3 Dec 15 7,8,14 *Prices are current as of the end of the previous trading session unless otherwise indicated and are sourced from local exchanges via Reuters, Bloomberg and other vendors . Other information is sourced from Deutsche Bank, subject companies, and other sources. For disclosures pertaining to recommendations or estimates made on securities other than the primary subject of this research, please see the most recently published company report or visit our global disclosure look-up page on our website at http://gm.db.com/ger/disclosure/DisclosureDirectory.eqsr.
Important Disclosures Required by U.S. Regulators
Disclosures marked with an asterisk may also be required by at least one jurisdiction in addition to the United States. See Important Disclosures Required by Non-US Regulators and Explanatory Notes.
7. Deutsche Bank and/or its affiliate(s) has received compensation from this company for the provision of investment banking or financial advisory services within the past year.
8. Deutsche Bank and/or its affiliate(s) expects to receive, or intends to seek, compensation for investment banking services from this company in the next three months.
14. Deutsche Bank and/or its affiliate(s) has received non-investment banking related compensation from this company within the past year.
Important Disclosures Required by Non-U.S. Regulators
Please also refer to disclosures in the Important Disclosures Required by US Regulators and the Explanatory Notes.
7. Deutsche Bank and/or its affiliate(s) has received compensation from this company for the provision of investment banking or financial advisory services within the past year.
For disclosures pertaining to recommendations or estimates made on securities other than the primary subject of this research, please see the most recently published company report or visit our global disclosure look-up page on our website at http://gm.db.com/ger/disclosure/Disclosure.eqsr?ricCode=BABA.N
Analyst Certification
The views expressed in this report accurately reflect the personal views of the undersigned lead analyst(s) about the subject issuer and the securities of the issuer. In addition, the undersigned lead analyst(s) has not and will not receive any compensation for providing a specific recommendation or view in this report. Alan Hellawell III
5 December 2015
Software & Services
Alibaba
Deutsche Bank AG/Hong Kong Page 17
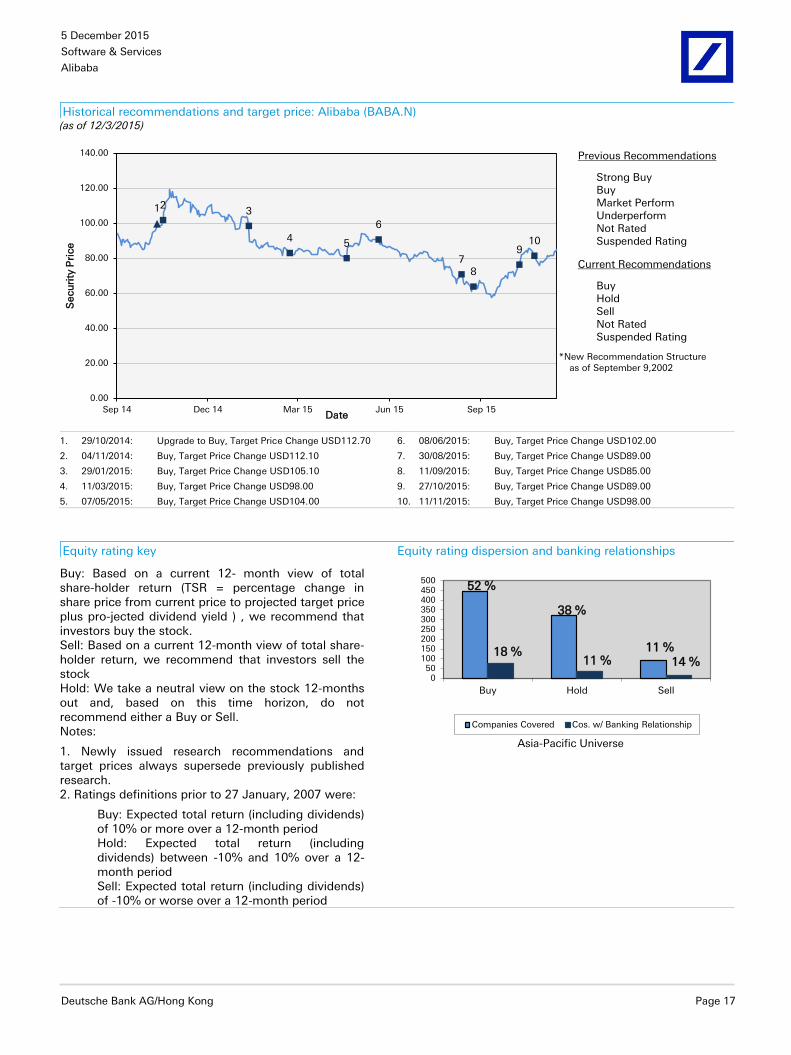
Historical recommendations and target price: Alibaba (BABA.N) (as of 12/3/2015)
123
45
6
78
910
0.00
20.00
40.00
60.00
80.00
100.00
120.00
140.00
Sep 14 Dec 14 Mar 15 Jun 15 Sep 15
Secu
rity
Pri
ce
Date
Previous Recommendations
Strong Buy Buy Market Perform Underperform Not Rated Suspended Rating
Current Recommendations
Buy Hold Sell Not Rated Suspended Rating
*New Recommendation Structure as of September 9,2002
1. 29/10/2014: Upgrade to Buy, Target Price Change USD112.70 6. 08/06/2015: Buy, Target Price Change USD102.00
2. 04/11/2014: Buy, Target Price Change USD112.10 7. 30/08/2015: Buy, Target Price Change USD89.00
3. 29/01/2015: Buy, Target Price Change USD105.10 8. 11/09/2015: Buy, Target Price Change USD85.00
4. 11/03/2015: Buy, Target Price Change USD98.00 9. 27/10/2015: Buy, Target Price Change USD89.00
5. 07/05/2015: Buy, Target Price Change USD104.00 10. 11/11/2015: Buy, Target Price Change USD98.00
Equity rating key Equity rating dispersion and banking relationships
Buy: Based on a current 12- month view of total share-holder return (TSR = percentage change in share price from current price to projected target price plus pro-jected dividend yield ) , we recommend that investors buy the stock. Sell: Based on a current 12-month view of total share-holder return, we recommend that investors sell the stock Hold: We take a neutral view on the stock 12-months out and, based on this time horizon, do not recommend either a Buy or Sell. Notes:
1. Newly issued research recommendations and target prices always supersede previously published research. 2. Ratings definitions prior to 27 January, 2007 were:
Buy: Expected total return (including dividends) of 10% or more over a 12-month period Hold: Expected total return (including dividends) between -10% and 10% over a 12-month period Sell: Expected total return (including dividends) of -10% or worse over a 12-month period
52 %
38 %
11 %18 %11 % 14 %
050
100150200250300350400450500
Buy Hold Sell
Asia-Pacific Universe
Companies Covered Cos. w/ Banking Relationship
5 December 2015
Software & Services
Alibaba
Page 18 Deutsche Bank AG/Hong Kong
Regulatory Disclosures
1.Important Additional Conflict Disclosures
Aside from within this report, important conflict disclosures can also be found at https://gm.db.com/equities under the
"Disclosures Lookup" and "Legal" tabs. Investors are strongly encouraged to review this information before investing.
2.Short-Term Trade Ideas
Deutsche Bank equity research analysts sometimes have shorter-term trade ideas (known as SOLAR ideas) that are
consistent or inconsistent with Deutsche Bank's existing longer term ratings. These trade ideas can be found at the
SOLAR link at http://gm.db.com.
5 December 2015
Software & Services
Alibaba
Deutsche Bank AG/Hong Kong Page 19
Additional Information
The information and opinions in this report were prepared by Deutsche Bank AG or one of its affiliates (collectively
"Deutsche Bank"). Though the information herein is believed to be reliable and has been obtained from public sources
believed to be reliable, Deutsche Bank makes no representation as to its accuracy or completeness.
Deutsche Bank may consider this report in deciding to trade as principal. It may also engage in transactions, for its own
account or with customers, in a manner inconsistent with the views taken in this research report. Others within
Deutsche Bank, including strategists, sales staff and other analysts, may take views that are inconsistent with those
taken in this research report. Deutsche Bank issues a variety of research products, including fundamental analysis,
equity-linked analysis, quantitative analysis and trade ideas. Recommendations contained in one type of communication
may differ from recommendations contained in others, whether as a result of differing time horizons, methodologies or
otherwise. Deutsche Bank and/or its affiliates may also be holding debt securities of the issuers it writes on.
Analysts are paid in part based on the profitability of Deutsche Bank AG and its affiliates, which includes investment
banking revenues.
Opinions, estimates and projections constitute the current judgment of the author as of the date of this report. They do
not necessarily reflect the opinions of Deutsche Bank and are subject to change without notice. Deutsche Bank has no
obligation to update, modify or amend this report or to otherwise notify a recipient thereof if any opinion, forecast or
estimate contained herein changes or subsequently becomes inaccurate. This report is provided for informational
purposes only. It is not an offer or a solicitation of an offer to buy or sell any financial instruments or to participate in any
particular trading strategy. Target prices are inherently imprecise and a product of the analyst’s judgment. The financial
instruments discussed in this report may not be suitable for all investors and investors must make their own informed
investment decisions. Prices and availability of financial instruments are subject to change without notice and
investment transactions can lead to losses as a result of price fluctuations and other factors. If a financial instrument is
denominated in a currency other than an investor's currency, a change in exchange rates may adversely affect the
investment. Past performance is not necessarily indicative of future results. Unless otherwise indicated, prices are
current as of the end of the previous trading session, and are sourced from local exchanges via Reuters, Bloomberg and
other vendors. Data is sourced from Deutsche Bank, subject companies, and in some cases, other parties.
Macroeconomic fluctuations often account for most of the risks associated with exposures to instruments that promise
to pay fixed or variable interest rates. For an investor who is long fixed rate instruments (thus receiving these cash
flows), increases in interest rates naturally lift the discount factors applied to the expected cash flows and thus cause a
loss. The longer the maturity of a certain cash flow and the higher the move in the discount factor, the higher will be the
loss. Upside surprises in inflation, fiscal funding needs, and FX depreciation rates are among the most common adverse
macroeconomic shocks to receivers. But counterparty exposure, issuer creditworthiness, client segmentation, regulation
(including changes in assets holding limits for different types of investors), changes in tax policies, currency
convertibility (which may constrain currency conversion, repatriation of profits and/or the liquidation of positions), and
settlement issues related to local clearing houses are also important risk factors to be considered. The sensitivity of fixed
income instruments to macroeconomic shocks may be mitigated by indexing the contracted cash flows to inflation, to
FX depreciation, or to specified interest rates – these are common in emerging markets. It is important to note that the
index fixings may -- by construction -- lag or mis-measure the actual move in the underlying variables they are intended
to track. The choice of the proper fixing (or metric) is particularly important in swaps markets, where floating coupon
rates (i.e., coupons indexed to a typically short-dated interest rate reference index) are exchanged for fixed coupons. It is
also important to acknowledge that funding in a currency that differs from the currency in which coupons are
denominated carries FX risk. Naturally, options on swaps (swaptions) also bear the risks typical to options in addition to
the risks related to rates movements.
Derivative transactions involve numerous risks including, among others, market, counterparty default and illiquidity risk.
The appropriateness or otherwise of these products for use by investors is dependent on the investors' own
circumstances including their tax position, their regulatory environment and the nature of their other assets and
liabilities, and as such, investors should take expert legal and financial advice before entering into any transaction similar
5 December 2015
Software & Services
Alibaba
Page 20 Deutsche Bank AG/Hong Kong
to or inspired by the contents of this publication. The risk of loss in futures trading and options, foreign or domestic, can
be substantial. As a result of the high degree of leverage obtainable in futures and options trading, losses may be
incurred that are greater than the amount of funds initially deposited. Trading in options involves risk and is not suitable
for all investors. Prior to buying or selling an option investors must review the "Characteristics and Risks of Standardized
Options”, at http://www.optionsclearing.com/about/publications/character-risks.jsp. If you are unable to access the
website please contact your Deutsche Bank representative for a copy of this important document.
Participants in foreign exchange transactions may incur risks arising from several factors, including the following: ( i)
exchange rates can be volatile and are subject to large fluctuations; ( ii) the value of currencies may be affected by
numerous market factors, including world and national economic, political and regulatory events, events in equity and
debt markets and changes in interest rates; and (iii) currencies may be subject to devaluation or government imposed
exchange controls which could affect the value of the currency. Investors in securities such as ADRs, whose values are
affected by the currency of an underlying security, effectively assume currency risk.
Unless governing law provides otherwise, all transactions should be executed through the Deutsche Bank entity in the
investor's home jurisdiction.
United States: Approved and/or distributed by Deutsche Bank Securities Incorporated, a member of FINRA, NFA and
SIPC. Non-U.S. analysts may not be associated persons of Deutsche Bank Securities Incorporated and therefore may not
be subject to FINRA regulations concerning communications with subject company, public appearances and securities
held by the analysts.
Germany: Approved and/or distributed by Deutsche Bank AG, a joint stock corporation with limited liability incorporated
in the Federal Republic of Germany with its principal office in Frankfurt am Main. Deutsche Bank AG is authorized under
German Banking Law (competent authority: European Central Bank) and is subject to supervision by the European
Central Bank and by BaFin, Germany’s Federal Financial Supervisory Authority.
United Kingdom: Approved and/or distributed by Deutsche Bank AG acting through its London Branch at Winchester
House, 1 Great Winchester Street, London EC2N 2DB. Deutsche Bank AG in the United Kingdom is authorised by the
Prudential Regulation Authority and is subject to limited regulation by the Prudential Regulation Authority and Financial
Conduct Authority. Details about the extent of our authorisation and regulation are available on request.
Hong Kong: Distributed by Deutsche Bank AG, Hong Kong Branch.
Korea: Distributed by Deutsche Securities Korea Co.
South Africa: Deutsche Bank AG Johannesburg is incorporated in the Federal Republic of Germany (Branch Register
Number in South Africa: 1998/003298/10).
Singapore: by Deutsche Bank AG, Singapore Branch or Deutsche Securities Asia Limited, Singapore Branch (One Raffles
Quay #18-00 South Tower Singapore 048583, +65 6423 8001), which may be contacted in respect of any matters
arising from, or in connection with, this report. Where this report is issued or promulgated in Singapore to a person who
is not an accredited investor, expert investor or institutional investor (as defined in the applicable Singapore laws and
regulations), they accept legal responsibility to such person for its contents.
Japan: Approved and/or distributed by Deutsche Securities Inc.(DSI). Registration number - Registered as a financial
instruments dealer by the Head of the Kanto Local Finance Bureau (Kinsho) No. 117. Member of associations: JSDA,
Type II Financial Instruments Firms Association and The Financial Futures Association of Japan. Commissions and risks
involved in stock transactions - for stock transactions, we charge stock commissions and consumption tax by
multiplying the transaction amount by the commission rate agreed with each customer. Stock transactions can lead to
losses as a result of share price fluctuations and other factors. Transactions in foreign stocks can lead to additional
losses stemming from foreign exchange fluctuations. We may also charge commissions and fees for certain categories
of investment advice, products and services. Recommended investment strategies, products and services carry the risk
of losses to principal and other losses as a result of changes in market and/or economic trends, and/or fluctuations in
market value. Before deciding on the purchase of financial products and/or services, customers should carefully read the
5 December 2015
Software & Services
Alibaba
Deutsche Bank AG/Hong Kong Page 21
relevant disclosures, prospectuses and other documentation. "Moody's", "Standard & Poor's", and "Fitch" mentioned in
this report are not registered credit rating agencies in Japan unless Japan or "Nippon" is specifically designated in the
name of the entity. Reports on Japanese listed companies not written by analysts of DSI are written by Deutsche Bank
Group's analysts with the coverage companies specified by DSI. Some of the foreign securities stated on this report are
not disclosed according to the Financial Instruments and Exchange Law of Japan.
Malaysia: Deutsche Bank AG and/or its affiliate(s) may maintain positions in the securities referred to herein and may
from time to time offer those securities for purchase or may have an interest to purchase such securities. Deutsche Bank
may engage in transactions in a manner inconsistent with the views discussed herein.
Qatar: Deutsche Bank AG in the Qatar Financial Centre (registered no. 00032) is regulated by the Qatar Financial Centre
Regulatory Authority. Deutsche Bank AG - QFC Branch may only undertake the financial services activities that fall
within the scope of its existing QFCRA license. Principal place of business in the QFC: Qatar Financial Centre, Tower,
West Bay, Level 5, PO Box 14928, Doha, Qatar. This information has been distributed by Deutsche Bank AG. Related
financial products or services are only available to Business Customers, as defined by the Qatar Financial Centre
Regulatory Authority.
Russia: This information, interpretation and opinions submitted herein are not in the context of, and do not constitute,
any appraisal or evaluation activity requiring a license in the Russian Federation.
Kingdom of Saudi Arabia: Deutsche Securities Saudi Arabia LLC Company, (registered no. 07073-37) is regulated by the
Capital Market Authority. Deutsche Securities Saudi Arabia may only undertake the financial services activities that fall
within the scope of its existing CMA license. Principal place of business in Saudi Arabia: King Fahad Road, Al Olaya
District, P.O. Box 301809, Faisaliah Tower - 17th Floor, 11372 Riyadh, Saudi Arabia.
United Arab Emirates: Deutsche Bank AG in the Dubai International Financial Centre (registered no. 00045) is regulated
by the Dubai Financial Services Authority. Deutsche Bank AG - DIFC Branch may only undertake the financial services
activities that fall within the scope of its existing DFSA license. Principal place of business in the DIFC: Dubai
International Financial Centre, The Gate Village, Building 5, PO Box 504902, Dubai, U.A.E. This information has been
distributed by Deutsche Bank AG. Related financial products or services are only available to Professional Clients, as
defined by the Dubai Financial Services Authority.
Australia: Retail clients should obtain a copy of a Product Disclosure Statement (PDS) relating to any financial product
referred to in this report and consider the PDS before making any decision about whether to acquire the product. Please
refer to Australian specific research disclosures and related information at
https://australia.db.com/australia/content/research-information.html
Australia and New Zealand: This research, and any access to it, is intended only for "wholesale clients" within the
meaning of the Australian Corporations Act and New Zealand Financial Advisors Act respectively.
Additional information relative to securities, other financial products or issuers discussed in this report is available upon
request. This report may not be reproduced, distributed or published by any person for any purpose without Deutsche
Bank's prior written consent. Please cite source when quoting.
Copyright © 2015 Deutsche Bank AG
David Folkerts-Landau Chief Economist and Global Head of Research
Raj Hindocha Global Chief Operating Officer
Research
Marcel Cassard Global Head
FICC Research & Global Macro Economics
Steve Pollard Global Head
Equity Research
Michael Spencer Regional Head
Asia Pacific Research
Ralf Hoffmann Regional Head
Deutsche Bank Research, Germany
Andreas Neubauer Regional Head
Equity Research, Germany
International locations
Deutsche Bank AG
Deutsche Bank Place
Level 16
Corner of Hunter & Phillip Streets
Sydney, NSW 2000
Australia
Tel: (61) 2 8258 1234
Deutsche Bank AG
Große Gallusstraße 10-14
60272 Frankfurt am Main
Germany
Tel: (49) 69 910 00
Deutsche Bank AG
Filiale Hongkong
International Commerce Centre,
1 Austin Road West,Kowloon,
Hong Kong
Tel: (852) 2203 8888
Deutsche Securities Inc.
2-11-1 Nagatacho
Sanno Park Tower
Chiyoda-ku, Tokyo 100-6171
Japan
Tel: (81) 3 5156 6770
Deutsche Bank AG London
1 Great Winchester Street
London EC2N 2EQ
United Kingdom
Tel: (44) 20 7545 8000
Deutsche Bank Securities Inc.
60 Wall Street
New York, NY 10005
United States of America
Tel: (1) 212 250 2500