Embed Size (px)
Citation preview
Hongguo International
1
Hongguo International (1028) – Initiating
Coverage with ‘Buy’ rating Hongguo International Holding Limited (“Hongguo”) is the second
largest retailer by sales of mid-to-high end women’s footwear, with
four self-developed brands (C.banner, EBLAN, Fabiola and
Sundance) and one licensed brand Naturalizer. Hongguo implements
multi-brands strategy to expand its market shares in different income
and age groups of consumers in China.
We expect the group’s net profit to grow at CAGR of 41.72%
between 2010 and 2013, based on its solid same stores sales growth
(SSSG) and rapid expansion of new stores.
Hongguo is trading at FY2012 PER of 7.51x, a 59% discount to
market leader Belle’s 18.21x. Given its fair value and solid growth
of women’s footwear business,we initiate coverage with ‘Buy’
rating.
Valuation:
We set 12M target price at HK$ 2.30, based on FY11PE of 13.5x
and FY 2012PE of 10.0x. The target price represents FY 2012 P/B of
2.17x. In view of its FY 2012 ROAE of 24.15%, we believe the
target price is reasonable.
Risk: 1) Intensive competition;2) Fail to manage multi-brand;3)
Rental hike and concessionaire fees increase;4) Low liquidity
Financial highlights
Yr ended Dec31 (Rmb mn ) 2010 2011 E 2012 F 2013 F
Revenue 1,575 2,044 2,600 3,293
Chg (yoy) 22.57% 29.77% 27.20% 26.67%
Gross profit 972 1,265 1,625 2,058
Chg (yoy) 49.31% 30.12% 28.43% 26.67%
Net Income 170 286 382 483
Chg ( yoy) 113.30% 68.65% 33.36% 26.54%
Diluted EPS (Rmb) 0.100 0.143 0.191 0.242
Chg (yoy) 113.30% 43.36% 33.36% 26.54%
P/E (x) 14.36 10.01 7.51 5.93
NBV (Rmb/share) 0.378 0.715 0.867 1.061
P/B (x) 3.80 2.01 1.65 1.35
DPS (Rmb/share) 0.113 0.061 0.038 0.048
Dividend yield 7.72% 4.17% 2.62% 3.31%
ROAE 26.16% 27.66% 24.15% 25.07%
ROAA 17.51% 21.24% 19.77% 20.61%
Source: Hongguo, ABCI Securities estimates; @Forex: HK$1.22/Rmb
Report date: 23 Dec, 2011
Analyst:
Judy Hu
Tel: (852) 21478310
Source: Bloomberg
Data
Price(22/12/2011) HK$1.75
Issued shares 2,000mn
Market cap HK$3,500mn
Free float ratio 25%
52week high/low HK$2.3/1.63
Major shareholders:
Chen Yixi-Chairman(36.59%)Li Wei-CEO(20.01%)Miao Bingwen(18.4%)
Stock performance
1M 3M YTD
1028 HK Equity -2.8% - -23.9%
HSI Index 0.7% 4.0% -20.2%
HSCICG Index 0.5% 7.0% -23.4%
Hongguo International
2
Macro economy
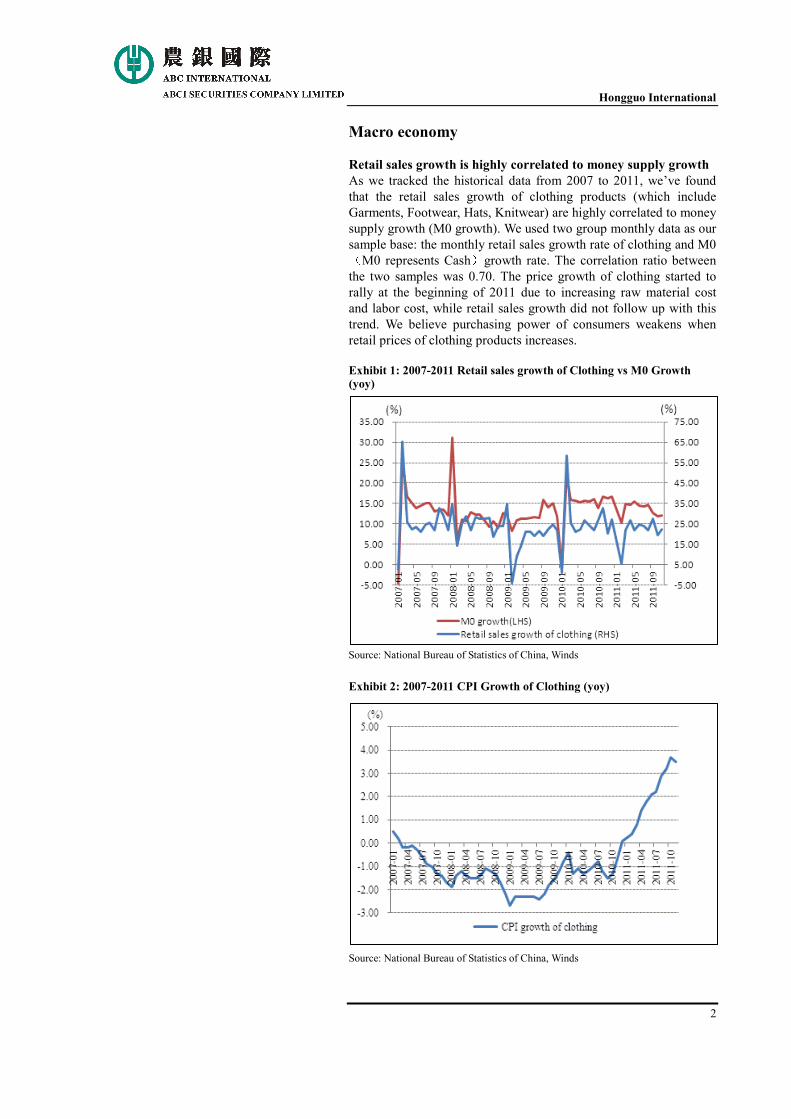
Retail sales growth is highly correlated to money supply growth
As we tracked the historical data from 2007 to 2011, we’ve found
that the retail sales growth of clothing products (which include
Garments, Footwear, Hats, Knitwear) are highly correlated to money
supply growth (M0 growth). We used two group monthly data as our
sample base: the monthly retail sales growth rate of clothing and M0(M0 represents Cash)growth rate. The correlation ratio between
the two samples was 0.70. The price growth of clothing started to
rally at the beginning of 2011 due to increasing raw material cost
and labor cost, while retail sales growth did not follow up with this
trend. We believe purchasing power of consumers weakens when
retail prices of clothing products increases.
Exhibit 1: 2007-2011 Retail sales growth of Clothing vs M0 Growth
(yoy)
Source: National Bureau of Statistics of China, Winds
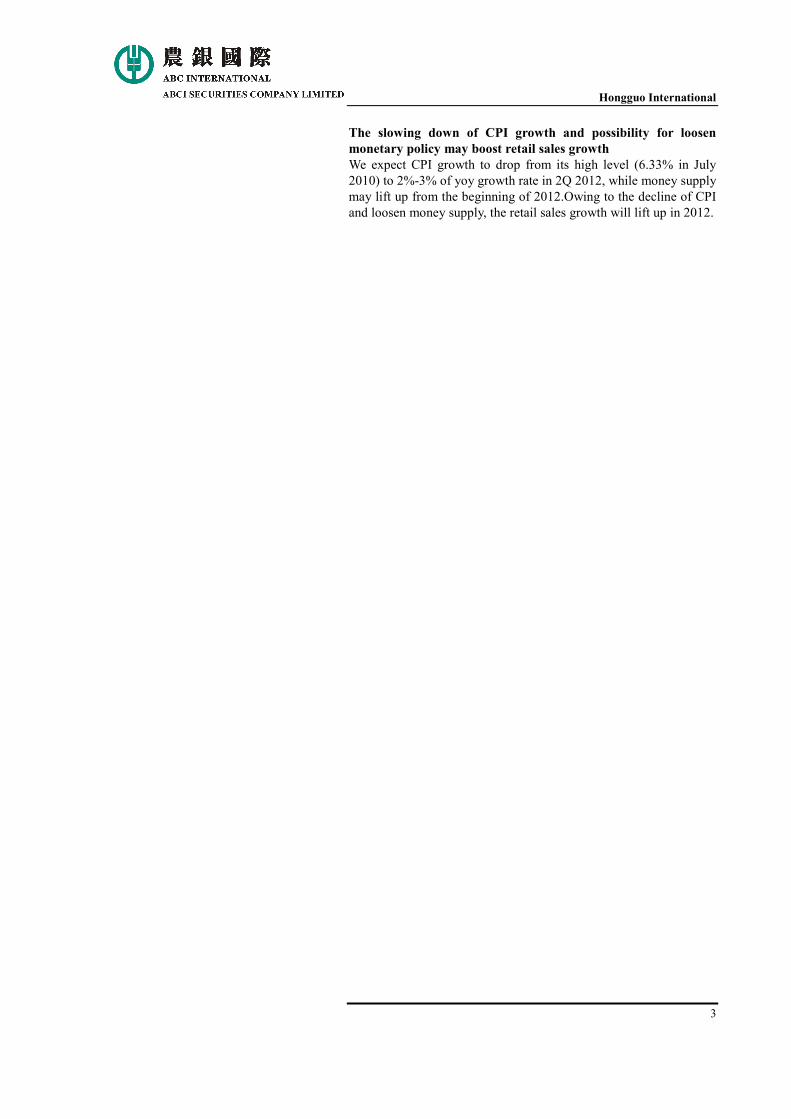
Exhibit 2: 2007-2011 CPI Growth of Clothing (yoy)
Source: National Bureau of Statistics of China, Winds
Hongguo International
3
The slowing down of CPI growth and possibility for loosen
monetary policy may boost retail sales growth
We expect CPI growth to drop from its high level (6.33% in July
2010) to 2%-3% of yoy growth rate in 2Q 2012, while money supply
may lift up from the beginning of 2012.Owing to the decline of CPI
and loosen money supply, the retail sales growth will lift up in 2012.
Hongguo International
4
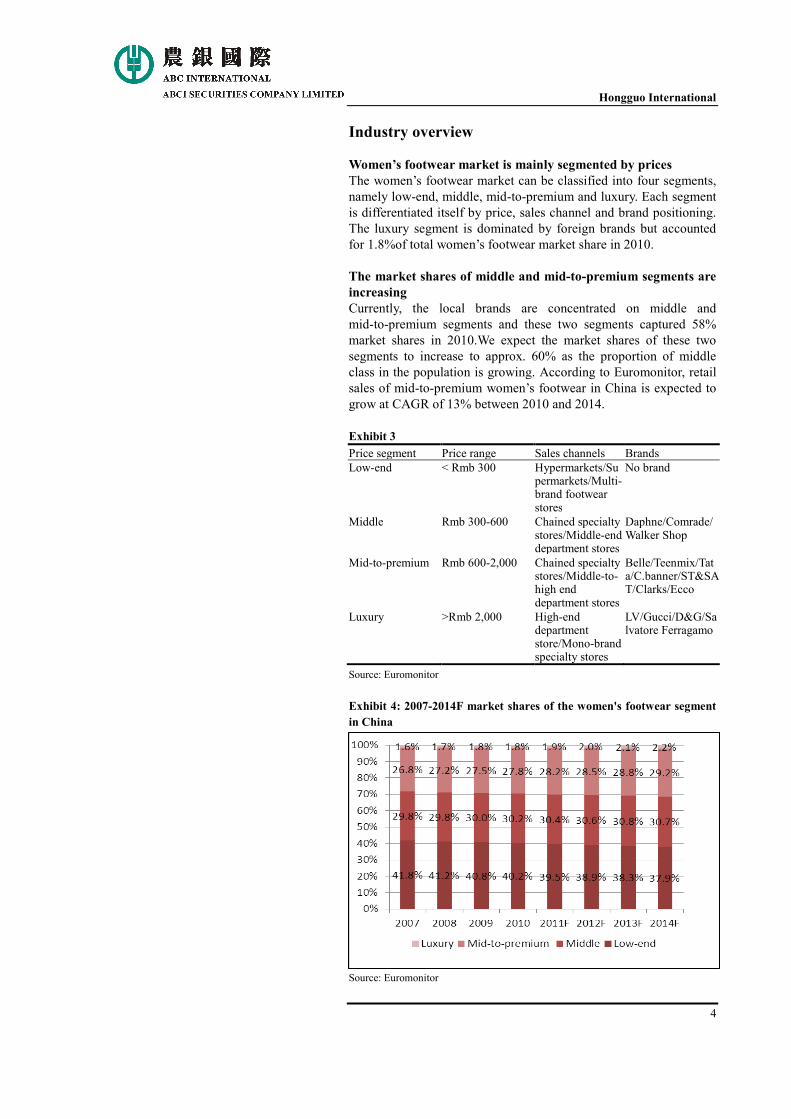
Industry overview Women’s footwear market is mainly segmented by prices
The women’s footwear market can be classified into four segments,
namely low-end, middle, mid-to-premium and luxury. Each segment
is differentiated itself by price, sales channel and brand positioning.
The luxury segment is dominated by foreign brands but accounted
for 1.8%of total women’s footwear market share in 2010.
The market shares of middle and mid-to-premium segments are
increasing
Currently, the local brands are concentrated on middle and
mid-to-premium segments and these two segments captured 58%
market shares in 2010.We expect the market shares of these two
segments to increase to approx. 60% as the proportion of middle
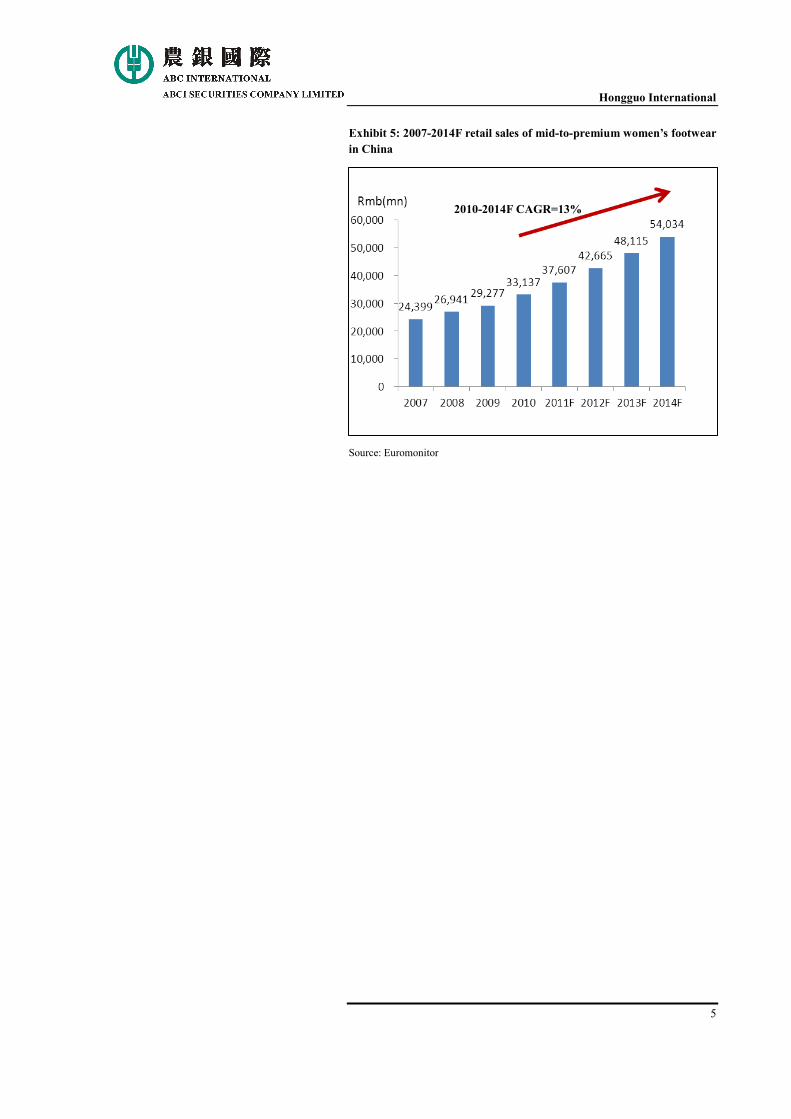
class in the population is growing. According to Euromonitor, retail
sales of mid-to-premium women’s footwear in China is expected to
grow at CAGR of 13% between 2010 and 2014.
Exhibit 3
Price segment Price range Sales channels Brands
Low-end < Rmb 300 Hypermarkets/Supermarkets/Multi-brand footwear stores
No brand
Middle Rmb 300-600 Chained specialty stores/Middle-end department stores
Daphne/Comrade/Walker Shop
Mid-to-premium Rmb 600-2,000 Chained specialty stores/Middle-to-high end department stores
Belle/Teenmix/Tata/C.banner/ST&SAT/Clarks/Ecco
Luxury >Rmb 2,000 High-end department store/Mono-brand specialty stores
LV/Gucci/D&G/Salvatore Ferragamo
Source: Euromonitor
Exhibit 4: 2007-2014F market shares of the women's footwear segment
in China
Source: Euromonitor
Hongguo International
5
Exhibit 5: 2007-2014F retail sales of mid-to-premium women’s footwear
in China
Source: Euromonitor
2010-2014F CAGR=13%
Hongguo International
6
Brand& Strategy Well established brand -C.banner
The group has four self-developed footwear brands and one licensed
brand in the market. The C.banner brand was launched in1996 and
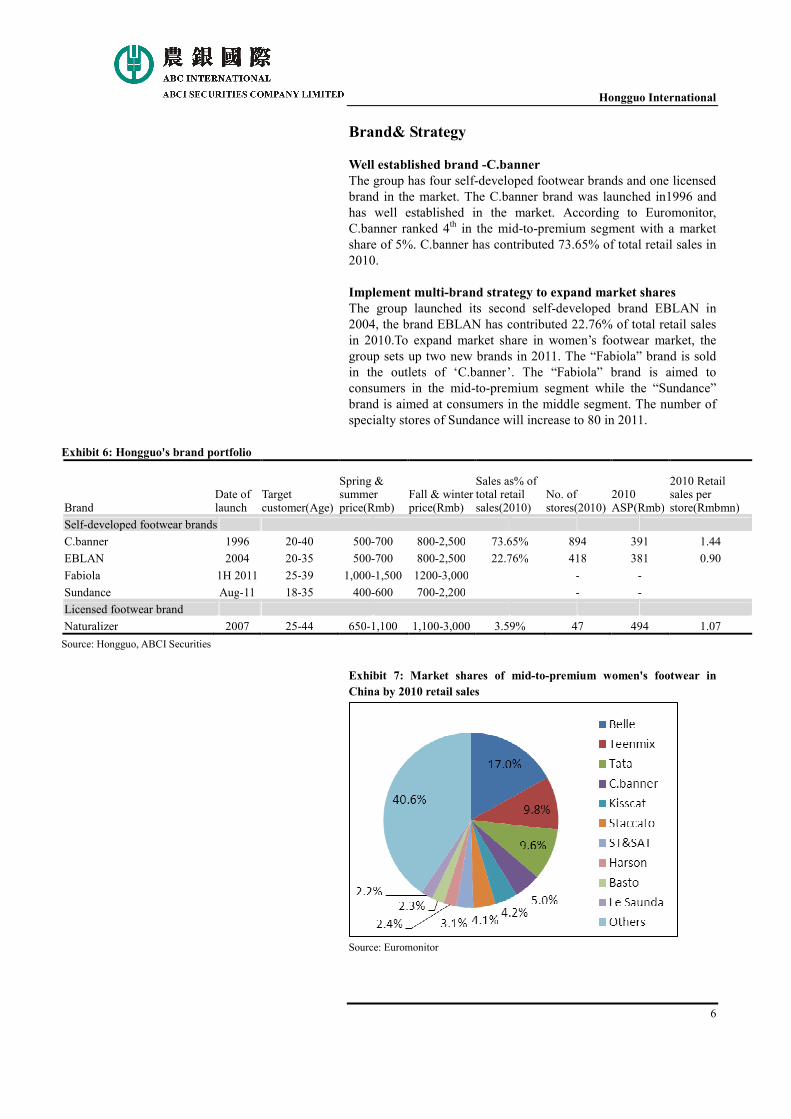
has well established in the market. According to Euromonitor,
C.banner ranked 4th in the mid-to-premium segment with a market
share of 5%. C.banner has contributed 73.65% of total retail sales in
2010.
Implement multi-brand strategy to expand market shares
The group launched its second self-developed brand EBLAN in
2004, the brand EBLAN has contributed 22.76% of total retail sales
in 2010.To expand market share in women’s footwear market, the
group sets up two new brands in 2011. The “Fabiola” brand is sold
in the outlets of ‘C.banner’. The “Fabiola” brand is aimed to
consumers in the mid-to-premium segment while the “Sundance”
brand is aimed at consumers in the middle segment. The number of
specialty stores of Sundance will increase to 80 in 2011.
Exhibit 6: Hongguo's brand portfolio
Brand Date of launch
Target customer(Age)
Spring & summer price(Rmb)
Fall & winter price(Rmb)
Sales as% of total retail sales(2010)
No. of stores(2010)
2010 ASP(Rmb)
2010 Retail sales per store(Rmbmn)
Self-developed footwear brands
C.banner 1996 20-40 500-700 800-2,500 73.65% 894 391 1.44
EBLAN 2004 20-35 500-700 800-2,500 22.76% 418 381 0.90
Fabiola 1H 2011 25-39 1,000-1,500 1200-3,000 - -
Sundance Aug-11 18-35 400-600 700-2,200 - -
Licensed footwear brand
Naturalizer 2007 25-44 650-1,100 1,100-3,000 3.59% 47 494 1.07
Source: Hongguo, ABCI Securities
Exhibit 7: Market shares of mid-to-premium women's footwear in
China by 2010 retail sales
Source: Euromonitor
Hongguo International
7
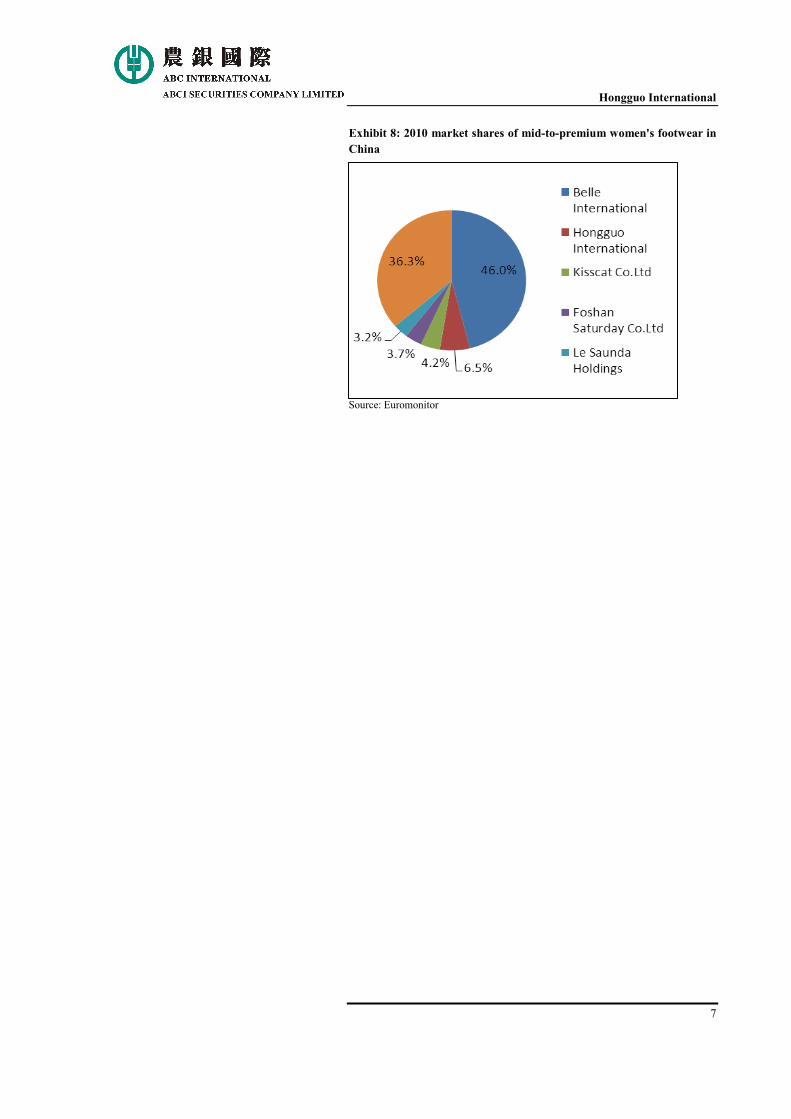
Exhibit 8: 2010 market shares of mid-to-premium women's footwear in
China
Source: Euromonitor
Hongguo International
8
Expansion of sales network
The group has an extensive distribution network with 1,181
proprietary outlets and 421 third-party outlets located in 31
provinces as of September 30, 2011. We expect the number of
outlets to increase at CAGR of 23% between 2010 and 2013. As
around 75% outlets are located in the department store, the group is
expected to penetrate into 3-4 tier cities with the expansion of
department stores.
Exhibit 9: Distribution network 2009 2010 2011F 2012F 2013F
Proprietary outlets 785 972 1202 1452 1737
Growth (yoy) 8.9% 23.8% 23.7% 20.8% 19.6%
Third-party outlets 260 317 437 557 667
Growth (yoy) 25.6% 21.9% 37.9% 27.5% 19.7%
Source: Hongguo, ABCI Securities
Exhibit 10: No. of department store outlets
Brand 2008 2009 2010 Mar 31,2011
C.banner 485 539 616 636
EBLAN 182 208 303 323
Naturalizer 38 31 42 47
Total 705 778 961 1006
% of total outlets 76.0% 74.4% 74.6% 74.0%
Source: Hongguo, ABCI Securities
Hongguo International
9
Facility& supply chain Vertical integration saves the cost
The group has three production facilities located in Nanjing,
Dongguan and Suining in China. We expect its capacity to reach to
8.1million pairs by end of 2013 as new production lines in Suining
put into operation. This may gradually lift its in-house production
ratio to save the cost as we expect in-house production costs to
be10%-15% lower than outsourcing production.
Tight supply chain management enhances operation efficiency
The group adopts a sales-based supply chain to enhance its operation
efficiency. The first order ratio (as % of total sales for new season) is
approximately 50% to 60%, while 40% to 50% are manufactured in
subsequent batch according to orders for replenishment. The tight
supply chain management will lower the backlog of inventory.
Hongguo International
10
Comparison with peers
Expansion of retail network: The group only has less than 1/5
outlets compared with market leader Belle and 1/4 outlets compared
with Daphne based on the stores number in 2010. We expect
Hongguo will expand rapidly for next 2-3years to set up more POS.
Lift in-house production ratio: The in-house ratio of Hongguo is
only around 50% that are lowest among other peers. We expect
Hongguo will expand production capacity to lift its in-house ratio
gradually to improve gross profit margin.
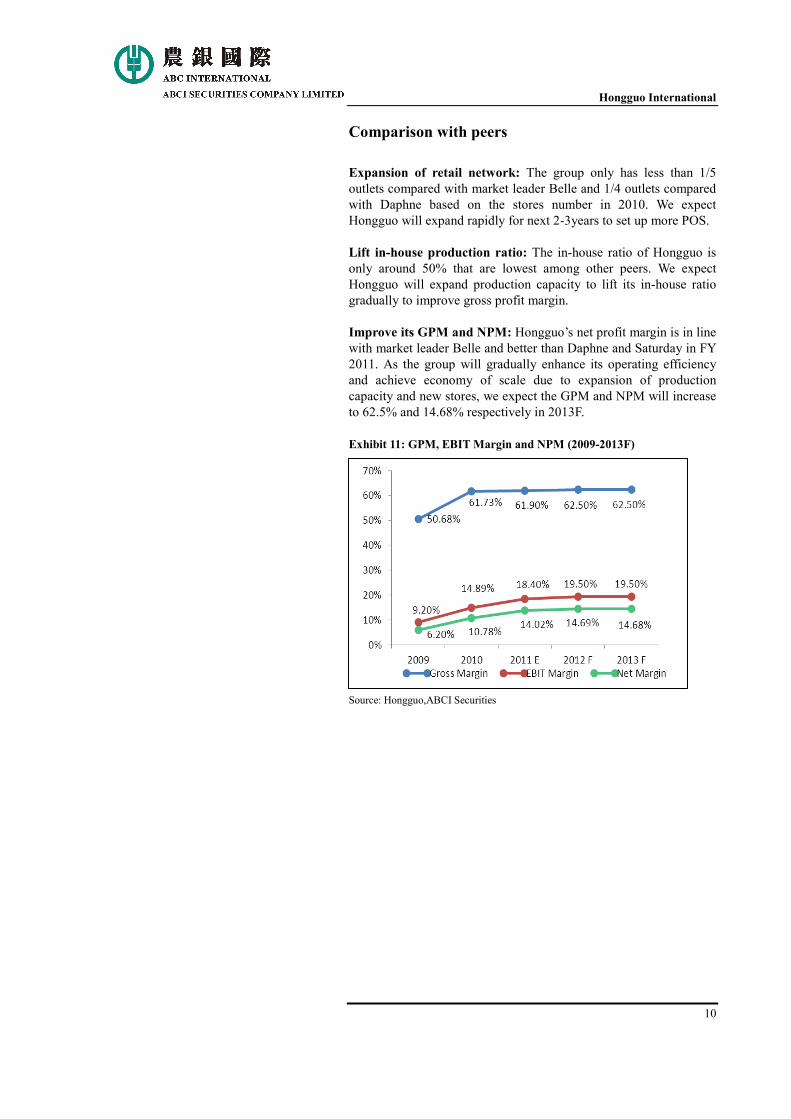
Improve its GPM and NPM: Hongguo’s net profit margin is in line
with market leader Belle and better than Daphne and Saturday in FY
2011. As the group will gradually enhance its operating efficiency
and achieve economy of scale due to expansion of production
capacity and new stores, we expect the GPM and NPM will increase
to 62.5% and 14.68% respectively in 2013F.
Exhibit 11: GPM, EBIT Margin and NPM (2009-2013F)
Source: Hongguo,ABCI Securities
Hongguo International
11
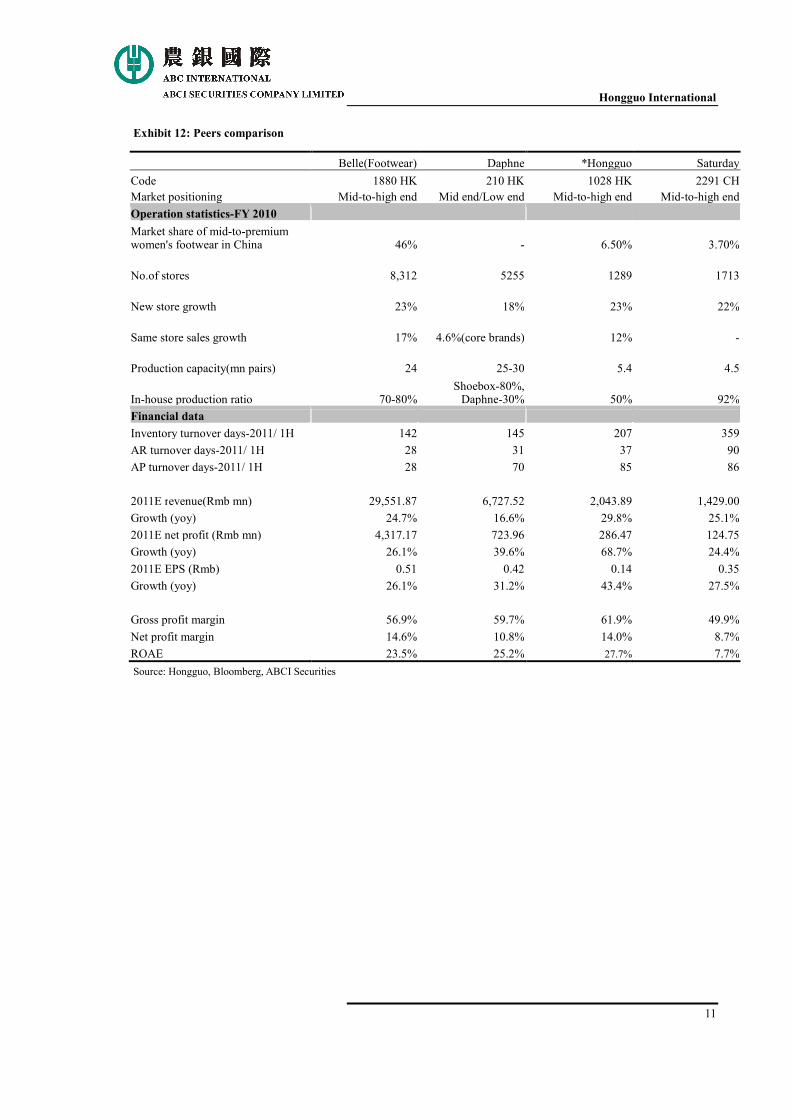
Exhibit 12: Peers comparison
Source: Hongguo, Bloomberg, ABCI Securities
Belle(Footwear) Daphne *Hongguo Saturday
Code 1880 HK 210 HK 1028 HK 2291 CH
Market positioning Mid-to-high end Mid end/Low end Mid-to-high end Mid-to-high end
Operation statistics-FY 2010 Market share of mid-to-premium women's footwear in China 46% - 6.50% 3.70%
No.of stores 8,312 5255 1289 1713
New store growth 23% 18% 23% 22%
Same store sales growth 17% 4.6%(core brands) 12% -
Production capacity(mn pairs) 24 25-30 5.4 4.5
In-house production ratio 70-80% Shoebox-80%, Daphne-30% 50% 92%
Financial data Inventory turnover days-2011/ 1H 142 145 207 359
AR turnover days-2011/ 1H 28 31 37 90
AP turnover days-2011/ 1H 28 70 85 86
2011E revenue(Rmb mn) 29,551.87 6,727.52 2,043.89 1,429.00
Growth (yoy) 24.7% 16.6% 29.8% 25.1%
2011E net profit (Rmb mn) 4,317.17 723.96 286.47 124.75
Growth (yoy) 26.1% 39.6% 68.7% 24.4%
2011E EPS (Rmb) 0.51 0.42 0.14 0.35
Growth (yoy) 26.1% 31.2% 43.4% 27.5%
Gross profit margin 56.9% 59.7% 61.9% 49.9%
Net profit margin 14.6% 10.8% 14.0% 8.7%
ROAE 23.5% 25.2% 27.7% 7.7%
Hongguo International
12
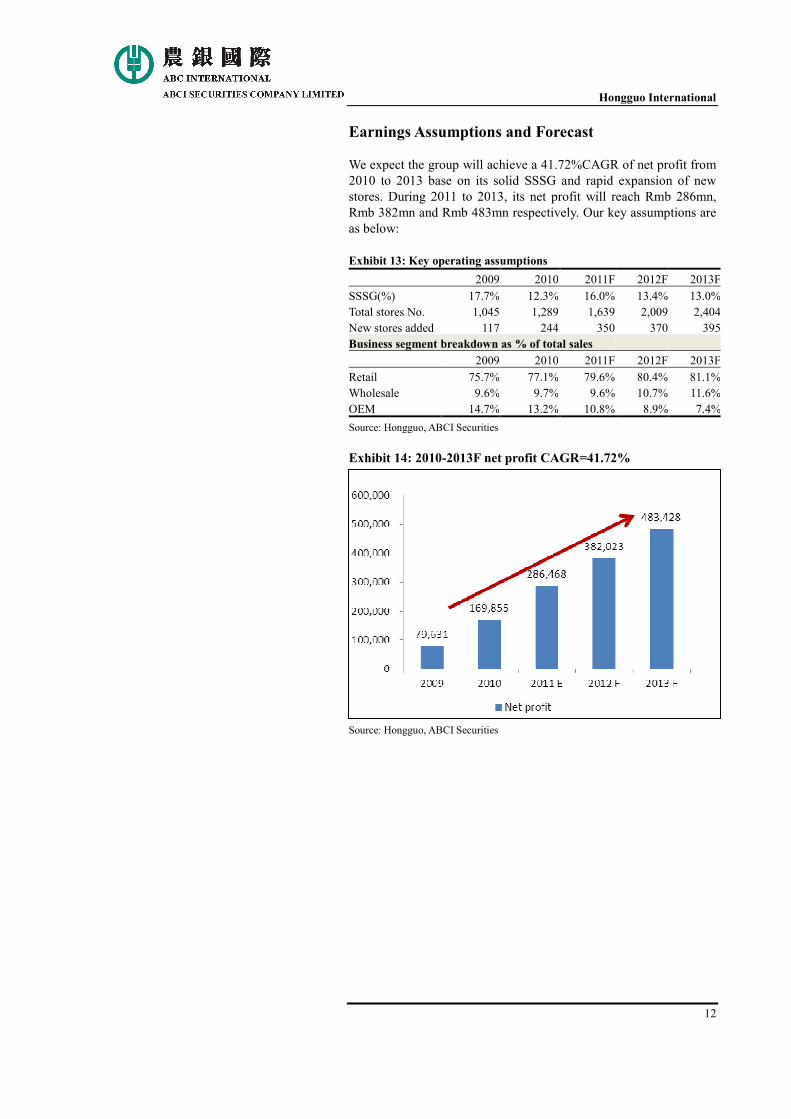
Earnings Assumptions and Forecast We expect the group will achieve a 41.72%CAGR of net profit from
2010 to 2013 base on its solid SSSG and rapid expansion of new
stores. During 2011 to 2013, its net profit will reach Rmb 286mn,
Rmb 382mn and Rmb 483mn respectively. Our key assumptions are
as below:
Exhibit 13: Key operating assumptions 2009 2010 2011F 2012F 2013F
SSSG(%) 17.7% 12.3% 16.0% 13.4% 13.0%
Total stores No. 1,045 1,289 1,639 2,009 2,404
New stores added 117 244 350 370 395
Business segment breakdown as % of total sales 2009 2010 2011F 2012F 2013F
Retail 75.7% 77.1% 79.6% 80.4% 81.1%
Wholesale 9.6% 9.7% 9.6% 10.7% 11.6%
OEM 14.7% 13.2% 10.8% 8.9% 7.4%
Source: Hongguo, ABCI Securities
Exhibit 14: 2010-2013F net profit CAGR=41.72%
Source: Hongguo, ABCI Securities
Hongguo International
13
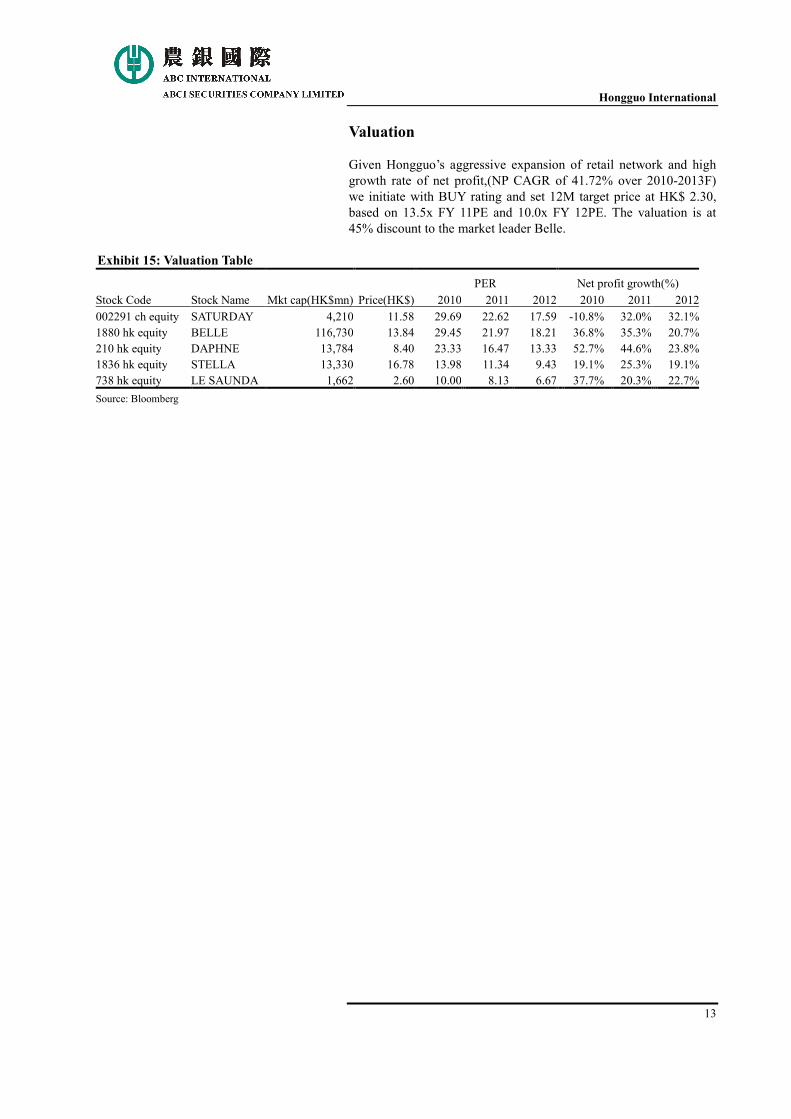
Valuation Given Hongguo’s aggressive expansion of retail network and high
growth rate of net profit,(NP CAGR of 41.72% over 2010-2013F)
we initiate with BUY rating and set 12M target price at HK$ 2.30,
based on 13.5x FY 11PE and 10.0x FY 12PE. The valuation is at
45% discount to the market leader Belle.
Exhibit 15: Valuation Table
Stock Code Stock Name Mkt cap(HK$mn) Price(HK$)
PER Net profit growth(%)
2010 2011 2012 2010 2011 2012
002291 ch equity SATURDAY 4,210 11.58 29.69 22.62 17.59 -10.8% 32.0% 32.1%
1880 hk equity BELLE 116,730 13.84 29.45 21.97 18.21 36.8% 35.3% 20.7%
210 hk equity DAPHNE 13,784 8.40 23.33 16.47 13.33 52.7% 44.6% 23.8%
1836 hk equity STELLA 13,330 16.78 13.98 11.34 9.43 19.1% 25.3% 19.1%
738 hk equity LE SAUNDA 1,662 2.60 10.00 8.13 6.67 37.7% 20.3% 22.7%
Source: Bloomberg
Hongguo International
14
Site visit to Maoye Department Store at Huaqiangbei district in Shenzhen We’ve chosen a peak hour (Saturday 3:00pm to 5:00pm at 17th Dec)
to visit Maoye Department Store at Huaqiangbei district in Shenzhen,
where it is a hot mid-to-high end shopping center. Our observations
are as follows.
� Intensive competition: Women’s shoes are crowded in the 1st
floor of the department store with 53 brands, which reflects
intensive competition in women’s brand shoes market.
� High homogeneity: As we walked through each shoe counter,
we’ve found different brands provide very similar products.
There are no obvious difference in designation, pricing and
product display among mid-to-high end women’s footwear
brands.
� High concentration: 1/4 brands (13 brands) are under Belle’s
brand portfolio, which confirmed its dominate position in this
mid-to-high end women’s shoe market. Daphne has 4 brands
located in the department store which is the second largest
brand retailer. Others are diversified with single retailers such
as Hongguo, Saturday, Le Saunda and Stella etc.
� Popular brands: Belle, Tata, Teenmix and Daphne’s counters
were more crowded compared with other brands with almost
10 peoples were trying shoes in their counters. C.banner,
Joy&Peace and Le Saunda also attract numerous people in their
counters (6 to 7ppls in each counters). We also observed
peoples are in long queue to pay the bill in the shoe cashier
counter. The purchasing power is strong due to weekend and
year-end promotion.
We conclude that the demand for brand women shoes is strong. The
strong demand will provide growth momentum of the women’s shoe
industry. Major brand enjoy stronger competitive advantages due to
extensive sales channels, stronger bargaining power with department
store and economy of scale to achieve operating efficiency. Industry
consolidation may happen as smaller players fail to catch up
consumers ’preference and fast change of fashion trend.
Hongguo International
15
Risk Factors Competition: The women’s footwear industry in China is highly
competition with numerous brands. If the group fails to catch up
fashion trend and cater customer’s taste, the existing brand retailers
and new enters may split up Hongguo’s market share.
Fail to manage multi-brand: Hongguo launched two new brands
this year in order to further diversify its brand portfolio. The new
brands need more time to be aware by the market. If Hongguo fail to
set up new brands and execute multi-brand strategy, it may take
huge new brands development cost and high inventory risk.
Heavily rely on department store: The group generated more than
70% of its total revenue from department store during last three
years. Hongguo do not have strong bargaining power with
department stores on concessionaire fees, outlets location etc. Any
increase in concessionaire fees and rental rates can drag down
Hongguo’s profit.
Lower liquidity of its shares: Due to its short listing history on the
Hong Kong market and small market cap, Hongguo’s average
trading volume over past one month is quite low. The liquidity risk
is very high.
Hongguo International
16
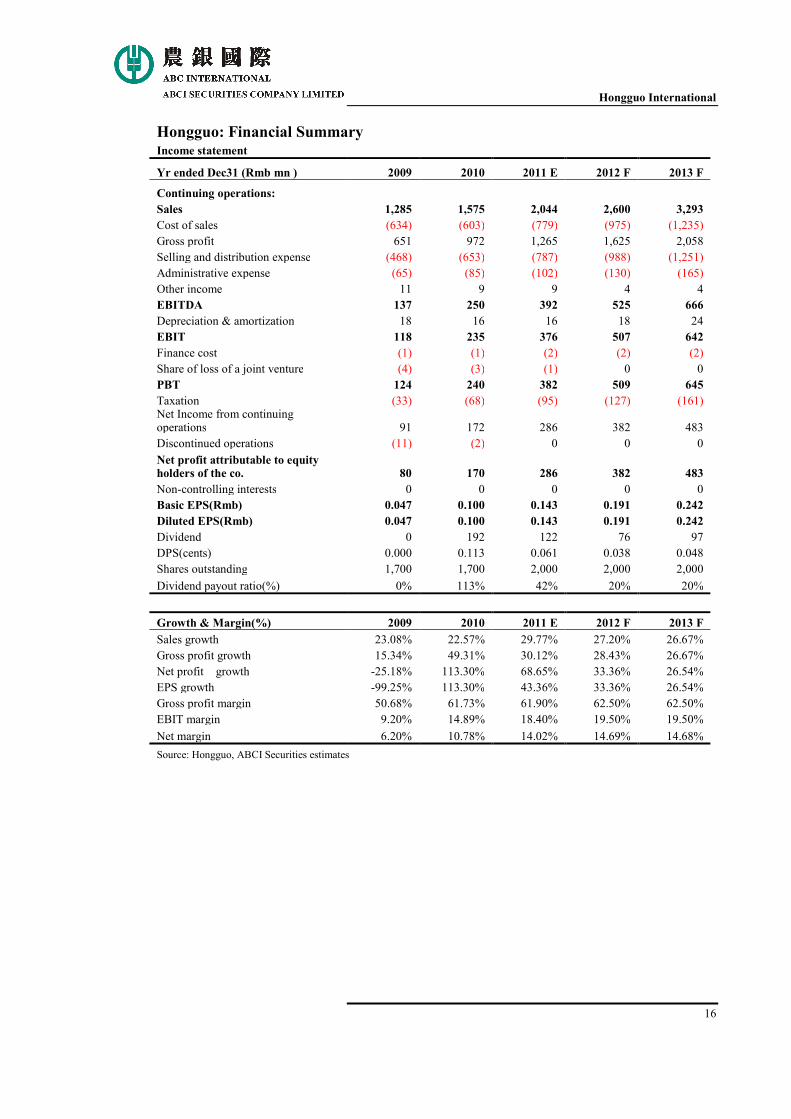
Hongguo: Financial Summary Income statement
Yr ended Dec31 (Rmb mn ) 2009 2010 2011 E 2012 F 2013 F
Continuing operations:
Sales 1,285 1,575 2,044 2,600 3,293
Cost of sales (634) (603) (779) (975) (1,235)
Gross profit 651 972 1,265 1,625 2,058
Selling and distribution expense (468) (653) (787) (988) (1,251)
Administrative expense (65) (85) (102) (130) (165)
Other income 11 9 9 4 4
EBITDA 137 250 392 525 666
Depreciation & amortization 18 16 16 18 24
EBIT 118 235 376 507 642
Finance cost (1) (1) (2) (2) (2)
Share of loss of a joint venture (4) (3) (1) 0 0
PBT 124 240 382 509 645
Taxation (33) (68) (95) (127) (161) Net Income from continuing operations 91 172 286 382 483
Discontinued operations (11) (2) 0 0 0
Net profit attributable to equity holders of the co. 80 170 286 382 483
Non-controlling interests 0 0 0 0 0
Basic EPS(Rmb) 0.047 0.100 0.143 0.191 0.242
Diluted EPS(Rmb) 0.047 0.100 0.143 0.191 0.242
Dividend 0 192 122 76 97
DPS(cents) 0.000 0.113 0.061 0.038 0.048
Shares outstanding 1,700 1,700 2,000 2,000 2,000
Dividend payout ratio(%) 0% 113% 42% 20% 20%
Growth & Margin(%) 2009 2010 2011 E 2012 F 2013 F
Sales growth 23.08% 22.57% 29.77% 27.20% 26.67%
Gross profit growth 15.34% 49.31% 30.12% 28.43% 26.67%
Net profit growth -25.18% 113.30% 68.65% 33.36% 26.54%
EPS growth -99.25% 113.30% 43.36% 33.36% 26.54%
Gross profit margin 50.68% 61.73% 61.90% 62.50% 62.50%
EBIT margin 9.20% 14.89% 18.40% 19.50% 19.50%
Net margin 6.20% 10.78% 14.02% 14.69% 14.68%
Source: Hongguo, ABCI Securities estimates
Hongguo International
17
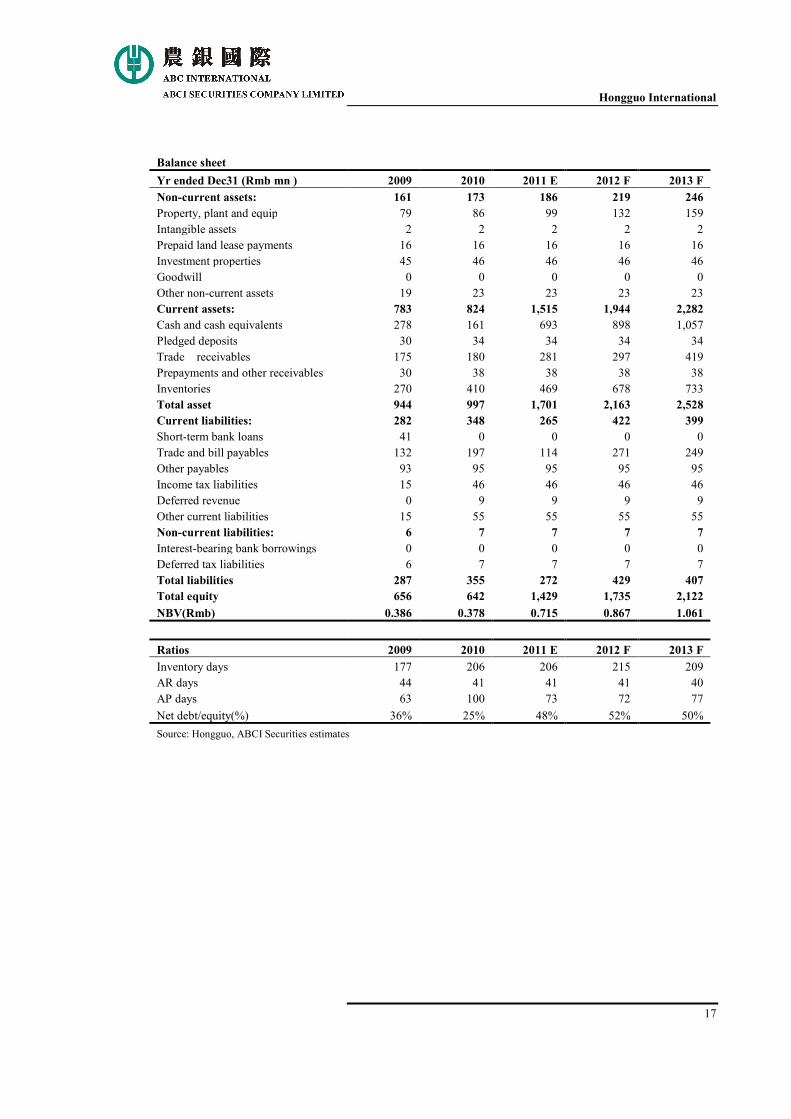
Balance sheet Yr ended Dec31 (Rmb mn ) 2009 2010 2011 E 2012 F 2013 F
Non-current assets: 161 173 186 219 246
Property, plant and equip 79 86 99 132 159
Intangible assets 2 2 2 2 2
Prepaid land lease payments 16 16 16 16 16
Investment properties 45 46 46 46 46
Goodwill 0 0 0 0 0
Other non-current assets 19 23 23 23 23
Current assets: 783 824 1,515 1,944 2,282
Cash and cash equivalents 278 161 693 898 1,057
Pledged deposits 30 34 34 34 34
Trade receivables 175 180 281 297 419
Prepayments and other receivables 30 38 38 38 38
Inventories 270 410 469 678 733
Total asset 944 997 1,701 2,163 2,528
Current liabilities: 282 348 265 422 399
Short-term bank loans 41 0 0 0 0
Trade and bill payables 132 197 114 271 249
Other payables 93 95 95 95 95
Income tax liabilities 15 46 46 46 46
Deferred revenue 0 9 9 9 9
Other current liabilities 15 55 55 55 55
Non-current liabilities: 6 7 7 7 7
Interest-bearing bank borrowings 0 0 0 0 0
Deferred tax liabilities 6 7 7 7 7
Total liabilities 287 355 272 429 407
Total equity 656 642 1,429 1,735 2,122
NBV(Rmb) 0.386 0.378 0.715 0.867 1.061
Ratios 2009 2010 2011 E 2012 F 2013 F
Inventory days 177 206 206 215 209
AR days 44 41 41 41 40
AP days 63 100 73 72 77
Net debt/equity(%) 36% 25% 48% 52% 50%
Source: Hongguo, ABCI Securities estimates
Hongguo International
18
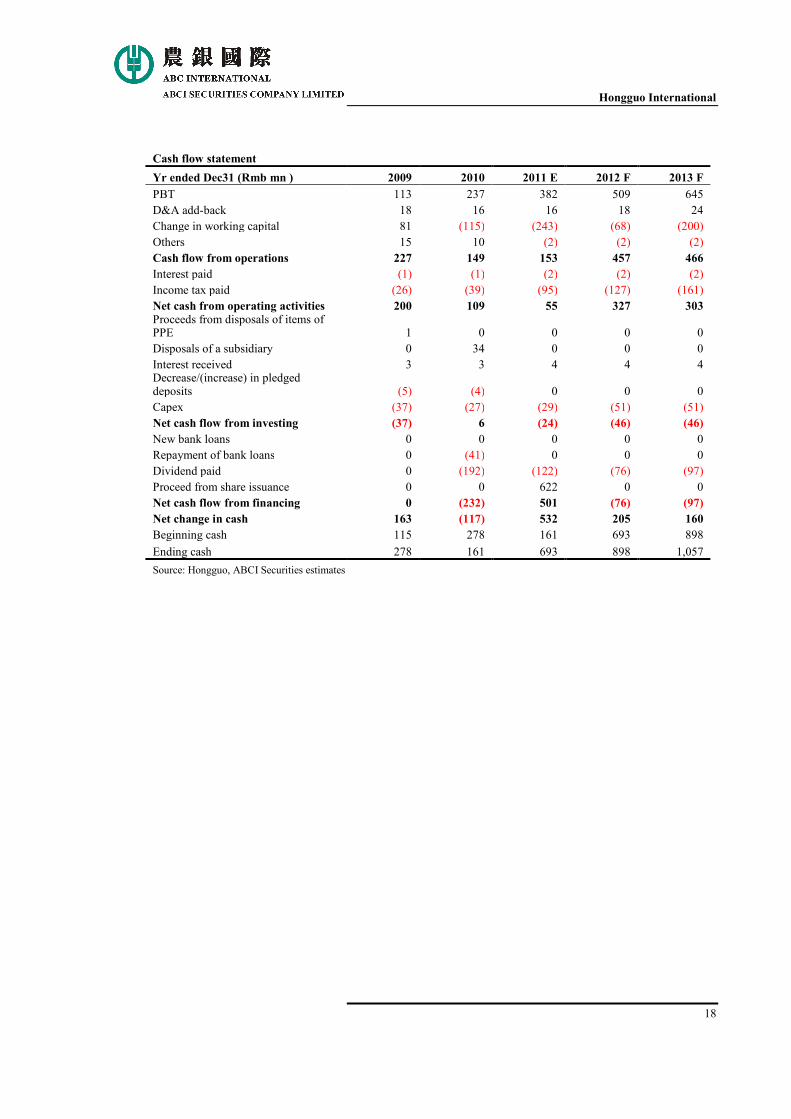
Cash flow statement
Yr ended Dec31 (Rmb mn ) 2009 2010 2011 E 2012 F 2013 F
PBT 113 237 382 509 645
D&A add-back 18 16 16 18 24
Change in working capital 81 (115) (243) (68) (200)
Others 15 10 (2) (2) (2)
Cash flow from operations 227 149 153 457 466
Interest paid (1) (1) (2) (2) (2)
Income tax paid (26) (39) (95) (127) (161)
Net cash from operating activities 200 109 55 327 303
Proceeds from disposals of items of PPE 1 0 0 0 0
Disposals of a subsidiary 0 34 0 0 0
Interest received 3 3 4 4 4 Decrease/(increase) in pledged deposits (5) (4) 0 0 0
Capex (37) (27) (29) (51) (51)
Net cash flow from investing (37) 6 (24) (46) (46)
New bank loans 0 0 0 0 0
Repayment of bank loans 0 (41) 0 0 0
Dividend paid 0 (192) (122) (76) (97)
Proceed from share issuance 0 0 622 0 0
Net cash flow from financing 0 (232) 501 (76) (97)
Net change in cash 163 (117) 532 205 160
Beginning cash 115 278 161 693 898
Ending cash 278 161 693 898 1,057
Source: Hongguo, ABCI Securities estimates
Hongguo International
19
Disclosures Analyst Certification
I, Hu Zhaoling, Judy , being the person primarily responsible for the content of this research report, in whole or in part, hereby certify that all of the views expressed in this report accurately reflect my personal view about the subject company or companies and its or their securities. I also certify that no part of my compensation was, is, or will be, directly or indirectly, related to the specific recommendations or views expressed in this report. I and/or my associates has/have no financial interests in relation to subject company(ies) covered in this report., as well as I and/or my associates do not serve as officer(s) of listed corporation(s) covered in this report.
Disclosures of Interests
ABCI Securities Company Limited and/or its member companies (“ABCI”) may, from time to time, solicit, perform or have performed investment banking, underwriting or other services (including acting as adviser, manager, underwriter or lender) within the last 12 months for any issuer(s) referred to in this report. As a result, investors should be aware that we may have a conflict of interest that could affect the objectivity of this report. Investors should consider this report as only a single factor in making their investment decision. Investors should obtain relevant and specific professional advice appropriate to his/her/its personal circumstances and investment objectives before making any investment decision. Investor should also carefully consider relevant risk factors. If investor has any questions about anything contained in this research report please consult ABCI Securities Company Limited or his/her/its professional advisors. ABCI Securities Company Limited and/or its affiliates, within the past 12 months, have received compensation and/or within the next 3 months seek to obtain compensation for investment banking services from the subject company.
Disclaimer
This report is for our clients only and is for distribution only under such circumstances as may be permitted by applicable law. It has no regard to the specific investment objectives, financial situation or particular needs of any specific recipient. It is published solely for informational purposes and is not to be construed as a solicitation or an offer to buy or sell any securities or related financial instruments. No representation or warranty, either expresses or implied, is provided in relation to the accuracy, completeness or reliability of the information contained herein. This report should not be regarded by recipients as a substitute for the exercise of their own judgment. Any opinions expressed in this report are subject to change without notice and may differ or be contrary to opinions expressed by other business areas as a result of using different assumptions and criteria. The analysis contained herein is based on numerous assumptions. Different assumptions could result in materially different results. The analyst(s) responsible for the preparation of this report may interact with trading desk personnel, sales personnel and other constituencies for the purpose of gathering, synthesizing and interpreting market information. ABCI Securities Company Limited is under no obligation to update or keep current the information contained herein. ABCI Securities Company Limited relies on information barriers to control the flow of information contained in one or more areas within ABCI Securities Company Limited, into other areas, units, groups or affiliates of ABCI Securities Company Limited. The compensation of the analyst who prepared this report is determined exclusively by research management and senior management (not including
Hongguo International
20
investment banking). Analyst compensation is not based on investment banking revenues, however, compensation may relate to the revenues of ABCI Securities Company Limited as a whole, of which investment banking, sales and trading are a part. The securities described herein may not be eligible for sale in all jurisdictions or to certain categories of investors. The price and value of the investments referred to in this research and the income from them may fluctuate. Past performance is not necessarily indicative of future results. Foreign currency rates of exchange may adversely affect the value, price or income of any security or related instrument mentioned in this report. For investment advice, trade execution or other enquiries, clients should contact their local sales representative. Neither ABCI Securities Company Limited nor any of its affiliates, directors, employees or agents accepts any liability for any loss or damage arising out of the use of all or any part of this report. Additional information will be made available upon request.
Copyright 2011 ABCI Securities Company Limited
No part of this material may be (i) copied, photocopied or duplicated in any
form by any means or (ii) redistributed without the prior written consent of
ABCI Securities Company Limited.
Office address: ABCI Securities Company Limited, 13/F Fairmont
House, 8 Cotton Tree Drive, Central, Hong Kong.
Tel: (852) 2868 2183