Embed Size (px)
Citation preview

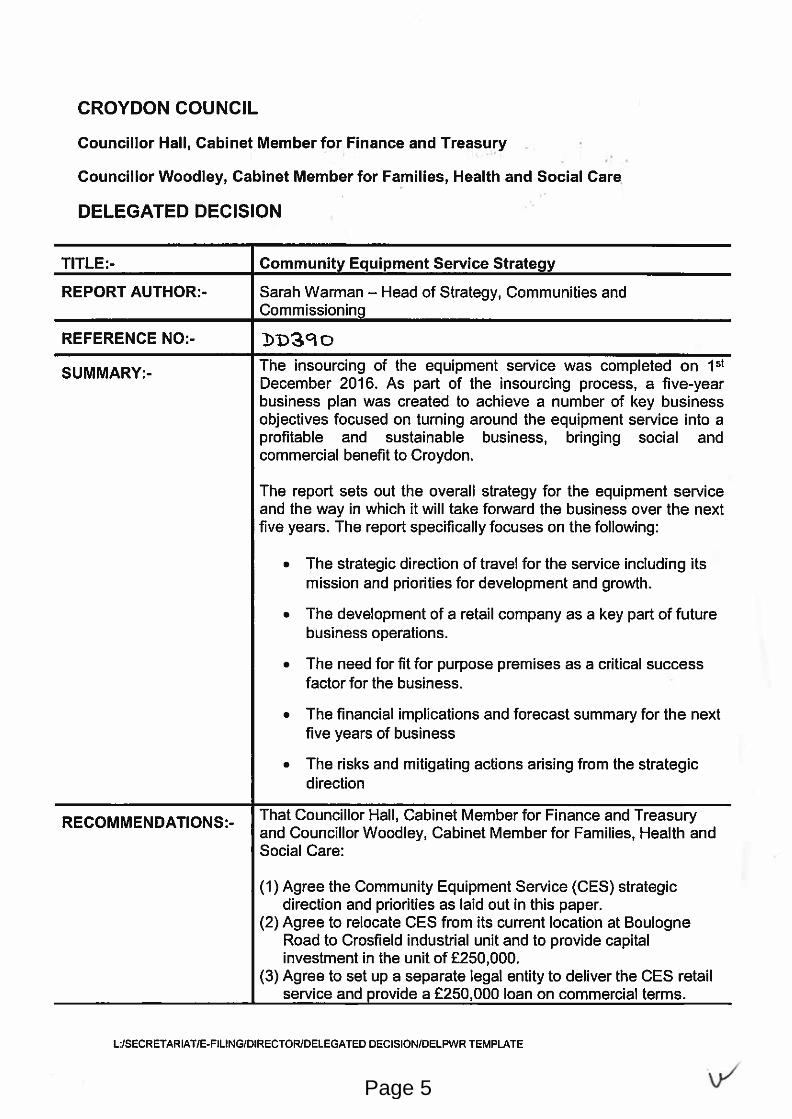
Cabinet Background documents
10. YourCare (Croydon) Options Appraisal (Pages 3 - 100)
Cabinet Member: Cabinet Member for Resources & Financial Governance, Councillor Callton Young Officer: Interim Executive Director Resources, Asmat Hussain Key decision: no
12. Investing in our Borough (Pages 101 - 128)
Cabinet Member: Cabinet Member Resources & Financial Governance, Councillor Callton Young Officer: Interim Executive Director Resources, Asmat Hussain Key decision: no
JACQUELINE HARRIS BAKER Council Solicitor and Monitoring Officer London Borough of Croydon Bernard Weatherill House 8 Mint Walk, Croydon CR0 1EA
Victoria Lower 020 8726 6000 x14773 020 8726 6000 [email protected] www.croydon.gov.uk/meetings
Public Document Pack

This page is intentionally left blank

Page 3
Agenda Item 10

This page is intentionally left blank
Page 5
Page 6
Page 7
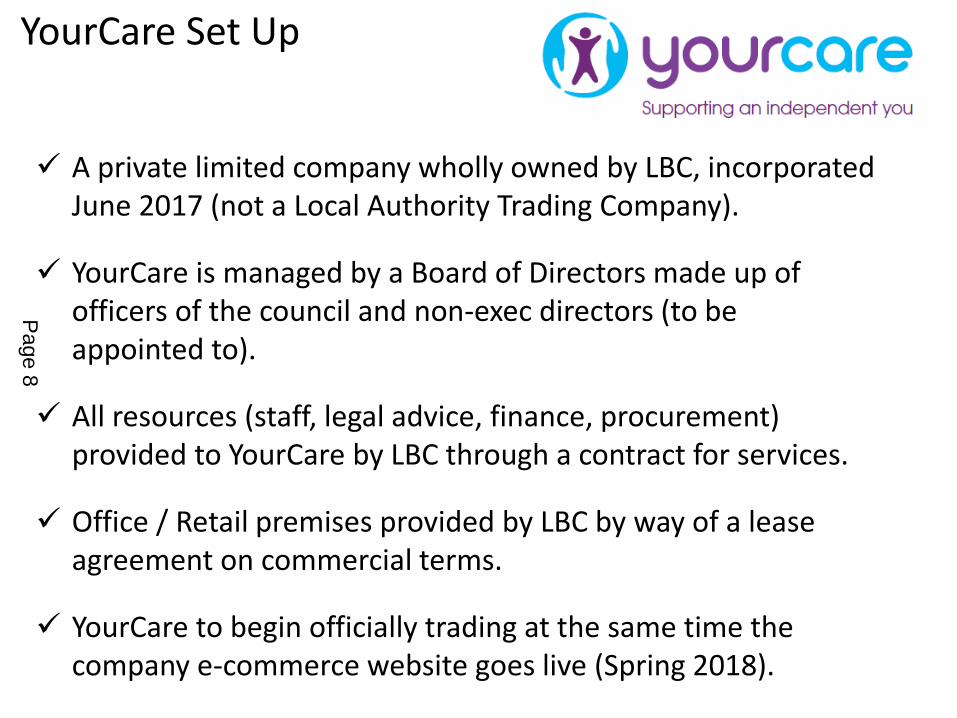
YourCare Set Up
A private limited company wholly owned by LBC, incorporated June 2017 (not a Local Authority Trading Company).
YourCare is managed by a Board of Directors made up of officers of the council and non-exec directors (to be appointed to).
All resources (staff, legal advice, finance, procurement) provided to YourCare by LBC through a contract for services.
Office / Retail premises provided by LBC by way of a lease agreement on commercial terms.
YourCare to begin officially trading at the same time the company e-commerce website goes live (Spring 2018).
Page 8
YourCare Offer
A fast-tracked alternative (to council provision) for individuals who want to purchase equipment privately.
Proactively supporting managing demand pressures for Croydon in the assessment and allocation of social care resources.
Reducing council waiting lists, particularly those people who have non-complex needs.
Supporting the preventative agenda by working with non – complex clients at an earlier stage.
Access to over 1000 equipment product lines (children and adults) coupled with expert advice and aftersales support.
Page 9
YourCare Compliance
Care Act Compliance - Disclaimers for members of the public from Croydon seeking to purchase privately, referring to potential eligibility from the Council.
State Aid compliance – Ensuring Croydon set up YCL to avoid state aid challenges e.g. commercial rates for all expenditure sourced from council.
Sign posting to YCL from Croydon – adhering to competition rules / balanced against Croydon maximising use of YCL. e.g. on council website including other suppliers of equipment when referencing YCL.
Page 10
Online
YourCare Website – target launch date April 2018.
Customer can access the website in the following ways:
• Accessing Croydon social care website pages (Via Ask Sara) linked to YourCare website for purchase.
• Through e-market place developed by LBC with link to YourCare website.
• Accessing web applications linked to the YourCare website e.g. From the Social Care Institute for Excellence (SCIE) Dementia App.
• Directly going to the website e.g. as a result of Google search, awareness of website.
Page 11

Page 12
• Providing a “one stop shop” for equipment needs.
• Demonstrating product ranges through its independent living centre (“try before you buy concept”).
• Offering expert trusted assessment, information, advice and guidance.
• Tailoring range of products to meet needs.
• Modern and conducive independent living centre at new site Crosfields, Imperial Way (12-18 months time).
• Satellite stores/pop up shops e.g. in hospitals, contact centres.
Retail Store
Page 13
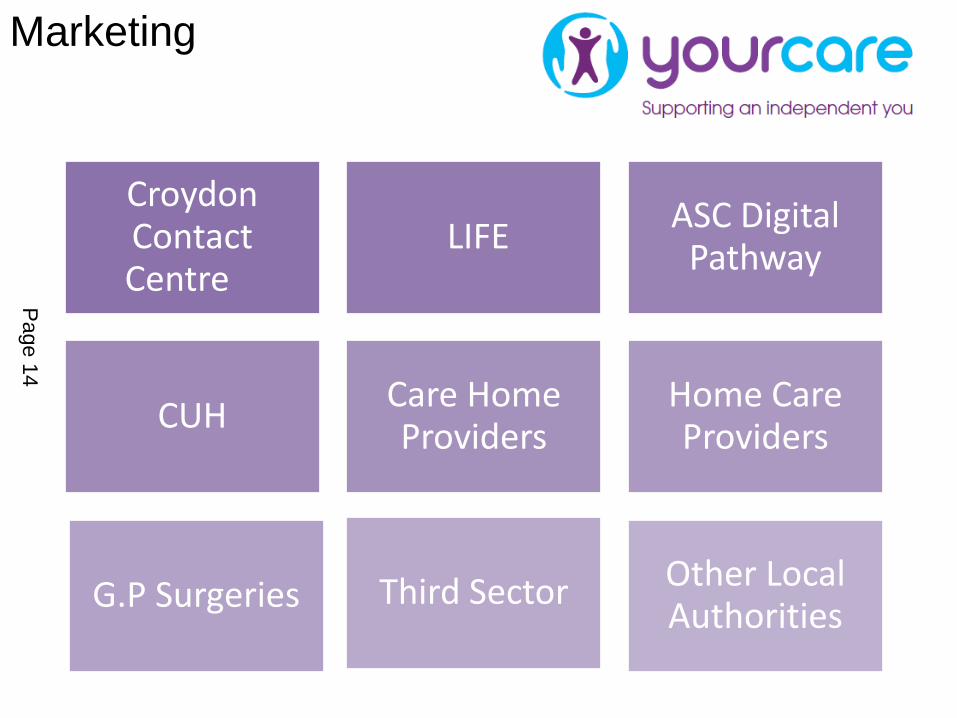
Croydon Contact Centre
LIFEASC Digital
Pathway
CUHCare Home Providers
Home Care Providers
G.P Surgeries Third Sector Other Local Authorities
Marketing
Page 14
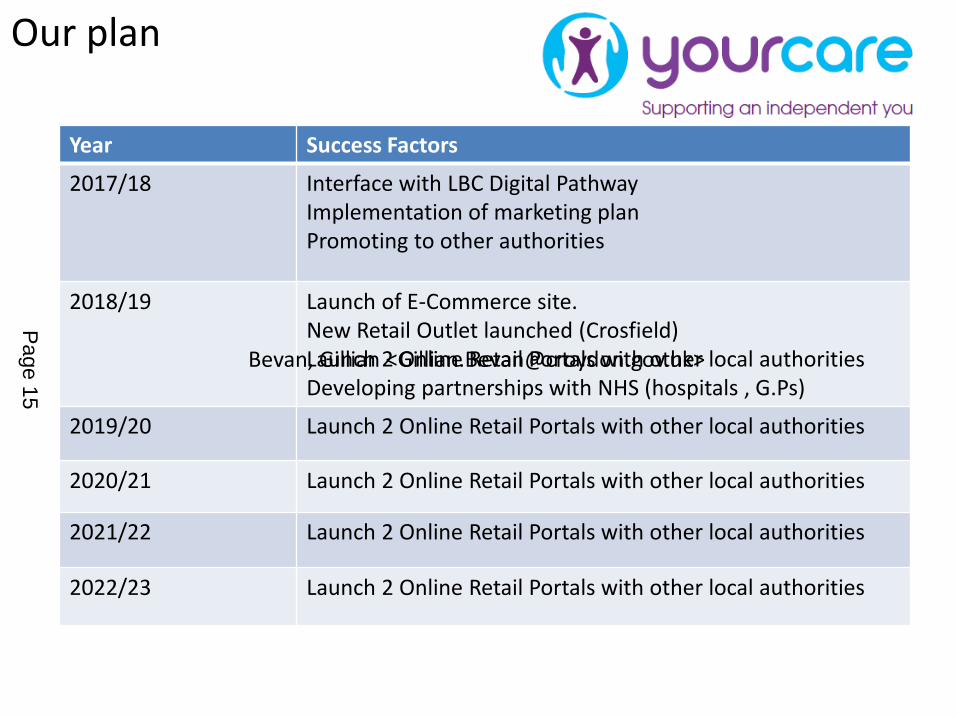
Our plan
Year Success Factors
2017/18 Interface with LBC Digital PathwayImplementation of marketing planPromoting to other authorities
2018/19 Launch of E-Commerce site.New Retail Outlet launched (Crosfield)Launch 2 Online Retail Portals with other local authoritiesDeveloping partnerships with NHS (hospitals , G.Ps)
2019/20 Launch 2 Online Retail Portals with other local authorities
2020/21 Launch 2 Online Retail Portals with other local authorities
2021/22 Launch 2 Online Retail Portals with other local authorities
2022/23 Launch 2 Online Retail Portals with other local authorities
Bevan, Gillian <[email protected]>
Page 15
Financial Forecast
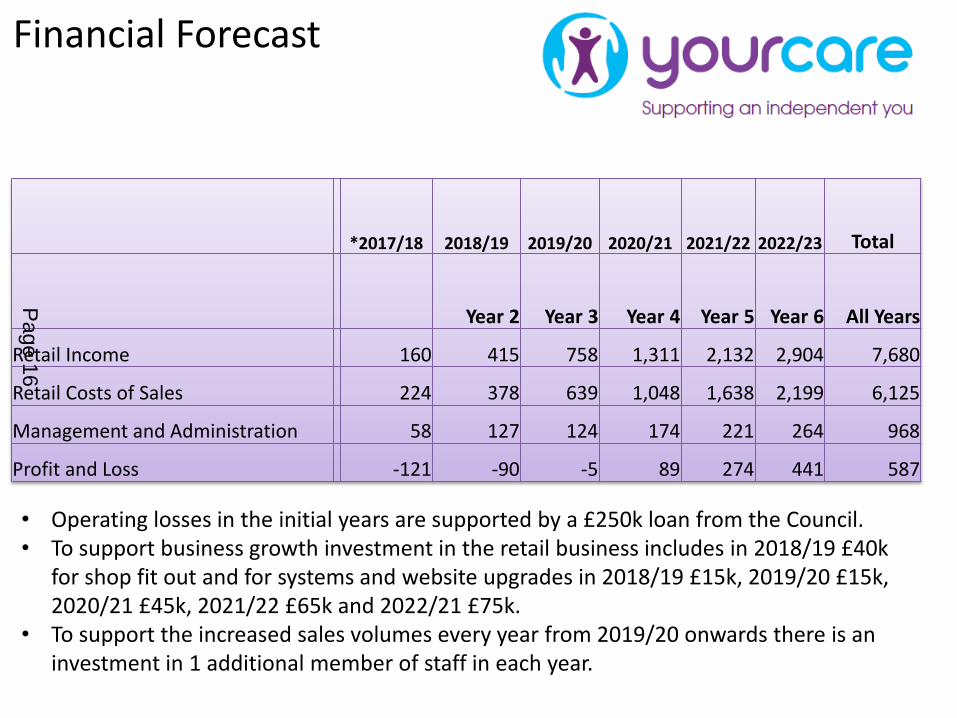
*2017/18 2018/19 2019/20 2020/21 2021/22 2022/23 Total
Year 2 Year 3 Year 4 Year 5 Year 6 All Years
Retail Income 160 415 758 1,311 2,132 2,904 7,680
Retail Costs of Sales 224 378 639 1,048 1,638 2,199 6,125
Management and Administration 58 127 124 174 221 264 968
Profit and Loss -121 -90 -5 89 274 441 587
• Operating losses in the initial years are supported by a £250k loan from the Council.• To support business growth investment in the retail business includes in 2018/19 £40k
for shop fit out and for systems and website upgrades in 2018/19 £15k, 2019/20 £15k, 2020/21 £45k, 2021/22 £65k and 2022/21 £75k.
• To support the increased sales volumes every year from 2019/20 onwards there is an investment in 1 additional member of staff in each year.
Page 16
Page 1 of 26
Next release: 30 September 2020
Release date: 12 August 2020
Contact: James Scruton [email protected] +44(0)1633 455284
Statistical bulletin
GDP first quarterly estimate, UK: April to June 2020
First quarterly estimate of gross domestic product (GDP). Contains current and constant price data on the value of goods and services to indicate the economic performance of the UK.
Correction
12 August 2020 14:46
A correction has been made to text relating to Trade in Section 5. Initially we referred to a trade deficit of 1.9% of nominal GDP. This has now been corrected to refer to a trade surplus of 1.9% of nominal GDP. You can see the original content in the superseded version.
We apologise for any inconvenience.
17 August 2020 14:20
A processing error was discovered in the datasets and time series related to the GDP first quarterly estimate, UK: April to June 2020 release. The error affected GVA excluding oil and gas (CDIDs KLS2, KLH7,KLH8 and KLH9) for Quarter 2 2020 in tables A2 and B1 of the data tables, the associated time series and the pdf tables attached to the statistical bulletin. This was due to a processing error in the creation of these datasets. We have now corrected for this.
We apologise for any inconvenience.
Please contact for more [email protected]
Page 17
Page 2 of 26
Table of contents
1. Main points
2. Things you need to know about this release
3. Headline GDP
4. Output
5. Expenditure
6. Income
7. Related links
8. Quality and methodology
Page 18
Page 3 of 26
1 . Main points
UK gross domestic product (GDP) is estimated to have fallen by a record 20.4% in Quarter 2 (Apr to June) 2020, marking the second consecutive quarterly decline after it fell by 2.2% in Quarter 1 (Jan to Mar) 2020.
When compared with Quarter 4 (Oct to Dec) 2019, UK GDP decreased by 22.1% in Quarter 2 2020.
Despite the weakness in Quarter 2 2020, there was some pick up in June as government restrictions on movement started to ease; see .GDP monthly estimate, UK: June 2020
There have been record quarterly falls in services, production and construction output in Quarter 2, which have been particularly prevalent in those industries that have been most exposed to government restrictions.
Private consumption accounted for more than 70% of the fall in the expenditure measure of GDP in Quarter 2 2020, falling by 23.1%; there were also notable falls in gross capital formation and government consumption.
GDP estimates for Quarter 1 2020 and Quarter 2 2020 are subject to more uncertainty than usual as a result of the we faced in collecting the data under government imposed public health restrictions.challenges
2 . Things you need to know about this release
Gross domestic product (GDP) growth is the main indicator of economic performance. There are three approaches used to measure GDP:
the output approach
the expenditure approach
the income approach
Further information on all three approaches to measuring GDP can be found in the Guide to the UK National .Accounts
In producing a balanced estimate of GDP, we reconcile information on the output, expenditure and income measures of GDP. In our first quarterly estimate, output tends to paint a more reliable picture of what is happening overall in the economy, and so balancing adjustments are applied to the expenditure and income components of GDP where required to align to output; these tend to be applied to components where data content is comparatively weak, or estimates are prone to revision.
Data in chained volume measures within this bulletin have had the effect of price changes removed (in other words, the data are deflated), except for income data, which are only available in current prices.
Page 19
Page 4 of 26
Impact of the coronavirus (COVID-19)
This release captures the direct effects of the coronavirus (COVID-19) pandemic and the government measures taken to reduce transmission of the virus. We have faced an increased number of challenges in producing quarterly estimates of UK GDP for Quarter 1 (Jan to Mar) 2020 and Quarter 2 (Apr to June) 2020. More detailed information on the challenges and the steps taken to mitigate those can be found in Coronavirus and the effects
.on UK GDP
As a result of these challenges, GDP estimates for Quarter 1 and Quarter 2 2020 are subject to more uncertainty than usual and are likely to have larger than usual revisions in subsequent releases.
3 . Headline GDP
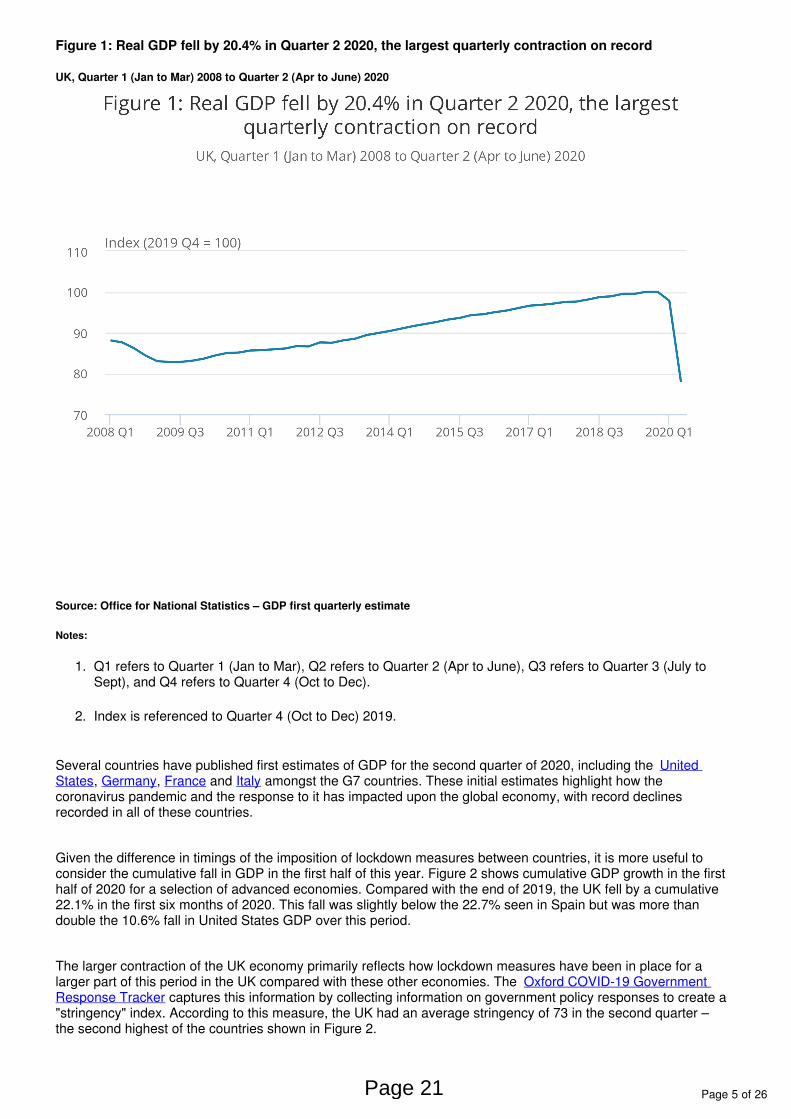
UK gross domestic product (GDP) is estimated to have fallen by a record 20.4% in Quarter 2 (Apr to June) 2020, marking the second consecutive quarterly decline after GDP fell by 2.2% in the previous quarter (Figure 1). This is the largest quarterly contraction in the UK economy since Office for National Statistics (ONS) quarterly records began in 1955, and reflects the ongoing public health restrictions and forms of voluntary social distancing that have been put in place in response to the coronavirus (COVID-19) pandemic. In level terms, real GDP was last lower in Quarter 2 2003. Compared with the same quarter a year ago, the UK economy fell by 21.7%.
Recent analysis explains our latest position on how we are looking to communicate GDP, including how we will continue to acknowledge “technical” recessions as comprising of at least two consecutive quarters of contracting GDP. While it is still true that these early estimates are prone to revision, we prefer to focus on the magnitude of the contraction that has taken place in response to the coronavirus pandemic. It is clear that the UK is in the largest recession on record. Our latest estimates show that the UK economy is now 22.1% smaller than it was at the end of 2019, highlighting the extent of this recession.
The decline in the second quarter was driven by the 20.0% fall in output in April 2020, the biggest monthly fall on record reflecting widespread monthly declines in output across the services, production, and construction industries. There has been a phased easing of lockdown restrictions through May and June, including the reopening of non-essential shops. This is reflected in the latest figures, which show some rebound in June, where GDP increased by 8.7% on the month. More information on the monthly profile of GDP can be found in the GDP
release.monthly estimate, UK: June 2020
Page 20
Page 5 of 26
1.
2.
Figure 1: Real GDP fell by 20.4% in Quarter 2 2020, the largest quarterly contraction on record
UK, Quarter 1 (Jan to Mar) 2008 to Quarter 2 (Apr to June) 2020
Source: Office for National Statistics – GDP first quarterly estimate
Notes:
Q1 refers to Quarter 1 (Jan to Mar), Q2 refers to Quarter 2 (Apr to June), Q3 refers to Quarter 3 (July to Sept), and Q4 refers to Quarter 4 (Oct to Dec).
Index is referenced to Quarter 4 (Oct to Dec) 2019.
Several countries have published first estimates of GDP for the second quarter of 2020, including the United , , and amongst the G7 countries. These initial estimates highlight how the States Germany France Italy
coronavirus pandemic and the response to it has impacted upon the global economy, with record declines recorded in all of these countries.
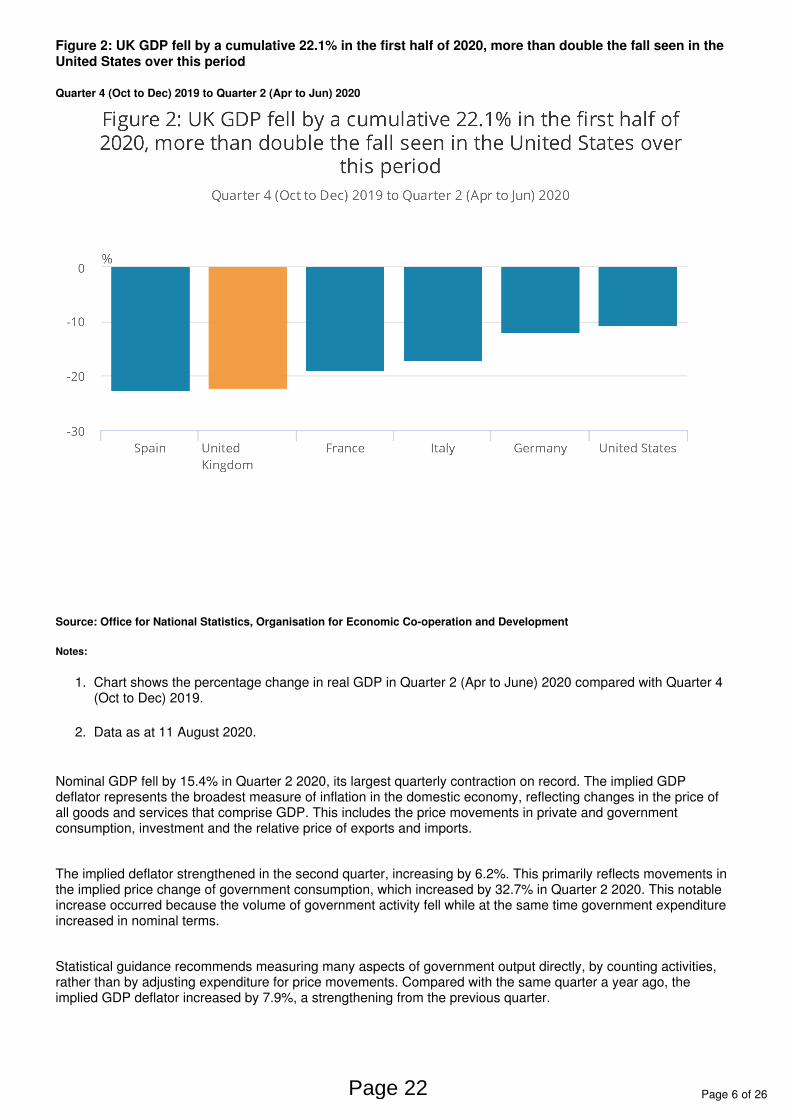
Given the difference in timings of the imposition of lockdown measures between countries, it is more useful to consider the cumulative fall in GDP in the first half of this year. Figure 2 shows cumulative GDP growth in the first half of 2020 for a selection of advanced economies. Compared with the end of 2019, the UK fell by a cumulative 22.1% in the first six months of 2020. This fall was slightly below the 22.7% seen in Spain but was more than double the 10.6% fall in United States GDP over this period.
The larger contraction of the UK economy primarily reflects how lockdown measures have been in place for a larger part of this period in the UK compared with these other economies. The Oxford COVID-19 Government
captures this information by collecting information on government policy responses to create a Response Tracker"stringency" index. According to this measure, the UK had an average stringency of 73 in the second quarter – the second highest of the countries shown in Figure 2.
Page 21
Page 6 of 26
1.
2.
Figure 2: UK GDP fell by a cumulative 22.1% in the first half of 2020, more than double the fall seen in the United States over this period
Quarter 4 (Oct to Dec) 2019 to Quarter 2 (Apr to Jun) 2020
Source: Office for National Statistics, Organisation for Economic Co-operation and Development
Notes:
Chart shows the percentage change in real GDP in Quarter 2 (Apr to June) 2020 compared with Quarter 4 (Oct to Dec) 2019.
Data as at 11 August 2020.
Nominal GDP fell by 15.4% in Quarter 2 2020, its largest quarterly contraction on record. The implied GDP deflator represents the broadest measure of inflation in the domestic economy, reflecting changes in the price of all goods and services that comprise GDP. This includes the price movements in private and government consumption, investment and the relative price of exports and imports.
The implied deflator strengthened in the second quarter, increasing by 6.2%. This primarily reflects movements in the implied price change of government consumption, which increased by 32.7% in Quarter 2 2020. This notable increase occurred because the volume of government activity fell while at the same time government expenditure increased in nominal terms.
Statistical guidance recommends measuring many aspects of government output directly, by counting activities, rather than by adjusting expenditure for price movements. Compared with the same quarter a year ago, the implied GDP deflator increased by 7.9%, a strengthening from the previous quarter.
Page 22
Page 7 of 26
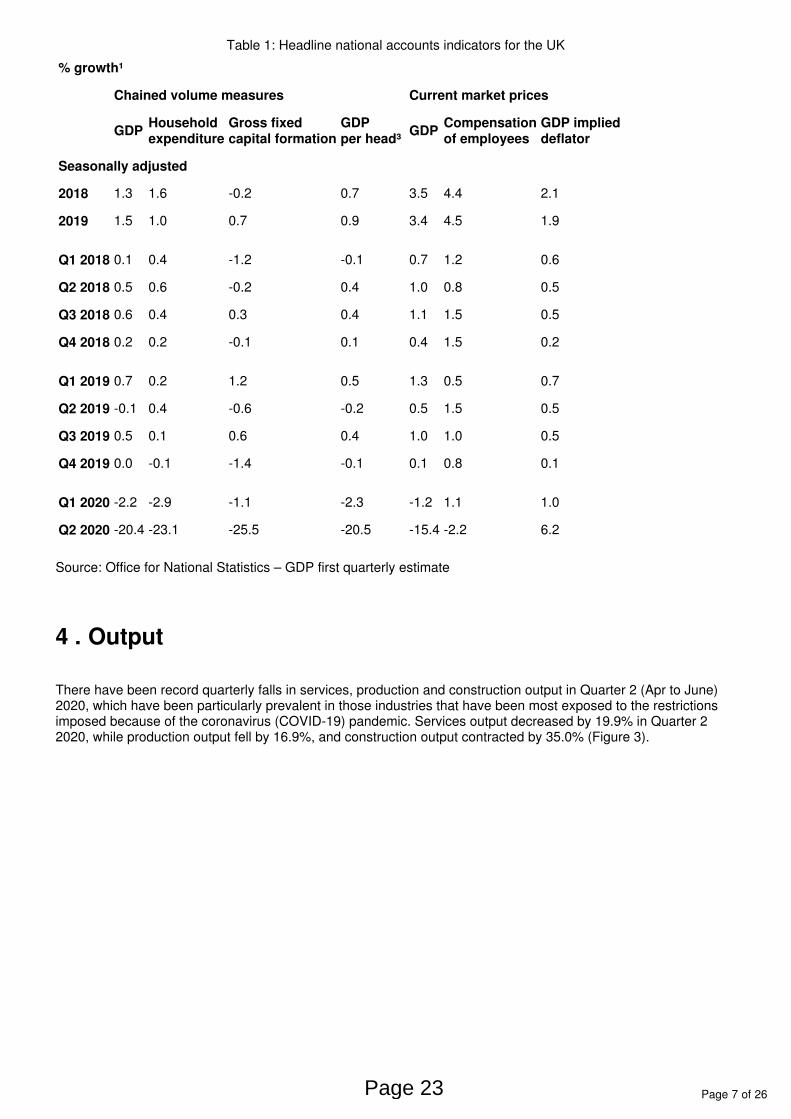
Table 1: Headline national accounts indicators for the UK
% growth¹
Chained volume measures Current market prices
GDPHouseholdexpenditure
Gross fixedcapital formation
GDPper head³
GDPCompensationof employees
GDP implieddeflator
Seasonally adjusted
2018 1.3 1.6 -0.2 0.7 3.5 4.4 2.1
2019 1.5 1.0 0.7 0.9 3.4 4.5 1.9
Q1 2018 0.1 0.4 -1.2 -0.1 0.7 1.2 0.6
Q2 2018 0.5 0.6 -0.2 0.4 1.0 0.8 0.5
Q3 2018 0.6 0.4 0.3 0.4 1.1 1.5 0.5
Q4 2018 0.2 0.2 -0.1 0.1 0.4 1.5 0.2
Q1 2019 0.7 0.2 1.2 0.5 1.3 0.5 0.7
Q2 2019 -0.1 0.4 -0.6 -0.2 0.5 1.5 0.5
Q3 2019 0.5 0.1 0.6 0.4 1.0 1.0 0.5
Q4 2019 0.0 -0.1 -1.4 -0.1 0.1 0.8 0.1
Q1 2020 -2.2 -2.9 -1.1 -2.3 -1.2 1.1 1.0
Q2 2020 -20.4 -23.1 -25.5 -20.5 -15.4 -2.2 6.2
Source: Office for National Statistics – GDP first quarterly estimate
4 . Output
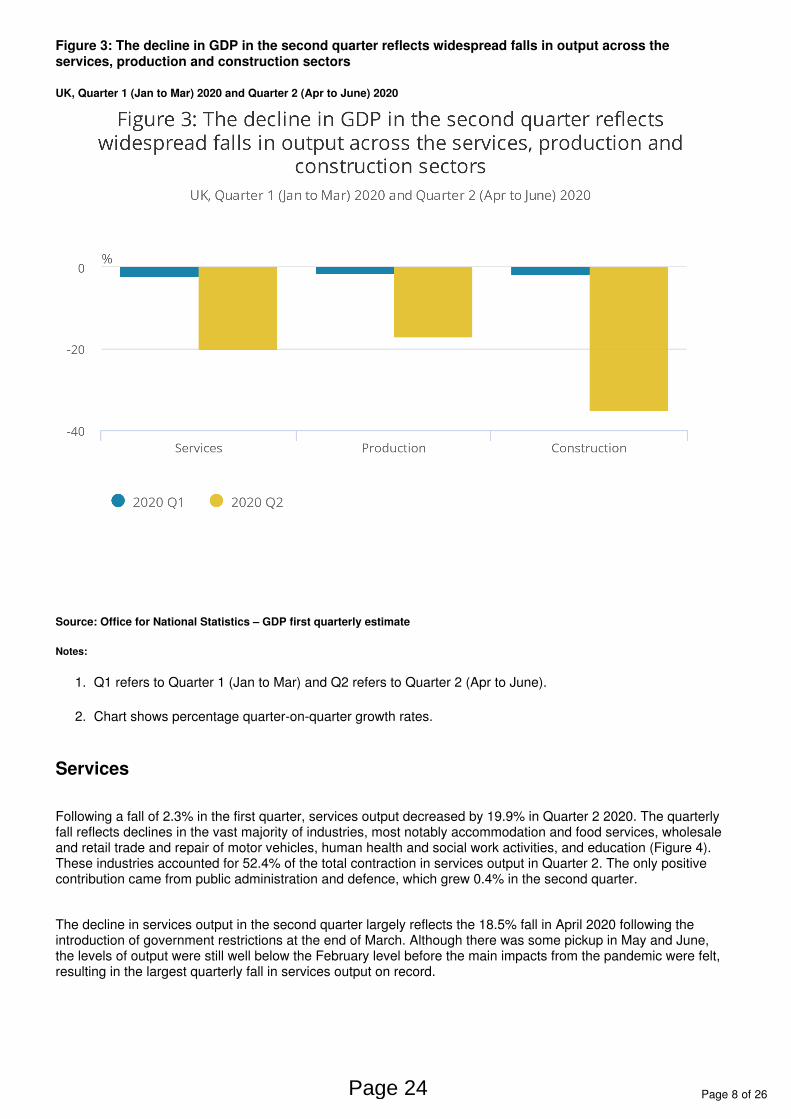
There have been record quarterly falls in services, production and construction output in Quarter 2 (Apr to June) 2020, which have been particularly prevalent in those industries that have been most exposed to the restrictions imposed because of the coronavirus (COVID-19) pandemic. Services output decreased by 19.9% in Quarter 2 2020, while production output fell by 16.9%, and construction output contracted by 35.0% (Figure 3).
Page 23
Page 8 of 26
1.
2.
Figure 3: The decline in GDP in the second quarter reflects widespread falls in output across the services, production and construction sectors
UK, Quarter 1 (Jan to Mar) 2020 and Quarter 2 (Apr to June) 2020
Source: Office for National Statistics – GDP first quarterly estimate
Notes:
Q1 refers to Quarter 1 (Jan to Mar) and Q2 refers to Quarter 2 (Apr to June).
Chart shows percentage quarter-on-quarter growth rates.
Services
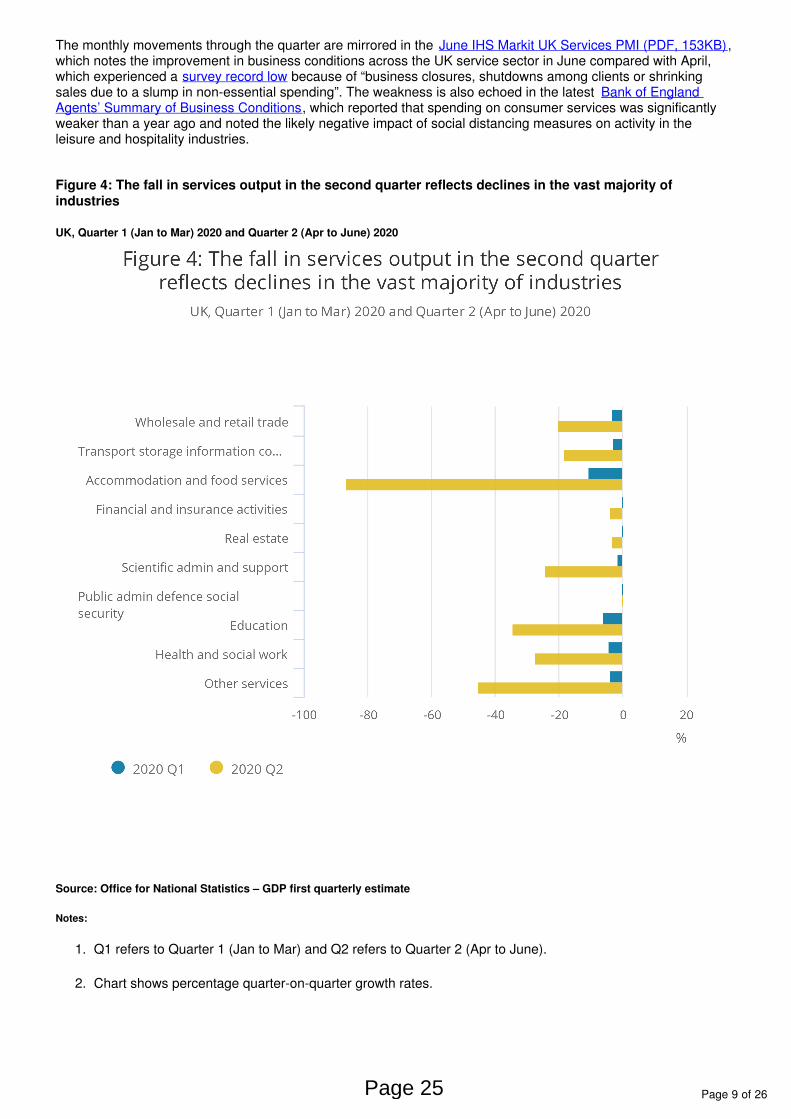
Following a fall of 2.3% in the first quarter, services output decreased by 19.9% in Quarter 2 2020. The quarterly fall reflects declines in the vast majority of industries, most notably accommodation and food services, wholesale and retail trade and repair of motor vehicles, human health and social work activities, and education (Figure 4). These industries accounted for 52.4% of the total contraction in services output in Quarter 2. The only positive contribution came from public administration and defence, which grew 0.4% in the second quarter.
The decline in services output in the second quarter largely reflects the 18.5% fall in April 2020 following the introduction of government restrictions at the end of March. Although there was some pickup in May and June, the levels of output were still well below the February level before the main impacts from the pandemic were felt, resulting in the largest quarterly fall in services output on record.
Page 24
Page 9 of 26
1.
2.
The monthly movements through the quarter are mirrored in the , June IHS Markit UK Services PMI (PDF, 153KB)which notes the improvement in business conditions across the UK service sector in June compared with April, which experienced a because of “business closures, shutdowns among clients or shrinking survey record lowsales due to a slump in non-essential spending”. The weakness is also echoed in the latest Bank of England
, which reported that spending on consumer services was significantly Agents’ Summary of Business Conditionsweaker than a year ago and noted the likely negative impact of social distancing measures on activity in the leisure and hospitality industries.
Figure 4: The fall in services output in the second quarter reflects declines in the vast majority of industries
UK, Quarter 1 (Jan to Mar) 2020 and Quarter 2 (Apr to June) 2020
Source: Office for National Statistics – GDP first quarterly estimate
Notes:
Q1 refers to Quarter 1 (Jan to Mar) and Q2 refers to Quarter 2 (Apr to June).
Chart shows percentage quarter-on-quarter growth rates.
Page 25
Page 10 of 26
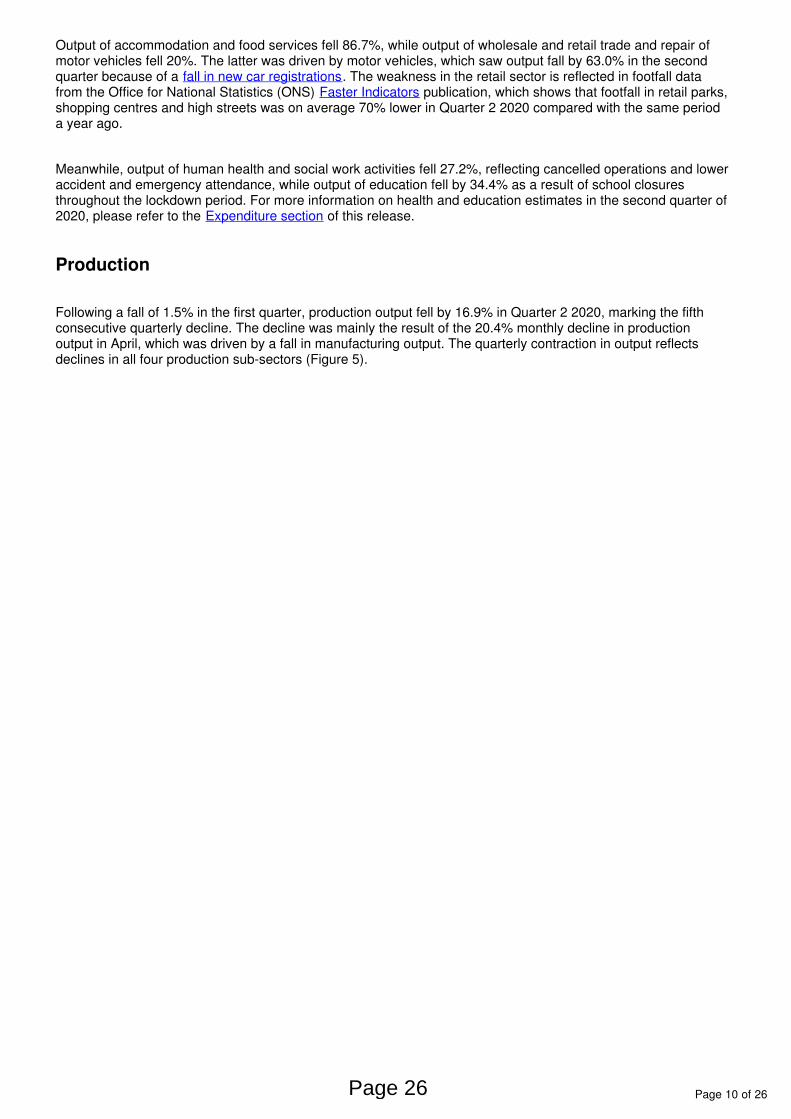
Output of accommodation and food services fell 86.7%, while output of wholesale and retail trade and repair of motor vehicles fell 20%. The latter was driven by motor vehicles, which saw output fall by 63.0% in the second quarter because of a . The weakness in the retail sector is reflected in footfall data fall in new car registrationsfrom the Office for National Statistics (ONS) publication, which shows that footfall in retail parks, Faster Indicatorsshopping centres and high streets was on average 70% lower in Quarter 2 2020 compared with the same period a year ago.
Meanwhile, output of human health and social work activities fell 27.2%, reflecting cancelled operations and lower accident and emergency attendance, while output of education fell by 34.4% as a result of school closures throughout the lockdown period. For more information on health and education estimates in the second quarter of 2020, please refer to the of this release.Expenditure section
Production
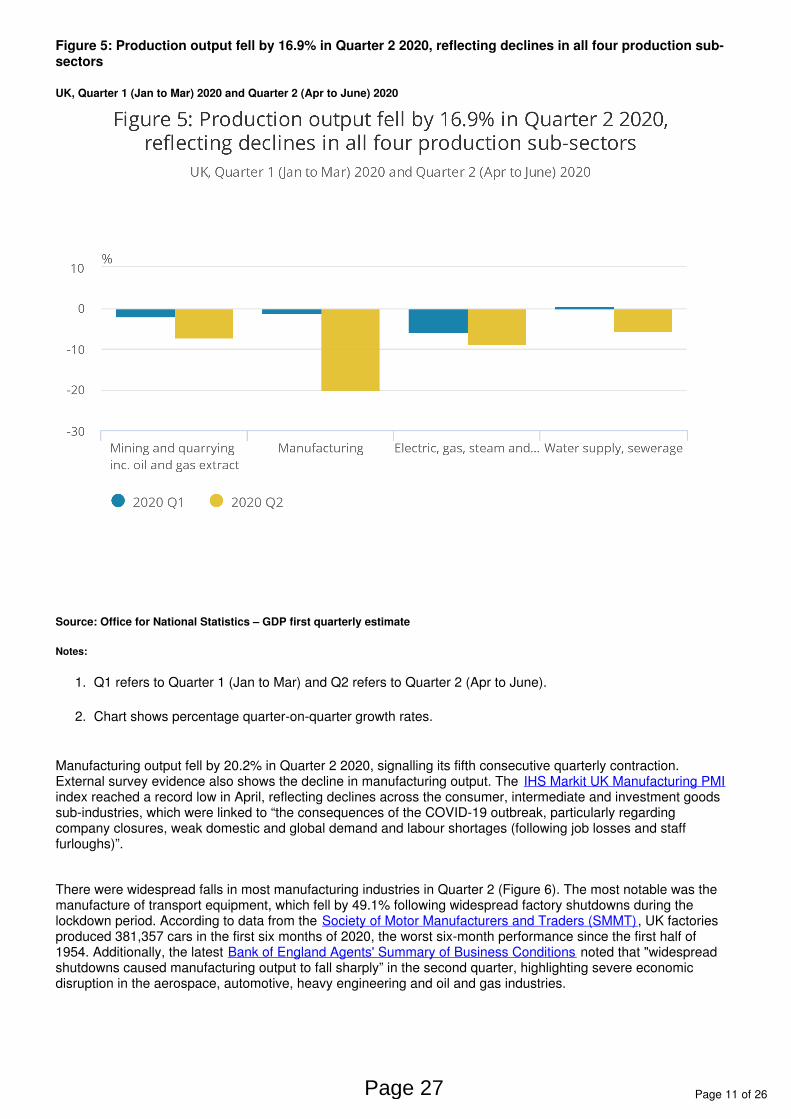
Following a fall of 1.5% in the first quarter, production output fell by 16.9% in Quarter 2 2020, marking the fifth consecutive quarterly decline. The decline was mainly the result of the 20.4% monthly decline in production output in April, which was driven by a fall in manufacturing output. The quarterly contraction in output reflects declines in all four production sub-sectors (Figure 5).
Page 26
Page 11 of 26
1.
2.
Figure 5: Production output fell by 16.9% in Quarter 2 2020, reflecting declines in all four production sub-sectors
UK, Quarter 1 (Jan to Mar) 2020 and Quarter 2 (Apr to June) 2020
Source: Office for National Statistics – GDP first quarterly estimate
Notes:
Q1 refers to Quarter 1 (Jan to Mar) and Q2 refers to Quarter 2 (Apr to June).
Chart shows percentage quarter-on-quarter growth rates.
Manufacturing output fell by 20.2% in Quarter 2 2020, signalling its fifth consecutive quarterly contraction. External survey evidence also shows the decline in manufacturing output. The IHS Markit UK Manufacturing PMIindex reached a record low in April, reflecting declines across the consumer, intermediate and investment goods sub-industries, which were linked to “the consequences of the COVID-19 outbreak, particularly regarding company closures, weak domestic and global demand and labour shortages (following job losses and staff furloughs)”.
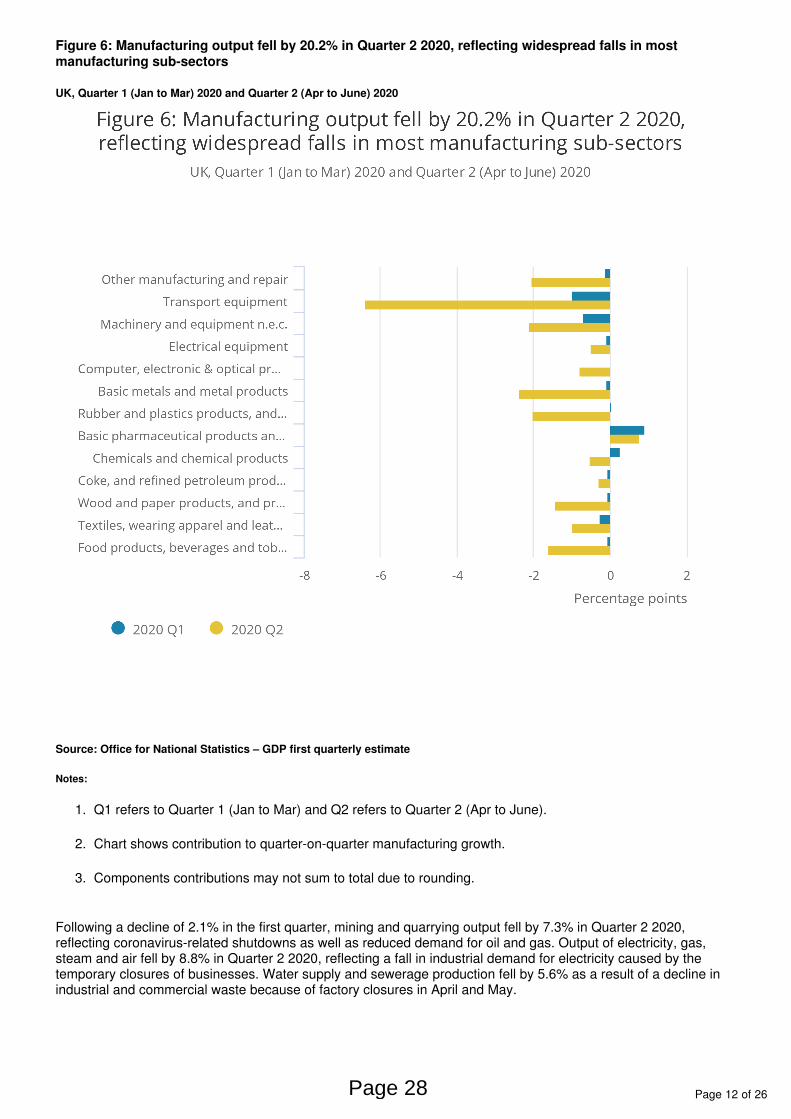
There were widespread falls in most manufacturing industries in Quarter 2 (Figure 6). The most notable was the manufacture of transport equipment, which fell by 49.1% following widespread factory shutdowns during the lockdown period. According to data from the , UK factories Society of Motor Manufacturers and Traders (SMMT)produced 381,357 cars in the first six months of 2020, the worst six-month performance since the first half of 1954. Additionally, the latest noted that "widespread Bank of England Agents' Summary of Business Conditionsshutdowns caused manufacturing output to fall sharply” in the second quarter, highlighting severe economic disruption in the aerospace, automotive, heavy engineering and oil and gas industries.
Page 27
Page 12 of 26
1.
2.
3.
Figure 6: Manufacturing output fell by 20.2% in Quarter 2 2020, reflecting widespread falls in most manufacturing sub-sectors
UK, Quarter 1 (Jan to Mar) 2020 and Quarter 2 (Apr to June) 2020
Source: Office for National Statistics – GDP first quarterly estimate
Notes:
Q1 refers to Quarter 1 (Jan to Mar) and Q2 refers to Quarter 2 (Apr to June).
Chart shows contribution to quarter-on-quarter manufacturing growth.
Components contributions may not sum to total due to rounding.
Following a decline of 2.1% in the first quarter, mining and quarrying output fell by 7.3% in Quarter 2 2020, reflecting coronavirus-related shutdowns as well as reduced demand for oil and gas. Output of electricity, gas, steam and air fell by 8.8% in Quarter 2 2020, reflecting a fall in industrial demand for electricity caused by the temporary closures of businesses. Water supply and sewerage production fell by 5.6% as a result of a decline in industrial and commercial waste because of factory closures in April and May.
Page 28
Page 13 of 26
Construction
Following a decline of 1.7% in the first quarter, construction output fell by 35.0% in Quarter 2 2020, reflecting declines in both new work, and repair and maintenance. Most notably, private new housing declined by 51.2% as housebuilding activity was affected by various social distancing measures that were put in place in response to the coronavirus pandemic.
New orders decreased by a record 51.1% in Quarter 2 2020, reflecting falls in both all other work and new housing, which fell by 51.9% and 49.0% respectively. The latest Bank of England Agents' Summary of Business
notes that construction output “is still significantly lower than a year ago due to weak private sector Conditionsdemand”, highlighting the spillover effects this could have “on other sectors, such as companies that provide furnishings and fittings”.
The decline in construction output in the second quarter was mainly driven by the 40.2% monthly decline in construction output in April, which was caused by record declines in all types of work. This is corroborated by the April , which reported “a rapid downturn in overall construction output” following IHS Markit UK Construction PMIbusiness closures in April.
5 . Expenditure
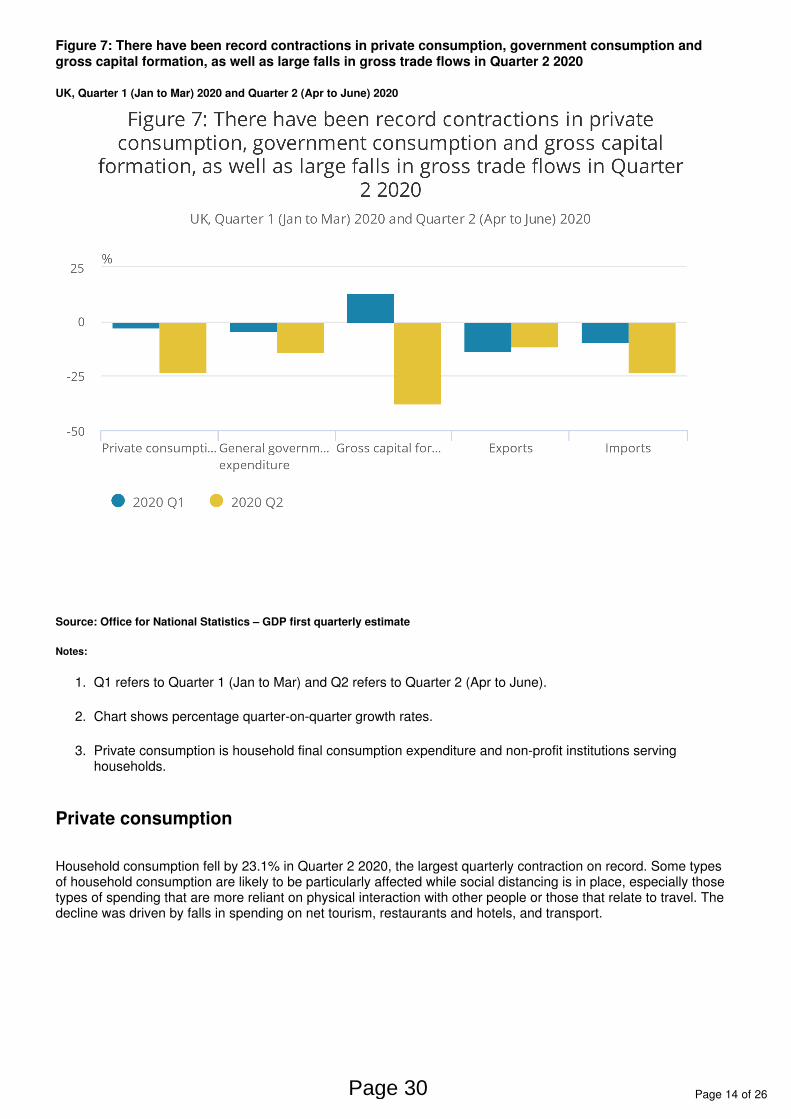
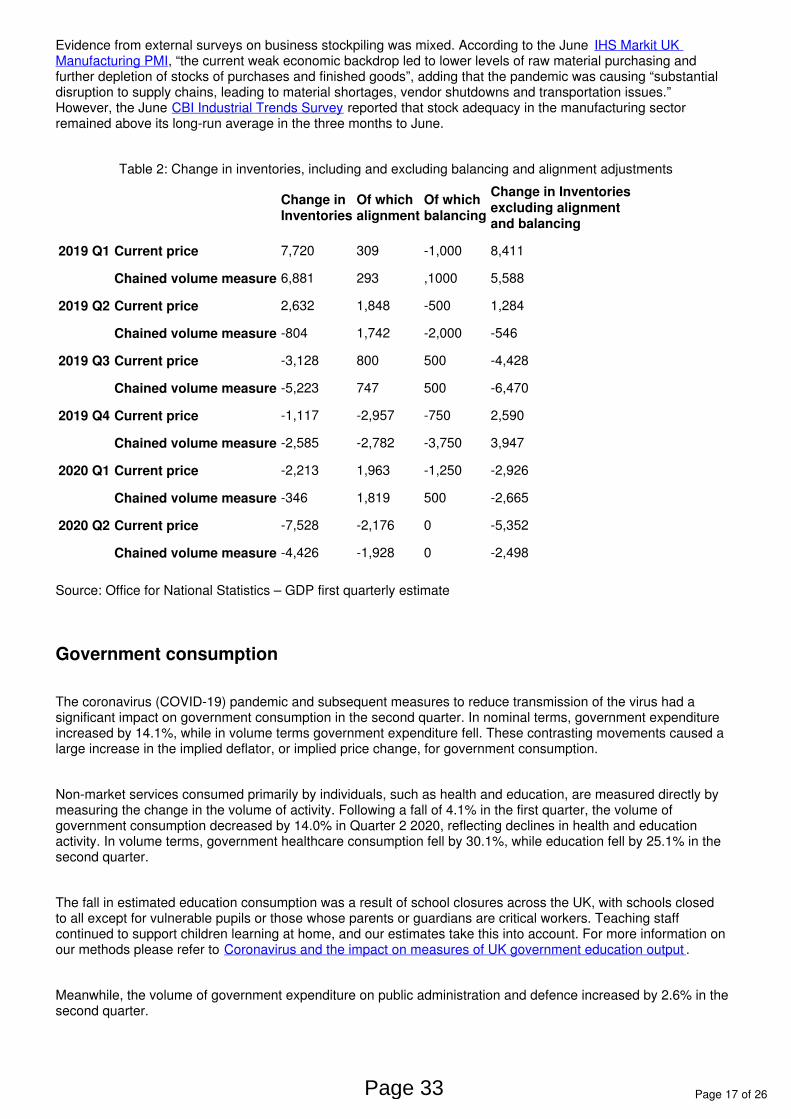
There have been large movements in all types of expenditure in Quarter 2 (Apr to June) 2020, most notably private consumption, which accounted for more than 70% of the fall in gross domestic product (GDP) in the second quarter (Figure 7).
Page 29
Page 14 of 26
1.
2.
3.
Figure 7: There have been record contractions in private consumption, government consumption and gross capital formation, as well as large falls in gross trade flows in Quarter 2 2020
UK, Quarter 1 (Jan to Mar) 2020 and Quarter 2 (Apr to June) 2020
Source: Office for National Statistics – GDP first quarterly estimate
Notes:
Q1 refers to Quarter 1 (Jan to Mar) and Q2 refers to Quarter 2 (Apr to June).
Chart shows percentage quarter-on-quarter growth rates.
Private consumption is household final consumption expenditure and non-profit institutions serving households.
Private consumption
Household consumption fell by 23.1% in Quarter 2 2020, the largest quarterly contraction on record. Some types of household consumption are likely to be particularly affected while social distancing is in place, especially those types of spending that are more reliant on physical interaction with other people or those that relate to travel. The decline was driven by falls in spending on net tourism, restaurants and hotels, and transport.
Page 30
Page 15 of 26
The latest figures show a 9.5% fall in the volume of retail sales in the three months to June, official retail saleswith declines across all store types except food stores and non-store retailing. The latest Bank of England
states that “spending on consumer services and non-food goods was Agents’ Summary of Business Conditionssignificantly weaker than a year ago, though online sales of some products were strong”. The BRC Retail Sales
shows that total sales returned to growth in June “as a result of lockdown measures being eased, and Monitorpent-up demand being released” though noting that the clothing, footwear, and health and beauty industries were still struggling.
The decline in transport spending is in line with figures, which indicate lower than Department for Transport (DfT)normal usage across motor vehicles, National Rail, the London Underground (Transport for London (TfL)) and bus travel in the second quarter. This is likely a result of the impact of the coronavirus (COVID-19) pandemic on work-related spending, reflected in lower levels of spending on fuel and public transport.
Gross capital formation
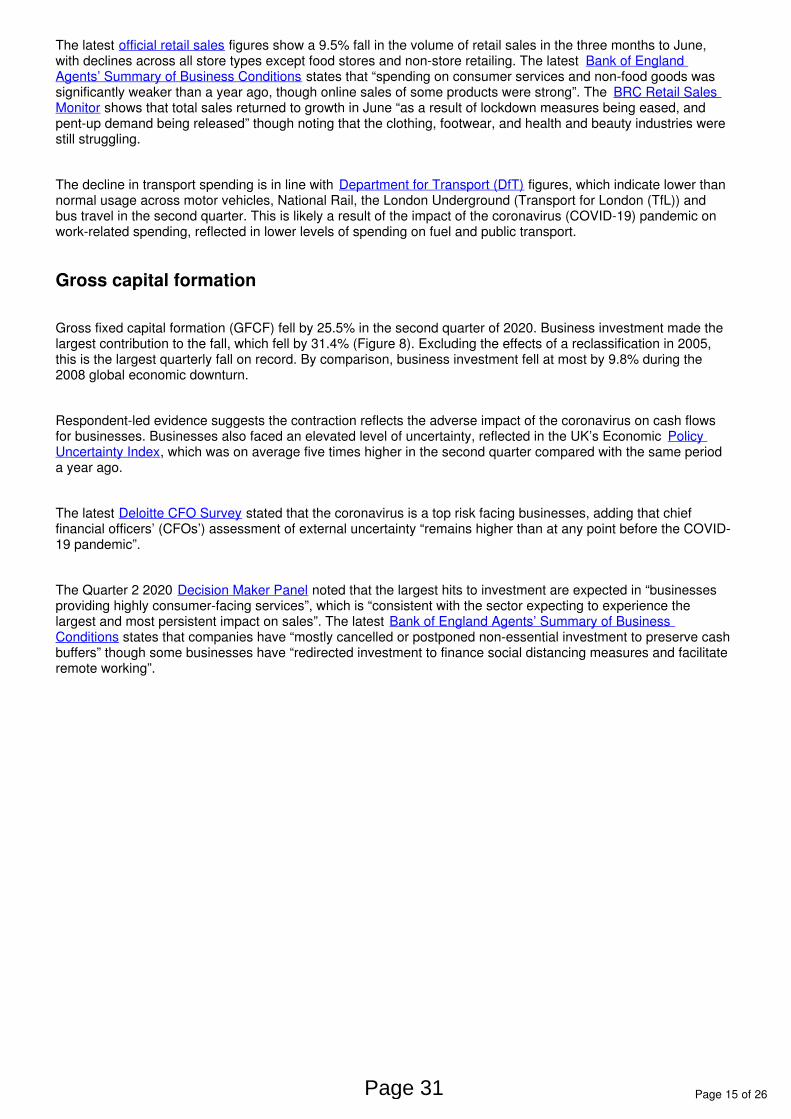
Gross fixed capital formation (GFCF) fell by 25.5% in the second quarter of 2020. Business investment made the largest contribution to the fall, which fell by 31.4% (Figure 8). Excluding the effects of a reclassification in 2005, this is the largest quarterly fall on record. By comparison, business investment fell at most by 9.8% during the 2008 global economic downturn.
Respondent-led evidence suggests the contraction reflects the adverse impact of the coronavirus on cash flows for businesses. Businesses also faced an elevated level of uncertainty, reflected in the UK’s Economic Policy
, which was on average five times higher in the second quarter compared with the same period Uncertainty Indexa year ago.
The latest stated that the coronavirus is a top risk facing businesses, adding that chief Deloitte CFO Surveyfinancial officers’ (CFOs’) assessment of external uncertainty “remains higher than at any point before the COVID-19 pandemic”.
The Quarter 2 2020 noted that the largest hits to investment are expected in “businesses Decision Maker Panelproviding highly consumer-facing services”, which is “consistent with the sector expecting to experience the largest and most persistent impact on sales”. The latest Bank of England Agents’ Summary of Business
states that companies have “mostly cancelled or postponed non-essential investment to preserve cash Conditionsbuffers” though some businesses have “redirected investment to finance social distancing measures and facilitate remote working”.
Page 31
Page 16 of 26
1.
2.
Figure 8: Business investment fell by 31.4% in Quarter 2 2020
UK, Quarter 1 (Jan to Mar) 2008 to Quarter 2 (Apr to June) 2020
Source: Office for National Statistics – GDP first quarterly estimate
Notes:
Q1 refers to Quarter 1 (Jan to Mar), Q2 refers to Quarter 2 (Apr to June), Q3 refers to Quarter 3 (July to Sept) and Q4 refers to Quarter 4 (Oct to Dec).
Index is referenced to Quarter 4 (Oct to Dec) 2019.
There was a record fall in private sector dwellings investment, and a fall in associated transfer costs in the second quarter. This reflects lower activity in construction and the property market during the lockdown period. Meanwhile, government investment increased by 11.4% in Quarter 2 2020, reflecting planned additional spending in various areas and possibly some additional spending related to the coronavirus. However, it should be noted that these are initial estimates for Quarter 2 2020 and that further updates are expected.
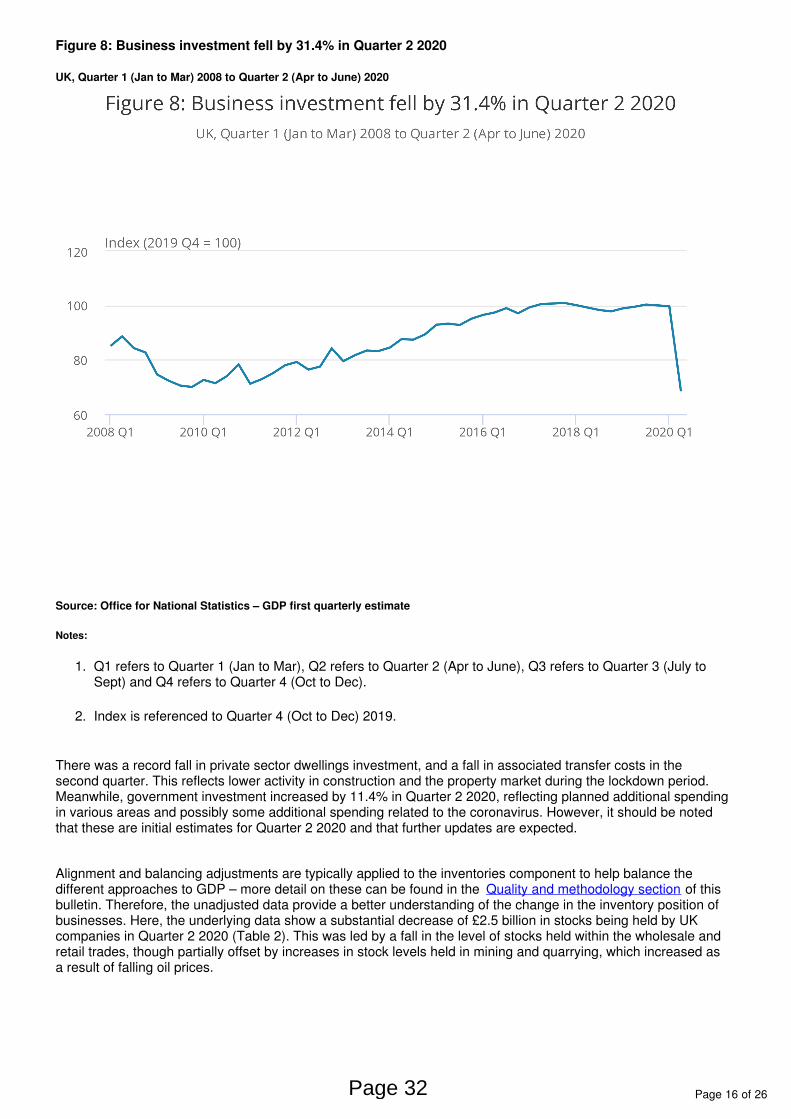
Alignment and balancing adjustments are typically applied to the inventories component to help balance the different approaches to GDP – more detail on these can be found in the of this Quality and methodology sectionbulletin. Therefore, the unadjusted data provide a better understanding of the change in the inventory position of businesses. Here, the underlying data show a substantial decrease of £2.5 billion in stocks being held by UK companies in Quarter 2 2020 (Table 2). This was led by a fall in the level of stocks held within the wholesale and retail trades, though partially offset by increases in stock levels held in mining and quarrying, which increased as a result of falling oil prices.
Page 32
Page 17 of 26
Evidence from external surveys on business stockpiling was mixed. According to the June IHS Markit UK , “the current weak economic backdrop led to lower levels of raw material purchasing and Manufacturing PMI
further depletion of stocks of purchases and finished goods”, adding that the pandemic was causing “substantial disruption to supply chains, leading to material shortages, vendor shutdowns and transportation issues.” However, the June reported that stock adequacy in the manufacturing sector CBI Industrial Trends Surveyremained above its long-run average in the three months to June.
Table 2: Change in inventories, including and excluding balancing and alignment adjustments
Change inInventories
Of whichalignment
Of whichbalancing
Change in Inventoriesexcluding alignmentand balancing
2019 Q1 Current price 7,720 309 -1,000 8,411
Chained volume measure 6,881 293 ,1000 5,588
2019 Q2 Current price 2,632 1,848 -500 1,284
Chained volume measure -804 1,742 -2,000 -546
2019 Q3 Current price -3,128 800 500 -4,428
Chained volume measure -5,223 747 500 -6,470
2019 Q4 Current price -1,117 -2,957 -750 2,590
Chained volume measure -2,585 -2,782 -3,750 3,947
2020 Q1 Current price -2,213 1,963 -1,250 -2,926
Chained volume measure -346 1,819 500 -2,665
2020 Q2 Current price -7,528 -2,176 0 -5,352
Chained volume measure -4,426 -1,928 0 -2,498
Source: Office for National Statistics – GDP first quarterly estimate
Government consumption
The coronavirus (COVID-19) pandemic and subsequent measures to reduce transmission of the virus had a significant impact on government consumption in the second quarter. In nominal terms, government expenditure increased by 14.1%, while in volume terms government expenditure fell. These contrasting movements caused a large increase in the implied deflator, or implied price change, for government consumption.
Non-market services consumed primarily by individuals, such as health and education, are measured directly by measuring the change in the volume of activity. Following a fall of 4.1% in the first quarter, the volume of government consumption decreased by 14.0% in Quarter 2 2020, reflecting declines in health and education activity. In volume terms, government healthcare consumption fell by 30.1%, while education fell by 25.1% in the second quarter.
The fall in estimated education consumption was a result of school closures across the UK, with schools closed to all except for vulnerable pupils or those whose parents or guardians are critical workers. Teaching staff continued to support children learning at home, and our estimates take this into account. For more information on our methods please refer to .Coronavirus and the impact on measures of UK government education output
Meanwhile, the volume of government expenditure on public administration and defence increased by 2.6% in the second quarter.
Page 33
Page 18 of 26
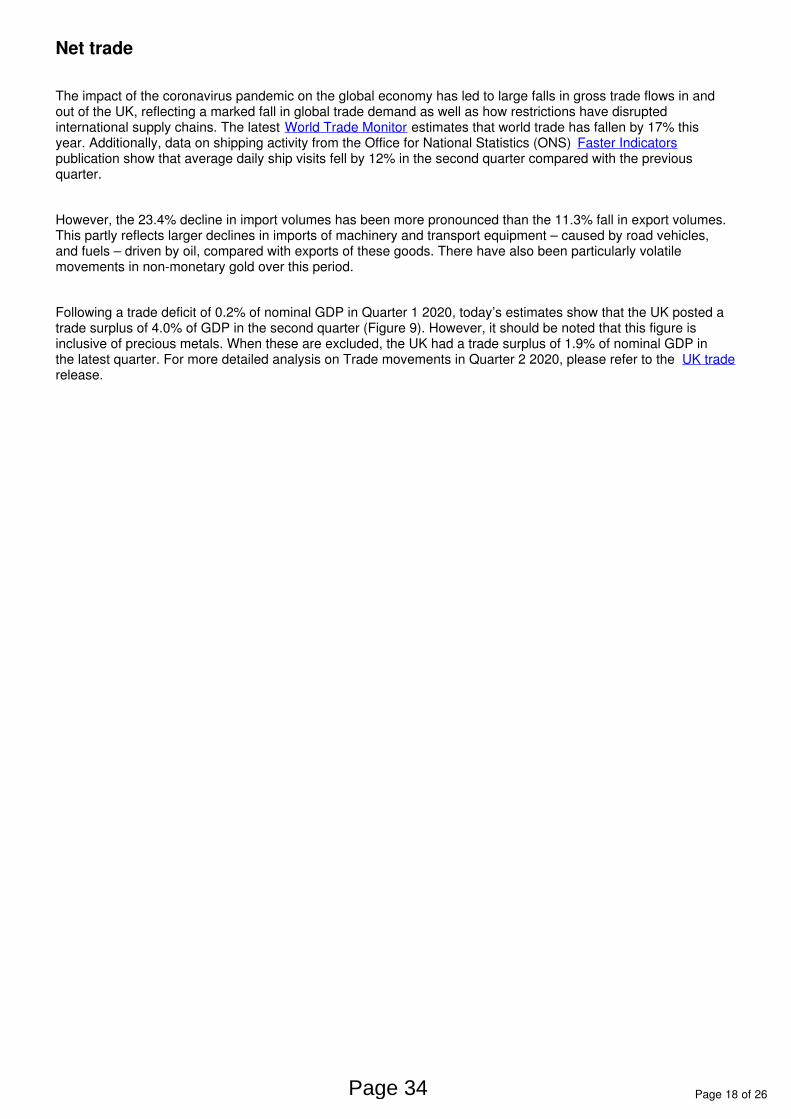
Net trade
The impact of the coronavirus pandemic on the global economy has led to large falls in gross trade flows in and out of the UK, reflecting a marked fall in global trade demand as well as how restrictions have disrupted international supply chains. The latest estimates that world trade has fallen by 17% this World Trade Monitoryear. Additionally, data on shipping activity from the Office for National Statistics (ONS) Faster Indicatorspublication show that average daily ship visits fell by 12% in the second quarter compared with the previous quarter.
However, the 23.4% decline in import volumes has been more pronounced than the 11.3% fall in export volumes. This partly reflects larger declines in imports of machinery and transport equipment – caused by road vehicles, and fuels – driven by oil, compared with exports of these goods. There have also been particularly volatile movements in non-monetary gold over this period.
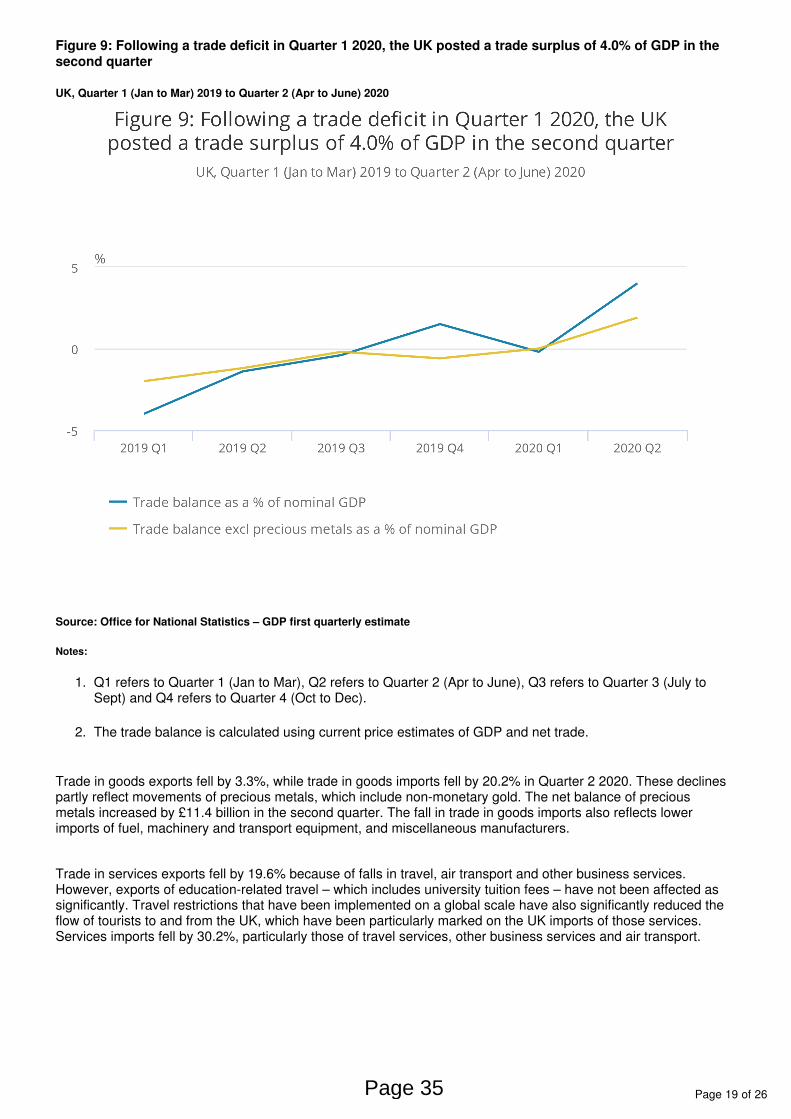
Following a trade deficit of 0.2% of nominal GDP in Quarter 1 2020, today’s estimates show that the UK posted a trade surplus of 4.0% of GDP in the second quarter (Figure 9). However, it should be noted that this figure is inclusive of precious metals. When these are excluded, the UK had a trade surplus of 1.9% of nominal GDP in the latest quarter. For more detailed analysis on Trade movements in Quarter 2 2020, please refer to the UK traderelease.
Page 34
Page 19 of 26
1.
2.
Figure 9: Following a trade deficit in Quarter 1 2020, the UK posted a trade surplus of 4.0% of GDP in the second quarter
UK, Quarter 1 (Jan to Mar) 2019 to Quarter 2 (Apr to June) 2020
Source: Office for National Statistics – GDP first quarterly estimate
Notes:
Q1 refers to Quarter 1 (Jan to Mar), Q2 refers to Quarter 2 (Apr to June), Q3 refers to Quarter 3 (July to Sept) and Q4 refers to Quarter 4 (Oct to Dec).
The trade balance is calculated using current price estimates of GDP and net trade.
Trade in goods exports fell by 3.3%, while trade in goods imports fell by 20.2% in Quarter 2 2020. These declines partly reflect movements of precious metals, which include non-monetary gold. The net balance of precious metals increased by £11.4 billion in the second quarter. The fall in trade in goods imports also reflects lower imports of fuel, machinery and transport equipment, and miscellaneous manufacturers.
Trade in services exports fell by 19.6% because of falls in travel, air transport and other business services. However, exports of education-related travel – which includes university tuition fees – have not been affected as significantly. Travel restrictions that have been implemented on a global scale have also significantly reduced the flow of tourists to and from the UK, which have been particularly marked on the UK imports of those services. Services imports fell by 30.2%, particularly those of travel services, other business services and air transport.
Page 35
Page 20 of 26
External survey evidence points towards weakened exports activity in the second quarter. The June IHS Markit stated that “new export business fell for the eighth straight month, reflecting low market UK Manufacturing PMI
confidence and the ongoing impact of COVID-19”. According to the June , export CBI Industrial Trends Surveyorders books in the manufacturing sector fell to an all-time low, reflecting a significant fall in external demand. Meanwhile, the latest by the British Chambers of Commerce reported that thebalance Quarterly Economic Surveyof firms reportingincreased export saleswas “substantiallylower than the worst quarterofthe 2008-09 recession”.
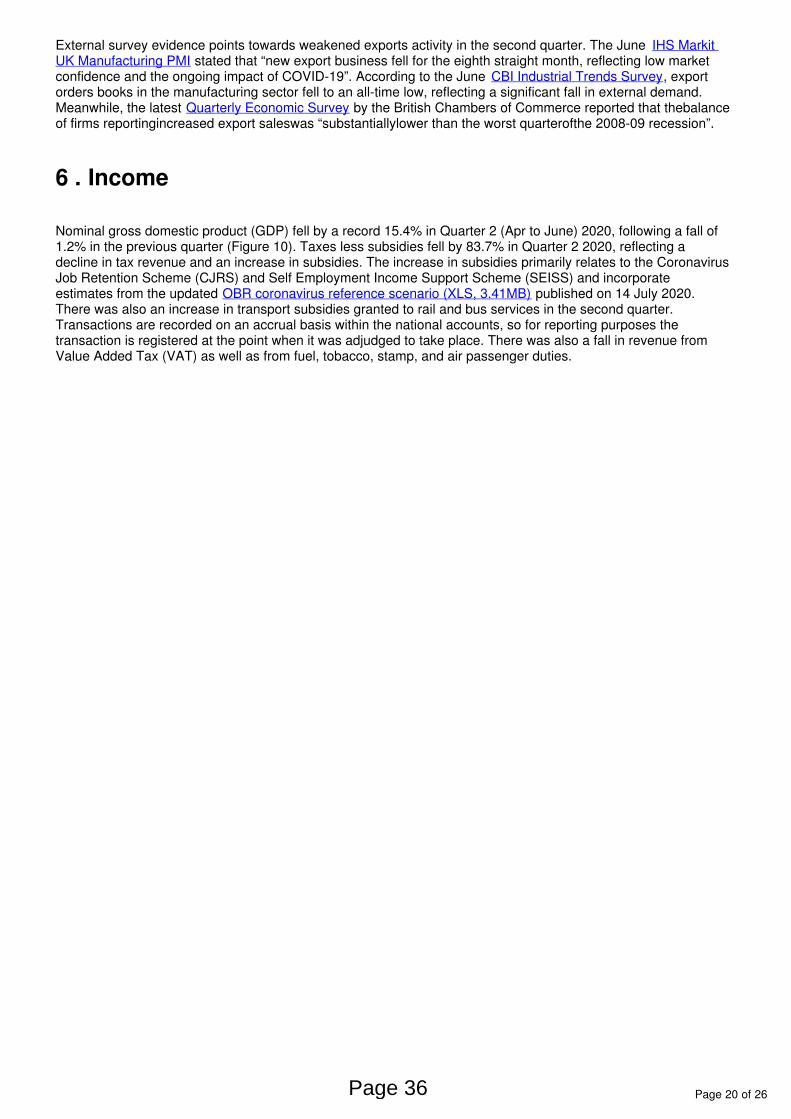
6 . Income
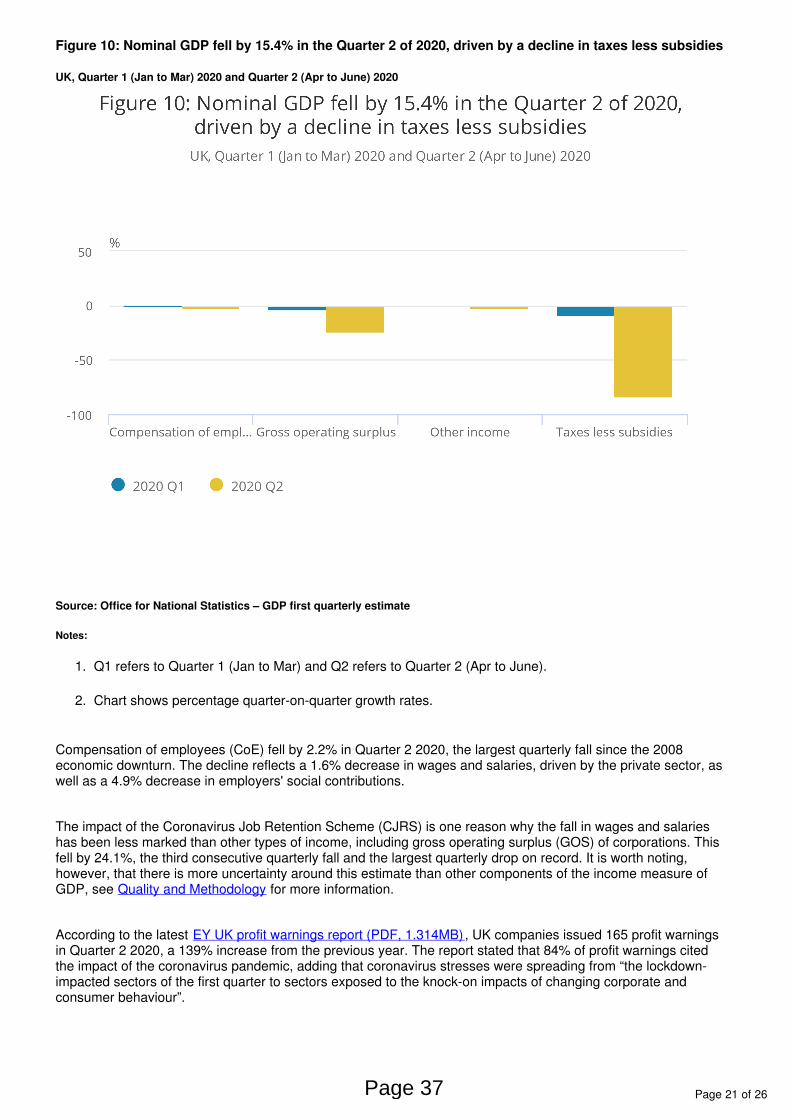
Nominal gross domestic product (GDP) fell by a record 15.4% in Quarter 2 (Apr to June) 2020, following a fall of 1.2% in the previous quarter (Figure 10). Taxes less subsidies fell by 83.7% in Quarter 2 2020, reflecting a decline in tax revenue and an increase in subsidies. The increase in subsidies primarily relates to the Coronavirus Job Retention Scheme (CJRS) and Self Employment Income Support Scheme (SEISS) and incorporate estimates from the updated published on 14 July 2020. OBR coronavirus reference scenario (XLS, 3.41MB)There was also an increase in transport subsidies granted to rail and bus services in the second quarter. Transactions are recorded on an accrual basis within the national accounts, so for reporting purposes the transaction is registered at the point when it was adjudged to take place. There was also a fall in revenue from Value Added Tax (VAT) as well as from fuel, tobacco, stamp, and air passenger duties.
Page 36
Page 21 of 26
1.
2.
Figure 10: Nominal GDP fell by 15.4% in the Quarter 2 of 2020, driven by a decline in taxes less subsidies
UK, Quarter 1 (Jan to Mar) 2020 and Quarter 2 (Apr to June) 2020
Source: Office for National Statistics – GDP first quarterly estimate
Notes:
Q1 refers to Quarter 1 (Jan to Mar) and Q2 refers to Quarter 2 (Apr to June).
Chart shows percentage quarter-on-quarter growth rates.
Compensation of employees (CoE) fell by 2.2% in Quarter 2 2020, the largest quarterly fall since the 2008 economic downturn. The decline reflects a 1.6% decrease in wages and salaries, driven by the private sector, as well as a 4.9% decrease in employers' social contributions.
The impact of the Coronavirus Job Retention Scheme (CJRS) is one reason why the fall in wages and salaries has been less marked than other types of income, including gross operating surplus (GOS) of corporations. This fell by 24.1%, the third consecutive quarterly fall and the largest quarterly drop on record. It is worth noting, however, that there is more uncertainty around this estimate than other components of the income measure of GDP, see for more information.Quality and Methodology
According to the latest , UK companies issued 165 profit warnings EY UK profit warnings report (PDF, 1.314MB)in Quarter 2 2020, a 139% increase from the previous year. The report stated that 84% of profit warnings cited the impact of the coronavirus pandemic, adding that coronavirus stresses were spreading from “the lockdown-impacted sectors of the first quarter to sectors exposed to the knock-on impacts of changing corporate and consumer behaviour”.
Page 37
Page 22 of 26
7 . Related links
A number of other economic indicators were published on 12 August 2020, these include:
GDP monthly estimate, UK: June 2020
Coronavirus and the impact on production and services, UK: June 2020
Construction output in Great Britain: June 2020, new orders and Construction Output Price Indices, April to June 2020
UK trade: June 2020
Data for , and a gross fixed capital formation (GFCF) by sector and asset revision triangles real-time database
All data in this bulletin are seasonally adjusted estimates. Non-seasonally adjusted data are available within the UK Economic Accounts (UKEA). These data can be downloaded directly from the and on the UKEA dataset
dataset table. Data published in the UKEA reflect data as published on 31 March 2020 UKEA main aggregatesand are consistent with the data in this release.
8 . Quality and methodology
More quality and methodology information on strengths, limitations, appropriate uses, and how the data were created is available in the .Gross domestic product (GDP) QMI
The UK National Accounts are drawn together using data from many different sources. This ensures that they are comprehensive and provide different perspectives on the economy; for example, sales by retailers and purchases by households.
Important quality information
There are common pitfalls in interpreting data series, and these include:
expectations of accuracy and reliability in early estimates are often too high
revisions are an inevitable consequence of the trade-off between timeliness and accuracy
early estimates are based on incomplete data
Very few statistical revisions arise as a result of “errors” in the popular sense of the word. All estimates, by definition, are subject to statistical “error”.
Many different approaches can be used to summarise revisions; the “Accuracy and reliability” section in the analyses the mean average revision and the mean absolute revision for GDP Gross domestic product (GDP) QMI
estimates over data publication iterations.
Page 38
Page 23 of 26
Reaching the GDP balance
The different data content and quality of the three approaches – the output approach, the expenditure approach and the income approach – dictates the approach taken in balancing quarterly data. In the UK, there are more data available on output in the short-term than in either of the other two approaches. However, to obtain the best estimate of GDP (the published figure), the estimates from all three approaches are balanced to produce an average, except in the latest two quarters where the output data take the lead because of the larger data content.
Information on the methods we use for Balancing the output, income and expenditure approaches to measuring is available.GDP
Alignment adjustments, found in Table M of the GDP first quarterly estimate data tables in this release, have a target limit of plus or minus £2,000 million on any quarter. However, in periods where the data sources are particularly difficult to balance, larger alignment adjustments are sometimes needed.
To achieve a balanced GDP dataset through alignment, balancing adjustments are applied to the components of GDP where required. They are applied to the individual components where data content is particularly weak in a given quarter because of a higher level of forecast content.
Page 39
Page 24 of 26
1.
2.
3.
4.
5.
Coronavirus (COVID-19) impact on response rates
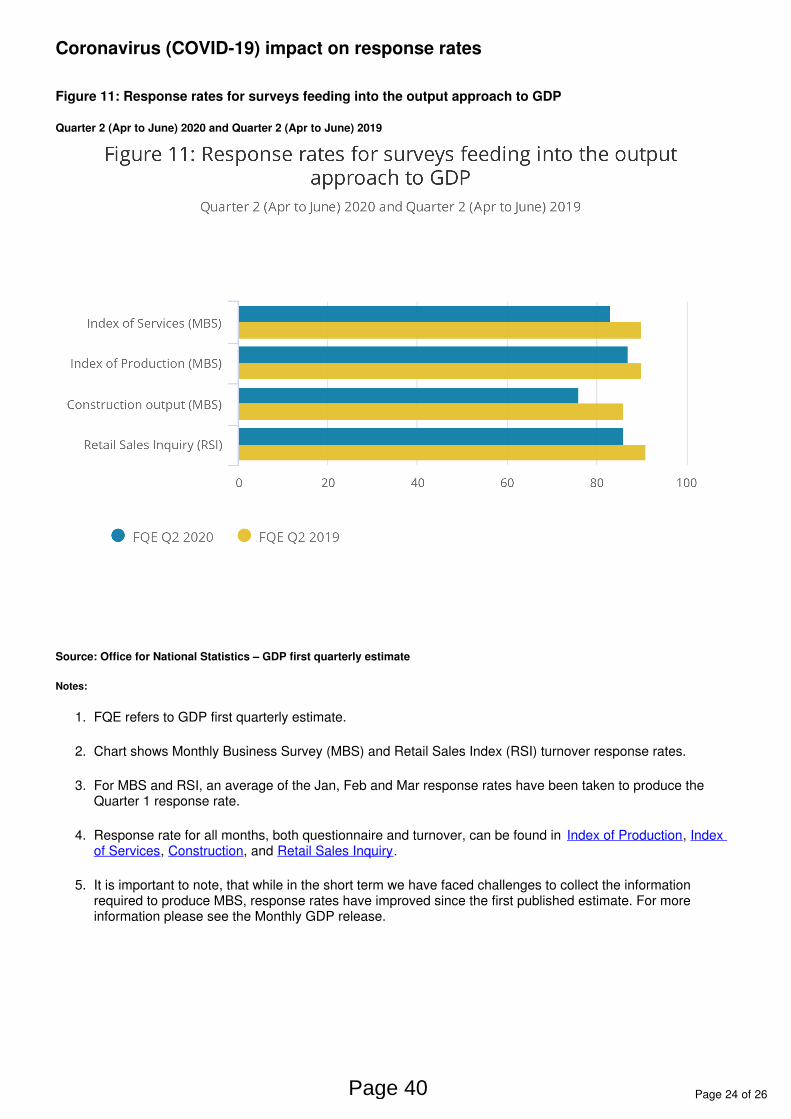
Figure 11: Response rates for surveys feeding into the output approach to GDP
Quarter 2 (Apr to June) 2020 and Quarter 2 (Apr to June) 2019
Source: Office for National Statistics – GDP first quarterly estimate
Notes:
FQE refers to GDP first quarterly estimate.
Chart shows Monthly Business Survey (MBS) and Retail Sales Index (RSI) turnover response rates.
For MBS and RSI, an average of the Jan, Feb and Mar response rates have been taken to produce the Quarter 1 response rate.
Response rate for all months, both questionnaire and turnover, can be found in , Index of Production Index , , and .of Services Construction Retail Sales Inquiry
It is important to note, that while in the short term we have faced challenges to collect the information required to produce MBS, response rates have improved since the first published estimate. For more information please see the Monthly GDP release.
Page 40
Page 25 of 26
1.
2.
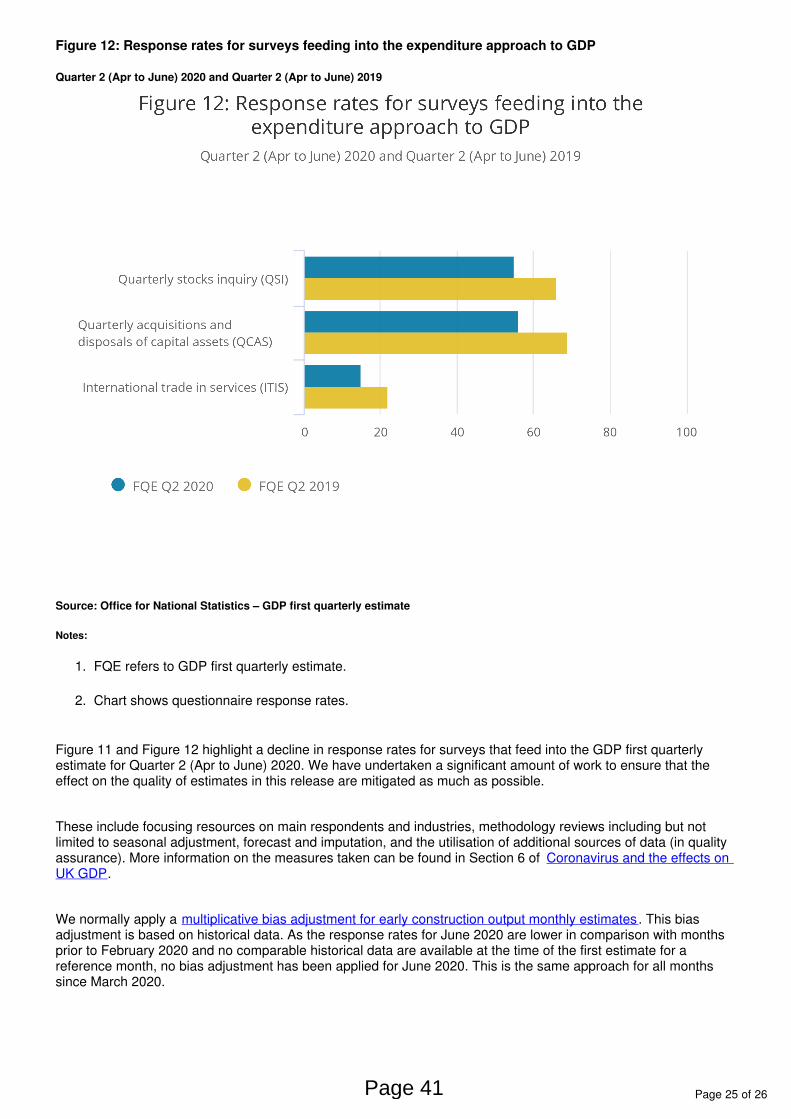
Figure 12: Response rates for surveys feeding into the expenditure approach to GDP
Quarter 2 (Apr to June) 2020 and Quarter 2 (Apr to June) 2019
Source: Office for National Statistics – GDP first quarterly estimate
Notes:
FQE refers to GDP first quarterly estimate.
Chart shows questionnaire response rates.
Figure 11 and Figure 12 highlight a decline in response rates for surveys that feed into the GDP first quarterly estimate for Quarter 2 (Apr to June) 2020. We have undertaken a significant amount of work to ensure that the effect on the quality of estimates in this release are mitigated as much as possible.
These include focusing resources on main respondents and industries, methodology reviews including but not limited to seasonal adjustment, forecast and imputation, and the utilisation of additional sources of data (in quality assurance). More information on the measures taken can be found in Section 6 of Coronavirus and the effects on
.UK GDP
We normally apply a . This bias multiplicative bias adjustment for early construction output monthly estimatesadjustment is based on historical data. As the response rates for June 2020 are lower in comparison with months prior to February 2020 and no comparable historical data are available at the time of the first estimate for a reference month, no bias adjustment has been applied for June 2020. This is the same approach for all months since March 2020.
Page 41
Page 26 of 26
From Quarter 2 2020, we have ceased the Quarterly Operating Profits Survey, which was previously the main basis for estimates of private non-financial corporations’ gross operating surplus (PNFC GOS). The survey is known to have several methodological weaknesses that can result in a higher degree of uncertainty around this component of the Income measure of GDP compared with other components. To address this weakness, we are investing in work to make greater use of administrative data to more accurately measure movements in PNFC GOS. Until this is in place, we will use a mixture of external indicators and evidence, along with information from the other components of GDP to inform our best estimate of PNFC GOS.
Quarterly Stocks Survey temporary expansion
The Quarterly Stocks Survey (formerly Inquiry) is used in the compilation of the changes in inventories component. To address users’ concerns about the sample size of the survey and the potential impact on quality, we temporarily increased the sample size from 5,500 to 9,500 businesses for Quarter 2 (Apr to June) 2019. We have continued to boost the sample in subsequent quarters and will continue to do so until further notice.
Page 42
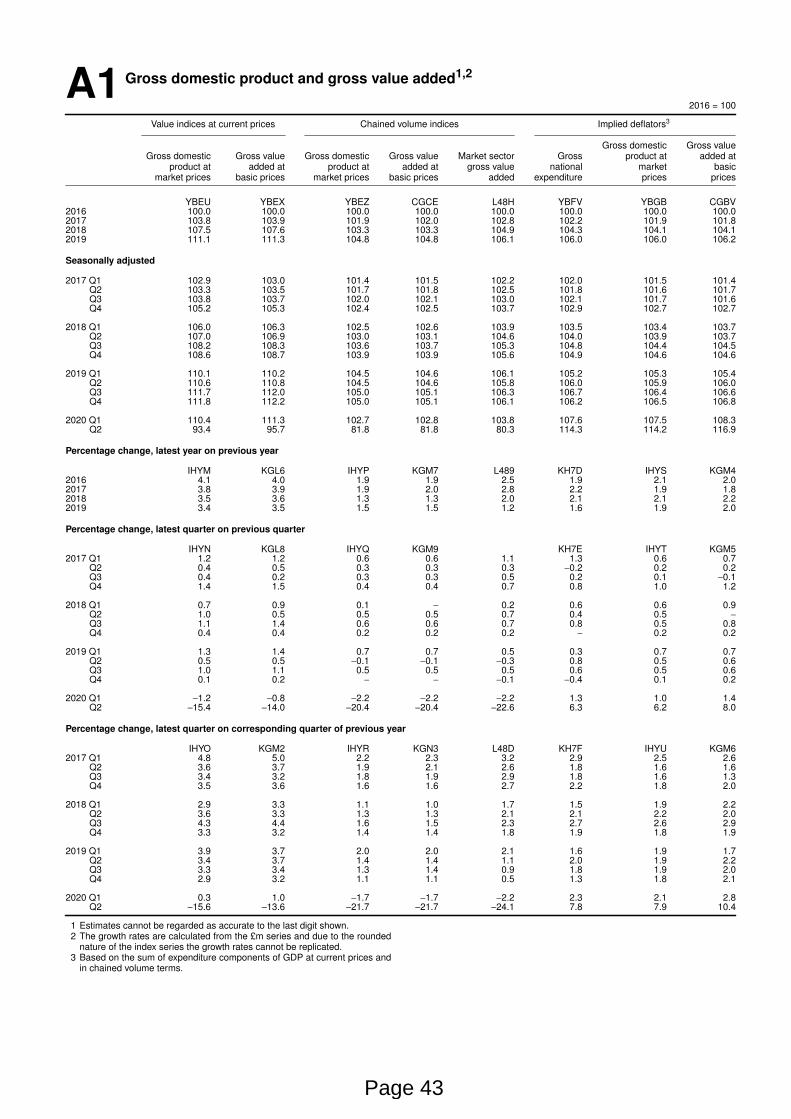
A1 Gross domestic product and gross value added1,2
2016 = 100
Value indices at current prices Chained volume indices Implied deflators3
Gross domestic Gross valueGross domestic Gross value Gross domestic Gross value Market sector Gross product at added at
product at added at product at added at gross value national mar ket basicmar ket prices basic pr ices mar ket prices basic pr ices added expenditure prices prices
YBEU YBEX YBEZ CGCE L48H YBFV YBGB CGBV2016 100.0 100.0 100.0 100.0 100.0 100.0 100.0 100.02017 103.8 103.9 101.9 102.0 102.8 102.2 101.9 101.82018 107.5 107.6 103.3 103.3 104.9 104.3 104.1 104.12019 111.1 111.3 104.8 104.8 106.1 106.0 106.0 106.2
Seasonally adjusted
2017 Q1 102.9 103.0 101.4 101.5 102.2 102.0 101.5 101.4Q2 103.3 103.5 101.7 101.8 102.5 101.8 101.6 101.7Q3 103.8 103.7 102.0 102.1 103.0 102.1 101.7 101.6Q4 105.2 105.3 102.4 102.5 103.7 102.9 102.7 102.7
2018 Q1 106.0 106.3 102.5 102.6 103.9 103.5 103.4 103.7Q2 107.0 106.9 103.0 103.1 104.6 104.0 103.9 103.7Q3 108.2 108.3 103.6 103.7 105.3 104.8 104.4 104.5Q4 108.6 108.7 103.9 103.9 105.6 104.9 104.6 104.6
2019 Q1 110.1 110.2 104.5 104.6 106.1 105.2 105.3 105.4Q2 110.6 110.8 104.5 104.6 105.8 106.0 105.9 106.0Q3 111.7 112.0 105.0 105.1 106.3 106.7 106.4 106.6Q4 111.8 112.2 105.0 105.1 106.1 106.2 106.5 106.8
2020 Q1 110.4 111.3 102.7 102.8 103.8 107.6 107.5 108.3Q2 93.4 95.7 81.8 81.8 80.3 114.3 114.2 116.9
Percentage chang e , latest year on previous year
IHYM KGL6 IHYP KGM7 L489 KH7D IHYS KGM42016 4.1 4.0 1.9 1.9 2.5 1.9 2.1 2.02017 3.8 3.9 1.9 2.0 2.8 2.2 1.9 1.82018 3.5 3.6 1.3 1.3 2.0 2.1 2.1 2.22019 3.4 3.5 1.5 1.5 1.2 1.6 1.9 2.0
Percentage chang e , latest quarter on previous quarter
IHYN KGL8 IHYQ KGM9 KH7E IHYT KGM52017 Q1 1.2 1.2 0.6 0.6 1.1 1.3 0.6 0.7
Q2 0.4 0.5 0.3 0.3 0.3 −0.2 0.2 0.2Q3 0.4 0.2 0.3 0.3 0.5 0.2 0.1 −0.1Q4 1.4 1.5 0.4 0.4 0.7 0.8 1.0 1.2
2018 Q1 0.7 0.9 0.1 − 0.2 0.6 0.6 0.9Q2 1.0 0.5 0.5 0.5 0.7 0.4 0.5 −
Q3 1.1 1.4 0.6 0.6 0.7 0.8 0.5 0.8Q4 0.4 0.4 0.2 0.2 0.2 − 0.2 0.2
2019 Q1 1.3 1.4 0.7 0.7 0.5 0.3 0.7 0.7Q2 0.5 0.5 −0.1 −0.1 −0.3 0.8 0.5 0.6Q3 1.0 1.1 0.5 0.5 0.5 0.6 0.5 0.6Q4 0.1 0.2 − − −0.1 −0.4 0.1 0.2
2020 Q1 −1.2 −0.8 −2.2 −2.2 −2.2 1.3 1.0 1.4Q2 −15.4 −14.0 −20.4 −20.4 −22.6 6.3 6.2 8.0
Percentage chang e , latest quarter on corresponding quarter of previous year
IHYO KGM2 IHYR KGN3 L48D KH7F IHYU KGM62017 Q1 4.8 5.0 2.2 2.3 3.2 2.9 2.5 2.6
Q2 3.6 3.7 1.9 2.1 2.6 1.8 1.6 1.6Q3 3.4 3.2 1.8 1.9 2.9 1.8 1.6 1.3Q4 3.5 3.6 1.6 1.6 2.7 2.2 1.8 2.0
2018 Q1 2.9 3.3 1.1 1.0 1.7 1.5 1.9 2.2Q2 3.6 3.3 1.3 1.3 2.1 2.1 2.2 2.0Q3 4.3 4.4 1.6 1.5 2.3 2.7 2.6 2.9Q4 3.3 3.2 1.4 1.4 1.8 1.9 1.8 1.9
2019 Q1 3.9 3.7 2.0 2.0 2.1 1.6 1.9 1.7Q2 3.4 3.7 1.4 1.4 1.1 2.0 1.9 2.2Q3 3.3 3.4 1.3 1.4 0.9 1.8 1.9 2.0Q4 2.9 3.2 1.1 1.1 0.5 1.3 1.8 2.1
2020 Q1 0.3 1.0 −1.7 −1.7 −2.2 2.3 2.1 2.8Q2 −15.6 −13.6 −21.7 −21.7 −24.1 7.8 7.9 10.4
1 Estimates cannot be regarded as accurate to the last digit shown.2 The growth rates are calculated from the £m series and due to the rounded
nature of the index ser ies the growth rates cannot be replicated.3 Based on the sum of expenditure components of GDP at current prices and
in chained volume terms.
Page 43
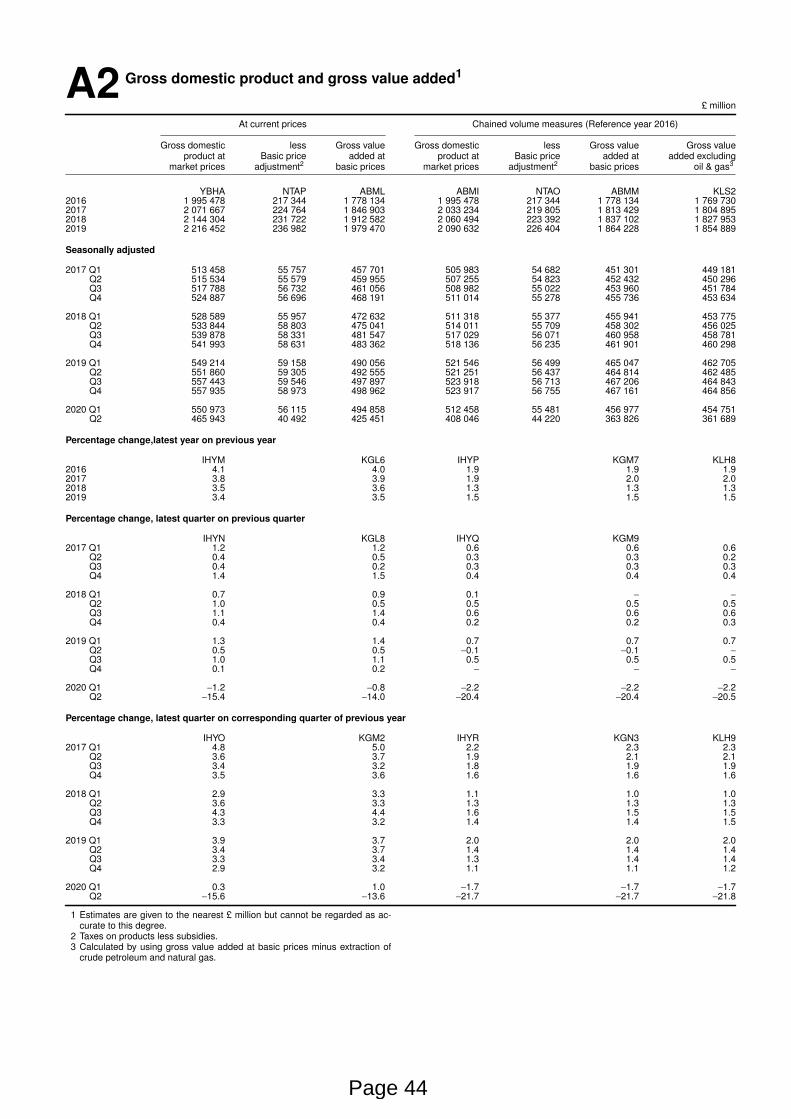
A2 Gross domestic product and gross value added1
£ million
At current prices Chained volume measures (Reference year 2016)
Gross domestic less Gross value Gross domestic less Gross value Gross valueproduct at Basic price added at product at Basic pr ice added at added excluding
mar ket prices adjustment2 basic prices market prices adjustment2 basic prices oil & gas3
YBHA NTAP ABML ABMI NTAO ABMM KLS22016 1 995 478 217 344 1 778 134 1 995 478 217 344 1 778 134 1 769 7302017 2 071 667 224 764 1 846 903 2 033 234 219 805 1 813 429 1 804 8952018 2 144 304 231 722 1 912 582 2 060 494 223 392 1 837 102 1 827 9532019 2 216 452 236 982 1 979 470 2 090 632 226 404 1 864 228 1 854 889
Seasonally adjusted
2017 Q1 513 458 55 757 457 701 505 983 54 682 451 301 449 181Q2 515 534 55 579 459 955 507 255 54 823 452 432 450 296Q3 517 788 56 732 461 056 508 982 55 022 453 960 451 784Q4 524 887 56 696 468 191 511 014 55 278 455 736 453 634
2018 Q1 528 589 55 957 472 632 511 318 55 377 455 941 453 775Q2 533 844 58 803 475 041 514 011 55 709 458 302 456 025Q3 539 878 58 331 481 547 517 029 56 071 460 958 458 781Q4 541 993 58 631 483 362 518 136 56 235 461 901 460 298
2019 Q1 549 214 59 158 490 056 521 546 56 499 465 047 462 705Q2 551 860 59 305 492 555 521 251 56 437 464 814 462 485Q3 557 443 59 546 497 897 523 918 56 713 467 206 464 843Q4 557 935 58 973 498 962 523 917 56 755 467 161 464 856
2020 Q1 550 973 56 115 494 858 512 458 55 481 456 977 454 751Q2 465 943 40 492 425 451 408 046 44 220 363 826 361 689
Percentage chang e ,latest year on previous year
IHYM KGL6 IHYP KGM7 KLH82016 4.1 4.0 1.9 1.9 1.92017 3.8 3.9 1.9 2.0 2.02018 3.5 3.6 1.3 1.3 1.32019 3.4 3.5 1.5 1.5 1.5
Percentage chang e , latest quarter on previous quarter
IHYN KGL8 IHYQ KGM92017 Q1 1.2 1.2 0.6 0.6 0.6
Q2 0.4 0.5 0.3 0.3 0.2Q3 0.4 0.2 0.3 0.3 0.3Q4 1.4 1.5 0.4 0.4 0.4
2018 Q1 0.7 0.9 0.1 − −
Q2 1.0 0.5 0.5 0.5 0.5Q3 1.1 1.4 0.6 0.6 0.6Q4 0.4 0.4 0.2 0.2 0.3
2019 Q1 1.3 1.4 0.7 0.7 0.7Q2 0.5 0.5 −0.1 −0.1 −
Q3 1.0 1.1 0.5 0.5 0.5Q4 0.1 0.2 − − −
2020 Q1 −1.2 −0.8 −2.2 −2.2 −2.2Q2 −15.4 −14.0 −20.4 −20.4 −20.5
Percentage chang e , latest quarter on corresponding quarter of previous year
IHYO KGM2 IHYR KGN3 KLH92017 Q1 4.8 5.0 2.2 2.3 2.3
Q2 3.6 3.7 1.9 2.1 2.1Q3 3.4 3.2 1.8 1.9 1.9Q4 3.5 3.6 1.6 1.6 1.6
2018 Q1 2.9 3.3 1.1 1.0 1.0Q2 3.6 3.3 1.3 1.3 1.3Q3 4.3 4.4 1.6 1.5 1.5Q4 3.3 3.2 1.4 1.4 1.5
2019 Q1 3.9 3.7 2.0 2.0 2.0Q2 3.4 3.7 1.4 1.4 1.4Q3 3.3 3.4 1.3 1.4 1.4Q4 2.9 3.2 1.1 1.1 1.2
2020 Q1 0.3 1.0 −1.7 −1.7 −1.7Q2 −15.6 −13.6 −21.7 −21.7 −21.8
1 Estimates are given to the nearest £ million but cannot be regarded as ac-curate to this degree.
2 Taxes on products less subsidies.3 Calculated by using gross value added at basic prices minus extraction of
cr ude petroleum and natural gas.
Page 44
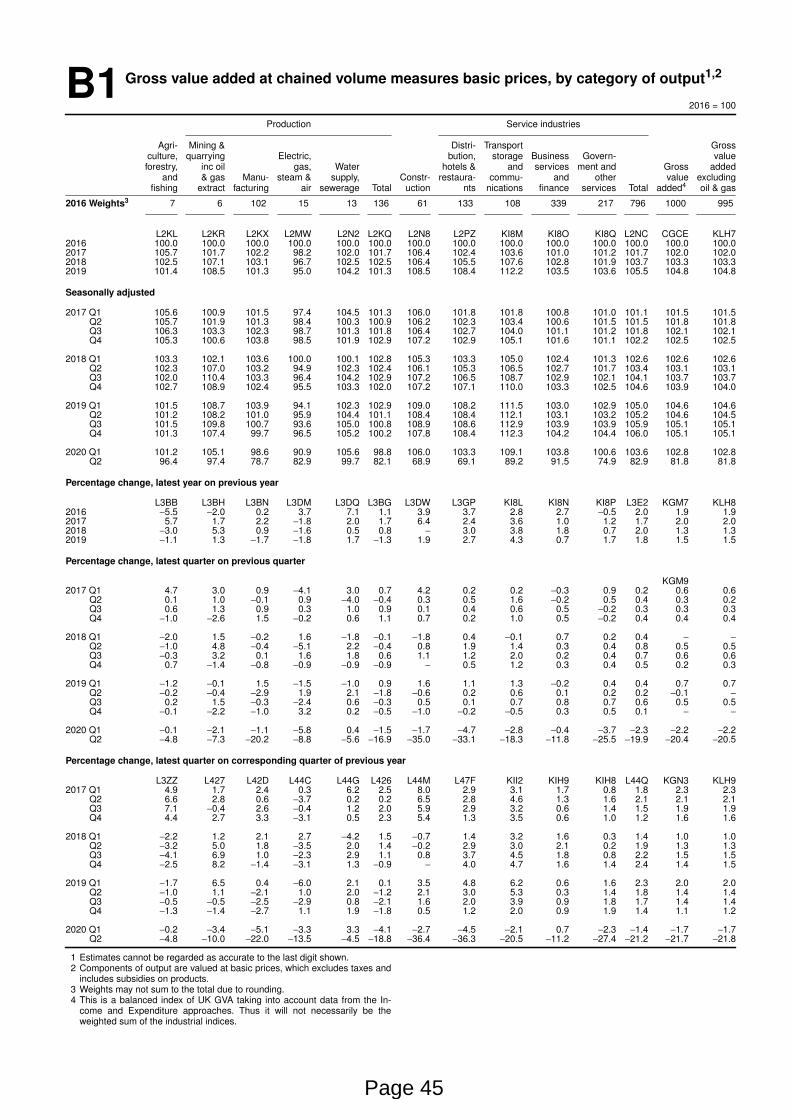
B1 Gross value added at chained volume measures basic prices, by categor y of output1,2
2016 = 100
Production Service industries
Agri- Mining & Distr i- Tr anspor t Grossculture, quarr ying Electr ic, bution, storage Business Govern- valueforestr y, inc oil gas, Water hotels & and services ment and Gross added
and & gas Manu- steam & supply, Constr- restaura- commu- and other value excludingfishing extract factur ing air sewerage Total uction nts nications finance services Total added4 oil & gas
2016 Weights3 7 6 102 15 13 136 61 133 108 339 217 796 1000 995
L2KL L2KR L2KX L2MW L2N2 L2KQ L2N8 L2PZ KI8M KI8O KI8Q L2NC CGCE KLH72016 100.0 100.0 100.0 100.0 100.0 100.0 100.0 100.0 100.0 100.0 100.0 100.0 100.0 100.02017 105.7 101.7 102.2 98.2 102.0 101.7 106.4 102.4 103.6 101.0 101.2 101.7 102.0 102.02018 102.5 107.1 103.1 96.7 102.5 102.5 106.4 105.5 107.6 102.8 101.9 103.7 103.3 103.32019 101.4 108.5 101.3 95.0 104.2 101.3 108.5 108.4 112.2 103.5 103.6 105.5 104.8 104.8
Seasonally adjusted
2017 Q1 105.6 100.9 101.5 97.4 104.5 101.3 106.0 101.8 101.8 100.8 101.0 101.1 101.5 101.5Q2 105.7 101.9 101.3 98.4 100.3 100.9 106.2 102.3 103.4 100.6 101.5 101.5 101.8 101.8Q3 106.3 103.3 102.3 98.7 101.3 101.8 106.4 102.7 104.0 101.1 101.2 101.8 102.1 102.1Q4 105.3 100.6 103.8 98.5 101.9 102.9 107.2 102.9 105.1 101.6 101.1 102.2 102.5 102.5
2018 Q1 103.3 102.1 103.6 100.0 100.1 102.8 105.3 103.3 105.0 102.4 101.3 102.6 102.6 102.6Q2 102.3 107.0 103.2 94.9 102.3 102.4 106.1 105.3 106.5 102.7 101.7 103.4 103.1 103.1Q3 102.0 110.4 103.3 96.4 104.2 102.9 107.2 106.5 108.7 102.9 102.1 104.1 103.7 103.7Q4 102.7 108.9 102.4 95.5 103.3 102.0 107.2 107.1 110.0 103.3 102.5 104.6 103.9 104.0
2019 Q1 101.5 108.7 103.9 94.1 102.3 102.9 109.0 108.2 111.5 103.0 102.9 105.0 104.6 104.6Q2 101.2 108.2 101.0 95.9 104.4 101.1 108.4 108.4 112.1 103.1 103.2 105.2 104.6 104.5Q3 101.5 109.8 100.7 93.6 105.0 100.8 108.9 108.6 112.9 103.9 103.9 105.9 105.1 105.1Q4 101.3 107.4 99.7 96.5 105.2 100.2 107.8 108.4 112.3 104.2 104.4 106.0 105.1 105.1
2020 Q1 101.2 105.1 98.6 90.9 105.6 98.8 106.0 103.3 109.1 103.8 100.6 103.6 102.8 102.8Q2 96.4 97.4 78.7 82.9 99.7 82.1 68.9 69.1 89.2 91.5 74.9 82.9 81.8 81.8
Percentage chang e , latest year on previous year
L3BB L3BH L3BN L3DM L3DQ L3BG L3DW L3GP KI8L KI8N KI8P L3E2 KGM7 KLH82016 −5.5 −2.0 0.2 3.7 7.1 1.1 3.9 3.7 2.8 2.7 −0.5 2.0 1.9 1.92017 5.7 1.7 2.2 −1.8 2.0 1.7 6.4 2.4 3.6 1.0 1.2 1.7 2.0 2.02018 −3.0 5.3 0.9 −1.6 0.5 0.8 − 3.0 3.8 1.8 0.7 2.0 1.3 1.32019 −1.1 1.3 −1.7 −1.8 1.7 −1.3 1.9 2.7 4.3 0.7 1.7 1.8 1.5 1.5
Percentage chang e , latest quarter on previous quarter
KGM92017 Q1 4.7 3.0 0.9 −4.1 3.0 0.7 4.2 0.2 0.2 −0.3 0.9 0.2 0.6 0.6
Q2 0.1 1.0 −0.1 0.9 −4.0 −0.4 0.3 0.5 1.6 −0.2 0.5 0.4 0.3 0.2Q3 0.6 1.3 0.9 0.3 1.0 0.9 0.1 0.4 0.6 0.5 −0.2 0.3 0.3 0.3Q4 −1.0 −2.6 1.5 −0.2 0.6 1.1 0.7 0.2 1.0 0.5 −0.2 0.4 0.4 0.4
2018 Q1 −2.0 1.5 −0.2 1.6 −1.8 −0.1 −1.8 0.4 −0.1 0.7 0.2 0.4 − −
Q2 −1.0 4.8 −0.4 −5.1 2.2 −0.4 0.8 1.9 1.4 0.3 0.4 0.8 0.5 0.5Q3 −0.3 3.2 0.1 1.6 1.8 0.6 1.1 1.2 2.0 0.2 0.4 0.7 0.6 0.6Q4 0.7 −1.4 −0.8 −0.9 −0.9 −0.9 − 0.5 1.2 0.3 0.4 0.5 0.2 0.3
2019 Q1 −1.2 −0.1 1.5 −1.5 −1.0 0.9 1.6 1.1 1.3 −0.2 0.4 0.4 0.7 0.7Q2 −0.2 −0.4 −2.9 1.9 2.1 −1.8 −0.6 0.2 0.6 0.1 0.2 0.2 −0.1 −
Q3 0.2 1.5 −0.3 −2.4 0.6 −0.3 0.5 0.1 0.7 0.8 0.7 0.6 0.5 0.5Q4 −0.1 −2.2 −1.0 3.2 0.2 −0.5 −1.0 −0.2 −0.5 0.3 0.5 0.1 − −
2020 Q1 −0.1 −2.1 −1.1 −5.8 0.4 −1.5 −1.7 −4.7 −2.8 −0.4 −3.7 −2.3 −2.2 −2.2Q2 −4.8 −7.3 −20.2 −8.8 −5.6 −16.9 −35.0 −33.1 −18.3 −11.8 −25.5 −19.9 −20.4 −20.5
Percentage chang e , latest quarter on corresponding quarter of previous year
L3ZZ L427 L42D L44C L44G L426 L44M L47F KII2 KIH9 KIH8 L44Q KGN3 KLH92017 Q1 4.9 1.7 2.4 0.3 6.2 2.5 8.0 2.9 3.1 1.7 0.8 1.8 2.3 2.3
Q2 6.6 2.8 0.6 −3.7 0.2 0.2 6.5 2.8 4.6 1.3 1.6 2.1 2.1 2.1Q3 7.1 −0.4 2.6 −0.4 1.2 2.0 5.9 2.9 3.2 0.6 1.4 1.5 1.9 1.9Q4 4.4 2.7 3.3 −3.1 0.5 2.3 5.4 1.3 3.5 0.6 1.0 1.2 1.6 1.6
2018 Q1 −2.2 1.2 2.1 2.7 −4.2 1.5 −0.7 1.4 3.2 1.6 0.3 1.4 1.0 1.0Q2 −3.2 5.0 1.8 −3.5 2.0 1.4 −0.2 2.9 3.0 2.1 0.2 1.9 1.3 1.3Q3 −4.1 6.9 1.0 −2.3 2.9 1.1 0.8 3.7 4.5 1.8 0.8 2.2 1.5 1.5Q4 −2.5 8.2 −1.4 −3.1 1.3 −0.9 − 4.0 4.7 1.6 1.4 2.4 1.4 1.5
2019 Q1 −1.7 6.5 0.4 −6.0 2.1 0.1 3.5 4.8 6.2 0.6 1.6 2.3 2.0 2.0Q2 −1.0 1.1 −2.1 1.0 2.0 −1.2 2.1 3.0 5.3 0.3 1.4 1.8 1.4 1.4Q3 −0.5 −0.5 −2.5 −2.9 0.8 −2.1 1.6 2.0 3.9 0.9 1.8 1.7 1.4 1.4Q4 −1.3 −1.4 −2.7 1.1 1.9 −1.8 0.5 1.2 2.0 0.9 1.9 1.4 1.1 1.2
2020 Q1 −0.2 −3.4 −5.1 −3.3 3.3 −4.1 −2.7 −4.5 −2.1 0.7 −2.3 −1.4 −1.7 −1.7Q2 −4.8 −10.0 −22.0 −13.5 −4.5 −18.8 −36.4 −36.3 −20.5 −11.2 −27.4 −21.2 −21.7 −21.8
1 Estimates cannot be regarded as accurate to the last digit shown.2 Components of output are valued at basic prices, which excludes taxes and
includes subsidies on products.3 Weights may not sum to the total due to rounding.4 This is a balanced index of UK GVA taking into account data from the In-
come and Expenditure approaches. Thus it will not necessarily be theweighted sum of the industrial indices.
Page 45
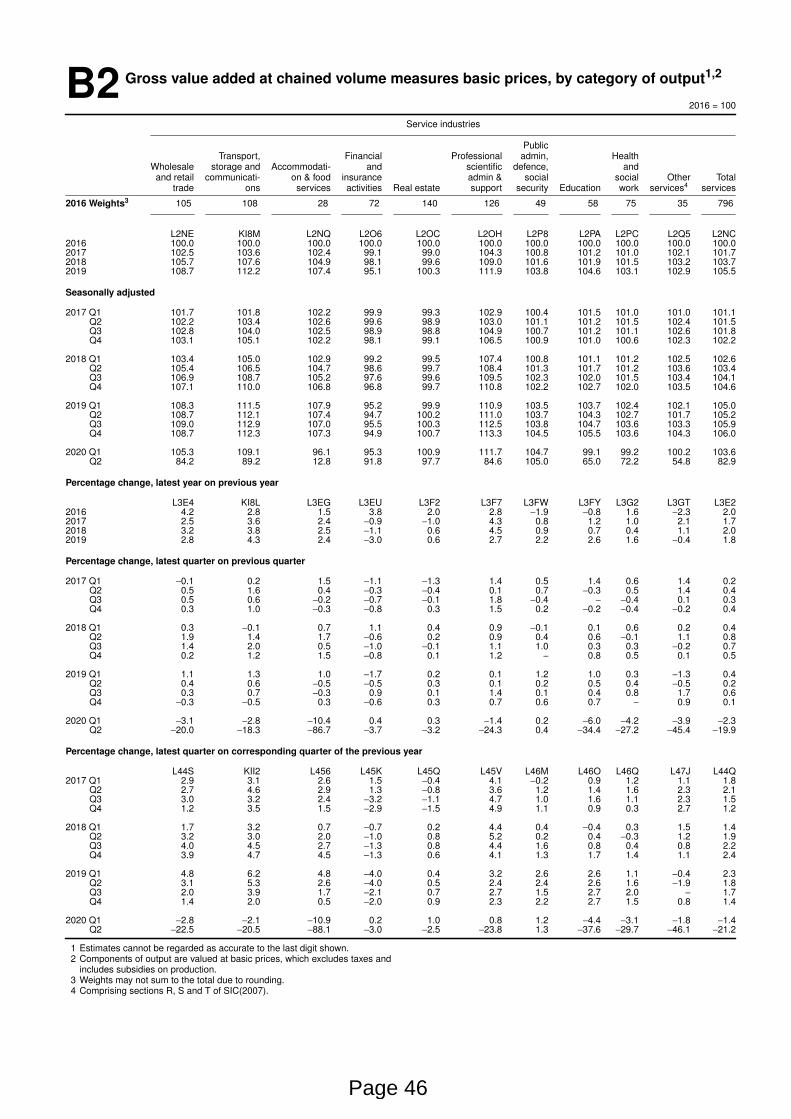
B2 Gross value added at chained volume measures basic prices, by categor y of output1,2
2016 = 100
Ser vice industr ies
PublicTr anspor t, Financial Professional admin, Health
Wholesale storage and Accommodati- and scientific defence, andand retail communicati- on & food insurance admin & social social Other Total
trade ons ser vices activities Real estate support secur ity Education wor k ser vices4 ser vices
2016 Weights3 105 108 28 72 140 126 49 58 75 35 796
L2NE KI8M L2NQ L2O6 L2OC L2OH L2P8 L2PA L2PC L2Q5 L2NC2016 100.0 100.0 100.0 100.0 100.0 100.0 100.0 100.0 100.0 100.0 100.02017 102.5 103.6 102.4 99.1 99.0 104.3 100.8 101.2 101.0 102.1 101.72018 105.7 107.6 104.9 98.1 99.6 109.0 101.6 101.9 101.5 103.2 103.72019 108.7 112.2 107.4 95.1 100.3 111.9 103.8 104.6 103.1 102.9 105.5
Seasonally adjusted
2017 Q1 101.7 101.8 102.2 99.9 99.3 102.9 100.4 101.5 101.0 101.0 101.1Q2 102.2 103.4 102.6 99.6 98.9 103.0 101.1 101.2 101.5 102.4 101.5Q3 102.8 104.0 102.5 98.9 98.8 104.9 100.7 101.2 101.1 102.6 101.8Q4 103.1 105.1 102.2 98.1 99.1 106.5 100.9 101.0 100.6 102.3 102.2
2018 Q1 103.4 105.0 102.9 99.2 99.5 107.4 100.8 101.1 101.2 102.5 102.6Q2 105.4 106.5 104.7 98.6 99.7 108.4 101.3 101.7 101.2 103.6 103.4Q3 106.9 108.7 105.2 97.6 99.6 109.5 102.3 102.0 101.5 103.4 104.1Q4 107.1 110.0 106.8 96.8 99.7 110.8 102.2 102.7 102.0 103.5 104.6
2019 Q1 108.3 111.5 107.9 95.2 99.9 110.9 103.5 103.7 102.4 102.1 105.0Q2 108.7 112.1 107.4 94.7 100.2 111.0 103.7 104.3 102.7 101.7 105.2Q3 109.0 112.9 107.0 95.5 100.3 112.5 103.8 104.7 103.6 103.3 105.9Q4 108.7 112.3 107.3 94.9 100.7 113.3 104.5 105.5 103.6 104.3 106.0
2020 Q1 105.3 109.1 96.1 95.3 100.9 111.7 104.7 99.1 99.2 100.2 103.6Q2 84.2 89.2 12.8 91.8 97.7 84.6 105.0 65.0 72.2 54.8 82.9
Percentage chang e , latest year on previous year
L3E4 KI8L L3EG L3EU L3F2 L3F7 L3FW L3FY L3G2 L3GT L3E22016 4.2 2.8 1.5 3.8 2.0 2.8 −1.9 −0.8 1.6 −2.3 2.02017 2.5 3.6 2.4 −0.9 −1.0 4.3 0.8 1.2 1.0 2.1 1.72018 3.2 3.8 2.5 −1.1 0.6 4.5 0.9 0.7 0.4 1.1 2.02019 2.8 4.3 2.4 −3.0 0.6 2.7 2.2 2.6 1.6 −0.4 1.8
Percentage chang e , latest quarter on previous quarter
2017 Q1 −0.1 0.2 1.5 −1.1 −1.3 1.4 0.5 1.4 0.6 1.4 0.2Q2 0.5 1.6 0.4 −0.3 −0.4 0.1 0.7 −0.3 0.5 1.4 0.4Q3 0.5 0.6 −0.2 −0.7 −0.1 1.8 −0.4 − −0.4 0.1 0.3Q4 0.3 1.0 −0.3 −0.8 0.3 1.5 0.2 −0.2 −0.4 −0.2 0.4
2018 Q1 0.3 −0.1 0.7 1.1 0.4 0.9 −0.1 0.1 0.6 0.2 0.4Q2 1.9 1.4 1.7 −0.6 0.2 0.9 0.4 0.6 −0.1 1.1 0.8Q3 1.4 2.0 0.5 −1.0 −0.1 1.1 1.0 0.3 0.3 −0.2 0.7Q4 0.2 1.2 1.5 −0.8 0.1 1.2 − 0.8 0.5 0.1 0.5
2019 Q1 1.1 1.3 1.0 −1.7 0.2 0.1 1.2 1.0 0.3 −1.3 0.4Q2 0.4 0.6 −0.5 −0.5 0.3 0.1 0.2 0.5 0.4 −0.5 0.2Q3 0.3 0.7 −0.3 0.9 0.1 1.4 0.1 0.4 0.8 1.7 0.6Q4 −0.3 −0.5 0.3 −0.6 0.3 0.7 0.6 0.7 − 0.9 0.1
2020 Q1 −3.1 −2.8 −10.4 0.4 0.3 −1.4 0.2 −6.0 −4.2 −3.9 −2.3Q2 −20.0 −18.3 −86.7 −3.7 −3.2 −24.3 0.4 −34.4 −27.2 −45.4 −19.9
Percentage chang e , latest quarter on corresponding quarter of the previous year
L44S KII2 L456 L45K L45Q L45V L46M L46O L46Q L47J L44Q2017 Q1 2.9 3.1 2.6 1.5 −0.4 4.1 −0.2 0.9 1.2 1.1 1.8
Q2 2.7 4.6 2.9 1.3 −0.8 3.6 1.2 1.4 1.6 2.3 2.1Q3 3.0 3.2 2.4 −3.2 −1.1 4.7 1.0 1.6 1.1 2.3 1.5Q4 1.2 3.5 1.5 −2.9 −1.5 4.9 1.1 0.9 0.3 2.7 1.2
2018 Q1 1.7 3.2 0.7 −0.7 0.2 4.4 0.4 −0.4 0.3 1.5 1.4Q2 3.2 3.0 2.0 −1.0 0.8 5.2 0.2 0.4 −0.3 1.2 1.9Q3 4.0 4.5 2.7 −1.3 0.8 4.4 1.6 0.8 0.4 0.8 2.2Q4 3.9 4.7 4.5 −1.3 0.6 4.1 1.3 1.7 1.4 1.1 2.4
2019 Q1 4.8 6.2 4.8 −4.0 0.4 3.2 2.6 2.6 1.1 −0.4 2.3Q2 3.1 5.3 2.6 −4.0 0.5 2.4 2.4 2.6 1.6 −1.9 1.8Q3 2.0 3.9 1.7 −2.1 0.7 2.7 1.5 2.7 2.0 − 1.7Q4 1.4 2.0 0.5 −2.0 0.9 2.3 2.2 2.7 1.5 0.8 1.4
2020 Q1 −2.8 −2.1 −10.9 0.2 1.0 0.8 1.2 −4.4 −3.1 −1.8 −1.4Q2 −22.5 −20.5 −88.1 −3.0 −2.5 −23.8 1.3 −37.6 −29.7 −46.1 −21.2
1 Estimates cannot be regarded as accurate to the last digit shown.2 Components of output are valued at basic prices, which excludes taxes and
includes subsidies on production.3 Weights may not sum to the total due to rounding.4 Compr ising sections R, S and T of SIC(2007).
Page 46
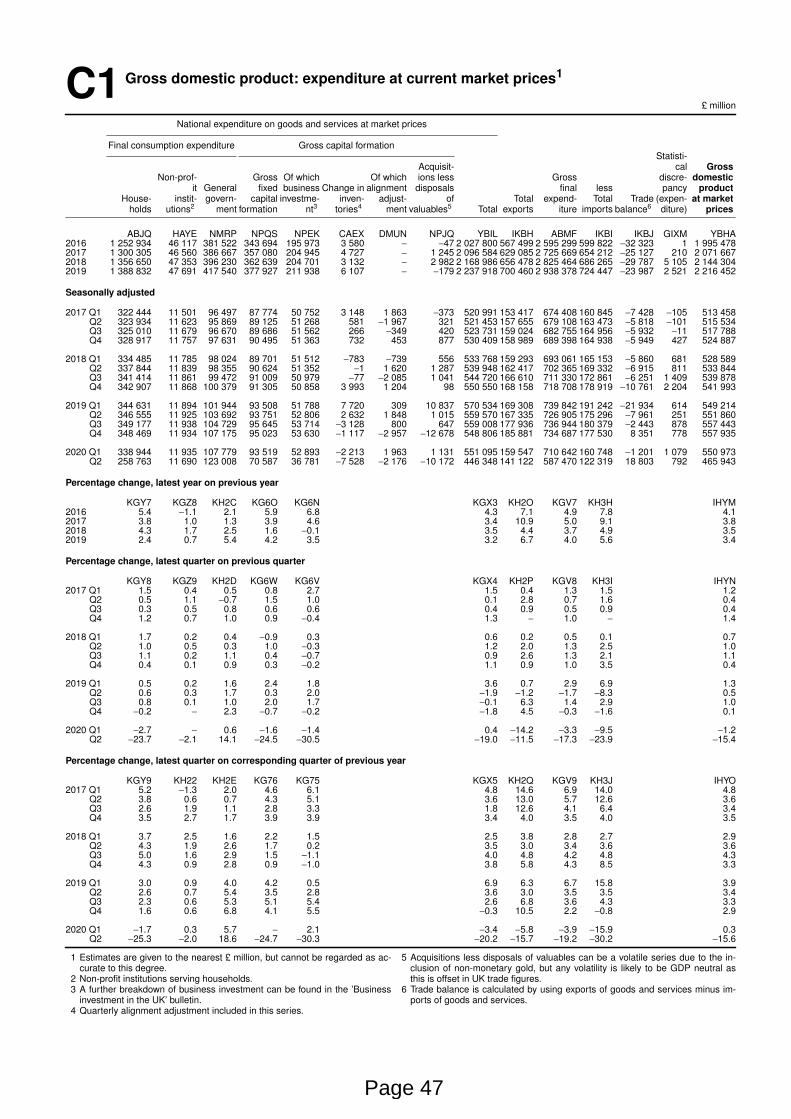
C1 Gross domestic product: expenditure at current market prices1
£ million
National expenditure on goods and services at market prices
Final consumption expenditure Gross capital for mationStatisti-
Acquisit- cal GrossNon-prof- Gross Of which Of which ions less Gross discre- domestic
it General fixed business Change in alignment disposals final less pancy productHouse- instit- govern- capital investme- inven- adjust- of Total expend- Total Trade (expen- at market
holds utions2 ment for mation nt3 tor ies4 ment valuables5 Total expor ts iture imports balance6 diture) prices
ABJQ HAYE NMRP NPQS NPEK CAEX DMUN NPJQ YBIL IKBH ABMF IKBI IKBJ GIXM YBHA2016 1 252 934 46 117 381 522 343 694 195 973 3 580 − −47 2 027 800 567 499 2 595 299 599 822 −32 323 1 1 995 4782017 1 300 305 46 560 386 667 357 080 204 945 4 727 − 1 245 2 096 584 629 085 2 725 669 654 212 −25 127 210 2 071 6672018 1 356 650 47 353 396 230 362 639 204 701 3 132 − 2 982 2 168 986 656 478 2 825 464 686 265 −29 787 5 105 2 144 3042019 1 388 832 47 691 417 540 377 927 211 938 6 107 − −179 2 237 918 700 460 2 938 378 724 447 −23 987 2 521 2 216 452
Seasonally adjusted
2017 Q1 322 444 11 501 96 497 87 774 50 752 3 148 1 863 −373 520 991 153 417 674 408 160 845 −7 428 −105 513 458Q2 323 934 11 623 95 869 89 125 51 268 581 −1 967 321 521 453 157 655 679 108 163 473 −5 818 −101 515 534Q3 325 010 11 679 96 670 89 686 51 562 266 −349 420 523 731 159 024 682 755 164 956 −5 932 −11 517 788Q4 328 917 11 757 97 631 90 495 51 363 732 453 877 530 409 158 989 689 398 164 938 −5 949 427 524 887
2018 Q1 334 485 11 785 98 024 89 701 51 512 −783 −739 556 533 768 159 293 693 061 165 153 −5 860 681 528 589Q2 337 844 11 839 98 355 90 624 51 352 −1 1 620 1 287 539 948 162 417 702 365 169 332 −6 915 811 533 844Q3 341 414 11 861 99 472 91 009 50 979 −77 −2 085 1 041 544 720 166 610 711 330 172 861 −6 251 1 409 539 878Q4 342 907 11 868 100 379 91 305 50 858 3 993 1 204 98 550 550 168 158 718 708 178 919 −10 761 2 204 541 993
2019 Q1 344 631 11 894 101 944 93 508 51 788 7 720 309 10 837 570 534 169 308 739 842 191 242 −21 934 614 549 214Q2 346 555 11 925 103 692 93 751 52 806 2 632 1 848 1 015 559 570 167 335 726 905 175 296 −7 961 251 551 860Q3 349 177 11 938 104 729 95 645 53 714 −3 128 800 647 559 008 177 936 736 944 180 379 −2 443 878 557 443Q4 348 469 11 934 107 175 95 023 53 630 −1 117 −2 957 −12 678 548 806 185 881 734 687 177 530 8 351 778 557 935
2020 Q1 338 944 11 935 107 779 93 519 52 893 −2 213 1 963 1 131 551 095 159 547 710 642 160 748 −1 201 1 079 550 973Q2 258 763 11 690 123 008 70 587 36 781 −7 528 −2 176 −10 172 446 348 141 122 587 470 122 319 18 803 792 465 943
Percentage chang e , latest year on previous year
KGY7 KGZ8 KH2C KG6O KG6N KGX3 KH2O KGV7 KH3H IHYM2016 5.4 −1.1 2.1 5.9 6.8 4.3 7.1 4.9 7.8 4.12017 3.8 1.0 1.3 3.9 4.6 3.4 10.9 5.0 9.1 3.82018 4.3 1.7 2.5 1.6 −0.1 3.5 4.4 3.7 4.9 3.52019 2.4 0.7 5.4 4.2 3.5 3.2 6.7 4.0 5.6 3.4
Percentage chang e , latest quarter on previous quarter
KGY8 KGZ9 KH2D KG6W KG6V KGX4 KH2P KGV8 KH3I IHYN2017 Q1 1.5 0.4 0.5 0.8 2.7 1.5 0.4 1.3 1.5 1.2
Q2 0.5 1.1 −0.7 1.5 1.0 0.1 2.8 0.7 1.6 0.4Q3 0.3 0.5 0.8 0.6 0.6 0.4 0.9 0.5 0.9 0.4Q4 1.2 0.7 1.0 0.9 −0.4 1.3 − 1.0 − 1.4
2018 Q1 1.7 0.2 0.4 −0.9 0.3 0.6 0.2 0.5 0.1 0.7Q2 1.0 0.5 0.3 1.0 −0.3 1.2 2.0 1.3 2.5 1.0Q3 1.1 0.2 1.1 0.4 −0.7 0.9 2.6 1.3 2.1 1.1Q4 0.4 0.1 0.9 0.3 −0.2 1.1 0.9 1.0 3.5 0.4
2019 Q1 0.5 0.2 1.6 2.4 1.8 3.6 0.7 2.9 6.9 1.3Q2 0.6 0.3 1.7 0.3 2.0 −1.9 −1.2 −1.7 −8.3 0.5Q3 0.8 0.1 1.0 2.0 1.7 −0.1 6.3 1.4 2.9 1.0Q4 −0.2 − 2.3 −0.7 −0.2 −1.8 4.5 −0.3 −1.6 0.1
2020 Q1 −2.7 − 0.6 −1.6 −1.4 0.4 −14.2 −3.3 −9.5 −1.2Q2 −23.7 −2.1 14.1 −24.5 −30.5 −19.0 −11.5 −17.3 −23.9 −15.4
Percentage chang e , latest quarter on corresponding quarter of previous year
KGY9 KH22 KH2E KG76 KG75 KGX5 KH2Q KGV9 KH3J IHYO2017 Q1 5.2 −1.3 2.0 4.6 6.1 4.8 14.6 6.9 14.0 4.8
Q2 3.8 0.6 0.7 4.3 5.1 3.6 13.0 5.7 12.6 3.6Q3 2.6 1.9 1.1 2.8 3.3 1.8 12.6 4.1 6.4 3.4Q4 3.5 2.7 1.7 3.9 3.9 3.4 4.0 3.5 4.0 3.5
2018 Q1 3.7 2.5 1.6 2.2 1.5 2.5 3.8 2.8 2.7 2.9Q2 4.3 1.9 2.6 1.7 0.2 3.5 3.0 3.4 3.6 3.6Q3 5.0 1.6 2.9 1.5 −1.1 4.0 4.8 4.2 4.8 4.3Q4 4.3 0.9 2.8 0.9 −1.0 3.8 5.8 4.3 8.5 3.3
2019 Q1 3.0 0.9 4.0 4.2 0.5 6.9 6.3 6.7 15.8 3.9Q2 2.6 0.7 5.4 3.5 2.8 3.6 3.0 3.5 3.5 3.4Q3 2.3 0.6 5.3 5.1 5.4 2.6 6.8 3.6 4.3 3.3Q4 1.6 0.6 6.8 4.1 5.5 −0.3 10.5 2.2 −0.8 2.9
2020 Q1 −1.7 0.3 5.7 − 2.1 −3.4 −5.8 −3.9 −15.9 0.3Q2 −25.3 −2.0 18.6 −24.7 −30.3 −20.2 −15.7 −19.2 −30.2 −15.6
1 Estimates are given to the nearest £ million, but cannot be regarded as ac-curate to this degree.
2 Non-profit institutions serving households.3 A fur ther breakdown of business investment can be found in the ’Business
investment in the UK’ bulletin.4 Quar terly alignment adjustment included in this series.
5 Acquisitions less disposals of valuables can be a volatile series due to the in-clusion of non-monetary gold, but any volatility is likely to be GDP neutral asthis is offset in UK trade figures.
6 Trade balance is calculated by using expor ts of goods and services minus im-por ts of goods and services.
Page 47
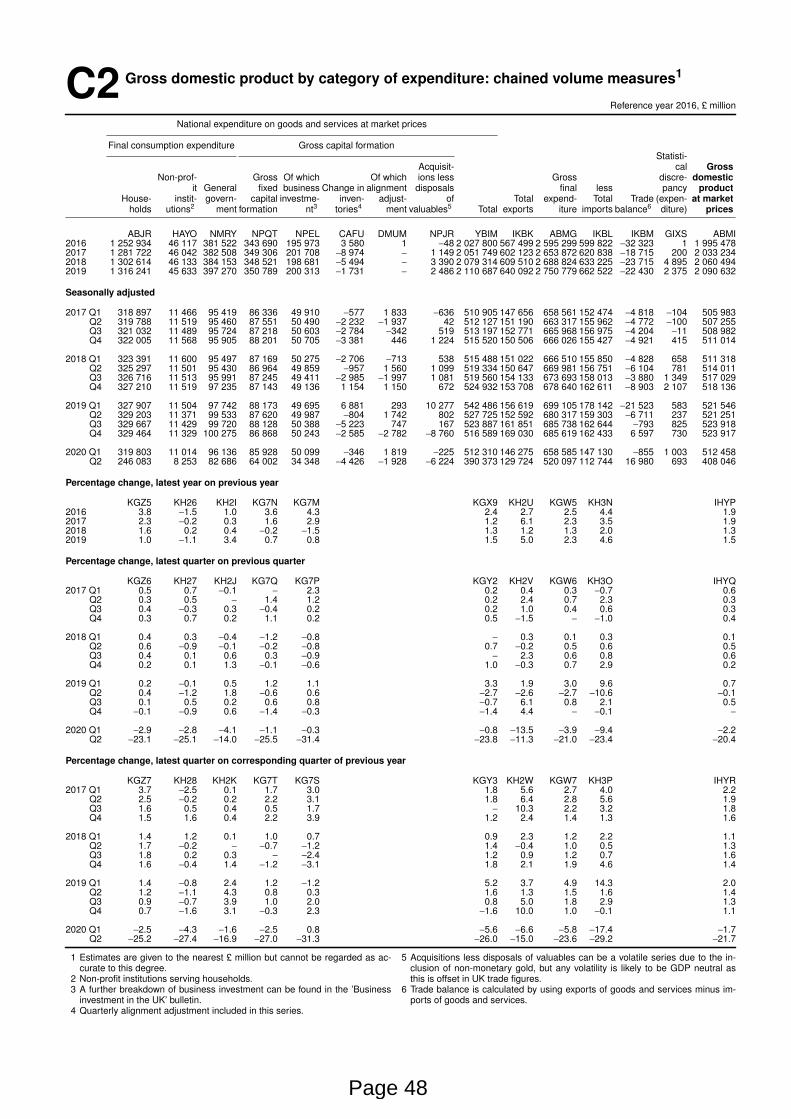
C2 Gross domestic product by categor y of expenditure: chained volume measures1
Reference year 2016, £ million
National expenditure on goods and services at market prices
Final consumption expenditure Gross capital for mationStatisti-
Acquisit- cal GrossNon-prof- Gross Of which Of which ions less Gross discre- domestic
it General fixed business Change in alignment disposals final less pancy productHouse- instit- govern- capital investme- inven- adjust- of Total expend- Total Trade (expen- at market
holds utions2 ment for mation nt3 tor ies4 ment valuables5 Total expor ts iture imports balance6 diture) prices
ABJR HAYO NMRY NPQT NPEL CAFU DMUM NPJR YBIM IKBK ABMG IKBL IKBM GIXS ABMI2016 1 252 934 46 117 381 522 343 690 195 973 3 580 1 −48 2 027 800 567 499 2 595 299 599 822 −32 323 1 1 995 4782017 1 281 722 46 042 382 508 349 306 201 708 −8 974 − 1 149 2 051 749 602 123 2 653 872 620 838 −18 715 200 2 033 2342018 1 302 614 46 133 384 153 348 521 198 681 −5 494 − 3 390 2 079 314 609 510 2 688 824 633 225 −23 715 4 895 2 060 4942019 1 316 241 45 633 397 270 350 789 200 313 −1 731 − 2 486 2 110 687 640 092 2 750 779 662 522 −22 430 2 375 2 090 632
Seasonally adjusted
2017 Q1 318 897 11 466 95 419 86 336 49 910 −577 1 833 −636 510 905 147 656 658 561 152 474 −4 818 −104 505 983Q2 319 788 11 519 95 460 87 551 50 490 −2 232 −1 937 42 512 127 151 190 663 317 155 962 −4 772 −100 507 255Q3 321 032 11 489 95 724 87 218 50 603 −2 784 −342 519 513 197 152 771 665 968 156 975 −4 204 −11 508 982Q4 322 005 11 568 95 905 88 201 50 705 −3 381 446 1 224 515 520 150 506 666 026 155 427 −4 921 415 511 014
2018 Q1 323 391 11 600 95 497 87 169 50 275 −2 706 −713 538 515 488 151 022 666 510 155 850 −4 828 658 511 318Q2 325 297 11 501 95 430 86 964 49 859 −957 1 560 1 099 519 334 150 647 669 981 156 751 −6 104 781 514 011Q3 326 716 11 513 95 991 87 245 49 411 −2 985 −1 997 1 081 519 560 154 133 673 693 158 013 −3 880 1 349 517 029Q4 327 210 11 519 97 235 87 143 49 136 1 154 1 150 672 524 932 153 708 678 640 162 611 −8 903 2 107 518 136
2019 Q1 327 907 11 504 97 742 88 173 49 695 6 881 293 10 277 542 486 156 619 699 105 178 142 −21 523 583 521 546Q2 329 203 11 371 99 533 87 620 49 987 −804 1 742 802 527 725 152 592 680 317 159 303 −6 711 237 521 251Q3 329 667 11 429 99 720 88 128 50 388 −5 223 747 167 523 887 161 851 685 738 162 644 −793 825 523 918Q4 329 464 11 329 100 275 86 868 50 243 −2 585 −2 782 −8 760 516 589 169 030 685 619 162 433 6 597 730 523 917
2020 Q1 319 803 11 014 96 136 85 928 50 099 −346 1 819 −225 512 310 146 275 658 585 147 130 −855 1 003 512 458Q2 246 083 8 253 82 686 64 002 34 348 −4 426 −1 928 −6 224 390 373 129 724 520 097 112 744 16 980 693 408 046
Percentage chang e , latest year on previous year
KGZ5 KH26 KH2I KG7N KG7M KGX9 KH2U KGW5 KH3N IHYP2016 3.8 −1.5 1.0 3.6 4.3 2.4 2.7 2.5 4.4 1.92017 2.3 −0.2 0.3 1.6 2.9 1.2 6.1 2.3 3.5 1.92018 1.6 0.2 0.4 −0.2 −1.5 1.3 1.2 1.3 2.0 1.32019 1.0 −1.1 3.4 0.7 0.8 1.5 5.0 2.3 4.6 1.5
Percentage chang e , latest quarter on previous quarter
KGZ6 KH27 KH2J KG7Q KG7P KGY2 KH2V KGW6 KH3O IHYQ2017 Q1 0.5 0.7 −0.1 − 2.3 0.2 0.4 0.3 −0.7 0.6
Q2 0.3 0.5 − 1.4 1.2 0.2 2.4 0.7 2.3 0.3Q3 0.4 −0.3 0.3 −0.4 0.2 0.2 1.0 0.4 0.6 0.3Q4 0.3 0.7 0.2 1.1 0.2 0.5 −1.5 − −1.0 0.4
2018 Q1 0.4 0.3 −0.4 −1.2 −0.8 − 0.3 0.1 0.3 0.1Q2 0.6 −0.9 −0.1 −0.2 −0.8 0.7 −0.2 0.5 0.6 0.5Q3 0.4 0.1 0.6 0.3 −0.9 − 2.3 0.6 0.8 0.6Q4 0.2 0.1 1.3 −0.1 −0.6 1.0 −0.3 0.7 2.9 0.2
2019 Q1 0.2 −0.1 0.5 1.2 1.1 3.3 1.9 3.0 9.6 0.7Q2 0.4 −1.2 1.8 −0.6 0.6 −2.7 −2.6 −2.7 −10.6 −0.1Q3 0.1 0.5 0.2 0.6 0.8 −0.7 6.1 0.8 2.1 0.5Q4 −0.1 −0.9 0.6 −1.4 −0.3 −1.4 4.4 − −0.1 −
2020 Q1 −2.9 −2.8 −4.1 −1.1 −0.3 −0.8 −13.5 −3.9 −9.4 −2.2Q2 −23.1 −25.1 −14.0 −25.5 −31.4 −23.8 −11.3 −21.0 −23.4 −20.4
Percentage chang e , latest quarter on corresponding quarter of previous year
KGZ7 KH28 KH2K KG7T KG7S KGY3 KH2W KGW7 KH3P IHYR2017 Q1 3.7 −2.5 0.1 1.7 3.0 1.8 5.6 2.7 4.0 2.2
Q2 2.5 −0.2 0.2 2.2 3.1 1.8 6.4 2.8 5.6 1.9Q3 1.6 0.5 0.4 0.5 1.7 − 10.3 2.2 3.2 1.8Q4 1.5 1.6 0.4 2.2 3.9 1.2 2.4 1.4 1.3 1.6
2018 Q1 1.4 1.2 0.1 1.0 0.7 0.9 2.3 1.2 2.2 1.1Q2 1.7 −0.2 − −0.7 −1.2 1.4 −0.4 1.0 0.5 1.3Q3 1.8 0.2 0.3 − −2.4 1.2 0.9 1.2 0.7 1.6Q4 1.6 −0.4 1.4 −1.2 −3.1 1.8 2.1 1.9 4.6 1.4
2019 Q1 1.4 −0.8 2.4 1.2 −1.2 5.2 3.7 4.9 14.3 2.0Q2 1.2 −1.1 4.3 0.8 0.3 1.6 1.3 1.5 1.6 1.4Q3 0.9 −0.7 3.9 1.0 2.0 0.8 5.0 1.8 2.9 1.3Q4 0.7 −1.6 3.1 −0.3 2.3 −1.6 10.0 1.0 −0.1 1.1
2020 Q1 −2.5 −4.3 −1.6 −2.5 0.8 −5.6 −6.6 −5.8 −17.4 −1.7Q2 −25.2 −27.4 −16.9 −27.0 −31.3 −26.0 −15.0 −23.6 −29.2 −21.7
1 Estimates are given to the nearest £ million but cannot be regarded as ac-curate to this degree.
2 Non-profit institutions serving households.3 A fur ther breakdown of business investment can be found in the ’Business
investment in the UK’ bulletin.4 Quar terly alignment adjustment included in this series.
5 Acquisitions less disposals of valuables can be a volatile series due to the in-clusion of non-monetary gold, but any volatility is likely to be GDP neutral asthis is offset in UK trade figures.
6 Trade balance is calculated by using expor ts of goods and services minus im-por ts of goods and services.
Page 48
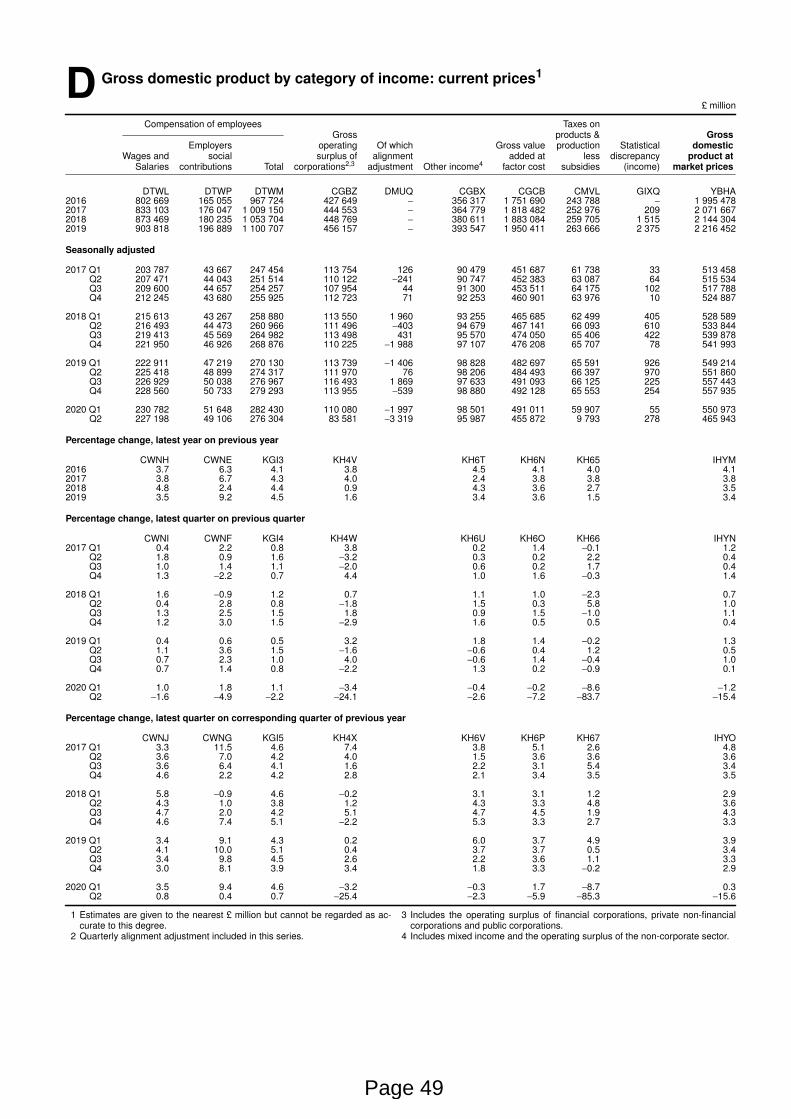
D Gross domestic product by categor y of income: current prices1
£ million
Compensation of employees Taxes onGross products & Gross
Employers operating Of which Gross value production Statistical domesticWages and social surplus of alignment added at less discrepancy product at
Salar ies contr ibutions Total corporations2,3 adjustment Other income4 factor cost subsidies (income) market prices
DTWL DTWP DTWM CGBZ DMUQ CGBX CGCB CMVL GIXQ YBHA2016 802 669 165 055 967 724 427 649 − 356 317 1 751 690 243 788 − 1 995 4782017 833 103 176 047 1 009 150 444 553 − 364 779 1 818 482 252 976 209 2 071 6672018 873 469 180 235 1 053 704 448 769 − 380 611 1 883 084 259 705 1 515 2 144 3042019 903 818 196 889 1 100 707 456 157 − 393 547 1 950 411 263 666 2 375 2 216 452
Seasonally adjusted
2017 Q1 203 787 43 667 247 454 113 754 126 90 479 451 687 61 738 33 513 458Q2 207 471 44 043 251 514 110 122 −241 90 747 452 383 63 087 64 515 534Q3 209 600 44 657 254 257 107 954 44 91 300 453 511 64 175 102 517 788Q4 212 245 43 680 255 925 112 723 71 92 253 460 901 63 976 10 524 887
2018 Q1 215 613 43 267 258 880 113 550 1 960 93 255 465 685 62 499 405 528 589Q2 216 493 44 473 260 966 111 496 −403 94 679 467 141 66 093 610 533 844Q3 219 413 45 569 264 982 113 498 431 95 570 474 050 65 406 422 539 878Q4 221 950 46 926 268 876 110 225 −1 988 97 107 476 208 65 707 78 541 993
2019 Q1 222 911 47 219 270 130 113 739 −1 406 98 828 482 697 65 591 926 549 214Q2 225 418 48 899 274 317 111 970 76 98 206 484 493 66 397 970 551 860Q3 226 929 50 038 276 967 116 493 1 869 97 633 491 093 66 125 225 557 443Q4 228 560 50 733 279 293 113 955 −539 98 880 492 128 65 553 254 557 935
2020 Q1 230 782 51 648 282 430 110 080 −1 997 98 501 491 011 59 907 55 550 973Q2 227 198 49 106 276 304 83 581 −3 319 95 987 455 872 9 793 278 465 943
Percentage chang e , latest year on previous year
CWNH CWNE KGI3 KH4V KH6T KH6N KH65 IHYM2016 3.7 6.3 4.1 3.8 4.5 4.1 4.0 4.12017 3.8 6.7 4.3 4.0 2.4 3.8 3.8 3.82018 4.8 2.4 4.4 0.9 4.3 3.6 2.7 3.52019 3.5 9.2 4.5 1.6 3.4 3.6 1.5 3.4
Percentage chang e , latest quarter on previous quarter
CWNI CWNF KGI4 KH4W KH6U KH6O KH66 IHYN2017 Q1 0.4 2.2 0.8 3.8 0.2 1.4 −0.1 1.2
Q2 1.8 0.9 1.6 −3.2 0.3 0.2 2.2 0.4Q3 1.0 1.4 1.1 −2.0 0.6 0.2 1.7 0.4Q4 1.3 −2.2 0.7 4.4 1.0 1.6 −0.3 1.4
2018 Q1 1.6 −0.9 1.2 0.7 1.1 1.0 −2.3 0.7Q2 0.4 2.8 0.8 −1.8 1.5 0.3 5.8 1.0Q3 1.3 2.5 1.5 1.8 0.9 1.5 −1.0 1.1Q4 1.2 3.0 1.5 −2.9 1.6 0.5 0.5 0.4
2019 Q1 0.4 0.6 0.5 3.2 1.8 1.4 −0.2 1.3Q2 1.1 3.6 1.5 −1.6 −0.6 0.4 1.2 0.5Q3 0.7 2.3 1.0 4.0 −0.6 1.4 −0.4 1.0Q4 0.7 1.4 0.8 −2.2 1.3 0.2 −0.9 0.1
2020 Q1 1.0 1.8 1.1 −3.4 −0.4 −0.2 −8.6 −1.2Q2 −1.6 −4.9 −2.2 −24.1 −2.6 −7.2 −83.7 −15.4
Percentage chang e , latest quarter on corresponding quarter of previous year
CWNJ CWNG KGI5 KH4X KH6V KH6P KH67 IHYO2017 Q1 3.3 11.5 4.6 7.4 3.8 5.1 2.6 4.8
Q2 3.6 7.0 4.2 4.0 1.5 3.6 3.6 3.6Q3 3.6 6.4 4.1 1.6 2.2 3.1 5.4 3.4Q4 4.6 2.2 4.2 2.8 2.1 3.4 3.5 3.5
2018 Q1 5.8 −0.9 4.6 −0.2 3.1 3.1 1.2 2.9Q2 4.3 1.0 3.8 1.2 4.3 3.3 4.8 3.6Q3 4.7 2.0 4.2 5.1 4.7 4.5 1.9 4.3Q4 4.6 7.4 5.1 −2.2 5.3 3.3 2.7 3.3
2019 Q1 3.4 9.1 4.3 0.2 6.0 3.7 4.9 3.9Q2 4.1 10.0 5.1 0.4 3.7 3.7 0.5 3.4Q3 3.4 9.8 4.5 2.6 2.2 3.6 1.1 3.3Q4 3.0 8.1 3.9 3.4 1.8 3.3 −0.2 2.9
2020 Q1 3.5 9.4 4.6 −3.2 −0.3 1.7 −8.7 0.3Q2 0.8 0.4 0.7 −25.4 −2.3 −5.9 −85.3 −15.6
1 Estimates are given to the nearest £ million but cannot be regarded as ac-curate to this degree.
2 Quar terly alignment adjustment included in this series.
3 Includes the operating surplus of financial corporations, private non-financialcor porations and public corporations.
4 Includes mixed income and the operating surplus of the non-corporate sector.
Page 49
F1Gross fixed capital formation by sector and type of assetCurrent prices
£ million
Analysis by sector Analysis by asset
Public corporations2 Pr ivate Sector
Costs of Costs oftransfer transfer ICT
of of equipmentownership ownership and other Other Intellect-
of of machiner y buildings ualBusiness General non-produ- non-produ- Tr anspor t and and Proper ty
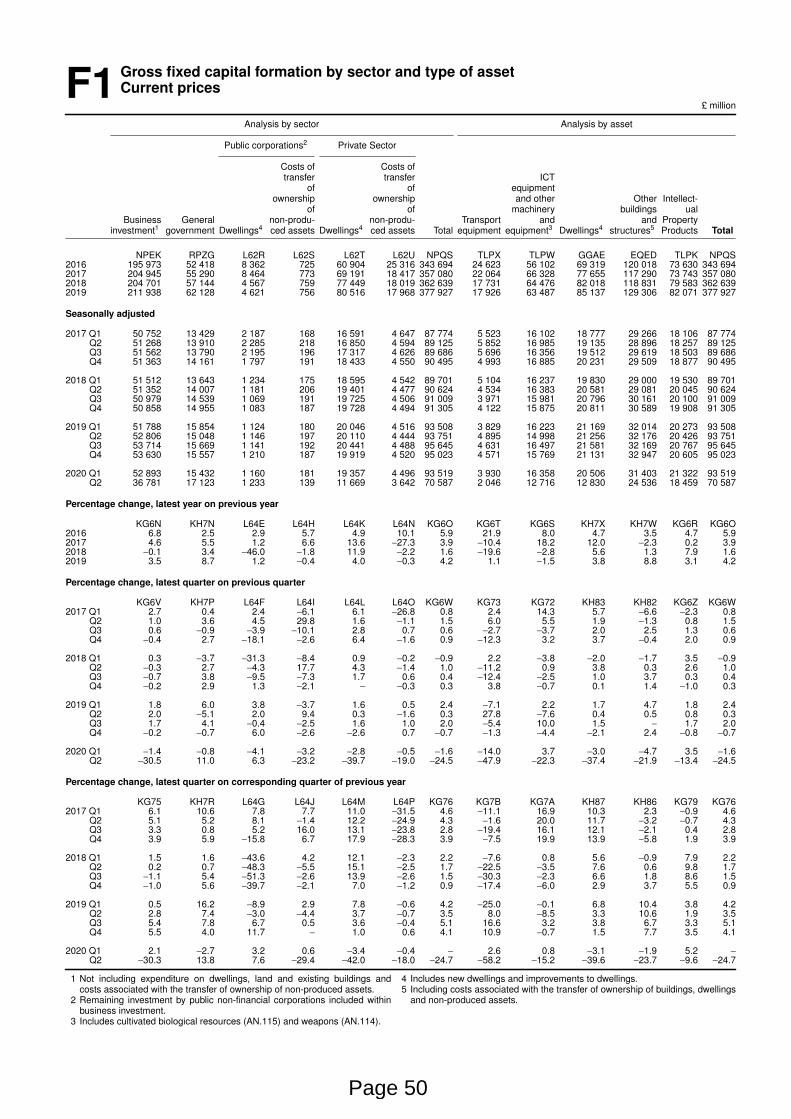
investment1 government Dwellings4 ced assets Dwellings4 ced assets Total equipment equipment3 Dwellings4 str uctures5 Products Total
NPEK RPZG L62R L62S L62T L62U NPQS TLPX TLPW GGAE EQED TLPK NPQS2016 195 973 52 418 8 362 725 60 904 25 316 343 694 24 623 56 102 69 319 120 018 73 630 343 6942017 204 945 55 290 8 464 773 69 191 18 417 357 080 22 064 66 328 77 655 117 290 73 743 357 0802018 204 701 57 144 4 567 759 77 449 18 019 362 639 17 731 64 476 82 018 118 831 79 583 362 6392019 211 938 62 128 4 621 756 80 516 17 968 377 927 17 926 63 487 85 137 129 306 82 071 377 927
Seasonally adjusted
2017 Q1 50 752 13 429 2 187 168 16 591 4 647 87 774 5 523 16 102 18 777 29 266 18 106 87 774Q2 51 268 13 910 2 285 218 16 850 4 594 89 125 5 852 16 985 19 135 28 896 18 257 89 125Q3 51 562 13 790 2 195 196 17 317 4 626 89 686 5 696 16 356 19 512 29 619 18 503 89 686Q4 51 363 14 161 1 797 191 18 433 4 550 90 495 4 993 16 885 20 231 29 509 18 877 90 495
2018 Q1 51 512 13 643 1 234 175 18 595 4 542 89 701 5 104 16 237 19 830 29 000 19 530 89 701Q2 51 352 14 007 1 181 206 19 401 4 477 90 624 4 534 16 383 20 581 29 081 20 045 90 624Q3 50 979 14 539 1 069 191 19 725 4 506 91 009 3 971 15 981 20 796 30 161 20 100 91 009Q4 50 858 14 955 1 083 187 19 728 4 494 91 305 4 122 15 875 20 811 30 589 19 908 91 305
2019 Q1 51 788 15 854 1 124 180 20 046 4 516 93 508 3 829 16 223 21 169 32 014 20 273 93 508Q2 52 806 15 048 1 146 197 20 110 4 444 93 751 4 895 14 998 21 256 32 176 20 426 93 751Q3 53 714 15 669 1 141 192 20 441 4 488 95 645 4 631 16 497 21 581 32 169 20 767 95 645Q4 53 630 15 557 1 210 187 19 919 4 520 95 023 4 571 15 769 21 131 32 947 20 605 95 023
2020 Q1 52 893 15 432 1 160 181 19 357 4 496 93 519 3 930 16 358 20 506 31 403 21 322 93 519Q2 36 781 17 123 1 233 139 11 669 3 642 70 587 2 046 12 716 12 830 24 536 18 459 70 587
Percentage chang e , latest year on previous year
KG6N KH7N L64E L64H L64K L64N KG6O KG6T KG6S KH7X KH7W KG6R KG6O2016 6.8 2.5 2.9 5.7 4.9 10.1 5.9 21.9 8.0 4.7 3.5 4.7 5.92017 4.6 5.5 1.2 6.6 13.6 −27.3 3.9 −10.4 18.2 12.0 −2.3 0.2 3.92018 −0.1 3.4 −46.0 −1.8 11.9 −2.2 1.6 −19.6 −2.8 5.6 1.3 7.9 1.62019 3.5 8.7 1.2 −0.4 4.0 −0.3 4.2 1.1 −1.5 3.8 8.8 3.1 4.2
Percentage chang e , latest quarter on previous quarter
KG6V KH7P L64F L64I L64L L64O KG6W KG73 KG72 KH83 KH82 KG6Z KG6W2017 Q1 2.7 0.4 2.4 −6.1 6.1 −26.8 0.8 2.4 14.3 5.7 −6.6 −2.3 0.8
Q2 1.0 3.6 4.5 29.8 1.6 −1.1 1.5 6.0 5.5 1.9 −1.3 0.8 1.5Q3 0.6 −0.9 −3.9 −10.1 2.8 0.7 0.6 −2.7 −3.7 2.0 2.5 1.3 0.6Q4 −0.4 2.7 −18.1 −2.6 6.4 −1.6 0.9 −12.3 3.2 3.7 −0.4 2.0 0.9
2018 Q1 0.3 −3.7 −31.3 −8.4 0.9 −0.2 −0.9 2.2 −3.8 −2.0 −1.7 3.5 −0.9Q2 −0.3 2.7 −4.3 17.7 4.3 −1.4 1.0 −11.2 0.9 3.8 0.3 2.6 1.0Q3 −0.7 3.8 −9.5 −7.3 1.7 0.6 0.4 −12.4 −2.5 1.0 3.7 0.3 0.4Q4 −0.2 2.9 1.3 −2.1 − −0.3 0.3 3.8 −0.7 0.1 1.4 −1.0 0.3
2019 Q1 1.8 6.0 3.8 −3.7 1.6 0.5 2.4 −7.1 2.2 1.7 4.7 1.8 2.4Q2 2.0 −5.1 2.0 9.4 0.3 −1.6 0.3 27.8 −7.6 0.4 0.5 0.8 0.3Q3 1.7 4.1 −0.4 −2.5 1.6 1.0 2.0 −5.4 10.0 1.5 − 1.7 2.0Q4 −0.2 −0.7 6.0 −2.6 −2.6 0.7 −0.7 −1.3 −4.4 −2.1 2.4 −0.8 −0.7
2020 Q1 −1.4 −0.8 −4.1 −3.2 −2.8 −0.5 −1.6 −14.0 3.7 −3.0 −4.7 3.5 −1.6Q2 −30.5 11.0 6.3 −23.2 −39.7 −19.0 −24.5 −47.9 −22.3 −37.4 −21.9 −13.4 −24.5
Percentage chang e , latest quarter on corresponding quarter of previous year
KG75 KH7R L64G L64J L64M L64P KG76 KG7B KG7A KH87 KH86 KG79 KG762017 Q1 6.1 10.6 7.8 7.7 11.0 −31.5 4.6 −11.1 16.9 10.3 2.3 −0.9 4.6
Q2 5.1 5.2 8.1 −1.4 12.2 −24.9 4.3 −1.6 20.0 11.7 −3.2 −0.7 4.3Q3 3.3 0.8 5.2 16.0 13.1 −23.8 2.8 −19.4 16.1 12.1 −2.1 0.4 2.8Q4 3.9 5.9 −15.8 6.7 17.9 −28.3 3.9 −7.5 19.9 13.9 −5.8 1.9 3.9
2018 Q1 1.5 1.6 −43.6 4.2 12.1 −2.3 2.2 −7.6 0.8 5.6 −0.9 7.9 2.2Q2 0.2 0.7 −48.3 −5.5 15.1 −2.5 1.7 −22.5 −3.5 7.6 0.6 9.8 1.7Q3 −1.1 5.4 −51.3 −2.6 13.9 −2.6 1.5 −30.3 −2.3 6.6 1.8 8.6 1.5Q4 −1.0 5.6 −39.7 −2.1 7.0 −1.2 0.9 −17.4 −6.0 2.9 3.7 5.5 0.9
2019 Q1 0.5 16.2 −8.9 2.9 7.8 −0.6 4.2 −25.0 −0.1 6.8 10.4 3.8 4.2Q2 2.8 7.4 −3.0 −4.4 3.7 −0.7 3.5 8.0 −8.5 3.3 10.6 1.9 3.5Q3 5.4 7.8 6.7 0.5 3.6 −0.4 5.1 16.6 3.2 3.8 6.7 3.3 5.1Q4 5.5 4.0 11.7 − 1.0 0.6 4.1 10.9 −0.7 1.5 7.7 3.5 4.1
2020 Q1 2.1 −2.7 3.2 0.6 −3.4 −0.4 − 2.6 0.8 −3.1 −1.9 5.2 −
Q2 −30.3 13.8 7.6 −29.4 −42.0 −18.0 −24.7 −58.2 −15.2 −39.6 −23.7 −9.6 −24.7
1 Not including expenditure on dwellings, land and existing buildings andcosts associated with the transfer of ownership of non-produced assets.
2 Remaining investment by public non-financial corporations included withinbusiness investment.
3 Includes cultivated biological resources (AN.115) and weapons (AN.114).
4 Includes new dwellings and improvements to dwellings.5 Including costs associated with the transfer of ownership of buildings, dwellings
and non-produced assets.
Page 50
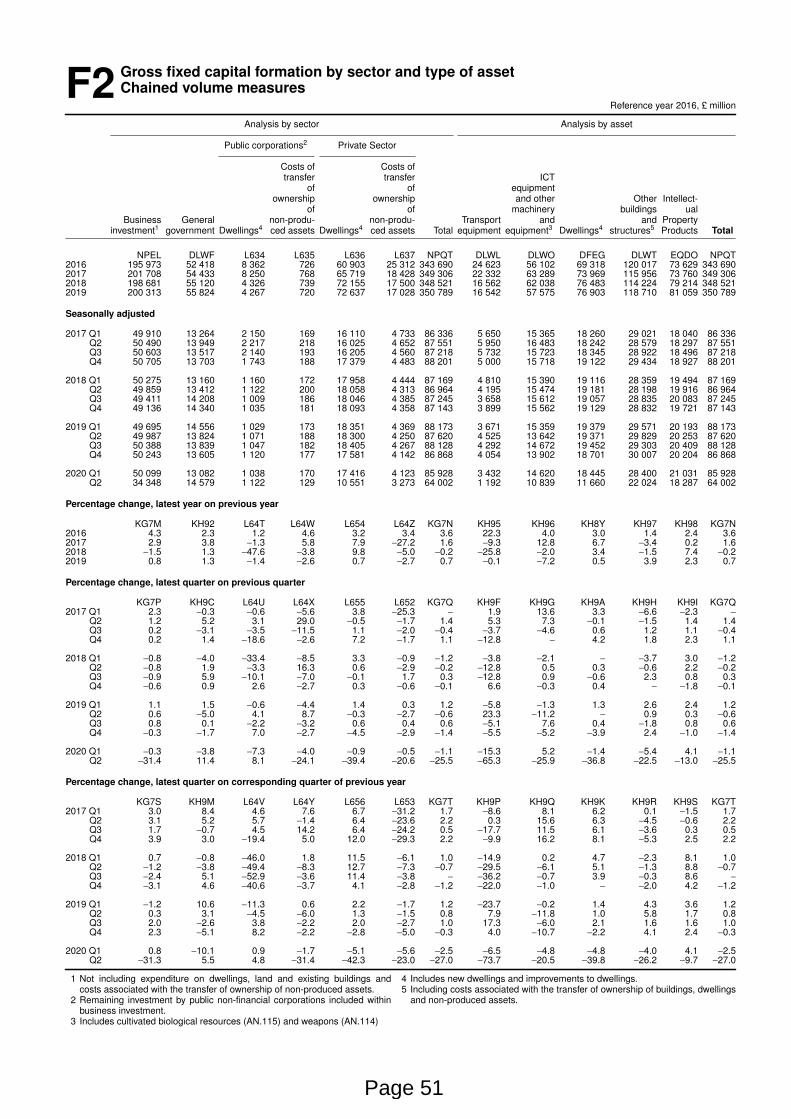
F2Gross fixed capital formation by sector and type of assetChained volume measures
Reference year 2016, £ million
Analysis by sector Analysis by asset
Public corporations2 Pr ivate Sector
Costs of Costs oftransfer transfer ICT
of of equipmentownership ownership and other Other Intellect-
of of machiner y buildings ualBusiness General non-produ- non-produ- Tr anspor t and and Proper ty
investment1 government Dwellings4 ced assets Dwellings4 ced assets Total equipment equipment3 Dwellings4 str uctures5 Products Total
NPEL DLWF L634 L635 L636 L637 NPQT DLWL DLWO DFEG DLWT EQDO NPQT2016 195 973 52 418 8 362 726 60 903 25 312 343 690 24 623 56 102 69 318 120 017 73 629 343 6902017 201 708 54 433 8 250 768 65 719 18 428 349 306 22 332 63 289 73 969 115 956 73 760 349 3062018 198 681 55 120 4 326 739 72 155 17 500 348 521 16 562 62 038 76 483 114 224 79 214 348 5212019 200 313 55 824 4 267 720 72 637 17 028 350 789 16 542 57 575 76 903 118 710 81 059 350 789
Seasonally adjusted
2017 Q1 49 910 13 264 2 150 169 16 110 4 733 86 336 5 650 15 365 18 260 29 021 18 040 86 336Q2 50 490 13 949 2 217 218 16 025 4 652 87 551 5 950 16 483 18 242 28 579 18 297 87 551Q3 50 603 13 517 2 140 193 16 205 4 560 87 218 5 732 15 723 18 345 28 922 18 496 87 218Q4 50 705 13 703 1 743 188 17 379 4 483 88 201 5 000 15 718 19 122 29 434 18 927 88 201
2018 Q1 50 275 13 160 1 160 172 17 958 4 444 87 169 4 810 15 390 19 116 28 359 19 494 87 169Q2 49 859 13 412 1 122 200 18 058 4 313 86 964 4 195 15 474 19 181 28 198 19 916 86 964Q3 49 411 14 208 1 009 186 18 046 4 385 87 245 3 658 15 612 19 057 28 835 20 083 87 245Q4 49 136 14 340 1 035 181 18 093 4 358 87 143 3 899 15 562 19 129 28 832 19 721 87 143
2019 Q1 49 695 14 556 1 029 173 18 351 4 369 88 173 3 671 15 359 19 379 29 571 20 193 88 173Q2 49 987 13 824 1 071 188 18 300 4 250 87 620 4 525 13 642 19 371 29 829 20 253 87 620Q3 50 388 13 839 1 047 182 18 405 4 267 88 128 4 292 14 672 19 452 29 303 20 409 88 128Q4 50 243 13 605 1 120 177 17 581 4 142 86 868 4 054 13 902 18 701 30 007 20 204 86 868
2020 Q1 50 099 13 082 1 038 170 17 416 4 123 85 928 3 432 14 620 18 445 28 400 21 031 85 928Q2 34 348 14 579 1 122 129 10 551 3 273 64 002 1 192 10 839 11 660 22 024 18 287 64 002
Percentage chang e , latest year on previous year
KG7M KH92 L64T L64W L654 L64Z KG7N KH95 KH96 KH8Y KH97 KH98 KG7N2016 4.3 2.3 1.2 4.6 3.2 3.4 3.6 22.3 4.0 3.0 1.4 2.4 3.62017 2.9 3.8 −1.3 5.8 7.9 −27.2 1.6 −9.3 12.8 6.7 −3.4 0.2 1.62018 −1.5 1.3 −47.6 −3.8 9.8 −5.0 −0.2 −25.8 −2.0 3.4 −1.5 7.4 −0.22019 0.8 1.3 −1.4 −2.6 0.7 −2.7 0.7 −0.1 −7.2 0.5 3.9 2.3 0.7
Percentage chang e , latest quarter on previous quarter
KG7P KH9C L64U L64X L655 L652 KG7Q KH9F KH9G KH9A KH9H KH9I KG7Q2017 Q1 2.3 −0.3 −0.6 −5.6 3.8 −25.3 − 1.9 13.6 3.3 −6.6 −2.3 −
Q2 1.2 5.2 3.1 29.0 −0.5 −1.7 1.4 5.3 7.3 −0.1 −1.5 1.4 1.4Q3 0.2 −3.1 −3.5 −11.5 1.1 −2.0 −0.4 −3.7 −4.6 0.6 1.2 1.1 −0.4Q4 0.2 1.4 −18.6 −2.6 7.2 −1.7 1.1 −12.8 − 4.2 1.8 2.3 1.1
2018 Q1 −0.8 −4.0 −33.4 −8.5 3.3 −0.9 −1.2 −3.8 −2.1 − −3.7 3.0 −1.2Q2 −0.8 1.9 −3.3 16.3 0.6 −2.9 −0.2 −12.8 0.5 0.3 −0.6 2.2 −0.2Q3 −0.9 5.9 −10.1 −7.0 −0.1 1.7 0.3 −12.8 0.9 −0.6 2.3 0.8 0.3Q4 −0.6 0.9 2.6 −2.7 0.3 −0.6 −0.1 6.6 −0.3 0.4 − −1.8 −0.1
2019 Q1 1.1 1.5 −0.6 −4.4 1.4 0.3 1.2 −5.8 −1.3 1.3 2.6 2.4 1.2Q2 0.6 −5.0 4.1 8.7 −0.3 −2.7 −0.6 23.3 −11.2 − 0.9 0.3 −0.6Q3 0.8 0.1 −2.2 −3.2 0.6 0.4 0.6 −5.1 7.6 0.4 −1.8 0.8 0.6Q4 −0.3 −1.7 7.0 −2.7 −4.5 −2.9 −1.4 −5.5 −5.2 −3.9 2.4 −1.0 −1.4
2020 Q1 −0.3 −3.8 −7.3 −4.0 −0.9 −0.5 −1.1 −15.3 5.2 −1.4 −5.4 4.1 −1.1Q2 −31.4 11.4 8.1 −24.1 −39.4 −20.6 −25.5 −65.3 −25.9 −36.8 −22.5 −13.0 −25.5
Percentage chang e , latest quarter on corresponding quarter of previous year
KG7S KH9M L64V L64Y L656 L653 KG7T KH9P KH9Q KH9K KH9R KH9S KG7T2017 Q1 3.0 8.4 4.6 7.6 6.7 −31.2 1.7 −8.6 8.1 6.2 0.1 −1.5 1.7
Q2 3.1 5.2 5.7 −1.4 6.4 −23.6 2.2 0.3 15.6 6.3 −4.5 −0.6 2.2Q3 1.7 −0.7 4.5 14.2 6.4 −24.2 0.5 −17.7 11.5 6.1 −3.6 0.3 0.5Q4 3.9 3.0 −19.4 5.0 12.0 −29.3 2.2 −9.9 16.2 8.1 −5.3 2.5 2.2
2018 Q1 0.7 −0.8 −46.0 1.8 11.5 −6.1 1.0 −14.9 0.2 4.7 −2.3 8.1 1.0Q2 −1.2 −3.8 −49.4 −8.3 12.7 −7.3 −0.7 −29.5 −6.1 5.1 −1.3 8.8 −0.7Q3 −2.4 5.1 −52.9 −3.6 11.4 −3.8 − −36.2 −0.7 3.9 −0.3 8.6 −
Q4 −3.1 4.6 −40.6 −3.7 4.1 −2.8 −1.2 −22.0 −1.0 − −2.0 4.2 −1.2
2019 Q1 −1.2 10.6 −11.3 0.6 2.2 −1.7 1.2 −23.7 −0.2 1.4 4.3 3.6 1.2Q2 0.3 3.1 −4.5 −6.0 1.3 −1.5 0.8 7.9 −11.8 1.0 5.8 1.7 0.8Q3 2.0 −2.6 3.8 −2.2 2.0 −2.7 1.0 17.3 −6.0 2.1 1.6 1.6 1.0Q4 2.3 −5.1 8.2 −2.2 −2.8 −5.0 −0.3 4.0 −10.7 −2.2 4.1 2.4 −0.3
2020 Q1 0.8 −10.1 0.9 −1.7 −5.1 −5.6 −2.5 −6.5 −4.8 −4.8 −4.0 4.1 −2.5Q2 −31.3 5.5 4.8 −31.4 −42.3 −23.0 −27.0 −73.7 −20.5 −39.8 −26.2 −9.7 −27.0
1 Not including expenditure on dwellings, land and existing buildings andcosts associated with the transfer of ownership of non-produced assets.
2 Remaining investment by public non-financial corporations included withinbusiness investment.
3 Includes cultivated biological resources (AN.115) and weapons (AN.114)
4 Includes new dwellings and improvements to dwellings.5 Including costs associated with the transfer of ownership of buildings, dwellings
and non-produced assets.
Page 51
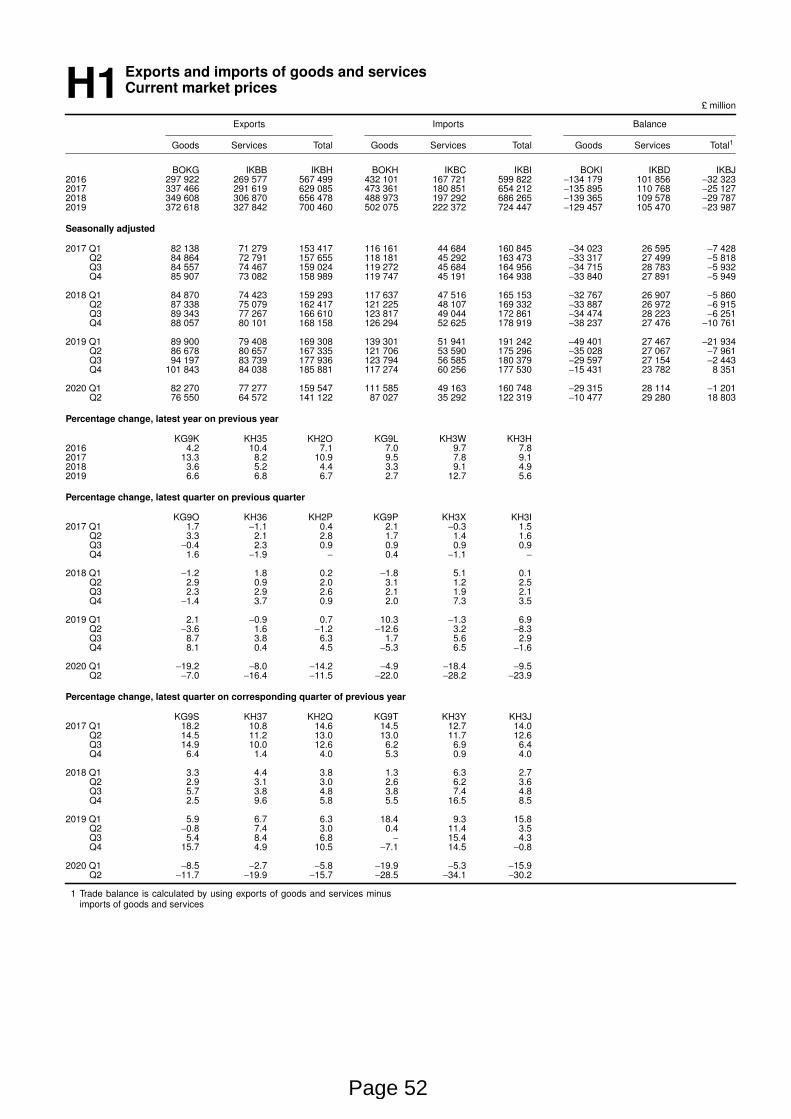
H1Expor ts and imports of goods and servicesCurrent market prices
£ million
Expor ts Impor ts Balance
Goods Services Total Goods Ser vices Total Goods Ser vices Total1
BOKG IKBB IKBH BOKH IKBC IKBI BOKI IKBD IKBJ2016 297 922 269 577 567 499 432 101 167 721 599 822 −134 179 101 856 −32 3232017 337 466 291 619 629 085 473 361 180 851 654 212 −135 895 110 768 −25 1272018 349 608 306 870 656 478 488 973 197 292 686 265 −139 365 109 578 −29 7872019 372 618 327 842 700 460 502 075 222 372 724 447 −129 457 105 470 −23 987
Seasonally adjusted
2017 Q1 82 138 71 279 153 417 116 161 44 684 160 845 −34 023 26 595 −7 428Q2 84 864 72 791 157 655 118 181 45 292 163 473 −33 317 27 499 −5 818Q3 84 557 74 467 159 024 119 272 45 684 164 956 −34 715 28 783 −5 932Q4 85 907 73 082 158 989 119 747 45 191 164 938 −33 840 27 891 −5 949
2018 Q1 84 870 74 423 159 293 117 637 47 516 165 153 −32 767 26 907 −5 860Q2 87 338 75 079 162 417 121 225 48 107 169 332 −33 887 26 972 −6 915Q3 89 343 77 267 166 610 123 817 49 044 172 861 −34 474 28 223 −6 251Q4 88 057 80 101 168 158 126 294 52 625 178 919 −38 237 27 476 −10 761
2019 Q1 89 900 79 408 169 308 139 301 51 941 191 242 −49 401 27 467 −21 934Q2 86 678 80 657 167 335 121 706 53 590 175 296 −35 028 27 067 −7 961Q3 94 197 83 739 177 936 123 794 56 585 180 379 −29 597 27 154 −2 443Q4 101 843 84 038 185 881 117 274 60 256 177 530 −15 431 23 782 8 351
2020 Q1 82 270 77 277 159 547 111 585 49 163 160 748 −29 315 28 114 −1 201Q2 76 550 64 572 141 122 87 027 35 292 122 319 −10 477 29 280 18 803
Percentage chang e , latest year on previous year
KG9K KH35 KH2O KG9L KH3W KH3H2016 4.2 10.4 7.1 7.0 9.7 7.82017 13.3 8.2 10.9 9.5 7.8 9.12018 3.6 5.2 4.4 3.3 9.1 4.92019 6.6 6.8 6.7 2.7 12.7 5.6
Percentage chang e , latest quarter on previous quarter
KG9O KH36 KH2P KG9P KH3X KH3I2017 Q1 1.7 −1.1 0.4 2.1 −0.3 1.5
Q2 3.3 2.1 2.8 1.7 1.4 1.6Q3 −0.4 2.3 0.9 0.9 0.9 0.9Q4 1.6 −1.9 − 0.4 −1.1 −
2018 Q1 −1.2 1.8 0.2 −1.8 5.1 0.1Q2 2.9 0.9 2.0 3.1 1.2 2.5Q3 2.3 2.9 2.6 2.1 1.9 2.1Q4 −1.4 3.7 0.9 2.0 7.3 3.5
2019 Q1 2.1 −0.9 0.7 10.3 −1.3 6.9Q2 −3.6 1.6 −1.2 −12.6 3.2 −8.3Q3 8.7 3.8 6.3 1.7 5.6 2.9Q4 8.1 0.4 4.5 −5.3 6.5 −1.6
2020 Q1 −19.2 −8.0 −14.2 −4.9 −18.4 −9.5Q2 −7.0 −16.4 −11.5 −22.0 −28.2 −23.9
Percentage chang e , latest quarter on corresponding quarter of previous year
KG9S KH37 KH2Q KG9T KH3Y KH3J2017 Q1 18.2 10.8 14.6 14.5 12.7 14.0
Q2 14.5 11.2 13.0 13.0 11.7 12.6Q3 14.9 10.0 12.6 6.2 6.9 6.4Q4 6.4 1.4 4.0 5.3 0.9 4.0
2018 Q1 3.3 4.4 3.8 1.3 6.3 2.7Q2 2.9 3.1 3.0 2.6 6.2 3.6Q3 5.7 3.8 4.8 3.8 7.4 4.8Q4 2.5 9.6 5.8 5.5 16.5 8.5
2019 Q1 5.9 6.7 6.3 18.4 9.3 15.8Q2 −0.8 7.4 3.0 0.4 11.4 3.5Q3 5.4 8.4 6.8 − 15.4 4.3Q4 15.7 4.9 10.5 −7.1 14.5 −0.8
2020 Q1 −8.5 −2.7 −5.8 −19.9 −5.3 −15.9Q2 −11.7 −19.9 −15.7 −28.5 −34.1 −30.2
1 Trade balance is calculated by using expor ts of goods and services minusimpor ts of goods and services
Page 52
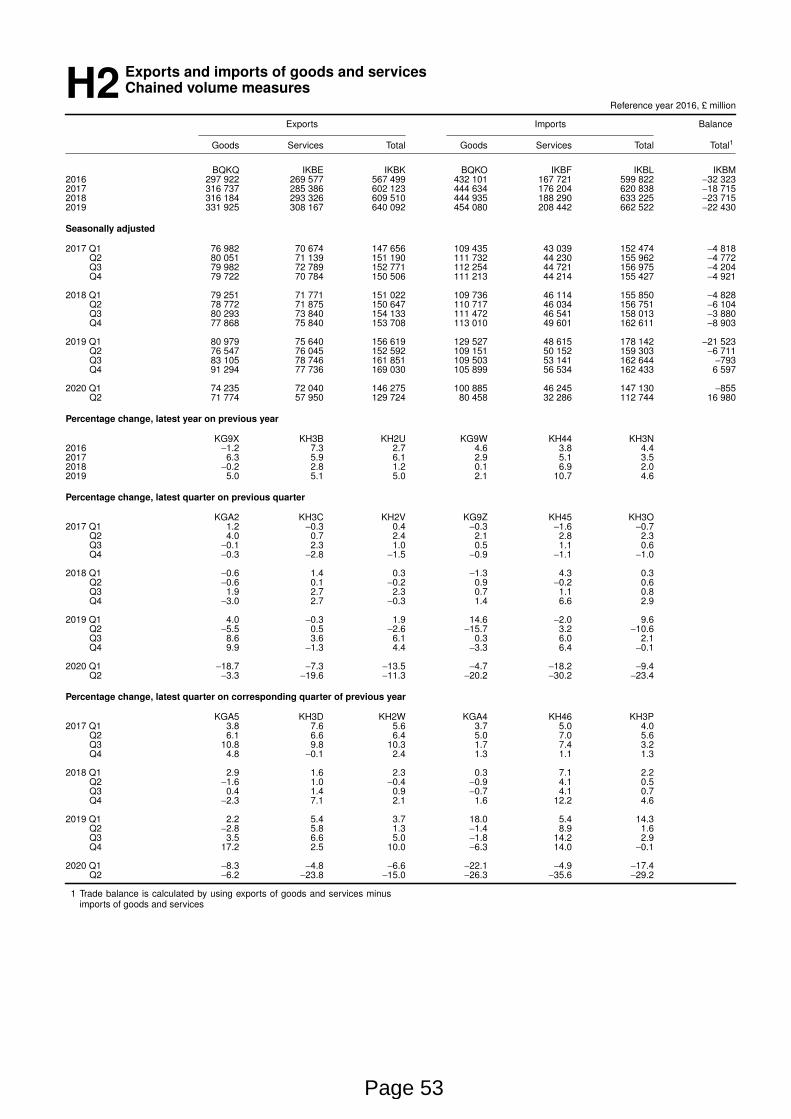
H2Expor ts and imports of goods and servicesChained volume measures
Reference year 2016, £ million
Expor ts Impor ts Balance
Goods Services Total Goods Ser vices Total Total1
BQKQ IKBE IKBK BQKO IKBF IKBL IKBM2016 297 922 269 577 567 499 432 101 167 721 599 822 −32 3232017 316 737 285 386 602 123 444 634 176 204 620 838 −18 7152018 316 184 293 326 609 510 444 935 188 290 633 225 −23 7152019 331 925 308 167 640 092 454 080 208 442 662 522 −22 430
Seasonally adjusted
2017 Q1 76 982 70 674 147 656 109 435 43 039 152 474 −4 818Q2 80 051 71 139 151 190 111 732 44 230 155 962 −4 772Q3 79 982 72 789 152 771 112 254 44 721 156 975 −4 204Q4 79 722 70 784 150 506 111 213 44 214 155 427 −4 921
2018 Q1 79 251 71 771 151 022 109 736 46 114 155 850 −4 828Q2 78 772 71 875 150 647 110 717 46 034 156 751 −6 104Q3 80 293 73 840 154 133 111 472 46 541 158 013 −3 880Q4 77 868 75 840 153 708 113 010 49 601 162 611 −8 903
2019 Q1 80 979 75 640 156 619 129 527 48 615 178 142 −21 523Q2 76 547 76 045 152 592 109 151 50 152 159 303 −6 711Q3 83 105 78 746 161 851 109 503 53 141 162 644 −793Q4 91 294 77 736 169 030 105 899 56 534 162 433 6 597
2020 Q1 74 235 72 040 146 275 100 885 46 245 147 130 −855Q2 71 774 57 950 129 724 80 458 32 286 112 744 16 980
Percentage chang e , latest year on previous year
KG9X KH3B KH2U KG9W KH44 KH3N2016 −1.2 7.3 2.7 4.6 3.8 4.42017 6.3 5.9 6.1 2.9 5.1 3.52018 −0.2 2.8 1.2 0.1 6.9 2.02019 5.0 5.1 5.0 2.1 10.7 4.6
Percentage chang e , latest quarter on previous quarter
KGA2 KH3C KH2V KG9Z KH45 KH3O2017 Q1 1.2 −0.3 0.4 −0.3 −1.6 −0.7
Q2 4.0 0.7 2.4 2.1 2.8 2.3Q3 −0.1 2.3 1.0 0.5 1.1 0.6Q4 −0.3 −2.8 −1.5 −0.9 −1.1 −1.0
2018 Q1 −0.6 1.4 0.3 −1.3 4.3 0.3Q2 −0.6 0.1 −0.2 0.9 −0.2 0.6Q3 1.9 2.7 2.3 0.7 1.1 0.8Q4 −3.0 2.7 −0.3 1.4 6.6 2.9
2019 Q1 4.0 −0.3 1.9 14.6 −2.0 9.6Q2 −5.5 0.5 −2.6 −15.7 3.2 −10.6Q3 8.6 3.6 6.1 0.3 6.0 2.1Q4 9.9 −1.3 4.4 −3.3 6.4 −0.1
2020 Q1 −18.7 −7.3 −13.5 −4.7 −18.2 −9.4Q2 −3.3 −19.6 −11.3 −20.2 −30.2 −23.4
Percentage chang e , latest quarter on corresponding quarter of previous year
KGA5 KH3D KH2W KGA4 KH46 KH3P2017 Q1 3.8 7.6 5.6 3.7 5.0 4.0
Q2 6.1 6.6 6.4 5.0 7.0 5.6Q3 10.8 9.8 10.3 1.7 7.4 3.2Q4 4.8 −0.1 2.4 1.3 1.1 1.3
2018 Q1 2.9 1.6 2.3 0.3 7.1 2.2Q2 −1.6 1.0 −0.4 −0.9 4.1 0.5Q3 0.4 1.4 0.9 −0.7 4.1 0.7Q4 −2.3 7.1 2.1 1.6 12.2 4.6
2019 Q1 2.2 5.4 3.7 18.0 5.4 14.3Q2 −2.8 5.8 1.3 −1.4 8.9 1.6Q3 3.5 6.6 5.0 −1.8 14.2 2.9Q4 17.2 2.5 10.0 −6.3 14.0 −0.1
2020 Q1 −8.3 −4.8 −6.6 −22.1 −4.9 −17.4Q2 −6.2 −23.8 −15.0 −26.3 −35.6 −29.2
1 Trade balance is calculated by using expor ts of goods and services minusimpor ts of goods and services
Page 53
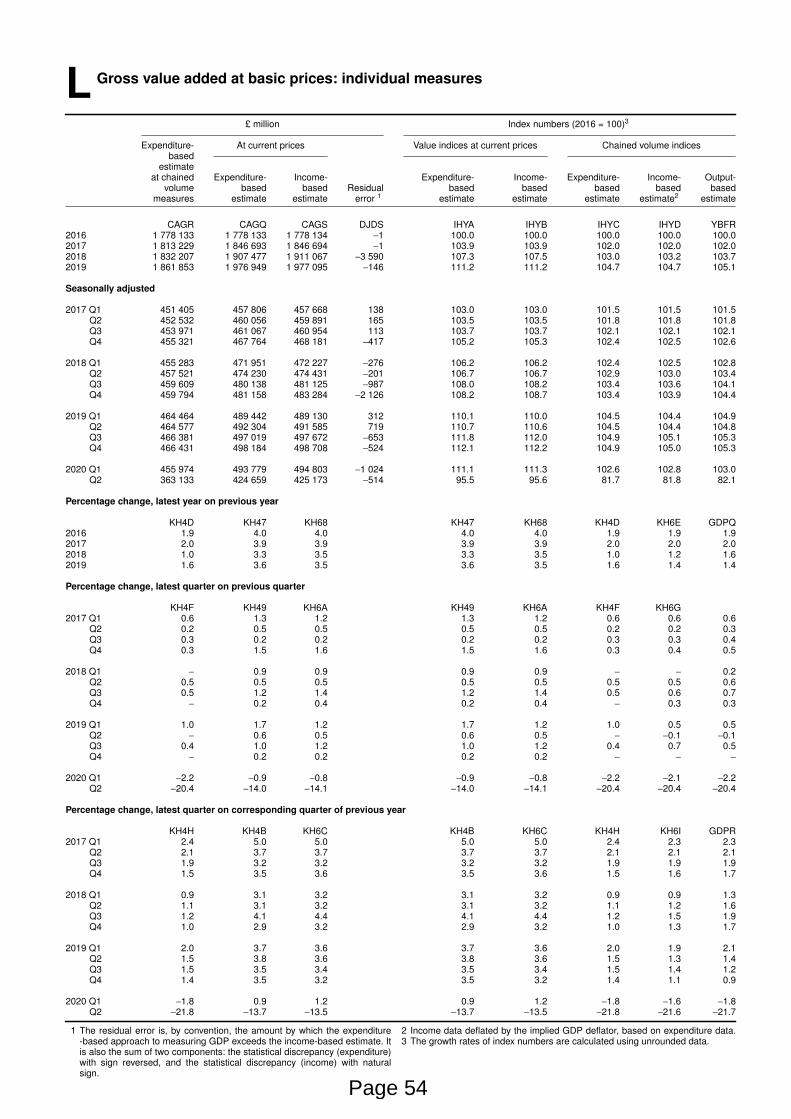
L Gross value added at basic prices: individual measures
£ million Index numbers (2016 = 100)3
Expenditure- At current prices Value indices at current prices Chained volume indicesbased
estimateat chained Expenditure- Income- Expenditure- Income- Expenditure- Income- Output-
volume based based Residual based based based based basedmeasures estimate estimate error 1 estimate estimate estimate estimate2 estimate
CAGR CAGQ CAGS DJDS IHYA IHYB IHYC IHYD YBFR2016 1 778 133 1 778 133 1 778 134 −1 100.0 100.0 100.0 100.0 100.02017 1 813 229 1 846 693 1 846 694 −1 103.9 103.9 102.0 102.0 102.02018 1 832 207 1 907 477 1 911 067 −3 590 107.3 107.5 103.0 103.2 103.72019 1 861 853 1 976 949 1 977 095 −146 111.2 111.2 104.7 104.7 105.1
Seasonally adjusted
2017 Q1 451 405 457 806 457 668 138 103.0 103.0 101.5 101.5 101.5Q2 452 532 460 056 459 891 165 103.5 103.5 101.8 101.8 101.8Q3 453 971 461 067 460 954 113 103.7 103.7 102.1 102.1 102.1Q4 455 321 467 764 468 181 −417 105.2 105.3 102.4 102.5 102.6
2018 Q1 455 283 471 951 472 227 −276 106.2 106.2 102.4 102.5 102.8Q2 457 521 474 230 474 431 −201 106.7 106.7 102.9 103.0 103.4Q3 459 609 480 138 481 125 −987 108.0 108.2 103.4 103.6 104.1Q4 459 794 481 158 483 284 −2 126 108.2 108.7 103.4 103.9 104.4
2019 Q1 464 464 489 442 489 130 312 110.1 110.0 104.5 104.4 104.9Q2 464 577 492 304 491 585 719 110.7 110.6 104.5 104.4 104.8Q3 466 381 497 019 497 672 −653 111.8 112.0 104.9 105.1 105.3Q4 466 431 498 184 498 708 −524 112.1 112.2 104.9 105.0 105.3
2020 Q1 455 974 493 779 494 803 −1 024 111.1 111.3 102.6 102.8 103.0Q2 363 133 424 659 425 173 −514 95.5 95.6 81.7 81.8 82.1
Percentage chang e , latest year on previous year
KH4D KH47 KH68 KH47 KH68 KH4D KH6E GDPQ2016 1.9 4.0 4.0 4.0 4.0 1.9 1.9 1.92017 2.0 3.9 3.9 3.9 3.9 2.0 2.0 2.02018 1.0 3.3 3.5 3.3 3.5 1.0 1.2 1.62019 1.6 3.6 3.5 3.6 3.5 1.6 1.4 1.4
Percentage chang e , latest quarter on previous quarter
KH4F KH49 KH6A KH49 KH6A KH4F KH6G2017 Q1 0.6 1.3 1.2 1.3 1.2 0.6 0.6 0.6
Q2 0.2 0.5 0.5 0.5 0.5 0.2 0.2 0.3Q3 0.3 0.2 0.2 0.2 0.2 0.3 0.3 0.4Q4 0.3 1.5 1.6 1.5 1.6 0.3 0.4 0.5
2018 Q1 − 0.9 0.9 0.9 0.9 − − 0.2Q2 0.5 0.5 0.5 0.5 0.5 0.5 0.5 0.6Q3 0.5 1.2 1.4 1.2 1.4 0.5 0.6 0.7Q4 − 0.2 0.4 0.2 0.4 − 0.3 0.3
2019 Q1 1.0 1.7 1.2 1.7 1.2 1.0 0.5 0.5Q2 − 0.6 0.5 0.6 0.5 − −0.1 −0.1Q3 0.4 1.0 1.2 1.0 1.2 0.4 0.7 0.5Q4 − 0.2 0.2 0.2 0.2 − − −
2020 Q1 −2.2 −0.9 −0.8 −0.9 −0.8 −2.2 −2.1 −2.2Q2 −20.4 −14.0 −14.1 −14.0 −14.1 −20.4 −20.4 −20.4
Percentage chang e , latest quarter on corresponding quarter of previous year
KH4H KH4B KH6C KH4B KH6C KH4H KH6I GDPR2017 Q1 2.4 5.0 5.0 5.0 5.0 2.4 2.3 2.3
Q2 2.1 3.7 3.7 3.7 3.7 2.1 2.1 2.1Q3 1.9 3.2 3.2 3.2 3.2 1.9 1.9 1.9Q4 1.5 3.5 3.6 3.5 3.6 1.5 1.6 1.7
2018 Q1 0.9 3.1 3.2 3.1 3.2 0.9 0.9 1.3Q2 1.1 3.1 3.2 3.1 3.2 1.1 1.2 1.6Q3 1.2 4.1 4.4 4.1 4.4 1.2 1.5 1.9Q4 1.0 2.9 3.2 2.9 3.2 1.0 1.3 1.7
2019 Q1 2.0 3.7 3.6 3.7 3.6 2.0 1.9 2.1Q2 1.5 3.8 3.6 3.8 3.6 1.5 1.3 1.4Q3 1.5 3.5 3.4 3.5 3.4 1.5 1.4 1.2Q4 1.4 3.5 3.2 3.5 3.2 1.4 1.1 0.9
2020 Q1 −1.8 0.9 1.2 0.9 1.2 −1.8 −1.6 −1.8Q2 −21.8 −13.7 −13.5 −13.7 −13.5 −21.8 −21.6 −21.7
1 The residual error is, by convention, the amount by which the expenditure-based approach to measuring GDP exceeds the income-based estimate. Itis also the sum of two components: the statistical discrepancy (expenditure)with sign reversed, and the statistical discrepancy (income) with naturalsign.
2 Income data deflated by the implied GDP deflator, based on expenditure data.3 The growth rates of index numbers are calculated using unrounded data.
Page 54
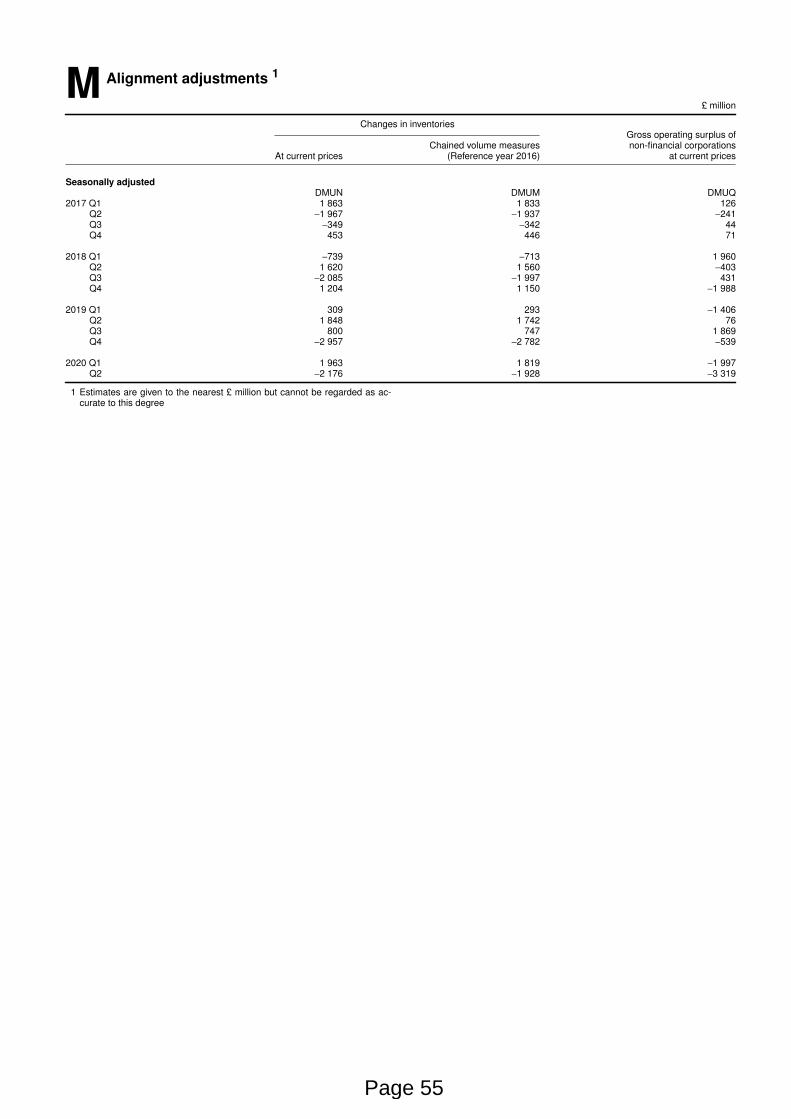
M Alignment adjustments 1
£ million
Changes in inventor iesGross operating surplus of
Chained volume measures non-financial corporationsAt current prices (Reference year 2016) at current prices
Seasonally adjustedDMUN DMUM DMUQ
2017 Q1 1 863 1 833 126Q2 −1 967 −1 937 −241Q3 −349 −342 44Q4 453 446 71
2018 Q1 −739 −713 1 960Q2 1 620 1 560 −403Q3 −2 085 −1 997 431Q4 1 204 1 150 −1 988
2019 Q1 309 293 −1 406Q2 1 848 1 742 76Q3 800 747 1 869Q4 −2 957 −2 782 −539
2020 Q1 1 963 1 819 −1 997Q2 −2 176 −1 928 −3 319
1 Estimates are given to the nearest £ million but cannot be regarded as ac-curate to this degree
Page 55
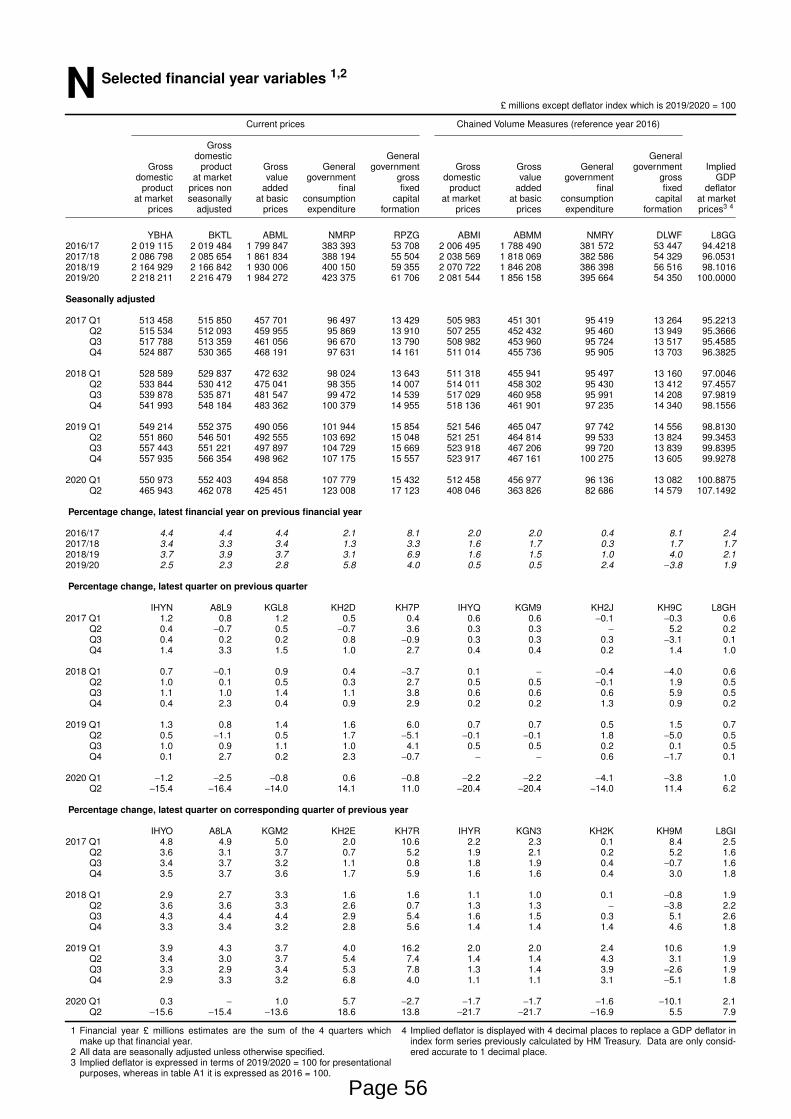
N Selected financial year variables 1,2
£ millions except deflator index which is 2019/2020 = 100
Current prices Chained Volume Measures (reference year 2016)
Grossdomestic General General
Gross product Gross General government Gross Gross General government Implieddomestic at mar ket value government gross domestic value government gross GDP
product prices non added final fixed product added final fixed deflatorat market seasonally at basic consumption capital at mar ket at basic consumption capital at mar ket
pr ices adjusted prices expenditure for mation pr ices pr ices expenditure for mation pr ices3 4
YBHA BKTL ABML NMRP RPZG ABMI ABMM NMRY DLWF L8GG2016/17 2 019 115 2 019 484 1 799 847 383 393 53 708 2 006 495 1 788 490 381 572 53 447 94.42182017/18 2 086 798 2 085 654 1 861 834 388 194 55 504 2 038 569 1 818 069 382 586 54 329 96.05312018/19 2 164 929 2 166 842 1 930 006 400 150 59 355 2 070 722 1 846 208 386 398 56 516 98.10162019/20 2 218 211 2 216 479 1 984 272 423 375 61 706 2 081 544 1 856 158 395 664 54 350 100.0000
Seasonally adjusted
2017 Q1 513 458 515 850 457 701 96 497 13 429 505 983 451 301 95 419 13 264 95.2213Q2 515 534 512 093 459 955 95 869 13 910 507 255 452 432 95 460 13 949 95.3666Q3 517 788 513 359 461 056 96 670 13 790 508 982 453 960 95 724 13 517 95.4585Q4 524 887 530 365 468 191 97 631 14 161 511 014 455 736 95 905 13 703 96.3825
2018 Q1 528 589 529 837 472 632 98 024 13 643 511 318 455 941 95 497 13 160 97.0046Q2 533 844 530 412 475 041 98 355 14 007 514 011 458 302 95 430 13 412 97.4557Q3 539 878 535 871 481 547 99 472 14 539 517 029 460 958 95 991 14 208 97.9819Q4 541 993 548 184 483 362 100 379 14 955 518 136 461 901 97 235 14 340 98.1556
2019 Q1 549 214 552 375 490 056 101 944 15 854 521 546 465 047 97 742 14 556 98.8130Q2 551 860 546 501 492 555 103 692 15 048 521 251 464 814 99 533 13 824 99.3453Q3 557 443 551 221 497 897 104 729 15 669 523 918 467 206 99 720 13 839 99.8395Q4 557 935 566 354 498 962 107 175 15 557 523 917 467 161 100 275 13 605 99.9278
2020 Q1 550 973 552 403 494 858 107 779 15 432 512 458 456 977 96 136 13 082 100.8875Q2 465 943 462 078 425 451 123 008 17 123 408 046 363 826 82 686 14 579 107.1492
Percentage chang e , latest financial year on previous financial year
2016/17 4.4 4.4 4.4 2.1 8.1 2.0 2.0 0.4 8.1 2.4
2017/18 3.4 3.3 3.4 1.3 3.3 1.6 1.7 0.3 1.7 1.7
2018/19 3.7 3.9 3.7 3.1 6.9 1.6 1.5 1.0 4.0 2.1
2019/20 2.5 2.3 2.8 5.8 4.0 0.5 0.5 2.4 −3.8 1.9
Percentage chang e , latest quarter on previous quarter
IHYN A8L9 KGL8 KH2D KH7P IHYQ KGM9 KH2J KH9C L8GH2017 Q1 1.2 0.8 1.2 0.5 0.4 0.6 0.6 −0.1 −0.3 0.6
Q2 0.4 −0.7 0.5 −0.7 3.6 0.3 0.3 − 5.2 0.2Q3 0.4 0.2 0.2 0.8 −0.9 0.3 0.3 0.3 −3.1 0.1Q4 1.4 3.3 1.5 1.0 2.7 0.4 0.4 0.2 1.4 1.0
2018 Q1 0.7 −0.1 0.9 0.4 −3.7 0.1 − −0.4 −4.0 0.6Q2 1.0 0.1 0.5 0.3 2.7 0.5 0.5 −0.1 1.9 0.5Q3 1.1 1.0 1.4 1.1 3.8 0.6 0.6 0.6 5.9 0.5Q4 0.4 2.3 0.4 0.9 2.9 0.2 0.2 1.3 0.9 0.2
2019 Q1 1.3 0.8 1.4 1.6 6.0 0.7 0.7 0.5 1.5 0.7Q2 0.5 −1.1 0.5 1.7 −5.1 −0.1 −0.1 1.8 −5.0 0.5Q3 1.0 0.9 1.1 1.0 4.1 0.5 0.5 0.2 0.1 0.5Q4 0.1 2.7 0.2 2.3 −0.7 − − 0.6 −1.7 0.1
2020 Q1 −1.2 −2.5 −0.8 0.6 −0.8 −2.2 −2.2 −4.1 −3.8 1.0Q2 −15.4 −16.4 −14.0 14.1 11.0 −20.4 −20.4 −14.0 11.4 6.2
Percentage chang e , latest quarter on corresponding quarter of previous year
IHYO A8LA KGM2 KH2E KH7R IHYR KGN3 KH2K KH9M L8GI2017 Q1 4.8 4.9 5.0 2.0 10.6 2.2 2.3 0.1 8.4 2.5
Q2 3.6 3.1 3.7 0.7 5.2 1.9 2.1 0.2 5.2 1.6Q3 3.4 3.7 3.2 1.1 0.8 1.8 1.9 0.4 −0.7 1.6Q4 3.5 3.7 3.6 1.7 5.9 1.6 1.6 0.4 3.0 1.8
2018 Q1 2.9 2.7 3.3 1.6 1.6 1.1 1.0 0.1 −0.8 1.9Q2 3.6 3.6 3.3 2.6 0.7 1.3 1.3 − −3.8 2.2Q3 4.3 4.4 4.4 2.9 5.4 1.6 1.5 0.3 5.1 2.6Q4 3.3 3.4 3.2 2.8 5.6 1.4 1.4 1.4 4.6 1.8
2019 Q1 3.9 4.3 3.7 4.0 16.2 2.0 2.0 2.4 10.6 1.9Q2 3.4 3.0 3.7 5.4 7.4 1.4 1.4 4.3 3.1 1.9Q3 3.3 2.9 3.4 5.3 7.8 1.3 1.4 3.9 −2.6 1.9Q4 2.9 3.3 3.2 6.8 4.0 1.1 1.1 3.1 −5.1 1.8
2020 Q1 0.3 − 1.0 5.7 −2.7 −1.7 −1.7 −1.6 −10.1 2.1Q2 −15.6 −15.4 −13.6 18.6 13.8 −21.7 −21.7 −16.9 5.5 7.9
1 Financial year £ millions estimates are the sum of the 4 quarters whichmake up that financial year.
2 All data are seasonally adjusted unless otherwise specified.3 Implied deflator is expressed in terms of 2019/2020 = 100 for presentational
pur poses, whereas in table A1 it is expressed as 2016 = 100.
4 Implied deflator is displayed with 4 decimal places to replace a GDP deflator inindex for m ser ies previously calculated by HM Treasur y. Data are only consid-ered accurate to 1 decimal place.
Page 56
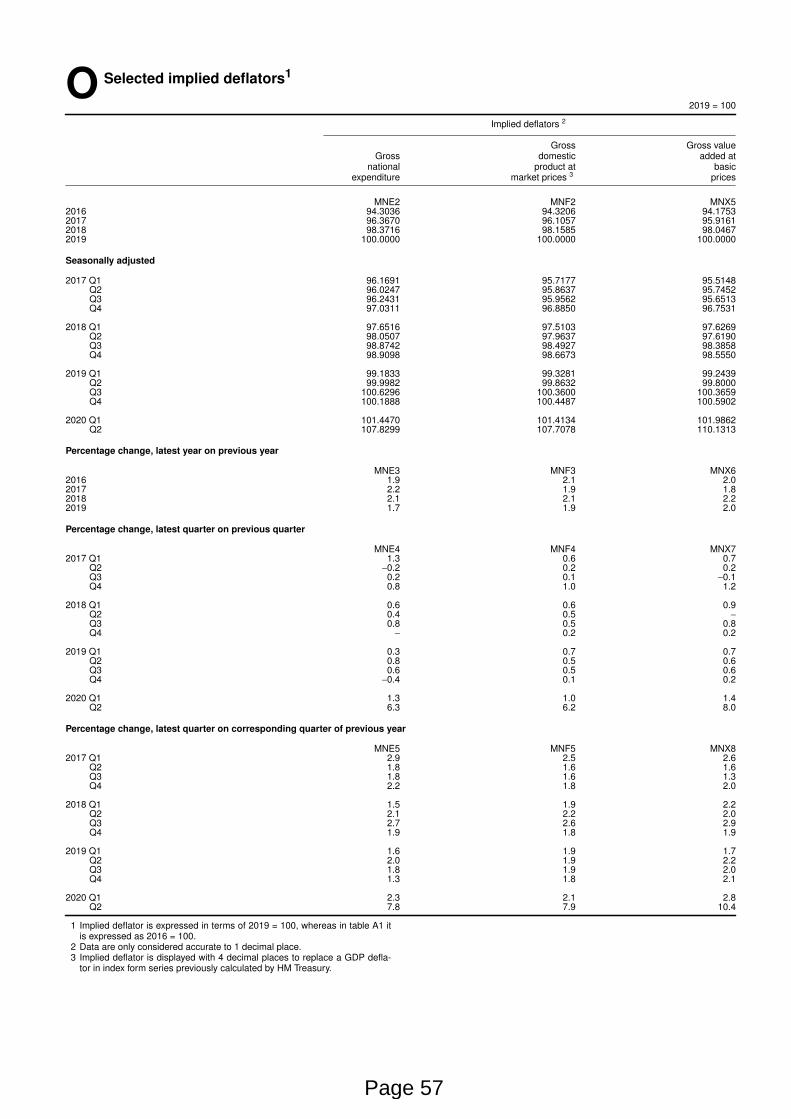
O Selected implied deflators1
2019 = 100
Implied deflators 2
Gross Gross valueGross domestic added at
national product at basicexpenditure market prices 3 pr ices
MNE2 MNF2 MNX52016 94.3036 94.3206 94.17532017 96.3670 96.1057 95.91612018 98.3716 98.1585 98.04672019 100.0000 100.0000 100.0000
Seasonally adjusted
2017 Q1 96.1691 95.7177 95.5148Q2 96.0247 95.8637 95.7452Q3 96.2431 95.9562 95.6513Q4 97.0311 96.8850 96.7531
2018 Q1 97.6516 97.5103 97.6269Q2 98.0507 97.9637 97.6190Q3 98.8742 98.4927 98.3858Q4 98.9098 98.6673 98.5550
2019 Q1 99.1833 99.3281 99.2439Q2 99.9982 99.8632 99.8000Q3 100.6296 100.3600 100.3659Q4 100.1888 100.4487 100.5902
2020 Q1 101.4470 101.4134 101.9862Q2 107.8299 107.7078 110.1313
Percentage chang e , latest year on previous year
MNE3 MNF3 MNX62016 1.9 2.1 2.02017 2.2 1.9 1.82018 2.1 2.1 2.22019 1.7 1.9 2.0
Percentage chang e , latest quarter on previous quarter
MNE4 MNF4 MNX72017 Q1 1.3 0.6 0.7
Q2 −0.2 0.2 0.2Q3 0.2 0.1 −0.1Q4 0.8 1.0 1.2
2018 Q1 0.6 0.6 0.9Q2 0.4 0.5 −
Q3 0.8 0.5 0.8Q4 − 0.2 0.2
2019 Q1 0.3 0.7 0.7Q2 0.8 0.5 0.6Q3 0.6 0.5 0.6Q4 −0.4 0.1 0.2
2020 Q1 1.3 1.0 1.4Q2 6.3 6.2 8.0
Percentage chang e , latest quarter on corresponding quarter of previous year
MNE5 MNF5 MNX82017 Q1 2.9 2.5 2.6
Q2 1.8 1.6 1.6Q3 1.8 1.6 1.3Q4 2.2 1.8 2.0
2018 Q1 1.5 1.9 2.2Q2 2.1 2.2 2.0Q3 2.7 2.6 2.9Q4 1.9 1.8 1.9
2019 Q1 1.6 1.9 1.7Q2 2.0 1.9 2.2Q3 1.8 1.9 2.0Q4 1.3 1.8 2.1
2020 Q1 2.3 2.1 2.8Q2 7.8 7.9 10.4
1 Implied deflator is expressed in terms of 2019 = 100, whereas in table A1 itis expressed as 2016 = 100.
2 Data are only considered accurate to 1 decimal place.3 Implied deflator is displayed with 4 decimal places to replace a GDP defla-
tor in index for m ser ies previously calculated by HM Treasur y.
Page 57
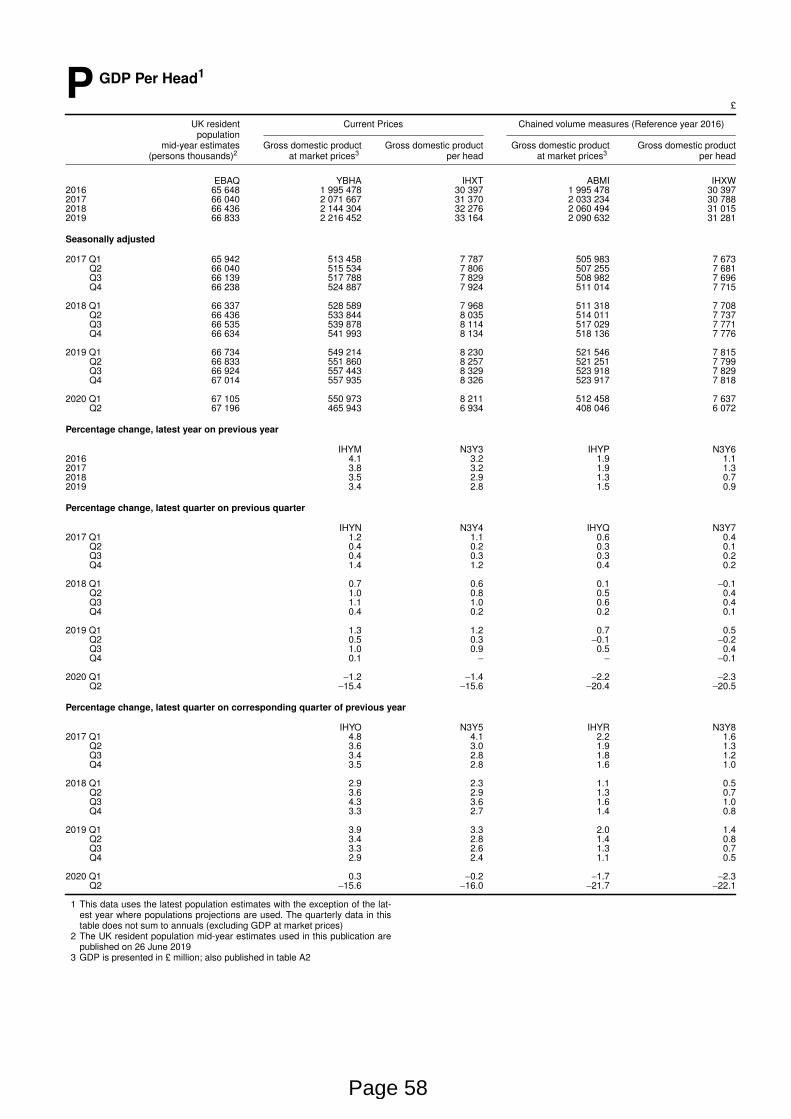
P GDP Per Head1
£
UK resident Current Prices Chained volume measures (Reference year 2016)population
mid-year estimates Gross domestic product Gross domestic product Gross domestic product Gross domestic product(persons thousands)2 at market prices3 per head at market prices3 per head
EBAQ YBHA IHXT ABMI IHXW2016 65 648 1 995 478 30 397 1 995 478 30 3972017 66 040 2 071 667 31 370 2 033 234 30 7882018 66 436 2 144 304 32 276 2 060 494 31 0152019 66 833 2 216 452 33 164 2 090 632 31 281
Seasonally adjusted
2017 Q1 65 942 513 458 7 787 505 983 7 673Q2 66 040 515 534 7 806 507 255 7 681Q3 66 139 517 788 7 829 508 982 7 696Q4 66 238 524 887 7 924 511 014 7 715
2018 Q1 66 337 528 589 7 968 511 318 7 708Q2 66 436 533 844 8 035 514 011 7 737Q3 66 535 539 878 8 114 517 029 7 771Q4 66 634 541 993 8 134 518 136 7 776
2019 Q1 66 734 549 214 8 230 521 546 7 815Q2 66 833 551 860 8 257 521 251 7 799Q3 66 924 557 443 8 329 523 918 7 829Q4 67 014 557 935 8 326 523 917 7 818
2020 Q1 67 105 550 973 8 211 512 458 7 637Q2 67 196 465 943 6 934 408 046 6 072
Percentage chang e , latest year on previous year
IHYM N3Y3 IHYP N3Y62016 4.1 3.2 1.9 1.12017 3.8 3.2 1.9 1.32018 3.5 2.9 1.3 0.72019 3.4 2.8 1.5 0.9
Percentage chang e , latest quarter on previous quarter
IHYN N3Y4 IHYQ N3Y72017 Q1 1.2 1.1 0.6 0.4
Q2 0.4 0.2 0.3 0.1Q3 0.4 0.3 0.3 0.2Q4 1.4 1.2 0.4 0.2
2018 Q1 0.7 0.6 0.1 −0.1Q2 1.0 0.8 0.5 0.4Q3 1.1 1.0 0.6 0.4Q4 0.4 0.2 0.2 0.1
2019 Q1 1.3 1.2 0.7 0.5Q2 0.5 0.3 −0.1 −0.2Q3 1.0 0.9 0.5 0.4Q4 0.1 − − −0.1
2020 Q1 −1.2 −1.4 −2.2 −2.3Q2 −15.4 −15.6 −20.4 −20.5
Percentage chang e , latest quarter on corresponding quarter of previous year
IHYO N3Y5 IHYR N3Y82017 Q1 4.8 4.1 2.2 1.6
Q2 3.6 3.0 1.9 1.3Q3 3.4 2.8 1.8 1.2Q4 3.5 2.8 1.6 1.0
2018 Q1 2.9 2.3 1.1 0.5Q2 3.6 2.9 1.3 0.7Q3 4.3 3.6 1.6 1.0Q4 3.3 2.7 1.4 0.8
2019 Q1 3.9 3.3 2.0 1.4Q2 3.4 2.8 1.4 0.8Q3 3.3 2.6 1.3 0.7Q4 2.9 2.4 1.1 0.5
2020 Q1 0.3 −0.2 −1.7 −2.3Q2 −15.6 −16.0 −21.7 −22.1
1 This data uses the latest population estimates with the exception of the lat-est year where populations projections are used. The quarter ly data in thistable does not sum to annuals (excluding GDP at market prices)
2 The UK resident population mid-year estimates used in this publication arepublished on 26 June 2019
3 GDP is presented in £ million; also published in table A2
Page 58
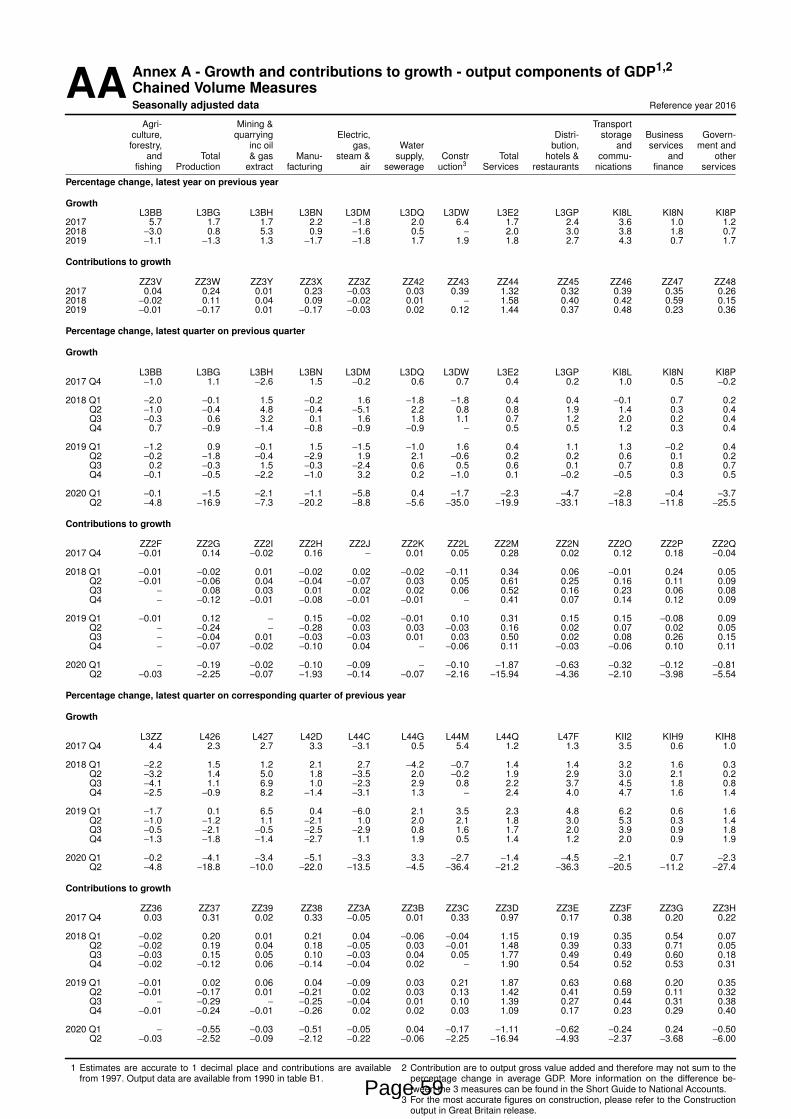
AAAnnex A - Gro wth and contributions to growth - output components of GDP1,2
Chained Volume MeasuresSeasonally adjusted data Reference year 2016
Agri- Mining & Tr anspor tculture, quarr ying Electr ic, Distr i- storage Business Govern-forestr y, inc oil gas, Water bution, and ser vices ment and
and Total & gas Manu- steam & supply, Constr Total hotels & commu- and otherfishing Production extract factur ing air sewerage uction3 Ser vices restaurants nications finance services
Percentage chang e , latest year on previous year
GrowthL3BB L3BG L3BH L3BN L3DM L3DQ L3DW L3E2 L3GP KI8L KI8N KI8P
2017 5.7 1.7 1.7 2.2 −1.8 2.0 6.4 1.7 2.4 3.6 1.0 1.22018 −3.0 0.8 5.3 0.9 −1.6 0.5 − 2.0 3.0 3.8 1.8 0.72019 −1.1 −1.3 1.3 −1.7 −1.8 1.7 1.9 1.8 2.7 4.3 0.7 1.7
Contributions to growth
ZZ3V ZZ3W ZZ3Y ZZ3X ZZ3Z ZZ42 ZZ43 ZZ44 ZZ45 ZZ46 ZZ47 ZZ482017 0.04 0.24 0.01 0.23 −0.03 0.03 0.39 1.32 0.32 0.39 0.35 0.262018 −0.02 0.11 0.04 0.09 −0.02 0.01 − 1.58 0.40 0.42 0.59 0.152019 −0.01 −0.17 0.01 −0.17 −0.03 0.02 0.12 1.44 0.37 0.48 0.23 0.36
Percentage chang e , latest quarter on previous quarter
Growth
L3BB L3BG L3BH L3BN L3DM L3DQ L3DW L3E2 L3GP KI8L KI8N KI8P2017 Q4 −1.0 1.1 −2.6 1.5 −0.2 0.6 0.7 0.4 0.2 1.0 0.5 −0.2
2018 Q1 −2.0 −0.1 1.5 −0.2 1.6 −1.8 −1.8 0.4 0.4 −0.1 0.7 0.2Q2 −1.0 −0.4 4.8 −0.4 −5.1 2.2 0.8 0.8 1.9 1.4 0.3 0.4Q3 −0.3 0.6 3.2 0.1 1.6 1.8 1.1 0.7 1.2 2.0 0.2 0.4Q4 0.7 −0.9 −1.4 −0.8 −0.9 −0.9 − 0.5 0.5 1.2 0.3 0.4
2019 Q1 −1.2 0.9 −0.1 1.5 −1.5 −1.0 1.6 0.4 1.1 1.3 −0.2 0.4Q2 −0.2 −1.8 −0.4 −2.9 1.9 2.1 −0.6 0.2 0.2 0.6 0.1 0.2Q3 0.2 −0.3 1.5 −0.3 −2.4 0.6 0.5 0.6 0.1 0.7 0.8 0.7Q4 −0.1 −0.5 −2.2 −1.0 3.2 0.2 −1.0 0.1 −0.2 −0.5 0.3 0.5
2020 Q1 −0.1 −1.5 −2.1 −1.1 −5.8 0.4 −1.7 −2.3 −4.7 −2.8 −0.4 −3.7Q2 −4.8 −16.9 −7.3 −20.2 −8.8 −5.6 −35.0 −19.9 −33.1 −18.3 −11.8 −25.5
Contributions to growth
ZZ2F ZZ2G ZZ2I ZZ2H ZZ2J ZZ2K ZZ2L ZZ2M ZZ2N ZZ2O ZZ2P ZZ2Q2017 Q4 −0.01 0.14 −0.02 0.16 − 0.01 0.05 0.28 0.02 0.12 0.18 −0.04
2018 Q1 −0.01 −0.02 0.01 −0.02 0.02 −0.02 −0.11 0.34 0.06 −0.01 0.24 0.05Q2 −0.01 −0.06 0.04 −0.04 −0.07 0.03 0.05 0.61 0.25 0.16 0.11 0.09Q3 − 0.08 0.03 0.01 0.02 0.02 0.06 0.52 0.16 0.23 0.06 0.08Q4 − −0.12 −0.01 −0.08 −0.01 −0.01 − 0.41 0.07 0.14 0.12 0.09
2019 Q1 −0.01 0.12 − 0.15 −0.02 −0.01 0.10 0.31 0.15 0.15 −0.08 0.09Q2 − −0.24 − −0.28 0.03 0.03 −0.03 0.16 0.02 0.07 0.02 0.05Q3 − −0.04 0.01 −0.03 −0.03 0.01 0.03 0.50 0.02 0.08 0.26 0.15Q4 − −0.07 −0.02 −0.10 0.04 − −0.06 0.11 −0.03 −0.06 0.10 0.11
2020 Q1 − −0.19 −0.02 −0.10 −0.09 − −0.10 −1.87 −0.63 −0.32 −0.12 −0.81Q2 −0.03 −2.25 −0.07 −1.93 −0.14 −0.07 −2.16 −15.94 −4.36 −2.10 −3.98 −5.54
Percentage chang e , latest quarter on corresponding quarter of previous year
Growth
L3ZZ L426 L427 L42D L44C L44G L44M L44Q L47F KII2 KIH9 KIH82017 Q4 4.4 2.3 2.7 3.3 −3.1 0.5 5.4 1.2 1.3 3.5 0.6 1.0
2018 Q1 −2.2 1.5 1.2 2.1 2.7 −4.2 −0.7 1.4 1.4 3.2 1.6 0.3Q2 −3.2 1.4 5.0 1.8 −3.5 2.0 −0.2 1.9 2.9 3.0 2.1 0.2Q3 −4.1 1.1 6.9 1.0 −2.3 2.9 0.8 2.2 3.7 4.5 1.8 0.8Q4 −2.5 −0.9 8.2 −1.4 −3.1 1.3 − 2.4 4.0 4.7 1.6 1.4
2019 Q1 −1.7 0.1 6.5 0.4 −6.0 2.1 3.5 2.3 4.8 6.2 0.6 1.6Q2 −1.0 −1.2 1.1 −2.1 1.0 2.0 2.1 1.8 3.0 5.3 0.3 1.4Q3 −0.5 −2.1 −0.5 −2.5 −2.9 0.8 1.6 1.7 2.0 3.9 0.9 1.8Q4 −1.3 −1.8 −1.4 −2.7 1.1 1.9 0.5 1.4 1.2 2.0 0.9 1.9
2020 Q1 −0.2 −4.1 −3.4 −5.1 −3.3 3.3 −2.7 −1.4 −4.5 −2.1 0.7 −2.3Q2 −4.8 −18.8 −10.0 −22.0 −13.5 −4.5 −36.4 −21.2 −36.3 −20.5 −11.2 −27.4
Contributions to growth
ZZ36 ZZ37 ZZ39 ZZ38 ZZ3A ZZ3B ZZ3C ZZ3D ZZ3E ZZ3F ZZ3G ZZ3H2017 Q4 0.03 0.31 0.02 0.33 −0.05 0.01 0.33 0.97 0.17 0.38 0.20 0.22
2018 Q1 −0.02 0.20 0.01 0.21 0.04 −0.06 −0.04 1.15 0.19 0.35 0.54 0.07Q2 −0.02 0.19 0.04 0.18 −0.05 0.03 −0.01 1.48 0.39 0.33 0.71 0.05Q3 −0.03 0.15 0.05 0.10 −0.03 0.04 0.05 1.77 0.49 0.49 0.60 0.18Q4 −0.02 −0.12 0.06 −0.14 −0.04 0.02 − 1.90 0.54 0.52 0.53 0.31
2019 Q1 −0.01 0.02 0.06 0.04 −0.09 0.03 0.21 1.87 0.63 0.68 0.20 0.35Q2 −0.01 −0.17 0.01 −0.21 0.02 0.03 0.13 1.42 0.41 0.59 0.11 0.32Q3 − −0.29 − −0.25 −0.04 0.01 0.10 1.39 0.27 0.44 0.31 0.38Q4 −0.01 −0.24 −0.01 −0.26 0.02 0.02 0.03 1.09 0.17 0.23 0.29 0.40
2020 Q1 − −0.55 −0.03 −0.51 −0.05 0.04 −0.17 −1.11 −0.62 −0.24 0.24 −0.50Q2 −0.03 −2.52 −0.09 −2.12 −0.22 −0.06 −2.25 −16.94 −4.93 −2.37 −3.68 −6.00
1 Estimates are accurate to 1 decimal place and contributions are availablefrom 1997. Output data are available from 1990 in table B1.
2 Contr ibution are to output gross value added and therefore may not sum to thepercentage change in average GDP. More infor mation on the difference be-tween the 3 measures can be found in the Short Guide to National Accounts.
3 For the most accurate figures on construction, please refer to the Constructionoutput in Great Britain release.
Page 59
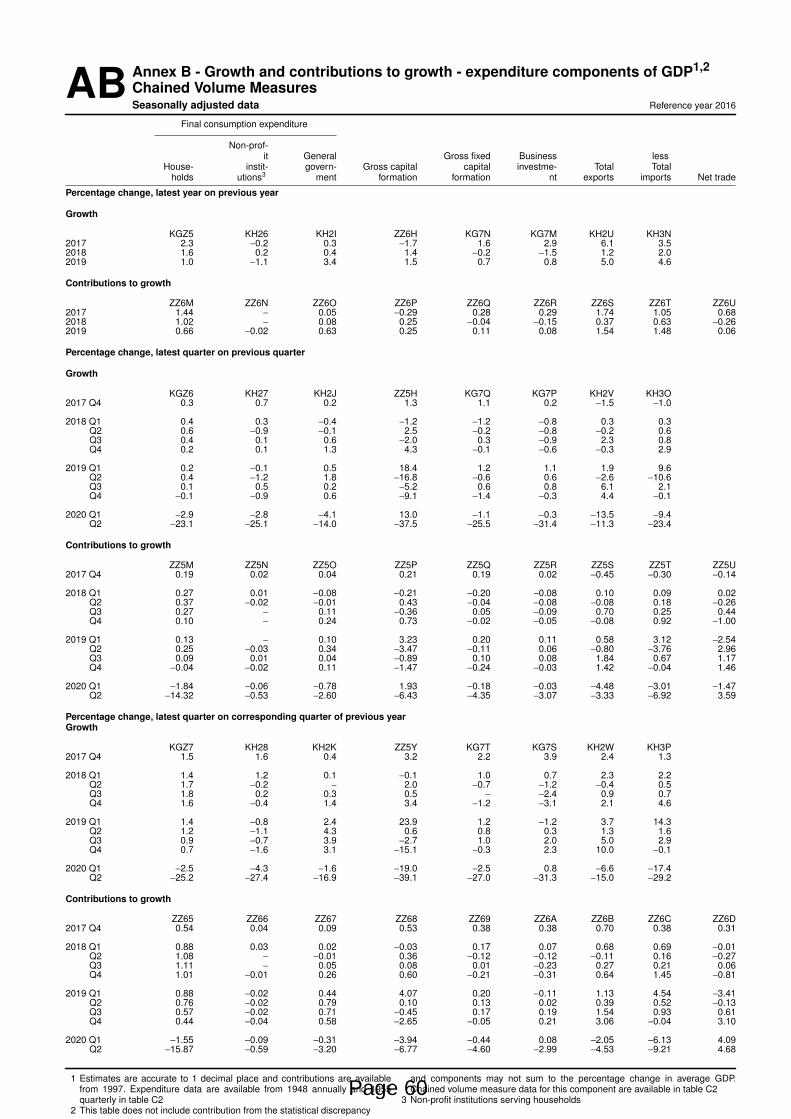
ABAnnex B - Gro wth and contributions to growth - expenditure components of GDP1,2
Chained Volume MeasuresSeasonally adjusted data Reference year 2016
Final consumption expenditure
Non-prof-it General Gross fixed Business less
House- instit- govern- Gross capital capital investme- Total Totalholds utions3 ment for mation formation nt expor ts impor ts Net trade
Percentage chang e , latest year on previous year
Growth
KGZ5 KH26 KH2I ZZ6H KG7N KG7M KH2U KH3N2017 2.3 −0.2 0.3 −1.7 1.6 2.9 6.1 3.52018 1.6 0.2 0.4 1.4 −0.2 −1.5 1.2 2.02019 1.0 −1.1 3.4 1.5 0.7 0.8 5.0 4.6
Contributions to growth
ZZ6M ZZ6N ZZ6O ZZ6P ZZ6Q ZZ6R ZZ6S ZZ6T ZZ6U2017 1.44 − 0.05 −0.29 0.28 0.29 1.74 1.05 0.682018 1.02 − 0.08 0.25 −0.04 −0.15 0.37 0.63 −0.262019 0.66 −0.02 0.63 0.25 0.11 0.08 1.54 1.48 0.06
Percentage chang e , latest quarter on previous quarter
Growth
KGZ6 KH27 KH2J ZZ5H KG7Q KG7P KH2V KH3O2017 Q4 0.3 0.7 0.2 1.3 1.1 0.2 −1.5 −1.0
2018 Q1 0.4 0.3 −0.4 −1.2 −1.2 −0.8 0.3 0.3Q2 0.6 −0.9 −0.1 2.5 −0.2 −0.8 −0.2 0.6Q3 0.4 0.1 0.6 −2.0 0.3 −0.9 2.3 0.8Q4 0.2 0.1 1.3 4.3 −0.1 −0.6 −0.3 2.9
2019 Q1 0.2 −0.1 0.5 18.4 1.2 1.1 1.9 9.6Q2 0.4 −1.2 1.8 −16.8 −0.6 0.6 −2.6 −10.6Q3 0.1 0.5 0.2 −5.2 0.6 0.8 6.1 2.1Q4 −0.1 −0.9 0.6 −9.1 −1.4 −0.3 4.4 −0.1
2020 Q1 −2.9 −2.8 −4.1 13.0 −1.1 −0.3 −13.5 −9.4Q2 −23.1 −25.1 −14.0 −37.5 −25.5 −31.4 −11.3 −23.4
Contributions to growth
ZZ5M ZZ5N ZZ5O ZZ5P ZZ5Q ZZ5R ZZ5S ZZ5T ZZ5U2017 Q4 0.19 0.02 0.04 0.21 0.19 0.02 −0.45 −0.30 −0.14
2018 Q1 0.27 0.01 −0.08 −0.21 −0.20 −0.08 0.10 0.09 0.02Q2 0.37 −0.02 −0.01 0.43 −0.04 −0.08 −0.08 0.18 −0.26Q3 0.27 − 0.11 −0.36 0.05 −0.09 0.70 0.25 0.44Q4 0.10 − 0.24 0.73 −0.02 −0.05 −0.08 0.92 −1.00
2019 Q1 0.13 − 0.10 3.23 0.20 0.11 0.58 3.12 −2.54Q2 0.25 −0.03 0.34 −3.47 −0.11 0.06 −0.80 −3.76 2.96Q3 0.09 0.01 0.04 −0.89 0.10 0.08 1.84 0.67 1.17Q4 −0.04 −0.02 0.11 −1.47 −0.24 −0.03 1.42 −0.04 1.46
2020 Q1 −1.84 −0.06 −0.78 1.93 −0.18 −0.03 −4.48 −3.01 −1.47Q2 −14.32 −0.53 −2.60 −6.43 −4.35 −3.07 −3.33 −6.92 3.59
Percentage chang e , latest quarter on corresponding quarter of previous yearGrowth
KGZ7 KH28 KH2K ZZ5Y KG7T KG7S KH2W KH3P2017 Q4 1.5 1.6 0.4 3.2 2.2 3.9 2.4 1.3
2018 Q1 1.4 1.2 0.1 −0.1 1.0 0.7 2.3 2.2Q2 1.7 −0.2 − 2.0 −0.7 −1.2 −0.4 0.5Q3 1.8 0.2 0.3 0.5 − −2.4 0.9 0.7Q4 1.6 −0.4 1.4 3.4 −1.2 −3.1 2.1 4.6
2019 Q1 1.4 −0.8 2.4 23.9 1.2 −1.2 3.7 14.3Q2 1.2 −1.1 4.3 0.6 0.8 0.3 1.3 1.6Q3 0.9 −0.7 3.9 −2.7 1.0 2.0 5.0 2.9Q4 0.7 −1.6 3.1 −15.1 −0.3 2.3 10.0 −0.1
2020 Q1 −2.5 −4.3 −1.6 −19.0 −2.5 0.8 −6.6 −17.4Q2 −25.2 −27.4 −16.9 −39.1 −27.0 −31.3 −15.0 −29.2
Contributions to growth
ZZ65 ZZ66 ZZ67 ZZ68 ZZ69 ZZ6A ZZ6B ZZ6C ZZ6D2017 Q4 0.54 0.04 0.09 0.53 0.38 0.38 0.70 0.38 0.31
2018 Q1 0.88 0.03 0.02 −0.03 0.17 0.07 0.68 0.69 −0.01Q2 1.08 − −0.01 0.36 −0.12 −0.12 −0.11 0.16 −0.27Q3 1.11 − 0.05 0.08 0.01 −0.23 0.27 0.21 0.06Q4 1.01 −0.01 0.26 0.60 −0.21 −0.31 0.64 1.45 −0.81
2019 Q1 0.88 −0.02 0.44 4.07 0.20 −0.11 1.13 4.54 −3.41Q2 0.76 −0.02 0.79 0.10 0.13 0.02 0.39 0.52 −0.13Q3 0.57 −0.02 0.71 −0.45 0.17 0.19 1.54 0.93 0.61Q4 0.44 −0.04 0.58 −2.65 −0.05 0.21 3.06 −0.04 3.10
2020 Q1 −1.55 −0.09 −0.31 −3.94 −0.44 0.08 −2.05 −6.13 4.09Q2 −15.87 −0.59 −3.20 −6.77 −4.60 −2.99 −4.53 −9.21 4.68
1 Estimates are accurate to 1 decimal place and contributions are availablefrom 1997. Expenditure data are available from 1948 annually and 1955quar terly in table C2
2 This table does not include contribution from the statistical discrepancy
and components may not sum to the percentage change in average GDP.Chained volume measure data for this component are available in table C2
3 Non-profit institutions serving householdsPage 60
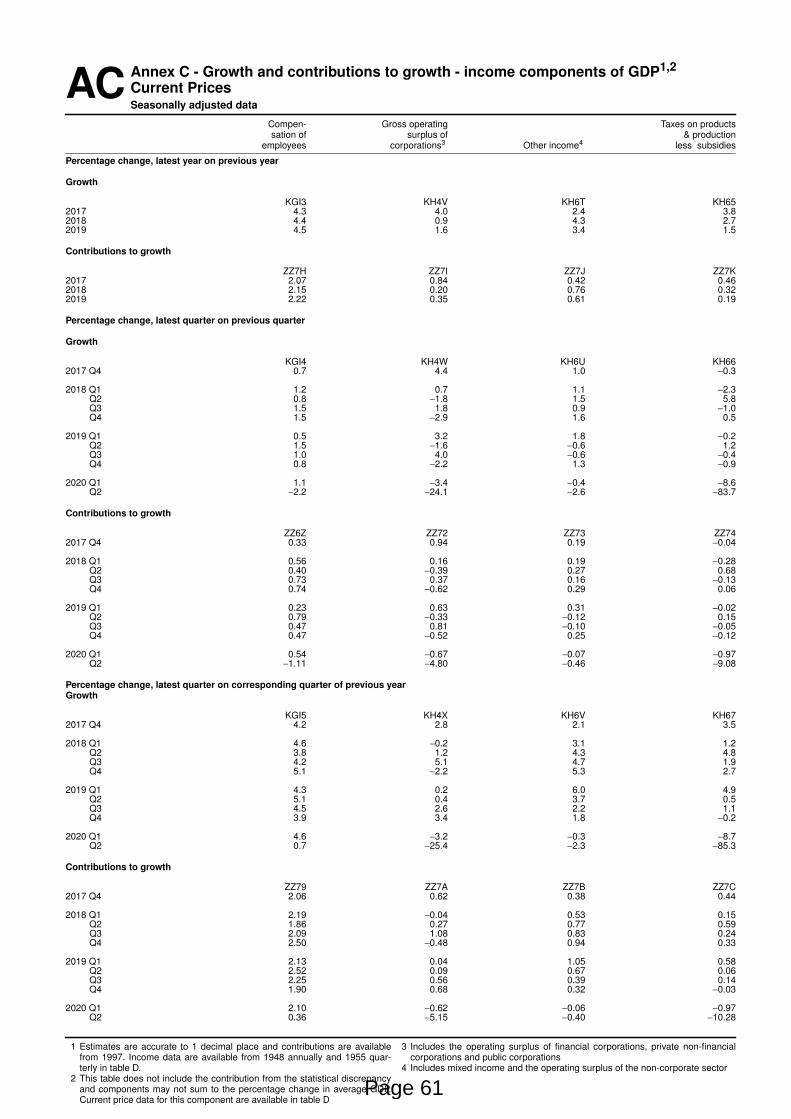
ACAnnex C - Gro wth and contributions to growth - income components of GDP1,2
Current PricesSeasonally adjusted data
Compen- Gross operating Taxes on productssation of sur plus of & production
employees corporations3 Other income4 less subsidies
Percentage chang e , latest year on previous year
Growth
KGI3 KH4V KH6T KH652017 4.3 4.0 2.4 3.82018 4.4 0.9 4.3 2.72019 4.5 1.6 3.4 1.5
Contributions to growth
ZZ7H ZZ7I ZZ7J ZZ7K2017 2.07 0.84 0.42 0.462018 2.15 0.20 0.76 0.322019 2.22 0.35 0.61 0.19
Percentage chang e , latest quarter on previous quarter
Growth
KGI4 KH4W KH6U KH662017 Q4 0.7 4.4 1.0 −0.3
2018 Q1 1.2 0.7 1.1 −2.3Q2 0.8 −1.8 1.5 5.8Q3 1.5 1.8 0.9 −1.0Q4 1.5 −2.9 1.6 0.5
2019 Q1 0.5 3.2 1.8 −0.2Q2 1.5 −1.6 −0.6 1.2Q3 1.0 4.0 −0.6 −0.4Q4 0.8 −2.2 1.3 −0.9
2020 Q1 1.1 −3.4 −0.4 −8.6Q2 −2.2 −24.1 −2.6 −83.7
Contributions to growth
ZZ6Z ZZ72 ZZ73 ZZ742017 Q4 0.33 0.94 0.19 −0.04
2018 Q1 0.56 0.16 0.19 −0.28Q2 0.40 −0.39 0.27 0.68Q3 0.73 0.37 0.16 −0.13Q4 0.74 −0.62 0.29 0.06
2019 Q1 0.23 0.63 0.31 −0.02Q2 0.79 −0.33 −0.12 0.15Q3 0.47 0.81 −0.10 −0.05Q4 0.47 −0.52 0.25 −0.12
2020 Q1 0.54 −0.67 −0.07 −0.97Q2 −1.11 −4.80 −0.46 −9.08
Percentage chang e , latest quarter on corresponding quarter of previous yearGrowth
KGI5 KH4X KH6V KH672017 Q4 4.2 2.8 2.1 3.5
2018 Q1 4.6 −0.2 3.1 1.2Q2 3.8 1.2 4.3 4.8Q3 4.2 5.1 4.7 1.9Q4 5.1 −2.2 5.3 2.7
2019 Q1 4.3 0.2 6.0 4.9Q2 5.1 0.4 3.7 0.5Q3 4.5 2.6 2.2 1.1Q4 3.9 3.4 1.8 −0.2
2020 Q1 4.6 −3.2 −0.3 −8.7Q2 0.7 −25.4 −2.3 −85.3
Contributions to growth
ZZ79 ZZ7A ZZ7B ZZ7C2017 Q4 2.06 0.62 0.38 0.44
2018 Q1 2.19 −0.04 0.53 0.15Q2 1.86 0.27 0.77 0.59Q3 2.09 1.08 0.83 0.24Q4 2.50 −0.48 0.94 0.33
2019 Q1 2.13 0.04 1.05 0.58Q2 2.52 0.09 0.67 0.06Q3 2.25 0.56 0.39 0.14Q4 1.90 0.68 0.32 −0.03
2020 Q1 2.10 −0.62 −0.06 −0.97Q2 0.36 −5.15 −0.40 −10.28
1 Estimates are accurate to 1 decimal place and contributions are availablefrom 1997. Income data are available from 1948 annually and 1955 quar-ter ly in table D.
2 This table does not include the contribution from the statistical discrepancyand components may not sum to the percentage change in average GDP.Current price data for this component are available in table D
3 Includes the operating surplus of financial corporations, private non-financialcor porations and public corporations
4 Includes mixed income and the operating surplus of the non-corporate sector
Page 61
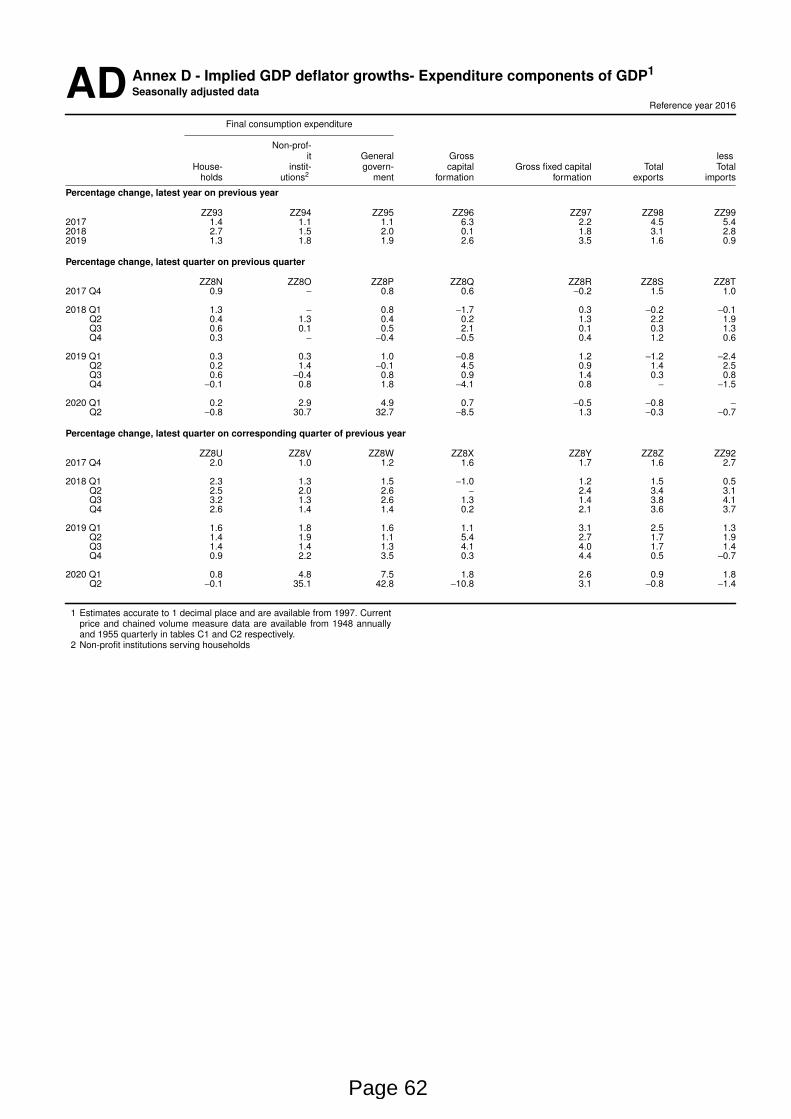
AD Annex D - Implied GDP deflator growths- Expenditure components of GDP1
Seasonally adjusted data
Reference year 2016
Final consumption expenditure
Non-prof-it General Gross less
House- instit- govern- capital Gross fixed capital Total Totalholds utions2 ment for mation formation expor ts impor ts
Percentage chang e , latest year on previous year
ZZ93 ZZ94 ZZ95 ZZ96 ZZ97 ZZ98 ZZ992017 1.4 1.1 1.1 6.3 2.2 4.5 5.42018 2.7 1.5 2.0 0.1 1.8 3.1 2.82019 1.3 1.8 1.9 2.6 3.5 1.6 0.9
Percentage chang e , latest quarter on previous quarter
ZZ8N ZZ8O ZZ8P ZZ8Q ZZ8R ZZ8S ZZ8T2017 Q4 0.9 − 0.8 0.6 −0.2 1.5 1.0
2018 Q1 1.3 − 0.8 −1.7 0.3 −0.2 −0.1Q2 0.4 1.3 0.4 0.2 1.3 2.2 1.9Q3 0.6 0.1 0.5 2.1 0.1 0.3 1.3Q4 0.3 − −0.4 −0.5 0.4 1.2 0.6
2019 Q1 0.3 0.3 1.0 −0.8 1.2 −1.2 −2.4Q2 0.2 1.4 −0.1 4.5 0.9 1.4 2.5Q3 0.6 −0.4 0.8 0.9 1.4 0.3 0.8Q4 −0.1 0.8 1.8 −4.1 0.8 − −1.5
2020 Q1 0.2 2.9 4.9 0.7 −0.5 −0.8 −
Q2 −0.8 30.7 32.7 −8.5 1.3 −0.3 −0.7
Percentage chang e , latest quarter on corresponding quarter of previous year
ZZ8U ZZ8V ZZ8W ZZ8X ZZ8Y ZZ8Z ZZ922017 Q4 2.0 1.0 1.2 1.6 1.7 1.6 2.7
2018 Q1 2.3 1.3 1.5 −1.0 1.2 1.5 0.5Q2 2.5 2.0 2.6 − 2.4 3.4 3.1Q3 3.2 1.3 2.6 1.3 1.4 3.8 4.1Q4 2.6 1.4 1.4 0.2 2.1 3.6 3.7
2019 Q1 1.6 1.8 1.6 1.1 3.1 2.5 1.3Q2 1.4 1.9 1.1 5.4 2.7 1.7 1.9Q3 1.4 1.4 1.3 4.1 4.0 1.7 1.4Q4 0.9 2.2 3.5 0.3 4.4 0.5 −0.7
2020 Q1 0.8 4.8 7.5 1.8 2.6 0.9 1.8Q2 −0.1 35.1 42.8 −10.8 3.1 −0.8 −1.4
1 Estimates accurate to 1 decimal place and are available from 1997. Currentpr ice and chained volume measure data are available from 1948 annuallyand 1955 quarter ly in tables C1 and C2 respectively.
2 Non-profit institutions serving households
Page 62
YourCare (Croydon)
Shareholder update
03/10/2020
Page 63
YourCare (Croydon)
• Update the shareholder on 19/20 performance and Q2 20/21
• Update the shareholder on action taken this year to manage the risks presented by
the pandemic
• Update the shareholder on the options appraisal the board has undertaken on the
future of YourCare
• Shareholder to review the recommendation and notify the board of directors of their view in light of the financial position of the Council
Purpose
Page 64
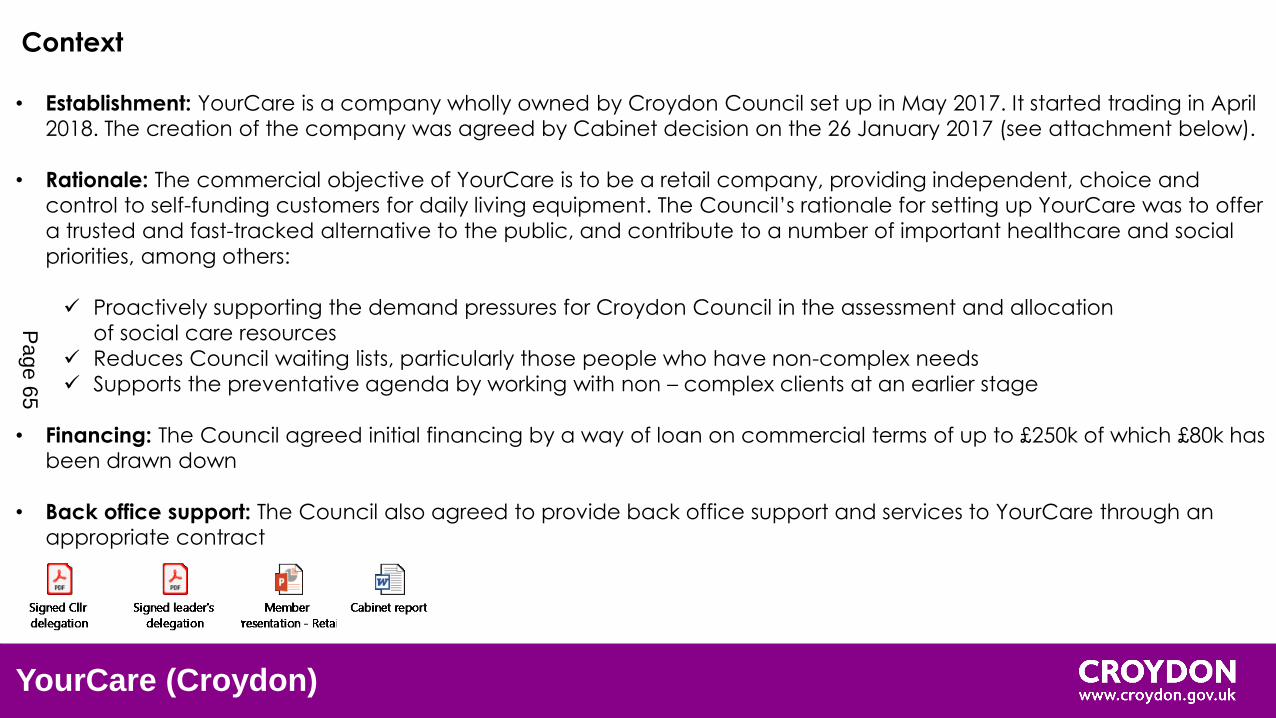
YourCare (Croydon)
• Establishment: YourCare is a company wholly owned by Croydon Council set up in May 2017. It started trading in April 2018. The creation of the company was agreed by Cabinet decision on the 26 January 2017 (see attachment below).
• Rationale: The commercial objective of YourCare is to be a retail company, providing independent, choice and control to self-funding customers for daily living equipment. The Council’s rationale for setting up YourCare was to offer
a trusted and fast-tracked alternative to the public, and contribute to a number of important healthcare and social
priorities, among others:
Proactively supporting the demand pressures for Croydon Council in the assessment and allocation
of social care resources
Reduces Council waiting lists, particularly those people who have non-complex needs
Supports the preventative agenda by working with non – complex clients at an earlier stage
• Financing: The Council agreed initial financing by a way of loan on commercial terms of up to £250k of which £80k has been drawn down
• Back office support: The Council also agreed to provide back office support and services to YourCare through an appropriate contract
Context
Page 65

YourCare (Croydon)
Directors Sarah Ireland (Appointed 08 June 2017, Resigned 22 March 2018)Lisa Taylor (Appointed 08 June 2017, Resigned 02 April 2019)
Rachel Soni (Appointed 08 June 2017, Resigned 15 April 2019)
Pratima Solanki (Appointed 30 April 2018, Resigned 15 April 2019)
Sarah Warman (Appointed 08 June 2017)
Paul Kouassi (Appointed 18 March 2019)
Mirella Peters (Appointed 18 March 2019)
Annette McPartland (Appointed 02 April 2019)
Company number 10809317
Registered office Croydon Living Independently Centre (CLIC)3 imperial way, CR0 4RR
Board
Page 66
YourCare (Croydon)
YourCare’s three core priorities are set out below. Progress against these priorities and a description of what
success looks like is set out on the next two slides.
1. Provide a viable alternative provision to self-funders for simple aids to support the preventative agenda and to
establish YourCare as the “go to” provider for all
2. Establish YourCare across all existing and new CES partnerships as a benchmark model for self-funding clients.
3. Establish third Party Partnerships (Care Homes, Suppliers etc.)
A key part of the growth strategy was the development of a strategic commercial relationship with other local
authorities through the website. The strategic relationship would involve having online portals linked to the main
YourCare website that could accommodate the needs of self-funding customers within a particular local authority
area.
Challenges
• YourCare was to move to a modern and more conducive independent living centre within 12 to 18 months of his
launch date. The site at Boulogne Road being considered no longer fit for purpose, in particular, the physical
dimensions of the site did not allow the expansion for the retail business. The move was delayed by 12 months
• The Covid-19 crisis has had a significant impact on the retail sector, YourCare included
Priorities
Page 67
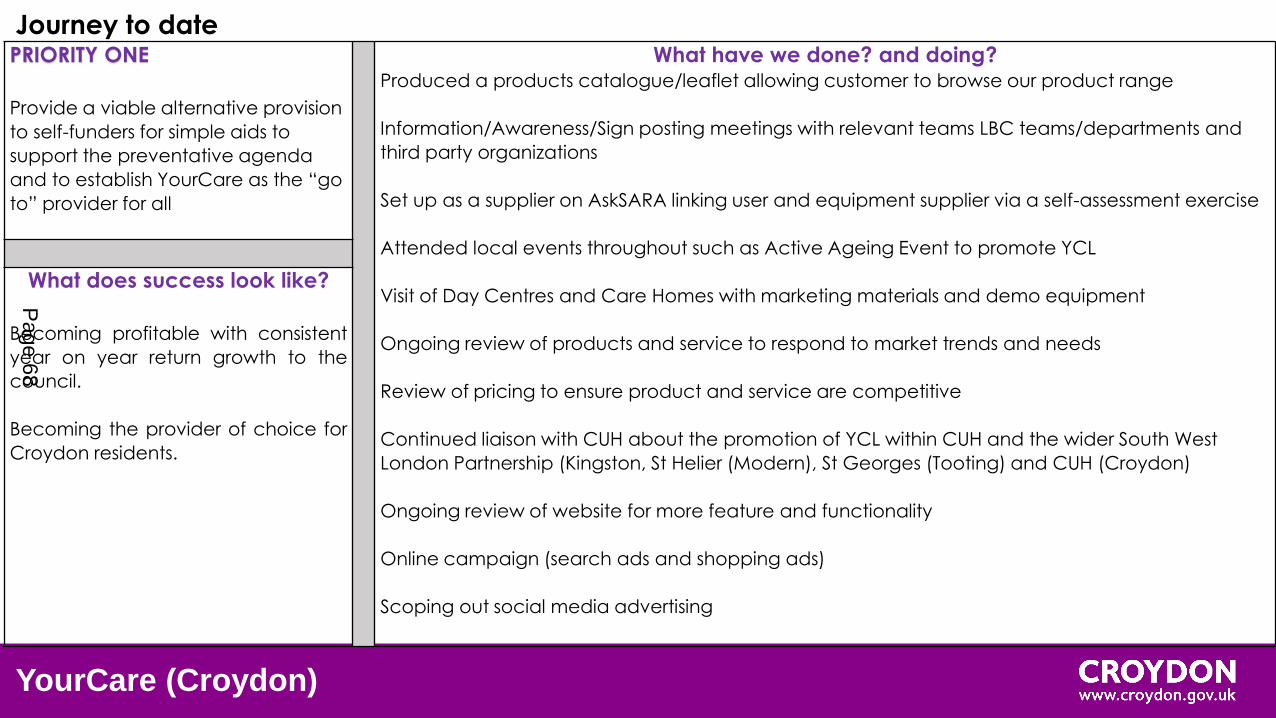
YourCare (Croydon)
Journey to date PRIORITY ONE
Provide a viable alternative provision
to self-funders for simple aids to
support the preventative agenda
and to establish YourCare as the “go
to” provider for all
What have we done? and doing?Produced a products catalogue/leaflet allowing customer to browse our product range
Information/Awareness/Sign posting meetings with relevant teams LBC teams/departments and
third party organizations
Set up as a supplier on AskSARA linking user and equipment supplier via a self-assessment exercise
Attended local events throughout such as Active Ageing Event to promote YCL
Visit of Day Centres and Care Homes with marketing materials and demo equipment
Ongoing review of products and service to respond to market trends and needs
Review of pricing to ensure product and service are competitive
Continued liaison with CUH about the promotion of YCL within CUH and the wider South West
London Partnership (Kingston, St Helier (Modern), St Georges (Tooting) and CUH (Croydon)
Ongoing review of website for more feature and functionality
Online campaign (search ads and shopping ads)
Scoping out social media advertising
What does success look like?
Becoming profitable with consistent
year on year return growth to the
council.
Becoming the provider of choice for
Croydon residents.
Page 68
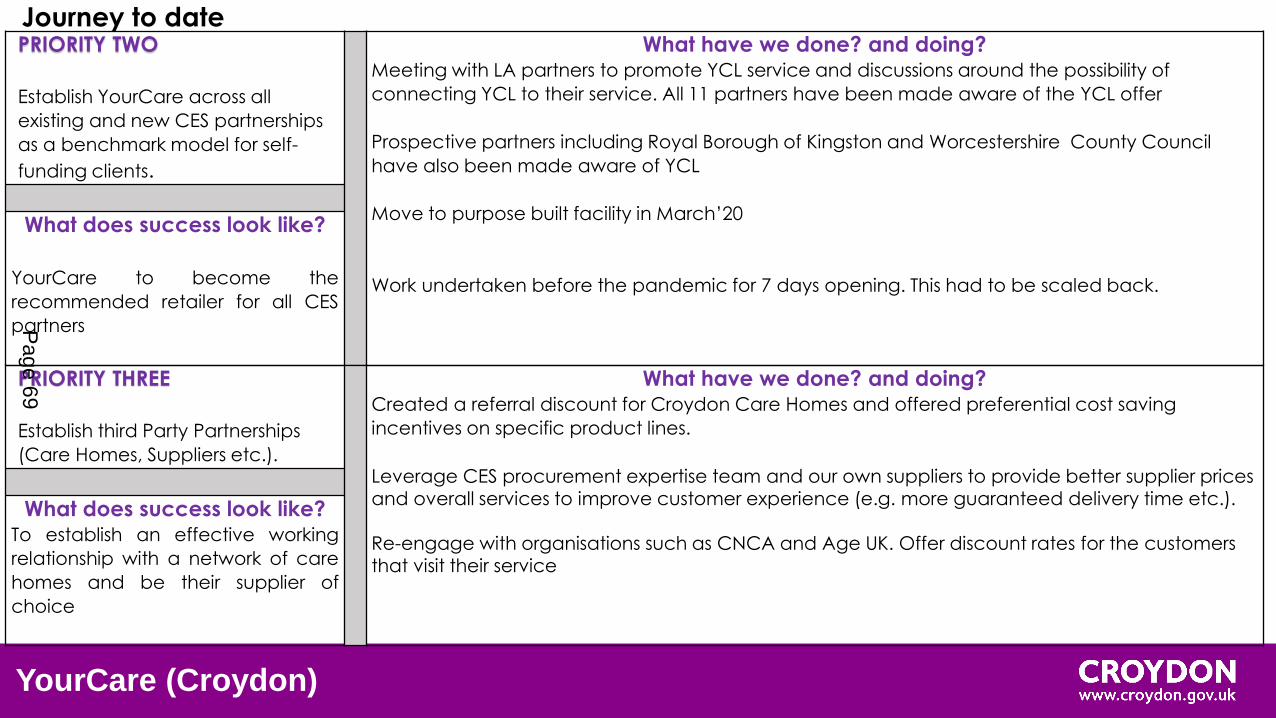
YourCare (Croydon)
Journey to date PRIORITY TWO
Establish YourCare across all
existing and new CES partnerships
as a benchmark model for self-
funding clients.
What have we done? and doing?Meeting with LA partners to promote YCL service and discussions around the possibility of
connecting YCL to their service. All 11 partners have been made aware of the YCL offer
Prospective partners including Royal Borough of Kingston and Worcestershire County Council
have also been made aware of YCL
Move to purpose built facility in March’20
Work undertaken before the pandemic for 7 days opening. This had to be scaled back.
What does success look like?
YourCare to become the
recommended retailer for all CES
partners
PRIORITY THREE
Establish third Party Partnerships
(Care Homes, Suppliers etc.).
What have we done? and doing?Created a referral discount for Croydon Care Homes and offered preferential cost saving
incentives on specific product lines.
Leverage CES procurement expertise team and our own suppliers to provide better supplier prices and overall services to improve customer experience (e.g. more guaranteed delivery time etc.).
Re-engage with organisations such as CNCA and Age UK. Offer discount rates for the customers that visit their service
What does success look like?To establish an effective working
relationship with a network of care
homes and be their supplier of
choice
Page 69
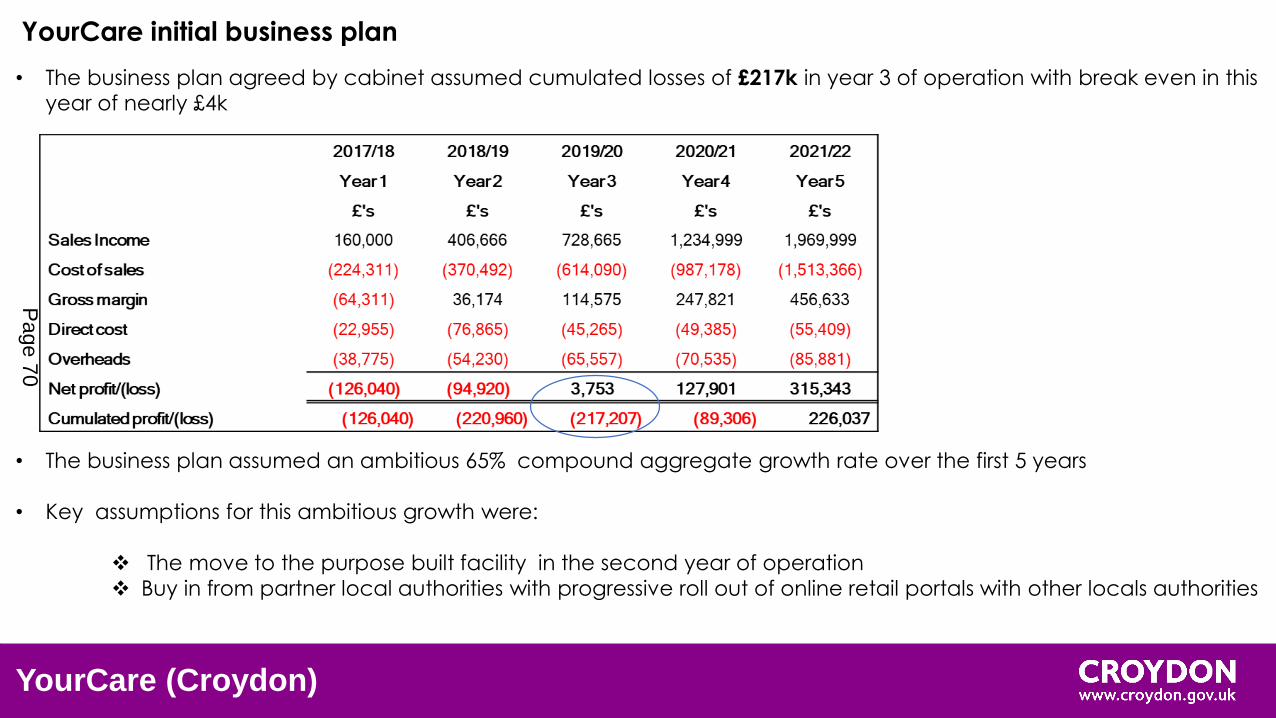
YourCare (Croydon)
• The business plan agreed by cabinet assumed cumulated losses of £217k in year 3 of operation with break even in this year of nearly £4k
• The business plan assumed an ambitious 65% compound aggregate growth rate over the first 5 years
• Key assumptions for this ambitious growth were:
The move to the purpose built facility in the second year of operation
Buy in from partner local authorities with progressive roll out of online retail portals with other locals authorities
YourCare initial business plan
Page 70
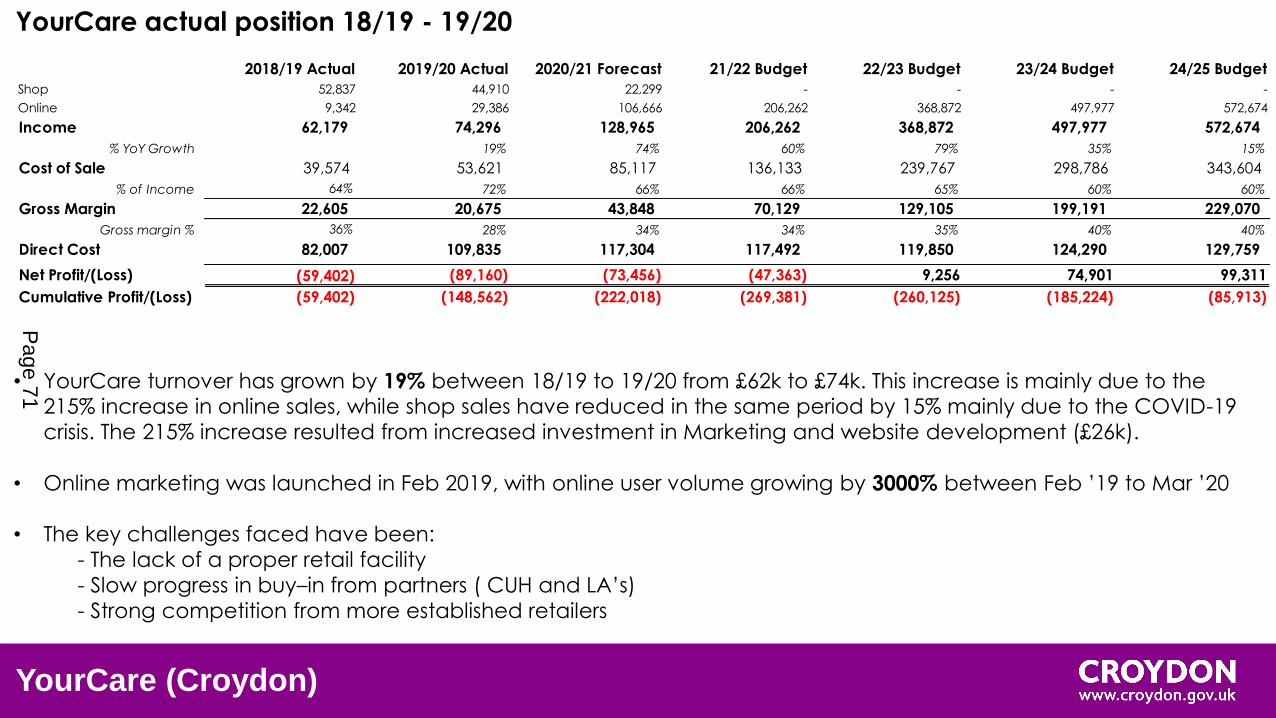
YourCare (Croydon)
• YourCare turnover has grown by 19% between 18/19 to 19/20 from £62k to £74k. This increase is mainly due to the 215% increase in online sales, while shop sales have reduced in the same period by 15% mainly due to the COVID-19
crisis. The 215% increase resulted from increased investment in Marketing and website development (£26k).
• Online marketing was launched in Feb 2019, with online user volume growing by 3000% between Feb ’19 to Mar ’20
• The key challenges faced have been:
- The lack of a proper retail facility
- Slow progress in buy–in from partners ( CUH and LA’s)
- Strong competition from more established retailers
YourCare actual position 18/19 - 19/20
2018/19 Actual 2019/20 Actual 2020/21 Forecast 21/22 Budget 22/23 Budget 23/24 Budget 24/25 Budget
Shop 52,837 44,910 22,299 - - - -
Online 9,342 29,386 106,666 206,262 368,872 497,977 572,674
Income 62,179 74,296 128,965 206,262 368,872 497,977 572,674
% YoY Growth 19% 74% 60% 79% 35% 15%
Cost of Sale 39,574 53,621 85,117 136,133 239,767 298,786 343,604
% of Income 64% 72% 66% 66% 65% 60% 60%
Gross Margin 22,605 20,675 43,848 70,129 129,105 199,191 229,070
Gross margin % 36% 28% 34% 34% 35% 40% 40%
Direct Cost 82,007 109,835 117,304 117,492 119,850 124,290 129,759
Net Profit/(Loss) (59,402) (89,160) (73,456) (47,363) 9,256 74,901 99,311
Cumulative Profit/(Loss) (59,402) (148,562) (222,018) (269,381) (260,125) (185,224) (85,913)
Page 71
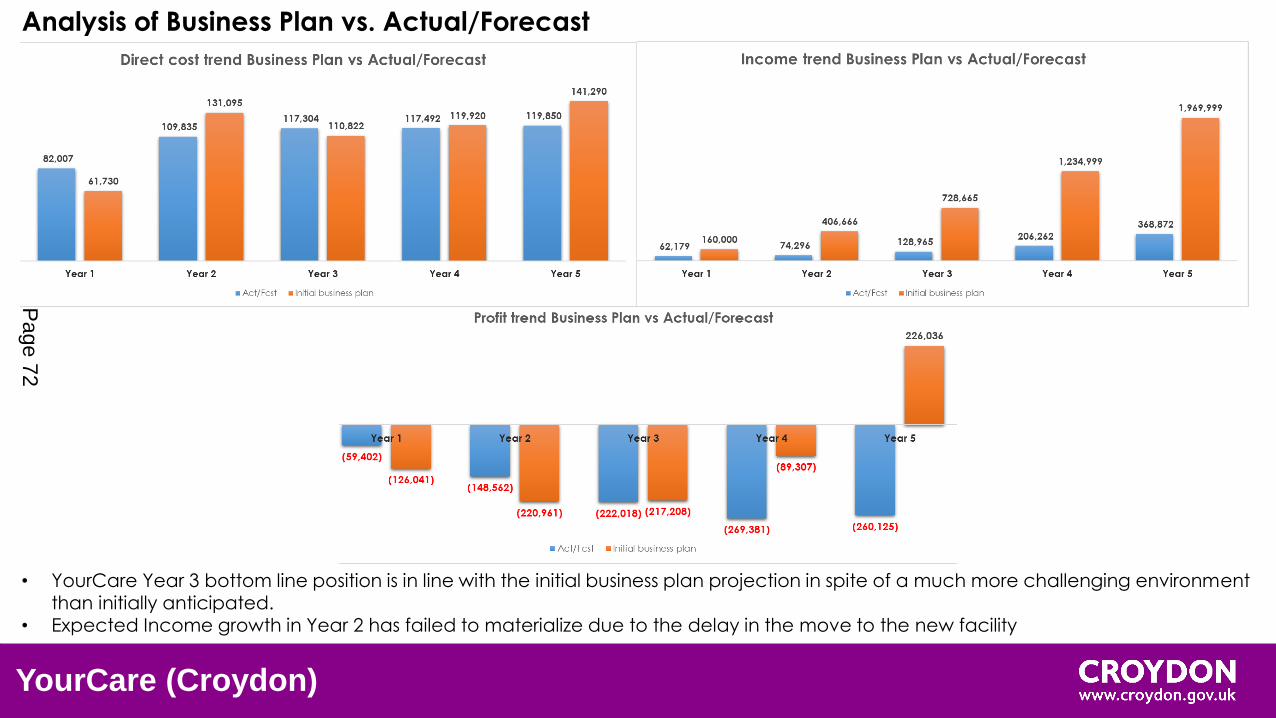
• YourCare Year 3 bottom line position is in line with the initial business plan projection in spite of a much more challenging environmentthan initially anticipated.
• Expected Income growth in Year 2 has failed to materialize due to the delay in the move to the new facility
Analysis of Business Plan vs. Actual/Forecast
YourCare (Croydon)
Page 72
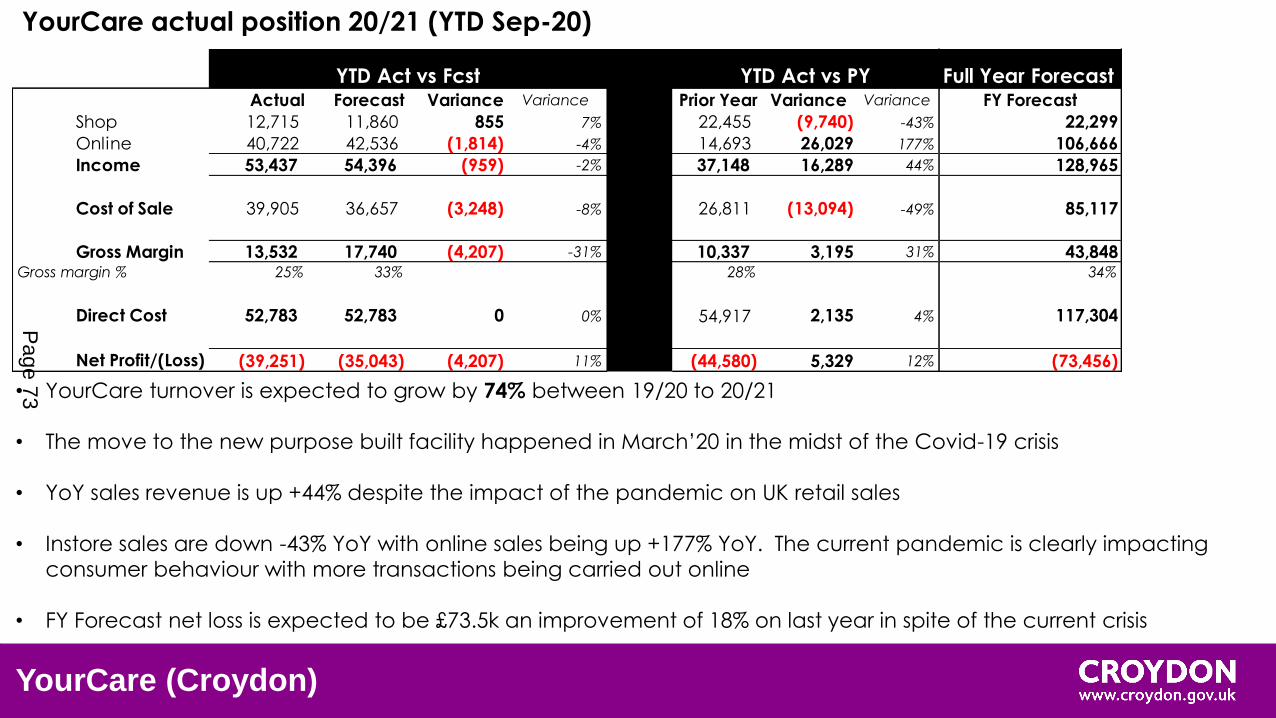
• YourCare turnover is expected to grow by 74% between 19/20 to 20/21
• The move to the new purpose built facility happened in March’20 in the midst of the Covid-19 crisis
• YoY sales revenue is up +44% despite the impact of the pandemic on UK retail sales
• Instore sales are down -43% YoY with online sales being up +177% YoY. The current pandemic is clearly impacting
consumer behaviour with more transactions being carried out online
• FY Forecast net loss is expected to be £73.5k an improvement of 18% on last year in spite of the current crisis
Full Year ForecastActual Forecast Variance Variance Prior Year Variance Variance FY Forecast
Shop 12,715 11,860 855 7% 22,455 (9,740) -43% 22,299
Online 40,722 42,536 (1,814) -4% 14,693 26,029 177% 106,666
Income 53,437 54,396 (959) -2% 37,148 16,289 44% 128,965
Cost of Sale 39,905 36,657 (3,248) -8% 26,811 (13,094) -49% 85,117
Gross Margin 13,532 17,740 (4,207) -31% 10,337 3,195 31% 43,848Gross margin % 25% 33% 28% 34%
Direct Cost 52,783 52,783 0 0% 54,917 2,135 4% 117,304
Net Profit/(Loss) (39,251) (35,043) (4,207) 11% (44,580) 5,329 12% (73,456)
YTD Act vs Fcst YTD Act vs PY
YourCare actual position 20/21 (YTD Sep-20)
YourCare (Croydon)
Page 73
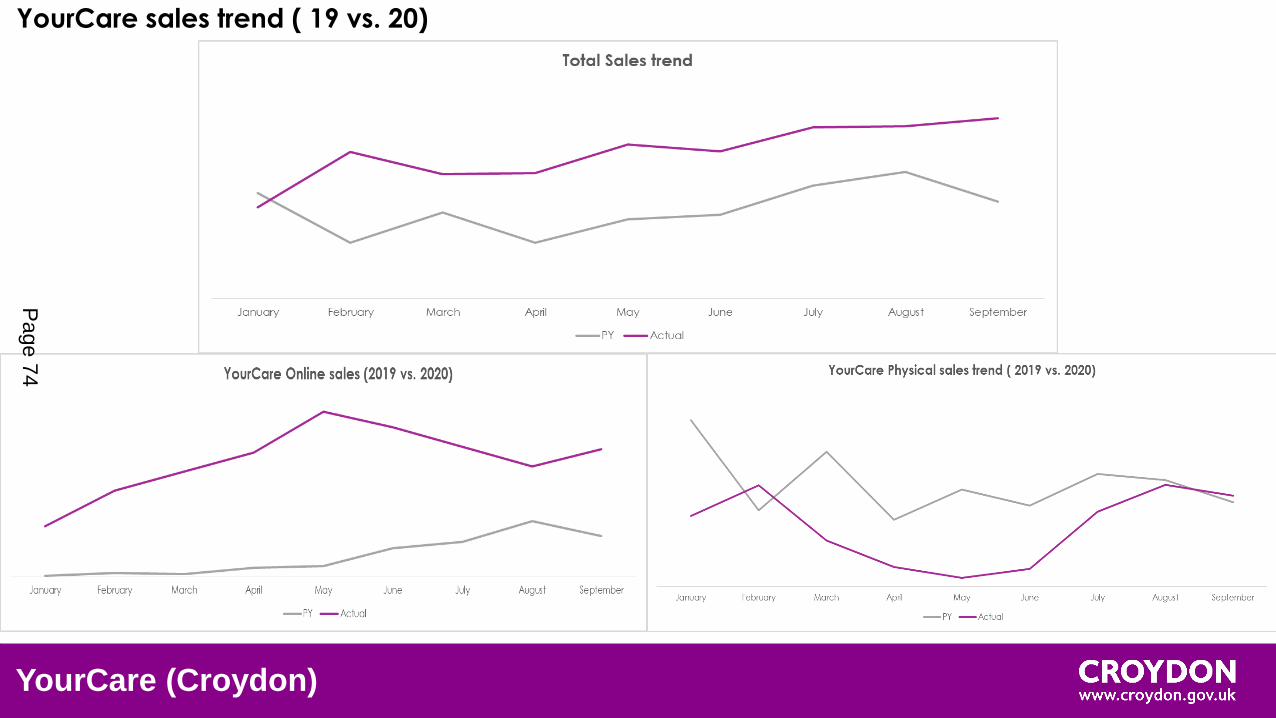
YourCare sales trend ( 19 vs. 20)
YourCare (Croydon)
Page 74
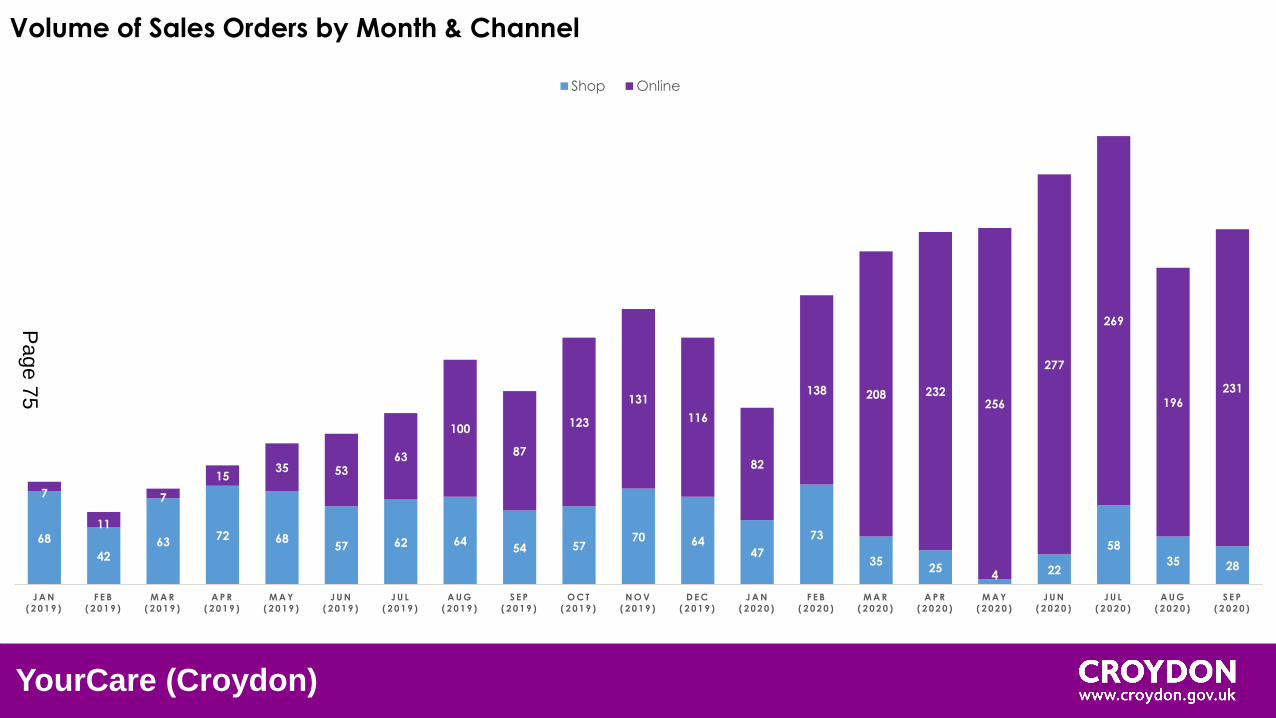
Volume of Sales Orders by Month & Channel
68
42
6372 68
57 62 6454 57
70 6447
73
3525
4 22
58
35 28
7
11
7
1535 53
63
100
87
123
131
116
82
138 208 232256
277
269
196
231
J A N
( 2 0 1 9 )
F E B
( 2 0 1 9 )
M A R
( 2 0 1 9 )
A P R
( 2 0 1 9 )
M A Y
( 2 0 1 9 )
J U N
( 2 0 1 9 )
J U L
( 2 0 1 9 )
A U G
( 2 0 1 9 )
S E P
( 2 0 1 9 )
O C T
( 2 0 1 9 )
N O V
( 2 0 1 9 )
D E C
( 2 0 1 9 )
J A N
( 2 0 2 0 )
F E B
( 2 0 2 0 )
M A R
( 2 0 2 0 )
A P R
( 2 0 2 0 )
M A Y
( 2 0 2 0 )
J U N
( 2 0 2 0 )
J U L
( 2 0 2 0 )
A U G
( 2 0 2 0 )
S E P
( 2 0 2 0 )
Shop Online
YourCare (Croydon)
Page 75
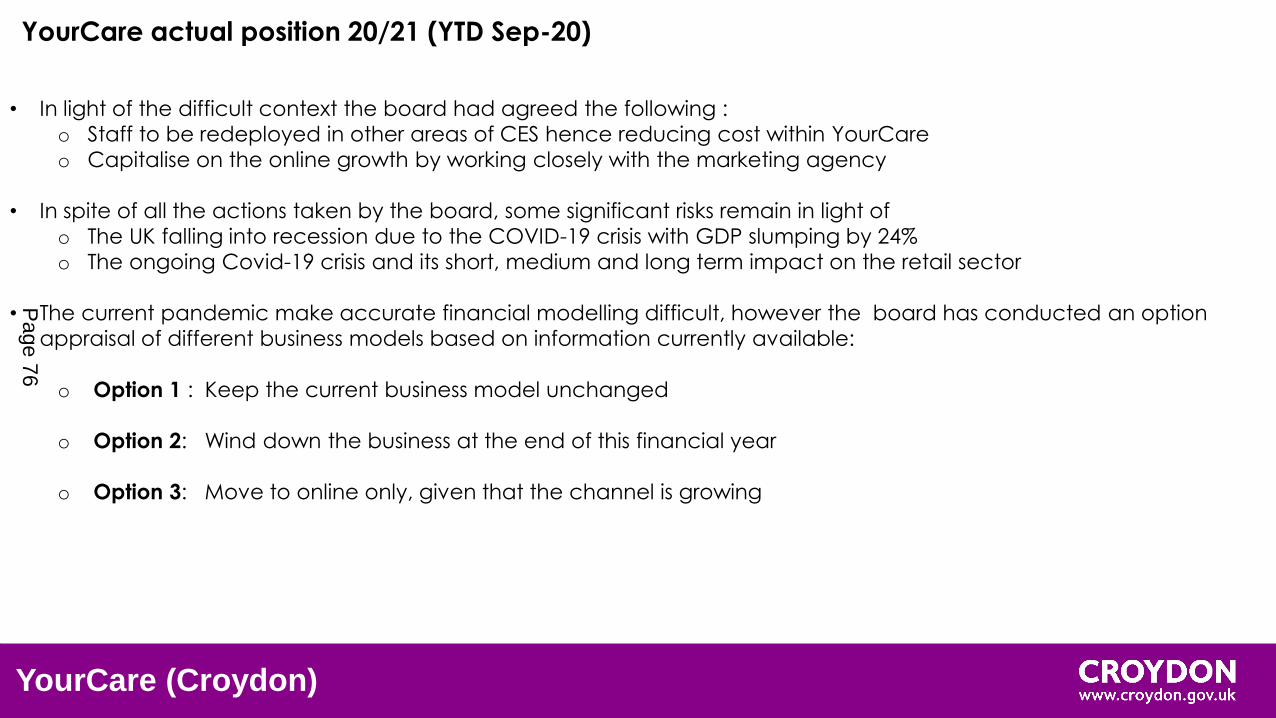
• In light of the difficult context the board had agreed the following :
o Staff to be redeployed in other areas of CES hence reducing cost within YourCare
o Capitalise on the online growth by working closely with the marketing agency
• In spite of all the actions taken by the board, some significant risks remain in light of
o The UK falling into recession due to the COVID-19 crisis with GDP slumping by 24%
o The ongoing Covid-19 crisis and its short, medium and long term impact on the retail sector
• The current pandemic make accurate financial modelling difficult, however the board has conducted an option
appraisal of different business models based on information currently available:
o Option 1 : Keep the current business model unchanged
o Option 2: Wind down the business at the end of this financial year
o Option 3: Move to online only, given that the channel is growing
YourCare actual position 20/21 (YTD Sep-20)
YourCare (Croydon)
Page 76
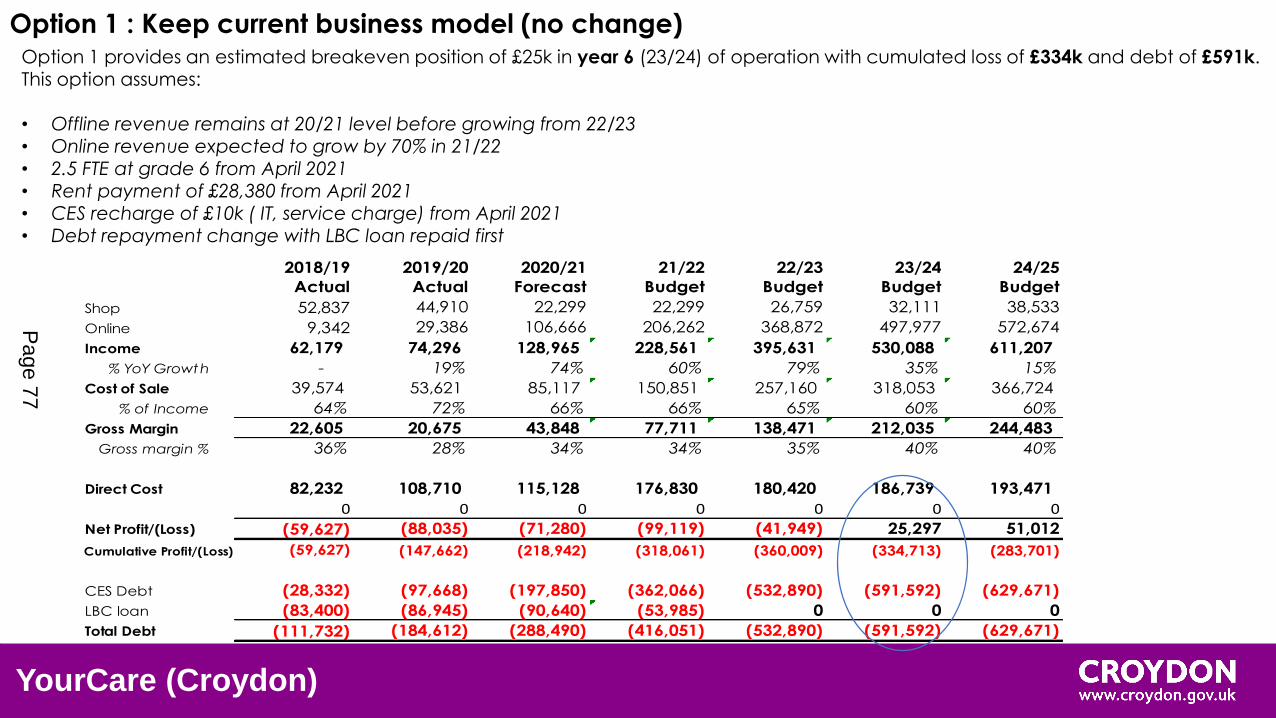
YourCare (Croydon)
Option 1 : Keep current business model (no change)Option 1 provides an estimated breakeven position of £25k in year 6 (23/24) of operation with cumulated loss of £334k and debt of £591k. This option assumes:
• Offline revenue remains at 20/21 level before growing from 22/23• Online revenue expected to grow by 70% in 21/22• 2.5 FTE at grade 6 from April 2021• Rent payment of £28,380 from April 2021• CES recharge of £10k ( IT, service charge) from April 2021• Debt repayment change with LBC loan repaid first
2018/19
Actual
2019/20
Actual
2020/21
Forecast
21/22
Budget
22/23
Budget
23/24
Budget
24/25
Budget
Shop 52,837 44,910 22,299 22,299 26,759 32,111 38,533
Online 9,342 29,386 106,666 206,262 368,872 497,977 572,674
Income 62,179 74,296 128,965 228,561 395,631 530,088 611,207
% YoY Growth - 19% 74% 60% 79% 35% 15%
Cost of Sale 39,574 53,621 85,117 150,851 257,160 318,053 366,724
% of Income 64% 72% 66% 66% 65% 60% 60%
Gross Margin 22,605 20,675 43,848 77,711 138,471 212,035 244,483
Gross margin % 36% 28% 34% 34% 35% 40% 40%
Direct Cost 82,232 108,710 115,128 176,830 180,420 186,739 193,471
0 0 0 0 0 0 0
Net Profit/(Loss) (59,627) (88,035) (71,280) (99,119) (41,949) 25,297 51,012
Cumulative Profit/(Loss) (59,627) (147,662) (218,942) (318,061) (360,009) (334,713) (283,701)
CES Debt (28,332) (97,668) (197,850) (362,066) (532,890) (591,592) (629,671)
LBC loan (83,400) (86,945) (90,640) (53,985) 0 0 0
Total Debt (111,732) (184,612) (288,490) (416,051) (532,890) (591,592) (629,671)
Page 77

YourCare (Croydon)
Option 1 : Keep current business model
Strengths
• Keeping both channels open (Online & Offline)
• New well located retail outlet• Maintain YCL as part of the CES offer
Weaknesses
• Higher running cost resulting in higher level of debts and losses
• Break even occur in year 6• Brand awarenessS W
• Build continued awareness of the new retail outlet
• Grow online presence • Prescribers pathway• Potential link up with CES partners
• Current economic crisis impacting purchasing power of target customers
• Covid-19 pandemic negatively impacting the retail sector
• More established competitors (CareCo, CompleteCare)O T
Opportunities Threats
SWOTAnalysis
Page 78
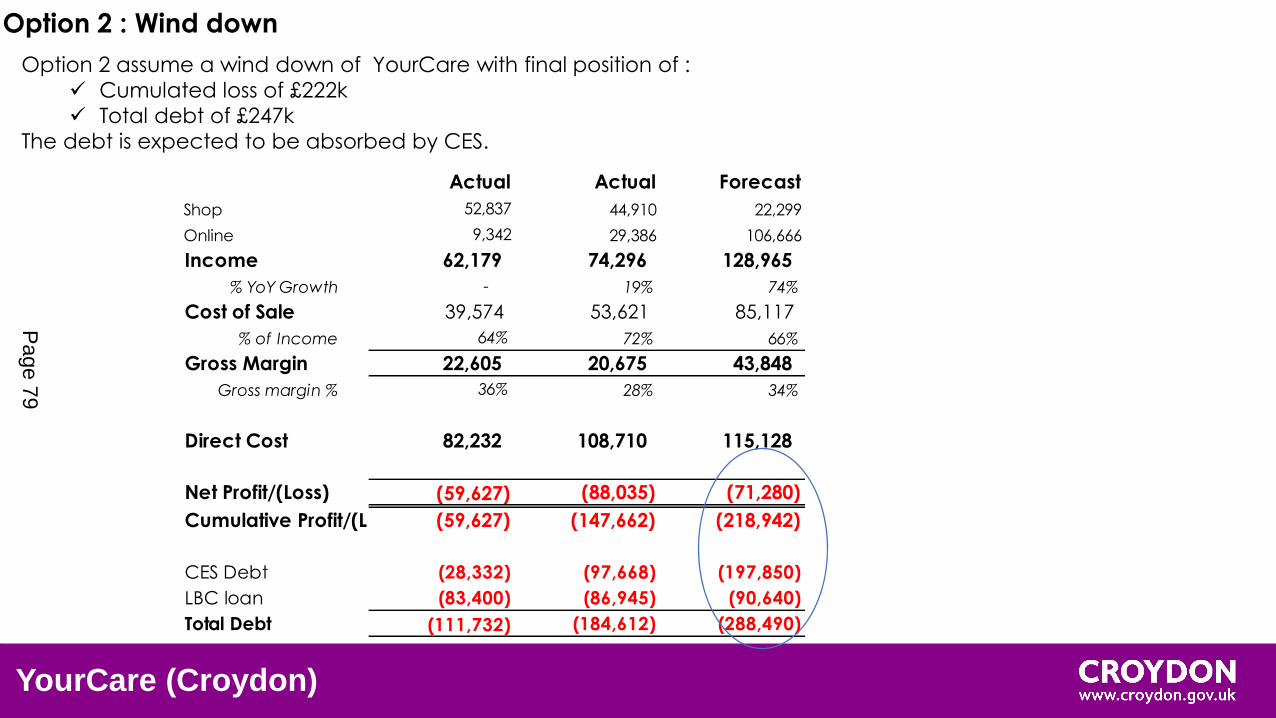
YourCare (Croydon)
Option 2 : Wind down
Option 2 assume a wind down of YourCare with final position of :
Cumulated loss of £222k
Total debt of £247k
The debt is expected to be absorbed by CES.2018/19
Actual
2019/20
Actual
2020/21
Forecast
Shop 52,837 44,910 22,299
Online 9,342 29,386 106,666
Income 62,179 74,296 128,965
% YoY Growth - 19% 74%
Cost of Sale 39,574 53,621 85,117
% of Income 64% 72% 66%
Gross Margin 22,605 20,675 43,848
Gross margin % 36% 28% 34%
Direct Cost 82,232 108,710 115,128
Net Profit/(Loss) (59,627) (88,035) (71,280)
Cumulative Profit/(Loss) (59,627) (147,662) (218,942)
CES Debt (28,332) (97,668) (197,850)
LBC loan (83,400) (86,945) (90,640)
Total Debt (111,732) (184,612) (288,490)
Page 79
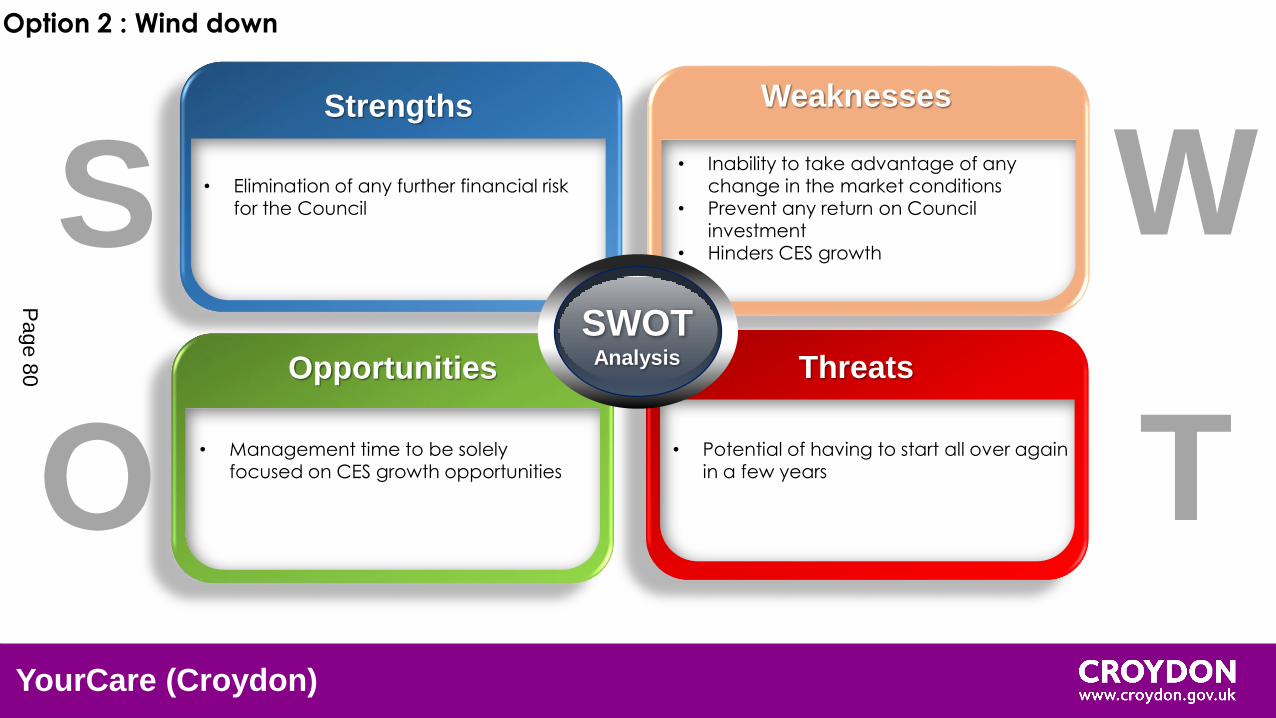
YourCare (Croydon)
Option 2 : Wind down
Strengths
• Elimination of any further financial risk for the Council
Weaknesses
• Inability to take advantage of any change in the market conditions
• Prevent any return on Council investment
• Hinders CES growthS W
• Management time to be solely focused on CES growth opportunities
• Potential of having to start all over again in a few years O T
Opportunities Threats
SWOTAnalysis
Page 80
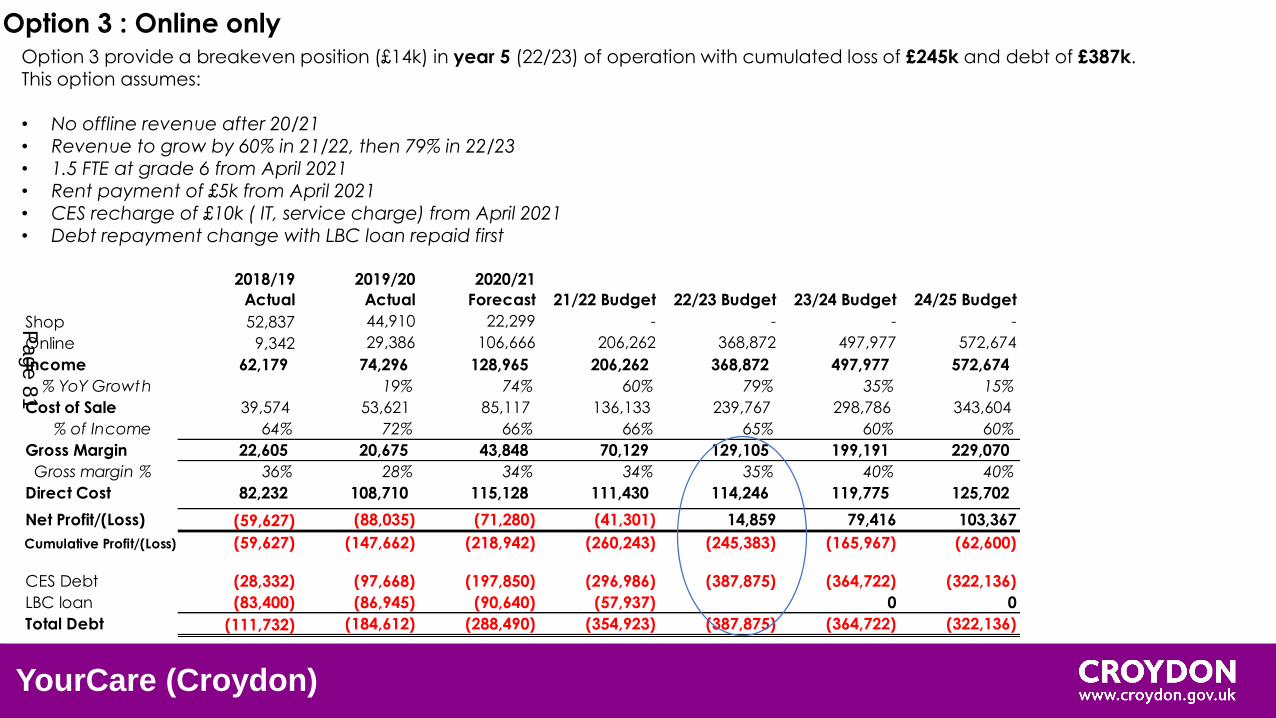
YourCare (Croydon)
Option 3 : Online onlyOption 3 provide a breakeven position (£14k) in year 5 (22/23) of operation with cumulated loss of £245k and debt of £387k.
This option assumes:
• No offline revenue after 20/21• Revenue to grow by 60% in 21/22, then 79% in 22/23• 1.5 FTE at grade 6 from April 2021• Rent payment of £5k from April 2021
• CES recharge of £10k ( IT, service charge) from April 2021• Debt repayment change with LBC loan repaid first
2018/19
Actual
2019/20
Actual
2020/21
Forecast 21/22 Budget 22/23 Budget 23/24 Budget 24/25 Budget
Shop 52,837 44,910 22,299 - - - -
Online 9,342 29,386 106,666 206,262 368,872 497,977 572,674
Income 62,179 74,296 128,965 206,262 368,872 497,977 572,674
% YoY Growth 19% 74% 60% 79% 35% 15%
Cost of Sale 39,574 53,621 85,117 136,133 239,767 298,786 343,604
% of Income 64% 72% 66% 66% 65% 60% 60%
Gross Margin 22,605 20,675 43,848 70,129 129,105 199,191 229,070
Gross margin % 36% 28% 34% 34% 35% 40% 40%
Direct Cost 82,232 108,710 115,128 111,430 114,246 119,775 125,702
Net Profit/(Loss) (59,627) (88,035) (71,280) (41,301) 14,859 79,416 103,367
Cumulative Profit/(Loss) (59,627) (147,662) (218,942) (260,243) (245,383) (165,967) (62,600)
CES Debt (28,332) (97,668) (197,850) (296,986) (387,875) (364,722) (322,136)
LBC loan (83,400) (86,945) (90,640) (57,937) 0 0
Total Debt (111,732) (184,612) (288,490) (354,923) (387,875) (364,722) (322,136)
Page 81
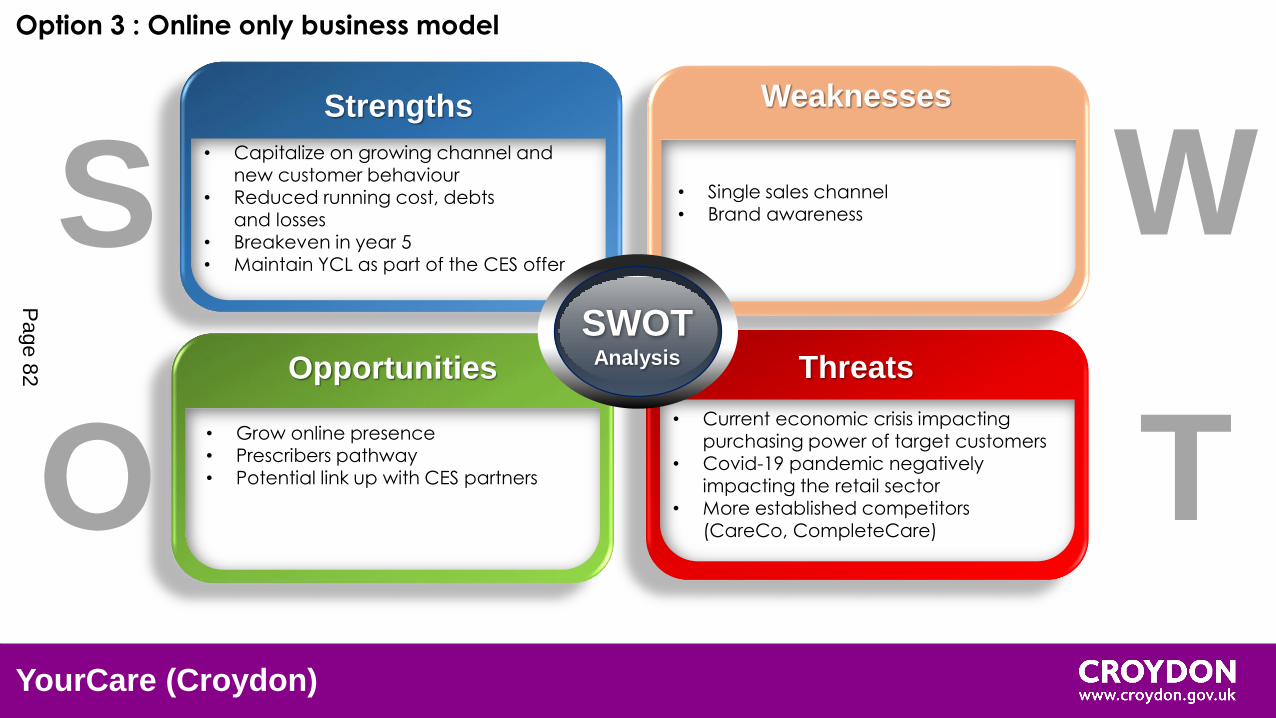
YourCare (Croydon)
Option 3 : Online only business model
Strengths
• Capitalize on growing channel and new customer behaviour
• Reduced running cost, debts and losses
• Breakeven in year 5• Maintain YCL as part of the CES offer
Weaknesses
• Single sales channel• Brand awarenessS W
• Grow online presence • Prescribers pathway• Potential link up with CES partners
• Current economic crisis impacting purchasing power of target customers
• Covid-19 pandemic negatively impacting the retail sector
• More established competitors (CareCo, CompleteCare)O T
Opportunities Threats
SWOTAnalysis
Page 82
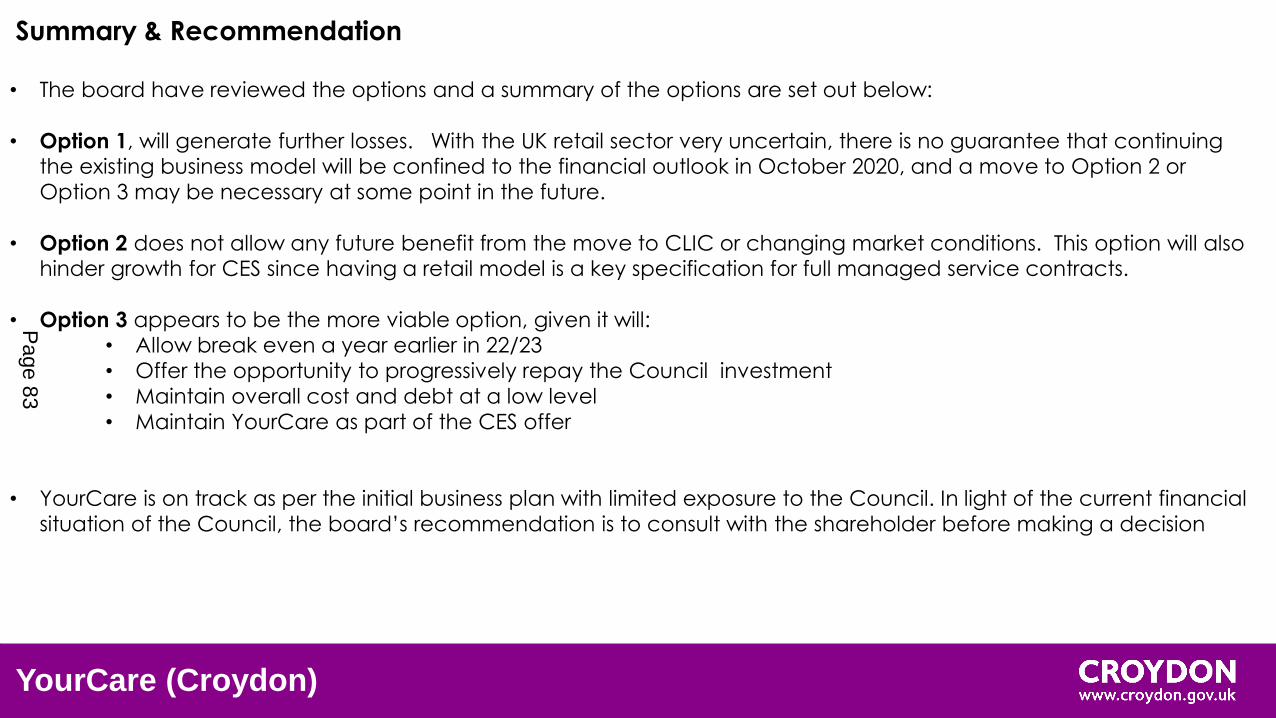
YourCare (Croydon)
Summary & Recommendation
• The board have reviewed the options and a summary of the options are set out below:
• Option 1, will generate further losses. With the UK retail sector very uncertain, there is no guarantee that continuing the existing business model will be confined to the financial outlook in October 2020, and a move to Option 2 or
Option 3 may be necessary at some point in the future.
• Option 2 does not allow any future benefit from the move to CLIC or changing market conditions. This option will also hinder growth for CES since having a retail model is a key specification for full managed service contracts.
• Option 3 appears to be the more viable option, given it will:• Allow break even a year earlier in 22/23
• Offer the opportunity to progressively repay the Council investment
• Maintain overall cost and debt at a low level
• Maintain YourCare as part of the CES offer
• YourCare is on track as per the initial business plan with limited exposure to the Council. In light of the current financial
situation of the Council, the board’s recommendation is to consult with the shareholder before making a decision
Page 83
YourCare (Croydon)
Governance and report to Shareholder
• The board of directors will provide trading update twice a year to the shareholder at the following intervals
• Mid-year : October
• Year end : April
• The board would like to get a view from the shareholder on YourCare’s future given the current financial
position of the Council
Page 84
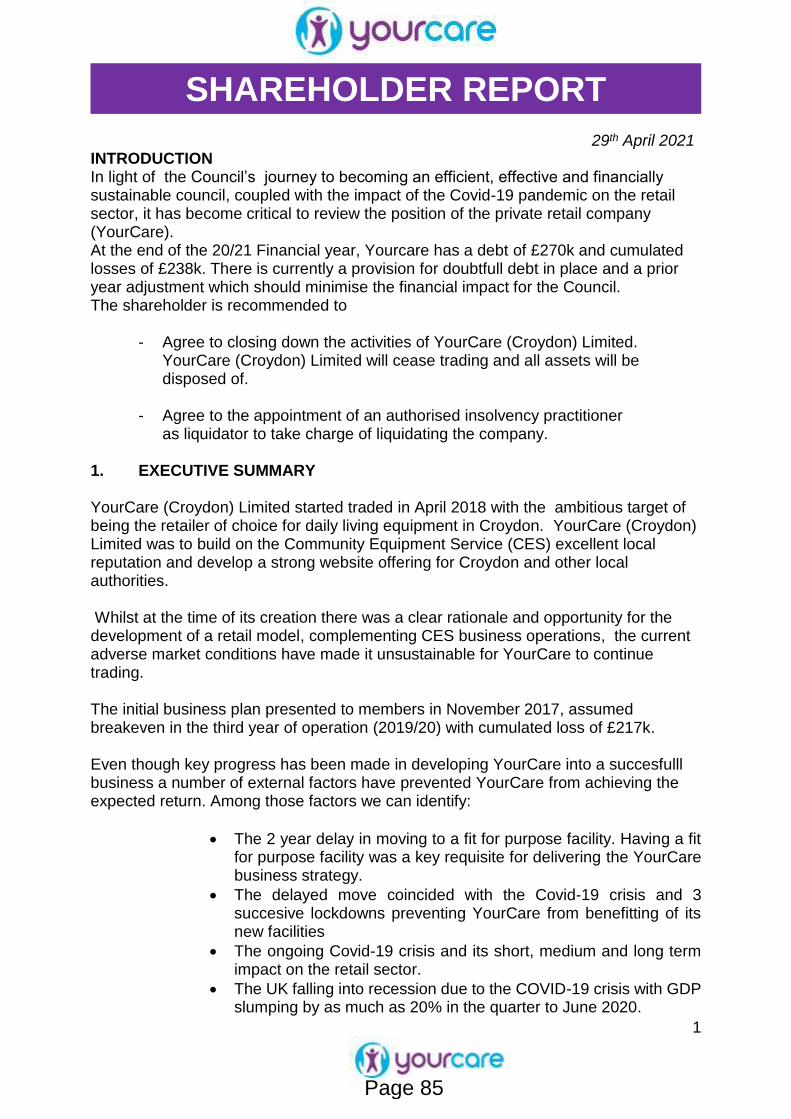
1
SHAREHOLDER REPORT
29th April 2021 INTRODUCTION In light of the Council’s journey to becoming an efficient, effective and financially sustainable council, coupled with the impact of the Covid-19 pandemic on the retail sector, it has become critical to review the position of the private retail company (YourCare). At the end of the 20/21 Financial year, Yourcare has a debt of £270k and cumulated losses of £238k. There is currently a provision for doubtfull debt in place and a prior year adjustment which should minimise the financial impact for the Council. The shareholder is recommended to
- Agree to closing down the activities of YourCare (Croydon) Limited.
YourCare (Croydon) Limited will cease trading and all assets will be disposed of.
- Agree to the appointment of an authorised insolvency practitioner
as liquidator to take charge of liquidating the company. 1. EXECUTIVE SUMMARY YourCare (Croydon) Limited started traded in April 2018 with the ambitious target of being the retailer of choice for daily living equipment in Croydon. YourCare (Croydon) Limited was to build on the Community Equipment Service (CES) excellent local reputation and develop a strong website offering for Croydon and other local authorities. Whilst at the time of its creation there was a clear rationale and opportunity for the development of a retail model, complementing CES business operations, the current adverse market conditions have made it unsustainable for YourCare to continue trading. The initial business plan presented to members in November 2017, assumed breakeven in the third year of operation (2019/20) with cumulated loss of £217k. Even though key progress has been made in developing YourCare into a succesfulll business a number of external factors have prevented YourCare from achieving the expected return. Among those factors we can identify:
The 2 year delay in moving to a fit for purpose facility. Having a fit for purpose facility was a key requisite for delivering the YourCare business strategy.
The delayed move coincided with the Covid-19 crisis and 3 succesive lockdowns preventing YourCare from benefitting of its new facilities
The ongoing Covid-19 crisis and its short, medium and long term impact on the retail sector.
The UK falling into recession due to the COVID-19 crisis with GDP slumping by as much as 20% in the quarter to June 2020.
Page 85
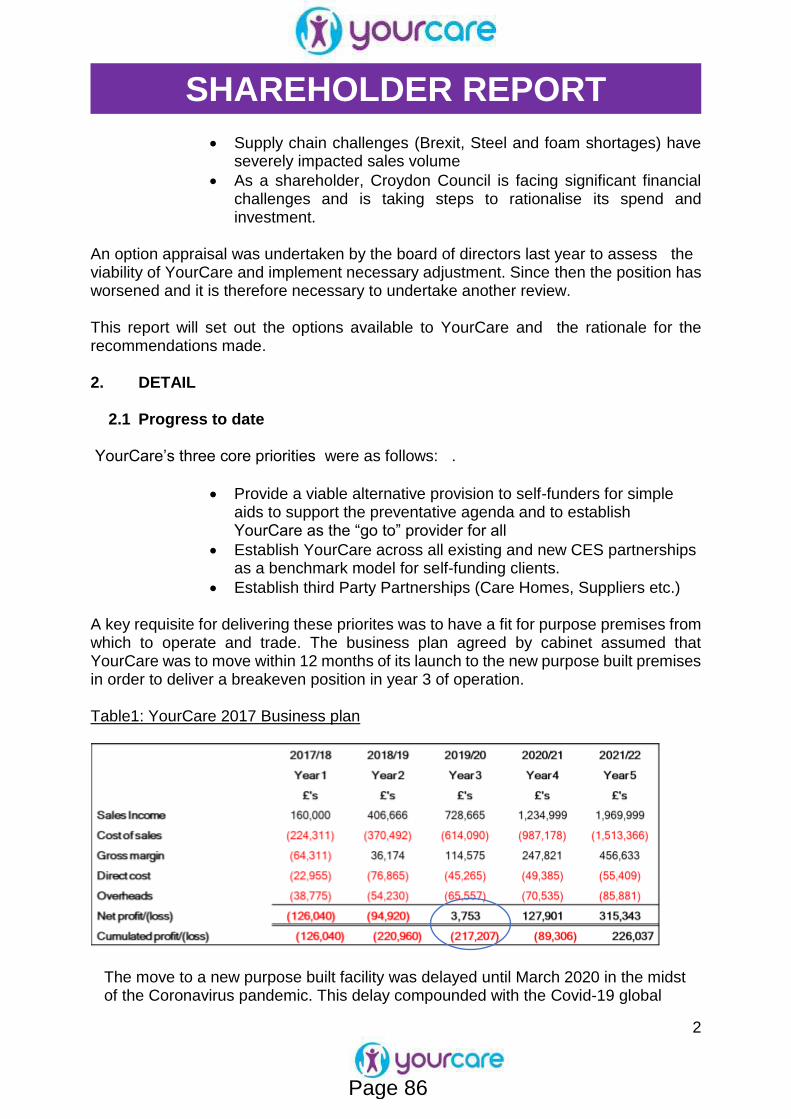
2
SHAREHOLDER REPORT
Supply chain challenges (Brexit, Steel and foam shortages) have severely impacted sales volume
As a shareholder, Croydon Council is facing significant financial challenges and is taking steps to rationalise its spend and investment.
An option appraisal was undertaken by the board of directors last year to assess the viability of YourCare and implement necessary adjustment. Since then the position has worsened and it is therefore necessary to undertake another review. This report will set out the options available to YourCare and the rationale for the recommendations made. 2. DETAIL 2.1 Progress to date YourCare’s three core priorities were as follows: .
Provide a viable alternative provision to self-funders for simple aids to support the preventative agenda and to establish YourCare as the “go to” provider for all
Establish YourCare across all existing and new CES partnerships as a benchmark model for self-funding clients.
Establish third Party Partnerships (Care Homes, Suppliers etc.) A key requisite for delivering these priorites was to have a fit for purpose premises from which to operate and trade. The business plan agreed by cabinet assumed that YourCare was to move within 12 months of its launch to the new purpose built premises in order to deliver a breakeven position in year 3 of operation. Table1: YourCare 2017 Business plan
The move to a new purpose built facility was delayed until March 2020 in the midst of the Coronavirus pandemic. This delay compounded with the Covid-19 global
Page 86
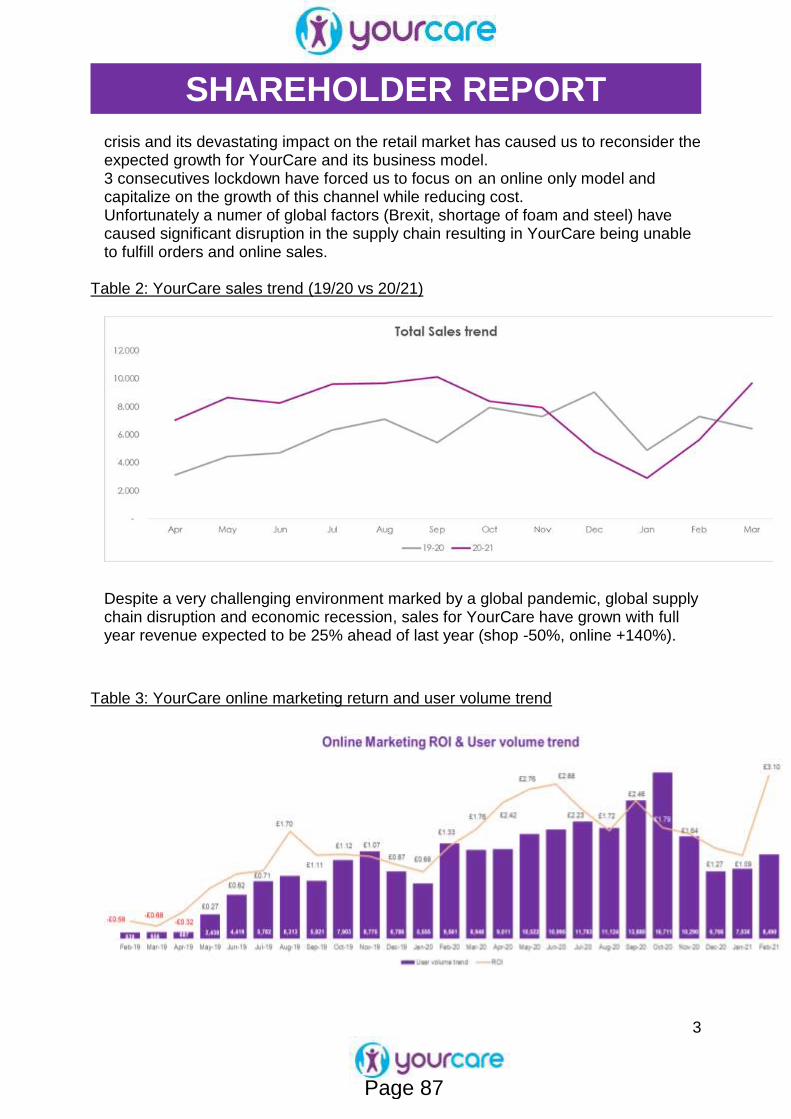
3
SHAREHOLDER REPORT
crisis and its devastating impact on the retail market has caused us to reconsider the expected growth for YourCare and its business model. 3 consecutives lockdown have forced us to focus on an online only model and capitalize on the growth of this channel while reducing cost. Unfortunately a numer of global factors (Brexit, shortage of foam and steel) have caused significant disruption in the supply chain resulting in YourCare being unable to fulfill orders and online sales.
Table 2: YourCare sales trend (19/20 vs 20/21)
Despite a very challenging environment marked by a global pandemic, global supply chain disruption and economic recession, sales for YourCare have grown with full year revenue expected to be 25% ahead of last year (shop -50%, online +140%).
Table 3: YourCare online marketing return and user volume trend
Page 87
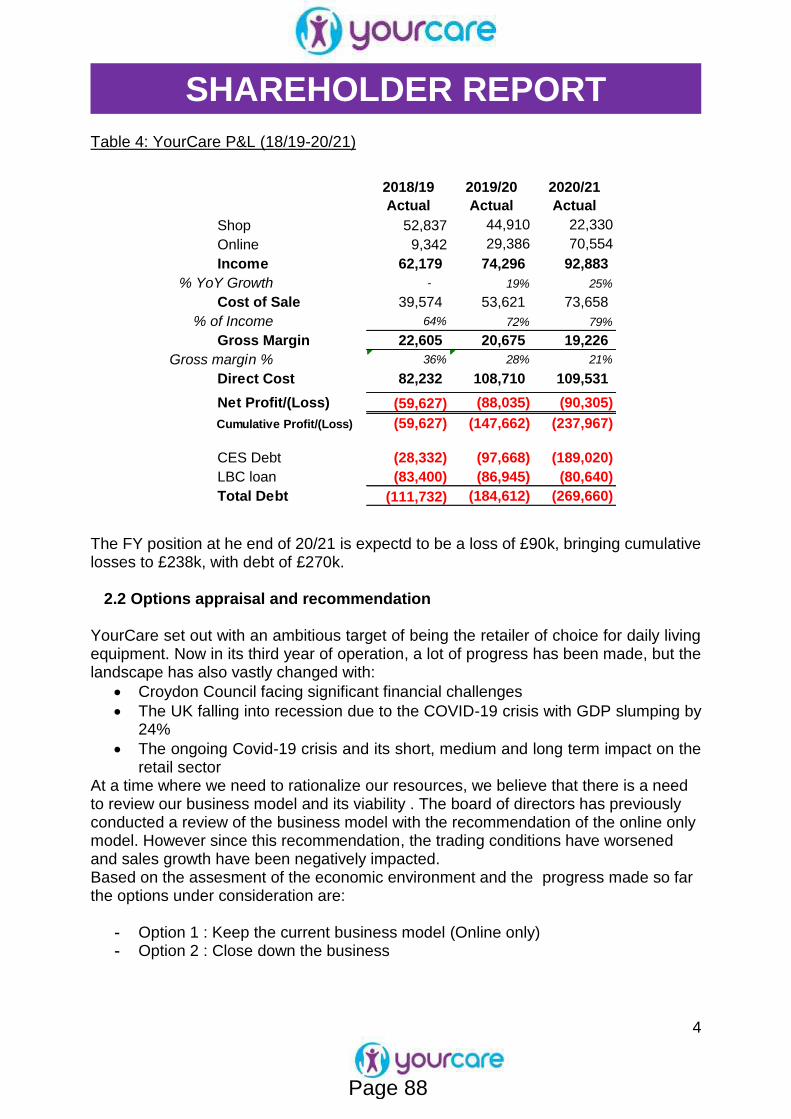
4
SHAREHOLDER REPORT
Table 4: YourCare P&L (18/19-20/21)
The FY position at he end of 20/21 is expectd to be a loss of £90k, bringing cumulative losses to £238k, with debt of £270k. 2.2 Options appraisal and recommendation YourCare set out with an ambitious target of being the retailer of choice for daily living equipment. Now in its third year of operation, a lot of progress has been made, but the landscape has also vastly changed with:
Croydon Council facing significant financial challenges
The UK falling into recession due to the COVID-19 crisis with GDP slumping by 24%
The ongoing Covid-19 crisis and its short, medium and long term impact on the retail sector
At a time where we need to rationalize our resources, we believe that there is a need to review our business model and its viability . The board of directors has previously conducted a review of the business model with the recommendation of the online only model. However since this recommendation, the trading conditions have worsened and sales growth have been negatively impacted. Based on the assesment of the economic environment and the progress made so far the options under consideration are:
- Option 1 : Keep the current business model (Online only) - Option 2 : Close down the business
2018/19
Actual
2019/20
Actual
2020/21
Actual
Shop 52,837 44,910 22,330
Online 9,342 29,386 70,554
Income 62,179 74,296 92,883
% YoY Growth - 19% 25%
Cost of Sale 39,574 53,621 73,658
% of Income 64% 72% 79%
Gross Margin 22,605 20,675 19,226
Gross margin % 36% 28% 21%
Direct Cost 82,232 108,710 109,531
Net Profit/(Loss) (59,627) (88,035) (90,305)
Cumulative Profit/(Loss) (59,627) (147,662) (237,967)
CES Debt (28,332) (97,668) (189,020)
LBC loan (83,400) (86,945) (80,640)
Total Debt (111,732) (184,612) (269,660)
Page 88
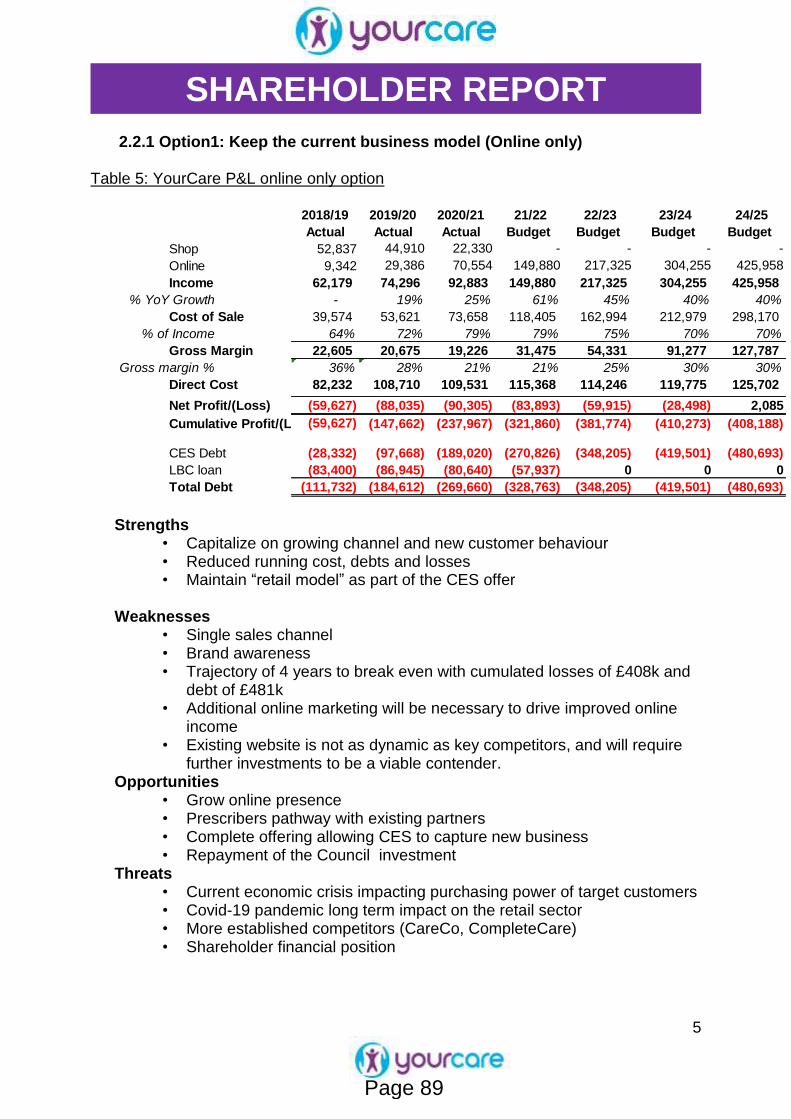
5
SHAREHOLDER REPORT
2.2.1 Option1: Keep the current business model (Online only)
Table 5: YourCare P&L online only option
Strengths
• Capitalize on growing channel and new customer behaviour • Reduced running cost, debts and losses • Maintain “retail model” as part of the CES offer
Weaknesses
• Single sales channel • Brand awareness • Trajectory of 4 years to break even with cumulated losses of £408k and
debt of £481k • Additional online marketing will be necessary to drive improved online
income • Existing website is not as dynamic as key competitors, and will require
further investments to be a viable contender. Opportunities
• Grow online presence • Prescribers pathway with existing partners • Complete offering allowing CES to capture new business • Repayment of the Council investment
Threats • Current economic crisis impacting purchasing power of target customers • Covid-19 pandemic long term impact on the retail sector • More established competitors (CareCo, CompleteCare) • Shareholder financial position
2018/19
Actual
2019/20
Actual
2020/21
Actual
21/22
Budget
22/23
Budget
23/24
Budget
24/25
Budget
Shop 52,837 44,910 22,330 - - - -
Online 9,342 29,386 70,554 149,880 217,325 304,255 425,958
Income 62,179 74,296 92,883 149,880 217,325 304,255 425,958
% YoY Growth - 19% 25% 61% 45% 40% 40%
Cost of Sale 39,574 53,621 73,658 118,405 162,994 212,979 298,170
% of Income 64% 72% 79% 79% 75% 70% 70%
Gross Margin 22,605 20,675 19,226 31,475 54,331 91,277 127,787
Gross margin % 36% 28% 21% 21% 25% 30% 30%
Direct Cost 82,232 108,710 109,531 115,368 114,246 119,775 125,702
Net Profit/(Loss) (59,627) (88,035) (90,305) (83,893) (59,915) (28,498) 2,085
Cumulative Profit/(Loss)(59,627) (147,662) (237,967) (321,860) (381,774) (410,273) (408,188)
CES Debt (28,332) (97,668) (189,020) (270,826) (348,205) (419,501) (480,693)
LBC loan (83,400) (86,945) (80,640) (57,937) 0 0 0
Total Debt (111,732) (184,612) (269,660) (328,763) (348,205) (419,501) (480,693)
Page 89
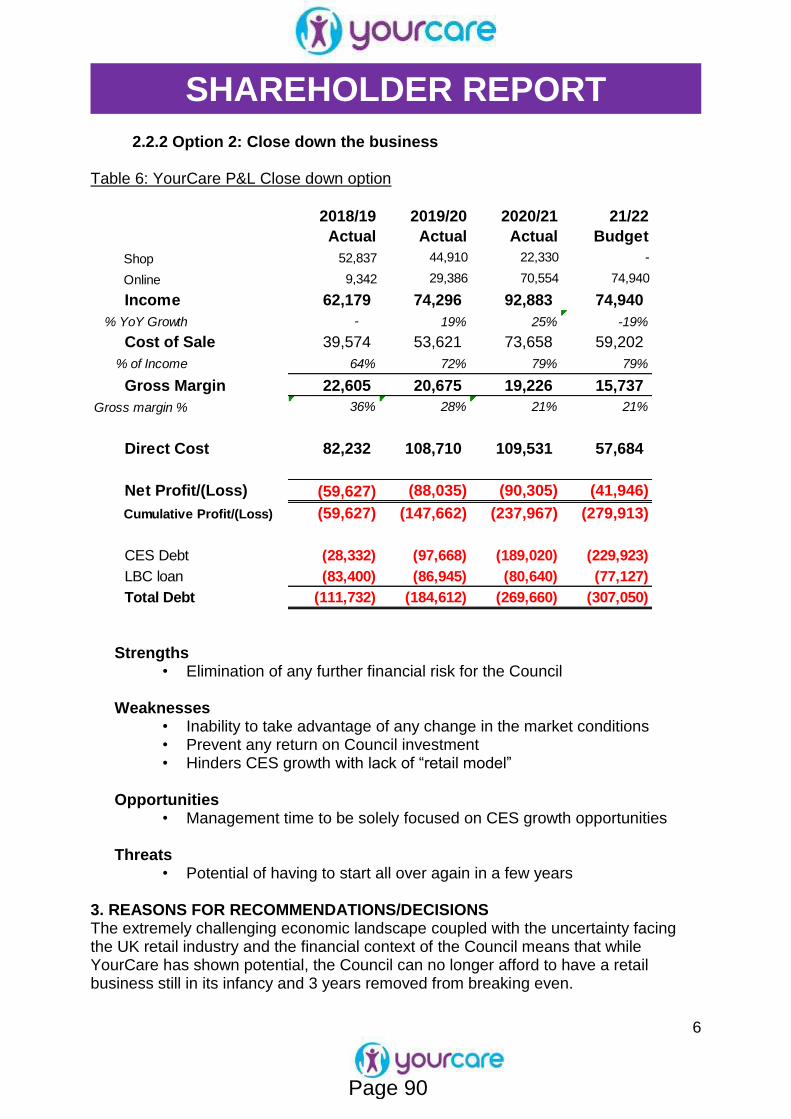
6
SHAREHOLDER REPORT
2.2.2 Option 2: Close down the business Table 6: YourCare P&L Close down option
Strengths • Elimination of any further financial risk for the Council
Weaknesses
• Inability to take advantage of any change in the market conditions • Prevent any return on Council investment • Hinders CES growth with lack of “retail model”
Opportunities
• Management time to be solely focused on CES growth opportunities Threats
• Potential of having to start all over again in a few years 3. REASONS FOR RECOMMENDATIONS/DECISIONS The extremely challenging economic landscape coupled with the uncertainty facing the UK retail industry and the financial context of the Council means that while YourCare has shown potential, the Council can no longer afford to have a retail business still in its infancy and 3 years removed from breaking even.
2018/19
Actual
2019/20
Actual
2020/21
Actual
21/22
Budget
Shop 52,837 44,910 22,330 -
Online 9,342 29,386 70,554 74,940
Income 62,179 74,296 92,883 74,940
% YoY Growth - 19% 25% -19%
Cost of Sale 39,574 53,621 73,658 59,202
% of Income 64% 72% 79% 79%
Gross Margin 22,605 20,675 19,226 15,737
Gross margin % 36% 28% 21% 21%
Direct Cost 82,232 108,710 109,531 57,684
Net Profit/(Loss) (59,627) (88,035) (90,305) (41,946)
Cumulative Profit/(Loss) (59,627) (147,662) (237,967) (279,913)
CES Debt (28,332) (97,668) (189,020) (229,923)
LBC loan (83,400) (86,945) (80,640) (77,127)
Total Debt (111,732) (184,612) (269,660) (307,050)
Page 90
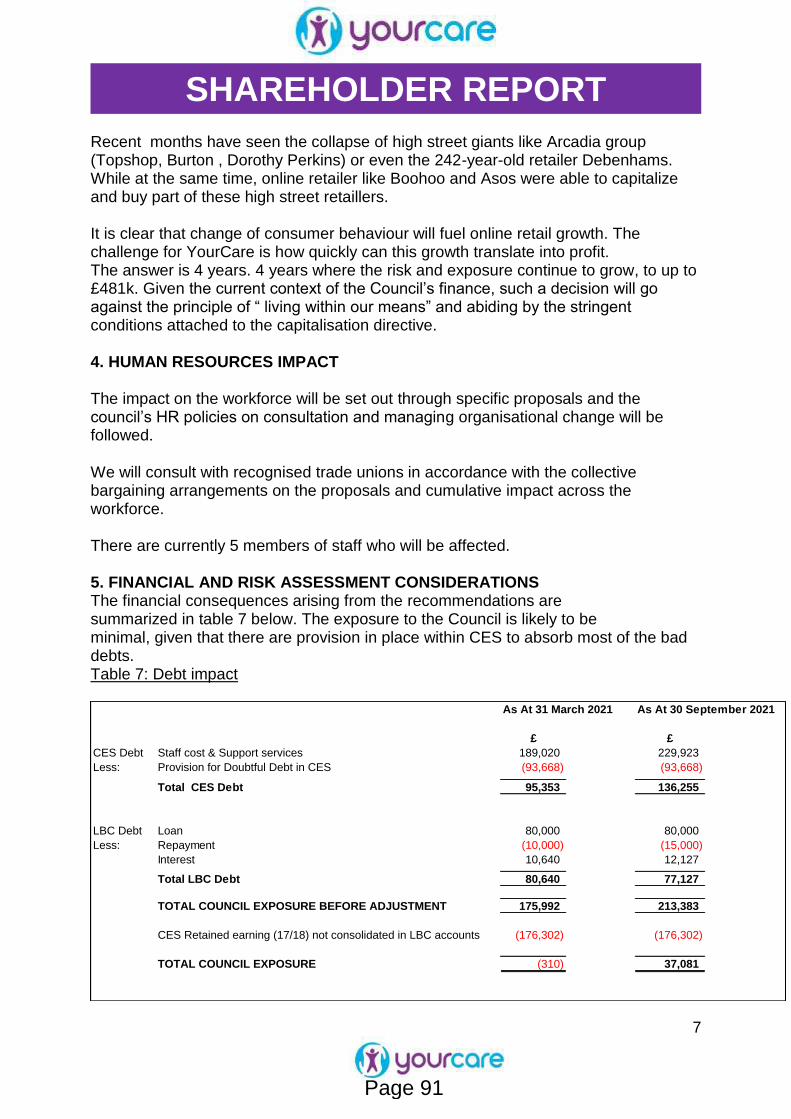
7
SHAREHOLDER REPORT
Recent months have seen the collapse of high street giants like Arcadia group (Topshop, Burton , Dorothy Perkins) or even the 242-year-old retailer Debenhams. While at the same time, online retailer like Boohoo and Asos were able to capitalize and buy part of these high street retaillers. It is clear that change of consumer behaviour will fuel online retail growth. The challenge for YourCare is how quickly can this growth translate into profit. The answer is 4 years. 4 years where the risk and exposure continue to grow, to up to £481k. Given the current context of the Council’s finance, such a decision will go against the principle of “ living within our means” and abiding by the stringent conditions attached to the capitalisation directive. 4. HUMAN RESOURCES IMPACT The impact on the workforce will be set out through specific proposals and the council’s HR policies on consultation and managing organisational change will be followed.
We will consult with recognised trade unions in accordance with the collective bargaining arrangements on the proposals and cumulative impact across the workforce. There are currently 5 members of staff who will be affected. 5. FINANCIAL AND RISK ASSESSMENT CONSIDERATIONS The financial consequences arising from the recommendations are summarized in table 7 below. The exposure to the Council is likely to be minimal, given that there are provision in place within CES to absorb most of the bad debts. Table 7: Debt impact
As At 31 March 2021 As At 30 September 2021
£ £
CES Debt Staff cost & Support services 189,020 229,923
Less: Provision for Doubtful Debt in CES (93,668) (93,668)
Total CES Debt 95,353 136,255
LBC Debt Loan 80,000 80,000
Less: Repayment (10,000) (15,000)
Interest 10,640 12,127
Total LBC Debt 80,640 77,127
TOTAL COUNCIL EXPOSURE BEFORE ADJUSTMENT 175,992 213,383
CES Retained earning (17/18) not consolidated in LBC accounts (176,302) (176,302)
TOTAL COUNCIL EXPOSURE (310) 37,081
Page 91

8
SHAREHOLDER REPORT
6. LEGAL CONSIDERATIONS As sole shareholder, the London Borough of Croydon has the ability to make a petition for the passing of a resolution for winding up in respect of the Company. This petition will then be voted on by the board of directors.
Page 92
1
SHAREHOLDER REPORT
29th April 2021 INTRODUCTION YourCare is a company wholly owned by Croydon Council set up in May 2017, which started trading in April 2018. The creation of the company was agreed by a Cabinet decision on the 26 January 2017. The commercial objective of YourCare is to be a retail company, providing independent, choice and control to self-funding customers for daily living equipment. The Council’s rationale for setting up YourCare was to offer a trusted and fast-tracked alternative to the public, while contributing to a number of important healthcare and social priorities, among others:
Proactively supporting the demand pressures for Croydon Council in the assessment and allocation of social care resources
Reduces Council waiting lists, particularly those people who have non-complex needs
Supports the preventative agenda by working with non – complex clients at an earlier stage.
All activities carried out by the company are outside the scope of the Care Act, as it focuses on customers who wish to purchase privately, or are not eligible for statutory provision. This report is produced to provide :
An update to the shareholder on the performance to date.
An update to the shareholder on the market conditions and the impact of the pandemic on the viability of the company.
1. EXECUTIVE SUMMARY YourCare (Croydon) Limited started traded in April 2018 with the ambitious target of being the retailer of choice for daily living equipment in Croydon. YourCare (Croydon) Limited was to build on the Community Equipment Service (CES) excellent local reputation and develop a strong website offering for Croydon and other local authorities. The initial business plan presented to members in November 2017, assumed breakeven in the third year of operation(2019/20) with cumulated loss of £217k. Even though key progress has been made in developing YourCare into a succesfulll business, a number of external factors have prevented YourCare from achieving the expected return. Among those factors we can identify:
- The 2 year delay in moving to a fit for purpose facility. Having a
fit for purpose facility was a key requisite for delivering the YourCare business strategy.
Page 93
2
SHAREHOLDER REPORT
- The delayed move coincided with the Covid-19 crisis and 3 succesive lockdowns preventing YourCare from benefitting of its new facilities
- The ongoing Covid-19 crisis and its short, medium and long term impact on the retail sector.
- The UK falling into recession due to the COVID-19 crisis with GDP slumping by as much as 20% in the quarter to June 2020.
- Supply chain challenges( Brexit, Steel and foam shortages) have severely impacted sales volume
- As a shareholder, Croydon Council is facing significant financial challenges and is taking steps to rationalise its spend and investment.
An option appraisal was undertaken by the board of directors last year to assess the viability of YourCare and implement necessary adjustment. 2. DETAIL 2.1 Background All local authorities and health partners have an equipment service, linked to
adult social care. This has two functions: the purchasing of equipment and the delivery and installation of equipment. This forms a core part of the health and social care offer. The equipment services play an important role in supporting local authorities and health partners in the delivery of key agendas including managing increasing demand, integration, prevention, hospital discharge and admission avoidance.
For five years from 2011 to 2016 the Croydon equipment service was delivered through Croydon Care Solutions, the Council’s Local Authority Trading Company (LATC). A governance review of Croydon Care Solutions took place in the summer of 2015. This review identified that the company was loss making and whilst elements of the service model had potential, the structure and delivery model needed considering.
In June 2016, the Council took the strategic decision to insource the equipment service and wind down the LATC. The insourcing of the equipment service was completed in December 2016.
As part of the insourcing process, a new five year business plan was created to achieve a number of key business objectives. The main objectives of the insourcing were:
To turnaround the service into a profitable business, bringing social and financial benefit to Croydon.
To invest into the service in order to ensure long term sustainability and growth.
To establish and grow the retail offer initially in Croydon and in
Page 94
3
SHAREHOLDER REPORT
turn with our partner authorities.
To position CES as a key strategic partner in the health and social care market.
The insourced structure was integrated into the Commisioning and
procurement division under the name Community Equipment Service (CES). CES was to be a key provider in helping to deliver social care and health transformation programmes, including demand management, models of care and personal budget uptake. CES was uniquely positioned to offer products and services that meet needs across the whole spectrum of social care, including low level simple aids to daily living, complex aids for managing multiple conditions and cutting edge technological solutions.
2.2 The retail model 2.2.1 Policy context
The Retail Model is part of the Government’s Personalisation agenda. The Retail Model relates to moving simple equipment into the retail market place so that the service users have greater choice, control and independence over their equipment provision. They can choose the product that best suits their lifestyle. If their choice costs more than the item on prescription, they can opt to pay the difference to the retailer. Consequently, where a Service User is assessed as eligible for simple aids for daily living equipment provision, they can take their prescription to a local accredited retailer who will exchange it for the items of equipment required. The model improves accessibility to these products for all users i.e. both state and self funded. The model, by opening up the market place for community equipment, empowers individuals to self-help thereby supporting the prevention and personalisation agenda.
Community Equipment providers are now required as part of tenders to support the Retail Model by offering facilities for displaying and demonstrating equipment to service user, web portals and payment system.
2.2.2 Demographic and economic context The COMODAL market analysis estimated the overall retail value of the market
(in 2011) for self funded products only to be £404 million pounds.
With public sector service provision diminishing due to reducing budgets and stringent application of the Fair Access to Care Services criteria (FACS), there is no doubt that the consumer market will grow to meet the levels of future demand.
The case for a consumer market for assisted living technology and services is getting stronger. Since the late 1980s, consecutive governments in the UK have supported the preference for people with health and social care needs to
Page 95
4
SHAREHOLDER REPORT
retain their independence and remain in their own homes for as long as possible. This preference is also supported by the need for people to embrace self-management and control of their own healthcare both in terms of those with long term conditions and the wider well-being agenda.
Older people are major users of health and social care services. As a consumer group, this market is set to grow significantly as the age of the population increases. This presents an enormous opportunity for those companies willing to address the needs of people as they get older.
The 2011 population estimates from the Office for National Statistics showed
that :
Over 30 per cent of the UK population was above the age of 50 and they held 80 per cent of the wealth in the country
There was more people In the UK above the age of 60 than under 18
By 2083 one in three people would be over 60
Households headed by someone aged 65+ contributed about £121 billion of spending power every year. For the 50 plus group as a whole, it was Over £300 billion a year
The spending power of the over 65s was £76 billion, and was set to grow to £127 Billion by 2030; a growth of 68%
2.2.3 Set up and structure
The evidence of a market, both local and national, supported the
rationale that the Community Equipment Service should position itself
in the market place as a trusted provider of all age equipment products
and services. The business strategy therefore was to build a retail
service through an appropriate delivery model consistent with the
provisions and requirements of the council under the Care Act.
The commercial objective of the retail company was:
To successfully trade for commercial purposes,
Becoming the retailer of choice with private consumers of community equipment.
The scope of services to be provided was based upon assessments of the retail market place and gaps in provision. These services included the following:
Simple aids to daily living, such as walking frames, perching stools
Complex aids to daily living, such as beds
Telecare stand-alone products, such as sensors and monitors
Mobility equipment, such as mobility scooters
Minor adaptations to properties, such as wheelchair ramps.
Private assessments on product requirements.
Key investment and development required in order for this business model to be succesfull included the folowing:
Page 96
5
SHAREHOLDER REPORT
A fit for purpose retail outlet, including clinical assessment space and
independent living centre.
Telephony system to support incoming sales calls.
Website (s) including online shopping and assessment capability.
Sales and Customer Relationship management system.
Marketing and sales strategy resource.
Retail equipment subject matter experts and trusted assessors.
Mail order shipping resources.
To ensure that all activities carried out by the company were outside the scope of the Care Act, the retail business would sell to the following customer base:
Customers who are outside the borough and who wish to purchase
privately from the retail service
Customers who have been assessed by the Council as having no
eligible needs, but who still wish to purchase equipment.
2.2.3.1 Company Structure and Directors YourCare was set up as a separate limited company wholly owned by Croydon Council with the following directors:
Sarah Ireland – Director of Communities Strategy and Commissioning
Pratima Solanki – Director of Adults Social Care
Lisa Taylor –Assistant Director Finance
Rachel Soni – Head of Communities Strategy and Commissioning
Sarah Warman – Head of Communities Strategy and Commissioning
2.2.3.2 Staff and Finance The company operates independently from the Council with office support functions (payroll support, company secretarial support, legal services and retail staffing) being “bought” from the Council through the provision of a contract for services. The Council provides these services at market rates so that the company is not receiving state aid from the Council.
A loan facility of £250,000 from Croydon Council on commercial terms was
agreed to support the initial launch activity and cashflow needs. To this date £80k of this facility has been drawn down, and £10k has been repaid.
2.3 Progress to date YourCare’s three core priorities were as follows:
Provide a viable alternative provision to self-funders for simple aids to support the preventative agenda and to establish YourCare as the “go to” provider for all
Establish YourCare across all existing and new CES partnerships as a benchmark model for self-funding clients.
Establish third Party Partnerships (Care Homes, Suppliers etc.)
Page 97
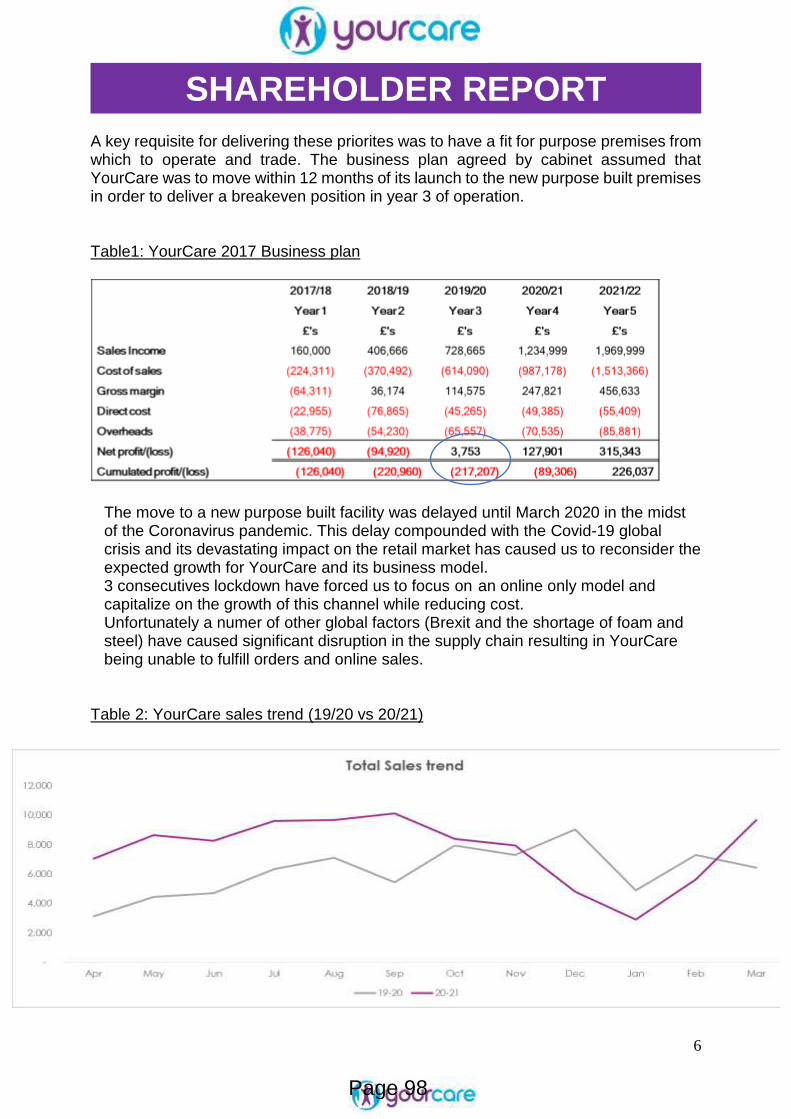
6
SHAREHOLDER REPORT
A key requisite for delivering these priorites was to have a fit for purpose premises from which to operate and trade. The business plan agreed by cabinet assumed that YourCare was to move within 12 months of its launch to the new purpose built premises in order to deliver a breakeven position in year 3 of operation. Table1: YourCare 2017 Business plan
The move to a new purpose built facility was delayed until March 2020 in the midst of the Coronavirus pandemic. This delay compounded with the Covid-19 global crisis and its devastating impact on the retail market has caused us to reconsider the expected growth for YourCare and its business model. 3 consecutives lockdown have forced us to focus on an online only model and capitalize on the growth of this channel while reducing cost. Unfortunately a numer of other global factors (Brexit and the shortage of foam and steel) have caused significant disruption in the supply chain resulting in YourCare being unable to fulfill orders and online sales.
Table 2: YourCare sales trend (19/20 vs 20/21)
Page 98
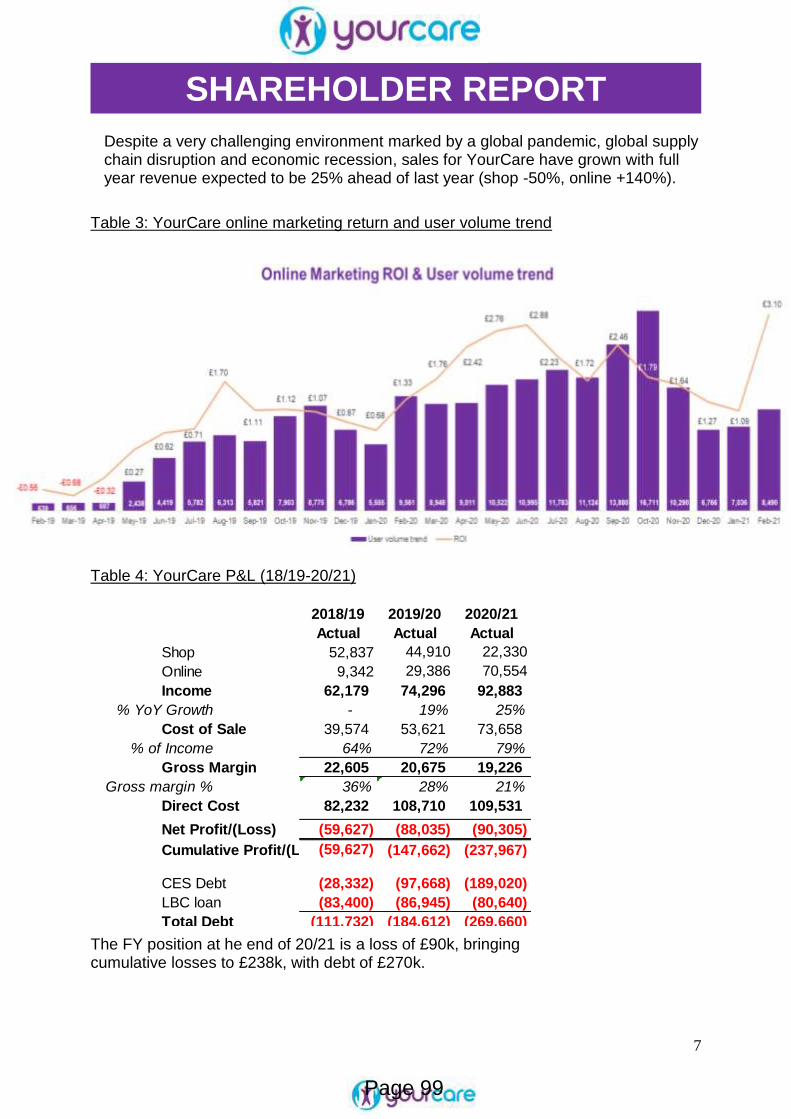
7
SHAREHOLDER REPORT
Despite a very challenging environment marked by a global pandemic, global supply chain disruption and economic recession, sales for YourCare have grown with full year revenue expected to be 25% ahead of last year (shop -50%, online +140%).
Table 3: YourCare online marketing return and user volume trend
Table 4: YourCare P&L (18/19-20/21)
The FY position at he end of 20/21 is a loss of £90k, bringing cumulative losses to £238k, with debt of £270k.
2018/19
Actual
2019/20
Actual
2020/21
Actual
Shop 52,837 44,910 22,330
Online 9,342 29,386 70,554
Income 62,179 74,296 92,883
% YoY Growth - 19% 25%
Cost of Sale 39,574 53,621 73,658
% of Income 64% 72% 79%
Gross Margin 22,605 20,675 19,226
Gross margin % 36% 28% 21%
Direct Cost 82,232 108,710 109,531
Net Profit/(Loss) (59,627) (88,035) (90,305)
Cumulative Profit/(Loss)(59,627) (147,662) (237,967)
CES Debt (28,332) (97,668) (189,020)
LBC loan (83,400) (86,945) (80,640)
Total Debt (111,732) (184,612) (269,660)
Page 99
8
SHAREHOLDER REPORT
3.Conclusion YourCare set out with an ambitious target of being the retailer of choice for daily living equipment. Now in its third year of operation a lot of progress has been made, but the landscape has also vastly changed with:
- Croydon Council facing significant financial challenges - The UK falling into recession due to the COVID-19 crisis with GDP
slumping by much as 20% in the quarter to June 2020. - The ongoing Covid-19 crisis and its short, medium and long term impact
on the retail sector
YourCare turnover has grown by 49% between 18/19 to 20/21 from £62k to £93 k. This increase is mainly due to the 655% increase in online sales, while shop sales have reduced in the same period by 58% mainly due to the COVID-19 crisis. The 655% increase resulted from increased investment in Marketing and website development. The key challenges faced have been: - The lack of a proper retail facility - Slow progress in buy–in from partners ( CUH and LA’s) - Strong competition from more established retailers - Covid-19 pandemic resulting in adverse market conditions
- Supply chain disruption (Brexit, Steel and foam shortages) severely impacting sales volume
Given the current context of the financial pressures experienced by the shareholder. It has become critical to review the position of the private retail company (YourCare) and its viability.
Page 100
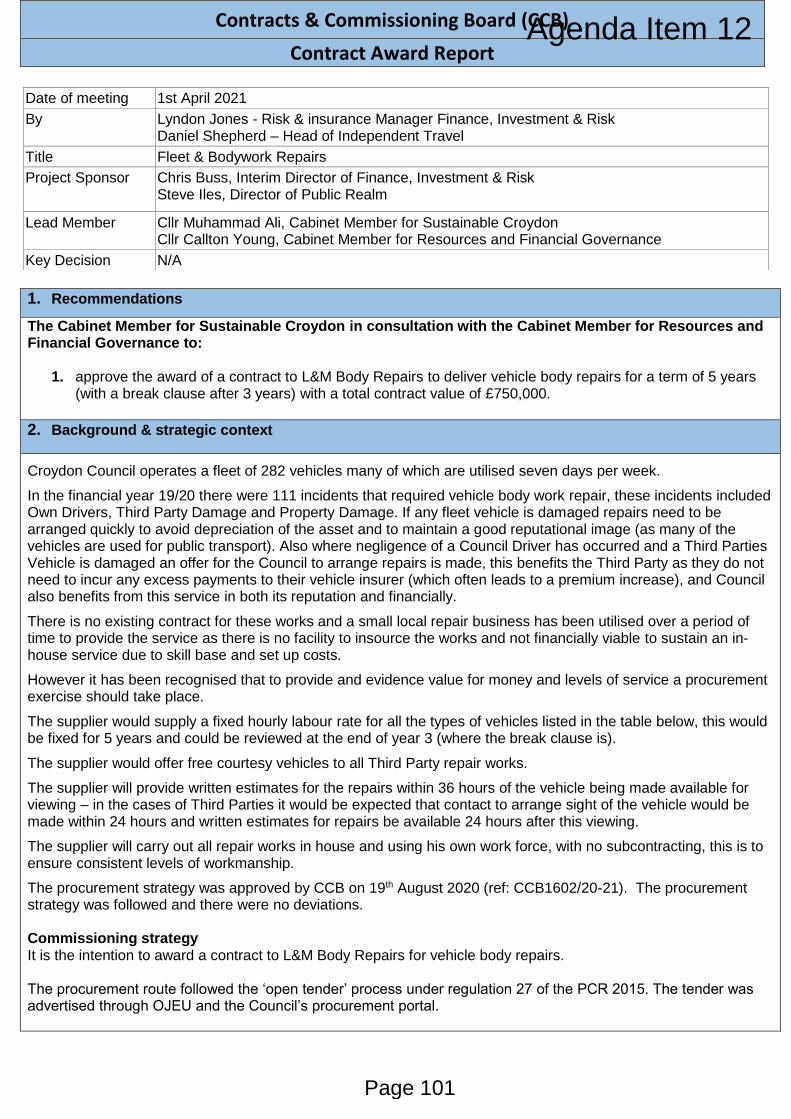
1. Recommendations
The Cabinet Member for Sustainable Croydon in consultation with the Cabinet Member for Resources and Financial Governance to:
1. approve the award of a contract to L&M Body Repairs to deliver vehicle body repairs for a term of 5 years (with a break clause after 3 years) with a total contract value of £750,000.
2. Background & strategic context
Croydon Council operates a fleet of 282 vehicles many of which are utilised seven days per week.
In the financial year 19/20 there were 111 incidents that required vehicle body work repair, these incidents included Own Drivers, Third Party Damage and Property Damage. If any fleet vehicle is damaged repairs need to be arranged quickly to avoid depreciation of the asset and to maintain a good reputational image (as many of the vehicles are used for public transport). Also where negligence of a Council Driver has occurred and a Third Parties Vehicle is damaged an offer for the Council to arrange repairs is made, this benefits the Third Party as they do not need to incur any excess payments to their vehicle insurer (which often leads to a premium increase), and Council also benefits from this service in both its reputation and financially.
There is no existing contract for these works and a small local repair business has been utilised over a period of time to provide the service as there is no facility to insource the works and not financially viable to sustain an in-house service due to skill base and set up costs.
However it has been recognised that to provide and evidence value for money and levels of service a procurement exercise should take place.
The supplier would supply a fixed hourly labour rate for all the types of vehicles listed in the table below, this would be fixed for 5 years and could be reviewed at the end of year 3 (where the break clause is).
The supplier would offer free courtesy vehicles to all Third Party repair works.
The supplier will provide written estimates for the repairs within 36 hours of the vehicle being made available for viewing – in the cases of Third Parties it would be expected that contact to arrange sight of the vehicle would be made within 24 hours and written estimates for repairs be available 24 hours after this viewing.
The supplier will carry out all repair works in house and using his own work force, with no subcontracting, this is to ensure consistent levels of workmanship.
The procurement strategy was approved by CCB on 19th August 2020 (ref: CCB1602/20-21). The procurement strategy was followed and there were no deviations. Commissioning strategy It is the intention to award a contract to L&M Body Repairs for vehicle body repairs. The procurement route followed the ‘open tender’ process under regulation 27 of the PCR 2015. The tender was advertised through OJEU and the Council’s procurement portal.
Contracts & Commissioning Board (CCB)
Contract Award Report
Date of meeting 1st April 2021
By Lyndon Jones - Risk & insurance Manager Finance, Investment & Risk Daniel Shepherd – Head of Independent Travel
Title Fleet & Bodywork Repairs
Project Sponsor Chris Buss, Interim Director of Finance, Investment & Risk Steve Iles, Director of Public Realm
Lead Member Cllr Muhammad Ali, Cabinet Member for Sustainable Croydon Cllr Callton Young, Cabinet Member for Resources and Financial Governance
Key Decision N/A
Page 101
Agenda Item 12
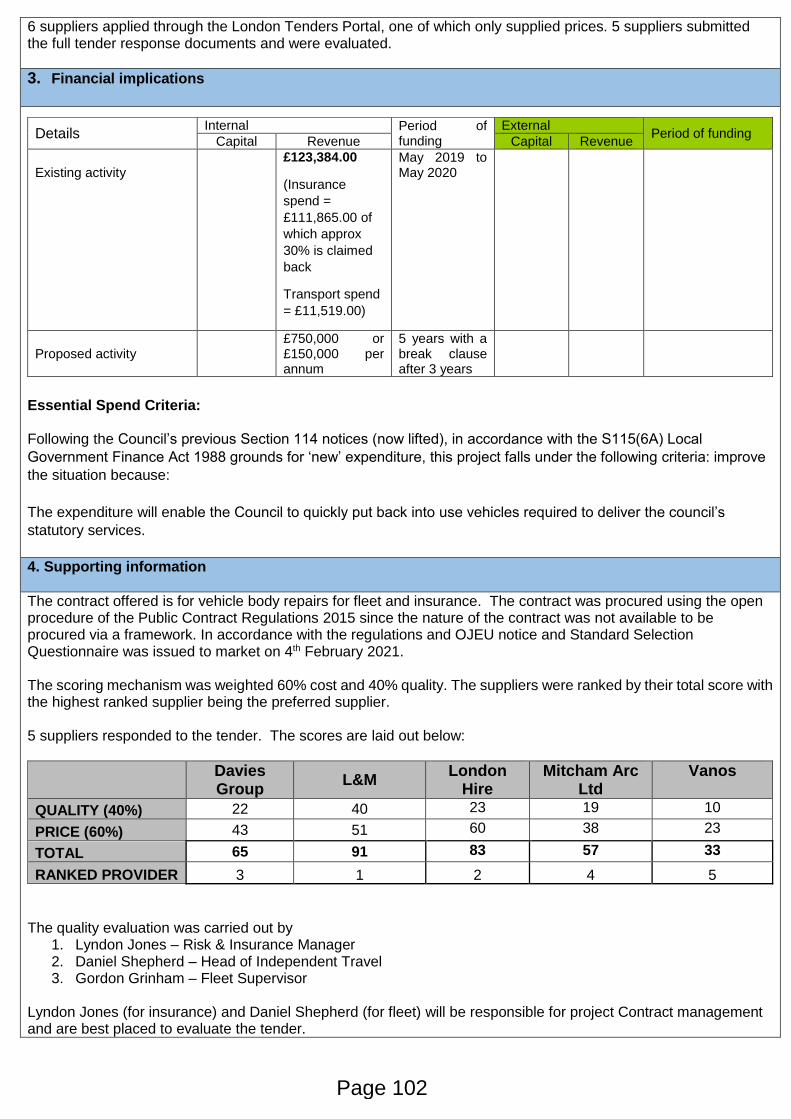
6 suppliers applied through the London Tenders Portal, one of which only supplied prices. 5 suppliers submitted the full tender response documents and were evaluated.
3. Financial implications
Essential Spend Criteria: Following the Council’s previous Section 114 notices (now lifted), in accordance with the S115(6A) Local
Government Finance Act 1988 grounds for ‘new’ expenditure, this project falls under the following criteria: improve
the situation because:
The expenditure will enable the Council to quickly put back into use vehicles required to deliver the council’s
statutory services.
Details Internal Period of
funding
External Period of funding
Capital Revenue Capital Revenue
Existing activity
£123,384.00
(Insurance
spend =
£111,865.00 of
which approx
30% is claimed
back
Transport spend
= £11,519.00)
May 2019 to May 2020
Proposed activity
£750,000 or £150,000 per annum
5 years with a break clause after 3 years
4. Supporting information
The contract offered is for vehicle body repairs for fleet and insurance. The contract was procured using the open procedure of the Public Contract Regulations 2015 since the nature of the contract was not available to be procured via a framework. In accordance with the regulations and OJEU notice and Standard Selection Questionnaire was issued to market on 4th February 2021. The scoring mechanism was weighted 60% cost and 40% quality. The suppliers were ranked by their total score with the highest ranked supplier being the preferred supplier. 5 suppliers responded to the tender. The scores are laid out below:
Davies Group
L&M London
Hire Mitcham Arc
Ltd Vanos
QUALITY (40%) 22 40 23 19 10
PRICE (60%) 43 51 60 38 23
TOTAL 65 91 83 57 33
RANKED PROVIDER 3 1 2 4 5
The quality evaluation was carried out by
1. Lyndon Jones – Risk & Insurance Manager 2. Daniel Shepherd – Head of Independent Travel 3. Gordon Grinham – Fleet Supervisor
Lyndon Jones (for insurance) and Daniel Shepherd (for fleet) will be responsible for project Contract management and are best placed to evaluate the tender.
Page 102
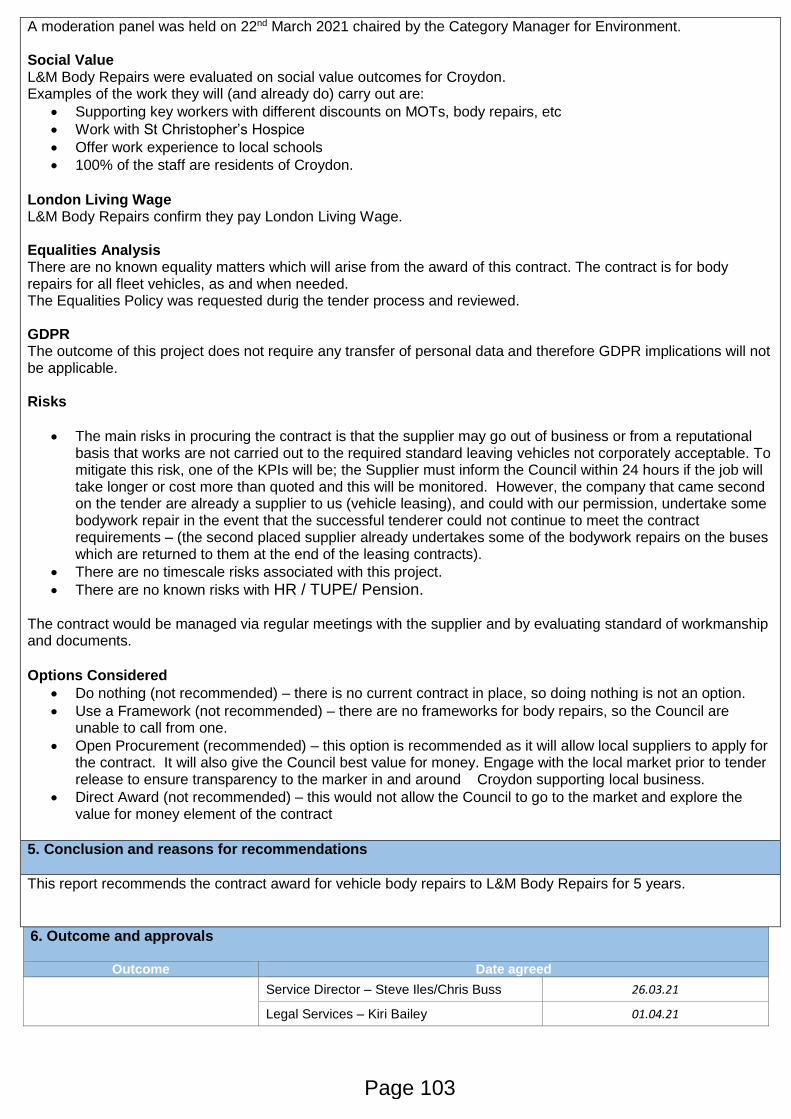
A moderation panel was held on 22nd March 2021 chaired by the Category Manager for Environment. Social Value L&M Body Repairs were evaluated on social value outcomes for Croydon. Examples of the work they will (and already do) carry out are:
Supporting key workers with different discounts on MOTs, body repairs, etc
Work with St Christopher’s Hospice
Offer work experience to local schools
100% of the staff are residents of Croydon. London Living Wage L&M Body Repairs confirm they pay London Living Wage. Equalities Analysis There are no known equality matters which will arise from the award of this contract. The contract is for body repairs for all fleet vehicles, as and when needed. The Equalities Policy was requested durig the tender process and reviewed. GDPR The outcome of this project does not require any transfer of personal data and therefore GDPR implications will not be applicable. Risks
The main risks in procuring the contract is that the supplier may go out of business or from a reputational basis that works are not carried out to the required standard leaving vehicles not corporately acceptable. To mitigate this risk, one of the KPIs will be; the Supplier must inform the Council within 24 hours if the job will take longer or cost more than quoted and this will be monitored. However, the company that came second on the tender are already a supplier to us (vehicle leasing), and could with our permission, undertake some bodywork repair in the event that the successful tenderer could not continue to meet the contract requirements – (the second placed supplier already undertakes some of the bodywork repairs on the buses which are returned to them at the end of the leasing contracts).
There are no timescale risks associated with this project.
There are no known risks with HR / TUPE/ Pension. The contract would be managed via regular meetings with the supplier and by evaluating standard of workmanship and documents.
Options Considered
Do nothing (not recommended) – there is no current contract in place, so doing nothing is not an option.
Use a Framework (not recommended) – there are no frameworks for body repairs, so the Council are unable to call from one.
Open Procurement (recommended) – this option is recommended as it will allow local suppliers to apply for the contract. It will also give the Council best value for money. Engage with the local market prior to tender release to ensure transparency to the marker in and around Croydon supporting local business.
Direct Award (not recommended) – this would not allow the Council to go to the market and explore the value for money element of the contract
5. Conclusion and reasons for recommendations
This report recommends the contract award for vehicle body repairs to L&M Body Repairs for 5 years.
6. Outcome and approvals
Outcome Date agreed
Service Director – Steve Iles/Chris Buss 26.03.21
Legal Services – Kiri Bailey 01.04.21
Page 103
Head of Finance – Geetha Blood 29.03.21
Human Resources (if applicable) N/A
C&P Head of Service – Scott Funnell 25.03.21
Lead Member - Cllr Ali 06.04.21
CCB CCB1679/21-22
21/04/2021
7. Comments of the Council Solicitor
Approved by Kiri Bailey on behalf of the Council Solicitor and Monitoring Officer
8. Chief Finance Officer comments on the financial implications
Page 104

1. Recommendations
The Leader of the Council has delegated to the Cabinet Member for Resources and Financial Governance the power to make the decisions set out in the recommendations below:
RECOMMENDATIONS
1.1 The Cabinet Member for Resources and Financial Governance and in consultation with the Leader is recommended to approve, pursuant to Regulation 30 of the Tenders and Contracts Regulations, the extension via variation of the contract with Premier Partnership Ltd for the provision of Manages Training Services, for a further period of 1 year from 01/08/2021 to 31/07/2022 resulting in a further increase to the contract value by £200,000 (£700,000 in aggregate).
2. Background & strategic context
1.1 An award report was approved in April 2016, REF CCB1123/16-17, to appoint Premier Partnership LTD under
a call off following mini competition from Framework [ESPO Framework 383)for a term of 2 years to provide managed training services to the Council for a value of up to £500K. In 2019 an extension to the contract was approved to extend the contract for 2 years until the 31/07/2021.
1.2 This request is to extend the contract for a further 1 year from August 2021, as an interim measure, to allow
time for a more flexible approach to learning and development procurement and to support the wider review and design of a learning and development procurement framework for the Council, under the scope of the Council’s Cultural Transformation priorities and Workforce Strategy.
3. Financial implications
L&D budgets have now been centralised and approval for L&D spend will now be approved through an L&D Board which will be chaired by a senior manager at a director level from one of the directorates and this role will be rotated quarterly. Additional members of the board will include a senior representative from all directorates, director of HR, Head of Learning & organisational development. The L&OD Board should be operational by the end of April 2021. This extension meets the following essential spend criteria to enable essential training to be delivered to support statutory services and meet statutory obligations
expenditure required to deliver the councils statutory services at a minimum possible level
urgent expenditure to safeguard vulnerable residents
Any one requiring training spend must now provide a business case on a template providing justification pursuant to the following categories to the Board:
Statutory/essential spend
Directly facilitates achievement of the Croydon renewal plan i.e. budget management training
Required to achieve competence to fulfil role
Legally bound and cannot be exempted
Contracts & Commissioning Board (CCB)
Contract Variation Report
Date of meeting
By Wumi Alejo, Category Manager, Procurement on behalf of Grace Addy, Head of Learning and Organisational Development
Title Managed Service Training Provider (Premier Partnership Ltd)
Project Sponsor Sue Moorman, Director of Human Resources
Lead Member Councillor Carlton Young, Resources and Financial Governance
Key Decision N/A
Page 105
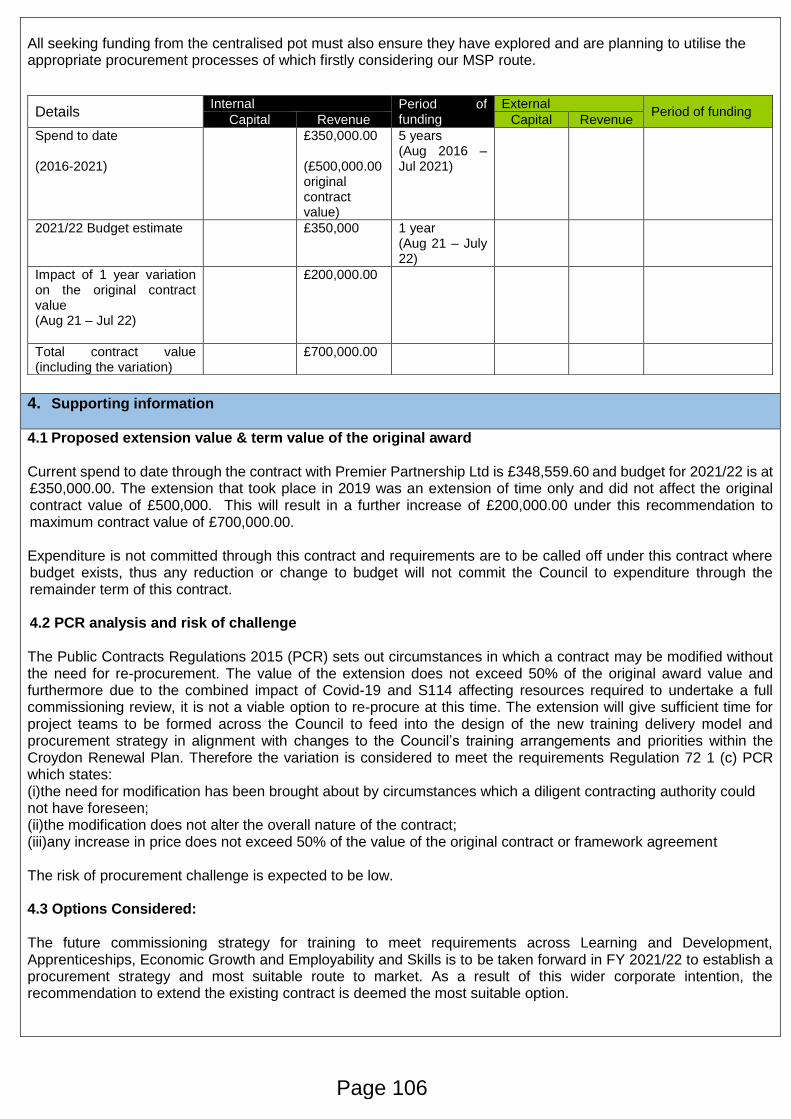
All seeking funding from the centralised pot must also ensure they have explored and are planning to utilise the appropriate procurement processes of which firstly considering our MSP route.
Details Internal Period of
funding
External Period of funding
Capital Revenue Capital Revenue
Spend to date (2016-2021)
£350,000.00 (£500,000.00 original contract value)
5 years (Aug 2016 – Jul 2021)
2021/22 Budget estimate £350,000 1 year (Aug 21 – July 22)
Impact of 1 year variation on the original contract value (Aug 21 – Jul 22)
£200,000.00
Total contract value (including the variation)
£700,000.00
4. Supporting information
4.1 Proposed extension value & term value of the original award Current spend to date through the contract with Premier Partnership Ltd is £348,559.60 and budget for 2021/22 is at £350,000.00. The extension that took place in 2019 was an extension of time only and did not affect the original contract value of £500,000. This will result in a further increase of £200,000.00 under this recommendation to maximum contract value of £700,000.00. Expenditure is not committed through this contract and requirements are to be called off under this contract where budget exists, thus any reduction or change to budget will not commit the Council to expenditure through the remainder term of this contract. 4.2 PCR analysis and risk of challenge The Public Contracts Regulations 2015 (PCR) sets out circumstances in which a contract may be modified without the need for re-procurement. The value of the extension does not exceed 50% of the original award value and furthermore due to the combined impact of Covid-19 and S114 affecting resources required to undertake a full commissioning review, it is not a viable option to re-procure at this time. The extension will give sufficient time for project teams to be formed across the Council to feed into the design of the new training delivery model and procurement strategy in alignment with changes to the Council’s training arrangements and priorities within the Croydon Renewal Plan. Therefore the variation is considered to meet the requirements Regulation 72 1 (c) PCR which states: (i)the need for modification has been brought about by circumstances which a diligent contracting authority could not have foreseen; (ii)the modification does not alter the overall nature of the contract; (iii)any increase in price does not exceed 50% of the value of the original contract or framework agreement The risk of procurement challenge is expected to be low. 4.3 Options Considered: The future commissioning strategy for training to meet requirements across Learning and Development, Apprenticeships, Economic Growth and Employability and Skills is to be taken forward in FY 2021/22 to establish a procurement strategy and most suitable route to market. As a result of this wider corporate intention, the recommendation to extend the existing contract is deemed the most suitable option.
Page 106
4.4 Why re-procurement is not recommended / not possible now The re-procurement intention is to streamline all requirements across the Council through a compliant procurement route. Due to current restructuring across Services, it is not viable to take forward a full commissioning review at this time, due to changes to internal structures and available resources to input into the review. 4.5 Risks
Performance Risk Feedback from Service Users across the Council relate to the performance and standard of Premier Trainings sub-contractors, which has been regarded as poor. To mitigate this risk, work can be taken forward with Premier Training to improve the selection and evaluation of suitable sub-contractors. Risk of challenge The risk of challenge is deemed low, as the variation is compliant with PCR regulation 72 (c) Modification of contracts during their term; (i)the need for modification has been brought about by circumstances which a diligent contracting authority could not have foreseen; (ii)the modification does not alter the overall nature of the contract; (iii)any increase in price does not exceed 50% of the value of the original contract or framework agreement. 4.6 The contractual impact / consequences of proposed variation and whether contractor agreed in principle The intention is discuss saving opportunities with Premier Training Ltd in negotiation to extend the contract. 4.7 The future commissioning plan and timescales The commission review of training requirements across Learning and Development, Economic Growth and Employment and Skills will commence in Q2 of 2021/22. The route to market will depend on the chosen delivery model following this review with the intention to award a new contract(s) by Q1 2022/23.
5. Conclusion and reasons for recommendations
The extension by variation of the current contract with Premier Partnership Ltd is to ensure there is provision in place to support the corporate learning and development strategy and cultural transformation priorities, to ensure there is sufficient provision to provide essential training to staff across the Council. The current contract has not been utilised to the maximum potential, as training has historically been managed by budget holders and procured through several routes. Extending this contract, will support the centralisation of essential training requirements under a single contract. To mitigate risk associated with standard and quality of training delivered through Premiers sub-contracting network, work will be undertaken with Premier Training to ensure that sub-contracted provision meets the standards of the council. The long term strategy is to streamline requirements across the Council and explore a single route to market that will meet the different training requirements. This commissioning review is planned to commence in Q2 of 2021/22.
6. Outcome and approvals
CCB outcome Date agreed
Finance 22/04/2021
Legal 14/4/2021
Lead Member (for values over £500k, +25% contract value or +£1m)
N/A
CCB CCB1683/21-22
Page 107
(25/05/2021)
7. Comments of the Council Solicitor
There are no additional legal considerations directly arising from this report
Approved by Sonia Likhari on behalf of the Director of Law and Governance
8. Chief Finance Officer comments on the financial implications
There is sufficient budget availability for the provision of the training contract by this provider for 2021/22. However, any subsequent savings in future years agreed as part of the MTFS programme may impact on the centralised training budget to deliver mandatory training to staff. The inherent risk of the contractor to deliver a satisfactory training programme would need to mitigated by ensuring the training providers subcontracted to provide the training to LBC is vetted by the contractor thoroughly and its track record to deliver a high standard of training is without dispute.
Approved by Geetha Blood, Interim Head of Finance, Place and Resources
Page 108

1. Recommendations
The Leader of the Council has delegated to the Cabinet Member for Families, Health, and Social Care the power to make the decisions set out in the recommendations below:
RECOMMENDATIONS:
1.1 The Cabinet Member for Families, Health and Social Care, in consultation with the Cabinet Member for Resources and Financial Governance, is recommended to approve, pursuant to Regulation 28.4 (c) of the Tenders and Contracts Regulations, the award of the fours contracts listed in table 1 of this Report for Employment and Welfare support services for a period of 12 months (with the option to extend for 12 a further months) from the 1st June 2021 to 31st May 2022 to those providers and for the individual contract values stated in the Part B report. The identity of providers will be released following approval of the award.
2. Background & strategic context
OVERVIEW AND CONTEXT
2.1 In December 2020, a strategy report was approved by the Contracts and Commissioning Board to seek
approval to commission a newly integrated mental health and learning disability employment and welfare
support services, to form a refined pathway of Supported Employability and Welfare Services with an
overall maximum annual value across all four contracts of £522,407 for a period of 12 months from 1 April
2021 with the option to extend for a further 12 months (total value of £1,044,814)
2.2 In commissioning a new service, the number of contracts in scope would be reduced from seven to four,
resulting in a decrease in contract value from £726,000 to £522,407 in current spend on Welfare and
Employment services. The reduction in value, demonstrates the council commitment to “spending within
its means” as part of the essential spend criteria, whilst ensuring support services are in place, to prevent
or delay the impact of higher cost interventions. The CCG provide funding of £15,000 per annum.
2.3 The procurement exercise commenced on the 10 February 2021 and concluded on the 26 March 2021
This report seeks approval to award the four new services as set out in the procurement strategy report
(Approval Reference Number CCB) and the table referenced in the table 1 below:
2.4 This report is to modernise the Welfare and Employment services support for residents and reduce spend
by £167,000 per annum. Awarding the contracts for one year will allow a full review of all information and
advice contracts and commissioned services, for possible future budget savings and rationalising of
service to residents to avoid duplication.
2.5 Service lots tendered under the Employment and Welfare Tender are set out in the table below
Contracts & Commissioning Board (CCB)
Contract Award Report (Part A)
Date of meeting 20th May 2021
By Camille Whyte, Commissioning & Procurement (Adults, Health and Integration)
Title Employment and Welfare Support Services
Executive Director Annette McPartland, Interim Executive Director , Health Wellbeing and Adults
Lead Member Councillor Janet Campbell - Cabinet Member for Families, Health & Social Care
Key Decision 2221RFG
Page 109
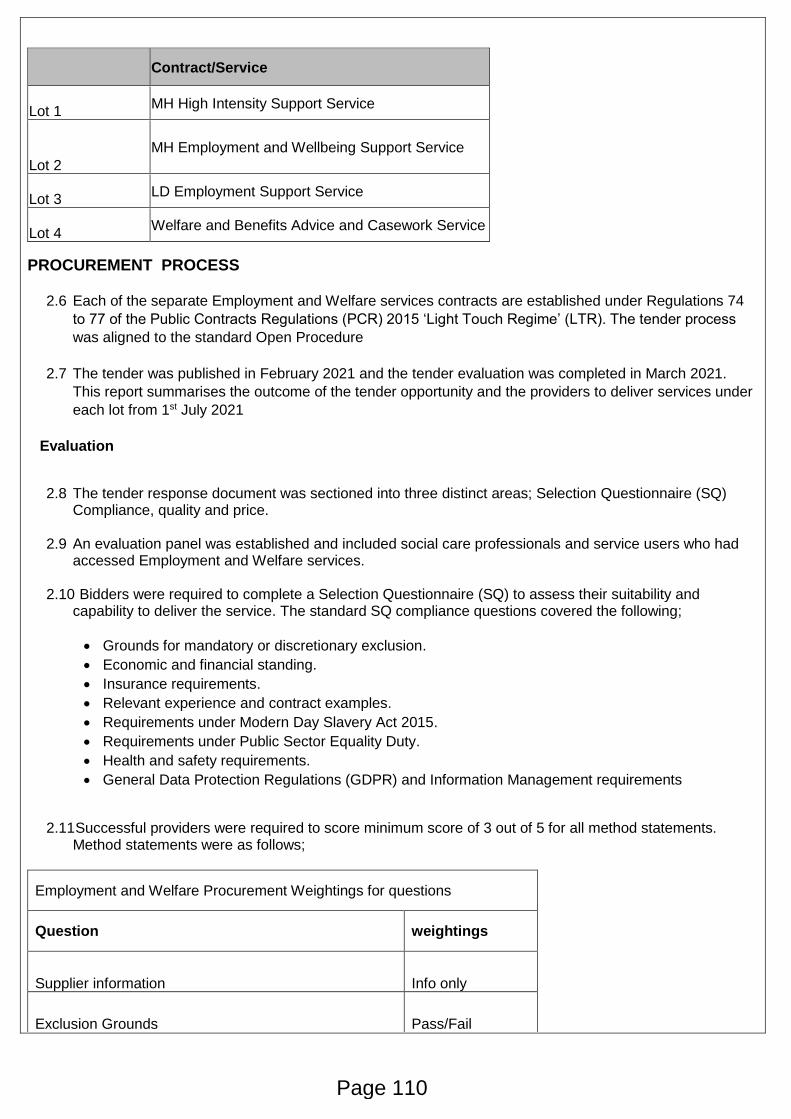
PROCUREMENT PROCESS
2.6 Each of the separate Employment and Welfare services contracts are established under Regulations 74
to 77 of the Public Contracts Regulations (PCR) 2015 ‘Light Touch Regime’ (LTR). The tender process
was aligned to the standard Open Procedure
2.7 The tender was published in February 2021 and the tender evaluation was completed in March 2021.
This report summarises the outcome of the tender opportunity and the providers to deliver services under
each lot from 1st July 2021
Evaluation
2.8 The tender response document was sectioned into three distinct areas; Selection Questionnaire (SQ) Compliance, quality and price.
2.9 An evaluation panel was established and included social care professionals and service users who had
accessed Employment and Welfare services.
2.10 Bidders were required to complete a Selection Questionnaire (SQ) to assess their suitability and capability to deliver the service. The standard SQ compliance questions covered the following;
Grounds for mandatory or discretionary exclusion.
Economic and financial standing.
Insurance requirements.
Relevant experience and contract examples.
Requirements under Modern Day Slavery Act 2015.
Requirements under Public Sector Equality Duty.
Health and safety requirements.
General Data Protection Regulations (GDPR) and Information Management requirements
2.11 Successful providers were required to score minimum score of 3 out of 5 for all method statements. Method statements were as follows;
Employment and Welfare Procurement Weightings for questions
Question weightings
Supplier information Info only
Exclusion Grounds Pass/Fail
Contract/Service
Lot 1 MH High Intensity Support Service
Lot 2
MH Employment and Wellbeing Support Service
Lot 3 LD Employment Support Service
Lot 4 Welfare and Benefits Advice and Casework Service
Page 110
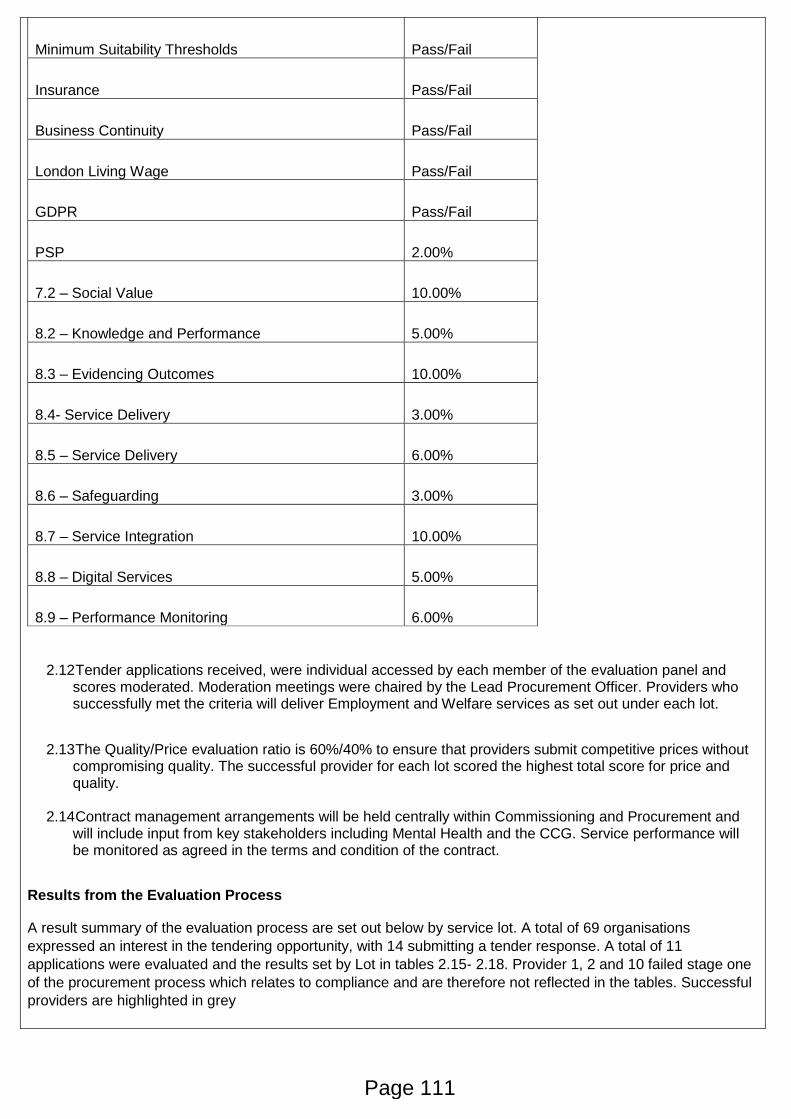
Minimum Suitability Thresholds Pass/Fail
Insurance Pass/Fail
Business Continuity Pass/Fail
London Living Wage Pass/Fail
GDPR Pass/Fail
PSP 2.00%
7.2 – Social Value 10.00%
8.2 – Knowledge and Performance 5.00%
8.3 – Evidencing Outcomes 10.00%
8.4- Service Delivery 3.00%
8.5 – Service Delivery 6.00%
8.6 – Safeguarding 3.00%
8.7 – Service Integration 10.00%
8.8 – Digital Services 5.00%
8.9 – Performance Monitoring 6.00%
2.12 Tender applications received, were individual accessed by each member of the evaluation panel and scores moderated. Moderation meetings were chaired by the Lead Procurement Officer. Providers who successfully met the criteria will deliver Employment and Welfare services as set out under each lot.
2.13 The Quality/Price evaluation ratio is 60%/40% to ensure that providers submit competitive prices without compromising quality. The successful provider for each lot scored the highest total score for price and quality.
2.14 Contract management arrangements will be held centrally within Commissioning and Procurement and
will include input from key stakeholders including Mental Health and the CCG. Service performance will be monitored as agreed in the terms and condition of the contract.
Results from the Evaluation Process
A result summary of the evaluation process are set out below by service lot. A total of 69 organisations
expressed an interest in the tendering opportunity, with 14 submitting a tender response. A total of 11
applications were evaluated and the results set by Lot in tables 2.15- 2.18. Provider 1, 2 and 10 failed stage one
of the procurement process which relates to compliance and are therefore not reflected in the tables. Successful
providers are highlighted in grey
Page 111
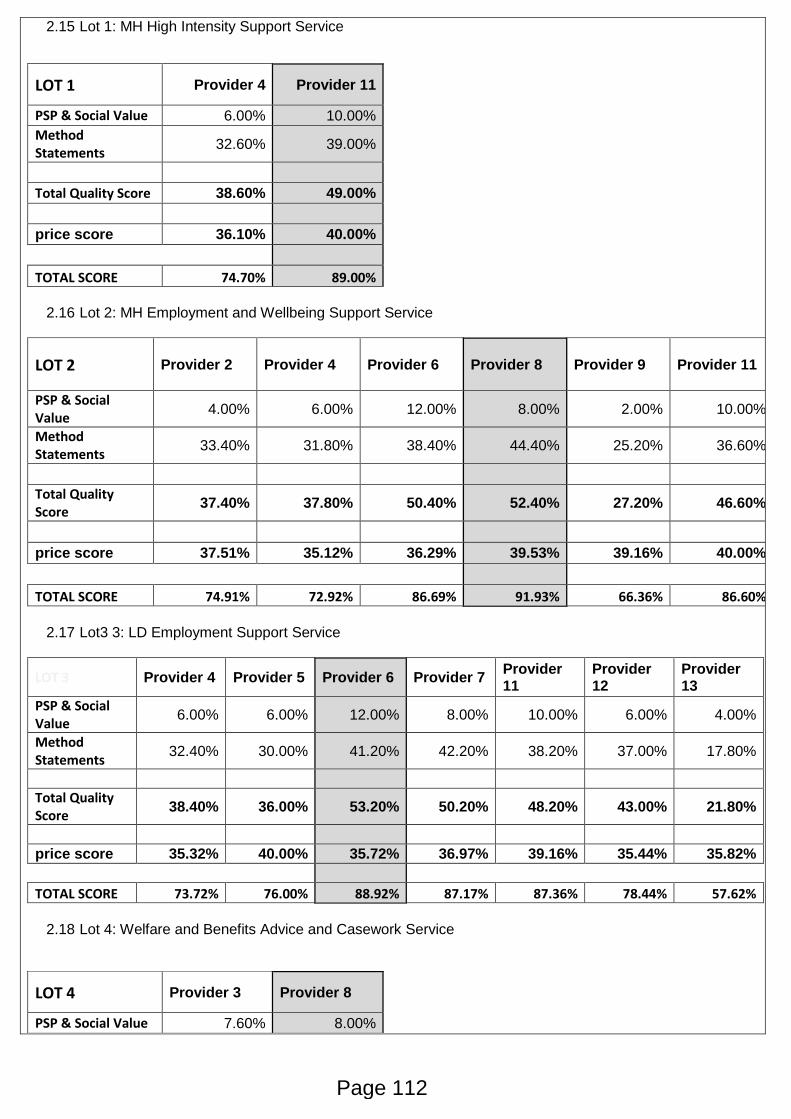
2.15 Lot 1: MH High Intensity Support Service
LOT 1 Provider 4 Provider 11
PSP & Social Value 6.00% 10.00%
Method Statements
32.60% 39.00%
Total Quality Score 38.60% 49.00%
price score 36.10% 40.00%
TOTAL SCORE 74.70% 89.00%
2.16 Lot 2: MH Employment and Wellbeing Support Service
LOT 2 Provider 2 Provider 4 Provider 6 Provider 8 Provider 9 Provider 11
PSP & Social Value
4.00% 6.00% 12.00% 8.00% 2.00% 10.00%
Method Statements
33.40% 31.80% 38.40% 44.40% 25.20% 36.60%
Total Quality Score
37.40% 37.80% 50.40% 52.40% 27.20% 46.60%
price score 37.51% 35.12% 36.29% 39.53% 39.16% 40.00%
TOTAL SCORE 74.91% 72.92% 86.69% 91.93% 66.36% 86.60%
2.17 Lot3 3: LD Employment Support Service
LOT 3 Provider 4 Provider 5 Provider 6 Provider 7 Provider 11
Provider 12
Provider 13
PSP & Social Value
6.00% 6.00% 12.00% 8.00% 10.00% 6.00% 4.00%
Method Statements
32.40% 30.00% 41.20% 42.20% 38.20% 37.00% 17.80%
Total Quality Score
38.40% 36.00% 53.20% 50.20% 48.20% 43.00% 21.80%
price score 35.32% 40.00% 35.72% 36.97% 39.16% 35.44% 35.82%
TOTAL SCORE 73.72% 76.00% 88.92% 87.17% 87.36% 78.44% 57.62%
2.18 Lot 4: Welfare and Benefits Advice and Casework Service
LOT 4 Provider 3 Provider 8
PSP & Social Value 7.60% 8.00%
Page 112
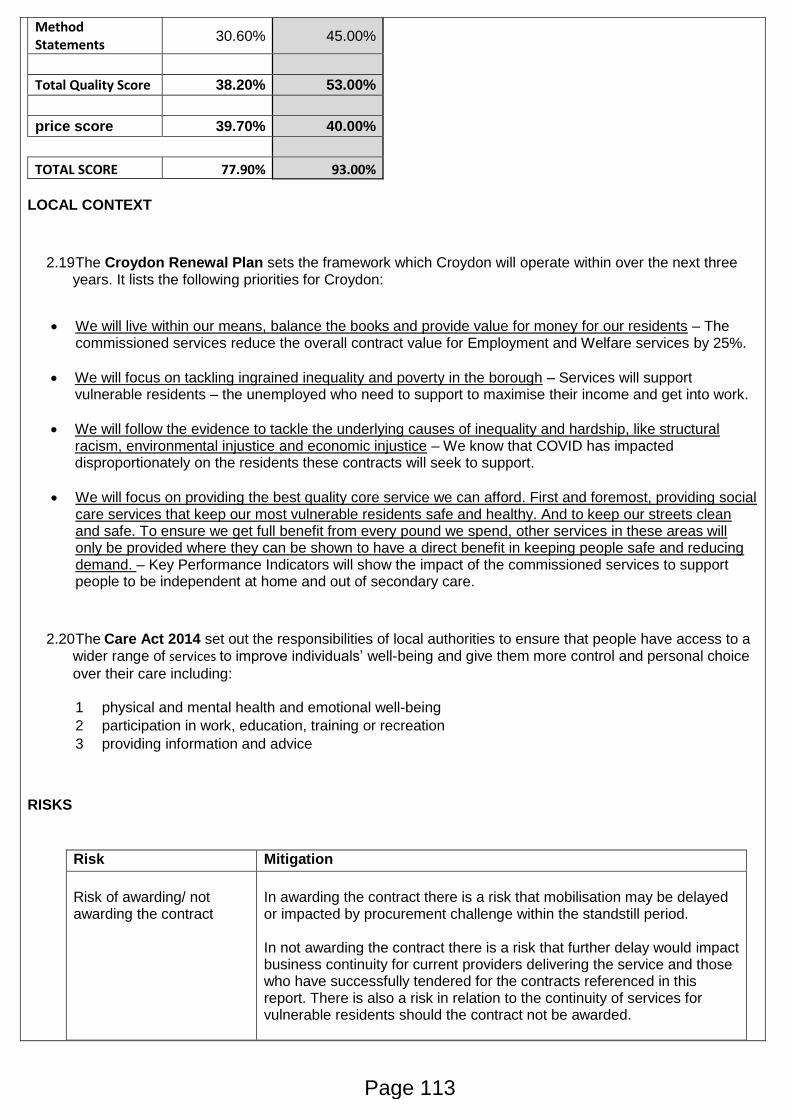
Method Statements
30.60% 45.00%
Total Quality Score 38.20% 53.00%
price score 39.70% 40.00%
TOTAL SCORE 77.90% 93.00%
LOCAL CONTEXT
2.19 The Croydon Renewal Plan sets the framework which Croydon will operate within over the next three years. It lists the following priorities for Croydon:
We will live within our means, balance the books and provide value for money for our residents – The commissioned services reduce the overall contract value for Employment and Welfare services by 25%.
We will focus on tackling ingrained inequality and poverty in the borough – Services will support vulnerable residents – the unemployed who need to support to maximise their income and get into work.
We will follow the evidence to tackle the underlying causes of inequality and hardship, like structural racism, environmental injustice and economic injustice – We know that COVID has impacted disproportionately on the residents these contracts will seek to support.
We will focus on providing the best quality core service we can afford. First and foremost, providing social care services that keep our most vulnerable residents safe and healthy. And to keep our streets clean and safe. To ensure we get full benefit from every pound we spend, other services in these areas will only be provided where they can be shown to have a direct benefit in keeping people safe and reducing demand. – Key Performance Indicators will show the impact of the commissioned services to support people to be independent at home and out of secondary care.
2.20 The Care Act 2014 set out the responsibilities of local authorities to ensure that people have access to a wider range of services to improve individuals’ well-being and give them more control and personal choice
over their care including:
1 physical and mental health and emotional well-being
2 participation in work, education, training or recreation
3 providing information and advice
RISKS
Risk Mitigation
Risk of awarding/ not awarding the contract
In awarding the contract there is a risk that mobilisation may be delayed or impacted by procurement challenge within the standstill period. In not awarding the contract there is a risk that further delay would impact business continuity for current providers delivering the service and those who have successfully tendered for the contracts referenced in this report. There is also a risk in relation to the continuity of services for vulnerable residents should the contract not be awarded.
Page 113
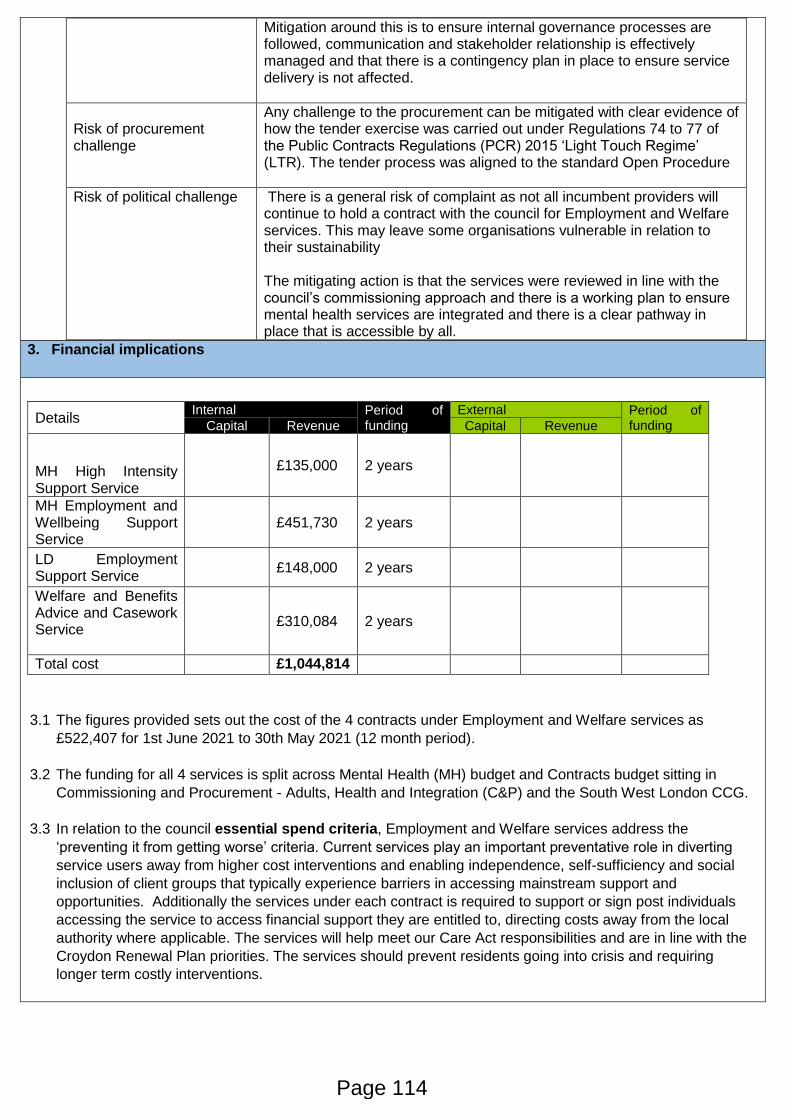
Mitigation around this is to ensure internal governance processes are followed, communication and stakeholder relationship is effectively managed and that there is a contingency plan in place to ensure service delivery is not affected.
Risk of procurement challenge
Any challenge to the procurement can be mitigated with clear evidence of how the tender exercise was carried out under Regulations 74 to 77 of the Public Contracts Regulations (PCR) 2015 ‘Light Touch Regime’ (LTR). The tender process was aligned to the standard Open Procedure
Risk of political challenge There is a general risk of complaint as not all incumbent providers will continue to hold a contract with the council for Employment and Welfare services. This may leave some organisations vulnerable in relation to their sustainability The mitigating action is that the services were reviewed in line with the council’s commissioning approach and there is a working plan to ensure mental health services are integrated and there is a clear pathway in place that is accessible by all.
3. Financial implications
3.1 The figures provided sets out the cost of the 4 contracts under Employment and Welfare services as
£522,407 for 1st June 2021 to 30th May 2021 (12 month period).
3.2 The funding for all 4 services is split across Mental Health (MH) budget and Contracts budget sitting in
Commissioning and Procurement - Adults, Health and Integration (C&P) and the South West London CCG.
3.3 In relation to the council essential spend criteria, Employment and Welfare services address the
‘preventing it from getting worse’ criteria. Current services play an important preventative role in diverting
service users away from higher cost interventions and enabling independence, self-sufficiency and social
inclusion of client groups that typically experience barriers in accessing mainstream support and
opportunities. Additionally the services under each contract is required to support or sign post individuals
accessing the service to access financial support they are entitled to, directing costs away from the local
authority where applicable. The services will help meet our Care Act responsibilities and are in line with the
Croydon Renewal Plan priorities. The services should prevent residents going into crisis and requiring
longer term costly interventions.
Details Internal Period of
funding
External Period of funding Capital Revenue Capital Revenue
MH High Intensity Support Service
£135,000 2 years
MH Employment and Wellbeing Support Service
£451,730 2 years
LD Employment Support Service
£148,000 2 years
Welfare and Benefits Advice and Casework Service
£310,084 2 years
Total cost £1,044,814
Page 114
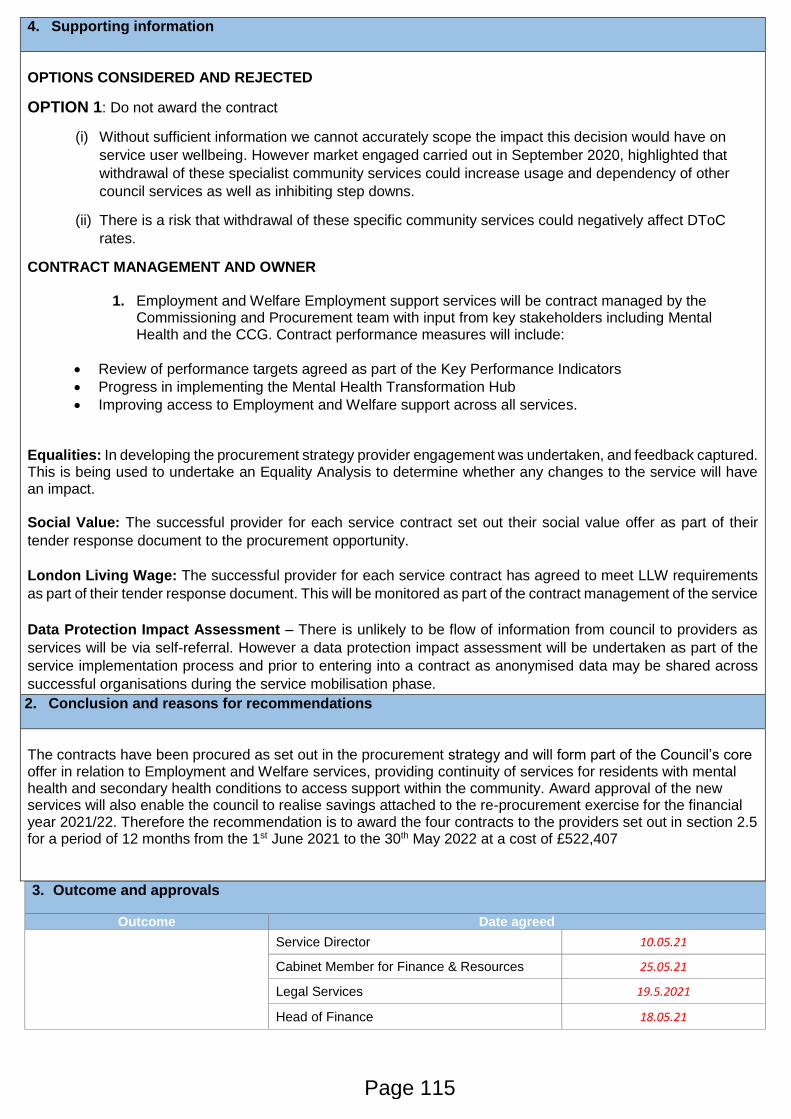
4. Supporting information
OPTIONS CONSIDERED AND REJECTED
OPTION 1: Do not award the contract
(i) Without sufficient information we cannot accurately scope the impact this decision would have on
service user wellbeing. However market engaged carried out in September 2020, highlighted that
withdrawal of these specialist community services could increase usage and dependency of other
council services as well as inhibiting step downs.
(ii) There is a risk that withdrawal of these specific community services could negatively affect DToC
rates.
CONTRACT MANAGEMENT AND OWNER
1. Employment and Welfare Employment support services will be contract managed by the Commissioning and Procurement team with input from key stakeholders including Mental Health and the CCG. Contract performance measures will include:
Review of performance targets agreed as part of the Key Performance Indicators
Progress in implementing the Mental Health Transformation Hub
Improving access to Employment and Welfare support across all services. Equalities: In developing the procurement strategy provider engagement was undertaken, and feedback captured. This is being used to undertake an Equality Analysis to determine whether any changes to the service will have an impact. Social Value: The successful provider for each service contract set out their social value offer as part of their
tender response document to the procurement opportunity.
London Living Wage: The successful provider for each service contract has agreed to meet LLW requirements
as part of their tender response document. This will be monitored as part of the contract management of the service
Data Protection Impact Assessment – There is unlikely to be flow of information from council to providers as
services will be via self-referral. However a data protection impact assessment will be undertaken as part of the
service implementation process and prior to entering into a contract as anonymised data may be shared across
successful organisations during the service mobilisation phase.
2. Conclusion and reasons for recommendations
The contracts have been procured as set out in the procurement strategy and will form part of the Council’s core offer in relation to Employment and Welfare services, providing continuity of services for residents with mental health and secondary health conditions to access support within the community. Award approval of the new services will also enable the council to realise savings attached to the re-procurement exercise for the financial year 2021/22. Therefore the recommendation is to award the four contracts to the providers set out in section 2.5 for a period of 12 months from the 1st June 2021 to the 30th May 2022 at a cost of £522,407
3. Outcome and approvals
Outcome Date agreed
Service Director 10.05.21
Cabinet Member for Finance & Resources 25.05.21
Legal Services 19.5.2021
Head of Finance 18.05.21
Page 115
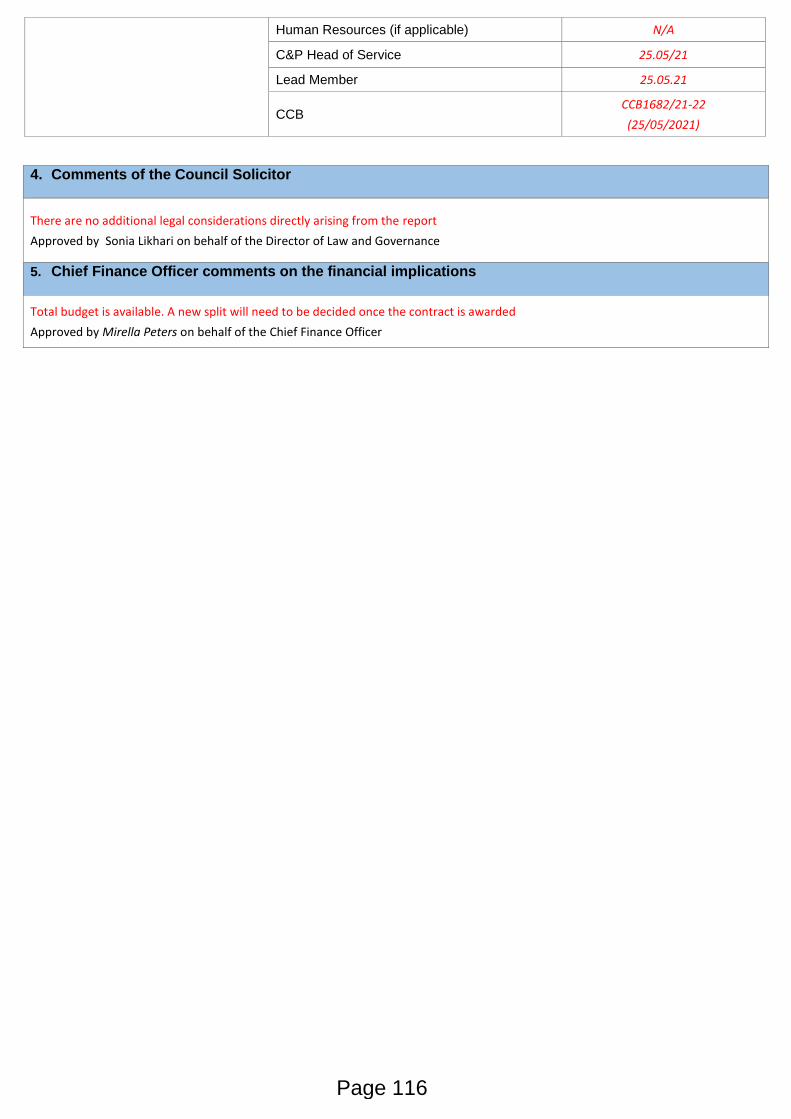
Human Resources (if applicable) N/A
C&P Head of Service 25.05/21
Lead Member 25.05.21
CCB CCB1682/21-22
(25/05/2021)
4. Comments of the Council Solicitor
There are no additional legal considerations directly arising from the report
Approved by Sonia Likhari on behalf of the Director of Law and Governance
5. Chief Finance Officer comments on the financial implications
Total budget is available. A new split will need to be decided once the contract is awarded
Approved by Mirella Peters on behalf of the Chief Finance Officer
Page 116

Document is Restricted
Page 117
By virtue of paragraph(s) 3 of Part 1 of Schedule 12Aof the Local Government Act 1972.

This page is intentionally left blank
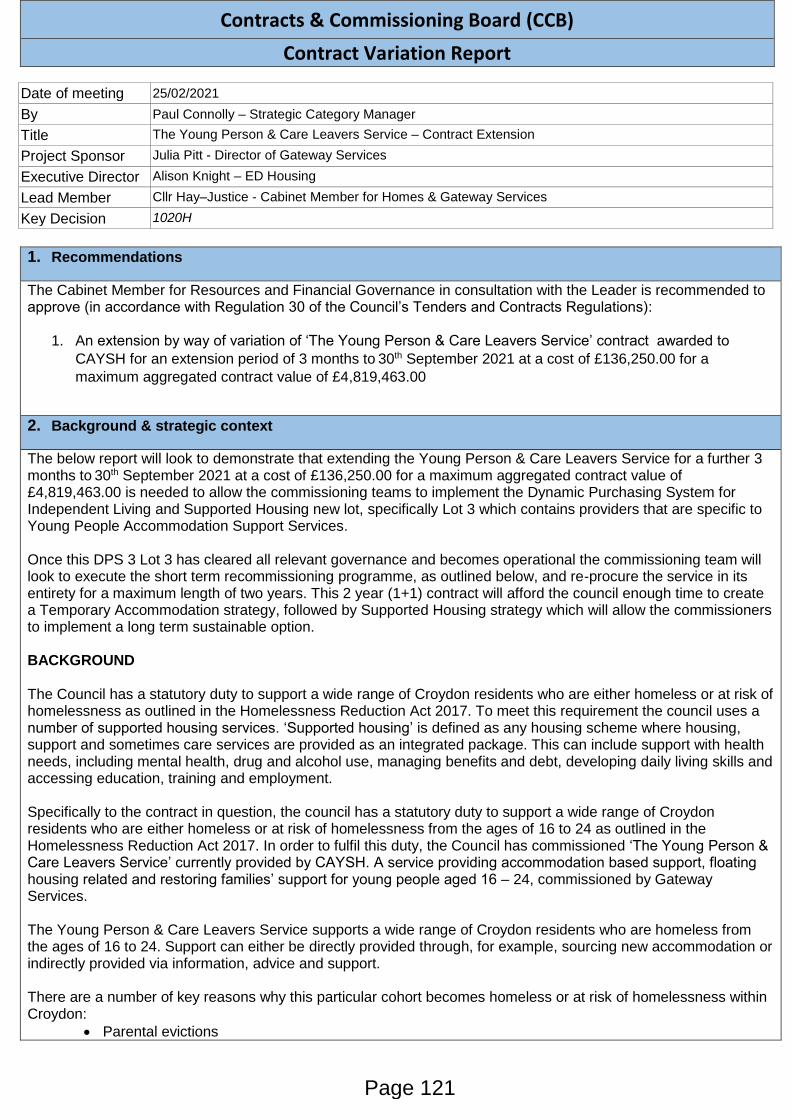
1. Recommendations
The Cabinet Member for Resources and Financial Governance in consultation with the Leader is recommended to approve (in accordance with Regulation 30 of the Council’s Tenders and Contracts Regulations):
1. An extension by way of variation of ‘The Young Person & Care Leavers Service’ contract awarded to
CAYSH for an extension period of 3 months to 30th September 2021 at a cost of £136,250.00 for a
maximum aggregated contract value of £4,819,463.00
2. Background & strategic context
The below report will look to demonstrate that extending the Young Person & Care Leavers Service for a further 3 months to 30th September 2021 at a cost of £136,250.00 for a maximum aggregated contract value of £4,819,463.00 is needed to allow the commissioning teams to implement the Dynamic Purchasing System for Independent Living and Supported Housing new lot, specifically Lot 3 which contains providers that are specific to Young People Accommodation Support Services. Once this DPS 3 Lot 3 has cleared all relevant governance and becomes operational the commissioning team will look to execute the short term recommissioning programme, as outlined below, and re-procure the service in its entirety for a maximum length of two years. This 2 year (1+1) contract will afford the council enough time to create a Temporary Accommodation strategy, followed by Supported Housing strategy which will allow the commissioners to implement a long term sustainable option. BACKGROUND
The Council has a statutory duty to support a wide range of Croydon residents who are either homeless or at risk of homelessness as outlined in the Homelessness Reduction Act 2017. To meet this requirement the council uses a number of supported housing services. ‘Supported housing’ is defined as any housing scheme where housing, support and sometimes care services are provided as an integrated package. This can include support with health needs, including mental health, drug and alcohol use, managing benefits and debt, developing daily living skills and accessing education, training and employment. Specifically to the contract in question, the council has a statutory duty to support a wide range of Croydon residents who are either homeless or at risk of homelessness from the ages of 16 to 24 as outlined in the Homelessness Reduction Act 2017. In order to fulfil this duty, the Council has commissioned ‘The Young Person & Care Leavers Service’ currently provided by CAYSH. A service providing accommodation based support, floating housing related and restoring families’ support for young people aged 16 – 24, commissioned by Gateway Services. The Young Person & Care Leavers Service supports a wide range of Croydon residents who are homeless from the ages of 16 to 24. Support can either be directly provided through, for example, sourcing new accommodation or indirectly provided via information, advice and support.
There are a number of key reasons why this particular cohort becomes homeless or at risk of homelessness within Croydon:
Parental evictions
Contracts & Commissioning Board (CCB)
Contract Variation Report
Date of meeting 25/02/2021
By Paul Connolly – Strategic Category Manager
Title The Young Person & Care Leavers Service – Contract Extension
Project Sponsor Julia Pitt - Director of Gateway Services
Executive Director Alison Knight – ED Housing
Lead Member Cllr Hay–Justice - Cabinet Member for Homes & Gateway Services
Key Decision 1020H
Page 121
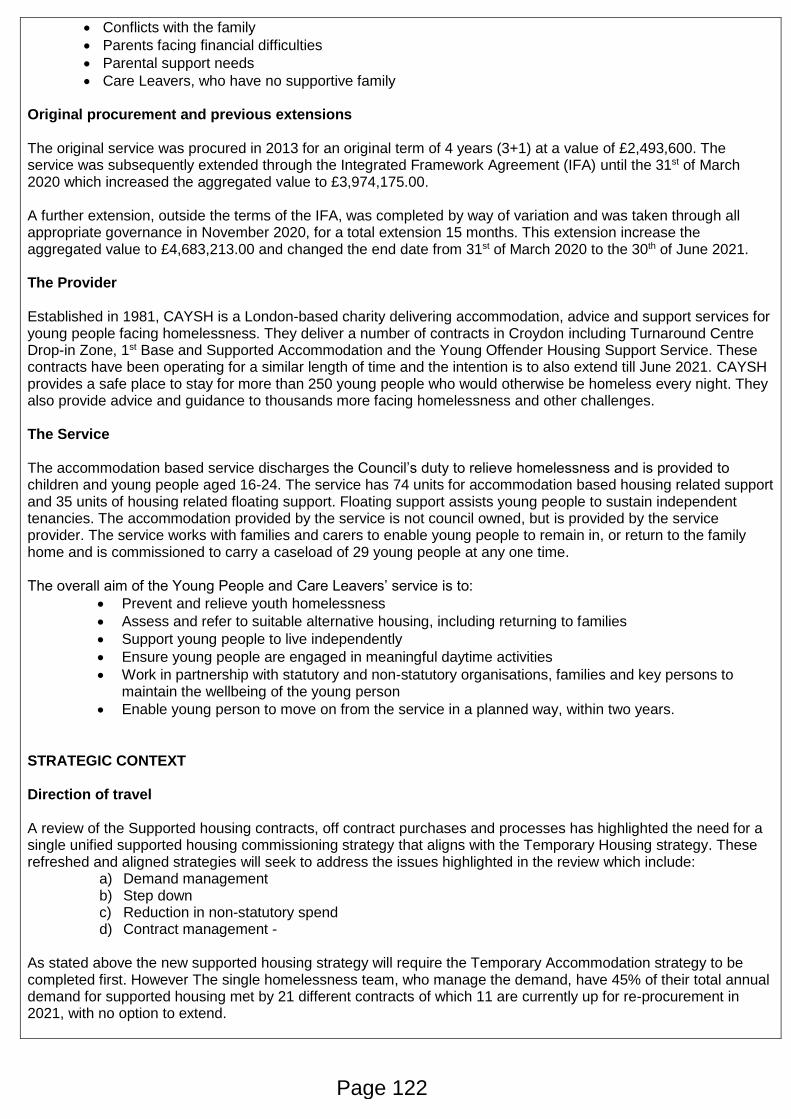
Conflicts with the family
Parents facing financial difficulties
Parental support needs
Care Leavers, who have no supportive family Original procurement and previous extensions
The original service was procured in 2013 for an original term of 4 years (3+1) at a value of £2,493,600. The service was subsequently extended through the Integrated Framework Agreement (IFA) until the 31st of March 2020 which increased the aggregated value to £3,974,175.00. A further extension, outside the terms of the IFA, was completed by way of variation and was taken through all appropriate governance in November 2020, for a total extension 15 months. This extension increase the aggregated value to £4,683,213.00 and changed the end date from 31st of March 2020 to the 30th of June 2021. The Provider
Established in 1981, CAYSH is a London-based charity delivering accommodation, advice and support services for young people facing homelessness. They deliver a number of contracts in Croydon including Turnaround Centre Drop-in Zone, 1st Base and Supported Accommodation and the Young Offender Housing Support Service. These contracts have been operating for a similar length of time and the intention is to also extend till June 2021. CAYSH provides a safe place to stay for more than 250 young people who would otherwise be homeless every night. They also provide advice and guidance to thousands more facing homelessness and other challenges. The Service The accommodation based service discharges the Council’s duty to relieve homelessness and is provided to children and young people aged 16-24. The service has 74 units for accommodation based housing related support and 35 units of housing related floating support. Floating support assists young people to sustain independent tenancies. The accommodation provided by the service is not council owned, but is provided by the service provider. The service works with families and carers to enable young people to remain in, or return to the family home and is commissioned to carry a caseload of 29 young people at any one time.
The overall aim of the Young People and Care Leavers’ service is to:
Prevent and relieve youth homelessness
Assess and refer to suitable alternative housing, including returning to families
Support young people to live independently
Ensure young people are engaged in meaningful daytime activities
Work in partnership with statutory and non-statutory organisations, families and key persons to maintain the wellbeing of the young person
Enable young person to move on from the service in a planned way, within two years.
STRATEGIC CONTEXT Direction of travel A review of the Supported housing contracts, off contract purchases and processes has highlighted the need for a single unified supported housing commissioning strategy that aligns with the Temporary Housing strategy. These refreshed and aligned strategies will seek to address the issues highlighted in the review which include:
a) Demand management b) Step down c) Reduction in non-statutory spend d) Contract management -
As stated above the new supported housing strategy will require the Temporary Accommodation strategy to be completed first. However The single homelessness team, who manage the demand, have 45% of their total annual demand for supported housing met by 21 different contracts of which 11 are currently up for re-procurement in 2021, with no option to extend.
Page 122
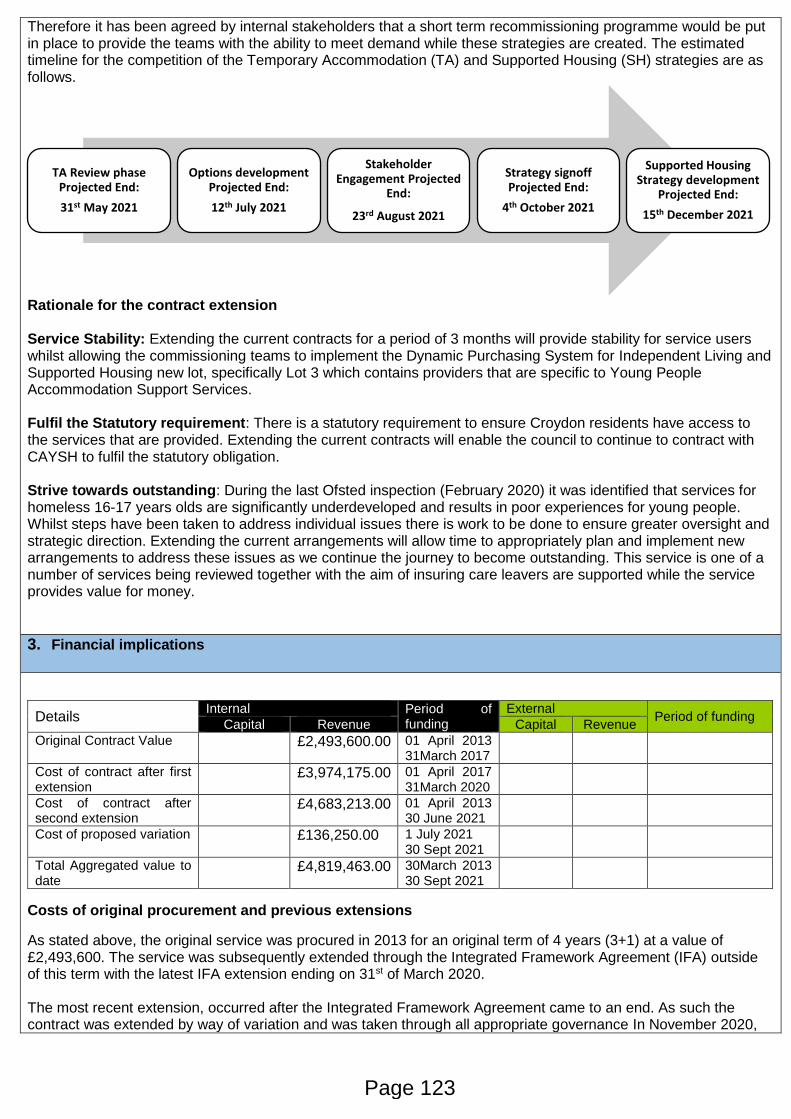
Therefore it has been agreed by internal stakeholders that a short term recommissioning programme would be put in place to provide the teams with the ability to meet demand while these strategies are created. The estimated timeline for the competition of the Temporary Accommodation (TA) and Supported Housing (SH) strategies are as follows.
Rationale for the contract extension Service Stability: Extending the current contracts for a period of 3 months will provide stability for service users whilst allowing the commissioning teams to implement the Dynamic Purchasing System for Independent Living and Supported Housing new lot, specifically Lot 3 which contains providers that are specific to Young People Accommodation Support Services.
Fulfil the Statutory requirement: There is a statutory requirement to ensure Croydon residents have access to the services that are provided. Extending the current contracts will enable the council to continue to contract with CAYSH to fulfil the statutory obligation. Strive towards outstanding: During the last Ofsted inspection (February 2020) it was identified that services for homeless 16-17 years olds are significantly underdeveloped and results in poor experiences for young people. Whilst steps have been taken to address individual issues there is work to be done to ensure greater oversight and strategic direction. Extending the current arrangements will allow time to appropriately plan and implement new arrangements to address these issues as we continue the journey to become outstanding. This service is one of a number of services being reviewed together with the aim of insuring care leavers are supported while the service provides value for money.
3. Financial implications
Costs of original procurement and previous extensions
As stated above, the original service was procured in 2013 for an original term of 4 years (3+1) at a value of £2,493,600. The service was subsequently extended through the Integrated Framework Agreement (IFA) outside of this term with the latest IFA extension ending on 31st of March 2020. The most recent extension, occurred after the Integrated Framework Agreement came to an end. As such the contract was extended by way of variation and was taken through all appropriate governance In November 2020,
Details Internal Period of
funding
External Period of funding
Capital Revenue Capital Revenue
Original Contract Value £2,493,600.00 01 April 2013 31March 2017
Cost of contract after first extension
£3,974,175.00 01 April 2017 31March 2020
Cost of contract after second extension
£4,683,213.00 01 April 2013 30 June 2021
Cost of proposed variation
£136,250.00 1 July 2021 30 Sept 2021
Total Aggregated value to date
£4,819,463.00 30March 2013 30 Sept 2021
TA Review phase Projected End:
31st May 2021
Options development Projected End:
12th July 2021
Stakeholder Engagement Projected
End:
23rd August 2021
Strategy signoff Projected End:
4th October 2021
Supported Housing Strategy development
Projected End:
15th December 2021
Page 123
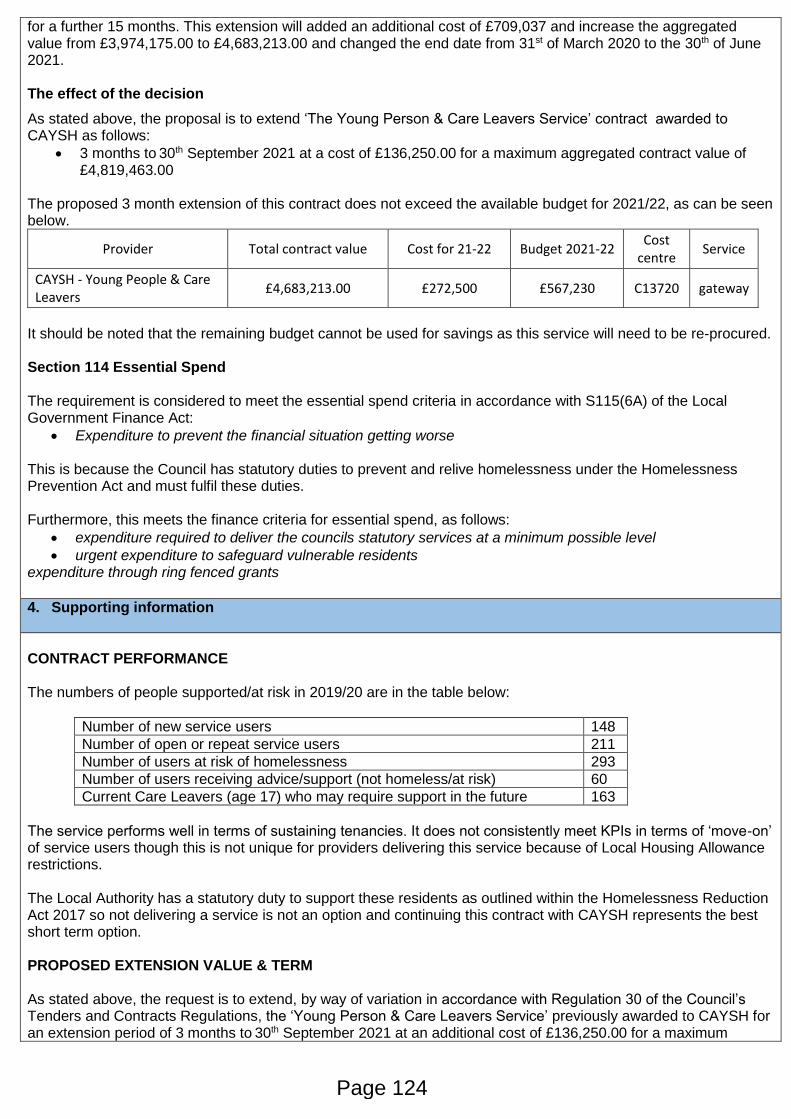
for a further 15 months. This extension will added an additional cost of £709,037 and increase the aggregated value from £3,974,175.00 to £4,683,213.00 and changed the end date from 31st of March 2020 to the 30th of June 2021. The effect of the decision
As stated above, the proposal is to extend ‘The Young Person & Care Leavers Service’ contract awarded to CAYSH as follows:
3 months to 30th September 2021 at a cost of £136,250.00 for a maximum aggregated contract value of £4,819,463.00
The proposed 3 month extension of this contract does not exceed the available budget for 2021/22, as can be seen below.
Provider Total contract value Cost for 21-22 Budget 2021-22 Cost
centre Service
CAYSH - Young People & Care Leavers
£4,683,213.00 £272,500 £567,230 C13720 gateway
It should be noted that the remaining budget cannot be used for savings as this service will need to be re-procured. Section 114 Essential Spend The requirement is considered to meet the essential spend criteria in accordance with S115(6A) of the Local Government Finance Act:
Expenditure to prevent the financial situation getting worse
This is because the Council has statutory duties to prevent and relive homelessness under the Homelessness Prevention Act and must fulfil these duties.
Furthermore, this meets the finance criteria for essential spend, as follows:
expenditure required to deliver the councils statutory services at a minimum possible level
urgent expenditure to safeguard vulnerable residents expenditure through ring fenced grants 4. Supporting information
CONTRACT PERFORMANCE The numbers of people supported/at risk in 2019/20 are in the table below:
Number of new service users 148
Number of open or repeat service users 211
Number of users at risk of homelessness 293
Number of users receiving advice/support (not homeless/at risk) 60
Current Care Leavers (age 17) who may require support in the future 163
The service performs well in terms of sustaining tenancies. It does not consistently meet KPIs in terms of ‘move-on’ of service users though this is not unique for providers delivering this service because of Local Housing Allowance restrictions.
The Local Authority has a statutory duty to support these residents as outlined within the Homelessness Reduction Act 2017 so not delivering a service is not an option and continuing this contract with CAYSH represents the best short term option. PROPOSED EXTENSION VALUE & TERM As stated above, the request is to extend, by way of variation in accordance with Regulation 30 of the Council’s Tenders and Contracts Regulations, the ‘Young Person & Care Leavers Service’ previously awarded to CAYSH for an extension period of 3 months to 30th September 2021 at an additional cost of £136,250.00 for a maximum
Page 124
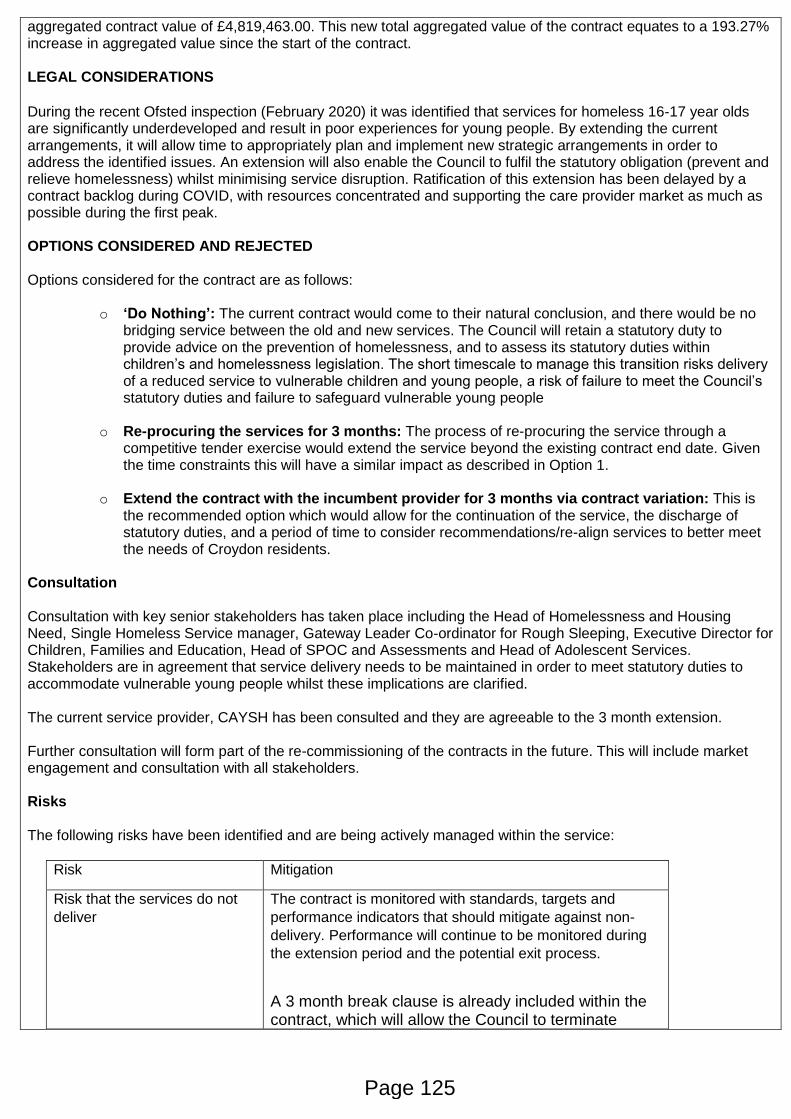
aggregated contract value of £4,819,463.00. This new total aggregated value of the contract equates to a 193.27% increase in aggregated value since the start of the contract. LEGAL CONSIDERATIONS During the recent Ofsted inspection (February 2020) it was identified that services for homeless 16-17 year olds are significantly underdeveloped and result in poor experiences for young people. By extending the current arrangements, it will allow time to appropriately plan and implement new strategic arrangements in order to address the identified issues. An extension will also enable the Council to fulfil the statutory obligation (prevent and relieve homelessness) whilst minimising service disruption. Ratification of this extension has been delayed by a contract backlog during COVID, with resources concentrated and supporting the care provider market as much as possible during the first peak. OPTIONS CONSIDERED AND REJECTED
Options considered for the contract are as follows:
o ‘Do Nothing’: The current contract would come to their natural conclusion, and there would be no
bridging service between the old and new services. The Council will retain a statutory duty to provide advice on the prevention of homelessness, and to assess its statutory duties within children’s and homelessness legislation. The short timescale to manage this transition risks delivery of a reduced service to vulnerable children and young people, a risk of failure to meet the Council’s statutory duties and failure to safeguard vulnerable young people
o Re-procuring the services for 3 months: The process of re-procuring the service through a competitive tender exercise would extend the service beyond the existing contract end date. Given the time constraints this will have a similar impact as described in Option 1.
o Extend the contract with the incumbent provider for 3 months via contract variation: This is the recommended option which would allow for the continuation of the service, the discharge of statutory duties, and a period of time to consider recommendations/re-align services to better meet the needs of Croydon residents.
Consultation Consultation with key senior stakeholders has taken place including the Head of Homelessness and Housing Need, Single Homeless Service manager, Gateway Leader Co-ordinator for Rough Sleeping, Executive Director for Children, Families and Education, Head of SPOC and Assessments and Head of Adolescent Services. Stakeholders are in agreement that service delivery needs to be maintained in order to meet statutory duties to accommodate vulnerable young people whilst these implications are clarified.
The current service provider, CAYSH has been consulted and they are agreeable to the 3 month extension. Further consultation will form part of the re-commissioning of the contracts in the future. This will include market engagement and consultation with all stakeholders. Risks
The following risks have been identified and are being actively managed within the service:
Risk Mitigation
Risk that the services do not
deliver
The contract is monitored with standards, targets and
performance indicators that should mitigate against non-
delivery. Performance will continue to be monitored during
the extension period and the potential exit process.
A 3 month break clause is already included within the contract, which will allow the Council to terminate
Page 125
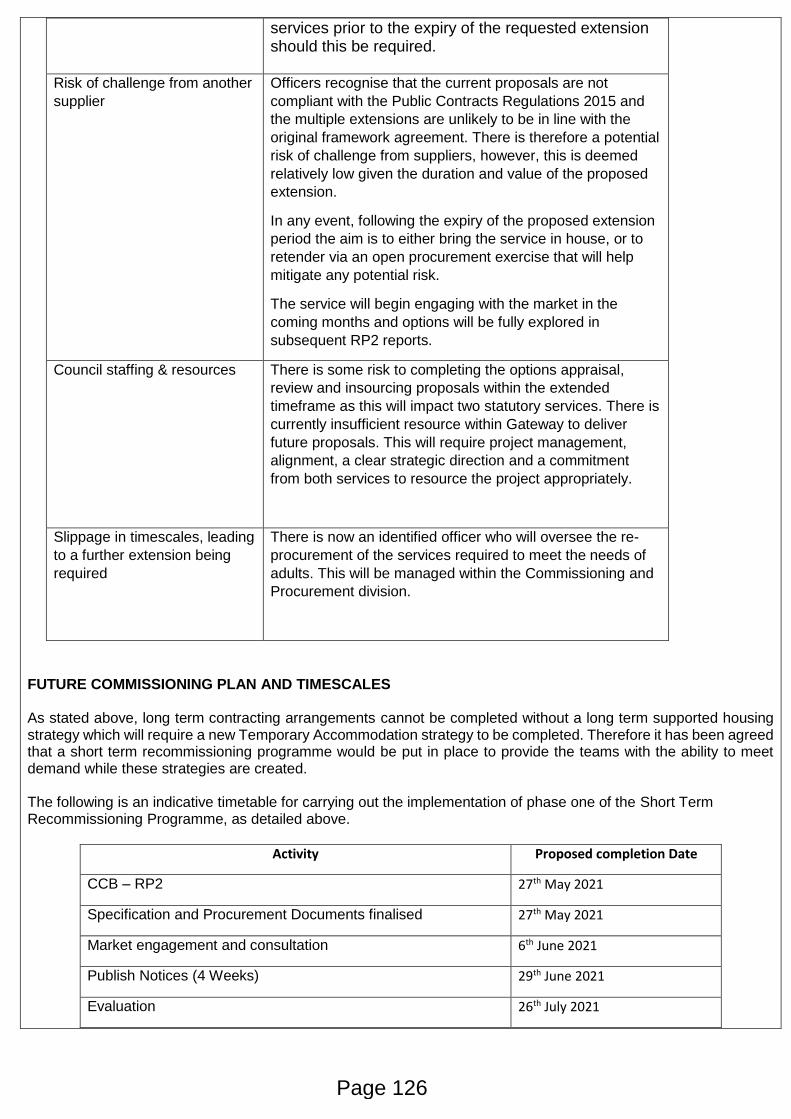
services prior to the expiry of the requested extension should this be required.
Risk of challenge from another
supplier
Officers recognise that the current proposals are not
compliant with the Public Contracts Regulations 2015 and
the multiple extensions are unlikely to be in line with the
original framework agreement. There is therefore a potential
risk of challenge from suppliers, however, this is deemed
relatively low given the duration and value of the proposed
extension.
In any event, following the expiry of the proposed extension
period the aim is to either bring the service in house, or to
retender via an open procurement exercise that will help
mitigate any potential risk.
The service will begin engaging with the market in the
coming months and options will be fully explored in
subsequent RP2 reports.
Council staffing & resources There is some risk to completing the options appraisal,
review and insourcing proposals within the extended
timeframe as this will impact two statutory services. There is
currently insufficient resource within Gateway to deliver
future proposals. This will require project management,
alignment, a clear strategic direction and a commitment
from both services to resource the project appropriately.
Slippage in timescales, leading
to a further extension being
required
There is now an identified officer who will oversee the re-
procurement of the services required to meet the needs of
adults. This will be managed within the Commissioning and
Procurement division.
FUTURE COMMISSIONING PLAN AND TIMESCALES As stated above, long term contracting arrangements cannot be completed without a long term supported housing strategy which will require a new Temporary Accommodation strategy to be completed. Therefore it has been agreed that a short term recommissioning programme would be put in place to provide the teams with the ability to meet demand while these strategies are created. The following is an indicative timetable for carrying out the implementation of phase one of the Short Term Recommissioning Programme, as detailed above.
Activity Proposed completion Date
CCB – RP2 27th May 2021
Specification and Procurement Documents finalised 27th May 2021
Market engagement and consultation 6th June 2021
Publish Notices (4 Weeks) 29th June 2021
Evaluation 26th July 2021
Page 126
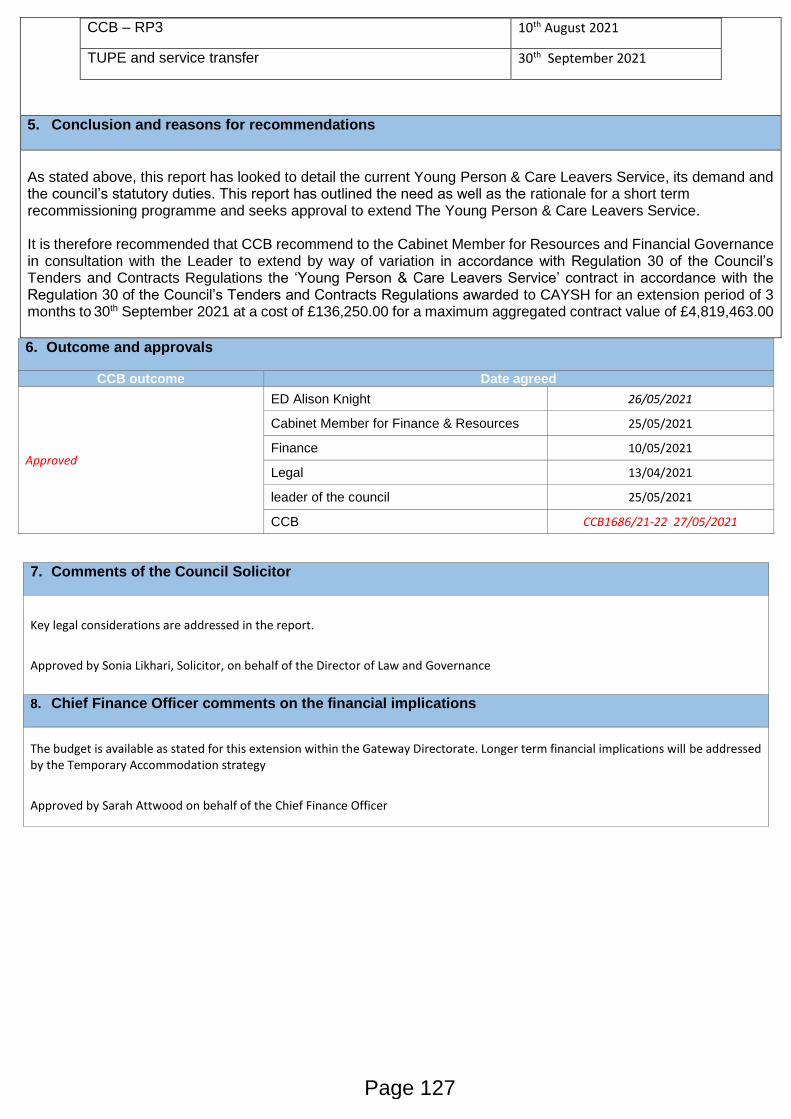
CCB – RP3 10th August 2021
TUPE and service transfer 30th September 2021
5. Conclusion and reasons for recommendations
As stated above, this report has looked to detail the current Young Person & Care Leavers Service, its demand and the council’s statutory duties. This report has outlined the need as well as the rationale for a short term recommissioning programme and seeks approval to extend The Young Person & Care Leavers Service. It is therefore recommended that CCB recommend to the Cabinet Member for Resources and Financial Governance in consultation with the Leader to extend by way of variation in accordance with Regulation 30 of the Council’s Tenders and Contracts Regulations the ‘Young Person & Care Leavers Service’ contract in accordance with the Regulation 30 of the Council’s Tenders and Contracts Regulations awarded to CAYSH for an extension period of 3 months to 30th September 2021 at a cost of £136,250.00 for a maximum aggregated contract value of £4,819,463.00
6. Outcome and approvals
CCB outcome Date agreed
Approved
ED Alison Knight 26/05/2021
Cabinet Member for Finance & Resources 25/05/2021
Finance 10/05/2021
Legal 13/04/2021
leader of the council 25/05/2021
CCB CCB1686/21-22 27/05/2021
7. Comments of the Council Solicitor
Key legal considerations are addressed in the report.
Approved by Sonia Likhari, Solicitor, on behalf of the Director of Law and Governance
8. Chief Finance Officer comments on the financial implications
The budget is available as stated for this extension within the Gateway Directorate. Longer term financial implications will be addressed by the Temporary Accommodation strategy
Approved by Sarah Attwood on behalf of the Chief Finance Officer
Page 127

This page is intentionally left blank


