Embed Size (px)
Citation preview

All public papers are available at www.warwickshire.gov.uk/cmis
1 of 4 00 Agenda Cab 18.02.15
The Cabinet will meet at SHIRE HALL, WARWICK on Thursday 15 February 2018 at 13.45. Please note that this meeting will be filmed for live broadcast on the internet. By entering the meeting room and using the public seating area you are consenting to being filmed. All recording will be undertaken in accordance with the Council's Standing Orders. The agenda will be: 1. General
1) Apologies for absence.
2) Members’ Disclosures of Pecuniary and Non-Pecuniary Interests.
Members are required to register their disclosable pecuniary interests within 28 days of their election of appointment to the Council. A member attending a meeting where a matter arises in which s/he has a disclosable pecuniary interest must (unless s/he has a dispensation):
• Declare the interest if s/he has not already registered it • Not participate in any discussion or vote • Must leave the meeting room until the matter has been dealt with. • Give written notice of any unregistered interest to the Monitoring Officer within
28 days of the meeting
Non-pecuniary interests must still be declared in accordance with the Code of Conduct. These should be declared at the commencement of the meeting.
3) Minutes of the meeting held on the 25 January 2018
To approve the minutes of the meeting held on 25 January 2018.
4) Public Speaking
To note any requests to speak in accordance with the Council’s Public Speaking Scheme (see footnote to this agenda).
Cabinet
Agenda
Thursday 15 February 2018

All public papers are available at www.warwickshire.gov.uk/cmis
2 of 4 00 Agenda Cab 18.02.15
2. Education and Learning Sufficiency Strategy for the Academic Years 2017-2022
Warwickshire County Council has a statutory responsibility to secure and ensure there are sufficient school places across the county. This report asks that Cabinet recommends that Council approves the Schools Sufficiency Strategy for the academic years 2017-2022. Cabinet Portfolio Holder: Councillor Colin Hayfield
3. Education and Learning (Schools) Capital Programme 2017/18 and Approval of
Statutory Proposals This report recommends proposals for allocating resources in the Education and Learning (Schools) Capital Programme to specific projects. Some of the proposals include funding from developer contributions. Cabinet Portfolio Holder: Councillor Colin Hayfield
4. Warwickshire Rural Growth Plan
The Rural Growth Plan highlights the Council’s support for the rural economy. It gives stakeholders and partners clarity of the Council’s commitment.
Cabinet Portfolio Holders: Councillor Izzi Seccombe and Councillor Jeff Clarke 5. Treasury Management Strategy 2018/19
Treasury management is defined as, “the management of the local authority’s investments and cash flows, its banking, money market and capital market transactions; the effective control of the risks associated with those activities; and the pursuit of optimum performance consistent with those risks.” This report and the strategy it seeks endorsement to are concerned with ensuring robust treasury management.
Cabinet Portfolio Holder: Councillor Peter Butlin 6. Review of section 75 Partnership Agreement between Warwickshire County
Council & Coventry & Warwickshire NHS Partnership Trust for Mental Health Services
The current s75 agreement between WCC and CWPT expires on 31 March 2018. During the last year, a detailed review of the formal partnership arrangements, involving both Coventry and Warwickshire, has been undertaken by an independent consultant in consultation with relevant stakeholders. The purpose of the review was to consider whether the formal partnership agreement should be continued for a

All public papers are available at www.warwickshire.gov.uk/cmis
3 of 4 00 Agenda Cab 18.02.15
further three years (April 2018 – March 2021).
Cabinet Portfolio Holder: Councillor Les Caborn 7. Any Urgent Items
Any other items the Chair considers are urgent 8. Reports Containing Confidential or Exempt Information
To consider passing the following resolution: ‘That members of the public be excluded from the meeting for the items mentioned below on the grounds that their presence would involve the disclosure of exempt information as defined in paragraph 3 of Part 1 of Schedule 12A of the Local Government Act 1972’. EXEMPT ITEMS FOR DISCUSSION IN PRIVATE (PURPLE PAPERS)
9. Exempt Minutes of the Meeting of 25 January 2018 To consider the exempt minutes of the 25 January 2018 meeting of Cabinet. 10. Capital Programme Provision for Disposal of Strategic Land
This report provides an update on the financial position since March 2016 and clarifies funding required to progress the disposal of the strategic sites. Cabinet Portfolio Holder: Councillor Peter Butlin
David Carter Joint Managing Director Warwickshire County Council February 2018

All public papers are available at www.warwickshire.gov.uk/cmis
4 of 4 00 Agenda Cab 18.02.15
Cabinet Membership and Portfolio Responsibilities
Councillor Izzi Seccombe OBE (Leader of the Council and Chair of Cabinet)
Councillor Peter Butlin (Deputy Leader, Finance) [email protected]
Councillor Les Caborn (Adult Social Care and Health)
Councillor Jeff Clarke (Transport & Environment) [email protected]
Councillor Colin Hayfield (Education and Learning)
Councillor Kam Kaur (Customer and Transformation) [email protected]
Councillor Jeff Morgan (Children’s Services)
Councillor Howard Roberts (Fire and Community Safety) [email protected]
Non-voting Invitees - Councillor Jerry Roodhouse (Leader of the Liberal Democrat Group), [email protected] Councillor Richard Chattaway (Leader of the Labour Group) [email protected] or their representatives. Public Speaking Any member of the public who is resident or who works in Warwickshire may speak at the meeting for up to three minutes on any item on the agenda for this meeting. This can be in the form of a statement or a question. If you wish to speak please notify Paul Williams (see below) in writing at least two clear working days before the meeting. You should give your name and address and the subject upon which you wish to speak. Full details of the public speaking scheme are set out in the Council’s Standing Orders (Standing Order 34). General Enquiries: Please contact Paul Williams, Democratic Services Team Leader Tel 01926 418196 or email: [email protected]

Cabinet Minutes 25 January 2018 1 of 9
Minutes of the meeting of the Cabinet held on 25 January 2018
Present Cabinet Members:
Councillors Izzi Seccombe OBE Leader of Council and Chair of Cabinet Peter Butlin Deputy Leader (Finance & Property) Les Caborn Adult Social Care & Health Jeff Clarke Transport & Environment Colin Hayfield Education and Learning Kam Kaur Customer & Transformation Jeff Morgan Children’s Services Howard Roberts Fire & Community Safety
Non-Voting Invitees:
Councillor Richard Chattaway Leader of the Labour Group Councillor Jerry Roodhouse Leader of the Liberal Democrat Group Other Councillors:
Councillors Sarah Boad, Neil Dirveiks, Judy Falp, Pete Gilbert, Clare Golby, Andy Jenns, Keith Kondakor, Caroline Phillips, Wallace Redford, Andy Wright, Alan Webb and Chris Williams Public attendance: 1 (Councillor David Humphries. Leader of North Warwickshire
Borough Council) 1. General
(1) Apologies for absence
Apologies had been received for Councillor Bill Olner who has been experiencing a period of ill health. Cabinet extended their best wishes to Councillor Olner for a rapid recovery.
(2) Members’ Disclosures of Pecuniary and Non-Pecuniary Interests
None
(3) Minutes of the meeting held on 7 December 2017and Matters Arising
The minutes for the meeting held on 7 December 2017 were agreed as an accurate record and signed by the Chair.
(4) Public Speaking None
Cabinet Minutes 25 January 2018 2 of 9
2. One Organisational Plan Quarterly Progress Report April – December 2017 Councillor Kam Kaur (Portfolio Holder for Customer and Transformation) introduced
the published report explaining that the Council is currently performing at an “amber level”. Referring to the overspends recorded on page 6 of the report it was explained that these will be addressed as part of the budget setting process. Councillor Keith Kondakor expressed concern over reported underspends on transport related projects. These, he suggested, were indicative of projects not progressing possibly through a lack of staff resource. Delays, he added, could end up costing the Council money in the longer term.
In response to a question from Councillor Keith Kondakor regarding cycle racing in
Warwickshire, Cabinet was informed of work to secure more visits by national cycle races to Warwickshire in the future. This news was welcomed by members.
Resolved That Cabinet:
1) Notes the progress on the delivery of the One Organisational Plan (2017-20) as at the end of December 2017 as summarised in Sections 1 to 3 of the report and detailed in Appendix A.
2) Wishes to remind Corporate Board and Heads of Service of the importance
of delivering a balanced budget both collectively and individually and that any proposal for action to bring those budgets overspending back on track should be discussed with Portfolio Holders as a matter of urgency.
3) Approves the net transfer of £1.581 million to Business Unit reserves to
support the delivery of services in future years, as outlined in section 3.2.
4) Agrees to the proposed use of some of the forecast underspend in Other Services as set out in paragraphs 3.1.4 and 3.1.5.
5) Approves the revised capital payments totals and the revised financing of the
2017/18 capital programme as detailed in the table in section 3.4. 3. 2018/19 Refresh of the Medium Term Financial Plan 2020 – Updated
Information
Councillor Peter Butlin (Deputy Leader – Finance and Property) explained that the report before Cabinet provided an indication of how the budget would be set. The ability to increase the tax base by 1% was noted and in this the 1st year of a 3 year plan it is necessary to adjust the budget to reflect changes that have occurred. Councillor Alan Webb, whilst welcoming the increase in the tax base noted that the pressure for services was increasing and that this would significantly increase costs. An example given was that of waste. Councillor Butlin explained that he was aware of the issue around waste stating that it will be considered as part of the budget setting process.

Cabinet Minutes 25 January 2018 3 of 9
Resolved That Cabinet:
1) Notes the latest resource and spending information and the impact on the emerging budget proposals.
2) Notes the Head of Finance’s risk assessment on the level of general
reserves, as detailed in Appendix A. 3) Agrees, in light of the information provided, their 2018/19 budget resolutions
for recommendation to Council on 6 February 2018. 4) Authorises the Head of Finance to incorporate the outstanding resource
information into the budget resolutions to be considered by Council on 6 February 2018.
5) Recommends Council, in the event of final central government funding
allocations and levels of business rates being above or below the provisional settlement level, approve that the variation be managed by an adjustment to the Medium Term Contingency.
4. Home to School Transport Policy
Councillor Colin Hayfield (Portfolio Holder for Education and Learning) informed Cabinet that this matter had been considered by the Children and Young People Overview and Scrutiny Committee on 16 January 2018. The committee had concluded that routes should be reassessed in the light of concerns raised. Cabinet was informed that the policy review had been subject to an extensive consultation exercise and that considerable effort had been made in the analysis of responses to it. In the light of the views of the Overview and Scrutiny Committee and further reflection on the consultation responses Councillor Hayfield tabled replacement wording to recommendation 2. This states, “Having regard to the concerns raised by the consultation exercise, by Overview and Scrutiny and by local members, Cabinet believes that it would be appropriate to reconsider the re-classified walking routes as outlined In the Cabinet paper”.
The meeting was informed that concern had been expressed over changes to arrangements for passenger assistants on buses. With regards to assistance for learners over the age of 18 Councillor Hayfield stated, “We have engaged representatives of the Warwickshire Parent Carer Forum on the development of SEN aspects with the Home to School Transport Policy. It is fair to say that on the matter of assistance for learners aged 19 and over, there are differing views. There is scope within the policy to allow for further discussion on how this aspect of the policy is applied, such as the process for whether other members of the household can provide transport assistance. We will work with the Parent Carer Forum to develop this administrative process. We are committed to ensuring that transport does not prove a barrier to education”.
Cabinet Minutes 25 January 2018 4 of 9
It was noted that the changes to 19-25 transport had been imposed by government but would lead to greater expenditure by the County Council. The concerns raised previously by Councillor Jerry Roodhouse (Leader of the Liberal Democrat Group) over the transition period for Special Education Need pupils were acknowledged. It was stressed that Cabinet was mindful of the need for a cross-departmental working approach to be taken with stakeholders and parents/carers. Councillor Jerry Roodhouse welcomed discussions regarding 19-25 as these are required around legal aspects of the service. With greater demands on resources future years’ budgets will need to take account of all aspects of 19-25 SEN transport and not simply the provision of buses. It was agreed that feedback on further discussions will be provided to the Overview and Scrutiny Committee. Cabinet was informed that cameras on buses can be used to record parking infringements outside schools. This information can be forwarded to the police for action as appropriate. Councillor Andy Jenns and Councillor Andy Wright welcomed the proposal to review the walking routes observing that this was evidence that the Council does listen to and take account of people’s views. Councillor Les Caborn (Portfolio Holder for Adult Social Care and Health) observed that young people’s transition into adulthood now commences earlier than 16 years. It was noted that the criteria for determining safe routes to school had been set many years ago and that traffic levels and driving styles had changed in that time. It was important that they now be reviewed. Councillor Neil Dirveiks welcomed the proposal for independent travel training.
Resolved
1. That Cabinet endorses the following revisions to the Home to School Transport policy:
a) That from 1st September 2019 the definition of “nearest qualifying
school” is altered to include only the school closest to the pupil’s home by the shortest route with a pupil place available, in line with statutory requirements.
b) That from 1st September 2019 pupils with special educational needs
and / or disabilities living within statutory walking distance receive transport assistance only if attending the nearest suitable school with a place available, and assessed as being unable to make the journey without transport assistance, even if accompanied.
c) That from 1st September 2018 free transport is no longer provided on
medical grounds for students aged 16-19.

Cabinet Minutes 25 January 2018 5 of 9
d) That from 1st September 2018 passenger assistants are provided only on vehicles carrying pupils with an Education Health and Care Plan, or in other very exceptional circumstances.
e) That the Independent Travel Training Scheme is included in the
revised policy. f) That from 1st September 2018 free transport is provided where
necessary for learners aged 19-25 with special educational needs and / or disabilities in line with requirements of the Children and Families Act 2014.
2. Having regard to the concerns raised by the consultation exercise, by
Overview and Scrutiny and by local members, Cabinet believes that it would be appropriate to reconsider the re-classified walking routes as outlined In the Cabinet paper.
5. Schools National Funding Formula Councillor Colin Hayfield summarised the key aspects of the published report. The
meeting was informed that overall Warwickshire will receive additional funds but these will not benefit all schools. Discussions had been held around whether funds should be moved between the Dedicated Schools Grants notional blocks (See para 1.1 of the report). School’s Forum had elected not to move 0.5%of the Schools Block Funding to the High Needs Block. The recommendations before Cabinet reflected the preferences of the School’s Forum.
In response to a question from Councillor Judy Falp the meeting was informed that finance support in the form of advice and guidance is available to schools during times of transition and at other times. No direct financial support is available. Councillor Sarah Boad requested that easily navigable information focusing on local schools be provided to members. It was agreed that this should be sent to members. Resolved
That Cabinet agrees to:
1) Implement the National Funding Formula at school level for 2018/19. 2) In doing so, agree that the Minimum Funding Guarantee should be set at
+0.5%. 3) Not take forward the transfer of 0.5% of the Schools Block funding to the High
Needs Block funding and note that a review of the High Needs Block will be a central part of the review of DSG.
4) Support the view of the School’s Forum that any Schools Block funding not
needed to deliver the “hard” National Funding Formula is set aside to meet the additional costs of growth in pupil numbers/schools during 2018/19.
Cabinet Minutes 25 January 2018 6 of 9
6. Early Years Funding Formula 2018/2019 Councillor Colin Hayfield explained that under the latest proposals from government
Warwickshire will see approximately a £1m reduction in its early years funding. The maintained nurseries in Warwickshire have been classified as either good or outstanding and there is a need to ensure they have a sustainable future.
Councillor Caroline Phillips highlighted the proposed reduction of £15k funding for a
nursery in an area of high need within her division. Her concerns focused on the funding of services into the future.
Reservations were expressed over the outcome of the School’s Forum Working Group. Members regretted the decision of the group not to direct more funds to high need groups. It was agreed that the Children and Young People Overview and Scrutiny Committee be requested to review early years provision with particular reference to the impact of take-up of 30 hours childcare and on quality control. Members requested and it was agreed that in the light of their concerns over reductions in funding, that the Portfolio Holder for Education and Learning write a letter to the Secretary of State for Education outlining those concerns.
Resolved That Cabinet:
1) Approves the allocation of:
• A universal rate to providers of £3.96 per hour for 2018/19 • A deprivation rate of £0.53 per hour for eligible children for 2018/19
2) Notes the reduction in the funding for centrally provided early years services to
£0.21 per hour for 2018/19 and that a review of early years funding will be a central part of the review of DSG.
3) Agrees that the Portfolio Holder for Education and Learning should write to the
Secretary of State for Education to express Cabinet’s concerns over reductions in early years funding.
7. School Admissions - 2019/20 Following introductory comments by Councillor Colin Hayfield, Councillor Sarah
Boad stated that she welcomed the reintroduction of the requirement for the formal acceptance of school places adding that that the system currently in use had led to confusion and upset for many. With the replacement system it will be necessary to ensure that parents/carers are clear that they must accept the place when it is offered. Failure to do so could mean they lose it. Members agreed that offers should be followed up to make sure of this.

Cabinet Minutes 25 January 2018 7 of 9
In response to a request from Councillor Keith Kondakor it was agreed that the school list should include those new ones that are scheduled to open in the next two or so years.
It was confirmed that all children in Warwickshire do get offered a school place although this may not be their first choice.
Resolved That Cabinet agrees that:
1) The 2019 entry Coordinated Schemes as set out at Appendices A1 – A4 are adopted.
2) The in-year admissions process for entry during the 2019/20 academic year is
adopted for all schools where Warwickshire County Council is the admission authority, and other admission authorities as agreed as set out at Appendix B.
3) The Joint Managing Director for Communities be authorised to agree the
published admission numbers for community and voluntary controlled schools in Warwickshire.
8. Adult Transport Policy Councillor Les Caborn introduced this item emphasising the need for an equitable
transport policy. There are around 400 people/families across Warwickshire whose needs will be subject to individual assessment. Through this the best and fairest transport solution can be identified. Transport training will be introduced thus helping to increase client independence. It had been noted that the easy read version of the consultation document had been well received.
Councillor Neil Dirveiks cautioned that clients run the risk of being lost to the service
during the transition from childhood to adulthood. He asked that resources be made available to help avoid this. In response Cabinet was informed that officers from the Communities Group and People Group will work closely together and with clients and carers to ensure a smooth transition.
Resolved That Cabinet approve the proposed Adult Transport Policy for implementation by
the County Council with effect from 1st April 2018 for new customers, and with effect from their first reassessment or review after 1st April 2018 for existing customers.
9. Delivery of the Warwickshire Energy Plan: Establishing a Collective Fuel
Switching Scheme Councillor Peter Butlin provided an introduction to this report explaining how access
to cheaper energy tariffs and assist many of the more vulnerable people of Warwickshire.
Councillor Richard Chattaway welcomed the initiative but expressed his regret that it had not been possible to pursue the previously discussed scheme to establish an energy company. He asked that the effectiveness of the new switching scheme be
Cabinet Minutes 25 January 2018 8 of 9
reviewed in May 2019 (once it had had time to become established). In response it was agreed that the Communities and Resources and Fire and Rescue Overview and Scrutiny Committee undertake this review jointly. Councillor Alan Webb suggested that the scheme be clearly branded as a local authority initiative as people will be prepared to trust this. Councillor Keith Kondakor called for more advice to be made available on the benefits of switching and on the pursuit of energy efficiency and how to undertake it. Cabinet was informed that the decision not to proceed with the establishment of an energy company was based on concerns over the level of risk to the authority and over the ability to attract sufficient customers to ensure viability.
Resolved That Cabinet:
1) Authorises that for an initial two year trial period Warwickshire County Council work with iChoosr to deliver a collective fuel switching scheme to households (gas and electricity) across Warwickshire.
2) Authorises up to £55k p.a. of the County Energy Plan monies be allocated to
cover costs to develop three promotional campaigns a year for two years aimed at enrolling and registering sufficient household gas and electricity accounts across Warwickshire to cover implementation costs. If any surplus were received this would go towards providing a registration & energy efficiency advice service for people needing assistance such as those without access to the internet, plus additional promotional activity for the next campaign.
3) Authorises the Joint Managing Director (Resources) to enter into:-
(i) any discussions which he considers necessary including investigating
the delivery of the scheme in partnership with Coventry City Council and the Warwickshire District and Borough Councils.
(ii) any arrangements which he considers necessary (and on acceptable
terms and conditions) to give effect to the scheme referred to above including any partnership arrangements.
4) Notes that a review will be carried out on the experience of each campaign
and reported on at the end of the first year to determine the future life of the scheme.
5) Authorises the carry forward of the remainder of the Warwickshire Energy Plan
monies to deliver three campaigns per year for the proposed ‘Switch and Save’ scheme. The end of year report will include recommendations for spending these and they will depend on the successful performance of the preceding campaigns.
10. Any Urgent Items None
Cabinet Minutes 25 January 2018 9 of 9
11. Reports Containing Confidential or Exempt Information EXEMPT ITEMS FOR DISCUSSION IN PRIVATE (PURPLE PAPERS) 12. Exempt Minutes of the Meeting of 7 December 2017 The exempt minutes from the 7 December 2017 meeting were agreed as an
accurate record for signing by the Chair. 13. Corporate Review of Traded Services
Councillor Kam Kaur explained the background to the published exempt report. Cabinet was informed of the drivers behind the review of traded services. Resolved As per the exempt minutes.
The meeting rose at 14.49.
.…………………………… Chair

02 Sufficiency Strategy Cab 18.02.15 1 of 8
Item 2
Cabinet
15 February 2018
Education and Learning Sufficiency Strategy for the Academic Years 2017-2022
Recommendation
That Cabinet recommends that Council approves the Schools Sufficiency Strategy for the academic years 2017-2022.
1.0 Key Issues
1.1 Warwickshire County Council has a statutory responsibility to secure and ensure there are sufficient school places across the county.
1.2 Large areas of Warwickshire have seen a significant increase in the birth
rate over recent years and this has resulted in pressure on existing primary school places. These have been addressed either by extensions to existing schools, new schools or reorganisations.
1.3 Primary cohorts are moving through to Secondary and this will require
further expansions at secondary schools and new schools to meet housing demands. To ensure viability of all of our schools, there is need to invest in buildings for our smaller schools in areas of demand such as Campion and Kineton.
1.4 Additional expansions are required to meet the demands of new housing
developments across the county. There is a commitment to ensure we achieve 4% surplus of places across planning areas to enable movement and midyear in-migration to the county.
1.5 Funding for the capital programme is reliant upon securing adequate
S106/CIL contributions from housing developers and basic need allocations. This process has been improved with the reduction of planning areas, update of forecasting processes in order to maximise income to the council.
1.6 Where there is forecast to be more pupils than school places for a short
period, it is proposed to add temporary classrooms where necessary and introduce a “bulge” class. This is a sustainable way to tackle short periods of growth. New policy on implementation of the growth funding for bulge classes has been agreed at Schools Forum to help schools maintain healthy budgets when accepting bulge classes.
02 Sufficiency Strategy Cab 18.02.15 2 of 8
1.7 Redefined planning areas have been approved by Education and Skills Funding Agency (ESFA) to better highlight the need in areas such as reducing planning areas to avoid showing surplus particularly in rural areas
1.8 Ongoing working relationships with Free Schools and ESFA are required to
ensure demand is met and over capacity is kept to a minimum. 2.0 The Proposals 2.1 Any specific school expansions or school organisation changes will be
subject to a further cabinet report. 2.2 All capital bids and bids for improvements are subject to scrutiny by three
stages. The first being capital working group, second capital board and the last being presentation for approval by cabinet.
3.0 Information and Engagement 3.1 Information and Engagement events on the sufficiency strategy and
subsequent delivery of school places across Warwickshire were held for Early Years settings, Head Teachers and school Governors. 3 events were held and were well attended by approximately 30-40 persons per meeting with attendance from Private, Voluntary and Independent settings within the Early Years sector and representatives from Primary and Secondary schools from across the county.
3.2 In addition a briefing session for members was held in January, which
focused on School Place Planning and the Sufficiency strategy and was well attended.
3.3 Following the information and engagement events a series of follow up
meetings have also been held, and will continue to be held, with individual schools, Early Years settings, and groups of schools within specific areas to discuss on a local level and ensure all stakeholders are kept informed.
4.0 Primary and Secondary School Headlines 4.1 Forecasts show the need to provide additional places in several areas of
Warwickshire in both primary and secondary schools. These additional places can be met by a mixture of expanding existing schools and opening new schools.
4.2 Pupil number forecasts at overall education area level are shown below.
Red indicates capacity below the 4% target. A full break down by education planning areas is included in the sufficiency strategy.
02 Sufficiency Strategy Cab 18.02.15 3 of 8
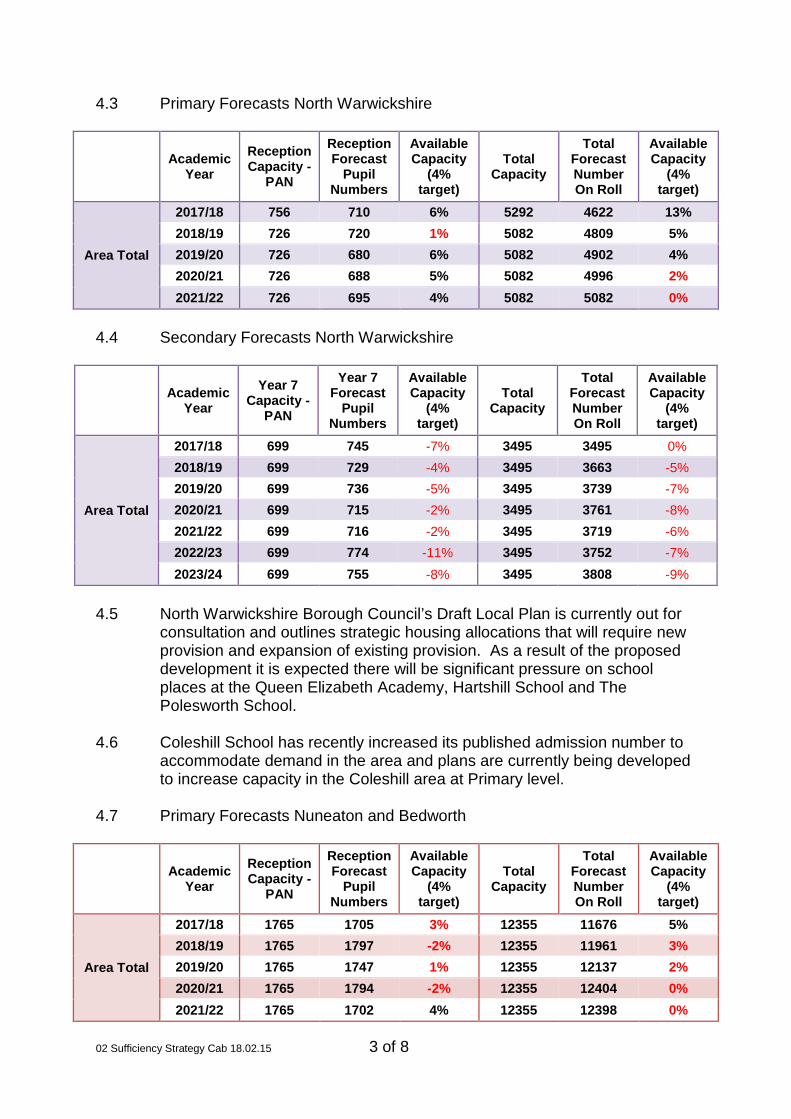
4.3 Primary Forecasts North Warwickshire
Academic
Year Reception Capacity -
PAN
Reception Forecast
Pupil Numbers
Available Capacity
(4% target)
Total Capacity
Total Forecast Number On Roll
Available Capacity
(4% target)
Area Total
2017/18 756 710 6% 5292 4622 13% 2018/19 726 720 1% 5082 4809 5% 2019/20 726 680 6% 5082 4902 4% 2020/21 726 688 5% 5082 4996 2% 2021/22 726 695 4% 5082 5082 0%
4.4 Secondary Forecasts North Warwickshire
Academic
Year Year 7
Capacity -PAN
Year 7 Forecast
Pupil Numbers
Available Capacity
(4% target)
Total Capacity
Total Forecast Number On Roll
Available Capacity
(4% target)
Area Total
2017/18 699 745 -7% 3495 3495 0% 2018/19 699 729 -4% 3495 3663 -5% 2019/20 699 736 -5% 3495 3739 -7% 2020/21 699 715 -2% 3495 3761 -8% 2021/22 699 716 -2% 3495 3719 -6% 2022/23 699 774 -11% 3495 3752 -7% 2023/24 699 755 -8% 3495 3808 -9%
4.5 North Warwickshire Borough Council’s Draft Local Plan is currently out for
consultation and outlines strategic housing allocations that will require new provision and expansion of existing provision. As a result of the proposed development it is expected there will be significant pressure on school places at the Queen Elizabeth Academy, Hartshill School and The Polesworth School.
4.6 Coleshill School has recently increased its published admission number to
accommodate demand in the area and plans are currently being developed to increase capacity in the Coleshill area at Primary level.
4.7 Primary Forecasts Nuneaton and Bedworth
Academic
Year Reception Capacity -
PAN
Reception Forecast
Pupil Numbers
Available Capacity
(4% target)
Total Capacity
Total Forecast Number On Roll
Available Capacity
(4% target)
Area Total
2017/18 1765 1705 3% 12355 11676 5% 2018/19 1765 1797 -2% 12355 11961 3% 2019/20 1765 1747 1% 12355 12137 2% 2020/21 1765 1794 -2% 12355 12404 0% 2021/22 1765 1702 4% 12355 12398 0%
02 Sufficiency Strategy Cab 18.02.15 4 of 8
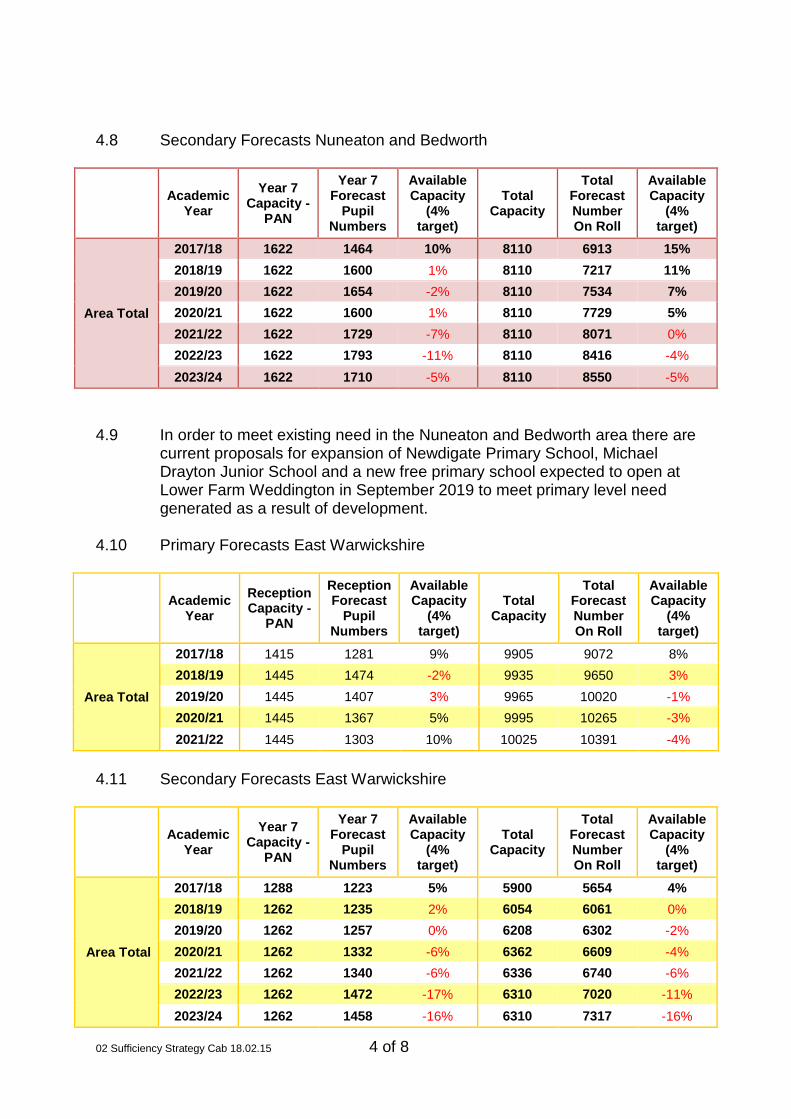
4.8 Secondary Forecasts Nuneaton and Bedworth
Academic
Year Year 7
Capacity -PAN
Year 7 Forecast
Pupil Numbers
Available Capacity
(4% target)
Total Capacity
Total Forecast Number On Roll
Available Capacity
(4% target)
Area Total
2017/18 1622 1464 10% 8110 6913 15% 2018/19 1622 1600 1% 8110 7217 11% 2019/20 1622 1654 -2% 8110 7534 7% 2020/21 1622 1600 1% 8110 7729 5% 2021/22 1622 1729 -7% 8110 8071 0% 2022/23 1622 1793 -11% 8110 8416 -4% 2023/24 1622 1710 -5% 8110 8550 -5%
4.9 In order to meet existing need in the Nuneaton and Bedworth area there are
current proposals for expansion of Newdigate Primary School, Michael Drayton Junior School and a new free primary school expected to open at Lower Farm Weddington in September 2019 to meet primary level need generated as a result of development.
4.10 Primary Forecasts East Warwickshire
Academic
Year Reception Capacity -
PAN
Reception Forecast
Pupil Numbers
Available Capacity
(4% target)
Total Capacity
Total Forecast Number On Roll
Available Capacity
(4% target)
Area Total
2017/18 1415 1281 9% 9905 9072 8% 2018/19 1445 1474 -2% 9935 9650 3% 2019/20 1445 1407 3% 9965 10020 -1% 2020/21 1445 1367 5% 9995 10265 -3% 2021/22 1445 1303 10% 10025 10391 -4%
4.11 Secondary Forecasts East Warwickshire
Academic
Year Year 7
Capacity -PAN
Year 7 Forecast
Pupil Numbers
Available Capacity
(4% target)
Total Capacity
Total Forecast Number On Roll
Available Capacity
(4% target)
Area Total
2017/18 1288 1223 5% 5900 5654 4% 2018/19 1262 1235 2% 6054 6061 0% 2019/20 1262 1257 0% 6208 6302 -2% 2020/21 1262 1332 -6% 6362 6609 -4% 2021/22 1262 1340 -6% 6336 6740 -6% 2022/23 1262 1472 -17% 6310 7020 -11% 2023/24 1262 1458 -16% 6310 7317 -16%
02 Sufficiency Strategy Cab 18.02.15 5 of 8
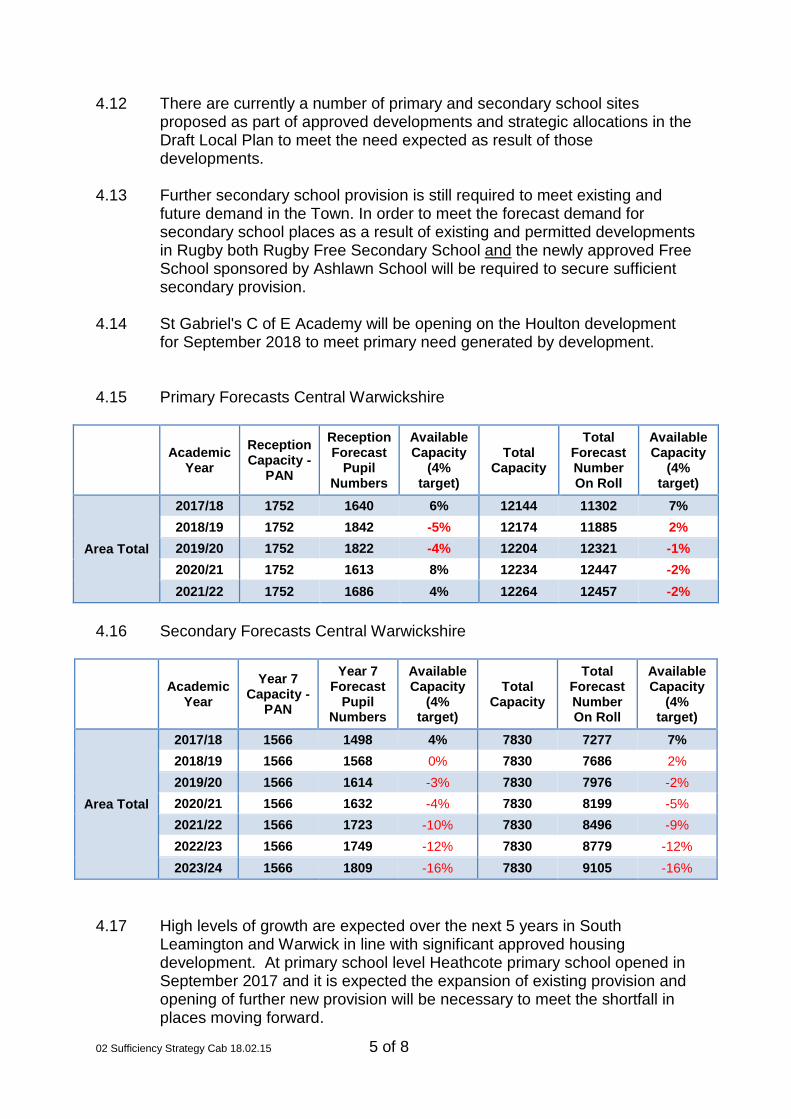
4.12 There are currently a number of primary and secondary school sites proposed as part of approved developments and strategic allocations in the Draft Local Plan to meet the need expected as result of those developments.
4.13 Further secondary school provision is still required to meet existing and
future demand in the Town. In order to meet the forecast demand for secondary school places as a result of existing and permitted developments in Rugby both Rugby Free Secondary School and the newly approved Free School sponsored by Ashlawn School will be required to secure sufficient secondary provision.
4.14 St Gabriel's C of E Academy will be opening on the Houlton development
for September 2018 to meet primary need generated by development.
4.15 Primary Forecasts Central Warwickshire
Academic
Year Reception Capacity -
PAN
Reception Forecast
Pupil Numbers
Available Capacity
(4% target)
Total Capacity
Total Forecast Number On Roll
Available Capacity
(4% target)
Area Total
2017/18 1752 1640 6% 12144 11302 7% 2018/19 1752 1842 -5% 12174 11885 2% 2019/20 1752 1822 -4% 12204 12321 -1% 2020/21 1752 1613 8% 12234 12447 -2% 2021/22 1752 1686 4% 12264 12457 -2%
4.16 Secondary Forecasts Central Warwickshire
Academic
Year Year 7
Capacity -PAN
Year 7 Forecast
Pupil Numbers
Available Capacity
(4% target)
Total Capacity
Total Forecast Number On Roll
Available Capacity
(4% target)
Area Total
2017/18 1566 1498 4% 7830 7277 7% 2018/19 1566 1568 0% 7830 7686 2% 2019/20 1566 1614 -3% 7830 7976 -2% 2020/21 1566 1632 -4% 7830 8199 -5% 2021/22 1566 1723 -10% 7830 8496 -9% 2022/23 1566 1749 -12% 7830 8779 -12% 2023/24 1566 1809 -16% 7830 9105 -16%
4.17 High levels of growth are expected over the next 5 years in South Leamington and Warwick in line with significant approved housing development. At primary school level Heathcote primary school opened in September 2017 and it is expected the expansion of existing provision and opening of further new provision will be necessary to meet the shortfall in places moving forward.
02 Sufficiency Strategy Cab 18.02.15 6 of 8
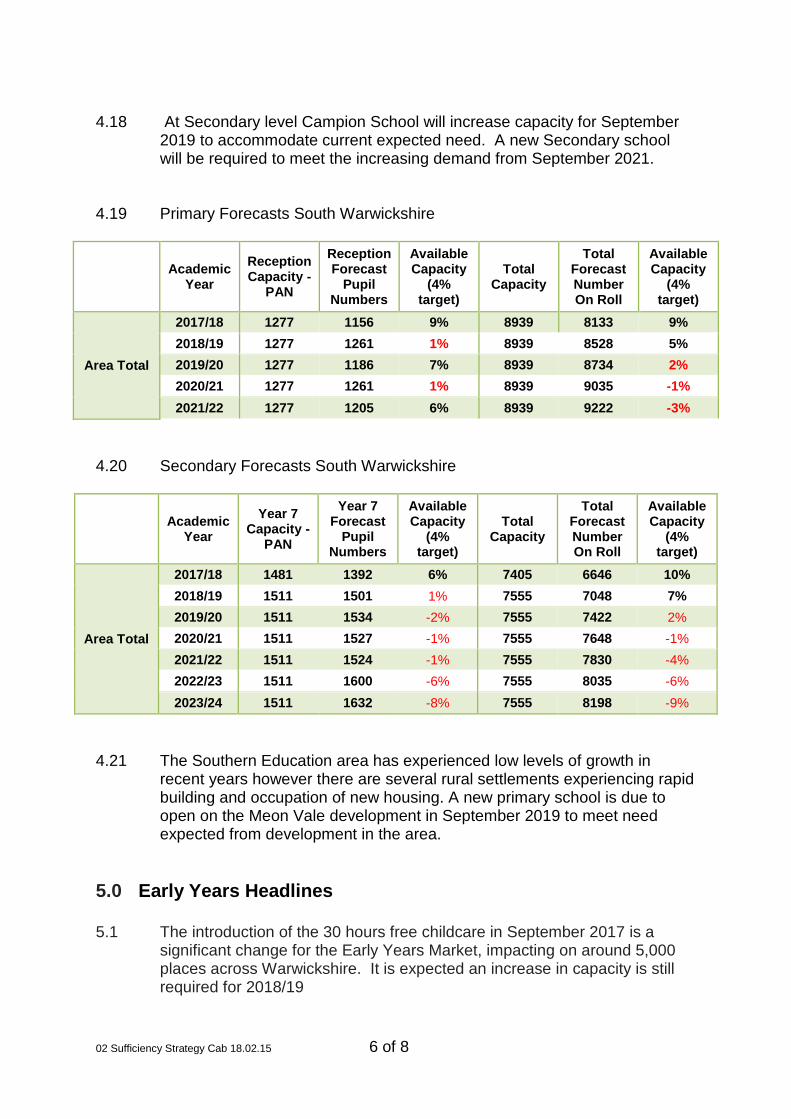
4.18 At Secondary level Campion School will increase capacity for September
2019 to accommodate current expected need. A new Secondary school will be required to meet the increasing demand from September 2021.
4.19 Primary Forecasts South Warwickshire
Academic
Year Reception Capacity -
PAN
Reception Forecast
Pupil Numbers
Available Capacity
(4% target)
Total Capacity
Total Forecast Number On Roll
Available Capacity
(4% target)
Area Total
2017/18 1277 1156 9% 8939 8133 9% 2018/19 1277 1261 1% 8939 8528 5% 2019/20 1277 1186 7% 8939 8734 2% 2020/21 1277 1261 1% 8939 9035 -1% 2021/22 1277 1205 6% 8939 9222 -3%
4.20 Secondary Forecasts South Warwickshire
Academic
Year Year 7
Capacity -PAN
Year 7 Forecast
Pupil Numbers
Available Capacity
(4% target)
Total Capacity
Total Forecast Number On Roll
Available Capacity
(4% target)
Area Total
2017/18 1481 1392 6% 7405 6646 10% 2018/19 1511 1501 1% 7555 7048 7% 2019/20 1511 1534 -2% 7555 7422 2% 2020/21 1511 1527 -1% 7555 7648 -1% 2021/22 1511 1524 -1% 7555 7830 -4% 2022/23 1511 1600 -6% 7555 8035 -6% 2023/24 1511 1632 -8% 7555 8198 -9%
4.21 The Southern Education area has experienced low levels of growth in
recent years however there are several rural settlements experiencing rapid building and occupation of new housing. A new primary school is due to open on the Meon Vale development in September 2019 to meet need expected from development in the area.
5.0 Early Years Headlines 5.1 The introduction of the 30 hours free childcare in September 2017 is a
significant change for the Early Years Market, impacting on around 5,000 places across Warwickshire. It is expected an increase in capacity is still required for 2018/19

02 Sufficiency Strategy Cab 18.02.15 7 of 8
5.2 Over 70% of early years provision in Warwickshire is provided by the private and voluntary sector, and therefore where a need for additional places is identified, the local authority will work in partnership with the sector to increase places to meet demand.
6.0 High Needs Provision Headlines
6.1 In the last few years special school growth has outstripped mainstream
growth by around three times the rate of increase. There is significant pressure particularly in Nuneaton and Bedworth, East and Central Warwickshire. There is a challenge to balance pressure to expand with resource constraints
7.0 Financial Implications
7.1 It is expected new school places will be funded via grant funding from the Department for Education and/or funding contributions from developers where a need is related to housing development.
7.2 All future additions to the capital programme will subject to a further cabinet report identifying specific funding streams.
7.3 When a school expands or a new school opens there is a potential time-lag between the schools admitting the additional pupils and the Education and Skills Funding Agency allocating revenue funding to the school. In order to support schools in the situation Warwickshire Education and Learning provide growth funding for the additional class.
7.4 The total budget for the growth fund in any given financial year is based on
the difference between the Dedicated Schools Grant allocation for the Schools Block, and the sum of the allocations to schools' budgets.
7.5 The growth fund for 2018/19 is estimated at £1.1million. Funding available to support those schools that are currently in the process of expansion or are expected to admit additional children for 2018/19 is therefore capped at this level.
8.0 Next Steps 8.1 Presentation to full council on 20thMarch 2018.
8.2 Following ratification by full council the strategy will be published on
Warwickshire County Council webpages.
02 Sufficiency Strategy Cab 18.02.15 8 of 8
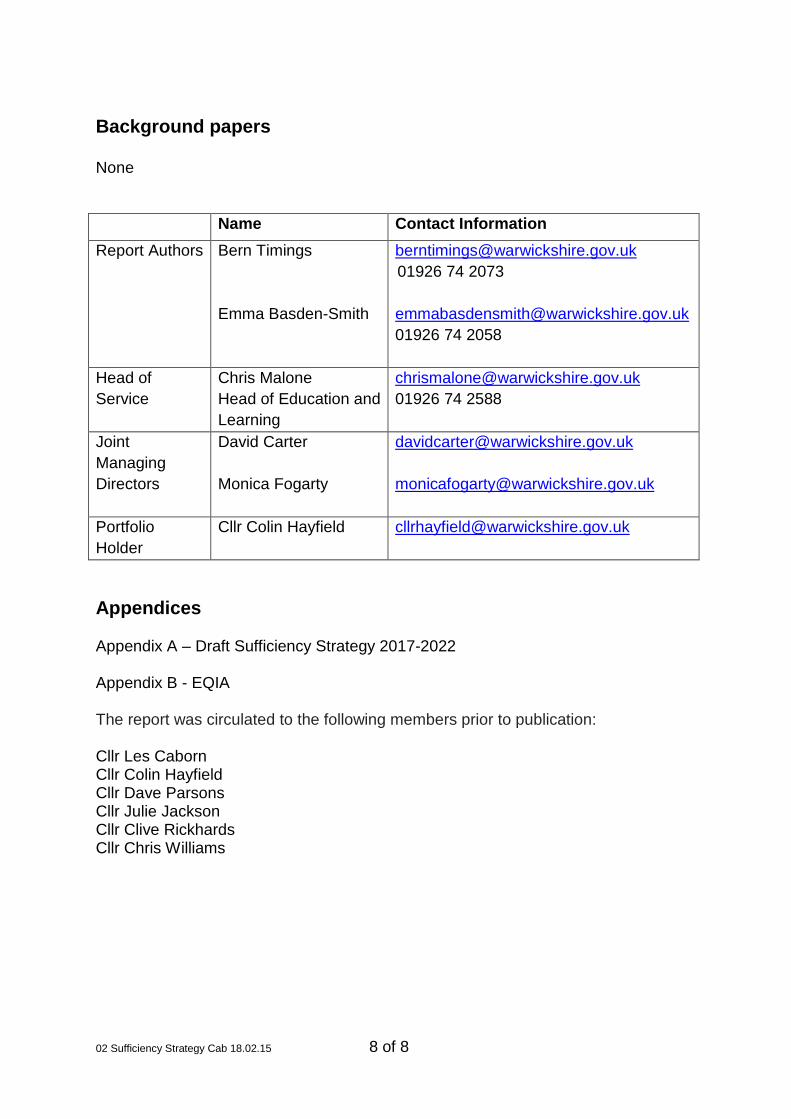
Background papers None Name Contact Information Report Authors Bern Timings
Emma Basden-Smith
[email protected] 01926 74 2073 [email protected] 01926 74 2058
Head of Service
Chris Malone Head of Education and Learning
[email protected] 01926 74 2588
Joint Managing Directors
David Carter Monica Fogarty
[email protected] [email protected]
Portfolio Holder
Cllr Colin Hayfield
Appendices Appendix A – Draft Sufficiency Strategy 2017-2022 Appendix B - EQIA The report was circulated to the following members prior to publication: Cllr Les Caborn Cllr Colin Hayfield Cllr Dave Parsons Cllr Julie Jackson Cllr Clive Rickhards Cllr Chris Williams
Warwickshire County Council
Education and Learning
Sufficiency Strategy for academic years 2017 – 2022
APPENDIX A
DRAFT
Page 2 of 84
Contents
1. Introduction 1.1. Warwickshire’s Education and Learning Vision 1.2. Statutory Context 1.3. Coordinated Strategic approach
2. Planning Methodology 2.1. Pupil Forecasts 2.2. Funding 2.3. Key strategic priorities 2.4. School expansions 2.5. New schools 2.6. Viability and Sustainability 2.7. Maintaining Available Capacity
3. Warwickshire 3.1. Warwickshire County 3.2. Characteristics of Warwickshire schools 3.3. Population Context 3.4. Housing Development 3.5. Movement of pupils
4. North Warwickshire 4.1. North Warwickshire population data 4.2. Future Development
Early Years 4.3. Children’s Centre Group Demographic Data
Primary 4.4. Context of primary schools 4.5. Pupil forecasts 4.6. Capital programme 4.7. Future need
Secondary 4.8. Context of secondary schools 4.9. Pupil forecasts 4.10. Capital programme 4.11. Future need
5. Nuneaton and Bedworth 5.1. Nuneaton and Bedworth population data 5.2. Future Development
Early Years 5.3. Children’s Centre Group Demographic Data
Primary 5.4. Context of primary schools 5.5. Pupil forecasts 5.6. Capital programme 5.7. Future need
Page 3 of 84
Secondary 5.8. Context of secondary schools 5.9. Pupil forecasts 5.10. Capital programme 5.11. Future need
6. East Warwickshire
6.1. East Warwickshire population data 6.2. Future Development
Early Years 6.3. Children’s Centre Group Demographic Data
Primary 6.4. Context of primary schools 6.5. Pupil forecasts 6.6. Capital programme 6.7. Future need
Secondary 6.8. Context of secondary schools 6.9. Pupil forecasts 6.10. Capital programme 6.11. Future need
7. Central Warwickshire
7.1. Central Warwickshire population data 7.2. Future Development
Early Years 7.3. Children’s Centre Group Demographic Data
Primary 7.4. Context of primary schools 7.5. Pupil forecasts 7.6. Capital programme 7.7. Future need
Secondary 7.8. Context of secondary schools 7.9. Pupil forecasts 7.10. Capital programme 7.11. Future need
8. South Warwickshire
8.1. South Warwickshire population data 8.2. Future Development
Early Years 8.3. Children’s Centre Group Demographic Data
Primary 8.4. Context of primary schools 8.5. Pupil forecasts
Page 4 of 84
8.6. Housing development 8.7. Capital programme 8.8. Future need
Secondary 8.9. Context of secondary schools 8.10. Pupil forecasts 8.11. Capital programme 8.12. Future need
9. SEN Provision
9.1. Drivers for change 9.2. Implications of Housing Development for Warwickshire’s Specialist
Provision 9.3. Projected Special School Growth 2018-23 – Primary and Secondary
Combined 9.4. Proposals 9.5. Special School Expansion 9.6. Development of New Special Schools 9.7. Secondary & Primary SEN Resourced Provision 9.8. Independent Specialist Provision
10. Appendix 1 – Children’s Centre Reach Areas
11. Appendix 2 – Primary Planning Areas
12. Appendix 3 – Secondary Planning Areas
13. Appendix 4 – Primary Forecasts
14. Appendix 5 – Secondary Forecasts
Page 5 of 84
1. Introduction
1.1. Warwickshire’s Education and Learning Vision
In this context, the Sufficiency Strategy will help schools, parents, council staff, local partners and stakeholders understand how Warwickshire County Council plans and provides school places to ensure that all children and young people thrive in sustainably good or outstanding schools and settings throughout their education, wherever they live in Warwickshire. It sets out the principles underpinning school place planning; the ways in which places will be delivered, the information which will be used and the way we work with Providers, Schools, Academy Trusts, and Partner agency’s to deliver high quality, accessible school and early years places for all learners. From publication in March 2018 this Sufficiency Strategy will cover the academic years 2017 to 2022 and makes provision to ensure on-going sufficiency for both in year pressures and those expected for the start of the academic years covered.
1.2. Statutory Context
Warwickshire County Council (WCC) has a legal duty to:
• ensure sufficient school places exist to meet local demand; • secure sufficient early years and childcare places; • ensure sufficient post 16 provision; • provide appropriate education provision for children with special
educational needs and disabilities;
This Sufficiency Strategy is designed to help deliver the vision for Education and Learning across Warwickshire that every child and young person in Warwickshire will:
• attend a good or outstanding school or setting;
• achieve well;
• go on to a positive destination;
• Continue to access high quality learning throughout their lives.

Page 6 of 84
• promote high education standards; • ensure fair access to educational opportunity; • promote the fulfilment of every child’s education potential; • promote diversity and parental choice.
These responsibilities still remain despite the recent direction of government policy towards giving schools more autonomy. As a result, all schools, including Academies and Free Schools, are considered equally in the County Council’s planning of school places. It is the Council’s role to plan, commission and organise school places in a way that raises standards, manages supply and demand and creates a diverse infrastructure. This strategy provides for the longest possible planning horizon to ensure that need is anticipated and met in a transparent, objective, cost effective and sustainable way.
1.3. Coordinated Strategic approach
The strategy supports the coordinated approach to Warwickshire County Council’s estates and assets, set out in the Council’s property strategy. The Council is committed to providing accommodation, whether permanent or temporary, that is high quality, fit for purpose, provides value for money and ensures flexibility to respond to changes in need and curriculum.
The focus of this strategy is the provision of places for age 0-19; this strategy also links with a number of other key Council strategies:
• Draft Education Strategy 2018-2023 (publication July 2018) • Early Years and Childcare Sufficiency Assessment • Vulnerable Learners strategy (to be superseded by the SEND & Inclusion
Strategy due for publication July 2018) • Post 16 – Raising the Participation Age Strategy • WCC One Organisational Plan for 2020

Page 7 of 84
2. Methodology and Planning Considerations
2.1. Pupil Forecasts
School-level forecasts of future pupil numbers are produced each year on the receipt of the latest population data from the health authorities and the latest data on parental preferences and housing numbers. The following process is followed:
Reception Intakes:
Data is provided at postcode level from health authorities on all Warwickshire resident children aged 0-4; this is then aggregated to match the LA’s SCAP (School Capacity) planning areas. This data is provided annually, which allows patterns to be found in families moving in and out of each area with pre-school children. Once these have been taken into account, it is possible to compare recent numbers of pre-school children with the number that then arrived in Warwickshire School Reception classes. A percentage is generated for each planning area (e.g. 95% of the number of children resident in Bedworth will enter a Reception class at a Warwickshire school); these percentages are then applied to the most recent data to give a forecast of the number of pupils living in each planning area likely to start in Reception in a Warwickshire school over the next few years. Once this has been established the Reception class numbers in each planning area are distributed across the County’s schools in line with recent patterns, e.g. 5% of pupils living in Warwick go to Westgate Primary school. Numbers are increased to account for the likely movement into Warwickshire of pupils living out of county but choosing a school within Warwickshire. Individual rates of increase are applied to individual schools as this is more of a factor for schools near the county boundaries. Those rates are based on recent trends.
Year 7 Intakes:
The process is identical to the one explained above for Reception intakes except that the expected number of Year 7 pupils living in each planning area is arrived at by comparing the size of recent Year 7 cohorts with the size of that cohort when they were in Year 6. This generates a percentage for each planning area and these are applied to all younger year groups to generate Year 7 number for future years for each planning area.
In-year Movement:
In most cases the numbers are rolled forwards with adjustments only made where a specific need has been identified or where there are irregular points of transfer such as with the county’s remaining infant and junior schools. Adjustments are made to account for pupils finding alternative routes at post-16 by looking at previous rates of transfer from Year 11 to Year 12.

Page 8 of 84
Housing development:
The County Council maintains a database of housing developments with their likely pupil yields, which are calculated using formulae that are sensitive to the part of the County the development falls in. Pupil yields are added to the forecasts where appropriate – in most cases assumptions are made as to the rate the houses will be built and occupied unless specific information is available. Adjustments are made as new pupil-level data becomes available.
2.2 Maintaining Available Capacity
The DfE previously recommended that Local Authorities should retain between 5 and 10% capacity as surplus to accommodate ‘In Year’ applications/growth.
The level of surplus capacity available in Warwickshire schools varies from area to area, with extremely low levels of surplus capacity available in urban areas, particularly across the primary phase of education. In contrast to this, higher levels of surplus capacity are recorded in the county’s rural areas.
There is a need to maintain a certain amount of capacity within a given area to allow for flexibility to meet parental preference as much as possible, enable in-year transfers and allow families moving to an area to be able to secure a place at a local school or for each of their children at the same school. The target for Warwickshire is for the supply of places to exceed demand by approximately 4%, with as even a spread across the County as possible. For the most part this 4% capacity will be measured within a planning area, however we recognise that where there are single school planning areas, 4% capacity may be unattainable or lead to issues with financial viability in the school. In these situations we will work with and support schools to allow for flexibility to admit pupils over the admission number as exceptions if no reasonable alternative school is available. This has been factored in all of the planning and analysis set out further on in this strategy. Current and forecast capacity is available within Appendix 4 (primary) and Appendix 5 (secondary).
2.3 School Admissions
All aspects of school admissions are based on the School Admissions Code. It governs the way all schools set their admissions oversubscription criteria, ensures compliance with local co-ordinated schemes, makes offers of places and allows for school admissions appeals. It also places the local authority as a regulator for all

Page 9 of 84
other admission authorities within its boundaries, with the expectation of the local authority reporting those admission authorities whose admission arrangements are not in line with the School Admissions Code to the schools adjudicator.
The School Admissions Code places a requirement on all local authorities to publish a ‘co-ordinated scheme’ and manage the admissions process for; entry into Reception, the transfer from Infant to Junior school (Years 2 to 3) and the transfer from primary to secondary school (Years 6 to 7).
2.4 Home to School transport
WCC provides home to school transport to pupils in accordance with national legislation. In instances where a place at a school named as a parental preference, cannot be offered to a pupil and the alternative place offered is above the distance criteria set out below (or use of a walking route that is deemed ‘unsafe’ is required), WCC will provide transport to the alternative school.
Pupils under the age of 8: 2 miles
Pupils aged 8 and over: 3 miles
Warwickshire Home to School transport Policy
It is the intention of WCC to provide ‘local places for local children’, reducing the need for pupils to access home to school transport services.
2.5 Key strategic priorities
Where possible, we will consult with all schools in the area and decide upon the most cost effective way forward. We are committed to ensuring all schools are kept informed with regards to long term school planning. We will, where possible, design buildings which enable schools to be flexible in the longer term regarding use of buildings and grounds. Each year we will communicate with all schools regarding our proposals for new schools, expansions and the long term demand by area. Schools will be invited to comment and declare an interest in expansion.

Page 10 of 84
We are committed, where expansions and funds allow, to addressing the following areas:
• Local places for local children
We are committed to providing school places for children in their local community whenever possible.
• Removal of half forms of entry
In order to provide schools with stability when organising classes we will look to remove half forms of entry.
• Increase 1 form of entry (FE) to 2 forms of entry (FE)
Where it is possible and appropriate we will look to expand schools to 2 (FE) to provide better financial stability.
• Amalgamate Infant and Junior schools
We will support and expect Infant and Junior schools to amalgamate where appropriate, particularly when both schools are located on a shared site or when one of the Head teachers leaves.
• Address safeguarding issues relating to buildings and grounds
We are committed to addressing any safeguarding within schools relating to the school building or grounds and will address any issues identified in a timely manner to ensure the safety of children in Warwickshire schools
• Address buildings defects and Equality Act noncompliance
Where funds allow we will address any identified defects. All school buildings in Warwickshire should be accessible to all and up to an equal standard.
• Incorporate SEND facilities within mainstream schools
To make best use of education facilities, and increase inclusion for pupils with Special Educational Needs and Disabilities, we are developing schemes to include SEND facilities within mainstream schools and expand capacity.

Page 11 of 84
2.6 Funding
Basic Need Grant Funding Capital allocations to meet projected shortfalls in provision are provided by the Education and Skills Funding Agency (ESFA) to all local authorities based on the data provided in the annual School Capacity return (SCAP). This return informs the ESFA of the expected change in pupil numbers over the next few years, the current capacity of schools to meet those numbers and the planned changes to that capacity. There is pressure on capital budgets for new school places across the country and it is likely that allocations will continue to be limited for the foreseeable future. It is important, therefore, to consider value for money in the process of commissioning school places.
The SCAP return asks local authorities to provide forecasts of pupil numbers that exclude pupils brought to the area by new housing development; there is an expectation that provision for these pupils will be funded through contributions provided by the developers. It is vital that all Net Capacity assessments are completed and maintained in order to inform the SCAP return. We will liaise with schools to ensure all plans and Net Capacity assessments are accurate. Breakdown of funding received Developer contributions When planning with the district and borough councils we are mindful of their need to meet the housing demand, versus our need to provide the infrastructure. The County is committed to ensuring we secure the best solution re the provision of additional school capacity. The County Council will seek to secure financial contributions and / or the provision of land from developers towards providing additional education provision, through the expansion of existing schools or the opening of new schools, when the predicted impact of a new housing development creates a shortfall. Where new housing development creates a demand for school places in excess of those available, the County Council will work with District/Borough Councils and developers to ensure that the appropriate contributions for the provision of additional school places are given. This will continue to be achieved through Section 106

Page 12 of 84
agreements and the Community Infrastructure Levy. We will seek the maximum contribution from developers to support the provision of additional places that we believe is proportionate to the impact of the development. It is critical that developers make a financial contribution to school places as, without it, the LA will be unable to deliver the required provision. Other capital funding Other funding streams that may be available to ensure sufficient school places include: • Centrally funded new schools via the Government’s Free School programme. • Capital Receipts – proceeds from the sale of former education settings deemed surplus to requirements. • Capital contributions from individual school budgets and/or bids by Academies for ‘Capital Infrastructure Funding’ (CIF). • Capital funding allocations for ‘Voluntary Aided’ schools (LCVAP funding). Pupil Increase revenue funding Warwickshire’s Schools Forum has agreed to retain centrally a level of revenue funding for schools that have been asked to expand. This growth fund is to support those schools that the local authority has specifically asked to take on additional pupils: the usual payment is £32,930 to support the initial cost of employing staff and purchasing resources. Growth funding will also be available to fund bulge classes and expanding schools across Key Stage 1.
The amount agreed is based on 7/12 of the cost of a main scale teacher and a teaching assistant (estimated total £27,500), with an additional sum of £5,000 to fund additional costs such as resources.
In line with the regulations above, this figure is increased proportionately for academies which are funded on an academic year and thus have a 12 month ‘lagged’ period.
Page 13 of 84
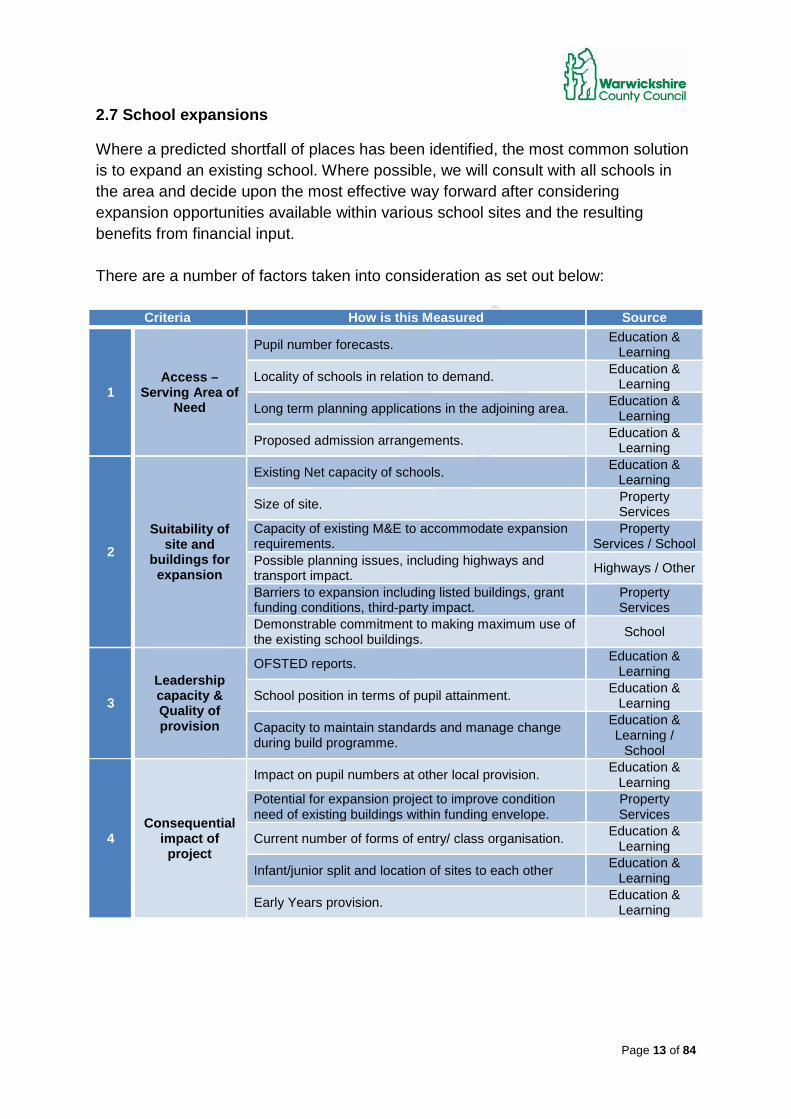
2.7 School expansions
Where a predicted shortfall of places has been identified, the most common solution is to expand an existing school. Where possible, we will consult with all schools in the area and decide upon the most effective way forward after considering expansion opportunities available within various school sites and the resulting benefits from financial input. There are a number of factors taken into consideration as set out below:
Criteria How is this Measured Source
1 Access –
Serving Area of Need
Pupil number forecasts. Education & Learning
Locality of schools in relation to demand. Education & Learning
Long term planning applications in the adjoining area. Education & Learning
Proposed admission arrangements. Education & Learning
2 Suitability of
site and buildings for expansion
Existing Net capacity of schools. Education & Learning
Size of site. Property Services
Capacity of existing M&E to accommodate expansion requirements.
Property Services / School
Possible planning issues, including highways and transport impact. Highways / Other
Barriers to expansion including listed buildings, grant funding conditions, third-party impact.
Property Services
Demonstrable commitment to making maximum use of the existing school buildings. School
3 Leadership capacity & Quality of provision
OFSTED reports. Education & Learning
School position in terms of pupil attainment. Education & Learning
Capacity to maintain standards and manage change during build programme.
Education & Learning /
School
4 Consequential
impact of project
Impact on pupil numbers at other local provision. Education & Learning
Potential for expansion project to improve condition need of existing buildings within funding envelope.
Property Services
Current number of forms of entry/ class organisation. Education & Learning
Infant/junior split and location of sites to each other Education & Learning
Early Years provision. Education & Learning

Page 14 of 84
2.8 New schools
The need for new schools often arises when there are no opportunities to expand existing local schools or where new housing developments are expected to bring large numbers of new families to an area. It is the responsibility of the local authority to seek sponsors for these new schools so the County Council will be looking to engage with potential suitable organisations over the next few years including existing high-quality providers within Warwickshire. When the need to establish a new school arises, there is a presumption in law that these schools will be Free Schools. The role of the local authority is to identify a site for the school and to seek applications to run the new school from potential sponsors. The final decision on who should sponsor a new school is taken by the Regional Schools Commissioner and is outside of local authority control. There are currently five Free Schools operating in Warwickshire; The Priors School, Rugby Free Primary School, Rugby Free Secondary School, Quest Academy, and Heathcote Primary School. There is a further Free School planned to open in 2018, St Gabriel’s C of E Academy and currently two further Free Schools proposed to open in September 2019. WCC has worked in partnership with Academy Trusts already operating within the county to support their Free School applications. This support has taken the form of providing demographic information to strengthen the Trust’s application, liaising with the ESFA regarding the need for the free school in question and also assisting the external providers in finding sites for their proposed schools. The council intends to work collaboratively with the ESFA and office of the Regional Schools Commissioner (RSC) and other external providers to open a number of new free schools across Warwickshire over the lifespan of this Sufficiency Strategy and beyond. The County Council has initiated discussions over the acquisition of a number of sites on which new schools will be located and is also engaging the office of the RSC regarding sponsors for these proposed new schools. WCC will actively seek to encourage ‘good’ and ‘outstanding’ education providers from other areas of the country to begin operating within Warwickshire. This will not only help ensure that the WCC continues to fulfil its statutory obligation of providing sufficient school places within the County over the coming years but also provide increased choice and diversity of education provision for parents.
Page 15 of 84
In order to provide sufficient Early Years/ Pre School places across Warwickshire, where existing provision in the local area is at capacity, all new build primary schools will include facilities for Pre School provision. Additional capacity will also be built into new schools to support the Local Authority’s commitment to increasing access to mainstream provision for SEND learners across the County wherever possible and appropriate.
2.9 Viability and Sustainability
Partnership working There is an expectation that small schools or schools with known budget pressures will work in partnership or collaborate with suitable partner schools whenever possible, to achieve economies of scale, for example: through federation and shared staffing/resources. This may help to maintain financial viability and remain sustainable longer term. Further to this governing bodies are expected to consider forming / joining a Multi-Academy Trust as part of plans to provide a strong and sustainable infrastructure.
Size
The minimum size for a primary school will vary across the County; however, it is an important consideration when looking to ensure the long-term viability of schools. In the County’s urban centres particularly, primary schools smaller than one form of entry (FE) (i.e. one class per year group) are likely to struggle financially. When looking at expanding primary school provision, the local authority will look to expand primary schools from 1FE to 2FE where possible to help with the financial viability of those schools. Where new schools are required, the preferred model will be for 2FE primaries, although specific context may require smaller or larger schools to be provided. The largest primary school in Warwickshire is 4FE. Similarly, the appropriate size for a secondary school will vary depending on where it is in the county; smaller secondary schools may be appropriate in more rural areas but may not be viable financially. It is unlikely that any new secondary school would be built at less than 6 forms of entry (180 places per year group).
Page 16 of 84
Organisation Warwickshire has a number of separate infant and junior schools but is committed to creating all-through primary schools where the opportunities allow; as this is considered a more effective and efficient way to organise provision. There is no overall requirement for Infant and Junior schools to amalgamate but we will expect and support Infant and Junior schools to amalgamate where and when appropriate; for example where both schools are located on a shared site or when a natural opportunity due to change in leadership arises. A number of schools in the county are operating with half forms of entry (e.g. admit 45 or 15 pupils per year group) this often requires the school to organise into mixed age classes in order to provide financial viability towards covering the cost of a full time teacher. Whilst it is possible to operate in this manner, it is more challenging for teachers and can be unpopular with parents. The local authority will look to remove half forms of entry where possible, particularly through expansion programmes. A small number of primary schools are based on split sites that are a significant distance from each other, this ultimately results in duplication of costs relating to administration, staffing etc. The County Council will look to address this through expansion and/or relocation where possible and appropriate. Warwickshire currently has one mainstream all-through school from age 4 to age 18 following the expansion of an existing secondary school. This model is seen as an effective way of creating new primary age places in areas of high demand. Where new housing developments justify a new primary and secondary school, the LA will look to open all-through schools to attain economies of scale. Rural schools Warwickshire has a number of schools serving predominantly rural areas; many of these schools operate with small admission numbers and/or small numbers on roll. Due to the rural nature of much of the county it is often the case that the next nearest alternative school is a significant distance away. We recognise that it is important to support these schools in ensuring they remain viable as they fill a particular need within the rural parts of the county in providing local school places. We aim to ensure children are able to gain a place at their local school; this may not always be the priority school where the family reside and could be the closest school by distance.

Page 17 of 84
Schools on borders It is essential that all factors are considered when planning for schools on the county borders with other local authorities, and not only the numbers on roll from out of county or numbers from within Warwickshire. As planning takes account of pupil preference, and there is a need to ensure support for rural and border schools, it is essential that when growth in a particular area is forecast or taking place a school is not penalised in terms of budget pressures whilst growing to accommodate forecast need.
Page 18 of 84
3. Warwickshire
3.1. Warwickshire County
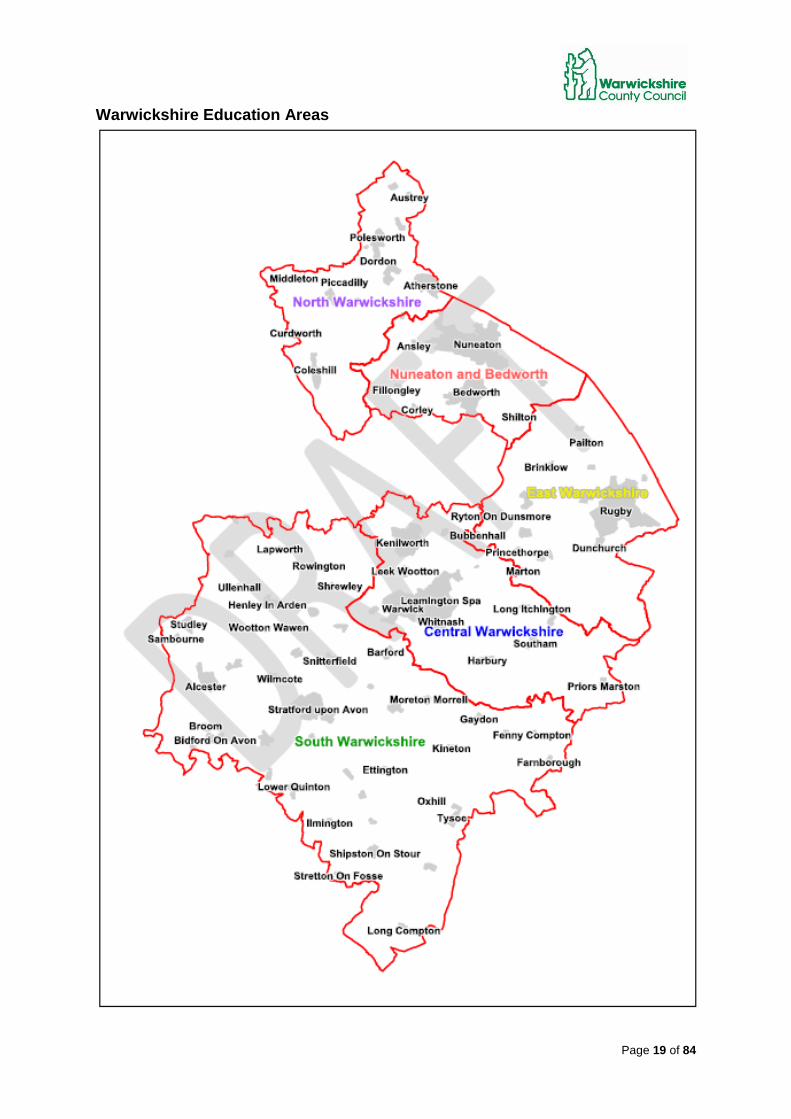
Warwickshire County covers an area of 763 square miles and is a geographically diverse county with relatively large urban areas and many smaller rural settlements. The county is made up of five Districts/Boroughs each with their own Districts/Boroughs Council, North Warwickshire, Nuneaton and Bedworth, Rugby, Warwick and Stratford-on-Avon. Each of these authorities has their own unique population and demographic make-up. In terms of planning for sufficient school places, Warwickshire is divided into five education areas, roughly following the five District/Borough boundaries with some exceptions. The map below outlines the education areas used in Warwickshire and the main towns/ settlements included in each. When reviewing sufficiency of school places each education area is then further broken down into Primary and Secondary planning areas, details of the planning areas and the schools included in each are outlined in Appendix 2 and Appendix 3.
Page 19 of 84
Warwickshire Education Areas
Page 20 of 84
3.2. Characteristics of Warwickshire schools
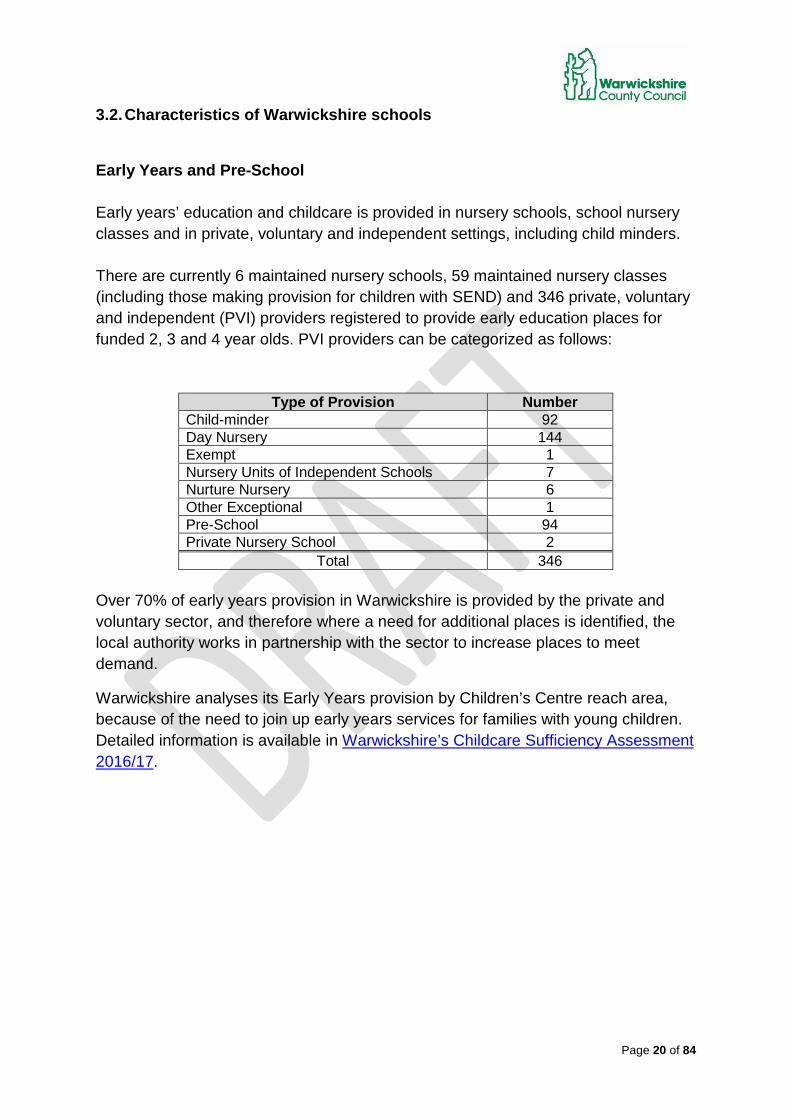
Early Years and Pre-School Early years’ education and childcare is provided in nursery schools, school nursery classes and in private, voluntary and independent settings, including child minders. There are currently 6 maintained nursery schools, 59 maintained nursery classes (including those making provision for children with SEND) and 346 private, voluntary and independent (PVI) providers registered to provide early education places for funded 2, 3 and 4 year olds. PVI providers can be categorized as follows:
Type of Provision Number Child-minder 92 Day Nursery 144 Exempt 1 Nursery Units of Independent Schools 7 Nurture Nursery 6 Other Exceptional 1 Pre-School 94 Private Nursery School 2
Total 346 Over 70% of early years provision in Warwickshire is provided by the private and voluntary sector, and therefore where a need for additional places is identified, the local authority works in partnership with the sector to increase places to meet demand.
Warwickshire analyses its Early Years provision by Children’s Centre reach area, because of the need to join up early years services for families with young children. Detailed information is available in Warwickshire’s Childcare Sufficiency Assessment 2016/17.
Page 21 of 84
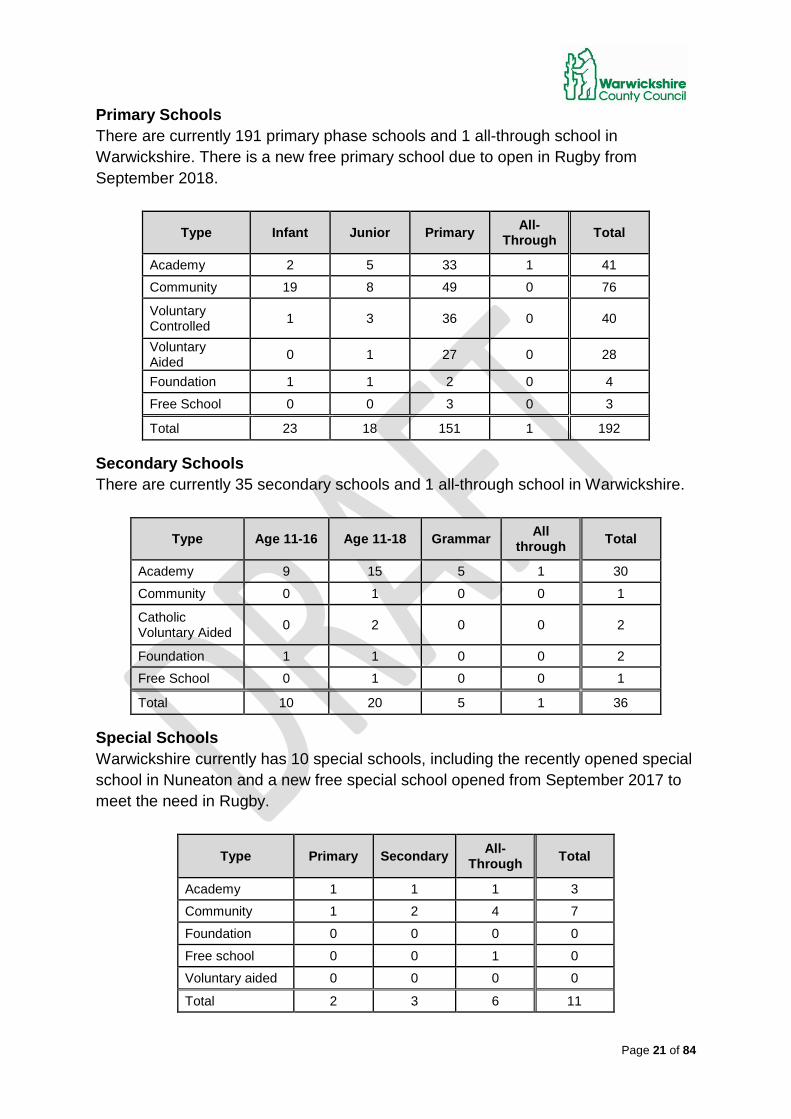
Primary Schools There are currently 191 primary phase schools and 1 all-through school in Warwickshire. There is a new free primary school due to open in Rugby from September 2018.
Type Infant Junior Primary All-Through Total
Academy 2 5 33 1 41
Community 19 8 49 0 76
Voluntary Controlled 1 3 36 0 40
Voluntary Aided 0 1 27 0 28
Foundation 1 1 2 0 4
Free School 0 0 3 0 3
Total 23 18 151 1 192
Secondary Schools There are currently 35 secondary schools and 1 all-through school in Warwickshire.
Type Age 11-16 Age 11-18 Grammar All through Total
Academy 9 15 5 1 30
Community 0 1 0 0 1
Catholic Voluntary Aided 0 2 0 0 2
Foundation 1 1 0 0 2
Free School 0 1 0 0 1
Total 10 20 5 1 36
Special Schools Warwickshire currently has 10 special schools, including the recently opened special school in Nuneaton and a new free special school opened from September 2017 to meet the need in Rugby.
Type Primary Secondary All-Through Total
Academy 1 1 1 3
Community 1 2 4 7
Foundation 0 0 0 0
Free school 0 0 1 0
Voluntary aided 0 0 0 0
Total 2 3 6 11
Page 22 of 84
3.3. Population Context
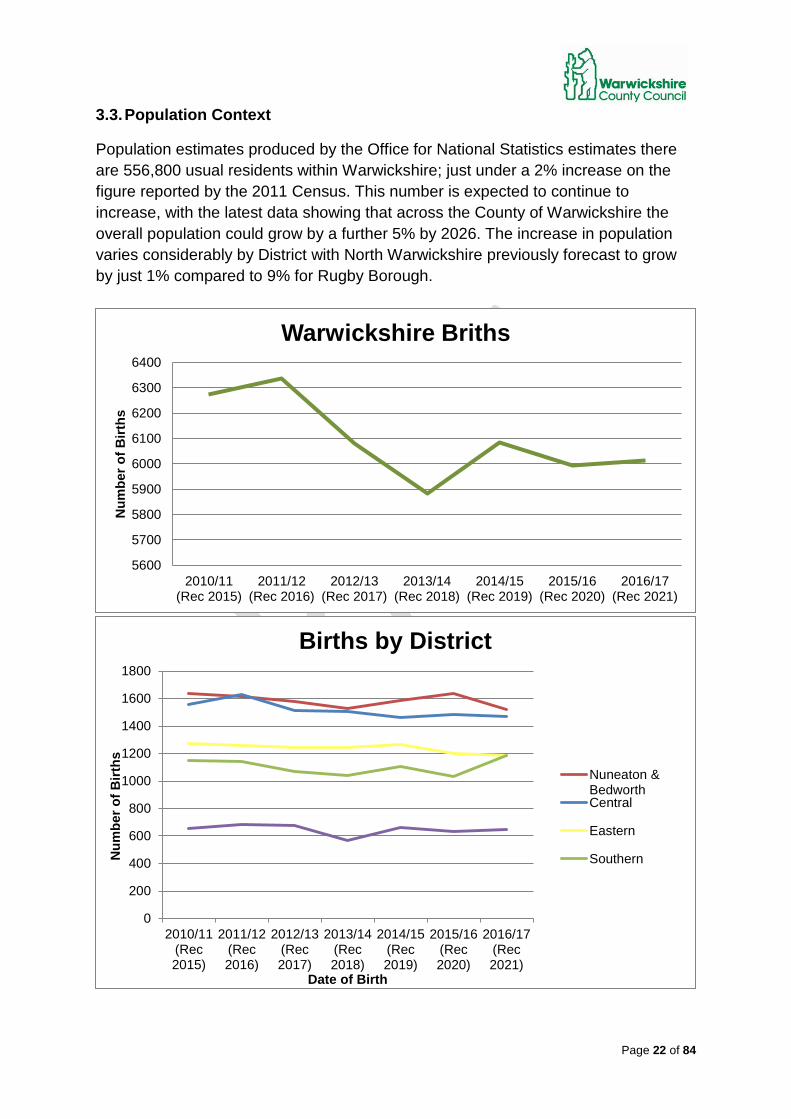
Population estimates produced by the Office for National Statistics estimates there are 556,800 usual residents within Warwickshire; just under a 2% increase on the figure reported by the 2011 Census. This number is expected to continue to increase, with the latest data showing that across the County of Warwickshire the overall population could grow by a further 5% by 2026. The increase in population varies considerably by District with North Warwickshire previously forecast to grow by just 1% compared to 9% for Rugby Borough.
5600
5700
5800
5900
6000
6100
6200
6300
6400
2010/11(Rec 2015)
2011/12(Rec 2016)
2012/13(Rec 2017)
2013/14(Rec 2018)
2014/15(Rec 2019)
2015/16(Rec 2020)
2016/17(Rec 2021)
Num
ber o
f Birt
hs
Warwickshire Briths
0
200
400
600
800
1000
1200
1400
1600
1800
2010/11(Rec2015)
2011/12(Rec2016)
2012/13(Rec2017)
2013/14(Rec2018)
2014/15(Rec2019)
2015/16(Rec2020)
2016/17(Rec2021)
Num
ber o
f Birt
hs
Date of Birth
Births by District
Nuneaton &BedworthCentral
Eastern
Southern
Page 23 of 84
Where the population growth has been driven by an increase in births or migration of families with school age children, clearly there will be an impact on the level of school places required. The number of births in Warwickshire increased by 21% between 2001 and 2010, which required the County to create additional primary school places. The latest data from the health authorities gives us some key headlines: • The number of children entering Reception (shown in chart above as 2011 birth
year) classes peaked for entry into September 2015 and, excluding the effect of new housing development, have begun to stabilize from September 2016 and in some areas start to decrease.
• Across the county there is a decrease in births for children expected to start school in September 2018.
• In some areas the impact of planned new housing is expected to offset any
decrease in Primary pupil numbers.
• Overall numbers in secondary schools have grown from September 2015 onwards as larger cohorts transfer from primary schools. Cohort numbers entering Year 7 are currently expecting to peak in September 2022 to correspond with the Reception peak seven years earlier. The impact of housing development is expected to lead to further rises in secondary pupil numbers beyond the current forecast period.
Page 24 of 84
3.4. Housing Development
New housing developments create additional demand for existing and new education facilities. Each District/ Borough Council produces a Local Plan which sets out development policies and sites over a fifteen year period. In total, there are plans to build circa 63,000 additional homes across the five areas. This new housing is estimated to bring over 30,000 additional children into Warwickshire across all age ranges in the next 15 plus years. Growth is not uniform across the County; for example Rugby is already one of the fastest growing towns outside London while there has been little growth to date in North Warwickshire. However as not all Local Plans have yet been adopted there is still uncertainty about the specifics of when and where some development will take place. There are also significant numbers of housing developments receiving planning permission outside the local plan process which are already beginning to impact on local schools, furthering the pressure on school places expected from proposed local plan housing.
3.5. Movement of pupils
The Warwickshire Admissions Service monitors In Year applications and trends in movement from both applications into the county and from current schools within the county. Current data indicates that certain areas experience significant numbers of pupils applying to move school with no associated house move and in some areas such as Rugby significant movement into the county. All these factors need to be taken into account when planning for school places in a particular area
Page 25 of 84
4. North Warwickshire
4.1. North Warwickshire population data
The increase in population has varied considerably across the County with North Warwickshire growing by just 1% between 2001 and 2011. However, North Warwickshire’s major urban centres are expected to receive a large influx of housing in the next five to ten years as part of the Borough’s draft Local Plan. If adopted, this will place increased pressure on schools in this area.
4.2. Future development
The Borough’s Emerging Local Plan is required to provide 9600 new homes over the next 15 years. These new homes will be primarily distributed across the main market towns and local population centres. Allocations include close to 2000 dwellings in the Atherstone and Mancetter area and over 3200 dwellings allocated to the area around Polesworth and Dordon. There are also over 1000 homes outlined for the Hartshill and Ansley Common area, however in terms of education planning areas, this will fall within Nuneaton and Bedworth.
Early Years
4.3. Children’s Centre Group Demographic Data
5 Children’s Centre reach areas cover the North Warwickshire district – Coleshill, Mancetter, Atherstone, Polesworth and Kingsbury.
Coleshill:
This is centred around the town of Coleshill and includes a large rural reach with limited childcare provision. It is expected that the current level of provision in the town will be sufficient to meet demand, including for the new 30 Hours offer. Families living in the rural villages including Fillongley and Curdworth travel to access full day care to meet working needs, although they have local term time only pre-schools.
Water Orton is close to Coleshill and has its own cluster of providers offering early years places. It is expected to be affected by the HS2 rail link, and the nursery on the school site will then be relocated together with the primary school.
Page 26 of 84
Mancetter:
The reach covers a large rural area incorporating villages and hamlets, and borders the outskirts of Nuneaton and Atherstone.
Significant growth in housing will put pressure on places in some areas, particularly Hartshill, where we expect a substantial increase in places to be needed. We anticipate sufficient places across the reach as a whole, but only if parents are able to travel.
Mancetter is at the northern edge of the reach, close to Atherstone, and projected housing growth may affect the sufficiency of places here.
Atherstone:
Atherstone reach is clustered around the town centre and spreads into the rural areas between the reaches of Polesworth and Mancetter Children’s Centres.
Current occupancy levels indicate there may be a shortage of places within Atherstone itself following the introduction of the 30 Hours offer in September 2017. There will be substantial levels of new housing in the town which will add a further need for childcare places.
There is sufficient provision in the rural areas at present, although in the longer term all providers are expected to become short of space once new housing is completed.
Kingsbury:
The area includes a large expanse of industrial site leaving the majority of the residential areas clustered around the large commuter village of Kingsbury.
There are sufficient places available within the reach area and local demand is not expected to increase significantly, although there is considerable cross border traffic, due to the proximity of the motorways. Demand from families outside Warwickshire may affect sufficiency of places.
Polesworth:
The reach is clustered around the large village of Polesworth and spreads to cover a large rural reach with three main smaller villages – Warton, Austrey and Newton Regis. The area borders Staffordshire and Leicestershire, and families travel to access childcare in these areas if it meets their needs, with other families travelling in to Warwickshire from outside the county.
Overall, the area is expected to have sufficient places to meet demand. Housing development may see a limited increase in need for places once completed.

Page 27 of 84
Primary
4.4. Context of North Primary schools
There are 20 primary schools in North Warwickshire and one infant school that feeds into a primary at KS2. The schools are mainly centred on the larger town and village settlements while still serving large surrounding rural areas. Several of the schools in the area attract pupils from outside of the county due to their location near to county borders.
Coleshill C of E Primary took a bulge class for Reception 2016 and Reception 2017 to accommodate increased demand. This area is experiencing increased in year pressure, particularly within Coleshill town as a result of a small amount of housing development and movement of pupils within the County.
4.5. Pupil forecasts
Current pupil forecasts for North Warwickshire show the majority of planning areas are predicted to have available capacity in excess of the 4% target. However, the Coleshill primary planning area is currently forecast to have a short fall of reception places each year and is currently experiencing pressure for in year applications in the majority of year groups.
Atherstone primary planning area may experience pressure from in year applications as the reception cohort moves through the Academic year; this will be monitored closely although available capacity is expected in the neighbouring Baddersly Grendon planning area.
Polesworth primary planning area is currently forecast possible over all in year pressure due to the popularity of the schools with children from outside of the area. 4.6. Capital programme
As part of the HS2 project, plans have been outlined to relocate Water Orton Primary School. The school will be rebuilt as a 1.5FE (315 places) primary and accommodate nursery and SEND resourced provision. The sale of the current school site will top up the funding from HS2 to build the new school building. It is proposed to expand the age range of High Meadow Infant School will be to create a 1FE primary school, increasing capacity by an additional 120 places across the school, in order to build available capacity back into the Coleshill area and address the pressure from in-year movement.
Page 28 of 84
In line with the expansion of High Meadow it is proposed to provide an additional class base at Coleshill Primary School to allow the school to admit up to 2FE, initially as bulge classes to meet forecast need in the area.
4.7. Future need
Current pupil forecasts and existing numbers on roll show available capacity in the majority of primary schools in the North Warwickshire primary planning areas. This capacity will accommodate any natural increase in pupils as well as any potential in year movement into the area. Any significant increase in need in this area will likely require additional primary provision, either as expansions of existing school or new primary schools depending on where and when the need arises.
The emerging North Warwickshire Borough Council Local Plan outlines an additional 5800 new dwellings over the plan period. It is expected that there will be a total of 800 additional primary age children generated by proposed development equating to the need for an additional 3-4 forms of entry across the Borough. These additional forms of entry will be required mainly as a result of development in Atherstone and Mancetter, Polesworth and Dordon, and the area bordering Tamworth. Development within the Hartshill and Ansley Common area may also require additional provision given the relation to developments across the border in Nuneaton and Bedworth and the existing schools within that area already being at capacity and forecast to remain so.
There is significant development along the Warwickshire/ Staffordshire county border in the Tamworth/ West Polesworth area. Development in Warwickshire is proposed alongside approved development in Staffordshire. Warwickshire will work closely with Staffordshire County Council to ensure an effective solution is found to meet additional need generated from development along the Tamworth border.
Secondary
4.8. Context of North Secondary schools
There are four secondary schools in North Warwickshire located in each of the main towns and also serving the surrounding large rural areas. The Polesworth School had previously admitted above PAN to 270 for 2015 and 2016 entry to accommodate demand for the school. The school are unable to
Page 29 of 84
sustain admitting 270 pupils beyond September 2016 due to lack of physical capacity in the school. A rebuild of The Queen Elizabeth Academy was completed by the Education and Skills Funding Agency as part of phase one of the Priority Schools Building programme and the school has been operating in new accommodation at a reduced PAN of 120 from September 2016.
4.9. Pupil forecasts
Current forecasts for North Warwickshire show that in contrast to the primary, the majority of secondary planning areas are predicted to be over capacity. It is expected that there will be in year pressure in the Atherstone area due to slightly higher birth rates and the build out of approved housing development in the area. Applications will be monitored closely and it is likely The Queen Elizabeth Academy will need expansion to accommodate this need.
The Polesworth planning area is expected to be slightly over capacity owing to the popularity of the school with pupils from outside of Warwickshire. Given this fact, there may be pressure for in year applications if pupils move into the area.
Kingsbury planning area is expected to be at or just under capacity with less than 4% available surplus. However there is limited development planned in this area so it is anticipated that there will not be a long term issue in the area as the school is popular with children from outside of Warwickshire.
The Coleshill planning area is expected to be slightly overcapacity for both Year 7 and across other year groups. The school have recently increased their PAN however there may be a pressure for in year applications as the school is popular with children from outside of Warwickshire.
4.10. Capital programme
The Coleshill School has increased its PAN to 210 from September 2017, increasing capacity by an additional 150 places across the school over the next 5 years. This increase will enable the school to accommodate demand from both in and out of county children, and address the predicted shortfalls currently forecast in this area. An additional 10 classrooms will be delivered early in the 2018/19 academic year to allow the school to accommodate the additional pupil numbers as they roll out across all year groups.
Page 30 of 84
A review of the accommodation at both The Polesworth School and The Queen Elizabeth Academy will be required to ensure both schools are able to meet the expected need from approved and future development in their respective areas.
4.11. Future need
The new housing development outlined in the North Warwickshire Borough Council Draft Local Plan is expected to yield an additional 700 Secondary age children, equating to approximately a further 4-5 forms of entry, and almost 300 post-16 children. This number may rise due to windfall sites, expected demographic shift and general population growth. The additional forms of entry will need to be distributed broadly along the same lines as the Primary schools. Between one and two additional forms of entry will likely be needed at The Queen Elizabeth School and two to four forms of entry added to The Polesworth School. As these schools are academies and therefore are their own admissions authority, the LA will need to engage as early as possible to ensure appropriate planning in line with the increased demand. Increasing provision might be more difficult at the Queen Elizabeth School as it has recently re-opened with a reduced Published Admission Number.
Page 31 of 84
5. Nuneaton and Bedworth
5.1. Nuneaton and Bedworth population data
The Borough of Nuneaton and Bedworth is concentrated around these two urban areas, as well as being located on the Coventry border. Nuneaton is currently the largest town in the county with a population of 81,000.
5.2. Future development
Nuneaton and Bedworth Borough Council’s emerging Borough Plan outlines proposals for just over 13,000 new homes across the Borough between 2011 and 2031. The majority of these new dwellings will be within or as extensions to the existing town boundaries.
It is also important to note that there are over 1000 homes currently proposed for the Hartshill and Ansley Common area in the North Warwickshire Local Plan which will fall within the Nuneaton and Bedworth education planning area.
Early Years
5.3. Children’s Centre Group Demographic Data
Six Children’s Centre reach areas cover the Nuneaton area – Abbey, Camp Hill, Ladybrook, Park Lane, Riversley and Stockingford. There are ten reach area across the whole of Nuneaton and Bedworth Borough.
Abbey:
The reach area covers Nuneaton town centre, bounded by the railway line to the north/north east. It is densely populated and unlikely to have significant housing development because of this. There is currently no sufficiency issue in this area, although the impact of the 30 Hours childcare offer may incentivise parents to increase working hours and so put some pressure on vacancy rates.
Camp Hill:
The reach area is almost entirely urban and has expanded in recent years due to new housing, which continues to be developed. Only a small proportion of parents will be entitled to 30 Hours childcare, and there is not expected to be a sufficiency gap here.
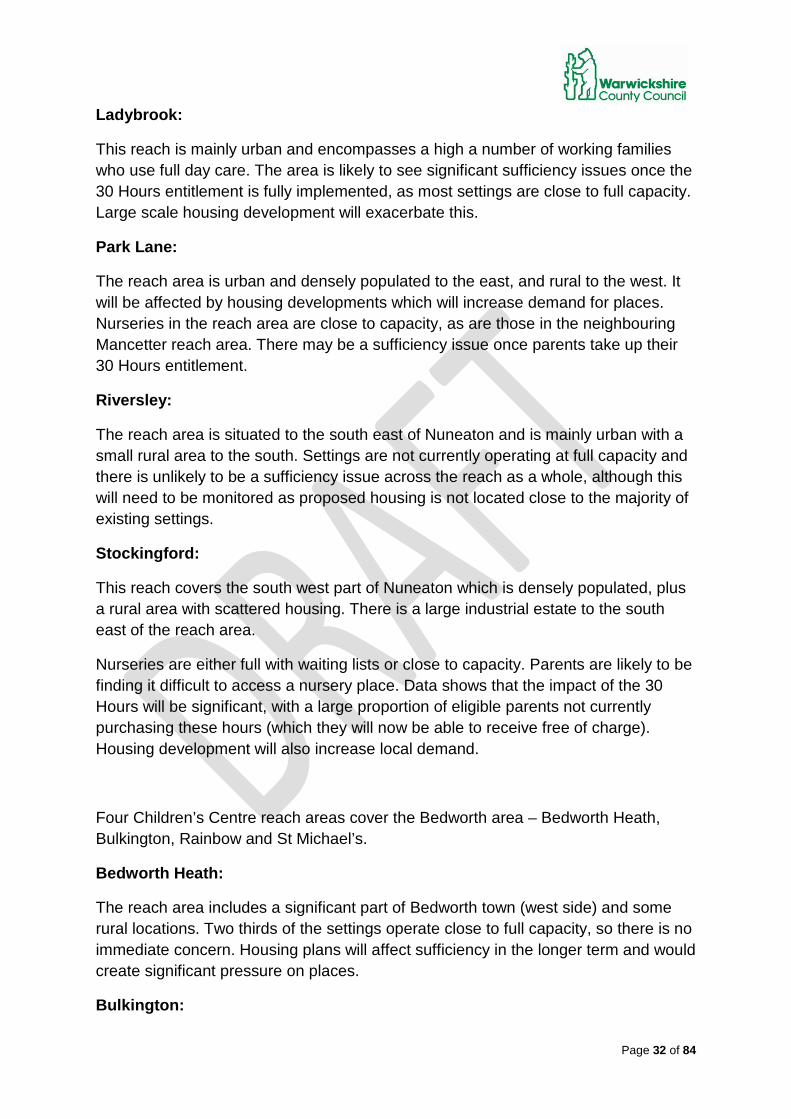
Page 32 of 84
Ladybrook:
This reach is mainly urban and encompasses a high a number of working families who use full day care. The area is likely to see significant sufficiency issues once the 30 Hours entitlement is fully implemented, as most settings are close to full capacity. Large scale housing development will exacerbate this.
Park Lane:
The reach area is urban and densely populated to the east, and rural to the west. It will be affected by housing developments which will increase demand for places. Nurseries in the reach area are close to capacity, as are those in the neighbouring Mancetter reach area. There may be a sufficiency issue once parents take up their 30 Hours entitlement.
Riversley:
The reach area is situated to the south east of Nuneaton and is mainly urban with a small rural area to the south. Settings are not currently operating at full capacity and there is unlikely to be a sufficiency issue across the reach as a whole, although this will need to be monitored as proposed housing is not located close to the majority of existing settings.
Stockingford:
This reach covers the south west part of Nuneaton which is densely populated, plus a rural area with scattered housing. There is a large industrial estate to the south east of the reach area.
Nurseries are either full with waiting lists or close to capacity. Parents are likely to be finding it difficult to access a nursery place. Data shows that the impact of the 30 Hours will be significant, with a large proportion of eligible parents not currently purchasing these hours (which they will now be able to receive free of charge). Housing development will also increase local demand.
Four Children’s Centre reach areas cover the Bedworth area – Bedworth Heath, Bulkington, Rainbow and St Michael’s.
Bedworth Heath:
The reach area includes a significant part of Bedworth town (west side) and some rural locations. Two thirds of the settings operate close to full capacity, so there is no immediate concern. Housing plans will affect sufficiency in the longer term and would create significant pressure on places.
Bulkington:
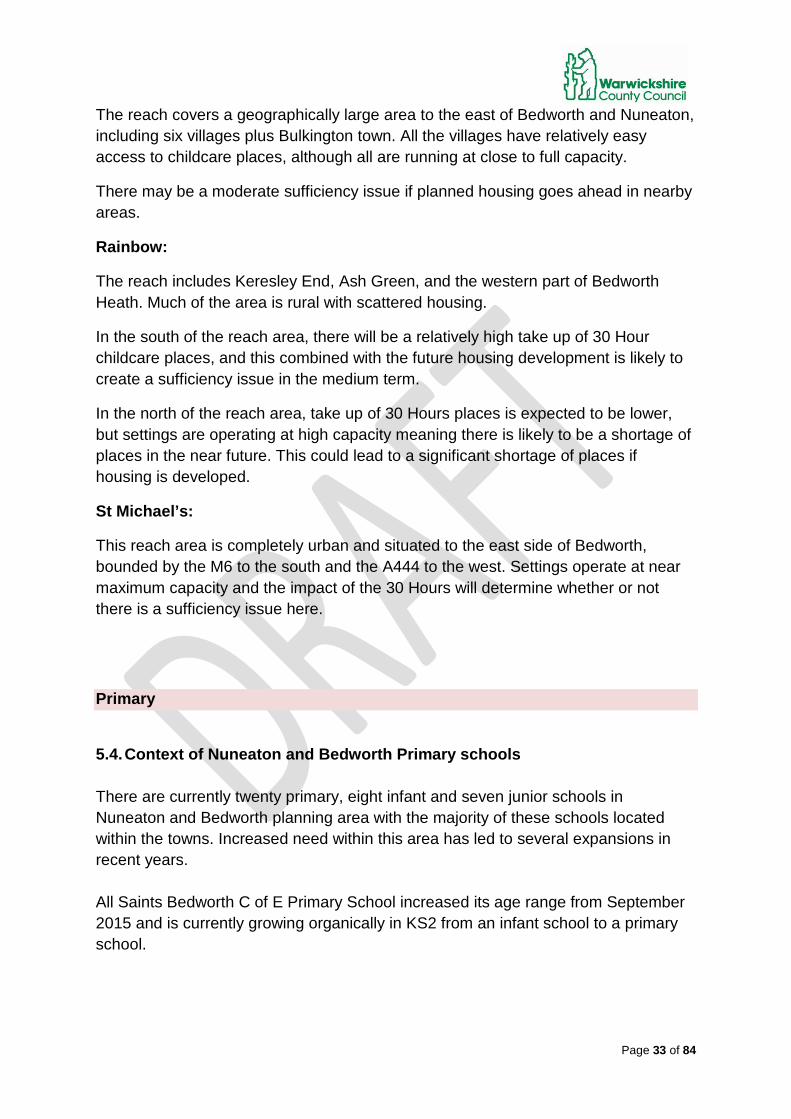
Page 33 of 84
The reach covers a geographically large area to the east of Bedworth and Nuneaton, including six villages plus Bulkington town. All the villages have relatively easy access to childcare places, although all are running at close to full capacity.
There may be a moderate sufficiency issue if planned housing goes ahead in nearby areas.
Rainbow:
The reach includes Keresley End, Ash Green, and the western part of Bedworth Heath. Much of the area is rural with scattered housing.
In the south of the reach area, there will be a relatively high take up of 30 Hour childcare places, and this combined with the future housing development is likely to create a sufficiency issue in the medium term.
In the north of the reach area, take up of 30 Hours places is expected to be lower, but settings are operating at high capacity meaning there is likely to be a shortage of places in the near future. This could lead to a significant shortage of places if housing is developed.
St Michael’s:
This reach area is completely urban and situated to the east side of Bedworth, bounded by the M6 to the south and the A444 to the west. Settings operate at near maximum capacity and the impact of the 30 Hours will determine whether or not there is a sufficiency issue here.
Primary
5.4. Context of Nuneaton and Bedworth Primary schools
There are currently twenty primary, eight infant and seven junior schools in Nuneaton and Bedworth planning area with the majority of these schools located within the towns. Increased need within this area has led to several expansions in recent years. All Saints Bedworth C of E Primary School increased its age range from September 2015 and is currently growing organically in KS2 from an infant school to a primary school.

Page 34 of 84
Nathaniel Newton infant school took bulge classes in September 2015, 2016 and 2017. Following this the school’s PAN will permanently increase to 90 from September 2018.
St. Michael's C of E Primary School has expanded and increased their PAN to 60.
5.5. Pupil forecasts
Current pupil forecasts for Nuneaton and Bedworth show the majority of planning areas to have less than 4% available capacity for Reception entry and a decreasing amount of capacity available overall.
Nuneaton North and East planning area in particular is forecast to have a shortfall by from September 2017 onwards, this is due to housing development and the popularity of those school attracting children from across Nuneaton town.
The Wolvey and Bulkington primary planning area are forecast to have pressure on reception places from 2018 as a result of a slight rise in birth rate.
Bedworth South West and Bedworth North East primary planning areas are predicted to have a short fall of reception places from September 2018.
5.6. Capital programme
Newdigate Primary School is increasing capacity from 1.5FE to 2FE from September 2018, creating an additional 105 places across the school over the next 7 years. This is to help meet the demand from pupils living within the Bedworth area and pupils arising from already approved housing developments in the locality.
Michael Drayton Junior School will increase capacity to 5 FE from September 2018, increasing capacity by an additional 120 places across the school over the next 4 years. This is as a result of the current bulge classes and expansion at Nathaniel Newton Infant School rolling through to Junior.
5.7. Future need
Development outlined in Nuneaton and Bedworth’s emerging Borough Plan is expected to produce an estimated additional 2700 primary age children which equates to an additional 12-13 forms of entry. The delivery of these additional places will vary and depend on the location of the main strategic development sites. While there will be capacity to extend several schools to accommodate some of the additional need certain proposed development sites are large enough to require new primary schools. The majority of these proposed new schools are on developments that as yet have not received planning permission and as such the expected level of need generated and any opening dates for new schools are yet to be finalised.

Page 35 of 84
The REAch2 Academy Trust has been granted permission to open a new free primary school in the Nuneaton area. Officers from the County Council are currently working with the ESFA to ensure this school is delivered on land reserved as part of the current Lower Farm development in North Nuneaton with an expected opening date of September 2019. This school will be built as 2 forms of entry and open in a phased manner from reception.
Secondary
5.8. Context of Nuneaton and Bedworth Secondary schools
There are currently 8 Secondary schools in this area, two in Bedworth and six in Nuneaton. Parental preference in this area in recent years has led to a division between oversubscribed schools and schools with significant capacity.
5.9. Pupil forecasts
The Bedworth planning area is currently predicted to generally have available capacity in both Year 7 and overall in the next 5 years. However, there is expected to be a slight pressure for year 7 entry in September 2021, increasing to a short fall of places in September 2022. This situation will need careful monitoring particularly if any of the current strategic housing allocations are approved as additional capacity may be required at Ash Green School.
The Hartshill planning area is expected to see a decrease in the capacity at year 7 in the next few years with a short fall for Year 7 intake expected by September 2022.
The Nuneaton planning area is currently forecast to have sufficient capacity overall until 2021 when there is expected to be a shortfall in places available. However for Year 7 entry current forecasts suggest a shortage of places by the end of the 2018/19 academic year, it is likely this will be pressure on in year applications throughout the academic year rather than any pressure on year 7 offers made for September entry. The expected shortfall in neighbouring Hartshill may compound this issue with available capacity at Nuneaton schools being utilised by children from the Hartshill planning area. In year applications will be monitored closely and will require close working with the existing secondary schools to ensure all children moving into the area can be accommodated.
Page 36 of 84
5.10. Future need
The proposed number of new homes outlined in Nuneaton and Bedworth’s emerging Borough Plan is expected to produce an additional 2,000 secondary age children and a further 700 post 16 students which equates to an additional 14-15 forms of entry (Inc 6th). There is limited capacity available in the existing schools and none are able to expand to sufficiently accommodate all of the additional need arising from these developments. It is proposed that a new secondary school will be required in the north of Nuneaton as well as expansions at several of the existing schools. Current forecasts suggest this new secondary provision could be required as early as September 2022. This is a provisional timeframe and largely dependent on proposed developments building at the rates outlined in the emerging Borough Plan.
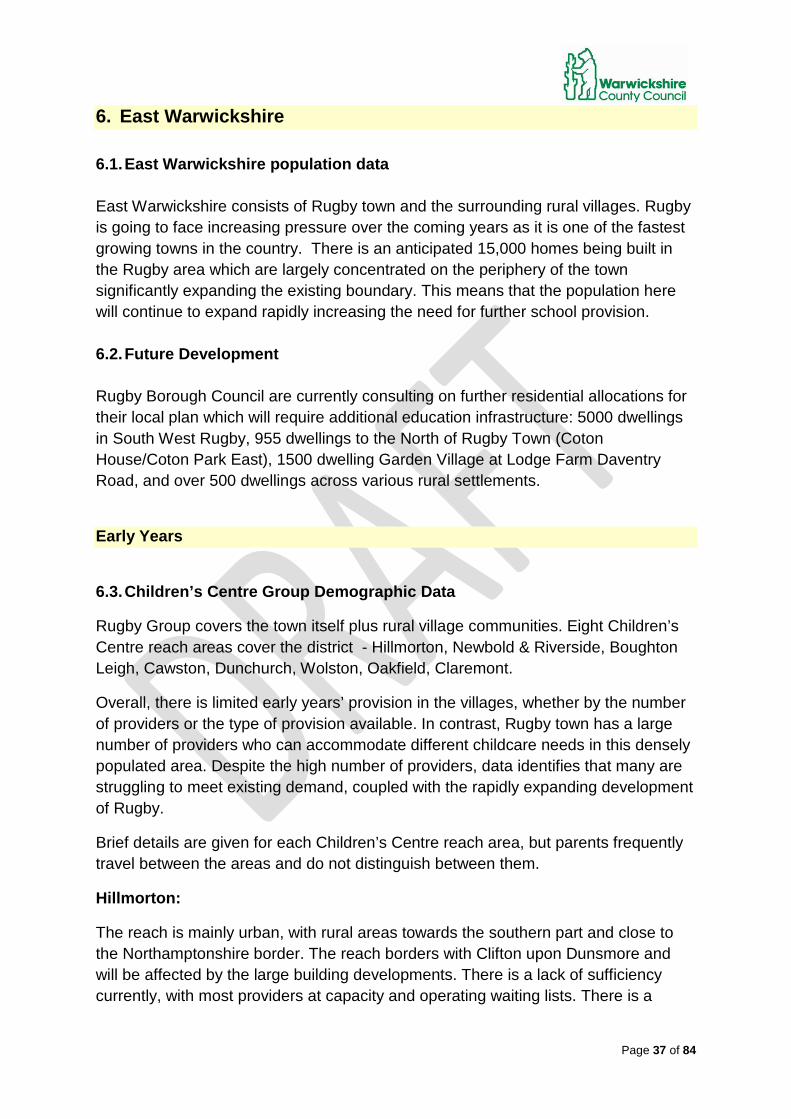
Page 37 of 84
6. East Warwickshire
6.1. East Warwickshire population data
East Warwickshire consists of Rugby town and the surrounding rural villages. Rugby is going to face increasing pressure over the coming years as it is one of the fastest growing towns in the country. There is an anticipated 15,000 homes being built in the Rugby area which are largely concentrated on the periphery of the town significantly expanding the existing boundary. This means that the population here will continue to expand rapidly increasing the need for further school provision. 6.2. Future Development
Rugby Borough Council are currently consulting on further residential allocations for their local plan which will require additional education infrastructure: 5000 dwellings in South West Rugby, 955 dwellings to the North of Rugby Town (Coton House/Coton Park East), 1500 dwelling Garden Village at Lodge Farm Daventry Road, and over 500 dwellings across various rural settlements.
Early Years
6.3. Children’s Centre Group Demographic Data
Rugby Group covers the town itself plus rural village communities. Eight Children’s Centre reach areas cover the district - Hillmorton, Newbold & Riverside, Boughton Leigh, Cawston, Dunchurch, Wolston, Oakfield, Claremont.
Overall, there is limited early years’ provision in the villages, whether by the number of providers or the type of provision available. In contrast, Rugby town has a large number of providers who can accommodate different childcare needs in this densely populated area. Despite the high number of providers, data identifies that many are struggling to meet existing demand, coupled with the rapidly expanding development of Rugby.
Brief details are given for each Children’s Centre reach area, but parents frequently travel between the areas and do not distinguish between them.
Hillmorton:
The reach is mainly urban, with rural areas towards the southern part and close to the Northamptonshire border. The reach borders with Clifton upon Dunsmore and will be affected by the large building developments. There is a lack of sufficiency currently, with most providers at capacity and operating waiting lists. There is a

Page 38 of 84
severe lack of full day care provision. The lack of places will become more critical as the 30 Hours free childcare is fully introduced and the new housing comes on stream.
Newbold & Riverside
The reach is extensive, covering Brownsover, Long Lawford and Clifton upon Dunsmore. There are very limited numbers of providers and many rural villages where access to provision is further than 2 miles. There will be significant impact from the large housing developments, and combined with the lack of existing early years’ provision this area is a severe sufficiency concern.
Boughton Leigh:
The reach is located towards the north of Rugby, in an area of concentrated housing and industrial estates with no rural areas. It borders Newbold & Riverside and Claremont reach areas, with close links to the town centre. There are only a limited number of early years’ providers and most operate at capacity with waiting lists. There will be increased demand from the large scale housing developments taking place in neighbouring Newbold & Riverside.
Cawston:
The reach is situated to the south east of Rugby and has expanded rapidly due to extensive housing development. It has a large concentration of family housing on new estates. The area of Cawston Grange is a significant concern as demand for places cannot be met locally and families are travelling to neighbouring Oakfield and Hillmorton reach areas. (Hillmorton is also an area of sufficiency concern). Providers continue to investigate options for expansion, but suitable premises are very hard to find.
There is less pressure in the Bilton area of the reach, although this may change with the full introduction of the 30 Hours free childcare.
Dunchurch:
The reach is located between Leamington and Rugby – it has many hamlets and villages, Dunchurch being the largest. Due to its proximity to Coventry, Leamington and Rugby, there are key road networks and many families commute in and out of the area. Some settings have capacity, but the geographical spread impacts on accessibility for some local families. Further work is needed to investigate the impact of 30 Hours places, and whether commuter families absorb these at the expense of local families.
Page 39 of 84
Wolston:
The reach covers a large area on the outskirts of Rugby Borough, bordering Coventry, Bedworth and Leicester. There are no concentrated urban areas, but strong road links, and so providers capture a wide market from the local area and further afield.
There are vacancies and the impact of 30 Hours should be absorbed within the current capacity, although families must travel to access provision.
Oakfield:
The reach is a densely populated area on the western outskirts of the town centre. There are key road networks through the reach, which neighbours with Cawston, Claremont, Dunchurch, Newbold & Riverside. Despite the large population, there are a limited number of early years’ providers, particularly for the north and centre of the reach. There are opportunities for existing providers to consider expanding to offer full day care or additional hours.
Claremont:
The reach predominantly covers the town centre, leading south towards Dunchurch. It borders with all the other reach areas of Rugby Town, and is therefore impacted by the availability of provision in these other areas.
The area is well served by early years provision, most of this being located towards the town centre. There is less choice for families located towards the Oakfield side of the reach.
There is current availability, but this is limited to sessional care, and this reach area needs to be monitored to see if it becomes an area of concern as the 30 Hours entitlement comes fully on stream.
Primary
6.4. Context of East Primary schools
There are 22 Primary, 8 Infant and 5 Junior schools in East Warwickshire. The majority of these schools are within the town itself with 6 Primary schools, 2 Infant and 1 Junior school located in the surrounding rural villages. In 2018 a new primary school, St Gabriel’s C of E Academy, will open as part of the Houlton development on the former Radio Mast site in the east of Rugby.

Page 40 of 84
Pressure on primary places in recent years has seen the expansion of a number of schools across Rugby town and several bulge classes being added to accommodate increasing pupil numbers within the town, as well as the opening of Rugby Free Primary School in September 2015. The more rural areas of East Warwickshire have not seen the same level of pressure and the schools have until now accommodated the existing pupil numbers.
6.5. Pupil forecasts
As a result of increased housing development and migration into Rugby town, current forecasts show several areas of pressure from September 2018 where the number of surplus places are below the 4% capacity for both reception places and overall capacity. The housing pressure in Rugby (see below) means that existing provision, where there are currently spaces, is expected to fill quickly over the coming years. This is particularly true in Rugby West, Rugby North of the Railway, and Dunchurch planning areas.
The Rugby Rural primary planning area is forecast pressure for both reception entry and over all, this situation will be monitored closely due to the rural nature of the planning area and the distance between the individual schools included.
6.6. Housing development
There has been significant housing development across Rugby in recent years with currently permitted development of 11500 new homes predicted to produce an additional 4000 Primary age children. This includes two strategic sites, The Rugby Radio Station and Gateway sites, both of which require the provision of new primary schools. The first Rugby Radio Station Site (Houlton) primary school, St Gabriel’s C of E Academy, is due to open in September 2018 to meet the need arising from this development. The opening of a new primary school on the Gateway site has been postponed due to delays with progression of the overall development. However building has recommenced and we would envisage the new primary school opening in September 2021 or 2022 at the earliest. The emerging Local plan currently outlines an additional 3000 homes proposed in South West Rugby with a further 2000 dwellings in the north of the town within the Plan period. However the overall planned a capacity of the sites is considerably larger and the County Council has assessed the wider impact of the total site areas.
Page 41 of 84
6.7. Capital programme
St Gabriel’s C of E Academy is due to open in 2018. Initially the school will open at 1FE (210 places) growing organically from Reception with the option to expand to 2FE (420 places) as the housing development at Houlton progresses. There is capacity on site for further expansion to 3FE (630 places) if required. Long Lawford Primary school is currently in the process of further expansion to take the school to 3FE from September 2018, increasing capacity by an additional 210 places across the school over the next 7 years. This is to address the shortfall identified in the pupil forecasts as a result of increasing pupil numbers within the school’s priority area due to housing development within Long Lawford village and to provide some surplus capacity for pupils moving into the area midyear. The School also admitted additional pupils in September 2017 to accommodate demand in the area.
6.8. Future need
The proposed development in the emerging Local plan highlights a need for new primary provision in the North of the town (1 to 2 FE at Coton Park East plus 1 to 2 FE from the delayed Gateway development), in South West Rugby (8 to 9 FE) and the Garden Village (2 to 3 FE). It is proposed that these additional forms of entry will be provided by new free schools opening in line with development phasing.
Some additional capacity may be required across the rural village settlements as a cumulative result of proposed small-scale developments.
The REAch2 Academy Trust has been granted permission to open a new free primary school in the Rugby area. There is currently no indication of a site for the new school or an opening date. (Correct at time of publication)
Secondary
6.9. Context of East Secondary schools
There are 7 secondary schools in East Warwickshire, including 2 grammar schools and 1 bilateral school, all of which are situated within Rugby town. The Rugby Free Secondary School opened from September 2016 towards the South of the town providing an additional 6 FE to address an existing short fall of places

Page 42 of 84
within the area as a result of permitted housing development and migration into the town. This school is in the South Rugby Planning area which is well placed to serve existing and forecast secondary need in Rugby due to large primary cohorts as a result of previous primary school expansions.
6.10. Pupil forecasts
Current forecasts show secondary schools in Rugby are expected to be overcapacity by September 2019 due to increasing pressure across the town; this is particularly true in the North of the town where there is currently only one secondary school. The Avon Valley School is at or over capacity in the majority of its year groups. There is further pressure in the south of the town due to significant growth in pupil numbers as a result of existing permitted housing developments as well attracting pupils from across the Borough, County and outside of Warwickshire due to the nature of selective schools.
Harris C of E Academy has taken the decision to reduce the Published Admission Number of the school from September 2018 due to low numbers on roll across the school.
While current pupil forecasts show there to be insufficient capacity for year 7 entry from September 2018 onwards, past trends suggest Ashlawn School is likely to admit over its established PAN meaning this pressure may be reduced until 2020 when there is a significant increase in pupil numbers across the town. However this position is not confirmed by the academy and therefore current forecasts reflect the expected shortfall.
6.11. Capital programme
With the opening of Rugby Free Secondary School (6FE/ 180 places) in September 2016 there is currently forecast capacity to meet the existing need within East Warwickshire until September 2020.
The Department for Education (DfE) has recently approved an application for Ashlawn School to open a Free School in Rugby. The location of this school has yet to be confirmed but WCC are working with the DfE and the Trust and Rugby Borough Council to locate a site in the North of Rugby.
The opening of both Rugby Free Secondary School and the newly approved Free School sponsored by Ashlawn School will ensure the forecast shortfall* of secondary school places is met across the Borough. *This includes permitted housing developments
6.12. Future need
The secondary provision being made on the Rugby Radio Station Site is self-sustaining and will serve the Houlton development. The current housing trajectory supplied by Rugby Borough Council anticipates the need for the new school will be

Page 43 of 84
approximately September 2022 onwards subject to housing trajectories supplied by Rugby Borough Council and may change depending on housing build out rates.
The South West Rugby development outlined in the draft Local Plan will require a new secondary school (8 to 9 FE). It is estimated the remaining new allocations would create the need to provide new secondary school provision for at least an additional 5 forms of entry, plus the further provision required as a result of already permitted developments (2-3 FE). This takes the required increase in secondary provision to an additional 8-9 FE across Rugby Town as a result of the proposed developments.
The Local Authority has a statutory duty to provide free transport for pupils (5-16) if their nearest school is beyond a 2 mile walking distance for primary age children and beyond 3 miles for secondary age children. Current and proposed development for the North of the town has seen and will continue to see the demand for school places in the local area rise but the supply of secondary school places within a 3 mile walking distance of this demand cannot currently be increased. The opening of the newly approved Free School sponsored by Ashlawn School on a site in the North of the town would alleviate this pressure. Failure to provide additional school places in the North of Rugby will leave a gap in pupil place sufficiency, impact on the promotion of sustainable travel and places further pressure on school transport, the transport infrastructure and budget.
In order to meet the forecast demand for secondary school places as a result of existing and permitted developments in Rugby both Rugby Free Secondary School and the newly approved Free School sponsored by Ashlawn School will be required to secure sufficient secondary provision. In response to approved and proposed developments outlined in the draft local plan, a further two secondary schools will be required. These two schools will be provided as part of the Houlton and South West Rugby housing developments respectively and will be opened in line with the housing trajectory for each development, thus ensuring all secondary schools in Rugby remain viable and sustainable.
Page 44 of 84
7. Central Warwickshire
7.1. Central Warwickshire population data
Central Warwickshire is comprised of the main towns of Leamington, Warwick, Kenilworth and Southam. This area has seen existing birth rates begin to decrease in recent years; however the large scale development already permitted in the area will likely lead to a rise in the number of births over the next few years.
7.2. Future development
Warwick District Council’s adopted local plan outlines an additional 16,776 homes across the district. Over the next 15 years almost 3700 of these homes will form an urban extension to south of Leamington and Warwick. There are 2415 homes proposed within Kenilworth town with an additional 4000 homes at Kings Hill to the north of the town on the border with Coventry.
It is also important to note that there are over 3500 homes currently outlined for the Southam area in the Stratford District core strategy which will fall within the Central education planning area.
Early Years
7.3. Children’s Centre Group Demographic Data
There are four Children’s Centres covering the central Leamington district – Kingsway, Sydenham, Lillington and Whitnash. There is a total of nine Children’s Centres across Warwick District. Families tend not to distinguish between them, as they are in close proximity to each other and there are no natural boundaries to separate them. Overall, there is a shortage of early years’ provision across the reach areas and providers cannot meet current demand. This shortage will become more acute as the significant housing expansion proceeds, as this will create an increased demand for new early years’ places.
Lillington:
The reach covers the urban areas close to Leamington town centre and rural areas including Weston under Wetherley and Bubbenhall. Some rural areas have no provision within 2 miles and families need to travel to access places. Providers in the town centre have capacity to meet current and anticipated future demand.

Page 45 of 84
Kingsway:
The reach covers a large area on the south side of Leamington, including Warwick Gates and the village of Bishops Tachbrook. It also includes part of North Leamington and the town centre which caters for working and commuter families.
This area already has a shortage of places, and the need will rise significantly with the extensive building developments taking place and the introduction of 30 Hours funded childcare. There are a large number of providers, but this remains an area where demand will outstrip supply. Providers have expressed an interest in opening new provision, but it remains very difficult to locate suitable premises here.
Whitnash:
The reach borders both Kingsway and Sydenham. There are very low numbers of providers here, and there is a need for further provision just to accommodate current demand. The reach will be impacted further by the extensive building development within Kingsway area. Due to the limited availability of provision, many working parents have to access childcare in alternative areas.
Sydenham:
The reach area is extensive, covering a concentrated urban area and rural villages which neighbour with Lillington, Whitnash and Southam. There is a lack of early years’ provision to accommodate existing demand for places, and the reach will be impacted by the building developments in the village of Radford Semele as well as those in Kingsway/Whitnash, increasing the need for early years’ provision. The introduction of 30 Hours funded childcare is adding to these pressures.
Warwick:
The reach area covers the town, except for its northern tip which is rural. Nurseries have high levels of occupancy, mainly due to the high percentages of working parents. The introduction of the 30 Hours entitlement is putting further pressure on the sufficiency of places.
Westgate & Newburgh:
This reach is mainly rural, covering the villages of Sherbourne, Barford, Hampton Magna and Hatton, as well as the south west tip of Warwick town. Most settings are at capacity and demand for places will increase in these areas when 30 Hours childcare is fully introduced, due to the high number of working parents, leaving a sufficiency gap.
Page 46 of 84
Kenilworth:
This reach area includes the north west of Kenilworth, including the villages of Baginton and Stoneleigh. It borders but does not include Warwick University to the north east.
There is no sufficiency issue at present, although families may find it difficult to find available hours that match their needs. A large proportion of families will be eligible for the 30 Hours entitlement, and this will have some impact on current settings.
St John’s:
The reach area is mainly rural and includes Leek Wootton, Burton Green, Lapworth and small villages including Rowington and Shrewley. It also covers the eastern side of Kenilworth.
There are no immediate sufficiency issues in Kenilworth. We expect there to be pressure in Burton Green which is on a busy commuter route to Solihull, Birmingham and Coventry, and which has some new housing.
The impact of the introduction of 30 Hours is likely to vary from village to village in the rural areas and further data is needed.
Southam:
This is a large mainly rural area centring on the town of Southam. Numbers of places across the reach area are generally sufficient at present, and it would be expected that if housing numbers remained unchanged, the increased demand for places generated by the introduction of 30 Hours childcare would be met by the present number of registered providers.
Significant amounts of new housing for Southam town and some outlying villages including Bishops Itchington and Long Itchington will put a strain on current provision and more places will be required to meet demand. Impact will also be felt from the large developments at Lighthorne Heath which will generate significant new demand for childcare places.
Primary
7.4. Context of Central Primary schools
Central Warwickshire comprises the towns of Leamington, Warwick, Kenilworth and Southam and the surrounding rural areas including several village settlements.

Page 47 of 84
There are 42 Primary Schools, 4 Infant Schools, 4 Junior Schools and 1 all through school in Central Warwickshire. There has been considerable growth in the South Leamington area with both Kingsway Primary and Whitnash Primary School taking bulge classes in September 2016 to accommodate the increase in demand. Heathcote Primary School opened in September 2017 as part of the strategic urban extension to the south of Leamington and Warwick.
7.5. Pupil forecasts
Warwick primary planning area is forecast pressure for reception places in 2019/20, with a slight possible pressure the previous year.
The Leamington area is facing significant pressure over the coming years due to housing development and it is expected that South Leamington primary planning area will be significantly over capacity from September 2019 onwards. Radford Semele primary planning area is currently forecast to be over capacity by the end of the 2017/18 academic year onwards. In addition North Leamington primary planning area is expected to have pressure on reception places for September 2018 and 2019 and then in year pressure overall from 2019 onwards.
It is also anticipated that some of the more rural villages with recently approved housing developments with see an increase in demand for pupil places. Some local primary schools could come under pressure from an increase in demand for pupil places, particularly from in year applications.
7.6. Housing development
There is still significant development planned within the Warwick and South Leamington area, with possibly a further three new primary schools being built to accommodate children generated as a result of these housing developments.
There are several strategic housing development sites, currently at pre-planning stage, in and around Kenilworth town which will significantly increase the pressure on school places. The Kings Hill development site to the North of Kenilworth town will increase pressure on both Coventry schools as well as those in Kenilworth town and will require new provision as part of the development
7.7. Capital programme
Heathcote Primary School in the South Leamington primary planning area opened in September 2017 to accommodate the need for primary places from the local housing development. This school has opened as 1FE (210 places) growing organically from

Page 48 of 84
Reception with the option to expand to 2FE (420 places) as housing development requires. In conjunction with the expansion of Heathcote primary and the eventual opening of further new provision in the South Leamington planning area it is proposed to expand Whitnash Primary school to 2 FE, increasing capacity by an additional 105 places across the school over the next 5 years; this will accommodate need arising from new development and ensure the school is supported and grows alongside the proposed new schools in Warwick and South Leamington primary planning areas.
7.8. Future need
Proposed development with the Leamington and Warwick area is likely to generate need for an additional 3-4 FE in excess of that already provided with the new Heathcote Primary School. These additional primary school places will be delivered by new free schools, opening in line with development phasing.
Significant development proposed in the Kenilworth town area is likely to need an additional 2-3 FE provided by new free schools in combination with expansion of existing schools where possible. The Kings Hill development includes proposals for two new primary schools to meet the expected 4FE of need generated by development.
Development around Southam will be accommodated initially through expansion of existing schools, with new provision likely required longer term.
Secondary
7.9. Context of Central Secondary schools
There are currently 7 secondary schools in Central Warwickshire, five of which are situated in Leamington and Warwick towns and with the other two schools located in and serving the towns of Southam and Kenilworth. Southam College has increased by 1 FE from September 2016 to accommodate increased demand, increasing capacity by an additional 150 places across the school over the next 5 years. Aylesford School extended their age range from September 2015 to become the first mainstream all through (age 4-18) school in Warwickshire.

Page 49 of 84
7.10. Pupil forecasts
Current forecasts show secondary schools in Leamington and Warwick are expected to be overcapacity from September 2019. As larger primary cohorts continue to roll through to Secondary school and housing development within the area progresses this shortfall is expected to increase rapidly and will likely support a new secondary school as early as September 2021. The expected increase in the number of places required is such that although the planning area will see a healthy surplus of places for year 7 entry in September 2017 this decreases over the next two years leading to a short fall of places in year 7 by the end on the 2019/2020 academic year.
The recent increase in PAN at Southam Collage has ensured all children in the Southam Planning area can be accommodated at the school. However due to the popularity of the school and a number of housing developments currently building in the area current forecasts suggest there will be a short fall of places by the end of the 2017/18 academic year. This shortfall is largely due to housing development it is likely that there will be increased in year pressure as families move into new homes in the area. This will be monitored closely and in turn may also place additional pressure on the neighbouring planning area of Leamington and Warwick.
The Kenilworth planning area is currently expected to be over capacity owing to increasing primary cohorts and the popularity of the school with pupils from outside the area. Given this fact there may be pressure for in year applications if pupils move into the area. In additional proposed housing development will increase this pressure further and eventually require additional Secondary provision.
7.11. Housing development
There are significant housing developments planned around Warwick and South Leamington and building work has commenced on several sites. Providing the build rate continues as assumed there will be a pressure on secondary school places by September 2019.
A considerable amount of planning has taken place to develop solutions around secondary school provision in this area including engagement with the two schools – Myton and Campion – likely to be most affected by the new housing. Given the scale of the new housing developments it is likely a new secondary school will be required in this area as well as the expansion of existing schools.
There are several strategic housing development sites, currently at pre-planning stage, in and around Kenilworth town which will significantly increase the existing pressure on school places. The Kings Hill development site to the North of Kenilworth town will increase pressure on both Coventry schools as well as those in Kenilworth town and will require new provision as part of the development.
Page 50 of 84
There are several permitted housing developments within the Southam area as well as others still pending. Due to the popularity of the school and the level of growth anticipated there is likely to be the need to add further capacity at Southam College.
7.12. Capital programme
Campion School by will increase capacity by just less than 2FE from September 2019 to address expected short falls in the area.
7.13. Future need
Development in South Leamington and Warwick will generate the need for an additional 6 FE and will be provided by a new free secondary school. Current forecasts show that taking expansion of existing provision into account this new school will likely be needed from September 2021 onwards.
Kenilworth town is likely to need an additional 5FE provided through preferred option of the relocation and expansion of the existing Kenilworth School or the opening of a new Free School. The Kings Hill development includes proposals for a new 6FE Secondary school to meet the expected need generated by the development.
Page 51 of 84
8. South Warwickshire
8.1. South Warwickshire population data
Stratford is a largely rural area and with an upturn in birth data in 2014/15 to 2011 levels. However the majority of these more recent births are not in similar areas to the 2011 births. Due to the rural nature of the county and the large amount of smaller schools, this will place pressure on these areas.
8.2. Future development
Stratford District Council adopted their Core Strategy in July 2016 which outlines proposals for an additional 14,600 new homes across the district. A large proportion of these homes will be delivered through large ‘garden village’ style developments in existing rural areas. This includes 3500 homes on the Long Marston Airfield development, 1200 at Meon Vale and 3000 homes at Gaydon Lighthorne Heath, although delivery of these homes extends beyond the current plan period.
There are up to an additional 3500 homes across permitted or currently pending housing developments within the Southam area which will fall within the Central education planning area.
Early Years
8.3. Children’s Centre Group Demographic Data
There are seven Children’s Centres operating within the district, covering a mainly very rural area.
Alcester:
The reach is clustered around Alcester town, with a significant rural area and the large village of Bidford on Avon. The main commuter routes cross the reach giving easy access to other towns for work and childcare for some families. The road network also fragments smaller villages and makes them difficult to access on foot or by public transport, limiting families’ childcare options here.
Statistically there are sufficient childcare place overall, however due to the distribution of providers, rural nature of the reach, and clusters of housing development, there is likely to be a need for more provision, particularly in the Bidford on Avon area.
Page 52 of 84
Studley:
The reach is clustered around Studley and covers the rural areas reaching out to the Solihull border, including the town of Henley in Arden. It borders Worcestershire and Solihull and has the main commuter routes of the M40 and M42. The childcare market is therefore not based simply on local demand as families will travel. The majority of childcare providers in the reach report capacity, and it is expected that increased demand for places will be met by current provision.
Badger Valley:
The reach covers a large rural area of South Warwickshire, with the majority of childcare providers spread among small communities.
The area is expecting significant housing developments, with large expansions at Lower Quinton (Meon Vale) and around Shipston on Stour. There will need to be an increase in childcare places to accommodate demand.
Stratford Upon Avon Town and Clopton:
These two reach areas cover the town of Stratford upon Avon and some of the outlying villages circling the town - Welford on Avon, Claverdon, Snitterfield, Hampton Lucy. The town is well served by several main commuter routes and this makes childcare accessible to many families who do not live in the immediate area but travel into or through Stratford for work.
Childcare businesses can struggle to identify suitable premises in the town itself – costs are high and road congestion at peak times means some locations are not appropriate.
We expect an imminent shortage of places in Stratford as there is a high demand for 30 Hours childcare, and this will use up any spare capacity. Housing growth will add a significant amount of pressure for places.
Much of the rural area on the outskirts of the reach has no childcare places, and demand in smaller hamlets would not be sufficient to establish standalone childcare provision. Many families travel to access services in nearby villages or the town centre.
Wellies:
This reach centres on the large village of Wellesbourne, and incorporates a mainly rural area, covering the very outer edges of Stratford upon Avon and close to Warwick. There is easy access to the main commuter links and many local families travel out to other locations to access childcare, linked to the availability of suitable places and work commitments.
Page 53 of 84
There will be a shortage of places within Wellesbourne itself once the 30 Hours entitlement is fully introduced. Substantial numbers of new houses will put further pressure on provision, and the demand for childcare places will not be met unless further places are created.
Lighthorne Heath:
This reach includes a substantial rural area and the villages of Lighthorne Heath, Gaydon, Kineton, Tysoe and Temple Herdewyke. There are large employers at Gaydon and these bring high numbers of employees to the area from other districts, adding to the pressures for childcare from local families. Marlborough Barracks and MoD Kineton mean that there are fluctuations in demand and this can be challenging for providers.
There is a need for more childcare places within the Kineton and Gaydon areas, to accommodate the increased demand created by the introduction of the 30 Hours entitlement – this demand will be increased by the large number of families coming in to the Jaguar Land Rover and Aston Martin sites. Demand will be intensified by the substantial number of new homes under construction for Kineton, Gaydon and Lighthorne Heath.
Primary
8.4. Context of South Primary schools
South Warwickshire education planning area covers a very large and predominantly rural area. There are 47 primaries, 1 infant and 1 junior school in south Warwickshire. Given the rural nature of this area the location of these schools varies from clusters of schools in towns to single schools in villages and small rural settlements. Several primary schools in this area are very small with admission numbers less than 1 form of entry.
8.5. Pupil forecasts
The majority of primary planning areas are expected to have sufficient capacity to accommodate the need in the area. However several areas may have very slight pressures for both reception entry and over all, these will be closely monitored as the academic year progresses.
Quinton Primary planning area is currently forecast to have a shortfall due to housing development at Long Marston Airfield and Meon Vale.
Page 54 of 84
The Stratford Rural, Ilmington, and Compton and Brailes primary planning areas are forecast pressure for both reception entry and over all, this situation will be monitored closely due to the rural nature of the planning area and the distance between the individual schools included.
Both Ettington and Alcester primary planning areas are expected to have slight sort term pressure on reception places and longer term pressure on in year places over all.
Kineton primary planning area is currently forecast to have slight in year pressure on reception and overall from September 2020 onwards.
8.6. Capital programme
The ESFA will be building a new primary school on the Meon Vale development due to open in September 2019 to meet the forecast need in the Quinton primary planning area.
8.7. Future need
The 7200 homes proposed in the Core Strategy equates to approximately 2000 additional primary age children or an additional 9-10 forms of entry.
These additional primary school places will be delivered by new free schools, opening in line with development phasing. The Long Marston Airfield development and Meon Vale developments will both include new primary schools and with the proposed relocation and expansion of the existing Lighthorne Heath Primary School onto the Gaydon Lighthorne Heath development.
In Stratford Town it is proposed to relocate and expand Shottery St Andrew’s primary school on to the development West of Shottery.

Page 55 of 84
Secondary
8.8. Context of South Secondary schools
There are 7 secondary schools in South Warwickshire, including 3 grammar schools, all located in the main towns and also serving the surrounding large rural areas. The 3 Grammar schools and Catholic Secondary school all serve a much wider area extending into Central Warwickshire and out of the county. Shipston High School has recently completed phase one of building work to provided additional capacity and increase the PAN to 120 from September 2017, increasing capacity by an additional 150 places across the school over the next 5 years.
Phase one of building works at Kineton High School have recently completed replacing and refurbishing accommodation at the school.
8.9. Pupil forecasts
Alcester and Studley planning area currently suggests pressure across the area however this is likely to be centred on Alcester town rather than Studley. Pressure from in year applications will need to be monitored closely owing to the popularity of schools in this area with out of county children.
There is forecast to be available capacity in the Henley planning area well in excess of the 4% target, both for Year 7 entry and overall.
Current forecasts for the Kineton planning area show available capacity until 2022 although there may be in year pressure for the 2017/18 academic year both for Year 7 entry and overall. It is likely there will be a shortfall as a result of housing development across the area towards the end of the forecast period. This may initially be presented as increasing in year pressure as the academic year progresses and ultimately this will likely require expansion of Kineton High School beyond the forecast period to meet this demand.
The Shipston planning area is currently forecast to be over capacity from September 2018 as a result of housing development within the planning area. This situation will be monitored closely and again may initially be presented as increasing in year pressure as the academic year progresses. Bulge classes may be required to accommodate potential additional children ahead of a permanent expansion of Shipston High School before a new Secondary school as part of proposed large scale garden village development in the area is opened beyond the current forecast period.
Page 56 of 84
8.10. Capital programme
Phase one of the master plan for Kineton High School is now complete with the opening of a new eight classroom science block and internal refurbishment of existing classrooms. While phase one does not add additional capacity to the school, as it replaces temporary accommodation removed in 2016, it seeks to begin to address the building condition issues identified at the school. Phase two of works will add additional capacity and be delivered in line with need arising from housing development in the area.
8.11. Future need
The 7200 homes proposed in the Core Strategy equates to approximately 1500 additional Secondary age children. The majority of these children will be accommodated through expansion of existing Secondary provision together with new provision proposed as part of the development at Long Marston Airfield.
Additional provision at Kineton High school is likely needed to address increasing pupil numbers generated as a result of development in the local area beyond the current forecast period. Developer contributions will be requested towards providing this provision and will be delivered at part of phase 2.
Page 57 of 84
9. Special Educational Needs (SEN) Provision
In recent months Warwickshire has been carrying out a strategic review of high needs provision, which has clarified and quantified the significant growth pressures on the County’s specialist provision as and identified remaining gaps in SEN provision across the County.
Development of new SEN provision over the last 18 months has made significant headway in addressing gaps, but further work needs to be done to keep pace with growing demand. It is therefore proposed to continue the development of a range of provision as set out below.
9.1. Drivers for change The following factors are creating pressure for change in Warwickshire’s education system in order to meet the needs of the County’s learners:
9.1.1. Increasing population: As set out earlier in this report Warwickshire’s population of children and young people is increasing, particularly driven by housing developments across the County. In the last 5 years Warwickshire’s mainstream schools have seen 4.5% growth in the number of pupils attending and this is set to continue, faster in some areas than others
9.1.2. Growing demand for specialist provision: Warwickshire’s Special Schools have seen even steeper increases in demand with 13.9% growth in the past 5 years – over 3 times faster than the increases in mainstream. There are particular pressures on generic special schools and there are still gaps in specialist resourced provision attached to mainstream schools.
9.1.3. Increasing complexity of need: There is evidence both nationally and locally that the complexity of needs of learners with EHC plans is changing and increasing and that this is increasing pressure on physical space and resources in specialist provision
9.1.4. Financial pressures across mainstream and specialist provision: Although historical overspends in the High Needs Block have been brought, to some extent, under control, there are increasing pressures on budgets both at individual school level and system-wide / Local Authority level. There are particular pressures on Top-Up funding as learners with SEND are provided for in mainstream schools and on Special Schools,
Page 58 of 84
many of which are moving to reduced class sizes in order to address complex needs.
9.1.5. Sustained demand for independent provision: Too many with the most severe and complex special educational needs are still unable to access appropriate local education provision. As a consequence of this the volume of placements with independent specialist providers, although this has been reduced, remains too high.
9.1.6. Sufficiency of provision: Warwickshire’s SEND needs assessment has identified that there remains insufficient good quality, specialist, local provision to meet the full range of pupil needs. Urgent growth is required. It is anticipated that in the next 5 years there will be the need for growth of 20% across Warwickshire’s specialist provision
9.2. Implications of Housing Development for Warwickshire’s Specialist Provision
9.2.1. Local Plans have set out proposals to build circa 63,000 additional
homes across the five areas over a 15 year period (2016-31). This new housing is estimated to lead to over 35,000 additional children across all age ranges
9.2.2. If we apply the current Warwickshire proportions, this will represent 1,085 more children with EHC Plans by 2031, of whom we can estimate that:
• 445 will be in mainstream • 543 children will require special schools • 65 will be in Resourced Provision • The remaining 32 will be Out of County or elsewhere
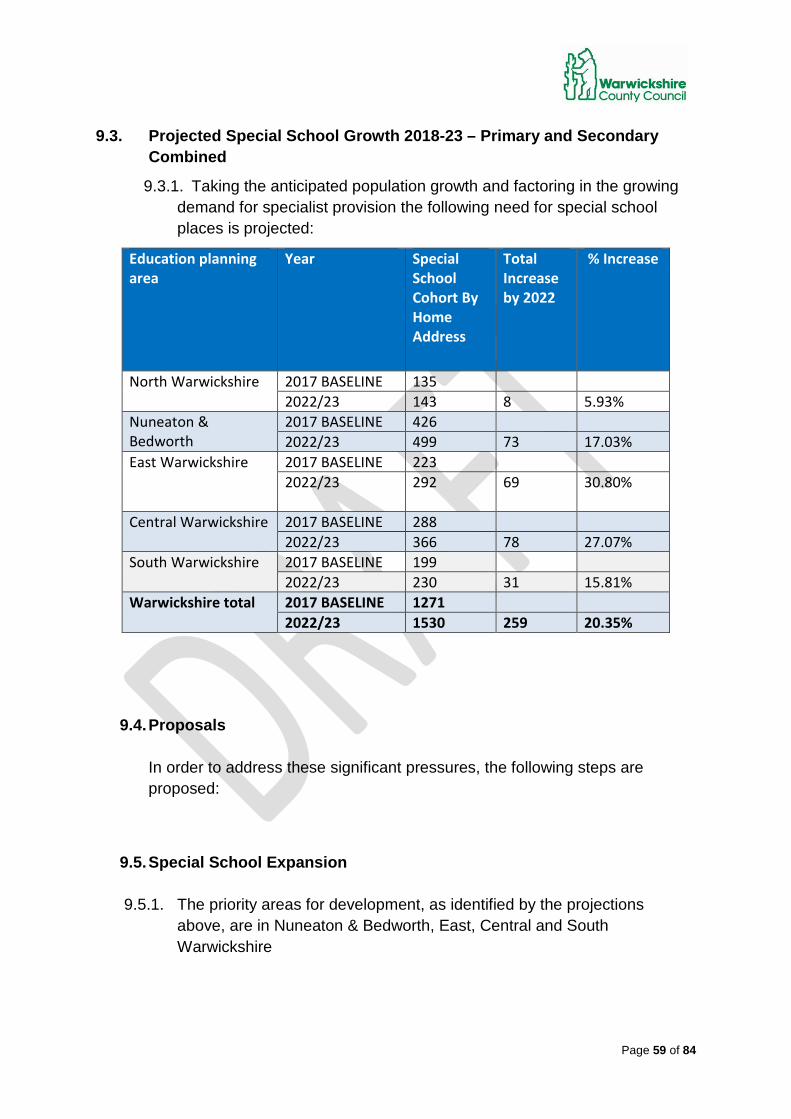
Page 59 of 84
9.3. Projected Special School Growth 2018-23 – Primary and Secondary
Combined
9.3.1. Taking the anticipated population growth and factoring in the growing demand for specialist provision the following need for special school places is projected:
Education planning area
Year Special School Cohort By Home Address
Total Increase by 2022
% Increase
North Warwickshire 2017 BASELINE 135 2022/23 143 8 5.93%
Nuneaton & Bedworth
2017 BASELINE 426 2022/23 499 73 17.03%
East Warwickshire 2017 BASELINE 223 2022/23 292 69 30.80%
Central Warwickshire 2017 BASELINE 288 2022/23 366 78 27.07%
South Warwickshire 2017 BASELINE 199 2022/23 230 31 15.81%
Warwickshire total 2017 BASELINE 1271 2022/23 1530 259 20.35%
9.4. Proposals
In order to address these significant pressures, the following steps are proposed:
9.5. Special School Expansion
9.5.1. The priority areas for development, as identified by the projections
above, are in Nuneaton & Bedworth, East, Central and South Warwickshire
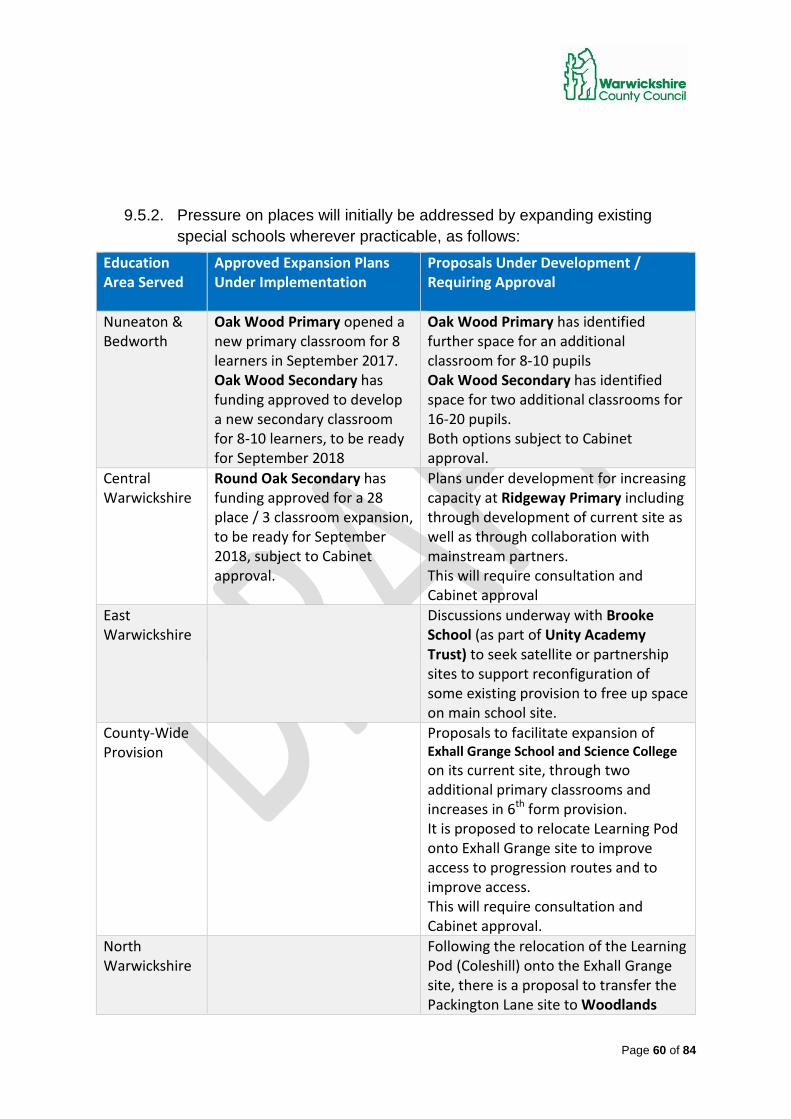
Page 60 of 84
9.5.2. Pressure on places will initially be addressed by expanding existing special schools wherever practicable, as follows:
Education Area Served
Approved Expansion Plans Under Implementation
Proposals Under Development / Requiring Approval
Nuneaton & Bedworth
Oak Wood Primary opened a new primary classroom for 8 learners in September 2017. Oak Wood Secondary has funding approved to develop a new secondary classroom for 8-10 learners, to be ready for September 2018
Oak Wood Primary has identified further space for an additional classroom for 8-10 pupils Oak Wood Secondary has identified space for two additional classrooms for 16-20 pupils. Both options subject to Cabinet approval.
Central Warwickshire
Round Oak Secondary has funding approved for a 28 place / 3 classroom expansion, to be ready for September 2018, subject to Cabinet approval.
Plans under development for increasing capacity at Ridgeway Primary including through development of current site as well as through collaboration with mainstream partners. This will require consultation and Cabinet approval
East Warwickshire
Discussions underway with Brooke School (as part of Unity Academy Trust) to seek satellite or partnership sites to support reconfiguration of some existing provision to free up space on main school site.
County-Wide Provision
Proposals to facilitate expansion of Exhall Grange School and Science College on its current site, through two additional primary classrooms and increases in 6th form provision. It is proposed to relocate Learning Pod onto Exhall Grange site to improve access to progression routes and to improve access. This will require consultation and Cabinet approval.
North Warwickshire
Following the relocation of the Learning Pod (Coleshill) onto the Exhall Grange site, there is a proposal to transfer the Packington Lane site to Woodlands
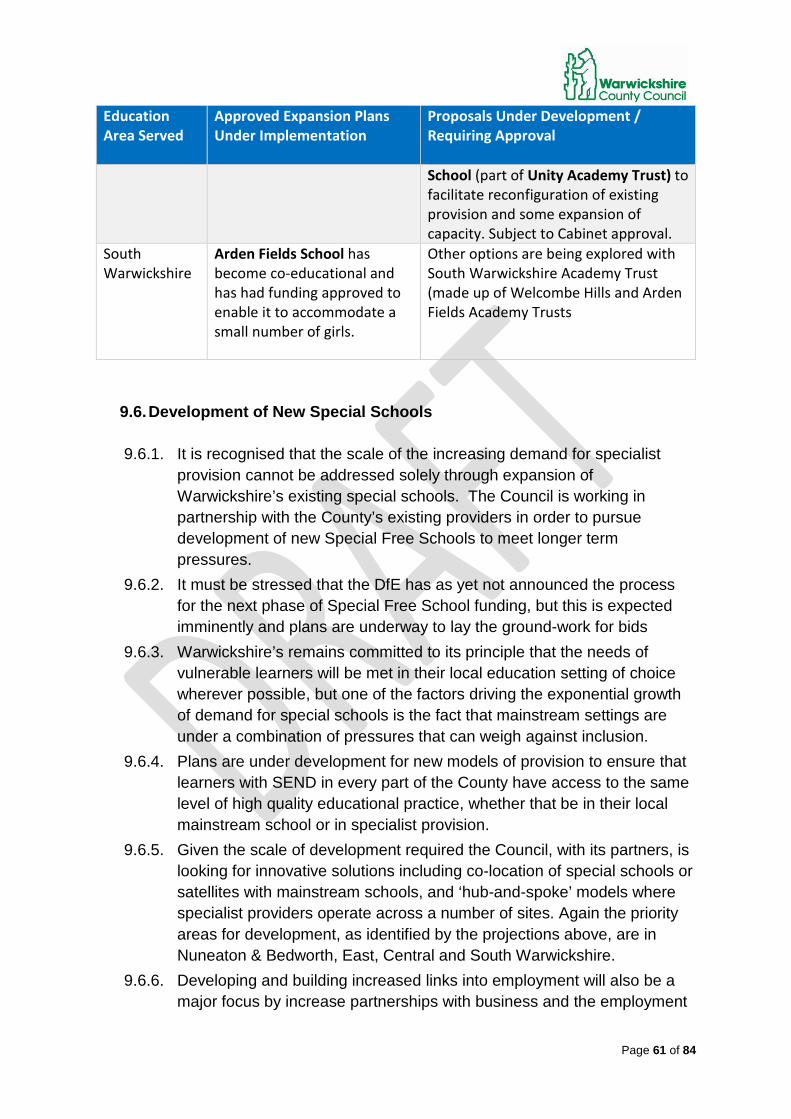
Page 61 of 84
Education Area Served
Approved Expansion Plans Under Implementation
Proposals Under Development / Requiring Approval School (part of Unity Academy Trust) to facilitate reconfiguration of existing provision and some expansion of capacity. Subject to Cabinet approval.
South Warwickshire
Arden Fields School has become co-educational and has had funding approved to enable it to accommodate a small number of girls.
Other options are being explored with South Warwickshire Academy Trust (made up of Welcombe Hills and Arden Fields Academy Trusts
9.6. Development of New Special Schools
9.6.1. It is recognised that the scale of the increasing demand for specialist provision cannot be addressed solely through expansion of Warwickshire’s existing special schools. The Council is working in partnership with the County’s existing providers in order to pursue development of new Special Free Schools to meet longer term pressures.
9.6.2. It must be stressed that the DfE has as yet not announced the process for the next phase of Special Free School funding, but this is expected imminently and plans are underway to lay the ground-work for bids
9.6.3. Warwickshire’s remains committed to its principle that the needs of vulnerable learners will be met in their local education setting of choice wherever possible, but one of the factors driving the exponential growth of demand for special schools is the fact that mainstream settings are under a combination of pressures that can weigh against inclusion.
9.6.4. Plans are under development for new models of provision to ensure that learners with SEND in every part of the County have access to the same level of high quality educational practice, whether that be in their local mainstream school or in specialist provision.
9.6.5. Given the scale of development required the Council, with its partners, is looking for innovative solutions including co-location of special schools or satellites with mainstream schools, and ‘hub-and-spoke’ models where specialist providers operate across a number of sites. Again the priority areas for development, as identified by the projections above, are in Nuneaton & Bedworth, East, Central and South Warwickshire.
9.6.6. Developing and building increased links into employment will also be a major focus by increase partnerships with business and the employment
Page 62 of 84
market to develop a wider range of work opportunities, supported internships and apprenticeships to maximize opportunities for learners with SEND.
9.7. Secondary & Primary SEN Resourced Provision
9.7.1. The past two years has seen growth in SEN Resourced Provision with the development of 7 bases offering around 60 places
9.7.2. These bases have proved themselves both in terms of improving access to education and financial impact
9.7.3. Plans and funding are already in place to develop a further 3-4 bases providing 24-32 places
9.7.4. Warwickshire still lags behind national and statistical neighbour averages for the amount of this provision available, so proposals are to continue with the current programme of development to develop an additional 60 places in a further 7 bases.
9.8. Independent Specialist Provision
9.8.1. Despite reductions, Warwickshire continues to make higher-than-average use of independent specialist provision, with around 8.6% of pupils with EHC Plans or statements placed in independent or non-maintained special schools as opposed to 6.5% across England as a whole.
9.8.2. It is intended to further reduce this figure to national averages through the development of an increased volume and range of state-funded provision.
9.8.3. There will continue to be a need for non-maintained and independent provision on an ongoing basis for the most complex cases; therefore Warwickshire plans to continue with the implementation of an approved Provider Framework in partnership with Coventry and Solihull in order to increase confidence regarding cost and quality of provision.
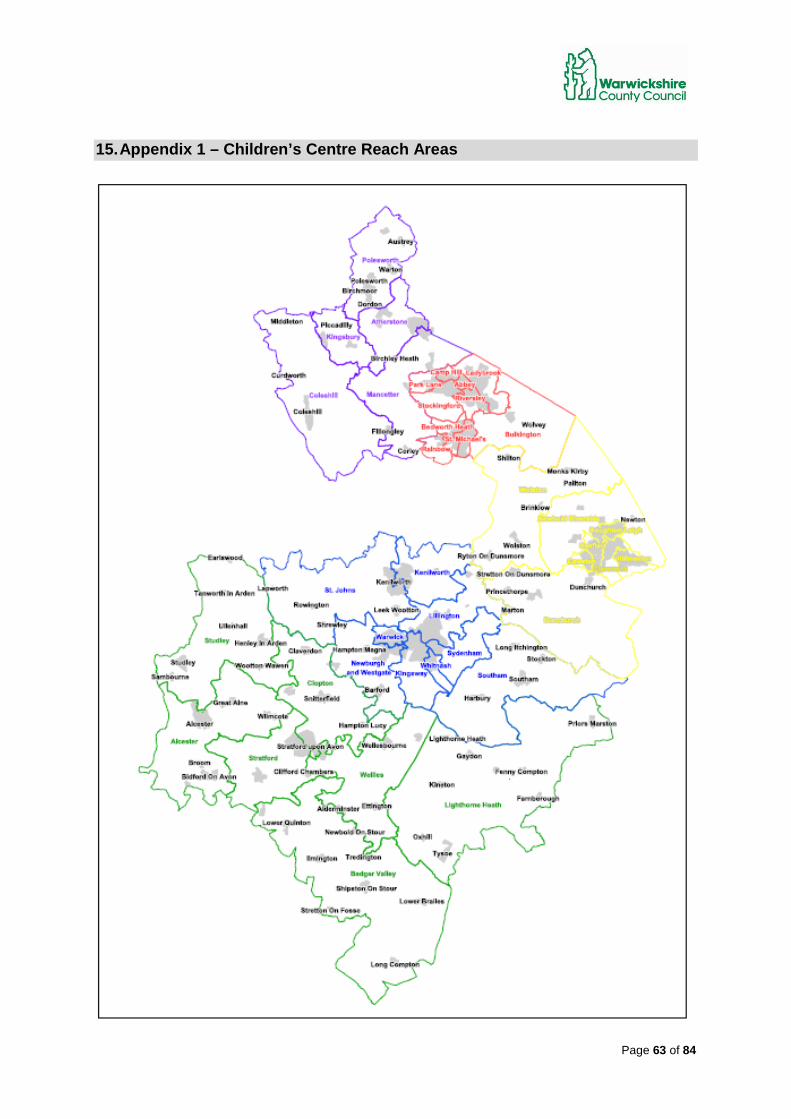
Page 63 of 84
15. Appendix 1 – Children’s Centre Reach Areas
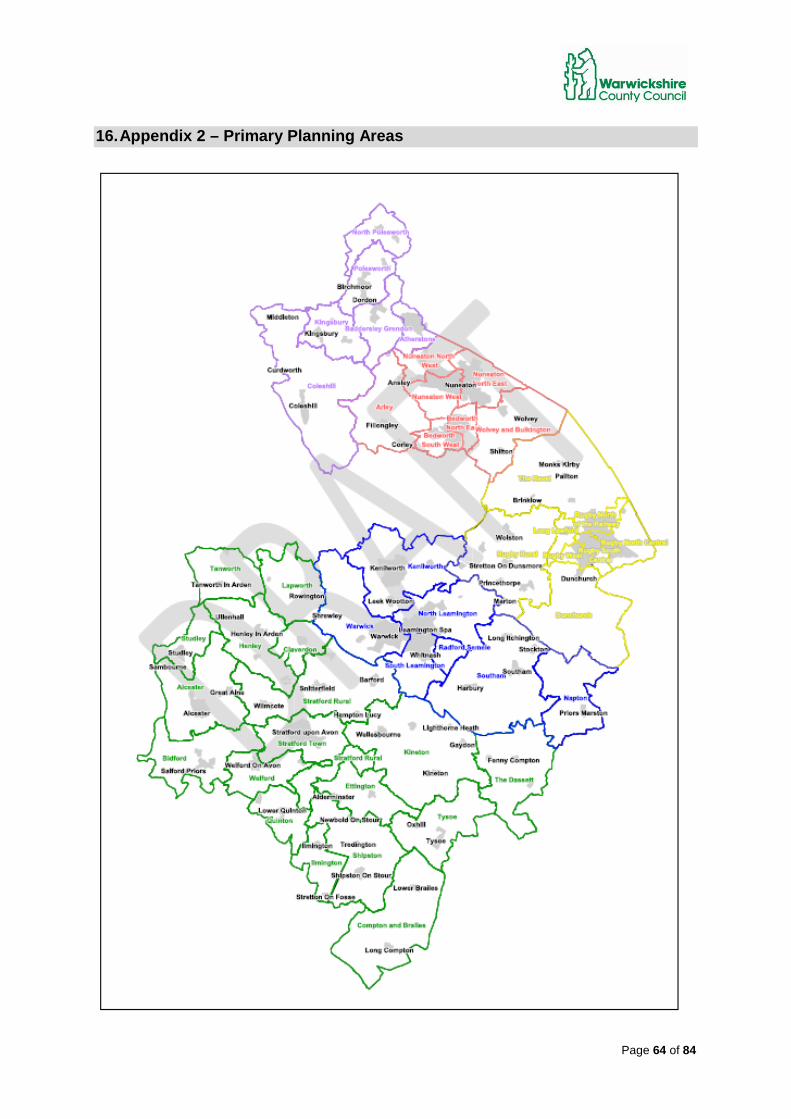
Page 64 of 84
16. Appendix 2 – Primary Planning Areas
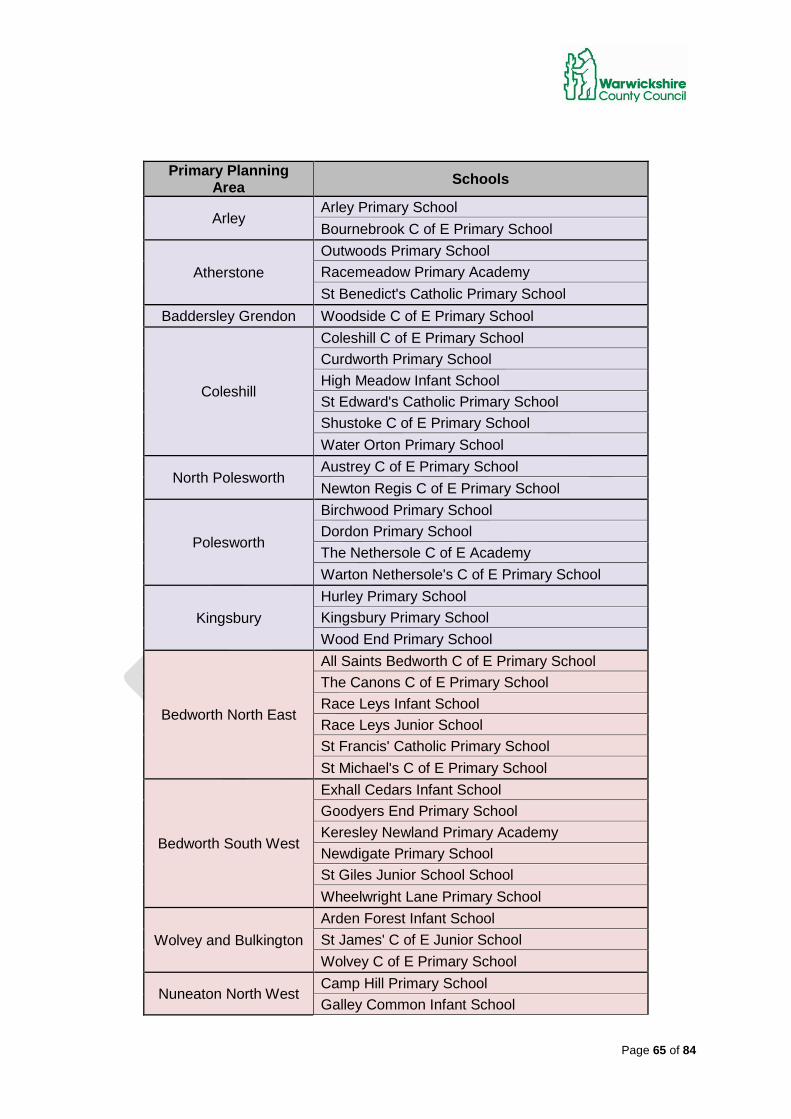
Page 65 of 84
Primary Planning Area Schools
Arley Arley Primary School Bournebrook C of E Primary School
Atherstone Outwoods Primary School Racemeadow Primary Academy St Benedict's Catholic Primary School
Baddersley Grendon Woodside C of E Primary School
Coleshill
Coleshill C of E Primary School Curdworth Primary School High Meadow Infant School St Edward's Catholic Primary School Shustoke C of E Primary School Water Orton Primary School
North Polesworth Austrey C of E Primary School Newton Regis C of E Primary School
Polesworth
Birchwood Primary School Dordon Primary School The Nethersole C of E Academy Warton Nethersole's C of E Primary School
Kingsbury Hurley Primary School Kingsbury Primary School Wood End Primary School
Bedworth North East
All Saints Bedworth C of E Primary School The Canons C of E Primary School Race Leys Infant School Race Leys Junior School St Francis' Catholic Primary School St Michael's C of E Primary School
Bedworth South West
Exhall Cedars Infant School Goodyers End Primary School Keresley Newland Primary Academy Newdigate Primary School St Giles Junior School School Wheelwright Lane Primary School
Wolvey and Bulkington Arden Forest Infant School St James' C of E Junior School Wolvey C of E Primary School
Nuneaton North West Camp Hill Primary School Galley Common Infant School
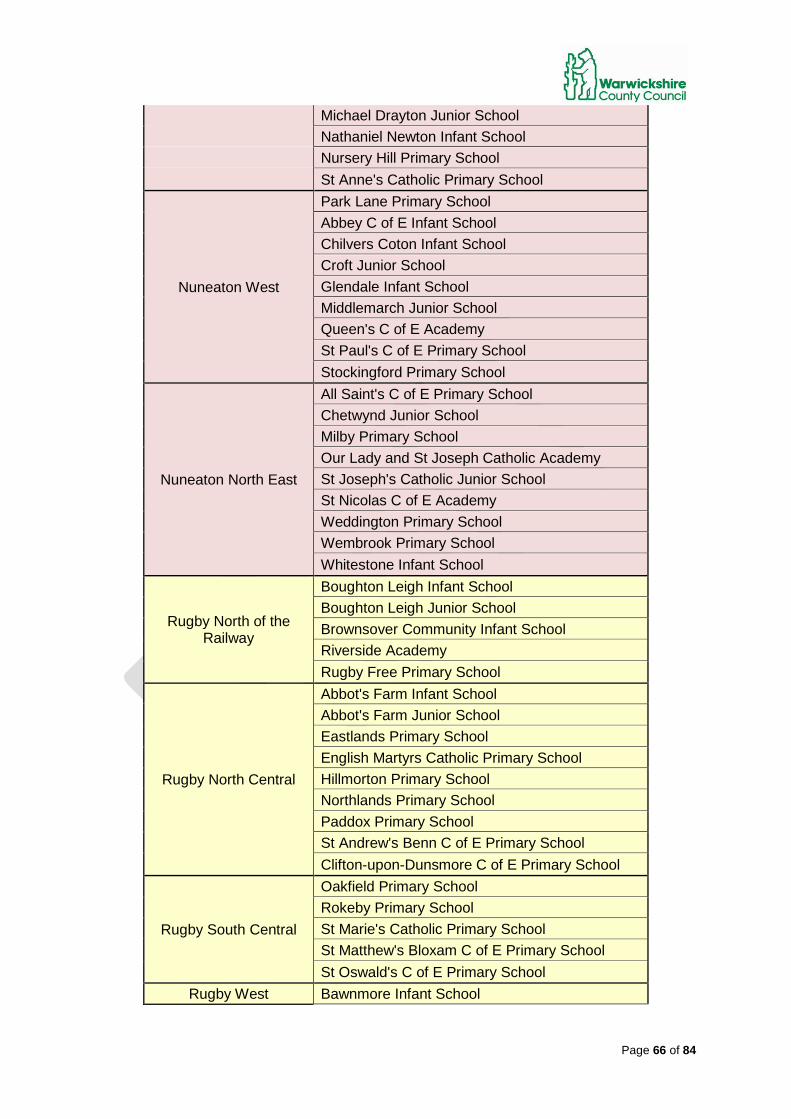
Page 66 of 84
Michael Drayton Junior School Nathaniel Newton Infant School Nursery Hill Primary School St Anne's Catholic Primary School
Nuneaton West
Park Lane Primary School Abbey C of E Infant School Chilvers Coton Infant School Croft Junior School Glendale Infant School Middlemarch Junior School Queen's C of E Academy St Paul's C of E Primary School Stockingford Primary School
Nuneaton North East
All Saint's C of E Primary School Chetwynd Junior School Milby Primary School Our Lady and St Joseph Catholic Academy St Joseph's Catholic Junior School St Nicolas C of E Academy Weddington Primary School Wembrook Primary School Whitestone Infant School
Rugby North of the Railway
Boughton Leigh Infant School Boughton Leigh Junior School Brownsover Community Infant School Riverside Academy Rugby Free Primary School
Rugby North Central
Abbot's Farm Infant School Abbot's Farm Junior School Eastlands Primary School English Martyrs Catholic Primary School Hillmorton Primary School Northlands Primary School Paddox Primary School St Andrew's Benn C of E Primary School Clifton-upon-Dunsmore C of E Primary School
Rugby South Central
Oakfield Primary School Rokeby Primary School St Marie's Catholic Primary School St Matthew's Bloxam C of E Primary School St Oswald's C of E Primary School
Rugby West Bawnmore Infant School
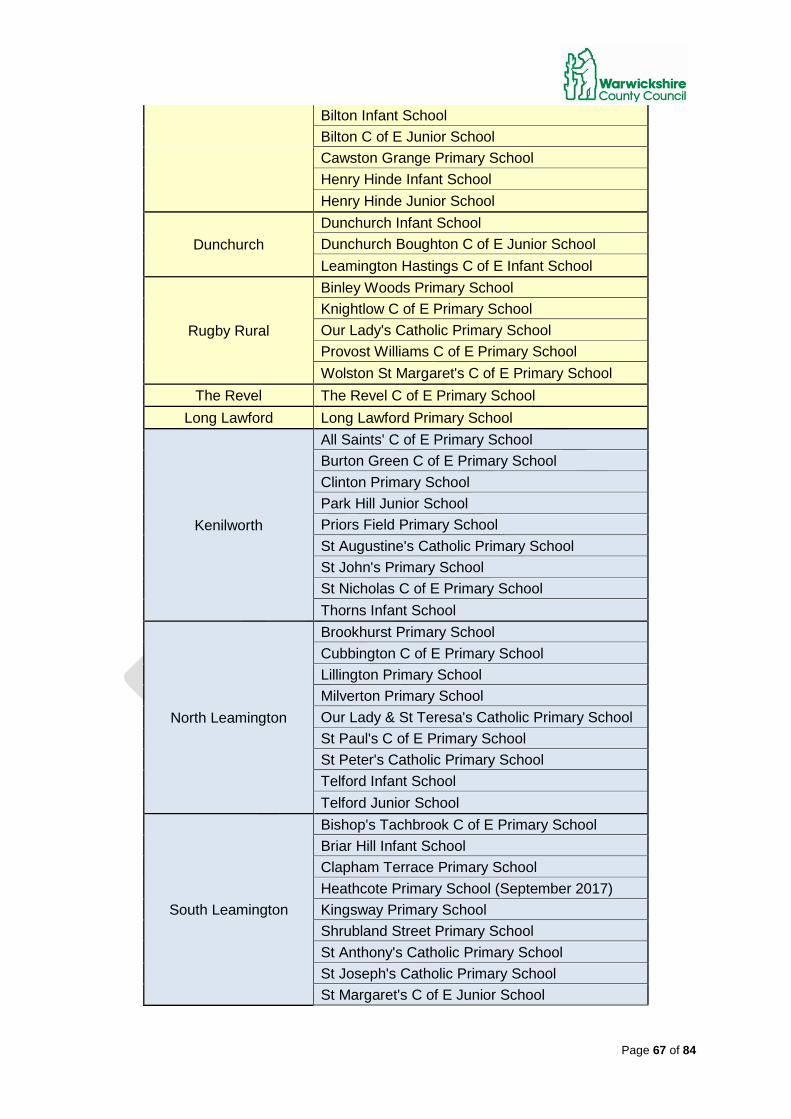
Page 67 of 84
Bilton Infant School Bilton C of E Junior School Cawston Grange Primary School Henry Hinde Infant School Henry Hinde Junior School
Dunchurch Dunchurch Infant School Dunchurch Boughton C of E Junior School Leamington Hastings C of E Infant School
Rugby Rural
Binley Woods Primary School Knightlow C of E Primary School Our Lady's Catholic Primary School Provost Williams C of E Primary School Wolston St Margaret's C of E Primary School
The Revel The Revel C of E Primary School Long Lawford Long Lawford Primary School
Kenilworth
All Saints' C of E Primary School Burton Green C of E Primary School Clinton Primary School Park Hill Junior School Priors Field Primary School St Augustine's Catholic Primary School St John's Primary School St Nicholas C of E Primary School Thorns Infant School
North Leamington
Brookhurst Primary School Cubbington C of E Primary School Lillington Primary School Milverton Primary School Our Lady & St Teresa's Catholic Primary School St Paul's C of E Primary School St Peter's Catholic Primary School Telford Infant School Telford Junior School
South Leamington
Bishop's Tachbrook C of E Primary School Briar Hill Infant School Clapham Terrace Primary School Heathcote Primary School (September 2017) Kingsway Primary School Shrubland Street Primary School St Anthony's Catholic Primary School St Joseph's Catholic Primary School St Margaret's C of E Junior School
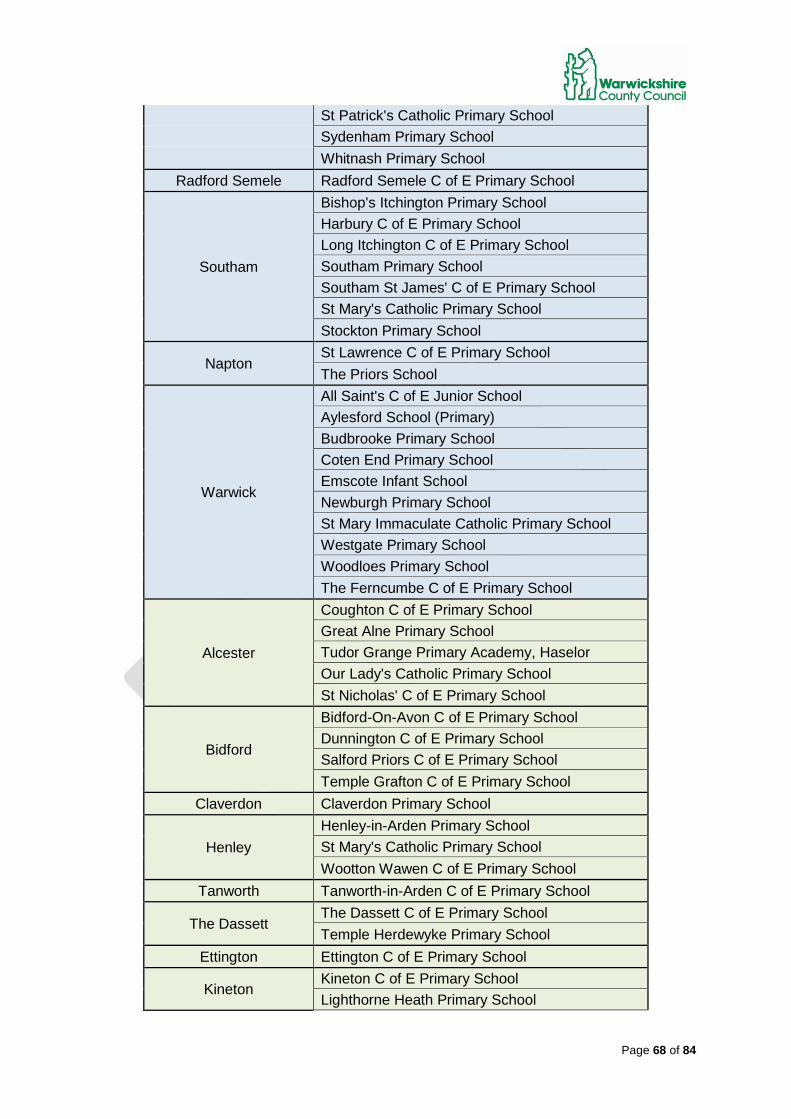
Page 68 of 84
St Patrick's Catholic Primary School Sydenham Primary School Whitnash Primary School
Radford Semele Radford Semele C of E Primary School
Southam
Bishop's Itchington Primary School Harbury C of E Primary School Long Itchington C of E Primary School Southam Primary School Southam St James' C of E Primary School St Mary's Catholic Primary School Stockton Primary School
Napton St Lawrence C of E Primary School The Priors School
Warwick
All Saint's C of E Junior School Aylesford School (Primary) Budbrooke Primary School Coten End Primary School Emscote Infant School Newburgh Primary School St Mary Immaculate Catholic Primary School Westgate Primary School Woodloes Primary School The Ferncumbe C of E Primary School
Alcester
Coughton C of E Primary School Great Alne Primary School Tudor Grange Primary Academy, Haselor Our Lady's Catholic Primary School St Nicholas' C of E Primary School
Bidford
Bidford-On-Avon C of E Primary School Dunnington C of E Primary School Salford Priors C of E Primary School Temple Grafton C of E Primary School
Claverdon Claverdon Primary School
Henley Henley-in-Arden Primary School St Mary's Catholic Primary School Wootton Wawen C of E Primary School
Tanworth Tanworth-in-Arden C of E Primary School
The Dassett The Dassett C of E Primary School Temple Herdewyke Primary School
Ettington Ettington C of E Primary School
Kineton Kineton C of E Primary School Lighthorne Heath Primary School
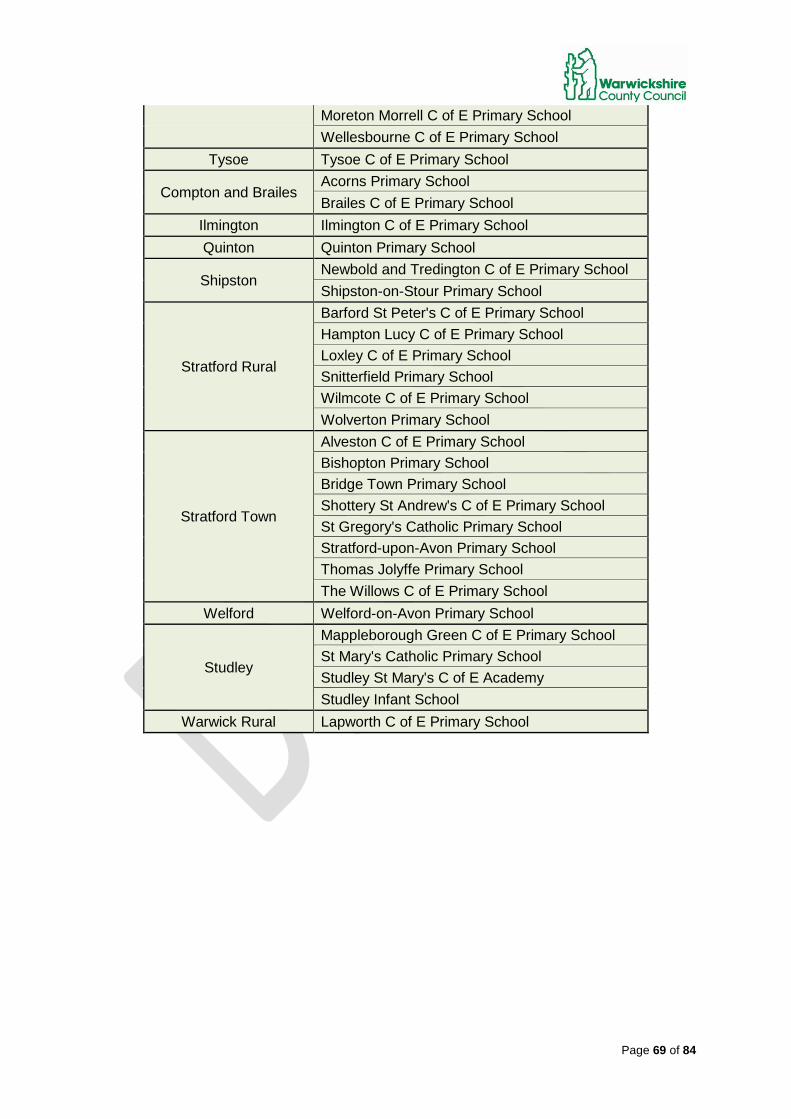
Page 69 of 84
Moreton Morrell C of E Primary School Wellesbourne C of E Primary School
Tysoe Tysoe C of E Primary School
Compton and Brailes Acorns Primary School Brailes C of E Primary School
Ilmington Ilmington C of E Primary School Quinton Quinton Primary School
Shipston Newbold and Tredington C of E Primary School Shipston-on-Stour Primary School
Stratford Rural
Barford St Peter's C of E Primary School Hampton Lucy C of E Primary School Loxley C of E Primary School Snitterfield Primary School Wilmcote C of E Primary School Wolverton Primary School
Stratford Town
Alveston C of E Primary School Bishopton Primary School Bridge Town Primary School Shottery St Andrew's C of E Primary School St Gregory's Catholic Primary School Stratford-upon-Avon Primary School Thomas Jolyffe Primary School The Willows C of E Primary School
Welford Welford-on-Avon Primary School
Studley
Mappleborough Green C of E Primary School St Mary's Catholic Primary School Studley St Mary's C of E Academy Studley Infant School
Warwick Rural Lapworth C of E Primary School
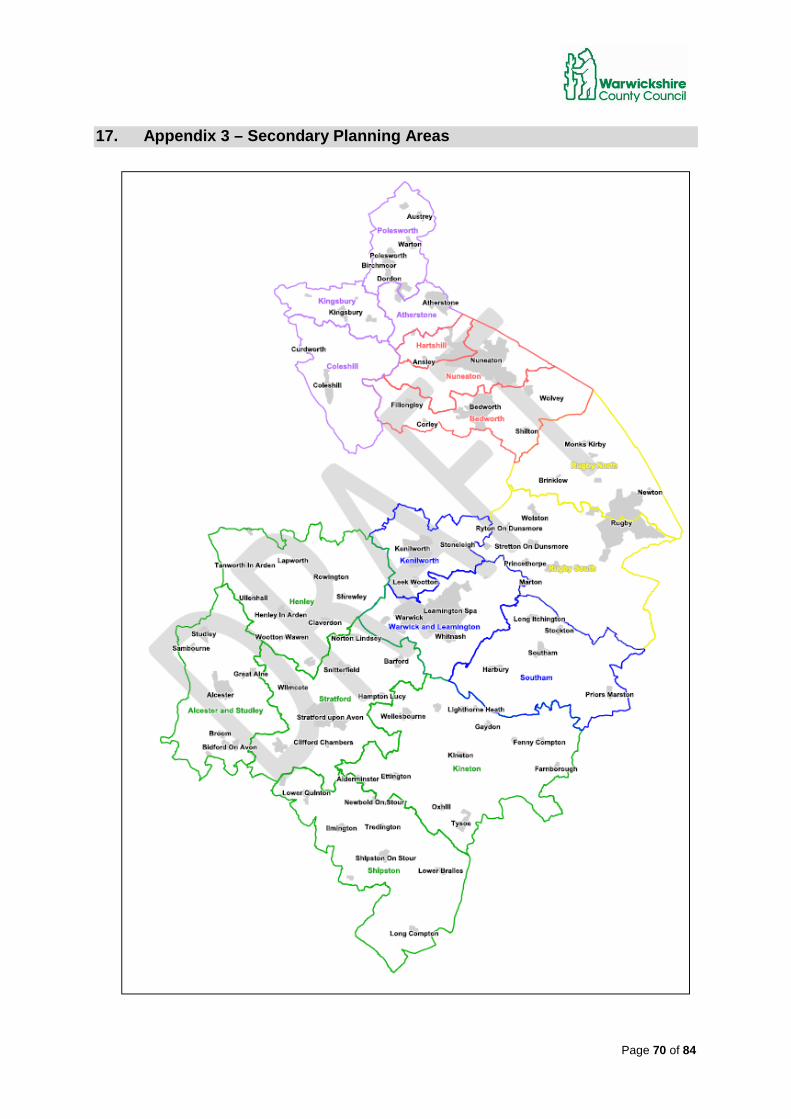
Page 70 of 84
17. Appendix 3 – Secondary Planning Areas
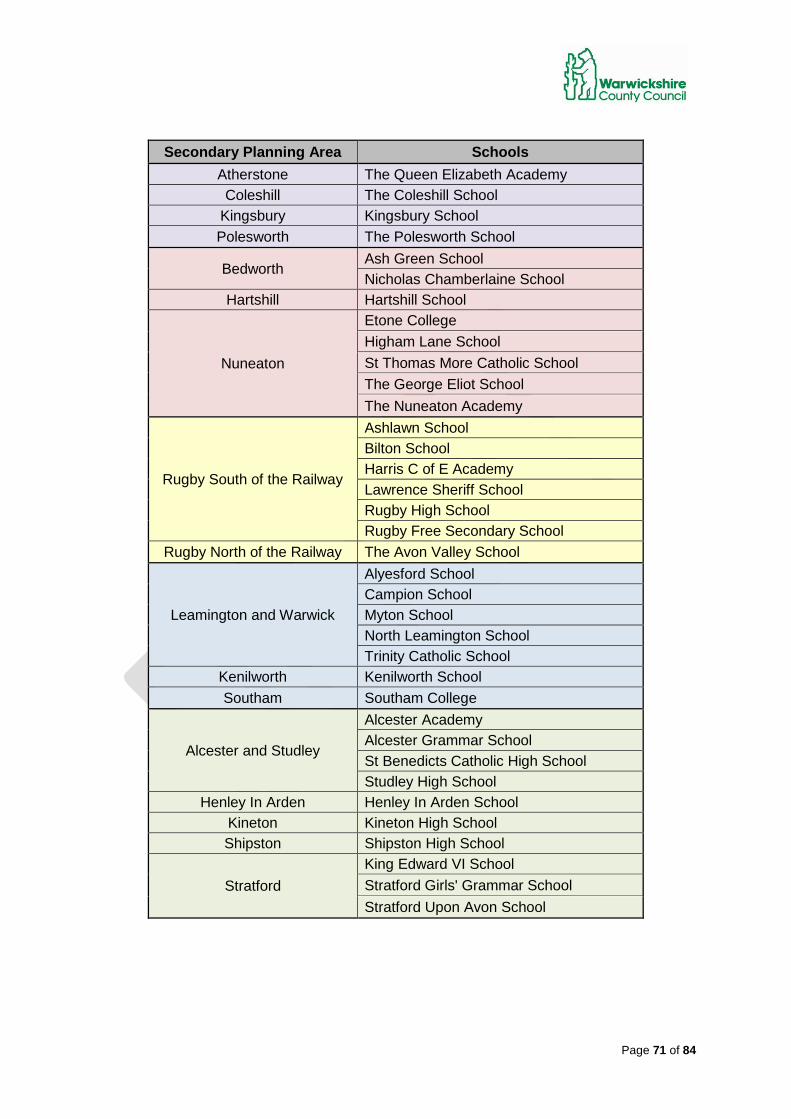
Page 71 of 84
Secondary Planning Area Schools Atherstone The Queen Elizabeth Academy Coleshill The Coleshill School
Kingsbury Kingsbury School Polesworth The Polesworth School
Bedworth Ash Green School Nicholas Chamberlaine School
Hartshill Hartshill School
Nuneaton
Etone College Higham Lane School St Thomas More Catholic School The George Eliot School The Nuneaton Academy
Rugby South of the Railway
Ashlawn School Bilton School Harris C of E Academy Lawrence Sheriff School Rugby High School Rugby Free Secondary School
Rugby North of the Railway The Avon Valley School
Leamington and Warwick
Alyesford School Campion School Myton School North Leamington School Trinity Catholic School
Kenilworth Kenilworth School Southam Southam College
Alcester and Studley
Alcester Academy Alcester Grammar School St Benedicts Catholic High School Studley High School
Henley In Arden Henley In Arden School Kineton Kineton High School Shipston Shipston High School
Stratford King Edward VI School Stratford Girls' Grammar School Stratford Upon Avon School
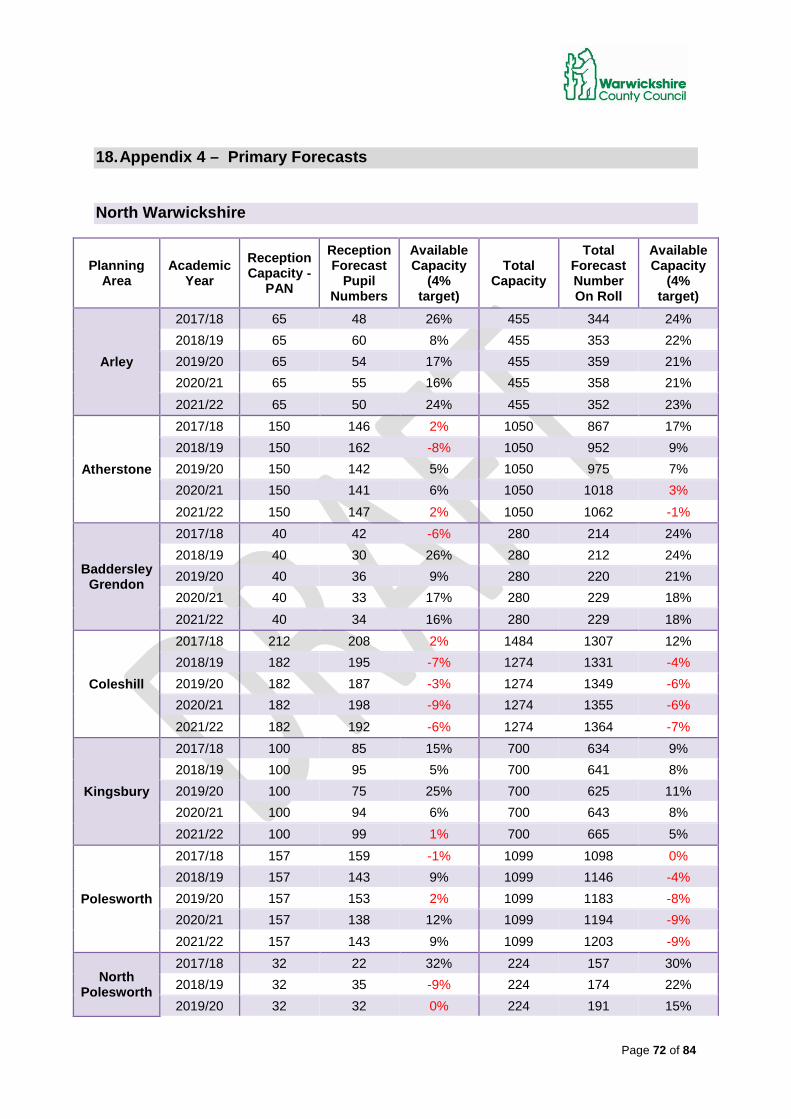
Page 72 of 84
18. Appendix 4 – Primary Forecasts
North Warwickshire
Planning Area
Academic Year
Reception Capacity -
PAN
Reception Forecast
Pupil Numbers
Available Capacity
(4% target)
Total Capacity
Total Forecast Number On Roll
Available Capacity
(4% target)
Arley
2017/18 65 48 26% 455 344 24% 2018/19 65 60 8% 455 353 22% 2019/20 65 54 17% 455 359 21% 2020/21 65 55 16% 455 358 21% 2021/22 65 50 24% 455 352 23%
Atherstone
2017/18 150 146 2% 1050 867 17% 2018/19 150 162 -8% 1050 952 9% 2019/20 150 142 5% 1050 975 7% 2020/21 150 141 6% 1050 1018 3% 2021/22 150 147 2% 1050 1062 -1%
Baddersley Grendon
2017/18 40 42 -6% 280 214 24% 2018/19 40 30 26% 280 212 24% 2019/20 40 36 9% 280 220 21% 2020/21 40 33 17% 280 229 18% 2021/22 40 34 16% 280 229 18%
Coleshill
2017/18 212 208 2% 1484 1307 12% 2018/19 182 195 -7% 1274 1331 -4% 2019/20 182 187 -3% 1274 1349 -6% 2020/21 182 198 -9% 1274 1355 -6% 2021/22 182 192 -6% 1274 1364 -7%
Kingsbury
2017/18 100 85 15% 700 634 9% 2018/19 100 95 5% 700 641 8% 2019/20 100 75 25% 700 625 11% 2020/21 100 94 6% 700 643 8% 2021/22 100 99 1% 700 665 5%
Polesworth
2017/18 157 159 -1% 1099 1098 0% 2018/19 157 143 9% 1099 1146 -4% 2019/20 157 153 2% 1099 1183 -8% 2020/21 157 138 12% 1099 1194 -9% 2021/22 157 143 9% 1099 1203 -9%
North Polesworth
2017/18 32 22 32% 224 157 30% 2018/19 32 35 -9% 224 174 22% 2019/20 32 32 0% 224 191 15%
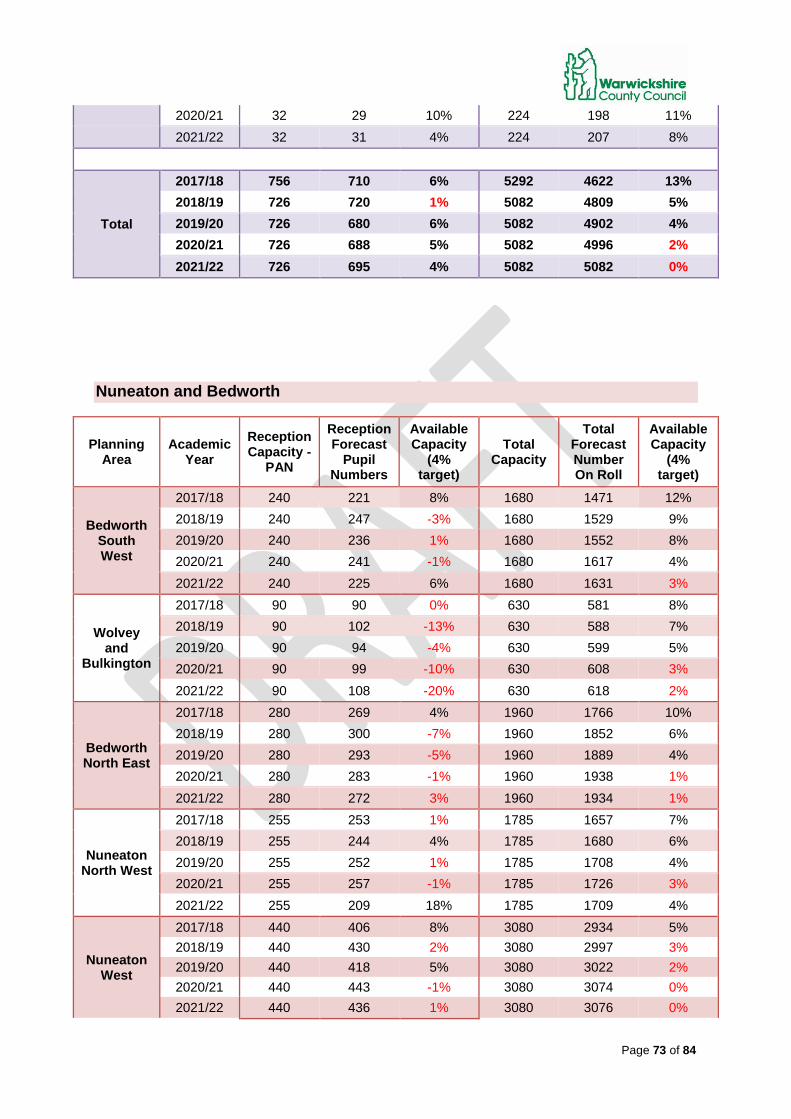
Page 73 of 84
2020/21 32 29 10% 224 198 11% 2021/22 32 31 4% 224 207 8%
Total
2017/18 756 710 6% 5292 4622 13% 2018/19 726 720 1% 5082 4809 5% 2019/20 726 680 6% 5082 4902 4% 2020/21 726 688 5% 5082 4996 2% 2021/22 726 695 4% 5082 5082 0%
Nuneaton and Bedworth
Planning Area
Academic Year
Reception Capacity -
PAN
Reception Forecast
Pupil Numbers
Available Capacity
(4% target)
Total Capacity
Total Forecast Number On Roll
Available Capacity
(4% target)
Bedworth South West
2017/18 240 221 8% 1680 1471 12% 2018/19 240 247 -3% 1680 1529 9% 2019/20 240 236 1% 1680 1552 8% 2020/21 240 241 -1% 1680 1617 4% 2021/22 240 225 6% 1680 1631 3%
Wolvey and
Bulkington
2017/18 90 90 0% 630 581 8% 2018/19 90 102 -13% 630 588 7% 2019/20 90 94 -4% 630 599 5% 2020/21 90 99 -10% 630 608 3% 2021/22 90 108 -20% 630 618 2%
Bedworth North East
2017/18 280 269 4% 1960 1766 10% 2018/19 280 300 -7% 1960 1852 6% 2019/20 280 293 -5% 1960 1889 4% 2020/21 280 283 -1% 1960 1938 1% 2021/22 280 272 3% 1960 1934 1%
Nuneaton North West
2017/18 255 253 1% 1785 1657 7% 2018/19 255 244 4% 1785 1680 6% 2019/20 255 252 1% 1785 1708 4% 2020/21 255 257 -1% 1785 1726 3% 2021/22 255 209 18% 1785 1709 4%
Nuneaton West
2017/18 440 406 8% 3080 2934 5% 2018/19 440 430 2% 3080 2997 3% 2019/20 440 418 5% 3080 3022 2% 2020/21 440 443 -1% 3080 3074 0% 2021/22 440 436 1% 3080 3076 0%
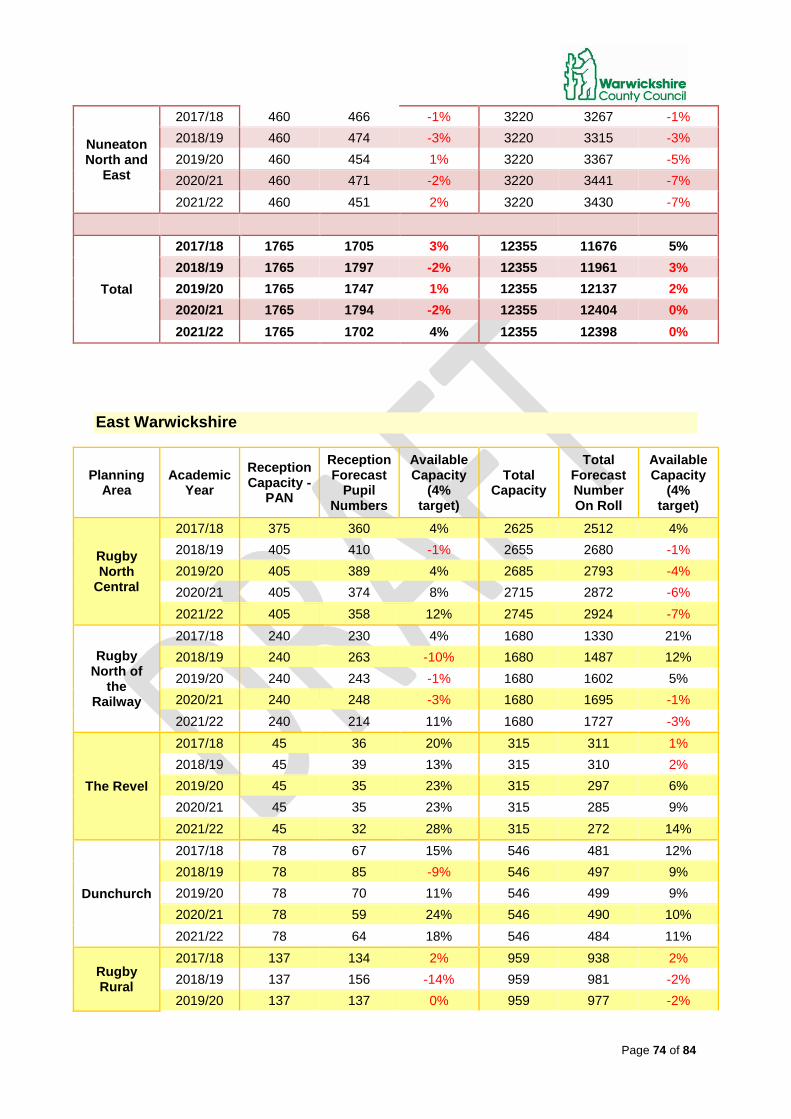
Page 74 of 84
Nuneaton North and
East
2017/18 460 466 -1% 3220 3267 -1% 2018/19 460 474 -3% 3220 3315 -3% 2019/20 460 454 1% 3220 3367 -5% 2020/21 460 471 -2% 3220 3441 -7% 2021/22 460 451 2% 3220 3430 -7%
Total
2017/18 1765 1705 3% 12355 11676 5% 2018/19 1765 1797 -2% 12355 11961 3% 2019/20 1765 1747 1% 12355 12137 2% 2020/21 1765 1794 -2% 12355 12404 0% 2021/22 1765 1702 4% 12355 12398 0%
East Warwickshire
Planning Area
Academic Year
Reception Capacity -
PAN
Reception Forecast
Pupil Numbers
Available Capacity
(4% target)
Total Capacity
Total Forecast Number On Roll
Available Capacity
(4% target)
Rugby North
Central
2017/18 375 360 4% 2625 2512 4% 2018/19 405 410 -1% 2655 2680 -1% 2019/20 405 389 4% 2685 2793 -4% 2020/21 405 374 8% 2715 2872 -6% 2021/22 405 358 12% 2745 2924 -7%
Rugby North of
the Railway
2017/18 240 230 4% 1680 1330 21% 2018/19 240 263 -10% 1680 1487 12% 2019/20 240 243 -1% 1680 1602 5% 2020/21 240 248 -3% 1680 1695 -1% 2021/22 240 214 11% 1680 1727 -3%
The Revel
2017/18 45 36 20% 315 311 1% 2018/19 45 39 13% 315 310 2% 2019/20 45 35 23% 315 297 6% 2020/21 45 35 23% 315 285 9% 2021/22 45 32 28% 315 272 14%
Dunchurch
2017/18 78 67 15% 546 481 12% 2018/19 78 85 -9% 546 497 9% 2019/20 78 70 11% 546 499 9% 2020/21 78 59 24% 546 490 10% 2021/22 78 64 18% 546 484 11%
Rugby Rural
2017/18 137 134 2% 959 938 2% 2018/19 137 156 -14% 959 981 -2% 2019/20 137 137 0% 959 977 -2%
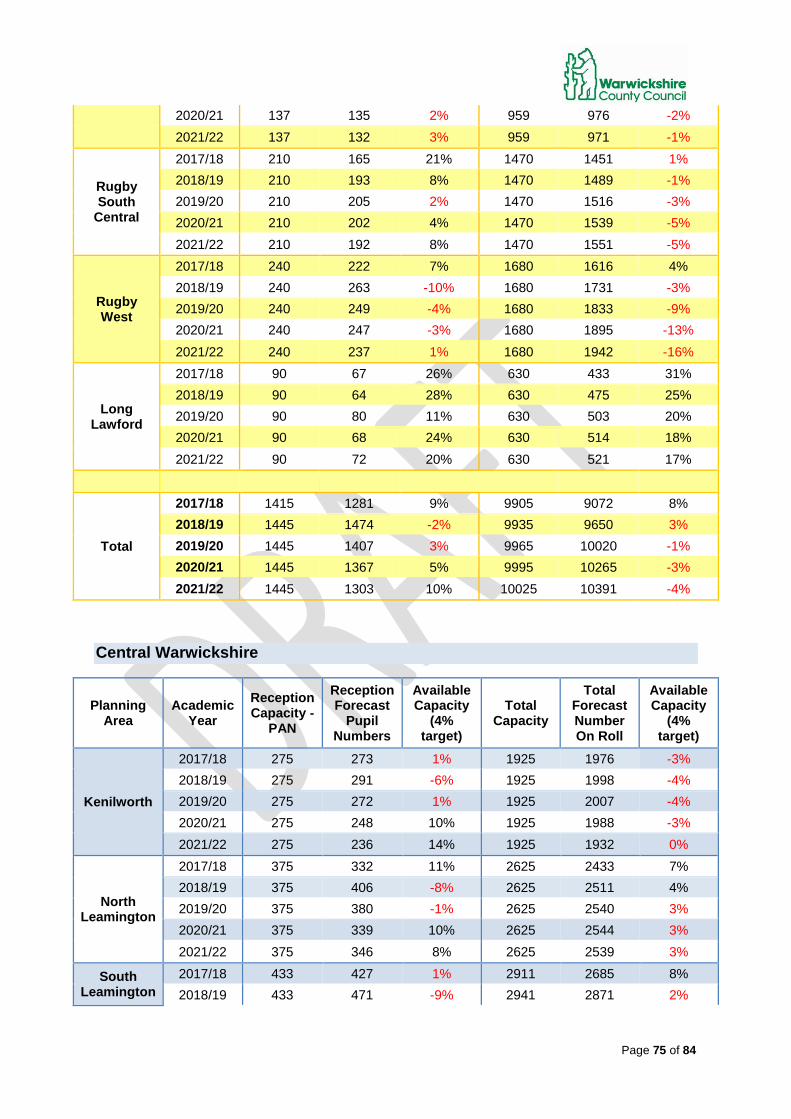
Page 75 of 84
2020/21 137 135 2% 959 976 -2% 2021/22 137 132 3% 959 971 -1%
Rugby South
Central
2017/18 210 165 21% 1470 1451 1% 2018/19 210 193 8% 1470 1489 -1% 2019/20 210 205 2% 1470 1516 -3% 2020/21 210 202 4% 1470 1539 -5% 2021/22 210 192 8% 1470 1551 -5%
Rugby West
2017/18 240 222 7% 1680 1616 4% 2018/19 240 263 -10% 1680 1731 -3% 2019/20 240 249 -4% 1680 1833 -9% 2020/21 240 247 -3% 1680 1895 -13% 2021/22 240 237 1% 1680 1942 -16%
Long Lawford
2017/18 90 67 26% 630 433 31% 2018/19 90 64 28% 630 475 25% 2019/20 90 80 11% 630 503 20% 2020/21 90 68 24% 630 514 18% 2021/22 90 72 20% 630 521 17%
Total
2017/18 1415 1281 9% 9905 9072 8% 2018/19 1445 1474 -2% 9935 9650 3% 2019/20 1445 1407 3% 9965 10020 -1% 2020/21 1445 1367 5% 9995 10265 -3% 2021/22 1445 1303 10% 10025 10391 -4%
Central Warwickshire
Planning Area
Academic Year
Reception Capacity -
PAN
Reception Forecast
Pupil Numbers
Available Capacity
(4% target)
Total Capacity
Total Forecast Number On Roll
Available Capacity
(4% target)
Kenilworth
2017/18 275 273 1% 1925 1976 -3% 2018/19 275 291 -6% 1925 1998 -4% 2019/20 275 272 1% 1925 2007 -4% 2020/21 275 248 10% 1925 1988 -3% 2021/22 275 236 14% 1925 1932 0%
North Leamington
2017/18 375 332 11% 2625 2433 7% 2018/19 375 406 -8% 2625 2511 4% 2019/20 375 380 -1% 2625 2540 3% 2020/21 375 339 10% 2625 2544 3% 2021/22 375 346 8% 2625 2539 3%
South Leamington
2017/18 433 427 1% 2911 2685 8% 2018/19 433 471 -9% 2941 2871 2%
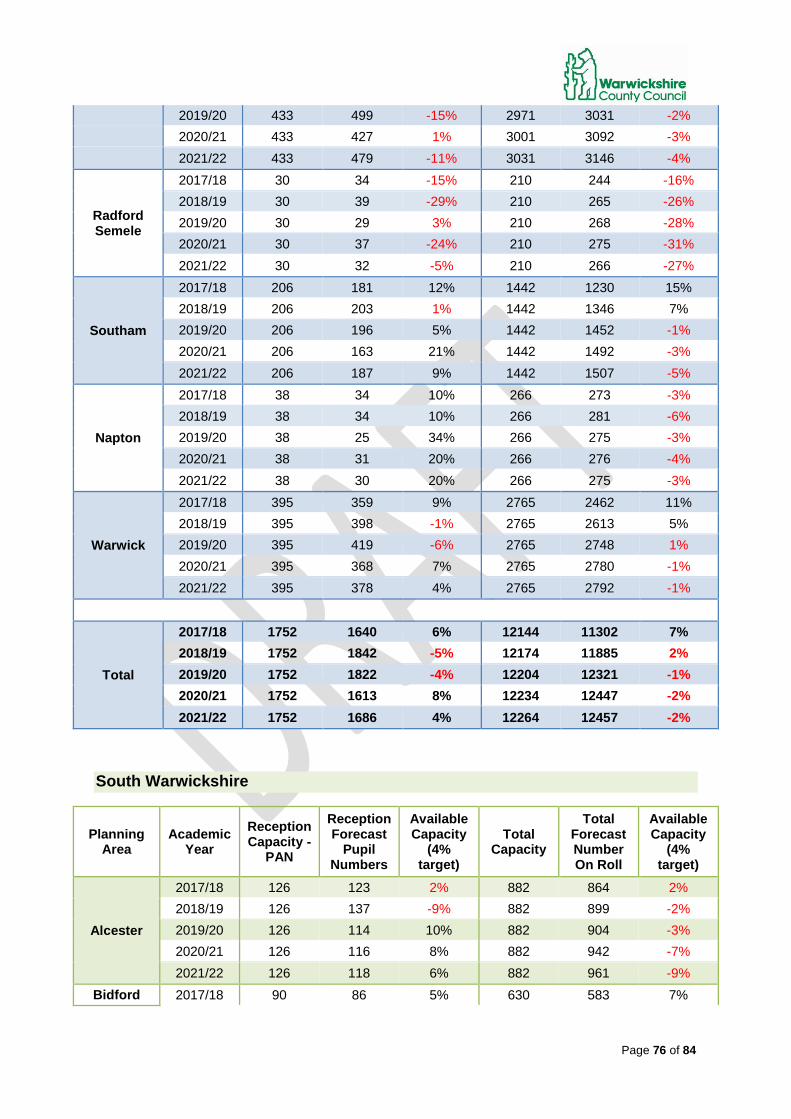
Page 76 of 84
2019/20 433 499 -15% 2971 3031 -2% 2020/21 433 427 1% 3001 3092 -3% 2021/22 433 479 -11% 3031 3146 -4%
Radford Semele
2017/18 30 34 -15% 210 244 -16% 2018/19 30 39 -29% 210 265 -26% 2019/20 30 29 3% 210 268 -28% 2020/21 30 37 -24% 210 275 -31% 2021/22 30 32 -5% 210 266 -27%
Southam
2017/18 206 181 12% 1442 1230 15% 2018/19 206 203 1% 1442 1346 7% 2019/20 206 196 5% 1442 1452 -1% 2020/21 206 163 21% 1442 1492 -3% 2021/22 206 187 9% 1442 1507 -5%
Napton
2017/18 38 34 10% 266 273 -3% 2018/19 38 34 10% 266 281 -6% 2019/20 38 25 34% 266 275 -3% 2020/21 38 31 20% 266 276 -4% 2021/22 38 30 20% 266 275 -3%
Warwick
2017/18 395 359 9% 2765 2462 11% 2018/19 395 398 -1% 2765 2613 5% 2019/20 395 419 -6% 2765 2748 1% 2020/21 395 368 7% 2765 2780 -1% 2021/22 395 378 4% 2765 2792 -1%
Total
2017/18 1752 1640 6% 12144 11302 7% 2018/19 1752 1842 -5% 12174 11885 2% 2019/20 1752 1822 -4% 12204 12321 -1% 2020/21 1752 1613 8% 12234 12447 -2% 2021/22 1752 1686 4% 12264 12457 -2%
South Warwickshire
Planning Area
Academic Year
Reception Capacity -
PAN
Reception Forecast
Pupil Numbers
Available Capacity
(4% target)
Total Capacity
Total Forecast Number On Roll
Available Capacity
(4% target)
Alcester
2017/18 126 123 2% 882 864 2% 2018/19 126 137 -9% 882 899 -2% 2019/20 126 114 10% 882 904 -3% 2020/21 126 116 8% 882 942 -7% 2021/22 126 118 6% 882 961 -9%
Bidford 2017/18 90 86 5% 630 583 7%
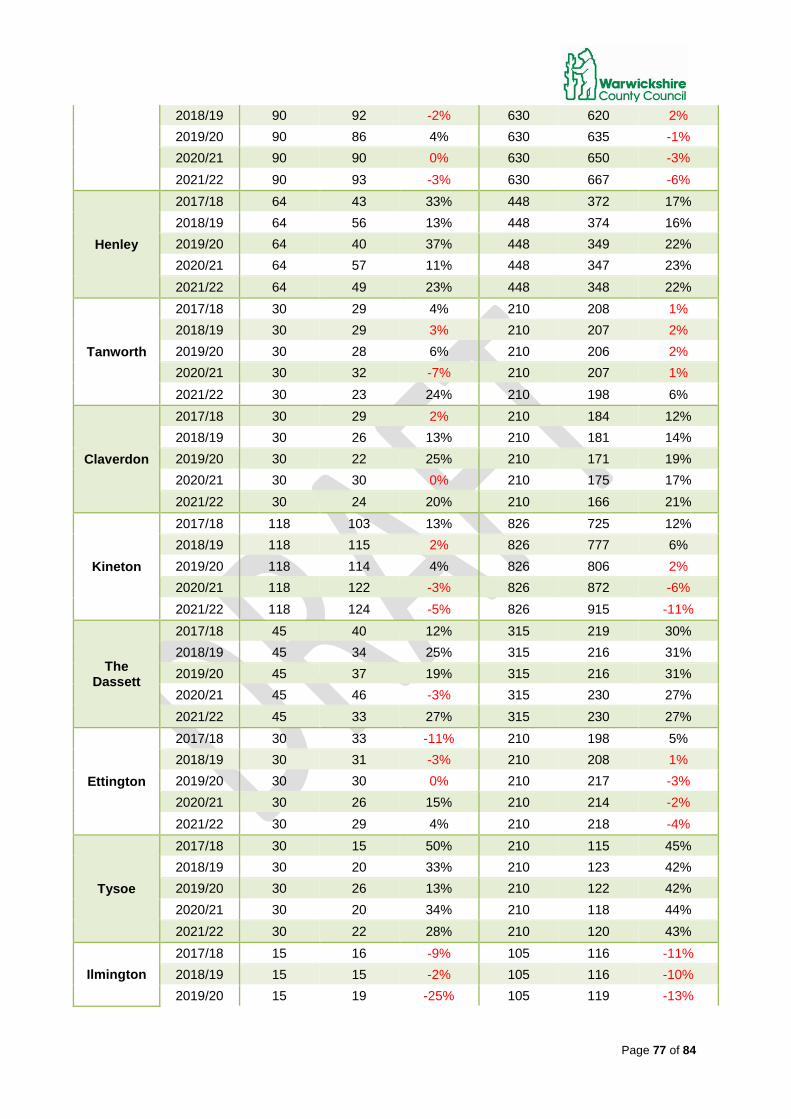
Page 77 of 84
2018/19 90 92 -2% 630 620 2% 2019/20 90 86 4% 630 635 -1% 2020/21 90 90 0% 630 650 -3% 2021/22 90 93 -3% 630 667 -6%
Henley
2017/18 64 43 33% 448 372 17% 2018/19 64 56 13% 448 374 16% 2019/20 64 40 37% 448 349 22% 2020/21 64 57 11% 448 347 23% 2021/22 64 49 23% 448 348 22%
Tanworth
2017/18 30 29 4% 210 208 1% 2018/19 30 29 3% 210 207 2% 2019/20 30 28 6% 210 206 2% 2020/21 30 32 -7% 210 207 1% 2021/22 30 23 24% 210 198 6%
Claverdon
2017/18 30 29 2% 210 184 12% 2018/19 30 26 13% 210 181 14% 2019/20 30 22 25% 210 171 19% 2020/21 30 30 0% 210 175 17% 2021/22 30 24 20% 210 166 21%
Kineton
2017/18 118 103 13% 826 725 12% 2018/19 118 115 2% 826 777 6% 2019/20 118 114 4% 826 806 2% 2020/21 118 122 -3% 826 872 -6% 2021/22 118 124 -5% 826 915 -11%
The Dassett
2017/18 45 40 12% 315 219 30% 2018/19 45 34 25% 315 216 31% 2019/20 45 37 19% 315 216 31% 2020/21 45 46 -3% 315 230 27% 2021/22 45 33 27% 315 230 27%
Ettington
2017/18 30 33 -11% 210 198 5% 2018/19 30 31 -3% 210 208 1% 2019/20 30 30 0% 210 217 -3% 2020/21 30 26 15% 210 214 -2% 2021/22 30 29 4% 210 218 -4%
Tysoe
2017/18 30 15 50% 210 115 45% 2018/19 30 20 33% 210 123 42% 2019/20 30 26 13% 210 122 42% 2020/21 30 20 34% 210 118 44% 2021/22 30 22 28% 210 120 43%
Ilmington 2017/18 15 16 -9% 105 116 -11% 2018/19 15 15 -2% 105 116 -10% 2019/20 15 19 -25% 105 119 -13%
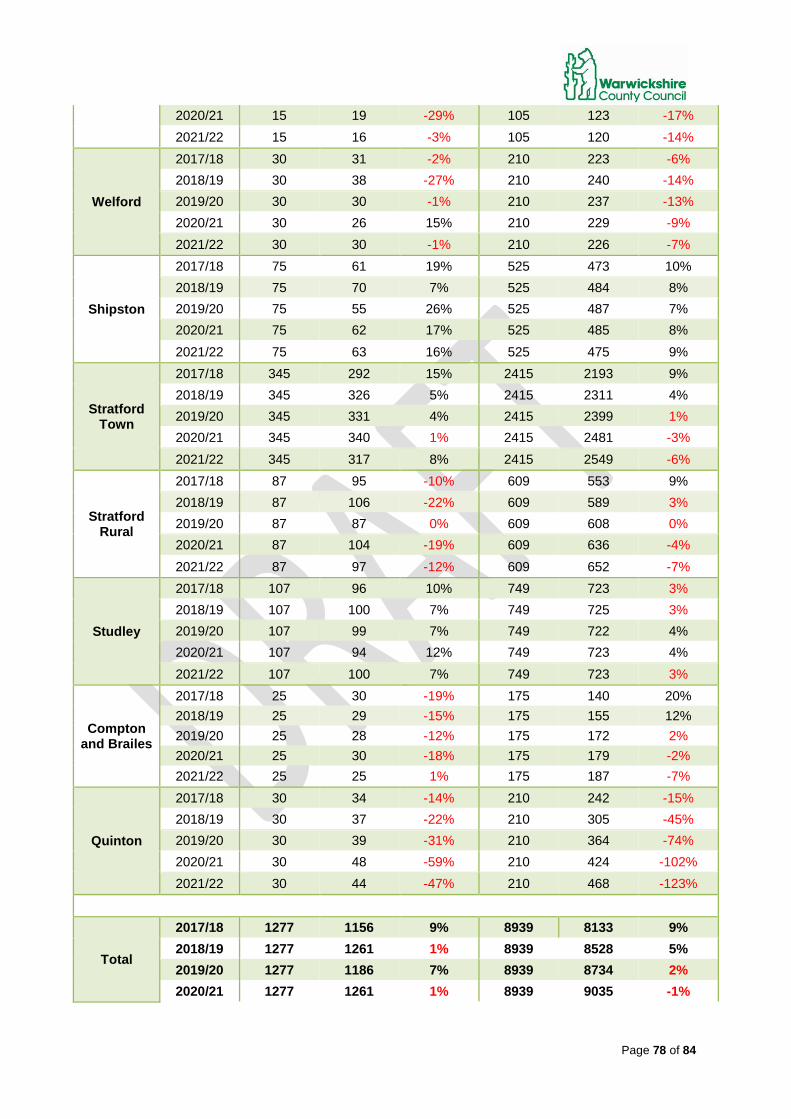
Page 78 of 84
2020/21 15 19 -29% 105 123 -17% 2021/22 15 16 -3% 105 120 -14%
Welford
2017/18 30 31 -2% 210 223 -6% 2018/19 30 38 -27% 210 240 -14% 2019/20 30 30 -1% 210 237 -13% 2020/21 30 26 15% 210 229 -9% 2021/22 30 30 -1% 210 226 -7%
Shipston
2017/18 75 61 19% 525 473 10% 2018/19 75 70 7% 525 484 8% 2019/20 75 55 26% 525 487 7% 2020/21 75 62 17% 525 485 8% 2021/22 75 63 16% 525 475 9%
Stratford Town
2017/18 345 292 15% 2415 2193 9% 2018/19 345 326 5% 2415 2311 4% 2019/20 345 331 4% 2415 2399 1% 2020/21 345 340 1% 2415 2481 -3% 2021/22 345 317 8% 2415 2549 -6%
Stratford Rural
2017/18 87 95 -10% 609 553 9% 2018/19 87 106 -22% 609 589 3% 2019/20 87 87 0% 609 608 0% 2020/21 87 104 -19% 609 636 -4% 2021/22 87 97 -12% 609 652 -7%
Studley
2017/18 107 96 10% 749 723 3% 2018/19 107 100 7% 749 725 3% 2019/20 107 99 7% 749 722 4% 2020/21 107 94 12% 749 723 4% 2021/22 107 100 7% 749 723 3%
Compton and Brailes
2017/18 25 30 -19% 175 140 20% 2018/19 25 29 -15% 175 155 12% 2019/20 25 28 -12% 175 172 2% 2020/21 25 30 -18% 175 179 -2% 2021/22 25 25 1% 175 187 -7%
Quinton
2017/18 30 34 -14% 210 242 -15% 2018/19 30 37 -22% 210 305 -45% 2019/20 30 39 -31% 210 364 -74% 2020/21 30 48 -59% 210 424 -102% 2021/22 30 44 -47% 210 468 -123%
Total
2017/18 1277 1156 9% 8939 8133 9% 2018/19 1277 1261 1% 8939 8528 5% 2019/20 1277 1186 7% 8939 8734 2% 2020/21 1277 1261 1% 8939 9035 -1%
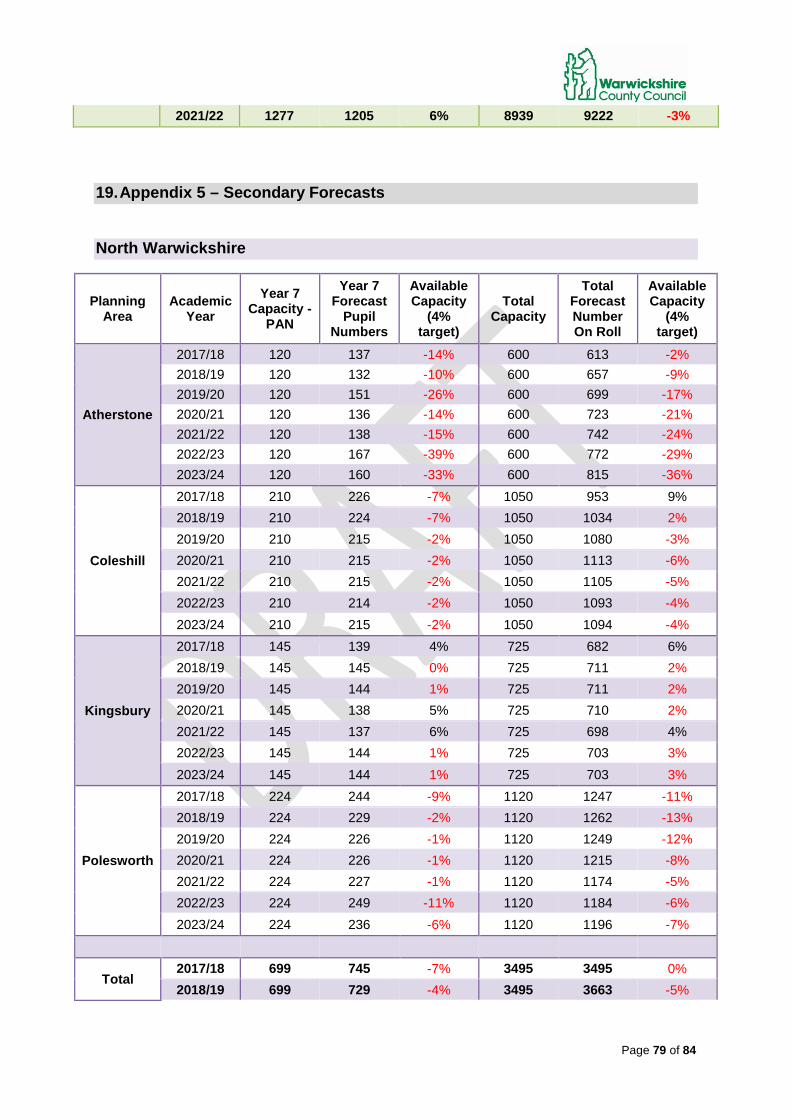
Page 79 of 84
2021/22 1277 1205 6% 8939 9222 -3%
19. Appendix 5 – Secondary Forecasts
North Warwickshire
Planning Area
Academic Year
Year 7 Capacity -
PAN
Year 7 Forecast
Pupil Numbers
Available Capacity
(4% target)
Total Capacity
Total Forecast Number On Roll
Available Capacity
(4% target)
Atherstone
2017/18 120 137 -14% 600 613 -2% 2018/19 120 132 -10% 600 657 -9% 2019/20 120 151 -26% 600 699 -17% 2020/21 120 136 -14% 600 723 -21% 2021/22 120 138 -15% 600 742 -24% 2022/23 120 167 -39% 600 772 -29% 2023/24 120 160 -33% 600 815 -36%
Coleshill
2017/18 210 226 -7% 1050 953 9% 2018/19 210 224 -7% 1050 1034 2% 2019/20 210 215 -2% 1050 1080 -3% 2020/21 210 215 -2% 1050 1113 -6% 2021/22 210 215 -2% 1050 1105 -5% 2022/23 210 214 -2% 1050 1093 -4% 2023/24 210 215 -2% 1050 1094 -4%
Kingsbury
2017/18 145 139 4% 725 682 6% 2018/19 145 145 0% 725 711 2% 2019/20 145 144 1% 725 711 2% 2020/21 145 138 5% 725 710 2% 2021/22 145 137 6% 725 698 4% 2022/23 145 144 1% 725 703 3% 2023/24 145 144 1% 725 703 3%
Polesworth
2017/18 224 244 -9% 1120 1247 -11% 2018/19 224 229 -2% 1120 1262 -13% 2019/20 224 226 -1% 1120 1249 -12% 2020/21 224 226 -1% 1120 1215 -8% 2021/22 224 227 -1% 1120 1174 -5% 2022/23 224 249 -11% 1120 1184 -6% 2023/24 224 236 -6% 1120 1196 -7%
Total 2017/18 699 745 -7% 3495 3495 0% 2018/19 699 729 -4% 3495 3663 -5%
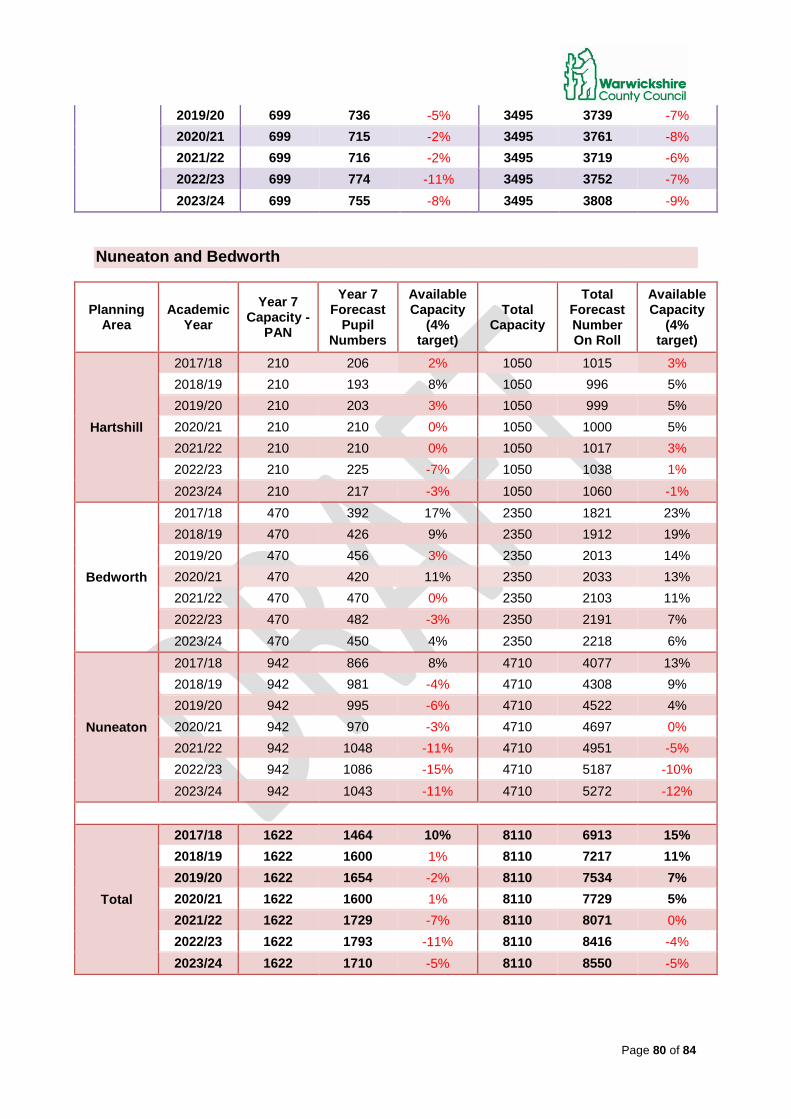
Page 80 of 84
2019/20 699 736 -5% 3495 3739 -7% 2020/21 699 715 -2% 3495 3761 -8% 2021/22 699 716 -2% 3495 3719 -6% 2022/23 699 774 -11% 3495 3752 -7% 2023/24 699 755 -8% 3495 3808 -9%
Nuneaton and Bedworth
Planning Area
Academic Year
Year 7 Capacity -
PAN
Year 7 Forecast
Pupil Numbers
Available Capacity
(4% target)
Total Capacity
Total Forecast Number On Roll
Available Capacity
(4% target)
Hartshill
2017/18 210 206 2% 1050 1015 3% 2018/19 210 193 8% 1050 996 5% 2019/20 210 203 3% 1050 999 5% 2020/21 210 210 0% 1050 1000 5% 2021/22 210 210 0% 1050 1017 3% 2022/23 210 225 -7% 1050 1038 1% 2023/24 210 217 -3% 1050 1060 -1%
Bedworth
2017/18 470 392 17% 2350 1821 23% 2018/19 470 426 9% 2350 1912 19% 2019/20 470 456 3% 2350 2013 14% 2020/21 470 420 11% 2350 2033 13% 2021/22 470 470 0% 2350 2103 11% 2022/23 470 482 -3% 2350 2191 7% 2023/24 470 450 4% 2350 2218 6%
Nuneaton
2017/18 942 866 8% 4710 4077 13% 2018/19 942 981 -4% 4710 4308 9% 2019/20 942 995 -6% 4710 4522 4% 2020/21 942 970 -3% 4710 4697 0% 2021/22 942 1048 -11% 4710 4951 -5% 2022/23 942 1086 -15% 4710 5187 -10% 2023/24 942 1043 -11% 4710 5272 -12%
Total
2017/18 1622 1464 10% 8110 6913 15% 2018/19 1622 1600 1% 8110 7217 11% 2019/20 1622 1654 -2% 8110 7534 7% 2020/21 1622 1600 1% 8110 7729 5% 2021/22 1622 1729 -7% 8110 8071 0% 2022/23 1622 1793 -11% 8110 8416 -4% 2023/24 1622 1710 -5% 8110 8550 -5%
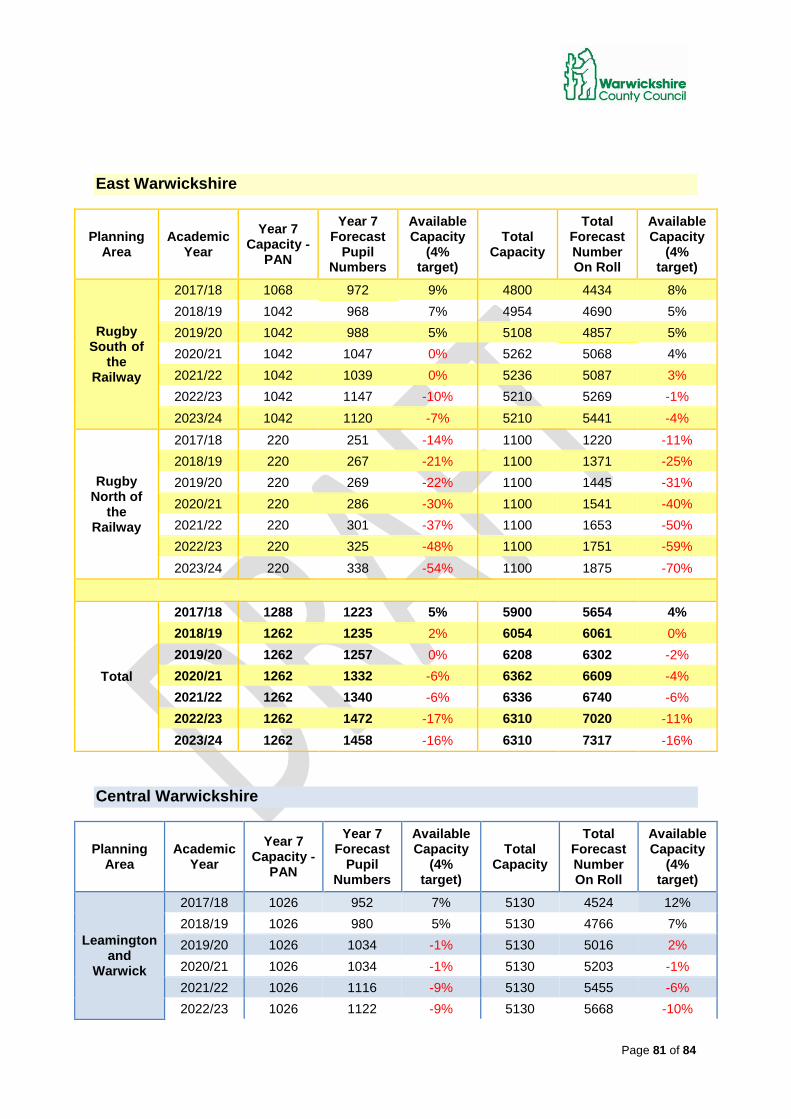
Page 81 of 84
East Warwickshire
Planning Area
Academic Year
Year 7 Capacity -
PAN
Year 7 Forecast
Pupil Numbers
Available Capacity
(4% target)
Total Capacity
Total Forecast Number On Roll
Available Capacity
(4% target)
Rugby South of
the Railway
2017/18 1068 972 9% 4800 4434 8% 2018/19 1042 968 7% 4954 4690 5% 2019/20 1042 988 5% 5108 4857 5% 2020/21 1042 1047 0% 5262 5068 4% 2021/22 1042 1039 0% 5236 5087 3% 2022/23 1042 1147 -10% 5210 5269 -1% 2023/24 1042 1120 -7% 5210 5441 -4%
Rugby North of
the Railway
2017/18 220 251 -14% 1100 1220 -11% 2018/19 220 267 -21% 1100 1371 -25% 2019/20 220 269 -22% 1100 1445 -31% 2020/21 220 286 -30% 1100 1541 -40% 2021/22 220 301 -37% 1100 1653 -50% 2022/23 220 325 -48% 1100 1751 -59% 2023/24 220 338 -54% 1100 1875 -70%
Total
2017/18 1288 1223 5% 5900 5654 4% 2018/19 1262 1235 2% 6054 6061 0% 2019/20 1262 1257 0% 6208 6302 -2% 2020/21 1262 1332 -6% 6362 6609 -4% 2021/22 1262 1340 -6% 6336 6740 -6% 2022/23 1262 1472 -17% 6310 7020 -11% 2023/24 1262 1458 -16% 6310 7317 -16%
Central Warwickshire
Planning Area
Academic Year
Year 7 Capacity -
PAN
Year 7 Forecast
Pupil Numbers
Available Capacity
(4% target)
Total Capacity
Total Forecast Number On Roll
Available Capacity
(4% target)
Leamington and
Warwick
2017/18 1026 952 7% 5130 4524 12% 2018/19 1026 980 5% 5130 4766 7% 2019/20 1026 1034 -1% 5130 5016 2% 2020/21 1026 1034 -1% 5130 5203 -1% 2021/22 1026 1116 -9% 5130 5455 -6% 2022/23 1026 1122 -9% 5130 5668 -10%
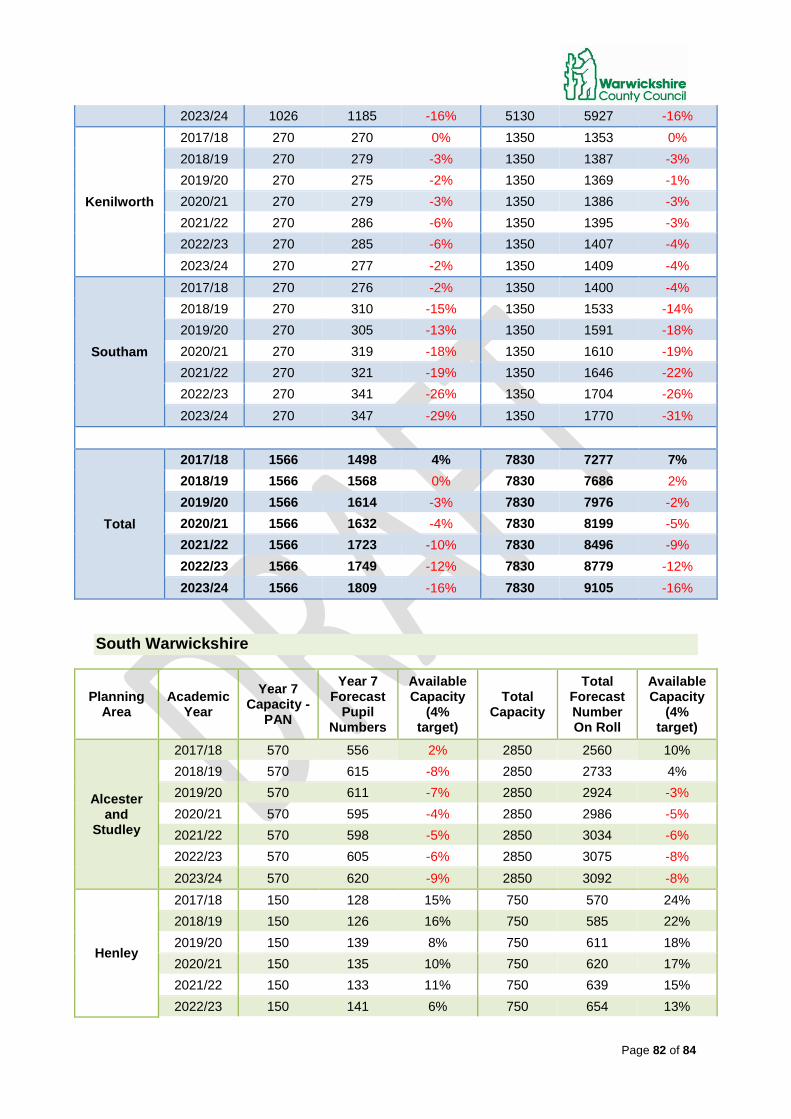
Page 82 of 84
2023/24 1026 1185 -16% 5130 5927 -16%
Kenilworth
2017/18 270 270 0% 1350 1353 0% 2018/19 270 279 -3% 1350 1387 -3% 2019/20 270 275 -2% 1350 1369 -1% 2020/21 270 279 -3% 1350 1386 -3% 2021/22 270 286 -6% 1350 1395 -3% 2022/23 270 285 -6% 1350 1407 -4% 2023/24 270 277 -2% 1350 1409 -4%
Southam
2017/18 270 276 -2% 1350 1400 -4% 2018/19 270 310 -15% 1350 1533 -14% 2019/20 270 305 -13% 1350 1591 -18% 2020/21 270 319 -18% 1350 1610 -19% 2021/22 270 321 -19% 1350 1646 -22% 2022/23 270 341 -26% 1350 1704 -26% 2023/24 270 347 -29% 1350 1770 -31%
Total
2017/18 1566 1498 4% 7830 7277 7% 2018/19 1566 1568 0% 7830 7686 2% 2019/20 1566 1614 -3% 7830 7976 -2% 2020/21 1566 1632 -4% 7830 8199 -5% 2021/22 1566 1723 -10% 7830 8496 -9% 2022/23 1566 1749 -12% 7830 8779 -12% 2023/24 1566 1809 -16% 7830 9105 -16%
South Warwickshire
Planning Area
Academic Year
Year 7 Capacity -
PAN
Year 7 Forecast
Pupil Numbers
Available Capacity
(4% target)
Total Capacity
Total Forecast Number On Roll
Available Capacity
(4% target)
Alcester and
Studley
2017/18 570 556 2% 2850 2560 10% 2018/19 570 615 -8% 2850 2733 4% 2019/20 570 611 -7% 2850 2924 -3% 2020/21 570 595 -4% 2850 2986 -5% 2021/22 570 598 -5% 2850 3034 -6% 2022/23 570 605 -6% 2850 3075 -8% 2023/24 570 620 -9% 2850 3092 -8%
Henley
2017/18 150 128 15% 750 570 24% 2018/19 150 126 16% 750 585 22% 2019/20 150 139 8% 750 611 18% 2020/21 150 135 10% 750 620 17% 2021/22 150 133 11% 750 639 15% 2022/23 150 141 6% 750 654 13%
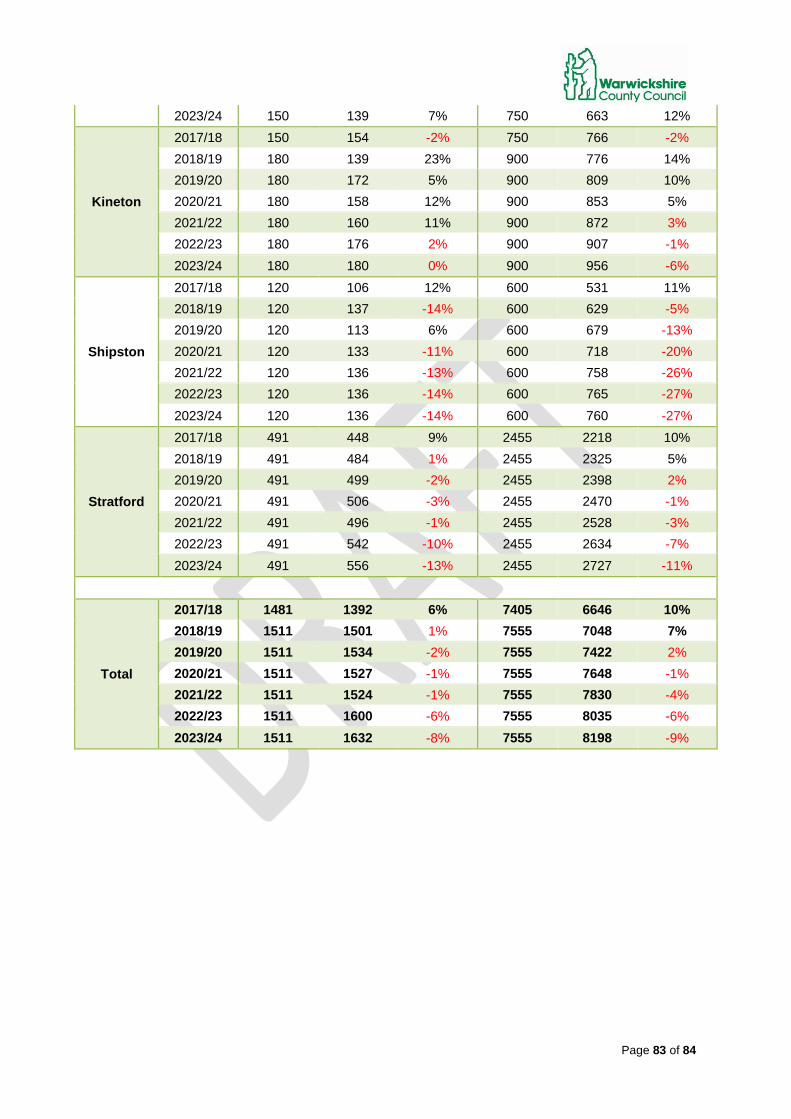
Page 83 of 84
2023/24 150 139 7% 750 663 12%
Kineton
2017/18 150 154 -2% 750 766 -2% 2018/19 180 139 23% 900 776 14% 2019/20 180 172 5% 900 809 10% 2020/21 180 158 12% 900 853 5% 2021/22 180 160 11% 900 872 3% 2022/23 180 176 2% 900 907 -1% 2023/24 180 180 0% 900 956 -6%
Shipston
2017/18 120 106 12% 600 531 11% 2018/19 120 137 -14% 600 629 -5% 2019/20 120 113 6% 600 679 -13% 2020/21 120 133 -11% 600 718 -20% 2021/22 120 136 -13% 600 758 -26% 2022/23 120 136 -14% 600 765 -27% 2023/24 120 136 -14% 600 760 -27%
Stratford
2017/18 491 448 9% 2455 2218 10% 2018/19 491 484 1% 2455 2325 5% 2019/20 491 499 -2% 2455 2398 2% 2020/21 491 506 -3% 2455 2470 -1% 2021/22 491 496 -1% 2455 2528 -3% 2022/23 491 542 -10% 2455 2634 -7% 2023/24 491 556 -13% 2455 2727 -11%
Total
2017/18 1481 1392 6% 7405 6646 10% 2018/19 1511 1501 1% 7555 7048 7% 2019/20 1511 1534 -2% 7555 7422 2% 2020/21 1511 1527 -1% 7555 7648 -1% 2021/22 1511 1524 -1% 7555 7830 -4% 2022/23 1511 1600 -6% 7555 8035 -6% 2023/24 1511 1632 -8% 7555 8198 -9%

Page 84 of 84
Appendix B
EQUALITY IMPACT ASSESSMENT/ ANALYSIS (EqIA)
Education and Learning Schools Sufficiency Strategy
This EqIA is a working document and therefore subject to continual review, amendment and refinement.
Warwickshire County Council
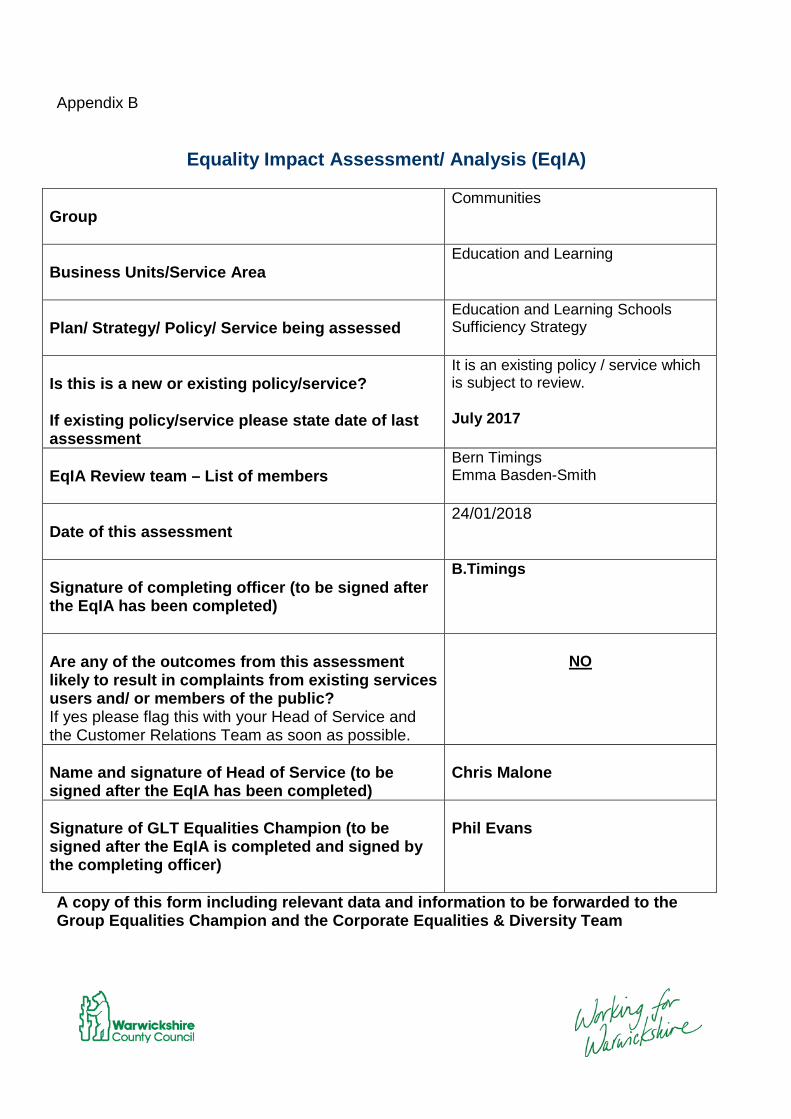
Appendix B
Equality Impact Assessment/ Analysis (EqIA)
Group
Communities
Business Units/Service Area
Education and Learning
Plan/ Strategy/ Policy/ Service being assessed
Education and Learning Schools Sufficiency Strategy
Is this is a new or existing policy/service? If existing policy/service please state date of last assessment
It is an existing policy / service which is subject to review. July 2017
EqIA Review team – List of members
Bern Timings Emma Basden-Smith
Date of this assessment
24/01/2018
Signature of completing officer (to be signed after the EqIA has been completed)
B.Timings
Are any of the outcomes from this assessment likely to result in complaints from existing services users and/ or members of the public? If yes please flag this with your Head of Service and the Customer Relations Team as soon as possible.
NO
Name and signature of Head of Service (to be signed after the EqIA has been completed)
Chris Malone
Signature of GLT Equalities Champion (to be signed after the EqIA is completed and signed by the completing officer)
Phil Evans
A copy of this form including relevant data and information to be forwarded to the Group Equalities Champion and the Corporate Equalities & Diversity Team

Appendix B
Form A1
INITIAL SCREENING FOR STRATEGIES/POLICIES/FUNCTIONS FOR EQUALITIES RELEVANCE TO ELIMINATE DISCRIMINATION, PROMOTE EQUALITY AND FOSTER GOOD RELATIONS
High relevance/priority Medium relevance/priority Low or no relevance/ priority
Note: 1. Tick coloured boxes appropriately, and depending on degree of relevance to each of the equality strands 2. Summaries of the legislation/guidance should be used to assist this screening process
Business Unit/Services:
Relevance/Risk to Equalities
State the Function/Policy /Service/Strategy being assessed:
Gender Race Disability Sexual Orientation
Religion/Belief Age Gender Reassignment
Pregnancy/ Maternity
Marriage/ Civil Partnership (only for staff)
✓ ✓ ✓ ✓ ✓ ✓ ✓ ✓ ✓ ✓ ✓ ✓ ✓ ✓ ✓ ✓ ✓ ✓ ✓ ✓ ✓
Sufficiency Strategy ✓ ✓ ✓ ✓ ✓ ✓ ✓
Are your proposals likely to impact on social inequalities e.g. child poverty for example or our most geographically disadvantaged communities? If yes please explain how. N/A
YES/ NO
Are your proposals likely to impact on a carer who looks after older people or people with disabilities? If yes please explain how.
YES/ NO
Appendix B
Form A2 – Details of Plan/ Strategy/ Service/ Policy
Stage 1 – Scoping and Defining
(1) What are the aims and objectives of Plan/Strategy/Service/Policy?
The Sufficiency Strategy will help schools, parents, council staff, local partners and stakeholders understand how Warwickshire County Council plans and provides school places to ensure that all children and young people thrive in sustainably good or outstanding schools and settings throughout their education, wherever they live. It sets out the principles underpinning school place planning; the ways in which places will be delivered, the information which will be used and the way we work with people to deliver high quality, accessible schools and early years places for all learners. Warwickshire County Council has a legal duty to:
• ensure sufficient schools and places in a locality; • secure sufficient early years & childcare places; • ensure sufficient post 16 provision; • provide appropriate education provision for children with special educational
needs and disabilities; • promote high education standards; • ensure fair access to educational opportunity; • promote the fulfilment of every child’s education potential; • promote diversity and parental choice.
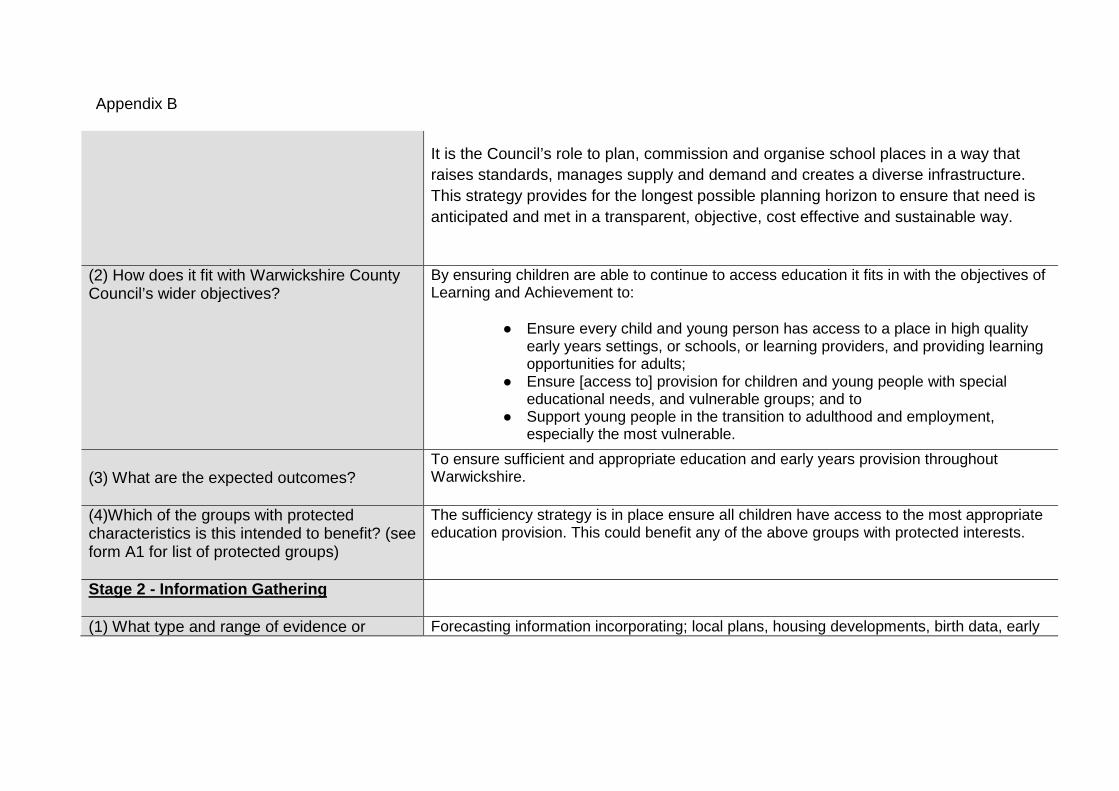
Appendix B
It is the Council’s role to plan, commission and organise school places in a way that raises standards, manages supply and demand and creates a diverse infrastructure. This strategy provides for the longest possible planning horizon to ensure that need is anticipated and met in a transparent, objective, cost effective and sustainable way.
(2) How does it fit with Warwickshire County Council’s wider objectives?
By ensuring children are able to continue to access education it fits in with the objectives of Learning and Achievement to:
● Ensure every child and young person has access to a place in high quality early years settings, or schools, or learning providers, and providing learning opportunities for adults;
● Ensure [access to] provision for children and young people with special educational needs, and vulnerable groups; and to
● Support young people in the transition to adulthood and employment, especially the most vulnerable.
(3) What are the expected outcomes?
To ensure sufficient and appropriate education and early years provision throughout Warwickshire.
(4)Which of the groups with protected characteristics is this intended to benefit? (see form A1 for list of protected groups)
The sufficiency strategy is in place ensure all children have access to the most appropriate education provision. This could benefit any of the above groups with protected interests.
Stage 2 - Information Gathering
(1) What type and range of evidence or Forecasting information incorporating; local plans, housing developments, birth data, early
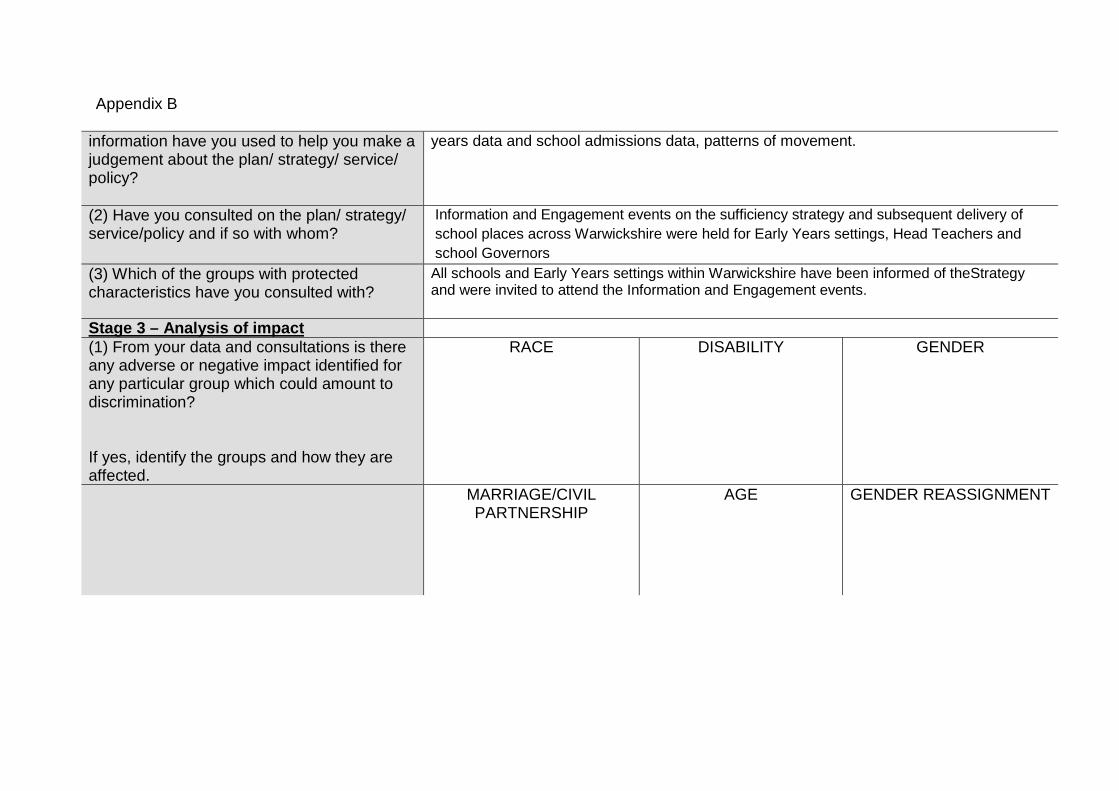
Appendix B
information have you used to help you make a judgement about the plan/ strategy/ service/ policy?
years data and school admissions data, patterns of movement.
(2) Have you consulted on the plan/ strategy/ service/policy and if so with whom?
Information and Engagement events on the sufficiency strategy and subsequent delivery of school places across Warwickshire were held for Early Years settings, Head Teachers and school Governors
(3) Which of the groups with protected characteristics have you consulted with?
All schools and Early Years settings within Warwickshire have been informed of theStrategy and were invited to attend the Information and Engagement events.
Stage 3 – Analysis of impact (1) From your data and consultations is there any adverse or negative impact identified for any particular group which could amount to discrimination? If yes, identify the groups and how they are affected.
RACE
DISABILITY
GENDER
MARRIAGE/CIVIL PARTNERSHIP
AGE
GENDER REASSIGNMENT
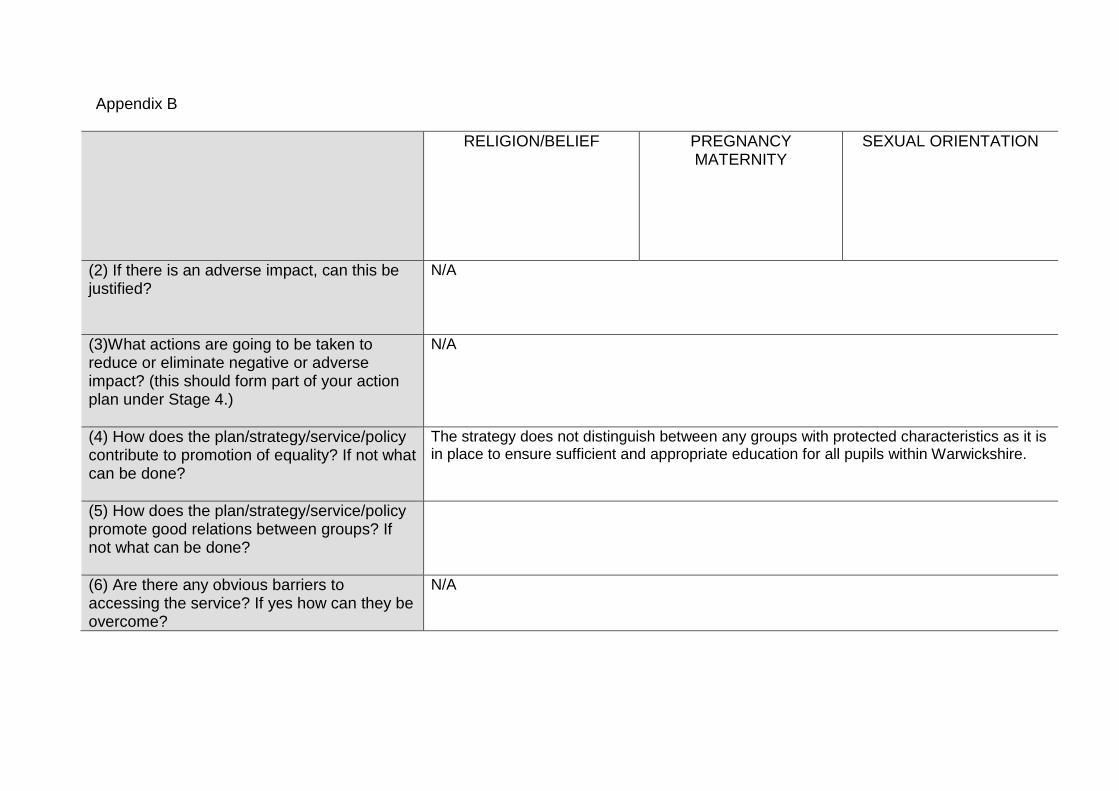
Appendix B
RELIGION/BELIEF
PREGNANCY MATERNITY
SEXUAL ORIENTATION
(2) If there is an adverse impact, can this be justified?
N/A
(3)What actions are going to be taken to reduce or eliminate negative or adverse impact? (this should form part of your action plan under Stage 4.)
N/A
(4) How does the plan/strategy/service/policy contribute to promotion of equality? If not what can be done?
The strategy does not distinguish between any groups with protected characteristics as it is in place to ensure sufficient and appropriate education for all pupils within Warwickshire.
(5) How does the plan/strategy/service/policy promote good relations between groups? If not what can be done?
(6) Are there any obvious barriers to accessing the service? If yes how can they be overcome?
N/A
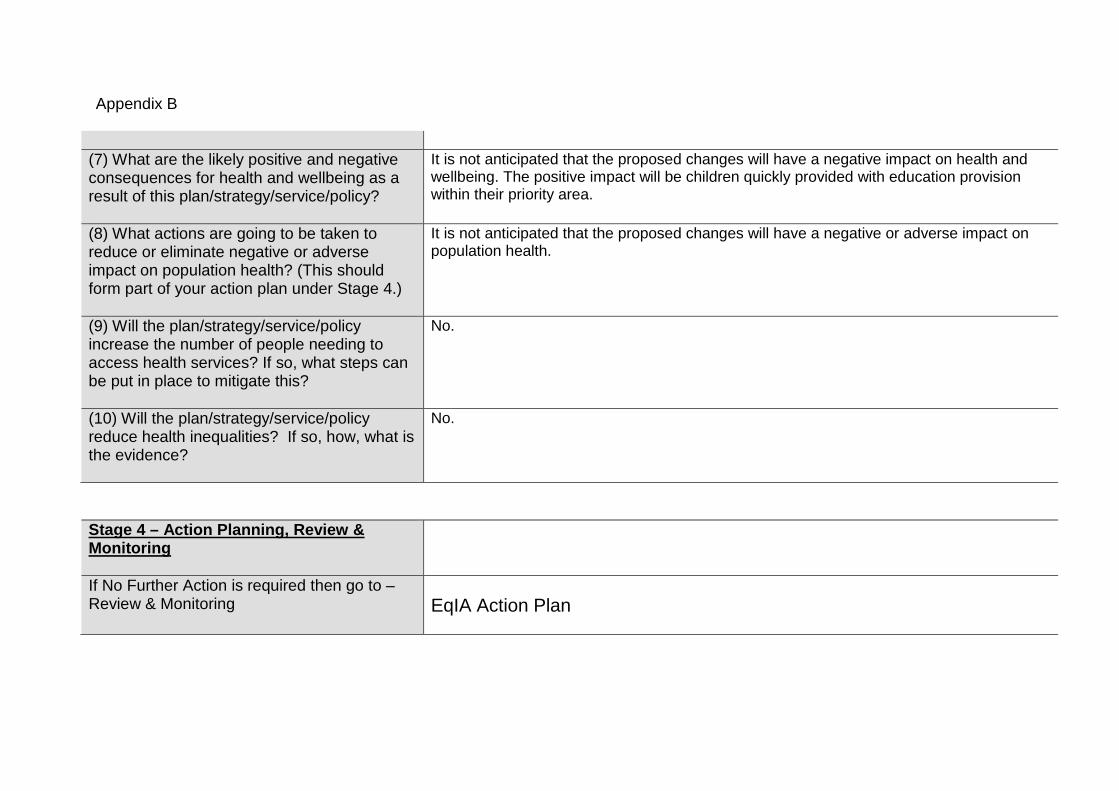
Appendix B
(7) What are the likely positive and negative consequences for health and wellbeing as a result of this plan/strategy/service/policy?
It is not anticipated that the proposed changes will have a negative impact on health and wellbeing. The positive impact will be children quickly provided with education provision within their priority area.
(8) What actions are going to be taken to reduce or eliminate negative or adverse impact on population health? (This should form part of your action plan under Stage 4.)
It is not anticipated that the proposed changes will have a negative or adverse impact on population health.
(9) Will the plan/strategy/service/policy increase the number of people needing to access health services? If so, what steps can be put in place to mitigate this?
No.
(10) Will the plan/strategy/service/policy reduce health inequalities? If so, how, what is the evidence?
No.
Stage 4 – Action Planning, Review & Monitoring
If No Further Action is required then go to – Review & Monitoring
EqIA Action Plan
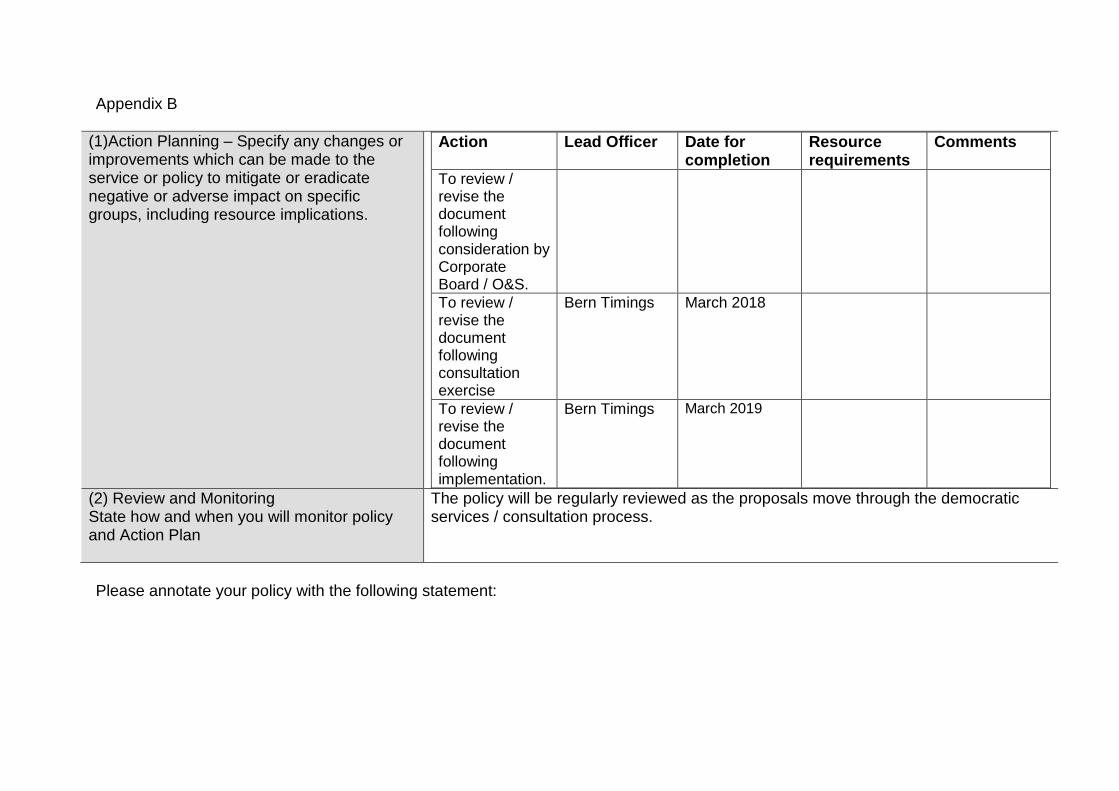
Appendix B
(1)Action Planning – Specify any changes or improvements which can be made to the service or policy to mitigate or eradicate negative or adverse impact on specific groups, including resource implications.
Action Lead Officer Date for completion
Resource requirements
Comments
To review / revise the document following consideration by Corporate Board / O&S.
To review / revise the document following consultation exercise
Bern Timings March 2018
To review / revise the document following implementation.
Bern Timings March 2019
(2) Review and Monitoring State how and when you will monitor policy and Action Plan
The policy will be regularly reviewed as the proposals move through the democratic services / consultation process.
Please annotate your policy with the following statement:
Appendix B
‘An Equality Impact Assessment/ Analysis on this policy was undertaken on 24/01/2017 and will be reviewed on an annual basis.

03 Schools Capital Programme Cab 18.02.15 1 of 15
Item 3 Cabinet
15 February 2018
Education and Learning (Schools) Capital Programme 2017/18 and
Approval of Statutory Proposals Recommendations That Cabinet agrees:
1) That the following proposals for prescribed alterations be approved: • The reconfiguration of classrooms at Round Oak School to enable the
increase in places for learners with SEND
2) That the request to carry out the following consultation be approved: • To increase the number of places for learners with SEND at Exhall
Grange School and Science College 3) That Council is recommended to approve that the sum of £3,076,540 is added to
the capital programme to deliver the schemes outlined in Section 3. 4) Subject to the approval of recommendation 1 above and Council agreeing to add
the schemes to the capital programme, that the Joint Managing Director (Communities) is authorised to invite tenders and enter into the appropriate contracts on terms and conditions acceptable to the Joint Managing Director (Resources), or (where the scheme is school-led) to make the necessary funding arrangements for these schemes.
1.0 Key Issues 1.1 This report recommends proposals for allocating resources in the Education and
Learning (Schools) Capital Programme to specific projects set out in section 3. Some of the proposals include funding from developer contributions.
1.2 The number of children entering Reception classes peaked for entry in September 2015
and, with no further housing development, have begun to stabilise and in some areas start to decrease.

03 Schools Capital Programme Cab 18.02.15 2 of 15
1.3 The overall numbers of Primary school children will continue to grow until September 2018, as larger year groups work their way through, before beginning to stabilise although the impact of planned new housing will offset this.
1.4 Overall numbers in secondary schools have been growing since September 2015 as
larger cohorts transfer from primary schools, currently expecting to peak in September 2022 to correspond with the Reception peak seven years earlier.
1.5 Where possible, and where economies of scale allow, expansions and building works will
address other factors such as encouraging infant and junior to become primary, addressing pre-school requirements in an area, providing specialist SEN provision, and addressing any outstanding DDA requirements.
1.6 The increased birth rate has seen an associated rise in the number of children with
special educational needs and we already secure places for a significant number of pupils at establishments outside the county. The housing demand will bring further increase in demand for SEN provision.
1.7 Formal consultation is required on proposals that would permanently increase the
capacity of a maintained school by: (a) more than 30 pupils; and (b) by 25% or 200 pupils (whichever is the lesser)
1.8 Proposals to increase the number of pupils admitted at schools across a wide area of
Warwickshire are explained within this report. 1.9 Whilst the issue of sufficiency of provision has to take priority, it is important to ensure
that schools that are not expanding are able to continue to operate within their existing accommodation. Details of proposed schemes to make improvements to existing schools are set out below. It is also important to recognise that whilst we are committed to offering good or outstanding places and invest in these schools; we are also committed to investing in schools struggling with improvements where the investment addresses capacity, education delivery, half forms to whole forms of entry and defects.
1.10 Cabinet has recently approved schemes to increase the number of special school places
across the County; however, the need for further projects is required to meet demand and reduce the need for out of area placements. Details of these are provided. These projects will help ensure there is sufficient provision of the right type meeting the appropriate levels of need within Warwickshire; thereby reducing both the cost and need to send pupils to out of county placements.
1.11 The current available funding is set out in Section 2.
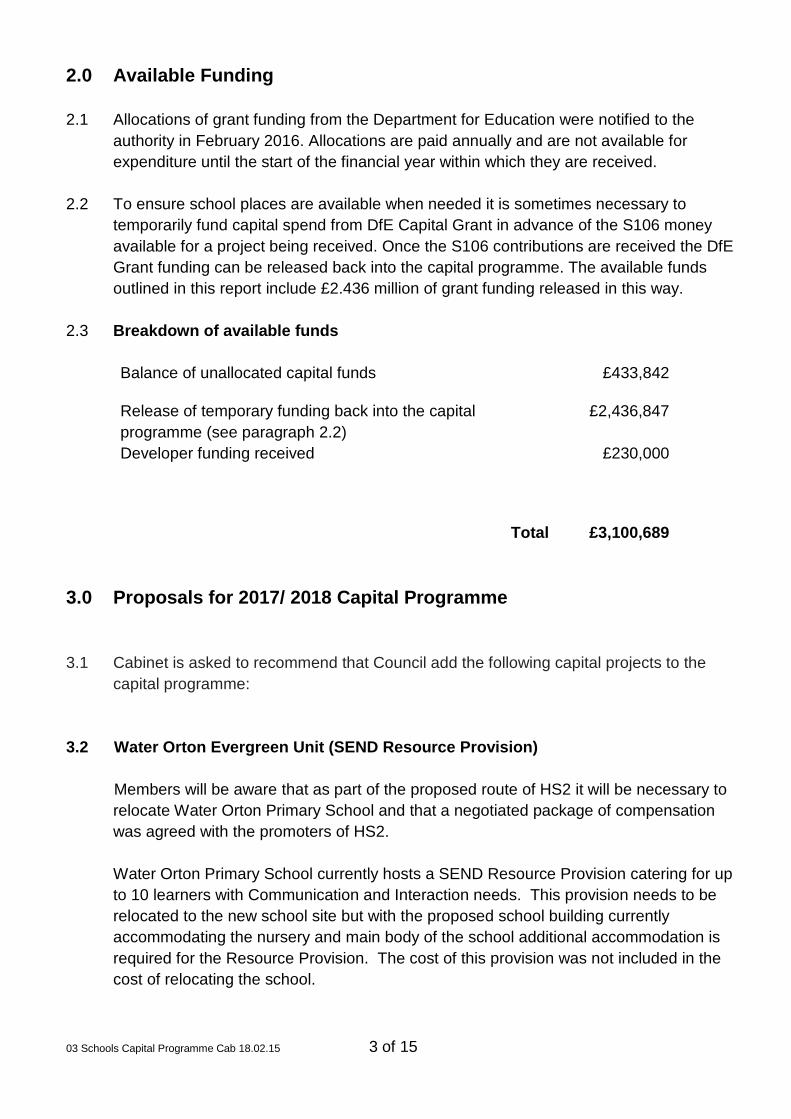
03 Schools Capital Programme Cab 18.02.15 3 of 15
2.0 Available Funding 2.1 Allocations of grant funding from the Department for Education were notified to the
authority in February 2016. Allocations are paid annually and are not available for expenditure until the start of the financial year within which they are received.
2.2 To ensure school places are available when needed it is sometimes necessary to
temporarily fund capital spend from DfE Capital Grant in advance of the S106 money available for a project being received. Once the S106 contributions are received the DfE Grant funding can be released back into the capital programme. The available funds outlined in this report include £2.436 million of grant funding released in this way.
2.3 Breakdown of available funds
Balance of unallocated capital funds £433,842
Release of temporary funding back into the capital programme (see paragraph 2.2)
£2,436,847
Developer funding received £230,000
Total £3,100,689 3.0 Proposals for 2017/ 2018 Capital Programme 3.1 Cabinet is asked to recommend that Council add the following capital projects to the
capital programme: 3.2 Water Orton Evergreen Unit (SEND Resource Provision)
Members will be aware that as part of the proposed route of HS2 it will be necessary to relocate Water Orton Primary School and that a negotiated package of compensation was agreed with the promoters of HS2. Water Orton Primary School currently hosts a SEND Resource Provision catering for up to 10 learners with Communication and Interaction needs. This provision needs to be relocated to the new school site but with the proposed school building currently accommodating the nursery and main body of the school additional accommodation is required for the Resource Provision. The cost of this provision was not included in the cost of relocating the school.
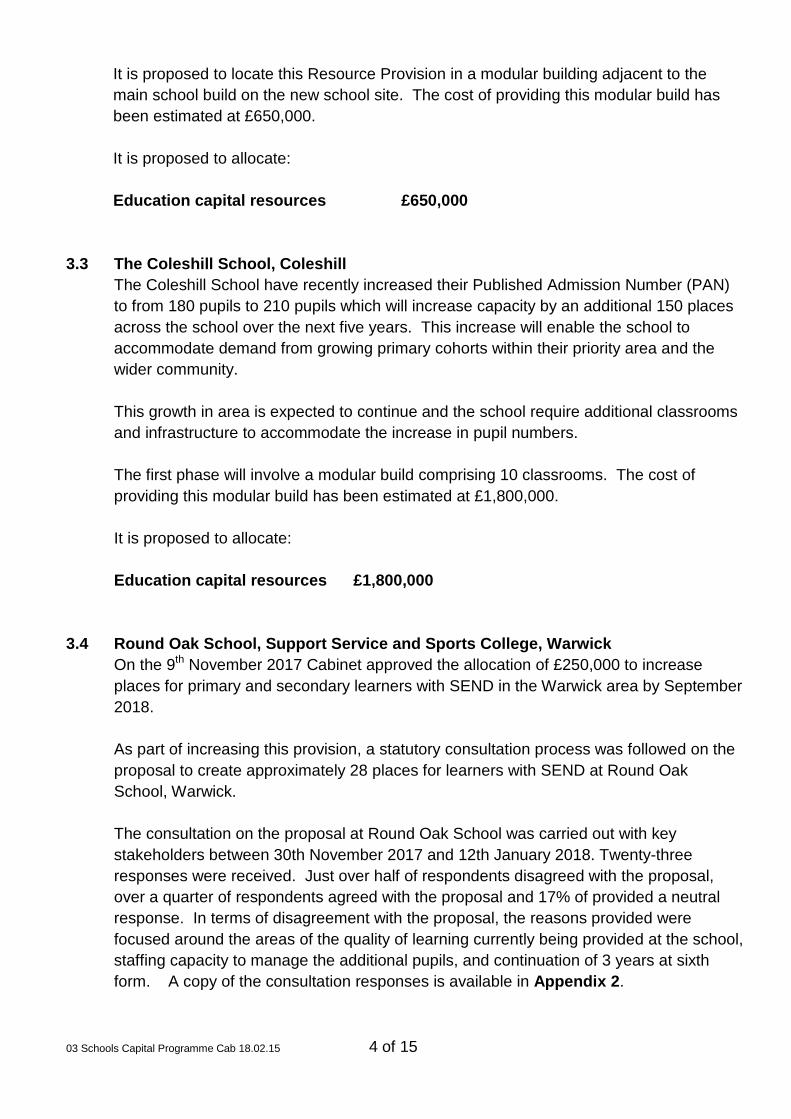
03 Schools Capital Programme Cab 18.02.15 4 of 15
It is proposed to locate this Resource Provision in a modular building adjacent to the main school build on the new school site. The cost of providing this modular build has been estimated at £650,000.
It is proposed to allocate:
Education capital resources £650,000
3.3 The Coleshill School, Coleshill
The Coleshill School have recently increased their Published Admission Number (PAN) to from 180 pupils to 210 pupils which will increase capacity by an additional 150 places across the school over the next five years. This increase will enable the school to accommodate demand from growing primary cohorts within their priority area and the wider community. This growth in area is expected to continue and the school require additional classrooms and infrastructure to accommodate the increase in pupil numbers. The first phase will involve a modular build comprising 10 classrooms. The cost of providing this modular build has been estimated at £1,800,000.
It is proposed to allocate:
Education capital resources £1,800,000 3.4 Round Oak School, Support Service and Sports College, Warwick
On the 9th November 2017 Cabinet approved the allocation of £250,000 to increase places for primary and secondary learners with SEND in the Warwick area by September 2018. As part of increasing this provision, a statutory consultation process was followed on the proposal to create approximately 28 places for learners with SEND at Round Oak School, Warwick. The consultation on the proposal at Round Oak School was carried out with key stakeholders between 30th November 2017 and 12th January 2018. Twenty-three responses were received. Just over half of respondents disagreed with the proposal, over a quarter of respondents agreed with the proposal and 17% of provided a neutral response. In terms of disagreement with the proposal, the reasons provided were focused around the areas of the quality of learning currently being provided at the school, staffing capacity to manage the additional pupils, and continuation of 3 years at sixth form. A copy of the consultation responses is available in Appendix 2.

03 Schools Capital Programme Cab 18.02.15 5 of 15
In terms of addressing some of the issues raised in the consultation, Warwickshire County Council (WCC), in partnership with all special schools, reviewed the funding matrix for the County's specialist provision in 2016 to ensure all schools were funded on a transparent and equitable basis. This means that children are funded on the same level based on assessed need no matter which generic school they attend. The changes identified are in the process of being phased in and are resulting in a relative increase in Round Oak's funding per pupil, which will ensure that staffing and resources are appropriate to meet the needs of learner's attending. Round Oak School is working closely with the Local Authority and other special schools to ensure effective planning to meet the needs of learners currently at primary age, to ensure readiness for their transition to secondary. The additional capital funding will support expansion and will ensure the right facilities are available to meet these needs, without compromising or impacting on learners already attending the school. WCC also wishes to stress that the proposed expansion does not impact on the School's sixth form and there are currently no plans for changes to the School's sixth form offer. It is proposed to create approximately 28 places for learners with SEND at Round Oak School, Warwick. To accommodate the additional pupils there will be a need to reconfigure existing classrooms to create further capacity. This work is estimated to cost £190,000 and will be funded out of the £250,000 allocation approved by Cabinet November 2017. The remaining allocation of £60,000 will be used to provide additional primary places at Ridgeway School.
3.5 Kenilworth School and Sports College, Kenilworth
As a result of the development outlined for Kenilworth town in Warwick District Councils adopted Local Plan, Kenilworth School and Sixth Form are leading on a project to relocate and expand the school. Approval is sought to allocate funds to Kenilworth School to be used during the master planning and land acquisition stages of the Kenilworth School relocation and expansion project. This is in addition to the £113,827 of developer funding from two agreements in the Kenilworth area that received approval in December 2017. The remaining funding associated with the project is expected from a combination of the sale of the existing school sites for housing development and future developer contributions. Any further use of Capital Resources or Developer Funding will be subject to a report to cabinet at a later stage. It is proposed to allocate:
Education Capital Resources £96,540
03 Schools Capital Programme Cab 18.02.15 6 of 15
3.6 Barford St. Peter's C.Of E. Primary School, Barford As a result of housing development in the area, Barford St Peter’s C.Of.E Primary School
was provided with an additional classroom to enable the school to operate as a one form entry primary school (210 pupils) from September 2016. This would allow the school to accommodate an additional 70 pupils.
With the current school capacity of 210 pupils plus the adjoining nursery, the school will
need to produce approximately 200 full service meals per day. The existing facilities in the school currently prevent the school from doing this effectively and as part of the school expansion it is proposed to replace and extend the kitchen and servery at the front of the site.
There are developer funds available from development in Barford village that can be
utilised to fund the project. The project will be undertaken by It is proposed to allocate:
Developer Funding £230,000
3.7 Coleshill C Of E Primary School, Coleshill The Coleshill Planning Area is experiencing increased in year pressure, particularly within Coleshill Town, as a result of a small amount of housing development and movement of pupils within the County.
In November 2017, Cabinet gave approval for the age range of High Meadow Infant to be extended to create a 1FE primary school and therefore increasing capacity by an additional 120 places across the school. Coleshill C of E Primary School took a bulge class for Reception 2016 and Reception 2017. To continue to build capacity back into the Coleshill area and address the pressure from in-year movement, it is proposed to provide an additional class base at Coleshill Primary School to allow the school to admit up to 2FE. These additional pupils will initially be admitted as bulge classes whilst the proposal at High Meadow Infant School is finalised. Consultation will be needed to make the additional capacity permanent. It is proposed to allocate:
Education capital resources £300,000

03 Schools Capital Programme Cab 18.02.15 7 of 15
3.8 Developer Funding to Education and Skills Funding Agency (ESFA), New Primary School Meon Vale
The Department for Education (DfE) have recently approved Tudor Grange Academies Trust as a sponsor to open a new school at Meon Vale, Stratford on Avon. The Education Skills Funding Agency (ESFA) is working alongside WCC and Tudor Grange Academies Trust in order that the school can open in September 2019 Land for the new primary school will be transferred to WCC as identified within an existing S106 Agreement with the Developer. The ESFA will forward fund and deliver the project for September 2019, subject to planning. Developer funding, as identified in the S106 Agreement, once received by WCC, will be transferred to ESFA to support the development of the school. The school site is retained by WCC and will be leased to the ESFA.
It is proposed to allocate up to:
Developer Funding £1,200,000
3.9 Developer Funding to Education and Skills Funding Agency (ESFA), New Primary
School Lower Farm, Nuneaton
The Department for Education (DfE) have recently approved REAch2 as a sponsor to open a new school in Nuneaton. The Education Skills Funding Agency (ESFA) is working alongside WCC and REAch2 in that order the school can open in September 2019. Land for the new primary school has been transferred to WCC and the ESFA will forward fund and deliver the project for September 2019, subject to planning. Developer funding, as identified in S106 agreements and once received, will be transferred to ESFA to support the development of the school. The school site is retained by WCC and will be leased to the ESFA. It is proposed to allocate up to: Developer Funding £1,300,000
3.10 DfE Special Provision Fund: Exhall Grange School and Science College, Oak wood Primary School and Oak Wood Secondary School
On 4 March 2017 the Department for Education (DfE) announced the ‘special provision fund’ allocations, to support local authorities (LAs) to make capital investments in provision for pupils with special educational needs and disabilities. Local authorities can invest in new places and improvements to facilities for pupils with education, health and
03 Schools Capital Programme Cab 18.02.15 8 of 15
care (EHC) plans in mainstream and special schools, nurseries, colleges and other provision. WCC Cabinet were notified of this funding in the Education & Learning (Schools) Capital Programme report approved on the 9th November 2017. The funding, totalling £1,273,573 over three years, 2018-21, arrives in three annual sums of £424,524. The first instalment of £424,524 is due to be received Summer 2018. As reported in the Draft Education & Learning Sufficiency Strategy 2017-22 there is severe pressure on Warwickshire’s Special Schools caused by steep increases in demand and wider population growth. This funding is therefore being prioritised for expansion of special schools, and approval is sought for the following proposals in sections 3.11 and 3.12
3.11 Exhall Grange School and Science College, Ash Green This school provides a County-wide service for pupils ranging in age from 2 to 19 years. The school meets the needs of pupils with a visual impairment, physical disabilities, complex medical needs and social communication difficulties including autism, who are able to access the national curriculum. As the school provides a service across the County this expansion would be of benefit to a wide range of areas. The school has recently retaken possession of part of the school premises that had been in use as office accommodation for third parties. Capital funding will enable reconfiguration of this space (the ‘Canterbury Wing’) to provide accommodation for the 6th Form enabling expansion of circa 12-16 places taking the up to a total of 50 places. This would in-turn free-up space to create two additional classrooms for approximately 24 pupils. This requires the reconfiguration of existing and installation of two additional toilets. The school also manages and operates a satellite Learning Pod on Packington Lane, Coleshill for learners with acute mental health needs, the majority of whom have been in in-patient psychiatric care. In order to further enhance this model of provision to benefit a wider range of learners and to improve pathways back in to education for learners who have been out of school, the school wishes to develop facilities on the school site to relocate the provision. This would reduce transportation costs and enable the Coleshill site to be transferred to another provider for educational use. The alterations proposed could increase the total number of pupils at the school by more than 10% or 20 pupils (whichever is the lesser) therefore a statutory process will need to be followed and a consultation undertaken. Cabinet approval is sought to carry out a consultation on the proposed increase in pupil numbers at Exhall Grange School and Science College.
03 Schools Capital Programme Cab 18.02.15 9 of 15
3.12 Oak Wood Primary and Secondary Special Schools, Nuneaton There are particular pressures on special school capacity in Nuneaton & Bedworth, and lack of capacity in the area is exacerbating transport costs of learners forced to travel to special schools in other areas. This capital funding would enable the school to reconfigure existing space within the school by relocating office accommodation and converting the ICT room in order to create 3 additional classrooms. One classroom would be for the primary school (an additional 8-10 pupils), the other two for secondary, one of which would be configured for learners with profound and multiple learning difficulties (PMLD), adding capacity for circa 16 pupils. This allocation of funding builds upon the Education Capital funding agreed in a previous report presented to Cabinet in November 2017 approving a two classroom expansion to address the urgent need for places. It is proposed to allocate: Special Provision Fund Contribution £85,000
4.0 Finance 4.1 Details of currently available capital funding are listed in section 2 of the report. This
available funding is a total of £2,870,689. 4.2 The project costs outlined within this report total £3,076,540, of which £230,000 is from
developer funding, and £2,846,540 is from Education capital resources. 4.3 This leaves a balance of £24,149 for future education capital projects. All future capital
projects would be subject to a separate report to Cabinet. 4.4 The report has outlined details of how the first instalment of the DfE Special Provision
Capital Fund allocation will be spent once received in summer 2018 4.4 See Appendix 1 for breakdown of income and expenditure. 5. Revenue Implications 5.1 Where schools are expanding at the request of the Local Authority, there is often a
revenue implication in that additional teaching staff are required in the September but the schools budget does not reflect this until the following April. The Schools Forum have agreed a policy to provide interim funding to schools to account for this and resources
03 Schools Capital Programme Cab 18.02.15 10 of 15
are provided from within the Dedicated Schools Grant (DSG). The schools noted in this report for expansion will be included in the relevant DSG budgets presented to the Forum for approval. However, it should be noted that the additional revenue costs associated with school expansions do put additional pressure on the DSG budgets which can contribute to DSG overspends.
6.0 Timescales associated with the decision and next steps 6.1 The Government is reviewing the responsibilities of local authorities in relation to
children, although responsibility for ensuring every child has a school place and ensuring the needs of vulnerable learners are met are expected to remain. Any implications for the proposals in this report that may arise as further details of these future proposals emerge will be brought back to Elected Members.
7.0 Background papers 7.1 None Name Contact Information Report Authors Emma Basden-Smith
Bern Timings
[email protected] 01926 74 2058 [email protected] 01926 74 2073
Head of Service Chris Malone Head of Education and Learning
[email protected] 01926 74 2588
Joint Managing Directors David Carter Monica Fogarty
[email protected] [email protected]
Portfolio Holder Cllr Colin Hayfield
Appendices Appendix 1 – Finance Breakdown Appendix 2 – Consultation responses for Round Oak School Appendix 3 – EQIA
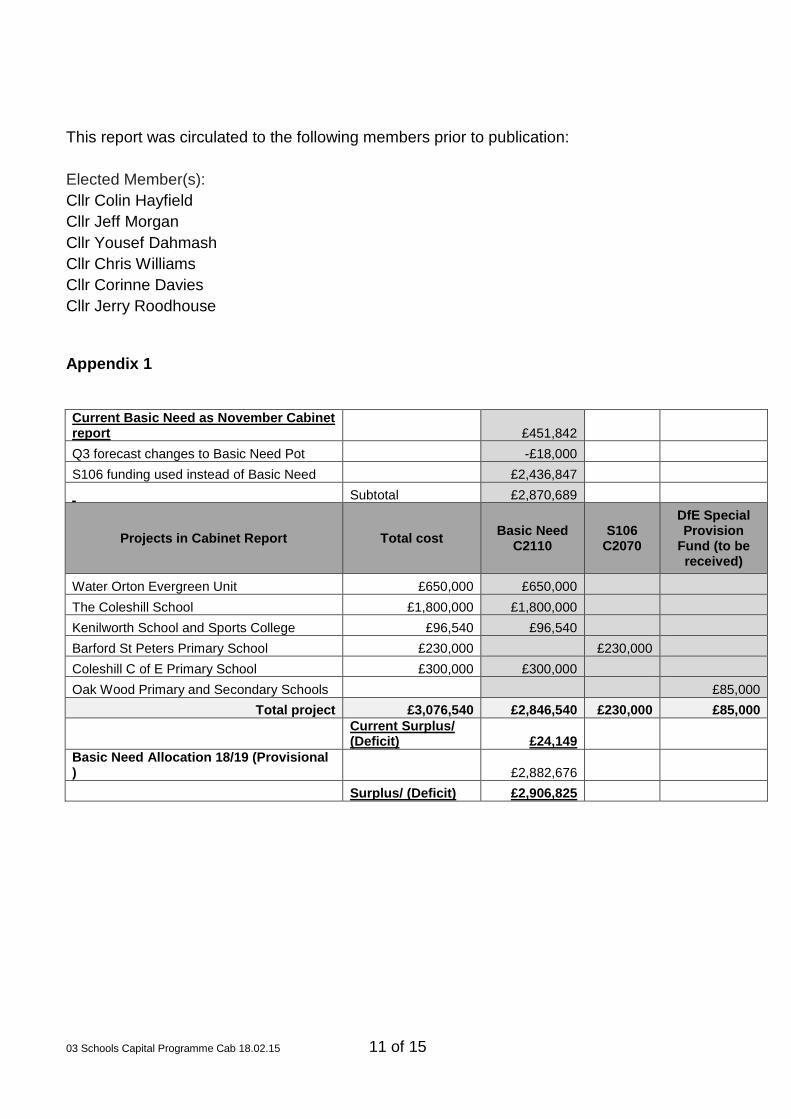
03 Schools Capital Programme Cab 18.02.15 11 of 15
This report was circulated to the following members prior to publication: Elected Member(s): Cllr Colin Hayfield Cllr Jeff Morgan Cllr Yousef Dahmash Cllr Chris Williams Cllr Corinne Davies Cllr Jerry Roodhouse Appendix 1
Current Basic Need as November Cabinet report £451,842 Q3 forecast changes to Basic Need Pot -£18,000 S106 funding used instead of Basic Need £2,436,847 Subtotal £2,870,689
Projects in Cabinet Report Total cost Basic Need C2110
S106 C2070
DfE Special Provision
Fund (to be received)
Water Orton Evergreen Unit £650,000 £650,000 The Coleshill School £1,800,000 £1,800,000 Kenilworth School and Sports College £96,540 £96,540 Barford St Peters Primary School £230,000 £230,000 Coleshill C of E Primary School £300,000 £300,000 Oak Wood Primary and Secondary Schools £85,000
Total project £3,076,540 £2,846,540 £230,000 £85,000
Current Surplus/ (Deficit) £24,149
Basic Need Allocation 18/19 (Provisional ) £2,882,676 Surplus/ (Deficit) £2,906,825
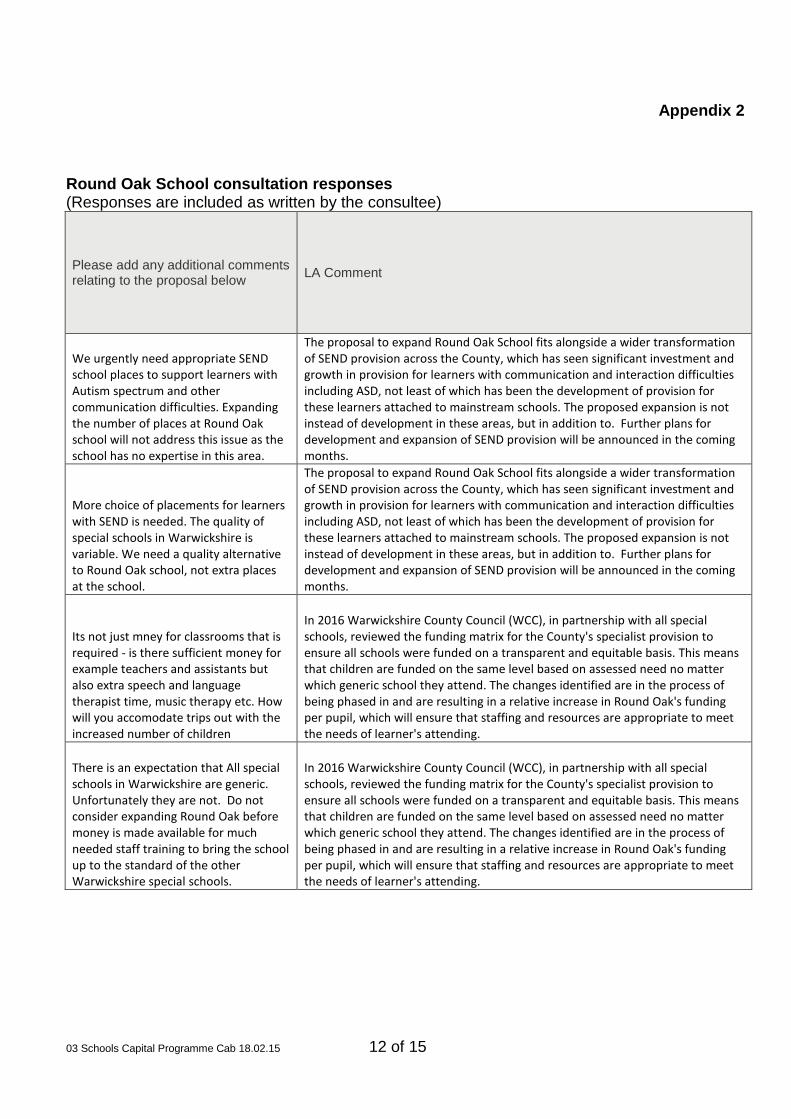
03 Schools Capital Programme Cab 18.02.15 12 of 15
Appendix 2 Round Oak School consultation responses (Responses are included as written by the consultee)
Please add any additional comments relating to the proposal below LA Comment
We urgently need appropriate SEND school places to support learners with Autism spectrum and other communication difficulties. Expanding the number of places at Round Oak school will not address this issue as the school has no expertise in this area.
The proposal to expand Round Oak School fits alongside a wider transformation of SEND provision across the County, which has seen significant investment and growth in provision for learners with communication and interaction difficulties including ASD, not least of which has been the development of provision for these learners attached to mainstream schools. The proposed expansion is not instead of development in these areas, but in addition to. Further plans for development and expansion of SEND provision will be announced in the coming months.
More choice of placements for learners with SEND is needed. The quality of special schools in Warwickshire is variable. We need a quality alternative to Round Oak school, not extra places at the school.
The proposal to expand Round Oak School fits alongside a wider transformation of SEND provision across the County, which has seen significant investment and growth in provision for learners with communication and interaction difficulties including ASD, not least of which has been the development of provision for these learners attached to mainstream schools. The proposed expansion is not instead of development in these areas, but in addition to. Further plans for development and expansion of SEND provision will be announced in the coming months.
Its not just mney for classrooms that is required - is there sufficient money for example teachers and assistants but also extra speech and language therapist time, music therapy etc. How will you accomodate trips out with the increased number of children
In 2016 Warwickshire County Council (WCC), in partnership with all special schools, reviewed the funding matrix for the County's specialist provision to ensure all schools were funded on a transparent and equitable basis. This means that children are funded on the same level based on assessed need no matter which generic school they attend. The changes identified are in the process of being phased in and are resulting in a relative increase in Round Oak's funding per pupil, which will ensure that staffing and resources are appropriate to meet the needs of learner's attending.
There is an expectation that All special schools in Warwickshire are generic. Unfortunately they are not. Do not consider expanding Round Oak before money is made available for much needed staff training to bring the school up to the standard of the other Warwickshire special schools.
In 2016 Warwickshire County Council (WCC), in partnership with all special schools, reviewed the funding matrix for the County's specialist provision to ensure all schools were funded on a transparent and equitable basis. This means that children are funded on the same level based on assessed need no matter which generic school they attend. The changes identified are in the process of being phased in and are resulting in a relative increase in Round Oak's funding per pupil, which will ensure that staffing and resources are appropriate to meet the needs of learner's attending.
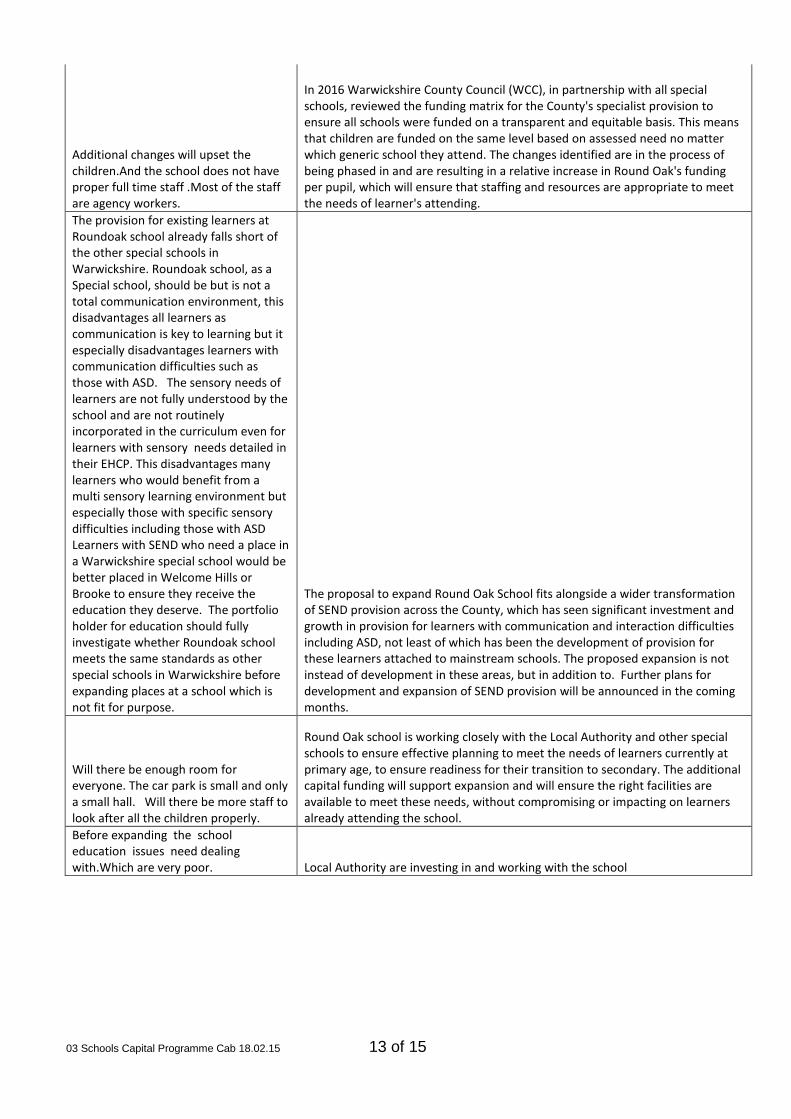
03 Schools Capital Programme Cab 18.02.15 13 of 15
Additional changes will upset the children.And the school does not have proper full time staff .Most of the staff are agency workers.
In 2016 Warwickshire County Council (WCC), in partnership with all special schools, reviewed the funding matrix for the County's specialist provision to ensure all schools were funded on a transparent and equitable basis. This means that children are funded on the same level based on assessed need no matter which generic school they attend. The changes identified are in the process of being phased in and are resulting in a relative increase in Round Oak's funding per pupil, which will ensure that staffing and resources are appropriate to meet the needs of learner's attending.
The provision for existing learners at Roundoak school already falls short of the other special schools in Warwickshire. Roundoak school, as a Special school, should be but is not a total communication environment, this disadvantages all learners as communication is key to learning but it especially disadvantages learners with communication difficulties such as those with ASD. The sensory needs of learners are not fully understood by the school and are not routinely incorporated in the curriculum even for learners with sensory needs detailed in their EHCP. This disadvantages many learners who would benefit from a multi sensory learning environment but especially those with specific sensory difficulties including those with ASD Learners with SEND who need a place in a Warwickshire special school would be better placed in Welcome Hills or Brooke to ensure they receive the education they deserve. The portfolio holder for education should fully investigate whether Roundoak school meets the same standards as other special schools in Warwickshire before expanding places at a school which is not fit for purpose.
The proposal to expand Round Oak School fits alongside a wider transformation of SEND provision across the County, which has seen significant investment and growth in provision for learners with communication and interaction difficulties including ASD, not least of which has been the development of provision for these learners attached to mainstream schools. The proposed expansion is not instead of development in these areas, but in addition to. Further plans for development and expansion of SEND provision will be announced in the coming months.
Will there be enough room for everyone. The car park is small and only a small hall. Will there be more staff to look after all the children properly.
Round Oak school is working closely with the Local Authority and other special schools to ensure effective planning to meet the needs of learners currently at primary age, to ensure readiness for their transition to secondary. The additional capital funding will support expansion and will ensure the right facilities are available to meet these needs, without compromising or impacting on learners already attending the school.
Before expanding the school education issues need dealing with.Which are very poor. Local Authority are investing in and working with the school
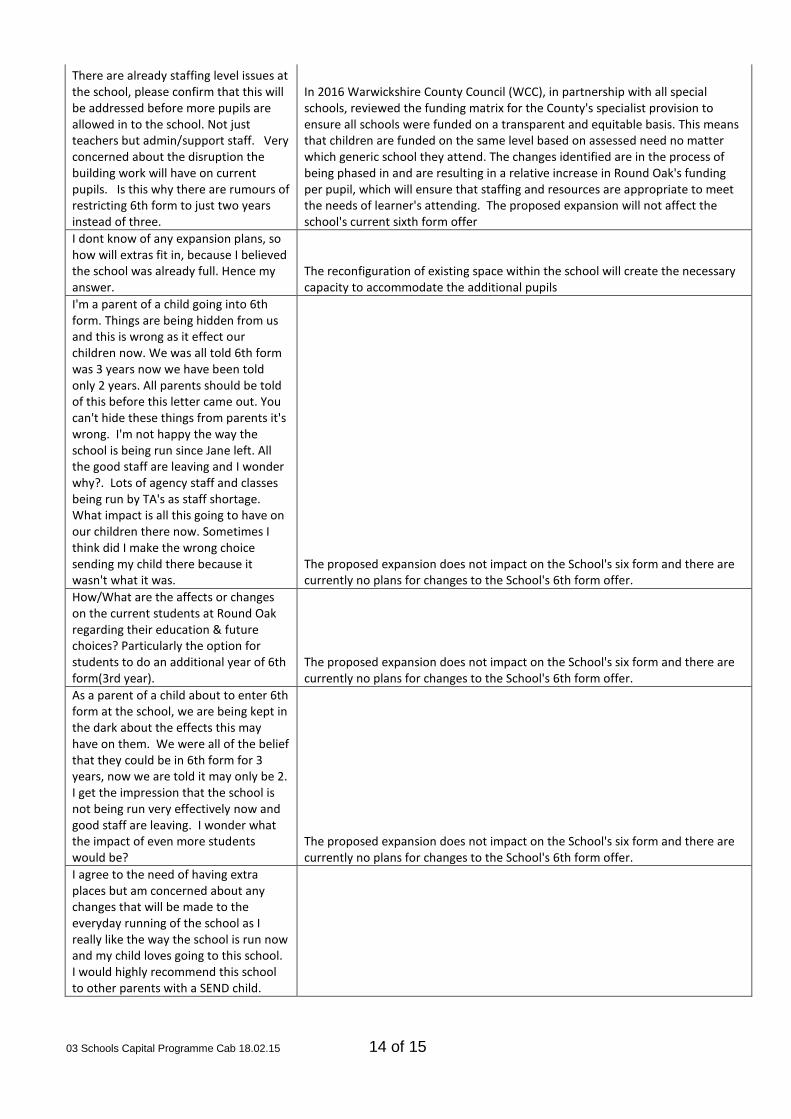
03 Schools Capital Programme Cab 18.02.15 14 of 15
There are already staffing level issues at the school, please confirm that this will be addressed before more pupils are allowed in to the school. Not just teachers but admin/support staff. Very concerned about the disruption the building work will have on current pupils. Is this why there are rumours of restricting 6th form to just two years instead of three.
In 2016 Warwickshire County Council (WCC), in partnership with all special schools, reviewed the funding matrix for the County's specialist provision to ensure all schools were funded on a transparent and equitable basis. This means that children are funded on the same level based on assessed need no matter which generic school they attend. The changes identified are in the process of being phased in and are resulting in a relative increase in Round Oak's funding per pupil, which will ensure that staffing and resources are appropriate to meet the needs of learner's attending. The proposed expansion will not affect the school's current sixth form offer
I dont know of any expansion plans, so how will extras fit in, because I believed the school was already full. Hence my answer.
The reconfiguration of existing space within the school will create the necessary capacity to accommodate the additional pupils
I'm a parent of a child going into 6th form. Things are being hidden from us and this is wrong as it effect our children now. We was all told 6th form was 3 years now we have been told only 2 years. All parents should be told of this before this letter came out. You can't hide these things from parents it's wrong. I'm not happy the way the school is being run since Jane left. All the good staff are leaving and I wonder why?. Lots of agency staff and classes being run by TA's as staff shortage. What impact is all this going to have on our children there now. Sometimes I think did I make the wrong choice sending my child there because it wasn't what it was.
The proposed expansion does not impact on the School's six form and there are currently no plans for changes to the School's 6th form offer.
How/What are the affects or changes on the current students at Round Oak regarding their education & future choices? Particularly the option for students to do an additional year of 6th form(3rd year).
The proposed expansion does not impact on the School's six form and there are currently no plans for changes to the School's 6th form offer.
As a parent of a child about to enter 6th form at the school, we are being kept in the dark about the effects this may have on them. We were all of the belief that they could be in 6th form for 3 years, now we are told it may only be 2. I get the impression that the school is not being run very effectively now and good staff are leaving. I wonder what the impact of even more students would be?
The proposed expansion does not impact on the School's six form and there are currently no plans for changes to the School's 6th form offer.
I agree to the need of having extra places but am concerned about any changes that will be made to the everyday running of the school as I really like the way the school is run now and my child loves going to this school. I would highly recommend this school to other parents with a SEND child.
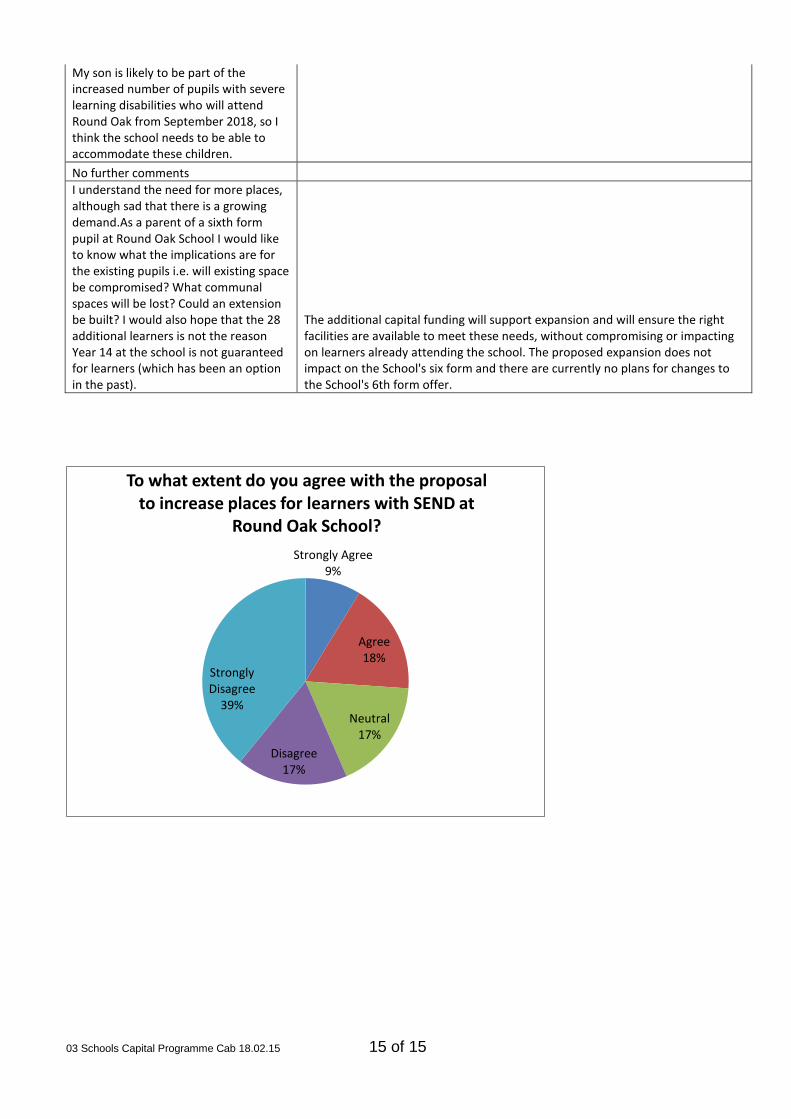
03 Schools Capital Programme Cab 18.02.15 15 of 15
My son is likely to be part of the increased number of pupils with severe learning disabilities who will attend Round Oak from September 2018, so I think the school needs to be able to accommodate these children. No further comments I understand the need for more places, although sad that there is a growing demand.As a parent of a sixth form pupil at Round Oak School I would like to know what the implications are for the existing pupils i.e. will existing space be compromised? What communal spaces will be lost? Could an extension be built? I would also hope that the 28 additional learners is not the reason Year 14 at the school is not guaranteed for learners (which has been an option in the past).
The additional capital funding will support expansion and will ensure the right facilities are available to meet these needs, without compromising or impacting on learners already attending the school. The proposed expansion does not impact on the School's six form and there are currently no plans for changes to the School's 6th form offer.
Strongly Agree 9%
Agree 18%
Neutral 17%
Disagree 17%
Strongly Disagree
39%
To what extent do you agree with the proposal to increase places for learners with SEND at
Round Oak School?
Appendix E
EQUALITY IMPACT ASSESSMENT/ ANALYSIS (EqIA)
Education and Learning Schools Capital Programme
This EqIA is a working document and therefore subject to continual review, amendment and refinement.
Warwickshire County Council
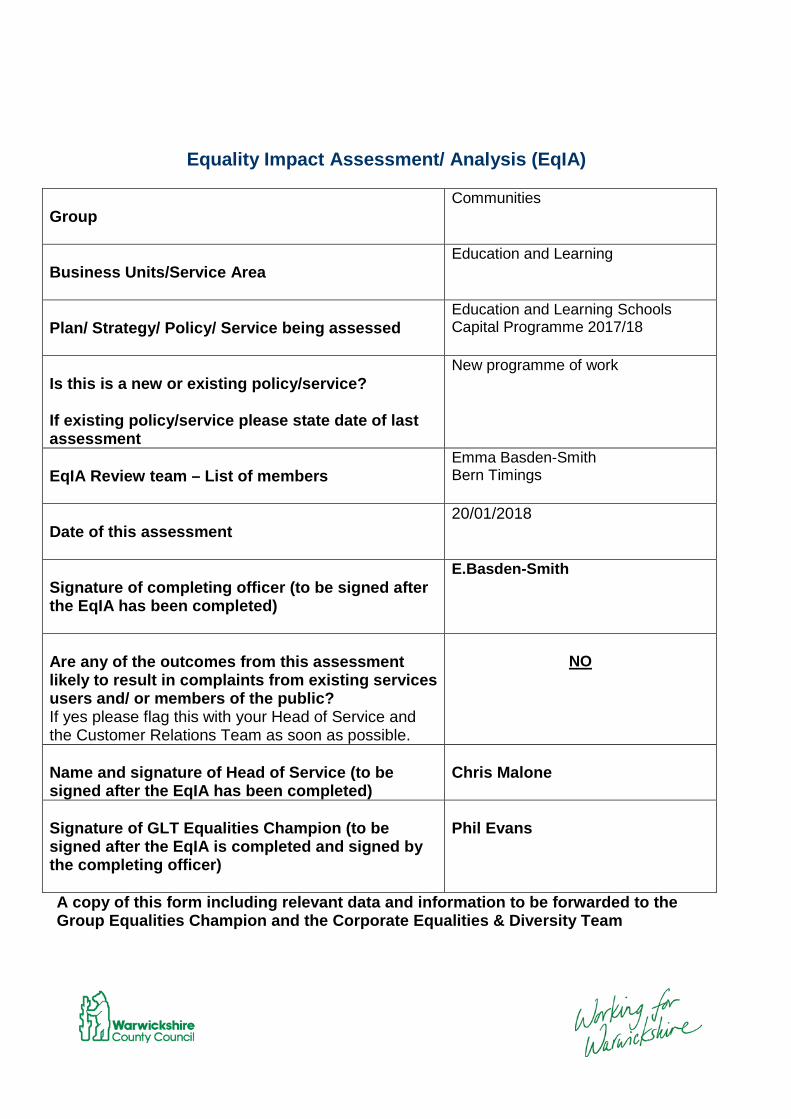
Appendix E
Equality Impact Assessment/ Analysis (EqIA)
Group
Communities
Business Units/Service Area
Education and Learning
Plan/ Strategy/ Policy/ Service being assessed
Education and Learning Schools Capital Programme 2017/18
Is this is a new or existing policy/service? If existing policy/service please state date of last assessment
New programme of work
EqIA Review team – List of members
Emma Basden-Smith Bern Timings
Date of this assessment
20/01/2018
Signature of completing officer (to be signed after the EqIA has been completed)
E.Basden-Smith
Are any of the outcomes from this assessment likely to result in complaints from existing services users and/ or members of the public? If yes please flag this with your Head of Service and the Customer Relations Team as soon as possible.
NO
Name and signature of Head of Service (to be signed after the EqIA has been completed)
Chris Malone
Signature of GLT Equalities Champion (to be signed after the EqIA is completed and signed by the completing officer)
Phil Evans
A copy of this form including relevant data and information to be forwarded to the Group Equalities Champion and the Corporate Equalities & Diversity Team
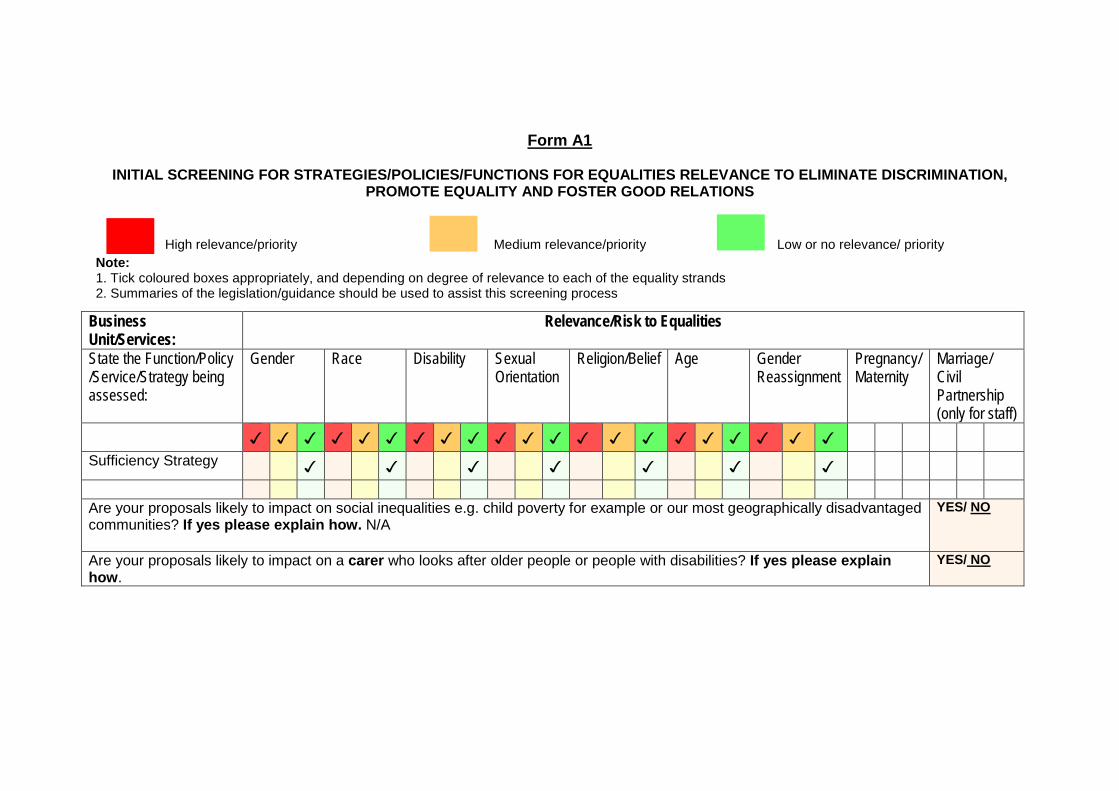
Appendix E
Form A1
INITIAL SCREENING FOR STRATEGIES/POLICIES/FUNCTIONS FOR EQUALITIES RELEVANCE TO ELIMINATE DISCRIMINATION, PROMOTE EQUALITY AND FOSTER GOOD RELATIONS
High relevance/priority Medium relevance/priority Low or no relevance/ priority
Note: 1. Tick coloured boxes appropriately, and depending on degree of relevance to each of the equality strands 2. Summaries of the legislation/guidance should be used to assist this screening process
Business Unit/Services:
Relevance/Risk to Equalities
State the Function/Policy /Service/Strategy being assessed:
Gender Race Disability Sexual Orientation
Religion/Belief Age Gender Reassignment
Pregnancy/ Maternity
Marriage/ Civil Partnership (only for staff)
✓ ✓ ✓ ✓ ✓ ✓ ✓ ✓ ✓ ✓ ✓ ✓ ✓ ✓ ✓ ✓ ✓ ✓ ✓ ✓ ✓
Sufficiency Strategy ✓ ✓ ✓ ✓ ✓ ✓ ✓
Are your proposals likely to impact on social inequalities e.g. child poverty for example or our most geographically disadvantaged communities? If yes please explain how. N/A
YES/ NO
Are your proposals likely to impact on a carer who looks after older people or people with disabilities? If yes please explain how.
YES/ NO
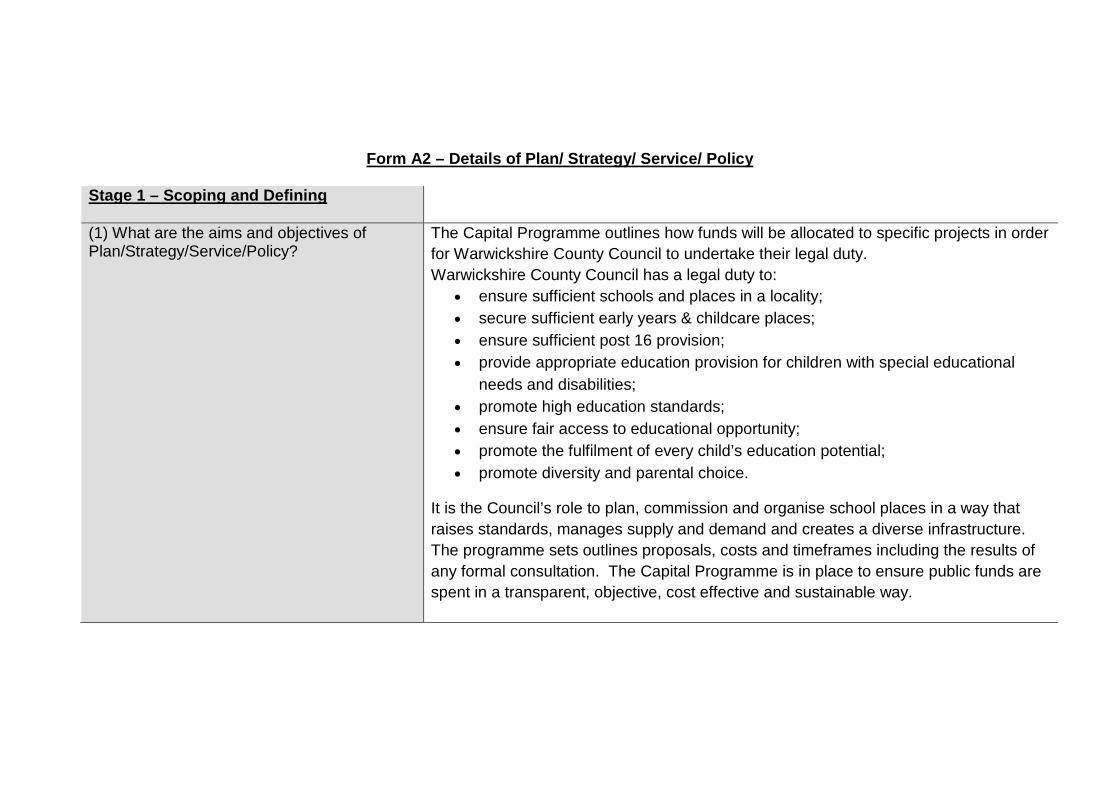
Appendix E
Form A2 – Details of Plan/ Strategy/ Service/ Policy
Stage 1 – Scoping and Defining
(1) What are the aims and objectives of Plan/Strategy/Service/Policy?
The Capital Programme outlines how funds will be allocated to specific projects in order for Warwickshire County Council to undertake their legal duty. Warwickshire County Council has a legal duty to:
• ensure sufficient schools and places in a locality; • secure sufficient early years & childcare places; • ensure sufficient post 16 provision; • provide appropriate education provision for children with special educational
needs and disabilities; • promote high education standards; • ensure fair access to educational opportunity; • promote the fulfilment of every child’s education potential; • promote diversity and parental choice.
It is the Council’s role to plan, commission and organise school places in a way that raises standards, manages supply and demand and creates a diverse infrastructure. The programme sets outlines proposals, costs and timeframes including the results of any formal consultation. The Capital Programme is in place to ensure public funds are spent in a transparent, objective, cost effective and sustainable way.
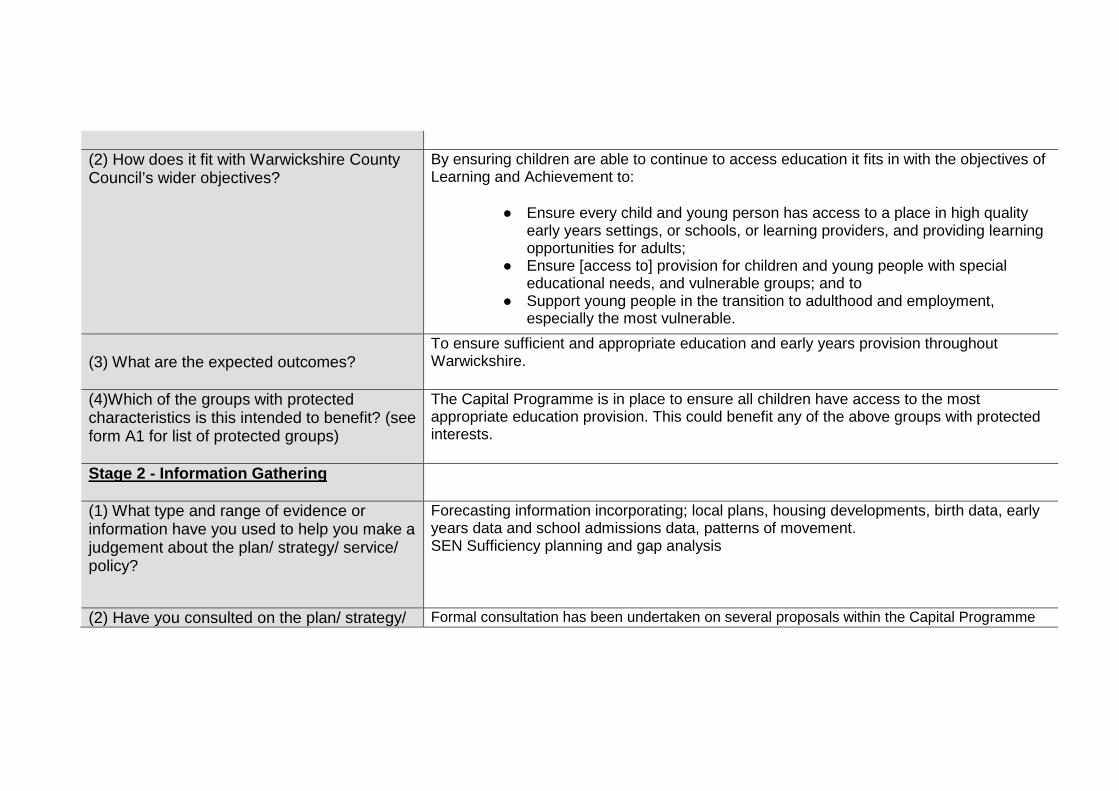
Appendix E
(2) How does it fit with Warwickshire County Council’s wider objectives?
By ensuring children are able to continue to access education it fits in with the objectives of Learning and Achievement to:
● Ensure every child and young person has access to a place in high quality early years settings, or schools, or learning providers, and providing learning opportunities for adults;
● Ensure [access to] provision for children and young people with special educational needs, and vulnerable groups; and to
● Support young people in the transition to adulthood and employment, especially the most vulnerable.
(3) What are the expected outcomes?
To ensure sufficient and appropriate education and early years provision throughout Warwickshire.
(4)Which of the groups with protected characteristics is this intended to benefit? (see form A1 for list of protected groups)
The Capital Programme is in place to ensure all children have access to the most appropriate education provision. This could benefit any of the above groups with protected interests.
Stage 2 - Information Gathering
(1) What type and range of evidence or information have you used to help you make a judgement about the plan/ strategy/ service/ policy?
Forecasting information incorporating; local plans, housing developments, birth data, early years data and school admissions data, patterns of movement. SEN Sufficiency planning and gap analysis
(2) Have you consulted on the plan/ strategy/ Formal consultation has been undertaken on several proposals within the Capital Programme
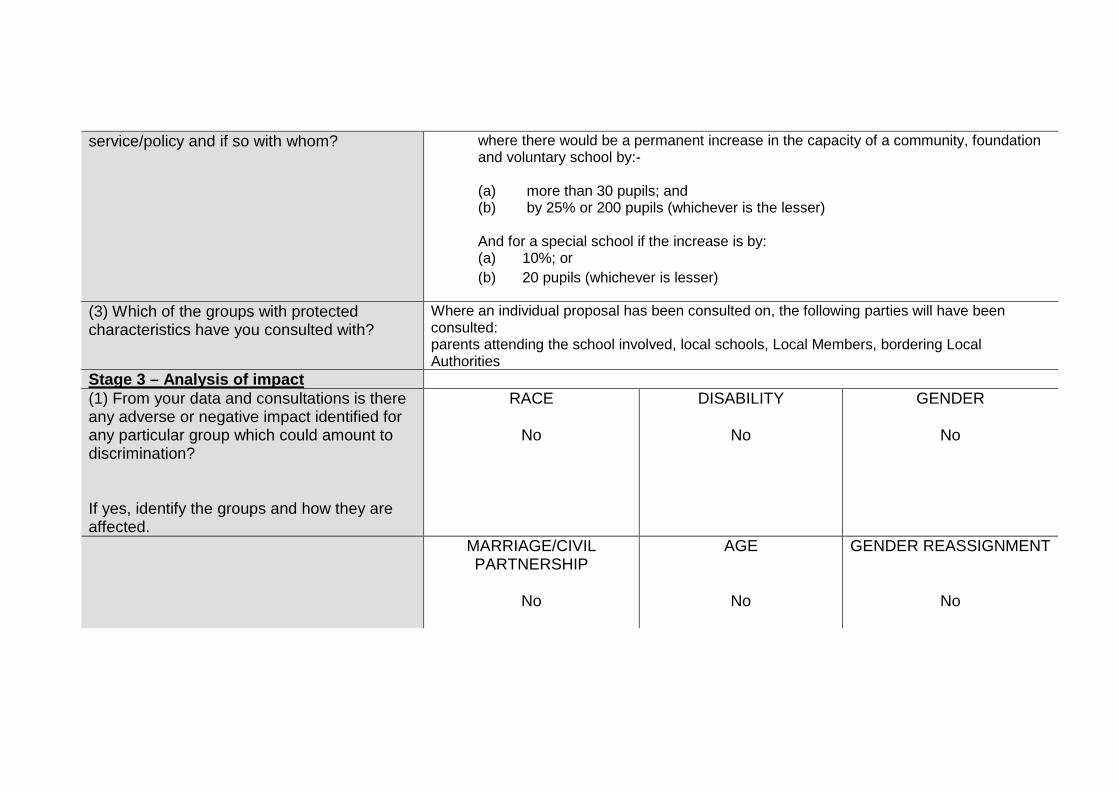
Appendix E
service/policy and if so with whom?
where there would be a permanent increase in the capacity of a community, foundation and voluntary school by:-
(a) more than 30 pupils; and (b) by 25% or 200 pupils (whichever is the lesser) And for a special school if the increase is by: (a) 10%; or (b) 20 pupils (whichever is lesser)
(3) Which of the groups with protected characteristics have you consulted with?
Where an individual proposal has been consulted on, the following parties will have been consulted: parents attending the school involved, local schools, Local Members, bordering Local Authorities
Stage 3 – Analysis of impact (1) From your data and consultations is there any adverse or negative impact identified for any particular group which could amount to discrimination? If yes, identify the groups and how they are affected.
RACE
No
DISABILITY
No
GENDER
No
MARRIAGE/CIVIL PARTNERSHIP
No
AGE
No
GENDER REASSIGNMENT
No
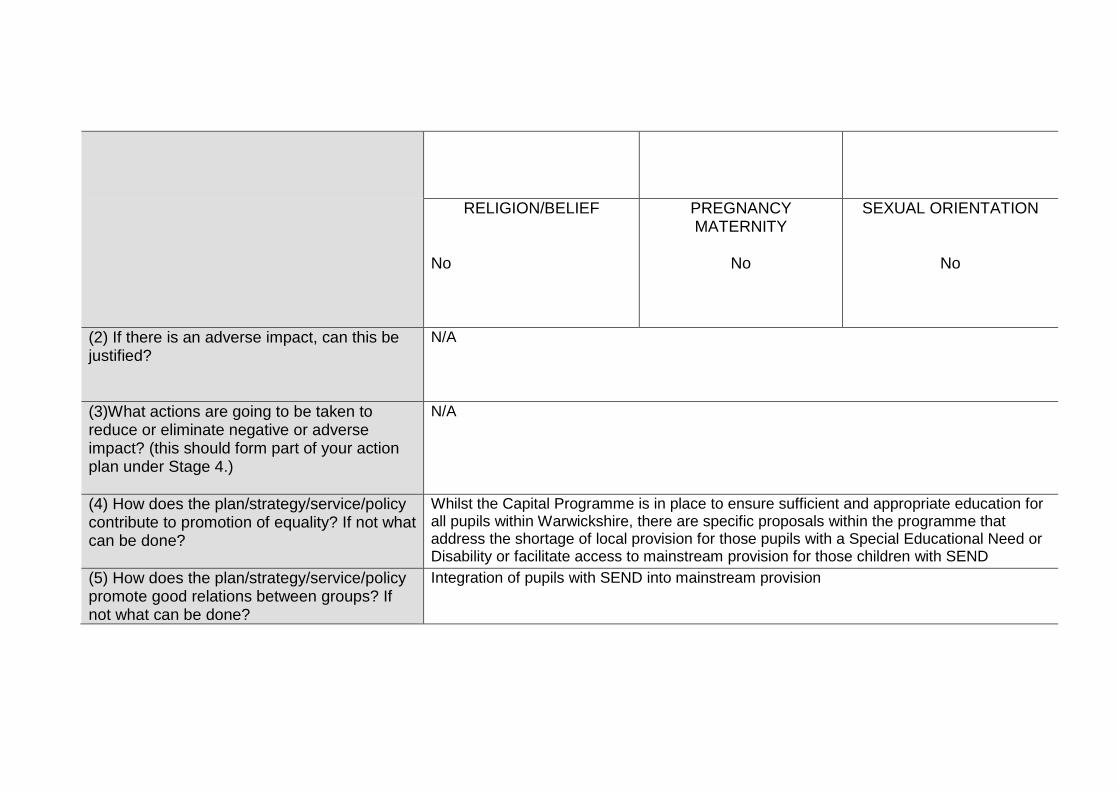
Appendix E
RELIGION/BELIEF
No
PREGNANCY MATERNITY
No
SEXUAL ORIENTATION
No
(2) If there is an adverse impact, can this be justified?
N/A
(3)What actions are going to be taken to reduce or eliminate negative or adverse impact? (this should form part of your action plan under Stage 4.)
N/A
(4) How does the plan/strategy/service/policy contribute to promotion of equality? If not what can be done?
Whilst the Capital Programme is in place to ensure sufficient and appropriate education for all pupils within Warwickshire, there are specific proposals within the programme that address the shortage of local provision for those pupils with a Special Educational Need or Disability or facilitate access to mainstream provision for those children with SEND
(5) How does the plan/strategy/service/policy promote good relations between groups? If not what can be done?
Integration of pupils with SEND into mainstream provision
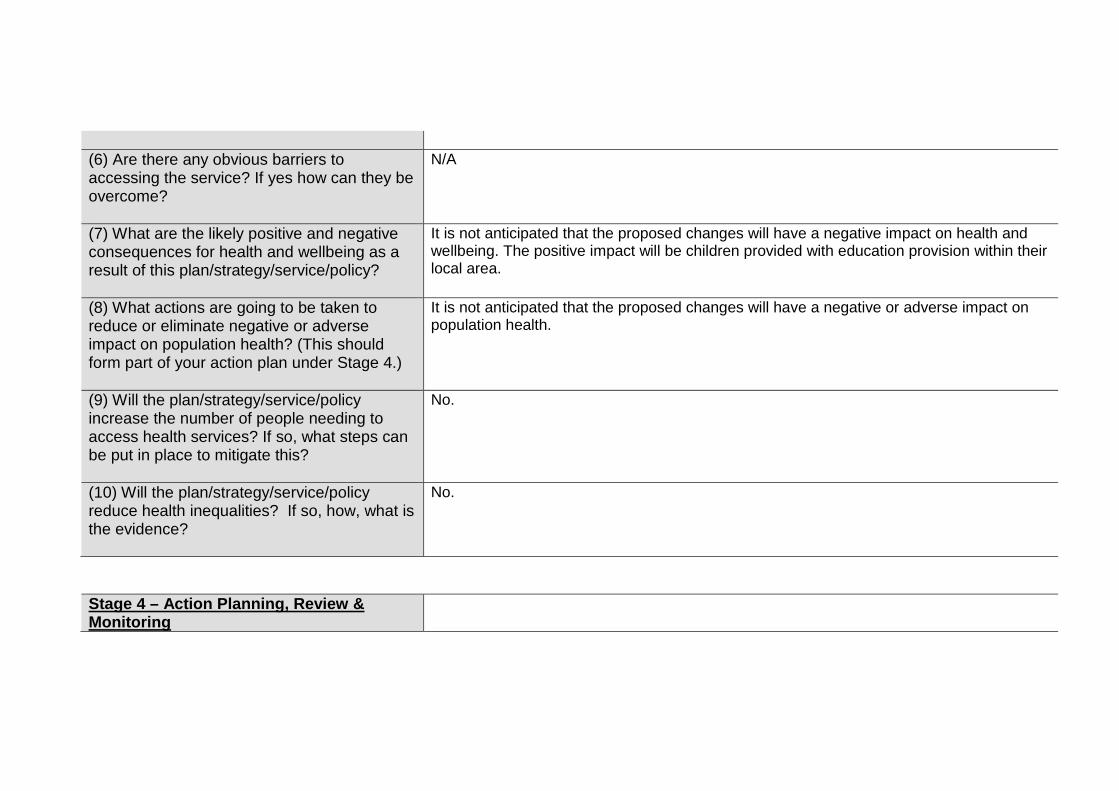
Appendix E
(6) Are there any obvious barriers to accessing the service? If yes how can they be overcome?
N/A
(7) What are the likely positive and negative consequences for health and wellbeing as a result of this plan/strategy/service/policy?
It is not anticipated that the proposed changes will have a negative impact on health and wellbeing. The positive impact will be children provided with education provision within their local area.
(8) What actions are going to be taken to reduce or eliminate negative or adverse impact on population health? (This should form part of your action plan under Stage 4.)
It is not anticipated that the proposed changes will have a negative or adverse impact on population health.
(9) Will the plan/strategy/service/policy increase the number of people needing to access health services? If so, what steps can be put in place to mitigate this?
No.
(10) Will the plan/strategy/service/policy reduce health inequalities? If so, how, what is the evidence?
No.
Stage 4 – Action Planning, Review & Monitoring
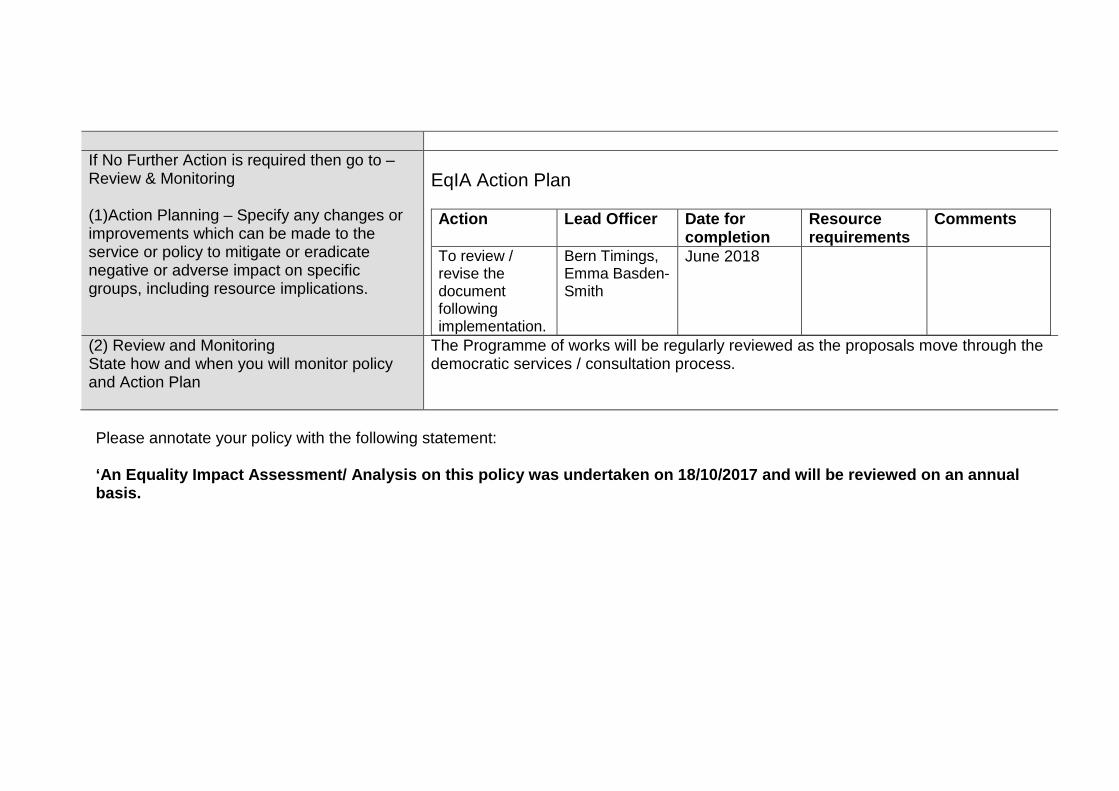
Appendix E
If No Further Action is required then go to – Review & Monitoring (1)Action Planning – Specify any changes or improvements which can be made to the service or policy to mitigate or eradicate negative or adverse impact on specific groups, including resource implications.
EqIA Action Plan Action Lead Officer Date for
completion Resource requirements
Comments
To review / revise the document following implementation.
Bern Timings, Emma Basden-Smith
June 2018
(2) Review and Monitoring State how and when you will monitor policy and Action Plan
The Programme of works will be regularly reviewed as the proposals move through the democratic services / consultation process.
Please annotate your policy with the following statement: ‘An Equality Impact Assessment/ Analysis on this policy was undertaken on 18/10/2017 and will be reviewed on an annual basis.
04 Rural Growth Plan Cab 18.02.15 1 of 4
Item 4
Cabinet
15 February 2018
Warwickshire Rural Growth Plan
Recommendation That Cabinet adopt WCC Rural Growth Plan 2017- 2020.
1.0 Context 1.1 Warwickshire County has a rich and natural heritage, combined with global
tourism. As a place, Warwickshire inspires its visitors and plays a major role in determining where people choose to live, work and enjoy leisure time.
1.2 Over one third of the Warwickshire population and 37% of Warwickshire businesses are located within rural areas. Warwickshire’s rural economy has a strong and diverse business base, many of which have a significant growth potential.
1.3 There are a range of social and community issues that affect both rural and urban life in Warwickshire. These issues can be more pronounced in rural areas and are often more challenging to deal with. For example, Warwickshire’s rural areas contain an increasing aging population and some areas are struggling to retain or attract young people to live and work locally. Access to work, services and training can be difficult, coupled with high housing costs.
1.4 The Warwickshire Rural Growth Plan provides the opportunity to put a spotlight on rural Warwickshire and to pledge our support for a vibrant and diverse rural economy.
2.0 Background 2.1 Warwickshire County Council supports the rural economy in many ways,
including having successfully delivered a range of business support to rural businesses, invested in the roll-out of super-fast broadband and tailored services to ensure accessibility in rural areas.
2.2 Over the last 18 months we have engaged with over 70 stakeholders, listened
and identified the key issues affecting those who live and work in our rural areas. Alongside reviewing the County Council’s activity in rural areas, the rural growth plan now identifies achievements - where things are going well
04 Rural Growth Plan Cab 18.02.15 2 of 4
and key issues where it is felt a focus of action is required to ensure a continued sustainable and viable future for rural Warwickshire.
3. The Rural Growth Plan 3.1 The Warwickshire Rural Growth Plan focusses on 7 key themes. 3.2 These are:
1) Supporting the growth of business in rural areas 2) Tackling skills gaps 3) Enhancing rural tourism 4) Increasing digital connectivity 5) Supporting innovation in rural areas, particularly in agriculture and the
agri food and drink sectors 6) Maximising Warwickshire’s natural assets and heritage 7) Improving access to services and community networks
3.3 These themes complement the ambitions of the Coventry and Warwickshire
Strategic Economic Plan which recognises the potential of Warwickshire’s rural areas, including the major contribution of culture and tourism to the economy.
3.4 The County Council’s pledge to support a vibrant and diverse rural economy
means that the Council will deliver on the key themes by:
• Working more closely and coordinating with our partners so that the whole of our activity is more than the sum of the parts
• Ensuring our activity adds value and complements Defra’s 10 point rural productivity plan and the Coventry and Warwickshire strategic economic plan (attached appendix B).
• Looking at cross border solutions with neighbouring authorities and those shires further afield, where there are shared rural agendas and joint solutions to be found
4.0 Next Steps 4.1 The media launch of the Rural Growth Plan will be a notable milestone in
raising awareness of the contribution which the rural economy makes to Warwickshire. The media launch of the Growth plan is to be arranged to take place in February 2018.
4.2 Working with partners, we will implement and monitor the Warwickshire Rural
Growth Plan and ensure that the Council’s activities complement and help grow the rural economy.
04 Rural Growth Plan Cab 18.02.15 3 of 4
4.3 The impact of the Rural Growth Plan will be monitored annually. Monitoring will be undertaken by the WCC internal officers Rural Working Group through a process of evaluating the challenges and actions as detailed within the report.
4.4 To avoid duplication and ensure a robust approach to project evaluation, the
work undertaken by the Rural Working Group will dovetail and support existing monitoring arrangements put in place by additional work streams and projects.
5. Equality Impact Assessment (EqIA) 5.1 An Equality Impact Assessment of the Rural Growth Plan was undertaken in
November 2017 and will be reviewed in Jan 2019. The Draft EqIA is attached at Appendix C.
6. Conclusion 6.1 The Rural Growth Plan puts a spot light on rural Warwickshire and seeks to
ensure that the Council’s limited resources and activities are focused where they can add most value.
6.2 In adopting the Rural Growth Plan the Council’s will highlight its support to the
rural economy. It will give stakeholders and partners clarity of the Council’s commitment.
7. Financial Implications 7.1 Implementation and monitoring of the Rural Growth Plan will be done utilising
existing resources and staff. No additional budget pressures have been identified in implementing and promoting the production of the Rural Growth Plan.
8. Background Papers 8.1 None Appendices
1. Warwickshire Rural Growth Plan 2017-2020 2. A) Coventry and Warwickshire strategic economic plan and B) Defra’s 10
point rural productivity plan 3. Draft Equality Impact Assessment
04 Rural Growth Plan Cab 18.02.15 4 of 4
Name Contact Information Report Author Chris Egan [email protected]
Tel: 01926 41 2813 Head of Service Mark Ryder [email protected]
Tel: 01926 412811 Joint Managing Director
Monica Fogarty [email protected] Tel: 01926 412514
Portfolio Holder Cllr Izzi Seccobme Economy Cllr Jeff Clarke Transport and Envionment
[email protected] [email protected]
The report was circulated to the following members prior to publication: Local Member(s): N/A Other members: Councillors Chattaway, Butlin, Boad, Shilton, Clarke, Fradgley, Horner, Seccombe, O’Rourke, Singh Birdi, Timms
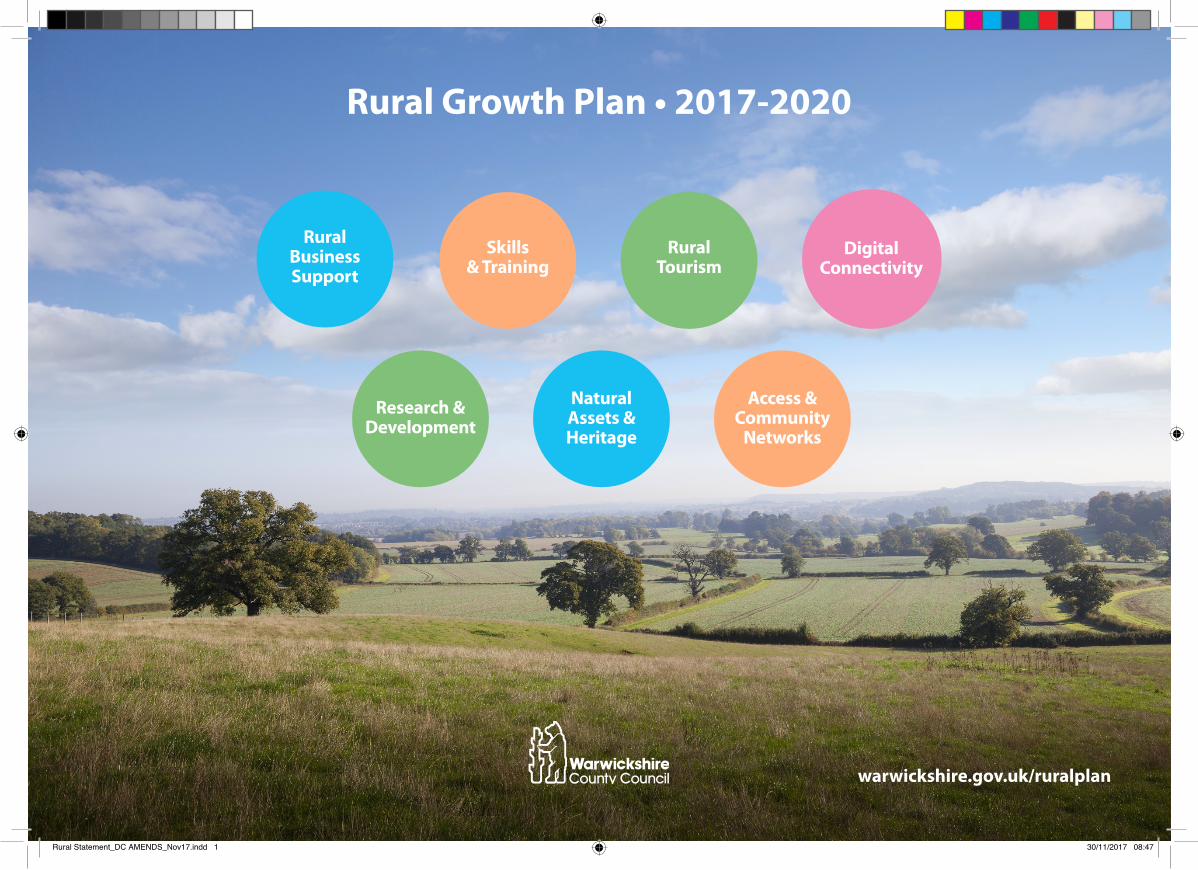
Rural Growth Plan • 2017-2020
Rural Business Support
Skills & Training
Rural Tourism
Digital Connectivity
Research & Development
Natural Assets & Heritage
Access &Community
Networks
warwickshire.gov.uk/ruralplan
Rural Statement_DC AMENDS_Nov17.indd 1 30/11/2017 08:47

Note for readers:All information & statistics were correct at the time of going to print – Feb 2017
Rural Statement_DC AMENDS_Nov17.indd 2 30/11/2017 08:47

Rural Business Support
Skills & Training
Rural Tourism
Digital Connectivity
Research & Development
Natural Assets & Heritage
Access &Community
Networks
I am pleased to introduce this Rural Growth Plan. The partnership influenced plan sets out Warwickshire County Council’s priorities for supporting and sustaining our unique rural areas. Rural Warwickshire is home to a wide range of businesses, from forestry and food production, arable and dairy farms, to highly specialised design and manufacturing companies and tourism businesses - to mention just a few. 37% of Warwickshire’s businesses are located in our rural areas and the rural economy makes up 34% of the County’s total output (£3.9billion), more than double the UK average for rural areas.
Our Growth Plan focuses on 7 key issues. These complement the ambitions of the Coventry & Warwickshire Strategic Economic Plan which recognises the potential inherent in Warwickshire’s rural areas, including the major contribution of culture & tourism to the economy. As we continue to work as part of the West Midlands Combined Authority, the contribution of key sites such as Stoneleigh Park as a developing science and innovation park of national significance, become ever important in contributing to increased regional productivity.
Our Rural Growth Plan is intended to put a spotlight on rural Warwickshire, to give it a louder voice and to ensure we focus the Council’s own limited resources and activities where we can add most value. Working with over 70 partners, we will ensure our own activity complements, helping to grow our rural economy, whilst supporting sustainable communities. I wish to thank all those that have contributed to this Rural Growth Plan. Working together I know that we can continue to achieve sustainable economic growth in our rural areas, whilst continuing to be stewards of our countryside.
Cllr Izzie Seccombe Leader, Warwickshire County Council , Nov 2017
One of the stated ambitions of the Coventry and Warwickshire LEP is ‘to create an environment in which SMEs can grow and prosper’. Although many of us would not necessarily think of farms as SMEs, they are important rural businesses and remain the fabric that holds the rural economy together. Indeed, the incentive for farmers to diversify their businesses has contributed greatly to the growth of a new, vibrant rural economy.
Warwickshire’s unique landscape has been sculpted over centuries by farming practice and is admired by residents, visitors and investors from home and abroad. This Rural Growth Plan articulates the importance of the physical environment, in which we live, work and play. Conserving our rural setting, which is actively managed and supported by the farming community, underpins the wider economic ambitions of both the Council and the CWLEP.
The next few years will be challenging as we start to exit the EU. Nonetheless, the agricultural sector is determined to make the most of the new trading opportunities, post-Brexit, and the Rural Growth Plan will help it to maximise its inherent talent for entrepreneurship which, in turn, will support the plan’s objectives to boost growth. Farmers provide the environmental bedrock of the rural economy and when one thrives, they both thrive.
Paul Rice Head of Agriculture, Wright Hassall LLP and member of the CWLEP SME Group
1
Rural Statement_DC AMENDS_Nov17.indd 3 30/11/2017 08:47
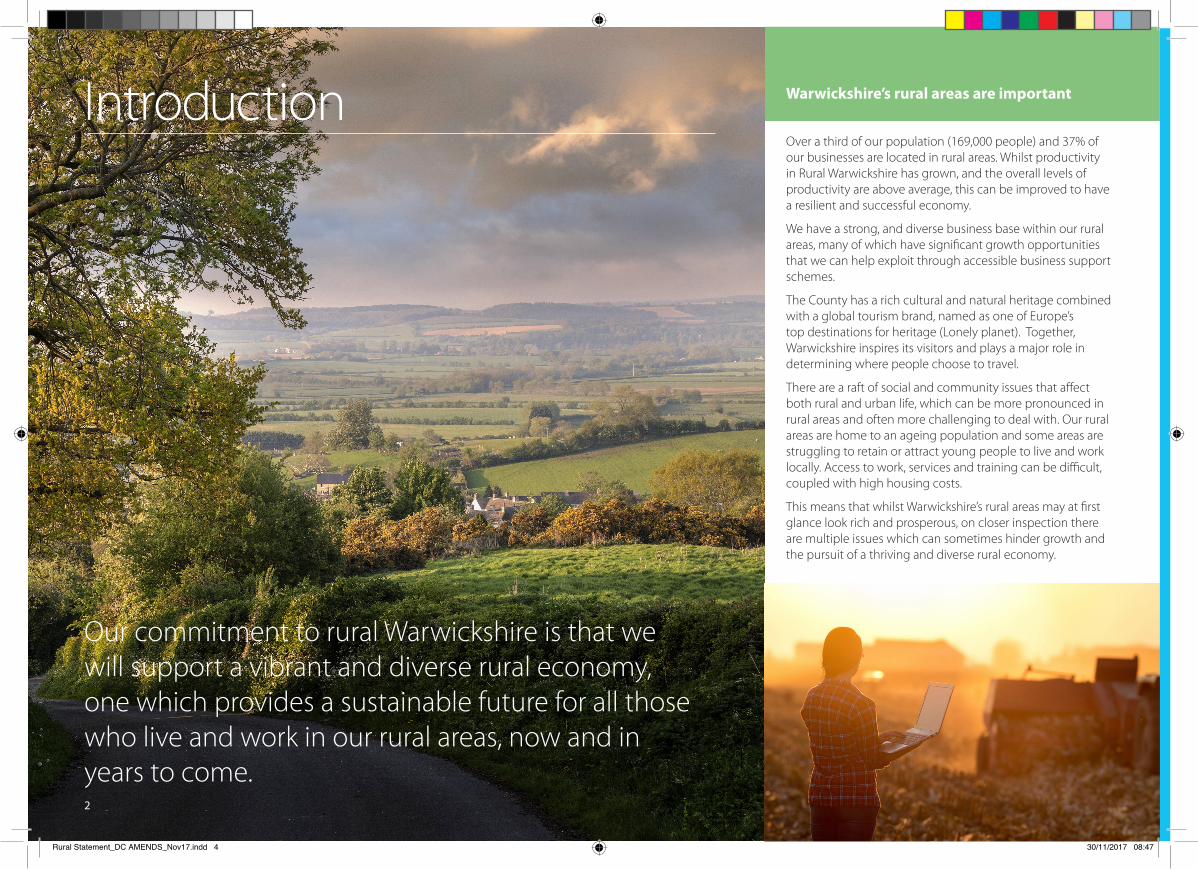
Introduction Warwickshire’s rural areas are important
Over a third of our population (169,000 people) and 37% of our businesses are located in rural areas. Whilst productivity in Rural Warwickshire has grown, and the overall levels of productivity are above average, this can be improved to have a resilient and successful economy.
We have a strong, and diverse business base within our rural areas, many of which have significant growth opportunities that we can help exploit through accessible business support schemes.
The County has a rich cultural and natural heritage combined with a global tourism brand, named as one of Europe’s top destinations for heritage (Lonely planet). Together, Warwickshire inspires its visitors and plays a major role in determining where people choose to travel.
There are a raft of social and community issues that affect both rural and urban life, which can be more pronounced in rural areas and often more challenging to deal with. Our rural areas are home to an ageing population and some areas are struggling to retain or attract young people to live and work locally. Access to work, services and training can be difficult, coupled with high housing costs.
This means that whilst Warwickshire’s rural areas may at first glance look rich and prosperous, on closer inspection there are multiple issues which can sometimes hinder growth and the pursuit of a thriving and diverse rural economy.
Our commitment to rural Warwickshire is that we will support a vibrant and diverse rural economy, one which provides a sustainable future for all those who live and work in our rural areas, now and in years to come. 2
Rural Statement_DC AMENDS_Nov17.indd 4 30/11/2017 08:47
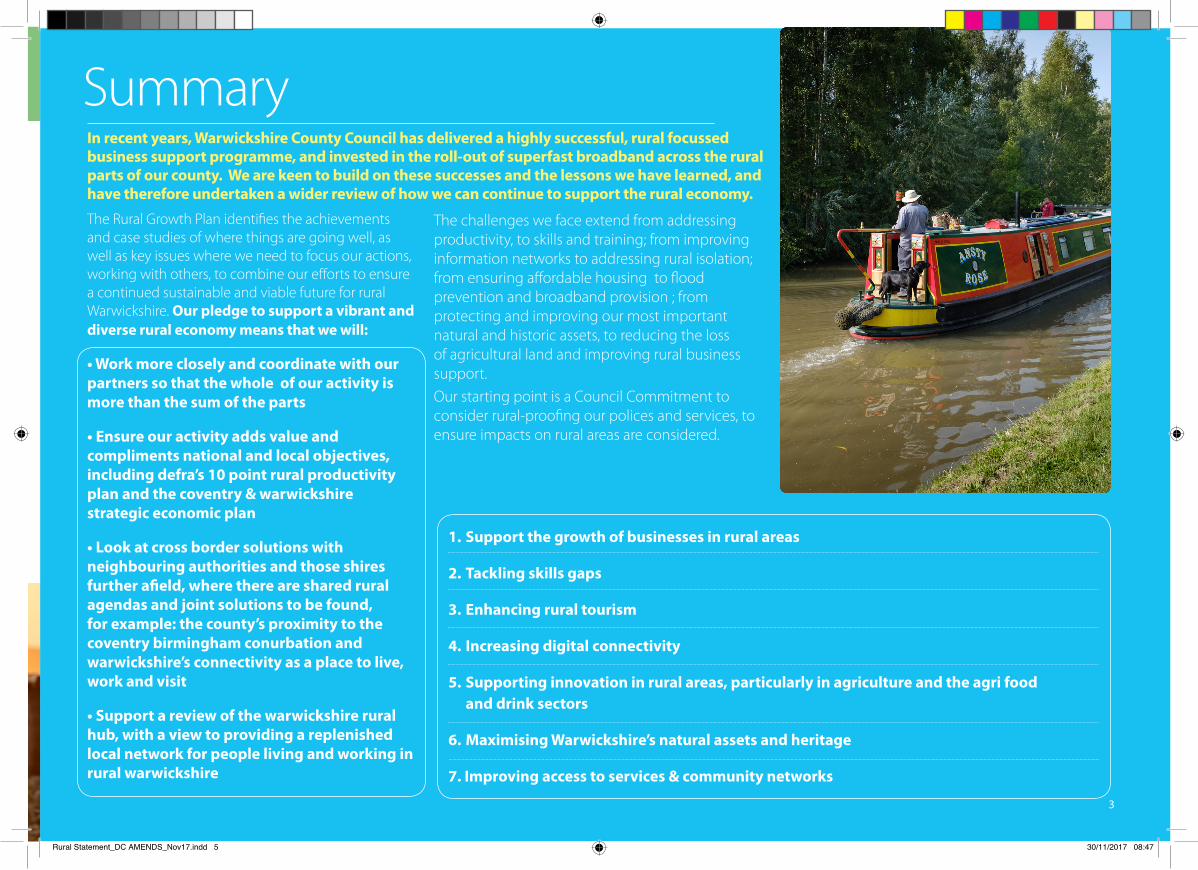
The challenges we face extend from addressing productivity, to skills and training; from improving information networks to addressing rural isolation; from ensuring affordable housing to flood prevention and broadband provision ; from protecting and improving our most important natural and historic assets, to reducing the loss of agricultural land and improving rural business support. Our starting point is a Council Commitment to consider rural-proofing our polices and services, to ensure impacts on rural areas are considered.
3
In recent years, Warwickshire County Council has delivered a highly successful, rural focussed business support programme, and invested in the roll-out of superfast broadband across the rural parts of our county. We are keen to build on these successes and the lessons we have learned, and have therefore undertaken a wider review of how we can continue to support the rural economy.
The Rural Growth Plan identifies the achievements and case studies of where things are going well, as well as key issues where we need to focus our actions, working with others, to combine our efforts to ensure a continued sustainable and viable future for rural Warwickshire. Our pledge to support a vibrant and diverse rural economy means that we will:
• Work more closely and coordinate with our partners so that the whole of our activity is more than the sum of the parts
• Ensure our activity adds value and compliments national and local objectives, including defra’s 10 point rural productivity plan and the coventry & warwickshire strategic economic plan
• Look at cross border solutions with neighbouring authorities and those shires further afield, where there are shared rural agendas and joint solutions to be found, for example: the county’s proximity to the coventry birmingham conurbation and warwickshire’s connectivity as a place to live, work and visit
• Support a review of the warwickshire rural hub, with a view to providing a replenished local network for people living and working in rural warwickshire
1. Support the growth of businesses in rural areas
2. Tackling skills gaps
3. Enhancing rural tourism
4. Increasing digital connectivity
5. Supporting innovation in rural areas, particularly in agriculture and the agri food and drink sectors
6. Maximising Warwickshire’s natural assets and heritage
7. Improving access to services & community networks
Summary
Rural Statement_DC AMENDS_Nov17.indd 5 30/11/2017 08:47
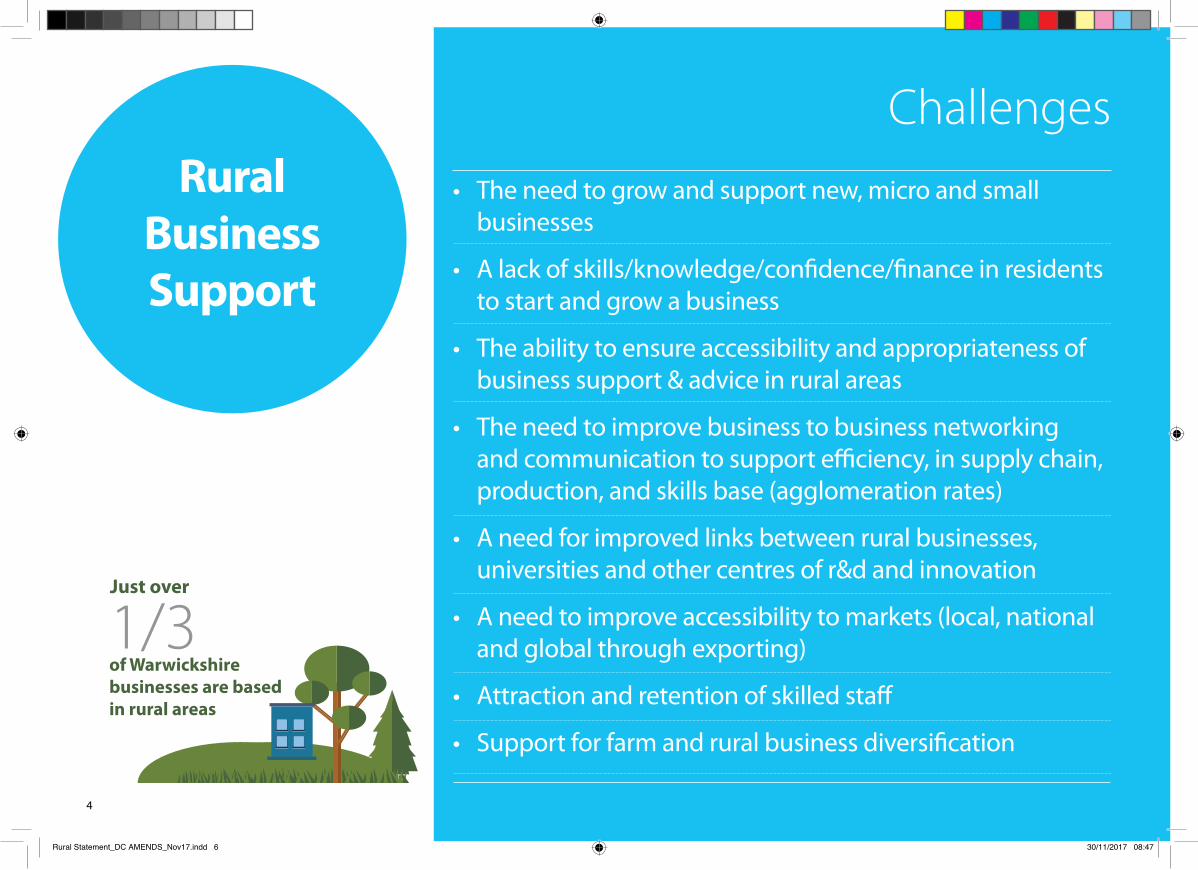
• The need to grow and support new, micro and small businesses
• A lack of skills/knowledge/confidence/finance in residents to start and grow a business
• The ability to ensure accessibility and appropriateness of business support & advice in rural areas
• The need to improve business to business networking and communication to support efficiency, in supply chain, production, and skills base (agglomeration rates)
• A need for improved links between rural businesses, universities and other centres of r&d and innovation
• A need to improve accessibility to markets (local, national and global through exporting)
• Attraction and retention of skilled staff
• Support for farm and rural business diversification
Rural Business Support
Challenges
4
1/3of Warwickshire businesses are based in rural areas
Just over
Rural Statement_DC AMENDS_Nov17.indd 6 30/11/2017 08:47
Warwickshire’s urban areas are forecast to grow 4% faster on average than rural areas over the next 20 years (2015 to 2035)
Actions• Build on lessons learnt from
the Warwickshire Rural Growth Network pilot, and ensure new £3.4m county-wide business support programme effectively addresses the needs and opportunities within our rural areas
• Work with key partners and providers of wider business support activity to help them deliver within our rural areas, and monitor delivery
• Work with Coventry & Warwickshire Local Enterprise Partnership area partners and Defra/Rural Payments Agency to promote and deliver the European Agricultural Fund for Rural Development programme across rural Warwickshire to support growth
• Help businesses in rural areas access finance, and ensure that WCC’s Capital Growth Fund (grants and loans to businesses) is accessible to, and utilised by, businesses in our rural areas
• Support North Warwickshire Borough Council with delivery of the £1.4m LEADER programme to support rural areas
• Monitor and review delivery of business support programmes, identifying any gaps in provision against identified need/demand
• Seek to improve business to business engagement and activity
• Work with the Coventry & Warwickshire Growth Hub to ensure effective communication and engagement with businesses across our rural areas
• Support and encourage development of knowledge transfer and innovation activity within rural areas
Warwickshire’s urban areas are forecast to grow 4% faster on average than rural areas over the next 20 years (2015 to 2035)
5
Rural Statement_DC AMENDS_Nov17.indd 7 30/11/2017 08:47
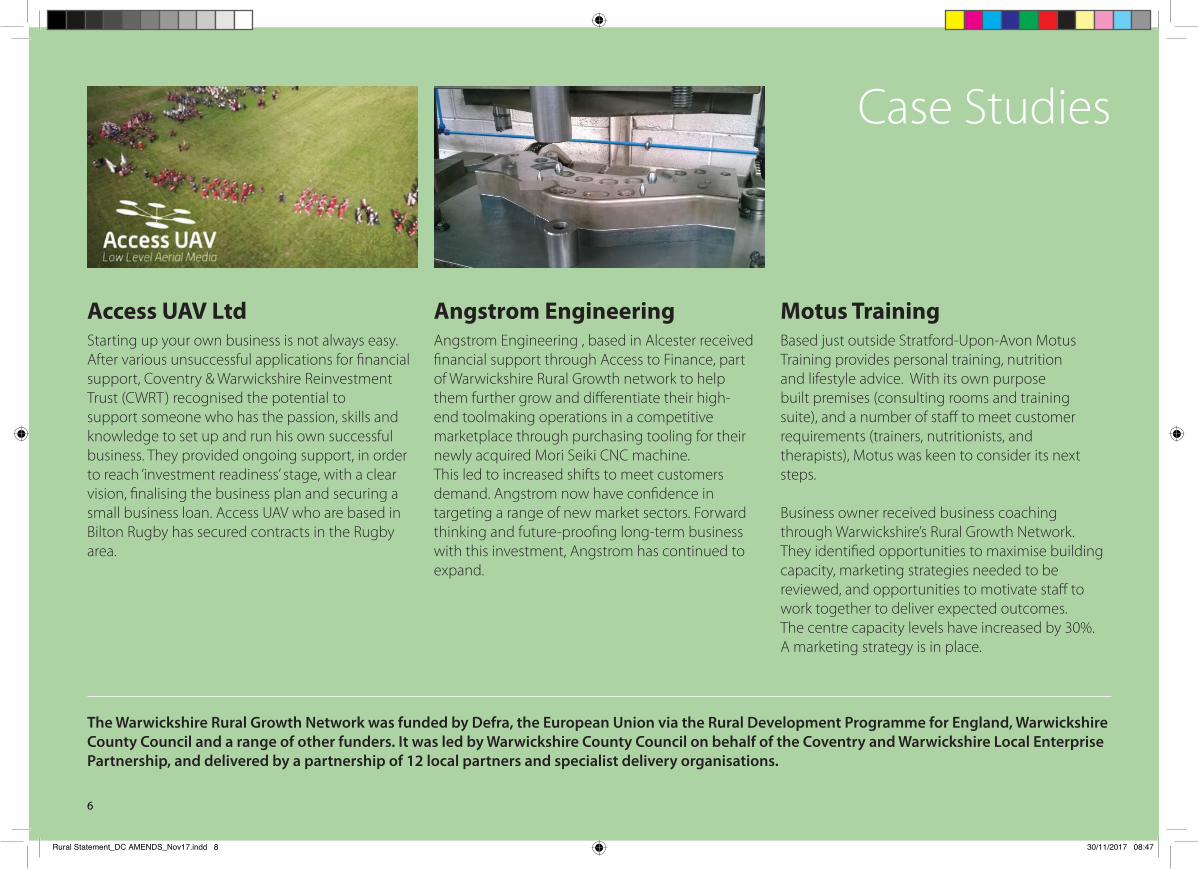
Case Studies
Access UAV LtdStarting up your own business is not always easy. After various unsuccessful applications for financial support, Coventry & Warwickshire Reinvestment Trust (CWRT) recognised the potential to support someone who has the passion, skills and knowledge to set up and run his own successful business. They provided ongoing support, in order to reach ‘investment readiness’ stage, with a clear vision, finalising the business plan and securing a small business loan. Access UAV who are based in Bilton Rugby has secured contracts in the Rugby area.
Angstrom EngineeringAngstrom Engineering , based in Alcester received financial support through Access to Finance, part of Warwickshire Rural Growth network to help them further grow and differentiate their high-end toolmaking operations in a competitive marketplace through purchasing tooling for their newly acquired Mori Seiki CNC machine.This led to increased shifts to meet customers demand. Angstrom now have confidence in targeting a range of new market sectors. Forward thinking and future-proofing long-term business with this investment, Angstrom has continued to expand.
Motus TrainingBased just outside Stratford-Upon-Avon Motus Training provides personal training, nutrition and lifestyle advice. With its own purpose built premises (consulting rooms and training suite), and a number of staff to meet customer requirements (trainers, nutritionists, and therapists), Motus was keen to consider its next steps.
Business owner received business coaching through Warwickshire’s Rural Growth Network. They identified opportunities to maximise building capacity, marketing strategies needed to be reviewed, and opportunities to motivate staff to work together to deliver expected outcomes.The centre capacity levels have increased by 30%. A marketing strategy is in place.
The Warwickshire Rural Growth Network was funded by Defra, the European Union via the Rural Development Programme for England, Warwickshire County Council and a range of other funders. It was led by Warwickshire County Council on behalf of the Coventry and Warwickshire Local Enterprise Partnership, and delivered by a partnership of 12 local partners and specialist delivery organisations.
6
Rural Statement_DC AMENDS_Nov17.indd 8 30/11/2017 08:47
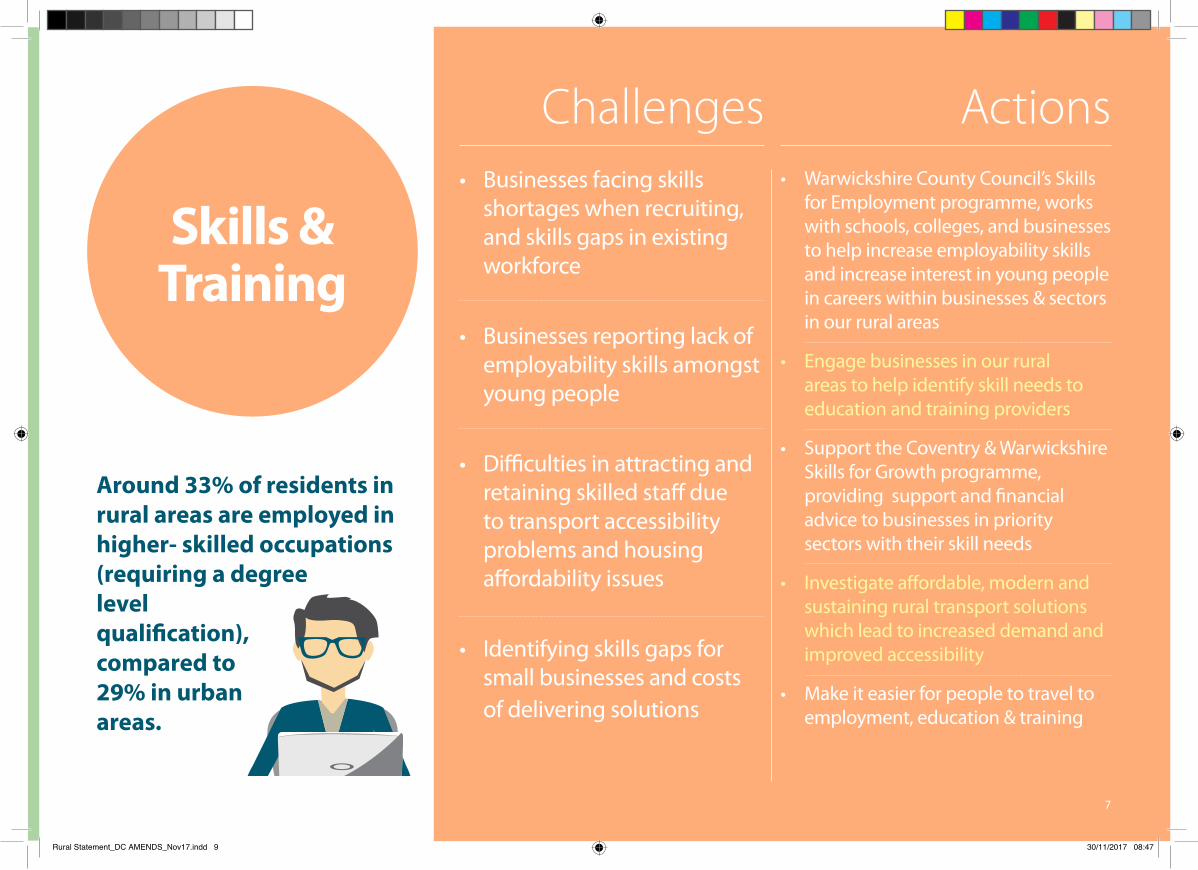
Skills & Training
Challenges Actions• Businesses facing skills
shortages when recruiting, and skills gaps in existing workforce
• Businesses reporting lack of employability skills amongst young people
• Difficulties in attracting and retaining skilled staff due to transport accessibility problems and housing affordability issues
• Identifying skills gaps for small businesses and costs of delivering solutions
• Warwickshire County Council’s Skills for Employment programme, works with schools, colleges, and businesses to help increase employability skills and increase interest in young people in careers within businesses & sectors in our rural areas
• Engage businesses in our rural areas to help identify skill needs to education and training providers
• Support the Coventry & Warwickshire Skills for Growth programme, providing support and financial advice to businesses in priority sectors with their skill needs
• Investigate affordable, modern and sustaining rural transport solutions which lead to increased demand and improved accessibility
• Make it easier for people to travel to employment, education & training
Around 33% of residents in rural areas are employed in higher- skilled occupations (requiring a degree level quali�cation), compared to 29% in urban areas.
7
Rural Statement_DC AMENDS_Nov17.indd 9 30/11/2017 08:47
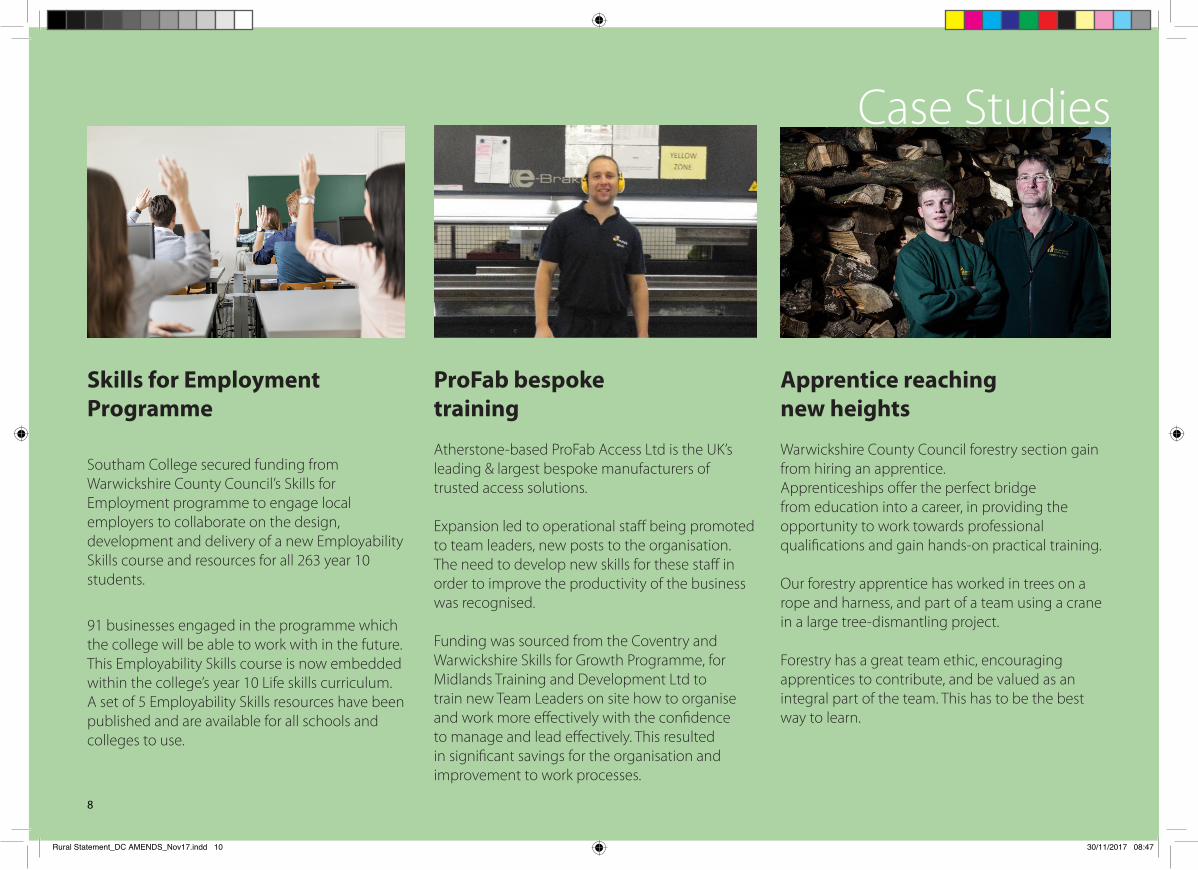
Case Studies
ProFab bespoke training
Atherstone-based ProFab Access Ltd is the UK’s leading & largest bespoke manufacturers of trusted access solutions.
Expansion led to operational staff being promoted to team leaders, new posts to the organisation. The need to develop new skills for these staff in order to improve the productivity of the business was recognised.
Funding was sourced from the Coventry and Warwickshire Skills for Growth Programme, for Midlands Training and Development Ltd to train new Team Leaders on site how to organise and work more effectively with the confidence to manage and lead effectively. This resulted in significant savings for the organisation and improvement to work processes.
Apprentice reaching new heights
Warwickshire County Council forestry section gain from hiring an apprentice.Apprenticeships offer the perfect bridge from education into a career, in providing the opportunity to work towards professional qualifications and gain hands-on practical training.
Our forestry apprentice has worked in trees on a rope and harness, and part of a team using a crane in a large tree-dismantling project.
Forestry has a great team ethic, encouraging apprentices to contribute, and be valued as an integral part of the team. This has to be the best way to learn.
Skills for Employment Programme
Southam College secured funding from Warwickshire County Council’s Skills for Employment programme to engage local employers to collaborate on the design, development and delivery of a new Employability Skills course and resources for all 263 year 10 students.
91 businesses engaged in the programme which the college will be able to work with in the future.This Employability Skills course is now embedded within the college’s year 10 Life skills curriculum.A set of 5 Employability Skills resources have been published and are available for all schools and colleges to use.
8
Rural Statement_DC AMENDS_Nov17.indd 10 30/11/2017 08:47

Rural Tourism
Review existing provision with local Destination Organisations, including Shakespeare’s England
Identify needs & consider options to improve support to local tourism partnerships and rural networking groups
Make better use of existing networks, including Warwickshire Rural Hub / Citizens Advice Bureau
Focus grant aid and advice to support farm tourism and diversification and growth of small scale tourism businesses
Establish clear signposting to available information
Support work to promote Warwickshire’s distinctive local produce and markets to encourage new market opportunities
Support Warwickshire College Group (WCG) with future hospitality training initiatives
Challenges Actions• More support for rural tourism• Support for cultural and heritage activity• Better tourism coordination / information• Better communication on events and funding• Lack of Tourist Information Centres in, for example, North Warwickshire• More support for ‘Local is best’ awareness and initiatives
Tourism
Top 3 employment sectors in rural economy:
Manufacturing Wholesaleand Retail
9
Rural Statement_DC AMENDS_Nov17.indd 11 30/11/2017 08:47

Case Studies
Northern Warwickshire Tourism
Northern Warwickshire Tourism (NWT) is a not-for-profit membership organisation, founded by tourism businesses in partnership with local authorities, to publicise the area for short breaks.
Run entirely by volunteers, it provides advice, support and publicity to members as diverse as the Ricoh Arena and the tiny glass-blowing workshop at Shenton Station, by way of leaflets, a website and regular networking meetings. NWT embarked on a project to make the rich Roman and Tudor history of the area more accessible to visitors. A feasibility study, funded by Warwickshire County Council, identified Henry VII’s connection with Merevale and Atherstone, the Roman Fort at Mancetter, and the story of Boudicca, as key opportunities to be developed.
Shakespeare’s England
Rural tourism is vitally important to Shakespeare’s England (SE), Warwickshire’s destination management organisation for South Warwickshire, which promotes the destination to domestic and international audiences. Warwickshire’s unique offer of flourishing market towns surrounded by thriving countryside provides a fantastic rural proposition.A public-private partnership, SE works with a wide range of rural suppliers, producers, farmers, attractions and accommodation businesses for the benefit of the wider community. Current plans to encourage visitors to explore more widely include a new “Explorer Pass”, “Made in Shakespeare’s England” food and drink trail, and heritage and waterways promotions with Visit England.
Joseph’s Amazing Camels
Based in Idlicote near Shipson-on-Stour, Joseph’s Amazing Camels (JAC) is the only company in the UK specialising in camels for all occasions, from racing, polo, rides and trekking, to camel promotions, functions, and corporate entertainment.
JAC is a growing, family business, with fresh ideas to expand camel trekking and start a camel dairy. Visitors come from all over the country to participate, providing additional income to the area through food, accommodation and visiting other attractions.
Marketing camel trekking is a challenge as the audience is so varied. ‘What to do in Warwickshire’ websites have proved fruitful to help spread the word.
10
Rural Statement_DC AMENDS_Nov17.indd 12 30/11/2017 08:47

Digital Connectivity
Challenges Actions• Poor availability of broadband and superfast broadband in some areas
• Poor mobile reception
Continue to extend the fibre broadband network
Investigate different technologies to bring faster broadband to hard to reach areas
Continue to apply for external funding to take the fibre network still further
Seek to achieve 98% coverage at superfast speeds ( minimum 24Mbps) by end of the Coventry Solihull Warwickshire Broadband Project
10%
of people living in rural areas are self-employed
11
Rural Statement_DC AMENDS_Nov17.indd 13 30/11/2017 08:47
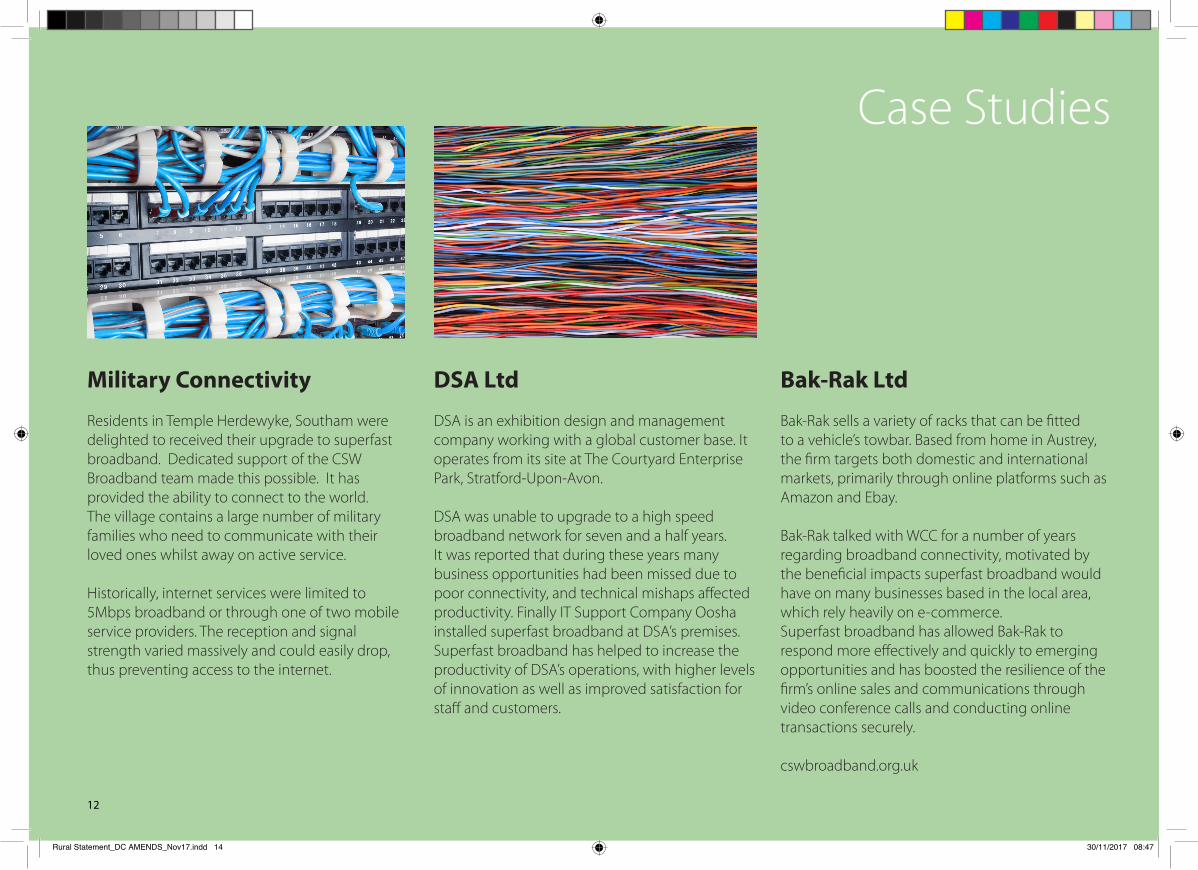
Case Studies
Bak-Rak Ltd
Bak-Rak sells a variety of racks that can be fitted to a vehicle’s towbar. Based from home in Austrey, the firm targets both domestic and international markets, primarily through online platforms such as Amazon and Ebay.
Bak-Rak talked with WCC for a number of years regarding broadband connectivity, motivated by the beneficial impacts superfast broadband would have on many businesses based in the local area, which rely heavily on e-commerce. Superfast broadband has allowed Bak-Rak to respond more effectively and quickly to emerging opportunities and has boosted the resilience of the firm’s online sales and communications through video conference calls and conducting online transactions securely.
cswbroadband.org.uk
DSA Ltd
DSA is an exhibition design and management company working with a global customer base. It operates from its site at The Courtyard Enterprise Park, Stratford-Upon-Avon.
DSA was unable to upgrade to a high speed broadband network for seven and a half years. It was reported that during these years many business opportunities had been missed due to poor connectivity, and technical mishaps affected productivity. Finally IT Support Company Oosha installed superfast broadband at DSA’s premises. Superfast broadband has helped to increase the productivity of DSA’s operations, with higher levels of innovation as well as improved satisfaction for staff and customers.
Military Connectivity
Residents in Temple Herdewyke, Southam were delighted to received their upgrade to superfast broadband. Dedicated support of the CSW Broadband team made this possible. It has provided the ability to connect to the world. The village contains a large number of military families who need to communicate with their loved ones whilst away on active service.
Historically, internet services were limited to 5Mbps broadband or through one of two mobile service providers. The reception and signal strength varied massively and could easily drop, thus preventing access to the internet.
12
Rural Statement_DC AMENDS_Nov17.indd 14 30/11/2017 08:47
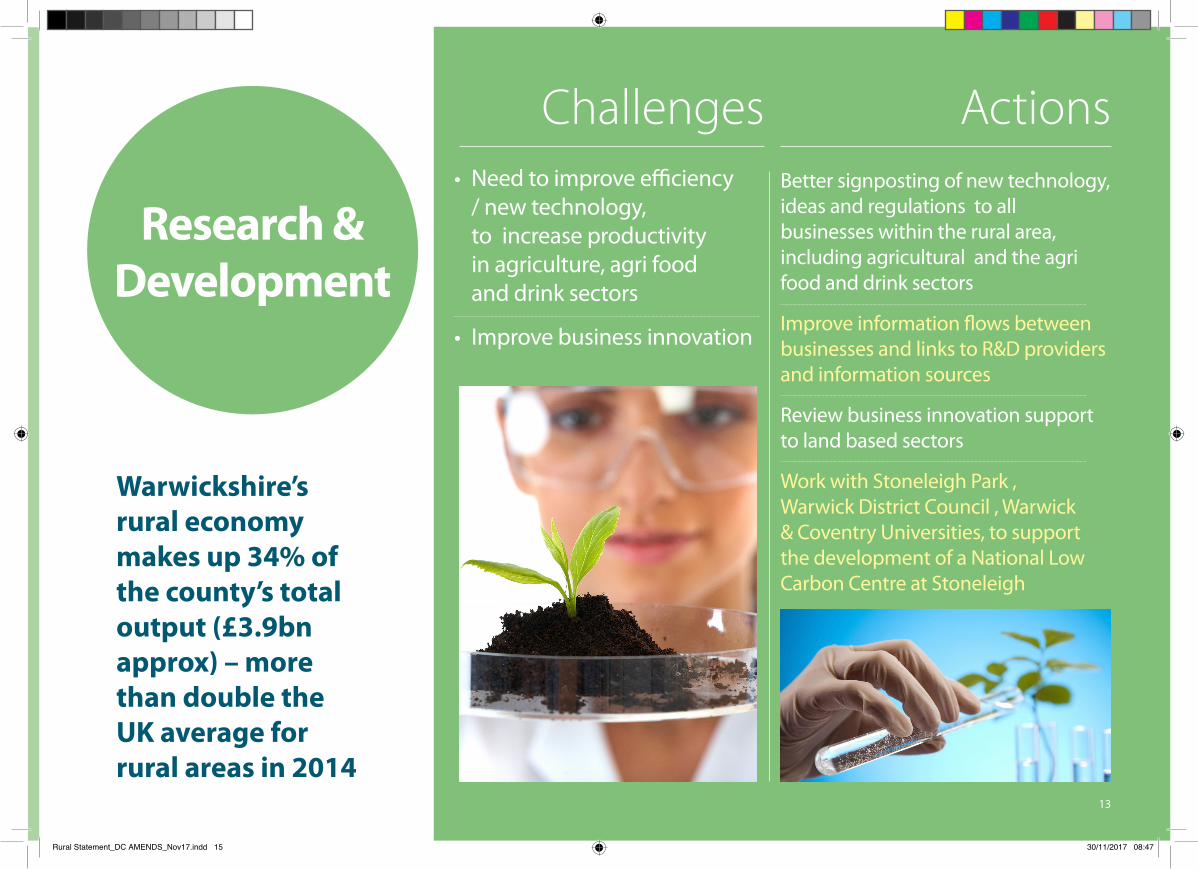
Research & Development
Challenges Actions• Need to improve efficiency / new technology, to increase productivity in agriculture, agri food and drink sectors
• Improve business innovation
Better signposting of new technology, ideas and regulations to all businesses within the rural area, including agricultural and the agri food and drink sectors
Improve information flows between businesses and links to R&D providers and information sources
Review business innovation support to land based sectors
Work with Stoneleigh Park , Warwick District Council , Warwick & Coventry Universities, to support the development of a National Low Carbon Centre at Stoneleigh
Warwickshire’s rural economy makes up 34% of the county’s total output (£3.9bn approx) – more than double the UK average for rural areas in 2014.
13
Rural Statement_DC AMENDS_Nov17.indd 15 30/11/2017 08:47
Case Studies
Moreton Morrell College offers a wide range of rural specialisms including Agriculture, Countryside, Arboriculture, Floristry, Animal, Equine, Veterinary Nursing and Sport courses.
Stoneleigh Park is becoming a science and innovation park of national status with sector focus upon emerging low carbon technologies, sustainable infrastructure and precision agriculture.
A master-plan has been approved by Warwick District Council for the revitalisation of Stoneleigh Park. Current on-site provision is 93,000m2 of buildings, occupied by over 80 businesses employing 1,250 people. The site is a major events venue - the National Agricultural and Exhibition Centre (NAEC) - hosting a wide range of national and international exhibitions, conferences and shows.
The National Low Carbon Centre (NLCC) will establish Stoneleigh Park as the ‘venue of choice’ for those doing business and/or engaged in
R&D and knowledge transfer within the UK low carbon sector. Comprising a Low Carbon
14
Enterprise Centre, a university-led Research and Innovation Centre, a Skills and Training Hub and a demonstration events venue, the 5,000 sqm new
development will provide business workspace, a business incubator, research laboratories, training and demonstration facilities. The NLCC Consortium currently consists of LaSalle Investment Management, Coventry, Aston and Birmingham City Universities, low carbon consultants Greenwatt Technology and a growing number of corporate and SME partners. Anticipated start for development is in 2017.
Research at the University of Warwick supported by Biotechnology and Biological Sciences and Research Council (BSRC) and Defra has enabled UK farmers to reduce the average level of lameness in sheep flocks from 10% in 2004 to 5% in 2013.
Professor Laura Green and colleagues demonstrated treating sheep within 3 days of becoming lame stopped the spread of disease and over 95% of sheep recovered within 2 – 10 days when treated with an antibiotic injection. In contrast, less than 25% of sheep recovered within 10 days when traditional methods of foot trimming and spraying were used. Over ten years, the research has saved UK farmers £700M and prevented 7.5 million sheep from becoming lame.
National Low Carbon Centre - Stoneleigh Park
Moreton Morrell College (part of WCG)
University of Warwick
Following an extensive review, the College Farm is going from strength to strength, ensuring education provision of current farming activities were reflective of industry best practice.
The farm is now commercially operated in partnership with Velcourt, a farm business management and advisory service. Velcourt are a leading provider of farm management services
across the UK and internationally. Most importantly have a proven experience in running college farms. The Velcourt-college partnership ensures agriculture students are provided with first class education both highly vocational and entrepreneurial education to become the farmers of the future.
Rural Statement_DC AMENDS_Nov17.indd 16 30/11/2017 08:47
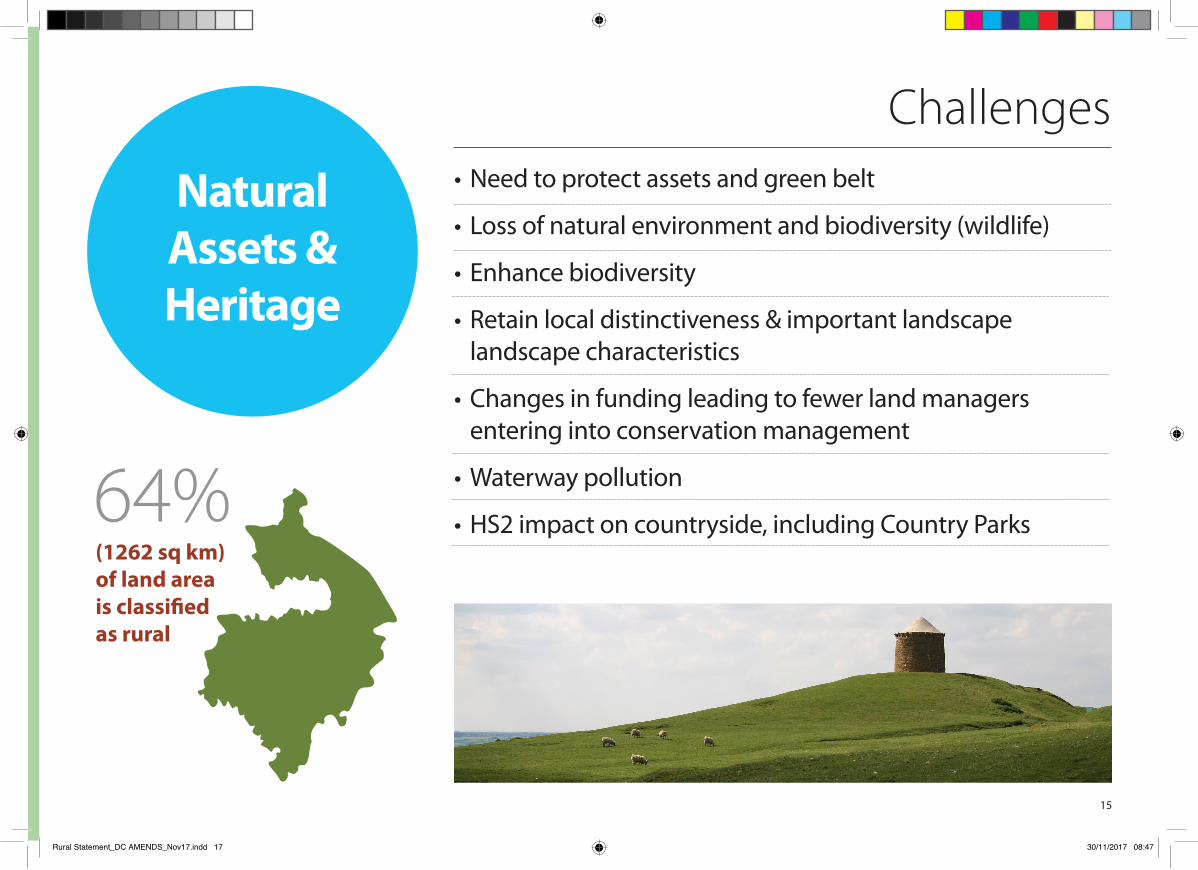
Natural Assets & Heritage
Challenges• Need to protect assets and green belt
• Loss of natural environment and biodiversity (wildlife)
• Enhance biodiversity
• Retain local distinctiveness & important landscape landscape characteristics
• Changes in funding leading to fewer land managers entering into conservation management
• Waterway pollution
• HS2 impact on countryside, including Country Parks 64%(1262 sq km) of land area is classi�ed as rural
15
Rural Statement_DC AMENDS_Nov17.indd 17 30/11/2017 08:47

Actions• Continue to support & enhance Warwickshire’s natural habitats
• Apply natural capital approach to quantify value
• Improve balance of development & biodiversity offsetting
• Support the Warwickshire , Coventry and Solihull Local Nature Partnership
• Increase people’s awareness & value of their environment and how to access the countryside
• Assist landowners in landscape enhancement
• Investigate possibility of compost produced in Warwickshire going back into the land
• Mitigate impacts of HS2 , maximise benefits
• Reduce the impact of transport on people and the (built and natural) environment and improve the journey experience of transport users
16
31% of people live in Warwickshire’s
rural areas
Rural Statement_DC AMENDS_Nov17.indd 18 30/11/2017 08:47
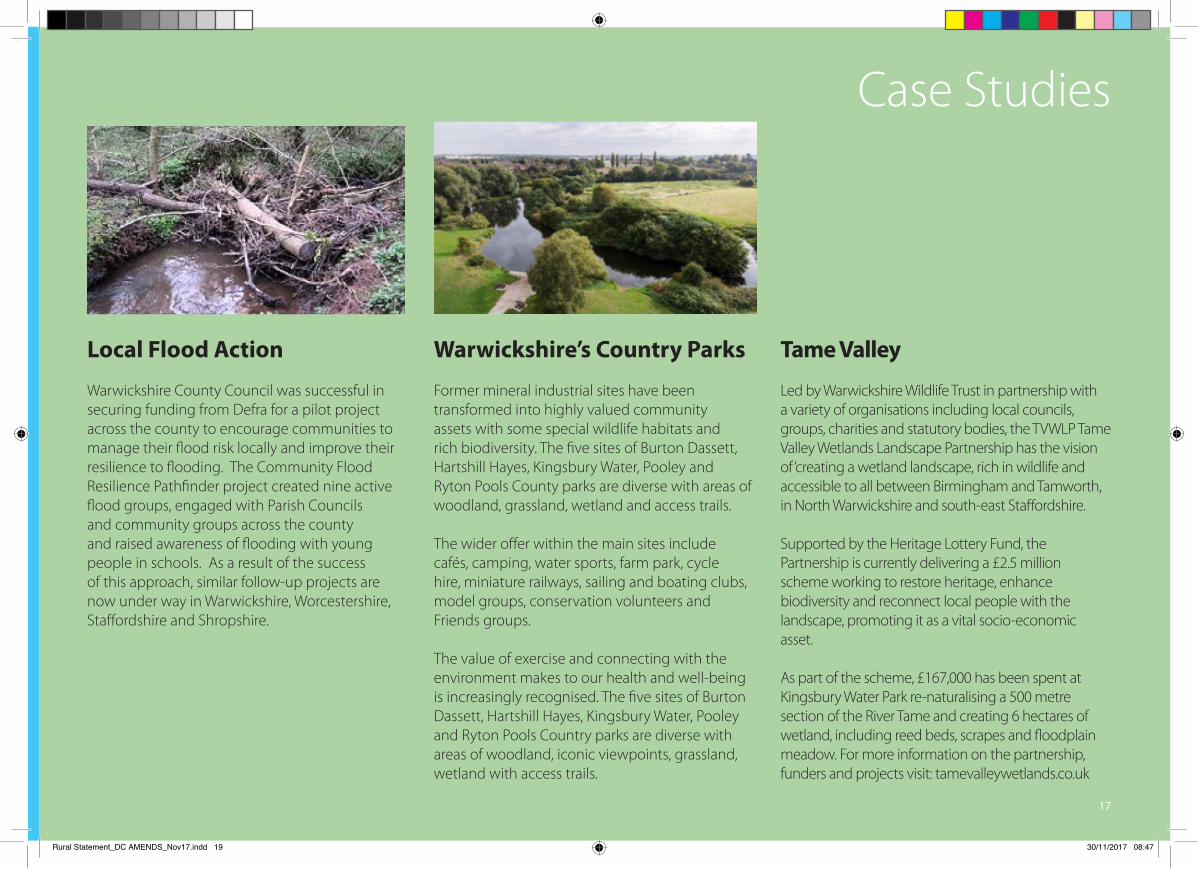
Case Studies
Local Flood Action
Warwickshire County Council was successful in securing funding from Defra for a pilot project across the county to encourage communities to manage their flood risk locally and improve their resilience to flooding. The Community Flood Resilience Pathfinder project created nine active flood groups, engaged with Parish Councils and community groups across the county and raised awareness of flooding with young people in schools. As a result of the success of this approach, similar follow-up projects are now under way in Warwickshire, Worcestershire, Staffordshire and Shropshire.
Tame Valley
Led by Warwickshire Wildlife Trust in partnership with a variety of organisations including local councils, groups, charities and statutory bodies, the TVWLP Tame Valley Wetlands Landscape Partnership has the vision of ‘creating a wetland landscape, rich in wildlife and accessible to all between Birmingham and Tamworth, in North Warwickshire and south-east Staffordshire.
Supported by the Heritage Lottery Fund, the Partnership is currently delivering a £2.5 million scheme working to restore heritage, enhance biodiversity and reconnect local people with the landscape, promoting it as a vital socio-economic asset.
As part of the scheme, £167,000 has been spent at Kingsbury Water Park re-naturalising a 500 metre section of the River Tame and creating 6 hectares of wetland, including reed beds, scrapes and floodplain meadow. For more information on the partnership, funders and projects visit: tamevalleywetlands.co.uk
Warwickshire’s Country Parks
Former mineral industrial sites have been transformed into highly valued community assets with some special wildlife habitats and rich biodiversity. The five sites of Burton Dassett, Hartshill Hayes, Kingsbury Water, Pooley and Ryton Pools County parks are diverse with areas of woodland, grassland, wetland and access trails.
The wider offer within the main sites include cafés, camping, water sports, farm park, cycle hire, miniature railways, sailing and boating clubs, model groups, conservation volunteers and Friends groups.
The value of exercise and connecting with the environment makes to our health and well-being is increasingly recognised. The five sites of Burton Dassett, Hartshill Hayes, Kingsbury Water, Pooley and Ryton Pools Country parks are diverse with areas of woodland, iconic viewpoints, grassland, wetland with access trails.
17
Rural Statement_DC AMENDS_Nov17.indd 19 30/11/2017 08:47
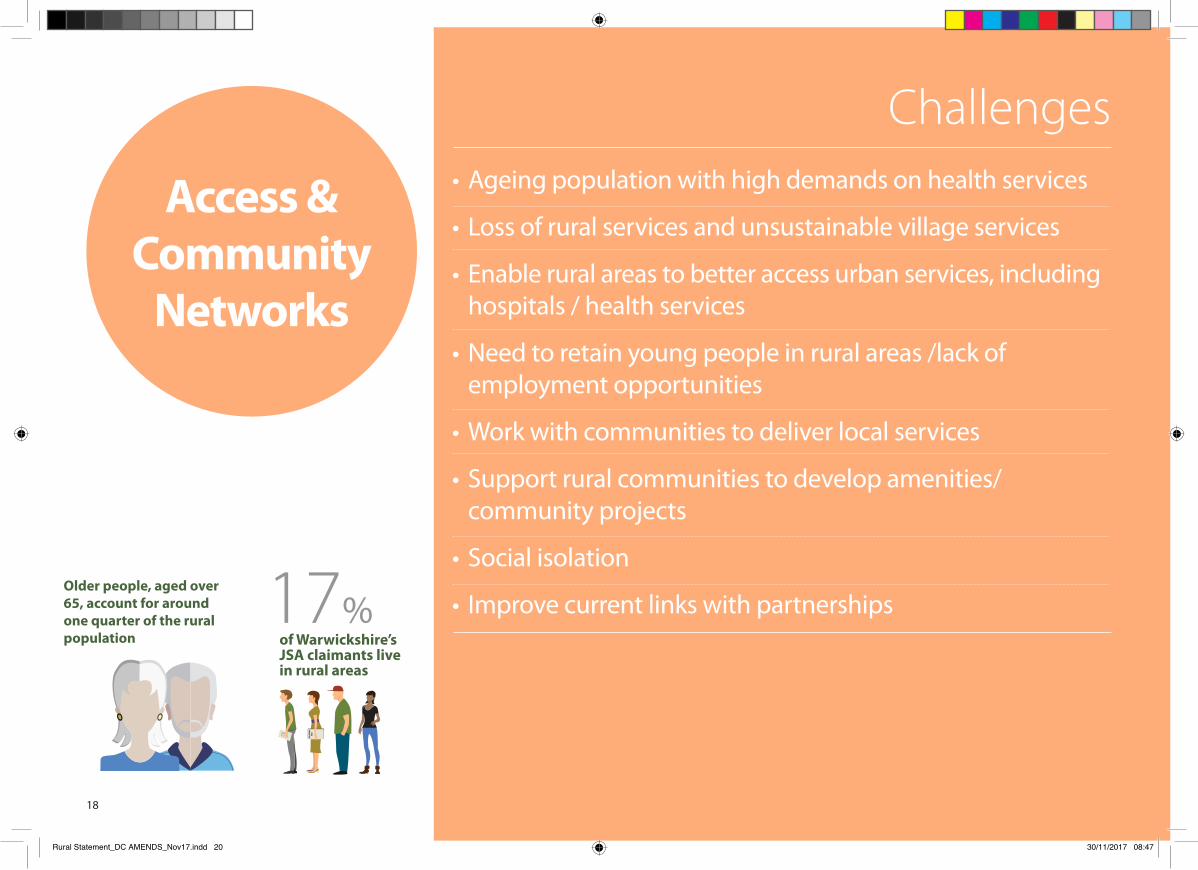
Access & Community
Networks
Challenges• Ageing population with high demands on health services
• Loss of rural services and unsustainable village services
• Enable rural areas to better access urban services, including hospitals / health services
• Need to retain young people in rural areas /lack of employment opportunities
• Work with communities to deliver local services
• Support rural communities to develop amenities/ community projects
• Social isolation
• Improve current links with partnerships 17of Warwickshire’s JSA claimants live in rural areas
%Older people, aged over 65, account for around one quarter of the rural population
18
Rural Statement_DC AMENDS_Nov17.indd 20 30/11/2017 08:47
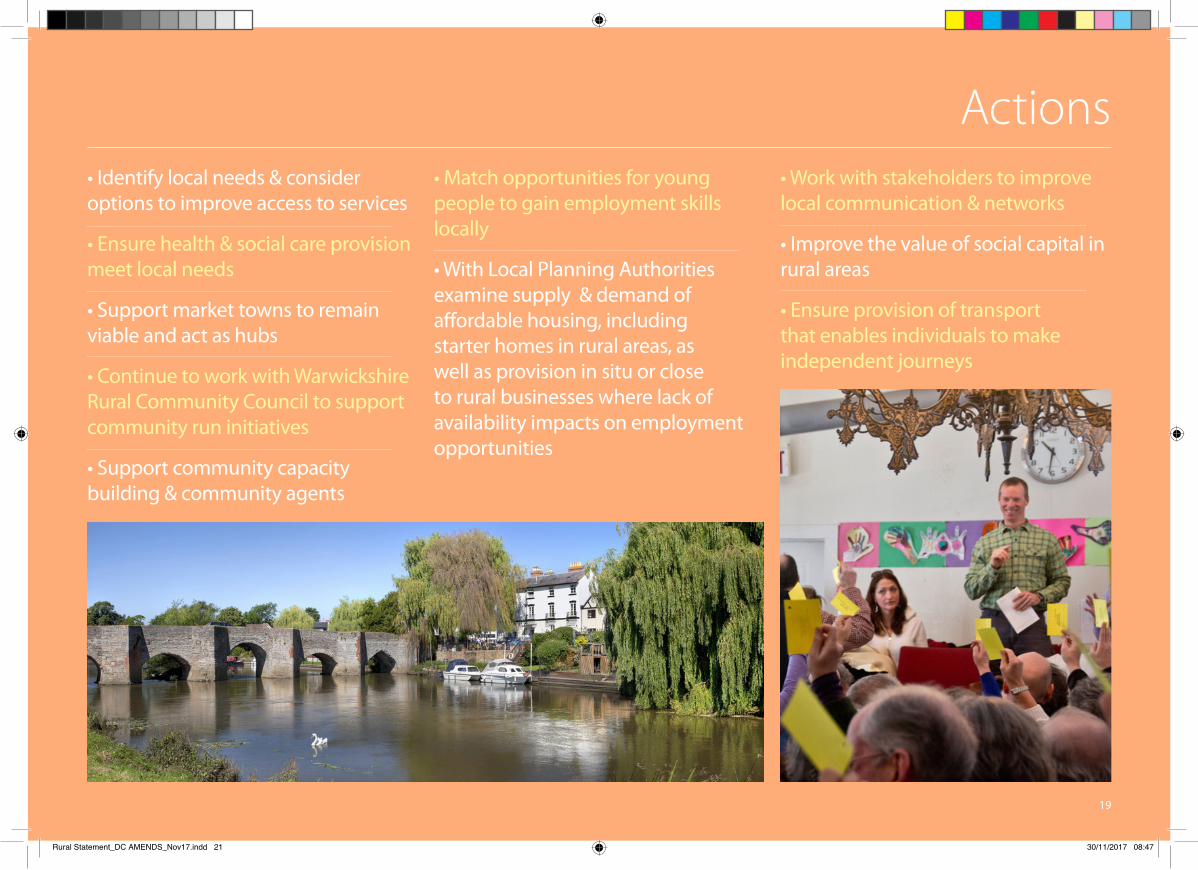
Actions• Identify local needs & consider options to improve access to services
• Ensure health & social care provision meet local needs
• Support market towns to remain viable and act as hubs
• Continue to work with Warwickshire Rural Community Council to support community run initiatives
• Support community capacity building & community agents
• Match opportunities for young people to gain employment skills locally
• With Local Planning Authorities examine supply & demand of affordable housing, including starter homes in rural areas, as well as provision in situ or close to rural businesses where lack of availability impacts on employment opportunities
• Work with stakeholders to improve local communication & networks
• Improve the value of social capital in rural areas
• Ensure provision of transport that enables individuals to make independent journeys
19
Rural Statement_DC AMENDS_Nov17.indd 21 30/11/2017 08:47
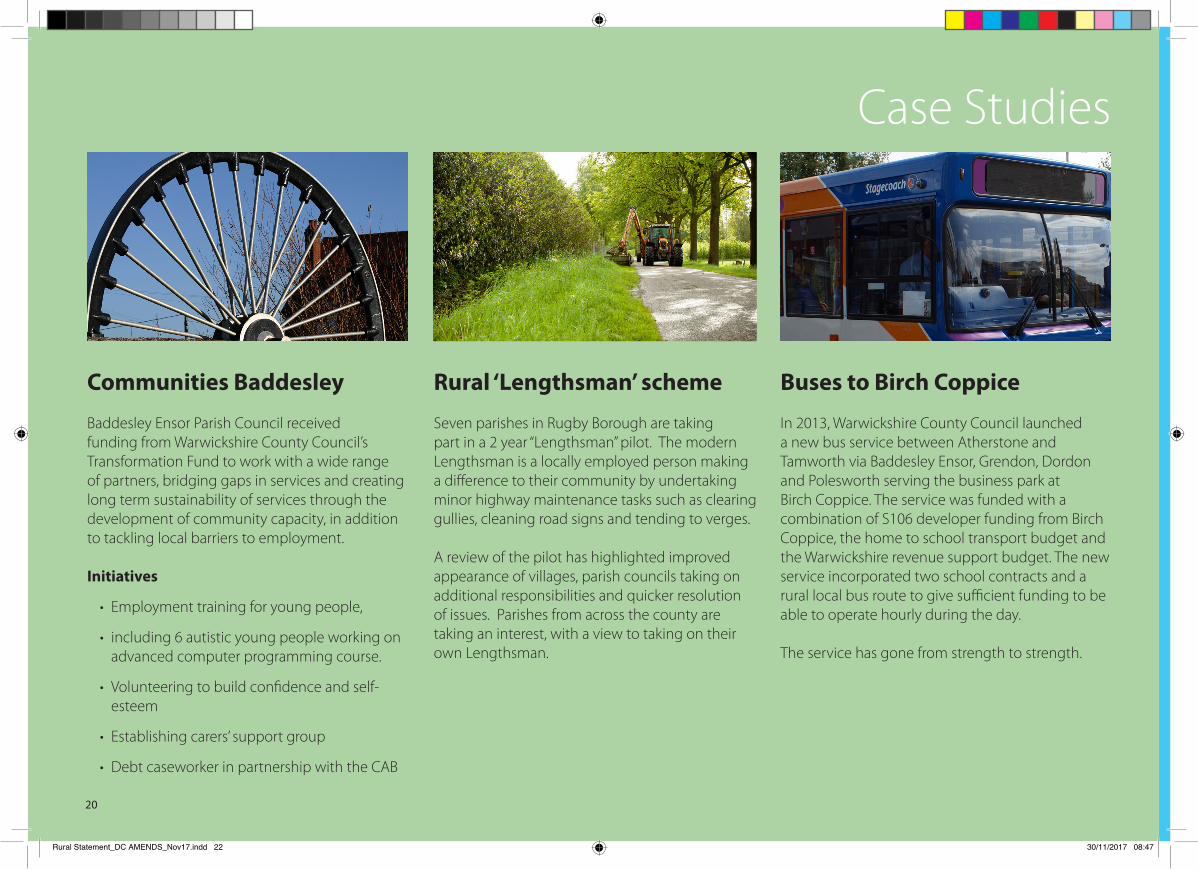
Case Studies
Communities Baddesley
Baddesley Ensor Parish Council received funding from Warwickshire County Council’s Transformation Fund to work with a wide range of partners, bridging gaps in services and creating long term sustainability of services through the development of community capacity, in addition to tackling local barriers to employment.
Initiatives
• Employment training for young people,
• including 6 autistic young people working on advanced computer programming course.
• Volunteering to build confidence and self-esteem
• Establishing carers’ support group
• Debt caseworker in partnership with the CAB
Rural ‘Lengthsman’ scheme
Seven parishes in Rugby Borough are taking part in a 2 year “Lengthsman” pilot. The modern Lengthsman is a locally employed person making a difference to their community by undertaking minor highway maintenance tasks such as clearing gullies, cleaning road signs and tending to verges.
A review of the pilot has highlighted improved appearance of villages, parish councils taking on additional responsibilities and quicker resolution of issues. Parishes from across the county are taking an interest, with a view to taking on their own Lengthsman.
Buses to Birch Coppice
In 2013, Warwickshire County Council launched a new bus service between Atherstone and Tamworth via Baddesley Ensor, Grendon, Dordon and Polesworth serving the business park at Birch Coppice. The service was funded with a combination of S106 developer funding from Birch Coppice, the home to school transport budget and the Warwickshire revenue support budget. The new service incorporated two school contracts and a rural local bus route to give sufficient funding to be able to operate hourly during the day.
The service has gone from strength to strength.
20
Rural Statement_DC AMENDS_Nov17.indd 22 30/11/2017 08:47
Next StepsWe will monitor our progress with partners annually, share our results and review our Rural Plan in three years’ time.
At that point we anticipate:
• more rural businesses will have grown, maximising their full potential and increasing jobs and growth in our rural areas
• people living and working in rural Warwickshire will have the support and services they need
• our information networks have improved and people are able to access the information they need
Like many, WCC is making its contribution to the need for austerity to address the national deficit and diminishing resources will continue to be used creatively. Economic growth remains a Council priority and rural Warwickshire has a role to play in delivering growth.
For more information and resources, please go to:www.warwickshire.gov.uk/ruralplan
or contact: Chris Egan, Senior Development Officer; Transport and EconomyInfrastructure and RegenerationWarwickshire County CouncilShire Hall , Warwick , CV34 4RL
email: [email protected]
Rural Statement_DC AMENDS_Nov17.indd 23 30/11/2017 08:47

warwickshire.gov.uk
If you require a version of this document in large prints, or a different language please contact: [email protected]
Rural Statement_DC AMENDS_Nov17.indd 24 30/11/2017 08:47

UPDATED STRATEGIC ECONOMIC PLANAUGUST 2016
cwlep.com

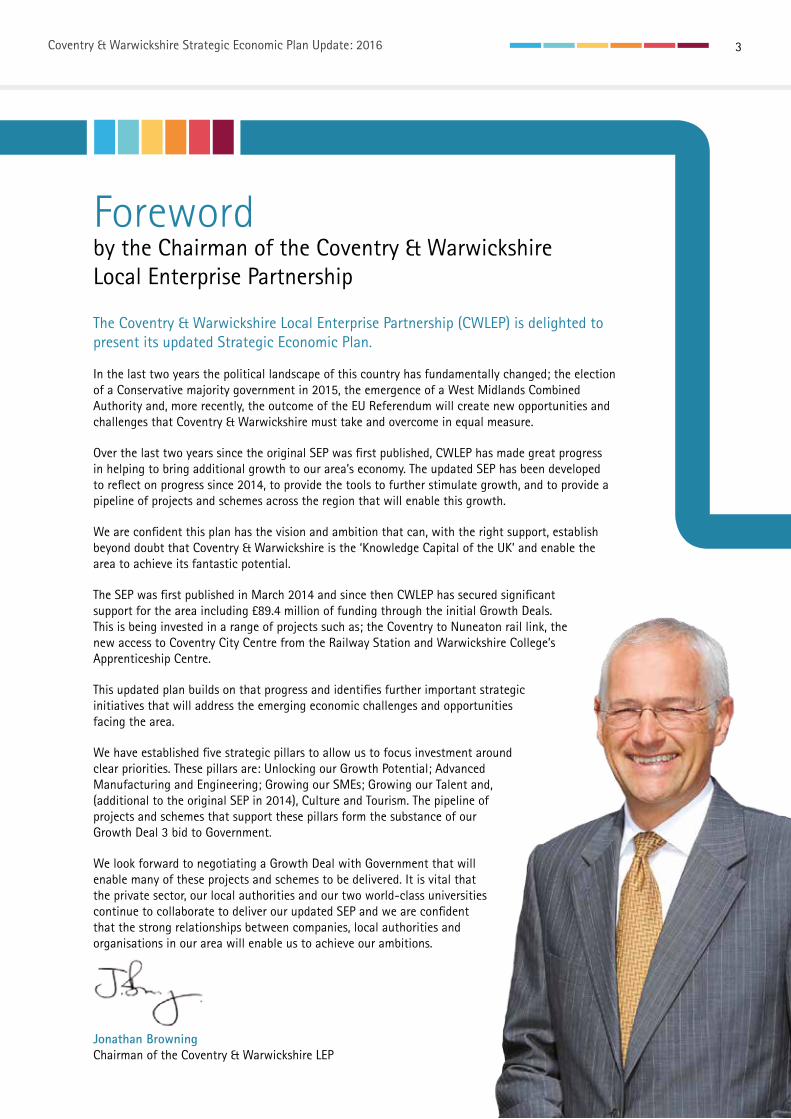
Coventry & Warwickshire Strategic Economic Plan Update: 2016 3
The Coventry & Warwickshire Local Enterprise Partnership (CWLEP) is delighted to present its updated Strategic Economic Plan.
In the last two years the political landscape of this country has fundamentally changed; the election of a Conservative majority government in 2015, the emergence of a West Midlands Combined Authority and, more recently, the outcome of the EU Referendum will create new opportunities and challenges that Coventry & Warwickshire must take and overcome in equal measure.
Over the last two years since the original SEP was first published, CWLEP has made great progress in helping to bring additional growth to our area’s economy. The updated SEP has been developed to reflect on progress since 2014, to provide the tools to further stimulate growth, and to provide a pipeline of projects and schemes across the region that will enable this growth.
We are confident this plan has the vision and ambition that can, with the right support, establish beyond doubt that Coventry & Warwickshire is the ‘Knowledge Capital of the UK’ and enable the area to achieve its fantastic potential.
The SEP was first published in March 2014 and since then CWLEP has secured significant support for the area including £89.4 million of funding through the initial Growth Deals. This is being invested in a range of projects such as; the Coventry to Nuneaton rail link, the new access to Coventry City Centre from the Railway Station and Warwickshire College’s Apprenticeship Centre.
This updated plan builds on that progress and identifies further important strategic initiatives that will address the emerging economic challenges and opportunities facing the area.
We have established five strategic pillars to allow us to focus investment around clear priorities. These pillars are: Unlocking our Growth Potential; Advanced Manufacturing and Engineering; Growing our SMEs; Growing our Talent and, (additional to the original SEP in 2014), Culture and Tourism. The pipeline of projects and schemes that support these pillars form the substance of our Growth Deal 3 bid to Government.
We look forward to negotiating a Growth Deal with Government that will enable many of these projects and schemes to be delivered. It is vital that the private sector, our local authorities and our two world-class universities continue to collaborate to deliver our updated SEP and we are confident that the strong relationships between companies, local authorities and organisations in our area will enable us to achieve our ambitions.
Jonathan Browning Chairman of the Coventry & Warwickshire LEP
Forewordby the Chairman of the Coventry & WarwickshireLocal Enterprise Partnership

Coventry & Warwickshire Strategic Economic Plan Update: 2016 5
Coventry & WarwickshireStrategic Economic Plan Update: 2016
Executive Summary 7
1 Review of The 2014 Strategic Economic Plan 8 1.2 Unlocking Our Growth Potential 13
1.3 Advanced Manufacturing and Engineering 15
1.4 Growth Hub 17
1.5 Growing Our Talent 17
1.6 Programme Management and Governance 18
2 2016 Strategic Economic Plan Update 20 2.1 Vision, Objectives, Strategy and Plans 20
2.2 Baseline Economic Forecast 21
2.3 Objectives and Core Strategic Themes 22
2.4 Unlocking Our Growth Potential 24
- 2.4.1 Employment Land 24
- 2.4.2 Transport Connectivity 26
- 2.4.3 Digital Connectivity 28
2.5 Advanced Manufacturing and Engineering 30
2.6 Growing Our SMEs 33
2.7 Growing Our Talent 35
- 2.7.1 Skills 35
- 2.7.2 Developing the Technologies of the Future 37
- 2.7.3 Digital and ICT Economy 39
2.8 Culture and Tourism 42
3 The West Midlands Combined Authority and Midlands Engine 44
The
Know
ledg
e Ca
pita
l of t
he U
K

Coventry & Warwickshire Strategic Economic Plan Update: 2016 7
Executive Summary
The Coventry & Warwickshire Strategic Economic Plan (CWSEP), published in March 2014, set out how the Coventry & Warwickshire Local Enterprise Partnership (CWLEP), along with its partners in the public, private and third sectors, will grow the economy over the short, medium and longer term. It recognised that co-ordinated action from all sectors will play a key role in stimulating growth and prosperity, and increasing the competitiveness of the local economy.
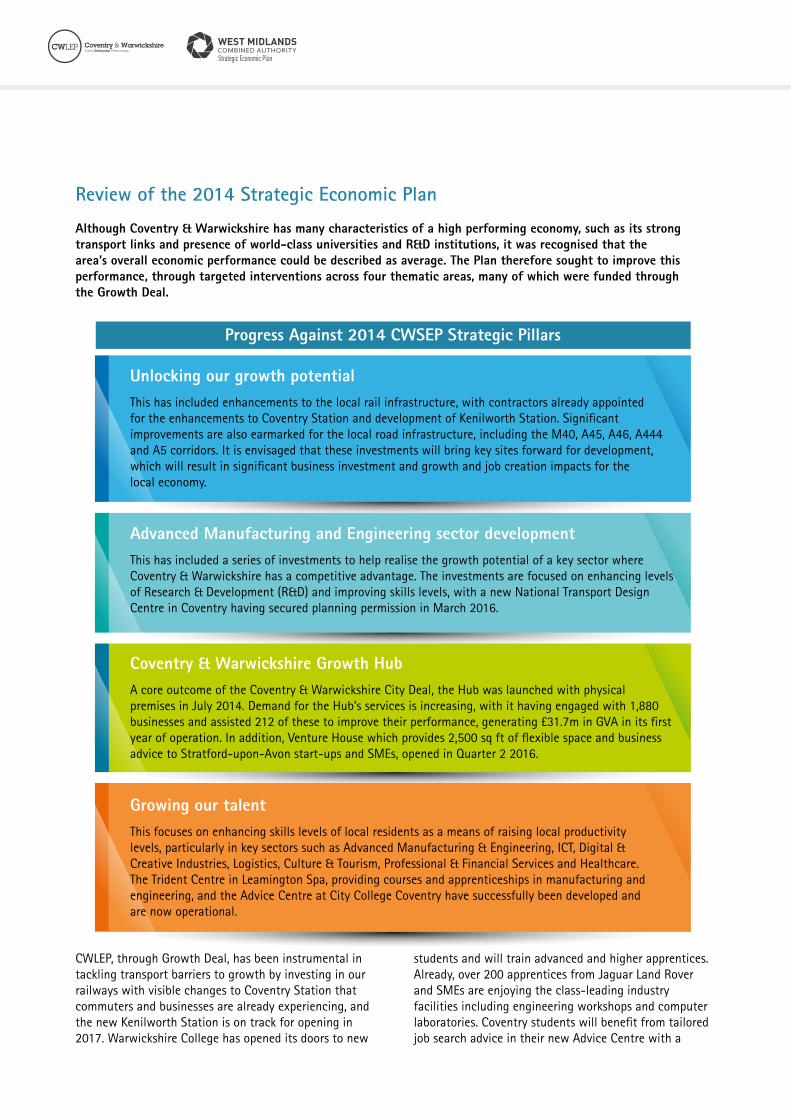
CWLEP, through Growth Deal, has been instrumental in tackling transport barriers to growth by investing in our railways with visible changes to Coventry Station that commuters and businesses are already experiencing, and the new Kenilworth Station is on track for opening in 2017. Warwickshire College has opened its doors to new
students and will train advanced and higher apprentices. Already, over 200 apprentices from Jaguar Land Rover and SMEs are enjoying the class-leading industry facilities including engineering workshops and computer laboratories. Coventry students will benefit from tailored job search advice in their new Advice Centre with a
Review of the 2014 Strategic Economic Plan
Although Coventry & Warwickshire has many characteristics of a high performing economy, such as its strong transport links and presence of world-class universities and R&D institutions, it was recognised that the area’s overall economic performance could be described as average. The Plan therefore sought to improve this performance, through targeted interventions across four thematic areas, many of which were funded through the Growth Deal.
Unlocking our growth potentialThis has included enhancements to the local rail infrastructure, with contractors already appointed for the enhancements to Coventry Station and development of Kenilworth Station. Significant improvements are also earmarked for the local road infrastructure, including the M40, A45, A46, A444 and A5 corridors. It is envisaged that these investments will bring key sites forward for development, which will result in significant business investment and growth and job creation impacts for the local economy.
Advanced Manufacturing and Engineering sector developmentThis has included a series of investments to help realise the growth potential of a key sector where Coventry & Warwickshire has a competitive advantage. The investments are focused on enhancing levels of Research & Development (R&D) and improving skills levels, with a new National Transport Design Centre in Coventry having secured planning permission in March 2016.
Coventry & Warwickshire Growth HubA core outcome of the Coventry & Warwickshire City Deal, the Hub was launched with physical premises in July 2014. Demand for the Hub’s services is increasing, with it having engaged with 1,880 businesses and assisted 212 of these to improve their performance, generating £31.7m in GVA in its first year of operation. In addition, Venture House which provides 2,500 sq ft of flexible space and business advice to Stratford-upon-Avon start-ups and SMEs, opened in Quarter 2 2016.
Growing our talentThis focuses on enhancing skills levels of local residents as a means of raising local productivity levels, particularly in key sectors such as Advanced Manufacturing & Engineering, ICT, Digital & Creative Industries, Logistics, Culture & Tourism, Professional & Financial Services and Healthcare. The Trident Centre in Leamington Spa, providing courses and apprenticeships in manufacturing and engineering, and the Advice Centre at City College Coventry have successfully been developed and are now operational.
Progress Against 2014 CWSEP Strategic Pillars
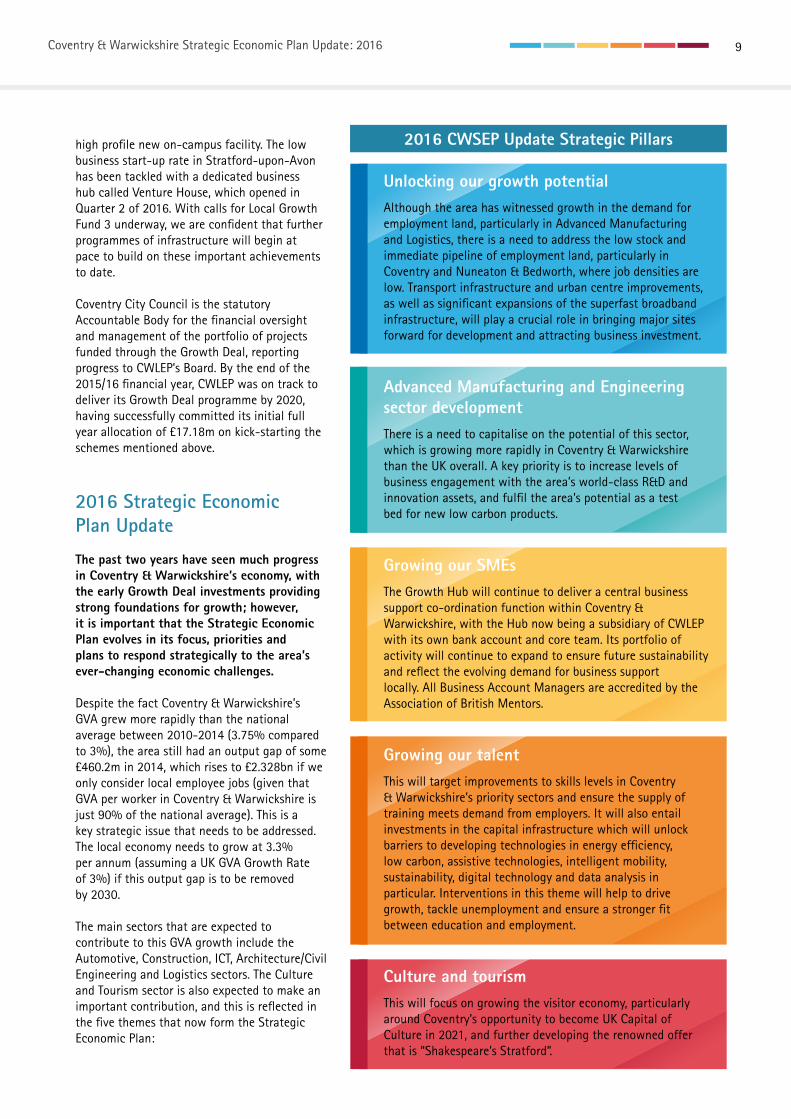
Coventry & Warwickshire Strategic Economic Plan Update: 2016 9
high profile new on-campus facility. The low business start-up rate in Stratford-upon-Avon has been tackled with a dedicated business hub called Venture House, which opened in Quarter 2 of 2016. With calls for Local Growth Fund 3 underway, we are confident that further programmes of infrastructure will begin at pace to build on these important achievements to date.
Coventry City Council is the statutory Accountable Body for the financial oversight and management of the portfolio of projects funded through the Growth Deal, reporting progress to CWLEP’s Board. By the end of the 2015/16 financial year, CWLEP was on track to deliver its Growth Deal programme by 2020, having successfully committed its initial full year allocation of £17.18m on kick-starting the schemes mentioned above.
2016 Strategic Economic Plan Update
The past two years have seen much progress in Coventry & Warwickshire’s economy, with the early Growth Deal investments providing strong foundations for growth; however, it is important that the Strategic Economic Plan evolves in its focus, priorities and plans to respond strategically to the area’s ever-changing economic challenges.
Despite the fact Coventry & Warwickshire’s GVA grew more rapidly than the national average between 2010-2014 (3.75% compared to 3%), the area still had an output gap of some £460.2m in 2014, which rises to £2.328bn if we only consider local employee jobs (given that GVA per worker in Coventry & Warwickshire is just 90% of the national average). This is a key strategic issue that needs to be addressed. The local economy needs to grow at 3.3% per annum (assuming a UK GVA Growth Rate of 3%) if this output gap is to be removed by 2030.
The main sectors that are expected to contribute to this GVA growth include the Automotive, Construction, ICT, Architecture/Civil Engineering and Logistics sectors. The Culture and Tourism sector is also expected to make an important contribution, and this is reflected in the five themes that now form the StrategicEconomic Plan:
Unlocking our growth potentialAlthough the area has witnessed growth in the demand for employment land, particularly in Advanced Manufacturing and Logistics, there is a need to address the low stock and immediate pipeline of employment land, particularly in Coventry and Nuneaton & Bedworth, where job densities are low. Transport infrastructure and urban centre improvements, as well as significant expansions of the superfast broadband infrastructure, will play a crucial role in bringing major sites forward for development and attracting business investment.
Advanced Manufacturing and Engineering sector developmentThere is a need to capitalise on the potential of this sector, which is growing more rapidly in Coventry & Warwickshire than the UK overall. A key priority is to increase levels of business engagement with the area’s world-class R&D and innovation assets, and fulfil the area’s potential as a testbed for new low carbon products.
Growing our SMEsThe Growth Hub will continue to deliver a central business support co-ordination function within Coventry & Warwickshire, with the Hub now being a subsidiary of CWLEP with its own bank account and core team. Its portfolio of activity will continue to expand to ensure future sustainability and reflect the evolving demand for business support locally. All Business Account Managers are accredited by the Association of British Mentors.
Growing our talentThis will target improvements to skills levels in Coventry & Warwickshire’s priority sectors and ensure the supply of training meets demand from employers. It will also entail investments in the capital infrastructure which will unlock barriers to developing technologies in energy efficiency, low carbon, assistive technologies, intelligent mobility, sustainability, digital technology and data analysis in particular. Interventions in this theme will help to drive growth, tackle unemployment and ensure a stronger fit between education and employment.
Culture and tourismThis will focus on growing the visitor economy, particularly around Coventry’s opportunity to become UK Capital of Culture in 2021, and further developing the renowned offer that is “Shakespeare’s Stratford”.
2016 CWSEP Update Strategic Pillars
Recognising the role that a range of sectors need to play in growing and diversifying the Coventry & Warwickshire economy, the CWSEP vision has been updated to reflect this:
West Midlands Combined Authority and Midlands Engine
The seven metropolitan authorities of Birmingham, Coventry, Dudley, Sandwell, Solihull, Walsall and Wolverhampton have established a West Midlands Combined Authority, working alongside the Local Enterprise Partnerships of the Black Country, Greater Birmingham & Solihull and Coventry & Warwickshire and other Local Authorities.
Nuneaton & Bedworth Borough Council is a non-constituent member, whilst Warwickshire County Council, North Warwickshire Borough Council, Rugby Borough Council, and Stratford-on-Avon District Council act as observers, with a view to joining as members in the future.
A Strategic Economic Plan has been established for the Combined Authority and three-LEP geography, which includes clear objectives and targets for the 2016-2030 period. As a result, the objectives proposed in the 2016 Coventry & Warwickshire Strategic Economic Plan are closely aligned with those of the emerging Combined Authority Strategic Economic Plan, particularly in terms of growing the manufacturing and digital/creative sectors, raising skills levels as a means of both supporting growth of key economic sectors and increasing employment rates, and enhancing the transport infrastructure as an enabler for economic growth.
2015 also witnessed the launch of the Midlands Engine, where the 11 Midlands-based LEPs will work together to respond to the Government’s economic and political challenges, particularly in:
• Enhancing transport connectivity.
• Increasing inward investment and local business growth.
• Enhancing education and skills.
• Increasing capacity and collaboration in Research, Development and Innovation.
“Coventry & Warwickshire is recognised as a global hub for knowledge-based industries, leading the way in advanced manufacturing & engineering and digital sectors.
Building on its central location, employment sites, distinctive businesses, innovation and cultural assets and highly talented workforce, by 2025 Coventry & Warwickshire will be a high performing economy with our innovative businesses competing internationally, growing and providing better paid employment opportunities for all of our residents across both our rural and urban areas.”

Coventry & Warwickshire Strategic Economic Plan Update: 2016 11
1
Review of the 2014 Strategic Economic Plan
1.1Introduction
The Coventry & Warwickshire Strategic Economic Plan, published in March 2014, set out how Coventry & Warwickshire Local Enterprise Partnership (CWLEP) will grow the economy over the short, medium and longer term. It recognised that building growth and prosperity requires co-ordinated action from all sectors.
In particular, investment from both national and local government would be required in the development of the Coventry & Warwickshire economy, and private sector companies would remain the key drivers of economic growth.
The ultimate aim set out in the Strategic Economic Plan (SEP) was to improve the competitiveness of the Coventry & Warwickshire economy, and increase employment and wealth opportunities for all, reflected in the creation of 94,500 new jobs and £15.823bn GVA per annum in the Coventry & Warwickshire economy by 2030. This was encapsulated in the vision presented in the plan:
“Coventry & Warwickshire is recognised as a global hub in the advanced manufacturing and engineering sector, with business and research links across the world.
Building on its central location, employment sites, distinctive businesses, innovation assets and highly
talented workforce, by 2025 Coventry & Warwickshire will be a high performing economy with our innovative businesses competing internationally, growing and providing better paid employment opportunities for all of our residents across both our rural and urban areas.”
The vision was long-term in nature, and reflected the requirements at that time that were needed to significantly grow the economy and build a stronger private sector. In this context, the Strategic Economic Plan set out a framework for growth and the economic priorities that would help deliver the economic vision.
The 2014 Strategic Economic Plan also recognised that the Coventry & Warwickshire area has many of the key characteristics of a high performing economy. It is extremely well placed on the strategic transport network and has excellent links with London. It is home to two leading global universities, six Further Education colleges and world-class R&D institutions. It has a range of multi-national companies (many with their headquarters here), and is a highly attractive environment for businesses to locate and residents to live, with a strong cultural and heritage offer.
However, when looked at in total, today’s Coventry & Warwickshire economic profile could be described as average, with multiple smaller economic geographies existing across the LEP area. It has the complexity of an urban city economy mixed with areas of deprivation and prosperity and a diverse peri-urban and rural county economy. It has generally higher levels of prosperity in the south in the districts of Stratford-on-Avon and Warwick, alongside challenges for skills, job creation and
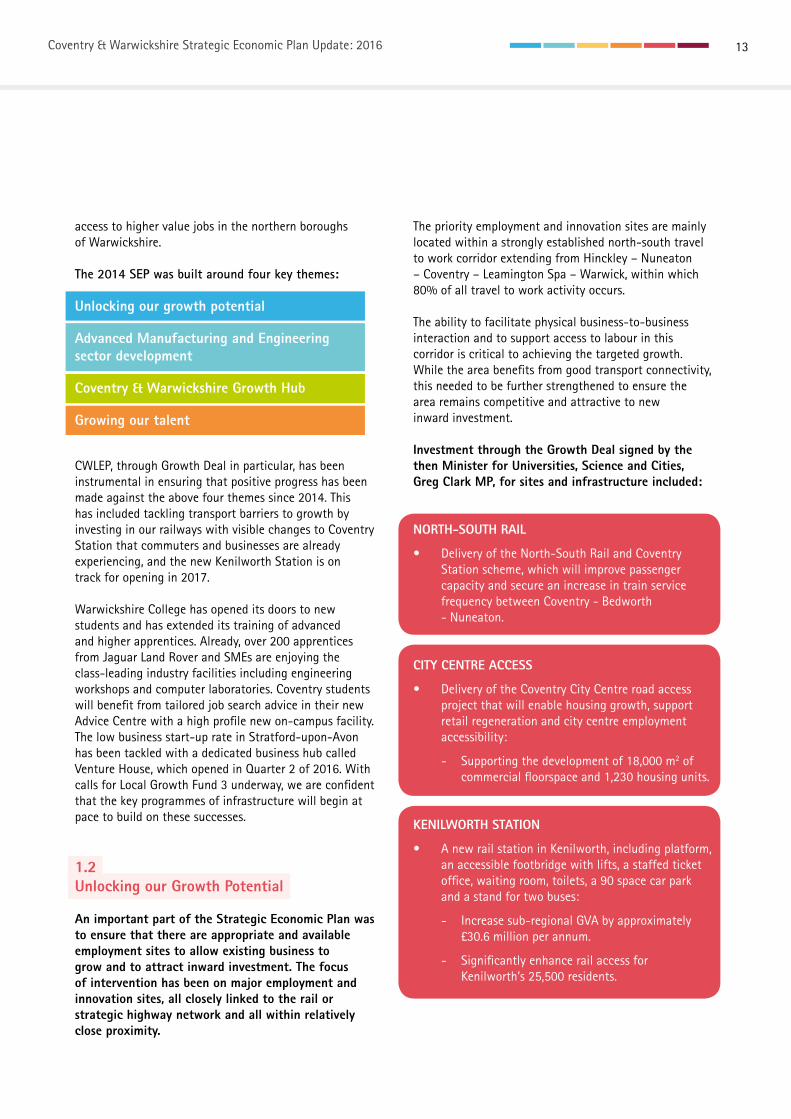
Coventry & Warwickshire Strategic Economic Plan Update: 2016 13
1
Review of the 2014 Strategic Economic Plan
Unlocking our growth potential
Advanced Manufacturing and Engineeringsector development
Coventry & Warwickshire Growth Hub
Growing our talent
access to higher value jobs in the northern boroughs of Warwickshire.
The 2014 SEP was built around four key themes:
CWLEP, through Growth Deal in particular, has been instrumental in ensuring that positive progress has been made against the above four themes since 2014. This has included tackling transport barriers to growth by investing in our railways with visible changes to Coventry Station that commuters and businesses are already experiencing, and the new Kenilworth Station is on track for opening in 2017.
Warwickshire College has opened its doors to new students and has extended its training of advanced and higher apprentices. Already, over 200 apprentices from Jaguar Land Rover and SMEs are enjoying the class-leading industry facilities including engineering workshops and computer laboratories. Coventry students will benefit from tailored job search advice in their new Advice Centre with a high profile new on-campus facility. The low business start-up rate in Stratford-upon-Avon has been tackled with a dedicated business hub called Venture House, which opened in Quarter 2 of 2016. With calls for Local Growth Fund 3 underway, we are confident that the key programmes of infrastructure will begin at pace to build on these successes.
1.2Unlocking our Growth Potential
An important part of the Strategic Economic Plan was to ensure that there are appropriate and available employment sites to allow existing business to grow and to attract inward investment. The focus of intervention has been on major employment and innovation sites, all closely linked to the rail or strategic highway network and all within relatively close proximity.
The priority employment and innovation sites are mainly located within a strongly established north-south travel to work corridor extending from Hinckley – Nuneaton – Coventry – Leamington Spa – Warwick, within which 80% of all travel to work activity occurs.
The ability to facilitate physical business-to-business interaction and to support access to labour in this corridor is critical to achieving the targeted growth. While the area benefits from good transport connectivity, this needed to be further strengthened to ensure the area remains competitive and attractive to new inward investment.
Investment through the Growth Deal signed by the then Minister for Universities, Science and Cities, Greg Clark MP, for sites and infrastructure included: NORTH-SOUTH RAIL
• Delivery of the North-South Rail and Coventry Station scheme, which will improve passenger capacity and secure an increase in train service frequency between Coventry - Bedworth - Nuneaton.
CITY CENTRE ACCESS
• Delivery of the Coventry City Centre road access project that will enable housing growth, support retail regeneration and city centre employment accessibility:
- Supporting the development of 18,000 m2 of commercial floorspace and 1,230 housing units.
KENILWORTH STATION
• A new rail station in Kenilworth, including platform, an accessible footbridge with lifts, a staffed ticket office, waiting room, toilets, a 90 space car park and a stand for two buses:
- Increase sub-regional GVA by approximately £30.6 million per annum.
- Significantly enhance rail access for Kenilworth’s 25,500 residents.
The Growth Deal included other projects with provisional allocations starting in 2016/17 and beyond:
ACCESS TO WARWICK
• Delivery of the A46/A425/A4177 Stanks Road network scheme. This will enhance access to Warwick town centre and facilitate future employment and housing growth in the area.
A5 CORRIDOR
• Delivery of the A5 Corridor scheme. This will enable the dualling of the A5/A47 Longshoot to Dodwells which will: reduce congestion, improve journey time reliability, and support current and future economic activity in Warwickshire, Leicestershire and the wider A5 corridor.
ACCESS TO UK CENTRAL
• Improve links to UK Central, Birmingham Airport & High Speed 2 (HS2). This scheme will improve key junctions along the A45, connecting the major employment sites of the University of Warwick, Whitley, and Ansty to major national and international gateways.
A45 CORRIDOR COVENTRY RAPID TRANSIT
• Contribution to a series of targeted improvements at junctions along the A45 from the A46/A45/A444 Stivichall junction through to the A45/Broad Lane junction.
COVENTRY SOUTH MASS RAPID TRANSIT
• Contribution towards enhanced transport connectivity between Coventry Airport, Middlemarch Business Park, Whitley Employment Zone with Coventry City Centre and Coventry Station.
In January 2015, Oliver Letwin MP, then Minister for Government Policy and Chancellor of the Duchy of Lancaster announced further sites and infrastructure investment through an extension to Growth Deal, including:
EMPLOYMENT SITES
• An Investment programme to bring forward key employment sites for development (e.g. Friargate and further employment land around J12 M40), enabling business growth and creating new job opportunities:
- Creating 43,200 m2 of new commercial floorspace.
- Stimulating £88.5 million of private sector investment into employment land.
- Creating 3,600 new jobs for the local economy by 2020.
- Creating almost £172 million in GVA.
INVESTMENT FUND
• A fund that will support local businesses to make major capital investments, develop buildings and infrastructure or access new technologies that will facilitate business growth and job creation:
- Creating at least 97 new jobs for the local economy by 2020.
- Creating £11.2 million in GVA within Coventry & Warwickshire.
CAPACITY IMPROVEMENT
• Capacity improvements in the A444 corridor at the Coton Arches roundabout in Nuneaton, which will facilitate housing and employment growth (including at the flagship Bermuda Park employment site) and improve access to Nuneaton town centre:
- Enabling over 400 new homes to be built.
- Enabling over 700 new jobs to be created.
- Creating at least £24.2 million in GVA for the local economy.
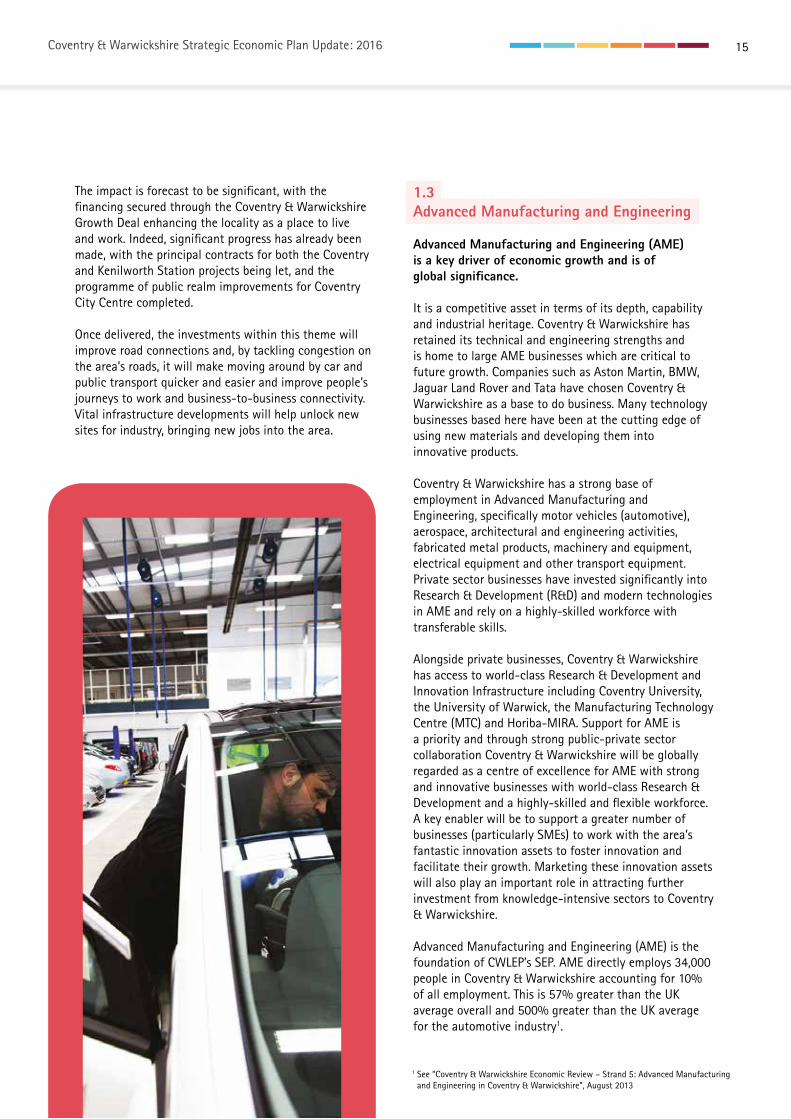
Coventry & Warwickshire Strategic Economic Plan Update: 2016 15
The impact is forecast to be significant, with the financing secured through the Coventry & Warwickshire Growth Deal enhancing the locality as a place to live and work. Indeed, significant progress has already been made, with the principal contracts for both the Coventry and Kenilworth Station projects being let, and the programme of public realm improvements for Coventry City Centre completed.
Once delivered, the investments within this theme will improve road connections and, by tackling congestion on the area’s roads, it will make moving around by car and public transport quicker and easier and improve people’s journeys to work and business-to-business connectivity. Vital infrastructure developments will help unlock new sites for industry, bringing new jobs into the area.
1.3Advanced Manufacturing and Engineering
Advanced Manufacturing and Engineering (AME) is a key driver of economic growth and is of global significance.
It is a competitive asset in terms of its depth, capability and industrial heritage. Coventry & Warwickshire has retained its technical and engineering strengths and is home to large AME businesses which are critical to future growth. Companies such as Aston Martin, BMW, Jaguar Land Rover and Tata have chosen Coventry & Warwickshire as a base to do business. Many technology businesses based here have been at the cutting edge of using new materials and developing them into innovative products.
Coventry & Warwickshire has a strong base of employment in Advanced Manufacturing and Engineering, specifically motor vehicles (automotive), aerospace, architectural and engineering activities, fabricated metal products, machinery and equipment, electrical equipment and other transport equipment. Private sector businesses have invested significantly into Research & Development (R&D) and modern technologies in AME and rely on a highly-skilled workforce with transferable skills.
Alongside private businesses, Coventry & Warwickshire has access to world-class Research & Development and Innovation Infrastructure including Coventry University, the University of Warwick, the Manufacturing Technology Centre (MTC) and Horiba-MIRA. Support for AME is a priority and through strong public-private sector collaboration Coventry & Warwickshire will be globally regarded as a centre of excellence for AME with strong and innovative businesses with world-class Research & Development and a highly-skilled and flexible workforce. A key enabler will be to support a greater number of businesses (particularly SMEs) to work with the area’s fantastic innovation assets to foster innovation and facilitate their growth. Marketing these innovation assets will also play an important role in attracting further investment from knowledge-intensive sectors to Coventry & Warwickshire.
Advanced Manufacturing and Engineering (AME) is the foundation of CWLEP’s SEP. AME directly employs 34,000 people in Coventry & Warwickshire accounting for 10% of all employment. This is 57% greater than the UK average overall and 500% greater than the UK average for the automotive industry1.
1 See “Coventry & Warwickshire Economic Review – Strand 5: Advanced Manufacturing and Engineering in Coventry & Warwickshire”, August 2013
Investment through Growth Deal included:
TRANSPORT DESIGN CENTRE
• Development of a National Transport Design Centre at Coventry University Technology park:
- 1,700 m² of purpose built grow-on space.
- 115 jobs created.
- 253 businesses assisted by 2021/22.
APPRENTICESHIP CENTRE
• Development of a new Apprenticeship Centre at Warwickshire College. This investment will enable the college to purchase new equipment and refurbish college buildings, which will provide additional apprenticeship training in advanced manufacturing and engineering:
- 312 Advanced Apprenticeships.
- 342 Higher Apprenticeships.
Investment through Growth Deal includes:
RESEARCH & DEVELOPMENT
• A new centre to deliver R&D activities developing new steel products that will service key sectors such as Automotive, Aerospace, Rail, Defence and Energy:
- Support 30 businesses in developing new high-value steel products.
- Safeguard 40 jobs initially within the businesses supported.
- Create at least £3million in GVA within Coventry & Warwickshire by 2018.
BUSINESS INVESTMENT FUND
• A fund that will address difficulties businesses are currently encountering in accessing finance from commercial providers to fund expansion projects.
• The fund will support businesses to make major capital investments, develop buildings and infrastructure or access new technologies that will facilitate business growth and job creation. The fund will create around 100 new jobs directly for the local economy.
EMPLOYMENT SITES
• Investment programme to bring forward key employment sites for development (e.g. further employment land around J12 M40, Gaydon). This will result in business growth and the creation of new job opportunities within the local economy.
The planned activities within this theme, particularly those funded through the Growth Deal, will potentially have a considerable impact on the local economy in the form of facilitating business growth and job creation. Indeed, planning permission has been secured and construction work started on the National Transport Design Centre. Longer-term, the development of the new R&D Centre for Innovative Steel Based Products, combined with the launch of the Business Investment Fund, will help to strengthen local supply chains within the automotive, aerospace, rail, defence and energy sectors, in particular.
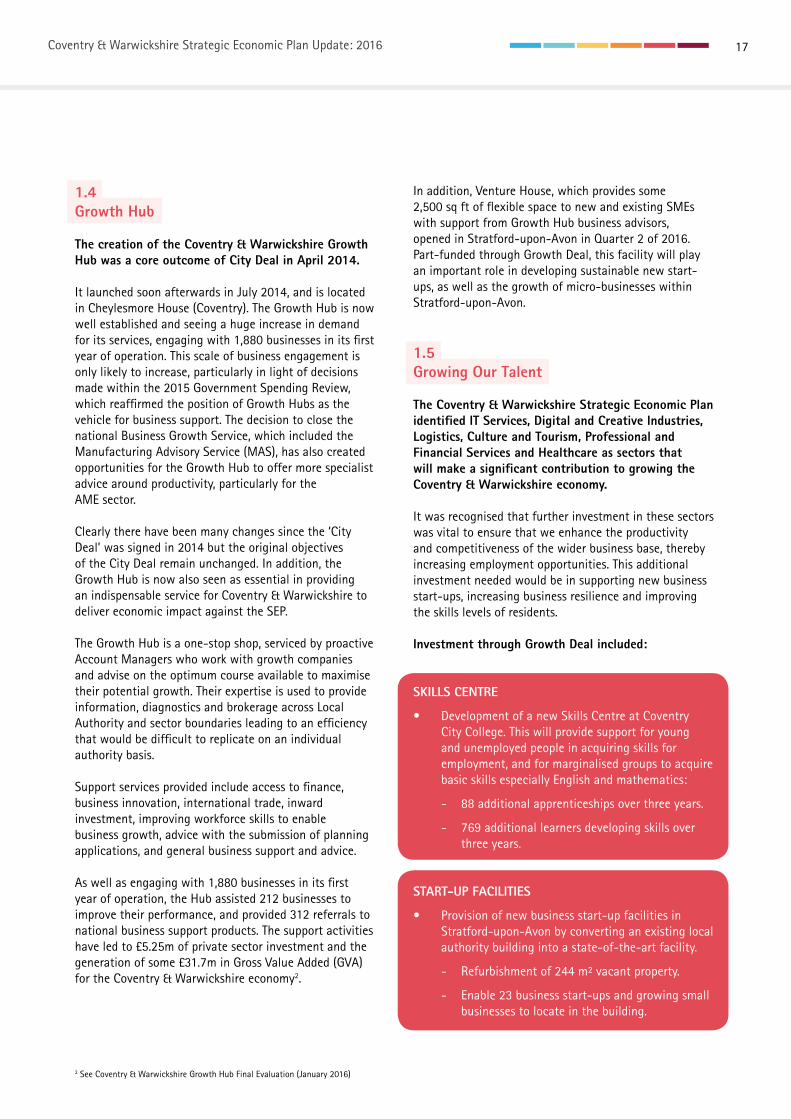
Coventry & Warwickshire Strategic Economic Plan Update: 2016 17
1.4Growth Hub
The creation of the Coventry & Warwickshire Growth Hub was a core outcome of City Deal in April 2014.
It launched soon afterwards in July 2014, and is located in Cheylesmore House (Coventry). The Growth Hub is now well established and seeing a huge increase in demand for its services, engaging with 1,880 businesses in its first year of operation. This scale of business engagement is only likely to increase, particularly in light of decisions made within the 2015 Government Spending Review, which reaffirmed the position of Growth Hubs as the vehicle for business support. The decision to close the national Business Growth Service, which included the Manufacturing Advisory Service (MAS), has also created opportunities for the Growth Hub to offer more specialist advice around productivity, particularly for the AME sector.
Clearly there have been many changes since the ‘City Deal’ was signed in 2014 but the original objectives of the City Deal remain unchanged. In addition, the Growth Hub is now also seen as essential in providing an indispensable service for Coventry & Warwickshire to deliver economic impact against the SEP.
The Growth Hub is a one-stop shop, serviced by proactive Account Managers who work with growth companies and advise on the optimum course available to maximise their potential growth. Their expertise is used to provide information, diagnostics and brokerage across Local Authority and sector boundaries leading to an efficiency that would be difficult to replicate on an individual authority basis.
Support services provided include access to finance, business innovation, international trade, inward investment, improving workforce skills to enable business growth, advice with the submission of planning applications, and general business support and advice.
As well as engaging with 1,880 businesses in its first year of operation, the Hub assisted 212 businesses to improve their performance, and provided 312 referrals to national business support products. The support activities have led to £5.25m of private sector investment and the generation of some £31.7m in Gross Value Added (GVA) for the Coventry & Warwickshire economy2.
In addition, Venture House, which provides some 2,500 sq ft of flexible space to new and existing SMEs with support from Growth Hub business advisors, opened in Stratford-upon-Avon in Quarter 2 of 2016. Part-funded through Growth Deal, this facility will play an important role in developing sustainable new start-ups, as well as the growth of micro-businesses within Stratford-upon-Avon.
1.5Growing Our Talent
The Coventry & Warwickshire Strategic Economic Plan identified IT Services, Digital and Creative Industries, Logistics, Culture and Tourism, Professional and Financial Services and Healthcare as sectors that will make a significant contribution to growing the Coventry & Warwickshire economy.
It was recognised that further investment in these sectors was vital to ensure that we enhance the productivity and competitiveness of the wider business base, thereby increasing employment opportunities. This additional investment needed would be in supporting new business start-ups, increasing business resilience and improving the skills levels of residents.
Investment through Growth Deal included:
SKILLS CENTRE
• Development of a new Skills Centre at Coventry City College. This will provide support for young and unemployed people in acquiring skills for employment, and for marginalised groups to acquire basic skills especially English and mathematics:
- 88 additional apprenticeships over three years.
- 769 additional learners developing skills over three years.
START-UP FACILITIES
• Provision of new business start-up facilities in Stratford-upon-Avon by converting an existing local authority building into a state-of-the-art facility.
- Refurbishment of 244 m² vacant property.
- Enable 23 business start-ups and growing small businesses to locate in the building.
2 See Coventry & Warwickshire Growth Hub Final Evaluation (January 2016)
CITY CENTRE ACCESS
• Delivery of the Coventry City Centre road access project that will enable housing growth, support retail regeneration and city centre employment accessibility.
ACCESS TO UK CENTRAL
• Improve links to UK Central, Birmingham Airport and High Speed 2 (HS2). This scheme will improve key junctions, connecting the major employment sites of University of Warwick, Whitley and Ansty to major national and international gateways.
Investment through Growth Deal included:
FE COLLEGES
• New facilities at FE Colleges to deliver skills as demanded by local employers. The Growth Deal will invest in skills training to increase the number of technically trained people to meet the continuing demands from existing and future local employers in the advanced manufacturing and construction sectors:
- Create 1,200 m2 of new learning space.
- Generate 1,200 new learners per annum.
- Create 730 new apprenticeship opportunities, particularly within construction and AME.
Significant progress has already been made within this theme, particularly through investments from the Growth Deal. The Trident Centre, a new 1,675 m2 learning centre for Warwickshire College in Leamington Spa, has been constructed, and the Centre is already operational. This delivers much needed courses and apprenticeships within the AME sector.
In addition, a new Advice Centre at City College Coventry to provide help and support for people wanting to find information about jobs, training or education, is also fully operational. A cross-LEP Skills Partnership has also been successfully established to deliver a co-ordinated approach that will enable residents to access training and employment in the North Warwickshire, Nuneaton & Bedworth and Hinckley & Bosworth Local Authority areas.
1.6Programme Management and Governance
Coventry City Council is the statutory Accountable Body for delivery and financial oversight and has put in a place a Growth Deal Programme Management Team. This team is responsible for managing the portfolio of projects funded through Growth Deal, and reporting progress to the CWLEP Board.
The CWLEP were early adopters of an approved Assurance Framework setting out how the Growth Deal Programme would be managed and governed. The programme is regularly monitored through monthly meetings with the Government’s Cities & Local Growth Unit and is accountable to the LEP Board via the board’s Programme Delivery Sub-Committee where the expenditure, delivery and output profiles are scrutinised on behalf of the LEP Board.
In December 2015, the Annual Performance Conversation took place between Government and the CWLEP. The CWLEP was judged to be delivering effective management, distribution of funds and execution of commitments within both the City and Growth Deals. Moreover, by the end of the 2015/16 financial year, CWLEP was on track to deliver its initial Growth Deal programme by 2020, having successfully committed its first full year allocation of £17.18m on kick-starting flagship schemes.

Coventry & Warwickshire Strategic Economic Plan Update: 2016 19
2
2016 Strategic Economic Plan Update
2.1Vision, objectives, strategy and plans
The past two years have seen significant progress within Coventry & Warwickshire’s economy, with the early Growth Deal investments providing a strong foundation for longer-term economic growth.
However, the SEP is a living document that must remain relevant to the key strategic socio-economic challenges and opportunities facing the area. Therefore, whilst we acknowledge the encouraging progress, we at CWLEP also need to continually revisit our focus, priorities and plans.
As a Local Enterprise Partnership area, Coventry & Warwickshire can highlight particular positive aspects of economic performance:
• The area has the lowest level of unemployment within its comparator group of 13 “Producing Places3” LEPs within England.
• The area has the 2nd highest level of employment opportunities compared to its population (job density) across our comparator group of 13 “Producing Places*” LEPs within England.
• The area is ranked 4th across our comparator group of 13 “Producing Places*” LEPs within England in relation to nominal GVA per head.
• The area has seen skills attainment and higher level skills attainment levels increase by greater than the English average between 2011 and 2014.
Yet there remain significant challenges that need to be addressed at both the Coventry & Warwickshire and individual Local Authority area levels, alongside the new opportunities that have emerged as a result of our success and in light of the changes taking place in both national and local government.
This 2016 update to the economic plan builds upon the 2014 SEP that supported negotiations with Government for the first local Growth Deal. It presents the most recent information and view on the local economy. It also includes an early view of the linkages to the emerging priorities of the West Midlands Combined Authority and Midlands Engine.
Alongside this update to the Strategic Economic Plan, CWLEP issued a call for Expressions of Interest to create a “long-list” of potential projects and programmes that could unlock further economic development. These projects and programmes are expected to align with the established priorities outlined in existing Coventry & Warwickshire LEP strategies. As a result of the call for Expressions of Interest, this update of the SEP identifies additional investment priorities that CWLEP will support through potential future rounds of Local Growth Deal.
3 Note: The typology of Local Enterprise Partnerships is based on comparative performance across a range of indicators. LEPs in the producing places group including Coventry & Warwickshire have a concentration of businesses in the production industries.
Coventry & Warwickshire Strategic Economic Plan Update: 2016 21
2.2Baseline Economic Forecast
The Office of National Statistics (ONS) estimated the contribution of Coventry & Warwickshire in terms of Gross Value Added (GVA) to the economy in 2010 to be £17.931bn. Undertaking calculations based on ONS population and GVA estimates, the output gap based on GVA per capita totalled £1.137bn in 2010.
From 2010 to 2014, GVA growth in the UK has been estimated utilising ONS estimates at 3%. In comparison over the same time period the Coventry & Warwickshire LEP area grew by 3.75%. This growth above the UK average has resulted in a significant reduction in the output gap based on GVA per capita, with the gap reducing to £460.2m in 20144. However, given that GVA per worker in Coventry & Warwickshire (£43,639) is just 90% of the national average5, if we only consider local employee jobs, this productivity gap rises to £2.328bn6.
Utilising national and sub-national population projections and an estimated UK GVA growth rate of 3% from 2015 to 2030, it is estimated that the Coventry & Warwickshire economy will need to increase the value of its goods and services by 3.3% per annum over the same time period for GVA to be in line with the UK per capita average by 2030. The key sectors that are expected to contribute to this GVA growth include the Automotive, Construction, Information & Communications Technology (ICT), Architecture/Civil Engineering, and Logistics sectors.
The 2014 Coventry & Warwickshire Strategic Economic Plan highlighted that through all the proposed Local Growth Deal Initiatives and Government asks that there would be a net additional increase in GVA per annum of £1.216bn by 2020, £2.221bn by 2025 and £2.761bn by 2030. Our current forecast, based on population and GVA estimates, is for overall growth in GVA per annum in Coventry & Warwickshire of £3.942bn by 2020, £9.916bn by 2025 and £15.823bn by 2030.
Moving forward, we recognise the need to focus our attention on productivity, and translating our stronger than average performance in total economic growth into more effective, efficient and productive growth.
In particular, there is a need to tackle the key factors driving Coventry & Warwickshire’s productivity gap:
• Lack of growth in our knowledge-intensive sectors – while the Coventry & Warwickshire area has a reasonably strong proportion of its economy in these sectors (particularly advanced manufacturing and digital & creative industries), the total amount of knowledge-intensive activity within the economy is growing at a rate that is slower than average.
• Lack of growth in our small and medium sized businesses – again, while the Coventry & Warwickshire area performs well in terms of the number of new business starts, we are not seeing as many of these small companies growing into larger businesses as we should.
• A need to invest in skills within the local population, increasing qualification levels, and ensuring that the workforce in Coventry & Warwickshire have the skills that effectively meet the needs of our business base.
• Increasing agglomeration effects within the local economy by improving connectivity both within and between the economic centres within Coventry & Warwickshire, and ensuring stronger connections across the wider Midlands area as part of Midlands Connect.
• Extracting increased value added from the economic activities within Coventry & Warwickshire through improved supply chain linkages, business support focused on growth and improving the competitiveness of Coventry & Warwickshire companies. This will ensure that we maximise the impact of key strengths within the area – including our culture and tourism offer.
There is also a need to address the inequality in economic performance within Coventry & Warwickshire and the underlying factors, which further contribute towards the productivity gap. For example, Nuneaton & Bedworth and Coventry have low job density levels (number of jobs relative to population size), whereas Stratford-on-Avon and Warwick districts have high job densities. Coventry’s unemployment rate also significantly exceeds the national average.
2
2016 Strategic Economic Plan Update
4 Coventry University Analysis (2016)5 Warwickshire County Council Analysis (2016)
6 In other words, the Coventry & Warwickshire economy would generate an additional £2.3bn in output if our productivity levels per worker were the same as the national average.

In addition, qualification levels in Nuneaton & Bedworth, Coventry and North Warwickshire are significantly lower than in the southern districts of Warwickshire. The proportion of residents in those areas with no qualifications exceeds the national average and the number with degree level qualifications is also below the national average, leading to employment rates below the national average.
These important economic differences, coupled with an analysis of Coventry & Warwickshire’s strengths and opportunities, have helped shape the major pillars that now form the updated Strategic Economic Plan.
In recognising the range of economic sectors that will play a key role in growing Coventry & Warwickshire’s economy, the four strategic pillars included in the 2014 SEP have evolved into five, with “Culture and Tourism” added as the fifth pillar given that sector’s increasing strategic importance. The sections that follow summarise the significant progress and evolution that has taken place within each of the five pillars.
2.3Objectives and Core Strategic Themes
After considering Coventry & Warwickshire’s recent economic performance, and the area’s economic needs, it was apparent that the vision from the 2014 Strategic Economic Plan remains broadly valid, but needed updating to reflect the growing importance of the digital and cultural sectors:
“Coventry & Warwickshire is recognised as a global hub for knowledge-based industries, leading the way in advanced manufacturing & engineering and digital sectors.
Building on its central location, employment sites, distinctive businesses, innovation and cultural assets and highly talented workforce, by 2025 Coventry & Warwickshire will be a high performing economy with our innovative businesses competing internationally, growing and providing better paid employment opportunities for all of our residents across both our rural and urban areas”.
Growing ourSMEsBuilding on the work of Coventry & Warwickshire Growth Hub to enable business development and improvement, through providing information, diagnostics and brokerage services, and ensuring a strong support infrastructure is in place to address barriers to business growth.
Growing our TalentEnhancing the productivity and competitiveness of our wider business base and increasing employment opportunities by supporting the development of new business start-ups, increasing business resilience and improving the skill levels of residents.
Culture& TourismAn essential element of Shakespeare’s England and the wider Coventry & Warwickshire economy. Improvements to the local tourism infrastructure will help to grow the sector.
AdvancedManufacturing& EngineeringCoventry & Warwickshire will be globally regarded as a centre of excellence with a strong and innovative business and R&D base and a highly skilled and flexible workforce.
Unlockingour GrowthPotentialEnsuring the availability of appropriate employment sites to allow existing businesses to grow and to attract inward investment.
It is also important to revisit the objectives that underpin this vision, and the 2016 Strategic Economic Plan Update proposes seven strategic objectives that reflect the five pillars of activity (detailed below).
2016 CWSEP Update Strategic Pillars
Coventry & Warwickshire Strategic Economic Plan Update: 2016 23
The concept of sustainable development will be integrated into all activities delivered through the five strategic pillars.
In measuring success, four outcome targets will be used which, when achieved, reduce disparities in performance between the Coventry & Warwickshire economy and the national economy as a whole by 2030. If these objectives and targets are to be achieved, it is a pre-condition that CWLEP works effectively with the public, private and third sectors locally.
All pillars of activity will ultimately help to improve the quality of life for Coventry & Warwickshire residents, particularly by stimulating additional sustainable employment and helping to raise income levels. The following sections describe the key activities that are proposed within each of the five pillars from 2016 onwards.
Objectives• Improve Coventry & Warwickshire’s economic competitiveness.• Address the existing productivity gap between the CWLEP area and the UK average.• Ensure strong road, rail and broadband connectivity across the full CWLEP area.• Become a global centre for R&D in Advanced Manufacturing and Engineering.• Create a supportive environment within which businesses can grow and prosper.• Invest in employment and skills provision to meet evolving demands of employers, providing a
world-class apprenticeship offer.• Grow the creative and cultural industries with Coventry becoming UK Capital of Culture 2021.
UNLOCKING OUR GROWTH POTENTIAL:Unlocking of new employments and housing sites.
ADVANCED MANUFACTURING & ENGINEERING:Enhance innovation, R&D and raise skills levels in the sector.
GROWING OUR SMEs:Build on the work of the Growth Hub as an enabler of business growth through IDB service, and deliver a strong business support system.
GROWING OUR TALENT:Raising skills level to help enhance business growth and raise employment rates.
CULTURE & TOURISM:Grow this strategically important sector.
Five pillars of activity
Outcome Targets• A minimum growth rate of 3.3% per annum to remove the output gap by 2030.• A GVA per annum increase of £15.823bn by 2030.• An economy which will employ an additional 94,500 people by 2030.• The provision of 75,000 - 76,000 new homes by 2030.
2.4Unlocking our Growth Potential
2.4.1 Employment Land
It is recognised that the ambitious plans CWLEP and its partners have for the area, building on the very positive growth of key sectors in recent years, has driven the take up of land on high-quality sites. These sites are now close to being exhausted and future growth will be constrained unless currently proposed sites are delivered and future sites are identified. The CBRE Employment Land Study commissioned by CWLEP was published in August 2015 and provided an up-to-date assessment of the ‘Objectively Assessed Need’ for employment land in Coventry & Warwickshire. Following the guidance set out in the National Planning Policy Framework and associated planning practice guidance it found that:
• Demand has been strong across the main components of employment land in the CWLEP area – in advanced manufacturing, particularly the automotive sector, and in logistics within the ‘Golden Triangle’ (bounded by the M6, M69 and M1). As a result, the supply of suitable sites is now at a critical level, with less than two years supply available across the area, much of it in smaller, ageing and unsuitable units.
• Future projections of demand have increased since previous assessments. Using the different Government recommended methodologies for calculating future demand, the range to 2031 ranges from 353 ha (sectorial), through 405 and 570 ha (demographic/labour market) to 637 to 660 ha (take up). The CBRE Employment Land Study recommended that CWLEP plans for the higher end of this range.
• Only 64 ha is available on ‘oven-ready’ sites which can meet current occupier demand. A further 93 ha may come forward on secondary sites with development potential. However future supply is reliant on new major strategic sites being brought forward.
STRATEGIC PROGRAMME:URBAN CORE DEVELOPMENT
As highlighted in the introduction to this SEP Update, Coventry & Warwickshire overall has a strong employment profile but this highlights significant challenges within specific economic geographies. In particular, Coventry and Nuneaton & Bedworth both face issues of lower job densities, economic inactivity and employment rates, relative to the Stratford-on-Avon and Warwick districts (where the number of jobs exceeds the resident population) and national average. The Urban Core strategic programme will concentrate investment in Coventry City Centre and in transforming Nuneaton to address these challenges where the focus will be on developing the town centre and the A444 growth corridor. Areas for investment include highway improvements and rail infrastructure enhancements to support north-south connectivity, town centre infrastructure and investments that support growth in tourism, the visitor economy, and the leisure and retail offer.
In Coventry, the unlocking of key development sites is essential to support private investment, job creation and housing growth. These include; City Centre South which will provide a significantly enhanced retail and leisure offer; the extension of the Friargate development; and the Civic Centre redevelopment by Coventry University. As with Nuneaton, transport connectivity is essential both within the City, north-south into Warwickshire and to UK Central and HS2.
The scarcity of available land in the short-term has the potential to damage the economic prospects of the area by preventing investment opportunities to be fully secured. Indeed, there is the risk that potential investors would be forced to consider alternative locations outside of Coventry & Warwickshire. Research carried out by the Federation of Small Businesses also identified shortages in industrial space as a notable barrier to business growth that affects a range of sectors. Moreover, there is a particular need for additional strategic sites that are capable of accommodating the largest storage and distribution requirements and sites suitable for development as R&D centres, in order for CWLEP to achieve its targets in relation to the growth of the local automotive cluster.
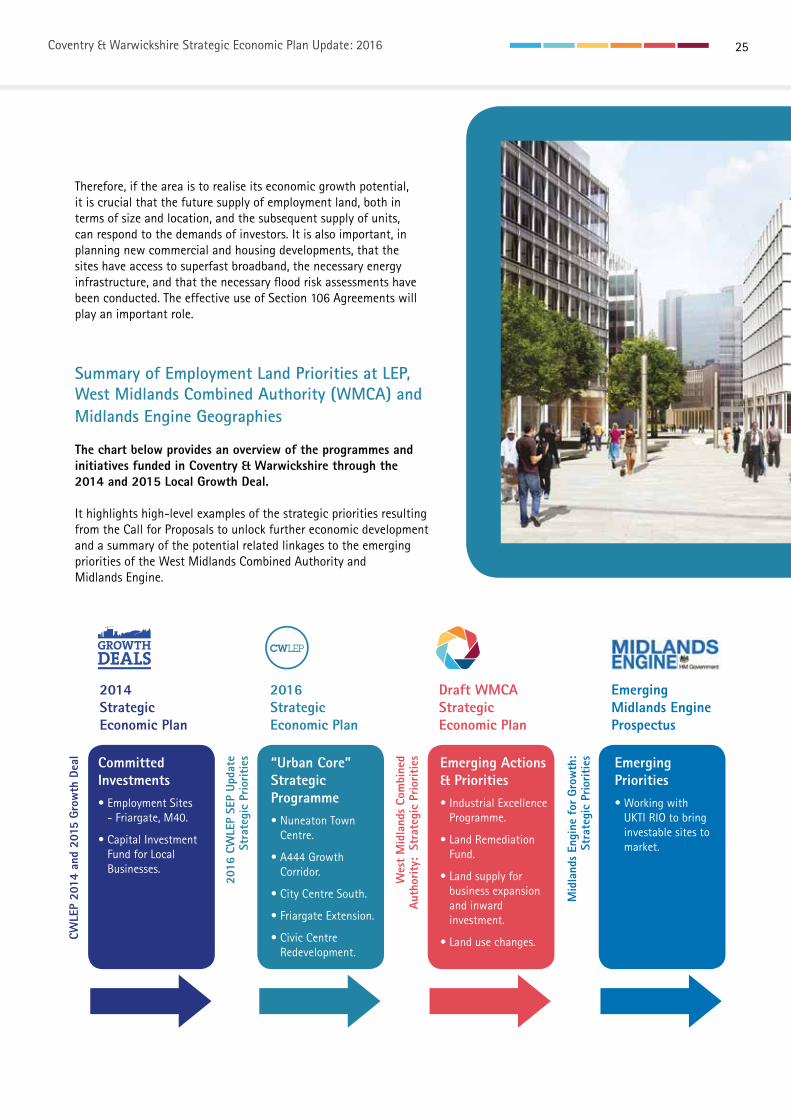
Coventry & Warwickshire Strategic Economic Plan Update: 2016 25
Therefore, if the area is to realise its economic growth potential, it is crucial that the future supply of employment land, both in terms of size and location, and the subsequent supply of units, can respond to the demands of investors. It is also important, in planning new commercial and housing developments, that the sites have access to superfast broadband, the necessary energy infrastructure, and that the necessary flood risk assessments have been conducted. The effective use of Section 106 Agreements will play an important role.
Summary of Employment Land Priorities at LEP, West Midlands Combined Authority (WMCA) and Midlands Engine Geographies
The chart below provides an overview of the programmes and initiatives funded in Coventry & Warwickshire through the 2014 and 2015 Local Growth Deal.
It highlights high-level examples of the strategic priorities resulting from the Call for Proposals to unlock further economic development and a summary of the potential related linkages to the emerging priorities of the West Midlands Combined Authority andMidlands Engine.
2014StrategicEconomic Plan
2016StrategicEconomic Plan
Draft WMCA StrategicEconomic Plan
EmergingMidlands Engine Prospectus
CW
LEP
2014
and
201
5 Gr
owth
Dea
l
2016
CW
LEP
SEP
Upda
te
Str
ateg
ic P
riorit
ies
Wes
t M
idla
nds
Com
bine
d Au
thor
ity:
Str
ateg
ic P
riorit
ies
Mid
land
s En
gine
for
Gro
wth
: St
rate
gic
Prio
ritie
sCommitted Investments• Employment Sites
- Friargate, M40.
• Capital Investment Fund for Local Businesses.
“Urban Core” Strategic Programme• Nuneaton Town
Centre.
• A444 Growth Corridor.
• City Centre South.
• Friargate Extension.
• Civic Centre Redevelopment.
Emerging Actions & Priorities• Industrial Excellence
Programme.
• Land Remediation Fund.
• Land supply for business expansion and inward investment.
• Land use changes.
Emerging Priorities• Working with
UKTI RIO to bring investable sites to market.
2.4.2 Transport ConnectivityThe need to maintain good connectivity both to and within the LEP area requires sustained investment in the transport network at both a strategic and local level. The LEP is actively involved in the Midlands Connect initiative, which is developing a clear and evidenced strategy for investment in the strategic road and rail network to support the ‘Midlands Engine for Growth’.
CWLEP is also represented on two multi-agency groups which are identifying the medium and longer-term needs of the A5 and A46 corridors, both of which are critical to the sub-regional economy. These corridors are predicted to come under significant pressure over the next 10-15 years as a result of planned housing and employment growth. Traffic switching from other routes (M1/M69, M42 etc.) as they become over capacity due to wider traffic growth and strategically significant growth proposals such as UK Central and HS2 will also add to the problem. CWLEP has funded development work to bring forward proposals to support the long-term economic sustainability of both these corridors. It is also working with Highways England to help inform its Strategic Economic Growth Plan and the emerging priorities across Coventry & Warwickshire for the next “Road Investment Strategy” period.
STRATEGIC PROGRAMME: ENABLING ECONOMIC GROWTH
Coventry & Warwickshire’s location in relation to the strategic transport network is a key enabler and driver of economic activity, and provides the basis for our high-level spatial plan. An effective transportation system provides the labour pool with the ability to access training and jobs; allows the local, national and international customer base to access goods and services; facilitates and supports growth; and enables efficient business to business activity, supporting innovation and the supply chain.
As highlighted previously, the need to maintain good connectivity both to and within the LEP area requires sustained investment in the transport network at both a strategic and local level. The LEP will support investment that enhances our rail infrastructure and transport corridors, including the A5, A45, A46, A444 and A452 corridors.
The LEP is also working with its Local Authority partners to develop robust proposals to ensure the impacts of housing and employment growth on the local transport network are properly understood and mitigated. The LEP has highlighted a number of locally strategic corridors which will require investment both to maintain their existing function and adapt to the pressures which growth will bring, both within urban and rural areas.
These include not only the A46 and A5 corridors, but also the A444 between Nuneaton and Coventry, the Coventry Ring Road, the A452 between Kenilworth, Leamington and the M40, the A3400 Birmingham Road in Stratford-upon-Avon and the A426 between the M6 and Rugby town centre. The A5 Corridor will also be a focus of infrastructure improvements to capitalise on potential future expansions to the MIRA site. Work to develop improvements in each of these corridors is well underway in terms of business case development and design.
Work on a number of heavy rail initiatives, including the next phase of improvements in the North-South Corridor, is also underway as part of the LEP’s adopted Rail Strategy for Coventry & Warwickshire. These, together with enhancements to rail connectivity from Stratford-upon-Avon, will play an important role in providing residents with access to employment and training opportunities. Improvements to the local bus and cycle networks will complement enhancements to the rail infrastructure.
Coventry & Warwickshire is at the forefront of the developing Connected and Autonomous Vehicles (CAV) sector, also known as Telematics, Infotainment or Mobility. The firms in this sector are adapting technologies from elsewhere for application in designing transport networks as systems of the future. From remotely operated vehicles to developments with iPad applications and diagnostics, the sub-region has a global presence in this sector with world-class research. The area is home to MIRA, the University of Warwick and Coventry University, who are all at the forefront of this new technology.
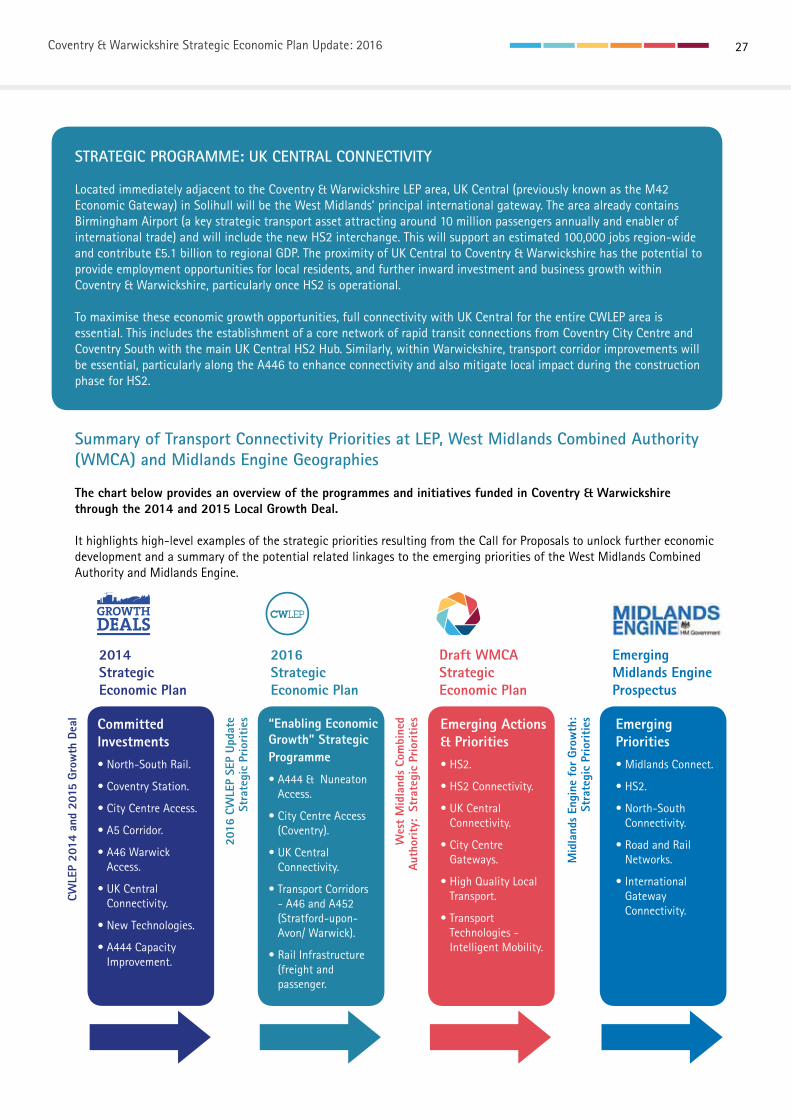
Coventry & Warwickshire Strategic Economic Plan Update: 2016 27
STRATEGIC PROGRAMME: UK CENTRAL CONNECTIVITY
Located immediately adjacent to the Coventry & Warwickshire LEP area, UK Central (previously known as the M42 Economic Gateway) in Solihull will be the West Midlands’ principal international gateway. The area already contains Birmingham Airport (a key strategic transport asset attracting around 10 million passengers annually and enabler of international trade) and will include the new HS2 interchange. This will support an estimated 100,000 jobs region-wide and contribute £5.1 billion to regional GDP. The proximity of UK Central to Coventry & Warwickshire has the potential to provide employment opportunities for local residents, and further inward investment and business growth within Coventry & Warwickshire, particularly once HS2 is operational.
To maximise these economic growth opportunities, full connectivity with UK Central for the entire CWLEP area is essential. This includes the establishment of a core network of rapid transit connections from Coventry City Centre and Coventry South with the main UK Central HS2 Hub. Similarly, within Warwickshire, transport corridor improvements will be essential, particularly along the A446 to enhance connectivity and also mitigate local impact during the construction phase for HS2.
Summary of Transport Connectivity Priorities at LEP, West Midlands Combined Authority (WMCA) and Midlands Engine Geographies
The chart below provides an overview of the programmes and initiatives funded in Coventry & Warwickshire through the 2014 and 2015 Local Growth Deal.
It highlights high-level examples of the strategic priorities resulting from the Call for Proposals to unlock further economic development and a summary of the potential related linkages to the emerging priorities of the West Midlands Combined Authority and Midlands Engine.
2014StrategicEconomic Plan
2016StrategicEconomic Plan
Draft WMCA StrategicEconomic Plan
EmergingMidlands Engine Prospectus
CW
LEP
2014
and
201
5 Gr
owth
Dea
l
2016
CW
LEP
SEP
Upda
te
Str
ateg
ic P
riorit
ies
Wes
t M
idla
nds
Com
bine
d Au
thor
ity:
Str
ateg
ic P
riorit
ies
Mid
land
s En
gine
for
Gro
wth
: St
rate
gic
Prio
ritie
sCommitted Investments• North-South Rail.
• Coventry Station.
• City Centre Access.
• A5 Corridor.
• A46 Warwick Access.
• UK Central Connectivity.
• New Technologies.
• A444 Capacity Improvement.
“Enabling Economic Growth” Strategic Programme
• A444 & Nuneaton Access.
• City Centre Access (Coventry).
• UK Central Connectivity.
• Transport Corridors - A46 and A452 (Stratford-upon-Avon/ Warwick).
• Rail Infrastructure (freight and passenger.
Emerging Actions & Priorities• HS2.
• HS2 Connectivity.
• UK Central Connectivity.
• City Centre Gateways.
• High Quality Local Transport.
• Transport Technologies - Intelligent Mobility.
Emerging Priorities• Midlands Connect.
• HS2.
• North-South Connectivity.
• Road and Rail Networks.
• International Gateway Connectivity.
2.4.3 Digital Connectivity Coventry & Warwickshire’s industrial sector is dominated by high-technology and high-value manufacturing and is also particularly strong in the areas of digital media and the development of various communications tools and software applications. These sectors are increasingly reliant upon high-performance connectivity to support, for example, collaboration and data exchange with national and international partners and suppliers. Indeed, FSB research indicates that 94% of small businesses view a reliable broadband connection as an important enabler of success.
The majority of SMEs in the UK use broadband, with 53% utilising a wired DSL connection, 12% with fibre optic connections, and the remaining 35% using mobile cellular networks. Worryingly, around 45,000 SMEs in the UK still use a dial-up connection, which can only achieve 20-56 kbps of data speed. This is primarily due to the lack of broadband access or expensive broadband connections in their area.
Up to 1 in 7 SMEs still identify that a low broadband speed is a barrier to growth, and these findings are evidence that there is both a private consumer demand and an industrial demand. To address this, there is already a strong recommendation to the government from both the FSB and the LEP Network to create a national strategy to deliver a universal minimum 10 Mbps broadband service to all premises in the UK by 2018/19, and increase that service floor to 100 Mbps by 20307.
Both mobile and fixed internet access is one of the fastest growing aspects of modern life. It is critical to supporting the dynamism of the modern economy and the mobility of the labour force. In terms of mobile access, small parts of Coventry & Warwickshire still suffer from being limited to 2G access only, a technology fromthe 1990s.
STRATEGIC PROGRAMME: DIGITAL CONNECTIVITY
The UK government terms superfast broadband to be 24 Mbps, which it aims to make available to 95% of UK premises by 2017. Current broadband uptake in UK is patchy, with superfast broadband take up in Coventry & Warwickshire between 70-80%, which is slightly below the UK average of 80% of premises having access to superfast fibre broadband.
When we examine the percentage of premises that have access to superfast broadband (24 Mbps), we see that large patches of South-East and West Warwickshire, as well as North Coventry, have below 50% access. Despite the success of the recent Coventry, Solihull and Warwickshire Broadband Superfast Broadband programme which helped to expand superfast broadband provision, very few areas in Coventry, Kenilworth, Warwick, and Stratford-upon-Avon have superfast broadband access at over 80%.
The low percentage of superfast broadband access and the high percentage of slow broadband access in Coventry & Warwickshire is falling well short of the UK government’s broadband policy which stipulates that 95% of premises should have access to 24 Mbps and that the remaining 5% will have access to 2 Mbps.
Future investment is required to ensure that at least 95% of Coventry & Warwickshire premises have access to reliable superfast broadband by 2020, and that a higher number of businesses can access ultra-fast broadband. This will particularly target the extension of superfast broadband to the areas within Coventry & Warwickshire still without superfast broadband, particularly new strategic commercial and housing development sites, through fibre broadband infrastructure or other technologies – capable of delivering a minimum 30Mbps download speed in line with the EU2020 targets. CWLEP will consider the commissioning of a technical study on future digital connectivity requirements and investment priorities.
7 FSB Research (2015)
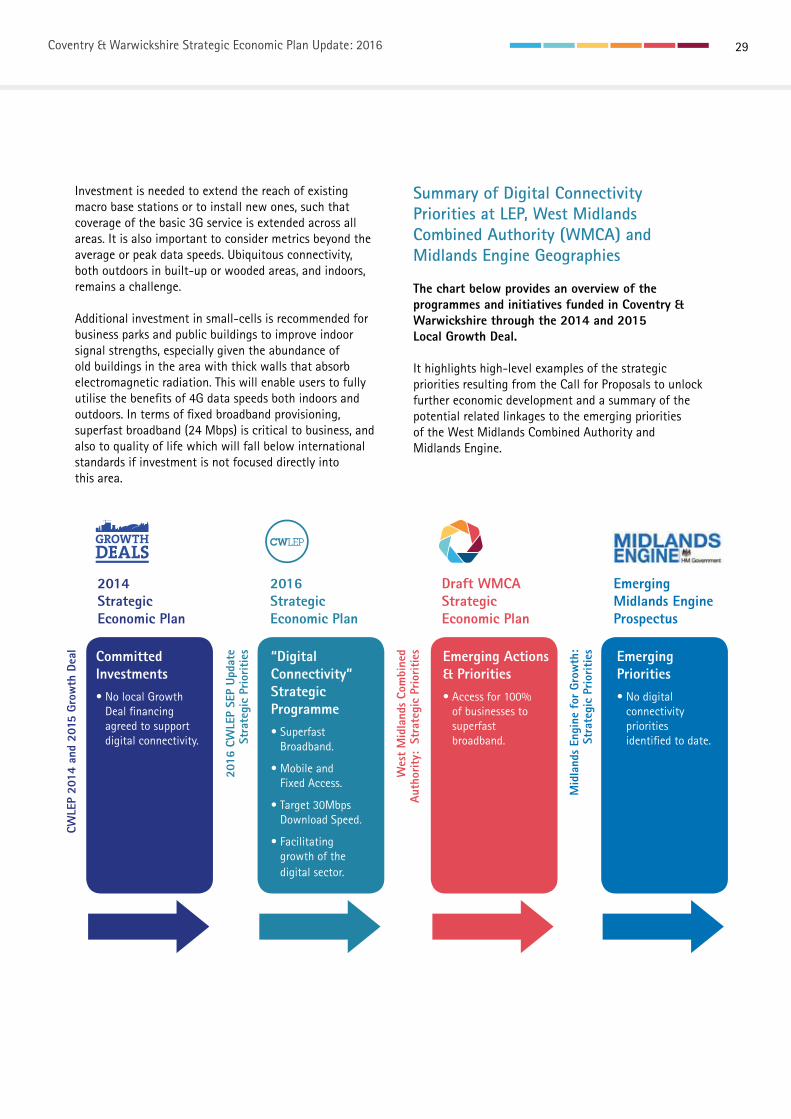
Coventry & Warwickshire Strategic Economic Plan Update: 2016 29
Investment is needed to extend the reach of existing macro base stations or to install new ones, such that coverage of the basic 3G service is extended across all areas. It is also important to consider metrics beyond the average or peak data speeds. Ubiquitous connectivity, both outdoors in built-up or wooded areas, and indoors, remains a challenge.
Additional investment in small-cells is recommended for business parks and public buildings to improve indoor signal strengths, especially given the abundance of old buildings in the area with thick walls that absorb electromagnetic radiation. This will enable users to fully utilise the benefits of 4G data speeds both indoors and outdoors. In terms of fixed broadband provisioning, superfast broadband (24 Mbps) is critical to business, and also to quality of life which will fall below international standards if investment is not focused directly into this area.
Summary of Digital Connectivity Priorities at LEP, West Midlands Combined Authority (WMCA) and Midlands Engine Geographies
The chart below provides an overview of the programmes and initiatives funded in Coventry & Warwickshire through the 2014 and 2015 Local Growth Deal.
It highlights high-level examples of the strategic priorities resulting from the Call for Proposals to unlock further economic development and a summary of the potential related linkages to the emerging priorities of the West Midlands Combined Authority and Midlands Engine.
2014StrategicEconomic Plan
2016StrategicEconomic Plan
Draft WMCA StrategicEconomic Plan
EmergingMidlands Engine Prospectus
CWLE
P 20
14 a
nd 2
015
Grow
th D
eal
2016
CW
LEP
SEP
Upda
te
Str
ateg
ic P
riorit
ies
Wes
t M
idla
nds
Com
bine
d Au
thor
ity:
Str
ateg
ic P
riorit
ies
Mid
land
s En
gine
for
Gro
wth
: St
rate
gic
Prio
ritie
sCommitted Investments• No local Growth
Deal financing agreed to support digital connectivity.
“Digital Connectivity” Strategic Programme• Superfast
Broadband.
• Mobile and Fixed Access.
• Target 30Mbps Download Speed.
• Facilitating growth of the digital sector.
Emerging Actions & Priorities• Access for 100%
of businesses to superfast broadband.
Emerging Priorities• No digital
connectivity priorities identified to date.
2.5Advanced Manufacturing and Engineering
Manufacturing, particularly automotive and machinery, remains a core strength of the Coventry & Warwickshire economy, and is the fifth largest sector in terms of GVA.
Coventry & Warwickshire considers itself to be the home of the automotive industry in the UK. Established here in the 20th century, the industry continues to be one of the mainstays of the local economy.
As a result of that, Coventry & Warwickshire has developed a strong competitive advantage in Advanced Manufacturing, with aspirations to become a globally-recognised leader. There are several internationally-renowned companies based in the region including Jaguar Land Rover, BMW, General Electric, and Aston Martin Lagonda; a high concentration of jobs in these sectors (34,000 people in Coventry & Warwickshire are employed in Advanced Manufacturing); and higher recent growth rates than the UK as a whole.
As the country’s economic recovery continues, the automotive and advanced manufacturers in general see the area as being the ideal place for new operations or for the expansion of existing ones. Coventry & Warwickshire is centrally placed in the country with excellent transport links and the areas strong tradition of manufacturing and excellent universities means that skilled engineers are readily available. The way in which major OEMs seek to interface with their Tier 1 suppliers is changing and it is now becoming more and more common for OEMs and suppliers to co-locate in
order to build partnerships focused on developing a particular technology.
This has led to the region being widely recognised as an established leader in the design, development and deployment of low carbon vehicles and powertrain. The work has been a natural progression from the area’s expertise in vehicle engineering. The area is home to a number of prestigious businesses and support organisations operating in the fields of electric, electric hybrid, fuel cells and hydrogen power systems and lightweight materials. Coventry has a network of publicly available third generation electric vehicle points and boasts the UK’s first all-electric bus service. The extensive Research & Development capability and capacity positions Coventry & Warwickshire as the ideal test-bed for low carbon transport technologies.
Jaguar Land Rover (JLR) has been behind a significant amount of capital investment into the Midlands automotive sector in recent years. In March 2015, JLR revealed the expansion of the company’s engineering and design centre at Whitley, Coventry. This will involve a doubling of the footprint at this site and allow for JLR’s development of ultra-low emission technologies. In September 2015, it also announced significant investment into its R&D facilities at Gaydon (near Stratford-upon-Avon) to further consolidate and expand its activities there. Following this, in January 2016 JLR announced its proposed £500m expansion plans for Whitley South including the co-location of top level JLR suppliers alongside a business park and hotel development. JLR are also a partner in the £150m investment to create the National Automotive Innovation Centre at the University of Warwick alongside Tata Motors European Technology Centre.
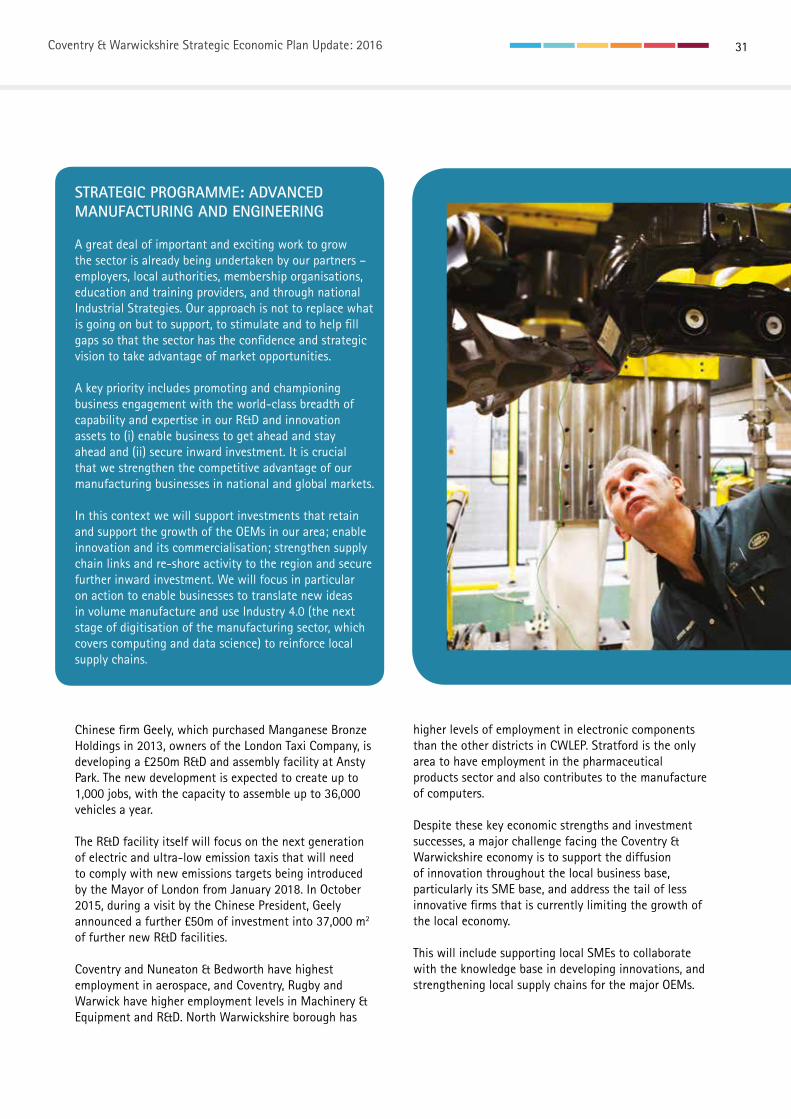
Coventry & Warwickshire Strategic Economic Plan Update: 2016 31
STRATEGIC PROGRAMME: ADVANCED MANUFACTURING AND ENGINEERING
A great deal of important and exciting work to grow the sector is already being undertaken by our partners – employers, local authorities, membership organisations, education and training providers, and through national Industrial Strategies. Our approach is not to replace what is going on but to support, to stimulate and to help fill gaps so that the sector has the confidence and strategic vision to take advantage of market opportunities.
A key priority includes promoting and championing business engagement with the world-class breadth of capability and expertise in our R&D and innovation assets to (i) enable business to get ahead and stay ahead and (ii) secure inward investment. It is crucial that we strengthen the competitive advantage of our manufacturing businesses in national and global markets.
In this context we will support investments that retain and support the growth of the OEMs in our area; enable innovation and its commercialisation; strengthen supply chain links and re-shore activity to the region and secure further inward investment. We will focus in particular on action to enable businesses to translate new ideas in volume manufacture and use Industry 4.0 (the next stage of digitisation of the manufacturing sector, which covers computing and data science) to reinforce local supply chains.
Chinese firm Geely, which purchased Manganese Bronze Holdings in 2013, owners of the London Taxi Company, is developing a £250m R&D and assembly facility at Ansty Park. The new development is expected to create up to 1,000 jobs, with the capacity to assemble up to 36,000 vehicles a year.
The R&D facility itself will focus on the next generation of electric and ultra-low emission taxis that will need to comply with new emissions targets being introduced by the Mayor of London from January 2018. In October 2015, during a visit by the Chinese President, Geely announced a further £50m of investment into 37,000 m2 of further new R&D facilities.
Coventry and Nuneaton & Bedworth have highest employment in aerospace, and Coventry, Rugby and Warwick have higher employment levels in Machinery & Equipment and R&D. North Warwickshire borough has
higher levels of employment in electronic components than the other districts in CWLEP. Stratford is the only area to have employment in the pharmaceutical products sector and also contributes to the manufacture of computers.
Despite these key economic strengths and investment successes, a major challenge facing the Coventry & Warwickshire economy is to support the diffusion of innovation throughout the local business base, particularly its SME base, and address the tail of less innovative firms that is currently limiting the growth of the local economy.
This will include supporting local SMEs to collaborate with the knowledge base in developing innovations, and strengthening local supply chains for the major OEMs.
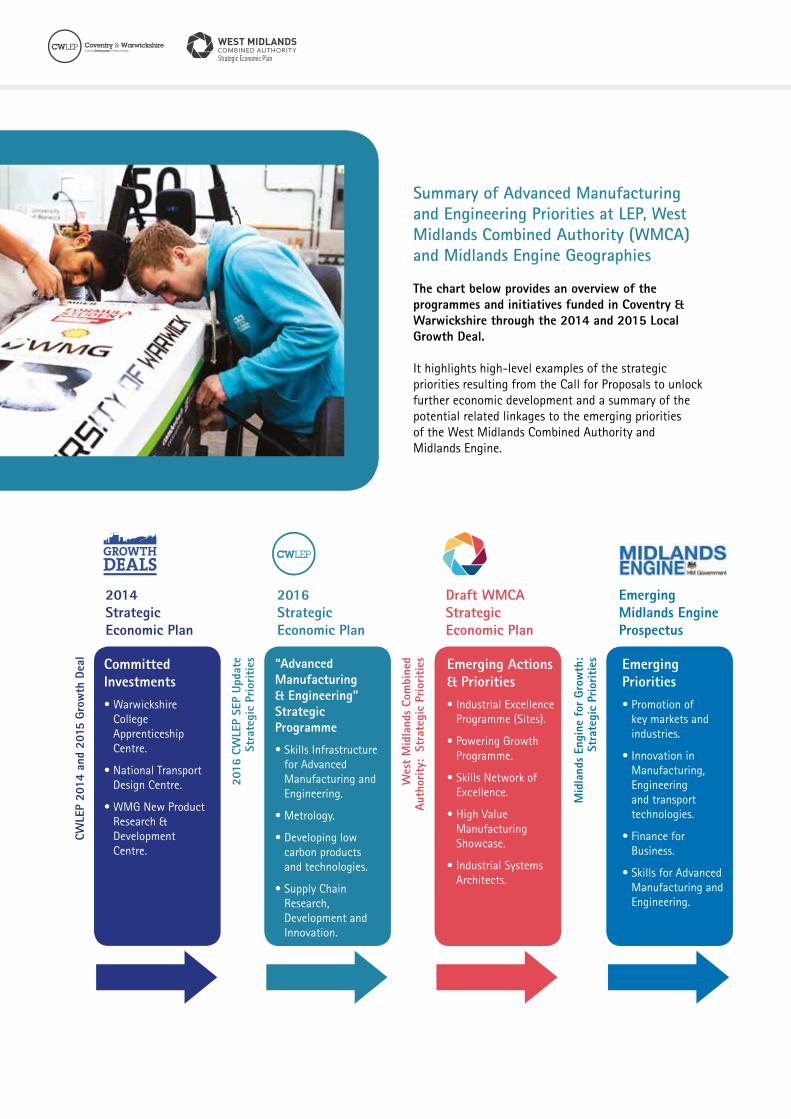
Summary of Advanced Manufacturing and Engineering Priorities at LEP, West Midlands Combined Authority (WMCA) and Midlands Engine Geographies
The chart below provides an overview of theprogrammes and initiatives funded in Coventry &Warwickshire through the 2014 and 2015 LocalGrowth Deal.
It highlights high-level examples of the strategic priorities resulting from the Call for Proposals to unlock further economic development and a summary of the potential related linkages to the emerging priorities of the West Midlands Combined Authority and Midlands Engine.
2014StrategicEconomic Plan
2016StrategicEconomic Plan
Draft WMCA StrategicEconomic Plan
EmergingMidlands Engine Prospectus
2016
CW
LEP
SEP
Upda
te
Str
ateg
ic P
riorit
ies
Wes
t M
idla
nds
Com
bine
d Au
thor
ity:
Str
ateg
ic P
riorit
ies
Mid
land
s En
gine
for
Gro
wth
: St
rate
gic
Prio
ritie
sCommitted Investments• Warwickshire
College Apprenticeship Centre.
• National Transport Design Centre.
• WMG New Product Research & Development Centre.
“Advanced Manufacturing & Engineering” Strategic Programme
• Skills Infrastructure for Advanced Manufacturing and Engineering.
• Metrology.
• Developing low carbon products and technologies.
• Supply Chain Research, Development and Innovation.
Emerging Actions & Priorities• Industrial Excellence
Programme (Sites).
• Powering Growth Programme.
• Skills Network of Excellence.
• High Value Manufacturing Showcase.
• Industrial Systems Architects.
Emerging Priorities• Promotion of
key markets and industries.
• Innovation in Manufacturing, Engineering and transport technologies.
• Finance for Business.
• Skills for Advanced Manufacturing and Engineering.
CWLE
P 20
14 a
nd 2
015
Grow
th D
eal
Coventry & Warwickshire Strategic Economic Plan Update: 2016 33
2.6Growing our SMEs
The Coventry & Warwickshire Growth Hub will continue to act as a central business support co-ordination function and will service business across a wide range of sectors. This will be across both urban and rural areas and enable businesses (particularly local SMEs) to grow and create new jobs within the local economy.
The Hub will provide a high quality service focused on delivering positive outcomes for the businesses supported. It will develop stronger integration with other national and local business support activities, as well as meet the demand of businesses looking to use the Hub’s services. Given that Coventry & Warwickshire is home to some 40,155 businesses, of which 99.5% are SMEs (83% micro businesses), the provision of a strong SME support infrastructure is an important enabler of economic growth.
The Growth Hub has evolved into operating as a subsidiary of CWLEP, with its own bank account and a core team of staff, which includes a Managing Director and Account Managers that engage directly with businesses. Moreover, a coherent financial plan is in place, which focuses on diversifying the Hub’s income base to ensure its future sustainability, including securing funding from other public sources (such as European Regional Development Fund), additional subcontracting opportunities, private sector rental of facilities and conferencing income.
To help to continually improve the quality of advice being given to businesses, Growth Hub staff are engaged in a training programme that will ensure the delivery of business support to a common standard. Moreover, all Growth Hub Account Managers have gained accreditation by the Association of British Business Mentors.
The Hub’s staff will continue to monitor changes in UK business support policy, as well as changes in the macro-economic environment and demand for business support provision, and adapt and align its services accordingly.
STRATEGIC PROGRAMME: COVENTRY & WARWICKSHIRE GROWTH HUB
The Growth Hub will continue to operate as a subsidiary of CWLEP, with a core team of staff, which includes the Managing Director, Business Account Managers that will engage directly with businesses, a Planning Officer, and Data Manager. Moreover, a coherent financial plan is in place, which focuses on diversifying the Hub’s income base to ensure its future sustainability, including:
• Securing funding from other public sources (such as European Regional Development Fund).
• Additional subcontracting opportunities.
• Private sector rental of facilities.
• Conferencing income.
This focus has already resulted in new high profile contracts being secured, which has led to income generation, and new licenses being purchased.
To help maximise the quality of advice being given to businesses across a wide range of sectors, the Growth Hub staff are engaged in a training programme that will ensure the delivery of business support to a common standard. Moreover, all Growth Hub Account Managers have gained accreditation by the Association of British Business Mentors.
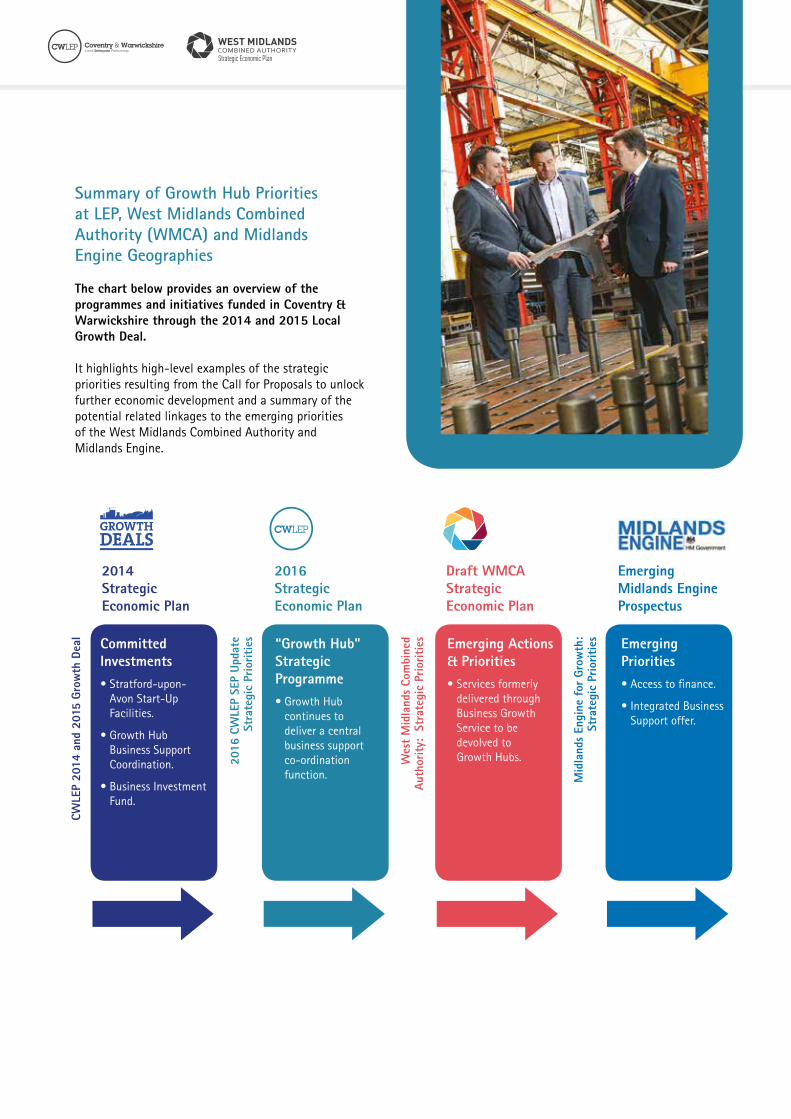
Summary of Growth Hub Priorities at LEP, West Midlands Combined Authority (WMCA) and Midlands Engine Geographies
The chart below provides an overview of the programmes and initiatives funded in Coventry & Warwickshire through the 2014 and 2015 Local Growth Deal.
It highlights high-level examples of the strategic priorities resulting from the Call for Proposals to unlock further economic development and a summary of the potential related linkages to the emerging priorities of the West Midlands Combined Authority and Midlands Engine.
2014StrategicEconomic Plan
2016StrategicEconomic Plan
Draft WMCA StrategicEconomic Plan
EmergingMidlands Engine Prospectus
CW
LEP
2014
and
201
5 Gr
owth
Dea
l
2016
CW
LEP
SEP
Upda
te
Str
ateg
ic P
riorit
ies
Wes
t M
idla
nds
Com
bine
d Au
thor
ity:
Str
ateg
ic P
riorit
ies
Mid
land
s En
gine
for
Gro
wth
: St
rate
gic
Prio
ritie
sCommitted Investments• Stratford-upon-
Avon Start-Up Facilities.
• Growth Hub Business Support Coordination.
• Business Investment Fund.
“Growth Hub” Strategic Programme• Growth Hub
continues to deliver a central business support co-ordination function.
Emerging Actions & Priorities• Services formerly
delivered through Business Growth Service to be devolved to Growth Hubs.
Emerging Priorities• Access to finance.
• Integrated Business Support offer.
Coventry & Warwickshire Strategic Economic Plan Update: 2016 35
2.7Growing our Talent
2.7.1 Skills It is recognised nationally that a significant factor in the relatively poor productivity performance of the UK overall is the low level of skills in the workforce: “We rank in the bottom four OECD countries for the literacy and numeracy skills of our 16-24 year olds. We also perform poorly on intermediate professional and technical skills, and are forecast to fall to the bottom five OECD countries for intermediate skills by 2020.” (HM Government, English Apprenticeships: Our 2020 Vision, 2015).
Nationally, projections indicate that over the next decade, there will be around 5 million new and replacement job openings for high skilled jobs (including management and professional roles) and 3.6 million openings for medium-skilled jobs (including skilled trades and associate professional/technical roles). There are also growing skills shortages in the Science, Technology, Engineering and Mathematics (STEM) and digital sectors (including computer science and digital science), which are increasingly critical to the strength and competitiveness of the UK economy. (HM Government, English Apprenticeships: Our 2020 Vision, 2015). As a result, there is a growing need to address job-specific vocational skills requirements across a range of sectors, which places a high importance on Further and Higher Education providers and employers working closely to address this issue. Increasing the provision of higher and degree level apprenticeships will also play an important role in addressing key job-specific skills shortages.
Skills attainment was a core issue identified in the 2014 Strategic Economic Plan with qualifications at all levels below the English average. The Coventry & Warwickshire LEP area skills profile has improved in relation to those people with no qualifications, seeing a reduction of 2.7% overall between 2011 and 2014 from 14.2% to 11.5%, against an English average reduction of 1.9% and a West Midlands area reduction of 0.8% over the same period. However, the CWLEP area (11.5%) remains above the English average (8.6%).
In relation to higher level skills at NVQ level 4 and above (including HND, Degree, Postgraduate level qualifications), a similar position emerges. The Coventry & Warwickshire area has improved its NVQ Level 4+ attainment rate by 5.2 % between 2011 and 2014 to 34.7% of the population overall. This compares with an English average of 35.7% in 2014 and an improvement
of 3.2% over the same timeline. Within the CWLEP area, it is notable that Coventry, North Warwickshire and Nuneaton & Bedworth contain a higher proportion of residents with no qualifications and fewer residents with degree level qualifications than the other Local Authority areas8.
STRATEGIC PROGRAMME: SKILLS
Through its Skills Strategy and Strategic Economic Plan, CWLEP will focus support on the skills and sectors most important for Coventry & Warwickshire to develop processes to ensure that its planning is informed by data on supply and demand and raise the profile of skills and local employment opportunities. A continued focus will be given to:
• Using skills to drive growth and create jobs – overcoming skills gaps and skills shortages to support the high value industries of the future.
• Developing skills to tackle unemployment and worklessness – future-proofing the workforce and helping those without jobs to get the skills that employers need, as well as tackling major barriers to employment such as poor health. This will include expanding the provision of apprenticeships, particularly by encouraging employers in key growth sectors of the local economy to utilise the Apprenticeship Levy. Indeed, CWLEP aims to make Coventry & Warwickshire a national exemplar in the provision of Apprenticeships, particularly in high value manufacturing.
• Getting a better fit between education and employment – closer working between employers and schools, colleges, universities and training providers. This will also include a need to retain more graduates from local universities to help ensure that higher value job opportunities are filled. Increasing the provision of work placements and traineeships will play an important role.
Investment through the local Growth Deal will include support for skills infrastructure for the renewal, modernisation and rationalisation of skills and education infrastructure, particularly to ensure that the evolving job-specific skills, generic and customer service skills needs of employers in growth sectors of the local economy are met. This is particularly important for the Advanced Manufacturing, Construction/Civil Engineering,
8 NOMIS data (2016)
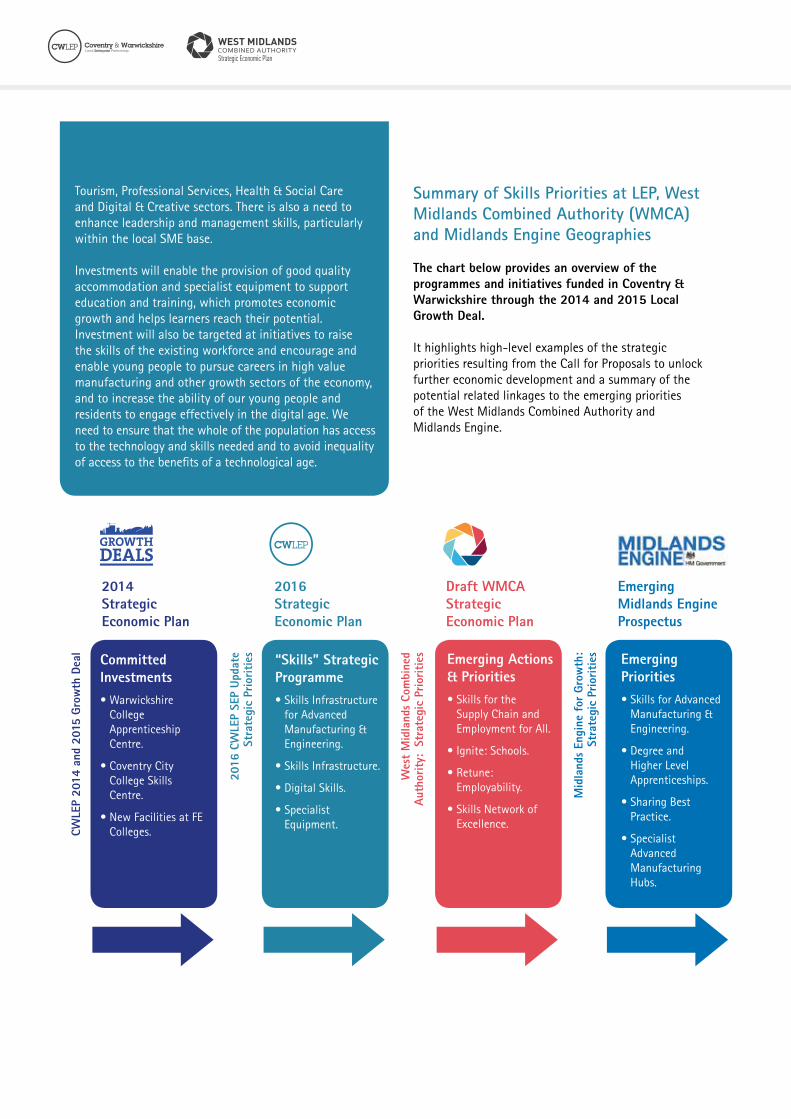
Tourism, Professional Services, Health & Social Care and Digital & Creative sectors. There is also a need to enhance leadership and management skills, particularly within the local SME base.
Investments will enable the provision of good quality accommodation and specialist equipment to support education and training, which promotes economic growth and helps learners reach their potential. Investment will also be targeted at initiatives to raise the skills of the existing workforce and encourage and enable young people to pursue careers in high value manufacturing and other growth sectors of the economy, and to increase the ability of our young people and residents to engage effectively in the digital age. We need to ensure that the whole of the population has access to the technology and skills needed and to avoid inequality of access to the benefits of a technological age.
Summary of Skills Priorities at LEP, West Midlands Combined Authority (WMCA) and Midlands Engine Geographies
The chart below provides an overview of the programmes and initiatives funded in Coventry & Warwickshire through the 2014 and 2015 Local Growth Deal.
It highlights high-level examples of the strategic priorities resulting from the Call for Proposals to unlock further economic development and a summary of the potential related linkages to the emerging priorities of the West Midlands Combined Authority and Midlands Engine.
2014StrategicEconomic Plan
2016StrategicEconomic Plan
Draft WMCA StrategicEconomic Plan
EmergingMidlands Engine Prospectus
CW
LEP
2014
and
201
5 Gr
owth
Dea
l
2016
CW
LEP
SEP
Upda
te
Str
ateg
ic P
riorit
ies
Wes
t M
idla
nds
Com
bine
d Au
thor
ity:
Str
ateg
ic P
riorit
ies
Mid
land
s En
gine
for
Gro
wth
: St
rate
gic
Prio
ritie
sCommitted Investments• Warwickshire
College Apprenticeship Centre.
• Coventry City College Skills Centre.
• New Facilities at FE Colleges.
“Skills” Strategic Programme• Skills Infrastructure
for Advanced Manufacturing & Engineering.
• Skills Infrastructure.
• Digital Skills.
• Specialist Equipment.
Emerging Actions & Priorities• Skills for the
Supply Chain and Employment for All.
• Ignite: Schools.
• Retune: Employability.
• Skills Network of Excellence.
Emerging Priorities• Skills for Advanced
Manufacturing & Engineering.
• Degree and Higher Level Apprenticeships.
• Sharing Best Practice.
• Specialist Advanced Manufacturing Hubs.
Coventry & Warwickshire Strategic Economic Plan Update: 2016 37
2.7.2 Developing the Technologies of the Future
Supporting technologies where our science strengths and business capabilities combine is a core part of the Government’s Industrial Strategy. In Autumn 2012, the Chancellor highlighted ‘eight great technologies’ where the UK can lead the world. Each technology is an area in which the UK has world-leading research, has a range of applications across a spectrum of industries, and has the potential for the UK to be at the forefront of commercialisation.
The eight great technologies are:
• Big data and energy-efficient computing.• Satellites and commercial applications of space.• Robotics and autonomous systems.• Synthetic biology.• Regenerative medicine.• Agri-science.• Advanced materials and nanotechnology.• Energy and its storage. These are not exclusive or exhaustive, and there are many other important areas of science and innovation in which the UK excels and will excel in future. The most valuable applications are likely to come when companies develop new combinations of these technologies. For example combining big data, satellites and autonomous systems could lead to cars and planes that drive and fly themselves.
In Coventry & Warwickshire, the unlocking of wider economic growth potential needs to be addressed by interventions which are both cross-cutting and sector specific. The areas of health, logistics, environmental technologies, IT Services and Digital & Creative Industries are increasingly important to our economy, alongside growth through innovation in rural areas and innovation in rural technologies. The 2014 Strategic Economic Plan highlighted the importance of interventions including technology centre facilities; specialist technology support programmes; demonstrator programmes and innovation support programmes for product design and development and systems integration.
It remains important to capitalise on the area’s world-class innovation assets and research institutions, given that the development and commercialisation of new technologies pertinent to the area’s priority growth sectors will play an important role in facilitating economic growth longer-term.
STRATEGIC PROGRAMME: DEVELOPING THE TECHNOLOGIES OF THE FUTURE
The development of future and emerging technologies is fundamental to enhancing business productivity and supporting economic growth. The LEP area has world-class universities providing access to leading Research & Development and innovation infrastructure, alongside a strong network of Further Education Colleges. It is vital that we utilise the core assets of our key partner institutions in the development, prototyping, testing, commercialisation, demonstration and training of new technologies for adoption across our major economic sectors.
CWLEP is particularly keen to invest in capitalinfrastructure that supports the development and uptake of solutions in energy efficiency, low carbon economy, assisted living and healthcare technologies, intelligent mobility, sustainability, digital technology and data analytics.
Summary of Technology Priorities at LEP, West Midlands Combined Authority (WMCA) and Midlands Engine Geographies
The chart below provides an overview of the programmes and initiatives funded in Coventry & Warwickshire through the 2014 and 2015 Local Growth Deal.
It highlights high-level examples of the strategic priorities resulting from the Call for Proposals to unlock further economic development and a summary of the potential related linkages to the emerging priorities of the West Midlands Combined Authority and Midlands Engine.
2014StrategicEconomic Plan
2016StrategicEconomic Plan
Draft WMCA StrategicEconomic Plan
EmergingMidlands Engine Prospectus
CW
LEP
2014
and
201
5 Gr
owth
Dea
l
2016
CW
LEP
SEP
Upda
te
Str
ateg
ic P
riorit
ies
Wes
t M
idla
nds
Com
bine
d Au
thor
ity:
Str
ateg
ic P
riorit
ies
Mid
land
s En
gine
for
Gro
wth
: St
rate
gic
Prio
ritie
sCommitted Investments• National Transport
Design Centre.
• R&D Centre of Excellence for Innovative and New Steel Products.
“Developing Technologies of the Future” Strategic Programme• Technologies of
the Future:
- Energy Efficiency.
- Low Carbon.
- Sustainability.
- Digital and ICT Economy.
Emerging Actions & Priorities• Prioritisation
of Disruptive and Emerging Technologies:
- New manufacturing.
- Creative & Digital.
- Environmental technologies.
- Medical, Health and Well Being.
Emerging Priorities• Key Market
Promotion and development in:
- Agri-food and drink.
- Healthcare & Lifescience.
- Energy & Low Carbon Technologies.
- Creative, Digital & Design.
- Manufacturing, engineering and transport technologies.
• Science Parks and innovation Centres to play key role.
Coventry & Warwickshire Strategic Economic Plan Update: 2016 39
2.7.3 Digital and ICT Economy
Information and Communication Technologies saw significant growth in the 1997 to 2012 period in both Coventry & Warwickshire. Indeed, Coventry & Warwickshire is already home to some 2,500 digital businesses (mainly hardware, software, digital content and gaming). The growth of the digital and ICT sectors is set to continue between 2015 and 2030 with computer programming and information services (software, computer systems, communications technologies and data processing) forecast to be the 6th largest sector in the economy in GVA terms and 13th in terms of employment9.
It was recognised in the SEP published in 2014 that “Coventry & Warwickshire is a UK hub for Serious Games and the Video Gaming industry, with leading computer games companies and a leading cluster of game development.” Silicon Spa is one of the UK’s largest concentrations of computer gaming companies and is situated in and around Leamington Spa in the south of Warwickshire, with some 30 studios employing 1,200 people making up 10% of the UK’s industry total. A strategic research study for Silicon Spa is being commissioned to create a rationale and basis for further action to support this key micro-cluster within Warwick District and the sub-region. In particular, further investment is required to enable the setting up of new studios, and retain and strengthen Coventry & Warwickshire’s competitive advantage in this sector.
The global video games industry is an economic and cultural success story. Nearly 140 of the UK’s best games businesses are based in the West Midlands creating highly-skilled, productive jobs and opportunities throughout the area. Between them, these businesses are responsible for many of the best known titles in the world including console blockbusters such as Forza Horizon and Guitar Hero Live, mobile hits like Warhammer, Freeblade and innovative PC titles such as LA Cops.
The growth of the games sector is key to the future economic growth of Coventry & Warwickshire, given that:
• Games are a blend of transferable 21st century skills: Making games is a fusion of art, design, programming, data analysis, science, mathematics – all skills transferable to other sectors.
• Games are key exports: 68% of games businesses generate over 60% of their annual turnover from sales outside the UK.
• Games appeal widely: 21m play games in the UK, half of them are women and 27% of them are over 44.
• Games are big sellers: The UK is the 6th largest global consumer market worth £3.9bn in UK consumer spend alone.
• Games can heal: Virtual Reality and Augmented Reality are used successfully in healthcare to treat and train.
• Games make you smart: Playing games gives you skills - problem solving, dexterity, systems thinking, team work. Games are also used to train surgeons and fighter pilots.
STRATEGIC PROGRAMME:DIGITAL AND ICT ECONOMY
CWLEP area has some 2,500 digital businesses, which principally consist of hardware, software, digital content and gaming. There is a globally-significant gaming cluster around Leamington Spa, Warwick and Southam, which has earned the title “Silicon Spa”. This has one of the largest clusters of gaming studios in the UK. Over 30 gaming studios are based in the area in and around Leamington Spa, including established names such as Codemasters, Exient, SEGA Hardlight, Full Fat and Freestyle Games.
However, the scale of the sector is frequently not recognised, and with other progressive digital clusters in the UK delivering significant investment in infrastructure, it is important that continued investment takes place to enable new studios to set up, and retain the area’s competitive advantage in this sector by growing this cluster.
As a result, CWLEP is keen to secure investment in Leamington Spa that will unlock its commercial and cultural potential in the creative and digital economy, including investment in buildings and improved transport and mobility infrastructure (e.g. A46, A452) and start-up facilities. Although this investment would enable the growth of a range of digital sectors, the local gaming sector is one that faces stiff competition from other clusters in the UK and overseas, and needs specific support to reach its full potential, given that:
• Global competition is a threat - since 2008 the games industries of Canada, South Korea and the Nordic countries have grown fast – clusters in these countries all benefit from consistent support and incentives from their national and regional governments.
9 Coventry University Analysis (2016)

• Games are a relatively new industry - public funding for the sector is still poorly understood, coordinated and designed. This inhibits further investment, growth and exports in one of the UK’s fastest growing export sectors.
• 95% of UK games businesses are SMEs - further resources are needed to scale these businesses up in the West Midlands.
• The ‘competition for talent’ remains a major challenge and the region requires skills development from school age onwards. Failure to recruit and retain the best talent can lead to investment locating elsewhere in the UK or overseas and stifle the growth of all industries that rely on these skills.
• The games sector relies on innovation and creativity – support should encourage more risk-taking to help local games businesses to continue to create cutting-edge world-class interactive entertainment.
Many of these issues are also pertinent to other digital and ICT sectors of the economy, and it is important that a strong business support infrastructure is in place to tackle these issues and enable SMEs in these sectors to realise their growth potential.
It is also notable that digital applications influence other strategically important economic sectors of the Coventry & Warwickshire economy (including high value manufacturing and a range of creative and service sector industries).
As a result, improving digital skills within the local workforce and addressing skills shortages in these areas will play an important role in improving the competitiveness of a range of key growth sectors of the local economy.
Coventry & Warwickshire Strategic Economic Plan Update: 2016 41
Summary of Digital and ICT Priorities at LEP, West Midlands Combined Authority (WMCA) and Midlands Engine Geographies
The chart below provides an overview of the programmes and initiatives funded in Coventry & Warwickshire through the 2014 and 2015 Local Growth Deal.
It highlights high-level examples of the strategic priorities resulting from the Call for Proposals to unlock further economic development and a summary of the potential related linkages to the emerging priorities of the West Midlands Combined Authority and Midlands Engine.
2014StrategicEconomic Plan
2016StrategicEconomic Plan
Draft WMCA StrategicEconomic Plan
EmergingMidlands Engine Prospectus
CW
LEP
2014
and
201
5 Gr
owth
Dea
l
2016
CW
LEP
SEP
Upda
te
Str
ateg
ic P
riorit
ies
Wes
t M
idla
nds
Com
bine
d Au
thor
ity:
Str
ateg
ic P
riorit
ies
Mid
land
s En
gine
for
Gro
wth
: St
rate
gic
Prio
ritie
sCommitted Investments• Digital Industries
Network & Telecommunications Centre at City College.
“Digital and ICT Economy” Strategic Programme• Strengthening of
digital sectors, particularly the gaming sector.
• Improvements to transport infrastructure in South Warwickshire.
• Investment in digital skills.
Emerging Actions & Priorities• Digital, Creative and
Design industries as priority sectors.
• Innovation Eco-System.
• Disruptive and Emerging Technologies.
• Improve business take-up of ICT.
Emerging Priorities• Strengthen digital
media sector, supported by smart technologies.
• Support prototyping of new products.
• Digital media and content fund.
2.8Culture and Tourism
Tourism and the visitor economy are an essential element of the economy of Shakespeare’s England, and the wider Coventry & Warwickshire economy. It supports businesses, jobs, routes to employment, and a wider supply chain with over 40,000 people employed in culture and tourism across the entire LEP area.
Both Warwick and Stratford-upon-Avon are considered to be two of Visit England’s “Attract Brands”, reflecting England’s best known destinations, via visitor numbers and consumer perceptions. The 10.2 million trips to Shakespeare’s England every year account for a total value from tourism to local businesses of £631 million, which supports 11,000 jobs.
• 10.2 million trips were taken in Shakespeare’s England – 9.3 million day trips and 0.89 million overnight visits.
• Visitors spent £505 million in the area, which is an average of £42 million spent in the local economy each month. The overnight trips account for a total of 2.37 million nights in the area. These overnight visits generated £175 million, compared with £315 million from day trips.
• The 10.2 million trips account for a total value of tourism to the local business turnover of £631 million, which supports 11,077 jobs. These jobs breakdown as 8,678 direct tourism related jobs and an additional 2,398 non tourism jobs dependent on the multiplier spend from tourism10.
In addition to Shakespeare’s England, Coventry City Centre contains a number of high-profile and internationally renowned visitor attractions such as the Cathedrals, Transport Museum and Herbert Art Gallery, whilst Nuneaton as the birthplace of the writer George Eliot, and Rugby (where the sport of Rugby Football originated) also both offer stronger tourism potential than is currently being fulfilled.
CWLEP will support the ambitions of cultural and touristic assets in the CWLEP area. The LEP will also support local cultural community activities, as well as high-profile events, that raise visibility nationally and internationally. It will also recognise the complementary rural and urban culture and tourism offers across Coventry & Warwickshire.
CWLEP is clear that a healthy cultural life is essential, and that tourism activity contributes to the positive economic performance, social environment, and wider health and wellbeing of our sub-region.
STRATEGIC PROGRAMME: CULTURE AND TOURISM
The Culture and Tourism strategic programme will focus on the opportunity for Coventry as UK Capital of Culture 2021 and support for developing the world renowned asset that is Shakespeare’s Stratford. It will also focus on ensuring that the benefits of an enhanced visitor economy are felt throughout Coventry & Warwickshire.
The Department of Culture Media and Sport (DCMS) manages the process for the UK City of Culture title. Following a recent consultation about the timetable, the DCMS has committed to inviting proposals for the 2021 title by early 2017. The emerging economic case for Coventry bidding for UK City of Culture is considered to be strong.
A successful partnership proposal is likely to bring significant national investment into the city from public and private sources, increased visitor spend, enhanced student numbers, as well as the potential economic benefits of accelerated development. In Derry/ Londonderry, major infrastructure developments were realised through the programme, and Hull is already attracting investment in transport, public realm and retail on the back of its successful bid.
Stratford-upon-Avon is a key asset within the CWLEP area, given its status as the birth place of William Shakespeare and a major English tourist town. Receiving around 5 million visitors per year, the district is home to the Royal Shakespeare Company (RSC) and Shakespeare Birthplace Trust (SBT) properties. The Shakespeare Birthplace Trust properties attract over 820,000 visits per annum with a significant proportion (approximately half) from international visitors.
Alongside this, the RSC has over 1 million visitors come to its Stratford-upon-Avon theatres each year. Both the SBT and RSC are a significant part of the wealth of cultural and tourism assets in Coventry & Warwickshire, contributing significantly towards the attractiveness of the LEP area as a place in which to locate business, work and study.
10 Warwickshire County Council “Destination Management Plan for Shakespeare’s England Region 2015-2020
Coventry & Warwickshire Strategic Economic Plan Update: 2016 43
Maintaining and growing our cultural and tourism assets is a key priority for CWLEP. To achieve this ambition, there is a need to build on existing strengths within the sub-region, coupled with a need to better package and promote key visitor attractions across the full CWLEP area. This would facilitate increases in overnight stays and therefore increases in visitor spend levels. Investment will focus on economic and cultural development, including:
• Innovative contemporary approaches in historic environments and joined-up public spaces.
• Deliver an improved and integrated transport infrastructure to improve connectivity.
• Training, skills development and cultural education.
• Investment in digital infrastructure.
• Enhancing the supply of accommodation to enable longer stays and increased visitor spending.
To enable the growth of the sector and maximise the impacts of visitor spend, it is crucial that the area’s visitor attractions, major events, and accommodation are marketed and promoted sufficiently.
Summary of Culture & Tourism Priorities at LEP, West Midlands Combined Authority (WMCA) and Midlands Engine Geographies
The chart below provides an overview of the programmes and initiatives funded in Coventry & Warwickshire through the 2014 and 2015 Local Growth Deal.
It highlights high-level examples of the strategic priorities resulting from the Call for Proposals to unlock further economic development and a summary of the potential related linkages to the emerging priorities of the West Midlands Combined Authority and Midlands Engine.
2014StrategicEconomic Plan
2016StrategicEconomic Plan
Draft WMCA StrategicEconomic Plan
EmergingMidlands Engine Prospectus
CW
LEP
2014
and
201
5 Gr
owth
Dea
l
2016
CW
LEP
SEP
Upda
te
Str
ateg
ic P
riorit
ies
Wes
t M
idla
nds
Com
bine
d Au
thor
ity:
Str
ateg
ic P
riorit
ies
Mid
land
s En
gine
for
Gro
wth
: St
rate
gic
Prio
ritie
sCommitted Investments• No local Growth
Deal financing agreed to support culture & tourism.
“Culture & Tourism” Strategic Programme• UK City of Culture
bid 2021.
• Shakespeare’s Stratford.
• Supporting growth of local culture and tourism sector.
Emerging Actions & Priorities• Enabling the
growth of the region’s leisure, cultural and visitor economy offer.
• Support for Coventry’s 2021 UK Capital of Culture bid.
Emerging Priorities• Develop “one
travel pass” to promote tourism sector.
• Importance of investing in transport infrastructure.
3
The West Midlands Combined Authority and Midlands Engine
The seven metropolitan authorities of Birmingham, Coventry, Dudley, Sandwell, Solihull, Walsall and Wolverhampton have established a West Midlands Combined Authority, working alongside the Local Enterprise Partnerships of the Black Country, Greater Birmingham & Solihull and Coventry & Warwickshire and other Local Authorities.
Nuneaton & Bedworth Borough Council is a non-constituent member, whilst Warwickshire County Council, North Warwickshire Borough Council, Rugby Borough Council, and Stratford-on-Avon District Council have observer status with a view to joining as members in the future.
The West Midlands Combined Authority (WMCA) is based on the functioning economic geography of three LEP areas: Greater Birmingham & Solihull; Black Country and Coventry & Warwickshire. 90% of the area’s population of 4 million live and work in this area. The region’s economy is worth £80 billion of GVA. The WMCA has unique characteristics:
• A legal body with powers of decision making granted by parliament.
• Currently seven constituent members (LA) with ultimate voting rights and eight non-constituent members (five LAs and three LEPs), with more LAs to formally join.
• A metro mayor for the West Midlands will be elected in May 2017.
• Will drive forward a series of joint objectives in support of economic growth and public service reform as outlined in its SEP.
• Negotiated a Devolution Deal with the government to receive powers and funding from Whitehall, made possible due to the strong governance arrangements in place.

Coventry & Warwickshire Strategic Economic Plan Update: 2016 45
3
The West Midlands Combined Authority and Midlands Engine
The Devolution Deal supports the overall aims of closing both the current productivity and the public spending gaps, and includes:
• Significant devolution of funding and financial flexibilities to support a locally controlled ten-year investment fund totalling around £8 billion. This will be used to take forward a Transport Investment Plan and to increase the supply of new development land.
• Implementation of the HS2 Growth Strategy, including regeneration around the Curzon Street (Birmingham city centre) and Interchange HS2 stations.
• An integrated new employment and skills system for the West Midlands.
• Transformation of public services for “troubled individuals”, including support for people with mental health and reforms to the criminal justice system.
Other elements of the Devolution Deal include plans to revitalise the housing market, transform business support and inward investment, create a National Pathfinder for Innovation, and invest in quality of life through an improved cultural offer.
A Strategic Economic Plan has been published for the West Midlands Combined Authority and three-LEP geography. This will provide the case for economic devolution, with clear objectives and targets covering the period 2016-2030. It will also establish the evidence base for the added value of the Combined Authority Economic Plan and associated activity and programmes.
The Combined Authority Strategic Economic Plan:
• Sets out an economic vision for the West Midlands and the opportunities and barriers that require attention at a conurbation level.
• Articulates the added value of activity at a Combined Authority level to enable economic growth and set out a series of propositions to enable that growth.
• Demonstrates the contribution of the partnership between business and the public sector that the LEPs can deliver alongside the Combined Authority.
The Plan contains eight priority actions:
• Strengthening the West Midlands’ position as one of the biggest concentration of high value manufacturing businesses and supply chains in Europe.
• Developing the Creative and Digital sector.
• Strengthening the Environmental Technologies sector.
• Enabling the further growth of the Medical and Life Sciences sector.
• Maximising the economic benefits of HS2.
• Meeting businesses’ skills needs and ensuring residents can access jobs created by growth.
• Accelerating the delivery of housing plans to ensure house building levels support growth rates.
• Exploiting the region’s economic geography.
It is important to note that the Combined Authority Strategic Economic Plan will sit alongside those of the Black Country, Greater Birmingham and Solihull and Coventry & Warwickshire LEPs. Indeed, the pillars and priorities of the 2016 CWSEP Update have been designed in a way that ensures alignment with the objectives and priorities of the Combined Authority Strategic Economic Plan.
In addition to the West Midlands Combined Authority, 2015 also witnessed the launch of the ‘Midlands Engine’. The Midlands Engine stretches from Wales to the North Sea and from the northern Home Counties to the Peak District. It includes 11 Local Enterprise Partnerships who together with their Local Authorities, businesses and the wider partners have come together to respond to the Government economic and productivity challenges.
The Midlands Engine region makes a £222bn (14.6%) annual contribution in GVA to the UK economy, and this has grown by 30% in the last decade. The Midlands Engine is home to a population of just over 11.5 million people (17.9%), of which 24% are under 20 years of age, offering a long-term, sustainable workforce. Around 4.3 million people (15.7%) in the Midlands Engine region are in employment, with 38.3% judged to be in knowledge-intensive sectors. Unemployment rates are 5.3%, marginally lower than the UK average.
There is still much to do to grow the economy and productivity of the region to ensure that the Midlands Engine meets its full potential as a driver of national economic success. The Midlands accounts for 15.7% of the UK’s employed population but only 14.6% of total UK economic output. GVA per worker is £46,310, some £7,000 below the national average. There are some particular socio-economic challenges, which have been characterised by a history of underinvestment. These include skills levels, an under-representation of knowledge-intensive business relative to the overall business base, levels of investment made by SMEs in innovation, and aspects of connectivity.
CWLEP needs to work in collaboration, both within its LEP geographical area and between its local authorities, businesses and educational institutions, and across wider economic geographies.
This is critical to ensuring that we are able to influence, inform, direct and benefit from major strategic initiatives that will support, for example:
• Enhanced transport connectivity – ensuring businesses and their supply chains are able to collaborate and distribute their products and services efficiently, and that our residents are able to access the widest possible employment opportunities.
• Increased inward investment and local business growth – ensuring that through joint marketing approaches at both a Combined Authority and Midlands Engine geography, we are able to actively promote our area as having a strong capacity and capability in terms of availability of employment land, skills, transport connectivity, and R&D infrastructure. This will encourage global employers to locate within our LEP area, and expand their operations.
• Enhanced education and skills – through combined approaches that directly target the skills deficits and challenges that exist at all levels, and through the exchange and transfer of the good practice that exists across the wider economic geographies.
• Increased capacity and collaboration in research, development and innovation – Coventry & Warwickshire is fortunate to have two world-class universities within its LEP area, operating alongside key national research and innovation centres. These institutions are engaged in strategically important collaborations operating on a local, regional, national and global scale. Through increased geographical collaboration, these institutions will be able to improve their existing infrastructure, resources and expertise.
Despite the importance of collaborating with wider economic geographies, it is critical that CWLEP does not lose sight of its own strategic priorities and how these align to those of the Combined Authority and Midlands Engine. CWLEP and partners will need to ensure that the benefits of this collaboration are maximised for the Coventry & Warwickshire economy.

Coventry & Warwickshire Strategic Economic Plan Update: 2016 47
Coventry & WarwickshireLocal Enterprise PartnershipThe Old Clink, The HollowayWarwick, CV34 4SJ
Telephone: 01926 418000Email: [email protected]
“Coventry & Warwickshire is recognised as aglobal hub for knowledge-based industries,
leading the way in advanced manufacturing &engineering and digital sectors.”
www.cwlep.com
www.gov.uk/defra
Towards a one nation economy: A 10-point plan for boosting productivity in rural areas August 2015

2
© Crown copyright 2015
You may re-use this information (excluding logos) free of charge in any format or medium, under the terms of the Open Government Licence v.3. To view this licence visit www.nationalarchives.gov.uk/doc/open-government-licence/version/3/ or email [email protected]
This publication is available at www.gov.uk/government/publications.
PB 14335
3
Contents
Foreword .............................................................................................................................. 4
10-point plan summary ........................................................................................................ 5
Introduction .......................................................................................................................... 7
The government’s 10-point plan for rural productivity ........................................................ 10
Rural areas fully connected to the wider economy ............................................................ 11
1. Extensive, fast and reliable broadband services ................................................... 12
2. High quality, widely available mobile communications .......................................... 13
3. Modern transport connections .............................................................................. 13
A highly skilled rural workforce .......................................................................................... 14
4. Access to high quality education and training ....................................................... 14
5. Expanded apprenticeships in rural areas .............................................................. 15
Strong conditions for rural business growth ....................................................................... 16
6. Enterprise Zones in rural areas............................................................................. 17
7. Better regulation and improved planning for rural businesses .............................. 18
Easier to live and work in rural areas ................................................................................. 18
8. More housing ........................................................................................................ 19
9. Increased availability of affordable childcare ........................................................ 19
Greater local control........................................................................................................... 20
10. Devolution of power .............................................................................................. 20
4
Foreword We want to harness the enormous economic potential England’s rural areas have to offer, both for the prosperity of those living in rural areas and for the benefit of the UK economy overall.
Last month, as a Government we published our ambitious plan (Fixing the foundations: Creating a more prosperous nation) for strengthening UK productivity. Relatively weak productivity performance has been a long term challenge for the UK economy and it is only by achieving world-beating productivity that we can deliver sustained growth and rising living standards for all. We set out a comprehensive set of actions for addressing the challenges and for ensuring that all parts of the country contribute to, and benefit from, productivity growth. As said then, ‘a nation flourishes when it uses the full skills of all its people in all parts of that nation’. That includes England’s rural areas, from Cornwall to Cumbria.
England’s rural areas are a distinct part of our national character. But they also make a substantial and vitally important contribution to the economy, accounting for around £210 billion, or 16%, of England’s total output. Economic activity in rural areas is diverse, with significant manufacturing and services sectors. It is also becoming increasingly dynamic. Knowledge-based and creative industries are growing rapidly. Flexible, home-working is more prevalent in rural than in urban areas, and tends to involve higher skilled, higher wage roles. We are seeing net internal migration from urban to rural areas, including of highly skilled people attracted by the excellent quality of life on offer.
We want to do all we can, whilst continuing on our path of fiscal responsibility, to remove barriers and put in place the best possible conditions for England’s rural areas to thrive. Here we set out our 10-point plan to help boost rural productivity. It complements the government’s wider efforts to promote access in rural areas to high quality public services, focusing on ten specific areas we believe could make a real difference to productivity. It is wide-ranging and will require efforts across government, as well as close working with others outside of government, to deliver. It is central to our offer and ambition for England’s rural areas. We will monitor progress closely.
George Osborne Chancellor of the Exchequer August 2015
Elizabeth Truss Secretary of State for Environment, Food and Rural Affairs August 2015
5
10-point plan summary Rural areas fully connected to the wider economy
1. Extensive, fast and reliable broadband services
• The government is committed to delivering superfast broadband of at least 24Mbps to 95% of UK households and businesses by 2017. Decisions on further broadband rollout will be taken in the Spending Review in November.
• By the end of 2015, access to standard broadband will be available to anyone unable to get a service of at least 2Mbps, through the option of satellite broadband.
2. High quality, widely available mobile communications
• The government will work closely with industry to support further improvements to mobile coverage.
• The government proposes to extend permitted development rights to taller mobile masts subject to conclusions from the Call for Evidence which closes on 21 August 2015.
3. Modern transport connections
• The government will improve transport connections for rural areas, including through its £15 billion Road Investment Strategy and £38 billion rail investment programme. To support smaller airports serving regions across the UK, the government is publishing proposals for new publicly-supported passenger air routes, with final decisions on funding for successful routes to be made in November.
A highly skilled rural workforce
4. Access to high quality education and training
• The government will ensure fairer funding for schools, including those in rural areas. It will turn inadequate schools into academies and focus efforts to support school improvement in underperforming rural areas.
• The government will invite local areas to participate in the re-shaping and commissioning of local post-16 skills provision.
5. Expanded apprenticeships in rural areas
• The government will increase apprenticeships in rural areas, including by tripling apprenticeships in food and farming and by helping small tourism businesses to provide more, high quality apprenticeships.
6
Strong conditions for rural business growth
6. Enterprise Zones in rural areas
• In the current bidding round for Enterprise Zones closing on 18th September 2015, preference will be given to proposals involving smaller towns, districts and rural areas.
• The government’s ambition is that businesses in all Enterprise Zones in rural areas will be able to access high speed broadband.
7. Better regulation and improved planning for rural businesses
• Alongside wider measures to reduce the regulatory burden and improve planning, the government will review planning and regulatory constraints facing rural businesses and measures that can be taken to address them by 2016.
• The government will introduce a fast-track planning certificate process for establishing the principle of development for minor development proposals.
Easier to live and work in rural areas
8. More housing
• Through the right combination of measures, the government wants to ensure that any village in England has the freedom to expand in an incremental way, subject to local agreement.
• The government will make it easier for villages to establish neighbourhood plans and allocate land for new homes, including the use of rural exception sites to deliver Starter Homes.
9. Increased availability of affordable childcare
• The government will work with local authorities and providers to ensure there is sufficient high-quality childcare to meet the needs of parents in rural areas.
• The government will welcome high quality early expressions of interest from rural areas to deliver 30 hours of free childcare to working parents.
Greater local control
10. Devolution of power
• The government will encourage further proposals from local areas for devolution of powers in return for strong and accountable local governance.
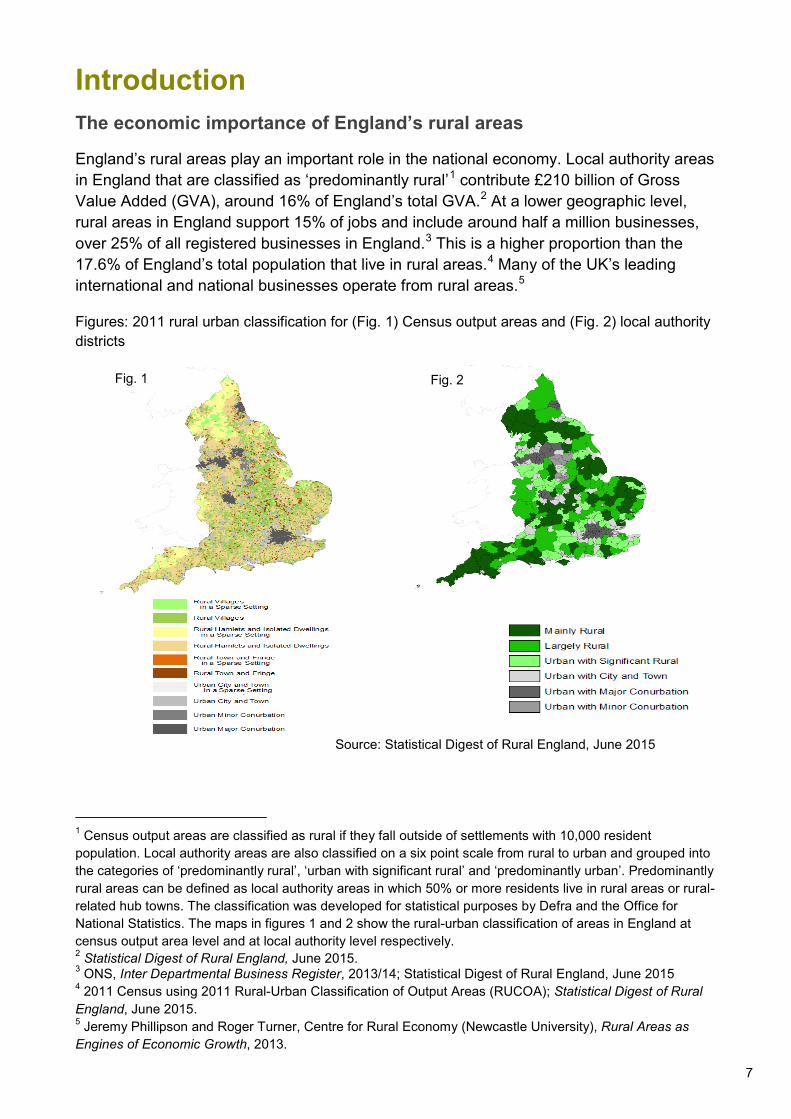
7
Introduction The economic importance of England’s rural areas
England’s rural areas play an important role in the national economy. Local authority areas in England that are classified as ‘predominantly rural’1 contribute £210 billion of Gross Value Added (GVA), around 16% of England’s total GVA.2 At a lower geographic level, rural areas in England support 15% of jobs and include around half a million businesses, over 25% of all registered businesses in England.3 This is a higher proportion than the 17.6% of England’s total population that live in rural areas.4 Many of the UK’s leading international and national businesses operate from rural areas.5
Figures: 2011 rural urban classification for (Fig. 1) Census output areas and (Fig. 2) local authority districts
1 Census output areas are classified as rural if they fall outside of settlements with 10,000 resident population. Local authority areas are also classified on a six point scale from rural to urban and grouped into the categories of ‘predominantly rural’, ‘urban with significant rural’ and ‘predominantly urban’. Predominantly rural areas can be defined as local authority areas in which 50% or more residents live in rural areas or rural-related hub towns. The classification was developed for statistical purposes by Defra and the Office for National Statistics. The maps in figures 1 and 2 show the rural-urban classification of areas in England at census output area level and at local authority level respectively. 2 Statistical Digest of Rural England, June 2015. 3 ONS, Inter Departmental Business Register, 2013/14; Statistical Digest of Rural England, June 2015 4 2011 Census using 2011 Rural-Urban Classification of Output Areas (RUCOA); Statistical Digest of Rural England, June 2015. 5 Jeremy Phillipson and Roger Turner, Centre for Rural Economy (Newcastle University), Rural Areas as Engines of Economic Growth, 2013.
Source: Statistical Digest of Rural England, June 2015
Fig. 1 Fig. 2
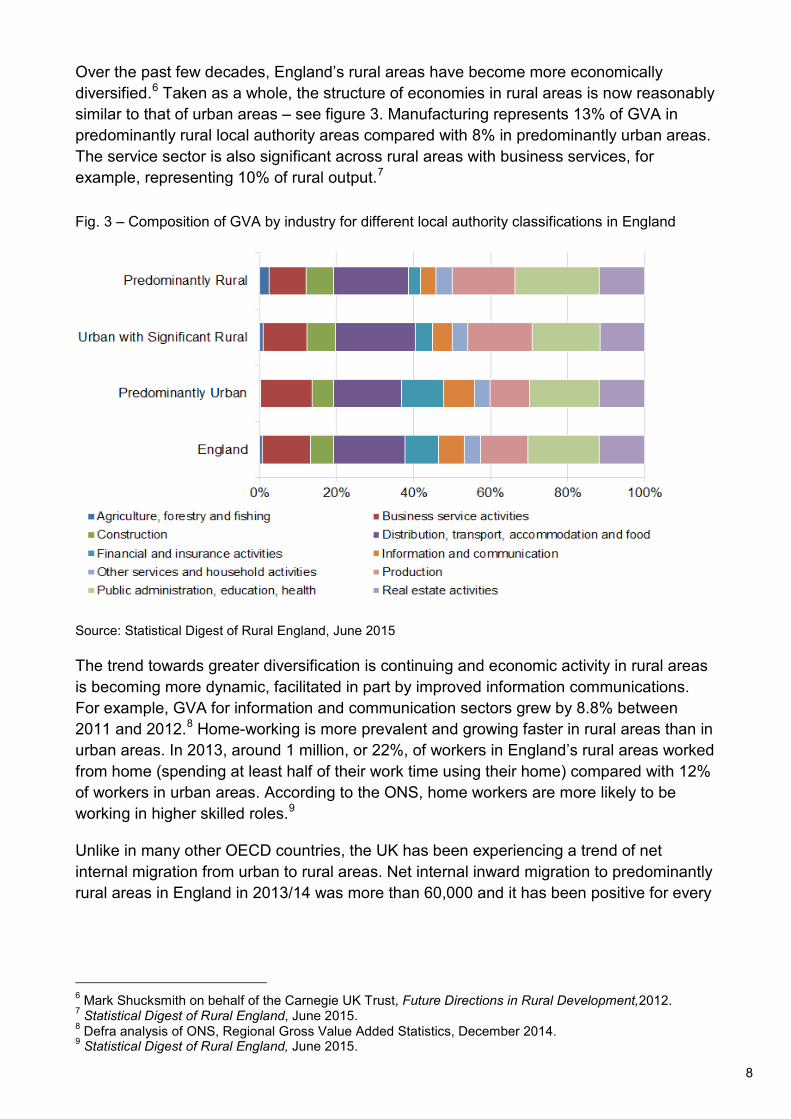
8
Over the past few decades, England’s rural areas have become more economically diversified.6 Taken as a whole, the structure of economies in rural areas is now reasonably similar to that of urban areas – see figure 3. Manufacturing represents 13% of GVA in predominantly rural local authority areas compared with 8% in predominantly urban areas. The service sector is also significant across rural areas with business services, for example, representing 10% of rural output.7
Fig. 3 – Composition of GVA by industry for different local authority classifications in England
Source: Statistical Digest of Rural England, June 2015
The trend towards greater diversification is continuing and economic activity in rural areas is becoming more dynamic, facilitated in part by improved information communications. For example, GVA for information and communication sectors grew by 8.8% between 2011 and 2012.8 Home-working is more prevalent and growing faster in rural areas than in urban areas. In 2013, around 1 million, or 22%, of workers in England’s rural areas worked from home (spending at least half of their work time using their home) compared with 12% of workers in urban areas. According to the ONS, home workers are more likely to be working in higher skilled roles.9
Unlike in many other OECD countries, the UK has been experiencing a trend of net internal migration from urban to rural areas. Net internal inward migration to predominantly rural areas in England in 2013/14 was more than 60,000 and it has been positive for every
6 Mark Shucksmith on behalf of the Carnegie UK Trust, Future Directions in Rural Development,2012. 7 Statistical Digest of Rural England, June 2015. 8 Defra analysis of ONS, Regional Gross Value Added Statistics, December 2014. 9 Statistical Digest of Rural England, June 2015.
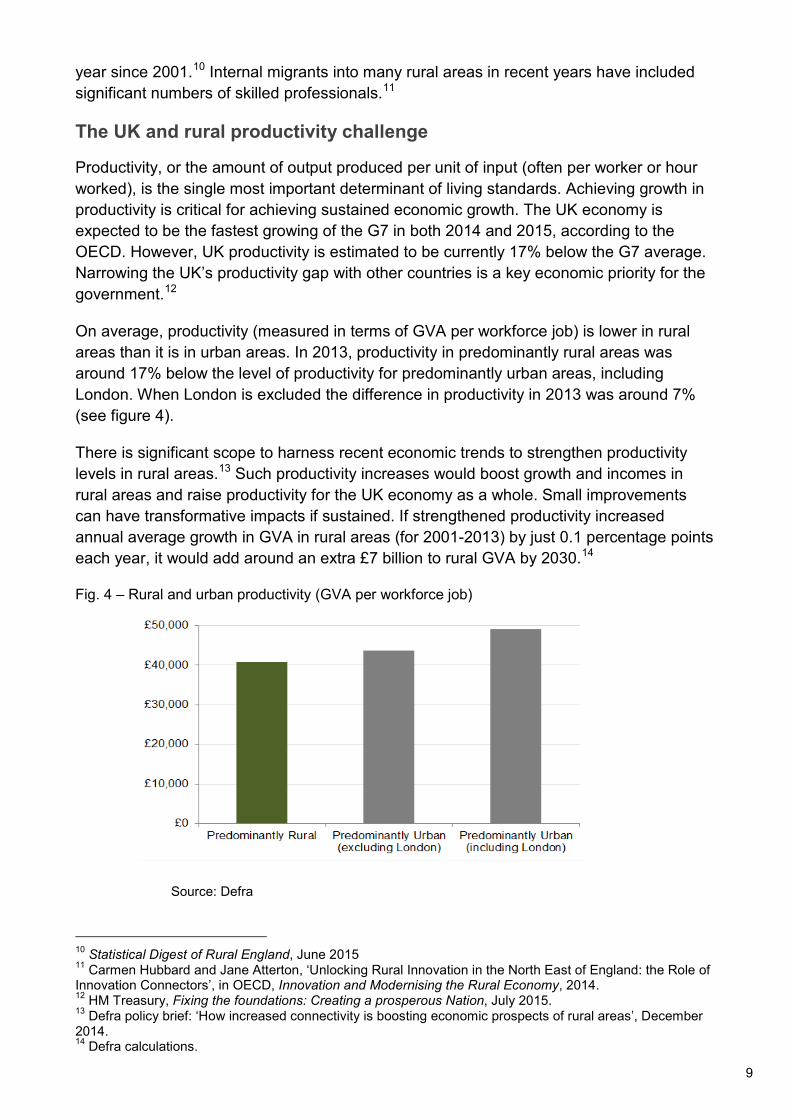
9
year since 2001.10 Internal migrants into many rural areas in recent years have included significant numbers of skilled professionals.11
The UK and rural productivity challenge
Productivity, or the amount of output produced per unit of input (often per worker or hour worked), is the single most important determinant of living standards. Achieving growth in productivity is critical for achieving sustained economic growth. The UK economy is expected to be the fastest growing of the G7 in both 2014 and 2015, according to the OECD. However, UK productivity is estimated to be currently 17% below the G7 average. Narrowing the UK’s productivity gap with other countries is a key economic priority for the government.12
On average, productivity (measured in terms of GVA per workforce job) is lower in rural areas than it is in urban areas. In 2013, productivity in predominantly rural areas was around 17% below the level of productivity for predominantly urban areas, including London. When London is excluded the difference in productivity in 2013 was around 7% (see figure 4).
There is significant scope to harness recent economic trends to strengthen productivity levels in rural areas.13 Such productivity increases would boost growth and incomes in rural areas and raise productivity for the UK economy as a whole. Small improvements can have transformative impacts if sustained. If strengthened productivity increased annual average growth in GVA in rural areas (for 2001-2013) by just 0.1 percentage points each year, it would add around an extra £7 billion to rural GVA by 2030.14
Fig. 4 – Rural and urban productivity (GVA per workforce job)
Source: Defra
10 Statistical Digest of Rural England, June 2015 11 Carmen Hubbard and Jane Atterton, ‘Unlocking Rural Innovation in the North East of England: the Role of Innovation Connectors’, in OECD, Innovation and Modernising the Rural Economy, 2014. 12 HM Treasury, Fixing the foundations: Creating a prosperous Nation, July 2015. 13 Defra policy brief: ‘How increased connectivity is boosting economic prospects of rural areas’, December 2014. 14 Defra calculations.
10
The government’s 10-point plan for rural productivity As set out in the Chancellor’s report, Fixing the foundations: Creating a prosperous nation, the government’s overall framework for raising productivity is built around two pillars:
• Encouraging long-term investment in economic capital, including infrastructure, skills and knowledge.
• Promoting a dynamic economy that encourages innovation and helps resources flow to their most productive use.
This framework, and the underlying productivity drivers within it, is based on widely agreed academic analysis. It has been used to identify the actions for raising productivity in rural areas set out in this plan. However, the 10 points have been organised around five broad areas considered to be reflective of the particular priorities for rural areas:
• Rural areas fully connected to the wider economy
• A highly skilled rural workforce
• Strong conditions for rural business growth
• Easier to live and work in rural areas
• Greater local control
There is considerable variation across rural areas in terms of their economic structures and their geographical distance from cities or other economic centres. Productivity performance and challenges will vary. Nevertheless, the themes and points covered in this plan can be considered to be pertinent to the needs of rural areas as a whole. Details of the plan are set out below.
11
Rural areas fully connected to the wider economy Rural areas are characterised, to different degrees, by lower physical density and greater ‘remoteness’ from economic centres. Better connecting rural areas to information and markets, both product and labour markets, through high quality communications and transport infrastructure can reduce the significance of these characteristics and, as a result, increase investment returns and reduce transaction costs substantially.
Improved connectivity can provide the means for people in rural areas to strengthen knowledge and skills, for example through e-learning. It can also enable businesses in rural areas to connect with centres of innovation and research, such as universities. In a survey of businesses in the North East of England in 2009, 46.4% reported that they had introduced an innovation in the last five years but only 15.4% reported that they had worked with an external organisation in introducing the innovation.15
Local availability of broadband and mobile communications is closely associated with rural economic performance.16 High speed broadband enables productive economic activity, especially more knowledge-intensive activity, to happen almost anywhere.
The experience of Cornwall, where superfast broadband coverage is approaching 90% of households and businesses, demonstrates the substantial economic benefits that high-powered broadband connections can bring. Survey responses from more than 2,000 businesses in Cornwall have indicated how broadband connections have enabled these businesses to save time and money, introduce new ways of working, develop new products and access new markets, including overseas markets. Further evidence from a sample of 22 businesses in Cornwall revealed that upgrading to superfast broadband had enabled those businesses to increase productivity by 30% on average.17
Modern transport infrastructure, particularly road infrastructure, is important for enabling rural businesses to supply goods to markets, including export markets, and for rural areas to attract workers and visitors. There is a critical need to improve the quality of roads across the UK.18
Investing in world class infrastructure is at the heart of the government’s plans to strengthen UK productivity and economic performance. Overall, the government will invest £100bn in infrastructure over this Parliament and will publish a new long-term National Infrastructure Plan for key infrastructure sectors, including transport, energy and communications.
The government will support the market to deliver the internationally competitive fixed and mobile digital communications infrastructure that the economy, including in rural areas,
15 Hubbard and Atterton, 2014. 16 Frontier Economics and Defra, Drivers of rural business employment growth, decline and stability, 2014. 17 Serio and Buckman Associates on behalf of Superfast Cornwall, Superfast Cornwall Evaluation: Final Evaluation Report, June 2015. 18 HM Treasury, July 2015.

12
needs to thrive and grow. It intends to legislate to reform the Electronic Communications Code, which regulates the relationship between network operators and site providers, to make it easier to roll out communications infrastructure. The government will also put in place a Digital Transformation Plan in the autumn to support the adoption of digital technologies across the economy.
As part of its work to promote transparency on the availability and speed of broadband and mobile services across rural areas, Ofcom has unveiled a new Mobile Coverage Checker and will publish in the autumn updated information by postcode on both superfast and standard broadband availability and performance.19
1. Extensive, fast and reliable broadband services Geographic coverage and take-up of superfast broadband in the UK is already the highest of the 5 largest economies in the EU.20 The government’s superfast broadband programme has recently reached over 3 million premises and is passing an additional 40,000 premises each week. There is a need to go further, particularly to better connect rural areas:
• The government is committed to delivering superfast services of at least 24 megabits per second (Mbps) to 95% of UK households and businesses by 2017.
• The government is also working closely with providers to explore how to extend superfast broadband beyond the current 95% target. It is investing in a series of market pilots to test alternative solutions. Lessons from the pilots will be published later in the year and decisions on further broadband rollout will be taken in the Spending Review in November.
• £129 million cashback from the existing superfast broadband programme will be made available to local authorities to reinvest in providing superfast broadband coverage to even more homes and businesses, much earlier than originally planned.
• By the end of 2015, access to standard broadband will be available to anyone unable to get a service of at least 2Mbps. This will be made available through the option of satellite broadband, which will have the capability of delivering superfast speeds for those that want them.
• The government will work with Local Enterprise Partnerships (LEPs) and other partners to ensure that EU funding to support broadband infrastructure in rural areas can be targeted effectively to support growth.
• To support fixed high speed broadband infrastructure, the government is considering making permanent the planning relaxations introduced in 2013.
19 Ofcom’s Mobile Coverage Checker is available at http://www.ofcom.org.uk/mobile-coverage. 20 HM Treasury, July 2015.
13
• Over the longer term, the government will support the market to deliver ultrafast (at least 100 Mbps) broadband coverage across the UK.
2. High quality, widely available mobile communications
The government will put in place the right conditions, and work actively with providers, to ensure rural areas have the best possible coverage of high quality mobile services:
• The government will work closely with industry to support further improvements to mobile coverage in the UK. This will supplement the legally binding obligation on Mobile Network Operators to provide voice and SMS text coverage to 90% of the UK by 2017 and Telefonica’s licence obligation to deliver indoor 4G coverage to 98% of UK premises by 2017.
• The government proposes to extend permitted development rights to taller mobile masts in both protected and non-protected areas in England to support improved mobile connectivity, subject to conclusions from the Call for Evidence which closes on 21 August 2015.
3. Modern transport connections The government’s major programme of transport investment will deliver substantially improved physical connectivity of rural areas:
• The government will ensure timely delivery of its £15 billion Road Investment Strategy for 2015-2020. This includes a number of schemes that will better connect rural areas, such as the A303 expressway to the South West, upgrading of the A1 in the North, dualling the rural sections of the A453 near Nottingham and improving traffic flow on the A11 in the East. Looking ahead as part of its preparations for the second Roads Investment Strategy for 2020 – 2025 the Department for Transport will be seeking the views of rural stakeholders on priorities.
• The government is making substantial investments in the local road network, providing £5.9 billion for local road maintenance between 2015/16 and 2020/21 and allocating £4.9 billion from the previous Local Authority Major Projects budget to the Local Growth Fund for the same period.
• Rural areas across England will also benefit from the government’s £38 billion rail investment programme and reforms including the devolution of decision-making power to route managers closer to the front line.
• To support smaller airports serving regions across the UK, the government is moving to the next stage of its competition for start-up aid. The Department for Transport is publishing a list of 15 proposals for new publicly-supported passenger air routes, which will now undergo commercial, economic and strategic appraisal in

14
advance of final decisions on funding for successful routes to be made in November this year. This is part of the Regional Air Connectivity Fund, with up to £20 million available. In England, the fund has already been used to support the air route connecting Newquay airport to London.
A highly skilled rural workforce Improving skills is a national priority for strengthening productivity performance given longstanding problems with the UK’s skills base.21 But employers in rural areas can face particular constraints in accessing the pool of skills they require. According to survey responses, businesses in rural areas are more likely than businesses in urban areas to have to outsource work, withdraw from markets and experience delays in developing new products and services as a result of skills shortages.22
The latest attainment data shows that overall in England, pupils in rural areas are more likely to meet expected standards by the end of key stage 4, with a higher proportion achieving 5 or more GCSEs, including English and Mathematics at grades A*-C. However, considering local area deprivation, pupils living in rural areas are less likely to achieve the same standards as pupils living in similarly deprived urban areas of the country.23
The proportion of people working in rural areas with qualifications at or above degree level, National Vocational Qualification Level 4 or equivalent is lower for rural areas than it is for urban areas.24 Businesses in rural areas are also less likely to provide vocational training, including NVQs and apprenticeships, than businesses in urban areas.25
4. Access to high quality education and training The government is implementing a wide-ranging programme of reform to improve the curriculum and strengthen the quality of schools in all areas of the country. It is also introducing changes to post-16 skills provision and improving destination data to enable informed career choices.
Several actions the government is taking will improve access to high quality education and training in rural areas:
• The government will ensure fairer funding for schools, including those in rural areas. The government has already increased funding for 69 under-funded local authorities, including 21 local authorities that recognise small schools in sparsely populated areas in their funding formula.
21 HM Treasury, July 2015. 22 UK Commission for Employment and Skills, Secondary Analysis of Employer Surveys: Urban and Rural Differences in Jobs, Training, and Skills, October 2013. 23 Department for Education, Statistics on GCSE and equivalent attainment by pupil characteristics: 2014. 24 Statistical Digest of Rural England, June 2015. 25 UK Commission for Employment and Skills, 2013.
15
• The government will turn inadequate schools into academies and improve their leadership, as well as target ‘coasting’ schools for improvement. The government will also focus efforts to support school improvement in underperforming areas, including rural areas, encouraging the best academy chains to expand and bringing new sponsors where they are needed.
• To promote skills provision that is responsive to local economic priorities, the government will invite local areas to participate in the reshaping, re-commissioning and ongoing commissioning of local post-16 skills provision. The government will set out more details in the autumn.
5. Expanded apprenticeships in rural areas Apprenticeships commonly form part of successful skills systems that have been adopted across the world. They can offer young people in particular high quality, targeted training that allows them to earn while they learn.26
The government is committed to increasing the quantity and quality of apprenticeships in England to 3 million starts this Parliament. It is introducing a UK-wide levy on larger employers to help fund the increase in apprenticeships training. The government’s measures will strengthen apprenticeships in rural areas:
• The government will increase apprenticeships in rural areas including by tripling apprenticeships in food and farming and by helping small tourism businesses to provide more, high quality apprenticeships.
• From April 2016, employers will not have to pay National Insurance contributions for most apprentices under the age of 25.
• Funding reforms, such as the digital apprenticeship voucher, will put control of funding for apprenticeships directly into the hands of employers.
26 HM Treasury, July 2015.
16
Strong conditions for rural business growth Enterprise and competition between enterprises are vital for productivity growth. They drive innovation and efficiency and help ensure that resources flow to their most productive uses.
Rural areas are full of enterprise. There are 430 registered businesses per 10,000 of population in predominantly rural areas compared with 400 businesses per 10,000 of population for England as a whole.27 But businesses need the right conditions to become established and, where productive, to grow.
As many businesses in rural areas are small or medium sized enterprises (SMEs), they can face constraints around disproportionately high regulatory burdens and more limited access to finance. For many businesses, and would-be businesses, in rural areas the lack of suitable business premises can limit possibilities for start-up and expansion. Many rural businesses cite difficulties in obtaining planning permission as a problem.28 There is also scope to encourage further clustering of businesses in rural areas to reduce transaction costs, improve knowledge exchange and strengthen innovation.
Tourism is an increasingly important component of rural economies, with farms the fastest growing visitor attraction category in 2014.29 However, a fragmented tourism landscape and wide variety of funding sources can hamper the effective co-ordination of tourism offers and their promotion.
The government is putting in place a range of measures at national level to provide the best possible conditions for business creation and growth:
• The government will reduce red tape, saving businesses £10 billion by the end of this Parliament.
• The government will cut corporation tax to 19% in 2017 and to 18% in 2020.
• By April 2016, the government will publish a Business Tax Roadmap setting out plans for business taxes across the rest of the Parliament.
• The government will increase the level of the Annual Investment Allowance permanently to £200,000 from January 2016. The government will also set higher investment limits for venture capital investments in knowledge-intensive businesses.
• The British Business Bank will facilitate up to £10 billion of finance for businesses by 2019 and will work with UK Export Finance to review access to finance challenges facing SMEs looking to export.
27 Statistical Digest of Rural England, June 2015. 28 Frontier Economics and Defra, 2014 29 VisitEngland’s visitor attraction survey.
17
• The government will strengthen industry collaboration and the commercialisation of research, including by responding to the recommendations in Professor Ann Dowling’s review of Business-University Research Collaborations by the time of the Spending Review.
• The government will strengthen programmes to support development of management and leadership capability of SMEs, and explore devolving responsibility to local areas for designing and delivering these.
• The government is working to ensure that decisions taken across government and the public sector that affect tourism are joined up, and align with the government’s ambition to grow tourism outside London.
The government will also take the following actions to improve conditions for rural business.
6. Enterprise Zones in rural areas The 24 Enterprise Zones that have been established across the country have so far attracted more than 15,500 jobs, over 480 businesses, and £2.1 billion of private investment. 7 of these Enterprise Zones are situated in rural areas and, by December 2014, had attracted 2,450 jobs.
A bidding process for a new round of Enterprise Zones was announced in July:
• The government wants all areas in England to have the opportunity to bid for Enterprise Zone status and in the current bidding round preference will be given to proposals which involve smaller towns, districts and rural areas. The government will continue to encourage such towns, districts and rural areas to work with LEPs to apply to become Enterprise Zones. The deadline for applications is 18th September 2015.
• If approved, new Enterprise Zones will provide positive incentives for businesses to locate within them. Businesses in Enterprise Zones sites will be able to claim either a 100% business rate discount worth up to £275,000 per business over a 5 year period or, in assisted areas, a 100% capital allowance on large investments in plant and machinery. All growth in business rates generated by the Enterprise Zone is retained by the relevant LEP for 25 years to reinvest in the Enterprise Zone and in local economic growth.
• The government’s ambition is that businesses in all Enterprise Zones in rural areas will be able to access high speed broadband. The government will work with each of the Enterprise Zones in rural areas that are successful in the current round of bidding with a view to realising this ambition.
• The government will work with LEPs and other partnerships to promote the use of available funding, including from the EU, to support broadband infrastructure in Enterprise Zones in rural areas.
18
7. Better regulation and improved planning for rural businesses
The government will:
• Review the planning and regulatory constraints facing rural businesses and measures that can be taken to address them, including how improved permitted development rights in rural areas can support new homes, jobs and innovation. The government will publish a Call for Evidence in the autumn with decisions to be made by 2016.
• Carry out a sector-specific review of regulations affecting agriculture and reduce farm inspections by 20,000 this Parliament.
• Take further action to ensure that planning decisions are taken on time, by bringing minor development within the government’s approach to managing planning performance, tightening the Planning Guarantee for minor schemes, and strengthening the minimum performance threshold for the speed of deciding major applications.
• Introduce a fast-track planning certificate process for establishing the principle of development for minor development proposals, providing much-needed certainty for small businesses in rural areas.
Easier to live and work in rural areas Improving the conditions for people to live and work in rural areas would help create more flexibility of labour markets, ensure that people with the right skills can be matched to job opportunities in rural areas, and facilitate the creation of new businesses. There is evidence that firms started by people moving into rural areas are more likely to supply to overseas markets,30 and that such firms in turn are more likely to be productive.31
Lack of housing is a national challenge but in rural areas it is a particular constraint to labour and entrepreneurial mobility.32 The stock of housing is limited in rural areas relative to demand and house prices are on average 6.7% higher in rural areas than in urban areas.33
Enabling more female participation in rural labour markets would expand the availability of skills in rural areas. In 2012 the proportion of women living in rural areas and working full time was 52.2% compared with 58.8% in urban areas.34 At least part of this is due to childcare. According to the 2012-13 DfE childcare and early years survey of parents
30 Centre for Rural Economy, 2013. 31 Richard Harris and Q Cher Li, Report for UKTI, ‘Firm Level Empirical Study of the Contribution of Exporting to UK Productivity Growth’, 2007. 32 Frontier Economics and Defra, 2014. 33 Rural Economic Bulletin Jan to Mar 2015 (Quarter 1), June 2015. 34 Statistical Digest for Rural England, January 2015.

19
nationally, over half (54%) of non-working mothers agreed that they would like to work if they could arrange good quality childcare that was convenient, reliable and affordable.35
8. More housing The government will increase the availability of housing in rural areas, allowing our rural towns and villages to thrive, whilst protecting the Green Belt and countryside. This will include a significant contribution to the 200,000 ‘Starter Homes’, to be offered at a 20% discount for first-time buyers under the age of 40, that the government is committed to delivering this Parliament. Through the right combination of measures, the government wants to ensure that any village in England has the freedom to expand in an incremental way, subject to local agreement.
In addition to carrying out the review of planning constraints in rural areas mentioned above, the government will:
• Ensure local authorities put local plans in place for housing according to agreed deadlines and require them to plan proactively for the delivery of Starter Homes. The government will also bring forward proposals to speed up the process of implementing or amending a plan.
• Help our villages to thrive by making it easier for them to establish a neighbourhood plan and allocate land for new homes, including through the use of rural exception sites to deliver Starter Homes.
• Review the current threshold for agricultural buildings to convert to residential buildings.
• Introduce a dispute resolution mechanism for section 106 agreements, to speed up negotiations and allow housing starts to proceed more quickly.
9. Increased availability of affordable childcare Ensuring that parents can access flexible childcare is a priority for the government. The government has already made changes that help meet the needs of parents in rural areas where childcare options may be more limited. It has encouraged more early years provision in schools, made it easier to open childcare services through changes to permitted development rights including for agricultural buildings, provided significant support for childcare through tax credits, and given entitlements to free early education for the most disadvantaged two-year-olds and for three- and four-year-olds. The government will be providing more support with the cost of childcare through the extension of free childcare for working parents of three- and four-year-olds to 30 hours per week and the introduction of Tax Free Childcare.
35 Department for Education, Childcare and Early Years Survey of Parents, 2012-13, January 2014.
20
The government will also:
• Work with local authorities and providers to ensure there is sufficient high-quality childcare to meet the needs of parents in rural areas.
• Invite high quality early expressions of interest to deliver 30 hours of free childcare to working parents and particularly welcome bids from rural areas that would like to be involved.
• Establish a digital way to provide parents with easily accessible information about childcare in their area.
• Strengthen the current requirement on local authorities to publish information on childcare in their local area.
The government’s wider actions to move the UK from a low wage, high tax, high welfare society to a higher wage, lower tax, lower welfare society will also encourage people to take up productive employment in rural areas.
From April 2016, the government will introduce a new mandatory National Living Wage (NLW) for workers aged 25 and above, initially set at £7.20 – a rise of 70p relative to the current National Minimum Wage. The government’s objective is to have a NLW of over £9 by 2020. The NLW is expected to benefit directly around 8% of the rural workforce from April 2016 and around 14% of the rural workforce by 2020.
Greater local control The government is committed to empowering local leaders to drive growth through policies anchored in the specific needs of local areas. The government is pursuing an ambitious agenda to devolve a range of powers to local level. A new Devolution Deal has already been agreed with Cornwall. This includes powers for re-shaping further education training and learning provision for adults, and for identifying and developing new apprenticeship opportunities.
10. Devolution of power The government will:
• Encourage any further proposals from local areas for devolution of significant powers in return for a mayor.
• Encourage proposals for increased powers and greater freedoms to maximise economic growth from places across the country that put in place strong and accountable local governance.
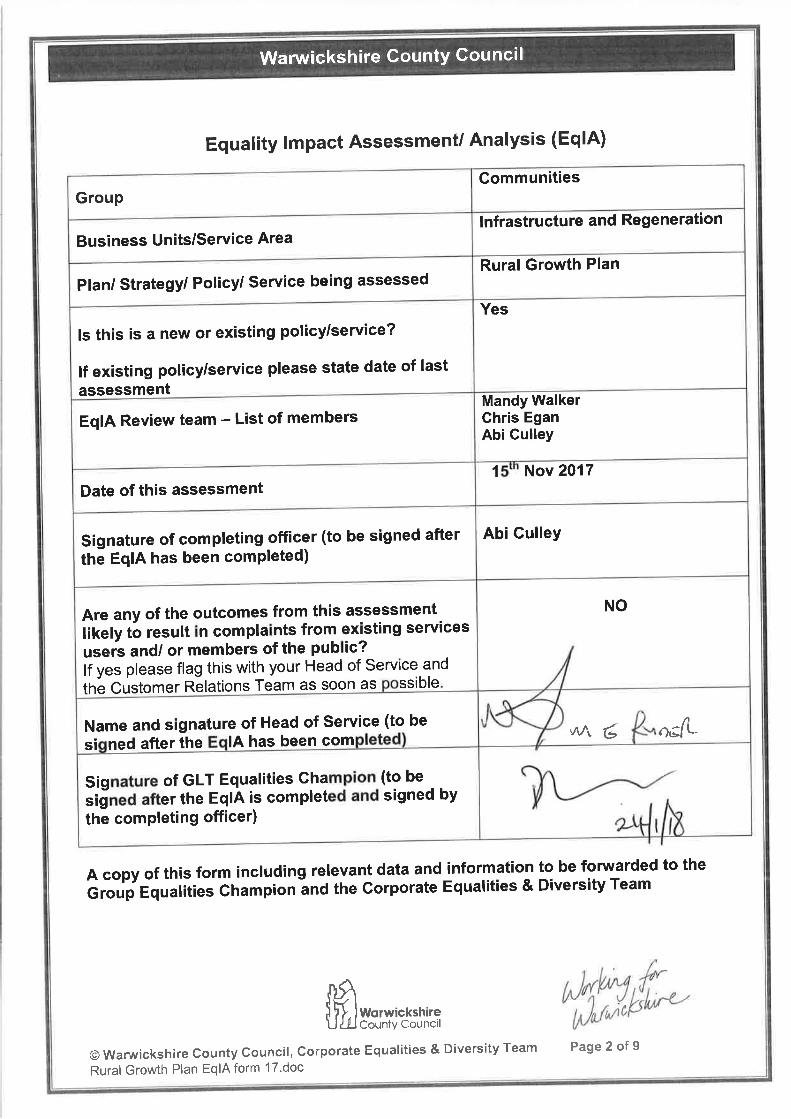

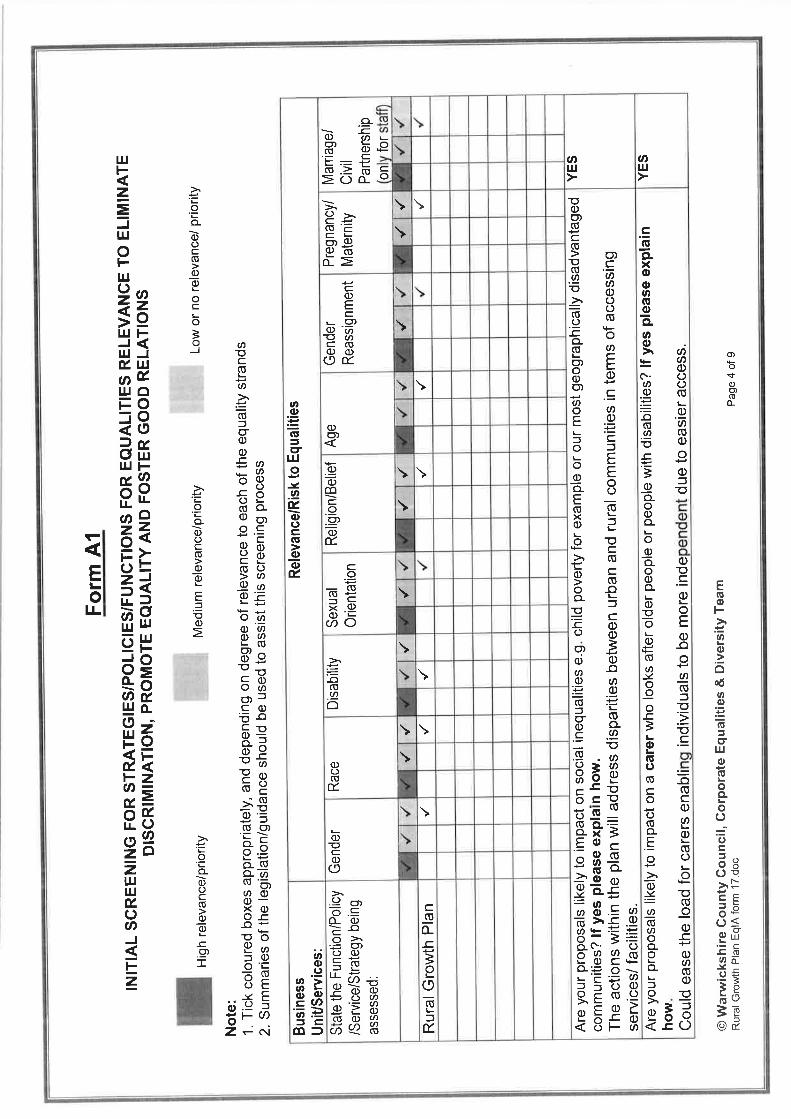
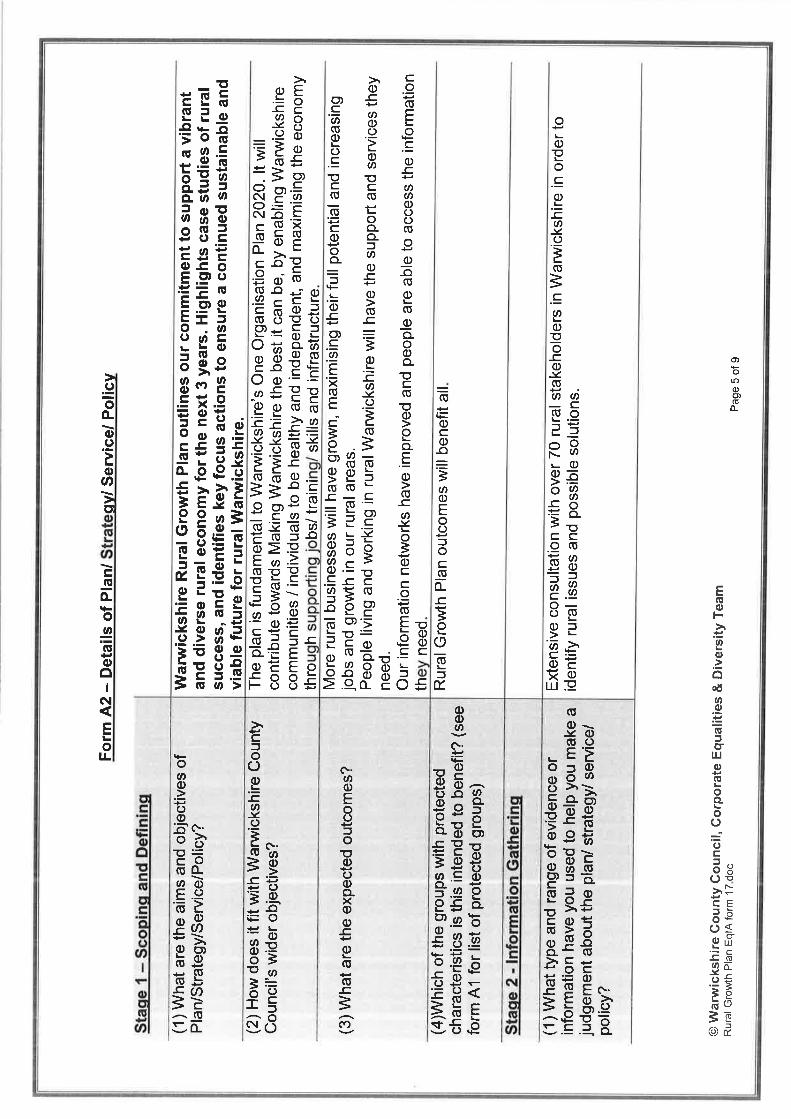
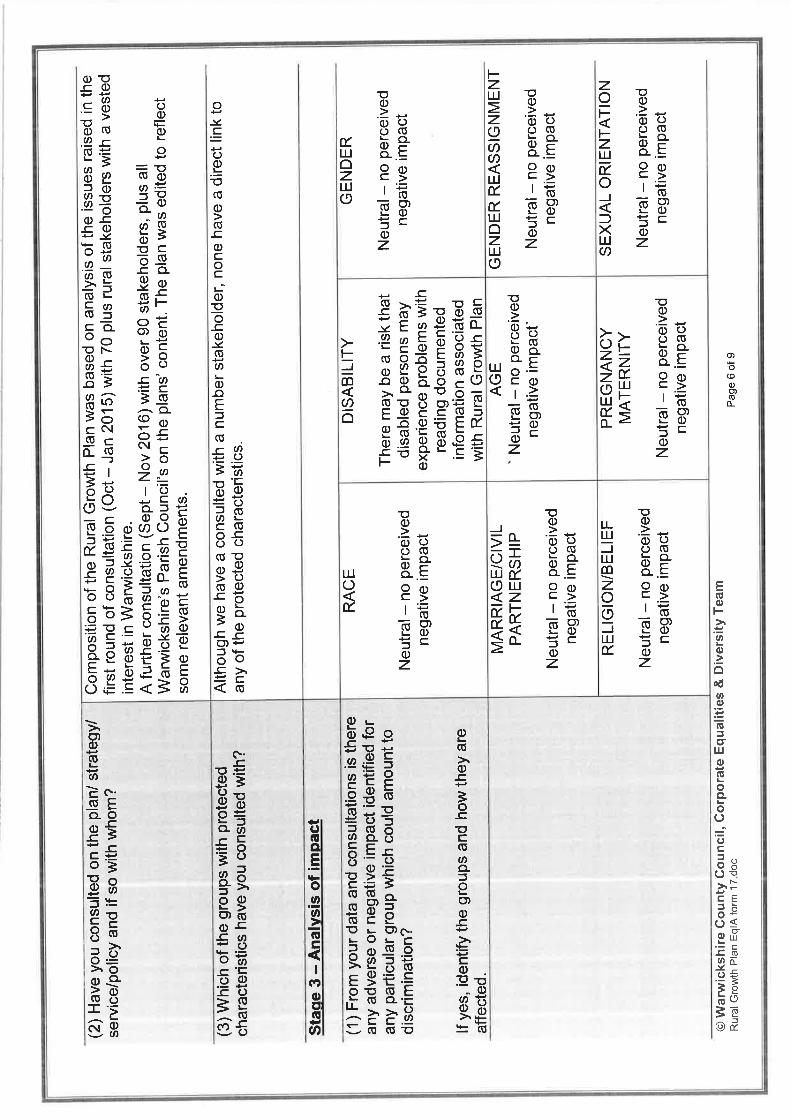
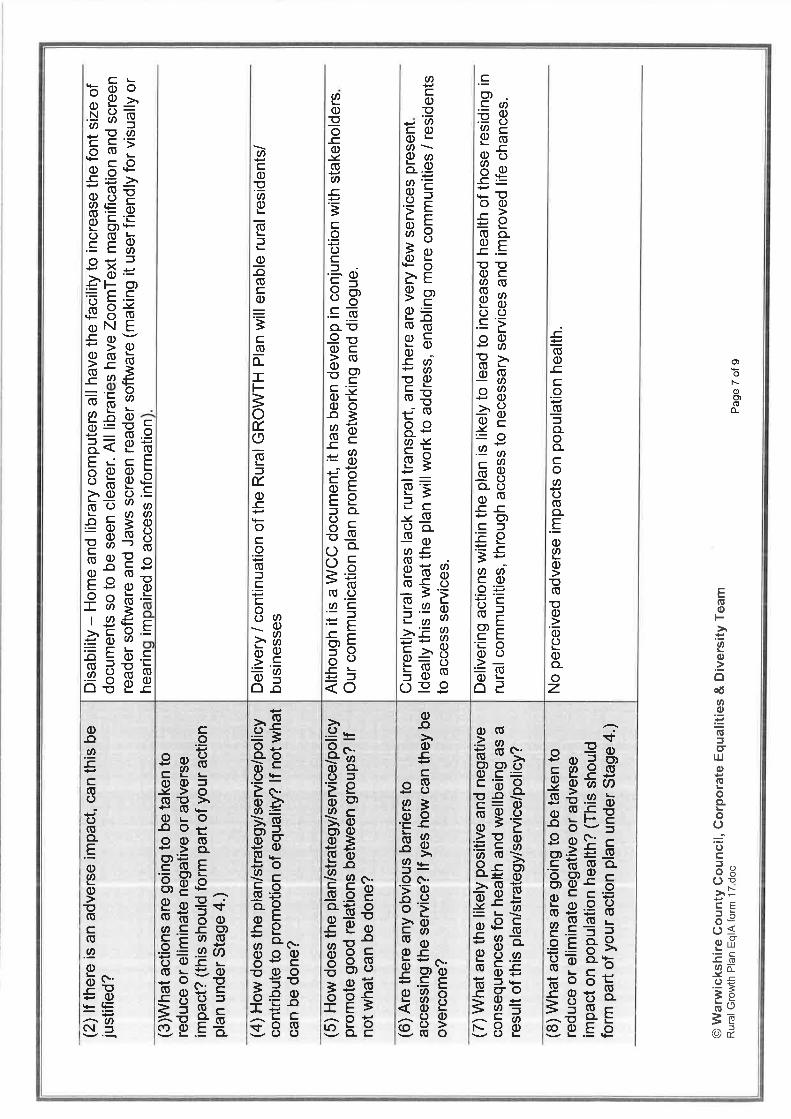
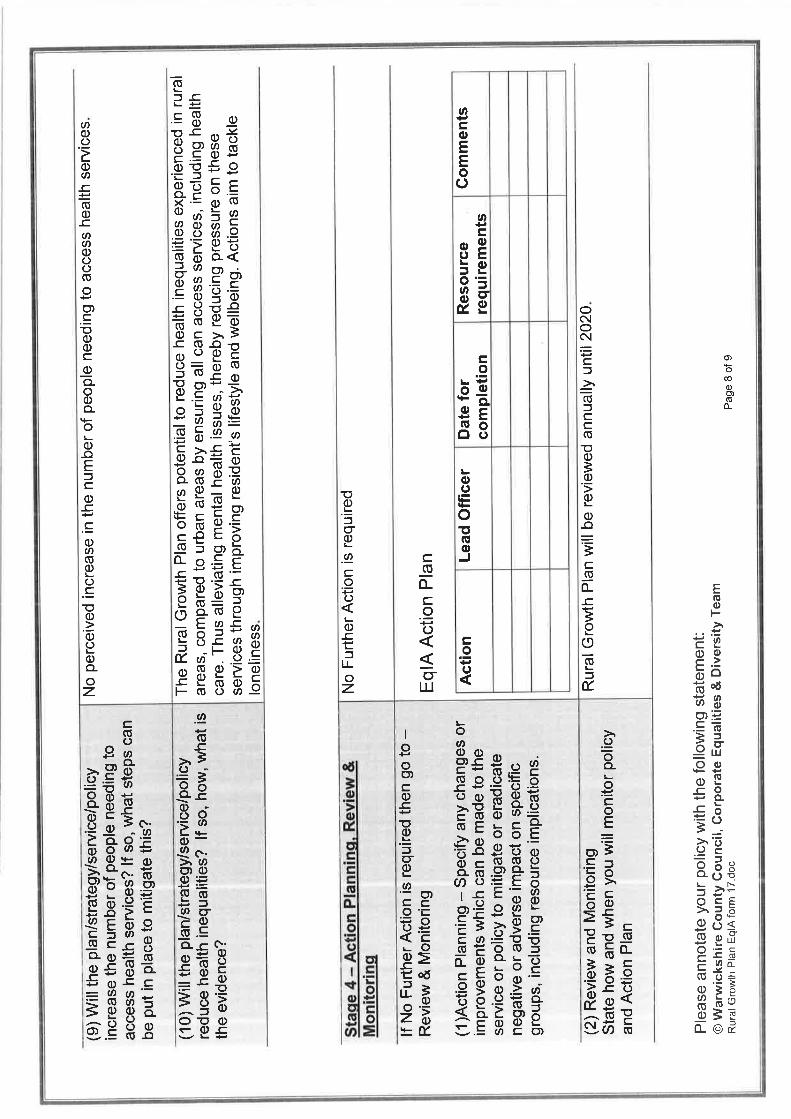


05 Treasury Management Strategy Cab 18.02.15 1 of 12
Item 5 Cabinet
15 February 2018
Treasury Management Strategy 2018/19
Recommendations That:
1) Cabinet recommends to the County Council that the Treasury Management Strategy and Investment Strategy for 2018/19 be approved and its provisions have immediate effect in the current financial year 2017/18.
2) The Prudential Indicators (see Appendix A) are noted and commented on.
3) Cabinet recommends that the County Council requires the Head of Finance to
ensure that gross borrowing does not exceed the prudential level as specified in Appendix A, taking into account current commitments, existing plans, and the proposals in the budget report.
4) Cabinet recommends that the County Council delegate authority to the Head
of Finance to undertake all the activities listed in Appendix G of this report, subject to the use of any new financial instruments being approved by Cabinet.
5) Cabinet recommends that the County Council requires the Head of Finance to
implement the Minimum Revenue Provision Policy as specified in Appendix H.
1 Introduction Background 1.1 Treasury management is defined as:
“The management of the local authority’s investments and cash flows, its banking, money market and capital market transactions; the effective control of the risks associated with those activities; and the pursuit of optimum performance consistent with those risks.”
1.2 The Council is required to operate a balanced budget, which broadly means
that cash raised during the year will meet cash expenditure. Part of the treasury management operation is to ensure that this cash flow is adequately planned, with cash being available when it is needed. Surplus monies are invested in low risk counterparties or instruments commensurate with the
05 Treasury Management Strategy Cab 18.02.15 2 of 12
Council’s low risk appetite, providing security of capital and sufficient liquidity initially before considering investment return.
1.3 The second main function of the treasury management service is the funding
of the Council’s capital plans. These capital plans provide a guide to the borrowing need of the Council, essentially the longer term cash flow planning to ensure that the Council can meet its capital spending obligations. This management of longer term cash may involve arranging long or short term loans, or using longer term cash flow surpluses. On occasions, debt previously drawn may be restructured to meet Council risk or cost objectives.
Statutory Requirements 1.4 The Local Government Act 2003 (the Act) and supporting regulations require
the Council to ‘have regard to’ the CIPFA Prudential Code and the CIPFA Treasury Management Code of Practice to set Prudential and Treasury Indicators for the next three years to ensure that the Council’s capital investment plans are affordable, prudent and sustainable.
1.5 The Act therefore requires the Council to set out its treasury strategy for
borrowing and to prepare an Annual Investment Strategy (as required by Investment Guidance subsequent to the Act and included in section 7 of this report). This sets out the Council’s policies for managing its investments and for giving priority to the security and liquidity of those investments.
CIPFA Requirements 1.7 The primary requirements of the Code are as follows:
1. Creation and maintenance of a Treasury Management Policy Statement which sets out the policies and objectives of the Council’s treasury management activities.
2. Creation and maintenance of Treasury Management Practices which set out the manner in which the Council will seek to achieve those policies and objectives.
3. Receipt by the full Council of an annual Treasury Management Strategy Statement, to include the Annual Investment Strategy and Minimum Revenue Provision Policy for the year ahead, a Mid-year Review Report and an Annual (stewardship) Report covering activities during the previous year. The authority has a Capital Strategy for which full council maintains overall responsibility.
4. Delegation by the Council of responsibilities for implementing and monitoring treasury management policies and practices and for the execution and administration of treasury management decisions.
5. Delegation by the Council of the role of scrutiny of treasury management strategy and policies to a specific named body. For this Council the delegated body is Resources and Fire & Rescue Overview and Scrutiny Committee.
05 Treasury Management Strategy Cab 18.02.15 3 of 12
Treasury Management Strategy for 2018/19 1.8 The proposed strategy for 2018/19 is based upon the treasury officers’ views
on interest rates, supplemented with leading market forecasts provided by the Council’s treasury adviser, Link Asset Services (Formerly known as Capita).
1.9 The strategy covers:
• Treasury limits for 2018/19 to 2020/21 • Prudential Indicators • Prospects for Interest Rates • Borrowing Strategy • Debt Rescheduling • Annual Investment Strategy • Minimum Revenue Provision Strategy
Balanced Budget Requirement
1.10 Under Section 42B of the Local Government Finance Act 1992, it is a statutory requirement for the Council to produce a balanced budget. In particular, Section 42A states a local authority must include the revenue costs that flow from capital financing decisions in its budget requirement for each financial year. Therefore increases in capital expenditure must be limited to a level whereby charges to revenue derived from increases in interest charges (caused by increased borrowing to finance additional capital expenditure and any increases in running costs from new capital projects) are limited.
MiFID II
1.11 The Markets in Financial Instruments Directive (‘MiFID’) was introduced due to increasing complexity of financial products and issues related to the 2008 financial crisis. It has now been revised (as MiFID II) to improve the functioning of financial markets in light of the financial crisis and to strengthen investor protection. MiFID II came into effect in January 2018 which re-classifies investors into ‘professional’ or ‘retail’ clients.
1.12 Officers have demonstrated with all appropriate providers that we have suitably qualified staff with the necessary skills, training and experience to fulfil the role of “professional client”. This has enabled the current treasury asset allocation to continue without disruption.
2 Treasury Limits for 2018/19 to 2020/1 2.1 It is a statutory duty under Section 3 of the Act and supporting regulations for
the Council to determine and keep under review how much it can afford to borrow. The amount so determined is termed the “Affordable Borrowing Limit”.
05 Treasury Management Strategy Cab 18.02.15 4 of 12
In England and Wales, the Authorised Limit represents the legislative limit specified in the Act.
2.2 The Council must have regard to the Prudential Code when setting the
Authorised Limit, which essentially requires it to ensure that total capital investment remains within sustainable limits and the impact upon its future council tax is ‘acceptable’.
2.3 Whilst termed an “Affordable Borrowing Limit”, the capital to be considered for
inclusion in corporate financing is both external borrowing and other forms of liability, such as credit arrangements. The Authorised Limit is to be set, on a rolling basis, for the forthcoming financial year and two successive financial years. Details of the Authorised Limit can be found in Appendix A of this report. Explanations of the terminology employed in the Appendix can be found in Appendix B.
3 Prudential Indicators for 2018/19 to 2020/21 3.1 Prudential and Treasury Indicators (Appendix A to this report) are relevant
for the purposes of setting an integrated Treasury Management Strategy. 3.2 Council will approve the Prudential Indicators as part of the budget resolution
in February 2017. These indicators will be revised, if necessary, for the Council approved capital programme.
3.3 The Prudential Indicators are relevant for the purposes of setting an
integrated Treasury Management Strategy. The indicators are provisional and based on the current agreed capital programme.
4 Prospects for Interest Rates 4.1 The Council has appointed Link as treasury advisor to the Council and part of
their service is to assist the Council to formulate a view on interest rates. The table below sets out Link’s view on the future Bank Rate.
Link Bank Rate Forecast
Period Bank Rate
% Jan 2018 to Dec 2018 0.50 Jan 2019 to Dec 2019 0.75 Jan 2020 to Dec 2020 1.00 Jan 2021 onwards 1.25
4.2 A detailed view of the current economic background is contained within
Appendix C to this report. 5 Borrowing Strategy 5.1 The Council is currently maintaining an over borrowed position. This means
there is no current need for capital borrowing (the Capital Financing
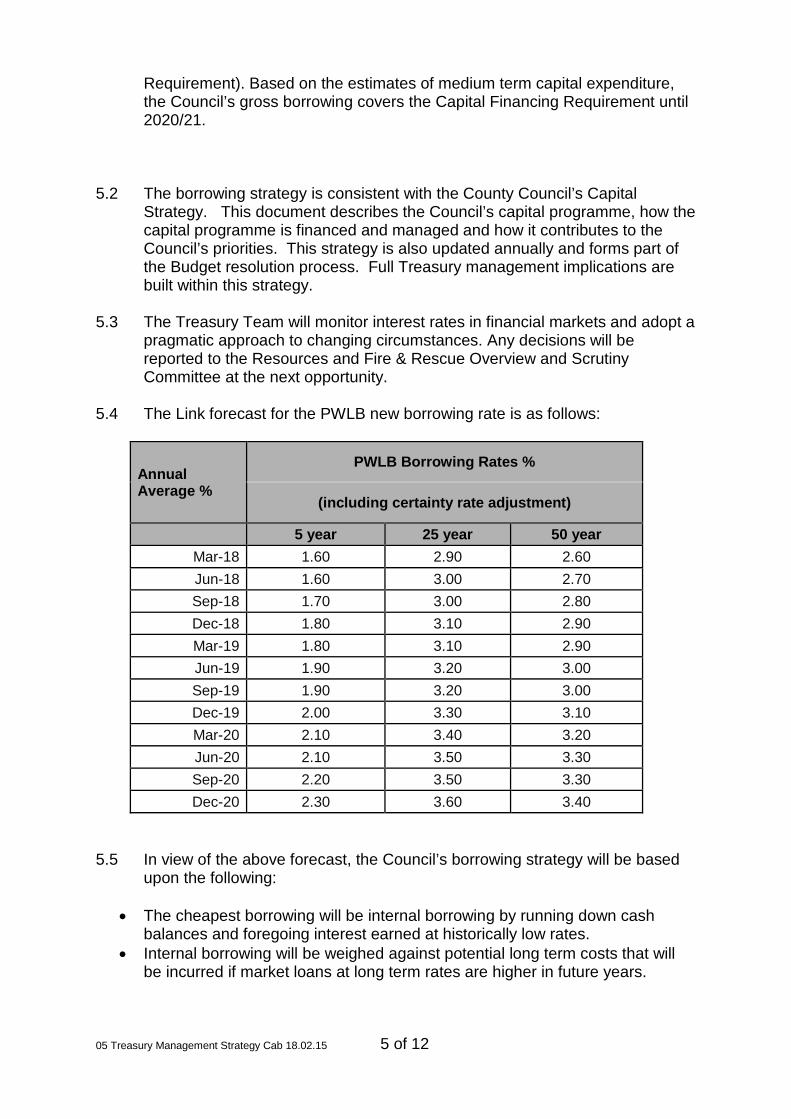
05 Treasury Management Strategy Cab 18.02.15 5 of 12
Requirement). Based on the estimates of medium term capital expenditure, the Council’s gross borrowing covers the Capital Financing Requirement until 2020/21.
5.2 The borrowing strategy is consistent with the County Council’s Capital
Strategy. This document describes the Council’s capital programme, how the capital programme is financed and managed and how it contributes to the Council’s priorities. This strategy is also updated annually and forms part of the Budget resolution process. Full Treasury management implications are built within this strategy.
5.3 The Treasury Team will monitor interest rates in financial markets and adopt a
pragmatic approach to changing circumstances. Any decisions will be reported to the Resources and Fire & Rescue Overview and Scrutiny Committee at the next opportunity.
5.4 The Link forecast for the PWLB new borrowing rate is as follows:
Annual Average %
PWLB Borrowing Rates %
(including certainty rate adjustment)
5 year 25 year 50 year Mar-18 1.60 2.90 2.60 Jun-18 1.60 3.00 2.70 Sep-18 1.70 3.00 2.80 Dec-18 1.80 3.10 2.90 Mar-19 1.80 3.10 2.90 Jun-19 1.90 3.20 3.00 Sep-19 1.90 3.20 3.00 Dec-19 2.00 3.30 3.10 Mar-20 2.10 3.40 3.20 Jun-20 2.10 3.50 3.30 Sep-20 2.20 3.50 3.30 Dec-20 2.30 3.60 3.40
5.5 In view of the above forecast, the Council’s borrowing strategy will be based
upon the following:
• The cheapest borrowing will be internal borrowing by running down cash balances and foregoing interest earned at historically low rates.
• Internal borrowing will be weighed against potential long term costs that will be incurred if market loans at long term rates are higher in future years.
05 Treasury Management Strategy Cab 18.02.15 6 of 12
• Long term fixed rate market loans at rates significantly below PWLB rates for the equivalent maturity period (where available) and to maintain an appropriate balance between PWLB and market debt in the debt portfolio.
• PWLB borrowing for periods under ten years where rates are expected to be significantly lower than rates for longer periods. This offers a range of options for new borrowing which will spread debt maturities away from a current concentration in longer dated debt.
5.6 Against this background and the risks within the economic forecast, caution will
be adopted within the treasury operations in 2018/19. The Head of Finance will monitor interest rates in financial markets and adopt a pragmatic approach to changing circumstances, for example:
• if it was felt that there was a significant risk of a sharp FALL in long and short
term rates (e.g. due to a marked increase of risks around relapse into recession or of risks of deflation), then long term borrowings may be postponed, and potential rescheduling from fixed rate funding into short term borrowing will be considered
• if it was felt that there was a significant risk of a much sharper RISE in long and short term rates than that currently forecast in world economic activity or a sudden increase in inflation risks, then the portfolio position will be reappraised with the likely action that fixed rate funding will be drawn whilst interest rates are still lower than they will be in the next few years
5.7 Appendix I sets out a graph of the existing Councils existing PWLB debt
portfolio and how that debt will mature over the life of the underlying loans (assuming no further re-structuring takes place).
Policy on borrowing in advance of need
5.8 The Council will not borrow more than or in advance of its needs purely in
order to profit from the investment of the extra sums borrowed. Any decision to borrow in advance will be considered carefully to ensure value for money can be demonstrated and that the Council can ensure the security of such funds.
5.9 In determining whether borrowing will be undertaken in advance of need, the
Council will:
• ensure that there is a clear link between the capital programme and maturity profile of the existing debt portfolio which supports the need to fund in advance of need;
• ensure the ongoing revenue liabilities created, and the implications on future plans and budgets have been considered;
• evaluate the economic and market factors that might influence the manner and timing of any decision;
• consider the merits and demerits of alternative forms of funding; • consider the alternative interest rate bases available, the most appropriate
time periods and repayment profiles;
05 Treasury Management Strategy Cab 18.02.15 7 of 12
• consider the impact on temporarily (until required to finance capital expenditure) increasing cash balances and the consequent increase in exposure to counterparty and other risks in light of the residual level of such risks given the controls in place to manage them.
Scheme of Delegation
5.10 The scheme of delegation in terms of financing options and decisions to be
taken by the Head of Finance is shown in Appendix G. 6 Debt Rescheduling 6.1 As short term borrowing rates will be considerably cheaper than longer term
rates, there may be opportunities to generate savings by switching from long term debt to short term debt. However, these savings will need to be considered in the light of their short term nature and the likely cost of debt repayments.
6.2 The reasons for any rescheduling to take place will include:
• the generation of cash savings and/or discounted cash flow savings; • helping to fulfil the strategy • enhancing the balance of the portfolio (amending the maturity profile and/or
the balance of volatility). 6.3 Consideration will also be given to identify if there is any potential for making
savings by running down investment balances in order to repay debt prematurely as short term interest received on investments is likely to be lower than interest paid on current debt.
6.4 The Council has examined the potential for undertaking early repayment of
some external debt to the PWLB in order to reduce the difference between its gross and net debt position. However, the premium that would be incurred by doing so means there would need to be careful analysis of the cost and benefit from such early repayment. The Municipal Bonds Agency is offering loans to local authorities. It is envisaged that the borrowing rates will be lower than those offered by the Public Works Loan Board (PWLB). This Authority is a founder member and would consider the agency alongside the PWLB in the event that borrowing was required.
7 Annual Investment Strategy
Investment Policy
7.1 The Council will have regard to the MHCLG’s Guidance on Local Government
Investments (“the Guidance”) and the revised CIPFA Treasury Management in Public Services Code of Practice and Cross Sectoral Guidance Notes (“the CIPFA TM Code”).
7.2 The Council’s investment priorities will be security first, liquidity second and
then return.
05 Treasury Management Strategy Cab 18.02.15 8 of 12
7.3 In accordance with the above, and in order to minimise the risk to
investments, the Council has stipulated in Appendix E, the minimum acceptable credit quality of counterparties for inclusion on the lending list.
7.4 Furthermore, the Council’s officers recognise that ratings should not be the
sole determinant of the quality of an institution and that it is important to continually assess and monitor the financial sector on both a micro and macro basis and in relation to the economic and political environments in which the institutions operate. The assessment will also take account of information that reflects the opinion of the markets. To this end the Council will engage with its advisors to monitor market pricing such as Credit Default Swaps and overlay that information on top of the credit ratings.
7.5 Other information sources used will include the financial press, share price
and other such information pertaining to the banking sector in order to establish the most robust scrutiny of the suitability of potential investment counterparties. The aim of the strategy is to generate a list of highly creditworthy counterparties which will enable diversification and therefore avoid concentration risk. The intention of the strategy is to provide security of investment and minimisation of risk.
7.6 Investment instruments identified for use in the financial year are listed in
Appendix E under the ‘Specified’ and ‘Non-Specified’ Investments categories. Counterparty limits will be as set through the Council’s Treasury Management Practices Schedules.
7.7 The Council on occasion will hold long term investments or provide loans for
operational policy reasons, for example, to our local authority traded companies. Operational loans and investments will be assessed and approval sought from members on a case-by-case basis. This will include a full assessment of the risk, including credit risk and how this will be managed.
Creditworthiness Policy 7.8 The primary principle governing the Council’s investment criteria is the
security of its investments, although the yield or return on the investment is also a key consideration. After this main principle, the Council will ensure that it maintains a policy covering both the categories and types of investment that It will invest in and the criteria for choosing investment counterparties with adequate security and the monitoring of their security. This is set out in the specified and non-specified investment sections in Appendix E. Also that It has sufficient liquidity in its investments. For this purpose it will set out procedures for determining the maximum periods for which funds may prudently be committed. These procedures also apply to the Council’s prudential indicators covering the maximum principal sums invested.
7.9 The Head of Finance will maintain a counterparty list in compliance with the criteria and will revise and submit the criteria to Council for approval as necessary. These criteria are separate to that which determines which types of investment instrument are either specified or non-specified as it provides an overall pool of counterparties considered high quality which the Council may
05 Treasury Management Strategy Cab 18.02.15 9 of 12
use, rather than defining what types of investment instruments are to be used. 7.10 The Council will ensure that it maintains its policy covering both the categories
and types of investment, the criteria for choosing investment counterparties with adequate security, and the monitoring of that security. Moreover, it will ensure it has sufficient liquidity in its investments. For this purpose, it will follow procedures for determining the maximum periods for which funds may be committed according to future cash flow requirements. The Head of Finance will maintain a list of counterparties in compliance with the stated criteria, providing a high quality pool of counterparties which the Council may use.
7.11 Credit rating information is supplied by Link, our treasury consultants, on all
counterparties that comply with the stated criteria. Any counterparty failing to meet the criteria will be deleted from the counterparty lending list. Any rating changes, watches (notification of a likely change), or outlooks (notification of a possible longer term change) are provided to officers almost immediately after they occur and this information is considered before dealing.
Country Limits
7.12 The Council has determined that it will only use approved counterparties from
countries with a minimum sovereign credit rating of AA from Fitch Ratings (or an equivalent rating from other agencies if Fitch does not provide). The list of countries that qualify using this credit criteria at the current time are shown in Appendix F. This list will be amended by officers as and when ratings change in accordance with this policy.
Investment Strategy
7.13 The Council has in-house managed funds that are mainly cash flow derived
and a core balance available for investment over a maximum one year period. Investments will be made with regard to the core balance, cash flow requirements and the outlook for short term interest rates.
7.14 For its cash flow generated balances, the Council will seek to utilise its
business reserve accounts, money market funds, and short dated deposits (overnight to three months) in order to benefit from the compounding of interest.
End of Year Investment Report 7.15 At the end of the financial year, the Council will report on its investment
activity as part of its Annual Treasury Outturn Report. External Fund Managers 7.16 The County Council uses a number of external managers to spread risk and
obtain maximum market exposure. The fund managers will use both specified and non-specified investments and must comply with the terms set out in Appendix E. External fund managers actively used are listed below.

05 Treasury Management Strategy Cab 18.02.15 10 of 12
Fund Manager Product/Fund Name CCLA Public Sector Deposit Fund CCLA Local Authority Property Fund Standard Life Short Duration Cash Fund Aberdeen Asset Management Sterling Liquidity Fund Federated Investors Sterling Liquidity Fund Columbia Threadneedle UK Social Bond Fund Aviva Investors Sterling Core Liquidity Fund Policy on the Use of External Service Providers 7.17 The Council uses Link as its external treasury management advisers. The
Council recognises that responsibility for treasury management decisions remains with the organisation at all times and will ensure that undue reliance is not placed upon our external service providers. The Council will ensure that the terms of their appointment and the methods by which their value will be assessed are properly agreed, documented and subject to regular review. Role of the Section 151 Officer
7.18 Please see Appendix G.
Pension Fund Cash 7.19 This Council will comply with the requirements of The Local Government
Pension Scheme (Management and Investment of Funds) Regulations 2009, implemented 1 January 2010. With effect 1 April 2010, the Council does not pool pension fund cash with its own cash balances for investment purposes. Any investments made by the pension fund directly with this local authority after 1 April 2010 must comply with the requirements of SI 2009 No 393.
8 Minimum Revenue Provision 8.1 The Council’s policy on Minimum Revenue Provision (MRP) is shown in
Appendix H. Background papers None Name Contact Information Report Author Mat Dawson
Treasury and Pension Fund Manager
[email protected] 01926 412227
Head of Service John Betts Head of Finance
[email protected] 01926 412441
Strategic Director David Carter, Joint Managing Director
[email protected] 01926 412564
Portfolio Holder Cllr Butlin

05 Treasury Management Strategy Cab 18.02.15 11 of 12
The report was not circulated to embers prior to publication.
05 Treasury Management Strategy Cab 18.02.15 12 of 12
APPENDICES A. Prudential and Treasury Indicators B. Prudential Term Explanations C. Link Economic Commentary D. Treasury Management Scheme of Delegation E. Schedule of Specified and Non Specified Investments F. Approved Countries for Investments G. The Treasury Management Role of the S151 (Responsible) Officer: Head
of Finance H. Minimum Revenue Provision
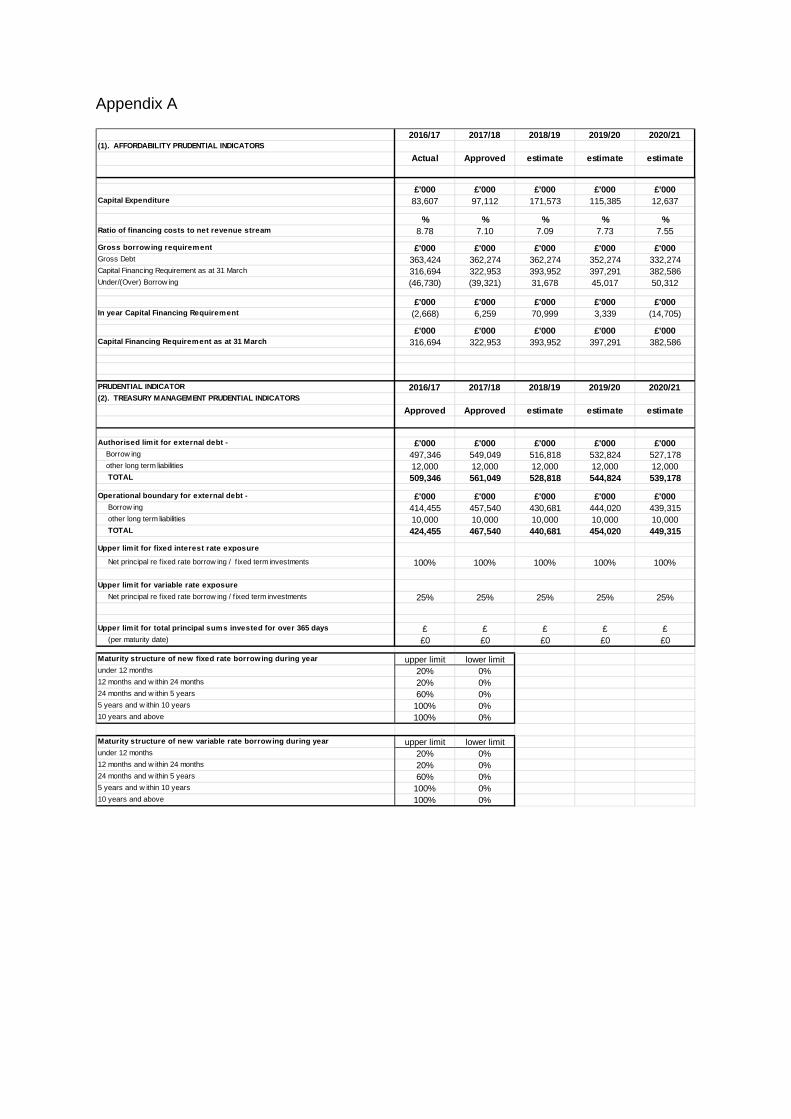
Appendix A
2016/17 2017/18 2018/19 2019/20 2020/21(1). AFFORDABILITY PRUDENTIAL INDICATORS
Actual Approved estimate estimate estimate
£'000 £'000 £'000 £'000 £'000Capital Expenditure 83,607 97,112 171,573 115,385 12,637
% % % % %Ratio of financing costs to net revenue stream 8.78 7.10 7.09 7.73 7.55
Gross borrowing requirement £'000 £'000 £'000 £'000 £'000Gross Debt 363,424 362,274 362,274 352,274 332,274Capital Financing Requirement as at 31 March 316,694 322,953 393,952 397,291 382,586Under/(Over) Borrow ing (46,730) (39,321) 31,678 45,017 50,312
£'000 £'000 £'000 £'000 £'000In year Capital Financing Requirement (2,668) 6,259 70,999 3,339 (14,705)
£'000 £'000 £'000 £'000 £'000Capital Financing Requirement as at 31 March 316,694 322,953 393,952 397,291 382,586
PRUDENTIAL INDICATOR 2016/17 2017/18 2018/19 2019/20 2020/21(2). TREASURY MANAGEMENT PRUDENTIAL INDICATORS
Approved Approved estimate estimate estimate
Authorised limit for external debt - £'000 £'000 £'000 £'000 £'000 Borrow ing 497,346 549,049 516,818 532,824 527,178 other long term liabilities 12,000 12,000 12,000 12,000 12,000 TOTAL 509,346 561,049 528,818 544,824 539,178
Operational boundary for external debt - £'000 £'000 £'000 £'000 £'000 Borrow ing 414,455 457,540 430,681 444,020 439,315 other long term liabilities 10,000 10,000 10,000 10,000 10,000 TOTAL 424,455 467,540 440,681 454,020 449,315
Upper limit for fixed interest rate exposure
Net principal re f ixed rate borrow ing / f ixed term investments 100% 100% 100% 100% 100%
Upper limit for variable rate exposure Net principal re f ixed rate borrow ing / f ixed term investments 25% 25% 25% 25% 25%
Upper limit for total principal sums invested for over 365 days £ £ £ £ £ (per maturity date) £0 £0 £0 £0 £0
Maturity structure of new fixed rate borrowing during year upper limit lower limitunder 12 months 20% 0%12 months and w ithin 24 months 20% 0%24 months and w ithin 5 years 60% 0%5 years and w ithin 10 years 100% 0%10 years and above 100% 0%
Maturity structure of new variable rate borrowing during year upper limit lower limitunder 12 months 20% 0%12 months and w ithin 24 months 20% 0%24 months and w ithin 5 years 60% 0%5 years and w ithin 10 years 100% 0%10 years and above 100% 0%
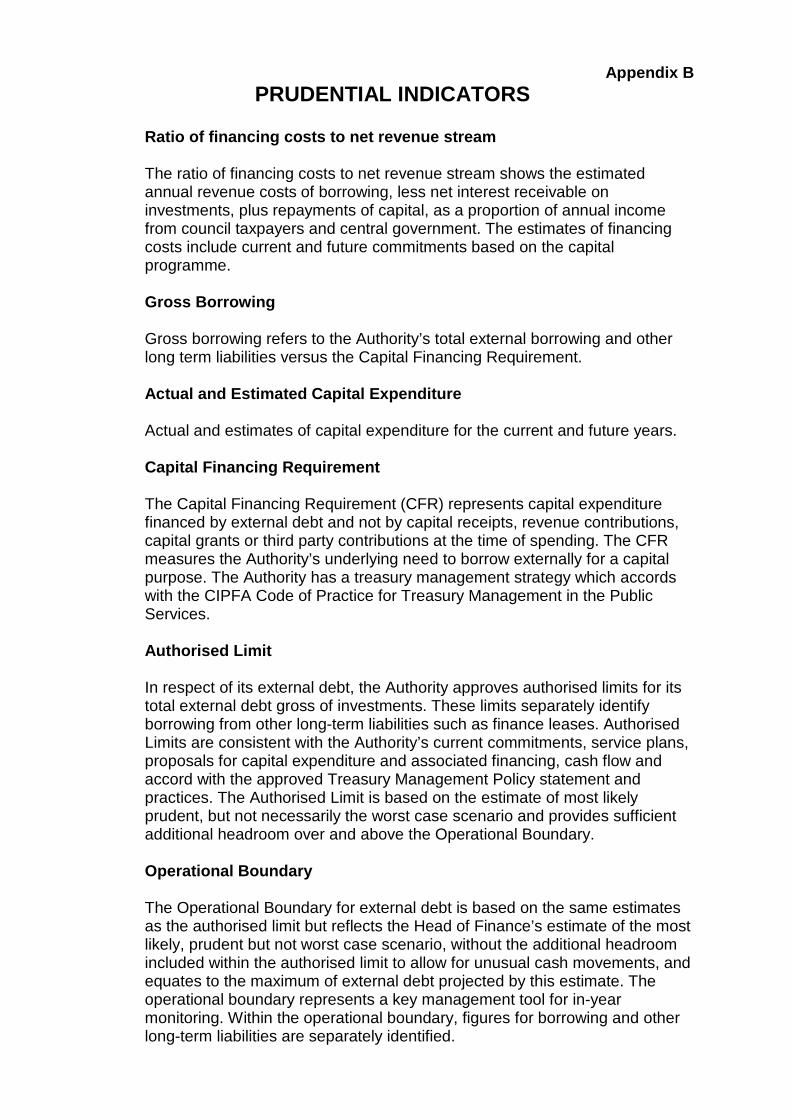
Appendix B PRUDENTIAL INDICATORS
Ratio of financing costs to net revenue stream
The ratio of financing costs to net revenue stream shows the estimated annual revenue costs of borrowing, less net interest receivable on investments, plus repayments of capital, as a proportion of annual income from council taxpayers and central government. The estimates of financing costs include current and future commitments based on the capital programme.
Gross Borrowing
Gross borrowing refers to the Authority’s total external borrowing and other long term liabilities versus the Capital Financing Requirement.
Actual and Estimated Capital Expenditure
Actual and estimates of capital expenditure for the current and future years.
Capital Financing Requirement
The Capital Financing Requirement (CFR) represents capital expenditure financed by external debt and not by capital receipts, revenue contributions, capital grants or third party contributions at the time of spending. The CFR measures the Authority’s underlying need to borrow externally for a capital purpose. The Authority has a treasury management strategy which accords with the CIPFA Code of Practice for Treasury Management in the Public Services.
Authorised Limit
In respect of its external debt, the Authority approves authorised limits for its total external debt gross of investments. These limits separately identify borrowing from other long-term liabilities such as finance leases. Authorised Limits are consistent with the Authority’s current commitments, service plans, proposals for capital expenditure and associated financing, cash flow and accord with the approved Treasury Management Policy statement and practices. The Authorised Limit is based on the estimate of most likely prudent, but not necessarily the worst case scenario and provides sufficient additional headroom over and above the Operational Boundary.
Operational Boundary
The Operational Boundary for external debt is based on the same estimates as the authorised limit but reflects the Head of Finance’s estimate of the most likely, prudent but not worst case scenario, without the additional headroom included within the authorised limit to allow for unusual cash movements, and equates to the maximum of external debt projected by this estimate. The operational boundary represents a key management tool for in-year monitoring. Within the operational boundary, figures for borrowing and other long-term liabilities are separately identified.

Limits on Interest Rate Exposure
This means that the Authority will manage fixed and variable interest rate exposure within the ranges. This provides flexibility to take advantage of any favourable movements in interest rates.
Appendix C Economic Commentary (Link’s View)
Economic Background
GLOBAL OUTLOOK. World growth looks to be on an encouraging trend of stronger performance, rising earnings and falling levels of unemployment. In October, the IMF upgraded its forecast for world growth from 3.2% to 3.6% for 2017 and 3.7% for 2018. In addition, inflation prospects are generally muted and it is particularly notable that wage inflation has been subdued despite unemployment falling to historically very low levels in the UK and US. This has led to many comments by economists that there appears to have been a fundamental shift downwards in the Phillips curve (this plots the correlation between levels of unemployment and inflation e.g. if the former is low the latter tends to be high). In turn, this raises the question of what has caused this? The likely answers probably lay in a combination of a shift towards flexible working, self-employment, falling union membership and a consequent reduction in union power and influence in the economy, and increasing globalisation and specialisation of individual countries, which has meant that labour in one country is in competition with labour in other countries which may be offering lower wage rates, increased productivity or a combination of the two. In addition, technology is probably also exerting downward pressure on wage rates and this is likely to grow with an accelerating movement towards automation, robots and artificial intelligence, leading to many repetitive tasks being taken over by machines or computers. Indeed, this is now being labelled as being the start of the fourth industrial revolution. KEY RISKS - central bank monetary policy measures Looking back on nearly ten years since the financial crash of 2008 when liquidity suddenly dried up in financial markets, it can be assessed that central banks’ monetary policy measures to counter the sharp world recession were successful. The key monetary policy measures they used were a combination of lowering central interest rates and flooding financial markets with liquidity, particularly through unconventional means such as Quantitative Easing (QE), where central banks bought large amounts of central government debt and smaller sums of other debt. The key issue now is that that period of stimulating economic recovery and warding off the threat of deflation is coming towards its close and a new period has already started in the US, and more recently, in the UK, on reversing those measures i.e. by raising central rates and (for the US) reducing central banks’ holdings of government and other debt. These measures are now required in order to stop the trend of an on-going reduction in spare capacity in the economy, and of unemployment falling to such low levels that the re-emergence of inflation is viewed as a major risk. It is, therefore, crucial that central banks get their timing right and do not cause shocks to market expectations that could destabilise financial markets. In particular, a key risk is that because QE-driven purchases of bonds drove up the price of government debt, and therefore caused a sharp drop in income yields, this then also encouraged investors into a search for yield and into investing in riskier assets such as equities. This resulted in bond markets and equity market prices both rising to historically high valuation levels simultaneously. This, therefore, makes both asset categories vulnerable to a sharp correction. It is important, therefore, that central banks only gradually unwind their holdings of bonds in order to prevent destabilising the financial markets. It is also likely that the timeframe for central banks unwinding their holdings of QE debt purchases will be over several years. They need to balance their timing to neither squash economic recovery by taking too rapid and too strong action, or, alternatively, let inflation run away by taking action that was too slow
and/or too weak. The potential for central banks to get this timing and strength of action wrong are now key risks. There is also a potential key question over whether economic growth has become too dependent on strong central bank stimulus and whether it will maintain its momentum against a backdrop of rising interest rates and the reversal of QE. In the UK, a key vulnerability is the low level of productivity growth, which may be the main driver for increases in wages; and decreasing consumer disposable income, which is important in the context of consumer expenditure primarily underpinning UK GDP growth. A further question that has come to the fore is whether an inflation target for central banks of 2%, is now realistic given the shift down in inflation pressures from internally generated inflation, (i.e. wage inflation feeding through into the national economy), given the above mentioned shift down in the Phillips curve.
• Some economists favour a shift to a lower inflation target of 1% to emphasise the need to keep the lid on inflation. Alternatively, it is possible that a central bank could simply ‘look through’ tepid wage inflation, (i.e. ignore the overall 2% inflation target), in order to take action in raising rates sooner than might otherwise be expected.
• However, other economists would argue for a shift UP in the inflation target to 3% in order to ensure that central banks place the emphasis on maintaining economic growth through adopting a slower pace of withdrawal of stimulus.
• In addition, there is a strong argument that central banks should target financial market stability. As mentioned previously, bond markets and equity markets could be vulnerable to a sharp correction. There has been much commentary, that since 2008, QE has caused massive distortions, imbalances and bubbles in asset prices, both financial and non-financial. Consequently, there are widespread concerns at the potential for such bubbles to be burst by exuberant central bank action. On the other hand, too slow or weak action would allow these imbalances and distortions to continue or to even inflate them further.
• Consumer debt levels are also at historically high levels due to the prolonged period of low cost of borrowing since the financial crash. In turn, this cheap borrowing has meant that other non-financial asset prices, particularly house prices, have been driven up to very high levels, especially compared to income levels. Any sharp downturn in the availability of credit, or increase in the cost of credit, could potentially destabilise the housing market and generate a sharp downturn in house prices. This could then have a destabilising effect on consumer confidence, consumer expenditure and GDP growth. However, no central bank would accept that it ought to have responsibility for specifically targeting house prices.
UK. After the UK surprised on the upside with strong economic growth in 2016, growth in 2017 has been disappointingly weak; quarter 1 came in at only +0.3% (+1.8% y/y), quarter 2 was +0.3% (+1.5% y/y) and quarter 3 was +0.4% (+1.5% y/y). The main reason for this has been the sharp increase in inflation, caused by the devaluation of sterling after the EU referendum, feeding increases in the cost of imports into the economy. This has caused, in turn, a reduction in consumer disposable income and spending power and so the services sector of the economy, accounting for around 80% of GDP, has seen weak growth as consumers cut back on their expenditure. However, more recently there have been encouraging statistics from the manufacturing sector which is seeing strong growth, particularly as a result of increased demand for exports. It has helped that growth in the EU, our main trading partner, has improved significantly over the last year while robust world growth has also been supportive. However, this sector only
accounts for around 10% of GDP so expansion in this sector will have a much more muted effect on the overall GDP growth figure for the UK economy as a whole. While the Bank of England is expected to give forward guidance to prepare financial markets for gradual changes in policy, the Monetary Policy Committee, (MPC), meeting of 14 September 2017 managed to shock financial markets and forecasters by suddenly switching to a much more aggressive tone in terms of its words around warning that Bank Rate will need to rise soon. The Bank of England Inflation Reports during 2017 have clearly flagged up that it expected CPI inflation to peak at just under 3% in 2017, before falling back to near to its target rate of 2% in two years’ time. The Bank revised its forecast for the peak to just over 3% at the 14 September meeting. (Inflation actually came in at 3.0% in both September and October so that might prove now to be the peak.) This marginal revision in the Bank’s forecast can hardly justify why the MPC became so aggressive with its wording; rather, the focus was on an emerging view that with unemployment having already fallen to only 4.3%, the lowest level since 1975, and improvements in productivity being so weak, that the amount of spare capacity in the economy was significantly diminishing towards a point at which they now needed to take action. In addition, the MPC took a more tolerant view of low wage inflation as this now looks like a common factor in nearly all western economies as a result of automation and globalisation. However, the Bank was also concerned that the withdrawal of the UK from the EU would effectively lead to a decrease in such globalisation pressures in the UK, and so this would cause additional inflationary pressure over the next few years. At Its 2 November meeting, the MPC duly delivered a 0.25% increase in Bank Rate. It also gave forward guidance that they expected to increase Bank Rate only twice more in the next three years to reach 1.0% by 2020. This is, therefore, not quite the ‘one and done’ scenario but is, nevertheless, a very relaxed rate of increase prediction in Bank Rate in line with previous statements that Bank Rate would only go up very gradually and to a limited extent. However, some forecasters are flagging up that they expect growth to accelerate significantly towards the end of 2017 and then into 2018. This view is based primarily on the coming fall in inflation, (as the effect of the effective devaluation of sterling after the EU referendum drops out of the CPI statistics), which will bring to an end the negative impact on consumer spending power. In addition, a strong export performance will compensate for weak services sector growth. If this scenario was indeed to materialise, then the MPC would be likely to accelerate its pace of increases in Bank Rate during 2018 and onwards. It is also worth noting the contradiction within the Bank of England between action in 2016 and in 2017 by two of its committees. After the shock result of the EU referendum, the Monetary Policy Committee (MPC) voted in August 2016 for emergency action to cut Bank Rate from 0.50% to 0.25%, restarting £70bn of QE purchases, and also providing UK banks with £100bn of cheap financing. The aim of this was to lower borrowing costs, stimulate demand for borrowing and thereby increase expenditure and demand in the economy. The MPC felt this was necessary in order to ward off their expectation that there would be a sharp slowdown in economic growth. Instead, the economy grew robustly, although the Governor of the Bank of England strongly maintained that this was because the MPC took that action. However, other commentators regard this emergency action by the MPC as being proven by events to be a mistake. Then in 2017, we had the Financial Policy Committee (FPC) of the Bank of England taking action in June and September over its concerns that cheap borrowing rates, and easy availability of consumer credit, had resulted in too rapid a rate of growth in consumer borrowing and in the size of total borrowing, especially of unsecured borrowing. It, therefore, took punitive action to clamp down on the ability of the main banks to extend such credit! Indeed, a PWC report in October 2017 warned that
credit card, car and personal loans and student debt will hit the equivalent of an average of £12,500 per household by 2020. However, averages belie wide variations in levels of debt with much higher exposure being biased towards younger people, especially the 25 -34 year old band, reflecting their lower levels of real income and asset ownership. One key area of risk is that consumers may have become used to cheap rates since 2008 for borrowing, especially for mortgages. It is a major concern that some consumers may have over extended their borrowing and have become complacent about interest rates going up after Bank Rate had been unchanged at 0.50% since March 2009 until falling further to 0.25% in August 2016. This is why forward guidance from the Bank of England continues to emphasise slow and gradual increases in Bank Rate in the coming years. However, consumer borrowing is a particularly vulnerable area in terms of the Monetary Policy Committee getting the pace and strength of Bank Rate increases right - without causing a sudden shock to consumer demand, confidence and thereby to the pace of economic growth. Moreover, while there is so much uncertainty around the Brexit negotiations, consumer confidence, and business confidence to spend on investing, it is far too early to be confident about how the next two to three years will actually pan out. Brexit timetable and process
• March 2017: UK government notifies the European Council of its intention to leave under the Treaty on European Union Article 50
• March 2019: initial two-year negotiation period on the terms of exit. In her Florence speech in September 2017, the Prime Minister proposed a two year transitional period after March 2019.
• UK continues as a full EU member until March 2019 with access to the single market and tariff free trade between the EU and UK. Different sectors of the UK economy will leave the single market and tariff free trade at different times during the two year transitional period.
• The UK and EU would attempt to negotiate, among other agreements, a bi-lateral trade agreement over that period.
• The UK would aim for a negotiated agreed withdrawal from the EU, although the UK could also exit without any such agreements in the event of a breakdown of negotiations.
• If the UK exits without an agreed deal with the EU, World Trade Organisation rules and tariffs could apply to trade between the UK and EU - but this is not certain.
• On full exit from the EU: the UK parliament would repeal the 1972 European Communities Act.
• The UK will then no longer participate in matters reserved for EU members, such as changes to the EU’s budget, voting allocations and policies.
APPENDIX D
Treasury Management Scheme of Delegation
(i) County Council • approval of annual strategy. • budget consideration and approval. • approval of the division of responsibilities.
(ii) Cabinet
• scrutinise the proposed annual strategy. • approval of/amendments to the organisation’s adopted clauses, treasury
management policy statement and treasury management practices. (iii) Resources and Fire & Rescue Overview and Scrutiny Committee
• reviewing the treasury management policy and procedures and making recommendations to the responsible body.
• receiving and reviewing regular monitoring reports and acting on recommendations.
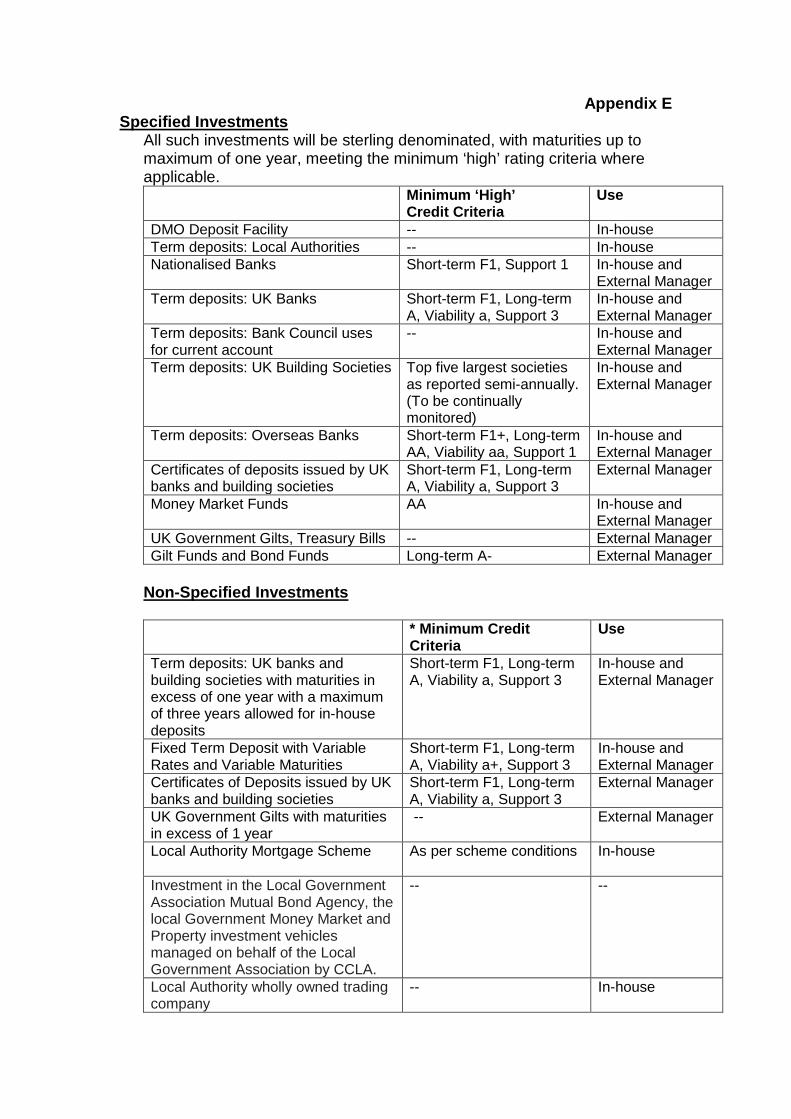
Appendix E Specified Investments
All such investments will be sterling denominated, with maturities up to maximum of one year, meeting the minimum ‘high’ rating criteria where applicable. Minimum ‘High’
Credit Criteria Use
DMO Deposit Facility -- In-house Term deposits: Local Authorities -- In-house Nationalised Banks Short-term F1, Support 1 In-house and
External Manager Term deposits: UK Banks Short-term F1, Long-term
A, Viability a, Support 3 In-house and External Manager
Term deposits: Bank Council uses for current account
-- In-house and External Manager
Term deposits: UK Building Societies Top five largest societies as reported semi-annually. (To be continually monitored)
In-house and External Manager
Term deposits: Overseas Banks Short-term F1+, Long-term AA, Viability aa, Support 1
In-house and External Manager
Certificates of deposits issued by UK banks and building societies
Short-term F1, Long-term A, Viability a, Support 3
External Manager
Money Market Funds AA In-house and External Manager
UK Government Gilts, Treasury Bills -- External Manager Gilt Funds and Bond Funds Long-term A- External Manager
Non-Specified Investments
* Minimum Credit
Criteria Use
Term deposits: UK banks and building societies with maturities in excess of one year with a maximum of three years allowed for in-house deposits
Short-term F1, Long-term A, Viability a, Support 3
In-house and External Manager
Fixed Term Deposit with Variable Rates and Variable Maturities
Short-term F1, Long-term A, Viability a+, Support 3
In-house and External Manager
Certificates of Deposits issued by UK banks and building societies
Short-term F1, Long-term A, Viability a, Support 3
External Manager
UK Government Gilts with maturities in excess of 1 year
-- External Manager
Local Authority Mortgage Scheme
As per scheme conditions In-house
Investment in the Local Government Association Mutual Bond Agency, the local Government Money Market and Property investment vehicles managed on behalf of the Local Government Association by CCLA.
-- --
Local Authority wholly owned trading company
-- In-house

The maximum sum that can be deposited with a single organisation (with the exception of the Debt Management Agency Deposit Facility and Local Authorities) is £20m. Investments can be made to other Local Authorities with a maximum of £10m per individual authority.
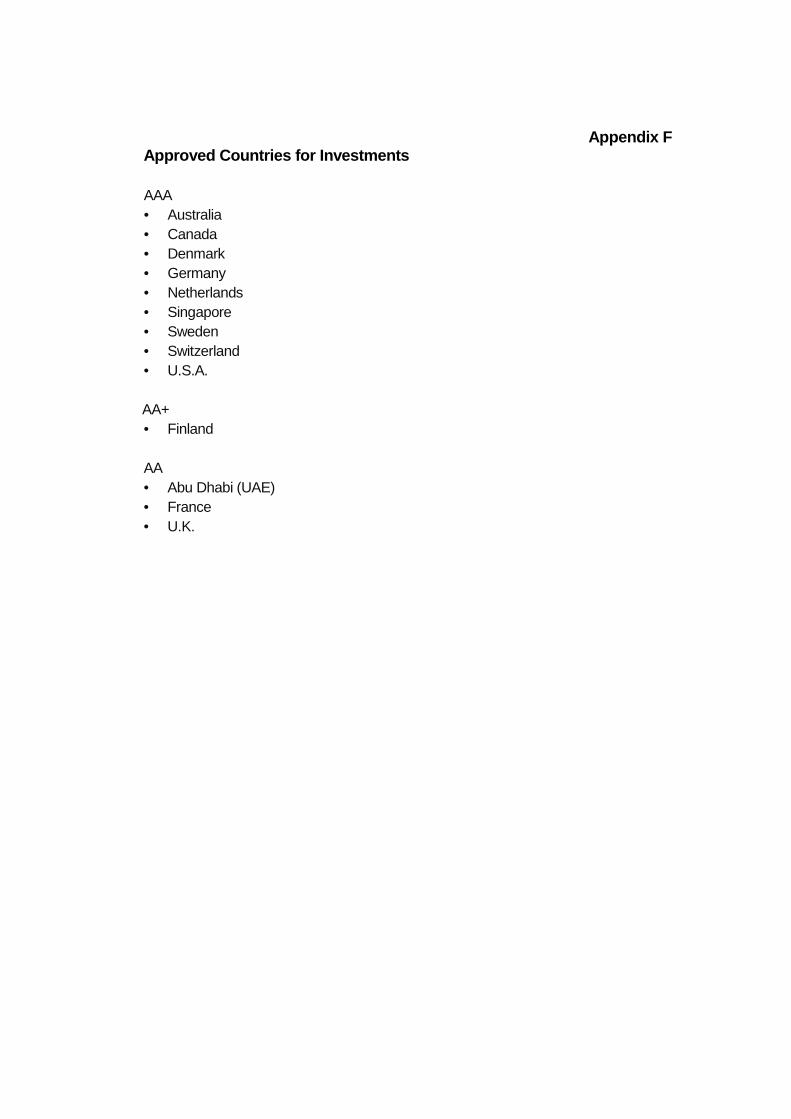
Appendix F Approved Countries for Investments
AAA • Australia • Canada • Denmark • Germany • Netherlands • Singapore • Sweden • Switzerland • U.S.A.
AA+
• Finland AA • Abu Dhabi (UAE) • France • U.K.
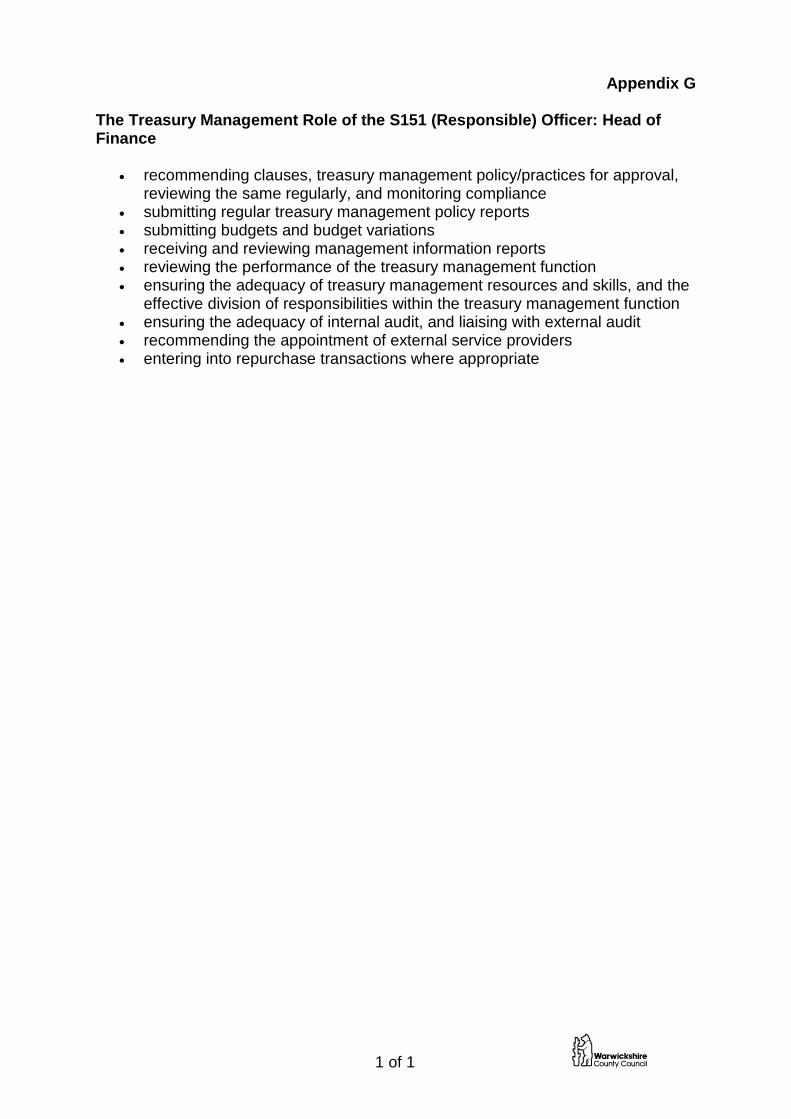
1 of 1
Appendix G
The Treasury Management Role of the S151 (Responsible) Officer: Head of Finance
• recommending clauses, treasury management policy/practices for approval, reviewing the same regularly, and monitoring compliance
• submitting regular treasury management policy reports • submitting budgets and budget variations • receiving and reviewing management information reports • reviewing the performance of the treasury management function • ensuring the adequacy of treasury management resources and skills, and the
effective division of responsibilities within the treasury management function • ensuring the adequacy of internal audit, and liaising with external audit • recommending the appointment of external service providers • entering into repurchase transactions where appropriate
Appendix H MINIMUM REVENUE PROVISION 1. What is a Minimum Revenue Provision? Capital expenditure is generally expenditure on assets which have a life expectancy of more than one year e.g. buildings, vehicles, machinery etc. It would be impractical to charge the entirety of such expenditure to revenue in the year in which it was incurred and so such expenditure is spread over several years so as to try to match the years over which such assets benefit the local community through their useful life. The manner of spreading these costs is through an annual Minimum Revenue Provision (MRP). Revised MRP guidance will be released for 2018/19 but it was not available when this report was drafted. No changes to current policy are anticipated but if required, a revised MRP policy will be presented to Members during 2018/19 financial year. 2. Statutory Duty Statutory Instrument 2008 no. 414 s4 lays down that: “A local authority shall determine for the current financial year an amount of minimum revenue provision that it considers to be prudent.” There is no requirement to charge MRP where the Capital Financing Requirement is nil or negative at the end of the preceding financial year. 3. Government Guidance Along with the above duty, the Government issued guidance in February 2008 which requires that a Statement on the Council’s policy for its annual MRP should be submitted to the full Council for approval before the start of the financial year to which the provision will relate. The Council is legally obliged to “have regard” to the guidance, which is intended to enable a more flexible approach to assessing the amount of annual provision than was required under the previous statutory requirements. The guidance offers four main options under which MRP could be made with an overriding recommendation that the Council should make prudent provision to redeem its debt liability over a period which is reasonably commensurate with that over which the capital expenditure is estimated to provide benefits. The requirement to “have regard” to the guidance therefore means that:
a. Although four main options are recommended in the guidance, there is no intention to be prescriptive by making these the only methods of charge under which a local authority may consider its MRP to be prudent.
b. It is the responsibility of each authority to decide upon the most
appropriate method of making a prudent provision, after having had regard to the guidance.
4. Warwickshire County Council Policy We have decided not to use any of the options outlined in the statutory guidance but to adopt an alternative approach, which we believe is prudent. The MRP provision will be calculated on the average remaining useful life of the Council’s asset portfolio. We will calculate and apply the remaining useful life over two categories of asset:
• Land, buildings and infrastructure; • Vehicles, plant and equipment.
The proportion of debt outstanding in each category of asset will be determined by the value of assets included in the balance sheet at the end of each financial year. The 2017 review shows that the remaining useful life of our assets is now 28 years. By using an average life of 28 years for our assets equates to an annual provision of 4% straight line MRP. For vehicles, plant and equipment, the remaining useful life is assumed to be five years e.g. 5 years average remaining useful life will result in 20% straight line MRP.
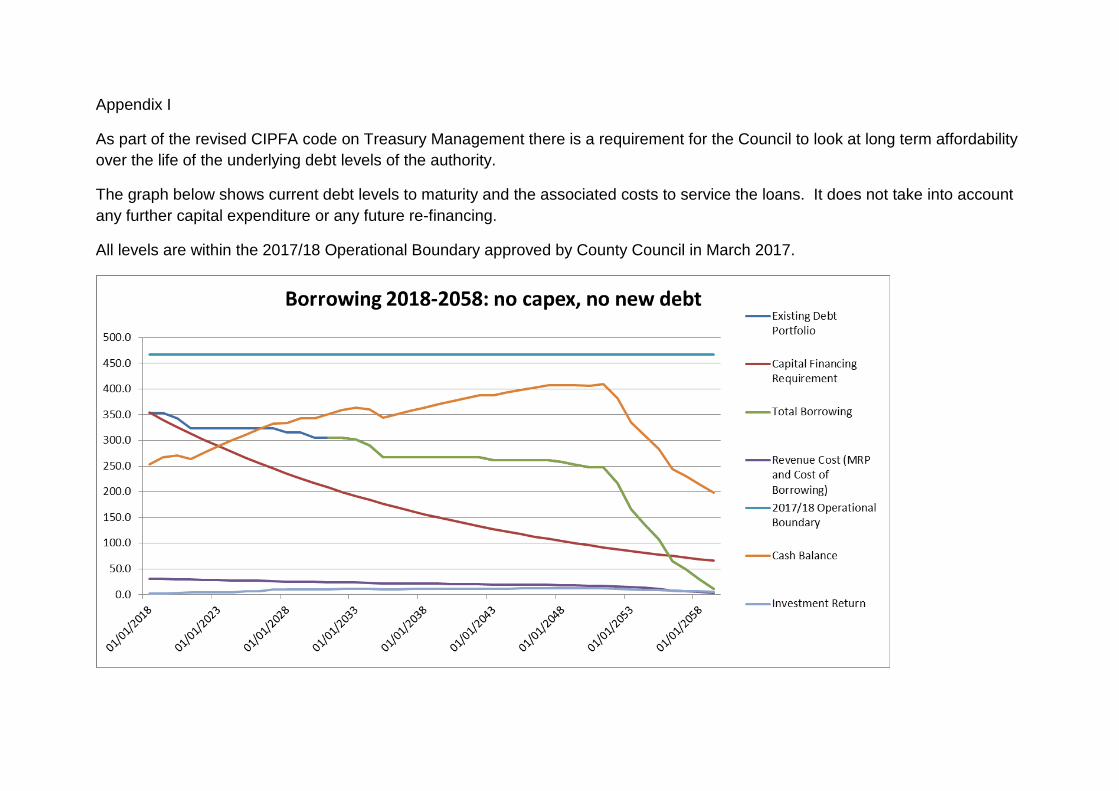
Appendix I
As part of the revised CIPFA code on Treasury Management there is a requirement for the Council to look at long term affordability over the life of the underlying debt levels of the authority.
The graph below shows current debt levels to maturity and the associated costs to service the loans. It does not take into account any further capital expenditure or any future re-financing.
All levels are within the 2017/18 Operational Boundary approved by County Council in March 2017.
06 Section 75 Cab 18.02.15 1 of 5
Item 6
Cabinet
15 February 2018
Review of Section 75 Partnership Agreement between Warwickshire County Council & Coventry & Warwickshire
NHS Partnership Trust for Mental Health Services
Recommendations That the Cabinet:
1) Agree to extend the current Section 75 agreement between
Warwickshire County Council and Coventry & Warwickshire NHS Partnership Trust for the provision of integrated mental health services for adults and older people in Warwickshire for a further period of 12 months expiring on 31st March 2019.
2) Authorises the development of an action plan to further improve
integrated partnership working in preparation for the development of a revised section 75 Partnership Agreement to cover the period April 2019 to March 2022.
3) That the Strategic Director for People is authorised to enter into the
arrangements on terms and conditions acceptable to the Joint Managing Director (Resources)
1.0 Background
1.1 Warwickshire County Council and the Coventry and Warwickshire Partnership Trust (CWPT) have, since 2010, operated formal partnership arrangements under Section 75 the National Health Service Act 2006 for the delivery of integrated community mental health and social care services for adults and older people. Coventry City Council has had a similar arrangement with CWPT since 2011. The arrangements involve the delegation of social care functions and the secondment of WCC staff to CWPT. The operation of the partnership is overseen by a Strategic Board, comprising representatives of WCC, CWPT and Coventry City Council. Overall responsibility for the management of the integrated mental health services rests with CWPT’s Deputy Director of Operations. WCC retains a Mental Health Management Team which is directly accountable to WCC and provides social care management and professional support to seconded social care employees.
06 Section 75 Cab 18.02.15 2 of 5
1.2 The current S75 agreement between WCC and CWPT expires on 31 March
2018. During the last year, a detailed review of the formal partnership arrangements, involving both Coventry and Warwickshire, has been undertaken by an independent consultant in consultation with relevant stakeholders. The purpose of the review was to consider whether the formal partnership agreement should be continued for a further three years (April 2018 – March 2021), and to identify any changes required to improve integrated working, service delivery and alignment with strategic requirements at national and local levels.
1.3 The objectives set for the review are set out in the Appendix.
2.0 Options and Proposal: Outcome of the section 75 Review 2.1 The Review has concluded that there remains a strong commitment from staff
and managers to a multi-disciplinary approach to providing health and social care in mental health services. This service model provides a more streamlined service delivery for customers and carers than a co-location model (or separate services) would. In summary the Review has concluded that there are strains and pressures on the Service that need consideration in order to enable staff and managers to deliver the integrated health and social care service and maximise the unique contribution each professional brings.
2.2 The areas identified for improvement are:
• Governance of the s75 Agreement at an operational and strategic level
• Robust performance data as evidence of the successful delivery of the delegated social care functions
• Technical solutions to avoid duplication of case recording • Leadership at operational level from social care in order to
protect social work role identity and the importance of the social model of recovery
• Workload pressures: AMHP versus Care Coordinator role • Service redesign to incorporate social care model and functions • Consideration of alignment and/or integration of services that
currently sit outside of the s75. For example Acute Liaison Service (AMHAT) & Clinical reviewing team
• Workforce development 2.3 The Review report recommends the development of an action plan to improve
integrated partnership working in preparation for renewal of a robust s75 Partnership Agreement. In order to develop the action plan and work on the
06 Section 75 Cab 18.02.15 3 of 5
substantive changes needed to the Agreement, it is proposed that there should be a further 12 month extension to the current agreement.
3.0 Timescales associated with the decision and next steps
3.1 The Cabinet is asked to approve the proposal extend the current Agreement for a further 12 months up to 31st March 2019 and to take forward the development of a new s75 Agreement to take effect after that for a three year period.
3.2 The Agreement is made up of the main terms and conditions section which set out the legal framework and the nature and terms of the partnership. This is supported by a number of schedules which define the main objectives, and the resource management, governance and key operational arrangements.
3.3 There current Agreement was updated on 1st April 2017 to take account of changes and therefore remains fit for purpose.
3.4 The financial framework described in the Agreement will remain unchanged and there are no financial implications associated with the further 12 month extension period.
Background paper
Review report dated November 2017 Name Contact Information Report Author Jas Dhadli [email protected]
01926 406743 Head of Service Pete Sidgwick [email protected]
Strategic Director Nigel Minns [email protected]
Portfolio Holder Councillor Les Caborn The report was circulated to the following members prior to publication: Local Member(s): N/A Other members: Councillors Redford, Golby, Parsons, Rolfe, Caborn
06 Section 75 Cab 18.02.15 4 of 5
Appendix
Vision Provision of integrated services across Coventry and Warwickshire that: • Delivers better outcomes for individuals experiencing mental ill health • Meets the vision and objectives for the partner organisations
Purpose To review the existing section 75 agreements that have been in place since April 2014 and are currently extended for the period of 12 months to 31st March 2018 pending the outcome of this review
Scope The initial scope of the project is to focus on the areas of delegated functions that comprise the current working arrangement which includes the following : -
• Services delivered through each of the Integrated Practice Units across Coventry and Warwickshire with particular attention to Care Act assessment, review process, active and non-active CPA
• Services provided through the Central Booking System • Services provided by the Crisis Resolution Home Treatment Teams, AMHAT [Acute
liaison service) and CRT [Clinical Reviewing Team]. • Delivery of Adult safeguarding functions and the general functions of the Care Act • Current governance arrangements supporting the S75 arrangements including
performance reporting, quality and safety (including audit), information governance and reporting schedules
• Progress of the CQC action plan particularly relating to provision of dementia services
Key Objectives
There are 10 distinct objectives expected from the review of the current arrangements:
1. Identify the most effective local arrangements for the delivery of Mental Health Services
2. To identify current levels of integrated practices and the outcomes delivered through the formal and informal arrangements in place and identify key development opportunities- detailed analysis of the ‘as is’ position.
3. Provide an analysis of the current performance frameworks, opportunities for change and make recommendations about future arrangements that are required
4. Identify key changes required over the 3 year period 2018 to 2021 to ensure strategic requirements at national and local levels are achieved, including alignment with BCF and Five Year Forward View for Mental Health
5. Identify key outcome measures that support service delivery and better outcomes for individuals
6. Workforce development and flexible approach to supporting ‘integrated’ roles i.e. AMHP role
7. The review would take account of: a. Better Social Work for Mental Health (self-assessment supported by
regional / national Mental Health ADASS forum) b. Staff consultations
06 Section 75 Cab 18.02.15 5 of 5
c. Service user and carer consultations d. S75 updates schedules e. Collaboration with CCG’s / Local Health & Social Care economy
8. Establish capacity required across the services to deliver integrated care in a seamless way.
9. Identify opportunities for increased integration 10. Provide analysis and recommendations about the leadership roles in delivery of
the organisational outcomes
Strategic Benefits
• Joined up and coherent case management focussed on outcomes for individuals that is
built on specialist knowledge and skills
• Effective use of resources to support financial balance for each organisation
• Clear joint operating procedures are in place to support multi-disciplinary and inter-
agency working
• Improved outcomes for citizens of Coventry and Warwickshire in relation to Caseload
management is built on specialist skills and knowledge
• Vision and priorities agreed through the partnership are delivered in practice


