Embed Size (px)
Citation preview

Calculation of cloud modification factors for the
horizontal plane eye damaging ultraviolet radiation
Parisi, A.V.,1,* Turnbull, D.J.,1 Turner, J.1
1Centre for Rural and Remote Area Health, University of Southern Queensland, Toowoomba, 4350, Australia. Ph: 61 7 4631 2226. FAX: 61 7 4631 2721. Email: [email protected] *To whom correspondence should be addressed.
1

Abstract This research examines the influence of cloud on the cataract effective UV (UVCat) irradiances on a horizontal plane over an extended period of 12 months that included the range of cloud conditions, solar zenith angle (SZA) and ozone conditions experienced over that time. The data were collected at five minute intervals. Cloud modification factors were determined from the influence of clouds on the global broadband solar radiation and these were applied to the cloud free cataract effective UV to evaluate the UVCat irradiances on a horizontal plane for all cloud conditions. A comparison of the measured and calculated UVCat irradiances for the 2004 data set in the range of SZA of 70o or less provided an R2 value of 0.85. The data in the first 6 months of 2005 for an SZA of 70o or less that were at a different time to that when the technique was developed provided an R2 value of 0.83 for the comparison of the measured and calculated UVCat irradiances. Keywords: UV, eye, cloud, spectrum, solar
2

1. Introduction Clouds are a significant modifier of the solar UV environment on the earth’s surface. The effects of clouds on the solar UV are difficult to predict due to the variability of clouds and the difficulty in quantifying the effects of the cloud characteristics on the solar UV. The different empirical studies of the cloud effects on UV radiation have been reviewed in Calbó et al (2005). In general, the previous studies have employed prediction of the solar UV using cloud parameters based on observations either by observers or measured by sky cameras or alternatively have employed the measurement of the global broadband solar radiation over the visible waveband and generally part of the infrared waveband to provide an evaluation of the solar UV. The research employing the cloud parameters in the prediction of the solar UV has employed different combinations of the parameters such as the amount of cloud cover, cloud uniformity and the cloud area (Sabburg and Wong, 2000). Researchers employing the modification by cloud of the global broadband solar radiation have employed the use of cloud cover modifier functions or cloud modification functions (CMF) (Schwander et al., 2002) to modify the clear sky erythemal irradiances in order to calculate the erythemal irradiances for all sky conditions (Foyo-Moreno et al., 2001; Foyo-Moreno et al., 2003; Trepte and Winkler, 2004; den Outer et al., 2000). The clear sky erythemal irradiances and clear sky global solar irradiances have been calculated by employing either an empirical approach with measured data or the output from a model (Bodeker and McKenzie, 1996; Foyo-Moreno et al., 2001; Trepte and Winkler, 2004). For the situations where there is information available on the cloud types, researchers have employed separate CMFs or global transmission functions, defined as the ratio of erythemal irradiances under cloudy and cloud free conditions for the different cloud categories (Thiel, Steiner and Seidlitz, 1997; Foyo-moreno et al., 2001; Alados-Arboledas et al., 2003). Another approach to employing the global broadband solar radiation in the determination of the CMFs has been to determine the relationship between the attenuation of the global broadband solar radiation and the attenuation of the erythemal UV to predict erythemal UV exposures (Bordewijk et al., 1995). The cloud modification of other wavebands has also been employed with Grant and Heisler (2000) using photosynthetically active photon flux density measurements referenced to clear sky values for the evaluation of the UVB (320-400 nm) under variable cloud conditions. Previous research has evaluated the erythemal UV, UVB, UVA (280-320 nm) and photosynthetically active radiation under cloudy conditions (Alados et al., 2000). The influence of cloud on the solar UV varies with wavelength (Seckmeyer, Erb and Albold, 1996; Alados et al., 2000; Sabburg and Parisi, 2006). Consequently, the previous research to predict the influence of clouds on the different wavebands needs to be extended to consider the biologically damaging UV for eyes. The effect of cloud on the photokeratitis and cataracts effective UV has been investigated (Parisi and Downs, 2004). This reported that 85% of the recorded data produced a measured irradiance to a cloud free irradiance ratio of 0.6 or higher while 76% produced a ratio of 0.8 and higher. Empirical expressions were developed for all sky conditions to allow the evaluation of the photokeratitis and cataracts effective UV irradiances from a knowledge of the unweighted UV irradiances. Cloud has a large
3

influence on the magnitude of the biologically damaging UV for cataracts. However, the influence of cloud on the short wavelength cut-off for the biologically damaging UV for cataracts has been found to be less than the influence of the solar zenith angle (Parisi and Turner, 2006). This paper extends the previous research to investigate the use of cloud modification factors derived from modification by cloud of the global broadband solar radiation to evaluate the horizontal plane cataract effective UV irradiances. 2. Materials and methods 2.1 Description of input data The calculation of the cloud modification factors to be employed in this research required a significant number of simultaneously measured cataract effective UV irradiances, global broadband solar radiation and cloud cover measurements, along with information on the amount of atmospheric ozone. A year of global broadband solar radiation, cataract effective UV and cloud cover recorded at five minute intervals throughout each day during 2004 were employed to develop the CMFs and data at five minute intervals during the first six months of 2005 was employed to test how well they apply to a different data set. The range of data employed to determine the CMFs incorporated the range of seasonal and solar zenith angles encountered over this period at the site. The global solar irradiances were measured at five minute intervals employing a solar radiation sensor (model SR2, Monitor Sensors, (Aust) Pty Ltd) with a response from 400 to 950 nm. The manufacturer’s calibration for the instrument was employed throughout the data period. The sensor was connected to a data logger that allowed automatic recording of the global solar irradiances at five minute intervals. The instrument and the other instrumentation described below are located on a relatively unobstructed roof of a building at the University of Southern Queensland, Toowoomba, Australia (27o 36´ S, 151o 55´ E, 693 m above sea level). The amount of cloud cover was quantified with a Total Sky Imager (TSI) (model TSI-440, Yankee Environmental Systems, MA, USA) currently installed on a building roof. This instrument, that has been described elsewhere (Sabburg and Parisi, 2006) consists of a CCD camera and software package to determine fractional cloud cover. The interval for the determination of the fractional cloud cover is at 5 minute intervals that coincide with the measurement of the global broadband solar radiation. The instrument provides the advantage of high frequency data and eliminates the issue of subjectivity that may be present with the determination of the amount of cloud cover by human observers. The software also provides the solar zenith angle (SZA) at each five minute point when the cloud cover is determined. The cataract effective UV was determined through the use of a UV spectroradiometer (Bentham Instruments, Reading, UK) described elsewhere (Parisi and Downs, 2004) that scanned from 280 to 400 nm in 0.5 nm increments. The cosine error of the input optics diffuser (model D6) was reported by the manufacturer as less than ±0.8% for a SZA up to 70o. The wavelength calibration of the system was against the UV spectral lines of a mercury lamp and irradiance calibration was against a 150 W quartz tungsten halogen lamp calibrated to the National Physical Laboratory, UK standard. The calibrations were approximately on a six month basis and the changes in the calibration were generally less than 6%, with the exception of two cases where the
4

changes were up to 18%. The spectroradiometer was scheduled to start scanning at 5:00 am till 7:00 pm local time at each five minutes. The system was initialised prior to each scan and the dark current measured in this time. Each scan was initialised at 60 seconds before the five minute point with the collection of the spectrum starting at approximately the five minute point and the scan from 280 to 400 nm taking approximately two minutes. The start of the scan coincided with the acquisition of the sky image for the quantification of the amount of cloud cover. The cataract effective UV irradiances, UVCat, were calculated employing: (1) λλλ Δ= ∑
UVCat ASUV )()(
where S(λ) is the measured spectral irradiance, A(λ) is the action spectrum for the induction of cataracts (Figure 1(a)) (Oriowo et al., 2001) and Δλ is the wavelength increment of 0.5 nm. The action spectrum has been linearly interpolated between the data points to 0.5 nm in order to allow the calculation to be done. The summation in the calculation of UVCat is over the wavelengths in the UV waveband for which the action spectrum is non zero. The cataract action spectrum is for in-vitro cataract formation for a cultured porcine lens. The pig’s lens is similar in shape and size to the human lens and as a result inferences may be made to the lens of humans (Oriowo et al., 2001). The influence of ozone concentration on the UVCat irradiances was taken into account by splitting the irradiance data into three categories according to the ozone concentration during the recording period in a similar fashion to a previously employed method (Sabburg and Parisi, 2006). The ozone values for each day were obtained for the research site from the web site for the Total Ozone Mapping Spectrometer (http://toms.gsfc.nasa.gov/eptoms/ep_ovplist_a.html). These values were valid for the time of the overpass at approximately 11:15 EST. 2.2 Evaluation of cataract effective UV The cloud modification functions for the cataract effective UV irradiances under any cloud conditions, CMFCat were evaluated employing a function structure employed to relate the CMF for solar radiation to the CMF for UV (295-385 nm) (Foyo-Moreno et al., 2003). The functional dependence employed was: ( )SolCMF
Cat eCMF βα −= 1 (2) where
ClearCat
CatCat UV
UVCMF = (3)
is the ratio of the measured cataract effective UV to that under clear sky conditions, for the same SZA and atmospheric ozone, α and β are coefficients to be
determined and CMF
ClearCatUV
Sol is the cloud modifier function for global broadband solar radiation that is derived by calculating the cloud modification of the global broadband solar radiation from 400 to 950 nm, as follows:
ClearSol GGCMF = (4)
where G is the global broadband solar radiation measured under all cloud conditions for the time and conditions that the global broadband solar radiation for cloud free conditions GClear was calculated. The use of the CMFSol in this manner to calculate the
5

CMFCat takes into account the influence of the cloud cover and the variation of the ozone and aerosols on the CMFCat. Following calculation of the CMFCat, the values of UVCat were calculated from for the same SZA and ozone. The calculation of the CMF
ClearCatUV
Cat irradiances was restricted to the cases when the SZA was 70o or less. This was to calculate the UVCat for the times when the irradiances were higher and made a more significant contribution to the total UVCat exposures over a day. The cloud free global broadband solar radiation was determined empirically using the parameterization employed in Pfister et al. (2003), as follows: ) (5) (cos SZAaG bClear =where a and b were determined from a least squares fit to the clear sky irradiances. The clear sky irradiances were determined by selecting the cases where the fractional cloud cover was less than or equal to 0.02. Although, the response of the sensor extends to 950 nm and not the entire solar spectrum, the general form of the parameterization is the same and the difference on the results due to the response extending only to 950 nm is not significant. The variations over a year in the ground cover albedo at the site of the measurements are small as the site is always snow free. The number of clear sky cases of global broadband solar radiation employed for the evaluation of the clear sky envelopes was 8958. Similarly, the clear sky UVCat irradiances were determined by selecting the cases where the fractional cloud cover was less than or equal to 0.02. For the UV waveband, the ozone concentration will have an influence on the irradiances. During 2004, the maximum and minimum ozone values at the site were 332 Dobson Units (DU) and 218 DU respectively. The categories of ozone levels employed were irradiances recorded when the ozone values were low, intermediate and high with the respective ozone values of less than or equal to 255 DU, greater than 255 DU and less than or equal to 285 DU and greater than 285 DU. Each category of irradiances was plotted against the optical airmass, m, defined as 1/sinα where α is the solar elevation at the time of the irradiance measurement. The recorded SZA from which α is derived is the value at the start of the two minute scan. Although each scan took approximately two minutes, the change in the value of α is minimal over the two minute period. The number of recorded irradiances was 2053, 2546 and 1787 in each category respectively. For each of the three categories, a power function was fitted to the data to provide the cloud free irradiances for each of the three categories of ozone concentration.
ClearCatUV
ClearCatUV
The CMFCat and the irradiances were employed to calculate the UVClear
CatUV Cat irradiances for 2004. These were compared to the measured UVCat irradiances. This validation data set consists of the data recorded in 2004 at the times when all of equipment providing the data set, namely the global broadband solar radiation meter, the TSI and the spectroradiometer were operational, along with the availability of the ozone data. This included the cloud free cases used in the determination of the clear sky envelopes, along with all of the other cases for all of the cloud conditions. A data set (namely first six months of 2005) that was at a different time to that when the technique and clear sky envelopes were developed was employed for another comparison of the measured and calculated UVCat irradiances.
6

3. Results The UVCat irradiances and the global broadband solar radiation for the 6 June 2004 are shown in Figure 1. The first part of the day was cloud free and then it became cloudy. The influence and high variability on the irradiances due to clouds is evident. For the cases when the spectroradiometer was operational in 2004 there are a total of 14,995 UVCat irradiances in the data set. The fractional cloud cover has been employed to calculate the cloud cover in octas (eighths). For each octa, the mean UVCat irradiances have been calculated employing the irradiance data for 2004 that is 0.5 octa above and below that octa for each of the SZA ranges of 15o or less, 15.1o to 30o, 30.1o to 45o, 45.1o to 60o, greater than 60o. Figure 2 shows the influence of cloud on the UVCat irradiances in each of the SZA ranges. The error bars are the standard deviations of the range of irradiances that fall within half an octa either side of the plotted value for the respective SZA range. The size of the error bars show the spread of the irradiances arising from such factors as the types of clouds, properties of the clouds and the relative positioning of the clouds and sun and include any variations in ozone and aerosols over the measurement period. The influence of increasing cloud for the different SZA ranges is evident from this data with a non linear influence of increasing cloud on the UVCat irradiances. This is similar to the influence of cloud on the unweighted UV irradiances from 295 to 385 nm (Foyo-Moreno et al., 2003). The relative decrease of the UVCat irradiances from 0 to 8 octa is higher for the cases of smaller SZA. The results of fitting the cloud free envelopes to the cloud free cases of the cataract effective UV irradiances plotted versus the optical air mass are provided in Figure 3 for each of the three ozone categories. The equations for the cloud free envelopes are: ozone ≤ 255 DU (6) 4.2514 −×= mUV Clear
Cat
255 DU < ozone ≤ 285 DU (7) 4.2331 −×= mUV ClearCat
-2.5307 mUV ClearCat ×= ozone > 285 DU (8)
where m is the optical airmass and the R2 value for the least squares fit in each case is better than 0.99. These allow the calculation of in Equation (3) for the appropriate ozone value. The ratios of UV
CatCMF
Cat/ for each of the cloud cover categories in each of the SZA ranges are provided in Figure 4. The error bars for the data for one set of SZA in each graph has been provided on each graph to provide an example of the standard deviation of the data in each category. The ratios of UV
ClearCatUV
Cat/ become smaller in a non-linear fashion with increasing cloud cover. The influence of SZA is small. There are cases when the error bar causes the range of values for that amount of cloud cover to extend above one. This is due to the cases where particular configurations of cloud have caused enhancement of the UV irradiances above that of the cloud free case (Sabburg and Parisi, 2006).
ClearCatUV
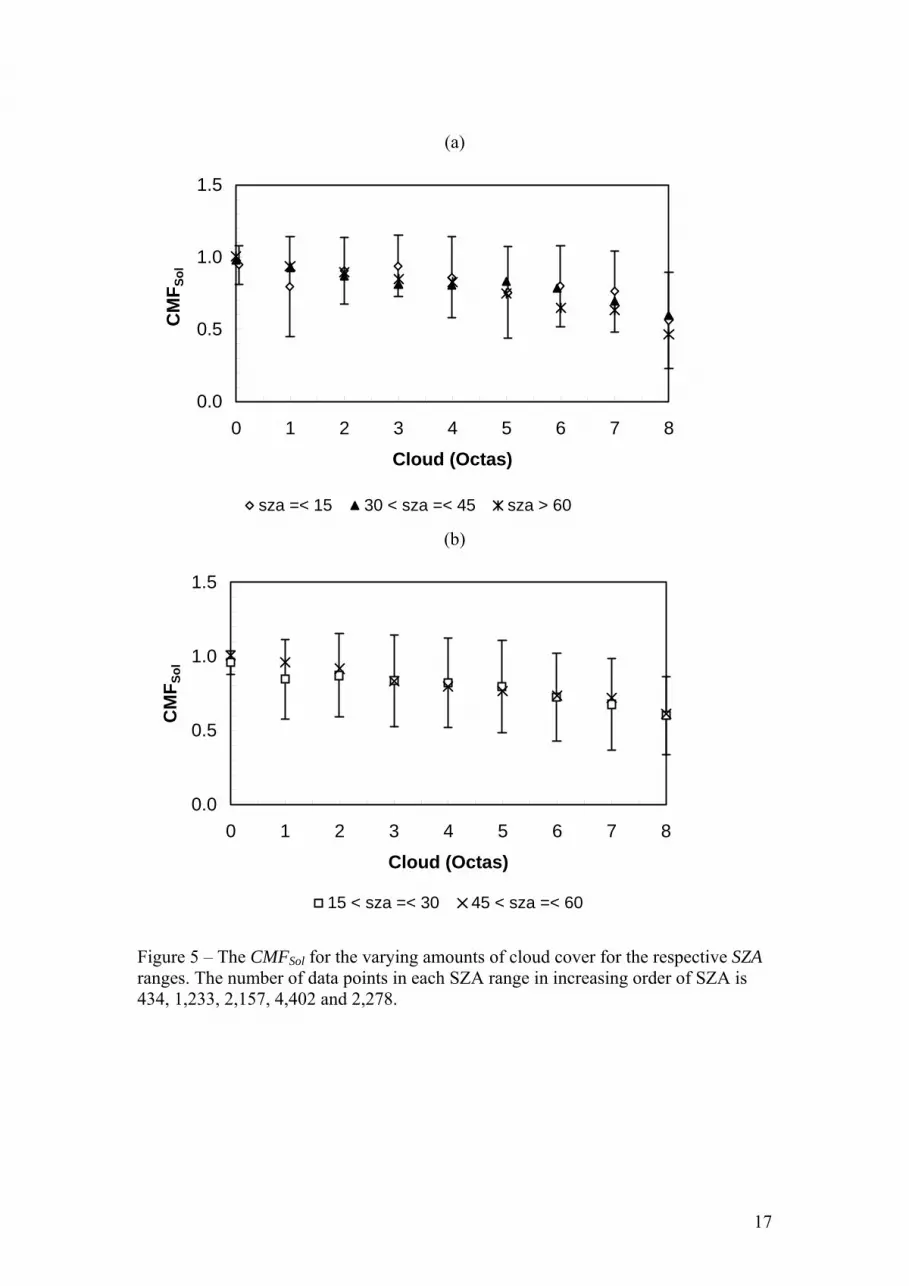
The ratios of G/GClear which are defined as the CMFSol are provided in Figure 5 for the different amounts of cloud cover and the respective SZA ranges. In a similar manner to the UVCat irradiances, the mean CMFSol have been calculated employing the global radiation data for 2004 that is 0.5 octa above and below that octa for each of the SZA ranges. One set of error bars for one category of SZA in each graph has been provided to give an example of the standard deviation of the data in each category. The CMFSol
7
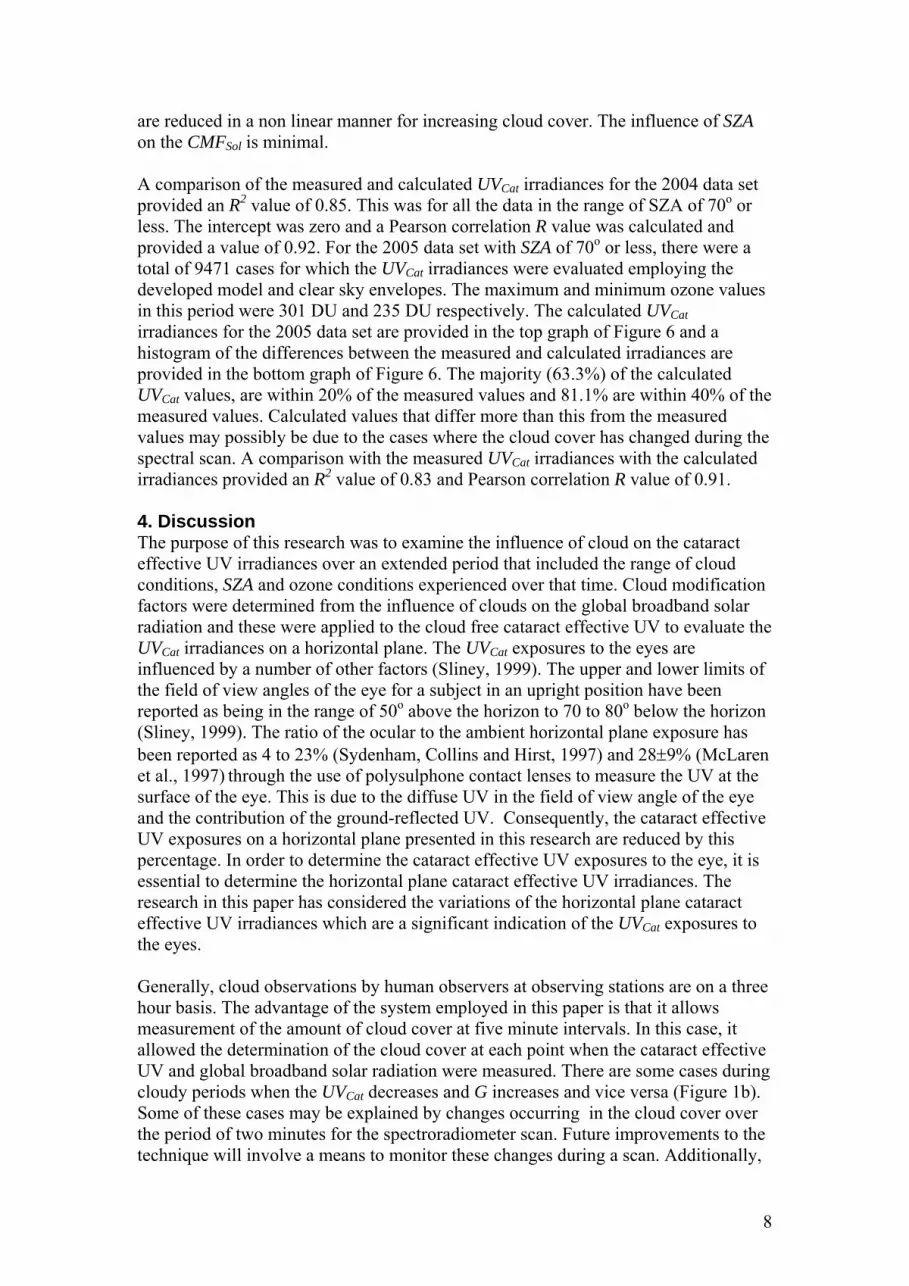
are reduced in a non linear manner for increasing cloud cover. The influence of SZA on the CMFSol is minimal. A comparison of the measured and calculated UVCat irradiances for the 2004 data set provided an R2 value of 0.85. This was for all the data in the range of SZA of 70o or less. The intercept was zero and a Pearson correlation R value was calculated and provided a value of 0.92. For the 2005 data set with SZA of 70o or less, there were a total of 9471 cases for which the UVCat irradiances were evaluated employing the developed model and clear sky envelopes. The maximum and minimum ozone values in this period were 301 DU and 235 DU respectively. The calculated UVCat irradiances for the 2005 data set are provided in the top graph of Figure 6 and a histogram of the differences between the measured and calculated irradiances are provided in the bottom graph of Figure 6. The majority (63.3%) of the calculated UVCat values, are within 20% of the measured values and 81.1% are within 40% of the measured values. Calculated values that differ more than this from the measured values may possibly be due to the cases where the cloud cover has changed during the spectral scan. A comparison with the measured UVCat irradiances with the calculated irradiances provided an R2 value of 0.83 and Pearson correlation R value of 0.91. 4. Discussion The purpose of this research was to examine the influence of cloud on the cataract effective UV irradiances over an extended period that included the range of cloud conditions, SZA and ozone conditions experienced over that time. Cloud modification factors were determined from the influence of clouds on the global broadband solar radiation and these were applied to the cloud free cataract effective UV to evaluate the UVCat irradiances on a horizontal plane. The UVCat exposures to the eyes are influenced by a number of other factors (Sliney, 1999). The upper and lower limits of the field of view angles of the eye for a subject in an upright position have been reported as being in the range of 50o above the horizon to 70 to 80o below the horizon (Sliney, 1999). The ratio of the ocular to the ambient horizontal plane exposure has been reported as 4 to 23% (Sydenham, Collins and Hirst, 1997) and 28±9% (McLaren et al., 1997) through the use of polysulphone contact lenses to measure the UV at the surface of the eye. This is due to the diffuse UV in the field of view angle of the eye and the contribution of the ground-reflected UV. Consequently, the cataract effective UV exposures on a horizontal plane presented in this research are reduced by this percentage. In order to determine the cataract effective UV exposures to the eye, it is essential to determine the horizontal plane cataract effective UV irradiances. The research in this paper has considered the variations of the horizontal plane cataract effective UV irradiances which are a significant indication of the UVCat exposures to the eyes. Generally, cloud observations by human observers at observing stations are on a three hour basis. The advantage of the system employed in this paper is that it allows measurement of the amount of cloud cover at five minute intervals. In this case, it allowed the determination of the cloud cover at each point when the cataract effective UV and global broadband solar radiation were measured. There are some cases during cloudy periods when the UVCat decreases and G increases and vice versa (Figure 1b). Some of these cases may be explained by changes occurring in the cloud cover over the period of two minutes for the spectroradiometer scan. Future improvements to the technique will involve a means to monitor these changes during a scan. Additionally,
8

some of the cases when G decreases and UVCat increases may be times when enhancement of the UV has occurred due to a particular configuration of cloud conditions (Sabburg et al., 2003). The increase of cloud cover causes a decrease in the UVCat irradiances, however the relative decrease from zero to eight octas is less for the higher SZA ranges. This is similar to that previously reported for the erythemal UV irradiances (Foyo-Moreno et al., 2003). The lower relative influence at the higher SZA is due to the higher proportion of diffuse UVCat that is present at the higher SZA. The R2 values obtained in the validation of the technique were 0.85 and 0.83 for the 2004 and 2005 data respectively. The time taken for a spectral scan of the UV waveband was approximately two minutes and the cloud cover over that time would have varied. Consequently, the correlation between the measured and the evaluated UVCat irradiances will be better than this. Further checking of this will require a technique to measure the UV spectrum over as short a period as possible in order to reduce the variation in the measured UVCat irradiances over the scanning interval. The clear sky values for the global broadband solar radiation and UVCat were determined by applying a least squares fit to the cloud free irradiances. The advantages and disadvantages of an empirical model compared to a method employing a model to calculate the clear sky irradiances have been discussed in Bodeker and McKenzie (1996). Although the empirical method of calculating the clear sky global radiation and the UVCat irradiances is relatively site specific, the method allows calculation of the respective clear sky irradiances without the requirement of the data for the input variables required by the method employing a model for the calculation of the irradiances (Foyo-Moreno et al., 2003). This allowed the testing of the method for the evaluation of the UVCat irradiances. The application to other sites can employ a model for the calculation of the spectral UV for clear skies from which the can be calculated. The global broadband solar radiation measured at a radiometric station can then be employed in the technique described in this paper for the evaluation of the UV
ClearCatUV
Cat irradiances. Acknowledgements: The authors acknowledge the technical staff in Physics and the Sciences workshop, USQ for their assistance in this project, along with the funding provided by the Australian Research Council for the spectroradiometer and the University of Southern Queensland for the TSI.
9

References Alados-Arboledas, L., Alados, I., Foyo-Moreno, I., Olmo, F.J., Alcanatara, A., 2003.
The influence of clouds on surface UV erythemal irradiance. Atmos.Res., 66, 273-290.
Alados, I., Olmo, F.J., Foyo-Moreno, I., Alados-Arboledas, L., 2000. Estimation of photosynthetically active radiation under cloudy conditions. Agric. For. Meteorol., 102, 39-50.
Bodeker, G.E., McKenzie, R.L., 1996. An algorithm for inferring surface UV irradiance including cloud effects. J. Appl. Meteorol., 35, 1860-1877.
Bordewijk, J.A., Slaper, H., Reinen, H.A.J.M., Schlamann, E., 1995. Total solar radiation and the influence of clouds and aerosols on the biologically effective UV. Geophys. Res. Lett., 22, 2151-2154.
Calbó, J., Pages, D., Gonzalez, J., 2005. Empirical studies of cloud effects on UV radiation: a review. Reviews Geophys., 43, RG2002, doi:10.1029/2004RG000155.
Den Outer, P.N. 2000. Variability of ground-level ultraviolet: model and measurement. Rad. Prot. Dos., 91, 105-110.
Grant, R.H., Heisler, G.M., 2000. Estimation of ultraviolet-B irradiance under variable cloud conditions. J. Appl. Meteorol., 39, 904-916.
Foyo-Moreno, I., Alados, I., Olmo, F.J., Alados-Arboledas, L., 2003. The influence of cloudiness on UV global irradiance (295-385 nm). Agric. For. Meteorol., 120, 101-111.
Foyo-Moreno, I., Alados, I., Olmo, F.J., Vida, J., Alados-Arboledas, L., 2001. On the use of a cloud modification factor for solar UV (290-385nm) spectral range. Theor. Appl. Climotol., 68, 41-50.
McLaren, K., Watson, W., Sanfilippo, P., Collins, M., Sydenham., Hirst, L., 1997. Contact lens dosimetry of solar ultraviolet radiation. Clin. Exp. Opt., 80.6, 204-210.
Oriowo, O.M., Cullen, A.P., Chou, B.R., Sivak J.G., 2001. Action spectrum and recovery for in vitro UV-induced cataract using whole lenses. Invest. Ophthal. Vis. Sci., 42, 2596-2602.
Parisi, A.V., Downs, N., 2004. Cloud cover and horizontal plane eye damaging solar UV exposures. Int. J. Biometeorol., 49, 130-136.
Parisi, A.V., Turner, J., 2006. Variations in the short wavelength cut-off of the solar UV spectra for cataracts. Photochem. Photobiol. Sci., 5, 331–335.
Pfister, G., McKenzie, R.L., Liley, J.B., Thomas, A., Forgan, B.W., Long, C.N., 2003. Cloud coverage based on all-sky imaging and its impact on surface solar irradiance. J. Appl. Meteorol., 42, 1421-1434.
Sabburg, J., Parisi, A.V., 2006. Spectral dependency of cloud enhanced UV irradiance. Atmos. Res., 81, 206-214.
Sabburg, J., Wong, J., 2000. Evaluation of a sky/cloud formula for estimating UV-B irradiance under cloudy skies. J. Geophys. Res., 105(D24), 29,685-29,292.
Sabburg, J.M., Parisi, A.V., Kimlin, M.G. 2003, Enhanced spectral UV irradiance: a one year preliminary study. Atmos. Res., 66, 261-272.
Schwander, H., Koepke, P., Kaifel, A., Seckmeyer, G. 2002, Modification of spectral UV irradiance by cloud. J. Geophys. Res., 107, no.0,10.1029/2001JD001297.
Seckmeyer, G., Erb, R., Albold, A., 1996. Transmittance of a cloud is wavelength-dependent in the UV-range. Geophys. Res. Lett., 23, 2753-2755.
Sliney, D.H., 1999. Geometrical assessment of ocular exposure to environmental UV radiation. J. Epidem., 9, S22-S32.
10

Sydenham, M.M., Collins, M.J., Hirst, L.W., 1997. Measurement of ultraviolet radiation at the surface of the eye. Inv. Ophthal. Vis. Sci., 38 (8), 1485-1492.
Thiel, S., Steiner, K., Seidlitz, H.K., 1997. Modification of global erythemally effective irradiance by clouds, Photochem. Photobiol., 65, 969-973.
Trepte, S., Winkler, P., 2004. Reconstruction of erythemal UV irradiance and dose at Hohenpeissenberg (1968-2001) considering trends of total ozone, cloudiness and turbidity. Theor. Appl. Climatol., 77, 159-171.
11

Figure Captions Figure 1 – (a) The normalised action spectrum for in-vitro cataract formation for a cultured porcine lens15 and (b) the cataract effective UV (♦) and global broadband solar radiation (+) versus time of day for the 6 June 2004 (bottom graph). Figure 2 – The cataract effective UV averaged for each octa of cloud cover for the SZA ranges of (a) less than 15o (531), 30.1 to 45.0o (2,498) and greater than 60.0o (4,848) and (b) 15.1 to 30.0o (1,367) and 45.1 to 60.0o (5,077). The number of data points in each SZA range is shown in parentheses. Figure 3 – The cloud free cataract effective UV irradiances versus the optical air mass (m) and the fitted function for the ozone levels of (a) less than or equal to 255 DU, (b) greater than 255 DU and less than or equal to 285 DU and (c) greater than 285 DU. Figure 4 – The CMFCat for the varying amounts of cloud cover for the respective SZA ranges. Figure 5 – The CMFSol for the varying amounts of cloud cover for the respective SZA ranges. The number of data points in each SZA range in increasing order of SZA is 434, 1,233, 2,157, 4,402 and 2,278. Figure 6 – (a) The UVCat irradiances calculated for the first six months of 2005 and (b) a histogram of the differences between the measured and calculated irradiances.
12

(a)
0.0001
0.001
0.01
0.1
1
250 300 350 400
Wavelength (nm)
Rel
ativ
e Ef
fect
iven
ess
(b)
0
30
60
90
120
150
180
07:
35
08:
55
10:
15
11:
35
12:
55
14:
15
15:
35
Time
UV C
at (m
W/m
2 )
0
200
400
600
800
1000
Glo
bal S
olar
(W/m
2 )
Figure 1 – (a) The normalised action spectrum for in-vitro cataract formation for a cultured porcine lens15 and (b) the cataract effective UV (♦) and global broadband solar radiation (+) versus time of day for the 6 June 2004 (bottom graph).
13

(a)
0
100
200
300
400
0 1 2 3 4 5 6 7 8
Cloud (Octas)
UV C
at (m
W/m
2 )
15 =< sza 30 < sza =< 45 sza > 60
(b)
0
100
200
300
400
0 1 2 3 4 5 6 7 8
Cloud (Octas)
UV C
at (m
W/m
2 )
15 < sza =< 30 45 < sza =< 60
Figure 2 – The cataract effective UV averaged for each octa of cloud cover for the SZA ranges of (a) less than 15o (531), 30.1 to 45.0o (2,498) and greater than 60.0o (4,848) and (b) 15.1 to 30.0o (1,367) and 45.1 to 60.0o (5,077). The number of data points in each SZA range is shown in parentheses.
14

(a)
0
100
200
300
400
0 2 4 6
m
UV C
at (m
W/m
2 )
(b)
0
100
200
300
400
0 2 4 6
m
UV C
at (m
W/m
2 )
(c)
0
100
200
300
400
0 2 4 6
m
UV C
at (m
W/m
2 )
Figure 3 – The cloud free cataract effective UV irradiances versus the optical air mass (m) and the fitted function for the ozone levels of (a) less than or equal to 255 DU, (b)
greater than 255 DU and less than or equal to 285 DU and (c) greater than 285 DU.
15

(a)
0.0
0.5
1.0
1.5
0 1 2 3 4 5 6 7 8
Cloud (Octas)
CM
F Cat
sza =< 15 30 < sza =< 45 sza > 60
(b)
0.0
0.5
1.0
1.5
0 1 2 3 4 5 6 7 8
Cloud (Octas)
CM
F Cat
15 < sza =< 30.0 45 < sza =< 60
Figure 4 – The CMFCat for the varying amounts of cloud cover for the respective SZA ranges.
16
(a)
0.0
0.5
1.0
1.5
0 1 2 3 4 5 6 7 8
Cloud (Octas)
CM
F Sol
sza =< 15 30 < sza =< 45 sza > 60
(b)
0.0
0.5
1.0
1.5
0 1 2 3 4 5 6 7 8
Cloud (Octas)
CM
F Sol
15 < sza =< 30 45 < sza =< 60
Figure 5 – The CMFSol for the varying amounts of cloud cover for the respective SZA ranges. The number of data points in each SZA range in increasing order of SZA is 434, 1,233, 2,157, 4,402 and 2,278.
17

(a)
0
200
400
600
0 10 20 30 40 50 60 70 80
SZA
UV C
at (m
W/m
2 )
(b)
0
10
20
30
40
50
60
70
0%-20% 20%-40% 40%-60% 60%-80% 80%-100%
>100%
Difference
%
Figure 6 – (a) The UVCat irradiances calculated for the first six months of 2005 and (b) a histogram of the differences between the measured and calculated irradiances.
18


