Embed Size (px)
Citation preview

Cancer Incidence and Survival among Adolescents andYoung Adults in KoreaEun-Kyeong Moon1, Hyeon Jin Park2, Chang-Mo Oh1, Kyu-Won Jung1, Hee Young Shin3,
Byung Kiu Park2, Young-Joo Won1*
1 Cancer Registration and Statistics Branch, National Cancer Control Institute, National Cancer Center, Goyang, Korea, 2 Cancer for Pediatric Oncology, National Cancer
Center, Goyang, Korea, 3 Department of Pediatrics, Seoul National University College of Medicine, Seoul, Korea
Abstract
Background: In Korea, cancer is the third leading cause of death among adolescents and young adults (AYAs). However,cancer incidence and survival trends among AYAs (15–29 years) have never been studied in Korea. Therefore, this studyaimed to investigate the incidence and relative survival rates and their trends among AYAs in Korea.
Materials and Methods: Cancer incidence data from 1999–2010 were obtained from the Korea Central Cancer Registry(KCCR). Each cancer was classified into subgroups according to the National Cancer Institute Surveillance, Epidemiology,and End Results (SEER) AYA site recode. Percent distributions, age-specific incidence rates, age-standardized incidence ratesper million, and annual percent changes (APCs) were calculated for AYAs according to sex. Five-year relative survival rateswere estimated for cases diagnosed between 1993 and 2010 and followed up to 2011.
Results: The age-standardized incidence rates of all cancers combined were 196.4 and 367.8 per million for males andfemales, respectively (male-to-female (M/F) ratio: 0.5). The age-standardized incidence rates increased from 208.7 per millionin 1999 to 396.4 per million in 2010, and the APC was 6.3% (P,0.001). The five most common cancers among AYAs werethyroid carcinoma, non-Hodgkin lymphoma, stomach carcinoma, breast carcinoma, and acute myeloid leukemia. In males,the 5-year relative survival rate improved, from 46.5% in 1993–1995 to 75.9% in 2006–2010. In females, the 5-year relativesurvival rate also improved, from 66.7% in 1993–1995 to 89.1% in 2006–2010.
Conclusions: Our study showed increases in cancer incidence and improvements in the 5-year relative survival rate amongKorean AYAs. This study also provides additional data regarding temporal and geographic trends in cancer that mayenhance future efforts to identify factors affecting cancer incidence and responses to treatment among AYAs.
Citation: Moon E-K, Park HJ, Oh C-M, Jung K-W, Shin HY, et al. (2014) Cancer Incidence and Survival among Adolescents and Young Adults in Korea. PLoSONE 9(5): e96088. doi:10.1371/journal.pone.0096088
Editor: Bart O. Williams, Van Andel Institute, United States of America
Received November 19, 2013; Accepted April 2, 2014; Published May 1, 2014
Copyright: � 2014 Moon et al. This is an open-access article distributed under the terms of the Creative Commons Attribution License, which permitsunrestricted use, distribution, and reproduction in any medium, provided the original author and source are credited.
Funding: This work was supported by the National Cancer Center Grant (NCC-1310222). The funders had no role in study design, data collection and analysis,decision to publish, or preparation of the manuscript.
Competing Interests: The authors have declared that no competing interests exist.
* E-mail: [email protected]
Introduction
Cancers in adolescents and young adults (AYAs; 15–29 years)
have distinctive characteristics compared with cancers in children
and older cohorts.
The incidence pattern of specific cancer types differ between
AYAs and younger and older patients. In addition, the genetic and
histologic patterns of cancers among AYAs differ from those of
older patients [1]. Because cancer is uncommon among AYAs, this
patient population has not drawn public attention compared with
the pediatric and adult populations. However, an increase in
cancer incidence among AYAs has been reported in Europe [2–4]
and the United States [5].
Over 200,000 new cancer patients are diagnosed annually in
Korea [6], and approximately 3,200 (1.6%) AYAs were diagnosed
with cancer in Korea in 2010. According to the U.S. National
Cancer Institute Surveillance Epidemiology and End Results
(SEER), 2% of all invasive cancers are diagnosed in individuals
aged 15–29 years [5]. Although only a small proportion of all
malignancies are diagnosed in AYAs, high-grade and later-stage
tumors of certain cancers are more likely to be diagnosed in this
patient population [1]. Furthermore, cancer diagnosis in AYAs
can greatly influence future quality of life and life expectancy [7].
In fact, in Korea, cancer is the leading cause of death among
AYAs, after suicide and traffic accidents [8]. However, to the best
of our knowledge, cancer incidence and survival among AYAs in
Korea have never been studied. Therefore, this study aimed to
investigate cancer incidence and survival among AYAs in Korea.
We examined the trends in cancer incidence rates from 1999 to
2010 and the trends in relative survival rates from 1993 to 2010
among Korean AYAs.
Materials and Methods
Data SourcesIn 1980, the Korean Ministry of Health and Welfare started
the Korea Central Cancer Registry (KCCR), a nationwide,
PLOS ONE | www.plosone.org 1 May 2014 | Volume 9 | Issue 5 | e96088

hospital-based cancer registry [9]. Until 1998, the registry
collected cancer cases from more than 180 hospitals in Korea
annually, and these data represent 80–90% of all cancer incidence
in Korea [10]. Since 1999, the KCCR has covered the entire
population under the population-based cancer registry program
[6]. The Korea National Cancer Incidence Database (KNCIDB)
KCCR data from 1999 to 2002 and from 2003 to 2007 have been
published in Cancer Incidence in Five Continents, which reflects
the completeness and validity of the incidence data [11].
Incidence data were collected for Korean AYAs aged 15–29
years who were newly diagnosed with cancer between 1999 and
2010. The incidence data were collected from the KNCIDB of the
KCCR and included age, sex, diagnosis date, primary tumor site,
morphology, the diagnostic method, and stage at diagnosis.
Survival data for individuals aged 15–29 years who were newly
diagnosed with cancer from 1993–2010 were obtained from the
KNCIDB, and the patients’ vital status was followed until
December 31, 2011. The survival analysis was based on the
KNCIDB data and mortality data obtained from Statistics Korea.
Case DefinitionIn accordance with the guidelines of the National Cancer
Institute SEER Program [5] and the Canadian Cancer Society
[12] in this study, AYAs were defined as adolescents and young
adults aged 15–29 years.
Cancer sites were coded by primary site and morphology using
the International Classification of Diseases for Oncology (third
edition) [13]. Cancers were classified according to the SEER AYA
scheme, which is based on a modified version of the International
Classification of Childhood Cancer [5]. In particular, the SEER
AYA scheme is based on an updated classification proposed by
Barr et al. and is composed of ten major groups and second- and
third-level subgroups according to the site of origin [14].
IncidenceAge-specific incidence rates per million were analyzed in each
diagnostic subgroup according to the age at diagnosis (15–19
years, 20–24 years, and 25–29 years), and age-standardized rates
(ASRs) according to sex were calculated using the world standard
population defined by the World Health Organization [15].
Trends in annual ASRs were calculated using the annual percent
change (APC), which was estimated using the following formula:
1006(eb-1), where b is the slope calculated from a linear regression
of log age-standardized incidence rates in a calendar year [16].
The male-to-female (M/F) ratio was the ratio of the ASR among
males to the ASR among females. Comparisons of age-standard-
ized incidence rates in males and females were calculated by the
direct method [17].
SurvivalRelative survival rates were estimated according to the time
period: 1993–1995, 1996–2000, 2001–2005 and 2006–2010.
Relative survival rates according to the diagnostic group were
calculated by dividing observed survival by expected survival
among comparable groups in the general population [18] using
the Ederer II method [19]. These survival rates were estimated
using ‘‘complete analysis’’, which included ‘‘right-censored’’
patients. Due to this inclusion of the early survival experience of
more recently recruited patients, the analysis provided more up-to-
date and precise survival rates in long-term survival [20]. Trends
in 5-year relative survival rates were also calculated. Additionally,
the effects of sex, diagnostic group, and time period on survival
were assessed using a relative excess risk model. All analyses were
performed using SAS version 9.2.
Results
IncidenceFrom 1999 to 2010, 39,639 cancer cases (2.3% of all cancer
patients) were newly diagnosed in AYAs. Of these cases, 14,016
(35.4%) and 25,623 (64.6%) cases were diagnosed in males and
females, respectively. According to the age at diagnosis, 6,396
(16.1%) cases were diagnosed at 15–19 years of age, 10,433
(26.3%) cases were diagnosed at 20–24 years, and 22,810 (26.3%)
cases were diagnosed at 25–29 years.
The number of cases per age group (15–19 years, 20–24 years
and 25–29 years) by sex, age-specific incidence rates, and age-
standardized incidence rates among both males and females and
M/F ratios according to the diagnostic group are shown in
Table 1.
Between 1999 and 2010, the overall age-standardized incidence
rate of cancers among AYAs in Korea was 279.9 per million.
Cancer incidence was higher in females (367.8 per million) than in
males (196.4 per million), and for all cancers combined, the male/
female ratio was 0.5 (P,0.05). The higher rate among females was
largely due to a much higher incidence rate of thyroid carcinomas
(24.7 per million among males vs. 154.2 per million among
females). Because the incidence rate of thyroid carcinoma was
unusually high, the age-standardized incidence rates of all cancers
combined were recalculated, excluding thyroid carcinoma (group
8.1). Removing thyroid carcinomas, the overall ASR of cancers
was 192.2 per million (171.7 per million for males and 213.6 per
million for females) (Table 1).
The incidence increased with age, from 150.9 in males and
160.4 in females per million at 15–19 years of age to 170.7 in
males and 305.6 in females per million, respectively, at 20–24
years of age. The incidence further increased at 25–59 years of
age, to 273.4 in males and 663.3 in females per million,
respectively (Table 1). The incidence rates were correlated with
age group for most subtypes, with the notable exceptions of
leukemia and osseous/chondromatous neoplasms, which were
more common among younger AYAs (Table 1).
Table 2 shows the secular trends in cancer incidence among
AYAs from 1999 to 2010 according to the diagnostic group. The
incidence rate of all cancers among AYAs significantly increased,
from 208.7 per million in 1999 to 396.4 per million in 2010
(APC = 6.3%; P,0.05). Over the studied time period, there was
also a steady increase in the incidence of cancer among AYAs for
both males (APC = 3.9%) and females (APC = 7.8%) (Figure 1).
Most cancer sites showed a trend of increasing incidence, with
the exception of unspecified malignant neoplasms (group 10)
among AYAs (APC = 210.9%). For miscellaneous specified
neoplasms, NOS (group 9), a rapid increase in the incidence rate
was observed for both sexes (APC = 9.8%), but the number of
cases was small. For carcinomas (group 10), a large increase in the
incidence rate was also observed among AYAs (APC = 9.4%). In
particular, among carcinomas, the incidence of thyroid carcinoma
showed the most rapid increase (APC = 17.9%; P,0.05). The
annual percent change in all cancer combined, excluding thyroid
carcinoma, was 1.8% (P,0.05) among AYAs (Table 2), with 1.9%
(P,0.05) for males and 1.8% (P,0.05) for females (data not
shown). Although the incidence of kidney carcinoma also
exhibited a notable increase (APC = 9.1%), the number of cases
was small.
The incidence of lymphomas (group 2) exhibited a large
increase among AYAs (APC = 5.3%, P,0.05). In particular,
Hodgkin lymphoma rapidly increased in incidence (APC = 9.1%,
P,0.05) (Table 2).
Cancer Among Adolescents and Young Adults in Korea
PLOS ONE | www.plosone.org 2 May 2014 | Volume 9 | Issue 5 | e96088

Ta
ble
1.
Nu
mb
er
of
case
s,ag
e-s
pe
cifi
cin
cid
en
cera
tes,
and
age
-sta
nd
ard
ize
din
cid
en
cera
tes
fro
m1
99
9to
20
10
acco
rdin
gto
sex
and
age
.
Dia
gn
ost
icg
rou
p(S
EE
R)
Ma
les
Fe
ma
les
To
tal
M/F
15
–1
9y
ea
rs2
0–
24
ye
ars
25
–2
9y
ea
rs1
5–
29
ye
ars
15
–1
9y
ea
rs2
0–
24
ye
ars
25
–2
9y
ea
rs1
5–
29
ye
ars
Ra
tio
*
Ca
ses
CR
Ca
ses
CR
Ca
ses
CR
Ca
ses
AS
RC
ase
sC
RC
ase
sC
RC
ase
sC
RC
ase
ss
AS
RA
SR
All
Ca
nce
rs3
,24
91
50
.93
,89
11
70
.76
,87
62
73
.41
4,0
16
19
6.4
3,1
47
16
0.4
6,5
42
30
5.6
15
,93
46
63
.32
5,6
23
36
7.8
27
9.9
0.5
{
All
Ca
nce
rs(e
xcl
ud
ing
thy
roid
carc
ino
ma
)`3
,06
51
42
.33
,44
51
51
.15
,66
52
25
.21
2,1
75
17
1.7
2,2
75
11
5.9
3,6
60
17
1.0
8,7
93
36
6.0
14
,72
82
13
.61
92
.20
.8{
1.
Le
uk
em
ias
73
71
7.1
60
01
3.2
69
41
3.8
2,0
31
14
.84
82
12
.34
30
10
.05
49
11
.41
,46
11
1.3
13
.11
.3{
1.1
Acu
tely
mp
ho
idle
uke
mia
30
77
.11
77
3.9
13
02
.66
14
4.6
17
04
.31
10
2.6
95
2.0
37
53
.03
.91
.5{
1.2
Acu
tem
yelo
idle
uke
mia
26
51
2.3
23
01
0.1
28
71
1.4
78
21
1.3
22
61
1.5
19
08
.92
83
11
.86
99
10
.81
1.0
1.1{
1.3
Ch
ron
icm
yelo
idle
uke
mia
96
4.5
13
15
.71
87
7.4
41
45
.83
71
.97
53
.59
23
.82
04
3.0
4.5
1.9{
1.4
Oth
er
and
un
spe
cifi
ed
leu
kem
ia6
93
.26
22
.79
03
.62
21
3.2
49
2.5
55
2.6
79
3.3
18
32
.83
.01
.1{
2.
Ly
mp
ho
ma
s5
16
24
.05
33
23
.46
12
24
.31
,66
12
3.9
26
91
3.7
41
41
9.3
56
82
3.6
1,2
51
18
.72
1.4
1.3
{
2.1
No
n-H
od
gki
nly
mp
ho
ma
40
61
8.9
43
71
9.2
52
42
0.8
1,3
67
19
.61
99
10
.13
14
14
.74
61
19
.29
74
14
.51
7.1
1.4{
2.2
Ho
dg
kin
lym
ph
om
a1
10
5.1
96
4.2
88
3.5
29
44
.37
03
.61
00
4.7
10
74
.52
77
4.2
4.3
1.0
3.
CN
Sa
nd
Oth
er
Intr
acr
an
ial
an
dIn
tra
spin
al
Ne
op
lasm
s3
32
15
.43
20
14
.04
06
16
.11
,05
81
5.2
22
81
1.6
21
41
0.0
36
11
5.0
80
31
2.2
13
.81
.2{
3.1
Ast
rocy
tom
a8
84
.11
10
4.8
17
16
.83
69
5.2
82
4.2
74
3.5
15
56
.53
11
4.7
4.9
1.1{
3.2
Oth
er
glio
ma
44
2.0
50
2.2
10
14
.01
95
2.7
42
2.1
33
1.5
88
3.7
16
32
.42
.61
.1{
3.3
Epe
nd
ymo
ma
23
1.1
24
1.1
33
1.3
80
1.1
15
0.8
21
1.0
22
0.9
58
0.9
1.0
1.3{
3.4
.M
ed
ullo
bla
sto
ma
and
oth
er
PN
ET6
63
.13
51
.52
41
.01
25
1.9
47
2.4
30
1.4
24
1.0
10
11
.61
.81
.2{
3.5
Oth
er
spe
cifi
ed
intr
acra
nia
lan
din
tras
pin
aln
eo
pla
sms
11
0.5
90
.41
00
.43
00
.43
0.2
70
.31
10
.52
10
.30
.41
.4{
3.6
Un
spe
cifi
ed
intr
acra
nia
lan
din
tras
pin
aln
eo
pla
sms
10
04
.69
24
.06
72
.72
59
3.8
39
2.0
49
2.3
61
2.5
14
92
.33
.11
.7{
4.
Oss
eo
us
an
dC
ho
nd
rom
ato
us
Ne
op
lasm
s3
79
17
.62
19
9.6
14
65
.87
44
11
.31
89
9.6
12
45
.81
20
5.0
43
36
.99
.21
.6{
4.1
Ost
eo
sarc
om
a2
57
11
.91
04
4.6
53
2.1
41
46
.41
26
6.4
49
2.3
47
2.0
22
23
.75
.11
.8{
4.2
Ch
on
dro
sarc
om
a2
81
.33
91
.74
51
.81
12
1.6
10
0.5
33
1.5
34
1.4
77
1.1
1.4
1.4{
4.3
Ewin
gtu
mo
r5
32
.54
41
.91
80
.71
15
1.7
30
1.5
14
0.7
21
0.9
65
1.0
1.4
1.7{
4.4
Oth
er
spe
cifi
ed
and
un
spe
cifi
ed
bo
ne
tum
ors
41
1.9
32
1.4
30
1.2
10
31
.52
31
.22
81
.31
80
.76
91
.11
.31
.4{
5.
So
ftT
issu
eS
arc
om
as
22
01
0.2
24
81
0.9
34
51
3.7
81
31
1.5
17
48
.92
23
10
.43
02
12
.66
99
10
.51
1.1
1.1
{
5.1
Fib
rom
ato
us
ne
op
lasm
s4
42
.06
32
.89
23
.71
99
2.8
35
1.8
59
2.8
88
3.7
18
22
.72
.71
.0
5.2
Rh
abd
om
yosa
rco
ma
58
2.7
26
1.1
25
1.0
10
91
.73
61
.81
60
.71
90
.87
11
.21
.41
.4{
5.3
Oth
er
soft
tiss
ue
sarc
om
a1
18
5.5
15
97
.02
28
9.1
50
57
.11
03
5.2
14
86
.91
95
8.1
44
66
.76
.91
.1{
6.
Ge
rmC
ell
an
dT
rop
ho
bla
stic
Ne
op
lasm
s3
40
15
.84
17
18
.34
73
18
.81
,23
01
7.6
34
11
7.4
30
01
4.0
29
51
2.3
93
61
4.7
16
.11
.2{
Cancer Among Adolescents and Young Adults in Korea
PLOS ONE | www.plosone.org 3 May 2014 | Volume 9 | Issue 5 | e96088

Ta
ble
1.
Co
nt.
Dia
gn
ost
icg
rou
p(S
EE
R)
Ma
les
Fe
ma
les
To
tal
M/F
15
–1
9y
ea
rs2
0–
24
ye
ars
25
–2
9y
ea
rs1
5–
29
ye
ars
15
–1
9y
ea
rs2
0–
24
ye
ars
25
–2
9y
ea
rs1
5–
29
ye
ars
Ra
tio
*
Ca
ses
CR
Ca
ses
CR
Ca
ses
CR
Ca
ses
AS
RC
ase
sC
RC
ase
sC
RC
ase
sC
RC
ase
ss
AS
RA
SR
6.1
Ge
rmce
llan
dtr
op
ho
bla
stic
ne
op
lasm
so
fg
on
ads
84
3.9
23
11
0.1
36
41
4.5
67
99
.32
83
14
.42
43
11
.41
95
8.1
72
11
1.4
10
.30
.8{
6.2
Ge
rmce
llan
dtr
op
ho
bla
stic
ne
op
lasm
so
fn
on
go
nad
alsi
tes
25
61
1.9
18
68
.21
09
4.3
55
18
.35
83
.05
72
.71
00
4.2
21
53
.25
.92
.5{
7.
Me
lan
om
aa
nd
Sk
inC
arc
ino
ma
s2
11
.04
01
.81
07
4.3
16
82
.31
91
.04
22
.09
84
.11
59
2.3
2.3
1.0
7.1
Me
lan
om
a1
20
.62
00
.95
02
.08
21
.11
10
.62
61
.24
61
.98
31
.21
.20
.9
7.2
Skin
carc
ino
mas
90
.42
00
.95
72
.38
61
.28
0.4
16
0.7
52
2.2
76
1.1
1.1
1.1
8.
Ca
rcin
om
as
51
62
4.0
1,2
72
55
.83
,65
31
45
.25
,44
17
3.0
1,2
57
64
.14
,45
12
07
.91
2,9
59
53
9.4
18
,66
72
62
.21
65
.00
.3{
8.1
Th
yro
idca
rcin
om
a1
84
8.5
44
61
9.6
1,2
11
48
.11
,84
12
4.7
87
24
4.4
2,8
82
13
4.6
7,1
41
29
7.3
10
,89
51
54
.28
7.7
0.2{
8.2
Oth
er
carc
ino
ma
of
he
adan
dn
eck
81
3.8
13
35
.82
13
8.5
42
75
.97
23
.71
33
6.2
19
98
.34
04
6.0
5.9
1.0
8.2
.1N
aso
ph
aryn
ge
alca
rcin
om
a4
01
.94
31
.94
71
.91
30
1.9
17
0.9
19
0.9
28
1.2
64
1.0
1.4
1.9{
8.2
.2O
the
rsi
tes
inlip
,o
ral
cavi
ty,
and
ph
aryn
x3
61
.78
13
.61
43
5.7
26
03
.64
72
.41
04
4.9
15
26
.33
03
4.4
4.0
0.8
8.2
.3N
asal
cavi
ty,
mid
dle
ear
,si
nu
ses,
lary
nx,
and
oth
er
ill-d
efi
ne
dsi
tes
inh
ead
/ne
ck
50
.29
0.4
23
0.9
37
0.5
80
.41
00
.51
90
.83
70
.50
.51
.0
8.3
Car
cin
om
ao
ftr
ach
ea,
bro
nch
us,
and
lun
g2
51
.25
02
.21
04
4.1
17
92
.41
60
.85
22
.41
21
5.0
18
92
.72
.60
.9{
8.4
Car
cin
om
ao
fb
reas
t2
0.1
30
.15
0.1
15
0.8
26
51
2.4
1,6
72
69
.61
,95
22
6.5
13
.00
.00
3{
8.5
Car
cin
om
ao
fg
en
ito
uri
nar
ytr
act
30
1.4
93
4.1
29
01
1.5
41
35
.51
54
7.8
52
42
4.5
1,9
86
82
.72
,66
43
7.1
20
.90
.1{
8.5
.1C
arci
no
ma
of
kid
ne
y1
70
.85
22
.31
73
6.9
24
23
.21
80
.93
41
.61
08
4.5
16
02
.32
.81
.4{
8.5
.2C
arci
no
ma
of
bla
dd
er
12
0.6
30
1.3
10
34
.11
45
1.9
20
.11
60
.73
11
.34
90
.71
.32
.8{
8.5
.3C
arci
no
ma
of
go
nad
s-
-3
0.1
20
.15
0.1
12
36
.32
42
11
.34
20
17
.57
85
11
.55
.60
.01{
8.5
.4C
arci
no
ma
of
cerv
ixan
du
teru
s-
--
--
--
-8
0.4
22
91
0.7
1,3
99
58
.21
,63
62
2.2
10
.8-
8.5
.5C
arci
no
ma
of
oth
er
and
ill-d
efi
ne
dsi
tes
ing
en
ito
uri
nar
ytr
act
10
.08
0.4
12
0.5
21
0.3
30
.23
0.1
28
1.2
34
0.5
0.4
0.6{
8.6
Car
cin
om
ao
fg
astr
oin
test
inal
trac
t1
61
7.5
50
02
1.9
1,7
15
68
.22
,37
63
1.5
11
35
.85
53
25
.81
,74
07
2.4
2,4
06
33
.53
2.5
0.9{
8.6
.1C
arci
no
ma
of
colo
nan
dre
ctu
m6
73
.11
76
7.7
53
02
1.1
77
31
0.3
46
2.3
16
57
.74
02
16
.76
13
8.7
9.5
1.2{
8.6
.2C
arci
no
ma
of
sto
mac
h4
11
.91
79
7.9
76
43
0.4
98
41
2.9
33
1.7
29
81
3.9
1,1
16
46
.51
,44
71
9.9
16
.30
.6{
8.6
.3C
arci
no
ma
of
live
ran
din
trah
ep
atic
bile
du
cts
51
2.4
12
15
.33
73
14
.85
45
7.3
18
0.9
66
3.1
15
16
.32
35
3.3
5.4
2.2{
8.6
.4C
arci
no
ma
of
pan
cre
as1
0.0
16
0.7
21
0.8
38
0.5
12
0.6
14
0.7
32
1.3
58
0.9
0.7
0.6{
8.6
.5C
arci
no
ma
of
oth
er
and
ill-d
efi
ne
dsi
tes
ing
astr
oin
test
inal
trac
t1
0.0
80
.42
71
.13
60
.54
0.2
10
0.5
39
1.6
53
0.7
0.6
0.6{
Cancer Among Adolescents and Young Adults in Korea
PLOS ONE | www.plosone.org 4 May 2014 | Volume 9 | Issue 5 | e96088

Ta
ble
1.
Co
nt.
Dia
gn
ost
icg
rou
p(S
EE
R)
Ma
les
Fe
ma
les
To
tal
M/F
15
–1
9y
ea
rs2
0–
24
ye
ars
25
–2
9y
ea
rs1
5–
29
ye
ars
15
–1
9y
ea
rs2
0–
24
ye
ars
25
–2
9y
ea
rs1
5–
29
ye
ars
Ra
tio
*
Ca
ses
CR
Ca
ses
CR
Ca
ses
CR
Ca
ses
AS
RC
ase
sC
RC
ase
sC
RC
ase
sC
RC
ase
ss
AS
RA
SR
8.7
Car
cin
om
ao
fo
the
ran
dill
-de
fin
ed
site
s3
51
.64
82
.11
17
4.7
20
02
.71
50
.84
22
.01
00
4.2
15
72
.22
.51
.2{
8.7
.1A
dre
no
cort
ical
carc
ino
ma
10
.05
0.2
60
.21
20
.23
0.2
70
.38
0.3
18
0.3
0.2
0.6{
8.7
.2C
arci
no
ma
of
oth
er
and
ill-d
efi
ne
dsi
tes,
NO
S3
41
.64
31
.91
11
4.4
18
82
.61
20
.63
51
.69
23
.81
39
2.0
2.3
1.3{
9.
Mis
cell
an
eo
us
Sp
eci
fie
dN
eo
pla
sms,
NO
S1
20
5.6
11
75
.11
81
7.2
41
86
.01
00
5.1
14
16
.62
54
10
.64
95
7.3
6.6
0.8
{
9.1
Oth
er
pe
dia
tric
and
em
bry
on
altu
mo
rs,
NO
S3
01
.42
00
.92
41
.07
41
.12
01
.01
70
.82
20
.95
90
.91
.01
.2{
9.2
Oth
er
spe
cifi
ed
and
em
bry
on
altu
mo
rs,
NO
S9
04
.29
74
.31
57
6.2
34
44
.98
04
.11
24
5.8
23
29
.74
36
6.4
5.6
0.8{
10
.U
nsp
eci
fie
dM
ali
gn
an
tN
eo
pla
sms
67
3.1
12
55
.52
59
10
.34
51
6.2
88
4.5
20
39
.54
28
17
.87
19
10
.48
.20
.6{
*M/F
Rat
io=
Mal
eA
SR/F
em
ale
ASR
.{ P
-val
ue
s,
0.0
5.
`T
hyr
oid
carc
ino
ma
was
exc
lud
ed
fro
mth
eca
lcu
lati
on
of
the
inci
de
nce
rate
of
all
can
cers
com
bin
ed
be
cau
seo
fit
su
nu
sual
lyh
igh
inci
de
nce
rate
.C
R,
cru
de
inci
de
nce
rate
;C
NS,
cen
tral
ne
rvo
us
syst
em
;P
NET
,p
rim
itiv
en
eu
roe
cto
de
rmal
tum
or;
NO
S,n
ot
oth
erw
ise
spe
cifi
ed
.d
oi:1
0.1
37
1/j
ou
rnal
.po
ne
.00
96
08
8.t
00
1
Cancer Among Adolescents and Young Adults in Korea
PLOS ONE | www.plosone.org 5 May 2014 | Volume 9 | Issue 5 | e96088

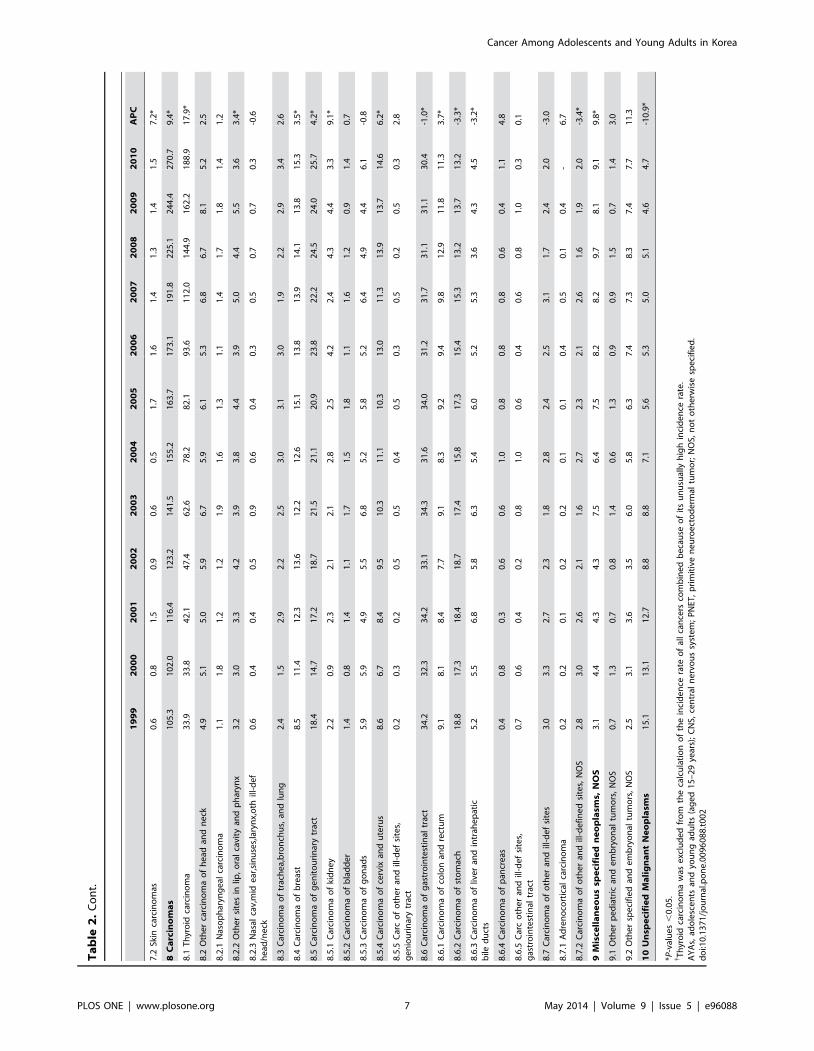
Ta
ble
2.
Tre
nd
sin
age
-sta
nd
ard
ize
din
cid
en
cera
tes
amo
ng
Ko
rean
AY
As
and
est
imat
ed
ann
ual
pe
rce
nt
chan
ge
s(A
PC
s).
19
99
20
00
20
01
20
02
20
03
20
04
20
05
20
06
20
07
20
08
20
09
20
10
AP
C
All
can
cers
20
8.7
20
4.7
23
0.3
22
6.4
25
6.3
26
6.2
27
5.6
29
0.8
31
5.8
35
5.6
37
0.4
39
6.4
6.3
*
All
can
cers
(exc
lud
ing
thyr
oid
carc
ino
ma)
{1
74
.81
70
.91
88
.21
78
.91
93
.61
88
.01
93
.51
97
.12
03
.82
10
.72
08
.22
07
.51
.8*
1L
eu
ke
mia
s2
3.4
24
.12
7.8
26
.02
4.5
24
.52
5.6
26
.62
8.2
29
.62
8.9
26
.51
.5*
1.1
Acu
tely
mp
ho
idle
uke
mia
7.0
7.6
7.4
7.2
6.7
6.9
7.7
8.0
8.4
8.3
8.9
8.8
2.2
*
1.2
Acu
tem
yelo
idle
uke
mia
10
.49
.21
2.3
12
.21
0.5
10
.51
0.8
12
.51
1.3
12
.71
1.1
9.3
0.3
1.3
Ch
ron
icm
yelo
idle
uke
mia
3.5
4.3
4.7
3.7
4.7
4.4
4.5
3.6
4.9
5.0
5.3
5.5
2.9
*
1.4
Oth
er
and
un
spe
cifi
ed
leu
kem
ia2
.53
.03
.42
.82
.72
.62
.72
.53
.63
.53
.62
.81
.5
2L
ym
ph
om
as
16
.61
5.0
17
.71
7.2
21
.82
3.1
21
.52
3.9
23
.92
6.7
26
.32
6.0
5.3
*
2.1
No
n-H
od
gki
nly
mp
ho
ma
14
.51
2.5
14
.41
3.6
17
.21
8.2
17
.71
9.6
18
.62
0.7
20
.81
9.9
4.5
*
2.2
Ho
dg
kin
lym
ph
om
a2
.12
.43
.33
.64
.64
.93
.84
.35
.36
.05
.56
.19
.1*
3C
NS
an
dO
the
rIn
tra
cra
nia
la
nd
Intr
asp
ina
lN
eo
pla
sms
(all
be
ha
vio
rs)
12
.71
2.9
12
.01
3.4
15
.01
4.5
12
.91
4.6
14
.51
5.7
14
.11
3.3
1.2
3.1
.A
stro
cyto
ma
4.8
3.8
4.7
4.5
4.7
5.4
4.6
5.0
6.3
5.6
4.8
5.3
2.3
*
3.2
Oth
er
glio
ma
1.4
1.8
1.5
2.8
2.8
2.5
2.5
2.6
2.7
4.2
3.3
3.4
8.0
*
3.3
Epe
nd
ymo
ma
0.5
1.0
1.1
0.9
1.1
0.9
0.7
1.2
1.0
1.4
1.2
1.3
4.9
*
3.4
.M
ed
ullo
bla
sto
ma
and
oth
er
PN
ET1
.61
.51
.62
.02
.32
.31
.22
.41
.32
.02
.01
.1-0
.8
3.5
Oth
er
spe
cifi
ed
intr
acra
nia
lan
din
tras
pin
aln
eo
pla
sms
0.6
0.4
0.4
0.2
0.5
0.4
0.3
0.2
0.5
0.5
0.2
0.3
-3.9
3.6
Un
spe
cifi
ed
intr
acra
nia
lan
din
tras
pin
aln
eo
pla
sms
3.7
4.5
2.8
3.0
3.7
2.9
3.6
3.1
2.8
2.0
2.5
2.1
-5.0
*
4O
sse
ou
s&
Ch
on
dro
ma
tou
sN
eo
pla
sms
8.4
8.7
11
.47
.91
0.6
8.5
8.2
7.6
9.7
10
.28
.81
0.5
0.6
4.1
Ost
eo
sarc
om
a5
.04
.96
.84
.95
.65
.34
.93
.84
.46
.14
.45
.2-1
.1
4.2
Ch
on
dro
sarc
om
a1
.41
.41
.10
.91
.91
.01
.31
.11
.51
.61
.22
.02
.3
4.3
Ewin
gtu
mo
r0
.71
.31
.71
.21
.41
.01
.21
.31
.91
.31
.92
.15
.8*
4.4
Oth
er
spe
cifi
ed
and
un
spe
cifi
ed
bo
ne
tum
ors
1.3
1.1
1.8
0.9
1.7
1.1
0.8
1.5
1.9
1.2
1.3
1.2
0.4
5S
oft
Tis
sue
Sa
rco
ma
s8
.98
.51
0.6
9.5
11
.01
0.9
9.7
12
.51
3.0
12
.91
3.6
12
.84
.1*
5.1
Fib
rom
ato
us
ne
op
lasm
s1
.41
.81
.72
.03
.22
.72
.53
.33
.24
.53
.14
.29
.6*
5.2
Rh
abd
om
yosa
rco
ma
1.2
1.6
1.2
1.6
0.6
2.5
1.3
2.4
1.5
0.7
1.0
1.3
-1.6
5.3
Oth
er
soft
tiss
ue
sarc
om
a6
.35
.07
.75
.97
.25
.75
.96
.88
.37
.79
.47
.33
.2*
6G
erm
Ce
lla
nd
Tro
ph
ob
last
icN
eo
pla
sms
13
.51
4.0
14
.81
4.3
14
.51
4.7
17
.01
6.4
19
.11
7.8
18
.32
0.2
3.6
*
6.1
Ge
rmce
llan
dtr
op
ho
bla
stic
ne
op
lasm
so
fg
on
ads
9.1
8.6
9.9
9.0
9.0
10
.21
0.3
10
.31
1.2
12
.01
1.4
12
.93
.3*
6.2
Ge
rmce
llan
dtr
op
ho
bla
stic
ne
op
lasm
so
fn
on
go
nad
alsi
tes
4.4
5.5
4.9
5.3
5.6
4.4
6.7
6.1
8.0
5.9
7.0
7.3
4.2
*
7M
ela
no
ma
an
dS
kin
Ca
rcin
om
as
1.7
2.1
2.6
1.8
1.0
1.5
3.7
2.5
2.3
2.7
3.2
2.5
4.8
7.1
Me
lan
om
a1
.11
.21
.20
.90
.50
.92
.00
.90
.91
.41
.91
.12
.6
Cancer Among Adolescents and Young Adults in Korea
PLOS ONE | www.plosone.org 6 May 2014 | Volume 9 | Issue 5 | e96088
Ta
ble
2.
Co
nt.
19
99
20
00
20
01
20
02
20
03
20
04
20
05
20
06
20
07
20
08
20
09
20
10
AP
C
7.2
Skin
carc
ino
mas
0.6
0.8
1.5
0.9
0.6
0.5
1.7
1.6
1.4
1.3
1.4
1.5
7.2
*
8C
arc
ino
ma
s1
05
.31
02
.01
16
.41
23
.21
41
.51
55
.21
63
.71
73
.11
91
.82
25
.12
44
.42
70
.79
.4*
8.1
Th
yro
idca
rcin
om
a3
3.9
33
.84
2.1
47
.46
2.6
78
.28
2.1
93
.61
12
.01
44
.91
62
.21
88
.91
7.9
*
8.2
Oth
er
carc
ino
ma
of
he
adan
dn
eck
4.9
5.1
5.0
5.9
6.7
5.9
6.1
5.3
6.8
6.7
8.1
5.2
2.5
8.2
.1N
aso
ph
aryn
ge
alca
rcin
om
a1
.11
.81
.21
.21
.91
.61
.31
.11
.41
.71
.81
.41
.2
8.2
.2O
the
rsi
tes
inlip
,o
ral
cavi
tyan
dp
har
ynx
3.2
3.0
3.3
4.2
3.9
3.8
4.4
3.9
5.0
4.4
5.5
3.6
3.4
*
8.2
.3N
asal
cav,
mid
ear
,sin
use
s,la
ryn
x,o
thill
-de
fh
ead
/ne
ck0
.60
.40
.40
.50
.90
.60
.40
.30
.50
.70
.70
.3-0
.6
8.3
Car
cin
om
ao
ftr
ach
ea,
bro
nch
us,
and
lun
g2
.41
.52
.92
.22
.53
.03
.13
.01
.92
.22
.93
.42
.6
8.4
Car
cin
om
ao
fb
reas
t8
.51
1.4
12
.31
3.6
12
.21
2.6
15
.11
3.8
13
.91
4.1
13
.81
5.3
3.5
*
8.5
Car
cin
om
ao
fg
en
ito
uri
nar
ytr
act
18
.41
4.7
17
.21
8.7
21
.52
1.1
20
.92
3.8
22
.22
4.5
24
.02
5.7
4.2
*
8.5
.1C
arci
no
ma
of
kid
ne
y2
.20
.92
.32
.12
.12
.82
.54
.22
.44
.34
.43
.39
.1*
8.5
.2C
arci
no
ma
of
bla
dd
er
1.4
0.8
1.4
1.1
1.7
1.5
1.8
1.1
1.6
1.2
0.9
1.4
0.7
8.5
.3C
arci
no
ma
of
go
nad
s5
.95
.94
.95
.56
.85
.25
.85
.26
.44
.94
.46
.1-0
.8
8.5
.4C
arci
no
ma
of
cerv
ixan
du
teru
s8
.66
.78
.49
.51
0.3
11
.11
0.3
13
.01
1.3
13
.91
3.7
14
.66
.2*
8.5
.5C
arc
of
oth
er
and
ill-d
ef
site
s,g
en
iou
rin
ary
trac
t0
.20
.30
.20
.50
.50
.40
.50
.30
.50
.20
.50
.32
.8
8.6
Car
cin
om
ao
fg
astr
oin
test
inal
trac
t3
4.2
32
.33
4.2
33
.13
4.3
31
.63
4.0
31
.23
1.7
31
.13
1.1
30
.4-1
.0*
8.6
.1C
arci
no
ma
of
colo
nan
dre
ctu
m9
.18
.18
.47
.79
.18
.39
.29
.49
.81
2.9
11
.81
1.3
3.7
*
8.6
.2C
arci
no
ma
of
sto
mac
h1
8.8
17
.31
8.4
18
.71
7.4
15
.81
7.3
15
.41
5.3
13
.21
3.7
13
.2-3
.3*
8.6
.3C
arci
no
ma
of
live
ran
din
trah
ep
atic
bile
du
cts
5.2
5.5
6.8
5.8
6.3
5.4
6.0
5.2
5.3
3.6
4.3
4.5
-3.2
*
8.6
.4C
arci
no
ma
of
pan
cre
as0
.40
.80
.30
.60
.61
.00
.80
.80
.80
.60
.41
.14
.8
8.6
.5C
arc
oth
er
and
ill-d
ef
site
s,g
astr
oin
test
inal
trac
t0
.70
.60
.40
.20
.81
.00
.60
.40
.60
.81
.00
.30
.1
8.7
Car
cin
om
ao
fo
the
ran
dill
-de
fsi
tes
3.0
3.3
2.7
2.3
1.8
2.8
2.4
2.5
3.1
1.7
2.4
2.0
-3.0
8.7
.1A
dre
no
cort
ical
carc
ino
ma
0.2
0.2
0.1
0.2
0.2
0.1
0.1
0.4
0.5
0.1
0.4
-6
.7
8.7
.2C
arci
no
ma
of
oth
er
and
ill-d
efi
ne
dsi
tes,
NO
S2
.83
.02
.62
.11
.62
.72
.32
.12
.61
.61
.92
.0-3
.4*
9M
isce
lla
ne
ou
ssp
eci
fie
dn
eo
pla
sms,
NO
S3
.14
.44
.34
.37
.56
.47
.58
.28
.29
.78
.19
.19
.8*
9.1
Oth
er
pe
dia
tric
and
em
bry
on
altu
mo
rs,
NO
S0
.71
.30
.70
.81
.40
.61
.30
.90
.91
.50
.71
.43
.0
9.2
Oth
er
spe
cifi
ed
and
em
bry
on
altu
mo
rs,
NO
S2
.53
.13
.63
.56
.05
.86
.37
.47
.38
.37
.47
.71
1.3
10
Un
spe
cifi
ed
Ma
lig
na
nt
Ne
op
lasm
s1
5.1
13
.11
2.7
8.8
8.8
7.1
5.6
5.3
5.0
5.1
4.6
4.7
-10
.9*
*P-v
alu
es
,0
.05
.{ T
hyr
oid
carc
ino
ma
was
exc
lud
ed
fro
mth
eca
lcu
lati
on
of
the
inci
de
nce
rate
of
all
can
cers
com
bin
ed
be
cau
seo
fit
su
nu
sual
lyh
igh
inci
de
nce
rate
.A
YA
s,ad
ole
sce
nts
and
you
ng
adu
lts
(ag
ed
15
–2
9ye
ars)
;C
NS,
cen
tral
ne
rvo
us
syst
em
;P
NET
,p
rim
itiv
en
eu
roe
cto
de
rmal
tum
or;
NO
S,n
ot
oth
erw
ise
spe
cifi
ed
.d
oi:1
0.1
37
1/j
ou
rnal
.po
ne
.00
96
08
8.t
00
2
Cancer Among Adolescents and Young Adults in Korea
PLOS ONE | www.plosone.org 7 May 2014 | Volume 9 | Issue 5 | e96088

Cancer incidence trends within diagnostic groups were observed
to differ by gender. Among males, the incidence of most cancer
sites was increased. Miscellaneous specified neoplasms, NOS,
showed the largest increase in incidence (APC = 12.9%, P,0.05),
followed by germ cell and trophoblastic neoplasms (APC = 6.9%,
P,0.05). Among females, the incidence of most cancer sites was
also increased. Carcinomas (APC = 10.7%, P,0.05) and miscel-
laneous specified neoplasms, NOS (APC = 7.6%, P,0.05), showed
the greatest increases. However, osseous/chondromatous neo-
plasms (APC = 20.5%) and germ cell and trophoblastic
neoplasms (APC = 20.4%) slightly decreased in incidence
(Figure 1). Additionally, a notable increase in the incidence of
carcinomas among females was observed in the cervix
(APC = 6.2%, P,0.05) and breast (APC = 3.5%, P,0.05) (data
not shown).
SurvivalA total of 52,077 cancer cases diagnosed from 1993 to 2010
were used for the survival analysis. Table 3 shows the 5-year
relative survival rates and numbers of cases in the four time
periods (1993–1995, 1996–2000, 2001–2005 and 2006–2010). For
all cancers combined, the 5-year relative survival rate of AYAs
significantly improved, from 58.9% in 1993–1995 to 84.8% in
2006–2010 (P,0.05). AYAs with leukemia and lymphoma showed
the most marked improvement in survival from 25.8% (95% CI:
22.9–28.7) and 55.4% (95% CI: 50.6–59.9) in 1993–1995 to
58.8% (95% CI: 55.5–61.8) and 83.6% (95% CI: 80.9–85.9) in
2006–2010, respectively. Conversely, decreases in survival were
observed from 1993–1995 to 2006–2010 for other glioma (group
3.2), carcinoma of gonads (group 8.5.3), and carcinoma of
pancreas (group 8.6.4) (Table 3).
Survival rates for thyroid carcinoma (group 8.1) and skin
carcinoma (group 7.2) were very high across all time periods. The
five-year relative survival rate for thyroid carcinoma among males
increased slightly, from 95.3% in 1993–1995 to 99.7% in 2006–
2010, whereas the rate was unchanged among females from 1993–
1995 (99.9%) to 2006–2010 (100.0%). The survival rates for germ
cell and trophoblastic neoplasms (group 6), skin carcinoma (group
7.2), and carcinoma of the genitourinary tract (group 8.5)
consistently exceeded 80–90% in all time periods. Conversely,
the lowest survival rates were observed for rhabdomyosarcoma
(group 5.2); carcinoma of the trachea, bronchus, and lung (group
8.3); and carcinoma of liver and intrahepatic bile ducts (group
8.6.3) (Table 3).
The survival rates for all cancers combined significantly
increased from 1993 to 2010 in both males and females. In
particular, the 5-year relative survival rate increased from 46.5%
to 75.9% in males (P,0.05) and from 66.7% to 89.1% in females
(P,0.05). However, the 5-year relative survival rate for all cancers
combined was slightly lower in males than in females, regardless of
whether thyroid carcinoma was excluded (Table 4).
Leukemia (group 1) showed the greatest increase in survival in
both males (32.5%) and females (33.7%). In particular, chronic
myeloid leukemia had the largest and second-largest increases in
survival in males (48.6%; from 40.5% to 89.1%) and females
(50.5%; from 42.7% to 93.2%), respectively.
Figure 2 depicts the 5-year relative survival rates of all cancer
patients in each of the four time periods according to age (15–19
years, 20–24 years and 25–29 years) and sex. Both gender, the 5-
year relative survival rates increased in all age groups. For males
aged 15–19 years, the 5-year relative survival rates in 1993–1995,
1996–2000, 2001–2005, and 2006–2010 for all cancers combined
were 45.3% (95.% CI: 41.2–49.2), 55.4% (95% CI: 52.5–58.1),
65.3% (95% CI: 62.5–67.9), and 72.2% (95% CI: 69.2–75.0),
respectively. The survival rates of males aged 20–24 years were
43.9% (95% CI: 40.2–47.5), 55.0% (95% CI: 52.2–57.7), 65.0%
(95% CI: 62.5–67.3), and 77.0% (95% CI: 74.3–79.5) in 1993–
1995, 1996–2000, 2001–2005, and 2006–2010, respectively. The
survival rates of males aged 25–29 years were 48.8% (95% CI:
45.9–51.7), 55.0% (95% CI: 52.9–57.0), 66.5% (95% CI: 64.6–
68.3), and 77.2% (95% CI: 75.3–79.0) in 1993–1995, 1996–2000,
2001–2005, and 2006–2010, respectively. For females aged 15–19
years, the 5-year relative survival rates for all cancers combined
were 62.0% (95% CI: 58.0–65.8), 72.0% (95% CI: 69.4–74.5),
78.8% (95% CI: 76.3–81.0), and 82.2% (95% CI: 79.7–84.5) in
1993–1995, 1996–2000, 2001–2005, and 2006–2010, respectively.
The survival rates of females aged 20–24 years were 67.4% (95%
CI: 64.6–70.1), 74.4% (95% CI: 72.4–76.3), 83.7% (95% CI:
Figure 1. Annual percent change (APC) from 1999–2010 according to the diagnostic group (SEER).doi:10.1371/journal.pone.0096088.g001
Cancer Among Adolescents and Young Adults in Korea
PLOS ONE | www.plosone.org 8 May 2014 | Volume 9 | Issue 5 | e96088

Ta
ble
3.
Five
-ye
arR
SRs
for
Ko
rean
AY
As
acco
rdin
gto
the
tim
ep
eri
od
of
can
cer
dia
gn
osi
s.
Dia
gn
ost
icg
rou
p(S
EE
R)
Bo
thse
xe
sC
ha
ng
e{
P
19
93
–1
99
51
99
6–
20
00
20
01
–2
00
52
00
6–
20
10
Ca
ses
RS
RC
ase
sR
SR
Ca
ses
RS
RC
ase
sR
SR
All
Ca
nce
rs6
,38
75
8.9
12
,45
36
6.4
14
,31
07
6.5
18
,92
78
4.8
25
.9*
All
Ca
nce
rs(e
xcl
ud
ing
thy
roid
carc
ino
ma
)`5
,52
55
2.6
10
,47
46
0.2
10
,55
56
8.2
10
,88
47
4.4
21
.8*
1.
Le
uk
em
ias
86
62
5.8
1,4
40
35
.91
,39
74
7.7
1,4
35
58
.83
3.0
*
1.1
Acu
tely
mp
ho
idle
uke
mia
23
71
9.9
43
32
93
79
33
.94
25
48
.62
8.7
*
1.2
Acu
tem
yelo
idle
uke
mia
37
52
6.0
60
23
7.5
62
44
7.2
58
85
2.7
26
.7*
1.3
Ch
ron
icm
yelo
idle
uke
mia
14
14
1.4
25
15
1.2
25
27
62
62
90
.54
9.1
*
1.4
Oth
er
and
un
spe
cifi
ed
leu
kem
ia1
13
17
.81
54
24
.11
42
36
16
05
8.8
41
.0*
2.
Ly
mp
ho
ma
s4
39
55
.49
37
65
1,1
33
75
.81
,31
58
3.6
28
.2*
2.1
No
n-H
od
gki
nly
mp
ho
ma
37
25
1.3
79
06
0.6
90
67
2.5
1,0
37
82
.03
0.7
*
2.2
Ho
dg
kin
lym
ph
om
a6
77
8.0
14
78
8.8
22
78
8.8
27
88
9.4
11
.4*
3.
CN
Sa
nd
Oth
er
Intr
acr
an
ial
an
dIn
tra
spin
al
Ne
op
lasm
s3
71
53
.46
89
54
.57
30
60
75
06
5.6
12
.2*
3.1
.A
stro
cyto
ma
17
94
3.2
30
54
5.1
27
54
5.2
29
15
4.3
11
.1*
3.2
Oth
er
glio
ma
65
72
.78
36
1.7
14
16
6.1
17
77
1.2
-1.5
3.3
Epe
nd
ymo
ma
14
86
.14
97
9.9
57
88
.06
28
7.0
0.9
3.4
Me
du
llob
last
om
aan
do
the
rP
NET
18
44
.68
44
99
24
7.9
84
52
.37
.7
3.5
Oth
er
spe
cifi
ed
intr
acra
nia
lan
din
tras
pin
aln
eo
pla
sms
13
61
.92
77
4.4
20
80
.21
87
2.6
10
.7
3.6
Un
spe
cifi
ed
intr
acra
nia
lan
din
tras
pin
aln
eo
pla
sms
82
55
.21
41
61
.21
45
76
.11
18
80
.62
5.4
*
4.
Oss
eo
us
an
dC
ho
nd
rom
ato
us
Ne
op
lasm
s2
62
48
.35
16
66
.14
79
68
.74
47
74
.82
6.5
*
4.1
Ost
eo
sarc
om
a1
60
43
.33
05
65
.52
81
65
.32
31
72
.22
8.9
*
4.2
Ch
on
dro
sarc
om
a2
86
4.6
75
87
.06
98
7.2
77
94
.93
0.3
*
4.3
Ewin
gtu
mo
r3
04
0.2
66
39
.56
75
2.4
72
51
.01
0.8
4.4
Oth
er
spe
cifi
ed
and
un
spe
cifi
ed
bo
ne
tum
ors
44
61
.77
07
1.7
62
80
.96
78
5.5
23
.8*
5.
So
ftT
issu
eS
arc
om
as
24
35
8.7
48
15
8.8
55
46
7.5
61
77
3.4
14
.7*
5.1
Fib
rom
ato
us
ne
op
lasm
s5
17
8.8
10
37
81
35
93
.61
93
95
.11
6.3
*
5.2
Rh
abd
om
yosa
rco
ma
32
28
.37
33
7.1
66
34
.95
53
7.5
9.2
5.3
Oth
er
soft
tiss
ue
sarc
om
a1
60
58
.43
05
57
.63
53
63
.63
69
67
.89
.4*
6.
Ge
rmC
ell
an
dT
rop
ho
bla
stic
Ne
op
lasm
s2
78
81
.67
45
87
84
28
9.9
93
69
1.7
10
.1*
6.1
Ge
rmce
llan
dtr
op
ho
bla
stic
ne
op
lasm
so
fg
on
ads
17
48
9.4
46
59
2.3
55
89
4.3
61
39
6.2
6.8
*
6.2
Ge
rmce
llan
dtr
op
ho
bla
stic
ne
op
lasm
so
fn
on
go
nad
alsi
tes
10
46
8.6
28
07
8.1
28
48
1.2
32
38
3.2
14
.6
7.
Me
lan
om
aa
nd
Sk
inC
arc
ino
ma
s5
66
4.6
11
15
9.7
12
27
7.3
13
88
6.3
21
.7*
7.1
Me
lan
om
a2
53
2.2
64
43
.96
36
0.5
59
65
.03
2.8
*
7.2
Skin
carc
ino
mas
31
90
.84
78
1.2
59
95
.27
99
9.0
8.2
*
8.
Ca
rcin
om
as
3,2
05
67
.56
,60
77
2.2
8,3
66
82
.41
2,6
01
89
.92
2.4
*
Cancer Among Adolescents and Young Adults in Korea
PLOS ONE | www.plosone.org 9 May 2014 | Volume 9 | Issue 5 | e96088

Ta
ble
3.
Co
nt.
Dia
gn
ost
icg
rou
p(S
EE
R)
Bo
thse
xe
sC
ha
ng
e{
P
19
93
–1
99
51
99
6–
20
00
20
01
–2
00
52
00
6–
20
10
Ca
ses
RS
RC
ase
sR
SR
Ca
ses
RS
RC
ase
sR
SR
8.1
Th
yro
idca
rcin
om
a8
62
99
.31
,97
99
9.6
3,7
55
99
.98
,04
39
9.9
0.6
*
8.2
Oth
er
carc
ino
ma
of
he
adan
dn
eck
14
06
9.6
28
97
7.8
33
98
3.1
33
38
5.5
15
.9*
8.2
.1N
aso
ph
aryn
ge
alca
rcin
om
a4
07
0.4
10
46
5.7
79
80
.07
58
5.1
14
.7*
8.2
.2O
the
rsi
tes
inlip
,o
ral
cavi
ty,
and
ph
aryn
x7
37
9.8
15
98
7.7
23
38
5.6
23
58
8.6
8.8
8.2
.3N
asal
cavi
ty,
mid
dle
ear
,si
nu
ses,
lary
nx,
and
oth
er
ill-d
efi
ne
dsi
tes
inh
ead
/ne
ck2
74
1.0
26
65
.62
77
0.6
23
60
.51
9.5
8.3
Car
cin
om
ao
ftr
ach
ea,
bro
nch
us,
and
lun
g7
32
4.8
13
63
6.2
14
44
7.4
13
24
3.1
18
.3*
8.4
Car
cin
om
ao
fb
reas
t3
10
68
.06
91
77
.28
25
82
.08
41
86
.51
8.5
*
8.5
Car
cin
om
ao
fg
en
ito
uri
nar
ytr
act
60
28
5.3
1,1
91
85
.51
,19
48
8.9
1,3
71
86
.51
.2
8.5
.1C
arci
no
ma
of
kid
ne
y3
56
8.9
94
76
.91
42
87
.62
09
87
.01
8.1
*
8.5
.2C
arci
no
ma
of
bla
dd
er
39
85
.17
79
4.0
90
93
.67
39
5.9
10
.8
8.5
.3C
arci
no
ma
of
go
nad
s2
34
86
.63
96
84
.53
26
88
.22
91
82
.7-3
.9
8.5
.4C
arci
no
ma
of
cerv
ixan
du
teru
s2
85
86
.66
05
86
.76
11
89
.17
81
87
.00
.4
8.5
.5C
arci
no
ma
of
oth
er
and
ill-d
efi
ne
dsi
tes,
ge
nit
ou
rin
ary
trac
t9
78
.31
97
9.2
25
84
.21
78
8.1
9.8
8.6
Car
cin
om
ao
fg
astr
oin
test
inal
trac
t1
,12
33
8.0
2,1
27
42
.31
,97
45
0.2
1,7
66
59
.22
1.2
*
8.6
.1C
arci
no
ma
of
colo
nan
dre
ctu
m2
46
47
.05
27
52
.85
00
63
.26
03
73
.92
6.9
*
8.6
.2C
arci
no
ma
of
sto
mac
h7
23
36
.31
,23
94
1.4
1,0
91
49
.08
31
58
.22
1.9
*
8.6
.3C
arci
no
ma
of
live
ran
din
trah
ep
atic
bile
du
cts
90
23
.52
77
23
.63
08
33
.62
56
31
.68
.1*
8.6
.4C
arci
no
ma
of
pan
cre
as3
05
6.9
35
57
.33
95
9.1
42
43
.8-1
3.1
8.6
.5C
arci
no
ma
of
oth
er
and
ill-d
efi
ne
dsi
tes
ing
astr
oin
test
inal
trac
t3
42
9.6
49
45
.13
63
9.0
34
59
.12
9.5
*
8.7
Car
cin
om
ao
fo
the
ran
dill
-de
fin
ed
site
s9
54
1.3
19
43
9.3
13
54
4.6
11
55
4.0
12
.7*
8.7
.1A
dre
no
cort
ical
carc
ino
ma
N/S
8.7
.2C
arci
no
ma
of
oth
er
and
ill-
de
fin
ed
site
s,N
OS
88
40
.01
81
39
.41
28
46
.29
95
6.2
16
.2*
9.
Mis
cell
an
eo
us
Sp
eci
fie
dN
eo
pla
sms,
NO
S1
21
54
.02
13
72
.53
48
79
.24
53
79
.72
5.7
*
9.1
Oth
er
pe
dia
tric
and
em
bry
on
altu
mo
rs,
NO
S3
33
0.5
43
46
.75
15
7.0
51
63
.13
2.6
*
9.2
Oth
er
spe
cifi
ed
and
em
bry
on
altu
mo
rs,
NO
S8
86
2.8
17
07
9.1
29
78
3.0
40
28
1.7
18
.9*
10
.U
nsp
eci
fie
dM
ali
gn
an
tN
eo
pla
sms
54
66
2.0
71
47
0.8
33
97
9.0
23
57
7.8
15
.8*
*P-v
alu
es
,0
.05
for
tre
nd
.{ C
han
ge
(%)
inth
e5
-ye
arR
SRfr
om
19
93
–1
99
5to
20
06
–2
01
0.
`T
hyr
oid
carc
ino
ma
was
exc
lud
ed
fro
mth
eca
lcu
lati
on
of
the
inci
de
nce
rate
of
all
can
cers
com
bin
ed
be
cau
seo
fit
su
nu
sual
lyh
igh
inci
de
nce
rate
.N
/S:
no
tsh
ow
nb
eca
use
,2
0ca
ses
we
rere
po
rte
din
eac
hp
eri
od
.A
YA
s,ad
ole
sce
nts
and
you
ng
adu
lts
(ag
ed
15
–2
9ye
ars)
;C
NS,
cen
tral
ne
rvo
us
syst
em
;P
NET
,p
rim
itiv
en
eu
roe
cto
de
rmal
tum
or;
NO
S,n
ot
oth
erw
ise
spe
cifi
ed
.d
oi:1
0.1
37
1/j
ou
rnal
.po
ne
.00
96
08
8.t
00
3
Cancer Among Adolescents and Young Adults in Korea
PLOS ONE | www.plosone.org 10 May 2014 | Volume 9 | Issue 5 | e96088

Ta
ble
4.
Five
-ye
arR
SRs
for
Ko
rean
AY
As
acco
rdin
gto
the
tim
ep
eri
od
of
can
cer
dia
gn
osi
san
dse
x.
Dia
gn
ost
icg
rou
p(S
EE
R)
Ma
les
Fe
ma
les
19
93
–1
99
51
99
6–
20
00
20
01
–2
00
52
00
6–
20
10
Ch
an
ge{
P1
99
3–
19
95
19
96
–2
00
02
00
1–
20
05
20
06
–2
01
0C
ha
ng
e{
P
Ca
ses
RS
RC
ase
sR
SR
Ca
ses
RS
RC
ase
sR
SR
Ca
ses
RS
RC
ase
sR
SR
Ca
ses
RS
RC
ase
sR
SR
All
Ca
nce
rs2
,47
84
6.5
4,8
01
55
.15
,16
66
5.8
6,1
49
75
.92
9.4
*3
,90
96
6.7
7,6
52
73
.69
,14
48
2.6
12
,77
88
9.1
22
.4*
All
Ca
nce
rs(e
xcl
ud
ing
thy
roid
carc
ino
ma
)`2
,36
64
4.2
4,5
16
52
.44
,69
66
2.3
4,9
24
70
.52
6.3
*3
,15
95
8.9
5,9
58
66
.05
,85
97
2.9
5,9
60
77
.61
8.7
*
1.
Le
uk
em
ias
49
22
5.4
79
13
3.0
82
64
6.2
84
15
7.9
32
.5*
37
42
6.3
64
93
9.4
57
14
9.8
59
46
0.0
33
.7*
1.1
Acu
tely
mp
ho
idle
uke
mia
14
02
2.3
25
32
7.4
23
63
0.2
27
24
9.2
26
.9*
97
16
.51
80
31
.21
43
39
.91
53
47
.43
0.9
*
1.2
Acu
tem
yelo
idle
uke
mia
19
42
6.5
30
73
0.4
31
84
4.5
31
35
1.1
24
.6*
18
12
5.5
29
54
4.8
30
65
0.1
27
55
4.7
29
.2*
1.3
Ch
ron
icm
yelo
idle
uke
mia
87
40
.51
52
51
.61
83
74
.01
73
89
.14
8.6
*5
44
2.7
99
50
.66
98
1.3
89
93
.25
0.5
*
1.4
Oth
er
and
un
spe
cifi
ed
leu
kem
ia7
19
.97
92
5.5
89
37
.28
35
1.4
41
.5*
42
31
.07
52
2.7
53
34
.07
76
7.3
36
.3*
2.
Ly
mp
ho
ma
s2
62
50
.75
58
60
.96
37
72
.87
48
80
.93
0.2
*1
77
62
.33
79
71
.14
96
79
.65
67
87
.02
4.7
*
2.1
No
n-H
od
gki
nly
mp
ho
ma
23
04
7.3
48
05
6.7
52
27
0.2
60
17
9.2
31
.9*
14
25
7.9
31
06
6.6
38
47
5.7
43
68
5.9
28
.0*
2.2
Ho
dg
kin
lym
ph
om
a3
27
5.5
78
86
.31
15
84
.61
47
87
.31
1.8
*3
58
0.2
69
91
.51
12
93
.01
31
91
.31
1.1
*
3.
CN
Sa
nd
Oth
er
Intr
acr
an
ial
an
dIn
tra
spin
al
Ne
op
lasm
s2
20
49
.93
93
52
.24
17
59
.44
23
63
.01
3.1
*1
51
58
.42
96
57
.63
13
60
.83
27
68
.91
0.5
*
3.1
.A
stro
cyto
ma
10
43
6.8
16
93
9.8
15
64
3.1
15
54
8.4
11
.67
55
2.2
13
65
1.6
11
94
8.0
13
66
0.8
8.6
3.2
Oth
er
glio
ma
41
76
.15
35
6.9
68
70
.81
02
66
.9-9
.22
46
6.9
30
70
.27
36
1.8
75
77
.01
0.1
3.3
Epe
nd
ymo
ma
51
00
.63
28
4.8
28
86
.03
99
4.0
-6.6
97
8.0
17
70
.72
98
9.8
23
74
.6-3
.4
3.4
Me
du
llob
last
om
aan
do
the
rP
NET
83
7.8
43
44
.45
13
7.4
46
41
.53
.71
05
0.1
41
53
.84
16
1.1
38
63
.81
3.7
3.5
Oth
er
spe
cifi
ed
intr
acra
nia
lan
din
tras
pin
aln
eo
pla
sms
N/S
N/S
-
3.6
Un
spe
cifi
ed
intr
acra
nia
lan
din
tras
pin
aln
eo
pla
sms
54
54
.18
06
1.5
10
27
7.7
72
78
.32
4.2
*2
85
7.3
61
60
.84
37
2.2
46
84
.32
7.0
*
4.
Oss
eo
us
an
dC
ho
nd
rom
ato
us
Ne
op
lasm
s1
63
48
.83
17
65
.02
90
66
.12
96
74
.72
5.9
*9
94
7.6
19
96
8.0
18
97
2.6
15
17
5.4
27
.8*
4.1
Ost
eo
sarc
om
a1
06
42
.71
95
64
.41
74
60
.51
60
71
.42
8.7
*5
44
4.6
11
06
7.4
10
77
3.0
71
74
.63
0.0
*
4.2
Ch
on
dro
sarc
om
a1
77
1.1
43
86
.54
49
3.5
44
93
.52
2.4
11
54
.73
28
7.7
25
76
.23
39
6.4
41
.7
4.3
Ewin
gtu
mo
r1
54
7.0
43
37
.43
84
4.9
46
49
.72
.71
53
3.4
23
43
.62
96
2.2
26
53
.31
9.9
4.4
Oth
er
spe
cifi
ed
and
un
spe
cifi
ed
bo
ne
tum
ors
25
60
.43
67
5.4
34
82
.64
68
9.4
29
.0*
19
63
.33
46
7.8
28
78
.72
17
7.1
13
.8
5.
So
ftT
issu
eS
arc
om
as
12
65
2.7
24
45
7.7
28
76
3.3
34
26
8.8
16
.1*
11
76
5.1
23
76
0.1
26
77
2.1
27
57
8.6
13
.5*
5.1
Fib
rom
ato
us
ne
op
lasm
s2
37
8.8
61
75
.86
49
0.9
10
39
3.4
14
.6*
28
78
.84
28
1.1
71
96
.09
09
6.7
17
.9*
5.2
Rh
abd
om
yosa
rco
ma
20
25
.24
33
5.0
41
34
.23
53
4.1
8.9
12
33
.43
04
0.1
25
36
.12
04
4.9
11
.5
5.3
Oth
er
soft
tiss
ue
sarc
om
a8
35
2.2
14
05
6.7
18
26
0.1
20
46
2.8
10
.6*
77
65
.11
65
58
.31
71
67
.41
65
73
.48
.3
6.
Ge
rmC
ell
an
dT
rop
ho
bla
stic
Ne
op
lasm
s9
87
2.9
32
37
9.3
45
78
5.8
57
48
8.8
15
.9*
18
08
6.4
42
29
2.9
38
59
4.7
36
29
6.3
9.9
*
Cancer Among Adolescents and Young Adults in Korea
PLOS ONE | www.plosone.org 11 May 2014 | Volume 9 | Issue 5 | e96088

Ta
ble
4.
Co
nt.
Dia
gn
ost
icg
rou
p(S
EE
R)
Ma
les
Fe
ma
les
19
93
–1
99
51
99
6–
20
00
20
01
–2
00
52
00
6–
20
10
Ch
an
ge{
P1
99
3–
19
95
19
96
–2
00
02
00
1–
20
05
20
06
–2
01
0C
ha
ng
e{
P
Ca
ses
RS
RC
ase
sR
SR
Ca
ses
RS
RC
ase
sR
SR
Ca
ses
RS
RC
ase
sR
SR
Ca
ses
RS
RC
ase
sR
SR
6.1
Ge
rmce
llan
dtr
op
ho
bla
stic
ne
op
lasm
so
fg
on
ads
47
90
.01
57
85
.82
55
90
.53
31
95
.45
.4*
12
78
9.2
30
89
5.7
30
39
7.5
28
29
7.0
7.8
*
6.2
Ge
rmce
llan
dtr
op
ho
bla
stic
ne
op
lasm
so
fn
on
go
nad
alsi
tes
51
57
.21
66
73
.22
02
79
.92
43
79
.92
2.7
53
79
.51
14
85
.38
28
4.3
80
93
.61
4.1
7.
Me
lan
om
aa
nd
Sk
inC
arc
ino
ma
s2
47
1.3
66
57
.96
67
3.0
67
83
.91
2.6
*3
25
9.6
45
62
.45
68
2.3
71
89
.12
9.5
*
7.1
Me
lan
om
a1
14
5.8
38
45
.03
35
1.7
26
45
.0-0
.81
42
1.5
26
42
.43
07
0.1
33
76
.55
5.0
*
7.2
Skin
carc
ino
mas
13
93
.02
87
5.4
33
94
.34
19
7.9
4.9
18
89
.21
98
9.7
26
96
.43
81
00
.21
1.0
8.
Ca
rcin
om
as
87
25
2.3
1,7
87
57
.01
,93
56
8.2
2,5
61
80
.52
8.2
*2
,33
37
3.1
4,8
20
77
.96
,43
18
6.6
10
,04
09
2.4
19
.3*
8.1
Th
yro
idca
rcin
om
a1
12
95
.32
85
97
.34
70
10
0.2
1,2
25
99
.74
.4*
75
09
9.9
1,6
94
99
.93
,28
59
9.8
6,8
18
10
0.0
0.1
8.2
Oth
er
carc
ino
ma
of
he
adan
dn
eck
76
62
.31
47
71
.11
77
79
.41
70
86
.82
4.5
*6
47
8.4
14
28
4.7
16
28
7.2
16
38
4.5
6.1
8.2
.1N
aso
ph
aryn
ge
alca
rcin
om
a2
87
1.9
70
60
.35
68
0.6
48
91
.61
9.7
*1
26
6.9
34
76
.72
37
8.4
27
77
.61
0.7
8.2
.2O
the
rsi
tes
inlip
,o
ral
cavi
ty,
and
ph
aryn
x3
27
2.4
65
86
.61
08
79
.91
12
86
.61
4.2
41
85
.69
48
8.5
12
59
0.5
12
39
0.3
4.7
8.2
.3N
asal
cavi
ty,
mid
dle
ear
,si
nu
ses,
lary
nx,
and
oth
er
ill-d
efi
ne
dsi
tes
inh
ead
/ne
ckN
/SN
/S
8.3
Car
cin
om
ao
ftr
ach
ea,
bro
nch
us,
and
lun
g4
12
4.6
68
37
.06
55
2.5
64
39
.61
5.0
32
25
.16
83
5.4
79
43
.16
84
6.7
21
.6*
8.4
Car
cin
om
ao
fb
reas
tN
/S3
09
67
.96
86
77
.38
22
81
.98
38
86
.61
8.7
*
8.5
Car
cin
om
ao
fg
en
ito
uri
nar
ytr
act
52
83
.31
16
91
.01
58
91
.51
97
92
.28
.95
50
85
.51
,07
58
5.0
1,0
36
88
.51
,17
48
5.5
0
8.5
.1C
arci
no
ma
of
kid
ne
y1
47
9.2
43
86
.58
58
9.8
12
99
1.9
12
.72
16
2.1
51
68
.85
78
4.4
80
78
.81
6.7
*
8.5
.2C
arci
no
ma
of
bla
dd
er
30
87
.36
19
5.6
61
95
.46
09
5.0
7.7
N/S
8.5
.3C
arci
no
ma
of
go
nad
sN
/S2
31
86
.83
92
84
.43
24
88
.12
90
82
.6-4
.2
8.5
.4C
arci
no
ma
of
cerv
ixan
du
teru
sN
/S2
85
86
.66
05
86
.76
11
89
.17
81
87
.00
.4
8.5
.5C
arci
no
ma
of
oth
er
and
ill-d
efi
ne
dsi
tes
ing
en
ito
uri
nar
ytr
act
N/S
N/S
8.6
Car
cin
om
ao
fg
astr
oin
test
inal
trac
t5
36
43
.11
,06
44
3.0
98
44
9.4
84
25
6.5
13
.4*
58
73
3.3
1,0
63
41
.59
90
51
.09
24
61
.72
8.4
*
8.6
.1C
arci
no
ma
of
colo
nan
dre
ctu
m1
40
51
.12
99
50
.12
87
62
.63
30
73
.62
2.5
*1
06
41
.62
28
56
.32
13
64
.02
73
74
.63
3.0
*
8.6
.2C
arci
no
ma
of
sto
mac
h3
07
44
.05
30
48
.04
45
51
.93
10
56
.51
2.5
*4
16
30
.67
09
36
.56
46
47
.05
21
59
.32
8.7
*
8.6
.3C
arci
no
ma
of
live
ran
din
trah
ep
atic
bile
du
cts
62
26
.01
93
19
.32
26
28
.41
70
31
.45
.4*
28
17
.98
43
3.4
82
47
.78
63
1.4
13
.5
8.6
.4C
arci
no
ma
of
pan
cre
asN
/S2
16
6.9
18
83
.52
47
1.0
28
69
.32
.4
8.6
.5C
arci
no
ma
oth
er
and
ill-d
efi
ne
dsi
tes
ing
astr
oin
test
inal
trac
t1
82
8.0
25
44
.31
14
5.6
18
45
.31
7.3
16
31
.32
44
6.0
25
36
.11
67
5.2
43
.9*
8.7
Car
cin
om
ao
fo
the
ran
dill
-de
fin
ed
site
s5
43
1.7
10
24
4.3
78
51
.56
04
8.1
16
.4*
41
53
.89
23
3.8
57
35
.25
56
0.2
6.4
8.7
.1A
dre
no
cort
ical
carc
ino
ma
N/S
N/S
8.7
.2C
arci
no
ma
of
oth
er
and
ill-d
efi
ne
dsi
tes,
NO
S5
13
3.6
94
44
.97
65
1.5
53
48
.71
5.1
*3
74
8.8
87
33
.45
23
8.5
46
66
.11
7.3
Cancer Among Adolescents and Young Adults in Korea
PLOS ONE | www.plosone.org 12 May 2014 | Volume 9 | Issue 5 | e96088
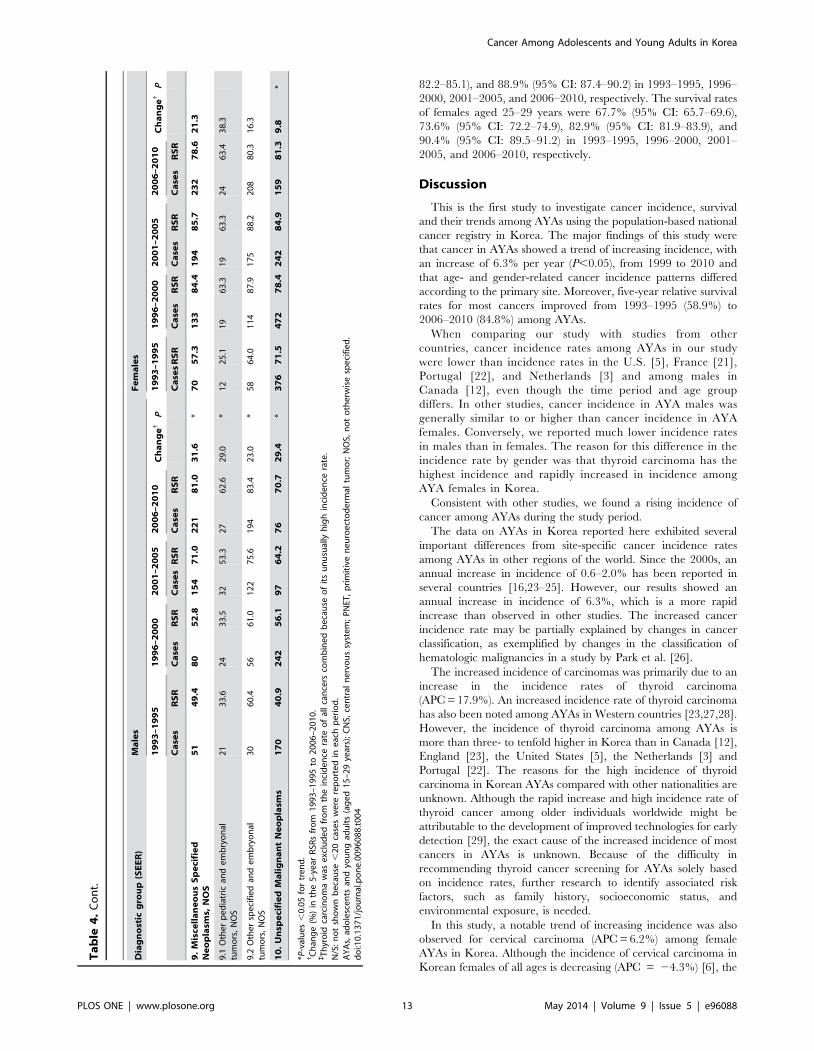
82.2–85.1), and 88.9% (95% CI: 87.4–90.2) in 1993–1995, 1996–
2000, 2001–2005, and 2006–2010, respectively. The survival rates
of females aged 25–29 years were 67.7% (95% CI: 65.7–69.6),
73.6% (95% CI: 72.2–74.9), 82.9% (95% CI: 81.9–83.9), and
90.4% (95% CI: 89.5–91.2) in 1993–1995, 1996–2000, 2001–
2005, and 2006–2010, respectively.
Discussion
This is the first study to investigate cancer incidence, survival
and their trends among AYAs using the population-based national
cancer registry in Korea. The major findings of this study were
that cancer in AYAs showed a trend of increasing incidence, with
an increase of 6.3% per year (P,0.05), from 1999 to 2010 and
that age- and gender-related cancer incidence patterns differed
according to the primary site. Moreover, five-year relative survival
rates for most cancers improved from 1993–1995 (58.9%) to
2006–2010 (84.8%) among AYAs.
When comparing our study with studies from other
countries, cancer incidence rates among AYAs in our study
were lower than incidence rates in the U.S. [5], France [21],
Portugal [22], and Netherlands [3] and among males in
Canada [12], even though the time period and age group
differs. In other studies, cancer incidence in AYA males was
generally similar to or higher than cancer incidence in AYA
females. Conversely, we reported much lower incidence rates
in males than in females. The reason for this difference in the
incidence rate by gender was that thyroid carcinoma has the
highest incidence and rapidly increased in incidence among
AYA females in Korea.
Consistent with other studies, we found a rising incidence of
cancer among AYAs during the study period.
The data on AYAs in Korea reported here exhibited several
important differences from site-specific cancer incidence rates
among AYAs in other regions of the world. Since the 2000s, an
annual increase in incidence of 0.6–2.0% has been reported in
several countries [16,23–25]. However, our results showed an
annual increase in incidence of 6.3%, which is a more rapid
increase than observed in other studies. The increased cancer
incidence rate may be partially explained by changes in cancer
classification, as exemplified by changes in the classification of
hematologic malignancies in a study by Park et al. [26].
The increased incidence of carcinomas was primarily due to an
increase in the incidence rates of thyroid carcinoma
(APC = 17.9%). An increased incidence rate of thyroid carcinoma
has also been noted among AYAs in Western countries [23,27,28].
However, the incidence of thyroid carcinoma among AYAs is
more than three- to tenfold higher in Korea than in Canada [12],
England [23], the United States [5], the Netherlands [3] and
Portugal [22]. The reasons for the high incidence of thyroid
carcinoma in Korean AYAs compared with other nationalities are
unknown. Although the rapid increase and high incidence rate of
thyroid cancer among older individuals worldwide might be
attributable to the development of improved technologies for early
detection [29], the exact cause of the increased incidence of most
cancers in AYAs is unknown. Because of the difficulty in
recommending thyroid cancer screening for AYAs solely based
on incidence rates, further research to identify associated risk
factors, such as family history, socioeconomic status, and
environmental exposure, is needed.
In this study, a notable trend of increasing incidence was also
observed for cervical carcinoma (APC = 6.2%) among female
AYAs in Korea. Although the incidence of cervical carcinoma in
Korean females of all ages is decreasing (APC = 24.3%) [6], the
Ta
ble
4.
Co
nt.
Dia
gn
ost
icg
rou
p(S
EE
R)
Ma
les
Fe
ma
les
19
93
–1
99
51
99
6–
20
00
20
01
–2
00
52
00
6–
20
10
Ch
an
ge{
P1
99
3–
19
95
19
96
–2
00
02
00
1–
20
05
20
06
–2
01
0C
ha
ng
e{
P
Ca
ses
RS
RC
ase
sR
SR
Ca
ses
RS
RC
ase
sR
SR
Ca
ses
RS
RC
ase
sR
SR
Ca
ses
RS
RC
ase
sR
SR
9.
Mis
cell
an
eo
us
Sp
eci
fie
dN
eo
pla
sms,
NO
S5
14
9.4
80
52
.81
54
71
.02
21
81
.03
1.6
*7
05
7.3
13
38
4.4
19
48
5.7
23
27
8.6
21
.3
9.1
Oth
er
pe
dia
tric
and
em
bry
on
altu
mo
rs,
NO
S2
13
3.6
24
33
.53
25
3.3
27
62
.62
9.0
*1
22
5.1
19
63
.31
96
3.3
24
63
.43
8.3
9.2
Oth
er
spe
cifi
ed
and
em
bry
on
altu
mo
rs,
NO
S3
06
0.4
56
61
.01
22
75
.61
94
83
.42
3.0
*5
86
4.0
11
48
7.9
17
58
8.2
20
88
0.3
16
.3
10
.U
nsp
eci
fie
dM
ali
gn
an
tN
eo
pla
sms
17
04
0.9
24
25
6.1
97
64
.27
67
0.7
29
.4*
37
67
1.5
47
27
8.4
24
28
4.9
15
98
1.3
9.8
*
*P-v
alu
es
,0
.05
for
tre
nd
.{ C
han
ge
(%)
inth
e5
-ye
arR
SRs
fro
m1
99
3–
19
95
to2
00
6–
20
10
.`T
hyr
oid
carc
ino
ma
was
exc
lud
ed
fro
mth
ein
cid
en
cera
teo
fal
lca
nce
rsco
mb
ine
db
eca
use
of
its
un
usu
ally
hig
hin
cid
en
cera
te.
N/S
:n
ot
sho
wn
be
cau
se,
20
case
sw
ere
rep
ort
ed
ine
ach
pe
rio
d.
AY
As,
ado
lesc
en
tsan
dyo
un
gad
ult
s(a
ge
d1
5–
29
year
s);
CN
S,ce
ntr
aln
erv
ou
ssy
ste
m;
PN
ET,
pri
mit
ive
ne
uro
ect
od
erm
altu
mo
r;N
OS,
no
to
the
rwis
esp
eci
fie
d.
do
i:10
.13
71
/jo
urn
al.p
on
e.0
09
60
88
.t0
04
Cancer Among Adolescents and Young Adults in Korea
PLOS ONE | www.plosone.org 13 May 2014 | Volume 9 | Issue 5 | e96088

incidence of cervical carcinoma has been increasing among
Korean females under 30 years of age [30]. A steady increase in
cervical carcinoma in young women (20–29 years) has also been
observed in England [31]. The increased incidence of cervical
carcinoma among AYAs has been attributed to increases in
human papillomavirus (HPV) infection [32,33]. More specifically,
an increase in sexual behavior among younger age groups has led
to an increased rate of HPV infection [34,35], and the prevalence
rate of HPV has been reported to increase with decreasing age
[32]. Therefore, since 2007, the Korean Society of Gynecologic
Oncology and Colposcopy (KSGOC) has recommended the HPV
vaccine for females aged 15–17 for the prevention of cervical
carcinoma. In fact, certain recent studies have reported a decrease
in the incidence of cervical carcinoma due to the use of the HPV
vaccine at an earlier age [36,37]. Therefore, the incidence of
cervical carcinoma is expected to gradually decline among AYAs
in Korea due to the HPV vaccine.
In terms of survival, our data are consistent with that reported
for other geographic regions. Although the time period in our
study differed, the overall cancer survival rate among AYAs in
Korea was similar to the rate and significantly improvement
reported in the U.S. and Germany. Improvements in relative
survival rates among AYAs can be partially explained by
advances in cancer detection, more intensive treatments, and
increased expertise in adolescent oncology [38]. Additionally,
access to effective protocols and the development of health
infrastructures may have also contributed to improvements in
survival rates [39].
However several important differences should be highlighted
in lymphoma and leukemia. In the present study, the most
significant improvements in survival were observed in leukemia
and lymphoma patients, but the survival rates for leukemia and
lymphoma were noticeably lower than in the U.S. and
Germany [40,41]. This reason for this difference in the
survival rate by ethnic was that the incidence cases of subgroup
of leukemia and lymphoma was different between U.S. AYAs
[41] and Korea AYAs. More, ethnic disparities in tumor
biology and clinical factors may influence cancer treatment
and survival [42].
Compared with the survival of patients aged 1 to 10 years,
overall survival and disease-specific survival are clinically
significantly poorer among AYA patients with acute lympho-
blastic leukemia [43]. The survival rates for leukemia among
the Korean AYAs in our study have remained worse
than among Korean children based on data from the KCCR
[44].
Figure 2. Trends in relative survival after cancer in Korea according to age and the time period.doi:10.1371/journal.pone.0096088.g002
Cancer Among Adolescents and Young Adults in Korea
PLOS ONE | www.plosone.org 14 May 2014 | Volume 9 | Issue 5 | e96088

Among AYAs, breast cancer accounts for approximately 7%
and 4.9% of all cancers diagnosed in the United States [5] and
Korea, respectively. In the United States, the 5-year survival rate
for breast cancer is lower among AYAs (80.2%) than among
patients in other age groups (30–39 years, 83.4%; 40–49 years,
88.9%), and particularly older patients [41]. Our study showed
similar results. The relative survival rate for breast cancer among
Korean females aged 15–29 years was 86.8% in 2006–2010,
whereas the relative survival rate among Korean females aged
$40 years was 91.0% based on a direct estimate from the
KNCIDB.
One limitation of our study is that the follow-up period began
relatively soon after the diagnosis of cancer, in contrast to the
protocols in other studies [3–5]. Another limitation of this study is
that we could not estimate the survival rates after adjusting for
cancer stage and treatment because our registry database did not
include information on cancer stage and treatment.
In conclusion, our study provides representative cancer statistics
regarding temporal trends in the AYA population in Korea. In
particular, the results showed an increasing trend in cancer
incidence and an improving survival trend among AYAs in Korea.
These results may support cancer control and prevention plans
focusing on AYAs.
In the future, further research will help to identify factors
affecting cancer incidence and responses to treatment among
AYAs. In particular, research on the etiological factors related to
the rapid increase in thyroid carcinoma in AYAs is needed.
Author Contributions
Conceived and designed the experiments: Y-JW . Analyzed the data: E-
KM . Wrote the paper: E-KM Y-JW. Interpreted the results: HJP E-KM
Y-JW. Contributed to the discussion and reviewed manuscript: HJP HYS
BKP C-MO K-WJ E-KM Y-JW.
References
1. Bleyer A, Barr R, Hayes-Lattin B, Thomas D, Ellis C, et al. (2008) The
distinctive biology of cancer in adolescents and young adults. Nature Reviews
Cancer 8: 288–298.
2. Cotterill SJ, Parker L, Malcolm AJ, Reid M, More L, et al. (2000) Incidence and
survival for cancer in children and young adults in the North of England, 1968–
1995: a report from the Northern Region Young Persons’ Malignant Disease
Registry. British journal of cancer 83: 397–403.
3. Aben KK, van Gaal C, van Gils NA, van der Graaf WT, Zielhuis GA (2012)
Cancer in adolescents and young adults (15–29 years): A population-based study
in the Netherlands 1989–2009. Acta Oncologica: 1–12.
4. Birch J, Alston R, Kelsey A, Quinn M, Babb P, et al. (2002) Classification and
incidence of cancers in adolescents and young adults in England 1979–1997.
British journal of cancer 87: 1267–1274.
5. Bleyer A, O’Leary M, Barr R, Ries L (2006) Cancer epidemiology in older
adolescents and young adults 15 to 29 years of age, including SEER incidence
and survival: 1975–2000. National Cancer Institue, NIH Pub No?06–
5767Bethesda, MD 2006.
6. Jung KW, Won YJ, Kong HJ, Oh CM, Seo HG, et al. (2013) Cancer statistics in
Korea: incidence, mortality, survival and prevalence in 2010. Cancer Res Treat
45: 1–14.
7. Bleyer A (2007) Young adult oncology: the patients and their survival challenges.
CA: A Cancer Journal for Clinicians 57: 242–255.
8. Statistics Korea (2011), website. Available : http://kostat.go.kr. Accessed 2013
September 24.
9. Korea Central Cancer Registry. Cancer registry system in Korea. Available :
http://www.ncc.re.kr. Accessed 2013 September 23.
10. Shin HR, Won YJ, Jung KW, Kong HJ, Yim SH, et al. (2005) Nationwide
cancer incidence in Korea, 1999?2001; first result using the national cancer
incidence database. Cancer Research and Treatment : Official Journal of
Korean Cancer Association 37: 325–331.
11. Cancer incidence in the Five Continents. Vol.X electronic version Lyon, IARC.
website. Available : http://ci5.iarc.fr. Accessed 2013 October 23.
12. Canadian Cancer Society’s Steering Committee. Canadian Cancer Statistics
2009. Website. Available : http://www.cancer.ca/en/cancer-information/
cancer-101/canadian-cancer-statistics-publication/past-editions-canadian-
cancer-statistics/?region = qc. Accessed 2013 May 13.
13. Fritz A, Percy C, Jack A, Shanmugaratnam K, Sobin L, et al. (2000)
International Classification of Diseases for Oncology. 3rd ed. Geneva,
Switzerland: World Health Organization.
14. Barr RD, Holowaty EJ, Birch JM (2006) Classification schemes for tumors
diagnosed in adolescents and young adults. Cancer 106: 1425–1430.
15. Segi M (1960) Cancer mortality for selected sites in 24 countries (1950–1957).
Sendai, Japan : Tohoku University School of Medicine.
16. Howlader N, Noone AM, Krapcho M, Garshell J, Neyman N, et al. SEER
Cancer Statistics Review, 1975–2010, National Cancer Institute. Bethesda, MD,
based on November 2012 SEER data submission, posted to the SEER web site,
April 2013. website. Available : http://seer.cancer.gov/csr/1975_2010/.
Accessed 2013 September 17.
17. Smith P (1992) Cancer Incidence in Five Continents. Comparison between
registries: age-standardized rates. IARC scientific publications: 865–870.
18. Ederer F, Axtell LM, Cutler SJ (1961) The relative survival rate: a statistical
methodology. National Cancer Institute monograph 6: 101–121.
19. Ederer F, Heise H Instructions to IBM 650 programmers in processing survival
computations. Methodological note No.10. End Results Evaluation Section.
Bethesda MD : National Cancer Institute. 1959.
20. Brenner H, Gefeller O (1997) Deriving more up-todate estimates of long-term
patient survival. Journal of clinical epidemiology 50: 211–216.
21. Desandes E, Lacour B, Belot A, Molinie F, Delafosse P, et al. (2013) CancerIncidence and Survival in Adolescents and Young Adults in France, 2000–2008.
Pediatric Hematology-Oncology 30: 291–306.
22. Carreira H, Antunes L, Castro C, Lunet N, Bento MJ (2012) Cancer Incidence
and Survival (1997–2006) Among Adolescents and Young Adults in the North ofPortugal. Pediatric Hematology-Oncology 29: 663–676.
23. Alston RD, Geraci M, Eden TO, Moran A, Rowan S, et al. (2008) Changes incancer incidence in teenagers and young adults (ages 13 to 24 years) in England
1979–2003. Cancer 113: 2807–2815.
24. Aben KK, van Gaal C, van Gils NA, van der Graaf WT, Zielhuis GA (2012)
Cancer in adolescents and young adults (15–29 years): A population-based studyin the Netherlands 1989–2009. Acta Oncologica 51: 922–933.
25. Haggar FA, Preen DB, Pereira G, Holman CD, Einarsdottir K (2012) Cancer
incidence and mortality trends in Australian adolescents and young adults,
1982–2007. BMC cancer 12: 151.
26. Park HJ, Park E-H, Jung K-W, Kong H-J, Won Y-J, et al. (2012) Statistics ofhematologic malignancies in Korea: incidence, prevalence and survival rates
from 1999 to 2008. The Korean Journal of Hematology 47: 28–38.
27. Marrett LD, Frood J, Nishri D, Ugnat AM (2002) Cancer in Young Adults in
Canada Working G Cancer incidence in young adults in Canada: preliminary
results of a cancer surveillance project. Chronic diseases in Canada 23: 58–64.
28. Hogan AR, Zhuge Y, Perez EA, Koniaris LG, Lew JI, et al. (2009) Pediatricthyroid carcinoma: incidence and outcomes in 1753 patients. Journal of Surgical
Research 156: 167–172.
29. Davies L, Welch HG (2006) Increasing incidence of thyroid cancer in the United
States, 1973–2002. JAMA: the journal of the American Medical Association295: 2164–2167.
30. Oh CM, Jung KW, Won YJ, Shin A, Kong HJ, et al. (2013) Trends in theincidence of in? situ and invasive cervical cancer by age group and histological
type in Korea from 1993 to 2009. (in press). Plos one.
31. Patel A, Galaal K, Burnley C, Faulkner K, Martin-Hirsch P, et al. (2012)
Cervical cancer incidence in young women: a historical and geographiccontrolled UK regional population study. Br J Cancer 106: 1753–1759.
32. Kim Y-T (2009) Current status of cervical cancer and HPV infection in Korea.Journal of gynecologic oncology 20: 1–7.
33. Han MA, Choi KS, Lee H-Y, Jun JK, Jung KW, et al. (2012) Performance of
papanicolaou testing and detection of cervical carcinoma in?situ in participants
of organized cervical cancer screening in South Korea. PloS one 7: e35469.
34. Vaccarella S, Franceschi S, Herrero R, Munoz N, Snijders PJ, et al. (2006)Sexual behavior, condom use, and human papillomavirus: pooled analysis of the
IARC human papillomavirus prevalence surveys. Cancer Epidemiology
Biomarkers & Prevention 15: 326–333.
35. Shin H-R, Franceschi S, Vaccarella S, Roh J-W, Ju Y-H, et al. (2004) Prevalenceand determinants of genital infection with papillomavirus, in female and male
university students in Busan, South Korea. Journal of Infectious Diseases 190:
468–476.
36. Cuzick J, Castanon A, Sasieni P (2010) Predicted impact of vaccination against
human papillomavirus 16/18 on cancer incidence and cervical abnormalities inwomen aged 20–29 in the UK. British journal of cancer 102: 933–939.
37. Barnabas RV, Laukkanen P, Koskela P, Kontula O, Lehtinen M, et al. (2006)
Epidemiology of HPV 16 and cervical cancer in Finland and the potential
impact of vaccination: mathematical modelling analyses. PLoS Medicine 3:e138.
38. Barr RD (2011) Adolescents, young adults, and cancer–the international
challenge. Cancer 117: 2245–2249.
39. Pritchard-Jones K, Kaatsch P, Steliarova-Foucher E, Stiller C, Coebergh J
(2006) Cancer in children and adolescents in Europe: developments over 20years and future challenges. European journal of Cancer 42: 2183–2190.
Cancer Among Adolescents and Young Adults in Korea
PLOS ONE | www.plosone.org 15 May 2014 | Volume 9 | Issue 5 | e96088

40. Steliarova-Foucher E, Stiller C, Kaatsch P, Berrino F, Coebergh J-W, et al.
(2004) Geographical patterns and time trends of cancer incidence and survival
among children and adolescents in Europe since the 1970s (the ACCIS project):
an epidemiological study. The Lancet 364: 2097–2105.
41. Gondos A, Hiripi E, Holleczek B, Luttmann S, Eberle A, et al. (2013) Survival
among adolescents and young adults with cancer in Germany and the United
States: An international comparison. International Journal of Cancer.
42. Shavers VL, Brown ML (2002) Racial and ethnic disparities in the receipt of
cancer treatment. Journal of the National Cancer Institute 94: 334–357.43. Tricoli JV, Seibel NL, Blair DG, Albritton K, Hayes-Lattin B (2011) Unique
characteristics of adolescent and young adult acute lymphoblastic leukemia,
breast cancer, and colon cancer. Journal of the National Cancer Institute 103:628–635.
44. The Korea Central Cancer Registry, National Cancer Center. Annual report ofcancer statistics in Korea in 2010, Ministry of Health and Welfare, 2012.
Cancer Among Adolescents and Young Adults in Korea
PLOS ONE | www.plosone.org 16 May 2014 | Volume 9 | Issue 5 | e96088