Embed Size (px)
Citation preview
sustainability
Article
Capacity Fade in Lithium-Ion Batteries and CyclicAging over Various State-of-Charge Ranges
Sophia Gantenbein *, Michael Schönleber, Michael Weiss and Ellen Ivers-Tiffée
Institute for Applied Materials (IAM-WET), Karlsruhe Institute of Technology (KIT), 76131 Karlsruhe, Germany;[email protected] (M.S.); [email protected] (M.W.); [email protected] (E.I.-T.)* Correspondence: [email protected]; Tel.: +49-721-608-47565
Received: 10 October 2019; Accepted: 18 November 2019; Published: 26 November 2019 �����������������
Abstract: In order to develop long-lifespan batteries, it is of utmost importance to identify the relevantaging mechanisms and their relation to operating conditions. The capacity loss in a lithium-ion batteryoriginates from (i) a loss of active electrode material and (ii) a loss of active lithium. The focus of thiswork is the capacity loss caused by lithium loss, which is irreversibly bound to the solid electrolyteinterface (SEI) on the graphite surface. During operation, the particle surface suffers from dilation,which causes the SEI to break and then be rebuilt, continuously. The surface dilation is expectedto correspond with the well-known graphite staging mechanism. Therefore, a high-power 2.6 Ahgraphite/LiNiCoAlO2 cell (Sony US18650VTC5) is cycled at different, well-defined state-of-charge(SOC) ranges, covering the different graphite stages. An open circuit voltage model is applied toquantify the loss mechanisms (i) and (ii). The results show that the lithium loss is the dominant causeof capacity fade under the applied conditions. They experimentally prove the important influenceof the graphite stages on the lifetime of a battery. Cycling the cell at SOCs slightly above graphiteStage II results in a high active lithium loss and hence in a high capacity fade.
Keywords: cyclic aging; capacity fade; active lithium loss; graphite staging mechanism; graphiteparticle dilation; open circuit voltage model
1. Introduction
The investigation of degradation mechanisms in lithium-ion batteries has proven essential forincreasing the service life and extending operation. Full understanding of these mechanisms enablesactions to reduce and mitigate degradation. In addition, a longer service life of the batteries used leadsto less frequent replacement in the application. This reduces resource consumption and contributes togreater sustainability. One consequence of degradation is capacity fade, which can lead to declines indevice usability.
Capacity fade is caused by a loss of active electrode material (loss of storage medium): For example,if the cathode material becomes unstable at high potentials, it can no longer store lithium [1,2]. Pressingly,recent studies have shown that the loss of active electrode material is actually low compared to the lossof active lithium (loss of storage content) [3]. Two main mechanisms cause active lithium loss.
Graphite is currently the most commonly used active anode material. Active lithium can getlost due to irreversible plating or the formation of a solid electrolyte interface (SEI) on the graphitesurface [4,5]. While plating can be reduced by applying an optimized charge process [6], SEI formationon the graphite particle surface is inevitable and even desirable. Liquid electrolytes for lithium-ionbatteries are not stable below a potential of 1.5 V vs. Li. They decompose at the graphite surfaceto form an ion-conducting surface film called SEI, which protects the electrolyte against furtherdecomposition [7]. Lithium is consumed in these decomposition reactions [8].
Sustainability 2019, 11, 6697; doi:10.3390/su11236697 www.mdpi.com/journal/sustainability
Sustainability 2019, 11, 6697 2 of 15
However, the SEI is not only built at the beginning of life (BOL) of the battery. During operation(i.e., during deintercalation and intercalation of lithium), the electrode particles suffer from volumechanges and mechanical stresses. The volume change is negligible for LiCoO2-based cathodematerials [9] but can be up to 10% for graphite [4,10]. The dilation of the graphite particle surfacecauses the SEI to break. This exposes fresh graphite surface on which new SEI is built. Hence, lithiumis consumed continuously due to volume changes of the particle surface during operation and the cellprogressively loses capacity.
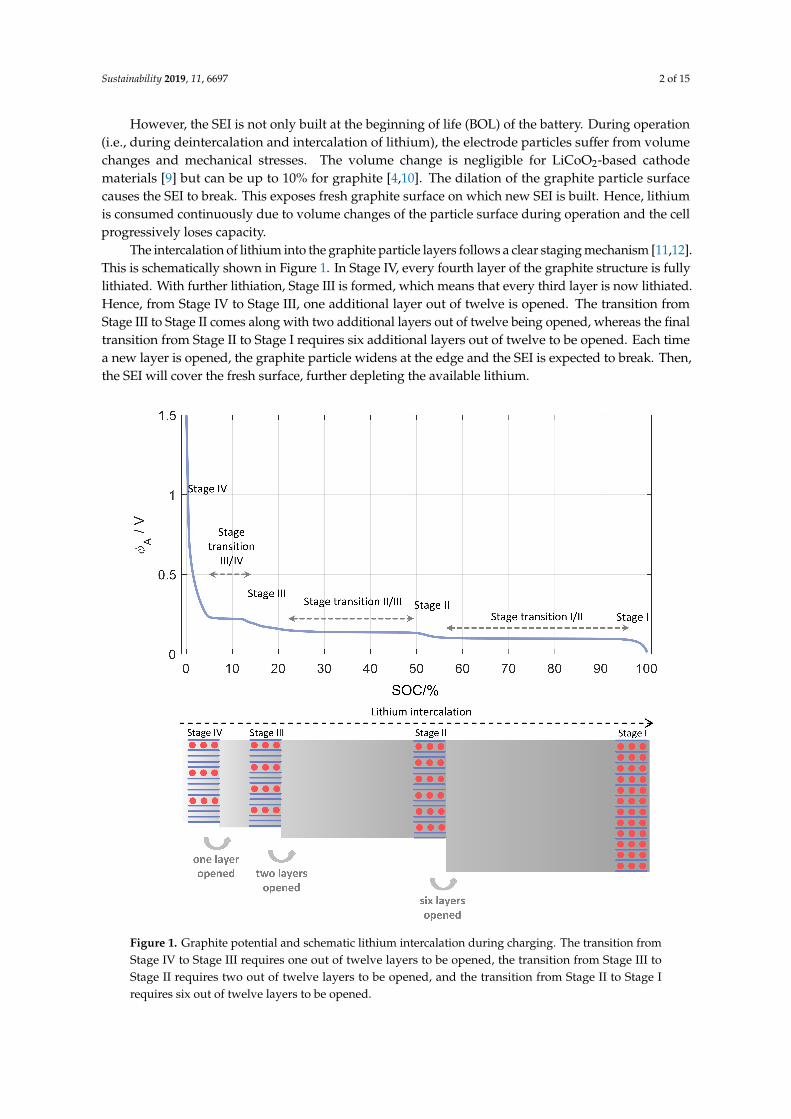
The intercalation of lithium into the graphite particle layers follows a clear staging mechanism [11,12].This is schematically shown in Figure 1. In Stage IV, every fourth layer of the graphite structure is fullylithiated. With further lithiation, Stage III is formed, which means that every third layer is now lithiated.Hence, from Stage IV to Stage III, one additional layer out of twelve is opened. The transition fromStage III to Stage II comes along with two additional layers out of twelve being opened, whereas the finaltransition from Stage II to Stage I requires six additional layers out of twelve to be opened. Each timea new layer is opened, the graphite particle widens at the edge and the SEI is expected to break. Then,the SEI will cover the fresh surface, further depleting the available lithium.
Figure 1. Graphite potential and schematic lithium intercalation during charging. The transition fromStage IV to Stage III requires one out of twelve layers to be opened, the transition from Stage III toStage II requires two out of twelve layers to be opened, and the transition from Stage II to Stage Irequires six out of twelve layers to be opened.
Sustainability 2019, 11, 6697 3 of 15
Therefore, when operating a lithium-ion cell with a graphite anode in different SOC ranges,the capacity loss caused by the loss of active lithium (due to the SEI breaking and rebuilding) is expectedto be greatest in the range of Stage II when Stage I is being opened. This is the point of highest risk.The transition from Stage II to Stage I was also modeled in [13]. The experimental investigation ofthis hypothesis is the focus of this work. For this reason, five different cycle-life experiments wereconducted, in which the cells were cycled across different ranges of the anode potential. The capacityloss of the commercial full cell was determined at regular intervals during aging. To quantify the activelithium loss, a nondestructive method was applied, based on an open circuit voltage (OCV) model.The model simulates the full-cell OCV by the difference between the cathode and the anode opencircuit potential (OCP) [14,15]. The cause of capacity loss can be determined with a little additionalexperimental effort. A single commercial cell does have to be opened, and both electrode potentialsare measured in experimental cells. This data set is then available for use in the OCV model at alltimes (and means that other cells need not be disassembled). In [15], it was already demonstrated thatthe model is applicable for the investigation of cell degradation. The approach was recently appliedin [16,17] to analyze the degradation mechanisms in a lithium-ion battery. Further, this study is the firsttime the model has been used to systematically investigate the influence of the graphite potentialand its stages on the capacity loss of a lithium-ion battery.
2. Experimental Section
2.1. Investigated Cell
This study investigated a high-power 18650 lithium-ion cell with a nominal capacity of 2.6 Ah(Sony US18650VTC5). The Sony VTC5 is a popular cell, ideal for modern power tools. The upperand lower voltage limits were 4.2 and 2.5 V, the maximum charge and discharge currents were 4(approx. 1.5 C-rate) and 20 A (approx. 8 C-rate). The cell is composed of graphite as anode materialand LiNiCoAlO2 and carbon black as cathode material.
2.2. Experimental Cells
To obtain the cathode and anode OCP, the 18650 cell was discharged to 2.5 V by a current rate ofC/2 and afterwards opened and disassembled in an argon filled glovebox. In the next step, experimentalhalf-cells with a diameter of 18 mm were built with a lithium counter electrode (Sigma-Aldrich, productnumber 265985, 99.9% trace metals basis). The experimental cell housings ECC-PAT-Core (EL-CELL)are equipped with a lithium reference electrode. The liquid electrolyte was a 1 mol/L–1 LiPF6 solutionin a 1:1 mixing ratio of ethylene carbonate:dimethyl carbonate (BASF, Selectilyte LP30). The twoexperimental cells were built with anode and cathode material, respectively, and the half-cell potentialswere recorded against the reference electrode with a C/40-rate (175 µA) from 0.05 to 1.5 V (anode)and from 4.4 to 3.0 V (cathode).
2.3. Analytical Equipment
The cycle-life aging tests were performed using a Basytec XCTS cell test system with 25 Amaximum output current. According to the technical data-sheet, this system has a currentprecision of 50 mA (see Table 1). Since the capacity measurements in the characterization testsand the experimental cell measurements require small currents (65 and 175 µA) and high precision,these tests were performed using a Basytec CTS-LAB cell test system with 3 A maximum outputcurrent. This system has a current precision of 50 and 0.2 µA in the required current ranges.
All measurements were carried out at a constant temperature of 25 ◦C. For this reason, the cellswere placed in a Friocell 55 climate chamber from MMM Medcenter Einrichtungen GmbH (0.0–99.9 ◦C).The climate chamber has a temporal temperature accuracy of±0.2 ◦C and a spatial temperature accuracyof ±0.5 ◦C. All cells were tested simultaneously in the same climate chamber, and the temperature wascontinuously monitored.
Sustainability 2019, 11, 6697 4 of 15
Table 1. Technical specifications of the Basytec XCTS and CTS-LAB systems.
Basytec XCTS Basytec CTS-LAB
current range 25 A 3 A/250 mA/15 mA/1 mAcurrent precision 50 mA up to 25 A 500 µA/50 µA/2.5 µA/0.2 µAcurrent resolution 1 mA 100 µA/8 µA/0.5 µA/0.05 µA
2.4. Test Procedure
After the initial characterization at BOL, the cells were cycled for 4000 cycles with 20% depth ofdischarge (∆DOD), which results in a total charge throughput of 4160 Ah. At the end of the cycle lifetest (EOT), a final characterization was conducted. Interim checkups were performed at intervals ofevery 500 cycles to as sess cell aging and to readjust the SOC ranges over which the cells were cycled.Two cells were tested under the same conditions to ensure result reproducibility.
2.4.1. Characterization Tests
The remaining cell capacity was determined by conducting a standard charge until 100% SOC(C/2-rate constant current charge to 4.2 V, constant voltage charge at 4.2 V until the current decreasedbelow 100 mA), and then discharging to 0% SOC (2.5 V). At BOL and EOT, the actual capacity wasmeasured by discharging the cell with a C/40-rate (65 mA). After each 500 cycles, the actual capacitywas measured by discharging the cell with a C/10-rate (260 mA) due to time constraints. The lowcurrent rate in the capacity measurements allowed us to measure the actual capacity fade. A capacitymeasurement at higher C-rates could have distorted the capacity fade: Higher losses during dischargecould have caused the lower voltage limit to be reached earlier, and the measurement result does notreflect the actual capacity. This effect was further reinforced during aging because the inner resistance ofthe cell increased. In addition, the low discharge rate ensured near-equilibrium conditions, which wasa prerequisite for the application of the OCV model (see Section 2.5).
2.4.2. Cycle-Life Tests
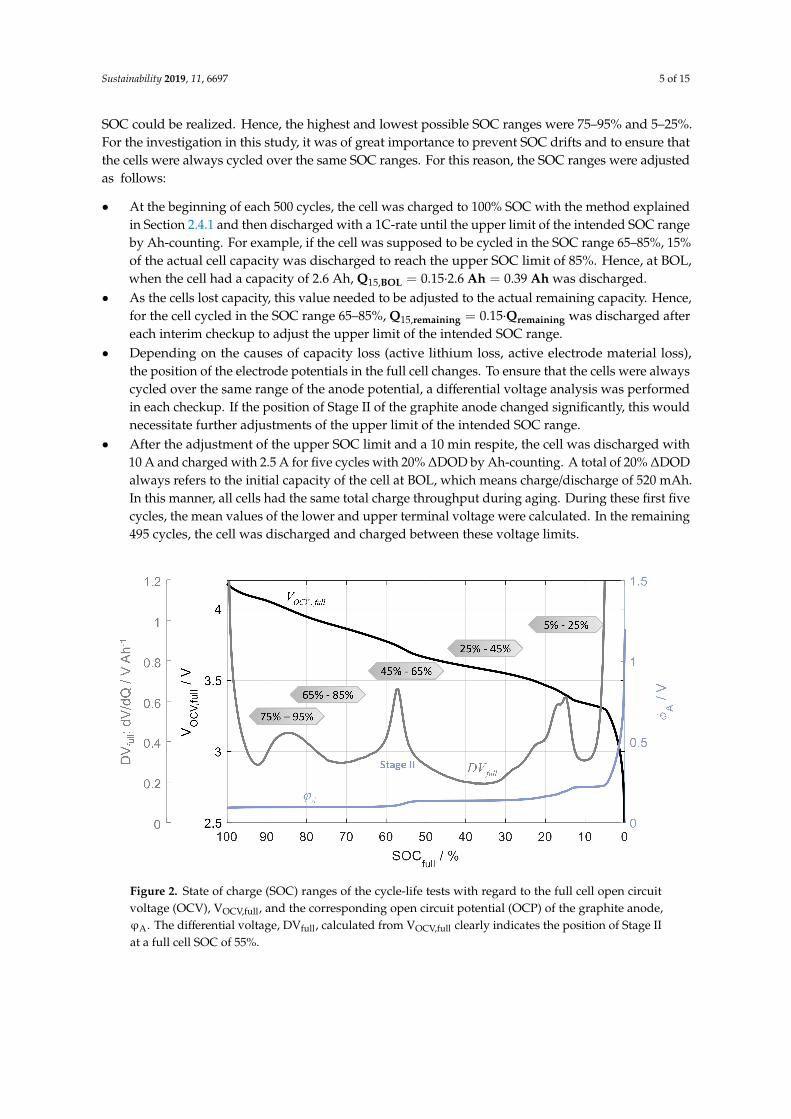
Cycle-life tests were performed following the information detailed in Table 2 and Figure 2.The focus of this test matrix was the influence of the SOC range (i.e., the graphite potential and itsstages) on the loss of active lithium. As explained in the introduction, a higher capacity loss is expectedin the range of Stage II when Stage I is opening. Figure 2 shows the quasi-OCV VOCV,full of the SonyVTC5 full cell (black line; recorded with a C/40-rate) and the corresponding anode potential ϕA
(blue line). Since the anode is usually oversized compared to the cathode, the fully lithiated state ofthe anode is not reached at a full cell SOC of 100%. The differential voltage, DVfull, of the full cell OCVis plotted (grey line) to clearly indicate the position of Stage II at a full cell SOC of 55%. The differentialvoltage is defined by:
DV(Q) = dQ/dU (1)
and allows us to better visualize the electrode features. In addition to the graphite stages,the LiNiCoAlO2 cathode feature is visible at a full cell SOC of 85%. The choice of SOC rangesfor cycling was motivated as follows:
• To ensure the cycling in an SOC range which fully passes Stage II, the first SOC range was set to45–65%;
• The charge throughput should not vary, which means all experiments passed a ∆DOD of 20%.Ideally, the whole SOC range (0–100%) should be covered, which requires five different SOC ranges;
• The SOC ranges 25–45% and 65–85% covered the plateau regions (stage transitions) of the graphiteanode. In theory, they should not pass any stages.
Cycling up to 100% and down to 0% SOC was not possible because of the system loss and the resultingovervoltage. The upper and lower voltage limits of 4.2 and 2.5 V would be reached before 100% and 0%
Sustainability 2019, 11, 6697 5 of 15
SOC could be realized. Hence, the highest and lowest possible SOC ranges were 75–95% and 5–25%.For the investigation in this study, it was of great importance to prevent SOC drifts and to ensure thatthe cells were always cycled over the same SOC ranges. For this reason, the SOC ranges were adjustedas follows:
• At the beginning of each 500 cycles, the cell was charged to 100% SOC with the method explainedin Section 2.4.1 and then discharged with a 1C-rate until the upper limit of the intended SOC rangeby Ah-counting. For example, if the cell was supposed to be cycled in the SOC range 65–85%, 15%of the actual cell capacity was discharged to reach the upper SOC limit of 85%. Hence, at BOL,when the cell had a capacity of 2.6 Ah, Q15,BOL = 0.15·2.6 Ah = 0.39 Ah was discharged.
• As the cells lost capacity, this value needed to be adjusted to the actual remaining capacity. Hence,for the cell cycled in the SOC range 65–85%, Q15,remaining = 0.15·Qremaining was discharged aftereach interim checkup to adjust the upper limit of the intended SOC range.
• Depending on the causes of capacity loss (active lithium loss, active electrode material loss),the position of the electrode potentials in the full cell changes. To ensure that the cells were alwayscycled over the same range of the anode potential, a differential voltage analysis was performedin each checkup. If the position of Stage II of the graphite anode changed significantly, this wouldnecessitate further adjustments of the upper limit of the intended SOC range.
• After the adjustment of the upper SOC limit and a 10 min respite, the cell was discharged with10 A and charged with 2.5 A for five cycles with 20% ∆DOD by Ah-counting. A total of 20% ∆DODalways refers to the initial capacity of the cell at BOL, which means charge/discharge of 520 mAh.In this manner, all cells had the same total charge throughput during aging. During these first fivecycles, the mean values of the lower and upper terminal voltage were calculated. In the remaining495 cycles, the cell was discharged and charged between these voltage limits.
Figure 2. State of charge (SOC) ranges of the cycle-life tests with regard to the full cell open circuitvoltage (OCV), VOCV,full, and the corresponding open circuit potential (OCP) of the graphite anode,ϕA. The differential voltage, DVfull, calculated from VOCV,full clearly indicates the position of Stage IIat a full cell SOC of 55%.
Sustainability 2019, 11, 6697 6 of 15
Table 2. Cycle-life tests.
T/◦C 25
discharge current/A 10
charge current/A 2.5
SOC range/% 5–25 25–45 45–65 65–85 75–95
2.5. Data Analysis
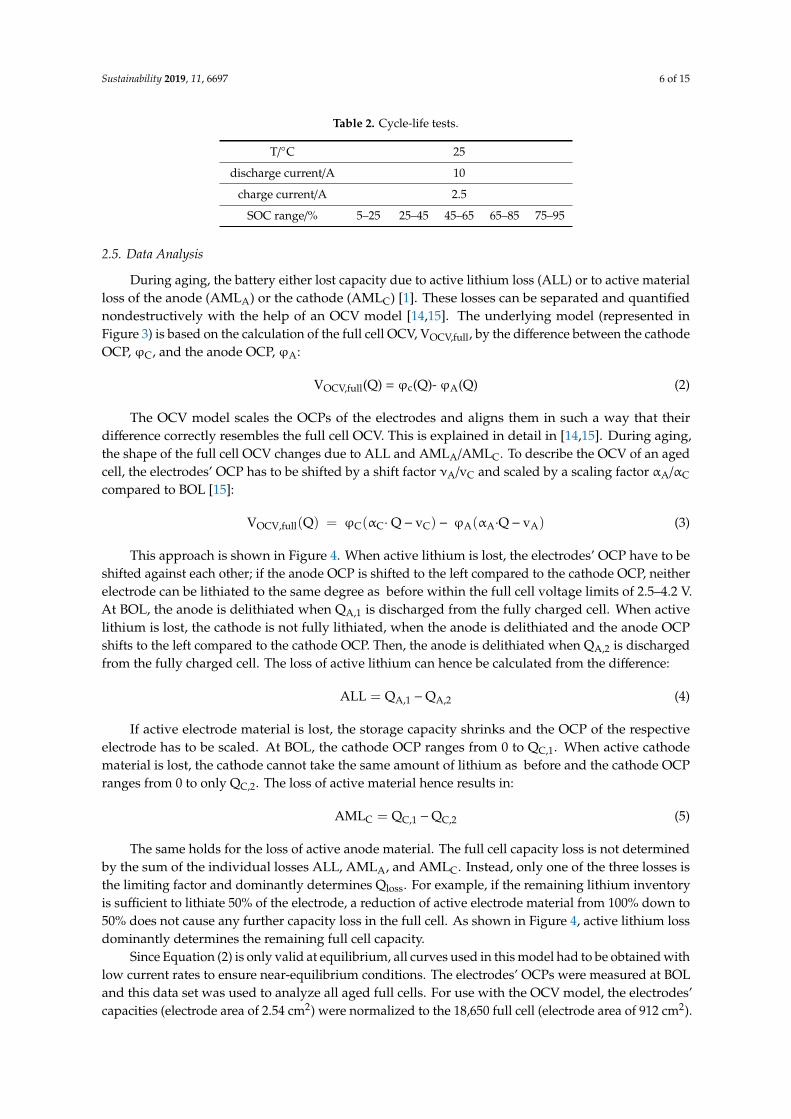
During aging, the battery either lost capacity due to active lithium loss (ALL) or to active materialloss of the anode (AMLA) or the cathode (AMLC) [1]. These losses can be separated and quantifiednondestructively with the help of an OCV model [14,15]. The underlying model (represented inFigure 3) is based on the calculation of the full cell OCV, VOCV,full, by the difference between the cathodeOCP, ϕC, and the anode OCP, ϕA:
VOCV,full(Q) = ϕc(Q)- ϕA(Q) (2)
The OCV model scales the OCPs of the electrodes and aligns them in such a way that theirdifference correctly resembles the full cell OCV. This is explained in detail in [14,15]. During aging,the shape of the full cell OCV changes due to ALL and AMLA/AMLC. To describe the OCV of an agedcell, the electrodes’ OCP has to be shifted by a shift factor νA/vC and scaled by a scaling factor αA/αC
compared to BOL [15]:
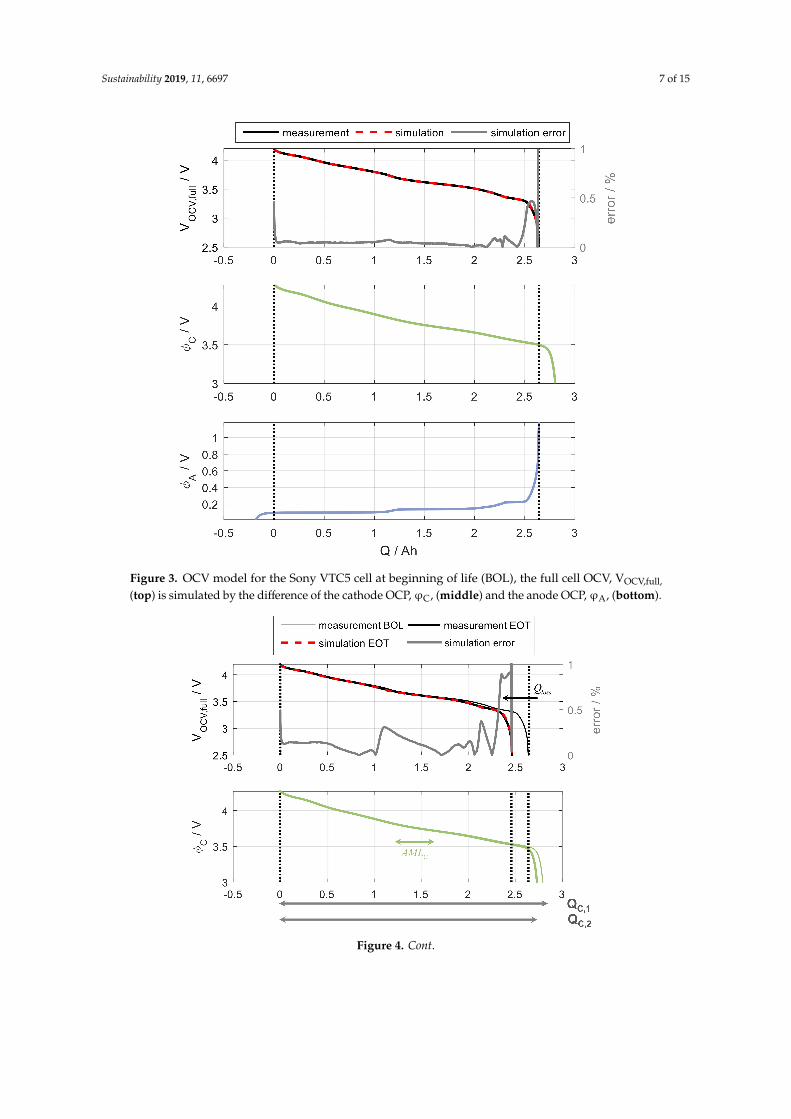
VOCV,full(Q) = ϕC(αC· Q− vC) − ϕA(αA·Q− vA) (3)
This approach is shown in Figure 4. When active lithium is lost, the electrodes’ OCP have to beshifted against each other; if the anode OCP is shifted to the left compared to the cathode OCP, neitherelectrode can be lithiated to the same degree as before within the full cell voltage limits of 2.5–4.2 V.At BOL, the anode is delithiated when QA,1 is discharged from the fully charged cell. When activelithium is lost, the cathode is not fully lithiated, when the anode is delithiated and the anode OCPshifts to the left compared to the cathode OCP. Then, the anode is delithiated when QA,2 is dischargedfrom the fully charged cell. The loss of active lithium can hence be calculated from the difference:
ALL = QA,1 −QA,2 (4)
If active electrode material is lost, the storage capacity shrinks and the OCP of the respectiveelectrode has to be scaled. At BOL, the cathode OCP ranges from 0 to QC,1. When active cathodematerial is lost, the cathode cannot take the same amount of lithium as before and the cathode OCPranges from 0 to only QC,2. The loss of active material hence results in:
AMLC = QC,1 −QC,2 (5)
The same holds for the loss of active anode material. The full cell capacity loss is not determinedby the sum of the individual losses ALL, AMLA, and AMLC. Instead, only one of the three losses isthe limiting factor and dominantly determines Qloss. For example, if the remaining lithium inventoryis sufficient to lithiate 50% of the electrode, a reduction of active electrode material from 100% down to50% does not cause any further capacity loss in the full cell. As shown in Figure 4, active lithium lossdominantly determines the remaining full cell capacity.
Since Equation (2) is only valid at equilibrium, all curves used in this model had to be obtained withlow current rates to ensure near-equilibrium conditions. The electrodes’ OCPs were measured at BOLand this data set was used to analyze all aged full cells. For use with the OCV model, the electrodes’capacities (electrode area of 2.54 cm2) were normalized to the 18,650 full cell (electrode area of 912 cm2).
Sustainability 2019, 11, 6697 7 of 15
Figure 3. OCV model for the Sony VTC5 cell at beginning of life (BOL), the full cell OCV, VOCV,full,
(top) is simulated by the difference of the cathode OCP,ϕC, (middle) and the anode OCP,ϕA, (bottom).
Figure 4. Cont.
Sustainability 2019, 11, 6697 8 of 15
Figure 4. OCV model for the Sony VTC5 cell at BOL and at end of cycle life test (EOT) for the cellcycled over the SOC range 75–95%. Active lithium loss requires a shift of the electrodes’ OCPs againsteach other. Active material loss requires a scaling of the electrodes’ OCPs.
3. Results
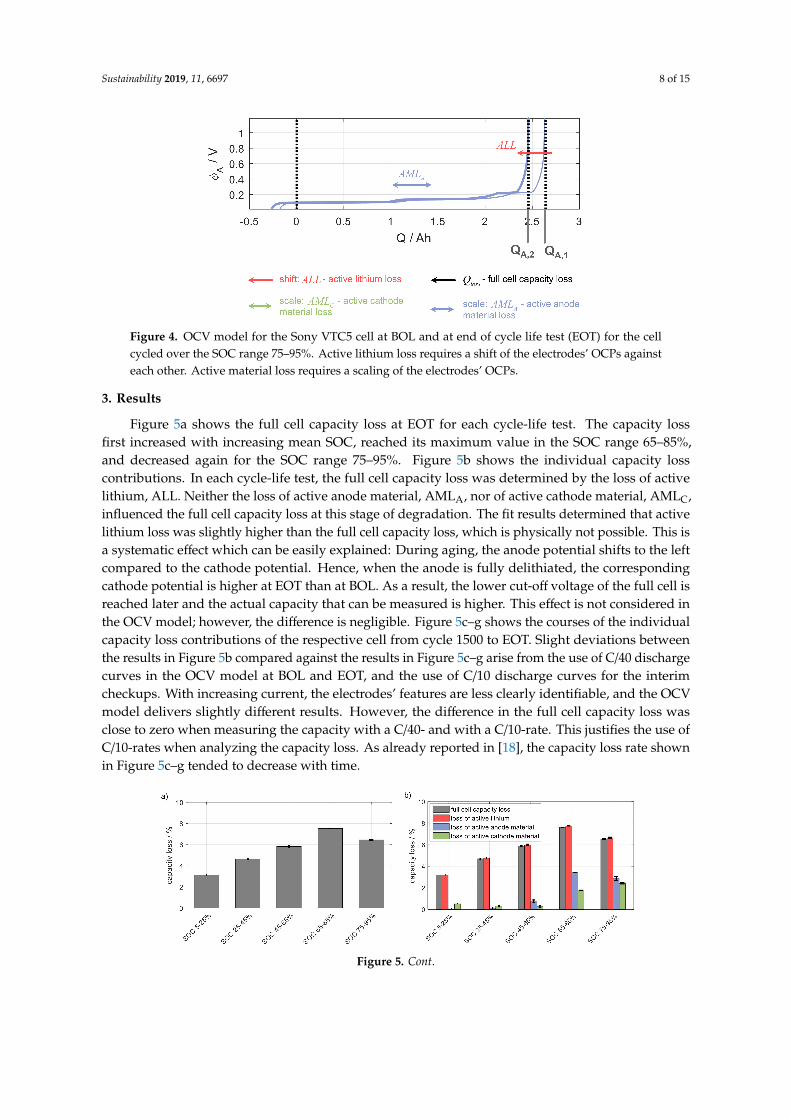
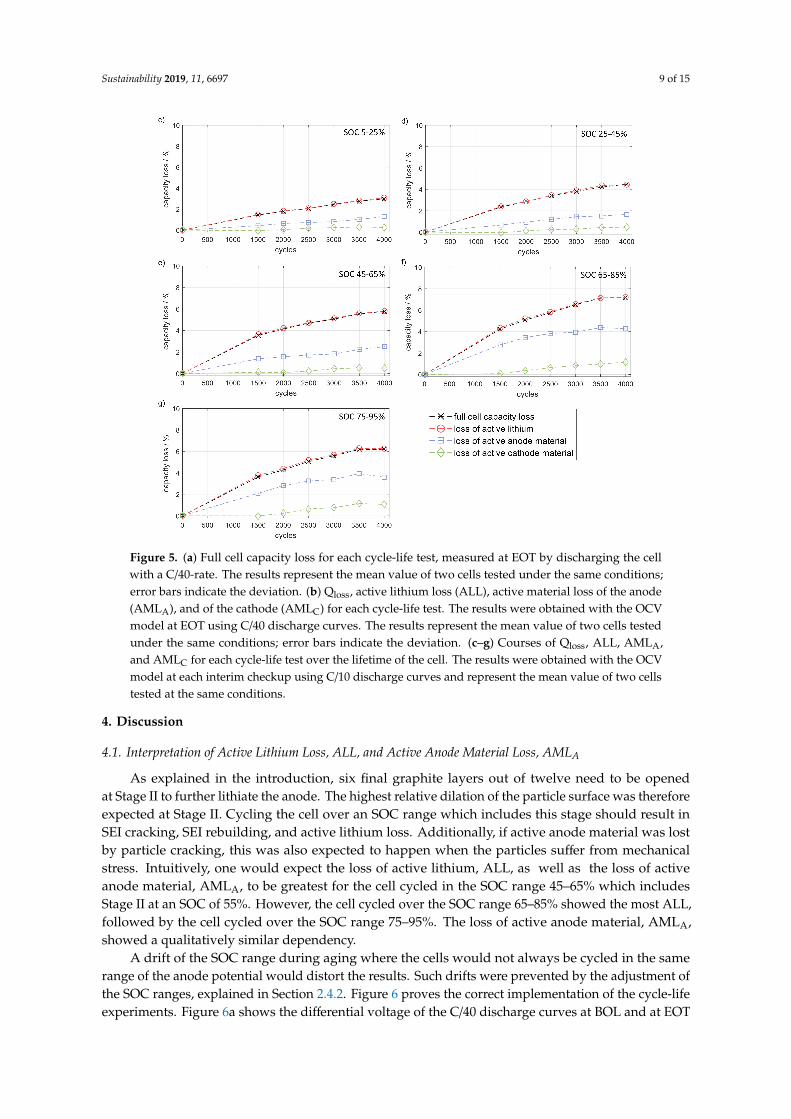
Figure 5a shows the full cell capacity loss at EOT for each cycle-life test. The capacity lossfirst increased with increasing mean SOC, reached its maximum value in the SOC range 65–85%,and decreased again for the SOC range 75–95%. Figure 5b shows the individual capacity losscontributions. In each cycle-life test, the full cell capacity loss was determined by the loss of activelithium, ALL. Neither the loss of active anode material, AMLA, nor of active cathode material, AMLC,influenced the full cell capacity loss at this stage of degradation. The fit results determined that activelithium loss was slightly higher than the full cell capacity loss, which is physically not possible. This isa systematic effect which can be easily explained: During aging, the anode potential shifts to the leftcompared to the cathode potential. Hence, when the anode is fully delithiated, the correspondingcathode potential is higher at EOT than at BOL. As a result, the lower cut-off voltage of the full cell isreached later and the actual capacity that can be measured is higher. This effect is not considered inthe OCV model; however, the difference is negligible. Figure 5c–g shows the courses of the individualcapacity loss contributions of the respective cell from cycle 1500 to EOT. Slight deviations betweenthe results in Figure 5b compared against the results in Figure 5c–g arise from the use of C/40 dischargecurves in the OCV model at BOL and EOT, and the use of C/10 discharge curves for the interimcheckups. With increasing current, the electrodes’ features are less clearly identifiable, and the OCVmodel delivers slightly different results. However, the difference in the full cell capacity loss wasclose to zero when measuring the capacity with a C/40- and with a C/10-rate. This justifies the use ofC/10-rates when analyzing the capacity loss. As already reported in [18], the capacity loss rate shownin Figure 5c–g tended to decrease with time.
Figure 5. Cont.
Sustainability 2019, 11, 6697 9 of 15
Figure 5. (a) Full cell capacity loss for each cycle-life test, measured at EOT by discharging the cellwith a C/40-rate. The results represent the mean value of two cells tested under the same conditions;error bars indicate the deviation. (b) Qloss, active lithium loss (ALL), active material loss of the anode(AMLA), and of the cathode (AMLC) for each cycle-life test. The results were obtained with the OCVmodel at EOT using C/40 discharge curves. The results represent the mean value of two cells testedunder the same conditions; error bars indicate the deviation. (c–g) Courses of Qloss, ALL, AMLA,and AMLC for each cycle-life test over the lifetime of the cell. The results were obtained with the OCVmodel at each interim checkup using C/10 discharge curves and represent the mean value of two cellstested at the same conditions.
4. Discussion
4.1. Interpretation of Active Lithium Loss, ALL, and Active Anode Material Loss, AMLA
As explained in the introduction, six final graphite layers out of twelve need to be openedat Stage II to further lithiate the anode. The highest relative dilation of the particle surface was thereforeexpected at Stage II. Cycling the cell over an SOC range which includes this stage should result inSEI cracking, SEI rebuilding, and active lithium loss. Additionally, if active anode material was lostby particle cracking, this was also expected to happen when the particles suffer from mechanicalstress. Intuitively, one would expect the loss of active lithium, ALL, as well as the loss of activeanode material, AMLA, to be greatest for the cell cycled in the SOC range 45–65% which includesStage II at an SOC of 55%. However, the cell cycled over the SOC range 65–85% showed the most ALL,followed by the cell cycled over the SOC range 75–95%. The loss of active anode material, AMLA,showed a qualitatively similar dependency.
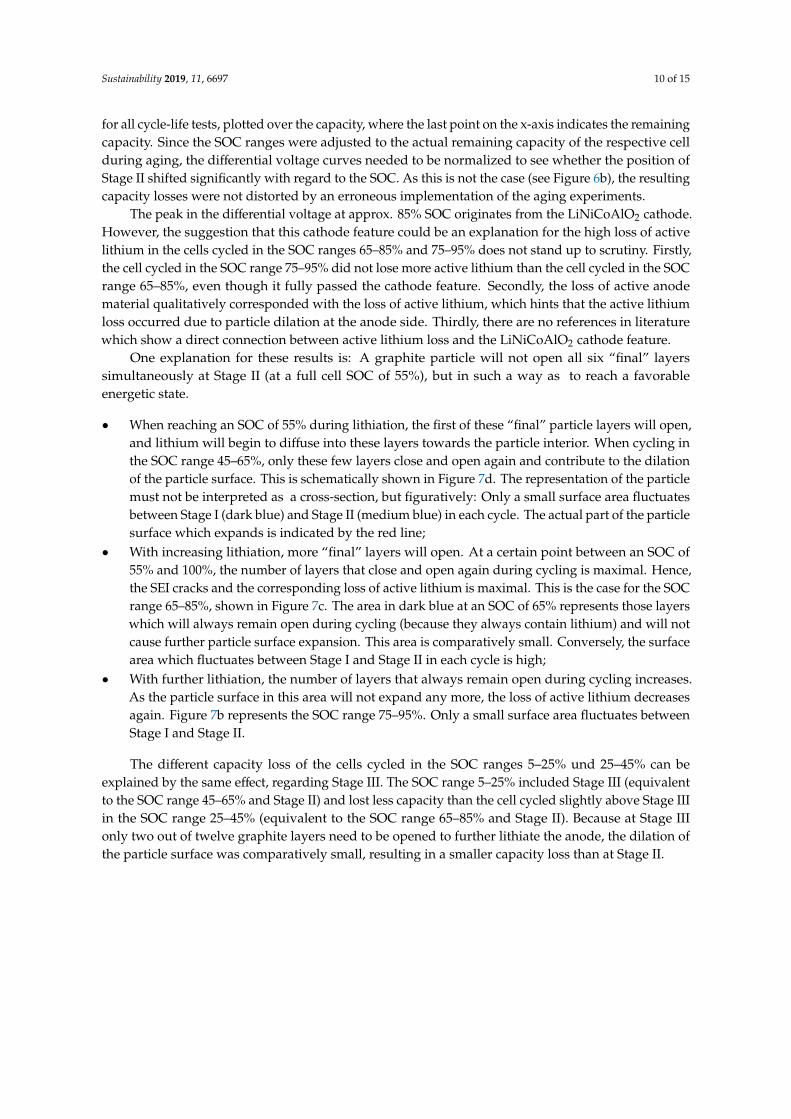
A drift of the SOC range during aging where the cells would not always be cycled in the samerange of the anode potential would distort the results. Such drifts were prevented by the adjustment ofthe SOC ranges, explained in Section 2.4.2. Figure 6 proves the correct implementation of the cycle-lifeexperiments. Figure 6a shows the differential voltage of the C/40 discharge curves at BOL and at EOT
Sustainability 2019, 11, 6697 10 of 15
for all cycle-life tests, plotted over the capacity, where the last point on the x-axis indicates the remainingcapacity. Since the SOC ranges were adjusted to the actual remaining capacity of the respective cellduring aging, the differential voltage curves needed to be normalized to see whether the position ofStage II shifted significantly with regard to the SOC. As this is not the case (see Figure 6b), the resultingcapacity losses were not distorted by an erroneous implementation of the aging experiments.
The peak in the differential voltage at approx. 85% SOC originates from the LiNiCoAlO2 cathode.However, the suggestion that this cathode feature could be an explanation for the high loss of activelithium in the cells cycled in the SOC ranges 65–85% and 75–95% does not stand up to scrutiny. Firstly,the cell cycled in the SOC range 75–95% did not lose more active lithium than the cell cycled in the SOCrange 65–85%, even though it fully passed the cathode feature. Secondly, the loss of active anodematerial qualitatively corresponded with the loss of active lithium, which hints that the active lithiumloss occurred due to particle dilation at the anode side. Thirdly, there are no references in literaturewhich show a direct connection between active lithium loss and the LiNiCoAlO2 cathode feature.
One explanation for these results is: A graphite particle will not open all six “final” layerssimultaneously at Stage II (at a full cell SOC of 55%), but in such a way as to reach a favorableenergetic state.
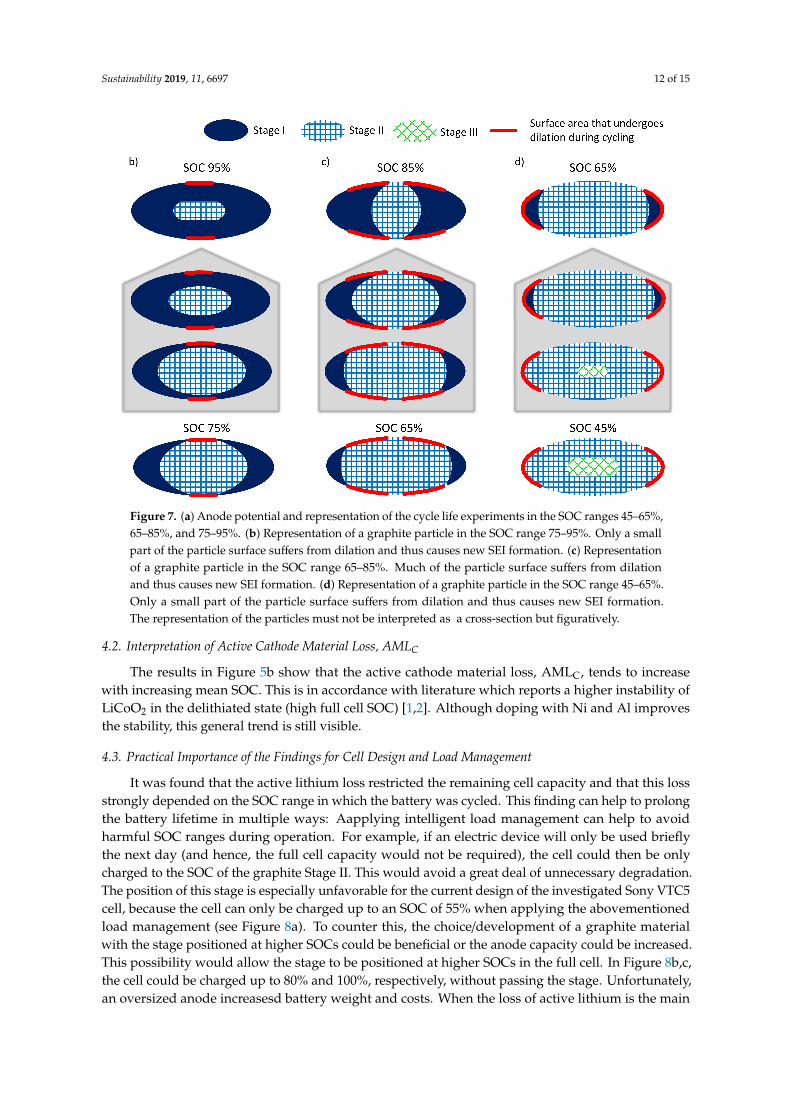
• When reaching an SOC of 55% during lithiation, the first of these “final” particle layers will open,and lithium will begin to diffuse into these layers towards the particle interior. When cycling inthe SOC range 45–65%, only these few layers close and open again and contribute to the dilationof the particle surface. This is schematically shown in Figure 7d. The representation of the particlemust not be interpreted as a cross-section, but figuratively: Only a small surface area fluctuatesbetween Stage I (dark blue) and Stage II (medium blue) in each cycle. The actual part of the particlesurface which expands is indicated by the red line;
• With increasing lithiation, more “final” layers will open. At a certain point between an SOC of55% and 100%, the number of layers that close and open again during cycling is maximal. Hence,the SEI cracks and the corresponding loss of active lithium is maximal. This is the case for the SOCrange 65–85%, shown in Figure 7c. The area in dark blue at an SOC of 65% represents those layerswhich will always remain open during cycling (because they always contain lithium) and will notcause further particle surface expansion. This area is comparatively small. Conversely, the surfacearea which fluctuates between Stage I and Stage II in each cycle is high;
• With further lithiation, the number of layers that always remain open during cycling increases.As the particle surface in this area will not expand any more, the loss of active lithium decreasesagain. Figure 7b represents the SOC range 75–95%. Only a small surface area fluctuates betweenStage I and Stage II.
The different capacity loss of the cells cycled in the SOC ranges 5–25% und 25–45% can beexplained by the same effect, regarding Stage III. The SOC range 5–25% included Stage III (equivalentto the SOC range 45–65% and Stage II) and lost less capacity than the cell cycled slightly above Stage IIIin the SOC range 25–45% (equivalent to the SOC range 65–85% and Stage II). Because at Stage IIIonly two out of twelve graphite layers need to be opened to further lithiate the anode, the dilation ofthe particle surface was comparatively small, resulting in a smaller capacity loss than at Stage II.
Sustainability 2019, 11, 6697 11 of 15
Figure 6. Differential voltage (DV), calculated from the C/40 discharge curves at BOL and at EOT forall cycle-life tests. (a) Differential voltage plotted over the capacity, Q, indicating the capacity loss, Qloss.(b) Differential voltage normalized to the actual remaining capacity, the peak indicating Stage II onlyshifts slightly to the left during aging.
Figure 7. Cont.
Sustainability 2019, 11, 6697 12 of 15
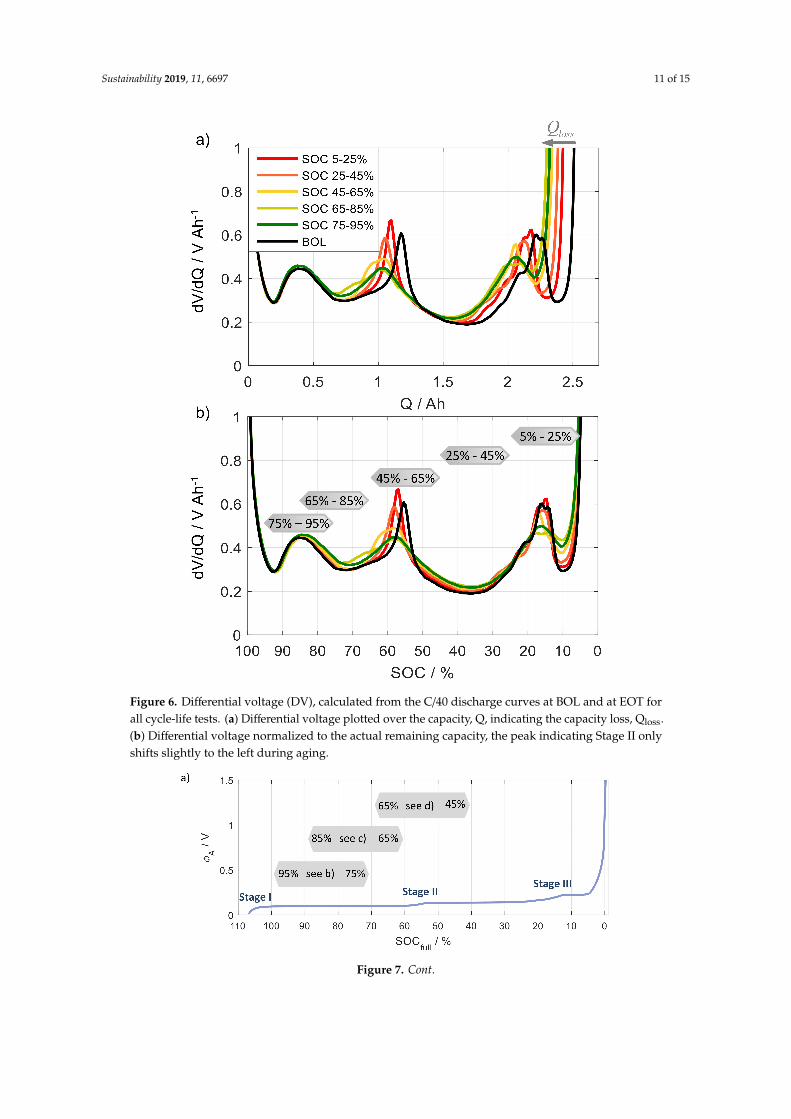
Figure 7. (a) Anode potential and representation of the cycle life experiments in the SOC ranges 45–65%,65–85%, and 75–95%. (b) Representation of a graphite particle in the SOC range 75–95%. Only a smallpart of the particle surface suffers from dilation and thus causes new SEI formation. (c) Representationof a graphite particle in the SOC range 65–85%. Much of the particle surface suffers from dilationand thus causes new SEI formation. (d) Representation of a graphite particle in the SOC range 45–65%.Only a small part of the particle surface suffers from dilation and thus causes new SEI formation.The representation of the particles must not be interpreted as a cross-section but figuratively.
4.2. Interpretation of Active Cathode Material Loss, AMLC
The results in Figure 5b show that the active cathode material loss, AMLC, tends to increasewith increasing mean SOC. This is in accordance with literature which reports a higher instability ofLiCoO2 in the delithiated state (high full cell SOC) [1,2]. Although doping with Ni and Al improvesthe stability, this general trend is still visible.
4.3. Practical Importance of the Findings for Cell Design and Load Management
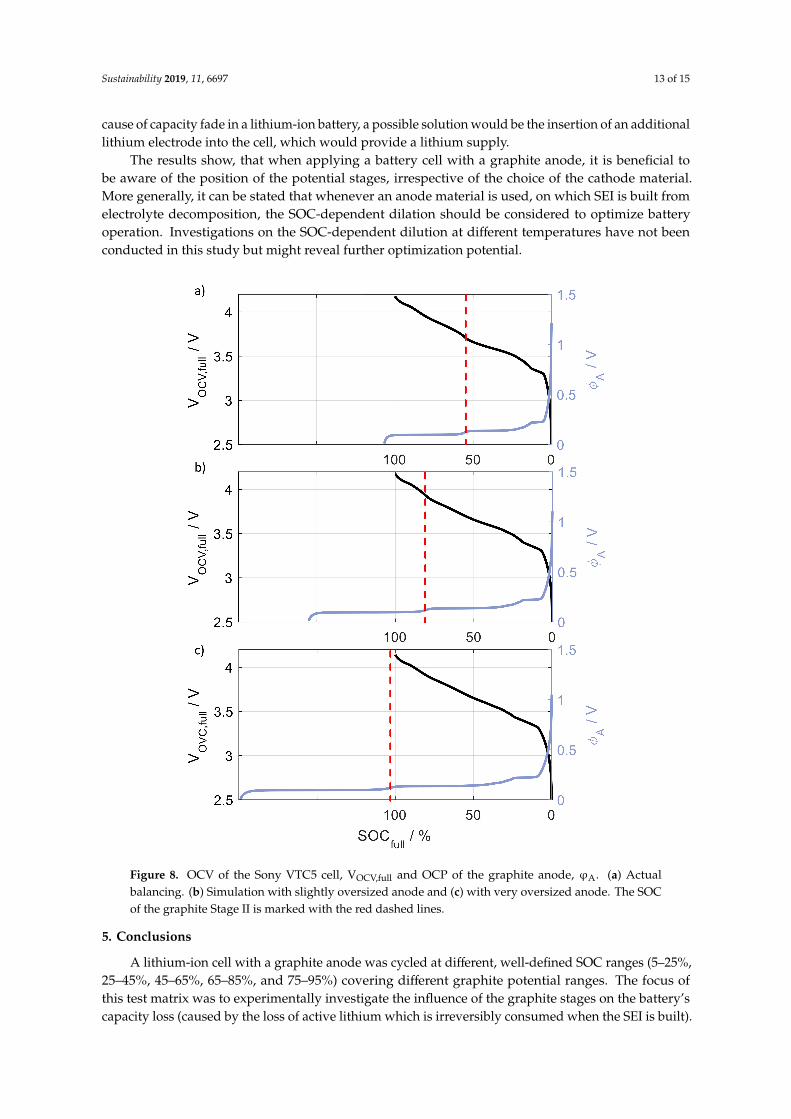
It was found that the active lithium loss restricted the remaining cell capacity and that this lossstrongly depended on the SOC range in which the battery was cycled. This finding can help to prolongthe battery lifetime in multiple ways: Aapplying intelligent load management can help to avoidharmful SOC ranges during operation. For example, if an electric device will only be used brieflythe next day (and hence, the full cell capacity would not be required), the cell could then be onlycharged to the SOC of the graphite Stage II. This would avoid a great deal of unnecessary degradation.The position of this stage is especially unfavorable for the current design of the investigated Sony VTC5cell, because the cell can only be charged up to an SOC of 55% when applying the abovementionedload management (see Figure 8a). To counter this, the choice/development of a graphite materialwith the stage positioned at higher SOCs could be beneficial or the anode capacity could be increased.This possibility would allow the stage to be positioned at higher SOCs in the full cell. In Figure 8b,c,the cell could be charged up to 80% and 100%, respectively, without passing the stage. Unfortunately,an oversized anode increasesd battery weight and costs. When the loss of active lithium is the main
Sustainability 2019, 11, 6697 13 of 15
cause of capacity fade in a lithium-ion battery, a possible solution would be the insertion of an additionallithium electrode into the cell, which would provide a lithium supply.
The results show, that when applying a battery cell with a graphite anode, it is beneficial tobe aware of the position of the potential stages, irrespective of the choice of the cathode material.More generally, it can be stated that whenever an anode material is used, on which SEI is built fromelectrolyte decomposition, the SOC-dependent dilation should be considered to optimize batteryoperation. Investigations on the SOC-dependent dilution at different temperatures have not beenconducted in this study but might reveal further optimization potential.
Figure 8. OCV of the Sony VTC5 cell, VOCV,full and OCP of the graphite anode, ϕA. (a) Actualbalancing. (b) Simulation with slightly oversized anode and (c) with very oversized anode. The SOCof the graphite Stage II is marked with the red dashed lines.
5. Conclusions
A lithium-ion cell with a graphite anode was cycled at different, well-defined SOC ranges (5–25%,25–45%, 45–65%, 65–85%, and 75–95%) covering different graphite potential ranges. The focus ofthis test matrix was to experimentally investigate the influence of the graphite stages on the battery’scapacity loss (caused by the loss of active lithium which is irreversibly consumed when the SEI is built).
Sustainability 2019, 11, 6697 14 of 15
All capacity loss mechanisms (loss of active lithium as well as loss of active electrode material)were quantified with an OCV model. The results show that the loss of active lithium was the dominantcause of capacity fade in each cycle-life test conducted in this work. Over the 4000 test cycles, the cellslost up to 7.5% of active lithium, whereas they only lost up to 3.5% of active anode material and upto 2.5% of active cathode material. Furthermore, the results reveal that cycling the cell in an SOC rangeslightly above Stage II of the graphite anode resulted in a high loss of active lithium. This can beattributed to the graphite particle surface suffering from high dilation at the threshold between Stages IIand I. As a result, the SEI on the surface broke and rebuilt irreversibly consuming active lithium.
Knowing which SOC ranges are especially harmful and cause a high degree of capacity loss canhelp to prolong the battery lifetime in multiple ways. Applying intelligent load management can helpto avoid harmful SOC ranges during operation. Unlike the discharge process (which is controlledby the user and depends on the individual application-specific operating conditions), the chargeprocess can be defined by the manufacturer and adapted to avoid SOC ranges with severe particlesurface dilation. For this reason, it is favorable to optimize the cell design in such a way that graphiteStage II is positioned in the edge regions of the SOC range (e.g., at high SOCs) to enable maximumSOC exploitation. The proportions of anode and cathode in a lithium-ion battery or the choice ofan appropriate graphite determines the position of the stages in the full cell.
Author Contributions: Conceptualization: M.S., M.W., and S.G.; Methodology: S.G., M.S., and M.W.; Software:M.S. and S.G.; Validation: S.G.; Formal analysis: S.G.; Investigation: S.G.; Resources: E.I.-T.; Data curation: S.G.;Writing—Original draft preparation: S.G.; Writing—Review and editing: M.S., M.W., and E.I.-T.; Visualization:S.G.; Supervision: E.I.-T.; Project administration: E.I.-T.; Funding acquisition: E.I.-T.
Funding: This research was funded by Deutsche Forschungsgemeinschaft (DFG) through projects IV 14/23-1and GRK 2218/1. We acknowledge support by the KIT-Publication Fund of the Karlsruhe Institute of Technology.
Acknowledgments: Sincere thanks are given to J. Packham for proofreading the manuscript.
Conflicts of Interest: The authors declare no conflict of interest. The funders had no role in the design of the study;in the collection, analyses, or interpretation of data; in the writing of the manuscript, or in the decision to publishthe results.
References
1. Vetter, J.; Novák, P.; Wagner, M.R.; Veit, C.; Möller, K.-C.; Besenhard, J.O.; Winter, M.; Wohlfahrt-Mehrens, M.;Vogler, C.; Hammouche, A. Ageing mechanisms in lithium-ion batteries. J. Power Sources 2005, 147, 269–281.[CrossRef]
2. Hausbrand, R.; Cherkashinin, G.; Ehrenberg, H.; Gröting, M.; Albe, K.; Hess, C.; Jaegermann, W. Fundamentaldegradation mechanisms of layered oxide Li-ion battery cathode materials: Methodology, insights and novelapproaches. Mater. Sci. Eng. B 2015, 192, 3–25. [CrossRef]
3. Stiaszny, B.; Ziegler, J.C.; Krauß, E.E.; Schmidt, J.P.; Ivers-tiffée, E. Electrochemical characterizationand post-mortem analysis of aged LiMn2O4-Li(Ni0.5Mn0.3Co0.2)O2/graphite lithium ion batteries. Part I:Cycle aging. J. Power Sour. 2014, 251, 439–450. [CrossRef]
4. Broussely, M.; Biensan, P.; Bonhomme, F.; Blanchard, P.; Herreyre, S.; Nechev, K.; Staniewicz, R.J. Main agingmechanisms in Li ion batteries. J. Power Sour. 2005, 146, 90–96. [CrossRef]
5. Uhlmann, C.; Illig, J.; Ender, M.; Schuster, R.; Ivers-Tiffée, E. In situ detection of lithium metal plating ongraphite in experimental cells. J. Power Sour. 2015, 279, 428–438. [CrossRef]
6. Zhang, S.S.; Xu, K.; Jow, T.R. Study of the charging process of a LiCoO2-based Li-ion battery. J. Power Sour.2006, 160, 1349–1354. [CrossRef]
7. Aurbach, D.; Talyosef, Y.; Markovsky, B.; Markevich, E.; Zinigrad, E.; Asraf, L.; Gnanaraj, J.S.; Kim, H.J.Design of electrolyte solutions for Li and Li-ion batteries: A review. Electrochim. Acta 2004, 50, 247–254.[CrossRef]
8. Christensen, J.; Newman, J. A Mathematical Model for the Lithium-Ion Negative Electrode Solid ElectrolyteInterphase. J. Electrochem. Soc. 2004, 151, A1977–A1988. [CrossRef]
9. Ueda, A.; Ohzuku, T. Solid-State Redox Reactions of LiCoO2 (R3m) for 4 Volt Secondary Lithium Cells.J. Electrochem. Soc. 1994, 141, 2972–2977. [CrossRef]
Sustainability 2019, 11, 6697 15 of 15
10. Nitta, N.; Wu, F.; Lee, J.T.; Yushin, G. Li-ion battery materials: Present and future. Mater. Today 2015,18, 252–264. [CrossRef]
11. Noel, M.; Santhanam, R. Electrochemistry of graphite intercalation compounds. J. Power Sour. 1998, 72, 53–65.[CrossRef]
12. Sethuraman, V.A.; Hardwick, L.J.; Srinivasan, V.; Kostecki, R. Surface structural disordering in graphite uponlithium intercalation/deintercalation. J. Power Sour. 2010, 195, 3655–3660. [CrossRef]
13. Mercer, M.P.; Otero, M.; Ferrer-Huerta, M.; Sigal, A.; Barraco, D.E.; Hoster, H.E.; Leiva, E.P.M. Transitions oflithium occupation in graphite: A physically informed model in the dilute lithium occupation limit supportedby electrochemical and thermodynamic measurements. Electrochim. Acta 2019, 324, 134774. [CrossRef]
14. Dubarry, M.; Truchot, C.; Liaw, B.Y. Synthesize battery degradation modes via a diagnostic and prognosticmodel. J. Power Sour. 2012, 219, 204–216. [CrossRef]
15. Schmidt, J.P.; Tran, H.Y.; Richter, J.; Ivers-Tiffée, E.; Wohlfahrt-Mehrens, M. Analysis and prediction ofthe open circuit potential of lithium-ion cells. J. Power Sour. 2013, 239, 696–704. [CrossRef]
16. Fu, R.; Choe, S.Y.; Agubra, V.; Fergus, J. Development of a physics-based degradation model for lithium ionpolymer batteries considering side reactions. J. Power Sour. 2015, 278, 506–521. [CrossRef]
17. Schindler, S.; Danzer, M.A. A novel mechanistic modeling framework for analysis of electrode balancingand degradation modes in commercial lithium-ion cells. J. Power Sour. 2017, 343, 226–236. [CrossRef]
18. Broussely, M.; Herreyre, S.; Biensan, P.; Kasztejna, P.; Nechev, K.; Staniewicz, R.J. Aging mechanism in Li ioncells and calendar life predictions. J. Power Sour. 2001, 97–98, 13–21. [CrossRef]
© 2019 by the authors. Licensee MDPI, Basel, Switzerland. This article is an open accessarticle distributed under the terms and conditions of the Creative Commons Attribution(CC BY) license (http://creativecommons.org/licenses/by/4.0/).


![A [sup 7]Li NMR Study of Capacity Fade in Metal-Substituted Lithium Manganese Oxide Spinels](https://img.pdfslide.net/doc/110x75/6344680d596bdb97a908722a/a-sup-7li-nmr-study-of-capacity-fade-in-metal-substituted-lithium-manganese-oxide.jpg)


![LiMnPO[sub 4] as an Advanced Cathode Material for Rechargeable Lithium Batteries](https://img.pdfslide.net/doc/110x75/634994ba09e11fdd740b5a76/limnposub-4-as-an-advanced-cathode-material-for-rechargeable-lithium-batteries.jpg)


