Embed Size (px)
Citation preview
CAR SAFETY
A detailed survey of the aspects that can influence traffic fatality andinjury rates
Hester I. Stasse
Delft, July 2001
Faculty of Aerospace EngineeringDepartment of Aerospace Materials
Delft University of Technology
i
Preface
This report was written as part of my final project at the Department of Aerospace Materialsof the Faculty of Aerospace Engineering at the Delft University of Technology. It is aninvestigation of the multifaceted subject of car safety and is meant to serve as a backgroundfor the DutchEVO project.
The reader is assumed to have a basic knowledge of cars and traffic, but does not need to bean expert on the subject. Most terms are explained within the text and, apart from that, a shortlist elucidating the most important terminology is included.
I would like to express my gratitude to all those people who stood by me and kept believing inme through the years; I do not think I could have done this without you, so thank you all very,very much! There are a few people I want to thank in particular, though. First of all, forhelping me to complete a period of hard work, the graduation committee: Prof. Dr. Ir. A. Vlot,Ir. J.L.C.G. de Kanter and Ir. A.R.C. de Haan.
I would also like to thank Joakim for his unfailing confidence in me and my abilities,the wake-up calls, the cards, the emails, the pep talk, generally being there for me, and somuch more; mere words cannot express what that all meant to me! For being there at themoments I needed them most: Jan and Magda [I DID IT!!]. For wacky phone calls and seriousconversations: Aldo. For friendship from a distance: Zeina and Ruben, but also Mia, Johannaand the rest of the "Swedish bunch". For attending some nice prog concerts together: Jan-Jaap, Nicole, Olga and Eric. And last, but certainly not least, I would like to thank the bandswhose music has helped to pull me through this (in alphabetical order): Arena, Ayreon, Fish,Five Fifteen, The Gathering, Genesis, IQ, Jadis, Marillion, No-Man, Omnia Opera,Pendragon, Pink Floyd, Porcupine Tree and Saga.
And to all those people who, for some reason, thought it necessary to point out to methat I could never pull this off, I just want to say this: HAH!!!
This report can be read in different ways:• Readers interested in traffic safety in general are referred to Chapter 2. This chapter
contains a detailed description of the development of traffic safety, risk and costs.• Those who want to know more about how accidents can be prevented are referred to
Chapter 3, 4, 5, 8 and 9.• Readers interested in what aspects influence the severity of a traffic accident are
recommended to read Chapter 6, 7 and 9.
Delft, July 2001
Hester I. Stasse

ii
iii
Summary
The faculties Applied Earth Sciences, Industrial Design Engineering, Electrical Engineering,Aerospace Engineering, Delft Institute of Microelectronics and Submicrontechnology andMechanical Engineering of the Delft University of Technology are currently working togetherto establish the design and building of a small concept car, the DutchEVO. One of thepurposes of this car is to evoke a change in how the public regards cars and transport ingeneral. Since traffic accidents cause about the same loss of preretirement years as diseaseslike cancer do, and can strike just about anybody, car safety should be an important ingredientin the DutchEVO project.
Finding a different approach to car safety does, however, require that one has a goodidea of what one is talking about. This report does therefore present a detailed survey of theaspects that can influence traffic fatality and injury rates, based on an extensive literaturesearch.
It appears that most accidents are in some way connected to human errors. One of thereasons for this is that drivers seem to consciously or unconsciously try to maintain a constantlevel of risk; a risk that seems to be slightly higher than what would be sensible. Apart fromthat, many drivers do not take full responsibility for their driving behaviour. Another reasonfor the occurrence of human errors are the non-realistic expectations of the driver. Hesystematically overestimates his skills, how well he perceives important things like distancesand (relative) speeds, how well he can drive even though he has drunk alcohol, used drugs ormedicines, his car's and other road users' abilities and behaviour, and how alert he is eventhough he is stressed or tired. The risk connected to these situations is, however,systematically underestimated. If a driver perceives a certain situation as safe, he oftenbecomes overconfident and takes more risk than is sensible, whereas the opposite happens ifhe thinks the situation is dangerous. Apart from that, drivers will drive more carefully if theyknow that it is likely that they will get a fine (police surveillance) or that they will berewarded for not having accidents (insurance).
The group of drivers between 18 and 24 years old, especially the male part, issignificantly overinvolved in (fatal) traffic accidents. These drivers have hedonistic instead oftransport reasons to drive, and have a completely unrealistic view on the risks of driving a carand behaving in certain ways. Basic driving education does learn them how to drive a car, butnot really how to do it safely. The latter is a matter of trial and error and young/novice driversobviously learn the reality of driving safely the hard way; speaking from a physical point ofview, they are less likely to die from an accident than older drivers, but this effect is morethan neutralised by their behaviour.
It is almost without any doubt that the scenes containing examples of irresponsibledriving and unrealistic accidents people are bombarded with through film and TV from theirearly childhood on, have a large influence on the way people drive. Especially young andinexperienced drivers seem to believe that what is shown is how it really is and that there areno risks involved in it. This influence lasts until they have found out the reality of driving.
Typical for rural roads is that their fatality rates are a lot higher than those on the otherroad types. Part of the problem appears to be that drivers are not sure about what they canexpect on them and are therefore virtually unable to spot any unexpected events in time. Apartfrom that, the use pattern of these roads is more risk-involved (e.g. higher speeds, morefrequent alcohol use) than that of the others.
The design of a car as regards geometry, stiffness and mass has a large influence onwhether its occupants, the occupants of the opposing car or the external road users –
iv
depending on the kind of crash – will be injured or not. Generally speaking, one could say thatthe lighter the vehicle, the less risk it poses to other road users and the heavier the vehicle, theless risk it poses to its occupants. Incompatibility of mass, geometry and/or stiffness makesthe consequences for a more vulnerable opponent in an accident much more severe than if hewould crash into a road user of his own kind. This is largely due to the higher accelerations –which means a higher chance to get injured – the more vulnerable party will usually undergo.
The best protection car occupants can get is a system in which seatbelt and airbag (thetwo forming the best reduction of injury risk available) are "working together" with a crash-friendly interior and headrests. It is important that the seatbelt part of this system is alwaysapplied since the airbag does not inflate under all crash circumstances. Although the a seatbeltcan cause injuries during a crash (largely dependant on the stiffness of the seat), these injurieswill always be much less severe than the ones it helps to prevent. In other words, the risk ofinjuries due to the seatbelt should not be a reason not to use it.
Systems which take over functions from the driver do help to reduce stress, but at thesame time they do not add to his sense of responsibility and make him care less about trafficsafety. Systems that help the driver to perform optimally by providing a function the driverlacks are better in that respect, because the driver keeps being responsible for taking everyaction. Still, the danger of these systems is that the driver can start to respond to anyrecommendation made by them without thinking about whether it is correct.
The way cars are made at the moment makes the driver feel safe and comfortable inthem, but that safety is only relative. These cars therefore provide drivers with a false feelingof safety. Apart from that, the fact that they are largely noise and vibration insulated givesdrivers a wrong idea of the speed with which they drive. Safety and comfort are importantfactors in a person's decision to buy a certain car. Someone going for a safe and comfortablefeeling car will therefore have a negative effect on traffic safety in general.
It seems that the Dutch government, car manufacturers and crash testing organisationEuroNCAP are trying to take away the responsibility for safe driving from the driver. Takingaccidents as a given, they all emphasise the importance of protective measures (ones that thedriver does not need to apply himself, apart from the seatbelt, at that), instead of measures toprevent accidents. The preventive systems that do get attention are more often than not able toanticipate on dangerous situations without the interference of the driver and thereby take thedriver out of the equation as well.
Another worrying trend is that many of the new accident prevention systems seem tobe largely meant for drivers who do not drive very carefully. They are meant for situationslike going off the road in a bend, and abrupt and heavy braking – situations that often have todo with risky driving.
A different mentality towards traffic safety should probably be founded in the way the driverhimself is treated. Even though the driver is to blame (partly) for 85 to 95% of all accidents,the emphasis seems to shift more and more to enhancing the car and its environment. Allparties seem to think that the only way traffic safety can be improved is by slowly replacingman; something which becomes clear from the way the driver's responsibilities are reducedmore and more.
v
Table of contents
Preface ............................................................................................................... i
Summary ............................................................................................................. iii
1. Introduction ...............................................................................................................1
2. Some facts about traffic safety....................................................................................32.1. The importance of a reduction in traffic fatalities.............................................32.2. The development of traffic safety in The Netherlands......................................62.3. Means of transportation and risk.....................................................................102.4. General patterns in traffic accidents which involve cars.................................132.5. Accident costs .................................................................................................142.6. Conclusions .....................................................................................................18
3. Accident prevention: the driver ...............................................................................193.1. Sex and age......................................................................................................193.2. Education.........................................................................................................213.3. Experience.......................................................................................................223.4. Physical condition ...........................................................................................22
3.4.1. Health .................................................................................................233.4.2. Perception...........................................................................................233.4.3. Comfort ...............................................................................................243.4.4. Tiredness.............................................................................................25
3.5. Mental condition .............................................................................................263.5.1. Personality ..........................................................................................263.5.2. Mood ...................................................................................................27
3.6. Constant risk theory ........................................................................................273.7. External influences..........................................................................................283.8. Conclusions .....................................................................................................36
4. Accident prevention: the car.....................................................................................394.1. State the car is in .............................................................................................404.2. Car design........................................................................................................404.3. Systems which take over functions from the driver........................................40
4.3.1. ABS .....................................................................................................404.3.2. Driver alertness monitoring ...............................................................414.3.3. Stability control ..................................................................................41
4.4. Systems which help the driver to function optimally......................................414.4.1. Air-conditioning..................................................................................424.4.2. Collision avoidance systems ...............................................................424.4.3. Noise reduction...................................................................................424.4.4. Route guidance systems ......................................................................434.4.5. Speedometer........................................................................................434.4.6. Surveyable dashboard ........................................................................434.4.7. Vision enhancement systems...............................................................43
4.5. Loss of responsibility ......................................................................................44
vi
4.6. Conclusions .....................................................................................................45
5. Accident prevention: the environment of the car ...................................................475.1. Natural environment........................................................................................48
5.1.1. Hour of the day ...................................................................................485.1.2. Season (weather situation and temperature) ......................................485.1.3. Wind force...........................................................................................505.1.4. Topography.........................................................................................505.1.5. Fauna..................................................................................................505.1.6. Flora ...................................................................................................51
5.2. Man-made environment ..................................................................................515.2.1. Road network ......................................................................................515.2.2. Road and roadside..............................................................................535.2.3. State the road is in ..............................................................................55
5.3. Social environment..........................................................................................555.3.1. Traffic density .....................................................................................555.3.2. Traffic flow..........................................................................................575.3.3. Visibility other road users ..................................................................575.3.4. Recognisability and predictability driving behaviour
other road-users ..................................................................................575.3.5. Interaction with other road-users.......................................................58
5.4. Distractions......................................................................................................585.5. Conclusions .....................................................................................................59
6. Influences on severity accident .................................................................................616.1. The car occupants............................................................................................61
6.1.1. Sex and age .........................................................................................616.1.2. Physique..............................................................................................636.1.3. Income.................................................................................................656.1.4. Alcohol ................................................................................................656.1.5. Seat in the car .....................................................................................66
6.2. The car.............................................................................................................686.2.1. Mass incompatibility...........................................................................686.2.2. Geometric incompatibility ..................................................................716.2.3. Stiffness incompatibility......................................................................73
6.3. The environment .............................................................................................746.4. Conclusions .....................................................................................................74
7. Reducing severity of the accident.............................................................................777.1. Self protection .................................................................................................77
7.1.1. Occupant protection ...........................................................................787.1.2. Self protection for external road users ...............................................89
7.2. Partner protection ............................................................................................917.2.1. Occupants other cars ..........................................................................917.2.2. External road users.............................................................................91
7.3. Conclusions .....................................................................................................95
8. Policies .............................................................................................................998.1. The Netherlands ..............................................................................................99
8.1.1. General policy ....................................................................................99
vii
8.1.2. Laws..................................................................................................1028.1.3. Law enforcement...............................................................................1078.1.4. Insurances.........................................................................................108
8.2. Europe ...........................................................................................................1088.2.1. European Union .........................................................................................108
8.2.2. EuroNCAP ........................................................................................1098.3. Conclusions ...................................................................................................111
9. Safety measures used in today's passenger cars ...................................................1139.1. Promotion of safety .......................................................................................1139.2. Active safety measures..................................................................................1139.3. Passive safety measures ................................................................................122
9.3.1. Passive passive safety measures.......................................................1229.3.2. Active passive measures ...................................................................127
9.4. Extra costs .....................................................................................................1279.5. Future ...........................................................................................................1289.6. Conclusions ...................................................................................................131
10. Summary of all aspects..........................................................................................133
11. Conclusions and recommendations......................................................................14511.1. Conclusions .................................................................................................14511.2. Recommendations .......................................................................................14711.3. The utopian car............................................................................................14811.4. DutchEVO...................................................................................................149
Literature ...........................................................................................................151Books ...........................................................................................................151Car brochures .......................................................................................................151Newspaper and magazine articles ........................................................................152Press releases........................................................................................................152Reports ...........................................................................................................153Websites ...........................................................................................................153
Terminology ...........................................................................................................155
Appendix A: Injuries...................................................................................................157A.1. Causes of injuries and occurrence ................................................................157A.2. AIS scale.......................................................................................................158A.3. PODS scale...................................................................................................158
Appendix B: Government-supported safety campaigns in The Netherlands ........159
Appendix C: 3VO's simulators...................................................................................161C.1. Crash-tilt simulator .......................................................................................161C.2. Driving simulator..........................................................................................161
Appendix D: Traffic violations and fines...................................................................163D.1. Car registration papers / Registration number..............................................163D.2. Behaviour in traffic ......................................................................................163
viii
D.3. Speeding .......................................................................................................164D.3.1. Speeding within the built-up area and on rural roads.....................164D.3.2. Speeding on the motorways .............................................................165D.3.3. Recidivism regulation for speeding .................................................165
Appendix E: Accident types........................................................................................167E.1. Bicycle-car accidents ....................................................................................167E.2. Car-moped accidents.....................................................................................167E.3. Car-pedestrian accidents ...............................................................................168E.4. Car-car accidents...........................................................................................169E.5. Car-object accidents......................................................................................170E.6. Car-no object accidents.................................................................................171E.7. Additional remarks .......................................................................................171
Appendix F: EuroNCAP's tests..................................................................................175F.1. Frontal impact test.........................................................................................175F.2. Side impact test .............................................................................................176F.3. Head protection or "pole test" .......................................................................177F.4. Pedestrian impact test....................................................................................178F.5. Test results ....................................................................................................178F.6. EuroNCAP's ratings ......................................................................................180F.7. Causes for downrating ..................................................................................181
Appendix G: EuroNCAP test results .........................................................................183G.1. Test results....................................................................................................183
G.1.1. Superminis .......................................................................................183G.1.2. Small family cars .............................................................................184G.1.3. Large Family Cars...........................................................................184G.1.4. Executive Cars .................................................................................185G.1.5. Mini MPVs .......................................................................................185G.1.6. MPVs................................................................................................185
G.2. Example: EuroNCAP's test results for the Renault Laguna.........................186
Appendix H: DutchEVO .............................................................................................189H.1. General description.......................................................................................189H.2. Safety and awareness through design...........................................................190H.3. Specifications ...............................................................................................191
Appendix I: ECE car safety regulations....................................................................193I.1. Regulation 12 .................................................................................................193I.2. Regulation 32 .................................................................................................194I.3. Regulation 33 .................................................................................................197I.4. Regulation 34 .................................................................................................200I.5. Regulation 94 .................................................................................................203I.6. Regulation 95 .................................................................................................209
1
1. Introduction
Our ever-increasing want, and nowadays often even need, to travel over shorter and longerdistances has made traffic and transportation an essential component of our society. The timesthat a passenger car was only affordable to the very rich are long past, so theoretically everyadult has the opportunity to purchase one of those vehicles which bring faraway places within(easier) reach. This all would not pose any problem if it were not for the fact that the highspeeds that enable the car to transport the occupants to any desired place within a muchshorter time than, for instance, by horse can be lethal both to the occupants and to eventualother people outside the car if it crashes into another object or being. Traffic fatalities are anasty side effect of the freedom to go wherever whenever one wants to go that the car hasprovided.
Traffic accidents are considered unnatural attacks on human health – contrary to, for in-stance, diseases – and are therefore counted among the external causes of death. On thewhole, external causes are of minor importance compared to, for instance, the amount ofpeople dying of tumours and diseases of the heart and the vascular system per year. Sinceonly roughly a quarter of all deaths by external causes are traffic fatalities, it is obvious thatthe amount of people dying in traffic is relatively small.
If traffic accidents are seemingly a relatively small problem, why then do they get somuch attention? In most parts of the western world, anyone who wants to travel from A to B –whether by bus, by car, by bike or on foot – has to use the existing infrastructure: the roads.And even if one is very careful oneself and never takes any risks, somebody else, who is lesscautious, can crash his or her means of transportation into yours causing you material and/orphysical damage. So absolutely anyone taking part in traffic is at risk and that is a situationthat people cannot live with. If someone chooses to take an above average risk and gets hurtin the process, then that is supposed to have been that person's own responsibility. But whensomeone does not take any exceptional risks, but still faces the possibility to get injured oreven lose his or her life, then some measures have to be taken to prevent that or at least reducethe effects.
Another reason why traffic accidents get so much attention is not that apparent at first.Most traffic deaths occur among young road users and because of that, many preretirementyears of productivity are lost. In fact, the amount of preretirement years lost through trafficaccidents more or less matches the amount lost through cancer and heart disease and this doesexplain why it is important to reduce the occurrence or otherwise the severity of the effects oftraffic accidents. There are many ways in which this can be achieved; some connected to thedriver, some to the car and some to their environment.
Several faculties of Delft University of Technology are currently working on the design of asmall concept car, the DutchEVO. One of the purposes of this car is to bring about a changein how the public regards cars and transport. Because of the important role it plays in trafficand transport, it would be good if the safety issue could be part of this change. However,changing something usually means that the conventional approach to the subject will (partly)have to be set overboard. To be able to find a different approach, one will really have to knowwhat one is talking about. The purpose of this report is therefore to present a detailed surveyof the aspects that can influence traffic fatality and injury rates and to take a few first stepstowards a different approach to car safety.
2
Part of the survey is a description of the different circumstances which can raise the risk thatan accident will occur as well as the risk that someone will get injured or even die if it does.Subsequently, the way drivers, external road users, car manufacturers and governments (can)anticipate on those circumstances is discussed. This is all done while keeping the car and thedriver in the spotlight; subjects connected to the external road user will be raised only briefly.The same applies to what happens after the accident; this report focuses on the phases rightbefore and during an accident.
This report is built up as follows. In chapter 2, some general facts about traffic safety are pre-sented. They will show why it is important to improve traffic safety. Chapter 3 zooms in onhow to prevent accidents from happening through the driver; the same is done in chapter 4and 5 for the car and the environment, respectively. The factors influencing the severity of anaccident are discussed in chapter 6, whereas chapter 7 shows how this severity can be re-duced. Chapter 8 is all about the European and Dutch policies regarding traffic safety. Finally,chapter 9 presents an overview of all safety measures used in the passenger cars of today.
3
2. Some facts about traffic safety
Traffic safety is a hot topic, even though cars have been a common element in society fordecades. The amount of traffic fatalities has gone down considerably through the years, but isstill considered unacceptably high. In this chapter, an overview is given of the reasons why itis important to improve traffic safety, the development of traffic safety in The Netherlandsthrough the years, the difference in risk connected to different means of transportation, com-mon features of traffic accidents which involve passenger cars, and the costs of traffic acci-dents.
2.1. The importance of a reduction in traffic fatalities
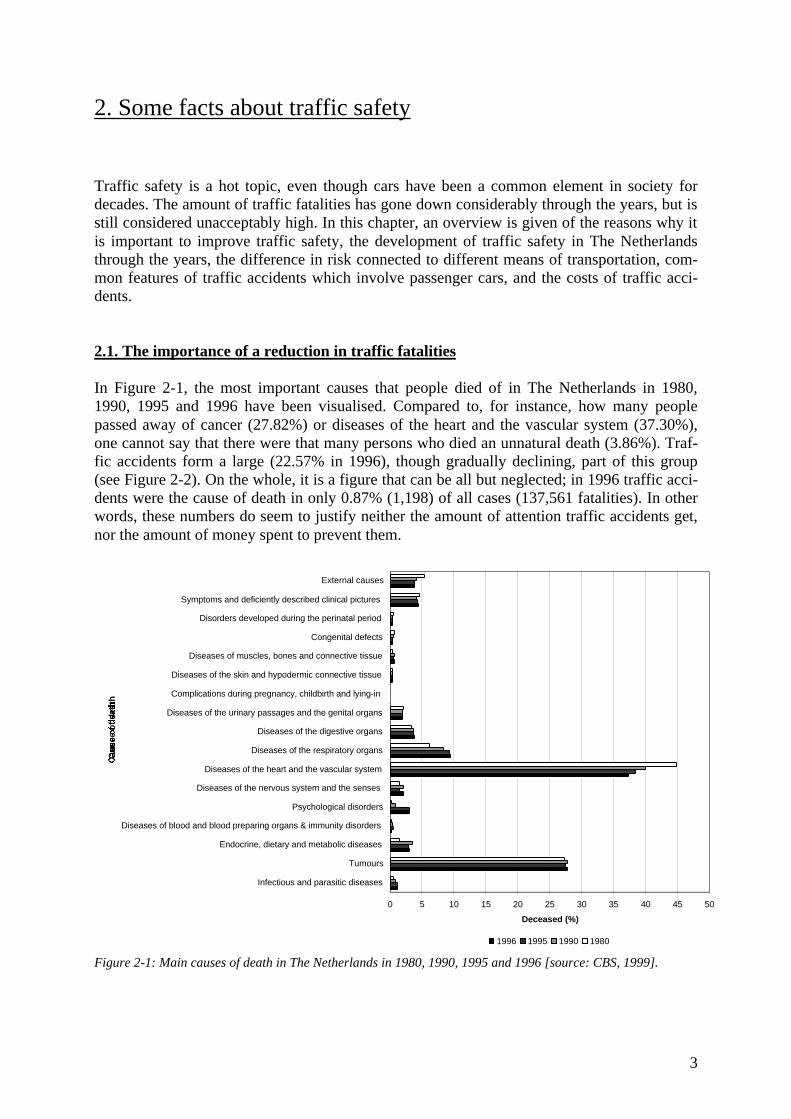
In Figure 2-1, the most important causes that people died of in The Netherlands in 1980,1990, 1995 and 1996 have been visualised. Compared to, for instance, how many peoplepassed away of cancer (27.82%) or diseases of the heart and the vascular system (37.30%),one cannot say that there were that many persons who died an unnatural death (3.86%). Traf-fic accidents form a large (22.57% in 1996), though gradually declining, part of this group(see Figure 2-2). On the whole, it is a figure that can be all but neglected; in 1996 traffic acci-dents were the cause of death in only 0.87% (1,198) of all cases (137,561 fatalities). In otherwords, these numbers do seem to justify neither the amount of attention traffic accidents get,nor the amount of money spent to prevent them.
0 5 10 15 20 25 30 35 40 45 50
Infectious and parasitic diseases
Tumours
Endocrine, dietary and metabolic diseases
Diseases of blood and blood preparing organs & immunity disorders
Psychological disorders
Diseases of the nervous system and the senses
Diseases of the heart and the vascular system
Diseases of the respiratory organs
Diseases of the digestive organs
Diseases of the urinary passages and the genital organs
Complications during pregnancy, childbirth and lying-in
Diseases of the skin and hypodermic connective tissue
Diseases of muscles, bones and connective tissue
Congenital defects
Disorders developed during the perinatal period
Symptoms and deficiently described clinical pictures
External causes
Cau
se o
f d
eath
Deceased (%)
1996 1995 1990 1980
Figure 2-1: Main causes of death in The Netherlands in 1980, 1990, 1995 and 1996 [source: CBS, 1999].
4
0 5 10 15 20 25 30 35
Traffic accidents
Accidental falls and fractures
Suicide
Murder and manslaughter
(Ext
ern
al)
cau
se o
f d
eath
Deceased (%)
1996 1995 1990 1980
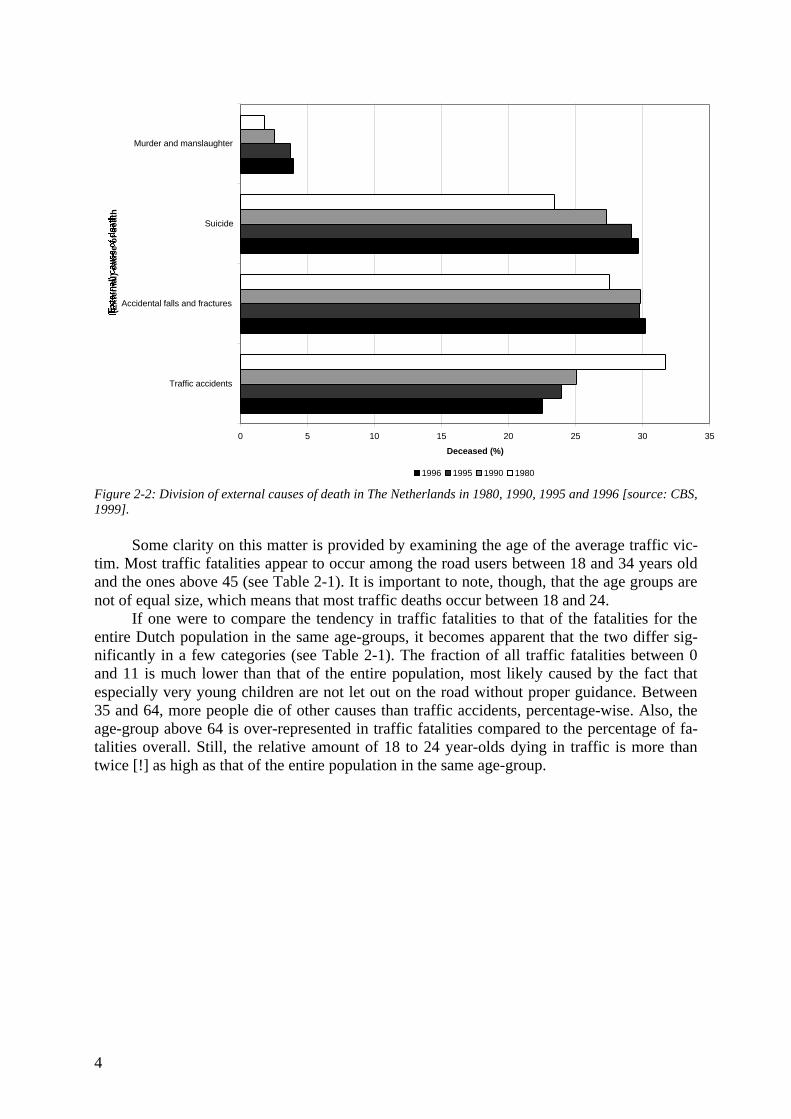
Figure 2-2: Division of external causes of death in The Netherlands in 1980, 1990, 1995 and 1996 [source: CBS,1999].
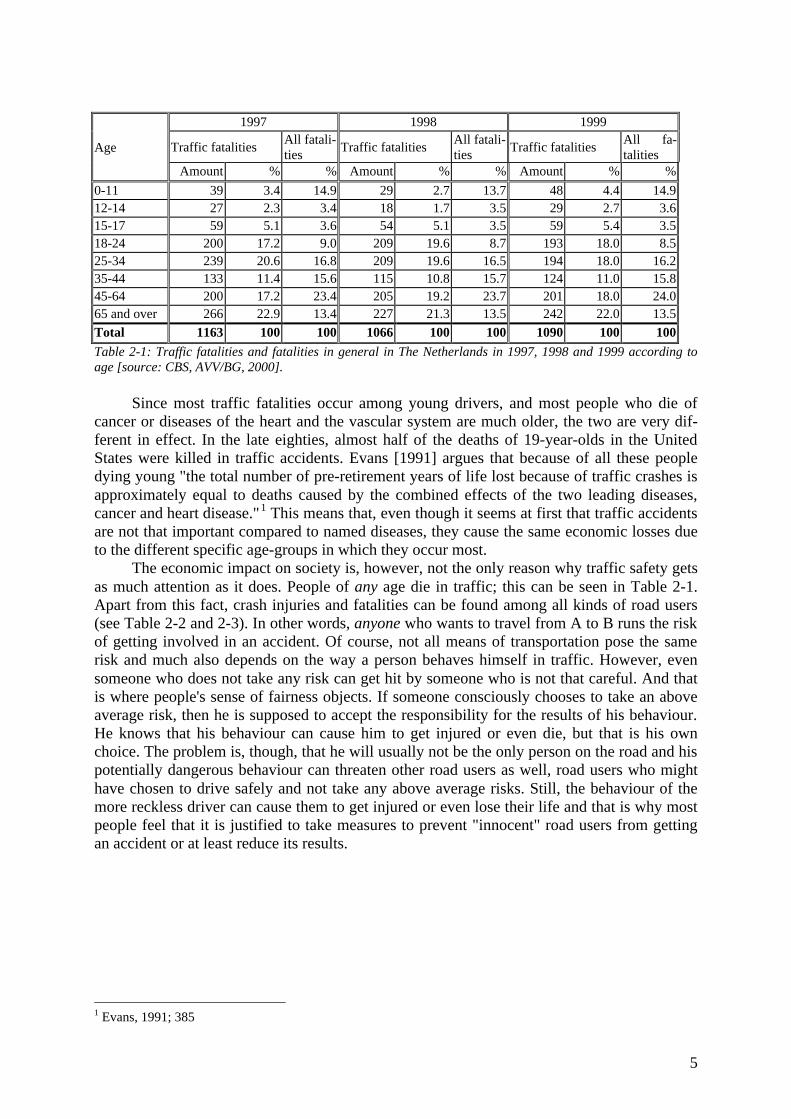
Some clarity on this matter is provided by examining the age of the average traffic vic-tim. Most traffic fatalities appear to occur among the road users between 18 and 34 years oldand the ones above 45 (see Table 2-1). It is important to note, though, that the age groups arenot of equal size, which means that most traffic deaths occur between 18 and 24.
If one were to compare the tendency in traffic fatalities to that of the fatalities for theentire Dutch population in the same age-groups, it becomes apparent that the two differ sig-nificantly in a few categories (see Table 2-1). The fraction of all traffic fatalities between 0and 11 is much lower than that of the entire population, most likely caused by the fact thatespecially very young children are not let out on the road without proper guidance. Between35 and 64, more people die of other causes than traffic accidents, percentage-wise. Also, theage-group above 64 is over-represented in traffic fatalities compared to the percentage of fa-talities overall. Still, the relative amount of 18 to 24 year-olds dying in traffic is more thantwice [!] as high as that of the entire population in the same age-group.
5
1997 1998 1999
Traffic fatalitiesAll fatali-ties
Traffic fatalitiesAll fatali-ties
Traffic fatalitiesAll fa-talitiesAge
Amount % % Amount % % Amount % %
0-11 39 3.4 14.9 29 2.7 13.7 48 4.4 14.912-14 27 2.3 3.4 18 1.7 3.5 29 2.7 3.615-17 59 5.1 3.6 54 5.1 3.5 59 5.4 3.518-24 200 17.2 9.0 209 19.6 8.7 193 18.0 8.525-34 239 20.6 16.8 209 19.6 16.5 194 18.0 16.235-44 133 11.4 15.6 115 10.8 15.7 124 11.0 15.845-64 200 17.2 23.4 205 19.2 23.7 201 18.0 24.065 and over 266 22.9 13.4 227 21.3 13.5 242 22.0 13.5
Total 1163 100 100 1066 100 100 1090 100 100
Table 2-1: Traffic fatalities and fatalities in general in The Netherlands in 1997, 1998 and 1999 according toage [source: CBS, AVV/BG, 2000].
Since most traffic fatalities occur among young drivers, and most people who die ofcancer or diseases of the heart and the vascular system are much older, the two are very dif-ferent in effect. In the late eighties, almost half of the deaths of 19-year-olds in the UnitedStates were killed in traffic accidents. Evans [1991] argues that because of all these peopledying young "the total number of pre-retirement years of life lost because of traffic crashes isapproximately equal to deaths caused by the combined effects of the two leading diseases,cancer and heart disease."1 This means that, even though it seems at first that traffic accidentsare not that important compared to named diseases, they cause the same economic losses dueto the different specific age-groups in which they occur most.
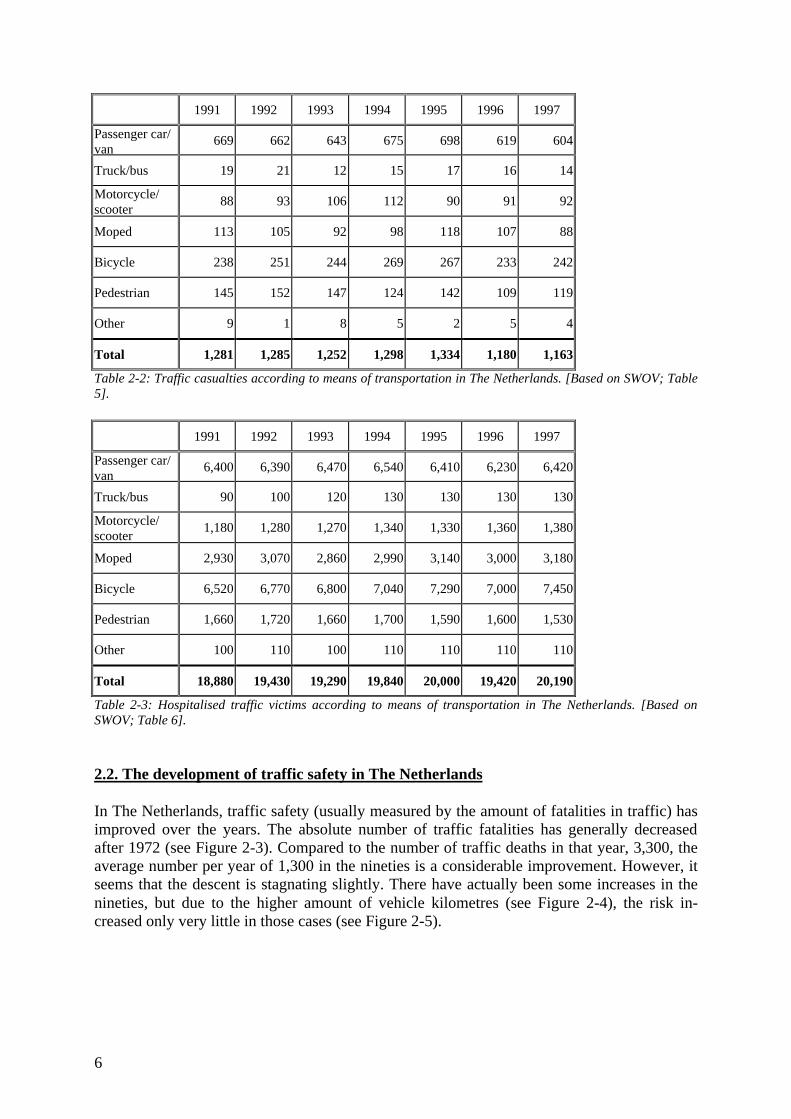
The economic impact on society is, however, not the only reason why traffic safety getsas much attention as it does. People of any age die in traffic; this can be seen in Table 2-1.Apart from this fact, crash injuries and fatalities can be found among all kinds of road users(see Table 2-2 and 2-3). In other words, anyone who wants to travel from A to B runs the riskof getting involved in an accident. Of course, not all means of transportation pose the samerisk and much also depends on the way a person behaves himself in traffic. However, evensomeone who does not take any risk can get hit by someone who is not that careful. And thatis where people's sense of fairness objects. If someone consciously chooses to take an aboveaverage risk, then he is supposed to accept the responsibility for the results of his behaviour.He knows that his behaviour can cause him to get injured or even die, but that is his ownchoice. The problem is, though, that he will usually not be the only person on the road and hispotentially dangerous behaviour can threaten other road users as well, road users who mighthave chosen to drive safely and not take any above average risks. Still, the behaviour of themore reckless driver can cause them to get injured or even lose their life and that is why mostpeople feel that it is justified to take measures to prevent "innocent" road users from gettingan accident or at least reduce its results.
1 Evans, 1991; 385
6
1991 1992 1993 1994 1995 1996 1997
Passenger car/van
669 662 643 675 698 619 604
Truck/bus 19 21 12 15 17 16 14
Motorcycle/scooter
88 93 106 112 90 91 92
Moped 113 105 92 98 118 107 88
Bicycle 238 251 244 269 267 233 242
Pedestrian 145 152 147 124 142 109 119
Other 9 1 8 5 2 5 4
Total 1,281 1,285 1,252 1,298 1,334 1,180 1,163
Table 2-2: Traffic casualties according to means of transportation in The Netherlands. [Based on SWOV; Table5].
1991 1992 1993 1994 1995 1996 1997
Passenger car/van
6,400 6,390 6,470 6,540 6,410 6,230 6,420
Truck/bus 90 100 120 130 130 130 130
Motorcycle/scooter
1,180 1,280 1,270 1,340 1,330 1,360 1,380
Moped 2,930 3,070 2,860 2,990 3,140 3,000 3,180
Bicycle 6,520 6,770 6,800 7,040 7,290 7,000 7,450
Pedestrian 1,660 1,720 1,660 1,700 1,590 1,600 1,530
Other 100 110 100 110 110 110 110
Total 18,880 19,430 19,290 19,840 20,000 19,420 20,190
Table 2-3: Hospitalised traffic victims according to means of transportation in The Netherlands. [Based onSWOV; Table 6].
2.2. The development of traffic safety in The Netherlands
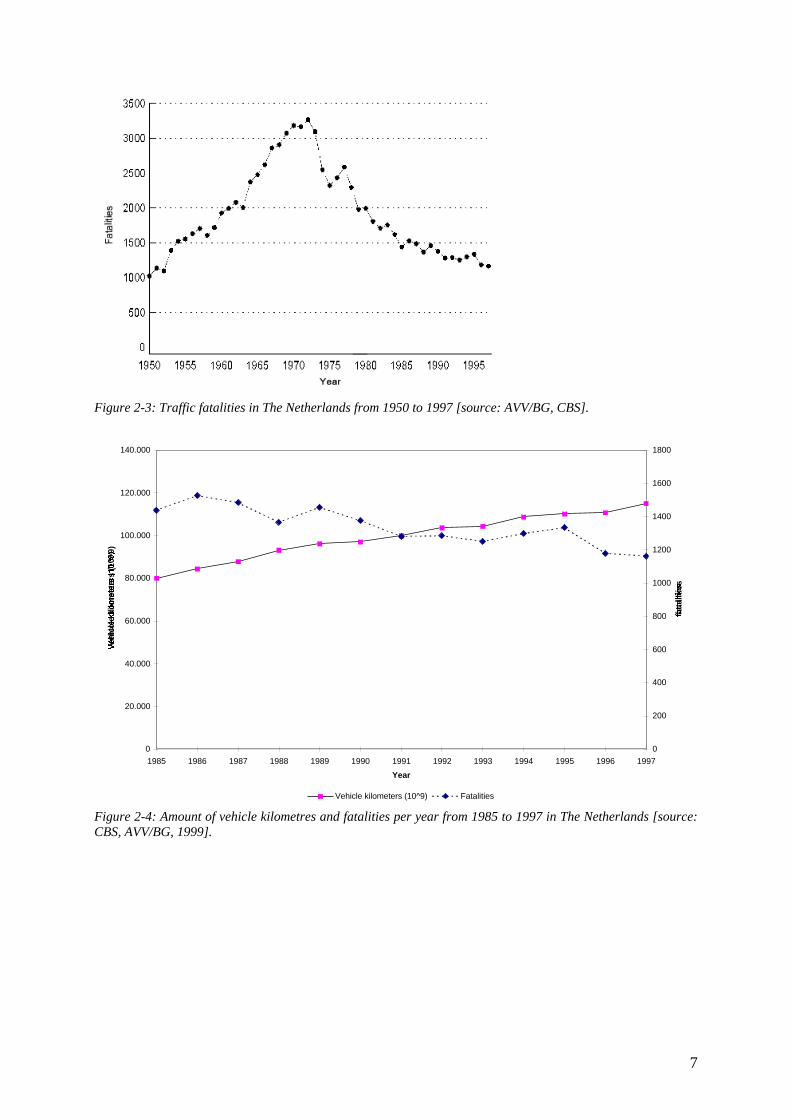
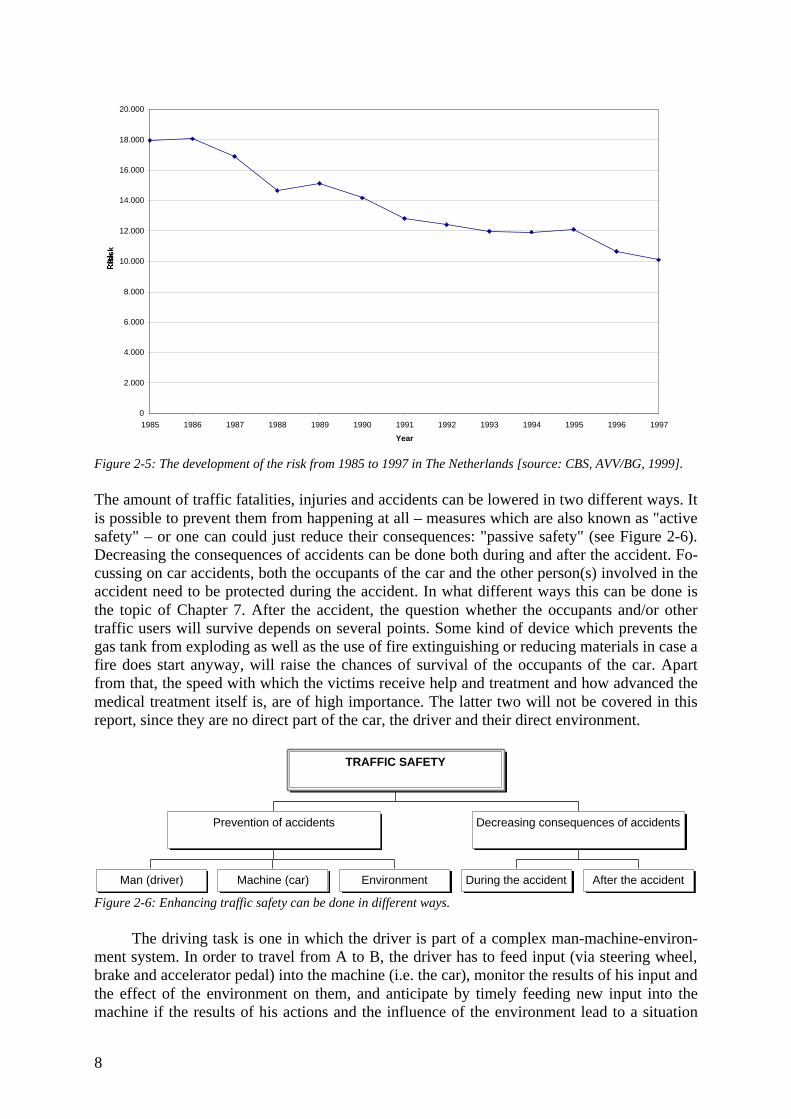
In The Netherlands, traffic safety (usually measured by the amount of fatalities in traffic) hasimproved over the years. The absolute number of traffic fatalities has generally decreasedafter 1972 (see Figure 2-3). Compared to the number of traffic deaths in that year, 3,300, theaverage number per year of 1,300 in the nineties is a considerable improvement. However, itseems that the descent is stagnating slightly. There have actually been some increases in thenineties, but due to the higher amount of vehicle kilometres (see Figure 2-4), the risk in-creased only very little in those cases (see Figure 2-5).
7
Figure 2-3: Traffic fatalities in The Netherlands from 1950 to 1997 [source: AVV/BG, CBS].
0
20.000
40.000
60.000
80.000
100.000
120.000
140.000
1985 1986 1987 1988 1989 1990 1991 1992 1993 1994 1995 1996 1997
Year
Veh
icle
kilo
met
ers
(10^
9)
0
200
400
600
800
1000
1200
1400
1600
1800
fata
litie
s
Vehicle kilometers (10^9) Fatalities
Figure 2-4: Amount of vehicle kilometres and fatalities per year from 1985 to 1997 in The Netherlands [source:CBS, AVV/BG, 1999].
8
0
2.000
4.000
6.000
8.000
10.000
12.000
14.000
16.000
18.000
20.000
1985 1986 1987 1988 1989 1990 1991 1992 1993 1994 1995 1996 1997
Year
Ris
k
Figure 2-5: The development of the risk from 1985 to 1997 in The Netherlands [source: CBS, AVV/BG, 1999].
The amount of traffic fatalities, injuries and accidents can be lowered in two different ways. Itis possible to prevent them from happening at all – measures which are also known as "activesafety" – or one can could just reduce their consequences: "passive safety" (see Figure 2-6).Decreasing the consequences of accidents can be done both during and after the accident. Fo-cussing on car accidents, both the occupants of the car and the other person(s) involved in theaccident need to be protected during the accident. In what different ways this can be done isthe topic of Chapter 7. After the accident, the question whether the occupants and/or othertraffic users will survive depends on several points. Some kind of device which prevents thegas tank from exploding as well as the use of fire extinguishing or reducing materials in case afire does start anyway, will raise the chances of survival of the occupants of the car. Apartfrom that, the speed with which the victims receive help and treatment and how advanced themedical treatment itself is, are of high importance. The latter two will not be covered in thisreport, since they are no direct part of the car, the driver and their direct environment.
Man (driver) Machine (car) Environment
Prevention of accidents
During the accident After the accident
Decreasing consequences of accidents
TRAFFIC SAFETY
Figure 2-6: Enhancing traffic safety can be done in different ways.
The driving task is one in which the driver is part of a complex man-machine-environ-ment system. In order to travel from A to B, the driver has to feed input (via steering wheel,brake and accelerator pedal) into the machine (i.e. the car), monitor the results of his input andthe effect of the environment on them, and anticipate by timely feeding new input into themachine if the results of his actions and the influence of the environment lead to a situation
9
which is not the one he desired.2 In many cases, the driver will be able to avoid an accident,but this is not always so.
There are many different aspects which can disturb the driving "process" in such a waythat a crash might occur. An accident can therefor be seen as the result of some kind of failureof the components of the system (i.e. man, machine or environment), or some kind of mal-functioning of their interaction. Whether and how seriously the car is damaged and its occu-pants are injured, depends on the specific crash situation. The prevention of accidents can beachieved by reducing the failures and malfunctions in the system. This can be done by im-proving the separate components of the system and the "communication" between them. Al-though usually only one component at the time is improved, an all-encompassing treatment inwhich all three components would be dealt with integrally would have a much larger effect.Further details about how accidents can be prevented can be found in Chapters 3, 4 and 5.
It is, of course, very dangerous to make assumptions based on the (apparent) tendenciesmentioned at the beginning of this paragraph, but it is possible that the annual amount of traf-fic fatalities will soon become more or less constant. Research has shown that about 85 to95% of all accidents are (partly) caused by mistakes that can be attributed to the man-part ofthe man-machine-environment system. Only 5 to 10% is caused by mechanical failure or er-rors in the direct environment of the car.3
Obviously, the driver is more likely to be "faulty" than the vehicle he drives in or theenvironment of the car. And well, we all know that no human is perfect and everyone has hisor her fair share of off-days. Apart from that, humans are known to sometimes take (irrespon-sibly high) risks. In other words, since driving a car does still largely depend on the actions ofthe human driver, it is almost impossible to prevent each and every accident from happening.It is therefore rather surprising that the driver seems to be all but forgotten when it comes toenhancing traffic safety; most research and innovations are focused on improving the passivesafety of the car and its environment.4
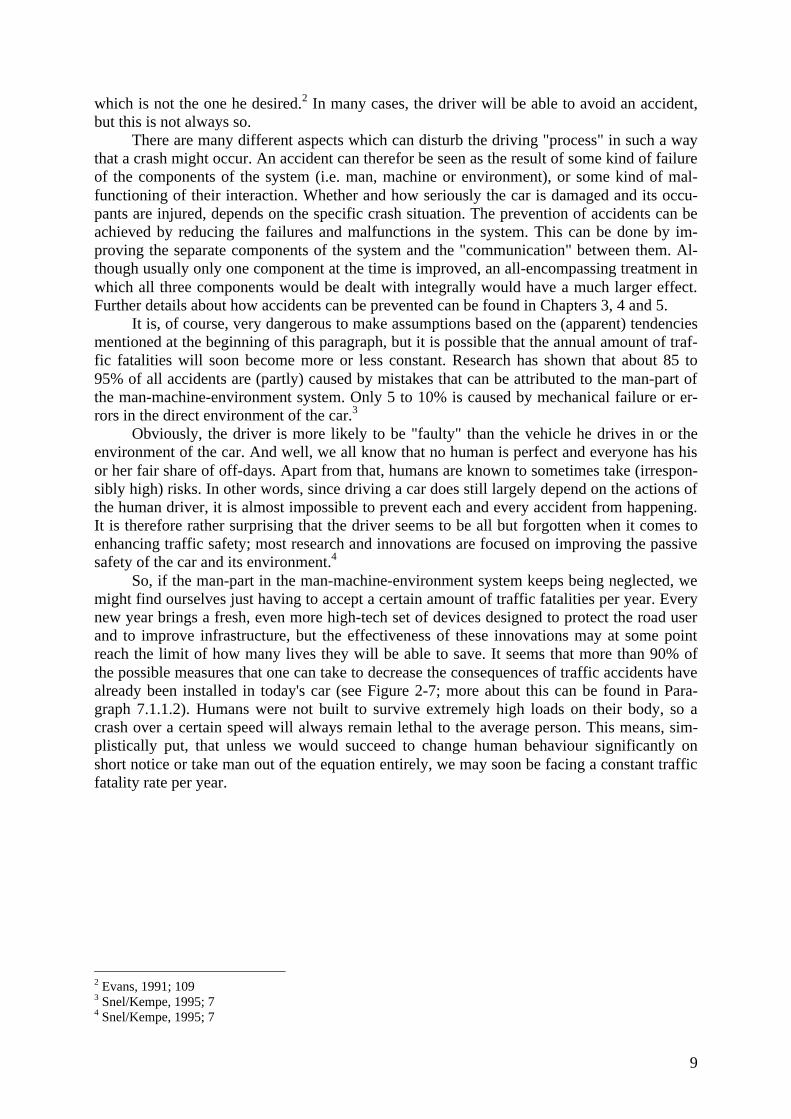
So, if the man-part in the man-machine-environment system keeps being neglected, wemight find ourselves just having to accept a certain amount of traffic fatalities per year. Everynew year brings a fresh, even more high-tech set of devices designed to protect the road userand to improve infrastructure, but the effectiveness of these innovations may at some pointreach the limit of how many lives they will be able to save. It seems that more than 90% ofthe possible measures that one can take to decrease the consequences of traffic accidents havealready been installed in today's car (see Figure 2-7; more about this can be found in Para-graph 7.1.1.2). Humans were not built to survive extremely high loads on their body, so acrash over a certain speed will always remain lethal to the average person. This means, sim-plistically put, that unless we would succeed to change human behaviour significantly onshort notice or take man out of the equation entirely, we may soon be facing a constant trafficfatality rate per year.
2 Evans, 1991; 1093 Snel/Kempe, 1995; 74 Snel/Kempe, 1995; 7
10
Figure 2-7: Percentage exploited of all safety measures possible to reduce the consequences of a crash in time[based on Seiffert, 2000-Figure 8].
However, even with a constant fatality rate, the total risk could still decrease. If theamount of vehicle kilometres driven per year would keep going up and the annual amount offatalities would stay about the same, then the risk (defined here as the chance of the occur-rence of one fatality per billion vehicle kilometres; see Figure 2-5) go down. Because of thereasons to decrease the absolute amount of fatalities given in Paragraph 2.1, this does seem tobe a rather lame excuse not to take appropriate measures, though.
2.3. Means of transportation and risk
Different means of transportation pose a different risk to both their users and the other trafficparticipants. A few factors that play a role here are the popularity of the specific means oftransportation, the typical age of its users and the extent of protection it offers to its users andto the vehicle or person(s) it crashed into.
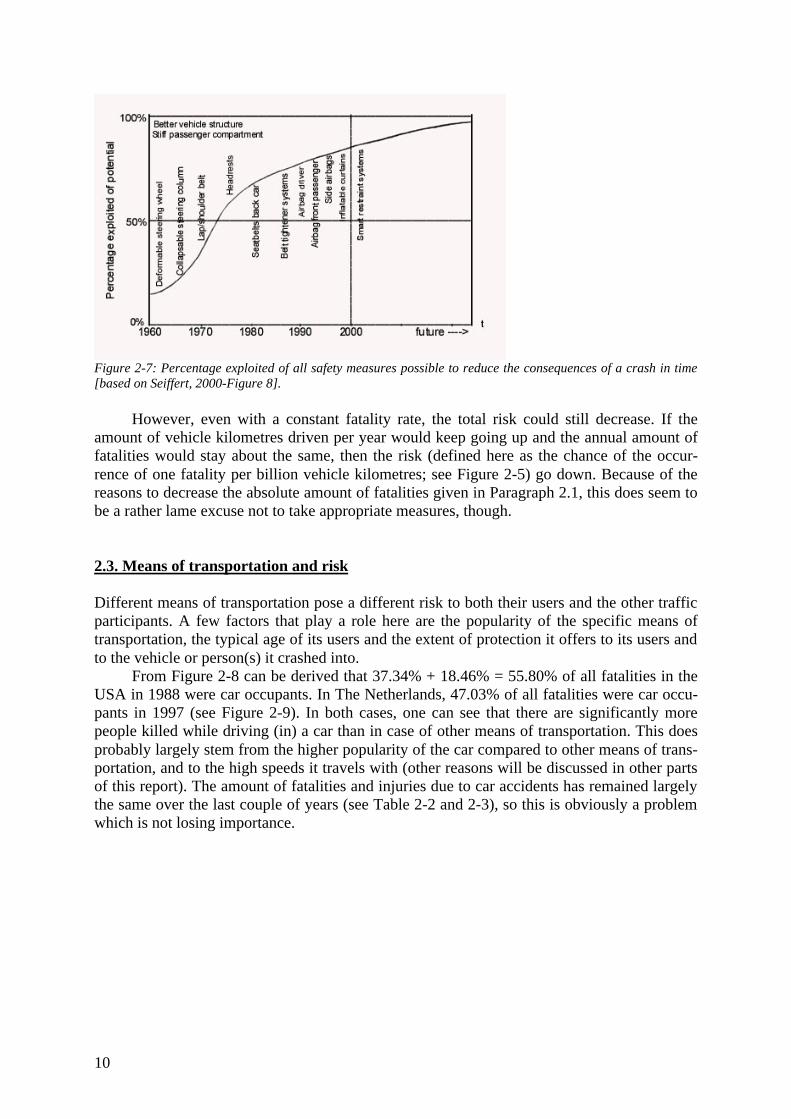
From Figure 2-8 can be derived that 37.34% + 18.46% = 55.80% of all fatalities in theUSA in 1988 were car occupants. In The Netherlands, 47.03% of all fatalities were car occu-pants in 1997 (see Figure 2-9). In both cases, one can see that there are significantly morepeople killed while driving (in) a car than in case of other means of transportation. This doesprobably largely stem from the higher popularity of the car compared to other means of trans-portation, and to the high speeds it travels with (other reasons will be discussed in other partsof this report). The amount of fatalities and injuries due to car accidents has remained largelythe same over the last couple of years (see Table 2-2 and 2-3), so this is obviously a problemwhich is not losing importance.
11
Cars37.34%
Pick-up trucks & vans11.64%
Trucks>10,000 lb.1.74%
Motorcycles7.02%
Buses0.02%
Other vehicles0.38%
Drivers58.14%
Cars18.46%
Pick-up trucks & vans5.34%
Trucks>10,000 lb.0.40%
Motorcycles0.80%
Buses0.09%
Other vehicles0.09%
Passengers25.18%
Vehicle occupants83.32%
Pedestrians14.73%
Bicyclists, etc.1.95%
Non-occupants16.68%
All 47,093 fatalities in the USA in 1988100%
Figure 2-8: Distribution of fatalities in the USA in 1988 according to the road user killed. The values in allboxes indicate the percentage of the total amount of 47,093 fatalities. Computed from FARS 1988 in Evans,1991.
Cars47.03%
Vans4.90%
Trucks>10,000 lb.0.95%
Buses0.26%
Motorcycles7.91%
Other vehicles0.00%
Vehicle occupants61.05%
Pedestrians10.23%
Bicyclists20.81%
Moped riders7.57%
Others0.34%
Non-occupants38.95%
All 1,163 fatalities in The Netherlands in 1997100%
Figure 2-9: Distribution of fatalities in The Netherlands in 1997 according to the road user killed. The values inall boxes indicate the percent of the total 1,163 fatalities. Computed from CBS data5.
It is logical that more drivers than passengers are killed in most traffic accidents, sincecars, vans, trucks and motorbikes are often used by only one person. In case of buses, how-ever, it is the other way around; more passengers are killed than drivers.
Trucks, vans and buses provide better protection to the occupants because of their sizeand construction and that is why their fatality rates are significantly lower. Another factor thatplays a role is that there are less vehicles of these kinds on the road than there are ordinarypassenger cars.
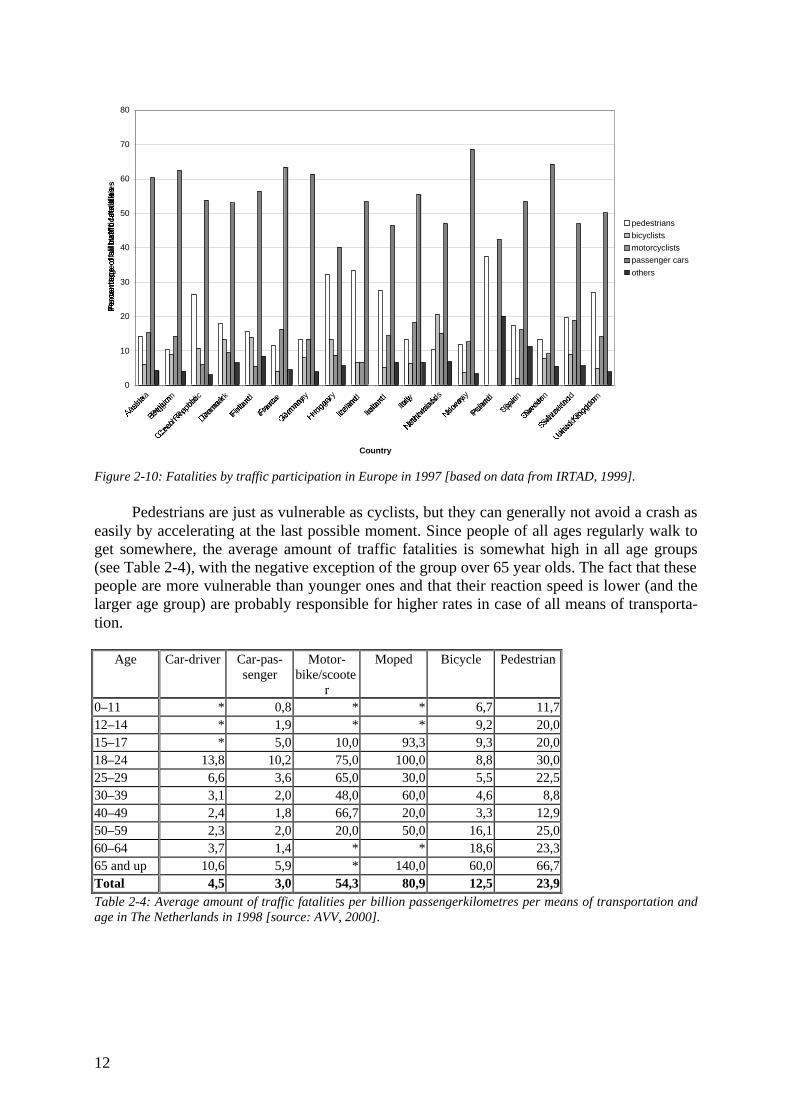
Motorbikes provide scant protection during a crash, but the fact that they are a lot lesspopular than passenger cars makes their fatality rate a lot lower than that of cars. The samegoes for mopeds (note the effect of the relatively large group of users between 15 and 24 inTable 2-4) and for bicycles in countries where the bike is not a common way of transporta-tion. In The Netherlands, many people regularly use the bicycle as a means of transportationand that shows in the fatality rates. Compared to other countries, the amount of fatalities andinjuries among cyclists is rather high (see Figure 2-10). Still, it could have been much higherwere it not for the fact that the collision speed is not very high if the cyclist hits the car, whichis as common a situation as the other way around. Because of the relatively low forces in-volved, this kind of crashes usually only results in injuries.
5 Centraal Bureau voor de Statistiek, 1998
12
0
10
20
30
40
50
60
70
80
Austri
a
Belgium
Czech
Rep
ublic
Denm
ark
Finlan
d
Franc
e
Germ
any
Hunga
ry
Icelan
d
Irelan
dIta
ly
Nethe
rland
s
Norway
Poland
Spain
Sweden
Switzer
land
United
King
dom
Country
Per
cen
tag
e o
f al
l tra
ffic
fat
alit
ies
pedestrians
bicyclists
motorcyclists
passenger cars
others
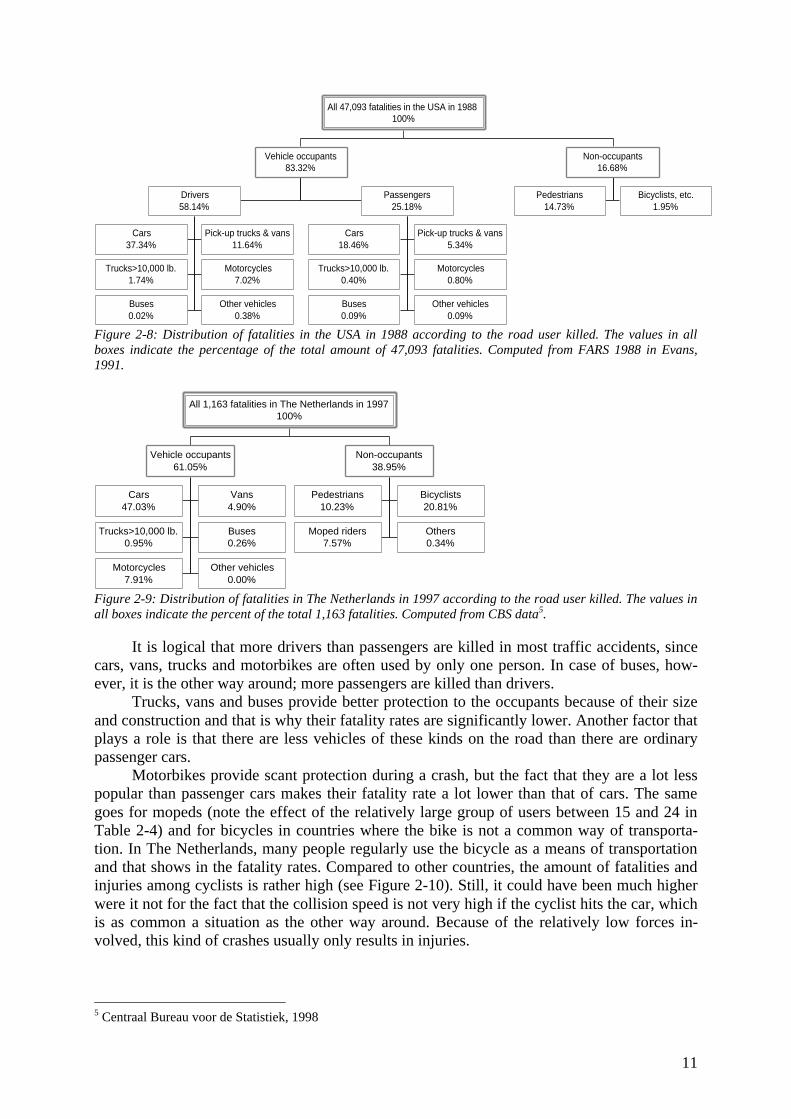
Figure 2-10: Fatalities by traffic participation in Europe in 1997 [based on data from IRTAD, 1999].
Pedestrians are just as vulnerable as cyclists, but they can generally not avoid a crash aseasily by accelerating at the last possible moment. Since people of all ages regularly walk toget somewhere, the average amount of traffic fatalities is somewhat high in all age groups(see Table 2-4), with the negative exception of the group over 65 year olds. The fact that thesepeople are more vulnerable than younger ones and that their reaction speed is lower (and thelarger age group) are probably responsible for higher rates in case of all means of transporta-tion.
Age Car-driver Car-pas-senger
Motor-bike/scoote
r
Moped Bicycle Pedestrian
0–11 * 0,8 * * 6,7 11,712–14 * 1,9 * * 9,2 20,015–17 * 5,0 10,0 93,3 9,3 20,018–24 13,8 10,2 75,0 100,0 8,8 30,025–29 6,6 3,6 65,0 30,0 5,5 22,530–39 3,1 2,0 48,0 60,0 4,6 8,840–49 2,4 1,8 66,7 20,0 3,3 12,950–59 2,3 2,0 20,0 50,0 16,1 25,060–64 3,7 1,4 * * 18,6 23,365 and up 10,6 5,9 * 140,0 60,0 66,7Total 4,5 3,0 54,3 80,9 12,5 23,9Table 2-4: Average amount of traffic fatalities per billion passengerkilometres per means of transportation andage in The Netherlands in 1998 [source: AVV, 2000].
13
2.4. General patterns in traffic accidents which involve cars
In 1990 a report was published which had the objective to present a more thorough categori-sation than the reports which usually only focus on the different parties involved in the acci-dent. C.M. Gundy registered a wide variety of details about more than 45,000 traffic accidentsin 1982 which involved one or more injuries or fatalities (a summary of the most importantresults can be found in Appendix E). This does, of course, not provide a complete picture ofall accidents that happened in that year, but the problem just always seems to be that "regis-tered injury traffic accidents are a biased sample of all injury traffic accidents, accidents withless severe injuries being more likely to be excluded than accidents with severe injuries [...]".6
Still, if one, for example, wants to get a general idea of what parts of the man and/or the ma-chine are most critical safety-wise, then it seems reasonable to use this information anyway.
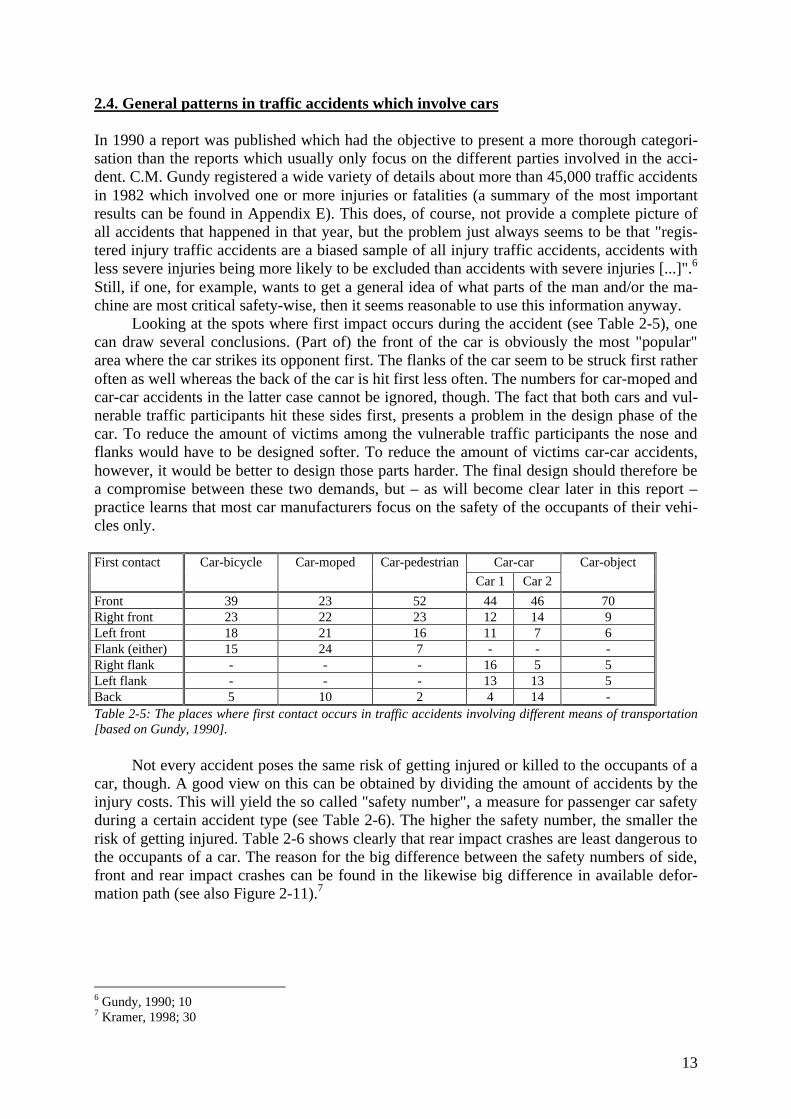
Looking at the spots where first impact occurs during the accident (see Table 2-5), onecan draw several conclusions. (Part of) the front of the car is obviously the most "popular"area where the car strikes its opponent first. The flanks of the car seem to be struck first ratheroften as well whereas the back of the car is hit first less often. The numbers for car-moped andcar-car accidents in the latter case cannot be ignored, though. The fact that both cars and vul-nerable traffic participants hit these sides first, presents a problem in the design phase of thecar. To reduce the amount of victims among the vulnerable traffic participants the nose andflanks would have to be designed softer. To reduce the amount of victims car-car accidents,however, it would be better to design those parts harder. The final design should therefore bea compromise between these two demands, but – as will become clear later in this report –practice learns that most car manufacturers focus on the safety of the occupants of their vehi-cles only.
Car-carFirst contact Car-bicycle Car-moped Car-pedestrian
Car 1 Car 2
Car-object
Front 39 23 52 44 46 70Right front 23 22 23 12 14 9Left front 18 21 16 11 7 6Flank (either) 15 24 7 - - -Right flank - - - 16 5 5Left flank - - - 13 13 5Back 5 10 2 4 14 -Table 2-5: The places where first contact occurs in traffic accidents involving different means of transportation[based on Gundy, 1990].
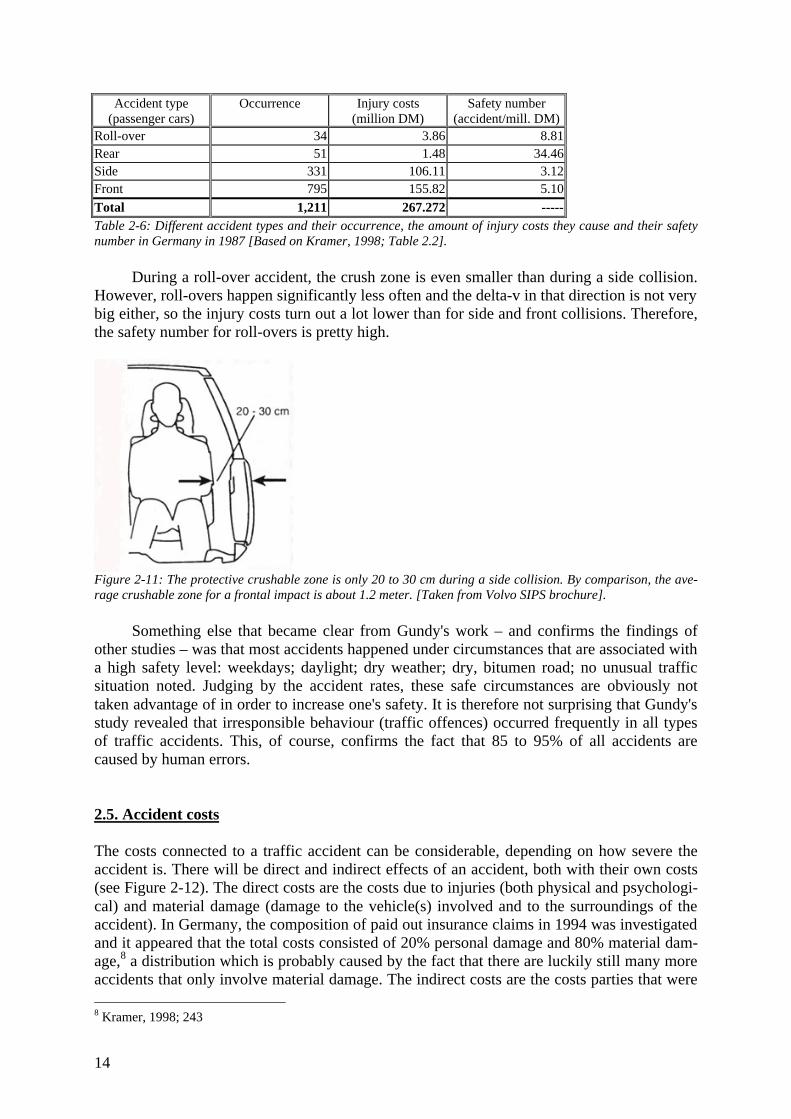
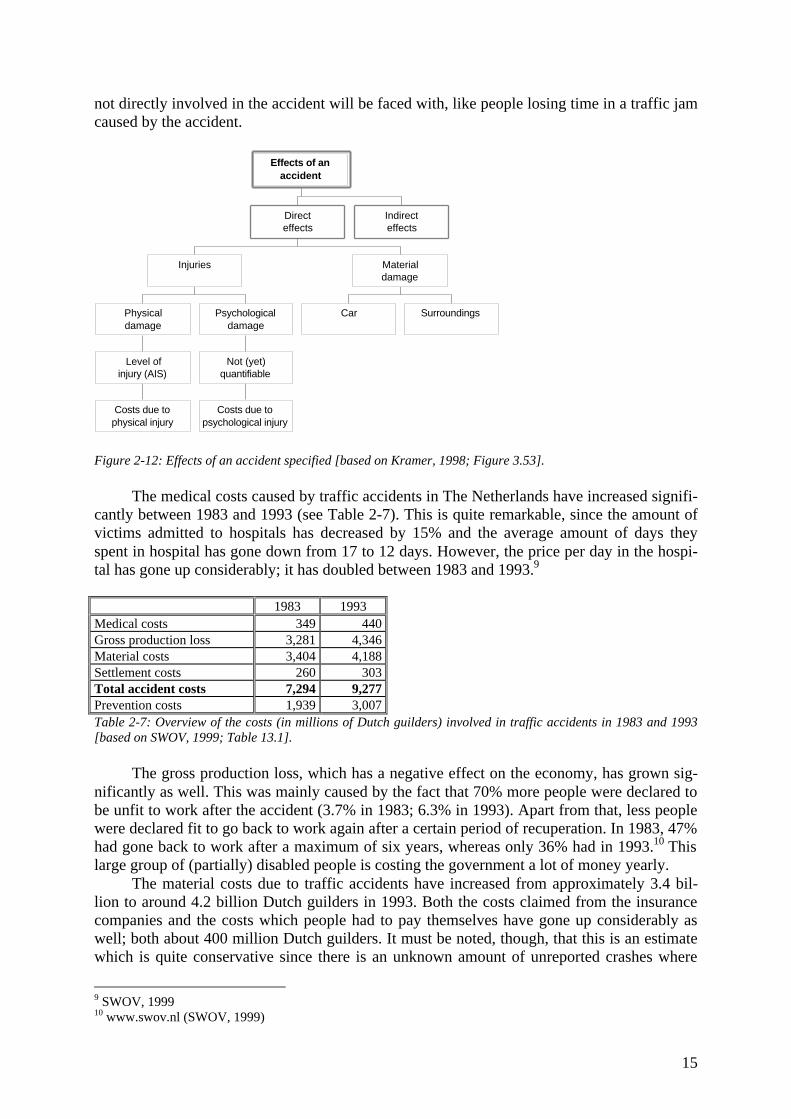
Not every accident poses the same risk of getting injured or killed to the occupants of acar, though. A good view on this can be obtained by dividing the amount of accidents by theinjury costs. This will yield the so called "safety number", a measure for passenger car safetyduring a certain accident type (see Table 2-6). The higher the safety number, the smaller therisk of getting injured. Table 2-6 shows clearly that rear impact crashes are least dangerous tothe occupants of a car. The reason for the big difference between the safety numbers of side,front and rear impact crashes can be found in the likewise big difference in available defor-mation path (see also Figure 2-11).7
6 Gundy, 1990; 107 Kramer, 1998; 30
14
Accident type(passenger cars)
Occurrence Injury costs(million DM)
Safety number(accident/mill. DM)
Roll-over 34 3.86 8.81Rear 51 1.48 34.46Side 331 106.11 3.12Front 795 155.82 5.10
Total 1,211 267.272 -----Table 2-6: Different accident types and their occurrence, the amount of injury costs they cause and their safetynumber in Germany in 1987 [Based on Kramer, 1998; Table 2.2].
During a roll-over accident, the crush zone is even smaller than during a side collision.However, roll-overs happen significantly less often and the delta-v in that direction is not verybig either, so the injury costs turn out a lot lower than for side and front collisions. Therefore,the safety number for roll-overs is pretty high.
Figure 2-11: The protective crushable zone is only 20 to 30 cm during a side collision. By comparison, the ave-rage crushable zone for a frontal impact is about 1.2 meter. [Taken from Volvo SIPS brochure].
Something else that became clear from Gundy's work – and confirms the findings ofother studies – was that most accidents happened under circumstances that are associated witha high safety level: weekdays; daylight; dry weather; dry, bitumen road; no unusual trafficsituation noted. Judging by the accident rates, these safe circumstances are obviously nottaken advantage of in order to increase one's safety. It is therefore not surprising that Gundy'sstudy revealed that irresponsible behaviour (traffic offences) occurred frequently in all typesof traffic accidents. This, of course, confirms the fact that 85 to 95% of all accidents arecaused by human errors.
2.5. Accident costs
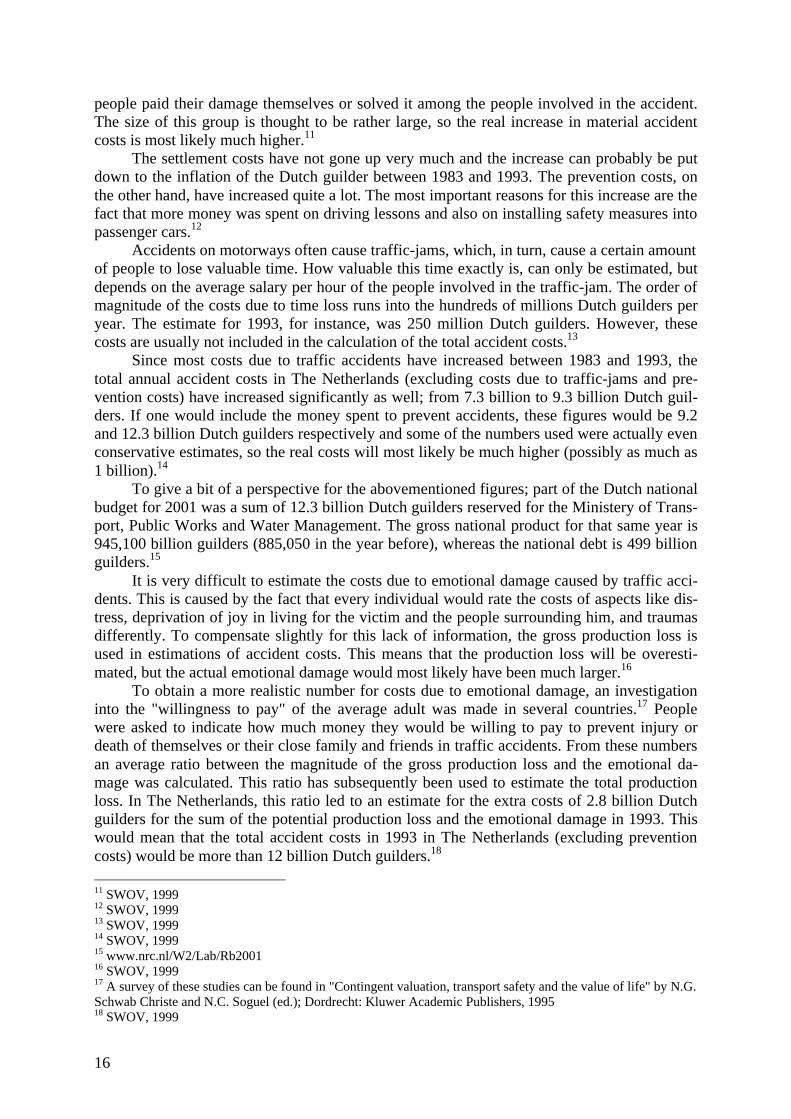
The costs connected to a traffic accident can be considerable, depending on how severe theaccident is. There will be direct and indirect effects of an accident, both with their own costs(see Figure 2-12). The direct costs are the costs due to injuries (both physical and psychologi-cal) and material damage (damage to the vehicle(s) involved and to the surroundings of theaccident). In Germany, the composition of paid out insurance claims in 1994 was investigatedand it appeared that the total costs consisted of 20% personal damage and 80% material dam-age,8 a distribution which is probably caused by the fact that there are luckily still many moreaccidents that only involve material damage. The indirect costs are the costs parties that were 8 Kramer, 1998; 243
15
not directly involved in the accident will be faced with, like people losing time in a traffic jamcaused by the accident.
Costs due tophysical injury
Level ofinjury (AIS)
Physicaldamage
Costs due topsychological injury
Not (yet)quantifiable
Psychologicaldamage
Injuries
Car Surroundings
Materialdamage
Directeffects
Indirecteffects
Effects of anaccident
Figure 2-12: Effects of an accident specified [based on Kramer, 1998; Figure 3.53].
The medical costs caused by traffic accidents in The Netherlands have increased signifi-cantly between 1983 and 1993 (see Table 2-7). This is quite remarkable, since the amount ofvictims admitted to hospitals has decreased by 15% and the average amount of days theyspent in hospital has gone down from 17 to 12 days. However, the price per day in the hospi-tal has gone up considerably; it has doubled between 1983 and 1993.9
1983 1993Medical costs 349 440Gross production loss 3,281 4,346Material costs 3,404 4,188Settlement costs 260 303Total accident costs 7,294 9,277Prevention costs 1,939 3,007Table 2-7: Overview of the costs (in millions of Dutch guilders) involved in traffic accidents in 1983 and 1993[based on SWOV, 1999; Table 13.1].
The gross production loss, which has a negative effect on the economy, has grown sig-nificantly as well. This was mainly caused by the fact that 70% more people were declared tobe unfit to work after the accident (3.7% in 1983; 6.3% in 1993). Apart from that, less peoplewere declared fit to go back to work again after a certain period of recuperation. In 1983, 47%had gone back to work after a maximum of six years, whereas only 36% had in 1993.10 Thislarge group of (partially) disabled people is costing the government a lot of money yearly.
The material costs due to traffic accidents have increased from approximately 3.4 bil-lion to around 4.2 billion Dutch guilders in 1993. Both the costs claimed from the insurancecompanies and the costs which people had to pay themselves have gone up considerably aswell; both about 400 million Dutch guilders. It must be noted, though, that this is an estimatewhich is quite conservative since there is an unknown amount of unreported crashes where
9 SWOV, 199910 www.swov.nl (SWOV, 1999)
16
people paid their damage themselves or solved it among the people involved in the accident.The size of this group is thought to be rather large, so the real increase in material accidentcosts is most likely much higher.11
The settlement costs have not gone up very much and the increase can probably be putdown to the inflation of the Dutch guilder between 1983 and 1993. The prevention costs, onthe other hand, have increased quite a lot. The most important reasons for this increase are thefact that more money was spent on driving lessons and also on installing safety measures intopassenger cars.12
Accidents on motorways often cause traffic-jams, which, in turn, cause a certain amountof people to lose valuable time. How valuable this time exactly is, can only be estimated, butdepends on the average salary per hour of the people involved in the traffic-jam. The order ofmagnitude of the costs due to time loss runs into the hundreds of millions Dutch guilders peryear. The estimate for 1993, for instance, was 250 million Dutch guilders. However, thesecosts are usually not included in the calculation of the total accident costs.13
Since most costs due to traffic accidents have increased between 1983 and 1993, thetotal annual accident costs in The Netherlands (excluding costs due to traffic-jams and pre-vention costs) have increased significantly as well; from 7.3 billion to 9.3 billion Dutch guil-ders. If one would include the money spent to prevent accidents, these figures would be 9.2and 12.3 billion Dutch guilders respectively and some of the numbers used were actually evenconservative estimates, so the real costs will most likely be much higher (possibly as much as1 billion).14
To give a bit of a perspective for the abovementioned figures; part of the Dutch nationalbudget for 2001 was a sum of 12.3 billion Dutch guilders reserved for the Ministery of Trans-port, Public Works and Water Management. The gross national product for that same year is945,100 billion guilders (885,050 in the year before), whereas the national debt is 499 billionguilders.15
It is very difficult to estimate the costs due to emotional damage caused by traffic acci-dents. This is caused by the fact that every individual would rate the costs of aspects like dis-tress, deprivation of joy in living for the victim and the people surrounding him, and traumasdifferently. To compensate slightly for this lack of information, the gross production loss isused in estimations of accident costs. This means that the production loss will be overesti-mated, but the actual emotional damage would most likely have been much larger.16
To obtain a more realistic number for costs due to emotional damage, an investigationinto the "willingness to pay" of the average adult was made in several countries.17 Peoplewere asked to indicate how much money they would be willing to pay to prevent injury ordeath of themselves or their close family and friends in traffic accidents. From these numbersan average ratio between the magnitude of the gross production loss and the emotional da-mage was calculated. This ratio has subsequently been used to estimate the total productionloss. In The Netherlands, this ratio led to an estimate for the extra costs of 2.8 billion Dutchguilders for the sum of the potential production loss and the emotional damage in 1993. Thiswould mean that the total accident costs in 1993 in The Netherlands (excluding preventioncosts) would be more than 12 billion Dutch guilders.18
11 SWOV, 199912 SWOV, 199913 SWOV, 199914 SWOV, 199915 www.nrc.nl/W2/Lab/Rb200116 SWOV, 199917 A survey of these studies can be found in "Contingent valuation, transport safety and the value of life" by N.G.Schwab Christe and N.C. Soguel (ed.); Dordrecht: Kluwer Academic Publishers, 199518 SWOV, 1999
17
Still, it appeared that the different surveys to estimate what people were willing to payto prevent injury or death were not as clear-cut as they seemed to be in advance.19 Small al-terations in unimportant-seeming variables like whether a sum of money was proposed or notcould lead to a completely different number. A more reliable way to estimate the costs ofemotional damage therefore will have to be developed.
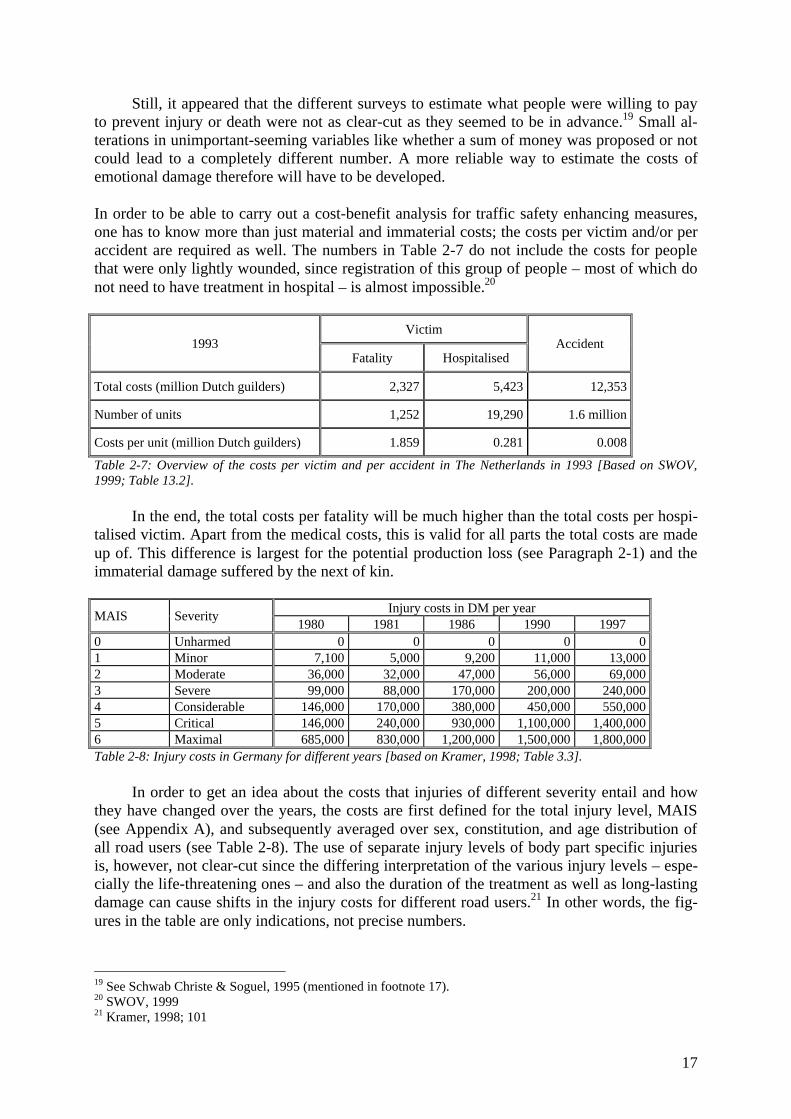
In order to be able to carry out a cost-benefit analysis for traffic safety enhancing measures,one has to know more than just material and immaterial costs; the costs per victim and/or peraccident are required as well. The numbers in Table 2-7 do not include the costs for peoplethat were only lightly wounded, since registration of this group of people – most of which donot need to have treatment in hospital – is almost impossible.20
Victim1993
Fatality HospitalisedAccident
Total costs (million Dutch guilders) 2,327 5,423 12,353
Number of units 1,252 19,290 1.6 million
Costs per unit (million Dutch guilders) 1.859 0.281 0.008
Table 2-7: Overview of the costs per victim and per accident in The Netherlands in 1993 [Based on SWOV,1999; Table 13.2].
In the end, the total costs per fatality will be much higher than the total costs per hospi-talised victim. Apart from the medical costs, this is valid for all parts the total costs are madeup of. This difference is largest for the potential production loss (see Paragraph 2-1) and theimmaterial damage suffered by the next of kin.
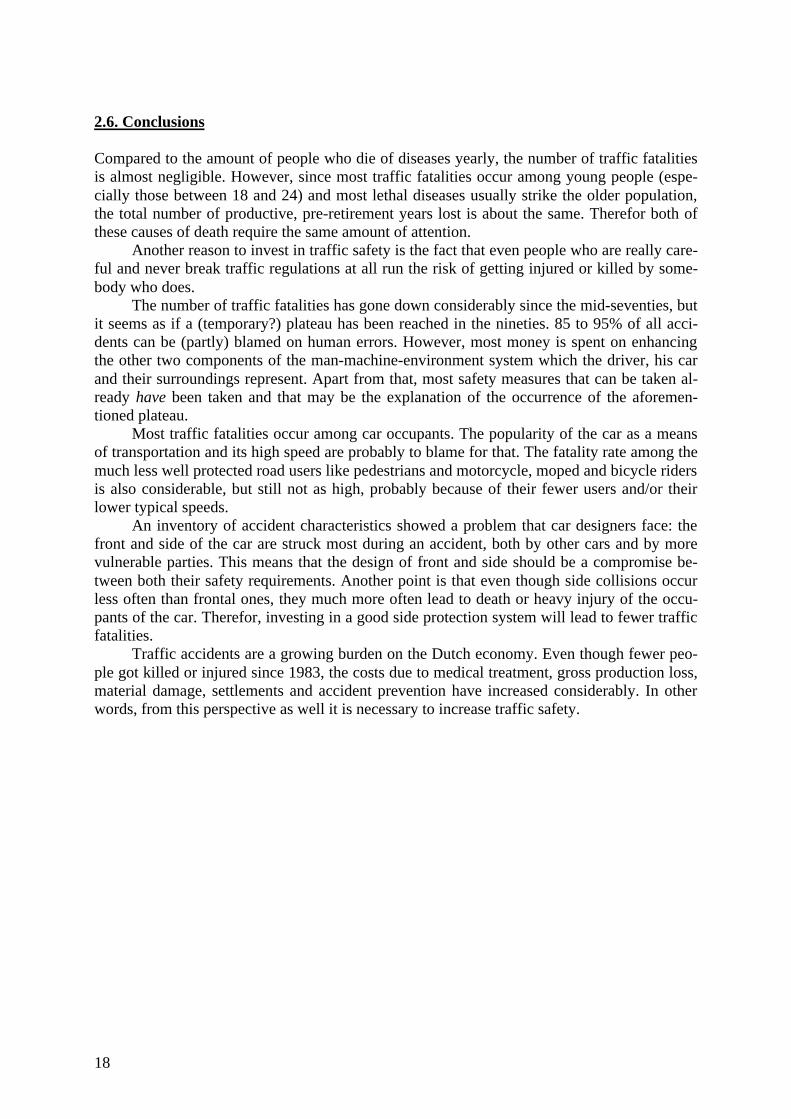
Injury costs in DM per yearMAIS Severity
1980 1981 1986 1990 19970 Unharmed 0 0 0 0 01 Minor 7,100 5,000 9,200 11,000 13,0002 Moderate 36,000 32,000 47,000 56,000 69,0003 Severe 99,000 88,000 170,000 200,000 240,0004 Considerable 146,000 170,000 380,000 450,000 550,0005 Critical 146,000 240,000 930,000 1,100,000 1,400,0006 Maximal 685,000 830,000 1,200,000 1,500,000 1,800,000Table 2-8: Injury costs in Germany for different years [based on Kramer, 1998; Table 3.3].
In order to get an idea about the costs that injuries of different severity entail and howthey have changed over the years, the costs are first defined for the total injury level, MAIS(see Appendix A), and subsequently averaged over sex, constitution, and age distribution ofall road users (see Table 2-8). The use of separate injury levels of body part specific injuriesis, however, not clear-cut since the differing interpretation of the various injury levels – espe-cially the life-threatening ones – and also the duration of the treatment as well as long-lastingdamage can cause shifts in the injury costs for different road users.21 In other words, the fig-ures in the table are only indications, not precise numbers.
19 See Schwab Christe & Soguel, 1995 (mentioned in footnote 17).20 SWOV, 199921 Kramer, 1998; 101
18
2.6. Conclusions
Compared to the amount of people who die of diseases yearly, the number of traffic fatalitiesis almost negligible. However, since most traffic fatalities occur among young people (espe-cially those between 18 and 24) and most lethal diseases usually strike the older population,the total number of productive, pre-retirement years lost is about the same. Therefor both ofthese causes of death require the same amount of attention.
Another reason to invest in traffic safety is the fact that even people who are really care-ful and never break traffic regulations at all run the risk of getting injured or killed by some-body who does.
The number of traffic fatalities has gone down considerably since the mid-seventies, butit seems as if a (temporary?) plateau has been reached in the nineties. 85 to 95% of all acci-dents can be (partly) blamed on human errors. However, most money is spent on enhancingthe other two components of the man-machine-environment system which the driver, his carand their surroundings represent. Apart from that, most safety measures that can be taken al-ready have been taken and that may be the explanation of the occurrence of the aforemen-tioned plateau.
Most traffic fatalities occur among car occupants. The popularity of the car as a meansof transportation and its high speed are probably to blame for that. The fatality rate among themuch less well protected road users like pedestrians and motorcycle, moped and bicycle ridersis also considerable, but still not as high, probably because of their fewer users and/or theirlower typical speeds.
An inventory of accident characteristics showed a problem that car designers face: thefront and side of the car are struck most during an accident, both by other cars and by morevulnerable parties. This means that the design of front and side should be a compromise be-tween both their safety requirements. Another point is that even though side collisions occurless often than frontal ones, they much more often lead to death or heavy injury of the occu-pants of the car. Therefor, investing in a good side protection system will lead to fewer trafficfatalities.
Traffic accidents are a growing burden on the Dutch economy. Even though fewer peo-ple got killed or injured since 1983, the costs due to medical treatment, gross production loss,material damage, settlements and accident prevention have increased considerably. In otherwords, from this perspective as well it is necessary to increase traffic safety.
19
3: Accident prevention: the driver
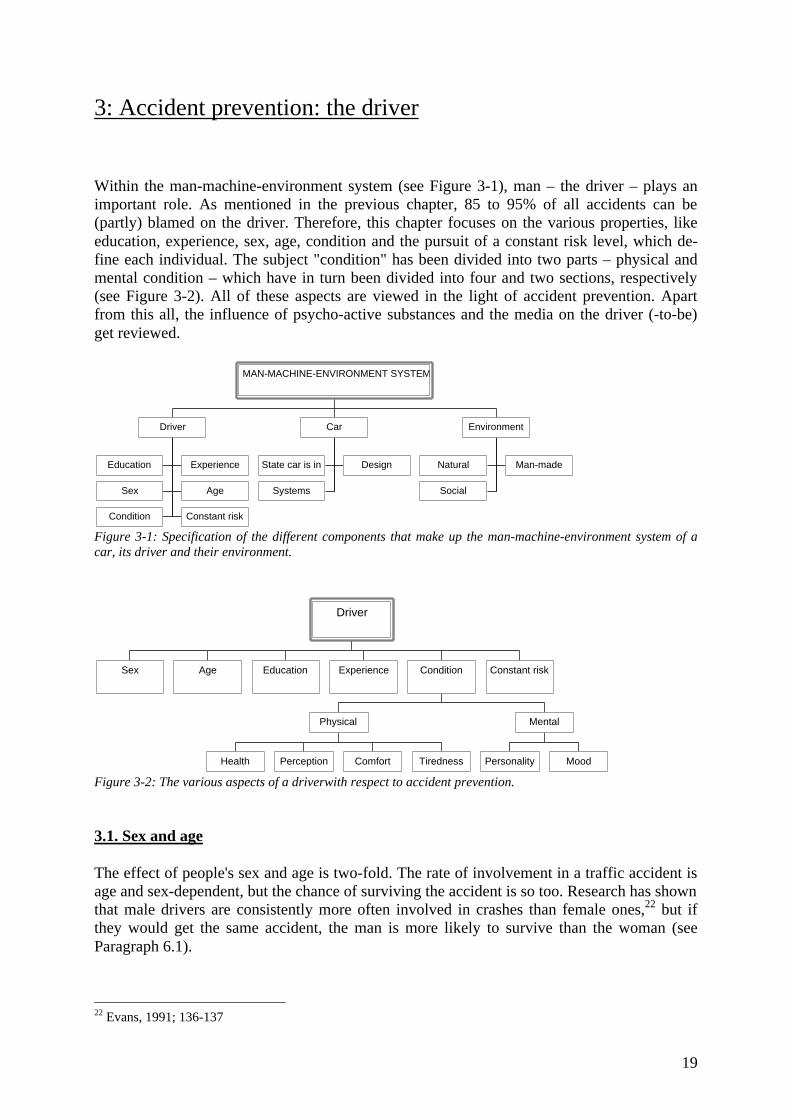
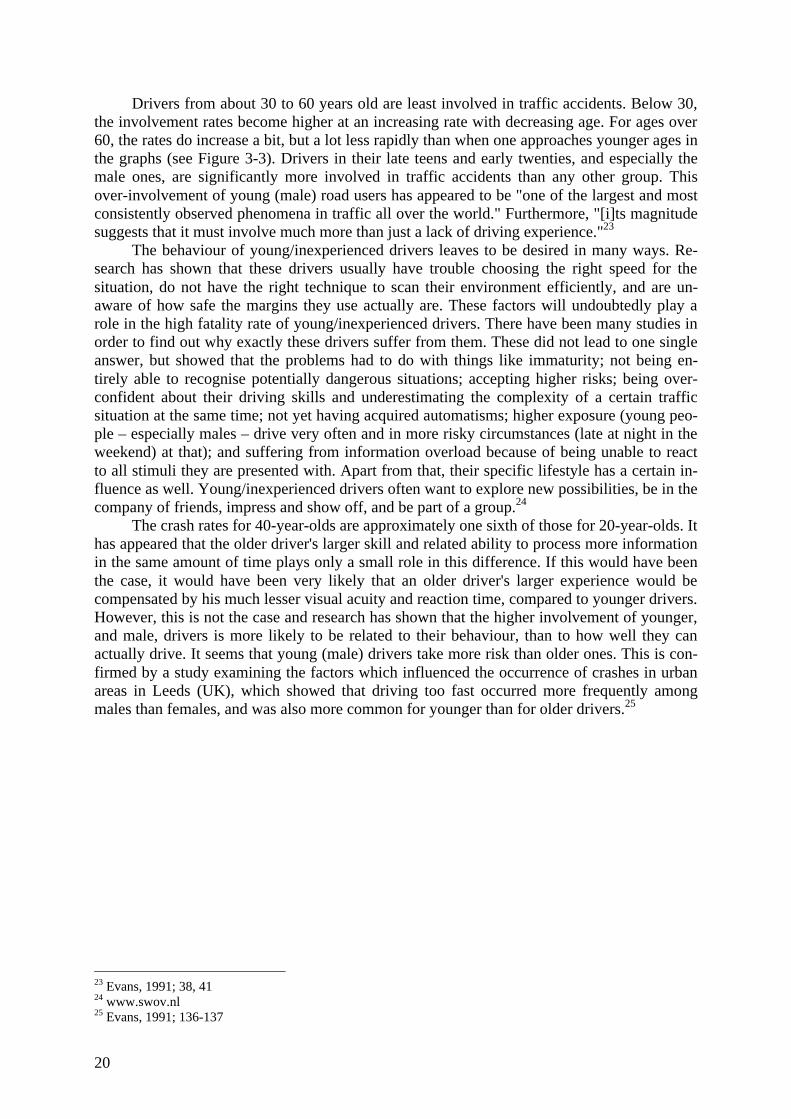
Within the man-machine-environment system (see Figure 3-1), man – the driver – plays animportant role. As mentioned in the previous chapter, 85 to 95% of all accidents can be(partly) blamed on the driver. Therefore, this chapter focuses on the various properties, likeeducation, experience, sex, age, condition and the pursuit of a constant risk level, which de-fine each individual. The subject "condition" has been divided into two parts – physical andmental condition – which have in turn been divided into four and two sections, respectively(see Figure 3-2). All of these aspects are viewed in the light of accident prevention. Apartfrom this all, the influence of psycho-active substances and the media on the driver (-to-be)get reviewed.
Education Experience
Sex Age
Condition Constant risk
Driver
State car is in Design
Systems
Car
Natural Man-made
Social
Environment
MAN-MACHINE-ENVIRONMENT SYSTEM
Figure 3-1: Specification of the different components that make up the man-machine-environment system of acar, its driver and their environment.
Sex Age Education Experience
Health Perception Comfort Tiredness
Physical
Personality Mood
Mental
Condition Constant risk
Driver
Figure 3-2: The various aspects of a driverwith respect to accident prevention.
3.1. Sex and age
The effect of people's sex and age is two-fold. The rate of involvement in a traffic accident isage and sex-dependent, but the chance of surviving the accident is so too. Research has shownthat male drivers are consistently more often involved in crashes than female ones,22 but ifthey would get the same accident, the man is more likely to survive than the woman (seeParagraph 6.1).
22 Evans, 1991; 136-137
20
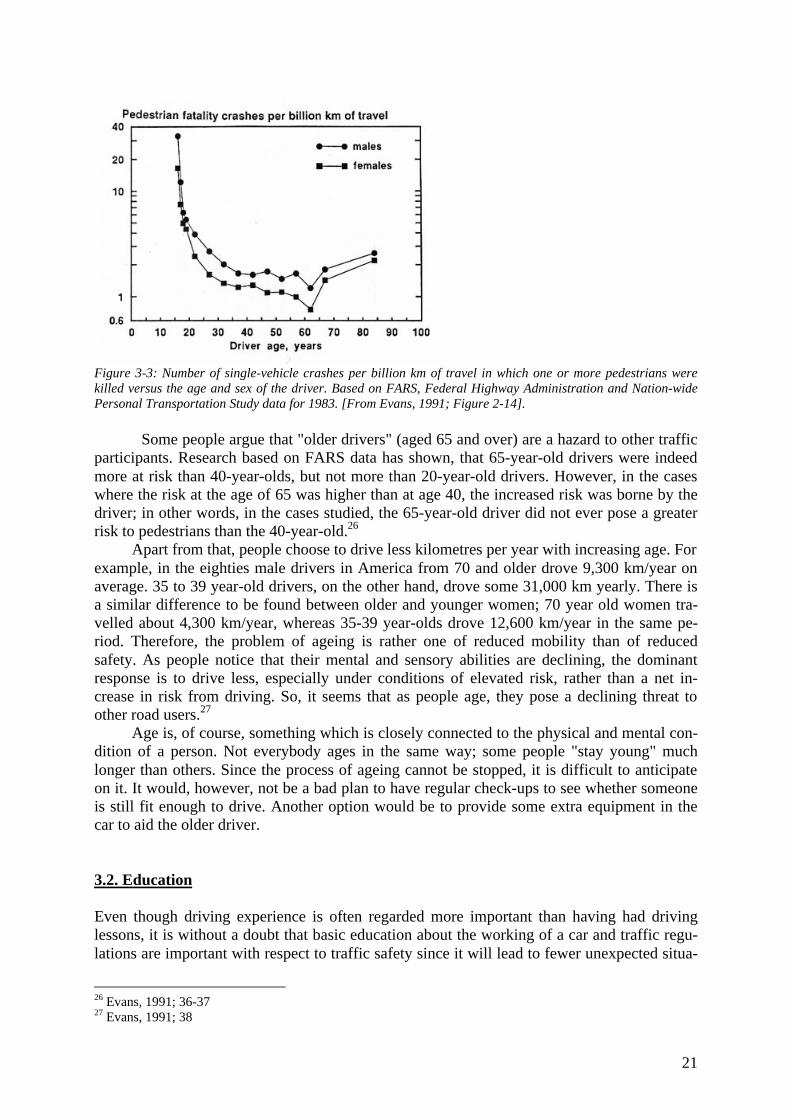
Drivers from about 30 to 60 years old are least involved in traffic accidents. Below 30,the involvement rates become higher at an increasing rate with decreasing age. For ages over60, the rates do increase a bit, but a lot less rapidly than when one approaches younger ages inthe graphs (see Figure 3-3). Drivers in their late teens and early twenties, and especially themale ones, are significantly more involved in traffic accidents than any other group. Thisover-involvement of young (male) road users has appeared to be "one of the largest and mostconsistently observed phenomena in traffic all over the world." Furthermore, "[i]ts magnitudesuggests that it must involve much more than just a lack of driving experience."23
The behaviour of young/inexperienced drivers leaves to be desired in many ways. Re-search has shown that these drivers usually have trouble choosing the right speed for thesituation, do not have the right technique to scan their environment efficiently, and are un-aware of how safe the margins they use actually are. These factors will undoubtedly play arole in the high fatality rate of young/inexperienced drivers. There have been many studies inorder to find out why exactly these drivers suffer from them. These did not lead to one singleanswer, but showed that the problems had to do with things like immaturity; not being en-tirely able to recognise potentially dangerous situations; accepting higher risks; being over-confident about their driving skills and underestimating the complexity of a certain trafficsituation at the same time; not yet having acquired automatisms; higher exposure (young peo-ple – especially males – drive very often and in more risky circumstances (late at night in theweekend) at that); and suffering from information overload because of being unable to reactto all stimuli they are presented with. Apart from that, their specific lifestyle has a certain in-fluence as well. Young/inexperienced drivers often want to explore new possibilities, be in thecompany of friends, impress and show off, and be part of a group.24
The crash rates for 40-year-olds are approximately one sixth of those for 20-year-olds. Ithas appeared that the older driver's larger skill and related ability to process more informationin the same amount of time plays only a small role in this difference. If this would have beenthe case, it would have been very likely that an older driver's larger experience would becompensated by his much lesser visual acuity and reaction time, compared to younger drivers.However, this is not the case and research has shown that the higher involvement of younger,and male, drivers is more likely to be related to their behaviour, than to how well they canactually drive. It seems that young (male) drivers take more risk than older ones. This is con-firmed by a study examining the factors which influenced the occurrence of crashes in urbanareas in Leeds (UK), which showed that driving too fast occurred more frequently amongmales than females, and was also more common for younger than for older drivers.25
23 Evans, 1991; 38, 4124 www.swov.nl25 Evans, 1991; 136-137
21
Figure 3-3: Number of single-vehicle crashes per billion km of travel in which one or more pedestrians werekilled versus the age and sex of the driver. Based on FARS, Federal Highway Administration and Nation-widePersonal Transportation Study data for 1983. [From Evans, 1991; Figure 2-14].
Some people argue that "older drivers" (aged 65 and over) are a hazard to other trafficparticipants. Research based on FARS data has shown, that 65-year-old drivers were indeedmore at risk than 40-year-olds, but not more than 20-year-old drivers. However, in the caseswhere the risk at the age of 65 was higher than at age 40, the increased risk was borne by thedriver; in other words, in the cases studied, the 65-year-old driver did not ever pose a greaterrisk to pedestrians than the 40-year-old.26
Apart from that, people choose to drive less kilometres per year with increasing age. Forexample, in the eighties male drivers in America from 70 and older drove 9,300 km/year onaverage. 35 to 39 year-old drivers, on the other hand, drove some 31,000 km yearly. There isa similar difference to be found between older and younger women; 70 year old women tra-velled about 4,300 km/year, whereas 35-39 year-olds drove 12,600 km/year in the same pe-riod. Therefore, the problem of ageing is rather one of reduced mobility than of reducedsafety. As people notice that their mental and sensory abilities are declining, the dominantresponse is to drive less, especially under conditions of elevated risk, rather than a net in-crease in risk from driving. So, it seems that as people age, they pose a declining threat toother road users.27
Age is, of course, something which is closely connected to the physical and mental con-dition of a person. Not everybody ages in the same way; some people "stay young" muchlonger than others. Since the process of ageing cannot be stopped, it is difficult to anticipateon it. It would, however, not be a bad plan to have regular check-ups to see whether someoneis still fit enough to drive. Another option would be to provide some extra equipment in thecar to aid the older driver.
3.2. Education
Even though driving experience is often regarded more important than having had drivinglessons, it is without a doubt that basic education about the working of a car and traffic regu-lations are important with respect to traffic safety since it will lead to fewer unexpected situa-
26 Evans, 1991; 36-3727 Evans, 1991; 38
22
tions. Driving lessons also provide the possibility to gain experience in driving a car in asomewhat controlled environment. The fact that everyone has to pass the same exam, meansthat it can be expected that all drivers more or less start out with the same knowledge andskills.
3.3. Experience
Driving is considered to be a "self-paced" task. Drivers choose their own levels of task diffi-culty depending on their experience as a driver. Examples of driving with a higher level oftask difficulty are driving faster, overtaking in heavier traffic, or accepting secondary taskswhile driving, such as listening to the radio. The striking point in this is that an increase inexperience would improve safety when the level of task difficulty would be kept the same; inother words, drivers seem to (consciously or unconsciously) choose for a constant level of risk(see also Paragraph 3.6),28 which implies that more experience does not necessarily help toprevent traffic accidents from happening.
Evans states about this: "The belief that increased skill would lead to lower crash in-volvement rates seems to many so intuitively obvious that it should be superfluous even toinvestigate it. Such a belief nurtures the view that driver education necessarily increasessafety. It is widely held by driving aficionados, especially the racing fraternity, that race driv-ers have fewer crashes than the average driver". Research on this matter has proven, however,that the accident rates for racing drivers actually exceeded those for comparison drivers.Racing drivers appeared to have substantially more crashes and, apart from that, more trafficoffences, especially speed violations.29
How to interpret this fact is, however, not very easy. Evans: "In interpreting the diffe-rence between the driving records of the race drivers and the comparison drivers, it is not pos-sible to determine whether the effect flows from the use of the additional skill acquired by thedrivers to drive more aggressively, or whether it is simply high-risk drivers who are attractedto racing. Perhaps, without the additional skills acquired in pursuit of their advanced license,they might have had yet higher crash rates. The study does show that higher skill levels arenot necessarily associated with lower crash rates."30
3.4. Physical condition
A person's physical condition can have a large influence on his reaction time. It has appearedthat small reductions in reaction time can reduce the probability and severity of crashes,31 andthe other way around. If a driver is not in good health, he is usually unable to react to unex-pected situations as fast as he usually can. His perception also plays a role in this, since thereaction time is largely dependent on how fast he recognises a potentially dangerous situation.Of course, it then depends on the number of stimuli presented to him and the number of pos-sible responses to those stimuli, whether he will be able to react timely.32
28 Evans, 1991; 13329 Evans, 1991; 13430 Evans, 1991; 13531 Evans, 1991; 12332 Evans, 1991; 118, 120
23
3.4.1. HealthI do not think that it is necessary to elaborate on the fact that a person who is not in top formdoes not perform as well as he could when healthy. Just think of how a light cold or the fluecan influence everything one does negatively. It would therefore probably be better if some-one who is not feeling well would not drive. Sometimes this cannot be avoided, though.
3.4.2. PerceptionDriving a car is an activity which is characterised by the fact that most information required toperform it is perceived visually. A driver's vision can, however, be severely limited at timesbecause of darkness, fog and heavy rain, hail or snow showers. Studies have shown that driv-ing by night is two to three times as dangerous per kilometre driven than during daytime, al-though it must be stressed that this is certainly not only caused by the darkness (see Paragraph5.1.1). The human eye has not primarily been "designed" to see in the dark or through fog.Apart from the lack of visual information that the aforementioned situations present, theavailable information might therefore be misleading. Still, people often drive at speeds whichrequire a stopping distance which is larger than the distance that they can actually discernobjects and other road users.33
According to Ian Noy [1997], there are several reasons why people suffer from percep-tion problems in situations with reduced visiblity: "major visual functions such as acuity,contrast sensitivity, and depth perception are reduced substantially at lower illumination le-vels; the glare of opposing headlights can reduce the visibility of low contrast objects such aspedestrians; and pedestrians grossly overestimate how visible they are to motorists who arefacing opposing headlights". The latter two are reflected in the above-average rate of acci-dents at night involving pedestrians.34
Apart from their vision, drivers suffer from more perception problems. Many studieshave shown that drivers who could not see their speedometer consistently estimated theirspeed lower than it actually was, for instance. These errors were usually not that large; typi-cally less than 5 km/h. When the subjects were could not hear any outside noises either, theyunderestimated their speed even more: typically around 8 km/h. Blindfolded people appearedto judge speed without systematic error, whereas people who were deprived from their audi-tory functions showed increased inaccuracy at maintaining instructed speeds.35 In otherwords, the hearing plays an important role in a driver's perception of speed.
If a driver has been driving on a motorway for a longer time, he will get used to the highspeed he is driving. The consequence of this habituation is that he will perceive lower speedseven lower than they are when he leaves the motorway, and will subsequently drive fasterthan the appropriate or instructed speed. This situation is called "speed adaptation" and hasappeared to mostly be a perceptual illusion in pretty much the same way as Escher's drawingsand etches are. Driving experience and training and visual training have appeared to be unableto change this situation. It is therefore important that people are made aware of the signifi-cance of using their speedometer, especially when having travelled at a high speed for awhile.36
Research has shown that drivers are also generally unable to correctly estimate both thedistance between their vehicle and the one in front of them, and their relative speed. Since alot of driving takes place while there are more vehicles on the road and one therefor has todrive behind other cars, this obviously is dangerous with respect to traffic safety. A driverfollowing another car seems to either not try, or probably rather to be unable, to keep the de-
33 Ian Noy, 1997; 239-24034 Ian Noy, 1997; 239-24035 Evans, 1991; 111-11236 Evans, 1991; 114
24
sired distance between the two vehicles constant by anticipating on the actual spacing grow-ing or declining. Drivers appear to generally accelerate when the distance becomes larger anddecelerate when it becomes smaller.37
Even though people are unable to estimate spacing and relative velocity correctly, astudy showed that they appeared to be capable of judging whether the lead car was comingcloser. The problem was though, that they would misjudge the speed with which they wouldbe closing in on the car in front and react too late because of that. Evans [1991] argues thatthis might happen because of the driver's expectancy. Based on their experience that cars infront of them will usually keep travelling at the same speed, the driver just does not expect thevehicle to decelerate, which will make this fact harder for him to perceive when it actuallydoes happen.38
The same problem as was found when someone is following a car occurs when he isconfronting a car. "The inability of drivers to estimate oncoming speed leads them to declinesafe passing opportunities when the oncoming car is travelling slower than expected, and toinitiate unsafe passing manoeuvres when the oncoming car is travelling faster than expected.Technology to inform the driver of the oncoming vehicle's speed could therefore increaseboth traffic efficiency and safety."39
The perception problems that every human has, become worse with age. A person's vi-sual performance, for instance, tends to decrease when he is getting older. But in spite of thefact that people are pretty much aware of their (growing) impairments and the dangers con-nected to them, they still drive too fast in situations of reduced visibility, and too close to thecar in front of them.40 It would therefore be positive with respect to traffic safety if a driver'svision could somehow be enhanced in these situations or that he would be warned about hisspeed being too high.
3.4.3. ComfortA person's sense of comfort does pretty much determine how well concentrated he is withrespect to the task at hand. An important part of that is the temperature around him. To feelcomfortable, a human should have a constant core temperature (the body temperature in thecentre of the human body; usually 37˚C). A temperature more than 2˚C over or under the coretemperature is known to form a serious stress factor. That is why both very high and very lowtemperatures can gravely effect a driver's reaction time and how many errors he makes.41
The ideal temperature to work in – depending, of course, on how much physical exer-tion the job requires – is between 20 and 29˚C. Higher temperatures cause people to sweatexcessively. If they do not take care of the amount of liquid in their body by drinking enough,this can lead to dehydration. On average, a fluids loss of 2% can already lead to the personbeing unable to function very well mentally. A 3% loss causes physiological and psychologi-cal changes; one will be less well able to work, gets a faster heartbeat and a worse mood. At a5% loss a person will display severe signs of exhaustion. 7% causes hallucination and a 10%fluids loss is even life-threatening.42
To be able to cope with high temperatures one will need to acclimatise. The problem is,though, that it will take days before a person has entirely got used to the heat; the exactamount of days depending on age and sex. In other words, a driver will not be able to accli-
37 Evans, 1991; 11438 Evans, 1991; 115, 11739 Evans, 1991; 11840 Ian Noy, 1997; 239-24041 Snel/Kempe, 1995; 8742 Snel/Kempe, 1995; 88-89
25
matise while travelling by car on a hot day. Therefore, his performance on the road will sufferfrom it, thus decreasing traffic safety.43
Research performed in Germany showed that the accident risk does indeed increasewith the outside temperature. Outside the built-up area the risk appeared to increase 6% withan outside temperature of 27˚C, inside the built-up area the risk increased even more, 11%. Ineven more extreme circumstances, namely with an outside temperature of 37˚C, these num-bers were even 18% and 30% respectively.44 Therefore, accidents would be prevented fromhappening if the temperature inside the car could be brought to a comfortable temperature.
3.4.4. TirednessTiredness can influence one's performance capacities so much that it might not be possible tomaintain the performance level required for a certain task. The nature and level of tirednessdepend on the kind of stress one has experienced, its intensity and how long one has been ex-posed to it. When one has to keep up a certain performance level – as is the case when one hasto drive a car while being tired – then it is possible to activate mental and physical processesto compensate the non-optimal capacity. This process is known as "putting in a great mentaleffort".45
Apart from (work) stress, one can become tired because of sleep deficiency, high orlow temperatures, the sound level in the car, driving long and monotonous routes, and gettingstuck in traffic jams. If one has to put in great mental effort to keep up the driving task for along time, it becomes very likely that one will contract an even more serious form of tired-ness, which one can hardly compensate for by putting in extra mental effort. In that state ofdecreased general attention and alertness, it often means that one will not notice traffic signsas well as when one is not that tired. One will respond to changes in traffic later, one will notbe able to keep to the middle of the road (lane drifting) and one's driving speed will be lessconstant. Apart from that, serious tiredness causes a driver to be unable to use all the infor-mation coming from his surroundings.46
Official reports show that tiredness is (one of) the cause(s) of traffic accidents in 2% ofall crashes. However, more targeted research gives numbers of at least 10%. In case of acci-dents which involve only one vehicle, tiredness is indicated to be the most important cause inat least 25% of all cases. And it is important to note that tiredness is indicated to be the mostimportant cause only when the driver has fallen asleep behind the wheel. Estimates of 40%(and even 50% in case of deadly accidents) when tiredness is viewed in a broader sense(counting driving less attentively because of feeling sleepy).47
In 1978, Mackie and Miller examined the effect of the time of day on driving behaviour.They measured matters like lane drifting, variation in speed, psychophysiological measures(EEG, heart frequency, excretion of hormones and suchlike) and subjective signs of tiredness.The conclusion of their research was that everything was strongly influenced by the time ofday. A logical explanation for that is the fact that a human is a daytime creature and thereforemore tired during the nightly hours and having more difficulties fighting tiredness than duringthe day.48
Apart from the nightly hours, there is another time of the day during which the risk tobe involved in a traffic accident is higher than average. According to an investigation byBrown in 1994, more crashes than usual happen in the afternoon, and especially in the time
43 Snel/Kempe, 1995; 8844 Autoweek 31, 200045 Snel/Kempe, 1995; 3446 Snel/Kempe, 1995; 34-3647 Snel/Kempe, 1995; 3648 Snel/Kempe, 1995; 37
26
just after people have had lunch. This so called "after-lunch dip" has to do mainly with di-gesting the food, but is also caused by the biorhythm of the body.49
In other words, there are two periods of time during 24 hours when people have an in-creased risk of getting a traffic accident: one between midnight and 8 a.m. (especially around4 a.m.) and one between 2 to 6 p.m. (especially after lunch). With respect to the rest of theday, 2.5 times as many accidents happen during the former period. The risk to get an accidentduring the latter period is even 7 times the risk during the rest of the day. When Brown tookthis second period of increased risk into account and did not include it in the lower risk period(which means that the "after-lunch dip" period is excluded), he concluded that it was even 10times as risky than during the lower risk time.50
If daily activities demand so much of a person that he does not get the chance to recu-perate entirely afterwards, he will still be somewhat tired after a night's sleep. This means thatwhen the person needs to perform at about the same level as during the previous day, he willneed to put in an extra effort to compensate the tiredness. At the end of the day, he will beeven more tired than the day before which makes it still harder for the person to relax suffi-ciently. As a result, the physiological and psychological activation associated with his day-time activities will continue in the home situation; a condition known as "spill-over".51
If a person experiences perpetual activation in the evening, it will be harder for him tofall asleep and it is more likely that he will sleep uneasily. This results in the person feelingeven more tired in the morning of the third day than on the day before. It is not very hard toimagine that the tiredness will accumulate more and more if the person does not get thechance to rest properly. To be able to achieve about the same level of performance, he has toput in more and more extra effort, which means that the amount of spill-over will grow. Inother words, the person will get caught up in a negative spiral, growing more and more tireduntil it will become impossible for him to compensate his tiredness sufficiently in order toperform certain tasks, such as driving a car, safely.52
Considering the high risk, it sounds somewhat strange that there are many drivers whopush on even though they are, in fact, too tired to drive. Whether that person can help it or notthat he is, should be beside the point. One does not only jeopardise one's own life by notpulling over to rest when one feels somewhat sleepy, but that of other road users as well. Inother words, a driver should take his responsibility in such situations, even when it is reallyimportant to get somewhere on time or when one is suffering from a high pressure of work.53
3.5. Mental condition
3.5.1. PersonalityIt seems that it is not that important how someone can drive, but rather how one does drive inreality. Everybody has to pass a certain amount of tests before getting his driver's license.This means that everybody starts out with more or less the same skills. However, since peo-ple's personality is usually not more or less the same and everybody has an "off day" everynow and then, there is a large difference in how well each separate person applies what hasbeen taught.
Evans states that "[p]ersonality denotes stable character traits that do not change overshort time periods". Studies on the subject of the relationship between crash involvement and
49 Snel/Kempe, 1995; 37-3850 Snel/Kempe, 1995; 3851 Snel/Kempe, 1995; 4152 Snel/Kempe, 1995; 4153 Snel/Kempe, 1995; 45
27
broad psychological characteristics have indeed shown that "we drive as we live". If someone,for instance, has a very cautious and considerate way of life, this will be reflected in the wayhe behaves himself in traffic. If, on the other hand, his life is marked by intolerant and aggres-sive behaviour and if taking risks is more rule than exception, it is very likely that this will bemirrored in a much higher rate of accident than the person described first will have in the longrun.54
A temporary influence on the way a person drives has to do with age and can actuallylast for several years. Young drivers have often appeared to pursue other motives than trans-portation to drive. These other motives "include competitiveness, sense of power and control,or more generally, hedonistic objectives – the pursuit of sensual pleasure for its own sake."55
Since pursuing these motives is connected to a higher risk, this is most likely another cause ofyoung drivers' higher crash rates. However, it is good to know that most young drivers willgrow past this phase at some point, whereas some people never seem to "grow up".
It is impossible (well, not entirely, but then we would be treading some dangerousgrounds) to change people's personality, even though that would be desirable with respect totraffic safety. It would, however, not be a bad plan to raise people's awareness of the benefits(both for themselves as for others) of driving somewhat less risky.
3.5.2. MoodThe influence of personality can be disturbed in either a positive or a negative way by themood the driver is in. Emotional stress, for instance, can cause a driver to drive less concen-trated – and thus more risky – for a shorter or longer time.56 A positive event, on the otherhand, can cause someone who usually does not care that much about traffic safety, to drivemore cautiously.
Theoretically speaking, it would be good if people in a very bad mood would not usetheir car, but this is something which is all but impossible to achieve.
3.6. Constant risk theory
Research has shown that people have the tendency to (un)intentionally react to an increase insafety in their car. This is a potentially dangerous situation, since this reaction is usually onetowards more unsafe behaviour. It has been proven that people who change over to a largercar, start driving faster, which means more dangerously. The same thing happens when anuneven road has been asphalted. Cars that have been equipped with ABS are not involved intraffic accidents any less than "ordinary" cars.57
A driver calculates either consciously or unconsciously how dangerous every situationis and changes his behaviour accordingly. The psychologist Wilde based his constant-risk-theory or risk-homeostasis-theory on this phenomenon in 1982.58 His theory states that peoplewill accept a certain level of perceived danger and that they will try to compensate anychanges in that level. If it starts to rain, the situation looks more dangerous, so people willslow down. Has the road been newly paved, then they will increase their speed.59 Still, itseems that most people's risk level always lies somewhat above the level sensible for a certainsituation.
54 Evans, 1991; 145-14655 Evans, 1991; 14956 Evans, 1991; 14857 Snel/Kempe, 1995; 2558 cited in Snel/Kempe, 1995; 2559 Snel/Kempe, 1995; 25
28
Wilde's theory seems to indicate that it is impossible to increase traffic safety, sincepeople will always try to go back to their old safety level. However, there are two factorswithin the theory that can be influenced. The first of these is the level of risk someone's wil-ling to accept. If someone would be rewarded for safe behaviour (e.g. no claims bonus on theinsurance premium), then he will not accept a certain perceived risk which was accepted be-fore.60
The second factor which can be influenced is the actual perception of risk. It is not somuch the real risk or danger that makes the driver change his behaviour, but the way he per-ceives it. Now, one can influence a person's perception of risk. One could, for instance, resortto making crossings less surveyable by planting trees and bushes in the middle. This way, thecrossing will look more dangerous and this should lead to the driver taking less risk whenapproaching it: slowing down, watching out better. Field-testing has shown that this does in-deed work.61
3.7. External influences
There are some external factors which can influence the physical and mental condition, and ina way also (temporarily) the personality. The most well-known influence is the use of so-called "psycho-active" substances like alcohol, medicines and drugs. Another factor whichcan influence a person's behaviour is the sometimes almost brainwash-like effect of the me-dia.
3.7.1. Consumption of alcohol, medicines or drugsMost people in the western world know that medicines, alcohol and drugs can influence hu-man behaviour in a negative way, but at the same time it is almost impossible to picture mod-ern society without them. Many adults in Europe and North-America drink smaller or largeramounts of alcohol on a (ir)regular basis. Apart from that, there are thousands of registeredmedicines easily available. Per year, more than half a million prescriptions for sleep-inducingdrugs alone are written out in Holland. The use of cannabis products like hashes and weed isnot that widespread, but has been growing since the sixties. During the flower power era halfof all young people (between 18 and 30 years old) used those drugs regularly; in Holland 10to 20%. In other words, it is inevitable that people under the influence of the mentioned psy-cho-active substances will also be participants in traffic.62
It is widely known that the use of many kinds of psycho-active substances diminishone's control over the lateral position of the car rapidly. This means that one starts zigzaggingalong the road. Therefore, the amount of zigzagging (defined as the average deviation of thelateral or sidelong position)63 is regarded as a standard measure to determine the effect of psy-cho-active substances on a person.64
Another indication that a person's attention to control the vehicle is waning is his in-ability to maintain a certain target speed. Even though it would seem that a highly varyingspeed is not directly a hazard for traffic safety, variable and inconsistent behaviour on theroad can lead to a chaotic traffic situation, which can get on the nerves of other road users.Therefore this situation is not desirable.65
60 Snel/Kempe, 1995; 2561 Snel/Kempe, 1995; 2662 Snel/Kempe, 1995; 4763 Deviations as seen from the side of the road and exceeding the normal amount of deviation.64 Snel/Kempe, 1995; 5165 Snel/Kempe, 1995; 51, 55
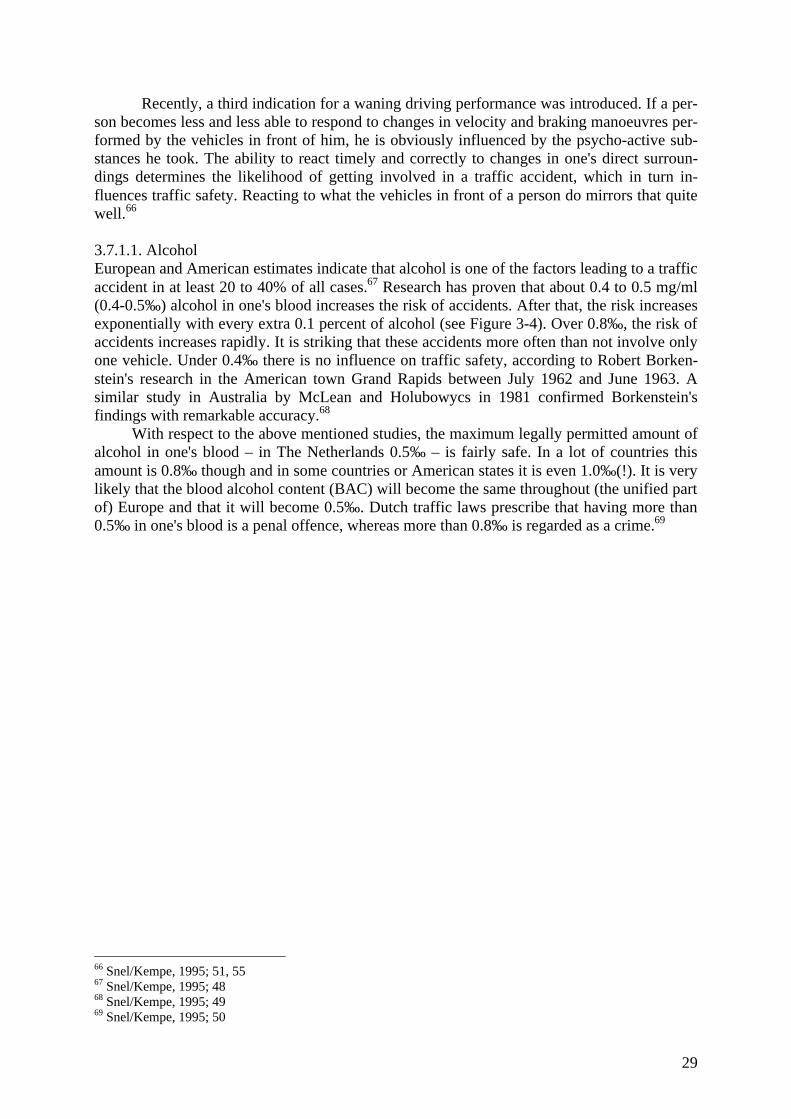
29
Recently, a third indication for a waning driving performance was introduced. If a per-son becomes less and less able to respond to changes in velocity and braking manoeuvres per-formed by the vehicles in front of him, he is obviously influenced by the psycho-active sub-stances he took. The ability to react timely and correctly to changes in one's direct surroun-dings determines the likelihood of getting involved in a traffic accident, which in turn in-fluences traffic safety. Reacting to what the vehicles in front of a person do mirrors that quitewell.66
3.7.1.1. AlcoholEuropean and American estimates indicate that alcohol is one of the factors leading to a trafficaccident in at least 20 to 40% of all cases.67 Research has proven that about 0.4 to 0.5 mg/ml(0.4-0.5‰) alcohol in one's blood increases the risk of accidents. After that, the risk increasesexponentially with every extra 0.1 percent of alcohol (see Figure 3-4). Over 0.8‰, the risk ofaccidents increases rapidly. It is striking that these accidents more often than not involve onlyone vehicle. Under 0.4‰ there is no influence on traffic safety, according to Robert Borken-stein's research in the American town Grand Rapids between July 1962 and June 1963. Asimilar study in Australia by McLean and Holubowycs in 1981 confirmed Borkenstein'sfindings with remarkable accuracy.68
With respect to the above mentioned studies, the maximum legally permitted amount ofalcohol in one's blood – in The Netherlands 0.5‰ – is fairly safe. In a lot of countries thisamount is 0.8‰ though and in some countries or American states it is even 1.0‰(!). It is verylikely that the blood alcohol content (BAC) will become the same throughout (the unified partof) Europe and that it will become 0.5‰. Dutch traffic laws prescribe that having more than0.5‰ in one's blood is a penal offence, whereas more than 0.8‰ is regarded as a crime.69
66 Snel/Kempe, 1995; 51, 5567 Snel/Kempe, 1995; 4868 Snel/Kempe, 1995; 4969 Snel/Kempe, 1995; 50
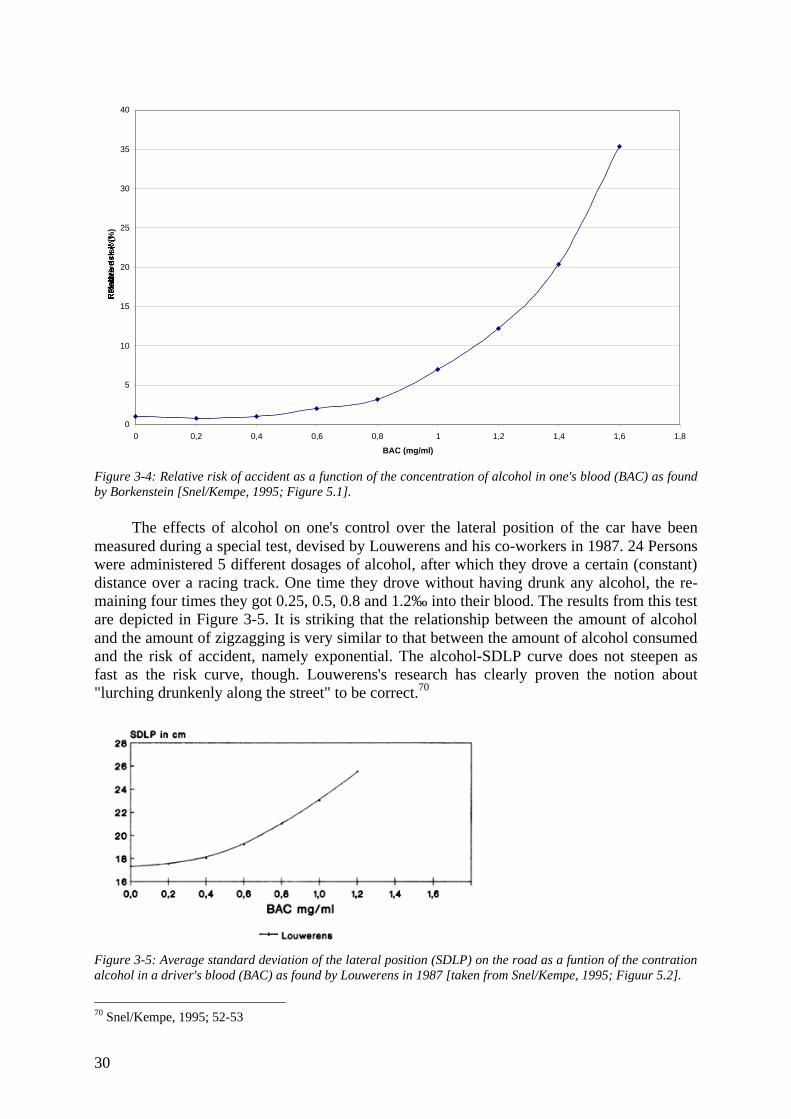
30
0
5
10
15
20
25
30
35
40
0 0,2 0,4 0,6 0,8 1 1,2 1,4 1,6 1,8
BAC (mg/ml)
Rel
ativ
e ri
sk (
%)
Figure 3-4: Relative risk of accident as a function of the concentration of alcohol in one's blood (BAC) as foundby Borkenstein [Snel/Kempe, 1995; Figure 5.1].
The effects of alcohol on one's control over the lateral position of the car have beenmeasured during a special test, devised by Louwerens and his co-workers in 1987. 24 Personswere administered 5 different dosages of alcohol, after which they drove a certain (constant)distance over a racing track. One time they drove without having drunk any alcohol, the re-maining four times they got 0.25, 0.5, 0.8 and 1.2‰ into their blood. The results from this testare depicted in Figure 3-5. It is striking that the relationship between the amount of alcoholand the amount of zigzagging is very similar to that between the amount of alcohol consumedand the risk of accident, namely exponential. The alcohol-SDLP curve does not steepen asfast as the risk curve, though. Louwerens's research has clearly proven the notion about"lurching drunkenly along the street" to be correct.70
Figure 3-5: Average standard deviation of the lateral position (SDLP) on the road as a funtion of the contrationalcohol in a driver's blood (BAC) as found by Louwerens in 1987 [taken from Snel/Kempe, 1995; Figuur 5.2].
70 Snel/Kempe, 1995; 52-53
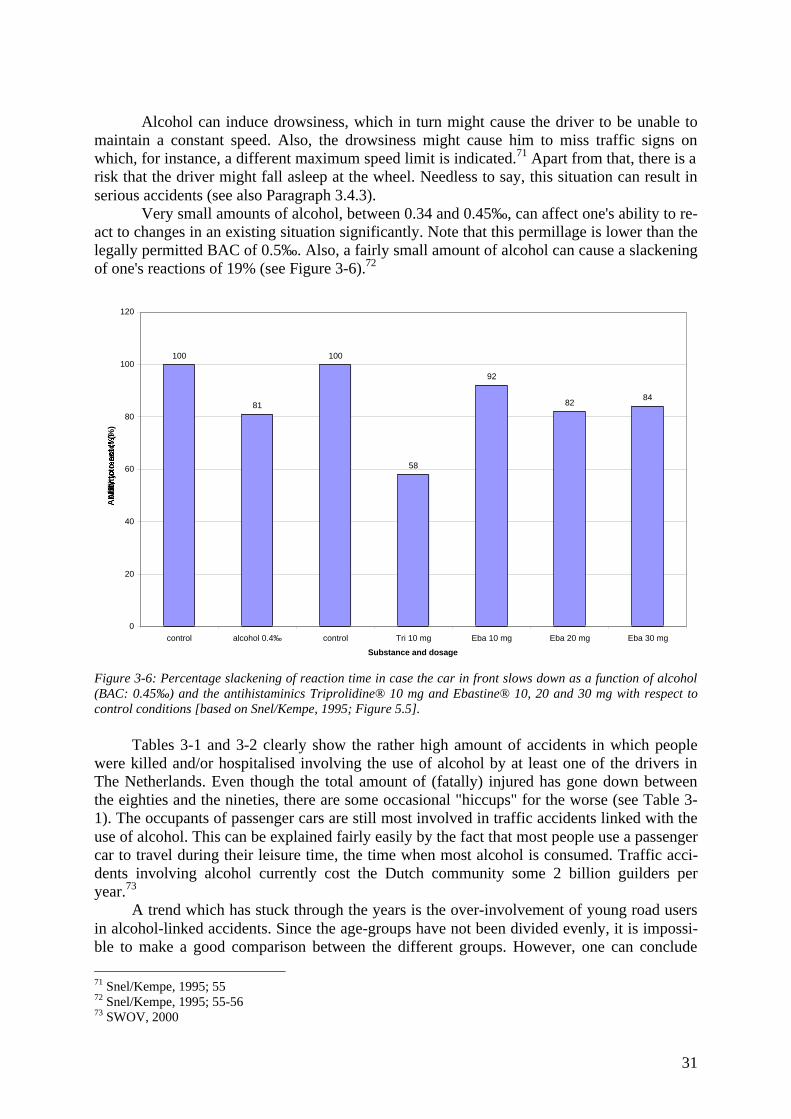
31
Alcohol can induce drowsiness, which in turn might cause the driver to be unable tomaintain a constant speed. Also, the drowsiness might cause him to miss traffic signs onwhich, for instance, a different maximum speed limit is indicated.71 Apart from that, there is arisk that the driver might fall asleep at the wheel. Needless to say, this situation can result inserious accidents (see also Paragraph 3.4.3).
Very small amounts of alcohol, between 0.34 and 0.45‰, can affect one's ability to re-act to changes in an existing situation significantly. Note that this permillage is lower than thelegally permitted BAC of 0.5‰. Also, a fairly small amount of alcohol can cause a slackeningof one's reactions of 19% (see Figure 3-6).72
100
81
100
58
92
8284
0
20
40
60
80
100
120
control alcohol 0.4‰ control Tri 10 mg Eba 10 mg Eba 20 mg Eba 30 mg
Substance and dosage
Ab
ility
to
rea
ct (
%)
Figure 3-6: Percentage slackening of reaction time in case the car in front slows down as a function of alcohol(BAC: 0.45‰) and the antihistaminics Triprolidine® 10 mg and Ebastine® 10, 20 and 30 mg with respect tocontrol conditions [based on Snel/Kempe, 1995; Figure 5.5].
Tables 3-1 and 3-2 clearly show the rather high amount of accidents in which peoplewere killed and/or hospitalised involving the use of alcohol by at least one of the drivers inThe Netherlands. Even though the total amount of (fatally) injured has gone down betweenthe eighties and the nineties, there are some occasional "hiccups" for the worse (see Table 3-1). The occupants of passenger cars are still most involved in traffic accidents linked with theuse of alcohol. This can be explained fairly easily by the fact that most people use a passengercar to travel during their leisure time, the time when most alcohol is consumed. Traffic acci-dents involving alcohol currently cost the Dutch community some 2 billion guilders peryear.73
A trend which has stuck through the years is the over-involvement of young road usersin alcohol-linked accidents. Since the age-groups have not been divided evenly, it is impossi-ble to make a good comparison between the different groups. However, one can conclude
71 Snel/Kempe, 1995; 5572 Snel/Kempe, 1995; 55-5673 SWOV, 2000
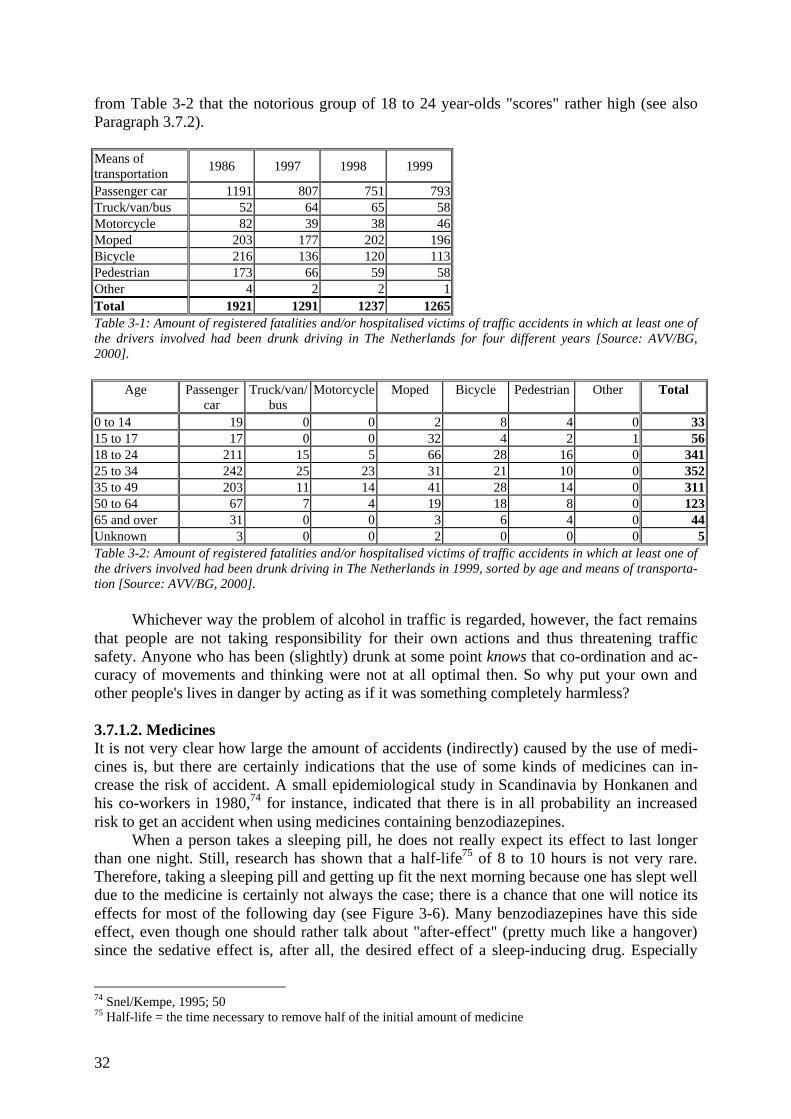
32
from Table 3-2 that the notorious group of 18 to 24 year-olds "scores" rather high (see alsoParagraph 3.7.2).
Means oftransportation
1986 1997 1998 1999
Passenger car 1191 807 751 793Truck/van/bus 52 64 65 58Motorcycle 82 39 38 46Moped 203 177 202 196Bicycle 216 136 120 113Pedestrian 173 66 59 58Other 4 2 2 1Total 1921 1291 1237 1265Table 3-1: Amount of registered fatalities and/or hospitalised victims of traffic accidents in which at least one ofthe drivers involved had been drunk driving in The Netherlands for four different years [Source: AVV/BG,2000].
Age Passengercar
Truck/van/bus
Motorcycle Moped Bicycle Pedestrian Other Total
0 to 14 19 0 0 2 8 4 0 3315 to 17 17 0 0 32 4 2 1 5618 to 24 211 15 5 66 28 16 0 34125 to 34 242 25 23 31 21 10 0 35235 to 49 203 11 14 41 28 14 0 31150 to 64 67 7 4 19 18 8 0 12365 and over 31 0 0 3 6 4 0 44Unknown 3 0 0 2 0 0 0 5Table 3-2: Amount of registered fatalities and/or hospitalised victims of traffic accidents in which at least one ofthe drivers involved had been drunk driving in The Netherlands in 1999, sorted by age and means of transporta-tion [Source: AVV/BG, 2000].
Whichever way the problem of alcohol in traffic is regarded, however, the fact remainsthat people are not taking responsibility for their own actions and thus threatening trafficsafety. Anyone who has been (slightly) drunk at some point knows that co-ordination and ac-curacy of movements and thinking were not at all optimal then. So why put your own andother people's lives in danger by acting as if it was something completely harmless?
3.7.1.2. MedicinesIt is not very clear how large the amount of accidents (indirectly) caused by the use of medi-cines is, but there are certainly indications that the use of some kinds of medicines can in-crease the risk of accident. A small epidemiological study in Scandinavia by Honkanen andhis co-workers in 1980,74 for instance, indicated that there is in all probability an increasedrisk to get an accident when using medicines containing benzodiazepines.
When a person takes a sleeping pill, he does not really expect its effect to last longerthan one night. Still, research has shown that a half-life75 of 8 to 10 hours is not very rare.Therefore, taking a sleeping pill and getting up fit the next morning because one has slept welldue to the medicine is certainly not always the case; there is a chance that one will notice itseffects for most of the following day (see Figure 3-6). Many benzodiazepines have this sideeffect, even though one should rather talk about "after-effect" (pretty much like a hangover)since the sedative effect is, after all, the desired effect of a sleep-inducing drug. Especially
74 Snel/Kempe, 1995; 5075 Half-life = the time necessary to remove half of the initial amount of medicine
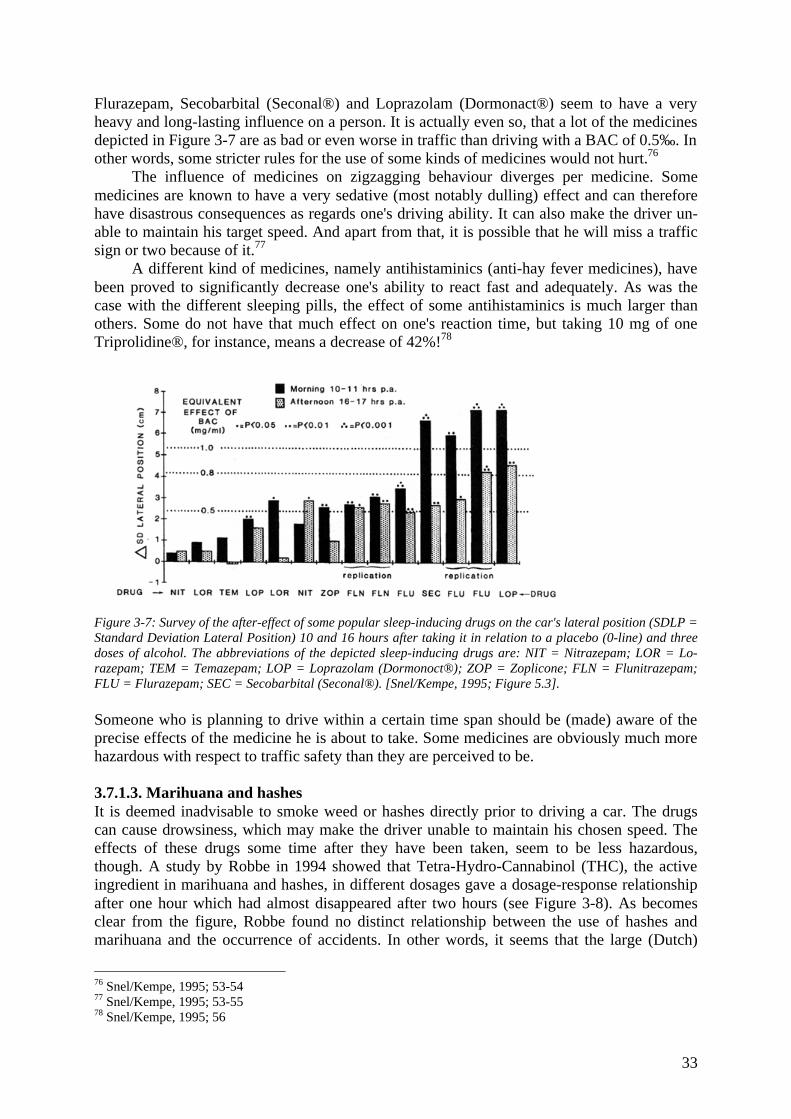
33
Flurazepam, Secobarbital (Seconal®) and Loprazolam (Dormonact®) seem to have a veryheavy and long-lasting influence on a person. It is actually even so, that a lot of the medicinesdepicted in Figure 3-7 are as bad or even worse in traffic than driving with a BAC of 0.5‰. Inother words, some stricter rules for the use of some kinds of medicines would not hurt.76
The influence of medicines on zigzagging behaviour diverges per medicine. Somemedicines are known to have a very sedative (most notably dulling) effect and can thereforehave disastrous consequences as regards one's driving ability. It can also make the driver un-able to maintain his target speed. And apart from that, it is possible that he will miss a trafficsign or two because of it.77
A different kind of medicines, namely antihistaminics (anti-hay fever medicines), havebeen proved to significantly decrease one's ability to react fast and adequately. As was thecase with the different sleeping pills, the effect of some antihistaminics is much larger thanothers. Some do not have that much effect on one's reaction time, but taking 10 mg of oneTriprolidine®, for instance, means a decrease of 42%!78
Figure 3-7: Survey of the after-effect of some popular sleep-inducing drugs on the car's lateral position (SDLP =Standard Deviation Lateral Position) 10 and 16 hours after taking it in relation to a placebo (0-line) and threedoses of alcohol. The abbreviations of the depicted sleep-inducing drugs are: NIT = Nitrazepam; LOR = Lo-razepam; TEM = Temazepam; LOP = Loprazolam (Dormonoct®); ZOP = Zoplicone; FLN = Flunitrazepam;FLU = Flurazepam; SEC = Secobarbital (Seconal®). [Snel/Kempe, 1995; Figure 5.3].
Someone who is planning to drive within a certain time span should be (made) aware of theprecise effects of the medicine he is about to take. Some medicines are obviously much morehazardous with respect to traffic safety than they are perceived to be.
3.7.1.3. Marihuana and hashesIt is deemed inadvisable to smoke weed or hashes directly prior to driving a car. The drugscan cause drowsiness, which may make the driver unable to maintain his chosen speed. Theeffects of these drugs some time after they have been taken, seem to be less hazardous,though. A study by Robbe in 1994 showed that Tetra-Hydro-Cannabinol (THC), the activeingredient in marihuana and hashes, in different dosages gave a dosage-response relationshipafter one hour which had almost disappeared after two hours (see Figure 3-8). As becomesclear from the figure, Robbe found no distinct relationship between the use of hashes andmarihuana and the occurrence of accidents. In other words, it seems that the large (Dutch)
76 Snel/Kempe, 1995; 53-5477 Snel/Kempe, 1995; 53-5578 Snel/Kempe, 1995; 56
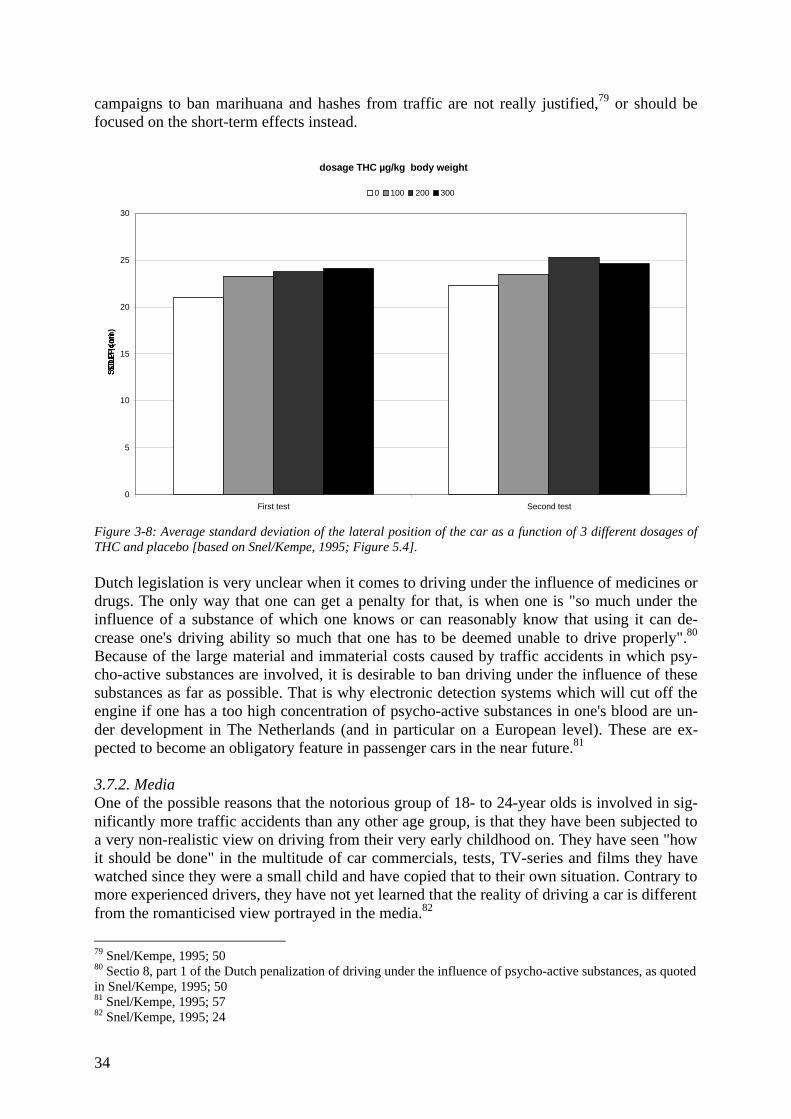
34
campaigns to ban marihuana and hashes from traffic are not really justified,79 or should befocused on the short-term effects instead.
dosage THC µg/kg body weight
0
5
10
15
20
25
30
First test Second test
SD
LP
(cm
)
0 100 200 300
Figure 3-8: Average standard deviation of the lateral position of the car as a function of 3 different dosages ofTHC and placebo [based on Snel/Kempe, 1995; Figure 5.4].
Dutch legislation is very unclear when it comes to driving under the influence of medicines ordrugs. The only way that one can get a penalty for that, is when one is "so much under theinfluence of a substance of which one knows or can reasonably know that using it can de-crease one's driving ability so much that one has to be deemed unable to drive properly".80
Because of the large material and immaterial costs caused by traffic accidents in which psy-cho-active substances are involved, it is desirable to ban driving under the influence of thesesubstances as far as possible. That is why electronic detection systems which will cut off theengine if one has a too high concentration of psycho-active substances in one's blood are un-der development in The Netherlands (and in particular on a European level). These are ex-pected to become an obligatory feature in passenger cars in the near future.81
3.7.2. MediaOne of the possible reasons that the notorious group of 18- to 24-year olds is involved in sig-nificantly more traffic accidents than any other age group, is that they have been subjected toa very non-realistic view on driving from their very early childhood on. They have seen "howit should be done" in the multitude of car commercials, tests, TV-series and films they havewatched since they were a small child and have copied that to their own situation. Contrary tomore experienced drivers, they have not yet learned that the reality of driving a car is differentfrom the romanticised view portrayed in the media.82
79 Snel/Kempe, 1995; 5080 Sectio 8, part 1 of the Dutch penalization of driving under the influence of psycho-active substances, as quotedin Snel/Kempe, 1995; 5081 Snel/Kempe, 1995; 5782 Snel/Kempe, 1995; 24
35
Research by Atkin in 1988 in the United States has shown that "TV viewers see severalthousand irregular driving acts and hundreds of instances where people are endangered, typi-cally performed in an engaging manner by attractive characters who suffer minimal harm". Heconcludes from his studies that "viewers can acquire and possibly imitate an array of uniqueand novel driving acts that are depicted on television but seldom observed first-hand". Also,he has found that "inhibitory constraints may be reduced as viewers learn that irregular ordangerous driving practices are commonplace and normative (and perhaps justified in variouscircumstances); external inhibitions may be minimised by the relatively infrequent portrayalof serious negative consequences such as legal punishment, social disapproval, and physicalharm resulting from illegal or high-risk behaviour".83
In most of the driving scenes shown on TV and in films, driving a car is depicted likesomething which involves (almost) no risk. We see cars roll over ten times before burstinginto flames, crashing at high speeds into walls, or being involved in heavy head-on crashes,but every time the driver walks away with only a few scratches. What the viewer does not getto see is how these scenes have been filmed. The reality of these shots is that a stunt driver,dressed in protective clothing, wearing a helmet and being entirely strapped into the vehiclewhich is especially built or adapted for the scene, performs the stunt, is helped out of the ve-hicle at which point the main character – without protective clothing, helmet and often noteven wearing a seatbelt during the scene – takes his place. He now appears to crawl out of thecar wreck and runs off just before the car is blown up. However, since the viewer usually onlygets to see the final result, it appears as if severe crashes like the ones described above are notthat dangerous to man.
As Atkin mentioned, apart from the unrealistic way car crashes are presented in filmsand series, driving itself is usually depicted in its most hazardous form. Driving at high speedswith only one hand on the steering wheel, breaking every possible traffic rule, taking bendswith squealing tires and causing all kinds of dangerous situations for other road users, the re-sults of which are, if at all, only very briefly shown from afar (so that the occupants of thevehicles are almost invisible) or in the main character's rear view mirror.
In commercials, driving is invariably depicted as something "cool", with the emphasison the car's high power to accelerate, its top speeds and sportiness. Of some car brands thesafety measures are emphasised, but those are usually not the kinds of cars that are aimed atyouthful buyers.
Commercials are probably also responsible for spreading a rather one-sided view on theeffects of alcohol in traffic. The overinvolvement of (male) drivers between 18 and 34 yearsold in traffic accidents is the often irresponsibly high use of alcoholic beverages prior todriving and may very well be caused by the distorted view presented by liquor and beer com-mercials. The product is usually overly glorified and very effectively portrayed to appeal toyoung people. Analysis of the content of beer commercials – beer is the most popular drinkamong young (male) people – showed that no expenses are spared to link varied benefits likesocial camaraderie, masculinity, delicious flavour/good taste, escape, femininity, romance,adventure, refreshment, physical relaxation, and elegance to the product. However, the down-sides of drinking alcohol, like the drunkenness and hangovers, are effectively left out of thepicture. The same applies to how the main characters in the commercials got to the party, baror other social environment. The most important mode of transport for adults in the westernworld is still the passenger car – something which is clearly reflected in the amount of carsinvolved in alcohol-linked accidents – but that fact is conspicuous by its absence.84
83 Evans, 1991; 35384 Evans, 1991; 208
36
Research performed in the USA in 1987 led to the estimate that American children seeapproximately 100,000 TV commercials for beer while growing up.85 Even if one would as-sume that European children are exposed to fewer beer commercials, the amount of beercommercials they see during their youth may have an effect which can almost be comparedwith brainwashing. And it does indeed seem that many of the existing misconceptions withrespect to the dangers of alcohol consumption are caused by what the commercials lead thepublic to believe. Atkin, who carried out the aforementioned study on beer commercials,stated: "Three advertising-promoted beliefs may disinhibit drinkers through legitimisation andrationalisation: the conceptions that drinking is a widespread norm, that alcohol is a harmlesssubstance, and that deficit motivations such as escape and relief are acceptable reasons fordrinking."86
As mentioned in Paragraph 3.5.1, young drivers generally have different reasons towant to drive than older people have. Together with what they have "learned" from TV andfilms, this leads to irresponsible behaviour, often ending in accidents. Therefore, much wouldbe gained if the norms and beliefs of the 18 to 24-year-old drivers regarding driving a car (af-ter drinking alcohol) could somehow be changed. Different studies have proven that the me-dia can also have a very positive effect on people's behaviour. For example, safety belt usehas improved significantly in the USA because of media coverage. Also, after the death of amother and her two small kids in Japan were covered and discussed in detail in the media, theawareness of the possibility of striking a two-wheeled vehicle while turning left (equivalent toright-turning traffic in Europe and the USA) increased significantly. This actually led to thefraction of all fatalities caused by left-turning traffic declining by a factor two from 1977 to1988.87 In other words, the trouble that has been caused by the media can also be restored bythe media.
3.8. Conclusions
Being (partly) responsible for 85 to 95% of all traffic accidents, the driver is obviously a veryimportant part of the man-machine-environment system. The fatality rate differs per age andsex. First of all, men seem to cause more accidents than women. Drivers from 30 to 60 yearsold are least involved in traffic accidents, whereas people over 60 have a higher fatality rate.However, their rate is not as extreme as that of the 18 to 24 year olds; especially the malepopulation of that age seems to take more risks and obviously pays dearly for that. Older driv-ers are often seen as a problem, but they have appeared to be a larger danger to themselvesthan to others. Generally speaking, they drive less frequently and shorter distances when theyfeel they do not perform as well in traffic as they used to do.
Age and sex cannot be altered to prevent traffic accidents, but it is possible to haveregular check-ups to see whether the person has become a danger to himself and others on theroad. Extra systems built into the car to aid the (older) driver would probably solve someproblems as well.
Education provides the possibility to gain experience in driving a car in a somewhatcontrolled environment and secures a basic level of knowledge in the driver population whichdecreases the occurrence of unexpected situations.
Experience is often thought to be important (notably more important than education),but it seems that the constant risk theory manifests itself here. The more experienced the
85 Evans, 1991; 35486 Evans, 1991; 208-20987 Evans, 1991; 353-354
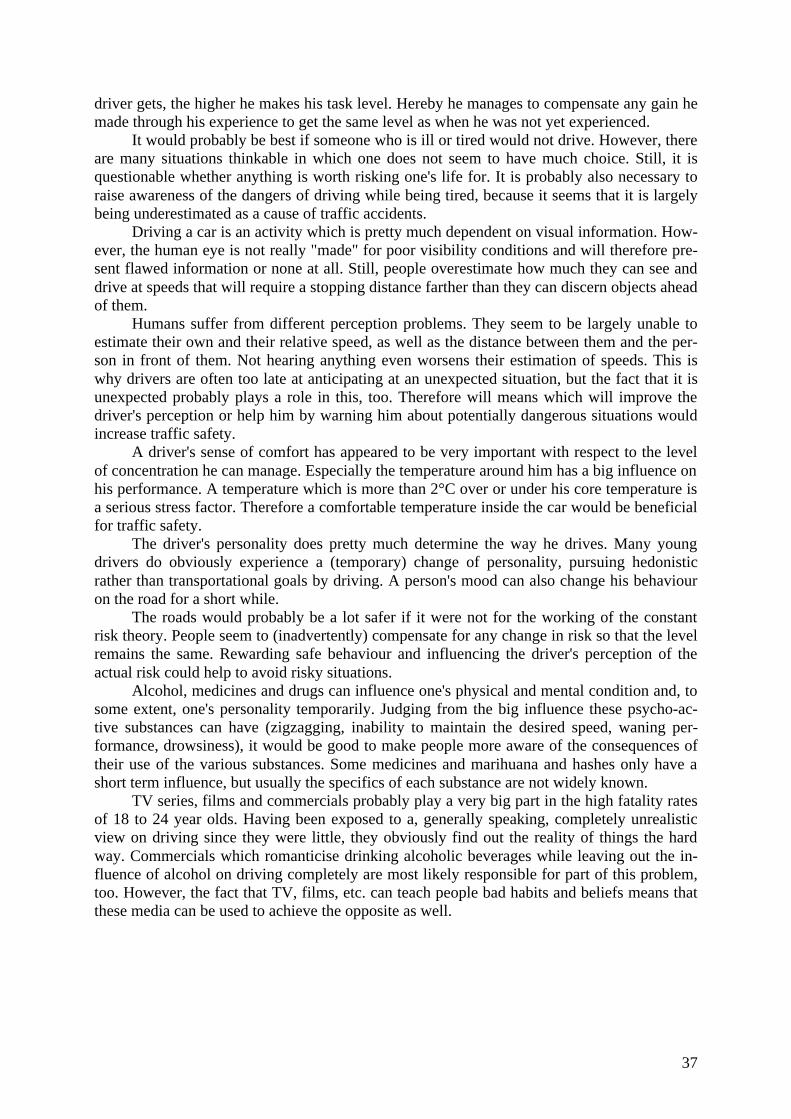
37
driver gets, the higher he makes his task level. Hereby he manages to compensate any gain hemade through his experience to get the same level as when he was not yet experienced.
It would probably be best if someone who is ill or tired would not drive. However, thereare many situations thinkable in which one does not seem to have much choice. Still, it isquestionable whether anything is worth risking one's life for. It is probably also necessary toraise awareness of the dangers of driving while being tired, because it seems that it is largelybeing underestimated as a cause of traffic accidents.
Driving a car is an activity which is pretty much dependent on visual information. How-ever, the human eye is not really "made" for poor visibility conditions and will therefore pre-sent flawed information or none at all. Still, people overestimate how much they can see anddrive at speeds that will require a stopping distance farther than they can discern objects aheadof them.
Humans suffer from different perception problems. They seem to be largely unable toestimate their own and their relative speed, as well as the distance between them and the per-son in front of them. Not hearing anything even worsens their estimation of speeds. This iswhy drivers are often too late at anticipating at an unexpected situation, but the fact that it isunexpected probably plays a role in this, too. Therefore will means which will improve thedriver's perception or help him by warning him about potentially dangerous situations wouldincrease traffic safety.
A driver's sense of comfort has appeared to be very important with respect to the levelof concentration he can manage. Especially the temperature around him has a big influence onhis performance. A temperature which is more than 2°C over or under his core temperature isa serious stress factor. Therefore a comfortable temperature inside the car would be beneficialfor traffic safety.
The driver's personality does pretty much determine the way he drives. Many youngdrivers do obviously experience a (temporary) change of personality, pursuing hedonisticrather than transportational goals by driving. A person's mood can also change his behaviouron the road for a short while.
The roads would probably be a lot safer if it were not for the working of the constantrisk theory. People seem to (inadvertently) compensate for any change in risk so that the levelremains the same. Rewarding safe behaviour and influencing the driver's perception of theactual risk could help to avoid risky situations.
Alcohol, medicines and drugs can influence one's physical and mental condition and, tosome extent, one's personality temporarily. Judging from the big influence these psycho-ac-tive substances can have (zigzagging, inability to maintain the desired speed, waning per-formance, drowsiness), it would be good to make people more aware of the consequences oftheir use of the various substances. Some medicines and marihuana and hashes only have ashort term influence, but usually the specifics of each substance are not widely known.
TV series, films and commercials probably play a very big part in the high fatality ratesof 18 to 24 year olds. Having been exposed to a, generally speaking, completely unrealisticview on driving since they were little, they obviously find out the reality of things the hardway. Commercials which romanticise drinking alcoholic beverages while leaving out the in-fluence of alcohol on driving completely are most likely responsible for part of this problem,too. However, the fact that TV, films, etc. can teach people bad habits and beliefs means thatthese media can be used to achieve the opposite as well.

38
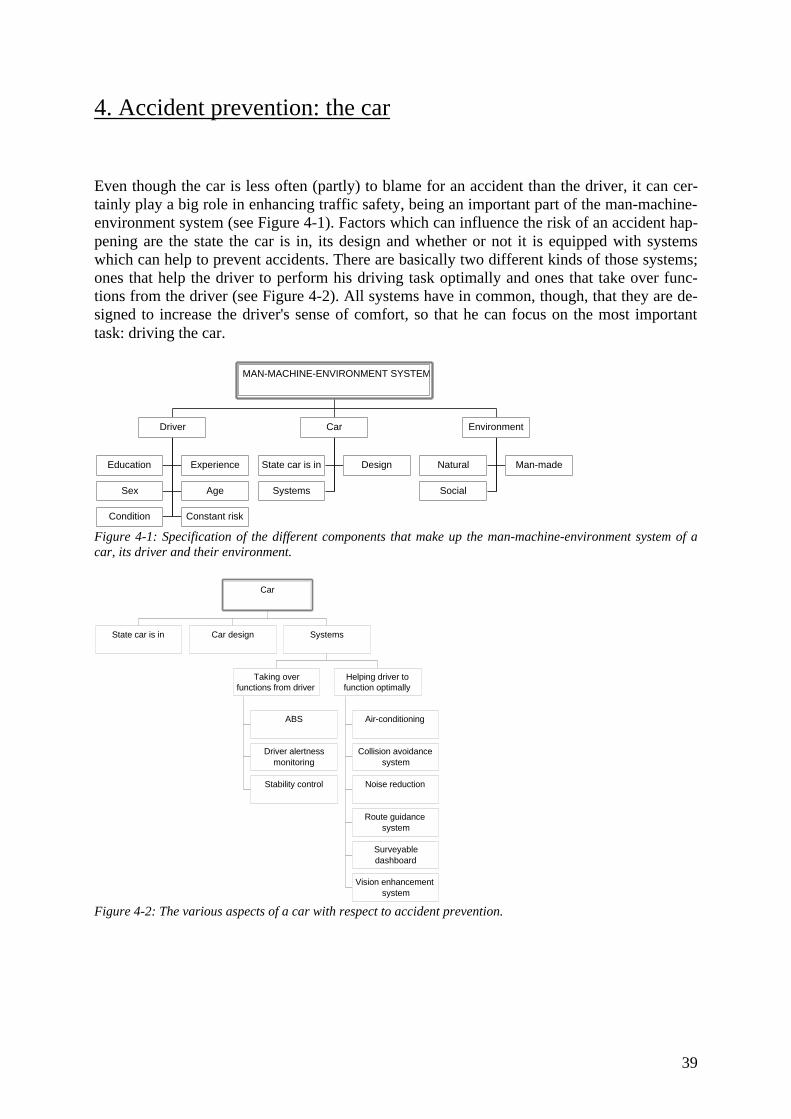
39
4. Accident prevention: the car
Even though the car is less often (partly) to blame for an accident than the driver, it can cer-tainly play a big role in enhancing traffic safety, being an important part of the man-machine-environment system (see Figure 4-1). Factors which can influence the risk of an accident hap-pening are the state the car is in, its design and whether or not it is equipped with systemswhich can help to prevent accidents. There are basically two different kinds of those systems;ones that help the driver to perform his driving task optimally and ones that take over func-tions from the driver (see Figure 4-2). All systems have in common, though, that they are de-signed to increase the driver's sense of comfort, so that he can focus on the most importanttask: driving the car.
Education Experience
Sex Age
Condition Constant risk
Driver
State car is in Design
Systems
Car
Natural Man-made
Social
Environment
MAN-MACHINE-ENVIRONMENT SYSTEM
Figure 4-1: Specification of the different components that make up the man-machine-environment system of acar, its driver and their environment.
State car is in Car design
ABS
Driver alertnessmonitoring
Stability control
Taking overfunctions from driver
Air-conditioning
Collision avoidancesystem
Noise reduction
Route guidancesystem
Surveyabledashboard
Vision enhancementsystem
Helping driver tofunction optimally
Systems
Car
Figure 4-2: The various aspects of a car with respect to accident prevention.
40
4.1. State the car is in
If a car is in a state of (partial) disrepair, the car could break down at any moment, theoreti-cally speaking. Needless to say, this could lead to some very risky situations. It is therefore ofthe utmost importance to keep cars in (near) top condition and have it checked regularly. Toavoid the situation in which the owners of older cars stop caring about the state their car is inand thereby posing a threat to themselves and other road users, many countries have com-pelled owners of cars 3 years old or older to have their vehicle tested by an officially regis-tered company every year (see Paragraph 8.1.2). This also means that every older vehicle ischecked at least once every year, so that excesses are avoided.
4.2. Car design
The design of a car can often help to prevent accidents. If a car has, for instance, been de-signed so that the driver has a good view on the road in front of him and behind him, he willbe able to see many potentially risky situations coming and anticipate on them. The same isachieved by reducing the amount of dead angles. Another way in which design can help toincrease traffic safety is by designing the car so that it has a high level of stability. That way,it will be much more difficult for the car to become uncontrollable.
At the moment, car manufacturers seem to want to isolate the driver more and morefrom his surroundings to increase his sense of comfort. However, the more measures are be-ing taken to reduce the amount of noise (sound of the motor, road and wind which usuallygive a person a sense of speed; see also Paragraph 3.4.2) and vibrations in the occupants'compartment, the faster a person can drive without really noticing it. And since higher speedsfeel just as smooth as the lower ones, the driver gets the (wrong) notion that those high speedsare not dangerous at all.88 Considering what was said in Paragraph 3.6 about the effect ofman's pursuit of a constant level of risk and how to influence it, it would be much better withrespect to traffic safety if a car would actually feel as if it was driving faster than the driverwould think. So in this way too the design of the car can have a significant influence on itsrisk to get involved in an accident.
4.3. Systems which take over functions from the driver
The first group of systems to decrease the risk that an accident will happen is based on takingfunctions over from the driver. Some of them take over tasks which are too complex or shouldbe carried out too fast for the driver to be able to perform them (ABS, stability control). Incase of driver alertness monitoring systems, they basically provide a safety net for driverswho are so tired that they do not trust themselves to be able to keep awake.
4.3.1. ABSThe Anti-lock Braking System, or ABS, is a system which uses electronic controls to main-tain wheel rotation during braking. Through that, it is possible to achieve maximum vehiclecontrol with near optimal braking compared to non-ABS cars which suffer from lockingwheels during hard braking. The ABS system thereby increases vehicle stability, especiallywhen tire/roadway friction is below average or varied (for instance when the road surface iswet or icy) and generally reduces the minimum stopping distance. 89
88 Snel/Kempe, 1995; 3089 Evans, 1991; 287-288
41
Based on historical traffic crash data for a non-ABS vehicle fleet, Langwieder pre-dicted in 1986 that all vehicles having ABS in Germany could decrease severe crashes by 10to 15%.90 However, Biehl, Aschenbrenner and Wurm compared the crash experience ofgroups of Munich taxi drivers randomly assigned vehicles with and without ABS in 1987 andfound that "there were decreases in the numbers of some types of crashes, but increases inothers, for no net overall change". It appeared that the changes in behaviour that ABS in-duced, more than outweighed the increase in safety. Trusting ABS to help them out in diresituations, people would be less cautious when driving on, for instance, roads covered withsnow and ice; a clear example of the constant risk theory. However, this decrease in safetyappeared to be beyond the reduction in caution justified by the advantage of ABS under suchcircumstances. The conclusion of the study was that the addition of ABS did reduce harm, butless than expected. Additional data from German insurance companies showed that vehiclesfeaturing ABS tended to have higher crash rates than similar vehicles without it. It is, ofcourse, very well possible that this is (partly) caused by riskier drivers choosing to equip theircar with ABS91, but there is no evidence of that (yet).
4.3.2. Driver alertness monitoringIn Paragraph 3.4.4, the serious consequences of driving while being too tired were discussed.As was already mentioned there, although it may sound somewhat irresponsible, not everyonefeels that he can just pull over and rest for a while when they detect symptoms of tiredness.Especially those with a job which requires them to drive far and long (e.g. truck drivers, salesrepresentatives) often do not really feel they have any choice but to go on. On the other hand,some people tend to overestimate their performance level while they are, in fact, too tired todrive on safely. For these and other reasons, the car industry is working on driver alertnessmonitoring systems. These systems are constantly "keeping an eye" on the driver's level ofarousal and warn them whenever it falls below the necessary level to drive a car.92
Some systems have proven in simulators that they were able to successfully detectdriver fatigue. The first real-life systems will probably be introduced into the passenger car inthe near future (Mercedes is already mentioning it as a future feature in their 1998 brochureon safety). There is a danger to this development though, because people might start to relyjust a little bit too much on their warning system. Thinking that the system will wake them upanyway, they may take even more unnecessary and irresponsibly high risks with respect totiredness than they already do now.
4.3.3. Stability controlThe Electronic Stability Programme (ESP) maintains a car's stability under all circumstances.Sensors are built into the car to compare the actual direction the car is moving in with the di-rection indicated by the driver. If the input from the steering wheel differs from the desireddirection, the system will correct this by applying the brakes on one or more wheels and/or byadjusting the engine couple.93
4.4. Systems which help the driver to function optimally
Systems which help the driver to function better are usually systems which provide the driverwith a function that he does not own himself or is not involved with the physical driving
90 Evans, 1991; 28891 Evans, 1991; 28892 Ian Noy, 1997; 33093 NRC Handelsblad, 16 September 2000
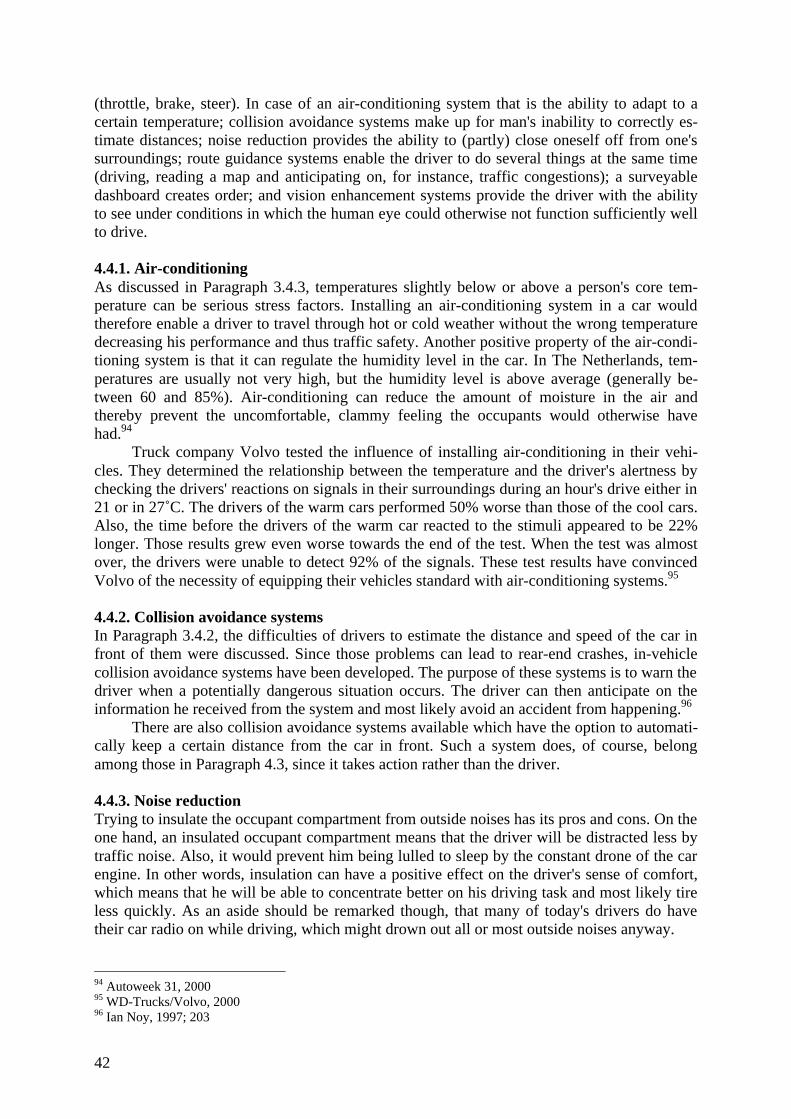
42
(throttle, brake, steer). In case of an air-conditioning system that is the ability to adapt to acertain temperature; collision avoidance systems make up for man's inability to correctly es-timate distances; noise reduction provides the ability to (partly) close oneself off from one'ssurroundings; route guidance systems enable the driver to do several things at the same time(driving, reading a map and anticipating on, for instance, traffic congestions); a surveyabledashboard creates order; and vision enhancement systems provide the driver with the abilityto see under conditions in which the human eye could otherwise not function sufficiently wellto drive.
4.4.1. Air-conditioningAs discussed in Paragraph 3.4.3, temperatures slightly below or above a person's core tem-perature can be serious stress factors. Installing an air-conditioning system in a car wouldtherefore enable a driver to travel through hot or cold weather without the wrong temperaturedecreasing his performance and thus traffic safety. Another positive property of the air-condi-tioning system is that it can regulate the humidity level in the car. In The Netherlands, tem-peratures are usually not very high, but the humidity level is above average (generally be-tween 60 and 85%). Air-conditioning can reduce the amount of moisture in the air andthereby prevent the uncomfortable, clammy feeling the occupants would otherwise havehad.94
Truck company Volvo tested the influence of installing air-conditioning in their vehi-cles. They determined the relationship between the temperature and the driver's alertness bychecking the drivers' reactions on signals in their surroundings during an hour's drive either in21 or in 27˚C. The drivers of the warm cars performed 50% worse than those of the cool cars.Also, the time before the drivers of the warm car reacted to the stimuli appeared to be 22%longer. Those results grew even worse towards the end of the test. When the test was almostover, the drivers were unable to detect 92% of the signals. These test results have convincedVolvo of the necessity of equipping their vehicles standard with air-conditioning systems.95
4.4.2. Collision avoidance systemsIn Paragraph 3.4.2, the difficulties of drivers to estimate the distance and speed of the car infront of them were discussed. Since those problems can lead to rear-end crashes, in-vehiclecollision avoidance systems have been developed. The purpose of these systems is to warn thedriver when a potentially dangerous situation occurs. The driver can then anticipate on theinformation he received from the system and most likely avoid an accident from happening.96
There are also collision avoidance systems available which have the option to automati-cally keep a certain distance from the car in front. Such a system does, of course, belongamong those in Paragraph 4.3, since it takes action rather than the driver.
4.4.3. Noise reductionTrying to insulate the occupant compartment from outside noises has its pros and cons. On theone hand, an insulated occupant compartment means that the driver will be distracted less bytraffic noise. Also, it would prevent him being lulled to sleep by the constant drone of the carengine. In other words, insulation can have a positive effect on the driver's sense of comfort,which means that he will be able to concentrate better on his driving task and most likely tireless quickly. As an aside should be remarked though, that many of today's drivers do havetheir car radio on while driving, which might drown out all or most outside noises anyway.
94 Autoweek 31, 200095 WD-Trucks/Volvo, 200096 Ian Noy, 1997; 203
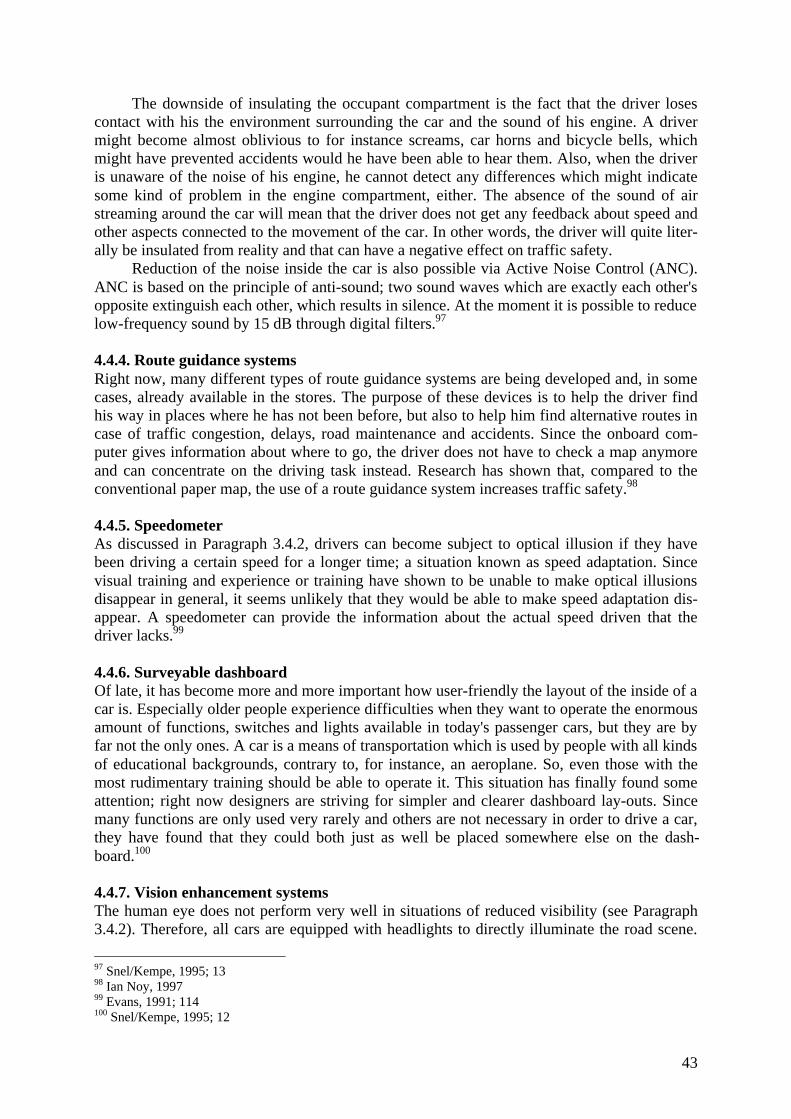
43
The downside of insulating the occupant compartment is the fact that the driver losescontact with his the environment surrounding the car and the sound of his engine. A drivermight become almost oblivious to for instance screams, car horns and bicycle bells, whichmight have prevented accidents would he have been able to hear them. Also, when the driveris unaware of the noise of his engine, he cannot detect any differences which might indicatesome kind of problem in the engine compartment, either. The absence of the sound of airstreaming around the car will mean that the driver does not get any feedback about speed andother aspects connected to the movement of the car. In other words, the driver will quite liter-ally be insulated from reality and that can have a negative effect on traffic safety.
Reduction of the noise inside the car is also possible via Active Noise Control (ANC).ANC is based on the principle of anti-sound; two sound waves which are exactly each other'sopposite extinguish each other, which results in silence. At the moment it is possible to reducelow-frequency sound by 15 dB through digital filters.97
4.4.4. Route guidance systemsRight now, many different types of route guidance systems are being developed and, in somecases, already available in the stores. The purpose of these devices is to help the driver findhis way in places where he has not been before, but also to help him find alternative routes incase of traffic congestion, delays, road maintenance and accidents. Since the onboard com-puter gives information about where to go, the driver does not have to check a map anymoreand can concentrate on the driving task instead. Research has shown that, compared to theconventional paper map, the use of a route guidance system increases traffic safety.98
4.4.5. SpeedometerAs discussed in Paragraph 3.4.2, drivers can become subject to optical illusion if they havebeen driving a certain speed for a longer time; a situation known as speed adaptation. Sincevisual training and experience or training have shown to be unable to make optical illusionsdisappear in general, it seems unlikely that they would be able to make speed adaptation dis-appear. A speedometer can provide the information about the actual speed driven that thedriver lacks.99
4.4.6. Surveyable dashboardOf late, it has become more and more important how user-friendly the layout of the inside of acar is. Especially older people experience difficulties when they want to operate the enormousamount of functions, switches and lights available in today's passenger cars, but they are byfar not the only ones. A car is a means of transportation which is used by people with all kindsof educational backgrounds, contrary to, for instance, an aeroplane. So, even those with themost rudimentary training should be able to operate it. This situation has finally found someattention; right now designers are striving for simpler and clearer dashboard lay-outs. Sincemany functions are only used very rarely and others are not necessary in order to drive a car,they have found that they could both just as well be placed somewhere else on the dash-board.100
4.4.7. Vision enhancement systemsThe human eye does not perform very well in situations of reduced visibility (see Paragraph3.4.2). Therefore, all cars are equipped with headlights to directly illuminate the road scene.
97 Snel/Kempe, 1995; 1398 Ian Noy, 199799 Evans, 1991; 114100 Snel/Kempe, 1995; 12
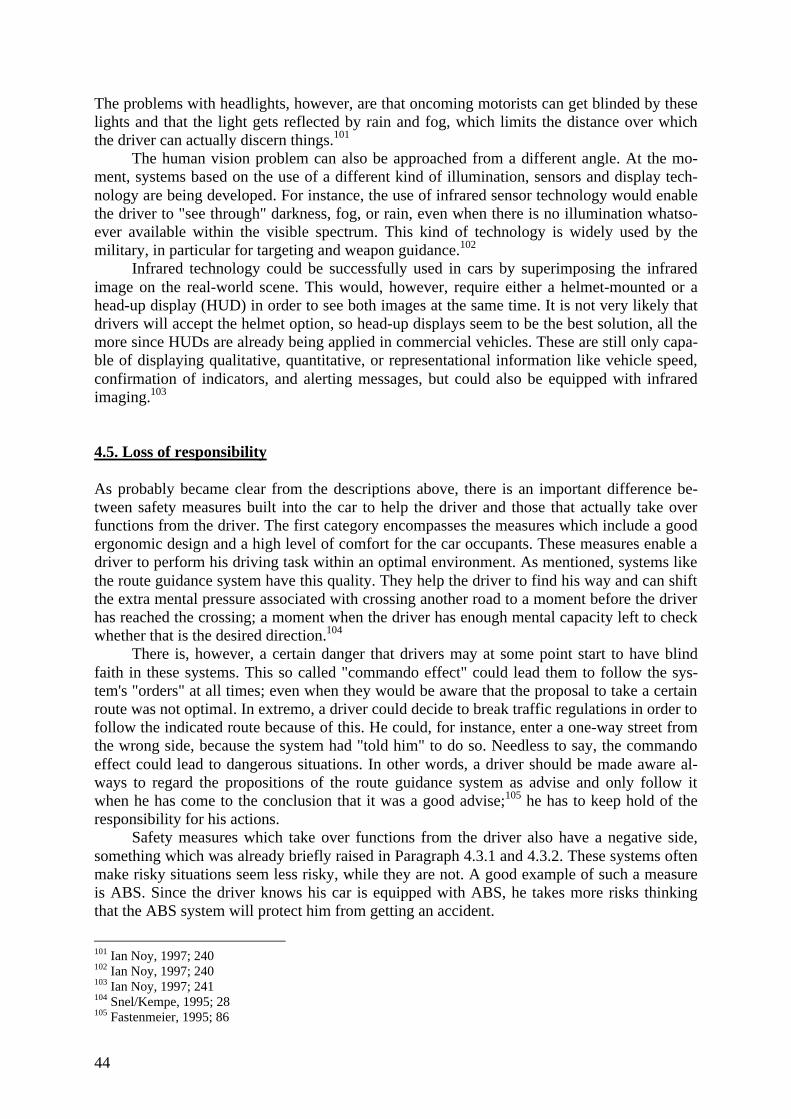
44
The problems with headlights, however, are that oncoming motorists can get blinded by theselights and that the light gets reflected by rain and fog, which limits the distance over whichthe driver can actually discern things.101
The human vision problem can also be approached from a different angle. At the mo-ment, systems based on the use of a different kind of illumination, sensors and display tech-nology are being developed. For instance, the use of infrared sensor technology would enablethe driver to "see through" darkness, fog, or rain, even when there is no illumination whatso-ever available within the visible spectrum. This kind of technology is widely used by themilitary, in particular for targeting and weapon guidance.102
Infrared technology could be successfully used in cars by superimposing the infraredimage on the real-world scene. This would, however, require either a helmet-mounted or ahead-up display (HUD) in order to see both images at the same time. It is not very likely thatdrivers will accept the helmet option, so head-up displays seem to be the best solution, all themore since HUDs are already being applied in commercial vehicles. These are still only capa-ble of displaying qualitative, quantitative, or representational information like vehicle speed,confirmation of indicators, and alerting messages, but could also be equipped with infraredimaging.103
4.5. Loss of responsibility
As probably became clear from the descriptions above, there is an important difference be-tween safety measures built into the car to help the driver and those that actually take overfunctions from the driver. The first category encompasses the measures which include a goodergonomic design and a high level of comfort for the car occupants. These measures enable adriver to perform his driving task within an optimal environment. As mentioned, systems likethe route guidance system have this quality. They help the driver to find his way and can shiftthe extra mental pressure associated with crossing another road to a moment before the driverhas reached the crossing; a moment when the driver has enough mental capacity left to checkwhether that is the desired direction.104
There is, however, a certain danger that drivers may at some point start to have blindfaith in these systems. This so called "commando effect" could lead them to follow the sys-tem's "orders" at all times; even when they would be aware that the proposal to take a certainroute was not optimal. In extremo, a driver could decide to break traffic regulations in order tofollow the indicated route because of this. He could, for instance, enter a one-way street fromthe wrong side, because the system had "told him" to do so. Needless to say, the commandoeffect could lead to dangerous situations. In other words, a driver should be made aware al-ways to regard the propositions of the route guidance system as advise and only follow itwhen he has come to the conclusion that it was a good advise;105 he has to keep hold of theresponsibility for his actions.
Safety measures which take over functions from the driver also have a negative side,something which was already briefly raised in Paragraph 4.3.1 and 4.3.2. These systems oftenmake risky situations seem less risky, while they are not. A good example of such a measureis ABS. Since the driver knows his car is equipped with ABS, he takes more risks thinkingthat the ABS system will protect him from getting an accident.
101 Ian Noy, 1997; 240102 Ian Noy, 1997; 240103 Ian Noy, 1997; 241104 Snel/Kempe, 1995; 28105 Fastenmeier, 1995; 86
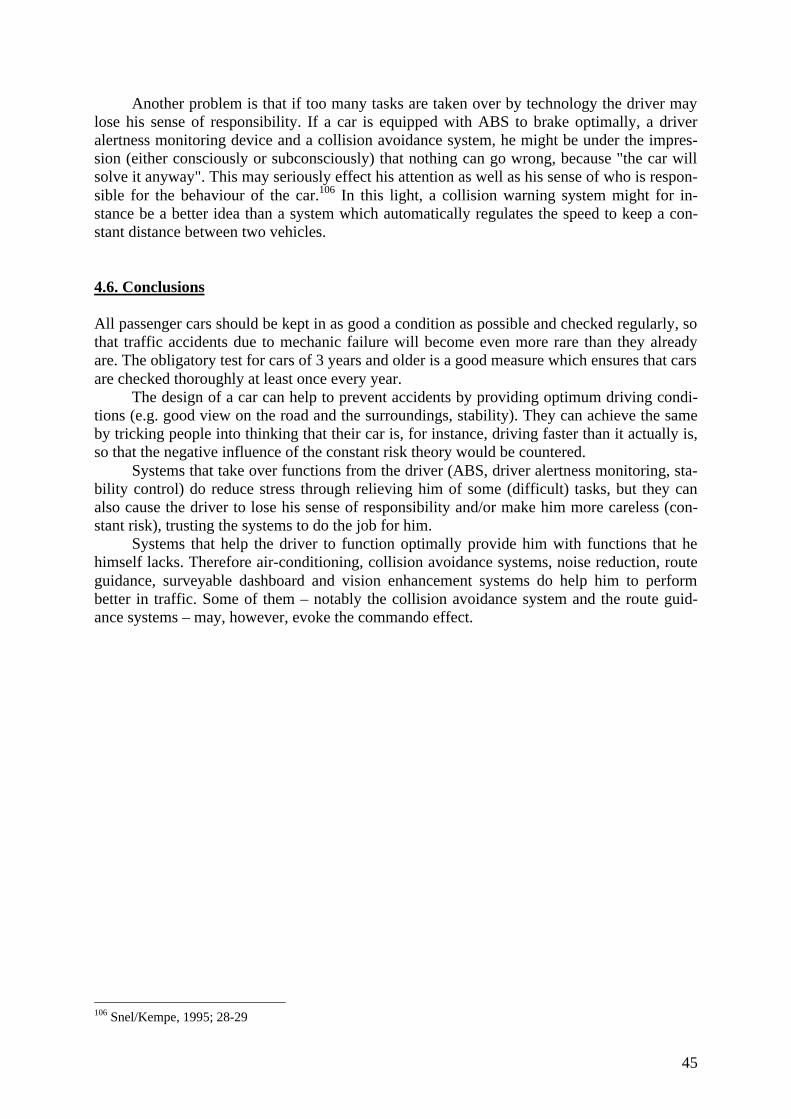
45
Another problem is that if too many tasks are taken over by technology the driver maylose his sense of responsibility. If a car is equipped with ABS to brake optimally, a driveralertness monitoring device and a collision avoidance system, he might be under the impres-sion (either consciously or subconsciously) that nothing can go wrong, because "the car willsolve it anyway". This may seriously effect his attention as well as his sense of who is respon-sible for the behaviour of the car.106 In this light, a collision warning system might for in-stance be a better idea than a system which automatically regulates the speed to keep a con-stant distance between two vehicles.
4.6. Conclusions
All passenger cars should be kept in as good a condition as possible and checked regularly, sothat traffic accidents due to mechanic failure will become even more rare than they alreadyare. The obligatory test for cars of 3 years and older is a good measure which ensures that carsare checked thoroughly at least once every year.
The design of a car can help to prevent accidents by providing optimum driving condi-tions (e.g. good view on the road and the surroundings, stability). They can achieve the sameby tricking people into thinking that their car is, for instance, driving faster than it actually is,so that the negative influence of the constant risk theory would be countered.
Systems that take over functions from the driver (ABS, driver alertness monitoring, sta-bility control) do reduce stress through relieving him of some (difficult) tasks, but they canalso cause the driver to lose his sense of responsibility and/or make him more careless (con-stant risk), trusting the systems to do the job for him.
Systems that help the driver to function optimally provide him with functions that hehimself lacks. Therefore air-conditioning, collision avoidance systems, noise reduction, routeguidance, surveyable dashboard and vision enhancement systems do help him to performbetter in traffic. Some of them – notably the collision avoidance system and the route guid-ance systems – may, however, evoke the commando effect.
106 Snel/Kempe, 1995; 28-29

46
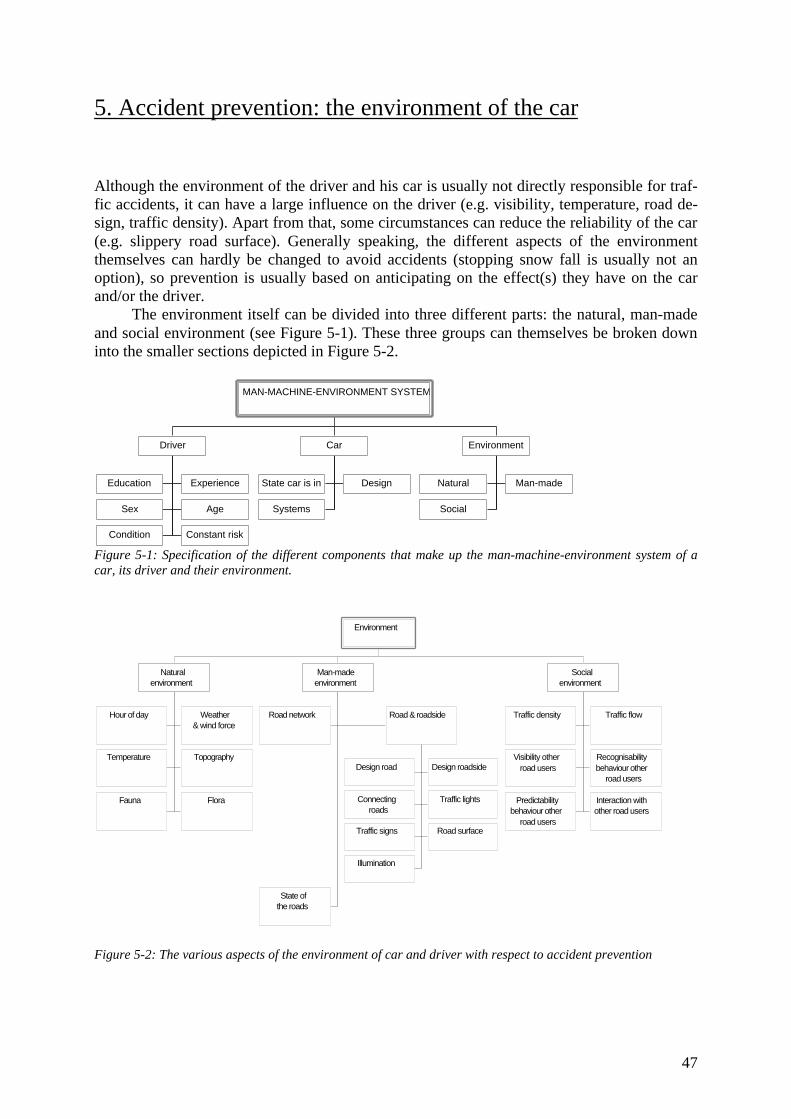
47
5. Accident prevention: the environment of the car
Although the environment of the driver and his car is usually not directly responsible for traf-fic accidents, it can have a large influence on the driver (e.g. visibility, temperature, road de-sign, traffic density). Apart from that, some circumstances can reduce the reliability of the car(e.g. slippery road surface). Generally speaking, the different aspects of the environmentthemselves can hardly be changed to avoid accidents (stopping snow fall is usually not anoption), so prevention is usually based on anticipating on the effect(s) they have on the carand/or the driver.
The environment itself can be divided into three different parts: the natural, man-madeand social environment (see Figure 5-1). These three groups can themselves be broken downinto the smaller sections depicted in Figure 5-2.
Education Experience
Sex Age
Condition Constant risk
Driver
State car is in Design
Systems
Car
Natural Man-made
Social
Environment
MAN-MACHINE-ENVIRONMENT SYSTEM
Figure 5-1: Specification of the different components that make up the man-machine-environment system of acar, its driver and their environment.
Hour of day Weather& wind force
Temperature Topography
Fauna Flora
Naturalenvironment
Road network
Design road Design roadside
Connectingroads
Traffic lights
Traffic signs Road surface
Illumination
Road & roadside
State ofthe roads
Man-madeenvironment
Traffic density Traffic flow
Visibility otherroad users
Recognisabilitybehaviour other
road users
Predictabilitybehaviour other
road users
Interaction withother road users
Socialenvironment
Environment
Figure 5-2: The various aspects of the environment of car and driver with respect to accident prevention
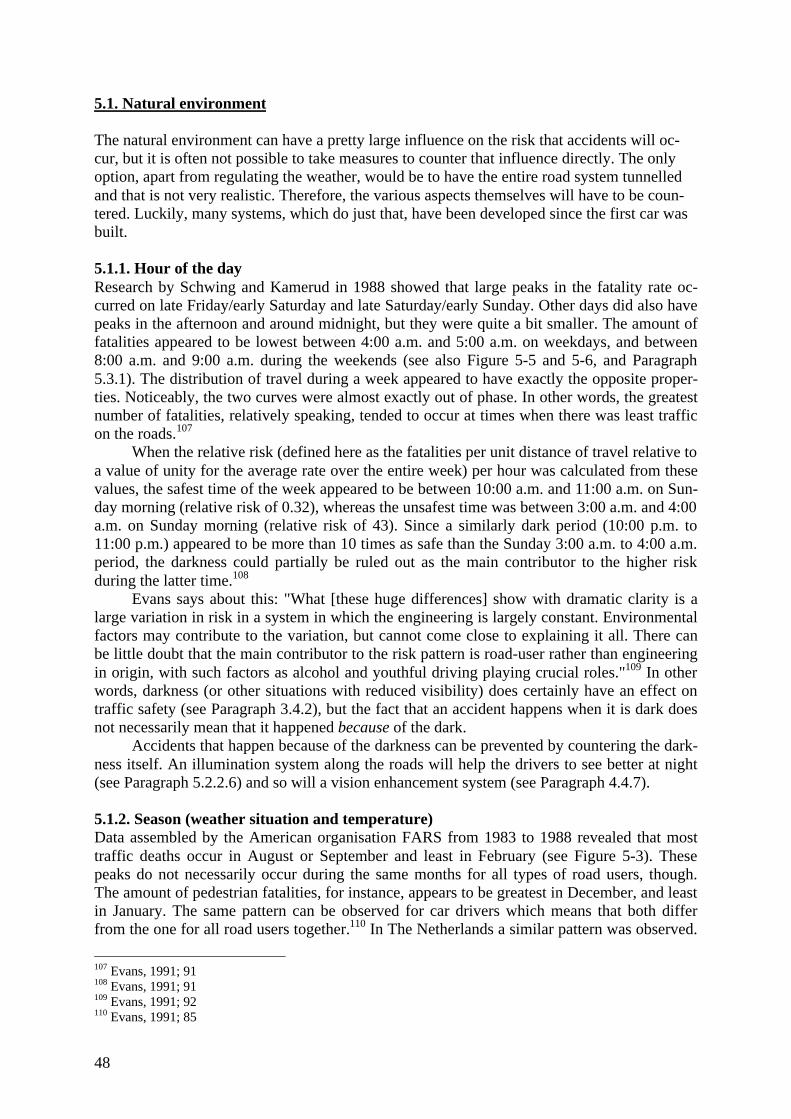
48
5.1. Natural environment
The natural environment can have a pretty large influence on the risk that accidents will oc-cur, but it is often not possible to take measures to counter that influence directly. The onlyoption, apart from regulating the weather, would be to have the entire road system tunnelledand that is not very realistic. Therefore, the various aspects themselves will have to be coun-tered. Luckily, many systems, which do just that, have been developed since the first car wasbuilt.
5.1.1. Hour of the dayResearch by Schwing and Kamerud in 1988 showed that large peaks in the fatality rate oc-curred on late Friday/early Saturday and late Saturday/early Sunday. Other days did also havepeaks in the afternoon and around midnight, but they were quite a bit smaller. The amount offatalities appeared to be lowest between 4:00 a.m. and 5:00 a.m. on weekdays, and between8:00 a.m. and 9:00 a.m. during the weekends (see also Figure 5-5 and 5-6, and Paragraph5.3.1). The distribution of travel during a week appeared to have exactly the opposite proper-ties. Noticeably, the two curves were almost exactly out of phase. In other words, the greatestnumber of fatalities, relatively speaking, tended to occur at times when there was least trafficon the roads.107
When the relative risk (defined here as the fatalities per unit distance of travel relative toa value of unity for the average rate over the entire week) per hour was calculated from thesevalues, the safest time of the week appeared to be between 10:00 a.m. and 11:00 a.m. on Sun-day morning (relative risk of 0.32), whereas the unsafest time was between 3:00 a.m. and 4:00a.m. on Sunday morning (relative risk of 43). Since a similarly dark period (10:00 p.m. to11:00 p.m.) appeared to be more than 10 times as safe than the Sunday 3:00 a.m. to 4:00 a.m.period, the darkness could partially be ruled out as the main contributor to the higher riskduring the latter time.108
Evans says about this: "What [these huge differences] show with dramatic clarity is alarge variation in risk in a system in which the engineering is largely constant. Environmentalfactors may contribute to the variation, but cannot come close to explaining it all. There canbe little doubt that the main contributor to the risk pattern is road-user rather than engineeringin origin, with such factors as alcohol and youthful driving playing crucial roles."109 In otherwords, darkness (or other situations with reduced visibility) does certainly have an effect ontraffic safety (see Paragraph 3.4.2), but the fact that an accident happens when it is dark doesnot necessarily mean that it happened because of the dark.
Accidents that happen because of the darkness can be prevented by countering the dark-ness itself. An illumination system along the roads will help the drivers to see better at night(see Paragraph 5.2.2.6) and so will a vision enhancement system (see Paragraph 4.4.7).
5.1.2. Season (weather situation and temperature)Data assembled by the American organisation FARS from 1983 to 1988 revealed that mosttraffic deaths occur in August or September and least in February (see Figure 5-3). Thesepeaks do not necessarily occur during the same months for all types of road users, though.The amount of pedestrian fatalities, for instance, appears to be greatest in December, and leastin January. The same pattern can be observed for car drivers which means that both differfrom the one for all road users together.110 In The Netherlands a similar pattern was observed.
107 Evans, 1991; 91108 Evans, 1991; 91109 Evans, 1991; 92110 Evans, 1991; 85
49
During the summers from 1990 to 1994 20% more traffic deaths were registered than duringthe winters of those years. 111
The remarkable thing about the fact that the lowest fatality rates occur during wintertime is that winter is usually associated with increased risk. Snow, ice and long hours of dark-ness make that road users have to be more careful during their travels. The summer, on theother hand, features long days with much sunlight and dry road surfaces and one would notexpect that exactly this time of the year and the autumn have the highest fatality rates.112
Figure 5-3: Left: US traffic fatalities per month (based on FARS data). Right: US traffic fatalities per unit dis-tance of travel versus month(based on FARS and FHWA data). In both graphs, the first point plotted is for Janu-ary 1983, and the last for December 1988 [taken from Evans, 1991; Figure 4-8 and 4-9].
There are several reasons and combinations of reasons for the large difference in fatalityrates between summer and winter. One of them is the fact that most humans are not very re-sistant against the summer's higher temperatures and therefore have more difficulties to focuson the driving task (see also Paragraph 3.4.3).113 Another reason for the higher amount of traf-fic deaths in the summer is that there are more people on the road during the summermonths.114 Also, the fact that they perceive the winter as being more dangerous counters theconstant risk problem (see Paragraph 3.6). The opposite obviously happens in the summer;people get overconfident because they think that there is nothing to worry about.
FARS data has shown that the highest fatality rates associate with dry roadway surfacesand favourable atmospheric conditions. The 1988 data, for instance, show that 8.3% of allfatal crashes occurred in rain, 1.9% in snow, and 1.5% in fog or other unusual atmosphericconditions. This means that the vast majority (88.3%) of fatal crashes occurred when therewere no risky atmospheric conditions. Apart from that, it appeared that 83.6% of all 1988 fa-tal crashes occurred on dry roadway surfaces, whereas the remainder happened under less safecircumstances (12.8% on wet surfaces, 1.6% on snow, 1.8% on ice, and 0.3% on sand or someother surface). A study of injury-producing crashes in Leeds, UK, confirmed the American
111 Snel/Kempe, 1995; 87112 Evans, 1991; 85113 Snel/Kempe, 1995; 87114 Evans, 1991; 85
50
findings. Researchers there found that 81% of those crashes occurred under fine weather con-ditions, 69% occurred in daylight, and 61% occurred when the road was dry.115
The conclusions that can be drawn from these studies are not entirely clear-cut. Evansstates that "[t]here are insufficient exposure data to determine to what extent crash rates de-pend on roadway surface, but crash rates almost certainly are higher with reduced roadwayfriction and visibility. Driver responses to inclement weather and slippery roadways, espe-cially reduced speeds, lead to more, but less severe crashes with consequent reductions in fa-talities."116 This leads to the paradoxical observation (one that, however, fits into the theorythat the behaviour of the driver can be influenced through his perception of things) that trafficsafety increases when the circumstances are more unfavourable.
To prevent accidents due to the weather, there are several measures possible to aid thedriver. These can be car-based, like ABS (see Chapter 4), or road-based, like a good road sur-face (see Paragraph 5.2.2.5)
5.1.3. Wind forceHeavy winds, especially gusts, can make driving a risky business. Coming from the side, theycan push the car from its intended route, which means that the driver will have to apply oppo-site lock in order not to be blown off the road. This can be a rather tiring business, particularlyif the wind comes in bursts. Places without very much protection, like open fields, bridges andmountain ridges can therefore be dangerous to drive in during turbulent weather. An aerody-namic design will solve some of this problem, but it is, of course, also possible to protect theroad somewhat by placing windbreaks. Still, this is only an option in case of motorways(where they can also function as noise abatement), since they will cause some serious de-struction of the landscape otherwise.
5.1.4. TopographyTopography can also play a role in how dangerous certain parts of the roads are. "Obstacles"like forests, buildings and mountains or hills can influence whether the driver can see otherroad users coming or not. This can sometimes be solved by installing mirrors to see what isbehind a certain "obstacle".
5.1.5. FaunaFauna of different sizes can cause crashes. On one side of the spectrum we can find the bug.Animals of this size cannot crash the car themselves, but no doubt there have been quite a fewaccidents because of, for instance, a wasp flying in through the open window and tempting thedriver to convert all his attention to either trying to kill the creature or to chase it off. Apartfrom keeping the car window closed, there is not much that one can do about bugs, though.
The next size would be that of the rabbit, cat and pigeon. Once more, the animal itselfwill not be able to crash the car. Big, heavy animals crossing the road can, however, definitelycause a car to crash. Many deer, but also cows and horses have caused deadly accidents.117
Most drivers will, of course, try to avoid driving over both middle and large-sized animalswhich often means that the driver behind or next to him will be surprised by a sudden ma-noeuvre. Prevention of these accident is possible in case of motorways through shielding them
115 Evans, 1991; 86116 Evans, 1991; 88-89117 On a protection- rather than prevention note, it may be interesting to know that Volvo actually design theircars to protect the occupants against a crash with a big, long-legged animal which is rather common in Sweden:the elk. One of their standard tests is therefore a simulation of a 250-kilo elk first landing on the windscreen(because of those long legs) and then rolling over the roof. [Information: Volvo Cars special edition 00, 2000]
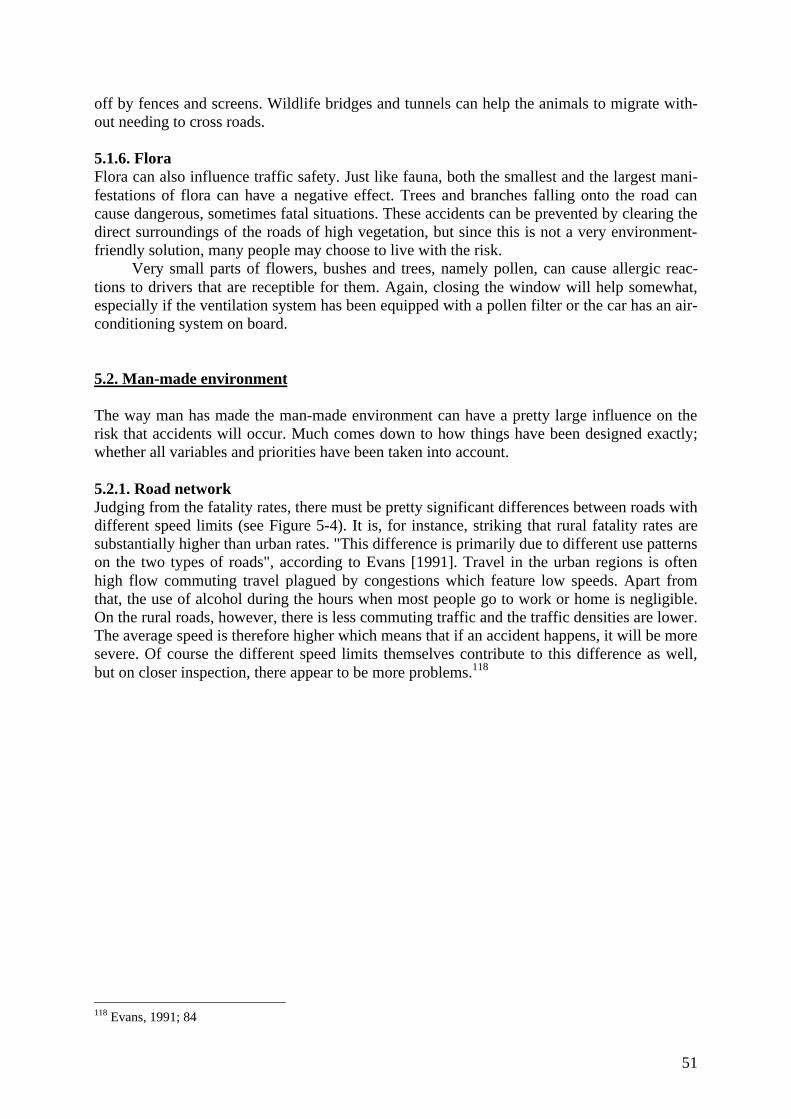
51
off by fences and screens. Wildlife bridges and tunnels can help the animals to migrate with-out needing to cross roads.
5.1.6. FloraFlora can also influence traffic safety. Just like fauna, both the smallest and the largest mani-festations of flora can have a negative effect. Trees and branches falling onto the road cancause dangerous, sometimes fatal situations. These accidents can be prevented by clearing thedirect surroundings of the roads of high vegetation, but since this is not a very environment-friendly solution, many people may choose to live with the risk.
Very small parts of flowers, bushes and trees, namely pollen, can cause allergic reac-tions to drivers that are receptible for them. Again, closing the window will help somewhat,especially if the ventilation system has been equipped with a pollen filter or the car has an air-conditioning system on board.
5.2. Man-made environment
The way man has made the man-made environment can have a pretty large influence on therisk that accidents will occur. Much comes down to how things have been designed exactly;whether all variables and priorities have been taken into account.
5.2.1. Road networkJudging from the fatality rates, there must be pretty significant differences between roads withdifferent speed limits (see Figure 5-4). It is, for instance, striking that rural fatality rates aresubstantially higher than urban rates. "This difference is primarily due to different use patternson the two types of roads", according to Evans [1991]. Travel in the urban regions is oftenhigh flow commuting travel plagued by congestions which feature low speeds. Apart fromthat, the use of alcohol during the hours when most people go to work or home is negligible.On the rural roads, however, there is less commuting traffic and the traffic densities are lower.The average speed is therefore higher which means that if an accident happens, it will be moresevere. Of course the different speed limits themselves contribute to this difference as well,but on closer inspection, there appear to be more problems.118
118 Evans, 1991; 84
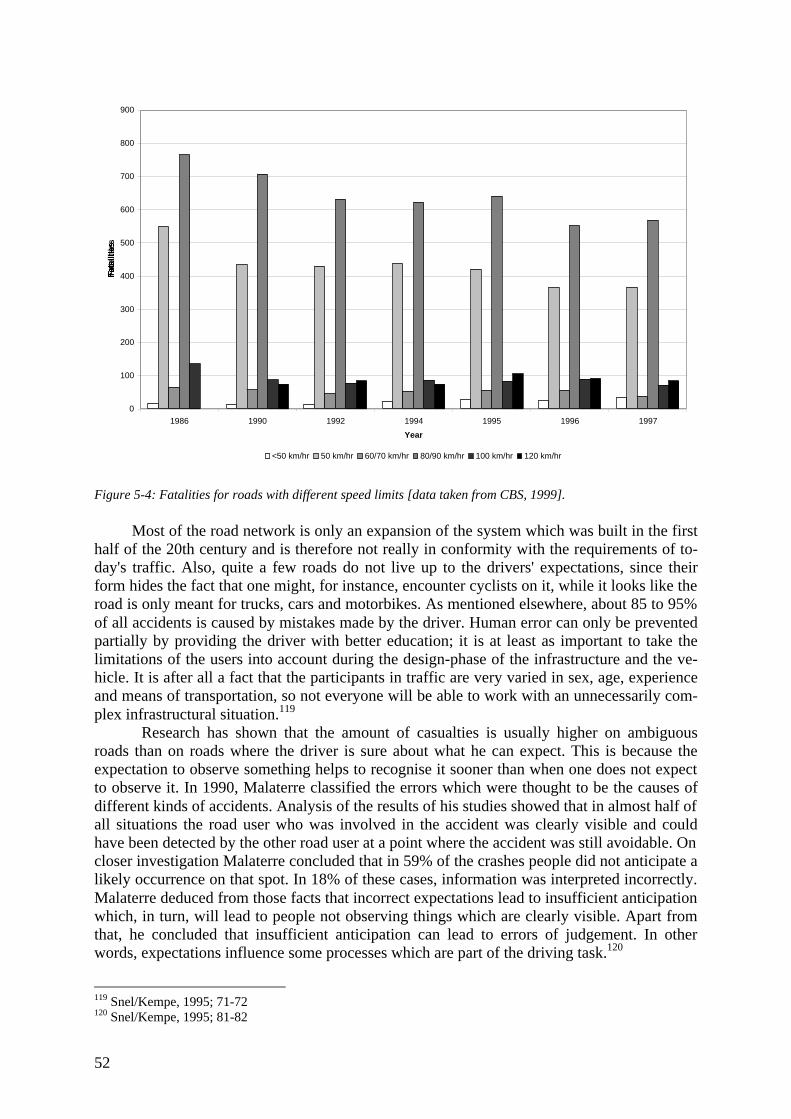
52
0
100
200
300
400
500
600
700
800
900
1986 1990 1992 1994 1995 1996 1997
Year
Fat
alit
ies
<50 km/hr 50 km/hr 60/70 km/hr 80/90 km/hr 100 km/hr 120 km/hr
Figure 5-4: Fatalities for roads with different speed limits [data taken from CBS, 1999].
Most of the road network is only an expansion of the system which was built in the firsthalf of the 20th century and is therefore not really in conformity with the requirements of to-day's traffic. Also, quite a few roads do not live up to the drivers' expectations, since theirform hides the fact that one might, for instance, encounter cyclists on it, while it looks like theroad is only meant for trucks, cars and motorbikes. As mentioned elsewhere, about 85 to 95%of all accidents is caused by mistakes made by the driver. Human error can only be preventedpartially by providing the driver with better education; it is at least as important to take thelimitations of the users into account during the design-phase of the infrastructure and the ve-hicle. It is after all a fact that the participants in traffic are very varied in sex, age, experienceand means of transportation, so not everyone will be able to work with an unnecessarily com-plex infrastructural situation.119
Research has shown that the amount of casualties is usually higher on ambiguousroads than on roads where the driver is sure about what he can expect. This is because theexpectation to observe something helps to recognise it sooner than when one does not expectto observe it. In 1990, Malaterre classified the errors which were thought to be the causes ofdifferent kinds of accidents. Analysis of the results of his studies showed that in almost half ofall situations the road user who was involved in the accident was clearly visible and couldhave been detected by the other road user at a point where the accident was still avoidable. Oncloser investigation Malaterre concluded that in 59% of the crashes people did not anticipate alikely occurrence on that spot. In 18% of these cases, information was interpreted incorrectly.Malaterre deduced from those facts that incorrect expectations lead to insufficient anticipationwhich, in turn, will lead to people not observing things which are clearly visible. Apart fromthat, he concluded that insufficient anticipation can lead to errors of judgement. In otherwords, expectations influence some processes which are part of the driving task.120
119 Snel/Kempe, 1995; 71-72120 Snel/Kempe, 1995; 81-82
53
If someone is expecting something else than what he is presented with and anticipateswrong because of that erratic assumption, it is likely that he will make errors of observationand judgement. To avoid drivers to mistake a certain road for what it is not, the Dutch re-search institute TNO-Technical Human Biology have developed the so-called "Self-Explai-ning Road" (SER). Their goal is to increase safety by creating an unambiguous road system.This means that it has to be clear what a driver can expect on/from a certain road just by see-ing it. They want to create, in the words of TNO, "[a] limited amount of road categories witheasily recognisable designs, which enables the road user to anticipate and react adequately tothe traffic situations occurring".121
At the moment, the different road types in The Netherlands are barely recognisable.This problem was partly solved in other countries by using simple codes. In America, for in-stance, yellow line in the middle of the road is used to indicate that one can encounter on-coming cars. In France, exits are systematically indicated by roadside poles.122 The SER willprovide a similar set of features for Dutch roads.
5.2.2. Road and roadsideMany aspects of the road and roadside can influence traffic safety:
5.2.2.1. Design of road and roadsideThe design of the road and roadside are important with respect to their specific function. It isobvious that a motorway, where speeds are high, needs a different lay-out than a small streetin a residential area, where they are low. During the design phase the primary goal of everyroad – transportation – should not be forgotten; it is of course possible to create traffic con-gestions everywhere so that the typical, low speeds would make sure that the fatality ratewould be low, but that surpasses a road's primary goal.
Traffic accidents can be avoided by making sure that the road first of all is unambiguous(see previous paragraph) and that the speed and amount of traffic during the busiest hours aretaken into account. This is why a busy motorway will be much safer if it is broad, has a suffi-cient amount of lanes (so that traffic congestion will not occur that regularly), and the sides ofthe road are separated by guard rails.
In residential areas, one of the goals is transportation, but the primary goal is givingaccess to the places where people live. This means that through traffic is not really desiredthere and therefore (and to protect children) the speeds need to be low in these places. Sincemany drivers still drove through them at irresponsibly high speeds, many cities have resortedto lowering the maximum permitted speed to 30 km/h and building speed ramps every somany meters. Apart from slowing the traffic down the speed ramps also have the effect ofwarning the driver what kind of road users and situations (e.g. children playing on the streets)he can expect (unambiguity).
Another way to lower the risk of traffic accidents is by removing the external road-users(i.e. road users which do not drive or ride in a car: pedestrians, cyclists, moped riders123) fromthe road and providing them with their own roads or part of the road. In 1997, 20.8% of allDutch road casualties were cyclists, 7.6% of them were moped riders and 10.2% were pedes-
121 Snel/Kempe, 1995; 72122 Snel/Kempe, 1995; 73123 Theoretically speaking, motorcyclists are also part of this group, but since they can compete with cars, speed-wise, they do not necessarily require their own road, although this would not be such a bad plan, consideringhow car drivers usually treat them.
54
trians. Especially accidents involving cyclists and moped riders did often happen because theywere sharing the same road.124
Pavements and bicycle paths are, however, not always as effective as they could be ifthe section reserved for these road users is not physically separated from the part where thecars move. The section has to be separated by means of a barrier or a marked difference inheight from the rest of the road, otherwise the risk will not decrease that much. Still, a clearlymarked bicycle path (by use of lines painted on the road surface) at the side of the road doesimprove the right expectation for the driver and will therefore lower the road's ambiguity con-siderably.
5.2.2.2. Connecting roadsWhere one or more roads connect is generally speaking a place of higher accident risk, be-cause of the different directions traffic will move in. Of course there are traffic signs, lightsand regulations which tell who gets right of way. Not everyone sticks to these rules, though,and there are also situations in which it is not entirely clear who gets to move first. In situa-tions like that, it comes down to something which sailors would call "good seamanship", inother words "giving and taking" or "compromising", to avoid accidents.
5.2.2.3. Traffic lightsTraffic lights are important regulatory devices at places where roads connect. If everyonewould wait for their lane or side to get a green light, there would be no problems whatsoeverat crossings.
5.2.2.4. Traffic signsThe requirements for traffic signs for motorways are different than those that are used in built-up areas. Since the average speed on a motorway is rather high, a driver needs to be able toread a traffic sign from far off, because otherwise he will just pass by the sign without havingbeen able to take in all the information on it. In case of exits, too small signs could lead tovery dangerous situations.
5.2.2.5. Road surfaceThere are several ways in which the road surface can be used to prevent accidents. Apart fromthe quality and composition of the surface itself, these consist of attaching or painting some-thing on it.• Quality and composition road surface _ There are many different materials that roads can
be made of. Among the most popular are paving stones and asphalt. A surface of goodquality will provide good grip both in dry and in wet weather and will not wear too fast.An example of striving for optimal quality of the road surface was the invention of"ZOAB" (Dutch: Zeer Open AsfaltBeton; English: Very Open Hot-Rolled Asphalt). Theopen structure of the asphalt helps to drain off rainwater very fast, so that the danger ofaquaplaning is decreased, thus making the road safer during rainfall. The problem, how-ever, is that people drive about 10 km/h faster than on ordinary asphalt roads on ZOABwhen it rains. The amount of accidents on ZOAB during rainy weather is therefore just ashigh as on ordinary asphalt (one can assume because of the ZOAB).125 This is a clear ex-ample of the constant risk theory at work.
• Lines painted on the road keep road users in their lane and tell them whether or not theyare allowed to overtake (usually these indications take into account whether it is at all safeto overtake or not).
124 SWOV website, 1999125 Snel/Kempe, 1995; 27
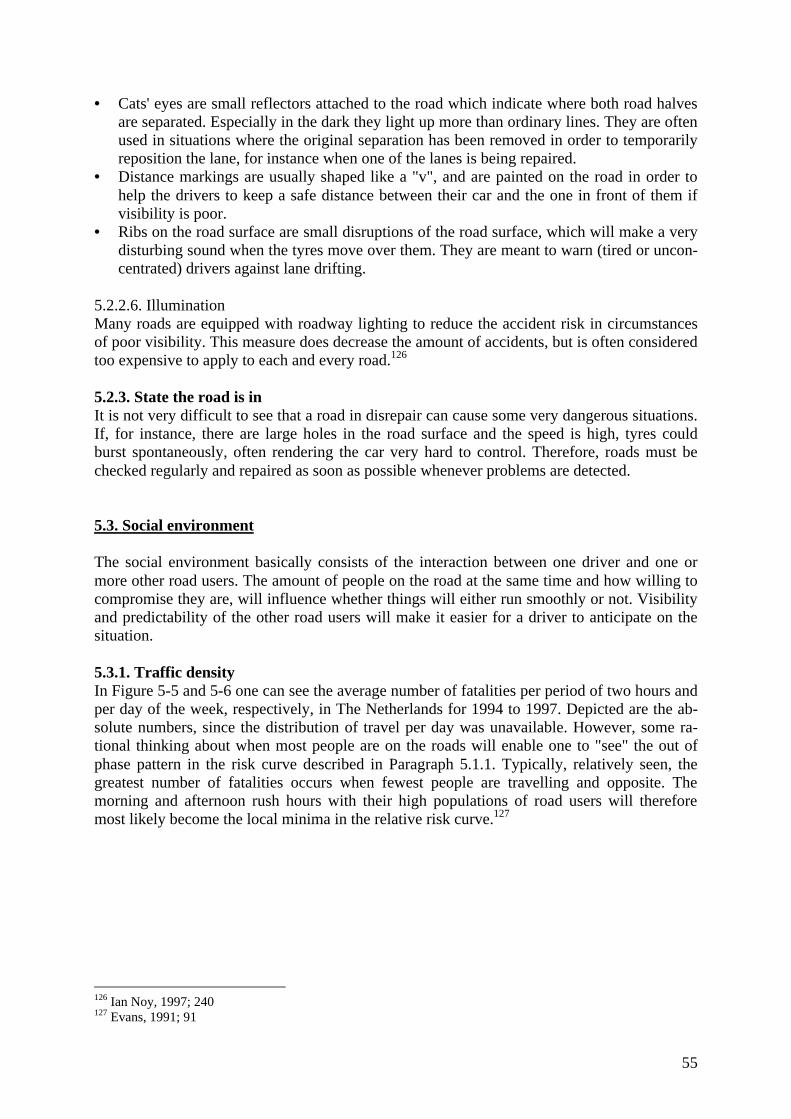
55
• Cats' eyes are small reflectors attached to the road which indicate where both road halvesare separated. Especially in the dark they light up more than ordinary lines. They are oftenused in situations where the original separation has been removed in order to temporarilyreposition the lane, for instance when one of the lanes is being repaired.
• Distance markings are usually shaped like a "v", and are painted on the road in order tohelp the drivers to keep a safe distance between their car and the one in front of them ifvisibility is poor.
• Ribs on the road surface are small disruptions of the road surface, which will make a verydisturbing sound when the tyres move over them. They are meant to warn (tired or uncon-centrated) drivers against lane drifting.
5.2.2.6. IlluminationMany roads are equipped with roadway lighting to reduce the accident risk in circumstancesof poor visibility. This measure does decrease the amount of accidents, but is often consideredtoo expensive to apply to each and every road.126
5.2.3. State the road is inIt is not very difficult to see that a road in disrepair can cause some very dangerous situations.If, for instance, there are large holes in the road surface and the speed is high, tyres couldburst spontaneously, often rendering the car very hard to control. Therefore, roads must bechecked regularly and repaired as soon as possible whenever problems are detected.
5.3. Social environment
The social environment basically consists of the interaction between one driver and one ormore other road users. The amount of people on the road at the same time and how willing tocompromise they are, will influence whether things will either run smoothly or not. Visibilityand predictability of the other road users will make it easier for a driver to anticipate on thesituation.
5.3.1. Traffic densityIn Figure 5-5 and 5-6 one can see the average number of fatalities per period of two hours andper day of the week, respectively, in The Netherlands for 1994 to 1997. Depicted are the ab-solute numbers, since the distribution of travel per day was unavailable. However, some ra-tional thinking about when most people are on the roads will enable one to "see" the out ofphase pattern in the risk curve described in Paragraph 5.1.1. Typically, relatively seen, thegreatest number of fatalities occurs when fewest people are travelling and opposite. Themorning and afternoon rush hours with their high populations of road users will thereforemost likely become the local minima in the relative risk curve.127
126 Ian Noy, 1997; 240127 Evans, 1991; 91
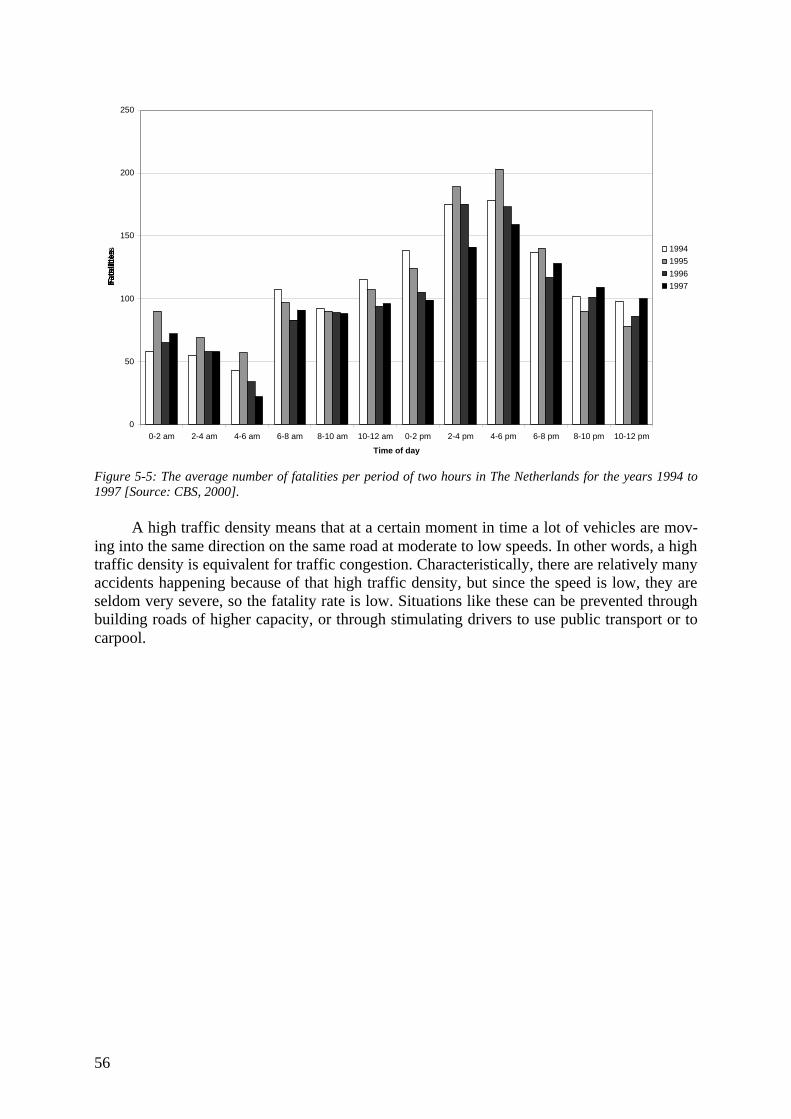
56
0
50
100
150
200
250
0-2 am 2-4 am 4-6 am 6-8 am 8-10 am 10-12 am 0-2 pm 2-4 pm 4-6 pm 6-8 pm 8-10 pm 10-12 pm
Time of day
Fat
alit
ies 1994
1995
1996
1997
Figure 5-5: The average number of fatalities per period of two hours in The Netherlands for the years 1994 to1997 [Source: CBS, 2000].
A high traffic density means that at a certain moment in time a lot of vehicles are mov-ing into the same direction on the same road at moderate to low speeds. In other words, a hightraffic density is equivalent for traffic congestion. Characteristically, there are relatively manyaccidents happening because of that high traffic density, but since the speed is low, they areseldom very severe, so the fatality rate is low. Situations like these can be prevented throughbuilding roads of higher capacity, or through stimulating drivers to use public transport or tocarpool.
57
0
50
100
150
200
250
300
Monday Tuesday Wednesday Thursday Friday Saturday Sunday
Day of the week
Fat
alit
ies 1994
1995
1996
1997
Figure 5-6: The average number of fatalities per day of the week in The Netherlands for the years 1994 to 1997[Source: CBS, 2000].
5.3.2. Traffic flowA high traffic flow does usually mean that the traffic density in a certain direction is lowwhereas the speeds are high. Characteristically, there are relatively few accidents, althoughthe ones that do happen are often rather serious. One can, ironically enough, achieve a lowerfatality and injury rate through traffic congestions, but then one has lost sight of the most im-portant function of traffic: transportation.
5.3.3. Visibility other road usersIn order to be able to anticipate on a certain situation in traffic it is important that all road us-ers are visible to each other. This can, however, be a problem during the dark hours of the dayand in bad weather situations. Under those circumstances, most cars use their lights whichdoes help them to become more visible, but can at the same time cause some problems. Asmentioned in Paragraph 3.4.2, the glare of opposing headlights can reduce the visibility of lowcontrast objects such as pedestrians and cyclists considerably when it is dark, although aheavy rain shower or fog can cause the same effect. Especially pedestrians seem to grosslyoverestimate how visible they are, since – contrary to bicycles – they are not equipped withlights or reflectors. In other words, in order to enhance traffic safety, there are several thingsthat can be done. First of all, the awareness about visibility under different meteorologicalcircumstances could be raised, especially in case of pedestrians, and the use of reflectorsstimulated. Secondly, the roads could be artificially illuminated (see Paragraph 5.2.2.6). Andthirdly, vision enhancement systems could be installed into cars, trucks, vans, buses, etc. (seeParagraph 4.4.7).
5.3.4. Recognisability and predictability driving behaviour other road-usersAs described in Paragraph 5.2.1, expectations have a large influence on the way people drive.People will expect the car in front of them to just keep on driving in the same direction untilthere is a curve or a possibility to change it. Usually the person changing direction will pre-
58
pare the other road users for it through the direction indicator or through extending his arm(cyclists and moped riders) should that be necessary. A sudden, unexpected action can there-fore be fatal. However, since the person making the manoeuvre is often anticipating on anunexpected event himself, these manoeuvres themselves can hardly be prevented from hap-pening. It will then come down to the quickness of reaction of the other driver(s). Some sys-tems, like ABS, could at times help to avoid an accident by supporting the sheer-away ma-noeuvre.
5.3.5. Interaction with other road-usersTraffic is a matter of give and take, as is the case with most situations in which more than oneperson is assembled. In some situations, traffic regulations or signs will be sufficient to knowhow to act in a certain situation, but in many others people will have to signal to each other orlet their actions speak for themselves to make their intentions clear. Much will then depend onthe aforementioned "good seamanship", because, just like in conversations, this interactioncan lead to misunderstandings and those can sometimes lead to accidents. Once again, themisunderstandings are not always avoidable and some quick reactions may be the only thingleft to avoid an accident.
5.4. Distractions
Distractions can, of course, also be caused by the car or even by a thought of the driver him-self, but in most cases distractions will originate in the environment of the car and the driver.That environment encompasses the car itself (passengers, car phone, etc.) as well as the out-side of the car (temperature, sounds, accidents on the other side of the road, recognisability oftraffic situations billboards, etc.). Distractions determine or influence the state or condition thedriver is in from the outside. It is possible that they effect his attention, reaction time or powerof observation and can cause him to react incorrectly or not at all upon stimuli like trafficsigns or spoken, traffic-related information. In other words, distractions can have a large in-fluence on the quality of people's driving behaviour.128
There has been much debate about the safety of having a phone conversation whiledriving. Research at the Verkeerskundig Studiecentrum in Groningen (The Netherlands),TÜV Rheinland in Cologne (Germany), VTI Linköping (Sweden), the University of Helsinki(Finland) and the University of Husat (United Kingdom) has shown that a driver automati-cally reduces his speed while talking on the phone. Apart from that, he applies his brakes lessoften and his steadiness and quickness of reaction drop. The main conclusion of theseauthorities is therefore that using a telephone while driving distracts the driver and can lead todangerous situations.129
A handheld mobile or car phone only adds some more risk to the situation, since thedriver will have to steer with only one hand on the wheel. Hands free phones are a good alter-native, although the fact that one will in many cases still need to punch in the phone number isnot optimal. Speech recognition will be a better option, but it is defiitely best not to havephone conversations while driving at all.
128 Snel/Kempe, 1995; 12, 14129 Snel/Kempe, 1995; 13,14
59
5.5. Conclusions
The greatest number of fatalities, relatively speaking, tends to coincide with the hours thatthere is least traffic on the roads. Many of those accidents happen when it is dark, but thatdoes not necessarily mean that they happened because of the darkness. The nightly hours tendto be the time of the day when youthful driving, drunk-driving and tiredness play a large roleas well. Accidents that do happen because of the dark, however, can be prevented through theinstallation of road illumination, and vision enhancement systems for the cars.
Seen on a yearly scale, most traffic deaths occur in August and September and least inFebruary. For passenger car drivers and pedestrians these months tend to be December andJanuary, respectively. Still, the public believes that most fatalities occur in the winter and/orin bad weather. This belief makes them drive so careful in those situations that the fatality rateis low, even though more accidents do occur. On the other hand, they are overconfident in thesummer and when the weather is good which leads to higher fatality rates. To prevent acci-dents in bad weather situations, systems that increase one's control over the car, like ABS,have been developed. A road surface that retains most of the grip during rain, ice or snow willhelp to prevent these accidents too.
Heavy wind, especially if it is gusty, can make driving an extra tiring task. Shielding ofthe road and using a more aerodynamic design for the car are about the only options tocounter wind, though an aerodynamic car design can also help.
Obstacles, like buildings, forests, mountains and hills, can influence the visibility ofother road users. Installing mirrors can help drivers to see what is lurking behind a certainobstacle.
Bugs and pollen can cause drivers much irritation. The (partial) solution not to get theminside the car is to keep the windows closed. Pollen filters in the ventilation system or air-conditioning will reduce the fauna-related problems even further.
Larger animals and vegetation can cause accidents if they were to move or fall on theroad. The animals could be kept from the motorways through fences and screens, whereastheir crossing the roads to migrate can be prevented by installing wildlife bridges. Trees couldbe cleared from the direct surroundings of the road, but that would not be a very environ-mental-friendly solution.
There are significantly more fatalities on rural roads than on urban ones. This is causedby the difference in use patterns. Rural roads are characterised by high speeds, low trafficdensities, little congestion, alcohol-usage at night; urban ones by lower speeds, high trafficdensities, a lot of congestion, little alcohol-usage. Apart from that, the lay-out of the ruralroads is often ambiguous.
The lay-out of the road network has to be unambiguous in order to signal to the driverswhat they can expect on a certain kind of road. Accidents can happen because of many drivershaving the wrong expectations of the Dutch roads. The expectation to observe somethinghelps to recognise it sooner than when one does not expect it. this means that the fact thatsomething is not expected often causes a driver to see it too late to avoid an accident. Thesolution to this problem lies in the Self-Explaining Road, which clearly "tells" the driver whathe can expect.
The road and roadside should be built with their specific purposes in mind; a motorwayrequires a different design than a back street in a city. In order to reduce the amount of acci-dents involving external road users, it is best to give these traffic participants their own (sec-tions of the) roads. Physically separated ones will be safer than those whose presence is onlyindicated by lines on the road surface.
60
Traffic lights, signs and regulations are regulatory devices which help to solve the issueof who gets right of way where different roads connect. In order to increase their readability,traffic signs need to be tuned to the speeds specific for the road they are intended for.
The road surface can help to enhance traffic safety by having the optimal compositionwith respect to grip, and by accommodating lines, cats' eyes, distance markings and ribs. Agood state of repair of both road surface and roadside will help, too.
Traffic congestions can lower the fatality rate of a certain road, but they lower the mostimportant function of roads, transportation, at the same time.
The visibility of all road users will make it easier to anticipate in each other's presenceand/or avoid crashing into each other. Especially pedestrians seem to underestimate how visi-ble they are in the dark and during bad weather. Awareness about visibility should be raised;otherwise, road illumination and vision enhancement systems will help to solve part of theproblem.
If a road user's actions are recognisable and predictable, it will be easier for other peopleto know what to expect and how to react. Sometimes, making a sudden manoeuvre cannot beavoided, though, and then the quickness of reaction of the other drivers plus the aid of sys-tems like ABS can help to avoid an accident. Interaction between road users can help to makeclear what their intended actions are in case traffic regulations, lights and –signs are absent ordo not say unambiguously what to do. All road users would then still know what to expect ofeach other.
Distractions determine or influence the state or condition of the driver from the outside.They can have a large influence on the quality of people's driving behaviour. Distractions thatcan be avoided, like having a phone conversation while driving, should be avoided as much aspossible. If a person would still want to make phone calls while driving, hands free phones,preferably with speech recognition are recommended.
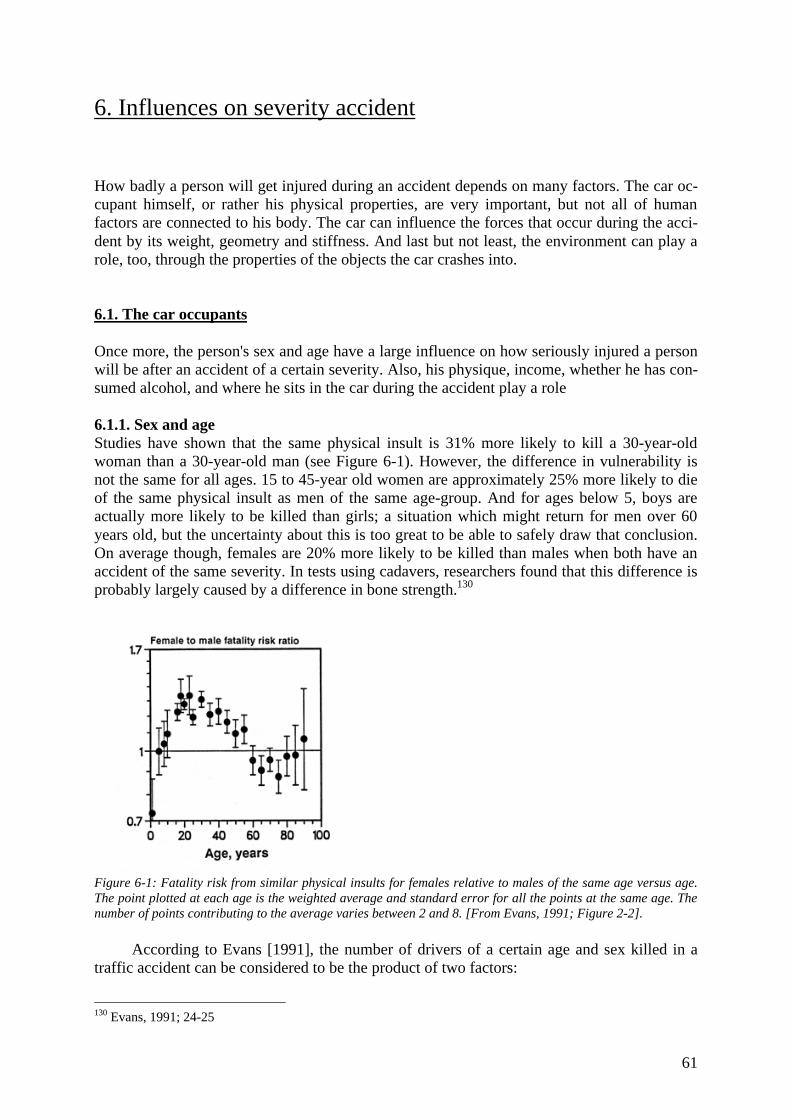
61
6. Influences on severity accident
How badly a person will get injured during an accident depends on many factors. The car oc-cupant himself, or rather his physical properties, are very important, but not all of humanfactors are connected to his body. The car can influence the forces that occur during the acci-dent by its weight, geometry and stiffness. And last but not least, the environment can play arole, too, through the properties of the objects the car crashes into.
6.1. The car occupants
Once more, the person's sex and age have a large influence on how seriously injured a personwill be after an accident of a certain severity. Also, his physique, income, whether he has con-sumed alcohol, and where he sits in the car during the accident play a role
6.1.1. Sex and ageStudies have shown that the same physical insult is 31% more likely to kill a 30-year-oldwoman than a 30-year-old man (see Figure 6-1). However, the difference in vulnerability isnot the same for all ages. 15 to 45-year old women are approximately 25% more likely to dieof the same physical insult as men of the same age-group. And for ages below 5, boys areactually more likely to be killed than girls; a situation which might return for men over 60years old, but the uncertainty about this is too great to be able to safely draw that conclusion.On average though, females are 20% more likely to be killed than males when both have anaccident of the same severity. In tests using cadavers, researchers found that this difference isprobably largely caused by a difference in bone strength.130
Figure 6-1: Fatality risk from similar physical insults for females relative to males of the same age versus age.The point plotted at each age is the weighted average and standard error for all the points at the same age. Thenumber of points contributing to the average varies between 2 and 8. [From Evans, 1991; Figure 2-2].
According to Evans [1991], the number of drivers of a certain age and sex killed in atraffic accident can be considered to be the product of two factors:
130 Evans, 1991; 24-25
62
* The number of involvements in very serious crashes* The probability that that involvement proves fatal
The first factor covers the influences from all use and behavioural factors, such as amount andway of driving, driver capabilities, type of vehicle driven, time of the day, degree of intoxica-tion, and driving risks. The second factor can also be influenced by behavioural factors likesafety belt use and the consumption of alcohol. Apart from that, the probability that a certaincrash will result in death for one of the persons involved in the accident is mainly physiologi-cal rather than behavioural in nature.
The probability that a certain impact will prove fatal relative to the probability that thesame impact will kill a 20-year-old male, R, can be expressed analytically as
Rmales(A) = exp 0.0231 (A–20) = 0.630 exp (0.0231 A)
and
Rfemales(A) = 1.3 exp 0.0197 (A–20) = 0.877 exp (0.0197 A)
for A ≥ 20, where A is the age in years. When a driver is between 16 and 20 years old, thefatality risk is assumed to be R=1 for males and R=1.3 for females; in other words, the fatalityrisk of a crash with the same severity is the same as for a 20-year-old driver of the same sex.An 80-year-old driver (male), for instance, would have a fatality risk of R=4.0.131
For people above 20 years old, the fatality risk grows at an almost constant rate of (2.3± 0.2)% per year for males and (2.0 ± 0.2)% per year for females. At the age of 70, the risk isabout three times as large as what it is at the age of 20 (see Figure 6-2-Left). Note, though,that the data used by Evans to derive the age and sex effects were included irrespective of thequestion whether alcohol was involved in the accident or not. As will be discussed in Para-graph 6.1.4, alcohol does increase the risk of death from the same impact. Also, the use ofalcohol is more widespread among males and young people. Therefore, it is likely that theresults depicted in Figure 6-2 underestimate how much more likely women will be killed thanmen by the same physical impact, and how much this risk increases with age.132
131 Evans, 1991; 32, 33132 Evans, 1991; 26, 28
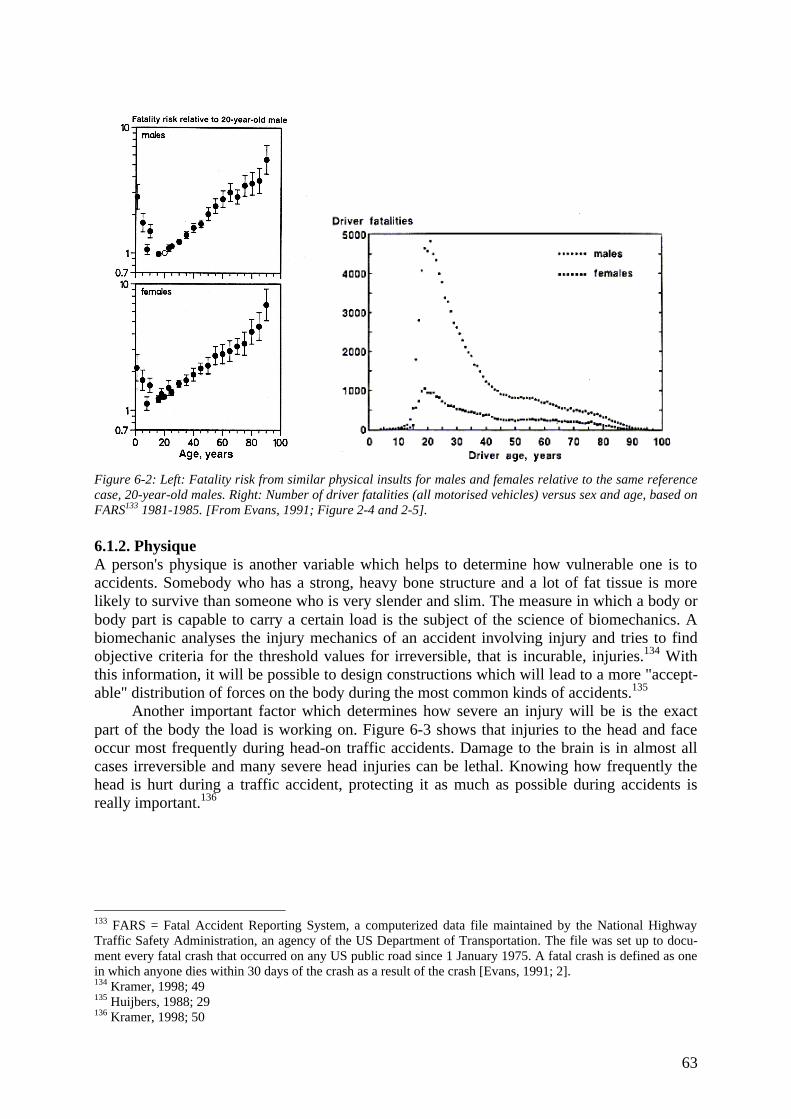
63
Figure 6-2: Left: Fatality risk from similar physical insults for males and females relative to the same referencecase, 20-year-old males. Right: Number of driver fatalities (all motorised vehicles) versus sex and age, based onFARS133 1981-1985. [From Evans, 1991; Figure 2-4 and 2-5].
6.1.2. PhysiqueA person's physique is another variable which helps to determine how vulnerable one is toaccidents. Somebody who has a strong, heavy bone structure and a lot of fat tissue is morelikely to survive than someone who is very slender and slim. The measure in which a body orbody part is capable to carry a certain load is the subject of the science of biomechanics. Abiomechanic analyses the injury mechanics of an accident involving injury and tries to findobjective criteria for the threshold values for irreversible, that is incurable, injuries.134 Withthis information, it will be possible to design constructions which will lead to a more "accept-able" distribution of forces on the body during the most common kinds of accidents.135
Another important factor which determines how severe an injury will be is the exactpart of the body the load is working on. Figure 6-3 shows that injuries to the head and faceoccur most frequently during head-on traffic accidents. Damage to the brain is in almost allcases irreversible and many severe head injuries can be lethal. Knowing how frequently thehead is hurt during a traffic accident, protecting it as much as possible during accidents isreally important.136
133 FARS = Fatal Accident Reporting System, a computerized data file maintained by the National HighwayTraffic Safety Administration, an agency of the US Department of Transportation. The file was set up to docu-ment every fatal crash that occurred on any US public road since 1 January 1975. A fatal crash is defined as onein which anyone dies within 30 days of the crash as a result of the crash [Evans, 1991; 2].134 Kramer, 1998; 49135 Huijbers, 1988; 29136 Kramer, 1998; 50
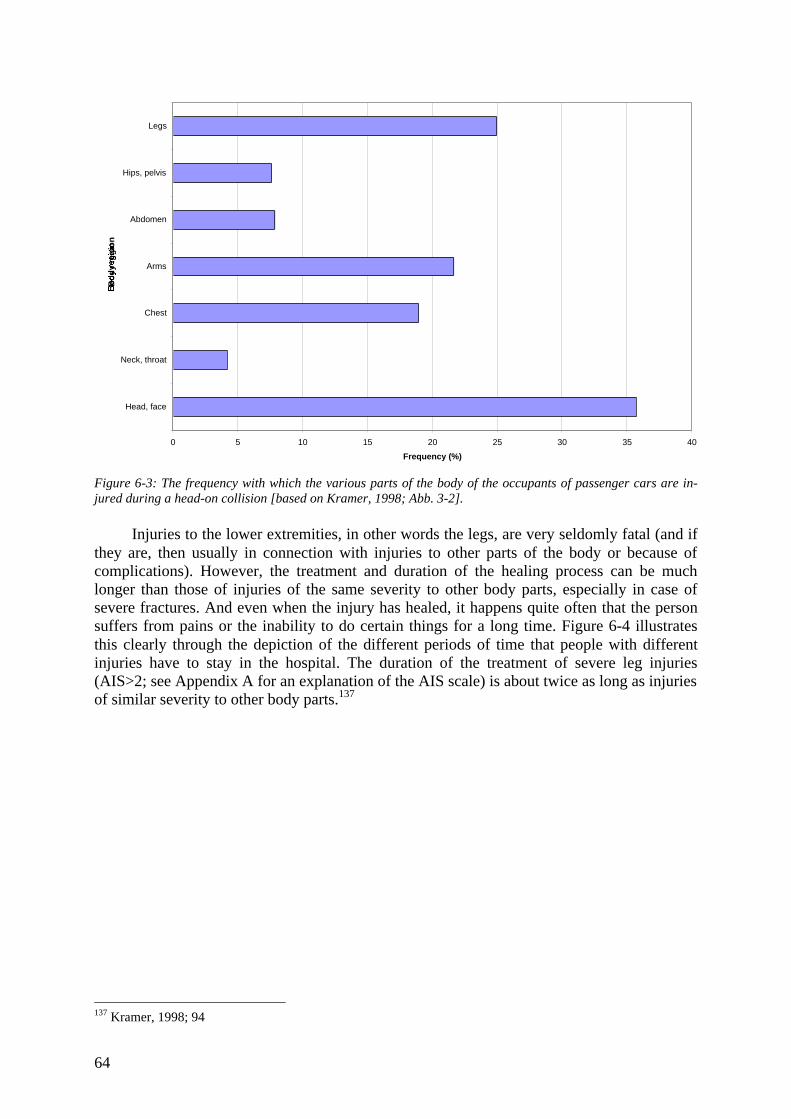
64
0 5 10 15 20 25 30 35 40
Head, face
Neck, throat
Chest
Arms
Abdomen
Hips, pelvis
Legs
Bo
dy
reg
ion
Frequency (%)
Figure 6-3: The frequency with which the various parts of the body of the occupants of passenger cars are in-jured during a head-on collision [based on Kramer, 1998; Abb. 3-2].
Injuries to the lower extremities, in other words the legs, are very seldomly fatal (and ifthey are, then usually in connection with injuries to other parts of the body or because ofcomplications). However, the treatment and duration of the healing process can be muchlonger than those of injuries of the same severity to other body parts, especially in case ofsevere fractures. And even when the injury has healed, it happens quite often that the personsuffers from pains or the inability to do certain things for a long time. Figure 6-4 illustratesthis clearly through the depiction of the different periods of time that people with differentinjuries have to stay in the hospital. The duration of the treatment of severe leg injuries(AIS>2; see Appendix A for an explanation of the AIS scale) is about twice as long as injuriesof similar severity to other body parts.137
137 Kramer, 1998; 94
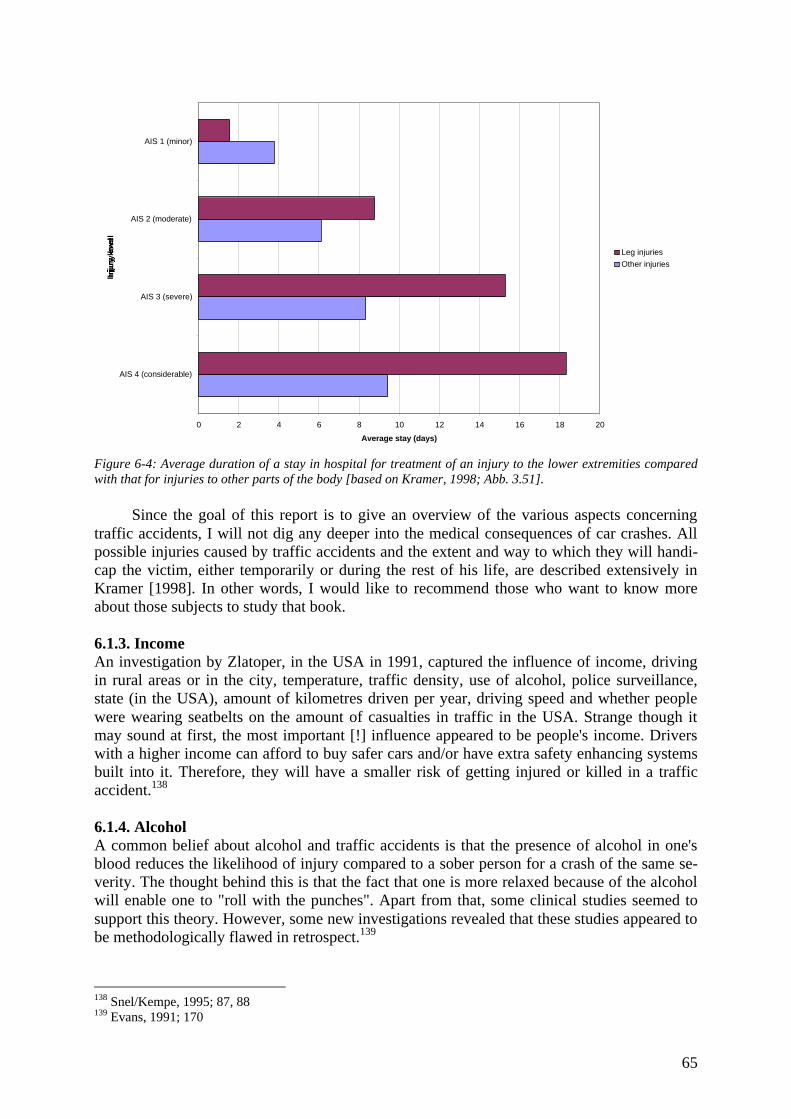
65
0 2 4 6 8 10 12 14 16 18 20
AIS 4 (considerable)
AIS 3 (severe)
AIS 2 (moderate)
AIS 1 (minor)
Inju
ry le
vel
Average stay (days)
Leg injuries
Other injuries
Figure 6-4: Average duration of a stay in hospital for treatment of an injury to the lower extremities comparedwith that for injuries to other parts of the body [based on Kramer, 1998; Abb. 3.51].
Since the goal of this report is to give an overview of the various aspects concerningtraffic accidents, I will not dig any deeper into the medical consequences of car crashes. Allpossible injuries caused by traffic accidents and the extent and way to which they will handi-cap the victim, either temporarily or during the rest of his life, are described extensively inKramer [1998]. In other words, I would like to recommend those who want to know moreabout those subjects to study that book.
6.1.3. IncomeAn investigation by Zlatoper, in the USA in 1991, captured the influence of income, drivingin rural areas or in the city, temperature, traffic density, use of alcohol, police surveillance,state (in the USA), amount of kilometres driven per year, driving speed and whether peoplewere wearing seatbelts on the amount of casualties in traffic in the USA. Strange though itmay sound at first, the most important [!] influence appeared to be people's income. Driverswith a higher income can afford to buy safer cars and/or have extra safety enhancing systemsbuilt into it. Therefore, they will have a smaller risk of getting injured or killed in a trafficaccident.138
6.1.4. AlcoholA common belief about alcohol and traffic accidents is that the presence of alcohol in one'sblood reduces the likelihood of injury compared to a sober person for a crash of the same se-verity. The thought behind this is that the fact that one is more relaxed because of the alcoholwill enable one to "roll with the punches". Apart from that, some clinical studies seemed tosupport this theory. However, some new investigations revealed that these studies appeared tobe methodologically flawed in retrospect.139
138 Snel/Kempe, 1995; 87, 88139 Evans, 1991; 170
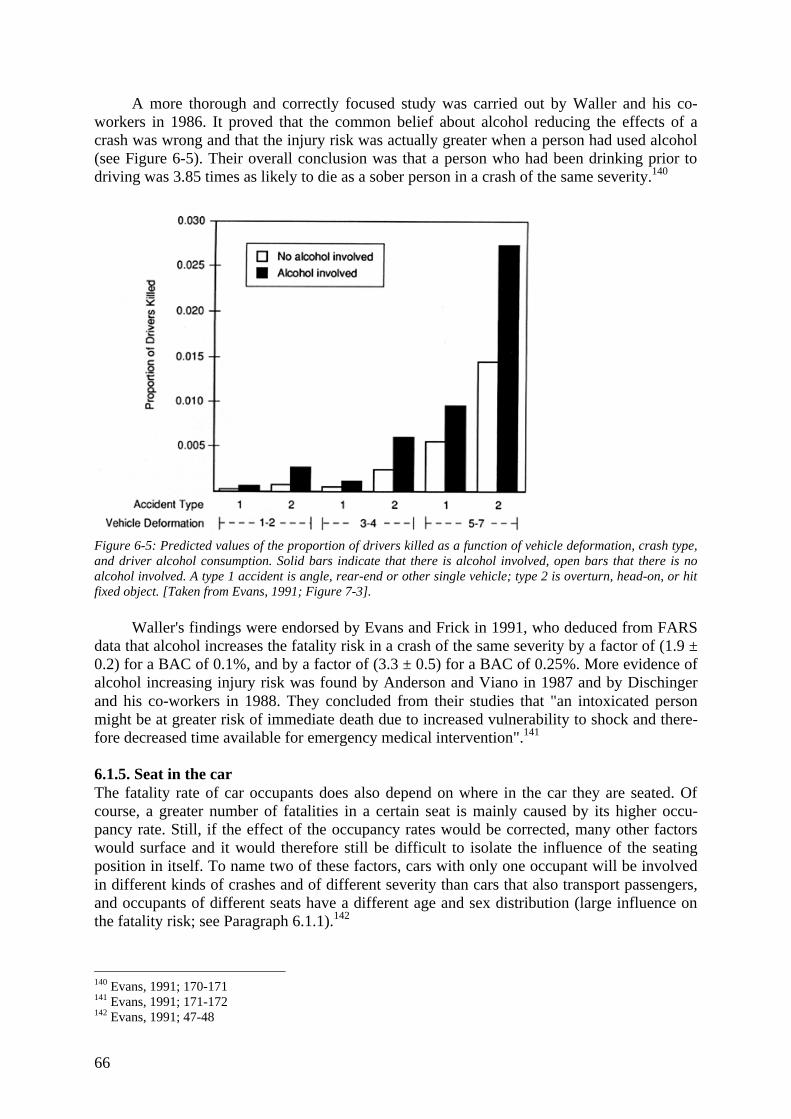
66
A more thorough and correctly focused study was carried out by Waller and his co-workers in 1986. It proved that the common belief about alcohol reducing the effects of acrash was wrong and that the injury risk was actually greater when a person had used alcohol(see Figure 6-5). Their overall conclusion was that a person who had been drinking prior todriving was 3.85 times as likely to die as a sober person in a crash of the same severity.140
Figure 6-5: Predicted values of the proportion of drivers killed as a function of vehicle deformation, crash type,and driver alcohol consumption. Solid bars indicate that there is alcohol involved, open bars that there is noalcohol involved. A type 1 accident is angle, rear-end or other single vehicle; type 2 is overturn, head-on, or hitfixed object. [Taken from Evans, 1991; Figure 7-3].
Waller's findings were endorsed by Evans and Frick in 1991, who deduced from FARSdata that alcohol increases the fatality risk in a crash of the same severity by a factor of (1.9 ±0.2) for a BAC of 0.1%, and by a factor of (3.3 ± 0.5) for a BAC of 0.25%. More evidence ofalcohol increasing injury risk was found by Anderson and Viano in 1987 and by Dischingerand his co-workers in 1988. They concluded from their studies that "an intoxicated personmight be at greater risk of immediate death due to increased vulnerability to shock and there-fore decreased time available for emergency medical intervention".141
6.1.5. Seat in the carThe fatality rate of car occupants does also depend on where in the car they are seated. Ofcourse, a greater number of fatalities in a certain seat is mainly caused by its higher occu-pancy rate. Still, if the effect of the occupancy rates would be corrected, many other factorswould surface and it would therefore still be difficult to isolate the influence of the seatingposition in itself. To name two of these factors, cars with only one occupant will be involvedin different kinds of crashes and of different severity than cars that also transport passengers,and occupants of different seats have a different age and sex distribution (large influence onthe fatality risk; see Paragraph 6.1.1).142
140 Evans, 1991; 170-171141 Evans, 1991; 171-172142 Evans, 1991; 47-48
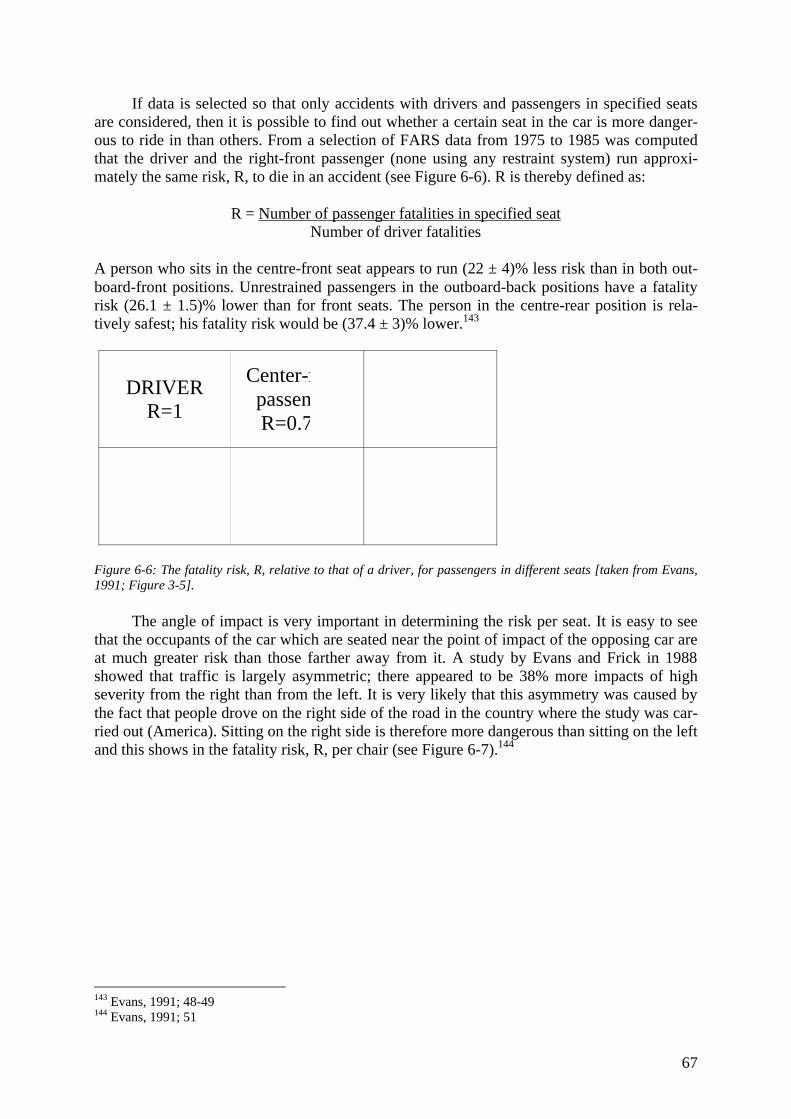
67
If data is selected so that only accidents with drivers and passengers in specified seatsare considered, then it is possible to find out whether a certain seat in the car is more danger-ous to ride in than others. From a selection of FARS data from 1975 to 1985 was computedthat the driver and the right-front passenger (none using any restraint system) run approxi-mately the same risk, R, to die in an accident (see Figure 6-6). R is thereby defined as:
R = Number of passenger fatalities in specified seatNumber of driver fatalities
A person who sits in the centre-front seat appears to run (22 ± 4)% less risk than in both out-board-front positions. Unrestrained passengers in the outboard-back positions have a fatalityrisk (26.1 ± 1.5)% lower than for front seats. The person in the centre-rear position is rela-tively safest; his fatality risk would be (37.4 ± 3)% lower.143
DRIVERR=1
Center-fpassenR=0.7
Left-rear Center-
Figure 6-6: The fatality risk, R, relative to that of a driver, for passengers in different seats [taken from Evans,1991; Figure 3-5].
The angle of impact is very important in determining the risk per seat. It is easy to seethat the occupants of the car which are seated near the point of impact of the opposing car areat much greater risk than those farther away from it. A study by Evans and Frick in 1988showed that traffic is largely asymmetric; there appeared to be 38% more impacts of highseverity from the right than from the left. It is very likely that this asymmetry was caused bythe fact that people drove on the right side of the road in the country where the study was car-ried out (America). Sitting on the right side is therefore more dangerous than sitting on the leftand this shows in the fatality risk, R, per chair (see Figure 6-7).144
143 Evans, 1991; 48-49144 Evans, 1991; 51
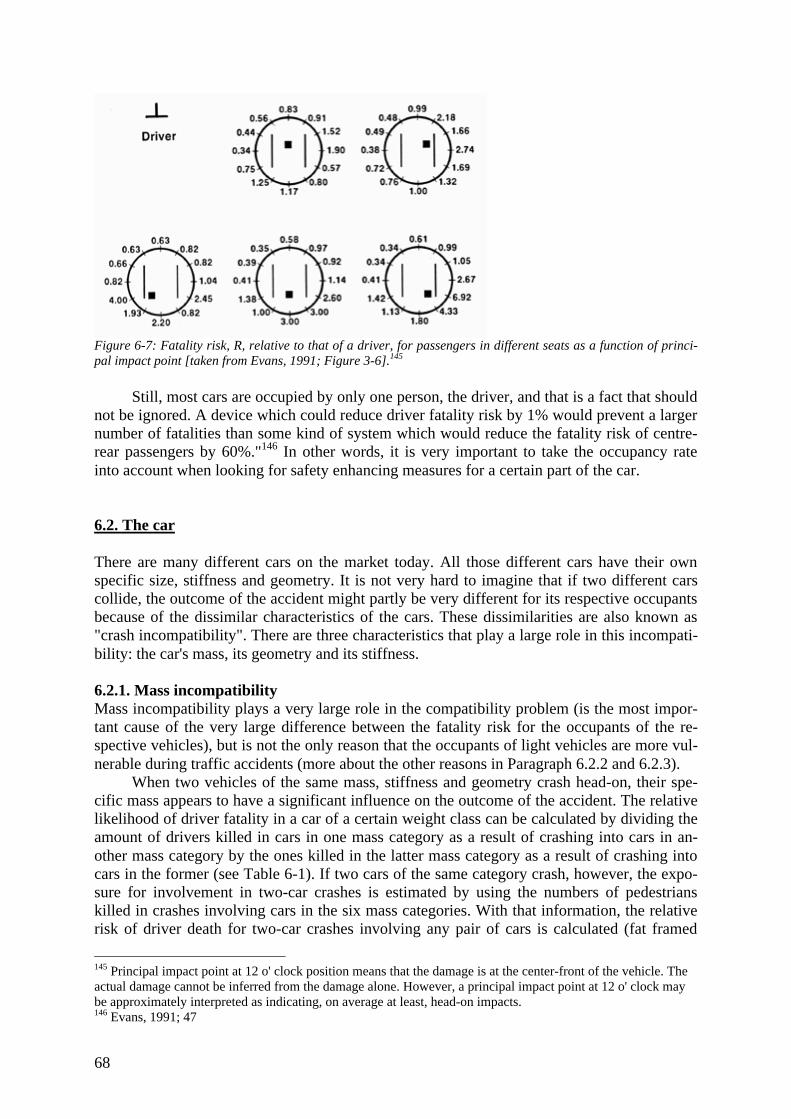
68
Figure 6-7: Fatality risk, R, relative to that of a driver, for passengers in different seats as a function of princi-pal impact point [taken from Evans, 1991; Figure 3-6].145
Still, most cars are occupied by only one person, the driver, and that is a fact that shouldnot be ignored. A device which could reduce driver fatality risk by 1% would prevent a largernumber of fatalities than some kind of system which would reduce the fatality risk of centre-rear passengers by 60%."146 In other words, it is very important to take the occupancy rateinto account when looking for safety enhancing measures for a certain part of the car.
6.2. The car
There are many different cars on the market today. All those different cars have their ownspecific size, stiffness and geometry. It is not very hard to imagine that if two different carscollide, the outcome of the accident might partly be very different for its respective occupantsbecause of the dissimilar characteristics of the cars. These dissimilarities are also known as"crash incompatibility". There are three characteristics that play a large role in this incompati-bility: the car's mass, its geometry and its stiffness.
6.2.1. Mass incompatibilityMass incompatibility plays a very large role in the compatibility problem (is the most impor-tant cause of the very large difference between the fatality risk for the occupants of the re-spective vehicles), but is not the only reason that the occupants of light vehicles are more vul-nerable during traffic accidents (more about the other reasons in Paragraph 6.2.2 and 6.2.3).
When two vehicles of the same mass, stiffness and geometry crash head-on, their spe-cific mass appears to have a significant influence on the outcome of the accident. The relativelikelihood of driver fatality in a car of a certain weight class can be calculated by dividing theamount of drivers killed in cars in one mass category as a result of crashing into cars in an-other mass category by the ones killed in the latter mass category as a result of crashing intocars in the former (see Table 6-1). If two cars of the same category crash, however, the expo-sure for involvement in two-car crashes is estimated by using the numbers of pedestrianskilled in crashes involving cars in the six mass categories. With that information, the relativerisk of driver death for two-car crashes involving any pair of cars is calculated (fat framed
145 Principal impact point at 12 o' clock position means that the damage is at the center-front of the vehicle. Theactual damage cannot be inferred from the damage alone. However, a principal impact point at 12 o' clock maybe approximately interpreted as indicating, on average at least, head-on impacts.146 Evans, 1991; 47
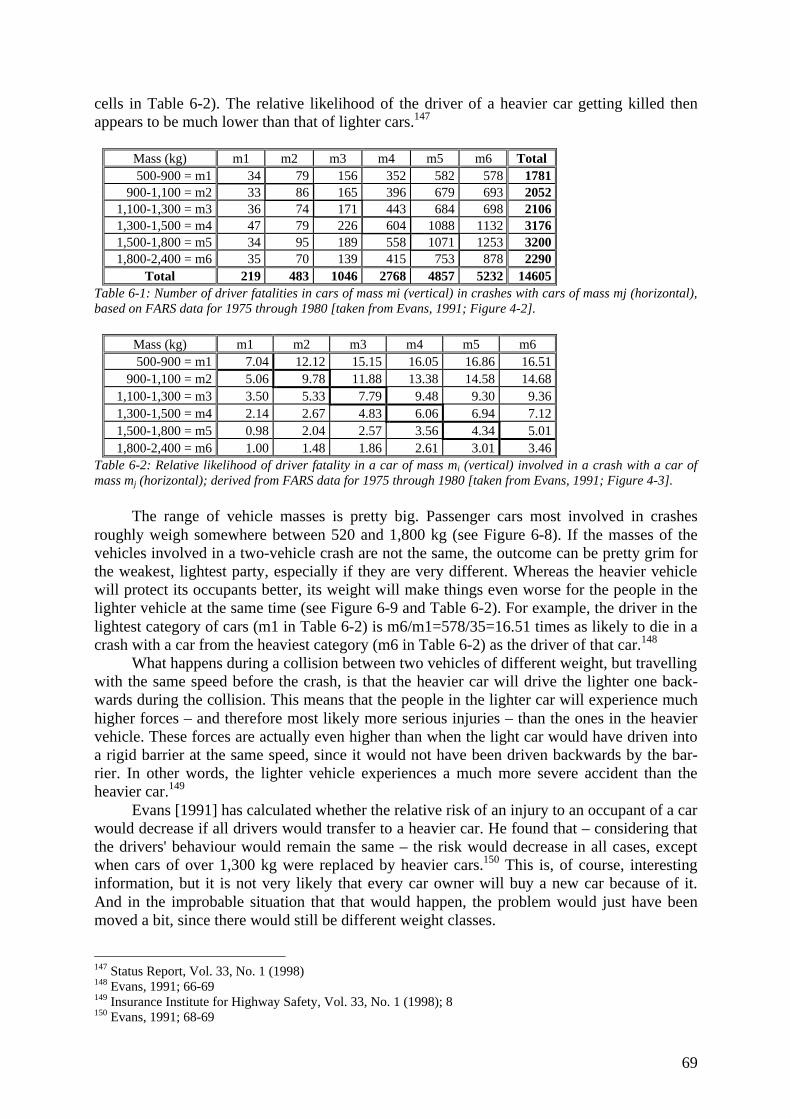
69
cells in Table 6-2). The relative likelihood of the driver of a heavier car getting killed thenappears to be much lower than that of lighter cars.147
Mass (kg) m1 m2 m3 m4 m5 m6 Total500-900 = m1 34 79 156 352 582 578 1781
900-1,100 = m2 33 86 165 396 679 693 20521,100-1,300 = m3 36 74 171 443 684 698 21061,300-1,500 = m4 47 79 226 604 1088 1132 31761,500-1,800 = m5 34 95 189 558 1071 1253 32001,800-2,400 = m6 35 70 139 415 753 878 2290
Total 219 483 1046 2768 4857 5232 14605Table 6-1: Number of driver fatalities in cars of mass mi (vertical) in crashes with cars of mass mj (horizontal),based on FARS data for 1975 through 1980 [taken from Evans, 1991; Figure 4-2].
Mass (kg) m1 m2 m3 m4 m5 m6500-900 = m1 7.04 12.12 15.15 16.05 16.86 16.51
900-1,100 = m2 5.06 9.78 11.88 13.38 14.58 14.681,100-1,300 = m3 3.50 5.33 7.79 9.48 9.30 9.361,300-1,500 = m4 2.14 2.67 4.83 6.06 6.94 7.121,500-1,800 = m5 0.98 2.04 2.57 3.56 4.34 5.011,800-2,400 = m6 1.00 1.48 1.86 2.61 3.01 3.46
Table 6-2: Relative likelihood of driver fatality in a car of mass mi (vertical) involved in a crash with a car ofmass mj (horizontal); derived from FARS data for 1975 through 1980 [taken from Evans, 1991; Figure 4-3].
The range of vehicle masses is pretty big. Passenger cars most involved in crashesroughly weigh somewhere between 520 and 1,800 kg (see Figure 6-8). If the masses of thevehicles involved in a two-vehicle crash are not the same, the outcome can be pretty grim forthe weakest, lightest party, especially if they are very different. Whereas the heavier vehiclewill protect its occupants better, its weight will make things even worse for the people in thelighter vehicle at the same time (see Figure 6-9 and Table 6-2). For example, the driver in thelightest category of cars (m1 in Table 6-2) is m6/m1=578/35=16.51 times as likely to die in acrash with a car from the heaviest category (m6 in Table 6-2) as the driver of that car.148
What happens during a collision between two vehicles of different weight, but travellingwith the same speed before the crash, is that the heavier car will drive the lighter one back-wards during the collision. This means that the people in the lighter car will experience muchhigher forces – and therefore most likely more serious injuries – than the ones in the heaviervehicle. These forces are actually even higher than when the light car would have driven intoa rigid barrier at the same speed, since it would not have been driven backwards by the bar-rier. In other words, the lighter vehicle experiences a much more severe accident than theheavier car.149
Evans [1991] has calculated whether the relative risk of an injury to an occupant of a carwould decrease if all drivers would transfer to a heavier car. He found that – considering thatthe drivers' behaviour would remain the same – the risk would decrease in all cases, exceptwhen cars of over 1,300 kg were replaced by heavier cars.150 This is, of course, interestinginformation, but it is not very likely that every car owner will buy a new car because of it.And in the improbable situation that that would happen, the problem would just have beenmoved a bit, since there would still be different weight classes.
147 Status Report, Vol. 33, No. 1 (1998)148 Evans, 1991; 66-69149 Insurance Institute for Highway Safety, Vol. 33, No. 1 (1998); 8150 Evans, 1991; 68-69
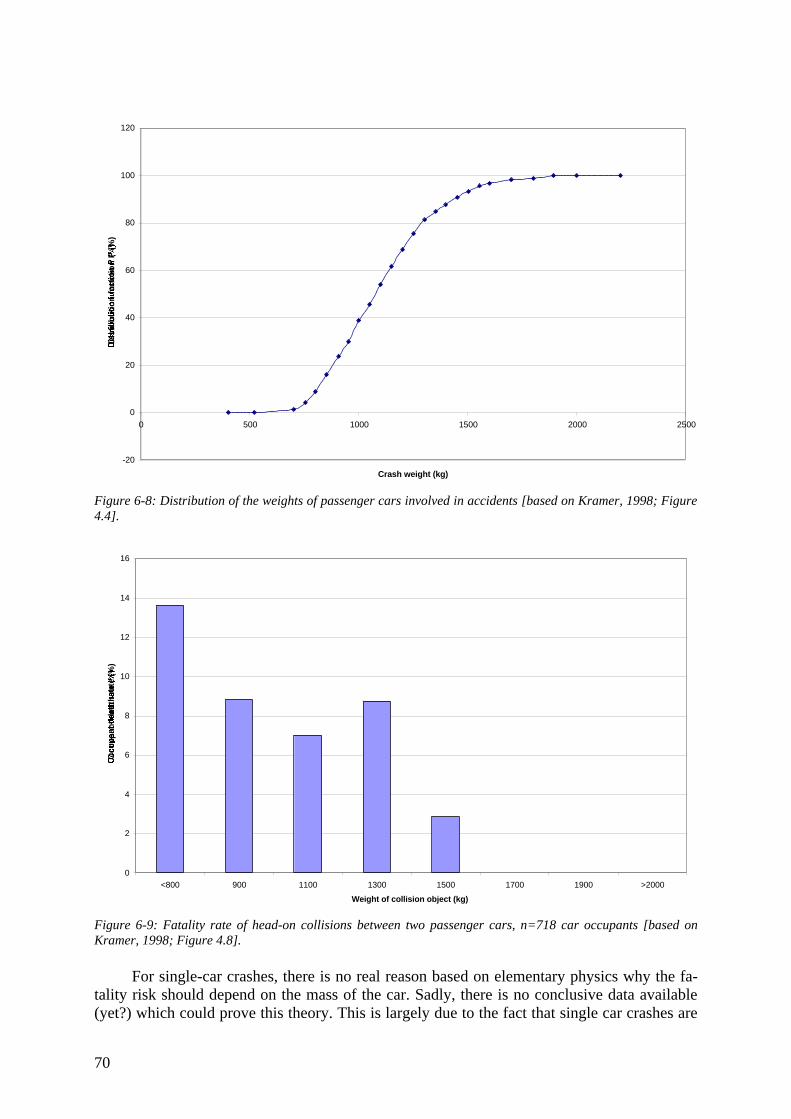
70
-20
0
20
40
60
80
100
120
0 500 1000 1500 2000 2500
Crash weight (kg)
Dis
trib
uti
on
fu
nct
ion
P (
%)
Figure 6-8: Distribution of the weights of passenger cars involved in accidents [based on Kramer, 1998; Figure4.4].
0
2
4
6
8
10
12
14
16
<800 900 1100 1300 1500 1700 1900 >2000
Weight of collision object (kg)
Occ
up
ant
dea
th r
ate
(%)
Figure 6-9: Fatality rate of head-on collisions between two passenger cars, n=718 car occupants [based onKramer, 1998; Figure 4.8].
For single-car crashes, there is no real reason based on elementary physics why the fa-tality risk should depend on the mass of the car. Sadly, there is no conclusive data available(yet?) which could prove this theory. This is largely due to the fact that single car crashes are
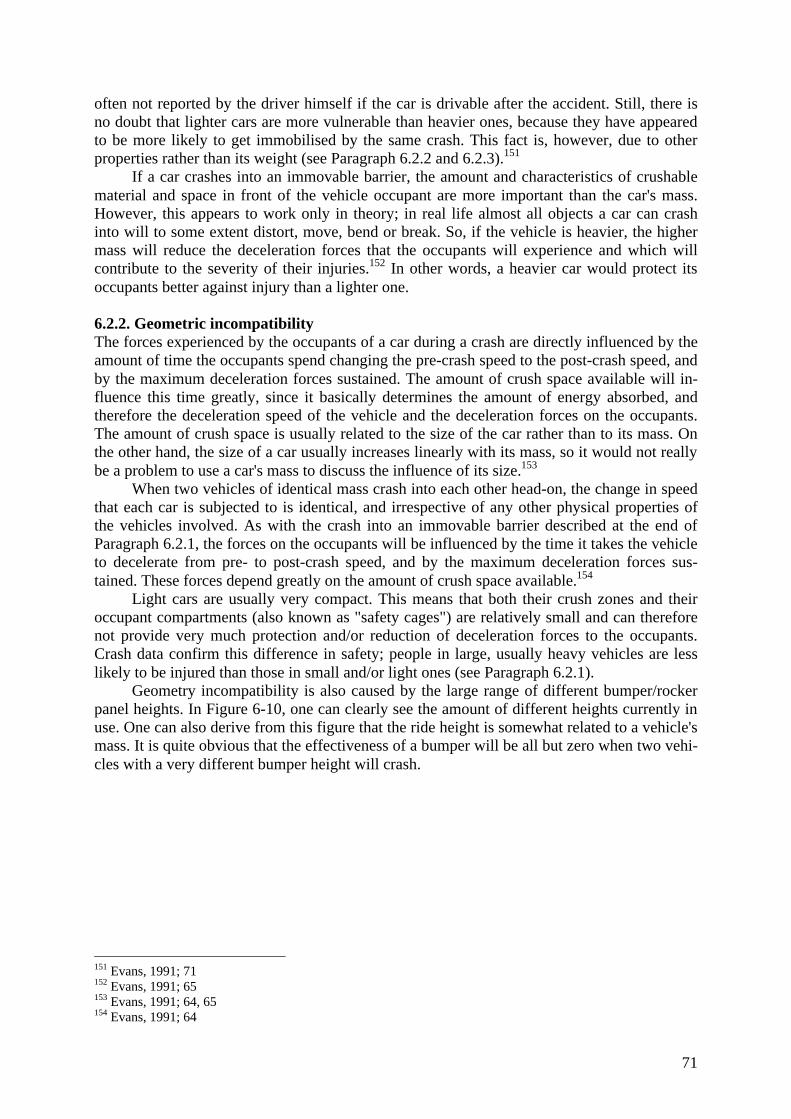
71
often not reported by the driver himself if the car is drivable after the accident. Still, there isno doubt that lighter cars are more vulnerable than heavier ones, because they have appearedto be more likely to get immobilised by the same crash. This fact is, however, due to otherproperties rather than its weight (see Paragraph 6.2.2 and 6.2.3).151
If a car crashes into an immovable barrier, the amount and characteristics of crushablematerial and space in front of the vehicle occupant are more important than the car's mass.However, this appears to work only in theory; in real life almost all objects a car can crashinto will to some extent distort, move, bend or break. So, if the vehicle is heavier, the highermass will reduce the deceleration forces that the occupants will experience and which willcontribute to the severity of their injuries.152 In other words, a heavier car would protect itsoccupants better against injury than a lighter one.
6.2.2. Geometric incompatibilityThe forces experienced by the occupants of a car during a crash are directly influenced by theamount of time the occupants spend changing the pre-crash speed to the post-crash speed, andby the maximum deceleration forces sustained. The amount of crush space available will in-fluence this time greatly, since it basically determines the amount of energy absorbed, andtherefore the deceleration speed of the vehicle and the deceleration forces on the occupants.The amount of crush space is usually related to the size of the car rather than to its mass. Onthe other hand, the size of a car usually increases linearly with its mass, so it would not reallybe a problem to use a car's mass to discuss the influence of its size.153
When two vehicles of identical mass crash into each other head-on, the change in speedthat each car is subjected to is identical, and irrespective of any other physical properties ofthe vehicles involved. As with the crash into an immovable barrier described at the end ofParagraph 6.2.1, the forces on the occupants will be influenced by the time it takes the vehicleto decelerate from pre- to post-crash speed, and by the maximum deceleration forces sus-tained. These forces depend greatly on the amount of crush space available.154
Light cars are usually very compact. This means that both their crush zones and theiroccupant compartments (also known as "safety cages") are relatively small and can thereforenot provide very much protection and/or reduction of deceleration forces to the occupants.Crash data confirm this difference in safety; people in large, usually heavy vehicles are lesslikely to be injured than those in small and/or light ones (see Paragraph 6.2.1).
Geometry incompatibility is also caused by the large range of different bumper/rockerpanel heights. In Figure 6-10, one can clearly see the amount of different heights currently inuse. One can also derive from this figure that the ride height is somewhat related to a vehicle'smass. It is quite obvious that the effectiveness of a bumper will be all but zero when two vehi-cles with a very different bumper height will crash.
151 Evans, 1991; 71152 Evans, 1991; 65153 Evans, 1991; 64, 65154 Evans, 1991; 64
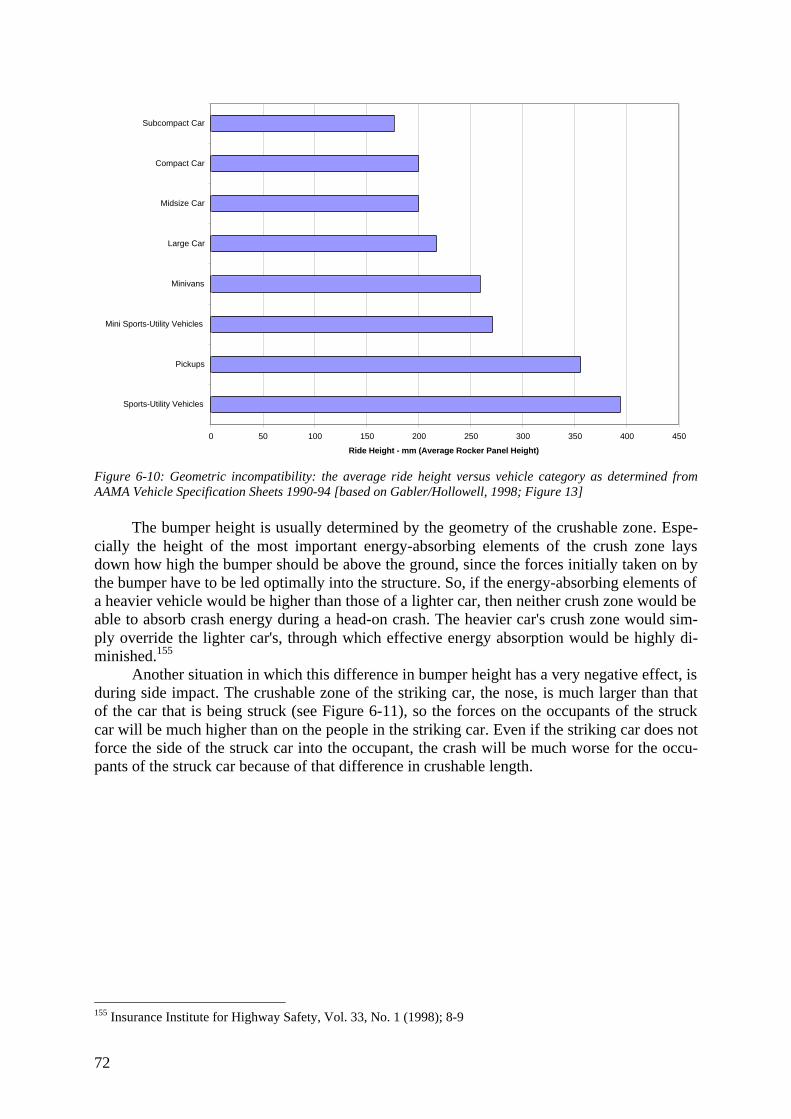
72
0 50 100 150 200 250 300 350 400 450
Sports-Utility Vehicles
Pickups
Mini Sports-Utility Vehicles
Minivans
Large Car
Midsize Car
Compact Car
Subcompact Car
Ride Height - mm (Average Rocker Panel Height)
Figure 6-10: Geometric incompatibility: the average ride height versus vehicle category as determined fromAAMA Vehicle Specification Sheets 1990-94 [based on Gabler/Hollowell, 1998; Figure 13]
The bumper height is usually determined by the geometry of the crushable zone. Espe-cially the height of the most important energy-absorbing elements of the crush zone laysdown how high the bumper should be above the ground, since the forces initially taken on bythe bumper have to be led optimally into the structure. So, if the energy-absorbing elements ofa heavier vehicle would be higher than those of a lighter car, then neither crush zone would beable to absorb crash energy during a head-on crash. The heavier car's crush zone would sim-ply override the lighter car's, through which effective energy absorption would be highly di-minished.155
Another situation in which this difference in bumper height has a very negative effect, isduring side impact. The crushable zone of the striking car, the nose, is much larger than thatof the car that is being struck (see Figure 6-11), so the forces on the occupants of the struckcar will be much higher than on the people in the striking car. Even if the striking car does notforce the side of the struck car into the occupant, the crash will be much worse for the occu-pants of the struck car because of that difference in crushable length.
155 Insurance Institute for Highway Safety, Vol. 33, No. 1 (1998); 8-9
73
Figure 6-11: During a side collision, the crushable zone is 20 to 30 cm long (depending on the type of car).During a frontal collision, this zone is about 1.2 m (again, depending on the type of car). [Taken from VolvoSIPS brochure].
Things are even worse when a heavy car – which usually has a (slightly) higher-placedbumper – crashes into the side of a lighter car. The bumper will most likely not hit the car onthe level of the door frame. Instead, it will penetrate the occupant compartment through therelatively weak door. The much sturdier door frame could have prevented intrusion of theinside of the car if the bumper had had a compatible height, but now the nose of the other carwill move into the passenger compartment rather easily.
How much the bumper height influences the outcome of an accident becomes clearfrom comparing the fatality figures for head-on and side-struck vehicles of different types. Ina head-on crash between a car and a full size van, 6 drivers died in the car for every driverwho was killed in the van. For crashes between a car and a full size pickup, a utility vehicle, amini-van and a small pickup those numbers would be 5.3, 4.1, 3.3 and 1.6 respectively (1992-96 FARS data).156
The geometric incompatibility is also clearly reflected in the numbers of fatally injureddrivers in side-struck vehicles. A collision between two passenger cars gives a relation of 1:6.When a full size van would crash into the side of a car, 23 drivers died in the car for everydriver who was killed in the van. For crashes between a full size pickup, a utility vehicle, amini-van, and a small pickup and a car, those numbers would be 17, 20, 16 and 11 respec-tively.157
6.2.3. Stiffness incompatibilityOn top of the mass and geometric incompatibility between cars, the stiffnesses of the varioustypes of vehicles often appear to be incompatible as well. Lighter cars often have a light con-struction so that the total weight of the vehicle can be kept low. This does, of course, makelight cars even more vulnerable than they already were because of their smaller size andweight. As mentioned in Paragraph 6.2.3, light cars – and especially the very light compactcars – usually do not have a very long nose because of their design specifications of smallouter dimensions. To compensate this lack of crush space, the safety cage is made stiffer. Thiswill ensure that the occupant compartment will remain largely intact during an accident. Thedownside of this higher stiffness, however, is that the already considerably high decelerationforces will be even higher.158
Most heavy cars have a much stiffer crush zone than lighter cars. So, when a light and aheavy car collide, the lighter one will be knocked backwards because of the higher mass of its
156 Gabler/Hollowell, Paper No. 98-S3-O-01157 Gabler/Hollowell, Paper No. 98-S3-O-01158 Kramer, 1998; 143
74
opponent. Apart from that, it will also be crushed more than the heavier car. Had the stiff-nesses of both cars been the same, and the heavier car a long crush zone as is usually the case,then both cars would have crushed equally. If the total available crush space would have beenlarge enough, then the crash energy could have been absorbed by both vehicles' crush zones.The joint length of the crushable zone would thereby diminish the crash forces for the peoplein the lighter vehicle to a more acceptable level.159
A solution – one which is already being applied in light cars – to the high decelerationforces that occur when a light and a heavy car crash head-on into each other, is increasing theinternal safety of the vehicle. The lack of external safety is then compensated by installinghigh quality safety belt and airbag systems into the car. Without these, it would be impossibleto reach an acceptable level of safety at all for small cars.160
As mentioned in Paragraph 6.2.2, when a vehicle hits another vehicle in its side, there isvirtually no crush space for the side-struck vehicle. Apart from that, though, the crush zone ofthe nose of the striking vehicle will always be stiffer than the door of the struck vehicle. Thedifference in stiffness will be even larger if the bumper height would be so far above theground, that the striking car would hit the door close to its centre.161 That this is not a veryuncommon situation becomes clear from Figure 6-10.
Seeing all the downsides of light cars, it is surprising that there are still people who buya small(er) car. However, it seems that the drivers of light cars are aware of their greater vul-nerability and therefore drive more carefully. Crash data obtained in the early seventiesshowed that, on a per registered car basis, cars weighing 900 kg crashed into other 900 kg carsat only 30% of the rate that 1,800 kg cars crashed into 1,800 kg cars. So, even though the fa-tality risk of two small cars of the same weight crashing into each other is higher, the totalamount of fatalities per car is actually estimated to be lower for such crashes, decreasing thefatality risk of that type of cars.162
6.3. The environment
The environment of car and driver can play a significant role in the severity of an accidentthrough the properties of the object(s) the car crashes into. If a car crashes into another car,the severity is determined by its mass, geometry and stiffness (see Paragraph 6.2). The sameapplies to the environment. The outcome of a crash into a concrete wall will be a lot moreserious than if the car were to crash into a guard rail. It is therefore recommended to haveheavy, hard, inflexible objects on the side of the road surrounded by guard rails.
6.4. Conclusions
The same physical insult is, on average, 20% more likely to kill a woman than a man. Thenumber of people of a certain age and sex killed in a traffic accident basically depends on thenumber of involvements in very serious crashes and the probability that that involvementproves fatal. For people over 20, the fatality risk grows at an almost constant rate per year.Since alcohol is usually left out of these equations, and is used most frequently by young(male) persons, their fatality risk will probably be even higher than assumed at first.
159 Insurance Institute for Highway Safety, Vol. 33, No. 1 (1998); 8160 Kramer, 1998; 143161 Insurance Institute for Highway Safety, Vol. 33, No. 1 (1998); 9162 Evans, 1991; 71
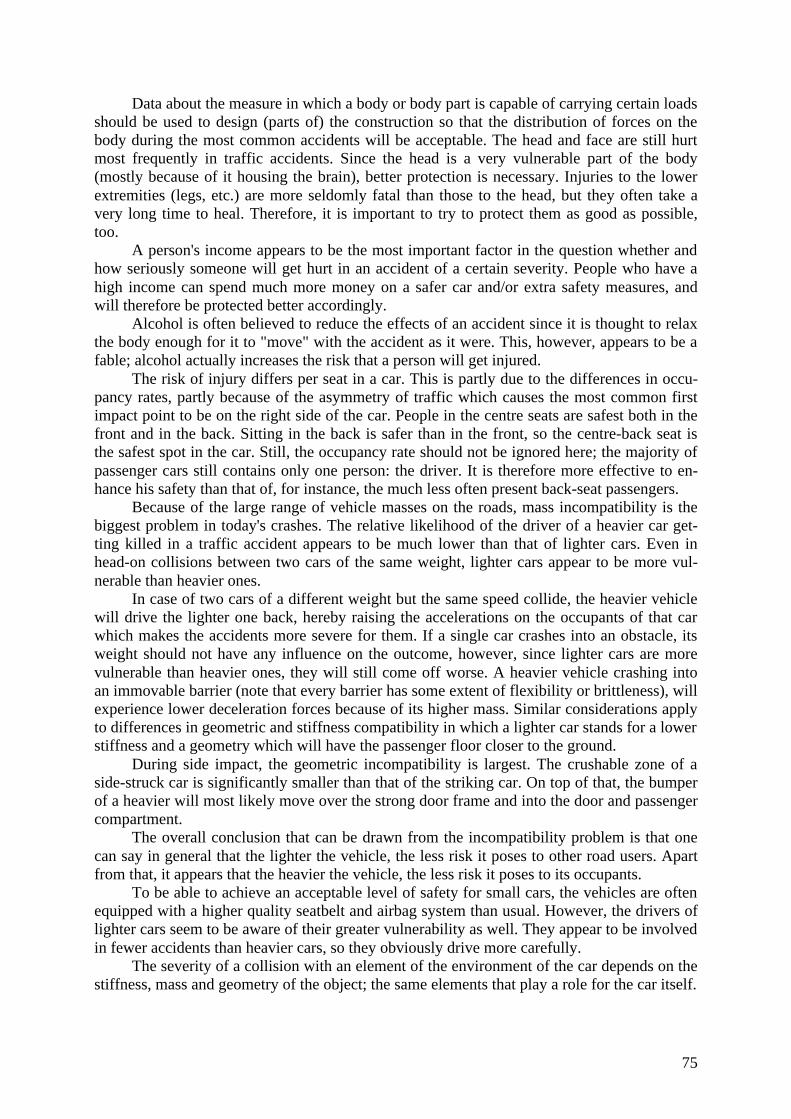
75
Data about the measure in which a body or body part is capable of carrying certain loadsshould be used to design (parts of) the construction so that the distribution of forces on thebody during the most common accidents will be acceptable. The head and face are still hurtmost frequently in traffic accidents. Since the head is a very vulnerable part of the body(mostly because of it housing the brain), better protection is necessary. Injuries to the lowerextremities (legs, etc.) are more seldomly fatal than those to the head, but they often take avery long time to heal. Therefore, it is important to try to protect them as good as possible,too.
A person's income appears to be the most important factor in the question whether andhow seriously someone will get hurt in an accident of a certain severity. People who have ahigh income can spend much more money on a safer car and/or extra safety measures, andwill therefore be protected better accordingly.
Alcohol is often believed to reduce the effects of an accident since it is thought to relaxthe body enough for it to "move" with the accident as it were. This, however, appears to be afable; alcohol actually increases the risk that a person will get injured.
The risk of injury differs per seat in a car. This is partly due to the differences in occu-pancy rates, partly because of the asymmetry of traffic which causes the most common firstimpact point to be on the right side of the car. People in the centre seats are safest both in thefront and in the back. Sitting in the back is safer than in the front, so the centre-back seat isthe safest spot in the car. Still, the occupancy rate should not be ignored here; the majority ofpassenger cars still contains only one person: the driver. It is therefore more effective to en-hance his safety than that of, for instance, the much less often present back-seat passengers.
Because of the large range of vehicle masses on the roads, mass incompatibility is thebiggest problem in today's crashes. The relative likelihood of the driver of a heavier car get-ting killed in a traffic accident appears to be much lower than that of lighter cars. Even inhead-on collisions between two cars of the same weight, lighter cars appear to be more vul-nerable than heavier ones.
In case of two cars of a different weight but the same speed collide, the heavier vehiclewill drive the lighter one back, hereby raising the accelerations on the occupants of that carwhich makes the accidents more severe for them. If a single car crashes into an obstacle, itsweight should not have any influence on the outcome, however, since lighter cars are morevulnerable than heavier ones, they will still come off worse. A heavier vehicle crashing intoan immovable barrier (note that every barrier has some extent of flexibility or brittleness), willexperience lower deceleration forces because of its higher mass. Similar considerations applyto differences in geometric and stiffness compatibility in which a lighter car stands for a lowerstiffness and a geometry which will have the passenger floor closer to the ground.
During side impact, the geometric incompatibility is largest. The crushable zone of aside-struck car is significantly smaller than that of the striking car. On top of that, the bumperof a heavier will most likely move over the strong door frame and into the door and passengercompartment.
The overall conclusion that can be drawn from the incompatibility problem is that onecan say in general that the lighter the vehicle, the less risk it poses to other road users. Apartfrom that, it appears that the heavier the vehicle, the less risk it poses to its occupants.
To be able to achieve an acceptable level of safety for small cars, the vehicles are oftenequipped with a higher quality seatbelt and airbag system than usual. However, the drivers oflighter cars seem to be aware of their greater vulnerability as well. They appear to be involvedin fewer accidents than heavier cars, so they obviously drive more carefully.
The severity of a collision with an element of the environment of the car depends on thestiffness, mass and geometry of the object; the same elements that play a role for the car itself.

76
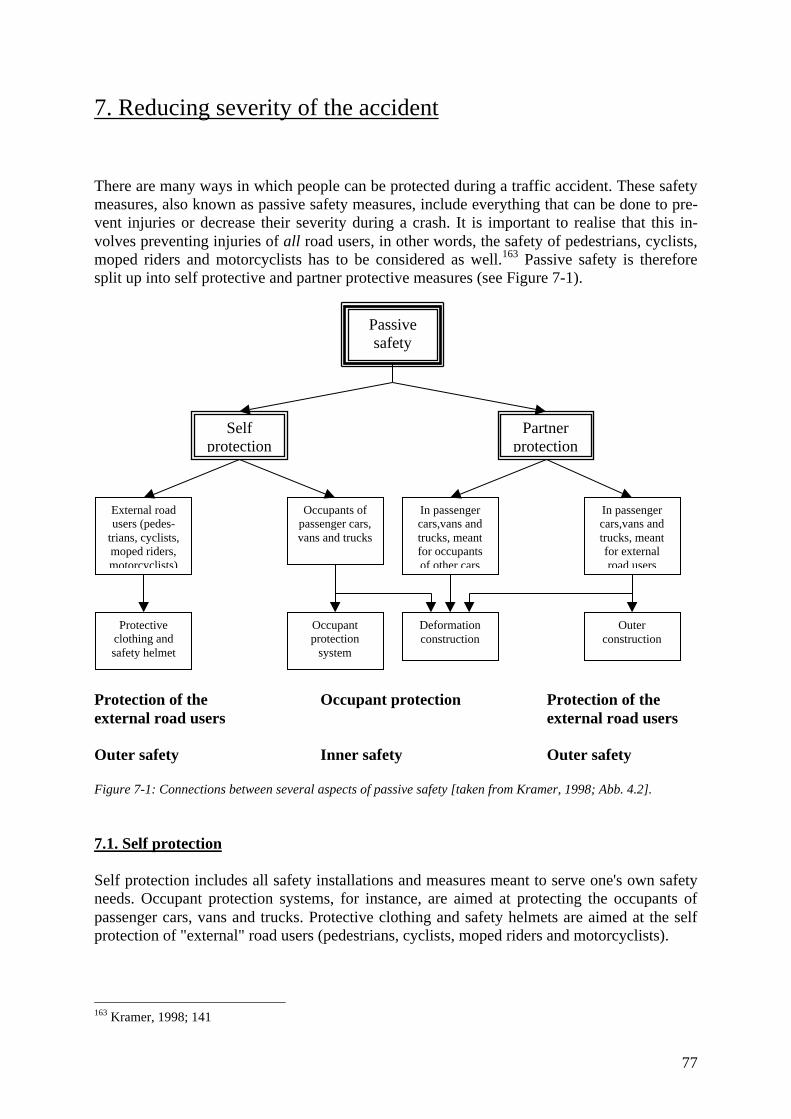
77
7. Reducing severity of the accident
There are many ways in which people can be protected during a traffic accident. These safetymeasures, also known as passive safety measures, include everything that can be done to pre-vent injuries or decrease their severity during a crash. It is important to realise that this in-volves preventing injuries of all road users, in other words, the safety of pedestrians, cyclists,moped riders and motorcyclists has to be considered as well.163 Passive safety is thereforesplit up into self protective and partner protective measures (see Figure 7-1).
Protection of the Occupant protection Protection of theexternal road users external road users
Outer safety Inner safety Outer safety
Figure 7-1: Connections between several aspects of passive safety [taken from Kramer, 1998; Abb. 4.2].
7.1. Self protection
Self protection includes all safety installations and measures meant to serve one's own safetyneeds. Occupant protection systems, for instance, are aimed at protecting the occupants ofpassenger cars, vans and trucks. Protective clothing and safety helmets are aimed at the selfprotection of "external" road users (pedestrians, cyclists, moped riders and motorcyclists).
163 Kramer, 1998; 141
Passivesafety
Selfprotection
Partnerprotection
External roadusers (pedes-
trians, cyclists,moped riders,motorcyclists)
Occupants ofpassenger cars,vans and trucks
Protectiveclothing andsafety helmet
Occupantprotection
system
In passengercars,vans andtrucks, meantfor occupantsof other cars
In passengercars,vans andtrucks, meantfor externalroad users
Deformationconstruction
Outerconstruction
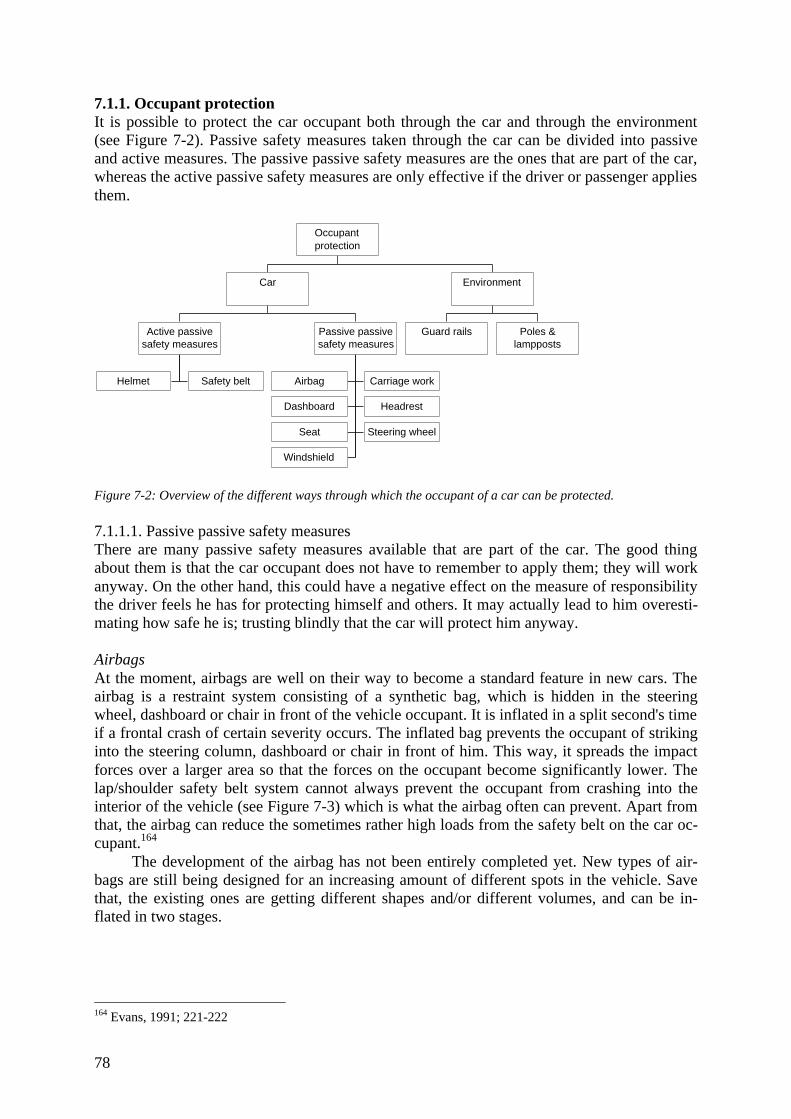
78
7.1.1. Occupant protectionIt is possible to protect the car occupant both through the car and through the environment(see Figure 7-2). Passive safety measures taken through the car can be divided into passiveand active measures. The passive passive safety measures are the ones that are part of the car,whereas the active passive safety measures are only effective if the driver or passenger appliesthem.
Helmet Safety belt
Active passivesafety measures
Airbag Carriage work
Dashboard Headrest
Seat Steering wheel
Windshield
Passive passivesafety measures
Car
Guard rails Poles &lampposts
Environment
Occupantprotection
Figure 7-2: Overview of the different ways through which the occupant of a car can be protected.
7.1.1.1. Passive passive safety measuresThere are many passive safety measures available that are part of the car. The good thingabout them is that the car occupant does not have to remember to apply them; they will workanyway. On the other hand, this could have a negative effect on the measure of responsibilitythe driver feels he has for protecting himself and others. It may actually lead to him overesti-mating how safe he is; trusting blindly that the car will protect him anyway.
AirbagsAt the moment, airbags are well on their way to become a standard feature in new cars. Theairbag is a restraint system consisting of a synthetic bag, which is hidden in the steeringwheel, dashboard or chair in front of the vehicle occupant. It is inflated in a split second's timeif a frontal crash of certain severity occurs. The inflated bag prevents the occupant of strikinginto the steering column, dashboard or chair in front of him. This way, it spreads the impactforces over a larger area so that the forces on the occupant become significantly lower. Thelap/shoulder safety belt system cannot always prevent the occupant from crashing into theinterior of the vehicle (see Figure 7-3) which is what the airbag often can prevent. Apart fromthat, the airbag can reduce the sometimes rather high loads from the safety belt on the car oc-cupant.164
The development of the airbag has not been entirely completed yet. New types of air-bags are still being designed for an increasing amount of different spots in the vehicle. Savethat, the existing ones are getting different shapes and/or different volumes, and can be in-flated in two stages.
164 Evans, 1991; 221-222
79
Figure 7-3: Principal movement of a driver who is being restrained by a safety belt during a crash [taken fromKramer, 1998; Abb. 4.25].
The form, size and inflation time of an airbag depend largely on where in the car theairbag will be used. For instance, the volume of an airbag for a driver is 45 to 60 litres with aninflation time of 30 to 40 milliseconds, whereas the one for the front-seat passenger is in be-tween 80 and 120 litres and will take 40 to 60 milliseconds to unfold. The objective is that theairbags inflate entirely before a vehicle with a collision speed of 50 km/h has come to a fullstop. At that moment, all loose objects in the car will still be moving because of their inertia,but the driver will have been "caught" by the airbag.165
Since cars appear to be usually occupied by only one person, most accidents happenwhen there are no passengers in the vehicle. It would, of course, be unnecessary to have allairbags in the car inflate while only the ones protecting the driver are necessary. The airbagfor the empty seats should therefore be prevented from becoming operational when this is thecase. Apart from that, the airbag should be prevented from inflating when the collision speedis so low that the safety belt is sufficient to prevent injuries. This is why cars are equippedwith sensors which "feel" when it is necessary to inflate a certain airbag.166
At first, passenger cars only featured an airbag for the driver, but soon after its intro-duction it became possible to have one built in for the right-front passenger well. Nowadays,more and more cars also provide the option to equip the car airbags for the passengers in theback. These airbags prevent them from crashing into the back of the seat in front of them.They usually have a larger volume than the ones for the driver and the right-front passenger.What complicates the airbag system for the back of the car is the fact that the front seats areadjustable in different positions and that the inclination of the back of the seat can be altered.This means that it is necessary to also install a sensor which can anticipate on the position andinclination of the front seat.167
Two other important variables in the question how much and how fast the airbag needsto be inflated are the size of the passenger and his position. The easiest way to inflate the air-bags in the back would be by connecting them to the ones in the front. This, however, is notunproblematic, since there is a certain risk that the passenger's eardrum will get damaged ifthe airbag were to inflate at the wrong moment, due to the required high volume of the backairbag.168
One of the newer types of airbags is the side airbag. As discussed in Paragraph 6.2,side-collisions are extremely dangerous because of the absence of a significant crush zone. Inother words, any protection to reduce the risk of injury would be more than welcome. Thesmall crush zone demands, however, that the side airbags are inflated in a much shorter timethan a steering wheel-based one in order to be effective. The inflation time of these airbagshas therefore been reduced to only 12 to 18 milliseconds.169
165 Kramer, 1998; 179, 182166 Kramer, 1998; 45167 Kramer, 1998; 184168 Kramer, 1998; 184169 Kramer, 1998; 183
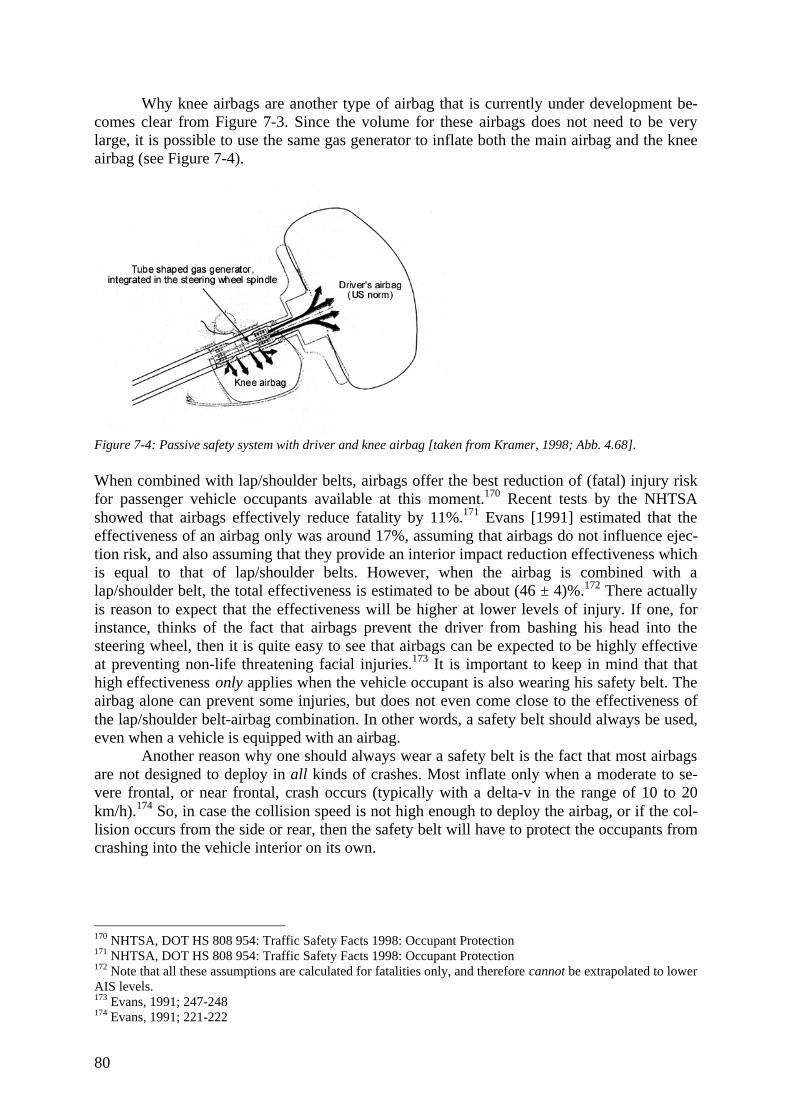
80
Why knee airbags are another type of airbag that is currently under development be-comes clear from Figure 7-3. Since the volume for these airbags does not need to be verylarge, it is possible to use the same gas generator to inflate both the main airbag and the kneeairbag (see Figure 7-4).
Figure 7-4: Passive safety system with driver and knee airbag [taken from Kramer, 1998; Abb. 4.68].
When combined with lap/shoulder belts, airbags offer the best reduction of (fatal) injury riskfor passenger vehicle occupants available at this moment.170 Recent tests by the NHTSAshowed that airbags effectively reduce fatality by 11%.171 Evans [1991] estimated that theeffectiveness of an airbag only was around 17%, assuming that airbags do not influence ejec-tion risk, and also assuming that they provide an interior impact reduction effectiveness whichis equal to that of lap/shoulder belts. However, when the airbag is combined with alap/shoulder belt, the total effectiveness is estimated to be about (46 ± 4)%.172 There actuallyis reason to expect that the effectiveness will be higher at lower levels of injury. If one, forinstance, thinks of the fact that airbags prevent the driver from bashing his head into thesteering wheel, then it is quite easy to see that airbags can be expected to be highly effectiveat preventing non-life threatening facial injuries.173 It is important to keep in mind that thathigh effectiveness only applies when the vehicle occupant is also wearing his safety belt. Theairbag alone can prevent some injuries, but does not even come close to the effectiveness ofthe lap/shoulder belt-airbag combination. In other words, a safety belt should always be used,even when a vehicle is equipped with an airbag.
Another reason why one should always wear a safety belt is the fact that most airbagsare not designed to deploy in all kinds of crashes. Most inflate only when a moderate to se-vere frontal, or near frontal, crash occurs (typically with a delta-v in the range of 10 to 20km/h).174 So, in case the collision speed is not high enough to deploy the airbag, or if the col-lision occurs from the side or rear, then the safety belt will have to protect the occupants fromcrashing into the vehicle interior on its own.
170 NHTSA, DOT HS 808 954: Traffic Safety Facts 1998: Occupant Protection171 NHTSA, DOT HS 808 954: Traffic Safety Facts 1998: Occupant Protection172 Note that all these assumptions are calculated for fatalities only, and therefore cannot be extrapolated to lowerAIS levels.173 Evans, 1991; 247-248174 Evans, 1991; 221-222
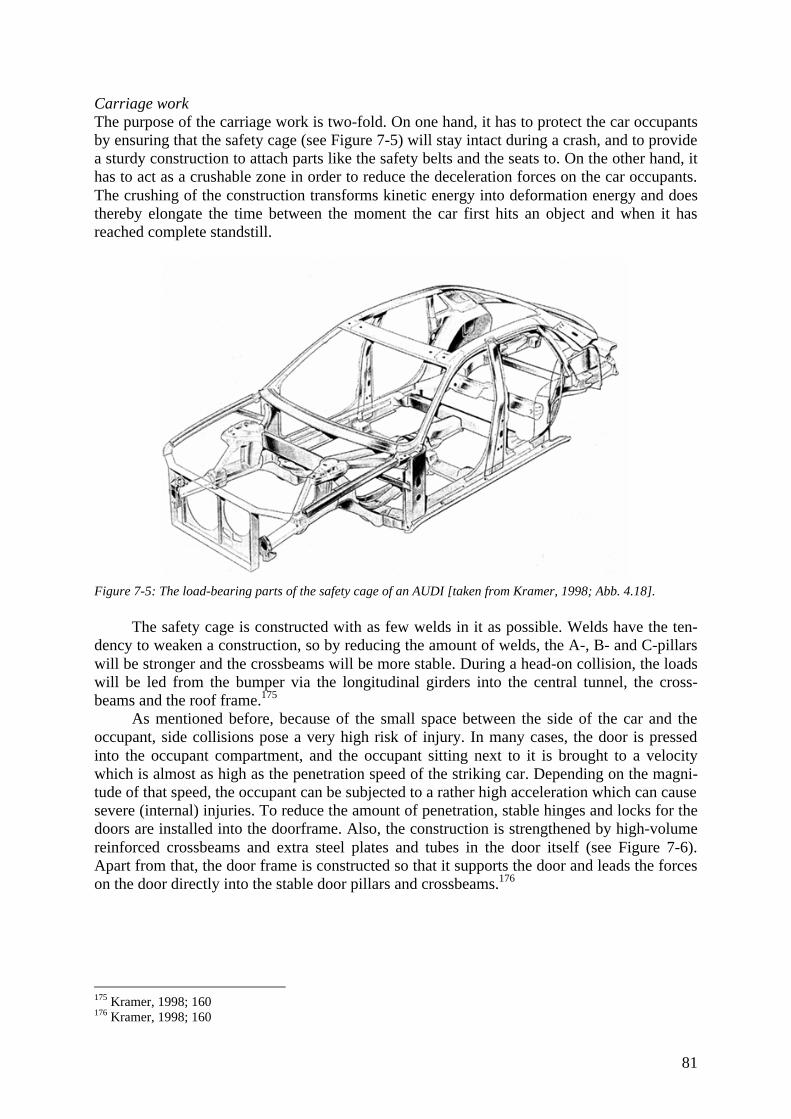
81
Carriage workThe purpose of the carriage work is two-fold. On one hand, it has to protect the car occupantsby ensuring that the safety cage (see Figure 7-5) will stay intact during a crash, and to providea sturdy construction to attach parts like the safety belts and the seats to. On the other hand, ithas to act as a crushable zone in order to reduce the deceleration forces on the car occupants.The crushing of the construction transforms kinetic energy into deformation energy and doesthereby elongate the time between the moment the car first hits an object and when it hasreached complete standstill.
Figure 7-5: The load-bearing parts of the safety cage of an AUDI [taken from Kramer, 1998; Abb. 4.18].
The safety cage is constructed with as few welds in it as possible. Welds have the ten-dency to weaken a construction, so by reducing the amount of welds, the A-, B- and C-pillarswill be stronger and the crossbeams will be more stable. During a head-on collision, the loadswill be led from the bumper via the longitudinal girders into the central tunnel, the cross-beams and the roof frame.175
As mentioned before, because of the small space between the side of the car and theoccupant, side collisions pose a very high risk of injury. In many cases, the door is pressedinto the occupant compartment, and the occupant sitting next to it is brought to a velocitywhich is almost as high as the penetration speed of the striking car. Depending on the magni-tude of that speed, the occupant can be subjected to a rather high acceleration which can causesevere (internal) injuries. To reduce the amount of penetration, stable hinges and locks for thedoors are installed into the doorframe. Also, the construction is strengthened by high-volumereinforced crossbeams and extra steel plates and tubes in the door itself (see Figure 7-6).Apart from that, the door frame is constructed so that it supports the door and leads the forceson the door directly into the stable door pillars and crossbeams.176
175 Kramer, 1998; 160176 Kramer, 1998; 160
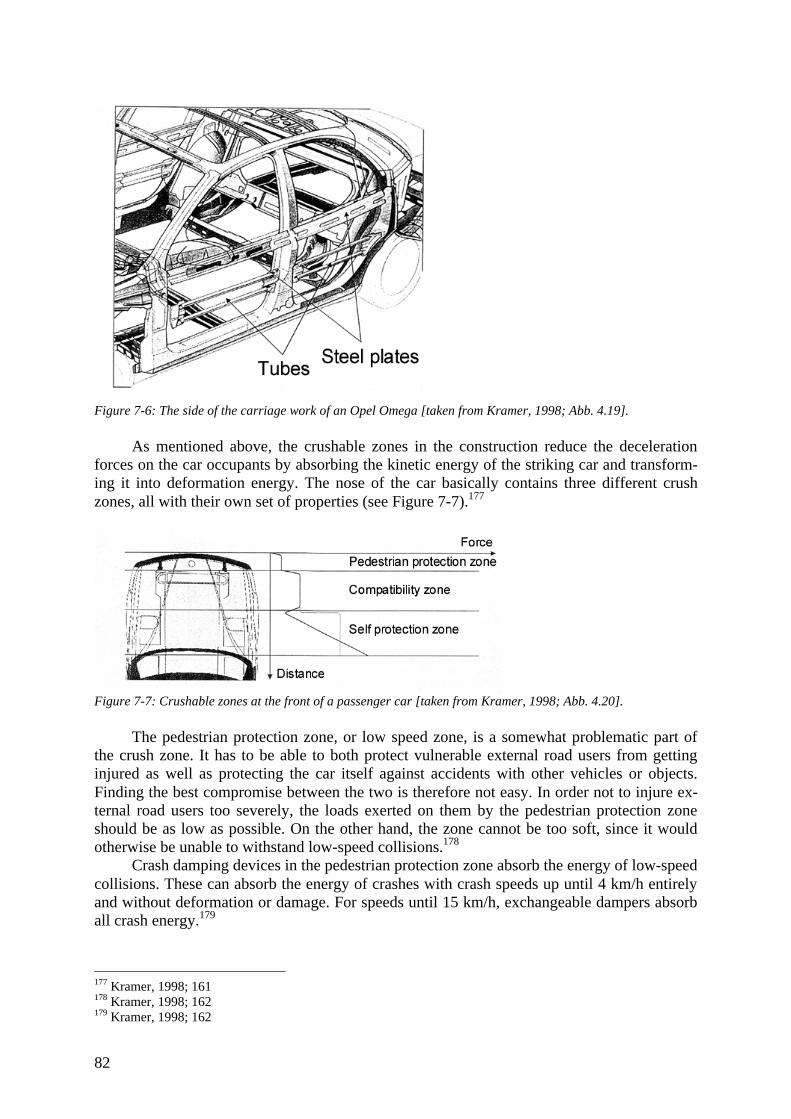
82
Figure 7-6: The side of the carriage work of an Opel Omega [taken from Kramer, 1998; Abb. 4.19].
As mentioned above, the crushable zones in the construction reduce the decelerationforces on the car occupants by absorbing the kinetic energy of the striking car and transform-ing it into deformation energy. The nose of the car basically contains three different crushzones, all with their own set of properties (see Figure 7-7).177
Figure 7-7: Crushable zones at the front of a passenger car [taken from Kramer, 1998; Abb. 4.20].
The pedestrian protection zone, or low speed zone, is a somewhat problematic part ofthe crush zone. It has to be able to both protect vulnerable external road users from gettinginjured as well as protecting the car itself against accidents with other vehicles or objects.Finding the best compromise between the two is therefore not easy. In order not to injure ex-ternal road users too severely, the loads exerted on them by the pedestrian protection zoneshould be as low as possible. On the other hand, the zone cannot be too soft, since it wouldotherwise be unable to withstand low-speed collisions.178
Crash damping devices in the pedestrian protection zone absorb the energy of low-speedcollisions. These can absorb the energy of crashes with crash speeds up until 4 km/h entirelyand without deformation or damage. For speeds until 15 km/h, exchangeable dampers absorball crash energy.179
177 Kramer, 1998; 161178 Kramer, 1998; 162179 Kramer, 1998; 162
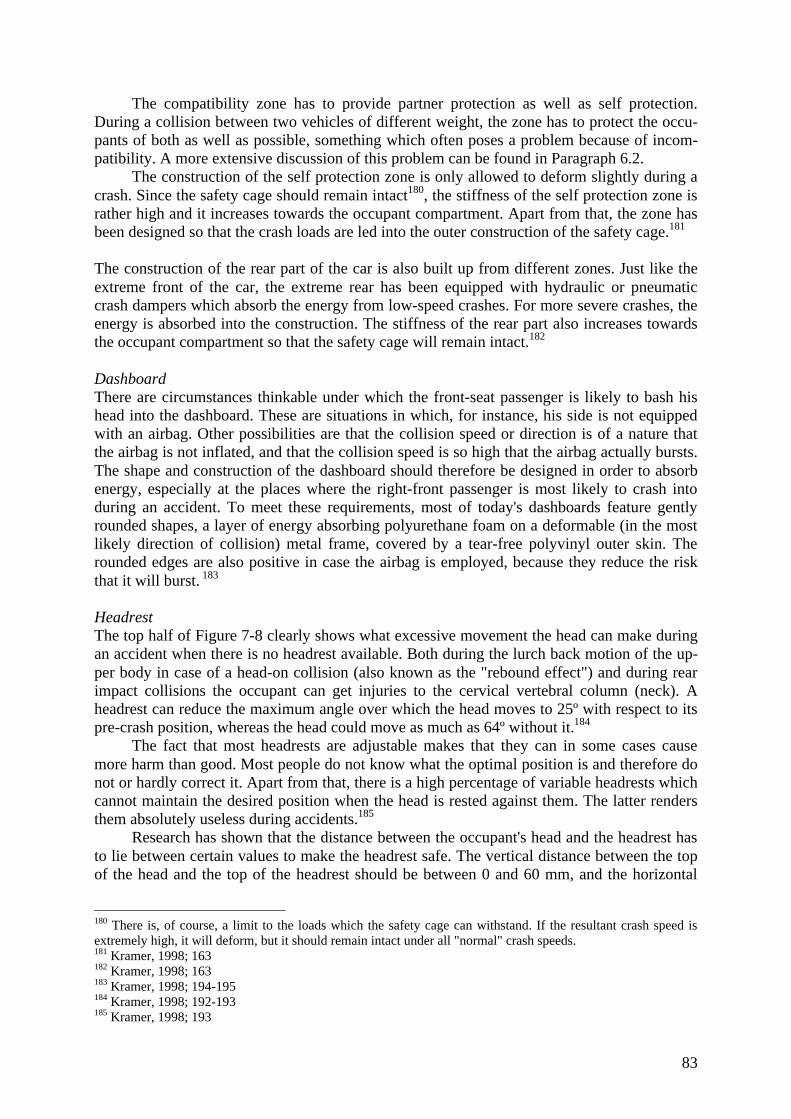
83
The compatibility zone has to provide partner protection as well as self protection.During a collision between two vehicles of different weight, the zone has to protect the occu-pants of both as well as possible, something which often poses a problem because of incom-patibility. A more extensive discussion of this problem can be found in Paragraph 6.2.
The construction of the self protection zone is only allowed to deform slightly during acrash. Since the safety cage should remain intact180, the stiffness of the self protection zone israther high and it increases towards the occupant compartment. Apart from that, the zone hasbeen designed so that the crash loads are led into the outer construction of the safety cage.181
The construction of the rear part of the car is also built up from different zones. Just like theextreme front of the car, the extreme rear has been equipped with hydraulic or pneumaticcrash dampers which absorb the energy from low-speed crashes. For more severe crashes, theenergy is absorbed into the construction. The stiffness of the rear part also increases towardsthe occupant compartment so that the safety cage will remain intact.182
DashboardThere are circumstances thinkable under which the front-seat passenger is likely to bash hishead into the dashboard. These are situations in which, for instance, his side is not equippedwith an airbag. Other possibilities are that the collision speed or direction is of a nature thatthe airbag is not inflated, and that the collision speed is so high that the airbag actually bursts.The shape and construction of the dashboard should therefore be designed in order to absorbenergy, especially at the places where the right-front passenger is most likely to crash intoduring an accident. To meet these requirements, most of today's dashboards feature gentlyrounded shapes, a layer of energy absorbing polyurethane foam on a deformable (in the mostlikely direction of collision) metal frame, covered by a tear-free polyvinyl outer skin. Therounded edges are also positive in case the airbag is employed, because they reduce the riskthat it will burst. 183
HeadrestThe top half of Figure 7-8 clearly shows what excessive movement the head can make duringan accident when there is no headrest available. Both during the lurch back motion of the up-per body in case of a head-on collision (also known as the "rebound effect") and during rearimpact collisions the occupant can get injuries to the cervical vertebral column (neck). Aheadrest can reduce the maximum angle over which the head moves to 25º with respect to itspre-crash position, whereas the head could move as much as 64º without it.184
The fact that most headrests are adjustable makes that they can in some cases causemore harm than good. Most people do not know what the optimal position is and therefore donot or hardly correct it. Apart from that, there is a high percentage of variable headrests whichcannot maintain the desired position when the head is rested against them. The latter rendersthem absolutely useless during accidents.185
Research has shown that the distance between the occupant's head and the headrest hasto lie between certain values to make the headrest safe. The vertical distance between the topof the head and the top of the headrest should be between 0 and 60 mm, and the horizontal
180 There is, of course, a limit to the loads which the safety cage can withstand. If the resultant crash speed isextremely high, it will deform, but it should remain intact under all "normal" crash speeds.181 Kramer, 1998; 163182 Kramer, 1998; 163183 Kramer, 1998; 194-195184 Kramer, 1998; 192-193185 Kramer, 1998; 193
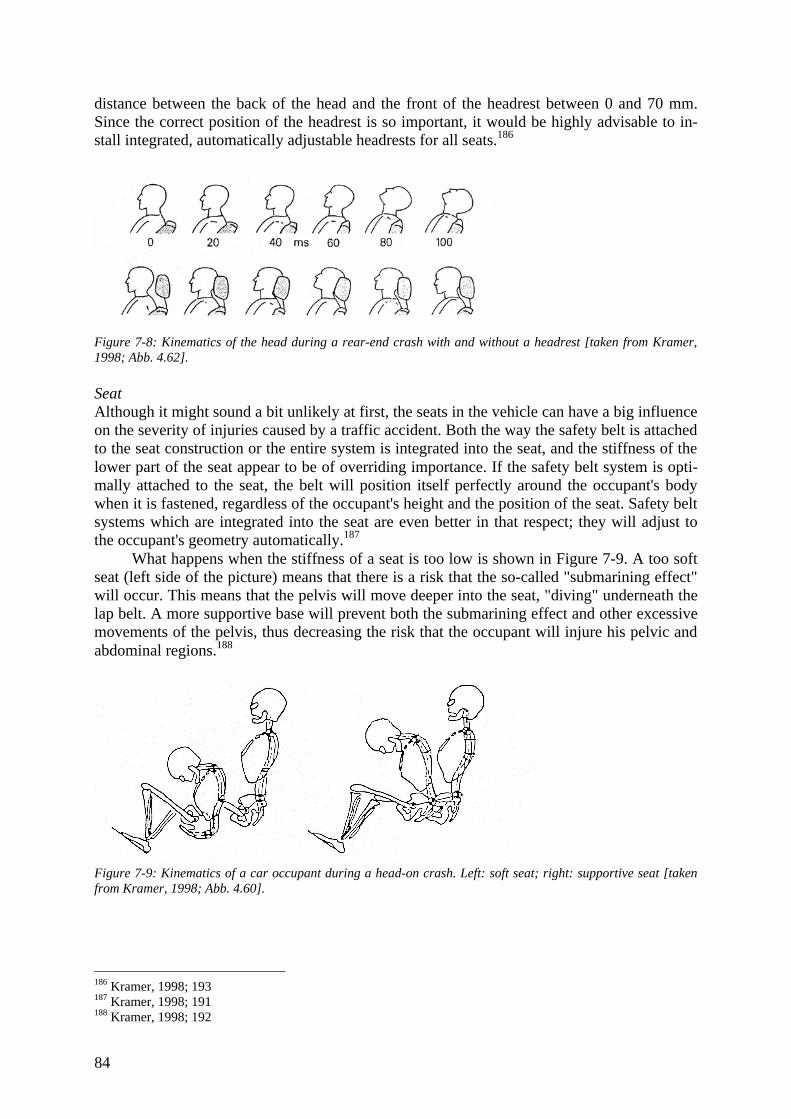
84
distance between the back of the head and the front of the headrest between 0 and 70 mm.Since the correct position of the headrest is so important, it would be highly advisable to in-stall integrated, automatically adjustable headrests for all seats.186
Figure 7-8: Kinematics of the head during a rear-end crash with and without a headrest [taken from Kramer,1998; Abb. 4.62].
SeatAlthough it might sound a bit unlikely at first, the seats in the vehicle can have a big influenceon the severity of injuries caused by a traffic accident. Both the way the safety belt is attachedto the seat construction or the entire system is integrated into the seat, and the stiffness of thelower part of the seat appear to be of overriding importance. If the safety belt system is opti-mally attached to the seat, the belt will position itself perfectly around the occupant's bodywhen it is fastened, regardless of the occupant's height and the position of the seat. Safety beltsystems which are integrated into the seat are even better in that respect; they will adjust tothe occupant's geometry automatically.187
What happens when the stiffness of a seat is too low is shown in Figure 7-9. A too softseat (left side of the picture) means that there is a risk that the so-called "submarining effect"will occur. This means that the pelvis will move deeper into the seat, "diving" underneath thelap belt. A more supportive base will prevent both the submarining effect and other excessivemovements of the pelvis, thus decreasing the risk that the occupant will injure his pelvic andabdominal regions.188
Figure 7-9: Kinematics of a car occupant during a head-on crash. Left: soft seat; right: supportive seat [takenfrom Kramer, 1998; Abb. 4.60].
186 Kramer, 1998; 193187 Kramer, 1998; 191188 Kramer, 1998; 192
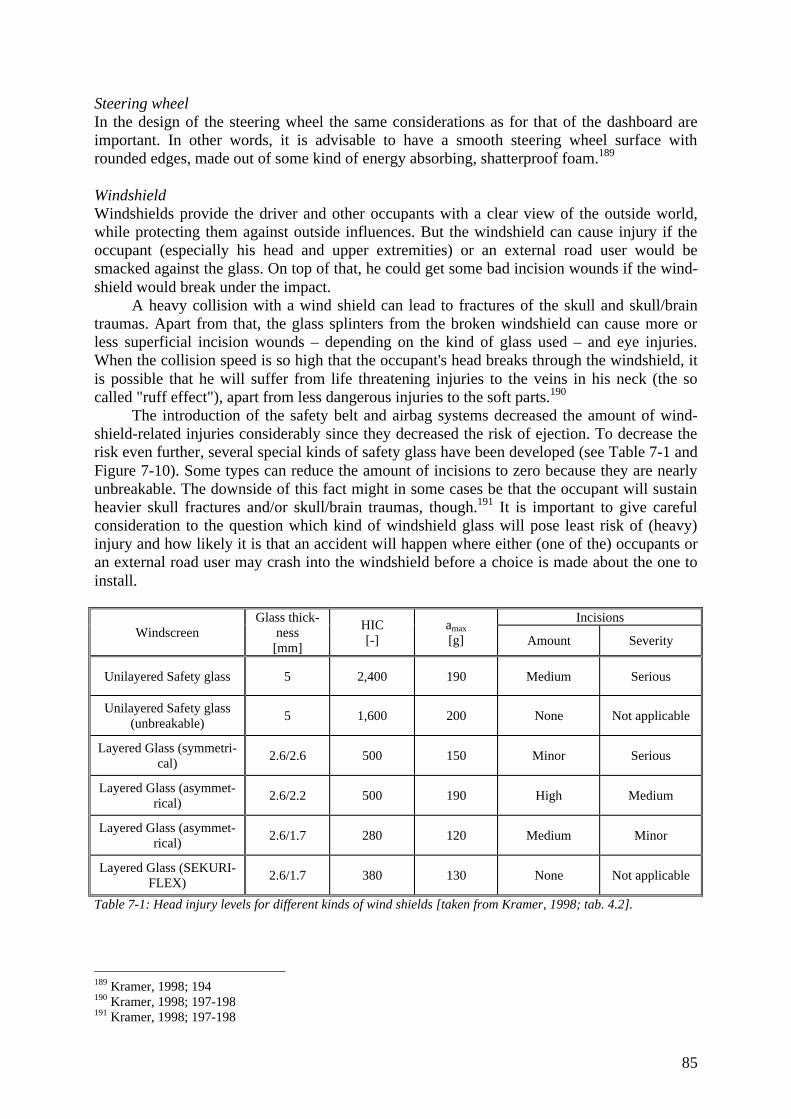
85
Steering wheelIn the design of the steering wheel the same considerations as for that of the dashboard areimportant. In other words, it is advisable to have a smooth steering wheel surface withrounded edges, made out of some kind of energy absorbing, shatterproof foam.189
WindshieldWindshields provide the driver and other occupants with a clear view of the outside world,while protecting them against outside influences. But the windshield can cause injury if theoccupant (especially his head and upper extremities) or an external road user would besmacked against the glass. On top of that, he could get some bad incision wounds if the wind-shield would break under the impact.
A heavy collision with a wind shield can lead to fractures of the skull and skull/braintraumas. Apart from that, the glass splinters from the broken windshield can cause more orless superficial incision wounds – depending on the kind of glass used – and eye injuries.When the collision speed is so high that the occupant's head breaks through the windshield, itis possible that he will suffer from life threatening injuries to the veins in his neck (the socalled "ruff effect"), apart from less dangerous injuries to the soft parts.190
The introduction of the safety belt and airbag systems decreased the amount of wind-shield-related injuries considerably since they decreased the risk of ejection. To decrease therisk even further, several special kinds of safety glass have been developed (see Table 7-1 andFigure 7-10). Some types can reduce the amount of incisions to zero because they are nearlyunbreakable. The downside of this fact might in some cases be that the occupant will sustainheavier skull fractures and/or skull/brain traumas, though.191 It is important to give carefulconsideration to the question which kind of windshield glass will pose least risk of (heavy)injury and how likely it is that an accident will happen where either (one of the) occupants oran external road user may crash into the windshield before a choice is made about the one toinstall.
IncisionsWindscreen
Glass thick-ness[mm]
HIC[-]
amax
[g] Amount Severity
Unilayered Safety glass 5 2,400 190 Medium Serious
Unilayered Safety glass(unbreakable)
5 1,600 200 None Not applicable
Layered Glass (symmetri-cal)
2.6/2.6 500 150 Minor Serious
Layered Glass (asymmet-rical)
2.6/2.2 500 190 High Medium
Layered Glass (asymmet-rical)
2.6/1.7 280 120 Medium Minor
Layered Glass (SEKURI-FLEX)
2.6/1.7 380 130 None Not applicable
Table 7-1: Head injury levels for different kinds of wind shields [taken from Kramer, 1998; tab. 4.2].
189 Kramer, 1998; 194190 Kramer, 1998; 197-198191 Kramer, 1998; 197-198
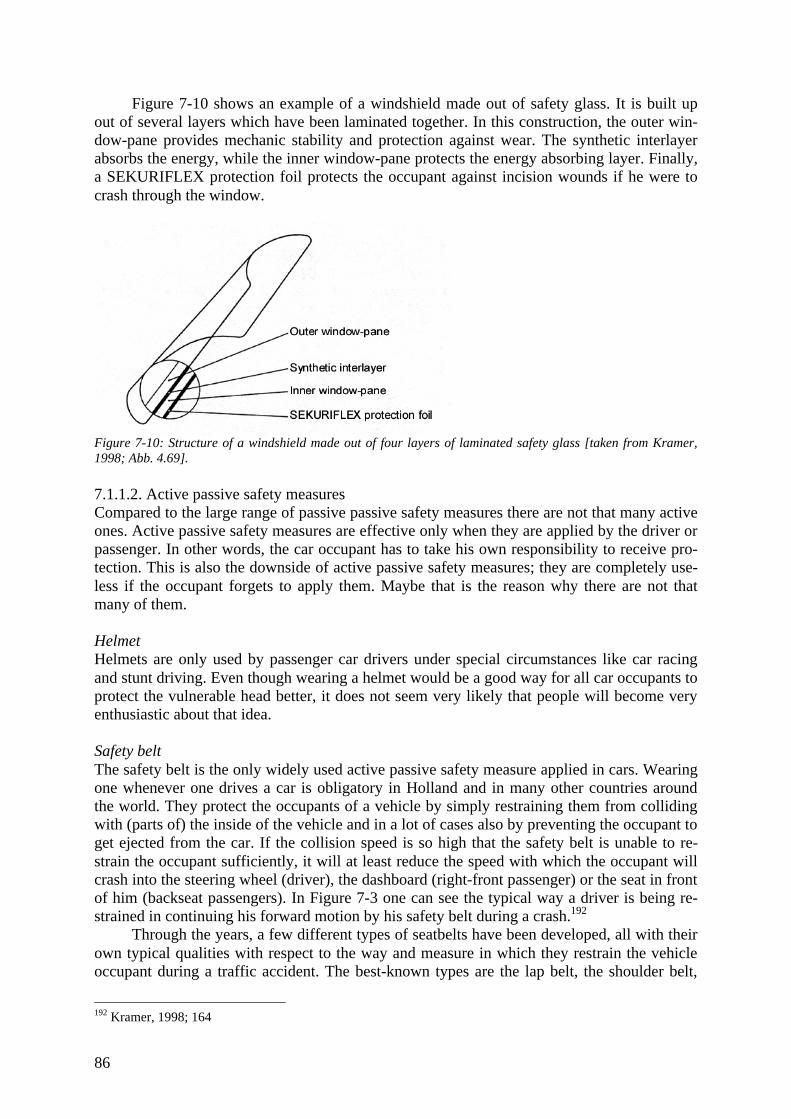
86
Figure 7-10 shows an example of a windshield made out of safety glass. It is built upout of several layers which have been laminated together. In this construction, the outer win-dow-pane provides mechanic stability and protection against wear. The synthetic interlayerabsorbs the energy, while the inner window-pane protects the energy absorbing layer. Finally,a SEKURIFLEX protection foil protects the occupant against incision wounds if he were tocrash through the window.
Figure 7-10: Structure of a windshield made out of four layers of laminated safety glass [taken from Kramer,1998; Abb. 4.69].
7.1.1.2. Active passive safety measuresCompared to the large range of passive passive safety measures there are not that many activeones. Active passive safety measures are effective only when they are applied by the driver orpassenger. In other words, the car occupant has to take his own responsibility to receive pro-tection. This is also the downside of active passive safety measures; they are completely use-less if the occupant forgets to apply them. Maybe that is the reason why there are not thatmany of them.
HelmetHelmets are only used by passenger car drivers under special circumstances like car racingand stunt driving. Even though wearing a helmet would be a good way for all car occupants toprotect the vulnerable head better, it does not seem very likely that people will become veryenthusiastic about that idea.
Safety beltThe safety belt is the only widely used active passive safety measure applied in cars. Wearingone whenever one drives a car is obligatory in Holland and in many other countries aroundthe world. They protect the occupants of a vehicle by simply restraining them from collidingwith (parts of) the inside of the vehicle and in a lot of cases also by preventing the occupant toget ejected from the car. If the collision speed is so high that the safety belt is unable to re-strain the occupant sufficiently, it will at least reduce the speed with which the occupant willcrash into the steering wheel (driver), the dashboard (right-front passenger) or the seat in frontof him (backseat passengers). In Figure 7-3 one can see the typical way a driver is being re-strained in continuing his forward motion by his safety belt during a crash.192
Through the years, a few different types of seatbelts have been developed, all with theirown typical qualities with respect to the way and measure in which they restrain the vehicleoccupant during a traffic accident. The best-known types are the lap belt, the shoulder belt,
192 Kramer, 1998; 164
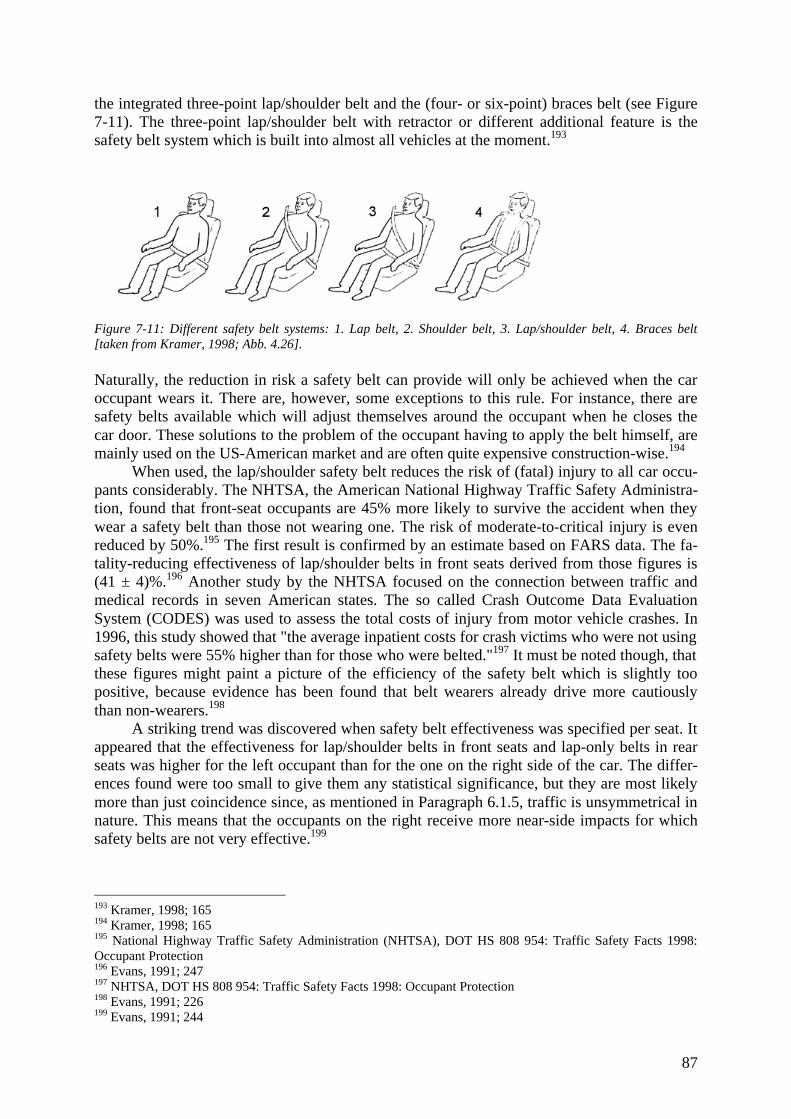
87
the integrated three-point lap/shoulder belt and the (four- or six-point) braces belt (see Figure7-11). The three-point lap/shoulder belt with retractor or different additional feature is thesafety belt system which is built into almost all vehicles at the moment.193
Figure 7-11: Different safety belt systems: 1. Lap belt, 2. Shoulder belt, 3. Lap/shoulder belt, 4. Braces belt[taken from Kramer, 1998; Abb. 4.26].
Naturally, the reduction in risk a safety belt can provide will only be achieved when the caroccupant wears it. There are, however, some exceptions to this rule. For instance, there aresafety belts available which will adjust themselves around the occupant when he closes thecar door. These solutions to the problem of the occupant having to apply the belt himself, aremainly used on the US-American market and are often quite expensive construction-wise.194
When used, the lap/shoulder safety belt reduces the risk of (fatal) injury to all car occu-pants considerably. The NHTSA, the American National Highway Traffic Safety Administra-tion, found that front-seat occupants are 45% more likely to survive the accident when theywear a safety belt than those not wearing one. The risk of moderate-to-critical injury is evenreduced by 50%.195 The first result is confirmed by an estimate based on FARS data. The fa-tality-reducing effectiveness of lap/shoulder belts in front seats derived from those figures is(41 ± 4)%.196 Another study by the NHTSA focused on the connection between traffic andmedical records in seven American states. The so called Crash Outcome Data EvaluationSystem (CODES) was used to assess the total costs of injury from motor vehicle crashes. In1996, this study showed that "the average inpatient costs for crash victims who were not usingsafety belts were 55% higher than for those who were belted."197 It must be noted though, thatthese figures might paint a picture of the efficiency of the safety belt which is slightly toopositive, because evidence has been found that belt wearers already drive more cautiouslythan non-wearers.198
A striking trend was discovered when safety belt effectiveness was specified per seat. Itappeared that the effectiveness for lap/shoulder belts in front seats and lap-only belts in rearseats was higher for the left occupant than for the one on the right side of the car. The differ-ences found were too small to give them any statistical significance, but they are most likelymore than just coincidence since, as mentioned in Paragraph 6.1.5, traffic is unsymmetrical innature. This means that the occupants on the right receive more near-side impacts for whichsafety belts are not very effective.199
193 Kramer, 1998; 165194 Kramer, 1998; 165195 National Highway Traffic Safety Administration (NHTSA), DOT HS 808 954: Traffic Safety Facts 1998:Occupant Protection196 Evans, 1991; 247197 NHTSA, DOT HS 808 954: Traffic Safety Facts 1998: Occupant Protection198 Evans, 1991; 226199 Evans, 1991; 244
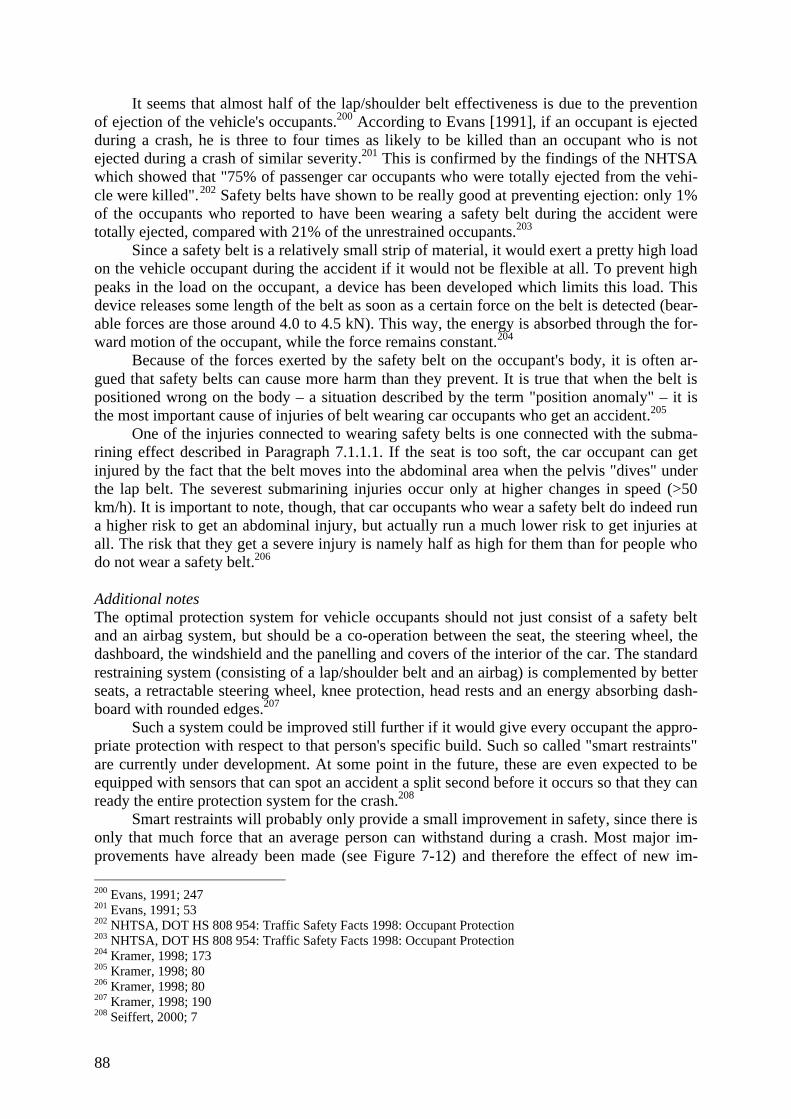
88
It seems that almost half of the lap/shoulder belt effectiveness is due to the preventionof ejection of the vehicle's occupants.200 According to Evans [1991], if an occupant is ejectedduring a crash, he is three to four times as likely to be killed than an occupant who is notejected during a crash of similar severity.201 This is confirmed by the findings of the NHTSAwhich showed that "75% of passenger car occupants who were totally ejected from the vehi-cle were killed".202 Safety belts have shown to be really good at preventing ejection: only 1%of the occupants who reported to have been wearing a safety belt during the accident weretotally ejected, compared with 21% of the unrestrained occupants.203
Since a safety belt is a relatively small strip of material, it would exert a pretty high loadon the vehicle occupant during the accident if it would not be flexible at all. To prevent highpeaks in the load on the occupant, a device has been developed which limits this load. Thisdevice releases some length of the belt as soon as a certain force on the belt is detected (bear-able forces are those around 4.0 to 4.5 kN). This way, the energy is absorbed through the for-ward motion of the occupant, while the force remains constant.204
Because of the forces exerted by the safety belt on the occupant's body, it is often ar-gued that safety belts can cause more harm than they prevent. It is true that when the belt ispositioned wrong on the body – a situation described by the term "position anomaly" – it isthe most important cause of injuries of belt wearing car occupants who get an accident.205
One of the injuries connected to wearing safety belts is one connected with the subma-rining effect described in Paragraph 7.1.1.1. If the seat is too soft, the car occupant can getinjured by the fact that the belt moves into the abdominal area when the pelvis "dives" underthe lap belt. The severest submarining injuries occur only at higher changes in speed (>50km/h). It is important to note, though, that car occupants who wear a safety belt do indeed runa higher risk to get an abdominal injury, but actually run a much lower risk to get injuries atall. The risk that they get a severe injury is namely half as high for them than for people whodo not wear a safety belt.206
Additional notesThe optimal protection system for vehicle occupants should not just consist of a safety beltand an airbag system, but should be a co-operation between the seat, the steering wheel, thedashboard, the windshield and the panelling and covers of the interior of the car. The standardrestraining system (consisting of a lap/shoulder belt and an airbag) is complemented by betterseats, a retractable steering wheel, knee protection, head rests and an energy absorbing dash-board with rounded edges.207
Such a system could be improved still further if it would give every occupant the appro-priate protection with respect to that person's specific build. Such so called "smart restraints"are currently under development. At some point in the future, these are even expected to beequipped with sensors that can spot an accident a split second before it occurs so that they canready the entire protection system for the crash.208
Smart restraints will probably only provide a small improvement in safety, since there isonly that much force that an average person can withstand during a crash. Most major im-provements have already been made (see Figure 7-12) and therefore the effect of new im-
200 Evans, 1991; 247201 Evans, 1991; 53202 NHTSA, DOT HS 808 954: Traffic Safety Facts 1998: Occupant Protection203 NHTSA, DOT HS 808 954: Traffic Safety Facts 1998: Occupant Protection204 Kramer, 1998; 173205 Kramer, 1998; 80206 Kramer, 1998; 80207 Kramer, 1998; 190208 Seiffert, 2000; 7
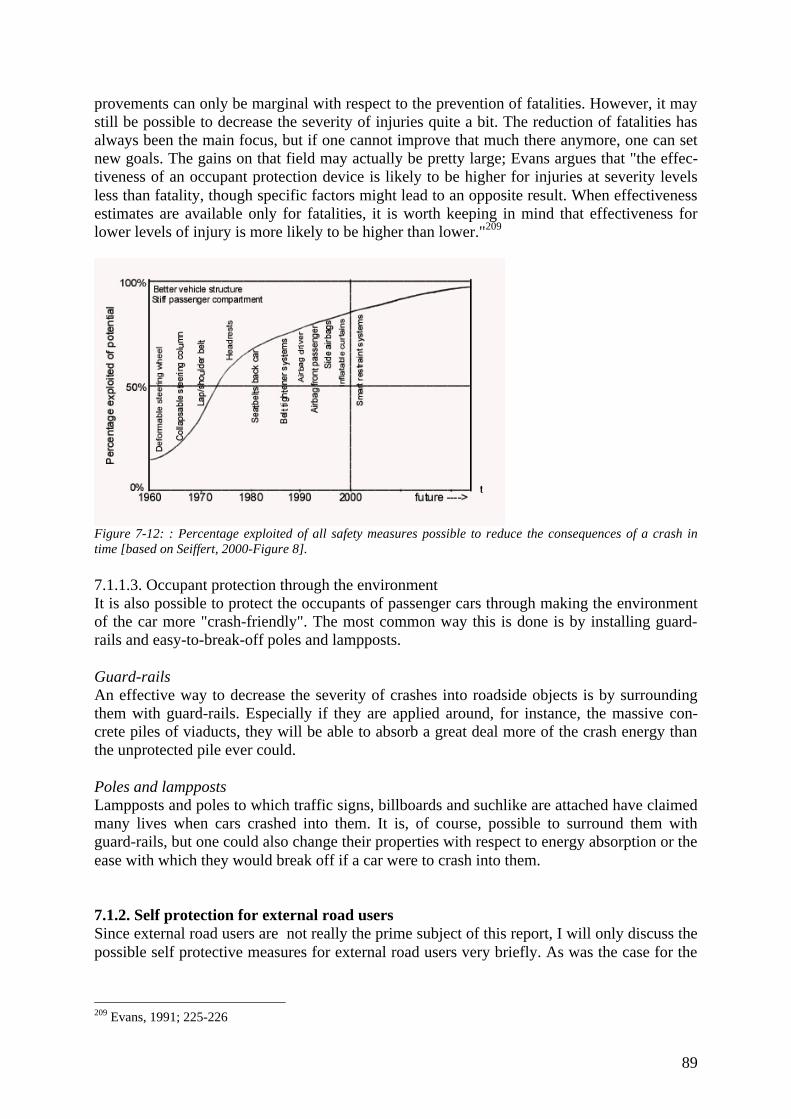
89
provements can only be marginal with respect to the prevention of fatalities. However, it maystill be possible to decrease the severity of injuries quite a bit. The reduction of fatalities hasalways been the main focus, but if one cannot improve that much there anymore, one can setnew goals. The gains on that field may actually be pretty large; Evans argues that "the effec-tiveness of an occupant protection device is likely to be higher for injuries at severity levelsless than fatality, though specific factors might lead to an opposite result. When effectivenessestimates are available only for fatalities, it is worth keeping in mind that effectiveness forlower levels of injury is more likely to be higher than lower."209
Figure 7-12: : Percentage exploited of all safety measures possible to reduce the consequences of a crash intime [based on Seiffert, 2000-Figure 8].
7.1.1.3. Occupant protection through the environmentIt is also possible to protect the occupants of passenger cars through making the environmentof the car more "crash-friendly". The most common way this is done is by installing guard-rails and easy-to-break-off poles and lampposts.
Guard-railsAn effective way to decrease the severity of crashes into roadside objects is by surroundingthem with guard-rails. Especially if they are applied around, for instance, the massive con-crete piles of viaducts, they will be able to absorb a great deal more of the crash energy thanthe unprotected pile ever could.
Poles and lamppostsLampposts and poles to which traffic signs, billboards and suchlike are attached have claimedmany lives when cars crashed into them. It is, of course, possible to surround them withguard-rails, but one could also change their properties with respect to energy absorption or theease with which they would break off if a car were to crash into them.
7.1.2. Self protection for external road usersSince external road users are not really the prime subject of this report, I will only discuss thepossible self protective measures for external road users very briefly. As was the case for the
209 Evans, 1991; 225-226
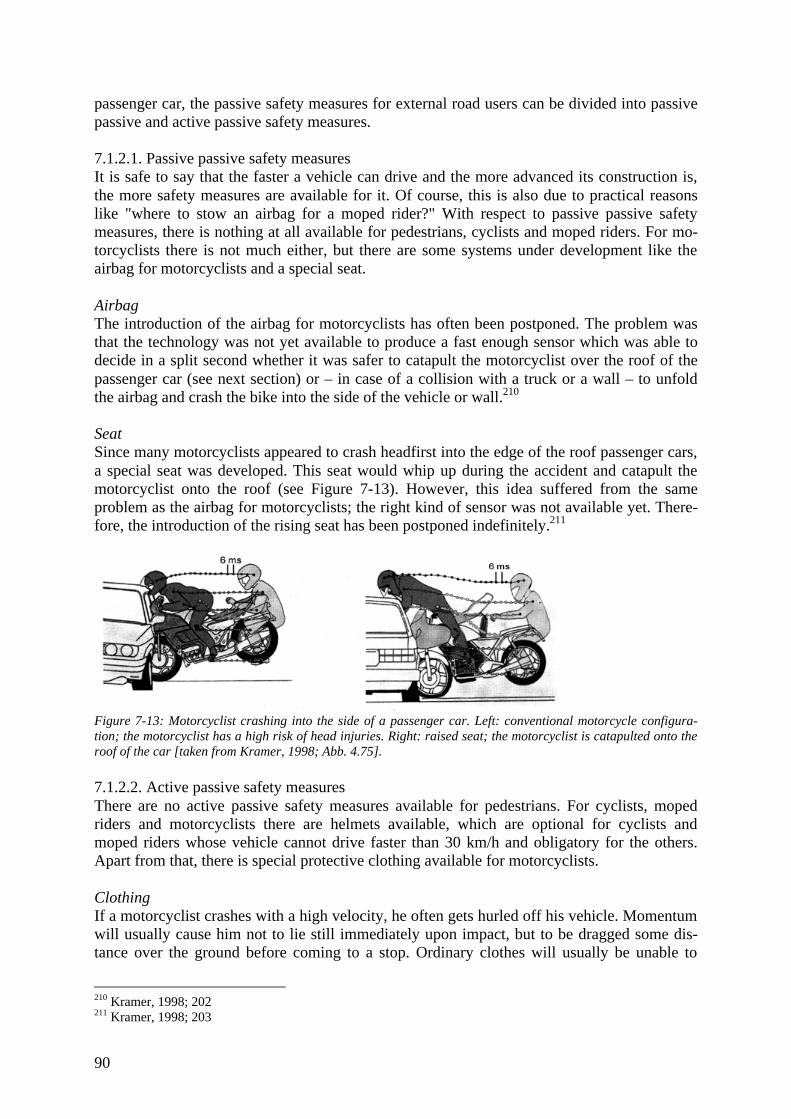
90
passenger car, the passive safety measures for external road users can be divided into passivepassive and active passive safety measures.
7.1.2.1. Passive passive safety measuresIt is safe to say that the faster a vehicle can drive and the more advanced its construction is,the more safety measures are available for it. Of course, this is also due to practical reasonslike "where to stow an airbag for a moped rider?" With respect to passive passive safetymeasures, there is nothing at all available for pedestrians, cyclists and moped riders. For mo-torcyclists there is not much either, but there are some systems under development like theairbag for motorcyclists and a special seat.
AirbagThe introduction of the airbag for motorcyclists has often been postponed. The problem wasthat the technology was not yet available to produce a fast enough sensor which was able todecide in a split second whether it was safer to catapult the motorcyclist over the roof of thepassenger car (see next section) or – in case of a collision with a truck or a wall – to unfoldthe airbag and crash the bike into the side of the vehicle or wall.210
SeatSince many motorcyclists appeared to crash headfirst into the edge of the roof passenger cars,a special seat was developed. This seat would whip up during the accident and catapult themotorcyclist onto the roof (see Figure 7-13). However, this idea suffered from the sameproblem as the airbag for motorcyclists; the right kind of sensor was not available yet. There-fore, the introduction of the rising seat has been postponed indefinitely.211
Figure 7-13: Motorcyclist crashing into the side of a passenger car. Left: conventional motorcycle configura-tion; the motorcyclist has a high risk of head injuries. Right: raised seat; the motorcyclist is catapulted onto theroof of the car [taken from Kramer, 1998; Abb. 4.75].
7.1.2.2. Active passive safety measuresThere are no active passive safety measures available for pedestrians. For cyclists, mopedriders and motorcyclists there are helmets available, which are optional for cyclists andmoped riders whose vehicle cannot drive faster than 30 km/h and obligatory for the others.Apart from that, there is special protective clothing available for motorcyclists.
ClothingIf a motorcyclist crashes with a high velocity, he often gets hurled off his vehicle. Momentumwill usually cause him not to lie still immediately upon impact, but to be dragged some dis-tance over the ground before coming to a stop. Ordinary clothes will usually be unable to
210 Kramer, 1998; 202211 Kramer, 1998; 203
91
withstand the abrasive working of the road surface and that is why somebody wearing thiskind of clothing is usually left with some severe flesh wounds after the crash (apart from pos-sible other injuries like fractured bones and suchlike). Therefore, there are special protectiveclothes available which can withstand the road surface and in most cases also have protectivepaddings to damp an impact on knees and elbows. The entire body can be protected; one canbuy gloves, boots, overalls, jackets and pants. For those people who do not want to show tooobviously that they are wearing protective clothing, there are even clothes on the marketwhich are made out of jeans fabric interwoven with Kevlar fibres.
Considering the fact that many people have their moped tuned up to drive at muchhigher speeds than it was made for (which is also illegal), protective clothing might be a goodplan for these people too.
HelmetHelmets can protect an external road user's most vulnerable part, the head, from getting in-jured during an accident. Contrary to other countries, very few cyclists wear helmets in TheNetherlands, which is probably due to the fact that the bike is such a normal means of trans-portation here. Still, especially the faster cyclists may want to consider this protective meas-ure.
7.1.2.3. Protection of external road users through the environmentProtecting the external road users from elements on the road and of the roadside requires adifferent approach than for cars because of the external road users' greater vulnerability.Measures to decrease the risk of injury posed by elements of the infrastructure would, for in-stance, include installing energy absorbing paddings on poles and other "aggressive" objectsalong the road.
7.2. Partner protection
Contrary to self protection, partner protection is aimed to diminish the severity of injuries to"accident partners", or rather "collision opponents", since the nature of the relationship be-tween the two sides in a traffic accident is not that partner-like really. Seen from the perspec-tive of a car driver, the opponents can be external road users as well as occupants of passengercars in case the traffic accident involves two (or more) cars. As mentioned in Paragraph7.1.1.1 (section "Carriage work"), that is also the dilemma here, because both of these partiesand the car itself require a different set of properties to reduce the risk of injury. In otherwords, partner protection has to be part of a well-considered compromise between the innerand the outer safety (see also Figure 7-1).212
7.2.1. Occupants other carsWhat influences the occurrence of injuries to people in the other car(s) involved in a crash isdiscussed in detail in the paragraph about (in)compatibility, Paragraph 6.2.
7.2.2. External road usersCharacteristic of crashes between cars and two-wheelers or pedestrians is that the injuries ofthe latter two are usually a lot more serious than those of the occupants of the car. This iscaused mainly by the large difference in mass and protection. When car manufacturers talkabout their cars being "safe", they usually mean that its occupants are well-protected. Sadly,
212 Kramer, 1998; 141-142
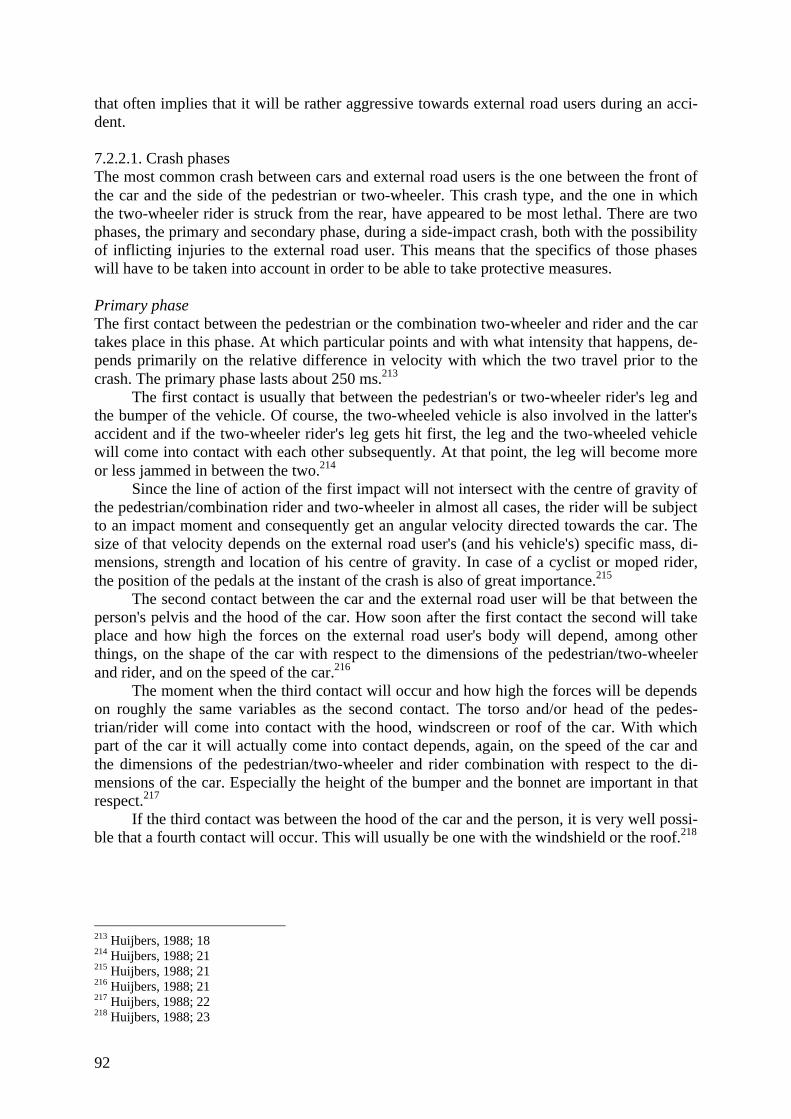
92
that often implies that it will be rather aggressive towards external road users during an acci-dent.
7.2.2.1. Crash phasesThe most common crash between cars and external road users is the one between the front ofthe car and the side of the pedestrian or two-wheeler. This crash type, and the one in whichthe two-wheeler rider is struck from the rear, have appeared to be most lethal. There are twophases, the primary and secondary phase, during a side-impact crash, both with the possibilityof inflicting injuries to the external road user. This means that the specifics of those phaseswill have to be taken into account in order to be able to take protective measures.
Primary phaseThe first contact between the pedestrian or the combination two-wheeler and rider and the cartakes place in this phase. At which particular points and with what intensity that happens, de-pends primarily on the relative difference in velocity with which the two travel prior to thecrash. The primary phase lasts about 250 ms.213
The first contact is usually that between the pedestrian's or two-wheeler rider's leg andthe bumper of the vehicle. Of course, the two-wheeled vehicle is also involved in the latter'saccident and if the two-wheeler rider's leg gets hit first, the leg and the two-wheeled vehiclewill come into contact with each other subsequently. At that point, the leg will become moreor less jammed in between the two.214
Since the line of action of the first impact will not intersect with the centre of gravity ofthe pedestrian/combination rider and two-wheeler in almost all cases, the rider will be subjectto an impact moment and consequently get an angular velocity directed towards the car. Thesize of that velocity depends on the external road user's (and his vehicle's) specific mass, di-mensions, strength and location of his centre of gravity. In case of a cyclist or moped rider,the position of the pedals at the instant of the crash is also of great importance.215
The second contact between the car and the external road user will be that between theperson's pelvis and the hood of the car. How soon after the first contact the second will takeplace and how high the forces on the external road user's body will depend, among otherthings, on the shape of the car with respect to the dimensions of the pedestrian/two-wheelerand rider, and on the speed of the car.216
The moment when the third contact will occur and how high the forces will be dependson roughly the same variables as the second contact. The torso and/or head of the pedes-trian/rider will come into contact with the hood, windscreen or roof of the car. With whichpart of the car it will actually come into contact depends, again, on the speed of the car andthe dimensions of the pedestrian/two-wheeler and rider combination with respect to the di-mensions of the car. Especially the height of the bumper and the bonnet are important in thatrespect.217
If the third contact was between the hood of the car and the person, it is very well possi-ble that a fourth contact will occur. This will usually be one with the windshield or the roof.218
213 Huijbers, 1988; 18214 Huijbers, 1988; 21215 Huijbers, 1988; 21216 Huijbers, 1988; 21217 Huijbers, 1988; 22218 Huijbers, 1988; 23
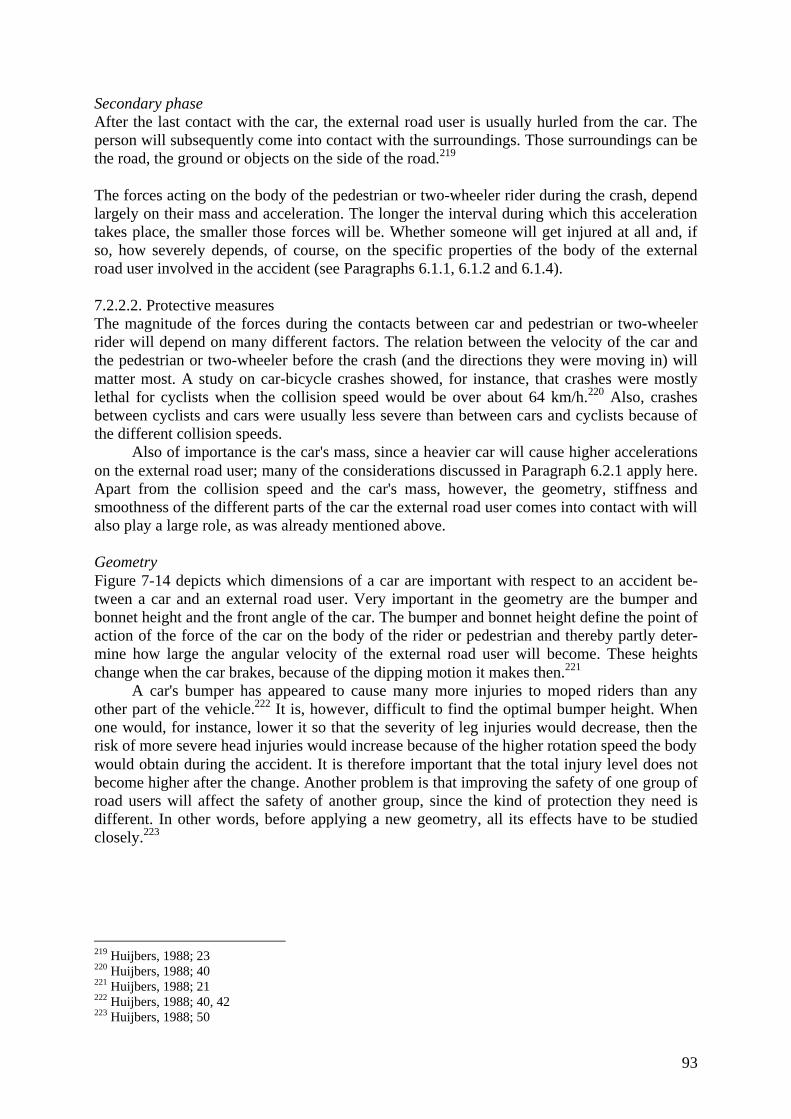
93
Secondary phaseAfter the last contact with the car, the external road user is usually hurled from the car. Theperson will subsequently come into contact with the surroundings. Those surroundings can bethe road, the ground or objects on the side of the road.219
The forces acting on the body of the pedestrian or two-wheeler rider during the crash, dependlargely on their mass and acceleration. The longer the interval during which this accelerationtakes place, the smaller those forces will be. Whether someone will get injured at all and, ifso, how severely depends, of course, on the specific properties of the body of the externalroad user involved in the accident (see Paragraphs 6.1.1, 6.1.2 and 6.1.4).
7.2.2.2. Protective measuresThe magnitude of the forces during the contacts between car and pedestrian or two-wheelerrider will depend on many different factors. The relation between the velocity of the car andthe pedestrian or two-wheeler before the crash (and the directions they were moving in) willmatter most. A study on car-bicycle crashes showed, for instance, that crashes were mostlylethal for cyclists when the collision speed would be over about 64 km/h.220 Also, crashesbetween cyclists and cars were usually less severe than between cars and cyclists because ofthe different collision speeds.
Also of importance is the car's mass, since a heavier car will cause higher accelerationson the external road user; many of the considerations discussed in Paragraph 6.2.1 apply here.Apart from the collision speed and the car's mass, however, the geometry, stiffness andsmoothness of the different parts of the car the external road user comes into contact with willalso play a large role, as was already mentioned above.
GeometryFigure 7-14 depicts which dimensions of a car are important with respect to an accident be-tween a car and an external road user. Very important in the geometry are the bumper andbonnet height and the front angle of the car. The bumper and bonnet height define the point ofaction of the force of the car on the body of the rider or pedestrian and thereby partly deter-mine how large the angular velocity of the external road user will become. These heightschange when the car brakes, because of the dipping motion it makes then.221
A car's bumper has appeared to cause many more injuries to moped riders than anyother part of the vehicle.222 It is, however, difficult to find the optimal bumper height. Whenone would, for instance, lower it so that the severity of leg injuries would decrease, then therisk of more severe head injuries would increase because of the higher rotation speed the bodywould obtain during the accident. It is therefore important that the total injury level does notbecome higher after the change. Another problem is that improving the safety of one group ofroad users will affect the safety of another group, since the kind of protection they need isdifferent. In other words, before applying a new geometry, all its effects have to be studiedclosely.223
219 Huijbers, 1988; 23220 Huijbers, 1988; 40221 Huijbers, 1988; 21222 Huijbers, 1988; 40, 42223 Huijbers, 1988; 50
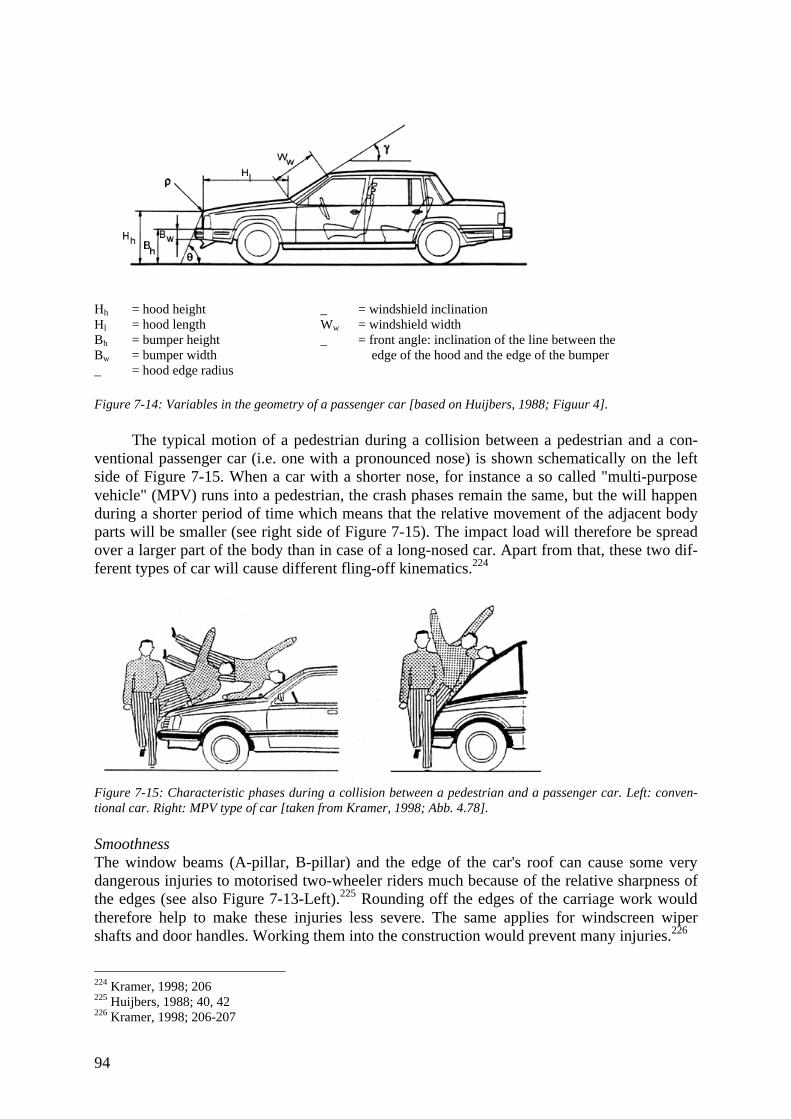
94
Hh = hood height _ = windshield inclinationHl = hood length Ww = windshield widthBh = bumper height _ = front angle: inclination of the line between theBw = bumper width edge of the hood and the edge of the bumper_ = hood edge radius
Figure 7-14: Variables in the geometry of a passenger car [based on Huijbers, 1988; Figuur 4].
The typical motion of a pedestrian during a collision between a pedestrian and a con-ventional passenger car (i.e. one with a pronounced nose) is shown schematically on the leftside of Figure 7-15. When a car with a shorter nose, for instance a so called "multi-purposevehicle" (MPV) runs into a pedestrian, the crash phases remain the same, but the will happenduring a shorter period of time which means that the relative movement of the adjacent bodyparts will be smaller (see right side of Figure 7-15). The impact load will therefore be spreadover a larger part of the body than in case of a long-nosed car. Apart from that, these two dif-ferent types of car will cause different fling-off kinematics.224
Figure 7-15: Characteristic phases during a collision between a pedestrian and a passenger car. Left: conven-tional car. Right: MPV type of car [taken from Kramer, 1998; Abb. 4.78].
SmoothnessThe window beams (A-pillar, B-pillar) and the edge of the car's roof can cause some verydangerous injuries to motorised two-wheeler riders much because of the relative sharpness ofthe edges (see also Figure 7-13-Left).225 Rounding off the edges of the carriage work wouldtherefore help to make these injuries less severe. The same applies for windscreen wipershafts and door handles. Working them into the construction would prevent many injuries.226
224 Kramer, 1998; 206225 Huijbers, 1988; 40, 42226 Kramer, 1998; 206-207
95
StiffnessOther solutions to protect external road users better during a traffic accident lie in the flexibil-ity of the materials used. Research has shown that the injury risk for pedestrians and two-wheeler riders was reduced demonstrably through the use of energy absorbing front struc-tures, like bumpers with deformable collision surfaces, a more yieldy structure, deformable(under both impact and pressure) grille attachments, and the use of energy absorbing materialsin the nose of the car (see Figure 7-16).227
Figure 7-16: Measure to protect external road users: a PUR foam nose as can be found on a Porsche 928 [takenfrom Kramer, 1998; Abb. 4.79].
More improvement can be achieved by making the hood out of a more flexible material,while simultaneously moving the place where the hood is attached to the frame backwards.Furthermore, stiff, untransformable parts in the engine compartment should not be placeddirectly underneath the hood; there should be some space between the two, because they cancause an inadmissibly high load on a person crashing into the hood.228
AirbagThe measures to reduce the injury risk for external road users described above are all con-struction-related. However, it is also possible to use a safety system which has already provenitself by protecting many car occupants during traffic accidents: the airbag. Of course, pre-venting pedestrians and two-wheeler riders from hitting the front of the car too hard requires adifferently shaped airbag than the ones used inside the car. Many think that a car-mountedairbag for external road users would not be easy to achieve, since the necessary external sen-sors and the electronics to process the information are hard to develop,229 but judging by thefact that Volvo is currently working on a concept car which should feature this kind of airbag,the biggest problems have obviously been solved.
7.3. Conclusions
Passive safety measures are safety measures to protect people against injury (or at least di-minish it) during an accident. It consists of both self-protective and partner-protective meas-ures. Occupant protection consists of passive passive safety measures (ones that are integrated
227 Kramer, 1998; 206228 Kramer, 1998; 206229 Kramer, 1998; 207
96
in the car) and active passive ones (the occupant has to apply them in order for them to beeffective).
Airbags protect car occupants from smashing into the interior and spreads the impactforces over a larger area so that they become lower. In collaboration with a safety belt system,airbags offer the best reduction of injury risk there is, but on its own it is not nearly as effec-tive. Since airbags do not inflate under all circumstances either, the safety belt should alwaysbe used.
The carriage work has to protect the occupants in two ways. Firstly, through the safetycage (which should stay intact under all circumstances), and secondly through its crushablezones (which should lower the deceleration forces on the occupants). To decrease the amountof penetration by another car during side collision, the construction around the doors has to bestrong as well as designed to distribute the forces to the rest of the construction. The crushablezones have to both provide sufficient protection to the occupants of the car as well as to theaccident partners.
To protect the airbag from bursting, but also to protect the occupants when the airbagdoes not inflate, the dashboard and steering wheel should not be shaped aggressively. Thismeans that they should have rounded edges and be built up out of an energy absorbing con-struction and material.
Headrests can limit the amount of movement the head makes during head-on and rearimpact collisions, thereby decreasing the risk of injury to the neck. They are rather useless,though, if they are positioned wrong, so it would be better if they were automatically adjust-able.
The seat can influence the risk of injury in two ways. On one hand, the way the safetybelt system is attached to or integrated in the seat construction will determine whether the beltis draped around the body as it should be. On the other hand, if the stiffness of the seat is toolow, it might lead to submarining injuries.
Windshields provide a clear view of the surroundings of the car while protecting its oc-cupants from the influences of the outside world, but they can also cause some severe injuriesduring a crash. This is possible both if they break (incision wounds) and if they do not (dam-age to the head and/or brain). There are many sorts of safety glass on the market, near-unbreakable glass among them. This means that the behaviour under impact as well as howlikely it is that an occupant or external road user would smack into the windshield should betaken into consideration to choose which type to use.
The helmet is an effective way to protect the vulnerable head, but not very likely to beused by other car occupants than racing or stunt drivers.
The safety belt (with load limiter) can decrease or eliminate injuries due to crashing into(parts of) the interior and, in most cases, ejection from the car by restraining the occupants. Ifthe safety belt is positioned wrong on the body or the seat is too soft, then the safety belt cancause injuries during a crash. However, those injuries are always much less severe than theinjuries they prevent by restraining the occupant.
The best level of protection will be obtained when all separate passive and active pas-sive safety measures co-operate.
Protecting the occupants of a car can also be done by changing some elements of theenvironment. Placing guard-rails around high-stiffness elements of the roadside is one option.Poles and lampposts that break off easily are another possibility to reduce the injury/fatalityrate.
There are a few options for self-protection for external road users. With respect to pas-sive passive safety measures only a few systems for motorcyclists have been thought out (air-bag, seat which can lift the motorcyclist over the sharp edge of the car). However, due totechnological problems these are no standard feature yet.
97
An active passive safety measure available for all two-wheeler riders, but obligatoryonly to moped riders (maximum speed over 40 km/h) and motorcyclists, is the helmet. Hel-mets can effectively protect the vulnerable head from becoming injured. For motorcycliststhere is also special protective clothing available. These clothes prevent their skin beingchafed open when they would be dragged over the road surface by their momentum. The softpaddings in these clothes help to absorb crash energy, which could also be achieved by ap-plying likewise paddings to immovable objects on the roadside.
Partner protection means protection of the other parties involved in an accident: bothoccupants of other cars and external road users. Characteristic of crashes with the latter is thatthe external road users are usually much worse off than the car occupants due to the differ-ence in mass and protection level. The most common crash between cars and external roadusers is the one where the car crashes into the latter's side. These crashes are, together withthe ones where the car hits the external road user's rear, the most lethal crashes. They are builtup from many moments in which the external road user comes into contact with the car beforehe ends up on the ground. All these instants can cause injuries, the severity of which dependson both their speeds and directions, but also the mass, geometry, stiffness and smoothness ofthe car, and the external road user's (and his vehicle's) mass, dimensions, strength, location ofcentre of gravity (and position of the pedals). All these elements decide the accelerations theexternal road user will feel, which will largely decide how badly injured he will get.
Some changes in a car's geometry can lower the risk of certain injuries for external roadusers. The problem is, though, that they can increase the risk of other injuries or of more se-vere injuries for other groups of road users at the same time. This means that geometricalchoices should be made only after careful consideration of all pros and cons.
It is also possible to lower the severity of certain injuries for external road users bymaking sure that the surface of cars is as smooth as possible, that all edges are rounded offand that the materials used are flexible and energy absorbing. Apart from that, there should beno hard parts directly below these surfaces. A system that might decrease the risk of injury forexternal road users even further is an airbag mounted on the front of the car, but this system isstill under development.

98
99
8. Policies
The government of a country or a group of countries like the European Union can have a largeinfluence on traffic safety. It lays down the basic requirements and rules for all road users andtheir vehicles. It can also decide about whether and, if so, how severely people who violatethese requirements and rules get punished.
8.1. The Netherlands
The policy of The Netherlands is not that different from that of other countries and thereforetaken as an example here. The Netherlands have a general policy, laid down in the NationalTraffic and Transport Plan, but also have a basic set of rules, the law, the violation of whichcan result in sometimes rather high fines. The Dutch police takes care of stating violations,but also of stimulating the public to apply to the rules.
8.1.1. General policyThe Dutch government has laid down its policies for the period between 2002 and 2020 in theNational Traffic and Transport Plan (Nationaal Verkeers- en Vervoersplan; NVVP), which initself is part of the Plan Law Traffic and Transport (Planwet Verkeer en Vervoer). At thismoment, the Structural Plan Traffic and Transport (Structuurschema Verkeer en Vervoer;SVV II) is still valid (until 17 January 2002 to be precise), though. These plans are created bythe Minister of Transport, Public Works, and Water Management (Verkeer en Waterstaat) inclose consideration with the Ministries of Economic Affairs (Economische Zaken), Housing,Spacial Planning, and the Environment (Volkshuisvesting, Ruimtelijke Ordening enMilieubeheer), Agriculture, Nature Management and Fisheries (Landbouw, Natuurbeheer enVisserij), Interior and Kingdom Relations (Binnenlandse Zaken en Koninkrijksrelaties),Finance (Financiën), the provinces, the municipal areas and the areas covered by the Frame-work Act (kaderwetgebieden). The goal of this large collaboration is to involve all significantparties and have them take their responsibility to take care of their part in the deal.230
The key objective of NVVP is "The Netherlands should offer everyone an efficient, safeand sustainable traffic and transportation system, whereby quality for individual users standsin a meaningful equilibrium with quality for the country as a whole".231 To put it into moreplain text: part of the plan is to tackle issues like the expected growth of traffic and transport,traffic congestion, infrastructure, the environment (emissions), traffic safety, and stimulationof the use of alternative means of transportation like public transport. Some of these subjectsare, of course, closely entangled. Traffic safety, for instance, is directly related to the growthof traffic, traffic congestions and the infrastructure.
Prognoses indicate that traffic and transport in The Netherlands will both grow furtherin the future. The top priority of NVVP is therefore to decrease the negative aspects of in-creasing mobility. The government thinks to reach this by increasing accessibility, safety andthe quality of life for all.232
The problem is that plans like these are always based on prognoses. Experience with theSVV II learnt that things do not always develop as expected. SVV II did, for instance, appear
230 www.minvenw.nl/rws/projects/nvvp231 Ministery of Transport, Public Works and Water Management, 2001; 6232 Ministery of Transport, Public Works and Water Management, 2001; 6
100
to be unable to attune its executory organs to reach the set goals. The amount of traffic greweven faster than they had expected, whereas the expansion of the infrastructure went slowerthan planned. In other words, the goal to diminish traffic congestion was not reached. This iswhy in case of the NVVP the planning is to keep an eye on the actual social developmentsand to fine-tune the policies based on that.233
Traffic safety is an important issue in the NVVP. The target is a reduction of traffic accidentfatalities and hospitalisations of 25% by 2010. This should be achieved, in the words used inthe NVVP, in the following manner: "The underlying principle for traffic safety is that indi-viduals accept responsibility for their own safety and for the safety of others. Business andindustry, the general public and governmental authorities are expected to devote maximumeffort toward improving safety – within the bounds of the feasible and affordable. The rele-vant instruments here are enforcement and regulation, information and education, alteringroads and railway-lines, and application of new technology".234
Since most accidents are (partly) caused by human errors, it is not a strange thought toapproach the improvement of traffic safety through the road user. Part of the NVVP is there-fore to stimulate road users to keep to the traffic rules by reminding them of their existencethrough intensified police surveillance. There will, for instance, be more speed checks. Apartfrom that, the plan is to lower the permitted amounts of drugs and medication as well as theamount of alcohol in one's blood for "new" drivers (from 0.5 to 0.2 per mille) with the optionto extend it to all drivers.235
Another way to approach the traffic safety issue through the driver is by educating andinforming the road user better. The education aspect of the NVVP focuses on the novicedriver, since the fatality rate among young drivers is still too high. A special driver's licensefor new drivers is one of the most important ideas. Apart from that, the large media cam-paigns (including billboards, posters, adverts, and radio and TV commercials) to make peoplemore aware of changes in the traffic rules as well as refreshing their memory with respect tosome more or less neglected issues will be continued (see Appendix B).236
In order to solve the problem of high fatality rates on rural roads, the so called "Sustain-able Safety Programme" will focus on influencing behaviour and realising a safer infrastruc-ture. Categorisation of the motorway network is prioritised in this programme.237
Much is expected from technological solutions to improve traffic safety. Top priority inthe NVVP is to decrease the fatality rate among external road users as well as the amount ofserious injuries among vehicle occupants. Projects which will be supported by the plan in-clude automatic vehicle guidance, lane keeping, on-board computers, chip-cards, speed con-trol devices, blind-spot mirrors, GPS systems,238 anti-whiplash measures and car designs inwhich the optimum combination of a reduction in vulnerability and an improvement in colli-sion compatibility has been found. On the longer term, it is expected that collision-preventiontechnology will get a larger role.239
Intelligent speed adjustment is another safety enhancing system of which much is ex-pected. Through this system the speed of a car can be controlled remotely. This means that theflow and average speed on a certain road can be adjusted from the outside so that they will bebest suited for the specific conditions "without serious enforcement problems". This system
233 Ministery of Transport, Public Works and Water Management, 2001; 6234 Ministery of Transport, Public Works and Water Management, 2001; 16235 Ministery of Transport, Public Works and Water Management, 2001; 16236 Ministery of Transport, Public Works and Water Management, 2001; 17237 Ministery of Transport, Public Works and Water Management, 2001; 17238 Ministery of Transport, Public Works and Water Management, 2001; 28239 Ministery of Transport, Public Works and Water Management, 2001; 18
101
can, in other words, prevent that people drive too fast in bad weather, during rush hour, or inresidential areas, as is often the case now.240
Indeed, the role of technology in the NVVP is thought to be so important that much ofthe plan's realisation is thought to be reached through technological solutions; "[t]echnologywill boost realisation of goals around traffic and transportation". A similar result is expectedfrom advances in the organisation of transportation and transportation systems. The timelyand effective employment of innovations should be achieved through a three-point reinforce-ment of policy:• A technology monitoring programme that will regularly report to the Dutch parliament on
developments relevant to policy;• Promotion of key technologies, market developments requiring a hands-on approach by
government, and system renewal in transportation (where the market cannot yet get inno-vation moving under its own steam);
• Boosting knowledge development and sharing via the strategic research programme oper-ated by the Ministry of Transport, Public Works and Water Management, and its part-ners.241
The industry is currently investing heavily in the development of many new systems in thefield of localisation, communication and identification of cars. Car manufacturers are plan-ning to equip cars standard with systems like these in the near future. This way, more andmore drivers can choose to be supported by traffic information, navigation, parking informa-tion, and first aid. Theft-detection and identification systems are also expected to become partof every new car.242
Another reason why the NVVP expects much of technology in the improvement of traf-fic safety is that it has appeared to be able to influence how people drive. As described in theNVVP: "[s]ystems now being developed will simplify the process of driving. The behaviouralaspect merits special attention in the overall field of technological advances. Pointing outbenefits to the population at large will not on its own win acceptance for new technology: pluspoints for individual road users must also be highlighted."243
The role of the Ministry of Transport, Public Works and Water Management in the de-velopment of new systems will be large: "[o]ngoing innovation is the responsibility of theMinistry [...] (with extensive contracting-out to industry)." According to the NVVP, theopinion of the government should be "both significant and – occasionally – decisive. Themain focus is on the results of new technology. Government imposes functional demands and,where appropriate, promotes application; however, it never actually imposes the technol-ogy."244
The costs for an increase in traffic safety will be born by the drivers themselves. Everyroad-user pays per kilometre driven, although people driving during the morning rush hourand on "higher quality" lanes and roads (the so called "pay-lanes" and "toll roads") will haveto pay some extra. At the same time, the fixed taxes will go down, so that those who use theircar most, pay most. The proceeds of the kilometre levy will also be used to perform mainte-nance and management, and to lower environmental damage.245
240 Ministery of Transport, Public Works and Water Management, 2001; 18241 Ministery of Transport, Public Works and Water Management, 2001; 21242 Ministery of Transport, Public Works and Water Management, 2001; 21243 Ministery of Transport, Public Works and Water Management, 2001; 21244 Ministery of Transport, Public Works and Water Management, 2001; 22245 Ministery of Transport, Public Works and Water Management, 2001; 25
102
Better protection of the vulnerable external road users is an important issue as well. TheNVVP contains plans in which the infrastructure will become "safety-oriented"; slow and fasttraffic will be streamed, or made to move slower where that is impossible.246
8.1.2. LawsTraffic safety is also stimulated through fining people who do not apply to the minimum re-quirements all road users have to apply to. Whenever the police or another authority find aviolation of these requirements, the offender is fined or – in serious cases – even brought up.The requirements entail ones to the driver, the vehicle, its registration, and the observation oftraffic signs and traffic rules.
8.1.2.1. DriverAll drivers have to apply to a set of basic rules. To be allowed to drive a car at all he will needa valid driver's licence. Apart from that, his BAC should not be over 0.5 per mille, he shouldwear a safety belt and his car should be insured. Violation of these rules will cost him some-where in between 60 (e.g. expired driver's licence) and 610 (no insurance) Dutch guilders.247
Driver's licenseJust like in all other Western countries, drivers have to pass a theoretical and a practical testbefore they get their driver's licence in The Netherlands. Driver's licenses are obligatory forall drivers and one is not allowed to take either the theoretical or the practical test beforeturning 18 (16 in the United States). Apart from the required age, one has to have a certificatethat one is both mentally and physically fit to drive.248
The driving tests (theoretical and practical) are administered by a statutory body calledCBR (Centraal Bureau Rijvaardigheidsbewijzen; Driving Test Organisation). Everybody whowants to drive a car takes the same theoretical and practical tests, and only passes if the CBRjudges them to be capable of taking part in traffic independently. Safety with respect to one-self and others plays a big role in that judgement. One can therefore expect a basic level ofknowledge and experience regarding safe driving from all Dutch passenger car drivers.249
Even though education is valued highly by most statutory bodies world-wide, several studieshave shown that there basically is no convincing evidence that driver education, or increaseddriving skill and knowledge, would increase traffic safety. Although driver education doesspeed up the process of learning driving skills, learning by trial and error has proved to be amore effective way to achieve this. And safety cannot really be taught; avoiding crashes isafter all something completely different from skilful driving. Knowing how to drive safely"requires the absorption of accumulated knowledge and the experience of interactions withothers".250 However, unless it would happen in a controlled and separated environment, it israther dangerous to let people learn to drive safely by making lots of educational accidents.Going through hazardous and even actual accidents in today's simulators (see Appendix C) oron special tracks (where the drivers could also use special equipment: extra protection pro-vided by special clothing, a helmet and a special safety construction in the car) would there-fore be a good solution. Spending some time in a simulator or on a track could be a very use-ful addition to the existing driving education and probably raise awareness about the dangersof driving.
246 Ministery of Transport, Public Works and Water Management, 2001; 25247 www.openbaarministerie.nl/boetebase248 www.cbr.nl249 www.cbr.nl250 Evans, 1991; 156
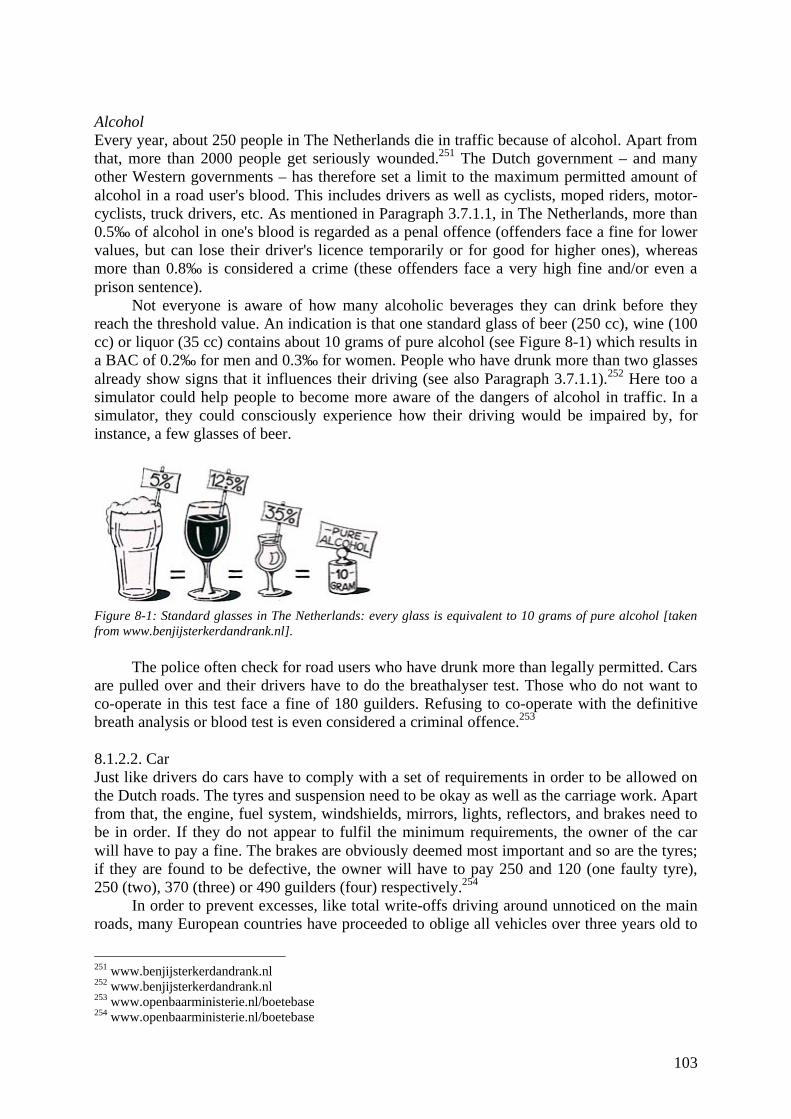
103
AlcoholEvery year, about 250 people in The Netherlands die in traffic because of alcohol. Apart fromthat, more than 2000 people get seriously wounded.251 The Dutch government – and manyother Western governments – has therefore set a limit to the maximum permitted amount ofalcohol in a road user's blood. This includes drivers as well as cyclists, moped riders, motor-cyclists, truck drivers, etc. As mentioned in Paragraph 3.7.1.1, in The Netherlands, more than0.5‰ of alcohol in one's blood is regarded as a penal offence (offenders face a fine for lowervalues, but can lose their driver's licence temporarily or for good for higher ones), whereasmore than 0.8‰ is considered a crime (these offenders face a very high fine and/or even aprison sentence).
Not everyone is aware of how many alcoholic beverages they can drink before theyreach the threshold value. An indication is that one standard glass of beer (250 cc), wine (100cc) or liquor (35 cc) contains about 10 grams of pure alcohol (see Figure 8-1) which results ina BAC of 0.2‰ for men and 0.3‰ for women. People who have drunk more than two glassesalready show signs that it influences their driving (see also Paragraph 3.7.1.1).252 Here too asimulator could help people to become more aware of the dangers of alcohol in traffic. In asimulator, they could consciously experience how their driving would be impaired by, forinstance, a few glasses of beer.
Figure 8-1: Standard glasses in The Netherlands: every glass is equivalent to 10 grams of pure alcohol [takenfrom www.benjijsterkerdandrank.nl].
The police often check for road users who have drunk more than legally permitted. Carsare pulled over and their drivers have to do the breathalyser test. Those who do not want toco-operate in this test face a fine of 180 guilders. Refusing to co-operate with the definitivebreath analysis or blood test is even considered a criminal offence.253
8.1.2.2. CarJust like drivers do cars have to comply with a set of requirements in order to be allowed onthe Dutch roads. The tyres and suspension need to be okay as well as the carriage work. Apartfrom that, the engine, fuel system, windshields, mirrors, lights, reflectors, and brakes need tobe in order. If they do not appear to fulfil the minimum requirements, the owner of the carwill have to pay a fine. The brakes are obviously deemed most important and so are the tyres;if they are found to be defective, the owner will have to pay 250 and 120 (one faulty tyre),250 (two), 370 (three) or 490 guilders (four) respectively.254
In order to prevent excesses, like total write-offs driving around unnoticed on the mainroads, many European countries have proceeded to oblige all vehicles over three years old to
251 www.benjijsterkerdandrank.nl252 www.benjijsterkerdandrank.nl253 www.openbaarministerie.nl/boetebase254 www.openbaarministerie.nl/boetebase
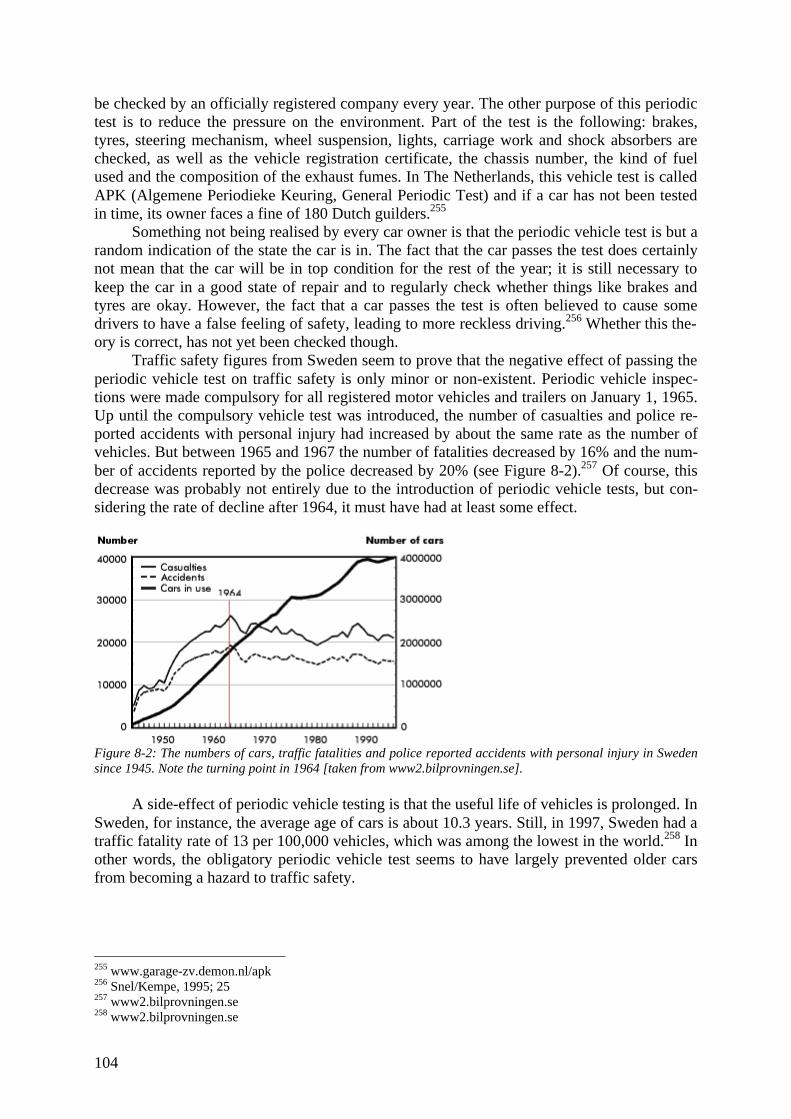
104
be checked by an officially registered company every year. The other purpose of this periodictest is to reduce the pressure on the environment. Part of the test is the following: brakes,tyres, steering mechanism, wheel suspension, lights, carriage work and shock absorbers arechecked, as well as the vehicle registration certificate, the chassis number, the kind of fuelused and the composition of the exhaust fumes. In The Netherlands, this vehicle test is calledAPK (Algemene Periodieke Keuring, General Periodic Test) and if a car has not been testedin time, its owner faces a fine of 180 Dutch guilders.255
Something not being realised by every car owner is that the periodic vehicle test is but arandom indication of the state the car is in. The fact that the car passes the test does certainlynot mean that the car will be in top condition for the rest of the year; it is still necessary tokeep the car in a good state of repair and to regularly check whether things like brakes andtyres are okay. However, the fact that a car passes the test is often believed to cause somedrivers to have a false feeling of safety, leading to more reckless driving.256 Whether this the-ory is correct, has not yet been checked though.
Traffic safety figures from Sweden seem to prove that the negative effect of passing theperiodic vehicle test on traffic safety is only minor or non-existent. Periodic vehicle inspec-tions were made compulsory for all registered motor vehicles and trailers on January 1, 1965.Up until the compulsory vehicle test was introduced, the number of casualties and police re-ported accidents with personal injury had increased by about the same rate as the number ofvehicles. But between 1965 and 1967 the number of fatalities decreased by 16% and the num-ber of accidents reported by the police decreased by 20% (see Figure 8-2).257 Of course, thisdecrease was probably not entirely due to the introduction of periodic vehicle tests, but con-sidering the rate of decline after 1964, it must have had at least some effect.
Figure 8-2: The numbers of cars, traffic fatalities and police reported accidents with personal injury in Swedensince 1945. Note the turning point in 1964 [taken from www2.bilprovningen.se].
A side-effect of periodic vehicle testing is that the useful life of vehicles is prolonged. InSweden, for instance, the average age of cars is about 10.3 years. Still, in 1997, Sweden had atraffic fatality rate of 13 per 100,000 vehicles, which was among the lowest in the world.258 Inother words, the obligatory periodic vehicle test seems to have largely prevented older carsfrom becoming a hazard to traffic safety.
255 www.garage-zv.demon.nl/apk256 Snel/Kempe, 1995; 25257 www2.bilprovningen.se258 www2.bilprovningen.se
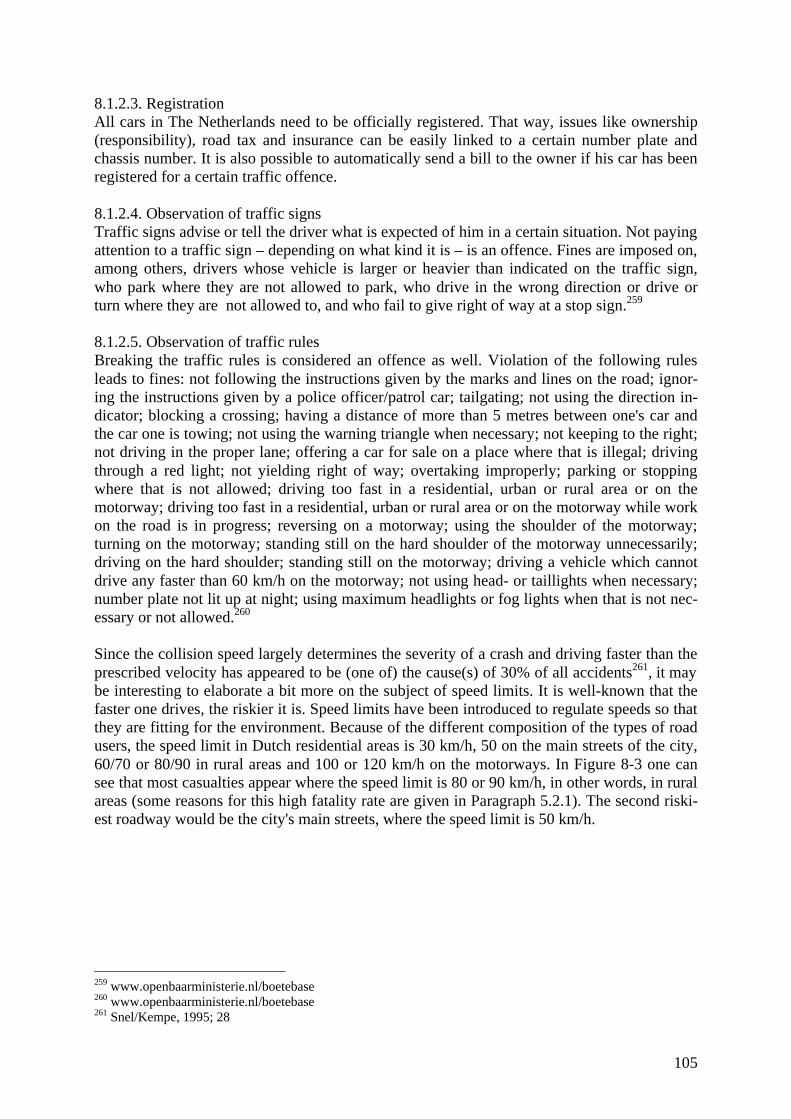
105
8.1.2.3. RegistrationAll cars in The Netherlands need to be officially registered. That way, issues like ownership(responsibility), road tax and insurance can be easily linked to a certain number plate andchassis number. It is also possible to automatically send a bill to the owner if his car has beenregistered for a certain traffic offence.
8.1.2.4. Observation of traffic signsTraffic signs advise or tell the driver what is expected of him in a certain situation. Not payingattention to a traffic sign – depending on what kind it is – is an offence. Fines are imposed on,among others, drivers whose vehicle is larger or heavier than indicated on the traffic sign,who park where they are not allowed to park, who drive in the wrong direction or drive orturn where they are not allowed to, and who fail to give right of way at a stop sign.259
8.1.2.5. Observation of traffic rulesBreaking the traffic rules is considered an offence as well. Violation of the following rulesleads to fines: not following the instructions given by the marks and lines on the road; ignor-ing the instructions given by a police officer/patrol car; tailgating; not using the direction in-dicator; blocking a crossing; having a distance of more than 5 metres between one's car andthe car one is towing; not using the warning triangle when necessary; not keeping to the right;not driving in the proper lane; offering a car for sale on a place where that is illegal; drivingthrough a red light; not yielding right of way; overtaking improperly; parking or stoppingwhere that is not allowed; driving too fast in a residential, urban or rural area or on themotorway; driving too fast in a residential, urban or rural area or on the motorway while workon the road is in progress; reversing on a motorway; using the shoulder of the motorway;turning on the motorway; standing still on the hard shoulder of the motorway unnecessarily;driving on the hard shoulder; standing still on the motorway; driving a vehicle which cannotdrive any faster than 60 km/h on the motorway; not using head- or taillights when necessary;number plate not lit up at night; using maximum headlights or fog lights when that is not nec-essary or not allowed.260
Since the collision speed largely determines the severity of a crash and driving faster than theprescribed velocity has appeared to be (one of) the cause(s) of 30% of all accidents261, it maybe interesting to elaborate a bit more on the subject of speed limits. It is well-known that thefaster one drives, the riskier it is. Speed limits have been introduced to regulate speeds so thatthey are fitting for the environment. Because of the different composition of the types of roadusers, the speed limit in Dutch residential areas is 30 km/h, 50 on the main streets of the city,60/70 or 80/90 in rural areas and 100 or 120 km/h on the motorways. In Figure 8-3 one cansee that most casualties appear where the speed limit is 80 or 90 km/h, in other words, in ruralareas (some reasons for this high fatality rate are given in Paragraph 5.2.1). The second riski-est roadway would be the city's main streets, where the speed limit is 50 km/h.
259 www.openbaarministerie.nl/boetebase260 www.openbaarministerie.nl/boetebase261 Snel/Kempe, 1995; 28
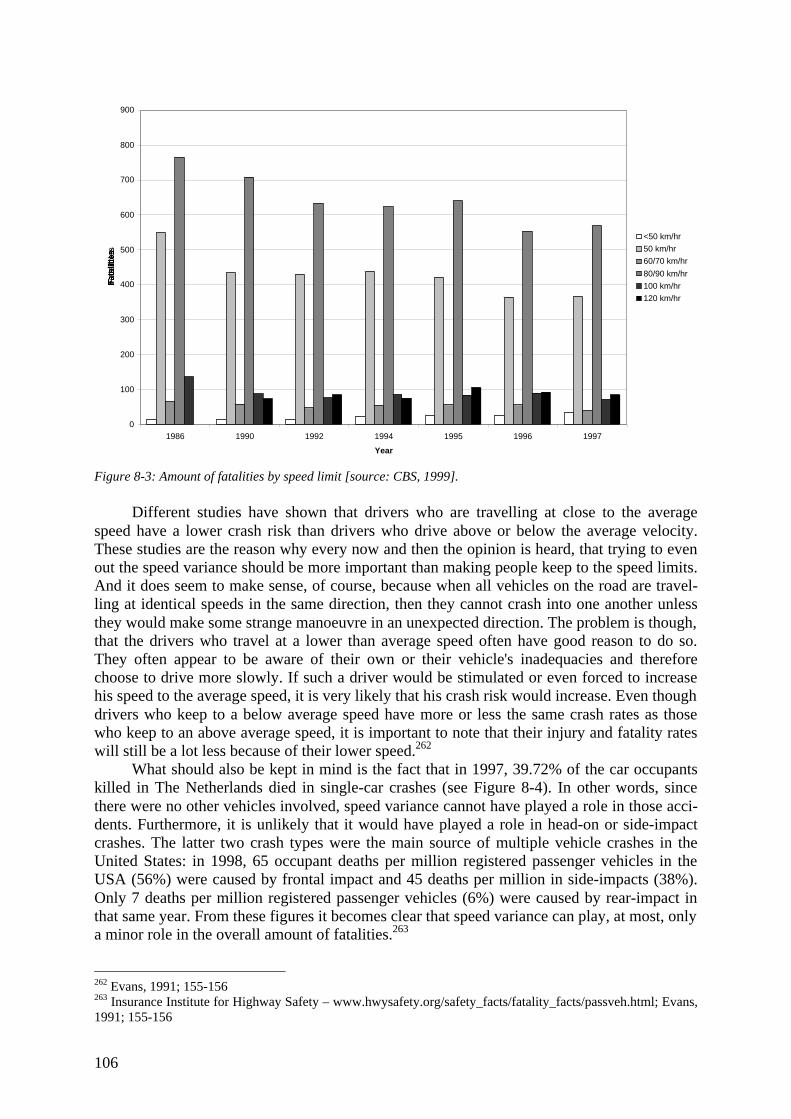
106
0
100
200
300
400
500
600
700
800
900
1986 1990 1992 1994 1995 1996 1997
Year
Fat
alit
ies
<50 km/hr
50 km/hr
60/70 km/hr
80/90 km/hr
100 km/hr
120 km/hr
Figure 8-3: Amount of fatalities by speed limit [source: CBS, 1999].
Different studies have shown that drivers who are travelling at close to the averagespeed have a lower crash risk than drivers who drive above or below the average velocity.These studies are the reason why every now and then the opinion is heard, that trying to evenout the speed variance should be more important than making people keep to the speed limits.And it does seem to make sense, of course, because when all vehicles on the road are travel-ling at identical speeds in the same direction, then they cannot crash into one another unlessthey would make some strange manoeuvre in an unexpected direction. The problem is though,that the drivers who travel at a lower than average speed often have good reason to do so.They often appear to be aware of their own or their vehicle's inadequacies and thereforechoose to drive more slowly. If such a driver would be stimulated or even forced to increasehis speed to the average speed, it is very likely that his crash risk would increase. Even thoughdrivers who keep to a below average speed have more or less the same crash rates as thosewho keep to an above average speed, it is important to note that their injury and fatality rateswill still be a lot less because of their lower speed.262
What should also be kept in mind is the fact that in 1997, 39.72% of the car occupantskilled in The Netherlands died in single-car crashes (see Figure 8-4). In other words, sincethere were no other vehicles involved, speed variance cannot have played a role in those acci-dents. Furthermore, it is unlikely that it would have played a role in head-on or side-impactcrashes. The latter two crash types were the main source of multiple vehicle crashes in theUnited States: in 1998, 65 occupant deaths per million registered passenger vehicles in theUSA (56%) were caused by frontal impact and 45 deaths per million in side-impacts (38%).Only 7 deaths per million registered passenger vehicles (6%) were caused by rear-impact inthat same year. From these figures it becomes clear that speed variance can play, at most, onlya minor role in the overall amount of fatalities.263
262 Evans, 1991; 155-156263 Insurance Institute for Highway Safety – www.hwysafety.org/safety_facts/fatality_facts/passveh.html; Evans,1991; 155-156
107
Single-vehicle crashes39.72%
Multi-vehicle crashes56.84%
All 1,163 traffic fatalities in 1997100%
Figure 8-4: The percentages single-vehicle and multi-vehicle crashes in The Netherlands in 1997 [source: CBS,1999].
Research has shown that "[a]mong the factors contributing to drivers' choice of speed isa systematic underestimation of the probability that they will be killed. Another factor is thatspeed is desired for its own sake, for sensuous pleasure rather than just for utilitarian motivessuch as saving time."264 Most drivers are, however, aware of the fact that driving (too) fastdoes pose a certain hazard and that is why they eventually choose a speed which is a com-promise between their desires for pleasure and those for safety.265
8.1.3. Law enforcementThe police is deployed to state penal offences in name of the public prosecutor. The publicprosecutor, in turn, is part of the Public Prosecution Department, one of the departments ofthe Ministry of Justice. Knowing that the police can issue fines, combined with the police'srecognisability in traffic – their patrol cars are rather eye-catching, to say the least – stimu-lates road users to keep to the traffic rules.266
Traffic safety is also enhanced by the police through the special tasks they carry out.Among other things, they deal with traffic accidents, they stimulate the traffic flow, they pro-vide information about traffic rules, and they escort special transports. However, checkingwhether people keep to the traffic rules is still their most important task. Accidents involvingserious injury are often (partly) caused by one of the following five offences: speeding, notwearing a safety belt, not wearing a helmet, jumping the lights and driving under the influ-ence. That is the reason why the police check traffic for these five offences daily.267
Preliminary results of more intensive traffic surveillance in The Netherlands showedthat the amount of fatalities had indeed decreased since the start of the project. In this project,special police teams monitor different spots in their region to fine people for the above men-tioned five offences. The goal is to decrease the amount of traffic deaths with 25% come2010. Officials were, however, reluctant to provide numbers 1.5 years after the beginning ofthe project, since it was too soon to see results, in their opinion. Still, it appeared that the na-tional average of speed violations went down 19%. Since speeding is, as was mentionedabove, one of the main causes of traffic accidents in 30% of all crashes, that can be considereda positive sign.268
In the Dutch province of Flevoland the amount of serious accidents decreased by 21%after more intensive surveillance was started. Spokesperson for 3VO Woudenberg was, how-
264 Evans, 1991; 152265 Evans, 1991; 153266 www.politie.nl267 www.politie.nl268 Pasma/Latijnhouwers, Metro 4 August 2000
108
ever, not entirely optimistic. He pointed out that data obtained from Slachtofferhulp Neder-land (Help to Victims Holland) indicated that the amount of injuries has increased in 1999.269
Police surveillance certainly appears to have a large influence on the amount of peoplewho decide to drive even though they drank too much alcohol in The Netherlands. When theDutch police had to cut back on surveillance in 1992 in order to carry out a large reorganisa-tion process within their ranks, the amount of drunk-drivers increased slightly (4.0% offend-ers in 1992, 4.2% in 1993 and 4.9% in 1994). In 1995, the police began to carry out surveil-lance on a larger scale again. Subsequently, less people driving under the influence werecaught and this decrease continued in the years to follow (4.7% offenders in 1995, 4.4% in1996 and 4.3% in 1997), although there was a slight fall-back in 1998 (4.5% offenders) whichwas set right in 1999 (4.3%). Still, the amount of offenders in 1999 was higher than in1991.270
8.1.4. InsurancesAll drivers have to have a car insurance; not having one means that one will be fined whenpulled over by the police. Insurances have a traffic safety enhancing value as well. Drivingwithout accidents is rewarded by a lower insurance premium; the so-called "no-claim bonus".This bonus can be built up over a certain amount of years and one will fall down one levelwhenever one does get an accident before reaching the maximum bonus value.
8.2. Europe
The exact requirements for passenger cars to be allowed on the roads in Europe are (still) amixture of the general requirements of the European Union and those of the separate memberstates. However, the car testing organisation EuroNCAP is getting an increasing influence onthe safety measures applied in passenger cars as well.
8.2.1. European UnionBy law, every new car in the European Union has to be approved of by means of a Type Ap-proval. This is a process which ensures that new models meet minimum safety and environ-mental standards. The reason why these regulations ensure only a minimum amount of pas-sive safety is that the legal regulations are somewhat behind with respect to the current stateof technology, as usual. These laws are an instantaneous compromise between research, de-velopment (state of technology at that time) and demands coming from (usually only national)society and that is why they become outdated pretty fast.271 An overview of the minimumsafety standards can be found in Appendix I.
Most of the national and European safety regulations with respect to passive safetyoriginate almost directly from those issued by the American Department of Transportationand National Highway Traffic Safety Administration since the end of the sixties.272 Contraryto national guidelines, the guidelines of the European Union (EU), issued by the EuropeanEnhanced Vehicle Safety Committee, are aimed at optional application; in other words, theycan be applied instead of national regulations ("optional harmonisation"). At the moment, theEU-countries are transferring to the system in which the members can be ordered to refusenational utilisation approval of a vehicle when it fails to meet EU-guidelines ("total harmoni-sation"). Apart from the guidelines, resolutions and decisions as well as recommendations and
269 Pasma/Latijnhouwers, Metro 4 August 2000270 SWOV, 2000271 Kramer, 1998; 112272 Kramer, 1998; 112
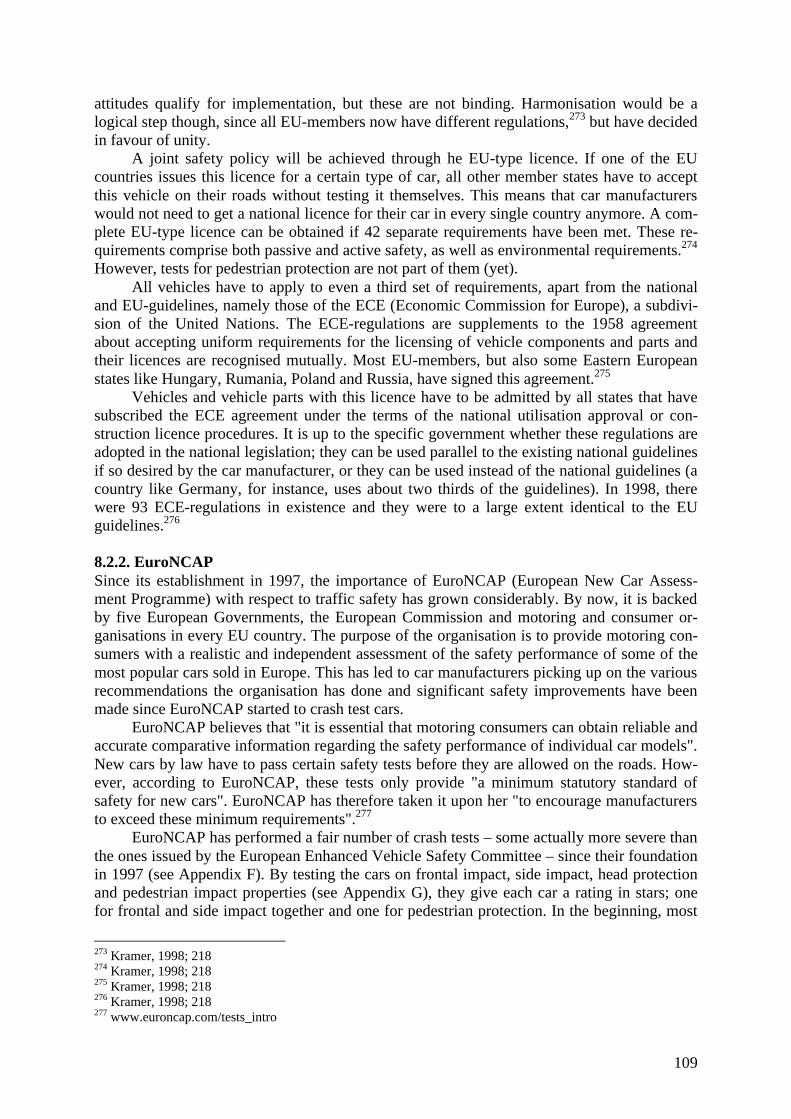
109
attitudes qualify for implementation, but these are not binding. Harmonisation would be alogical step though, since all EU-members now have different regulations,273 but have decidedin favour of unity.
A joint safety policy will be achieved through he EU-type licence. If one of the EUcountries issues this licence for a certain type of car, all other member states have to acceptthis vehicle on their roads without testing it themselves. This means that car manufacturerswould not need to get a national licence for their car in every single country anymore. A com-plete EU-type licence can be obtained if 42 separate requirements have been met. These re-quirements comprise both passive and active safety, as well as environmental requirements.274
However, tests for pedestrian protection are not part of them (yet).All vehicles have to apply to even a third set of requirements, apart from the national
and EU-guidelines, namely those of the ECE (Economic Commission for Europe), a subdivi-sion of the United Nations. The ECE-regulations are supplements to the 1958 agreementabout accepting uniform requirements for the licensing of vehicle components and parts andtheir licences are recognised mutually. Most EU-members, but also some Eastern Europeanstates like Hungary, Rumania, Poland and Russia, have signed this agreement.275
Vehicles and vehicle parts with this licence have to be admitted by all states that havesubscribed the ECE agreement under the terms of the national utilisation approval or con-struction licence procedures. It is up to the specific government whether these regulations areadopted in the national legislation; they can be used parallel to the existing national guidelinesif so desired by the car manufacturer, or they can be used instead of the national guidelines (acountry like Germany, for instance, uses about two thirds of the guidelines). In 1998, therewere 93 ECE-regulations in existence and they were to a large extent identical to the EUguidelines.276
8.2.2. EuroNCAPSince its establishment in 1997, the importance of EuroNCAP (European New Car Assess-ment Programme) with respect to traffic safety has grown considerably. By now, it is backedby five European Governments, the European Commission and motoring and consumer or-ganisations in every EU country. The purpose of the organisation is to provide motoring con-sumers with a realistic and independent assessment of the safety performance of some of themost popular cars sold in Europe. This has led to car manufacturers picking up on the variousrecommendations the organisation has done and significant safety improvements have beenmade since EuroNCAP started to crash test cars.
EuroNCAP believes that "it is essential that motoring consumers can obtain reliable andaccurate comparative information regarding the safety performance of individual car models".New cars by law have to pass certain safety tests before they are allowed on the roads. How-ever, according to EuroNCAP, these tests only provide "a minimum statutory standard ofsafety for new cars". EuroNCAP has therefore taken it upon her "to encourage manufacturersto exceed these minimum requirements".277
EuroNCAP has performed a fair number of crash tests – some actually more severe thanthe ones issued by the European Enhanced Vehicle Safety Committee – since their foundationin 1997 (see Appendix F). By testing the cars on frontal impact, side impact, head protectionand pedestrian impact properties (see Appendix G), they give each car a rating in stars; onefor frontal and side impact together and one for pedestrian protection. In the beginning, most
273 Kramer, 1998; 218274 Kramer, 1998; 218275 Kramer, 1998; 218276 Kramer, 1998; 218277 www.euroncap.com/tests_intro
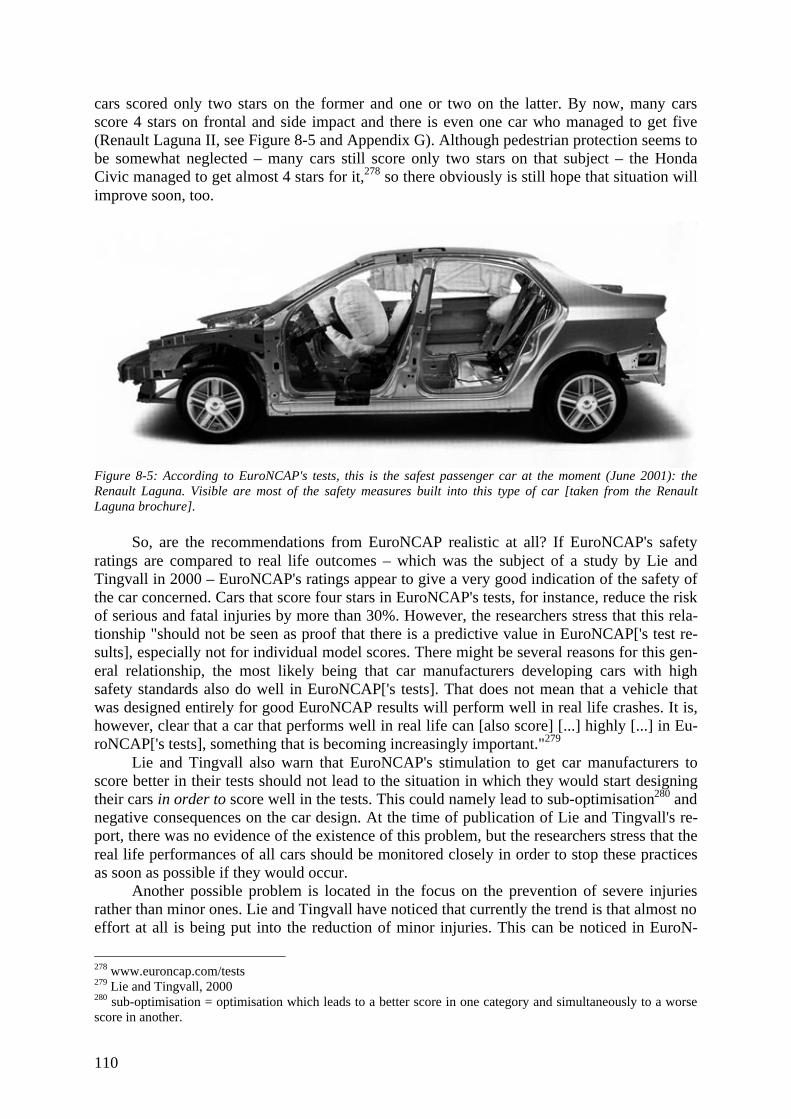
110
cars scored only two stars on the former and one or two on the latter. By now, many carsscore 4 stars on frontal and side impact and there is even one car who managed to get five(Renault Laguna II, see Figure 8-5 and Appendix G). Although pedestrian protection seems tobe somewhat neglected – many cars still score only two stars on that subject – the HondaCivic managed to get almost 4 stars for it,278 so there obviously is still hope that situation willimprove soon, too.
Figure 8-5: According to EuroNCAP's tests, this is the safest passenger car at the moment (June 2001): theRenault Laguna. Visible are most of the safety measures built into this type of car [taken from the RenaultLaguna brochure].
So, are the recommendations from EuroNCAP realistic at all? If EuroNCAP's safetyratings are compared to real life outcomes – which was the subject of a study by Lie andTingvall in 2000 – EuroNCAP's ratings appear to give a very good indication of the safety ofthe car concerned. Cars that score four stars in EuroNCAP's tests, for instance, reduce the riskof serious and fatal injuries by more than 30%. However, the researchers stress that this rela-tionship "should not be seen as proof that there is a predictive value in EuroNCAP['s test re-sults], especially not for individual model scores. There might be several reasons for this gen-eral relationship, the most likely being that car manufacturers developing cars with highsafety standards also do well in EuroNCAP['s tests]. That does not mean that a vehicle thatwas designed entirely for good EuroNCAP results will perform well in real life crashes. It is,however, clear that a car that performs well in real life can [also score] [...] highly [...] in Eu-roNCAP['s tests], something that is becoming increasingly important."279
Lie and Tingvall also warn that EuroNCAP's stimulation to get car manufacturers toscore better in their tests should not lead to the situation in which they would start designingtheir cars in order to score well in the tests. This could namely lead to sub-optimisation280 andnegative consequences on the car design. At the time of publication of Lie and Tingvall's re-port, there was no evidence of the existence of this problem, but the researchers stress that thereal life performances of all cars should be monitored closely in order to stop these practicesas soon as possible if they would occur.
Another possible problem is located in the focus on the prevention of severe injuriesrather than minor ones. Lie and Tingvall have noticed that currently the trend is that almost noeffort at all is being put into the reduction of minor injuries. This can be noticed in EuroN-
278 www.euroncap.com/tests279 Lie and Tingvall, 2000280 sub-optimisation = optimisation which leads to a better score in one category and simultaneously to a worsescore in another.
111
CAP's tests and in the direction car development in general is taking, and is also reflected inreal life crashes. Even though this does not seem to be that problematic at first sight, experi-ence learns that especially minor injuries like fractures and whiplash can generate long termhealth loss (see also Paragraph 6.1.2).
8.3. Conclusions
The Dutch government is planning to take measures to anticipate on the expected growth oftraffic, transport and traffic congestions in the near future. Apart from that, they strive to im-prove the infrastructure, environment, safety and to increase the use of public transport as analternative for the car.
The improvement in traffic safety should be achieved by getting everybody to take re-sponsibility for their own safety and that of others. The tools to create that situation arethought to be law enforcement and regulation, information and education, altering roads andapplying new technology. However, paradoxically enough, most of the technology sponsoredby the NVVP, like automatic vehicle guidance, lane-keeping, on-board computers, sped con-trol devices, intelligent speed adjustment and collision prevention, seem to rather take thisresponsibility away from the driver. New technology is also expected to simplify the processof driving, which too seems to take some responsibility away, though now for the drivingprocess, since the car takes that over from the driver. The costs to increase traffic safety – butalso to aid the environment, road maintenance and management – will, however, certainly bethe responsibility of the driver; the more someone drives, the more he'll have to pay.
Driver education does speed up the learning process of how to drive a car, but it cannotteach safety. Learning the latter is more a case of trial and error, but – apart from simulatorsand special circuits – there is no space to carry that out safely. Simulators could probably alsomake drivers more aware of the effect of alcohol on their driving, because most people stillappear to be somewhat in the dark with respect to how many glasses of which alcoholic bev-erage will still be "safe".
A car needs to be in perfect working order and shape to be allowed on the roads. De-fects which could threaten traffic safety (or environment) are subject to fines. In order to pre-vent excesses, all owners of cars 3 years old and older have to get their car checked (at least)every year. On the other hand, the fact that the car passed the test is thought to give drivers afalse feeling of safety; they become over-confident. Still, Swedish figures seem to negate boththis effect and the possible dangers of an older population of cars.
All drivers have to observe traffic signs and rules. Speed limits are probably one of themost important issues in those categories since speeding causes many accidents. Driving adifferent (much lower or higher) speed can lead to crashes, where the actual speed (partly)determines the severity of the crash. The choice of speed has appeared to be a compromisebetween a driver's desires for pleasure and those for safety. The latter has appeared to be un-derestimated systematically, though.
The police carry out large monitoring actions in which offenders are fined for speeding,not wearing a safety belt, not wearing a helmet, jumping the lights, and driving under the in-fluence; the five things that most lead to severe accidents. Figures have shown that this sur-veillance does indeed help to decrease the occurrence of these offences.
The European Union is striving for harmonisation of type-licenses. Cars that have beenapproved under that licence in one country will have to be accepted in the others as well.
Another European organisation, EuroNCAP, is stimulating car manufacturers to in-crease the safety level of their products. Their tests are in a few cases even more severe than
112
the minimum requirements issued by the European Enhanced Vehicle safety Committee andthey seem to have indeed resulted in safer cars.
However, EuroNCAP seems to distract the attention of the public from the real prob-lem. By rating popular cars with certain amounts of stars to indicate how safe they are in frontand side-crashes, and stimulating car manufacturers to reach the maximum of 5 stars, theysuggest that the manufacturers are pretty much responsible for the outcome of an accident.The point that gets largely neglected through this is that the driver is to blame for the accidentin 85 to 95% of all cases. It seems as if this responsibility is pushed more and more into thedirection of the car (-manufacturer). With the ongoing computerisation of the modern passen-ger car, this responsibility is gradually taken out of the driver's hands and I would argue thatthat is a bad development, unless the government and/or the public would decide that thedriver should be taken out of the man-machine-environment system entirely. (This seems tobe a viable option, considering the direction both car manufacturers and government aremoving in.)
Another point I would like to raise with respect to EuroNCAP is their, in my opinion,sometimes rather overestimated importance. One could, of course, argue that the organisationhas not been in existence for that long (1997), but the fact is that the information they provideis incomplete and often outdated. Of course, it is near impossible to test all passenger cars thatare being built around the world, but then it might be a good plan to follow the developmentof the cars they did test very closely in order to present trends in the development of safetymeasures. Car manufacturers tend to update their products about every year, but EuroNCAPdoes not always do the same. This is why one could get the impression that a certain type ofcar would not be that good safety-wise, although the version of the year running would live upto higher standards indeed.
Furthermore, the incompleteness of EuroNCAP's information can be found in the factthat they only test one version of a certain type of car. That is not necessarily the standardversion! Since the more luxurious versions are often equipped with more extensive safetymeasures than the standard version, the level of protection of the occupants will most likelybe different as well. Still, this fact is not clearly mentioned on EuroNCAP's website where theresults are presented to the public.
Another question is: what will be the next step when all but every type of car hasreached the magical five star ratings? I have the feeling that they would just raise the condi-tions. Still, as mentioned in Chapter 2, there is a limit to how much the safety of a car can beincreased.
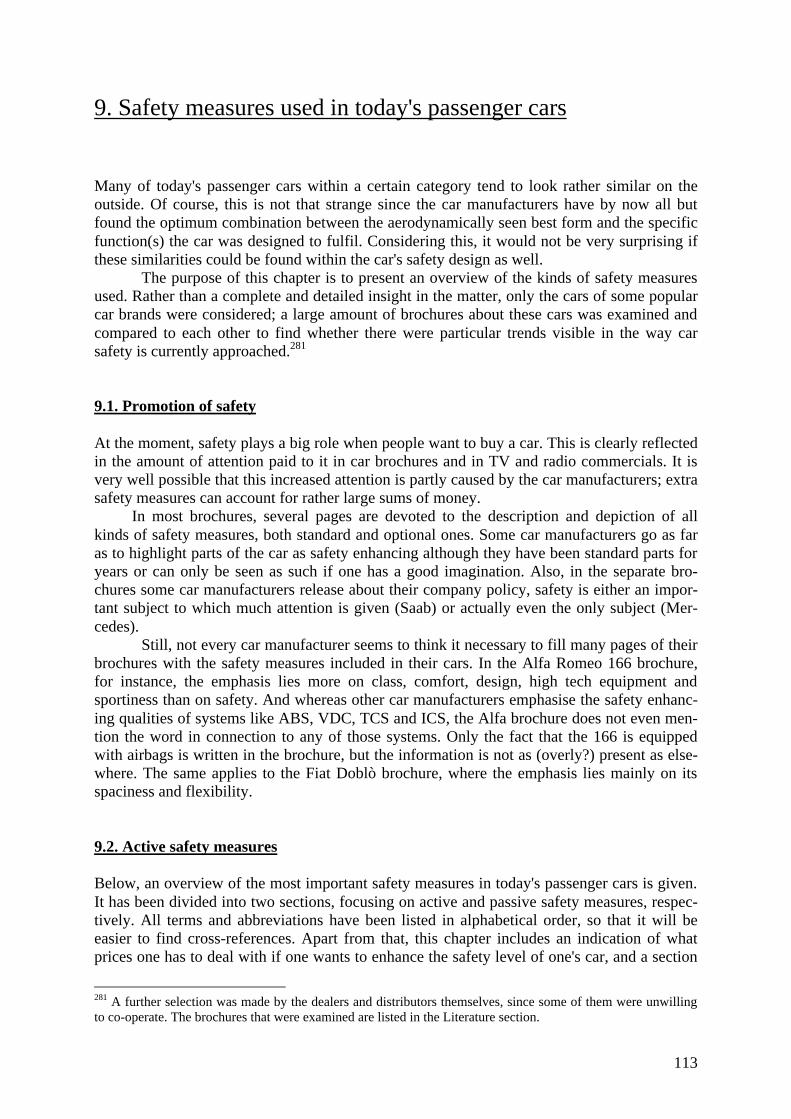
113
9. Safety measures used in today's passenger cars
Many of today's passenger cars within a certain category tend to look rather similar on theoutside. Of course, this is not that strange since the car manufacturers have by now all butfound the optimum combination between the aerodynamically seen best form and the specificfunction(s) the car was designed to fulfil. Considering this, it would not be very surprising ifthese similarities could be found within the car's safety design as well.
The purpose of this chapter is to present an overview of the kinds of safety measuresused. Rather than a complete and detailed insight in the matter, only the cars of some popularcar brands were considered; a large amount of brochures about these cars was examined andcompared to each other to find whether there were particular trends visible in the way carsafety is currently approached.281
9.1. Promotion of safety
At the moment, safety plays a big role when people want to buy a car. This is clearly reflectedin the amount of attention paid to it in car brochures and in TV and radio commercials. It isvery well possible that this increased attention is partly caused by the car manufacturers; extrasafety measures can account for rather large sums of money.
In most brochures, several pages are devoted to the description and depiction of allkinds of safety measures, both standard and optional ones. Some car manufacturers go as faras to highlight parts of the car as safety enhancing although they have been standard parts foryears or can only be seen as such if one has a good imagination. Also, in the separate bro-chures some car manufacturers release about their company policy, safety is either an impor-tant subject to which much attention is given (Saab) or actually even the only subject (Mer-cedes).
Still, not every car manufacturer seems to think it necessary to fill many pages of theirbrochures with the safety measures included in their cars. In the Alfa Romeo 166 brochure,for instance, the emphasis lies more on class, comfort, design, high tech equipment andsportiness than on safety. And whereas other car manufacturers emphasise the safety enhanc-ing qualities of systems like ABS, VDC, TCS and ICS, the Alfa brochure does not even men-tion the word in connection to any of those systems. Only the fact that the 166 is equippedwith airbags is written in the brochure, but the information is not as (overly?) present as else-where. The same applies to the Fiat Doblò brochure, where the emphasis lies mainly on itsspaciness and flexibility.
9.2. Active safety measures
Below, an overview of the most important safety measures in today's passenger cars is given.It has been divided into two sections, focusing on active and passive safety measures, respec-tively. All terms and abbreviations have been listed in alphabetical order, so that it will beeasier to find cross-references. Apart from that, this chapter includes an indication of whatprices one has to deal with if one wants to enhance the safety level of one's car, and a section
281 A further selection was made by the dealers and distributors themselves, since some of them were unwillingto co-operate. The brochures that were examined are listed in the Literature section.
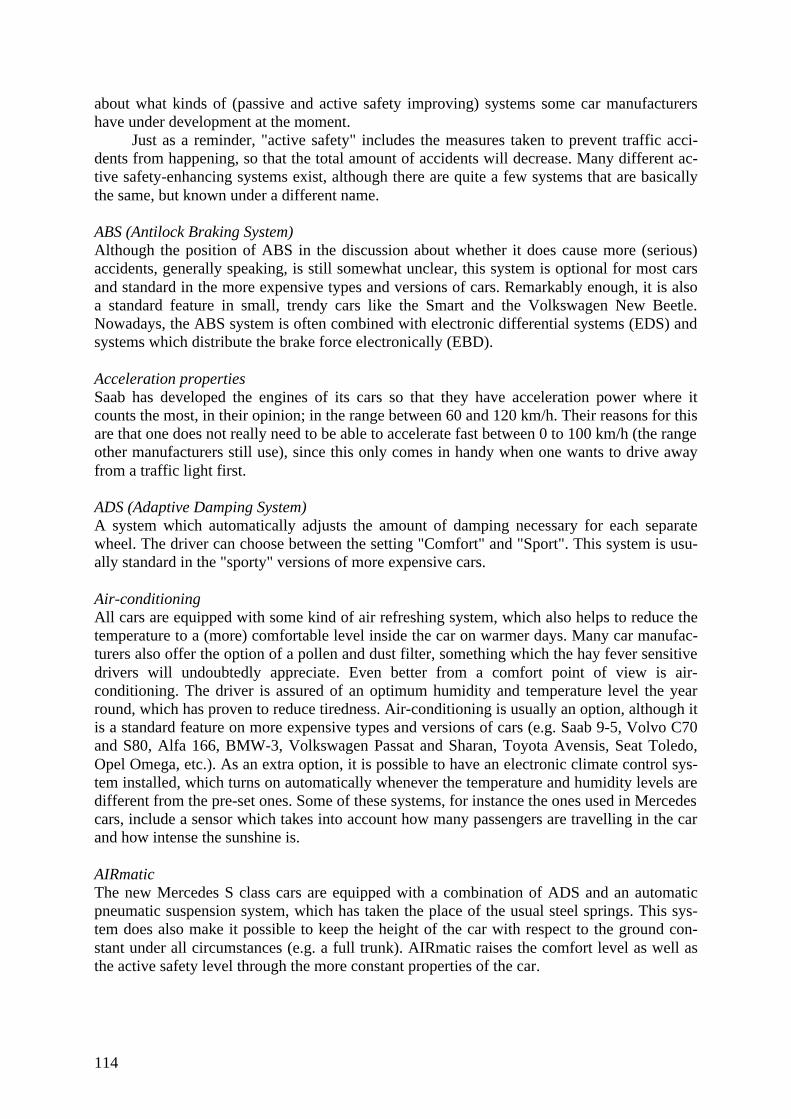
114
about what kinds of (passive and active safety improving) systems some car manufacturershave under development at the moment.
Just as a reminder, "active safety" includes the measures taken to prevent traffic acci-dents from happening, so that the total amount of accidents will decrease. Many different ac-tive safety-enhancing systems exist, although there are quite a few systems that are basicallythe same, but known under a different name.
ABS (Antilock Braking System)Although the position of ABS in the discussion about whether it does cause more (serious)accidents, generally speaking, is still somewhat unclear, this system is optional for most carsand standard in the more expensive types and versions of cars. Remarkably enough, it is alsoa standard feature in small, trendy cars like the Smart and the Volkswagen New Beetle.Nowadays, the ABS system is often combined with electronic differential systems (EDS) andsystems which distribute the brake force electronically (EBD).
Acceleration propertiesSaab has developed the engines of its cars so that they have acceleration power where itcounts the most, in their opinion; in the range between 60 and 120 km/h. Their reasons for thisare that one does not really need to be able to accelerate fast between 0 to 100 km/h (the rangeother manufacturers still use), since this only comes in handy when one wants to drive awayfrom a traffic light first.
ADS (Adaptive Damping System)A system which automatically adjusts the amount of damping necessary for each separatewheel. The driver can choose between the setting "Comfort" and "Sport". This system is usu-ally standard in the "sporty" versions of more expensive cars.
Air-conditioningAll cars are equipped with some kind of air refreshing system, which also helps to reduce thetemperature to a (more) comfortable level inside the car on warmer days. Many car manufac-turers also offer the option of a pollen and dust filter, something which the hay fever sensitivedrivers will undoubtedly appreciate. Even better from a comfort point of view is air-conditioning. The driver is assured of an optimum humidity and temperature level the yearround, which has proven to reduce tiredness. Air-conditioning is usually an option, although itis a standard feature on more expensive types and versions of cars (e.g. Saab 9-5, Volvo C70and S80, Alfa 166, BMW-3, Volkswagen Passat and Sharan, Toyota Avensis, Seat Toledo,Opel Omega, etc.). As an extra option, it is possible to have an electronic climate control sys-tem installed, which turns on automatically whenever the temperature and humidity levels aredifferent from the pre-set ones. Some of these systems, for instance the ones used in Mercedescars, include a sensor which takes into account how many passengers are travelling in the carand how intense the sunshine is.
AIRmaticThe new Mercedes S class cars are equipped with a combination of ADS and an automaticpneumatic suspension system, which has taken the place of the usual steel springs. This sys-tem does also make it possible to keep the height of the car with respect to the ground con-stant under all circumstances (e.g. a full trunk). AIRmatic raises the comfort level as well asthe active safety level through the more constant properties of the car.
115
Air quality sensorMercedes cars have been equipped with a sensor which measures the quality of the air andautomatically closes the ventilation valves when it senses too high amounts of carbon mon-oxide or nitrogen oxide.
ASC&T (Automatic Stability and Traction Control)A system which prevents skidding of the powered wheels at all velocities, in other words, astability enhancing feature. If the car threatens to lose traction, for instance when it acceler-ates from standstill or in a bend, then the engine management computer decreases the enginepower automatically (see Figure 9-1). If this does not have the desired effect, the brake is ap-plied to the skidding wheel or wheels until the traction has reached its optimum value again.This system can be turned off if the driver wants to be able to leave "spinning wheels". Stan-dard on all BMW 3 series cars and on many other more luxurious cars, but usually knownunder a different name (see also under TCS).
Figure 9-1: How ASC&T can prevent the car from being uncontrollable entirely [taken from the BMW 3 seriesbrochure].
ASR (Anti Spin Regulation)System which prevents skidding of the wheels in case of fast acceleration or acceleration on aslippery road. Standard on the Volkswagen Passat, Citroën C5 Berline and Peugeot 607 V6,but used (under a different name) in other cars as well.
Audio system control on the steering wheelLooking for a different radio channel or changing a tape or CD has probably caused quite afew dangerous situations and accidents. This is why expensive types and versions of cars havethe option to install a control for the audio system on the steering wheel.
BAS (Brake Assist System)People have appeared to be unable to maintain the necessary force on the brake pedal duringemergency stops in 90% of all cases. Therefore, a system was developed which judges thenecessary force from the speed the driver is applying the brake. At a speed of 50 km/h thedistance before the car came to a complete halt was 11 m shorter with BAS than without.Some car manufacturers mention this system separately (Citroën, Toyota), others see it as anintegral part of ABS.
CBC (Cornering Brake Control)This system is a more advanced version of ABS. CBC is claimed to deliver perfect directionstability through separate brake pressure on each wheel in case one needs to brake firmly inbends (see Figure 9-2). Standard on BMW 3 series.
116
Figure 9-2: One of the manoeuvres a car can perform through CBC in case of an emergency [taken from theBMW 3 series brochure].
ComfortIn order to reduce stress and tiredness for the driver and with that increasing safety, many carmanufacturers provide a wide range of comfort enhancing systems and parts. Mercedes goeseven as far as to install seats with adjustable heating and a pulsating aircushion in the backinto its S-class cars.
Dependable mirrorsExternal mirrors can get covered with ice in the winter, which means that the driver is unableto see clearly what happens behind him. A heated mirror is therefore a safety enhancing solu-tion which is standard on the more expensive types and versions of cars and optional other-wise. Some external mirrors of today have been made a-spherical, so that they almost have noblind spots anymore.An internal mirror can blind a driver at night when the headlights of a car behind him shinedirectly into it. Almost all cars offer the opportunity to turn the mirror downwards, to avoidthis, but there are also cars that feature a mirror with darkening glass instead.
DISTRONICThis is a system based on radar which reacts to the behaviour of the car in front and automati-cally adjusts the distance between the two cars when it threatens to become too small. Whenthe system has not been activated, Distronic will only register the traffic situation and warnthe driver whenever the distance between the cars becomes unsafe. Optional on all Mercedescars.282
DSA (Dynamic Safety)Course stability and precise transfer of the steering wheel movements to the wheels in bends.Standard on Opel's Astra, Omega, Vectra and Zafira types.
DSC (Dynamic Stability Control)A system which includes ADB (Automatic Differential Brake) and DBC (Dynamic BrakeControl). Its sensors which will notice any out of the ordinary acceleration in whichever di-rection. The system will subsequently regulate the engine and brake one or more wheels ifnecessary. This way the car will keep to its intended trajectory (see Figure 9-3). Optional onBMW 3 series and Mazda 323 2.0i Sportive.
282 Mercedes-Benz News: over de toekomst van de automobiel, winter 2000
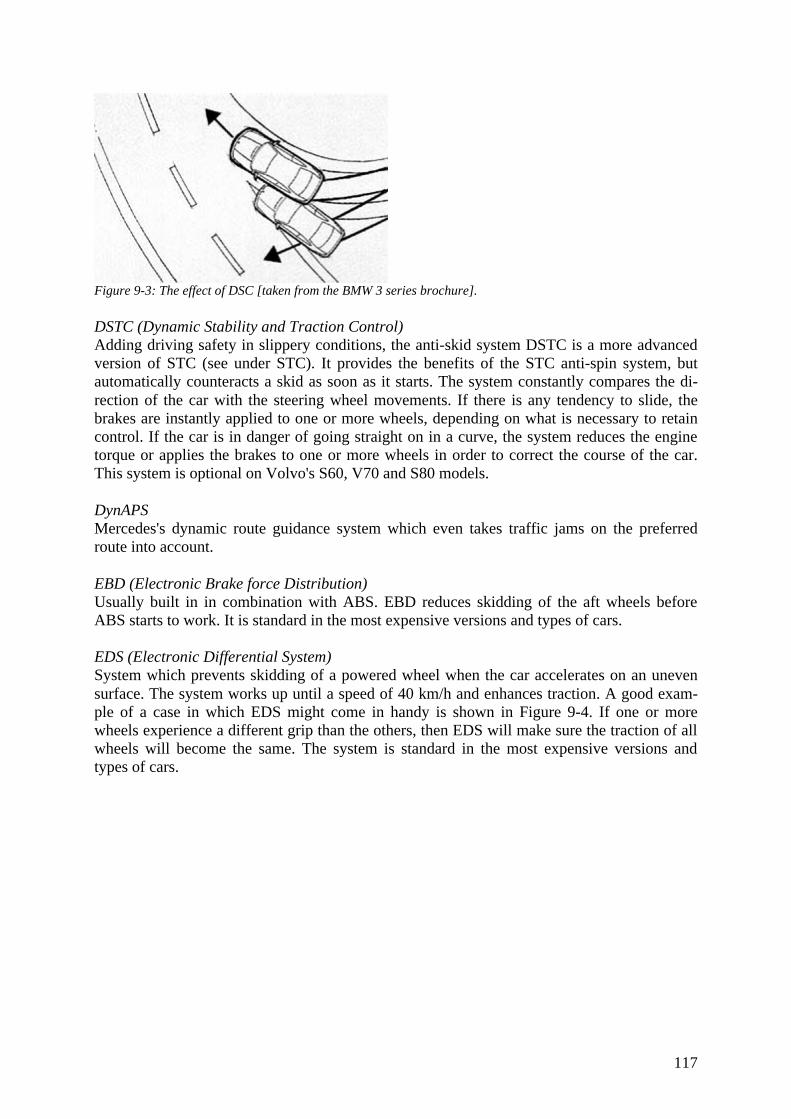
117
Figure 9-3: The effect of DSC [taken from the BMW 3 series brochure].
DSTC (Dynamic Stability and Traction Control)Adding driving safety in slippery conditions, the anti-skid system DSTC is a more advancedversion of STC (see under STC). It provides the benefits of the STC anti-spin system, butautomatically counteracts a skid as soon as it starts. The system constantly compares the di-rection of the car with the steering wheel movements. If there is any tendency to slide, thebrakes are instantly applied to one or more wheels, depending on what is necessary to retaincontrol. If the car is in danger of going straight on in a curve, the system reduces the enginetorque or applies the brakes to one or more wheels in order to correct the course of the car.This system is optional on Volvo's S60, V70 and S80 models.
DynAPSMercedes's dynamic route guidance system which even takes traffic jams on the preferredroute into account.
EBD (Electronic Brake force Distribution)Usually built in in combination with ABS. EBD reduces skidding of the aft wheels beforeABS starts to work. It is standard in the most expensive versions and types of cars.
EDS (Electronic Differential System)System which prevents skidding of a powered wheel when the car accelerates on an unevensurface. The system works up until a speed of 40 km/h and enhances traction. A good exam-ple of a case in which EDS might come in handy is shown in Figure 9-4. If one or morewheels experience a different grip than the others, then EDS will make sure the traction of allwheels will become the same. The system is standard in the most expensive versions andtypes of cars.
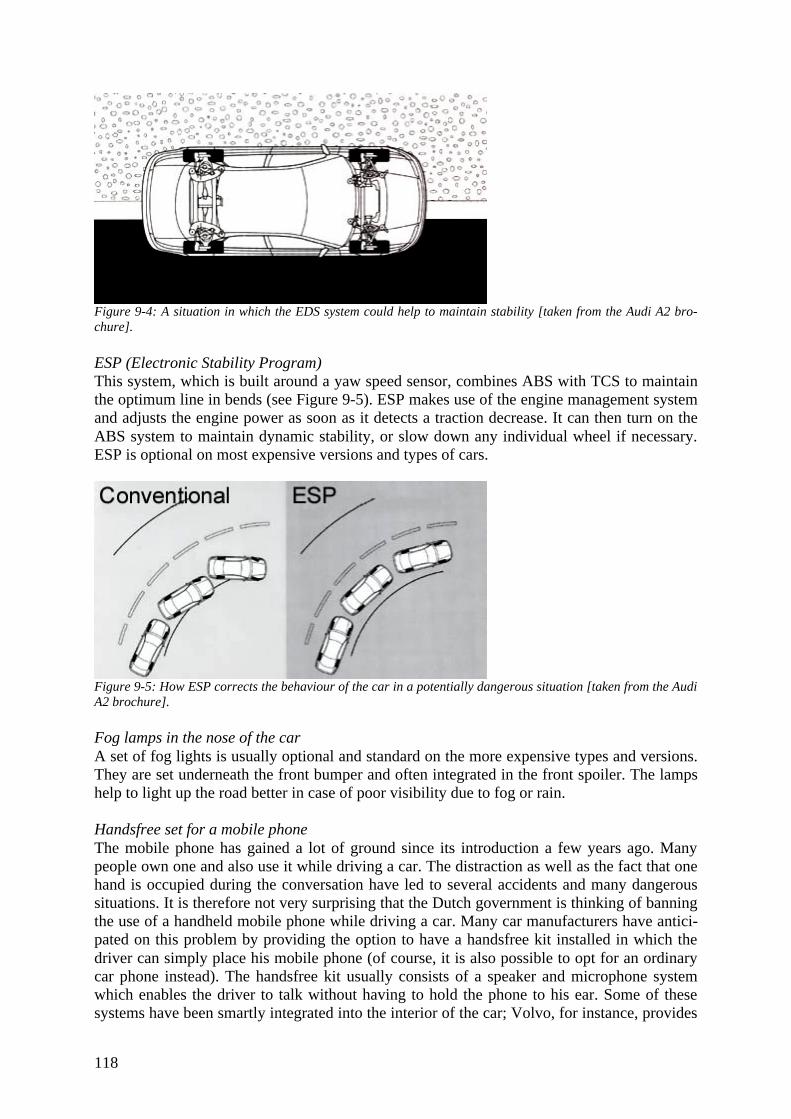
118
Figure 9-4: A situation in which the EDS system could help to maintain stability [taken from the Audi A2 bro-chure].
ESP (Electronic Stability Program)This system, which is built around a yaw speed sensor, combines ABS with TCS to maintainthe optimum line in bends (see Figure 9-5). ESP makes use of the engine management systemand adjusts the engine power as soon as it detects a traction decrease. It can then turn on theABS system to maintain dynamic stability, or slow down any individual wheel if necessary.ESP is optional on most expensive versions and types of cars.
Figure 9-5: How ESP corrects the behaviour of the car in a potentially dangerous situation [taken from the AudiA2 brochure].
Fog lamps in the nose of the carA set of fog lights is usually optional and standard on the more expensive types and versions.They are set underneath the front bumper and often integrated in the front spoiler. The lampshelp to light up the road better in case of poor visibility due to fog or rain.
Handsfree set for a mobile phoneThe mobile phone has gained a lot of ground since its introduction a few years ago. Manypeople own one and also use it while driving a car. The distraction as well as the fact that onehand is occupied during the conversation have led to several accidents and many dangeroussituations. It is therefore not very surprising that the Dutch government is thinking of banningthe use of a handheld mobile phone while driving a car. Many car manufacturers have antici-pated on this problem by providing the option to have a handsfree kit installed in which thedriver can simply place his mobile phone (of course, it is also possible to opt for an ordinarycar phone instead). The handsfree kit usually consists of a speaker and microphone systemwhich enables the driver to talk without having to hold the phone to his ear. Some of thesesystems have been smartly integrated into the interior of the car; Volvo, for instance, provides
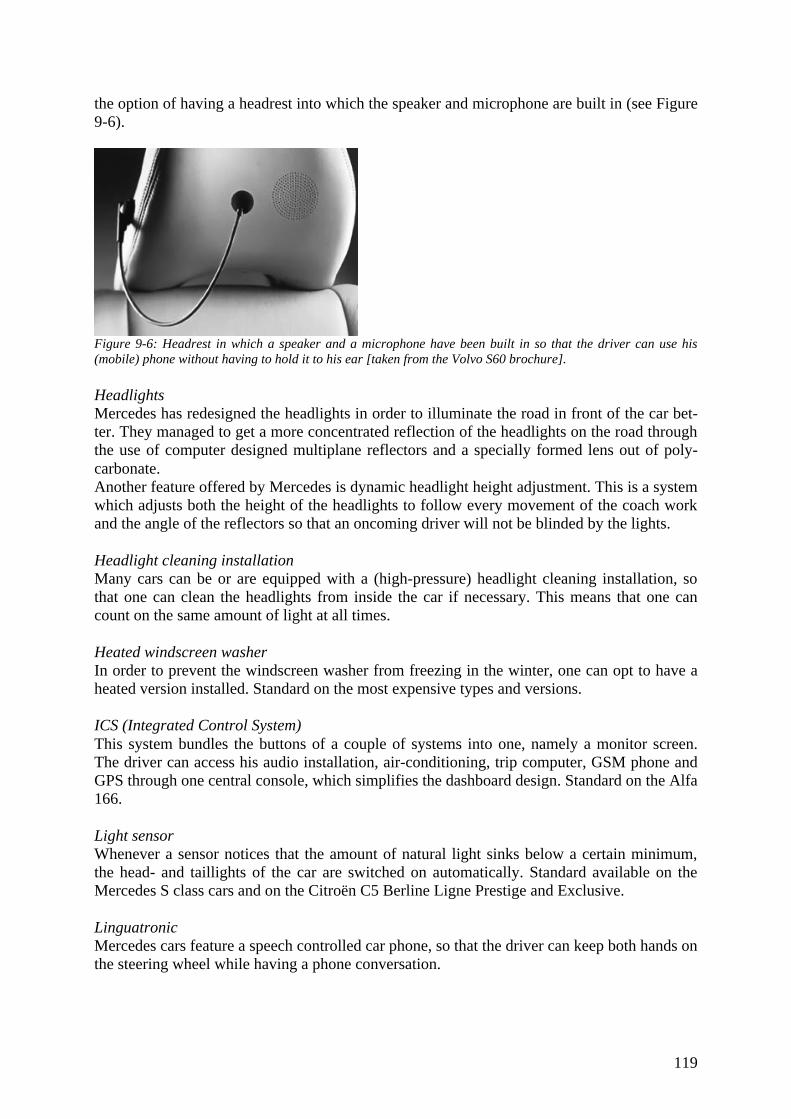
119
the option of having a headrest into which the speaker and microphone are built in (see Figure9-6).
Figure 9-6: Headrest in which a speaker and a microphone have been built in so that the driver can use his(mobile) phone without having to hold it to his ear [taken from the Volvo S60 brochure].
HeadlightsMercedes has redesigned the headlights in order to illuminate the road in front of the car bet-ter. They managed to get a more concentrated reflection of the headlights on the road throughthe use of computer designed multiplane reflectors and a specially formed lens out of poly-carbonate.Another feature offered by Mercedes is dynamic headlight height adjustment. This is a systemwhich adjusts both the height of the headlights to follow every movement of the coach workand the angle of the reflectors so that an oncoming driver will not be blinded by the lights.
Headlight cleaning installationMany cars can be or are equipped with a (high-pressure) headlight cleaning installation, sothat one can clean the headlights from inside the car if necessary. This means that one cancount on the same amount of light at all times.
Heated windscreen washerIn order to prevent the windscreen washer from freezing in the winter, one can opt to have aheated version installed. Standard on the most expensive types and versions.
ICS (Integrated Control System)This system bundles the buttons of a couple of systems into one, namely a monitor screen.The driver can access his audio installation, air-conditioning, trip computer, GSM phone andGPS through one central console, which simplifies the dashboard design. Standard on the Alfa166.
Light sensorWhenever a sensor notices that the amount of natural light sinks below a certain minimum,the head- and taillights of the car are switched on automatically. Standard available on theMercedes S class cars and on the Citroën C5 Berline Ligne Prestige and Exclusive.
LinguatronicMercedes cars feature a speech controlled car phone, so that the driver can keep both hands onthe steering wheel while having a phone conversation.
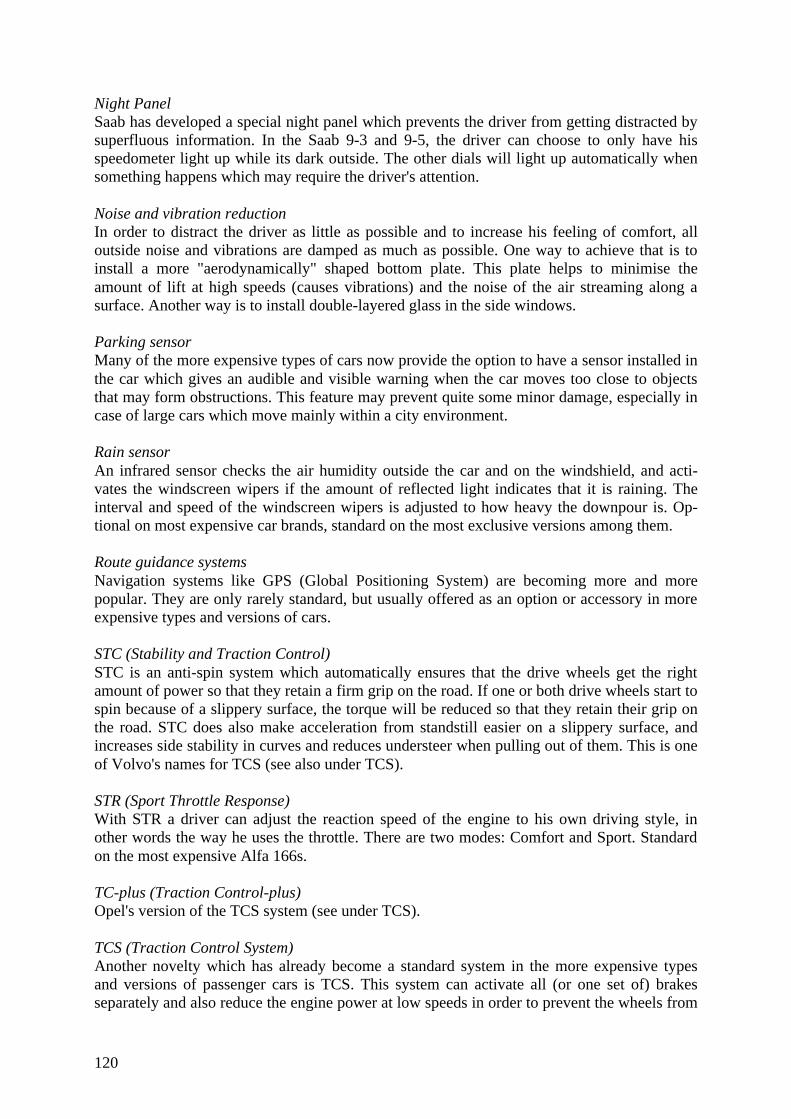
120
Night PanelSaab has developed a special night panel which prevents the driver from getting distracted bysuperfluous information. In the Saab 9-3 and 9-5, the driver can choose to only have hisspeedometer light up while its dark outside. The other dials will light up automatically whensomething happens which may require the driver's attention.
Noise and vibration reductionIn order to distract the driver as little as possible and to increase his feeling of comfort, alloutside noise and vibrations are damped as much as possible. One way to achieve that is toinstall a more "aerodynamically" shaped bottom plate. This plate helps to minimise theamount of lift at high speeds (causes vibrations) and the noise of the air streaming along asurface. Another way is to install double-layered glass in the side windows.
Parking sensorMany of the more expensive types of cars now provide the option to have a sensor installed inthe car which gives an audible and visible warning when the car moves too close to objectsthat may form obstructions. This feature may prevent quite some minor damage, especially incase of large cars which move mainly within a city environment.
Rain sensorAn infrared sensor checks the air humidity outside the car and on the windshield, and acti-vates the windscreen wipers if the amount of reflected light indicates that it is raining. Theinterval and speed of the windscreen wipers is adjusted to how heavy the downpour is. Op-tional on most expensive car brands, standard on the most exclusive versions among them.
Route guidance systemsNavigation systems like GPS (Global Positioning System) are becoming more and morepopular. They are only rarely standard, but usually offered as an option or accessory in moreexpensive types and versions of cars.
STC (Stability and Traction Control)STC is an anti-spin system which automatically ensures that the drive wheels get the rightamount of power so that they retain a firm grip on the road. If one or both drive wheels start tospin because of a slippery surface, the torque will be reduced so that they retain their grip onthe road. STC does also make acceleration from standstill easier on a slippery surface, andincreases side stability in curves and reduces understeer when pulling out of them. This is oneof Volvo's names for TCS (see also under TCS).
STR (Sport Throttle Response)With STR a driver can adjust the reaction speed of the engine to his own driving style, inother words the way he uses the throttle. There are two modes: Comfort and Sport. Standardon the most expensive Alfa 166s.
TC-plus (Traction Control-plus)Opel's version of the TCS system (see under TCS).
TCS (Traction Control System)Another novelty which has already become a standard system in the more expensive typesand versions of passenger cars is TCS. This system can activate all (or one set of) brakesseparately and also reduce the engine power at low speeds in order to prevent the wheels from
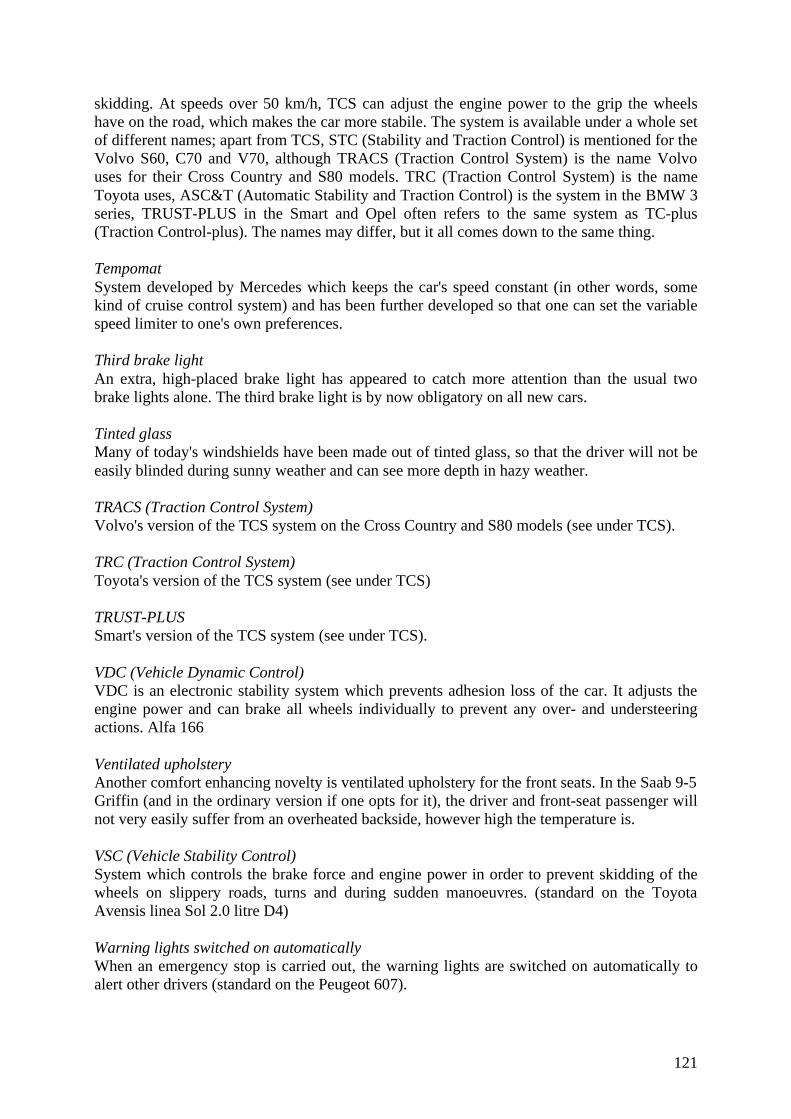
121
skidding. At speeds over 50 km/h, TCS can adjust the engine power to the grip the wheelshave on the road, which makes the car more stabile. The system is available under a whole setof different names; apart from TCS, STC (Stability and Traction Control) is mentioned for theVolvo S60, C70 and V70, although TRACS (Traction Control System) is the name Volvouses for their Cross Country and S80 models. TRC (Traction Control System) is the nameToyota uses, ASC&T (Automatic Stability and Traction Control) is the system in the BMW 3series, TRUST-PLUS in the Smart and Opel often refers to the same system as TC-plus(Traction Control-plus). The names may differ, but it all comes down to the same thing.
TempomatSystem developed by Mercedes which keeps the car's speed constant (in other words, somekind of cruise control system) and has been further developed so that one can set the variablespeed limiter to one's own preferences.
Third brake lightAn extra, high-placed brake light has appeared to catch more attention than the usual twobrake lights alone. The third brake light is by now obligatory on all new cars.
Tinted glassMany of today's windshields have been made out of tinted glass, so that the driver will not beeasily blinded during sunny weather and can see more depth in hazy weather.
TRACS (Traction Control System)Volvo's version of the TCS system on the Cross Country and S80 models (see under TCS).
TRC (Traction Control System)Toyota's version of the TCS system (see under TCS)
TRUST-PLUSSmart's version of the TCS system (see under TCS).
VDC (Vehicle Dynamic Control)VDC is an electronic stability system which prevents adhesion loss of the car. It adjusts theengine power and can brake all wheels individually to prevent any over- and understeeringactions. Alfa 166
Ventilated upholsteryAnother comfort enhancing novelty is ventilated upholstery for the front seats. In the Saab 9-5Griffin (and in the ordinary version if one opts for it), the driver and front-seat passenger willnot very easily suffer from an overheated backside, however high the temperature is.
VSC (Vehicle Stability Control)System which controls the brake force and engine power in order to prevent skidding of thewheels on slippery roads, turns and during sudden manoeuvres. (standard on the ToyotaAvensis linea Sol 2.0 litre D4)
Warning lights switched on automaticallyWhen an emergency stop is carried out, the warning lights are switched on automatically toalert other drivers (standard on the Peugeot 607).
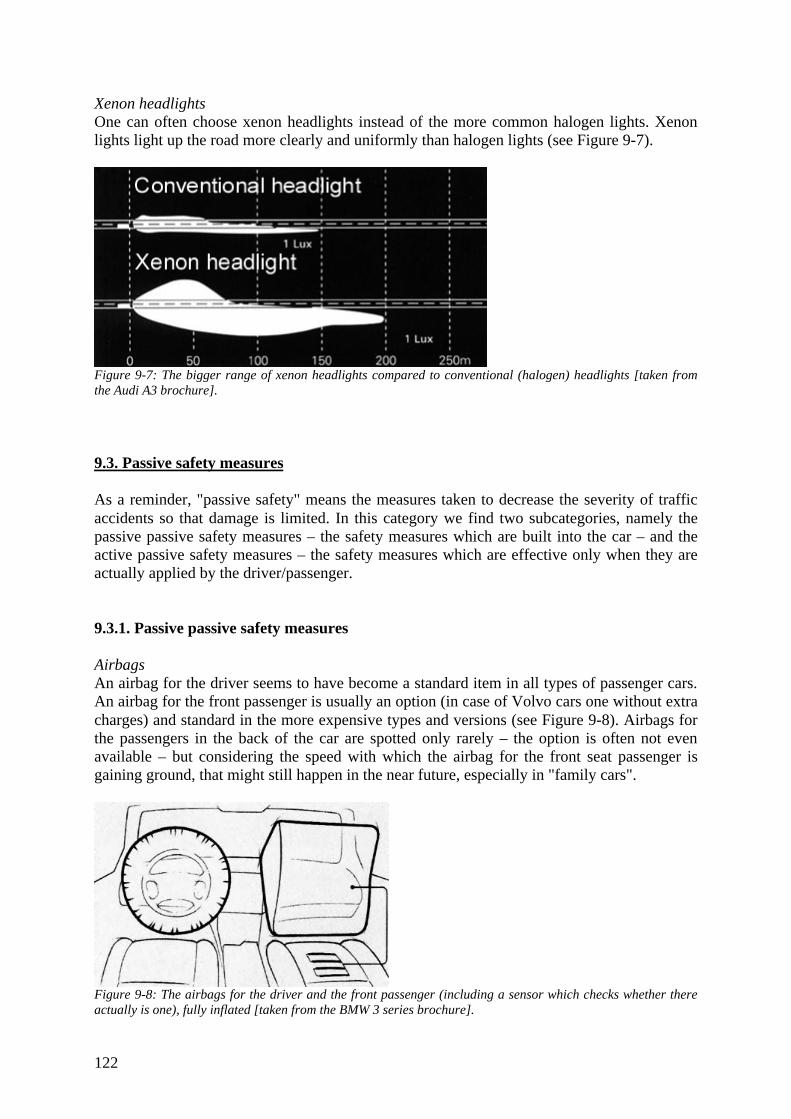
122
Xenon headlightsOne can often choose xenon headlights instead of the more common halogen lights. Xenonlights light up the road more clearly and uniformly than halogen lights (see Figure 9-7).
Figure 9-7: The bigger range of xenon headlights compared to conventional (halogen) headlights [taken fromthe Audi A3 brochure].
9.3. Passive safety measures
As a reminder, "passive safety" means the measures taken to decrease the severity of trafficaccidents so that damage is limited. In this category we find two subcategories, namely thepassive passive safety measures – the safety measures which are built into the car – and theactive passive safety measures – the safety measures which are effective only when they areactually applied by the driver/passenger.
9.3.1. Passive passive safety measures
AirbagsAn airbag for the driver seems to have become a standard item in all types of passenger cars.An airbag for the front passenger is usually an option (in case of Volvo cars one without extracharges) and standard in the more expensive types and versions (see Figure 9-8). Airbags forthe passengers in the back of the car are spotted only rarely – the option is often not evenavailable – but considering the speed with which the airbag for the front seat passenger isgaining ground, that might still happen in the near future, especially in "family cars".
Figure 9-8: The airbags for the driver and the front passenger (including a sensor which checks whether thereactually is one), fully inflated [taken from the BMW 3 series brochure].
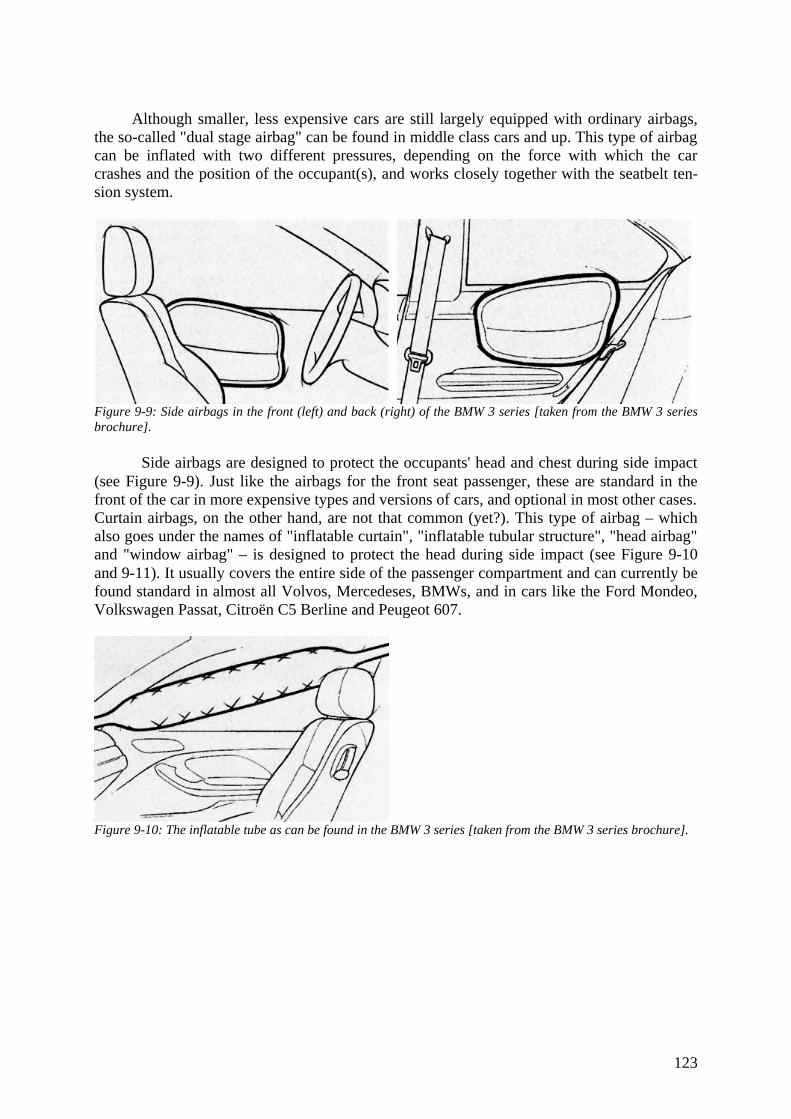
123
Although smaller, less expensive cars are still largely equipped with ordinary airbags,the so-called "dual stage airbag" can be found in middle class cars and up. This type of airbagcan be inflated with two different pressures, depending on the force with which the carcrashes and the position of the occupant(s), and works closely together with the seatbelt ten-sion system.
Figure 9-9: Side airbags in the front (left) and back (right) of the BMW 3 series [taken from the BMW 3 seriesbrochure].
Side airbags are designed to protect the occupants' head and chest during side impact(see Figure 9-9). Just like the airbags for the front seat passenger, these are standard in thefront of the car in more expensive types and versions of cars, and optional in most other cases.Curtain airbags, on the other hand, are not that common (yet?). This type of airbag – whichalso goes under the names of "inflatable curtain", "inflatable tubular structure", "head airbag"and "window airbag" – is designed to protect the head during side impact (see Figure 9-10and 9-11). It usually covers the entire side of the passenger compartment and can currently befound standard in almost all Volvos, Mercedeses, BMWs, and in cars like the Ford Mondeo,Volkswagen Passat, Citroën C5 Berline and Peugeot 607.
Figure 9-10: The inflatable tube as can be found in the BMW 3 series [taken from the BMW 3 series brochure].
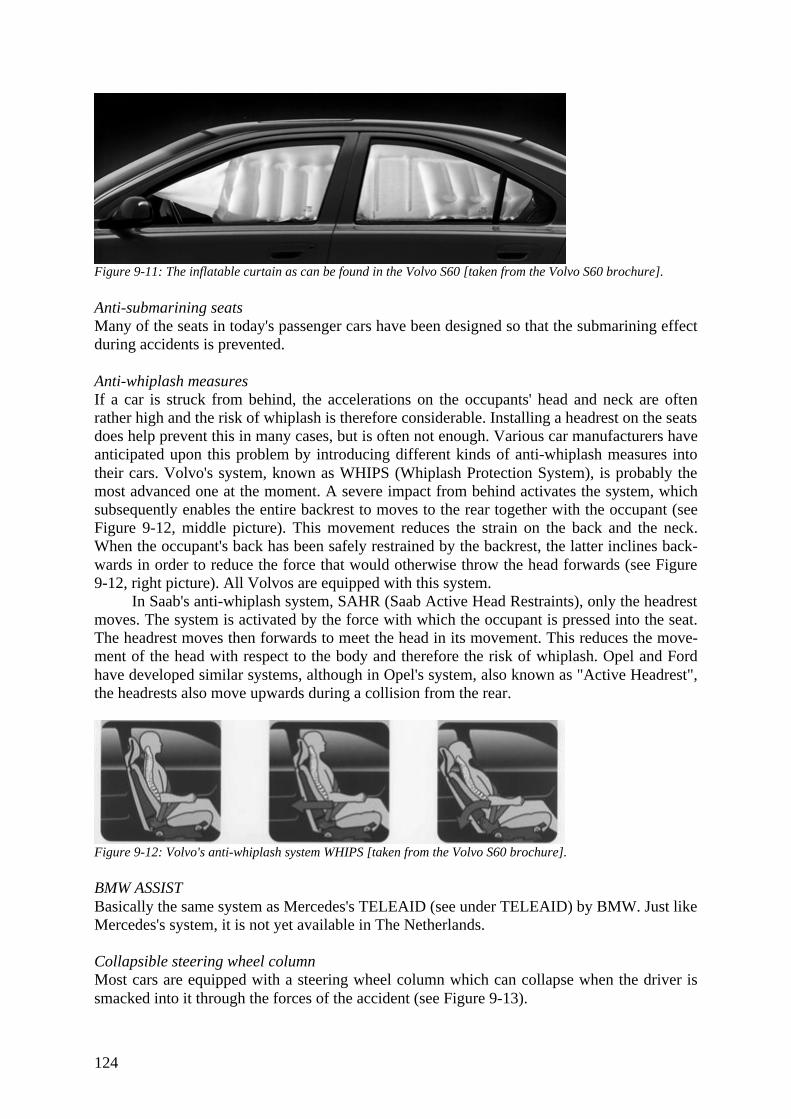
124
Figure 9-11: The inflatable curtain as can be found in the Volvo S60 [taken from the Volvo S60 brochure].
Anti-submarining seatsMany of the seats in today's passenger cars have been designed so that the submarining effectduring accidents is prevented.
Anti-whiplash measuresIf a car is struck from behind, the accelerations on the occupants' head and neck are oftenrather high and the risk of whiplash is therefore considerable. Installing a headrest on the seatsdoes help prevent this in many cases, but is often not enough. Various car manufacturers haveanticipated upon this problem by introducing different kinds of anti-whiplash measures intotheir cars. Volvo's system, known as WHIPS (Whiplash Protection System), is probably themost advanced one at the moment. A severe impact from behind activates the system, whichsubsequently enables the entire backrest to moves to the rear together with the occupant (seeFigure 9-12, middle picture). This movement reduces the strain on the back and the neck.When the occupant's back has been safely restrained by the backrest, the latter inclines back-wards in order to reduce the force that would otherwise throw the head forwards (see Figure9-12, right picture). All Volvos are equipped with this system.
In Saab's anti-whiplash system, SAHR (Saab Active Head Restraints), only the headrestmoves. The system is activated by the force with which the occupant is pressed into the seat.The headrest moves then forwards to meet the head in its movement. This reduces the move-ment of the head with respect to the body and therefore the risk of whiplash. Opel and Fordhave developed similar systems, although in Opel's system, also known as "Active Headrest",the headrests also move upwards during a collision from the rear.
Figure 9-12: Volvo's anti-whiplash system WHIPS [taken from the Volvo S60 brochure].
BMW ASSISTBasically the same system as Mercedes's TELEAID (see under TELEAID) by BMW. Just likeMercedes's system, it is not yet available in The Netherlands.
Collapsible steering wheel columnMost cars are equipped with a steering wheel column which can collapse when the driver issmacked into it through the forces of the accident (see Figure 9-13).
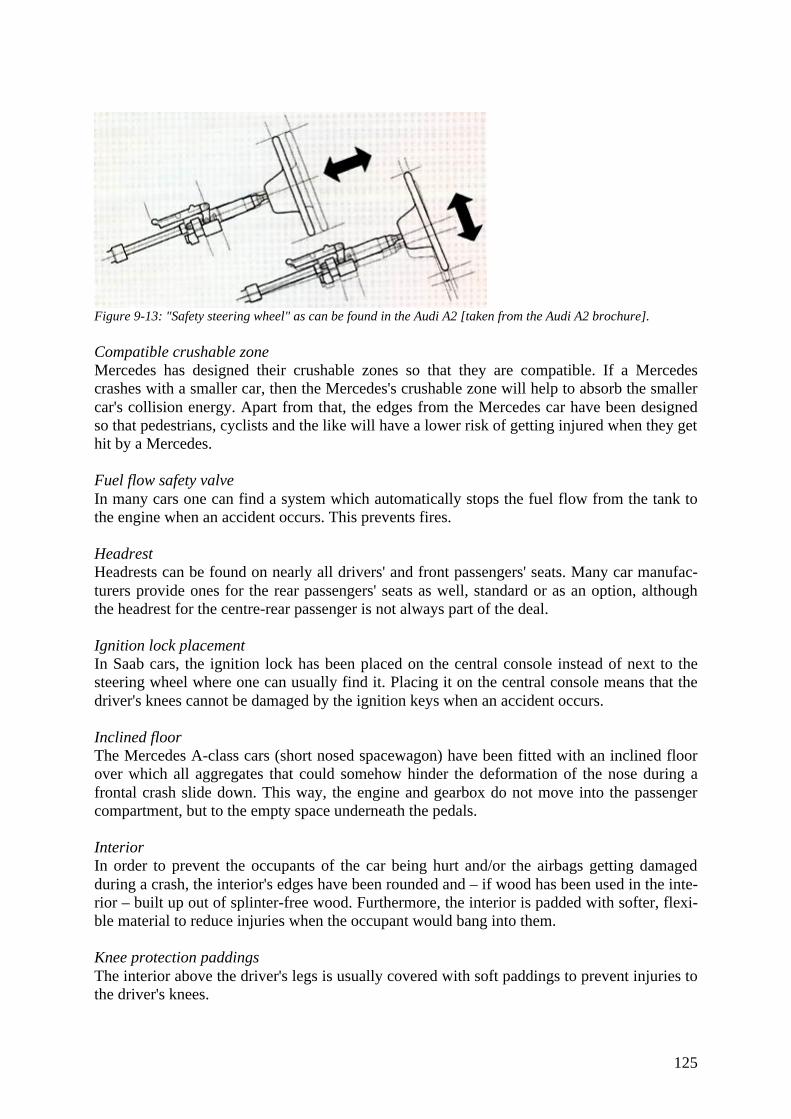
125
Figure 9-13: "Safety steering wheel" as can be found in the Audi A2 [taken from the Audi A2 brochure].
Compatible crushable zoneMercedes has designed their crushable zones so that they are compatible. If a Mercedescrashes with a smaller car, then the Mercedes's crushable zone will help to absorb the smallercar's collision energy. Apart from that, the edges from the Mercedes car have been designedso that pedestrians, cyclists and the like will have a lower risk of getting injured when they gethit by a Mercedes.
Fuel flow safety valveIn many cars one can find a system which automatically stops the fuel flow from the tank tothe engine when an accident occurs. This prevents fires.
HeadrestHeadrests can be found on nearly all drivers' and front passengers' seats. Many car manufac-turers provide ones for the rear passengers' seats as well, standard or as an option, althoughthe headrest for the centre-rear passenger is not always part of the deal.
Ignition lock placementIn Saab cars, the ignition lock has been placed on the central console instead of next to thesteering wheel where one can usually find it. Placing it on the central console means that thedriver's knees cannot be damaged by the ignition keys when an accident occurs.
Inclined floorThe Mercedes A-class cars (short nosed spacewagon) have been fitted with an inclined floorover which all aggregates that could somehow hinder the deformation of the nose during afrontal crash slide down. This way, the engine and gearbox do not move into the passengercompartment, but to the empty space underneath the pedals.
InteriorIn order to prevent the occupants of the car being hurt and/or the airbags getting damagedduring a crash, the interior's edges have been rounded and – if wood has been used in the inte-rior – built up out of splinter-free wood. Furthermore, the interior is padded with softer, flexi-ble material to reduce injuries when the occupant would bang into them.
Knee protection paddingsThe interior above the driver's legs is usually covered with soft paddings to prevent injuries tothe driver's knees.
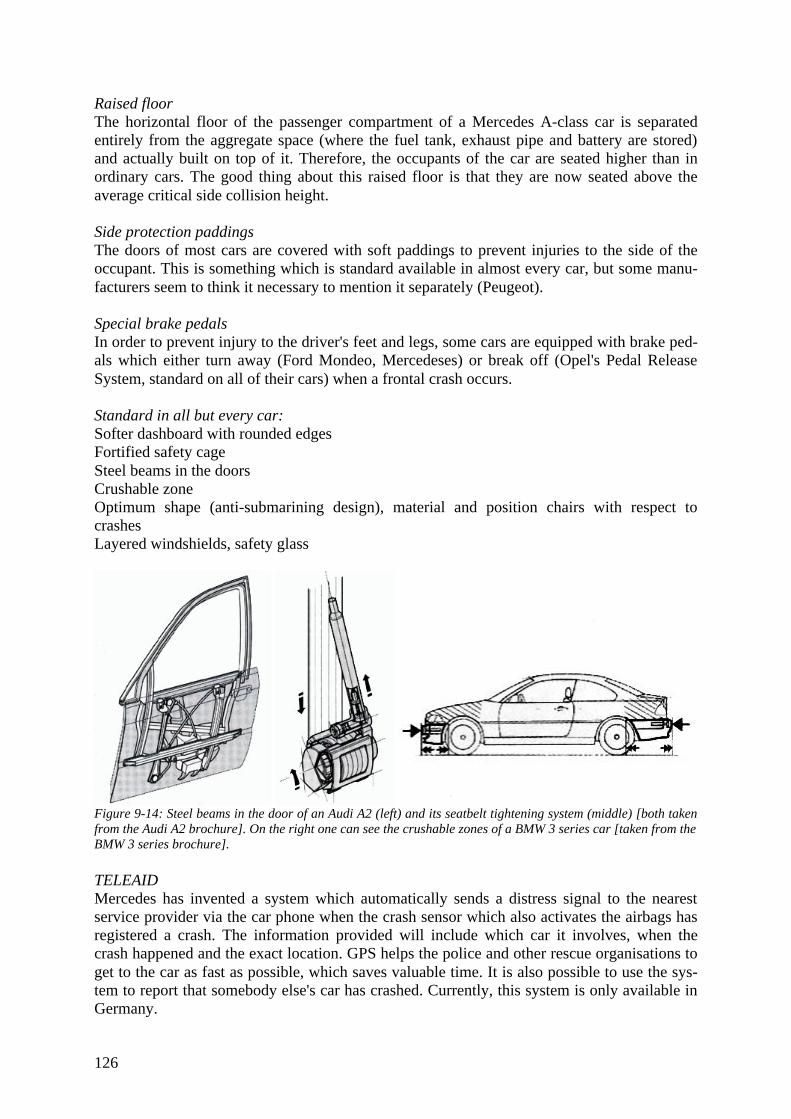
126
Raised floorThe horizontal floor of the passenger compartment of a Mercedes A-class car is separatedentirely from the aggregate space (where the fuel tank, exhaust pipe and battery are stored)and actually built on top of it. Therefore, the occupants of the car are seated higher than inordinary cars. The good thing about this raised floor is that they are now seated above theaverage critical side collision height.
Side protection paddingsThe doors of most cars are covered with soft paddings to prevent injuries to the side of theoccupant. This is something which is standard available in almost every car, but some manu-facturers seem to think it necessary to mention it separately (Peugeot).
Special brake pedalsIn order to prevent injury to the driver's feet and legs, some cars are equipped with brake ped-als which either turn away (Ford Mondeo, Mercedeses) or break off (Opel's Pedal ReleaseSystem, standard on all of their cars) when a frontal crash occurs.
Standard in all but every car:Softer dashboard with rounded edgesFortified safety cageSteel beams in the doorsCrushable zoneOptimum shape (anti-submarining design), material and position chairs with respect tocrashesLayered windshields, safety glass
Figure 9-14: Steel beams in the door of an Audi A2 (left) and its seatbelt tightening system (middle) [both takenfrom the Audi A2 brochure]. On the right one can see the crushable zones of a BMW 3 series car [taken from theBMW 3 series brochure].
TELEAIDMercedes has invented a system which automatically sends a distress signal to the nearestservice provider via the car phone when the crash sensor which also activates the airbags hasregistered a crash. The information provided will include which car it involves, when thecrash happened and the exact location. GPS helps the police and other rescue organisations toget to the car as fast as possible, which saves valuable time. It is also possible to use the sys-tem to report that somebody else's car has crashed. Currently, this system is only available inGermany.
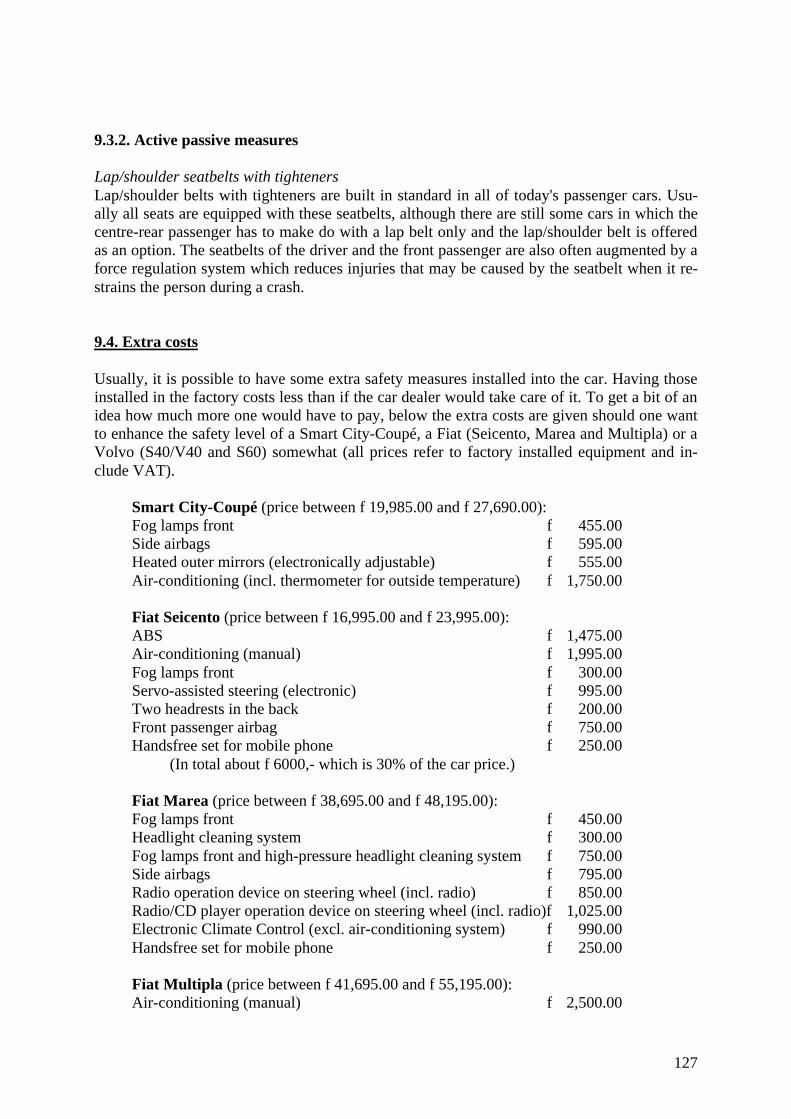
127
9.3.2. Active passive measures
Lap/shoulder seatbelts with tightenersLap/shoulder belts with tighteners are built in standard in all of today's passenger cars. Usu-ally all seats are equipped with these seatbelts, although there are still some cars in which thecentre-rear passenger has to make do with a lap belt only and the lap/shoulder belt is offeredas an option. The seatbelts of the driver and the front passenger are also often augmented by aforce regulation system which reduces injuries that may be caused by the seatbelt when it re-strains the person during a crash.
9.4. Extra costs
Usually, it is possible to have some extra safety measures installed into the car. Having thoseinstalled in the factory costs less than if the car dealer would take care of it. To get a bit of anidea how much more one would have to pay, below the extra costs are given should one wantto enhance the safety level of a Smart City-Coupé, a Fiat (Seicento, Marea and Multipla) or aVolvo (S40/V40 and S60) somewhat (all prices refer to factory installed equipment and in-clude VAT).
Smart City-Coupé (price between f 19,985.00 and f 27,690.00):Fog lamps front f 455.00Side airbags f 595.00Heated outer mirrors (electronically adjustable) f 555.00Air-conditioning (incl. thermometer for outside temperature) f 1,750.00
Fiat Seicento (price between f 16,995.00 and f 23,995.00):ABS f 1,475.00Air-conditioning (manual) f 1,995.00Fog lamps front f 300.00Servo-assisted steering (electronic) f 995.00Two headrests in the back f 200.00Front passenger airbag f 750.00Handsfree set for mobile phone f 250.00
(In total about f 6000,- which is 30% of the car price.)
Fiat Marea (price between f 38,695.00 and f 48,195.00):Fog lamps front f 450.00Headlight cleaning system f 300.00Fog lamps front and high-pressure headlight cleaning system f 750.00Side airbags f 795.00Radio operation device on steering wheel (incl. radio) f 850.00Radio/CD player operation device on steering wheel (incl. radio)f 1,025.00Electronic Climate Control (excl. air-conditioning system) f 990.00Handsfree set for mobile phone f 250.00
Fiat Multipla (price between f 41,695.00 and f 55,195.00):Air-conditioning (manual) f 2,500.00
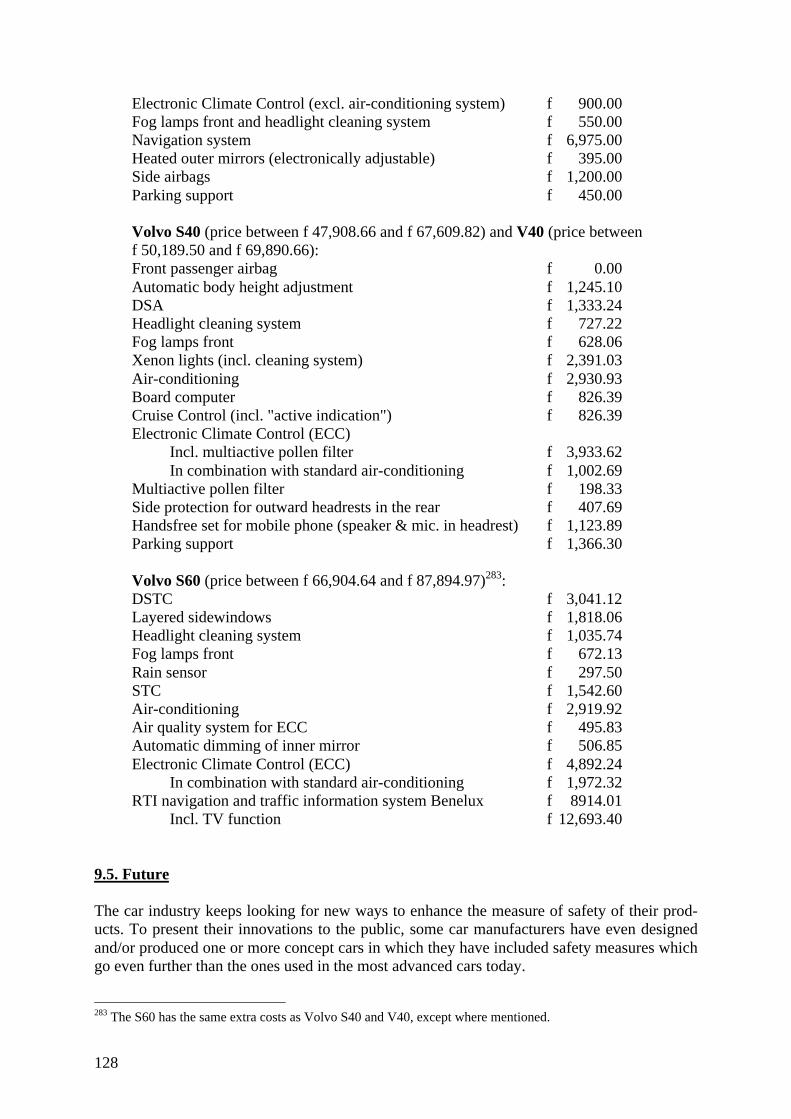
128
Electronic Climate Control (excl. air-conditioning system) f 900.00Fog lamps front and headlight cleaning system f 550.00Navigation system f 6,975.00Heated outer mirrors (electronically adjustable) f 395.00Side airbags f 1,200.00Parking support f 450.00
Volvo S40 (price between f 47,908.66 and f 67,609.82) and V40 (price betweenf 50,189.50 and f 69,890.66):Front passenger airbag f 0.00Automatic body height adjustment f 1,245.10DSA f 1,333.24Headlight cleaning system f 727.22Fog lamps front f 628.06Xenon lights (incl. cleaning system) f 2,391.03Air-conditioning f 2,930.93Board computer f 826.39Cruise Control (incl. "active indication") f 826.39Electronic Climate Control (ECC)
Incl. multiactive pollen filter f 3,933.62In combination with standard air-conditioning f 1,002.69
Multiactive pollen filter f 198.33Side protection for outward headrests in the rear f 407.69Handsfree set for mobile phone (speaker & mic. in headrest) f 1,123.89Parking support f 1,366.30
Volvo S60 (price between f 66,904.64 and f 87,894.97)283:DSTC f 3,041.12Layered sidewindows f 1,818.06Headlight cleaning system f 1,035.74Fog lamps front f 672.13Rain sensor f 297.50STC f 1,542.60Air-conditioning f 2,919.92Air quality system for ECC f 495.83Automatic dimming of inner mirror f 506.85Electronic Climate Control (ECC) f 4,892.24
In combination with standard air-conditioning f 1,972.32RTI navigation and traffic information system Benelux f 8914.01
Incl. TV function f 12,693.40
9.5. Future
The car industry keeps looking for new ways to enhance the measure of safety of their prod-ucts. To present their innovations to the public, some car manufacturers have even designedand/or produced one or more concept cars in which they have included safety measures whichgo even further than the ones used in the most advanced cars today.
283 The S60 has the same extra costs as Volvo S40 and V40, except where mentioned.
129
In 1996 Mercedes presented its Coupé F200 Imagination to the public. This concept car in-cluded a completely new way of driving, namely by using a sidestick to steer. Mercedesthinks that this system will replace the steering wheel altogether in the near future. With asidestick, the driver can steer, brake, accelerate and decelerate.
Another feature on this car is the active undercarriage. It is the backbone of a new sys-tem called Active Body Control in which sensors measure the transverse accelerations, and allchanges in the distance between the carriage work and the road. With this information a com-puter will calculate what commandos it needs to send to the hydraulic cylinders to which thewheels are attached in order to keep the carriage work as parallel to the road as possible. ABCprovides the optimum contact between tyre and road through keeping the pressure betweenthe two almost constant.
Apart from the innovations included in the Coupé F200 Imagination, Mercedes is cur-rently working on a wide variety of other new safety measures, one of which is a systemwhich can recognise traffic signs. It informs the driver about the kind of traffic sign it hasspotted and can send commands to an auxiliary system if that would be necessary.
Mercedes is also working on an automatic stop-and-go system which can brake andaccelerate on its own. Apart from that, the system is able to keep to a set course and canovertake other cars automatically through a set of video cameras and sensors which constantlyscan the direct surroundings of the car.
The headlight system of today can also be improved, according to Mercedes. The com-pany is working on headlights which can dim automatically when the car encounters an on-coming car. Also, headlights are being developed that will automatically shine far on free-ways and broad on secondary roads. The company even wants the lights to turn in curves sothat they will always light up the road in front of the car.
Every driver can buy special coatings in car stores which will make rain flow off thewindshield so fast that windscreen wipers are almost unnecessary. Many have never heardabout these fluids, though, and the coatings have a tendency of wearing down after a coupleof weeks of rainy weather. This is why Mercedes is working on so called "hydrophobic"glass. This glass basically has the same effect as the coatings.
Another system which Mercedes is planning to use in their future cars is a warning sys-tem against dozing off. Whenever a sensor notices that the driver is threatening to fall asleepbehind the wheel, a rattling sound (pretty much like the one you hear when the wheels driveover a ribbed profile in the road surface) will ring out to make the driver aware of his drowsi-ness.
Research has proven that many drivers underestimate how much grip their tyres have onthe road, especially during bad weather. Mercedes wants to build in a system into its carswhich provides the driver with information about the state of the road, so that he can adjusthis driving to it. Sensors will determine the amount of grip and the expected amount of con-tact between tyres and road. It also takes the actual properties of the car into account; itsspeed, weight and the state of the tyres. Combined with systems like ESP or Tempomat (withdistance control), the car could automatically adjust itself to the state of the road and deceler-ate if necessary.
Mercedes is actually even thinking of having a systems which make the car so to say"prepare" for an accident. The system the company is thinking of would consist of sensorswhich would send a warning to the airbags and/or seatbelt system whenever something wouldfast move into the area 1 meter in front of the car. The airbags could then be inflated and thesafety belts tightened before the car would strike the object.
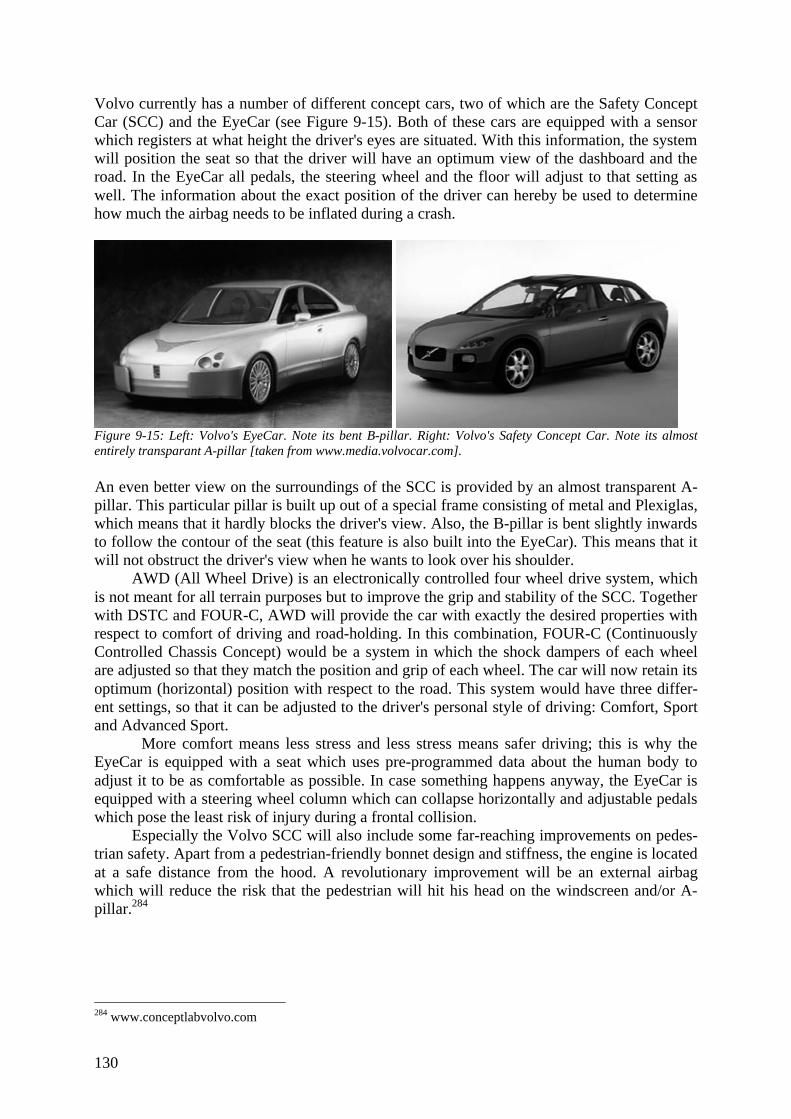
130
Volvo currently has a number of different concept cars, two of which are the Safety ConceptCar (SCC) and the EyeCar (see Figure 9-15). Both of these cars are equipped with a sensorwhich registers at what height the driver's eyes are situated. With this information, the systemwill position the seat so that the driver will have an optimum view of the dashboard and theroad. In the EyeCar all pedals, the steering wheel and the floor will adjust to that setting aswell. The information about the exact position of the driver can hereby be used to determinehow much the airbag needs to be inflated during a crash.
Figure 9-15: Left: Volvo's EyeCar. Note its bent B-pillar. Right: Volvo's Safety Concept Car. Note its almostentirely transparant A-pillar [taken from www.media.volvocar.com].
An even better view on the surroundings of the SCC is provided by an almost transparent A-pillar. This particular pillar is built up out of a special frame consisting of metal and Plexiglas,which means that it hardly blocks the driver's view. Also, the B-pillar is bent slightly inwardsto follow the contour of the seat (this feature is also built into the EyeCar). This means that itwill not obstruct the driver's view when he wants to look over his shoulder.
AWD (All Wheel Drive) is an electronically controlled four wheel drive system, whichis not meant for all terrain purposes but to improve the grip and stability of the SCC. Togetherwith DSTC and FOUR-C, AWD will provide the car with exactly the desired properties withrespect to comfort of driving and road-holding. In this combination, FOUR-C (ContinuouslyControlled Chassis Concept) would be a system in which the shock dampers of each wheelare adjusted so that they match the position and grip of each wheel. The car will now retain itsoptimum (horizontal) position with respect to the road. This system would have three differ-ent settings, so that it can be adjusted to the driver's personal style of driving: Comfort, Sportand Advanced Sport.
More comfort means less stress and less stress means safer driving; this is why theEyeCar is equipped with a seat which uses pre-programmed data about the human body toadjust it to be as comfortable as possible. In case something happens anyway, the EyeCar isequipped with a steering wheel column which can collapse horizontally and adjustable pedalswhich pose the least risk of injury during a frontal collision.
Especially the Volvo SCC will also include some far-reaching improvements on pedes-trian safety. Apart from a pedestrian-friendly bonnet design and stiffness, the engine is locatedat a safe distance from the hood. A revolutionary improvement will be an external airbagwhich will reduce the risk that the pedestrian will hit his head on the windscreen and/or A-pillar.284
284 www.conceptlabvolvo.com
131
9.6. Conclusions
Several conclusions can be drawn from the kinds and amounts of safety measures built intotoday's cars. First of all, it is very clear that safety is seen as a very important issue by mostcar manufacturers; it sells. The primary goal of a car is transportation, but in most brochures,quite a bit of text is dedicated to the safety measures built into the car. EuroNCAP does in-deed claim that "[t]oday, more than ever before, safety sells cars. For car buyers it is a keyelement of their purchasing decision".285 However, it sometimes seems as if buyers are(made?) more concerned about the safety of the car than whether it lives up to their transpor-tation needs.
Something that was to be expected is that the more money a buyer is willing to spend ona car, the more active and passive safety measures it contains. Cheaper, usually smaller andlighter, cars are therefore less safe and do not even always offer the possibility to have someextra safety measures installed. The more expensive, usually bigger and heavier, cars alreadyhad the advantage of their weight in accidents, and now all the extra safety measures they areequipped with seem to even widen the gap in compatibility between small and large cars.
Extra safety measures often represent a large percentage of the prize of the car (over30%: 15% standard and another 15% as options or accessories). This means that car dealersand manufacturers can make a great deal of money from the current wish for safety. There-fore, it is very well possible that the emphasis on safety portrayed in car brochures is not justconcern-about-our-buyers driven.
If one considers the kinds of safety measures that are applied in the more expensivetypes and versions of cars, and in the concept cars, it becomes obvious that even the simplestduties like turning on the windscreen wipers are taken over by automatic systems. The em-phasis seems to lead more and more away from the driver's own actions; all kinds of tasks aretaken out of his hands and computerised systems get the power to act automatically, withoutthe interference of the driver, if the situation requires that. Most of them are introduced as"safety enhancing", but in some cases (e.g. the automatically turned on windscreen wipers)that seems a bit exaggerated.
The electronic control systems that can be found in the more expensive executive andsporty versions function only in case of extreme driving behaviour. The roads have been builtso that everyone who keeps to the speed limits can drive safely, but these systems are built toprevent spinning wheels, breaking out of bends and stopping within a very short distance;situations that are more associated to "adventurous" driving. This means that the car manu-facturers actually help people who like risky driving to do so and one could even arguestimulate such behaviour by providing the possibility to do that relatively safely. This is asomewhat dubious development.
Another noteworthy point is that, apart from the lap/shoulder belt, no other active pas-sive safety measures have been introduced into the passenger car. The same applies to meas-ures to keep the driver alert; only air-conditioning is a feature which can be found in more andmore cars. In other words, here too the conclusion can be drawn that enhancing safety is leftto the car rather than to the driver or passenger.
285 www.euroncap.com/tests

132
133
10. Summary of all aspects
Basic facts# The driver is part of a complex man-machine-environment system. A failure of one of thesethree elements or the communication between them can lead to an accident.
# 85 to 95% of all accidents are (partially) caused by mistakes made by the man-part of theman-machine-environment system; the driver.
# The percentage traffic fatalities per year is relatively small (<1%) compared to the amountof people dying from, for instance, cancer and diseases of the heart and vascular system.
# Most traffic fatalities occur among young drivers, which means that many preretirementyears are lost (gives economic impact on society); in the USA in the mid to late-eighties ap-proximately as many as caused by cancer and heart diseases.
# The risk of accident is always larger than zero, so ANY road user can get an accident,sometimes even independent of his own careful behaviour.
# The number of traffic fatalities in the Netherlands is decreasing, gradually speaking.
# The risk (chance of one fatality occurring per one billion vehicle kilometre) is also graduallydecreasing in The Netherlands, although the rate of decline has grown smaller lately (i.e. inthe nineties).
# The Dutch national budget for 2001 included a sum of 12.3 billion Dutch guilders reservedfor the different projects of the Ministry of Transport, Public Works and Water Management.The gross national product for that same year is 945,100 billion guilders.
# The costs of accidents yearly are considerable compared to the budget of the Ministry ofTPWWM; in 1993 they were estimated to be 12 billion Dutch guilders (excluding preventioncosts of 3 billion Dutch guilders).
# In 1993, there were 1.6 million fatal and non-fatal accidents. The average costs per accidentwere approximately 8,000 Dutch guilders; per hospitalised person they were 0.281 millionguilders; per fatality they were 1.859 million guilders.
# Passenger cars have the highest rate of fatalities of all road users yearly.
# In The Netherlands, the highest amount of injuries occurs among cyclists, closely followedby passenger car occupants.
# Vulnerable road users like pedestrians, cyclists and moped riders account for a large part ofthe annual amount of traffic fatalities (approximately 37%).
# Around 40% of all fatalities is caused by single car crashes.
134
# Most accidents involving passenger cars occur at times and under circumstances associatedwith low risk: Summer; dry weather; dry, bitumen road surface; daylight; weekdays; no un-usual traffic situation.
# Irresponsible behaviour (traffic offences) is often involved in traffic accidents.
# The greatest number of fatalities occurs when there is least traffic on the roads.
# Driving by night is two to three times as dangerous per kilometre than during daytime, butnot just because of the darkness. Tiredness, alcohol, and youthful driving play a large rolehere, too.
# Most traffic deaths in The Netherlands (and in other countries) occur in the rural areas.Also, the main streets in cities "score" very high.
# The difference in fatality rates between rural and urban roads is partly caused by their dif-ferent use patterns.
# Cars with only one occupant are, generally speaking, involved in different types of crashesthan with more than one occupant.
# Traffic has proven to be asymmetrical. 38% more impacts occur on the right side of the car,probably because people drive on that side of the road (which were the circumstances of thestudy concerned).
# The amount of traffic accidents, injuries and fatalities can be lowered by taking active safetymeasures. The latter two can also be lowered by taking passive safety measures.
# The front of a car is struck most frequently during accidents, although the sides are alsovery "popular".
Man# The composition of the population of road users is very varied in sex, age, experience,background and means of transportation.
# It is very important to take the limitations of the drivers into account in the design of theinfrastructure and the vehicle; contrary to pilots, drivers have not been carefully selected andtrained.
# Male drivers are more often involved in traffic accidents per distance travelled than femaleones.
# Drivers above 60 years old are more than average involved in traffic accidents.
# Older drivers are aware of their impairments and therefore choose to drive less often and farthemselves.
135
# Young drivers (<30 years old) are also more than average involved in traffic accidents, butsignificantly more often than senior drivers, even though young drivers have the advantage ofa better reaction time and visual acuity.
# Young drivers have higher crash rates because of the fact that they often have other motivesto drive than transportation: competitiveness, sense of power and control and hedonistic ob-jectives.
# Driving is a self-paced task; every driver chooses his own level of risk (usually around thesame value à constant risk).
# A person's income has appeared to have the largest effect on traffic fatality rates in theUSA, since people with more money can buy a safer car and/or extra safety measures.
# People adapt their driving behaviour to less favourable circumstances (although they usuallyoverestimate their driving skills at the same time).
# Constant risk theory/risk homeostasis theory: drivers seem to (consciously or uncon-sciously) choose to have (about) the same amount of risk (usually a bit higher than the riskthey can handle) during their trips.
# Driving is largely dependent on the visual information received.
# The human eye is not really "built" for low visibility situations.
# In situations of low visibility, people often drive at speeds which require a stopping distancewhich is larger than the distance at which the driver can still discern objects.
# Humans are incapable of estimating their own speed, relative speeds, and the distance be-tween them and the car in front.
# People deprived from their auditory functions show an increased inability to estimatespeeds.
# Speed adaptation: if a driver has driven at a certain, high speed for a long time, he will drivefaster than necessary if he suddenly has to drive a lower speed.
# Expectations influence the reaction speed since one will be able to observe somethingsooner if one expects it to be there.
# Observation errors and errors of judgement often happen because of a wrong or failing an-ticipation usually caused by wrong expectations.
# Rear-end crashes often happen because the driver does not expect the car in front of him tochange speed.
# The main contributor to the risk pattern is road-user rather than engineering in origin (fac-tors like alcohol and youthful driving, for instance, play a large role).
# "We drive as we live": people's personality is reflected in their behaviour in traffic.
136
# People's personality can change temporarily because of the use of alcohol, drugs or medi-cines, but also by being young and/or inexperienced.
# The problem of traffic crashes is much more one of drivers doing things that they know theyought not to, than of drivers not knowing what to do. Since it will be nigh impossible tochange human nature, a behavioural change is necessary.
# The influence of the media – especially TV and films – is large. Young drivers' beliefs withrespect to how one should drive and alcohol are largely determined by the (bad) examplesthey have seen on TV and in films from early childhood on.
# A temperature more than 2° over or under a person's core temperature causes stress.
# Stress of any kind will cause a driver to drive less concentrated.
# Alcohol:* One of the factors leading to accidents in at least 20 to 40% of all cases.* Alcohol induces drowsiness.* The relationship between the amount of alcohol consumed and the amount of zigzaggingdemonstrated by the driver is exponential (as is the relationship between BAC and accidentrisk).* One standard glass of an alcoholic beverage equals about 0.2‰ for men and 0.3‰ forwomen.* 0.4-0.5‰ BAC increases the risk of accidents.* Very small amounts (0.34-0.45‰ BAC) can already significantly effect a driver's ability toreact to changes in the existing situation.* People who have drunk alcohol have a higher risk of dying in a traffic accident.* Most people are unfamiliar with the exact effects of drinking alcohol; a simulator couldmake them experience that safely.
# Some kinds of medicines, like sedatives, have a very long after-effect, which in some casesis as bad or even (much) worse than the effect of 0.5‰ BAC.
# Only when used directly prior to driving, hashes and marihuana can cause drowsiness, oth-erwise no distinct relationship between these psycho-active substances and the occurrence oftraffic accidents was not detectable.
# Official reports say that tiredness is (one of) the cause(s) in 2% of all traffic crashes. Moretargeted research, on the other hand, shows that this is the case in 10% of all crashes and in25% if single-vehicle crashes are considered. However, these numbers only count the cases inwhich the driver actually fell asleep [!] and estimates of the real influence of tiredness on traf-fic accidents are that 40% of all fatal crashes is caused by it and even 50% in case of single-vehicle crashes.
# Tiredness can seriously influence a driver's performance capacities and actually cause himto have a performance level below the one required to drive safely. Symptoms:* increased reaction time.* lane drifting.* inability to perceive all (useful) information coming from the driver's surroundings.
137
# Tiredness is an important cause of accidents between 0:00 and 8:00 a.m. and between 2:00and 6:00 p.m. ("after lunch dip").
# Stress aggravates the effects of tiredness.
#Pedestrians grossly overestimate how visible they are to motorists who are facing opposingheadlights at night.
# Driving faster than the prescribed velocity has appeared to be (one of) the cause(s) in 30%of all accidents.
# One of the factors contributing to what speed a driver chooses is a systematic underestima-tion of the probability that he will be killed.
# The speed a driver chooses is a compromise between his desires for pleasure and those forsafety.
# One way to counter man's behaviour towards achieving constant risk is to reward safe be-haviour.
# Another way to counter man's behaviour towards achieving constant risk is to influence hisperception of risk; make situations seem more dangerous than they actually are.
# A phone conversation while driving is a very large source of distraction.
# Using a handheld phone while driving means both distraction and having only one hand todrive with.
Machine# Today's average and even "minimal" car has been constructed so that it feels safe enough to,for instance, perform a secondary task while driving fast.
# The design of a car can help to enhance safety, for instance, by providing a good view onthe road.
# Drivers are getting more and more isolated from the surroundings of the car by measuresagainst noise and vibration.
# Noise reduction means that the driver is less distracted by outside noises, but at the sametime the driver loses contact with his surroundings and the sound of his engine.
# ABS was meant to increase safety but appeared not to live up to that expectation in practicebecause people started to drive more recklessly.
# When designed optimally, a route guidance system can largely take over the navigation taskfrom the driver, so that he can focus on driving.
138
# A route guidance system does bear the risk of the commando effect, which reduces trafficsafety.
# Collision avoidance systems provide a feature which is all but absent in a driver: the abilityto estimate the distance between the driver and the car before him.
# Infrared sensors could make the objects and road users visible when the driver cannot seethem because of poor visibility (darkness, bad weather).
# Systems which warn the driver when tiredness causes his level of arousal to drop below thenecessary level to drive a car take away the driver's responsibility to stay awake.
# Trusting systems blindly can induce the commando effect.
# Air-conditioning enables a driver to perform the driving task in an environment with an op-timal temperature and humidity level, which makes the driving task less tiring, stressful, etc.
# The simplification of the dashboard will make it more easily surveyable, which means thatreaction speed is increased.
# Safety measures which help the driver to perform his driving task (sometimes by providinga function the driver lacks) in an optimal environment (e.g. ergonomic design, comfort, anti-collision and route guidance systems) increase traffic safety.
# Safety measures which take over functions from the driver enable him to concentrate on thedriving task, but also take away some of his responsibility for driving safely.
Environment# Research has shown that darkness can be largely ruled out as the main contributor to thehigher risk during certain times of the day.
# Heavy wind, especially gust, can be risky for traffic.
# Roads which are safer during rainfall (e.g. "ZOAB") make drivers feel safer while drivingon them, which in turn causes them to drive approximately 10 km/h faster. [constant risk]
# The road surface can enhance safety though a good surface quality, and through lines, cats'eyes, distance markings and ribs attached to it.
# The current road system is not really in conformity with the requirements of today's trafficsince it is basically an expansion of the system built in the first half of the 20th century.
# Roads and roadsides should be designed to fit their primary goals.
# Many roads do not live up to the drivers' expectations, since their form is ambiguous.
# Unambiguous roads would be a huge improvement in traffic safety, since the expectation toobserve something helps to recognise it sooner.
139
# Separation of road sections for different kinds of road users by means of barriers is veryeffective.
# A clearly marked cycle path on the side of the road makes the road less ambiguous, sincethe drivers will expect to encounter cyclists, but a physical separation will enhance its safetyeven more.
# A high traffic density or a low traffic flow mean low speeds, and many – though usually notvery severe – accidents
Policies# The Dutch government (Ministry of Transport, Public Works, and Water Management) su-pervises the way the expected traffic and transport growth is handled, as well as traffic con-gestion, infrastructure, the environment, traffic safety and the use of public transport.
# The target of the Dutch government is to have reduced the amount of traffic fatalities by25% come 2010. They want to achieve this through getting all individuals to take responsibil-ity for their own safety and that of other people, through information and education, throughaltering roads, and through the application of new technology.
# The innovative, safety-enhancing systems supported by the Dutch government mostly sim-plify the process of driving.
# The costs that will have to be made to increase traffic safety will be paid by the driversthemselves, in proportion with how much they drive.
# If all drivers were forced to drive (close to) the same speed, that would not guarantee thatthe fatality rates would decrease.
# More intensive traffic surveillance appears to have reduced the amount of speed and BACviolations in The Netherlands.
# The obligatory periodic motor vehicle test (for cars over three years old) can both decreaseand increase safety; cars in a deplorable state will be taken from the road, but if a car passesthe test its owner can acquire a false feeling of safety, leading to recklessness.
# BAC limit in The Netherlands: >0.5‰ is rated as a penal offence, >0.8‰ is rated as acrime.
# Having a driver's license does mean that one has proved to have acquired some basic driv-ing skills, but it does not mean that one can drive safely.
# Driving safely is learnt in a process of trial and error. Simulators or special test tracks wouldbe useful to do that safely.
# Every car of 3 years old or older has to be checked each year for the periodic motor vehicletest (APK).
140
# In Sweden, the obligatory periodic test helped to decrease the fatality rate even though theaverage age of cars increased.
# Fines can, amongst other things, be obtained by having a car which does not fulfil theminimum safety standard, and by not observing the traffic signs and/or regulations.
# Many situations in which it is unclear how to act can be solved by "good seamanship".
# Insurance companies stimulate safe driving by lowering insurance premiums if someonedrives without accidents for a longer time: no-claim bonus.
# Every new type of car needs several licences before being allowed on the road in the EU.Through harmonisation of these licences getting a licence in one EU country means that thecar has to be admitted to all countries.
# EuroNCAP has succeeded in stimulating car manufacturers to improve the safety of theircars. Still, the danger exists that cars will be built in order to meet their requirements or thatthey focus on fatality prevention only.
Occupant protection# About 90% of all passive safety measures possible has already been taken, so there is littleroom left for improvement.
# A car can hardly be designed to anticipate on differences in vulnerability caused by sex, ageand physique.
# Women are more likely to die or get injured during an accident than men.
# A person with a solid bone structure is less vulnerable than someone who is built ratherfragile.
# Head/brain injuries are most dangerous.
# The head and face are hurt most frequently during head-on accidents.
# Injuries to the lower extremities are seldom fatal, but can cause a very long revalidationperiod.
# The fact that the fatality rate for certain seats in the car is higher is mainly caused by the factthat those seats have a higher occupancy rate.
# Occupants in different seats have different distributions by sex and age, which strongly in-fluences the fatality risk.
# The fatality risks for the driver and right-front passenger are about the same. People sittingin the back run a smaller risk and those in the middle run an even smaller risk than the peoplethey are sitting next to.
141
# The way the outside of a car deforms under a load influences both the amount of self pro-tection and the amount of partner protection.
# Incompatibility problem:* the lighter the car, the less risk posed to other road users.* the heavier the car, the less risk posed to its occupants.
# Lighter cars are more vulnerable than heavier ones; not just because of their lower mass, butalso because of their different geometry (e.g. lower bumper, smaller crush zone and safetycage) and stiffness (e.g. less stiff crush zone, stiffer safety cage).
# Geometric incompatibility sometimes can make a bumper override the bumper of anothercar, which makes both bumpers much less useful.
# Side crashes are always more dangerous than head-on crashes, since there is virtually nocrush-space and the nose of the striking car is much stiffer than the side of the struck car.
# Geometric incompatibility sometimes can make a bumper override the sill and/or rocker ofanother car and penetrate the passenger compartment during a side collision.
# Rear impact crashes are least hazardous to car occupants, whereas side impact crashes aremost hazardous (small crush zone, high delta-v). Head-on crashes are slightly less hazardousthan side impact ones, but occur most.
# Many lives would be saved if cars would be designed to be more compatible in mass, ge-ometry and stiffness.
#Owners of small/light cars are usually aware of their greater vulnerability, which makesthem take less risks.
# In order to get control over traffic safety permanently, an integral approach of improvingman, vehicle and road is necessary.
# A windshield made out of safety glass can reduce the amount of incision wounds comparedto ordinary glass when a person crashes through it (both car occupant and external road user).
# Unbreakable windshields do reduce the amount of incisions to zero, but at the same timeincrease the risk of getting skull fractures and/or skull/brain traumas.
# The shorter the time between first contact and standstill, the higher the accelera-tion/deceleration.
# The higher the accelerations/decelerations on the occupant, the greater the risk of injury.
# Safety belts effectively prevent vehicle occupants to crash their head into steering wheel,dashboard or seat, or will at least reduce the speed with which they'll crash into the part infront of them.
# The reduction of risk a safety belt can provide will only be achieved when the occupant ap-plies it.
142
# Lap/shoulder belts reduce fatality rates by 40 to 45%.
# Half of the effectiveness of safety belts is the fact that they prevent ejection in 99% of allcases. Note: an ejected occupant is three to four times as likely to die from it than one who isnot ejected.
# Safety belts can cause injuries to the abdominal area during an accident, but they reduce therisk of getting a severe injury by 50% compared to the non-belted situation.
# Airbags can co-operate with safety belts by preventing the occupant to crash into the vehi-cle's interior if the belt is insufficient (in case of high speeds) and also by reducing loadingforces on the belt.
# When combined with lap/shoulder belts, airbags offer the best reduction of (fatal) injury riskavailable for vehicle occupants.
# The airbag was designed primarily as an extension of the safety belt system. Without thebelt it only reduces fatality rates by 11%; in other words, the safety belt should always be ap-plied.
# Airbags do not deploy in all kinds of crashes and at all crash speeds and can even burst ifthe speed is too high. This is another reason why the safety belt should always be applied.
# The design and stiffness of a seat can have a big influence on the severity of the injuriescaused by an accident.
# Headrests are often not effective at all because they cannot be or are not positioned cor-rectly.
# An integrated, automatically adjustable headrest is advisable to prevent injuries to the neckdue to excessive movement of the head during head-on and rear-impact crashes.
# Both to prevent the airbag from ripping and to reduce injuries when the airbag is not inflatedor has burst, the steering wheel and dashboard should have rounded edges.
# Side airbags can reduce the severity of injuries during side impact.
# The outside of steering wheel and dashboard should be made out of energy absorbing, shat-terproof foam to protect the car occupants.
# A helmet is an effective but unpopular safety measure.
# The optimal protection system for vehicle occupants is one in which the best systems arecombined and complement each other.
# Crash energy absorbing guard rails and poles that can break off or swing back reduce thedecelerations on the car occupants during a crash.
# At the moment, safety sells cars; it is a key element in the choice of car someone makes.
143
# Money buys safety (and car manufacturers exploit that fact cleverly).
# The current trend is that car manufacturers simplify the driving task more and more, therebytaking away (some of) the responsibility for safe driving from the driver.
# Many of the new electronic control systems are only functional in risky situations like driv-ing too fast, driving too close to other cars, driving through a bend too fast, etc.
# The availability of systems that only come in handy in extreme situations invite the driver totry them out; in other words, to perform some risky driving.
# Extra safety measures in big, expensive cars only widen the compatibility gap with respectto smaller, cheaper cars even further.
# Since the safety belt, there have been no new active passive safety measures. The driver hasreceived no extra responsibility for his safety, in other words.
# Apart from air-conditioning there are no new systems which improve a driver's alertness;there are, however, new systems that can take that responsibility over.
Partner protection# The injuries of pedestrians, cyclists and riders of motorised two-wheelers are usually a lotmore severe than those from the occupants of the car they crashed into or crashed into them,because of the difference in protection and mass.
# One of the factors that influence crash severity is the relationship between the velocity ofthe car and the two-wheeler (measured in the same direction).
# The geometry of the car largely determines the severity of an accident between car and ex-ternal road user.
# The design of the bumper (and its height), window beams and the edge of the roof is veryimportant for the severity of the injuries of external road users.
# The injury risk for pedestrians and cyclists is reduced demonstrably through the use of en-ergy absorbing front structures in cars.
# Untransformable parts in the engine and/or hood should not be placed directly under or atthe front of the hood since they could unnecessarily cause inadmissably high loads on the per-son crashing into it.
# A car's carriage work has to 1. keep the safety cage intact, and 2. reduce the decelerations(for both accident parties) accompanying a crash through crushing.
# External road users could be protected by an airbag on the front of the car.

144
145
11. Conclusions and recommendations
11.1. Conclusions
The key to a different mentality towards traffic safety seems to be the way the driver himselfis treated. Although the man-part in the man-machine-environment system is (partly) respon-sible for 85 to 95% of all accidents, most money is spent on enhancing the other two parts ofthat system; the car and the environment. It seems as if all parties have all but given up on thedriver. Instead of looking for ways to turn people into better, safer, more responsible andaware drivers, they think of systems to take over his responsibilities and, with that, his con-cern about traffic safety. Apart from that, the car is turned into an isolated cell; a small spaceon the road which only offers one way to the driver to be aware of his surroundings: throughhis eyes. In the event all systems fail, there is already a solution available which adds to thebreakdown of the driver's responsibility: the car is filled with all kinds of protective measuresthe driver does not need to think of when getting into the car (except for the safety belt), andwill protect him from getting (too severely) injured.
Traffic safety still needs to be improved. Indeed, the number of traffic accidents in The Neth-erlands has gone down considerably since the mid-seventies, but the fact that quite a numberof young people – especially car occupants – is killed or injured in traffic every year, weighsdown heavily on the Dutch economy. Apart from that, even the most careful person can getkilled in traffic.
Most accidents are in one way or another related to human errors. These errors oftenstem from at least one of three problems, namely man's conscious or unconscious pursuit ofconstant risk (a level which seems to lie slightly above what would be sensible in a certainsituation), his reluctance to take responsibility for his own behaviour, and his non-realisticexpectations of his own, his car's and other road users' abilities and behaviour. These prob-lems can only in a few cases be solved by alterations in the design of passenger cars; a changein human behaviour would be much more effective.
If a driver perceives a certain situation as safe, he often becomes overconfident andtakes more risk than is sensible. This is demonstrated quite clearly by the fact that most seri-ous accidents happen under circumstances generally associated with safety. The opposite ap-plies as well; if the driver thinks a situation may be dangerous he usually becomes careful, asthe fact that older drivers drive less often and less far shows.
Overestimating something is frequently (one of) the reason(s) that car accidents occur.Drivers can overestimate their skills, how well they perceive important things like distancesand (relative) speeds, how well they can drive even though they have drunk alcohol, useddrugs or medicines, and how alert they are even though they are stressed or tired. The riskconnected to these situations is, however, systematically underestimated.
Drivers between 18 and 24 years old, especially the male ones, are significantly overin-volved in traffic accidents. This group of drivers probably suffers most from overestimatingthings like their driving skills, and seems to think they are untouchable. They undergo a kindof temporary change of personality which leads them to elevate competitiveness, the sense ofpower and control and other hedonistic objectives to the ultimate goal of driving a car, andcan only be changed into a more sensible one through experience. The education of novicedrivers has namely shown that it does help them to acquire basic driving skills but cannotteach them how to drive safely. Trial and error seems to be the best way to learn that, which isanother reason why the fatality rate among young/novice drivers is high. Theoretically
146
speaking, young, male drivers should die in traffic less than average, since the fact that theyare young and male makes them less vulnerable, but this effect is obviously more than nulli-fied by their irresponsible behaviour.
The enormous amount of accidents and driving scenes shown in films and on TV usu-ally has nothing to do with reality but appears to have a large influence on many a driver'sbehaviour. Their brainwash-like effect strengthens the belief of especially young and inexpe-rienced drivers that what is shown is how it should be done and that there are no risks in-volved in it. This influence lasts until they have found out the reality of driving.
Any driver's alertness can be seriously impaired by tiredness and by temperatures morethan 2°C over or under his core temperature. A similar effect can be obtained by the use ofalcohol, drugs or medicines. Other consequences are zigzagging, not being able to maintain acertain speed, a waning performance level and nodding off.
There is a large difference in fatality rates between urban and rural roads. This is causedby the different use patterns both road types have and by the fact that the ambiguity of thelatter influences drivers' expectancy to encounter certain situations in a negative way. Roadscan, however, have a positive influence on traffic safety. A deceptive design can decrease theconstant risk problem and protective measures can decrease the severity of an accident if onewere to happen anyway.
The enforcement by the police of the various traffic regulations has shown to help in-crease traffic safety; people are more careful if they know that their driving behaviour will bechecked. The same applies for car insurances; the fact that drivers are rewarded for drivingwithout accidents stimulates drivers to be more careful.
Just as is the case with drivers, the state a car is in determines how likely it is that some part(s)of the car will fail or break down and thereby become a risk to traffic safety. The general pe-riodic test (APK) helps to avoid excesses with respect to the state of repair cars are in.
Generally speaking, one can say that the lighter the vehicle, the less risk it poses to otherroad users and the heavier the vehicle, the less risk it poses to its occupants. Incompatibility ofmass, geometry and/or stiffness makes the consequences for a more vulnerable opponent in anaccident much more severe than if he would crash into a road user of his own kind. This islargely due to the higher accelerations (= higher chance to get injured) the more vulnerableparty will usually undergo.
The design of a car's carriage work has to be able to protect the occupants of the par-ticular car, the occupants of an opposing car and external road users. For the latter, especiallythe geometry of the carriage work, its stiffness and how smooth it is are important. The ge-ometry and stiffness of the crushable zone will be of importance for both opponents and theoccupants, and the stiffness of the safety cage determines whether the occupant compartmentwill stay intact during a crash.
The properties of the windshield are important to both the car occupants and externalroad users. It can cause injuries by breaking under the impact (incision wounds) and by notbreaking (traumas to the head and/or brain). The situation that causes fewest (severe) injuriesshould be applied.
The combination of a seatbelt and an airbag provides the best reduction in injury riskavailable, although the situation approves even further if a crash-friendly interior and head-rests are included in this "system". An airbag does not inflate under all crash circumstances,which means that the safety belt should always be applied, and illustrates the importance of acrash-friendly interior. Although the a seatbelt can cause injuries during a crash (largely de-pendant on the stiffness of the seat), these injuries will always be much less severe than theones it helps to prevent.
147
Systems which take over functions from the driver do help to reduce stress, but at the sametime they do not add to his sense of responsibility and make him care less about traffic safety.There are also systems that help the driver to perform optimally by providing a function thedriver lacks and since these only warn the driver about certain things, the driver stays respon-sible for every action taken. However, it is important that the driver keeps being aware of thefact that he has the final responsibility and not the system.
Car manufacturers strengthen the driver's misconception of the risks he runs by makingtheir vehicles feel safe and comfortable. This has the side-effect of largely closing out thedriver's contact with the environment. Since safety and – to a lesser extent – comfort are cur-rently very important factors in a person's decision to buy a certain car, this has a negativeeffect on traffic safety in general, paradoxically enough. Still, the fact that car manufacturerscan earn a lot of money from that trend, makes one suspect that they do not mind underliningthe importance of safety even further.
Both car manufacturers and the Dutch government obviously consider the occurrence oftraffic accidents to be a given. Both invest large sums of money into inventing more and moreprotective systems that the driver does not need to apply himself, but that add less and less tothe total level of protection possible. The measures meant to prevent accidents also seem to befocused on taking the driver ever further out of the equation. The Dutch government and thecar manufacturers come up with an increasing amount of systems and measures to decreasethe occurrence and severity of accidents which can anticipate on dangerous situations inde-pendent of the driver. It does, however, seem somewhat strange that the Dutch governmentpromotes this process, since they were planning to increase the sense of responsibility of allroad users.
EuroNCAP crash tests some types of cars and gives them safety ratings, hereby focus-ing all attention on the protective side of car safety; as if there are no other ways to decreasetraffic fatality rates. This, again, pushes the responsibility for his and other people's safetyaway from the driver and towards the car (manufacturer).
Many of the new accident prevention systems seem to be largely meant for drivers whodo not drive very carefully. Most of them help – one could even argue stimulate – drivers todrive too fast, keep too small distances between them and the car in front of them, and takebends too fast without any consequences for the driver's safety. Since, for instance, speedingcauses many accidents, this is not a very positive development.
11.2. Recommendations
The most important recommendation is to put the responsibility for traffic safety back towhere it belongs: in the hands of the driver. This will require a different approach to the de-sign of the car, the systems installed in it and the way the driver is regarded. Most important isto make the driver aware of all aspects of driving, and especially of the risks involved in it.This will probably mean that one will have to sacrifice some comfort (e.g. noise and vibrationprevention), but that will avoid giving the driver a false feeling of safety when driving fast.
To make a driver's expectations more realistic, a more extensive use of driving simula-tors and courses in which the participants experience extreme situations in real life are highlyrecommended. As mentioned, trial and error has appeared to be a very effective method tolearn something. Using a simulator, a driver can experience extreme situations without therisk of getting (fatally) injured and can thereby learn to recognise a potentially hazardoussituation. Also, he can learn how to anticipate on it to prevent accidents from happening or atleast decrease their severity. By loading the specific characteristics of the car(s) a particular
148
driver uses into the simulation programme, the driver will get to know the limits and possi-bilities of that car; a situation which is not very likely otherwise.
The same applies for courses in which drivers get to experience extreme situations inreal life. On special test tracks, using protective clothing and cars with extra safety measures,a participant can get to know what the limitations of his car are and how it reacts under ex-treme circumstances. This way, it is more likely that he will be able to anticipate on hazardoussituations and act to prevent an accident from happening or at least reduce its severity.
Apart from trying to alter man's behaviour in traffic through controlled trial and error, itwould be advisable to change a few basic features in the design of the car in order to furtherprevent traffic accidents or reduce their severity. Many fatalities and injuries would be pre-vented if compatibility (mass, stiffness, geometry) between cars would be improved. Apartfrom that, the design and stiffness of the parts of the car most likely to experience collisionswith external road users should be so that the risk of these road users getting (fatally) injuredis as small as possible while still leaving a high enough level of protection for the car occu-pants.
It seems that a driver's pursuit of constant risk can be successfully countered by use ofdeception. Drivers do adjust their behaviour to riskier situations by driving slower and morecarefully. So if they are led to believe that their vehicle or the traffic situation they are facingis more dangerous than it actually is, then they will act upon that, increasing traffic safety. Inother words, if car manufacturers want to contribute to a safer situation on the roads, then theyshould actually make people feel less safe in their cars. Of course every company will have todo that, or otherwise the effect would almost certainly be lost. Sadly though, it does not seemlikely that this idea will be carried out.
Another thing that might restore the balance between protective measures and crashprevention somewhat is carrying out crash prevention tests as well as crash safety tests. Rais-ing the awareness of the reality of driving a car through direct media campaigns will probablyalso help to increase traffic safety.
11.3. The "ideal" car
Based on the description of the different possibilities with respect to the geometry of the car,the properties of its construction parts and the various systems which can be built into it, it ispossible to put together the outlines of the "ideal" car. This description will by all means notbe complete, since there are still quite a few unknowns regarding the effects that some of thechanges might have on the whole.
GeometryThe nose should be a compromise between the ideal shape, length, and stiffness for occupantprotection and partner protection.Bumper height should be based on the one most used in cars today.All edges should be smoothed out as much as possible.Elements which are protruding from the construction should be either covered or worked intothe construction smoothly.Front stiffness should be based on the car's weight and the class of cars it belongs to.Side stiffness should be as high as possible. A raised floor [approximately at the height mostof today's bumpers are placed] to absorb the energy of side crashes would be a great im-provement in that respect.
149
Occupant protectionAirbags and seatbelts for all occupantsAutomatically adjusting head rests for all occupantsSeats with stiff bases to prevent submarining.Energy absorbing dashboard and steering wheel with blunt edges.Windshield: either ordinary or unbreakable safety glass; research will have to prove whichoption will cause least (severe) injuries.
Improvement of ergonomicsRoute guidance system: advisable, since it can reduce stress, but the driver has to be madeaware of the risk of the commando effect occurring.Collision avoidance system: advisable, since it provides a feature which is absent in a driver.Air-conditioning: definitely advisable, since it will optimise the driver's "work space".Noise and vibration reduction: seems to disturb the driver's contact with reality, therefore notadvisable.ABS, driver alertness monitoring, stability control and vision enhancement systems: seemonly to lead to drivers feeling less responsible and taking more risks, so these should be leftout.
11.4. The DutchEVO
As an addition, I will now give a short evalution of the (proposed) design of the DutchEVO(see Appendix H for details) in the light of what has been said about a different approach to-ward the car safety issue.
One of the important aspects of the philosophy behind the DutchEVO is that they want tocause a mentality change in the general public, starting with the owner of the car. The idea ofcreating a bond between car and owner seems a sound one, because the owner will proablybecome more careful not to damage the car.
Another point was to break down mcuh of the technological, isolated shell of the car inorder to make the driver more aware of his surroundings. This would make it less "necessary"for the driver to look for risky situations to feel more alive. The importance of getting morecontact with the surroundings of the car was discussed a couple of times; the driver will havea more realistic notion of the risks of driving if he can sense how fast he is moving. The factthat the driver would probably feel less need for risky driving is a good addition to that.
One of the downsides of the "other-ness" of the DutchEVO is that it will not appeal toeveryone. On the other hand, just like is the case with the Smart, the DutchEVO will mostlikely stand out against the rest of the passenger car population and may therefore function asa physical reminder of its phylosophy. Seeing more and more of these cars on the roads mayslowly alter the possible initial scepticism and may make people more open to the differentapproach to car safety propagated by DutchEVO.
Those who are already feeling positive towards the philosophy behind DutchEVO andmay even consider buying one, will probably not mind exchanging some comfort and luxuryfor more responsibility over their own safety. This will gain him a certain status (even if onlyin his own eyes) which will give him the feeling that he is "at least doing something to changethings", as one so often hears.
Making the DutchEVO safer through a wider wheel base and a lower centre of mass isalso a good plan. Feeling the stability of the car in spite of different load situations will install

150
trust in the driver. Apart from that, it shows that one does not necessarily need a system toenhance a car's stability.
The idea of the raised floor is also a keeper. Since the car will be very light, it will suf-fer from incompatibility problems in crashes with heavier cars. The raised floor will ensurethat such crashes will at least not be accompanied by the penetration of the striking car intothe occupant compartment. Apart from that, it will provide a more stable crush behaviourduring the impact which is important with respect to the accelerations the occupants will un-dergo then. The proposed deformation profiles will protect the occupants from being sub-jected to high accelerations even further.
Concluding, the DutchEVO project contains a sensible set of traffic safety enhancingsystems and geometrical solutions. It therefore stands a fair chance of at least paving the wayfor a change in the mentality of the general public.
151
Literature
Books
Centraal Bureau voor de Statistiek, Ministerie van Verkeer en Waterstaat, Adviesdienst Ver-voer, Verkeersongevallen 1997. Assen (NL): Van Gorcum, 1998.
Evans, L., Traffic safety and the driver. New York (USA): Van Nostrand Reinhold, 1991.
Fastenmeier, W. (Bd.-Hrsg.), Autofahrer und Verkehrssituation: neue Wege zur Bewertungvon Sicherheit und Zuverlässigkeit moderner Straßenverkehrssysteme. Köln (D): TÜVRheinland, 1995.
Gundy, C.M., Accident typology. Leidschendam: SWOV Institute for Road Safety Research,1990.
Huijbers, J.J.W., Letselpreventie-onderzoek gericht op fietsers en bromfietsers: theorie enpraktijk. Leidschendam: SWOV Institute for Road Safety Research, 1988.
Ian Noy, Y. (ed.), Ergonomics and safety of intelligent driver interfaces. Mahwah (USA):Lawrence Erlbaum Associates, 1997.
Kramer, F., Passive Sicherheit von Kraftfahrzeugen: Grunlagen – Komponenten – Systeme.Braunschweig/Wiesbaden (D): Friedr. Vieweg & Sohn Verlagsgesellschaft mbH, 1998.
Snel, J. and P.T. Kempe (red.), De mens in het verkeer: de zwakste schakel?! Assen: VanGorcum & Comp. BV, 1995.
Car brochures
Alfa Romeo Alfa 166
Audi A2, A3, A4, S4, S6
BMW BMW 3-serie coupé
Citroën C5 Berline, Saxo, Xsara Picasso
Fiat Doblò
Ford Mondeo, Puma
Mazda 121, 323, 626, Demio, MPV, Premacy
Mercedes (Electronic Stability Program ESP; Voor de veiligheid)
Mitsubishi Carisma, Pajero, Space Star
152
Opel Agila, Astra, Corsa, Omega, Vectra, Zafira
Peugeot 106, 206, 206CC, 306, 306 Break, 306 Cabriolet, 406, 406 Break,406 Coupé, 607, 806
Renault Avantine, Laguna, Mégane, Twingo
Saab 9-3, 9-5, (Control-Performance-Safety-Design)
Seat Arosa, Toledo
Smart Cabrio 2001, City-Coupé 2001
Toyota Avensis, Previa, Yaris
Volkswagen Bora, Golf Variant, Lupo, New Beetle, Passat, Passat Variant, Polo, Sharan
Volvo C70, Cross Country, S40/V40, S60, S80, V70,(Volvo SIPS: Beschermingssysteem tegen zijdelingse aanrijdingen)
Newspaper and magazine articles
Burg, S. van der, "Veiligheid en Volvo". WD Trucks/Volvo, 2000.
Hogeweg, B., "Autoweek in Death Valley: Houdt airco het hoofd koel?". Autoweek 31, 2000.
Insurance Institute for Highway Safety, "Crash compatibility: How vehicle type, weight affectoutcomes". Status Report Vol. 33, No. 1 (14 February, 1998).
Lingnau, G., "Met afstand houden vertrouwen op radar: Distronic". Mercedes-Benz News:over de toekomst van de automobiel, winter 2000.
Öfverman, P. (ed.), "Distribution of accident types". Volvo Cars: the international inhousemagazine special edition 00, 2000.
Pasma, C.P. and J. Latijnhouwers, "Minder verkeersdoden door strenge controles". Metro, 4August 2000.
Ribbens, A., "Digitaal Blik". NRC Handelsblad, 16 September, 2000.
Wijngaarden, W. van, "Auto-elektronica voor grotere veiligheid". Technieuws 4, juni 2000.
Press releases
"National Traffic and Transport Plan: summary of proposed policy". January 2001. Ministeryof Transport, Public Works and Water Management.
153
"Volvo en veiligheid: Progressief in protectie". January 2001. Volvo.
"Volvo EyeCar: Oog voor alles". December 2000. Volvo.
"Volvo Performance Concept Car: Ambitieus studiemodel op basis van Volvo S60". October2000. Volvo.
Reports
Gabler, H.C. and W.T. Hollowell, NHTSA's vehicle aggressivity and compatibility researchprogram. U.S. National Highway Traffic Safety Administration, Paper No. 98-S3-O-01.
Hobbs, C.A., P.F. Gloyns and S.J. Rattenbury, Assessment protocol and biomechanical limits.European New Car Assessment Programme, version 2 May 1999.
Lie, A. and C. Tingvall, How do[es] Euro NCAP Results correlate to real life injury risks. Apaired comparison study of car-to-car crashes. IRCOBI conference, 20 September 2000.
Seiffert, U., Die Automobiltechnik im neuen Jahrtausend. Vision Automobil Euroforum,München, 22 – 23 May 2000.
Knoppert, M. and R. Porcelijn (and others), DutchEVO: the development of an ultralight sus-tainable conceptcar. Smart Product Systems, Delft, May 1999.
Websites
3VO (Verenigde Verkeersveiligheids Organisatie): http://www.3vo.nl
AB Svensk Bilprovning: http://www2.bilprovningen.se
Alcoholvoorlichting: http://www.alcoholvoorlichting.nl
Adviesdienst Verkeer en Vervoer (AVV): http://www.rws-avv.nl
Ben jij sterker dan drank?: http://www.benjijsterkerdandrank.nl
Centraal Bureau Rijvaardigheid (CBR): http://www.cbr.nl
Centraal Bureau voor de Statistiek (CBS): http://www.cbs.nl
EuroNCAP (European New Car Assessment Program): http://www.euroncap.com
FIA (Federation Internationale de l'Automobile): http://www.fia.com
Garage Zuijderwijk & Vogels (betr. APK): http://www.garage-zv.demon.nl/apk
Insurance Institute for Highway Safety: http://www.hwysafety.org
154
International Regulations (InterRegs): http://www.interregs.com
Ministerie van Verkeer en Waterstaat: http://www.minvenw.nl
National Highway Traffic Safety Administration (NHTSA): http://www.nhtsa.dot.gov
NRC Handelsblad: http://www.nrc.nl
Openbaar Ministerie: http://www.openbaarministerie.nl
Politie: http://www.politie.nl
Stichting Wetenschappelijk Onderzoek Verkeersveiligheid (SWOV): http://www.swov.nl
Volvo's Concept Lab: http://www.conceptlabvolvo.com
155
Terminology
A-pillar = the pillar at the front of the door which also forms the windscreen side support.
Active safety = measures to prevent traffic accidents from happening, so that the total amountof accidents will decrease.
B-pillar = the pillar at the back of the door, or between the front and back door in case of a 5-door car.
C-pillar = the pillar which forms the aft windscreen side support and, in case of a 5-door car,the pillar at the back of the back door.
Crashworthiness = describes a car's ability to provide protection during a crash.
Damage = loss through impairment of interests on the basis of a certain technical process orstate. The magnitude of the damage is called "material damage" in case of damage to the ve-hicle (e.g. costs of repair, replacement value, decrease in value on the basis of the vehicle be-ing damaged), and "personal damage" in case of damage to the person involved (e.g. injurylevel, injury costs).286
Danger = a situation in which the risk is higher than the highest acceptable risk (limiting riskvalue) of a particular technical process or state.287
Delta-v = the change in speed during an accident; an important measure of crash severity. Acar crashing into a stationery car at 60 km/h, for instance, would have the same delta-v as acar crashing into a barrier at 30 km/h."288
FARS = Fatal Accident Reporting System; came into existence in 1975 and is part of the Na-tional Highway Traffic Safety Administration (NHTSA).
Footwell = the area where the pedals are located.
Intrusion = plastic (=non-reversible) deformation of the passenger compartment or itemssuch as the facia or steering wheel moving towards the driver during an accident.
Lane drifting = serious deviation from the middle of the roadway.
Menace = a hazard to a person, thing or function defined by a certain time and space as wellas type, size and direction. This means that an accident directly resulting in damage is a men-ace. To define the difference between manoeuvres with and without damage relevant from thestandpoint of accidents, the ones who end up without damage are referred to as "near-collisions". These potentially form a menace as much as actual accidents, but ultimately do
286 Kramer, 1998; 1287 Kramer, 1998; 2288 Evans, 1991; 220-221
156
not lead to damage, because there is no damage causing situation (e.g. a collision opponent)available.289
Offset = a frontal crash test where the impact is on one side of front of the car only.
Passive safety = measures to decrease the severity of traffic accidents so that damage is lim-ited.
Risk = that which is connected to a particular technical process or state and, summarising, isdescribed by a pronouncement concerning the likelihood
- that the expected frequency of the occurrence of a situation which could lead to dam-age and
- the expected amount of damage when the situation occurs.290
Safety = the opposite of danger; a situation in which the risk is lower than the highest accept-able risk (limiting risk value) of a particular technical process or state.291
Safety = 1 – dangerAn increase in safety is basically a logical result from a decrease in risk. This could either becaused by the likelihood of occurrence of a situation leading to damage having decreased(prevention of the accident), or it could be caused by a reduction of the measure of damage(reduction of the results of the accident).292
Safety measures = all measures meant to prevent accidents from happening and all measuresto minimise the consequences of an accident in case one does happen.293
Sub-optimisation = optimisation which leads to a better score in one category and simultani-ously to a worse score in another.
Traffic accident = event in which the difference between the projected driving task and itsrealisation is larger than a particular permitted quantity (a control task one is unable to takeon), the direct results of which being the occurrence of a particular amount and kind ofdamage.294
289 Kramer, 1998; 2290 Kramer, 1998; 1291 Kramer, 1998; 2292 Kramer, 1998; 2293 Kramer, 1998; 141294 Kramer, 1998; 1
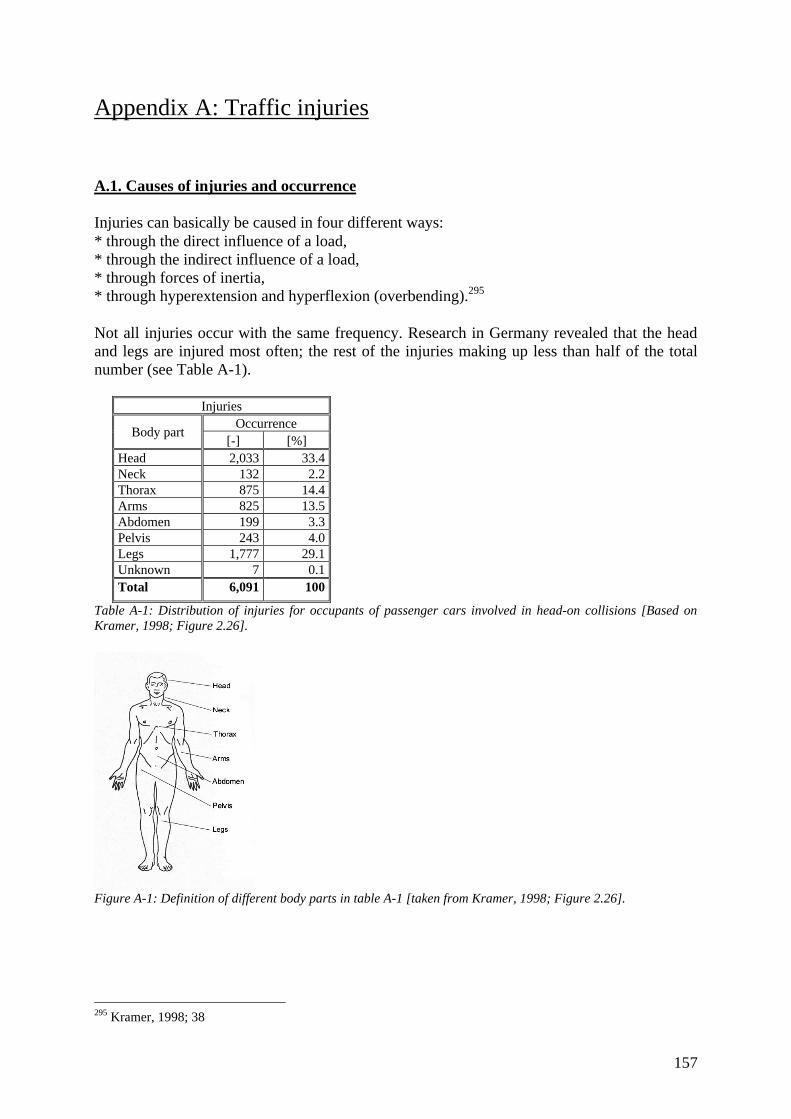
157
Appendix A: Traffic injuries
A.1. Causes of injuries and occurrence
Injuries can basically be caused in four different ways:* through the direct influence of a load,* through the indirect influence of a load,* through forces of inertia,* through hyperextension and hyperflexion (overbending).295
Not all injuries occur with the same frequency. Research in Germany revealed that the headand legs are injured most often; the rest of the injuries making up less than half of the totalnumber (see Table A-1).
InjuriesOccurrence
Body part[-] [%]
Head 2,033 33.4Neck 132 2.2Thorax 875 14.4Arms 825 13.5Abdomen 199 3.3Pelvis 243 4.0Legs 1,777 29.1Unknown 7 0.1Total 6,091 100
Table A-1: Distribution of injuries for occupants of passenger cars involved in head-on collisions [Based onKramer, 1998; Figure 2.26].
Figure A-1: Definition of different body parts in table A-1 [taken from Kramer, 1998; Figure 2.26].
295 Kramer, 1998; 38
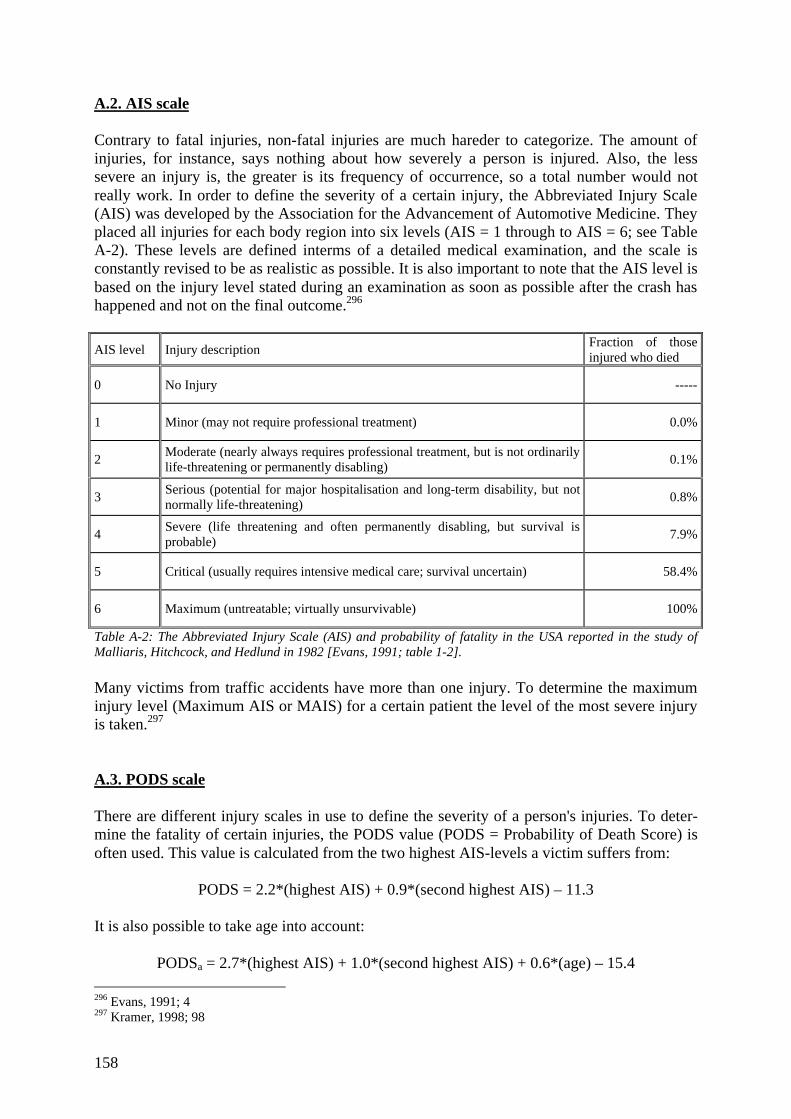
158
A.2. AIS scale
Contrary to fatal injuries, non-fatal injuries are much hareder to categorize. The amount ofinjuries, for instance, says nothing about how severely a person is injured. Also, the lesssevere an injury is, the greater is its frequency of occurrence, so a total number would notreally work. In order to define the severity of a certain injury, the Abbreviated Injury Scale(AIS) was developed by the Association for the Advancement of Automotive Medicine. Theyplaced all injuries for each body region into six levels (AIS = 1 through to AIS = 6; see TableA-2). These levels are defined interms of a detailed medical examination, and the scale isconstantly revised to be as realistic as possible. It is also important to note that the AIS level isbased on the injury level stated during an examination as soon as possible after the crash hashappened and not on the final outcome.296
AIS level Injury descriptionFraction of thoseinjured who died
0 No Injury -----
1 Minor (may not require professional treatment) 0.0%
2Moderate (nearly always requires professional treatment, but is not ordinarilylife-threatening or permanently disabling)
0.1%
3Serious (potential for major hospitalisation and long-term disability, but notnormally life-threatening)
0.8%
4Severe (life threatening and often permanently disabling, but survival isprobable)
7.9%
5 Critical (usually requires intensive medical care; survival uncertain) 58.4%
6 Maximum (untreatable; virtually unsurvivable) 100%
Table A-2: The Abbreviated Injury Scale (AIS) and probability of fatality in the USA reported in the study ofMalliaris, Hitchcock, and Hedlund in 1982 [Evans, 1991; table 1-2].
Many victims from traffic accidents have more than one injury. To determine the maximuminjury level (Maximum AIS or MAIS) for a certain patient the level of the most severe injuryis taken.297
A.3. PODS scale
There are different injury scales in use to define the severity of a person's injuries. To deter-mine the fatality of certain injuries, the PODS value (PODS = Probability of Death Score) isoften used. This value is calculated from the two highest AIS-levels a victim suffers from:
PODS = 2.2*(highest AIS) + 0.9*(second highest AIS) – 11.3
It is also possible to take age into account:
PODSa = 2.7*(highest AIS) + 1.0*(second highest AIS) + 0.6*(age) – 15.4
296 Evans, 1991; 4297 Kramer, 1998; 98
159
Appendix B. Government-supported safety campaigns in TheNetherlands
The Ministry of Transport, Public Works and Water Management (Ministerie van Verkeer enWaterstaat) regularly launches large media campaigns if some kind of regulation is not livedup to as much as the Ministery would like or if a new regulation has been approved of. Re-sponsible for these campaigns is 3VO (Verenigde Verkeers Veiligheids Organisatie or UnitedTraffic Safety Organisation). Some examples of their campaigns relevant for the subject ofthis report are listed below.
• Drive handsfree ("Rij handsfree"), a campaign to stimulate people to use a handsfreephone while driving.
• Seatbelt on! ("Gordel om!!"), a campaign to remind people of the necessity of wearingseatbelts.
• Keep a distance of 2 seconds ("Houd 2 seconden afstand"), a campaign to stimulate peo-ple to keep a distance of at least two seconds between their car and the car in front ofthem, since 90% of all rear-end collisions are caused by keeping a too small distance."Sticking" to somebody else's bumper can also cause irritation and aggression.
• Tell everyone about it; those from the right have right of way ("Geef het door, rechts gaatvoor"), a campaign to make people aware of the new traffic regulation that provides rightof way to cyclists and moped riders.
• Zipping up ("Ritsen"), a campaign to get people to merge into the traffic of the otherroadway(s) smoothly if one roadway is closed.
• Fog: halve your speed and double your distance ("Mist: halveer je snelheid, verdubbel jeafstand), a campaign to stimulate people to lower their speed when it is foggy.
• Don't drink and drive ("Rij alcoholvrij"), a campaign to stimulate people not to drink al-cohol prior to driving.
• Low Sun, sunglasses on ("Laagstaande zon, zonnebril op"), a campaign to warn driversabout the dangers of being blinded by sunlight.
• 30 makes your neighbourhood nice again ("30 maakt je buurt weer prettig"), a campaignto stimulate people to drive 30 km/h in residential areas.
• Campaign driving safely ("Actie veilig rijden"), a campaign aimed at professional roadusers to stimulate them to drive more safely.
• No lights, not me ("Geen verlichting, mij niet gezien"), a campaign to convince cyclists ofthe importance of lights on their bicycle.
• Brains for moped riders ("Brains voor brommen"), a campaign to get moped riders to at-tend riding courses.
• Cyclists visible from the right ("Fietsers zichtbaar van rechts").

160
161
Appendix C. 3VO's simulators
The Dutch traffic safety organisation 3VO (Verenigde Verkeers Veiligheids Organisatie orUnited Traffic Safety Organisation) possesses two types of simulators; the crash-tilt simulatorand the driving simulator. Both simulators can be rented; using the driving simulator for fourhours, for instance, will cost 1,759.- guilders on weekdays.
C.1. Crash-tilt simulator
The crash-tilt simulator is basically a car which can be tilted with respect to its longitudinalaxis. By means of this simulator, drivers and passengers can be trained to leave a tilted car inthe safest possible way. They learn to unbuckle their safety belt without any additionalinjuries that may otherwise have been caused by going about it the wrong way, and leavingthe car.
C.2. Driving simulator
The 3VO driving simulator consists of the occupant compartment of a passenger car. Thewindshield has been replaced by a monitorscreen on which the trip is displayed for the driver.Two other monitor screens show the actions of the driver to the audience. This way, a team of2VO advisers can judge the driver's driving behaviour.
It is possible to run different programmes on this simulator. One can, for instance,experience the influence of alcohol consumption on driving behaviour, but it is also possibleto drive under circumstances of decreased visibility, to drive as economically as possible andto test the driver's reactions. Part of the simulator is also an extensive eye test.

162
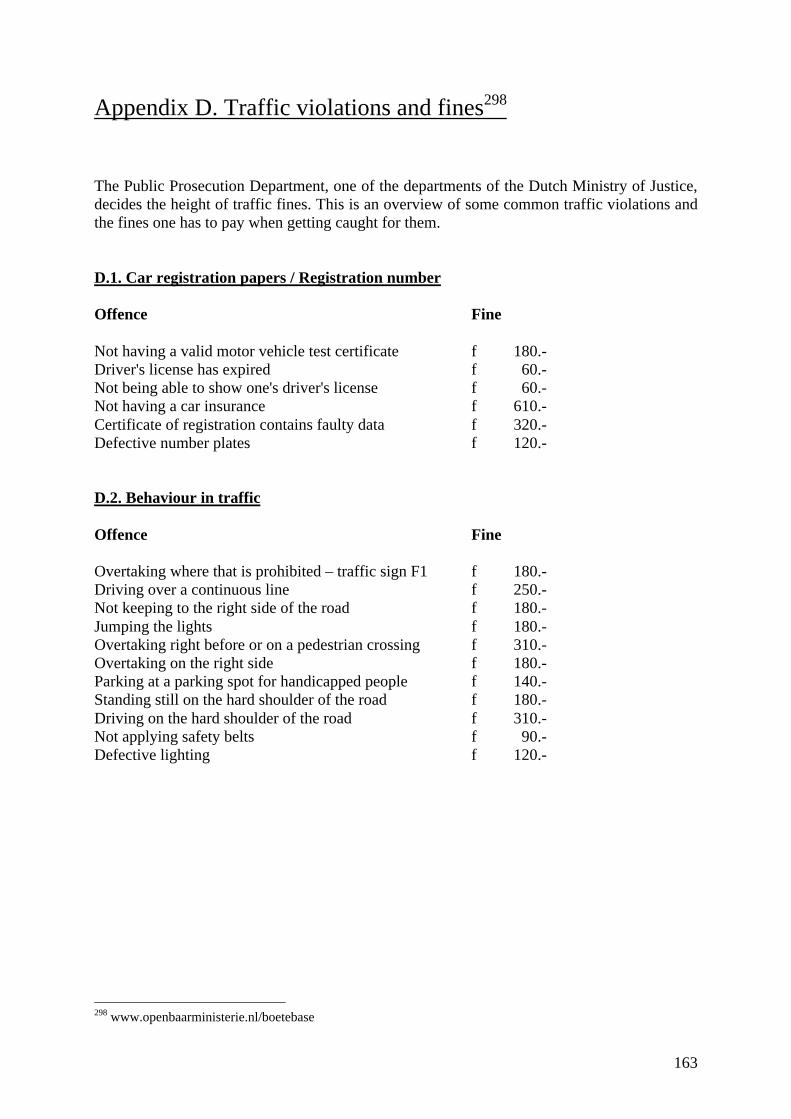
163
Appendix D. Traffic violations and fines298
The Public Prosecution Department, one of the departments of the Dutch Ministry of Justice,decides the height of traffic fines. This is an overview of some common traffic violations andthe fines one has to pay when getting caught for them.
D.1. Car registration papers / Registration number
Offence Fine
Not having a valid motor vehicle test certificate f 180.-Driver's license has expired f 60.-Not being able to show one's driver's license f 60.-Not having a car insurance f 610.-Certificate of registration contains faulty data f 320.-Defective number plates f 120.-
D.2. Behaviour in traffic
Offence Fine
Overtaking where that is prohibited – traffic sign F1 f 180.-Driving over a continuous line f 250.-Not keeping to the right side of the road f 180.-Jumping the lights f 180.-Overtaking right before or on a pedestrian crossing f 310.-Overtaking on the right side f 180.-Parking at a parking spot for handicapped people f 140.-Standing still on the hard shoulder of the road f 180.-Driving on the hard shoulder of the road f 310.-Not applying safety belts f 90.-Defective lighting f 120.-
298 www.openbaarministerie.nl/boetebase
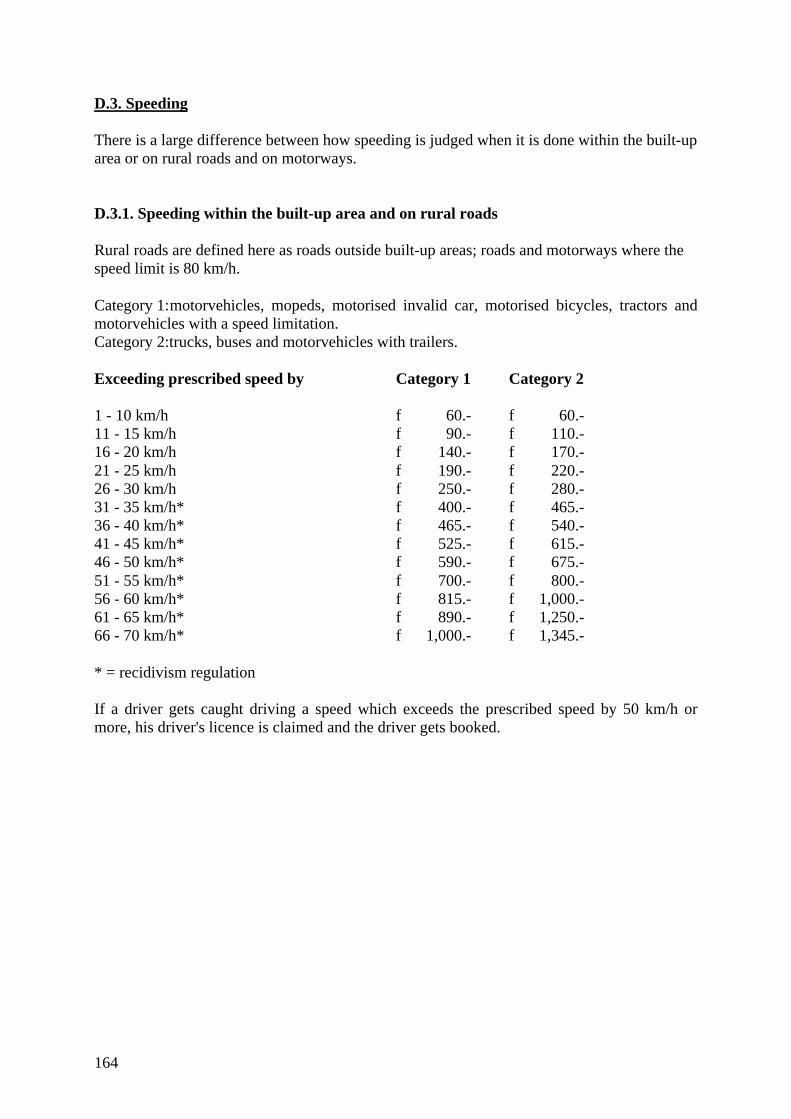
164
D.3. Speeding
There is a large difference between how speeding is judged when it is done within the built-uparea or on rural roads and on motorways.
D.3.1. Speeding within the built-up area and on rural roads
Rural roads are defined here as roads outside built-up areas; roads and motorways where thespeed limit is 80 km/h.
Category 1:motorvehicles, mopeds, motorised invalid car, motorised bicycles, tractors andmotorvehicles with a speed limitation.Category 2:trucks, buses and motorvehicles with trailers.
Exceeding prescribed speed by Category 1 Category 2
1 - 10 km/h f 60.- f 60.-11 - 15 km/h f 90.- f 110.-16 - 20 km/h f 140.- f 170.-21 - 25 km/h f 190.- f 220.-26 - 30 km/h f 250.- f 280.-31 - 35 km/h* f 400.- f 465.-36 - 40 km/h* f 465.- f 540.-41 - 45 km/h* f 525.- f 615.-46 - 50 km/h* f 590.- f 675.-51 - 55 km/h* f 700.- f 800.-56 - 60 km/h* f 815.- f 1,000.-61 - 65 km/h* f 890.- f 1,250.-66 - 70 km/h* f 1,000.- f 1,345.-
* = recidivism regulation
If a driver gets caught driving a speed which exceeds the prescribed speed by 50 km/h ormore, his driver's licence is claimed and the driver gets booked.
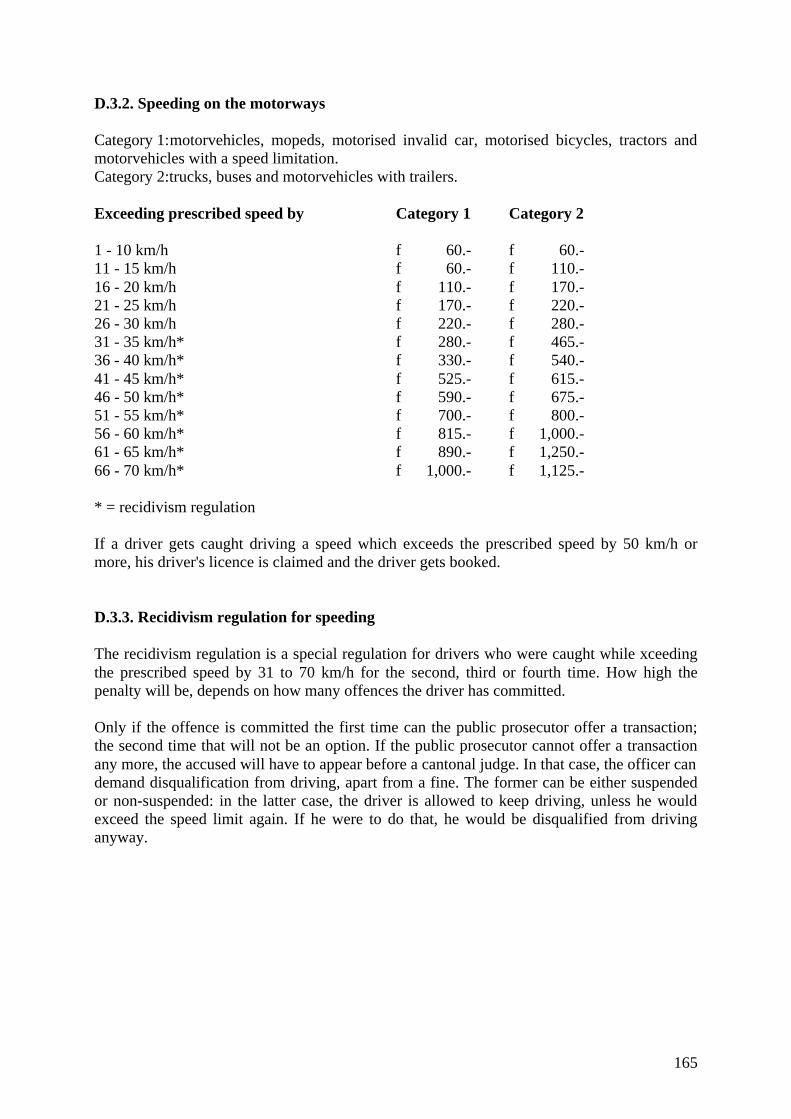
165
D.3.2. Speeding on the motorways
Category 1:motorvehicles, mopeds, motorised invalid car, motorised bicycles, tractors andmotorvehicles with a speed limitation.Category 2:trucks, buses and motorvehicles with trailers.
Exceeding prescribed speed by Category 1 Category 2
1 - 10 km/h f 60.- f 60.-11 - 15 km/h f 60.- f 110.-16 - 20 km/h f 110.- f 170.-21 - 25 km/h f 170.- f 220.-26 - 30 km/h f 220.- f 280.-31 - 35 km/h* f 280.- f 465.-36 - 40 km/h* f 330.- f 540.-41 - 45 km/h* f 525.- f 615.-46 - 50 km/h* f 590.- f 675.-51 - 55 km/h* f 700.- f 800.-56 - 60 km/h* f 815.- f 1,000.-61 - 65 km/h* f 890.- f 1,250.-66 - 70 km/h* f 1,000.- f 1,125.-
* = recidivism regulation
If a driver gets caught driving a speed which exceeds the prescribed speed by 50 km/h ormore, his driver's licence is claimed and the driver gets booked.
D.3.3. Recidivism regulation for speeding
The recidivism regulation is a special regulation for drivers who were caught while xceedingthe prescribed speed by 31 to 70 km/h for the second, third or fourth time. How high thepenalty will be, depends on how many offences the driver has committed.
Only if the offence is committed the first time can the public prosecutor offer a transaction;the second time that will not be an option. If the public prosecutor cannot offer a transactionany more, the accused will have to appear before a cantonal judge. In that case, the officer candemand disqualification from driving, apart from a fine. The former can be either suspendedor non-suspended: in the latter case, the driver is allowed to keep driving, unless he wouldexceed the speed limit again. If he were to do that, he would be disqualified from drivinganyway.
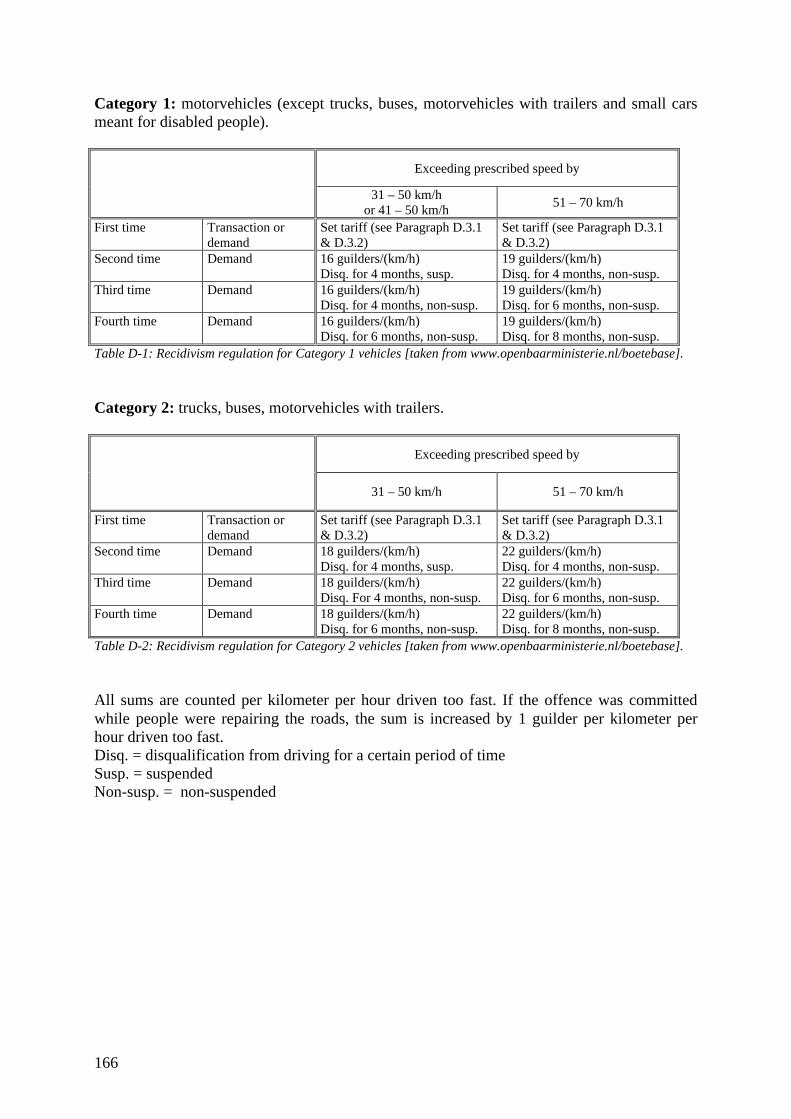
166
Category 1: motorvehicles (except trucks, buses, motorvehicles with trailers and small carsmeant for disabled people).
Exceeding prescribed speed by
31 – 50 km/hor 41 – 50 km/h
51 – 70 km/h
First time Transaction ordemand
Set tariff (see Paragraph D.3.1& D.3.2)
Set tariff (see Paragraph D.3.1& D.3.2)
Second time Demand 16 guilders/(km/h)Disq. for 4 months, susp.
19 guilders/(km/h)Disq. for 4 months, non-susp.
Third time Demand 16 guilders/(km/h)Disq. for 4 months, non-susp.
19 guilders/(km/h)Disq. for 6 months, non-susp.
Fourth time Demand 16 guilders/(km/h)Disq. for 6 months, non-susp.
19 guilders/(km/h)Disq. for 8 months, non-susp.
Table D-1: Recidivism regulation for Category 1 vehicles [taken from www.openbaarministerie.nl/boetebase].
Category 2: trucks, buses, motorvehicles with trailers.
Exceeding prescribed speed by
31 – 50 km/h 51 – 70 km/h
First time Transaction ordemand
Set tariff (see Paragraph D.3.1& D.3.2)
Set tariff (see Paragraph D.3.1& D.3.2)
Second time Demand 18 guilders/(km/h)Disq. for 4 months, susp.
22 guilders/(km/h)Disq. for 4 months, non-susp.
Third time Demand 18 guilders/(km/h)Disq. For 4 months, non-susp.
22 guilders/(km/h)Disq. for 6 months, non-susp.
Fourth time Demand 18 guilders/(km/h)Disq. for 6 months, non-susp.
22 guilders/(km/h)Disq. for 8 months, non-susp.
Table D-2: Recidivism regulation for Category 2 vehicles [taken from www.openbaarministerie.nl/boetebase].
All sums are counted per kilometer per hour driven too fast. If the offence was committedwhile people were repairing the roads, the sum is increased by 1 guilder per kilometer perhour driven too fast.Disq. = disqualification from driving for a certain period of timeSusp. = suspendedNon-susp. = non-suspended
167
Appendix E. Accident types
In 1990, C.M. Gundy published a detailed study focusing on the different circumstances sur-rounding traffic accidnts. His purpose was to find out whether there were certain patterns inthese circumstances that could subsequently be used to identify behavioral scenarios in acci-dents. This appendix contains an overview of the most important and/or remarkable resultsfrom his study.
E.1. Bicycle-car accidents299:
"Collisions between cars and bicyclists are primarily harmful for the bicyclist."Size of this group of accidents: 6,333Casualties and injured: 2.9% of the accidents ended up in the death of the bicyclist, in32.6% of all cases (at least one) bicyclist had to be taken to hospital, 60.5% resulted in someregistered injury which did not require a trip to the hospital. No drivers were killed, 0.2% hadto be taken to hospital and some light injury was observed in 0.7% of all accidents.Circumstances: these accidents happen usually during weekdays, daylight, dry weather, on adry, bitumen road. Other specific circumstances are that they usually occur inside built-upareas, where the maximum speed is 50 km/h.Gender and age: 79% men, 31% 25 years old or less, 56% are between 25 and 56 years old.56% of the bicyclists are men, 40% of the bicyclists are 18 or younger, 25% are between 18and 40 and 18% are between 40 and 65; the remaining 15% are 65 or older.Situation right before the accident: most accidents occur at an intersection with no unusualtraffic situation noted. Most drivers are driving on the right hand side of the road, usuallydriving straight ahead (71%). Most cyclists are on the right hand side of the road too, or onthe cycle path. 59% is riding straight ahead, 26% turning left, 6% crossing the road.First contact: 41% of the cyclists is struck from the left side, 32% from the front, 21% fromthe right side and 6% from the back. 39% of the drivers are struck directly in front, 23% onthe right front bumper, 18% on the left front bumper, and 15% on either flank, 5% struckfrom behind.Irresponsible behaviour: Alcohol use was determined in 2.5% of the drivers and in 1.5% ofthe cyclists. 39% of the drivers is "charged with some infraction of the traffic regulations.22% are accused of giving no right of way, and 4% are accused of driving too far to the right.On the other hand, bicyclists are blamed in 68% of the cases. The main accusations are: notgiving right of way (47%), riding through a stop sign or light (4%), not riding far enough tothe right (4%), and suddenly crossing the road (3%)."
E.2. Car-moped accidents300:
"Collisions between cars and mopeds are primarily harmful for the moped rider, even thoughthey seem to be somewhat less serious than car-bicycle collisions." [helmet?]Size of this group of accidents: 6,263.
299 Gundy, 1990; 14-16300 Gundy, 1990; 28-30
168
Casualties and injured: 0.8% of the accidents resulted in the death of the moped rider,27.8% required that (at least one) moped rider be taken into hospital, and 68.1% resulted insome registered injury which did not require a trip to the hospital. No drivers were killed,0.1% had to be taken to hospital and some light injury was observed in 0.8% of all accidents.Circumstances: primarily during weekdays, late spring and fall months, daylight, dryweather, dry bitumen roads in built-up areas (maximum speed is 50 km/h).Gender and age: 80% of the drivers are men, 29% are 25 or younger, 57% are between 25and 56 years old. 80% of the moped riders are men, 56% are 18 or younger, 35% are between18 and 40, 7% are between 40 and 65, the remaining 2% are 65 or older. (Obviously a differ-ent age distribution than among bicyclists).Situation right before the accident: most accidents occur at intersections with no unusualtraffic situation noted. Most drivers are driving on the right hand side of the road, mostlydriving straight ahead (47%), although turning left (22%) or right (19%) occur rather oftentoo. Turning accidents appear to be more frequent than in the case of bicycle-car accidents.61% of the moped users are on the right hand side of the road and 26% are on the cycle path.80% is riding straight ahead, 11% is turning left and 3% is turning right.First contact: 23% of the moped riders are struck from the left side, 59% from the front, 34%from the right side, 1% from behind. 23% of the drivers are struck directly in front, 22% onthe right front bumper, 21% on the left front bumper, and 24% on either flank, 10% from be-hind.Irresponsible behaviour: Alcohol use was determined in 2.5% of the drivers, 1.8% of themoped riders. 55% of the drivers are charged with some infraction of the traffic regulations.54% are accused of not yielding right of way! Moped users are blamed in 53% of the cases.The main accusations: not yielding right of way (32%), driving through a stop sign or light(3%), not riding far enough to the right (3%) and driving incorrectly through a curve (3%).
E.3. Car-pedestrian accidents301:
Size of this group of accidents: 2,900.Casualties and injured: These accidents are much more serious than those between cars andbicyclists and cars and moped riders. 5.3% resulted in the death of the pedestrian, 42.2% re-quired that the pedestrian was taken to the hospital and 48.1% resulted in some registeredinjury which did not require a trip to the hospital. No drivers were killed or taken to hospitaland only 0.2% suffered from some kind of light injury.Circumstances: primarily during weekdays, daylight, dry weather, dry, bitumen road surfacein built-up areas with a speed limit of 50 km/h.Gender and age: 80% of the drivers are men, 30% is 25 or younger, 57% are between 25 and56. 60% of the pedestrians are men, 54% are 18 or younger, 17% are between 18 and 40, 13%are between 40 and 65, 16% 65 or older. Younger people are obviously involved more oftenin this type of accident.Situation right before the accident: 75% of the accidents occur on a straight road section,24% at an intersection. In 74% of the cases there is no unusual traffic situation. In 40% of thecases involved the pedestrian "suddenly" crossing the road and being struck by the car. 23%:pedestrian crossing the road after emerging from behind an object and getting struck. Cross-ing road on a pedestrian/zebra crossing: 16%! Most of the drivers are on the right hand side ofthe road, driving straight ahead; turning accidents are rather rare. 62% of the pedestrians de-
301 Gundy, 1990; 44-46
169
part from the sidewalk, 9% are on the road itself, and 12% are using a pedestrian crossingwhen struck. 88% are crossing the road, 7% are walking along the road.First contact: 52% of the drivers are struck directly in front, 23% on the right front bumper,16% on the left front bumper and 7% on either flank, 2% from behind.Irresponsible behaviour: Alcohol use was determined with 3.7% of the drivers, 4.1% of thepedestrians had used alcohol. Only 22% of the drivers are charged with some infraction of thetraffic regulations: 11% because of not yielding right of way. Pedestrians are blamed in 85%(!) of the cases. Main accusations: being careless while crossing the road (72%), being care-less while walking along the road (4%), ignoring a stop light or some other traffic sign (4%).
E.4. Car-car accidents302:
Size of this group of accidents: 4,655.Casualties and injured: 2.5% of the registered accidents resulted in death for at least oneperson. 29.2% required that someone had to be taken to hospital and 75.7% resulted in someregistered injury which did not require treatment at the hospital. A crucial difference betweenthis kind of accident and the ones mentioned before is that since automobiles can carry morepassengers, multiple deaths and severe injuries are more frequent even though uncommon:e.g. 1.3% had more than four victims.Circumstances: Primarily during weekdays (67%), daylight conditions, dry weather, dry bi-tumen. Built-up areas usually with a maximum speed limit of 50 km/h.Gender and age: 78% and 80% of these two vehicles' drivers are men. 29% of the first vehi-cles' and 25% of the second vehicles' drivers are less than 25 years of age, 54% and 64% arebetween 25 and 56, 18% and 11% are older.Situation right before the accident: 23% on a straight road section, 51% at a "normal" inter-section, 20% at a T or Y intersection, and 6% in a curve. Most frequent are two vehiclescrossing each other's path at right angles at an intersection without turning (34%); two carsare travelling on the same road in opposite direction while one vehicle attempts to turn leftand is struck by the vehicle coming from the opposite direction (14%), bumper to bumpercollision (13%), two vehicles crossing each other's path at right angles at an intersection,while one vehicle attempts to turn left and is struck by the vehicle coming from the left(12%), two vehicles are travelling on the same road in opposite directions and collide fron-tally without a lane change or any special manoeuvre (11%).In the following, the first vehicle mentioned is the vehicle whose driver is primarily blamedfor the accident, and the second vehicle's driver is mostly exonerated or only partially toblame. Most of these two vehicles drivers are on the right side of the road. Most are drivingstraight ahead, although slightly fewer in case of the first driver (61% straight, 24% turningleft).First contact: With respect to the first vehicle, 44% are struck in the centre front of the vehi-cle, 12% and 11% to the centre left and centre right respectively, 16% and 13% on the rightand left flanks respectively. Only 4% from behind. 46% of the second vehicle are struck onthe centre front, and 14% and 7% on the left and right front respectively, 5% and 13% arestruck on the left and right flank respectively and 14% are struck from behind.Irresponsible behaviour: 89% of the first and 95% of the second vehicles' driver have nothad any registered alcohol use. The first vehicle is (mainly) the vehicle who receives the pri-mary blame for the accidents. Indeed, only 3% of these drivers are exonerated. 61% areblamed for not yielding the right-of-way, 11% are blamed for not keeping sufficient distance,
302 Gundy, 1990; 57-59
170
4% are blamed for ignoring a stop sign or traffic light, 3% drove incorrectly through a curve,3% did not keep sufficiently to the right, and 3% were on the wrong side of the road. On theother hand, the second vehicle was accounted no blame in 92% of the cases. Failure to yieldright-of-way was cited in 3% of these accidents.
E.5. Car-object accidents303:
Size of this group of accidents: 3,162."Preliminary studies revealed that a large distinction was made between accidents whereincars collide with an object and accidents wherein cars collide with nothing, e.g., slips, runningoff the road, etc."Casualties and injured: This category is extremely serious: 7.0% of the accidents resulted indeath for at lest one person, 42.1% required that someone had to be taken to hospital, and55.8% resulted in some registered injury which did not require a trip to hospital.Circumstances: Primarily during weekdays (59%), although Saturdays and Sundays areclearly over-represented. They occur more frequently during the evening and early morninghours. Only 41% occurs during daylight, 81% during dry weather, bitumen, dry roads. (Only)47% of these accidents occur inside built-up areas, where the maximum speed is 50 km/h in46% of the cases, 80 km/h in 42% of the cases (!) and 100 km/h in 8% of the cases.Gender and age: 82% of the drivers are men, 41% are less than 25 years of age, 46% arebetween 25 and 50 years, 12% are older.Situation right before the accident: 54% (!) of these accidents occur on a straight road sec-tion, only 14% at some sort of intersection, and 33% (!) in a curve. Unusual road situationsare rather infrequent. The vehicle manoeuvres being executed are, in order of frequency: asingle car strikes an object on the side of the road (57%); a single car strikes a streetlight onthe side of the road (20%); a single car strikes from behind a parked vehicle on the same road(5%). Most drivers were driving on the right side of the road. In 87% of the cases the driverwas driving straight ahead, in 4%, 4% and 2% of the cases he was, respectively, braking, orturning left or right.First contact: His car was initially struck on the front left in 6% of the cases, centre front in70% of the cases and right front in 9% of the cases. In 5% of the cases, he was struck on theleft flank, and on the right flank in 5% of the cases. In 24% of the cases, the driver "lost con-trol over the car"; in 18% of the cases he was driving too far to the right. 17% of the time thedriver went into a slip, and 15% of the time he drove incorrectly through a curve. Trees werestruck most frequently (44%), followed by light masts (22%) and fixed objects (24%). Parkedvehicles were struck about 8% of the time. The struck object was usually located on theshoulder of the road (57%), on the sidewalk (28%). The remainder was found on the roaditself, on a safety island, or "somewhere else".Irresponsible behaviour: Only 65% of the drivers had not had any registered alcohol use,21% (!) were charged with drinking and driving.
303 Gundy, 1990; 74-75
171
E.6. Car-no object accidents304:
Size of this group of accidents: 851.Casualties and injured: This category is also a rather serious one. 6.6% of the registeredaccidents resulted in death for at least one person, 42.2% required that someone be taken tohospital, 55.1% resulted in some registered injury which did not require a trip to hospital.Circumstances: Primarily during weekdays (60%), although Saturdays and Sundays areclearly over-represented. More frequently during the evening and early morning hours, with(only) 50% occurring between 7 o' clock in the morning and 7 o' clock in the evening. 51%occur during daylight. Most occur during dry weather on dry, bitumen roads. Most accidentsoccur in rural areas; only 13% of these accidents occur inside built-up areas, which is ex-tremely few compared to the other types of accident. The speed limit is 50 km/h in 14% of thecases, 80 km/h in 60% of the cases (!), and 100 km/h in 23% of the cases. These single caraccidents appear to be quite different from the car-object accidents.Gender and age: 67% of the drivers are men. 43% of the drivers are less than 25 years ofage, 46% are between 25 and 50, 11% are older.Situation right before the accident: 54% (!) of these accidents occur on a straight road sec-tion, only 7% at some sort of intersection, and 40% (!) in a curve. Manoeuvres occurring mostfrequently: a single car drives off the road into the water (54%); a single car drives off astraight road section (16%), a single vehicle skids, yet remains on the road (13%); a singlevehicle drives off the road in the vicinity of a curve (13%); etc. Most of the drivers were onthe right side of the road. In 89% of the cases, the driver was driving straight ahead, in 4%and 4% he was respectively braking or turning. In 32% of the cases, the car overturned. In28% of the cases, the driver "lost control of the car"; in 14% of the cases he was driving toofar to the right. 18% of the time the driver went into a skid and 17% of the time he drove in-correctly through a curve.Irresponsible behaviour: Only 73% of the drivers had not had any registered alcohol use,14% (!) were charged with drinking and driving.
E.7. Additional remarks
Even though many patterns were not as clear as expected, there were certainly some scenariosthat stood out.
* The less well-known category "young child mid-block dart-out" could be detected, althoughit this scenario was somewhat blurred by the fact that certain choices were made in categoris-ing the data.305
* The archetypical alcohol accident – defined as "young male, single moving automobile,rural, night-time, run-off-the-road-in-a-curve type of accident in which a tree is involved" –appeared to be less clearly defined than expected. The single-moving automobile type of ac-cident did indeed frequently involve alcohol use. In the cases a vehicle collided with anotherobject, alcohol use is clearly over-represented in a cluster involving a more urban, badweather type of accident. In the cases a vehicle did not strike anything (situations such asdriving into a ditch), the more classical stereotype of the alcohol-involved accident was ob-tained (with the exception that no tree was involved).306
304 Gundy, 1990; 84-85305 Gundy, 1990; 101306 Gundy, 1990; 101
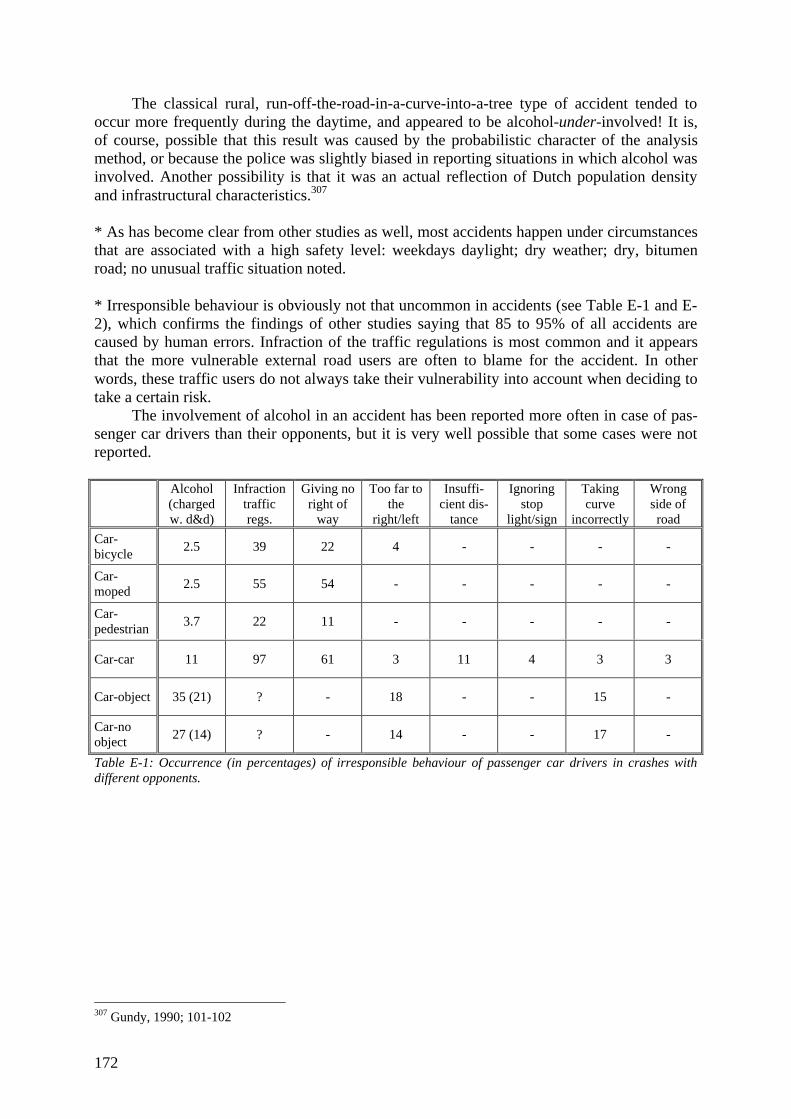
172
The classical rural, run-off-the-road-in-a-curve-into-a-tree type of accident tended tooccur more frequently during the daytime, and appeared to be alcohol-under-involved! It is,of course, possible that this result was caused by the probabilistic character of the analysismethod, or because the police was slightly biased in reporting situations in which alcohol wasinvolved. Another possibility is that it was an actual reflection of Dutch population densityand infrastructural characteristics.307
* As has become clear from other studies as well, most accidents happen under circumstancesthat are associated with a high safety level: weekdays daylight; dry weather; dry, bitumenroad; no unusual traffic situation noted.
* Irresponsible behaviour is obviously not that uncommon in accidents (see Table E-1 and E-2), which confirms the findings of other studies saying that 85 to 95% of all accidents arecaused by human errors. Infraction of the traffic regulations is most common and it appearsthat the more vulnerable external road users are often to blame for the accident. In otherwords, these traffic users do not always take their vulnerability into account when deciding totake a certain risk.
The involvement of alcohol in an accident has been reported more often in case of pas-senger car drivers than their opponents, but it is very well possible that some cases were notreported.
Alcohol(chargedw. d&d)
Infractiontrafficregs.
Giving noright of
way
Too far tothe
right/left
Insuffi-cient dis-
tance
Ignoringstop
light/sign
Takingcurve
incorrectly
Wrongside ofroad
Car-bicycle
2.5 39 22 4 - - - -
Car-moped
2.5 55 54 - - - - -
Car-pedestrian
3.7 22 11 - - - - -
Car-car 11 97 61 3 11 4 3 3
Car-object 35 (21) ? - 18 - - 15 -
Car-noobject
27 (14) ? - 14 - - 17 -
Table E-1: Occurrence (in percentages) of irresponsible behaviour of passenger car drivers in crashes withdifferent opponents.
307 Gundy, 1990; 101-102
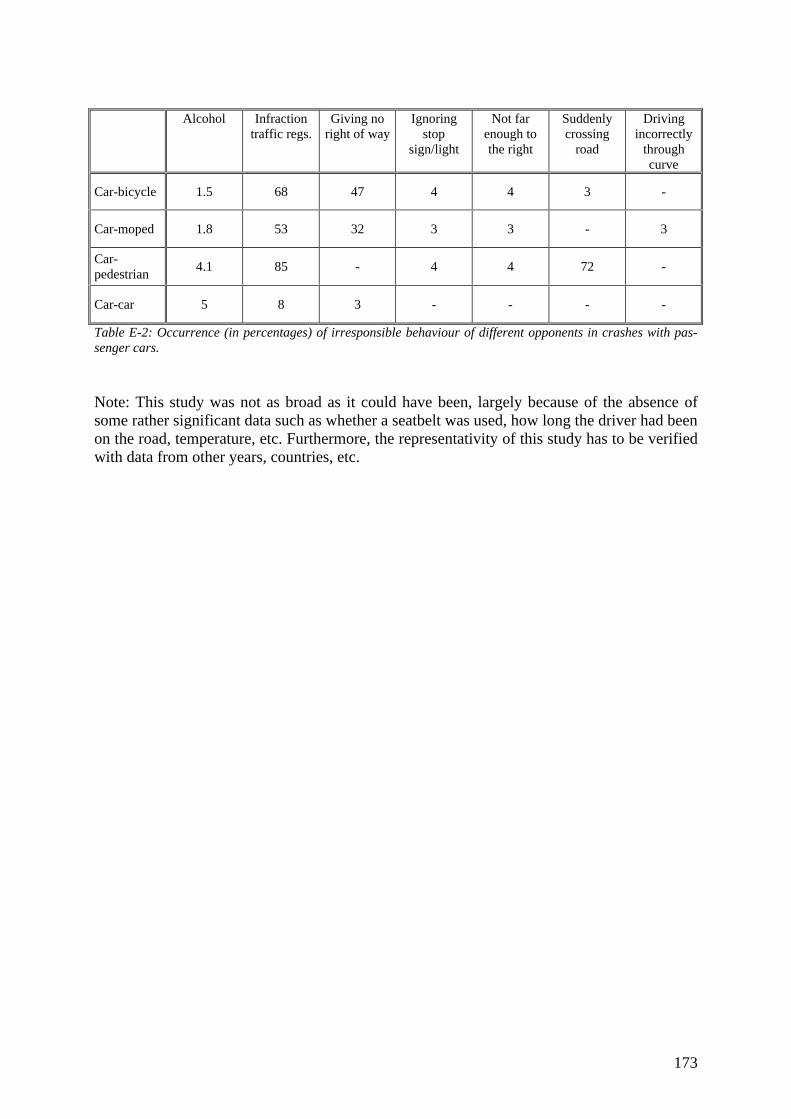
173
Alcohol Infractiontraffic regs.
Giving noright of way
Ignoringstop
sign/light
Not farenough tothe right
Suddenlycrossing
road
Drivingincorrectly
throughcurve
Car-bicycle 1.5 68 47 4 4 3 -
Car-moped 1.8 53 32 3 3 - 3
Car-pedestrian
4.1 85 - 4 4 72 -
Car-car 5 8 3 - - - -
Table E-2: Occurrence (in percentages) of irresponsible behaviour of different opponents in crashes with pas-senger cars.
Note: This study was not as broad as it could have been, largely because of the absence ofsome rather significant data such as whether a seatbelt was used, how long the driver had beenon the road, temperature, etc. Furthermore, the representativity of this study has to be verifiedwith data from other years, countries, etc.

174
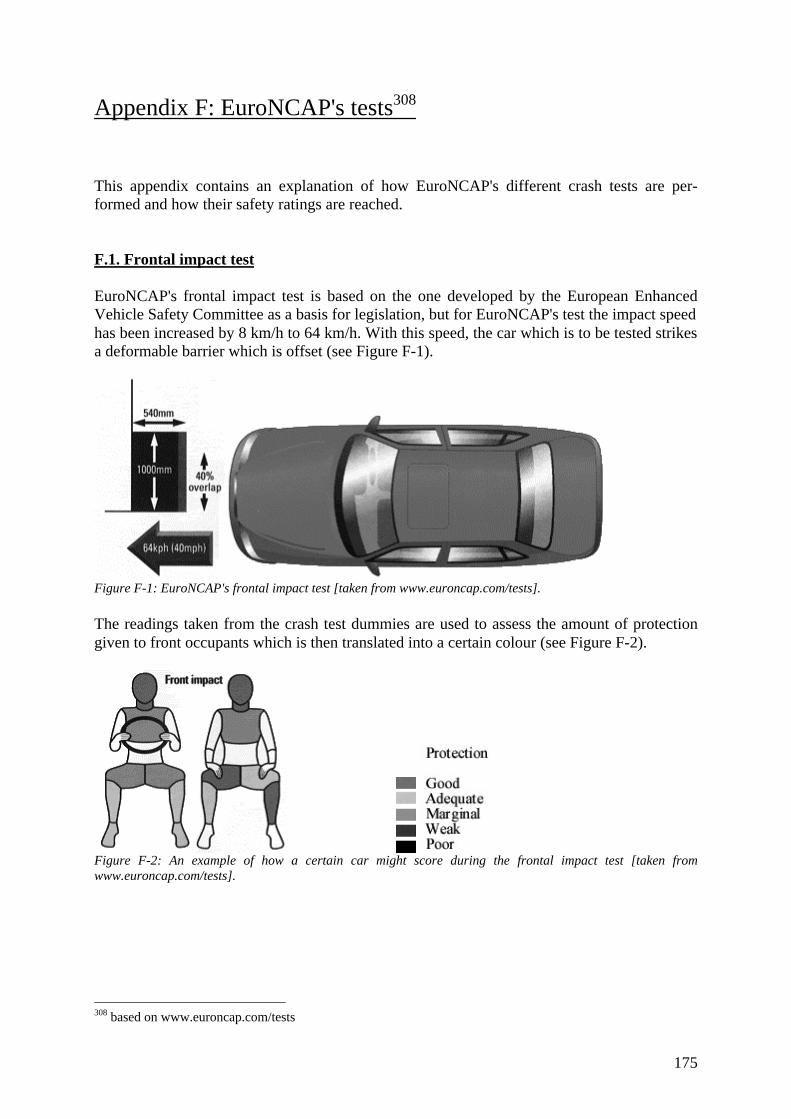
175
Appendix F: EuroNCAP's tests308
This appendix contains an explanation of how EuroNCAP's different crash tests are per-formed and how their safety ratings are reached.
F.1. Frontal impact test
EuroNCAP's frontal impact test is based on the one developed by the European EnhancedVehicle Safety Committee as a basis for legislation, but for EuroNCAP's test the impact speedhas been increased by 8 km/h to 64 km/h. With this speed, the car which is to be tested strikesa deformable barrier which is offset (see Figure F-1).
Figure F-1: EuroNCAP's frontal impact test [taken from www.euroncap.com/tests].
The readings taken from the crash test dummies are used to assess the amount of protectiongiven to front occupants which is then translated into a certain colour (see Figure F-2).
Figure F-2: An example of how a certain car might score during the frontal impact test [taken fromwww.euroncap.com/tests].
308 based on www.euroncap.com/tests
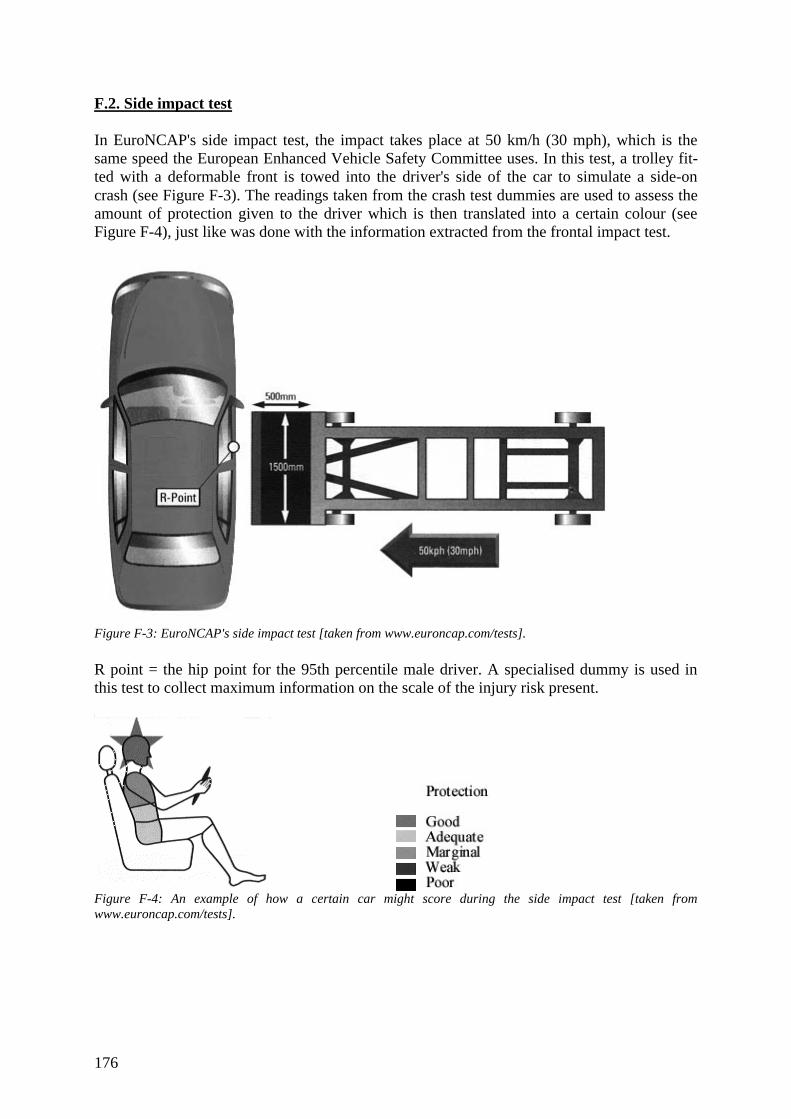
176
F.2. Side impact test
In EuroNCAP's side impact test, the impact takes place at 50 km/h (30 mph), which is thesame speed the European Enhanced Vehicle Safety Committee uses. In this test, a trolley fit-ted with a deformable front is towed into the driver's side of the car to simulate a side-oncrash (see Figure F-3). The readings taken from the crash test dummies are used to assess theamount of protection given to the driver which is then translated into a certain colour (seeFigure F-4), just like was done with the information extracted from the frontal impact test.
Figure F-3: EuroNCAP's side impact test [taken from www.euroncap.com/tests].
R point = the hip point for the 95th percentile male driver. A specialised dummy is used inthis test to collect maximum information on the scale of the injury risk present.
Figure F-4: An example of how a certain car might score during the side impact test [taken fromwww.euroncap.com/tests].
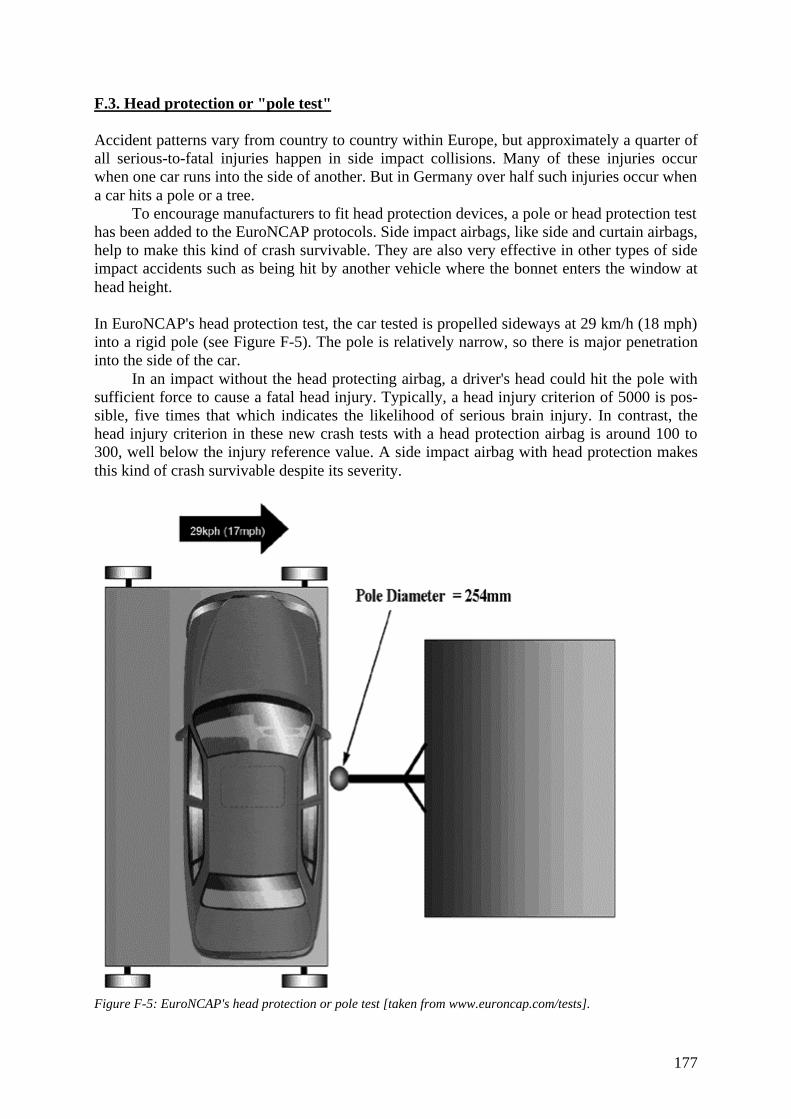
177
F.3. Head protection or "pole test"
Accident patterns vary from country to country within Europe, but approximately a quarter ofall serious-to-fatal injuries happen in side impact collisions. Many of these injuries occurwhen one car runs into the side of another. But in Germany over half such injuries occur whena car hits a pole or a tree.
To encourage manufacturers to fit head protection devices, a pole or head protection testhas been added to the EuroNCAP protocols. Side impact airbags, like side and curtain airbags,help to make this kind of crash survivable. They are also very effective in other types of sideimpact accidents such as being hit by another vehicle where the bonnet enters the window athead height.
In EuroNCAP's head protection test, the car tested is propelled sideways at 29 km/h (18 mph)into a rigid pole (see Figure F-5). The pole is relatively narrow, so there is major penetrationinto the side of the car.
In an impact without the head protecting airbag, a driver's head could hit the pole withsufficient force to cause a fatal head injury. Typically, a head injury criterion of 5000 is pos-sible, five times that which indicates the likelihood of serious brain injury. In contrast, thehead injury criterion in these new crash tests with a head protection airbag is around 100 to300, well below the injury reference value. A side impact airbag with head protection makesthis kind of crash survivable despite its severity.
Figure F-5: EuroNCAP's head protection or pole test [taken from www.euroncap.com/tests].
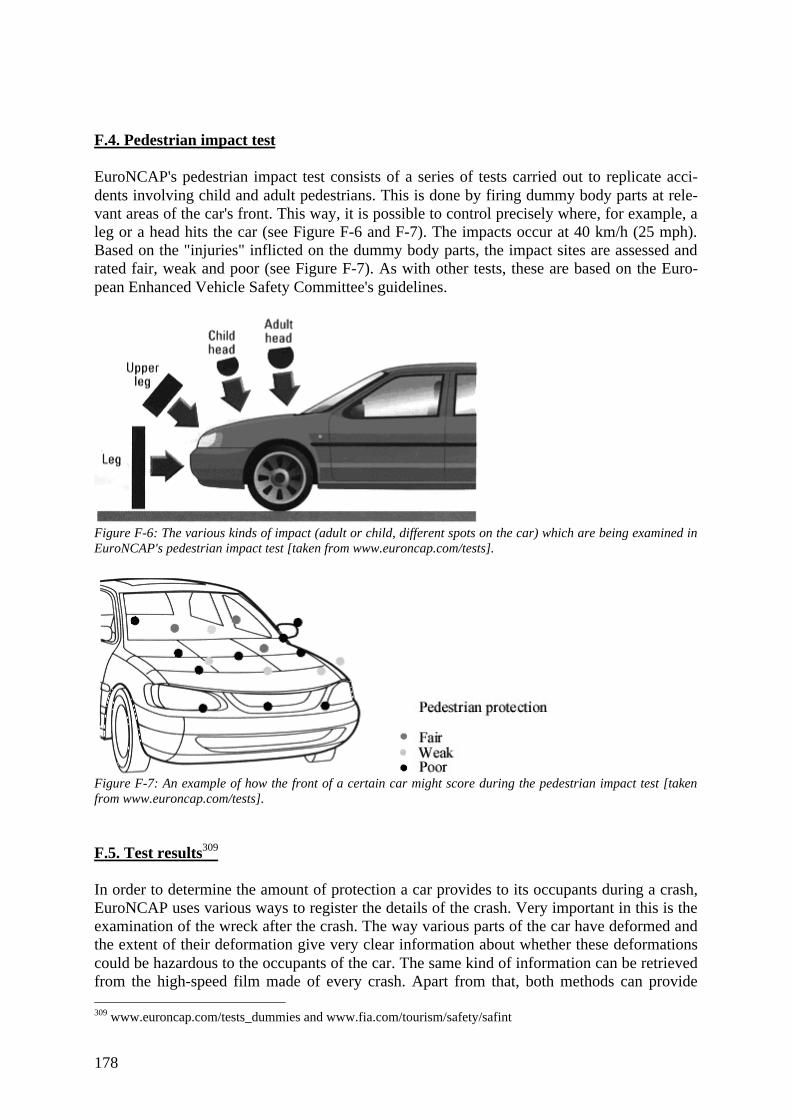
178
F.4. Pedestrian impact test
EuroNCAP's pedestrian impact test consists of a series of tests carried out to replicate acci-dents involving child and adult pedestrians. This is done by firing dummy body parts at rele-vant areas of the car's front. This way, it is possible to control precisely where, for example, aleg or a head hits the car (see Figure F-6 and F-7). The impacts occur at 40 km/h (25 mph).Based on the "injuries" inflicted on the dummy body parts, the impact sites are assessed andrated fair, weak and poor (see Figure F-7). As with other tests, these are based on the Euro-pean Enhanced Vehicle Safety Committee's guidelines.
Figure F-6: The various kinds of impact (adult or child, different spots on the car) which are being examined inEuroNCAP's pedestrian impact test [taken from www.euroncap.com/tests].
Figure F-7: An example of how the front of a certain car might score during the pedestrian impact test [takenfrom www.euroncap.com/tests].
F.5. Test results309
In order to determine the amount of protection a car provides to its occupants during a crash,EuroNCAP uses various ways to register the details of the crash. Very important in this is theexamination of the wreck after the crash. The way various parts of the car have deformed andthe extent of their deformation give very clear information about whether these deformationscould be hazardous to the occupants of the car. The same kind of information can be retrievedfrom the high-speed film made of every crash. Apart from that, both methods can provide 309 www.euroncap.com/tests_dummies and www.fia.com/tourism/safety/safint
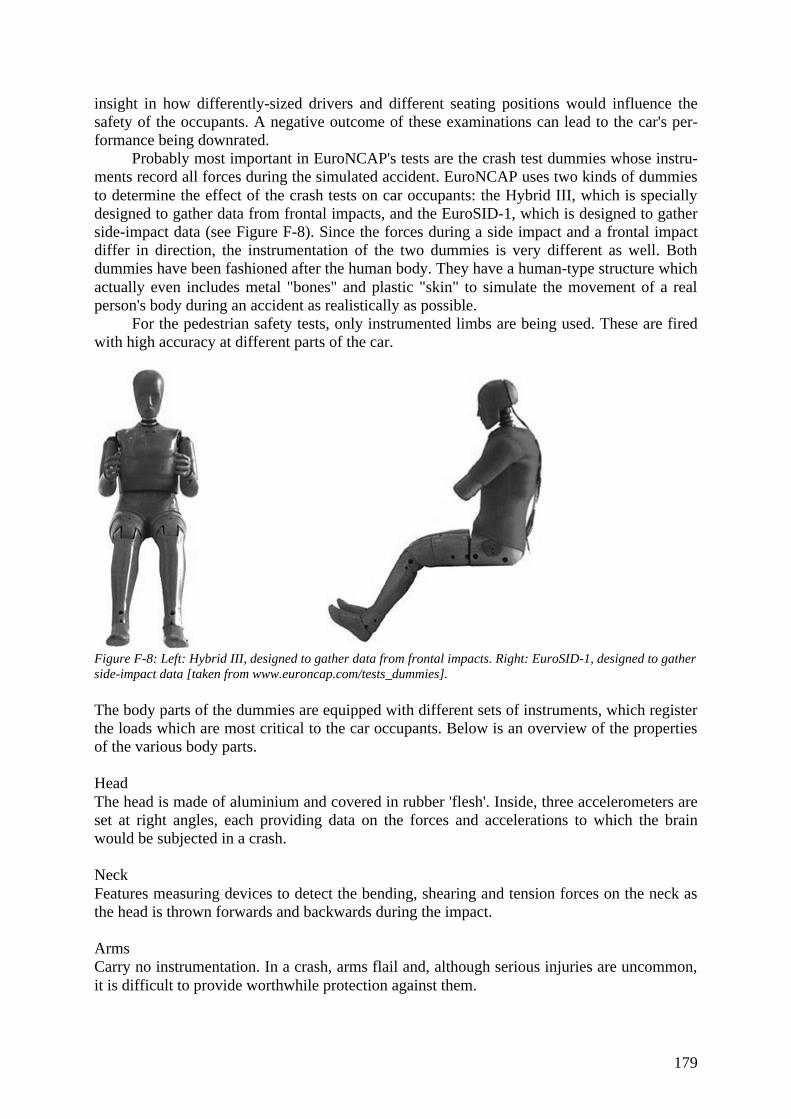
179
insight in how differently-sized drivers and different seating positions would influence thesafety of the occupants. A negative outcome of these examinations can lead to the car's per-formance being downrated.
Probably most important in EuroNCAP's tests are the crash test dummies whose instru-ments record all forces during the simulated accident. EuroNCAP uses two kinds of dummiesto determine the effect of the crash tests on car occupants: the Hybrid III, which is speciallydesigned to gather data from frontal impacts, and the EuroSID-1, which is designed to gatherside-impact data (see Figure F-8). Since the forces during a side impact and a frontal impactdiffer in direction, the instrumentation of the two dummies is very different as well. Bothdummies have been fashioned after the human body. They have a human-type structure whichactually even includes metal "bones" and plastic "skin" to simulate the movement of a realperson's body during an accident as realistically as possible.
For the pedestrian safety tests, only instrumented limbs are being used. These are firedwith high accuracy at different parts of the car.
Figure F-8: Left: Hybrid III, designed to gather data from frontal impacts. Right: EuroSID-1, designed to gatherside-impact data [taken from www.euroncap.com/tests_dummies].
The body parts of the dummies are equipped with different sets of instruments, which registerthe loads which are most critical to the car occupants. Below is an overview of the propertiesof the various body parts.
HeadThe head is made of aluminium and covered in rubber 'flesh'. Inside, three accelerometers areset at right angles, each providing data on the forces and accelerations to which the brainwould be subjected in a crash.
NeckFeatures measuring devices to detect the bending, shearing and tension forces on the neck asthe head is thrown forwards and backwards during the impact.
ArmsCarry no instrumentation. In a crash, arms flail and, although serious injuries are uncommon,it is difficult to provide worthwhile protection against them.
180
Chest (front impact)Hybrid III's steel ribs are fitted with equipment that records deflection of the rib cage in thefrontal impact. Injuries result if forces exerted on the chest, such as from the seat belt are toogreat.
Chest (side impact)The side-impact dummy, EuroSID-1, has a different chest from the others and three ribs areinstrumented to record compression of the chest and the velocity of this compression.
AbdomenEuroSID-I is equipped with sensors to record forces likely to cause abdominal injury.
PelvisEuroSID-I has instruments fitted in its pelvic girdle. They record lateral forces that may resultin fractures or hip-joint dislocation.
Upper legIn Hybrid III, this area is made up of the pelvis, femur (thigh) and knee. Load cells in the fe-mur provide data in frontal impacts on likely injury to all sections, including the hip jointwhich can suffer fractures and dislocations. A 'knee slider' is used to measure forces trans-mitted through the dummy's knees, particularly if they strike the lower facia.
Lower legInstruments fitted inside the dummies' legs measure bending, shear, compression and tension,allowing injury risks to the tibia (shin-bone) and fibula (connecting knee to ankle) to be as-sessed.
Feet and anklesAssessment of injury risk in the frontal impact is made by afterwards measuring distortionand rearward movement of the driver's footwell area.
F.6. EuroNCAP's ratings
EuroNCAP uses stars to indicate a vehicle's level of safety. In this system, five stars is thebest score a car can get for its combined performances on the side and frontal impact tests,and for its performance in the pedestrian impact test. The star scoring is based on point scoresfor the front and side together and for pedestrian impact separately.
A maximum of 32 points can be achieved for the combined front and side impact score.Both frontal and side impact have four regions which all can be awarded with a maximum offour points. The thresholds for one, two, three and four stars in the overall rating are at 8, 16,24, and 32 points respectively. A fifth star is given if the point score is 32 points or more."The intention of the scores is to give an indication to what extent best practive or bench-marking has been applied to an individual car model, and not to predict the real-life out-come."310
If an important body region is poorly protected, the final star of the rating is struckthrough with a diagonal red line. This happens "when zero points are scored, on the basis ofdummy response alone, for any body region where there is "an unacceptably high risk of life-
310 Lie & Tingvall, September 2000
181
threatening injury."" In head-on collisions, body regions which could give rise to a strucktrhough star are the head, the neck and the chest. In side impact accidents the important re-gions are the head, the chest, the abdomen and the pelvis.311
For pedestrian impact, 18 test sites have been designated on the car, which all can beawarded with a maximum of two points. The maximum amount of points a car can get forpedestrian impact is therefore 36 points. The thresholds for one, two, three and four stars inthe overall pedestrian impact rating are at 9, 18, 27, and 36 points respectively.312
In the tests, a car's performance in key ways is described by adjectives, all of which are basedon actual measures313:
A-pillar movementLimited: up to 100 mm (4 inches)Moderate: 100 to 200 mm (4 to 8 inches)Excessive: more than 200 mm (8 inches)
Steering wheel displacementGood: less than 100 mm (4 iches) horizontally, 80 mm (3 inches) verticallyLimited: 100 to 150 mm (4 to 6 inches) horizontally, 80 to 130 mm (3 to 5 inches)
verticallyModerate: 150 to 200 mm (6 to 8 inches) horizontally, 130 to 180 inches (5 to 7 inches)
verticallyExcessive: more than 200 mm (8 inches) horizontally, 180 mm (7 inches) vertically
FootwellLimited: less than 100 mm (4 inches)Moderate: 100 to 200 mm (4 to 8 inches)Excessive: more than 200 mm (8 inches)
F.7. Causes for downrating
A number of factors can cause a car's performance as recorded by the dummies to be modi-fied, for example, from "marginal" to "weak". This may be because of a potentially greaterrisk of injury to differetnly-sized drivers, or the likely consequences of an impact at a differ-ent speed or angle. These factors, which are normally only relevant to the driver in the frontalimpact test, are based on structural performance and the extent to which the passenger com-partment survives the impact. Excessive deformation can namely create greater risks forlarger occupants or drivers with their seats nearer to the steering wheel.
Unstable passenger compartmentAt the spot where structural failure occurs, for instance where the facia is attached to the sideof the car or the doorlatches, a small increase in impact severity could result in mych moreintrusion.
Steering wheel movement/airbag stability
311 Hobbs, Gloyns and Rattenbury, 1999; 16312 Hobbs, Gloyns and Rattenbury, 1999; 16313 www.fia.com/tourism/safety/safint ; the equivalents in inches are approximates only
182
The protection rating for the driver's head is adjusted if the steering wheel moves back or upfurther than the proposed limits for legislation. It is also adjusted if the head does not makeproper contact with the airbag. The position of the steering wheel (and thus the airbag) shouldbe maintained in order to provide good protection for a wide range of occupant sizes and seatpositions.
Facia designThe protection rating for the driver's upper legs is adjusted if the area of the facia where theknees hit is "aggressive", that is, if there are stiff structures behind the facia that could con-centrate forces on part of the knee or cause sharply increased loads if the knees penetratedfurther into the facia. As not every car driver has his knees in the same position, a wider areais considered than that hit by the dummy's knees.
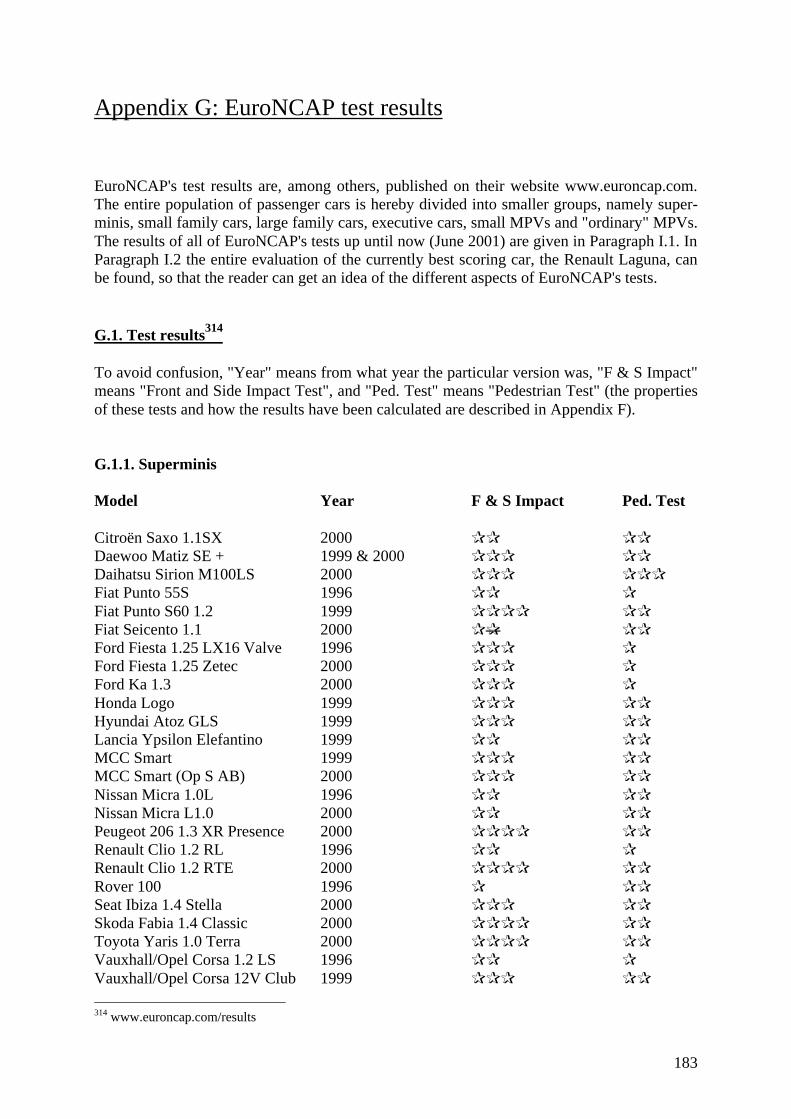
183
Appendix G: EuroNCAP test results
EuroNCAP's test results are, among others, published on their website www.euroncap.com.The entire population of passenger cars is hereby divided into smaller groups, namely super-minis, small family cars, large family cars, executive cars, small MPVs and "ordinary" MPVs.The results of all of EuroNCAP's tests up until now (June 2001) are given in Paragraph I.1. InParagraph I.2 the entire evaluation of the currently best scoring car, the Renault Laguna, canbe found, so that the reader can get an idea of the different aspects of EuroNCAP's tests.
G.1. Test results314
To avoid confusion, "Year" means from what year the particular version was, "F & S Impact"means "Front and Side Impact Test", and "Ped. Test" means "Pedestrian Test" (the propertiesof these tests and how the results have been calculated are described in Appendix F).
G.1.1. Superminis
Model Year F & S Impact Ped. Test
Citroën Saxo 1.1SX 2000 PP PPDaewoo Matiz SE + 1999 & 2000 PPP PPDaihatsu Sirion M100LS 2000 PPP PPPFiat Punto 55S 1996 PP PFiat Punto S60 1.2 1999 PPPP PPFiat Seicento 1.1 2000 PP PPFord Fiesta 1.25 LX16 Valve 1996 PPP PFord Fiesta 1.25 Zetec 2000 PPP PFord Ka 1.3 2000 PPP PHonda Logo 1999 PPP PPHyundai Atoz GLS 1999 PPP PPLancia Ypsilon Elefantino 1999 PP PPMCC Smart 1999 PPP PPMCC Smart (Op S AB) 2000 PPP PPNissan Micra 1.0L 1996 PP PPNissan Micra L1.0 2000 PP PPPeugeot 206 1.3 XR Presence 2000 PPPP PPRenault Clio 1.2 RL 1996 PP PRenault Clio 1.2 RTE 2000 PPPP PPRover 100 1996 P PPSeat Ibiza 1.4 Stella 2000 PPP PPSkoda Fabia 1.4 Classic 2000 PPPP PPToyota Yaris 1.0 Terra 2000 PPPP PPVauxhall/Opel Corsa 1.2 LS 1996 PP PVauxhall/Opel Corsa 12V Club 1999 PPP PP
314 www.euroncap.com/results
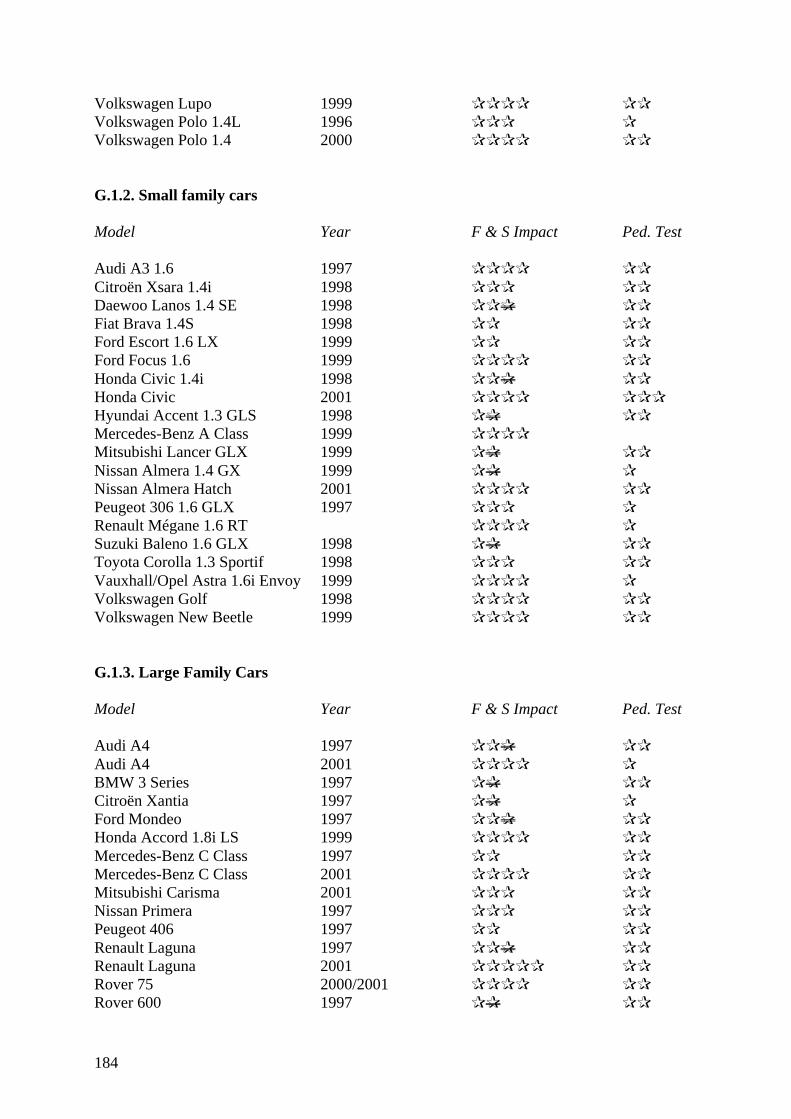
184
Volkswagen Lupo 1999 PPPP PPVolkswagen Polo 1.4L 1996 PPP PVolkswagen Polo 1.4 2000 PPPP PP
G.1.2. Small family cars
Model Year F & S Impact Ped. Test
Audi A3 1.6 1997 PPPP PPCitroën Xsara 1.4i 1998 PPP PPDaewoo Lanos 1.4 SE 1998 PPP PPFiat Brava 1.4S 1998 PP PPFord Escort 1.6 LX 1999 PP PPFord Focus 1.6 1999 PPPP PPHonda Civic 1.4i 1998 PPP PPHonda Civic 2001 PPPP PPPHyundai Accent 1.3 GLS 1998 PP PPMercedes-Benz A Class 1999 PPPPMitsubishi Lancer GLX 1999 PP PPNissan Almera 1.4 GX 1999 PP PNissan Almera Hatch 2001 PPPP PPPeugeot 306 1.6 GLX 1997 PPP PRenault Mégane 1.6 RT PPPP PSuzuki Baleno 1.6 GLX 1998 PP PPToyota Corolla 1.3 Sportif 1998 PPP PPVauxhall/Opel Astra 1.6i Envoy 1999 PPPP PVolkswagen Golf 1998 PPPP PPVolkswagen New Beetle 1999 PPPP PP
G.1.3. Large Family Cars
Model Year F & S Impact Ped. Test
Audi A4 1997 PPP PPAudi A4 2001 PPPP PBMW 3 Series 1997 PP PPCitroën Xantia 1997 PP PFord Mondeo 1997 PPP PPHonda Accord 1.8i LS 1999 PPPP PPMercedes-Benz C Class 1997 PP PPMercedes-Benz C Class 2001 PPPP PPMitsubishi Carisma 2001 PPP PPNissan Primera 1997 PPP PPPeugeot 406 1997 PP PPRenault Laguna 1997 PPP PPRenault Laguna 2001 PPPPP PPRover 75 2000/2001 PPPP PPRover 600 1997 PP PP
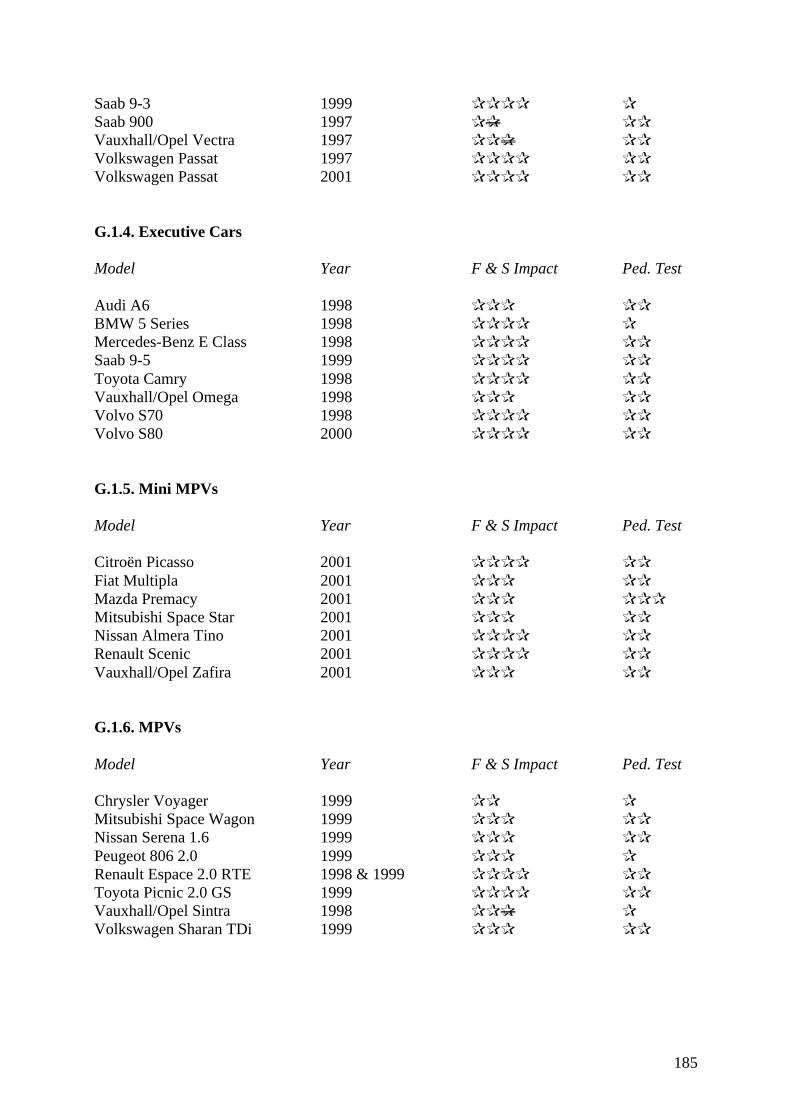
185
Saab 9-3 1999 PPPP PSaab 900 1997 PP PPVauxhall/Opel Vectra 1997 PPP PPVolkswagen Passat 1997 PPPP PPVolkswagen Passat 2001 PPPP PP
G.1.4. Executive Cars
Model Year F & S Impact Ped. Test
Audi A6 1998 PPP PPBMW 5 Series 1998 PPPP PMercedes-Benz E Class 1998 PPPP PPSaab 9-5 1999 PPPP PPToyota Camry 1998 PPPP PPVauxhall/Opel Omega 1998 PPP PPVolvo S70 1998 PPPP PPVolvo S80 2000 PPPP PP
G.1.5. Mini MPVs
Model Year F & S Impact Ped. Test
Citroën Picasso 2001 PPPP PPFiat Multipla 2001 PPP PPMazda Premacy 2001 PPP PPPMitsubishi Space Star 2001 PPP PPNissan Almera Tino 2001 PPPP PPRenault Scenic 2001 PPPP PPVauxhall/Opel Zafira 2001 PPP PP
G.1.6. MPVs
Model Year F & S Impact Ped. Test
Chrysler Voyager 1999 PP PMitsubishi Space Wagon 1999 PPP PPNissan Serena 1.6 1999 PPP PPPeugeot 806 2.0 1999 PPP PRenault Espace 2.0 RTE 1998 & 1999 PPPP PPToyota Picnic 2.0 GS 1999 PPPP PPVauxhall/Opel Sintra 1998 PPP PVolkswagen Sharan TDi 1999 PPP PP
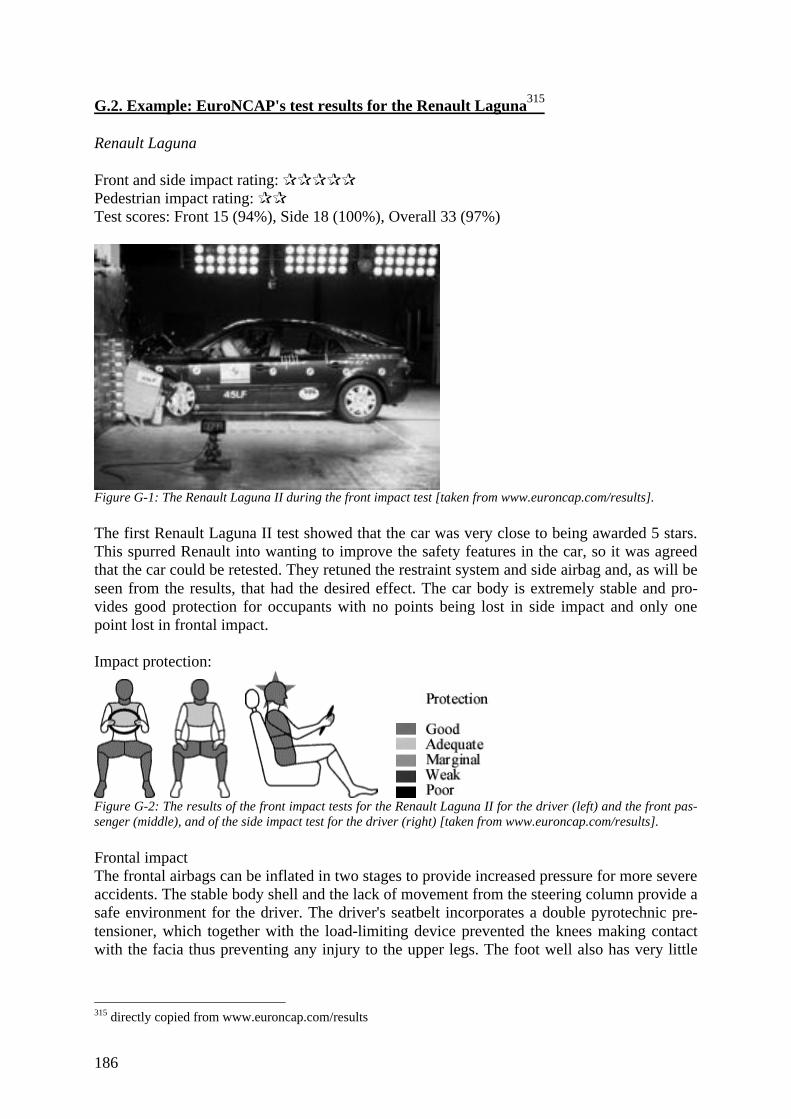
186
G.2. Example: EuroNCAP's test results for the Renault Laguna315
Renault Laguna
Front and side impact rating: PPPPPPedestrian impact rating: PPTest scores: Front 15 (94%), Side 18 (100%), Overall 33 (97%)
Figure G-1: The Renault Laguna II during the front impact test [taken from www.euroncap.com/results].
The first Renault Laguna II test showed that the car was very close to being awarded 5 stars.This spurred Renault into wanting to improve the safety features in the car, so it was agreedthat the car could be retested. They retuned the restraint system and side airbag and, as will beseen from the results, that had the desired effect. The car body is extremely stable and pro-vides good protection for occupants with no points being lost in side impact and only onepoint lost in frontal impact.
Impact protection:
Figure G-2: The results of the front impact tests for the Renault Laguna II for the driver (left) and the front pas-senger (middle), and of the side impact test for the driver (right) [taken from www.euroncap.com/results].
Frontal impactThe frontal airbags can be inflated in two stages to provide increased pressure for more severeaccidents. The stable body shell and the lack of movement from the steering column provide asafe environment for the driver. The driver's seatbelt incorporates a double pyrotechnic pre-tensioner, which together with the load-limiting device prevented the knees making contactwith the facia thus preventing any injury to the upper legs. The foot well also has very little
315 directly copied from www.euroncap.com/results
187
intrusion and padding is provided to protect the feet. The centre rear seat has a three pointseatbelt which is much safer than a lap-belt.
Side impactA very impressive side impact protection system that includes a thorax side airbag and anadvanced head curtain airbag. The Renault Laguna II achieved full marks in our tests.
Child restraintA passenger airbag is standard and Renault provides good warnings about the danger of arear-facing seat placed on the front passenger seat. The only criticism is that the labels couldbe peeled off. The Renault 'Kiddy Easyfix' restraints use special mounting points in the adultseats. Unusually the forward facing 3 year-old restraint used a strap from the top of the re-straint over the car seat back and secured to a buckle in the boot area. This is the first timeEuroNCAP has seen this arrangement that worked well in the frontal impact. It is clear thatRenault are working hard to improve the protection of children in their cars but some of theseefforts were not fully documented for our tests. Renault tell us that the labelling issues will becorrect from the date of the launch of our results. Unfortunately the side impact protection forthe children still leaves their heads exposed.
Pedestrian protectionPedestrian protection unfortunately has not improved in the same manner as occupant protec-tion. The front of the car is very stiff but there are some points on the bonnet, which provideprotection.
Model history and safety equipmentThe original Laguna was introduced in 1994. The New Laguna II. was launched on the 23February 2001. Standard safety equipment includes dual frontal airbags (dual chamber), tho-racic side airbags, head protection airbag (curtain), load limiters for all safety belts, doublepre-tensioner for the driver's belt, buckle pre-tensioner for the front passenger's belt, retractorpre-tensioners for outboard rear safety belts and ABS.
Make, model and hand of drive Renault Laguna II 1.8 ltr 16vLHD
Body type 5-door hatchbackModel year 2001Kerb weight 1385 kgVIN and date when rating applies S215, S1178, S4601 or S5590Cars built on the same platform None

188
189
Appendix H. DutchEVO316
H.1. General description
The DutchEVO project ("EVO" as in "evolution") is a project which should result in the con-struction of the prototype of a new car, the DutchEVO. It is part of one of the DIOC pro-grammes (DIOC = Delfts Interfacultair Onderzoek Centrum; Delft Interfacultary ResearchCentre) of Delft University of Technology. The DIOC concerned, DIOC 16, is also known as"Smart Product Systems" and focuses on life cycle efficiency; "the production of goods withminimal waste and maximum recycling of raw materials and reuse of components in the elec-tronic and other industries". Several faculties of the Delft University are involved in the de-velopment of the DutchEVO, namely Applied Earth Sciences, Industrial Design Engineering,Electrical Engineering, Aerospace Engineering, Delft Institute of Microelectronics and Sub-microntechnology and Mechanical Engineering.
The objective of the DutchEVO project is to influence the public opinion concerningcars and transport. The prototype is the tool to achieve that, its design and what it stands forhopefully bringing about a mentality change in young people. Apart from that, the DutchEVOwill be a platform for specialised research and, as such, also an object to promote Delft Uni-versity of Technology.
The primary specifications of the DutchEVO are that it should have minimum fuel con-sumption and that its mass should be low. Apart from that, the car should be environmentfriendly, designed for recycling, and be constructed out of renewable material sources wherepossible. The car should also appeal to the public through its comfort, affordable price and itsabove mentioned environment friendly properties. The exploratory phase of the DutchEVOproject has therefore been divided into three parts: conceptual design within the context of theproduct as such as well as the social influences; engineering design with application of newmaterials, including renewable material resources; safety.
In order not to fall for the sometimes illogical and/or public opinion-driven choicesmade in the designs of many of today's cars, the DutchEVO will be designed independent ofexisting conventions as much as possible. Of course, the car should at the same time be ableto apply to the regulations with respect to safety, emissions, visibility, recycling, fuel con-sumption and weight all passenger cars (in Europe) have to apply to, otherwise it would notbecome the realistic, alternative car design it was intended to be.
The design process has been divided into several aspects, each of which has received a certainpriority, based on a functional approach and sustainability. The aspect highest in the list willtherefore get most attention, and so on. In case of conflicting interests between two aspects,the highest in the hierarchy will win. The design priorities are:1. Mass2. Safety3. Cost4. Volume (compactness)5. ComfortThe shape of most of today's cars is designed by industrial designers, after which structuralengineers have to create a decent structure to support that design. In case of the DutchEVO,however, the structural and the industrial design will have to be merged, since the wish for a
316 based on Smart Product Systems, 1999
190
sober and lightweight approach requires the structure to define the shape of the car as well ascarry its function. This means that the exterior will have to be part of the load carrying struc-ture wherever possible, and that the structure will have to be able to provide both thermal andacoustic insulation as well. In this, the specific requirements of the car should dictate the ulti-mate design: the right geometry combined with the material best suitable for the purposes ofthe particular part of the car. This optimisation should also take into account the behaviour ofmaterial and structure during production, assembly, use, disassembly and separation.
The design will also need to cause the desired mentality change. This is expected to beachieved by bringing about a different kind of relationship between user and product, some-thing that will forge an increasing bond between them. Apart from a different physical ap-pearance, the perception of the car and all of its aspects will therefore have to be differentfrom other cars.
Most of today's cars have the effect of alienating its occupants from their environment.This is largely caused by the fact that they are made dependent on technology to perform theirtasks and because they are pretty much isolated from the environment (the occupant com-partment is made more and more sound, vibration and temperature proof) for the sake of com-fort. The distance between man and environment created by the technological shell the carrepresents can make people forget their being human and having human emotions. This situa-tion of being cut off from their emotions can cause people to start looking for thrills; to try tofind risky situations that make them feel more alive.
Considering the process of alienation, it would be good to break down as much of thetechnological shell of a car as possible. That is why the DutchEVO project is aiming for adesign that will reinstall a driver's connection with his environment, thereby lowering his de-sire to take more risk than necessary.
However, due to its "other-ness" the DutchEVO will most likely not appeal to all driv-ers. The car stands for a specific way of life; one that focuses on the driver's awareness of hissurroundings. Ecology plays a large role in this and will probably be one of the reasons thatthe car owner is willing to go for less luxury and comfort in exchange for the feeling that bybuying a DutchEVO, he is gaining a certain status – if only in his own view. The mentionedawareness does also come into play in how safe he feels his car is. The driver can namelypartly control his own safety by being aware of the car's vulnerability and anticipating upon it.
H.2. Safety and awareness through design
In the DutchEVO, several safety and awareness enhancing measures are taken through thecar's design. The vehicle has, for instance, been designed to have a high degree of stability(wide wheel base and low centre of mass). Since that will largely avoid oversteering and roll-over tendencies in spite of variations in load, the safety of the car will increase. Because of thedemand for a more direct contact with and perception of the car's surroundings, vibrationalisolation is not really wanted. Therefore the suspension will provide a less comfortable ride tothe occupants of the DutchEVO than those in most of today's cars.
Another safety enhancing feature is the raised floor. The idea is to place the floor of thecar higher than average, so that the compatibility in geometry and stiffness will increase. Thisis applicable for impacts from the side (the bumper of the striking car will now hit the floorand rocker instead of overriding the sill or rocker while crushing the door and B-pillar), aswell as from the front and back. The raised floor will therefore result in a more stable crushbehaviour at impact.
191
The high accelerations accompanying a crash are lowered by adding deformation pro-files. A high degree of plastic deformation will namely lead to higher crash energy absorptionand therefore lower accelerations, which is better for the car occupants.
H.3. Specifications
In the design phase, the following specifications have been laid down for the DutchEVO:• Family car: 4 occupants plus luggage• Three doors• Four wheels• European legislation and standards• Mass product (approximately 400,000 units in 2-4 years production)• Consumer price approximately _ 12,000.-• Usage in and around Western European cities after the year 2009• Usage on motorways• Design life time 200,000 km or 15 years• Mass 400 kg• Full payload 352 kg• Compact:
• Interior height 1150 mm• Exterior length 3300 mm• Exterior width 1550 mm• Exterior height 1570 mm
• Ground clearance 400 mm• Wheel base 2500 mm• Wheel span 1415 mm• Wheels R15/80/135• Wheel arches R = 325 mm• Turning radius 10 m• Off the shelf engine (and suspension) technology• Maximum speed (full payload) 130 km/h• Maximum acceleration from 0 to 100 km/h 25 sec• Fuel consumption 1:40 (2.5 ltr/100 km) or less• Range 400 (+100) km• Aerodynamic drag coefficient: Cd = 0.25• Frontal area A = 1.8 m2 à Cd A = 0.45 m2

192
193
Appendix I. ECE car safety requirements317
The ECE car safety regulations are spread by InterRegs. All regulations contain detailed de-scriptions of what the car (part) should live up to and how the test to check that should be car-ried out. For the full description of the regulations important for this report, I would like torefer to the regulations concerned; here, I will just reproduce the test requirements.
NB. The paragraph numbers mentioned in this appendix do not refer to the paragraphs of thisreport, but to the paragraphs in the various regulations.
I.1. Regulation 12
Regulation 12 concerns the protection of the driver against the steering mechanism in theevent of impact.
5. REQUIREMENTS
5.1 When the unladen vehicle, in running order, without a manikin, is collision-tested againsta barrier at a speed of 48.3 km/h (30 mph), the top of the steering column and its shaft shallnot move backwards, horizontally and parallel to the longitudinal axis of the vehicle, by morethan 12.7 cm and also not more than 12.7 cm vertically upwards, both dimensions consideredin relation to a point of the vehicle not affected by the impact. (See Annex 3, Paragraph 3. 1.)
5.1.2. Specifications of Paragraph 5.1 are deemed to be met if the vehicle equipped with sucha steering system complies with the specifications of Paragraph 5.2.2 of Regulation No. 94,01 series of amendments.
5.2 When the steering control is struck by a body block released against this control at a rela-tive speed of 24.1 km/h (15 mph), the force applied to the body block by the steering controlshall not exceed 1,111 daN.
5.2.1. If the steering control is fitted with a steering wheel airbag, specifications of part 2above are deemed to be met if the vehicle equipped with such a steering system complies withthe specifications of Paragraphs 5.2.1.4 and 5.2.1.5 of Regulation No. 94, 01 series ofamendments.
5.3 When the steering control is struck by an impactor released against this control at a rela-tive speed of 24.1 km/h, in accordance with the procedures of Annex 5, the deceleration of theimpactor shall not exceed 80 g cumulative for more than 3 milliseconds. The decelerationshall always be lower than 120 g with C.F.C. 600 Hz.
5.4 The steering control shall be designed, constructed and fitted in such a way that:
5.4.1 Before the impact test prescribed in Paragraphs 5.2. and 5.3. above no part of the steer-ing control surface, directed towards the driver, which can be contacted by a sphere of 165
317 InterRegs, 2000
194
mm in diameter shall present any roughness or sharp edges with a radius of curvature of lessthan 2.5 mm.
5.4.1.1. After any impact test prescribed in parts 5.2. and 5.3. the part of the steering controlsurface directed towards the driver shall not present any sharp or rough edges likely to in-crease the danger or severity of injuries to the driver. Small surface cracks and fissures shallbe disregarded.
5.4.1.1.1 In the case of a projection consisting of a component made of non-rigid material ofless than 50 Shore A hardness mounted on rigid support, the requirement of Paragraph5.4.1.1. shall only apply to the rigid support.
5.4.2. The steering control shall be so designed, constructed and fitted as not to embody com-ponents or accessories, including the horn control and assembly accessories, capable ofcatching in the driver's clothing or jewellery in normal driving movements.
5.4.3. In the case of steering controls not intended to form part of the original equipment theyshall be required to meet the specification when tested in accordance with Annex 4, Paragraph2.1.3. and Annex 5, Paragraph 2.3.
5.4.4. In the case of "general steering controls", the requirements shall be met over:
5.4.4.1 the full range of column angles, it being understood that the tests shall be performed atleast for the maximum and minimum column angles for the range of approved vehicle typesfor which the controls are intended;
5.4.4.2. the full range of possible impactor and body block positions in relation to the steeringcontrol, it being understood that the test shall be performed at least for the mean position forthe range of approved vehicle types for which the controls are intended. Where a steering col-umn is used, it shall be of a type corresponding to the "worst case" conditions.
5.4.5. Where adapters are used to adapt a single type of steering control to a range of steeringcolumn, and it can be demonstrated that with such adapters the energy-absorbing characteris-tics of the system are the same, all the tests may be performed with one type of adapter.
I.2. Regulation 32
Regulation 32 concerns the behaviour of the structure of the impacted vehicle in a rear-endcollision.
5. REQUIREMENTS
5.1. When the vehicle has undergone the test referred to in Regulation 32, Paragraph 6 below,the displacement referred to in Annex 4, Paragraph 3, to this Regulation shall not exceed 75mm.
5.2. After the test, no rigid component in the passenger compartment shall constitute a risk ofserious injury to the vehicle's occupants.
195
5.3. In addition, the side doors of the vehicle shall not open under the effect of the impact.
5.4. Except in the case of a vehicle not having a roof of rigid construction, the opening of anumber of doors sufficient to enable all the occupants to emerge shall, after the impact, con-tinue to be possible without the use of tools.
ANNEX 4
2. INSTALLATIONS, PROCEDURES AND MEASURING INSTRUMENTS
2.1. Testing groundThe test area shall be large enough to accommodate the impactor (striker) propulsion systemand to permit after-impact displacement of the vehicle impacted and installation of the testequipment. The part in which vehicle impact and displacement occur shall be horizontal, flatand smooth and have a coefficient of friction of not less than 0.5.
2.2. Impactor (striker)
2.2.1. The impactor shall be of steel and of rigid construction
2.2.2. The impacting surface shall be flat, not less than 2,500 mm wide, and 800 mm high,and its edges shall be rounded to a radius of curvature of between 40 and 50 mm. It shall beclad with a layer of plywood 20 mm thick.
2.2.3. At the moment of impact the following requirements shall be met:
2.2.3.1. the impacting surface shall be vertical and perpendicular to the median longitudinalplane of the impacted vehicle;
2.2.3.2. the direction of movement of the impactor shall be substantially horizontal and paral-lel to the median longitudinal plane of the impacted vehicle;
2.2.3.3. the maximum lateral deviation tolerated between the median vertical line of the sur-face of the impactor and the median longitudinal plane of the impacted vehicle shall be 300mm. In addition, the impacting surface shall extend over the entire width of the impacted ve-hicle;
2.2.3.4. the ground clearance of the lower edge of the impacting surface shall be 175 ± 25 mm
2.3. Propulsion of the impactorThe impactor may either be secured to a carriage (moving barrier) or form part of a pendulum.
2.4 Special provisions applicable where a moving harrier is used
2.4.1. If the impactor is secured to a carriage (moving harrier) by a restraining element, thelatter must be rigid and be incapable of being deformed by the impact; the carriage shall at themoment of impact be capable of moving freely and no longer be subject to the action of thepropelling device.
2.4.2. The velocity of impact shall be between 35 and 38 km/h
196
2.4.3. The aggregate weight (mass) of carriage and impactor shall be 1,100 ± 20 kg.
2.5. Special provisions applicable where a pendulum is used
2.5.1. The distance between the centre of the impacting surface and the axis of rotation Of thependulum shall be not less than 5 m.
2.5.2. The impactor shall be freely suspended by rigid arms rigidly secured to it. The pendu-lum so constituted shall be substantially incapable of being deformed by the impact.
2.5.3. Arresting gear shall be incorporated in the pendulum to prevent any secondary impactby the impactor on the test vehicle.
2.5.4. At the moment of impact the velocity of the centre of percussion of the pendulum shallbe between 35 and 38 km/h.
2.5.5. The reduced mass "mr" at the centre of percussion of the pendulum is defined as afunction of the total mass "m", of the distance "a" (it is recalled that the distance "a" is equalto the length of the synchronous pendulum of the pendulum under consideration) between thecentre of percussion and the axis of rotation, and of the distance "I" between the centre ofgravity and the axis of rotation, by the following equation:
mr = m * 1/a
2.5.6. The reduced mass "mr" shall be 1,100 ± 20 kg.
2.6. General Provisions relating to the mass and velocity of the impactorIf the test has been conducted at an impactor velocity higher than those prescribed in Para-graphs 2.4.2. and 2.5.4. and/or with a mass greater than those prescribed in Paragraphs 2.4.3.or 2.5.6. and the vehicle has met the- requirements prescribed, the test shall be consideredsatisfactory.
2.7. State of vehicle under test
2.7.1. The vehicle under test shall either be fitted with all the normal components and equip-ment included in its unladen kerb weight or be in such condition as to fulfil this requirementso far as the components and equipment of concern to the passenger compartment and thedistribution of the weight of the vehicle as a whole, in running order, are concerned.
2.7.2. The fuel tank must be filled to at least 90 per cent of its capacity with a liquid having adensity close to that of the fuel normally used. Alt other systems (brake-fluid, header tanks,radiator, etc.) may be empty.
2.7.3. A gear may be engaged and the brakes may be applied
2.7.4. If the manufacturer so requests, the following derogations shall be permitted;
197
2.7.4.1. The technical service responsible for conducting the test may allow the same vehicleas is used for tests prescribed by other Regulations (including tests capable of affecting itsstructure) to be used also for the tests prescribed by this Regulation.
2.7.4.2. The vehicle may be weighted to an extent not exceeding 10 per cent of its unladenkerb weight with additional weights rigidly secured to the structure in such a way as not toaffect the behaviour of the structure of the passenger compartment during the test.
2.8. Measuring instrumentsThe instruments used to record the speed referred to in Paragraph 2.4.2. and 2.5.4. above shallbe accurate to within one per cent.
I.3. Regulation 33
Regulation 33 concerns the approval of vehicles with regard to the behaviour of the structureof the impacted vehicle in a head-on collision.
5. REQUIREMENTS
5.1. After the unladen vehicle without a manikin has been collision-tested forwards against abarrier at a speed of 48.3 km/h, the interior space of the passenger compartment shall satisfythe requirements of Paragraphs 5.2. to 5.9. below.
5.2. For each seat as defined by the manufacturer the distance after impact shall be determinedbetween two transverse planes, one passing through the corresponding "R" point and the otherthrough the rearmost projection of the lines of the instrument panel (switches and controlsbeing disregarded) over a width of 150 mm to each side of the longitudinal plane passingthrough the centre of the seat. This distance shall be not less than 450 mm.
5.3. Before impact, the straight line formed for each front seat by the intersection of thelongitudinal plane passing through the centre of the seat with the horizontal plane passingthrough the centre of the service brake pedal in the position of rest shall be determined. Thedistance between the point of intersection of the said straight line with the front of thepassenger compartment and its point of intersection with the transverse plane passing throughthe corresponding "R" point shall then be determined. After impact, this distance shall be notless than 650 mm.
5.4. The width of the footwell shall be determined as follows:
5.4.1. before impact, the points shall be determined at which a transverse horizontal axispassing through the centre of the service brake pedal in the position of rest meets the sidewalls of the footwell;
5.4.2. after impact, the distance separating two longitudinal vertical planes passing throughthe same points shall be measured. This distance shall be not less than 250 mm for each frontseat.
198
5.5. The distance from floor to roof shall be determined along a vertical passing through the"R' point and situated in the longitudinal plane passing through the centre of each front seat.After impact, this distance shall not be reduced by more than 10%.
5.6. For measuring the distances referred to in Paragraphs 5.2., 5.3., 5.4. and 5.5.,compression corresponding to a force of 10 daN applied over a surface of 5 x 5 cm may beexerted in the direction of measurement.
5.7. After the test, no rigid component in the passenger compartment shall constitute a risk ofserious injury to the vehicle's occupants.
5.8. In addition, the side doors of the vehicle shall not open under the effect of the impact.
5.9. Except in the case of a vehicle not having a roof of rigid construction, the opening of anumber of doors sufficient to enable all the occupants to get out must be possible after theimpact without the use of tools.
5.10. Specifications of Paragraphs 5.1. to 5.9. above are deemed to be met if the vehicleconcerned complies with the requirements of Regulation No. 94, 01 series of amendments.
6. TESTSThe vehicle's compliance with the requirements of Paragraph 5. above shall be checked by themethods set out in Annexes 3 and 4 to this Regulation.
ANNEX 4
FRONTAL-IMPACT TEST AGAINST A BARRIER318
1. INSTALLATIONS, PROCEDURE AND MEASURING INSTRUMENTS
1.1. Testing GroundThe test area shall be large enough to accommodate the run-up track, barrier and technicalinstallations necessary for the test. The last part of the track, for at least 5 m before the barrier,must be horizontal, flat and smooth.
1.2. BarrierThe barrier consists of a block of reinforced concrete not less than 3 m wide in front and notless than 1.5 m high. The barrier must be of such thickness that it weighs at least 70 tons. Thefront face must be vertical, perpendicular to the axis of the run-up track, and covered withplywood boards 2 cm thick in good condition. The barrier shall be either anchored in theground or placed on the ground with, if necessary, additional arresting devices to limit itsdisplacement. A barrier with different characteristics, but giving results at least equallyconclusive, may likewise be used.
1.3. Propulsion of VehicleAt the moment of impact the vehicle must no longer be subject to the action of any additionalsteering or propelling device. It must reach the obstacle on a course perpendicular to the colli-
318 This method is not applicable to vehicles weighing more than 3.5 metric tons
199
sion wall; the maximum lateral disalignment tolerated between the vertical median line of thefront of the vehicle and the vertical median line of the collision wall is ± 30 cm.
1.4. State of Vehicle
1.4.1. The vehicle under test must either be fitted with all the normal components andequipment included in its unladen kerb weight or be in such a condition as to fulfil thisrequirement so far as the components and equipment of concern to the passengercompartment and the distribution of the weight of the vehicle as a whole, in running order, areconcerned.
1.4.2. If the vehicle is driven by external means, the fuel installation must be filled to at least90% of its capacity either with fuel or with a non-inflammable liquid having a density and aviscosity close to those of the fuel normally used. All other systems (brake-fluid header tanks,radiator, etc.) may be empty.
1.4.3. If the vehicle is driven by its own engine, the fuel tank must be at least 90% full. Allother liquid-holding tanks may be filled to capacity.
1.4.4. If the manufacturer so requests, the technical service responsible for conducting thetests may allow the same vehicle as is used for tests prescribed by other Regulations (includ-ing tests capable of affecting its structure) to be used also for the tests prescribed by thisRegulation.
1.5. Velocity on ImpactThe velocity on impact must be between 48.3 km/h and 53.1 km/h. However, if the test hasbeen carried out at a higher impact velocity and the vehicle has satisfied the conditionsprescribed, the test is considered satisfactory.
1.6. Measuring Instruments
The instrument used to record the speed referred to in Paragraph 1.5. above shall be accurateto within 1 %.
2. RESULTSBefore and after impact, the dimensions specified in Paragraph 5. of this Regulation shall bemeasured and recorded.
3. CORRECTION FACTORS
3.1. Notation
v Recorded speed in km/h;
m0 Weight mass of prototype in state defined in Paragraph 1.4. of this Annex;
m Weight mass of prototype with testing apparatus;
D0 Residual dimensions measured after the impact, as defined in Paragraph 5. of thisRegulation;
200
D1 Corrected residual dimensions used to determine results of test;
K1 = the greater of (48.3)2/V and 0.83;
K2 = the greater of m0/m and 0.8.
3.2. The corrected dimensions D, used to check the conformity of the prototype with therequirements of this Regulation shall be calculated by the following formula:
D1 = D0 . K1 . K2
3.3. A front impact test against a barrier is not needed in the case of a vehicle which isidentical to the prototype considered as regards the characteristics specified in Paragraph2.2.2.1. of this Regulation but whose weight (mass) m1 is greater than m0, if m1 is not morethan 1.25 m0 and if the corrected dimension D2 obtained from the dimensions D1 by theformula
D2 = D1 * m0/m1
are such as to show that the new vehicle still meets the requirements of Paragraph 5 of thisRegulation.
I.4. Regulation 34
Regulation 34 concerns the approval of vehicles with regard to the prevention of fire risks.
5. REQUIREMENTS
5.1. Fuel Installation
5.1.1. The component of the fuel installation shall be adequately protected by parts of theframe or bodywork against contact with possible obstacles on the ground. Such protectionshall not be required if the components beneath the vehicle are further from the ground thanthe part of the frame or bodywork in front of them.
5.1.2. The fuel installation shall be so designed, constructed and fitted that its components areable to resist the internal and external corrosion phenomena to which they are exposed.
5.1.3. The pipes and all other parts of the fuel installation shall be accommodated on the vehi-cle at sites protected to the fullest possible extent. Twisting and bending movements, and vi-brations of the vehicles structure or drive unit, shall not subject the components of the fuelinstallation to friction, compression or any other abnormal stress.
5.1.4. The connections of pliable or flexible pipes with rigid parts of components of the fuelinstallation shall be so designed and constructed as to remain leak-proof under the variousconditions of use of the vehicle, despite twisting and bending movements and despite vibra-tions of the vehicle's structure or drive unit.
201
5.1.5. The fuel tank (tanks) shall be made of a fire-resistant metallic material. It (they) may bemade of a plastics material, provided the requirements of Annex 5 are complied with.
5.1.6. The fuel tank (tanks) shall not be situated in or form a bulkhead of the passenger com-partment.
5.1.7. A bulkhead shall be provided to separate the passenger compartment from the fuel tank(tanks). It shall be capable of withstanding an open petrol fire for two minutes when placedhorizontally 20 cm above the liquid level. The bulkhead may be traversed by apertures (e.g. toaccommodate cables) provided they are so arranged that fuel cannot flow freely into the pas-senger compartment.
5.1.8. The fuel tank shall be securely fixed and so placed as to ensure that any fuel leakingfrom the tank, its filter hole or its pipe connections will escape to the ground and outside thevehicle.
5.1.9. The fuel tank and the accessories connected to it shall be so made and installed thatthey cannot acquire a static electrical charge in relation to the vehicle.
5.1.10. The filler hole shall not be situated in the passenger compartment, in the luggage com-partment or in the engine compartment.
5.1.11. If the filter hole is situated on the side of the vehicle, the filler cap shall not, whenclosed, project beyond the adjacent surfaces of the bodywork.
5.1.12. Any fuel which may leak when the fuel tank (tanks) is (are) being filled shall not beable to fail onto the exhaust system. It shall be channelled to the ground.
5.2. Electrical Installation
5.2.1. 'Electric wires other than wires accommodated in hollow components shall be attachedto the vehicle's structure or walls or partitions near which they lead. The points at which theypass through walls or partitions shall be, satisfactorily protected to prevent cutting of the in-sulation.
5.2.2. The electrical installation shall be so designed, constructed and fitted that its compo-nents are able to resist the corrosion phenomena to which they are exposed.
6. TESTS
6.1. Hydraulic Test of the Fuel TankThe tank shall be subjected to a hydraulic internal-pressure test, which shall be carried out onan isolated unit complete with standard filter pipe, filter neck and cap. The tank shall be com-pletely filled with water. After alt communication with the outside has been cut off, the pres-sure shall be gradually increased, through the pipe connection through which fuel is fed to theengine, to a relative pressure of 0.3 kg/cm , which shall be maintained for one minute. Duringthis time the tank shell must not crack or teak; however, it may be permanently distorted.
6.2. Tests on the Vehicle
202
In the frontal-impact test against a barrier carried out by the procedure specified in Annex 3 tothis Regulation, and in the rear-end impact test carried out by the procedure specified in An-nex 4 hereto,
6.2.1. no more than a slight leakage of liquid in the fuel installation shall occur on collision;
6.2.2. If there is continuous leakage in the fuel installation after the collision, the rate of leak-age must not exceed 30 g/min; if the liquid from the fuel installation mixes with liquids fromthe other systems, and if the several liquids cannot be easily separated and identified, the con-tinuous leakage shall be evaluated from all the fluids collected;
6.2.3. no fire maintained by the fuel shall occur.
6.2.4. During and after the impacts described in Paragraph 6.2 above, the battery must be keptin position by its securing device.
ANNEX 3 FRONTAL-IMPACT TEST AGAINST A BARRIER
2. INSTALLATIONS, PROCEDURES AND MEASURING INSTRUMENTS
2.1. Testing GroundThe test area shall be large enough to accommodate the run-up track, barrier and technicalinstallations necessary for the test. The last part of the track, for at least 5 m before the barrier,must be horizontal flat and smooth.
2.2. BarrierThe barrier consists of a block of reinforced concrete not less than 3 m wide in front and notless than 1,5 m high. The barrier must be of such thickness that it weighs at least 70 t. Thefront face must be vertical, perpendicular to the axis of the run-up track, and covered withplywood boards 2 cm thick in good condition. The barrier shall be either anchored in theground or placed on the ground with, if necessary, additional arresting devices to limit its dis-placement. A barrier with different characteristics, but giving results at least equally conclu-sive, may likewise be used.
2.3. Propulsion of VehicleAt the moment of impact, the vehicle must no longer be subject to the action of any additionalsteering or propelling device. It must reachthe obstacle on a course perpendicular to the collision wall; the maximum lateral disalignmenttolerated between the vertical median line of the front of the vehicle and the vertical medianline of the collision wall is ± 30 cm.
2.4. State of Vehicle
2.4.1. The vehicle under test shall either be fitted with all the normal components and equip-ment included in its unladen kerb weight or be in such condition as to fulfil this requirementso far as the components and equipment affecting fire risks are concerned.
2.4.2 If the vehicle is driven by external means, the fuel installation must be filled to at least90% of its capacity either with fuel or with a non- inflammable liquid having a density and a
203
viscosity close to those of the fuel normally used. All other systems (brake-fluid header tanks,radiator, etc.) may be empty.
2.4.3. If the vehicle is driven by its own engine, the fuel tank must be at least 90% full. Allother liquid holding tanks may be filled to capacity.
2.4.4. If the manufacturer so requests, the technical service responsible for conducting thetests may allow the same vehicle as is used for tests prescribed by other Regulations (includ-ing tests capable of affecting its structure) to be used also for the tests prescribed by thisRegulation.
2.5. Velocity on ImpactThe velocity on impact must be between 48.3 km/hr and 53.1 km/hr. However, if the test hasbeen carried out at a higher impact velocity and the vehicle has satisfied the conditions pre-scribed, the test shall be considered satisfactory.
2.6. Measuring InstrumentsThe instrument used to record the speed referred to in Paragraph 2.5 above shall be accurateto within one per cent.
I.5. Regulation 94
Regulation 94 concerns the approval of vehicles with regard to the protection of the occupantsin the event of a frontal collision.
5. SPECIFICATIONS
5.1. General specifications applicable to all tests
5.1.1. The "H" point for each seat shall be determined in accordance with the proceduredescribed in Annex 6.
5.1.2. When the protective system for the front seating positions includes belts, the beltcomponents shall meet the requirements of Regulation No. 16.
5.1.3. Seating positions where a dummy is installed and the protective system includes belts,shall be provided with anchorage points conforming to Regulation No. 14.
5.2. SpecificationsThe test of the vehicle carried out in accordance with the method described in Annex 3 shallbe considered satisfactory if all the conditions set out in Paragraphs 5.2.1. to 5.2.6. below areall satisfied at the same time.
5.2.1. The performance criteria recorded, in accordance with Annex 8, on the dummies in thefront outboard seats shall meet the following conditions:
5.2.1.1. The head performance criterion (HPC) shall not exceed 1000 and the resultant headacceleration shall not exceed 80 g for more than 3 ms. The latter shall be calculatedcumulatively, excluding rebound movement of the head;
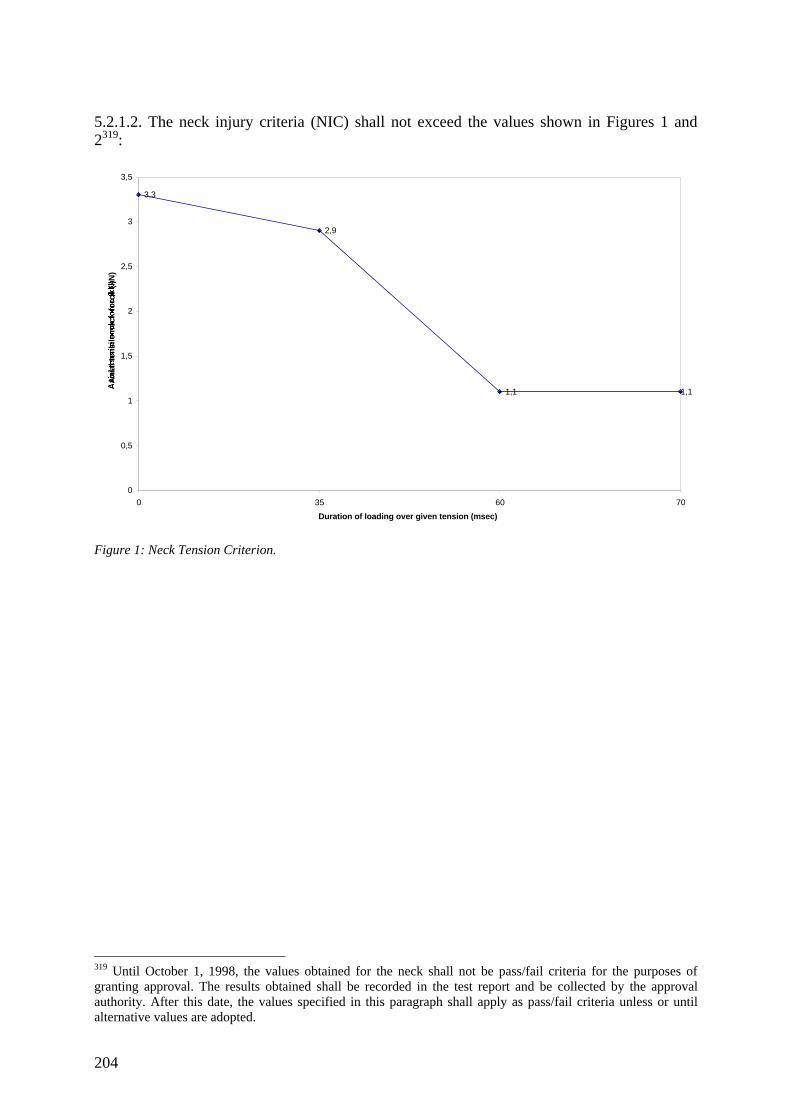
204
5.2.1.2. The neck injury criteria (NIC) shall not exceed the values shown in Figures 1 and2319:
3,3
2,9
1,1 1,1
0
0,5
1
1,5
2
2,5
3
3,5
0 35 60 70
Duration of loading over given tension (msec)
Axi
al t
ensi
le n
eck
forc
e (k
N)
Figure 1: Neck Tension Criterion.
319 Until October 1, 1998, the values obtained for the neck shall not be pass/fail criteria for the purposes ofgranting approval. The results obtained shall be recorded in the test report and be collected by the approvalauthority. After this date, the values specified in this paragraph shall apply as pass/fail criteria unless or untilalternative values are adopted.
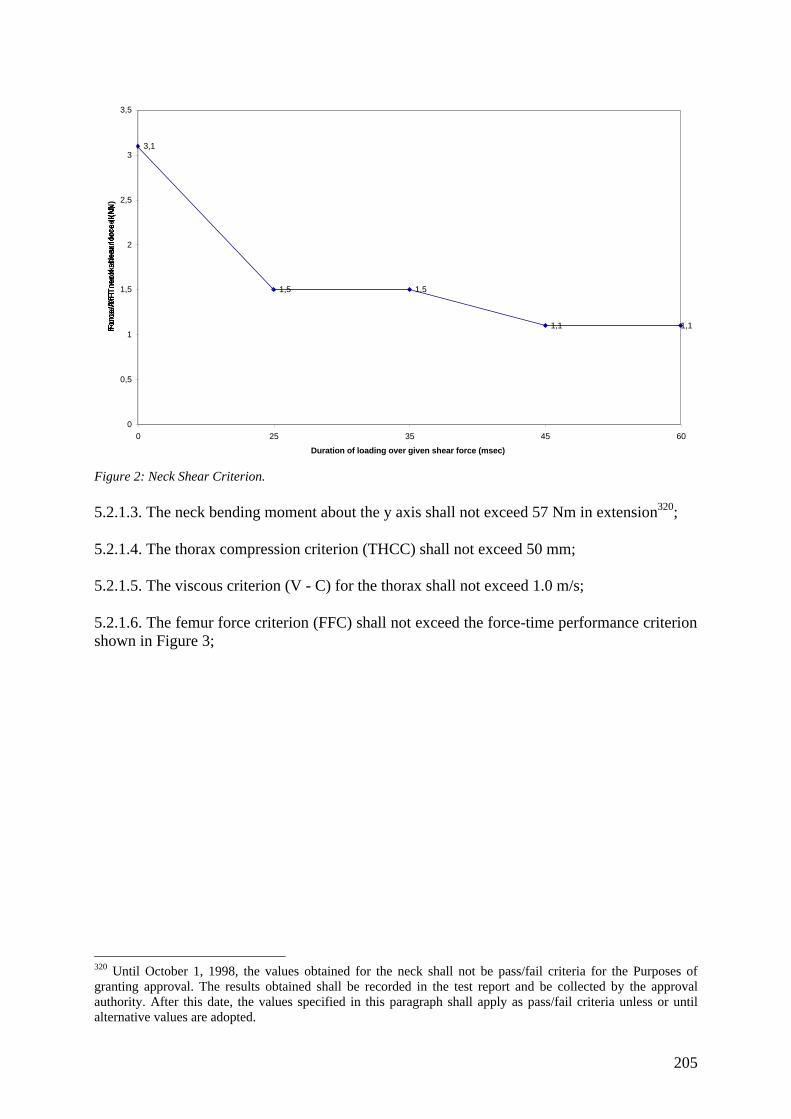
205
3,1
1,5 1,5
1,1 1,1
0
0,5
1
1,5
2
2,5
3
3,5
0 25 35 45 60
Duration of loading over given shear force (msec)
Fo
rce/
AF
T n
eck
shea
r fo
rce
(kN
)
Figure 2: Neck Shear Criterion.
5.2.1.3. The neck bending moment about the y axis shall not exceed 57 Nm in extension320;
5.2.1.4. The thorax compression criterion (THCC) shall not exceed 50 mm;
5.2.1.5. The viscous criterion (V - C) for the thorax shall not exceed 1.0 m/s;
5.2.1.6. The femur force criterion (FFC) shall not exceed the force-time performance criterionshown in Figure 3;
320 Until October 1, 1998, the values obtained for the neck shall not be pass/fail criteria for the Purposes ofgranting approval. The results obtained shall be recorded in the test report and be collected by the approvalauthority. After this date, the values specified in this paragraph shall apply as pass/fail criteria unless or untilalternative values are adopted.
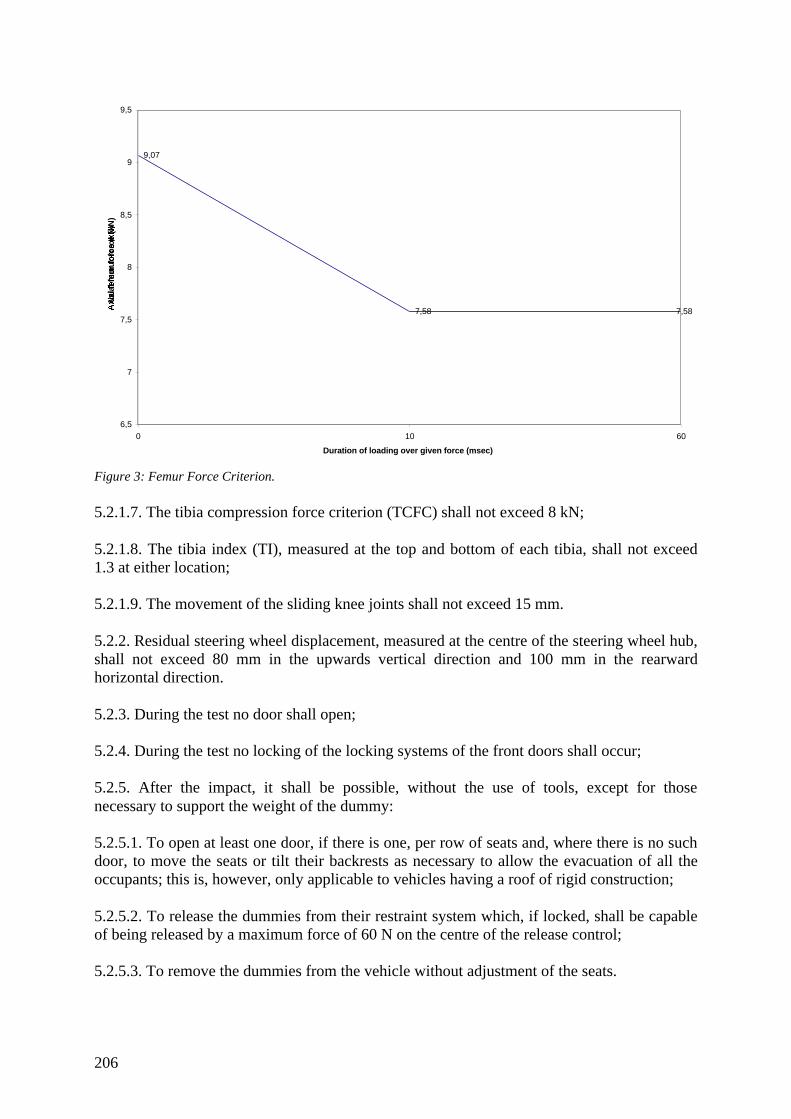
206
9,07
7,58 7,58
6,5
7
7,5
8
8,5
9
9,5
0 10 60
Duration of loading over given force (msec)
Axi
al f
emu
r fo
rce
(kN
)
Figure 3: Femur Force Criterion.
5.2.1.7. The tibia compression force criterion (TCFC) shall not exceed 8 kN;
5.2.1.8. The tibia index (TI), measured at the top and bottom of each tibia, shall not exceed1.3 at either location;
5.2.1.9. The movement of the sliding knee joints shall not exceed 15 mm.
5.2.2. Residual steering wheel displacement, measured at the centre of the steering wheel hub,shall not exceed 80 mm in the upwards vertical direction and 100 mm in the rearwardhorizontal direction.
5.2.3. During the test no door shall open;
5.2.4. During the test no locking of the locking systems of the front doors shall occur;
5.2.5. After the impact, it shall be possible, without the use of tools, except for thosenecessary to support the weight of the dummy:
5.2.5.1. To open at least one door, if there is one, per row of seats and, where there is no suchdoor, to move the seats or tilt their backrests as necessary to allow the evacuation of all theoccupants; this is, however, only applicable to vehicles having a roof of rigid construction;
5.2.5.2. To release the dummies from their restraint system which, if locked, shall be capableof being released by a maximum force of 60 N on the centre of the release control;
5.2.5.3. To remove the dummies from the vehicle without adjustment of the seats.
207
5.2.6. In the case of a vehicle propelled by liquid fuel, no more than slight leakage of liquidfrom the fuel feed installation shall occur on collision;
5.2.7. If there is continuous leakage of liquid from the fuel-feed installation after the collision,the rate of leakage shall not exceed 30 g/min; if the liquid from the fuel-feed system mixeswith liquids from the other systems and the various liquids cannot easily be separated andidentified, all the liquids collected shall be taken into account in evaluating the continuousleakage.
ANNEX 3
TEST PROCEDURE
1. INSTALLATION AND PREPARATION OF THE VEHICLE
1.1. Testing GroundThe test area shall be large enough to accommodate the run-up track, barrier and technicalinstallations necessary for the test. The last part of the track, for at least 5 m before the barrier,shall be horizontal, flat and smooth.
1.2. BarrierThe front face of the barrier consists of a deformable structure as defined in Annex 9 of thisRegulation. The front face of the deformable structure is perpendicular within ± 10 to thedirection of travel of the test vehicle. The barrier is secured to a mass of not less than 7 x 10⁴kg, the front face of which is vertical within ± 111. The mass is anchored in the ground orplaced on the ground with, if necessary, additional arresting devices to restrict its movement.
1.3. Orientation of the BarrierThe orientation of the barrier is such that the first contact of the vehicle with the barrier is onthe steering-column side. Where there is a choice between carrying out the test with a right-hand or left-hand drive vehicle, the test shall be carried out with the less favourable hand ofdrive as determined by the technical service responsible for the tests.
1.3.1. Alignment of the Vehicle to the BarrierThe vehicle shall overlap the barrier face by 40% ± 20 mm.
1.4. State of Vehicle
1.4.1. General SpecificationThe test vehicle shall be representative of the series production, shall include all theequipment normally fitted and shall be in normal running order. Some components may bereplaced by equivalent masses where this substitution clearly has no noticeable effect on theresults measured under Paragraph 6.
1.4.2. Mass of Vehicle
1.4.2.1. For the test, the mass of the vehicle submitted shall be the unladen kerb mass;
1.4.2.2. The fuel tank shall be filled with water to mass equal to 90% of the mass of a full asspecies by the manufacturer with a tolerance of ± 1 %.
208
1.4.2.3. All the other systems (brake, cooling, ... ) may be empty in this case, the mass of theliquids shall be carefully compensated.
1.4.2.4. If the mass of the measuring apparatus on board the vehicle exceeds the 25 kgallowed, it may be compensated by reductions which have no noticeable effect on the resultsmeasured under Paragraph 6 below-,
1.4.2.5. The mass of the measuring apparatus shall not change each axis reference load bymore than 5%, each variation not exceeding 20 kg.
1.4.2.6. The mass of the vehicle resulting from the provisions of Paragraph 1.4.2.1. aboveshall be indicated in the report.
1.4.3. Passenger Compartment Adjustments
1.4.3.1. Position of steering wheelThe steering wheel, if adjustable, shall be placed in the normal position indicated by themanufacturer or, failing that, midway between the limits of its range(s) of adjustment. At theend of propelled travel, the steering wheel shall be left free, with its spokes in the positionwhich according to the manufacturer corresponds to straight-ahead travel of the vehicle.
1.4.3.2. GlazingThe movable glazing of the vehicle shall be in the closed position. For test measurementpurposes and in agreement with the manufacturer, it may be lowered, provided that theposition of the operating handle corresponds to the closed position.
1.4.3.3. Gear-change leverThe gear-change lever shall be in the neutral position.
1.4.3.4. PedalsThe pedals shall be in their normal position of rest. If adjustable, they shall be set in their midposition unless another position is specified by the manufacturer.
1.4.3.5. DoorsThe doors shall be closed but not locked.
1.4.3.6. Opening roof]f an opening or removable roof is fitted, it shall be in place and in the closed position. Fortest measurement purposes and in agreement with the manufacturer, it may be open.
1.4.3.7. Sun-visorThe sun-visors shall be in the stowed position
1.4.3.8. Rear-view mirrorThe interior rear-view mirror shall be in the normal position of use.
1.4.3.9. Arm-restsArm-rests at the front and rear, if movable, shall be in the lowered position, unless this isprevented by the position of the dummies in the vehicles.
209
1.4.3.10. Head restraintsHead restraints adjustable for height shall be in their uppermost position.
1.4.3.11. SeatsPosition of front seats
Seats adjustable longitudinally shall be placed so that their "H" point, determined inaccordance with the procedure set out in Annex 6 is in the middle position of travel or in thenearest locking position thereto, and at the height position defined by the manufacturer (ifindependently adjustable for height). In the case of a bench seat, the reference shall be to the"H" point of the driver's place.
1.4.3.11.2. Position of the front seat-backsIf adjustable, the seat-backs shall be adjusted so that the resulting inclination of the torso ofthe dummy is as close as possible to that recommended by the manufacturer for normal useor, in the absence of any particular recommendation by the manufacturer, to 25° towards therear from the vertical.
1.4.3.11.3. Rear seatsIf adjustable, the rear seats or rear bench seats shall be placed in the rearmost position
4. TEST SPEEDVehicle speed at the moment of impact shall be 56 -01+1 km/h. However, if the test wasperformed at a higher impact speed and the vehicle met the requirements, the test shall beconsidered satisfactory.
I.6. Regulation 95
Regulation 95 concerns the approval of vehicles with regard to the protection of the occupantsin the event of a lateral collision.
5. SPECIFICATIONS AND TESTS
5.1. The vehicle shall undergo a test in accordance with Annex 4 to this Regulation.
5.1.1. The test will be carried out on the driver's side unless asymmetric side structures, if any,are so different as to affect the performance in a side impact. In that case either of thealternatives in Paragraph 5.1.1.1. or 5.1.1.2. may be used by agreement between themanufacturer and test authority.
5.1.1.1. The manufacturer will provide the authority responsible for approval with informationregarding the compatibility of performances in comparison with the driver's side when the testis being carried out on that side.
5.1.1.2. The approval authority, if concerned as to the construction of the vehicle, will decideto have the test performed on the side opposite the driver, this being considered the leastfavourable.
210
5.1.2. The Technical Service, after consultation with the manufacturer, may require the test tobe carried out with the scat in a position other than the one indicated in Paragraph 5.5.1. ofAnnex 4. This position shall be indicated in the test report.321
5.1.3. The result of this test shall be considered satisfactory if the conditions set out inParagraphs 5.2. and 5.3. below are satisfied.
5.2. Performance criteria
5.2.1. The performance criteria, as determined for the collision test in accordance with theappendix to Annex 4 to this Regulation shall meet the following conditions:
5.2.1.1. the head performance criterion (HPC) shall be less than or equal to 1,000; when thereis no head contact, then the HPC shall not be measured or calculated but recorded as "NoHead Contact."
5.2.1.2. the thorax performance criteria shall be:(a) Rib Deflection Criterion (RDC) less than or equal to 42 mm;(b) Soft Tissue Criterion (VC) less or equal to 1.0 m/sec.
For a transitional period of two years after the date specified in Paragraph 10.2. of thisRegulation the V * C value is not a pass/fail criterion for the approval testing, but this valuehas to be recorded in the test report and to be collected by the approval authorities. After thistransitional period, the VC value of 1.0 m/sec shall apply as a pass/fail criterion unless theContracting Parties applying this Regulation decide otherwise.
5.2.1.3 the pelvis performance criterion shall be:Pubic Symphysis Peak Force (PSPF) less than or equal to 6 kN.
5.2.1.4. the abdomen performance criterion shall be:Abdominal Peak Force (APF) less than or equal to 2.5 kN internal force (equivalent toexternal force of 4.5 kN).
5.3. Particular requirements
5.3.1. No door shall open during the test.
5.3.2. After the impact, it shall be possible without the use of tools to:
5.3.2.1. open a sufficient number of doors provided for normal entry and exit of passengers,and if necessary tilt the seat-backs or scats to allow evacuation of all occupants;
5 3.2.2. release the dummy from the protective system;
5.3.2.3. remove the dummy from the vehicle;
5.3.3. no interior device or component shall become detached in such a way as noticeably toincrease the risk of injury from sharp projections or jagged edges; 321 Until September 30, 2000, for the purposes of the test requirements, the range of normal longitudinal adjust-ments shall be limited such that the H-point lies within the length of the door aperture.
211
5.3.4. ruptures, resulting from permanent deformation are acceptable, provided these do notincrease the risk of injury;
5.3.5 if there is continuous leakage of liquid from the fuel-feed installation after the collision,the rate of leakage shall not exceed 30 g/min; if the liquid from the fuel-feed system mixeswith liquids from the other systems and the various liquids cannot easily be separated andidentified, all the liquids collected shall be taken into account in evaluating the continuousleakage.
ANNEX 4
COLLISION TEST PROCEDURE
1. INSTALLATIONS
1.1. Testing groundThe test area shall be large enough to accommodate the mobile deformable barrier propulsionsystem and to permit after-impact displacement of the vehicle impacted and installation of thetest equipment. The part in which vehicle impact and displacement occur shall be horizontal,flat and uncontaminated, and representative of a normal, dry, uncontaminated road surface.
2. TEST CONDITIONS
2.1. The vehicle to be tested shall be stationary.
2.2. The mobile deformable barrier shall have the characteristics set out in annex 5 to thisRegulation. Requirements for the examination are given in the appendix to annex 5. Themobile deformable barrier shall be equipped with a suitable device to prevent a second impacton the struck vehicle.
2.3. The trajectory of the mobile deformable barrier longitudinal median vertical plane shallbe perpendicular to the longitudinal median vertical plane of the impacted vehicle.
2.4. The longitudinal vertical median plane of the mobile deformable barrier shall becoincident within ± 25 mm with a transverse vertical plane passing through the R point of thefront seat adjacent to the struck side of the tested vehicle. The horizontal median plane limitedby the external lateral vertical planes of the front face shall be at the moment of impact withintwo planes determined before the test and situated 25 mm above and below the previouslydefined plane.
2.5. Instrumentation shall comply with ISO 6487:1987 unless otherwise specified in thisRegulation.
2.6. The stabilised temperature of the test dummy at the time of the side impact test shall be22 ± 4°C.
3. TEST SPEEDThe mobile deformable barrier speed at the moment of impact shall be 50 ± 1 km/h. Thisspeed shall be stabilised at least 0.5 m before impact. Accuracy of measurement: 1 per cent.

212
However, if the test was performed at a higher impact speed and the vehicle met therequirements, the test shall be considered satisfactory.
213
I'm breaking out of this wildernessI turn my back on all the make believe and promises
A soldier of fortuneI fell once beforeBut I live again!
Part of this once more!
[Arena – Out Of The Wilderness, 1995]