Embed Size (px)
Citation preview
1
CARBONATION-INDUCED REINFORCEMENT CORROSION IN SILICA
FUME CONCRETE
Marlova P. Kulakowskia,∗, Fernanda M. Pereirab, Denise C. C. Dal Molinc
a Programa de Pós-Graduação em Engenharia Civil, Universidade do Vale do Rio dos Sinos (UNISINOS), Brazil.
b Programa de Pós-Graduação em Engenharia: Energia, Ambiente e Materiais, Universidade Luterana do Brasil (ULBRA), Fundação de Ciência e Tecnologia (CIENTEC), Brazil.
c Programa de Pós-Graduação em Engenharia Civil, Universidade Federal do Rio Grande do Sul (UFRGS), Brazil.
Abstract This study presents the results of carbonation depth and carbonation-induced
reinforcement corrosion in concrete samples with silica fume additions of up to 20%
and water/binder ratios ranging from 0.30 to 0.80. The behavior of the additions is
determined by the w/b ratios. For w/b ratios lower or equal to 0.45-0.50, carbonation
processes in these materials are controlled by the porosity of the material and the
consumption of Ca(OH)2 has a negligible effect on carbonation. For higher w/b ratios,
the consumption of Ca(OH)2 plays a significant role. At the same time, the results of
reinforcement corrosion indicate that the effect of silica fume additions depends on their
concentration. In concentrations equal to or lower than 10%, silica fume will not reduce
corrosion resistance and it may actually increase it when used in concentrations below
this level. When used in concentrations greater than 10%, silica fume increases the
potential for carbonation-induced reinforcement corrosion.
Keywords: Concrete, Silica Fume, Carbonation, Corrosion
∗ Corresponding author. Programa de Pós-Graduação em Engenharia Civil, Universidade do Vale do Rio dos Sinos (UNISINOS), Av. Unisinos, 950, 93022-000 São Leopoldo, RS, Brazil. a
2
1. Introduction
The widespread use of reinforced concrete as a construction material derives
from the excellent compatibility between the materials used in its production. The
synergy between steel and concrete improves physical, mechanical and chemical
properties of both components. The physical-mechanical synergy is evident from the
fact that the use of steel reinforcements makes it possible for engineers to erect
buildings with different shapes and design and build wide spans. At the same time, the
steel is protected from physical and chemical agents by the concrete layer, in this way
solving the major problem that affects metallic structures, namely the corrosion of steel
when exposed to the environment. Concrete also offers chemical protection to the steel
through the alkaline pH of the concrete pore solution, which creates a passivation layer
on the surface of the reinforcements that provides chemical equilibrium and protects the
metal from corrosion. However, the durability of concrete structures is subject to
considerable changes and reinforcements often start showing signs of decay much
earlier than expected for the structure’s service life. There are several factors that can
account for pathological manifestations in shorter time spans, such as: (a) The
development of new improved cement formulations, which achieve the same
mechanical strength as in the best with higher water/cement ratios. This results in higher
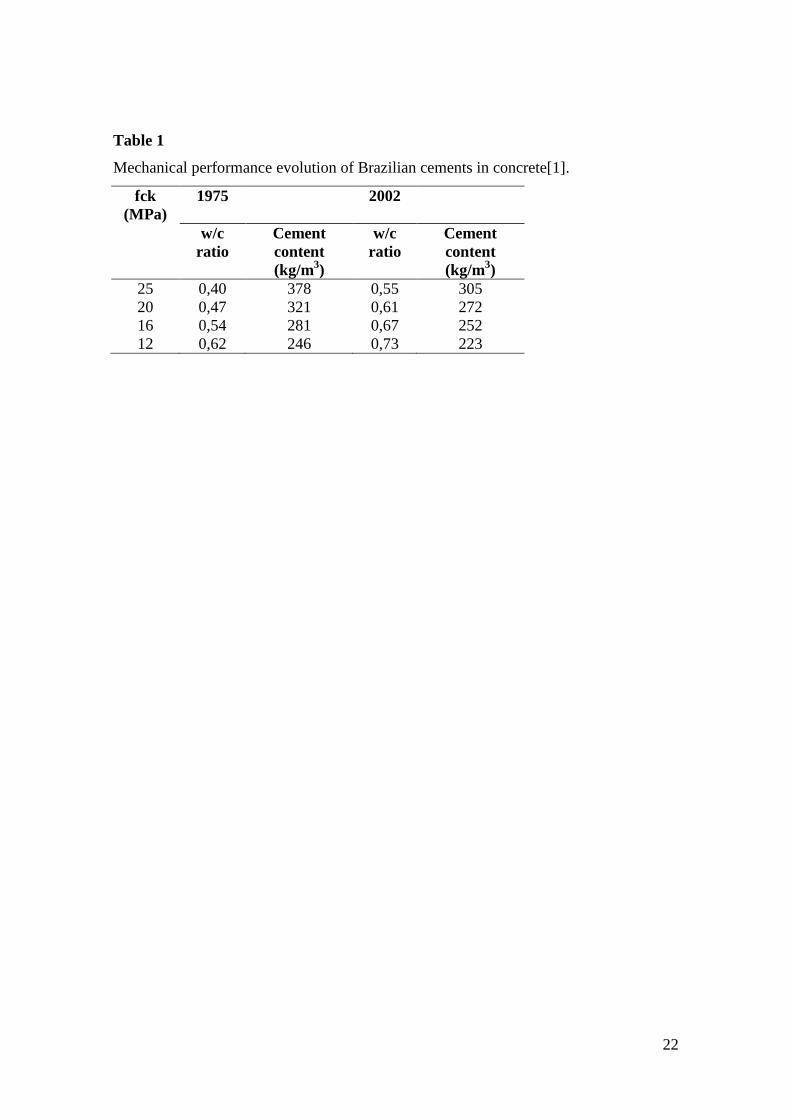
porosity and reduces durability, as shown in Table 1 [1]; (b) Modern calculation
methods that allow engineers to design leaner structures with smaller structural
elements. For this reason, the thickness of the concrete layer is sometimes smaller that
the values recommended by applicable standards; (c) Increased pollution levels,
meaning that the concrete is exposed to a more aggressive environment.
Therefore, studies aiming at the development and improvement of reinforced
3
concrete structures are of paramount importance. They can help improve the quality of
materials used and their combinations for improved durability and extended service life.
The Federal University of Rio Grande do Sul (UFRGS) has been studying the behavior
of concrete and mortars produced with additions of silica fume for some years in order
to fins ways of improving the quality of materials used in concrete structures and
identify potential uses and limitations in their use.
Although many studies [2, 3, 4, 5], show improvements in the performance of
concrete with silica fume in terms of chloride resistance and mechanical properties,
some questions requiring further research remain. These questions refer mainly to the
properties of concrete formulations in terms of carbonation and carbonation-induced
reinforcement corrosion. The aim of the present study is to evaluate carbonation
processes in concrete samples with the addition of silica fume and their behavior
regarding carbonation induced corrosion in order to answer these questions.
2. Methods and materials
The tests of carbonation and reinforcement corrosion were conducted
simultaneously, using the same materials. The test methods used for carbonation
measurements over time and the tests of carbonation-induced reinforcement corrosion
were carried out on concrete.
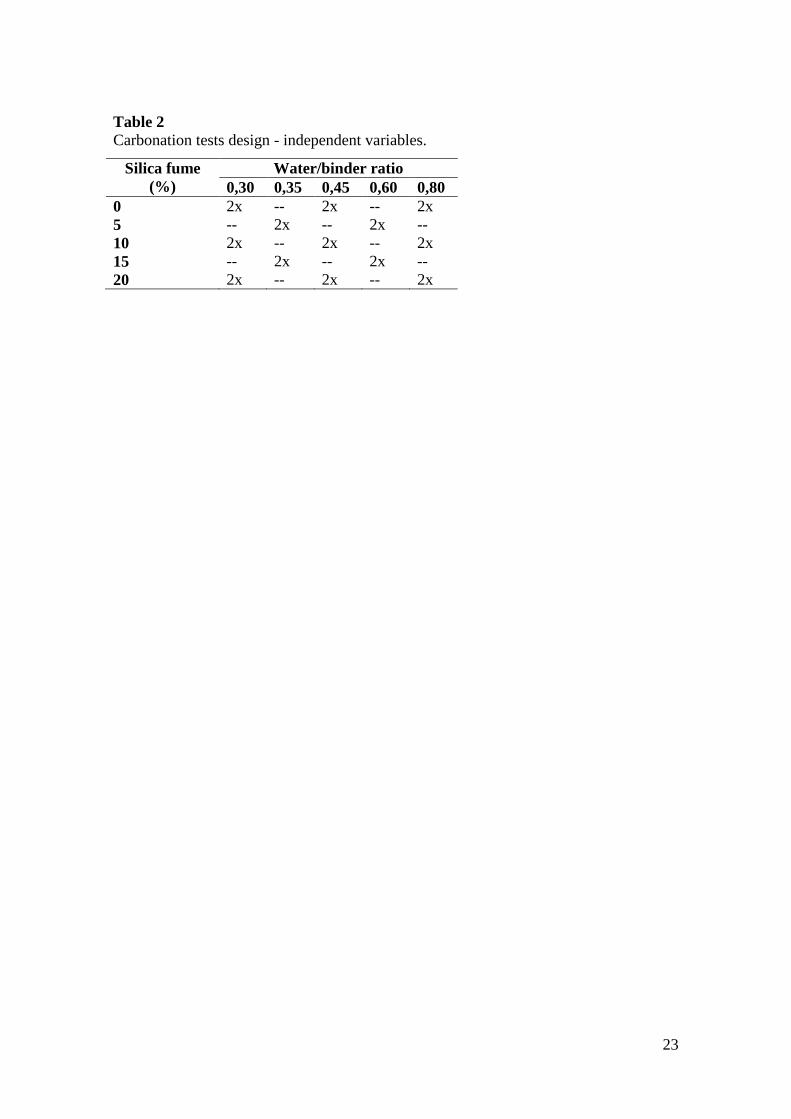
2.1. Variables
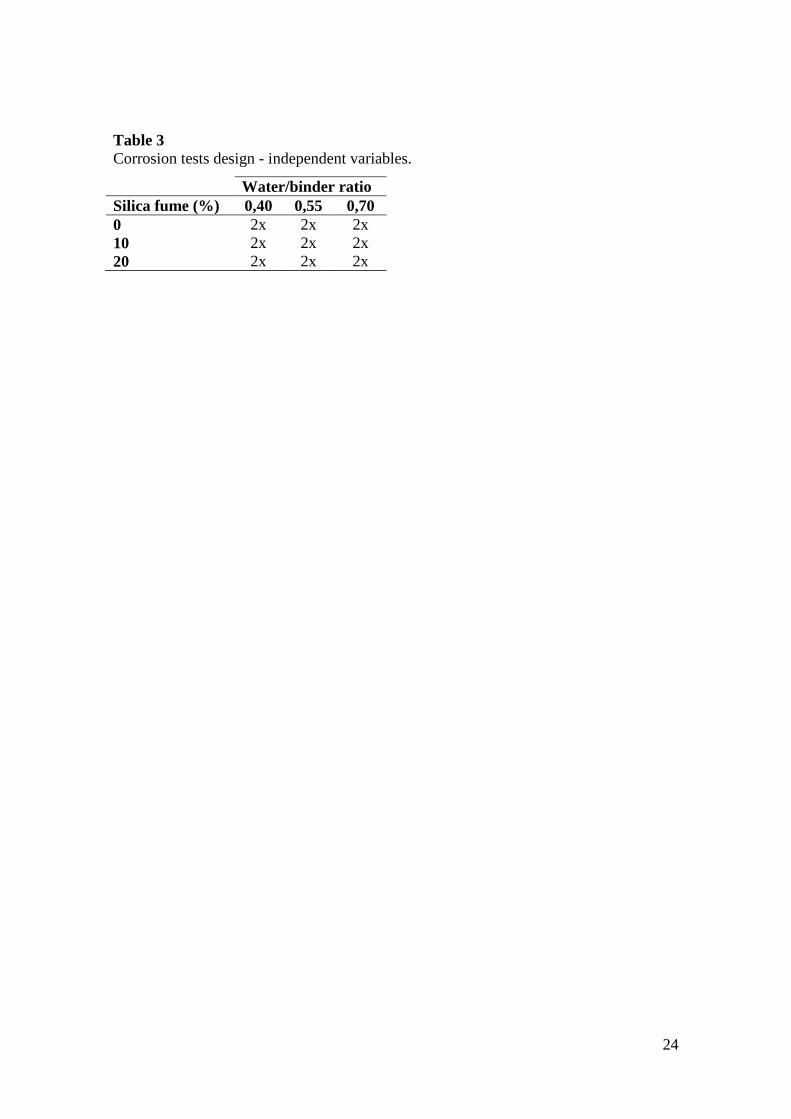
The experiments were planned using a fractionated crossed factorial design for
the carbonation tests and a fully crossed factorial design for the corrosion tests, with two
repetitions for each combination of variables. The combinations of independent
variables for the carbonation tests are shown in Table 2. As the corrosion tests extend
over a longer period, for this case the matrix of variables was reduced and was kept
4
within the limits of the matrix of carbonation tests, as shown in Table 3.
2.2. Materials
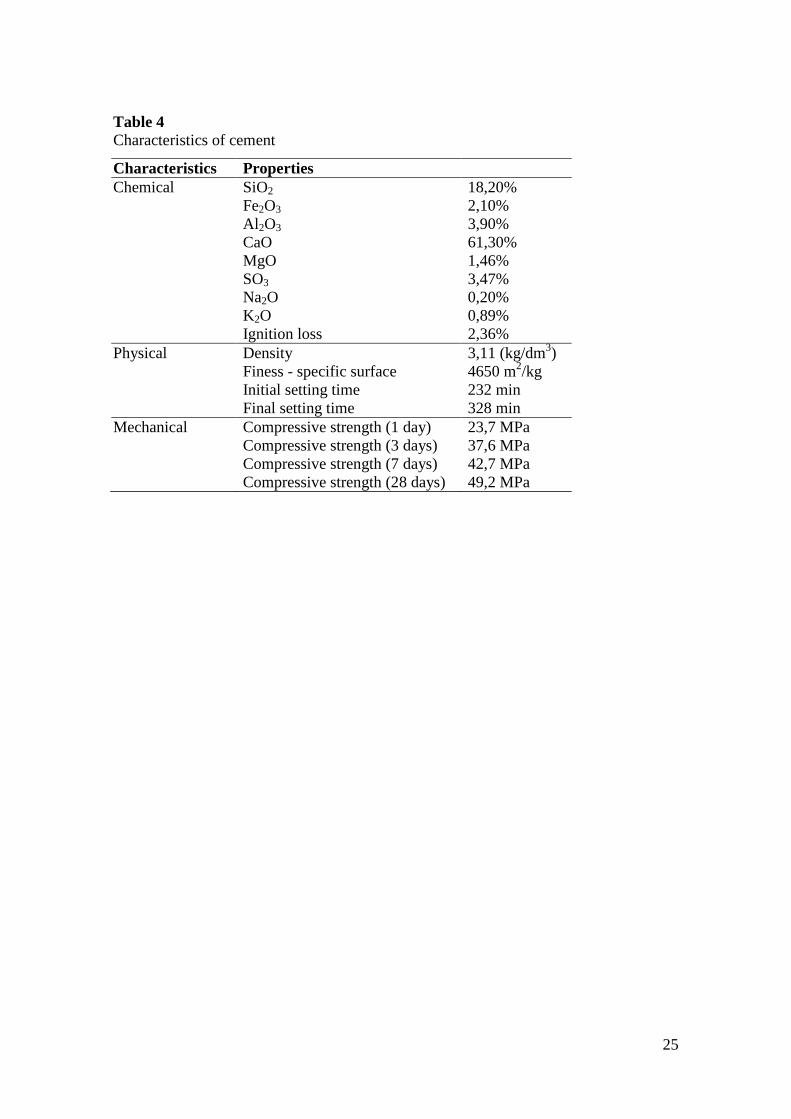
High initial strength Portland cement (Brazilian grade CP V-ARI) from a single
lot was used in the production of concrete samples. This type of cement was chosen
because it does not have any pozzolanic additions, which eliminated the possibility of
influences from other reactive additions in the results. The chemical and
physical/mechanical properties of this cement are shown in Table 4.
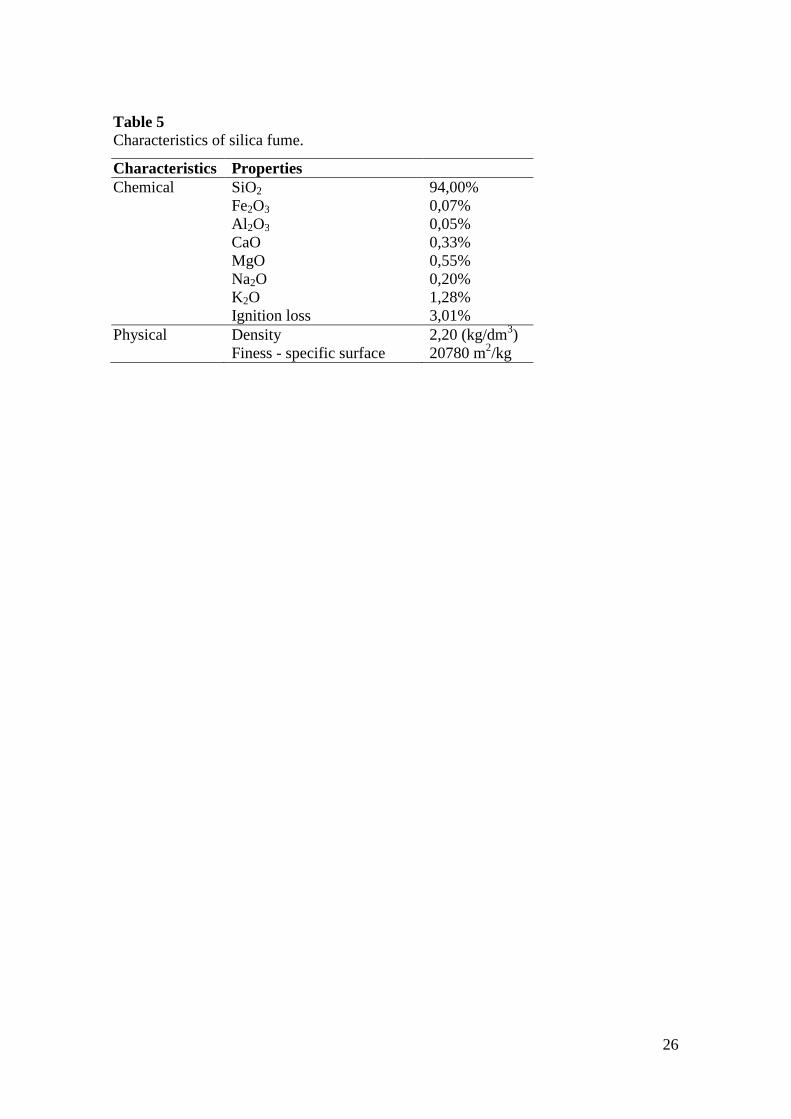
This study used uncompacted silica fume powder supplied as a single lot by a
Brazilian manufacturer. The chemical composition and the physical characteristics of
the silica fume are shown in Table 5.
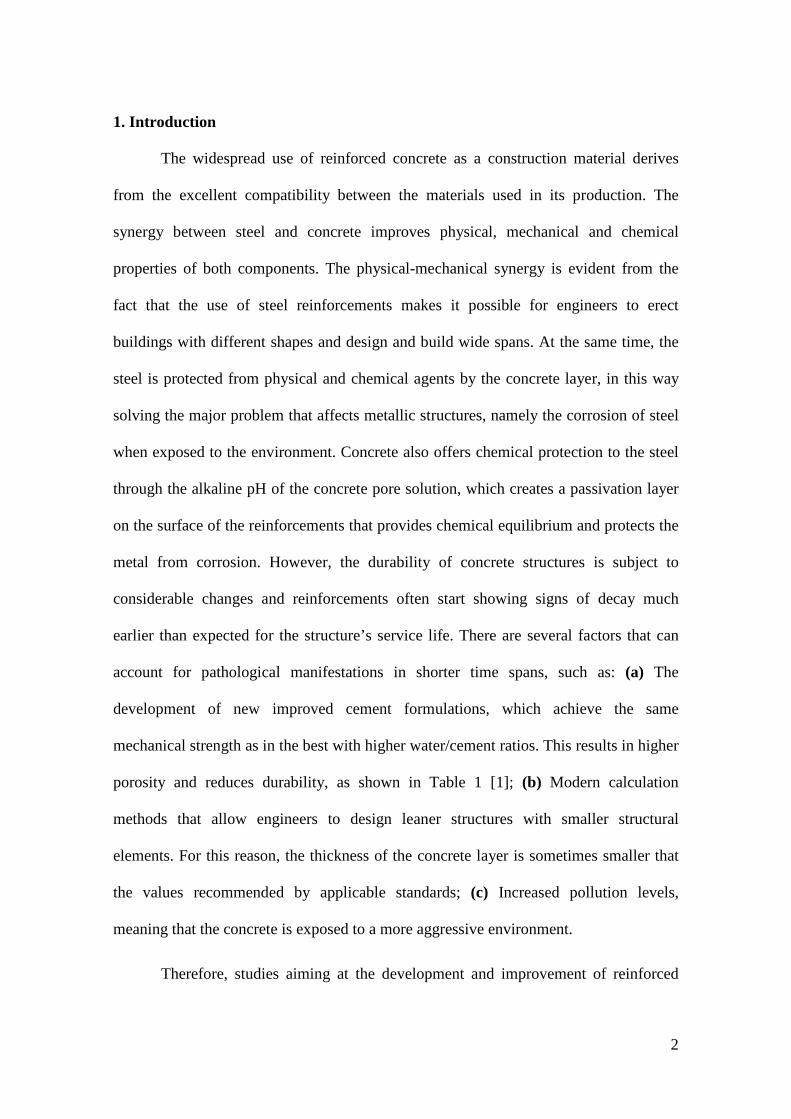
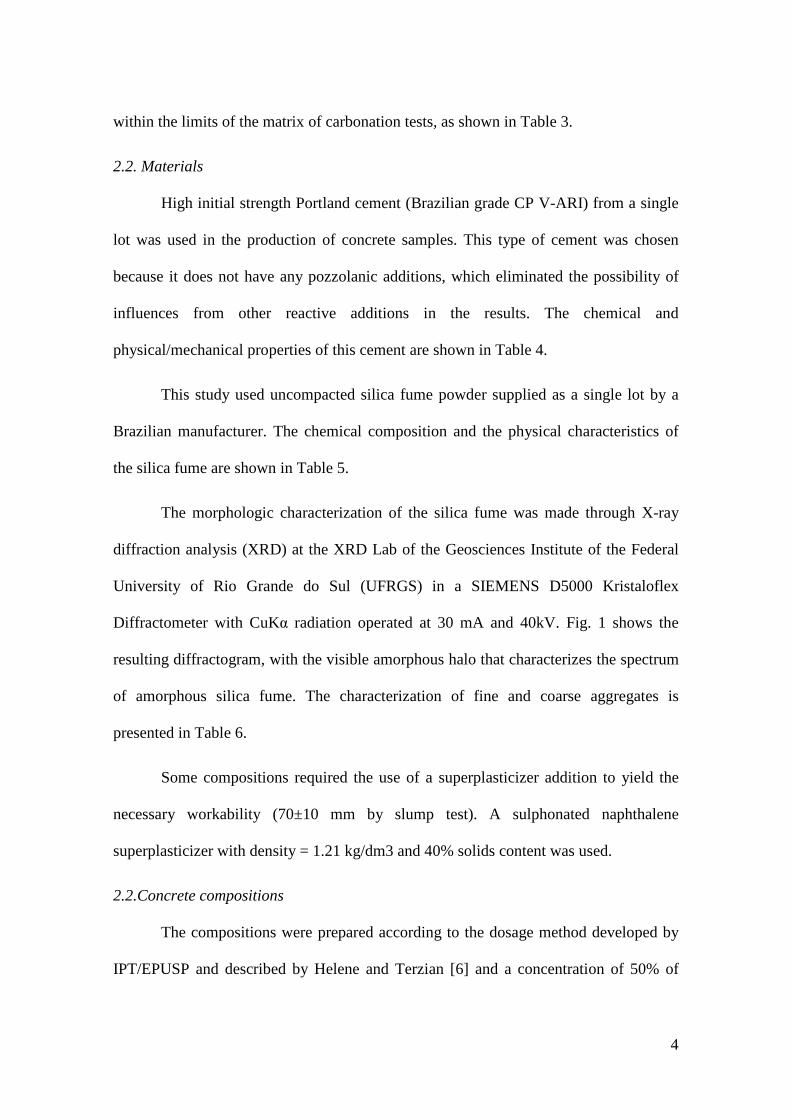
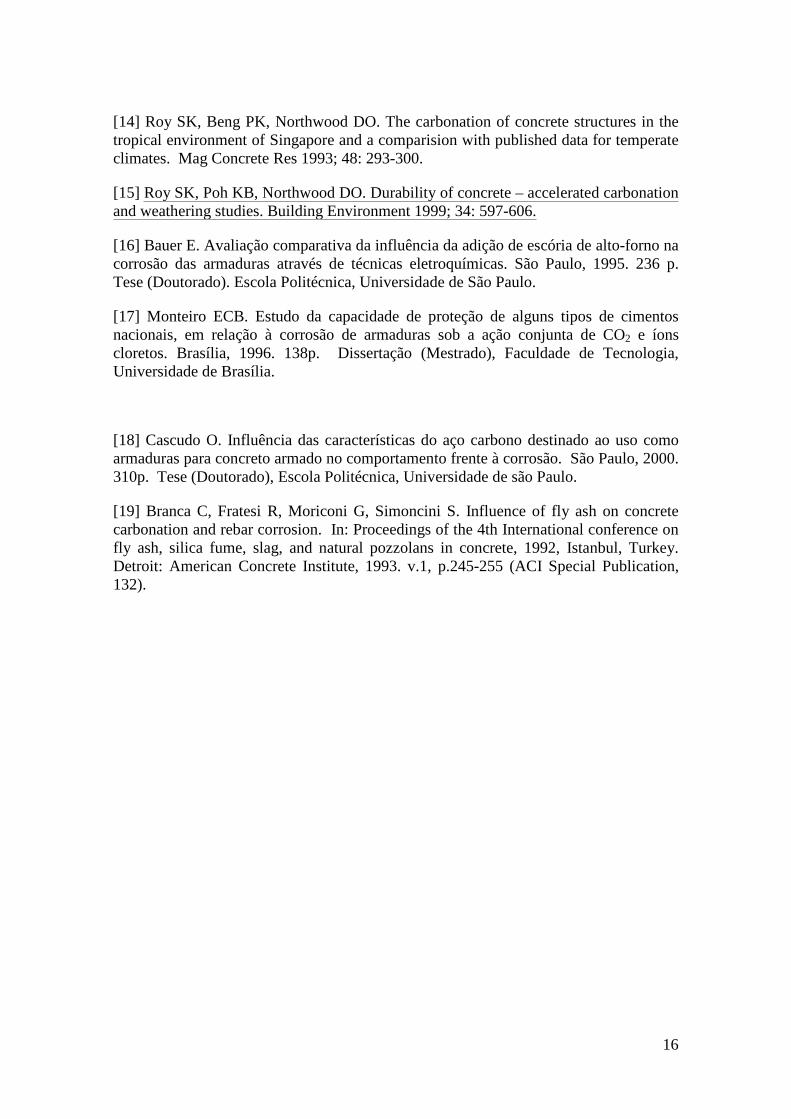
The morphologic characterization of the silica fume was made through X-ray
diffraction analysis (XRD) at the XRD Lab of the Geosciences Institute of the Federal
University of Rio Grande do Sul (UFRGS) in a SIEMENS D5000 Kristaloflex
Diffractometer with CuKα radiation operated at 30 mA and 40kV. Fig. 1 shows the
resulting diffractogram, with the visible amorphous halo that characterizes the spectrum
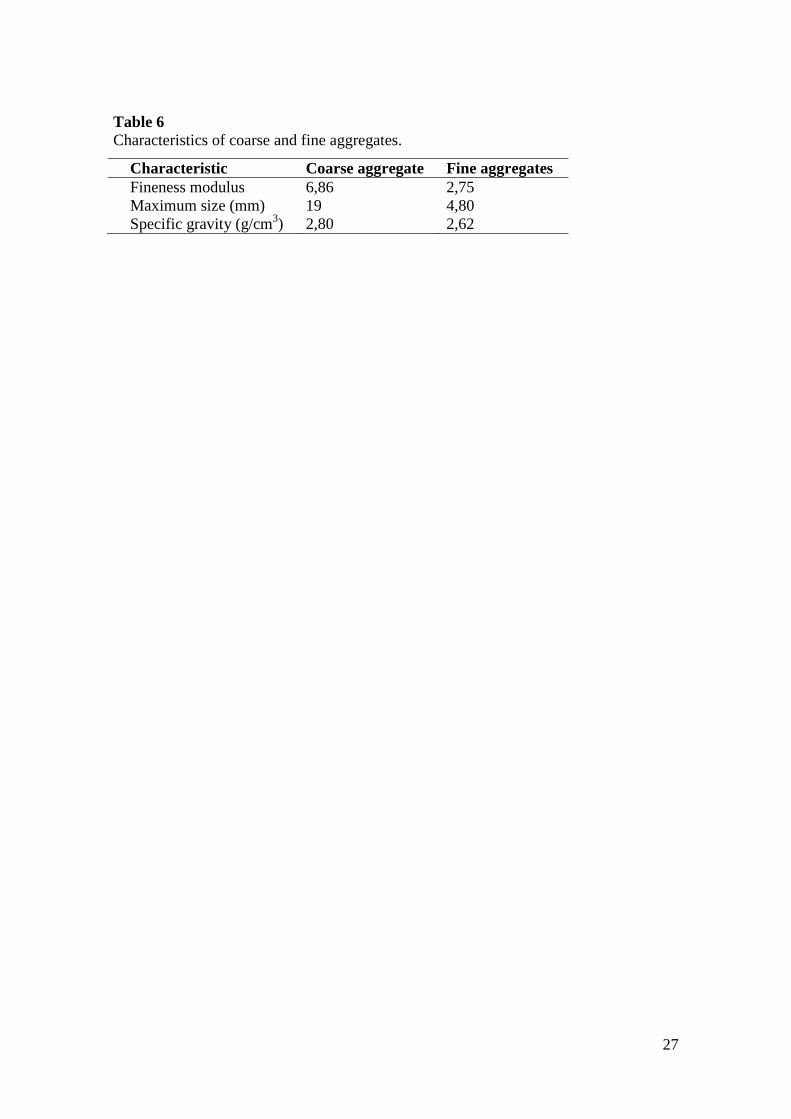
of amorphous silica fume. The characterization of fine and coarse aggregates is
presented in Table 6.
Some compositions required the use of a superplasticizer addition to yield the
necessary workability (70±10 mm by slump test). A sulphonated naphthalene
superplasticizer with density = 1.21 kg/dm3 and 40% solids content was used.
2.2.Concrete compositions
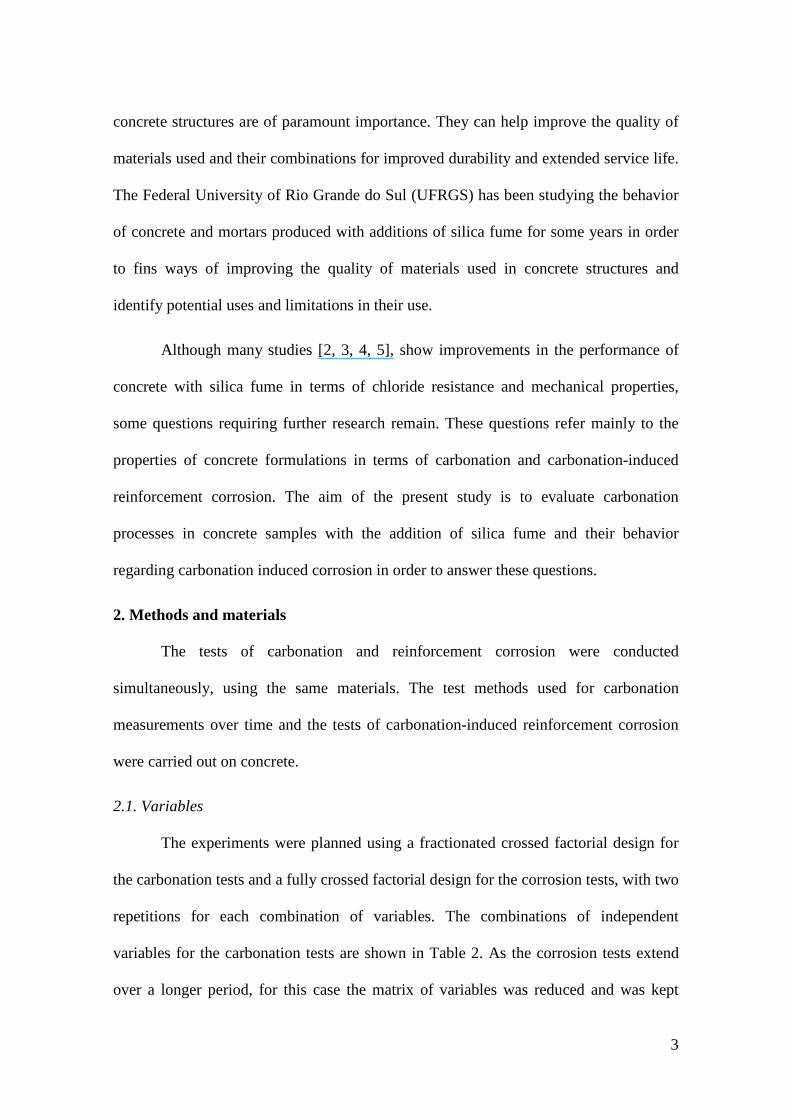
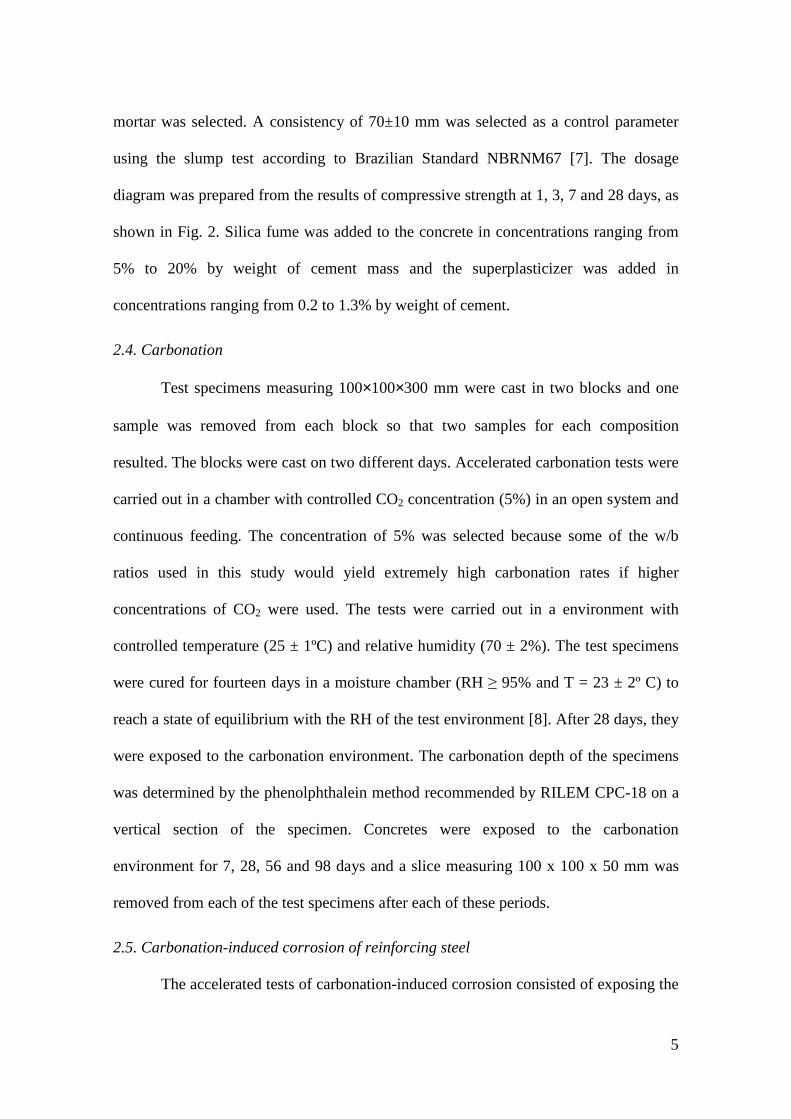
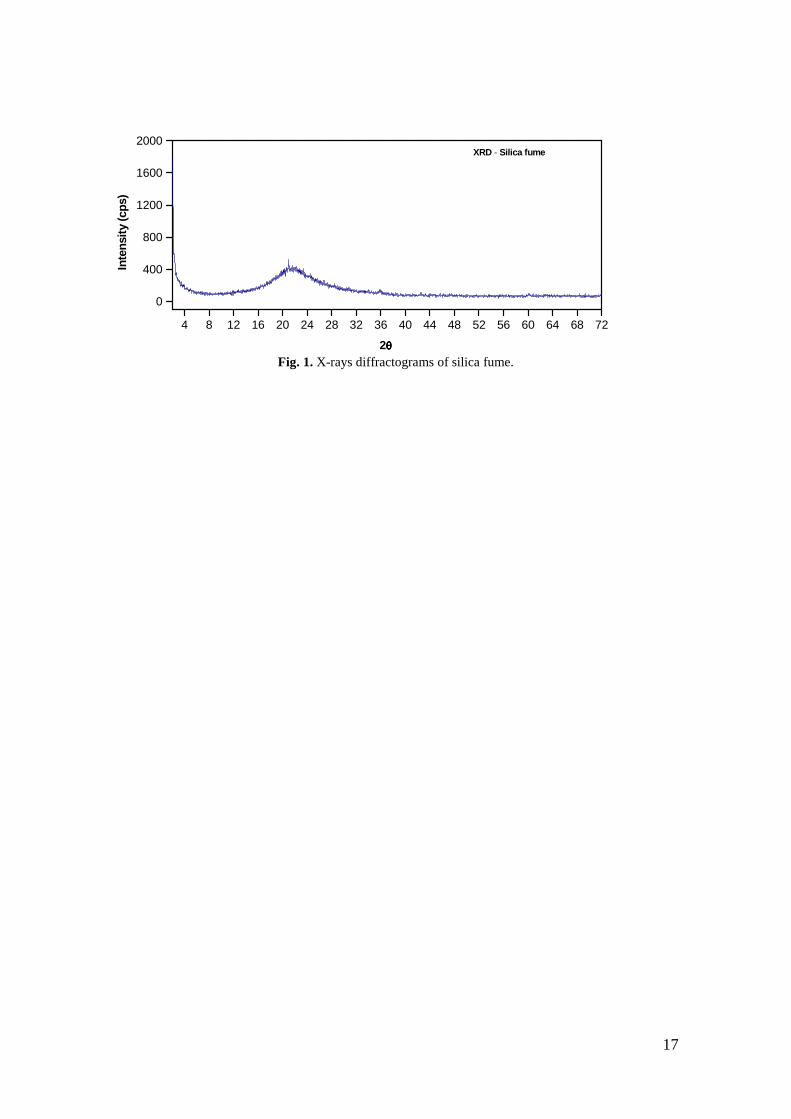
The compositions were prepared according to the dosage method developed by
IPT/EPUSP and described by Helene and Terzian [6] and a concentration of 50% of
5
mortar was selected. A consistency of 70±10 mm was selected as a control parameter
using the slump test according to Brazilian Standard NBRNM67 [7]. The dosage
diagram was prepared from the results of compressive strength at 1, 3, 7 and 28 days, as
shown in Fig. 2. Silica fume was added to the concrete in concentrations ranging from
5% to 20% by weight of cement mass and the superplasticizer was added in
concentrations ranging from 0.2 to 1.3% by weight of cement.
2.4. Carbonation
Test specimens measuring 100×100×300 mm were cast in two blocks and one
sample was removed from each block so that two samples for each composition
resulted. The blocks were cast on two different days. Accelerated carbonation tests were
carried out in a chamber with controlled CO2 concentration (5%) in an open system and
continuous feeding. The concentration of 5% was selected because some of the w/b
ratios used in this study would yield extremely high carbonation rates if higher
concentrations of CO2 were used. The tests were carried out in a environment with
controlled temperature (25 ± 1ºC) and relative humidity (70 ± 2%). The test specimens
were cured for fourteen days in a moisture chamber (RH ≥ 95% and T = 23 ± 2º C) to
reach a state of equilibrium with the RH of the test environment [8]. After 28 days, they
were exposed to the carbonation environment. The carbonation depth of the specimens
was determined by the phenolphthalein method recommended by RILEM CPC-18 on a
vertical section of the specimen. Concretes were exposed to the carbonation
environment for 7, 28, 56 and 98 days and a slice measuring 100 x 100 x 50 mm was
removed from each of the test specimens after each of these periods.
2.5. Carbonation-induced corrosion of reinforcing steel
The accelerated tests of carbonation-induced corrosion consisted of exposing the
6
test specimens to an atmosphere with a concentration of CO2 ≥ 50%. The test specimens
for the accelerated carbonation test were cured for 28 days in a moisture chamber (RH ≥
95% and T = 23 ± 2ºC) and were stabilized in an oven at 50ºC for seven days in a room
with controlled temperature (25 ± 2ºC) and relative humidity (70 ± 5%) for a period of
14 days. After that, the test specimens were placed in the accelerated carbonation
chamber inside a room with controlled temperature. In this way, an optimal level of
humidity for the development of carbonation reactions was ensured.
The assessment of corrosion on the steel bars was made through an
electrochemical technique of polarization resistance using an Gill AC potentiostat
(ACM Instruments) with automatic IR drop compensation. The potentiostat was
connected to a computer and electrochemical measurements were made using data
acquisition (Sequencer) and data analysis software (V4 Analysis).
From the polarization resistance data, the intensity of corrosion over time was
obtained and this yielded the intensity of total corrosion [9]. Electrochemical
measurements to determine ohmic resistance (IR drop), corrosion potential and
polarization resistance in the test specimens were made after 24 hours and 96 hours in
the carbonation chamber and after that were made once a week. Before making the
electrochemical measurements, the test specimens were weighed to monitor their mass
along the experiment.
3 Results and analysis
3.1. Carbonation
As the four periods of exposure to CO2 resulted in a large number of graphs and
analyses produced by, a choice was made to present only the results and analyses of the
samples after 126 days, which means 28 days of set time and 98 days of exposure to
7
CO2.
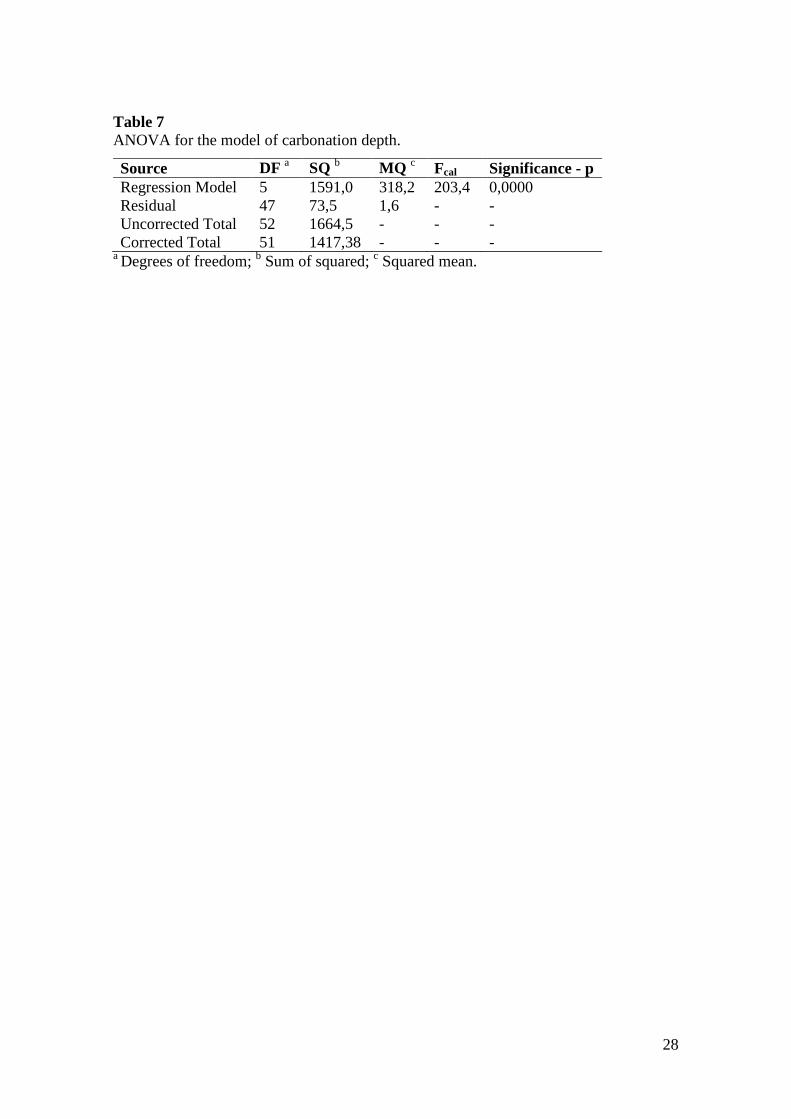
The statistical analysis tool used non-linear multiple regression with results
presented in tables of analysis of variance (ANOVA), mathematical models and curves
representing resulting models. A graph shows a comparison between forecast values and
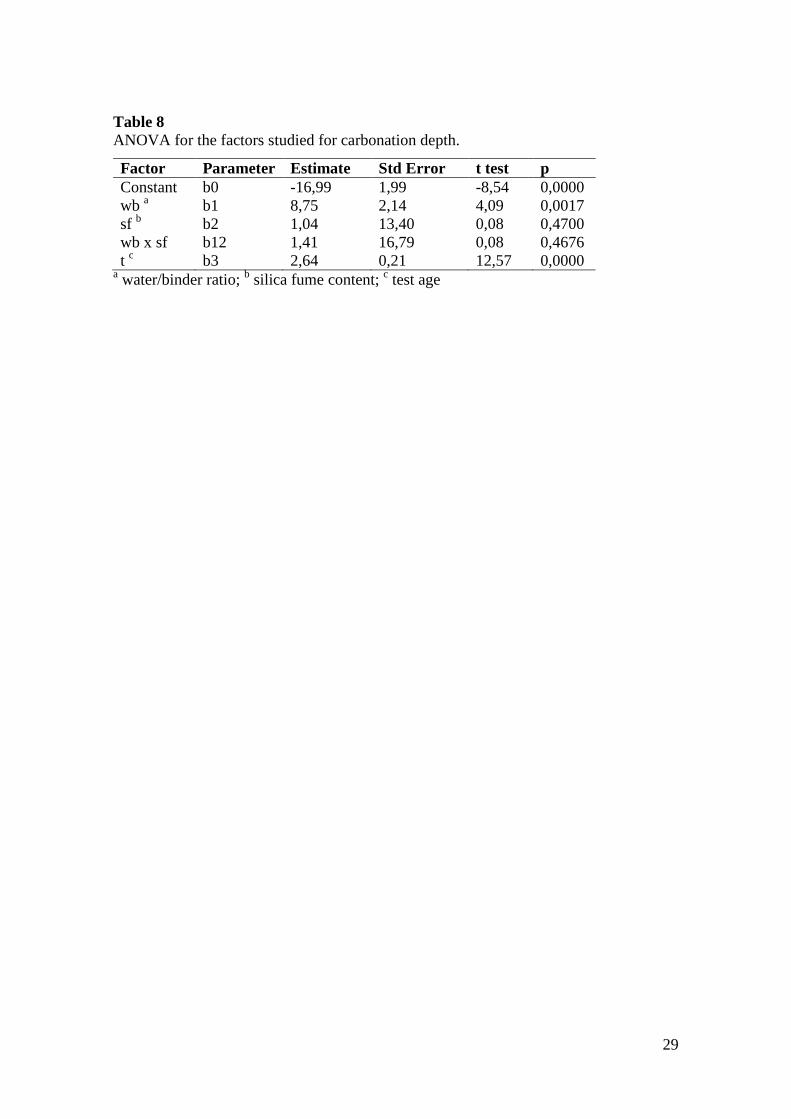
actual values. Table 7 presents the analysis of variance for the model obtained and
Table 8 presents the analysis of variance for the factors studied. A value of ‘p’ lower
than 0.01 indicates that the relationship between the variables is statistically significant
for a confidence level of 99%. The determination coefficient r2 obtained (0.9481)
indicates that the model explains 94.81% of the variability of the values observed for
the carbonation depth in concrete.
Considering the values analyzed in the model and their interactions, the results
in Table 8 indicate that only the variable water/binder ratio (wb) and test age (t) are
statistically significant for a confidence level of 99% because their value of ‘p’ is lower
than 0.01. Therefore, the contribution of silica fume to carbonation depth is not
significant because the value of ‘p’ for factors ‘sf’ (silica fume content) and ‘wb x sf’ is
greater than 0.10 (the lowest value usually accepted for a factor to be considered
significant at a confidence level of 90%). However, factors ‘sf’ and ‘wb x sf’ with a
significance of 53% were considered in the model in order to forecast correlations with
other response variables in the tests performed. Eq. 1 shows the model for carbonation
depth.
( ) ( ) ( )[ ] 6424110417589916
,,,,,exp tsfwbsfwbdc ×××+×+×+−= Eq. 1
Where:
dc = carbonation depth (mm); wb = water/binder ratio (with values between 0,30 and 0,80); sf = silica
fume content (with values between 0 and 0,20); t = test age (126 days).
8
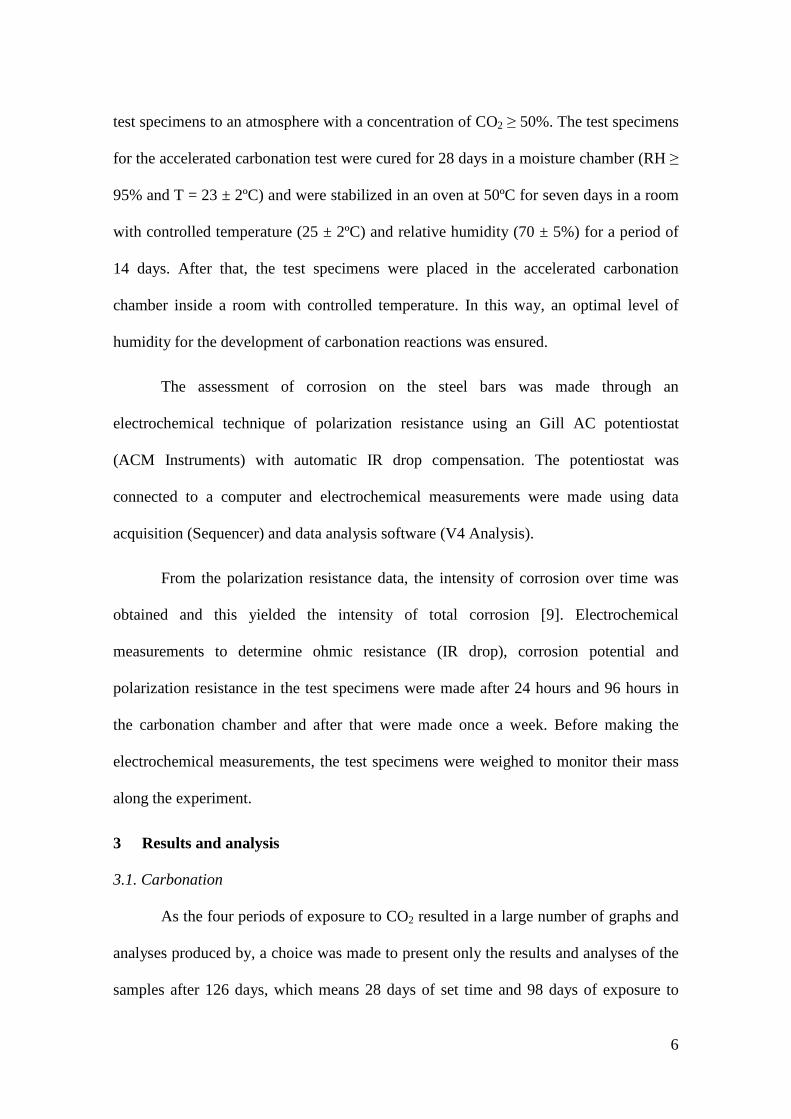
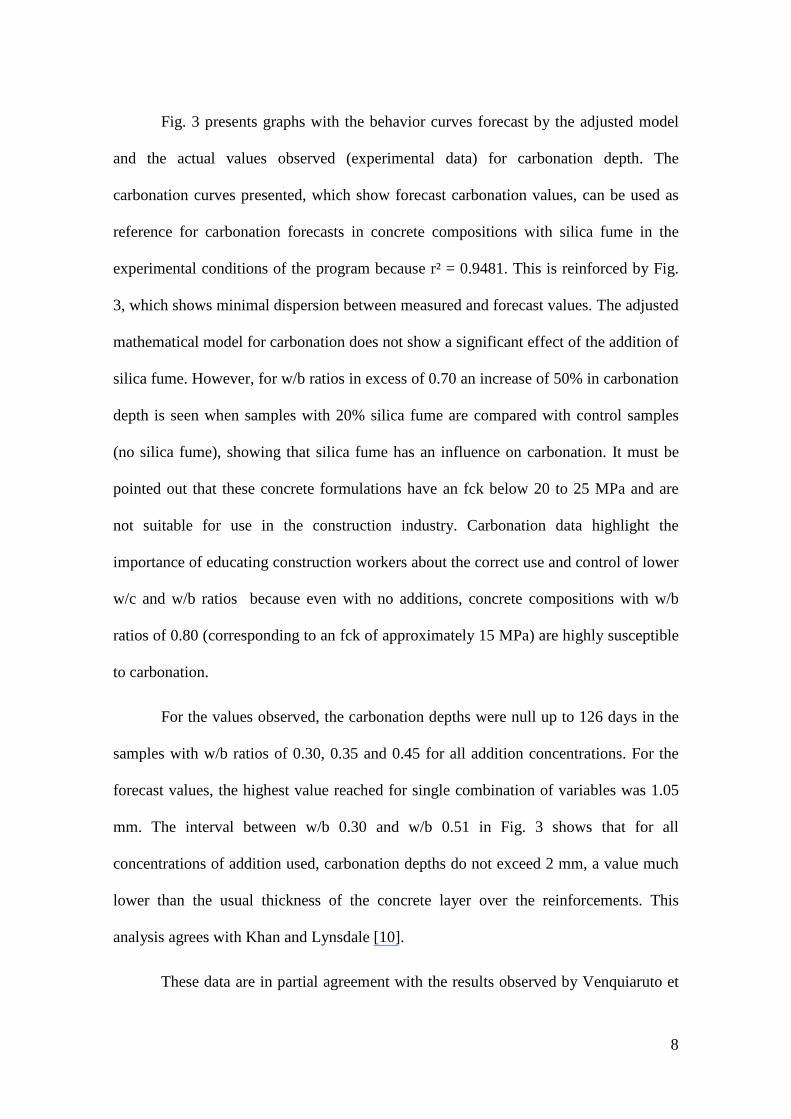
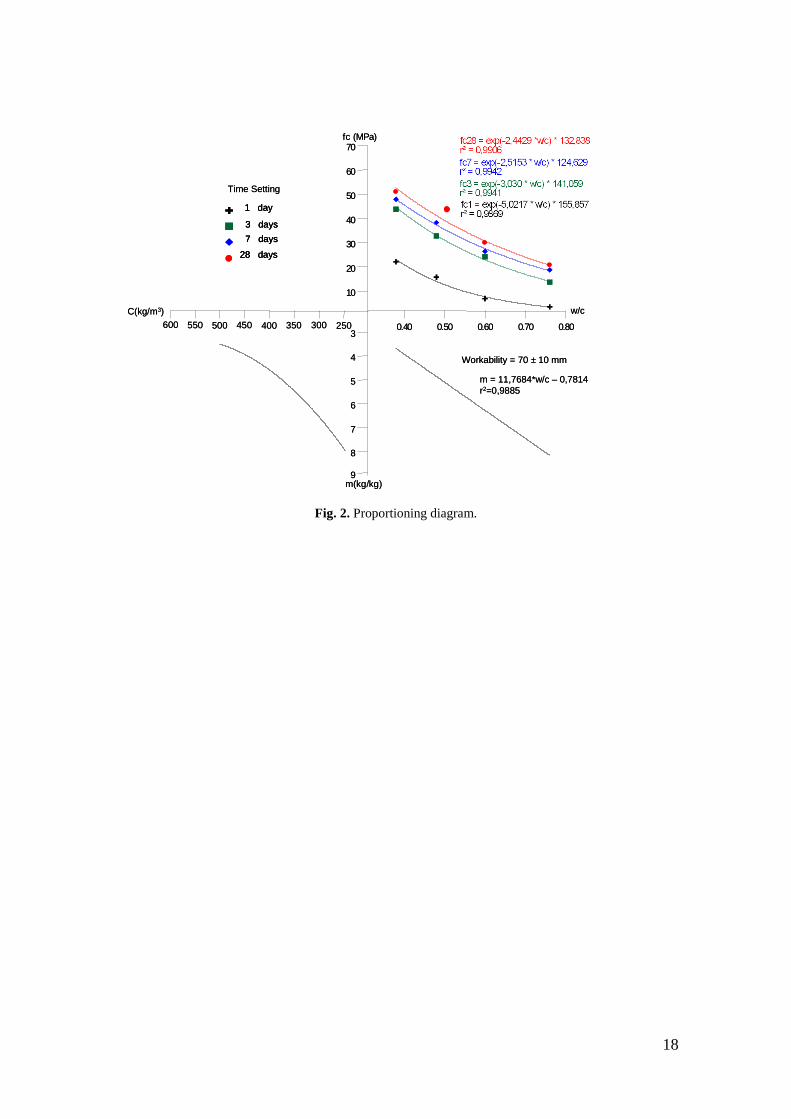
Fig. 3 presents graphs with the behavior curves forecast by the adjusted model
and the actual values observed (experimental data) for carbonation depth. The
carbonation curves presented, which show forecast carbonation values, can be used as
reference for carbonation forecasts in concrete compositions with silica fume in the
experimental conditions of the program because r² = 0.9481. This is reinforced by Fig.
3, which shows minimal dispersion between measured and forecast values. The adjusted
mathematical model for carbonation does not show a significant effect of the addition of
silica fume. However, for w/b ratios in excess of 0.70 an increase of 50% in carbonation
depth is seen when samples with 20% silica fume are compared with control samples
(no silica fume), showing that silica fume has an influence on carbonation. It must be
pointed out that these concrete formulations have an fck below 20 to 25 MPa and are
not suitable for use in the construction industry. Carbonation data highlight the
importance of educating construction workers about the correct use and control of lower
w/c and w/b ratios because even with no additions, concrete compositions with w/b
ratios of 0.80 (corresponding to an fck of approximately 15 MPa) are highly susceptible
to carbonation.
For the values observed, the carbonation depths were null up to 126 days in the
samples with w/b ratios of 0.30, 0.35 and 0.45 for all addition concentrations. For the
forecast values, the highest value reached for single combination of variables was 1.05
mm. The interval between w/b 0.30 and w/b 0.51 in Fig. 3 shows that for all
concentrations of addition used, carbonation depths do not exceed 2 mm, a value much
lower than the usual thickness of the concrete layer over the reinforcements. This
analysis agrees with Khan and Lynsdale [10].
These data are in partial agreement with the results observed by Venquiaruto et
9
al [11] in a study using 5% CO2, RH 75% and 24ºC with a range of pozzolans at
different concentrations (including 8% silica fume) combined with w/b ratios of 0.35,
0.50 and 0.60. For a w/b ratio of 0.35, the concrete with 8% silica fume show no
carbonation depth and for the other two w/b ratios, carbonation depths were lower than
that observed in the reference concrete. At 84 days of exposure, carbonation depth
values of approximately 11 mm were observed for w/b = 0.50 and of 18mm for w/b =
0.65. The test conditions were similar to the ones used in the current study. The results
also agree with the observed by Khunthongkeaw et al [12] shows that for a given fly ash
content, a lower w/b leads to a lower carbonation coefficient, due to the pore structure
densification.
The data collected in this study indicate that carbonation is null in the range of
w/b ratios between 0.45 and 0.50, which could be termed a critical threshold between
different regions of carbonation behavior. For w/b ratios above this threshold,
carbonation depths become more evident. The mathematical model shows distinctive
behaviors in terms of carbonation depth and porosity depending on the w/b ratio used.
For w/b ratios below the critical threshold, the carbonation depths observed are far
lower than those produced by the model. However, carbonation values observed for w/b
ratios above the critical threshold are very high. As these values have a great weight in
adjustments of the model, the calculated values tend to be far higher than those
observed in the interval below the critical threshold. These observations are in
agreement with the very low or null carbonation depth data found by Cabrera et al. [13]
when studying several parameters linked with the corrosion of reinforcing steel, using
concrete with 0 and 20% substitutions of silica fume for cement and w/b ratios of 0.30
and 0.46.
10
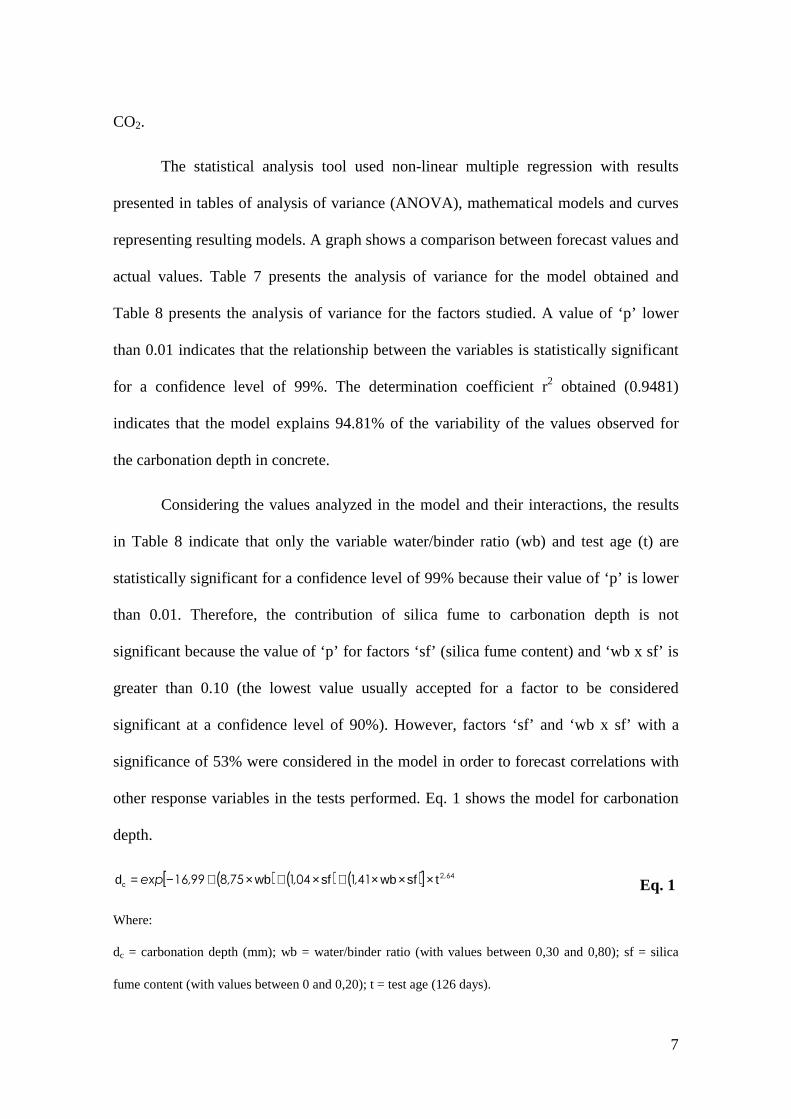
However, the adjusted mathematical models picture very clearly the “critical
point” found at the threshold w/b ratio. Data for w/b = 0.5 (Fig. 4) indicate that the
carbonation depth in concrete at 126 days increases by 0.48 mm when the concentration
of addition is increased from 0 to 20% and by 0.22 mm when the concentration of
addition is increased from 0 to 10%. For a w/b ratio = 0.45, the carbonation depth
increases by 0.30 when the concentration of addition is increased from 0 to 20% and by
0.14 mm when the concentration of addition is increased from 0 to 10%. If these
findings are transferred to actual building site conditions, it could be said that increases
in carbonation depth in this range would not be harmful to the structure of concrete.
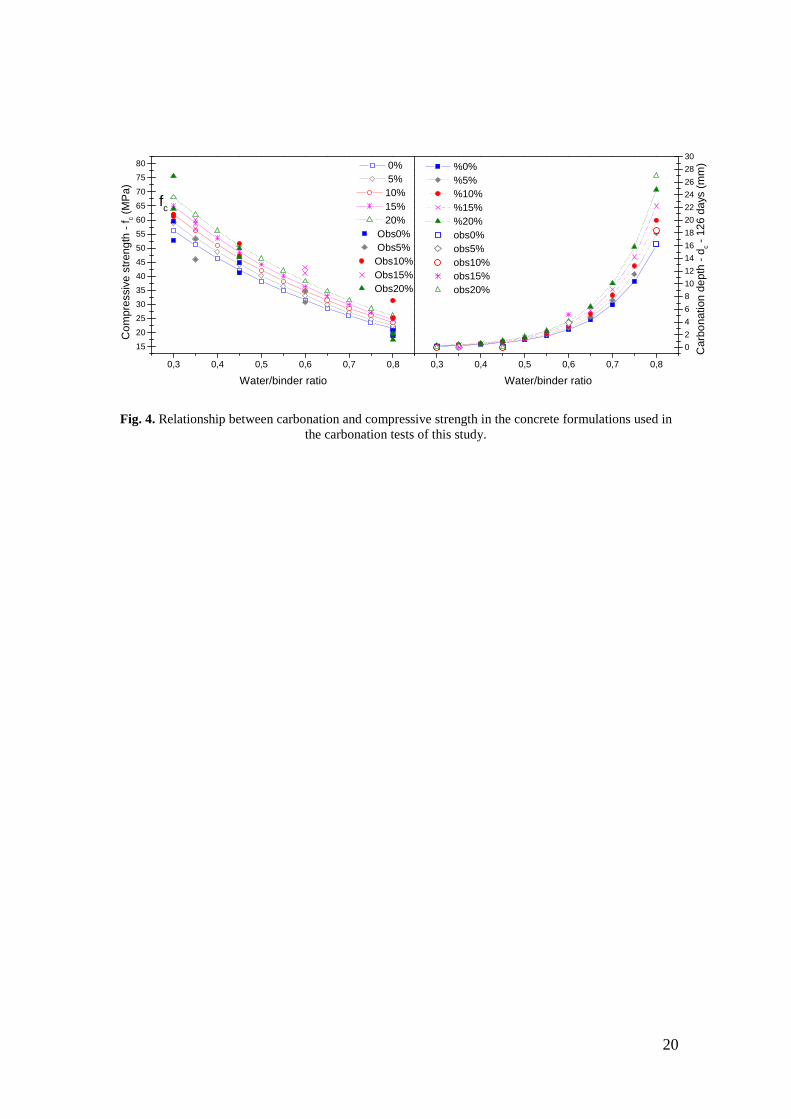
3.2 Carbonation x Compressive strength
The relationship between carbonation and compressive strength in the concrete
formulations used in the carbonation tests of this study is shown in the graph of Fig. 4.
By analyzing the graphs in Fig. 4 and using the curves of fc and dc without the addition
of silica fume as reference, the behavior often described in the literature is seen, as
pointed out by Roy et al. [14, 15] and others. In other words, the compressive strength is
lowered and the carbonation depth increases as the w/b ratio increases in samples with
the same concentration of addition. However, the same behavior cannot be extended to
the curves of silica fume additions. While the compressive strength of concrete shows
improvements when additions are used, carbonation depth values increase. However,
the carbonation depth showed no technically significant changes with increased
concentrations of additions with w/b ratios below the 0.45-0.50 range (“carbonation
threshold”).
However, the average increase in compressive strength with additions of 10%
silica fume amounts to 10% and the mean reduction in the consumption of cement by
11
m² is 23%. The comparison of compressive strength and carbonation depth curves in
concrete also highlights the fact that compressive strength is not the only parameter that
should be used to estimate the service life of concrete structures. The w/b ratio used
must be assessed in combination with the type of binder used. To confirm this assertion,
Table 1 shows the improvements in compressive strength properties of cements over
time, which indicates that using higher w/c ratios present-day cements can reach the
same strength that in the past was only possible with lower w/c ratios. To reach an fck
of 25 MPa in the past, a w/c ratio of 0.40 was used (below the “carbonation threshold”)
and nowadays the same strength is achieved with a w/c ratio of 0.55, a value above the
carbonation threshold.
3.3. Carbonation-induced corrosion of reinforcing steel
The statistical analysis of the results of total corrosion intensity for accelerated
carbonation-induced corrosion was performed in order to obtain a mathematical model
that represented the effect of the w/b ratio and the concentration of silica fume on the
final variation in the intensity of corrosion. The mathematical model proposed, shown in
Eq. 2, was obtained through multiple non-linear regression analysis. Like in the case of
carbonation data, the corrosion results observed are presented in the same graphs where
the curves of the mathematical models obtained from the statistical analysis are plotted.
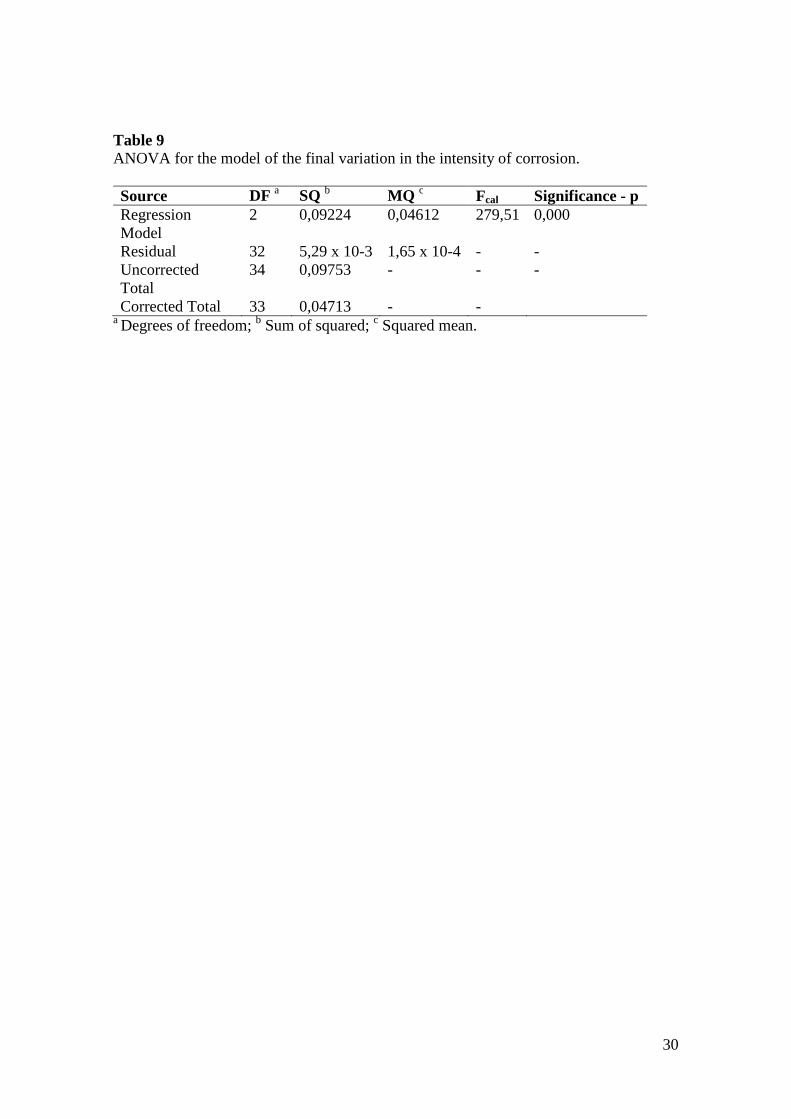
Table 9 presents the analysis of variance (ANOVA) of the proposed model,
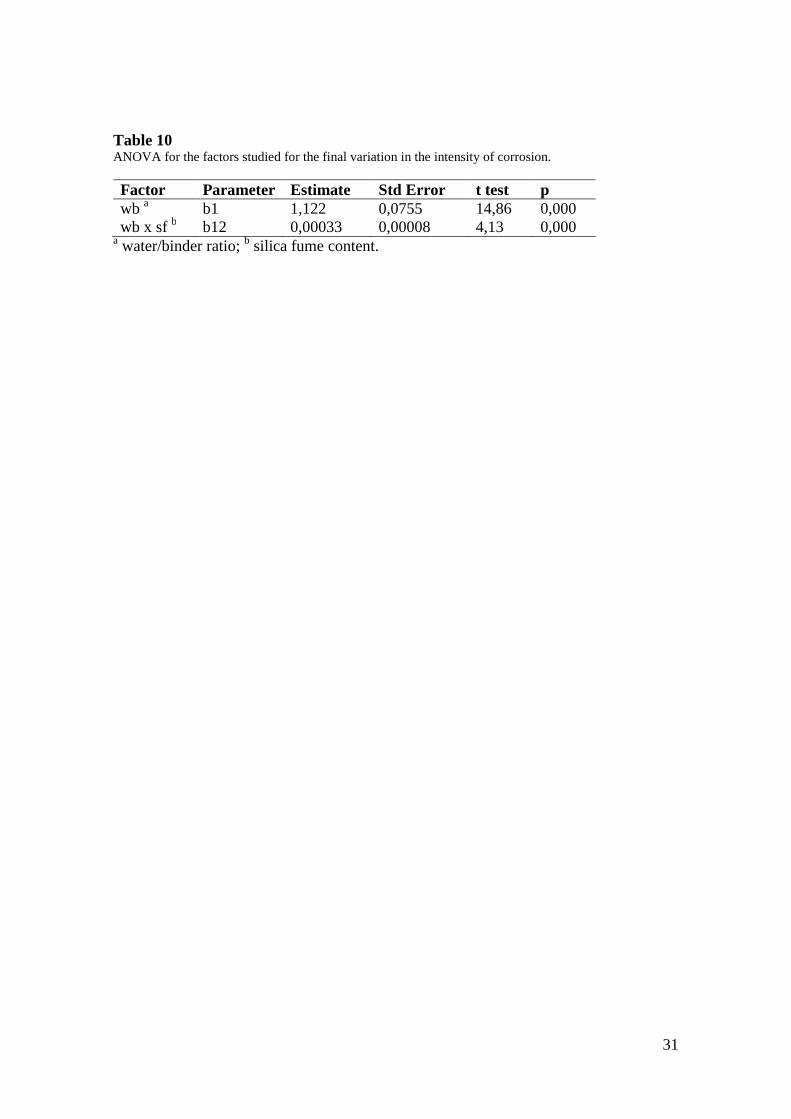
which indicated a determination coefficient (r2) of 0.888 while Table 10 shows the
parameters of the factors considered in this model, with estimations for the data of this
experimental program, as well as the statistical parameters calculated for the factors
being investigated. The determination coefficient r2 = 0.888 shows that the model
explains 88.8% of the variability of the values observed for the final variation in
12
corrosion intensity. The results presented in Table 10 indicate that both the w/b ratio
(wb) and the interaction between the w/b ratio and the concentration of silica fume have
a significant influence on the intensity of corrosion to a confidence level of 95% (“p” <
0.05). The results in Tables 9 and 10 show that Eq. 2 presents the regression model that
explains the relationship between the factors investigated and the final variation of the
intensity of corrosion.
( )[ ] ( ) ( )[ ]24253001033300221 −×−××+−×=∆ − sfwbwbicorr ,,,, Eq. 2
Where:
∆icorr = final variation in the intensity of corrosion (µA/cm2); wb = water/binder ratio (with values
between 0,40 and 0,70); f = silica fume content (with values between 0 and 0,20).
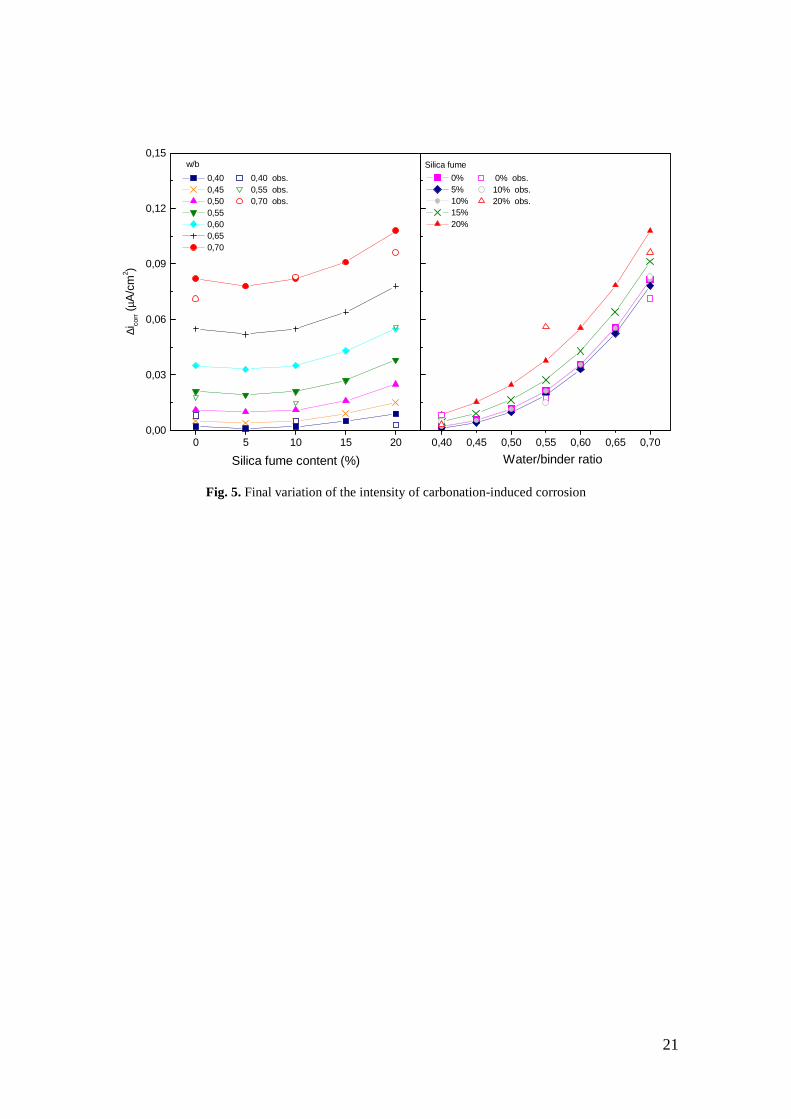
Fig. 5 presents the behavior curves obtained from the model proposed, as well as
the values observed for the final variation of the intensity of corrosion. The influence of
the w/b ratio on the intensity of corrosion is clearly visible in the curves of behavior in
Fig. 5. These results indicate that the mean final variation of the intensity of corrosion
for w/b = 0.70 is twenty times greater than the value for w/b = 0.40. This fact is related
to the increase in porosity of the concrete with higher w/b. In addition to facilitating
CO2 diffusion, this accelerates the onset of corrosion reactions. This behavior is similar
to the results published by other researchers [16, 17, 18] who found greater corrosion
intensities for higher w/b ratios when investigating carbonation-induced corrosion.
The effect of silica fume in the variation of the intensity of corrosion is more
significant for higher w/b ratios, as Fig. 5 shows. The performance of concrete with an
10% addition of silica fume is equivalent to the performance of the reference concrete
and the addition of higher concentrations of this admixture results in greater variations
in corrosion intensity, particularly for higher w/b ratios. A small reduction in the final
13
variation of corrosion intensity in the concrete with 5% silica fume was also observed.
Silica fume can react with calcium hydroxide and lower the pH of the pore
solution, in this way facilitating the carbonation process. However, BRANCA et al [19]
point out that while the lowered alkalinity caused by carbonation or the pozzolanic
reaction is a necessary condition to promote the corrosion of reinforcements, it is not
enough to trigger this phenomenon. These researchers claim that permeability and
porosity are key factors that can limit or accelerate corrosion processes. This claim is in
agreement with the results obtained for the variation of corrosion intensity, where the
reduction in porosity caused by the formation of a finer pore structure as a result of the
addition of up to 10% of silica fume compensates for the consumption of calcium
hydroxide, and the protection of the steel structure is not compromised. The finer pore
structure results in increased resistivity and decreased oxygen diffusion in concrete,
which hinders the onset of corrosion reactions. On the other hand, for higher
concentrations of additions, the reduction in porosity provided by silica fume does not
seem to be a determinant factor in corrosion and the effect of reduced alkalinity seems
to prevail, which results in an increase in corrosion intensity.
4. Conclusions
Regarding the carbonation study, this study showed:
• The existence of a ‘critical threshold’ in the carbonation behavior of
concrete, delimited by an interval of w/b ratios, which this study showed to be 0.45 and
0.50;
• Below the lower w/b ratio limit, carbonation is determined mainly by the
porosity of the cementitious matrix while the concentration of Ca(OH)2 and pH have
14
little influence on carbonation depths at this ratio;
• For values above the upper w/b ratio limit, chemical characteristics start to
play a more significant role in carbonation depth and the consumption of Ca(OH)2 in the
pozzolanic reactions caused by silica fume starts to have a detrimental effect on
carbonation;
• Therefore, carbonation processes are determined by the porosity provided
to the materials as a result of the w/b ratio. The effect of silica fume, in practice, is only
detrimental for w/b ratios above the ‘critical carbonation threshold’;
However, in the case of carbonation-induced reinforcement corrosion, it was
seen that the effect of silica fume on the performance of concrete is affected by the
concentration of addition used. In this way, it was possible to conclude that:
• For concentrations of additions below 10%, silica fume increases the
resistance to carbonation-induced corrosion even though it increases carbonation depth.
• In concrete preparations with 10% silica fume there is an increase in
carbonation depth, but silica fume will not affect carbonation-induced corrosion. At the
same time, it improves other properties considerably.
• When the concentration of silica fume exceeds 10%, it not only increases
carbonation depth but it also increases the variation in the intensity of carbonation-
induced corrosion, particularly for higher w/b ratios. It must be highlighted, however,
that in the current stage of concrete technology, addition concentrations exceeding 10%
are rarely used and common sense dictates that ideal concentrations fall in the 5 to 10%
range.
15
References
[1] Associação Brasileira de Cimento Portland, Evolução do cimento por melhorias do processo industrial. In.: www.comunidadedaconstrução.com.br. (December 9th, 2002; at 5:25 p.m.)
[2] Hoffman AT. Influência da adição de sílica ativa, da relação água/aglomerante, temperatura e tempo de cura no coeficiente de difusão de cloretos em concretos, Porto Alegre, 2001. Dissertação (Mestrado em Engenharia Civil) – Programa de Pós-graduação em Engenharia Civil, Escola de Engenharia da Universidade Federal do Rio Grande do Sul. 133p.
[3] Dotto JMR, Abreu AG, Dal Molin DCC, Muller IL. Influence of silica fume addition on concretes physical properties. Cement Concrete Comp 2004; 26: 31-9.
[4] Dal Molin DCC. Contribuição ao estudo das propriedades mecânicas dos concretos de alta resistência com e sem adições de microssílica, São Paulo, 1995. Tese (Doutorado em Engenharia) - Escola Politécnica, Universidade de São Paulo.
[5] Gonen T, Yazicioglu S. The influence of mineral admixtures on the short and long-term performance of concrete. Building Environment 2007; 42: 3080-85.
[6] Helene PRL, Terzian P. Manual de Dosagem e Controle do Concreto. São Paulo: PINI; 1992. p. 349.
[7] ASSOCIAÇÃO BRASILEIRA DE NORMAS TÉCNICAS. NBRNM67: Concreto - Determinação da consistência pelo abatimento do tronco de cone. Rio de Janeiro; 1998. p. 8.
[8] Kulakowski MP. Contribuição ao estudo da carbonatação em concretos e argamassas compostos com adição de sílica ativa. Porto Alegre, 2002. 200p. Tese (Doutorado), Programa de Pós-Graduação em Engenharia de Minas, Metalúrgica e de Materiais, Universidade Federal do Rio Grande do Sul.
[9] Vieira FMP. Contribuição ao estudo da corrosão de armaduras em concretos com adição de sílica ativa. Porto Alegre, 2003. 270p. Tese (Doutorado), Programa de Pós-Graduação em Engenharia de Minas, Metalúrgica e de Materiais, Universidade Federal do Rio Grande do Sul.
[10] Khan MI, Lynsdale CJ. Strength, permeability, and carbonation of high-performance concrete. Cement Concrete Res 2002; 32: 123–31.
[11] Venquiaruto SD, Isaia GC, Gastaldini ALG. A Influência do teor e da quantidade de adições minerais na carbonatação do concreto. In: Proceedings of the 43th Congresso Brasileiro do Conreto, Foz-do-Iguaçu, Brasil; 2001. São Paulo: IBRACON, 2001. 1v. (cd), p.14
[12] Khunthongkeaw J, Tangtermsirikul S, Leelawat T. A study on carbonation depth prediction for fly ash concrete. Construction Building Mat 2006; 20: 744-53.
[13] Cabrera J.G, Claisse P.A, Hunt D.N. A statistical analysis of the factors which contribute to the corrosion of steel in Portland cement and silica fume concrete. Construction Building Mat 1995; 9: 105-13.
16
[14] Roy SK, Beng PK, Northwood DO. The carbonation of concrete structures in the tropical environment of Singapore and a comparision with published data for temperate climates. Mag Concrete Res 1993; 48: 293-300.
[15] Roy SK, Poh KB, Northwood DO. Durability of concrete – accelerated carbonation and weathering studies. Building Environment 1999; 34: 597-606.
[16] Bauer E. Avaliação comparativa da influência da adição de escória de alto-forno na corrosão das armaduras através de técnicas eletroquímicas. São Paulo, 1995. 236 p. Tese (Doutorado). Escola Politécnica, Universidade de São Paulo.
[17] Monteiro ECB. Estudo da capacidade de proteção de alguns tipos de cimentos nacionais, em relação à corrosão de armaduras sob a ação conjunta de CO2 e íons cloretos. Brasília, 1996. 138p. Dissertação (Mestrado), Faculdade de Tecnologia, Universidade de Brasília.
[18] Cascudo O. Influência das características do aço carbono destinado ao uso como armaduras para concreto armado no comportamento frente à corrosão. São Paulo, 2000. 310p. Tese (Doutorado), Escola Politécnica, Universidade de são Paulo.
[19] Branca C, Fratesi R, Moriconi G, Simoncini S. Influence of fly ash on concrete carbonation and rebar corrosion. In: Proceedings of the 4th International conference on fly ash, silica fume, slag, and natural pozzolans in concrete, 1992, Istanbul, Turkey. Detroit: American Concrete Institute, 1993. v.1, p.245-255 (ACI Special Publication, 132).
17
4 8 12 16 20 24 28 32 36 40 44 48 52 56 60 64 68 72
0
400
800
1200
1600
2000
XRD - Silica fume
Inte
nsity
(cps
)
2θθθθ Fig. 1. X-rays diffractograms of silica fume.
18
Time Setting
0.40 0.50 0.60 0.70 0.80
10
20
30
40
50
60
70fc (MPa)
3
4
5
6
7
8
9m(kg/kg)
Workability = 70 ± 10 mm
w/c
600C(kg/m3)
550 500 450 400 350 300 250
1 day
3 days
7 days
28 days
m = 11,7684*w/c – 0,7814r2=0,9885
Time Setting
0.40 0.50 0.60 0.70 0.80
10
20
30
40
50
60
70fc (MPa)
3
4
5
6
7
8
9m(kg/kg)
Workability = 70 ± 10 mm
w/c
600C(kg/m3)
550 500 450 400 350 300 250
1 day
3 days
7 days
28 days
1 day
3 days
7 days
28 days
m = 11,7684*w/c – 0,7814r2=0,9885
Fig. 2. Proportioning diagram.
19
0,3 0,4 0,5 0,6 0,7 0,8
0
5
10
15
20
25
30
obs 0% obs 5% obs 10% obs 15% obs 20%
0% 5% 10% 15% 20%
Car
bona
tion
dept
h -
d c (m
m)
water/binder ratio
0 5 10 15 20
obs 0,30 obs 0,35 obs 0,45 obs 0,60 obs 0,80
silica fume content (%)
0,30 0,35 0,45 0,60 0,80
Fig. 3. Concrete carbonation – 126 days concrete age (98 days accelerated carbonation test).
20
0,3 0,4 0,5 0,6 0,7 0,8
15
20
25
30
35
40
45
50
55
60
65
70
75
80
fc
0% 5%
10% 15% 20%
Obs0%Obs5%Obs10%Obs15%Obs20%
Com
pres
sive
str
engt
h -
f c (M
Pa)
Water/binder ratio
0,3 0,4 0,5 0,6 0,7 0,8
0
2
4
6
8
10
12
14
16
18
20
22
24
26
28
30 %0% %5% %10% %15% %20% obs0% obs5% obs10% obs15% obs20%
Water/binder ratio
Car
bona
tion
dept
h -
d c - 1
26 d
ays
(mm
)
Fig. 4. Relationship between carbonation and compressive strength in the concrete formulations used in the carbonation tests of this study.
21
0 5 10 15 200,00
0,03
0,06
0,09
0,12
0,15w/b
0,40 obs.0,55 obs.0,70 obs.
Water/binder ratio
0,40 0,45 0,50 0,55 0,60 0,65 0,70
∆ico
rr (
µA/c
m2 )
Silica fume content (%)
0,40 0,45 0,50 0,55 0,60 0,65 0,70
0% obs.10% obs.20% obs.
Silica fume
0% 5% 10% 15% 20%
Fig. 5. Final variation of the intensity of carbonation-induced corrosion
22
Table 1
Mechanical performance evolution of Brazilian cements in concrete[1].
fck (MPa)
1975 2002
w/c ratio
Cement content (kg/m3)
w/c ratio
Cement content (kg/m3)
25 0,40 378 0,55 305 20 0,47 321 0,61 272 16 0,54 281 0,67 252 12 0,62 246 0,73 223
23
Table 2 Carbonation tests design - independent variables.
Silica fume (%)
Water/binder ratio 0,30 0,35 0,45 0,60 0,80
0 2x -- 2x -- 2x 5 -- 2x -- 2x -- 10 2x -- 2x -- 2x 15 -- 2x -- 2x -- 20 2x -- 2x -- 2x
24
Table 3 Corrosion tests design - independent variables.
Water/binder ratio Silica fume (%) 0,40 0,55 0,70 0 2x 2x 2x 10 2x 2x 2x 20 2x 2x 2x
25
Table 4 Characteristics of cement
Characteristics Properties Chemical SiO2 18,20% Fe2O3 2,10% Al2O3 3,90% CaO 61,30% MgO 1,46% SO3 3,47% Na2O 0,20% K2O 0,89% Ignition loss 2,36% Physical Density 3,11 (kg/dm3) Finess - specific surface 4650 m2/kg Initial setting time 232 min Final setting time 328 min Mechanical Compressive strength (1 day) 23,7 MPa Compressive strength (3 days) 37,6 MPa Compressive strength (7 days) 42,7 MPa Compressive strength (28 days) 49,2 MPa
26
Table 5 Characteristics of silica fume.
Characteristics Properties Chemical SiO2 94,00% Fe2O3 0,07% Al2O3 0,05% CaO 0,33% MgO 0,55% Na2O 0,20% K2O 1,28% Ignition loss 3,01% Physical Density 2,20 (kg/dm3) Finess - specific surface 20780 m2/kg
27
Table 6 Characteristics of coarse and fine aggregates.
Characteristic Coarse aggregate Fine aggregates Fineness modulus 6,86 2,75 Maximum size (mm) 19 4,80 Specific gravity (g/cm3) 2,80 2,62
28
Table 7 ANOVA for the model of carbonation depth.
Source DF a SQ b MQ c Fcal Significance - p Regression Model 5 1591,0 318,2 203,4 0,0000 Residual 47 73,5 1,6 - - Uncorrected Total 52 1664,5 - - - Corrected Total 51 1417,38 - - -
a Degrees of freedom; b Sum of squared; c Squared mean.
29
Table 8 ANOVA for the factors studied for carbonation depth.
Factor Parameter Estimate Std Error t test p Constant b0 -16,99 1,99 -8,54 0,0000 wb a b1 8,75 2,14 4,09 0,0017 sf b b2 1,04 13,40 0,08 0,4700 wb x sf b12 1,41 16,79 0,08 0,4676 t c b3 2,64 0,21 12,57 0,0000
a water/binder ratio; b silica fume content; c test age
30
Table 9 ANOVA for the model of the final variation in the intensity of corrosion.
Source DF a SQ b MQ c Fcal Significance - p Regression Model
2 0,09224 0,04612 279,51 0,000
Residual 32 5,29 x 10⁻³ 1,65 x 10⁻⁴ - - Uncorrected Total
34 0,09753 - - -
Corrected Total 33 0,04713 - - a Degrees of freedom; b Sum of squared; c Squared mean.
31
Table 10 ANOVA for the factors studied for the final variation in the intensity of corrosion.
Factor Parameter Estimate Std Error t test p wb a b1 1,122 0,0755 14,86 0,000 wb x sf b b12 0,00033 0,00008 4,13 0,000
a water/binder ratio; b silica fume content.