Embed Size (px)
Citation preview

Cardiac Markers of Pre-Clinical Disease in Adolescents With theMetabolic Syndrome:The Strong Heart Study
Marcello Chinali, MD*,†, Giovanni de Simone, MD*,†, Mary J. Roman, MD†, Lyle G. Best,MD‡, Elisa T. Lee, PhD§, Marie Russell, MD║, Barbara V. Howard, PhD║, and Richard B.Devereux, MD†
*Department of Clinical and Experimental Medicine, “Federico II” University Hospital School of Medicine,Naples, Italy
†Department of Medicine, Weill Cornell Medical College, New York, New York
‡Missouri Breaks Industries Research, Inc., Timber Lake, South Dakota
§University of Oklahoma Health Sciences Center, Oklahoma City, Oklahoma
║MedStar Research Institute, Washington, DC
AbstractObjectives—Our aim was to evaluate the impact of metabolic syndrome (MetS) on cardiacphenotype in adolescents.
Background—A high prevalence of MetS has been reported in adolescents.
Methods—Four hundred forty-six nondiabetic American Indian adolescents (age 14 to 20 years,238 girls) underwent clinical evaluation, laboratory testing, and Doppler echocardiography. Age-and gender-specific partition values were used to define obesity and hypertension. Metabolicsyndrome was defined according to Adult Treatment Panel III criteria, modified for adolescents. Leftventricular (LV) hypertrophy and left atrial (LA) dilation were identified using age- and gender-specific partition values.
Results—One hundred eleven participants met criteria for MetS. They had a similar age and genderdistribution as non-MetS participants. Analysis of covariance, controlling for relevant confounders,demonstrated that participants with MetS had higher LV, LA, and aortic root diameters, higher LVrelative wall thickness, and greater LV mass index. Accordingly, MetS participants showed higherprevalences of LV hypertrophy (43.2% vs. 11.7%) and LA dilation (63.1% vs. 21.9%, both p < 0.001)compared with non-MetS participants. In addition, MetS was associated with a reduction in midwallshortening, lower transmitral mitral early to atrial peak velocity ratio, and mildly prolonged mitralearly deceleration time (all p < 0.05). In multiple regression analysis, independently of demographics,obesity, blood pressure, and single metabolic components of MetS, clustered MetS was associatedwith a 2.6-fold higher likelihood of LV hypertrophy and a 2.3-fold higher likelihood of LA dilation(both p ≤ 0.02).
© 2008 by the American College of Cardiology FoundationReprint requests and correspondence: Dr. Marcello Chinali, Echocardiography Laboratory, Department of Clinical and ExperimentalMedicine, “Federico II” University Hospital; Ed. 1, Via Sergio Pansini 5, 80131, Napoli, Italy. E-mail: E-mail: [email protected] Information about ordering reprints can be found online: http://content.onlinejacc.org/misc/reprints.dtl
NIH Public AccessAuthor ManuscriptJ Am Coll Cardiol. Author manuscript; available in PMC 2009 June 30.
Published in final edited form as:J Am Coll Cardiol. 2008 September 9; 52(11): 932–938. doi:10.1016/j.jacc.2008.04.013.
NIH
-PA Author Manuscript
NIH
-PA Author Manuscript
NIH
-PA Author Manuscript

Conclusions—In a population sample of adolescents, MetS is associated with higher prevalencesof LV hypertrophy and LA dilation and with reduced LV systolic and diastolic function,independently of individual MetS components.
Keywordschildren; hypertension; obesity; left ventricular hypertrophy; left atrium; echocardiography;population study
The metabolic syndrome (MetS) is characterized by clusters of metabolic risk factors (1), whichmight increase cardiovascular (CV) risk beyond what is predicted by single components (2–5). The MetS is associated with an increased risk of cardiac mortality in the absence of diabetesand independently of arterial hypertension (6–8). It has been previously reported that MetS isrelated to abnormal left ventricular (LV) geometry and function in nondiabetic adults with ahigh prevalence of obesity, and that increased blood pressure is the MetS component moststrongly associated with markers of pre-clinical CV disease even in the absence of traditionallydefined hypertension (9).
The rising prevalence of obesity and hypertension among children and adolescents is now amajor health concern with both epidemiological and economic implications (9–12). We havealready reported that LV hypertrophy can be found in 30% of obese adolescents at a mean age<18 years, despite a low prevalence of hypertension (13). And it has also been observed thatobese adolescents often have MetS, suggesting that the increased LV mass might be a responsenot only to increased hemodynamic load but also to possible neurohormonal effects of clusteredmetabolic factors influencing LV growth (13). To date, little information is available onwhether the presence of MetS is associated with significant cardiac abnormalities inadolescents, or whether the impact of MetS on cardiac phenotype is independent of the singlecomponents of the syndrome. Accordingly, the present analysis has been designed to study theCV effects of MetS in adolescents from a population-based sample.
MethodsStudy population
The SHS (Strong Heart Study) is a longitudinal study of CV risk factors and prevalent andincident CV disease in American Indian communities in Arizona, Oklahoma, and North/SouthDakota. As previously described (14), 4,549 members of 13 tribes age 45 to 74 years wererecruited from defined sampling frames (overall participation rate >61%) for baselineexamination in July 1989 to January 1992. The fourth SHS examination (13), conducted in2001 to 2003, enrolled members of large 3-generation families, ascertained by having multiplefamily members in the initial SHS cohort, which included a total of 460 adolescent participants(age <20 years, mean 17.3 ± 1.5 years; 53.2% female participants). After excluding participantswith American Diabetes Association–defined diabetes (n = 10) and/or significant valvulardisease (n = 4), 446 adolescents (14 to <20 years of age) were included in the present analysis.
Physical examination and laboratory testingThe examination included medical history, computerized electrocardiogram, measurement ofbrachial blood pressure, fasting glucose and insulin, glycated hemoglobin, lipid and lipoproteinlevels, and a 2-h, 75-g glucose tolerance test (15). Blood pressure was measured asrecommended by the Fifth Report of the Joint National Committee on Prevention, Detection,Evaluation, and Treatment of High Blood Pressure (15). Laboratory tests and anthropometricmeasures (weight, height, and waist circumferences) were taken as previously reported (16).Fat-free mass and adipose body mass were estimated by the use of an RJL impedance meter
Chinali et al. Page 2
J Am Coll Cardiol. Author manuscript; available in PMC 2009 June 30.
NIH
-PA Author Manuscript
NIH
-PA Author Manuscript
NIH
-PA Author Manuscript

(model B14101, RJL Equipment Co., Clinton Township, Missouri) and equations based ontotal body water validated in the American Indian population (17).
Definition of obesity, hypertension, and MetSAs recommended, 95th percentiles of body mass index (BMI)-for-age charts developed by theNational Center for Health Statistics (18) were used to define obesity. Guidelines correctionwas applied (19) so that the limit separating overweight and obesity did not exceed a BMI of30 kg/m2.
For adolescents 18 years of age and younger, hypertension was assessed by using age-, gender-,and height-specific partition values according to the Fourth Report on the Diagnosis,Evaluation, and Treatment of High Blood Pressure in Children and Adolescents (20). Foradolescents older than 18 years of age, recommendations from the Seventh Report of the JointNational Committee on Prevention, Detection, Evaluation, and Treatment of High BloodPressure were followed (21). The MetS was preliminarily identified using the Adult TreatmentPanel III (ATP III) (22) definition (with partition value of 100 mg/dl for fasting glucose), andthen applying the ATP III modified definition developed by Jolliffe and Janssen (23) foradolescents. Under both criteria, MetS was diagnosed when at least 3 of the 5 components ofthe syndrome (increased waist circumference, high blood pressure, high triglycerides, highfasting glucose, and low high-density lipoprotein cholesterol [HDL-C]) exceeded age- andgender-specific partition values (Online Appendix).
EchocardiographyEchocardiograms were performed by expert sonographers, according to standardized methods,and reviewed off-line by 2 independent readers (M.C., R.B.D.) using a computerized reviewstation with digitizing tablet and monitor screen overlay for calibration and performance ofneeded measurements (24). Left ventricular internal dimension, and septal and posterior wallthickness were measured at end-diastole and -systole by American Society ofEchocardiography recommendations on 3 cycles (25,26). As previously described (27), leftatrial (LA) anteroposterior diameter was measured in long-axis views in end-systole, and aorticroot diameter was measured at the level of the sinus of Valsalva in end-diastole. Since normalLA size in children increases with growth (28), LA diameter was normalized for body heightto account for differences in body maturation. Partition values to detect LA dilation were 2.23cm/m in boys and 2.11 cm/m in girls, representing age-, gender-, and ethnic-specific 95thpercentiles derived in a subgroup of 92 normal adolescent participants. A necropsy-validatedformula was used to calculate LV mass (29), which was normalized for body height in metersto the allometric power of 2.7, which linearizes the relation between LV mass and height (i.e.,body growth) and identifies the impact of excess body weight (30). Partition values for thedefinition of LV hypertrophy were 40.75 g/m2.7 for boys and 38.49 g/m2.7 for girls,representing previously reported age-, gender-, and ethnic-specific cutoff points (13). Toevaluate the concentricity of LV geometry, myocardial thickness (wall + septum) was dividedby LV minor axis (diameter) to generate relative wall thickness (RWT). Because normal RWTincreases with age (31), its raw value was adjusted for age (RWTa) by previously reportedequations (31). Left ventricular systolic performance was assessed by LV ejection fraction andby LV shortening measured at the midwall level (midwall shortening) (32). Stroke volume wasdetermined by an invasively validated Doppler method (33) and used to calculate cardiacoutput.
Left ventricular diastolic properties were assessed by Doppler interrogation of transmitral peakearly (E) and late (A) velocities and by measurement of the deceleration time of peak E velocity.Isovolumic relaxation time was measured between mitral valve closure and aortic valveopening.
Chinali et al. Page 3
J Am Coll Cardiol. Author manuscript; available in PMC 2009 June 30.
NIH
-PA Author Manuscript
NIH
-PA Author Manuscript
NIH
-PA Author Manuscript

Statistical analysisStatistical analyses were performed using SPSS 12.0.0 (SPSS Inc., Chicago, Illinois) software.Data are presented as mean ± SD for continuous variables and as proportions for categoricalvariables. Descriptive statistics were based on normal or chi-square distributions. Thepopulation was dichotomized according to the presence of MetS. Comparison of demographicsand laboratory tests was performed by independent t test. Comparison of cardiac geometry andfunction was performed by analysis of covariance adjusting for differences in age, gender,heart rate, and body height (considered an estimate of body maturation at a given age andgender). In addition, binary logistic multiple regression modeling was performed, controllingfor confounders (age and gender), with the specific aim of determining whether clustered MetSconfers additional independent risk of presenting markers of pre-clinical CV disease (i.e., LVhypertrophy and LA dilation) over and above the effects of single-component risk factors.Covariates were entered in the model using a hierarchical enter procedure in the followingorder: 1) age and gender; 2) presence of obesity; 3) systolic blood pressure; 4) single metaboliccomponents of MetS (including fasting glucose, HDL-C, and triglycerides); and 5) presenceof MetS. Alternative models were also performed replacing obesity with waist circumference,and fasting glucose with either plasma insulin or homeostasis model assessment (HOMA)index.
ResultsDistribution of risk factors
Adult ATP III criteria for the definition of MetS identified 71 participants with the syndrome(15.9% of population, 53.5% girls). According to the adolescent criteria, MetS was insteadpresent in 111 participants (24.9% of population, 55.9% girls; kappa score between criteria =0.66) with similar prevalence in women (26.3%) and men (23.3%; p = NS). The most prevalentcomponent of the MetS by the adolescent definition was increased waist circumference(54.3%), followed by low HDL-C (46.4%), high blood pressure (30.3%), increasedtriglycerides (27.8%), and increased fasting glucose (2.5%). Of the 446 participants, 102(22.9%) had no component of the MetS, 116 (26%) had only 1 MetS component, 117 (26.2%)had 2 clustered risk factors, 77 (17.3%) had 3, 32 (7.2%) had 4, and only 2 participants (0.4%)showed clustered presence of all 5 risk factors.
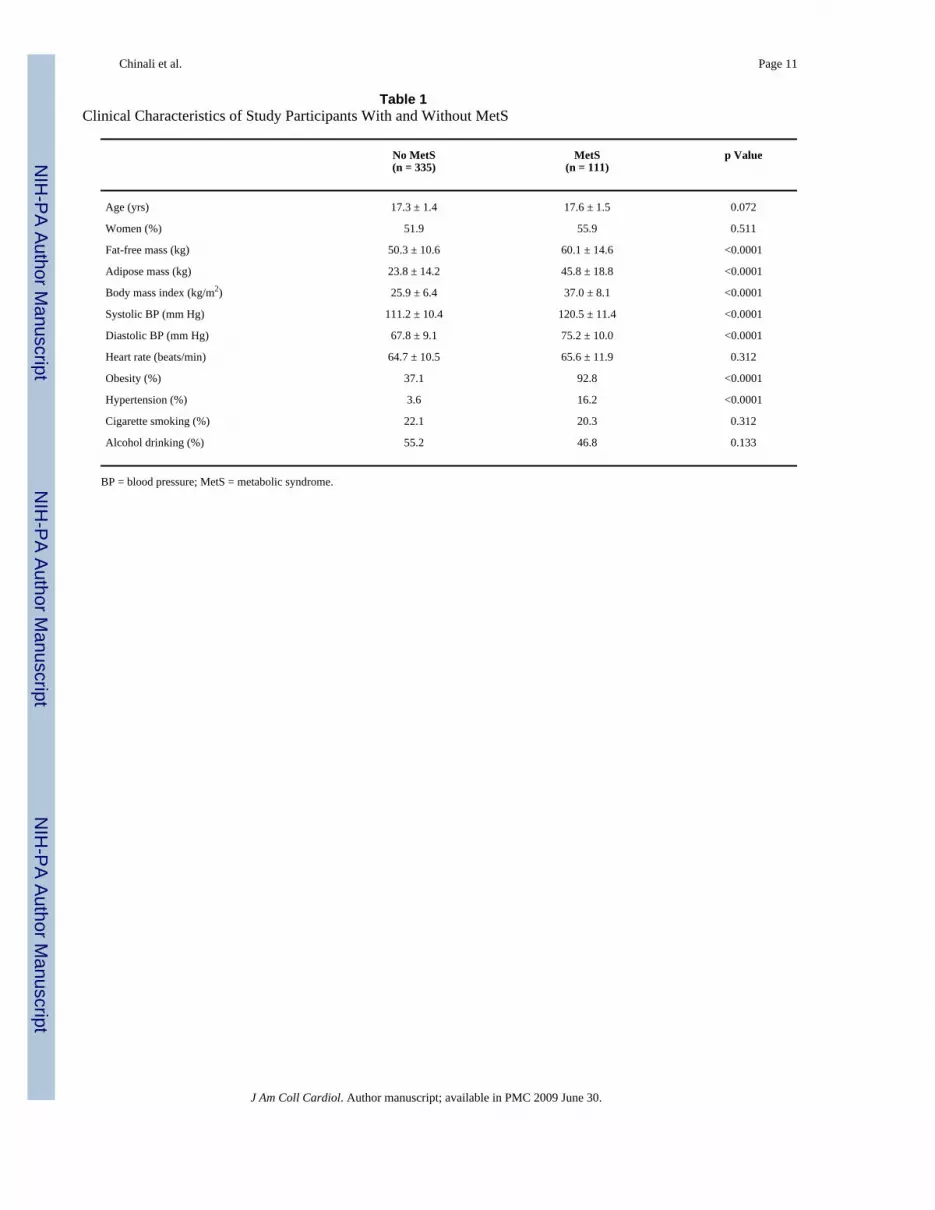
Clinical and laboratory characteristics of the population by MetS classParticipants with MetS had similar age, gender distribution, and heart rate compared with non-MetS participants (Table 1). Comparison of anthropometrics, body composition, andlaboratory tests identified the expected unfavorable phenotype in the MetS participants asopposed to non-MetS participants, characterized by higher fat and fat-free body mass, higherBMI, and higher blood pressure values. Prevalences of obesity and hypertension were alsosignificantly higher in MetS participants (both p<0.001). A similar prevalence of smoking habitand alcohol drinking was observed between the 2 groups (p = NS).
Metabolic characteristics of the study population are shown in Table 2. As expected,participants with the MetS showed a worse glycemic profile (higher fasting glucose, insulin,and HOMA index), worse lipid profile (higher total cholesterol, low-density lipoproteincholesterol, and triglycerides, and lower HDL-C), and higher values of plasma fibrinogen, withsimilar plasma creatinine levels between groups.
Cardiac geometric and functional characteristics by MetS classAfter adjustment for age, gender, height, and heart rate, LV chamber size (diameter), aorticroot, and LA diameter were greater in MetS adolescents compared with non-MetS adolescents
Chinali et al. Page 4
J Am Coll Cardiol. Author manuscript; available in PMC 2009 June 30.
NIH
-PA Author Manuscript
NIH
-PA Author Manuscript
NIH
-PA Author Manuscript
(Table 3). Left ventricular mass and RWTa were also significantly higher in MetS participants(all p < 0.0001). Accordingly, prevalence of LA dilation (63.1% vs. 21.9%) and LVhypertrophy (43.2% vs. 11.7%) were markedly higher in the presence of MetS (both p < 0.001).Stroke volume and cardiac output were increased in MetS participants, due to enlarged LVchamber size. Ejection fraction was similar in the 2 groups; in contrast, midwall shorteningwas lower in MetS than in non-MetS adolescents. Finally, MetS adolescents exhibited asignificantly lower transmitral E/A ratio and slightly longer deceleration time of E velocity,but no significant difference in isovolumic relaxation time. Results were also confirmed whenapplying adult ATP III criteria for the definition of MetS (data not shown).
Predictors of LA dilation and LV hypertrophyIn univariate binary logistic regression, LA dilation was predicted mainly by the presence ofobesity (odds ratio [OR]: 26.26; 95% confidence interval [CI]: 10.33 to 66.77; p < 0.001) andhigher systolic blood pressure (OR: 1.04 per mm Hg; 95% CI: 1.02 to 1.06; p < 0.001), andthen by higher triglycerides (OR: 1.01 per mg/dl; 95% CI: 1.00 to 1.02; p < 0.01) and malegender (OR: 1.65; 95% CI: 1.47 to 1.77; p < 0.01), and negatively by higher HDL-C (OR: 0.96per mg/dl; 95% CI: 0.94 to 0.98; p < 0.01), with no significant impact of fasting glucose or age(p = NS). As shown in Table 4, in hierarchical multivariate regression, male gender (OR: 3.32;95% CI: 1.80 to 6.13), obesity (OR: 4.17; 95% CI: 2.62 to 6.66; both p < 0.001), and systolicblood pressure (OR: 1.03; 95% CI: 1.01 to 1.06; p < 0.01) still predicted LA dilation, with nosignificant impact of age and single metabolic components of the MetS. In contrast, asignificant effect was observed for clustered MetS, which conferred an additional 2.3-foldincreased risk of LA dilation (OR: 2.33; 95% CI: 1.14 to 4.73; p = 0.020), independently ofdemographics and single components of the syndrome.
Similar results were also observed for LV hypertrophy. In univariate binary logistic analysis,LV hypertrophy was predicted mainly by the presence of obesity (OR: 12.10; 95% CI: 4.29 to33.99; p < 0.001) and higher systolic blood pressure (OR: 1.03 per mm Hg; 95% CI: 1.01 to1.06; p < 0.001), and then by higher triglycerides (OR: 1.02 per mg/dl; 95% CI: 1.01 to 1.04;p < 0.05) and older age (OR: 1.19 per year; 95% CI: 1.01 to 1.41; p < 0.05), and negatively byhigher HDL-C (OR: 0.96 per mg/dl; 95% CI: 0.94 to 0.99; p < 0.01), with no significant impactof fasting glucose or gender (p = NS). As shown in Table 5, in hierarchical multivariateregression, obesity (OR: 2.38; 95% CI: 1.41 to 4.04) and systolic blood pressure (OR: 1.04;95% CI: 1.01 to 1.07) still predicted LV hypertrophy (both p < 0.01), with no significant impactof age, gender, or single metabolic components of MetS. In contrast, a significant effect wasobserved for clustered MetS, which conferred an additional 2.6-fold increased risk of LVhypertrophy (OR: 2.57; 95% CI: 1.21 to 5.44; p = 0.014), independently of demographics andsingle components of the syndrome. When the smaller number of participants with MetS bythe adult ATP III definition was evaluated, no additional independent risk was found for MetSfor either LA dilation or LV hypertrophy. Alternative models replacing obesity with waistcircumference, and fasting glucose with either HOMA index or insulin did not significantlychange the reported results. In particular, no independent impact was observed for plasmainsulin (OR: 1.007 per IU/ml; 95% CI: 0.95 to 1.019; p = 0.262) or HOMA index (OR: 1.027;95% CI: 0.98 to 1.075; p = 0.259).
DiscussionThe present study provides the first evidence of a strong impact of MetS on cardiac phenotypein an unselected population of adolescents applying criteria for the definition of MetSspecifically designed for this age range (23,34–36). To our knowledge, only 1 recent reporthas attempted to identify a possible independent impact of MetS on CV phenotype in
Chinali et al. Page 5
J Am Coll Cardiol. Author manuscript; available in PMC 2009 June 30.
NIH
-PA Author Manuscript
NIH
-PA Author Manuscript
NIH
-PA Author Manuscript

adolescents and has failed to show a significant association between MetS and intima-mediathickness (37).
In a previous report that analyzed data of the NHANES (National Health and NutritionExamination Survey) study, a highly representative study of the U.S., Goodman et al. (34)described a 4.2% prevalence of the MetS in the general adolescent U.S. population, with amarkedly higher prevalence, reaching 19.5%, in overweight/obese adolescents when applyingadolescent-ATP III criteria. The evidence that MetS is associated with unfavorable CVphenotype and unfavorable clinical outcome even in the absence of overt hypertension and/ordiabetes supports the hypothesis that MetS might represent a distinct medical condition, at leastfrom an epidemiological point of view (38). The high prevalence of MetS in adults andadolescents has increased medical attention on the syndrome (11,12,34–36), also consideringthe increasing burden of obesity and related metabolic complications found in epidemiologicalsurveys in different countries (39).
In the present study, adolescents with MetS exhibit worrisome abnormalities of cardiacgeometry and function, including aortic root and LA dilation, a trend towards concentric LVgeometry, and a remarkably high prevalence of LV hypertrophy, present in over 40% of MetSadolescents. Furthermore, we found significant impairment in LV wall mechanics and diastolicfunction (as shown by reduced mitral E/A ratio and prolonged E-wave deceleration time).Interestingly, the negative effect of MetS on cardiac phenotype was independent of the effectof the single risk factors defining the syndrome, consistent with the concept that in adolescents,clustering of risk factors in MetS may predict CV disease above and beyond the risk associatedwith its single components.
Other authors have reported independent correlations among body size, metabolicabnormalities, and LV mass growth, in children and adolescents (40,41), but MetS has not yetbeen considered as a pathologic entity in this setting. The Bogalusa Heart study reported anassociation between insulin and LV mass growth in obese adolescent girls, also independentlyof blood pressure (42). In the present study, multivariate modeling showed that the MetS isassociated with LV hypertrophy and LA dilation independent of the effects of obesity andblood pressure, while single metabolic risk factors are associated with manifestations of pre-clinical CV disease only in univariate regression.
It has been recently reported that the prevalence of MetS varies widely in overweightadolescents depending on the MetS definition used (43) and that the instability in the diagnosisof MetS in adolescents (caused by both gain and loss of the diagnosis) might imply a reducedclinical utility of the syndrome (44). In the present study, we have tested age- and gender-specific criteria for the definition of MetS, proposed with the specific aim of minimizing theinstability of the MetS diagnosis in the adolescent age range (23,44). Of note, compared withthe adult definition of MetS, the proposed adolescent criteria were able to identify a strong,independent, and additional impact of the MetS on cardiac markers of pre-clinical disease. Inaddition, although follow-up data for the adolescents included in the present analysis are notyet available, the significant alteration of CV phenotype identified in the presence of MetSstrongly suggests that the diagnosis of MetS even obtained from a single clinical examinationshould encourage prompt life-style risk-reducing interventions in otherwise healthyadolescents.
Study limitationsThe present study has been performed on American Indians, an ethnic group in whichadolescent-ATP III criteria were not specifically tested in NHANES. However, in our sampleof adolescents with a high prevalence of obesity, the MetS was present in 25% of the population,similar to the prevalences reported in NHANES in the obese/overweight U.S. adolescent
Chinali et al. Page 6
J Am Coll Cardiol. Author manuscript; available in PMC 2009 June 30.
NIH
-PA Author Manuscript
NIH
-PA Author Manuscript
NIH
-PA Author Manuscript

population (34). As suggested by current guidelines for the definition of MetS, we have appliedwaist circumference partition values to identify the presence of abdominal obesity, althoughincreasing evidence suggests that a direct measure of intra-abdominal fat should be preferred.However, it has been recently shown in a population-based sample of boys and girls that waistcircumference offers a feasible alternative to the magnetic resonance imaging estimation ofintra-abdominal adipose tissue (45). Finally, Tanner stage was not determined, and the relationbetween body maturation and cardiac geometry/function could not be investigated. Of note,both LV mass and LA diameter were indexed by height, a method that has been previouslyshown to correct for body growth (29); in addition, all but 2 participants were ≥15 years ofage, thereby minimizing the proportion of pre-pubertal participants.
ConclusionsIn a population-based sample of adolescents, MetS was associated with high prevalences ofLV hypertrophy and LA dilation, and with increased aortic root diameter and impairment inboth systolic and diastolic LV performance. The impact of the MetS on cardiac markers of pre-clinical disease was independent and additional to obesity, blood pressure, and single metabolicabnormalities, suggesting that, also in adolescents, the risk associated with MetS might bebeyond what is predicted by single risk factors. Our findings, paired with previous studiesreporting a steep increase in the prevalence of obesity and associated metabolic abnormalitiesin children and young adults, suggest that the presence of MetS in adolescents should promptaggressive lifestyle modifications to reduce the increasing burden of future CV disease.
Supplementary MaterialRefer to Web version on PubMed Central for supplementary material.
AcknowledgmentsThis work was supported by grants HL41642, HL41652, HL41654, HL65521, and M10RR0047-34 (General ClinicalResearch Centers) from the National Institutes of Health, Bethesda, Maryland. The views expressed in this study arethose of the authors and do not necessarily reflect those of the Indian Health Service.
Abbreviations and AcronymsBMI, body mass index; CI, confidence interval; CV, cardiovascular; HDL-C, high-densitylipoprotein cholesterol; LA, left atrium/atrial; LV, left ventricle/ventricular; MetS, metabolicsyndrome; OR, odds ratio; RWT, relative wall thickness; RWTa, relative wall thickness age-adjusted.
REFERENCES1. Grundy SM. Metabolic syndrome: a multiplex cardiovascular risk factor. J Clin Endocrinol Metab
2007;92:399–404. [PubMed: 17284640]2. Laaksonen DE, Lakka HM, Niskanen LK, Kaplan GA, Salonen JT, Lakka TA. Metabolic syndrome
and development of diabetes mellitus: application and validation of recently suggested definitions ofthe metabolic syndrome in a prospective cohort study. Am J Epidemiol 2002;156:1070–1077.[PubMed: 12446265]
3. Meigs JB, Wilson PW, Fox CS, et al. Body mass index, metabolic syndrome, and risk of type 2 diabetesor cardiovascular disease. J Clin Endocrinol Metab 2006;91:2906–2912. [PubMed: 16735483]
4. de Simone G, Olsen MH, Wachtell K, et al. Clusters of metabolic risk factors predict cardiovascularevents in hypertension with target-organ damage: the LIFE study. J Hum Hypertens 2007;21:625–632. [PubMed: 17476291]
Chinali et al. Page 7
J Am Coll Cardiol. Author manuscript; available in PMC 2009 June 30.
NIH
-PA Author Manuscript
NIH
-PA Author Manuscript
NIH
-PA Author Manuscript

5. Lakka HM, Laaksonen DE, Lakka TA, et al. The metabolic syndrome and total and cardiovasculardisease mortality in middle-aged men. JAMA 2002;288:2709–2716. [PubMed: 12460094]
6. de Simone G, Devereux RB, Chinali M, et al. Prognostic impact of metabolic syndrome by differentdefinitions in a population with high prevalence of obesity and diabetes: the Strong Heart study.Diabetes Care 2007;30:1851–1856. [PubMed: 17440172]
7. Jeppesen J, Hansen TW, Rasmussen S, Ibsen H, Torp-Pedersen C, Madsbad S. Insulin resistance, themetabolic syndrome, and risk of incident cardiovascular disease: a population-based study. J Am CollCardiol 2007;49:2112–2119. [PubMed: 17531661]
8. Lorenzo C, Williams K, Hunt KJ, Haffner SM. The National Cholesterol Education Program—AdultTreatment Panel III, International Diabetes Federation, and World Health Organization definitions ofthe metabolic syndrome as predictors of incident cardiovascular disease and diabetes. Diabetes Care2007;30:8–13. [PubMed: 17192325]
9. Chinali M, Devereux RB, Howard BV, et al. Comparison of cardiac structure and function in AmericanIndians with and without the metabolic syndrome (the Strong Heart study). Am J Cardiol 2004;93:40–44. [PubMed: 14697463]
10. Ogden CL, Carroll MD, Curtin LR, McDowell MA, Tabak CJ, Flegal KM. Prevalence of overweightand obesity in the United States, 1999–2004. JAMA 2006;295:1549–1555. [PubMed: 16595758]
11. Kosti RI, Panagiotakos DB. The epidemic of obesity in children and adolescents in the world. CentEur J Public Health 2006;14:151–159. [PubMed: 17243492]
12. Mensah GA, Mokdad AH, Ford E, et al. Obesity, metabolic syndrome, and type 2 diabetes: emergingepidemics and their cardiovascular implications. Cardiol Clin 2004;22:485–504. [PubMed:15501618]
13. Chinali M, de Simone G, Roman MJ, et al. Impact of obesity on cardiac geometry and function in apopulation of adolescents: the Strong Heart study. J Am Coll Cardiol 2006;47:2267–2273. [PubMed:16750694]
14. Lee EL, Welty TK, Fabsitz R, et al. The Strong Heart study: a study of cardiovascular disease inAmerican Indians: design and methods. Am J Epidemiol 1990;13:1141–1155. [PubMed: 2260546]
15. Howard BV, Lee ET, Cowan LD, et al. Coronary heart disease prevalence and its relation to riskfactors in American Indians: the Strong Heart study. Am J Epidemiol 1995;142:254–268. [PubMed:7631630]
16. The fifth report of the Joint National Committee on Detection, Evaluation, and Treatment of HighBlood Pressure (JNC V). Arch Intern Med 1993;153:154–183. [PubMed: 8422206]
17. Rising R, Swinburn B, Larson K, Ravussin E. Body composition in American Indians: validation ofbioelectric resistance. Am J Clin Nutr 1991;53:594–598. [PubMed: 2000812]
18. Kuczmarski RJ, Ogden CL, Guo SS, et al. CDC growth charts for the United States: methods anddevelopment. Vital Health Stat 2000;246:1–190.
19. Must A, Dallal GE, Dietz WH. Reference data for obesity: 85th and 95th percentiles of body massindex (wt/ht2) and triceps skinfold thickness (erratum in: Am J Clin Nutr 1991;54:773). Am J ClinNutr 1991;53:839–846. [PubMed: 2008861]
20. National High Blood Pressure Education Program Working Group on High Blood Pressure inChildren and Adolescents. The fourth report on the diagnosis, evaluation, and treatment of high bloodpressure in children and adolescents; Pediatrics. 2004. p. 555-576.
21. Chobanian AV, Bakris GL, Black HR, et al. National Heart, Lung, and Blood Institute Joint NationalCommittee on Prevention, Detection, Evaluation, and Treatment of High Blood Pressure; NationalHigh Blood Pressure Education Program Coordinating Committee. The seventh report of the JointNational Committee on Prevention, Detection, Evaluation, and Treatment of High Blood Pressure:the JNC 7 report. JAMA 2003;289:2560–2572. [PubMed: 12748199]
22. National Cholesterol Education Program (NCEP) Expert Panel on Detection, Evaluation, andTreatment of High Blood Cholesterol in Adults (Adult Treatment Panel III). Third report of theNational Cholesterol Education Program (NCEP) Expert Panel on Detection, Evaluation, andTreatment of High Blood Cholesterol in Adults (Adult Treatment Panel III) final report. Circulation2002;106:3143–3421. [PubMed: 12485966]
Chinali et al. Page 8
J Am Coll Cardiol. Author manuscript; available in PMC 2009 June 30.
NIH
-PA Author Manuscript
NIH
-PA Author Manuscript
NIH
-PA Author Manuscript
23. Jolliffe CJ, Janssen I. Development of age-specific adolescent metabolic syndrome criteria that arelinked to the Adult Treatment Panel III and International Diabetes Federation criteria. J Am CollCardiol 2007;49:891–898. [PubMed: 17320748]
24. Devereux RB, Roman MJ, de Simone G, et al. Relations of LV mass to demographic andhemodynamic variables in American Indians—the Strong Heart study. Circulation 1997;96:1416–1423. [PubMed: 9315526]
25. Sahn DJ, De Maria A, Kisslo J, Weyman A. The Committee on M-mode Standardization of theAmerican Society of Echocardiography—recommendations regarding quantitation in M-modeechocardiography: results of a survey of echocardiographic measurements. Circulation1978;58:1072–1083. [PubMed: 709763]
26. Schiller NB, Shah PM, Crawford M, et al. American Society of Echocardiography Committee onStandards, Subcommittee on Quantitation of Two-Dimensional Echocardiograms.Recommendations for quantitation of the left ventricle by two-dimensional echocardiography. J AmSoc Echocardiogr 1989;2:358–367. [PubMed: 2698218]
27. Devereux, RB.; Roman, MJ. Evaluation of cardiac and vascular structure by echocardiography andother noninvasive techniques. In: Laragh, JH.; Brenner, BM., editors. Hypertension:Pathophysiology, Diagnosis and Treatment. Vol. 2nd edition. New York, NY: Raven Press; 1995. p.1969-1985.
28. Daniels SR, Witt SA, Glascock B, Khoury PR, Kimball TR. Left atrial size in children withhypertension: the influence of obesity, blood pressure, and left ventricular mass. J Pediatr2002;141:186–190. [PubMed: 12183712]
29. Devereux RB, Alonso DR, Lutas EM, et al. Echocardiographic assessment of left ventricularhypertrophy—comparison to necropsy findings. Am J Cardiol 1987;56:450–458.
30. de Simone G, Daniels SR, Devereux RB, et al. Left ventricular mass and body size in normotensivechildren and adults: assessment of allometric relations and impact of overweight. J Am Coll Cardiol1992;20:1251–1260. [PubMed: 1401629]
31. de Simone G, Daniels SR, Kimball TR, et al. Evaluation of concentric left ventricular geometry inhumans: evidence for age-related systematic underestimation. Hypertension 2005;45:64–68.[PubMed: 15557389]
32. de Simone G, Devereux RB, Koren MJ, Mensah GA, Casale PN, Laragh JH. Midwall left ventricularmechanics: an independent predictor of cardiovascular risk in arterial hypertension. Circulation1996;93:259–265. [PubMed: 8548897]
33. Dubin J, Wallerson DC, Cody RJ, Devereux RB. Comparative accuracy of Doppler echocardiographicmethods for clinical stroke volume determination. Am Heart J 1990;120:116–123. [PubMed:2360495]
34. Goodman E, Daniels SR, Morrison JA, Huang B, Dolan LM. Contrasting prevalence of anddemographic disparities in the World Health Organization and National Cholesterol EducationProgram Adult Treatment Panel III definitions of metabolic syndrome among adolescents. J Pediatr2004;145:445–451. [PubMed: 15480365]
35. Zimmet P, Alberti G, Kaufman F, et al. International Diabetes Federation Task Force on Epidemiologyand Prevention of Diabetes. The metabolic syndrome in children and adolescents. Lancet2007;369:2059–2061. [PubMed: 17586288]
36. Weiss R, Dziura J, Burgert TS, et al. Obesity and the metabolic syndrome in children and adolescents.N Engl J Med 2004;350:2362–2374. [PubMed: 15175438]
37. Reinehr T, Wunsch R, de Sousa G, Toschke AM. Relationship between metabolic syndromedefinitions for children and adolescents and intima-media thickness. Atherosclerosis 2008;199:193–200. [PubMed: 18031749]
38. Johnson LW, Weinstock RS. The metabolic syndrome: concepts and controversy. Mayo Clin Proc2006;81:1615–1620. [PubMed: 17165640]
39. Haslam DW, James WP. Obesity. Lancet 2005;366:1197–1209. [PubMed: 16198769]40. Daniels SR, Kimball TR, Morrison JA, Khoury P, Witt S, Meyer RA. Effect of lean body mass, fat
mass, blood pressure, and sexual maturation on left ventricular mass in children and adolescents.Statistical, biological, and clinical significance. Circulation 1995;92:3249–3254. [PubMed:7586311]
Chinali et al. Page 9
J Am Coll Cardiol. Author manuscript; available in PMC 2009 June 30.
NIH
-PA Author Manuscript
NIH
-PA Author Manuscript
NIH
-PA Author Manuscript

41. Hirschler V, Acebo HL, Fernandez GB, de Lujan Calcagno M, Gonzalez C, Jadzinsky M. Influenceof obesity and insulin resistance on left atrial size in children. Pediatr Diabetes 2006;7:39–44.[PubMed: 16489973]
42. Urbina EM, Gidding SS, Bao W, Elkasabany A, Berenson GS. Association of fasting blood sugarlevel, insulin level, and obesity with left ventricular mass in healthy children and adolescents: theBogalusa Heart study. Am Heart J 1999;138:122–127. [PubMed: 10385774]
43. Reinehr T, de Sousa G, Toschke AM, Andler W. Comparison of metabolic syndrome prevalenceusing eight different definitions: a critical approach. Arch Dis Child 2007;92:1067–1072. [PubMed:17301109]
44. Goodman E, Daniels SR, Meigs JB, Dolan LM. Instability in the diagnosis of metabolic syndromein adolescents. Circulation 2007;115:2316–2322. [PubMed: 17420347]
45. Benfield LL, Fox KR, Peters DM, et al. Magnetic resonance imaging of abdominal adiposity in alarge cohort of British children. Int J Obes (Lond) 2008;32:91–99. [PubMed: 18193066]
APPENDIXFor a complete explanation of the partition values for the definition of metabolic syndrome,please see the online version of this article.
Chinali et al. Page 10
J Am Coll Cardiol. Author manuscript; available in PMC 2009 June 30.
NIH
-PA Author Manuscript
NIH
-PA Author Manuscript
NIH
-PA Author Manuscript
NIH
-PA Author Manuscript
NIH
-PA Author Manuscript
NIH
-PA Author Manuscript
Chinali et al. Page 11
Table 1Clinical Characteristics of Study Participants With and Without MetS
No MetS(n = 335)
MetS(n = 111)
p Value
Age (yrs) 17.3 ± 1.4 17.6 ± 1.5 0.072
Women (%) 51.9 55.9 0.511
Fat-free mass (kg) 50.3 ± 10.6 60.1 ± 14.6 <0.0001
Adipose mass (kg) 23.8 ± 14.2 45.8 ± 18.8 <0.0001
Body mass index (kg/m2) 25.9 ± 6.4 37.0 ± 8.1 <0.0001
Systolic BP (mm Hg) 111.2 ± 10.4 120.5 ± 11.4 <0.0001
Diastolic BP (mm Hg) 67.8 ± 9.1 75.2 ± 10.0 <0.0001
Heart rate (beats/min) 64.7 ± 10.5 65.6 ± 11.9 0.312
Obesity (%) 37.1 92.8 <0.0001
Hypertension (%) 3.6 16.2 <0.0001
Cigarette smoking (%) 22.1 20.3 0.312
Alcohol drinking (%) 55.2 46.8 0.133
BP = blood pressure; MetS = metabolic syndrome.
J Am Coll Cardiol. Author manuscript; available in PMC 2009 June 30.

NIH
-PA Author Manuscript
NIH
-PA Author Manuscript
NIH
-PA Author Manuscript
Chinali et al. Page 12
Table 2Metabolic Characteristics of Study Participants With and Without MetS
No MetS(n = 335)
MetS(n = 111)
p Value
Fasting glucose (mg/dl) 89.2 ± 8.4 94.2 ± 8.0 <0.0001
Plasma insulin (IU/ml) 13.2 ± 10.7 28.7 ± 37.2 <0.0001
Log HOMA index 0.36 ± 0.30 0.70 ± 0.27 <0.0001
Triglycerides (mg/dl) 93.6 ± 43.1 178.0 ± 72.3 <0.0001
Total cholesterol (mg/dl) 149.7 ± 26.7 168.6 ± 27.7 <0.0001
LDL cholesterol (mg/dl) 79.9 ± 23.1 95.1 ± 25.0 <0.0001
HDL cholesterol (mg/dl) 51.3 ± 12.1 40.1 ± 10.1 <0.0001
Fibrinogen (mg/dl) 341.6 ± 76.4 393.3 ± 73.0 <0.0001
Creatinine (mg/dl) 0.79 ± 0.15 0.77 ± 0.13 0.179
HDL = high-density lipoprotein; HOMA = homeostasis model assessment; LDL = low-density lipoprotein; MetS = metabolic syndrome.
J Am Coll Cardiol. Author manuscript; available in PMC 2009 June 30.

NIH
-PA Author Manuscript
NIH
-PA Author Manuscript
NIH
-PA Author Manuscript
Chinali et al. Page 13
Table 3Cardiac Characteristics of Study Participants With and Without MetS
No MetS(n = 335)
Mets(n = 111)
p Value*
LV diameter (cm) 5.21 ± 0.39 5.38 ± 0.44 0.001
Aortic root (cm) 3.03 ± 0.25 3.14 ± 0.31 0.001
Left atrial diameter (cm) 3.31 ± 0.41 3.79 ± 0.35 <0.0001
Left atrial dilation (%) 21.9 63.1 <0.0001
LV mass (g) 132.3 ± 31.2 157.7 ± 39.1 <0.0001
LV mass index (g/m2.7) 32.0 ± 6.1 38.0 ± 7.2 <0.0001
LV hypertrophy (%) 10.8 41.8 <0.0001
Age-adjusted relative wall thickness 0.27 ± 0.04 0.29 ± 0.04 <0.0001
Stroke volume (ml) 78.1 ± 14.2 84.9 ± 14.6 <0.0001
Cardiac output (l/min) 5.02 ± 0.99 5.47 ± 1.01 <0.0001
Ejection fraction (%) 59.9 ± 4.4 59.7 ± 4.8 0.612
Midwall shortening (%) 18.9 ± 1.5 18.3 ± 1.7 0.001
Mitral E/A ratio 1.86 ± 0.45 1.71 ± 0.40 0.001
E deceleration time (ms) 206.5 ± 36.2 215.9 ± 36.7 0.022
IVRT (ms) 71.9 ± 8.5 79.9 ± 9.1 0.318
*Analysis of covariance with Sidak’s adjusted means for age, gender, heart rate, and height.
E/A ratio = mitral early to atrial peak velocity ratio; IVRT = isovolumic relaxation time; LV = left ventricular; MetS = metabolic syndrome.
J Am Coll Cardiol. Author manuscript; available in PMC 2009 June 30.

NIH
-PA Author Manuscript
NIH
-PA Author Manuscript
NIH
-PA Author Manuscript
Chinali et al. Page 14
Table 4Hierarchical Multivariate Regression for LA Dilation
p Value OR 95% CI
Step 1 Age (yrs) 0.058 0.842 0.706–1.006
Gender (male) 0.001 3.322 1.800–6.130
Step 2 Presence of obesity 0.001 4.174 2.617–6.657
Step 3 Systolic blood pressure (mm Hg) 0.015 1.032 1.006–1.059
Step 4 HDL-C (mg/dl) 0.171 0.985 0.965–1.006
Fasting glucose (mg/dl) 0.644 0.992 0.960–1.025
Triglycerides (mg/dl) 0.557 0.999 0.994–1.003
Step 5 MetS 0.020 2.326 1.143–4.734
CI = confidence interval; HDL-C = high-density lipoprotein cholesterol; LA = left atrial; MetS = metabolic syndrome; OR = odds ratio.
J Am Coll Cardiol. Author manuscript; available in PMC 2009 June 30.

NIH
-PA Author Manuscript
NIH
-PA Author Manuscript
NIH
-PA Author Manuscript
Chinali et al. Page 15
Table 5Hierarchical Multivariate Regression for LV Hypertrophy
p Value OR 95% CI
Step 1 Age (yrs) 0.368 1.093 0.900–1.328
Gender (male) 0.518 1.241 0.645–2.386
Step 2 Presence of obesity 0.001 2.385 1.408–4.041
Step 3 Systolic blood pressure (mm Hg) 0.006 1.041 1.012–1.071
Step 4 HDL-C (mg/dl) 0.407 0.990 0.966–1.014
Fasting glucose (mg/dl) 0.262 0.980 0.945–1.016
Triglycerides (mg/dl) 0.946 1.000 0.995–1.004
Step 5 MetS 0.014 2.565 1.210–5.438
LV = left ventricular; other abbreviations as in Table 4.
J Am Coll Cardiol. Author manuscript; available in PMC 2009 June 30.


