Embed Size (px)
Citation preview
RESEARCH ARTICLE Open Access
Carotenoid coloration and coloration-linkedgene expression in red tilapia (Oreochromissp.) tissuesKhristina G. Judan Cruz1* , Ervee P. Landingin1, Maureen B. Gajeton1, Somar Israel D. Fernando1 andKozo Watanabe2,3
Abstract
Background: Production, marketability and consumer preference of red tilapia often depends upon the intensity ofcoloration. Hence, new approaches to develop coloration are now geared to improve market acceptability andprofit. This study evaluated the effects of carotenoid-rich diets on the phenotypic coloration, carotenoid level,weight gain and expression of coloration-linked genes in skin, fin and muscle tissues. Carotenoids were extractedfrom dried Daucus carota peel, Ipomoea aquatica leaves, and Moringa oleifera leaves. Eighty (80) size-14 fish werefed with carotenoid-rich treatments twice a day for 120 days. The phenotypic effect of the carotenoid extracts wasmeasured through a color chart. Skin carotenoid level was measured through UV-vis spectrophotometer. csf1ra,Bcdo2 and StAR expression analysis was done using qRT-PCR.
Results: Treatments with carotenoid extracts yielded higher overall scores on phenotypic coloration and tissuecarotenoid levels. Differential expression of carotenoid-linked genes such as the elevated expression in csf1ra andlower expression in Bcdo2b following supplementation of the enhanced diet supports the phenotypic redness andincreased carotenoid values in red tilapia fed with D. carota peel and I. aquatica leaves.
Conclusions: Overall improvement in the redness of the tilapia was achieved through the supplementation ofcarotenoid-rich diet derived from readily available plants. Differential expression of coloration-linked genes supportsthe increase in the intensity of phenotypic coloration and level of carotenoids in the tissues. The study emphasizesthe importance of carotenoids in the commercial tilapia industry and highlights the potential of the plant extractsfor integration and development of feeds for color enhancement in red tilapia.
Keywords: Carotenoid level, Coloration, red tilapia, csf1ra, Bcdo2, StAR
BackgroundThe phenomenal growth of aquaculture production haspushed researches to improve the quality of the fish inthe past three decades. Among the most cultured fish,the tilapia (Oreochromis sp.) stands out as one of themost important, possessing remarkable characteristics
for breeding, disease resilience and faster growth [1, 2].Their popularity paved for species genetic improvementthat produced superior strains with enhanced perform-ance such as higher productivity and survival [3]. Amongthe genetically enhanced strains, the red tilapia is con-siderably preferred than that of the other tilapia hybrids[4, 5] due to its attractive color and bright pigmentation.This strain was produced from a mutant cross of up tofour different species, largely dominated by Oreochromismossambicus and O. niloticus species [6]. Since its
© The Author(s). 2021 Open Access This article is licensed under a Creative Commons Attribution 4.0 International License,which permits use, sharing, adaptation, distribution and reproduction in any medium or format, as long as you giveappropriate credit to the original author(s) and the source, provide a link to the Creative Commons licence, and indicate ifchanges were made. The images or other third party material in this article are included in the article's Creative Commonslicence, unless indicated otherwise in a credit line to the material. If material is not included in the article's Creative Commonslicence and your intended use is not permitted by statutory regulation or exceeds the permitted use, you will need to obtainpermission directly from the copyright holder. To view a copy of this licence, visit http://creativecommons.org/licenses/by/4.0/.The Creative Commons Public Domain Dedication waiver (http://creativecommons.org/publicdomain/zero/1.0/) applies to thedata made available in this article, unless otherwise stated in a credit line to the data.
* Correspondence: [email protected] of Biological Sciences, College of Science, Central Luzon StateUniversity, Nueva Ecija, Science City of Munoz, PhilippinesFull list of author information is available at the end of the article
Judan Cruz et al. BMC Veterinary Research (2021) 17:314 https://doi.org/10.1186/s12917-021-03006-5
marketability is highly influenced by its color, several re-searches are now geared towards improving red tilapiapigmentation to enhance color quality and profit.It is widely recognized that consumers subconsciously
associate coloration with quality, flavor, nutritive valueand general acceptability [7–10] which often impactscommercial value, especially in fishes [7, 8]. Significantwork has demonstrated that coloration in fishes is highlyinfluenced by the carotenoid level in their diets [9, 11].To date, dietary supplementation of carotenoids in aqua-culture have been used extensively and feed formulationhave been gaining considerable interest especially forfish cultured for human consumption, particularly Niletilapia, as a result of market demand and preference tocolorful fishes [12, 13].The role of carotenoids in fish health is widely recog-
nized. Carotenoids does not only provide consistent pig-mentation [11, 14] but also affect fish growth,performance and overall health [15] affecting key pro-duction parameters in fish. Carotenoids serve functionsin cellular pathways [16] that increase the metabolism ofanimals [15]. Carotenoids are one of the most powerfulantioxidants [16] which provides protection against sev-eral stressors including ultraviolet (UV) radiation, react-ive oxygen species and free radicals [15, 17]. Carotenoidsalso serve as precursors of transcription regulators andplays a critical role in the immune system [15, 18–21]. Ithas also been shown that fishes with elevated carotenoidlevels are more resistant to bacterial and fungal diseases[7, 8, 10]. Carotenoids, thus, are routinely added to thediets not only for pigmentation, but also for their opti-mal health.Since fishes cannot synthesize carotenoids de novo [7,
8, 11, 22], suitable feeds must be formulated throughnatural carotenoid supplementation incorporated in fishmeals to efficiently provide the carotenoids necessary forthe target color enhancement and intensification [7, 8,15, 23–25]. Naturally-occurring carotenoids such asthose in carotenoid-rich plants can be tapped as sourcesfor feed supplementation for color enhancement. Nat-ural carotenoids are generally safer than synthetic carot-enoids [7, 8, 22] typically incorporated in fish feeds bycommercial fish producers for faster color intensificationand maintaining overall fish health. Integrating naturalcarotenoids is a more practical approach in aquaculturesince these plant materials are readily available, easily in-corporated in the fishmeal and usually freely.As to date, only the study of Velasco et al. [26] reports
on the effect of carotenoid supplementation on the gen-eral phenotypic coloration in red tilapia. This paper fur-ther explored the effect of carotenoid-rich dietformulated from three plants not only on the generalcoloration but also on the carotenoid level and molecu-lar expression in the integument, muscle and fin. The
understanding on the pathways behind carotenoid regu-lation is relatively limited [16], especially on the genesregulating its metabolism [14]. Genes linked to color-ation expression, such as csf1ra [13], Bcdo2b [27] andstAR [28], were included in this study to evaluate the ef-fect of carotenoids at the molecular level.
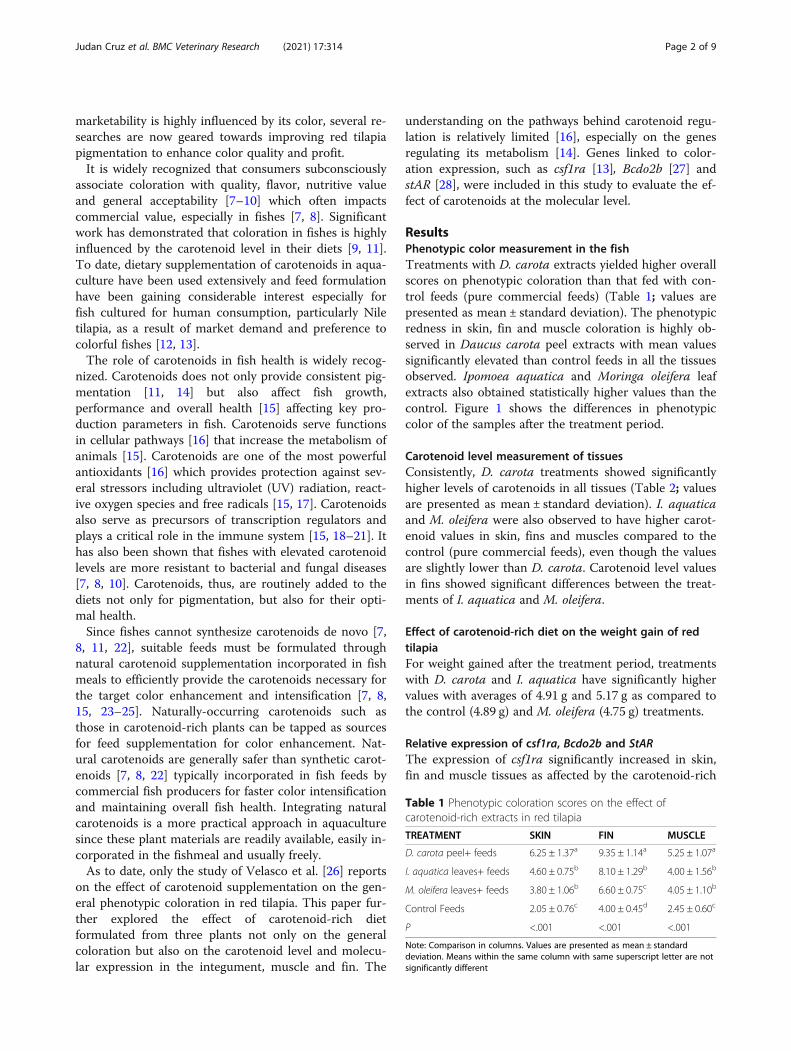
ResultsPhenotypic color measurement in the fishTreatments with D. carota extracts yielded higher overallscores on phenotypic coloration than that fed with con-trol feeds (pure commercial feeds) (Table 1; values arepresented as mean ± standard deviation). The phenotypicredness in skin, fin and muscle coloration is highly ob-served in Daucus carota peel extracts with mean valuessignificantly elevated than control feeds in all the tissuesobserved. Ipomoea aquatica and Moringa oleifera leafextracts also obtained statistically higher values than thecontrol. Figure 1 shows the differences in phenotypiccolor of the samples after the treatment period.
Carotenoid level measurement of tissuesConsistently, D. carota treatments showed significantlyhigher levels of carotenoids in all tissues (Table 2; valuesare presented as mean ± standard deviation). I. aquaticaand M. oleifera were also observed to have higher carot-enoid values in skin, fins and muscles compared to thecontrol (pure commercial feeds), even though the valuesare slightly lower than D. carota. Carotenoid level valuesin fins showed significant differences between the treat-ments of I. aquatica and M. oleifera.
Effect of carotenoid-rich diet on the weight gain of redtilapiaFor weight gained after the treatment period, treatmentswith D. carota and I. aquatica have significantly highervalues with averages of 4.91 g and 5.17 g as compared tothe control (4.89 g) and M. oleifera (4.75 g) treatments.
Relative expression of csf1ra, Bcdo2b and StARThe expression of csf1ra significantly increased in skin,fin and muscle tissues as affected by the carotenoid-rich
Table 1 Phenotypic coloration scores on the effect ofcarotenoid-rich extracts in red tilapia
TREATMENT SKIN FIN MUSCLE
D. carota peel+ feeds 6.25 ± 1.37a 9.35 ± 1.14a 5.25 ± 1.07a
I. aquatica leaves+ feeds 4.60 ± 0.75b 8.10 ± 1.29b 4.00 ± 1.56b
M. oleifera leaves+ feeds 3.80 ± 1.06b 6.60 ± 0.75c 4.05 ± 1.10b
Control Feeds 2.05 ± 0.76c 4.00 ± 0.45d 2.45 ± 0.60c
P <.001 <.001 <.001
Note: Comparison in columns. Values are presented as mean ± standarddeviation. Means within the same column with same superscript letter are notsignificantly different
Judan Cruz et al. BMC Veterinary Research (2021) 17:314 Page 2 of 9
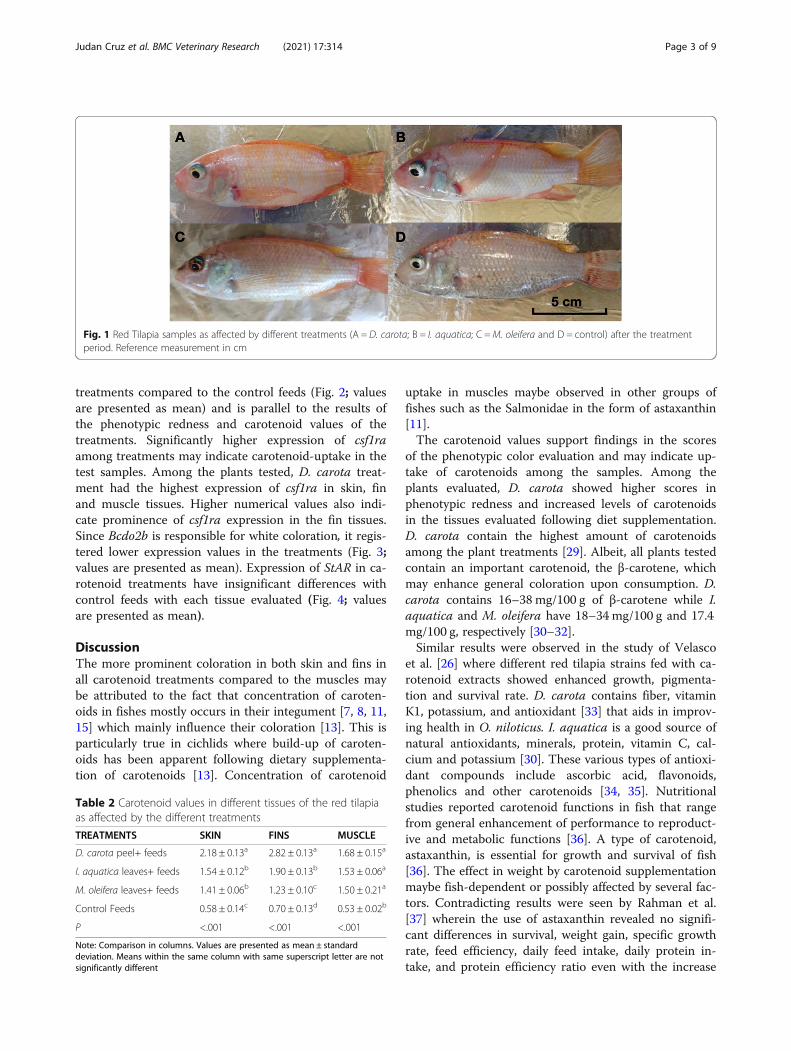
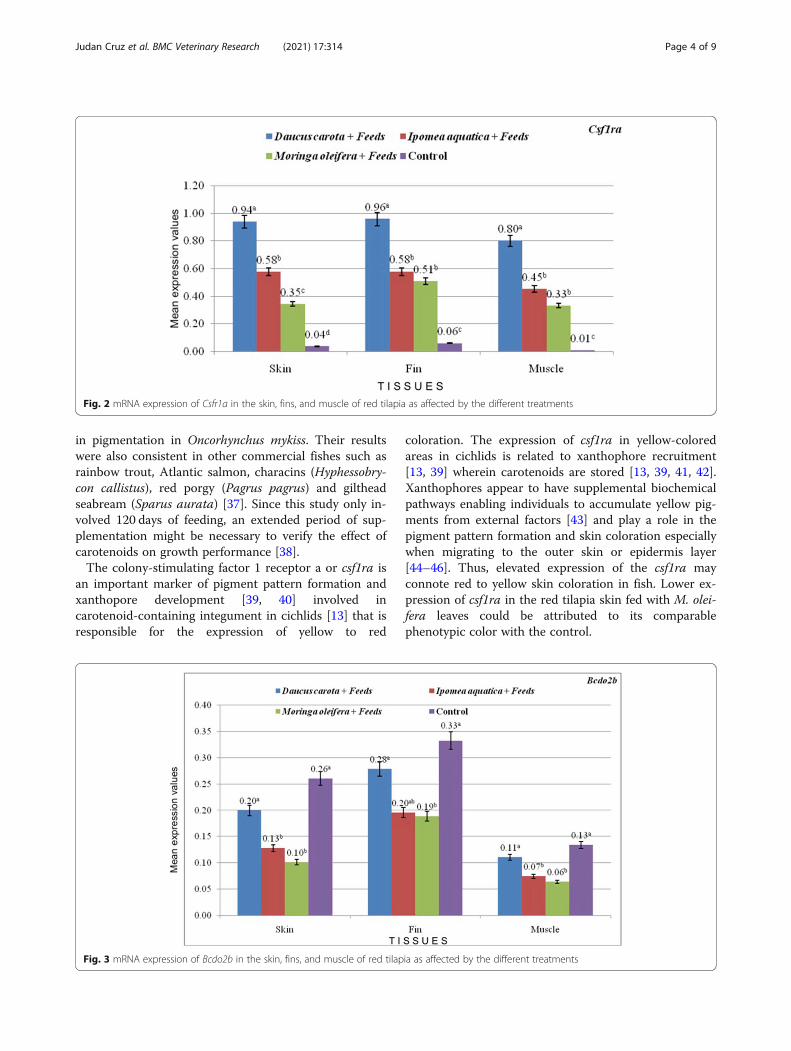
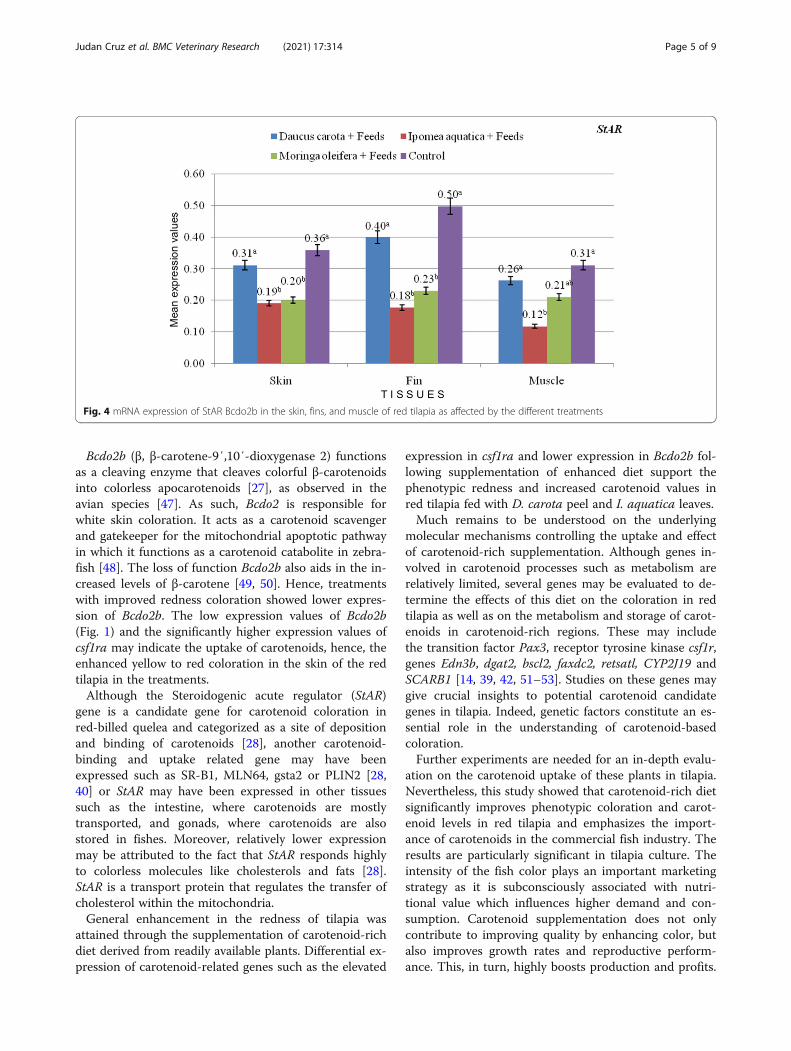
treatments compared to the control feeds (Fig. 2; valuesare presented as mean) and is parallel to the results ofthe phenotypic redness and carotenoid values of thetreatments. Significantly higher expression of csf1raamong treatments may indicate carotenoid-uptake in thetest samples. Among the plants tested, D. carota treat-ment had the highest expression of csf1ra in skin, finand muscle tissues. Higher numerical values also indi-cate prominence of csf1ra expression in the fin tissues.Since Bcdo2b is responsible for white coloration, it regis-tered lower expression values in the treatments (Fig. 3;values are presented as mean). Expression of StAR in ca-rotenoid treatments have insignificant differences withcontrol feeds with each tissue evaluated (Fig. 4; valuesare presented as mean).
DiscussionThe more prominent coloration in both skin and fins inall carotenoid treatments compared to the muscles maybe attributed to the fact that concentration of caroten-oids in fishes mostly occurs in their integument [7, 8, 11,15] which mainly influence their coloration [13]. This isparticularly true in cichlids where build-up of caroten-oids has been apparent following dietary supplementa-tion of carotenoids [13]. Concentration of carotenoid
uptake in muscles maybe observed in other groups offishes such as the Salmonidae in the form of astaxanthin[11].The carotenoid values support findings in the scores
of the phenotypic color evaluation and may indicate up-take of carotenoids among the samples. Among theplants evaluated, D. carota showed higher scores inphenotypic redness and increased levels of carotenoidsin the tissues evaluated following diet supplementation.D. carota contain the highest amount of carotenoidsamong the plant treatments [29]. Albeit, all plants testedcontain an important carotenoid, the β-carotene, whichmay enhance general coloration upon consumption. D.carota contains 16–38 mg/100 g of β-carotene while I.aquatica and M. oleifera have 18–34mg/100 g and 17.4mg/100 g, respectively [30–32].Similar results were observed in the study of Velasco
et al. [26] where different red tilapia strains fed with ca-rotenoid extracts showed enhanced growth, pigmenta-tion and survival rate. D. carota contains fiber, vitaminK1, potassium, and antioxidant [33] that aids in improv-ing health in O. niloticus. I. aquatica is a good source ofnatural antioxidants, minerals, protein, vitamin C, cal-cium and potassium [30]. These various types of antioxi-dant compounds include ascorbic acid, flavonoids,phenolics and other carotenoids [34, 35]. Nutritionalstudies reported carotenoid functions in fish that rangefrom general enhancement of performance to reproduct-ive and metabolic functions [36]. A type of carotenoid,astaxanthin, is essential for growth and survival of fish[36]. The effect in weight by carotenoid supplementationmaybe fish-dependent or possibly affected by several fac-tors. Contradicting results were seen by Rahman et al.[37] wherein the use of astaxanthin revealed no signifi-cant differences in survival, weight gain, specific growthrate, feed efficiency, daily feed intake, daily protein in-take, and protein efficiency ratio even with the increase
Fig. 1 Red Tilapia samples as affected by different treatments (A = D. carota; B = I. aquatica; C =M. oleifera and D = control) after the treatmentperiod. Reference measurement in cm
Table 2 Carotenoid values in different tissues of the red tilapiaas affected by the different treatments
TREATMENTS SKIN FINS MUSCLE
D. carota peel+ feeds 2.18 ± 0.13a 2.82 ± 0.13a 1.68 ± 0.15a
I. aquatica leaves+ feeds 1.54 ± 0.12b 1.90 ± 0.13b 1.53 ± 0.06a
M. oleifera leaves+ feeds 1.41 ± 0.06b 1.23 ± 0.10c 1.50 ± 0.21a
Control Feeds 0.58 ± 0.14c 0.70 ± 0.13d 0.53 ± 0.02b
P <.001 <.001 <.001
Note: Comparison in columns. Values are presented as mean ± standarddeviation. Means within the same column with same superscript letter are notsignificantly different
Judan Cruz et al. BMC Veterinary Research (2021) 17:314 Page 3 of 9
in pigmentation in Oncorhynchus mykiss. Their resultswere also consistent in other commercial fishes such asrainbow trout, Atlantic salmon, characins (Hyphessobry-con callistus), red porgy (Pagrus pagrus) and giltheadseabream (Sparus aurata) [37]. Since this study only in-volved 120 days of feeding, an extended period of sup-plementation might be necessary to verify the effect ofcarotenoids on growth performance [38].The colony-stimulating factor 1 receptor a or csf1ra is
an important marker of pigment pattern formation andxanthopore development [39, 40] involved incarotenoid-containing integument in cichlids [13] that isresponsible for the expression of yellow to red
coloration. The expression of csf1ra in yellow-coloredareas in cichlids is related to xanthophore recruitment[13, 39] wherein carotenoids are stored [13, 39, 41, 42].Xanthophores appear to have supplemental biochemicalpathways enabling individuals to accumulate yellow pig-ments from external factors [43] and play a role in thepigment pattern formation and skin coloration especiallywhen migrating to the outer skin or epidermis layer[44–46]. Thus, elevated expression of the csf1ra mayconnote red to yellow skin coloration in fish. Lower ex-pression of csf1ra in the red tilapia skin fed with M. olei-fera leaves could be attributed to its comparablephenotypic color with the control.
Fig. 2 mRNA expression of Csfr1a in the skin, fins, and muscle of red tilapia as affected by the different treatments
Fig. 3 mRNA expression of Bcdo2b in the skin, fins, and muscle of red tilapia as affected by the different treatments
Judan Cruz et al. BMC Veterinary Research (2021) 17:314 Page 4 of 9
Bcdo2b (β, β-carotene-9′,10′-dioxygenase 2) functionsas a cleaving enzyme that cleaves colorful β-carotenoidsinto colorless apocarotenoids [27], as observed in theavian species [47]. As such, Bcdo2 is responsible forwhite skin coloration. It acts as a carotenoid scavengerand gatekeeper for the mitochondrial apoptotic pathwayin which it functions as a carotenoid catabolite in zebra-fish [48]. The loss of function Bcdo2b also aids in the in-creased levels of β-carotene [49, 50]. Hence, treatmentswith improved redness coloration showed lower expres-sion of Bcdo2b. The low expression values of Bcdo2b(Fig. 1) and the significantly higher expression values ofcsf1ra may indicate the uptake of carotenoids, hence, theenhanced yellow to red coloration in the skin of the redtilapia in the treatments.Although the Steroidogenic acute regulator (StAR)
gene is a candidate gene for carotenoid coloration inred-billed quelea and categorized as a site of depositionand binding of carotenoids [28], another carotenoid-binding and uptake related gene may have beenexpressed such as SR-B1, MLN64, gsta2 or PLIN2 [28,40] or StAR may have been expressed in other tissuessuch as the intestine, where carotenoids are mostlytransported, and gonads, where carotenoids are alsostored in fishes. Moreover, relatively lower expressionmay be attributed to the fact that StAR responds highlyto colorless molecules like cholesterols and fats [28].StAR is a transport protein that regulates the transfer ofcholesterol within the mitochondria.General enhancement in the redness of tilapia was
attained through the supplementation of carotenoid-richdiet derived from readily available plants. Differential ex-pression of carotenoid-related genes such as the elevated
expression in csf1ra and lower expression in Bcdo2b fol-lowing supplementation of enhanced diet support thephenotypic redness and increased carotenoid values inred tilapia fed with D. carota peel and I. aquatica leaves.Much remains to be understood on the underlying
molecular mechanisms controlling the uptake and effectof carotenoid-rich supplementation. Although genes in-volved in carotenoid processes such as metabolism arerelatively limited, several genes may be evaluated to de-termine the effects of this diet on the coloration in redtilapia as well as on the metabolism and storage of carot-enoids in carotenoid-rich regions. These may includethe transition factor Pax3, receptor tyrosine kinase csf1r,genes Edn3b, dgat2, bscl2, faxdc2, retsatl, CYP2J19 andSCARB1 [14, 39, 42, 51–53]. Studies on these genes maygive crucial insights to potential carotenoid candidategenes in tilapia. Indeed, genetic factors constitute an es-sential role in the understanding of carotenoid-basedcoloration.Further experiments are needed for an in-depth evalu-
ation on the carotenoid uptake of these plants in tilapia.Nevertheless, this study showed that carotenoid-rich dietsignificantly improves phenotypic coloration and carot-enoid levels in red tilapia and emphasizes the import-ance of carotenoids in the commercial fish industry. Theresults are particularly significant in tilapia culture. Theintensity of the fish color plays an important marketingstrategy as it is subconsciously associated with nutri-tional value which influences higher demand and con-sumption. Carotenoid supplementation does not onlycontribute to improving quality by enhancing color, butalso improves growth rates and reproductive perform-ance. This, in turn, highly boosts production and profits.
Fig. 4 mRNA expression of StAR Bcdo2b in the skin, fins, and muscle of red tilapia as affected by the different treatments
Judan Cruz et al. BMC Veterinary Research (2021) 17:314 Page 5 of 9
Therefore, considerable potential is shown on the use ofnatural plant-based carotenoids in aquaculture feed in-dustries and fish farming.
ConclusionsOverall improvement in the redness of red tilapia wasachieved through the supplementation of carotenoid-rich diet. Differential expression of coloration-linkedgenes supports the increase in the intensity of pheno-typic coloration and level of carotenoids in the tissues.The study emphasizes the importance of carotenoids inthe commercial tilapia industry and highlights the poten-tial of the plant extracts for integration and developmentof feeds for color enhancement in red tilapia.
MethodsCollection and preparation of extracts and experimentaldietsSamples of D. carota were obtained from the CordilleraAdministrative Region (Baguio), Philippines. I. aquaticaleaves and M. oleifera leaves were collected in the Sci-ence City of Munoz, province of Nueva Ecija(Philippines) by Ms. Ervee P. Landingin. Voucher speci-mens were identified by Mr. Paul Henric P. Gojo Cruz(Department of Biological Sciences, Central Luzon StateUniversity). D. carota peel, I. aquatica leaves and M.oleifera leaves were dried in an oven with temperature of50 °C for about 8 h until the plant samples were com-pletely dried and suitable for grinding. The dried plantsamples were pulverized and sieved to get fine particles.Acetone was used to extract carotenoid pigments. Onehundred fifty grams (150 g) of dried plant samples wasimmersed individually in 750 ml of acetone for 24 h. Theextracts were filtered, air dried and kept refrigerateduntil use. Five hundred milligrams (500 mg) of the col-lected pigment extract were dissolved in 500 ml of ethylalcohol separately and mixed in one kilogram of com-mercial feed. The prepared diets were air-dried until thealcohol completely evaporated and were kept in con-tainer until use. This method was adapted from Velascoet al. [26]. The carotenoid concentration was computedusing the formula of de Carvalho et al. [54] that resultedto 500 mg/kg ratio of extracts to feeds. This concentra-tion is considered high in comparison to the carotenoidconcentrations in commercial formulated fish diets re-ported by Wallat et al. [55].Pure commercial fish feed (BMEG Premium Fry Mash,
San Miguel Corp) was used as control with the followingcomponents in percent (%): crude protein (31), crudefiber (7), crude fat (9), ash (16) and moisture (13). Thecommercial feed was mixed with respective carotenoidextracts for the treatments with carotenoid-rich diet.
Fish and treatment set-upThe red tilapia samples were reared at the FreshwaterAquaculture Center, Central Luzon State University,Nueva Ecija (Philippines). Eighty (80) size-14 red tilapiaweighing 4–5 g were stocked randomly and separately infifteen-liter capacity aquaria measuring 10 in. × 10 in. ×10 in. holding 12 l of water. The fish were acclimatizedfor 2 weeks prior to set-up. The treatments were namedafter the plant extracts received: D. carota, M. oleiferaand I. aquatica. A total of 80 fish consisting 4 runs with5 fish per treatment were used for analysis.Aquaria were regularly maintained to ensure cleanli-
ness and prevent water quality deterioration. Aeratorswere installed. Water parameters such as temperatureand dissolved oxygen were monitored. The fish weremonitored and fed twice daily using the feeds mixedwith carotenoid-rich plant extracts. Feeding rate was adlibitum for the duration of 120 days. Initial and finalweights of the fish were determined.Fish were handled and sacrificed for the collection of
tissues following the Institutional Animal Care and UseCommittee (IACUC) policies, procedures and guidelines,with institutional approval from the Central Luzon StateUniversity (Philippines).
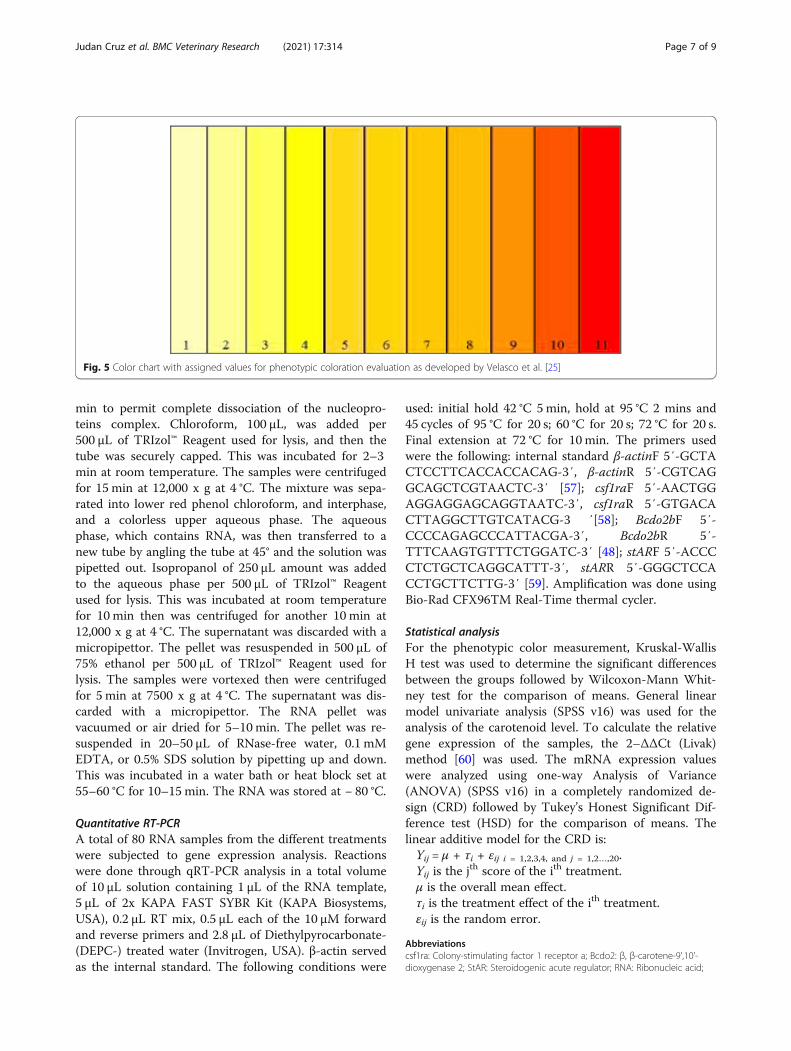
Color measurement of the fishThe experimental fish were photographed using a digitalcamera. A color chart developed by Velasco et al. [26](Fig. 5) with corresponding degrees of coloration fromlight yellow to red orange and assigned values (1–11)was used in differentiating the degree of skin colorationin all treatments.
Measurement of carotenoidsPrior to collection of tissues, fish were euthanized withbuffered MS-222 with a concentration of 250 mg/L andpithed with a 1-cc syringe needle following the 2-stepmethod for the sacrifice of cichlids. 150 g of skin, fin andmuscle tissues of the experimental fish with differenttreatments were collected after 120 days of feeding andwere placed in falcon tubes with 2mL of acetone. Sam-ples were stored at − 20 °C before analysis. The sampleswere placed in room temperature to allow the acetoneto evaporate overnight. Leftover liquid in the sample(2 μL) was used in the measurement of the carotenoidwhere the absorbance of the extracts was determined at449 nm wavelength in a UV-vis spectrophotometer [56].
Gene expression analysisRNA extractionThe tissue samples were lysed and homogenized in TRI-zol™ Reagent by adding 500 μL of TRIzol™ Reagent per50–100 mg of tissue to the sample and were homoge-nized using a homogenizer. This was incubated for 5
Judan Cruz et al. BMC Veterinary Research (2021) 17:314 Page 6 of 9
min to permit complete dissociation of the nucleopro-teins complex. Chloroform, 100 μL, was added per500 μL of TRIzol™ Reagent used for lysis, and then thetube was securely capped. This was incubated for 2–3min at room temperature. The samples were centrifugedfor 15 min at 12,000 x g at 4 °C. The mixture was sepa-rated into lower red phenol chloroform, and interphase,and a colorless upper aqueous phase. The aqueousphase, which contains RNA, was then transferred to anew tube by angling the tube at 45° and the solution waspipetted out. Isopropanol of 250 μL amount was addedto the aqueous phase per 500 μL of TRIzol™ Reagentused for lysis. This was incubated at room temperaturefor 10 min then was centrifuged for another 10 min at12,000 x g at 4 °C. The supernatant was discarded with amicropipettor. The pellet was resuspended in 500 μL of75% ethanol per 500 μL of TRIzol™ Reagent used forlysis. The samples were vortexed then were centrifugedfor 5 min at 7500 x g at 4 °C. The supernatant was dis-carded with a micropipettor. The RNA pellet wasvacuumed or air dried for 5–10min. The pellet was re-suspended in 20–50 μL of RNase-free water, 0.1 mMEDTA, or 0.5% SDS solution by pipetting up and down.This was incubated in a water bath or heat block set at55–60 °C for 10–15 min. The RNA was stored at − 80 °C.
Quantitative RT-PCRA total of 80 RNA samples from the different treatmentswere subjected to gene expression analysis. Reactionswere done through qRT-PCR analysis in a total volumeof 10 μL solution containing 1 μL of the RNA template,5 μL of 2x KAPA FAST SYBR Kit (KAPA Biosystems,USA), 0.2 μL RT mix, 0.5 μL each of the 10 μM forwardand reverse primers and 2.8 μL of Diethylpyrocarbonate-(DEPC-) treated water (Invitrogen, USA). β-actin servedas the internal standard. The following conditions were
used: initial hold 42 °C 5min, hold at 95 °C 2 mins and45 cycles of 95 °C for 20 s; 60 °C for 20 s; 72 °C for 20 s.Final extension at 72 °C for 10 min. The primers usedwere the following: internal standard β-actinF 5′-GCTACTCCTTCACCACCACAG-3′, β-actinR 5′-CGTCAGGCAGCTCGTAACTC-3′ [57]; csf1raF 5′-AACTGGAGGAGGAGCAGGTAATC-3′, csf1raR 5′-GTGACACTTAGGCTTGTCATACG-3 ′[58]; Bcdo2bF 5′-CCCCAGAGCCCATTACGA-3′, Bcdo2bR 5′-TTTCAAGTGTTTCTGGATC-3′ [48]; stARF 5′-ACCCCTCTGCTCAGGCATTT-3′, stARR 5′-GGGCTCCACCTGCTTCTTG-3′ [59]. Amplification was done usingBio-Rad CFX96TM Real-Time thermal cycler.
Statistical analysisFor the phenotypic color measurement, Kruskal-WallisH test was used to determine the significant differencesbetween the groups followed by Wilcoxon-Mann Whit-ney test for the comparison of means. General linearmodel univariate analysis (SPSS v16) was used for theanalysis of the carotenoid level. To calculate the relativegene expression of the samples, the 2–ΔΔCt (Livak)method [60] was used. The mRNA expression valueswere analyzed using one-way Analysis of Variance(ANOVA) (SPSS v16) in a completely randomized de-sign (CRD) followed by Tukey’s Honest Significant Dif-ference test (HSD) for the comparison of means. Thelinear additive model for the CRD is:Yij = μ + τi + εij i = 1,2,3,4, and j = 1,2…,20.Yij is the jth score of the ith treatment.μ is the overall mean effect.τi is the treatment effect of the ith treatment.εij is the random error.
Abbreviationscsf1ra: Colony-stimulating factor 1 receptor a; Bcdo2: β, β-carotene-9’,10’-dioxygenase 2; StAR: Steroidogenic acute regulator; RNA: Ribonucleic acid;
Fig. 5 Color chart with assigned values for phenotypic coloration evaluation as developed by Velasco et al. [25]
Judan Cruz et al. BMC Veterinary Research (2021) 17:314 Page 7 of 9
qRT-PCR: Real-time quantitative reverse transcription polymerase chainreaction; Ct: threshold cycle
AcknowledgementsThe authors appreciate the support of the following: Molecular Biology andBiotechnology Laboratory and Wet Laboratory of the College of Fisheries,Central Luzon State University; Department of Biological Sciences, CentralLuzon State University, Science City of Munoz, Nueva Ecija, Philippines, forthe use of their facilities; and the DOST-Applied Science and Technology Hu-man Resource Development Program (DOST-ASTHRDP) Philippines.
Authors’ contributionsKJC provided the concept and design of the study, wrote the final draft ofthe manuscript, and performed laboratory works. EPL, MBG and SIDF wrotethe first draft of the manuscript, performed laboratory works, providedlaboratory materials and performed statistical analyses. KW wrote a section ofthe manuscript, provided a portion of the laboratory funding, and supervisedthe research. All authors contributed to manuscript revision, read, andapproved the submitted version.
FundingThis study was partly supported by the DOST-Applied Science and Technol-ogy Human Resource Development Program (DOST-ASTHRDP), Philippinesawarded to MBG through funding of the laboratory reagents and other la-boratory materials. The funding agency played no role in the design of thestudy, collection, analysis, and interpretation of data or in the writing themanuscript.
Availability of data and materialsAll data generated or analyzed in this study are available from thecorresponding author on reasonable request.
Declarations
Ethics approval and consent to participateThis study followed the Institutional Animal Care and Use Committee(IACUC) policies, procedures and guidelines, with institutional approval fromthe Central Luzon State University (Philippines).
Consent for publicationNot applicable.
Competing interestsThe authors declare no conflict of interest.
Author details1Department of Biological Sciences, College of Science, Central Luzon StateUniversity, Nueva Ecija, Science City of Munoz, Philippines. 2Department ofCivil and Environmental Engineering, Ehime University, Bunkyo-cho 3,Matsuyama 790-8577, Japan. 3Center for Marine Environmental Studies(CMES), Ehime University, Bunkyo-cho 2-5, Matsuyama, Ehime 790-8577,Japan.
Received: 15 January 2021 Accepted: 27 August 2021
References1. Aketch B, Ang’ienda P, Radull JO, Waindi EN. Effect of stocking density on
the expression of glucose transporter protein 1 and other physiologicalfactors in the Lake Victoria Nile tilapia, Oreochromis niloticus (L.). Int AquatRes. 2014;6:69. https://doi.org/10.1007/s40071-014-0069-3.
2. Asian Development Bank (ADB). Impact evaluation study on thedevelopment of genetically improved farmed tilapia and theirdissemination in selected countries. Manila, Philippines: Impact EvaluationStudy, Asian Development Bank; 2005.
3. Mair GC, Lakapunrat S, Jere WL, Bart A. Comparisons of ReproductiveParameters Among Improved Strains of Nile Tilapia Oreochromis niloticus L.2004. https://cals.arizona.edu
4. Rezoanul H, Ashraful M, Islam M, Abdul W, Md, Enamul Hoq M, MojibarRahman M, Ekram Azim. Evaluation of production performance andprofitability of hybrid red tilapia and genetically improved farmed tilapia
(GIFT) strains in the carbon/nitrogen controlled periphyton-based (C/N- CP)on-farm prawn culture system in Bangladesh. Elsevier. Aquaculture Reports.2016;4:101–111.
5. Siddiqui A, Al-Harbi A. Evaluation of three species of tilapia, red tilapia and ahybrid tilapia as culture species in Saudi Arabia. Aquaculture. 1995;138:145–57. https://doi.org/10.1016/0044-8486(95)01088-2.
6. Behrends L, Nelson R, Smitherman R, Stone N. Breeding and culture ofthe red-gold color phase of tilapia. J the World Mariculture Soc 2009;13: 210–220. https://doi.org/10.1111/j.1749-7345.1982.tb00028.
7. Chavarria M, Flores M. The use of carotenoids in aquaculture. Res J FisheriesHydrobiol. 2013a;8(2):38–49 ISSN 1816–9112.
8. Chavarria M, Flores M. The use of carotenoids in aquaculture. Res J FishHydrobiol. 2013b;8(2):38–49.
9. Lehnert SJ, Christensen KA, Vandersteen WE, Sakhrani D, Pitcher TE, HeathJW, et al. Carotenoid pigmentation in salmon: variation in expression atBCO2-l locus controls a key fitness trait affecting red coloration. Proc R SocB. 2019;286:20191588 https://doi.org/10.1098/rspb.2019.1588.
10. Shahidi F, Brown JA. Carotenoid pigments in seafoods and aquaculture. CritRev Food Sci 1998;38:1–67. https://doi.org/10.1080/1040869989127416.
11. Das AP, Biswas SP. Carotenoids and pigmentation in ornamental fish. JAquac Mar Biol 2016;4(4):00093. https://doi.org/10.15406/jamb.2016.04.00093
12. Bjerkeng B. Carotenoids in aquaculture: fish and crustaceans. In: Britton G.,Liaaen-Jensen S., Pfander H. (eds) carotenoids. 2008;4. Birkhäuser Baselhttps://doi.org/10.1007/978-3-7643-7499-0_12.
13. Sefc KM, Brown AC, Clotfelter ED. Carotenoid-based coloration in cichlidfishes. Comp Biochem Physiol Part A 2014;173:42–51. https://doi.org/10.1016/j.cbpa.2014.03.006
14. Ahi EP, Lecaudey LA, Ziegelbecker A, Steiner O, Glabonjat G, Goessler W, HoisV, Wagner C, Lass A, Sefc KM. Comparative transcriptomics reveals candidatecarotenoid color genes in an east African cichlid fish. BMC Genomics 2020;21:54. https://doi.org/10.1186/s12864-020-6473-8
15. De Carvalho CCCR, Caramujo MJ. Carotenoids in aquatic ecosystems andaquaculture: a colorful business with implications for human health. FrontMar Sci. 2017;4:93. https://doi.org/10.3389/fmars.2017.00093.
16. Rajasingh H, Øyehaug L, Våge DI, Omholt SW. Carotenoid dynamics inAtlantic salmon. BMC Biol. 2006;4:10. https://doi.org/10.1186/1741-7007-4-10.
17. Maoka T, Yokoi S, Matsuno T. Comparative biochemical studies ofcarotenoids in nine species of cephalopoda. Comp Biochem Physiol BBiochem Mol Biol. 1989;92:247–50. https://doi.org/10.1016/0305-0491(89)90273-3.
18. Bendich A, Olson J. Biological actions of carotenoids. FASEB J. 1989;3:1927–32.
19. Hill GE, Johnson JD. The vitamin A–redox hypothesis: a biochemical basisfor honest signaling via carotenoid pigmentation. Am Natl. 2012;180:E127–50. https://doi.org/10.1086/667861.
20. von Schantz T, Bensch S, Grahn M, Hasselquist D, Wittzell H. Good genes,oxidative stress and condition–dependent sexual signals. Biol Chem J. 1999;266:1–12. https://doi.org/10.1098/rspb.1999.0597.
21. Anbazahan S, Mari L, Yogeshwari G, Jagruthi C, Thirumurugan R, ArockiarajJ. Immune response and disease resistance of carotenoids supplementationdiet in Cyprinus carpio against Aeromonas hydrophila. Fish Shellfish Immunol.2014;40(1):9–13. https://doi.org/10.1016/j.fsi.2014.06.011.
22. Gupta SK, Jha AK, Pal AK, Venkateshwarlu G. Use of natural carotenoids forpigmentation in fishes. Nat Product Radiance. 2007;6(1):46–9.
23. Kaur S, Kaur VI, Holeyappa SA, Khairnar SO. Effect of dietarysupplementation of synthetic and natural b-carotene on survival, growthand pigmentation in freshwater ornamental koi (Cyprinus carpio L.) carp.Indian J Anim Nutr. 2016;33(4): 448–455. https://doi.org/10.5958/2231-6744.2016.00079.7
24. Ranjan A. The importance of carotenoids in aquafeeds. Global AquacultureAdvocate 2016. https://www.aquaculturealliance.org/advocate/the-importance-of-carotenoids-in-aquafeeds/?headlessPrint=AAAAAPIA9c8r7gs82oWZBA.
25. Yedier S, Gumus E, Livengood E, Chapman F. The relationship betweencarotenoid type and skin color in the ornamental red zebra cichlidMaylandia estherae. Aquaculture, aquarium, Conservation & Legislation. Int JBioflux Soc. 2014;7(3):207–16.
26. Velasco RR, Dandan RR, Tomas PAG, Torres JC, Galvan JA, Fernando SID,et al. Quantifying the skin pigmentation of gray (Oreochromis niloticus) and
Judan Cruz et al. BMC Veterinary Research (2021) 17:314 Page 8 of 9
red (Oreochromis spp.) tilapia fed with carotenoid rich plants. Int J BiolPharm Allied Sci. 2018;7(8):1601–15.
27. Kiefer C, Hessel S, Lampert JM, Vogt K, Lederer MO, Breithaupt DE, et al.Identification and characterization of a mammalian enzyme catalyzing theasymmetric oxidative cleavage of provitamin a. J Biol Chem. 2001;276:14110–6. https://doi.org/10.1074/jbc.M011510200.
28. Walsh N, Dale J, McGraw KJ, Pointer MA, Mundy NI. Candidate genes forcarotenoid coloration in vertebrates and their expression profiles in thecarotenoid-containing plumage and bill of a wild bird. Proc R Soc B. 2012;279:58–66. https://doi.org/10.1098/rspb.2011.0765.
29. Desobry A, Netto FM, Labuza TP. Preservation of beta-carotene from carrots.Crit Rev Food Sci Nutr. 1998;38:381–96.
30. Anwar F, Latif S, Ashraf M. Gilani. Moringa oleifera: a food plant withmultiple medicinal uses. Phytother Res. 2007;21:17–25.
31. Igwenyi I, Offor O, Obinna A, Nwankwo U, Aja P. Chemical Composition ofIpomea aquatica (Green kangkong). Int J Pharma Bio Sci. 2011;2:593–8.
32. Mustafa A, Trevino LM, Turner C. Pressurized hot ethanol extraction ofcarotenoids from carrot by-products. Molecules. 2012;17:1809–18.
33. Sharma KD, Karki S, Thakur NS, Attri S. Chemical composition, functionalproperties and processing of carrot-a review. J Food Sci Technol. 2012;49(1):22–32. https://doi.org/10.1007/s13197-011-0310-7.
34. Dillard CJ, German JB. Phytochemicals: nutraceuticals and human health: areview. J Sci Food Agric. 2000;80:1744–56.
35. Siddhuraju P, Becker K. Antioxidant properties of various solvent extracts oftotal phenolic constituents from three different agro-climatic origins ofdrumstick tree (Moringa oleifera lam.). J Agric Food Chem. 2003;15:2144–55.
36. Torrissen O, Christiansen R. Requirements for carotenoids in fish diets. JAppl Ichthyol. 2007;11(3–4):225–30. https://doi.org/10.1111/j.1439-0426.1995.tb00022.x.
37. Rahman MM, Khosravi S, Chang KH, Lee SM. Effects of dietary inclusion ofAstaxanthin on growth, muscle pigmentation and antioxidant capacity ofjuvenile rainbow trout (Oncorhynchus mykiss). Prev Nutr Food Sci. 2016;21(3):281–8 https://doi.org/10.3746/pnf.2016.21.3.281.
38. Nickell DC, Bromage NR. The effect of timing and duration of feedingastaxanthin on the development and variation of fillet colour and efficiencyof pigmentation in rain- bow trout (Oncorhynchus mykiss). Aquaculture.1998;169:233–46.
39. Salzburger W, Braasch I, Meyer A. Adaptive sequence evolution in a colorgene involved in the formation of the characteristic egg-dummies of malehaplochromine cichlid fishes. BMC Biol. 2007;5(51).
40. Tripathy PS, Devi NC, Parhi J, Priyadarshi H, Patel AB, Pramod KP, et al.Molecular mechanisms of natural carotenoid-based pigmentation of queenloach, Botia dario (Hamilton, 1822) under captive condition. Sci Rep. 2019;9:12585 https://doi.org/10.1038/s41598-019-48982-9.
41. Braasch I, Salzburger W, Meyer A. Asymmetric evolution in two fish-specifically duplicated receptor tyrosine kinase paralogons involved inteleost coloration. Mol Biol Evol. 2006;23(6):1192–202.
42. Parichy DM, Ransom DG, Paw B, Zon LI, Johnson SL. An orthologue of thekit related gene fms is required for development of neural crest-derivedxanthophores and a subpopulation of adult melanocytes in the zebrafish,Danio rerio. Development. 2000;127:3031–44.
43. Bagnara J, Matsumoto J. Comparative anatomy and physiology of pigmentcells in nonmammalian tissues. In: The Pigmentary System: Physiology andPathophysiology. 2nd ed. Oxford: Blackwell Science; 2006. p. 11–59.
44. Patterson LB, Bain EJ, Parichy DM. Pigment cell interactions and differentialxanthophore recruitment underlying zebrafish stripe reiteration and Daniopattern evolution. Nat Commun. 2015;5:5299.
45. Pederzoli A, Gambarelli A, Restani C. Xanthophore migration from thedermis to the epidermis and dermal remodeling during Salamandrasalamandra salamandra (L.) larval development. Pigment Cell Res. 2003;16(1):50–8.
46. Singh AP, Nüsslein-Volhard C. Zebrafish stripes as a model for vertebratecolour patten formation. Curr Biol. 2015;25(2):81–92.
47. Eriksson J, Larson G, Gunnarsson U, Bed'hom B, Tixier-Boichard M,Strömstedt L, et al. Identification of the yellow skin gene reveals a hybridorigin of the domestic chicken. PLoS Genet. 2008;4:e1000010.
48. Lobo GP, Isken A, Hoff S, Babino D, von Lintig J. BCDO2 acts as a carotenoidscavenger and gatekeeper for the mitochondrial apoptotic pathway.Development. 2012;139(16):2966–77.
49. Berry SD, Davis SR, Beattie EM, Thomas NL, Burrett AK, Ward HE, et al.Mutation in bovine β-carotene oxygenase 2 affects milk color. Genetics.2009;182(3):923–6.
50. Tian R, Pitchford WS, Morris CA, Cullen NG, Bottema CD. Genetic variation inthe beta, beta-carotene-9′, 10′-dioxygenase gene and association with fatcolour in bovine adipose tissue and milk. Anim Genet. 2010;41:253–9.https://doi.org/10.1111/j.1365-2052.2009.01990.x.
51. Diepeveen ET, Salzburger W. Molecular characterization of two endothelinpathways in east African cichlid fishes. J Mol Evol. 2011;73:355–68.
52. Minchin JEN, Hughes SM. Sequential actions of Pax3 and Pax7 drivexanthophore development in zebrafish neural crest. Dev Biol. 2008;317:508–22.
53. O’Quin CT, Drilea AC, Conte MA, Kocher TD. Mapping of pigmentation QTLon an anchored genome assembly of the cichlid fish, Metraclima zebra.BMC Genomics. 2013;14(287):1–8.
54. De Carvalho LMJ, Gomes PB, Godoy RLDO, Pacheco S, Do Monte PHF,Carvalho JLV, Nutti MR, Neves ACL, Vieira ACRA, Ramos SRR. Totalcarotenoid content, α-carotene and β-carotene, of landrace pumpkins(Cucurbita moschata Duch): a preliminary study. Food Res Int 2012;47(2)337–340. https://doi.org/https://doi.org/10.1016/j.foodres.2011.07.040.
55. Wallat GK, Lazur A, Chapman FA. Carotenoids of different types andconcentrations in commercial formulated fish diets affect color and itsdevelopment in the skin of the red Oranda variety of goldfish. N Am JAquac. 2005;67(1):42–51.
56. Hui N, Guo-qing H, Hui R, Qi-he C, Feng C. Application of derivative ratiospectrophotometry for determination of β-carotene and astaxanthin fromPhaffia rhodozyma extract. J Zhejiang Univ Sci. 2005;6B(6):514–22.
57. Ran C, Huang L, Hu J, Tacon P, He S, Li Z, et al. Effects of dietary live andheat-inactive baker’s yeast on growth, gut health, and disease resistance ofNile tilapia under high rearing density. Fish Shellfish Immunol. 2016;56:263–71.
58. Kottler V, Fadeev A, Weigel D, Dreyer C. Pigment pattern formation in theguppy, Poecilia reticulate, involves the kita and Csf1ra receptor tyrosinekinases. Genetics. 2013;194(3):631–46. https://doi.org/10.1534/genetics.113.151738.
59. Kocerha J, Prucha M, Kroll K, Steinhilber D, Denslow N. Regulation ofSteroidogenic acute regulatory protein transcription in largemouth bass byorphan nuclear receptor signaling pathways. Endocrinology. 2009;151:341–9.https://doi.org/10.1210/en.2009-0551.
60. Livak KJ, Schmittgen TD. Analysis of relative gene expression data usingreal-time quantitative PCR and the 2(−Delta Delta C(T)) method. Methods.2001;25:402–8.
Publisher’s NoteSpringer Nature remains neutral with regard to jurisdictional claims inpublished maps and institutional affiliations.
Judan Cruz et al. BMC Veterinary Research (2021) 17:314 Page 9 of 9