Embed Size (px)
Citation preview

1 / 37 Article 10.47982/cgc.8.388 Challenging Glass Conference Proceedings – Volume 8 – 2022 – Belis, Bos & Louter (Eds.)
Challenging Glass Conference Proceedings – Volume 8 – 2022 – Belis, Bos & Louter (Eds.) Challenging Glass Conference 8 – 23 & 24 June 2022 – Ghent University – Ghent – Belgium Conference on Architectural and Structural Applications of Glass
Case Studies on the Thermally Induced Stresses in Insulating Glass Units via Numerical Calculation
Gregor Schwind, Franz Paschke, Jens Schneider
Technical University of Darmstadt, Institute of Structural Mechanics and Design (ISM+D), Germany, [email protected]
Abstract
In the structural design of facade glazing, various types of loads such as dead weight, wind and climatic loads (pressure differences) must be taken into account. In practice, however, there are many cases of damage that can be attributed to direct solar radiation. In these cases, a so-called thermally induced fracture takes place, which can occur as a result of large in-plane temperature differences within the glass. Due to the increasing complexity of glazing constructions, this load type should be taken into account in future glass design. For this reason, thermal-mechanical investigations, were conducted. Commercially used double and triple insulating glass units were considered as vertical glazing and the solar direct absorptance per glass pane was varied. For numerical calculations, measured temperature data from the German Weather Service and free available Clear Sky model data were used as meteorological input. The results show that solar irradiance, along with temperature, is the driving influence on the thermally induced stress in insulating glass units. The investigations indicate that the inner pane becomes relevant on colder days and the outer pane on warmer days. Results also show, that the level of the outside temperature plays a negligible role for the thermally induced stresses of the middle pane.
Keywords
Facade Glazing, Structural Design, Solar Irradiance, Thermally Induced Stress, Insulating Glass Unit
Article Information • Digital Object Identifier (DOI): 10.47982/cgc.8.388 • This article is part of the Challenging Glass Conference Proceedings, Volume 8, 2022, Belis, Bos & Louter (Eds.) • Published by Challenging Glass, on behalf of the author(s), at Stichting OpenAccess Platforms • This article is licensed under a Creative Commons Attribution 4.0 International License (CC BY 4.0) • Copyright © 2022 with the author(s)

2 / 37 Article 10.47982/cgc.8.388 Challenging Glass Conference Proceedings – Volume 8 – 2022 – Belis, Bos & Louter (Eds.)
1. Introduction
Facade glazing is exposed to different loads such as dead weight and wind loads and must be designed according to the relevant standards. In the case of insulating glazing, climatic loads such as the change in air pressure due to the difference in height (production site to installation site) or due to the expansion of the gas in the cavity between the panes due to a change in temperature are also taken into account. In connection with these climatic loads, however, the action on the glass due to solar irradiance is often neglected, which can be relevant for the dimensioning of glazing, as many cases of damage from practice show. When solar irradiance hits unshaded areas of the glazing, these areas heat up more than the areas that are in the shadow. The shading can be caused by external environmental influences, such as surrounding architecture, or by the construction itself, e.g., glass rebate in the window frame or roof overhang. Due to the uneven in-plane heating of the glass pane (the gradient of the temperature over the thickness of the glass is almost negligible Pilette and Taylor 1988), the warmer central area of the glass pane expands more than the comparatively cooler edge of the glass, which is equal to a restraint of the expansion of the warmer central area, as it can be seen in Fig. 1 a) on the left. These resulting unevenly distributed thermal strains (usually: positive strain at the edge of the glass - tension, negative strain in the centre of the glass - compression) can be translated into so-called thermally induced stresses with the help of the law of elasticity. Large in-plane temperature differences may lead the glass to fracture at the edge, as it can be seen exemplary in the close-up views in Fig. 1 b) and c). This phenomenon can be caused not only by solar irradiance, but also by various heat sources, such as in the case of fire, where the glazing must be able to withstand high temperatures and high thermal radiation depending on the installation situation.
a) b) c)
Fig. 1: a) Phenomenon of thermally induced stresses in glass and b) and c) exemplary fracture pattern due to thermally induced stresses.
In the current state of standardization, only the French standard NF DTU 39 P3 (2006) exists in Europe, which enables the design of glazing with regard to thermally induced stresses. There, different simplified one-dimensional calculation methods are provided that enable the engineer to design with regard to the avoidance of thermally induced glass edge breakage. In the Italian guideline CNR DT 210 (2013), boundary conditions for the calculation are proposed and a temperature calculation procedure for double insulating glass units (DGU) is provided. Various leaflets of different countries, like Glass & Glazing Association of Australia AGGA (2015), Flachglas Schweiz AG (2021) and Verband Fenster + Fassade e.V. (2012) can be found on this topic, but in these leaflets only information on the phenomenon itself can be found, but no boundary conditions or methods for the thermally induced stress calculation are given there. In a few older publications such as Mai and Jacob (1980), Pilette and Taylor (1988), but also in more recent publications such as Chen et al. (2017), Hildebrand and Pankratz

3 / 37 Article 10.47982/cgc.8.388 Challenging Glass Conference Proceedings – Volume 8 – 2022 – Belis, Bos & Louter (Eds.)
(2013), Kozlowski et al. (2018), Montali et al. (2020) and Polakova et al. (2018), the topic of glass edge fracture of facade glazing induced by direct solar radiation was considered. In other publications with the background of fire behaviour of glazing Cuzzillo and Pagni (1998), Dembele et al. (2012) and Tofilo and Delichatsios (2010), the topic of thermally induced glass breakage was also considered. Although these publications already describe the relationship between the non-uniform temperature distribution and the resulting thermally induced stresses in the plane of the glass pane, only in Polakova et al. (2018) currently used calculation methods, including the approach of various meteorological data, are discussed in more detail. For the above-mentioned reasons, a research project, which is described in Ensslen et al. (2022), investigates different meteorological conditions as well as state-of-the-art glazing in more detail. In the context of the publication presented here, the basics of numerical modelling for the thermal calculation of insulating glass units are described. In the next step the calculation of the thermal transmittance Ug of the insulating glass unit is used to validate the model. Subsequently, initial calculation results on the thermally induced glass edge stresses of double and triple insulating glass units (DGU and TGU) are presented using realistic and artificially generated meteorological data to present the range in which thermally induced stresses can arise. For the calculations, half-sided shading of the glazing is assumed (as an example) in order to take into account a shadowed situation, with reference to NF DTU 39 P3 (2006) and to additionally clarify the results using the temperature and stress plots presented later.
2. Heat transfer mechanisms
The transfer of heat, as a form of energy, takes place through the three mechanisms: heat conduction, convection and radiation. According to the second law of thermodynamics, energy always is transferred, from the warmer to the colder region for every transfer mechanism (Verein deutscher Ingenieure VDI e.V. 2013).
Heat conduction
Heat conduction describes the transfer of energy within a material that is exposed to a temperature gradient. In this process, energy is transferred from molecule to molecule through the movement of the molecules (oscillation and impact processes). Heat conduction is not necessarily bound to the solid state of aggregation and can therefore also take place in liquids and gases. With the help of Fourier's law (Jean Baptiste Joseph Fourier around 1822) (Verein deutscher Ingenieure VDI e.V. 2013), the heat transfer or heat flux density �̇�𝑞conduction [W/m2] through heat conduction can be calculated, as shown in Eq. 1 for the one-dimensional and steady state case (time independent). The so-called thermal conductivity λ [W/(m K)] is used as a proportionality factor, which is assumed to be constant and isotropic for all further considerations. The temperature T1 is the temperature of the warmer surface, while the temperature T2 is the temperature of the colder surface. The thickness over which heat conduction occurs is taken into account with d.
�̇�𝑞conduction = 𝜆𝜆𝑑𝑑
(𝑇𝑇1 − 𝑇𝑇2) (1)
In the case, when boundary conditions may change with the parameter time t (e.g., solar irradiance or outdoor temperature), a transient analysis can be useful. Therefore, the transient heat conduction equation, which is given in Eq. 2 (Stephan 2013) for the three-dimensional case applies.

4 / 37 Article 10.47982/cgc.8.388 Challenging Glass Conference Proceedings – Volume 8 – 2022 – Belis, Bos & Louter (Eds.)
𝜕𝜕𝜕𝜕𝜕𝜕𝜕𝜕
= 𝜆𝜆𝑐𝑐p𝜌𝜌
�𝜕𝜕2𝜕𝜕
𝜕𝜕𝑥𝑥2+ 𝜕𝜕2𝜕𝜕
𝜕𝜕𝑦𝑦2+ 𝜕𝜕2𝜕𝜕
𝜕𝜕𝑧𝑧2� (2)
Equation 2 shows the dependence of the temperature T, time t, location x, y and z, thermal conductivity λ, specific heat capacity cp [J/(kg K)] and density ρ [kg/m3]. For the thermal calculations presented later, these input variables are defined in Section 5.
Convection
Convection describes the heat transfer between fluids (liquids and gases) and solids and contains the part of heat conduction. Convection could therefore also be simplified formulated as heat conduction, which is intensified by the flow of the medium. This connection will become clear later in Section 4.2 with the help of Equation 9. If the flow velocity of the medium is zero, no convection takes place and the medium transports heat only by the mechanism of heat conduction (see Section 2.1). In addition to the flow velocity, other parameters such as the temperature of the flowing medium and the surface roughness and temperature of the solid can also influence the heat transfer by convection. The heat flux density due to convection �̇�𝑞convection [W/m2] can be calculated in a simplified way as shown in Equation 3 (Verein deutscher Ingenieure VDI e.V. 2013) and applies for the steady and transient state.
�̇�𝑞convection = ℎconvection(𝑇𝑇Surface − 𝑇𝑇Bulk) (3)
Here, hconvection [W/(m2 K)] describes the convective heat transfer coefficient, whose size depends on the usually temperature-dependent material properties of the flowing medium, the flow velocity of the medium and the surface roughness of the solid in contact with the flowing medium. The temperature TSurface represents the surface temperature of the construction (e.g., glass or frame surfaces), while the temperature TBulk takes into account the temperature of the environment (outside or inside temperature). For external surfaces, the convective heat transfer coefficient hconvection, outside can be calculated in a simplified way according to EN ISO 6946 (2017) as a function of the wind speed v [m/s] using Equation 4.
ℎconvection, outside = 4 + 4𝑣𝑣 (4)
For the glass surfaces surrounding the cavity of an insulating glass unit, the convective heat transfer coefficient hg,k can be calculated according to EN 673 (2011) depending on the gas properties and the temperature differences of the glass surfaces. The calculation of hg,k is explained in more detail in Section 4. For the convective heat transfer coefficient on interior surfaces hconvection, inside = 3.6 W/(m2 K), as proposed in EN 673 (2011), can be used. Further considerations on the convective heat transfer coefficient can be found in Jelle (2013).
Radiation
Heat transfer by radiation is caused by electromagnetic waves, which do not require a medium for propagation. In the case of radiative heat transfer on glazing, a distinction should be made between heat input and heat output by radiation. The direct solar irradiance on the glazing represents the heat input, which depends on the luminous and solar characteristics of the glazing: absorption α [-], reflection ρ [-], transmission τ [-] and emissivity ε [-]. The quantities just mentioned are additionally dependent on the wavelength of the incoming radiation. With the help of EN 410 (2011), the solar direct absorptance αe [-] of each glass pane can be calculated, which indicates how many percent of the incoming solar irradiance I [W/m2] is effectively absorbed by the glass pane. The energy input (heat

5 / 37 Article 10.47982/cgc.8.388 Challenging Glass Conference Proceedings – Volume 8 – 2022 – Belis, Bos & Louter (Eds.)
flux density �̇�𝑞direct, irradiance) into a glass pane due to direct solar radiation can be calculated if the solar irradiance and the solar direct absorptance αe are known, as described in Equation 5.
�̇�𝑞direct, irradiance = 𝐼𝐼𝛼𝛼e (5)
At the same time, the emissivity ε of each glass surface is relevant for the heat exchange, as the emissivity indicates how much of the heat energy can be released to the environment as diffuse radiation �̇�𝑞diffuse, radiation. The heat exchange by means of diffuse thermal radiation goes back to the Stefan-Boltzmann law and can be formulated in a simplified form as shown in Equation 6 (applies for steady and transient state), where the emissivity ε of the surface (here outer/inner surface of the glazing) is included in the radiative heat transfer coefficient hradiation, outside/inside [W/(m2 K)] and may be calculated with Equation 7 (see EN ISO 6946 2017). In Equation 7 the temperature TSurface represents the surface temperature of the construction (e.g., glass or frame surfaces), while the temperature TBulk takes into account the radiant temperature of the environment. In Jelle (2013) further information is given regarding the radiative heat transfer coefficient and the wavelength-dependent quantities of absorption, reflection, transmission and emission. For the surfaces of the glass surrounding the cavity of an insulating glass unit, the radiative heat transfer coefficient hrad can be calculated according to EN 673 (2011) as a function of the emissivities of the glass surfaces surrounding the cavity. The calculation is discussed in more detail in Section 4.
�̇�𝑞diffuse, radiation = ℎradiation(𝑇𝑇Surface − 𝑇𝑇Bulk) (6)
ℎradiation, outside/inside = 4𝜎𝜎𝜎𝜎𝑇𝑇m3 (7)
Regarding the temperature difference of the bodies exchanging heat by means of diffuse radiation, it should be noted that the surface temperature of the glazing and the bulk temperature (also radiant temperature) are combined by the mean temperature Tm (arithmetic mean of TSurface and TBulk). This approach is based on the fact that the surface temperatures of the considered bodies exchanging radiant heat are not too different. The radiant bulk temperature depends on the inclination (e.g., vertical) of the glazing, as the inclination of the glazing results in a different viewing factor to the surrounding external surfaces. E.g., a horizontal roof glazing “sees” more of the sky and less of the rest of the surroundings, while it is correspondingly the other way round for a vertical glazing. Since vertical glazing is considered in the studies presented here, the assumption that the radiation bulk temperature of the surroundings and of the outer glass surface are not too different is approximately justified. When considering horizontal glazing, it is important to look closely at the radiant bulk temperatures of the surfaces involved (sky and glazing), as in particular the sky temperature on a cloudless day can be as low as - 20 °C (regardless of the time of year) (Maroy et al. 2017), while at the same time the ambient temperature on a summer day in Europe can be between 30 °C and 40 °C based on experience.

6 / 37 Article 10.47982/cgc.8.388 Challenging Glass Conference Proceedings – Volume 8 – 2022 – Belis, Bos & Louter (Eds.)
3. Description of the investigated glazing
For the investigations presented here, double and triple insulating glazing (see cross-sections through the frame in Fig. 3a and 3b) in southern orientation (azimuth 180 °) as vertical glazing are considered. The dimensions of the glass panes were chosen to 2000 mm x 1000 mm (see Fig. 2), whereby the glazing is assumed to be so-called standing glazing (see glazing blocks in Fig. 2). The glazing blocks have usually a length of around 100 mm and are installed with a distance from the corner of the glass of around their length. The exact position of the glazing blocks is not specified, as these are later neglected in the numerical simulations for simplification. Each glass pane is assumed to be monolithic with a nominal thickness of 4 mm. For the cavities of the insulating glass units, which would be filled with an argon-air mixture (90% argon, 10% air), a distance of 16 mm is chosen, which is common in practice. At the edge of the cavities, an edge pacer of the so-called warm edge technology with polysulphide sealant is used. A simplified wooden frame (base frame taken from EN ISO 10077-2 Annex H Figure H.5 2017) with a light colour (assumption αe,frame = 0.2) and relatively good thermal insulation properties (thermal transmittance of Uf ≈ 1.4 W/(m2 K) - further investigations on currently used window frames can be found in Baldinelli et al. 2020) is assumed for the framing of the insulating glass. The glass rebate in the wooden frame is assumed to be 15 mm, whereby a 3 mm thick EPDM (ethylene-propylene-diene monomer rubber) sealant is assumed at the juncture between the wooden frame and the glass (see Figs. 3a and 3b).
Fig. 2: Glass dimensions and glazing blocks. All dimensions in mm.
The basic values of the material properties were taken from EN ISO 10456 (2007) and EN 572-1 (2016). For the warm edge spacer, the equivalent thermal conductivity for the 2-box model (Svendsen et al. 2005) was taken from an information sheet (Bundesverband Flachglas e.V. 2013). The density ρ and specific heat capacity cp of the edge spacer were averaged via the cross-sectional area. The material properties used in all numerical simulations can be found in Tables 1 and 2.

7 / 37 Article 10.47982/cgc.8.388 Challenging Glass Conference Proceedings – Volume 8 – 2022 – Belis, Bos & Louter (Eds.)
a) b)
Fig. 3: Cross-section through the simplified wooden frame of a) double insulating glass unit and b) triple insulating glass unit.
Table 1: Material properties used for thermal steady state and transient simulation, taken from a) EN ISO 10456 (2007), b) EN 572-1 (2016), c) Bundesverband Flachglas e.V. (2013) and d) averaged via cross-sectional area.
Material Density ρ
[kg/m] Isotropic thermal conductivity λ
[W/(m K)] Specific heat cp
[J/(kg K)]
Timbera) 500 0.13 1600
Ethylen-Propylen-Dien-Monomera) 1150 0.25 1000
Soda-lime silicate glassb) 2500 1.00 720
Polysulphidea) 1700 0.40 1000
Warm edge spacer (λ: 2-box model; ρ and cp: averaged) 1079d) 0.28c) 992d)
Composition of warm edge spacer:
Polyvinyl chloride (PVC)a) 1390 0.17 900
Stainless steel, austenitic or austenitic-ferritica) 7900 17.00 500
Silica gel (drying medium)a) 720 0.13 1000
Butyl rubber (isobutene rubber), hard/hot melteda) 1200 0.24 1400
Table 2: Material properties used for mechanical simulation, taken from EN 572-1 (2016).
Material Young’s Modulus [MPa] Poisson’s ratio [-] Coefficient of linear thermal expansion αT [1/K]
Soda-lime silicate glass 70000 0.2 9 ∙ 10-6

8 / 37 Article 10.47982/cgc.8.388 Challenging Glass Conference Proceedings – Volume 8 – 2022 – Belis, Bos & Louter (Eds.)
4. Modelling of heat transfer in cavity and calculation of thermal transmittance (Ug) for a triple insulating glass unit (validation of model)
Before the thermal-mechanical calculations (Section 6) can be conducted, it must first be checked whether it is possible to model the thermal behaviour of an insulating glass unit using commercial finite element software by just using solids (no fluid dynamics). In particular, the question arises how the heat transfer in the cavity between the glass panes can be modelled, since here, compared to all other areas of the glazing, a fluid and not a solid is present. A fluid dynamic simulation of the thermal behaviour of the gas in the cavity would probably reflect the heat transfer by convection taking place there with the best accuracy, but is not practical for an engineering application. For this reason, it was decided to model the heat transfer in the cavity using convection boundary conditions with combined heat transfer coefficients (superposition of radiation and convection). In doing so, the effects of fluid flow due to convection are taken into account in a simplified way. This engineering approach is based on the procedure in EN 673 (2011), which is the basis for the calculation of the thermal transmittance Ug.
As already described in Section 2.2, convection is influenced by the flow velocity of the gas in the cavity between the glass panes. To avoid complex calculations to determine the flow velocity, the so-called Nusselt number Nu can be used. This dimensionless characteristic number describes the ratio of the heat transfer mechanisms of convection to conduction (Nu = qconvection / qconduction) and thus describes how much greater the heat transfer of the heat conduction is increased by the fluid flow. This results in the physical limit value of Nu = 1 for the Nusselt number, which describes the condition that the heat transfer mechanisms of conduction and convection are to be regarded as equivalent. In this state, the heat transfer in the cavity can be represented either by conduction or convection. At the same time, heat radiation must also be taken into account to complete the heat transfer phenomenon within the cavity. If the Nusselt number is larger than one, the heat transfer by means of heat conduction is amplified by the fluid flow. This phenomenon could be described as an increased heat conduction, which can be physically represented with a convection boundary condition. If the calculation of the Nusselt number (for given temperature difference between the surfaces of the cavity) results in Nu < 1, Nu = 1.0 must be set (EN 673 2011). Values for Nu < 1 would be equivalent to a negative flow velocity, which is physically impossible. In the case of Nu < 1, heat transfer in the cavity takes place by means of thermal conduction and radiation, whereas for Nu ≥ 1, heat transfer takes place by means of convection and radiation.
In order to check whether the approach chosen here (heat transfer in the cavity by means of convection boundary conditions with combined heat transfer coefficients) can be validated, the thermal transmittance Ug of a triple insulating glass unit was calculated using finite element software and finally compared with the manual calculation according to EN 673 (2011). For this purpose, a thermal steady state analysis with constant boundary conditions is carried out on a finite element model and the heat flux density in each glass pane is evaluated. Subsequently, the thermal transmittance Ug can be calculated using the numerically determined heat flux density in the glass and the present temperature difference between inside and outside. The boundary conditions and the calculation are described in Sections 4.1 and 4.2.

9 / 37 Article 10.47982/cgc.8.388 Challenging Glass Conference Proceedings – Volume 8 – 2022 – Belis, Bos & Louter (Eds.)
Thermal boundary conditions on the outer and inner surface for thermal transmittance (Ug) calculation
The thermal boundary conditions for the outer (outside of the building skin) and inner (inside of the building skin) surfaces of the insulating glass unit are taken from EN 673 (2011). It should be noted that the heat transfer coefficients provided there represent a superposition of the heat transfers of radiation and convection. The external heat transfer coefficient is composed of a convective part of hext., conv. = 20 W/(m2 K) and a radiative part of approx. hext., rad. = 5 W/(m2 K), which results in a combined heat transfer coefficient of hext. = 25 W/(m2 K) on the external surfaces (see EN 673 2011). This composition can be traced by the information given in Table 7 of EN ISO 6946 (2017). The internal heat transfer coefficient is composed of the convective component of hint., conv. = 3.6 W/(m2 K) and, depending on the emissivity of the glass surface, a radiative component of hint., rad. = 4.1 W/(m2 K) (for an emissivity of εglass, uncoated = 0.837 see EN 572-1 2016), resulting in a combined heat transfer coefficient of hint. = 7.7 W/(m2 K) on inner surfaces (see EN 673 2011). The superposition of the convective and radiative parts of the heat transfer coefficient is based on the assumption that the radiation bulk temperature of the environment is similar to the bulk air temperature (see Section 2.3). With the help of this assumption and the similarity of Equations 3 and 6, the heat transfer coefficients for radiation and convection can be superposed and used in a convection boundary condition (separately for the outside and inside of the glazing).
The bulk temperature of the convection boundary condition on the outer surfaces is chosen to Text. = 5 °C, while for the interior surfaces the bulk temperature was chosen to Tint. = 20 °C, which results in a temperature difference of ΔT = 15 K from inside to outside according to EN 673 (2011). In summary, the following thermal boundary conditions result on the outer and inner surfaces for the thermal transmittance (Ug) calculation:
• External combined heat transfer coefficient, constant: hext. = 25 W/(m2 K) with constant external temperature of Text. = 5 °C as convection boundary condition,
• Internal combined heat transfer coefficient, constant: hint. = 7.7 W/(m2 K) with constant external temperature of Tint. = 20 °C as convection boundary condition.
Thermal boundary conditions on glass surfaces surrounding the cavity for thermal transmittance (Ug) calculation
To take into account the heat transfer through the cavity, the equations of EN 673 (2011) are used to determine the combined (radiation and convection) heat transfer coefficient. For the two cavities of the triple insulating glass unit, the assumption is made that thermal insulation coatings (emissivity ε3,5 = 0.0352) are applied on positions 3 and 5. Positions 2 and 4, with an emissivity according to EN 572-1 (2016) of ε2,4 = 0.837, are not coated. The numbering of the positions can be understood from Fig. 5. This results in an identical constellation of emissivities for both cavities and, as can be seen from Equation 8 (EN 673 2011), also the same radiative heat transfer coefficient.
ℎr,k = 4𝜎𝜎 � 1𝜀𝜀2/4,k
+ 1𝜀𝜀3/5,k
− 1�−1𝑇𝑇m,k3 (8)
Where:
• 𝜎𝜎 = 5.67 ∙ 10−8 Wm4K2 Stefan-Boltzmann constant
• 𝜎𝜎2/4,k = 0.837 Emissivity of Pos. 2 and 4

10 / 37 Article 10.47982/cgc.8.388 Challenging Glass Conference Proceedings – Volume 8 – 2022 – Belis, Bos & Louter (Eds.)
• 𝜎𝜎3/5,k = 0.0352 Emissivity of Pos. 3 and 5 • 𝑇𝑇m,k = 283 K Mean thermodynamic temperature for both cavities, see also EN 673
Annex A (2011)
The radiative heat transfer coefficient is calculated with the help of the assumed input values to hr,2/3 = hr,4/5 = 0.17 W/(m2 K).
The convective heat transfer coefficient hg,k for both cavities will be calculated in line with the formulae and boundary conditions given by EN 673 (2011), whereby it is assumed that the cavity is filled with 90 % argon gas and 10 % air. To determine the convective heat transfer coefficient, the Nusselt number is required, which, under the given boundary conditions by EN 673 (2011), is calculated to Nu ≈ 0.85 and is set to Nu = 1 by the limit condition. Based on the calculated Nusselt number (Nu = 0.85 < 1), it can be concluded that for the temperature condition described in EN 673 (2011) (Text. = 5 °C und Tint. = 20 °C), heat transfer in the cavity does not take place by means of convection, but rather via heat conduction due to the low Nusselt number. In this sense, the idea could arise that the heat transfer through the cavity can be modelled with a volumetric body with a volumetrically averaged thermal conductivity (𝜆𝜆cavity = 1.7652 ∙ 10−2 W (m K)⁄ for the gas mixture assumed here, 90 % argon and 10 % air filling). With this approach, however, it would no longer be possible to take thermal radiation into account and incorrect results would follow. For this reason, a convection boundary condition is used to model the heat transfer in the cavity, which contains the combined heat transfer coefficient (radiation and convection). Finally, the convective heat transfer coefficient hg,k according to EN 673 (2011) can be determined using Equation 9.
ℎg,k = 𝑁𝑁𝑁𝑁 ∙ 𝜆𝜆k𝑠𝑠k
= 1.0 ∙1.7652∙10−2 W
m∙K0.016m
≈ 1.1 Wm2∙K
(9)
The combined heat transfer coefficient for the cavity of the triple insulating glass unit is finally obtained by the superposition of radiation and convection (hr,2/3 = hr,4/5 = hr,cav. = 0.17 W/(m2 K) and hg,k = 1.1 W/(m2 K)) to hcavity = hr,cav. + hg,k = 1.28 W/(m2 K). For the thermal transmittance calculation of the insulating glass all required input values are now available.
Calculation of the thermal transmittance Ug via numerical simulation
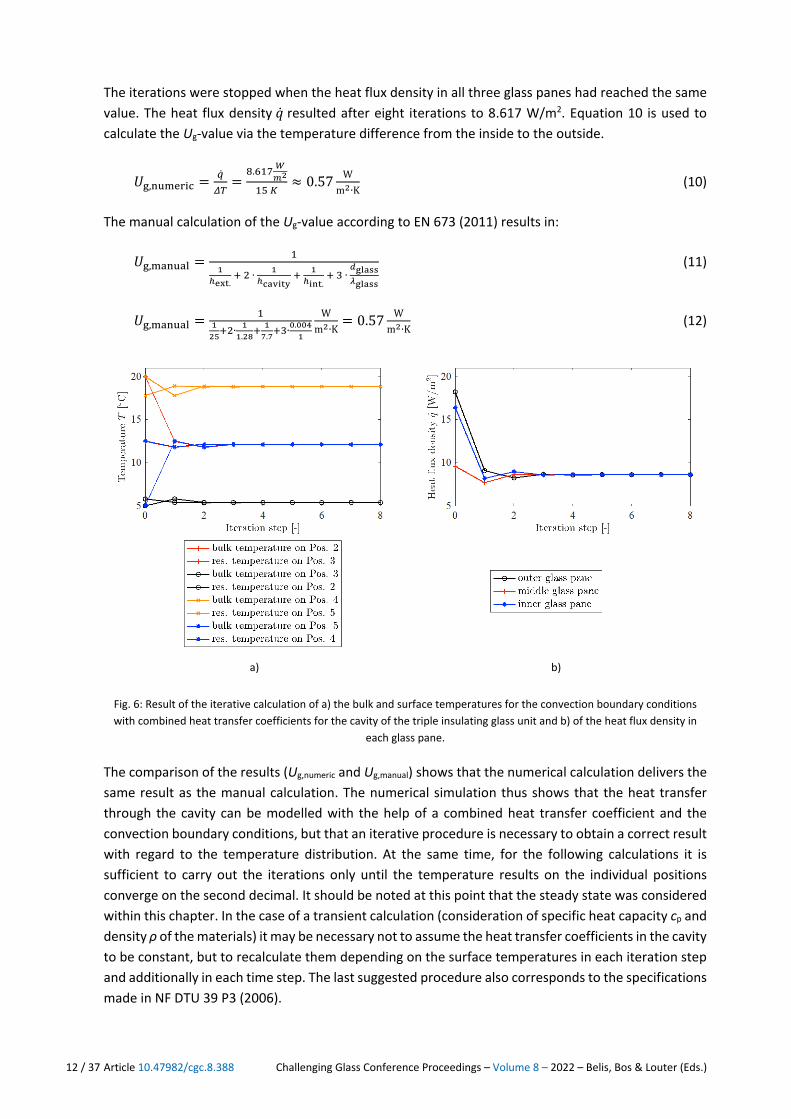
In the numerical simulation, a simplified finite element volume body model is generated in order to calculate the thermal transmittance Ug of the glazing with the help of the cavity heat transfer coefficient hcavity = 1.28 W/(m2 K) calculated in Section 4.2. It should be noted that edge spacers and frame construction have no influence on the Ug-value (Paschke et al. 2021) and therefore do not need to be represented in the model. In this sense, the numerical model shown in Fig. 4 results with one element in the x-y-plane and three elements across the thickness of each glass pane (z-direction). The boundary conditions used for the thermal transmittance calculation by means of thermal steady state simulation are shown in Fig. 5 in a side view.
As it can be seen from Fig. 5 an initial guess for the bulk temperature of the convective boundary conditions on position 2, 3, 4 and 5 is needed. Due to the fact, that the bulk temperature for the convection boundary condition of pos. 2 equals to the surface temperature of pos. 3 (TBulk,Pos.2 = Tsurf.,Pos.3) and vice versa and so on, the correct bulk temperatures of the convection boundary conditions in the cavity need to be calculated iteratively. In the first calculation (iteration step 0) the bulk temperatures are chosen (initial guess) as described in Fig. 5 and can additionally be seen in the columns two to five of Table 3. The surface temperature results of the calculation using the
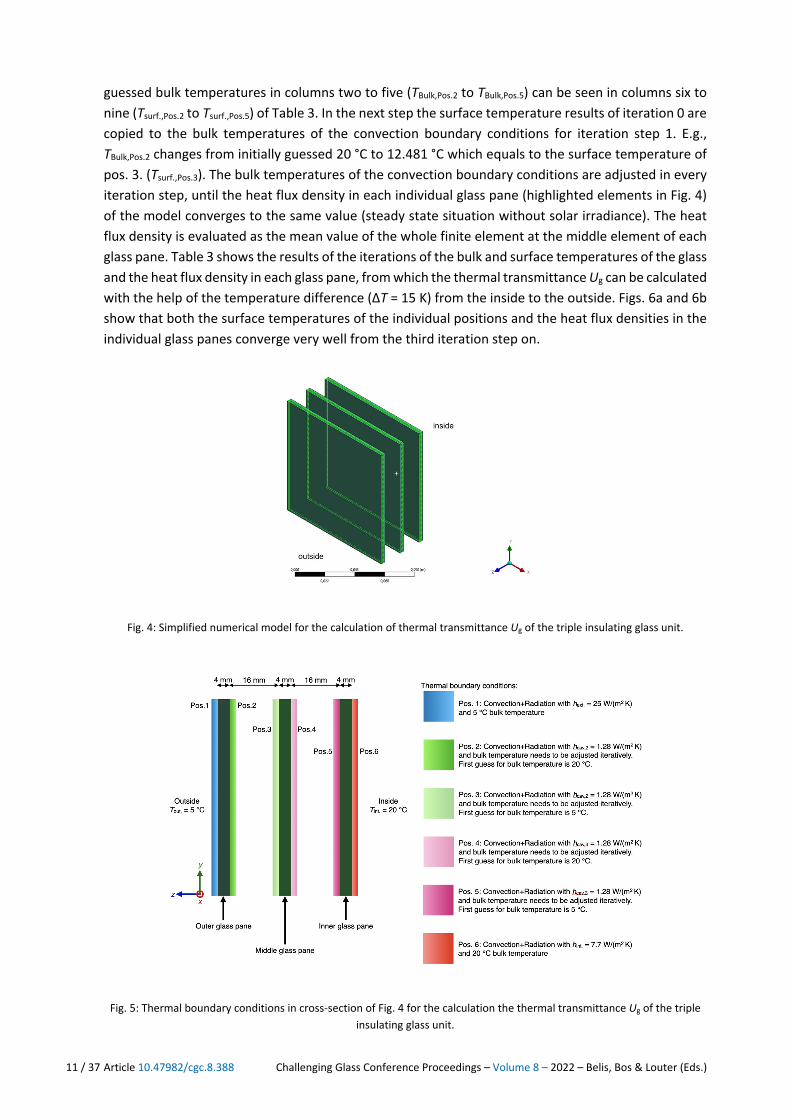
11 / 37 Article 10.47982/cgc.8.388 Challenging Glass Conference Proceedings – Volume 8 – 2022 – Belis, Bos & Louter (Eds.)
guessed bulk temperatures in columns two to five (TBulk,Pos.2 to TBulk,Pos.5) can be seen in columns six to nine (Tsurf.,Pos.2 to Tsurf.,Pos.5) of Table 3. In the next step the surface temperature results of iteration 0 are copied to the bulk temperatures of the convection boundary conditions for iteration step 1. E.g., TBulk,Pos.2 changes from initially guessed 20 °C to 12.481 °C which equals to the surface temperature of pos. 3. (Tsurf.,Pos.3). The bulk temperatures of the convection boundary conditions are adjusted in every iteration step, until the heat flux density in each individual glass pane (highlighted elements in Fig. 4) of the model converges to the same value (steady state situation without solar irradiance). The heat flux density is evaluated as the mean value of the whole finite element at the middle element of each glass pane. Table 3 shows the results of the iterations of the bulk and surface temperatures of the glass and the heat flux density in each glass pane, from which the thermal transmittance Ug can be calculated with the help of the temperature difference (ΔT = 15 K) from the inside to the outside. Figs. 6a and 6b show that both the surface temperatures of the individual positions and the heat flux densities in the individual glass panes converge very well from the third iteration step on.
Fig. 4: Simplified numerical model for the calculation of thermal transmittance Ug of the triple insulating glass unit.
Fig. 5: Thermal boundary conditions in cross-section of Fig. 4 for the calculation the thermal transmittance Ug of the triple insulating glass unit.
12 / 37 Article 10.47982/cgc.8.388 Challenging Glass Conference Proceedings – Volume 8 – 2022 – Belis, Bos & Louter (Eds.)
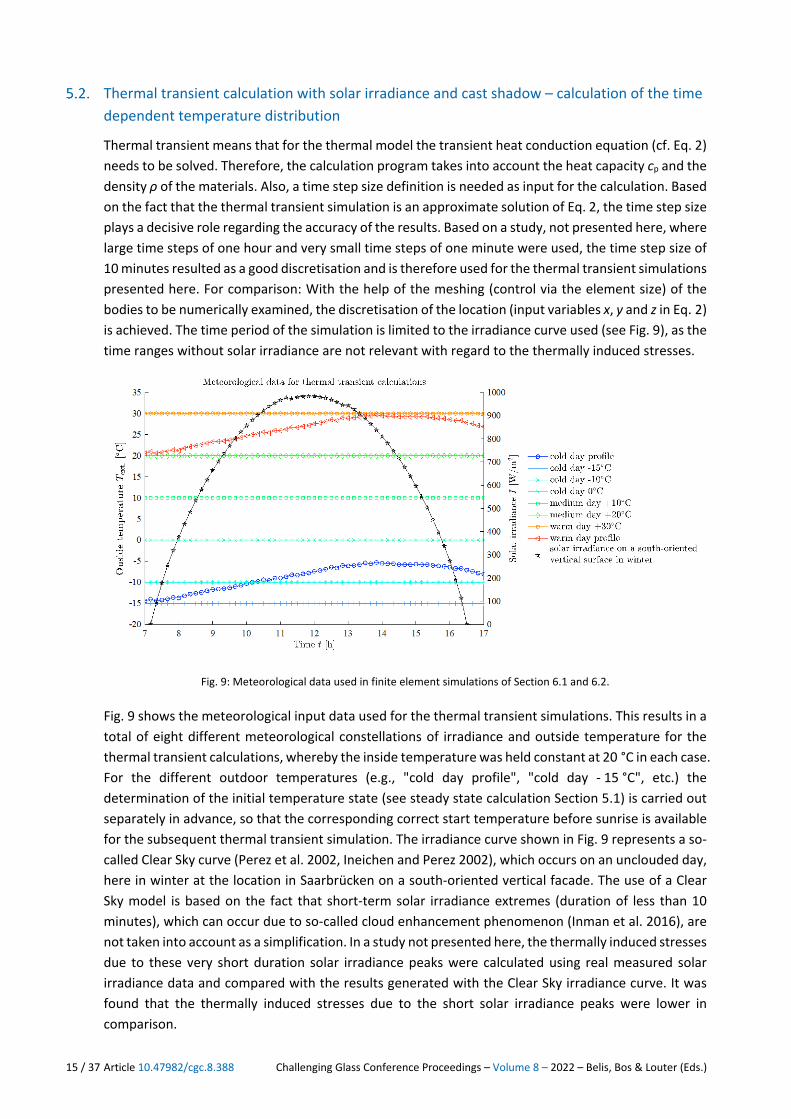
The iterations were stopped when the heat flux density in all three glass panes had reached the same value. The heat flux density �̇�𝑞 resulted after eight iterations to 8.617 W/m2. Equation 10 is used to calculate the Ug-value via the temperature difference from the inside to the outside.
𝑈𝑈g,numeric = �̇�𝑞𝛥𝛥𝜕𝜕
=8.617 𝑊𝑊
𝑚𝑚2
15 𝐾𝐾≈ 0.57 W
m2∙K (10)
The manual calculation of the Ug-value according to EN 673 (2011) results in:
𝑈𝑈g,manual = 11
ℎext. + 2 ∙ 1
ℎcavity + 1
ℎint. + 3 ∙
𝑑𝑑glass𝜆𝜆glass
(11)
𝑈𝑈g,manual = 1125+2∙
11.28+
17.7+3∙
0.0041
Wm2∙K
= 0.57 Wm2∙K
(12)
a) b)
Fig. 6: Result of the iterative calculation of a) the bulk and surface temperatures for the convection boundary conditions with combined heat transfer coefficients for the cavity of the triple insulating glass unit and b) of the heat flux density in
each glass pane.
The comparison of the results (Ug,numeric and Ug,manual) shows that the numerical calculation delivers the same result as the manual calculation. The numerical simulation thus shows that the heat transfer through the cavity can be modelled with the help of a combined heat transfer coefficient and the convection boundary conditions, but that an iterative procedure is necessary to obtain a correct result with regard to the temperature distribution. At the same time, for the following calculations it is sufficient to carry out the iterations only until the temperature results on the individual positions converge on the second decimal. It should be noted at this point that the steady state was considered within this chapter. In the case of a transient calculation (consideration of specific heat capacity cp and density ρ of the materials) it may be necessary not to assume the heat transfer coefficients in the cavity to be constant, but to recalculate them depending on the surface temperatures in each iteration step and additionally in each time step. The last suggested procedure also corresponds to the specifications made in NF DTU 39 P3 (2006).

13 / 37 Article 10.47982/cgc.8.388 Challenging Glass Conference Proceedings – Volume 8 – 2022 – Belis, Bos & Louter (Eds.)
Table 3: Results of the iterative calculation procedure for the calculation of the thermal transmittance Ug of triple insulating glazing. Exemplary explanation: �̇�𝑞outer ≜ resulting heat flux density in outer glass pane.
Iteration step
TBulk,Pos.2 [°C]
TBulk,Pos.3 [°C]
TBulk,Pos.4 [°C]
TBulk,Pos.5 [°C]
Tsurf.,Pos.2 [°C]
Tsurf.,Pos.3 [°C]
Tsurf.,Pos.4 [°C]
Tsurf.,Pos.5 [°C]
�̇�𝑞outer [W/m2]
�̇�𝑞middle [W/m2]
�̇�𝑞inner [W/m2]
0 20.000 5.000 20.000 5.000 5.802 12.481 12.519 17.801 18.217 9.598 16.424
1 12.481 5.802 17.801 12.519 5.400 11.786 11.817 18.903 9.085 7.678 8.191
2 11.786 5.400 18.903 11.817 5.363 12.134 12.169 18.801 8.241 8.640 8.960
3 12.134 5.363 18.801 12.169 5.381 12.065 12.099 18.852 8.664 8.599 8.575
4 12.065 5.381 18.852 12.099 5.378 12.099 12.134 18.842 8.580 8.619 8.651
5 12.099 5.378 18.842 12.134 5.379 12.093 12.127 18.847 8.621 8.615 8.613
6 12.093 5.379 18.847 12.127 5.379 12.096 12.130 18.846 8.614 8.617 8.621
7 12.096 5.379 18.846 12.130 5.379 12.095 12.130 18.846 8.618 8.617 8.617
8 12.095 5.379 18.846 12.130 5.379 12.095 12.130 18.846 8.617 8.617 8.617
5. Modelling of the thermal-mechanical simulations
The thermal-mechanical simulation is carried out in three steps, which are shown graphically in Fig. 7. In the first step, the initial temperature state of the numerical model is calculated via a thermal steady state calculation (situation before sunrise). This initial temperature in each node is then transferred to the thermally transient model as start temperature. In the thermal transient simulation, the temperature development in the model is then simulated over time by the input of the solar irradiance and the specification of the indoor and outdoor temperature. The temperatures of each time step are then transferred to the mechanical model. There, based on the temperatures, the thermal expansions and thermally induced stresses are determined.
Fig. 7: Calculation procedure of the thermal-mechanical simulation.

14 / 37 Article 10.47982/cgc.8.388 Challenging Glass Conference Proceedings – Volume 8 – 2022 – Belis, Bos & Louter (Eds.)
Thermal steady state calculation without solar irradiance – calculation of the start temperature
In the first step, the start temperature distribution, required for the thermal transient calculation, is determined in the numerical volume model, whereby the time shortly before sunrise (see Fig. 9, 7:00 a.m.) is considered. This results in the start temperature distribution for the thermal transient calculation. The calculation of the start temperature distribution is carried out accordingly as a steady state calculation without solar irradiance and without shading. With regard to the external heat transfer coefficient, the value of hext. = 25 W/(m2 K) previously used for the calculation of the thermal transmittance (Ug) is reduced to 10.5 W/(m2 K) (based on the French standard NF DTU 39 P3 2006). The external ambient temperature is adjusted in each case depending on the meteorological situation considered (see Section 6 and Fig. 9). The internal heat transfer coefficient is left at 7.7 W/(m2 K) following NF DTU 39 P3 (2006). The interior temperature is assumed to be constant at 20 °C for each outdoor temperature variant (see Fig. 9). For the heat transfer through the cavity, the value of hcavity - DGU = 1.4 W/(m2 K) is used for the double insulating glass unit and the value of hcavity – TGU = 1.28 W/(m2 K) for the triple insulating glass unit. These heat transfer coefficients were calculated according to the specifications of EN 673 (2011) and assumed to be constant for all calculations.
Fig. 8 shows the convection boundary conditions summarised in a cross-section exemplarily for the triple insulating glass unit. It should be noted here that on the surfaces of the edge spacers no boundary conditions are applied, since the respective opposite edge spacer is at the same temperature level based on symmetry and thus no heat flow takes place between the opposite edge spacers. The bulk temperatures for the convection boundary conditions on the glass surfaces surrounding the cavity are iterated until the difference between the input (bulk temperature of convection boundary condition) and the result (temperature of the opposite located glass surface) tends to zero (see iterative procedure described in Section 4.3). Once the iterations are complete, the correct start temperature distribution for the thermal transient simulation is obtained.
Fig. 8: Convection boundary conditions for thermal steady state and thermal transient simulation, exemplary for triple insulating glass unit.
15 / 37 Article 10.47982/cgc.8.388 Challenging Glass Conference Proceedings – Volume 8 – 2022 – Belis, Bos & Louter (Eds.)
Thermal transient calculation with solar irradiance and cast shadow – calculation of the time dependent temperature distribution
Thermal transient means that for the thermal model the transient heat conduction equation (cf. Eq. 2) needs to be solved. Therefore, the calculation program takes into account the heat capacity cp and the density ρ of the materials. Also, a time step size definition is needed as input for the calculation. Based on the fact that the thermal transient simulation is an approximate solution of Eq. 2, the time step size plays a decisive role regarding the accuracy of the results. Based on a study, not presented here, where large time steps of one hour and very small time steps of one minute were used, the time step size of 10 minutes resulted as a good discretisation and is therefore used for the thermal transient simulations presented here. For comparison: With the help of the meshing (control via the element size) of the bodies to be numerically examined, the discretisation of the location (input variables x, y and z in Eq. 2) is achieved. The time period of the simulation is limited to the irradiance curve used (see Fig. 9), as the time ranges without solar irradiance are not relevant with regard to the thermally induced stresses.
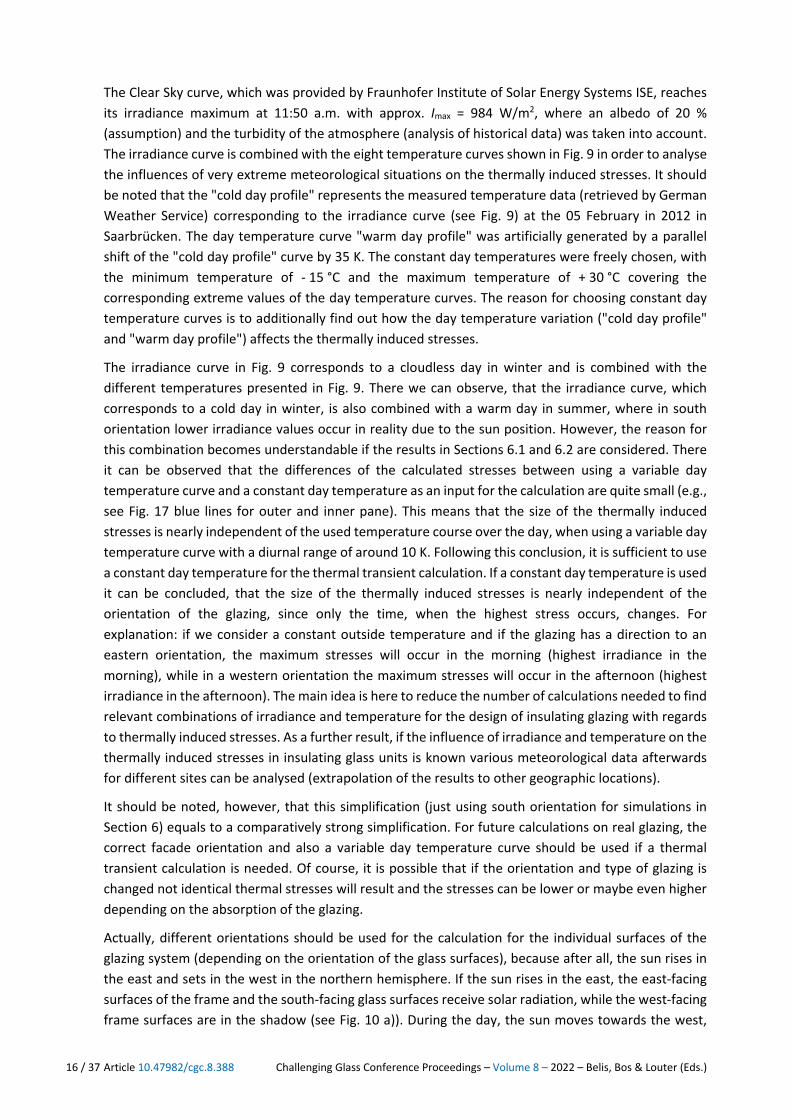
Fig. 9: Meteorological data used in finite element simulations of Section 6.1 and 6.2.
Fig. 9 shows the meteorological input data used for the thermal transient simulations. This results in a total of eight different meteorological constellations of irradiance and outside temperature for the thermal transient calculations, whereby the inside temperature was held constant at 20 °C in each case. For the different outdoor temperatures (e.g., "cold day profile", "cold day - 15 °C", etc.) the determination of the initial temperature state (see steady state calculation Section 5.1) is carried out separately in advance, so that the corresponding correct start temperature before sunrise is available for the subsequent thermal transient simulation. The irradiance curve shown in Fig. 9 represents a so-called Clear Sky curve (Perez et al. 2002, Ineichen and Perez 2002), which occurs on an unclouded day, here in winter at the location in Saarbrücken on a south-oriented vertical facade. The use of a Clear Sky model is based on the fact that short-term solar irradiance extremes (duration of less than 10 minutes), which can occur due to so-called cloud enhancement phenomenon (Inman et al. 2016), are not taken into account as a simplification. In a study not presented here, the thermally induced stresses due to these very short duration solar irradiance peaks were calculated using real measured solar irradiance data and compared with the results generated with the Clear Sky irradiance curve. It was found that the thermally induced stresses due to the short solar irradiance peaks were lower in comparison.
16 / 37 Article 10.47982/cgc.8.388 Challenging Glass Conference Proceedings – Volume 8 – 2022 – Belis, Bos & Louter (Eds.)
The Clear Sky curve, which was provided by Fraunhofer Institute of Solar Energy Systems ISE, reaches its irradiance maximum at 11:50 a.m. with approx. Imax = 984 W/m2, where an albedo of 20 % (assumption) and the turbidity of the atmosphere (analysis of historical data) was taken into account. The irradiance curve is combined with the eight temperature curves shown in Fig. 9 in order to analyse the influences of very extreme meteorological situations on the thermally induced stresses. It should be noted that the "cold day profile" represents the measured temperature data (retrieved by German Weather Service) corresponding to the irradiance curve (see Fig. 9) at the 05 February in 2012 in Saarbrücken. The day temperature curve "warm day profile" was artificially generated by a parallel shift of the "cold day profile" curve by 35 K. The constant day temperatures were freely chosen, with the minimum temperature of - 15 °C and the maximum temperature of + 30 °C covering the corresponding extreme values of the day temperature curves. The reason for choosing constant day temperature curves is to additionally find out how the day temperature variation ("cold day profile" and "warm day profile") affects the thermally induced stresses.
The irradiance curve in Fig. 9 corresponds to a cloudless day in winter and is combined with the different temperatures presented in Fig. 9. There we can observe, that the irradiance curve, which corresponds to a cold day in winter, is also combined with a warm day in summer, where in south orientation lower irradiance values occur in reality due to the sun position. However, the reason for this combination becomes understandable if the results in Sections 6.1 and 6.2 are considered. There it can be observed that the differences of the calculated stresses between using a variable day temperature curve and a constant day temperature as an input for the calculation are quite small (e.g., see Fig. 17 blue lines for outer and inner pane). This means that the size of the thermally induced stresses is nearly independent of the used temperature course over the day, when using a variable day temperature curve with a diurnal range of around 10 K. Following this conclusion, it is sufficient to use a constant day temperature for the thermal transient calculation. If a constant day temperature is used it can be concluded, that the size of the thermally induced stresses is nearly independent of the orientation of the glazing, since only the time, when the highest stress occurs, changes. For explanation: if we consider a constant outside temperature and if the glazing has a direction to an eastern orientation, the maximum stresses will occur in the morning (highest irradiance in the morning), while in a western orientation the maximum stresses will occur in the afternoon (highest irradiance in the afternoon). The main idea is here to reduce the number of calculations needed to find relevant combinations of irradiance and temperature for the design of insulating glazing with regards to thermally induced stresses. As a further result, if the influence of irradiance and temperature on the thermally induced stresses in insulating glass units is known various meteorological data afterwards for different sites can be analysed (extrapolation of the results to other geographic locations).
It should be noted, however, that this simplification (just using south orientation for simulations in Section 6) equals to a comparatively strong simplification. For future calculations on real glazing, the correct facade orientation and also a variable day temperature curve should be used if a thermal transient calculation is needed. Of course, it is possible that if the orientation and type of glazing is changed not identical thermal stresses will result and the stresses can be lower or maybe even higher depending on the absorption of the glazing.
Actually, different orientations should be used for the calculation for the individual surfaces of the glazing system (depending on the orientation of the glass surfaces), because after all, the sun rises in the east and sets in the west in the northern hemisphere. If the sun rises in the east, the east-facing surfaces of the frame and the south-facing glass surfaces receive solar radiation, while the west-facing frame surfaces are in the shadow (see Fig. 10 a)). During the day, the sun moves towards the west,

17 / 37 Article 10.47982/cgc.8.388 Challenging Glass Conference Proceedings – Volume 8 – 2022 – Belis, Bos & Louter (Eds.)
which is why in the afternoon the west-facing frame surfaces and the south-facing glass surfaces are irradiated and the east-facing frame surfaces are in the shadow (see Fig. 10 b)). This means that different orientations are relevant for different surfaces that can be irradiated by the sun. However, for the calculations in Section 6, the simplification was made that the irradiance only affects the south-projected surfaces and all other surfaces do not receive solar irradiation (see Fig. 10 c)). Based on this assumption just described, it can be assumed that the system is symmetrical with respect to the north-south axis. In a preliminary study, which is not presented here, it was observed that this assumption (irradiation on projected surfaces) leads to thermally induced stresses on the safe side.
a)
b)
c)
Fig. 10: Schematic representation of the sun moving from east to west over the day for a south-oriented glazing in a horizontal section a) in the morning, b) in the afternoon and c) simplification including the utilisation of symmetry.
The solar irradiance is thus applied only on the in south direction projected surfaces of the lower half of the glazing (insulating glass and frame), which is illustrated in Fig. 11 and Fig. 12. Irradiance is not applied to the frame reveals and the small glass areas that are shaded by the frame in the projection, as it is presented in Figs. 10c and 11. The convection boundary conditions are applied to the numerical model as shown in Fig. 8. The heat transfer coefficient in the cavity was assumed to be time and temperature independent.
As already mentioned, the solar irradiance is only applied to the lower half of the glazing (see Fig. 12), which corresponds to half-sided shading (50 % cast shadow on glazing). Usually, at least some diffuse irradiance reaches the shadowed area (see also NF DTU 39 P3 2006), which was neglected here for simplification. As a further simplification, the assumption is made that the glazing blocks have only a very small influence on the temperature distribution in the glazing and are therefore, neglected in the thermal calculation. This simplification may be made, because the glazing blocks have very small dimensions compared to the glazing.

18 / 37 Article 10.47982/cgc.8.388 Challenging Glass Conference Proceedings – Volume 8 – 2022 – Belis, Bos & Louter (Eds.)
Fig. 11: Cross-section A-A in Fig. 9, additional boundary conditions (solar irradiance) in the irradiated area of the glazing for the thermal transient calculation.
Fig. 12: Glazing with 50 % cast shadow and utilisation of symmetry. All dimensions in mm.
Mechanical calculation of the thermally induced stresses
In the next step, the temperatures of the single time steps from the thermal transient calculation are transferred to the mechanical model. In the mechanical model, the volume bodies: wooden frame, EPDM and polysulphide sealant and edge spacer are suppressed and thus excluded from the mechanical calculation. The reason for this is that free thermal expansion of the glazing within the frame is assumed. This strong simplification can be justified by the fact that in the case considered here a so-called standing glazing is assumed. In the case of vertical glazing, a glazing block is only placed at the lower horizontal glass edge on the left and right and at the upper end of the vertical glass edge on the left and right respectively (see Fig. 2). In addition, it is assumed that the edge spacer (consisting of the edge spacer itself and the polysulphide sealant) has only a low shear stiffness and thus does not counteract the expansion of the glass. The glass plate is thus supported by three displacement boundary conditions, which are presented graphically in Fig. 13.

19 / 37 Article 10.47982/cgc.8.388 Challenging Glass Conference Proceedings – Volume 8 – 2022 – Belis, Bos & Louter (Eds.)
Fig. 13: Structural system for outer, middle and inner pane respectively, utilising symmetry for double and triple insulating glass unit.
The boundary conditions for the structural analysis are summarised as follows:
• Circumferential simple support (C-shaped due to the utilisation of symmetry) perpendicular to the plane of the glass, which corresponds to a fixed displacement in z-direction,
• Fixed displacement in x-direction on the symmetry surface of the numerical model, • Fixed displacement in y-direction of a corner node (here on the symmetry axis). • Due to the fact that the glazing blocks have only very small dimensions, the assumption is made that
these can be neglected in the mechanical simulation. At the same time, it should be noted that this is a rather strong assumption, as the real mechanical system, consisting of glazing, glazing block, edge spacer and frame, probably has a higher in-plane stiffness than the numerical model, in which these components are neglected. The results that are generated with the numerical model are on the safe side in this respect, since the expansion/contraction of the glass can be freely adapted by neglecting the glazing blocks, edge spacer and frame.
Before the thermal-mechanical simulations in Sections 6.1 and 6.2 were conducted, a mesh study was carried out, using the thermally induced stress at the glass edge as a convergence criterion. The mesh shown in Figs. 14, 15 and 16 represents the result of the mesh study.

20 / 37 Article 10.47982/cgc.8.388 Challenging Glass Conference Proceedings – Volume 8 – 2022 – Belis, Bos & Louter (Eds.)
Fig. 14: Meshing on the surface of the insulating glass unit. View of the thermal steady state and transient model.
Fig. 15: Meshing of the insulating glass unit. Isometric view of the thermal steady state and transient model in detail.
Fig. 16: Meshing of the insulating glass unit. Isometric view of the structural model in detail.

21 / 37 Article 10.47982/cgc.8.388 Challenging Glass Conference Proceedings – Volume 8 – 2022 – Belis, Bos & Louter (Eds.)
6. Absorptance and outside temperature variations
The solar direct absorptance αe of the single glass panes is a decisive influencing factor for the magnitude of the thermally induced stresses, since the absorptance αe is directly physically related to the solar irradiance (see Eq. 5). The insulating glass units used in practice can have the most diverse combinations of solar control and thermal insulation coatings, which influence the absorptance per glass pane. At the same time, the absorptance per glass pane can be influenced by the construction itself (e.g., coloured glass) or also by the user (e.g., installing interior sun protection devices, placing furniture or other interior objects too close to the insulating glass from inside). Therefore, in order to investigate the influence of the solar direct absorptance on the thermally induced stresses in a generalised way and at the same time to show extreme situations, so-called absorptance Options were defined, which are represented in Tables 4 and 8. For glazing that occur in practice, EN 410 (2011) provides formulas with which the solar direct absorption coefficient αe can be calculated, taking into account the multiple reflection of the sun's rays through the cavities. With regard to the absorptance Options, care was taken to limit the absorptance to realistically achievable maximum values. The absorptance αe of the outer pane was set to 50%, which can be a usual high value for a solar control glass (Option 1 for DGU and TGU). The absorptance of the middle pane was maximised to 15 %, which may result from the user installing brightly coloured highly reflective blinds or privacy screens (Option 2 just for TDU). For the inner glass pane, the absorptance was also set to 50% in order to reflect the influences of use, e.g., the application of a dark foil to the inner pane (Option 3 for DGU and TDU). In order to be able to compare the resulting thermally induced stresses between high absorption and low absorption insulating glazing (standard thermal insulation glass), Option 4 for TDU and Option 3 for DGU were defined (see Tables 4 and 8). For these two low absorbing Options, the absorption coefficients αe of each glass pane were determined with the help of software using the formulae given in EN 410 (2011). Here the respective values α, τ and ρ of the individual panes, as well as the emissivities were taken into account. At the same time, the absorptance of the window frame was assumed to be constant with 20% (bright frame colour) for each absorptance Option.
As already presented in Section 5.2, different outside temperatures (see Fig. 9) are used in the thermal-mechanical simulations to calculate the thermally induced stresses. The reason for this is that insulating glass units are exposed to external conditions, namely solar irradiance and external temperature, throughout the year and in Europe, due to geographical location and the resulting seasons, a wide variety of external temperatures can occur. At the same time, the irradiance curve is not varied (explanation see Section 5.2), even if it changes accordingly over the seasons and facade orientation.
Thermally induced stresses of double insulating glass unit
Within this section, the results of the thermal-mechanical simulations of the double insulating glass unit are presented. Here, the combined heat transfer coefficient for the cavity was determined to 1.4 W/(m2 K) according to the specifications of EN 673 (2011) and assumed to be constant for each calculation (no variation over time and temperature-independent). In addition to the two extreme absorptance Options 1 and 2 (for explanations see introductory description to Section 6), a standard thermal insulating glass with a low-ε coating on position 3 was added to the simulations as so-called Option 3 for comparison reasons. Table 4 provides an overview of the absorptance Options for the double insulating glass unit.

22 / 37 Article 10.47982/cgc.8.388 Challenging Glass Conference Proceedings – Volume 8 – 2022 – Belis, Bos & Louter (Eds.)
Table 4: Considered absorptance Options of double insulating glass unit.
Solar direct absorptance αe
of outer pane
Solar direct absorptance αe
of inner pane
Option 1 50 5
Option 2 5 50
Option 3 7 7
As can be seen from Fig. 17 and the results in Table 5, for Option 1 for the outer pane (absorptance αe = 50 %), the highest thermally induced glass edge stresses result on warmer days and the lowest on colder days. Quantitatively, the outer pane has up to (25.3 MPa / 19.6 MPa) 29 % higher glass edge stresses on warmer days. In contrast, Fig. 18 and the results in Table 6 show that for Option 2 for the inner pane (absorptance αe = 50 %) the highest stresses result on colder days and correspondingly lower stresses on warmer days. For the inner pane up to (39.3 MPa / 31.7 MPa) 24 % higher glass edge stresses result on colder days.
In order to obtain the relevant thermally induced glass edge stresses of the outer pane, the largest possible temperature gradient from the outside to the inside is therefore required. This means that for a thermal stress design of the outer pane, an outer temperature as high as possible is required with an inner temperature as low as possible at the same time. For the inner pane, this relationship is reversed (direction of the heat flow now from the inside to the outside), so that for a thermal stress design of the inner pane, the lowest possible outside temperature is required at the same time as the highest possible inside temperature. Based on the results in Figs. 17 and 18, it can also be seen that when the solar direct absorptance of a glass pane reaches 50 %, high thermally induced stresses occur at all considered outside temperatures, which can presumably lead to glass edge fracture. The comparative calculation of Option 3 (see Fig. 19 and Table 7) shows that lower thermally induced stresses occur in standard thermal insulating glazing.
Fig. 17: Time dependency of thermally induced edge stress in double insulating glass as Option 1.

23 / 37 Article 10.47982/cgc.8.388 Challenging Glass Conference Proceedings – Volume 8 – 2022 – Belis, Bos & Louter (Eds.)
Table 5: Thermally induced edge stress results for double insulating glass as Option 1.
Max. edge stress of outer pane [MPa] / Time of
occurrence [h] Max. edge stress of inner pane [MPa] / Time of
occurrence [h]
Cold day profile 20.9 / 12:00 9.1 / 10:20
Cold day -15 °C 19.6 / 11:50 9.6 / 11:00
Cold day -10 °C 20.5 / 11:50 8.4 / 11:00
Medium day +10 °C 22.6 / 11:40 5.5 / 11:00
Warm day +30 °C 25.3 / 11:40 2.3 / 11:00
Warm day profile 25.3 / 12:00 3.4 / 10:30
When comparing the times of occurrence of the maximum glass edge stress, which are documented in Tables 5 (column two) and 7 (column three), with the time of maximum irradiance (11:50 a.m.), there is a time shift of maximum 10 minutes. The maximum glass edge stress for Options 1 and 2 therefore occurs with almost no time shift to the occurrence of the maximum irradiance. For Option 3, the maximum glass edge stress (see Table 7, column three) on the inner pane occurs approx. 40 minutes before the irradiance peak is reached when constant outdoor temperatures are considered. Using variable day temperature curves ("cold day profile" and "warm day profile"), the maximum stresses occur approx. 60 minutes before the solar irradiance peak is reached. For double insulating glass units with high absorption, it can thus be concluded that the kind of the thermal simulation is not necessarily transient, but can be performed in steady state. For low-absorbing double insulating glass units, this should be investigated by further studies.
Fig. 18: Time dependency of thermally induced edge stress in double insulating glass as Option 2.

24 / 37 Article 10.47982/cgc.8.388 Challenging Glass Conference Proceedings – Volume 8 – 2022 – Belis, Bos & Louter (Eds.)
Table 6: Thermally induced edge stress results for double insulating glass as Option 2.
Max. edge stress of outer pane [MPa] / Time of
occurrence [h] Max. edge stress of inner pane [MPa] / Time of
occurrence [h]
Cold day profile 1.1 / 11:50 38.5 / 11:40
Cold day -15 °C 1.4 / 13:10 39.3 / 11:50
Cold day -10 °C 1.2 / 13:10 38.1 / 11:50
Medium day +10 °C 0.8 / 10:00 35.0 / 11:50
Warm day +30 °C 3.2 / 9:50 31.7 / 11:50
Warm day profile 3.0 / 10:30 32.6 / 11:40
Option 3 (see Fig. 19) shows the differences between the approach of a varying day temperature curve ("cold day profile" with a temperature amplitude of approx. 10 K) and a constant day temperature ("cold day - 15 °C" and "cold day - 10 °C") as it was already mentioned in Section 5.2. Using the varying day temperature curve causes the maximum of the thermally induced glass edge stress to occur at an earlier time of day (related to the inner pane, time shift of 40 minutes, compare rows two and three or six and seven in Table 7) than when the constant day temperature is used. Using the constant day temperature of - 15 °C yields approx. 7 % (9.7 MPa / 9.1 MPa, see Table 7) higher stresses compared to the varying day temperature curve "cold day profile". When comparing the most critical constellations (Option 1 - warmer day, Option 2 - colder day), the dependence of the glass edge stresses on the used outside temperature (day temperature curve or constant day temperature) almost completely disappears (Option 1: 0 %, when considering 25.3 MPa / 25.3 MPa, see Table 5; Option 2: 2 %, when considering 39.3 MPa / 38.5 MPa, see Table 6), which can be explained by the high absorptance levels. Based on the results, it can be stated that the calculation of the thermally induced stress for low- and high-absorptive double insulating glass units with a constant daily temperature curve provides comparably good results (maximum difference round 7 %). This also means that the approach of using just the south orientation irradiance curve for cold and warm day temperatures also is acceptable for the calculations presented here. As already in Section 5.2 explained the usage of a different facade orientation for the irradiance would just result in a time shift of the occurrence of the thermally induced stress (e.g., eastern orientation: highest stresses in the morning, western orientation: highest stresses in the afternoon). As a further result, it can be observed that based on the results determined here (constellation of values from radiation, temperature and stress), the evaluation of meteorological data can presumably be simplified for a wide variety of locations.

25 / 37 Article 10.47982/cgc.8.388 Challenging Glass Conference Proceedings – Volume 8 – 2022 – Belis, Bos & Louter (Eds.)
Fig. 19: Time dependency of thermally induced edge stress in double insulating glass as Option 3.
Table 7: Thermally induced edge stress results for double insulating glass as Option 3.
Max. edge stress of outer pane [MPa] / Time of
occurrence [h] Max. edge stress of inner pane [MPa] / Time of
occurrence [h]
Cold day profile 0.9 / 7:00 9.1 / 10:30
Cold day -15 °C 1.0 / 16:30 9.7 / 11:10
Cold day -10 °C 0.8 / 16:30 8.5 / 11:10
Medium day +10 °C 0.4 / 10:30 5.4 / 11:10
Warm day +30 °C 3.1 / 10:30 2.2 / 11:10
Warm day profile 3.0 / 12:30 3.2 / 10:40
Thermally induced stresses of triple insulating glass unit
Within this section, the results of the thermal-mechanical simulations of the triple insulating glass unit are presented. Here, the combined heat transfer coefficient for the cavity was determined to 1.28 W/(m2 K) according to the specifications of EN 673 (2011) and assumed to be constant for each calculation (no variation over time and temperature-independent). In addition to the extreme absorptance Options 1, 2 and 3 (for explanations see introductory description to Section 6), a standard thermal insulation glass, with low-ε coatings on pos. 2 and pos. 5, was added to the simulations as so-called Option 4 for comparison reasons. Table 8 gives an overview of the absorptance Options for the triple insulating glass unit.

26 / 37 Article 10.47982/cgc.8.388 Challenging Glass Conference Proceedings – Volume 8 – 2022 – Belis, Bos & Louter (Eds.)
Table 8: Considered absorption Options of triple insulating glass unit.
Solar direct absorptance αe
of outer pane
Solar direct absorptance αe
of middle pane
Solar direct absorptance αe
of inner pane
Option 1 50 5 5
Option 2 5 15 5
Option 3 5 5 50
Option 4 13 4 5
Fig. 20: Time dependency of thermally induced edge stress in triple insulating glass as Option 1.
As can be seen from Fig. 20 and the results in Table 9, for Option 1 for the outer pane (absorptance αe = 50 %) the highest thermally induced stresses result on warmer days and the lowest on colder days. Qualitatively, the outer pane has up to (26.2 MPa / 20.9 MPa) 25 % higher glass edge stresses on warmer days. In contrast for Option 3, Fig. 22 and the maximum stresses documented in Table 11 show that for the inner pane (absorptance αe = 50 %) the highest stresses result on colder days. For the inner pane up to (41 MPa / 35.1 MPa) 17 % higher stresses result on colder days. These two basic results are consistent with the previously presented results for the double insulating glass unit (see Section 6.1).
For a thermal stress design of the outer pane of a triple insulating glass unit, the highest possible outside temperature and the lowest possible inside temperature are required, analogous to the double insulating glass unit. For the inner pane, this relationship is reversed, so that for a thermal stress verification of the inner pane, as with the double insulating glass unit, the lowest possible outside temperature is required with the highest possible inside temperature at the same time.

27 / 37 Article 10.47982/cgc.8.388 Challenging Glass Conference Proceedings – Volume 8 – 2022 – Belis, Bos & Louter (Eds.)
Table 9: Thermally induced edge stress results for double insulating glass as Option 1.
Max. edge stress on outer pane [MPa] / Time of occurrence [h]
Max. edge stress on middle pane [MPa] / Time of occurrence [h]
Max. edge stress on inner pane [MPa] / Time of occurrence [h]
Cold day profile 22.2 / 12:00 25.3 / 12:40 7.7 / 10:40
Cold day -15 °C 20.9 / 11:50 25.3 / 12:40 8.2 / 11:10
Cold day -10 °C 21.5 / 11:50 25.2 / 12:40 7.5 / 11:10
Cold day 0 °C 22.6 / 11:50 25.0 / 12:40 6.2 / 11:10
Medium day +10 °C 23.8 / 11:50 25.1 / 12:40 4.9 / 11:10
Medium day +20 °C 24.9 / 11:50 25.1 / 12:40 3.6 / 11:10
Warm day +30 °C 26.1 / 11:40 25.1 / 12:40 2.3 / 11:10
Warm day profile 26.2 / 12:00 25.3 / 12:40 3.2 / 10:50
Fig. 21: Time dependency of thermally induced edge stress in triple insulating glass as Option 2.
As can be seen from Fig. 21 and the maximum glass edge stresses documented in Table 10 for Option 2, the thermally induced glass edge stress of the middle pane depends only slightly on the applied outside temperature. Nevertheless, on colder days, the higher glass edge stresses tend to occur (maximum edge stress of 44.3 MPa at “cold day profile” and “cold day - 15 °C”). This behaviour is novel compared to the results presented here so far. The explanation why the thermally induced glass edge stress at the middle pane is almost always the same regardless of the outside temperature is that the middle pane is always located in the middle of the temperature gradient (from outside to inside or vice versa). It is therefore located on half of the thermal gradient. Looking at the results of the thermally induced glass edge stress of the middle pane in Table 10, it can be seen that the maximum glass edge stress occurs 50 minutes after the irradiance peak reached its maximum. The reason for this is that the middle pane is comparatively thermally insulated compared to the outer and inner panes. This becomes apparent in the exemplary comparison of the applied heat transfer coefficients on the respective surfaces. For the outer pane of the triple insulating glass unit, a combined heat transfer coefficient of 10.5 W/(m2 K) was applied on the outer surface and 1.28 W/(m2 K) on the surface towards the cavity, while the heat transfer coefficient of 1.28 W/(m2 K) was used for both surfaces of the middle pane. For the outer pane, the heat transfer is thus greater by a factor of 10.5 W/(m2 K) / 1.28 W/(m2 K) ≈ 8. Compared to the outer and inner pane, the middle pane thus seems to reacts more slowly to changes

28 / 37 Article 10.47982/cgc.8.388 Challenging Glass Conference Proceedings – Volume 8 – 2022 – Belis, Bos & Louter (Eds.)
in the thermal boundary conditions (outside and inside temperature, solar irradiance). When comparing the times of occurrence of the maximum glass edge stress of Options 1 and 3 (Tables 9 and 11), with the time of maximum solar irradiance (11:50 a.m.), it can be seen that the maximum stresses occur, analogous to the double insulating glass unit, maximum 10 minutes before the irradiance peak. The maximum glass edge stress for Options 1 and 3 thus occurs with almost no time shift to the occurrence of the maximum irradiance. For highly absorbent outer and inner panes of triple insulating glass units, it can thus be concluded that the thermal calculation can also be carried out in a steady state situation, as for double insulating glass units. For Option 2 (highly absorbent middle pane) and Option 4, a steady state calculation should still be investigated.
Table 10: Thermally induced edge stress results for double insulating glass as Option 2.
Max. edge stress on outer pane [MPa] / Time of occurrence [h]
Max. edge stress on middle pane [MPa] / Time of occurrence [h]
Max. edge stress on inner pane [MPa] / Time of occurrence [h]
Cold day profile 1.0 / 14:30 44.3 / 12:40 9.6 / 11:10
Cold day -15 °C 1.3 / 14:20 44.3 / 12:40 10.0 / 11:40
Cold day -10 °C 1.2 / 14:20 44.2 / 12:40 9.4 / 11:50
Cold day 0 °C 0.9 / 14:20 44.1 / 12:40 8.1 / 11:40
Medium day +10 °C 0.8 / 11:00 43.9 / 12:40 6.8 / 11:40
Medium day +20 °C 1.9 / 11:00 43.8 / 12:40 5.5 / 11:50
Warm day +30 °C 3.2 / 10:40 43.8 / 12:40 4.2 / 11:40
Warm day profile 3.2 / 12:30 44.0 / 12:40 5.0 / 11:10
Based on Options 1 (Fig. 20) and 3 (Fig. 22), it can also be seen that the glass edge stresses of the middle pane, although it only absorbs 5 % of the solar irradiance in these absorptance Options (see Table 8), also reach high values, which could become relevant for the design under certain circumstances. The reason for this is that the outer pane (Option 1) and the inner pane (Option 3) heat up strongly due to their high absorption and this heat is transferred to the middle pane. If Option 2 is added to this comparison, it can be seen that the middle pane is not able to heat up the outer and inner panes to such an extent that high stresses also result here. The reason for this is that the heat transfer coefficients on the outer and inner surfaces are at least by a factor of 7.7 W/(m2 K) / 1.28 W/(m2 K) ≈ 6 greater than the heat transfer coefficient in the cavity and no greater temperature differences can occur on the outer and inner pane.

29 / 37 Article 10.47982/cgc.8.388 Challenging Glass Conference Proceedings – Volume 8 – 2022 – Belis, Bos & Louter (Eds.)
Fig. 22: Time dependency of thermally induced edge stress in triple insulating glass as Option 3.
Table 11: Thermally induced edge stress results for double insulating glass as Option 3.
Max. edge stress on outer pane [MPa] / Time of occurrence [h]
Max. edge stress on middle pane [MPa] / Time of occurrence [h]
Max. edge stress on inner pane [MPa] / Time of occurrence [h]
Cold day profile 1.0 / 14:50 29.3 / 12:40 40.4 / 11:50
Cold day -15 °C 1.2 / 14:30 29.2 / 12:40 41.0 / 11:50
Cold day -10 °C 1.1 / 14:30 29.1 / 12:40 40.3 / 11:50
Cold day 0 °C 0.9 / 14:30 29.0 / 12:40 39.0 / 11:50
Medium day +10 °C 0.7 / 14:30 28.8 / 12:40 37.7 / 11:50
Medium day +20 °C 0.9 / 9:10 28.7 / 12:40 36.4 / 11:50
Warm day +30 °C 2.1 / 9:00 28.5 / 12:40 35.1 / 11:50
Warm day profile 1.8 / 10:30 28.7 / 12:40 35.9 / 11:50
When considering the results of Option 4 (see Fig. 23 and Table 12), it can be seen that relevant glass edge stresses do not occur on the outer pane in any irradiance-temperature constellation. On the inner pane, comparatively higher thermally induced stresses result on a colder day, which are of a similar order of magnitude as for the double insulated glass unit as Option 3. The glass edge stresses of the middle pane, however, reach comparatively high thermally induced stresses, which can presumably become even higher with a variation of the coating positions (e.g., low-ε coating on pos. 3 and pos.5), since the solar direct absorptance αe of the middle pane is increased by the variation of the coating position (pos. 3 and pos. 5).

30 / 37 Article 10.47982/cgc.8.388 Challenging Glass Conference Proceedings – Volume 8 – 2022 – Belis, Bos & Louter (Eds.)
Fig. 23: Time dependency of thermally induced edge stress in triple insulating glass as Option 4.
Table 12: Thermally induced edge stress results for double insulating glass as Option 4.
Max. edge stress on outer pane [MPa] / Time of occurrence [h]
Max. edge stress on middle pane [MPa] / Time of occurrence [h]
Max. edge stress on inner pane [MPa] / Time of occurrence [h]
Cold day profile 2.1 / 11:20 14.6 / 12:40 7.8 / 10:50
Cold day -15 °C 0.9 / 11:10 14.5 / 12:40 8.3 / 11:10
Cold day -10 °C 1.5 / 11:10 14.5 / 12:40 7.6 / 11:10
Cold day 0 °C 2.6 / 11:10 14.3 / 12:40 6.2 / 11:10
Medium day +10 °C 3.8 / 11:10 14.2 / 12:40 4.8 / 11:10
Medium day +20 °C 5.0 / 11:10 14.1 / 12:40 3.6 / 11:10
Warm day +30 °C 6.3 / 11:10 14.1 / 12:40 2.3 / 11:10
Warm day profile 6.3 / 11:20 14.3 / 12:40 3.1 / 11:00
In Option 4, as in Option 3 of the double insulating glass unit, the differences between the approach of a varying day temperature curve ("cold day profile" with a temperature amplitude of approx. 10 K) and a constant day temperature ("cold day - 15 °C" and ("cold day - 10 °C") can also be seen. Using the varying day temperature curve causes the maximum of the thermally induced glass edge stress to occur at an earlier time of day (related to the inner pane, time shift of 10 to 20 minutes, compare rows two and three or eight and nine in Table 12) than when the constant day temperature is used. Using the constant day temperature of - 15 °C yields approx. 6 % (8.3 MPa / 7.8 MPa, see Table 12) higher stresses for the inner pane compared to the varying day temperature curve "cold day profile", while using the varying day temperature curve for the middle pane yields only slightly different results. When comparing the most critical constellations (Option 1 - warmer day, Option 2 - almost independent of temperature, Option 3 - colder day), the dependence of the glass edge stresses on the used outside temperature (day temperature curve or constant day temperature) almost completely disappears (Option 1: 1 %, when considering 26 MPa / 26.1 MPa, see Table 9; Option 3: 2 %, when considering 41 MPa / 40.4 MPa, see Table 11), which can be explained by the high absorption levels. Based on the results, it can be stated that the calculation of the thermally induced stress for low- and high-

31 / 37 Article 10.47982/cgc.8.388 Challenging Glass Conference Proceedings – Volume 8 – 2022 – Belis, Bos & Louter (Eds.)
absorptive triple insulating glass units with a constant day temperature provides comparably good results (maximum difference around 6 %). Here also, the idea of using just the in the south oriented irradiance curve (explanation see Section 5.2), as an influence curve, can be understood, as it could be shown that the thermally induced stresses are nearly independent from the course of the day temperature.
Temperature and stress field exemplary for the triple insulating glass unit on „cold day - 15 °C“
In Figs. 24 and 25, the temperature field and the corresponding maximum principal tensile stress field of the middle pane have been evaluated exemplarily for Option 2 for constant day temperature of "cold day - 15 °C". The inner pane is not presented because the temperature and stress field there is qualitatively similar to that of the middle pane. Only very small stresses (< 3 MPa, see Table 11) resulted on the outer pane, which is why its temperature and stress field is also not shown here. For reasons of better representation, the view of the glass was rotated by 90 degrees; it is still a vertical glazing. The evaluation of the maximum principal tensile stresses was carried out on the entire surface of the glass and not limited to the edge of the glass in order to better understand the relationship between the temperature field and the corresponding stress field.
Fig. 24: Temperature field of middle glass pane of triple insulating glass unit as absorptance Option 2 at cold day - 15 °C at time step 12:40 h where maximum thermally induced glass edge stress arises.
When considering the temperature and stress fields in Figs. 24 and 25, the phenomenon of thermally induced stresses due to solar irradiance in a half side shadowed situation can be explained and understood. In the left half of the glazing (irradiated area), the warmer irradiated glass centre expands (see dashed arrows in Fig. 24) more compared to the colder glass edge in the frame, which leads to increased stress at the glass edge. In addition, it can be seen from the stress field in Fig. 25 that the highest glass edge stress at around 44 MPa occurs in the irradiated area of the glazing at the transition from irradiated to shadowed zone, which was also documented in Pilette and Taylor (1988). The position of the glass edge stress is thus also determined by the temperature distribution in the shadowed area (right half). Therefore, the stresses depend on the temperature distribution of the whole glass plate. The stress field in Fig. 25 also shows that stresses of approx. 15 MPa also result in the shadowed area in the centre of the middle pane, which might have to be taken into account when superimposing other load cases.

32 / 37 Article 10.47982/cgc.8.388 Challenging Glass Conference Proceedings – Volume 8 – 2022 – Belis, Bos & Louter (Eds.)
Fig. 25: Associated thermally induced stress field of middle glass pane of triple insulating glass unit as absorptance Option 2 at cold day - 15 °C at time step 12:40 h.
Comparison of the determined thermally induced stresses with glass edge resistance
Within this Section, the thermally induced stresses, numerically calculated in Sections 6.1 and 6.2, are compared with glass edge strengths determined using the rules of ONR CEN/TS 19100-1 Annex B (2021). To be able to calculate the glass edge resistance several decisions have to made at first to choose the correct input values for the design formula given in ONR CEN/TS 19100-1 Annex B (2021). The design formula is given as:
𝑓𝑓g,d = 𝑘𝑘e𝑘𝑘sp𝜆𝜆A𝜆𝜆l𝑘𝑘mod𝑓𝑓g,k
𝛾𝛾M+ 𝑘𝑘p𝑘𝑘e,p
𝑓𝑓b,k−𝑓𝑓g,k
𝑘𝑘i𝛾𝛾P (13)
First of all, it has to be decided in which Consequence Class (according to EN 1990 (2010)) the thermally induced glass fracture has to be classified. However, this decision also depends on the type of construction. Certainly, a simple window will correspond to a different Consequence Class (CC) than a static-constructive and load-bearing glass element like a glass roof. In order to be able to calculate a possible range of resistances, the consequence classes CC1 and CC2 are considered in more detail. By choosing the CC’s, the partial safety factors (material and model: γM,CC1 = 1.6; γM,CC2 = 1.8; prestress: γP,CC1 = 1.1; γP,CC1 = 1.2) can be selected. For the calculation of the resistance, annealed glass (AG, fg,k = 45 MPa) and thermally toughened glass (TTG, fg,k = 120 MPa) are considered exemplary in the following. In the next step, to calculate the resistance of the glass edge, the choice of an edge treatment is required. For the edge finishing, the cut (ke = 0.8) and polished (ke = 1.0) edge are selected. Actual research shows that the cutting parameters (such as cutting speed and pressure of the cutting wheel, which is applied while cutting) that can be chosen or also the polish procedure can be chosen in that way, that higher edge strengths may result (Müller-Braun 2022). In order to capture the duration of the load effect on the glass, the modification coefficient kmod is chosen to be 0.58 (in case of AG), which corresponds to a duration of around 8 h (this duration is also suggested for the pressure differences due to a temperature rise in the cavity of an IGU). The surface profile factor ksp and the factors to include size effects λA and λL are assumed to be equal to one. In the case of thermally toughened glass, the edge prestress factor ke,p is chosen to 0.8, as it is constant for all possible edge finishings. For the prestressing factor kp a vertical prestress treatment of the glass is assumed so that kp equals to one. The interference factor ki, where actually new results were obtained by Pisano et al. (2022), will be chosen on the safe side to 1.0. By using the above-described input values a comparatively low resistance for annealed glass and a higher resistance for thermally toughened glass can be combined and calculated. For a construction that can be assigned to CC1, the use of annealed glass seems appropriate, while thermally toughened glass seems appropriate for a construction that can be assigned to CC2. This results in the following exemplary combinations:
33 / 37 Article 10.47982/cgc.8.388 Challenging Glass Conference Proceedings – Volume 8 – 2022 – Belis, Bos & Louter (Eds.)
• Annealed glass, cut edge, CC1 (hereafter abbreviated with AG-CC1) • Thermally toughened glass, polished edge, CC2 (hereafter abbreviated with TTG-CC2)
This results in the following glass edge resistances for the two considered cases:
• AG-CC1: 𝑓𝑓g,d,AG = 0.8 ∙ 0.58 ∙ 45 MPa1.6
= 13.1 MPa
• TTG-CC2: 𝑓𝑓g,d,TTG = 45 MPa1.8
+ 0.8 ∙ 120 MPa−45 MPa1.2
= 75 MPa
By comparing the maximum stresses which were determined in Section 6.1 and 6.2 it seems that the single glass panes of the most Options only will be verifiable with the use of TTG, which corresponds to the engineering practise today: if a high absorbent glazing is to be designed, the use of TTG becomes necessary; if low absorbent glazing is to be designed, the use of AG becomes possible. The problem that arises here is, that the irradiance and temperatures, used for the calculations, correspond to peak value situations and do not represent design values which would be needed for sufficient design according to EN 1990 (2010). Therefore, statistical analyses of the input variables (irradiance and temperature) are required that meet the safety requirements of EN 1990 (2010). When comparing the resistances with the thermally induced stresses, it should also be noted that various assumptions were taken into account for the calculations presented here, which are on the safe side. By adjusting these simplifications to more realistic assumptions (e. g., application of diffuse radiation in shaded areas of the glazing, as well as on frame reveals and spacer surfaces), the stresses could be reduced and thus the prestress level of the glass can possibly also be reduced.
7. Conclusion
With the help of the model validation in Section 4 (calculation of thermal transmittance Ug calculation of a triple insulating glass unit), it could be shown that the heat transfer across the cavity can be correctly modelled with the help of convection boundary conditions, using combined heat transfer coefficients (radiation and convection). However, it should be noted that the bulk temperatures of the convection boundary conditions in the cavity are not initially known and must therefore be determined via an iterative calculation as it is stated in NF DTU 39 P3 (2006). Only when the difference between bulk temperature of the convection boundary condition (input data) and resulting surface temperature tends to zero, the thermal calculation can be considered as finished (after approx. 7 to 8 iterations). This procedure applies to both the thermal steady state and the thermal transient calculation. The assumption of a constant combined heat transfer coefficient within the steady state and transient calculation has to be checked by further investigations, as the heat transfer coefficient itself is temperature dependent, changes over time according due to the change of the surface temperatures by solar irradiance and can influence the results determined in Section 6.
Within the context of the thermal-mechanical simulations (Section 6), results show that, for double and triple insulating glass units, the relevant thermally induced glass edge stresses result for the outer pane on warmer days, while the relevant stresses for the inner pane result on colder days (valid for high and low absorbing insulating glazing). This information is therefore useful for future insulating glass design with regards to thermally induced stress as they are not presented in the current French Standard NF DTU 39 P3 (2006).
It was shown in Section 6, that the middle pane of the triple insulating glass unit is a special case because it is thermally insulated on its front and back side compared to the outer and inner pane due to the thermal boundary conditions (see results of Option 1 and 3 in Section 6.2) and at the same time

34 / 37 Article 10.47982/cgc.8.388 Challenging Glass Conference Proceedings – Volume 8 – 2022 – Belis, Bos & Louter (Eds.)
it is located in the middle of the temperature gradient (from outside to inside and vice versa, respectively). By varying the outside temperatures, it could be seen that the thermally induced glass edge stresses at the middle pane are almost independent of the respective external temperature present, which can be explained by the reasons just mentioned. The comparative calculation with Option 4 has shown that even in the case of a low-absorbing triple insulating glass unit, comparatively high thermally induced glass edge stresses can occur on the middle pane, while lower stresses resulted for the outer and inner panes. The temperature independence of the thermally induced stresses of the middle pane is valid for absorptance Options 1 to 4. For the case of four or more glass panes, further investigations are necessary. For the future design of the middle pane of triple insulating glazing, based on the assumptions used here, a cold day with high irradiance can be used as the relevant combination. Nevertheless, high stresses can also result for the middle pane on warm days.
The numerical calculations presented in Section 6 have also shown the level of thermally induced glass edge stresses that can occur under the assumptions used, whereby it should be mentioned, that strong simplifications were made e.g., application of the irradiance just on the projected surfaces. For the outer pane of the triple insulating glass unit (Option 1), maximum glass edge stresses of approximately 26 MPa were shown on warmer days, while up to 41 MPa (Option 3) resulted on the inner pane on colder days. The results of the glass edge stresses of the double insulating glass unit were of a similar order of magnitude. For the middle pane of the triple insulating glass unit, a maximum edge stress of 45 MPa was obtained almost independently of the outside temperature. Additionally, two resistances of the glass edge (for annealed glass and thermally toughened glass) were calculated with the design formula and suggested input values given in ONR CEN/TS 19100-1 Annex B (2021). There it could be observed, that the todays often engineering practise (experience-based design by blanket use of TTG for glasses with high absorptance) can be retraced. Parallel to that, it should be noted, that the chosen modelling here, has large potential reserves with regards to the reduction of the stresses, e.g., applying diffuse irradiance on shadowed surfaces and also on frame reveals and spacer surfaces. Also, the approach of a time and temperature independent heat transfer coefficient (simplification see Section 5 and 6) on the glass surfaces which surround the cavity, equals to a strong simplification. Taken into account the time and temperature dependency of the heat transfer coefficient within the cavity will presumably reduce the determined stresses especially for the middle pane. As a further simplification the external heat transfer coefficient could be analysed deeper with regards to the radiant temperatures. In particular, the separation of the radiation temperatures of the sky vault and the environment could reduce the stresses especially for the outer pane. A deeper analysis of the internal heat transfer coefficient (change of indoor temperature over the day and detailed analysis of convection and radiation for indoor) could reduce the stresses for the inner pane. By adapting the described simplifications, which were made for the investigations presented here, it may be possible that in particular low-absorbing glazing with annealed glass becomes verifiable in terms of the design. For highly absorbent solar control glass, for example, an adjustment of the simplifications will probably not lead to any change with regard to the design (use of thermally toughened glass), but this has to be checked. Nevertheless, in the future, based on the calculation method presented here, glazing can be calculated in detail under certain assumptions and finally verified by means of a structurally verifiable calculation, which is advantageous for the future design of glazing against thermally induced glass fracture.
It was additionally shown in Section 6.3, in the presentation of the maximum principal tensile stresses, that the relevant glass edge stresses in the irradiated area set in the vicinity of the transition from shadowed to irradiated area. At least for the considered case of a half-sided shading, the position of

35 / 37 Article 10.47982/cgc.8.388 Challenging Glass Conference Proceedings – Volume 8 – 2022 – Belis, Bos & Louter (Eds.)
the maximum glass edge stress is now known. In further studies, the influence of the shadow geometry on the thermally induced edge stress will be investigated.
For glasses with high solar direct absorptance, the approach of the outside temperature: as a constant value or as a curve with a temperature amplitude of approx. 10 K, showed that here almost equally high thermally induced glass edge stresses result. For glass panes with lower absorptances, the approach of a constant day temperature was on the safe side with approx. 6 to 7 % higher thermally induced stresses. The approach of a constant day temperature can thus be considered as a sufficiently accurate assumption for the calculation of thermally induced stresses of insulating glass units. As a further result of that, it can be concluded that the usage of a different facade orientation will mostly change the time of occurrence of the maximum stress and less the level of stress itself. Nevertheless, for future insulating glass design and in the case of a transient analysis the correct orientation of the facade considered should be used.
With regard to the question of whether the thermal calculation, for the stress calculation afterwards, should be carried out in a steady state or transient, an initial hypothesis could already be developed in Section 6 on the basis of the thermally induced stresses raised. Due to the small difference in time of 10 minutes between the occurrence of the maximum solar irradiance and the occurrence of the maximum glass edge stress for highly absorbent outer and inner panes, it could be deduced that the thermal calculation can also be carried out in a steady state. If the calculation may be performed in steady state, the shape of the irradiance curve for the different facade orientation is not relevant, because only the maximum irradiance is needed for the calculation. In further studies it will be checked, if a steady state analysis may be applied, in particular whether this type of calculation is also permissible for the middle pane and low-absorbing insulating glass units, since here the maximum glass edge stresses occurred with a time delay of up to 50 minutes.
As already mentioned, further numerical simulations are planned for the future in order to investigate the influencing factors on thermally induced stresses in facade glazing in detail and to be able to make suggestions for engineering design. For this purpose, in addition to the parameters already mentioned (heat transfer through the cavity, steady state or transient calculation, shadow geometry and intensity), further parameters such as variation of the external and internal heat transfer coefficient (in particular here the consideration of the radiation temperature of the sky, the surroundings and the glass surface), thermal conduction of the glass, window frame colour, consideration of the situation in the state of construction, thermal properties of the frame, sudden shadow or radiation or also variation of the geometry of the glazing will be investigated by numerical calculations. In addition to these parameters, special constructions such as sliding doors, so-called shadow-boxes, vacuum insulating glass or also spandrel constructions are a relevant part of future investigations.

36 / 37 Article 10.47982/cgc.8.388 Challenging Glass Conference Proceedings – Volume 8 – 2022 – Belis, Bos & Louter (Eds.)
Acknowledgements
This project has been receiving funding by the German Federal Ministry for Economic Affairs and Energy in the project Verbundprojekt »Thermobruch«: Normentwurf zur Ermittlung der thermischen Beanspruchung von Glas und Glas-PV-Modulen (BIPV) im Bauwesen under grant no. 03TN0007.
On behalf of all authors, the corresponding author sates that there is no conflict of interest.
References Glass & Glazing Association of Australia: AGGA Technical fact sheet, Thermal Stress Glass Breakage.
https://www.festivalglass.com.au/wp-content/uploads/2015/08/Thermal-Stress-Glass-Breakage-factsheet.pdf (2015)
Baldinelli, G.; Lechowska, A.; Bianchi, F.; Schnotale, J. Sensitivity Analysis of Window Frame Components Effect on Thermal Transmittance. Energies 2020, 13, 2957. (2020) https://doi.org/10.3390/en13112957
Bundesverband Flachglas e.V., Datenblatt Psi-Werte Fenster auf Basis messtechnischer Ermittlung der äquivalenten Wärmeleitfähigkeit der Abstandhalter, Nr. W16 – Änderungsindex 4-06/2021, https://www.bundesverband-flachglas.de/index.php?eID=tx_securedownloads&p=230&u=0&g=0&t=1645874632&hash=19d2f538845ec07f132e7844e80e22925b13a2ce&file=fileadmin/user_upload/16-W-DE-Chromatech_Ultra_F1_4-06-21.pdf (2013)
Chen, H., Wang, Q., Wang, Y., Zhao, H., Sun, J., He, L., Experimental and Numerical Study of Window Glass Breakage with Varying Shaded Widths under Thermal Loading. Fire Technol 53, 43–64 (2017). https://doi.org/10.1007/s10694-016-0596-0
Cuzzillo, B. R., Pagni, P. J. Thermal Breakage of Double-Pane Glazing By Fire, Journal of Fire Protection Engineering, 9(1), pp. 1–11, (1998), http://dx.doi.org/10.1177/104239159800900101
Dembele, S., Rosario, R. A. F., Wen, J. X., Thermal breakage of window glass in room fires conditions – Analysis of some important parameters, Building and Environment, Volume 54, Pages 61-70, ISSN 0360-1323, (2012) https://doi.org/10.1016/j.buildenv.2012.01.009.
Ensslen, F., Schwind, G., Schneider, J., Beinert, A., Mahfoudi, A., Lorenz, E., Herzberg, W., Elstner, M., Polakova, M., Schäfer, S., Erban, C., Röhner, J., Sommer, R.: Joint research project (in progress): Draft standard for determining the thermal stress of glass and glass-glass PV modules (BIPV) in the construction industry. Challenging Glass Conference Proceedings – Volume 8 – June 2022.
Flachglas Schweiz AG: Thermische Beanspruchung von Glas. https://flachglas.ch/fileadmin/user_upload/fgs_download/Merkblaetter_Oktober2020_Gruppe/deutsch/PI_018CH_Th ermische_Beanspruchung_von_Glas_Maerz2021.pdf (2021)
Hildebrand, J., Pankratz, M., Experimentelle und numerische Analyse des thermisch-induzierten Glaskantenbruchs. Stahlbau. 82. (2013) http://dx.doi.org/10.1002/stab.201390066
Ineichen, P., Perez, R., A New airmass independent formulation for the Linke turbidity coefficient, Solar Energy, vol 73, pp. 151-157, 2002. https://doi.org/10.1016/S0038-092X(02)00045-2
Inman, R. H., Chu, Y., Coimbra, C. F. M., Cloud enhancement of global horizontal irradiance in California and Hawaii, Solar Energy, Volume 130, 2016, Pages 128-138, ISSN 0038-092X, https://doi.org/10.1016/j.solener.2016.02.011.
Jelle, B. P., Solar radiation glazing factors for window panes, glass structures and electrochromic windows in buildings—Measurement and calculation, Solar Energy Materials and Solar Cells, Volume 116, 2013, Pages 291-323, ISSN 0927-0248, https://doi.org/10.1016/j.solmat.2013.04.032.
Kozlowski, M.; Bedon, C.; Honfi, D., Numerical Analysis and 1D/2D Sensitivity Study for Monolithic and Laminated Structural Glass Elements under Thermal Exposure. Materials 2018, 11, 1447. (2018) https://doi.org/10.3390/ma11081447
Mai, Y.W., Jacob, L. J. S., Thermal fracture of building glass subjected to solar radiation, Editor(s): K.J. MILLER, R.F. SMITH, Mechanical Behaviour of Materials, Pergamon, Pages 57-65, ISBN 9781483284149, (1980) https://doi.org/10.1016/B978-1-4832-8414-9.50099-7.

37 / 37 Article 10.47982/cgc.8.388 Challenging Glass Conference Proceedings – Volume 8 – 2022 – Belis, Bos & Louter (Eds.)
Maroy, K., Carbonez, K., Steeman, M., Van Den Bossche, N., Assessing the thermal performance of insulating glass units with infrared thermography: Potential and limitations, Energy and Buildings, Volume 138, 2017, Pages 175-192, ISSN 0378-7788, https://doi.org/10.1016/j.enbuild.2016.10.054.
Montali, J.; Laffranchini, L.; Micono, C. Early-Stage Temperature Gradients in Glazed Spandrels Due to Aesthetical Features to Support Design for Thermal Shock. Buildings 2020, 10, 80. https://doi.org/10.3390/buildings10050080
Müller-Braun, S., Risssystem und Festigkeit der geschnittenen Kante von Floatglas, Springer Vieweg Wiesbaden,2022, https://doi.org/10.1007/978-3-658-36791-6
Perez, R., Ineichen, P., Moore, K., Kmiecik, M., Chain, C., George, R., Vignola, F., A New Operational Model for Satellite-Derived Irradiances: Description and Validation, Solar Energy, vol 73, pp. 307-317, 2002. https://doi.org/10.1016/S0038-092X(02)00122-6
Paschke, F., Bishara, N., Schulz, I., Kocer, C., Schneider, J., Maier, A., In situ Ug-value measurement on three different glazing types, J. Phys.: Conf. Ser. 2069 012134, (2021), https://doi.org/10.1088/1742-6596/2069/1/012134
Pilette, C. F., Taylor, D. A., Thermal stresses in double-glazed windows. Canadian Journal of Civil Engineering. 15(5): 807-814. (1988) https://doi.org/10.1139/l88-105
Polakova, M., Schäfer, S., Elstner, M., Thermal Glass Stress Analysis – Design Considerations, Vol. 6 (2018): Challenging Glass 6, https://doi.org/10.7480/cgc.6.2193
Svendsen, S., Laustsen, J. B., Kragh, J., Linear thermal transmittance of the assembly of the glazing and the frame in windows, Proceedings of the 7th Symposium on Building Physics in the Nordic Countries, pp. 995-1002, ISSN 9979-9174-5-8, Raykjavik, Iceland (2005)
Tofilo, P., Delichatsios, M., Thermally Induced Stresses in Glazing Systems. Journal of Fire Protection Engineering - J FIRE PROT ENG. 20. 101-116. (2010) https://doi.org/10.1177%2F1042391509344243
ONR CEN/TS 19100-1 Design of glass structures - Part 1: Basis of design and materials (2021).
EN 1990:2010, Eurocode: Basis of structural design (2010).
EN 410:2011-04, Glass in building – Determination of luminous and solar characteristics of glazing (EN 410:2011).
EN 572-1:2016-06, Glass in building – Basic soda-lime silicate glass products – Part 1: Definitions and general physical and mechanical properties (EN 572-1:2012+A1:2016).
EN 673:2011-04, Glass in building – Determination of thermal transmittance (U value) – Calculation method (EN 673:2011).
EN ISO 6946:2018-03, Building components and building elements – Thermal resistance and thermal transmittance – Calculation methods (ISO 6946:2017).
EN ISO 10077-2:2018-01, Thermal performance of windows, doors and shutters – Calculation of thermal transmittance – Part 2: Numerical method for frames (ISO 10077-2:2017).
EN ISO 10456:2010-05, Building materials and products – Hygrothermal properties – Tabulated design values and procedures for determining declared and design thermal values (ISO 10456:2007 + Cor. 1:2009).
DIN 18008-1:2020-05, Glass in building – Design and construction rules – Part 1: Terms and general bases (DIN 18008-1:2010-12)
NF DTU 39 P3, Travaux de bâtiment - Travaux de vitrerie-miroiterie - Partie 3: Mémento calculs des contraintes thermiques. (2006)
CNR-DT 210, Guide for the Design, Construction and Control of Buildings with Structural Glass Elements. NATIONAL RESEARCH COUNCIL OF ITALY. CNR – Advisory Committee on Technical Recommendations for Construction https://www.cnr.it/en/node/3843 (2013)
Verein deutscher Ingenieure VDI e.V., VDI-Wärmeatlas, Book, Springer, Berlin Heidelberg, ed. (2013). https://doi.org/10.1007/978-3-642-19981-3
Verband Fenster + Fassade e.V. (VFF): Thermische Beanspruchung von Gläsern in Fenstern und Fassaden. (2012)

Challenging Glass Conference Proceedings – Volume 8 – 2022 – Belis, Bos & Louter (Eds.) Challenging Glass Conference 8 – 23 & 24 June 2022 – Ghent University – Ghent – Belgium Conference on Architectural and Structural Applications of Glass
Platinum Sponsors
Gold Sponsors
Silver Sponsors
Organising Partners


