Embed Size (px)
Citation preview

Catalytic Properties of SingleLayers of Transition MetalSulfide Catalytic Materials
Russell R. Chianelli, Mohammad H. Siadati,
and Myriam Perez De la Rosa
Materials Research and Technology Institute, The University of Texas at El Paso,El Paso, Texas, USA
Gilles Berhault
Institut, de Recherches sur la Catalyse, Villeurbanne, France
Jess P. Wilcoxon
Sandia National Laboratories, Albuquerque, New Mexico, USA
Roby Bearden, Jr.
Retired from ExxonMobil Process Research Laboratories, Baton Rouge, Louisiana, USA
Billie L. Abrams
Sandia National Laboratories, Albuquerque, New Mexico, USA
Single layer transition metal sulfides (SLTMS) such as MoS2, WS2, and ReS2, play animportant role in catalytic processes such as the hydrofining of petroleum streams,and are involved in at least two of the slurry-catalyst hydroconversion processes thathave been proposed for upgrading heavy petroleum feed and other sources of hydro-carbon fuels such as coal and shale oils. Additional promising catalytic applications ofthe SLTMS are on the horizon. The physical, chemical, and catalytic properties ofthese materials are reviewed in this report. Also discussed are areas for futureresearch that promise to lead to advanced applications of the SLTMS.
Keywords SLTMS, Catalytic processes, Transition metal sulfides
Received September 1, 2005; accepted October 23, 2005.Address correspondence to Russell R. Chianelli, Materials Research and TechnologyInstitute, The University of Texas at El Paso, El Paso, TX, USA. E-mail: [email protected]
Catalysis Reviews, 48:1–41, 2006Copyright # Taylor & Francis Group, LLCISSN: 0161-4940 print 1520-5703 onlineDOI: 10.1080/01614940500439776
1

1. INTRODUCTION
Catalysts based on the layered transition metal sulfides (LTMS) have played acentral role in petroleum refining since beforeWW II. The LTMS catalysts weredeveloped and applied precisely because of their ability to catalyze hydro-carbon-upgrading reactions such as hydrodesulfurization (HDS) and hydro-genation (HYD) in the presence of large amounts of sulfur and othercontaminants including nitrogen and metals. It is for this reason that catalystscontaining the transition metal sulfides MoS2 and WS2 operate in almost everyrefinery in the world today to upgrade fuels by removing contaminants, as wellas, by increasing the hydrogen content of the feedstock through hydrogenationof aromatic molecules. Moreover, many other important petroleum refinery orchemical manufacturing processes have used these materials (reforming) inthe past or may use them in the future (alcohol) production. These applicationsof LTMS catalytic materials were thoroughly reviewed in the 1973 work byWeisser and Landa (1). The applications of LTMS catalytic materials wererecently updated (2–4).
Recent literature, to be discussed later, indicates that when the LTMS isoperated in a catalytic environment, particularly in hydrogen, it stabilizesas single layers. It is the properties and application of these single layers oftransition metal sulfides, the SLTMS that are the subject of this review. Itis a major conclusion of this review that the SLTMS will continue to play amajor role in hydrocarbon upgrading and chemical processing in the future.This conclusion is based on an analysis of the chemical and physical propertiesof the SLTMS and the fact that much work has led to a deeper understandingof their catalytic structure/function relation. This deeper understanding alsoleads to an increased ability to synthesize and optimize their catalytic per-formance for application in specific catalytic processes. Improving catalyticprocesses that include HDS, HYD, and HDN, as well as synthesis reactionssuch as CO/H2, are crucial for the continuing economic prosperity of theworld economy. Furthermore, photocatalytic applications of the SLTMS arealso promising areas of research in several environmental and sustainableenergy applications.
2. STRUCTURE OF THE LTMS
Catalysts based on MoS2 are the most commonly used LTMS catalysts in pet-roleum refining. The WS2 is used to a lesser extent but both have an identicalstructure based on trigonal prisms of sulfur coordinated to Mo or W. Thetrigonal prisms are strongly bonded in two dimensions that form the S–Mo–S(S–W–S) sandwiches that can then stack to form three-dimensional crystalsof varying stacking arrangements. The single layer structure is indicated inFig. 1. It should be noted, however, that reduction of the single layers of
R. R. Chianelli et al.2

MoS2 could result in a distorted octahedral configuration in which the Mo IV isreduced to Mo III. TheMo III then bonds with another Mo III resulting in a dis-tortion of the closely packed sulfur layers. This distortion is usually describedas the distorted octahedral with respect to the Mo coordination. This form isisostructural with layers of ReS2 (Fig. 1b) with Re IV being isoelectronic withMo III (5).
Figure 1: (A) Single layer structure of MoS2 and WS2. The yellow spheres are sulfur and thepurple spheres are Mo or W. (B) Single layer structure of ReS2. The yellow spheres are sulfur andthe green spheres are Re. Notice the Re–Re bonds.
Catalytic Properties of SLTMS 3

Stacking of single layers of MoS2 occurs in several polytypes that reflectdifferent repeat units in the third dimension. The MoS2 is usually found inthe 2H (hexagonal) form indicating that the unit cell repeats along the hexago-nal c-axis after two layers (0.612nm perpendicular to the layers). Within eachlayer the closely packed sulfur atoms determine the hexagonal a-axis of0.312 nm. The 2H designation indicates that the second layer is translated toone half with respect to the first layer. However, MoS2 can also be found inthe 3R (rhombohedral) form (6). The 3R designation indicates that the MoS2
layers repeat after three layers with the layers translated by one third withrespect to each other. Since this report is focused on single layers (SLTMS),the stacking polytypes of MoS2 are of secondary importance. The reader isdirected for further information to an extensive review of LTMS structureand properties by Wilson and Yoffe (7).
3. FOLDING OF SINGLE LAYERS OF LTMS
The MoS2 occurs naturally as molybdenite. A crystal of molybdenite is illus-trated in Fig. 2. Single crystals of MoS2 can also be grown synthetically byvapor transport. However, synthetically grown MoS2 may occur in the 3Rpolytype as opposed to molybdenite, which grows naturally in the 2Hpolytype. The MoS2 can also be prepared by many methods described later.Temperatures of preparation range from room temperature to temperaturesabove 10008C. Low temperature preparation can lead to highly folded andbent layers, termed the “rag structure” as shown in Fig. 3 (8). The ubiquitousrag structure is most commonly found in MoS2 catalysts as described later.The MoS2 particle shown in Fig. 3 is several layers thick and more than100nm across. However, catalytically stabilized MoS2 particles are oftensingle layers and approximately 5 to 10nm across. Higher temperaturemethods of preparation of MoS2 often produce Russian doll structures asseen in Fig. 4 (9). These structures are often referred to as “nested nanotubes”of MoS2 and have also been reported to occur in ReS2 (10). Nanotubes of MoS2
potentially have many useful catalytic applications as well as applications inhydrogen storage and lubrication. However, a closer look at Fig. 4 will showthat the nanotubes are fractured and incomplete. It is not known at thistime if single walled nanotubes of MoS2 can be produced and much effort isbeing expended to synthesize them since many important applications ofthese materials can be envisioned. When considering single layer or singlewalled nanotubes of MoS2 or other LTMS, we must consider the flexibilityinherent in the layers and to what degree the layers can be bent and stillmaintain chemical integrity. The bending and compression of trigonal prismsof Mo and S will limit the diameter to which the layers can be closed to formnanotubes. One should note that carbon nanotubes are formed when achange in stereochemistry is effected by introducing five membered rings
R. R. Chianelli et al.4

into a six membered ring lattice. Such a change in symmetry has not yet beenreported in the LTMS family.
However, the LTMS do exhibit dynamic flexibility to a certain extent.Although the catalytic literature involving TiS2 is very limited (11), the
Figure 2: Naturally occurring crystal of Molybdenite (MoS2). The crystals are approximately2 cm across.
Catalytic Properties of SLTMS 5

material has been studied extensively for application as a battery cathode in Linonaqueous batteries. During discharge the TiS2 layers must open to accom-modate entering Li cations as indicated in Fig. 5. This intercalation processcan also be achieved chemically and the process has been observed dynamicallyin small single crystals using an optical microscope over a period of severalhours (12). In the dynamic intercalation process, the layers are bent andstretched as shown schematically in Fig. 5. The moving front in the crystalliteis shown in Fig. 6. The process can also be followed using dynamic X-ray diffrac-tion techniques (13). The X-ray study showed that the crystals would anneal totheir ordered state upon stopping the intercalation process. These studiesdemonstrate that the LTMS have a degree of flexibility. In fact, in the Li inter-calation studies for battery application, it was shown that the stress of bendingand straightening of the layers was a major factor in limiting the operation ofthe cathodes at high rates. It is also concluded from these studies that thelimiting diameter of potential single-layer nanotubes of the layered LTMScannot be smaller than about 20nm without stereochemical modification,although more work is required to refine this point.
4. SYNTHESIS OF SINGLE LAYERED TRANSITIONMETAL SULFIDES
The synthesis and properties of the LTMS and their intercalation compoundshave been recently updated (14). The MoS2 occurs naturally as described
Figure 3: MoS2 in the “rag structure” (8).
R. R. Chianelli et al.6

previously. The WS2 and ReS2 do not occur naturally and must be synthesizedin the laboratory. Historically, the LTMS have been synthesized from theelements at a temperature above approximately 4008C and single crystalsmay be grown by various techniques, vapor transport being the mostcommon method (15). The high temperature growth methods produce crystal-line LTMS that are excellent for fundamental studies of catalytic properties,but these methods are of little use in practical application of LTMS catalysts.Thus, low temperature methods have been traditionally used. The mostcommon method used to produce commercial catalysts is the aqueous impreg-nation of alumina supports using ammonium molybdate compounds. Thesepreparations are described in hundreds of patents and publications spanningthe long history of LTMS catalysis. An exhaustive review of these techniques
Figure 4: MoS2 in the Russian doll structure (9).
Catalytic Properties of SLTMS 7

is found in Ref. 1. Further discussion of these techniques is beyond the scope ofthis review, which concentrates on the synthesis of SLTMS and their catalyticapplications. However, more specific preparations of the SLTMS are describedin specific sections related to catalytic applications. A systematic method of pro-ducing transition metal sulfide (TMS) materials including SLTMS using low
Figure 5: Intercalation of Li cations into TiS2 from: Optical studies of transition metalchalcogenides (12).
Figure 6: Intercalating single crystal of TiS2 from: Optical studies of transition metalchalcogenides (12).
R. R. Chianelli et al.8

temperature precipitation from nonaqueous solvents (16) was reported. Thisproduced a wide variety of the structures reported earlier including poorlycrystalline, amorphous, glasses and SLTMS. The SLTMS could also beproduced as dispersions in nonaqueous solvents such as dimethyl formamide.This method and the properties associated with the materials produced havebeen extensively reviewed (17).
In the exfoliation method, crystalline MoS2 is first reacted withn-butyllithium to form LixMoS2, and then the LixMoS2 is reacted with waterin the presence of a surfactant producing single layers of MoS2 (18). Thesingle layers are produced as the reaction product of lithium with water, H2
escapes forcing the layers apart. The single layers can then be dispersed inother solvents or flocculated, reassembling as new intercalation compounds.For example, naphthalene can be inserted between the layers they reassemble(19). In another variation of this method, single layered MoS2 is produceddirectly in alkyl-amine melts using Mo(CO)6 and a sulfiding agent (20). Thismethod and related methods are the basis of new and interesting chemistrythat will produce novel and useful materials.
Figure 7: (a) Unoxidized crystal of MoS2 and (b) oxidized crystal from: The reactivity of MoS2
single crystal edge planes (23).
Catalytic Properties of SLTMS 9

5. CATALYTIC PROPERTIES OF LTMS AND SLTMSEDGE PLANES
The anisotropic structure of the LTMS has been described previously. Thoughthe pervasive nature of the SLTMS in catalytic application has only been recog-nized recently, the importance of the anisotropy in catalytic reactions has longbeen recognized. It was the original work of Tauster et al. using the techniqueof oxygen chemisorption that pointed to the role of MoS2 “edge area” in catalyticreactions (21). This led to the reemergence of the importance of the earlier workby Thomas on the chemical nature of MoS2 edges (22). This elegant workopened a series of optical and other studies on MoS2 single crystals in whichchemical reactions and their subsequent effect on the edges of an MoS2
single crystal could be observed directly. In Thomas’ original work the effectof oxidation on the edges and defects in MoS2 is easily seen. This work wasrepeated and optical micrographs of the “eroded” MoS2 crystallites can beseen in Fig. 7 and schematically in Fig. 8. This work also added an extendedstudy of the MoS2 crystallites using Auger and scanning electron microscope(SEM) techniques. These techniques clearly showed the chemical interactionof oxygen, carbon, Co, and other elements with the MoS2 edges (23). TheAuger maps of Co on the edges of MoS2 crystallites are particularly strikingand important to the crucial problem of promotion by Co and Ni. An exampleis shown in Fig. 9. Tanaka and Okuhara demonstrated the chemical reactivity
Figure 8: Schematic diagram of the oxidation of the MoS2 single crystal shown in Fig. 7.Numbers on the crystal faces are in mm.
R. R. Chianelli et al.10

of the edges in a dramatic way by studying the reactivity of single crystals cutinto pieces (24).
Classical high vacuum studies of MoS2 single crystals are virtuallynonexistent because the compound tends to lose sulfur under high vacuumconditions and because Mo single crystals tend to form disordered and
Figure 9: Auger elemental spatial mapping of Co on MoS2 single crystal edges from: Thereactivity of MoS2 single crystal edge planes (23).
Catalytic Properties of SLTMS 11

amorphous sulfides (25) when covered with sulfur. Additionally, it has beenshown that the basal planes of MoS2 single crystals are highly inert whenwell-crystallized leading to the necessity of the studies described in theprevious paragraph (26). An alternate approach to studying the edges ofMoS2 single crystals was presented by Roxlo, et al. (27). In this approach,single crystals of MoS2 were etched by a lithographic technique to producepyramids of MoS2. The pyramids where then studied with photodeflectionspectroscopy (PDS) (28). These studies associated optical absorption abovethe band edge of MoS2 with dangling bonds that give rise to the catalyticactivity. A good correlation to this absorption in several catalysts wasobtained. This and related work gave insight into the actual chemical natureof the defects that give rise to the catalytic activity of MoS2 edge sites asdescribed more thoroughly in the next section.
In addition to the oxygen chemisorption and PDS correlation to HDSactivity as previously described, other correlations to the activity of the edgeplanes have been reported. For example, both NMR and ESR give good corre-lations to HDS activity (29, 30). The ESR measurements on a variety of MoS2
samples gave a straight-line correlation for the HDS activity in modelcompound studies. Approximately 10 � 1018 spins/gram of catalyst werereported in good agreement with the calculated edge area of the samples.Magnetic susceptibility and ESR were measured together at 10GHz on molyb-denum sulfide catalytic materials. The densities of paramagnetic centersinferred from the two types of measurements differ by an order of magnitude(approximately 1 and 0.1mol%, respectively). This demonstrated that theESR measurements probe a subset of the magnetic species detected by the sus-ceptibility measurements. This result led to a model that suggested pairing ofMo atoms at the edge and single Mo atoms giving unpaired spins at the cornersof the particles. Thus, the catalyst particles are electronically conducting at theedges. This idea has been recently confirmed in STM studies as described later.
The property of electron quantum confinement due to the presence of smallsheets of MoS2 is important to photocatalytic effects described later, but also tothe presence of small sheets of MoS2 in supported HDS catalysts. This effectwas described by Garoff et al. (31) through application of Mie scatteringtheory. The measurement of the optical response of materials occurring asfinely divided powders is difficult due to the complex interaction of the opticalwave with the material. Mie theory was used to study the optical propertiesof composites such as supported MoS2 catalysts. Experimental and theoreticaltechniques were developed for characterizing the optical properties of thesematerials. The results need to be exploited further because the techniquesgive direct information regarding the electronic properties of the SLTMS.
It should be noted, however, that all the work described earlier was per-formed on “stacked” MoS2 layers and though catalytically relevant still leaveopen questions regarding the precise nature of the SLTMS occurring in
R. R. Chianelli et al.12

single layers. This means that in this article several fascinating and importantcatalytic applications and studies are not addressed. For example, the syn-thesis of alcohols by alkali promoted MoS2 catalysts probably requiresmultiple layers in a stacked sequence (32).
6. PHYSICAL AND CHEMICAL STRUCTURE OF LTMSAND SLTMS EDGE PLANES
When discussing what is known about the structure of single layers it is essen-tial to distinguish between the “catalyst precursor” and the “stabilizedcatalyst.” The discussion that follows is limited to MoS2 catalysts that areused in hydrogenation processes containing sulfur. These applications are cur-rently the major use of these catalytic materials. The scheme described laterwill change according to the catalytic environment. The simple scheme thatfollows indicates that the “edge plane” chemistry changes after sulfidationand after stabilization in the catalytic environment.
Sulfidation ) MoS2þxð0 , x , 0:5Þ
catalytic conditions ) MoS2�xCyð0 , y , 1Þ
The values of x and y grow as the particle size decreases. A large amount ofinformation exists for the sulfided precursors and much less for the stabilizedcatalyst state. The fact that the MoS2 edge planes are the catalytically import-ant sites is well established. What are the chemical states of these edge planesites? The answer depends on the conditions under which the observations aremade. For example, Chang and Chan (33) observed that after sulfiding MoS2
catalyst precursors disulfide bonds were observed using infrared (IR) andRaman techniques. They observed that catalytically active, poorly crystallineMoS2 exhibit sharp infrared bands at 385 and 470 cm21. However, broadbands at 287, 335, 373, and 522 cm21 appear after H2S treatment indicatingthe presence of polysulfide bands. The intensity of the IR peaks increased asthe MoS2 edge area increased (33). This would lead to a composition that canbe described as MoS2-x(S–S)0.5y. A simulation of this state is shown inFig. 10. In this example, the hypothetical cluster would have the stoichiometryMoS1.88(S–S)1.12. The polysulfide bonds could be placed in other locations,illustrating the complexity of defining the MoS2 catalytic edge planes.
In Fig. 11 we see another hypothetical MoS2 cluster after the edge planesare stabilized in a catalytic hydrodesulfurization environment. In this case,the catalyst is sulfur deficient and contains carbon in a “carbide” environment.The stoichiometry in this case is MoS1.88C1.12. Although, the exact structure ofthe edge carbide is not known the carbiding of theMoS2 edge plane is supportedby synchrotron studies of catalysts stabilized in HDS conditions (34). In thisstudy, carbon edge X-ray absorption studies clearly indicated through the
Catalytic Properties of SLTMS 13

Figure 10: Cerius2 simulation of MoS2þx. A small cluster with the stoichiometry MoS1.88 (S–S)1.12.
Figure 11: Cerius2 simulation of MoS2-xCx.
R. R. Chianelli et al.14

measurement of Auger electrons emanating from the catalyst surface as afunction of X-ray energy, that the surfaces of MoC and the stabilized MoS2
catalysts were identical. This is an example of the surface of a workingcatalyst and indicates that understanding of catalyst structure/functionrelations requires the study of such stabilized catalysts and that the study ofprecursors, though useful in understanding the chemistry of the catalyticmaterial, is not sufficient.
A strikingly beautiful image of a single layer MoS2 catalyst precursorcreated under vacuum and then sulfided can be found in the work of H.Topsøe (35). The atomic force microscopy (AFM) image of a single triangularlayer of MoS2 may be seen in Fig. 12. The single layer crystallite is approxi-mately 3nm wide and was prepared on a Au(111) substrate by depositing themetal in an atmosphere of H2S (1 � 10–6 mbar at 400K) and then annealing(673K for 15 minutes). The triangular shape was unexpected but, as describedlater appears to be the stable state for single layer MoS2 hydroprocessingcatalysts. Sulfur vacancies were also imaged after treatment with hydrogenby treating the catalyst with atomic hydrogen. The edge chemistry of thesematerials is complex and flexible as expected for a catalyst, but the basicmorphology of the MoS2 illustrated in Fig. 12 best describes a model forsubsequent fundamental studies of the catalytic chemistry of the SLTMS.However, one should consider that operating SLTMS are generally highlydisordered, thus introducing another level of complexity. Detailed theoreticalstudies of the physical and chemical structure of the SLTMS are described inthe next section.
7. THEORETICAL STUDIES OF THE PHYSICAL ANDCHEMICAL STRUCTURE OF SLTMS EDGE PLANES
It has been well established that the catalytically important electronic states atthe edge of the MoS2 layers are “dangling” d electron states. This was estab-lished by electron spin resonance (ESR) and magnetic susceptibility studies(36). These ESR studies measured 10–20 � 1018 spins per gram of MoS2
catalyst and this correlated well with the oxygen chemisorption studiesdescribed earlier. A paramagnetic model was assumed that described theedges of the MoS2 as electronic, paramagnetic conductors. The danglingbonds of catalysts in the precursor state (sulfided) were studied using XPSand UPS photoemission techniques (37). The electronic energies measured inthis study were:
dz2 � 2:2 eV nonbonding d electrons
d–p � 3–9 eV bonding Mo 4d and S 3p
s � 13:5 eV non bonding S 3s
Catalytic Properties of SLTMS 15

The study further concluded that the tail above the dz band was due to danglingbond catalytic defects that reversibly chemisorbed/physisorbed oxygen andthat these edge defects were possibly dimers that were electronically conduc-tive. Recent theoretical studies confirm and expand this idea (38).
In the past 20 years theoretical computing has become easier and theoreti-cal studies of catalysts have become more and more common. This is parti-cularly true in the case of the subject materials of this article. Densityfunctional theory (DFT) has become almost routine as applied toMoS2 catalyticparticles. At this writing the theoretical work has concentrated primarily onthe structure of MoS2 precursors in the sulfided or activated state. Manycalculations on MoS2 layers have been done. The most useful are those thatare accompanied with complementary surface and analytical techniques. Arecent example of this approach is the result of the efforts of the researchgroup of and colleagues Klier (39, 40). Stable edge periodic structures werepredicted with edge stability found to be in the order (1 0 1x) (moststable) . (1 . 2 1x) . (1 . 2 1 0) . (1 0 . 1 0), where the inclination index x ¼ 3or 4 (inclination index ¼ angle of cutting the plane). A large relaxationenergy associated with the reconstruction of the edge from ideal geometry ofa cut through the 2H-MoS2 crystal: for the (1 0 . 1 x) edge, energy of 0.63 eVper MoS2 molecular formula is released upon a concerted movement ofexposed S atoms that increases the coordination of the edge Mo atoms from 4to 5. The calculated states were also metallic in agreement with previousstudies. However, calculations on single layers of MoS2 were not includedand the results reported are for stacked crystallites. These studies alsoincluded detailed calculations using DFT methods of MoS2 monomers,clusters, and edges in periodic structures as they activate hydrogen.Hydrogen was found to bind in stable configurations to Mo or S atoms or inbridging positions across two Mo atoms. From these calculations the followingvibrational frequencies were calculated:
Mo-H-Mo 1223 cm�1
Mo-H 1860 cm�1
Mo-S 2500 cm�1
An example of the power of combining surface studies (STM) with theoreticalcalculations (DFT) can be found in recent work by the Topsøe group (41).Single layers of MoS2 were synthesized and studied using STM techniques.The STM studies were performed in an environment of hydrogen and thio-phene with the surprising result that thiophene adsorbed on full sulfidededges. The binding sites are one dimensional metallic brim sites (metallicedge site) as described by DFT calculations. This result is in contrast to thecommon wisdom that coordinately unsaturated sites (CUS) sites are required
R. R. Chianelli et al.16

for the molecular binding to occur. Reconstruction of the edge sites is alsoshown in these studies along with remarkable details regarding the formationof vacancies, the binding of hydrogen and thiophene, and the mechanism ofdesulfurization under STM conditions. The combination of DFT techniquesand surface techniques is the way to future detailed information regarding cat-alytic pathways. For this information to be related to commercial catalysts, thecatalyst must be studied after it has been stabilized under operating conditionsand the structural role of carbon explained.
8. SINGLE LAYERS IN COMMERCIAL CATALYSTS
As described previously the reactivity of MoS2-based catalysts depends ondisordered edge planes presenting themselves to the reactants in a catalyticenvironment. The edge planes are highly active, unlike the basal planes thatare thought to be inert. The total activity depends on the number of thesesites present in a stabilized catalytic environment. Basic studies prove thatthe selectivity of unsupported MoS2 catalysts are affected by the stackingheight of the MoS2 slabs in the Rim and Edge model proposed by Chianelliet al. (42). In such a model, the rim sites are active for hydrogenation reactionsand C–S bond rupture while edge sites are active only in C–S rupture (seeFig. 13). A freshly prepared active catalyst presents stacks of four to fiveslabs. Much of the HDS literature has attempted to rectify the “rim/edge”theory with selectivity studies done on commercial alumina-supported cata-lysts. However, the original rim/edge theory did not include the promotioneffect on selectivity and, furthermore, most studies have been done on commer-cial catalysts that are not stabilized in a catalytic environment. Recent studiesshow that when a commercial catalyst is stabilized in an operating catalyticenvironment, only single layers exist as described later. This fact has beenmissed until recently and is a crucial concept for understanding and optimizingthese catalysts. In addition, it has become necessary to reevaluate andunderstand the selectivity of promoted single layer commercial catalysts at afundamental level.
Numerous techniques have been extensively used in an attempt to under-stand the structure of the catalyst active phase including high resolution trans-mission electron microscopy (HRTEM) and X-ray absorption spectroscopy(XAS). However, the highly anisotropic layered stacked structure has limitedthe information that can be drawn from the catalytically stable state of anHDS catalyst. Furthermore, the interaction of the support with the activephase adds to the difficulty in determining catalyst dispersion. Perhaps oneof the leading techniques used to average slab lengths and mean values forthe stacking numbers is HRTEM. However, its ability to detect the MoS2
slabs strongly depends on how the slabs are bonded to the support (43).Edge-bonded layers are clearly visible whereas thin flat slabs of MoS2 are
Catalytic Properties of SLTMS 17

Figure 13: Rim and Edge Theory (42).
Figure 12: AFM micrograph of single layer of MoS2 on gold substrate (35).
R. R. Chianelli et al.18

simply missed. The XAS measurements underestimate the dimensions alongthe basal plane because ordered sulfide particles are assumed in the fittingprocedure while they are disordered and distorted in real catalysts (44).Structural analysis of X-ray diffraction patterns on the other hand, probesall orientations of the MoS2 slabs and gives an unbiased picture of thecatalyst morphology.
In a recent study by Perez De la Rosa et al. (45) three commercial Co/MoS2/Al2O3 catalysts were analyzed using synchrotron radiation X-ray diffrac-tion. The catalysts differ by the length of time of use: the first run for one week,the second run for one month in a pilot plant, and the third run in an industrialplant for four years. The widths of the diffraction peaks were used to estimatethe size of the lattice coherence normal to the diffraction vector. Liang andcoworkers (46) established a procedure for quantitatively determining thesize of the MoS2 slabs from the analysis of the diffraction pattern of poorlycrystalline MoS2 (illustrated in Fig. 14). Following their procedure the (002)peak was used to determine the height and the (110) peak to determine thediameter of the MoS2 slab. The line broadening analysis was complementedby a full scattering model. The full scattering model evaluates the area of the
Figure 14: Typical X-ray diffraction profile of the poorly crystalline MoS2 phase. The positions ofthe main diffraction peaks are indicated by arrows (45).
Catalytic Properties of SLTMS 19

(002) peak and the diffuse scattering area under the (002) peak to determinethe fractions of stacked and unstacked layers. The relative proportions ofstacked and unstacked layers were then directly obtained from the X-raydiffraction (XRD) data. Their results were surprising and unexpected. Afterfour years of industrial hydrotreating operations, the synchrotron scatteringpatterns of these catalysts show that they are completely destacked (seeFig. 15). The catalyst consists of single layers of MoS2 with a minor loss ofactivity. As the pressure increased from 5.5MPa to 7.8MPa a strongdecrease in stacking was observed. Therefore, high pressure applied duringthe hydrotreating conditions was determined to be the main cause for thedestacking effect observed in the spent commercial catalysts under industrialconditions. This result was also seen in freshly prepared catalyst run in diben-zothiophene (DBT) reported in the same paper (46).
A materials study with similar pressure-crystallization effects wasreported by Peng et al. (47) where the slab stacking decreased with increasingpressure inside the reactor during the hydrothermal synthesis of MoS2 in anautoclave. The authors suggested that perhaps other experimental parametersof the HDS process, such as the hydrocarbon pressure or concentration couldcontribute to the destacking effect. The formation of multilayered stacksthrough van der Waals forces seems counterbalanced by the strong interaction
Figure 15: The low-angle X-ray synchrotron patterns for a commercial CoMo/Al2O3
catalyst at the three different stages of catalytic life: one week (A), one month (B), andfour years (C) (45).
R. R. Chianelli et al.20

of adsorbed hydrocarbon molecules that provide stability to single MoS2 layers(see Fig. 16). If a strong interacting support is present the destacking effect isaccentuated. This result also confirmed a recent study by Glasson et al. (48)that showed that less stacked CoMo/Al2O3 catalysts could be obtained if theywere pretreated with gas oil or other oils. Their treatment at atmosphericpressure found that hydrocarbons are able to enhance the destackingprocess. However, applying high pressure will favor the stabilization effectby increasing the interaction between hydrocarbons and MoS2 single layers.In retrospect, this point seems obvious in that if hydrogen intercalates athigh pressure, then the layers would simply slide apart with time. This facthowever, emphasizes the importance of studying stabilized catalyst todevelop fundamental insight. Further support for the single layers being the
Figure 16: Destacking effect under the hydrodesulfurization process: A) sulfided precursor,B) hydrogen activated catalyst, C) stabilized single layer catalyst.
Figure 17: Optical micrograph of Mo microcat catalyst dispersed in Cold Lake crude afterhydroconversion reaction.
Catalytic Properties of SLTMS 21

stable catalytic entity in HDS catalysis is found in a recent paper that describesthe morphology of carbon-supported WS2 catalysts (38). The paper also reportsimages of triangular nanoclusters.
9. SINGLE LAYERED TRANSITION METAL SULFIDE (SLTMS)CATALYSIS IN HEAVY OIL PROCESSING
In the previous section we described catalysts that commercially available inthe form of solid pellets and usually are used in various fixed bed reactorsystems. However, in this section we describe certain finely divided, transitionmetal–based catalysts that are used as slurries in heavy crude oils (e.g.,Canadian bitumen) or the residual fraction thereof (i.e., material typicallyboiling above 5668C) to catalyze the hydroconversion upgrading of theseheavy materials. Hydroconversion upgrading denotes conversion of oilboiling above 5668C to liquid products boiling below 5668C, along with signifi-cant removal of contaminants such as sulfur andmetals. Amajor role played bycatalysts in all slurry technologies is suppression of coke formation in thehydroconversion step that operates at thermal cracking temperatures(i.e., .4008C). Catalyst or catalyst precursor can be added to the feed by oneof several methods that include addition as a finely divided powder, disperionin feed as an emulsion of a water solubilized metal compound, or by additionas an oil soluble metal compound.
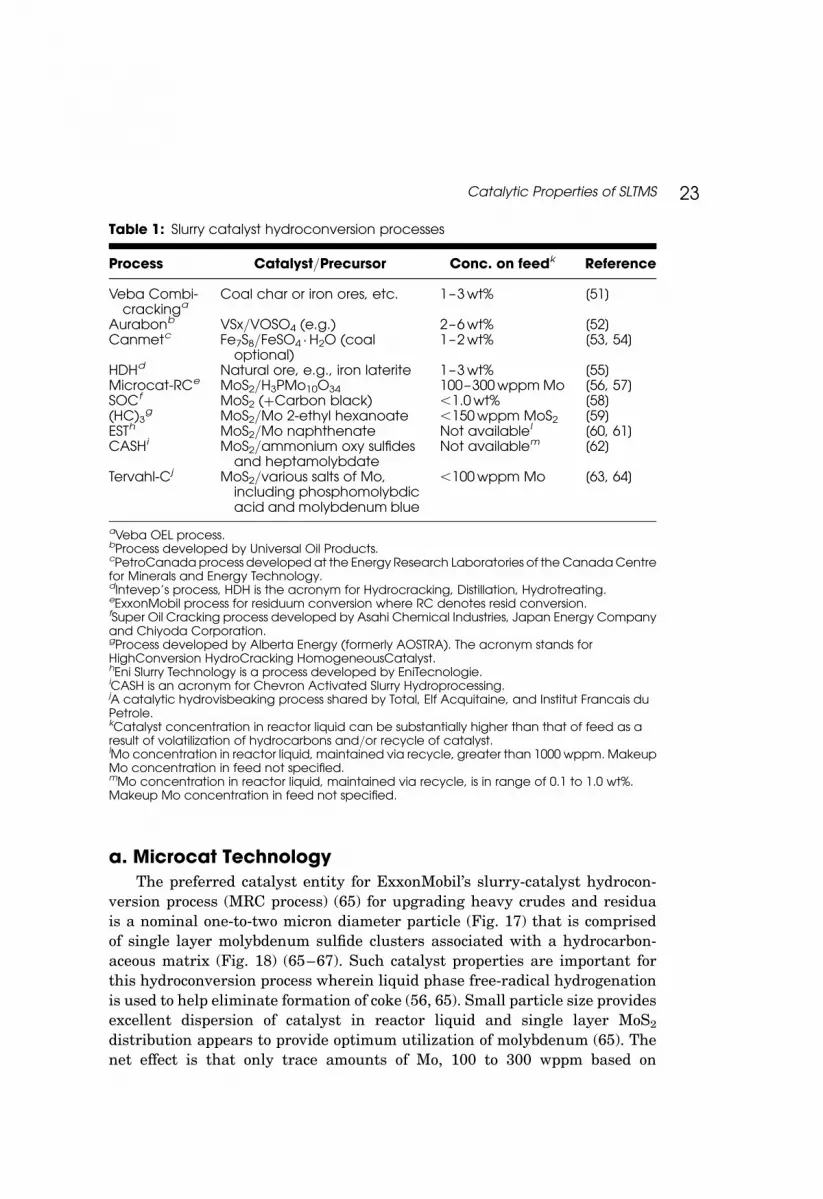
This general area of technology dates to the 1920s when Pier added catalystslurry to the Bergius high-pressure process for hydroliquefaction of coal (49).The apparent first application of transitionmetal slurry catalysis for petroleumwas reported by Zorn in 1932 (50). However, it was not until about 1960 thatthere was a resurgence of interest in slurry catalysts for treating heavypetroleum feeds. Numerous patents and publications have appeared since1960 and research continues to the present day. Ten slurry-catalyst hydro-conversion processes have evolved from this body of research (Table 1).Patents that cover these various processes generally provide considerablelatitude with respect to the catalyst metal or metals that are used, as well ascatalyst (or additive) concentration on feed. Selections quoted in Table 1 arebest estimates based on references cited.
There is little information in the literature concerning the SLTMScharacter of the catalysts that are used in the various processes cited inTable 1. The two exceptions are for the catalysts that are used in theMicrocat-RC process and in the ENI-EST process. Both of these processesoperate with catalysts that contain single layer MoS2 platelets. A possibleexplanation for SLTMS formation in MoS2 slurry systems, i.e., coordinationwith asphaltenes and/or resins in heavy feeds, is discussed in the followingsection on Microcat technology.
R. R. Chianelli et al.22
a. Microcat TechnologyThe preferred catalyst entity for ExxonMobil’s slurry-catalyst hydrocon-
version process (MRC process) (65) for upgrading heavy crudes and residuais a nominal one-to-two micron diameter particle (Fig. 17) that is comprisedof single layer molybdenum sulfide clusters associated with a hydrocarbon-aceous matrix (Fig. 18) (65–67). Such catalyst properties are important forthis hydroconversion process wherein liquid phase free-radical hydrogenationis used to help eliminate formation of coke (56, 65). Small particle size providesexcellent dispersion of catalyst in reactor liquid and single layer MoS2
distribution appears to provide optimum utilization of molybdenum (65). Thenet effect is that only trace amounts of Mo, 100 to 300 wppm based on
Table 1: Slurry catalyst hydroconversion processes
Process Catalyst/Precursor Conc. on feedk Reference
Veba Combi-crackinga
Coal char or iron ores, etc. 1–3 wt% [51]
Aurabonb VSx/VOSO4 (e.g.) 2–6 wt% [52]Canmetc Fe7S8/FeSO4
. H2O (coaloptional)
1–2 wt% [53, 54]
HDHd Natural ore, e.g., iron laterite 1–3 wt% [55]Microcat-RCe MoS2/H3PMo10O34 100–300 wppm Mo [56, 57]SOCf MoS2 (þCarbon black) ,1.0 wt% [58](HC)3
g MoS2/Mo 2-ethyl hexanoate ,150 wppm MoS2 [59]ESTh MoS2/Mo naphthenate Not availablel [60, 61]CASHi MoS2/ammonium oxy sulfides
and heptamolybdateNot availablem [62]
Tervahl-Cj MoS2/various salts of Mo,including phosphomolybdicacid and molybdenum blue
,100 wppm Mo [63, 64]
aVeba OEL process.bProcess developed by Universal Oil Products.cPetroCanada process developed at the Energy Research Laboratories of the Canada Centrefor Minerals and Energy Technology.dIntevep’s process, HDH is the acronym for Hydrocracking, Distillation, Hydrotreating.eExxonMobil process for residuum conversion where RC denotes resid conversion.fSuper Oil Cracking process developed by Asahi Chemical Industries, Japan Energy Companyand Chiyoda Corporation.gProcess developed by Alberta Energy (formerly AOSTRA). The acronym stands forHighConversion HydroCracking HomogeneousCatalyst.hEni Slurry Technology is a process developed by EniTecnologie.iCASH is an acronym for Chevron Activated Slurry Hydroprocessing.jA catalytic hydrovisbeaking process shared by Total, Elf Acquitaine, and Institut Francais duPetrole.kCatalyst concentration in reactor liquid can be substantially higher than that of feed as aresult of volatilization of hydrocarbons and/or recycle of catalyst.lMo concentration in reactor liquid, maintained via recycle, greater than 1000 wppm. MakeupMo concentration in feed not specified.mMo concentration in reactor liquid, maintained via recycle, is in range of 0.1 to 1.0 wt%.Makeup Mo concentration in feed not specified.
Catalytic Properties of SLTMS 23
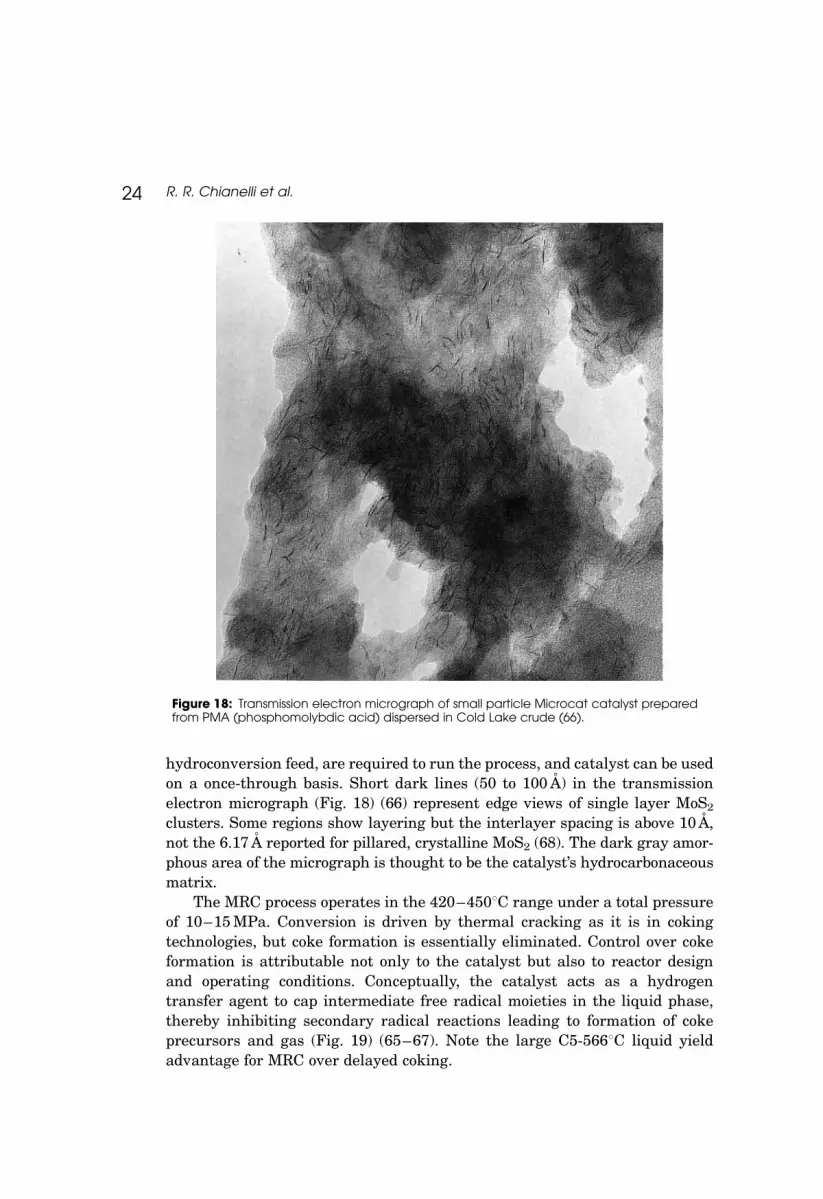
hydroconversion feed, are required to run the process, and catalyst can be usedon a once-through basis. Short dark lines (50 to 100 A) in the transmissionelectron micrograph (Fig. 18) (66) represent edge views of single layer MoS2
clusters. Some regions show layering but the interlayer spacing is above 10 A,not the 6.17 A reported for pillared, crystalline MoS2 (68). The dark gray amor-phous area of the micrograph is thought to be the catalyst’s hydrocarbonaceousmatrix.
The MRC process operates in the 420–4508C range under a total pressureof 10–15MPa. Conversion is driven by thermal cracking as it is in cokingtechnologies, but coke formation is essentially eliminated. Control over cokeformation is attributable not only to the catalyst but also to reactor designand operating conditions. Conceptually, the catalyst acts as a hydrogentransfer agent to cap intermediate free radical moieties in the liquid phase,thereby inhibiting secondary radical reactions leading to formation of cokeprecursors and gas (Fig. 19) (65–67). Note the large C5-5668C liquid yieldadvantage for MRC over delayed coking.
Figure 18: Transmission electron micrograph of small particle Microcat catalyst preparedfrom PMA (phosphomolybdic acid) dispersed in Cold Lake crude (66).
R. R. Chianelli et al.24

The Mo Microcat catalyst described here is one of a family of Microcatcatalysts that have been prepared from Groups IB, IVB, VB, VIB, VIIB, andVIII metals (57). These catalytic materials can be formed in situ in theprocess feed, typically a heavy crude oil or the 566þ8C fraction of the crudeoil, by heating a mixture of feed and suitable catalyst precursor preferably inthe presence of sulfiding agent and hydrogen. Preferably, a concentrate thatcontains the catalyst metal is prepared in a portion of process feed, and the con-centrate is metered into themain feed stream to provide the desired level of cat-alytic metal in reactor liquid. For the molybdenum-based system, the Mocomponent of the concentrate can be the catalyst precursor, a presulfided pre-cursor, or a preformed catalyst (69, 70). One of several molybdenum compoundscan be used as catalyst precursor. However, a phosphomolybdic acid (PMA) ispreferred. Phosphomolybdic acids are readily prepared via reflux of pure-grade MoO3 with dilute phosphoric acid at the desired P/Mo atom ratio (71).Moreover, when an aqueous solution of PMA is blended with heavy crude oil,the acid reacts with organic bases in the oil, thereby leading to an essentiallyhomogeneous dispersion of PMA. The aqueous PMA used in most of thiswork had an empirical formula of H3P1.25 Mo10O34.
Studies on catalyst preformation, i.e., preparing catalyst concentrate in areactor separate from the hydroconversion reactor, led to an improved under-standing of the chemistry of catalyst formation. For example, in a preparationsequence using PMA dispersed in Cold Lake crude, phosphomolybdate wasfirst converted to MoS3 (likely present as thiomolybdate) by treating withhydrogen sulfide at 150–2008C. The crude oil plus MoS3 was homogeneousat this point, but upon heating to 320–3308C (with or without hydrogen), adispersion of oil-insoluble catalyst appeared (Fig. 20). The temperature at
Figure 19: Catalytically controlled thermal cracking.
Catalytic Properties of SLTMS 25

which catalyst formation occurs is consistent with the range reported for thedecomposition to (NH4)2MoS4 and then to MoS2
1.The hydrocarbonaceous matrix that forms is not a pyrolytic coke. The
temperature of formation is too low for reactions leading to coke. Furthermore,when Cold Lake crude oil is subjected to the same treatment conditions withoutto molybdenum present, solids are not obtained. Thus, it appears that singlelayer MoS2 clusters react or coordinate with components of the feed to formthe hydrocarbonaceous matrix. An elemental assay of Mo Microcat catalystformed in a Cold Lake crude shows that the hydrocarbonaceous matrix has acomposition similar to that of the heptane insoluble asphaltene fraction ofthe crude (Table 2). The hydrogen to carbon atomic ratio is as expected, as isthe high content of heteroatom impurities. The nature of association betweensingle layer MoS2 clusters and hydrocarbonaceous matrix is not known, butis likely to involve coordination with organo-sulfur sites within the matrix.
Catalyst formed from molybdenum naphthenate dissolved in Cold Lakecrude oil yields a catalyst of comparable activity to that obtained with PMA(57). In the initial step of catalyst formation, molybdenum naphthenate decom-poses (starting at about 1508C) to yield a dispersion of MoO3 in oil. From thatpoint on, catalyst formation steps are thought to parallel those of the PMAsystem. Catalyst infrastructure is similar to that of the PMA-derived
Figure 20: Threshold temperature for Mo Microcat formation from PMA (phosphomolybdicacid) dispersed in Cold Lake crude.
R. R. Chianelli et al.26

catalyst but with more ordering of layers, albeit with very large (20 A) inter-layer spacing (Fig. 21) (66). Without further characterization, it is difficult tosay whether heptane-insoluble asphaltenes are the sole contributor to for-mation of the catalyst’s hydrocarbonaceous matrix. Resins (polar aromatics)are also possible candidates. In view of this uncertainty, Conradson carbon(CCR) was chosen as a feed parameter for study of feed composition effect on
Table 2: Mo Microcat catalyst assay: Nature of hydrocarbonaceousmatrix, catalyst formed with PMA in Cold Lake crude (67).
Component,wt% Catalyst
Matrix(normalized)
C7asphaltene
Mo 10.9a 0.0 0.0C 65.5 80.2 81.9H 5.4 6.6 7.9S 16.8 11.8 7.5N 1.2 1.5 1.2Ni þ V ,0.1 ,0.1 0.1H/C atom ratio 1.0 1.0 1.15
a.99% MoS2 by ESCA.
Figure 21: TEM of Mo Microcat catalyst formed from Mo naphthenate dissolved in Cold Lakecrude oil (66).
Catalytic Properties of SLTMS 27

catalyst properties. The CCR is a measure of molecules in heavy crude orresiduum that will form coke upon thermal cracking (72). Asphaltenes andresins are the principal contributors to CCR (73).
Several catalysts were prepared in a hydrocarbonmedium inwhich variousblends of Cold Lake crude (11wt% CCR) and a Cold Lake derived vacuum gasoil (1.0wt% CCR) were used to vary the amount of CCR present for catalystformation. Molybdenum naphthenate was used as the catalyst precursor.Catalysts were formed by heating at 3858C for 30min with 5 molar% H2S inhydrogen under 12MPa total pressure (74). Results of these experiments(Fig. 22) show that catalyst particle size and surface area vary inversely withthe CCR/Mo atomic ratio, where CCR was given the atomic weight ofcarbon. Catalysts that are preferred for controlled thermal cracking, thesmall particle size single layer MoS2-containing catalysts, are formed at highratios (e.g., 3000:1 or higher). High surface area, larger particle catalystswith layered MoS2 are favored by low CCR/Mo ratios. One conclusion thatcan be drawn from this correlation is that the hydrocarbonaceous matrix isneeded in a high concentration to stabilize single layer MoS2. This conclusionis further illustrated by assays of catalysts formed at high and low CCR/Moratios (Table 3). The TEM of high surface area Mo Microcat (Fig. 23) indicatesa fairly amorphous composition. There are islands of highly folded MoS2 asdescribed earlier, but with no more than three to six layers.
High surface area Mo catalysts, because of larger particle size, performpoorly for coke suppression when used at low Mo concentrations on feed
Figure 22: Effect of Conradson carbon to Mo ratio on catalyst particle size and surface area.
R. R. Chianelli et al.28

(i.e., 100–300wppm Mo). On the other hand, when used at concentrations inthe 1–3wt% range and above, the high surface area catalysts provide cokesuppression as well as enhanced rates of 566þ8C conversion, sulfur removal,and Conradson carbon conversion (67). Because of cost, the use of effectiveamounts of high surface area Mo catalysts for heavy crude hydroconversionrequires provisions for catalyst recovery and recycling. High surface areaMicrocat catalysts have been prepared with metals from Groups IB, IVB,VB, VIB, and VIIB (76).
Table 3: Molybdenum Microcat catalysts (prepared by oil in-situdecomposition of Mo naphthenate).
CCR/Mo atom ratio 3000:1 11:1
Particle size range, microns 1–2 50–100þSurface area, m2/g 20 335Elemental assay, wt%
Carbon 72.2 11.8Hydrogen 6.0 1.1Molybdenum 5.8 47.1Sulfur — 35.0
Figure 23: Electron micrograph of high surface area Mo Microcat Catalyst prepared withCCR/Mo atomic ratio of 11:1 (75).
Catalytic Properties of SLTMS 29

b. ENI-EST CatalystAnother example of MoS2 single layer catalysis is found in work relating to
ENI-EST hydroconversion technology (61). This Mo-based catalyst was formedin situ in sulfur-rich Belayin vacuum residue from molybdenum naphthenate.An X-ray analysis of the catalyst recovered after a standard hydroconversiontest suggested the presence of monolayers of MoS2 or of crystallites with amaximum of two or three layers. A TEM-EDS analysis indicated thepresence of isolated slabs of MoS2 and, to a lesser extent, slabs grouped insheaves with parallel and regular spacing of 25–30 A. Several catalysts otherthan the molybdenum-based catalyst were also screened. These catalystswere formed in situ in the feed from oil soluble salts, including those of iron,nickel, cobalt, vanadium, and ruthenium. Molybdenum was preferred basedon overall performance.
Based on findings for the Microcat and ESTcatalysts, it appears likely thatMoS2 catalysts used in the SOC, (HC)3 CASH, and Tervahl-C technologies(Table 1) also contain single layer MoS2.
c. Related StudiesThe direct liquefaction of coal using MoS2-based catalysts (77, 78) is also an
area where SLTMS catalysis may be involved, as well as in the hydroconver-sion of coal and heavy oil mixtures (79). Also, a study has been reportedwhere exfoliation/restacking of MoS2 crystallites was applied in exploratorystudies as a methodology for development of layered catalysts, especially forcoal liquefaction and hydrorefining of petroleum residues (80). Several depart-ment of energy (DOE) contract studies have been reported for MoS2 slurry cat-alysts, iron catalysts, andMo promoted iron catalysts for the direct liquefactionof coal as well as the hydroconversion of coal mixed with oil (81).
Overall, it appears that single layered Group VIB metal sulfides willremain an important tool in catalytic hydroprocessing, particularly as moreof the world’s enormous reserves of heavy crude oils are needed to meetenergy demands.
10. PHOTOCATALYSIS BY SLTMS (PHOTOCATALYSISUSING MOS2 NANOCLUSTERS)
Efficient photocatalytic destruction of toxic waste or splitting of water toproduce hydrogen requires a photocatalyst capable of being activated byvisible light. In the bulk form, MoS2 has a band gap corresponding to nearinfrared wavelengths. However, because of quantum confinement on theproperties of nanosized MoS2 (n-MoS2) the optical gap is shifted intothe visible wavelength regime. Accompanying optical gap widening is the
R. R. Chianelli et al.30

favorable alignment of the valence and conduction bands with redoxpotentials of interest. Thus, nanosized MoS2 photocatalyst can be drivenwith visible radiation. Several studies have reported the photocatalyticactivity of bulk TMS and SLTMS (82) but few have studied these propertieson the nanoscale.
Initial studies in photooxidation of toxic wastes such as phenol usingn-MoS2 were performed by Thurston and Wilcoxon (83). They used differentsizes of n-MoS2 clusters (4.5 nm and 8nm) to examine the effectiveness ofphenol destruction compared to the standard Degussa P25 TiO2 photocatalyst(83). Using high pressure liquid chromatography (HPLC) they could monitorthe concentration of phenol as a function of time after illumination of then-MoS2 photocatalyst/phenol solution at 455nm. Figure 24 shows a 225nmabsorption chromatogram using 4.5 nm MoS2 where the phenol elutes at�14.6 minutes. Over an 8-hour period, the area of the phenol peak decreasesby �25% accompanied by the appearance of two phenol photooxidationproducts: catechol (13.4min) and a possible isomer of catechol (12.2min). TheDegussa P25 TiO2 exhibited a similar reaction pathway for phenol photooxida-tion upon illumination with 365nm radiation (Fig. 25). However, there was noreaction upon illumination with visible light (Fig. 26). The active sites on theMoS2 clusters corresponding to the active Ti (IV) sites of TiO2 are presumably
Figure 24: HPLC absorption chromatogram showing phenol destruction with visible light(455 nm) using 4.5 nm MoS2 clusters as the photocatalyst (83).
Catalytic Properties of SLTMS 31

the empty d-orbitals accessible at the Mo metal edge sites. Phenol absorptionand hole transfer could occur at these locations.
Other important requirements in photocatalysis (or in any catalyticprocess) are photocatalyst regeneration and degradation resistance.Figure 27 shows the absorbance spectrum (collected as part of an HPLC chro-matogram) of 4.5 nm MoS2 clusters before and after photocatalysis (84). Therewas no decrease in the area under the curves (representative of MoS2 concen-tration) with either visible or ultraviolet (UV) illumination. There are no shiftsin the characteristic excitonic peak positions for MoS2 before and after thephotocatalytic oxidation of phenol. This shows the true photocatalytic natureof MoS2 nanoclusters, i.e., it is regenerated and does not exhibit any signs ofphotodegradation.
Photooxidation of phenol was also possible using 8–10nm MoS2 clustersbut not to the extent as of the 4.5 nm clusters. The extent of phenol photodes-truction is represented in Fig. 28, which shows a plot of phenol concentration asa function of time under visible illumination for 4.5 nmMoS2 clusters, 8–10nmMoS2 clusters, and Degussa P25 TiO2. There was a steady decline in the phenolconcentration with the 4.5 nm MoS2 (Fig. 24), some reduction with 8–10nmMoS2 (Fig. 25), and no change with the P25 TiO2 (Fig. 26). For the 4.5 nm
Figure 25: HPLC chromatogram showing phenol destruction with 365 nm UV illuminationcatalyzed by Degussa P25 TiO2 (83).
R. R. Chianelli et al.32

MoS2 the phenol destruction rate could be replicated upon adding more phenolaftermost of thephenol hadbeendestroyed (indicated inFig. 26). This is anotherdemonstration of the regenerative photocatalytic nature of these nanoclusters.
Quantum confinement effects were also observed during photooxidationstudies of pentachlorophenol (PCP) using even smaller (3 nm) sized MoS2
clusters (85). The PCP is a chlorinated aromatic molecule from the chlorinatedphenol family. This very toxic chemical is thought to originate fromwater treat-ment using chlorine in the presence of organic materials, sewage treatmentplants, and incinerators. Its slow natural degradation rate allows it topersist in the environment. Direct photolysis of PCP leads to highly toxic bypro-ducts such as octachlorodibenzo-p-dioxin (86). Many studies have shown thetotal mineralization of PCP to CO2 and HCl using TiO2 (87, 88). However,due to the large optical gap of TiO2 (3.2 eV), it is limited to excitation by UVlight, which is only �3% of the solar spectrum. Excitation with visible lightwould allow for use of a larger part of the solar spectrum. Since MoS2
clusters are highly active under visible illumination, they are ideally suitedfor visible light photooxidation studies of PCP.
Bulk CdS powder was used as a comparative standard to the MoS2 clustersstudied (68). Using HPLC the mineralization rate of the PCP could be
Figure 26: HPLC chromatogram of attempted phenol destruction using Degussa P25 TiO2
illuminated by visible light (455 nm). No decrease in phenol concentration is observed and nophotooxidation products develop (83).
Catalytic Properties of SLTMS 33

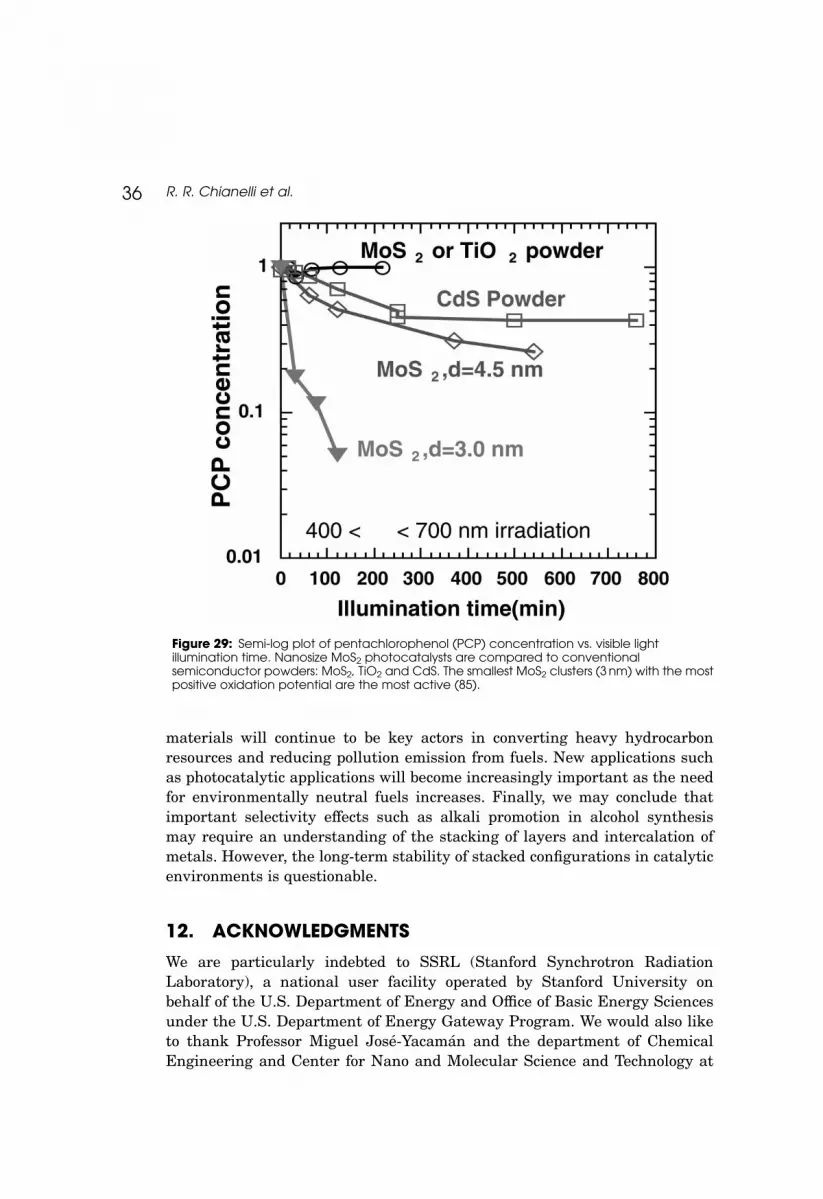
determined. The decrease in PCP concentration as a function of time for twosizes of MoS2 clusters (4.5 nm and 3nm), bulk CdS powder, bulk MoS2
powder, and TiO2 illuminated with visible light is shown in Fig. 29 (85). BulkMoS2 and bulk TiO2 had no effect on the PCP under visible light radiation,as expected. The bulk CdS powder standard did show some ability to slightlymineralize the PCP. However, both sizes of MoS2 clusters exhibited substan-tially more activity than the CdS standard.
A dramatic increase in PCP destruction rate occurred for the 3nm MoS2
compared to the 4.5 nm MoS2 (Fig. 29). Complete photooxidation of PCPoccurs in t ¼ 120 minutes. This rate increase with decreasing nanoclustersize demonstrates the effects of strong quantum confinement. Valence andconduction band energy level shifts to favorable values relative to the redoxpotential for the smaller 3 nm MoS2 clusters allowing the complete mineraliz-ation of PCP. This level of PCP destruction using visible light excitation ofMoS2 clusters is higher than that for TiO2 using full lamp irradiation(300 nm , l , 700nm) (85).
The groundwork showing the effective use of nanosized MoS2 as a photoca-talyst for the destruction of toxic waste was laid by Wilcoxon et al. (89–92).Very few other groups have studied the photocatalytic behavior of nanosizedSLTMS materials. One other group recently reported using MoS2 and WS2
nanoclusters as TiO2 sensitizers in studying the photocatalytic degradationof 4-chlorophenol (93). Due to quantum size effects exhibited by the n-MoS2
and n-WS2, they were able to use visible irradiation for the successful destruc-tion of the 4-chlorophenol.
Figure 27: Optical absorption of MoS2 before and after photocatalysis showing nochange (84).
R. R. Chianelli et al.34

Bulk MoS2 has been studied extensively. However, nanosized MoS2 is stillin its infancy. The potential for use of this material in many aspects ofphotocatalysis is very promising. The next step is to see how it performs inthe photocatalytic production of hydrogen through the splitting of water.
11. CONCLUSIONS
The transition metal sulfide (TMS) materials have been extraordinarily usefulmaterials as catalysts and lubricants. They have also been the subject ofnumerous fundamental and applied research programs over the past 100years. The materials are two-dimensional with only weak van der Waalsforces holding the layers together. Thus, it has been recognized recently thatsingle layered transition metal sulfides (SLTMS) are generally the stablestate in heterogeneous catalytic reactions and that understanding their struc-ture/function properties requires that we study them as single layers and inchemically stabilized catalytic states. As single layers, this class of catalytic
Figure 28: Visible light–induced photooxidation of phenol as a function of time asdetermined form HPLC. Order of phenol destruction: 4.5 nm MoS2 . 8–10 nm MoS2 . P25 TiO2
(no activity) The error bar represents reproducibility (83).
Catalytic Properties of SLTMS 35
materials will continue to be key actors in converting heavy hydrocarbonresources and reducing pollution emission from fuels. New applications suchas photocatalytic applications will become increasingly important as the needfor environmentally neutral fuels increases. Finally, we may conclude thatimportant selectivity effects such as alkali promotion in alcohol synthesismay require an understanding of the stacking of layers and intercalation ofmetals. However, the long-term stability of stacked configurations in catalyticenvironments is questionable.
12. ACKNOWLEDGMENTS
We are particularly indebted to SSRL (Stanford Synchrotron RadiationLaboratory), a national user facility operated by Stanford University onbehalf of the U.S. Department of Energy and Office of Basic Energy Sciencesunder the U.S. Department of Energy Gateway Program. We would also liketo thank Professor Miguel Jose-Yacaman and the department of ChemicalEngineering and Center for Nano and Molecular Science and Technology at
Figure 29: Semi-log plot of pentachlorophenol (PCP) concentration vs. visible lightillumination time. Nanosize MoS2 photocatalysts are compared to conventionalsemiconductor powders: MoS2, TiO2 and CdS. The smallest MoS2 clusters (3 nm) with the mostpositive oxidation potential are the most active (85).
R. R. Chianelli et al.36

the University of Texas at Austin for the HRTEM analysis and the RobertA. Welch Foundation for financial support. We give a special thanks to DaveRendina (Refinery Sciences Corp.) for encouragement and useful discussionsand to Dr. Carolina Kretschmer for revising the manuscript.
REFERENCES
[1] Weisser, O. and Landa, S. (1973) Sulfide Catalysts, Their Properties and Appli-cations; Pergamon Press: New York.
[2] Chianelli, R.R., Daage, M., and Ledoux, M. (1994) Advances in Catalysis, 40:177–232.
[3] Occelli, M.L. and Chianelli, R.R. (1996) Hydrotreating Technology for PollutionControl: Catalysts, Catalysis, and Processes (Chemical Industries); Dekker/CRCPress.
[4] Breysse, M., Furimsky, E., Kasztelan, S., Lacroix, M., and Perot, G. (2002) Cataly-sis Reviews, 44 (4): 651–735.
[5] Murray, H.H., Kelty, S.P., Day, C.S., and Chianelli, R.R. (1993) Inorganic Chem.Comm., 33 (19): 4418.
[6] Schonfeld, B., Huang, J.J., and Moss, S.C. (1983) Acta Cryst., B39: 404.
[7] Wilson, J.A. and Yoffe, A.D. (1969) Adv. Phys., 18: 193.
[8] Chianelli, R.R., Prestridge, E.B., Pecoraro, T.A., and DeNeufville, J.P. (1979)Science, 203: 1105.
[9] Tenne, R., Margulis, L., Genut, M., and Hodes, G. (1992) Nature, 360: 444.
[10] Bronson, M., Hansen, T.W., and Jacobsen, C.J.H. (2002) JACS Comm., 124: 11582.
[11] Hisashi, U., Tadao, S., and Michiko, Y. (1986) Kokai Tokkyo Koho, Japan.
[12] Chianelli, R.R. (1976) J. Crystal Growth, 34: 239.
[13] Chianelli, R.R., Scanlon, J.C., and Rao, B.M.L. (1978) J. Electro Chem. Soc.,125 (10): 1563.
[14] Benavente, E., Santa Ana, M.A., Mendizabal, F., and Gonzalez, G. (2002) Coordi-nation Chemistry Reviews, 224: 87.
[15] Thompson, A.H., Gamble, F.R., and Symon, C.R. (1975) Mat. Res. Bull., 10: 915.
[16] Chianelli, R.R. and Dines, M.B. (1978) Inorg. Chem., 17: 2758.
[17] Chianelli, R.R. (1982) Int. Rev. Phys. Chem., 2: 127.
[18] Gee, M.A., Frindt, R.F., Joensen, P., andMorrison, S.R. (1986) Mater. Res. Bull., 20:543.
[19] Kosidowski, L. and Powell, A.V. (1998) Chem. Commun., 2201.
[20] Vanchura, B.A., Ho, P., Antochshuk, V., Jaroniec, M., Ferryman, A., Barbash, D.,Fulghum, J.E., and Huang, S.D. (2002) J. Am. Chem. Soc., 124: 12090.
[21] Tauster, S.J., Percoraro, T.A., and Chianelli, R.R. (1980) J. Catal., 63 (2): 515.
[22] Bahl, O.P., Evans, E.L., and Thomas, J.M. (1968) Proc. Royal Soc. London Ser.,A306: 53.
Catalytic Properties of SLTMS 37

[23] Chianelli, R.R., Ruppert, A.F., Behal, S.K., Kear, B.H., Wold, A., and Kershaw, R.(1985) J. Catal., 92: 56.
[24] Tanaka, K. and Okuhara, T. (1982) The third climax conference on molybdenum1979. J. Catal., 78: 155.
[25] Salmeron, M. and Somorjai, G.A. (1983) Surf. Sci., 127: 526.
[26] Farias, M.H., Gelman, A.J., Somorjai, G.A., Chianelli, R.R., and Liang, K.S. (1984)Surf. Sci., 140: 181.
[27] Roxlo, C.B., Deckman, H.W., Gland, J., Cameron, S.D., and Chianelli, R.R. (1987)Science, 235: 1629.
[28] Roxlo, C.B., Daage, M., Ruppert, A.F., and Chianelli, R.R. (1986) J. Catal., 100 (1):176.
[29] Johnston, D.C., Jacobson, A.J., Silbernagel, B.G., Frysinger, S.P., Rich, S.M., andGebhard, L.A. (1984) J. Catal., 89 (2): 244.
[30] Johnston, D.C., Silbernagel, B.G., Daage, M., and Chianelli, R.R. (1985)Preprints—American Chemical Society, Division of Petroleum Chemistry, 30 (1):206.
[31] Garoff, S. and Hanson, C.D. (1981) Applied Optics, 20 (5): 758.
[32] Klier, K., Beretta, A., Sun Qun, Feeley, O.C., and Herman, R.G. (1997) CatalysisToday, 36: 3.
[33] Chang, C.H. and Chan, S.S. (1981) J. Catal., 72 (1): 139.
[34] Berhault, G., Mehta, A., Pavel, A., Yang, J., Rendon, L., Jose-Yacaman, M., Cota-Araiza, L., Moller, A., and Chianelli, R.R. (2001) J. Catal., 198: 9.
[35] Helveg, S., Lauritsen, J.V., Laegsgaard, E., Stensgaard, I., Nørskov, J.,Clausen, B.S., Topsøe, H., and Besenbacher, F. (2000) Phys. Rev. Letters, 84 (5): 851.
[36] Silbernagel, B.G., Pecoraro, T.A., and Chianelli, R.R. (1982) J. Catal., 28 (2): 380.
[37] Liang, K.S., Hughes, G.J., and Chianelli, R.R. (1984) J. Vac. Sci. Technol., A2 (2):991.
[38] Carlsson, A., Brorson, M., and Topsøe, H.J. (2004) J. Catal., 227: 530.
[39] Spirko, J.A., Neiman, M.L., Oelker, A.M., and Klier, K. (2003) Surface Science, 542:192.
[40] Spirko, J.A., Neiman, M.L., Oelker, A.M., and Klier, K. (2004) Surface Science, 572:191.
[41] Lauritsen, J.V., Nyberg, M., Nørskov, J.K., Clausen, B.S., Topsøe, H.,Laesgaard, E., and Besenbacher, F. (2004) J. Catal., 224: 94.
[42] Daage, M. and Chianelli, R.R. (1994) J. Catal., 149: 414.
[43] Eijsbouts, S. and VanLeerdam, G.C. (1995) Bull. Soc. Chim. Belg., 104: 347.
[44] Shido, T. and Prins, R. (1998) J. Phys. Chem., B102: 8426.
[45] Perez De la Rosa, M., Texier, S., Berhault, G., Camacho, A., Jose-Yacaman, M.,Mehta, A., Fuentes, S., Montoya, J.A., Murrieta, F., and Chianelli, R.R. (2004)J. Catal., 225: 288.
[46] Liang, K.S., Chianelli, R.R., Chien, F.Z., and Moss, S.C. (1986) J. Non-Cryst.Solids, 79: 251.
R. R. Chianelli et al.38

[47] Peng, Y., Meng, Z., Zhong, C., Lu, J., Yu, W., Yang, Z., and Qian, Y. (2001) J. SolidState Chem., 159: 170.
[48] Glasson, C., Geantet, C., Lacroix, M., Labruyere, F., and Dufresne, P. (2002)J. Catal., 212: 76.
[49] Sherwood, P.W. (2002) High pressure hydrogenation in Germany. I: The LiquidPhaseU.S. Department of Commerce, Technical Final Industrial IntelligenceDivision:p.2; FAIT final Report No. 952.
[50] Zorn, H., inventor: I.G. Farbenindustrie, assignee (1932) Conversion of higherboiling hydrocarbons to those of lower boiling point. U.S. Patent 1,876,270.
[51] Kretschmar, K., Merz, L., Niemana, K., Guitian, J., Krasuk, J., and Marruffo, F.,inventors; Veba OEL and Intevep S.A., assignees. (1989) Process for the hydrogen-ation of heavy residual oils. U.S. Patent 4,851,107.
[52] Braun, R.; Johnson, R.W.; Gatsis, J.G., inventors; UOP, Inc., assignee. (1981).Catalytic slurry process for black oil conversion. U.S. Patent 4,285,80.
[53] Ranganathan, R.; Denis; Jean-Marie, D.; Pruden, B.B., inventors; Energy Minesand Resources Canada, assignee, “Hydrocracking of heavy oils using iron coalcatalyst.” U.S. Patent 4,214,977 (1980).
[54] Benham, N.K. and et al. (1996) Canmet Residuum Hydrocracking Advancesthrough Control of Polar Aromatics. Paper AM-96-58, NPRA Annual Meeting,San Antonio, Texas, March 17–19.
[55] Krasuk, J.H.; Silva, F.J.; Galiasso, R.E.; Souto, A., inventors: Intevep, S.A.,assignee. (1986) Process for hydroconversion and upgrading of heavy crudes ofhigh metal and asphaltene content. U.S. Patent 4,591,426.
[56] Bearden, R., Jr. and Aldridge, C.L. inventors: Exxon Research and EngineeringCompany, assignee. (1979) Hydroconversion of heavy hydrocarbons. U.S. Patent4,134,825.
[57] Bearden, R., Jr. and Aldridge, C.L. (1981) Energy Progress, 1 (1–4): 44. Note thatM-Coke (micrometallic coke) was used to designate catalyst in this publication.M-coke was subsequently dropped in favor of Microcat.
[58] Silverman, M.A. (1995) (Stone andWebster), SOC Technology-A Flexible Approachto Residual Oil Upgrading, AIChE Spring Meeting, Houston, Texas, March 19–23.
[59] U.S. Patent 5,578,197, 1996.
[60] Montanari, R., Dellagiovanna, S., Rosi, S., Panoriti, N., Marchionna, M., and DelBianco, A. (2003) Convert Heaviest Crude and Bitumen into Extra CleanProducts, 2003 NPRA Annual Meeting, San Antonio, Texas, March 23–25.
[61] Panariti, N., Del Bianco, A., Del Piero, G., and Marchionna, M. (2000) Appl. Catal.A. Gen., 204: 203.
[62] Kramer, David C.; inventor; Chevron Research and Technology Company, assignee.(1994) Process to prevent catalyst deactivation in activated slurry processing. U.S.Patent 5,298,152.
[63] Peries, J.P., Raimbault, C., des Courieres, J., and Gouzien, L. (1990) TervahlProcess at the Border Between Thermal and Catalytic Upgrading Processes,1990 NPRA Annual Meeting, March 25–27.
[64] Giuliani, P., Le Page, Jean-Francois; Plumail, Jean-Claude; Espaillac, M.,inventors. Institute Francais du Petrole, assignee. (1991) Catalytic compositioncomprising a metal sulfide suspended in a liquid containing asphaltenes andhydrovisbreaking process of a hydrocarbon charge. U.S. Patent 5,024,751.
Catalytic Properties of SLTMS 39

[65] Poole, M.C., Bauman, R.F., Bearden, R., Jr., Effron, E., and Wu, F.S. (1994)Microcat-RCw Upgrading Option for Heavy Crudes and Residua. AIChE AnnualMeeting, Atlanta, Georgia, April 21.
[66] Transmission electronmicrographs provided by G.W. Bailey of Exxon Research andDevelopment Labs in 1978. The micrographs were taken on a Phillips EM 300instrument. Toluene washed, dry catalyst powders were dispersed in isopropylalcohol using sonocation. A drop of dispersion was then placed on a carboncoated copper grid and alcohol was evaporated. Micrographs were taken at highmagnification and then further enlarged photographically to provide the finalmagnified images.
[67] Bearden, R., Jr. (1997) Microcat-RC: Technology for the HydroconversionUpgrading of Petroleum Residua. Presentation for the George A. Olah Award inhydrocarbon or petroleum chemistry, Petroleum Division, 213th ACS NationalMeeting, San Francisco, California, April 13–17.
[68] Bell, R.E. and Herfert, R.E. (1957) J. Am. Chem. Soc., 79 (3): 351.
[69] Bearden, R., Aldridge, C. L.; inventors; Exxon Research and Engineering Company,assignee. (1987) Hydrocracking with phosphomolybdic acid and phosphoric acid.U.S. Patent 4,637,870.
[70] Bearden, R., Aldridge, C. L., inventors; Exxon Research and Engineering Company,assignee. (1991) Hydroconversion process using a sulfided molybdenum catalystconcentrate. U.S. Patent 5,039,392.
[71] Killerfer, D.H. and Linz, A. (1952) Molybdenum Compounds; Interscience Publish-ers: New York, NY, 88.
[72] Conradson Carbon was measured using ASTM Test D-189.
[73] Schucker, R.C. (1983) Ind. Eng. Chem. Process Des., Dev., 22 (4).
[74] Aldridge, C. L., Bearden, R., inventors. Exxon Research and Engineering Company,assignee. (1981) High Surface Area Catalysts. U.S. Patent 4,244,839.
[75] Micrograph provided by G.W. Bailey and Ezra Shannon of Exxon Research anddevelopment Laboratories in 1981. See footnote 66 for procedure.
[76] U.S. Patent 4,244,839, 1981.
[77] Moll, N.G. and Quarderer, G.J. (1979) Chem. Engin. Prog., 75 (11): 46.
[78] Aldridge, C. L., Bearden, R., inventors; Exxon Research and Engineering Company,assignee. (1983) Coal Liquefaction Process. U.S. Patent 4,369,106.
[79] Aldridge, C. L., Bearden, R., inventors; Exxon Research and Engineering Company,assignee. (1981) Hydroconversion of an oil-coal mixture. U.S. Patent 4,298,454.
[80] Application of exfoliation techniques to the preparation of MoS2 liquefactioncatalysts. Bockrath, Bradley, C. and Parfitt, D.S. (1995) United States DepartmentEnergy, Pittsburgh Energy Technology Center: Pittsburgh, PA, USA. Coal Sci.Technol. 24(Coal Science, Vol. 2), 1343–1346.
[81] FETC Publications (1997) Conference Proceedings, Coal Liquefaction & Solid FuelsContractors Review Conference.
[82] Ahmed, S.M. (1982) Electrochim. Acta, 27 (6): 707.
[83] Thurston, T.R. and Wilcoxon, J.P. (1999) J. Phys. Chem., B, 103 (1): 11.
[84] Wilcoxon, J.P. and Thurston, T.R. (1999) Materials Research Society SymposiumProceedings, Symposium on Advanced Catalytic Materials-1998 at the 1998 MRSFall Meeting, 549: 119.
R. R. Chianelli et al.40

[85] Wilcoxon, J.P. (2000) J. Phys. Chem. B, 104 (31): 7334.
[86] Mills, G. and Hoffmann, M.R. (1993) Environ. Sci. Technol., 27 (8): 1681.
[87] Hoffmann, M.R., Martin, S.T., Choi, W.Y., and Bahnemann, D.W. (1995) Chem.Rev., 95 (1): 69.
[88] Serpone, N., Maruthamuthu, P., Pichat, P., Pelizzetti, E., and Hidaka, H. (1995)J. Photochem. Photobiol. A—Chem., 85 (3): 247.
[89] Wilcoxon, J.P., Newcomer, P.P., and Samara, G.A. (1997) J. Appl. Phys., 81 (12):7934.
[90] Wilcoxon, J.P., Martino, A., Baughmann, R.L., Klavetter, E., and Sylwester, A.P.(1993) Materials Research Society Conference Proceedings, Symp. on Nanophaseand Nanocomposite Materials, Komarneni, S., Parker, J. and Thomas, G., eds.;Materials Research Soc: Boston, MA, Vol. 286, 131.
[91] Wilcoxon, J.P., Martino, A., Baughmann, R.L., Klavetter, E., and Sylwester, A.P.(1994) Advanced Study Institute on Nanophase Materials Series E, AppliedSciences: Synthesis—Properties—Applications, Hadjipanayis, G. and Siegel, R.,eds.; Kluwer Academic Publishers: Corfu, Greece, Vol. 260, 780.
[92] Wilcoxon, J.P. and Samara, G.A. (1995) Phys. Rev. B (Condensed Matter), 51 (11):7299.
[93] Ho, W.K., Yu, J.C., Lin, J., Yu, J.G., and Li, P.S. (2004) Langmuir, 20 (14): 5865.
Catalytic Properties of SLTMS 41


