Embed Size (px)
Citation preview
This article appeared in a journal published by Elsevier. The attachedcopy is furnished to the author for internal non-commercial researchand education use, including for instruction at the authors institution
and sharing with colleagues.
Other uses, including reproduction and distribution, or selling orlicensing copies, or posting to personal, institutional or third party
websites are prohibited.
In most cases authors are permitted to post their version of thearticle (e.g. in Word or Tex form) to their personal website orinstitutional repository. Authors requiring further information
regarding Elsevier’s archiving and manuscript policies areencouraged to visit:
http://www.elsevier.com/copyright
Author's personal copy
Cenomanian – Turonian Oceanic Anoxic Event (OAE2) in the Sakarya Zone,northwestern Turkey: Sedimentological, cyclostratigraphic, andgeochemical records
Ismail Omer Yilmaz a,*, Demir Altiner a, Ugur Kagan Tekin b, Okan Tuysuz c,Faruk Ocakoglu d, Sanem Acikalin d
a Department of Geological Engineering, Middle East Technical University, 06531, Ankara, Turkeyb Department of Geological Engineering, Hacettepe University, 06800, Beytepe, Ankara, Turkeyc Eurasia Institute of Earth Sciences, Istanbul Technical University, 34469, Maslak, Istanbul, Turkeyd Department of Geological Engineering, Eskisehir Osmangazi University, 26480 Meselik, Eskisehir, Turkey
a r t i c l e i n f o
Article history:Received 6 May 2009Accepted in revised form 28 October 2009Available online 10 November 2009
Keywords:Anoxic and oxicBlack shales and pelagic red bedsCenomanian/Turonian boundaryCyclicitySea level changesTurkey
a b s t r a c t
The Cenomanian/Turonian oceanic anoxic event as recorded in many parts of the world is characterizedby presence of black shales and global carbon isotope peaks. Cyclic variations within the anoxic eventand association with pelagic red beds are indicated by many studies. Global tectonic/volcanic controls onthe origin and the chronostratigraphic position of the anoxic event within the global sea-level changesare important for understanding the paleoceanographic and paleoclimatic conditions during the depo-sition of Cenomanian/Turonian sediments.
Three measured stratigraphic sections in the Central Pontides and the Central Sakarya region of Turkeyon the Sakarya Zone of the Pontides have been studied in detail. Cyclic facies alternations have beenanalysed and Ficher plot curves have been established for the measured sections. According to thecyclostratigraphic analysis, position of the C/T boundary with black shales/mudstones coincides with theglobal sea-level rise. This indicates that global sea-level change is one of the controlling parameters ofblack shale generation at the boundary and the long distance correlation between pelagic/hemipelagicsuccessions of different parts of the Sakarya Zone and with global counterparts displays the effect ofa large-scale event rather than local.
A positive shift in the d13C curve has been obtained just below the C/T boundary similar to many curvesobtained around the world. The depletion of Mn indicates oxygen-depleted bottom conditions. Parallelincrease of Cd, P, Ba, and Fe indicates increased productivity. Increase in Zn, Cu, Pb and the presence ofvolcanoclastic sands just below the boundary indicate the fact that volcanism was present during thedeposition of anoxic sediments and affected the productivity. TOC values of black shales reach up to 1,95% at the boundary but drop suddenly after the boundary in parallel with other proxies. The Milan-kovitch-scale frequent rise and fall of the sea-level superimposed on larger cycles also triggered thenutrient enrichment and the ventilation of the basin resulting in the repetitive alternation of black shalesand red marls or cherts.
Therefore, this study indicates that the OAE2 including cyclic black shale and red marl/chert alter-nations on the Sakarya Zone was developed by the cooperation of volcanism, productivity and small andlarge-scale sea level changes.
� 2009 Elsevier Ltd. All rights reserved.
1. Introduction
The Cenomanian/Turonian black shales have been the focus ofmany studies concerning petroleum explorations. The global
meaning of these black shales was described and called as ‘‘LivelloBonarelli’’ level in the Tethyan Mesozoic in 1970’s (Bernoulli, 1972).In many localities of Europe, the Bonarelli Level, recognized asoccurrence of black shale interval within whitish pelagic lime-stones, was interpereted as the record of anoxic conditions on themargins of the Tethyan and Proto-Atlantic margins (Jenkyns 1980;Jenkyns and Wilson 1999; Bernoulli and Jenkyns, 2009; Emeis andWeissert, 2009).
* Corresponding author.E-mail address: [email protected] (I.O. Yilmaz).
Contents lists available at ScienceDirect
Cretaceous Research
journal homepage: www.elsevier .com/locate/CretRes
0195-6671/$ – see front matter � 2009 Elsevier Ltd. All rights reserved.doi:10.1016/j.cretres.2009.10.005
Cretaceous Research 31 (2010) 207–226
Author's personal copy
Later, this black shale interval was analyzed in detail by multi-disciplinary studies and it is shown that it was not a product ofhomogeneous process. Internal rhythmic sedimentary pattern andglobal carbon and oxygen isotope records of the black shales dis-played that Cretaceous paleoceanographic and climatic changes werethe main controlling factors in collaboration with tectonic events(Claps and Masatti, 1994; Kuhnt et al., 1997; Stoll and Schrag, 2000;Price, 2003; Yilmaz et al., 2004a, b; Yilmaz 2008). It has also beendemonstrated that deposition of black shales and associated bioticcrisis were also affected by changes in nutrient influxes, weatheringand climate conditions and volcanism (Weissert et al.,1998; Coccioniand Galeotti, 2003; Erba, 2004; Coccioni et al., 2006; Keller, 2008).
Alternation of black shales with red colored marls/limestones insmall-scale or large-scale has been focused for paleoceanographicand paleoclimatic studies recently (Hu et al., 2005a, b; Wang et al.,2005; Neuhuber et al., 2007; Yilmaz, 2008). Hu et al. (2005a, b)indicated that occurrences of oceanic red beds are associated withnutrient poor waters in deep water environment, however, in thisstudy, it has been interpreted that pelagic red limestones withabundant planktonic foraminifera and iron bearing minerals occur innutrient rich conditions in relatively shallow pelagic conditions, notbelow CCD, and associated with relatively high sea-level /flooding onplatforms. Positions of pelagic red beds within or on the black shalesuccessions indicate a change from anoxic to oxic bottom conditionsand are the result of switching off and on of the anoxic environmentdue to change in oceanic circulation, climate and sea-level in short-term, and tectonics and volcanism in long-term.
In northern Turkey, Gorur et al. (1993), Eren and Kadir (1999),Eren and Tasli (2002) and Tuysuz (1999, 2002, and 2003) stated theoccurrence of the Upper Cretaceous pelagic red beds withinturbidite/volcanic successions. Eren and Kadir (1999) analysed themajor oxide elements and concluded that the red colouring of thepelagic red beds is diagenetic in origin in the eastern Pontides.
Gorur et al. (1993) emphasized the tectonic control on the origin ofUpper Cretaceous pelagic red beds in the Pontides. Yilmaz (2008)investigated the relationship between sea-level change, paleo-ceanography and tectonics on the occurences of Upper and LowerCretaceous pelagic red beds.
The black shale interval composed of alternation of radiolariteand black shales at the Cenomanian/Turonian boundary in theAntalya area of southwestern Turkey was studied by Yurtsever et al.(2003), and interpreted as the equivalent to the ‘Bonarelli’ level(OAE 2). Bragin et al. (2001) introduced the presence of Cen-omanian radiolarian cherts and mudstones overlying the Precam-brian metamorphics from the Devrekhani Basin in the Central BlackSea Region (Sakarya Zone), but did not discuss the detail of theCenomanian/Turonian boundary. Similarly, Tuysuz and Tekin(2007) mentioned about the alternation of shale/mudstone andradiolarian cherts of late Cenomanian-Turonian in age on the KargiMassif of the Central Black Sea Region, but did not emphasize theC/T boundary event. Therefore, this study is the first record for theanalysis of Cenomanian/Turonian boundary event, ‘Bonarelli’ level(OAE 2), from the Sakarya Zone and indicates the record of theglobal carbon and oxygen isotope excursions, presence of the cyclicblack shales alternating with red beds indicating small- and large-scale productivity and sea-level fluctuations around the boundary.
2. Geologic setting
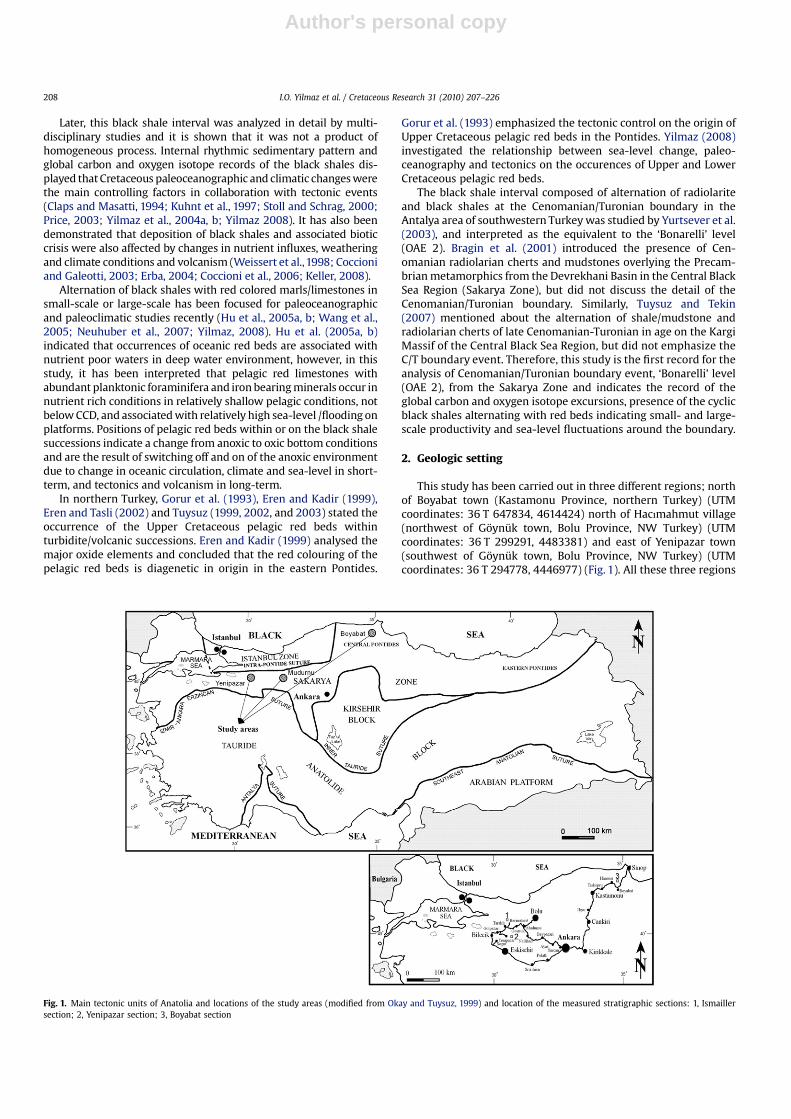
This study has been carried out in three different regions; northof Boyabat town (Kastamonu Province, northern Turkey) (UTMcoordinates: 36 T 647834, 4614424) north of Hacımahmut village(northwest of Goynuk town, Bolu Province, NW Turkey) (UTMcoordinates: 36 T 299291, 4483381) and east of Yenipazar town(southwest of Goynuk town, Bolu Province, NW Turkey) (UTMcoordinates: 36 T 294778, 4446977) (Fig. 1). All these three regions
Fig. 1. Main tectonic units of Anatolia and locations of the study areas (modified from Okay and Tuysuz, 1999) and location of the measured stratigraphic sections: 1, Ismaillersection; 2, Yenipazar section; 3, Boyabat section
I.O. Yilmaz et al. / Cretaceous Research 31 (2010) 207–226208
Author's personal copy
lie on the Sakarya Zone, one of the main tectonic units of Turkey(Okay and Tuysuz; 1999). This continental fragment is delimited byTethyan sutures such as Intra-Pontide suture zone to the north, andthe Izmir-Ankara-Erzincan suture zone to the south (Sengor andYilmaz, 1981; Okay and Tuysuz, 1999) (Fig. 1). Yenipazar andIsmailler sections were measured from the Mudurnu – Goynukbasin (Saner, 1980), whereas the Boyabat section was measuredfrom the Sinop basin (Tuysuz, 1999).
The Cretaceous sedimentary succession of the Sinop basin,which is an asymmetric basin facing to the Black Sea in the north,starts with siliciclastic turbiditic sandstone and mudstone alterna-tions and black shales of the Caglayan Formation over the JurassicPlatform Carbonates of the Inalti Formation with an unconformity(Ketin, 1966; Gedik and Korkmaz, 1984; Tuysuz, 1990, 1999). TheBoyabat stratigraphic section was measured in the uppermost partof the Caglayan Formation.
The Mudurnu-Goynuk basin, also called as the Mudurnu trough, isa kind of rift basin along the continental margin of the Sakarya Zone(Kocyigit et al., 1991) and characterized by a Mesozoic- Cenozoicsedimentary succession over the Palaeozoic to Triassic metamorphicbasement. The Upper Jurassic to Cretaceous succession starts with
alternating shelf carbonates, following pelagic sediments, cherts,volcanics, and volcaniclastics, and terminates with Upper Cretaceousslope and basinal deposits (Altiner 1991; Altiner et al., 1991). Withinthese Cretaceous successions, Lower Cretaceous pelagic carbonatesalternating with black shales/mudstones belong to the SogukcamLimestone (Altiner et al., 1991; Yilmaz, 2008). The overlying Yenipa-zar Formation is characterized by a turbiditic/volcano-turbiditicsuccession and pelagic carbonates of Albian-Santonian age. TheYenipazar and Ismailler sections were measured within the Yenipa-zar Formation.
3. Lithostratigraphy and biostratigraphy
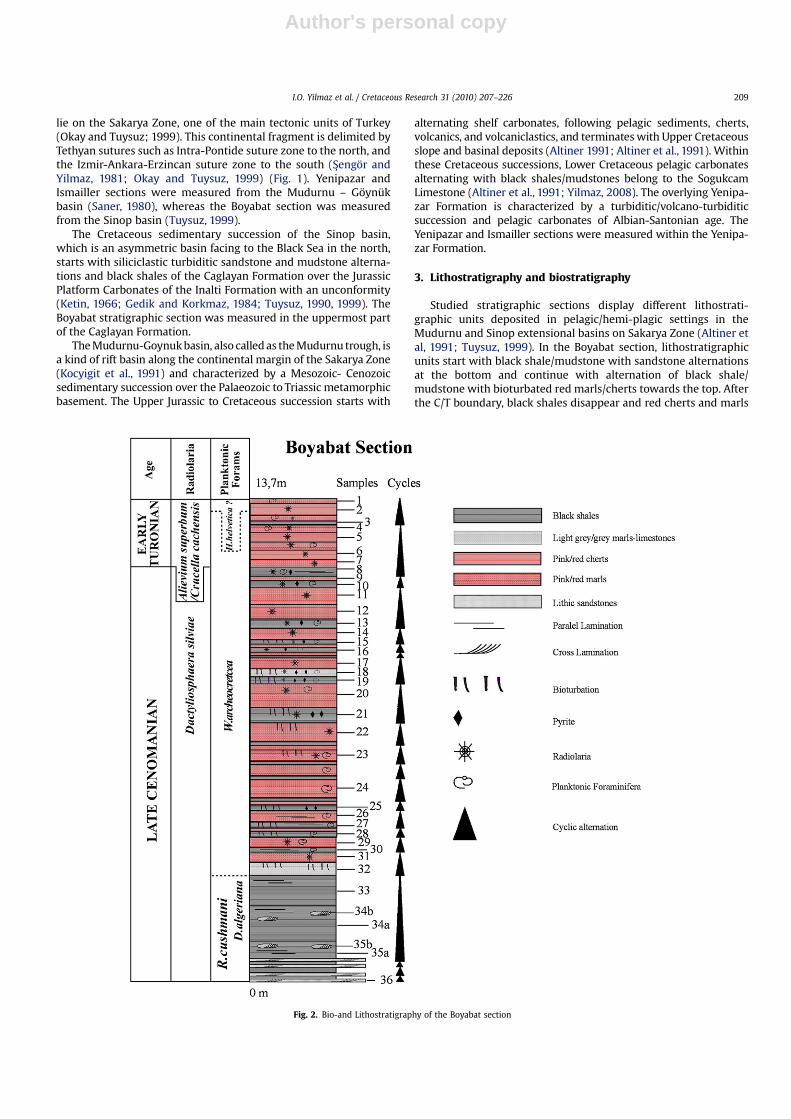
Studied stratigraphic sections display different lithostrati-graphic units deposited in pelagic/hemi-plagic settings in theMudurnu and Sinop extensional basins on Sakarya Zone (Altiner etal, 1991; Tuysuz, 1999). In the Boyabat section, lithostratigraphicunits start with black shale/mudstone with sandstone alternationsat the bottom and continue with alternation of black shale/mudstone with bioturbated red marls/cherts towards the top. Afterthe C/T boundary, black shales disappear and red cherts and marls
Fig. 2. Bio-and Lithostratigraphy of the Boyabat section
I.O. Yilmaz et al. / Cretaceous Research 31 (2010) 207–226 209
Author's personal copy
alternate. As indicated by Yilmaz (2008), the Ismailler sectiondisplays an alternation of white to light grey bioturbated lime-stones/marls with black shales/dark grey silty mudstones from thebottom to mid-part of the section. This succession is overlain by analternation of brownish/orange radiolarian cherts with darkermudstones/black shales just below the boundary. Alternation of redcoloured marls with limestones takes place after the boundary.
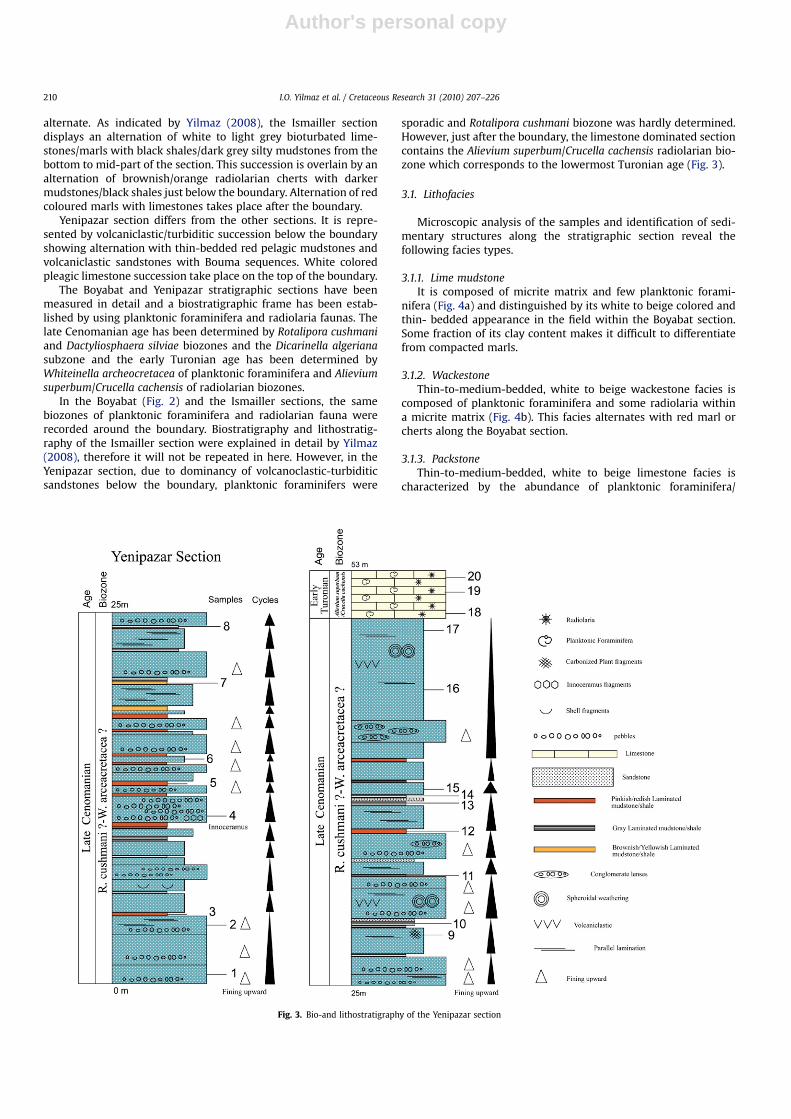
Yenipazar section differs from the other sections. It is repre-sented by volcaniclastic/turbiditic succession below the boundaryshowing alternation with thin-bedded red pelagic mudstones andvolcaniclastic sandstones with Bouma sequences. White coloredpleagic limestone succession take place on the top of the boundary.
The Boyabat and Yenipazar stratigraphic sections have beenmeasured in detail and a biostratigraphic frame has been estab-lished by using planktonic foraminifera and radiolaria faunas. Thelate Cenomanian age has been determined by Rotalipora cushmaniand Dactyliosphaera silviae biozones and the Dicarinella algerianasubzone and the early Turonian age has been determined byWhiteinella archeocretacea of planktonic foraminifera and Alieviumsuperbum/Crucella cachensis of radiolarian biozones.
In the Boyabat (Fig. 2) and the Ismailler sections, the samebiozones of planktonic foraminifera and radiolarian fauna wererecorded around the boundary. Biostratigraphy and lithostratig-raphy of the Ismailler section were explained in detail by Yilmaz(2008), therefore it will not be repeated in here. However, in theYenipazar section, due to dominancy of volcanoclastic-turbiditicsandstones below the boundary, planktonic foraminifers were
sporadic and Rotalipora cushmani biozone was hardly determined.However, just after the boundary, the limestone dominated sectioncontains the Alievium superbum/Crucella cachensis radiolarian bio-zone which corresponds to the lowermost Turonian age (Fig. 3).
3.1. Lithofacies
Microscopic analysis of the samples and identification of sedi-mentary structures along the stratigraphic section reveal thefollowing facies types.
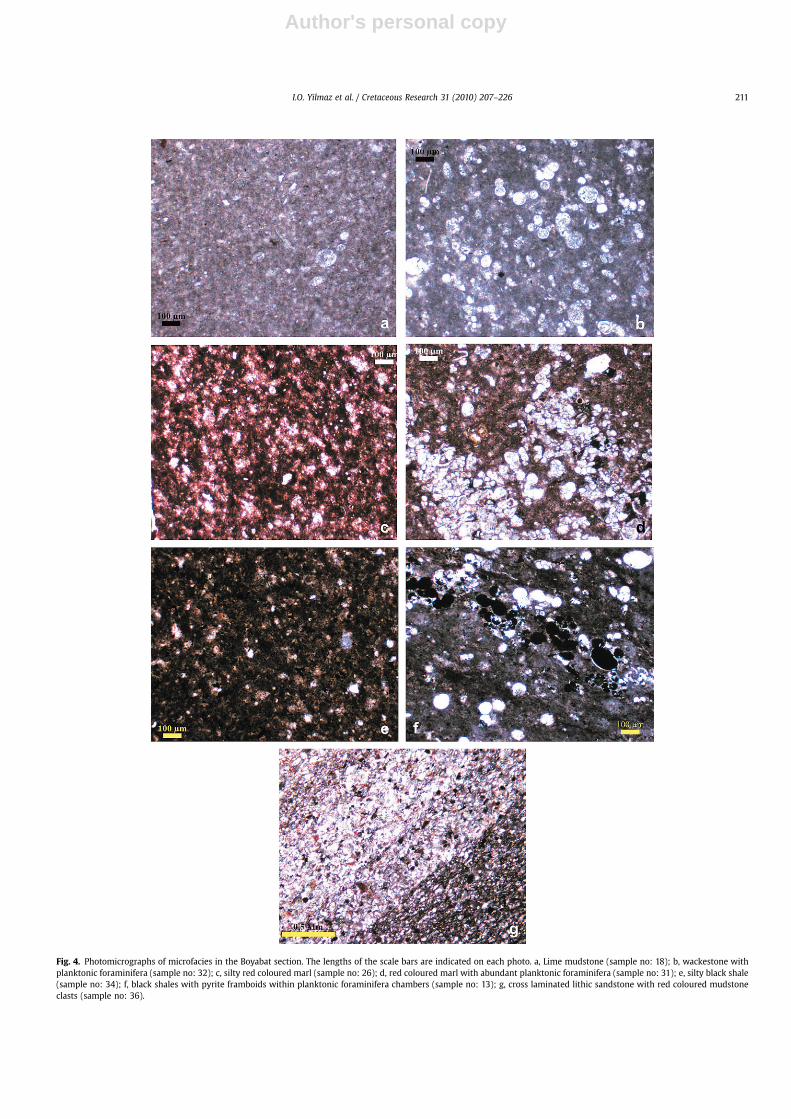
3.1.1. Lime mudstoneIt is composed of micrite matrix and few planktonic forami-
nifera (Fig. 4a) and distinguished by its white to beige colored andthin- bedded appearance in the field within the Boyabat section.Some fraction of its clay content makes it difficult to differentiatefrom compacted marls.
3.1.2. WackestoneThin-to-medium-bedded, white to beige wackestone facies is
composed of planktonic foraminifera and some radiolaria withina micrite matrix (Fig. 4b). This facies alternates with red marl orcherts along the Boyabat section.
3.1.3. PackstoneThin-to-medium-bedded, white to beige limestone facies is
characterized by the abundance of planktonic foraminifera/
Fig. 3. Bio-and lithostratigraphy of the Yenipazar section
I.O. Yilmaz et al. / Cretaceous Research 31 (2010) 207–226210
Author's personal copy
Fig. 4. Photomicrographs of microfacies in the Boyabat section. The lengths of the scale bars are indicated on each photo. a, Lime mudstone (sample no: 18); b, wackestone withplanktonic foraminifera (sample no: 32); c, silty red coloured marl (sample no: 26); d, red coloured marl with abundant planktonic foraminifera (sample no: 31); e, silty black shale(sample no: 34); f, black shales with pyrite framboids within planktonic foraminifera chambers (sample no: 13); g, cross laminated lithic sandstone with red coloured mudstoneclasts (sample no: 36).
I.O. Yilmaz et al. / Cretaceous Research 31 (2010) 207–226 211
Author's personal copy
radiolaria in a micritic matrix along the Boyabat section. This faciesalso alternates with red marl and/or cherts. However, packstonefacies has only been observed in the lower Turonian limestone atthe top of in the Yenipazar section (Fig. 6g).
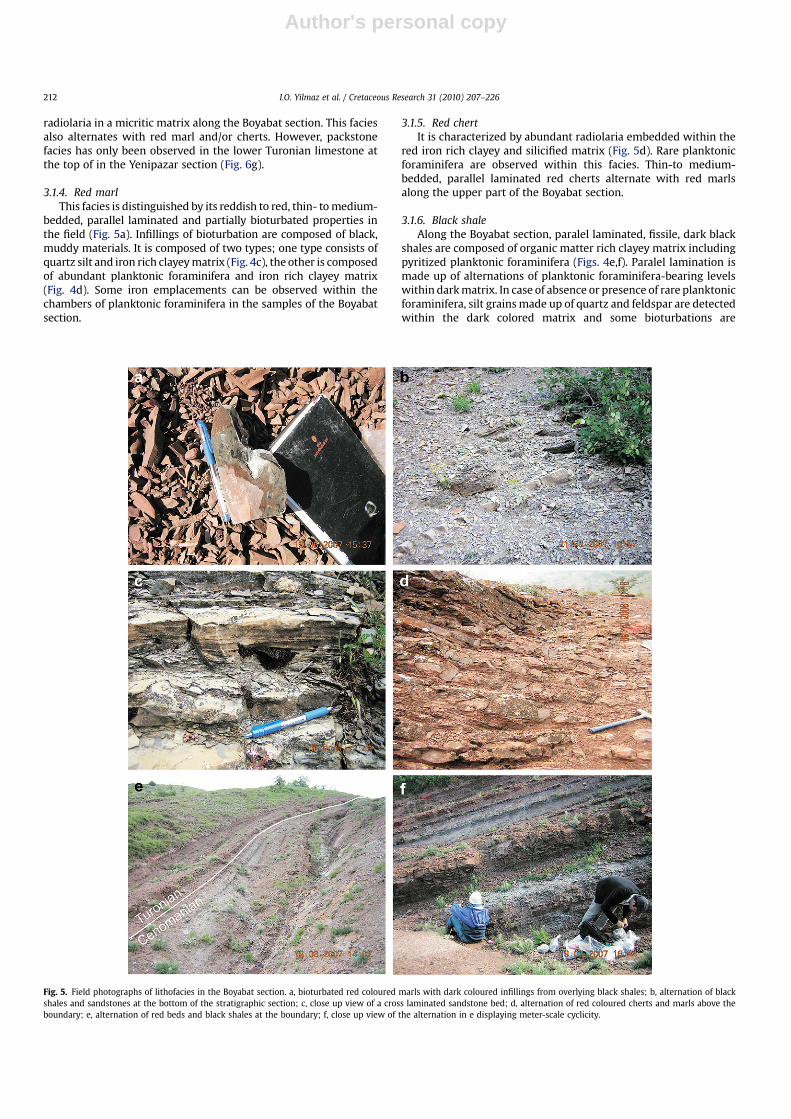
3.1.4. Red marlThis facies is distinguished by its reddish to red, thin- to medium-
bedded, parallel laminated and partially bioturbated properties inthe field (Fig. 5a). Infillings of bioturbation are composed of black,muddy materials. It is composed of two types; one type consists ofquartz silt and iron rich clayey matrix (Fig. 4c), the other is composedof abundant planktonic foraminifera and iron rich clayey matrix(Fig. 4d). Some iron emplacements can be observed within thechambers of planktonic foraminifera in the samples of the Boyabatsection.
3.1.5. Red chertIt is characterized by abundant radiolaria embedded within the
red iron rich clayey and silicified matrix (Fig. 5d). Rare planktonicforaminifera are observed within this facies. Thin-to medium-bedded, parallel laminated red cherts alternate with red marlsalong the upper part of the Boyabat section.
3.1.6. Black shaleAlong the Boyabat section, paralel laminated, fissile, dark black
shales are composed of organic matter rich clayey matrix includingpyritized planktonic foraminifera (Figs. 4e,f). Paralel lamination ismade up of alternations of planktonic foraminifera-bearing levelswithin dark matrix. In case of absence or presence of rare planktonicforaminifera, silt grains made up of quartz and feldspar are detectedwithin the dark colored matrix and some bioturbations are
Fig. 5. Field photographs of lithofacies in the Boyabat section. a, bioturbated red coloured marls with dark coloured infillings from overlying black shales; b, alternation of blackshales and sandstones at the bottom of the stratigraphic section; c, close up view of a cross laminated sandstone bed; d, alternation of red coloured cherts and marls above theboundary; e, alternation of red beds and black shales at the boundary; f, close up view of the alternation in e displaying meter-scale cyclicity.
I.O. Yilmaz et al. / Cretaceous Research 31 (2010) 207–226212
Author's personal copy
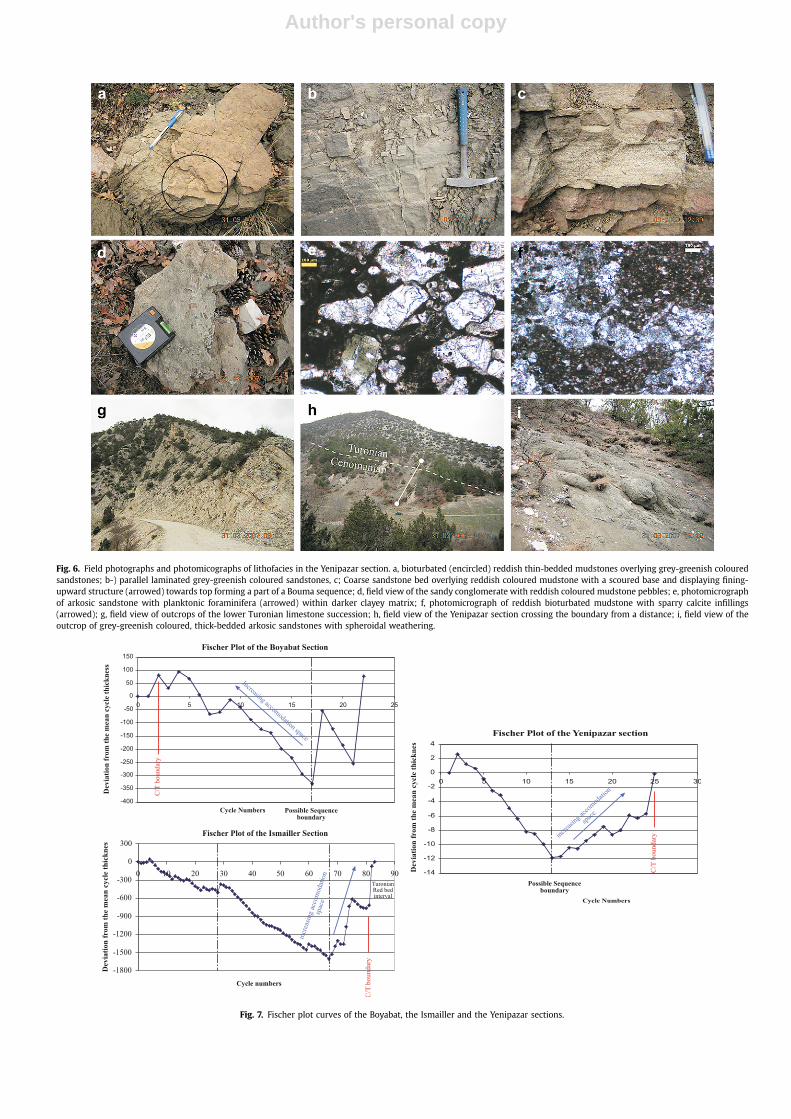
Fig. 6. Field photographs and photomicographs of lithofacies in the Yenipazar section. a, bioturbated (encircled) reddish thin-bedded mudstones overlying grey-greenish colouredsandstones; b-) parallel laminated grey-greenish coloured sandstones, c; Coarse sandstone bed overlying reddish coloured mudstone with a scoured base and displaying fining-upward structure (arrowed) towards top forming a part of a Bouma sequence; d, field view of the sandy conglomerate with reddish coloured mudstone pebbles; e, photomicrographof arkosic sandstone with planktonic foraminifera (arrowed) within darker clayey matrix; f, photomicrograph of reddish bioturbated mudstone with sparry calcite infillings(arrowed); g, field view of outcrops of the lower Turonian limestone succession; h, field view of the Yenipazar section crossing the boundary from a distance; i, field view of theoutcrop of grey-greenish coloured, thick-bedded arkosic sandstones with spheroidal weathering.
Fig. 7. Fischer plot curves of the Boyabat, the Ismailler and the Yenipazar sections.
Author's personal copy
observed at the contacts of red marls. Mn enrichment is observedwithin black shales and red marls/cherts close to the boundary.
3.1.7. Lithicarkose/subarkose sandstoneThis facies is mostly composed of lithic fragments of red marls
and black shales and quartz and feldspar grains (Figs. 4g, 5c). Thin-to medium-bedded, grey-greenish, parallel-cross laminated sand-stone facies takes place towards the bottom of the succession andalternate with black shales. Presence of ripple lamination and lithicfragments of red marls and black shales within sandstones indicatethat they may have taken place as sudden influxes within the basinafter the deposition of black shales and red marls. This facies hasonly been observed in the Boyabat section.
3.1.8. Arkose sandstoneMedium-thick bedded, grey-greenish colored, parallel lami-
nated sandstone includes some planktonic foraminifera within the
clayey matrix (Figs. 6b,e, i). Fresh feldspars and quartz are dominantelements. Spherodial weathering is also observed. These sand-stones generally overlie conglomerates and are capped by reddish-pinkish mudstones in the Yenipazar section.
3.1.9. Sandy conglomerateMedium bedded grey-greenish conglomerate with a sandy
matrix displays fining –upward graded bedding (Figs. 6c). Pebblesare subrounded to subangular in shape and include polygeniclithologies derived from the reddish colored mudstone beneath. Thisindicates that the conglomerate was suddenly deposited after thedeposition of reddish mudstones. This facies has only been observedin the Yenipazar section.
3.1.10. Reddish-pinkish mudstoneThis facies is characterized by thin-bedded, reddish-pinkish,
bioturbated, silty mudstones (Figs. 6a, f). It is associated with
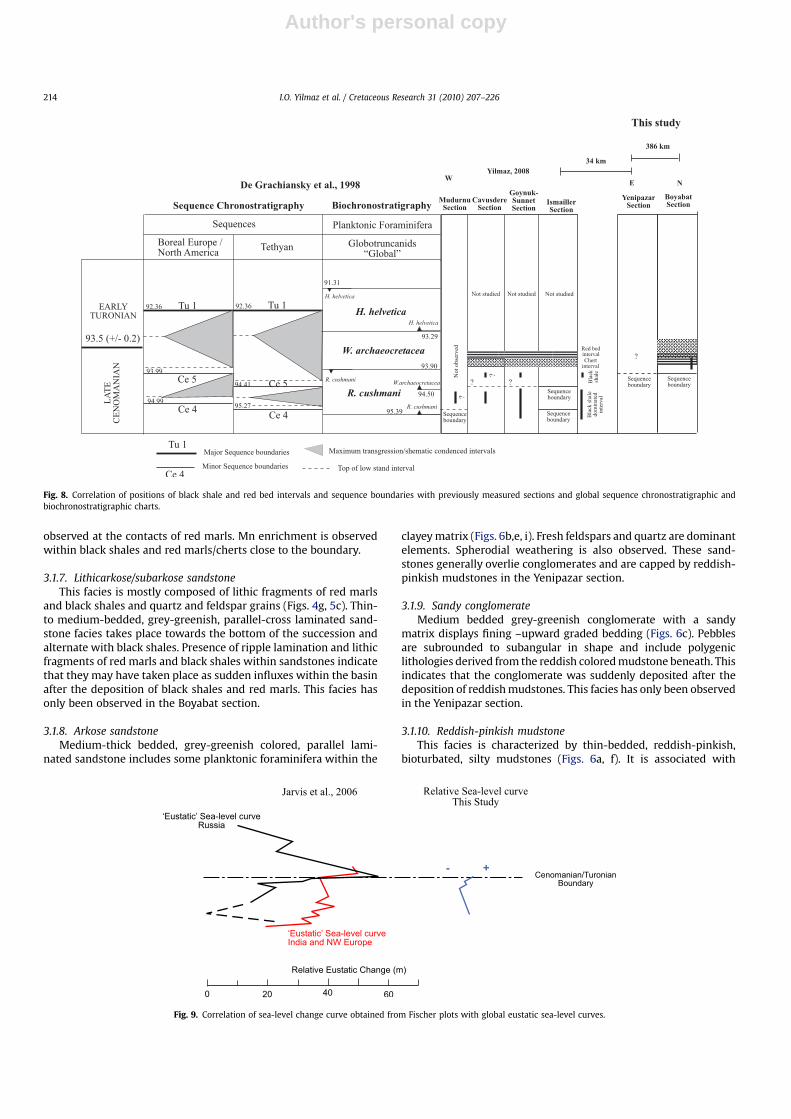
Fig. 8. Correlation of positions of black shale and red bed intervals and sequence boundaries with previously measured sections and global sequence chronostratigraphic andbiochronostratigraphic charts.
Fig. 9. Correlation of sea-level change curve obtained from Fischer plots with global eustatic sea-level curves.
I.O. Yilmaz et al. / Cretaceous Research 31 (2010) 207–226214
Author's personal copy
parallel laminated sandstones and conglomerates in the Yenipazarsection. They are generally situated at the top of each cycle in themeasured section.
4. Cyclostratigraphy
Lithofacies association of the Boyabat section within the conceptof cyclostratigraphy can be seen as rhythmic alternation (Einseleet al., 1991; Einsele, 2001) and consist of an alternation of blackshales and red marls/cherts close to the boundary (Figs. 5e, f) andsandstone and black shale alternation towards the bottom of thesuccession (Figs. 5b).
However, in the Yenipazar section, cyclicity is composed of analternation of fining-upward turbiditic and volcanoclastic beds. Theygenerally display the Bouma sequences (Fig. 6c) and are composed ofpolygenic matrix-supported conglomerates at the bottom and theoverlying sandstones with parallel laminations and capped byreddish colored bioturbated mudstones with rare radiolaria andplanktonic foraminifera at the top.
In the _Ismailler section, the dominant cyclicity is observed as therhythmic alternation of limestones and marls/black shales (Yilmaz,2008). However, just around the boundary, alternation of blackshales and red cherts is quite similar to the Boyabat section.
There is a general resemblance between the Boyabat and theIsmailler sections in the concept of cyclostratigraphy, especiallyaround the C/T boundary. However, in the Yenipazar section, cyclicproperty displays a difference in terms of sediment type and isdominated by a turbiditic supply. Over the boundary, the limestone-dominated section continues upward (Figs. 6g, h). However, in theBoyabat section, chert beds dominate up in the section andmudstone/marl and limestone alternation in the Ismailler section.These differences reveal that paleoproductivity and paleotopographicchanges could have possibly taken place within different parts of thebasin after the C/T boundary.
Fischer plot analysis (Sadler et al., 1993) has been applied for theBoyabat, the Ismailler and the Yenipazar sections by using changesin cycle thickness along the sections independently from sedi-mentary facies associations (Fig. 7). Yilmaz (2008) documentedpossible correlative conformities of the sequence boundariescoinciding with falling limps of curves and displayed the change inthe position and thicknesses of carbonate and shale dominatedintervals associated with sea-level change. These occurrences in thecurves indicate decreased accommodation space, whereas blackshales are generally observed in the rising limbs. Pelagic red bedsgenerally follow black shales and can be observed in relativelyhigh-stand conditions (Yilmaz, 2008).
Similar cyclicity superimposed on larger-scale rising and fallinglimbs and similar correlative conformities of sequence boundaries
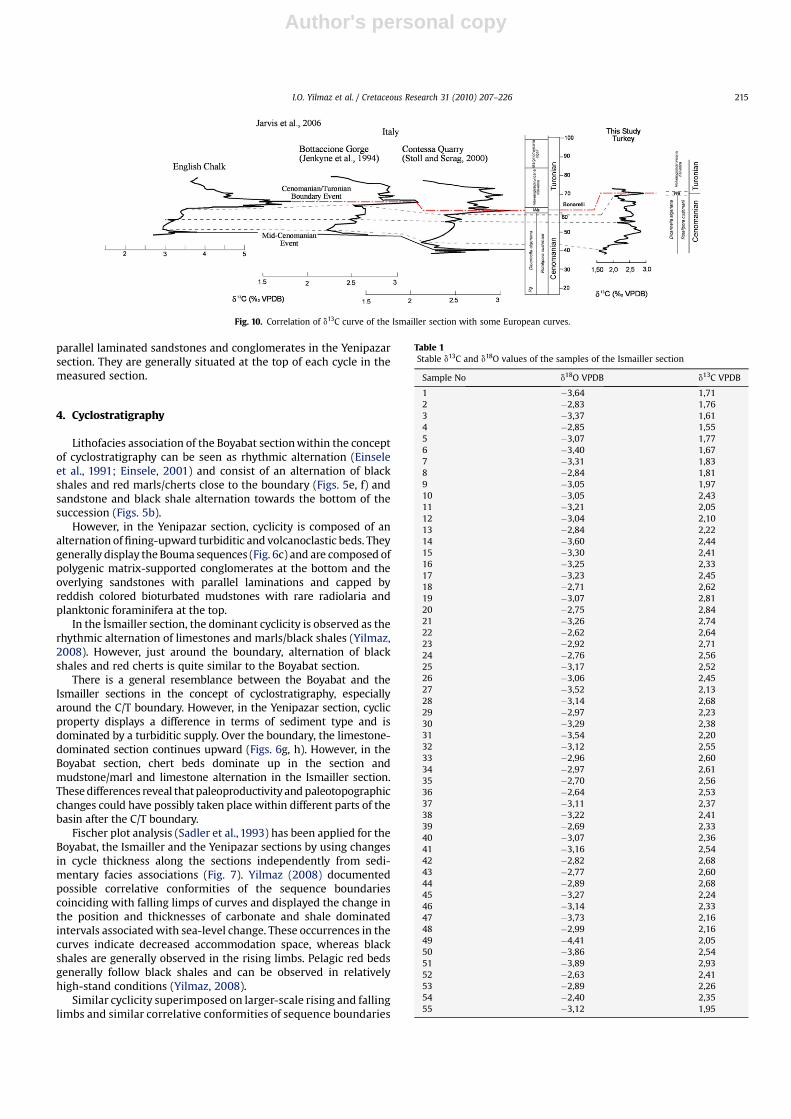
Fig. 10. Correlation of d13C curve of the Ismailler section with some European curves.
Table 1Stable d13C and d18O values of the samples of the Ismailler section
Sample No d18O VPDB d13C VPDB
1 �3,64 1,712 �2,83 1,763 �3,37 1,614 �2,85 1,555 �3,07 1,776 �3,40 1,677 �3,31 1,838 �2,84 1,819 �3,05 1,9710 �3,05 2,4311 �3,21 2,0512 �3,04 2,1013 �2,84 2,2214 �3,60 2,4415 �3,30 2,4116 �3,25 2,3317 �3,23 2,4518 �2,71 2,6219 �3,07 2,8120 �2,75 2,8421 �3,26 2,7422 �2,62 2,6423 �2,92 2,7124 �2,76 2,5625 �3,17 2,5226 �3,06 2,4527 �3,52 2,1328 �3,14 2,6829 �2,97 2,2330 �3,29 2,3831 �3,54 2,2032 �3,12 2,5533 �2,96 2,6034 �2,97 2,6135 �2,70 2,5636 �2,64 2,5337 �3,11 2,3738 �3,22 2,4139 �2,69 2,3340 �3,07 2,3641 �3,16 2,5442 �2,82 2,6843 �2,77 2,6044 �2,89 2,6845 �3,27 2,2446 �3,14 2,3347 �3,73 2,1648 �2,99 2,1649 �4,41 2,0550 �3,86 2,5451 �3,89 2,9352 �2,63 2,4153 �2,89 2,2654 �2,40 2,3555 �3,12 1,95
I.O. Yilmaz et al. / Cretaceous Research 31 (2010) 207–226 215
Author's personal copy
have also been observed in the Fischer plot curve of the Boyabatand the Yenipazar sections (Fig. 7). Especially just around theCenomanian/Turonian boundary, a sudden rise has been observedin all sections and similar facies also took place within the samebiozones except the Yenipazar section. This indicates a trans-gressive system tract recorded in all sections. Occurrence of analternation of radiolarian cherts and organic matter rich facieswithin this transgressive system indicates that their alternation ispossibly related with sea-level changes. This data also reveals thatthe global sea-level change is one of the controlling parameters ofblack shale generation at the boundary. This long distance corre-lation between pelagic/hemipelagic successions of different partsof the Sakarya Zone demostrates the effect of a large-scale eventrather than a local one. In the Yenipazar section, the increase in thethickness of volcaniclastic-turbiditic beds coinciding withthe rising limb before the boundary can be interpreted as anincrease in influx to this part of the basin due to the sudden riseof sea-level and/or volcanic activity in relation with tectonicmovements.
Large-scale sea-level curve obtained from Fischer plots andcorrelative conformities of the sequence boundaries of the allsections display a good correlation with global sea-level changecurves and sequence chronostratigraphic charts (Figs. 7 and 8).Even very similar pattern of cyclicity and nearly the same larger-scale third-order sea-level curve was obtained around the Cen-omanian/Turonian boundary in the Tarfaya Atlantic Coastal Basin(Morocco) by Kuhnt et al. (1997). In addition to this, Niebuhr, andProkoph (1997) also published very similar third-order sea-levelchange curves indicating a sudden sea-level rise around the Cen-omanain/Turonian boundary in the northern German Basin anddocumented the Milankovitch cycles within the black shale intervalincluding red carbonates. In south Atlantic Ocean, Jacquin and deGraciansky (1988) described cyclic fluctuations in anoxia in theCenomanian/Turonian boundary sucession and interpreted thesefluctuations with the combination of increased rate of sea floorspreading, high sea-level and low water-circulation. From Proto-North Atlantic off coast of North America, Kuypers et al., (2004)introduced the Milankovitch type redox cyclicity within the OAE2.
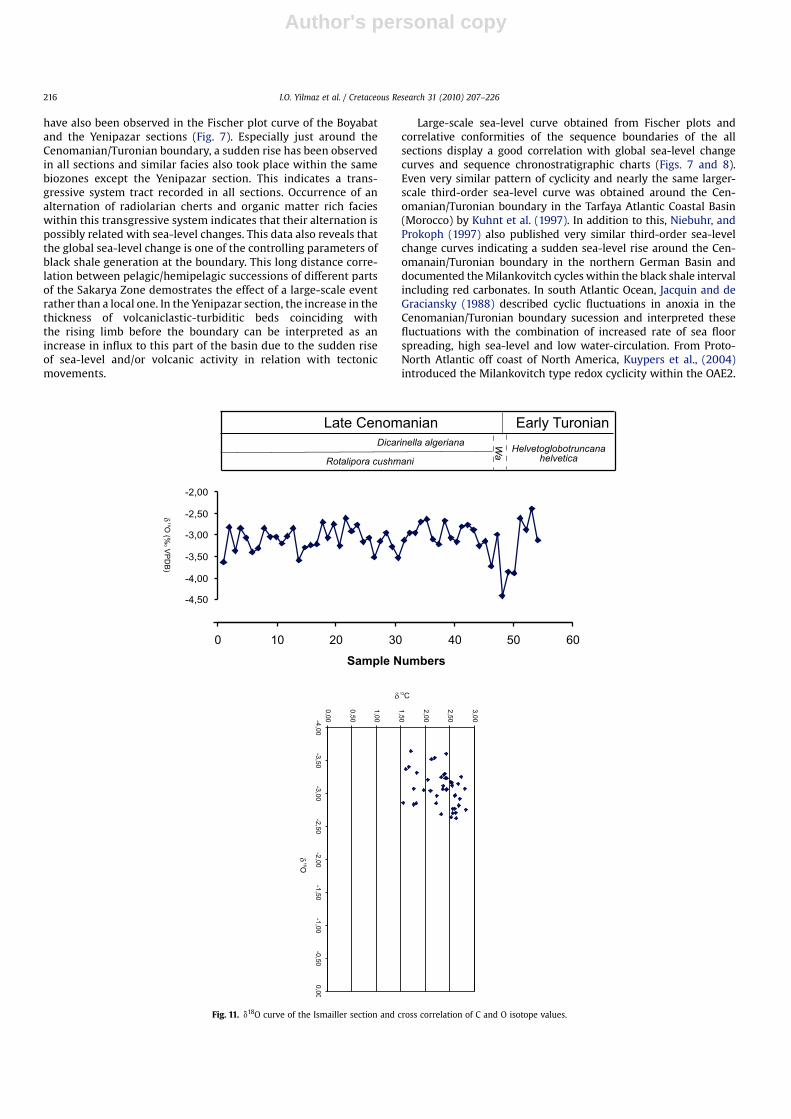
Fig. 11. d18O curve of the Ismailler section and cross correlation of C and O isotope values.
I.O. Yilmaz et al. / Cretaceous Research 31 (2010) 207–226216
Author's personal copy
Keller et al. (2004) demonstrated small and large-scale sea levelrise and falls within the OAE2 and indicated the control of sea-levelchange within OAE2 as a fluctuation in salinity and organismabundances from Pueblo, Colorado. Mitchell et al. (2008) statedthat cyclic variations within the OAE2 ‘‘Bonarelli Level’’ in Scaglia-Bianca Formation in the Umbria–Marche region of Italy wascompletely composed of Milankovitch signals and must be orbitallycontrolled. They also concluded that cyclicity within the OAE2 mustbe globally synchronous.
There is a conformable pattern between the European andRussian Eustatic sea-level change curves and relative sea-levelchanges of the Cenomanian/Turonian boundary on the SakaryaZone. In all curves, just at the boundary, a sudden rise of sea-levelappears considerably (Fig. 9).
5. Geochemistry
5.1. Methods
The element analyses have been carried out in Acme Labs,Vancouver, Canada and stable isotope analyses have been carriedout in the Institute of Mineralogy and Geochemistry of theUniversity of Lausanne, Switzerland.
Total abundances of the major oxides and several minorelements are reported on a 0.1 g powdered limestone/marl/mudstone/shale samples (<63 mm) analyzed by ICP-emissionspectrometry following a Lithium metaborate/tetrabortate fusionand dilute nitric digestion. Loss on ignition (LOI) is by weightdifference after ignition at 1000 �C.
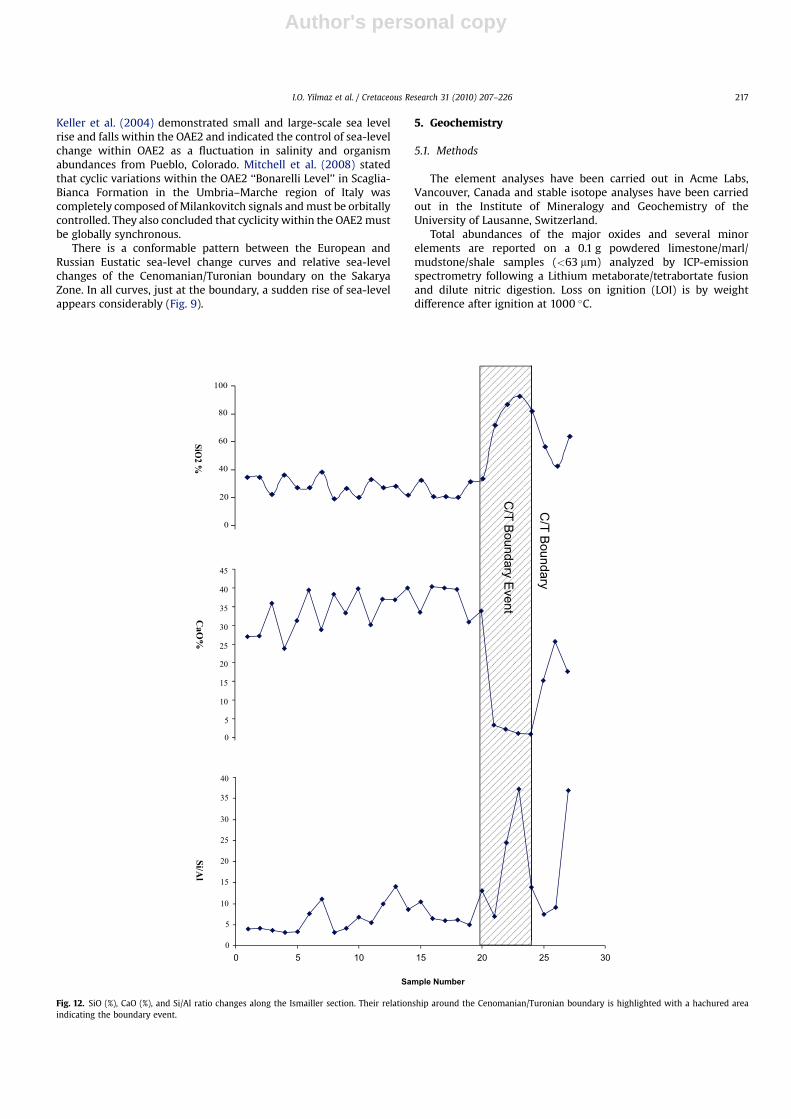
Fig. 12. SiO (%), CaO (%), and Si/Al ratio changes along the Ismailler section. Their relationship around the Cenomanian/Turonian boundary is highlighted with a hachured areaindicating the boundary event.
I.O. Yilmaz et al. / Cretaceous Research 31 (2010) 207–226 217
Author's personal copy
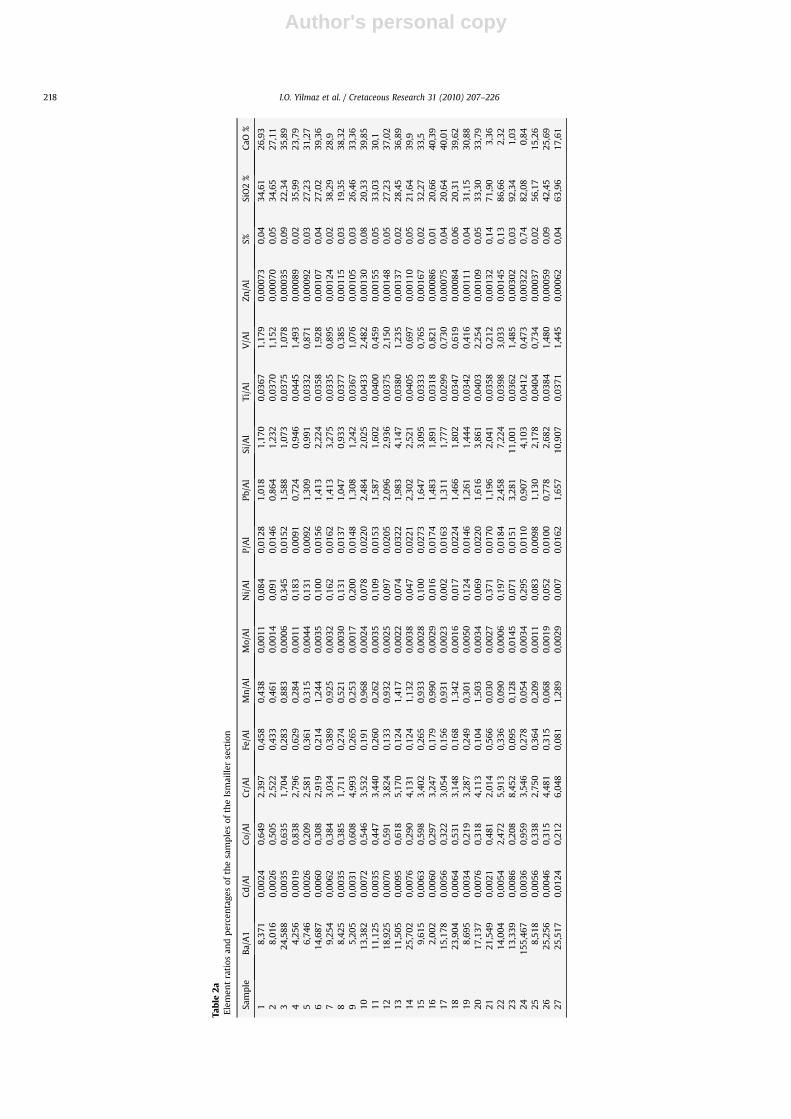
Tab
le2a
Elem
ent
rati
osan
dp
erce
nta
ges
ofth
esa
mp
les
ofth
eIs
mai
ller
sect
ion
Sam
ple
Ba/
A1
Cd
/Al
Co/
Al
Cr/
Al
Fe/A
lM
n/A
lM
o/A
lN
i/A
lP/
Al
Pb/A
lSi
/Al
Ti/A
lV
/Al
Zn/A
lS%
SiO
2%
CaO
%
18
,37
10
,00
24
0,6
49
2,3
97
0,4
58
0,4
38
0,0
01
10
,08
40
,01
28
1,0
18
1,1
70
0,0
36
71
,17
90
,00
07
30
,04
34
,61
26
,93
28
,01
60
,00
26
0,5
05
2,5
22
0,4
33
0,4
61
0,0
01
40
,09
10
,01
46
0,8
64
1,2
32
0,0
37
01
,15
20
,00
07
00
,05
34
,65
27
,11
32
4,5
88
0,0
03
50
,63
51
,70
40
,28
30
,88
30
,00
06
0,3
45
0,0
15
21
,58
81
,07
30
,03
75
1,0
78
0,0
00
35
0,0
92
2,3
43
5,8
94
4,2
56
0,0
01
90
,83
82
,79
60
,62
90
,28
40
,00
11
0,1
83
0,0
09
10
,72
40
,94
60
,04
45
1,4
93
0,0
00
89
0,0
23
5,9
92
3,7
95
6,7
46
0,0
02
60
,20
92
,58
10
,36
10
,31
50
,00
44
0,1
31
0,0
09
21
,30
90
,99
10
,03
32
0,8
71
0,0
00
92
0,0
32
7,2
33
1,2
76
14
,68
70
,00
60
0,3
08
2,9
19
0,2
14
1,2
44
0,0
03
50
,10
00
,01
56
1,4
13
2,2
24
0,0
35
81
,92
80
,00
10
70
,04
27
,02
39
,36
79
,25
40
,00
62
0,3
84
3,0
34
0,3
89
0,9
25
0,0
03
20
,16
20
,01
62
1,4
13
3,2
75
0,0
33
50
,89
50
,00
12
40
,02
38
,29
28
,98
8,4
25
0,0
03
50
,38
51
,71
10
,27
40
,52
10
,00
30
0,1
31
0,0
13
71
,04
70
,93
30
,03
77
0,3
85
0,0
01
15
0,0
31
9,3
53
8,3
29
5,2
05
0,0
03
10
,60
84
,99
30
,26
50
,25
30
,00
17
0,2
00
0,0
14
81
,30
81
,24
20
,03
67
1,0
76
0,0
01
05
0,0
32
6,4
63
3,3
61
01
3,3
82
0,0
07
20
,54
63
,53
20
,19
10
,96
80
,00
24
0,0
78
0,0
22
02
,48
42
,02
50
,04
33
2,4
82
0,0
01
30
0,0
82
0,3
33
9,8
51
11
1,1
25
0,0
03
50
,44
73
,44
00
,26
00
,26
20
,00
35
0,1
09
0,0
15
31
,58
71
,60
20
,04
00
0,4
59
0,0
01
55
0,0
53
3,0
33
0,1
12
18
,92
50
,00
70
0,5
91
3,8
24
0,1
33
0,9
32
0,0
02
50
,09
70
,02
05
2,0
96
2,9
36
0,0
37
52
,15
00
,00
14
80
,05
27
,23
37
,02
13
11
,50
50
,00
95
0,6
18
5,1
70
0,1
24
1,4
17
0,0
02
20
,07
40
,03
22
1,9
83
4,1
47
0,0
38
01
,23
50
,00
13
70
,02
28
,45
36
,89
14
25
,70
20
,00
76
0,2
90
4,1
31
0,1
24
1,1
32
0,0
03
80
,04
70
,02
21
2,3
02
2,5
21
0,0
40
50
,69
70
,00
11
00
,05
21
,64
39
,91
59
,61
50
,00
63
0,5
98
3,4
02
0,2
65
0,9
33
0,0
02
80
,10
00
,02
73
1,6
47
3,0
95
0,0
33
30
,76
50
,00
16
70
,02
32
,27
33
,51
62
,00
20
,00
60
0,2
97
3,2
47
0,1
79
0,9
90
0,0
02
90
,01
60
,01
74
1,4
83
1,8
91
0,0
31
80
,82
10
,00
08
60
,01
20
,66
40
,39
17
15
,17
80
,00
56
0,3
22
3,0
54
0,1
56
0,9
31
0,0
02
30
,00
20
,01
63
1,3
11
1,7
77
0,0
29
90
,73
00
,00
07
50
,04
20
,64
40
,01
18
23
,90
40
,00
64
0,5
31
3,1
48
0,1
68
1,3
42
0,0
01
60
,01
70
,02
24
1,4
66
1,8
02
0,0
34
70
,61
90
,00
08
40
,06
20
,31
39
,62
19
8,6
95
0,0
03
40
,21
93
,28
70
,24
90
,30
10
,00
50
0,1
24
0,0
14
61
,26
11
,44
40
,03
42
0,4
16
0,0
01
11
0,0
43
1,1
53
0,8
82
01
7,1
37
0,0
07
60
,31
84
,11
30
,10
41
,50
30
,00
34
0,0
69
0,0
22
01
,61
63
,86
10
,04
03
2,2
54
0,0
01
09
0,0
53
3,3
03
3,7
92
12
1,5
49
0,0
02
10
,48
12
,01
40
,56
60
,03
00
,00
27
0,3
71
0,0
17
01
,19
62
,04
10
,03
58
0,2
12
0,0
01
32
0,1
47
1,9
03
,36
22
14
,00
40
,00
54
2,4
72
5,9
13
0,3
36
0,0
90
0,0
00
60
,19
70
,01
84
2,4
58
7,2
24
0,0
39
83
,03
30
,00
14
50
,13
86
,66
2,3
22
31
3,3
39
0,0
08
60
,20
88
,45
20
,09
50
,12
80
,01
45
0,0
71
0,0
15
13
,28
11
1,0
01
0,0
36
21
,48
50
,00
30
20
,03
92
,34
1,0
32
41
55
,46
70
,00
36
0,9
59
3,5
46
0,2
78
0,0
54
0,0
03
40
,29
50
,01
10
0,9
07
4,1
03
0,0
41
20
,47
30
,00
32
20
,74
82
,08
0,8
42
58
,51
80
,00
56
0,3
38
2,7
50
0,3
64
0,2
09
0,0
01
10
,08
30
,00
98
1,1
30
2,1
78
0,0
40
40
,73
40
,00
03
70
,02
56
,17
15
,26
26
25
,25
60
,00
46
0,3
15
4,4
81
0,3
15
0,0
68
0,0
01
90
,05
20
,01
00
0,7
78
2,6
82
0,0
38
41
,48
00
,00
05
90
,09
42
,45
25
,69
27
25
,51
70
,01
24
0,2
12
6,0
48
0,0
81
1,2
89
0,0
02
90
,00
70
,01
62
1,6
57
10
,90
70
,03
71
1,4
45
0,0
00
62
0,0
46
3,9
61
7,6
1
I.O. Yilmaz et al. / Cretaceous Research 31 (2010) 207–226218
Author's personal copy
Rare earth and refractory elements are determined by ICP massspectrometry following a Lithium metaborate / tetrabortate fusionand nitric acid digestion of a 0.1 g sample. In addition a separate0.5 g split is digested in Aqua Regia and analysed by ICP MassSpectrometry to report the precious and base metals. Each analysisrequire 5 g sample and determination limits of the elements are0.04 % for SiO2, 0.03 % for Al2O3, 0.04 % for Fe2O3, 0.01 % for CaO, 0.01
% for MgO, 0.01 % for Na2O, 0.04 % for K2O, 0.01 % for MnO, TiO2 andP2O5, 0.5 ppm for Ba, 0,1 ppm for Cd, Cu, Mo, Ni and Pb, 1 ppm forZn, and 5 ppm for V.
For stable isotopes, powdered limestone/marl/mudstone/shalesamples were run in the Finnigan MAT Delta Plus XL with He carriergas on-line to Gas-Bench for carbon and oxygen isotopes ofcarbonates with precession of 0.08 & and accuracy of 0.1 &.
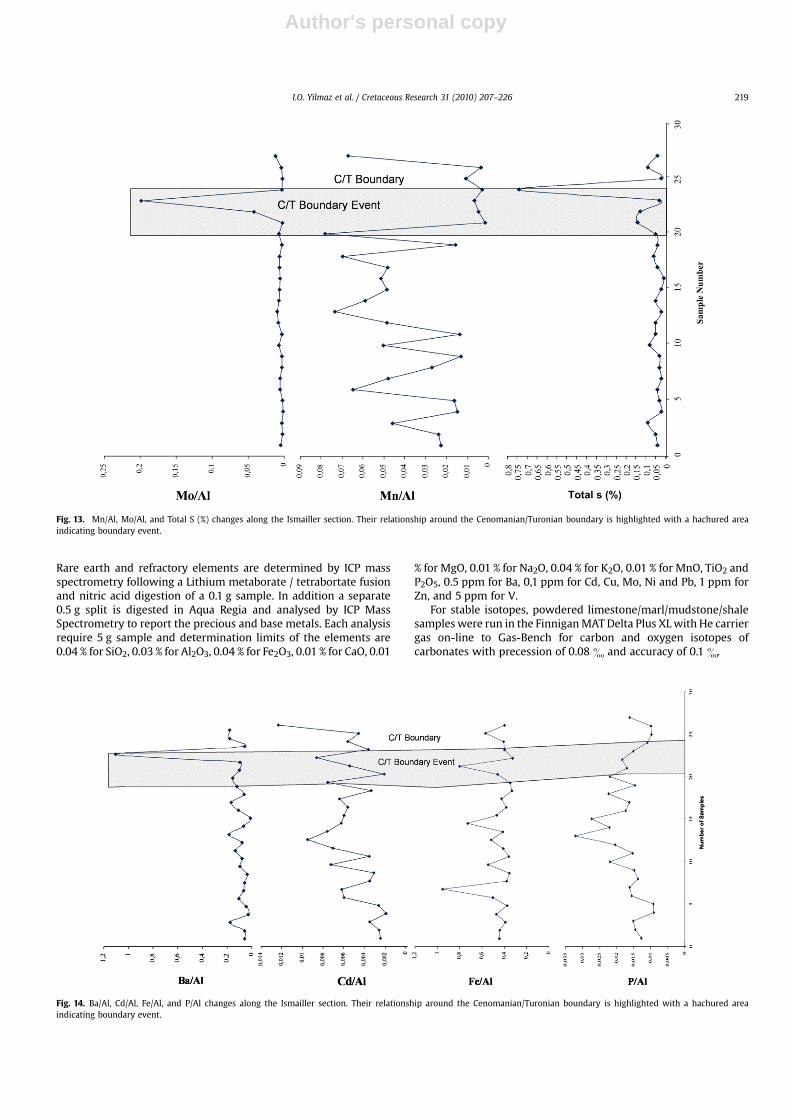
Fig. 14. Ba/Al, Cd/Al, Fe/Al, and P/Al changes along the Ismailler section. Their relationship around the Cenomanian/Turonian boundary is highlighted with a hachured areaindicating boundary event.
Fig. 13. Mn/Al, Mo/Al, and Total S (%) changes along the Ismailler section. Their relationship around the Cenomanian/Turonian boundary is highlighted with a hachured areaindicating boundary event.
I.O. Yilmaz et al. / Cretaceous Research 31 (2010) 207–226 219
Author's personal copy
In this study,12 black shale samples across the C/T boundary havebeen analyzed for total organic carbon content by Rock Eval-VImachine using IFP 160000 standarts (Institute Francais du Petrole) inthe laboratory of the Turkish Petroleum Corporation, Ankara, Turkey.
In total, 55 samples have been analyzed for stable isotopes,major and trace elements. For SEM image analysis of the samples,QUANTA 400F Field Emission SEM with 1.2 nm resolution has beenused in the central laboratory of the Middle East TechnicalUniversity, Ankara, Turkey. At some specific points on the samples,back-scattered images and Edx analysis have been performed onthe same electron microscope. The samples have been covered byAu-Pd and stacked on carbon tapes for analysis.
5.2. Stable isotope, element, TOC analysis
d13C and d18O stable isotope analysis have been applied to theIsmailler section. A positive shift in the d13C curve has beenobtained just below the Cenomanian/Turonian boundary similar tomany sections around the world (Jarvis et al., 2006) (Fig. 10, Table 1).
d18O displays a sudden negative shift just around the C/T boundary.Cross plot of d13C and d18O values display similar pattern withmodern marine cements (Fig. 11). This implies that the diagenesisdid not fractionate the isotope values too much and display more orless preserved values. Sudden change of d18O curve just around theC/T boundary may indicate the effect of climate and rise oftemperature in the ocean (Skelton, 2003).
Major elements such as CaO and SiO2 are inversely related.Amount of CaO decreases, whereas the amount of SiO2 rises aroundthe boundary. Additionally Si/Al element ratio displays sudden dropand rise respectively just around the boundary (Fig. 12, Table 2a). Thismay indicate that the supply of SiO2 can be related with productivity.Because, sudden increase in abundance of cherts occurs very nearto the SiO2 peak.
The element values are normalized with respect to Al andcompared to the North American Shale Composite (NASC) (Grometet al., 1984; Van der Weijden, 2002). The depletion of Mn, increasein Mo and total S just before the boundary (Fig. 13) indicate oxygen-depleted bottom conditions and relative enrichment of Mo and S
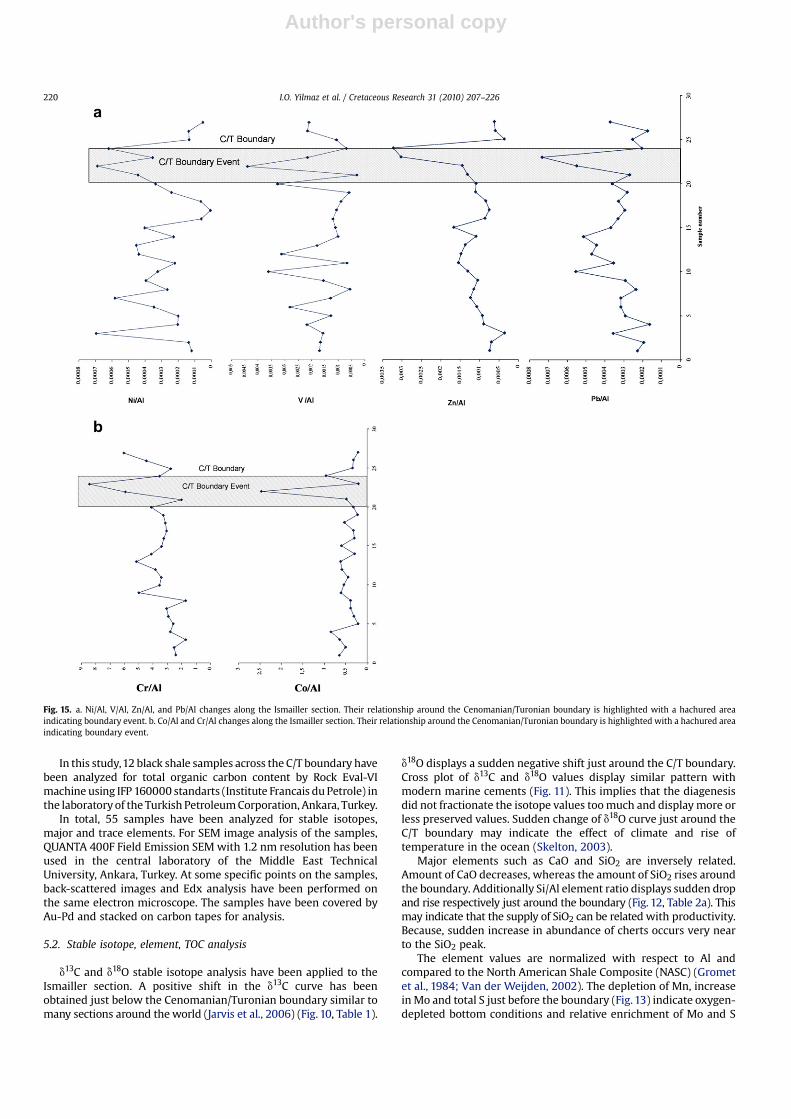
Fig. 15. a. Ni/Al, V/Al, Zn/Al, and Pb/Al changes along the Ismailler section. Their relationship around the Cenomanian/Turonian boundary is highlighted with a hachured areaindicating boundary event. b. Co/Al and Cr/Al changes along the Ismailler section. Their relationship around the Cenomanian/Turonian boundary is highlighted with a hachured areaindicating boundary event.
I.O. Yilmaz et al. / Cretaceous Research 31 (2010) 207–226220
Author's personal copy
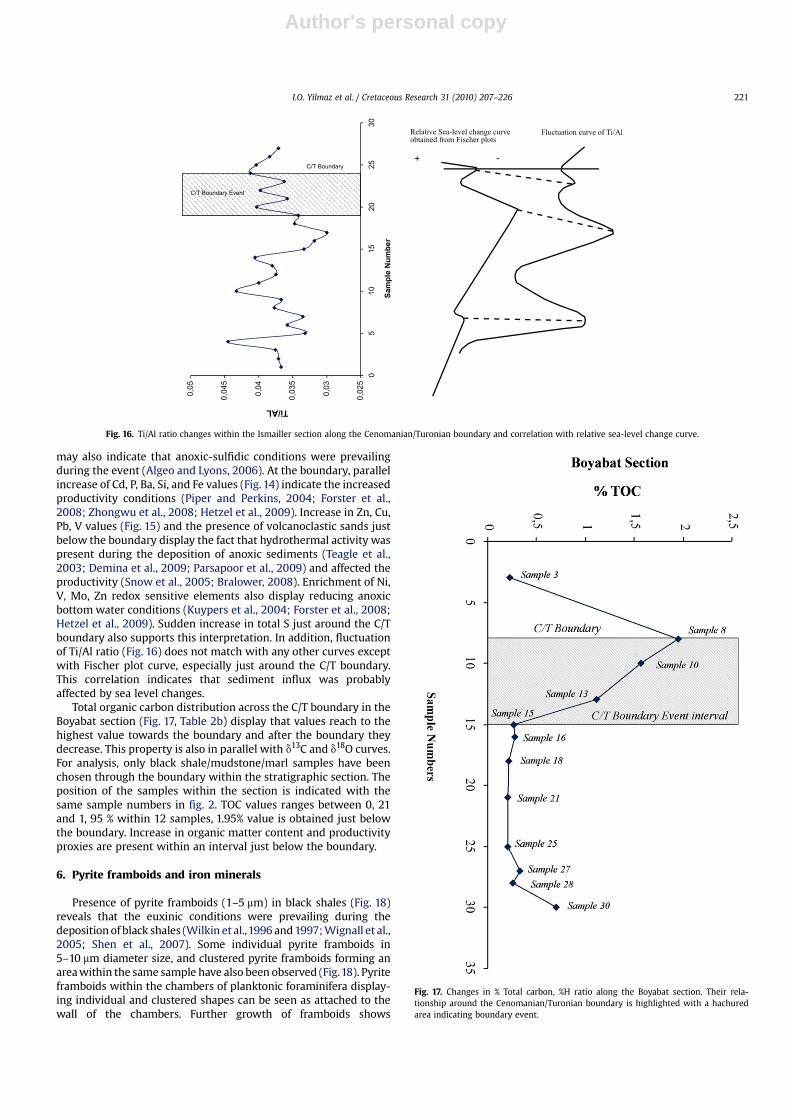
may also indicate that anoxic-sulfidic conditions were prevailingduring the event (Algeo and Lyons, 2006). At the boundary, parallelincrease of Cd, P, Ba, Si, and Fe values (Fig. 14) indicate the increasedproductivity conditions (Piper and Perkins, 2004; Forster et al.,2008; Zhongwu et al., 2008; Hetzel et al., 2009). Increase in Zn, Cu,Pb, V values (Fig. 15) and the presence of volcanoclastic sands justbelow the boundary display the fact that hydrothermal activity waspresent during the deposition of anoxic sediments (Teagle et al.,2003; Demina et al., 2009; Parsapoor et al., 2009) and affected theproductivity (Snow et al., 2005; Bralower, 2008). Enrichment of Ni,V, Mo, Zn redox sensitive elements also display reducing anoxicbottom water conditions (Kuypers et al., 2004; Forster et al., 2008;Hetzel et al., 2009). Sudden increase in total S just around the C/Tboundary also supports this interpretation. In addition, fluctuationof Ti/Al ratio (Fig. 16) does not match with any other curves exceptwith Fischer plot curve, especially just around the C/T boundary.This correlation indicates that sediment influx was probablyaffected by sea level changes.
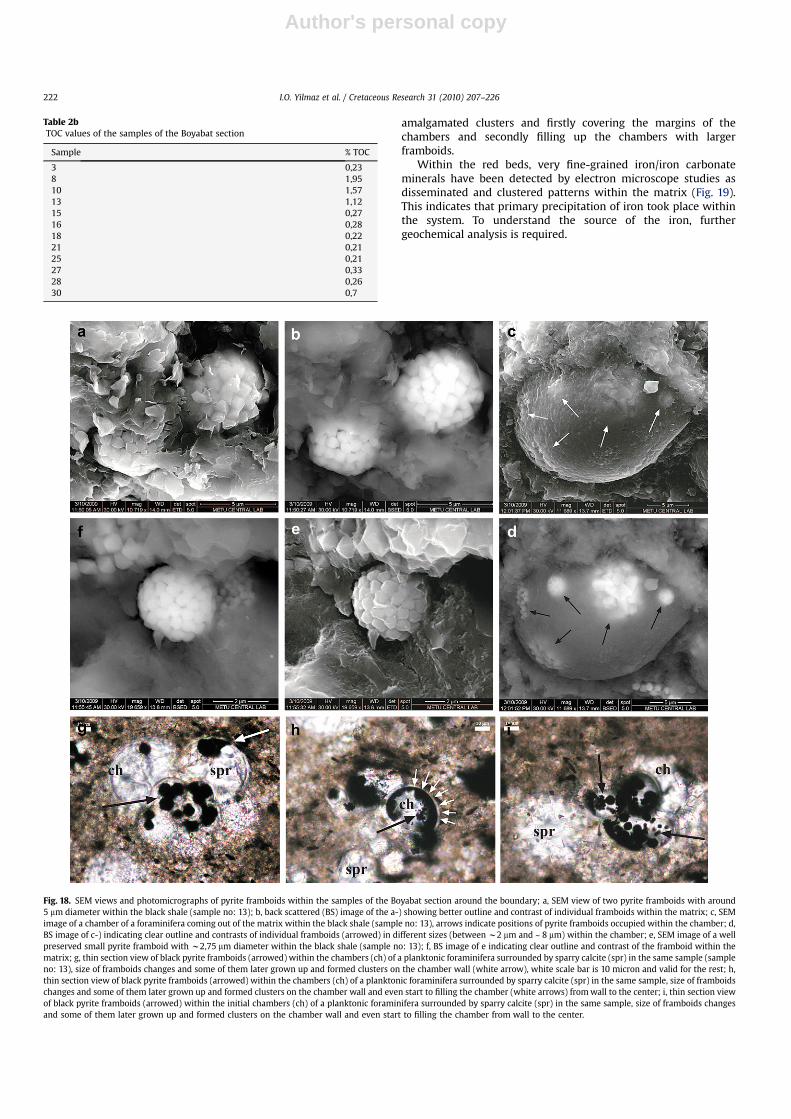
Total organic carbon distribution across the C/T boundary in theBoyabat section (Fig. 17, Table 2b) display that values reach to thehighest value towards the boundary and after the boundary theydecrease. This property is also in parallel with d13C and d18O curves.For analysis, only black shale/mudstone/marl samples have beenchosen through the boundary within the stratigraphic section. Theposition of the samples within the section is indicated with thesame sample numbers in fig. 2. TOC values ranges between 0, 21and 1, 95 % within 12 samples, 1.95% value is obtained just belowthe boundary. Increase in organic matter content and productivityproxies are present within an interval just below the boundary.
6. Pyrite framboids and iron minerals
Presence of pyrite framboids (1–5 mm) in black shales (Fig. 18)reveals that the euxinic conditions were prevailing during thedeposition of black shales (Wilkin et al.,1996 and 1997; Wignall et al.,2005; Shen et al., 2007). Some individual pyrite framboids in5–10 mm diameter size, and clustered pyrite framboids forming anarea within the same sample have also been observed (Fig.18). Pyriteframboids within the chambers of planktonic foraminifera display-ing individual and clustered shapes can be seen as attached to thewall of the chambers. Further growth of framboids shows
Fig. 16. Ti/Al ratio changes within the Ismailler section along the Cenomanian/Turonian boundary and correlation with relative sea-level change curve.
Fig. 17. Changes in % Total carbon, %H ratio along the Boyabat section. Their rela-tionship around the Cenomanian/Turonian boundary is highlighted with a hachuredarea indicating boundary event.
I.O. Yilmaz et al. / Cretaceous Research 31 (2010) 207–226 221
Author's personal copy
amalgamated clusters and firstly covering the margins of thechambers and secondly filling up the chambers with largerframboids.
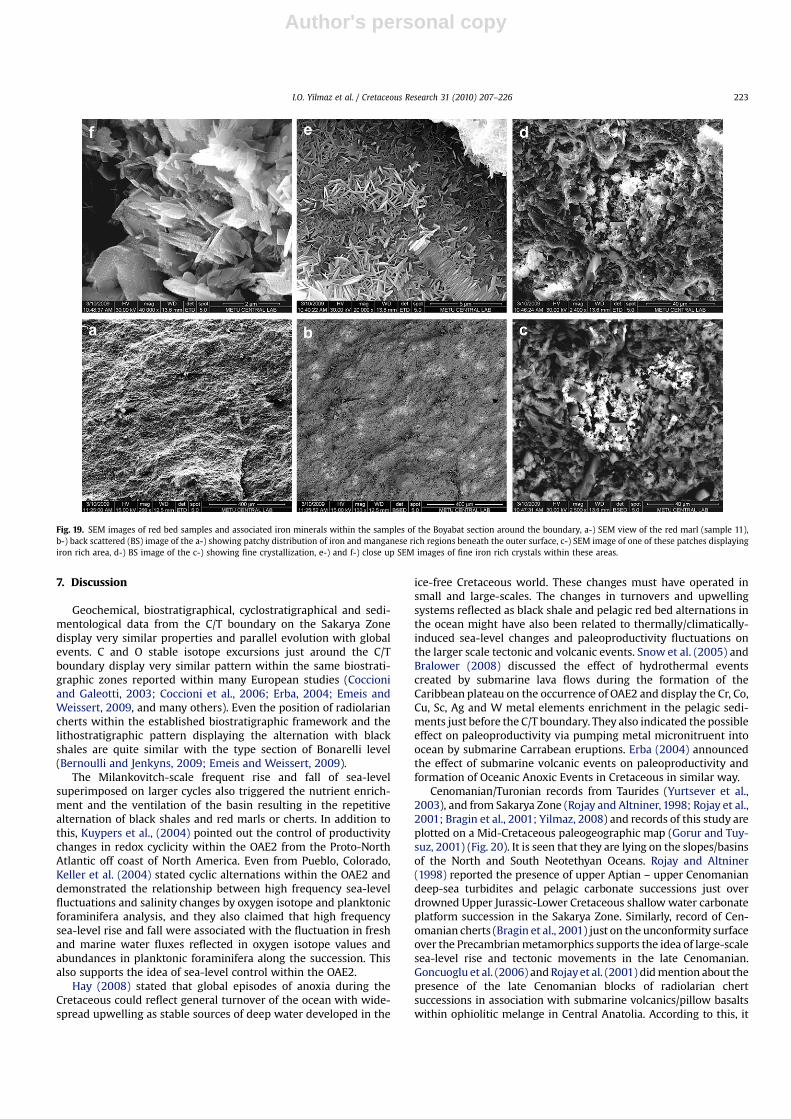
Within the red beds, very fine-grained iron/iron carbonateminerals have been detected by electron microscope studies asdisseminated and clustered patterns within the matrix (Fig. 19).This indicates that primary precipitation of iron took place withinthe system. To understand the source of the iron, furthergeochemical analysis is required.
Table 2bTOC values of the samples of the Boyabat section
Sample % TOC
3 0,238 1,9510 1,5713 1,1215 0,2716 0,2818 0,2221 0,2125 0,2127 0,3328 0,2630 0,7
Fig. 18. SEM views and photomicrographs of pyrite framboids within the samples of the Boyabat section around the boundary; a, SEM view of two pyrite framboids with around5 mm diameter within the black shale (sample no: 13); b, back scattered (BS) image of the a-) showing better outline and contrast of individual framboids within the matrix; c, SEMimage of a chamber of a foraminifera coming out of the matrix within the black shale (sample no: 13), arrows indicate positions of pyrite framboids occupied within the chamber; d,BS image of c-) indicating clear outline and contrasts of individual framboids (arrowed) in different sizes (between w2 mm and ~ 8 mm) within the chamber; e, SEM image of a wellpreserved small pyrite framboid with w2,75 mm diameter within the black shale (sample no: 13); f, BS image of e indicating clear outline and contrast of the framboid within thematrix; g, thin section view of black pyrite framboids (arrowed) within the chambers (ch) of a planktonic foraminifera surrounded by sparry calcite (spr) in the same sample (sampleno: 13), size of framboids changes and some of them later grown up and formed clusters on the chamber wall (white arrow), white scale bar is 10 micron and valid for the rest; h,thin section view of black pyrite framboids (arrowed) within the chambers (ch) of a planktonic foraminifera surrounded by sparry calcite (spr) in the same sample, size of framboidschanges and some of them later grown up and formed clusters on the chamber wall and even start to filling the chamber (white arrows) from wall to the center; i, thin section viewof black pyrite framboids (arrowed) within the initial chambers (ch) of a planktonic foraminifera surrounded by sparry calcite (spr) in the same sample, size of framboids changesand some of them later grown up and formed clusters on the chamber wall and even start to filling the chamber from wall to the center.
I.O. Yilmaz et al. / Cretaceous Research 31 (2010) 207–226222
Author's personal copy
7. Discussion
Geochemical, biostratigraphical, cyclostratigraphical and sedi-mentological data from the C/T boundary on the Sakarya Zonedisplay very similar properties and parallel evolution with globalevents. C and O stable isotope excursions just around the C/Tboundary display very similar pattern within the same biostrati-graphic zones reported within many European studies (Coccioniand Galeotti, 2003; Coccioni et al., 2006; Erba, 2004; Emeis andWeissert, 2009, and many others). Even the position of radiolariancherts within the established biostratigraphic framework and thelithostratigraphic pattern displaying the alternation with blackshales are quite similar with the type section of Bonarelli level(Bernoulli and Jenkyns, 2009; Emeis and Weissert, 2009).
The Milankovitch-scale frequent rise and fall of sea-levelsuperimposed on larger cycles also triggered the nutrient enrich-ment and the ventilation of the basin resulting in the repetitivealternation of black shales and red marls or cherts. In addition tothis, Kuypers et al., (2004) pointed out the control of productivitychanges in redox cyclicity within the OAE2 from the Proto-NorthAtlantic off coast of North America. Even from Pueblo, Colorado,Keller et al. (2004) stated cyclic alternations within the OAE2 anddemonstrated the relationship between high frequency sea-levelfluctuations and salinity changes by oxygen isotope and planktonicforaminifera analysis, and they also claimed that high frequencysea-level rise and fall were associated with the fluctuation in freshand marine water fluxes reflected in oxygen isotope values andabundances in planktonic foraminifera along the succession. Thisalso supports the idea of sea-level control within the OAE2.
Hay (2008) stated that global episodes of anoxia during theCretaceous could reflect general turnover of the ocean with wide-spread upwelling as stable sources of deep water developed in the
ice-free Cretaceous world. These changes must have operated insmall and large-scales. The changes in turnovers and upwellingsystems reflected as black shale and pelagic red bed alternations inthe ocean might have also been related to thermally/climatically-induced sea-level changes and paleoproductivity fluctuations onthe larger scale tectonic and volcanic events. Snow et al. (2005) andBralower (2008) discussed the effect of hydrothermal eventscreated by submarine lava flows during the formation of theCaribbean plateau on the occurrence of OAE2 and display the Cr, Co,Cu, Sc, Ag and W metal elements enrichment in the pelagic sedi-ments just before the C/T boundary. They also indicated the possibleeffect on paleoproductivity via pumping metal micronitruent intoocean by submarine Carrabean eruptions. Erba (2004) announcedthe effect of submarine volcanic events on paleoproductivity andformation of Oceanic Anoxic Events in Cretaceous in similar way.
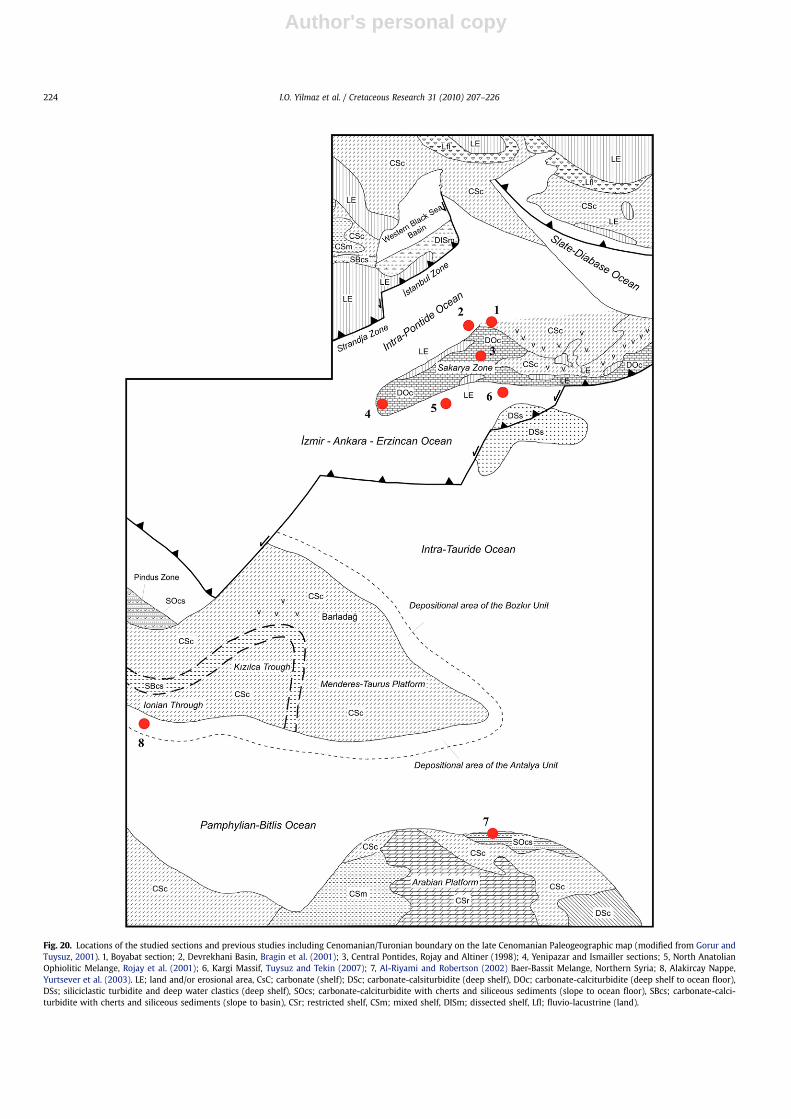
Cenomanian/Turonian records from Taurides (Yurtsever et al.,2003), and from Sakarya Zone (Rojay and Altniner, 1998; Rojay et al.,2001; Bragin et al., 2001; Yilmaz, 2008) and records of this study areplotted on a Mid-Cretaceous paleogeographic map (Gorur and Tuy-suz, 2001) (Fig. 20). It is seen that they are lying on the slopes/basinsof the North and South Neotethyan Oceans. Rojay and Altniner(1998) reported the presence of upper Aptian – upper Cenomaniandeep-sea turbidites and pelagic carbonate successions just overdrowned Upper Jurassic-Lower Cretaceous shallow water carbonateplatform succession in the Sakarya Zone. Similarly, record of Cen-omanian cherts (Bragin et al., 2001) just on the unconformity surfaceover the Precambrian metamorphics supports the idea of large-scalesea-level rise and tectonic movements in the late Cenomanian.Goncuoglu et al. (2006) and Rojay et al. (2001) did mention about thepresence of the late Cenomanian blocks of radiolarian chertsuccessions in association with submarine volcanics/pillow basaltswithin ophiolitic melange in Central Anatolia. According to this, it
Fig. 19. SEM images of red bed samples and associated iron minerals within the samples of the Boyabat section around the boundary, a-) SEM view of the red marl (sample 11),b-) back scattered (BS) image of the a-) showing patchy distribution of iron and manganese rich regions beneath the outer surface, c-) SEM image of one of these patches displayingiron rich area, d-) BS image of the c-) showing fine crystallization, e-) and f-) close up SEM images of fine iron rich crystals within these areas.
I.O. Yilmaz et al. / Cretaceous Research 31 (2010) 207–226 223
Author's personal copy
Fig. 20. Locations of the studied sections and previous studies including Cenomanian/Turonian boundary on the late Cenomanian Paleogeographic map (modified from Gorur andTuysuz, 2001). 1, Boyabat section; 2, Devrekhani Basin, Bragin et al. (2001); 3, Central Pontides, Rojay and Altiner (1998); 4, Yenipazar and Ismailler sections; 5, North AnatolianOphiolitic Melange, Rojay et al. (2001); 6, Kargi Massif, Tuysuz and Tekin (2007); 7, Al-Riyami and Robertson (2002) Baer-Bassit Melange, Northern Syria; 8, Alakircay Nappe,Yurtsever et al. (2003). LE; land and/or erosional area, CsC; carbonate (shelf); DSc; carbonate-calsiturbidite (deep shelf), DOc; carbonate-calciturbidite (deep shelf to ocean floor),DSs; siliciclastic turbidite and deep water clastics (deep shelf), SOcs; carbonate-calciturbidite with cherts and siliceous sediments (slope to ocean floor), SBcs; carbonate-calci-turbidite with cherts and siliceous sediments (slope to basin), CSr; restricted shelf, CSm; mixed shelf, DISm; dissected shelf, Lfl; fluvio-lacustrine (land).
I.O. Yilmaz et al. / Cretaceous Research 31 (2010) 207–226224
Author's personal copy
can be implied that the oceanic crust of the Neotethyan Ocean waspresent in the Cenomanian and large-scale submarine volcanic andtectonic activities took place in the northern Neotethyan Oceanduring the Cenomanian. In addition to this, Tuysuz and Tekin (2007)indicated the presence of northward subduction of the NeotethyanOcean during the Valanginian to Campanian in the NoerthernTurkey. Al-Riyami and Robertson (2002) indicated the presence ofassociation of Cenomanian radiolarian cherts, mudstones andreddish pelagic limestones, ferromanganese rich pelagic siliciouslimestones and submarine volcanics within the Baer–Bassit Melangeof northern Syria indicating deepwater sedimentation and volca-nism adjacent to the Arabian continental margin and emphasised onthe effect of complex interplay between post-rift thermal subsi-dence, plume-inducted thermal uplift, oceanographic siliceousproductivity events, eustatic sea-level change and climatic change onthe sedimentation on the South-Tethyan Ocean in northern Syria.However they also announce the large-scale dominant effect astectonic/magmatic events.
8. Conclusion
Close to the C/T boundary, the appearance of pelagic red bedsalternating with black shales is very spectacular. Cyclic alternationof red beds/cherts and black shales is similar in between theIsmailler and Boyabat sections and differently, red-pink mudstonesalternate with volcanoclastic sandstones in the Yenipazar section.These lithologic features, sedimentological properties, trace andmajor element anomalies and isotope excursions observed at theC/T boundary indicate a kind of interplay between paleoproductivity,climate induced (Milankovitch bands) small-scale sea-level changessuperimposed on larger-scale, volcanism and tectonic movements.The large-scale sea-level change curve obtained from the measuredsections fits to the global sea-level curves and displays consistencywith paleoclimate proxies. This collaboration caused swithcing onand off of the ocean ventilation and affected the amount of nutrientdistribution, sediment influx, changes in the thickness of the oceanlayers, and their connectivity. Record of the sudden rise of sea-leveland temperature coincided to the the C/T boundary on the SakaryaZone as in many examples from the world (Skelton, 2003).
Acknowledgements
This work was supported by the Turkish Scientific and Tech-nological Research Council (TUBiTAK, Project Numbers: ÇAYDAG-104Y010, and ÇAYDAG-104Y153 Ankara, Turkey) and the MiddleEast Technical University (Ankara, Turkey), Hacettepe University(Ankara, Turkey), Eskisehir Osmangazi University (Eskisehir,Turkey) and _Istanbul Technical University (_Istanbul, Turkey). Weare very thankful to Dr. Torsten Vennemann, Institute of Miner-alogy and Geochemistry of University of Lausanne, Switzerland, forhis helps in stable isotope analysis and helps of other lab techni-cians in the universities.
References
Al-Riyami, K., Robertson, A., 2002. Mesozoic sedimentary and magmatic evolutionof the Arabian continental margin, northern Syria: evidence from the Baer–Bassit Melange. Geological Magazine 139 (4), 395–420.
Altiner, D., 1991. Microfossil biostratigraphy (mainly foraminifers) of the jurassic–lower cretaceous carbonate successions in Northwestern Anatolia (Turkey).Geologica Romana 27, 167–215.
Altiner, D., Kocyigit, A., Farinacci, A., Nicosia, U., Conti, M.A., 1991. Jurassic–LowerCretaceous stratigraphy and paleogeographic evolution of the southern part ofNorth-Western Anatolia (Turkey). Geologica Romana 27, 13–81.
Algeo, T.J., Lyons, T.W., 2006. Mo–total organic carbon covariation in modern anoxicmarine environments: implications for analysis of paleoredox and paleohy-drographic conditions. Paleoceonography 21, 1–23.
Bernoulli, D., 1972. North Atlantic and Mediterranean Mesozoic Facies, a compar-ison. In: Init. In: Hollister, C.D., Ewing, J.L., Habib, D., Hathaway, J.C., Lancelot, Y.,Luterbacher, H., Paulus, F.J., Poag, C.W., Wilcoxon, J.A., Worstell, P. (Eds.), Reportsof the Deep Sea Drilling Project, 11. U.S. Govt. Printing Office, Washington, D.C,pp. 801–822.
Bernoulli, D., Jenkyns, H.C., 2009. Ancient oceans and continental margins of theAlpine-Mediterranean Tethys: deciphering clues from Mesozoic pelagic sedi-ments and ophiolites. Sedimentology 56, 149–190.
Bragin, N., Bragina, L., Tunoglu, C., Tekin, U.K., 2001. The Cenomanian (Late Creta-ceous) Radiolarians from the Tomalar Formation, Central Pontides, NorthernTurkey. Geologica Carpathica 52 (6), 349–360.
Bralower, T.J., 2008. Volcanic cause of catastrophe. Nature 454, 285–287.Claps, M., Masatti, D., 1994. Milankovitch periodicities recorded in Cretaceous deep
sea sequences from the southern Alps (Northern Italy). In: De Boer, P.L.,Smith, D.G. (Eds.), Orbital Forcing and Cyclic Sequences, 19. Special Publicationof Internal Association of Sedimentologists, pp. 99–109.
Coccioni, R., Galeotti, S., 2003. The mid-Cenomanian event: prelude to OAE2.Palaeogeography, Palaeoclimatology, Palaeoecology 190, 427–440.
Coccioni, R., Luciani, V., Marsili, A., 2006. Cretaceous oceanic anoxic events andradially elongated chambered planktonic foraminifera: Paleoecological andpaleoceanographic implications. Palaeogeography, Palaeoclimatology. Palae-oecology 235, 66–92.
Demina, L.L., Galkin, S.V., Shumilin, E.N., 2009. Bioaccumulation of some traceelements in the biota of hydrothermal fields of the Guaymas Basin (Gulf ofCalifornia). Boletin de la Sociedad Geologica Mexicana 61 (1), 31–45.
Einsele, G., Ricken, W., Seilacher, A., 1991. Cycles and events in stratigraphy. SpringerVerlag. 955pp.
Einsele, G., 2001. Sedimentary basins: evolution, facies and sediment budget.Springer-Verlag. 792pp.
Emeis, K.-C., Weissert, H., 2009. Tethyan–Mediterranean organic carbon-rich sedi-ments from Mesozoic black shales to sapropels. Sedimentology 56, 247–266.
Erba, E., 2004. Calcareous nannofossils and Mesozoic oceanic anoxic events. MarineMicropaleontology 52, 85–106.
Eren, M., Kadir, S., 1999. Colour origin of upper Cretaceous pelagic red sedimentswithin the Eastern Pontides, northeast Turkey. International Journal of EarthSciences 88, 593–595.
Eren, M., Tasli, K., 2002. Kliop Cretaceous hardground (Kale, Gumuflhane, NETurkey): description and origin. Journal of Asian Earth Sciences 20, 433–448.
Forster, A., Kuypers, M.M.M., Turgeon, S.C., Brumsack, H.-J., Petrizzo, M.R.,Damste, J.S.S., 2008. The Cenomanian/Turonian oceanic anoxic event in theSouth Atlantic: new insights from a geochemical study of DSDP Site 530A.Palaeogeography, Palaeoclimatology, Palaeoecology 267, 256–283.
Gedik, A, Korkmaz, S, 1984. Geology of the Sinop basin and petroleum possibilities.Jeoloji Muhendisligi Dergisi 19, 53–80 (in Turkish with English Abstract).
Goncuoglu, M.C., Yaliniz, M.K., Tekin, U.K., 2006. Geochemistry, Tectono-magmaticdiscrimination and radiolarian ages of basic extrusives within the Izmir-Ankarasuture belt (NW Turkey): time constraints for the Neotethyan evolution. Ofioliti31 (1), 25–38.
Gorur, N., Tuysuz, O., Akyol, A., Sakinc, M., Yigitbas, E., Akkok, R., 1993. Cretaceousred pelagic carbonates of northern Turkey: their place in the opening history ofBlack Sea. Eclogae Geologicae Helvetiae 36, 819–838.
Gorur, N., Tuysuz, O., 2001. Cretaceous to Miocene palaeogeographic evolution ofTurkey: implications for hydrocarbon potential. April 2001. Journal of Petro-leum Geology vol. 24 (2), 119–146.
Gromet, L.P., Dymek, R.F., Haskin, L.A., Korotev, R.L., 1984. The ‘North American shalecomposite’: Its compilation, major and trace element characteristics. Geochim.Cosmochim. Acta 48, 2469–2482.
Hay, W.W., 2008. Evolving ideas about the Cretaceous climate and ocean circula-tion. Cretaceous Research 29, 725–753.
Hetzel, A., Bottcher, M.E., Wortmann, U.G., Brumsack, H.-J., 2009. Paleo-redoxconditions during OAE 2 reflected in Demerara Rise sediment geochemistry (ODPLeg 207). Palaeogeography, Palaeoclimatology, Palaeoecology 273, 302–328.
Hu, X., Jansa, L., Wang, C., Sarti, M., Bak, K., Wagreich, M., Michalik, J., Sotak, J.,2005a. Upper Cretaceous oceanic red beds (CORBs) in the Tethys: occurrences,lithofacies, age, and environments. Cretaceous Research 26, 3–20.
Hu, X., Jansa, L., Sarti, M., 2005b. Mid-Cretaceous pelagic red beds in the Umbria-Marche Basin, central Italy: Constraints on paleoceanography and paleoclimate.Palaeogeography, Palaeoclimatology, Palaeoecology 233, 163–186.
Jacquin, T., de Graciansky, P.Ch, 1988. Cyclic fluctuations of anoxia during Cretaceoustime in the South Atlantic Ocean. Marine and Petroleum Geology 5 (4), 359–369.
Jarvis, I., Gale, A.S., Jenkyns, H.C., Pearce, M.A., 2006. Secular variation in LateCretaceous carbon isotopes:a new d13C carbonate reference curve forthe Cenomanian–Campanian (99.6–70.6 Ma). Geological Magazine 143 (5),561–608.
Jenkyns, H.C., 1980. Cretaceous anoxic events: from continents to oceans. Journal ofthe Geological Society of London 137, 171–188.
Jenkyns, H.C., Wilson, P.A., 1999. Stratigraphy, paleoceanography, and evolution ofCretaceous pacific guyots: relics from a greenhouse earth. American Journal ofScience 299, 341–392.
Keller, G., 2008. Cretaceous climate, volcanism, impacts, and biotic effects. Creta-ceous Research 29, 754–771.
Keller, G., Berner, Z., Adattec, T., Stueben, D., 2004. Cenomanian–Turonian and d13C,and d18O, sea level and salinity variations at Pueblo, Colorado. Palaeogeography,Palaeoclimatology, Palaeoecology 211, 19–43.
Ketin, I, 1966. Anadolu’nun tektonik birlikleri. MTA Dergisi, Ankara 66, 20–34.
I.O. Yilmaz et al. / Cretaceous Research 31 (2010) 207–226 225
Author's personal copy
Kocyigit, A., Altiner, D., Farinacci, A., Nicosia, U., Conti, M.A., 1991. Late Triassic–Aptian evolution of the Sakarya divergent margin: implications for the openinghistory of the Northern Neo-Tethys, in the North-Western Anatolia, Turkey.Geologica Romana 27, 81–101.
Kuhnt, W., Nederbrag, A., Leine, L., 1997. Cyclicity of Cenomanian – Turonianorganic-carbonrich sediments in the Tarfaya Atlantic Coastal Basin (Morocco).Cretaceous Research 18, 587–601.
Kuypers, M.M.M., Lourens, L., J., Rijpstra, W.I.C., Pancost, R.D., Nijenhuis, I.A.,Damste, J.S.S., 2004. Orbital forcing of organic carbon burial in the proto-NorthAtlantic during oceanic anoxic event 2. Earth and Planetary Science Letters 228,465–482.
Mitchell, R.N., Bice, D.M., Montanari, A., Cleaveland, L.C., Christianson, K.T.,Coccioni, R., Hinnov, L.A., 2008. Oceanic anoxic cycles? Orbital prelude to theBonarelli Level (OAE 2). Earth and Planetary Science Letters 267, 1–16.
Neuhuber, S., Wagreich, M., Wendler, I., Spotl, C., 2007. Turonian Oceanic Red Beds inthe Eastern Alps: Concepts for palaeoceanographic changes in the MediterraneanTethys. Palaeogeography, Palaeoclimatology, Palaeoecology 251, 222–238.
Niebuhr, B., Prokoph, A., 1997. Periodic-cyclic and chaotic successions of UpperCretaceous (Cenomanian to Campanian) pelagic sediments in the NorthGerman Basin. Cretaceous Research 18, 731–750.
Okay, A.I., Tuysuz, O., 1999. Geological Society1999. Tethyan sutures of northernTurkey, 156. Special Publications, London. 475-515.
Parsapoor, P., Khalili, M., Mackizadeh, M.A., 2009. The behaviour of trace and rareearth elements (REE) during hydrothermal alteration in the Rangan area(Central Iran). Journal of Asian Earth Sciences 34, 123–134.
Price, G.D., 2003. New constraints upon isotope variation during the Early Creta-ceous (Barremian-Cenomanian) from the Pacific Ocean. Geological Magazine140, 513–522.
Piper, D.Z., Perkins, R.B., 2004. A modern vs. Permian black shaledthe hydrography,primary productivity, and water-column chemistry of deposition. ChemicalGeology 206, 177–197.
Rojay, B., Altniner, D., 1998. Middle Jurassic-Lower Cretaceous biotratigraphy in thecentral Pontides (Turkey): remarks on paleogeagraphy and tectonic evolution.Rivista Italiana di Paleontologia e Stratigrafia 104 (2), 167–180.
Rojay, B., Yaliniz, K.M., Altiner, D., 2001. Tectonic Implications of Some CretaceousPillow Basalts from the North Anatolian Ophiolitic Melange (Central Anato-lia-Turkey) to the Evolution of Neotethys. Turkish Journal of Earth Sciences 10,93–102.
Sadler, P.M., Osleger, D.A., Montanez, I.P., 1993. On the labelling, length and objec-tive basis of Fischer plots. Journal of Sedimentary Petrology 63, 360–368.
Saner, S, 1980. The paleogeographical interpretation of the Mudurnu-Goynukbasin based on the depositional features of the Jurassic and later age. Bulletinof the Geological Society of Turkey 23, 39–52 (in Turkish with EnglishAbstract).
Sengor, A.M.C., Yilmaz, Y, 1981. Tethyan evolution of Turkey: A plate tectonicapproach. Tectonophysics 75, 181–241.
Shen, W., Lin, Y., Xu, L., Li, J., Wu, Y., Sun, Y., 2007. Pyrite framboids in the Permian–Triassic boundary section at Meishan, China: Evidence for dysoxic deposition.Palaeogeography, Palaeoclimatology. Palaeoecology 253, 323–331.
Skelton, P., 2003. The Cretaceous World. Cambridge University Press, 360 pp.Snow, L.J., Duncan, R.A., Bralower, T.J., 2005. Trace element abundances in the Rock
Canyon Anticline, Pueblo, Colorado, marine sedimentary section and theirrelationship to Caribbean plateau construction and oxygen anoxic event 2.Paleoceanography 20, 1–14.
Stoll, H.M., Schrag, D.P., 2000. High-resolution stable isotope records from theUpper Cretaceous rocks of Italy and Spain: Glacial episodes in a greenhouseplanet? Geological Society of America Bulletin 112, 308–319.
Teagle, D.A.H., Bickle, M.J., Alt, J.C., 2003. Recharge flux to ocean-ridge black smokersystems: a geochemical estimate from ODP Hole 504B. Earth and PlanetaryScience Letters 210, 81–89.
Tuysuz, O, 1990. Tectonic evolution of a part of the Tethyside orogenic collage: TheKargı massif, Northern Turkey. Tectonics 9, 141–160.
Tuysuz, O., 1999. Geology of the Cretaceous sedimentary basins of the WesternPontides. Geological Journal 34, 75–93.
Tuysuz, O. 2002. Upper Cretaceous red pelagic limestones in the Pontides, northernTurkey and their significance on the geological evolution of Black Sea. InauguralWorkshop of IGCP 463, Ancona, Italy, Program and Abstracts, p. 30.
Tuysuz, O. 2003. Oceanic red beds within the Neo-Tethyan suture zone, NorthernTurkey. Workshop of Upper Cretaceous Red Beds IGCP 463, Bartın Turkey,August 23–28, Abstract Book, p. 24.
Tuysuz, O., Tekin, U.K., 2007. Timing of imbrication of an active continental marginfacing the northern branch of Neotethys, Kargı Massif, northern Turkey.Cretaceous Research 28, 754–764.
Van der Weijden, C.H., 2002. Pitfalls of normalization of marine geochemical datausing a common divisor. Marine Geology 184, 167–187.
Wang, C., Hu, X., Sarti, M., Scott, R.W., Li, X., 2005. Upper Cretaceous oceanic redbeds in southern Tibet: a major change from anoxic to oxic, deep-sea envi-ronments. Cretaceous Research 26, 21–32.
Weissert, H., Lini, A., Follmi, K.B., Kuhn, O., 1998. Correlation of Early Cretaceouscarbon isotope stratigraphy and platform drowning events: a possible link?Palaeogeography, Palaeoclimatology, Palaeoecology 137, 3–4. 189-203.
Wignall, P.B., Newton, R., Brookfield, M.E., 2005. Pyrite framboid evidence for oxygen-poor deposition during the Permian–Triassic crisis in Kashmir. Palaeogeography,Palaeoclimatology, Palaeoecology 216 (3–4), 183–188.
Wilkin, R.T., Barnes, H.L., Brantley, S.L., 1996. The size distribution of framboidalpyrite in modern sediments: an indicator of redox conditions. Geochimica etCosmochimica Acta 60 (20), 3897–3912.
Wilkin, R.T., Arthur, M.A., Dean, W.E., 1997. History of water-column anoxia in theBlack Sea indicated by pyrite framboid size distributions. Earth and PlanetaryScience Letters 148 (3–4), 517–525.
Yilmaz, I.O., 2008. Cretaceous Pelagic Red Beds and Black Shales (Aptian � Santo-nian), NW Turkey: Global Oceanic Anoxic and Oxic Events. Turkish Journal ofEarth Sciences 17, 263–296.
Yilmaz, I.O., Vennemann, T., Altiner, D., Satir, M., 2004a. Stable isotope evidence formeter-scale sea level changes in lower Cretaceous inner platform and pelagiccarbonate successions of Turkey. Geologica Carpathica 55, 19–36.
Yilmaz, I.O., Vennemann, T., Altiner, D., Ozkan-Altiner, S., Satir, M. 2004b. Cyclicrecords of pelagic carbonate successions (Barremian-Aptian) in NW Turkey:internal structure of the Selli anoxia level and interpretation of anoxic-oxicchanges. IGCP 463 and 494 Workshop Meeting "Upper Cretaceous Oceanic RedBeds: Response to Ocean/Climate Global Change, Romanian Carpathians,Bucharest, Abstract Book, p. 34–35.
Yurtsever, T.S., Tekin, U.K., Demirel, I.H., 2003. First evidence of the Cenomanian/Turonian boundary event (CTBE) in the Alakircay Nappe of the Antalya Nappes,southwest Turkey. Cretaceous Research 24, 41–53.
Zhongwu, M., Chaoyong, H., Jiaxin, Y., Xinong, X., 2008. Biogeochemical Records atShangsi Section, Northeast Sichuan in China: the permian paleoproductivityproxies. Journal of China University of Geosciences 19 (5), 461–470.
I.O. Yilmaz et al. / Cretaceous Research 31 (2010) 207–226226


