Embed Size (px)
Citation preview
i
Central Asian and Caspian Gas Production
and the Constraints on Export
Simon Pirani
NG 69
December 2012
ii
The contents of this paper are the author’s sole responsibility. They do not
necessarily represent the views of the Oxford Institute for Energy Studies,
of any of the Institute’s members, and/or of the author’s other affiliations.
Copyright © 2012
Oxford Institute for Energy Studies
(Registered Charity, No. 286084)
This publication may be reproduced in part for educational or non-profit purposes without
special permission from the copyright holder, provided acknowledgment of the source is
made. No use of this publication may be made for resale or for any other commercial purpose
whatsoever without prior permission in writing from the Oxford Institute for Energy Studies.
ISBN 978-1-907555-62-6
iii
Acknowledgements
Thanks are due to my colleagues Howard Rogers, Jonathan Stern, Yelena Kalyuzhnova,
Laura El-Katiri and James Henderson, who kindly read all or parts of the text, and to Michael
Chen, Andy Flower, Elham Hassanzadeh, Anouk Honoré, David Ledesma and Lavan
Mahadeva in Oxford, and Tatiana Mitrova of the Skolkovo Energy Centre, who also helped
in various ways. The opinions expressed, and the mistakes made, are mine alone.
I am very deeply indebted to a large number of people who work in, or with, the four
countries covered, who shared insights and information, and helped me in other ways.
Without their generosity – and hospitality, during trips made to the region between 2010 and
2012 – I could not have written the paper.
Thanks to David Sansom, who drew the maps, and to John Elkins for editing the text.
iv
Preface
Over the past decade, a substantial literature has emerged on the geopolitics of gas supplies in
Central Asia and the Caspian region. These countries have been seen as “strategically
located” in relation to a number of external gas markets and able to provide diversification
away from current and potential dependence on Russian supplies. Some have even spoken of
a new “Great Game” between Europe and Russia for these resources. Thousands of pages
have been devoted to the development of many pipelines which have been proposed to take
Central Asian, Caspian and Russian gas to various destinations via different routes, and the
likely competition between these projects.
Much less attention has been paid to the details of gas production and utilisation in the
countries themselves and how the timing of resource development is affected by domestic
and external political and economic developments. This is understandable given the lack of
easily available information and statistical complexity, particularly in relation to the Central
Asian gas industries. But it is a crucial element of understanding why aside from their
traditional markets in Russia and Iran, so little progress has been made in moving gas
resources beyond regional borders, with the exception of pipelines to China, despite
substantial political support in Europe.
Simon Pirani’s study surveys the landscape of current and future gas development in these
countries, explaining why the existence of substantial reserves does not necessarily guarantee
rapid development, and certainly not when coupled with complex and costly pipeline export
projects. Given the changes which are happening in all of the gas markets which surround the
region, but particularly in Europe, the picture which emerges suggests that a substantial
rethink of the conclusions from the literature of the 2000s is required in relation to the
availability and timing of particularly Central Asian gas in the period up to 2030. If there is a
Great Game emerging for Central Asian gas – and there is considerable doubt whether this is
an appropriate concept – then it is clear that China is becoming the most important player.
Jonathan Stern
Chairman Natural Gas Research Programme and Senior Research Fellow, OIES
v
Contents
1. Introduction: gas in the Central Asian/Caspian energy balance ............................................ 1
2. Economic, political and social contexts ........................................................................... 10
3. Reserves and production ................................................................................................... 20
3.1. Turkmenistan ................................................................................................................ 21
3.2. Uzbekistan .................................................................................................................... 32
3.3 Kazakhstan .................................................................................................................... 38
3.4. Azerbaijan .................................................................................................................... 49
3.5. The region’s other producers........................................................................................ 55
4. Domestic markets and intra-Central Asian trade........................................................... 57
4.1. Uzbekistan .................................................................................................................... 57
4.2. Turkmenistan ................................................................................................................ 63
4.3. Kazakhstan ................................................................................................................... 64
4.4. Uzbek exports to other Central Asian countries, and the alternatives ......................... 71
4.5 Gas consumption in Azerbaijan, Georgia and Armenia ................................................ 75
5. Export routes and markets ............................................................................................... 77
5.1. Exports to Russia, Ukraine and westwards .................................................................. 77
5.2. Exports to China ........................................................................................................... 83
5.3 Pricing and volumes: China versus westward export.................................................... 88
5.4. Exports to Iran .............................................................................................................. 92
5.5. Exports from Azerbaijan to Georgia, Russia, Turkey and beyond .............................. 94
5.6. Other possible export routes ......................................................................................... 99
6. Future outlook and conclusions ...................................................................................... 104
Appendix 1. Statistical and price information .................................................................. 110
Appendix 2. Changes in trade flows ................................................................................... 111
Appendix 3. Turkmenistan: export revenues and their contribution to the economy .. 113
Appendix 4. Production from projects in Uzbekistan with Gazprom participation ..... 119
Appendix 5. Gas supply problems in Uzbekistan ............................................................. 120
Bibliography ......................................................................................................................... 121
Tables
Table 1: Energy Balances (Abbreviated) ................................................................................... 3 Table 2: Turkmenistan: Gas and Other Energy ......................................................................... 5
Table 3: Energy Efficiency and Gas Efficiency Compared ....................................................... 5 Table 4: Gas Balances ................................................................................................................ 8 Table 5: Caspian and Central Asian Gas Exporters: economic indicators .............................. 11 Table 6: Reserves and Reserves-Production Ratios................................................................. 20 Table 7: Leading Gas Reserves Holders .................................................................................. 21
Table 8: Gaffney Cline & Associates Survey Results of South Yolotan and Yashlar Gas
Fields ........................................................................................................................................ 28
Table 9: Infrastructure Construction at South Yoltan Field ..................................................... 30 Table 10: Kazakhstan Natural Gas Production (bcm) ............................................................. 40 Table 11: Azerbaijan Gas Production (bcm) ........................................................................... 50 Table 12: Azerbaijan: offshore Caspian projects at pre-development stage............................ 53 Table 13: Selected Economic Indicators for Uzbekistan, Russia and Ukraine ........................ 57 Table 14: Uzbekistan and Russia: levels of Gasification ......................................................... 58 Table 15: Gas Tariffs in Uzbekistan (per mcm) ...................................................................... 59
vi
Table 16: Turkmenistan: gas consumption (bcm) ................................................................... 64
Table 17: Kazakhstan Gas Consumption Data ........................................................................ 65 Table 18: Kazakh Gas Consumption by Region ...................................................................... 67 Table 19: Kazakhstan: selected retail gas prices ...................................................................... 71 Table 20: The Intra-Central Asian Gas Trade.......................................................................... 72
Table 21: Prices of Westward Gas Exports, 2005–09 ............................................................. 78 Table 22: Shanghai Gas Prices, October 2011......................................................................... 86 Table 23: Central Asian Gas Prices, 2011 ............................................................................... 89 Table 24: Azerbaijan: estimates of gas production and sales in 2005 ..................................... 98 Table 25: Gas Balances: projections ...................................................................................... 107
Table 26: Central Asian and Caspian Gas Exports 2011–20: projections ............................. 109 Table A1: Selected partners’ Shares of Trade ....................................................................... 111 Table A2: Turkmenistan Gas and Oil Exports ....................................................................... 114 Table A3: Turkmenistan GDP and Export Revenues: IMF statistics .................................... 115 Table A4: Turkmenistan GDP: IMF and EBRD views compared ........................................ 116
Table A5: Turkmenistan: foreign exchange reserves and external debts .............................. 117 Table A6: Production from Uzbekistan Projects with Gazprom Participation, 2010 ............ 119
Maps
Map 1: Central Asian and Caspian Region……………………………………………………1
Map 2: Turkmenistan Gas Infrastructure…………………………………………………….22
Map 3: Uzbekistan Gas Infrastructure……………………………………………………….31
Map 4: Kazakhstan Gas Infrastructure………………………………………………………42
Map 5: Azerbaijan Gas Infrastructure……………………………………………………….51
Map 6: Kazakhstan Regions…………………………………………………………………66
Figures
Figure 1: Uzbekistan: gas and oil production and consumption .............................................. 60
Figure 2: Estimates of costs of gas delivered to Moscow, 2020 .............................................. 91
1
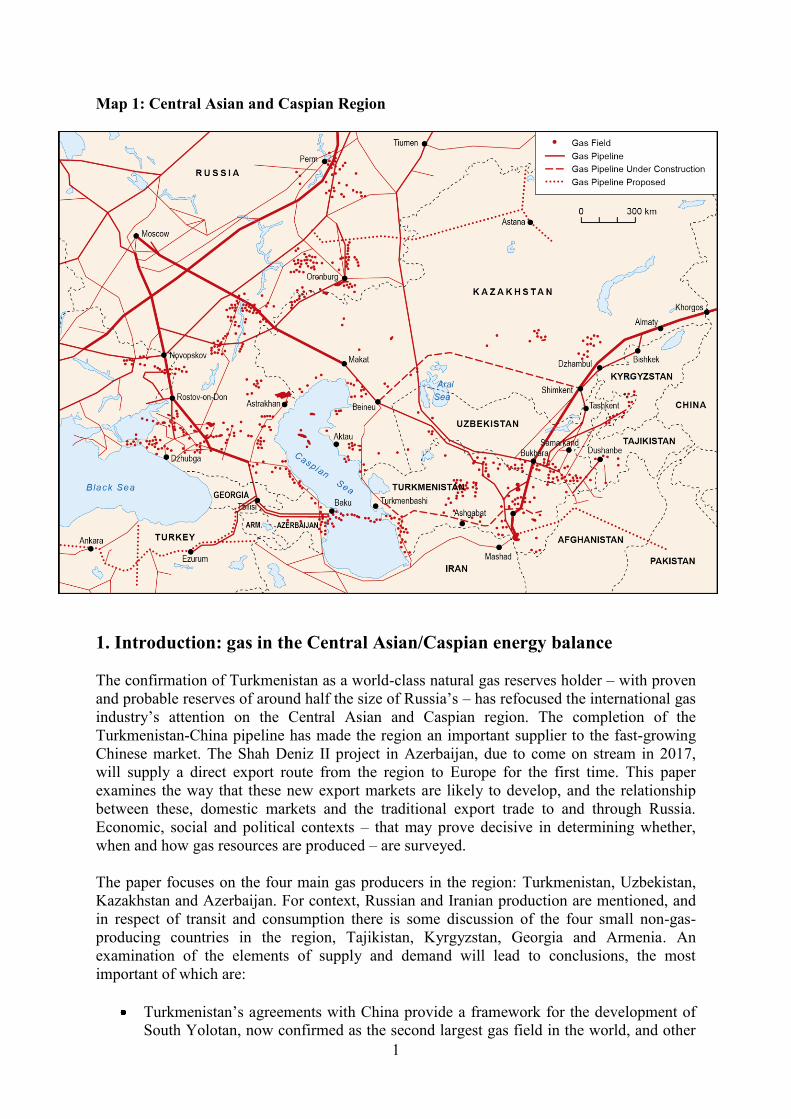
Map 1: Central Asian and Caspian Region
1. Introduction: gas in the Central Asian/Caspian energy balance
The confirmation of Turkmenistan as a world-class natural gas reserves holder – with proven
and probable reserves of around half the size of Russia’s – has refocused the international gas
industry’s attention on the Central Asian and Caspian region. The completion of the
Turkmenistan-China pipeline has made the region an important supplier to the fast-growing
Chinese market. The Shah Deniz II project in Azerbaijan, due to come on stream in 2017,
will supply a direct export route from the region to Europe for the first time. This paper
examines the way that these new export markets are likely to develop, and the relationship
between these, domestic markets and the traditional export trade to and through Russia.
Economic, social and political contexts – that may prove decisive in determining whether,
when and how gas resources are produced – are surveyed.
The paper focuses on the four main gas producers in the region: Turkmenistan, Uzbekistan,
Kazakhstan and Azerbaijan. For context, Russian and Iranian production are mentioned, and
in respect of transit and consumption there is some discussion of the four small non-gas-
producing countries in the region, Tajikistan, Kyrgyzstan, Georgia and Armenia. An
examination of the elements of supply and demand will lead to conclusions, the most
important of which are:
Turkmenistan’s agreements with China provide a framework for the development of
South Yolotan, now confirmed as the second largest gas field in the world, and other
2
resources. The target set by the Chinese and Turkmen presidents, of 65 bcm/year
exports, is achievable, although field development and infrastructure development for
these volumes may take until the end of the decade to complete. This target implies a
total of up to 110 bcm/year production all together by Turkmenistan (65 bcm for
China, e.g. up to 10 bcm for Iran, 11 bcm to and through Russia, 4 bcm for Central
Asian countries and 20 bcm for the domestic market).
Even if Turkmenistan’s total production and exports were lower than that, it would
still probably earn revenues in excess of spending requirements. While Turkmen
government policy is to increase gas production and exports to underpin a “golden
age” for the country, this is likely to be achieved mainly on the basis of exports to
China. This is the policy that Turkmenistan is following in practice, whatever is
occasionally said about higher production levels.
For either a European or south Asian export route to be opened up from
Turkmenistan, the government would need (i) buyers in these locations prepared to
commit to the investments and long-term contracts required and take all transport and
financial risk from the Turkmen border, and (ii) a set of compelling reasons to tackle
the difficulties involved. These are not present now.
Exports to and through Russia from Central Asia are currently conducted at European
netback prices, with the gas delivered mainly to Ukraine and central Europe. These
exports were sharply reduced in 2009, are unlikely to be increased again, and could be
further reduced to the extent that market forces, rather than political relationships,
decide. Central Asian gas would struggle to compete on price with Russian-produced
gas in a liberalised Russian market.
With European demand low, Russian exports to Europe likely to remain at a reduced
level, and Turkmen exports to Iran subject to possible decline due to the development
of Iranian domestic gas infrastructure, the worst-case scenario for Turkmenistan is
that it will end up becoming the supplier of last resort to these markets. This would
make it more dependent than it wishes to be on Chinese purchases – and vulnerable to
demands from China that prices, which are among the highest for imported gas, be
renegotiated.
Uzbekistan, currently Central Asia’s largest producer, consumes most of its gas
production. The near-crisis conditions in its domestic energy sector – caused by the
poor state of distribution infrastructure, the tension between energy-saving policies
and energy-intensive industrial development policies, the substitution of oil products
with gas – make the future trajectory of Uzbek consumption very difficult to project.
But it is unlikely to fall by much.
Another uncertainty in Uzbekistan is the tension between high domestic consumption
and exports. New fields are being developed, but mostly in partnership with foreign
companies who have collectively set their sights on 17 bcm/year of incremental
exports by the end of this decade. If this new gas is to be exported, then either
Uzbekistan will need to replace the output of fields in natural decline with other new
resources, or cut consumption, or find other solutions. Uzbekistan is likely first to
cede its Central Asian export trade to Turkmenistan, and may then be compelled to
prioritise energy-saving measures over energy-intensive industrial policies.
3
Kazakhstan will raise gas production, particularly from the Kashagan field, and is
likely to produce more than 25 bcm/year of sales gas by the end of the decade.
However consumption will also increase, due to government policies on associated
gas utilisation and gasification – although the government’s target of 24 bcm/year
consumption may not be met by 2020.
Apart from the opening of the Chinese route, the other significant change that is likely
in the region in this decade is the growth of Azeri exports to Turkey (to 13 bcm/year)
and the start-up of Azeri exports, from the Shah Deniz II project, to Europe
(10bcm/year). As well as Shah Deniz II there are several Azeri offshore prospects
that, subject to the success of exploration, could start producing by 2020, but most
will probably start after that, given upstream infrastructure constraints.
Gas in the energy balance
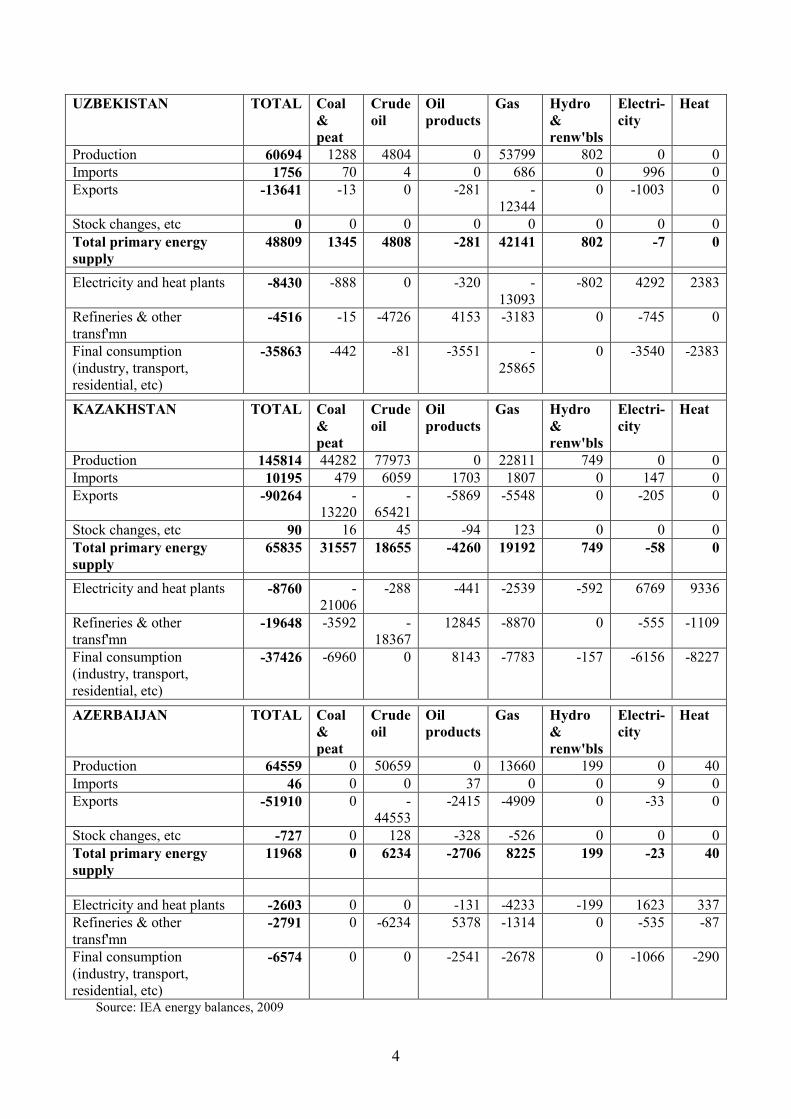
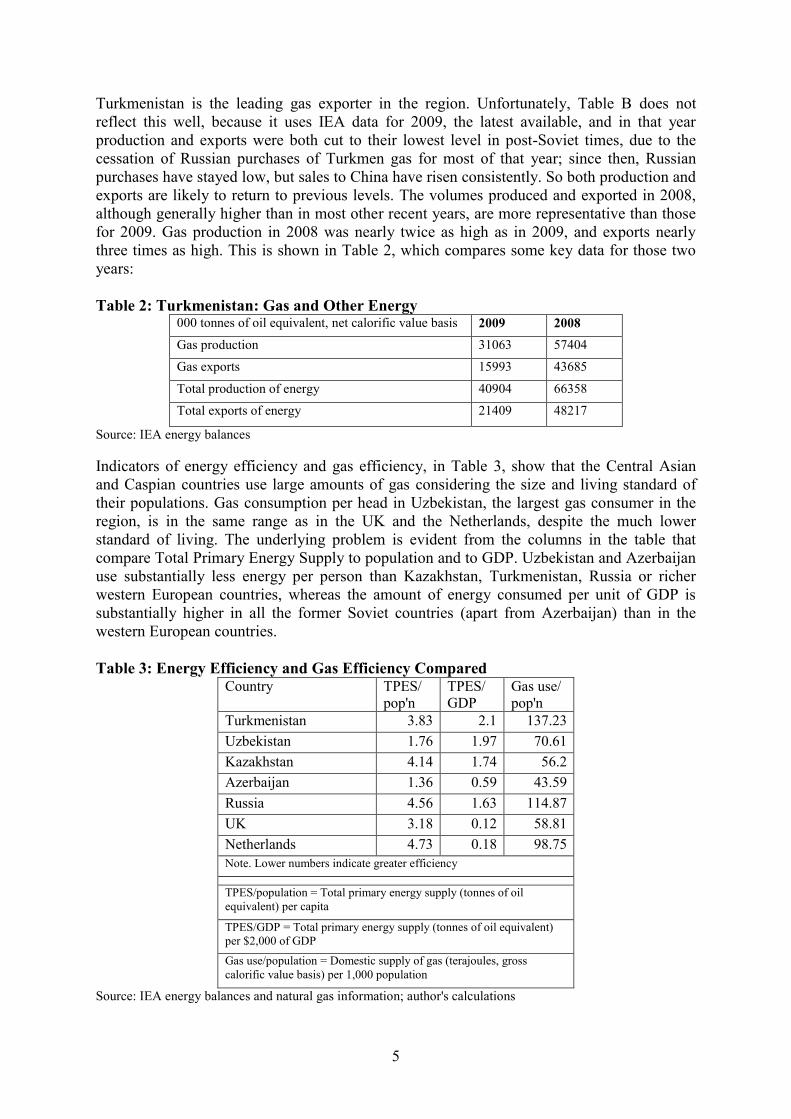
There are marked differences between the part played by gas in the energy sectors, and
economies, of the four producer countries. These are highlighted in Table 1, which presents
the IEA’s data on their energy balances in abbreviated form.1
Table 1: Energy Balances (Abbreviated)
2009, in 000 tonnes of oil equivalent, net calorific value basis
TURKMENISTAN TOTAL Coal
&
peat
Crude
oil
Oil
products
Gas Hydro
&
renw'bls
Electri-
city
Heat
Production 40904 0 9841 0 31063 0 0 0
Imports 88 0 0 88 0 0 0 0
Exports -21409 0 -2010 -3270 -
15993
0 -135 0
Stock changes, etc 0 0 0 0 0 0 0 0
Total primary energy
supply
19584 0 7831 -3182 15070 0 -135 0
Electricity and heat plants -4564 0 0 0 -6122 0 1374 184
Refineries & other
transf'mn -3447 0 -7831 6548 -1725 0 -440 0
Final consumption
(industry, transport,
residential, etc)
-11573 0 0 -3366 -7223 0 -800 -184
1 The row “Refineries and other transformation” includes energy industry own use and losses. (Gas produced
and reinjected in Kazakhstan, and also possibly in Uzbekistan, is wrongly included in that category by the IEA,
making it unfeasibly large.) That row also includes some coal transformation in Kazakhstan. I have not included
any breakdown of final consumption, and I have merged all hydro and renewables in one column: this is all
hydro in Uzbekistan and Azerbaijan, and four-fifths hydro in Kazakhstan. Simon. I checked addition in the table
and there are things wrong where I've highlighted in red - Uzbek and Azer..
4
UZBEKISTAN TOTAL Coal
&
peat
Crude
oil
Oil
products
Gas Hydro
&
renw'bls
Electri-
city
Heat
Production 60694 1288 4804 0 53799 802 0 0
Imports 1756 70 4 0 686 0 996 0
Exports -13641 -13 0 -281 -
12344
0 -1003 0
Stock changes, etc 0 0 0 0 0 0 0 0
Total primary energy
supply
48809 1345 4808 -281 42141 802 -7 0
Electricity and heat plants -8430 -888 0 -320 -
13093
-802 4292 2383
Refineries & other
transf'mn -4516 -15 -4726 4153 -3183 0 -745 0
Final consumption
(industry, transport,
residential, etc)
-35863 -442 -81 -3551 -
25865
0 -3540 -2383
KAZAKHSTAN TOTAL Coal
&
peat
Crude
oil
Oil
products
Gas Hydro
&
renw'bls
Electri-
city
Heat
Production 145814 44282 77973 0 22811 749 0 0
Imports 10195 479 6059 1703 1807 0 147 0
Exports -90264 -
13220
-
65421
-5869 -5548 0 -205 0
Stock changes, etc 90 16 45 -94 123 0 0 0
Total primary energy
supply
65835 31557 18655 -4260 19192 749 -58 0
Electricity and heat plants -8760 -
21006
-288 -441 -2539 -592 6769 9336
Refineries & other
transf'mn -19648 -3592 -
18367
12845 -8870 0 -555 -1109
Final consumption
(industry, transport,
residential, etc)
-37426 -6960 0 8143 -7783 -157 -6156 -8227
AZERBAIJAN TOTAL Coal
&
peat
Crude
oil
Oil
products
Gas Hydro
&
renw'bls
Electri-
city
Heat
Production 64559 0 50659 0 13660 199 0 40
Imports 46 0 0 37 0 0 9 0
Exports -51910 0 -
44553
-2415 -4909 0 -33 0
Stock changes, etc -727 0 128 -328 -526 0 0 0
Total primary energy
supply
11968 0 6234 -2706 8225 199 -23 40
Electricity and heat plants -2603 0 0 -131 -4233 -199 1623 337
Refineries & other
transf'mn -2791 0 -6234 5378 -1314 0 -535 -87
Final consumption
(industry, transport,
residential, etc)
-6574 0 0 -2541 -2678 0 -1066 -290
Source: IEA energy balances, 2009
5
Turkmenistan is the leading gas exporter in the region. Unfortunately, Table B does not
reflect this well, because it uses IEA data for 2009, the latest available, and in that year
production and exports were both cut to their lowest level in post-Soviet times, due to the
cessation of Russian purchases of Turkmen gas for most of that year; since then, Russian
purchases have stayed low, but sales to China have risen consistently. So both production and
exports are likely to return to previous levels. The volumes produced and exported in 2008,
although generally higher than in most other recent years, are more representative than those
for 2009. Gas production in 2008 was nearly twice as high as in 2009, and exports nearly
three times as high. This is shown in Table 2, which compares some key data for those two
years:
Table 2: Turkmenistan: Gas and Other Energy 000 tonnes of oil equivalent, net calorific value basis 2009 2008
Gas production 31063 57404
Gas exports 15993 43685
Total production of energy 40904 66358
Total exports of energy 21409 48217
Source: IEA energy balances
Indicators of energy efficiency and gas efficiency, in Table 3, show that the Central Asian
and Caspian countries use large amounts of gas considering the size and living standard of
their populations. Gas consumption per head in Uzbekistan, the largest gas consumer in the
region, is in the same range as in the UK and the Netherlands, despite the much lower
standard of living. The underlying problem is evident from the columns in the table that
compare Total Primary Energy Supply to population and to GDP. Uzbekistan and Azerbaijan
use substantially less energy per person than Kazakhstan, Turkmenistan, Russia or richer
western European countries, whereas the amount of energy consumed per unit of GDP is
substantially higher in all the former Soviet countries (apart from Azerbaijan) than in the
western European countries.
Table 3: Energy Efficiency and Gas Efficiency Compared Country TPES/
pop'n
TPES/
GDP
Gas use/
pop'n
Turkmenistan 3.83 2.1 137.23
Uzbekistan 1.76 1.97 70.61
Kazakhstan 4.14 1.74 56.2
Azerbaijan 1.36 0.59 43.59
Russia 4.56 1.63 114.87
UK 3.18 0.12 58.81
Netherlands 4.73 0.18 98.75
Note. Lower numbers indicate greater efficiency
TPES/population = Total primary energy supply (tonnes of oil
equivalent) per capita
TPES/GDP = Total primary energy supply (tonnes of oil equivalent)
per $2,000 of GDP
Gas use/population = Domestic supply of gas (terajoules, gross
calorific value basis) per 1,000 population
Source: IEA energy balances and natural gas information; author's calculations
6
It is useful to compare Turkmenistan with Uzbekistan. Since the mid 1990s, the two countries
have produced similar volumes of gas, between 55 bcm and 70 bcm annually. Although
Turkmen production fell sharply in 2009-11, as Russian purchases were cut, it is likely to
return to its previous level within the next two to three years, as exports to China rise. From
similar production volumes, Uzbekistan, with a population rising from 20-24 million in the
1990s to 29.1 million now,2 has always consumed most of what it has produced;
Turkmenistan, with a population of about 5 million, has always exported most of its gas.
Turkmenistan’s economy and state finances are dominated by gas export revenues in a way
that the other producers’ economy and finances are not. Natural gas has historically
accounted for up to two thirds of export revenues; the only other energy produced is a small
amount of oil, and Turkmenistan probably earns from its oil products exports about one-third
of what it earns from gas. (See Appendix 3 on Turkmenistan’s finances.) Gas is also
predominant in Turkmenistan’s domestic energy consumption. This is evident from Table 1
(the row “total primary energy supply”): the entire electricity and heat sector runs on gas, and
gas accounts for most energy supplied to industry and the residential sector. Turkmenistan
has gas for export not because its domestic consumption is more diversified than
Uzbekistan’s, but because its population is so much smaller.
It is Uzbekistan’s heavy dependence on gas for domestic consumption that is the key
constraint on its role as an exporter. This is a problem it shares with many producing
countries, those in the Gulf region in particular.3 As Table 1 shows, gas accounts for about
nine-tenths of the energy produced in Uzbekistan, accompanied only by small volumes of
coal, oil and hydro electricity. Table 1 also shows that gas accounts for almost all of the fuel
for Uzbekistan’s electricity and heat plants (13 million boe), compared to 2 million boe from
all other sources in 2009), and for nearly 26 million boe of the 36 million boe of final energy
consumption in 2009. Table 3 shows that Uzbekistan’s consumption of gas per head is
substantially higher than Kazakhstan’s or Azerbaijan’s – and although Turkmenistan’s is
higher still, it is sufficiently well endowed that it has surplus gas for export that Uzbekistan
does not.
Uzbekistan entered the post-Soviet period already highly dependent on gas, and its economic
policy since then, which has prioritised self-sufficiency and import substitution, has worked
against any diversification of energy supply. Uzbekistan’s demand for gas could increase – or
at least, energy-saving efforts could be cancelled out by fresh sources of demand – in the next
few years. Uzbekistan has begun to import oil products, and the government is hoping to use
gas to substitute for these. This significant problem with Uzbekistan’s energy balance, will be
discussed below in section 4.1. Uzbekistan’s gas export potential has always been strongly
constrained by its high, and very inefficient, domestic consumption, and this paper will argue
that it will remain the case at least for the rest of this decade.
In Kazakhstan, gas is less important than oil as an export commodity, and less important than
coal as a domestic energy source – although government policy is directed at expanding its
role in the economy. As Table 1 shows, Kazakhstan produces more than twice as much
energy as any of the three other countries (146 million boe in 2009). Of this, more than half
(78 million boe) is crude oil, and almost one third (44 million boe) is coal. Six-sevenths of
the crude oil and nearly one third of the coal is exported – and economically, Kazakhstan is
heavily dependent on oil export revenues. The gas produced amounts to only about half the
2 Population estimates by national statistical agency of Uzbekistan. See <http://www.stat.uz/uz/demographic/>
3 See, for example, Laura El-Katiri, “Energy sustainability in the Gulf”, Gulf Oil Review, November 2012, p. 3.
7
energy content of the coal (23 million boe), but much of what is counted by the IEA is
reinjected or flared. Gas production and exports could both increase in the next decade, but
this paper suggests that this will depend largely on (i) the pace of upstream investment and
development, and (ii) the course taken by the controversy over associated gas, and by the
government’s attempt to raise domestic gas consumption.
In Azerbaijan, gas is less important than oil as an export commodity, but its importance will
grow steadily in the coming years. As Table 1 shows, crude oil accounts for more than three
quarters of the energy produced and more than five sixths of the energy exported; gas
accounts for nearly all of what remains, supplemented by a small volume of hydro electricity.
Gas already plays an important part in the domestic economy since, unlike Kazakhstan,
Azerbaijan has no coal. The electricity and heat sector is overwhelmingly fuelled by gas and
it has a slightly larger share than oil products of final consumption (in industry, transport and
the residential sector, etc). Gas’s importance will grow for reasons to do with Azerbaijan’s
hydrocarbon reserves: its oil production is estimated to have peaked, and the government
aims to raise gas production and exports as one means to replace oil export revenues as
output declines.
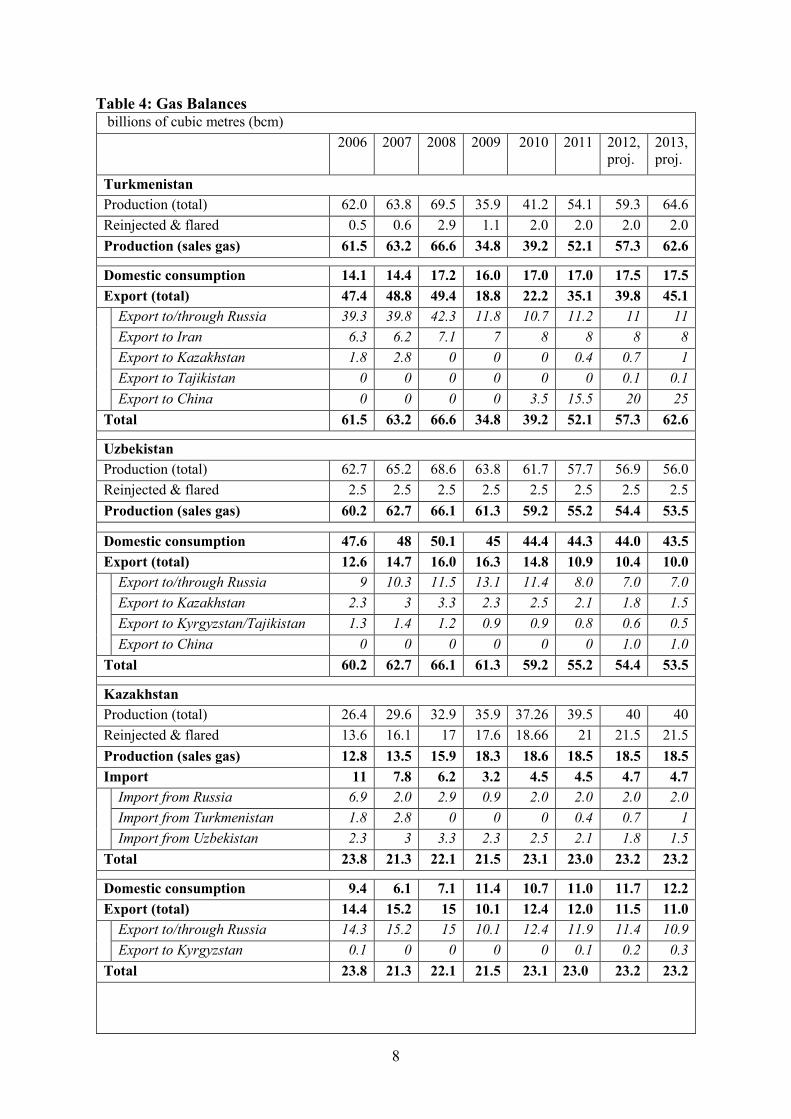
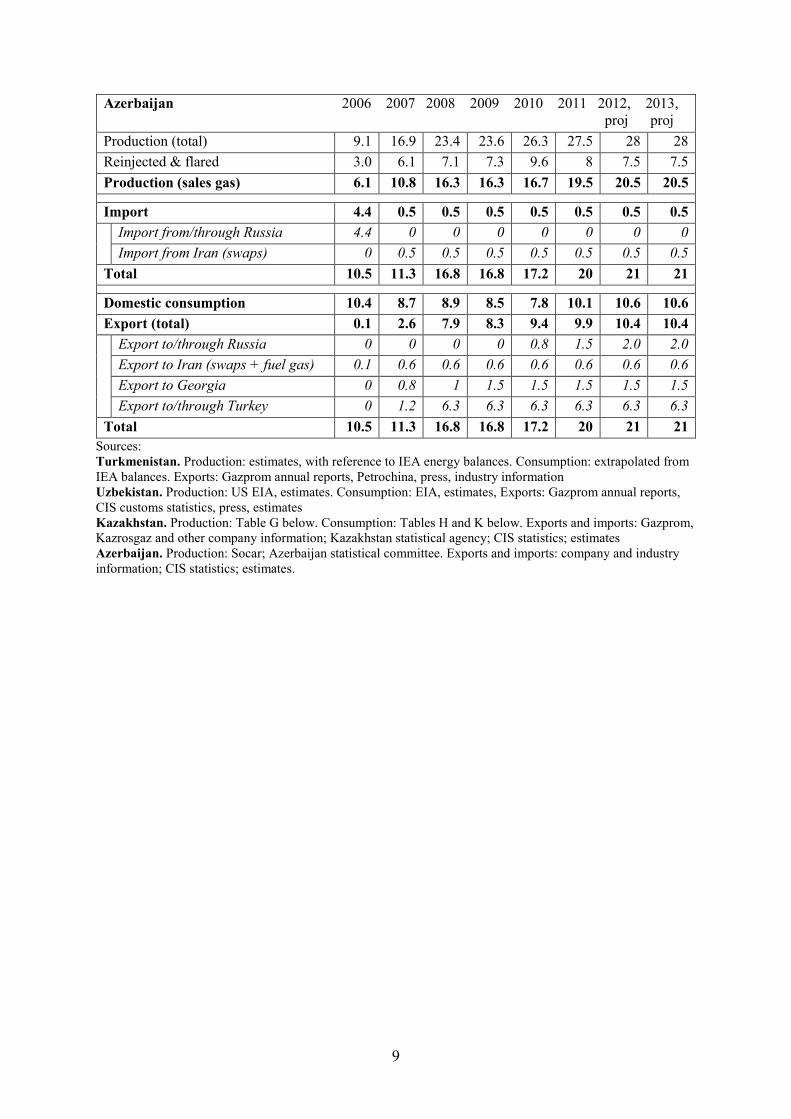
Table 4 shows the four countries’ gas balances, starting from 2005, with the author’s
estimates for 2012 and 2013.
There are some key points to draw to the reader’s attention, as follows. On production, an
attempt has been made to show the difference between the total volume of gas produced
(including that reinjected or flared) and the volume available as sales gas. Industry practice,
and standard practice of the IEA and most other statistical agencies, is not to count reinjected
and flared gas as produced. But practice in post-Soviet countries – and the Soviet Union
before them – has sometimes been the opposite. This has led to confusion, particularly in
Kazakhstan, where such a large proportion of gas is associated gas produced with oil.
Azerbaijan’s statistical agency has always made the difference clear; Kazakhstan’s has begun
to do so too, and this is reflected in Table 4. The numbers given for reinjected and flared gas
in Uzbekistan and Turkmenistan are estimates, in the latter case reflecting some information
in the IEA’s statistics. (For information on the data used, see Appendix 1.)
A final point to be made by way of introduction is that while the Central Asian-Caspian
region’s natural gas resources are ample, they generally have a high hydrogen sulphide
content. Concentrations of hydrogen sulphide greater than 300 parts per million are lethal,
and so it has to be extracted immediately after production, to meet grid specifications. This
adds to processing costs and produces a surfeit of sulphur byproduct.
8
Table 4: Gas Balances billions of cubic metres (bcm)
2006 2007 2008 2009 2010 2011 2012,
proj.
2013,
proj.
Turkmenistan
Production (total) 62.0 63.8 69.5 35.9 41.2 54.1 59.3 64.6
Reinjected & flared 0.5 0.6 2.9 1.1 2.0 2.0 2.0 2.0
Production (sales gas) 61.5 63.2 66.6 34.8 39.2 52.1 57.3 62.6
Domestic consumption 14.1 14.4 17.2 16.0 17.0 17.0 17.5 17.5
Export (total) 47.4 48.8 49.4 18.8 22.2 35.1 39.8 45.1
Export to/through Russia 39.3 39.8 42.3 11.8 10.7 11.2 11 11
Export to Iran 6.3 6.2 7.1 7 8 8 8 8
Export to Kazakhstan 1.8 2.8 0 0 0 0.4 0.7 1
Export to Tajikistan 0 0 0 0 0 0 0.1 0.1
Export to China 0 0 0 0 3.5 15.5 20 25
Total 61.5 63.2 66.6 34.8 39.2 52.1 57.3 62.6
Uzbekistan
Production (total) 62.7 65.2 68.6 63.8 61.7 57.7 56.9 56.0
Reinjected & flared 2.5 2.5 2.5 2.5 2.5 2.5 2.5 2.5
Production (sales gas) 60.2 62.7 66.1 61.3 59.2 55.2 54.4 53.5
Domestic consumption 47.6 48 50.1 45 44.4 44.3 44.0 43.5
Export (total) 12.6 14.7 16.0 16.3 14.8 10.9 10.4 10.0
Export to/through Russia 9 10.3 11.5 13.1 11.4 8.0 7.0 7.0
Export to Kazakhstan 2.3 3 3.3 2.3 2.5 2.1 1.8 1.5
Export to Kyrgyzstan/Tajikistan 1.3 1.4 1.2 0.9 0.9 0.8 0.6 0.5
Export to China 0 0 0 0 0 0 1.0 1.0
Total 60.2 62.7 66.1 61.3 59.2 55.2 54.4 53.5
Kazakhstan
Production (total) 26.4 29.6 32.9 35.9 37.26 39.5 40 40
Reinjected & flared 13.6 16.1 17 17.6 18.66 21 21.5 21.5
Production (sales gas) 12.8 13.5 15.9 18.3 18.6 18.5 18.5 18.5
Import 11 7.8 6.2 3.2 4.5 4.5 4.7 4.7
Import from Russia 6.9 2.0 2.9 0.9 2.0 2.0 2.0 2.0
Import from Turkmenistan 1.8 2.8 0 0 0 0.4 0.7 1
Import from Uzbekistan 2.3 3 3.3 2.3 2.5 2.1 1.8 1.5
Total 23.8 21.3 22.1 21.5 23.1 23.0 23.2 23.2
Domestic consumption 9.4 6.1 7.1 11.4 10.7 11.0 11.7 12.2
Export (total) 14.4 15.2 15 10.1 12.4 12.0 11.5 11.0
Export to/through Russia 14.3 15.2 15 10.1 12.4 11.9 11.4 10.9
Export to Kyrgyzstan 0.1 0 0 0 0 0.1 0.2 0.3
Total 23.8 21.3 22.1 21.5 23.1 23.0 23.2 23.2
9
Azerbaijan 2006 2007 2008 2009 2010 2011 2012, 2013,
proj proj
Production (total) 9.1 16.9 23.4 23.6 26.3 27.5 28 28
Reinjected & flared 3.0 6.1 7.1 7.3 9.6 8 7.5 7.5
Production (sales gas) 6.1 10.8 16.3 16.3 16.7 19.5 20.5 20.5
Import 4.4 0.5 0.5 0.5 0.5 0.5 0.5 0.5
Import from/through Russia 4.4 0 0 0 0 0 0 0
Import from Iran (swaps) 0 0.5 0.5 0.5 0.5 0.5 0.5 0.5
Total 10.5 11.3 16.8 16.8 17.2 20 21 21
Domestic consumption 10.4 8.7 8.9 8.5 7.8 10.1 10.6 10.6
Export (total) 0.1 2.6 7.9 8.3 9.4 9.9 10.4 10.4
Export to/through Russia 0 0 0 0 0.8 1.5 2.0 2.0
Export to Iran (swaps + fuel gas) 0.1 0.6 0.6 0.6 0.6 0.6 0.6 0.6
Export to Georgia 0 0.8 1 1.5 1.5 1.5 1.5 1.5
Export to/through Turkey 0 1.2 6.3 6.3 6.3 6.3 6.3 6.3
Total 10.5 11.3 16.8 16.8 17.2 20 21 21
Sources:
Turkmenistan. Production: estimates, with reference to IEA energy balances. Consumption: extrapolated from
IEA balances. Exports: Gazprom annual reports, Petrochina, press, industry information
Uzbekistan. Production: US EIA, estimates. Consumption: EIA, estimates, Exports: Gazprom annual reports,
CIS customs statistics, press, estimates
Kazakhstan. Production: Table G below. Consumption: Tables H and K below. Exports and imports: Gazprom,
Kazrosgaz and other company information; Kazakhstan statistical agency; CIS statistics; estimates
Azerbaijan. Production: Socar; Azerbaijan statistical committee. Exports and imports: company and industry
information; CIS statistics; estimates.
10
2. Economic, political and social contexts
Some historical and economic background
Even though more than two decades have passed since the break-up of the Soviet Union, the
origin of the Central Asian and Caspian gas producers as Soviet republics, both
geographically and economically, needs to be borne in mind. While all the peoples in the
region have a rich history and culture stretching back many centuries, there were no
sovereign states bearing the names of the four states under discussion, and occupying the
same territory, prior to the first world war; broadly speaking, they all took on their current
names and borders as Soviet republics during the 1920s. The Soviet Union shaped their
economic development. They were in the first place suppliers of raw materials to industry in
central Russia and the Urals: Kazakhstan supplied coal, minerals and wheat; Uzbekistan and
Turkmenistan produced cotton and textiles, until natural gas production took off in the 1950s
and 1970s respectively and Uzbek gold production began; Azerbaijan supplied, above all, oil.
The region’s natural resources were developed in line with the requirements of the Soviet
economy. This is obvious to all who know the gas sector, the pipeline infrastructure for
which fanned out from Moscow and other industrial centres, leaving big gaps within the
producing countries – e.g. between west and east in both Kazakhstan and Turkmenistan – that
remain to this day. On the other hand, the Soviet Union left interdependencies between
republics that might never have developed between politically separate states, such as the
gas-water-electricity connections between Tajikistan and Uzbekistan.
The collapse of the Soviet Union suddenly and unexpectedly forced the Central Asian and
Caspian states not only to develop political systems and social policies from scratch, but also
to devise independent economic strategies. Each of them has adopted distinct approaches e.g.
to the management of natural resources and to the state’s role in the economy. But some
changes have applied across the region. Perhaps the most significant trend is that the Central
Asian and Caspian states’ economic ties with Russia, and with each other, have loosened,
while those with other partners – China and other Asian countries for Central Asia, Turkey
and European countries for Azerbaijan – have grown.4 Even Kazakhstan, which has retained
the closest relationship with Russia – and formed a Customs Union together with Russia and
Belarus in 2010, and is working with those countries to establish a Eurasian Union with a
view to further integration – did more than twice as much trade with China as with Russia in
2011. China became Turkmenistan’s largest trading partner in 2011, accounting for more
than one third of trade, in large part due to rising gas exports. Although Russia remains
Uzbekistan’s largest trading partner, Uzbekistan imports from Russia are smaller than those
from China and Korea combined. Turkey, Italy, France and the USA each did more trade
with Azerbaijan in 2011 than Russia did. (Table A1, in Appendix 2, shows trade volumes.)
The remainder of this section comprises (i) economic indicators, presented in Table 5, (ii) an
overview of the economic strategies devised, and of social and political factors at work, in the
four countries, and (iii) some points of comparison and reference to the “resource curse” and
other frameworks used to interpret the policies of hydrocarbons-exporting countries.
4 On some political aspects of this process, see Nixey (2012)
11
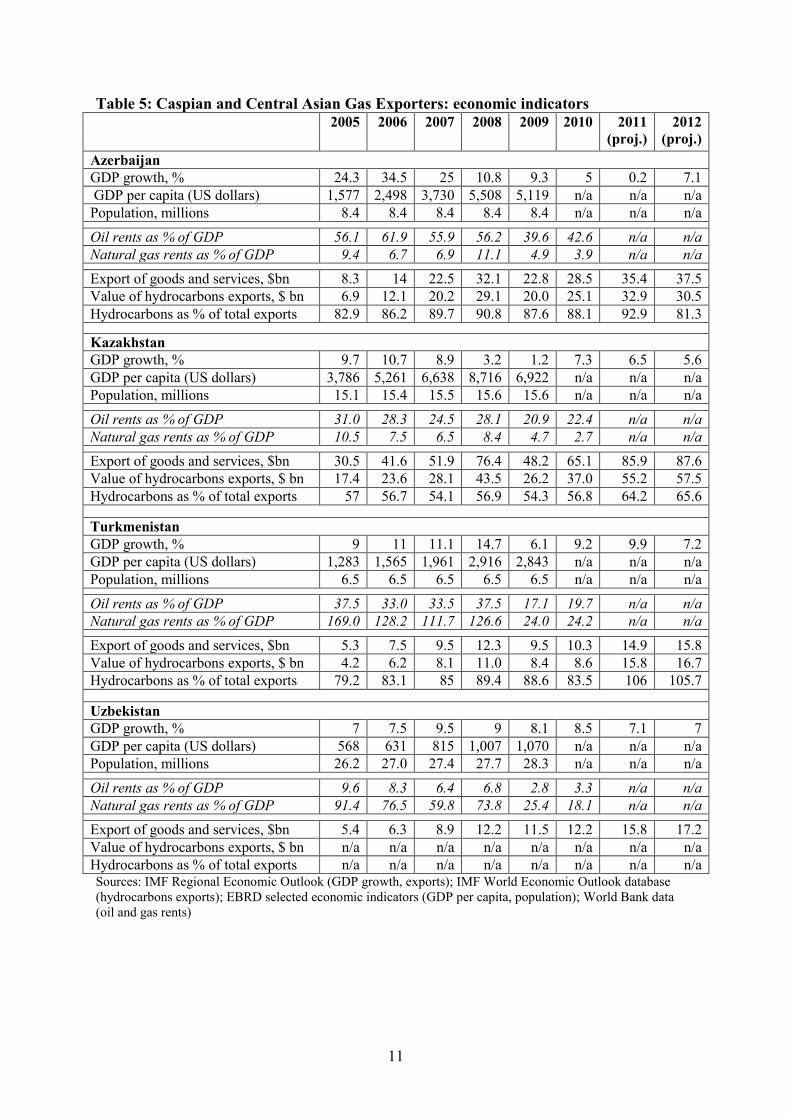
Table 5: Caspian and Central Asian Gas Exporters: economic indicators 2005 2006 2007 2008 2009 2010 2011
(proj.)
2012
(proj.)
Azerbaijan
GDP growth, % 24.3 34.5 25 10.8 9.3 5 0.2 7.1
GDP per capita (US dollars) 1,577 2,498 3,730 5,508 5,119 n/a n/a n/a
Population, millions 8.4 8.4 8.4 8.4 8.4 n/a n/a n/a
Oil rents as % of GDP 56.1 61.9 55.9 56.2 39.6 42.6 n/a n/a
Natural gas rents as % of GDP 9.4 6.7 6.9 11.1 4.9 3.9 n/a n/a
Export of goods and services, $bn 8.3 14 22.5 32.1 22.8 28.5 35.4 37.5
Value of hydrocarbons exports, $ bn 6.9 12.1 20.2 29.1 20.0 25.1 32.9 30.5
Hydrocarbons as % of total exports 82.9 86.2 89.7 90.8 87.6 88.1 92.9 81.3
Kazakhstan
GDP growth, % 9.7 10.7 8.9 3.2 1.2 7.3 6.5 5.6
GDP per capita (US dollars) 3,786 5,261 6,638 8,716 6,922 n/a n/a n/a
Population, millions 15.1 15.4 15.5 15.6 15.6 n/a n/a n/a
Oil rents as % of GDP 31.0 28.3 24.5 28.1 20.9 22.4 n/a n/a
Natural gas rents as % of GDP 10.5 7.5 6.5 8.4 4.7 2.7 n/a n/a
Export of goods and services, $bn 30.5 41.6 51.9 76.4 48.2 65.1 85.9 87.6
Value of hydrocarbons exports, $ bn 17.4 23.6 28.1 43.5 26.2 37.0 55.2 57.5
Hydrocarbons as % of total exports 57 56.7 54.1 56.9 54.3 56.8 64.2 65.6
Turkmenistan
GDP growth, % 9 11 11.1 14.7 6.1 9.2 9.9 7.2
GDP per capita (US dollars) 1,283 1,565 1,961 2,916 2,843 n/a n/a n/a
Population, millions 6.5 6.5 6.5 6.5 6.5 n/a n/a n/a
Oil rents as % of GDP 37.5 33.0 33.5 37.5 17.1 19.7 n/a n/a
Natural gas rents as % of GDP 169.0 128.2 111.7 126.6 24.0 24.2 n/a n/a
Export of goods and services, $bn 5.3 7.5 9.5 12.3 9.5 10.3 14.9 15.8
Value of hydrocarbons exports, $ bn 4.2 6.2 8.1 11.0 8.4 8.6 15.8 16.7
Hydrocarbons as % of total exports 79.2 83.1 85 89.4 88.6 83.5 106 105.7
Uzbekistan
GDP growth, % 7 7.5 9.5 9 8.1 8.5 7.1 7
GDP per capita (US dollars) 568 631 815 1,007 1,070 n/a n/a n/a
Population, millions 26.2 27.0 27.4 27.7 28.3 n/a n/a n/a
Oil rents as % of GDP 9.6 8.3 6.4 6.8 2.8 3.3 n/a n/a
Natural gas rents as % of GDP 91.4 76.5 59.8 73.8 25.4 18.1 n/a n/a
Export of goods and services, $bn 5.4 6.3 8.9 12.2 11.5 12.2 15.8 17.2
Value of hydrocarbons exports, $ bn n/a n/a n/a n/a n/a n/a n/a n/a
Hydrocarbons as % of total exports n/a n/a n/a n/a n/a n/a n/a n/a Sources: IMF Regional Economic Outlook (GDP growth, exports); IMF World Economic Outlook database
(hydrocarbons exports); EBRD selected economic indicators (GDP per capita, population); World Bank data
(oil and gas rents)
12
Kazakhstan
Kazakhstan, the largest energy producer and exporter in the Central Asian and Caspian
region, has generally pursued economic policies based on oil-led economic development. In
the initial post-Soviet period, much effort had to be focused on loosening Kazakhstan’s ties
with Russia, not only economically but even in terms of physical infrastructure. For example
the electricity grid, poorly suited to an independent Kazakhstan, began to be reconstructed.
Even now many infrastructural links persist – such as, in the gas sector, the processing of gas
from one of Kazakhstan’s largest fields, Karachaganak, at Orenburg over the Russian border.
In the 1990s, Kazakhstan’s political and economic elite pushed more vigorously than others
in Central Asia for privatisation and other pro-market economic reforms – and some
economists have argued that the imperative of achieving greater economic independence
from Russia pushed them further in that direction.5 The privatisation of the oil industry was
characterised by a series of large deals with international oil companies (IOCs), including the
production-sharing agreement signed in 1993 with Chevron and others for the Tengiz field,
the PSAs signed in 1997 covering the Kashagan and Karachaganak projects, and the sale of
stakes in large oil companies to Indonesian, Chinese, American and other companies. This
struck a contrast with the Russian privatisations of the same period that mainly benefited
Russian-owned companies. Kazakhstan also took determined steps to integrate into the world
economy and financial system: liberalisation of prices (for food, consumer goods, industrial
goods, etc) was largely complete by the end of 1994; its currency was made convertible in
1996; it took steps to establish private banks and a stock exchange.6
In the 2000s, on the back of rising international oil prices, Kazakh oil output grew
substantially: having wavered between 20 and 27 million tonnes/year since the late Soviet
period (1985-1998), oil production rose steadily from 30.8 million tonnes in 1999 to 78
million tonnes in 2009.7 Although Kazakhstan’s economy is more diversified than e.g.
Azerbaijan’s or Turkmenistan’s – it mines and exports coal, metals and uranium as well as oil
and gas, and also has some industrial capacity built up in Soviet times – oil remains its most
important industry and most valuable export. The oil boom resulted, as it did in Russia, in
rapid economic expansion and rising average living standards. It also formed the background,
first, to the government’s decision to increase the state’s role in the oil industry, in the first
place by greater involvement by Kazmunaigaz, the national oil and gas company established
in its current form in 2002, and second, to a series of increasingly serious disputes between
the government and IOCs, both western and Chinese, over the terms of access to upstream
assets. This came to a climax with the renegotiation in 2007 of the PSA for the Kashagan
project, where costs had risen sharply in the course of the oil boom. Some researchers have
interpreted this shift in policy in the context of “resource nationalism”, i.e. the perception by
producer country governments that hydrocarbons resources are a means to nation-building.8
In any case, in the last few years, the government has brought substantial assets into
Kazmunaigaz, including shares in the Tengiz and Kashagan projects, and floated shares in its
exploration and production subsidiary on the international stock exchanges.
5 This argument is made in Blackmon (2011), pages 7, 18 and 95-97. On the relationship between Russia and
Kazakhstan see also Sorbello (2011). 6 See e.g. Blackmon, op. cit.; Luong and Weinthal (2010), pp. 261-265; and Ostrowski (2010), pp. 32-72.
7 BP Statistical Review of World Energy, various issues.
8 Recent examples are Kalyuzhnova and Nygaard (2008), pp. 1829-1842; Cutler (2012); and Sarsenbayev
(2011) , pp. 369-379.
13
Kazakhstan, which has a population of 17 million, has higher GDP per head, and higher
average living standards, than other Central Asian states. But severe inequalities in living
standards persist; some researchers have argued that there has been a failure in the manner in
which oil revenues have been redistributed.9 The gap between richer and poorer regions of
the country widened sharply during the 2000s, with Mangistau, one of the principal oil
producing regions with 32.4% of the population, registering the highest poverty level in 2008.
Accumulating social unrest gave rise in 2011 to a lengthy strike by oil workers demanding
changes to pay and working conditions, which Kazmunaigaz E&P reported as the principal
cause of a fall in output in that year; this dispute culminated in December 2011 in violent
clashes with security forces involving at least 17 fatalities. In the IMF’s judgement the strikes
signalled “underlying discontent”, and against this backdrop, the government has announced
increased social spending and investment projects in non-oil sectors, including employment
programmes.10
These social tensions need to be borne in mind with respect to the
government’s gas sector policy. The priority it accords to gasification, its projection of more
than doubling domestic consumption by 2020, and its requirement that associated gas be
utilised for local supply and the necessary infrastructure constructed, is part of a wider social
policy aimed at addressing the causes of discontent.
Azerbaijan
Azerbaijan emerged from the Soviet Union with great potential as an oil-producing nation –
but also with a damaging legacy from the break-up of the Union. This consisted of its
diplomatic and military conflicts with Armenia over the status of Nagorno-Karabakh (1988-
94) and the unresolved status of Nagorno-Karabakh. Azerbaijan’s geographical position west
of the Caspian meant that it was seen from the moment of its independence as a potential
exporter of oil and gas westward to Turkey and European destinations. This was a key
consideration not only for the new Azeri governing class, but also for the USA and the large
European oil consuming nations, who attached their hopes of gaining access to Caspian
resources in the first place to Azerbaijan. In 1994, shortly after signing a ceasefire with
Armenia, Azerbaijan signed the PSA with the AIOC consortium to develop the Azeri-Chirag-
Gunashli field (ACG). This set the pattern for the development of Azerbaijan’s hydrocarbons
resources: it would be carried out by its national state-owned oil and gas company, Socar, in
partnership with IOCs. This partnership, in different corporate forms, undertook the
construction of the Baku-Tbilisi-Ceyhan pipeline that brought ACG oil to the Mediterranean
and the South Caucasus pipeline alongside it through which Azeri gas is exported to Turkey,
and is now developing the Shah Deniz gas field.
Azerbaijan’s economy is even more oil-dependent than Kazakhstan’s; its non-hydrocarbons
sector is even less significant than Kazakhstan’s. During the oil boom of the 2000s, the oil
and gas sector’s share in exports rose from around 85% to around 90% (as Table 5 above
shows), and Azerbaijan experienced double-digit growth. It weathered the recession well due
to high oil prices; the decline in oil output in 2010 (partly related to extensive maintenance
works) was the main factor in reducing the pace of growth.11
In Azerbaijan, as in Kazakhstan,
oil revenues have been unevenly distributed; some areas of the country retained high poverty
rates through the oil boom, a problem exacerbated by the large number of internally displaced
9 Najman, Pomfret, Raballand and Sourdin (2008), pp. 111-131
10 UNDP Kazakhstan, Human Development Report 2009, pp. 103-106; Kazmunaigaz E&P Annual Report 2011,
pp. 4-5; IMF 2012 Article IV Report: Republic of Kazakhstan, p. 4. 11
Luecke and Trofimenko (2008) pp. 132-175; Kalyuzhnova (2008), pp. 11-12 and 37-39; Luong and Weinthal
(2010) pp. 219-258. On the economy in 2010, EBRD Transition Report 2010, pp. 114-115.
14
refugees (a result of the conflict with Armenia). Researchers who studied this issue drew the
“preliminary” conclusion that some revenue redistribution had been accomplished, i.e. that
the government had used part of its rents to mitigate the impact of the war with Armenia and
of economic problems on vulnerable sections of the population – but that many problems
remained.12
It is also clear that the unresolved conflict with Armenia remains a key factor in
Azerbaijan – not only in respect of the internal refugees and other effects on the economy,
but also because, in political circles, resolution of the conflict remains high on the agenda and
some see the strategic advantages that result from Azerbaijan’s position as a hydrocarbons
exporter as a means to resolve the dispute.13
A big challenge for the Azeri economy in the coming years is the fall in oil export revenue,
and the impact on economic growth, which will result from the decline of the ACG field from
about 2015. The IEA recently projected that total Azeri production will reach a peak of about
65 million tonnes/year in 2014-15, and then decline steadily to under 55 million tonnes/year
by 2030, and more rapidly thereafter. Earlier estimates by the World Bank forecast a higher
peak, 70 million tonnes/year in 2009-10, and a more rapid decline, to 20 million tonnes/year
by 2024. Actual production statistics suggest that the peak may be still lower than the IEA’s
estimates: output of 44.7 million tonnes (2008), 50.6 million tonnes (2009), 50.8 million
tonnes (2010) and 45.6 million tonnes (2011) has been registered.14
The government has
indicated that a planned increase in gas production – in the first place from the Shah Deniz
field, but then from other fields that are currently undeveloped – is central to its strategy. This
focus on gas may be the reason that the Azeri government has become increasingly pro-active
in influencing the development of export routes and construction of westward pipeline
infrastructure, as discussed in section 5.5 below. It is argued below in section 3.4 that the
government’s stance may also support the development of the post-Shah Deniz fields. It is
unlikely, however, that the export revenues from Azerbaijan’s gas resources could fully
replace those derived from oil.
Turkmenistan
Turkmenistan’s economy became heavily reliant on gas exports in the Soviet period, and has
continued to be ever since. Its only other significant exports are oil products from the
Turkmenbashi refinery and cotton; its agricultural sector and its small textile industry mainly
supply the domestic market. In Soviet times, up to 90 bcm/year of Turkmen gas was added to
the gas balance of Russia and other Soviet republics; it was assumed in accounting terms that
a proportion of this was exported to western Europe, in exchange for which Turkmenistan
received a quota of hard currency. This system continued in the first years after
independence, and in 1990-93, the only years for which information is available, this hard
currency quota equated to 15-25% of Turkmenistan’s total exports. In the mid 1990s, the
collapse of the Russian and Ukrainian economies disrupted this arrangement; cash payments
for gas dried up, and barter payments were introduced. By this time intra-Soviet payment
methods had been replaced by sales contracts between Turkmen entities and industrial and
energy sector customers, mostly in Ukraine – but barter continued to account for a substantial
part of Turkmenistan’s gas export revenues until 2005.15
Turkmenistan was constrained by
dependence on pipelines running through Kazakhstan and Russia. From the early 1990s,
diversification of gas exports was declared an important aim, but with the corollary that the
12
Luecke and Trofimenko (2008) p. 152 13
Ibragimov (2012) pp. 39-52. See also Kjaernet (2009), pp. 2-5 14
IEA World Energy Outlook 2010, p. 504; World Bank (2005); BP Statistical Review of World Energy, 2012. 15
Stern (2005), p. 72; Bagratian and Gurgen (1997), pp. 4-5; Dodsworth, Mathie and Shiells (2002), p. 13.
15
volumes would be sold at the border with buyers assuming all transport and other associated
risks – a function of Turkmenistan’s small size and lack of experience of statehood. The
opening of the first pipeline to Iran in 1997 was the first success of the diversification policy,
while the cessation of exports to Russia in the same year, as a result of a dispute over prices,
underlined the difficulties caused by dependence on Russia.
The economic boom of the mid and late 2000s helped Turkmenistan in three ways. First, gas
prices in Europe (which were linked to those of oil) rose steeply, and Russia, conscious of the
persistent efforts by China and Europe to source gas from Central Asia, agreed to pass
through the benefit of these prices to Turkmenistan and the other Central Asian exporters.16
Second, gas demand in Russia rose sharply, supporting Russia’s own demand for Central
Asian imports. Third, China, which elevated the sourcing of energy supplies to a strategic
priority as its economic growth accelerated, agreed to build a pipeline from Turkmenistan to
its western border and committed to substantial gas purchases into the future. The
replacement of Russia by China as the main export destination for Turkmen gas is one of the
key developments dealt with in this paper, particularly in sections 5.1-5.3 below.
Post-Soviet Turkmenistan has made few pro-market economic reforms. Not only the oil and
gas sector but most other economic activity, including the financial sector, remains in state
hands; many prices are controlled; and water, gas and electricity are provided free to the
population. Politically, an autocratic system of presidential rule has been established, with no
legislature to speak of, no meaningful elections, and no evidence of freedom of speech or
assembly.17
The dispute with Russia in 1997-98 led some observers to believe that a
combination of low gas export prices and friction with Russia might lead Turkmenistan’s
model of political and economic development into crisis. But the dispute was resolved, and
from the mid 2000s, gas export revenues were sufficient to fund substantial increases in
public sector wages and other social benefits; numerous prestige projects; and a considerable
expansion of Turkmenistan’s sovereign wealth funds.
In 2009, Turkmenistan experienced a second major dispute with Russia and a reduction of
Russian purchases – but, firstly, the start-up of exports to China was by then only months
away, and, secondly, export prices were so much higher than in 1997-98, and Turkmenistan’s
finances were so much stronger, that the two disputes are not really comparable. In this
connection it is relevant to correct two misconceptions that became widespread among
western observers: (i) that Turkmenistan would experience a debt crisis as a result of the
dispute with Russia in 2009; and (ii) that over the longer term the Chinese export trade would
be insufficient to finance Turkmenistan’s needs, and that Turkmenistan would be driven by
economic necessity to raise gas output e.g. to 230 bcm/year (which is the government’s target
for 2030), and to make significant changes in its upstream policy (e.g. to abandon the strict
limits placed on upstream activity by IOCs) and/or its export policy (e.g. by abandoning its
requirement that prospective customers finance and build pipelines, and by becoming active
in that area itself).
In fact, with regard to (i), the limited information available suggests that while Turkmenistan
probably drew on its offshore sovereign wealth funds in 2009 to balance its budget, and was
unable to contribute to them in 2010, it has weathered the storm of its 2009 dispute with
Russia. (Turkmenistan’s fiscal position, the contribution of gas and other export revenues to
it, and the statistics published by the IMF and other bodies, are covered in Appendix 3).
16
Details in Henderson, Pirani and Yafimava (2012). 17
An overview of the economy is: Pomfret (2006), pp. 46-73; see also Peyrouse (2012)
16
As for (ii), the outlines of an answer to this question are available to all observers. They are:
(a) Turkmenistan’s economic model relies on it being able to finance almost all state
spending from gas revenues. It was apparently able to do this up until the mid 2000s without
taking on any substantial debt, and its debt-to-GDP ratio remains negligible.
(b) From the mid 2000s, it was evident to the casual observer – who could see that many
hundreds of millions of dollars were being spent on prestige building projects (financed off-
budget), and that Turkmenistan was putting money into offshore sovereign wealth funds –
that the export revenues exceeded Turkmenistan’s basic spending requirements.
(c) While it could take two or three more years from the time of writing for Turkmenistan’s
exports to reach the level by volume that they were at in the mid 2000s, each cubic metre of
gas is being sold for at least five times the price that was paid in the mid 2000s.
(d) While Turkmenistan has taken $9 billion of loans from China to finance the development
of the South Yolotan gas field, as part of the two countries’ strategic partnership, this debt
burden is insubstantial in comparison to that of most other countries, and insubstantial in
comparison to even the most conservative estimates of future revenues from gas exports from
South Yolotan.
The argument put here is that, even if Turkmenistan’s budget spending rises – as usually
happens in hydrocarbons-exporting countries, even with small populations, at times of high
prices – tension may well be placed on the state’s finances, but there is no evidence at this
point that that tension would produce a crisis. This argument would have to be reassessed in
the case of any major change in Turkmenistan’s relationship with China that had a substantial
impact on export revenues, e.g. a sudden and unexpected reduction of purchases or a Chinese
demand for substantial renegotiation of gas prices. At present, no such change is on the
horizon – although over the course of this decade, a renegotiation of prices and/or price
formulae is possible. (See section 5.3.) Note also that this argument does not imply that
Turkmenistan’s political-economic model is assured of avoiding crises brought on by other
causes. The way that the social crisis in the Middle East and North Africa has shaken not only
countries with large, restive populations, but also those with small populations and little
history of unrest, suggests that no states are immune from such developments.
The final point is that it is difficult to see, except in the case of very drastic changes in its
relationship with China, why Turkmenistan would either try to increase its gas output much
above 100-150 bcm/year, or make rapid changes in its policies on upstream access and gas
exports. Such a scenario is difficult to reconcile with its record of statecraft over the last two
decades. Turkmenistan emerged as one of the smallest post-Soviet republics by population.
Its government, in which the president has the overwhelming role in making decisions, has
always proceeded cautiously in its international relationships, of which none of its leading
personnel had any previous experience; its “multi vector” foreign policy is designed to ensure
peaceful cooperation in the relevant fields with its larger partners. Moreover, Turkmenistan
has a limited pool of officials able to participate in government, energy sector management,
etc. One of the problems caused by its political-economic model is that it appears to have
eroded the cadre of officials further and constrained relevant forms of education and training.
Autarchic economic policies and minimal social, cultural and political interchange with other
countries have taken their toll. The collective capacity of Turkmenistan’s elite to conduct
17
relationships with business and trading partners is therefore limited.18
None of this means that
Turkmenistan will never change the outlines of the strategy it has devised for the
hydrocarbons upstream and export. But it does mean that, since that strategy has served the
government’s requirements adequately for the past two decades, it has every incentive to
remain extremely cautious about change.
Uzbekistan
Uzbekistan, unlike the other three countries covered here, is not a major exporter of energy.
The economy is heavily dependent on cotton; Uzbekistan is one of the largest cotton
producers and exporters in the world. Gold, and to a lesser extent copper, uranium and some
minor metals, are also significant exports. Uzbekistan’s considerable energy resources, of
which gas is the most significant, are used principally to fuel the domestic economy. This
economic structure is inherited from the Soviet Union; in the late Soviet period, Uzbekistan
was a net energy importer, importing both oil and hydroelectricity from other Soviet
republics, while its main contribution to the Soviet economy was cotton.19
After the break-up of the USSR, Uzbekistan was far slower than e.g. Kazakhstan to adopt
economic reforms. From 1994 Uzbekistan, following advice from the IMF, relaxed foreign
exchange controls, reduced price controls and committed itself to currency convertibility. But
in 1996 it abruptly reversed its policy, re-imposing exchange controls; a limited form of
currency convertibility was introduced in 2003 but exchange controls and a multiple
exchange rate remain. Privatisation and financial sector reform have been limited.20
Some
researchers argue that Uzbekistan lacks a strong local elite that would benefit from
privatisation and therefore support economic reform.21
Whether or not that is the case, it is
indisputable that by the 2000s the government had found its way to an autarchic economic
policy in which intensive industrial development and import substitution policies played a
prominent role.
Uzbekistan, which has a larger population than the rest of Central Asia put together, has
experienced significant social tensions in recent years.22
Rioting and protests have not
recurred on the scale of the 2004-05 unrest, which culminated in the Andizhan events in
which the security forces killed 179 demonstrators (according to official statistics) – but most
observers believe that the underlying tension that sparked these events remains. Poverty and
unemployment rates are high, and migration to Russia and elsewhere to find work is high.
The use of gas as a cheap input for the local economy, to fuel energy-intensive schemes to
encourage small industry, and as a subsidy for the population (described below in section
4.1), needs to be considered in this context.
18
This does not mean, however, a lack of interest in international cooperation. A good example from the
hydrocarbons sector is the new series of publications by the Institute of Oil and Gas, the research division of
Turkmengaz, clearly directed at attracting international interest from geologists and other specialists in research
issues in Turkmenistan. Among the publications so far are: Tashliev (2010) and Bairamova et al. (eds.) (2011).. 19
Pomfret (2006) pp. 25-30 and 143-153; Luong and Weinthal (2010), p. 80. 20
Pomfret, ibid., pp. 30-37 21
For example Blackmon (2011) pp. 29-34 and 36-41. 22
For a discussion of the implications, see De Cordier (2012).
18
Economic policies compared and “resource curse” issues
There is a considerable literature on the economies of the Central Asian and Caspian states
and the paths of development they may follow. Some researchers have argued that, in order
to sustain economic growth, a common challenge for Kazakhstan, Azerbaijan and
Turkmenistan is to diversify away from the hydrocarbons sector, both by retaining oil and gas
revenues in transparently-managed sovereign wealth funds and by establishing frameworks
for competitive growth in non-hydrocarbons sectors.23
The success of such policies in the
region has so far been limited. The governments of Kazakhstan and Azerbaijan have stated
their intention of promoting non-oil economic sectors (e.g. manufacturing, consumer goods
production, etc), but such policies have yet to make a substantial impact on either economy.
In Turkmenistan, economic policy remains focused on gas-driven development. In all four
countries, there are examples of government-backed initiatives designed to promote energy-
intensive industries (e.g. petrochemicals), but the results of these have been limited, and the
long-term impact is still unclear.
Some researchers argue that hydrocarbons exporters such as Turkmenistan, Azerbaijan and
Kazakhstan suffer from the “resource curse”, i.e. that the presence of hydrocarbons resources,
and the economies’ heavy dependence on the revenues they generate, confounds economic
and political development. A recent polemic against some of the “resource curse” literature,
by Pauline Jones Luong and Erika Weinthal, presents detailed studies of former Soviet
economies, including the four covered in this paper, and concludes that the “resource curse”
concept has “impeded our understanding of the relationship between mineral wealth and
institutions”, by taking too little account of changes in historical circumstances, and wrongly
ignoring other factors such as the ownership structure of the hydrocarbons-producing
companies.24
This paper does not seek to make a contribution to this debate. But the author
favours approaches that consider the economies of hydrocarbons-producing countries in an
all-sided manner – rather than some of the too narrowly-focused uses of such interpretive
concepts as the “resource curse” – and hopes that the material presented here on the gas
sector might be of use in doing so.
Points that emerge from research of the gas sector, that might be of use in forming a clearer
understanding of the drivers of economic development and of economic policy, include:
(i) a distinction between Uzbekistan, which exports cotton and gold but uses its main
hydrocarbons resource, gas, to fuel its domestic economy, underpinning economic policies of
autarchy and import substitution, and the other three states, for whom hydrocarbons exports
are the main driver of economic development; and
(ii) significant differences in gas policies between the three other countries. In Turkmenistan,
where gas rather than oil is the most significant hydrocarbons resource, production will be
increased to serve the Chinese market but, for now, other export routes will not be opened up
and resources to supply them will not be developed. Turkmenistan has discovered gas
resources sufficient to underpin many decades of production at two, three or more times the
23
This argument is made in Kalyuzhnova (2008), pp. 44-65, 206-213 and 220-222 24
Luong and Weinthal (2010), p. 322. An example of the “resource curse” approach is Sabonis-Helf (2004), pp.
159-185. Pomfret (2006) p 167 concludes from his discussion of the applicability of the “resource curse”
argument to Central Asia that the long-run relationship between resource abundance and economic performance
is hard to assess; that resource booms create potential for investment to promote long-run economic growth but
that global evidence indicates that resource abundance can be a curse; and that “a more subtle interpretation
relates the characteristics of the specific resource to institutional change”.
19
current level. This paper argues that output e.g. at twice the current level (i.e. 110 bcm/year)
is probably sufficient to meet the country’s economic and fiscal needs, no matter how
generously interpreted, and that the political elite, conscious of its own limited capacity for
managing large-scale production and commercial relationships, has no real incentive to
develop production much further than that. In Kazakhstan, the government’s priority is and
will remain to produce oil for export, in partnership with IOCs; gas production will be mainly
for domestic consumption, which is being increased, with an emphasis – stemming primarily
from the government’s social policy – on upgrading networks built in Soviet times and
gasifying new areas. In Azerbaijan, the emphasis is on raising output of gas for export
westwards; as oil output declines from 2015, the government hopes that part of the lost
revenue will be compensated by gas exports, and will therefore probably do its best to
stimulate the development not only of Shah Deniz II but of other new fields.
20
3. Reserves and production
Table 6 shows the proven gas reserves in the Central Asian and Caspian producing countries,
with the Russian Federation included for comparison, as reported by BP 25
. The most
important change in recent years is the rapid increase in Turkmenistan’s volume of proven
reserves, due to the progress of geological surveys of the South Yolotan (Galkynysh) field,
now confirmed as the world’s second largest behind the South Pars field shared between Iran
and Qatar. This makes Turkmenistan’s reserves the fourth-largest in the world, behind
Russia, Iran and Qatar, with nearly three times the reserves of the USA, the fifth-placed
country by reserves. The other recognised source of reserves data available to this author, the
Cedigaz compilation Natural Gas in the World, also acknowledges the South Yolotan field as
the world’s second largest, and Turkmenistan’s reserves as the world’s fourth largest, but has
restated Turkmenistan’s reserves as 10 tcm, as against BP’s estimate of 24.3 tcm.26
The
difference is in the assessment of the field’s development potential (see section 3.1 below, in
the sub-section “South Yolotan (Galkynysh)”).
The other interesting point brought out by Table 6 is Uzbekistan’s relatively low level of
proven reserves, which have fallen below 30 years’ worth of production, and hardly increased
for the last five years, indicating a lack of successful exploration activity.
Table 6: Reserves and Reserves-Production Ratios
Proved reserves of natural gas (Tcm)*
1997 2007 2008 2009 2010 2011
Turkmenistan 2.6 2.6 8.1 8.0 13.4 24.3
Uzbekistan 1.6 1.7 1.7 1.6 1.6 1.6
Kazakhstan 1.8 1.9 1.9 1.9 1.9 1.9
Azerbaijan 0.8 1.2 1.3 1.3 1.3 1.3
Russian Federation 43.8 43.3 43.3 44.4 44.4 44.6
Reserves/production ratio** and production (bcm)
1997 2007 2008 2009 2010 2011
Turkmenistan R/P ratio 167.6 39.5 122.7 221.2 315.7 408.4
Production 15.7 65.4 66.1 36.4 42.4 59.5
Uzbekistan R/P ratio 34.2 28.6 27.1 27.0 26.9 28.1
Production 46.4 59.1 62.2 60.0 59.6 57.0
Kazakhstan R/P ratio 296.6 112.9 100.6 105.7 107.0 97.6
Production 6.1 16.7 18.7 17.8 17.6 19.3
Azerbaijan R/P ratio 27.6 126.5 88.7 85.6 84.2 85.8
Production 5.4 9.8 14.8 14.8 15.1 14.8
Russian Federation R/P ratio 85.1 73.2 72.0 84.1 75.4 73.5
Production 515.2 592.0 601.7 527.7 588.9 607.0 * defined as those quantities that geological and engineering information indicates with
reasonable certainty can be recovered in the future from known reservoirs under existing
economic and operation conditions
** the reserves at the end of the year, divided by the production in that year
Source: BP Statistical Review of World Energy, 2012
25
BP Statistical Review of World Energy - June 2012 26
Cedigaz, Natural Gas in the World: 2012 Edition, pp. 10 and 19-20.
21
Table 7: Leading Gas Reserves Holders Proved reserves, trillion cubic metres, at year-end
2001 2010 2011
tcm tcm tcm share of
total
1 Russian Federation 42.4 44.4 44.6 21.4%
2 Iran 26.1 33.1 33.1 15.9%
3 Qatar 25.8 25.0 25.0 12.0%
4 Turkmenistan 2.6 13.4 24.3 11.7%
5 US 5.2 8.2 8.5 4.1%
6 Saudi Arabia 6.5 8.0 8.2 3.9%
Total World 168.5 196.1 208.4 100.0%
Source: BP Statistical Review of World Energy, 2012
Overall, Table 7 shows that Turkmenistan’s reserves are sufficient for it to develop
substantially its role as a major gas producer and exporter, and that the constraints on such
development are entirely related to its ability to produce, transport and market the gas.
Kazakh and Azeri reserves are also ample to allow for production growth, but the situation in
Uzbekistan is less straightforward. The remainder of this section covers upstream activities in
the four countries. Maps 2-5 show the location of all the most important fields and pipelines.
3.1. Turkmenistan
Turkmenistan’s currently producing assets are of three types, shown on Map 2:
(i) onshore natural gas fields, mostly developed in the Soviet period, including (a) a relatively
small group of fields in the west, mainly operated by the state oil production company
Turkmenneft, from which gas may be exported southwards to Iran via the Korpedzhe-Kord
Kuy pipeline, and (b) a much larger group of fields in the south east and east, operated by
Turkmengaz, that can supply either the Central Asia-Centre pipeline to Russia, the Central
Asia-China pipeline, or in the case of the largest field, Dauletabad, the Dauletabad-Sarakhs-
Sangbast pipeline to northern Iran;
(ii) the onshore fields on the left bank (i.e. north-eastern side) of the Amu Darya river,
bordering on Uzbekistan, in the block licensed to China National Petroleum Corporation
(CNPC) under a production sharing agreement, from which gas is fed directly into the
Central Asia-China pipeline.
(iii) offshore blocks, some of which are licensed to foreign companies, that produce small
quantities of gas along with oil, and can raise production only if and when agreement is
reached with the Turkmen authorities and Turkmengaz on the terms of its purchase and
export.
This section sets out the historical and political context, and then covers current production
and development of South Yolotan and other new fields.
22
23
Historical and political context
The origins of gas production in Turkmenistan in Soviet times, and the disruption of those
economic relationships in the 1990s, were covered in section 2 above. In 1997 Turkmenistan
took its first step towards export diversification, by starting to sell gas from its western fields
to Iran. In the 1990s and early 2000s, Turkmenistan also sought to establish a commercial
relationship with Ukraine, and sold some gas to Naftogaz Ukrainy and other Ukrainian
entities on its border, with a transit fee being paid to Russia – but this came to an end in 2006,
when Gazprom signed a contract under which it effectively bought all Turkmenistan’s
westward-bound gas.27
The next, and by far the more important, step towards export
diversification came in 2006, when Turkmenistan concluded a framework agreement with
China under which it agreed to build the Central Asia-China pipeline and for China to
participate in developing the Amu Darya deposits. Construction of the pipeline began in
2007.
In April 2009, Russia sharply cut its purchases from Turkmenistan; in December of that year,
shipments to China began. (See Section 5.1). These two events have shaped the development
of Turkmenistan’s upstream assets since then. Exports to Russia are now expected to stay at
their current low level for the foreseeable future, and plans mooted in the early 2000s to build
a Caspian Coastal pipeline from western Turkmenistan to Russia have been put on hold –
with the result that offshore gas being developed by foreign companies is in danger of being
stranded. In south-eastern Turkmenistan, by contrast, development is being stimulated by
demand from China, and potentially from elsewhere in Central Asia. The new (CAC)
pipeline is already accepting gas from Malay and other Turkmengaz fields in the south east,
and from the CNPC fields; it will also provide a route to market for gas from South Yolotan.
The government’s policy on gas exports has since the mid 1990s been conducted in line with
its “multi vector” foreign policy, i.e. of seeking constructive relationships with all its
neighbours. It has (i) sought to diversify export routes, and (ii) maintained a requirement that
gas be sold on the Turkmen border; the government seeks to minimise its involvement with
infrastructure projects beyond its borders and to place all of the export risks – transportation
and marketing – with buyers.
Turkmenistan’s attitude to foreign investment in upstream oil and gas production, like its
stance on exports, must be seen in the context of its economic requirements and its foreign
policy. It has been argued above in section 2 that, although Turkmenistan has officially set
ambitious targets for raising production – most recently, to 230 bcm/year by 2030 – there is
no obvious economic rationale for such a steep increase. Turkmenistan’s post-Soviet history
suggests that, while its government sees gas production as the foundation stone on which the
rest of the economy rests, it intends to proceed cautiously. In particular, while the
government has for many years sought the involvement of foreign partners to explore and
develop blocks in the Turkmen sector of the Caspian sea, it has always been reluctant to
conclude production sharing agreements (PSAs) for onshore fields. The one exception has
been the Amu Darya PSA with CNPC (see below), which was agreed on in the context of the
strategic Turkmen-Chinese partnership and plans for large-scale gas exports. Turkmenistan’s
ongoing reluctance to bring IOCs (except those from China) into onshore PSAs is illustrated
by the single case of an onshore PSA (for some oil fields in western Turkmenistan), signed in
the mid 1990s with a small western company (Burren Energy). In 2007, Burren was taken
over by ENI of Italy. The takeover was not cleared with the authorities in advance; this
27
For details on the 1990s, see Pirani (2009), especially pp. 288-297.
24
resulted in friction between ENI and the government, and largely for that reason, production
from the field was halved from 24,000 bpd (2007) to 12,000 bpd (2010).28
Under the regulatory system set up in 2007-08 – when the State Agency on Management and
Use of Hydrocarbon resources was set up to issue licences and contracts, and the
Hydrocarbon Law was passed, to provide greater clarity on the ownership of projects –
foreign investors have only been invited to participate in offshore projects. In 2011, the
government announced explicitly that PSAs would not be offered onshore. Consequently, the
South Yolotan field is being developed by Turkmengaz as project manager, and with CNPC
and other foreign companies working on service contracts.29
Production (onshore)
The mainstay of Turkmen gas production historically is the Dauletabad field in the south-east
of the country, a few kilometres from the Iranian border. Dauletabad was discovered in 1974;
production started in 1984 and it became a key source of supply to the Central Asia-Centre
pipeline to southern Russia and Ukraine. Recoverable gas resources have been estimated in
recent years at 0.9-1.7 tcm; the reservoir is at a depth of 2,800-3,000 metres, with 5,700 psi
pressure. Although Dauletabad has been on stream for nearly 30 years, it is estimated to be
only about one-third depleted, largely due to reduced production in the 1990s. At the height
of the 2000s boom, Dauletabad was producing 28-31 bcm/year, i.e. just under half of
Turkmenistan’s total output. This was reduced by about two-thirds in 2009, as a consequence
of the reduction in Russian purchases, but is now assumed to be returning to previous
levels.30
Since 2009, infrastructure has been built to carry Dauletabad gas to new export routes. The
Dauletabad-Sarakhs-Khangiran pipeline to Iran was opened in January 2010, and extended a
further 190 km to Sangbast, near Mashhad in Iran, in November of that year. In October 2011
a new compressor station, Dauletabad-2 (built by Enex Process Engineering of Belgium) was
commissioned, with three units and a capacity of 20 bcm, to carry Dauletabad gas to the
Turkmenistan-China pipeline – although it is not clear when and on what scale such
deliveries will begin.31
The northbound pipeline that feeds Dauletabad gas into the Central
Asia-Centre line has also been upgraded, with looping added to cut out a section of the line
that briefly traverses Uzbek territory (to the Khiva compressor station). Turkmen official
sources state the capacity of this line as 54 bcm/year.32
It is probable that at present
Dauletabad is supplying most of the Turkmen gas exported to and through Russia (estimated
at 11 bcm in 2012) and some of the exports to Iran (estimated at 8 bcm in 2012).
The gas supplied by Turkmengaz to China (i.e. excluding that produced by CNPC) is sourced
from two other eastern fields: Malay, the second largest producing field after Dauletabad, and
the Uchadzi group. Malay, which prior to 2009 produced gas for delivery to Russia via the
28
ENI web site, “Turkmenistan” page; Tsakiris (2012). 29
US Energy Information Administration, “Turkmenistan Country Analysis”; Valdez and Weaver (2012), p.
285 30
Bernstein Research (2011), p. 73; “Turkmenistan”, in Pirani (ed.) (2009) p.280 31
“Turkmenistan razvivaet moshch i vozmozhnosti gazovoi otrasli”, Neft’ Gaz i mineral’nye resursy
Turkmenistana no. 3 2011, pp. 42-43; “GKS ‘Dovletabad-2’ stoimost’iu 132 mln evro vvedena v
Turkmenistane”, Oil Capital 23 October 2011 <http://www.oilcapital.ru/upstream/124112.html> 32
“Narastaet industrial’naia moshch’ toplivno-energeticheskogo kompleksa Turkmenistana”, Turkmenistan:
zolotoi vek 21 October 2012 <www.turkmenistan.gov.tm/?id=72>; “V Turkmenii vveli v ekspluatatsiiu GKS
‘Dovletabad-2’”, Energo News (Moscow), 24 October 2011
25
Central Asia-Centre pipeline, has been designated as the main source of Turkmengaz gas for
China. In 2010, shortly after the Turkmenistan-China pipeline was opened, a 185 km, 1,420-
mm feeder line, linking the field to the Bagtyiarlyk compressor station from which the
Turkmenistan-China pipeline starts, was completed by Stroitransgaz of Russia.33
The
construction of a compressor station at the field, to raise the capacity of the feeder line to 30
bcm/year, has been highlighted as a priority by the Turkmen government since 2010 but is
not yet completed; president Berdymukhammedov again referred to it as a priority in a key
speech to the government in January 2012.34
The station is projected to gather gas both from
Malay and from the Uchadzi fields (Uchadzi, East Uchadzi and Seirab) nearby.35
Other eastern fields that could supply either eastern or western routes include Bagadzha, an
oil and gas field, and site of a gas processing plant that produces gas condensate for further
processing at the Seidi oil refinery, and LPG. The first line of this plant was commissioned in
2006, the second in 2011.36
Also in the eastern region is the Naip group of fields, where some
gas was produced from exploration wells in 2010, and where some processing capacity is
available.37
Turkmenistan’s other onshore producing assets, in the western and south-western regions,
include oil and gas fields and are operated by the state oil production company, Turkmenneft.
Their aggregate output is much smaller than that of the eastern fields – probably up to 4-5
bcm for export southwards to Iran via the Korpedzhe-Kord Kuy pipeline, plus about the same
amount for local domestic use. Turkmenneft’s largest field is Korpedzhe, which reported
production averaging more than 4 bcm/year in the early 2000s; Turkmen official sources state
that the pipeline accepts (i) gas from Korpedzhe, (ii) associated gas from Kamyshlydzha
nearby, and (iii) gas from the Keimir, Akpatlavuk and Nebitlidzhe oil and gas fields in the
Keimir area in the south west. Some associated gas in this region is flared; Turkmenneft
states that flaring will be reduced by the construction of a new compressor station at Keimir,
and by the introduction of gas-lift technology (which compresses gas and pumps it down oil
wells to enhance oil recovery).38
Production (onshore – CNPC’s production sharing agreement)
The production sharing contract (PSC) between CNPC and Turkmengaz, covering the very
large Bagtyiarlyk contract area on the right bank of the Amu Darya river, is a key element in
China’s strategic partnership with Turkmenistan. The 35-year contract was signed in July
2007 between CNPC and the State Agency for the Management and Use of Hydrocarbon
33
Stroitransgaz web site, “Gazoprovod Malai-Bagtyiarlyk”,
<http://www.stroytransgaz.ru/projects/turkmenistan/malai-bagtyyarlyk> 34
“Turkmenistan narashchivaet svoi gazoeksportnye vozmozhnosti”, Neft’, Gaz i mineral’nyie resursy
Turkmenistana no. 3 2010, pp 72-73; press monitoring by British Embassy, Ashgabat 35
State information agency of Turkmenistan, “2010 god v letopisi epokhi novogo vozrozhdeniia”, 13 January
2011 <http://tdh.gov.tm/?id=2426> 36
“Na mestorozhdenii Bagadzha vveden v stroi gazopererabatyvaiushchii kompleks”, Turkmenistan.ru, 23
September 2006
<http://www.turkmenistan.ru/index.php?page_id=3&lang_id=ru&elem_id=8638&type=event>; “Narastaet
industrial’naia moshch’ toplivno-energeticheskogo kompleksa Turkmenistana”, Turkmenistan: zolotoi vek 21
October 2012 <www.turkmenistan.gov.tm/?id=72> 37
State information agency of Turkmenistan, “2010 god v letopisi epokhi novogo vozrozhdeniia”, 13 January
2011, <http://tdh.gov.tm/?id=2426> 38
“Turkmenneft’: dinamika razvitiia”, Turkmenistan August 2006 no. 16-17; presentation by Oraz Orazov,
Director, Nebitgazylmytaslama Institute, at the Turkmenistan International Oil and Gas Exhibition (TIOGE)
2011
26
Resources, and covers 14,300 sq km, i.e. all of Turkmen territory between the Amu Darya
river and the border with Uzbekistan (see map 2). There are two blocks, A and B, with
separate sets of commercial terms; block A, covering about 1,000 sq km, is explored and
developed to a much greater extent than block B; reserves for the entire area are estimated at
1.3 tcm. In 2009, the rights in the PSC were valued at $1.187 billion in an intra-company
transaction (purchase of the rights by PetroChina, a CNPC subsidiary, from its parent
company).39
A 70.5 Mw compressor station at Bagtyiarlyk, opened in September 2010, takes
gas from both CNPC’s contract area and the Malay and Uchadzi fields (see above), for
transmission to China.40
CNPC aims to reach peak production of 13 bcm/year by the end of 2012; production began in
2010 and cumulative output had reached 10.5 bcm in mid 2012. CNPC states that its
development work has been focused on the Samandepe gas field in Block A, where “efficient
and orderly seismic acquisition and drilling” has led to significant increases in reserves, and
capacity expanded with new wells. CNPC gives the daily average output of its new wells as
1-2 mmcm. But perhaps most significant is CNPC’s success in raising production from
individual wells by renovation, with daily average capacity per mature well more than
doubling, from 300,000 cu m to 650,000 cu m, as a result of new acidising techniques and
optimal re-perforation measures.41
This may reflect the capacity for heightened efficiency
throughout Turkmenistan's gas fields if the correct technology and field management
techniques are applied.
Gas processing, as well as production facilities, needs to be completed before the Amu Darya
project reaches peak output. The first of two planned gas processing plants, which with 5
bcm/year capacity CNPC states is the largest in Central Asia, was built by Chungqing
Drilling Engineering Co and commissioned in December 2009 together with the pipeline to
China. A second plant, with a projected capacity of 9 bcm/year, is due for completion in
2013-14 (one line in June 2013 and a second in June 2014).42
Production (offshore)
Two foreign companies – Petronas of Malaysia and Dragon Oil of Dubai, who signed PSAs
in 1996 and 1999 respectively – are now producing gas in offshore blocks in the Caspian Sea.
Petronas is producing considerable volumes of natural gas (3 bcm in 2011, and potentially as
much as 10 bcm/year in future); Dragon’s gas is associated with its oil production. But the
common problem for both companies is the lack of a market for the gas: physically, it can be
exported southwards to Iran or, with the necessary enhancement of infrastructure, northwards
to Russia, or it can be sold in the domestic market. But the glut of local supply that resulted
from the fall in Russian purchases – which in the west of Turkmenistan cannot be eased by
exporting gas to China or to other Central Asian countries – raises the prospect that the gas
could be stranded.
39
PetroChina, Connected Transaction: Acquisition of Rights Under Product Sharing Contract (Hong Kong
stock exchange filing); Bernstein Research, The Caspian, p. 85. 40
“Turkmenistan narashchivaet”, Neft’, Gaz i mineral’nyie resursy Turkmenistana, op. cit. 41
“CNPC in Turkmenistan” page of the CNPC web site
<http://www.cnpc.com.cn/en/cnpcworldwide/turkmenistan/Turkmenistan.htm?COLLCC=160372454&> 42
Presentation by Lu Gongxun, General Director, CNPC Turkmenistan,TIOGE 2011; “Otkryto mestorozhdenie
gaza ‘Agairy’”, Neft’, Gaz i mineral’nyie resursy Turkmenistana no. 3 2010, p. 77; “V Turkmenii nachalos
stroitel’stvo novogo GPZ”, Energyland.info, 14 December 2011 <http://www.energyland.info/news-print-
80733>
27
In July 2011, Petronas started production from its Block 1 PSA of oil (6,000 bpd), gas
condensate (20,000 bpd) and gas (at the estimated rate of 3 bcm/year). The gas, some natural
and some associated, goes to an onshore terminal at Kianly (with a capacity of 5 bcm/year),
where there is processing capacity. From there it goes into the Caspian Littoral pipeline,
which runs south to the Iranian border. In 2011 Petronas signed a sale-purchase agreement
with Turkmengaz, the terms of which are not disclosed. In particular, it is not clear whether
Petronas has agreed on terms with Turkmengaz that reflect export prices. But Petronas
representatives have indicated (a) that the start-up was delayed from the start of 2011, due to
the lack of agreement on terms for marketing the gas, and (b) that its readiness to raise output
in future depends on the type of commercial agreements it can achieve. Sharbini Suhaili,
Petronas vice president, told an industry conference in 2011: “We could raise production to
7.5 bcm or even 10 bcm. It all depends on whether it is economically viable.”43
It may be
inferred that Turkmengaz, for quite obvious commercial reasons, is hesitant to conclude long-
term agreements to purchase larger volumes of gas, given that it shut in some of its own
production after the fall in Russian purchases; moreover, the Turkmen authorities are unlikely
to agree to Petronas exporting its own gas, as this would break Turkmengaz’s de facto export
monopoly and allow a competitor into the oversupplied Russian market.
Dragon Oil, which operates the Cheleken contract area in the Turkmen Caspian under a 25-
year PSA effective from 2000, has been flaring some gas (less than 1 bcm/year) associated
with its oil production, which has been rising and reached 70,000 bpd in 2011. Some of
Dragon’s associated gas is delivered, without processing, into the domestic distribution
network via a gas compressor station at Hazar. But in order to reduce flaring further, (i) a gas
treatment plant needs to be built, and a tender for a 2.3 bcm/year plant was due to be held in
2012 and construction is expected to take two or three years, and (ii) a sales agreement needs
to be reached, presumably with Turkmengaz. Dragon has reported in recent annual reports
and conference presentations that negotiations with Turkmengaz on monetisation of the gas
are ongoing; in November 2012 the company stated that “the discussions on a gas agreement
are subject to demand for gas in the region, which is weak at the moment”.44
The problem with Dragon Oil’s associated gas is essentially the same as with Petronas’s
production – that while Turkmengaz’s own exports westward have been depressed so
sharply, and Russian demand for Turkmen gas remains minimal, it is difficult to see any
motivation for Turkmengaz to buy the gas, or any immediate prospect of access to export
markets. As map 2 shows, without substantial investment in infrastructure, the western and
Caspian offshore resources cannot form part of the export volumes to China. Over the long
term, one possibility is that – should Chinese demand remain strong, and the Turkmen west-
east pipeline (discussed below in section 5.3) be completed – gas could be transported across
Turkmenistan in an eastward direction, rather than in a westward direction as was
contemplated when the pipeline was planned.
South Yolotan (Galkynysh)
Turkmenistan’s importance as a source of gas over the long term was substantially enhanced
in 2011, when the South Yolotan field was confirmed to be the second largest in the world
(after the South Pars (Iran)-North (Qatar) field in the Persian Gulf). The name South Yolotan
is often used to denote three adjacent fields: South Yolotan (by far the largest), Osman and
43
“Petronas’s Caspian Block Delay”, Platt’s International Gas Report, 14 March 2011, p. 20; “Petronas starts
Caspian Block 1”, Platt’s International Gas Report, 15 August 2011; author’s notes from TIOGE, 2011 44
Dragon Oil Annual Reports 2008, 2009, 2010 and 2011, and 2012 interim report; author’s notes from TIOGE
2011; email from Dragon Oil to the author, November 2012
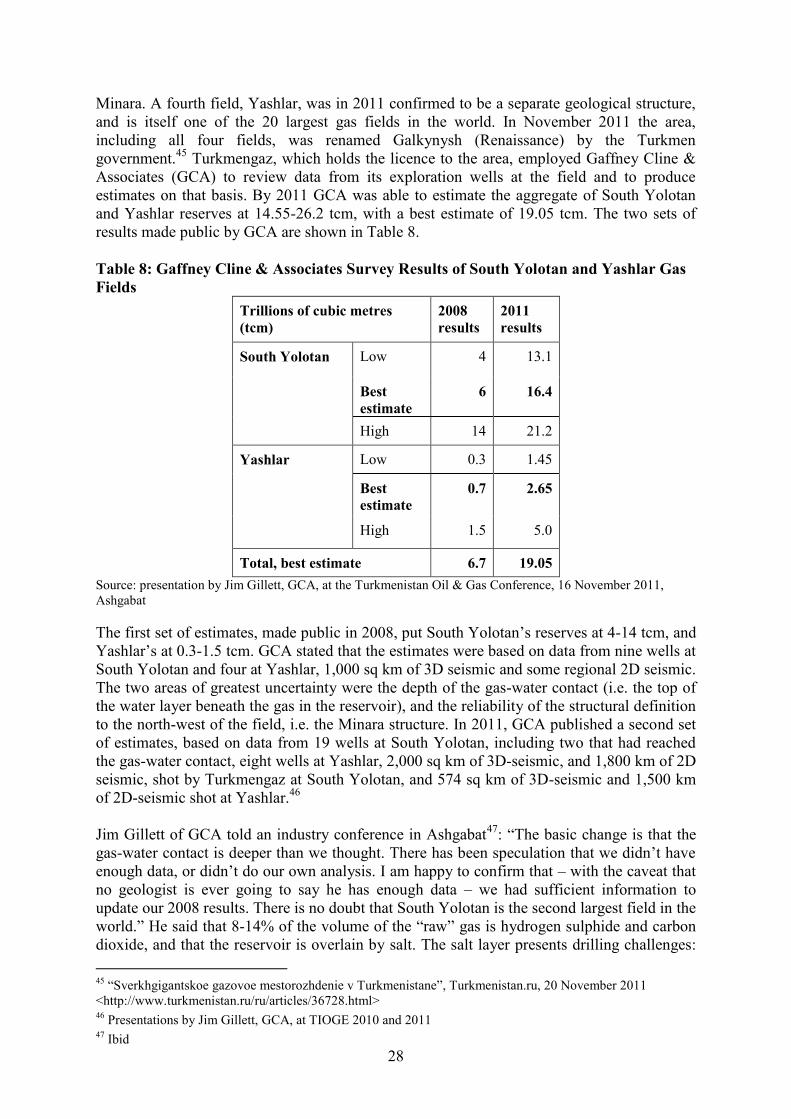
28
Minara. A fourth field, Yashlar, was in 2011 confirmed to be a separate geological structure,
and is itself one of the 20 largest gas fields in the world. In November 2011 the area,
including all four fields, was renamed Galkynysh (Renaissance) by the Turkmen
government.45
Turkmengaz, which holds the licence to the area, employed Gaffney Cline &
Associates (GCA) to review data from its exploration wells at the field and to produce
estimates on that basis. By 2011 GCA was able to estimate the aggregate of South Yolotan
and Yashlar reserves at 14.55-26.2 tcm, with a best estimate of 19.05 tcm. The two sets of
results made public by GCA are shown in Table 8.
Table 8: Gaffney Cline & Associates Survey Results of South Yolotan and Yashlar Gas
Fields
Trillions of cubic metres
(tcm)
2008
results
2011
results
South Yolotan Low 4 13.1
Best
estimate
6 16.4
High 14 21.2
Yashlar Low 0.3 1.45
Best
estimate
0.7 2.65
High 1.5 5.0
Total, best estimate 6.7 19.05
Source: presentation by Jim Gillett, GCA, at the Turkmenistan Oil & Gas Conference, 16 November 2011,
Ashgabat
The first set of estimates, made public in 2008, put South Yolotan’s reserves at 4-14 tcm, and
Yashlar’s at 0.3-1.5 tcm. GCA stated that the estimates were based on data from nine wells at
South Yolotan and four at Yashlar, 1,000 sq km of 3D seismic and some regional 2D seismic.
The two areas of greatest uncertainty were the depth of the gas-water contact (i.e. the top of
the water layer beneath the gas in the reservoir), and the reliability of the structural definition
to the north-west of the field, i.e. the Minara structure. In 2011, GCA published a second set
of estimates, based on data from 19 wells at South Yolotan, including two that had reached
the gas-water contact, eight wells at Yashlar, 2,000 sq km of 3D-seismic, and 1,800 km of 2D
seismic, shot by Turkmengaz at South Yolotan, and 574 sq km of 3D-seismic and 1,500 km
of 2D-seismic shot at Yashlar.46
Jim Gillett of GCA told an industry conference in Ashgabat47
: “The basic change is that the
gas-water contact is deeper than we thought. There has been speculation that we didn’t have
enough data, or didn’t do our own analysis. I am happy to confirm that – with the caveat that
no geologist is ever going to say he has enough data – we had sufficient information to
update our 2008 results. There is no doubt that South Yolotan is the second largest field in the
world.” He said that 8-14% of the volume of the “raw” gas is hydrogen sulphide and carbon
dioxide, and that the reservoir is overlain by salt. The salt layer presents drilling challenges:
45
“Sverkhgigantskoe gazovoe mestorozhdenie v Turkmenistane”, Turkmenistan.ru, 20 November 2011
<http://www.turkmenistan.ru/ru/articles/36728.html> 46
Presentations by Jim Gillett, GCA, at TIOGE 2010 and 2011 47
Ibid
29
at depth and under pressure salt behaves as a plastic; wells have to be cased with steel and
cement, because wells without casing will slowly cave in.
In 2011 a measure of confusion was introduced into the discussion about South Yolotan’s
reserves, firstly by Gazprom, some of whose senior managers claimed that Soviet-era data
showed that the reserves did not exist, and also by some Turkmen officials, who cited
unexplained numbers in media interviews prior to the publication of GCA’s estimates. These
doubts have largely been put to rest by the publication of the estimates shown in Table 8, and
their acceptance by the BP Statistical Review of World Energy in its 2012 edition. Cedigaz, in
its published review of world natural gas reserves, reports Gaffney Cline’s estimates, and
states that South Yolotan is the second-largest field in the world, but has restated
Turkmenistan’s total reserves more conservatively, at 10 tcm in contrast to BP’s figure of
23.4 bcm. Cedigaz states that “development of the field will be challenging because of high
pressure reservoirs and a high proportion of acid gases [...] and the recovery factor remains
uncertain.”48
The magnitude of hypothetical production from a 19 tcm field may be illustrated as follows.49
If it were assumed to produce at a plateau equivalent to 3% of reserves for 20 years
(following a 10 year production build-up phase), and decline post-plateau at a rate of 10% per
year, the peak production would be 570 bcm/year. This compares with this author’s
projection of a requirement for 110 bcm/year of total Turkmen production at some point in
the 2020s, and the government’s publicly stated target of 230 bcm/year of total Turkmen
production by 2030. The actual production profile will be decided by above-ground factors
including Turkmenistan’s capacity for managing the field and how this fits in to its political
and economic strategies.
In December 2009 Turkmengaz signed service contracts to develop the South Yolotan field
with foreign contractors, worth $9.74 billion in total, as follows: $3.128 billion CNPC
(China), $3.979 billion Petrofac International (UAE), $1.15 billion Gulf Oil & Gas (UAE)
and $1.485 billion consortium of LG International and Hyundai Engineering (South Korea).
The work is being undertaken as indicated in Table 9. Turkmen official sources have
indicated that the first phase of development will be completed in 2014, and the second phase
will start in that year; in November 2012, the president of Turkmengaz stated that first gas
would be produced from the field in 2013.50
A third phase will be implemented “if
necessary”, and the field is expected to reach peak output of around 70 bcm/year in 2020-22.
48
See, for example, Posaner and Korobov (2012), p. 1. Cedigaz (2012), pp. 19-20. 49
With thanks to Howard Rogers 50
“Gaz s samogo krupnogo mestorozhdeniia v Turkmenistane nachnut dobyvat’ v 2013 godu”, Kursiv, 20
November 2012.
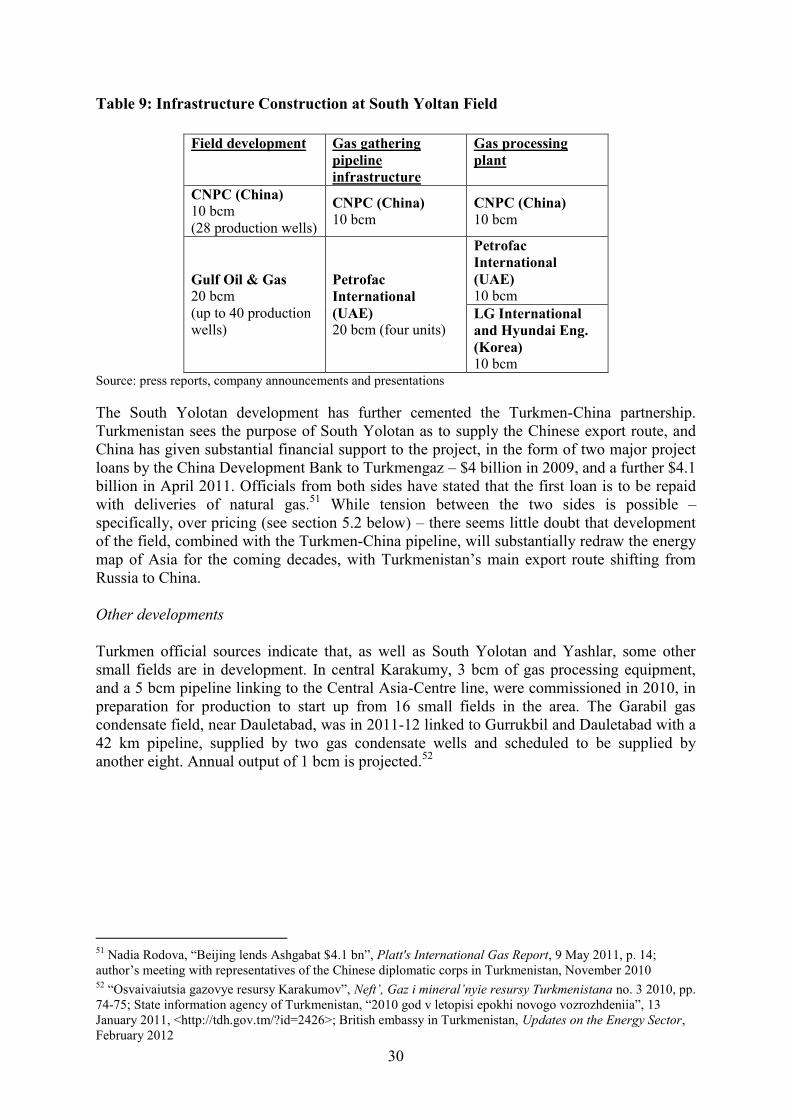
30
Table 9: Infrastructure Construction at South Yoltan Field
Field development Gas gathering
pipeline
infrastructure
Gas processing
plant
CNPC (China)
10 bcm
(28 production wells)
CNPC (China)
10 bcm CNPC (China)
10 bcm
Gulf Oil & Gas
20 bcm
(up to 40 production
wells)
Petrofac
International
(UAE)
20 bcm (four units)
Petrofac
International
(UAE)
10 bcm
LG International
and Hyundai Eng.
(Korea)
10 bcm Source: press reports, company announcements and presentations
The South Yolotan development has further cemented the Turkmen-China partnership.
Turkmenistan sees the purpose of South Yolotan as to supply the Chinese export route, and
China has given substantial financial support to the project, in the form of two major project
loans by the China Development Bank to Turkmengaz – $4 billion in 2009, and a further $4.1
billion in April 2011. Officials from both sides have stated that the first loan is to be repaid
with deliveries of natural gas.51
While tension between the two sides is possible –
specifically, over pricing (see section 5.2 below) – there seems little doubt that development
of the field, combined with the Turkmen-China pipeline, will substantially redraw the energy
map of Asia for the coming decades, with Turkmenistan’s main export route shifting from
Russia to China.
Other developments
Turkmen official sources indicate that, as well as South Yolotan and Yashlar, some other
small fields are in development. In central Karakumy, 3 bcm of gas processing equipment,
and a 5 bcm pipeline linking to the Central Asia-Centre line, were commissioned in 2010, in
preparation for production to start up from 16 small fields in the area. The Garabil gas
condensate field, near Dauletabad, was in 2011-12 linked to Gurrukbil and Dauletabad with a
42 km pipeline, supplied by two gas condensate wells and scheduled to be supplied by
another eight. Annual output of 1 bcm is projected.52
51
Nadia Rodova, “Beijing lends Ashgabat $4.1 bn”, Platt's International Gas Report, 9 May 2011, p. 14;
author’s meeting with representatives of the Chinese diplomatic corps in Turkmenistan, November 2010 52
“Osvaivaiutsia gazovye resursy Karakumov”, Neft’, Gaz i mineral’nyie resursy Turkmenistana no. 3 2010, pp.
74-75; State information agency of Turkmenistan, “2010 god v letopisi epokhi novogo vozrozhdeniia”, 13
January 2011, <http://tdh.gov.tm/?id=2426>; British embassy in Turkmenistan, Updates on the Energy Sector,
February 2012
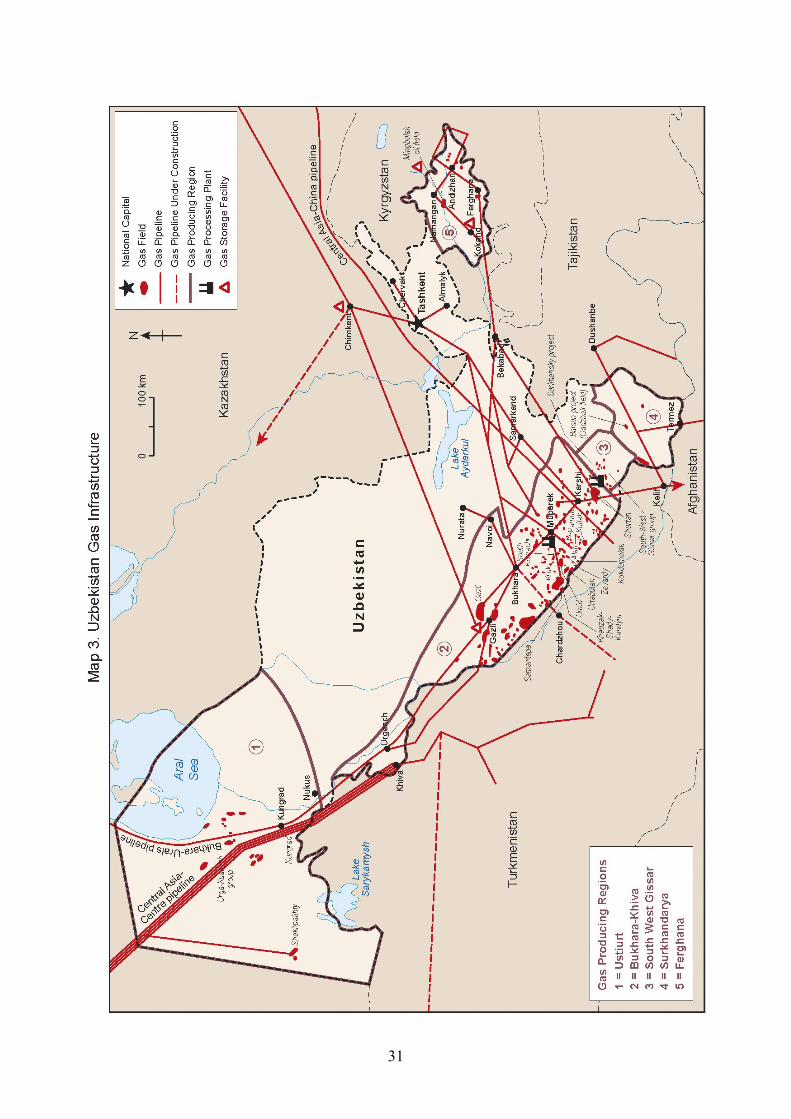
31
32
3.2. Uzbekistan
Uzbekistan is currently the largest gas producer in Central Asia, with estimated annual output
of 58-66 bcm of sales gas over the last decade. In 2002-08 Turkmenistan and Uzbekistan
produced similar volumes – but at times when Turkmenistan’s production was reduced due to
the lack of export markets, in 1994-2002 and again after the reduction of purchases by Russia
in 2009, Uzbekistan’s production surpassed it. Uzbekistan has always had far less gas
available for export than Turkmenistan, though, because of its high, inefficient domestic
consumption, estimated at 44-50 bcm/year over the last decade (see section 4.1 below).
More than two thirds of Uzbek gas is produced in the Bukhara-Khiva region in the south of
the country. Smaller volumes are produced in the Ustiurt region in western Uzbekistan. In
order to maintain or increase output, Uzbekistan is relying not only on development work
underway in new fields in Bukhara-Khiva and Ustiurt, and in new fields in the south-eastern
and eastern regions, but also on the application of enhanced recovery techniques to existing
fields.
Uzbekistan exports gas to Russia via the Central Asia-Centre pipeline system and the
Bukhara-Urals pipeline, and in 2012 started to export very small volumes to China via the
Turkmenistan-China pipeline. Uzbek gas is also supplied to south-east Kazakhstan, and to
Tajikistan and Kyrgyzstan, under arrangements inherited from the Soviet period – although
both Uzbekistan and these importers have found, or are seeking, arrangements to reduce their
mutual trade obligations. However for the foreseeable future the main call on Uzbek gas, and
the main factor limiting its capacity to export gas, will be its domestic consumption. This
section covers the historical and political background, and surveys production and
development region by region.
Historical and political context
Gas production began in Uzbekistan in the 1950s, and Gazli in the Bukhara-Khiva region was
the largest producing field in the Soviet Union throughout the 1960s. The Bukhara-Urals and
Central Asia-Centre pipelines (first lines commissioned in 1962 and 1967 respectively) were
built to supply gas from both Uzbekistan and Turkmenistan to the USSR’s largest industrial
regions. In 1992, Uzbekistan became independent and adopted an autarchic economic policy
that prioritised self-sufficiency and import substitution (see section 2 above). Uzbekistan,
even more than other post-Soviet states, used its gas as a subsidy for local industry and the
population. It also began to divert resources away from cotton, its main Soviet-era export,
and sought to build up its hydrocarbons processing capacity and automobile production. All
these policies increased domestic demand for gas. The vast majority of exploration, field
development and production in the post-Soviet period has been undertaken by the state-
owned oil and gas company, which was reorganised in 1998 under its present name,
Uzbekneftegaz. Uzbekistan has limited the involvement of foreign companies in the oil and
gas sector, in keeping with its policy of self-sufficiency and its view of the sector as a
strategic one. In the mid 1990s some large US, Saudi and other companies were active in
Uzbekistan, but foreign involvement essentially came to a halt in the late 1990s, as
international oil prices fell and Uzbek production of both oil and gas declined.53
A new chapter of Uzbek-foreign cooperation opened in the mid 2000s, as oil prices, and
Russian demand for Central Asian gas, rose. Uzbekistan began to negotiate production
53
See Zhukov (2009), pp. 373-374.
33
sharing agreements with foreign companies, and Gazprom and Lukoil of Russia became the
largest investors in the Uzbek upstream. There was something of a false start in 2001, when
Uzbekistan signed its first upstream PSA, for the development of the South West Gissar
group of fields, with Uzbekneftegaz and UzPEC, a subsidiary of Trinity Energy of the UK.
First oil was produced in 2002, but in 2004 Uzbekneftegaz dissolved its partnership with
Trinity, stating that contractual terms had been breached;54
Soiuzneftegaz of Russia took
control of UzPEC; and in 2008 Lukoil bought out Soiuzneftegaz’s interest in the project.55
Much more significant and successful was the PSA signed in 2004 between Uzbekistan and
Lukoil for the development of the Khauzak, Shady and Kandym fields in Bukhara-Khiva
region, which are projected to achieve 11 bcm/year of gas production at peak, and the
Kungrad field in Ustiurt.56
In 2004, Uzbekistan also signed a PSA with two Gazprom
subsidiaries (Zarubezhneftegaz and Gas Project Development Central Asia (GPD)) to
redevelop the Shakhpakhty deposit in Ustiurt region, which had been in production between
1971 and 2002. Finally, in 2006, Uzbekistan signed a PSA with an international consortium
to explore the Uzbek section of the Aral Sea.
Since the late 2000s, all the signs are that Uzbekistan’s gas production is in decline. The US
EIA statistics used in the gas balance (Table 1 above) indicate a fall in total output (including
gas reinjected and flared) from 68.6 bcm in 2008 to 61.6 bcm in 2010. News outlets, quoting
official sources, reported that production was 2.1% lower in 2010 than in 2009, and 4.1%
lower in the first half of 2011 than in the first half of 2010.57
This fall in output is due largely
to the natural decline of old fields, which is apparently exacerbated by limited use of
enhanced recovery techniques in the past. It comes at a time when demand, and potential
demand, is being driven upwards. Given these circumstances, Uzbekistan has again – in spite
of its emphasis on self-sufficiency – sought to bring in foreign companies, usually on the
basis of PSAs or service contracts, both to develop new fields and to enhance production at
existing ones.
During this latest phase of Uzbek efforts to attract foreign investment, the sources of the
investment have shifted in three ways: The Swiss-based company Zeromax went bankrupt
and its Uzbek upstream assets passed to others; among Russian investors, while Lukoil’s
investments in Uzbek gas have risen – in line with its stated intention of exporting gas from
Uzbekistan to China – Gazprom’s have been reduced; by far the most significant, there has
been a surge of Asian investment.
The bankruptcy of Zeromax appears to have resulted from a failed attempt by members of the
Uzbek elite to establish private ownership of oil and gas assets, in a manner similar to that
used in Russia and other post-Soviet states in the 1990s. This attempt ran counter to the
prevailing policy of Uzbekistan’s government, which, like Turkmenistan’s, has sought to
retain control of the energy sector through state-owned entities. Whereas Zeromax
presumably acquired its upstream assets in “insider privatisations” similar to those in Russia
and Kazakhstan, its bankruptcy appears to amount to a reaffirmation in practice that – while
54
“‘Soiuzneftegaz’ prosiat osvobodit’ ploshchad’”, Kommersant, 14 February 2005; “Rossiia. Ofitsial’nyi vizit.
Strategicheskie resheniia”, Novosti Uzbekistana, 22 February 2008
<http://www.novostiuzbekistana.st.uz/8_394/ru.htm> 55
Zhukov (2009), p. 380; A. Strokov and V. Paramonov, “Evropeiskoe prisutstvie v energetike Uzbekistana,
Kyrgystana i Tadzhikistana: obshchie napravaleniia, perspektivy i riski”, Tsentral’naia Evraziia, 6 March 2012 56
Lukoil Overseas Holding Ltd, Corporate Report 2010, p. 35 57
Neftegazexpert, “Ukrainskii Turbogaz vyigral tender na postavku oborudovaniia”, 30 April 2011,
<http://www.neftegazexpert.ru/neftegazline/neftegaztext110164.html>; “UNG rekonstruiruet DKS na
Shurtanneftegaze za $48m”, 19 Sep 2011, http://www.oilcapital.ru/industry/35587.html
34
Uzbekistan is ready to work with some foreign investors – Uzbek interests in the energy
sector will be held through state rather than private companies. Zeromax, founded in 2001
and presumed to be owned by members of the Uzbek elite, entered the upstream in 2004 via
stakes in two joint ventures with Gazprom subsidiaries, Gissarneftegaz and Kokdumalakgaz,
which both produce gas from Bukhara-Khiva fields. (It also owned other assets, e.g. part of
an LPG production business, a network of petrol stations, and stakes in the gold mining
sector.) In May 2010 Zeromax was declared bankrupt, with reported debts of $500 million.
Some of Zeromax’s upstream assets had come under the control of Gazprom-Germania, the
Gazprom subsidiary that works in the Central Asian upstream.58
The replacement of Gazprom by Lukoil as the largest foreign investor in the Uzbek upstream
is a reflection of developments in the Russian gas sector, where non-Gazprom producers –
including Lukoil and other oil companies – now account for more than one-quarter of
Russian gas output, and have lobbied successfully for changes to gas industry regulation to
ensure access to local industrial consumers. Lukoil’s senior managers have made clear from
2004, when they signed the Khauzak-Shady-Kazym-Kungrad PSA, that they viewed their
Uzbek investment as a key to opening up Asian gas markets. In 2010, Vagit Alekperov,
Lukoil’s CEO, announced that the company had made a “provisional” agreement with
Chinese buyers to sell future gas from its Uzbek PSAs to China (although negotiations with
Uzbekneftegaz about the terms of export sales agreements are understood to be continuing).
Alekperov said in 2012 that Lukoil expects to raise gas production in Uzbekistan from around
3 bcm/year currently to 17-18 bcm/year by 2017.59
Gazprom has retained shares in the
Kokdumalak, Gissarneftegaz and Shakhpakhty projects, and continues to conduct exploration
under a long-term partnership agreement with Uzbekneftegaz, but on the other hand has
relinquished licences in the Urga-Kuanysh area in Ustiurt on the grounds that they cannot be
developed economically; these are now being explored and developed by Petronas under a
PSA signed in 2009. Moreover, Gazprom’s share of the output of the Uzbek projects in
which it participates is estimated at less than 1.5 bcm/year in total and less than 0.75 bcm of
that is exported; the remainder of Gazprom’s gas purchases from Uzbekistan are reportedly
made directly from Uzbekneftegaz. Gazprom’s holdings in Uzbekistan are set out in
Appendix 4.
The rise of Asian investment in the Uzbek upstream reflects both the broad trend of increased
Chinese and east Asian economic ties with Central Asia, and China’s specific interest in
Uzbekistan as a potential supplier of export volumes via the Turkmenistan-China pipeline.
CNPC and Petronas are both involved in exploration and development of gas in Uzbekistan,
although not yet producing on the scale that they are in Turkmenistan. Both those companies,
together with Korea National Oil Corporation, Lukoil and Uzbekneftegaz, are participating in
the Aral Sea consortium that in 2006 signed a PSA with the government. Also in 2006,
CNPC signed an oil and gas exploration agreement with Uzbekneftegaz, covering five
onshore blocks totalling 34,000 sq km. In 2008 the two companies agreed to boost the output
of mature oilfields in the Ferghana basin and set up a joint venture to work there.60
Petronas
is undertaking exploration in Ustiurt, under the Urga-Kuanysh PSA mentioned above, and in
2010 signed a PSA covering the Baisun field in the Surkhandarya region, where it also has an
58
Zhukov (2009) pp. 376-378; Lenta.ru, “Sud Uzbekistana pristupil k bankrotstvu dvukh struktur Gazproma”,
10 September 2010; Neftegazexpert, “Gazprom kupit neftegazovye aktivy”, 2 Feb 2007,
<http://www.neftegazexpert.ru/neftegazline/neftegaztext20287.html>; Gazprom Germania Management Report
for 2010, p. 16 59
“Lukoil offers Uzbek gas to China”, Platt’s International Gas Report, 11 October 2010; “Lukoil nameren
cherez 10 let dobyvat’”, 22 Feb 2012, www.angi.ru 60
CNPC web site, “Uzbekistan” page
35
exploration agreement covering the Surkhansky field nearby.61
Aggregate output from those
fields, when developed, is projected at 3-3.5 bcm/year. Korean companies and financial
institutions, and the Asian Development Bank, are in talks the Uzbek government and
Uzbekneftegaz about investment in petrochemicals projects (see section 4.1 below) that
would require substantial upstream gas development for their success; the most far advanced
of these would be sited at the Surgil field in Ustiurt. The substantial investments by Asian
companies contrast sharply with the minimal activity by western oil companies in
Uzbekistan; only one, Tethys Petroleum, is known to be working in the country, at the
Urtabulak field in Bukhara-Khiva.
An unresolved issue that hangs over Uzbekistan’s gas production in the coming years is how
Uzbekneftegaz and its foreign partners will strike a balance between production for export
and production for the domestic market. By the end of the decade, foreign companies are
likely to be producing more than 20 bcm/year of gas, i.e. Lukoil, 17-18 bcm/year; Gazprom,
1.5 bcm/year; Petronas, 3-3.5 bcm/year; CNPC unknown. There is no doubt that all of these
companies hope to export this gas; Lukoil’s senior executives have said so explicitly. That
would imply incremental exports of at least 17 bcm/year (Lukoil 14-15 bcm/year; Petronas 3-
3.5 bcm/year; CNPC unknown). The Uzbek government is sure to see such exports as being
in its interests too, provided that total production rises far enough to cover both these
incremental exports, and domestic demand at roughly the current level (as argued in section
4.1 below, it is unlikely to fall significantly). This implies that the natural decline of
Uzbekneftegaz’s major fields must be covered mainly by enhanced recovery or by
development of its own new production. Since there is little public information about the rate
of decline of existing fields, or of Uzbekneftegaz’s projections for enhanced recovery
implementation and new field development, this author cannot comment on the scale of that
problem. What can be said is that, by and large, the foreign companies’ capital and
technology are not being applied to it.
Uzbekistan’s oil and gas fields are divided administratively into five geographical regions
(see map 3). The remainder of this section describes the main producing fields in turn.
Bukhara-Khiva region
Most gas production, 45-50 bcm/year of 60-70 bcm/year in total, comes from the Bukhara-
Khiva region, almost entirely from fields operated by Uzbekneftegaz. Uzbekistan’s oil and
gas fields are all small by international standards, and Uzbekneftegaz has constantly to
manage the decline of some fields, the opportunities for enhanced recovery, and the need to
develop new fields. Currently, the most significant producing fields are Shurtan, Kultak,
Alan, Zevardy, Umid, South Kemachi, Kruk, Urtabulak and Gazli.62
There are significant
technological problems: the gas is of poor quality, most of it containing relatively high
concentrations of hydrogen sulphide; there is also some liquids content. Uzbekneftegaz also
regularly undertakes projects to modernise infrastructure at these fields, most of which have
been producing since the 1970s. Uzbekistan’s two major gas processing plants, Mubarek
(commissioned 1973, capacity for 30 bcm of feedstock) and Shurtan (commissioned 1980,
61
“Petronas v Uzbekistane: vzaimovygodnoe partnerstvo”, Uzbekskii zhurnal neft i gaza, May 2012, pp. 71-72 62
Uzbekistan does not release field-by-field information consistently. In 1990, Shurtan, Zevardy and
Dengizkul’-Khauzak accounted for 75% of production; in the early 2000s, those three fields plus Alan,
Kokdumalak, Pamuk and Kultak accounted for 95% of production; in 2011, media citing official sources
reported that Shurtan, Kultak, Alan, Zevardi, South Kemachi and Umid accounted for 48.5 bcm. Zhukov (2009)
pp. 360-361; Neftegazexpert, “Ukrainskii Turbogaz vyigral tender na postavku oborudovaniia”, 30 April 2011,
<http://www.neftegazexpert.ru/neftegazline/neftegaztext110164.html>
36
capacity for 24 bcm/year of feedstock) are in the Bukhara-Khiva region, and are supplied by
gas from all its fields. Their output includes dry gas, stable gas condensate and liquefied
petroleum gas (LPG). At Shurtan there is also a gas chemical complex that started operation
in 2001; its annual installed capacity is 4.5 bcm, from which it produces refined gas,
polyethylene, LPG, gas condensate and granulated sulphur.63
In recent years, much effort has been focused in Bukhara-Khiva on the increasingly severe
problem of falling pressure at aging fields. In 2011, Uzbekneftegaz officials announced a
$783 million investment programme into enhanced recovery techniques, to be implemented
in 2012-15. Turbogaz of Ukraine won a tender to supply turbo-expanders, to be installed at
the surface, to increase flow rates at Shurtan, Kultak, Alan, Zevardy, Umid and South
Kemachi. In 2012 Uzbekneftegaz officials announced that a foreign partner was sought to
work on utilisation (i.e. compression, and extraction of liquid hydrocarbons) of low-pressure
associated gas at the South Kemachi, Kruk, Western Kruk, North Urtabulak and Umid
fields.64
Another announcement indicated that new exploration methods would be applied at
the Shurtan, Alan and Samantepe fields, with a view to increasing the level of recoverable
reserves.65
At Shurtan, historically one of Uzbekistan’s largest fields, a new 15 bcm/year
compressor station is under construction, which will replace six old units with an aggregate
capacity of 12 bcm/year.66
At Gazli, which in the 1970s was the largest producing field in the
Soviet Union but is now in decline, a new compressor station became operational in 2008,
replacing worn-out units and raising the rate at which gas could be extracted at the field;
compressors at the Pamuk field were replaced in the same year.67
Petronas representatives
state that they are in discussion with Uzbekneftegaz about enhanced recovery projects at
Gazli.
In addition to Uzbekneftegaz’s own production in Bukhara region, there are fields it operates
jointly with Lukoil under a PSA and with Gazprom subsidiaries and others as joint ventures.
The largest of these, the Kandym-Khauzak-Shady project, is being developed under a 35-year
PSA, effective from November 2004, in which Lukoil (via its Lukoil Overseas division) has a
90% share and Uzbekneftegaz a 10% share. Output was 2.66 bcm in 2010 and is projected to
rise to 4 bcm/year from 2012; plateau production is projected at 3 bcm/year from Khauzak-
Shady and 8 bcm from Kandym. Gas from the project is currently processed at the Mubarek
processing plant, but Lukoil plans to build its own processing plant at Kandym, to be
commissioned in 2016. In March 2012, a consortium led by the Asian Development Bank
and Islamic Development Bank provided a $500 million loan to Lukoil, thought to be the
largest such deal ever for any privately-owned foreign company in Uzbekistan, to finance
field development; the ADB has expressed interest in financing the processing plant too.68
63
Uzbekneftegaz web site, “Uzbekistan narashchivaet pererabotku gaza”
<http://www.ung.uz/ru/press_center/smi/energet/>; “Aktual’nye tendentsii razvitiia neftegazovoi otrasli
Uzbekistana”, Uzbekskii zhurnal nefti i gaza, May 2010 64
Presentation by Sherzod Akhudjanov, Neftegazinvest, at the Oil Gas Uzbekistan conference (OGU), May
2012, Tashkent 65
Neftegazexpert, op. cit; Uzinform, “UNG planiruet uvelichit’ dobychu i eksport gaza”, 26 December 2011,
<http://www.uzinform.com/ru/news/20111226/10666.html> 66
Oilcapital.ru, “UNG rekonstruiruet DKS na Shurtanneftegaze za $48m”, 19 September 2011,
<http://www.oilcapital.ru/industry/35587.html> 67
“Aktual’nye tendentsii razvitiia neftegazovoi otrasli Uzbekistana”, Uzbekskii zhurnal nefti i gaza, May 2010;
gazeta.uz, “Na Gazli dobavili gaza”, 30 December 2008 < http://www.gazeta.uz/2008/12/30/gazli>; Zonaks,
Kazakhstan, “Uzbekneftegaz do 2015 g. rekonstruiruet podzemnoe khranilishche”, 22 August 2011
<http://www.zonakz.net/articles/36557> 68
Lukoil Overseas Holding, Corporate Report 2010, p. 35; “Lukoil boosts Uzbek output”, Platt’s International
Gas Report, 4 July 2011; Lukoil press release, “Lukoil privlek krupnyi kredit”, 30 March 2012.
37
Uzbekneftegaz operates two projects in Bukhara-Khiva together with Gazprom subsidiaries:
Kokdumalak and Gissarneftegaz. Kokdumalak is an oil and gas field, which in 2010
produced 6 bcm of associated gas in total (i.e. including a considerable proportion that was
reinjected). Kokdumalak is operated by a joint venture, Kokdumalakgaz, set up in 2004 on a
parity basis between Zeromax and Mubarekneftegaz, an Uzbekneftegaz subsidiary; since
about 2006 there has been participation by Gazprom subsidiaries; now, 25% of
Kokdumalakgaz is owned by GPD, a 50% Gazprom Germania subsidiary, and some or all of
the rest by Mubarekneftegaz. There are considerable technical challenges at the field due to
the presence of over-pressured salt water aquifers, some of which were overcome by CNPC,
which worked there on a service contract. CNPC states that more than 100 wells had been
discarded because of the high-pressure salt water problem, but that in 2006 its engineers
successfully completed six wells through the layers, including one with the longest horizontal
interval in the Uzbek upstream.69
The second area worked with Gazprom participation is
Gissar, a group of gas condensate fields including North Nishan and North Guzar. These are
operated by Gissarneftegaz, a joint venture formed on a parity basis between Zeromax and
Shurtanneftegaz, an Uzbekneftegaz subsidiary; subsequently Zeromax’s share passed to
Gazprom subisidiaries; now, GPD has a 40% share. In 2010, the project produced 4.1 bcm of
gas, plus 105,600 tonnes of crude oil and 234,800 tonnes of condensate, that were processed
in Uzbekistan and exported.70
Ustiurt region
Small volumes of gas are produced from two projects in the Ustiurt region of western
Uzbekistan, Shakhpakhty and Urga-Kuanysh. Transport infrastructure links these fields to the
Central Asia-Centre pipeline system via which gas is exported to and through Russia. The
Shakhpakhty project is operated under a PSA, in which shares are held by Uzbekneftegaz,
GPD and Gazpromzarubezhneftegaz; in 2010 it produced 0.2 bcm and peak annual
production is expected to be 0.5 bcm. The Urga-Kuanysh project covers the Urga, Kuanysh,
Dal, Garbii Borsakel’mas, Karachalak, Kokchalak and Akchalak fields. Prospecting was
undertaken by Gazprom and Uzbekneftegaz under an agreement signed in 2006 but Gazprom
abandoned the project soon afterwards. A 35-year PSA was signed with Petronas in May
2008, covering the same territory; in 2012 small volumes of gas (0.2 bcm/year) were being
produced and sold to Gazprom.71
The other significant project in western Uzbekistan is the exploration of a 12,000 sq km area
of the Aral Sea, mentioned above. This is being conducted by a consortium of Lukoil
Overseas, Korea National Oil Company, Petronas and CNPC, under a PSA signed in 2006.
There are no firm estimates of resources, but they are thought to be up to 1 tcm of gas and
150 million tonnes of oil. In 2010, high-yield gas flow was obtained from a test at the first
exploration well, CNPC stated.72
69
Gazprom Germania Management Report for 2010, p. 16; CNPC web site, “Uzbekistan” page
<http://www.cnpc.com.cn/en/cnpcworldwide/uzbekistan/Uzbekistan.htm#> 70
Gazprom Germania Management Report, op. cit.; Zhukov (2009) p. 377. 71
Uzbekistan Investment Guide, “Petronas has signed its second PSA in Uzbekistan”, 14 June 2010, citing
Gazeta.uz. 72
CNPC web site, “Uzbekistan” page
38
New production in south and east Uzbekistan
There are three other gas projects being developed with participation by foreign partners:
South West Gissar (Lukoil), and Baisunsky and Surkhansky (Petronas). (A fourth project,
Mingbulak (CNPC), in the Ferghana region, is an oil project with no reported prospects of
associated gas output.)
South-West Gissar, in the South-West Gissar region south-east of Bukhara-Khiva, is being
developed by Lukoil Overseas under a 36-year PSA from April 2007. There are seven fields
in total – Dzharkudak-Iangi Kyzylcha, Gumbulak, Amanata, Pachkamar and Adamtash (all
gas condensate), Iuzhnyi Kyzylbairak (oil-gas condensate) and Koshkuduk (oil). Planned
output is 1.1 bcm/year at the first stage, and 5.8 bcm/year at peak. In December 2011 Lukoil
reported that the first gas had been produced from Dzharkudak-Iangi Kyzylcha, the largest
block.73
The Baisunsky and Surkhansky projects are based in the Surkhandarya region of south-east
Uzbekistan, between South-West Gissar and the Tajik border. The Baisunsky project is being
developed under a 35-year PSA signed with Petronas in June 2010; Petronas has undertaken
seismic surveys and well testing in the Gadzhak field, the largest in the project area. The
presidential decree approving the project provides for Delta Oil of Saudi Arabia to work in
the area.74
Petronas has also signed a memorandum with Uzbekneftegaz in 2008, and a short-
term exploration agreement some time afterwards, under which it is conducting exploration at
five fields in the Surkhansky area.
3.3 Kazakhstan
More than 72% of the gas that reaches the surface in Kazakhstan’s hydrocarbon fields is
associated with oil; 28% is non-associated natural gas. Most of the associated gas is
reinjected to support the pressure in oil deposits and enhance oil output; some is flared. The
remainder is contributed to Kazakhstan’s gas balance, and accounts for a greater share than
non-associated natural gas. (There is also blast furnace gas and coke oven gas from steel
plants.)75
Associated and non-associated natural gas produced by oil companies completely
dominates the gas production profile. In recent years more than four-fifths of the total sales
gas produced has come from the two largest oil fields – Tengiz, operated by the
Tengizchevroil joint venture, and Karachaganak, operated by the Karachaganak Petroleum
Operating company (KPO). A third large oilfield, Kashagan, is expected to start production in
2013, and will also contribute associated gas to the balance. In addition to these three large
fields, there are a swathe of onshore oil and gas deposits in western and southern Kazakhstan,
many of which are being produced by subsidiaries of Kazmunaigaz, the national oil and gas
company, or of CNPC, or joint ventures, including some that bring together those two
companies.
In the past it has been difficult to build up a meaningful statistical picture of Kazakh gas
production because the relevant government agencies have only reported total gas production
prior to reinjection and flaring, rather than volumes of sales gas. Statistics for sales gas
73
“First Uzbek Gissar gas for Lukoil”, Platt’s International Gas Report, 16 January 2012, pp 16-17 74
Postanovlenie Prezidenta respubliki Uzbekistan, 8 June 2010, no. PP-1351; Uzbekistan Investment Guide,
“Petronas has signed its second PSA in Uzbekistan”, 14 June 2010 75
By energy content, 2009, extrapolated from Stalistical Agency of the Kazakh republic, Toplivno-
energeticheski balans respubliki Kazakhstan. See also Pirani, Elusive Potential: Gas Consumption in the CIS
(Oxford: OIES, 2011), p. 106
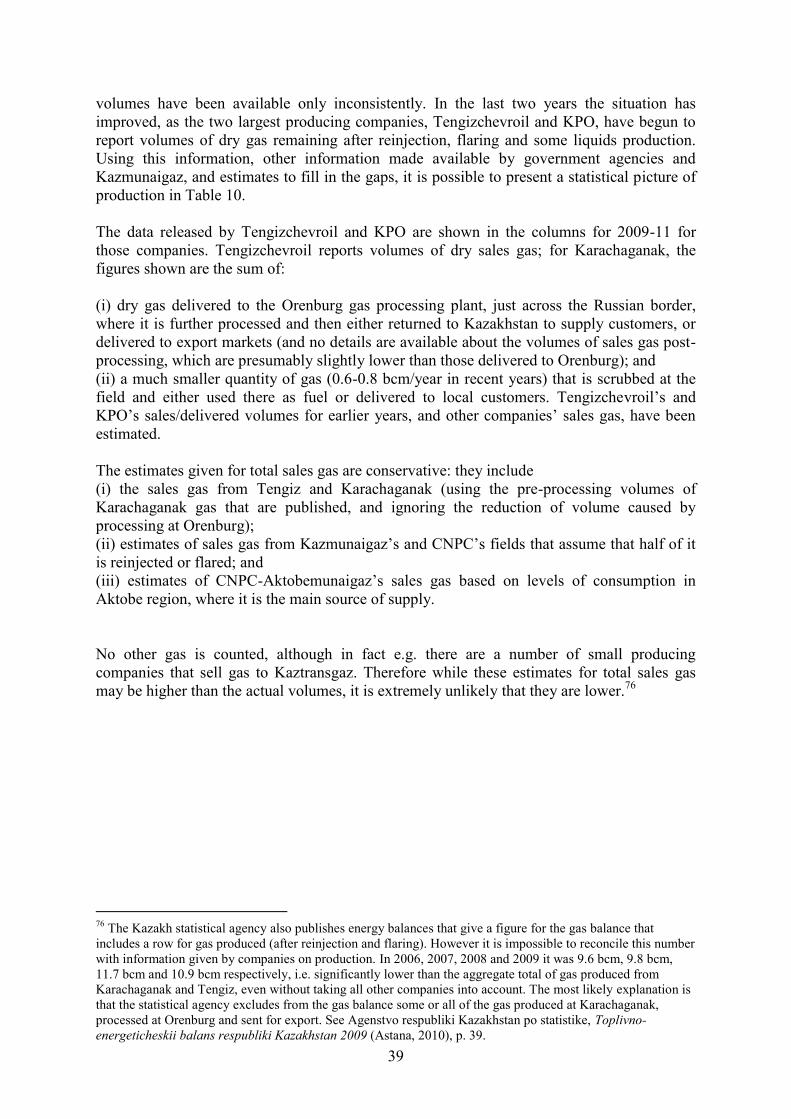
39
volumes have been available only inconsistently. In the last two years the situation has
improved, as the two largest producing companies, Tengizchevroil and KPO, have begun to
report volumes of dry gas remaining after reinjection, flaring and some liquids production.
Using this information, other information made available by government agencies and
Kazmunaigaz, and estimates to fill in the gaps, it is possible to present a statistical picture of
production in Table 10.
The data released by Tengizchevroil and KPO are shown in the columns for 2009-11 for
those companies. Tengizchevroil reports volumes of dry sales gas; for Karachaganak, the
figures shown are the sum of:
(i) dry gas delivered to the Orenburg gas processing plant, just across the Russian border,
where it is further processed and then either returned to Kazakhstan to supply customers, or
delivered to export markets (and no details are available about the volumes of sales gas post-
processing, which are presumably slightly lower than those delivered to Orenburg); and
(ii) a much smaller quantity of gas (0.6-0.8 bcm/year in recent years) that is scrubbed at the
field and either used there as fuel or delivered to local customers. Tengizchevroil’s and
KPO’s sales/delivered volumes for earlier years, and other companies’ sales gas, have been
estimated.
The estimates given for total sales gas are conservative: they include
(i) the sales gas from Tengiz and Karachaganak (using the pre-processing volumes of
Karachaganak gas that are published, and ignoring the reduction of volume caused by
processing at Orenburg);
(ii) estimates of sales gas from Kazmunaigaz’s and CNPC’s fields that assume that half of it
is reinjected or flared; and
(iii) estimates of CNPC-Aktobemunaigaz’s sales gas based on levels of consumption in
Aktobe region, where it is the main source of supply.
No other gas is counted, although in fact e.g. there are a number of small producing
companies that sell gas to Kaztransgaz. Therefore while these estimates for total sales gas
may be higher than the actual volumes, it is extremely unlikely that they are lower.76
76
The Kazakh statistical agency also publishes energy balances that give a figure for the gas balance that
includes a row for gas produced (after reinjection and flaring). However it is impossible to reconcile this number
with information given by companies on production. In 2006, 2007, 2008 and 2009 it was 9.6 bcm, 9.8 bcm,
11.7 bcm and 10.9 bcm respectively, i.e. significantly lower than the aggregate total of gas produced from
Karachaganak and Tengiz, even without taking all other companies into account. The most likely explanation is
that the statistical agency excludes from the gas balance some or all of the gas produced at Karachaganak,
processed at Orenburg and sent for export. See Agenstvo respubliki Kazakhstan po statistike, Toplivno-
energeticheskii balans respubliki Kazakhstan 2009 (Astana, 2010), p. 39.
40
Table 10: Kazakhstan Natural Gas Production (bcm)
2006 2007 2008 2009 2010 2011
Total prior to reinjection/flaring 27 29.6 33 36 37.26 39.5
Total sales gas (estimated) 12.8 14.2 15.9 18.3 18.6 18.5
Kazmunaigaz E&P 1.181 1.098 1.018 0.932 0.89 n/a
Kazgermunai (KMG 50% share) 0.118 0.276 0.262 0.26 0.258 n/a
Kazakhoil-Aktobe 0.224 0.14 0.107 0.136 0.141 n/a
Mangistaumunaigaz (KMG 50% share) 0 0 0 0 0.227 n/a
Other KMG 0.319 0.573 0.601 0.666 0.672 n/a
Amangeldy (Kaztransgaz) 0.28 0.28 0.338 0.354 0.344 n/a
KMG and affiliates: prior to
reinjection/flaring
2.122 2.367 2.326 2.348 2.532 2.5
KMG and affiliates: sales gas -
estimate
1.0 1.2 1.2 1.2 1.2 1.2
CNPC-Aktobemunaigaz: prior to
reinj'n/flaring
2.95 2.97 3.0 3.1 3.0 3.4
CNPC-Aktobemunaigaz "utilised" (i.e.
not flared)
2.6 3.2
CNPC-Aktobemunaigaz sales gas -
est.
0.8 1.0 1.2 1.2 1.7 1.7
Petrokazakhstan (67% CNPC) 0.26 n/a
KuatAmnlonMubai (50% CNPC) 0.17 n/a
CNPC other sales gas - estimate 0.1 0.1
Tengiz: prior to reinjection/flaring 6.91 7.254 8.977 11.691 13.62 13
Tengiz dry gas sold 3.5 4.0 5.0 7.0 7.1 6.9
Karachaganak: est. total prior to
reinj'n/flaring
11.9 15.541 14.988 16.854
Karachaganak: reinjected 6.589 6.437 8.129
Karachaganak dry gas - (sum of "dry
gas to Orenburg" and "processed gas
for fuel/sales")
7.5 8.0 8.5 8.952 8.551 8.725
Other prior to reinjection/flaring 3.3 2.7 3.7
Note: Blank spaces indicate no information available
Sources:
National total. Prior to reinjection/flaring: 2006-09, Kazakhstan v tsifrakh p. 17; 2010-11, ministry of oil and
gas web site. Sales gas: author’s estimates.
Kazmunaigaz affiliates. Prior to r/f: Kazmunaigaz annual report 2010, pp. 22-23. Sales gas: author’s estimates.
CNPC companies. Prior to r/f: CNPC-Aktobemunaigaz web site, Bernstein, The Caspian: Cradle of Oil
Production, p. 28. Sales gas: author’s estimates.
Tengizchevroil. Prior to r/f: Kazmunaigaz annual report 2010, p. 23. Sales gas: up to 2008, author’s estimates;
from 2009, company reports.
Karachaganak. Prior to r/f: 2007, Yenikeyeff, “Kazakhstan’s gas sector”, p. 326; from 2009, extrapolated from
company reports (sum of dry gas to Orenburg, processed gas for fuel/sales, and volumes reinjected). Sales gas:
up to 2008, author’s estimates. From 2009, from company reports.
Other prior to r/f: residual estimates
In addition to reinjection, volumes of gas are flared at all Kazakh producing fields, although
the level of flaring is a matter of dispute between government, companies, and Global Gas
Flaring Reduction (GGFR), the international partnership launched by the World Bank to
monitor and reduce flaring, in which Kazakhstan participates. Estimates by GGFR, based on
41
satellite data and generally regarded as the most accurate, are that 3.8 bcm was flared in 2010
and 4.7 bcm in 2011 (making Kazakhstan the seventh-largest flarer in the world); for 2008,
GGFR’s estimate was 5.4 bcm, while figures reported by KPO implied a national total of 6.8
bcm flared. The oil and gas ministry states that 1.35 bcm were flared in 2010 and 1.2 bcm in
2011.77
Both Kazakhstan’s largest oil projects have substantially reduced flaring in recent
years. Tengizchevroil reports that flaring has fallen from around 1.8 million tonnes per year
in the late 1990s to less than 200,000 tonnes in 2010; in that year the Gas Utilisation Project
was completed and routine flaring ceased. KPO reported that flaring had been reduced to
very low levels (0.13% of all gas produced in 2010, 0.08% in 2011).78
77
Ministry of oil and gas web site, “Itogi deiatel’nosti neftegazovoi otrasli za 2011 god”; GGFR web site,
“Estimated flared volumes from satellite data, 2007-2011”; KPO, Otchet ob ustoichivom razvitii za 2009 god, p.
17, which states that KPO’s own flared volume of 33 million cubic metres was 0.48% of the national total. 78
KPO, Otchet ob ustoichivom razvitii za 2010 god, p. 2; Otchet ob ustoichivom razvitii za 2011 god, p. 12.
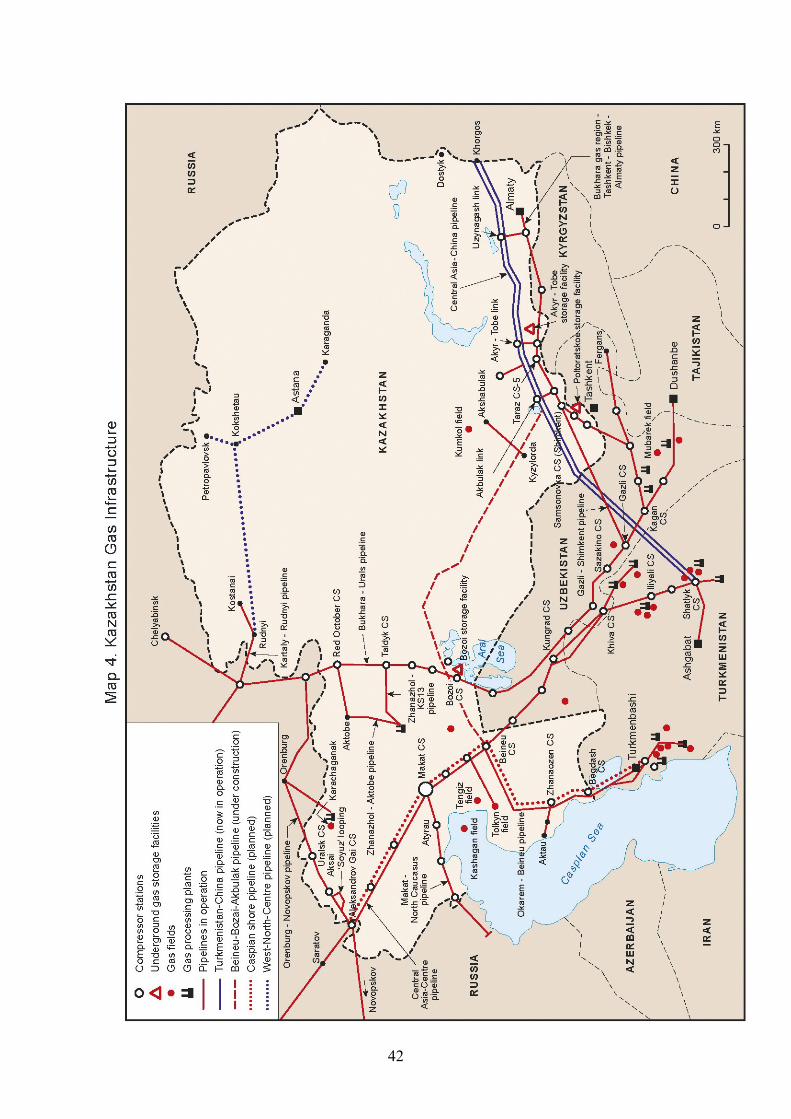
42
43
Historical and political context
Kazakhstan, unlike Uzbekistan and Turkmenistan, is primarily an oil producer. For the
government and all those concerned with the Kazakh economy as a whole, gas is third in
importance among fossil fuels after oil, Kazakhstan’s main export commodity, and coal, the
main fuel for Kazakhstan’s power and heat sector, as discussed in section 2 above. So while
Kazakhstan has since Soviet times exported some gas to and through Russia, and like
Uzbekistan has expressed hope of exporting gas to China, these exports are less important to
the economy and the government than they are in other Central Asian countries.
Kazakhstan’s huge geographical size, and its position, also impact on its role as a gas
exporter. Although Kazakhstan is slightly nearer to Russian, European and Chinese markets
than Turkmenistan and Uzbekistan, it shares with these two countries the problem that the
export infrastructure built in Soviet times takes gas to or through Russia. As market
relationships increasingly come to dominate the gas sector, Central Asian exports will
struggle to compete with Russian-produced gas – and opening up alternative export routes is
difficult and expensive. Kazakhstan has cooperated with its Central Asian neighbours to
complete the main export diversification route, to China – but, since gas is far less important
an export than oil, it has had little or no reason to pursue diversification strategies apart from
this. Secondly, because of its size and because of the availability of coal, especially in the
north-east, Kazakhstan is behind the other Central Asian states in making gas available to its
own population. Out of 14 administrative regions (oblasts), five have no gas transport
infrastructure at all and three of the most heavily populated, in the south-east, rely on imports
from Uzbekistan. Even in western Kazakhstan, where oil and gas production is concentrated,
gas supply infrastructure is in need of great improvement.
The Kazakh government has viewed gasification as an important aspect of its social policy,
and in recent years – no doubt with the social discontent, mentioned in section 2 above, in
mind – has given it increasing priority. President Nazarbayev has frequently referred to the
importance of gasification in keynote speeches: for example in an address to parliament in
September 2012, he referred to the importance of associated gas utilisation, and called for the
construction of gas-fired power capacity in western Kazakhstan to be supplied by it (although
there is some doubt as to the efficacy of that particular proposal).79
The policy objective is to
raise domestic gas consumption from around 6-10 bcm/year in recent years to 24 bcm in
2020. (The gasification campaign is discussed in more detail in section 4.3, below.) Whether
or not this policy objective is modified, and whether or not gasification is implemented on
this scale, there is little doubt that domestic consumption will rise. So, in addition to existing
exports to Russia and existing local consumption, there are two likely sources of incremental
demand that will provide the impetus for increased production in the coming years: growth in
the local market, and possible shipments to China. This is the background to the
government’s adoption of a strategic plan for 2011-16 that envisages raising total output of
sales gas from 21.3 bcm in 2010 to 30.7 bcm by 2016, on the basis of gas output (prior to
reinjection and flaring) of 55.8 bcm. The challenges in doing so include not only improving
the rate of recovery of associated gas from oilfields, but also raising the gas processing
capacity, which was reported in 2012 as 20.6 bcm/year, i.e. slightly above the current total
volume of sales gas produced.80
79
“Elektricheskii koloss na gazovykh nogakh”, Kursiv, 6 September 2012 80
“Kazakhstan planiruet uvelichit’ dobychu gaza”, Interfax-Kazakhstan, 16 March 2011; “Elektricheskii koloss
na gazovykh nogakh”, Kursiv, 6 September 2012
44
In Kazakhstan, in contrast to Uzbekistan and Turkmenistan, the decisions about how gas will
be produced to meet demand, investment priorities, etc, are to a large extent subordinated to
decisions about oil production. Decisions about both oil and gas production have for many
years been the subject of tough negotiations between Kazakhstan and the IOCs, both western
and Chinese, who account for most oil and gas production. The story of this relationship has
been told elsewhere,81
but one aspect of it is relevant: the government’s consistent efforts to
raise the proportion of sales gas made available from the big projects and to compel the IOCs
to invest in gas infrastructure.
In a series of negotiations with IOCs, in 2008-12 about the largest development project,
Kashagan, and in 2009-11 about investment in Kazakhstan’s largest producing field,
Karachaganak, the government has pressed not only for participation by the national oil
company, Kazmunaigaz, but also for greater investment in gas production and processing for
the local market. With respect to smaller fields – including the Zhanazhol field operated by
CNPC-Aktobemunaigaz, and the Akshabulak field operated by the Kazgermunai joint
venture between CNPC and Kazmunaigaz – the government has sought administratively to
encourage IOCs to support gas infrastructure projects. The largest and most significant gas
infrastructure project in which the government has sought, and received, commitments of
IOC participation, is the pipeline under construction between Beineu and Shimkent,
scheduled for completion in 2016. This will not only be able to transport gas from western
Kazakh fields to the Central Asia-China pipeline, but will also serve local areas en route,
boosting the gasification campaign and providing a means of supplying those areas with
Kazakh, rather than Uzbek, gas. But there is friction between the government’s domestic
priorities and the Chinese investors’ focus on exports, and in mid 2012 it was reported that
the project is being delayed as a result. (See section 5.2.)
The final noteworthy aspect of the government’s drive to raise the level of gas available for
the local market is the new gas law, which took effect in early 2012, and requires sale of
associated gas volumes to Kazmunaigaz affiliates at closely regulated prices. The law
establishes a pre-emptive right of the state to purchase gas disposed of by subsoil users and
owned by them under the subsoil law and subsoil use contracts (excluding gas from gas fields
and imported gas); that this right shall be exercised by a national operator; and that prices
shall cover recovery and transportation costs and be approved by the ministry of oil and gas.
As expected, in July 2012 Kaztransgaz was appointed national gas supply operator under the
new law.82
IOCs working in Kazakhstan have lobbied, to date with little success, for more
flexible rules on the sale of associated gas volumes to the operator; two lawyers at a leading
commercial law firm in Kazakhstan have commented that the law negatively affects the
investment climate, since it introduces rather strict regulation of gas sales, transportation and
other aspects of the market.83
The purchase prices currently paid by Kaztransgaz for
associated gas from the major projects are not published, but gas produced by Tethys
Petroleum from its Kyzyloi and Akkulka field in the Aktobe region has since 2010 been sold
to Asia Gas for $38/mcm, only slightly higher than the price paid in 2006-10 of $32/mcm84
–
81
See, for example, Ostrowski (2010). A journalistic account, which also covers Azerbaijan, is LeVine (2007) 82
Zakon respubliki Kazakhstan “O gaze i gazosnabzhenii” (law no. 532-IV signed by the president on 9
January 2012); Ivest.kz, “Kaztransgaz stal natsional’nym operatorom”, 11 July 2012
<http://news.ivest.kz/15754722>. 83
Maksim Burak and Daria Saginova, “Novyi zakon Respubliki Kazakhstan ‘O gaze i gazosnabzhenii’”, 23
January 2012 <http://www.gratanet.com/ru/publications/457> 84
Tethys Petroleum, Introduction to the Official List (for trading on the London Stock Exchange), 2011, pp.
101-102
45
and well below the regulated wholesale prices paid by gas consumers. At the time of writing
much detail about how the law’s provisions will be implemented is unclear.
The remainder of this section describes production and development prospects by field.
Production: the large oil projects
Karachaganak is Kazakhstan’s largest gas producer, with output of 8.5-9 bcm/year of dry gas
in recent years, which is purchased at the field by Kazrosgaz, the Gazprom-Kazmunaigaz
joint venture. More than 90% of this gas is delivered to the Orenburg gas processing plant in
Russia, and then either returned to Kazakhstan to supply local customers, or sent to export
destinations.
Karachaganak, which produces nearly one-fifth of Kazakhstan’s oil production and
substantial volumes of gas condensate, as well as gas, is operated by KPO under a 40-year
concession that began in January 1998.85
In December 2011 Kazmunaigaz took a 10% stake
in the project, in exchange for a payment to the other partners of $3 billion; shares are now
held by the two joint operators, ENI (29.25%) and BG Group (29.25%), and by Chevron
(18%), Lukoil (13.5%) and Kazmunaigaz (10%). The agreement under which Kazmunaigaz
entered the project brought to an end two years of mounting friction between the government
and the consortium, which had been accused of licence breaches, unlawful use of foreign
workers, incorrect tax payments, and other alleged offences. In 2010 the sides went to
international arbitration over accusations that the consortium had overstated costs. Under the
December 2011 agreement both sides dropped all claims against each other.86
At Karachaganak, two development phases, out of four planned, have been completed.
Negotiations over phase three, on which the future level of gas output will depend, have not
been concluded. There are two claims on phase three gas from Karachaganak: for an extra 7-
8 bcm/year to Orenburg, to raise volumes sent there to 16 bcm/year, and for 5 bcm/year to
supply a new gas processing plant at Karachaganak itself, proposed by the Kazakh
government. The extra volumes for Orenburg were agreed upon in principle in October 2006,
between the Russian and Kazakh governments. They agreed to establish a joint venture to
operate the Orenburg plant, as and when the Karachaganak phase three development began.
The Soviet-era infrastructure that links Karachaganak to Orenburg has 20 bcm/year of
capacity, so there are no constraints. But in 2009, the two sides agreed to put this plan on ice,
since the stalled negotiations between the consortium and the Kazakh government had
delayed the start of Karachaganak’s phase three.87
Since then, demand projections for both
the Russian and European markets have been severely reduced, and it is unclear whether or
how these proposals could be revised.
The proposal to build a 5 bcm/year gas processing plant at Karachaganak is part of the
government’s gasification drive, and was highlighted by president Nazarbayev in a speech in
February 2012. At public hearings in the West Kazakhstan region on the future development
of Karachaganak, both oil minister Sauat Mynbayev and representatives of Kazrosgaz
pressed for the consortium to take the gas processing plant into account. Kazmunaigaz has
stated that in keeping with the gasification drive, construction of the plant should be
85
For the earlier history of the project and other details, see Yenikeyeff (2009), pp. 325-326. 86
Isabel Gorst, “Oil group secures Kazakh agreement”, Financial Times, 14 December 2011; “State takes
Karachaganak stake”, International Gas Report, 19 December 2011 87
Kazmunaigaz, Godovoi Otchet 2010, p. 30
46
undertaken in 2014-18, and that the plant could be included in the consortium’s phase three,
or financed separately as a joint venture or by the state.88
Whether and how quickly gas
output will be raised from Karachaganak to meet this and other possible demand will be
resolved in the course of the negotiations on the third phase.
Kashagan, the largest Caspian offshore oil and gas field, has estimated recoverable resources
of 7-9 billion barrels of oil and 490 bcm of proven gas reserves, and is due to start
commercial production in mid 2013. It should easily overtake Karachaganak as Kazakhstan’s
largest producer of gas at some point thereafter. The field is projected to be developed in two
main stages: the experimental programme (2013-18), during which commercial production
will start, the reservoir will be assessed, and production brought to around 400,000
barrels/day of oil and 10.5 bcm/year of gas – of which 55% will be reinjected, leaving around
4.8 bcm of sales gas. During further phases of development, oil production could reach 1.5
million barrels/day, although, due to planned reinjection, gas output may not rise
substantially. The volume of gas reinjection during the further phases of development has not
been finalised, however.
The start-up of production at Kashagan, originally scheduled for 2005, has been repeatedly
delayed, partly because of the considerable technical difficulties presented by offshore
development in shallow but seasonally ice-covered water, the levels of hydrogen sulphide in
the hydrocarbons, the lack of infrastructure, etc. There have been a series of disputes between
the Kazakh government and the IOCs that work at the field, the most recent chapter of which
started in 2007, when Eni, then the operator, announced a sharp increase in the projected
budget (from $57 billion to $136 billion), and the most recent postponement of production.
The government suspended the project and threatened to annul the licence.89
The outcome
was that the government insisted that Eni be replaced by joint operatorship. In 2008,
Kazmunaigaz doubled its stake in the project, and joint operatorship was agreed. (From that
point the consortium consisted of Kazmunaingaz, ExxonMobil, Shell, Total, Eni (with
16.81% each), Conoco Phillips (8.39%) and Inpex of Japan (7.56%).
Disagreements between the consortium and the government over costs erupted again in 2011,
however. Reportedly, alternative scenarios prepared by Shell’s Kashagan Cost Reduction
Team were presented to the oil and gas ministry, and the other partners, in December that
year, but not agreed. In February 2012 work was wound down on the second phase of
development, as disagreements persisted. In May a new agreement was signed, with the
foreign partners agreeing to pay $986 million to fund the state’s contribution to development
costs for 2012-13.90
Within the larger dispute about costs, the government and IOCs were also negotiating over
the field’s future gas output. In 2008, one of the changes made to the development plan by
Eni was to scrap proposals to install gas processing capacity in Atyrau, and to raise the
proportion of gas to be reinjected. This was opposed by the government. In 2012, as part of
the agreement on costs signed in May, the foreign partner companies conceded that from the
start-up of commercial hydrocarbons production, gas will be purchased by KazTransGas for
88
Kazrosgaz press release, “Construction of a new gas processing plant at Karachaganak”, 7 February 2012;
“Gas Refinery Planned for BG, Eni-Led Field”, 10 February 2012, Bloomberg News; “Pervuiu ochered’ GPZ na
Karachaganake vvedut v ekspluatatsiiu v 2019 godu”, Tengri News, 10 Feburary 2012
<http://tengrinews.kz/mney/207960/> 89
Babali (2009), pp. 1298-1308; Isabel Gorst, “Kashagan: a Caspian dream turned headache for oil majors”,
Financial Times, 9 June 2011; Richard Orange, “Shell shuts Caspian office”, Daily Telegraph, 24 May 2011 90
Reuters, “Kazakh oilfield firms to pay $1 bn state investment”, 28 May 2012
47
sale on the domestic market. The companies’ hopes of achieving export prices for the gas
have not been realised, but neither have the government’s hopes of the gas being supplied
free of charge, as it is from the ACG field in Azerbaijan.91
During 2012 there have been reports of further possible changes in the consortium.
ExxonMobil was reported to be in talks with ONGC of India about selling part of its stake;
more recently, both Shell and ExxonMobil were reported to be seeking greater shares, an
extension of the PSA and a new agreement on operatorship; in November 2012,
ConocoPhillips announced that it will sell its stake to ONGC.92
At the time of writing these
issues remain unresolved. Clearly, as with the negotiations over Karachaganak, the decisions
about what proportion of the project’s gas is sold, and under what terms, will be crucial for
the future of Kazakhstan’s market and gas production profile.
Tengiz, currently Kazakhstan’s second largest source of gas, is operated by Tengizchevroil (a
partnership formed in 1993, with current partners Chevron (50%), Kazmunaigaz (20%),
ExxonMobil Kazakhstan (25%) and LukArco, a Lukoil-BP joint venture (5%)). Tengiz began
production in 1993 and raised output to 12-15 million tonnes/year of oil and around 2.5
bcm/year of gas during the 2000s. The commissioning of the Second Generation Plant in
2008 made possible a further increase in oil output, which reached 25.6 million tonnes in
2011; the volume of dry sales gas (after reinjection) reached about 7 bcm/year (6.9 bcm in
2011; see Table 10 above).93
At the time of writing, the shareholders are in discussion with
government about the future development of the project. An increase in oil output to 36
million tonnes/year is projected; according to newspaper reports, some shareholders advocate
construction of a third processing complex to achieve this, while Samruk Kazyna, the state
holding company that manages the government’s share, believes this is unnecessary.94
There
are also proposals under discussion for a petrochemicals complex supplied by Tengiz
production (see section 4.3 below).
Other onshore projects
Apart from the gas produced at Karachaganak and Tengiz, most of Kazakhstan’s gas
production is associated gas from onshore oil fields. In the past the gas was mostly flared or
reinjected. But the way that it is used is changing, firstly due to government and company
policies requiring greater utilisation (i.e. reinjection, use as fuel, or processing for sale, rather
than flaring), and secondly, due to local demand, which is increasing, in part due to
gasification policies. The situation, by region (oblast), is as follows:
Mangistau, in south-west Kazakhstan, the historical heart of oil production. The largest oil
producers are two Kazmunaigaz subsidiaries, Ozenmunaigaz (which produces 5-6 million
tonnes/year of oil) and Embamunaigaz (2.8-2.9 million tonnes). Ozenmunaigaz has much
greater associated and natural gas resources, which are supplied to a processing plant. Its
output is (i) dry gas, some of which is used to supply power to the company’s fields, and the
remainder of which is supplied to the local market (probably less than 1 bcm/year), and (ii)
NGLs. In recent years the market for compressed natural gas (CNG) for transport in the
91
Yenikeyeff (2009) , p. 329; Reuters, “Kazakh oilfield firms to pay”, op. cit. 92
Reuters, “Kashagan’s big oil coming to market mid 2013”, 10 August 2012; Bloomberg, “Exxon, Shell Said
Seeking Control of Kashagan”, 30 August 2012 93
Tengizchevroil Annual Report 2011; Tengizchevroil web site; Yenikeyeff (2009), pp. 326-327. 94
“Tengiz popal pod davlenie”, Kursiv, 21 June 2012; “Stroitel’stvo novogo zavoda na Tengize otlozheno”,
Kapital, 23 October 2012
48
region has risen substantially, and production has risen accordingly.95
Reported associated
gas production at two other fields in Mangistau, Tolkyn and Borankol, increased during the
2000s – from about 0.6 bcm in 2003 to 2.4 bcm in 2009 – until the operating companies,
Tolkynneftegaz and Kazpolmunai, had their licences withdrawn by the ministry of oil and gas
in July 2010. The construction of a 2.4 bcm/year gas processing plant has been put on hold,
Kazmunaigaz stated. (According to press reports, Ascom, a Moldovan-based holding
company, has taken a case to the Stockholm arbitration court as a result of the licence
withdrawal.) The fields have been put under the temporary management of Kazmunaigaz.96
Aktobe. The main oil field in the region, Zhanazhol, is operated by a CNPC subsidiary,
CNPC-Aktobemunaigaz (oil production 6.2 million tonnes in 2011). Gas production of 3.4
bcm was reported in 2011, but most of this is used to apply gas-lift technology for oil
production (where it is currently used in two-thirds of producing wells), or for reinjection, or
for power supply on the field. However CNPC-Aktobemunaigaz is also investing in a gas
processing plant that supplies gas to the local market via the 5 bcm/year Zhanazhol-
Oktyabrsk-Aktobe pipeline, which runs eastward from the field and connects to the Bukhara-
Urals pipeline. In 2007 the first of three units of the plant, with a capacity reported at 0.7
bcm/year, was commissioned. Construction of the second unit is due to begin in 2012; when
all three are completed the plant will have a capacity of 5 bcm/year.97
The Urikhtau field, which borders directly on Zhanazhol, was in 2008 earmarked for
development by a Kazakh-Chinese joint venture, under a framework agreement between
CNPC and Kazmunaigaz. In May 2011 it was reported that Kazmunaigaz, through its wholly-
owned subsidiary Urikhtau Operating, had discovered much more substantial reserves at
Urikhtau than had been known about before: about 200 million tonnes of oil, in addition to
previous reserves of 40 bcm of gas and 11 million tonnes of condensate. This is the first
discovery of this scale by a Kazakh company working independently of foreign partners. In
May 2012, Kazmunaigaz executives announced plans for the drilling of exploration wells –
but up to the time of writing, no announcement has been made about the formation of the
joint venture.98
Industry sources suggest that there is tension between Kazakhstan and China
over the issue, that Kazakhstan hopes to limit Chinese involvement in the field, and that this
is exacerbating tensions over the construction of the Beineu-Shimkent pipeline (see section
5.2).
95
Kazmunaigaz Annual Report 2011, p. 23; Kazmunaigaz web site, “Utilizatsiia gaza” page
<http://www.kmg.kz/ecology/programme/utilization/> 96
Kazakh ministry of oil and gas press release, “Borankol’skii GPZ perekhodit vo vremennoe upravlenie
Kazmunaigaza”, 21 July 2010; Kazmunaigaz press release, “S TOO ‘Tolkynneftegaz’ rastorgnut kontrakt”, 22
July 2010; Neftegazekspert, “Dosrochno prekrashcheno distvie kontraktov na pravo nedropol’zovaniia”, 2
August 2010 <http://www.neftegazexpert.ru/neftegazline/neftegaztext91024.html>; Kazakhstan Today, “Na
mestorozhdeniakh Tolkyn i Borankol’”, 26 January 2004; “Po itogam 2008 goda”, Kazenergy no. 2, 2010, p. 65. 97
CNPC web site, Kazakhstan page < http://www.cnpc.com.cn/NR/exeres/3CAE5E89-8280-4FB3-BB4C-
C7EBD3811473.htm?NRMODE=Unpublished&wbc_purpose=Basic&WBCMODE=PresentationUnpublished>
; Interfax-Kazakhstan, “CNPC-Aktobemunaigaz pristupit k stroitel’stvu II ocheredi Zhanazholskogo TPZ-3”, 25
November 2011; Halyk finance, “CNPC-Aktobemunaigas increased 2011 oil production”, 24 February 2012. 98
CNPC press release “CNPC and KazMunayGas sign framework agreement”, 1 November 2008; Urikhtau
Operating web site; “KMG otkryl novoe krupnoe mestorozhdenie nefti”, Kursiv, 19 May 2011; “Urikhtau
mozhet dostat’sia Kitaiu”, Kursiv, 27 May 2011; “Razvedochnye skvazhiny na Urikhtau nachnut burit’ cherez
dva mesiatsa”, Novosti Kazakhstan, 23 May 2012.
49
The picture of production in Aktobe is completed with Tethys Petroleum, which produces a
small quantity of gas from three blocks near the Aral Sea in the south of the region. This is
supplied into the Bukhara-Urals pipeline.99
Kyzylorda. The two main oil producers in the Kyzylorda region are PetroKazakhstan, which
operates fields in the Kumkol area and is owned by CNPC (67%) and Kazmunaigaz (33%);
and Kazgermunai, which operates fields in the South Turgai area and is owned by
PetroKazakhstan (50%) and Kazmunaigaz (50%). In 2005 Kazgermunai commissioned a gas
treatment plant and began to supply a small quantity of gas (about 0.1 bcm) to the local
market. PetroKazakhstan also has a gas utilisation programme that had by 2009 put an end to
flaring at its operations; the gas is used mainly for reinjection and for power generation in the
oil fields.100
Zhambyl in southern Kazakhstan. The Amangeldy group of fields in Zhambyl have been
developed by Kaztransgaz, a Kazmunaigaz subsidiary whose main business is gas
transportation and supply. The project has been prioritised by Kazmunaigaz as a means of
reducing dependence of south and south-east Kazakhstan on gas imports from Uzbekistan.
Production began in 2006, and rose from 0.28 bcm in that year to 0.34 bcm in 2010.101
3.4. Azerbaijan
Almost all of Azerbaijan’s current gas production comes from three offshore projects: the
Azeri-Chirag-Guneshli (ACG) oilfield, operated by BP on behalf of an international
consortium, from which 4-5 bcm/year of associated gas is brought ashore as sales gas; the
Shah Deniz (stage 1) gas project, operated by BP and Statoil on behalf of an international
consortium, which produces 6-7 bcm/year and is expected to achieve peak output of 8.9
bcm/year; and the Guneshli shallow fields, operated by Socar, the national oil and gas
company, producing 5-6 bcm/year. This gas is effectively divided between the domestic
market and exports to Turkey and Georgia. Small amounts of gas (2-3 bcm/year) are
produced onshore by Socar; these are mostly exported to Russia; to Georgia; and to Iran in
return for gas supplied to Nakhchivan, the Azeri enclave south-west of Armenia. The
production statistics published by the state statistics agency and Socar are shown in table 11:
99
Tethys web site, “Operations/Kazkahstan” page 100
Kazgermunai web site; PetroKazakhstan corporate brochure, p. 19 101
Kazmunaigaz Godovoi otchet 2010, pp. 22-23.
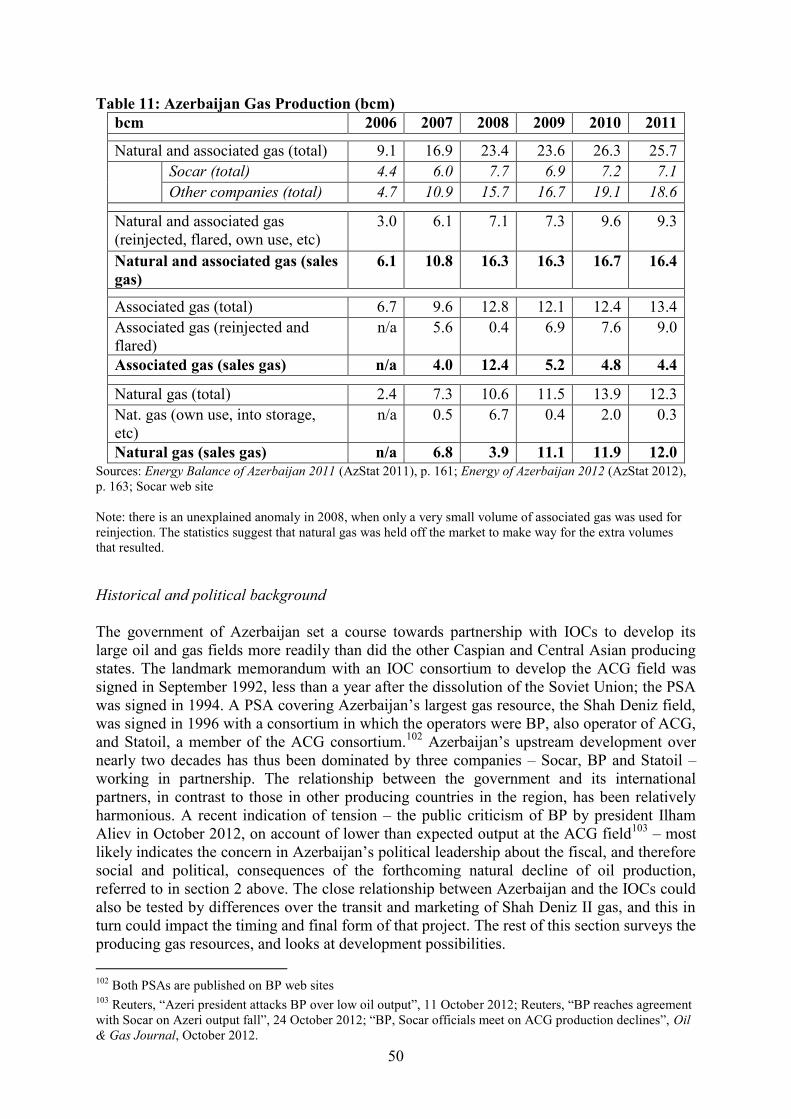
50
Table 11: Azerbaijan Gas Production (bcm)
bcm 2006 2007 2008 2009 2010 2011
Natural and associated gas (total) 9.1 16.9 23.4 23.6 26.3 25.7
Socar (total) 4.4 6.0 7.7 6.9 7.2 7.1
Other companies (total) 4.7 10.9 15.7 16.7 19.1 18.6
Natural and associated gas
(reinjected, flared, own use, etc)
3.0 6.1 7.1 7.3 9.6 9.3
Natural and associated gas (sales
gas)
6.1 10.8 16.3 16.3 16.7 16.4
Associated gas (total) 6.7 9.6 12.8 12.1 12.4 13.4
Associated gas (reinjected and
flared)
n/a 5.6 0.4 6.9 7.6 9.0
Associated gas (sales gas) n/a 4.0 12.4 5.2 4.8 4.4
Natural gas (total) 2.4 7.3 10.6 11.5 13.9 12.3
Nat. gas (own use, into storage,
etc)
n/a 0.5 6.7 0.4 2.0 0.3
Natural gas (sales gas) n/a 6.8 3.9 11.1 11.9 12.0
Sources: Energy Balance of Azerbaijan 2011 (AzStat 2011), p. 161; Energy of Azerbaijan 2012 (AzStat 2012),
p. 163; Socar web site
Note: there is an unexplained anomaly in 2008, when only a very small volume of associated gas was used for
reinjection. The statistics suggest that natural gas was held off the market to make way for the extra volumes
that resulted.
Historical and political background
The government of Azerbaijan set a course towards partnership with IOCs to develop its
large oil and gas fields more readily than did the other Caspian and Central Asian producing
states. The landmark memorandum with an IOC consortium to develop the ACG field was
signed in September 1992, less than a year after the dissolution of the Soviet Union; the PSA
was signed in 1994. A PSA covering Azerbaijan’s largest gas resource, the Shah Deniz field,
was signed in 1996 with a consortium in which the operators were BP, also operator of ACG,
and Statoil, a member of the ACG consortium.102
Azerbaijan’s upstream development over
nearly two decades has thus been dominated by three companies – Socar, BP and Statoil –
working in partnership. The relationship between the government and its international
partners, in contrast to those in other producing countries in the region, has been relatively
harmonious. A recent indication of tension – the public criticism of BP by president Ilham
Aliev in October 2012, on account of lower than expected output at the ACG field103
– most
likely indicates the concern in Azerbaijan’s political leadership about the fiscal, and therefore
social and political, consequences of the forthcoming natural decline of oil production,
referred to in section 2 above. The close relationship between Azerbaijan and the IOCs could
also be tested by differences over the transit and marketing of Shah Deniz II gas, and this in
turn could impact the timing and final form of that project. The rest of this section surveys the
producing gas resources, and looks at development possibilities.
102
Both PSAs are published on BP web sites 103
Reuters, “Azeri president attacks BP over low oil output”, 11 October 2012; Reuters, “BP reaches agreement
with Socar on Azeri output fall”, 24 October 2012; “BP, Socar officials meet on ACG production declines”, Oil
& Gas Journal, October 2012.
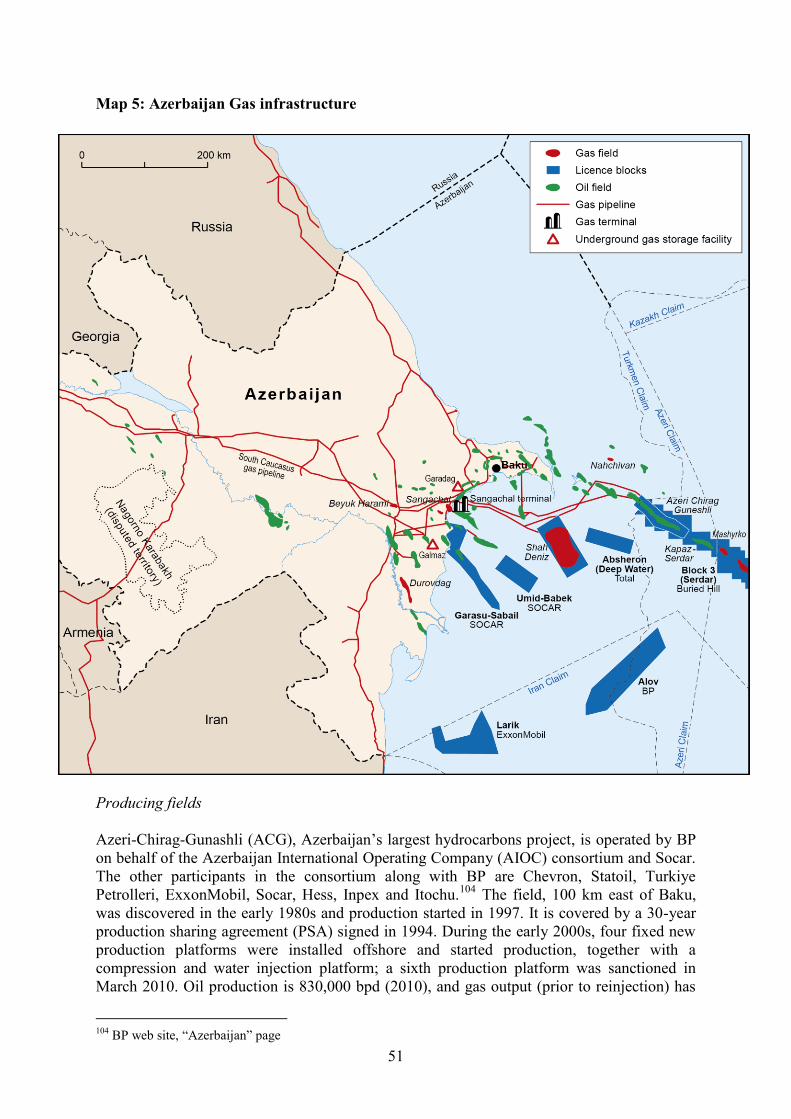
51
Map 5: Azerbaijan Gas infrastructure
Producing fields
Azeri-Chirag-Gunashli (ACG), Azerbaijan’s largest hydrocarbons project, is operated by BP
on behalf of the Azerbaijan International Operating Company (AIOC) consortium and Socar.
The other participants in the consortium along with BP are Chevron, Statoil, Turkiye
Petrolleri, ExxonMobil, Socar, Hess, Inpex and Itochu.104
The field, 100 km east of Baku,
was discovered in the early 1980s and production started in 1997. It is covered by a 30-year
production sharing agreement (PSA) signed in 1994. During the early 2000s, four fixed new
production platforms were installed offshore and started production, together with a
compression and water injection platform; a sixth production platform was sanctioned in
March 2010. Oil production is 830,000 bpd (2010), and gas output (prior to reinjection) has
104
BP web site, “Azerbaijan” page
52
risen from 6.7 bcm in 2006 to 12-13 bcm in recent years.105
Most of the gas produced is
reinjected into the oil reservoirs to increase pressure; the remainder of it is delivered to the
Sangachal terminal, offshore south of Baku, for delivery into Azerbaijan’s transportation
network. Although the volumes of sales gas are not made public by the consortium, they
account for the vast majority, if not all, of associated gas delivered for sale in Azerbaijan, as
indicated in Table 11, i.e. between 4 bcm and 5.2 bcm in recent years. (There is an
unexplained anomaly in the statistics in 2008, when the volume was much larger, perhaps due
e.g. to technical problems related to reinjection.) The sales gas is delivered free of charge to
Socar, under the terms of the PSA.106
The Shah Deniz field is operated by BP and Statoil on behalf of a consortium, comprising BP
(25.5%), Statoil (25.5%), Total (10%), Lukoil (10%), Socar (10%), OIEC of Iran (10%), and
Turkiye Petrolleri (9%). (Of these companies, BP, Statoil, Turkiye Petrolleri and Socar also
participate in the ACG consortium.) Shah Deniz, 70 km south east of Baku in water depths of
50-500 metres, is one of the world’s largest gas-condensate fields, with more than 1 tcm of
gas in place. The stage 1 project began producing gas in 2006; output has risen from 3.1 bcm
in 2007, and will peak about 9 bcm/year; its gas is sold on the Azeri domestic market, and
exported to Georgia and Turkey (see section 5.5 below).107
The shallow water Guneshli fields are operated by Socar. They account for 70% of Socar's
production of gas, i.e. 4-5.5 bcm/year in total (prior to reinjection, own use and flaring) in
recent years, as well as about 60% of its production of oil, i.e. 5.0-5.5 million tonnes/year in
recent years. Large amounts of gas were flared or vented, but this has been reduced in recent
years: according to the Global Gas Flaring Reduction Initiative, the volumes flared or vented
fell from 0.49 bcm in 2007 to 0.276 bcm in 2010.108
In 2011 Socar adopted a development
programme for 2011-15 for the field, which set out the means by which production would be
maintained at the current level. It provided for the drilling of new wells, and the introduction
of gas-lift technology in order to maintain pressure in the oil reservoir. In early 2012, under
this programme, a compressor station was installed on the Guneshli-4 platform, comprising
two turbines, with an aggregate capacity of 2 million cu m/day (1.4 bcm/year); the
pressurised gas will either be reinjected or taken ashore as sales gas.109
A much smaller
quantity of gas (less than 1bcm/year) is produced by Socar from onshore fields.
Gas produced in Azerbaijan is processed at a dedicated Soviet-era gas processing plant at
Garadagh, and at the integrated oil and gas terminal at Sangachal, which was completed in
1997. The Garadagh plant is operated by Socar, and processes gas both from ACG and from
Socar’s own production. It was first commissioned in 1961, attained a capacity of 4.5
bcm/year in the 1970s and was expanded to a capacity of 6.5 bcm/year in 1986. The plant
105
Oil production, Statoil web site,
<http://www.statoil.com/en/About/Worldwide/Azerbaijan/Pages/AzeriChiragGunashli.aspx>; gas production,
author’s estimate from company information and press reports 106
Agreement on the Joint Development and Production Sharing for the Azeri and Chirag Fields and the Deep
Water Portion of the Gunashli Field in the Azerbaijan Sector of the Caspian Sea, Article 15.1, states that
residue Associated Natural Gas (but not non-associated gas) shall be “delivered free of charge to Socar at the
delivery point”. 107
BP web site, “BP Caspian: Shah Deniz” page; Bowden (2009), pp. 203-234. 108
World Bank/GGFR web site, “Azerbaijan: Reducing Associated Petroleum Gas Flaring and Venting” 109
Socar annual report 2010, p. 29; www.economy.az, “GNKAR utverdila piatiletniuiu programmu”, 4 April
2011 <http://www.economy.az/archives/54379>; www.rusenergy.com, “Socar povyshaet effektivnost’ sbora
gaza”, 16 March 2012 <http://www.rusenergy.com/ru/news/news.php?id=58689>; Interfax Azerbaijan, “Socar
postroila gazokompressornuiu stantsiu”, 4 May 2012.
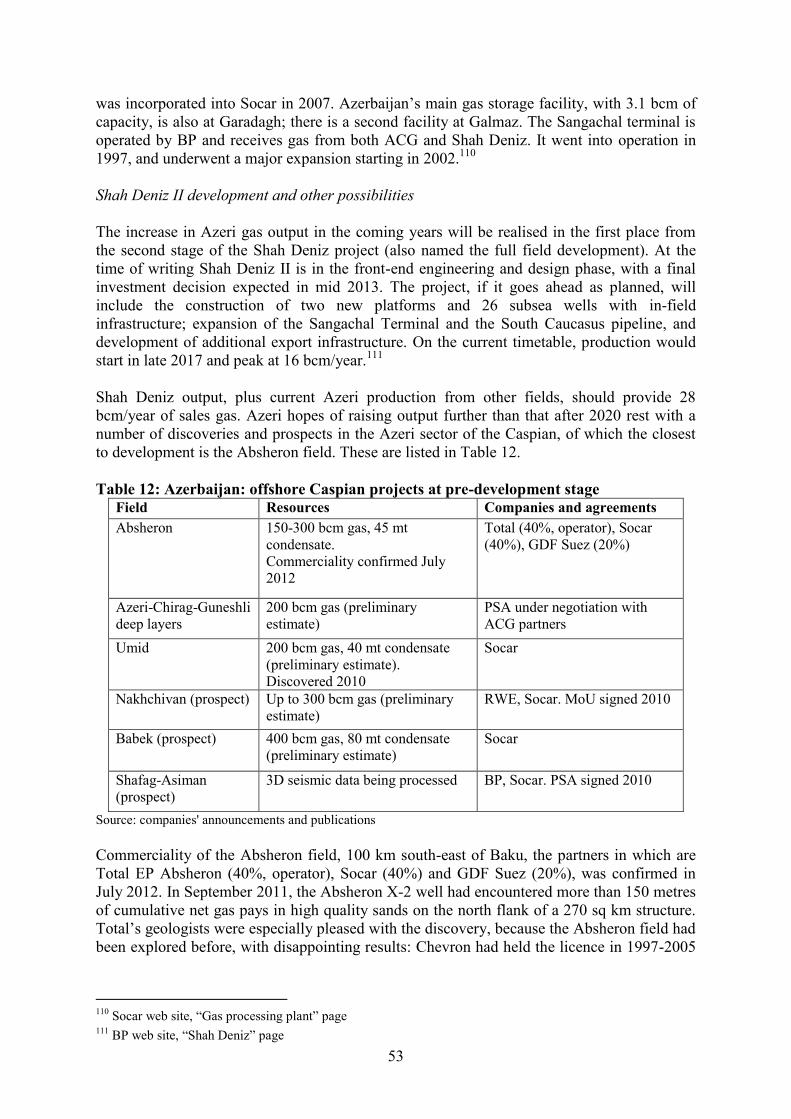
53
was incorporated into Socar in 2007. Azerbaijan’s main gas storage facility, with 3.1 bcm of
capacity, is also at Garadagh; there is a second facility at Galmaz. The Sangachal terminal is
operated by BP and receives gas from both ACG and Shah Deniz. It went into operation in
1997, and underwent a major expansion starting in 2002.110
Shah Deniz II development and other possibilities
The increase in Azeri gas output in the coming years will be realised in the first place from
the second stage of the Shah Deniz project (also named the full field development). At the
time of writing Shah Deniz II is in the front-end engineering and design phase, with a final
investment decision expected in mid 2013. The project, if it goes ahead as planned, will
include the construction of two new platforms and 26 subsea wells with in-field
infrastructure; expansion of the Sangachal Terminal and the South Caucasus pipeline, and
development of additional export infrastructure. On the current timetable, production would
start in late 2017 and peak at 16 bcm/year.111
Shah Deniz output, plus current Azeri production from other fields, should provide 28
bcm/year of sales gas. Azeri hopes of raising output further than that after 2020 rest with a
number of discoveries and prospects in the Azeri sector of the Caspian, of which the closest
to development is the Absheron field. These are listed in Table 12.
Table 12: Azerbaijan: offshore Caspian projects at pre-development stage
Field Resources Companies and agreements
Absheron 150-300 bcm gas, 45 mt
condensate.
Commerciality confirmed July
2012
Total (40%, operator), Socar
(40%), GDF Suez (20%)
Azeri-Chirag-Guneshli
deep layers
200 bcm gas (preliminary
estimate)
PSA under negotiation with
ACG partners
Umid 200 bcm gas, 40 mt condensate
(preliminary estimate).
Discovered 2010
Socar
Nakhchivan (prospect) Up to 300 bcm gas (preliminary
estimate)
RWE, Socar. MoU signed 2010
Babek (prospect) 400 bcm gas, 80 mt condensate
(preliminary estimate)
Socar
Shafag-Asiman
(prospect)
3D seismic data being processed BP, Socar. PSA signed 2010
Source: companies' announcements and publications
Commerciality of the Absheron field, 100 km south-east of Baku, the partners in which are
Total EP Absheron (40%, operator), Socar (40%) and GDF Suez (20%), was confirmed in
July 2012. In September 2011, the Absheron X-2 well had encountered more than 150 metres
of cumulative net gas pays in high quality sands on the north flank of a 270 sq km structure.
Total’s geologists were especially pleased with the discovery, because the Absheron field had
been explored before, with disappointing results: Chevron had held the licence in 1997-2005
110
Socar web site, “Gas processing plant” page 111
BP web site, “Shah Deniz” page
54
but relinquished it. Reprocessing and reconsideration of 3D seismic data, with the aid of more
advanced modelling, and the drilling of new wells, had made the difference.112
Other resources that may be close to development are the deep gas reservoirs below the ACG
fields. The reservoirs, Girmekiustu and Girmekialti, underneath the Fasila layer, are
understood to contain substantial gas resources, but the lack of appraisal drilling means that
the scale of these is uncertain. There have been long-running discussions between Socar and
the ACG consortium members about the terms on which these fields will be developed.
Socar’s chief executive stated in April 2012 that agreement was close on a second contract
for the development of the deep layers; the company reiterated this in September 2012.113
The Umid field, which is licenced to Socar, was explored from 2009, and the discovery of
both gas and oil confirmed in November 2010, from a well drilled to 6,006 metres. At the
time of writing, a second well is being drilled into the same geological structure.114
Two other substantial prospects are the subject of agreement between Socar and foreign
companies: the Shafag-Asiman structure, a PSA covering the exploration and development of
which was signed by Socar and BP in October 2010; and the Nakhchivan structure, being
explored by RWE under a memorandum of understanding signed with Socar in 2010. In
addition, there are blocks licenced to Socar itself where exploration is being conducted: the
Babek fields, and some smaller deposits.115
Another prospective area, the Alov, Araz and Sharg prospects, is covered by a PSA signed by
BP, Statoil and Socar with the Azeri government in 1998. Technical evaluations of the area
were made in 2002, but work has stopped since then because of a dispute between Iran and
Azerbaijan about the position of maritime boundaries. Little progress has been made in talks
between the two governments; these fields have therefore not been included in the above
table of projects with the potential for development.
The main factor that makes likely the continued expansion of offshore gas production, after
Shah Deniz II is commissioned in 2017, is the emphasis that the Azeri government is placing
on developing the gas resource. Not only does the government see rising gas output as a key
strategy to counter the decline of oil production, but it has also cooperated with international
oil companies on major hydrocarbons development projects over a longer period, and with
greater success, than Uzbekistan or Turkmenistan, and appears to be more disposed to
continue to do so than Kazakhstan. There remains, however, (i) doubts about the transport
and marketing issues related to Shah Deniz II gas will be resolved, which are discussed
further in section 5.5 below, and (ii) significant constraints on other fields, i.e. a range of
infrastructure and logistical problems associated with field development in the Caspian,
which is landlocked and only accessible to vessels via the Volga-Don canal from Russia. The
most serious of these logistical problems is the shortage of exploration rigs. Of the handful of
floating and semi-submersible rigs in the Caspian, the one most suitable for working at great
depths and at high pressure, the Heydar Aliev (Maersk Explorer), was returned to the Shah
Deniz field in 2012 after a spell at Absheron. The other semi-submersible rigs available in the
112
Zulfugar Agayev, “Total, GDF Confirm Gas Find”, Bloomberg, 2 July 2012; presentation by Bertrand
Chevalier, Total, at the Caspian Oil and Gas conference, May 2012, Baku. 113
“Socar to sign gas agreement with BP in 2012”, Reuters, 10 April 2012; “Azerbaijan prepares new contract”,
Bloomberg Business News, 6 September 2012. 114
Socar web site <http://new.socar.az/socar/en/activities/exploration/umid> 115
From companies’ reports and web sites
55
Azeri sector, the Dada Gorgud and Istiglal, are in use at ACG and Shah Deniz respectively.
At the time of writing, Socar had begun talks with Total, BP and other companies working in
the Caspian about the possibility of building two more semi-submersible rigs for the Caspian,
the first of which could be launched as soon as 2014. The other factor on which the pace of
Azeri offshore development depends is the development of the markets into which Azeri gas
is likely to be exported, i.e. Turkey and European countries, which will influence the
financing of projects. A senior Total executive, commenting on the prospects for Absheron
just after the announcement of commerciality, stated that rig constraints and the great expense
of the project were the two “major challenges”.116
Senior Socar executives have projected up to 50-55 bcm/year of total production, and 40
bcm/year of sales gas output, by 2020, and these appear to be achievable aims – subject to
exploration success on identified prospects. Rovnag Abdullayev, CEO of Socar, recently
projected an increase of total production (i.e. prior to own use, flaring, etc) from 25.7 bcm in
2011 to 50-55 bcm in 2025.117
His senior deputy forecast that the volume of sales gas
produced will rise from 16.4 bcm in 2011 to 20 bcm in 2020 and 40 bcm in 2025.118
Let us
assume that the output from currently producing fields falls only slightly, e.g. in round
numbers from 26 bcm to 25 bcm/year (i.e. that slightly more gas is reinjected by ACG as
pressure falls, and that the output of Socar’s own fields stays level); and that 16 bcm is added,
as planned, from Shah Deniz II. This amounts to 41 bcm/year of output. The implication of
Abdullayev’s projection is that within 12 years a further 9-14 bcm/year of production can be
added. Given the size of the discovered fields, the remaining identified prospects, the general
capability of the industry, and the level of government support for achieving this target, it
seems realistic. The caveat is that success is dependent on measures being taken in the near
future to address the infrastructure squeeze in the Caspian. (These estimates are shown in
Table 24, below in section 5.5 on Azeri exports.)
3.5. The region’s other producers
Apart from output by the four countries covered, the only other gas sure to be produced in
this decade in the Central Asian/Caspian region is associated gas from oil fields in the
Russian section of the Caspian Sea. These small, but growing, volumes will be processed in
southern Russia and fed into the Russian gas supply system, and will therefore impact only
indirectly on the market for gas from the other Central Asian and Caspian producers. To the
south, Iran has the second-largest gas reserves in the world – but, apart from a possible
substitution of domestic gas for Turkmen imports, Iran will only have an effect on its Caspian
neighbours if and when the sanctions against it by the UN and major consuming countries are
lifted. In the eastern part of the region, gas resources in Tajikistan, Kyrgyzstan and
Afghanistan could be produced in future.
Russia. The increase in production at Lukoil’s North Caspian oil fields in the coming years
could bring substantial volumes of associated gas. Lukoil has licences covering six fields, in
which it reported proved gas reserves of 170 bcm in 2008; production was launched in 2010
at the Yuri Korchagin field, the first to be developed. Output from the field rose to 338,100
tonnes of oil in 2011; in its most recent annual report the company projected peak output of
116
“Socar in plan to build Caspian semisubs”, Upstream, 3 February 2012; Caspian Drilling Co. web site;
presentation by Christian Guidicelli of Total at the Caspian Gas Forum, July 2012, Istanbul. 117
“Scalability as Drawn”, Azerbaijan 2012: The Business Year, pp. 92-93 118
Presentation by Khoshbakht Yusifzade, vice-president of Socar, at the Caspian Oil and Gas Conference,
Baku, May 2012.
56
2.4 million tonnes/year of oil and 1 bcm/year of gas from the field. The Sarmatskoye gas field
nearby contains substantial reserves; its C1 gas reserves were increased by 55.6 bcm in 2011.
The largest field, Filanovsky, could produce an estimated 8 bcm/year at peak.119
The extent
of associated gas utilisation from the fields will depend on developments in the Russian
market. Lukoil has sought to invest in gas consumers who can buy the North Caspian
production, and in 2008 bought TGK-8, the territorial power generation company in south-
west Russia, in the area bordering the Caspian. Lukoil has also begun construction of a
petrochemicals complex in the region, Stavrolen, which will require 2 bcm/year of feedstock
from 2015 for a first production line, and more thereafter. In March 2011 Lukoil reported that
it had reached agreement with Gazprom under which Gazprom would “do all in its power” to
accept North Caspian gas into the unified gas supply system; this is in line with the trend in
the Russian market towards increased sales of non-Gazprom gas.120
If in future Central Asian
exports are sold directly into the Russian market – rather than being sold on to Ukrainian and
central European markets as they are at present – a substantial increase in production by
Lukoil from the North Caspian will compete with them. Given the speed at which projects are
developing, and the current oversupply of the Russian market, such competition is unlikely to
take shape prior to the 2020s.
Iran. Most of Iran’s gas resources are in the south of the country and offshore in the Persian
Gulf. Iran is currently undertaking a major development of transport infrastructure to bring
gas to its northern regions, and this could result in Turkmen imports to northern Iran being
substituted by domestic supplies, significantly impacting Turkmenistan’s export trade (see
section 5.4 below). Iranian exports to Turkey comprise competition for current and future
Azeri exports, but Turkish-Iranian disputes over prices and commercial terms have made this
relationship difficult long before Azerbaijan became a significant supplier to the Turkish
market in 2007.121
Tajikistan, Kyrgyzstan and Afghanistan. In Tajikistan, exploration for both oil and gas is
being conducted by Tethys Petroleum which has signed a production sharing contract with
the government covering 35,000 square km in the south-west of the country. The company
reports audited resources of 1.13 billion boe in the “largely underexplored” territory. In 2011
it made a discovery of oil at East Olimtoi, is acquiring further seismic data and has stated that
it is seeking a farm-in partner.122
In Kyrgyzstan, which has proven natural gas reserves of 2-6
bcm, gas field development could be conducted by a joint venture between Kyrgyzgas and
Gazprom. There were talks in 2006-08 between the Kyrgyz Republic and Gazprom about
establishing a joint venture to undertake exploration and development; in early 2011 a
memorandum was issued providing for these negotiations to be reopened; but there have been
no results.123
In Afghanistan, CNPC was awarded exploration licences for three hydrocarbons
blocks in the Amu Darya basin, which contain both oil and gas-condensate fields; in October
2012 it began producing small volumes of oil from the Angot field, which was discovered in
1967 and has produced oil in the past.124
119
Lukoil Annual Report 2011; Henderson (2010), pp. 136-138. 120
Lukoil Annual Report 2011 121
See a detailed account in Kinnander (2010) 122
Tethys Petroleum Ltd, Management’s Discussion and Analysis, 30 June 2012; Tethys company presentations 123
Gazprom web site, “Kyrgyzstan” page; Gazprom press release of 7 September 2011, “Gazprom group to
open its representative office in Kyrgyzstan” 124
“CNPC gets three Afghanistan Amu Darya blocks”, Oil & Gas Journal, 16 January 2012; “CNPC producing
oil from Afghan block”, Oil & Gas Journal, 24 October 2012.
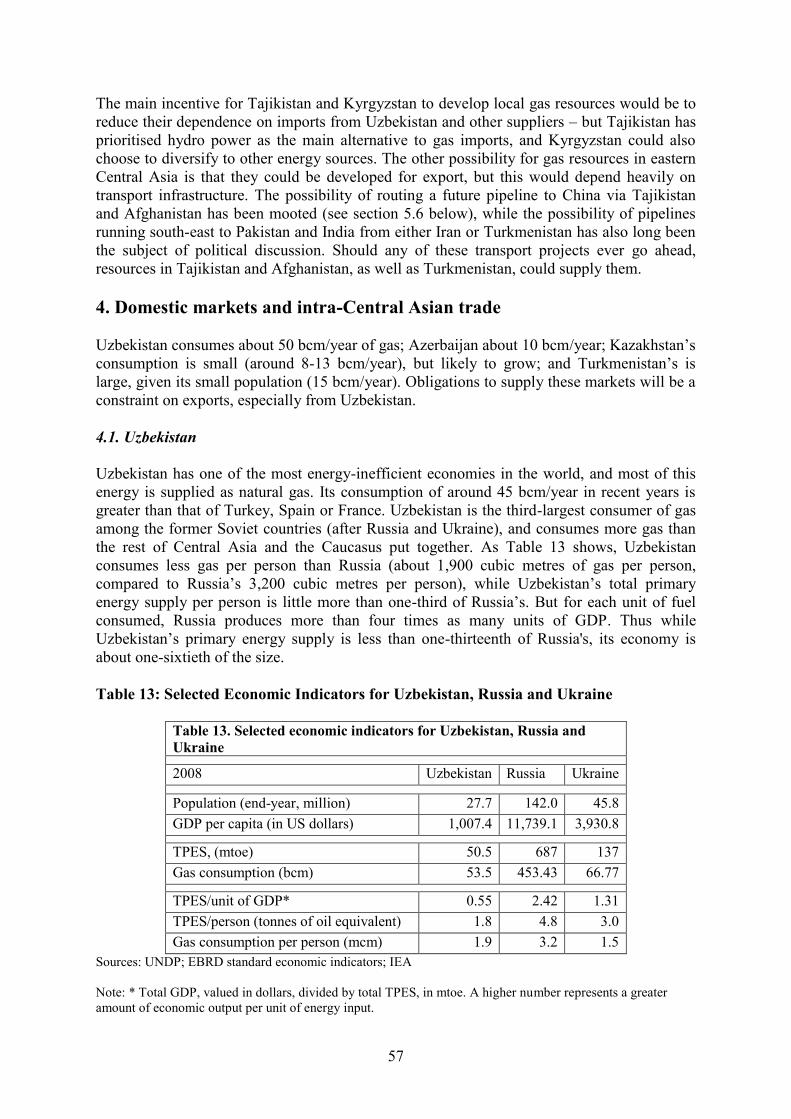
57
The main incentive for Tajikistan and Kyrgyzstan to develop local gas resources would be to
reduce their dependence on imports from Uzbekistan and other suppliers – but Tajikistan has
prioritised hydro power as the main alternative to gas imports, and Kyrgyzstan could also
choose to diversify to other energy sources. The other possibility for gas resources in eastern
Central Asia is that they could be developed for export, but this would depend heavily on
transport infrastructure. The possibility of routing a future pipeline to China via Tajikistan
and Afghanistan has been mooted (see section 5.6 below), while the possibility of pipelines
running south-east to Pakistan and India from either Iran or Turkmenistan has also long been
the subject of political discussion. Should any of these transport projects ever go ahead,
resources in Tajikistan and Afghanistan, as well as Turkmenistan, could supply them.
4. Domestic markets and intra-Central Asian trade
Uzbekistan consumes about 50 bcm/year of gas; Azerbaijan about 10 bcm/year; Kazakhstan’s
consumption is small (around 8-13 bcm/year), but likely to grow; and Turkmenistan’s is
large, given its small population (15 bcm/year). Obligations to supply these markets will be a
constraint on exports, especially from Uzbekistan.
4.1. Uzbekistan
Uzbekistan has one of the most energy-inefficient economies in the world, and most of this
energy is supplied as natural gas. Its consumption of around 45 bcm/year in recent years is
greater than that of Turkey, Spain or France. Uzbekistan is the third-largest consumer of gas
among the former Soviet countries (after Russia and Ukraine), and consumes more gas than
the rest of Central Asia and the Caucasus put together. As Table 13 shows, Uzbekistan
consumes less gas per person than Russia (about 1,900 cubic metres of gas per person,
compared to Russia’s 3,200 cubic metres per person), while Uzbekistan’s total primary
energy supply per person is little more than one-third of Russia’s. But for each unit of fuel
consumed, Russia produces more than four times as many units of GDP. Thus while
Uzbekistan’s primary energy supply is less than one-thirteenth of Russia's, its economy is
about one-sixtieth of the size.
Table 13: Selected Economic Indicators for Uzbekistan, Russia and Ukraine
Table 13. Selected economic indicators for Uzbekistan, Russia and
Ukraine
2008 Uzbekistan Russia Ukraine
Population (end-year, million) 27.7 142.0 45.8
GDP per capita (in US dollars) 1,007.4 11,739.1 3,930.8
TPES, (mtoe) 50.5 687 137
Gas consumption (bcm) 53.5 453.43 66.77
TPES/unit of GDP* 0.55 2.42 1.31
TPES/person (tonnes of oil equivalent) 1.8 4.8 3.0
Gas consumption per person (mcm) 1.9 3.2 1.5
Sources: UNDP; EBRD standard economic indicators; IEA
Note: * Total GDP, valued in dollars, divided by total TPES, in mtoe. A higher number represents a greater
amount of economic output per unit of energy input.
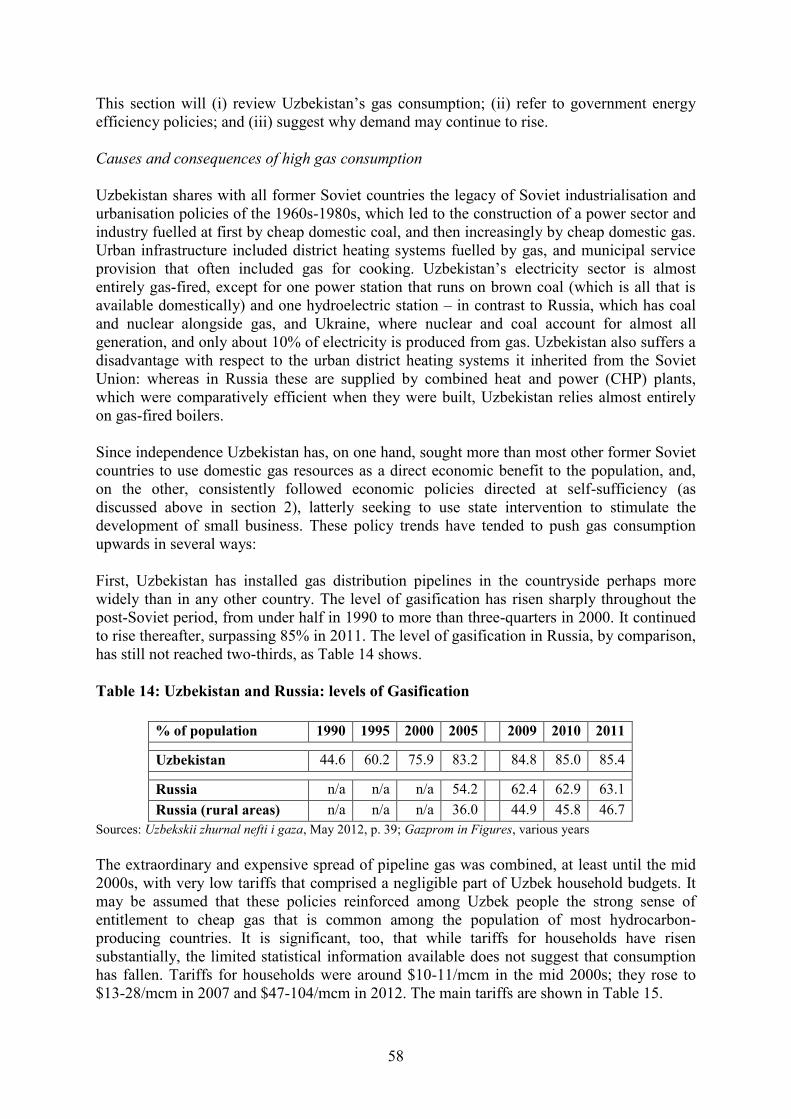
58
This section will (i) review Uzbekistan’s gas consumption; (ii) refer to government energy
efficiency policies; and (iii) suggest why demand may continue to rise.
Causes and consequences of high gas consumption
Uzbekistan shares with all former Soviet countries the legacy of Soviet industrialisation and
urbanisation policies of the 1960s-1980s, which led to the construction of a power sector and
industry fuelled at first by cheap domestic coal, and then increasingly by cheap domestic gas.
Urban infrastructure included district heating systems fuelled by gas, and municipal service
provision that often included gas for cooking. Uzbekistan’s electricity sector is almost
entirely gas-fired, except for one power station that runs on brown coal (which is all that is
available domestically) and one hydroelectric station – in contrast to Russia, which has coal
and nuclear alongside gas, and Ukraine, where nuclear and coal account for almost all
generation, and only about 10% of electricity is produced from gas. Uzbekistan also suffers a
disadvantage with respect to the urban district heating systems it inherited from the Soviet
Union: whereas in Russia these are supplied by combined heat and power (CHP) plants,
which were comparatively efficient when they were built, Uzbekistan relies almost entirely
on gas-fired boilers.
Since independence Uzbekistan has, on one hand, sought more than most other former Soviet
countries to use domestic gas resources as a direct economic benefit to the population, and,
on the other, consistently followed economic policies directed at self-sufficiency (as
discussed above in section 2), latterly seeking to use state intervention to stimulate the
development of small business. These policy trends have tended to push gas consumption
upwards in several ways:
First, Uzbekistan has installed gas distribution pipelines in the countryside perhaps more
widely than in any other country. The level of gasification has risen sharply throughout the
post-Soviet period, from under half in 1990 to more than three-quarters in 2000. It continued
to rise thereafter, surpassing 85% in 2011. The level of gasification in Russia, by comparison,
has still not reached two-thirds, as Table 14 shows.
Table 14: Uzbekistan and Russia: levels of Gasification
% of population 1990 1995 2000 2005 2009 2010 2011
Uzbekistan 44.6 60.2 75.9 83.2 84.8 85.0 85.4
Russia n/a n/a n/a 54.2 62.4 62.9 63.1
Russia (rural areas) n/a n/a n/a 36.0 44.9 45.8 46.7
Sources: Uzbekskii zhurnal nefti i gaza, May 2012, p. 39; Gazprom in Figures, various years
The extraordinary and expensive spread of pipeline gas was combined, at least until the mid
2000s, with very low tariffs that comprised a negligible part of Uzbek household budgets. It
may be assumed that these policies reinforced among Uzbek people the strong sense of
entitlement to cheap gas that is common among the population of most hydrocarbon-
producing countries. It is significant, too, that while tariffs for households have risen
substantially, the limited statistical information available does not suggest that consumption
has fallen. Tariffs for households were around $10-11/mcm in the mid 2000s; they rose to
$13-28/mcm in 2007 and $47-104/mcm in 2012. The main tariffs are shown in Table 15.
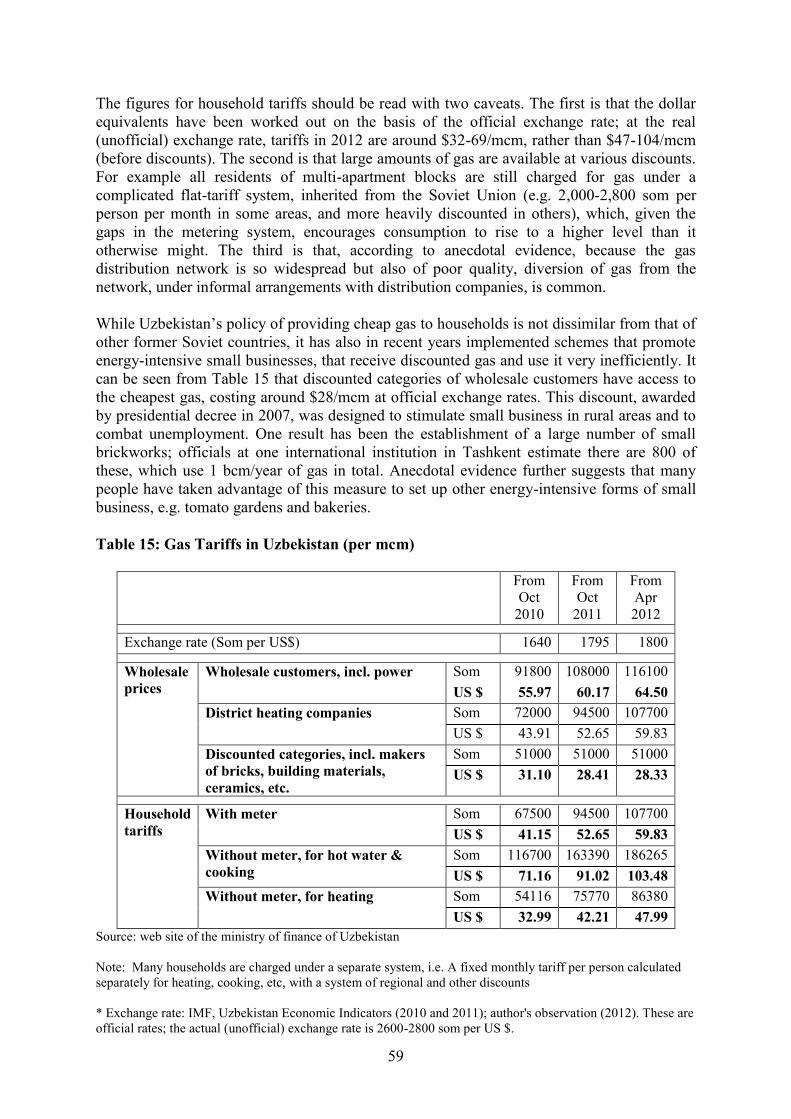
59
The figures for household tariffs should be read with two caveats. The first is that the dollar
equivalents have been worked out on the basis of the official exchange rate; at the real
(unofficial) exchange rate, tariffs in 2012 are around $32-69/mcm, rather than $47-104/mcm
(before discounts). The second is that large amounts of gas are available at various discounts.
For example all residents of multi-apartment blocks are still charged for gas under a
complicated flat-tariff system, inherited from the Soviet Union (e.g. 2,000-2,800 som per
person per month in some areas, and more heavily discounted in others), which, given the
gaps in the metering system, encourages consumption to rise to a higher level than it
otherwise might. The third is that, according to anecdotal evidence, because the gas
distribution network is so widespread but also of poor quality, diversion of gas from the
network, under informal arrangements with distribution companies, is common.
While Uzbekistan’s policy of providing cheap gas to households is not dissimilar from that of
other former Soviet countries, it has also in recent years implemented schemes that promote
energy-intensive small businesses, that receive discounted gas and use it very inefficiently. It
can be seen from Table 15 that discounted categories of wholesale customers have access to
the cheapest gas, costing around $28/mcm at official exchange rates. This discount, awarded
by presidential decree in 2007, was designed to stimulate small business in rural areas and to
combat unemployment. One result has been the establishment of a large number of small
brickworks; officials at one international institution in Tashkent estimate there are 800 of
these, which use 1 bcm/year of gas in total. Anecdotal evidence further suggests that many
people have taken advantage of this measure to set up other energy-intensive forms of small
business, e.g. tomato gardens and bakeries.
Table 15: Gas Tariffs in Uzbekistan (per mcm)
From
Oct
2010
From
Oct
2011
From
Apr
2012
Exchange rate (Som per US$) 1640 1795 1800
Wholesale
prices
Wholesale customers, incl. power Som 91800 108000 116100
US $ 55.97 60.17 64.50
District heating companies Som 72000 94500 107700
US $ 43.91 52.65 59.83
Discounted categories, incl. makers
of bricks, building materials,
ceramics, etc.
Som 51000 51000 51000
US $ 31.10 28.41 28.33
Household
tariffs
With meter Som 67500 94500 107700
US $ 41.15 52.65 59.83
Without meter, for hot water &
cooking
Som 116700 163390 186265
US $ 71.16 91.02 103.48
Without meter, for heating Som 54116 75770 86380
US $ 32.99 42.21 47.99
Source: web site of the ministry of finance of Uzbekistan
Note: Many households are charged under a separate system, i.e. A fixed monthly tariff per person calculated
separately for heating, cooking, etc, with a system of regional and other discounts
* Exchange rate: IMF, Uzbekistan Economic Indicators (2010 and 2011); author's observation (2012). These are
official rates; the actual (unofficial) exchange rate is 2600-2800 som per US $.
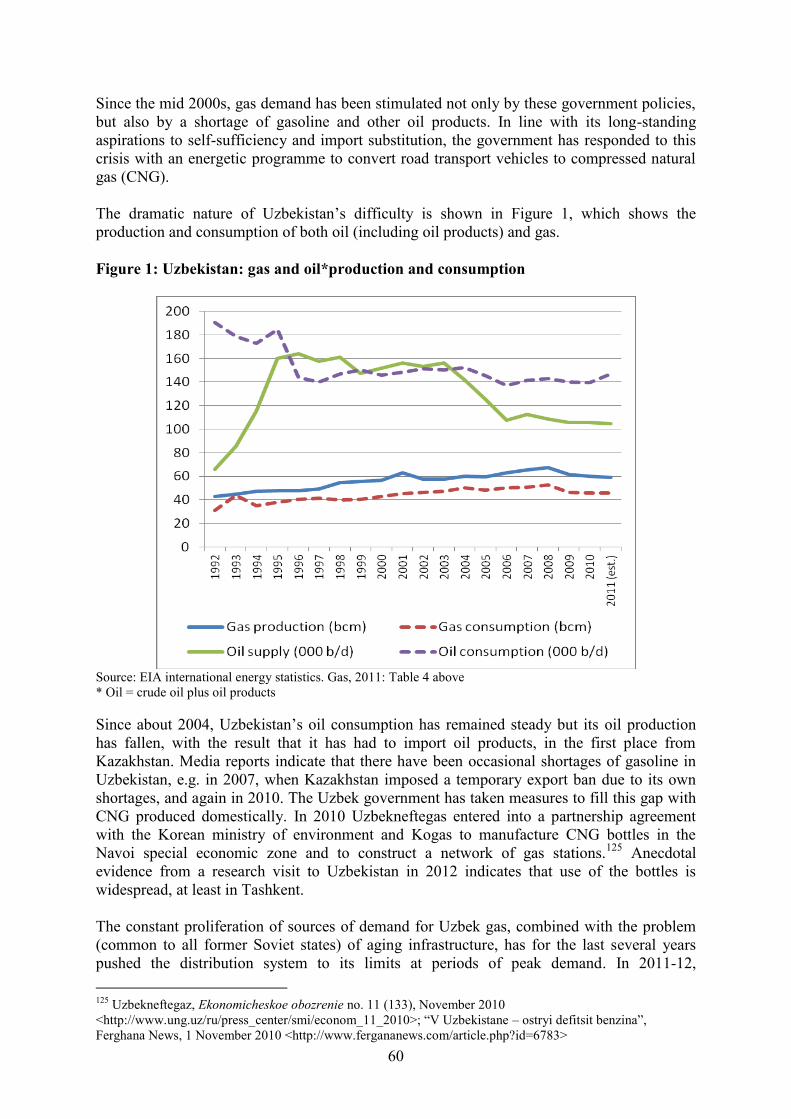
60
Since the mid 2000s, gas demand has been stimulated not only by these government policies,
but also by a shortage of gasoline and other oil products. In line with its long-standing
aspirations to self-sufficiency and import substitution, the government has responded to this
crisis with an energetic programme to convert road transport vehicles to compressed natural
gas (CNG).
The dramatic nature of Uzbekistan’s difficulty is shown in Figure 1, which shows the
production and consumption of both oil (including oil products) and gas.
Figure 1: Uzbekistan: gas and oil*production and consumption
Source: EIA international energy statistics. Gas, 2011: Table 4 above
* Oil = crude oil plus oil products
Since about 2004, Uzbekistan’s oil consumption has remained steady but its oil production
has fallen, with the result that it has had to import oil products, in the first place from
Kazakhstan. Media reports indicate that there have been occasional shortages of gasoline in
Uzbekistan, e.g. in 2007, when Kazakhstan imposed a temporary export ban due to its own
shortages, and again in 2010. The Uzbek government has taken measures to fill this gap with
CNG produced domestically. In 2010 Uzbekneftegas entered into a partnership agreement
with the Korean ministry of environment and Kogas to manufacture CNG bottles in the
Navoi special economic zone and to construct a network of gas stations.125
Anecdotal
evidence from a research visit to Uzbekistan in 2012 indicates that use of the bottles is
widespread, at least in Tashkent.
The constant proliferation of sources of demand for Uzbek gas, combined with the problem
(common to all former Soviet states) of aging infrastructure, has for the last several years
pushed the distribution system to its limits at periods of peak demand. In 2011-12,
125
Uzbekneftegaz, Ekonomicheskoe obozrenie no. 11 (133), November 2010
<http://www.ung.uz/ru/press_center/smi/econom_11_2010>; “V Uzbekistane – ostryi defitsit benzina”,
Ferghana News, 1 November 2010 <http://www.fergananews.com/article.php?id=6783>
61
Uzbekistan’s supply squeeze appears to have contributed to reductions of its exports to
Russia and to central Asian countries. In the winters of 2010-11 and 2011-12, the strain on
the distribution system resulted in unscheduled cuts in the supply of gas, heating and
electricity that were more extensive than in previous years. No information is available from
official sources on the scale of this problem. However in November 2011 the government
announced that the heavily-populated Andizhan district of the Ferghana valley would rely
solely on coal for heating purposes over the winter; the head of the administration of another
district, Rishtansky, urged residents to collect firewood and coal to ensure that their heating
needs were met; and authorities in Tashkent were directed to draw up a list of 500 industrial
enterprises that could if necessary have their gas supply cut off.126
A very large number of
reports in the media suggested that in many towns outside Tashkent, gas and electricity cuts
of many hours’ duration were an almost daily occurrence. These are summarised in Appendix
5. As for exports, in 2011 Uzbek exports to Russia fell to 8 bcm, their lowest level since the
mid-2000s; this was attributed by Gazprom managers to Uzbekistan’s problems in meeting
domestic demand. In the winter of 2011-12, Kazakhstan, Kyrgyzstan and Tajikistan all
experienced interruptions in the supply of gas from Uzbekistan, and all sought alternative
supplies of gas, principally from Turkmenistan. This had a knock-on effect in China, where it
was reported that Turkmengaz asked for a 0.5 bcm reduction in import volumes over the
winter, to accommodate additional demand in central Asia.127
Energy efficiency policies
Uzbekistan’s excessive and inefficient consumption of gas does not have one simple cause.
The factors at work include some, such as the power sector’s heavy dependence on gas, and
the predominance of gas-fired boilers for urban district heating, inherited from the Soviet
Union. Others – such as rural gasification, state stimulation of small, energy-intensive
industry, and the provision of cheap gas to households – stem from post-Soviet Uzbek
governments’ economic and social policy decisions. Finally there is the exhaustion of
infrastructure, and specifically distribution networks – which operate with heavy gas losses –
that Uzbekistan, along with most other former Soviet states, has done little to address.
In response to these problems, Uzbekistan has adopted legislation aimed at more efficient
energy use, starting with the 1997 law “on the rational use of energy resources”. There have
been many subsequent initiatives by the government, some specifically aimed at gas
consumption (e.g. a national energy saving programme adopted in 2005 that set the target of
reducing gas consumption to 32 bcm/year by 2020).128
However such aims have not been
fully implemented, probably because (i) energy efficiency aims do not receive the highest
priority when it comes to allocating resources, and (ii) it is not clear to officials responsible
for implementation how to deal with the tension, and even direct conflict, between energy
efficiency aims and other policy initiatives.
In recent years, as the danger of a gas supply gap has become more evident, fresh efforts have
been made, some involving cooperation between the government and international
institutions. First, Uzbekistan has launched 13 energy-saving projects under the UNFCCC
126
“Uzbekistan: svyshe 500 prepriiatii Tashkentsoi oblasti budut otkliucheny”, Ferghana News, 25 October
2011; “Uzbekistan: zhiteliam Ferganskoi oblasti rekomandovano zapastis’m drovami i uglem”, Ferghana News,
9 November 2011. 127
Xu Yihe, “China turns taps to fill Turkmen gas shortfall”, Upstream, 20 January 2012 128
Paramonov (2008), p. 4.
62
clean development mechanism including one on gas transportation, one on gas distribution
and one on landfill gas. Other projects, including some to improve energy efficiency in public
buildings, have been funded by the Global Environment Facility.129
Second, the government
is developing energy efficiency projects together with the World Bank both in the power
sector (e.g. with a metering project launched in 2012) and in industry, e.g. to introduce heat
recovery in cement production, to upgrade air separation equipment, and to modernise
fertiliser manufacture. Third, Uzbekneftegaz has launched a programme to reduce leakage in
gas transportation and distribution networks with projected aggregate savings of 0.3
bcm/year.130
Future demand trends
Despite the adoption of the energy efficiency policies mentioned, Uzbekistan may well
increase its gas consumption in the coming years. Even if e.g. residential consumption falls as
discounts continue to be reduced, and the efficiency of municipal supply systems improves,
the resulting reductions could be offset by rising population. Moreover, the government is not
only likely to continue to support energy-intensive small businesses, but is also working,
together with foreign partners and international agencies, towards its long-term goal of
establishing major petrochemical projects, each one of which could add up to 1 bcm/year to
demand. The most advanced projects are:
The Ustiurt gas-chemical complex, a $4.1 billion project to be based at the Surgil gas
field, comprising a gas separation plant, and units producing 400,000 tonnes/year of
high-density polyethylene, 100,000 tonnes of polypropylene and 110,000 tonnes of
pyrolised gasoline, scheduled to start production in 2016. It will require 4.5 bcm/year
of natural gas feedstock from Surgil and nearby fields, and its projected output of
sales gas is 3.7 bcm/year, implying a use of 0.8 bcm/year in the complex. This is a
joint venture between Uzbekneftegaz (50%) and Kor-Uz Gas Chemical (50%), which
is owned 45% by Korea Gas Corporation, 45% by Honam Petrochemical and 10% by
STC Energy. In May 2012, an engineering, procurement and construction (EPC)
contract was signed for this project and a $2.54 billion loan agreement signed between
Uzbekneftegaz and a consortium of banks including the Asian Development Bank, the
Export-Import Bank of Korea and the China Development Bank.131
The Uzbekistan GTL project. This is a $2-2.5 billion project, to be sited near the
Shurtan gas processing plant, to produce 1.1 million tonnes/year of synthetic liquid
fuels (diesel oil, jet fuel, naphtha and LPG. The gas demand implications are more
substantial: it will require 3.5 bcm/year of feedstock. This is a joint venture between
Uzbekneftegaz (44.5%), Sasol of South Africa (44.5%) and Petronas of Malaysia
11%). Technip of Italy completed the first stage of front-end engineering and design
(FEED) in 2010 and is due to complete the remainder by 2013.132
129
UNFCCC clean development mechanism web site <http://ji.unfccc.int> 130
Uzbekneftegaz, “Prioritet realizuemoi politiki – povyshenie energoeffektivnosti”, Ekonomicheskoe obozrenie
no. 11, 2010; World Bank press release, “World Bank Helps Reduce Energy Losses, 27 March 2012; V.V.
Eshmuratov, “Edinaia tekhnologicheskaia sistema po transportirovke i realizatsii prirodnogo gaza”, Uzbekskii
zhurnal nefti i gaza, May 2012, p. 94. 131
“Uzbekistan gets $2.54 bln in loans for gas project”, Reuters, 21 May 2012; ADB press release, “ADB to
help develop Uzbekistan’s largest petrochemical plant”, 25 January 2012; Uz-Kor Chemical, UZB: Surgil
Natural Gas Chemicals. Environmental Impact Assesment – Part 1. 132
Technip press release, “Technip awarded gas-to-liquids contract”, 13 December 2011; presentations by
Neftegazinvest and by Simone Bonetti, Technip, at the Oil and Gas Uzbekistan conference, May 2012, Tashkent
63
Other petrochemicals projects that have been discussed by Uzbekneftegaz and foreign
partners are (i) the addition of an ethylene plant to the Shurtan gas processing plant; (ii) the
installation at the Mubarek complex of petrochemicals manufacture capacity (polyethylene,
gas condensate and diesel fuel). (This project was initially planned in 2008 by Zeromax, and
has been revived in 2011-12 with the support of the ADB and with Indorama of Indonesia as
the joint-venture partner.)133
Given the level of government support for these projects, it seems likely that one or more of
them will go into construction. The Uzbekistan GTL plant, in particular, would produce
substantial incremental gas demand.
The factors influencing Uzbek gas demand in the coming years may be summarised as
follows:
Demographic. The steady increase of population will contribute to higher demand.
Uzbekistan is the only one of the three principal former Soviet gas consumers with rising
population (the other two are Russia and Ukraine).
Industrial policy. (1) Policies supporting small-scale energy-intensive industry. These may be
scaled back, which would have a neutral effect, or continued, which would increase demand.
(2) Policies supporting the petrochemicals sector and, in particular, the gas-to-liquids project.
The incremental demand is small from the petrochemicals projects (less than 1 bcm/year
each), but more substantial if the GTL project goes ahead (3.5 bcm/year).
Social policy. (1) Upgrading of gas distribution networks. This is desperately needed in order
to ensure security of supply for households. The results are difficult to predict: savings from
elimination of waste may be cancelled by additional consumption by consumers whose
supply improves. (2) Pricing policy. It seems likely that prices will continue to rise, but only
gradually. Any reduction in demand may be cancelled out by increases resulting from
population growth.
Energy sector. (1) Use of natural gas in transportation sector to substitute for oil products.
This is likely to increase demand. (2) Modernisation in the power sector. This would decrease
demand, but only gradually. (3) Energy efficiency measures. These will decrease demand, but
only gradually.
4.2. Turkmenistan
Turkmenistan’s economy is even more gas-intensive than Uzbekistan’s; with a population of
5-6 million, it has consumed 15-17 bcm/year in recent years. Only a small amount of
information about its gas consumption is available; the most recent statistics are shown in
Table 16.
133
Temur Malikov, “Shurtan dobavit etilena”, Podrobno.uz, 15 September 2010; presentations by
Neftegazinvest and the ADB at the Oil and Gas Uzbekistan conference, May 2012, Tashkent
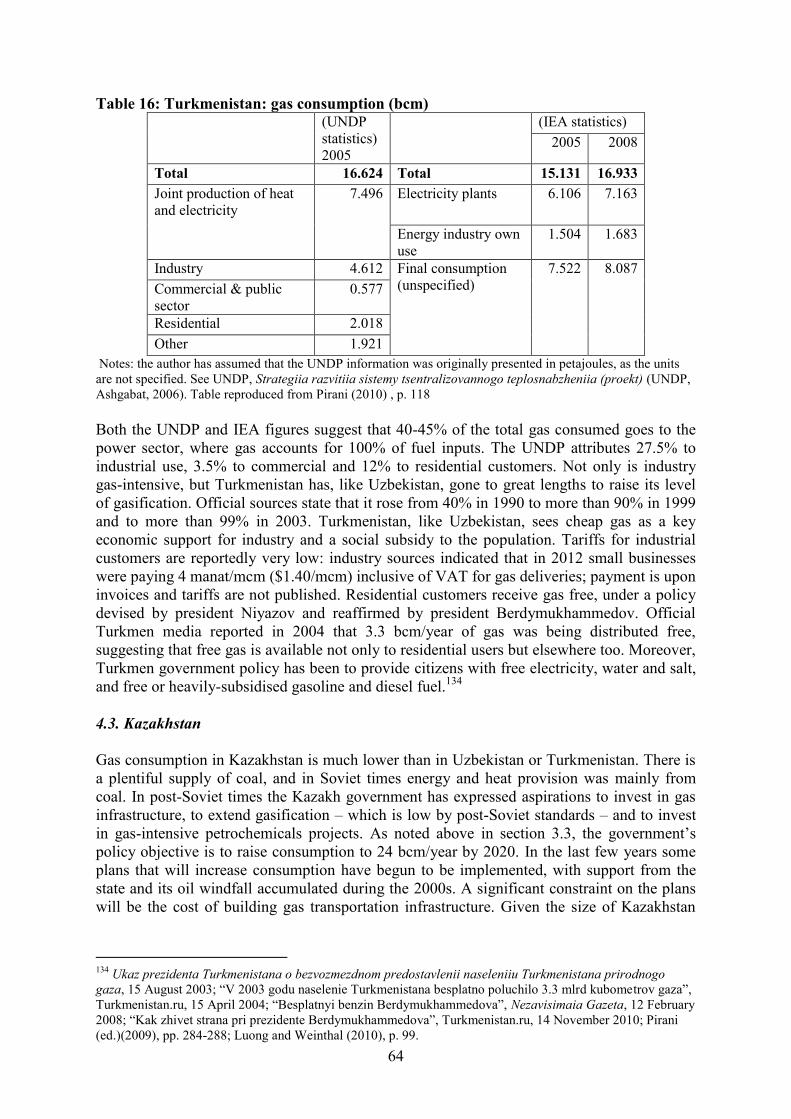
64
Table 16: Turkmenistan: gas consumption (bcm) (UNDP
statistics)
2005
(IEA statistics)
2005 2008
Total 16.624 Total 15.131 16.933
Joint production of heat
and electricity
7.496
Electricity plants 6.106 7.163
Energy industry own
use
1.504 1.683
Industry 4.612 Final consumption
(unspecified)
7.522 8.087
Commercial & public
sector
0.577
Residential 2.018
Other 1.921
Notes: the author has assumed that the UNDP information was originally presented in petajoules, as the units
are not specified. See UNDP, Strategiia razvitiia sistemy tsentralizovannogo teplosnabzheniia (proekt) (UNDP,
Ashgabat, 2006). Table reproduced from Pirani (2010) , p. 118
Both the UNDP and IEA figures suggest that 40-45% of the total gas consumed goes to the
power sector, where gas accounts for 100% of fuel inputs. The UNDP attributes 27.5% to
industrial use, 3.5% to commercial and 12% to residential customers. Not only is industry
gas-intensive, but Turkmenistan has, like Uzbekistan, gone to great lengths to raise its level
of gasification. Official sources state that it rose from 40% in 1990 to more than 90% in 1999
and to more than 99% in 2003. Turkmenistan, like Uzbekistan, sees cheap gas as a key
economic support for industry and a social subsidy to the population. Tariffs for industrial
customers are reportedly very low: industry sources indicated that in 2012 small businesses
were paying 4 manat/mcm ($1.40/mcm) inclusive of VAT for gas deliveries; payment is upon
invoices and tariffs are not published. Residential customers receive gas free, under a policy
devised by president Niyazov and reaffirmed by president Berdymukhammedov. Official
Turkmen media reported in 2004 that 3.3 bcm/year of gas was being distributed free,
suggesting that free gas is available not only to residential users but elsewhere too. Moreover,
Turkmen government policy has been to provide citizens with free electricity, water and salt,
and free or heavily-subsidised gasoline and diesel fuel.134
4.3. Kazakhstan
Gas consumption in Kazakhstan is much lower than in Uzbekistan or Turkmenistan. There is
a plentiful supply of coal, and in Soviet times energy and heat provision was mainly from
coal. In post-Soviet times the Kazakh government has expressed aspirations to invest in gas
infrastructure, to extend gasification – which is low by post-Soviet standards – and to invest
in gas-intensive petrochemicals projects. As noted above in section 3.3, the government’s
policy objective is to raise consumption to 24 bcm/year by 2020. In the last few years some
plans that will increase consumption have begun to be implemented, with support from the
state and its oil windfall accumulated during the 2000s. A significant constraint on the plans
will be the cost of building gas transportation infrastructure. Given the size of Kazakhstan
134
Ukaz prezidenta Turkmenistana o bezvozmezdnom predostavlenii naseleniiu Turkmenistana prirodnogo
gaza, 15 August 2003; “V 2003 godu naselenie Turkmenistana besplatno poluchilo 3.3 mlrd kubometrov gaza”,
Turkmenistan.ru, 15 April 2004; “Besplatnyi benzin Berdymukhammedova”, Nezavisimaia Gazeta, 12 February
2008; “Kak zhivet strana pri prezidente Berdymukhammedova”, Turkmenistan.ru, 14 November 2010; Pirani
(ed.)(2009), pp. 284-288; Luong and Weinthal (2010), p. 99.
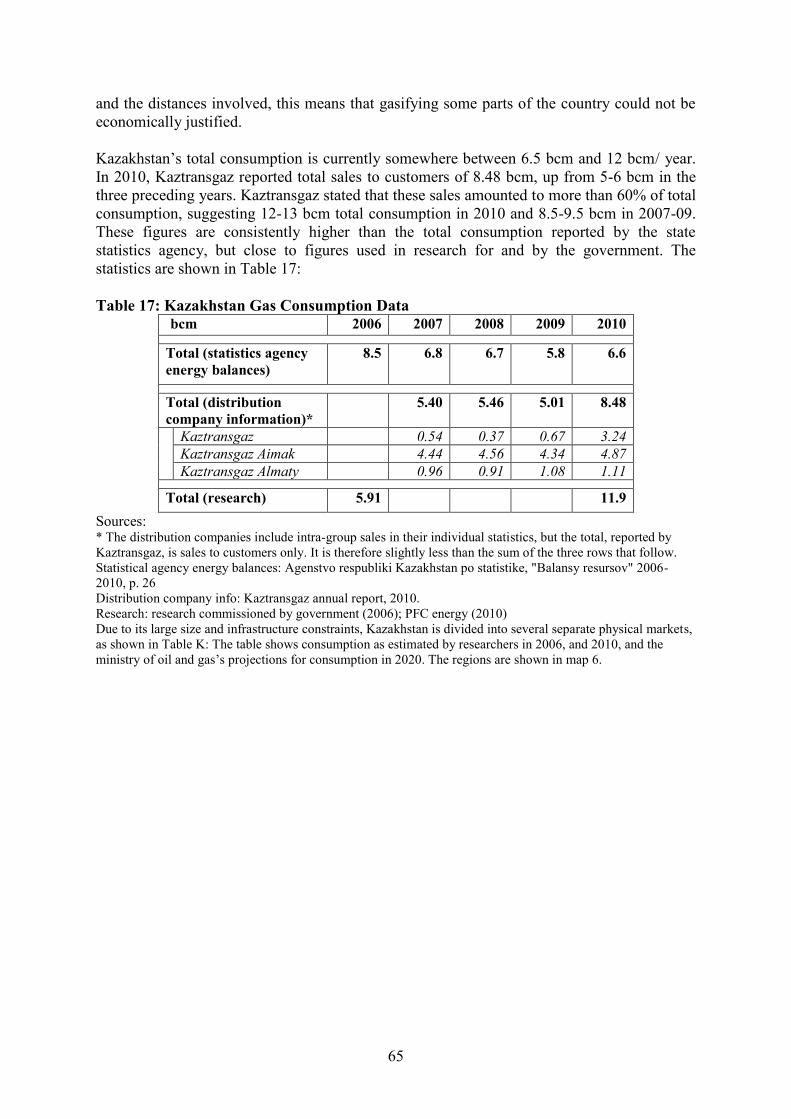
65
and the distances involved, this means that gasifying some parts of the country could not be
economically justified.
Kazakhstan’s total consumption is currently somewhere between 6.5 bcm and 12 bcm/ year.
In 2010, Kaztransgaz reported total sales to customers of 8.48 bcm, up from 5-6 bcm in the
three preceding years. Kaztransgaz stated that these sales amounted to more than 60% of total
consumption, suggesting 12-13 bcm total consumption in 2010 and 8.5-9.5 bcm in 2007-09.
These figures are consistently higher than the total consumption reported by the state
statistics agency, but close to figures used in research for and by the government. The
statistics are shown in Table 17:
Table 17: Kazakhstan Gas Consumption Data
bcm 2006 2007 2008 2009 2010
Total (statistics agency
energy balances)
8.5 6.8 6.7 5.8 6.6
Total (distribution
company information)*
5.40 5.46 5.01 8.48
Kaztransgaz 0.54 0.37 0.67 3.24
Kaztransgaz Aimak 4.44 4.56 4.34 4.87
Kaztransgaz Almaty 0.96 0.91 1.08 1.11
Total (research) 5.91 11.9
Sources: * The distribution companies include intra-group sales in their individual statistics, but the total, reported by
Kaztransgaz, is sales to customers only. It is therefore slightly less than the sum of the three rows that follow.
Statistical agency energy balances: Agenstvo respubliki Kazakhstan po statistike, "Balansy resursov" 2006-
2010, p. 26
Distribution company info: Kaztransgaz annual report, 2010.
Research: research commissioned by government (2006); PFC energy (2010)
Due to its large size and infrastructure constraints, Kazakhstan is divided into several separate physical markets,
as shown in Table K: The table shows consumption as estimated by researchers in 2006, and 2010, and the
ministry of oil and gas’s projections for consumption in 2020. The regions are shown in map 6.
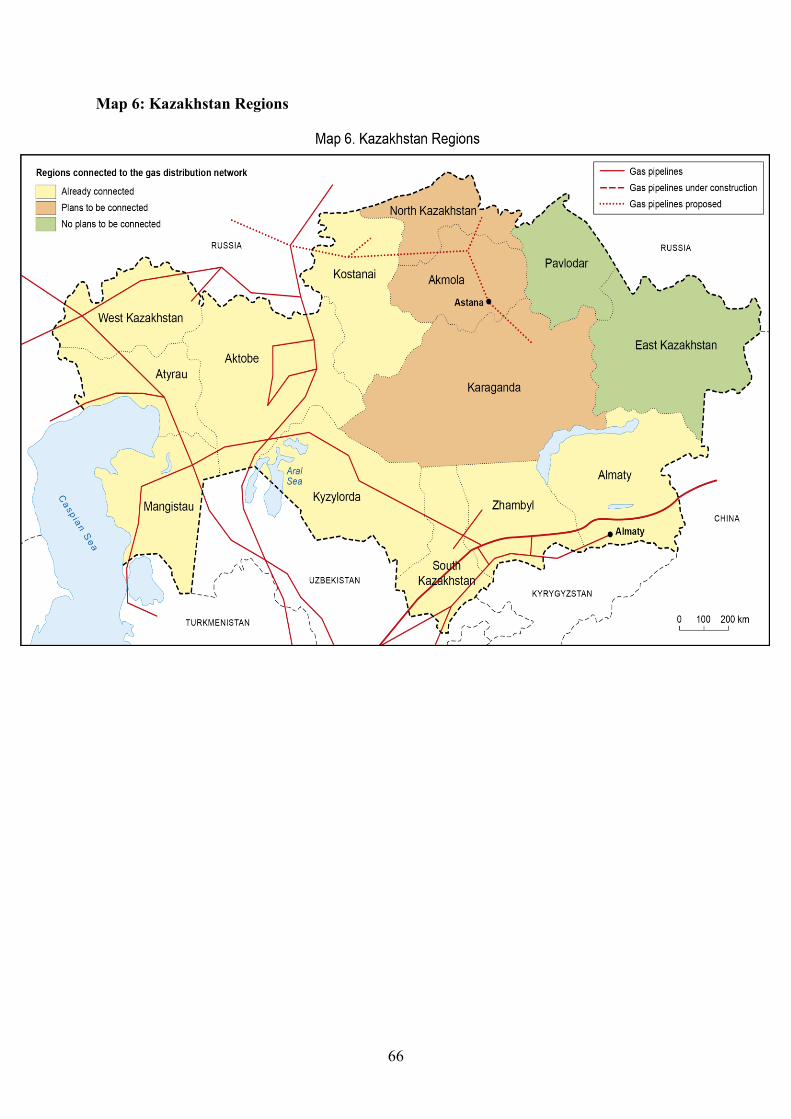
66
Map 6: Kazakhstan Regions
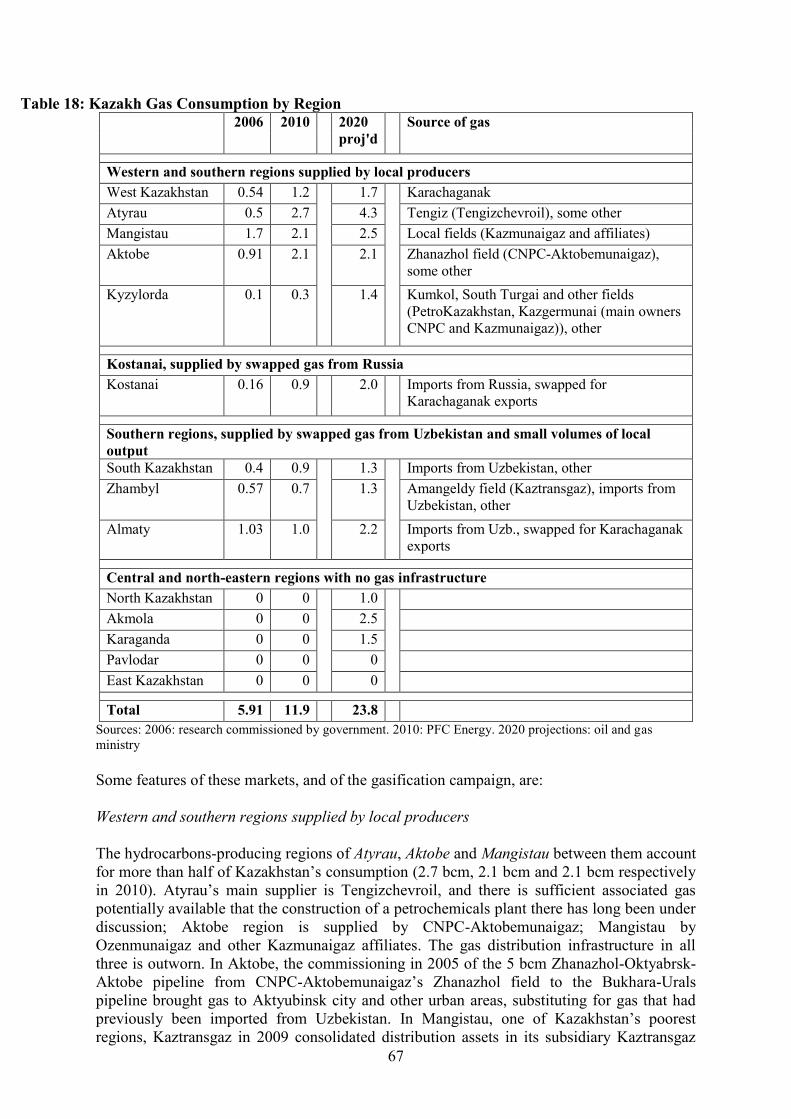
67
Table 18: Kazakh Gas Consumption by Region
2006 2010 2020
proj'd
Source of gas
Western and southern regions supplied by local producers
West Kazakhstan 0.54 1.2 1.7 Karachaganak
Atyrau 0.5 2.7 4.3 Tengiz (Tengizchevroil), some other
Mangistau 1.7 2.1 2.5 Local fields (Kazmunaigaz and affiliates)
Aktobe 0.91 2.1 2.1 Zhanazhol field (CNPC-Aktobemunaigaz),
some other
Kyzylorda 0.1 0.3 1.4 Kumkol, South Turgai and other fields
(PetroKazakhstan, Kazgermunai (main owners
CNPC and Kazmunaigaz)), other
Kostanai, supplied by swapped gas from Russia
Kostanai 0.16 0.9 2.0 Imports from Russia, swapped for
Karachaganak exports
Southern regions, supplied by swapped gas from Uzbekistan and small volumes of local
output
South Kazakhstan 0.4 0.9 1.3 Imports from Uzbekistan, other
Zhambyl 0.57 0.7 1.3 Amangeldy field (Kaztransgaz), imports from
Uzbekistan, other
Almaty 1.03 1.0 2.2 Imports from Uzb., swapped for Karachaganak
exports
Central and north-eastern regions with no gas infrastructure
North Kazakhstan 0 0 1.0
Akmola 0 0 2.5
Karaganda 0 0 1.5
Pavlodar 0 0 0
East Kazakhstan 0 0 0
Total 5.91 11.9 23.8
Sources: 2006: research commissioned by government. 2010: PFC Energy. 2020 projections: oil and gas
ministry
Some features of these markets, and of the gasification campaign, are:
Western and southern regions supplied by local producers
The hydrocarbons-producing regions of Atyrau, Aktobe and Mangistau between them account
for more than half of Kazakhstan’s consumption (2.7 bcm, 2.1 bcm and 2.1 bcm respectively
in 2010). Atyrau’s main supplier is Tengizchevroil, and there is sufficient associated gas
potentially available that the construction of a petrochemicals plant there has long been under
discussion; Aktobe region is supplied by CNPC-Aktobemunaigaz; Mangistau by
Ozenmunaigaz and other Kazmunaigaz affiliates. The gas distribution infrastructure in all
three is outworn. In Aktobe, the commissioning in 2005 of the 5 bcm Zhanazhol-Oktyabrsk-
Aktobe pipeline from CNPC-Aktobemunaigaz’s Zhanazhol field to the Bukhara-Urals
pipeline brought gas to Aktyubinsk city and other urban areas, substituting for gas that had
previously been imported from Uzbekistan. In Mangistau, one of Kazakhstan’s poorest
regions, Kaztransgaz in 2009 consolidated distribution assets in its subsidiary Kaztransgaz
68
Aimak. It stated that 300km (13%) of the 2,320km of distribution pipelines were unfit for
use, and launched a 1,633 billion tenge ($10.9 billion) programme to upgrade distribution
networks and extend gasification.135
West Kazakhstan is supplied, presumably with all its needs, from the Karachaganak field. A 3
bcm pipeline runs from the field to the city of Uralsk, which accounts for most of the region’s
consumption, and where the Zhaikteploenergo combined heat and power plant runs on gas.
Kyzylorda region is supplied mainly from the Kazgermunai joint venture. In 2004, a
presidential decree on social measures in Kyzylorda provided for gasification. New gas
transport infrastructure to supply associated gas to the local area was installed, the first such
project in post-Soviet times, and this set a precedent that would be followed subsequently in
other regions. A gas processing plant was commissioned at Kazgermunai’s Akshabulak field,
and a 123km pipeline completed between that field and Kyzylorda city; in July this year three
gas turbines were installed at the field to produce electricity for local use. By 2010
Kaztransgaz reported that the region was 77% gasified and that this would rise to 90%.136
Kostanai region Gas is imported by Kazrosgaz to Kostanai via the Kartaly Kostanai pipeline,
a 238km branch line from the Bukhara-Urals line; in 2010 consumption was 0.9 bcm. The
imports are undertaken by Kazrosgaz, in return for gas exported to Russia from
Karachaganak.
South-eastern regions, supplied mainly by imports from Uzbekistan
Almaty, South Kazakhstan and Zhambyl regions in the south-east are the second large centre
of gas consumption after western Kazakhstan, jointly consuming 1.7 bcm in 2010. Since
Soviet times these regions have been supplied by Uzbekistan, along the Kazakh section of the
Bukhara Gas Region-Tashkent-Bishkek-Almaty (BGR-TBA) pipeline. Supply interruptions
in winter, and political friction between the two countries, has led Kazakhstan to seek
alternative sources of gas, including: (i) its own production from the Amangeldy field, which
now accounts for most of the gas delivered to Zhambyl region, and (ii) gas from
Turkmenistan, delivered via a link, completed in 2010, between the Central Asia-China
pipeline and the BGR-TBA pipeline. In 2011 a small volume (0.3 bcm) of Turkmen imports
to Kazakhstan was reported, the first trade between the two countries for several years.137
Kazakhstan’s main hope for ending its dependence on Uzbek imports altogether is the
completion of the Beineu-Shimkent pipeline, which will bring gas from western Kazakhstan
to the south and south-east.
The south-eastern regions have also been at the forefront of the gasification campaign. In
Almaty region, Kaztransgaz in 2009 began a 35 billion tenge ($233.1 million) distribution
pipeline reconstruction project; this runs alongside a project entitled “gasification of micro-
districts of Almaty and population centres in Almaty region”. In Zhambyl, the akimat (local
municipality) and Kaztransgaz are jointly implementing a campaign to raise the level of
pipeline gas access from 53.5% in January 2010 to 60% by 2013, which would expand the
system to supply 15,000 extra households and involve construction of 400 km of distribution
135
Kaztransgaz press release, “AO Kaztransgaz Aimak reanimiruet gazovuiu sistemu Mangistauskoi oblasti”, 1
August 2011; “Edinym operatorom na rynke gazosnabzheniia”, Aktau News, 3 September 2011. 136
Kaztransgaz godovoi otchet 2010, “Investitstionnaia deiatelnost’”; “Na mestorozhdenii Akshabulak vvedeny
v ekspluatatsiiu tri gazovye turbiny”, Kursiv, 12 July 2012 137
Kaztransgaz Godovoi otchet 2010, “Kliucheviie sobytiia v realizatsii strategicheskikh prioritetov”
69
pipelines. A similar programme in South Kazakhstan, prioritising the reconstruction of
distribution networks in Shimkent city, projects a four-fold increase in the system’s capacity
between 2010 and 2018.138
Regions with no gas transport infrastructure
By far the most difficult aspect of Kazakhstan’s gasification campaign is the expansion of the
pipeline network into three northern regions – Akmola, Karaganda and North Kazakhstan.
The government has identified gasification of Astana, the Kazakh capital, as a priority.
Research commissioned by the government in 2006 concluded that this could “never” be
done economically, but it appears to be proceeding in any case, for broadly political reasons.
In April 2012 the minister of oil and gas, Sauat Mynbayev, announced that construction of a
1.5-2 bcm pipeline from Kartaly in the Chelyabinsk region of Russia to Kokshetau and
Astana, which will be supplied with swapped gas imported from Russia, would begin in early
2013. (See Map 6.) Mynbayev acknowledged that gas would “not come cheap”, and that even
though state funding will be provided for pipeline construction, said that he expected prices
of around $105/mcm at the border, plus $60/mcm transport and $50/mcm distribution,
bringing the delivered price in Astana to $210/mcm for most customers and $160/mcm for a
planned power station to be supplied directly from the high-pressure pipeline (i.e. net of
distribution costs). In October 2012, Kazakh prime minister Serik Akhmetov said that a
feasability study for the project had been approved, with an estimated investment cost of
$1.33 billion.139
The extent of this gasification – projected in government plans at 5 bcm/year
to three regions by 2020 – will depend on the state’s willingness to fund the infrastructure
expansion and is ultimately a political decision.
Petrochemical plant
Another project that will substantially increase Kazakhstan’s gas demand is for the
construction of a petrochemical plant, producing polyethylene and polypropylene, at
Karabatan in Atyrau region, supplied by up to 6-7 bcm/year of feedstock gas by
Tengizchevroil. While such plans have now been under discussion for many years, they
received a significant boost in 2010-11, when agreements were made with China on
construction, offtake and – most importantly – finance for the first phase of construction.
Whether or not the project goes ahead will depend on whether the Chinese support is
sufficient to bear the significant risks presented by rising costs.
A feasibility study for the plant was approved by the Kazakh energy ministry in 2007 and a
project company, Kazakhstan Petrochemical Industries, incorporated. It is owned 51% by
Kazmunaigaz Exploration & Production, and 49% by Sat & Company, a Kazakh private
company that bought out the original minority shareholder, LyondellBasell of Switzerland, in
2010. A contract was signed in March 2009 with Tengizchevroil for supply of feedstock gas,
underpinned by the conditions of its PSA on associated gas utilisation. In March 2010
Sinopec of China won a tender for construction of the first stage of the plant, to produce
polypropylene, and simultaneously agreed to buy and export all the production. In February
2011 the Export Import Bank of China agreed with the Development Bank of Kazakhstan to
provide $1.38 billion in project finance for first-stage construction. In August 2011 LG Chem
138
Kaztransgaz Godovoi otchet 2010, “Investitsionnaia deiatel’nost’” 139
Kazrosgaz website, “Construction of gas pipeline in Central Kazakhstan is scheduled to begin in 2013”, 27
April 2012. <http://www.kazrosgas.org/?nc142&version=en>; Kazenergy website, “Stoimost’ stroitel’stva
gazoprovoda” < http://www.kazenergy.com/ru/2012-06-20-08-42-46/6562.html>
70
of South Korea was awarded a $4 billion contract to work on the second stage of the plant,
for ethylene and polyethylene production. It has been reported that the main current danger to
the project’s success is further delay. Under the present timetable, it would go into production
in 2016-17, with 15 years remaining of the Tengizchevroil PSA. Some commentators believe
that with feedstock at relatively low prices guaranteed over any shorter period, the project
could not be economic.140
Gas market development
In line with its aim of increasing domestic gas consumption, the Kazakh government has
developed a programme of market development under which Kaztransgaz will assume the
role of the dominant buyer of gas, operator of the pipeline system and dominant market
participant. The new gas law that took effect in January 2012, mentioned above in section
3.3, specifies these functions. Currently, Kaztransgaz and its subsidiaries Kaztransgaz Aimak
and Kaztransgaz Almaty distribute and supply most volumes consumed domestically; the law
reinforces their position and provides a framework for the regulation of their activity and that
of other market players.
Retail gas prices, which are regulated by the Agency for the Regulation of Natural
Monopolies, will under the gas law also be subject to government approval. They vary widely
across the country, depending on the source of gas – and vary in the producing regions
depending on whether the source is associated or non-associated gas – as shown in Table 19,
based on information published by Kaztransgaz Aimak.
The Programme for the Development of the Oil and Gas Sector adopted by the government in
2010 envisaged price increases, and eventual liberalisation, in line with the changes in the gas
market in Russia – to which Kazakhstan is closely linked by infrastructure, and with which it
shares membership of a Customs Union. This document referred to the necessity to
“undertake a staged reform of pricing policy” for gas. It stated that in view of the prospect of
price liberalisation in Russia, the preparation of “the introduction of staged price
liberalisation” was necessary in Kazakhstan, and that this would be targeted at bringing prices
to the level of European netback, minus 20-25%.141
Other publications of the OIES natural gas research programme have argued extensively that
price reform in the Russian market will move gradually towards greater liberalisation, but
that the original aim adopted in 2006 of achieving equivalence with European netback levels
is likely to be abandoned, not least because European gas prices have increased so
substantially in the meantime, and because conditions in the European market are now so
uncertain.142
In Kazakhstan, the gas law ensures a dominant role in the wholesale market for
Kaztransgaz (for domestically produced volumes) and KazRosGaz (for imported volumes),
and control over transport and supply by Kaztransgaz. A gradual increase of consumer prices
seems likely; how that revenue is shared with upstream sellers remains to be seen.
140
Chemicals-Technology web site, “Kazakhstan Petrochemical Complex” page < http://www.chemicals-
technology.com/projects/kazakhstan_petrochem>; KASE press release, 25 February 2011, “Development Bank
of Kazakhstan signed an individual credit agreement with Eximbank of China”; Oksana Martyniuk, “Restart
Kazakhstanskoi gazokhimii”, Kursiv, 12 July 2012; information from energy ministry and KPI web sites. 141
Programma po razvitiiu neftegazovogo sektora v Respublike Kazakhstan na 2010-2014 gody, approved by
presidential decree no. 1072, 18 October 2010. 142
Henderson (2011); Henderson, Pirani and Yafimava (2012).
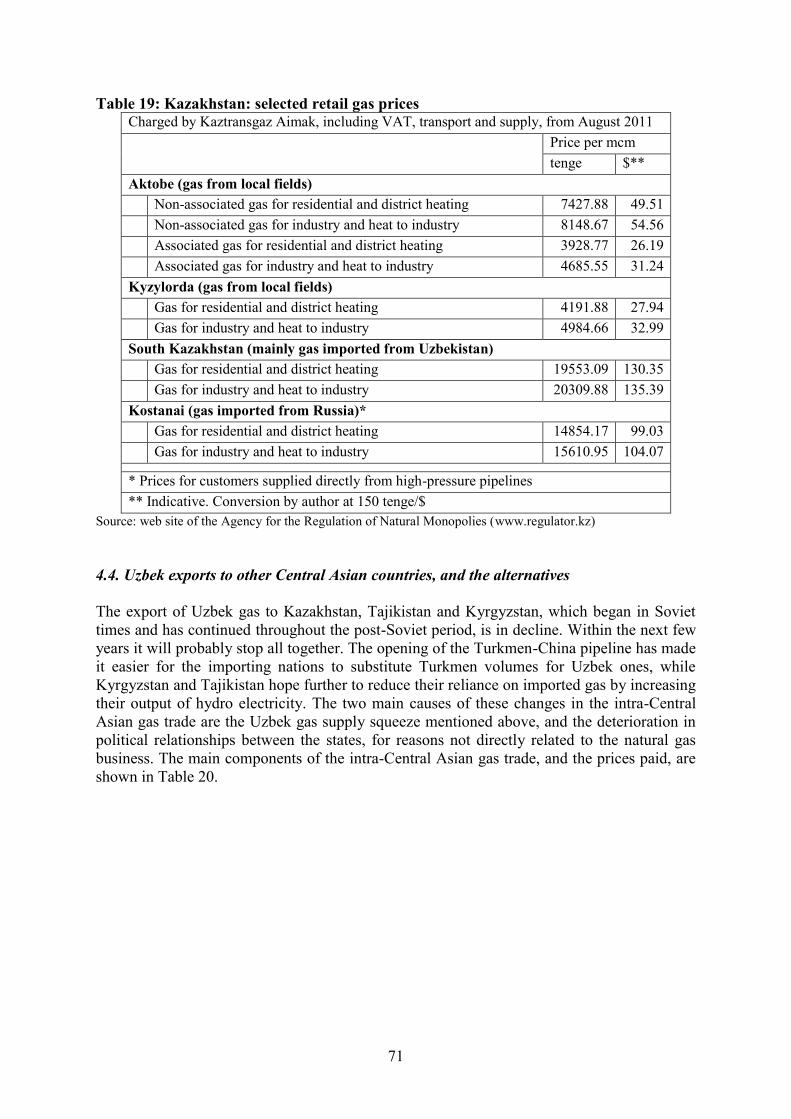
71
Table 19: Kazakhstan: selected retail gas prices Charged by Kaztransgaz Aimak, including VAT, transport and supply, from August 2011
Price per mcm
tenge $**
Aktobe (gas from local fields)
Non-associated gas for residential and district heating 7427.88 49.51
Non-associated gas for industry and heat to industry 8148.67 54.56
Associated gas for residential and district heating 3928.77 26.19
Associated gas for industry and heat to industry 4685.55 31.24
Kyzylorda (gas from local fields)
Gas for residential and district heating 4191.88 27.94
Gas for industry and heat to industry 4984.66 32.99
South Kazakhstan (mainly gas imported from Uzbekistan)
Gas for residential and district heating 19553.09 130.35
Gas for industry and heat to industry 20309.88 135.39
Kostanai (gas imported from Russia)*
Gas for residential and district heating 14854.17 99.03
Gas for industry and heat to industry 15610.95 104.07
* Prices for customers supplied directly from high-pressure pipelines
** Indicative. Conversion by author at 150 tenge/$
Source: web site of the Agency for the Regulation of Natural Monopolies (www.regulator.kz)
4.4. Uzbek exports to other Central Asian countries, and the alternatives
The export of Uzbek gas to Kazakhstan, Tajikistan and Kyrgyzstan, which began in Soviet
times and has continued throughout the post-Soviet period, is in decline. Within the next few
years it will probably stop all together. The opening of the Turkmen-China pipeline has made
it easier for the importing nations to substitute Turkmen volumes for Uzbek ones, while
Kyrgyzstan and Tajikistan hope further to reduce their reliance on imported gas by increasing
their output of hydro electricity. The two main causes of these changes in the intra-Central
Asian gas trade are the Uzbek gas supply squeeze mentioned above, and the deterioration in
political relationships between the states, for reasons not directly related to the natural gas
business. The main components of the intra-Central Asian gas trade, and the prices paid, are
shown in Table 20.
72
Table 20: The Intra-Central Asian Gas Trade 2005 2006 2007 2008 2009 2010 2011 2012,
proj.
2013,
proj.
Exports, bcm
From
Turkmenistan
To Kazakhstan 1.1 1.8 2.8 0 0 0 0.4 0.7 1
To Tajikistan 0 0 0 0 0 0 0 0.06 0.06
From
Uzbekistan
To Kazakhstan 3.3 2.3 3 3.3 2.3 2.5 2.1 1.8 1.5
To Kyrgyzstan 0.7 0.7 0.8 0.74 0.65 0.7 0.6 0.5 0.4
To Tajikistan 0.6 0.6 0.64 0.5 0.22 0.25 0.17 0.10 0.10
From
Kazakhstan
To Kyrgyzstan 0.6 0.1 0 0 0 0 0.1 0.2 0.3
Imports, bcm
To Kazakhstan From
Turkmenistan
1.1 1.8 2.8 0 0 0 0.4 0.7 1
From Uzbekistan 3.3 2.3 3 3.3 2.3 2.5 2.1 1.8 1.5
To Tajikistan From Uzbekistan 0.6 0.6 0.64 0.5 0.22 0.25 0.17 0.10 0.10
From
Turkmenistan
0 0 0 0 0 0 0 0.06 0.06
To Kyrgyzstan From Uzbekistan 0.7 0.7 0.8 0.74 0.65 0.7 0.6 0.5 0.4
From
Kazakhstan
0.6 0.1 0 0 0 0 0.1 0.2 0.3
Prices, $/mcm
From
Uzbekistan
To Kazakhstan 42 55 55 55-
85
85 85 85 n/a
To Tajikistan 42 55 100 150 240 231 249 n/a
To Kyrgyzstan 43 55 100 145 240 240 223-
278
290
From
Kazakhstan
To Kyrgyzstan 195 224
Sources: CIS statistics, press reports, company statements
The main features of the trade, by importing country, are as follows:
Kazakhstan
Kazakhstan has traditionally imported 2.3-3.4 bcm/year of Uzbek gas to supply the south-
eastern region (i.e. Almaty and South Kazakhstan regions, and part of Zhambyl region). The
gas is imported along the Bukhara Gas Region-Tashkent-Bishkek-Almaty (BGR-TBA)
pipeline that runs from the Bukhara gas producing area in Uzbekistan through Kyrgyzstan to
south-east Kazakhstan. Throughout the post-Soviet period, Uzbekistan has frequently
reduced deliveries, or failed to deliver, at peak consumption periods in the winter. The
interruptions are attributed to the difficulties of balancing deliveries with peak demand,
which are exacerbated by a lack of storage capacity and the poor state of the aging transport
infrastructure. In December 2006, Gazprom, Uzbekneftegaz and Kaztransgaz entered into a
swap arrangement whereby Gazprom became the supplier of Uzbek gas to south-east
Kazakhstan, in return for volumes exported to Russia from north-west Kazakhstan. The
Uzbek exports to Kazakhstan were priced at $55/mcm. In December 2007, the agreement was
renewed and the price held at that level, although Central Asian exports to and through
73
Russia were by that time priced at much higher levels reflecting netback from the European
export market.143
The entry of China into the Central Asian gas trade and the construction of the Turkmenistan-
China pipeline has provided Kazakhstan with opportunities to diversify away from Uzbek
imports and secure more reliable supplies for the south-east of the country. After the
completion of the Turkmenistan-China pipeline in December 2009, Kaztransgaz began
construction of three links between that line and the BGR-TBA line. The first of these, at
Uzynagash near Almaty, was completed rapidly, by November 2010, providing a route for
Turkmen gas to reach Almaty, Kazakhstan’s second city and usually the most severely
affected by peak season reductions of Uzbek imports. Two more links between the two
pipelines, at Akbulak in South Kazakhstan and Akyrtobe in Zhambyl, are under construction
and due for completion by the end of 2012. Kaztransgaz has stated that the links will make it
possible to use the Turkmenistan-China pipeline “as an alternative means of meeting gas
demand and to ensure stability in the region”.144
In November 2011, when supply from Uzbekistan was interrupted for a longer stretch than in
previous years, arrangements were made with Turkmenistan and CNPC to receive Turkmen
gas on a swap basis to supply customers in Almaty, presumably through the new link. In
September 2012 Sauat Mynbayev, the Kazakh oil and gas minister, announced that a similar
swap arrangement would be made to cover the 2012-13 heating season, and that negotiations
were in progress with Turkmenistan, CNPC and Gazprom on the contractual details.145
The next stage of Kazakh diversification from Uzbek imports will be completion of the
Beineu-Shimkent pipeline, which will bring gas from western Kazakhstan’s producing fields
to the south-east region, as well as potentially for export to China (see section 5.2).
Tajikistan
Uzbekistan has since Soviet times supplied Tajikistan with small volumes of gas (around 0.6
bcm/year up to the mid 2000s), as part of a complex swap arrangement, under which
Tajikistan supplied in return water (for irrigation in the Ferghana valley region), electricity
and transit services. Uzbekistan is the monopoly supplier and the only gas pipeline into
Tajikistan comes from Uzbekistan; although Tajikistan’s power is generated primarily from
hydro plants, three of its largest industrial enterprises – its aluminium smelter, cement plant
and nitrogen fertiliser plant – are dependent on imported Uzbek gas.
Since 2007 Uzbekistan has raised the price of its exports in line with European netback price
levels, and gas exports to Tajikistan have been frequently interrupted on the grounds of non-
payment. This is not primarily a gas dispute, however: political and diplomatic relations
between the two countries have deteriorated significantly in recent years. Uzbekistan is
fiercely opposed to Tajikistan’s plans to construct a dam at Rogun on the Vakhsh river. This
143
Zhukov (2009), p. 371, and Yenikeyeff (2009), pp. 336-337; Kazmunaigaz, Godovoi otchet 2010, “Kratkaia
informatsiia”; Kazmunaigaz, Godovoi otchet 2009, p. 35 144
Kazmunaigaz press release, 30 November 2010; “Novaia peremychka pozvolit bespereboino obespechivat’
gazom iuzhnye regiony”, Meta.kz, 30 November 2010 145
“Postavki uzbekskogo gaza v Kazakhstan sushchestvenno snizheny”, Ferghana News, 15 November 2011
<http://www.fergananews.com/news.php?id=17629>; “Iug Kazakhstana pereidet na turkmenskii gaz”, Nur.Kz
14 November 2011 <http://news.nur.kz/200885.html>; “Kazakhstan mulling gas imports from Turkmenistan”,
Tengri News service, 8 May2012; “Kazakhstan vernet gaz Turkmenii i zaimet ego u Rossii, Kitaia i
Uzbekistana”, Regnum.ru news agency, 15 September 2012
74
would boost Tajikistan’s economy by producing electricity for export, but also give
Tajikistan undue influence over irrigation of the Ferghana valley, which is heavily dependent
on the Vakhsh, which runs into the Amu Darya river, one of Uzbekistan’s main sources of
irrigation water. After an unsuccessful attempt by Russia to mediate the dispute in 2010, the
Uzbek and Tajik governments issued hostile statements against each other, with the Tajik
embassy in Moscow blaming Uzbekistan in April 2012 for trying to “blockade” Tajikistan,
not only in respect of gas but also rail and road transport.146
Against this background, in 2009, Uzbekistan increased export prices to Tajikistan to
$240/mcm from $150/mcm; only 0.21 bcm of a contracted 0.5 bcm was delivered in that year
due to interruptions for non-payment. In 2010, only 0.25 bcm was delivered and in 2011, 0.17
bcm.147
In 2012, a contract for 0.2 bcm was agreed for the year. In March 2012,
Uzbekneftegaz announced that it would stop supplying Tajikistan in order to have gas
available for export to China. Tajikistan reported extensive power cuts, and said that it was
aiming to secure gas supplies, presumably swaps, from Turkmenistan; in August, Turkmen
president Gurbanguly Berdymukhammedov and Tajik president Emomali Rakhmon met and
discussed (but did not finalise) arrangements for imports of both oil and gas; Tajikistan also
entered into discussions with Iran about fuel imports. Rakhmon directed that all industry
should make arrangements to use coal rather than gas as fuel, and coal production was
increased.148
Kyrgyzstan
Kyrgyzstan has traditionally imported a small quantity of gas from Uzbekistan, about 0.7
bcm/year up to the mid 2000s. Like Tajikistan, it inherited this arrangement from the Soviet
era, when the gas was effectively paid for with electricity and water supplies. Like Tajikistan,
Kyrgyzstan has plans to build dams that could exacerbate Uzbekistan’s water problems,
albeit not as far advanced as Tajikistan’s. While political and diplomatic relationships have
not deteriorated as sharply as in the case of Tajikistan, they are poor, and were exacerbated
by inter-ethnic violence in southern Kyrgyzstan in 2010 which resulted in a flow of ethnic
Uzbek refugees into Uzbekistan.
Uzbekistan’s pricing policy towards Kyrgyzstan has been the same as towards Tajikistan, and
it increased prices from $100/mcm in 2007 to $145/mcm in 2008 and $240/mcm in 2009.
Kyrgyzstan’s main strategy in response has been to secure gas imports from Kazakhstan.
Kyrgyzstan is better placed than Tajikistan to diversify, in terms of infrastructure: the BGR-
TBA pipeline arrives in the north of the country via Kazakh territory. Kyrgyz imports from
Kazakhstan began in September 2011, when it contracted to buy 0.3 bcm for the 2011-12
heating season, priced at $195/mcm, a discount to the Uzbek price of $305/mcm in 2011. In
146
Farkhod Tolipov, “Uzbekistan-Tajikistan relations in limbo”, Central Asia-Caucasus Analyst, 16 May 2012.
On the background to Uzbek-Tajik relations, see e.g. Alexander Sodiqov, “The Rogun Dam controversy: is
compromise possible”, Central Asia-Caucasus Analyst, 2 May 2012, and Johannes Linn, “Central Asia: long-
term challenges and short-term crises”, International Water Power & Dam Construction, March 2009, pp. 14-
17. 147
“Uzbekistan vdvoe urezal postavki gaza Tadzhikistanu”, Itar-Tass, 1 January 2011; “Ob”em exporta
uzbekskogo gaza”, Tsentraziia 9 January 2009; industry sources. 148
“Uzbekistan vozobnovil postavki gaz v Tadzhikistan”, Kursiv, 16 April 2012; “V Tadzhikistane snizilsia
import gaza, no uvelichilas’ dobycha uglia”, pressa. tj <www.pressa.tj/tj/print/13950>; British embassy,
Updates on the Energy Sector of Turkmenistan, March 2012; “Iran budet eksportirovat’ gaz”, Kursiv, 2 May
2012
75
2012, Kaztransgaz and Kyrgyzgas announced that they were discussing a contract for 0.3
bcm of imports in 2013.149
Conclusion
It seems likely that in the next few years, gas demand in the heavily populated areas of south-
eastern Kazakhstan may well continue to rise, but it will increasingly be met from non-Uzbek
supplies. Uzbek exports to Kazakhstan will be mostly or completely replaced by swapped gas
from Turkmenistan, delivered via the Turkmenistan-China pipeline, and then by gas from
western Kazakhstan, delivered via the Beineu-Shimkent pipeline. Uzbek exports to
Kyrgyzstan may also be reduced to a minimal level as Kazakh sales to Kyrgyzstan increase,
while Uzbek exports to Tajikistan are likely to be halted altogether, and replaced with
minimal volumes of swapped gas from Turkmenistan. Over a longer period, i.e. into the
2020s, demand for gas from both Tajikistan and Kyrgyzstan is likely to fall still further, as
power generation requirements are covered by hydro and other supply diversification
measures take effect.
4.5 Gas consumption in Azerbaijan, Georgia and Armenia
Azerbaijan has consumed between 7.0 and 10.5 bcm of gas each year throughout the 2000s.
In 2007, with the start-up of production at Shah Deniz, Azerbaijan became a net exporter,
stopped importing gas from Russia and has since then supplied the domestic market from its
own resources. About 50% of gas consumed goes into power generation; 2-3 bcm/year in
recent years has been consumed by residential customers; the petrochemical sector and other
industry have consumed about 1 bcm/year each.
Azerigaz, a Socar subsidiary, carries out natural gas processing, transport, distribution and
storage in the domestic market. Government policy is to expand gas consumption further:
Azerigaz is carrying out a range of construction and repair work, under the State Programme
of Social Economic Development of Regions for 2009-2013, to gasify regions that are
currently not supplied to the network. Socar reported that in 2010, 4,250 km of new pipe was
laid and 1,180 km repaired, and 67,272 subscribers’ gas supply was restored.150
The
government is also supporting projects designed to use Azerbaijan’s natural gas resources to
stimulate industrial development: a methanol plant is under construction, and in 2012 a tender
process was underway for construction of a large fertiliser plant to supply the Azeri and
Georgian markets. Azerbaijan implemented a sharp increase in the price of gas for domestic
consumers in 2007, to about $115/mcm. Although further increases were envisaged at that
time, prices have since remained at that level. Socar states that no further increases are
planned in the near future.151
The combination of policies under which domestically-
produced gas is used to stimulate industrial development on the one hand, but relatively high
sales prices on the other, suggests that while consumption will continue to rise, it will
probably do so less dramatically than in other countries in the region.
Georgia consumes 1-2 bcm/year of gas, almost all of it imported from Azerbaijan. (See also
section 5.5 below.) Socar is also now a leading player in gas distribution in Georgia. Until the
149
“Peregovory o postavke kazakhstanskogo prirodnogo gaza”, Kursiv, 8 Aug 2012; Kyrgyzgas press release, 8
May 2012; “Kazakhstan postavliaet Kyrgyzstanu gaz”, Fergana.ru, 28 September 2011; “Kazakhs ready to sell
gas to Kyrgyz”, RFE-RL, 20 Sep 2011 150
Socar, Annual Report 2010, p. 29. 151
Author’s meetings with Socar representatives, Baku, May 2012
76
late 2000s, Georgia’s main source of imported gas was Russia; as a result of the deteriorating
political relationship between those countries, Georgia has sought to reduce gas consumption
e.g. by raising hydropower production.
Armenia consumes 2-2.5 bcm/year of gas: this is almost all imported from Russia, and does
not therefore impact on market dynamics in the rest of the Central Asian/Caspian region.
(There is more information about the Azeri, Georgian and Armenian markets in other
publications by the OIES natural gas research programme.152
)
152
See the chapters on these countries in Pirani (ed.) (2009), and Henderson, Pirani and Yafimava (2012), pp.
210-212.
77
5. Export routes and markets
In the early and mid 2000s, the volume of gas exported from Central Asia (by Turkmenistan,
Uzbekistan and Kazakhstan) rose steadily, from around 45 bcm/year to 75 bcm/year. More
than 85% of this gas went to or through Russia; large-scale flows that began in Soviet times
but had been disrupted during the 1990s slump were revived. The remainder were the small
volumes (5-8 bcm/year) exported from Turkmenistan to Iran. In 2009-10 came two
fundamental changes. First, Russia slashed its purchases from Turkmenistan as it struggled to
deal with the recession and the consequent over-supply. Second, Turkmenistan began
exporting gas to China: these flows were about 20 bcm/year at the time of writing and will
grow to two or three times that level. The third big change in recent years is the start-up of
Azeri exports. After the Shah Deniz field started producing in 2006, Azerbaijan began
exporting small volumes to Georgia and Turkey; these flows will increase, and some will
reach Europe, in the coming years. But hopes of bringing large volumes of Caspian gas to
Europe have not yet been realised, and plans to build infrastructure to take Turkmen gas to
south Asia remain on paper. This section will (i) cover the current export of Central Asian
and Caspian gas into Russia/FSU, Chinese, Iranian and Turkish markets, (ii) discuss the
implications of changes in demand and pricing in those markets, and (iii) assess past
setbacks, and future prospects, for other export routes.
5.1. Exports to Russia, Ukraine and westwards
During the 2000s, the Central Asian gas export trade to Russia recovered from the instability
of the 1990s, against a background of Russian economic recovery, European economic
growth, rising oil prices, and rising prices of gas (both Russian and Central Asian) sold into
Europe on long-term, oil-linked contracts.153
The way in which this trade evolved reflected
the specific circumstances of post-Soviet transition. In the oil and oil products markets,
Kazakhstan, Turkmenistan and Azerbaijan had already gone a long way in diversifying their
sales away from Russia and other former Soviet trading partners. Gas exports were however
constrained by the transport infrastructure, built in Soviet times, which took all gas from the
region to Russia, (i) via the Central Asia-Centre pipeline corridor towards central Russia and
Ukraine, (ii) via the Orenburg processing plant to the southern Urals, and (iii) via the
Bukhara-Urals pipeline to the Urals. (The only other pipelines from the Central Asian
countries were the small-volume links from Turkmenistan and Azerbaijan to northern Iran,
and links between Afghanistan and Turkmenistan that had been used to import gas to the
Soviet Union but had fallen into disuse.)
The system that had taken shape in the 1990s was that Gazprom, having inherited most of the
Soviet Union’s gas sector assets, acted as a monopsonistic buyer of Central Asian exports and
added them to its gas balance. This balance then satisfied three sources of demand: Russian
domestic consumers, the western CIS gas importers (Ukraine, Belarus and Moldova) and the
European market, to which Gazprom exported 130-170 bcm/year during the 2000s. Market
forces played only an indirect role in determining prices. Gazprom’s exports to Europe were
sold on long-term contracts with prices linked to those of oil products, a system established in
Soviet times that persisted until the end of the 2000s (although it is now undergoing
substantial change, and may give way to a gas-to-gas market system, in the 2010s). These
export prices were many times higher than the prices paid both by Russian domestic
consumers and by the western CIS importers (prices for which were set, usually annually, in
153
More detail on the 1990s and early 2000s, may be found in Henderson, Pirani and Yafimava (2012.), and in
the relevant chapters of Pirani (ed.) (2009).
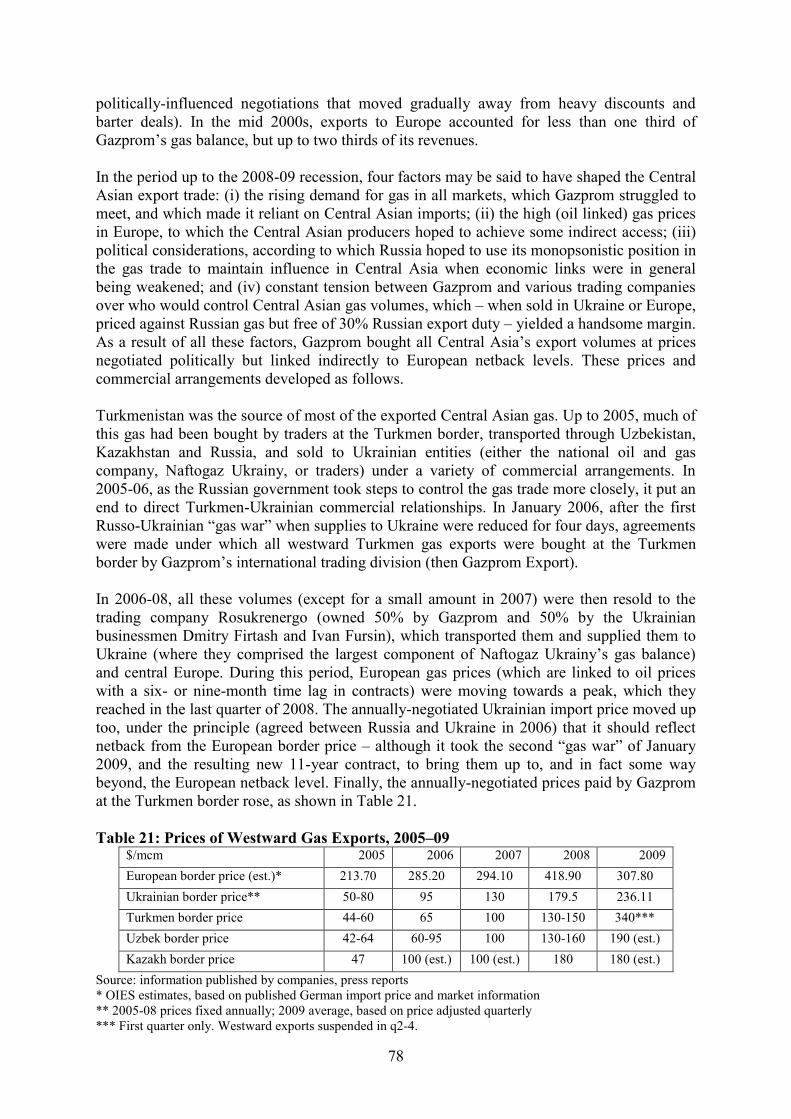
78
politically-influenced negotiations that moved gradually away from heavy discounts and
barter deals). In the mid 2000s, exports to Europe accounted for less than one third of
Gazprom’s gas balance, but up to two thirds of its revenues.
In the period up to the 2008-09 recession, four factors may be said to have shaped the Central
Asian export trade: (i) the rising demand for gas in all markets, which Gazprom struggled to
meet, and which made it reliant on Central Asian imports; (ii) the high (oil linked) gas prices
in Europe, to which the Central Asian producers hoped to achieve some indirect access; (iii)
political considerations, according to which Russia hoped to use its monopsonistic position in
the gas trade to maintain influence in Central Asia when economic links were in general
being weakened; and (iv) constant tension between Gazprom and various trading companies
over who would control Central Asian gas volumes, which – when sold in Ukraine or Europe,
priced against Russian gas but free of 30% Russian export duty – yielded a handsome margin.
As a result of all these factors, Gazprom bought all Central Asia’s export volumes at prices
negotiated politically but linked indirectly to European netback levels. These prices and
commercial arrangements developed as follows.
Turkmenistan was the source of most of the exported Central Asian gas. Up to 2005, much of
this gas had been bought by traders at the Turkmen border, transported through Uzbekistan,
Kazakhstan and Russia, and sold to Ukrainian entities (either the national oil and gas
company, Naftogaz Ukrainy, or traders) under a variety of commercial arrangements. In
2005-06, as the Russian government took steps to control the gas trade more closely, it put an
end to direct Turkmen-Ukrainian commercial relationships. In January 2006, after the first
Russo-Ukrainian “gas war” when supplies to Ukraine were reduced for four days, agreements
were made under which all westward Turkmen gas exports were bought at the Turkmen
border by Gazprom’s international trading division (then Gazprom Export).
In 2006-08, all these volumes (except for a small amount in 2007) were then resold to the
trading company Rosukrenergo (owned 50% by Gazprom and 50% by the Ukrainian
businessmen Dmitry Firtash and Ivan Fursin), which transported them and supplied them to
Ukraine (where they comprised the largest component of Naftogaz Ukrainy’s gas balance)
and central Europe. During this period, European gas prices (which are linked to oil prices
with a six- or nine-month time lag in contracts) were moving towards a peak, which they
reached in the last quarter of 2008. The annually-negotiated Ukrainian import price moved up
too, under the principle (agreed between Russia and Ukraine in 2006) that it should reflect
netback from the European border price – although it took the second “gas war” of January
2009, and the resulting new 11-year contract, to bring them up to, and in fact some way
beyond, the European netback level. Finally, the annually-negotiated prices paid by Gazprom
at the Turkmen border rose, as shown in Table 21.
Table 21: Prices of Westward Gas Exports, 2005–09 $/mcm 2005 2006 2007 2008 2009
European border price (est.)* 213.70 285.20 294.10 418.90 307.80
Ukrainian border price** 50-80 95 130 179.5 236.11
Turkmen border price 44-60 65 100 130-150 340***
Uzbek border price 42-64 60-95 100 130-160 190 (est.)
Kazakh border price 47 100 (est.) 100 (est.) 180 180 (est.)
Source: information published by companies, press reports
* OIES estimates, based on published German import price and market information
** 2005-08 prices fixed annually; 2009 average, based on price adjusted quarterly
*** First quarter only. Westward exports suspended in q2-4.
79
Table 21 shows that European border prices were rising so fast that, even while Russia shared
some of this windfall with Turkmenistan, it also had at its disposal a widening margin
between Turkmen border prices on one hand and both European and Ukrainian prices on the
other. During the three years under which Rosukrenergo supervised this trade as shipper and
supplier, the revenues it earned in Ukraine were probably minimal, due to payment delays
and other risks. But it made substantial profits on the sales of the remaining Central Asian
volumes (not only Turkmen but also Uzbek and Kazakh) in central Europe, where these were
priced against Gazprom’s Russian gas, on which 30% Russian export duty had to be paid.154
Uzbekistan’s westward exports were far smaller than Turkmenistan’s, but rose steadily, from
4.9 bcm in 2003 to 9 bcm in 2006 and 12.4 bcm in 2009. Prices also rose steadily, in close
correlation with the prices achieved by Turkmenistan. In the early 2000s, Uzbek gas had been
marketed in Ukraine by the Industrial Union of Donbass, and elsewhere in small quantities by
other traders. Gazprom’s efforts to centralise the gas trade made an impact here too. The
agreements made after the January 2006 “gas war” provided for Gazprom Export to buy 7
bcm of Uzbek gas (and 8 bcm of Kazakh gas), and for these volumes to be resold to
Rosukrenergo. Alongside this arrangement, some Uzbek gas – including Gazprom’s own
volumes from the Gissarneftegaz and Shakhpakhty projects – was marketed by ZMB
Schweiz, a subsidiary of Gazprom Germania, one of Gazprom’s principal European
marketing companies. (ZMB Schweiz marketed 6.4 bcm of Uzbek gas in 2007 and 11.5 bcm
in 2008; some of this may have been repurchased from Rosukrenergo.)155
Kazakhstan’s exports to and through Russia were at a slightly lower level than Uzbekistan’s,
and some of the gas was swapped for Russian gas delivered to Kaztransgaz customers in the
Caucasus. Information on volumes up to 2005 are not available; in 2005-08 exports rose
steadily from 7.8 bcm to 10 bcm. The prices paid were not made public, but reported prices
were correlated with those paid to Turkmenistan and Uzbekistan. The marketing
arrangements for Kazakh gas also changed, and some flows were brought under the control
of Kazrosgaz, the joint venture between Gazprom and Kazmunaigaz, established in 2002 to
handle the export of Kazakh volumes to Orenburg for reprocessing and re-import. In May
2007, Kazrosgaz signed a 15-year export contract with Gazprom Germania, for the sale of
gas at Aleksandrov Gai on the border of Russia and Kazakhstan. Kazrosgaz’s principal
counter-parties were Gazprom Germania and ZMB (Schweiz) (now Gazprom Schweiz). It
may be presumed that the agreement made in 2006, to resell Kazakh gas to Rosukrenergo,
stood until 2008, in which case Gazprom’s side of it may have been kept by Gazprom
Germania.156
While the disposal of the trading margin on Central Asian gas, and the disputes between
Russia and Ukraine over import contracts, have both been the subject of much public
discussion, a neglected aspect of this episode is the way that Gazprom – no doubt under the
influence of the Russian government, its main shareholder – shared some of the benefits of
rising gas prices in Europe with its Central Asian suppliers. In May 2006, against a
background of rapidly rising European gas prices, the price paid for Kazakh exports was
reportedly raised substantially as the direct result of political intervention. Vladimir Putin,
then prime minister, met with Kazakh president Nursultan Nazarbayev and shortly afterwards
154 For more details, see e.g. Pirani, Stern and Yafimava (2010), and the relevant chapters of Pirani (ed.) 2009.
155 ZMB (Schweiz) Annual Report 2007, p. 70; Annual Report 2008, p. 20.
156 Kazrosgaz web site, “Eksport gaza” page
80
secured agreement with Gazprom to triple the price it was paying.157
In March 2008, as the
oil boom was reaching its apex, and Russia and Ukraine were once again at loggerheads over
gas supplies and transit, the chief executives of Gazprom and the three Central Asian
producer companies (Turkmengaz, Uzbekneftegaz and Kazmunaigaz) met in Moscow and
agreed that Russia would in future pay “European prices”, i.e. presumably netback from
European prices, for Central Asian imports. A statement by Gazprom indicated that the
agreement was made “considering the interests of the national economies and taking into
account international conditions with regard to reliable and uninterrupted fuel supplies”.158
Three months later, in June 2008, Gazprom CEO Aleksei Miller visited Ashgabat and signed
a new agreement with Turkmengaz; reportedly, it provided for purchase prices to $225-
295/mcm in the second half of the year, from the $130-150/mcm paid previously.159
The 2009 crisis
The dispute between Russia and Turkmenistan in 2009, and the sharp reduction in Russian
purchases, was caused by a combination of the collapse of demand in Russian and European
markets and extremely high purchase prices. Gazprom has stated that in 2008-09 its Central
Asian purchase prices were tied to those in Europe; this may have meant a link to the prices
in Gazprom’s European export contracts, most of which are designed to reflect oil prices with
a six- or nine-month time lag. With oil prices reaching their peak in mid 2008, it is probable
that Gazprom’s Central Asian purchase prices reached their peak in early 2009. This was the
very point at which European and FSU gas demand was crashing, due to the economic
recession. The best indication available of the price of Turkmen gas in the first quarter of
2009 is a statement by then prime minister Putin, implying that it was $340/mcm; other
reports suggested it was above $300/mcm, and may have been as high as $375.50/mcm.160
In
any case, the combination of such high purchase prices and the lack of demand was regarded
by Gazprom as unsustainable, and purchases were summarily halted in April 2009.
The cessation of Russian purchases from Turkmenistan followed an accident on the Central
Asia-Centre pipeline system on 9 April 2009 that was the subject of recriminations by
Turkmen officials against Gazprom. There was an explosion at the SATs-4 compressor
station; subsequently Odek Odekov, a senior Turkmen official (head of Turkmengeologia),
said that a valve had been closed without Turkmen engineers’ knowledge, “producing a so-
called vacuum bomb effect”. The valve closure stopped gas flowing along the main export
route, and only one day’s notice was given when three is required to take adequate remedial
action, Odekov said. Turkmen officials stated that 195 production wells had been closed in as
a result of the accident. Whatever the cause of the explosion, what is not disputed is that (i)
all Turkmen export flows ceased as a result, (ii) the compressor station was repaired within a
few days, and (iii) afterwards, Gazprom unilaterally decided not to restart imports. Although
the terms of Gazprom’s contract with Turkmengaz are not known, Odekov said that
Turkmenistan had not ruled out international arbitration, suggesting (as seems logical) that
157
Iiulia Sinchuk, “Gazprom dal Kazakhstanu evropeiskuiu tsenu”, Kommersant, 22 May 2009. This is an
interview with Uzbakbai Karabalin, president of Kazmunaigaz, who implicitly confirmed that Kazakh export
prices had risen to $140/mcm in 2006 from $47/mcm in 2005. Other industry information suggests that the price
rise was to $100/mcm (see Table 21). 158
“Ob itogakh rabochei vstrechi”, Gazprom press release, 11 March 2008; “Sredneaziatskii gaz – po
evropeiskim tsenam”, Interfax, 11 March 2008 159
The prices were not disclosed, and are estimated on the basis of press reports. “Sergei Ivanov proshchupaet
uzbekskuiu pochvu”, Kommersant, 25 August 2008 160
ICIS Heren, European Gas Markets, 17 December 2009; “Rossiia i Turkmenistan: okonchilas’ li ‘gazovaya
voina’?”, Kazenergy, January 2010, pp. 22-23.
81
the cessation of purchases had breached contractual terms. Shortly after the accident Valerii
Golubov, Gazprom deputy CEO, stated that the Gazprom had asked Turkmenistan to reduce
volumes or prices, that “there is nowhere to sell your gas, at that price, today: either we
reconsider the price, or the volume”.161
With the benefit of hindsight it is clear that during this incident Gazprom’s hand was forced
by the consequences of the economic recession. In 2009 gas consumption in Russia was
about 6% lower than in 2008; in Ukraine, previously the main destination (at least
contractually) for Turkmen gas, it was about 21% lower; and in Europe, about 5% lower.
Having at the height of the oil boom agreed to share the benefits of high European prices with
the Central Asian suppliers, Gazprom suddenly found itself unable even to handle physically
the quantities of gas it had agreed to offtake. Its own production, as well as Turkmenistan’s,
was being shut in. And it was embarking on a major dispute with its largest European
customers, who, believing that the differential opened up between oil-linked prices and gas-
to-gas market prices by the recession would remain for the medium term, demanded the
renegotiation of contracts.
Commercially, the cessation of purchases from Turkmenistan in 2009 could only have been
damaging for Gazprom; politically, only damaging for Russia. It must have confirmed fears
in Ashgabat that Russia was potentially an unreliable partner. It surely redoubled
Turkmenistan’s determination to develop its multi-vector foreign policy in general and its
relationship with China it particular. This is a significant conclusion, because it contradicts
the widely held interpretation of Russia’s decisions on natural gas trading issues as the use of
an “energy weapon”. Here, Russia’s decisions showed its weakness: confronted by the
economic crisis, the gas demand slump and the consequent loss of revenues, it chose to
breach agreements with Turkmenistan as the least damaging option, but nevertheless an
option that undermined its own foreign policy aim of retaining strategic influence in Central
Asia.162
Westward export arrangements from 2009
In December 2009, after an eight-month suspension of imports from Turkmenistan, addenda
and amendments to sales contracts were signed by Gazprom Export and Turkmengaz,
providing for sales to be resumed from 1 January 2010. Gazprom stated that the price formula
was “indexed to correlate with changes in the prices of oil products” (i.e. reflecting the price
levels at which Gazprom was selling into Europe).163
The agreement provided for
Turkmengaz to sell up to 30 bcm/year to Gazprom, but it was stated by both sides that
exports would be 10-11 bcm/year for the foreseeable future. Price levels were not made
public, but Gazprom management price forecasts, reported in Moscow, were for purchases in
2010 from Turkmenistan at $222/mcm, Kazakhstan at $230/mcm and from Azerbaijan at
$244.50/mcm. In the event, Gazprom’s purchase prices were lower than that: the company’s
annual reports gave the average price of its purchases of gas from Central Asia and
Azerbaijan as $197.20/mcm in 2010 (down from $233.55 in 2009) and $244/mcm in 2011.164
161
Aleksandr Tutushkin, “Vygodnaia avariia”, Vedomosti, 10 April 2009; “Turkmeniia ostanovila dobychu na
195 skvazhinakh”, Vzglyad.ru, 29 May; “Gazoprovod ‘Turkmeniya’ gotov k vozobnobleniiu podachi gaza”,
Vzglyad.ru, 29 May 2009; Upstream, 26 June 2009. 162
See also Simon Pirani, “Russian gas: the next ten years”, Oxford Energy Forum, August 2012, p. 12. 163
Gazprom web site, “Zakupki gaza” page <http://www.gazprom.ru/about/production/central-asia/> 164
Gazprom, Annual Report 2011, p. 80; Geller( 2011), quoting Gazprom presentation Gaining Momentum.
82
The volumes and prices of Gazprom’s purchases from Kazakhstan and Uzbekistan remained
essentially unchanged through the 2009 crisis. In 2010 Gazprom reported purchases of 12.4
bcm from Kazakhstan and of 11.4 bcm from Uzbekistan (respectively, up from 10.1 bcm in
2009 and down from 13.1 bcm in 2009). There is only patchy information about prices and
contract terms. In the case of Uzbekistan, Gazprom has stated that in December 2009 it
signed contracts with Uztransgaz for the purchase of a total of 15.5 bcm in 2010, an increase
of 4.25 bcm on the volumes agreed upon earlier; prices would be linked by a formula to
average European prices. In a subsequent presentation, Gazprom indicated that purchases
from Uzbekistan would be 17.2 bcm in 2010.165
As it turned out, in 2010, only 11.4 bcm was
delivered, and in 2011, only 8 bcm. Gazprom managers told journalists in Moscow that this
was as a result of the Uzbek supply squeeze discussed in section 4.1 above. It is significant
that both the long-term contracts agreed in 2002 between Gazprom and Uzbekneftegaz, and
the supplementary agreements made in 2010, expire at the end of 2012. This could be a
turning-point at which the gas trading relationship between Russia and Uzbekistan is further
reduced.
In the case of Kazakhstan, there were also discussions about adjusting prices and contract
terms during 2009. No information is available on the terms agreed. Kazmunaigaz has stated
that Kazrosgaz, its joint venture with Gazprom, exports gas that it has purchased (i) under a
15-year sales agreement with the Karachaganak project, starting in 2007, and (ii) from the
Tengiz field, on terms that are not specified. Kazrosgaz stated that it exported only 2.9 bcm
of gas in 2010, According to press reports, in 2009 Gazprom with its Kazakh counterparts
agreed to buy 10-15 bcm/year at European-linked prices and a further 3 bcm/year at prices
related to those in Ukraine.166
The commercial arrangements for the westward export of Central Asian gas also changed in
2009. Up until the end of 2008, most volumes were purchased from the Central Asian
suppliers by Gazprom Export and resold to Rosukrenergo, which acted as shipper and
supplier. As a result of the January 2009 “gas war” between Russia and Ukraine and the new
contractual arrangements made between them, Rosukrenergo’s role as a purchaser and re-
seller of Central Asian gas ceased. From March 2009, Gazprom Germania, Gazprom’s
wholly-owned trading subsidy based in Germany, has purchased all westward-bound gas
from Central Asia on Gazprom group’s behalf, transported it to Ukraine, Belarus, Georgia
and western Europe and transferred it to Gazpromexport for onward sale.167
The trading
margin on Central Asian volumes remains high because although there are additional
transport costs to pay, they are priced against volumes from Russia that incur 30% export
duty. There is no comprehensive information on the destination of the gas.168
The traditional
sale of Central Asian volumes to Ukraine continues: in 2011, in addition to purchases by
Naftogaz Ukrainy, there were purchases of 4.8 bcm by Ostchem Holding, a holding company
that dominates the Ukrainian chemical fertiliser sector and is controlled by Dmitry Firtash,
165
Gazprom investor day presentation, Gaining Momentum, February 2010; Gazprom press release 28
December 2009; Gazprom web site, “Zakupki gaza” page 166
Kazmunaigaz Godovoi Otchet 2010, p. 32; Iiulia Sinchuk, “Gazprom dal Kazakhstanu evropeiskuiu tsenu”,
Kommersant, 22 May 2009. 167
Gazprom Germania Annual Report 2010, pp. 13-14. There is an anomaly with regard to volumes. Gazprom
Germania states that its Central Asian trading volumes were 32 bcm in 2009 and 38 bcm in 2010, while
Gazprom group states that its Central Asian trading volumes were 35 bcm in 2009 and 34.5 bcm in 2010. It
appears that in 2009, 3 bcm were traded under previous arrangements. There is no obvious reason for the
disparity between the figures given for 2010. 168
Physically, the volumes are added to the Russian gas balance in the Russian united transport system.
Contractually, they are treated as exports to Ukraine and other destinations.
83
part-owner of Rosukrenergo. It is presumed that Gazpromexport sells most of the remaining
volumes of Central Asian gas mostly in European markets.
The momentous changes in the European gas market (transition away from oil-linked pricing
to gas-to-gas hub-based pricing) and in the Russian market (transition towards higher prices
and away from Gazprom quasi-monopoly) imply changes for Central Asia’s westward
exports. This is discussed below in section 5.3.
5.2. Exports to China
The start-up in 2010 of Central Asian gas exports to China was the result of a strategic policy
initiative by the Chinese government, which made agreements with the three Central Asian
producing countries to construct the Turkmenistan-China pipeline and to bring Chinese
companies into upstream production. China’s move into the gas sector followed its
substantial investment in the Kazakh oil sector, and growth of its economic and trading
activity throughout Central Asia. Exports of Turkmen gas through the pipeline are now
running at about 20 bcm/year; there seems little doubt that the volumes exported will rise to
30 bcm/year by 2015 (the capacity of lines A and B of the Turkmenistan-China pipeline,
which are completed) and to as much as 55 bcm/year in the second half of the decade
(including line C, which is under construction). Kazakhstan could add 5-10 bcm to this;
Uzbekistan has a framework agreement to supply 10 bcm but may be constrained by
upstream issues and its own consumption requirements. But there is little doubt that China
will be able to source these volumes from Turkmenistan, even if the timetable of South
Yolotan and other fields coming on stream may be revised.
The Turkmenistan-China pipeline
The Turkmenistan-China pipeline comprises: Line A (1,067 mm), commissioned in
December 2009; Line B (1,067 mm), commissioned in July 2010; and Line C, which is under
construction, and due to be completed by 2015. In Turkmenistan, the pipelines run from the
Bagtyiarlyk compressor station to the Uzbek border. The Uzbek section is 529 km long and is
operated by Asia Transgaz, a CNPC-Uzbekneftegaz joint venture. The Kazakh section is
1,308 km long; work on it has been completed under an agreement between Kazmunaigaz
and CNPC; construction was by Aziatskii gazoprovod, a joint venture between Kazntransgaz
and Trans Asia Gas Pipeline Ltd, a CNPC subsidiary. The capacity of Lines A and B has
risen in stages as compressor stations have been added in Uzbekistan and Kazakhstan;
according to company information, the capacity was under 17 bcm/year at the end of 2010,
and after the completion of compressor stations nos. 1, 4 and 6 in Uzbekistan in 2011 had
risen to 23 bcm/year. The joint total capacity of lines A and B is projected to be 30
bcm/year.169
Two further expansions of the pipeline are currently planned. The first is the construction of
line C, which will add a further 25 bcm/year of capacity. In September 2011, agreements
were signed respectively between CNPC and Uzbekneftegaz, and CNPC and Kazmunaigaz,
on the construction and operation of line C through Uzbekistan and Kazakhstan. The planned
date of completion was reported as 2014. In April 2012 the agreement on the Uzbek section
was complemented by a presidential decree that set out a timetable for construction to be
169
CNPC web site, “Turkmenistan” and “Uzbekistan” pages; Kaztransgaz annual report 2010
84
completed in 2015.170
The second expansion of the pipeline is for 10 bcm/year of additional
capacity to be added in Kazakhstan, in conjunction with the completion of the Beineu-
Shimkent pipeline.171
This would presumably provide for flows of Kazakh gas to China –
although, as indicated below, there are some disagreements between Kazakhstan and China
on the timing and scale of these projects.
Turkmen exports to China and pricing issues
The Turkmenistan-China pipeline began to be filled with linepack in December 2009.
Exports have risen from about 3.5 bcm in 2010, and 15.5 bcm in 2010 to 20 bcm in 2012.
(The information available about volumes is not consistent; these are estimates. See box
below on Volumes of Central Asian exports to China.) So far, all the gas exported has been
from Turkmenistan; if Uzbekistan has begun exporting gas at all, the volumes are negligible.
The gas exported is (i) CNPC’s own gas produced at Bagtyiarlyk, comprising about one-third
of exports so far;172
and (ii) Turkmengaz production, mostly from Malay and the Uchadzi
group of fields. The development plan agreed between China and Turkmenistan projects that
the initial target of 30 bcm/year will comprise 13 bcm/year from CNPC’s PSA (its projected
peak output), and 17 bcm/year from Turkmengaz.173
Turkmen gas is fed into the West-East Gas Pipeline Corridor at Horgos, in China’s Xinjiang
autonomous region on the Kazakh border, and transported eastwards. It has been supplied to
south-central China and industrial regions of eastern China. Deliveries to south-central China
began in December 2010, when CNPC announced that the Zhongwei-Huangpi trunk line of
the eastern segment of the West-East Gas Pipeline had become operational ahead of schedule,
and that Turkmen volumes were flowing to Hubei and Hunan, easing gas supply shortages. In
June 2011, the 2,517 km eastern section of the pipeline, from Zhongwei to Guangzhou, was
completed, together with a branch line from Guangzhou to Shenzhen, one of China’s largest
industrial concentrations. In November 2011, natural gas lighting ceremonies were held in
both Shenzen and Guangzhou, as Turkmen gas arrived there for the first time. Gas is supplied
to Shenzen under a sales agreement signed in 2010 between Shenzen Gas Corp and
PetroChina for 4 bcm/year.174
170
CNPC web site; “China, Kazakhstan agree Line C”, Platt’s International Gas Report, 10 October 2011;
presentation by Abdubakhram Vakilov, Asia Transgaz, at Oil and Gas Uzbekistan conference, May 2012,
Tashkent 171
Kazmunaingaz, Godovoi Otchet 2010, p. 36; Kaztransgaz Godovoi Otchet 2010, “Investitsionnaia
deiatel’nost’” 172
The cumulative output from CNPC’s PSA was 10.5 bcm up to mid 2012 (see section 3.1 above); cumulative
exports up to mid 2012 were reported as 30 bcm by the China Daily (see box). 173
Bernstein Research, The Caspian: Cradle of Oil Production, p. 85 174
“China builds 2nd West-East line”, Platt’s International Gas Report, 20 June 2011; “Turkmenistan Natural
Gas Arrived in Guangdong”, SZ Energy, 28 November 2011.
85
On a political level, there are intentions to increase Turkmen exports to China even further
than the 40 bcm/year of pipeline capacity in operation or under construction. The original
agreement between the two countries, made in 2006, envisaged exports of 30 bcm/year for 30
years after initial field and pipeline development, with an option on increasing volumes to 40
bcm/year. Since the exports began, the two sides have explored the possibility of expansion.
In March 2011 the Chinese National Development and Reform Commission said that it had
reached “consensus” on adding a further 20 bcm/year to the initial 30 bcm/year. And in
November that year, Turkmen president Berdymukhammedov and Chinese president Hu
Jintao signed a further agreement providing for increased exports and for further cooperation
at South Yolotan. Berdymukhammedov stated after the meeting that Turkmenistan was ready
to raise the volume of exports planned from 40 bcm/year to 65 bcm/year.175
Turkmen reserves are ample to meet demand at these levels. There are three possible
constraints: (i) Given Turkmenistan’s small population and the limits to its requirement for
export revenues, Turkmen governments may be inclined to increase exports to China
gradually, or to limit them at some stage (as argued above in section 2). (ii) Given the
Turkmen government’s apparent determination to limit the involvement of foreign companies
(excluding the Chinese state-owned companies) in the upstream, and the country’s limited
supply of managerial experience and skilled labour, field development may take longer than
anticipated. A lack of information makes it difficult to assess this constraint in more detail.
(iii) The evolution of the Chinese gas market which, in line with government policy, is both
expanding rapidly and moving away from fixed and regulated prices towards market
mechanisms,176
may put in question the price formulas being used, which at present require
CNPC, the importer, to bear a considerable loss on sales.
Chinese official sources have stated that prices in the Turkmen contracts are linked to oil
prices. Details are confidential, but it is clear that Turkmen imports are substantially more
expensive than domestically-produced Chinese gas, and, in the east of the country, even more
175
“China hits Turkmen landmark”, Platt’s International Gas Report, 6 June 2011; Robert Cutler,
“Turkmenistan to raise gas exports to China”, Asia Times, 30 November 2011, cited by InoZpress web site. 176
For Chinese market and pricing issues, see Chen (2012), pp. 310-337.
Volumes of Central Asian exports to China
For 2010, Cedigaz reported 3.55 bcm of exports while Aziatskii gazoprovod, the Kazakh
joint venture that operates the Kazakh section of the pipeline, said it had transported 4.4
bcm of gas during the year. In 2011, PetroChina said it had imported 15.5 bcm, while
customs statistics showed that in June-December 2011, 6.7 bcm was imported,
suggesting either a lower level of imports or that the customs statistics excluded CNPC’s
own gas produced at Bagtyarlyk. In 2012, customs statistics showed 4.8 bcm of imports
during the first four months, suggesting that imports for the year (assuming a steady
increase) will be 15-20 bcm; PetroChina announced that 24.1 bcm of gas could be
imported from Central Asia this year. Finally, the China Daily reported in June 2012 that
total import via the pipeline up to that date was 30 bcm.
Sources: BMI, Turkmenistan Oil & Gas Report Q1 2012, p. 5; Kaztransgaz Annual Report 2010,
“Osnovnye rezul’taty deiatel’nosti”; SZ Energy, “Turkmenistan takes growing share of China gas market”,
13 June 2012; customs statistics; “China’s imports of Turkmen gas since 2009 totals 30 bcm”, Platts, 4 Jun
2012.
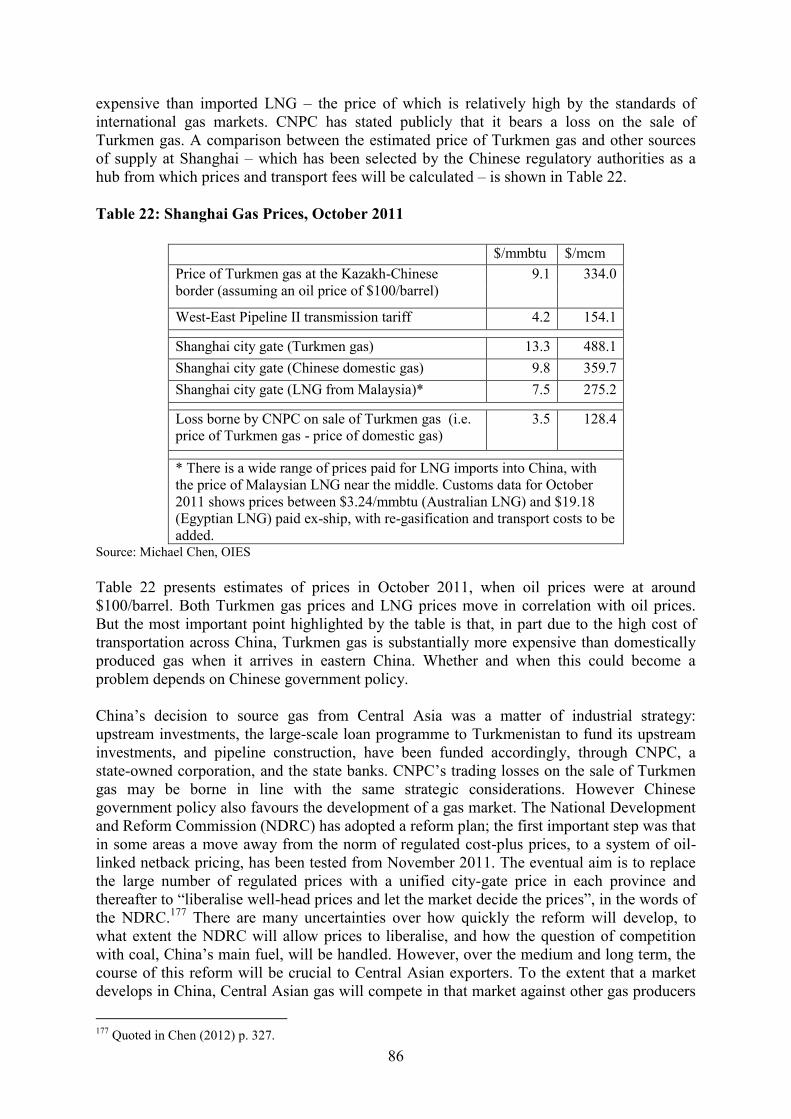
86
expensive than imported LNG – the price of which is relatively high by the standards of
international gas markets. CNPC has stated publicly that it bears a loss on the sale of
Turkmen gas. A comparison between the estimated price of Turkmen gas and other sources
of supply at Shanghai – which has been selected by the Chinese regulatory authorities as a
hub from which prices and transport fees will be calculated – is shown in Table 22.
Table 22: Shanghai Gas Prices, October 2011
$/mmbtu $/mcm
Price of Turkmen gas at the Kazakh-Chinese
border (assuming an oil price of $100/barrel)
9.1 334.0
West-East Pipeline II transmission tariff 4.2 154.1
Shanghai city gate (Turkmen gas) 13.3 488.1
Shanghai city gate (Chinese domestic gas) 9.8 359.7
Shanghai city gate (LNG from Malaysia)* 7.5 275.2
Loss borne by CNPC on sale of Turkmen gas (i.e.
price of Turkmen gas - price of domestic gas)
3.5 128.4
* There is a wide range of prices paid for LNG imports into China, with
the price of Malaysian LNG near the middle. Customs data for October
2011 shows prices between $3.24/mmbtu (Australian LNG) and $19.18
(Egyptian LNG) paid ex-ship, with re-gasification and transport costs to be
added. Source: Michael Chen, OIES
Table 22 presents estimates of prices in October 2011, when oil prices were at around
$100/barrel. Both Turkmen gas prices and LNG prices move in correlation with oil prices.
But the most important point highlighted by the table is that, in part due to the high cost of
transportation across China, Turkmen gas is substantially more expensive than domestically
produced gas when it arrives in eastern China. Whether and when this could become a
problem depends on Chinese government policy.
China’s decision to source gas from Central Asia was a matter of industrial strategy:
upstream investments, the large-scale loan programme to Turkmenistan to fund its upstream
investments, and pipeline construction, have been funded accordingly, through CNPC, a
state-owned corporation, and the state banks. CNPC’s trading losses on the sale of Turkmen
gas may be borne in line with the same strategic considerations. However Chinese
government policy also favours the development of a gas market. The National Development
and Reform Commission (NDRC) has adopted a reform plan; the first important step was that
in some areas a move away from the norm of regulated cost-plus prices, to a system of oil-
linked netback pricing, has been tested from November 2011. The eventual aim is to replace
the large number of regulated prices with a unified city-gate price in each province and
thereafter to “liberalise well-head prices and let the market decide the prices”, in the words of
the NDRC.177
There are many uncertainties over how quickly the reform will develop, to
what extent the NDRC will allow prices to liberalise, and how the question of competition
with coal, China’s main fuel, will be handled. However, over the medium and long term, the
course of this reform will be crucial to Central Asian exporters. To the extent that a market
develops in China, Central Asian gas will compete in that market against other gas producers
177
Quoted in Chen (2012) p. 327.
87
and potentially against others fuels. If the substantial differential between the price of Central
Asian gas and that of other gas persists, it could come under downward pressure from the
market.
Constraints on Uzbek and Kazakh exports to China
China’s initial agreement with Kazakhstan on the pipeline and gas exports was signed by
CNPC and Kazmunaigaz executives in October 2008, with support from their respective
governments, which followed a lengthy history of cooperation in the oil sector. Kazmunaigaz
agreed to “take all necessary measures” to facilitate the export of 5 bcm/year from CNPC’s
subsidiary, CNPC-Aktobemunaigaz, and a further 5-10 bcm/year from the Urikhtau field,
which would be developed jointly; some Urikhtau gas would be supplied to south-eastern
Kazakhstan; and the two sides jointly would build and operate the Beineu-Shimkent
pipeline.178
Further agreements were signed on pipeline construction, and in February 2011 a
new “oil and gas cooperation agreement” was signed by presidents Hu Jintao of China and
Nursultan Nazarbayev of Kazakhstan, specifying that a 50-50 joint venture would be
established by CNPC and Kazmunaigaz to develop Urikhtau.179
However, in contrast to the rapid construction and expansion of the Turkmenistan-China
route, these agreements have been implemented slowly or not implemented. This appears to
be because the two sides have not resolved differences about how the gas resources will be
divided between them, including such issues as the funding of, and control over, production
and transportation projects, and the allotment of gas to domestic and export markets.
The outward signs of tension between the two sides are: (i) The lack of movement towards
the formation of a joint venture at Urikhtau, as provided for in agreements (see section 3.3
above), apparently due to Kazakhstan’s desire to increase its own share of, and control over,
the development of the field. (ii) Initial reluctance by China to agree to the Beineu-Shimkent
pipeline project in the form proposed by Kazakhstan, and, since the agreement was made in
mid 2010 to go ahead with the pipeline, disagreement over its financing. (It has been agreed
that each partner would contribute $500 million, and a further $2 billion would be available
in loans from Chinese banks). The source of some of this tension is reported to be the Kazakh
side’s insistence on measures to ensure maximum benefit to its gasification plans from the
project (see section 4.3 above). (iii) Reported delays in the start-up of construction of the
Kazakh section of Line C of the Turkmenistan-China pipeline, and a reported dispute over
the level of transit tariffs to be set for that line.180
In June 2012, during a summit of the Shanghai Cooperation Organisation (SCO) in Beijing, a
plan to build a pipeline from Turkmenistan, through northern Afghanistan and Tajikistan to
China was reported in official Chinese media after meetings between Chinese president Hu,
CNPC chairman Jiang Jiemin and Afghan president Hamid Karzai.181
Although the
announcement was interpreted as a means of cutting across US-supported plans for a pipeline
from Turkmenistan across Afghanistan to south Asia (see below section 5.6), it may also
have served as a reminder to Kazakhstan that there were potential export routes for Turkmen
gas to China avoiding its territory.
178
CNPC press release, 1 November 2008, “CNPC and KazMunayGas sign framework agreement” 179
CNPC press release, “New oil and gas cooperation agreement”, 23 Feburary 2011 180
PFC Energy, Kazakhstan: China Gas Route May Be Delayed, 30 July 2012 181
Vladimir Socor, “Beijing Proposes Turkmenistan-China Gas Pipeline Through Northern Afghanistan”,
Eurasia Daily Monitor, 19 June 2012
88
In the case of Uzbekistan, China’s interest in the gas sector started in the upstream, where
CNPC began work in 2006. In 2009, CNPC signed a series of agreements on cooperation in
the energy sector with Uzbekneftegaz, and in 2010 came an intergovernmental memorandum
of understanding and a framework agreement providing for the sale of 10 bcm/year of gas to
China.182
In contrast to Kazakhstan, where the terms on which to cooperate with China are
still being decided, it appears that the difficulty in Uzbekistan will be in ensuring sufficient
gas is available for export. In January 2012 Uzbek official media stated that gas exports to
China would start in April, although no information on volumes was given. But in May 2012
it was reported that exports had not yet begun: an official of Uzbekneftegaz, cited by Reuters,
said that exports could be 2-4 bcm this year, but that legal issues still had to be resolved
before they could begin.183
5.3 Pricing and volumes: China versus westward export
The establishment of China as a second main market for Central Asian gas raises the issue of
how netbacks from sales in China compare to those of westward exports. Table 23 presents
an attempted comparison. Netbacks have been estimated using the Chinese border prices in
Table 22, and Ukrainian import prices extrapolated from customs information. Table 23 also
compares the average price at which Gazprom buys gas in Central Asia with its gas sales
prices to customers in two of the largest consuming regions (Moscow and Sverdlovsk) and
two regions that border on Kazakhstan (Orenburg and Saratov).
182
CNPC press release, “CNPC and Uzbekneftegaz sign agreements”, 1 July 2009; CNPC press release,
“Natural gas purchase and sale framework agreement”,, 10 June 2010 183
angi.ru, “Uzbekistan s 1 aprelia nachnet postavki gaza v Kitai”, 13 January 2012; Dmitry Solovev,
“Uzbekistan aims to join China gas supply route”, Reuters, 17 May 2012
<http://www.reuters.com/article/2012/05/17/gas-uzbekistan-china-idUSL5E8GHCR220120517>
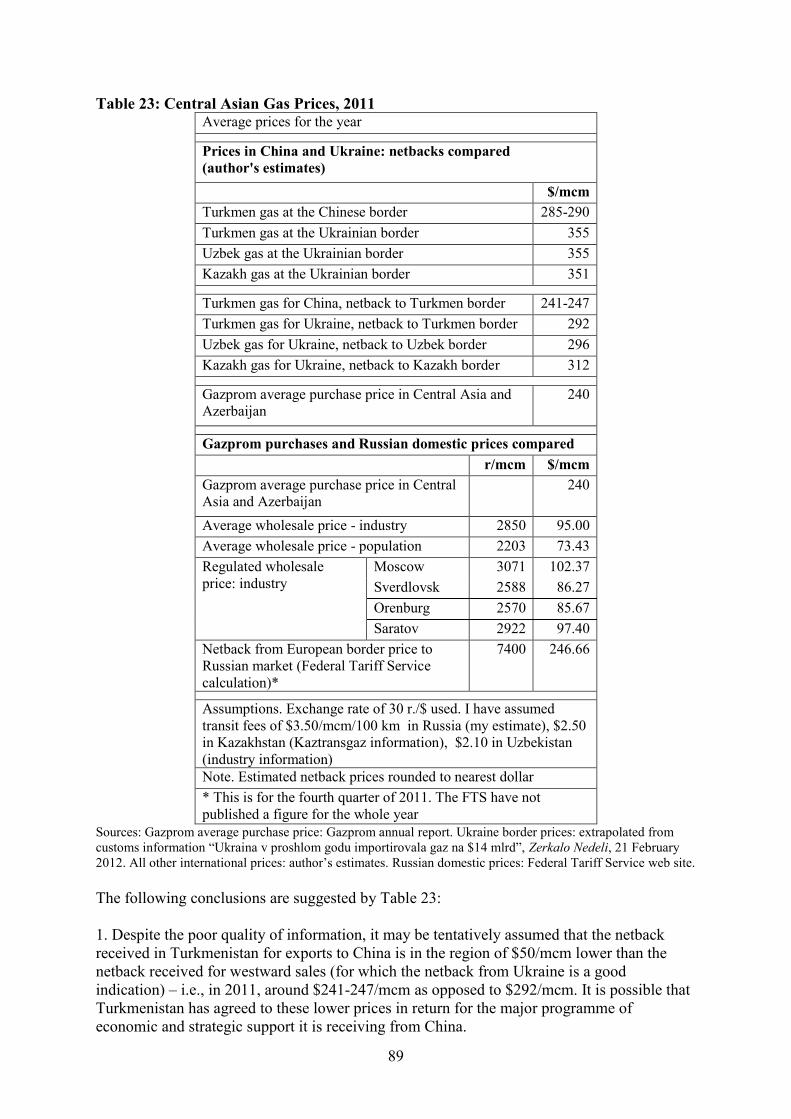
89
Table 23: Central Asian Gas Prices, 2011 Average prices for the year
Prices in China and Ukraine: netbacks compared
(author's estimates)
$/mcm
Turkmen gas at the Chinese border 285-290
Turkmen gas at the Ukrainian border 355
Uzbek gas at the Ukrainian border 355
Kazakh gas at the Ukrainian border 351
Turkmen gas for China, netback to Turkmen border 241-247
Turkmen gas for Ukraine, netback to Turkmen border 292
Uzbek gas for Ukraine, netback to Uzbek border 296
Kazakh gas for Ukraine, netback to Kazakh border 312
Gazprom average purchase price in Central Asia and
Azerbaijan
240
Gazprom purchases and Russian domestic prices compared
r/mcm $/mcm
Gazprom average purchase price in Central
Asia and Azerbaijan
240
Average wholesale price - industry 2850 95.00
Average wholesale price - population 2203 73.43
Regulated wholesale
price: industry
Moscow 3071 102.37
Sverdlovsk 2588 86.27
Orenburg 2570 85.67
Saratov 2922 97.40
Netback from European border price to
Russian market (Federal Tariff Service
calculation)*
7400 246.66
Assumptions. Exchange rate of 30 r./$ used. I have assumed
transit fees of $3.50/mcm/100 km in Russia (my estimate), $2.50
in Kazakhstan (Kaztransgaz information), $2.10 in Uzbekistan
(industry information)
Note. Estimated netback prices rounded to nearest dollar
* This is for the fourth quarter of 2011. The FTS have not
published a figure for the whole year
Sources: Gazprom average purchase price: Gazprom annual report. Ukraine border prices: extrapolated from
customs information “Ukraina v proshlom godu importirovala gaz na $14 mlrd”, Zerkalo Nedeli, 21 February
2012. All other international prices: author’s estimates. Russian domestic prices: Federal Tariff Service web site.
The following conclusions are suggested by Table 23:
1. Despite the poor quality of information, it may be tentatively assumed that the netback
received in Turkmenistan for exports to China is in the region of $50/mcm lower than the
netback received for westward sales (for which the netback from Ukraine is a good
indication) – i.e., in 2011, around $241-247/mcm as opposed to $292/mcm. It is possible that
Turkmenistan has agreed to these lower prices in return for the major programme of
economic and strategic support it is receiving from China.
90
2. Even assuming that sales to China are priced with this type of discount to westward
exports, Turkmen gas still struggles to compete with other Chinese imports after transport
costs to southern and eastern China are taken into account.
3. In the case of exports to Ukraine, if my estimates of netbacks to the producer countries’
borders ($292/mcm, $296/mcm and $312/mcm in 2011) are even roughly correct, the fact
that Gazprom’s average purchase price in 2011 was $240/mcm implies that Gazprom earned
a margin of $50/mcm or more, minus transport costs, on gas exported to Ukraine.
4. From Gazprom’s point of view, buying Central Asian gas and selling it net of Russian
export duty in Ukraine, at the high European-linked prices paid there, was a profitable
exercise in 2011 and may be for some time yet. But the long-term prospects for this trade are
less clear. The prevalence of oil-linked prices in the European market is in question.
Ukrainian import prices were tied to a European-type oil-linked formula when negotiated in
2009 but, if and when European price formation changes, Ukrainian price formation may
change too. Although Russia and Gazprom have robustly refused to renegotiate the Ukrainian
import contracts so far, further fundamental shifts in the European market would weaken
their negotiating position. Secondly, at long last the Ukrainian government has begun to react
to high import prices by actively seeking to reduce consumption and to increase its own
production. Such measures will take some years to make a fundamental difference to the gas
balance, but they may start quite soon to reduce Ukraine’s import requirement.
5. Central Asian gas exported westwards has been sold according to contract in Ukraine or
central Europe, but physically goes into the Russian pipeline network and is probably
swapped for Russia’s own production. Should changes in the European and Russian market
lead to Central Asian gas competing directly against Russia’s own production in the Russian
market, it would struggle to do so. Gazprom’s average purchase price in Central Asia of
$240/mcm, low enough to assure it of a profitable margin on Ukrainian sales, is far too high
to allow Central Asian gas to compete either in Russia’s major industrial areas or even in the
areas close to the Kazakh border at current prices. As the Russian market develops, domestic
prices will rise – but they may never reach levels comparable to netback from oil-linked
European prices. Over the medium and long term, therefore, Central Asian producers may
face difficulty (i) in preserving the principle of netback from European oil-linked prices with
which they have worked with Gazprom since 2008, as Gazprom itself may have to yield that
principle in many respects; and (ii) in competing in the Russian market, which may become
the main destination for their westward exports. If the Russian market remains oversupplied,
as it has been in 2009-2012, there will be correspondingly less motivation for Gazprom or
any Russian entity to import Turkmen gas to Russia, or to make arrangements for it to be
exported to Ukraine.
The point about the medium- and long-term prospects for Central Asian sales into the
Russian market is brought home forcefully by Figure 2, which shows estimates by the
Moscow School of Management, Skolkovo Energy Centre of the comparative costs of gas
supplied to central Russia in 2020. The most striking implication of the Figure is that even
the most expensive Russian domestically-produced gas is likely to be little more than half the
cost of Central Asian gas, should they compete directly.
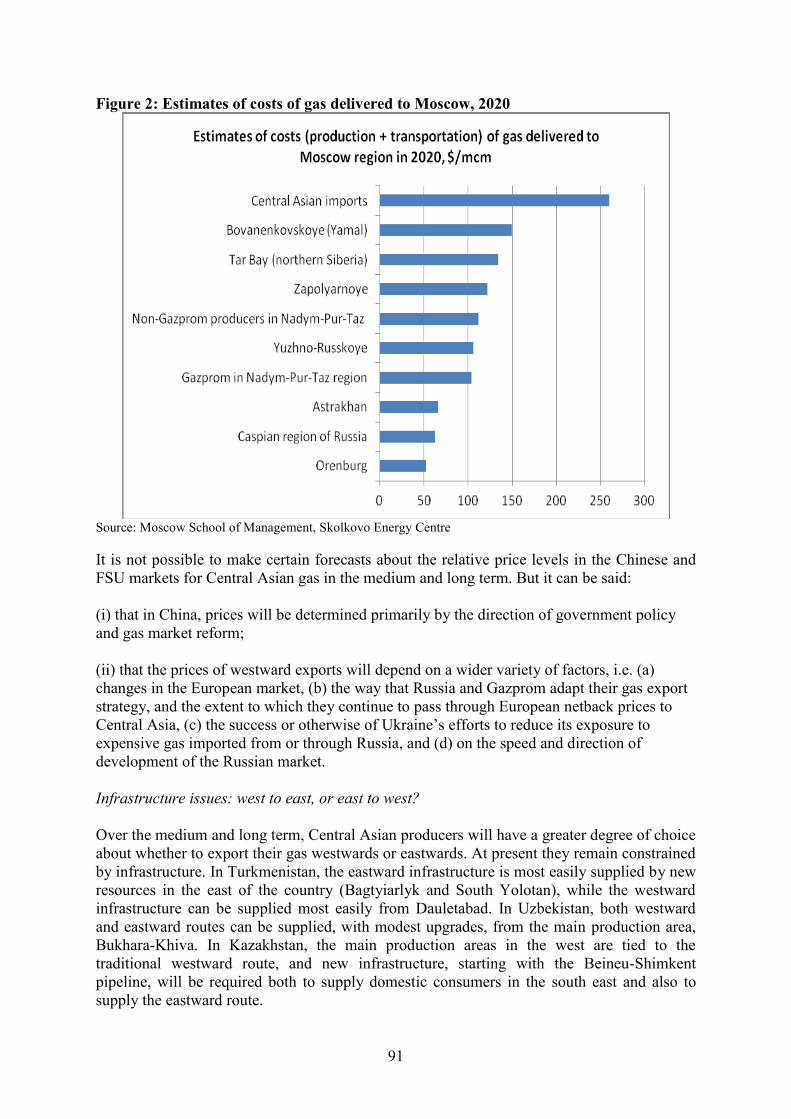
91
Figure 2: Estimates of costs of gas delivered to Moscow, 2020
Source: Moscow School of Management, Skolkovo Energy Centre
It is not possible to make certain forecasts about the relative price levels in the Chinese and
FSU markets for Central Asian gas in the medium and long term. But it can be said:
(i) that in China, prices will be determined primarily by the direction of government policy
and gas market reform;
(ii) that the prices of westward exports will depend on a wider variety of factors, i.e. (a)
changes in the European market, (b) the way that Russia and Gazprom adapt their gas export
strategy, and the extent to which they continue to pass through European netback prices to
Central Asia, (c) the success or otherwise of Ukraine’s efforts to reduce its exposure to
expensive gas imported from or through Russia, and (d) on the speed and direction of
development of the Russian market.
Infrastructure issues: west to east, or east to west?
Over the medium and long term, Central Asian producers will have a greater degree of choice
about whether to export their gas westwards or eastwards. At present they remain constrained
by infrastructure. In Turkmenistan, the eastward infrastructure is most easily supplied by new
resources in the east of the country (Bagtyiarlyk and South Yolotan), while the westward
infrastructure can be supplied most easily from Dauletabad. In Uzbekistan, both westward
and eastward routes can be supplied, with modest upgrades, from the main production area,
Bukhara-Khiva. In Kazakhstan, the main production areas in the west are tied to the
traditional westward route, and new infrastructure, starting with the Beineu-Shimkent
pipeline, will be required both to supply domestic consumers in the south east and also to
supply the eastward route.
92
Prior to the economic crisis of 2008-09 and the reduction of Russian purchases, it was
assumed that additional infrastructure would be required for westward exports. Turkmenistan
and Kazakhstan had signed memoranda with Russia on the reconstruction of the Caspian
Littoral pipeline (also called, confusingly, pre-Caspian from the Russian prikaspiskii). This
Soviet-era pipeline carried gas from Turkmenistan’s western fields to Russia via Kazakhstan,
joining the main Central Asia-Centre pipeline at Beineu, but by 2007 had been reduced to
half of its 10 bcm/year capacity.184
In mid 2010, Turkmenistan announced that it would build an East-West pipeline linking its
eastern fields to the Caspian Littoral line, at an estimated cost of $2 billion. Construction of
the 720km, 1420mm line was begun in 2011 by Turkmenneftegazstroi, the general
contractor; it was reported that with three compressor stations (at Sergar, Gumdag and Belek)
it would have up to 30 bcm/year capacity, and that 7-800 metres of pipes were being laid per
day.185
In the light of the reduction of Russian purchases, and the absence of any indication that they
will be increased again, the question arises: whom will the east-west pipeline supply?
Demand is substantial, and expanding, for eastward exports – while the destination of
Turkmen offshore gas developed by Petronas remains unclear and there is a danger of
Turkmen offshore resources remaining stranded. It is reasonable, therefore, to speculate that
the east-west line could in the future be operated in the opposite direction, to supply Turkmen
offshore gas for eastward export – i.e. working in parallel with Kazakhstan’s Beineu-
Shymkent line, rather than in the opposite direction. In any case, the existence of both such
east-west links will increase flexibility and provide new physical links between the markets
in Central Asia-Russia-Ukraine on one side and in China on the other.
5.4. Exports to Iran
Turkmenistan has in recent years exported 6-8 bcm/year of gas, and possibly more, to Iran.
The signing in 1995 of a 25-year contract to supply 8 bcm/year of gas, with 35% of this
volume as repayment for Iran’s contribution to pipeline construction, marked the first success
of Turkmenistan’s policy of diversifying exports away from Russia and Ukraine. Exports
started in 1997, via the 200 km, 40-inch Korpedzhe-Kurt-Kui pipeline that runs southwards
from Turkmenistan’s western gas fields. A second 35 km, 48-inch pipeline, running
westwards from Turkmenistan’s largest producing field, Dauletabad, over the border to
Sarakhs and the nearby Khangiran (Hashimi-Nejad) refinery in the north-east of Iran, was
commissioned in January 2010. It was extended to Sangbast, near Mashhad, in November
2010. The Turkmen and Iranian governments then stated that Turkmen exports to Iran could
rise to 20 bcm/year.186
Notwithstanding the completion of this important new export route, disputes continued
between the two sides, mainly over the prices to be paid. Turkmenistan reportedly ceased
supplies in 2008 and 2009, when Iran refused to agree to prices linked to the high, oil-linked
prices being paid in Europe. Reports of a similar dispute over price, and cuts in deliveries,
184
Stern (2012), p. 70; Gazprom press release, “Ob itogakh vizita delegatsii”, 9 April 2009 185
“Goluboe kol’tso – na karte Turkmenistana”, Neft’, Gaz i mineral’nyie resursy Turkmenistana no. 3 2010,
pp. 68-71; Turkmenistan.ru, 20 November 2011; “Magistral’nyi gazoprovok Vostok-Zapad stroitsia”,
Turkmenistan Zolotoi Vek, 10 April 2012; Bernstein Research, The Caspian: Cradle of Oil Production, p. 71 186
“New Turkmenistan-Iran gas pipeline launched”, turkmenistan.ru, 7 January 2010; State information agency
of Turkmenistan, “2010 god v letopisi epokhi novogo vozrozhdeniia”, 13 January 2011,
http://tdh.gov.tm/?id=2426
93
recurred in November 2012: Iranian oil minister Rostam Qasemi was quoted by Reuters as
saying that supplies had been halted due to unresolved price negotiations, a claim denied by
Turkmen officials.187
Iran’s gas reserves are the second largest in the world after Russia’s, but demand for
Turkmen imports has been driven by rising consumption in heavily-populated northern areas
that are not well-connected to Iran’s main producing regions in the south and offshore in the
Persian Gulf. Iran has a long-term domestic pipeline construction project, the Iranian Gas
Trunkline (IGAT) series, which is aimed at bringing its own gas to major consuming regions.
Gas is already brought to northern cities including Tehran, the capital, via the IGAT-1 and
IGAT-2 lines from the southern part of the country, and via the IGAT-3 line from the South
Pars field in the Persian Gulf. Two further pipelines are under construction which, once
completed, could bring gas to the northern and north-eastern regions that currently rely on
Turkmen gas. These are:
The 1,050 km, 56-inch IGAT-8 line that Iranian officials said was about 60%
complete in March 2011. A section that runs from Assaluyeh to the Parsian gas
processing plant in Fars province, and from there to Isfahan and Qom provinces, was
completed in 2009. It is planned to continue, to meet the North and North-East
pipeline, in 2014.
The 1,059 km, 42- and 48-inch North and North-East pipeline, which was more than
70% complete in March 2011. This consists of two phases, the first running 524 km
from Parchin to Miami and Dasht; and the second running 380 km from Miami to
Sangbast.
Another line, IGAT-11, will also facilitate south-north flows of Iranian gas.188
These projects may take time to complete, given the economic problems faced by Iran as the
result of trade sanctions and other factors. But once they are finished, the prospect will be
raised of price competition between Turkmen gas and Iran’s own production. Thus while in
the immediate future Turkmen exports to Iran are likely to continue at around the same level,
in the long term they could fall or even cease altogether.
Azerbaijan also exports small volumes of gas to Iran, mostly as swaps for small volumes
delivered by Iran to the Nakhchivan exclave of Azerbaijan, which is physically divided from
the rest of Azeri territory by Armenia. The deliveries to Nakhchivan began in 2004, when a
pipeline into Nakhchivan was completed and a 25-year swap contract signed. Roughly 0.5
bcm/year is exported to swap, and 0.1 bcm/year for Iran, in lieu of transit fees. In 2010
Azerbaijan and Iran reportedly concluded a broader inter-governmental memorandum of
cooperation, covering both natural gas trade and electricity swaps in border areas; it
apparently envisaged the export of additional volumes via the Kazi-Magomed-Astara pipeline
for consumption in northern Iran, but it does not appear that any substantial deliveries have
been made.189
In 2012, Azeri officials stated that exports are steady at 0.6 bcm/year,
comprising 0.5 bcm for Nakhchivan and 0.1 bcm of fuel gas.
187
Adibi and Fesharaki (2011), p. 300; “Iran says Turkmen gas supplies cut in row over terms”, Reuters, 14
November 2012. 188
With thanks to Elham Hassanzadeh. See also Hedayat Omidvar (National Iranian Gas Company), Iranian
Gas Prospect (slide presentation, 2008); US Energy Information Administration, Iran: Country Analysis Brief. 189
Adibi and Fesharaki (2011), pp. 289-290; World Gas Intelligence, 3 February 2010; Socar Annual Report
2010, p. 3; US EIA web site, “Azerbaijan: natural gas” page; industry information.
94
5.5. Exports from Azerbaijan to Georgia, Russia, Turkey and beyond
Azerbaijan has in recent years turned from being a gas importer to being a gas exporter, as a
result of the build-up of associated gas production at the ACG field, and the start-up of the
Shah Deniz project. In 2006-07, Azerbaijan started exporting gas to Turkey (now about 6.3
bcm/year) and Georgia (about 1.5 bcm/year); in 2010 it began exporting small volumes to
Russia (1.5 bcm in 2011). Azerbaijan also exports a small amount of gas to northern Iran (0.6
bcm/year) (see section 5.4 above). Azerbaijan’s gas export trade could expand substantially
from 2017, when stage II of the Shah Deniz project is expected to be commissioned. Another
6 bcm/year will be available for Turkey, and 10 bcm/year for European buyers. This section
covers the export trade, the transport and marketing options for Shah Deniz II exports, and
the implications of Azeri government policy directed at making available additional export
volumes after Shah Deniz II.
Azerbaijan’s current exports
There are three sources of gas for westward export: (1) about 4-5 bcm/year of associated gas
from the ACG field, delivered to Socar free of charge under the field PSA at the Sangachal
terminal; (2) part of Socar’s own production; and (3) about 6-7 bcm/year from the Shah
Deniz field, brought to the Sangachal terminal and sold by the consortium to the Azeri Gas
Supply Company, a trading company operated by Statoil on behalf of the consortium. Most
of this is exported and sold by AGSC in Turkey; a fixed amount of less than 1 bcm/year is
delivered to Georgia at discounted prices as part of a barter arrangement covering transit via
the South Caucasus Pipeline; and what remains is sold to Socar under a “swing contract”, to
add to its gas balance.
Georgia. In recent years, Azerbaijan has supplied more than 90% of Georgia’s imports of
1.5-2 bcm/year. (For 2012, for example, the government set a gas balance of 1.48 bcm for
2012, of which 1.26 bcm will be imported from Azerbaijan, 0.2 bcm imported from Russia
and a small amount produced domestically.) Most Azeri exports to Georgia are sold under the
barter arrangement mentioned above: Georgia heavily discounts transit tariffs for Azeri oil,
and takes transit tariffs for gas through the South Caucasus pipeline in the form of (i) the
right to buy 5% of the gas transported at $50/mcm and (ii) up to 0.5 bcm discounted to
$55/mcm (2006 prices that escalate under a formula). Parallel to these transit-related sales,
Socar exports gas at higher, bilaterally-negotiated prices that are somewhat reflective of
European netback levels. When these sales started in 2006, Socar priced its gas at $120/mcm,
compared to the $230/mcm charged by Gazprom, which until then had a near-monopoly on
gas imports to Georgia. Import prices moved to $187/mcm in 2009 and $161/mcm in 2010.190
Azeri gas became available at a time when Georgian-Russian relations were deteriorating
sharply; imports from Azerbaijan have now entirely replaced those from Russia. Georgia has
also opened a substantial part of its domestic gas market to a Socar subsidiary.
Turkey. Azeri exports to Turkey started in 2007, under a contract providing for 6.3 bcm/year
between Socar and Botas, the Turkish gas company. Prices were set bilaterally, using oil-
linked formulae, and – as in the case of many of Russia’s bilateral arrangements – revised
upwards as oil prices rose. The base price used from 2007 was widely reported to be
$120/mcm. In June 2010 a lengthy intergovernmental negotiation concluded with an
agreement to raise the base price, and for Turkey to pay retroactively at the new, higher price
190
Tokmazishvili and Bowden (2009). “Georgia to get over 1.2bn cubic meters”, News.Az, 2 February 2012.
On Socar’s non-transit-related sales, AzStat, Foreign Trade of Azerbaijan 2011 (Baku, 2011), pp. 214 and 258.
95
levels for gas purchased in 2008-09. This agreement also set out the volumes of gas that
Turkey would, from 2017, purchase from the Shah Deniz II project and terms on which Shah
Deniz gas would be transported through Turkey (see below). Import prices of Azeri gas in
Turkey were reported by the Turkish energy ministry in 2011 at $220/mcm and $282/mcm,
and in 2012 at $330/mcm, prices in all cases lower than those of Russian and Iranian imports
to Turkey.”191
Greece. From 2007, Botas resold 0.5-0.7 bcm of Azeri gas to Greece. In April 2011, it was
agreed to reassign the supply contract between Depa of Greece and Botas to Socar, making
Socar the direct supplier of the gas.192
Russia. Gas exported to Russia from Azerbaijan is mostly produced onshore, in the northern
part of the country, and delivered via the 240 km Gazi-Magomed-Mozdok pipeline that
formerly brought Russian gas to Azerbaijan. The compressor station at Siyazan was
refurbished in 2010 to handle the reversal of flows. In October 2009, Gazprom agreed with
Socar to buy 0.5 bcm/year in 2010-2015; at a further meeting between the two companies in
January 2010, additional volumes of 1 bcm in 2010 and 2 bcm in 2011 were agreed. In the
event, volumes were 0.8 bcm in 2010, 1.5 bcm in 2011 and 3 bcm (estimated) in 2010; while
prices were $244/mcm in 2010 and $288/mcm in 2011.193
Iran. See above, section 5.4.
Shah Deniz II
If the Shah Deniz II project goes ahead as currently planned, a further 16 bcm/year of extra
will become available for westward export from 2017-18. This will necessitate the
construction of new transport infrastructure. Throughout the 2000s, political hopes were
raised in Europe and the USA that these Shah Deniz volumes could become the focus of a
large-scale transport project, initiated and financed by consumer countries, that would also
bring supplies from Turkmenistan, and perhaps elsewhere, to Europe, and create a new
“southern corridor” of supplies. The failure of such projects yet to materialise is discussed
below in section 5.6. In their place, over the last two years, plans have been generated for
smaller projects, tailored to the transport of Shah Deniz II volumes only, at least to begin
with. The government of Azerbaijan has taken the initiative in these projects, and sought
greater involvement for Socar in transport, at least as far as the western border of Turkey.
At the time of writing it seems likely, although not certain, that the transport and marketing
arrangements for Shah Deniz II gas will be finalised in 2013, and will comprise: (i) expansion
of the South Caucasus Pipeline from its current capacity of 7 bcm/year to 23 bcm/year, to
bring gas to the eastern border of Turkey; (ii) construction by Socar and Botas of the Trans-
Anatolian pipeline (TANAP) to take the gas across Turkey, probably with the added
participation of the other members of the Shah Deniz consortium (BP, Statoil and Total); and
(iii) the transportation of the gas from Turkey’s western border either to central Europe via
the Nabucco West pipeline, a scaled-down version of the larger Nabucco project originally
191
“Turkey, Azerbaijan pen three strategic deals”, Today’s Zaman, 8 June 2010; “More Shah Deniz surprises in
store?”, World Gas Intelligence, 2 November 2011; “During 2011 Shah Deniz partners made only $1,269
billion”, Contact.az, 29 March 2012; Ahmed Mehdi, “Turkish gas price rise not linked to Azeri imports”,
Interfax Natural Gas Daily, 10 April 2012. 192
“Azerbaijan’s Socar and Greece’s Depa sign MoU”, ICIS Heren, 5 April 2011. 193
Socar web site, “Gas export department” page; Socar Annual Report 2010, p. 3; AzStat, Foreign Trade of
Azerbaijan 2011 (Baku, 2011), p. 258.
96
envisaged for transporting gas directly from the Caspian to Europe, or to Italy via the Trans
Adriatic Pipeline (TAP). It is expected that, of the 16 bcm/year of new supplies, the Shah
Deniz consortium will sell 6 bcm/year in Turkey and the remainder in European destinations.
There are still hurdles to be overcome, i.e. (i) Azerbaijan and the Shah Deniz consortium
partners need to reach agreement on transportation and marketing issues, (ii) contracts need
to be signed for gas sales in Europe in difficult market conditions.
The evolution of the new plans has been notable for the way that both Azerbaijan and Turkey
have sought to take a greater share of the control of transport and marketing arrangements. In
Azerbaijan’s case, this involvement is seen as a first step in raising Azerbaijan’s economic
and strategic influence, with further expansion of gas output from fields other than Shah
Deniz being linked to further such steps.
A turning point in these processes was the signing of intergovernmental agreements between
Azerbaijan and Turkey in June 2010, which not only altered the price formulae for existing
gas exports in Azerbaijan’s favour, but also mapped out arrangements (i) for the sale of Shah
Deniz II volumes in Turkey (with offtake levels set at 2 bcm in 2017, 4 bcm in 2018 and 6
bcm/year from 2019) and (ii) for the transit of the remaining volumes through Turkey.194
The
background to these agreements was the economic recession in Europe, and the resulting
steep fall in gas demand, which placed question marks against previous assumptions about
the level of European demand and prices in the late 2010s when Shah Deniz II came on
stream. This unpredictability contrasted sharply with the continued expansion of the Turkish
gas market.
In 2011, the Shah Deniz II consortium asked the consortia working on the pipeline projects to
submit bids to it, stating the terms on which they would make capacity available. By the
deadline of 1 October, four proposals were on the table – two (TAP and the Italy-Turkey
Greece Interconnector) that envisaged transporting the gas to southern Europe, and two
(Nabucco and BP’s South East European pipeline (SEEP)) that envisaged taking it to central
Europe. But the decision-making process took a new turn within weeks, when the Azeri
energy minister, Natiq Aliyev, announced in Istanbul that Azerbaijan and Turkey were
working on a pipeline project that would bring gas to Turkey’s western border, making the
eastern section of the proposed Nabucco pipeline superfluous. In December 2011, statements
from Socar and Botas, that they were working on a detailed proposal for TANAP, followed;
and in February 2012, a statement from the Turkish energy minister that discussions were in
progress about how TANAP and the cut-down version of Nabucco, that would start from
Turkey’s western border, could cooperate.195
In June 2012 an intergovernmental agreement on pipeline construction, and a host country
agreement for TANAP, were signed by Azeri president Ilham Aliyev and Turkish prime
minister Recep Tayyip Erdogan. The proposed capacity of the 2,000km pipeline has been
reported as 16-24 bcm/year, with the possibility of subsequent expansion; some Azeri sources
have claimed that initial capacity could be as much as 31 bcm/year. Although details of the
TANAP consortium are not public, it has been widely reported that it is owned 80% by
Socar, and that the remaining 20% is split between Botas and TPAO of Turkey. In November
194
“Turkey, Azerbaijan pen three strategic deals”, Today’s Zaman, 8 June 2010; “More Shah Deniz surprises in
store?”, World Gas Intelligence, 2 November 2011; Statoil web site, “Shah Deniz” page. 195
“Prospects Appear to Dim for EU-backed Gas Pipeline, Wall Street Journal, 19 Nov 2011; Gulmira Rzayeva
and Theodoros Tsakiris, Strategic Imperative: Azerbaijani Gas Strategy and the EU’s Southern Corridor (Baku,
SAM Center for Strategic Studies, 2012), pp. 16-18; “Nabucco pipelines merger to be discussed”, Reuters, 28
Feb 2012; “EU Loses Clout Over Caspian Gas”, Wall Street Journal 22 February 2012
97
2012 it was reported that Socar had agreed to bring the other Shah Deniz consortium
members into the TANAP consortium, by selling 12% to BP, 12% to Statoil and 5% to
Total.196
In the light of the TANAP initiative, the Shah Deniz consortium narrowed down the field of
possible pipelines to Europe to two. First it accepted an amended bid from the Nabucco
consortium, envisaging a pipeline from the Turkish-Bulgarian border to Baumgarten, named
Nabucco West. Then in February 2012 it announced that TAP would be favoured over the
Interconnector Turkey-Greece-Italy (ITGI) project as a candidate to carry gas to southern
Europe, and in June 2012 announced that Nabucco West would be favoured over SEEP as a
candidate to carry gas to central Europe. Gas sales agreements will be signed, and the final
choice made between these two options, prior to the Final Investment Decision on Shah
Deniz II scheduled for June 2013. After the field was narrowed in this way, consortium
members BP and Statoil agreed with the TAP consortium on an option of taking a 50% equity
stake, and a memorandum of understanding signed by Italy, Greece and Albania confirming
governmental support.197
In addition to Azerbaijan’s pipeline diplomacy, Socar has begun to market gas directly to
European countries prior to Shah Deniz II coming on stream. In addition to the reassignment
to Socar of Botas’s contract with Depa of Greece, mentioned above, Socar in April 2012
signed an agreement with BEH of Bulgaria providing for the sale of 1 bcm/year of Azeri gas
to Bulgaria from 2014, when the necessary infrastructure between Turkey and Bulgaria is due
to be in place.198
Remaining problems surrounding Shah Deniz II are (i) whether the recovery of European
demand will be sufficient, as assumed, for 10 bcm/year of Shah Deniz gas to find buyers
from 2017-18, and (ii) the difficulty in setting price levels and in particular price formulas.
Shah Deniz is the largest new source of gas to become available for the European market
since the dramatic changes in its structure that have undermined the role of oil-linked price
structures. Oil linkage is therefore unlikely to be the predominant pricing method used in the
Shah Deniz contracts, if indeed it is used at all.199
Possible further expansion of exports
Azeri officials have drawn attention to the importance of putting in place infrastructure
sufficient to export not only the new volumes from Shah Deniz, but also volumes that may
become available from the fields due to be developed after it. In a recent interview Rovnag
Abdullayev, CEO of Socar, pointed out that infrastructure that can “service all these fields
and be upgraded as the necessity arises” should be put in place. Reportedly, plans are being
considered under which (i) TANAP would have 31 bcm/year capacity initially, and would be
scalable up to 60 bcm/year; and (ii) that in place of the planned South Caspian pipeline
expansion to 23 bcm/year, a more ambitious expansion should be undertaken, with Socar as
196
Andrew Neff, “Turkey, Azerbaijan Sign Inter Governmental Agreement on TANAP pipeline”, 26 June 2012,
IHS Global Insight Daily analysis; “Europe’s plan to control Azeri gas supply in jeopardy”, Reuters, 3 August
2012; Rzayeva and Tsakiris, Strategic Imperative, p. 18; “BP, Total, Statoil to take stakes in TANAP”, Platt’s
European Gas Daily, 8 November 2012 197
BP press release, “The Nabucco West project has been selected”, 28 June 2012; “BP, Socar, Total pledge to
fund gas pipeline”, Reuters, 9 August 2012 198
Reuters, “Bulgaria, Azerbaijan sign accord on gas cooperation”, 27 April 2012 199
The issues in Europe are dealt with in detail in Stern and Rogers (2012), pp. 145-177.
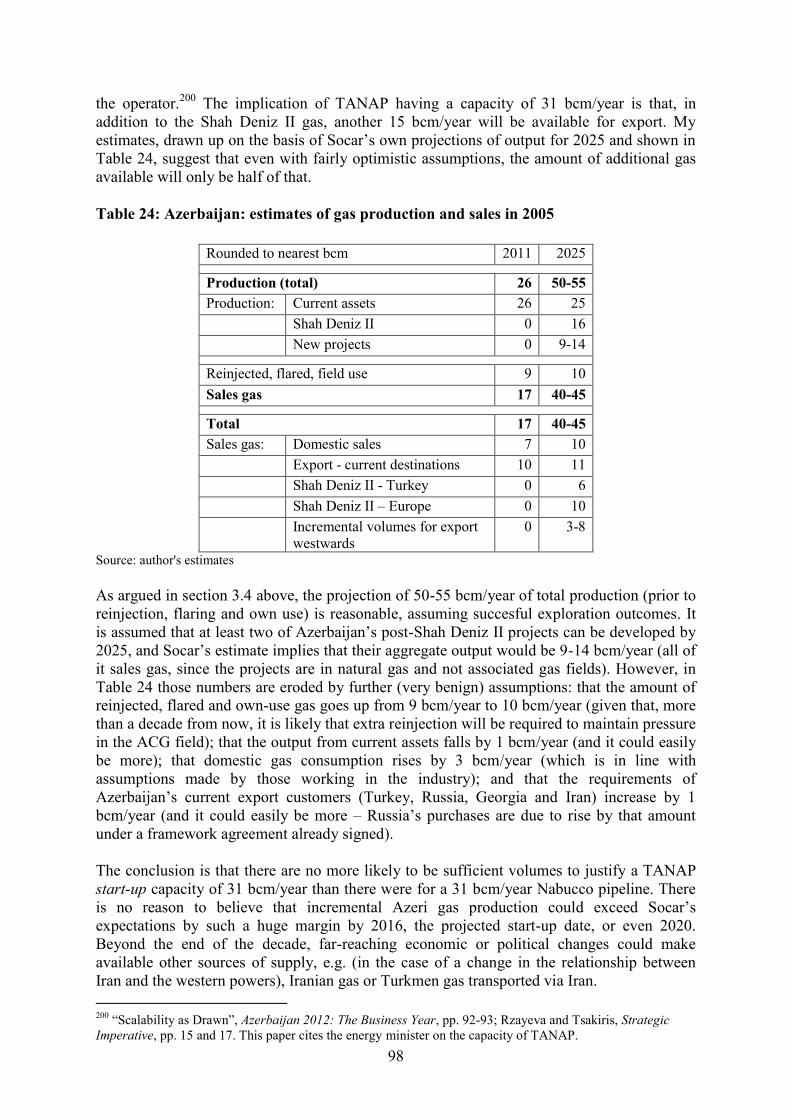
98
the operator.200
The implication of TANAP having a capacity of 31 bcm/year is that, in
addition to the Shah Deniz II gas, another 15 bcm/year will be available for export. My
estimates, drawn up on the basis of Socar’s own projections of output for 2025 and shown in
Table 24, suggest that even with fairly optimistic assumptions, the amount of additional gas
available will only be half of that.
Table 24: Azerbaijan: estimates of gas production and sales in 2005
Rounded to nearest bcm 2011 2025
Production (total) 26 50-55
Production: Current assets 26 25
Shah Deniz II 0 16
New projects 0 9-14
Reinjected, flared, field use 9 10
Sales gas 17 40-45
Total 17 40-45
Sales gas: Domestic sales 7 10
Export - current destinations 10 11
Shah Deniz II - Turkey 0 6
Shah Deniz II – Europe 0 10
Incremental volumes for export
westwards
0 3-8
Source: author's estimates
As argued in section 3.4 above, the projection of 50-55 bcm/year of total production (prior to
reinjection, flaring and own use) is reasonable, assuming succesful exploration outcomes. It
is assumed that at least two of Azerbaijan’s post-Shah Deniz II projects can be developed by
2025, and Socar’s estimate implies that their aggregate output would be 9-14 bcm/year (all of
it sales gas, since the projects are in natural gas and not associated gas fields). However, in
Table 24 those numbers are eroded by further (very benign) assumptions: that the amount of
reinjected, flared and own-use gas goes up from 9 bcm/year to 10 bcm/year (given that, more
than a decade from now, it is likely that extra reinjection will be required to maintain pressure
in the ACG field); that the output from current assets falls by 1 bcm/year (and it could easily
be more); that domestic gas consumption rises by 3 bcm/year (which is in line with
assumptions made by those working in the industry); and that the requirements of
Azerbaijan’s current export customers (Turkey, Russia, Georgia and Iran) increase by 1
bcm/year (and it could easily be more – Russia’s purchases are due to rise by that amount
under a framework agreement already signed).
The conclusion is that there are no more likely to be sufficient volumes to justify a TANAP
start-up capacity of 31 bcm/year than there were for a 31 bcm/year Nabucco pipeline. There
is no reason to believe that incremental Azeri gas production could exceed Socar’s
expectations by such a huge margin by 2016, the projected start-up date, or even 2020.
Beyond the end of the decade, far-reaching economic or political changes could make
available other sources of supply, e.g. (in the case of a change in the relationship between
Iran and the western powers), Iranian gas or Turkmen gas transported via Iran.
200
“Scalability as Drawn”, Azerbaijan 2012: The Business Year, pp. 92-93; Rzayeva and Tsakiris, Strategic
Imperative, pp. 15 and 17. This paper cites the energy minister on the capacity of TANAP.
99
5.6. Other possible export routes
The selection by the Shah Deniz consortium of Nabucco West and TAP as the two favoured
bidders to provide transportation – and the implication that gas would reach Turkey’s western
border via TANAP or a similar, separate project – brought to an end a decade-long phase of
European planning for a large-scale integrated Caspian-to-Europe gas transport project. The
Nabucco project in its original form, i.e. a single pipeline from Erzurum in eastern Turkey to
European locations, has been superseded; European political efforts to get commitments from
Turkmenistan to supply gas volumes for such a project, and from Turkmenistan and
Azerbaijan to construct a Trans-Caspian pipeline to transport them, have not yet borne fruit.
By contrast, the infrastructure needed to take Turkmen gas to China – first mooted in 2006,
four years after preparations for Nabucco began – has been planned, agreed upon by
governments, built and commissioned, and is now being expanded. This section covers some
reasons why the gas supply route from Turkmenistan to Europe remains closed, and the
difficulties that surround the route from Turkmenistan to south Asia, which has yet to move
from the political sphere to the commercial.
Possible routes from Turkmenistan to Europe
The geographical attraction of a Trans-Caspian pipeline (TCP) is obvious (see maps 1 and 5):
the distance from the westernmost Turkmen offshore gas fields to Baku is relatively short.
The perceived political attraction to the European Union and the USA is also well known, i.e.
that Turkmenistan’s substantial gas resources would become available to European
customers, further reducing dependence on Russia for energy supplies. It was therefore
logical that European countries would take an interest in this issue in the early 2000s as gas
demand rose. Three categories of difficulty arose, though, which have yet to be overcome:
first, those arising from Turkmenistan’s export policy and attitude to its role as a gas-
producing nation; second, the mismatch of political and commercial interests in Europe; and
third, legal and political problems surrounding international cooperation between Caspian
nations.
1. Turkmenistan’s export policy has been consistent throughout the post-Soviet period: (i) in
line with its “multi-vector” foreign policy it has made no distinction between potential buyers
on political or strategic grounds; but (ii) it is ready to sell gas only on its border, with
transport and other risks taken by the buyer from that point onwards. This implies that
pipeline construction, too, should be undertaken by the buyer. Turkmenistan has adhered to
this principle with regard to a possible Trans-Caspian route: while senior Turkmen officials,
from the president downwards, have often made positive statements about its desirability,
Turkmenistan has never taken the initiative e.g. by seeking agreement with Azerbaijan to
form a pipeline construction consortium.
Turkmenistan’s national interest, as interpreted by all its post-Soviet governments, is served
by maintaining peaceful relationships with all its neighbours, while ensuring sufficient gas
export sales to meet its perceived needs for revenues. Statements about increasing production
beyond the level required to assure that income (e.g. to 100-200 bcm/year or even beyond)
may express long-term aspirations, but bear no relation to real Turkmen policymaking, as I
have argued in section 2 above. From this standpoint, the importance of the agreements with
China on gas exports cannot be stressed enough. They assured Turkmenistan of a second
major export destination alongside Russia, and of a source of export revenues, more reliable
than Russia had been in the post-Soviet period, for several decades to come; they enabled the
100
Turkmen government confidently to see through the 2009 dispute with Russia. The question
asked so often in Europe in 2009-12 – why is Turkmenistan not giving greater priority to the
Trans-Caspian route? – was the wrong one. The question from a Turkmen point of view was:
why, in the light of success with China, should any priority at all be attached to the Trans-
Caspian route? The answer was that, while Turkmenistan remained interested in the idea, it
was not urgent enough for it to break with its policy of leaving pipeline construction and
transit risks to the buyer – a policy that presented no obstacle to China.
2. Mismatch of interests in Europe. The European Commission responded to Turkmenistan’s
export policy (i) with diplomatic efforts aimed at persuading Turkmenistan and Azerbaijan to
overcome legal and political obstacles to a TCP, and (ii) by proposing in 2009 the creation of
the Caspian Development Corporation, envisaged as a single commercial vehicle that could
aggregate the purchase of Turkmen gas. Finally, in apparent desperation at the lack of
progress, the Commission in September 2011 secured an unprecedented decision by the EU’s
governing Council, mandating it to negotiate a legally-binding treaty with Turkmenistan and
Azerbaijan providing for pipeline construction.201
This was the first time such powers had
been given to the Commission with respect to an infrastructure project.
The sponsors of the Nabucco project could hardly have asked for a stronger political signal to
be sent to the Shah Deniz consortium, which in October 2011 received bids from pipeline
consortia for transporting its gas to European destinations. But the Shah Deniz consortium
operated strictly on commercial principles, and once Azerbaijan and Turkey had decided to
move forward with TANAP, accepted the revised Nabucco bid for a pipeline starting from
the western border of Turkey. All this amounted to recognition in practice that, even with the
exceptional efforts of the EU Council, progress towards bringing Turkmen gas across the
Caspian had fallen short of what was needed for commitments to be made to build pipelines.
The difficulty of securing an agreement with Azerbaijan and Turkmenistan on a TCP was not
the only obstacle in the Commission’s path. It was assumed that a TCP could only be
financed on the basis of 30 bcm/year worth of sales, and the Commission also faced, after the
2008-09 economic crisis, reluctance from European energy companies to commit to the long-
term gas purchase contracts necessary for this. IHS Cera, who were retained to create an
institutional design and commercial framework for the Caspian Development Corporation,
surveyed major energy companies as potential participants, and found that while they were
“ready and willing to begin talking about specific volume commitments”, a number of them
were “concerned about the risk of taking on potentially onerous new take-or-pay contracts in
an environment of short term, and possibly long term, demand uncertainty”. IHS Cera also
reported companies’ “surprise” that the European Commission was championing a
coordinated purchase model, having for the previous 20 years been “pushed in the other
direction […] to allow for more direct competition”, and in some cases faced regulatory risks
and even substantial fines, for practices that they perceived had followed from “coordinated
purchase of gas and shipping capacity”.202
One of IHS Cera’s key proposals was that the
single-buyer model would require either a guidance letter from the EC’s competition
directorate, or preferably a formal exception to competition rules by the Commission, at an
early stage.203
201
See European Commission, On security of energy supply and international cooperation: “The EU Energy
Policy: Engaging with Partners Beyond Our Borders” (COM (2011) 539), 7 September 2011 202
IHS Cera, Caspian Development Corporation: Final Implementation Report (December 2010), p. 12 203
IHS Cera, op. cit., p. 5
101
An important conclusion about the failure yet to open up a Turkmen-European route,
therefore, is that – given Turkmenistan’s consistent policy of seeking to sell gas on its borders
– the European Union’s political drive to make this possible was not matched by the
necessary commitment from European energy companies, due above all to (i) the market
uncertainty created by the recession, and (ii) concerns that a single-buyer model, that the
Commission perceived as being necessary to negotiate with Turkmenistan, conflicted with
EU competition rules. The mismatch between political and commercial interests in Europe,
and the tension between the need for a joint approach to Turkmenistan and EU competition
principles, contrasts sharply with the Chinese approach. This was spearheaded by CNPC, a
state-owned corporation that, on the basis of government decisions, was able to commit to the
huge investment costs of the Turkmenistan-China pipeline, and was able to call on the
support of Chinese state-owned banks that financed a large part of the Turkmen upstream
investments required to supply the project.
3. Caspian political issues. The legal and diplomatic problems for the TCP are well-known
and have been described in detail elsewhere.204
The first is that since the dissolution of the
Soviet Union, no agreement has been reached between the Caspian littoral states (Russia,
Kazakhstan, Turkmenistan, Azerbaijan and Iran) on the territorial delimitation of the Caspian
Sea. Some legal opinion asserts that this issue need not obstruct a TCP supported by
Turkmenistan and Azerbaijan. And indeed in November 2010 president Berdymukhammedov
stated at a meeting of the littoral states that any transport project supported by any two states
should not require the permission of others.205
Senior Turkmen officials clarified, though, that
only three of the five states (presumably Azerbaijan, Turkmenistan and Kazakhstan) had
endorsed this position. This underlined the political reality: that it is in the interest of neither
Russia nor Iran to hasten the development of a Turkmen-Europe gas corridor, and there is no
obvious motive for Azerbaijan and/or Turkmenistan to push a project of which their larger
neighbours strongly disapprove (and from which Azerbaijan potentially has much to lose
commercially).
The second obstruction to progress is the border dispute between Azerbaijan and
Turkmenistan themselves: both claim sovereignty over the Serdar-Kyapaz oil field in the mid
Caspian. Although they have maintained reasonable relations in spite of this, the dispute
flares up periodically – most recently in June 2012, when Azeri border guards ordered a
Turkmen vessel conducting seismic work out of the area, on the grounds that its presence
violated a 2008 agreement that neither side would work on the field until the maritime
borders were delimited. Turkmenistan subsequently announced that it would take this dispute
to an international court of arbitration.206
None of these accumulated problems mean that a Turkmen-European gas supply route cannot
be opened. But they do suggest that greater motivation both from Turkmenistan as a producer
nation, and from European energy companies as buyers, will be required in order to
overcome the considerable political obstacles. A reminder of how difficult the process will be
without such motivation came in August 2012 when the EU Energy Commissioner Gunther
Oettinger, having recruited Turkey to the diplomatic efforts behind the pipeline, visited
Ashgabat to discuss this with president Berdymukhammedov, only to be refused a meeting.207
204
See e.g. Pirani (ed.) (2009) especially pp. 282-284 and 298-299 205
Reuters, “Total CEO meets Turkmen president”, 24 November 2010 206
Interfax, “Azerbaijan warns Turkmenistan over Kyapaz oil field”, 18 June 2012; UPI, “Turkmenistan takes
action over oil dispute”, 2 July 2012 <http://www.upi.com/Business_News/Energy-
Resources/2012/07/02/Turkmenistan-takes-action-over-oil-dispute/UPI-56191341233607/> 207
“Turkmenistan Snubs EU Over Trans Caspian Pipeline”, NefteCompass, 20 September 2012
102
Apart from a breakthrough on a TCP driven by economic imperatives, any rapprochement
between Europe and Iran – however politically unlikely it is at present – would open the
possibility of gas transport via existing infrastructure linking western Turkmenistan to
northern Iran and thence to Turkey. This could be upgraded with a relatively modest level of
investment.
Possible routes from Turkmenistan to Pakistan and India
The possibility of a Turkmenistan-Afghanistan-Pakistan-India (TAPI) gas pipeline has been
mooted in diplomatic circles for many years. The most recent round of discussions on the
subject received an impetus in December 2010, when the governments of Turkmenistan,
Afghanistan, Pakistan and India signed inter-governmental memoranda, a gas pipeline
framework agreement and heads of agreement on the terms of gas sales in Ashgabat. One
obvious obstacle to the project is the security situation in Afghanistan, and to some extent
Pakistan – although the USA energetically supports TAPI as a “peace pipeline”, i.e. sees
potential benefits to the stability of Afghanistan. In 2011, US deputy assistant secretary of
state Susan Elliott addressed an industry event in Ashgabat and, while pointedly failing to
mention the “southern corridor” between the Caspian and Europe, lauded the future TAPI as
a means to “a stable and secure Afghanistan”, that would “provide revenue and jobs for
Afghanistan at a critical stage of its economic development”, while also supplying clean fuel
to Pakistan and India.208
During 2011, diplomatic contacts continued, while oil and gas executives in the region
considered reports of the price at which Turkmen gas might be delivered in Pakistan or India.
Although no firm announcements were made, reports suggested that Pakistan was seeking 14
bcm/year of gas at 70% of Brent oil prices per unit of energy at Multan (which at late 2011
oil prices of around $100/barrel implied a gas price around $11/mmbtu). Other reports
indicated a landing price in India, including transport, of $13/mmbtu with oil prices at around
$100/barrel, i.e. roughly three times what ONGC, the state-owned Indian oil and gas
corporation, pays for gas produced domestically.209
In May 2012, GAIL (India) and Inter State Gas System of Pakistan signed gas sales and
purchase agreements with Turkmenistan that provide for the delivery of an aggregate 32.8
bcm/year via the pipeline.210
It was expected that an Afghan energy company would sign a
similar deal shortly, although one has not been forthcoming in the succeeding months. The
Asian Development Bank, which has acted as the TAPI Secretariat since 2002, stated that the
next step would be for the four TAPI nations to attract commercial partners to build, finance
and operate the pipeline.
There are some similarities between the problems facing the “southern corridor” projects and
those facing TAPI. In both cases, negotiations have been driven forward at government level,
on the basis of strategic aims, but these political drivers have not been matched by economic
imperatives strong enough to convince energy companies to invest the large sums required
for complicated infrastructure projects. In TAPI’s case, it is significant that a few weeks after
the gas sales and purchase agreements were signed – a breakthrough never achieved by
208
US State Department, “Deputy Assistant Secretary for Central Asia Susan Elliott’s Remarks for
Turkmenistan International Oil and Gas Conference”, 17 November 2010, Ashgabat 209
British Embassy in Ashgabat, Updates on the Energy Sector, January 2012; BMI, Turkmenistan Oil & Gas
Report Q1 2012, p. 20 210
ADB press release, “Historic Agreements Bring Long-Awaited TAPI Pipeline Closer”, 23 May 2012
103
supporters of projects to take Turkmen gas westward – an agreement was signed by the
presidents of China and Afghanistan supporting a feasibility study, to be conducted by
CNPC, on a pipeline taking Turkmen gas via northern Afghanistan and Tajikistan to
China.211
This not only served as a reminder to Kazakhstan that China could import gas via
routes that did not cross its territory, as mentioned above in section 5.2, but also underlined
the fact that China would not wish to hasten the construction of TAPI.
211
Vladimir Socor, “Beijing Proposes Turkmenistan-China Gas Pipeline Through Northern Afghanistan”,
Eurasia Daily Monitor, 19 June 2012
104
6. Future outlook and conclusions
In considering how the Central Asian and Caspian gas sector might develop up to the end of
the decade, the economic, political and social factors mentioned in section 2 should be borne
in mind. Turkmenistan will surely overtake Uzbekistan again and become the largest
producer of gas in the region; it also has the greatest potential for increasing exports. But the
extent to which it does so will be determined partly by its size, political structure and foreign
policy. Its underground gas resources may be extensive, but its above-ground management
and engineering capacities are limited. Foreign companies (excluding the Chinese state-
owned companies) may see their provision of these capacities as the obvious solution, but the
Turkmen government will probably remain cautious about dealing with them. Its agreements
with China provide a framework under which it can develop South Yolotan and other
resources. The target set recently by the Chinese and Turkmen presidents, of 65 bcm/year
exports, implies a total of up to 110 bcm/year production all together (adding to China-bound
exports e.g. up to 10 bcm/year to Iran, 11 bcm/year to and through Russia, 4 bcm/year to
Central Asian countries and 20 bcm/year for the domestic market).
The case made here is that, even if all those figures were reduced e.g. by one quarter (i.e. if
Turkmenistan were producing 73 bcm/year and exporting 58 bcm/year of it), it would still
probably have revenues in excess of spending requirements. (It should be recalled that
Turkmenistan began to accumulate its foreign exchange reserve fund in the early 2000s,
when it was selling gas to Russia and Ukraine for $50/mcm, part of which was paid in barter.
The state budget has of course increased since then, but not by the same proportion as gas
prices have increased.) While Turkmen government policy is to increase gas production and
exports to underpin a “golden age” for the country, it should be possible for it to implement
this largely on the basis of its exports to China, even if they fall short of the targets
mentioned.
For either a European or a south Asian export route to be opened up from Turkmenistan, the
government would have to be faced with (i) a group of buyers in those locations prepared to
commit in advance to the substantial investments and purchase commitments required to
finance the route, and (ii) a set of compelling reasons to tackle all the difficulties (political,
managerial, commercial) that would surround the required increase in production. These
routes may yet be opened up, but not before the end of this decade.
As for exports to and through Russia, the steady movement towards the operation of market
mechanisms in Russia’s gas sector suggests that the exports at high, oil-linked prices that the
Central Asian countries enjoyed in the mid 2000s are unlikely to be resurrected. Russia’s
current purchase prices in Central Asia are far above the prices in its domestic market and,
should Central Asian gas compete in Russia with Russian gas – rather than being transported
to Ukraine and Europe and sold at netback prices – demand for it would fall. This outcome
seems likely. In the Russian market, Turkmen gas would have to compete not only with
Gazprom production, but with the large volumes of low-cost gas produced by non-Gazprom
producers who are increasingly gaining access to transport infrastructure for these volumes.
One significant bellweather will be Turkmenistan’s East-West pipeline, due for completion in
2015. It was conceived in the mid 2000s as a means of bringing gas from eastern Turkmen
fields westwards. Now, with Turkmen offshore gas in danger of being stranded, and the
Chinese export route open, it is not beyond the realms of possibility that it could be used in
the opposite direction, or at least used to give Turkmenistan greater flexibility in deployment
of its eastern and western resources.
105
Scepticism has been expressed in the paper about Turkmenistan confronting problems drastic
enough for it to try to ramp up production above 100-150 bcm/year, or hurriedly to revise its
policies on upstream development (that non-Chinese IOCs will not be given access to
reserves) and exports (that it sells gas at the border, leaving transport and marketing risks
with purchasers). It is not intended to suggest, however, that Turkmenistan’s relationship
with China is free of problems. China decided to construct the pipeline from Turkmenistan,
and to pay a premium for gas delivered, for strategic reasons. But, towards the end of the
decade, or in the 2020s, developments in Chinese and other gas markets could cause a
reassessment of these arrangements. Turkmen exports to and through Russian are likely to
remain at a reduced level, and those to Iran could be reduced or even stopped. In short,
Turkmenistan could become the supplier of last resort to these markets. This would make it
more dependent than it wishes to be on Chinese purchases – and vulnerable to demands from
China that prices be renegotiated.
Social factors are important in all hydrocarbon-producing countries, however small their
populations, as last year’s events in north Africa showed. In Turkmenistan, it seems likely
that the government, mindful of the importance of meeting social expectations, will continue
with the provision of energy either free or at very low cost both to the population and to
industry. This should not present any insuperable difficulty. In Uzbekistan, however, things
are different: the population is more than five times the size of Turkmenistan’s, and the level
of domestic gas consumption is worryingly close to total production. The near-crisis
conditions in Uzbekistan’s domestic energy sector – the worsening supply difficulties at peak
times of year, the substitution of imported oil products with gas, the lack of coordination
between energy-saving policies and those designed to stimulate small industry with cheap
energy – make it impossible to project with any confidence whether gas consumption will go
up or down, let alone by how much.
A further enigma in Uzbekistan is that while new fields are certainly being developed to
replace those in natural decline, a large proportion of this development is being undertaken,
under PSAs or joint ventures, by foreign companies whose business models imply exporting
the gas. Those companies have collectively set their sights on 17 bcm/year of incremental
exports by the end of this decade, as shown in section 3.2. As for the fields that serve the
domestic market, there is no firm information either about the pace of decline of existing
production, or about the measures being taken to replace it. It seems likely that, once the
exports from fields developed by foreign companies are set aside, Uzbek gas supply will be
squeezed. The conclusion here is that, first, Uzbekistan will cede its Central Asian export
trade (up to 4 bcm/year) to Turkmenistan; second, it may well be compelled not only to
prioritise energy-saving measures, but also to abandon some of its more energy-intensive
industrial policies. Beyond that, there are only drastic scenarios: swingeing, compulsory
power cuts; renegotiation of terms with foreign producing companies; revision of energy
pricing policy; etc.
On the demand side, social factors will also play an important part in Kazakhstan. While the
government’s target of raising gas consumption to 24 bcm/year (i.e. more than doubling it)
may not be reached by the end of the decade, progress will be made in that direction. The
government of Kazakhstan, by far the largest hydrocarbons producer in the region, feels a
particularly acute need to show the population that it is benefiting from the oil boom.
Mangistau, one of Kazakhstan’s main oil-producing regions and also one of its poorest, was
last year affected by one of the most serious waves of social unrest in Central Asia in post-
Soviet times. The government’s policy, of raising oil exports but basing its domestic energy
policy more heavily on associated gas utilisation and gasification, is therefore unlikely to
106
change. During the long-running dispute between government and foreign companies over
this policy, the companies have often argued that many of the utilisation and gasification
measures are not economically rational. But the government will probably continue to see
this issue from a political rather than an economic point of view. So while Kazakhstan will
raise gas output, mainly as a result of the start-up of the first phase of the Kashagan project,
the incremental gas will to the end of the decade be shared between the domestic market and
the start-up of small volumes of exports to China.
Apart from the opening of the Chinese export route, the other significant change in the region
this decade is likely to be the growth of Azeri exports to Turkey and the start of Azeri exports
to European countries. But this will become certain only after the final investment decision
on the Shah Deniz II project, due in mid 2013. With Shah Deniz II gas, Azerbaijan could be
exporting 13 bcm to Turkey and 10 bcm to European destinations by the end of the decade.
Beyond that, on the supply side there are several Caspian projects at the pre-development
stage that could be producing some gas by 2020. On the demand side, the proximity of
Turkey, where the gas market is expanding much faster than it is in Europe, will be a crucial
factor; there could also be some small incremental Azeri exports to Russia and Georgia.
Taking all these factors into account, Table 25 has been drawn up with a view to focusing on
possible changes. To the extent that the assumptions in the right-hand column are valid, the
columns for 2015 and 2020 give an indication of how gas balances could look in those years.
If those assumptions prove to be incorrect, elements in the balances will change.
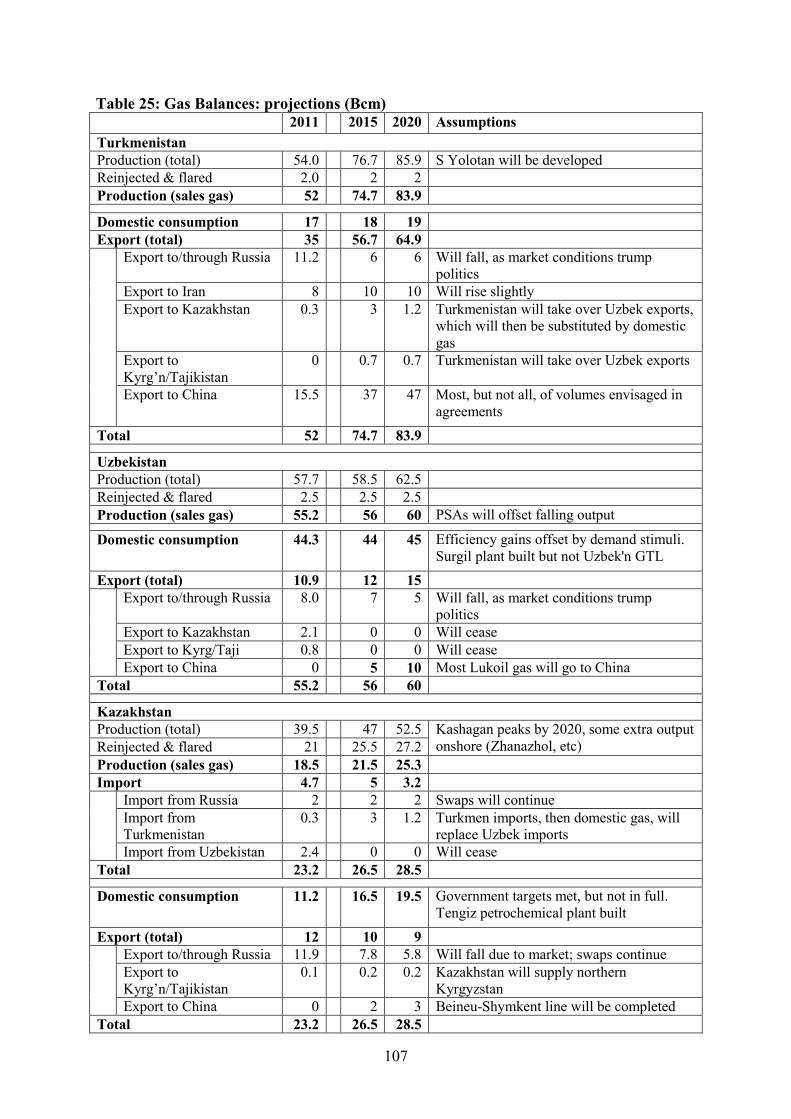
107
Table 25: Gas Balances: projections (Bcm)
2011 2015 2020 Assumptions
Turkmenistan
Production (total) 54.0 76.7 85.9 S Yolotan will be developed
Reinjected & flared 2.0 2 2
Production (sales gas) 52 74.7 83.9
Domestic consumption 17 18 19
Export (total) 35 56.7 64.9
Export to/through Russia 11.2 6 6 Will fall, as market conditions trump
politics
Export to Iran 8 10 10 Will rise slightly
Export to Kazakhstan 0.3 3 1.2 Turkmenistan will take over Uzbek exports,
which will then be substituted by domestic
gas
Export to
Kyrg’n/Tajikistan
0 0.7 0.7 Turkmenistan will take over Uzbek exports
Export to China 15.5 37 47 Most, but not all, of volumes envisaged in
agreements
Total 52 74.7 83.9
Uzbekistan
Production (total) 57.7 58.5 62.5
Reinjected & flared 2.5 2.5 2.5
Production (sales gas) 55.2 56 60 PSAs will offset falling output
Domestic consumption 44.3 44 45 Efficiency gains offset by demand stimuli.
Surgil plant built but not Uzbek'n GTL
Export (total) 10.9 12 15
Export to/through Russia 8.0 7 5 Will fall, as market conditions trump
politics
Export to Kazakhstan 2.1 0 0 Will cease
Export to Kyrg/Taji 0.8 0 0 Will cease
Export to China 0 5 10 Most Lukoil gas will go to China
Total 55.2 56 60
Kazakhstan
Production (total) 39.5 47 52.5 Kashagan peaks by 2020, some extra output
onshore (Zhanazhol, etc) Reinjected & flared 21 25.5 27.2
Production (sales gas) 18.5 21.5 25.3
Import 4.7 5 3.2
Import from Russia 2 2 2 Swaps will continue
Import from
Turkmenistan
0.3 3 1.2 Turkmen imports, then domestic gas, will
replace Uzbek imports
Import from Uzbekistan 2.4 0 0 Will cease
Total 23.2 26.5 28.5
Domestic consumption 11.2 16.5 19.5 Government targets met, but not in full.
Tengiz petrochemical plant built
Export (total) 12 10 9
Export to/through Russia 11.9 7.8 5.8 Will fall due to market; swaps continue
Export to
Kyrg’n/Tajikistan
0.1 0.2 0.2 Kazakhstan will supply northern
Kyrgyzstan
Export to China 0 2 3 Beineu-Shymkent line will be completed
Total 23.2 26.5 28.5
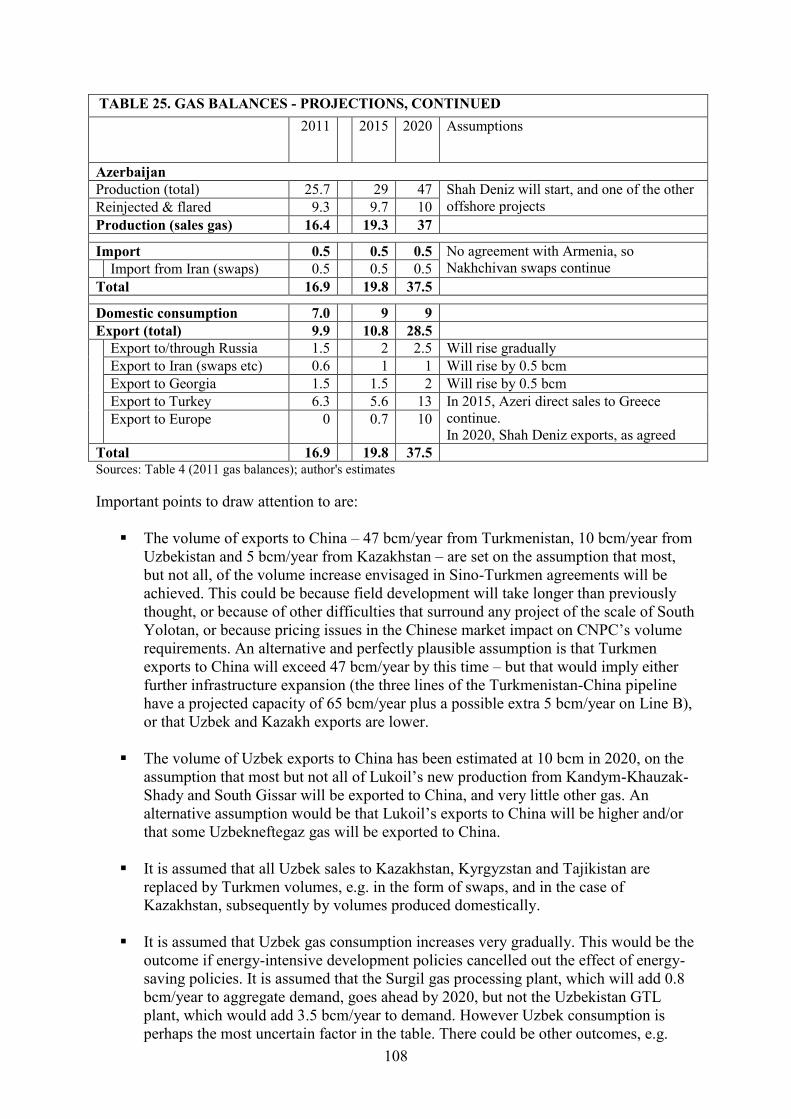
108
TABLE 25. GAS BALANCES - PROJECTIONS, CONTINUED
2011 2015 2020 Assumptions
Azerbaijan
Production (total) 25.7 29 47 Shah Deniz will start, and one of the other
offshore projects Reinjected & flared 9.3 9.7 10
Production (sales gas) 16.4 19.3 37
Import 0.5 0.5 0.5 No agreement with Armenia, so
Nakhchivan swaps continue Import from Iran (swaps) 0.5 0.5 0.5
Total 16.9 19.8 37.5
Domestic consumption 7.0 9 9
Export (total) 9.9 10.8 28.5
Export to/through Russia 1.5 2 2.5 Will rise gradually
Export to Iran (swaps etc) 0.6 1 1 Will rise by 0.5 bcm
Export to Georgia 1.5 1.5 2 Will rise by 0.5 bcm
Export to Turkey 6.3 5.6 13 In 2015, Azeri direct sales to Greece
continue.
In 2020, Shah Deniz exports, as agreed Export to Europe 0 0.7 10
Total 16.9 19.8 37.5 Sources: Table 4 (2011 gas balances); author's estimates
Important points to draw attention to are:
The volume of exports to China – 47 bcm/year from Turkmenistan, 10 bcm/year from
Uzbekistan and 5 bcm/year from Kazakhstan – are set on the assumption that most,
but not all, of the volume increase envisaged in Sino-Turkmen agreements will be
achieved. This could be because field development will take longer than previously
thought, or because of other difficulties that surround any project of the scale of South
Yolotan, or because pricing issues in the Chinese market impact on CNPC’s volume
requirements. An alternative and perfectly plausible assumption is that Turkmen
exports to China will exceed 47 bcm/year by this time – but that would imply either
further infrastructure expansion (the three lines of the Turkmenistan-China pipeline
have a projected capacity of 65 bcm/year plus a possible extra 5 bcm/year on Line B),
or that Uzbek and Kazakh exports are lower.
The volume of Uzbek exports to China has been estimated at 10 bcm in 2020, on the
assumption that most but not all of Lukoil’s new production from Kandym-Khauzak-
Shady and South Gissar will be exported to China, and very little other gas. An
alternative assumption would be that Lukoil’s exports to China will be higher and/or
that some Uzbekneftegaz gas will be exported to China.
It is assumed that all Uzbek sales to Kazakhstan, Kyrgyzstan and Tajikistan are
replaced by Turkmen volumes, e.g. in the form of swaps, and in the case of
Kazakhstan, subsequently by volumes produced domestically.
It is assumed that Uzbek gas consumption increases very gradually. This would be the
outcome if energy-intensive development policies cancelled out the effect of energy-
saving policies. It is assumed that the Surgil gas processing plant, which will add 0.8
bcm/year to aggregate demand, goes ahead by 2020, but not the Uzbekistan GTL
plant, which would add 3.5 bcm/year to demand. However Uzbek consumption is
perhaps the most uncertain factor in the table. There could be other outcomes, e.g.
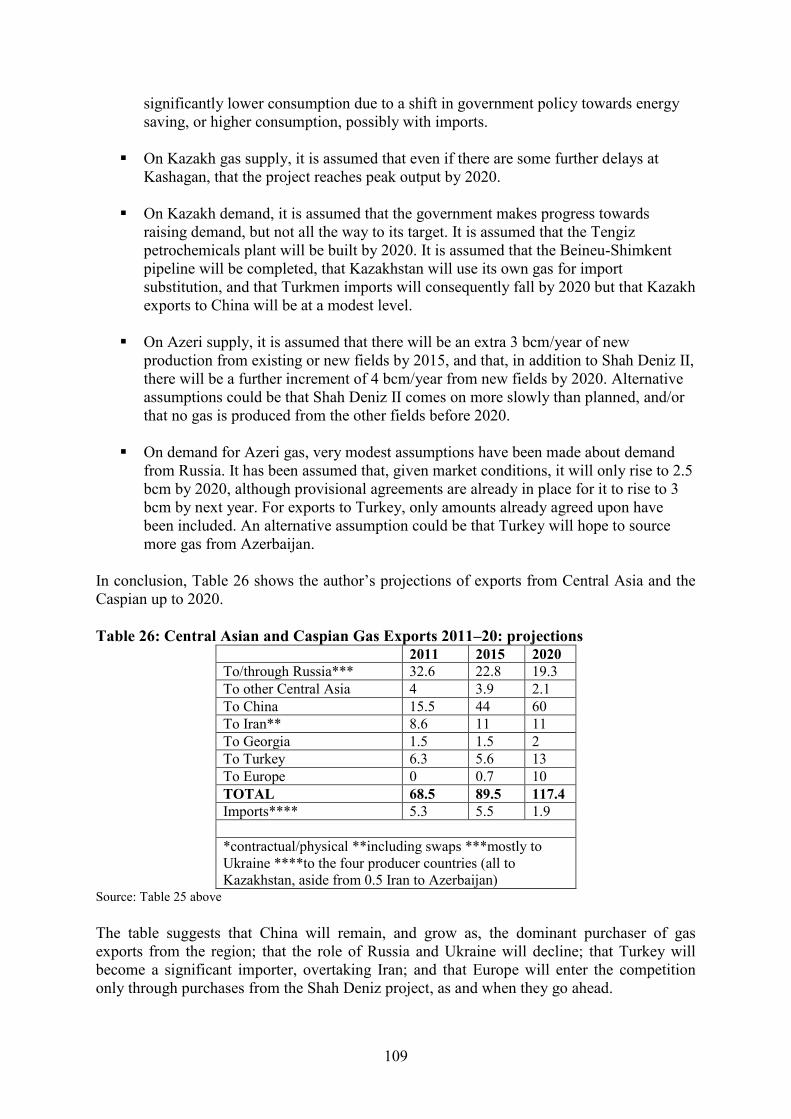
109
significantly lower consumption due to a shift in government policy towards energy
saving, or higher consumption, possibly with imports.
On Kazakh gas supply, it is assumed that even if there are some further delays at
Kashagan, that the project reaches peak output by 2020.
On Kazakh demand, it is assumed that the government makes progress towards
raising demand, but not all the way to its target. It is assumed that the Tengiz
petrochemicals plant will be built by 2020. It is assumed that the Beineu-Shimkent
pipeline will be completed, that Kazakhstan will use its own gas for import
substitution, and that Turkmen imports will consequently fall by 2020 but that Kazakh
exports to China will be at a modest level.
On Azeri supply, it is assumed that there will be an extra 3 bcm/year of new
production from existing or new fields by 2015, and that, in addition to Shah Deniz II,
there will be a further increment of 4 bcm/year from new fields by 2020. Alternative
assumptions could be that Shah Deniz II comes on more slowly than planned, and/or
that no gas is produced from the other fields before 2020.
On demand for Azeri gas, very modest assumptions have been made about demand
from Russia. It has been assumed that, given market conditions, it will only rise to 2.5
bcm by 2020, although provisional agreements are already in place for it to rise to 3
bcm by next year. For exports to Turkey, only amounts already agreed upon have
been included. An alternative assumption could be that Turkey will hope to source
more gas from Azerbaijan.
In conclusion, Table 26 shows the author’s projections of exports from Central Asia and the
Caspian up to 2020.
Table 26: Central Asian and Caspian Gas Exports 2011–20: projections
2011 2015 2020
To/through Russia*** 32.6 22.8 19.3
To other Central Asia 4 3.9 2.1
To China 15.5 44 60
To Iran** 8.6 11 11
To Georgia 1.5 1.5 2
To Turkey 6.3 5.6 13
To Europe 0 0.7 10
TOTAL 68.5 89.5 117.4
Imports**** 5.3 5.5 1.9
*contractual/physical **including swaps ***mostly to
Ukraine ****to the four producer countries (all to
Kazakhstan, aside from 0.5 Iran to Azerbaijan) Source: Table 25 above
The table suggests that China will remain, and grow as, the dominant purchaser of gas
exports from the region; that the role of Russia and Ukraine will decline; that Turkey will
become a significant importer, overtaking Iran; and that Europe will enter the competition
only through purchases from the Shah Deniz project, as and when they go ahead.
110
Appendix 1. Statistical and price information
The availability of information on gas production volumes, trade flows and domestic
consumption in the region remains patchy. In compiling the gas balances in Table 1, I drew
on a variety of sources, as follows.
For Turkmenistan, where data on production volumes are considered to be state secrets, I
extrapolated these from other items in the gas balance, i.e.: domestic consumption (as
recorded by the IEA), with the assumption that most of what is recorded as “energy industry
own use” is reinjected or flared; and exports (as stated in various published sources, including
official Russian and Chinese sources). Turkmenistan does not report its export volumes to the
CIS statistical agency, but most of these can be extrapolated from reports by the importers.
Turkmen exports to Iran are available from official Iranian sources.
Uzbekistan also treats production data as state secrets. For production (sales gas) and
domestic consumption I have used statistics published by the US Energy Information
Agency; I have estimated the volumes reinjected and flared on the basis of industry
information. Export volumes can mostly be extrapolated from import data published by the
CIS statistical agency, press reports, and other published sources.
Kazakhstan presents the biggest statistical puzzle, because there has not been a uniform
approach by the energy ministry, state statistics agency and companies to recording (i) the
volumes of gas reinjected, and (ii) the volumes exported and either reimported (from the
Orenburg processing plant) or swapped. These swap arrangements are discussed in section
4.3. The energy ministry has published information on total production and amounts
reinjected and flared, but I have not found any for recent years. But the state statistical agency
began in 2009 to publish much fuller information on the gas balance, and I have used the
agency’s figures for 2006-10 (for production (sales gas), consumption and export) as a
starting-point. Estimates, and extrapolations from CIS trade statistics, have been used to
complete the balance.
Azerbaijan’s state statistical agency publishes data both for total production and production
(sales gas). I have used these, together with some published information on domestic
consumption and exports.
There is little publicly available information on the prices in cross-border contracts. For gas
exported westward, Gazprom’s average purchase price in the region is published. For exports
to China I have relied on information from Chinese official sources. Other prices, including
those in the intra-Central Asian gas trade, are often reported by the local financial press.
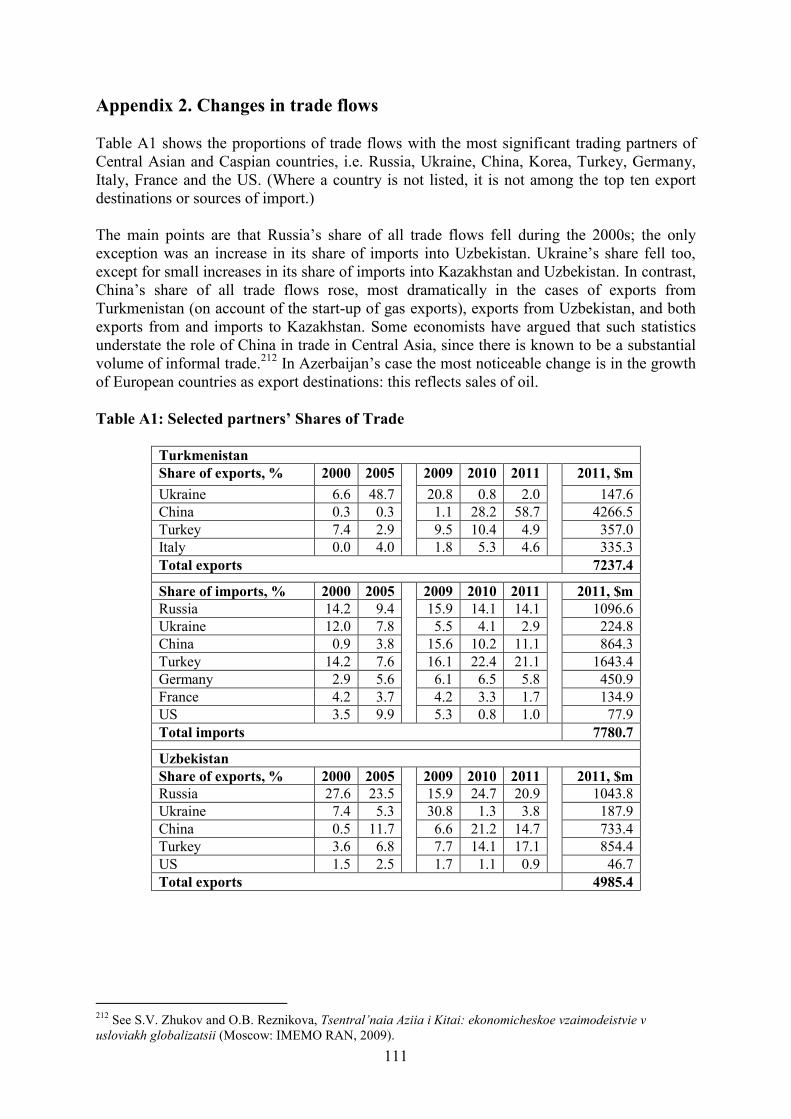
111
Appendix 2. Changes in trade flows
Table A1 shows the proportions of trade flows with the most significant trading partners of
Central Asian and Caspian countries, i.e. Russia, Ukraine, China, Korea, Turkey, Germany,
Italy, France and the US. (Where a country is not listed, it is not among the top ten export
destinations or sources of import.)
The main points are that Russia’s share of all trade flows fell during the 2000s; the only
exception was an increase in its share of imports into Uzbekistan. Ukraine’s share fell too,
except for small increases in its share of imports into Kazakhstan and Uzbekistan. In contrast,
China’s share of all trade flows rose, most dramatically in the cases of exports from
Turkmenistan (on account of the start-up of gas exports), exports from Uzbekistan, and both
exports from and imports to Kazakhstan. Some economists have argued that such statistics
understate the role of China in trade in Central Asia, since there is known to be a substantial
volume of informal trade.212
In Azerbaijan’s case the most noticeable change is in the growth
of European countries as export destinations: this reflects sales of oil.
Table A1: Selected partners’ Shares of Trade
Turkmenistan
Share of exports, % 2000 2005 2009 2010 2011 2011, $m
Ukraine 6.6 48.7 20.8 0.8 2.0 147.6
China 0.3 0.3 1.1 28.2 58.7 4266.5
Turkey 7.4 2.9 9.5 10.4 4.9 357.0
Italy 0.0 4.0 1.8 5.3 4.6 335.3
Total exports 7237.4
Share of imports, % 2000 2005 2009 2010 2011 2011, $m
Russia 14.2 9.4 15.9 14.1 14.1 1096.6
Ukraine 12.0 7.8 5.5 4.1 2.9 224.8
China 0.9 3.8 15.6 10.2 11.1 864.3
Turkey 14.2 7.6 16.1 22.4 21.1 1643.4
Germany 2.9 5.6 6.1 6.5 5.8 450.9
France 4.2 3.7 4.2 3.3 1.7 134.9
US 3.5 9.9 5.3 0.8 1.0 77.9
Total imports 7780.7
Uzbekistan
Share of exports, % 2000 2005 2009 2010 2011 2011, $m
Russia 27.6 23.5 15.9 24.7 20.9 1043.8
Ukraine 7.4 5.3 30.8 1.3 3.8 187.9
China 0.5 11.7 6.6 21.2 14.7 733.4
Turkey 3.6 6.8 7.7 14.1 17.1 854.4
US 1.5 2.5 1.7 1.1 0.9 46.7
Total exports 4985.4
212
See S.V. Zhukov and O.B. Reznikova, Tsentral’naia Aziia i Kitai: ekonomicheskoe vzaimodeistvie v
usloviakh globalizatsii (Moscow: IMEMO RAN, 2009).
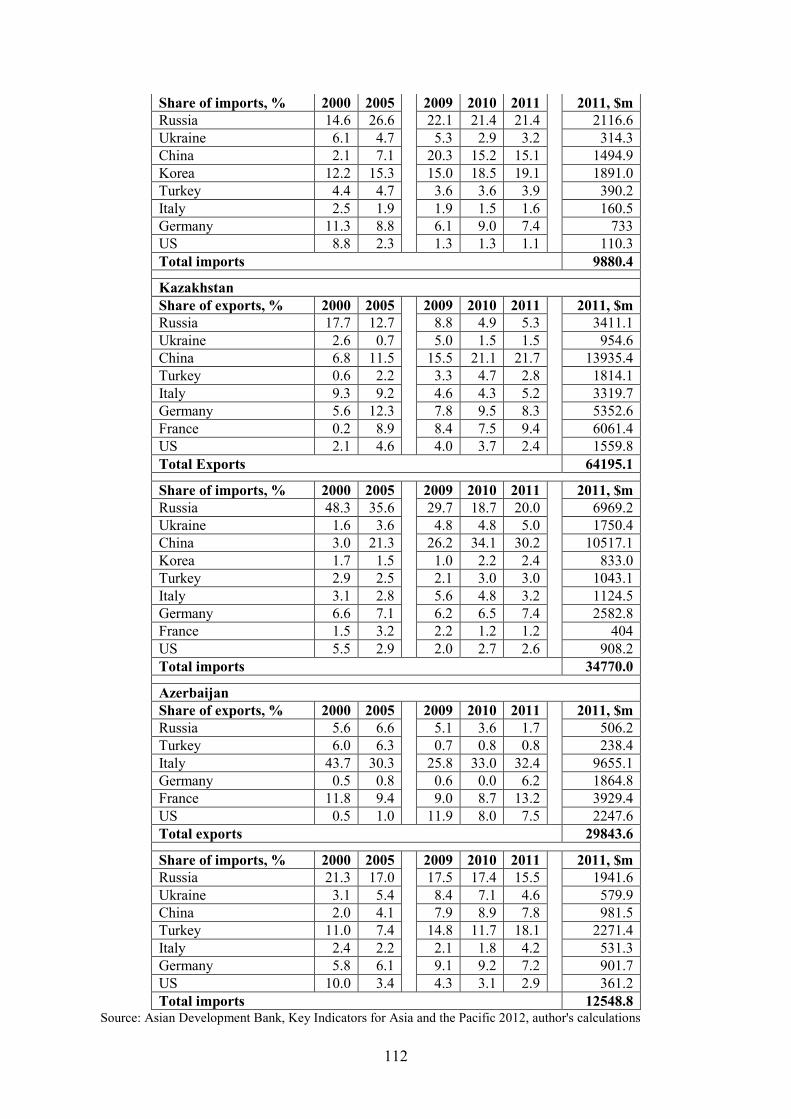
112
Share of imports, % 2000 2005 2009 2010 2011 2011, $m
Russia 14.6 26.6 22.1 21.4 21.4 2116.6
Ukraine 6.1 4.7 5.3 2.9 3.2 314.3
China 2.1 7.1 20.3 15.2 15.1 1494.9
Korea 12.2 15.3 15.0 18.5 19.1 1891.0
Turkey 4.4 4.7 3.6 3.6 3.9 390.2
Italy 2.5 1.9 1.9 1.5 1.6 160.5
Germany 11.3 8.8 6.1 9.0 7.4 733
US 8.8 2.3 1.3 1.3 1.1 110.3
Total imports 9880.4
Kazakhstan
Share of exports, % 2000 2005 2009 2010 2011 2011, $m
Russia 17.7 12.7 8.8 4.9 5.3 3411.1
Ukraine 2.6 0.7 5.0 1.5 1.5 954.6
China 6.8 11.5 15.5 21.1 21.7 13935.4
Turkey 0.6 2.2 3.3 4.7 2.8 1814.1
Italy 9.3 9.2 4.6 4.3 5.2 3319.7
Germany 5.6 12.3 7.8 9.5 8.3 5352.6
France 0.2 8.9 8.4 7.5 9.4 6061.4
US 2.1 4.6 4.0 3.7 2.4 1559.8
Total Exports 64195.1
Share of imports, % 2000 2005 2009 2010 2011 2011, $m
Russia 48.3 35.6 29.7 18.7 20.0 6969.2
Ukraine 1.6 3.6 4.8 4.8 5.0 1750.4
China 3.0 21.3 26.2 34.1 30.2 10517.1
Korea 1.7 1.5 1.0 2.2 2.4 833.0
Turkey 2.9 2.5 2.1 3.0 3.0 1043.1
Italy 3.1 2.8 5.6 4.8 3.2 1124.5
Germany 6.6 7.1 6.2 6.5 7.4 2582.8
France 1.5 3.2 2.2 1.2 1.2 404
US 5.5 2.9 2.0 2.7 2.6 908.2
Total imports 34770.0
Azerbaijan
Share of exports, % 2000 2005 2009 2010 2011 2011, $m
Russia 5.6 6.6 5.1 3.6 1.7 506.2
Turkey 6.0 6.3 0.7 0.8 0.8 238.4
Italy 43.7 30.3 25.8 33.0 32.4 9655.1
Germany 0.5 0.8 0.6 0.0 6.2 1864.8
France 11.8 9.4 9.0 8.7 13.2 3929.4
US 0.5 1.0 11.9 8.0 7.5 2247.6
Total exports 29843.6
Share of imports, % 2000 2005 2009 2010 2011 2011, $m
Russia 21.3 17.0 17.5 17.4 15.5 1941.6
Ukraine 3.1 5.4 8.4 7.1 4.6 579.9
China 2.0 4.1 7.9 8.9 7.8 981.5
Turkey 11.0 7.4 14.8 11.7 18.1 2271.4
Italy 2.4 2.2 2.1 1.8 4.2 531.3
Germany 5.8 6.1 9.1 9.2 7.2 901.7
US 10.0 3.4 4.3 3.1 2.9 361.2
Total imports 12548.8 Source: Asian Development Bank, Key Indicators for Asia and the Pacific 2012, author's calculations
113
Appendix 3. Turkmenistan: export revenues and their contribution to the
economy
Estimates of hydrocarbons export revenues, 2005-2011
The IMF publishes estimates of the value both of Turkmenistan’s total exports and of its
hydrocarbons exports, making use of information reported directly to it by the Turkmen
authorities but not published. The IMF takes into account these statistics, and other
information supplied by the Turkmen authorities, in calculating GDP growth estimates and
projections for Turkmenistan.
The author’s estimates of Turkmenistan’s earnings from hydrocarbons exports are based on
statistics published by the International Energy Agency (IEA), and market information. To
estimate volumes of natural gas exports, and the prices charged, market information,
including statements by importing companies; for crude oil, volumes reported by the IEA and
the average Russian export price as a proxy; for oil products, volumes reported by the IEA
and the average Eurasian market price quoted by Bloomberg.
Table A2 compares the IMF’s estimates of hydrocarbons revenues to mine, and shows
substantial differences.
In 2005-07, the author’s estimates of export revenues (which reflect market perception) were
higher than the IMF’s. For 2008 the author’s estimates were lower than the IMF’s, and in
2009 they were substantially lower (by nearly one third). The IMF’s projections for
hydrocarbons revenues in 2010 are higher than the author’s, by about one quarter, and for
2011 substantially higher, by considerably more than one third. This means that either the
market (price perceptions in which have guided the author’s estimates) has seriously mis-
called Turkmen export prices, or that the IMF’s understanding of the level of hydrocarbons
revenues, sourced from the national statistical agency, has – particularly during and after the
economic crisis and the 2009 dispute with Russia – been overstated.
The impact of the Russian cutback on Turkmen export revenues, according to the author’s
estimates, was cushioned by several factors. First, market information (including in this case,
statements and hints from Gazprom management and the Russian government) indicates that
when the gas was still flowing in the first quarter of 2009, a very high price was being paid.
So although exports for the year only totalled 11.8 bcm, revenues were $3.776 billion.
In 2010, gas export revenues fell significantly: only 11 bcm was exported during the whole
year, but at lower prices, giving an estimated revenue of $2.2 billion. However the effect was
cushioned by strong oil and oil products prices, which meant that sales of these commodities
made up much of the loss on gas sales.
When information becomes available for 2011-12, increased gas export revenues from sales
to China are sure to change the picture substantially, while strong sales of oil and oil products
will also play a part.
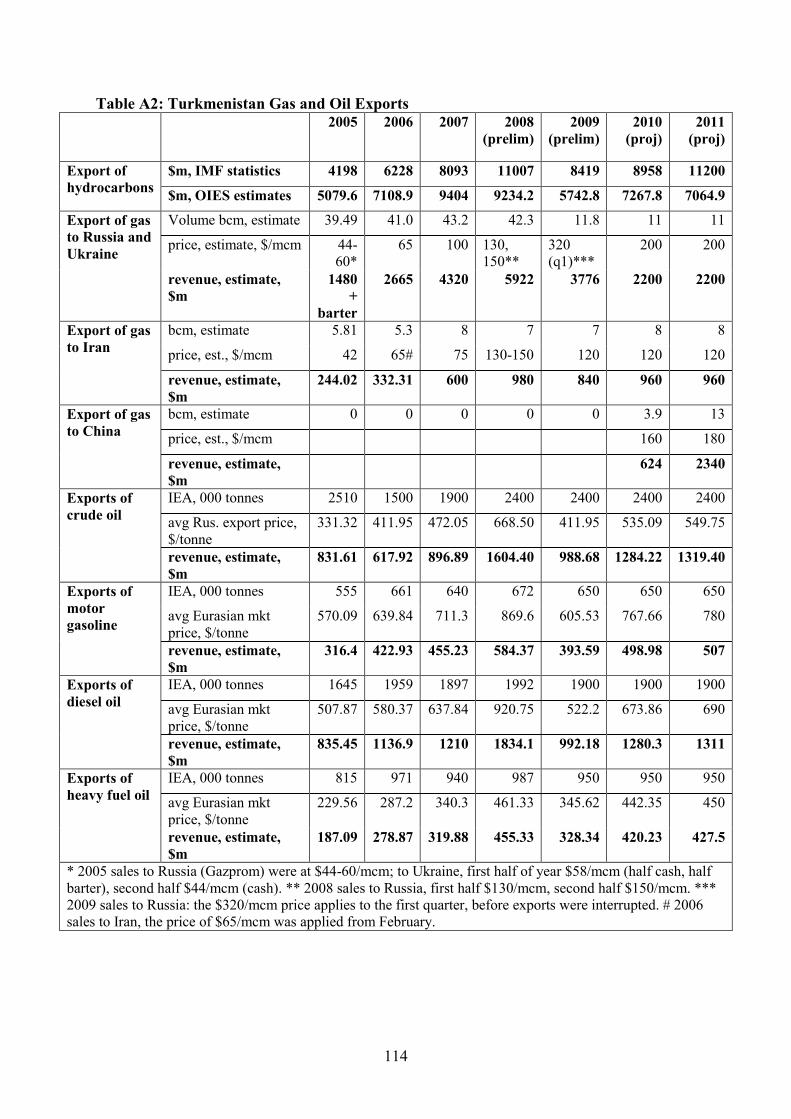
114
Table A2: Turkmenistan Gas and Oil Exports
2005 2006 2007 2008
(prelim)
2009
(prelim)
2010
(proj)
2011
(proj)
Export of
hydrocarbons
$m, IMF statistics 4198 6228 8093 11007 8419 8958 11200
$m, OIES estimates 5079.6 7108.9 9404 9234.2 5742.8 7267.8 7064.9
Export of gas
to Russia and
Ukraine
Volume bcm, estimate 39.49 41.0 43.2 42.3 11.8 11 11
price, estimate, $/mcm 44-
60*
65 100 130,
150**
320
(q1)***
200 200
revenue, estimate,
$m
1480
+
barter
2665 4320 5922 3776 2200 2200
Export of gas
to Iran
bcm, estimate 5.81 5.3 8 7 7 8 8
price, est., $/mcm 42 65# 75 130-150 120 120 120
revenue, estimate,
$m
244.02 332.31 600 980 840 960 960
Export of gas
to China
bcm, estimate 0 0 0 0 0 3.9 13
price, est., $/mcm 160 180
revenue, estimate,
$m
624 2340
Exports of
crude oil
IEA, 000 tonnes 2510 1500 1900 2400 2400 2400 2400
avg Rus. export price,
$/tonne
331.32 411.95 472.05 668.50 411.95 535.09 549.75
revenue, estimate,
$m
831.61 617.92 896.89 1604.40 988.68 1284.22 1319.40
Exports of
motor
gasoline
IEA, 000 tonnes 555 661 640 672 650 650 650
avg Eurasian mkt
price, $/tonne
570.09 639.84 711.3 869.6 605.53 767.66 780
revenue, estimate,
$m
316.4 422.93 455.23 584.37 393.59 498.98 507
Exports of
diesel oil
IEA, 000 tonnes 1645 1959 1897 1992 1900 1900 1900
avg Eurasian mkt
price, $/tonne
507.87 580.37 637.84 920.75 522.2 673.86 690
revenue, estimate,
$m
835.45 1136.9 1210 1834.1 992.18 1280.3 1311
Exports of
heavy fuel oil
IEA, 000 tonnes 815 971 940 987 950 950 950
avg Eurasian mkt
price, $/tonne
229.56 287.2 340.3 461.33 345.62 442.35 450
revenue, estimate,
$m
187.09 278.87 319.88 455.33 328.34 420.23 427.5
* 2005 sales to Russia (Gazprom) were at $44-60/mcm; to Ukraine, first half of year $58/mcm (half cash, half
barter), second half $44/mcm (cash). ** 2008 sales to Russia, first half $130/mcm, second half $150/mcm. ***
2009 sales to Russia: the $320/mcm price applies to the first quarter, before exports were interrupted. # 2006
sales to Iran, the price of $65/mcm was applied from February.
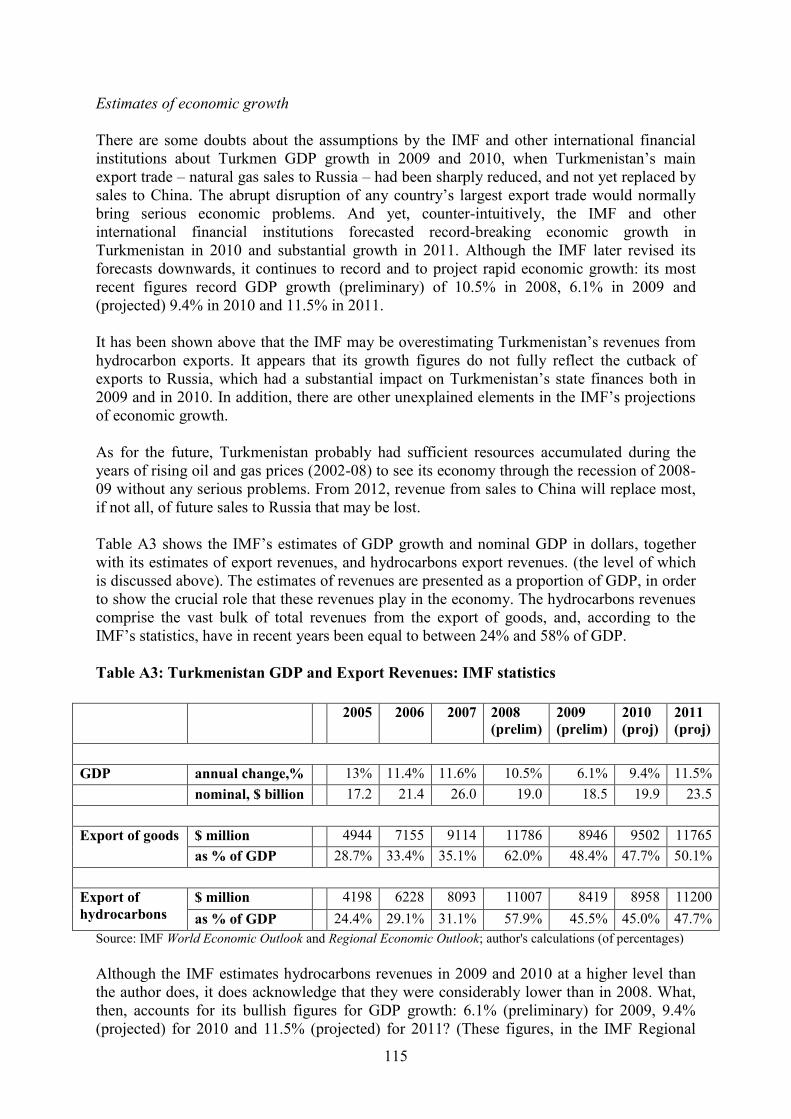
115
Estimates of economic growth
There are some doubts about the assumptions by the IMF and other international financial
institutions about Turkmen GDP growth in 2009 and 2010, when Turkmenistan’s main
export trade – natural gas sales to Russia – had been sharply reduced, and not yet replaced by
sales to China. The abrupt disruption of any country’s largest export trade would normally
bring serious economic problems. And yet, counter-intuitively, the IMF and other
international financial institutions forecasted record-breaking economic growth in
Turkmenistan in 2010 and substantial growth in 2011. Although the IMF later revised its
forecasts downwards, it continues to record and to project rapid economic growth: its most
recent figures record GDP growth (preliminary) of 10.5% in 2008, 6.1% in 2009 and
(projected) 9.4% in 2010 and 11.5% in 2011.
It has been shown above that the IMF may be overestimating Turkmenistan’s revenues from
hydrocarbon exports. It appears that its growth figures do not fully reflect the cutback of
exports to Russia, which had a substantial impact on Turkmenistan’s state finances both in
2009 and in 2010. In addition, there are other unexplained elements in the IMF’s projections
of economic growth.
As for the future, Turkmenistan probably had sufficient resources accumulated during the
years of rising oil and gas prices (2002-08) to see its economy through the recession of 2008-
09 without any serious problems. From 2012, revenue from sales to China will replace most,
if not all, of future sales to Russia that may be lost.
Table A3 shows the IMF’s estimates of GDP growth and nominal GDP in dollars, together
with its estimates of export revenues, and hydrocarbons export revenues. (the level of which
is discussed above). The estimates of revenues are presented as a proportion of GDP, in order
to show the crucial role that these revenues play in the economy. The hydrocarbons revenues
comprise the vast bulk of total revenues from the export of goods, and, according to the
IMF’s statistics, have in recent years been equal to between 24% and 58% of GDP.
Table A3: Turkmenistan GDP and Export Revenues: IMF statistics
2005 2006 2007 2008
(prelim)
2009
(prelim)
2010
(proj)
2011
(proj)
GDP annual change,% 13% 11.4% 11.6% 10.5% 6.1% 9.4% 11.5%
nominal, $ billion 17.2 21.4 26.0 19.0 18.5 19.9 23.5
Export of goods $ million 4944 7155 9114 11786 8946 9502 11765
as % of GDP 28.7% 33.4% 35.1% 62.0% 48.4% 47.7% 50.1%
Export of
hydrocarbons
$ million 4198 6228 8093 11007 8419 8958 11200
as % of GDP 24.4% 29.1% 31.1% 57.9% 45.5% 45.0% 47.7%
Source: IMF World Economic Outlook and Regional Economic Outlook; author's calculations (of percentages)
Although the IMF estimates hydrocarbons revenues in 2009 and 2010 at a higher level than
the author does, it does acknowledge that they were considerably lower than in 2008. What,
then, accounts for its bullish figures for GDP growth: 6.1% (preliminary) for 2009, 9.4%
(projected) for 2010 and 11.5% (projected) for 2011? (These figures, in the IMF Regional
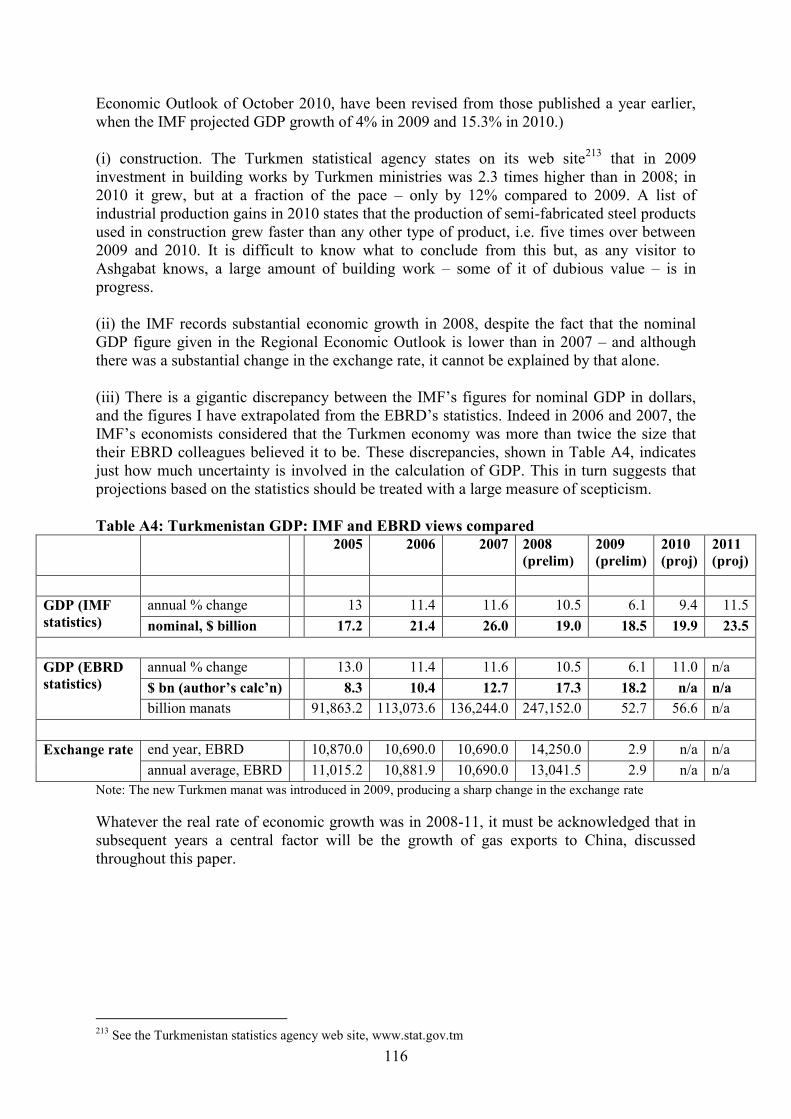
116
Economic Outlook of October 2010, have been revised from those published a year earlier,
when the IMF projected GDP growth of 4% in 2009 and 15.3% in 2010.)
(i) construction. The Turkmen statistical agency states on its web site213
that in 2009
investment in building works by Turkmen ministries was 2.3 times higher than in 2008; in
2010 it grew, but at a fraction of the pace – only by 12% compared to 2009. A list of
industrial production gains in 2010 states that the production of semi-fabricated steel products
used in construction grew faster than any other type of product, i.e. five times over between
2009 and 2010. It is difficult to know what to conclude from this but, as any visitor to
Ashgabat knows, a large amount of building work – some of it of dubious value – is in
progress.
(ii) the IMF records substantial economic growth in 2008, despite the fact that the nominal
GDP figure given in the Regional Economic Outlook is lower than in 2007 – and although
there was a substantial change in the exchange rate, it cannot be explained by that alone.
(iii) There is a gigantic discrepancy between the IMF’s figures for nominal GDP in dollars,
and the figures I have extrapolated from the EBRD’s statistics. Indeed in 2006 and 2007, the
IMF’s economists considered that the Turkmen economy was more than twice the size that
their EBRD colleagues believed it to be. These discrepancies, shown in Table A4, indicates
just how much uncertainty is involved in the calculation of GDP. This in turn suggests that
projections based on the statistics should be treated with a large measure of scepticism.
Table A4: Turkmenistan GDP: IMF and EBRD views compared 2005 2006 2007 2008
(prelim)
2009
(prelim)
2010
(proj)
2011
(proj)
GDP (IMF
statistics)
annual % change 13 11.4 11.6 10.5 6.1 9.4 11.5
nominal, $ billion 17.2 21.4 26.0 19.0 18.5 19.9 23.5
GDP (EBRD
statistics)
annual % change 13.0 11.4 11.6 10.5 6.1 11.0 n/a
$ bn (author’s calc’n) 8.3 10.4 12.7 17.3 18.2 n/a n/a
billion manats 91,863.2 113,073.6 136,244.0 247,152.0 52.7 56.6 n/a
Exchange rate end year, EBRD 10,870.0 10,690.0 10,690.0 14,250.0 2.9 n/a n/a
annual average, EBRD 11,015.2 10,881.9 10,690.0 13,041.5 2.9 n/a n/a
Note: The new Turkmen manat was introduced in 2009, producing a sharp change in the exchange rate
Whatever the real rate of economic growth was in 2008-11, it must be acknowledged that in
subsequent years a central factor will be the growth of gas exports to China, discussed
throughout this paper.
213
See the Turkmenistan statistics agency web site, www.stat.gov.tm
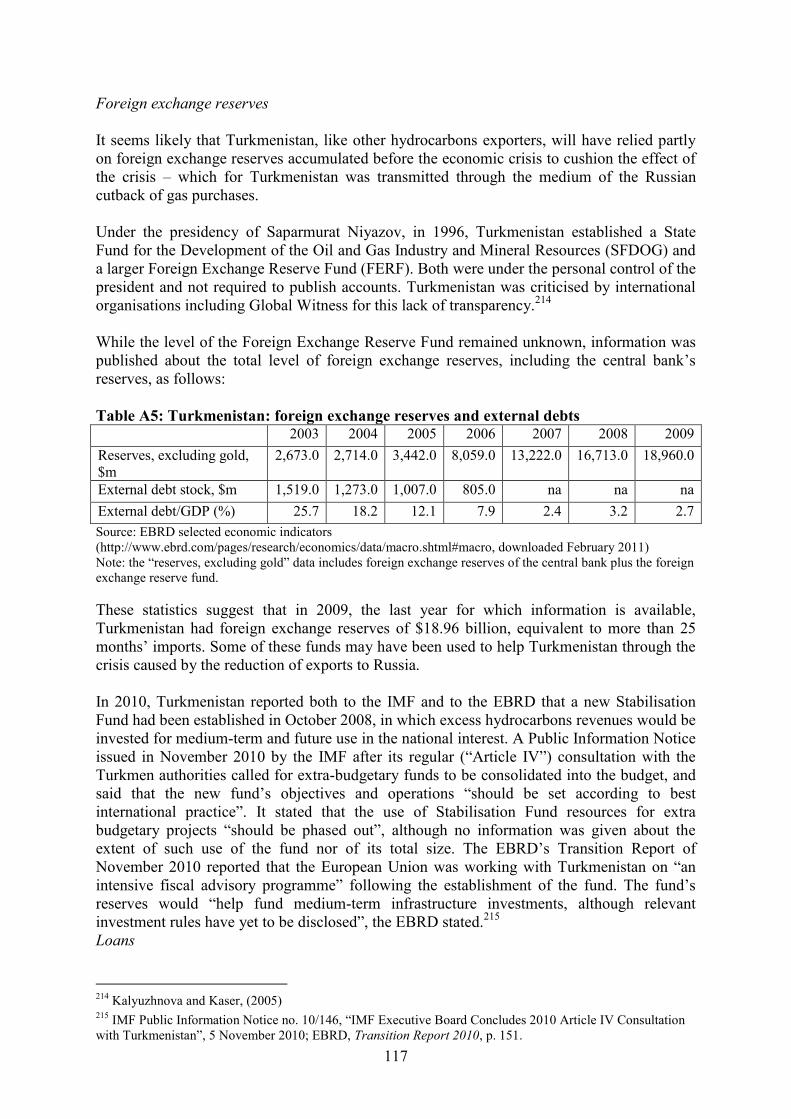
117
Foreign exchange reserves
It seems likely that Turkmenistan, like other hydrocarbons exporters, will have relied partly
on foreign exchange reserves accumulated before the economic crisis to cushion the effect of
the crisis – which for Turkmenistan was transmitted through the medium of the Russian
cutback of gas purchases.
Under the presidency of Saparmurat Niyazov, in 1996, Turkmenistan established a State
Fund for the Development of the Oil and Gas Industry and Mineral Resources (SFDOG) and
a larger Foreign Exchange Reserve Fund (FERF). Both were under the personal control of the
president and not required to publish accounts. Turkmenistan was criticised by international
organisations including Global Witness for this lack of transparency.214
While the level of the Foreign Exchange Reserve Fund remained unknown, information was
published about the total level of foreign exchange reserves, including the central bank’s
reserves, as follows:
Table A5: Turkmenistan: foreign exchange reserves and external debts 2003 2004 2005 2006 2007 2008 2009
Reserves, excluding gold,
$m
2,673.0 2,714.0 3,442.0 8,059.0 13,222.0 16,713.0 18,960.0
External debt stock, $m 1,519.0 1,273.0 1,007.0 805.0 na na na
External debt/GDP (%) 25.7 18.2 12.1 7.9 2.4 3.2 2.7
Source: EBRD selected economic indicators
(http://www.ebrd.com/pages/research/economics/data/macro.shtml#macro, downloaded February 2011)
Note: the “reserves, excluding gold” data includes foreign exchange reserves of the central bank plus the foreign
exchange reserve fund.
These statistics suggest that in 2009, the last year for which information is available,
Turkmenistan had foreign exchange reserves of $18.96 billion, equivalent to more than 25
months’ imports. Some of these funds may have been used to help Turkmenistan through the
crisis caused by the reduction of exports to Russia.
In 2010, Turkmenistan reported both to the IMF and to the EBRD that a new Stabilisation
Fund had been established in October 2008, in which excess hydrocarbons revenues would be
invested for medium-term and future use in the national interest. A Public Information Notice
issued in November 2010 by the IMF after its regular (“Article IV”) consultation with the
Turkmen authorities called for extra-budgetary funds to be consolidated into the budget, and
said that the new fund’s objectives and operations “should be set according to best
international practice”. It stated that the use of Stabilisation Fund resources for extra
budgetary projects “should be phased out”, although no information was given about the
extent of such use of the fund nor of its total size. The EBRD’s Transition Report of
November 2010 reported that the European Union was working with Turkmenistan on “an
intensive fiscal advisory programme” following the establishment of the fund. The fund’s
reserves would “help fund medium-term infrastructure investments, although relevant
investment rules have yet to be disclosed”, the EBRD stated.215
Loans
214
Kalyuzhnova and Kaser, (2005) 215
IMF Public Information Notice no. 10/146, “IMF Executive Board Concludes 2010 Article IV Consultation
with Turkmenistan”, 5 November 2010; EBRD, Transition Report 2010, p. 151.
118
Loans from China for the development of the South Yolotan gas field that have been publicly
reported amount to $8.1 billion: a $4 billion loan from the China Development Bank to
Turkmengaz in June 2009, a a further $4.1 billion loan from the China Development Bank to
Turkmengaz in April 2011. According to Chinese official sources, 100% of repayments on
the 2009 loan will be taken in the form of gas exports. However the repayment curve on the
loan is unknown, i.e. it is unknown when the repayments will start and what their level will
be in different years.216
Since the repayment terms of the loans are unknown, it is difficult to
know what the economic effect will be. In the next few years this factor will reduce the
economic benefit to Turkmenistan of gas export revenues. Nevertheless, given
Turkmenistan’s size, population and budget requirements, and its overall debt position, this is
unlikely to cause a fiscal crisis.
Conclusions
The IMF’s estimates for hydrocarbons revenues in 2008-09, and its projections for 2010-11,
are inexplicably high. The cutback of exports to Russia had a substantial impact on
Turkmenistan’s state finances both in 2009 and in 2010. In addition to problems with the
stated hydrocarbons export revenues, there are other unexplained elements in the IMF’s
projections of economic growth.
As for the future, Turkmenistan probably had sufficient resources accumulated during the
years of rising oil and gas prices (2002-08) to see its economy through the recession of 2008-
09 without any serious problems, and revenue from sales to China will replace most, but
probably not all, of future sales that may be lost to Russia – although the lack of transparency
of export prices, and concerning the repayment of China’s substantial loans to Turkmengaz,
make it impossible to assess the economic effect of these gas sales in any detailed way.
216
State News Agency of Turkmenistan, “World economies count on Turkmen gas”, 28 April 2011,
turkmenistan.gov.tm; Turkmenistan.ru web site, “Turkmenistan will raise extra US $4.1 billion”, 27 April 2011;
Reuters, “China in Central Asia: latest investments”, 11 March 2010.
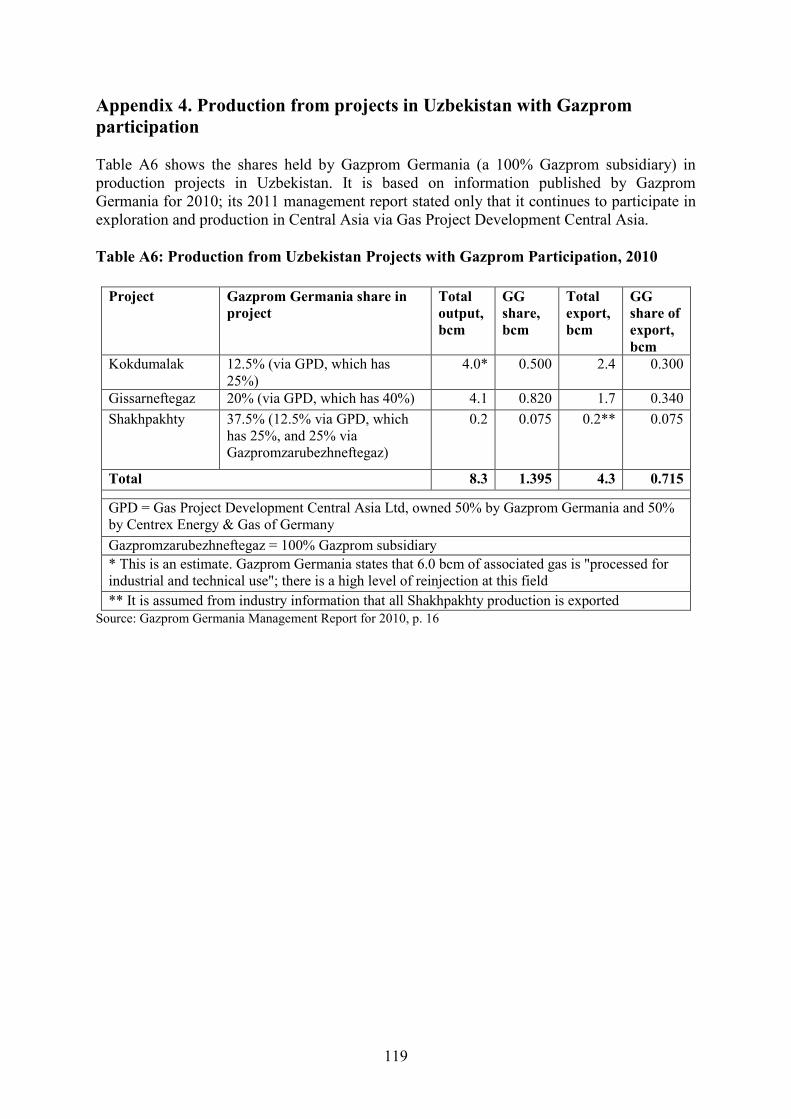
119
Appendix 4. Production from projects in Uzbekistan with Gazprom
participation
Table A6 shows the shares held by Gazprom Germania (a 100% Gazprom subsidiary) in
production projects in Uzbekistan. It is based on information published by Gazprom
Germania for 2010; its 2011 management report stated only that it continues to participate in
exploration and production in Central Asia via Gas Project Development Central Asia.
Table A6: Production from Uzbekistan Projects with Gazprom Participation, 2010
Project Gazprom Germania share in
project
Total
output,
bcm
GG
share,
bcm
Total
export,
bcm
GG
share of
export,
bcm
Kokdumalak 12.5% (via GPD, which has
25%)
4.0* 0.500 2.4 0.300
Gissarneftegaz 20% (via GPD, which has 40%) 4.1 0.820 1.7 0.340
Shakhpakhty 37.5% (12.5% via GPD, which
has 25%, and 25% via
Gazpromzarubezhneftegaz)
0.2 0.075 0.2** 0.075
Total 8.3 1.395 4.3 0.715
GPD = Gas Project Development Central Asia Ltd, owned 50% by Gazprom Germania and 50%
by Centrex Energy & Gas of Germany
Gazpromzarubezhneftegaz = 100% Gazprom subsidiary
* This is an estimate. Gazprom Germania states that 6.0 bcm of associated gas is "processed for
industrial and technical use"; there is a high level of reinjection at this field
** It is assumed from industry information that all Shakhpakhty production is exported
Source: Gazprom Germania Management Report for 2010, p. 16
120
Appendix 5. Gas supply problems in Uzbekistan
The assumption that some parts of Uzbekistan are suffering very severe gas supply problems
in winter is difficult to verify, and it is impossible to judge the extent of the problems
accurately. The only source of information I have found is reports by reliable news
organisations based outside Uzbekistan. Some of these are summarised here.
May 2010
Journalists who travelled to Andizhan in the Ferghana Valley were told that throughout the
winter there had been no gas supply for weeks on end, and that electricity had only been
available from 05.00 to 13.00 and from 17.00 to 18.00. During their ten-day visit they
collected information about four explosions in apartment blocks, caused by people attempting
to divert to their homes gas that they considered was being unfairly directed elsewhere.
January 2011
The town of Margilan in the Ferghana valley had had no gas supplied since November 2010,
it was reported. In Kokand, pressure in distribution networks was so low that gas was to all
intents and purposes unavailable for most consumers. A programme of infrastructure
upgrades was in progress but had yet to produce results
November 2011
There were reported warnings of extensive gas and power cuts, followed by reports of cuts, in
the Rishtanskyi, Altyaryksky, Buvaidiiskyi and Bagdadsky districts in the Ferghana Valley.
In Sokhsky district gas had been cut off, reportedly due to higher-than-planned use in districts
of Kyrgyzstan served by the same infrastructure. (All these areas had been subjected to 20+
hours a day electricity cuts since the mid 1990s.) The head of the Ferghana valley
administration was dismissed by presidential decree on 7 November.
In Tashkent, the capital of Uzbekistan, the adminstration of the Almazarskii district was
reported to have distributed announcements to industrial and residential customers urging
them to limit their consumption of gas and electricity.
In the Syrdarya region, a demonstration by residents at the town hall, demanding restoration
of gas supplies, was reported. The town of Urgench was reported to have had no gas supplied
for “nearly a month”, and to be suffering regular unscheduled electricity cuts. More serious
problems than usual were also reported in Samarkand region: in the city of Samarkand it was
reported that there was no gas supply, and electricity only every other day. There were
reports from Dzhizhakskaia region that most businesses were using coal and wood as fuel, in
the absence of gas.217
217
Sources: “Andizhan pod ‘mudrym rukovodstvom’ Islama Karimova”, Ferghana News, 27 May 2010;
“Uzbekistan: zhiteli Margilana snova ostalis’ bez gaza”, Ferghana News, 9 January 2011; “Uzbekistan: Islam
Karimov smenil glavu administratsii Ferganskoi oblasti”, Ferghana News, 8 November 2011; “Uzbekistan:
zhiteliam Ferganskoi oblasti rekomandovano zapastis’m drovami i uglem”, Ferghana News, 9 November 2011;
“V Uzbekistane nekhvatka gaza grozit sotsial’nym vsryvom”, Rosbalt.ru, 11 November 2011; “Byt i oil
opredeliaiut soznanie”, Uzmetronom news agency, 14 November 2011; “Uzbekistan: k 20-letiiu nezavisimosti
my ostalis’ bez gaza i sveta”, Ferghana News, 23 November 2011; “Postavki uzbekskogo gaza v Kazakhstan
sushchestvenno snizheny”, Ferghana News, 15 November 2011
121
Bibliography
Official and government documents and statistics
Agenstvo respubliki Kazakhstan po statistike, Toplivno-energeticheskii balans respubliki
Kazakhstan 2009 (Astana, 2010)
Azerbaijan Ministry of Economy web site www.economy.az
AzStat, Foreign Trade of Azerbaijan 2011 (Baku, 2011)
Hrant Bagratian and Emine Gurgen, IMF Working Paper: Payments Arrears in the Gas and
Electric Power Sectors of the Russian Federation and Ukraine (December 1997)
BP Statistical Review of World Energy - June 2012
British embassy in Turkmenistan, Updates on the Energy Sector
Cedigaz, Natural Gas in the World: 2012 Edition
John Dodsworth, Paul Mathie and Clinton Shiells, IMF Policy Discussion Paper: Cross-
Border Issues in Energy Trade in the CIS Countries (December 2002)
EBRD Transition Report 2010
European Commission, On security of energy supply and international cooperation: “The
EU Energy Policy: Engaging with Partners Beyond Our Borders” (COM (2011) 539), 7
September 2011
Global Gas Flaring Initiative web site
http://web.worldbank.org/WBSITE/EXTERNAL/TOPICS/EXTOGMC/EXTGGFR/0,,menu
PK:578075~pagePK:64168427~piPK:64168435~theSitePK:578069,00.html
IEA World Energy Outlook 2010
IMF 2012 Article IV Report: Republic of Kazakhstan
Kazakhstan ministry of oil and gas web site < http://mgm.gov.kz/>
National statistical agency of Uzbekistan. <http://www.stat.uz/>
Postanovlenie Prezidenta respubliki Uzbekistan, 8 June 2010, no. PP-1351;
Programma po razvitiiu neftegazovogo sektora v Respublike Kazakhstan na 2010-2014 gody,
approved by presidential decree no. 1072, 18 October 2010
State information agency of Turkmenistan, “2010 god v letopisi epokhi novogo
vozrozhdeniia”, 13 January 2011 <http://tdh.gov.tm/?id=2426>
122
Turkmenistan statistics agency web site, <www.stat.gov.tm>
Ukaz prezidenta Turkmenistana o bezvozmezdnom predostavlenii naseleniiu Turkmenistana
prirodnogo gaza, 15 August 2003
UNDP Kazakhstan, Human Development Report 2009
UNFCCC clean development mechanism web site <http://ji.unfccc.int>
US Energy Information Administration web site < http://www.eia.gov/>
US State Department, “Deputy Assistant Secretary for Central Asia Susan Elliott’s Remarks
for Turkmenistan International Oil and Gas Conference”, 17 November 2010, Ashgabat
World Bank, Azerbaijan: issues and options associated with energy reform (report no.
32371-AZ), 31 March 2005
Zakon respubliki Kazakhstan “O gaze i gazosnabzhenii” (law no. 532-IV signed by the
president on 9 January 2012);
Company materials and web sites
Agreement on the Joint Development and Production Sharing for the Azeri and Chirag Fields
and the Deep Water Portion of the Gunashli Field in the Azerbaijan Sector of the Caspian
Sea
Bernstein Research, The Caspian: Cradle of Oil Production Can Rock World Output (New
York, January 2011)
BMI, Turkmenistan Oil & Gas Report Q1 2012
BP web site <http://www.bp.com/>
Caspian Drilling Co. web site < http://www.caspiandrilling.com/index.php>
Chemicals-Technology web site <http://www.chemicals-technology.com>
CNPC web site <http://www.cnpc.com.cn>
Dragon Oil Annual Reports and interim reports
ENI web site <http://www.eni.com/>
Gazprom, Annual Report 2011
Gazprom web site <http://gazprom.com/>
Gazprom investor day presentation, Gaining Momentum, February 2010
Gazprom Germania Management Report for 2010
Halyk finance research notes
IHS Cera, Caspian Development Corporation: Final Implementation Report (December
2010)
123
Kazgermunai web site <http://www.kazgermunay.kz/>
Kazmunaigaz, Godovoi otchet 2009
Kazmunaigaz, Godovoi Otchet 2010
Kazmunaigaz Annual Report 2011
Kazmunaigaz web site <http://www.kmg.kz/>
Kazmunaigaz E&P Annual Report 2011
Kazrosgaz website <http://www.kazrosgas.org
Kaztransgaz Godovoi otchet 2010
KPO, Otchet ob ustoichivom razvitii za 2009 god
KPO, Otchet ob ustoichivom razvitii za 2010 god
Lukoil Annual Report 2011
Lukoil Overseas Holding Ltd, Corporate Report 2010
Hedayat Omidvar (National Iranian Gas Company), Iranian Gas Prospect (slide presentation,
2008)
PetroChina, Connected Transaction: Acquisition of Rights Under Product Sharing Contract
(Hong Kong stock exchange filing);
PetroKazakhstan corporate brochure
PFC Energy Russia and Caspian Service memorandum, Kazakhstan: China Gas Route May
Be Delayed, 30 July 2012
Presentation by Lu Gongxun, General Director, CNPC Turkmenistan,TIOGE 2011
Presentation by Oraz Orazov, Director, Nebitgazylmytaslama Institute, Turkmenistan
International Oil and Gas Exhibition (TIOGE) 2011
Presentation by Abdubakhram Vakilov, Asia Transgaz, at Oil and Gas Uzbekistan
conference, May 2012, Tashkent
Presentation by Sherzod Akhudjanov, Neftegazinvest, at the Oil Gas Uzbekistan conference
(OGU), May 2012, Tashkent
Presentation by Bertrand Chevalier, Total, at the Caspian Oil and Gas conference, May 2012,
Baku
124
Presentation by Khoshbakht Yusifzade, vice-president of Socar, at the Caspian Oil and Gas
Conference, Baku, May 2012Presentation by Christian Guidicelli of Total at the Caspian Gas
Forum, July 2012, Istanbul.
Presentations by Jim Gillett, GCA, at TIOGE 2010 and 2011
Presentation by Neftegazinvest at the Oil and Gas Uzbekistan conference, May 2012,
Tashkent
Presentation by Simone Bonetti, Technip, at the Oil and Gas Uzbekistan conference, May
2012, Tashkent
Socar Annual Report 2010
Socar web site <http://new.socar.az>
Statoil web site <http://www.statoil.com>
Stroitransgaz web site <http://www.stroytransgaz.ru>
Tengizchevroil Annual Report 2011
Tengizchevroil web site <http://www.tengizchevroil.com/>
Tethys Petroleum, Introduction to the Official List (for trading on the London Stock
Exchange)
Tethys Petroleum Ltd, Management’s Discussion and Analysis, 30 June 2012; Tethys
company presentations
Tethys Petroleum web site <http://www.tethyspetroleum.com/>
Urikhtau Operating web site <http://www.urikhtau.kz/>
Uzbekneftegaz web site <www.ung.uz/ru/>
Uzbekneftegaz, Ekonomicheskoe obozrenie no. 11 (133), November 2010
<http://www.ung.uz/ru/press_center/smi/econom_11_2010>
Uz-Kor Chemical, UZB: Surgil Natural Gas Chemicals. Environmental Impact Assesment –
Part 1.
ZMB (Schweiz) Annual Report 2007
ZMB (Schweiz) Annual Report 2008
125
Newspapers, magazines and news agencies
Agenstvo neftegazovoi informatsii (Samotlor) <www.angi.ru>
Aktau News (Aktau)
Azerbaijan 2012: The Business Year
Bloomberg Business News <http://www.bloomberg.com/>
Central Asia-Caucasus Analyst (Washington DC)
China Daily (Beijing)
Daily Telegraph (London)
Energo News (Moscow)
Energyland.info <www.energyland.info>
Eurasia Daily Monitor
European Energy Policy Observer
Ferghana News <http://www.fergananews.com>
Financial Times
gazeta.uz, <www.gazeta.uz>
Gulf Oil Review
ICIS Heren, European Gas Markets (London)
IHS Global Insight Daily analysis
Interfax-Azerbaijan
Interfax-Kazakhstan
Interfax Natural Gas Daily
International Water Power & Dam Construction
Itar-Tass <http://www.itar-tass.com/>
Ivest.kz web site <http://news.ivest.kz>
Kapital (Almaty)
Kazakhstan Today (Astana)
Kazenergy (Astana)
Kommersant (Moscow)
Kursiv (Almaty)
NefteCompass
Neftegazexpert web site <www.neftegazexpert.ru>
Neft’ Gaz i mineral’nye resursy Turkmenistana
Neft’ i kapital web site <www.oilcapital.ru>
News.Az news agency <http://www.news.az/>
Nezavisimaia Gazeta (Moscow)
Novosti Kazakhstan
Novosti Uzbekistana web site <www.novostiuzbekistana.st.uz >
Nur.Kz news agency, Astana <http://news.nur.kz>;
Oil & Gas Journal (Houston)
Oil Capital <www.oilcapital.ru>
Oxford Energy Forum
Platt’s European Gas Daily
Platt’s International Gas Report
Podrobno.uz news agency <http://podrobno.uz/>
Pressa.tj news agency, Tajikistan <www.pressa.tj>
RFE-RL <http://www.rferl.org/>
Regnum.ru news agency <http://www.regnum.ru/>
Reuters <http://www.reuters.com/>
Rosbalt.ru <http://www.rosbalt.ru/>
Rusenergy.com web site <http://www.rusenergy.com>
126
SZ Energy web site <http://www.szenergy.biz/>
Tengri News <http://tengrinews.kz>
Today’s Zaman (Ankara)
Tsentral’naia Evraziia (Tashkent)
Tsentraziia
Turkmenistan
Turkmenistan: zolotoi vek <www.turkmenistan.gov.tm>
Turkmenistan.ru <http://www.turkmenistan.ru>
UPI news agency <http://www.upi.com >
Upstream (London)
Uzbekistan Investment Guide <www.investor.uz>
Uzbekskii zhurnal neft i gaza (Tashkent)
Uzinform <www.uzinform.com/ru/>
Uzmetronom news agency <http://www.uzmetronom.com/>
Vedomosti (Moscow)
Vzglyad.ru <http://www.vzglyad.ru/>
World Gas Intelligence
Zonaks news agency, Kazakhstan <www.zonakz.net>
Books and articles
Adibi, Siamak and Fesharaki, Fereidun (2011), “The Iranian Gas Industry” in Jonathan
Stern and Bassam Fattouh (eds.), Natural Gas Markets in the Middle East and North Africa
(Oxford: Oxford University Press, 2011).
Babali, Tuncay (2009): “Prospects of export routes for Kashagan oil”, Energy Policy 37
(2009), pp. 1298-1308.
Bairamova, I.A. et al. (eds.) (2011):, Nauchnye osnovy dal’neishego progressa gazovoi
otrasli Turkmenistana: Sbornik statei (Ashgabat: Turkmenskaia gosizdat, 2011), vols. I and
II.
Blackmon, Pamela (2011): In the Shadow of Russia: reform in Kazakhstan and Uzbekistan
(East Lansing: Michigan State University Press, 2011).
Bowden, Julian (2009): “Azerbaijan: from gas importer to gas exporter”, in Pirani
(ed.)(2009), pp. 203-234.
Burak, Maksim and Saginova, Daria (2012): “Novyi zakon Respubliki Kazakhstan ‘O
gaze i gazosnabzhenii’”, 23 January 2012 <http://www.gratanet.com/ru/publications/457>
Chen, Michael Xiaobao (2012): “Gas Pricing in China”, in Stern (ed.)(2012), pp. 310-337.
Cutler, Robert (2012): Kazakhstan’s “Resource Nationalism”: Its Sources and Motives
(Elliott School of International Affairs, Central Asia Economic Paper no. 2, September 2012)
De Cordier, Bruno (2012): Can an Arab Uprising Scenario also Happen in Southern
Eurasia? (Elliott School of International Affairs, Central Asia Research Paper no. 2, October
2012)
Geller, E.I. (2011): Structural and Geopolitical Developments of Central Asian Gas Market
in the Period of Crisis (Moscow: ERI-RAS, 2011)
127
Henderson, James (2010): Non-Gazprom Gas Producers in Russia (Oxford: Oxford
University Press, 2010)
Henderson, James (2011): Domestic Gas Prices in Russia – Towards European Netback?
(Oxford: OIES, November 2011)
Henderson, James, Pirani, Simon and Yafimava, Katja (2012): “CIS Gas Pricing:
Towards European Netback?”, in Jonathan Stern, The Pricing of Internationally Traded Gas
(Oxford: Oxford University Press, 2012)
Ibragimov, R (2012): “Vliianie ekonomicheskikh faktorov na vozmozhnosti uregulirovaniia
Nagorno-Karabakhskogo konflikta” in Tsentr Strategicheskikh Isledovanii, Azerbaidzhan:
put’ k nezavisimosti (SAM: Baku, 2012)
Kalyuzhnova, Yelena (2008): Economics of the Caspian Oil and Gas Wealth (Basingstoke:
Palgrave Macmillan, 2008)
Kalyuzhnova, Yelena and Kaser, Michael (2005): Prudential Management of
Hydrocarbon Revenues in Resource-Rich Countries (Geneva, United Nations Economic
Commission for Europe, 2005)
Kalyuzhnova, Yelena and Nygaard, Christian (2008): “State governance evolution in
resource-rich transition economies: an application to Russia and Kazakhstan”, Energy Policy
36 (2008), pp. 1829-1842
Kinnander, Elin (2010): The Turkish-Iranian Gas Relationship: Politically Successful,
Commercially Problematic (Oxford, OIES, January 2010)
Kjaernet, Heidi (2009): “The Energy Dimension of Azerbaijani-Russian Relations:
maneuvering for Nagorno-Karabakh”, Russian Analytical Digest 56 (2009), pp. 2-5
LeVine, Steve (2007): The Oil and the Glory: the pursuit of empire and fortune on the
Caspian Sea (Random House: New York, 2007)
Luecke, Matthias and Trofimenko, Natalia (2008): “Whither Oil Money? Redistribution of
oil revenues in Azerbaijan”, in Najman, Pomfret and Raballand (eds.), The Economics and
Politics
Luong, Pauline Jones and Weinthal, Erika (2010): Oil is Not a Curse: ownership structure
and institutions in Soviet successor states (New York: Cambridge University Press, 2010)
Najman, Boris Pomfret, Richard Raballand, Gael and Sourdin, Patricia (2008): “Redistribution of oil revenue in Kazakhstan”, in Najman, Pomfret and Raballand (eds.)
(2008)
Najman, Pomfret and Raballand (eds) (2008): The Economics and Politics of Oil in the
Caspian Basin. The redistribution of oil revenues in Azerbaijan and Central Asia (London:
Routledge, 2008)
128
Nixey, James (2012): The Long Goodbye: Waning Russian Influence in the South Caucasus
and Central Asia (Chatham House Briefing Paper, June 2012)
Ostrowski, Wojciech (2010): Politics and Oil in Kazakhstan (London: Routledge, 2010
Paramonov, Vladimir (2008): The future supply of gas from Central Asia to Russia
(Shrivenham, Defence Academy of the UK, 2008)
Peyrouse, Sebastien (2012): Turkmenistan: strategies of power, dilemmas of development
(London, M.E.Sharpe, 2012)
Pirani, Simon (ed.) (2009): Russian and CIS Gas Markets and their Impact on Europe
(Oxford: Oxford University Press, 2009)
Pirani, Simon (2011): Elusive Potential: Gas Consumption in the CIS (Oxford: OIES, 2011)
Pirani, Stern and Yafimava (2010): The 2010 Russo-Ukrainian gas agreement and its
implications for Europe (OIES Working Paper 2010)
Pomfret, Richard (2006): The Central Asian Economies Since Independence (Oxford:
Princeton University Press, 2006)
Rzayeva, Gulmira and Tsakiris, Theodoros (2012): Strategic Imperative: Azerbaijani Gas
Strategy and the EU’s Southern Corridor (Baku, SAM Center for Strategic Studies, 2012)
Sabonis-Helf, Theresa (2004): “The Rise of the Post-Soviet Petro-States: Energy Exports
and Domestic Governance in Turkmenistan and Kazakhstan”, in In the Tracks of Tamerlane:
Central Asia’s Path to the 21st Century (Washington: National Defense University, 2004),
pp. 159-185
Sarsenbayev, Kuanysh (2011): “Kazakhstan petroleum industry 2008-2010: trends of
resource nationalism policy?”, Journal of World Energy Law & Business vol. 4 (2011) no. 4,
pp. 369-379
Sorbello, Paolo (2011): The Role of Energy in Russian Foreign Policy Towards Kazakhstan
(Saarbrucken: Lambert Academic Publishing, 2011)
Stern, Jonathan (2005): The Future of Russian Gas and Gazprom (Oxford: Oxford
University Press, 2005)
Stern, Jonathan (2009): “The Russian Gas Balance to 2015”, in Pirani (ed.)(2009)
Stern, Jonathan (ed.) (2012): The Pricing of Internationally Traded Gas (Oxford: Oxford
University Press, 2012)
Stern, Jonathan and Fattouh, Bassam (2011): Jonathan Stern and Bassam Fattouh (eds.),
Natural Gas Markets in the Middle East and North Africa (Oxford: Oxford University Press,
2011)
Stern, Jonathan and Rogers, Howard (2012): “The Transition to Hub-Based Gas Pricing in
Continental Europe”, in Stern (ed.), The Pricing of Internationally Traded Gas, pp. 145-177.
129
Tashliev, M.Sh.(2020): Melovye otlozheniia Turkmenistana: regional’naia litmologiia i
neftegazonosnost’ (Ashgabat: Turkmenskaia gosizdat, 2010)
Tokmazishvili, Micheil and Bowden, Julian (2009):“Georgia’s Gas Sector”, in Pirani (ed.)
(2009)
Valdez, Marla and Weaver, Kenyon (2012): “Turkmenistan”, in ICLG to Gas Regulation
2012, p. 285
Yenikeyeff, Shamil (2009): “Kazakhstan’s Gas Sector”, pp. 325-326, in Pirani (ed.) (2009)
Zhukov, Stanislav (2009): “Uzbekistan: a domestically oriented gas producer”, in Pirani
(ed) (2009)
Zhukov, Stanislav and Reznikova, Olga (2009): Tsentral’naia Aziia i Kitai:
ekonomicheskoe vzaimodeistvie v usloviakh globalizatsii (Moscow: IMEMO RAN, 2009)