Embed Size (px)
Citation preview

CURRENT RESEARCH
Geological Survey of Canada
2003
Ressources naturelles Canada
Natural Resources Canada
2003-C24
Central Baffin Electromagnetic Experiment (CBEX), Phase 2
Shane Evans, Alan G. Jones, Jessica Spratt, and John Katsube

©Her Majesty the Queen in Right of Canada 2003ISSN 1701-4387Catalogue No. M44-2003/C24E-INISBN 0-662-33544-9
Available in Canada from theGeological Survey of Canada Bookstore website at:http://www.nrcan.gc.ca/gsc/bookstore (Toll-free: 1-888-252-4301)
A copy of this publication is also available for reference by depositorylibraries across Canada through access to the Depository Services Program'swebsite at http://dsp-psd.pwgsc.gc.ca
All requests for permission to reproduce this work, in whole or in part, for purposes of commercial use, resale, or redistribution shall be addressed to: Earth Sciences Sector Information Division, Room 402, 601 Booth Street, Ottawa, Ontario K1A 0E8.
Authors' addresses S. Evans ([email protected])Department of Geological Sciencesand Geological Engineering
Queen's UniversityKingston, Ontario K7L 3N6
A.G. Jones ([email protected])Geological Survey of Canada615 Booth StreetOttawa, Ontario K1A 0E9
J. Spratt ([email protected]) Department of Earth SciencesSyracuse UniversitySyracuse, New York 13244 U.S.A.
J. Katsube ([email protected]) Geological Survey of Canada 601 Booth Street Ottawa, Ontario K1A 0E8
Publication approved by Continental Geoscience Division

Central Baffin Electromagnetic Experiment (CBEX), Phase 2
Shane Evans, Alan G. Jones, Jessica Spratt, and John Katsube
Evans, S., Jones, A.G., Spratt, J., and Katsube, J., 2003: Central Baffin Electromagnetic Experiment (CBEX), Phase 2; Geological Survey of Canada, Current Research 2003-C24, 10 p.
Abstract: As a part of the Central Baffin Multidisciplinary Project (a collaborative effort of the Geological Survey of Canada, The Canada-Nunuvut Geoscience Centre, and the Polar Continental Shelf Project), a 45 station, 500 km long regional-scale magnetotelluric profile was acquired. The profile crosses the northern margin of the Trans-Hudson Orogen and extends northward into the Archean Rae Craton. To the south, the profile crosses the Paleoproterozoic Piling Group. The primary goal of the experiment was to determine major geological boundaries by delineating regional electrical structures. Preliminary analysis shows that the conductive Astarte River Formation can be mapped and used as a proxy for the base of the Piling Group. Analysis has also revealed a high conductivity contrast between the Piling Group metasedimentary rocks and the northern Archean granite and gneissic complexes. Laboratory results indicate that the conductivity in the Astarte River Formation is due to the high content of interconnected graphite.
Résumé : Un profil magnétotellurique d’étendue régionale, composé de 45 stations et s’étirant sur une longueur de 500 km, a été réalisé au cours des deux derniers étés dans le cadre du Projet scientifique multidisciplinaire de l’île de Baffin centrale (une initiative menée en collaboration par la Commission géologique du Canada, le Bureau géoscientifique Canada-Nunavut et l’Étude du plateau continental polaire). Ce profil recoupe la marge septentrionale de l’orogène trans-hudsonien et se prolonge vers le nord dans le craton de Rae de l’Archéen. Au sud, le profil recoupe le Groupe de Piling du Paléoprotérozoïque. Le but principal de l’expérience consistait à définir les principales limites géologiques en délimitant les structures électriques d’étendue régionale. L’analyse provisoire des données démontre que la Formation d’Astarte River, à comportement conducteur, peut être cartographiée et servir d’indicateur indirect de la base du Groupe de Piling. Un autre résultat de l’analyse tient à l’identification d’un contraste marqué de conductivité entre les roches métasédimentaires du Groupe de Piling et les complexes de granite et de gneiss de l’Archéen au nord. Les résultats obtenus en laboratoire indiquent que la conductivité de la Formation d’Astarte River est attribuable à sa teneur élevée en graphite à cristaux jointifs.
Page 1

OVERVIEW
During July and August of 2001 and 2002, magnetotelluric (MT) measurements were made on Baffin Island, Nunavut, Canada (Jones et al., 2002b). The magnetotelluric surveys were undertaken as part of the Geological Survey of Canada’s multidisciplinary Central Baffin project to study the northern margin of the Paleoproterozoic Trans-Hudson Orogen (Corrigan et al., 2001; Scott et al., 2002, 2003). In 2001, broadband (1000–0.001Hz) and long-period (20–10 000 s) data were recorded at 15 locations approximately equispaced along the 300 km long northwest-southeast profile (Fig. 1). In 2002, 30 broad-bandmeasurements were made at stations located between the 2001 stations and beyond, thus extending the profile 200 km northward onto the Archean Rae Craton and outside the project area (Fig. 1). The survey line thus comprises 15 long-period stations and 45 broadband stations with a total profile length of approximately 500 km.
The Central Baffin project area (Fig. 1) straddles the north-ern margin of the eastern segment of the ca. 1.8 Ga Trans-Hudson Orogen (Hoffman, 1988; Lewry and Collerson, 1990), a Himalayan-scale collisional mountain belt that is exposed from Greenland in the east, across Baffin Island and beneath Hudson Bay, to Manitoba and Saskatchewan in the west. The northern part of the project area is underlain by various orthogneiss, metamorphosed sedimentary and volcanic rocks of the Mary River Group, and younger felsic plutonic rocks, all of Archean age and ascribed to the Rae Craton (Jackson, 1969; Bethune and Scammell, 1997; Corrigan et al., 2001; Scott et al., 2002, 2003). The central part of the area is underlain by siliciclastic, carbonaceous, and mafic volcanic rocks of the Paleoproterozoic Piling Group (Morgan et al., 1975, 1976; Morgan, 1983; Henderson et al., 1988, 1989; Henderson and Henderson, 1994; St-Onge et al., 2001, 2002).
The primary goal of the magnetotelluric experiments was to determine the subsurface geometry of major geological boundaries, particularly between Archean rocks to the north and Paleoproterozoic continental-margin units to the south. Within the Piling Group lies a black shale and sulphide-facies iron-formation unit, the Astarte River Formation. Given its enhanced electrical conductivity, this formation is a particular horizon for electromagnetic imaging of crustal-scale structural geometry.
MAGNETOTELLURIC DATA ACQUISITION AND QUALITY
Two different acquisition systems were used during the two summers of fieldwork. In 2001, both long-period (LiMS) and broadband (V5-2000) magnetotelluric measurements were taken at 15 sites (Jones et al., 2002b). The GSC-designed LiMS system acquires long-period magnetotelluric data at periods of 20 to 10 000 s, probing the middle crust to upper mantle, by recording five components of the time-varying electromagnetic field, i.e. the two horizontal components of
the electric field (Ex, Ey) and all three components of the magnetic field (Hx, Hy, Hz). The systems remained at each site for 4 to 5 weeks from July to mid-August. The sites were visited whenever helicopters were available in order to minimize data loss due to local wildlife. Data loss was a major issue at sites baf003 and baf013, where wolves chewed up electrode lines.
Broadband measurements, in the band of 0.001 to 1000 s, were made using two Phoenix MTU V5-2000 systems. With these systems, the depth of investigation is typically from a few kilometres down to the lower crust. The shallow occurrence of permafrost prevented the installation of the vertical magnetic field sensor, and thus only four components of the electromagnetic field were measured (Ex, Ey, Hx, and Hy). The MTU systems recorded for a period of two days at each site. Broadband measurements were taken at a total of 45 stations, i.e. at 15 sites during the summer of 2001 and at 30 sites during the 2002 field season (including the 10-site extension to the northwest).
One of the problems encountered in these two surveys was very high contact resistances between electrodes, especially at sites with little surficial cover due the recent retreat of the Barnes Ice Cap. In magnetotellurics, we strive to have resistance between the electrodes below 10 kΩ to ensure good ground contact. At the worst site (001), situated in a boulder field, resistances were measured at greater than 2 MΩ. Such high contact resistances result in capacitive coupling with the ground becoming important and with the consequence that the ground acts as a low-pass filter to the electric signal. This can be seen in the data from sites baf001 and baf201 where a significant decrease occurs in the apparent resistivity and phase at a period less than 0.1 s (Fig. 2).
Electric-field distortions due to local heterogeneities were strong at some sites and can be attributed to current channel-ling. The most severe distortions are seen at the sites located in river valleys (sites baf003 and baf205) and result in phases shifting into the wrong quadrant for two-dimensional model-ling. In severe cases of distortion, it may only be possible to extract information about one of the two modes.
PROCESSING AND ANALYSIS
Magnetotelluric data consist of a number of time series that reflect temporal changes in the Earth’s magnetic and electric fields. The spectral ratio between the electric field and the perpendicular magnetic field provides information about the electrical properties of the subsurface. High-frequency signals contain information about shallow structure and low-frequency signals are sensitive to deep structure.
The first step in processing raw magnetotelluric data involves the spectral analysis of the time-series data using robust processing codes. Both the long-period magnetotelluric and the broadband data were processed using the Jones-Jödicke code (Jones and Jödicke, 1984; method 6 in Jones et al., 1989). In the cases where two or more sites are
Page 2

-500
km
A
rche
an-P
rote
rozo
ic m
etam
orph
ic r
ocks
70°N
A
rche
an s
edim
enta
ry a
nd v
olca
nic
rock
s
Ice
Pha
nero
zoic
sed
imen
tary
roc
ks
Mes
opro
tero
zoic
sed
imen
tary
roc
ks
rock
s
Pal
eopr
oter
ozoi
cin
trus
ive
rock
s
Pal
eopr
oter
ozoi
cse
dim
enta
ry
Arc
hean
met
amor
phic
roc
ks
Arc
hean
intr
usiv
e ro
cks
Arc
hean
sed
imen
tary
roc
ks
Figure
1. Magnetotelluric site
locations
superimposed on
Baffin
Island
regional
geology.
Baf
201
Baf
205
68°W
72°W
72°N
Baf
001
Baf
003
68°N
84°W
Page 3

Baf201 Baf003
-180
102
101
10-3 100 102 103 104
103
104
. .
103
102
100
101
180
10-3 10-2 10-1 100 101 102 103 104
180 90 90 0 0
-90 -90 -180
10-2 10-1 101 Period (s) Period (s)
Baf205 Baf001
104 104
. .
103
102
101
180 90 0
-90 -180
103
180 90 0
-90 -180
10-3 10-2 10-1 100 101 102 103 104 10-3 10-2 10-1 100 101 102 103 104
102
101
Period (s) Period (s)
Figure 2. Magnetotelluric response curves derived from data acquired at sites baf003, baf003, baf201, and baf205 (see Fig. 1). Red curves are the responses for currents flowing perpendicular to the profile, and blue profiles are the responses for current flowing along the profile.
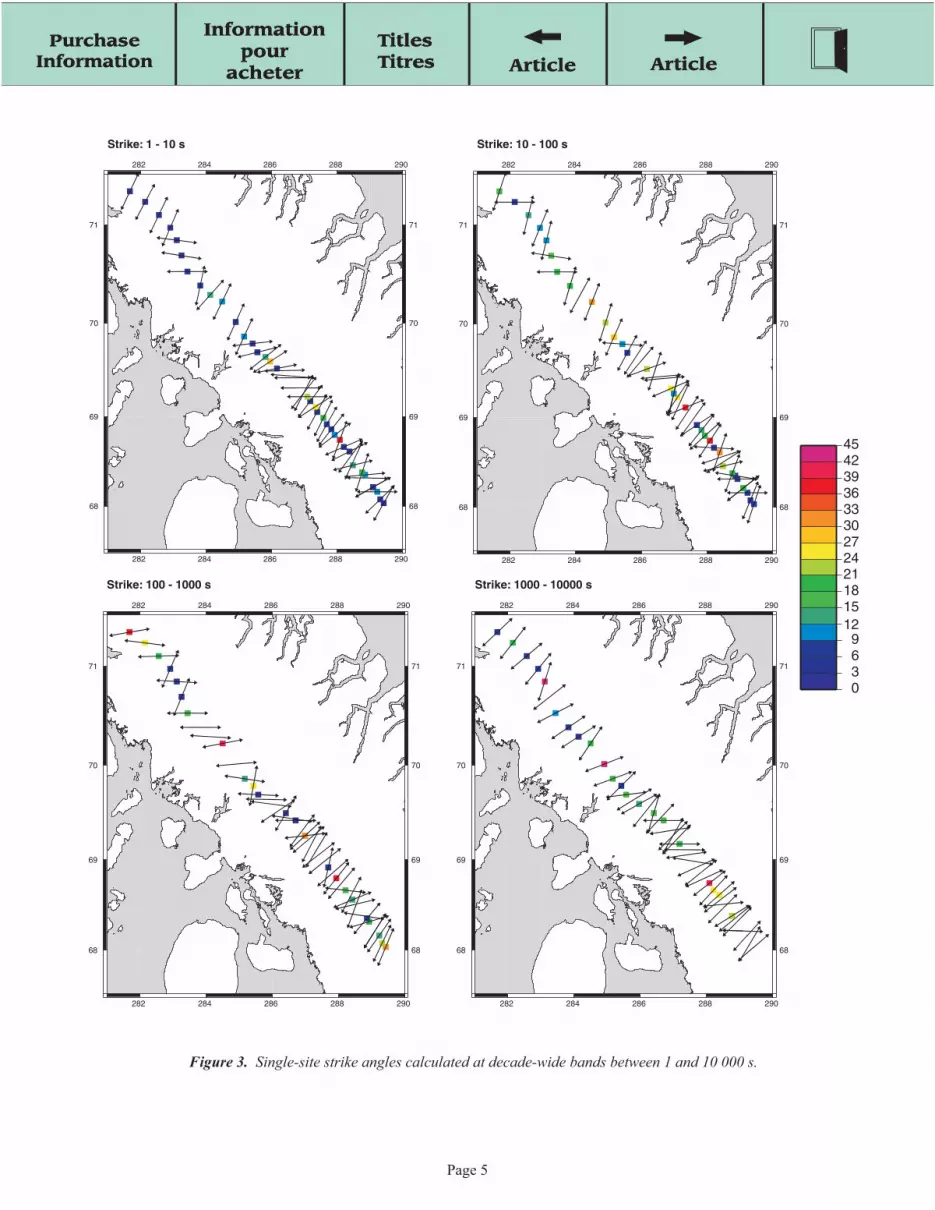
recording concurrently, the remote reference technique been investigated. However, the presence of conductive sea(Gamble et al., 1979) is used to reduce the biasing effects of water within 70 km of the profile may affect the data at longer noise in the data. In the case of the long-period magne- periods. Strike angles and phase differences in decade-wide totelluric data, given that all 15 sites recorded simultaneously, bands for single-site analysis are shown in Figure 3 for four multiremote processing was possible. bands of data. A great variation of strike angles can be
observed along the profile, and regions with consistent strikeThe magnetotelluric data were analyzed for galvanic dis- angles can be distinguished throughout. The electrical striketortions caused by small, near-surface inhomogeneities using direction correlates well with the surface observation of geothe McNeice and Jones (2001) multisite, multifrequency dis- logical strike. A strike angle of 33° was determined to be mosttortion decomposition code, and to determine appropriate appropriate for the decomposition when all sites at all periodsstrike direction. Distortions due to coastal effects have not yet are being analyzed. The decomposition analysis has revealed
m) Ω
m)
Ω m
)A
pp. R
ho (
P
hase
(°)
A
pp. R
ho (
Ω
Ω m
) P
hase
(°)
A
pp. R
ho (
App
. Rho
(
Pha
se (
°)
Pha
se (
°)
Page 4
Page 5
282
282
284
284
286
286
288
288
290
290
68 68
69 69
70 70
71 71
Strike: 1 - 10 s
282
282
284
284
286
286
288
288
290
290
68 68
69 69
70 70
71 71
Strike: 10 - 100 s
282
282
284
284
286
286
288
288
290
290
68 68
69 69
70 70
71 71
Strike: 100 - 1000 s
0369
121518212427303336394245
282
282
284
284
286
286
288
288
290
290
68 68
69 69
70 70
71 71
Strike: 1000 - 10000 s
Figure 3. Single-site strike angles calculated at decade-wide bands between 1 and 10 000 s.
.
Ω m
) 90
00
5781
37
13
2385
15
32
Rho
(
Xbaf310g
Xbaf309g
Xbaf308g
Xbaf307g
Xbaf306g
Xbaf305g
Xbaf304g
Xbaf303g
Xbaf302g
Xbaf301g
Xbaf015g
Xbaf220g Xbaf014g
Xbaf219g
Xbaf013g
Xbaf218g Xbaf012g
Xbaf217g Xbaf216g
Xbaf011g Xbaf215g Xbaf214g Xbaf010g
Xbaf212g Xbaf009g Xbaf211g Xbaf008g
Xbaf210g Xbaf209g
Xbaf007g Xbaf208g Xbaf006g
Xbaf207g Xbaf005g Xbaf206g Xbaf205g Xbaf004g
Xbaf204g Xbaf203g Xbaf003g
Xbaf202g Xbaf002g
Xbaf201g Xbaf001g
SO
UT
H
NO
RT
H
-900
00
40
6
0
80
1
00
1
20
1
40
1
60
1
80
2
00
2
20
2
40
2
60
2
80
3
00
3
20
3
40
3
60
3
80
4
00
4
20
4
40
4
60
4
80
5
00
5
20
Figu
re 4
. M
agne
tote
lluri
c re
sist
ivity
mod
el.
1000
0
0
-100
00
-200
00
2000
0
-300
00
-400
00
-500
00
-600
00
-700
00
-800
00
Page 6
984
632
261
167
108 69
28
18
12 8 3 2
406 44
5

TE
Phi
Cal
c.
Phi
Orig
. A
pp R
ho C
alc.
A
pp R
ho O
rig.
Xba
f310
g
Xba
f309
g
Xba
f308
g
Xba
f307
g
Xba
f306
g
Xba
f305
g
Xba
f304
g
Xba
f303
g
Xba
f302
g
Xba
f301
g
Xba
f015
g
Xba
f220
g X
baf0
14g
Xba
f219
g
Xba
f013
g X
baf2
18g
Xba
f012
g
Xba
f217
g X
baf2
16g
Xba
f215
g X
baf2
14g
Xba
f010
g
Xba
f212
g X
baf0
09g
Xba
f211
g X
baf0
08g
Xba
f210
g X
baf2
09g
Xba
f007
g X
baf2
08g
Xba
f006
g X
baf2
07g
Xba
f206
g
Xba
f004
g
Xba
f204
g X
baf0
03g
Xba
f202
g X
baf0
02g
Xba
f201
g X
baf0
01g
10-2
10-1
100
101
102
103
104
10-2
10-1
100
101
102
103
104
10-2
10-1
100
101
102
103
104
10-2
10-1
100
101
102
103
104
90 80 70 60 50 40 30 20 10
App Rho (
Phase (°)
Ω.m)
2097153 1048576
524288 262144 131072655363276816384
8192409620481024
512256128643216
842
40 60 80 100 120 140 160 180 200 220 240 260 280 300 320 340 360 380 400 420 440 460 480 500
TM
Xba
f310
g
Xba
f309
g
Xba
f308
g
Xba
f307
g
Xba
f306
g
Xba
f305
g
Xba
f304
g
Xba
f303
g
Xba
f302
g
Xba
f301
g
Xba
f015
g
Xba
f220
g X
baf0
14g
Xba
f219
g
Xba
f013
g X
baf2
18g
Xba
f012
g
Xba
f217
g X
baf2
16g
Xba
f215
g X
baf2
14g
Xba
f010
g
Xba
f212
g X
baf0
09g
Xba
f211
g X
baf0
08g
Xba
f210
g X
baf2
09g
Xba
f007
g X
baf2
08g
Xba
f006
g X
baf2
07g
Xba
f206
g
Xba
f004
g
Xba
f204
g X
baf0
03g
Xba
f202
g X
baf0
02g
Xba
f201
g X
baf0
01g
10-2
10-1
10-2
10-1
10-2
10-1
10-2
10-1
90 80 70 60 50 40 30 20 10
1048576 524288 262144 131072 65536 32768 16384
App Rho (
Phase (°)
Ω.m)
100
101
102
103 81924096
104 20481024
512256128
100 6432
101 168
102 4
103 2
104
100
101
102
103
104
100
101
102
103
104
40 60 80 100 120 140 160 180 200 220 240 260 280 300 320 340 360 380 400 420 440 460 480 500
App
Rho
Orig
. P
hi C
alc.
Phi
Orig
. A
pp R
ho C
alc.
Figure 5. Pseudo-sections showing apparent resistivity and phase from the raw data and calculated from the model for TM and TE modes.
Page 7

Figu
re 6
. C
arto
on in
terp
reta
tion
of p
relim
inar
y m
agne
tote
lluri
c da
ta.
that at some sites, processing artefacts have been introduced to the data in an effort to reduce the RMS misfit. This may be due to the variation in dimensionality along the profile. In most cases, the artefacts occur at high frequencies; as a consequence, the interpretation of shallow features must be investigated further to ensure their robustness. As part of this distortion analysis, estimates are derived of the frequency-dependent magnetotelluric impedance tensor apparent resistivity and phase due to regional structures. The apparent resistivity and phase information can then be imported into analysis and modelling software packages (e.g. WinGLink, Geotools) in order to derive a two-dimensional model from which geological interpretations are made.
PRELIMINARY MODEL
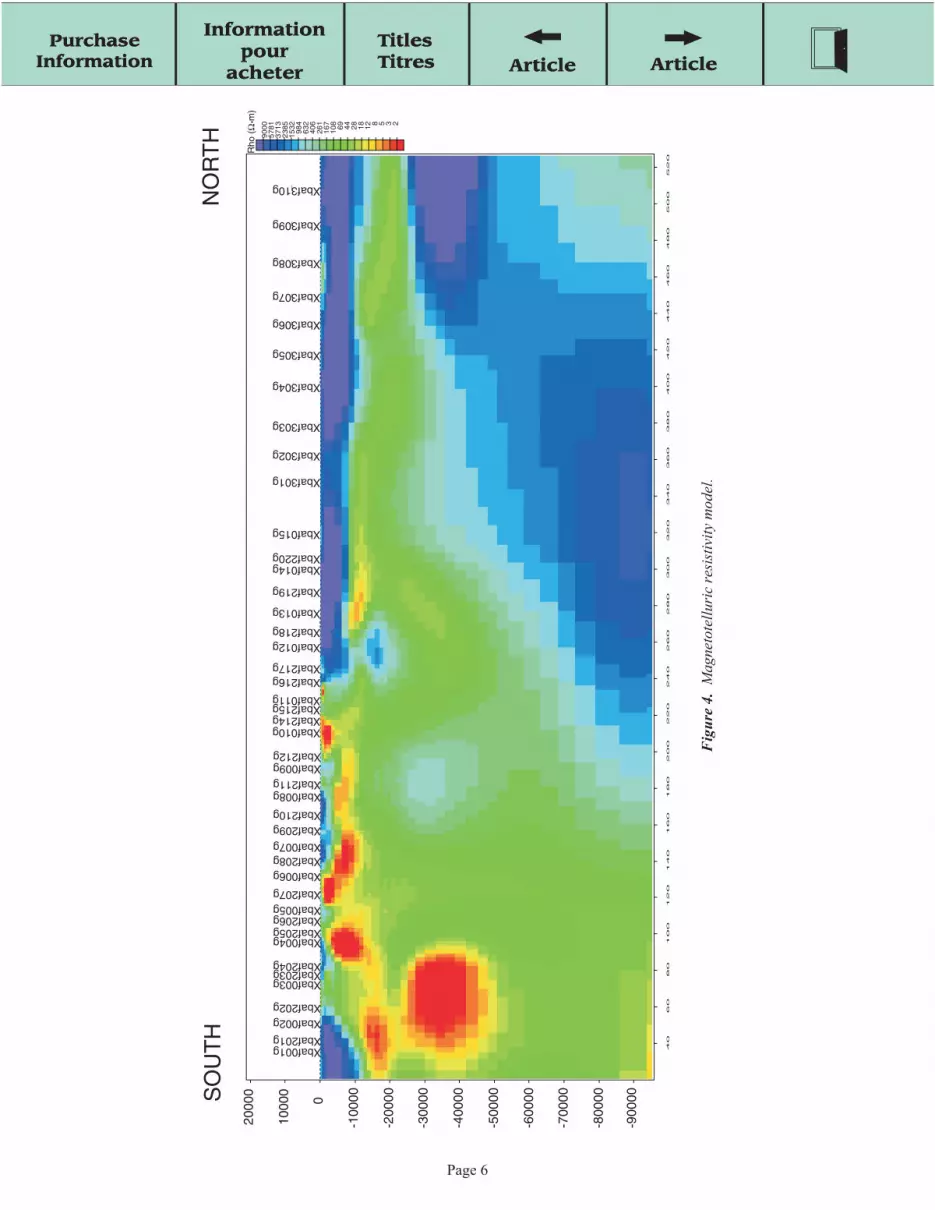
A preliminary two-dimensional resistivity-depth model is shown in Figure 4. It was obtained using the RLM2DI code of Rodi and Mackie (2001), using data from both the MT mode for current flowing parallel to strike (TE mode) and the MT mode for current flowing perpendicular to strike (TM mode). The theoretical response of the model fits observations very well in some parts of the profile and not no well in other parts (Fig. 5). The main misfit occurs at the longer period in the phase (100–1000 s). This is not an uncommon occurrence when trying to model a profile with a large number of stations. The modelling procedure nonetheless ensures low structural complexity, and sub-sequent modelling to improve the fit will likely still have the following large-scale electrical structures:
1. A conductive layer forms a basinal feature with a maximum depth of approximately 15 km between sites baf207 and baf010. This structure can be associated with the graphite-rich Astarte River Formation.
2. A distinct contrast, to a depth of approximately 20 km, can be seen as we go northward from sites baf214 to baf216. This contrast is indicative of the contact between the southern Paleoproterozoic metasedimentary rocks and the northern reworked Archean Rae Craton. The resistive Rae Craton can be mapped to the northern end of the profile.
Rae
man
tle
3000
m
Ω
Res
istiv
e up
per
crus
t
Con
duct
ive
low
er c
rust
50
m
Ω
??
Low
er c
rust
al
cond
ucto
r 5
Ω
5 Ω
.
.
.
.
m
m
500
520
460
480
420
440
380
400
340
360
300
320
260
280
220
240
180
200
140
160
100
120
60
80
xbaf002g xbaf202g
xbaf003g xbaf203gxbaf204g
xbaf004gxbaf205g xbaf206g xbaf005g xbaf207g xbaf006g xbaf208g xbaf007g xbaf209g xbaf210g
xbaf008g xbaf211g xbaf009g xbaf212g
xbaf010g xbaf214g xbaf215gxbaf011g xbaf216g xbaf217g
xbaf012g xbaf218g
xbaf013g
xbaf219g
xbaf014g xbaf220g
xbaf015g
xbaf301g
xbaf302g
xbaf303g
xbaf304g
xbaf305g
xbaf306g
xbaf307g
xbaf308g
xbaf309g
xbaf310g
Rae
Cra
ton
Pro
tero
zoic
in
trus
ive
rock
s P
iling
Gro
up
xbaf001g xbaf201g
40
2000
0
1000
0 0
-100
00
-200
00
-300
00
-400
00
-500
00
-600
00
-700
00
-800
00
-900
00
Page 8

3. Beneath the Rae Craton is a lower crustal conductor whose northern extent appears similar to that of the over-lying craton and that also extends beneath the Piling Group. Such lower crustal conductors have been observed pervasively around the world (Jones, 1992), although electrical properties of the lower crust of the Rae Craton are markedly different here from those in the western Churchill Province (Jones et al., 2000, 2002a). Although the cause of the enhanced conductivity of the lower continental crust is still contentious, it is clear that different formation and deformation processes must have occurred here compared to the western Churchill Province.
4. Closely associated resistive and conductive bodies south of site baf205 are possibly related to the Cumberland batholith and mafic–ultramafic intrusions
INTERPRETATIONS
These preliminary observations give good insight into the geometry of the regional structures along the profile. The Astarte River Formation is of particular interest as it is exposed over a large area and laboratory analyses show that the conducting phase is interconnected graphite. The Astarte River Formation is mapped between sites baf207 and baf010 and can be used as a proxy for the base of the Piling Group as Piling Group rocks beneath the Astarte River Formation are at most 2 km thick (Scott et al. 2002, 2003). To the north, a high conductivity contrast between the Piling Group metasedimentary rocks and the northern Archean Rae Craton places the contact between the two at approximately site baf011.
A resistive body beneath sites baf001 to baf203 is spatially associated with the Cumberland batholith. Beneath and north of this resistive body is an upper crustal conductor. Sulphides associated with the Bravo Lake Formation (Stacey and Pattison, 2003) may be the source of the conducting phase within this body.
The lower crustal conductor seen in the northern half of the profile may be attributed to the Mary River Group. The imbrication of Archean basement or the emplacement of younger granitic bodies may explain why this feature is seen at such depths. Further localized analysis of this area may reveal the southern extent of this body and shed light onto questions about the basement beneath the Piling Group (Fig. 6).
REFERENCES
Bethune, K.M. and Scammell, R.J.1997: Geology, Koch Island area, District of Franklin, Northwest
Territories (part of NTS 37 C); Geological Survey of Canada, Open File 3391.
Corrigan, D., Scott, D.J., and St-Onge, M.R. 2001: Geology of the northern margin of the Trans-Hudson Orogen (Foxe
Fold Belt), central Baffin Island, Nunavut; Geological Survey of Canada, Current Research 2001-C23, 17 p.
Gamble, T.D., Groubau, W.M., and Clarke, J. 1979: Magnetotellurics with remote reference; Geophysics, v. 44,
p. 53–68.
Henderson, J.R. and Henderson, M.N. 1994: Geology of the Dewar Lakes area, central Baffin Island, District of
Franklin, N.W.T. (parts of 27 B and 37 A); Geological Survey of Canada, Open File 2924, scale 1:100 000.
Henderson, J.R., Grocott, J., Henderson, M.N., Falardeau, F., and Heijke, P. 1988: Results of field work near Dewar Lakes, Baffin Island, N.W.T.; in
Current Research, Part C; Geological Survey of Canada, Paper 88-1C, p. 101–108.
Henderson, J.R., Grocott, J., Henderson, M.N., and Perreault, S. 1989: Tectonic history of the Lower Proterozoic Foxe–Rinkian Belt in
central Baffin Island, N.W.T.; in Current Research, Part C; Geological Survey of Canada, Paper 89-1C, p. 186–187.
Hoffman, P. 1988: United plates of America, the birth of a craton: early Proterozoic
assembly and growth of Proto-Laurentia; Annual Reviews of Earth and Planetary Sciences, v. 16, p. 543–603.
Jackson, G.D. 1969: Reconnaissance of north-central Baffin Island: in Report of Activi
ties, Part A, April to October 1968; Geological Survey of Canada, Paper 69-01A, p. 186–187.
Jones, A.G. 1992: Electrical conductivity of the continental lower crust; in Continental
Lower Crust, (ed.) D.M. Fountain, R.J. Arculus, and R.W. Kay; Elsevier, Amsterdam, p. 81–143.
Jones, A.G. and Jödicke, H. 1984: Magnetotelluric transfer function estimation improvement by a
coherence-based rejection technique; Abstract Volume, 54th
Society of Exploration Geophysics Annual General Meeting, Atlanta, Georgia, U.S.A., December 2 to 6, p. 51–55.
Jones, A.G., Chave, A.D., Egbert, G., Auld, D., and Bahr, K. 1989: A comparison of techniques for magnetotelluric response function
est imation; Journal of Geophysical Research, v . 94, p. 14 201–14 213.
Jones, A.G., Snyder, D., Asudeh, I., White, D., Eaton, D., and Clarke, G. 2000: Lithospheric architecture at the Rae-Hearne boundary revealed
through magnetotelluric and seismic experiments; in GeoCanada 2000; Geological Association of Canada–Mineralogical Association of Canada, Joint Annual Meeting, Calgary, Alberta, CD-ROM.
Jones, A.G., Snyder, D., Hanmer, S., Asudeh, I., White, D., Eaton, D., and Clarke, G. 2002a: Magnetotelluric and teleseismic study across the Snowbird Tec
tonic Zone, Canadian Shield: a Neoarchean mantle suture?; Geophysical Research Letters, v. 29, no. 17.
Jones, A.G., Spratt, J., and Evans, S. 2002b: Central Baffin electromagnetic experiment (CBEX); Geological
Survey of Canada, Current Research 2002-C19, 5 p. Lewry, J.F. and Collerson, K.D. 1990: The Trans-Hudson Orogen: extent, subdivision, and problems; in
The Early Proterozoic Trans-Hudson Orogen of North America, (ed.) J.F. Lewry and M.R. Stauffer; Geological Association of Canada, Special Paper 37, p. 1–14.
McNeice, G. and Jones, A.G. 2001: Multisite, multifrequency tensor decomposition of magnetotelluric
data; Geophysics, v. 66, p. 158–173. Morgan, W.C. 1983: Lake Gillian, District of Franklin, Northwest Territories; Geologi
cal Survey of Canada, Map 1560A, scale 1:250 000. Morgan, W.C., Bourne, J., Herd, R.K., Pickett, J.W., and Tippett, C.R. 1975: Geology of the Foxe Fold Belt, Baffin Island, District of Franklin; in
Report of Activities, Part A; Geological Survey of Canada, Paper 75-1A, p. 343–347.
Morgan, W.C., Okulitch, A.V., and Thompson, P.H. 1976: Stratigraphy, structure and metamorphism of the west half of the
Foxe Fold Belt, Baffin Island; in Report of Activities, Part A; Geological Survey of Canada, Paper 76-1A, p. 387–391.
Rodi, W. and Mackle, R.K. 2001: Nonlinear conjugate gradients algorithm for 2-D magnetotelluric
inversion; Geophysics, v. 66, p. 174–187. Scott, D.J., St-Onge, M.R., and Corrigan, D. 2002: Geology of the Paleoproterozoic Piling Group and underlying
Archean gneiss, central Baffin Island, Nunavut; Geological Survey of Canada, Current Research 2002-C17, 12 p.
Page 9

Scott, D.J., St-Onge, M.R., and Corrigan, D. (cont.) St-Onge, M.R., Scott D.J, and Corrigan, D. 2003: Geology of the Archean Rae Craton and Mary River Group and the 2001: Geology, central Baffin Island area, Nunavut; Geological Survey of
Paleoproterozoic Piling Group, central Baffin Island, Nunavut; Canada, Open File D3996, scale 1:250 000 (CD-ROM). Geological Survey of Canada, Current Research 2003-C26. 2002: Geology, Unuksulik Lake, Nunavut; Geological Survey of Canada,
Stacey, J. and Pattison, D.R.M. Open File 4317, scale 1:250 000 (CD-ROM). 2003: Stratigraphy, structure, and petrology of a representative klippe of
the Bravo Lake Formation, Central Baffin Island, Nunavut; Geological Survey of Canada, Current Research 2003-C13. Geological Survey of Canada Project PS1006
Page 10