Embed Size (px)
Citation preview

iii
CHANGES IN MATERNAL, NEWBORN AND CHILD HEALTH IN 115 RURAL
WOREDAS OF AMHARA, OROMIA, SNNP, AND TIGRAY REGIONS OF ETHIOPIA,
2008 – 2010
FINDINGS FROM THE LAST TEN KILOMETERS PROJECT BASELINE AND MIDTERM SURVEYS
Addis Ababa, Ethiopia
July 2012

iv
v
The Last Ten Kilometers: What it takes to Improve Health Outcomes in Rural Ethiopia
The Last Ten Kilometers: What it takes to Improve Health Outcomes in Rural Ethiopia is a Bill & Melinda Gates Foundation funded project implemented by JSI Research & Training Institute, Inc. The Last Ten Kilometers Project (L10K) aims to strengthen the bridge between households, communities, and the health extension program (HEP) of the Ethiopian Government. L10K mobilizes families and communities to more fully engage to improve household and community health practices, ultimately leading to improved key maternal, neonatal and child health (MNCH) outcomes and contributing towards achieving Millennium Development Goals 4 and 5 (i.e., decrease child and maternal mortality rates). In order to spread its reach and learning, L10K partners with and enhances the capacity of 12 local Civil Society Organizations and Non-Governmental Organizations to cover 115 woredas (i.e., districts) and reach about 14 million people in four of the most populous regions of the country: Amhara, Oromia, Tigray, and the Southern Nations, Nationalities and People’s Region (SNNPR). The L10K foundational community strategy improves the skills of Health Extension Workers (HEWs) to work with their communities by organizing and utilizing a network of Community Health Promoters (CHPs), now the Health Development Army (HDA). The L10K project mobilizes existing community structures, organizations and institutions (such as idirs, churches, mosques, and women’s and youth associations) to act as anchors to motivate and sustain the activities of the HDA. In addition to the foundational community strategy, L10K also implements four distinct innovative community strategies. These are: Community Based Data for Decision Making (CBDDM), Participatory Community Quality Improvement (PCQI), Community Solution Fund (CSF), and Non-Financial Incentives (NFI). These four strategies are implemented in addition to the L10K foundational strategy in a limited number of woredas (14 woredas per strategy) to demonstrate their added value in achieving the project objectives. Recommended Citation The Last Ten Kilometers Project (L10K). 2012. Changes in maternal, newborn and child health in 115 rural woredas of Amhara, Oromia, SNNP, and Tigray Regions of Ethiopia, 2008–2010: Findings from the L10K baseline and midterm surveys. JSI Research & Training Institute, Inc., Addis Ababa, Ethiopia. Abstract Data from the December 2008 L10K baseline survey and the December 2010 midterm survey was used to assess changes in the kebele health systems supporting the HEP, changes in access and exposure to MNCH messages and services, and changes in MNCH care behavior and practices. For these purposes, bivariate statistical procedures were used to analyze information obtained from 6,292 women and 204 communities (i.e., kebeles) during the baseline survey and 9,960 women and 330 kebeles during the midterm survey. The findings indicate that the HEP coverage was almost universal during baseline; nevertheless, the midterm survey recorded further expansion of HEP infrastructure and greater deployment of human resources since then. Interactions between the HEP frontline workers, i.e., the HEWs and CHPs (now HDA), and households increased. MNCH behavior and practices including utilization of services improved in L10K areas between the survey periods. For example, over the analysis period the contraceptive prevalence rate increased from 29 to 40 percent; antenatal care coverage increased from 52 to 66 percent; institutional deliveries increased from 6 to 11 percent; coverage of any postnatal care increased from 8 to 19 percent; thermal care of the newborn increased from 12 to 23 percent; and initiation of breastfeeding immediately after birth increased from 43 to 53 percent. However, the rate of change of some indicators, mainly relating to delivery and postnatal care, were not on track to reach MDG 5; while the quality of services is still not optimal. Special attention will be needed to increase institutional deliveries, deliveries assisted by trained professionals and the quality of maternal and neonatal health services provided by HEWs. The report has implications for future maternal and newborn health interventions in the country. The Last Ten Kilometers Project JSI Research & Training Institute, Inc. PO Box 13898, Addis Ababa, Ethiopia Phone: +251 11 662 0066; Fax: +251-11-6630919 Email: [email protected]; Website: www.l10k.jsi.com

vi
vii
CONTENTS
TABLES ........................................................................................................................................................................... XI
MAPS AND FIGURES .............................................................................................................................................. XIII
ACRONYMS .................................................................................................................................................................. XV
ACKNOWLEDGMENT .......................................................................................................................................... XVII
EXECUTIVE SUMMARY ............................................................................................................................................ 1
INTRODUCTION .............................................................................................................................................................................. 1
METHODOLOGY ............................................................................................................................................................................. 1
RESULTS ............................................................................................................................................................................................ 2
Changes in the situation of kebele health services ................................................................................................................................... 2
Changes in exposure of households and families to the health extension program .............................................................................. 3
Changes in family planning indicators .................................................................................................................................................... 4
Changes in maternal and newborn health indicators ............................................................................................................................. 4
Changes in child health indicators ........................................................................................................................................................... 6
CONCLUSIONS AND RECOMMENDATIONS .............................................................................................................................. 7
INTRODUCTION .......................................................................................................................................................... 9
THE L10K STRATEGY AND THE PROGRAM THEORY ......................................................................................................... 10
METHODOLOGY ....................................................................................................................................................... 15
STUDY DESIGN ............................................................................................................................................................................. 15
DATA ............................................................................................................................................................................................... 15
Baseline survey......................................................................................................................................................................................... 15
Midterm survey ....................................................................................................................................................................................... 18
Data quality assurance ........................................................................................................................................................................... 20
ANALYSIS ....................................................................................................................................................................................... 20
HOUSEHOLD AND RESPONDENT CHARACTERISTICS ........................................................................ 23
RESPONDENT CHARACTERISTICS ........................................................................................................................................... 23
HOUSEHOLD CHARACTERISTICS ............................................................................................................................................. 25
Household water supply and sanitation ................................................................................................................................................ 25
Bed net ownership ................................................................................................................................................................................... 26
CONCLUSION ................................................................................................................................................................................ 28
SITUATION ANALYSIS OF KEBELE HEALTH SERVICES ....................................................................... 29
HEALTH EXTENSION PROGRAM COVERAGE ....................................................................................................................... 29
viii
THE LAST TEN KILOMETERS PROJECT (L10K) COVERAGE ........................................................................................... 30
COMMUNITY HEALTH PROMOTERS (CHPS) AND ANCHORS ........................................................................................... 33
KEBELE HEALTH COMMITTEES ............................................................................................................................................... 38
SUPPORTIVE SUPERVISION ........................................................................................................................................................ 39
HEALTH MANAGEMENT INFORMATION SYSTEM (HMIS) ................................................................................................ 42
AVAILABILITY OF COMMODITIES AND SUPPLIES................................................................................................................ 43
CONCLUSIONS AND RECOMMENDATIONS ........................................................................................................................... 47
INTERACTION OF THE FRONTLINE HEALTH WORKERS WITH HOUSEHOLDS AND
FAMILIES ...................................................................................................................................................................... 49
HEALTH POST VISITS DURING THE PRECEDING 12 MONTHS ......................................................................................... 49
HOUSEHOLD VISITS BY HEWS DURING THE LAST SIX MONTHS ................................................................................... 49
HOUSEHOLD VISITS BY CHPS DURING THE LAST SIX MONTHS ..................................................................................... 51
MODEL FAMILY HOUSEHOLDS ................................................................................................................................................ 53
FAMILY HEALTH CARD POSSESSION ....................................................................................................................................... 53
CONCLUSIONS AND RECOMMENDATIONS ........................................................................................................................... 53
FAMILY PLANNING ................................................................................................................................................. 57
KNOWLEDGE AND APPROVAL OF FAMILY PLANNING, AND EVER USING CONTRACEPTIVES .............................. 57
CURRENTLY USING CONTRACEPTIVES .................................................................................................................................. 59
SOURCE OF FAMILY PLANNING MESSAGES .......................................................................................................................... 60
HEALTH WORKERS’ INTERACTIONS WITH CONTRACEPTIVE NONUSERS .................................................................... 60
FUTURE DESIRE TO USE CONTRACEPTIVES ......................................................................................................................... 60
FERTILITY PREFERENCE ............................................................................................................................................................ 60
CONCLUSIONS AND RECOMMENDATIONS ........................................................................................................................... 62
MATERNAL AND NEWBORN HEALTH ......................................................................................................... 63
HOUSEHOLD VISITS BY HEALTH WORKERS DURING PREGNANCY ............................................................................... 63
TETANUS TOXOID INJECTION ................................................................................................................................................. 64
ANTENATAL CARE ....................................................................................................................................................................... 66
BED NET USE BY PREGNANT WOMEN ................................................................................................................................... 68
BIRTH PREPAREDNESS ............................................................................................................................................................... 68
SAFE AND CLEAN DELIVERY .................................................................................................................................................... 70
Institutional delivery ............................................................................................................................................................................... 70
Deliveries assisted by trained professionals ........................................................................................................................................... 70
Clean umbilical cord care ....................................................................................................................................................................... 72
POSTNATAL PERIOD ................................................................................................................................................................... 72
ix
Postnatal care .......................................................................................................................................................................................... 72
Newborn check-up .................................................................................................................................................................................. 73
NEWBORN HEALTH CARE ......................................................................................................................................................... 74
Keeping the baby warm ........................................................................................................................................................................... 74
Early initiation of breastfeeding ............................................................................................................................................................. 75
Exclusive breastfeeding ........................................................................................................................................................................... 75
KNOWLEDGE OF DANGER SIGNS ........................................................................................................................................... 76
Danger signs during pregnancy and childbirth...................................................................................................................................... 76
Danger signs during postnatal period .................................................................................................................................................... 76
Danger signs during neonatal period ..................................................................................................................................................... 78
CONCLUSIONS AND RECOMMENDATIONS ........................................................................................................................... 78
CHILD HEALTH ........................................................................................................................................................ 81
HEALTH WORKERS’ INTERACTION WITH HOUSEHOLDS FOR CHILD NUTRITION ..................................................... 81
CHILDHOOD IMMUNIZATION, VITAMIN A AND DE-WORMING ..................................................................................... 81
CHILDHOOD ILLNESS AND CARE-SEEKING BEHAVIORS .................................................................................................. 86
KNOWLEDGE OF DANGER SIGNS OF CHILDHOOD ILLNESSES ....................................................................................... 86
CONCLUSIONS AND RECOMMENDATIONS ........................................................................................................................... 86
REFERENCES ............................................................................................................................................................. 89
APPENDIX 1 ................................................................................................................................................................. 91
APPENDIX 2 ................................................................................................................................................................. 93
APPENDIX 3 ................................................................................................................................................................. 95
APPENDIX 4 ................................................................................................................................................................. 97

x
xi
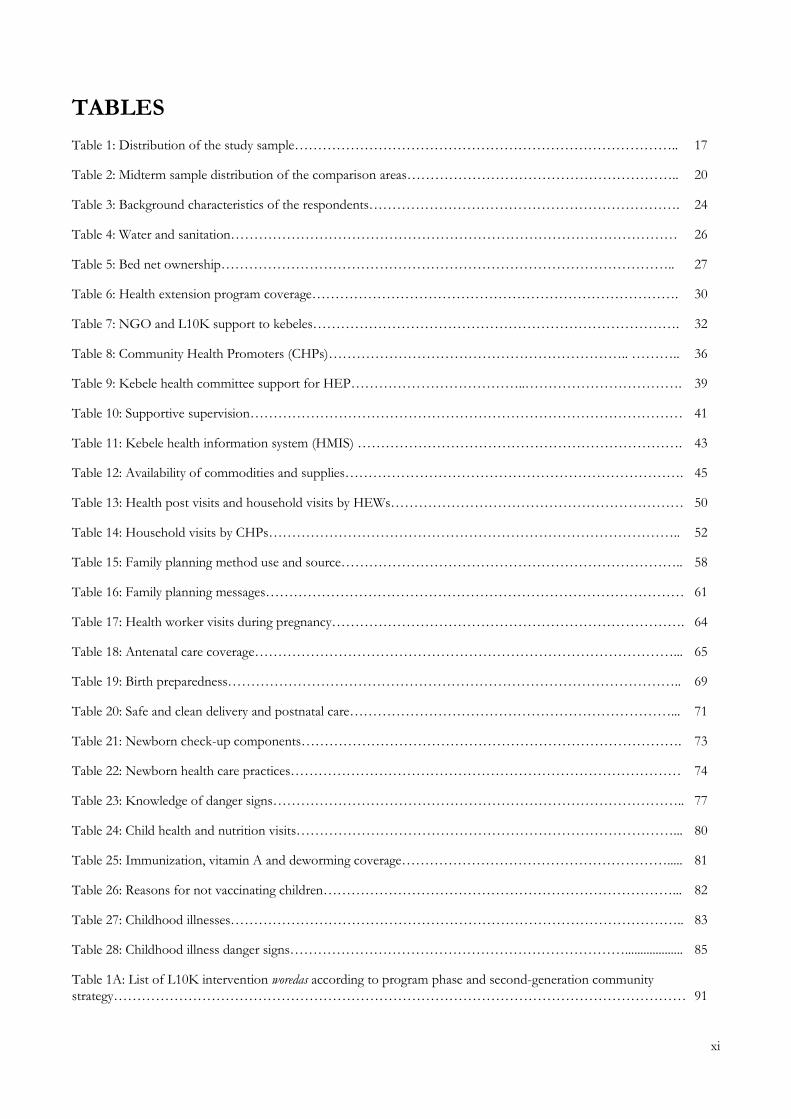
TABLES
Table 1: Distribution of the study sample……………………………………………………………………….. 17
Table 2: Midterm sample distribution of the comparison areas………………………………………………….. 20
Table 3: Background characteristics of the respondents…………………………………………………………. 24
Table 4: Water and sanitation…………………………………………………………………………………… 26
Table 5: Bed net ownership…………………………………………………………………………………….. 27
Table 6: Health extension program coverage……………………………………………………………………. 30
Table 7: NGO and L10K support to kebeles……………………………………………………………………. 32
Table 8: Community Health Promoters (CHPs)……………………………………………………….. ……….. 36
Table 9: Kebele health committee support for HEP………………………………..……………………………. 39
Table 10: Supportive supervision………………………………………………………………………………… 41
Table 11: Kebele health information system (HMIS) ……………………………………………………………. 43
Table 12: Availability of commodities and supplies………………………………………………………………. 45
Table 13: Health post visits and household visits by HEWs……………………………………………………… 50
Table 14: Household visits by CHPs…………………………………………………………………………….. 52
Table 15: Family planning method use and source……………………………………………………………….. 58
Table 16: Family planning messages……………………………………………………………………………… 61
Table 17: Health worker visits during pregnancy…………………………………………………………………. 64
Table 18: Antenatal care coverage………………………………………………………………………………... 65
Table 19: Birth preparedness…………………………………………………………………………………….. 69
Table 20: Safe and clean delivery and postnatal care……………………………………………………………... 71
Table 21: Newborn check-up components………………………………………………………………………. 73
Table 22: Newborn health care practices………………………………………………………………………… 74
Table 23: Knowledge of danger signs…………………………………………………………………………….. 77
Table 24: Child health and nutrition visits………………………………………………………………………... 80
Table 25: Immunization, vitamin A and deworming coverage…………………………………………………..... 81
Table 26: Reasons for not vaccinating children…………………………………………………………………... 82
Table 27: Childhood illnesses…………………………………………………………………………………….. 83
Table 28: Childhood illness danger signs………………………………………………………………................... 85
Table 1A: List of L10K intervention woredas according to program phase and second-generation community
strategy…………………………………………………………………………………………………………… 91

xii
xiii
MAPS AND FIGURES
Map 1: L10K woredas by tier one grantee organization…………………………………………………………. 11 Map 2: L10K woredas according to implementation phase and second-generation activity……………………... 12 Figure 1: Distribution of the 115 L10K woredas according to program strategy and phase……………………... 13 Figure 2: The L10K program theory framework ……………………………………………………………….. 13 Figure 3: Percentage of health posts within 2 hours distance from a health center, according to region and survey periods, L10K areas, 2008 – 2010……………………..………………………………………………… 31 Figure 4: Mean L10K intensity score as a percentage of the maximum score, according to region in the Midterm survey……………………….………………………………………………………………………... 33 Figure 5a: Changes in the median number of households per CHP between survey periods, according to region in L10K areas, 2008 – 2010………………………..……………………………………………………. 34 Figure 5b: Percentage of CHPs in the kebele who were female, according to region in L10K areas, midterm survey…………………………………………………………………………………………………………... 34 Figure 6: Changes in the mean HEW support for CHP index score between survey periods, according to region in L10K areas, 2008 – 2010…………..………………………………………………………………….. 37 Figure 7: Changes in the mean CHP support for HEP index score, according to region in L10K areas, 2008 – 2010…………………………………………………………………………………………………………….. 37 Figure 8: Changes in the percentage of kebeles where kebele health committee meetings are held every month or every quarter, according to region in L10K areas, 2008 –2010………………………………………………. 38 Figure 9: Changes in the mean kebele health committee support index score, according to region in L10K areas, 2008 –2010………………………………………………………………………………………………. 40 Figure 10: Changes in the percentage of kebeles that received supportive supervisory visits during the last three months, according to region in L10K areas, 2008 – 2010……………………………………………………….. 40 Figure 11: Changes in the mean quality of supportive supervision index score by region in L10K areas, 2008 – 2010…………………………………………………………………………………………………………….. 42 Figure 12: Changes in the mean HMIS performance index score by region in L10K areas, 2008 – 2010 ……….. 43 Figure 13: Changes in the mean contraceptive availability index score by region in, L10K areas………………… 46 Figure 14: Changes in the mean child health commodity availability index score by region in L10K areas, 2008 – 2010…………………………………………………………………………………………………………….. 46 Figure 15: Changes in the mean maternal health commodity availability index score by region in L10K areas, 2008 – 2010…………………………………………………………………………………………………….. 47 Figure 16: Changes in the percentage of women who were from a model family household (graduated or working towards it), by region in L10K areas, 2008 – 2010……………………………………………………... 54 Figure 17: Changes in the percentage of women who have a family health card, by region in L10K areas, 2008 – 2010…………………………………………………………………………………………………………….. 54 Figure 18: Changes in the percentage of women in union who are currently using a contraceptive method, by region in L10K areas, 2008 – 2010………………………………………………………..…………………….. 59
xiv
Figure 19: Changes in the percentage of women of reproductive age whose current pregnancy is wanted, baseline (n=276) and midterm (286) surveys, in L10K areas……………………………………………………. 61 Figure 20: Changes in the percentage of women with children 0 to 11 months who received at least four antenatal checkups during their last pregnancy, by region in L10K areas, 2008 – 2010…………………………. 67 Figure 21: Changes in the percentage who received complete ANC (weighed, BP checked, and urine & blood tested), by region in L10K areas, 2008 – 2010…………………………………………………………………... 67 Figure 22: Changes in birth preparedness score (percentage of the maximum possible score), by region in L10K areas, 2008 – 2010……………………………………………………………………………………………… 69 Figure 23: Changes in the percentage of women with children 0 to 11 months whose last delivery was at home and who received PNC, by region in L10K areas, 2008 – 2010…………………………………………………. 73 Figure 24: Changes in percentage following key newborn health practices during last birth among women with children 0 to 11 months, in L10K areas, 2008 – 2010…………………………………………………………... 75 Figure 25: Changes in women's (with children 0 to 11 months) knowledge of neonatal danger signs score (percentage of the maximum possible score), by region in L10K areas, 2008 – 2010…………………………… 78
xv
ACRONYMS
ACT
ANC
Artemisinin Combination Therapy
Antenatal Care
ARI Acute Respiratory Infection
BCC Behavioral Change Communication
BCG
CBRH
Bacillus Calmette–Guérin Vaccine
Community Based Reproductive Health
CBRHA Community Based Reproductive Health Agents
CHP Community Health Promoter
CPR Contraceptive Prevalence Rate
DK
EDHS
EmONC
EPI
Don’t Know
Ethiopian Demographic and Health Survey
Emergency Obstetric and Neonatal Care
Expanded Program of Immunization
ENA Essential Nutrition Action
ESHE Essential Services for Health in Ethiopia
FMOH Federal Ministry of Health
FP
HDA
Family Planning
Health Development Army
HEP
HEW
Health Extension Program
Health Extension Worker
HH
HMIS
HP
IMNCI
Household
Health Management Information System
Health Post
Integrated Management of Newborn and Childhood Illness
IUD
JSI
Intrauterine device
JSI Research & Training Institute, Inc.
L10K Last Ten Kilometers
MDGs Millennium Development Goals
MF
MNCH
Model Family
Maternal, Neonatal and Child Health
M&NH Maternal and Neonatal Health
NGO Non-Governmental Organization
ORS Oral Rehydration Salt
ORT Oral Rehydration Therapy
PHCU
PNC
PPS
Primary Health Care Unit
Postnatal Care
Probability Proportional to Size

xvi
RHB Regional Health Bureau
RHF Recommended Home Fluid
RMNCH Reproductive, Maternal, Neonatal, and Child Health
SNNP Southern Nations, Nationalities and People’s Region
TT2+
TTI
Two or More Tetanus Toxoid Injections
Tetanus Toxoid Injection
USAID United States Agency for International Development
vCHW Volunteer Community Health Worker
WHO World Health Organization
xvii
ACKNOWLEDGMENT
First of all, we would like to thank the Bill & Melinda
Gates Foundation for funding this midterm survey and the
Federal Ministry of Health of the Ethiopian Government
for supporting it. The findings from the midterm survey
were crucial for monitoring and evaluating the progress of
the L10K project, as well as planning its future direction.
The implementation of the baseline and midterm
surveys would not have been possible without the support
of the Regional Health Bureaus (RHBs) of Amhara,
Oromia, Southern Nations, Nationalities, and Peoples’
Region, and Tigray. The involvement of the RHBs during
the baseline and midterm surveys, including providing us
with staff from the regions to be trained as interviewers
and supervisors, has been crucial for maintaining data
quality. We thank the interviewers and the supervisors for
their hard work, their dedication, and for finishing the field
work on schedule.
We are especially grateful to our implementing
partners: Amhara Development Association, Bench Maji
Development Association, Ethiopian Kale Hiwot Church,
Fayyaa Integrated Development Association, Illu Women
and Children Integrated Development Association, Kaffa
Development Association, Oromiya Development
Association, Sheka Peoples’ Development Association,
Siltie Development Association, Southern Region’s
Women’s Association, Relief Society of Tigray, and
Women’s Association of Tigray.
We also thank the woreda health bureau staff,
health extension workers and the community health
promoters for their sincerity and hard work. Their hard
work has bought about significant improvements in
maternal, newborn and child health care behaviors and
practices. We express our gratitude to our implementing
partners for providing staff support for survey supervision,
as well as logistics support which helped contain survey
expenses. The sincere dedication of the supervisors was
key to maintaining survey quality and finishing the field
work on time.
The contributions of those who worked as
consultants during the midterm survey were vital for
maintaining survey quality. Dr. Alemayehu Mekonnen
provided training for the survey teams in Amhara and
SNNP regions; Ato Saail Mohammed and Ato Kasahun
Mengistu provided training to the Oromia survey team and
coordinated their activities; Ato Dawit Birhanu and Ato
Ambanesh Necho coordinated field operations in the
Amhara region; Ato Hibret Bireda coordinated field
operations in SNNP; Ato Legesse Hadush coordinated
field activities in Tigay; and Dr. Solomon Shiferaw lead the
midterm survey database design and management, which
was instrumental for maintaining the quality of electronic
data capturing, data cleaning and data validation.
The contributions of the central and regional
L10K teams at every step of the process have been the
foundation of its success. We express our appreciation to
the L10K team for their perseverance; hard work,
enthusiasm and a can-do mentality made this survey
possible.
Many have contributed to this report: Comments
from Dr. Mary Taylor throughout all stages of the survey
were vital in the preparation of this report. Questions and
comments from health and development partners during
the midterm survey dissemination workshop were also
essential. Comments and support from Dr. Kesetebirhane
Admassu were helpful and noteworthy. The technical
review of the first draft of this report by Dr. Simon
Cousens, IDEAS, London School of Hygiene and Tropical
Medicine, was also very helpful.
Lastly, we would also like to thank the women,
including the health extension workers who took their time
to respond to the questionnaire and share with us a
glimpse of their realities. Their feedback was invaluable not
only for L10K but for all partners and stakeholders
supporting the Government of Ethiopia’s health extension
program.

Changes in Maternal, Newborn and Child Health in 115 Rural Ethiopian Woredas: JSI Research & Training Institute, Inc./L10K 1
EXECUTIVE SUMMARY
Introduction
Since December 2008, the Last Ten Kilometers Project
(L10K), funded by the Bill & Melinda Gates
Foundation and implemented by JSI Research &
Training Institute, Inc., has provided grants and
technical support to 12 regional-level civil society
organizations. These civil society organizations
implement innovative strategies to engage local
communities to participate in and strengthen the
Health Extension Program (HEP) of the Ethiopian
Government to improve maternal, neonatal,1 and child
health (MNCH). These activities are ongoing in 115
rural woredas2 of Amhara, Oromia, Southern Nations,
Nations and Nationalities and Peoples (SNNP), and
Tigray regions, and contribute towards Ethiopia’s
Millennium Development Goals (MDGs) 4 and 5.
A baseline survey was conducted in December
2008 – January 2009 to benchmark the MNCH
indicators in the L10K intervention areas. A midterm
survey was then conducted in December 2010. This
report presents the changes between the baseline and
midterm surveys in 1) the kebele health system situation
supporting the HEP; 2) access and exposure to MNCH
messages and services; and 3) MNCH behavior and
practices.
Methodology
The baseline and midterm surveys were conducted
with two-stage stratified cluster sampling of
representative women and communities in the L10K
intervention areas. In the first stage, kebeles were
randomly selected; one community questionnaire was
1 Newborn and neonate are used synonymously in this report to indicate the first four weeks of life.
2 Woredas are administrative units comprising about 20 kebeles, on average.
completed in each kebele by interviewing at least one
health extension worker (HEW). In the second stage,
households in the kebele were selected for interviews
with three target populations—women of reproductive
age, women with children 0 to 11 months, and women
with children 12 to 23 months. The WHO 30 by 7
sampling method was used to select respondents.
During the baseline survey 204 kebeles were visited,
from which 203 community questionnaires were
completed and 6,292 women were interviewed,
including 4,080 women of reproductive age, 2,448
women with children 0 to 11 months, and 2,040
women with children 12 to 23 months. During the
midterm survey 330 kebeles were visited, from which
326 community questionnaires were completed and
9,967 women were interviewed, including 3,960
women of reproductive age, 3,959 women with
children 0 to 11 months, and 3,948 women with
children 12 to 23 months.
Data from the community questionnaires
were used for the situation analysis of the kebele health
systems. Interviews with women of reproductive age
were used in the analysis of family planning indicators;
interviews of women with children 0 to 11 months
were used in the analysis of maternal and newborn
health indicators; and interviews of women with
children 12 to 23 months were used in the analysis of
child health indicators. Tests were done to see whether
differences in MNCH indicators over time and across
regions were statistically significant. Thresholds for
statistical significance were set at p<0.10 for the
situation analysis of the kebele health systems, and
p<0.05 for the analysis of the women’s interviews.
Only statistically significant results are presented in this
report, and findings are generalizable to the L10K areas
only.
Changes in Maternal, Newborn and Child Health in 115 Rural Ethiopian Woredas: JSI Research & Training Institute, Inc./L10K 2
Results
Changes in the situation of kebele health
services
Health extension program coverage: The
percentage of kebeles with at least one health post
increased from 77 to 91 percent between the baseline
and midterm surveys. At midterm Tigray had the
lowest proportion of kebeles with at least one health
post (78 percent); health posts were more common in
kebeles in Amhara (99 percent), SNNP, and then
Oromia (87 percent). The proportion of kebeles with at
least one HEW increased from 94 to 99 percent, while
the population-to-HEW ratio remained unchanged. At
the time of the midterm survey the population-to-
HEW ratio was 3,104 people per HEW; which was
higher in Amhara and Tigray (3,977 people per HEW,
and 3,699 people per HEW, respectively) compared to
SNNP and Oromia (2,290 people per HEW and 2,162
people per HEW, respectively).
The Last Ten Kilometers Project (L10K)
coverage: Ninety-seven percent of HEWs reported
during the midterm survey that they had received
training from the L10K project, while 95 percent
attended at least one review meeting organized by
L10K. The level of L10K intensity in kebeles was
measured using an index constructed from 11 items
that assessed the HEWs’ perception of the level of
support they receive from the L10K project for each of
the eleven MNCH components.3 The average L10K
intensity score during the midterm survey was 39
percent of the maximum possible score, with
significant regional differences: Oromia (58 percent),
Tigray (40 percent), Amhara (37 percent), and SNNP
(18 percent).
3 The MNCH components considered were EPI, nutrition/growth monitoring, essential newborn care, ANC, delivery, referral, PNC, breastfeeding counseling, complementary feeding, family planning and CHP training/follow-up.
Community health promoters (CHPs):4
The median number of households (HHs) covered by
one community health promoter (CHP) decreased
from 99 to 31 HHs per CHP during the analysis
period. During the midterm survey, the average
number of HHs per CHP ranged between 29 and 37;
41 percent of CHPs were female—the proportion of
female being the highest in Tigray (65 percent),
followed by Oromia (45 percent), then Amhara and
SNNP (36 and 28 percent, respectively).
The level of support HEWs provide to CHPs
was measured with an index combining four aspects of
HEW support.5 Between the two survey periods the
average score of this index increased from 61 to 85
percent of the maximum possible score. HEW support
for CHPs was strongest in Amhara and Oromia and
weakest in Tigray and SNNP. At the time of the
midterm survey the HEW support for CHP was the
highest in Amhara and Oromia (91 and 86 percent,
respectively), followed by Tigray and SNNP (82 and 76
percent, respectively).
Like the HEP support for CHP index, the
extent of CHPs’ support for the HEP (as perceived by
HEWs) was measured with an index combining 17
aspects of support from CHPs.6 The average score on
this index increased from 48 to 66 percent of the
maximum between the surveys.
4 The CHP strategy was present during the time of the midterm survey. The CHPs are now being replaced by women volunteers referred to as the Health Development Army (HDA) with increased density. While one CHP was responsible for providing health education to 25 to 30 households, one HDA will be responsible for the same for 5 households.
5 The index was the sum of four items: 1) conducted regular meeting with the CHPs, 2) planned activities together, 3) set and reviewed targets for CHPs, and 4) provided supportive supervision to the CHPs.
6 The 17 items were: immunization, child health/nutrition, essential neonatal care, diarrhea management, recognition of the danger signs of childhood illnesses, breastfeeding practices, complementary feeding, family planning, maternal health (ANC, delivery & PNC), latrine construction and use, personal hygiene, community mobilization, training/follow-up of model families; personal hygiene, community mobilization, household visits, outreach services, HMIS, and malaria.
Changes in Maternal, Newborn and Child Health in 115 Rural Ethiopian Woredas: JSI Research & Training Institute, Inc./L10K 3
Kebele health committee: The regularity
(i.e., at least one meeting in three months) of kebele
health committee meetings increased from 38 to 54
percent of the maximum in the last two years. Support
from kebele health committee for HEP activities was
measured with an index combining 12 different aspects
of support.7 Between the survey periods the average
kebele health committee support for HEP index score
increased from 24 to 35 percent.
Supportive supervision: The regularity of
supportive supervisory (i.e., at least one visit in the last
three months) visits to HEWs increased from 62 to 76
percent between the surveys, with the lowest rates in
Amhara followed by the other regions that ranged
between 80 and 90 percent. The quality of supportive
supervision was measured with an index constructed
from 10 components of good supervision.8 The
average score on this index increased from 55 to 69
percent of the maximum possible.
Health management information system
(HMIS): HMIS performance was measured with an
index combining nine services monitored by HMIS.9
The average HMIS performance score increased from
46 to 61 percent of the maximum. HMIS performance
was strongest in Tigray (72 percent) and weakest in
SNNP (51 percent); while it was in between in the
other two regions.
7 The 12 items were: planning and monitoring HEP activities, pulling essential supplies from the woreda, pulling supportive supervision from the woredas, identifying barriers to the quality of services, coordinating with local developmental partners, referral services for EOC, referral services for sick children, community mobilization, latrine construction, personal hygiene, school health, and, provide incentives/motivation to CHPs.
8 The following 10 aspects of supportive supervision were summed to produce the index: supplies, record keeping and reporting (HMIS), observe client interaction, provide written feedback, provide encouragement, provide administrative and technical updates, discuss problems encountered, conducted household visits, reviewed work-plan and results, and discussed CHP activities.
9 The following nine items were summed to construct the index: vaccination, growth monitoring, essential newborn care, ANC, delivery, PNC, family planning, follow-up model families, and follow-up CHPs.
Commodity availability: Three indices were
constructed to measure the availability of MNCH
commodities. The contraceptive availability index (i.e.,
availability of pills, condoms & injectables) increased
from 59 to 85 percent of the maximum. The child health
commodity availability index (i.e., ORS, Vitamin A,
Vaccine, anthelmintics, cotrimoxizole, and ACT) score
increased from 25 to 47 percent of the maximum.
Child health commodities were more available in
Amhara and Tigray (59 and 52 percent, respectively)
than in SNNP and Oromia (where it was 39 and 33
percent, respectively). The maternal health commodity
availability index (i.e., iron tablets, misoprostol and
ergometrine) remained problematically low, at 11
percent of the maximum possible index score during
the midterm survey. During the midterm survey, the
maternal health commodity availability index score was
the highest in Tigray (22 percent) followed by the other
three regions (ranging from 8 to 10 percent).
Changes in exposure of households and
families to the health extension program
Household visits by HEWs: The proportion of
women visited by a HEW in the six months preceding
the survey increased from 37 to 50 percent between
the survey periods. The quality of household visits by
HEWs was measured with an index composed of 12
items HEWs should discuss during a home visit (i.e.,
women were asked to recall which topics the HEW
discussed).10 The assumption is that better interaction
of the HEWs’ visit with women would result in better
recall of the topics discussed during the interaction.
The average score of this index increased from 27 to
32 percent of the maximum scores.
Household visits by CHPs: The proportion
of women visited by a CHP in the six months
10The following 12 items were summed to create this index: The items were latrine use, hygiene, pit latrine construction, immunization, child nutrition, safe water use, family planning, pregnancy care, HIV/AIDS, newborn care, diarrhea treatment, and PNC.
Changes in Maternal, Newborn and Child Health in 115 Rural Ethiopian Woredas: JSI Research & Training Institute, Inc./L10K 4
preceding the survey doubled from 16 to 32 percent,
with higher coverage in Tigray (56 percent) and the
lowest coverage in Oromia (20 percent). Similar to the
quality of HEW’s household visits, the quality of CHP
household visits was measured with an index of 12
items that should be discussed (with women being
asked to recall what the CHP discussed.11 This score
increased from 22 to 27 percent of the maximum.
Model family households: The percentage
of the women in L10K areas who were from a model
family household or working towards becoming one
increased from 9 to 30 percent. Model families are
more common in Amhara and Tigray (45 and 37
percent, respectively) than SNNP and Oromia (15 and
1 percent, respectively).
Family health cards: The percentage of
women with a family health card increased from 6 to
36 percent between the survey periods, with the
highest coverage in Tigray (49 percent), followed by
the other three regions (which ranged between 32 to 37
percent).
Changes in family planning indicators
The percentage of women of reproductive age who
were in a union and currently using a contraceptive
method (i.e., the contraceptive prevalence rate or CPR)
increased from 29 to 40 percent. The method mix
shifted between the two surveys, the proportion of
contraceptive users using injectables declined from 87
to 81 percent; the proportion using implants increased
from four to 10 percent; while the proportion using
oral pills declined from eight to five percent.
The proportion of contraceptive nonusers
who were advised about family planning by a health
worker increased from 25 to 40 percent in the last two
years. During the midterm survey, the health worker’s
11 The 12 items were: hygiene, pit latrine construction, immunization, child nutrition, latrine use, safe water use, HIV/AIDS, pregnancy care, family planning, diarrhea treatment, and family health services.
interactions with contraceptive nonusers to discuss
family planning were highest in Tigray (53 percent),
followed by SNNP (43 percent), and then Amhara and
Oromia (37 and 33 percent, respectively).
There were no changes in future desire to use
contraceptives among nonusers (62 at midterm); the
desired number of children among women of
reproductive age (4.5 children); and the desire to limit
childbirth among women of reproductive age (39
percent).
Changes in maternal and newborn health
indicators
Household visits by health workers during
pregnancy: The percentage of women with children 0
to 11 months who were visited by a HEW or CHP
during their last pregnancy increased from 15 to 34
percent in midterm. At midterm household visits by
health workers during pregnancy were the highest in
Tigray (43 percent) and the lowest in Oromia (27
percent), and in-between in the other two regions. An
index of quality of household visits by health workers
during pregnancy (composed of 19 items health
workers should discuss, as recalled by women in the
survey) increased from 11 to 17 percent of the
maximum possible.12 The quality score during the
midterm was the highest in Oromia (22 percent)
followed by Tigray (18 percent), and then Amhara and
SNNP (15 percent, each).
Tetanus toxoid injection: The percentage of
women with children 0 to 11 months who reported
that they received two or more tetanus toxoid injection
during their last pregnancy increased from 41 to 45
percent in midterm. During the midterm the tetanus
12 The 19 items were: to get ANC, to get TT vaccination, take iron tablet, take extra food, take rest, avoid heavy work, seek care if health problem, exclusive breastfeeding, put the baby to breast after birth, to save money for emergency, delay bathing the newborn, sleep under bed net, counsel and test for HIV, No pre-lacteals, to arrange emergency transport, give colostrum, LAM, ensure a trained birth attendant, and apply nothing on umbilical stump.
Changes in Maternal, Newborn and Child Health in 115 Rural Ethiopian Woredas: JSI Research & Training Institute, Inc./L10K 5
toxoid coverage was the highest in SNNP (56 percent;
while in the other regions it ranged between 39 and 48
percent.
Antenatal care: The percentage of women
with children 0 to 11 months who visited a health
facility during their last pregnancy for a check-up (i.e.,
ANC coverage) increased from 52 to 66 percent. ANC
coverage varied significantly by region—coverage was
the highest in Tigray (87 percent), then SNNP (74
percent), Oromia (64 percent), and then in Amhara (56
percent). The proportion of women receiving four or
more ANC visits increased from 18 to 26 percent
during the same period. The percentage receiving four
or more ANC was the highest in SNNP and Tigray (37
and 34 percent, respectively) followed by Oromia (28
percent) and then Amhara (15 percent).
The source of ANC changed between the
surveys. Whereas during the baseline more women
received ANC at health centers (54 percent compared
to 33 percent at health posts), by the midterm survey
the two types of facilities each provided about half of
ANC. ANC quality was measured with an index
constructed from 7 types of services and counseling as
recalled by women.13 The assumption is that better
interaction during ANC is expected to result in better
recall of the services received by the women. The index
increased from 27 to 40 percent of the maximum
possible score. During the midterm the quality of ANC
was the highest in Tigray (47 percent) and between 37
and 39 percent in the other regions.
Birth preparedness: The percentage of
women with children 0 to 11 months who reported
taking any birth preparedness measure during their last
pregnancy increased from 68 to 75 percent. The
number of birth preparedness measures taken by
13 The 7 items were: weight taken, blood pressure measured, urine sample taken, blood sample taken, iron supplement given, given drugs for malaria, and intestinal parasite drugs given.
women increased from 17 to 23 percent (of seven
possible measures).14
Bed net use by pregnant women: The
percentage of pregnant women in malarious regions
who slept under a bed net during the night preceding
the survey increased from 24 to 45 percent.
Safe and clean delivery: The percentage of
institutional deliveries increased from six to 11 percent.
At midterm, the practice of institutional deliveries was
the highest in Tigray (18 percent) followed by the other
three regions where it ranged between nine to 11
percent. Deliveries assisted by health professionals
(including HEWs) increased from 10 to 16 percent.
The indicator at midterm was the highest in Tigray (26
percent) followed by Oromia and SNNP (16 percent
each), and then Amhara (11 percent).
Cutting the umbilical cord with a clean or
sterile blade remained almost universal (97 percent at
midterm). Tying the cut cord stump with sterile or
clean thread increased from 54 to 64 percent; it was
highest during the midterm survey in Tigray (84
percent) followed by SNNP (79 percent), then Oromia
(60 percent), and then Amhara (52 percent).
Application of butter to the stump of the umbilical
cord decreased slightly, from 29 to 25 percent. At
midterm, the practice of applying butter to the cord
was least common in SNNP (10 percent), followed by
Oromia (23 percent), and then Amhara and Tigray (30
and 35 percent, respectively).
Postnatal care: The percentage of women
with children 0 to 11 months whose last birth took
place at home and who received a postnatal check-up
(PNC) within 7 days increased from 4 to 14 percent,
while PNC within 48 hours increased from 1.6 to 5.8
percent. The highest coverage of PNC in 7 days was
observed in SNNP and Tigray (20 and 17 percent,
14 The 7 birth preparedness measures considered: financial, transport, food, arrange birth attendant, identify health facility for delivery, prepare delivery materials, and identify blood donor.
Changes in Maternal, Newborn and Child Health in 115 Rural Ethiopian Woredas: JSI Research & Training Institute, Inc./L10K 6
respectively) during the baseline survey, followed by
Oromia and Amhara (11 percent each); with similar
patterns for PNC in 48 hours coverage. The PNC
quality was measured with an index summing 7
components of PNC.15 Better quality of PNC was
expected to lead to better recall of the services
received. This index of the quality of PNC by HEWs
and CHPs increased from 14 to 24 percent.
Newborn check-up: PNC coverage for
women was used as a proxy for newborn check-up
services provided by health workers. The quality of
newborn check-ups was measured with an index of
nine components of the check-up.16 This index quality
of newborn check-ups increased from 12 to 23
percent.
Newborn health practice: Of women with
children 0 to 11 months whose last delivery was not
attended by a skilled health professional, the
proportion who took clean care of the umbilical cord (i.e.,
cleanly cut and tied the cord and applied nothing to the
cut stump) increased from 30 to 42 percent. Clean cord
care at midterm was the highest in SNNP (63 percent),
followed by Tigray and Oromia (47 and 39 percent,
respectively), then Amhara (30 percent). The
proportion of women with children 0 to 11 months in
L10K areas who reported that they took thermal care of
the newborn increased from 12 to 23 percent.17
Breastfeeding the newborn: The proportion
reported giving first milk (i.e., colostrum) to the baby
increased from 44 to 53 percent, with the highest rate
now being in Tigray (69 percent), followed by Oromia
15 The 7 items were: examined body, checked breast, checked for heavy bleeding, counseled on danger signs, counseled on family planning, counseled on nutrition, and referred to health center/hospital.
16 The 9 items were: examined baby’s body, weighed baby, checked cord, counseled on breastfeeding, observed breastfeeding, counseled on keeping baby warm, checked on danger signs, counseled on danger signs, and referred to health center/hospital.
17 Thermal care of the newborn includes drying and wrapping the baby before the placenta was delivered or immediately after birth, delaying bathing the baby more than six hours, and always maintaining skin-to-skin contact.
(58 percent), SNNP (52 percent) and then Amhara (44
percent). Putting the baby to the breast immediately after birth
also increased from 43to 53 percent, with the highest
rates now in SNNP and Oromia (68 and 66 percent,
respectively) followed by Tigray (54 percent) and then
Amhara (34 percent). Feeding the baby only breast milk
during the first three days of life increased from 70 to 80
percent. Again, this indicator was lowest in Amhara (60
percent) while in the other regions it ranged between
89 and 96 percent.
Exclusive breastfeeding of infants under six
months of age during the 24 hours preceding the
survey increased substantially from 66 to 80 percent.
During the midterm survey the practice of exclusive
breastfeeding was more-or-less at the same levels in
Tigray, Amhara and SNNP (between 82 and 87
percent) while it was lagging behind in Oromia (73
percent).
Changes in child health indicators
Childhood immunization: Access to immunization,
as measured by coverage of the Bacillus Calmette–
Guérin (BCG) vaccine for tuberculosis, remained
more-or-less the same (at about 84 percent). BCG
coverage was highest at midterm in Tigray (97 percent),
followed by Oromia (86 percent), then the other two
regions (about 81 percent each). The dropout rate
between the first and third dose of pentavalent
declined modestly from 26 to 21 percent. The dropout
rate at midterm was lowest in Tigray (7 percent),
followed by Oromia (20 percent), and then the other
two regions (about 26 percent each). Measles vaccine
coverage increased slightly, from 69 to 75 percent. At
midterm, the measles vaccine coverage was the highest
in Tigray (90 percent), followed by the other regions
(which ranged between 71 and 74 percent). The
percentage of children fully vaccinated increased from
45 to 52 percent; which during the midterm was the
highest in Tigray (77 percent), followed by Oromia (53
Changes in Maternal, Newborn and Child Health in 115 Rural Ethiopian Woredas: JSI Research & Training Institute, Inc./L10K 7
percent), then the other two regions (about 46 percent
each).
Childhood illness and its care seeking
behaviors: Of children 0 to 23 months of age with any
ARI symptoms, the percentage taken to a health
provider or given antibiotics remained unchanged (36
and 27 percent, respectively). Of children 0 to 23
months of age with diarrhea, the percentage taken to a
health provider increased from 36 to 45 percent. ORS
treatment for children with diarrhea increased from 23
to 28 percent. Of children aged 0 to 23 months with
fever, the percentage taken to a health provider or
given anti-malarials remained mostly unchanged (41
and 4 percent, respectively).
Children sleeping under bed nets: The
proportion of children between the ages 0 and 23
months who slept under a bed net the night before the
survey increased by 13 percentage points from 31 to 44
percent. In the malarious area the increase was even
greater (from 36 to 55 percent; i.e., increased by 19
percentage points). During the midterm survey the
proportion of children in malarious areas who were
sleeping under a bed net was lowest in Oromia (46
percent), while it ranged between 55 and 62 percent in
the other areas.
Knowledge about danger signs of
childhood illnesses: Mothers’ knowledge of danger
signs during childhood was measured with an index
constructed from 19 items. This score increased from
18 to 23 percent of the maximum possible. The
knowledge of childhood illness signs among women
was higher at midterm in Tigray and Oromia (about 25
percent each) compared to the Amhara and SNNP
(where it was 22 and 19 percent, respectively).
Conclusions and
recommendations
There have been significant improvements in HEP
infrastructure establishment and human resources
deployment in L10K areas. The kebele level health
systems and functions supporting HEWs and the HEP
have also improved; this includes the HMIS, MNCH
commodity logistics systems, supportive supervision
systems, kebele health committees and CHPs. Despite
these improvements, the kebele health systems are still
less than optimal; as such, the health and development
partners (including L10K) should target their efforts on
areas where performance is lagging behind
expectations. Special efforts will be required to
improve maternal and child health commodity
availability; to improve kebele health committee’s
support of HEP activities; to improve the
performance of HMIS; to improve the availability
of essential equipment and materials required to
provide HEP services, and to improve the
frequency and quality of supportive supervision.
Although the coverage of L10K training for
HEWs is universal, the intensity of the support the
project provides to HEWs can be improved
further. The L10K project should also track CHPs
who have been replaced by the HDA to ensure
that they are properly trained on high impact
MNCH interventions.
The intensity, quality, and efficiency of the
interactions between the frontline health workers—i.e.,
HEWs and CHPs—with households and families have
been improving in L10K areas. However, there is room
for improvement both in overall quality and in
particular regions that are lagging behind. The
intensity of household visits by CHPs is lagging in
Amhara, Oromia, and especially in SNNP; special
attention will be required to help these regions
catch-up with Tigray’s achievements. Distribution
of family health cards can also be improved in
Amhara, Oromia and SNNP. All regions have
room for improvement in the quality of health
workers’ interactions with families, with special
attention towards improving counseling on
Changes in Maternal, Newborn and Child Health in 115 Rural Ethiopian Woredas: JSI Research & Training Institute, Inc./L10K 8
maternal and newborn health during household
visits.
There have been significant increases in
contraceptive use, and there is evidence that women
are beginning to choose longer-acting methods. This
reflects the national family planning policy and its
emphasis on promoting the use of implant. In the
Ethiopia Demographic and Health Survey (EDHS)
2011 the total demand for family planning was 54
percent, which is not enough to reach the Federal
Ministry of Health’s (FMOH) target for CPR—65
percent. As such, multi-sectorial initiatives will be
required to increase the demand for family
planning in Ethiopia. There is also an opportunity
for the FMOH to expand the use of intra-uterine
devices (IUDs) and permanent contraceptive
methods, which in the long run will reduce costs
for the national family planning program.
More and better interactions between the
HEP frontline health workers and women during
pregnancy, delivery, and postnatal periods have been
taking place since the inception of the L10K project.
However, the observed improvements are not
sufficient to reach the maternal health related MDG
targets of the FMOH. There is an opportunity for
learning within the project to improve these maternal
and newborn health (M&NH) indicators. Best
practices should be identified from high
performing areas to be replicated in the others.
Still, replication of these best practices will not be
sufficient to attain some of the MDG targets set by the
Health Sector Development Program (HSDP) IV.
Special, additional initiatives will be required to
increase PNC, skilled attendance during delivery,
and institutional deliveries. The impact of the
HEP on M&NH can be further enhanced by
improvements in the quality of M&NH services.
Over the past two years child immunization
coverage improved in L10K areas. The dropout rate of
immunization from DPT1 to DPT3 was higher at
midterm in SNNP, Amhara, and Oromia (between 20
and 27 percent) compared to Tigray (7 percent), which
is consistent with the EDHS 2011. Immunization
coverage strategies being implemented in Tigray
should be identified and replicated.
There have been no major improvements in
the management of childhood illness in L10K areas,
other than an increase in the use of oral rehydration
therapy for treating diarrhea. As such it is encouraging
to note that the Integrated Community Case
Management of Common Childhood Illnesses (ICCM)
is being scaled up in Ethiopia.
Changes in Maternal, Newborn and Child Health in 115 Rural Ethiopian Woredas: JSI Research & Training Institute, Inc./L10K 9
INTRODUCTION
Ethiopia has a formidable task in reducing its child and
maternal mortality rates to reach Millennium
Development Goals (MDGs) 4 and 5. To achieve the
goals by 2015 the Federal Ministry of Health of the
Government of Ethiopia (2010) has set several targets:
reduce the neonatal mortality rate (NMR)—the risk of
mortality within the first four weeks of life—by more
than half from 37 per 1,000 live births observed in the
EDHS 2011 to 15 per 1,000 live births; reduce the
infant mortality rate by nearly half from 59 to 31 per
1,000 live births during the same period; and reduce the
under-five mortality rate (U5MR) from 88 to 67 per
1,000 live births during the same period. Ethiopia must
also reduce the maternal mortality ratio from 673 per
100,000 live births observed in EDHS 2005 to 267 per
100,000 live births by 2015. In order to reach these
maternal and child mortality reduction targets the health
sector development strategy aims to do the following:
increase the contraceptive prevalence rate (CPR) from
29 percent observed in EDHS 2011 to 65 percent in
2015; increase antenatal care coverage from 66 to 90
percent; increase deliveries attended by skilled birth
attendants from 18 to 60 percent; increase postnatal
care coverage from 34 to 78 percent; increase measles
vaccination coverage from 77 to 90 percent; increase
management of newborn18 asphyxia from 7 to 75
percent; increase management of newborn sepsis from
25 to 74 percent; and increase appropriate management
of childhood illnesses in health posts from zero to 100
percent (FMOH 2010, 2010a).
Launched in 2003, the health extension
program (HEP) and its support system is Ethiopia’s
primary means to achieve its health related MDGs
(Temiess 2008, Koblinsky et al. 2010, FMOH 2010).
The main strategies of the HEP include expansion of
18 Newborn and neonate are synonymously used in this report to indicate the first four weeks of life.
physical health infrastructure and training and
countrywide deployment of a cadre of female health
extension workers (HEWs) who mainly provide a
package of promotive and preventive health care
services, with some basic curative services (Admassie et
al. 2009; CNHDE 2008; Temiess 2008; Wakabi 2008).
The HEP achieved almost universal coverage by
establishing at least one health post and deploying at
least two HEWs in almost all of the 15 thousand
kebeles19 in the country (FMOH 2010a). The HEWs are
expected to spend 75 percent of their time conducting
household visits and community outreach activities;
training families to adopt the desirable health practices
and serve as ‘models’ in their neighborhood; and,
organizing communities to participate in the expansion
of HEP services (see Appendix 1 for further details on
the HEP).
Over the past decade the U5MR in the country
declined by nearly half from 166 deaths per 1,000 live
births in 2000 to 88 deaths per 1,000 live births in 2011
(Central Statistical Agency and ICF Macro 2011, Central
Statistical Agency and ORC Macro 2005)—indicating
that the country is on track to meet its MDG 4 to
reduce U5MR to 67 deaths per 1,000 live births by
2015, if the current trend is maintained. Similar to many
other developing countries, the observed reduction in
U5MR is mainly due to the reduction in mortality
among children 1 to 59 months of age, while the NMR
remained mostly unchanged (Central Statistical Agency
and ICF Macro 2011, Central Statistical Agency and
ORC Macro 2005, Oestergaard et al. 2011). Neonatal
deaths now account for 63 percent of all infant deaths
and 42 percent of all under-five deaths (Central
Statistical Agency and ICF Macro 2011). Therefore,
Ethiopia must reduce the NMR to maintain the
19 A kebele is the smallest administrative unit of the country with a population of about five thousand.
Changes in Maternal, Newborn and Child Health in 115 Rural Ethiopian Woredas: JSI Research & Training Institute, Inc./L10K 10
declining U5MR trend. A growing body of evidence
shows that, in resource-poor settings, simple
community-based interventions to change antenatal,
delivery, and newborn health care practices can
significantly reduce neonatal deaths (Darmstadt et al.
2005; Kumar et al. 2008, Bhutta et al. 2008, Manandhar
et al. 2004, Jokhio et al. 2005). Adapting these
community-based interventions is ideal for Ethiopia
because 90 percent of the births in the country take
place at home (EDHS 2011) and the Health Extension
Program (HEP) of the country provides the perfect
platform to implement community-based health
interventions.
The Last Ten Kilometers Project (L10K)—
funded by The Bill & Melinda Gates Foundation and
implemented by JSI Research & Training Institute, Inc.
(JSI)—rolled out innovative community-based, high
impact maternal and newborn health strategies in
December 2008. L10K enhance interactions between
the HEWs and the households and communities to
achieve more accessible, efficient and equitable MNCH
services in 115 woredas.20
The specific objectives of the L10K project
are:
Objective 1: HHs and kebeles actively engaged
in the provision of kebele-based health services in
conjunction with the HEP in order to increase
availability of services and change household/kebele
health practices.
Objective 2: Households and kebeles actively
informing, leading, owning, planning and monitoring
their own MNH interventions.
Objective 3: Households and kebeles address
identified barriers to quality MNH household/ kebele
health practices and services through innovative kebele
approaches.
20 Woredas are administrative units comprising about 20 kebeles, on average.
Objective 4: HEWs, vCHWs, and model
families motivated by non-financial incentives to
provide RMNCH services in a sustainable manner.
Objective 5: Civil society partners capable of
implementing grants program and building capacities of
households and kebeles to participate in health
programming with HEWs.
Objective 6: L10K project partners learn,
document, and disseminate project experiences through
monitoring and evaluation.
A baseline survey was conducted in December
2008 – January 2009 to benchmark the MNCH
indicators in the L10K intervention areas (L10K 2009).
Subsequently, a midterm survey was conducted in
December 2010. This report presents the changes
during that time period in the situation of the kebele
health systems supporting the HEP; changes in the
access and exposure to MNCH messages and services;
and, changes in MNCH behavior and practices. (Please
visit www.l10k.jsi.com to learn more about the baseline
and midterm surveys and their findings.)
The L10K strategy and the
program theory
Since 2008, L10K has been working with 12 regional-
level civil society organizations (CSOs)—i.e., tier one
implementing partners (IPs) or grantees—and about
24 woreda-level public administrations and CSOs—
i.e., tier two grantees. L10K and its grantees work to
implement innovative strategies that engage local
communities to participate in strengthening the HEP
to improve MNCH. The program is being
implemented in 115 rural woredas located in Amhara,
Oromia, Southern Nations, Nations and Nationalities
and Peoples (SNNP), and Tigray, the four most
populous regions of the country. These four regions
cover a population of about 14 million—i.e., about
19 percent of the population of Ethiopia. (The list of
Changes in Maternal, Newborn and Child Health in 115 Rural Ethiopian Woredas: JSI Research & Training Institute, Inc./L10K 11
woredas is provided in Table 1A of
Appendix 2.) In doing so, L10K
collaborates and coordinates with
the respective regional, zonal and
woreda health bureau
administrations and other
development partners. The L10K
project works towards the six
objectives described above to
achieve more, better, efficient and
equitable MNCH services provided
by the HEP at scale.
The L10K project
provides technical support to the
12 tier one grantees to implement the foundational
community strategy in all 115 woredas. The number of
woredas to be covered by L10K in each of the four
regions was determined by the project, while the
regional health bureaus (RHBs)21 identified the
specific woredas that would be covered within their
respective regions. The location of the 115 L10K
woredas according to their implementing partners is
illustrated in Map 1. Brief descriptions of the 12
grantees are provided in Appendix 3. The
foundational community strategy improves the skills
of HEWs to work with their communities, organizing
and utilizing a geographically dispersed network of
community health promoters (CHPs)—now the
Health Development Army (HDA).22 The CHPs and
the HDA are model family members selected by the
community to volunteer and help the HEWs deliver
21 The RHB is the section of the regional government that is responsible for coordinating and implementing all health related activities within the region, with policy guidance provided by the Federal Ministry of Health of the Government of Ethiopia.
22 The CHP strategy was present during the time of the midterm survey. The CHPs are now being replaced by women volunteers referred to as the Health Development Army (HDA) with increased density. While one CHP was responsible for providing health education to 25 to 30 households, one HDA will be responsible for the same for 5 households.
health messages for changing health practices in their
neighborhood. The Essential Services for Health in
Ethiopia (ESHE) project, implemented in 2003-2008,
demonstrated a significant impact on child survival
programs in Ethiopia using CHPs as one of its
components (ESHE 2008). As they gain experience,
the HEP expects the HEWs to give short trainings,
then to mentor, encourage and supervise the CHPs
(FMOH 2007). To motivate and sustain support
from households, CHPs and the community as a
whole, the L10K project fosters participation through
existing community structures, organizations or
institutions (such as idirs,23 churches, mosques,
women’s and youth associations). The value of
embedding the community health program within
community institutions or ‘anchors’ is hypothesized
to improve and sustain community health outcomes.
These anchors foster credibility and recognition for
CHPs, leading to sustained volunteerism by working
through recognized community structures. The
project develops tools and job aids and supports tier
one and tier two grantees to improve the skills the
23 Idirs are community insurance groups to finance funerals
Changes in Maternal, Newborn and Child Health in 115 Rural Ethiopian Woredas: JSI Research & Training Institute, Inc./L10K 12
frontline workers—i.e., HEWs and the
CHPs/HDA—use when interacting with households
and communities. One major aid for this job is the
family health card,24 which the HDA provided to all
households. The family health card contains pictorial
information on key MNCH messages that the HEWs
and HDA use to educate individuals in one-to-one
health sessions. The foundational community strategy
was rolled out to the 115 woredas in two phases, due
to both management issues and difficulty in
identifying appropriate tier one grantees. Phase one,
initiated in December 2008, covered 71 woredas (i.e.,
20 in Amhara, 22 in Oromia, 19 in SNNP, and 10 in
Tigray); while Phase two, initiated in December 2009,
covers 44 woredas (i.e., 15 in Amhara, 13 in Oromia,
11 in SNNP, and five in Tigray).
Four additional activities comprise
the second-generation community strategies;
these fall under objectives two, three and
four. Once the foundational community
strategy was in place in woredas, these four
second-generation strategies were added as a
means of achieving the overarching objectives
of the project. These are: Community Based
Data for Decision Making (CBDDM) under
objective two; Participatory Community
Quality Improvement (PCQI) and
Community Solution Fund (CSF) under
objective three; and, Non-Financial Incentives
(NFI) under objective four. The four
strategies were implemented in 14 woredas
each (i.e., totaling 56 woredas). L10K
coordinated with the respective RHBs to
select the woredas for the second-generation
activities. The list of L10K woredas according
24The family health card can be downloaded from www.l10k.jsi.com.
to implementation phase and second-generation
activities is given in Table 1A of Appendix 2 and
illustrated in both Map 2 and Figure 1. The CBDDM
activities were initiated in August 2009 in the Phase
One woredas while the other three community
strategies were initiated in June 2010 in Phase One
and Phase Two woredas. The CBDDM and PCQI
activities are implemented by tier two grantees (i.e.,
mainly woreda health bureaus, woreda administration
and woreda-level CSOs) with technical support from
the tier one grantee; while the CSF and NFI activities
are implemented by tier one grantees.
The L10K program theory framework is
illustrated in Figure 2, which is derived from the
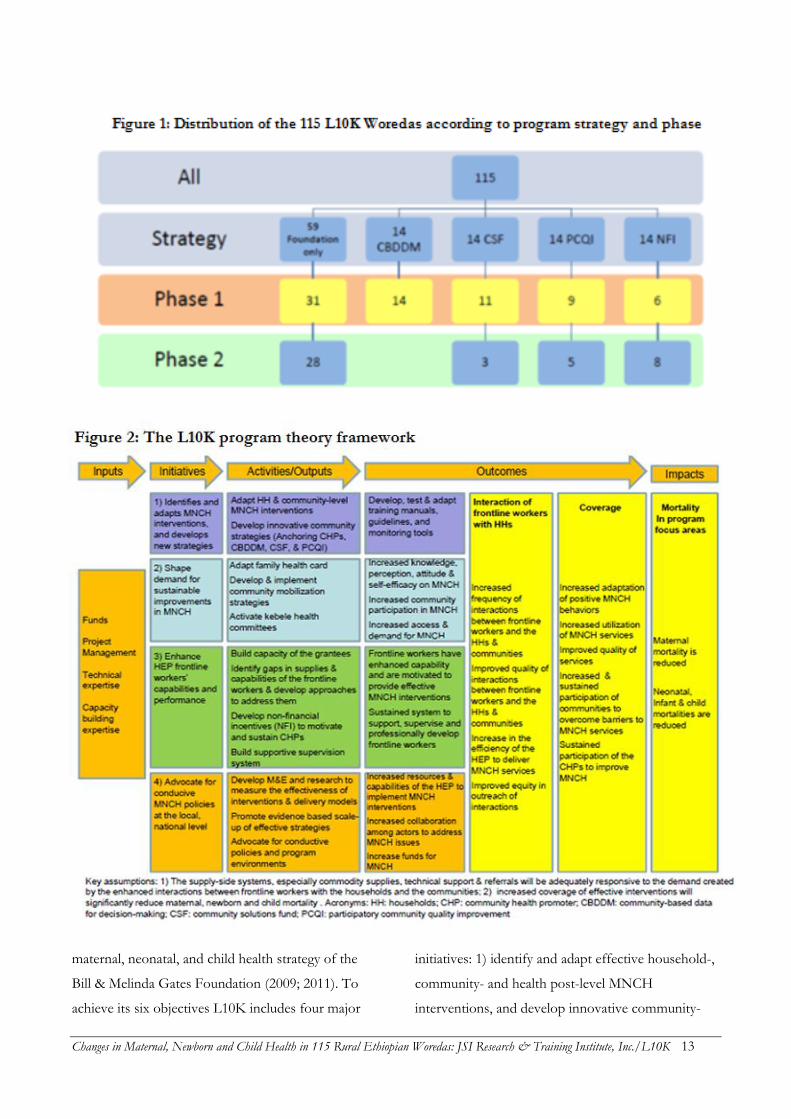
Changes in Maternal, Newborn and Child Health in 115 Rural Ethiopian Woredas: JSI Research & Training Institute, Inc./L10K 13
maternal, neonatal, and child health strategy of the
Bill & Melinda Gates Foundation (2009; 2011). To
achieve its six objectives L10K includes four major
initiatives: 1) identify and adapt effective household-,
community- and health post-level MNCH
interventions, and develop innovative community-
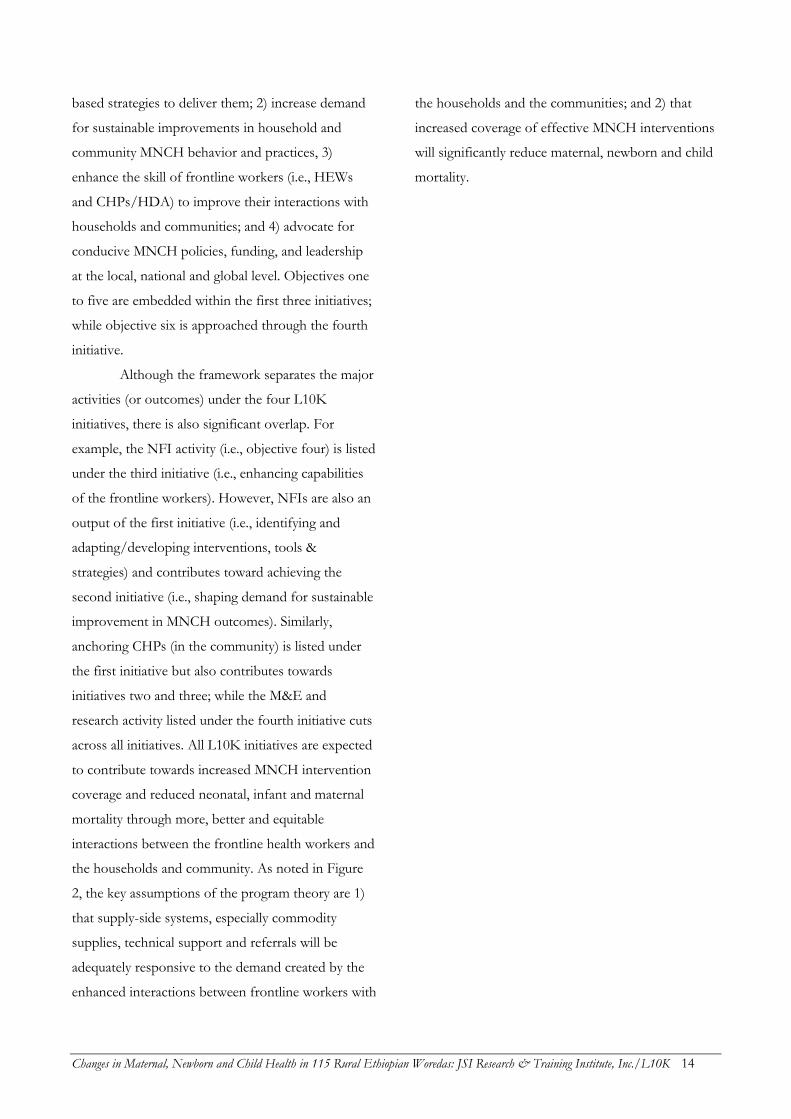
Changes in Maternal, Newborn and Child Health in 115 Rural Ethiopian Woredas: JSI Research & Training Institute, Inc./L10K 14
based strategies to deliver them; 2) increase demand
for sustainable improvements in household and
community MNCH behavior and practices, 3)
enhance the skill of frontline workers (i.e., HEWs
and CHPs/HDA) to improve their interactions with
households and communities; and 4) advocate for
conducive MNCH policies, funding, and leadership
at the local, national and global level. Objectives one
to five are embedded within the first three initiatives;
while objective six is approached through the fourth
initiative.
Although the framework separates the major
activities (or outcomes) under the four L10K
initiatives, there is also significant overlap. For
example, the NFI activity (i.e., objective four) is listed
under the third initiative (i.e., enhancing capabilities
of the frontline workers). However, NFIs are also an
output of the first initiative (i.e., identifying and
adapting/developing interventions, tools &
strategies) and contributes toward achieving the
second initiative (i.e., shaping demand for sustainable
improvement in MNCH outcomes). Similarly,
anchoring CHPs (in the community) is listed under
the first initiative but also contributes towards
initiatives two and three; while the M&E and
research activity listed under the fourth initiative cuts
across all initiatives. All L10K initiatives are expected
to contribute towards increased MNCH intervention
coverage and reduced neonatal, infant and maternal
mortality through more, better and equitable
interactions between the frontline health workers and
the households and community. As noted in Figure
2, the key assumptions of the program theory are 1)
that supply-side systems, especially commodity
supplies, technical support and referrals will be
adequately responsive to the demand created by the
enhanced interactions between frontline workers with
the households and the communities; and 2) that
increased coverage of effective MNCH interventions
will significantly reduce maternal, newborn and child
mortality.
Changes in Maternal, Newborn and Child Health in 115 Rural Ethiopian Woredas: JSI Research & Training Institute, Inc./L10K 15
METHODOLOGY
Study design
Using the L10K baseline survey, conducted in
December 2008–January 2009, and the L10K
midterm—also referred as the follow-up—survey
conducted in December 2010, this study first examines
whether there have been adequate improvements in
indicators that measure 1) coverage of the health
extension program and the performances of its
systems; 2) interactions of the HEP frontline workers
with households and families; 3) MNCH behavior and
practices; and 4) the quality of MNCH services. The
Institutional Review Board (IRB) clearance for this
study was obtained from the Ethiopian Public Health
Association (EPHA).
Data
The baseline and midterm surveys used two-stage
stratified cluster sampling to obtain family planning
related information from women of reproductive age
(i.e., women 15 to 49 years); maternal, newborn and
infant health and nutrition related measurements from
women with children 0 to 11 months; child
immunization and childhood illnesses related
measurements from women with children 12 to 23
months; and HEP coverage, performance of the health
systems supporting the HEP, and exposure to the
L10K program coverage information from HEW
interviews and observation of the health posts (HP).
The questionnaires for women’s interviews also
collected data on the socio-demographic characteristics
of the women, socio-economic and sanitation status of
the households, and access and exposure to health
messages and services. Altogether four survey
instruments were used (i.e., three women’s
questionnaire and one community questionnaire; the
questionnaires are available at www.l10k.jsi.com).The
women’s questionnaires were pre-coded and translated
into the three major local languages (Amharic, Oromifa
and Tigregna). In SNNP there were at least 11 more
local languages for which it was not feasible to translate
the questionnaires. The interviewers, who were from
these communities, translated the questions from
Amharic into the local language while administering
the questionnaires.
Most questions from the baseline survey were
retained without changes in the midterm survey
instrument. A few more questions were added to the
midterm survey to measure the performance of the
second-generation community strategies.
Baseline survey
With the statistical power set at 80 percent25 and two-
sided alpha error set at 0.0526 the sample size for the
women of reproductive age interviews during baseline
was determined based on the assumption that the
contraceptive prevalence rate would increase from 23
percent at baseline to 30 percent at the end of the
project (in September 2012); for the women with
children 0 to 11 months the baseline sample size
assumption was that tetanus toxoid injection coverage
during pregnancy would increase from 50 to 60 percent
during the same period; and, for women with children
12 to 23 months the sample size assumption was that
the children fully immunized would increase from 34
to 45 percent. The expected changes in the indicators
were based on the trends observed by the Essential
Services for Health in Ethiopia end-line survey
(ESHE 2008). The cluster sampling design effect was
assumed to be 1.5 for all the estimates. Accordingly,
25 Eighty percent chance to detect the difference in estimates between two samples when it truly exists in the population.
26 Five percent or less chance to indicate that there is difference between two samples when in reality it does not exist in the population.
Changes in Maternal, Newborn and Child Health in 115 Rural Ethiopian Woredas: JSI Research & Training Institute, Inc./L10K 16
the sample size estimates (rounded) for the women of
reproductive age sample was 1,000, for the women
with children 0 to 11 months sample it was 600, and
for the women with children 12 to 23 months it was
500. The analytic domains for the baseline survey were
the four regions; as such, the estimated sample size was
obtained from each region of the regions. During the
first-stage of the cluster sampling, 50 kebeles each from
Amhara, Oromia and SNNP were selected as the
primary sampling units (PSUs) with the probability
proportional to their population size (PPS).
Populations of kebeles were obtained from each
respective woreda administration because these data
were more recent than the 2007 census.
In the course of another evaluation (the
USAID funded Integrated Family Health Program
[IFHP]), all woredas of Tigray, L10K and non-L10K,
were included in the sampling frame and stratified into
four domains (i.e., non-IFHP & L10K, non-IFHP &
non-L10K, IFHP & L10K, and IFHP & non-L10K).
The required number of clusters (kebeles were treated as
clusters) from each domain were selected using PPS,
which yielded 54 kebeles from the 15 L10K woredas.
During the second-stage of the cluster sampling the
World Health Organization (WHO) 30 by 7 cluster
sample strategy, described by Lemeshow and Robinson
(1985), was used to obtain information from 20
women of reproductive age (i.e., in ages 15 – 49 years),
12 women of reproductive age with children 0 to 11
months, and 10 women of reproductive age with
children 12 to 23 months from each of the primary
sampling units (the sample sizes according to sampling
stage and domain is given in Table 1). The interviewers
first went to the middle of the kebele where they
randomly selected a household, and then visited every
fifth household and interviewed all the women in that
household if they were within the target population.
Accordingly, if a woman of reproductive age had a
child between 0 to 11 months of age she was
interviewed for the women of reproductive age
questionnaire as well as the questionnaire for women
with children 0 to 11 months. However, after
completing the quota for women of reproductive age
in a given kebeles, the interviewers only sought to
complete interviews for the other target groups.
Interviewing at least one HEW and reviewing the
documents from the health post completed the
community questionnaire, one per kebele.
The fieldwork was carried out by a number of
survey teams, each team consisting of one field
supervisor and four interviewers. Overall, in the four
regions 89 interviewers, 30 supervisors, and 5 regional
survey coordinators were deployed. The interviewers
and supervisors were all health professionals working
for regional health bureaus at the zonal or woreda levels
and were recruited in close consultation with the
regional health bureaus. To avoid bias the interviewers
and the supervisors were not responsible for the areas
in which they worked. A total of 30 four-wheel drive
vehicles were also used for the survey.
Training of the field staff was conducted in
three sessions; Amhara and SNNP survey field teams
were trained together in one session in Addis Ababa;
the Oromia team was trained in Jimma; and the team
from Tigray was trained in Mekelle. The five-day
training in each of the sessions consisted of a general
introduction to the concepts and objectives of the
L10K project, classroom instruction on interviewing
techniques and field survey procedures, a detailed
review of each item in the questionnaires, specific
survey instructions, and role-play. The training
concluded with a one-day field practice. Survey
supervisors and regional survey coordinators were also
given training on how to organize the survey, monitor
and supervise the field work, and techniques for
detecting errors in the field and correcting them on
spot, among others. The whole survey including the
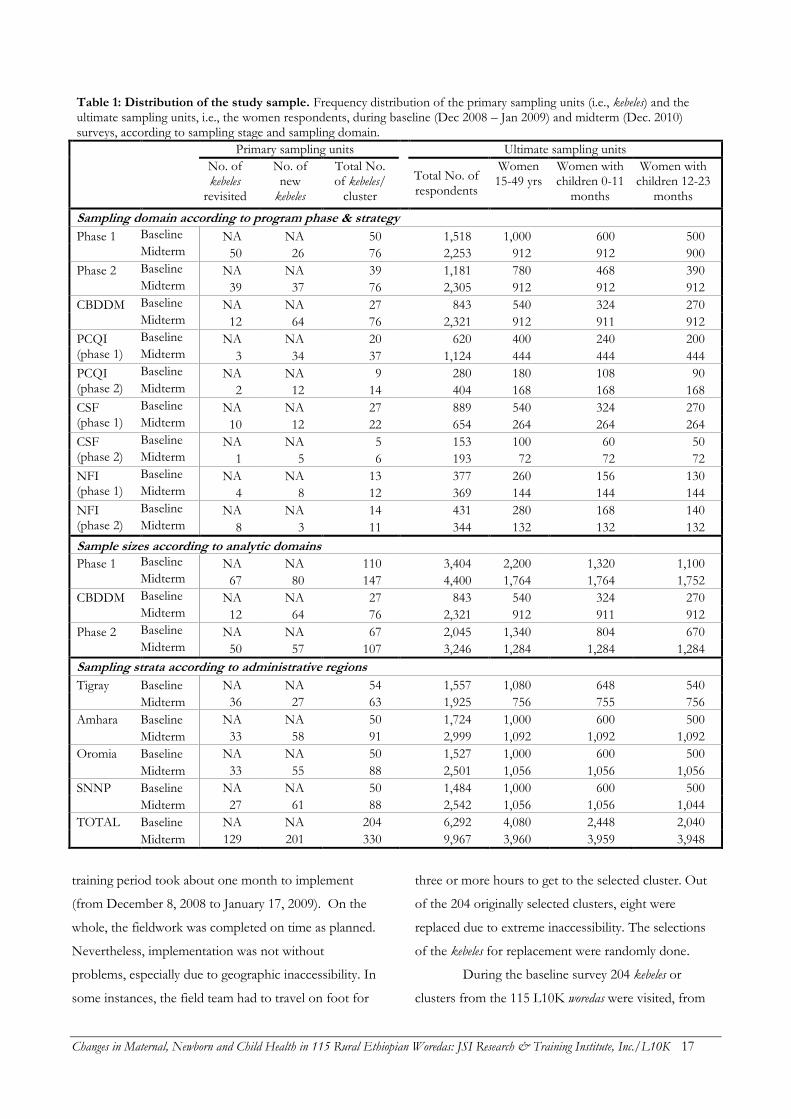
Changes in Maternal, Newborn and Child Health in 115 Rural Ethiopian Woredas: JSI Research & Training Institute, Inc./L10K 17
Table 1: Distribution of the study sample. Frequency distribution of the primary sampling units (i.e., kebeles) and the ultimate sampling units, i.e., the women respondents, during baseline (Dec 2008 – Jan 2009) and midterm (Dec. 2010) surveys, according to sampling stage and sampling domain.
Primary sampling units
Ultimate sampling units
No. of kebeles
revisited
No. of new
kebeles
Total No. of kebeles/
cluster Total No. of respondents
Women 15-49 yrs
Women with children 0-11
months
Women with children 12-23
months
Sampling domain according to program phase & strategy
Phase 1 Baseline NA NA 50 1,518 1,000 600 500
Midterm 50 26 76 2,253 912 912 900
Phase 2 Baseline NA NA 39 1,181 780 468 390
Midterm 39 37 76 2,305 912 912 912
CBDDM Baseline NA NA 27 843 540 324 270
Midterm 12 64 76 2,321 912 911 912
PCQI Baseline NA NA 20 620 400 240 200 (phase 1) Midterm 3 34 37 1,124 444 444 444
PCQI Baseline NA NA 9 280 180 108 90 (phase 2) Midterm 2 12 14 404 168 168 168
CSF Baseline NA NA 27 889 540 324 270 (phase 1) Midterm 10 12 22 654 264 264 264
CSF Baseline NA NA 5 153 100 60 50 (phase 2) Midterm 1 5 6 193 72 72 72
NFI Baseline NA NA 13 377 260 156 130 (phase 1) Midterm 4 8 12 369 144 144 144
NFI Baseline NA NA 14 431 280 168 140 (phase 2) Midterm 8 3 11 344 132 132 132
Sample sizes according to analytic domains
Phase 1 Baseline NA NA 110 3,404 2,200 1,320 1,100
Midterm 67 80 147 4,400 1,764 1,764 1,752
CBDDM Baseline NA NA 27 843 540 324 270
Midterm 12 64 76 2,321 912 911 912
Phase 2 Baseline NA NA 67 2,045 1,340 804 670
Midterm 50 57 107 3,246 1,284 1,284 1,284
Sampling strata according to administrative regions
Tigray Baseline NA NA 54 1,557 1,080 648 540
Midterm 36 27 63 1,925 756 755 756
Amhara Baseline NA NA 50 1,724 1,000 600 500
Midterm 33 58 91 2,999 1,092 1,092 1,092
Oromia Baseline NA NA 50 1,527 1,000 600 500
Midterm 33 55 88 2,501 1,056 1,056 1,056
SNNP Baseline NA NA 50 1,484 1,000 600 500
Midterm 27 61 88 2,542 1,056 1,056 1,044
TOTAL Baseline NA NA 204 6,292 4,080 2,448 2,040
Midterm 129 201 330 9,967 3,960 3,959 3,948
training period took about one month to implement
(from December 8, 2008 to January 17, 2009). On the
whole, the fieldwork was completed on time as planned.
Nevertheless, implementation was not without
problems, especially due to geographic inaccessibility. In
some instances, the field team had to travel on foot for
three or more hours to get to the selected cluster. Out
of the 204 originally selected clusters, eight were
replaced due to extreme inaccessibility. The selections
of the kebeles for replacement were randomly done.
During the baseline survey 204 kebeles or
clusters from the 115 L10K woredas were visited, from
Changes in Maternal, Newborn and Child Health in 115 Rural Ethiopian Woredas: JSI Research & Training Institute, Inc./L10K 18
which 203 community questionnaires were completed
and 6,292 women were interviewed (i.e., an average of
31 respondents per kebele). These included 4,080
women of reproductive age, 2,448 women with children
0 to 11 months, and 2,040 women with children 12 to
23 months. The sample sizes reported here vary slightly
from those reported in the baseline survey report (L10K
2009) because the baseline report included five urban
woredas in Tigray. These urban woredas were subsequently
replaced by rural woredas as the L10K foundational
community strategies were rolled out during the second
phase of program implementation.
Midterm survey
The initial plan for any follow-up survey was to
revisit the kebeles surveyed during the baseline to
correlate programmatic changes within a kebele with
the changes in the outcome measures to assess dose-
response relationship between program exposure and
the outcomes of interest. However, the number and
location of the woredas for the L10K second-
generation community strategies (i.e., CBDDM,
PCQI, CSF & NFI) were not confirmed before the
baseline survey. Moreover, the second-generation
community strategies are limited to about half
(usually 10) of the kebeles of an intervention woreda. As
such, the baseline sample sizes within a second-
generation community strategy area were not
sufficient to measure their added value; and some of
the kebeles that were surveyed from the second-
generation community strategy woredas during the
baseline were not selected for the second-generation
activities. Therefore, the midterm survey had to
increase the sample size within each of the second-
generation community strategy areas and replace the
kebeles surveyed during baseline that did not include
the second-generation community strategy woredas
with those that were. Selection of the replacement
kebeles were done randomly from the list of kebeles
with second generation activities. Accordingly, the
midterm survey of the L10K areas has six main
strata, which are 1) the phase one woredas with only
the foundational community strategy (31 woredas), 2)
the phase two woredas with only the foundational
community strategy (28 woredas), 3) the CBDDM
woredas (14 phase one woredas), 4) the NFI woredas (six
phase one and eight phase two woredas), 5) the PCQI
woredas (nine phase one and five phase two woredas),
and 6) the CSF woredas (11 phase one and three phase
two woredas). Therefore, the sampling strategy of the
first-stage of the two-stage cluster sampling during
the midterm survey differed from the first-stage
sampling strategy of the baseline survey.
Like the second-stage sampling strategy of
the baseline survey, the second-stage sampling
strategy during the midterm survey followed the
WHO 30 by 7 cluster sampling technique in
combination with the parallel sampling technique.
The midterm survey interviewed 12 respondents
from each of the three target populations in each
kebele so that there is 80 percent power to detect at
least 8 percentage points difference in the changes
over time of an indicator between two programmatic
domains (with baseline point estimates at the project
level set at 50 percent, two-sided alpha error set at
0.05 and cluster survey design effect assumed to be
1.5).
Like the baseline survey, the fieldwork was
carried out by a number of survey teams, each team
consisting of one field supervisor and four
interviewers. Overall in the four regions, 124
interviewers, 32 supervisors, and 10 regional survey
coordinators were deployed. The interviewers were
all health professionals working for regional health
bureaus at the zonal or woreda levels and were
Changes in Maternal, Newborn and Child Health in 115 Rural Ethiopian Woredas: JSI Research & Training Institute, Inc./L10K 19
recruited in close consultation with the regional
health bureaus. The supervisors were mostly the
staff of the tier one grantees. To avoid bias the
interviewers and supervisors were not responsible for
the areas in which they worked. In addition, six
consultants were hired who provided training and
conducted supervision of the survey teams (see
Appendix 4 for the list of the interviewers,
supervisors, and the consultants). Training of the
field staff followed the same format as with the
baseline survey. The midterm survey likewise took
about a month to implement (from December 4,
2010 to January 5, 2011).
Table 1 gives the distribution of the sampling
units according to target population, region, and
program strata. Of the 204 baseline kebeles, 129 kebeles
were revisited during the midterm survey while 75
kebeles were replaced and126 new kebeles were added,
resulting in visits to 330 total kebeles during the
midterm survey. In all, the midterm survey in L10K
areas involved the completion of 326 community
questionnaires and interviews with 9,967 women (i.e.,
an average of about 30 women respondents per
kebele), including 3,960 women of reproductive age,
3,959 women with children 0 to 11 months, and
3,948 women with children 12 to 23 months.
Although the midterm survey had six
sampling domains due to the different L10K
community strategies, the coverage and duration of
the PCQI, CSF and NFI at the time of the midterm
survey were considered negligible. As such, at the
time of the midterm survey, the L10K areas
effectively included three programmatic domains: 1)
the phase one woredas with only the foundational
community strategy (which includes phase one
woredas with PCQI, CSF and NFI strategies with
negligible duration—i.e., less than 3 months of
exposure); 2) the phase one woredas with CBDDM
activities added to the foundational community
strategy; and, 3) the phase two woredas with only the
foundation strategy (which includes phase two woredas
with PCQI, CSF and NFI strategies with negligible
duration of exposure).
During the midterm survey, data was also
collected from selected non-L10K woredas to serve as
comparison areas. This was done to introduce an
intervention-comparison group pretest-posttest
design using data from the midterm and end-line
surveys that would complement the initial dose-
response relationship design that is being used to
assess the impact of L10K strategies. During the
midterm survey, data was collected from 2,308
women respondents from 30 non-L10K woredas, of
which six woredas were in Tigray, and eight woredas
were from each of the other three regions. The non-
L10K sample included 912 respondents from each of
the three survey target groups (see Table 2). The
comparison woredas were either from the same
zones27 or near to where L10K woredas are located.
While the baseline survey was conducted without the
consideration of an intervention-comparison group
evaluation design because a dose-response study was
the initial design; in Tigray baseline data from
potential comparison woredas were nevertheless
available, as the survey in that region collected data
from L10K and non-L10K woredas (due to reasons
mentioned earlier). Thus, the six comparison woredas
in Tigray also have baseline data from a total of 289
respondents (180 women of reproductive age, 108
women with children 0 to 11 months, and 90 women
with children 12 to 23 months).
27 Zones are administrative areas comprising several woredas.
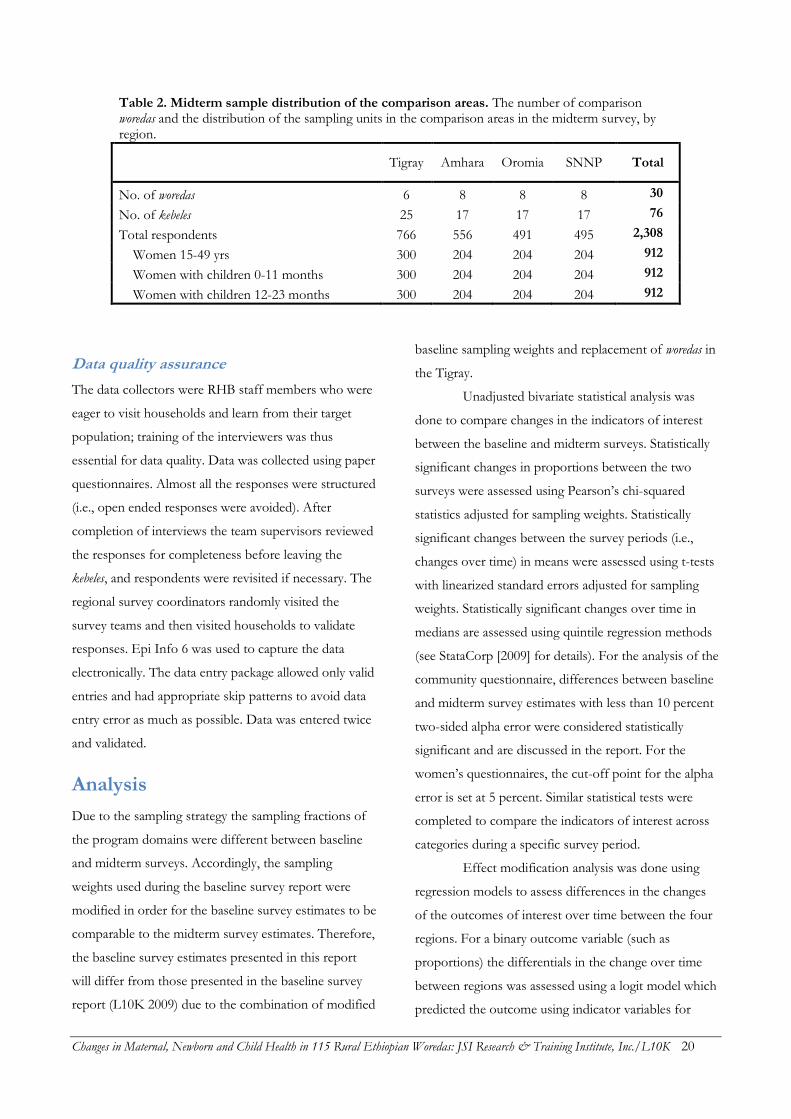
Changes in Maternal, Newborn and Child Health in 115 Rural Ethiopian Woredas: JSI Research & Training Institute, Inc./L10K 20
Table 2. Midterm sample distribution of the comparison areas. The number of comparison woredas and the distribution of the sampling units in the comparison areas in the midterm survey, by region.
Tigray Amhara Oromia SNNP Total
No. of woredas 6 8 8 8 30
No. of kebeles 25 17 17 17 76
Total respondents 766 556 491 495 2,308
Women 15-49 yrs 300 204 204 204 912
Women with children 0-11 months 300 204 204 204 912
Women with children 12-23 months 300 204 204 204 912
Data quality assurance
The data collectors were RHB staff members who were
eager to visit households and learn from their target
population; training of the interviewers was thus
essential for data quality. Data was collected using paper
questionnaires. Almost all the responses were structured
(i.e., open ended responses were avoided). After
completion of interviews the team supervisors reviewed
the responses for completeness before leaving the
kebeles, and respondents were revisited if necessary. The
regional survey coordinators randomly visited the
survey teams and then visited households to validate
responses. Epi Info 6 was used to capture the data
electronically. The data entry package allowed only valid
entries and had appropriate skip patterns to avoid data
entry error as much as possible. Data was entered twice
and validated.
Analysis
Due to the sampling strategy the sampling fractions of
the program domains were different between baseline
and midterm surveys. Accordingly, the sampling
weights used during the baseline survey report were
modified in order for the baseline survey estimates to be
comparable to the midterm survey estimates. Therefore,
the baseline survey estimates presented in this report
will differ from those presented in the baseline survey
report (L10K 2009) due to the combination of modified
baseline sampling weights and replacement of woredas in
the Tigray.
Unadjusted bivariate statistical analysis was
done to compare changes in the indicators of interest
between the baseline and midterm surveys. Statistically
significant changes in proportions between the two
surveys were assessed using Pearson’s chi-squared
statistics adjusted for sampling weights. Statistically
significant changes between the survey periods (i.e.,
changes over time) in means were assessed using t-tests
with linearized standard errors adjusted for sampling
weights. Statistically significant changes over time in
medians are assessed using quintile regression methods
(see StataCorp [2009] for details). For the analysis of the
community questionnaire, differences between baseline
and midterm survey estimates with less than 10 percent
two-sided alpha error were considered statistically
significant and are discussed in the report. For the
women’s questionnaires, the cut-off point for the alpha
error is set at 5 percent. Similar statistical tests were
completed to compare the indicators of interest across
categories during a specific survey period.
Effect modification analysis was done using
regression models to assess differences in the changes
of the outcomes of interest over time between the four
regions. For a binary outcome variable (such as
proportions) the differentials in the change over time
between regions was assessed using a logit model which
predicted the outcome using indicator variables for
Changes in Maternal, Newborn and Child Health in 115 Rural Ethiopian Woredas: JSI Research & Training Institute, Inc./L10K 21
survey period and regions with interaction terms
between survey period and regions, with adjustments
for sampling weights. Statistically significant (i.e., p<0.1)
interaction terms would indicate that the change of the
outcome variable between baseline and midterm surveys
varied across regions. Analogous linear regression
models were used for outcomes measured as
continuous variables.

Changes in Maternal, Newborn and Child Health in 115 Rural Ethiopian Woredas: JSI Research & Training Institute, Inc./L10K 22
Changes in Maternal, Newborn and Child Health in 115 Rural Ethiopian Woredas: JSI Research & Training Institute, Inc./L10K 23
HOUSEHOLD AND RESPONDENT CHARACTERISTICS
This section describes the sample characteristics of the
midterm survey respondents and compares them with
the baseline survey respondents. Only the unique
respondents from all three target groups—i.e., women
of reproductive age, women with children 0 to 11
months, and women with children 12 to 23 months—
are included in the description (i.e., if a woman
participated in more than one target group responses
than she was counted only once).
Reliably demonstrating changes in MNCH
care-seeking behavior and practices between the
baseline and midterm surveys requires the assumption
that respondents to the two surveys were otherwise
similar; it was important that the background
characteristics of the baseline and midterm survey
respondents are similar or at least not very different.
This is especially true since the midterm sampling
strategy differed from the baseline sampling strategy.
Respondent characteristics
The percentage distributions of the baseline and
midterm survey respondents by program domain, age
group, marital status, education, number of children,
religion, and the distance of the respondent’s household
from any health facility according to region are
presented in Table 3. Whether differences in a particular
sample characteristic between baseline and midterm
survey respondents was assessed using Pearson’s chi-
squared statistics (adjusted for sampling weights). Since
a major fraction of the survey respondents were
selected conditionally upon having a child between the
ages 0 to 11 months or having a child between the ages
12 to 23 months, the distribution of the background
characteristics of L10K survey respondents were not
expected to be similar to that of the general population
of women of reproductive age in Ethiopia.
Baseline and midterm survey respondents in
L10K areas were similar in terms of region and program
domain, largely due to the application of sampling
weights that adjusted for differences in sampling
strategies between the baseline and midterm surveys.
Fifteen percent of the L10K population is in Tigray, 41
percent in Amhara, 24 percent in Oromia, and 20
percent in SNNP. Encouragingly, the age distribution of
the baseline and midterm survey respondents in L10K
areas was similar, with about half of the respondents
between 15 and 34 years old. Although the distribution
of respondents according to parity varied between
baseline and midterm surveys in Tigray and SNNP, on
average, it was not different across L10K areas. Nearly
half of the respondents already have four or more
children.
The vast majority of respondents (92 percent) were
married, a one percentage-point decrease in the
percentage married. It is unlikely that this small
difference in marital status between the baseline and
midterm survey will bias the observed changes over
time in MNCH indicators. At the time of the midterm
survey, the percentage not married was the highest in
Tigray (14 percent) followed by Amhara (11 percent),
followed by the other two regions (5 percent in SNNP
and 3 percent in Oromia).
Women’s education improved slightly between
the two survey periods in L10K areas, with increases
recorded in all four regions. The proportion of
respondents without any education in L10K areas was
81 percent during the baseline survey, declining to 78
percent during the midterm survey. This indicates that
women’s education in rural Ethiopia is improving,
reflecting developmental momentum in rural Ethiopia.
Almost two-thirds of the respondents in L10K
areas were Orthodox Christians, followed by Muslims
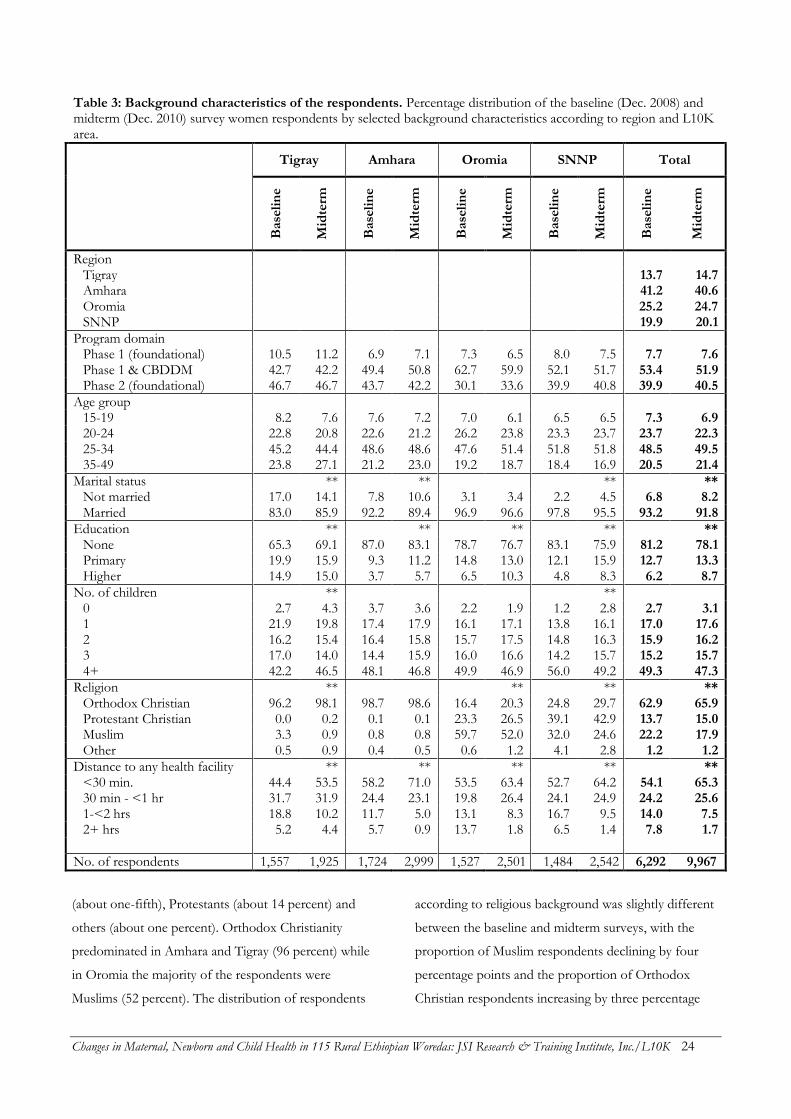
Changes in Maternal, Newborn and Child Health in 115 Rural Ethiopian Woredas: JSI Research & Training Institute, Inc./L10K 24
Table 3: Background characteristics of the respondents. Percentage distribution of the baseline (Dec. 2008) and midterm (Dec. 2010) survey women respondents by selected background characteristics according to region and L10K area.
Tigray Amhara Oromia SNNP Total
Base
lin
e
Mid
term
Base
lin
e
Mid
term
Base
lin
e
Mid
term
Base
lin
e
Mid
term
Base
lin
e
Mid
term
Region Tigray 13.7 14.7 Amhara 41.2 40.6 Oromia 25.2 24.7 SNNP 19.9 20.1
Program domain
Phase 1 (foundational) 10.5 11.2 6.9 7.1 7.3 6.5 8.0 7.5 7.7 7.6 Phase 1 & CBDDM 42.7 42.2 49.4 50.8 62.7 59.9 52.1 51.7 53.4 51.9 Phase 2 (foundational) 46.7 46.7 43.7 42.2 30.1 33.6 39.9 40.8 39.9 40.5
Age group
15-19 8.2 7.6 7.6 7.2 7.0 6.1 6.5 6.5 7.3 6.9 20-24 22.8 20.8 22.6 21.2 26.2 23.8 23.3 23.7 23.7 22.3 25-34 45.2 44.4 48.6 48.6 47.6 51.4 51.8 51.8 48.5 49.5 35-49 23.8 27.1 21.2 23.0 19.2 18.7 18.4 16.9 20.5 21.4
Marital status
**
**
**
** Not married 17.0 14.1 7.8 10.6 3.1 3.4 2.2 4.5 6.8 8.2 Married 83.0 85.9 92.2 89.4 96.9 96.6 97.8 95.5 93.2 91.8
Education
**
**
**
**
** None 65.3 69.1 87.0 83.1 78.7 76.7 83.1 75.9 81.2 78.1 Primary 19.9 15.9 9.3 11.2 14.8 13.0 12.1 15.9 12.7 13.3 Higher 14.9 15.0 3.7 5.7 6.5 10.3 4.8 8.3 6.2 8.7
No. of children
**
**
0 2.7 4.3 3.7 3.6 2.2 1.9 1.2 2.8 2.7 3.1 1 21.9 19.8 17.4 17.9 16.1 17.1 13.8 16.1 17.0 17.6 2 16.2 15.4 16.4 15.8 15.7 17.5 14.8 16.3 15.9 16.2 3 17.0 14.0 14.4 15.9 16.0 16.6 14.2 15.7 15.2 15.7 4+ 42.2 46.5 48.1 46.8 49.9 46.9 56.0 49.2 49.3 47.3
Religion
**
**
**
** Orthodox Christian 96.2 98.1 98.7 98.6 16.4 20.3 24.8 29.7 62.9 65.9 Protestant Christian 0.0 0.2 0.1 0.1 23.3 26.5 39.1 42.9 13.7 15.0 Muslim 3.3 0.9 0.8 0.8 59.7 52.0 32.0 24.6 22.2 17.9 Other 0.5 0.9 0.4 0.5 0.6 1.2 4.1 2.8 1.2 1.2
Distance to any health facility ** ** ** ** ** <30 min. 44.4 53.5 58.2 71.0 53.5 63.4 52.7 64.2 54.1 65.3 30 min - <1 hr 31.7 31.9 24.4 23.1 19.8 26.4 24.1 24.9 24.2 25.6 1-<2 hrs 18.8 10.2 11.7 5.0 13.1 8.3 16.7 9.5 14.0 7.5 2+ hrs 5.2 4.4 5.7 0.9 13.7 1.8 6.5 1.4 7.8 1.7
No. of respondents 1,557 1,925 1,724 2,999 1,527 2,501 1,484 2,542 6,292 9,967
(about one-fifth), Protestants (about 14 percent) and
others (about one percent). Orthodox Christianity
predominated in Amhara and Tigray (96 percent) while
in Oromia the majority of the respondents were
Muslims (52 percent). The distribution of respondents
according to religious background was slightly different
between the baseline and midterm surveys, with the
proportion of Muslim respondents declining by four
percentage points and the proportion of Orthodox
Christian respondents increasing by three percentage
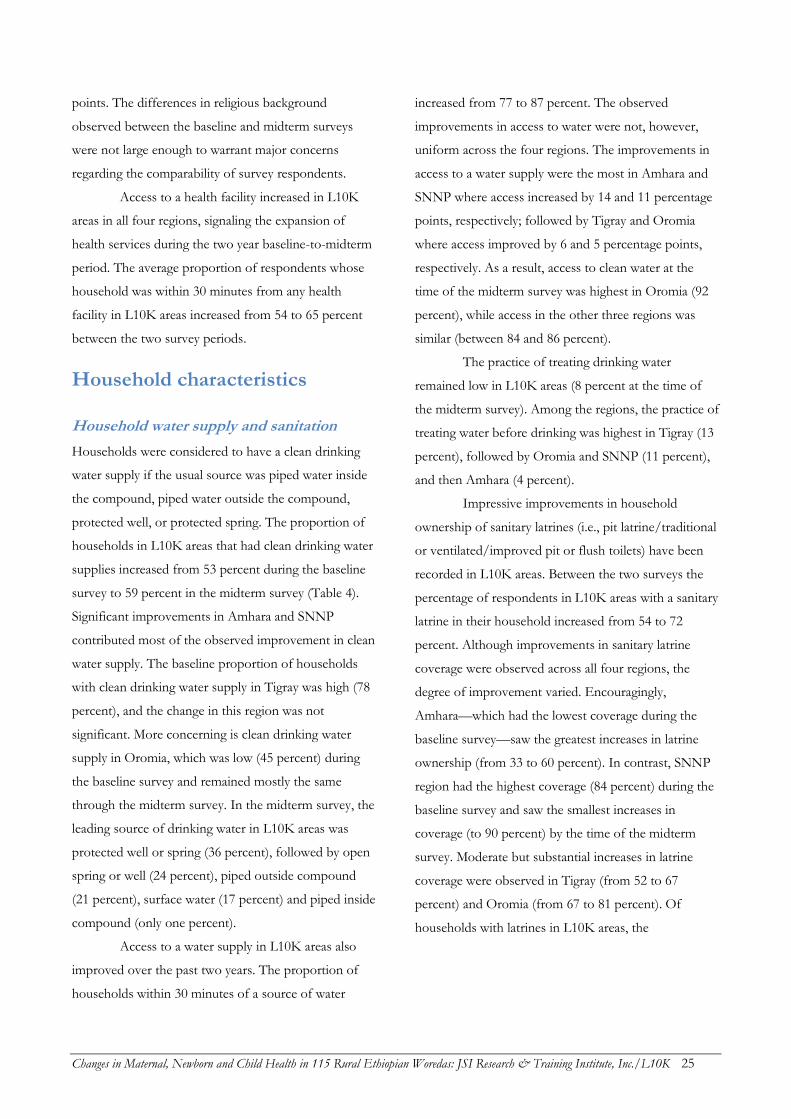
Changes in Maternal, Newborn and Child Health in 115 Rural Ethiopian Woredas: JSI Research & Training Institute, Inc./L10K 25
points. The differences in religious background
observed between the baseline and midterm surveys
were not large enough to warrant major concerns
regarding the comparability of survey respondents.
Access to a health facility increased in L10K
areas in all four regions, signaling the expansion of
health services during the two year baseline-to-midterm
period. The average proportion of respondents whose
household was within 30 minutes from any health
facility in L10K areas increased from 54 to 65 percent
between the two survey periods.
Household characteristics
Household water supply and sanitation
Households were considered to have a clean drinking
water supply if the usual source was piped water inside
the compound, piped water outside the compound,
protected well, or protected spring. The proportion of
households in L10K areas that had clean drinking water
supplies increased from 53 percent during the baseline
survey to 59 percent in the midterm survey (Table 4).
Significant improvements in Amhara and SNNP
contributed most of the observed improvement in clean
water supply. The baseline proportion of households
with clean drinking water supply in Tigray was high (78
percent), and the change in this region was not
significant. More concerning is clean drinking water
supply in Oromia, which was low (45 percent) during
the baseline survey and remained mostly the same
through the midterm survey. In the midterm survey, the
leading source of drinking water in L10K areas was
protected well or spring (36 percent), followed by open
spring or well (24 percent), piped outside compound
(21 percent), surface water (17 percent) and piped inside
compound (only one percent).
Access to a water supply in L10K areas also
improved over the past two years. The proportion of
households within 30 minutes of a source of water
increased from 77 to 87 percent. The observed
improvements in access to water were not, however,
uniform across the four regions. The improvements in
access to a water supply were the most in Amhara and
SNNP where access increased by 14 and 11 percentage
points, respectively; followed by Tigray and Oromia
where access improved by 6 and 5 percentage points,
respectively. As a result, access to clean water at the
time of the midterm survey was highest in Oromia (92
percent), while access in the other three regions was
similar (between 84 and 86 percent).
The practice of treating drinking water
remained low in L10K areas (8 percent at the time of
the midterm survey). Among the regions, the practice of
treating water before drinking was highest in Tigray (13
percent), followed by Oromia and SNNP (11 percent),
and then Amhara (4 percent).
Impressive improvements in household
ownership of sanitary latrines (i.e., pit latrine/traditional
or ventilated/improved pit or flush toilets) have been
recorded in L10K areas. Between the two surveys the
percentage of respondents in L10K areas with a sanitary
latrine in their household increased from 54 to 72
percent. Although improvements in sanitary latrine
coverage were observed across all four regions, the
degree of improvement varied. Encouragingly,
Amhara—which had the lowest coverage during the
baseline survey—saw the greatest increases in latrine
ownership (from 33 to 60 percent). In contrast, SNNP
region had the highest coverage (84 percent) during the
baseline survey and saw the smallest increases in
coverage (to 90 percent) by the time of the midterm
survey. Moderate but substantial increases in latrine
coverage were observed in Tigray (from 52 to 67
percent) and Oromia (from 67 to 81 percent). Of
households with latrines in L10K areas, the
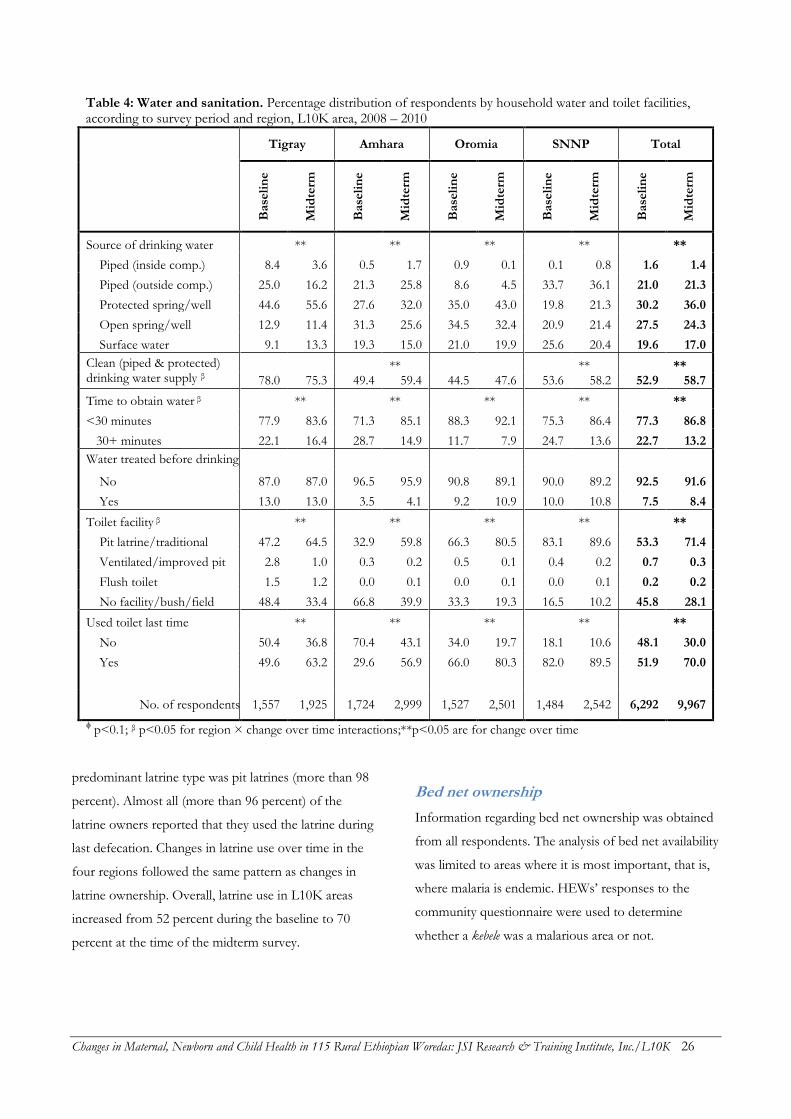
Changes in Maternal, Newborn and Child Health in 115 Rural Ethiopian Woredas: JSI Research & Training Institute, Inc./L10K 26
Table 4: Water and sanitation. Percentage distribution of respondents by household water and toilet facilities, according to survey period and region, L10K area, 2008 – 2010
Tigray Amhara Oromia SNNP Total
Base
lin
e
Mid
term
Base
lin
e
Mid
term
Base
lin
e
Mid
term
Base
lin
e
Mid
term
Base
lin
e
Mid
term
Source of drinking water
**
**
**
**
**
Piped (inside comp.) 8.4 3.6 0.5 1.7 0.9 0.1 0.1 0.8 1.6 1.4
Piped (outside comp.) 25.0 16.2 21.3 25.8 8.6 4.5 33.7 36.1 21.0 21.3
Protected spring/well 44.6 55.6 27.6 32.0 35.0 43.0 19.8 21.3 30.2 36.0
Open spring/well 12.9 11.4 31.3 25.6 34.5 32.4 20.9 21.4 27.5 24.3
Surface water 9.1 13.3 19.3 15.0 21.0 19.9 25.6 20.4 19.6 17.0
Clean (piped & protected) drinking water supply β
**
**
** 78.0 75.3 49.4 59.4 44.5 47.6 53.6 58.2 52.9 58.7
Time to obtain water β
**
**
**
**
**
<30 minutes 77.9 83.6 71.3 85.1 88.3 92.1 75.3 86.4 77.3 86.8
30+ minutes 22.1 16.4 28.7 14.9 11.7 7.9 24.7 13.6 22.7 13.2
Water treated before drinking
No 87.0 87.0 96.5 95.9 90.8 89.1 90.0 89.2 92.5 91.6
Yes 13.0 13.0 3.5 4.1 9.2 10.9 10.0 10.8 7.5 8.4
Toilet facility β
**
**
**
**
**
Pit latrine/traditional 47.2 64.5 32.9 59.8 66.3 80.5 83.1 89.6 53.3 71.4
Ventilated/improved pit 2.8 1.0 0.3 0.2 0.5 0.1 0.4 0.2 0.7 0.3
Flush toilet 1.5 1.2 0.0 0.1 0.0 0.1 0.0 0.1 0.2 0.2
No facility/bush/field 48.4 33.4 66.8 39.9 33.3 19.3 16.5 10.2 45.8 28.1
Used toilet last time
**
**
**
**
**
No 50.4 36.8 70.4 43.1 34.0 19.7 18.1 10.6 48.1 30.0
Yes 49.6 63.2 29.6 56.9 66.0 80.3 82.0 89.5 51.9 70.0
No. of respondents 1,557 1,925 1,724 2,999 1,527 2,501 1,484 2,542 6,292 9,967
ϕ p<0.1; β p<0.05 for region × change over time interactions;**p<0.05 are for change over time
predominant latrine type was pit latrines (more than 98
percent). Almost all (more than 96 percent) of the
latrine owners reported that they used the latrine during
last defecation. Changes in latrine use over time in the
four regions followed the same pattern as changes in
latrine ownership. Overall, latrine use in L10K areas
increased from 52 percent during the baseline to 70
percent at the time of the midterm survey.
Bed net ownership
Information regarding bed net ownership was obtained
from all respondents. The analysis of bed net availability
was limited to areas where it is most important, that is,
where malaria is endemic. HEWs’ responses to the
community questionnaire were used to determine
whether a kebele was a malarious area or not.
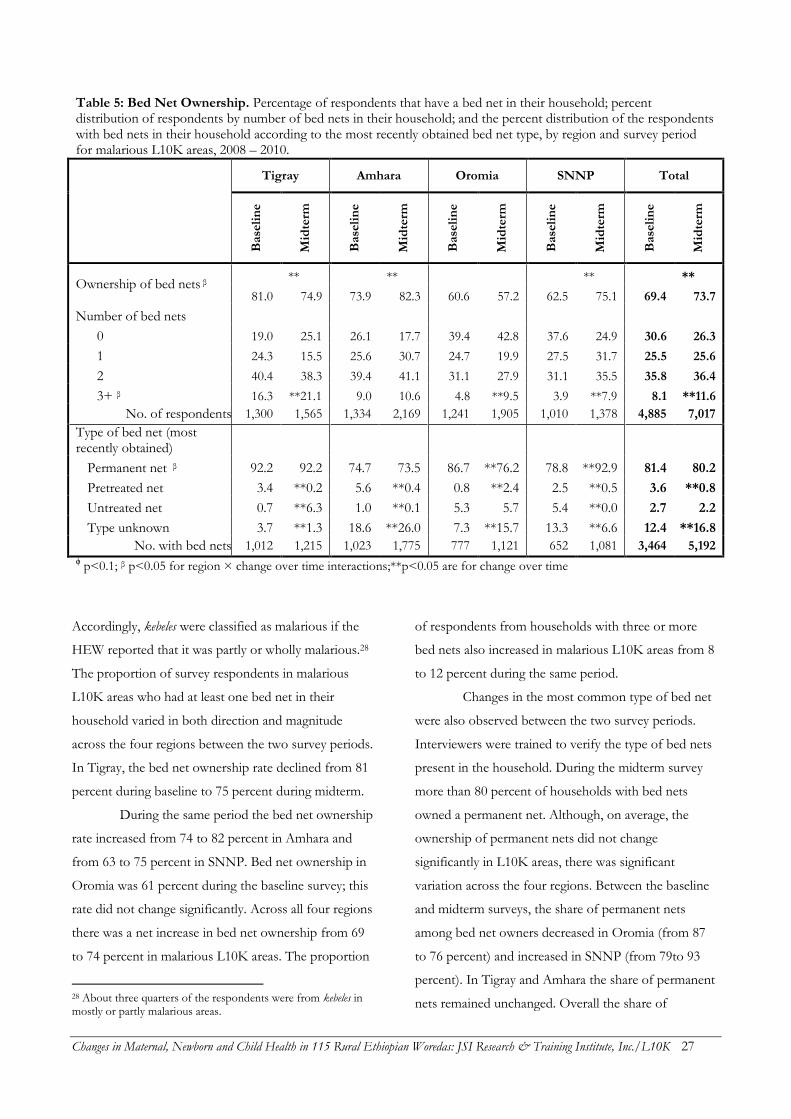
Changes in Maternal, Newborn and Child Health in 115 Rural Ethiopian Woredas: JSI Research & Training Institute, Inc./L10K 27
Table 5: Bed Net Ownership. Percentage of respondents that have a bed net in their household; percent distribution of respondents by number of bed nets in their household; and the percent distribution of the respondents with bed nets in their household according to the most recently obtained bed net type, by region and survey period for malarious L10K areas, 2008 – 2010.
Tigray Amhara Oromia SNNP Total
B
ase
lin
e
Mid
term
Base
lin
e
Mid
term
Base
lin
e
Mid
term
Base
lin
e
Mid
term
Base
lin
e
Mid
term
Ownership of bed nets β
**
**
**
**
81.0 74.9 73.9 82.3 60.6 57.2 62.5 75.1 69.4 73.7
Number of bed nets 0 19.0 25.1 26.1 17.7 39.4 42.8 37.6 24.9 30.6 26.3
1 24.3 15.5 25.6 30.7 24.7 19.9 27.5 31.7 25.5 25.6
2 40.4 38.3 39.4 41.1 31.1 27.9 31.1 35.5 35.8 36.4
3+ β 16.3 **21.1 9.0 10.6 4.8 **9.5 3.9 **7.9 8.1 **11.6
No. of respondents 1,300 1,565 1,334 2,169 1,241 1,905 1,010 1,378 4,885 7,017
Type of bed net (most recently obtained)
Permanent net β 92.2 92.2 74.7 73.5 86.7 **76.2 78.8 **92.9 81.4 80.2
Pretreated net 3.4 **0.2 5.6 **0.4 0.8 **2.4 2.5 **0.5 3.6 **0.8
Untreated net 0.7 **6.3 1.0 **0.1 5.3 5.7 5.4 **0.0 2.7 2.2
Type unknown 3.7 **1.3 18.6 **26.0 7.3 **15.7 13.3 **6.6 12.4 **16.8
No. with bed nets 1,012 1,215 1,023 1,775 777 1,121 652 1,081 3,464 5,192 ϕ p<0.1; β p<0.05 for region × change over time interactions;**p<0.05 are for change over time
Accordingly, kebeles were classified as malarious if the
HEW reported that it was partly or wholly malarious.28
The proportion of survey respondents in malarious
L10K areas who had at least one bed net in their
household varied in both direction and magnitude
across the four regions between the two survey periods.
In Tigray, the bed net ownership rate declined from 81
percent during baseline to 75 percent during midterm.
During the same period the bed net ownership
rate increased from 74 to 82 percent in Amhara and
from 63 to 75 percent in SNNP. Bed net ownership in
Oromia was 61 percent during the baseline survey; this
rate did not change significantly. Across all four regions
there was a net increase in bed net ownership from 69
to 74 percent in malarious L10K areas. The proportion
28 About three quarters of the respondents were from kebeles in mostly or partly malarious areas.
of respondents from households with three or more
bed nets also increased in malarious L10K areas from 8
to 12 percent during the same period.
Changes in the most common type of bed net
were also observed between the two survey periods.
Interviewers were trained to verify the type of bed nets
present in the household. During the midterm survey
more than 80 percent of households with bed nets
owned a permanent net. Although, on average, the
ownership of permanent nets did not change
significantly in L10K areas, there was significant
variation across the four regions. Between the baseline
and midterm surveys, the share of permanent nets
among bed net owners decreased in Oromia (from 87
to 76 percent) and increased in SNNP (from 79to 93
percent). In Tigray and Amhara the share of permanent
nets remained unchanged. Overall the share of
Changes in Maternal, Newborn and Child Health in 115 Rural Ethiopian Woredas: JSI Research & Training Institute, Inc./L10K 28
pretreated nets among bed net owners declined from
four percent to about one percent; despite the increase
in the share of pretreated nets in Tigray. Between the
two survey periods the proportion of bed net owners
who had untreated bed nets increased in Tigray and
decreased in Amhara and SNNP; the overall result was
that there was no net change in the share of untreated
nets among bed net owners in malarious L10K areas.
For about 17 percent of respondents to the midterm
survey, the type of bed net could not be determined.
The highest rates of unknown bed net type was
observed in Amhara (26 percent), followed by Oromia
(16 percent), SNNP (7 percent), and Tigray (one
percent) regions.
Conclusion
There was significant economic and social development
in L10K areas between the baseline survey conducted in
December 2008 and the midterm survey conducted in
December 2010. Improvements in women’s education,
access to health facilities, access to water, toilet facilities
and household ownership of bed nets were observed.
Improvements in education and health facility access
likely contributed to changes in the MNCH indicators
of interest for this study. However, the minor changes
in sample characteristics (especially marital status and
religion) between baseline and midterm survey
respondents are less likely to be associated with changes
in the MNCH indicators.
Changes in Maternal, Newborn and Child Health in 115 Rural Ethiopian Woredas: JSI Research & Training Institute, Inc./L10K 29
SITUATION ANALYSIS OF KEBELE HEALTH SERVICES
This section describes changes in health infrastructure,
health services, and health systems that support the
health extension program (HEP) in L10K area kebeles
using data from the baseline and midterm community
surveys. The midterm survey results are used to
describe the current situation, with an emphasis on
maternal, newborn and child health services. The
specific topics included in this section are the coverage
of the health extension program, measures of L10K
program intensity, community health promoters and
their anchors, the kebele health committee, supportive
supervision, health management information system
(HMIS), and logistics systems including the availability
of essential health supplies and commodities.
The analysis of changes in the health services
situation in L10K kebeles between the two survey
periods is separated by region to better inform the
regional health bureaus (RHBs), as these fairly
autonomous bodies implement the HEP in their
respective regions. However, sample sizes at the kebeles
(i.e., community) level are small, ranging from 49 to 54
responses per kebele at baseline and 63 to 89 responses
during the midterm survey. Thus there was insufficient
statistical power to determine whether changes to the
health services within each region were statistically
significant (even if the changes appeared to be
programmatically significant, in most cases).
Unadjusted bivariate statistical analyses were
used to detect significant changes (p<0.1) over time or
to detect significant differences (p<0.1) between regions
during a single survey period. Effect modification
analysis was used to assess whether the rate of change
of the indicator was different between regions.
Statistical tests for each outcome indicator of interest
were done to answer the following questions:
1) Has there been significant change (of the indicator)
between the baseline and the midterm surveys?
2) Is the rate of change of the indicator between
baseline and midterm surveys different across
regions? In other words, does the change over time
of the indicator vary by region? If so, across which
regions were the difference in change over time
mainly observed? And,
3) Is there any significant variation of the indicator
across the regions at the time of the midterm survey?
The primary limitation of this analysis by
region is the small sample size. Therefore, statistical
power to assess different rates of change in the health
service situation across regions was very low. Only the
statistically significant (p<0.1) results are described.
Health extension program
coverage
Table 6 shows the coverage of L10K area kebeles with
any health facility (i.e., health post, health center, health
station,29 or hospital), with a health post, with at least
one HEW, and the mean number of people served by
one HEW across survey periods. The findings indicate
that the HEP has reached universal coverage in L10K
areas. Between December 2008 and December 2010,
the percentage of L10K kebeles with any health facility
increased from 87 to 97 percent; the percentage with at
least one health post increased from 77 to 91 percent;
and the percentage with at least one HEW increased
from 94 to 99 percent.30 The change in the number of
people covered by one HEW was not significant (from
3,267 to 3,104 people per HEW).
An increase in the presence of any health
facility in kebeles was observed only in Amhara (from 94
29 Health centers and health stations are higher-level health facilities staffed with nurses, midwives and health officers.
30 In the absence of health posts the HEWs work from rented houses. Accordingly, the presence of health posts indicated by the analysis includes only those that were constructed by the local government and reflects the performance of the government to expand the HEP.
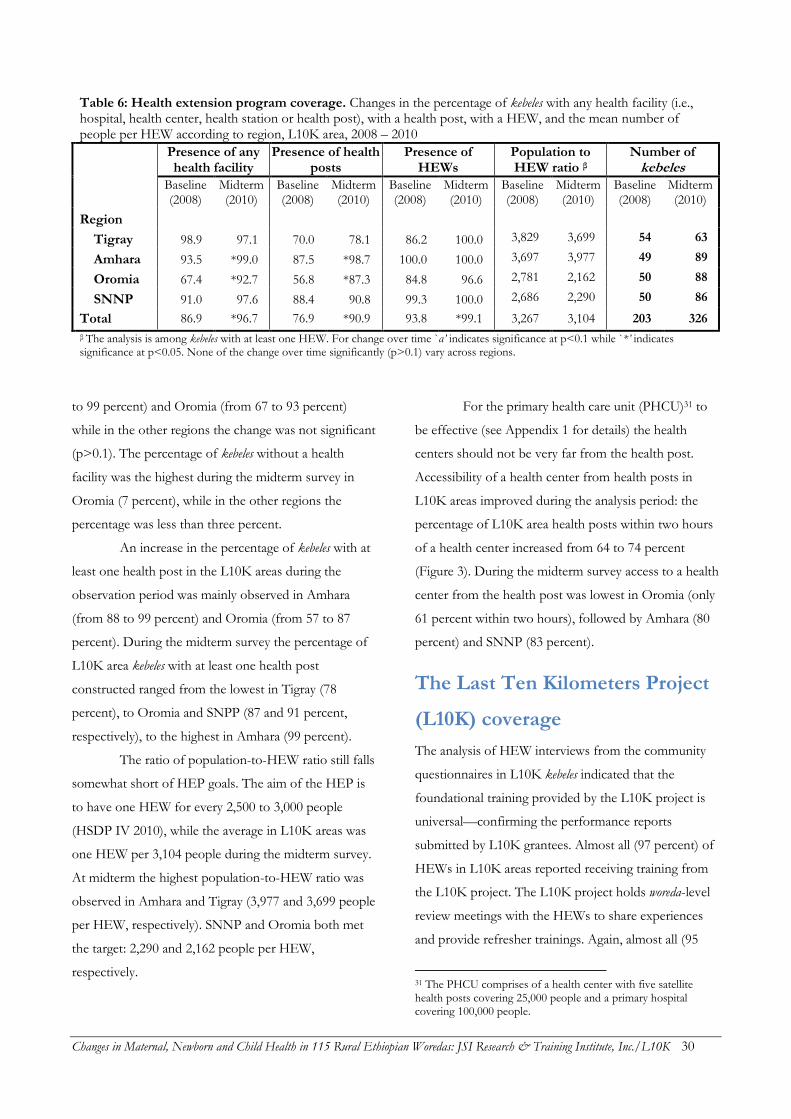
Changes in Maternal, Newborn and Child Health in 115 Rural Ethiopian Woredas: JSI Research & Training Institute, Inc./L10K 30
Table 6: Health extension program coverage. Changes in the percentage of kebeles with any health facility (i.e., hospital, health center, health station or health post), with a health post, with a HEW, and the mean number of people per HEW according to region, L10K area, 2008 – 2010
Presence of any health facility
Presence of health posts
Presence of HEWs
Population to HEW ratio β
Number of kebeles
Baseline (2008)
Midterm (2010)
Baseline (2008)
Midterm (2010)
Baseline (2008)
Midterm (2010)
Baseline (2008)
Midterm (2010)
Baseline (2008)
Midterm (2010)
Region Tigray 98.9 97.1 70.0 78.1 86.2 100.0 3,829 3,699 54 63
Amhara 93.5 *99.0 87.5 *98.7 100.0 100.0 3,697 3,977 49 89
Oromia 67.4 *92.7 56.8 *87.3 84.8 96.6 2,781 2,162 50 88
SNNP 91.0 97.6 88.4 90.8 99.3 100.0 2,686 2,290 50 86
Total 86.9 *96.7 76.9 *90.9 93.8 *99.1 3,267 3,104 203 326
β The analysis is among kebeles with at least one HEW. For change over time `α’ indicates significance at p<0.1 while `*’ indicates significance at p<0.05. None of the change over time significantly (p>0.1) vary across regions.
to 99 percent) and Oromia (from 67 to 93 percent)
while in the other regions the change was not significant
(p>0.1). The percentage of kebeles without a health
facility was the highest during the midterm survey in
Oromia (7 percent), while in the other regions the
percentage was less than three percent.
An increase in the percentage of kebeles with at
least one health post in the L10K areas during the
observation period was mainly observed in Amhara
(from 88 to 99 percent) and Oromia (from 57 to 87
percent). During the midterm survey the percentage of
L10K area kebeles with at least one health post
constructed ranged from the lowest in Tigray (78
percent), to Oromia and SNPP (87 and 91 percent,
respectively), to the highest in Amhara (99 percent).
The ratio of population-to-HEW ratio still falls
somewhat short of HEP goals. The aim of the HEP is
to have one HEW for every 2,500 to 3,000 people
(HSDP IV 2010), while the average in L10K areas was
one HEW per 3,104 people during the midterm survey.
At midterm the highest population-to-HEW ratio was
observed in Amhara and Tigray (3,977 and 3,699 people
per HEW, respectively). SNNP and Oromia both met
the target: 2,290 and 2,162 people per HEW,
respectively.
For the primary health care unit (PHCU)31 to
be effective (see Appendix 1 for details) the health
centers should not be very far from the health post.
Accessibility of a health center from health posts in
L10K areas improved during the analysis period: the
percentage of L10K area health posts within two hours
of a health center increased from 64 to 74 percent
(Figure 3). During the midterm survey access to a health
center from the health post was lowest in Oromia (only
61 percent within two hours), followed by Amhara (80
percent) and SNNP (83 percent).
The Last Ten Kilometers Project
(L10K) coverage
The analysis of HEW interviews from the community
questionnaires in L10K kebeles indicated that the
foundational training provided by the L10K project is
universal—confirming the performance reports
submitted by L10K grantees. Almost all (97 percent) of
HEWs in L10K areas reported receiving training from
the L10K project. The L10K project holds woreda-level
review meetings with the HEWs to share experiences
and provide refresher trainings. Again, almost all (95
31 The PHCU comprises of a health center with five satellite health posts covering 25,000 people and a primary hospital covering 100,000 people.
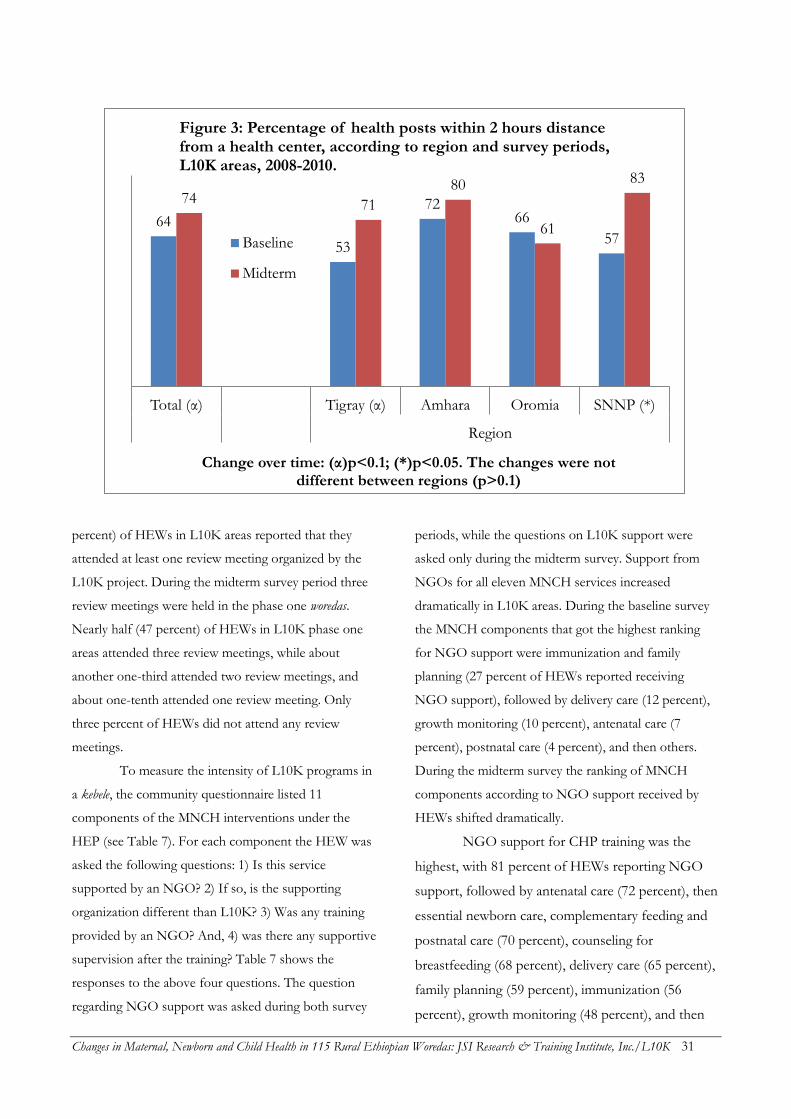
Changes in Maternal, Newborn and Child Health in 115 Rural Ethiopian Woredas: JSI Research & Training Institute, Inc./L10K 31
percent) of HEWs in L10K areas reported that they
attended at least one review meeting organized by the
L10K project. During the midterm survey period three
review meetings were held in the phase one woredas.
Nearly half (47 percent) of HEWs in L10K phase one
areas attended three review meetings, while about
another one-third attended two review meetings, and
about one-tenth attended one review meeting. Only
three percent of HEWs did not attend any review
meetings.
To measure the intensity of L10K programs in
a kebele, the community questionnaire listed 11
components of the MNCH interventions under the
HEP (see Table 7). For each component the HEW was
asked the following questions: 1) Is this service
supported by an NGO? 2) If so, is the supporting
organization different than L10K? 3) Was any training
provided by an NGO? And, 4) was there any supportive
supervision after the training? Table 7 shows the
responses to the above four questions. The question
regarding NGO support was asked during both survey
periods, while the questions on L10K support were
asked only during the midterm survey. Support from
NGOs for all eleven MNCH services increased
dramatically in L10K areas. During the baseline survey
the MNCH components that got the highest ranking
for NGO support were immunization and family
planning (27 percent of HEWs reported receiving
NGO support), followed by delivery care (12 percent),
growth monitoring (10 percent), antenatal care (7
percent), postnatal care (4 percent), and then others.
During the midterm survey the ranking of MNCH
components according to NGO support received by
HEWs shifted dramatically.
NGO support for CHP training was the
highest, with 81 percent of HEWs reporting NGO
support, followed by antenatal care (72 percent), then
essential newborn care, complementary feeding and
postnatal care (70 percent), counseling for
breastfeeding (68 percent), delivery care (65 percent),
family planning (59 percent), immunization (56
percent), growth monitoring (48 percent), and then
64
53
72 66
57
74 71
80
61
83
Total (α) Tigray (α) Amhara Oromia SNNP (*)
Region
Change over time: (α)p<0.1; (*)p<0.05. The changes were not different between regions (p>0.1)
Figure 3: Percentage of health posts within 2 hours distance from a health center, according to region and survey periods, L10K areas, 2008-2010.
Baseline
Midterm
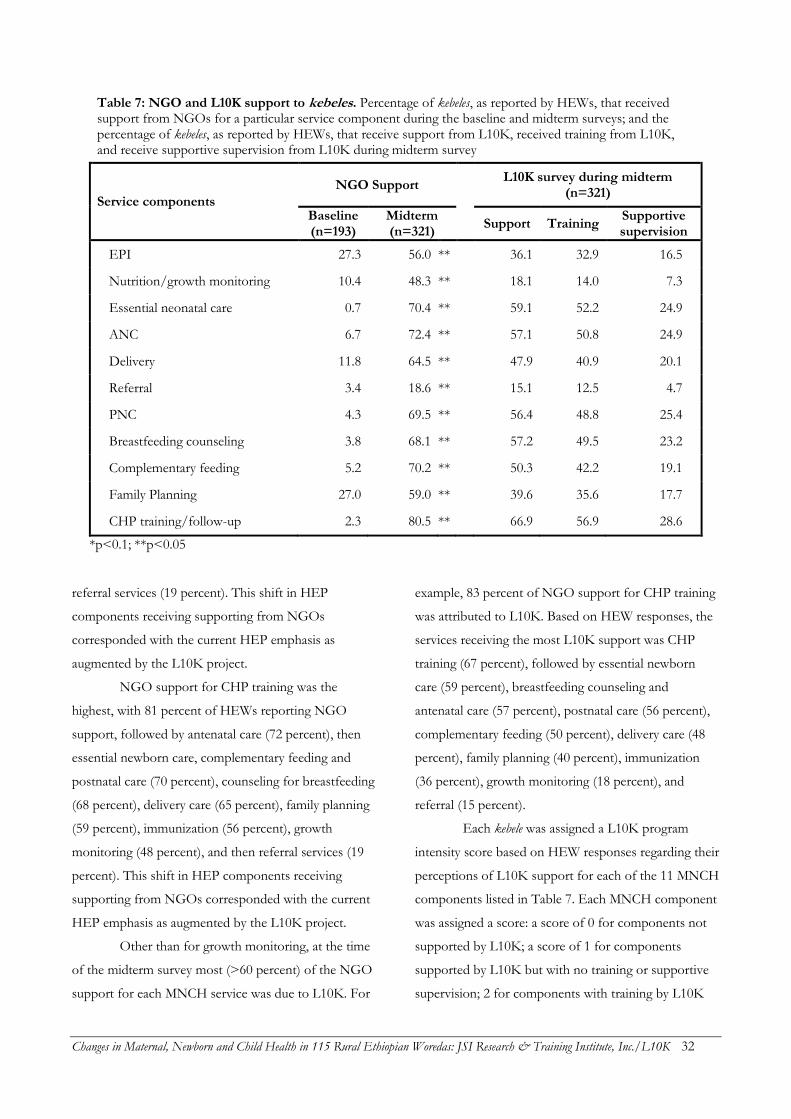
Changes in Maternal, Newborn and Child Health in 115 Rural Ethiopian Woredas: JSI Research & Training Institute, Inc./L10K 32
Table 7: NGO and L10K support to kebeles. Percentage of kebeles, as reported by HEWs, that received support from NGOs for a particular service component during the baseline and midterm surveys; and the percentage of kebeles, as reported by HEWs, that receive support from L10K, received training from L10K, and receive supportive supervision from L10K during midterm survey
Service components
NGO Support
L10K survey during midterm (n=321)
Baseline (n=193)
Midterm (n=321)
Support Training Supportive supervision
EPI 27.3 56.0 **
36.1 32.9 16.5
Nutrition/growth monitoring 10.4 48.3 **
18.1 14.0 7.3
Essential neonatal care 0.7 70.4 **
59.1 52.2 24.9
ANC 6.7 72.4 **
57.1 50.8 24.9
Delivery 11.8 64.5 **
47.9 40.9 20.1
Referral 3.4 18.6 **
15.1 12.5 4.7
PNC 4.3 69.5 **
56.4 48.8 25.4
Breastfeeding counseling 3.8 68.1 **
57.2 49.5 23.2
Complementary feeding 5.2 70.2 **
50.3 42.2 19.1
Family Planning 27.0 59.0 **
39.6 35.6 17.7
CHP training/follow-up 2.3 80.5 **
66.9 56.9 28.6
*p<0.1; **p<0.05
referral services (19 percent). This shift in HEP
components receiving supporting from NGOs
corresponded with the current HEP emphasis as
augmented by the L10K project.
NGO support for CHP training was the
highest, with 81 percent of HEWs reporting NGO
support, followed by antenatal care (72 percent), then
essential newborn care, complementary feeding and
postnatal care (70 percent), counseling for breastfeeding
(68 percent), delivery care (65 percent), family planning
(59 percent), immunization (56 percent), growth
monitoring (48 percent), and then referral services (19
percent). This shift in HEP components receiving
supporting from NGOs corresponded with the current
HEP emphasis as augmented by the L10K project.
Other than for growth monitoring, at the time
of the midterm survey most (>60 percent) of the NGO
support for each MNCH service was due to L10K. For
example, 83 percent of NGO support for CHP training
was attributed to L10K. Based on HEW responses, the
services receiving the most L10K support was CHP
training (67 percent), followed by essential newborn
care (59 percent), breastfeeding counseling and
antenatal care (57 percent), postnatal care (56 percent),
complementary feeding (50 percent), delivery care (48
percent), family planning (40 percent), immunization
(36 percent), growth monitoring (18 percent), and
referral (15 percent).
Each kebele was assigned a L10K program
intensity score based on HEW responses regarding their
perceptions of L10K support for each of the 11 MNCH
components listed in Table 7. Each MNCH component
was assigned a score: a score of 0 for components not
supported by L10K; a score of 1 for components
supported by L10K but with no training or supportive
supervision; 2 for components with training by L10K
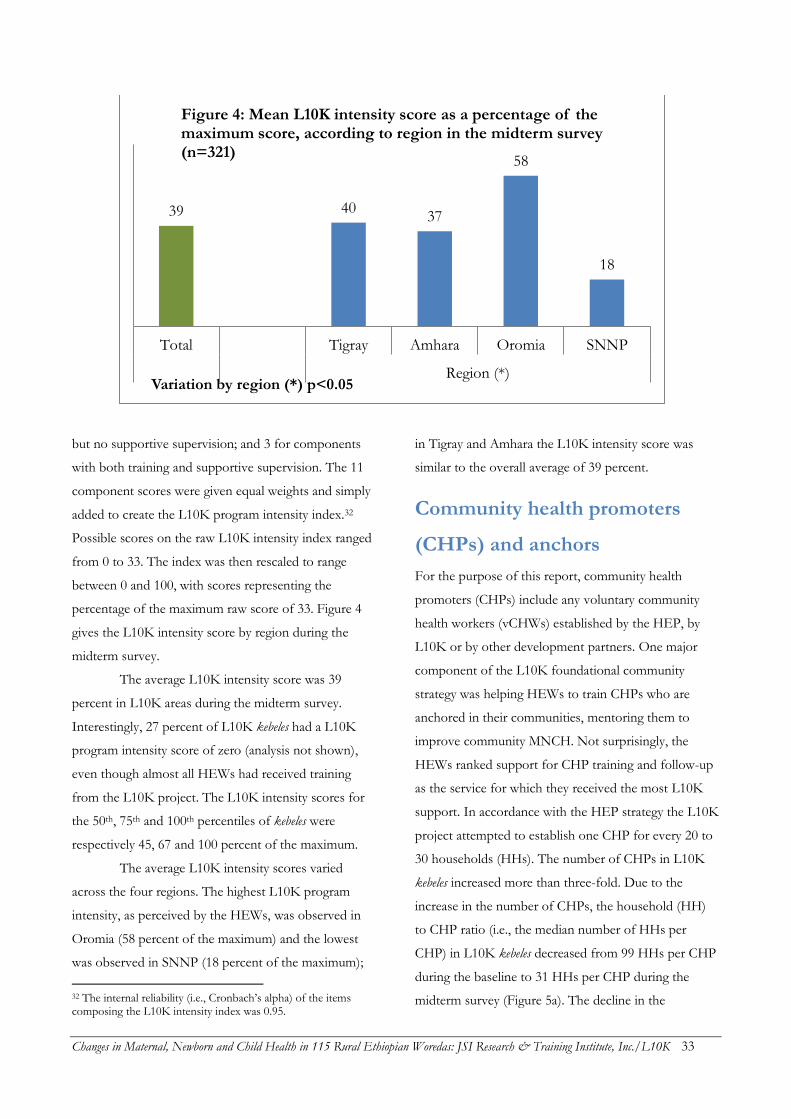
Changes in Maternal, Newborn and Child Health in 115 Rural Ethiopian Woredas: JSI Research & Training Institute, Inc./L10K 33
but no supportive supervision; and 3 for components
with both training and supportive supervision. The 11
component scores were given equal weights and simply
added to create the L10K program intensity index.32
Possible scores on the raw L10K intensity index ranged
from 0 to 33. The index was then rescaled to range
between 0 and 100, with scores representing the
percentage of the maximum raw score of 33. Figure 4
gives the L10K intensity score by region during the
midterm survey.
The average L10K intensity score was 39
percent in L10K areas during the midterm survey.
Interestingly, 27 percent of L10K kebeles had a L10K
program intensity score of zero (analysis not shown),
even though almost all HEWs had received training
from the L10K project. The L10K intensity scores for
the 50th, 75th and 100th percentiles of kebeles were
respectively 45, 67 and 100 percent of the maximum.
The average L10K intensity scores varied
across the four regions. The highest L10K program
intensity, as perceived by the HEWs, was observed in
Oromia (58 percent of the maximum) and the lowest
was observed in SNNP (18 percent of the maximum);
32 The internal reliability (i.e., Cronbach’s alpha) of the items composing the L10K intensity index was 0.95.
in Tigray and Amhara the L10K intensity score was
similar to the overall average of 39 percent.
Community health promoters
(CHPs) and anchors
For the purpose of this report, community health
promoters (CHPs) include any voluntary community
health workers (vCHWs) established by the HEP, by
L10K or by other development partners. One major
component of the L10K foundational community
strategy was helping HEWs to train CHPs who are
anchored in their communities, mentoring them to
improve community MNCH. Not surprisingly, the
HEWs ranked support for CHP training and follow-up
as the service for which they received the most L10K
support. In accordance with the HEP strategy the L10K
project attempted to establish one CHP for every 20 to
30 households (HHs). The number of CHPs in L10K
kebeles increased more than three-fold. Due to the
increase in the number of CHPs, the household (HH)
to CHP ratio (i.e., the median number of HHs per
CHP) in L10K kebeles decreased from 99 HHs per CHP
during the baseline to 31 HHs per CHP during the
midterm survey (Figure 5a). The decline in the
39 40 37
58
18
Total Tigray Amhara Oromia SNNP
Region (*)Variation by region (*) p<0.05
Figure 4: Mean L10K intensity score as a percentage of the maximum score, according to region in the midterm survey (n=321)
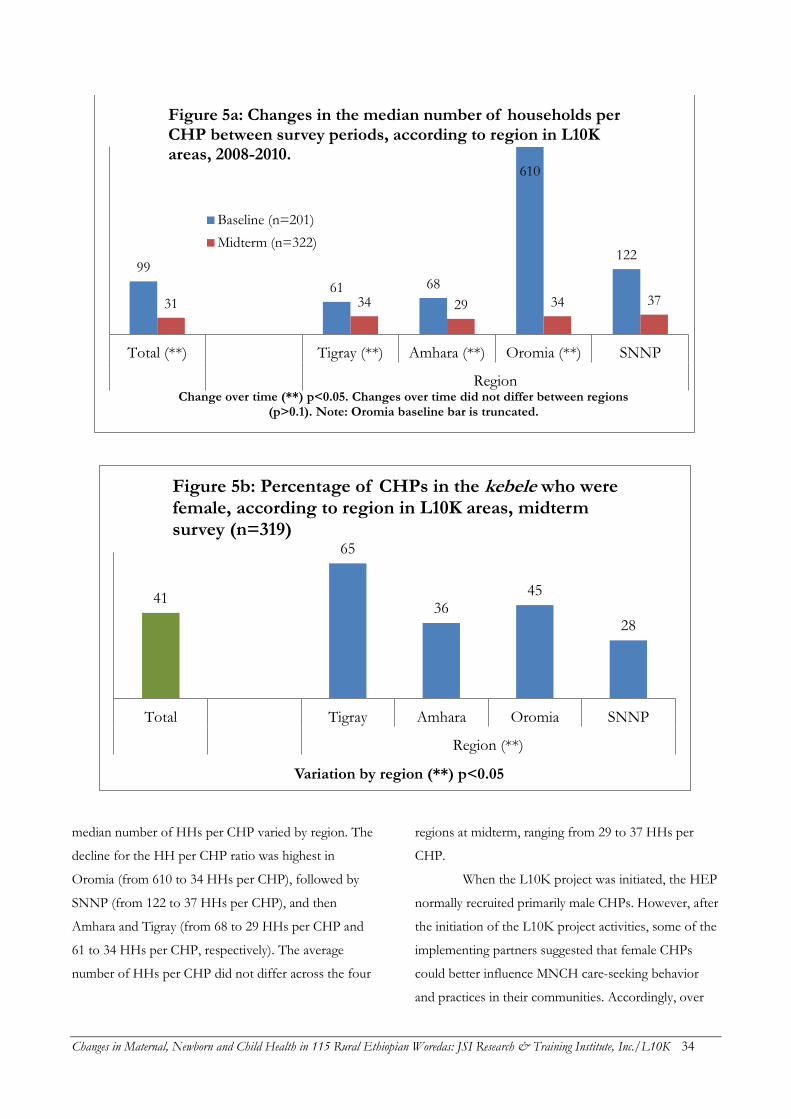
Changes in Maternal, Newborn and Child Health in 115 Rural Ethiopian Woredas: JSI Research & Training Institute, Inc./L10K 34
median number of HHs per CHP varied by region. The
decline for the HH per CHP ratio was highest in
Oromia (from 610 to 34 HHs per CHP), followed by
SNNP (from 122 to 37 HHs per CHP), and then
Amhara and Tigray (from 68 to 29 HHs per CHP and
61 to 34 HHs per CHP, respectively). The average
number of HHs per CHP did not differ across the four
regions at midterm, ranging from 29 to 37 HHs per
CHP.
When the L10K project was initiated, the HEP
normally recruited primarily male CHPs. However, after
the initiation of the L10K project activities, some of the
implementing partners suggested that female CHPs
could better influence MNCH care-seeking behavior
and practices in their communities. Accordingly, over
99
61 68
610
122
31 34 29 34 37
Total (**) Tigray (**) Amhara (**) Oromia (**) SNNP
RegionChange over time (**) p<0.05. Changes over time did not differ between regions
(p>0.1). Note: Oromia baseline bar is truncated.
Figure 5a: Changes in the median number of households per CHP between survey periods, according to region in L10K areas, 2008-2010.
Baseline (n=201)
Midterm (n=322)
41
65
36 45
28
Total Tigray Amhara Oromia SNNP
Region (**)
Variation by region (**) p<0.05
Figure 5b: Percentage of CHPs in the kebele who were female, according to region in L10K areas, midterm survey (n=319)
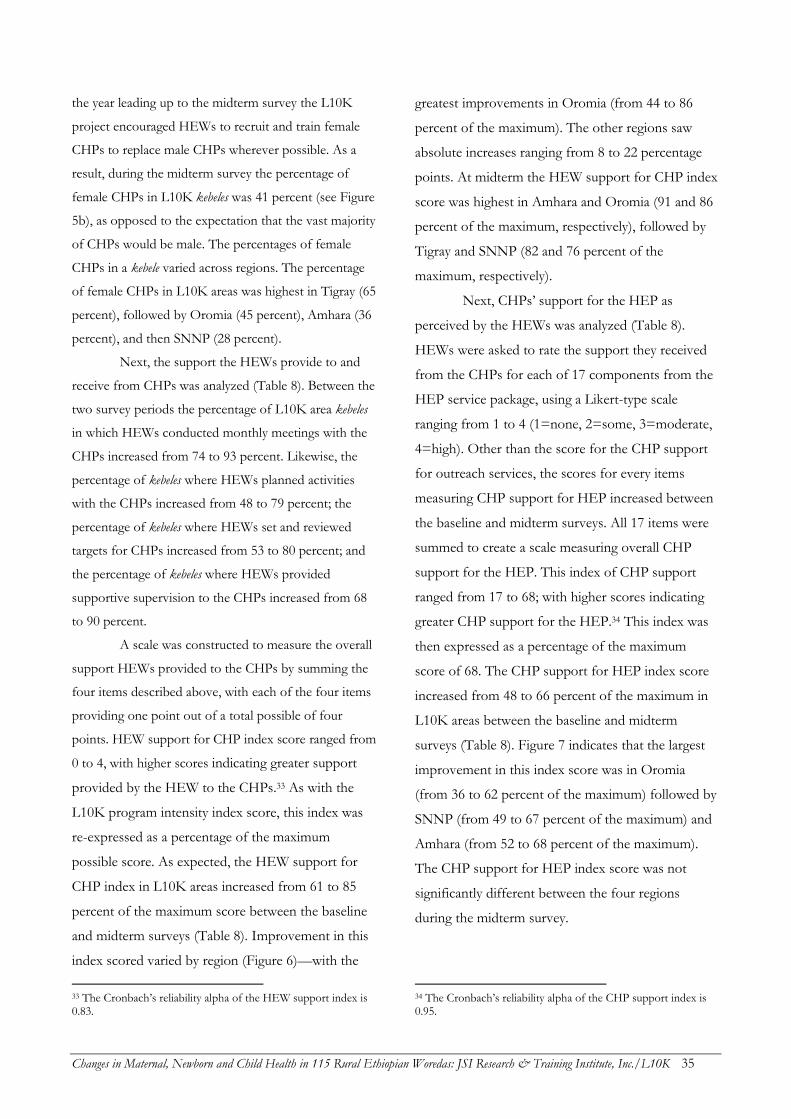
Changes in Maternal, Newborn and Child Health in 115 Rural Ethiopian Woredas: JSI Research & Training Institute, Inc./L10K 35
the year leading up to the midterm survey the L10K
project encouraged HEWs to recruit and train female
CHPs to replace male CHPs wherever possible. As a
result, during the midterm survey the percentage of
female CHPs in L10K kebeles was 41 percent (see Figure
5b), as opposed to the expectation that the vast majority
of CHPs would be male. The percentages of female
CHPs in a kebele varied across regions. The percentage
of female CHPs in L10K areas was highest in Tigray (65
percent), followed by Oromia (45 percent), Amhara (36
percent), and then SNNP (28 percent).
Next, the support the HEWs provide to and
receive from CHPs was analyzed (Table 8). Between the
two survey periods the percentage of L10K area kebeles
in which HEWs conducted monthly meetings with the
CHPs increased from 74 to 93 percent. Likewise, the
percentage of kebeles where HEWs planned activities
with the CHPs increased from 48 to 79 percent; the
percentage of kebeles where HEWs set and reviewed
targets for CHPs increased from 53 to 80 percent; and
the percentage of kebeles where HEWs provided
supportive supervision to the CHPs increased from 68
to 90 percent.
A scale was constructed to measure the overall
support HEWs provided to the CHPs by summing the
four items described above, with each of the four items
providing one point out of a total possible of four
points. HEW support for CHP index score ranged from
0 to 4, with higher scores indicating greater support
provided by the HEW to the CHPs.33 As with the
L10K program intensity index score, this index was
re-expressed as a percentage of the maximum
possible score. As expected, the HEW support for
CHP index in L10K areas increased from 61 to 85
percent of the maximum score between the baseline
and midterm surveys (Table 8). Improvement in this
index scored varied by region (Figure 6)—with the
33 The Cronbach’s reliability alpha of the HEW support index is 0.83.
greatest improvements in Oromia (from 44 to 86
percent of the maximum). The other regions saw
absolute increases ranging from 8 to 22 percentage
points. At midterm the HEW support for CHP index
score was highest in Amhara and Oromia (91 and 86
percent of the maximum, respectively), followed by
Tigray and SNNP (82 and 76 percent of the
maximum, respectively).
Next, CHPs’ support for the HEP as
perceived by the HEWs was analyzed (Table 8).
HEWs were asked to rate the support they received
from the CHPs for each of 17 components from the
HEP service package, using a Likert-type scale
ranging from 1 to 4 (1=none, 2=some, 3=moderate,
4=high). Other than the score for the CHP support
for outreach services, the scores for every items
measuring CHP support for HEP increased between
the baseline and midterm surveys. All 17 items were
summed to create a scale measuring overall CHP
support for the HEP. This index of CHP support
ranged from 17 to 68; with higher scores indicating
greater CHP support for the HEP.34 This index was
then expressed as a percentage of the maximum
score of 68. The CHP support for HEP index score
increased from 48 to 66 percent of the maximum in
L10K areas between the baseline and midterm
surveys (Table 8). Figure 7 indicates that the largest
improvement in this index score was in Oromia
(from 36 to 62 percent of the maximum) followed by
SNNP (from 49 to 67 percent of the maximum) and
Amhara (from 52 to 68 percent of the maximum).
The CHP support for HEP index score was not
significantly different between the four regions
during the midterm survey.
34 The Cronbach’s reliability alpha of the CHP support index is 0.95.
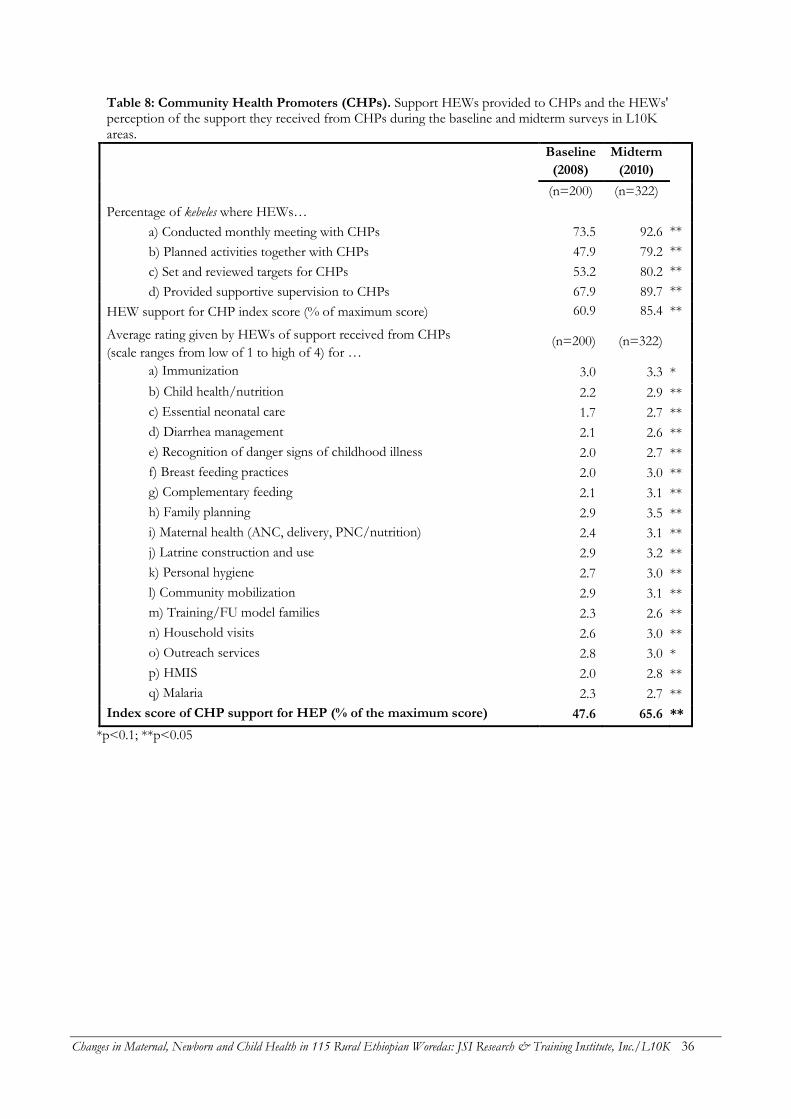
Changes in Maternal, Newborn and Child Health in 115 Rural Ethiopian Woredas: JSI Research & Training Institute, Inc./L10K 36
Table 8: Community Health Promoters (CHPs). Support HEWs provided to CHPs and the HEWs' perception of the support they received from CHPs during the baseline and midterm surveys in L10K areas.
Baseline
(2008)
Midterm
(2010)
(n=200) (n=322)
Percentage of kebeles where HEWs…
a) Conducted monthly meeting with CHPs 73.5 92.6 **
b) Planned activities together with CHPs 47.9 79.2 **
c) Set and reviewed targets for CHPs 53.2 80.2 **
d) Provided supportive supervision to CHPs 67.9 89.7 **
HEW support for CHP index score (% of maximum score) 60.9 85.4 **
Average rating given by HEWs of support received from CHPs
(scale ranges from low of 1 to high of 4) for … (n=200) (n=322)
a) Immunization 3.0 3.3 *
b) Child health/nutrition 2.2 2.9 **
c) Essential neonatal care 1.7 2.7 **
d) Diarrhea management 2.1 2.6 **
e) Recognition of danger signs of childhood illness 2.0 2.7 **
f) Breast feeding practices 2.0 3.0 **
g) Complementary feeding 2.1 3.1 **
h) Family planning 2.9 3.5 **
i) Maternal health (ANC, delivery, PNC/nutrition) 2.4 3.1 **
j) Latrine construction and use 2.9 3.2 **
k) Personal hygiene 2.7 3.0 **
l) Community mobilization 2.9 3.1 **
m) Training/FU model families 2.3 2.6 **
n) Household visits 2.6 3.0 **
o) Outreach services 2.8 3.0 *
p) HMIS 2.0 2.8 **
q) Malaria 2.3 2.7 **
Index score of CHP support for HEP (% of the maximum score) 47.6 65.6 **
*p<0.1; **p<0.05
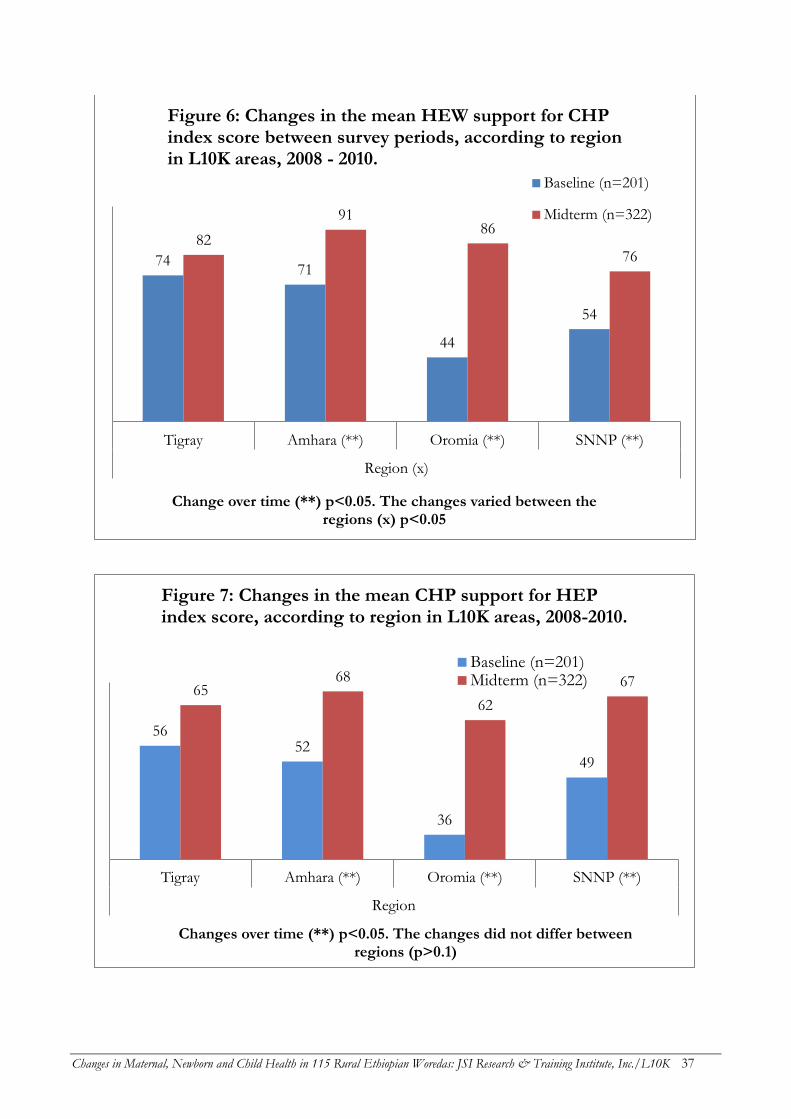
Changes in Maternal, Newborn and Child Health in 115 Rural Ethiopian Woredas: JSI Research & Training Institute, Inc./L10K 37
74 71
44
54
82
91 86
76
Tigray Amhara (**) Oromia (**) SNNP (**)
Region (x)
Change over time (**) p<0.05. The changes varied between the regions (x) p<0.05
Figure 6: Changes in the mean HEW support for CHP index score between survey periods, according to region in L10K areas, 2008 - 2010.
Baseline (n=201)
Midterm (n=322)
56 52
36
49
65 68
62
67
Tigray Amhara (**) Oromia (**) SNNP (**)
Region
Changes over time (**) p<0.05. The changes did not differ between regions (p>0.1)
Figure 7: Changes in the mean CHP support for HEP index score, according to region in L10K areas, 2008-2010.
Baseline (n=201)Midterm (n=322)
Changes in Maternal, Newborn and Child Health in 115 Rural Ethiopian Woredas: JSI Research & Training Institute, Inc./L10K 38
Kebele health committees
One of the two HEWs in a kebele is expected to be a
member of the kebele administration and serve as the
secretary of the kebele health committee. The kebele
health committee is responsible for ensuring that the
HEP is being smoothly implemented within the kebele.
The L10K project encourages the HEWs to use the
kebele health committee to organize community
mobilization activities including promoting community
conversations, establishing anchors, motivating CHPs
to sustain their activities, and mitigating problems
associated with providing services within the kebele. In
the CBDDM areas the kebele health committee is also
engaged in monitoring and evaluating MNCH services
in the kebele. The percentage of the L10K kebeles where
kebele health committee meetings usually take place
every month or every quarter increased from 38 to 54
percent between the baseline and midterm surveys
(Figure 8). This improvement in the regularity of the
kebele health committee meetings was significant only
for Tigray (from 41 to 80 percent). Kebele health
committee meetings were more regular at midterm in
Tigray (80 percent) compared to the other three regions,
where the indicator ranged from 43 to 55 percent.
Next, the HEWs’ perceptions regarding the support
they receive from the kebele health committee was
analyzed. HEWs were asked to rate the support that
they get from the kebele health committee for each of
the 12 components of the HEP service package. Each
of the 12 components was assigned a score on a Likert-
type scale ranging from 1 to 5 (1=none, 2=limited,
3=some, 4=frequent, 5=always). Other than the scores
for transporting essential supplies from the woreda and
for school health, the scores for the all the items
measuring kebele health committee support for HEP
increased (see Table 9). A scale was constructed to
measure the overall support the HEP receives from
the kebele health committee by summing all the 12
items. The possible kebele health committee support
index score ranged from 12 to 60, with higher scores
38 41
36 36 41
54
80
43
54 55
Total (**) Tigray (**) Amhara Oromia SNNP
Region
Change over time (**) p<0.05. The changes were not different between regions (p>0.1)
Figure 8: Changes in the percentage of kebeles where kebele health committee meetings are held every month or every quarter, according to region in L10K areas, 2008 - 2010.
Baseline (n=201)
Midterm (n=322)
Changes in Maternal, Newborn and Child Health in 115 Rural Ethiopian Woredas: JSI Research & Training Institute, Inc./L10K 39
Table 9: Kebele health committee support for HEP. Changes in HEW’s perception of support received from kebele health committees between baseline and midterm surveys in L10K areas, expressed in a Likert-type scale from a low of 1 to a high of 5.
Baseline (2008)
Midterm (2010)
(n=196) (n=312)
a) Plan and monitor health extension program activities (e.g. outreach services) 2.2 2.5 **
b) Pull essential supplies from the woreda 1.9 2.0
c) Pull supportive supervision from the woreda 1.6 2.0 **
d) Identify barriers to quality RMNCH services 1.8 2.4 **
e) Coordinate with local public and private sector developmental partners to overcome barriers to quality RMNCH services 1.8 2.4 **
f) Referral services for essential obstetric care 1.7 2.2 **
g) Providing referral services for sick children 1.8 2.2 **
h) Mobilizing the community 2.3 2.9 **
i) Constructing latrines 2.4 2.9 **
j) Promoting personal hygiene 2.2 2.7 **
k) Promoting school health 2.2 2.4
l) Providing incentives/encouragement to vCHWs/CHPs 1.4 2.5 **
Index score of kebele health committee support for HEP (% of maximum score) 24.1 35.3 **
*p<0.1; **p<0.05
indicating relatively stronger support from the kebele
health committee.35 The index was then expressed as a
percentage of the maximum possible score. The average
kebele health committee support index for L10K
increased modestly from 24 to 35 percent of the
maximum score between the baseline and midterm
surveys.
Figure 9 indicates that changes in the kebele
health committee support index scores differed by
region. While the index score did not change in SNNP,
the other three regions saw improvement between
baseline and midterm: In Tigray it increased from 30 to
46 percent of the maximum, in Amhara from 15 to 26
percent, and in Oromia from 25 to 45 percent.
Although the kebele health committee support index
improved in Amhara, the average score there was still
the lowest (26 percent), along with SNNP (32 percent).
35 The Cronbach’s reliability alpha of the kebele health committee support index was 0.95.
Oromia’s average kebele health committee support index
score was 45 percent of the maximum, while in Tigray it
was 46 percent.
Supportive supervision
Providing supportive supervision to the HEWs is vital
to ensure the quality of HEP services, as well as to
encourage and motivate HEWs and CHPs. The
percentage of L10K area kebeles that received supportive
supervision during the last three months increased from
62 percent during baseline to 76 percent during the
midterm (Table 10). The improvements in supportive
supervision varied between the four regions (Figure 9).
The gains were mainly observed in Oromia (from 37 to
89 percent), and Tigray (from 49 to 90 percent). At
midterm the lowest rate of supportive supervision was
reported in Amhara (60 percent).
Changes in Maternal, Newborn and Child Health in 115 Rural Ethiopian Woredas: JSI Research & Training Institute, Inc./L10K 40
30
15
25
35
46
26
45
32
Tigray (**) Amhara (**) Oromia (**) SNNP
Region (x)Change over time (**)p<0.05. The changes over time varied between
regions (x) p <0.05
Figure 9: Changes in the mean kebele health committee support index score, according to region in L10K areas, 2008-2010.
Baseline (n=201)
Midterm (n=322)
49
71
37
86 90
60
89
80
Tigray (**) Amhara Oromia (**) SNNP
Region (x)
Change over time (**) p<0.05. The changes over time differed between regions (x) p<0.05
Figure 10: Changes in the percentage of kebeles that received supportive supervisory visits during the last three months, according to region in L10K areas, 2008-2010.
Baseline (n=201)
Midterm (n=322)
Changes in Maternal, Newborn and Child Health in 115 Rural Ethiopian Woredas: JSI Research & Training Institute, Inc./L10K 41
Table 10: Supportive supervision. During the baseline and midterm surveys in the L10K areas, the percentage of kebeles that received supportive supervision visits during the last three months; components of the supportive supervision visits; and the average number of components of the supportive supervision received during the most recent visit.
Baseline (2008)
Midterm (2010)
n=200 n=320
Supportive supervision visits within last three months 62.3 76.2 **
Supportive supervision visits included…
a) Receiving supplies 51.7 61.5
b) Reviewing record keeping and reporting (HMIS) 80.5 85.9
c) Observing interaction with clients 46.3 54.2
d) Providing written feedback 35.8 43.0
e) Providing encouragement 68.3 79.6 *
f) Providing updates on administrative or technical issues 46.7 68.5 **
g) Discussing problems the HEW encountered 65.7 83.0 **
h) Conducting household visits 54.0 67.3 *
i) Reviewing work plans and results 63.7 80.6 **
j) Discussing CHP activities 36.4 71.3 **
Quality of supportive supervision index score (% of the maximum score)
54.6 69.3 **
*p<0.1; **p<0.05
Supportive supervision has several
components, and the improvements between the
baseline and midterm surveys were constituted largely
by changes in a few activities. Discussions of CHP
activities increased from 36 to 71 percent, followed by
updates on administrative and technical issues (from 47
to 69 percent), discussion of problems encountered
(from 66 to 83 percent), reviewing work-plans and
results (from 64 to 81 percent), conducting household
visits (from 54 to 67 percent), and providing
encouragement (from 68 to 80 percent). Although
there is still room for improvement in all areas of
supervision, the supervisory areas that lagged at
midterm include providing written feedback (43
percent), observing client interactions (54 percent),
enquiring about the adequacy of supplies (62 percent),
and conducting household visits (67 percent).
A scale was constructed to measure the quality
of the supportive supervision in L10K areas by
summing 10 items that measure supportive supervision.
Each item contributed one point to the index; possible
scores on the supportive supervision index ranged from
0 to 10, with higher index scores indicating better
quality of supportive supervisory visits.36 The scale was
then expressed as a percentage of the maximum
possible score. The mean value of the supportive
supervisory visit index score increased from 55 to 69
percent of the maximum between the baseline and
midterm surveys (Table 10). Figure 11 indicates that
improvements in the quality of supportive supervision
varied by region, with the greatest improvements being
observed in Oromia (from 43 to 74 percent of the
maximum) and Amhara (from 54 to 69 percent of the
maximum), followed by the other two regions.
However, the quality of supportive supervision was
similar across all four regions during the midterm
survey.
36 The Cronbach’s reliability alpha of the quality of the supportive supervision index was 0.73.
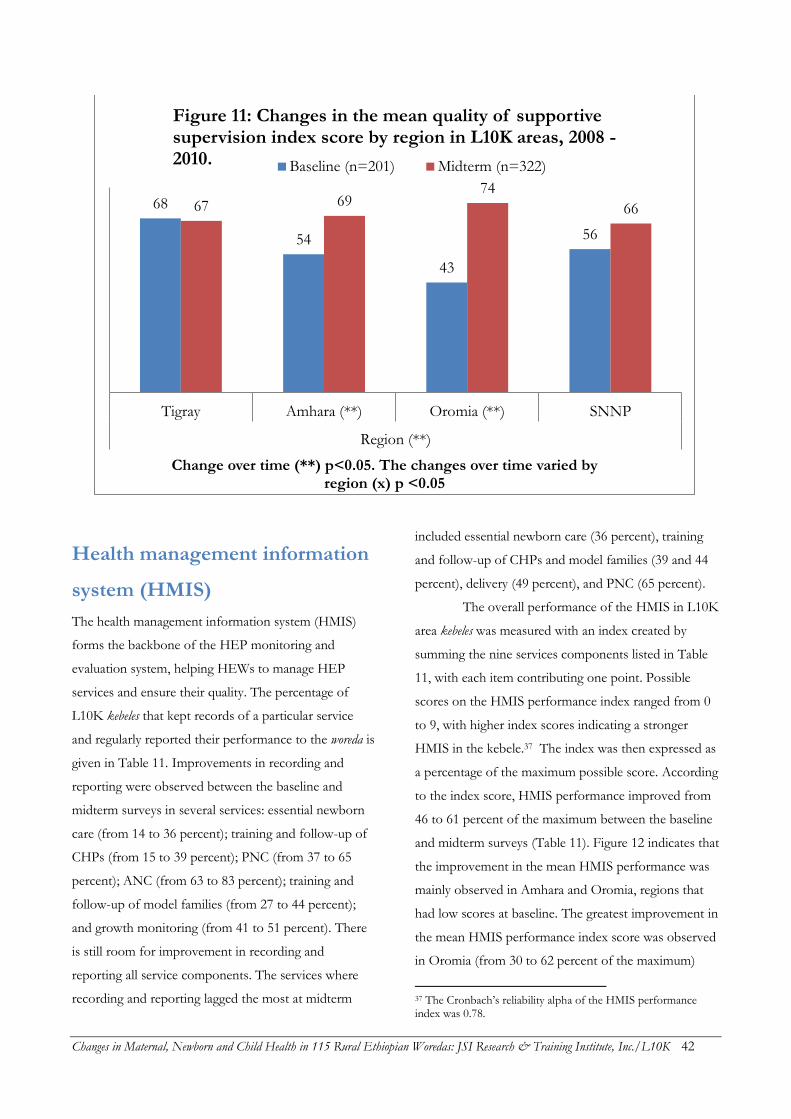
Changes in Maternal, Newborn and Child Health in 115 Rural Ethiopian Woredas: JSI Research & Training Institute, Inc./L10K 42
Health management information
system (HMIS)
The health management information system (HMIS)
forms the backbone of the HEP monitoring and
evaluation system, helping HEWs to manage HEP
services and ensure their quality. The percentage of
L10K kebeles that kept records of a particular service
and regularly reported their performance to the woreda is
given in Table 11. Improvements in recording and
reporting were observed between the baseline and
midterm surveys in several services: essential newborn
care (from 14 to 36 percent); training and follow-up of
CHPs (from 15 to 39 percent); PNC (from 37 to 65
percent); ANC (from 63 to 83 percent); training and
follow-up of model families (from 27 to 44 percent);
and growth monitoring (from 41 to 51 percent). There
is still room for improvement in recording and
reporting all service components. The services where
recording and reporting lagged the most at midterm
included essential newborn care (36 percent), training
and follow-up of CHPs and model families (39 and 44
percent), delivery (49 percent), and PNC (65 percent).
The overall performance of the HMIS in L10K
area kebeles was measured with an index created by
summing the nine services components listed in Table
11, with each item contributing one point. Possible
scores on the HMIS performance index ranged from 0
to 9, with higher index scores indicating a stronger
HMIS in the kebele.37 The index was then expressed as
a percentage of the maximum possible score. According
to the index score, HMIS performance improved from
46 to 61 percent of the maximum between the baseline
and midterm surveys (Table 11). Figure 12 indicates that
the improvement in the mean HMIS performance was
mainly observed in Amhara and Oromia, regions that
had low scores at baseline. The greatest improvement in
the mean HMIS performance index score was observed
in Oromia (from 30 to 62 percent of the maximum)
37 The Cronbach’s reliability alpha of the HMIS performance index was 0.78.
68
54
43
56
67 69 74
66
Tigray Amhara (**) Oromia (**) SNNP
Region (**)
Change over time (**) p<0.05. The changes over time varied by region (x) p <0.05
Figure 11: Changes in the mean quality of supportive supervision index score by region in L10K areas, 2008 - 2010. Baseline (n=201) Midterm (n=322)
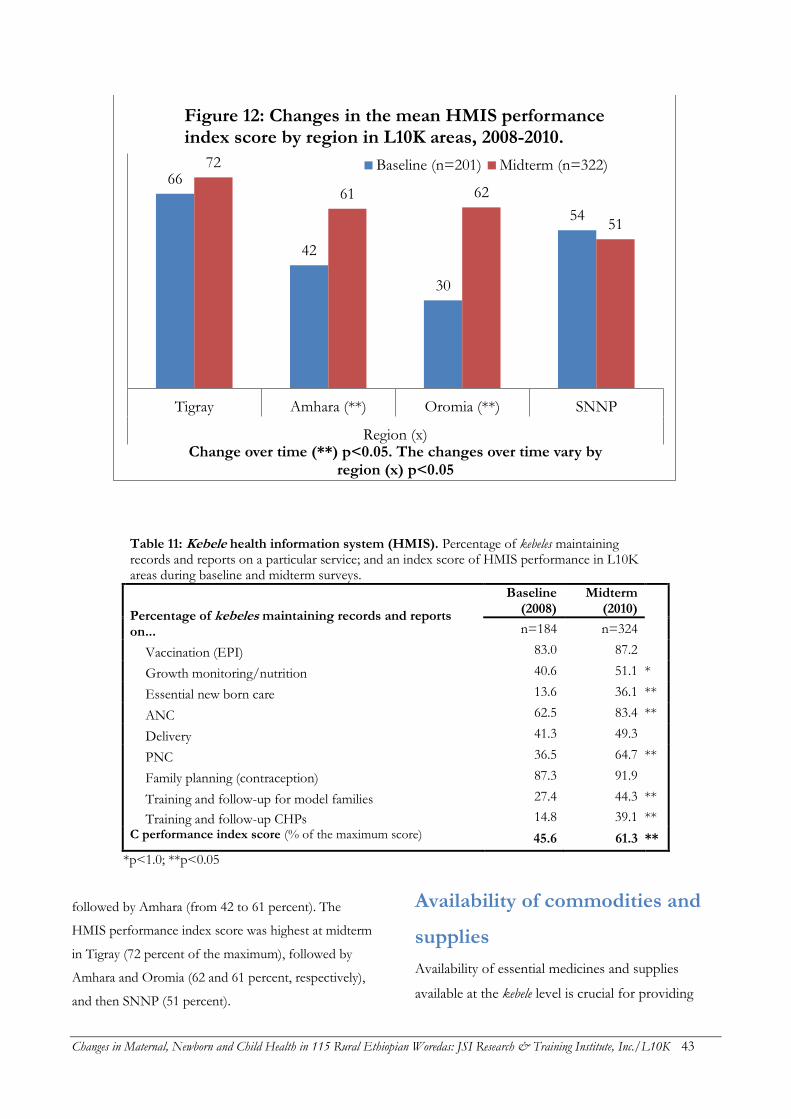
Changes in Maternal, Newborn and Child Health in 115 Rural Ethiopian Woredas: JSI Research & Training Institute, Inc./L10K 43
Table 11: Kebele health information system (HMIS). Percentage of kebeles maintaining records and reports on a particular service; and an index score of HMIS performance in L10K areas during baseline and midterm surveys.
Percentage of kebeles maintaining records and reports on...
Baseline (2008)
Midterm (2010)
n=184 n=324
Vaccination (EPI) 83.0 87.2
Growth monitoring/nutrition 40.6 51.1 *
Essential new born care 13.6 36.1 **
ANC 62.5 83.4 **
Delivery 41.3 49.3
PNC 36.5 64.7 **
Family planning (contraception) 87.3 91.9
Training and follow-up for model families 27.4 44.3 **
Training and follow-up CHPs 14.8 39.1 **
C performance index score (% of the maximum score) 45.6 61.3 **
*p<1.0; **p<0.05
followed by Amhara (from 42 to 61 percent). The
HMIS performance index score was highest at midterm
in Tigray (72 percent of the maximum), followed by
Amhara and Oromia (62 and 61 percent, respectively),
and then SNNP (51 percent).
Availability of commodities and
supplies
Availability of essential medicines and supplies
available at the kebele level is crucial for providing
66
42
30
54
72
61 62
51
Tigray Amhara (**) Oromia (**) SNNP
Region (x)Change over time (**) p<0.05. The changes over time vary by
region (x) p<0.05
Figure 12: Changes in the mean HMIS performance index score by region in L10K areas, 2008-2010.
Baseline (n=201) Midterm (n=322)
Changes in Maternal, Newborn and Child Health in 115 Rural Ethiopian Woredas: JSI Research & Training Institute, Inc./L10K 44
optimal maternal, newborn and child health services.
Stock-outs of essential commodities may lead to
program failure; for example, family planning clients
who leave health facilities without receiving
contraceptives may have unintended pregnancies
with all the adverse consequences. Therefore,
availability of essential medicines in the kebeles’ health
posts is essential for the success of the HEP. The
availability of essential commodities reflects the
performance of HEP commodity supply chains.
Contraceptive commodity availability in L10K kebeles
improved substantially between the baseline and
midterm surveys (Table 12). The percentage of kebeles
where combination pill was available during the day
of the survey visit increased from 60 to 83 percent;
availability of injectable contraceptives improved
from 64 to 88 percent; and the availability of male
condoms increased from 49 to 68 percent. The
availability of commodities for child health also
improved substantially, including oral rehydration
salts (ORS) (from 38 to 65 percent), vitamin A (30 to
62 percent), de-worming (18 to 51 percent),
artemisinin combination therapy (ACT) (37 to 52
percent) and vaccines (19 to 36 percent). However,
cotrimoxizole was not available anywhere, and
availability of other child health commodities was less
than optimal. Particularly concerning was the
availability of iron tablets, a vital maternal health
commodity, which was very low during the baseline
survey (only 27 percent) and remained more-or-less
the same during the midterm survey (29 percent).
Providing high-quality HEP services requires
continuous availability of essential supplies,
equipment, and tools, not to mention
communication. The availability of most supplies and
equipment in kebeles improved between the baseline
and midterm surveys (Table 12). Nevertheless,
availability of a functional refrigerator and an ORT
corner remains low (24 and 33 percent, respectively).
The availability of the essential supplies listed in
Table 12 was used to construct an essential supplies
availability index, with higher scores indicating better
availability of supplies. This index was also expressed
as a percentage of the maximum possible score. The
essential supplies availability index increased from 44
to 67 percent of the maximum between the baseline
and midterm surveys.
Since the financing, procurement and supply
chain systems for reproductive, child and maternal
health commodities in the HEP may face different
obstacles, the availability of commodities for
reproductive, child, and maternal health were
assessed separately. For this purpose, all the
commodities within each service category were
summed to produce commodity availability indices.
The indices were then expressed as percentages of
the maximum possible score. The contraceptive
availability index includes the availability of
combination pills, injectables and condoms; the child
health commodity availability index includes ORS,
vitamin A, vaccines, de-worming medication,
cotrimoxizole, and anti-malarials; and the maternal
health commodity availability index includes iron
tablets, misoprostol and ergometrine. Table 12 shows
that the contraceptive availability index score
improved from 59 to 85 percent of the maximum
between the baseline and midterm surveys in L10K
areas; the child health commodity availability index
score improved from 25 to 47 percent; and the
maternal health commodity availability index score
remained more-or-less unchanged during the same
period (between 14 and 11 percent of the maximum).
Figure 13 shows that the contraceptive availability index
score in L10K area kebeles improved uniformly in all
four regions. The availability of contraceptives was
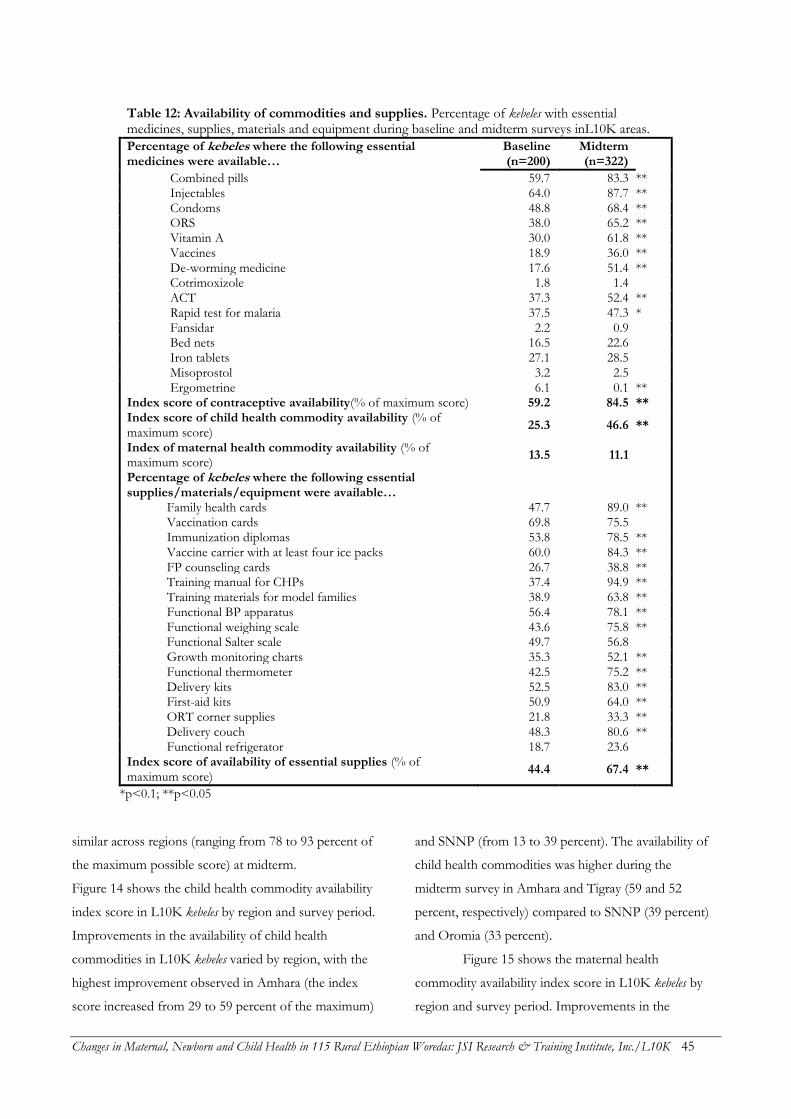
Changes in Maternal, Newborn and Child Health in 115 Rural Ethiopian Woredas: JSI Research & Training Institute, Inc./L10K 45
Table 12: Availability of commodities and supplies. Percentage of kebeles with essential medicines, supplies, materials and equipment during baseline and midterm surveys inL10K areas.
Percentage of kebeles where the following essential medicines were available…
Baseline (n=200)
Midterm (n=322)
Combined pills 59.7 83.3 ** Injectables 64.0 87.7 ** Condoms 48.8 68.4 ** ORS 38.0 65.2 ** Vitamin A 30.0 61.8 ** Vaccines 18.9 36.0 ** De-worming medicine 17.6 51.4 ** Cotrimoxizole 1.8 1.4 ACT 37.3 52.4 ** Rapid test for malaria 37.5 47.3 * Fansidar 2.2 0.9 Bed nets 16.5 22.6 Iron tablets 27.1 28.5 Misoprostol 3.2 2.5 Ergometrine 6.1 0.1 **
Index score of contraceptive availability(% of maximum score) 59.2 84.5 ** Index score of child health commodity availability (% of maximum score)
25.3 46.6 **
Index of maternal health commodity availability (% of maximum score)
13.5 11.1
Percentage of kebeles where the following essential supplies/materials/equipment were available…
Family health cards 47.7 89.0 ** Vaccination cards 69.8 75.5 Immunization diplomas 53.8 78.5 ** Vaccine carrier with at least four ice packs 60.0 84.3 ** FP counseling cards 26.7 38.8 ** Training manual for CHPs 37.4 94.9 ** Training materials for model families 38.9 63.8 ** Functional BP apparatus 56.4 78.1 ** Functional weighing scale 43.6 75.8 ** Functional Salter scale 49.7 56.8 Growth monitoring charts 35.3 52.1 ** Functional thermometer 42.5 75.2 ** Delivery kits 52.5 83.0 ** First-aid kits 50.9 64.0 ** ORT corner supplies 21.8 33.3 ** Delivery couch 48.3 80.6 ** Functional refrigerator 18.7 23.6
Index score of availability of essential supplies (% of maximum score)
44.4 67.4 **
*p<0.1; **p<0.05
similar across regions (ranging from 78 to 93 percent of
the maximum possible score) at midterm.
Figure 14 shows the child health commodity availability
index score in L10K kebeles by region and survey period.
Improvements in the availability of child health
commodities in L10K kebeles varied by region, with the
highest improvement observed in Amhara (the index
score increased from 29 to 59 percent of the maximum)
and SNNP (from 13 to 39 percent). The availability of
child health commodities was higher during the
midterm survey in Amhara and Tigray (59 and 52
percent, respectively) compared to SNNP (39 percent)
and Oromia (33 percent).
Figure 15 shows the maternal health
commodity availability index score in L10K kebeles by
region and survey period. Improvements in the
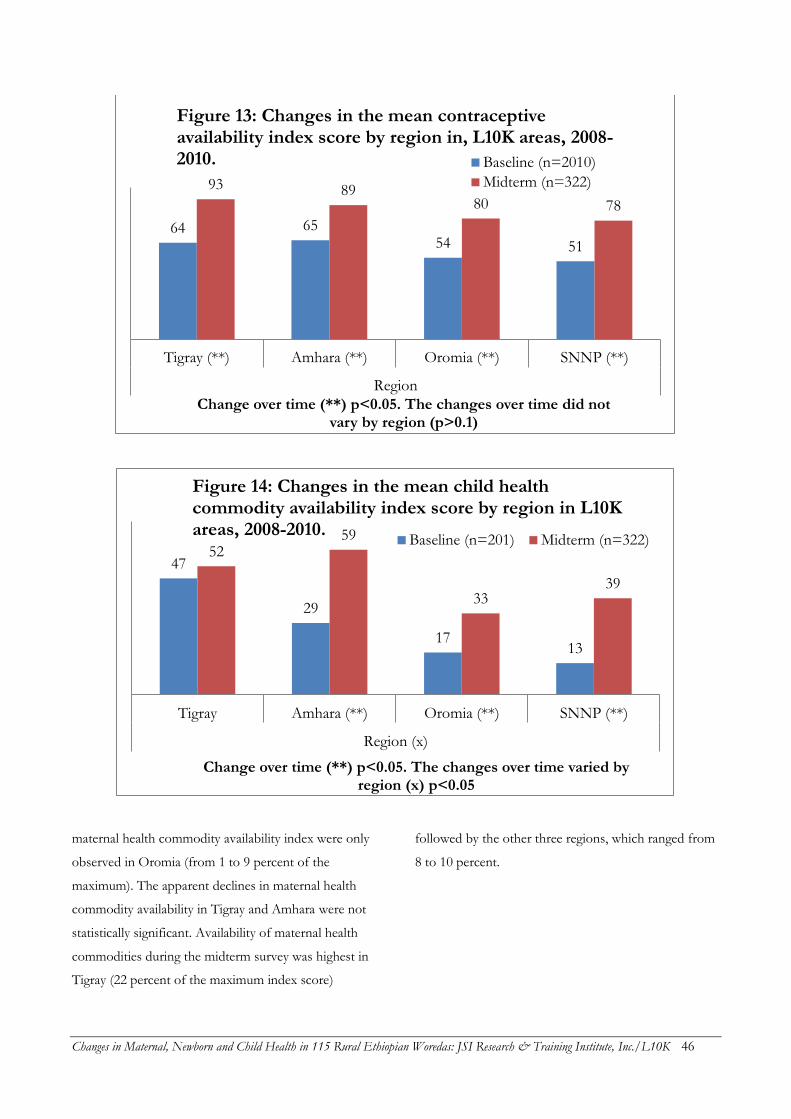
Changes in Maternal, Newborn and Child Health in 115 Rural Ethiopian Woredas: JSI Research & Training Institute, Inc./L10K 46
maternal health commodity availability index were only
observed in Oromia (from 1 to 9 percent of the
maximum). The apparent declines in maternal health
commodity availability in Tigray and Amhara were not
statistically significant. Availability of maternal health
commodities during the midterm survey was highest in
Tigray (22 percent of the maximum index score)
followed by the other three regions, which ranged from
8 to 10 percent.
64 65 54 51
93 89 80 78
Tigray (**) Amhara (**) Oromia (**) SNNP (**)
Region
Change over time (**) p<0.05. The changes over time did not vary by region (p>0.1)
Figure 13: Changes in the mean contraceptive availability index score by region in, L10K areas, 2008-2010. Baseline (n=2010)
Midterm (n=322)
47
29
17 13
52 59
33 39
Tigray Amhara (**) Oromia (**) SNNP (**)
Region (x)
Change over time (**) p<0.05. The changes over time varied by region (x) p<0.05
Figure 14: Changes in the mean child health commodity availability index score by region in L10K areas, 2008-2010.
Baseline (n=201) Midterm (n=322)
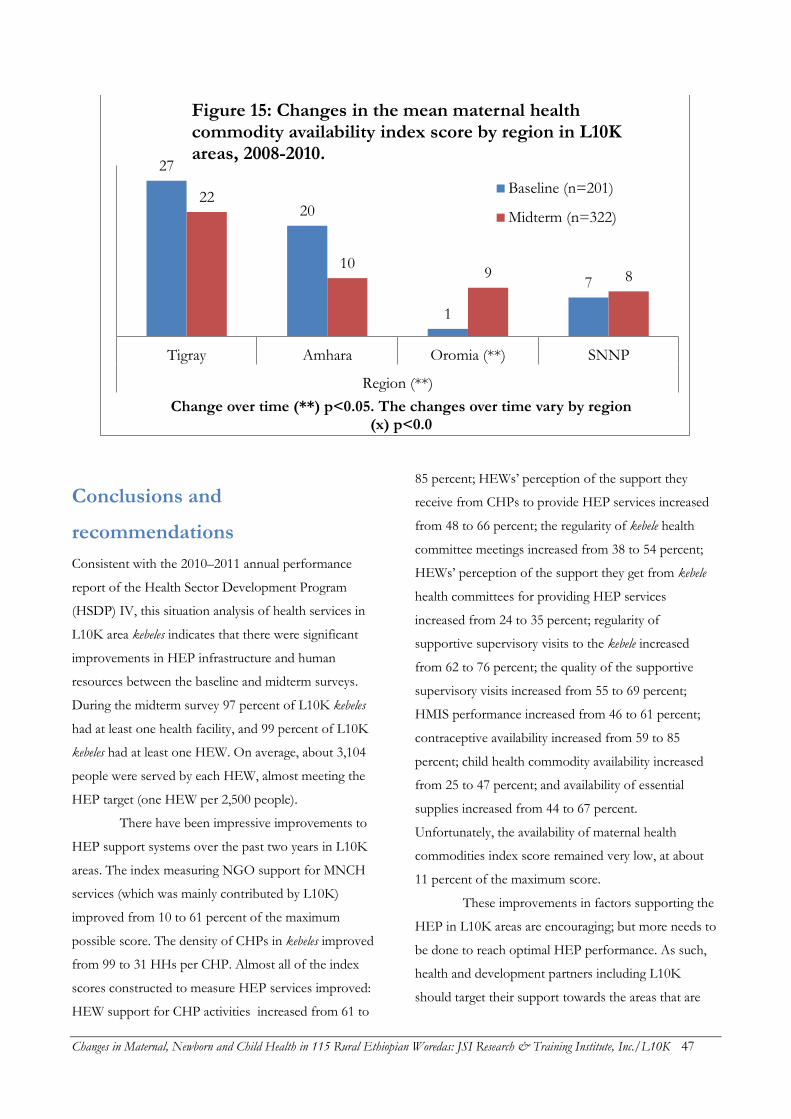
Changes in Maternal, Newborn and Child Health in 115 Rural Ethiopian Woredas: JSI Research & Training Institute, Inc./L10K 47
Conclusions and
recommendations
Consistent with the 2010–2011 annual performance
report of the Health Sector Development Program
(HSDP) IV, this situation analysis of health services in
L10K area kebeles indicates that there were significant
improvements in HEP infrastructure and human
resources between the baseline and midterm surveys.
During the midterm survey 97 percent of L10K kebeles
had at least one health facility, and 99 percent of L10K
kebeles had at least one HEW. On average, about 3,104
people were served by each HEW, almost meeting the
HEP target (one HEW per 2,500 people).
There have been impressive improvements to
HEP support systems over the past two years in L10K
areas. The index measuring NGO support for MNCH
services (which was mainly contributed by L10K)
improved from 10 to 61 percent of the maximum
possible score. The density of CHPs in kebeles improved
from 99 to 31 HHs per CHP. Almost all of the index
scores constructed to measure HEP services improved:
HEW support for CHP activities increased from 61 to
85 percent; HEWs’ perception of the support they
receive from CHPs to provide HEP services increased
from 48 to 66 percent; the regularity of kebele health
committee meetings increased from 38 to 54 percent;
HEWs’ perception of the support they get from kebele
health committees for providing HEP services
increased from 24 to 35 percent; regularity of
supportive supervisory visits to the kebele increased
from 62 to 76 percent; the quality of the supportive
supervisory visits increased from 55 to 69 percent;
HMIS performance increased from 46 to 61 percent;
contraceptive availability increased from 59 to 85
percent; child health commodity availability increased
from 25 to 47 percent; and availability of essential
supplies increased from 44 to 67 percent.
Unfortunately, the availability of maternal health
commodities index score remained very low, at about
11 percent of the maximum score.
These improvements in factors supporting the
HEP in L10K areas are encouraging; but more needs to
be done to reach optimal HEP performance. As such,
health and development partners including L10K
should target their support towards the areas that are
27
20
1
7
22
10 9 8
Tigray Amhara Oromia (**) SNNP
Region (**)
Change over time (**) p<0.05. The changes over time vary by region (x) p<0.0
Figure 15: Changes in the mean maternal health commodity availability index score by region in L10K areas, 2008-2010.
Baseline (n=201)
Midterm (n=322)
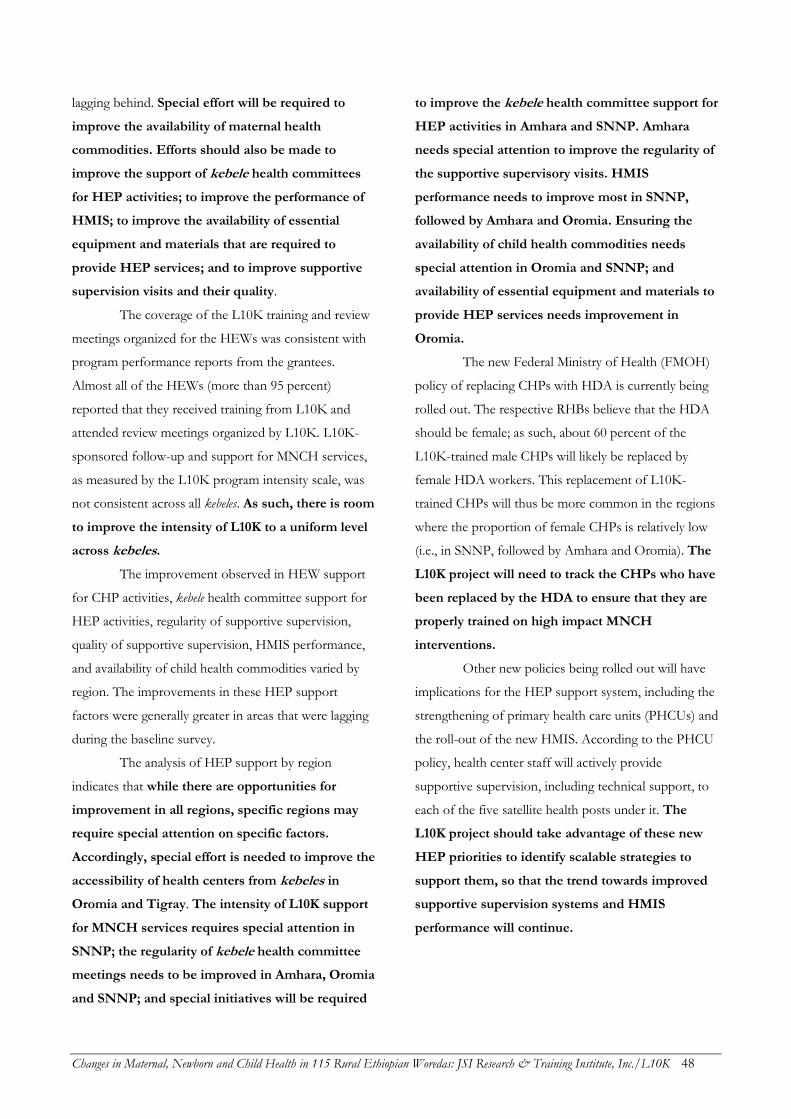
Changes in Maternal, Newborn and Child Health in 115 Rural Ethiopian Woredas: JSI Research & Training Institute, Inc./L10K 48
lagging behind. Special effort will be required to
improve the availability of maternal health
commodities. Efforts should also be made to
improve the support of kebele health committees
for HEP activities; to improve the performance of
HMIS; to improve the availability of essential
equipment and materials that are required to
provide HEP services; and to improve supportive
supervision visits and their quality.
The coverage of the L10K training and review
meetings organized for the HEWs was consistent with
program performance reports from the grantees.
Almost all of the HEWs (more than 95 percent)
reported that they received training from L10K and
attended review meetings organized by L10K. L10K-
sponsored follow-up and support for MNCH services,
as measured by the L10K program intensity scale, was
not consistent across all kebeles. As such, there is room
to improve the intensity of L10K to a uniform level
across kebeles.
The improvement observed in HEW support
for CHP activities, kebele health committee support for
HEP activities, regularity of supportive supervision,
quality of supportive supervision, HMIS performance,
and availability of child health commodities varied by
region. The improvements in these HEP support
factors were generally greater in areas that were lagging
during the baseline survey.
The analysis of HEP support by region
indicates that while there are opportunities for
improvement in all regions, specific regions may
require special attention on specific factors.
Accordingly, special effort is needed to improve the
accessibility of health centers from kebeles in
Oromia and Tigray. The intensity of L10K support
for MNCH services requires special attention in
SNNP; the regularity of kebele health committee
meetings needs to be improved in Amhara, Oromia
and SNNP; and special initiatives will be required
to improve the kebele health committee support for
HEP activities in Amhara and SNNP. Amhara
needs special attention to improve the regularity of
the supportive supervisory visits. HMIS
performance needs to improve most in SNNP,
followed by Amhara and Oromia. Ensuring the
availability of child health commodities needs
special attention in Oromia and SNNP; and
availability of essential equipment and materials to
provide HEP services needs improvement in
Oromia.
The new Federal Ministry of Health (FMOH)
policy of replacing CHPs with HDA is currently being
rolled out. The respective RHBs believe that the HDA
should be female; as such, about 60 percent of the
L10K-trained male CHPs will likely be replaced by
female HDA workers. This replacement of L10K-
trained CHPs will thus be more common in the regions
where the proportion of female CHPs is relatively low
(i.e., in SNNP, followed by Amhara and Oromia). The
L10K project will need to track the CHPs who have
been replaced by the HDA to ensure that they are
properly trained on high impact MNCH
interventions.
Other new policies being rolled out will have
implications for the HEP support system, including the
strengthening of primary health care units (PHCUs) and
the roll-out of the new HMIS. According to the PHCU
policy, health center staff will actively provide
supportive supervision, including technical support, to
each of the five satellite health posts under it. The
L10K project should take advantage of these new
HEP priorities to identify scalable strategies to
support them, so that the trend towards improved
supportive supervision systems and HMIS
performance will continue.
Changes in Maternal, Newborn and Child Health in 115 Rural Ethiopian Woredas: JSI Research & Training Institute, Inc./L10K 49
INTERACTION OF THE FRONTLINE HEALTH WORKERS WITH HOUSEHOLDS AND FAMILIES
Exposure or interactions of households and families
with frontline health workers of the HEP—i.e., HEWs
and CHPs/HDA—is measured by any health posts
visits by women, any household visits by frontline
health workers, model family (MF) households, and
household’s possession of family health card. The target
populations for this analysis are the women in
reproductive age, women with children 0 to 11 months,
and women with children 12 to 23 months. The target
populations for this analysis are the unique respondents
from all the three target groups of women (i.e., the
sample described in Table 3).
Unadjusted bivariate statistical analyses were
done to detect statistically significant changes (p<0.1)
over time or statistically significant differences (p<0.1)
between regions. Effect modification analysis was done
to assess whether the rate of change of indicators
differed by regions. The results of these analyses were
used to answer the following questions:
1) Were there significant changes in the interaction (or
exposure) indicators between the baseline and
midterm surveys?
2) Did the rate of change over time of an indicator
differ by region? If so, across which regions was the
difference mainly observed? And,
3) Are there currently any significant variations in the
indicators across regions? If so, which regions are
doing better or worse in terms of programmatic
performance?
Health post visits during the
preceding 12 months
The percentage of women who visited a health post in
the last 12 months before the survey improved
modestly, from 52 to 59 percent between the baseline
and midterm surveys (see Table 13). The highest
increase in health post utilization was observed in
Oromia (14 percentage points, from 50 to 64 percent),
followed by SNNP (from 56 to 64 percent) and Tigray
(53 to 59 percent). No appreciable change was observed
in Amhara (51 percent at baseline and 53 percent at
midterm).
The five most commonly reported reasons to
visit a health post remained mostly the same between
the survey periods (Table 13). The most common
reasons for visiting health posts were child
immunization (52 percent at midterm), followed by
family planning (35 percent), maternal health (25
percent, including ANC, PNC and delivery care),
malaria treatment (10 percent), health education (seven
percent), and then referral of a sick child (six percent).
Other reasons for visiting health posts included growth
monitoring (three percent), diarrhea treatment (two
percent), obtaining a bed net (one percent), and other
reasons. Even though about 40 percent of survey
respondents had children aged 0 to 11 months,
newborn health care was still an uncommon reason for
visiting a health post (one percent).
Household visits by HEWs
during the last six months
During the baseline and midterm surveys women were
asked whether they knew the HEWs in their kebele,
followed by questions about interactions with the
HEWs. The proportion of women in L10K areas who
knew the HEW in her kebele increased from 73 to 87
percent between the baseline and midterm surveys
(Table 13). The rate of increase in the awareness of the
HEW among respondents varied across the four
regions, with the higher rates of increase observed in
Changes in Maternal, Newborn and Child Health in 115 Rural Ethiopian Woredas: JSI Research & Training Institute, Inc./L10K 50
Table 13: Health post visits and household visits by HEWs. Percentage of respondents who visited a health post during
the last 12 months and the reasons for visiting the health post; and the percentage of respondents who were visited by a HEW during the last 6 months and the topics discussed by the HEW; in L10K areas during the baseline (Dec. 2008) and midterm (Dec. 2010) surveys.
Tigray Amhara Oromia SNNP Total
B
ase
lin
e
Mid
term
Base
lin
e
Mid
term
Base
lin
e
Mid
term
Base
lin
e
Mid
term
Base
lin
e
Mid
term
No. of respondents 1,557 1,925 1,724 2,999 1,527 2,501 1,484 2,542 6,292 9,967
% visited health post in 12 mo β 53.4 **59.4 50.7 52.8 50.2 **64.4 56.4 **64.1 52.1 **58.8
Reasons for visiting the HP (n) (897) (1,205) (856) (1,595) (766) (1,696) (777) (1,659) (3,296) (6,155)
Child immunization 58.3 54.2 58.7 46.3 53.7 57.9 67.3 51.8 59.3 51.7
Family planning 20.3 25.3 37.9 38.5 31.3 39.9 32.5 31.4 32.7 35.4
Antenatal care (ANC) 27.5 20.6 9.4 17.9 22.2 21.1 22.4 25.3 17.8 20.8
Malaria treatment 13.4 25.8 14.8 8.1 22.2 9.7 8.7 2.8 15.1 10.0
Referral of sick child 27.6 5.8 4.7 5.7 9.5 6.0 6.0 4.5 9.4 5.5
Health education 3.0 9.0 5.6 2.6 2.4 12.5 7.8 7.4 4.9 7.2
Postnatal care (PNC) 2.4 1.9 0.9 1.9 4.5 5.4 1.2 1.1 2.1 2.7
Growth monitoring 8.8 8.9 1.5 1.1 0.4 3.3 1.4 1.6 2.3 2.9
Diarrhea treatment 6.0 3.9 3.1 1.8 6.4 1.9 2.0 1.1 4.1 2.0
Pneumonia treatment 2.2 1.0 2.1 1.2 3.7 0.5 1.0 0.3 2.3 0.8
Obtaining bed nets 0.9 1.4 1.1 1.7 0.0 1.0 1.2 0.3 0.8 1.2
Delivery care 0.9 1.4 0.6 1.4 0.9 0.7 0.5 0.5 0.7 1.0
Neonatal care 1.3 1.2 0.9 0.7 0.2 1.7 0.2 0.7 0.6 1.0
% heard of HEW β 56.2 **88.2 76.3 **87.5 66.1 **86.8 83.7 83.3 72.5 **86.6
% visited by HEW in 6 months β 36.7 **55.3 35.2 **49.0 35.1 **51.9 42.0 **47.7 36.7 **50.4
Topics recalled being discussed by
the HEW (n) (522) (1,045) (656) (1,546) (471) (1,294) (592) (1,165) (2,241) (5,050)
Latrine use 53.8 60 45 59.3 58.1 63.5 51.9 60.3 50.9 60.7
Hygiene 78.7 69.6 39.8 45.4 49.2 66.2 69.6 65.6 54.1 58.3
Pit latrine construction 71 66 58.8 62.6 62.7 47.3 42.5 54.3 57.7 57.8
Immunization 45.9 51 58.9 47.2 38.9 49.1 33.2 44 46.5 47.7
Child nutrition 18 29.5 9.1 19.3 5.7 41.8 11 23.8 9.9 27.4
Safe water use 22.8 32.2 18.5 28.3 20.8 23.9 16.1 20.3 19.1 26.3
Family planning 22.6 33.6 16.3 12.2 18.5 28.8 11.3 12 16.6 19.7
Pregnancy care (ANC) 10.4 13.5 1.7 5.6 4.1 13.3 2.9 8.3 3.7 9.3
HIV/AIDS 14.7 15.1 2.5 5.9 2.7 10.4 8.5 6.9 5.6 8.7
Newborn care NA 5.2 NA 4.8 NA 11.5 NA 9.4 NA 7.4
Diarrhea treatment 5.2 8 1.8 3.4 1.8 10 2.8 3.6 2.5 5.8
PNC NA 4.3 NA 2.1 NA 4.9 NA 1.9 NA 3.1
% of the expected No. of topics
recalled being discussed β 34.3 **37.9 25.2 **28.9 26.3 **35.4 25.0 **29.9 26.7 **32.2
β p<0.05 for region × change over time interactions; **p<0.05 for change over time. Statistical tests for the changes in the reasons for visiting the health posts and the changes in the topic items discussed by the HEW were not conducted.
Changes in Maternal, Newborn and Child Health in 115 Rural Ethiopian Woredas: JSI Research & Training Institute, Inc./L10K 51
regions with lower baseline rates. The highest rate of
increase in the indicator was observed in Tigray (32
percentage points, from 56 to 88 percent), where the
indicator was the lowest during the baseline survey.
Oromia saw a 20 percentage-point improvement (from
66 to 87 percent); Amhara a 12 percentage-point
increase (from 76 to 88 percent); and SNNP remained
unchanged at about 83 percent. The current proportion
of women who know their HEWs was lowest in SNNP
(83 percent), while the other three regions range from
87 to 88 percent recognition.
The proportion of women in L10K areas who
reported that the HEW visited (or contacted) them to
discuss their or their children’s health during the
previous six months increased from 37 to 50 percent
between the baseline and midterm surveys (Table 13).
The rate of increase in household visits by HEWs
between the two survey periods was lower in SNNP
(from 42 to 48 percent) compared to the other three
regions, where increases ranged between 14 and 18
percentage points. The proportion of households
visited by HEW was the highest at midterm in Tigray
(55 percent), followed by the other three regions (52
percent in Oromia, 49 percent in Amhara, and 48
percent in SNNP).
Women were asked about the information that
was provided by the HEW during the last household
visit. Their spontaneous responses were recording
without any probing. The items they mentioned were
matched with a list of ten expected topics. The
percentage of these ten topics that women recalled the
HEW discussing was then used as a measure of the
quality of HEW household visits. The major
assumption of this quality indicator is that higher quality
interactions between HEWs and households will lead to
better spontaneous recall of the topics discussed.
According to this metric, the quality of household visits
by HEWs increased from 27 to 32 percent between the
two survey periods (Table 13). The largest increase was
seen in Oromia (nine percentage points) followed by
the other three regions with increases of approximately
4 to 5 percentage points. The quality of household visits
by the HEWs at midterm was highest in Tigray (38
percent), followed by Oromia (35 percent), and then
Amhara and SNNP (29 and 30 percent, respectively).
Household sanitation (including hygiene, latrine
construction, and latrine use) and immunization were
the major topics of discussion during the baseline
survey and remained so during the midterm. Some
notable increases in topics discussed by the HEWs
during household visits were child nutrition (which
increased from 10 to 27 percent), antenatal care (from 4
to 9 percent), diarrhea treatment (from 3 to 6 percent),
HIV/AIDS (from 6 to 9 percent), and safe water use
(from 19 to 26 percent). Although a few women
recalled the HEW discussing postnatal care and
newborn health care (3 and 7 percent, respectively),
these levels were not optimal.
Household visits by CHPs during
the last six months
The network of CHPs informs and reminds households
to maintain good hygiene and household sanitation, and
to utilize services offered by the HEP. One of the major
activities of the L10K project has been to encourage
and support the HEWs as they train and supervise the
CHPs to promote maternal, newborn and child health.
The proportion of women in L10K areas who reported
that they knew the CHP in their neighborhood
increased from 37 to 49 percent between the baseline
and midterm surveys (Table 14). The highest increases
in awareness of CHPs was seen in Amhara and SNNP
(from 36 to 53 percent in Amhara and from 29 to 44
percent in SNNP), followed by Tigray (from 71 to 81
percent); awareness did not change significantly in
Oromia. CHP awareness was highest at midterm in
Tigray (81
Changes in Maternal, Newborn and Child Health in 115 Rural Ethiopian Woredas: JSI Research & Training Institute, Inc./L10K 52
Table 14: Household visits by CHPs. Percentage of respondents heard of the CHP and the percentage visited by a CHP during last 6 months and the topics discussed by the CHP, by region and survey periods, L10K area, 2008 – 2010.
Tigray Amhara Oromia SNNP Total
Base
lin
e
Mid
term
Base
lin
e
Mid
term
Base
lin
e
Mid
term
Base
lin
e
Mid
term
Base
lin
e
Mid
term
No. of respondents 1,557 1,925 1,724 2,999 1,527 2,501 1,484 2,542 6,292 9,967
% heard of CHP β 71.4 **81.2 36.3 **52.8 24.6 25.8 29.0 **43.8 36.7 **48.7
% visited by CHP in 6 months β 42.9 **55.7 17.5 **31.3 4.4 **20.0 9.7 **28.6 16.1 **31.6
Topic items recalled being discussed by the CHP (n)
(605) (1,088) (335) (1,002) (103) (516) (141) (705) (1,184) (3,311)
Hygiene 60.2 65.7 25.0 47.7 20.1 69.9 58.3 63.7 41.5 58.6
Pit latrine construction 41.3 51.8 29.6 59.6 19.4 48.1 43.6 54.6 34.8 54.9
Immunization 55.8 59.9 68.1 53.7 69.4 53.7 40.2 45.9 60.4 53.9
Child nutrition 33.4 30.7 5.8 16.9 5.2 50.3 8.8 16.5 16.1 25.5
Latrine use 19.9 29.9 11.5 22.5 10.2 19.0 21.8 19.6 15.7 23.4
Safe water use 23.1 24.4 14.6 9.8 36.1 29.2 9.9 11.4 18.5 16.8
HIV/AIDS 16.4 14.5 3.7 8.2 9.8 16.5 6.1 9.7 9.0 11.3
Pregnancy care (ANC) 11.5 9.4 1.8 6.1 6.6 21.1 2.5 9.2 5.7 9.8
Family planning 11.2 9.1 5.8 4.1 18.6 20.0 11.6 5.4 9.3 8.0
Diarrhea treatment 5.6 6.1 2.3 3.6 7.3 10.0 5.2 2.6 4.2 5.1
Family health services 0.7 1.4 1.3 0.6 0.3 0.8 0.0 0.8 0.9 0.9
% of expected topics recalled being discussed β
27.6 **29.9 17.6 **24.6 17.9 **30.8 21.0 **24.5 21.7 **26.9
ϕ p<0.1; β p<0.05 for region × change over time interactions;**p<0.05 for change over time. Statistical tests for the changes in the topic items discussed by the CHP were not conducted
percent), followed by Amhara (53 percent), SNNP (44
percent), and then Oromia (26 percent).
The percentage of women in L10K areas who
were contacted by the CHP to discuss their or their
children’s health during the six months preceding the
survey increased by two-fold, from 16 to 32 percent
between the two survey periods (Table 14). The rate of
increase in the prevalence of household visits by CHPs
was highest in Oromia (a 4.6-fold increase, from 4.4 to
20 percent), followed by SNNP (from 9.7 to 28.6
percent), Amhara (from 17.5 to 31.3 percent), and then
Tigray (from 42.9 to 55.7 percent). The prevalence of
household contacts by a CHP was highest during the
midterm survey in Tigray (56 percent), then Amhara
and SNNP (31 and 29 percent, respectively), and then
Oromia (20 percent).
The quality of CHP household visits was
assessed using methods similar to how the quality of
household visits by a HEW was assessed. The
percentage of items that women spontaneously recalled
CHPs discussing, out of an expected list of 12 items,
was used as a measure of the quality of household visits
by the CHPs. The quality of CHP household visits, as
measured by the index, increased from 22 to 27 percent
of the maximum possible score between the two survey
periods (Table 14). The rate of improvement of the
CHP visit quality was the highest in Oromia (13
percentage points), followed by Amhara (7 percentage
points), and then the other two regions (4 percentage
points in SNNP and 2 percentage points in Tigray). The
quality of CHP visits at midterm was the best in Tigray
and Oromia (30 and 31 percent of the maximum,
respectively) followed by the other regions (both at 25
percent). As expected, the top five types of information
discussed by the CHPs were similar to the topics
discussed most by the HEWs—they include hygiene,
latrine construction, immunization, child nutrition and
latrine use. According to the women’s recollection, the
Changes in Maternal, Newborn and Child Health in 115 Rural Ethiopian Woredas: JSI Research & Training Institute, Inc./L10K 53
emphasis on most topics increased between the two
survey periods. The rate of increase was highest for
pregnancy care (a 1.7-fold increase from 5.7to 9.8
percent), followed by child nutrition and pit latrine
construction (1.6-fold increase), latrine use (1.5-fold
increase), and hygiene (1.4-fold increase), followed by
the other topics.
Model family households
The HEWs spent a significant portion of their time
interacting with households on training model families.
For a household to graduate as a model family, they
must receive a number of training sessions and adopt a
number of healthy household practices that are part of
the primary health package of the HEP. Model families
are believed not only to change their own behaviors, but
also to act as role models to influence their neighbors
and the community at large to improve health
outcomes. The percentage of women in L10K areas
who were from a model family household or working
towards becoming one increased from 9 to 30 percent
between the survey periods (Figure 16). The rate of
increase in model family households was the highest in
Oromia (an 11.0-fold increase in the percentage of
model families), followed by Amhara (3.5-fold), Tigray
(2.2-fold), and SNNP (1.7-fold). The prevalence of
model families or families working towards becoming
one was highest in Amhara (45 percent), followed by
Tigray (37 percent), SNNP (15 percent), and then
Oromia (11 percent).
Family health card possession
Family health cards were distributed by HEWs to all
women of reproductive ages in a household. The cards
are used as a tool to provide health education and thus
promote MNCH. The card is also used to record the
MNCH services provided to the household. The CHPs
use the family health cards to re-enforce health
education and remind households about the health
services they can receive from the HEP. The percentage
of women with a family health card increased from 6 to
36 percent between the baseline and midterm surveys
(Figure 17). By region, the highest rate of increase in
family health card possession was in Oromia, where
coverage increased from 0.5 to 33.4 percent (a 67-fold
increase). SNNP and Oromia saw 9.5-fold and 9.4-fold
increases, respectively; Tigray had a two-fold increase.
The possession of a family health card at midterm was
highest in Tigray (49 percent), followed by SNNP (37
percent), Oromia (33 percent), and then Amhara (32
percent).
Conclusions and
recommendations
The indicators measuring the exposure of households
and families to the HEP—i.e., interactions of HEP
frontline health workers with households and families—
illustrate the recent changes in HEP outreach activities.
More interactions between frontline health workers and
families are taking place in L10K areas than at the
inception of the project. The quality of interactions
between health workers and households are also
improving. The substantial increase in household visits
by HEWs in L10K areas without concurrent
improvements in the ratio of HEWs to the population
indicates that HEWs are working more efficiently.
Encouragingly, the frequency of household
visits by HEWs was similar across the four regions.
However, the frequency of household visits by
CHPs in Amhara, Oromia, and especially in SNNP
was low. Special attention will be necessary to help
these regions catch up with the levels achieved in
Tigray. As the HDA policy is implemented, the male
CHPs in these regions will be gradually replaced by
female HDAs, so further attention is necessary to
ensure that visit frequency increases with the new
workers. Although the prevalence of model family
households in L10K areas (30 percent) was slightly
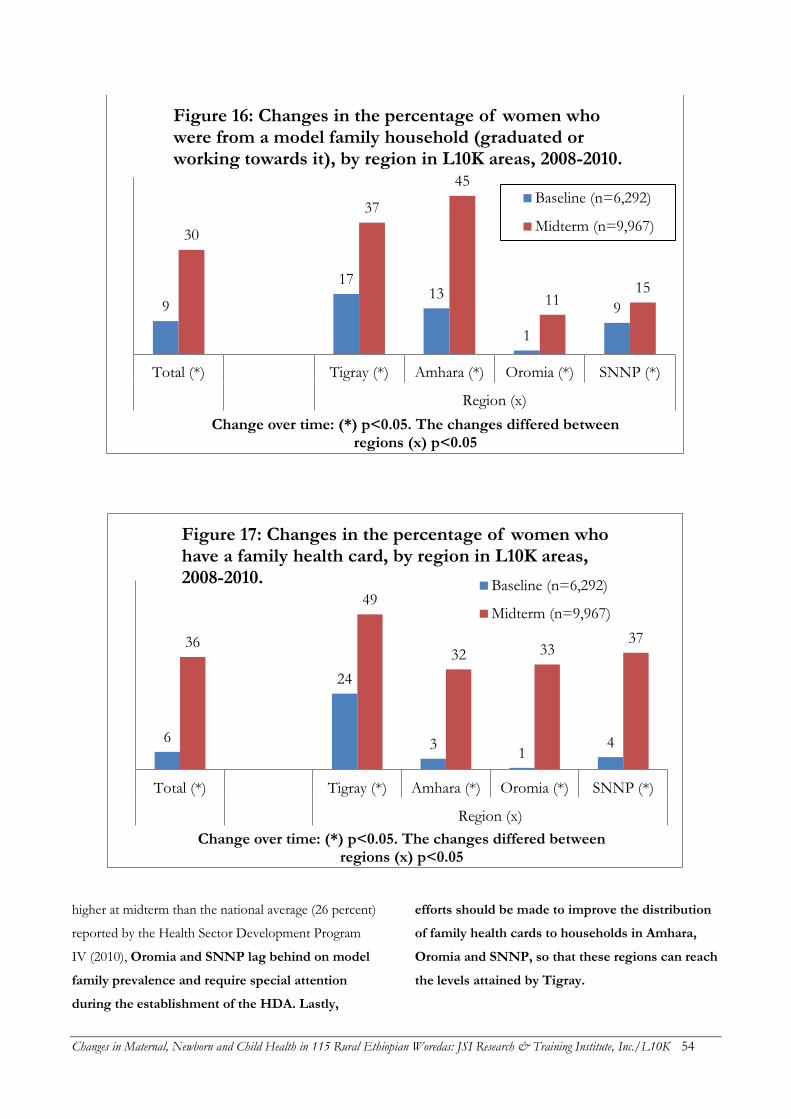
Changes in Maternal, Newborn and Child Health in 115 Rural Ethiopian Woredas: JSI Research & Training Institute, Inc./L10K 54
higher at midterm than the national average (26 percent)
reported by the Health Sector Development Program
IV (2010), Oromia and SNNP lag behind on model
family prevalence and require special attention
during the establishment of the HDA. Lastly,
efforts should be made to improve the distribution
of family health cards to households in Amhara,
Oromia and SNNP, so that these regions can reach
the levels attained by Tigray.
9
17 13
1
9
30
37
45
11 15
Total (*) Tigray (*) Amhara (*) Oromia (*) SNNP (*)
Region (x)
Change over time: (*) p<0.05. The changes differed between regions (x) p<0.05
Figure 16: Changes in the percentage of women who were from a model family household (graduated or working towards it), by region in L10K areas, 2008-2010.
Baseline (n=6,292)
Midterm (n=9,967)
6
24
3 1
4
36
49
32 33 37
Total (*) Tigray (*) Amhara (*) Oromia (*) SNNP (*)
Region (x)
Change over time: (*) p<0.05. The changes differed between regions (x) p<0.05
Figure 17: Changes in the percentage of women who have a family health card, by region in L10K areas, 2008-2010. Baseline (n=6,292)
Midterm (n=9,967)
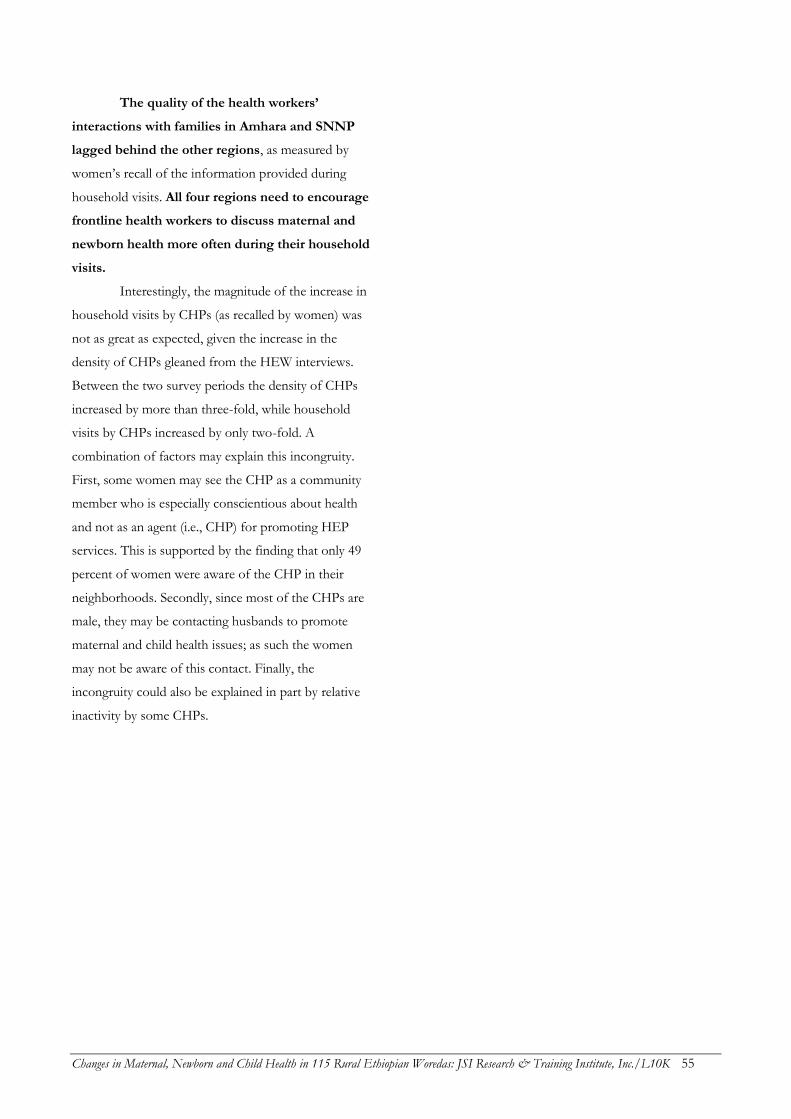
Changes in Maternal, Newborn and Child Health in 115 Rural Ethiopian Woredas: JSI Research & Training Institute, Inc./L10K 55
The quality of the health workers’
interactions with families in Amhara and SNNP
lagged behind the other regions, as measured by
women’s recall of the information provided during
household visits. All four regions need to encourage
frontline health workers to discuss maternal and
newborn health more often during their household
visits.
Interestingly, the magnitude of the increase in
household visits by CHPs (as recalled by women) was
not as great as expected, given the increase in the
density of CHPs gleaned from the HEW interviews.
Between the two survey periods the density of CHPs
increased by more than three-fold, while household
visits by CHPs increased by only two-fold. A
combination of factors may explain this incongruity.
First, some women may see the CHP as a community
member who is especially conscientious about health
and not as an agent (i.e., CHP) for promoting HEP
services. This is supported by the finding that only 49
percent of women were aware of the CHP in their
neighborhoods. Secondly, since most of the CHPs are
male, they may be contacting husbands to promote
maternal and child health issues; as such the women
may not be aware of this contact. Finally, the
incongruity could also be explained in part by relative
inactivity by some CHPs.

Changes in Maternal, Newborn and Child Health in 115 Rural Ethiopian Woredas: JSI Research & Training Institute, Inc./L10K 56
Changes in Maternal, Newborn and Child Health in 115 Rural Ethiopian Woredas: JSI Research & Training Institute, Inc./L10K 57
FAMILY PLANNING
Improving family planning (FP) is expected to decrease
maternal and newborn health morbidity and mortality
(Darmstadt et al. 2005; Dieltiens et al. 2005; Stover and
Ross 2010). As part of its efforts to improve maternal
and newborn health, the L10K project enhances the FP
component of the HEP. This section describes changes
in indicators that measure the interactions of frontline
HEP health workers with women of reproductive age
aimed at improving family planning indicators. The
target population for this analysis included respondents
to the questionnaire for women of reproductive age.
Unadjusted bivariate statistical analyses (i.e.,
crude associations) were conducted to answer the
following questions:
1) Have the family planning indicators changed
significantly between the baseline and the midterm
surveys, and in the expected direction?
2) Does the rate of the change over time vary by region?
If so, between which regions are differences in rates
of change primarily observed? And,
3) Do the indicators currently (i.e., during the midterm
survey) vary significantly across the regions? If so,
which region is programmatically better or worse?
Knowledge and approval of
family planning, and ever using
contraceptives
Between the two survey periods the percentage of
women of reproductive age who had heard of family
planning increased modestly from 89 to 92 percent in
L10K areas. The percentage of women who approved
of family planning also increased modestly from 83 to
87 percent; the percentage of women who knew where
to obtain family planning methods increased from 80 to
86 percent; and the percentage of women who had ever
used family planning increased from 47 to 55 percent
(Table 15).
The improvement in women’s knowledge of
family planning recorded in other l10K areas was not
observed in SNNP (where it remained at about 83
percent). Women’s knowledge of family planning
methods at midterm was highest in Tigray and Amhara
(about 96 percent each), followed by Oromia (91
percent), and then SNNP (83 percent).
Improvements in women’s approval for family
planning were seen in L10K areas, but the changes were
mainly attributable to Amhara and Oromia. Approval of
family planning improved by about five percentage
points in Amhara and in Oromia, while changes in
approval in Tigray and SNNP were not statistically
significant. Approval of family planning remained the
highest in Tigray and Amhara (about 91 percent, each),
followed by Oromia (87 percent) and SNNP (79
percent).
Although improvements in women’s
knowledge regarding sources of family planning
methods were observed in all four regions, SNNP
experienced the least improvement. The percentage of
women of reproductive age who knew where to obtain
contraceptives increased between five and 10
percentage points in the other regions, but only three
percentage points in SNNP. Women’s knowledge of
where to obtain family planning during the midterm
survey was highest in Tigray (93 percent), followed by
Amhara (89 percent), Oromia (86 percent) and SNNP
(75 percent).
The rate of ever using contraceptives improved
from six to 12 percentage points in L10K areas in
Amhara, Oromia and SNNP, while it remained mostly
the same in Tigray. Ever having used a family planning
method at was highest during the midterm survey in
Amhara (59 percent) compared to the other three
Changes in Maternal, Newborn and Child Health in 115 Rural Ethiopian Woredas: JSI Research & Training Institute, Inc./L10K 58
Table 15: Family planning method use and source. Percentage of women of reproductive age who heard of any family planning (FP) method, approve of using a FP method, know where to obtain a FP method, and ever used a FP method; percentage of women in union currently using a FP method; and the percentage distribution of women who were currently using a FP method by source of method currently used, between the baseline (2008) and midterm (2010) survey periods in L10K areas.
Tigray Amhara Oromia SNNP Total
Base
lin
e
Mid
term
Base
lin
e
Mid
term
Base
lin
e
Mid
term
Base
lin
e
Mid
term
Base
lin
e
Mid
term
Ever heard of FP method ϕ 93.0 *96.0 92.0 *95.6 87.0 *91.2 82.8 83.3 88.9 *91.9
Approve of FPϕ 88.8 90.9 86.0 *91.2 80.8 *86.8 78.0 78.8 83.4 *87.3
Knows where to obtain FP method β 87.9 93.1 82.9 *89.1 75.9 *86.0 72.8 *75.4 79.7 *86.0
Ever used a FP method β 50.2 51.2 47.2 *59.1 47.0 *53.3 42.7 *52.1 46.6 *55.0
No. of women in reproductive age 1,080 756 1,000 1,092 1,000 1,056 1,000 1,056 4,080 3,960
Currently using a FP method 24.3 *34.1 29.7 *44.6 31.4 *41.1 28.8 *36.8 29.3 *40.4
Pill 1.9 1.6 0.7 1.4 3.7 3.5 3.2 1.9 2.2 2.2
Injectables 20.9 *27.7 27.4 *36.7 26.2 *32.6 24.0 *30.6 25.4 *32.9
IUD 0.0 0.0 0.3 0.0 0.1 0.4 0.2 0.0 0.2 0.1
Implant 0.2 *4.3 1.3 *5.8 1.1 *3.4 1.3 2.5 1.1 *4.2
Condom 0.0 0.0 0.0 0.0 0.0 0.0 0.0 0.1 0.0 0.0
Sterilization 0.1 0.3 0.0 0.3 0.0 0.5 0.0 0.3 0.0 0.4
Other modern methods 0.0 0.0 0.0 0.0 0.0 0.0 0.0 0.1 0.0 0.0
Traditional 0.7 0.0 0.0 0.0 0.2 0.6 0.0 0.8 0.2 0.4
Not mentioned 0.5 0.1 0.0 0.3 0.0 0.1 0.0 0.4 0.1 0.2
Currently using FP from health post β 8.6 *18.5 24.3 28.1 12.7 *27.0 21.8 24.2 18.5 *25.6
No. of women in union 879 598 881 916 957 1,005 971 958 3,688 3,477
Source of current method
Health post β 35.6 *52.0 81.4 *61.1 40.1 *66.6 74.4 66.5 62.7 62.6
Health center/station β 58.8 *43.6 16.5 *31.7 39.8 *27.1 19.9 23.0 28.9 30.2
Hospital 0.8 1.5 0.7 1.9 1.8 1.7 0.9 2.7 1.1 2.0
Outreach 0.9 1.1 0.0 0.1 5.5 0.1 1.8 1.1 2.1 0.4
Ngo health facility 0.0 0.0 0.0 0.1 2.5 0.8 0.1 0.8 0.7 0.4
Private clinic 0.0 0.0 0.7 0.6 4.0 1.9 0.0 0.5 1.4 0.9
Pharmacy 0.2 0.0 0.3 1.2 3.7 0.6 0.7 0.3 1.3 0.7
DK/other/missing 3.8 1.8 0.4 3.3 2.6 1.1 2.3 5.0 1.9 2.9
No. of women using method 256 239 284 395 305 468 308 372 1,153 1,474
ϕ p<0.1; β p<0.05 for region ×change over time interactions; *p<0.05 for change over time
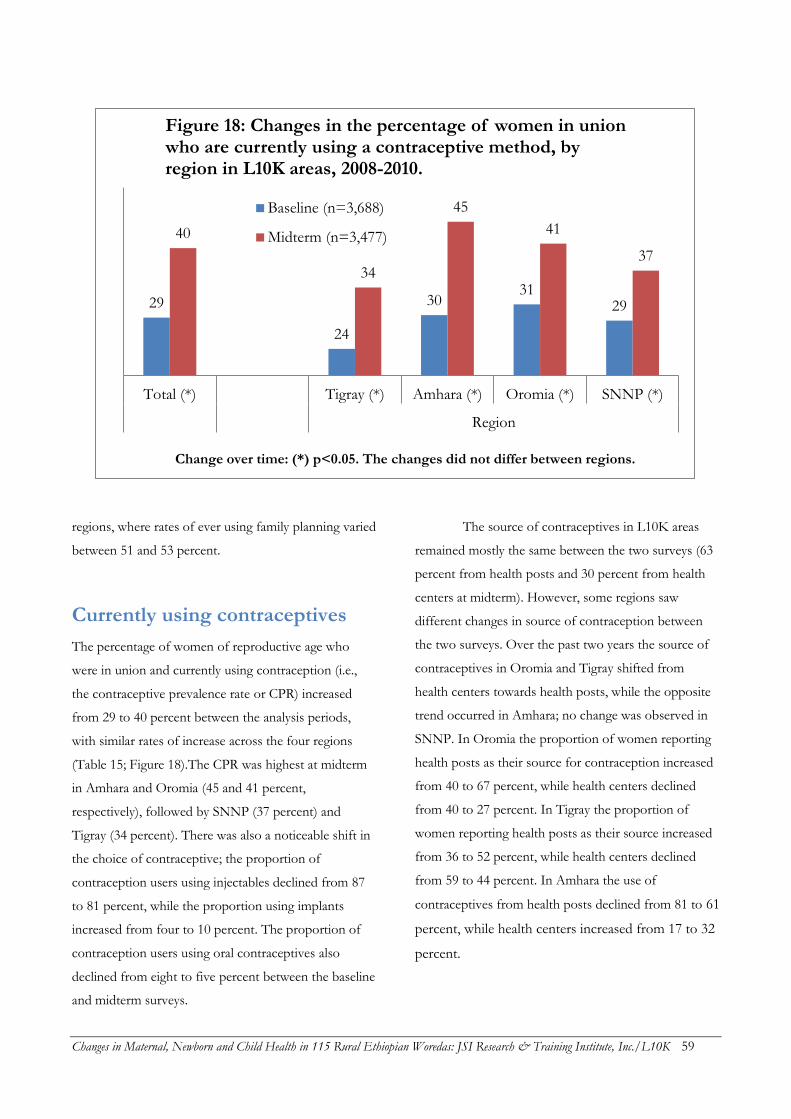
Changes in Maternal, Newborn and Child Health in 115 Rural Ethiopian Woredas: JSI Research & Training Institute, Inc./L10K 59
regions, where rates of ever using family planning varied
between 51 and 53 percent.
Currently using contraceptives
The percentage of women of reproductive age who
were in union and currently using contraception (i.e.,
the contraceptive prevalence rate or CPR) increased
from 29 to 40 percent between the analysis periods,
with similar rates of increase across the four regions
(Table 15; Figure 18).The CPR was highest at midterm
in Amhara and Oromia (45 and 41 percent,
respectively), followed by SNNP (37 percent) and
Tigray (34 percent). There was also a noticeable shift in
the choice of contraceptive; the proportion of
contraception users using injectables declined from 87
to 81 percent, while the proportion using implants
increased from four to 10 percent. The proportion of
contraception users using oral contraceptives also
declined from eight to five percent between the baseline
and midterm surveys.
The source of contraceptives in L10K areas
remained mostly the same between the two surveys (63
percent from health posts and 30 percent from health
centers at midterm). However, some regions saw
different changes in source of contraception between
the two surveys. Over the past two years the source of
contraceptives in Oromia and Tigray shifted from
health centers towards health posts, while the opposite
trend occurred in Amhara; no change was observed in
SNNP. In Oromia the proportion of women reporting
health posts as their source for contraception increased
from 40 to 67 percent, while health centers declined
from 40 to 27 percent. In Tigray the proportion of
women reporting health posts as their source increased
from 36 to 52 percent, while health centers declined
from 59 to 44 percent. In Amhara the use of
contraceptives from health posts declined from 81 to 61
percent, while health centers increased from 17 to 32
percent.
29
24
30 31
29
40
34
45
41
37
Total (*) Tigray (*) Amhara (*) Oromia (*) SNNP (*)
Region
Change over time: (*) p<0.05. The changes did not differ between regions.
Figure 18: Changes in the percentage of women in union who are currently using a contraceptive method, by region in L10K areas, 2008-2010.
Baseline (n=3,688)
Midterm (n=3,477)
Changes in Maternal, Newborn and Child Health in 115 Rural Ethiopian Woredas: JSI Research & Training Institute, Inc./L10K 60
Source of family planning
messages
Women of reproductive age were asked whether they
received any information regarding family planning
from a list of potential sources during the six months
preceding the survey (see Table 16). During the
midterm survey the primary source for family planning
messages was health workers (i.e., HEWs and other
community health workers; 71 percent), followed by
family or friends (23 percent), community events (21
percent), radio (17 percent) and then the others (i.e.
television, newspaper or magazine, and pamphlet or
posters). This relative order of importance for sources
of family planning messages did not shift between the
surveys.
In the baseline survey, 55 percent of women
reported health workers as a source of FP information;
this increased substantially to 71 percent during the
midterm survey. This change was observed in all four
regions, with the great increased in Oromia (a 25
percentage point increase). Radio as a source for FP
messages increased in Tigray (from 11 to 16 percent),
declined in Amhara (from 16 to 12 percent), and
remained unchanged in the other two regions—
resulting in no net change in L10K areas. Small
increases were observed in the proportion receiving FP
messages from television and pamphlet or posters,
while the proportion receiving messages from
community events and family or friends declined
modestly.
Health workers’ interactions with
contraceptive nonusers
The percentage of contraceptive nonusers who were
either contacted by a health worker at home to discuss
family planning, or who discussed family planning with
a health worker during a health facility visit in the last
12 months increased from 25 to 40 percent between the
baseline and midterm surveys (Table 16). The
magnitude of increase in this indicator varied between
10 and 17 percentage points amongst the four regions.
During the midterm survey the proportion of
contraceptive nonusers reporting interactions with
health workers was highest in Tigray (53 percent),
followed by SNNP (43 percent), and then Amhara and
Oromia (37 and 33 percent, respectively).
Future desire to use
contraceptives
The proportion of contraceptive nonusers who want to
use contraception in the future stayed constant between
the baseline (64 percent) and midterm (62 percent)
surveys (see Table 16), and changes over time were
similar across the four regions. The proportion of
nonusers who want to use contraceptives in the future
was lowest at midterm in Amhara (58 percent), followed
by the other three regions (between 63 and 67 percent).
Fertility preference
Fertility preference was measured in three ways: 1)
desired number of children among women of
reproductive age, 2) the desire to limit childbirth (i.e.,
not wanting any more children) among women of
reproductive age, and 3) among currently pregnant
women, whether the pregnancy was wanted. In L10K
areas the average number of children desired by women
of reproductive age remained constant at 4.5; the
percentage of women who wanted to limit childbirth
(39 percent) also did not change. Figure 19 indicates
that the percentage of pregnant women who reported
that their current pregnancy was desired increased from
59 to 69 percent.
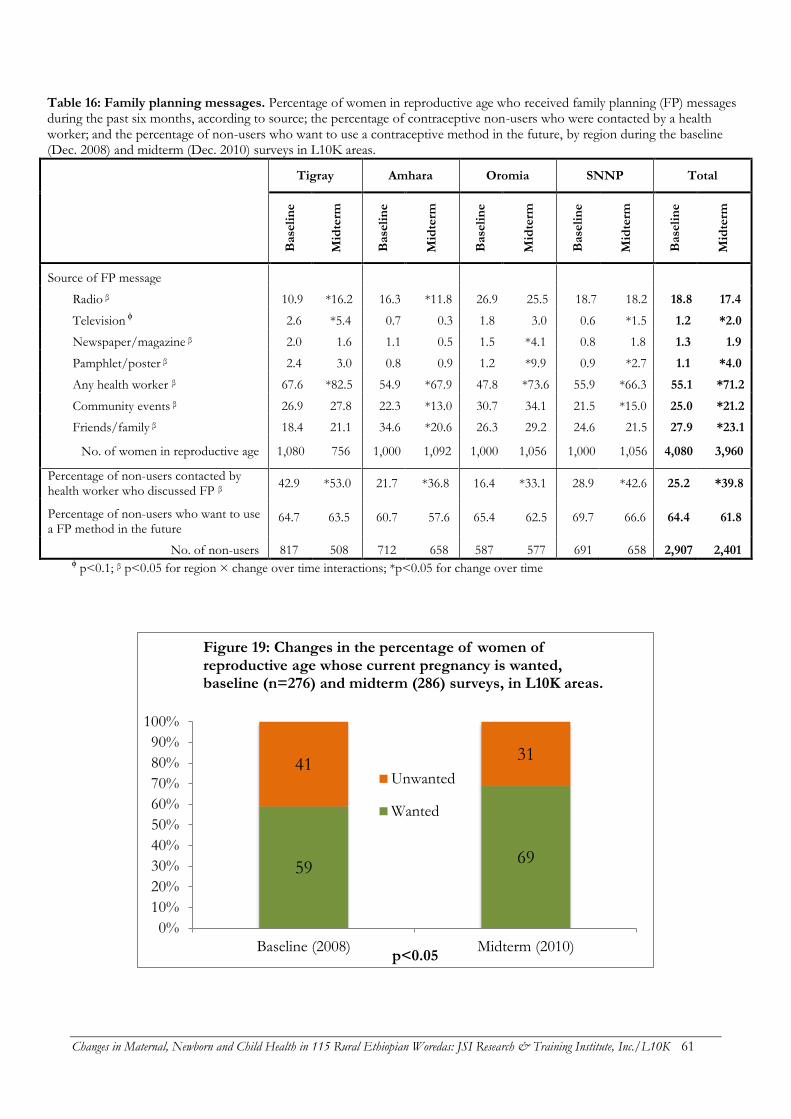
Changes in Maternal, Newborn and Child Health in 115 Rural Ethiopian Woredas: JSI Research & Training Institute, Inc./L10K 61
Table 16: Family planning messages. Percentage of women in reproductive age who received family planning (FP) messages during the past six months, according to source; the percentage of contraceptive non-users who were contacted by a health worker; and the percentage of non-users who want to use a contraceptive method in the future, by region during the baseline (Dec. 2008) and midterm (Dec. 2010) surveys in L10K areas.
Tigray Amhara Oromia SNNP Total
Base
lin
e
Mid
term
Base
lin
e
Mid
term
Base
lin
e
Mid
term
Base
lin
e
Mid
term
Base
lin
e
Mid
term
Source of FP message
Radio β 10.9 *16.2 16.3 *11.8 26.9 25.5 18.7 18.2 18.8 17.4
Television ϕ 2.6 *5.4 0.7 0.3 1.8 3.0 0.6 *1.5 1.2 *2.0
Newspaper/magazine β 2.0 1.6 1.1 0.5 1.5 *4.1 0.8 1.8 1.3 1.9
Pamphlet/poster β 2.4 3.0 0.8 0.9 1.2 *9.9 0.9 *2.7 1.1 *4.0
Any health worker β 67.6 *82.5 54.9 *67.9 47.8 *73.6 55.9 *66.3 55.1 *71.2
Community events β 26.9 27.8 22.3 *13.0 30.7 34.1 21.5 *15.0 25.0 *21.2
Friends/family β 18.4 21.1 34.6 *20.6 26.3 29.2 24.6 21.5 27.9 *23.1
No. of women in reproductive age 1,080 756 1,000 1,092 1,000 1,056 1,000 1,056 4,080 3,960
Percentage of non-users contacted by health worker who discussed FP β
42.9 *53.0 21.7 *36.8 16.4 *33.1 28.9 *42.6 25.2 *39.8
Percentage of non-users who want to use a FP method in the future
64.7 63.5 60.7 57.6 65.4 62.5 69.7 66.6 64.4 61.8
No. of non-users 817 508 712 658 587 577 691 658 2,907 2,401 ϕ p<0.1; β p<0.05 for region × change over time interactions; *p<0.05 for change over time
59 69
41 31
0%
10%
20%
30%
40%
50%
60%
70%
80%
90%
100%
Baseline (2008) Midterm (2010)p<0.05
Figure 19: Changes in the percentage of women of reproductive age whose current pregnancy is wanted, baseline (n=276) and midterm (286) surveys, in L10K areas.
Unwanted
Wanted
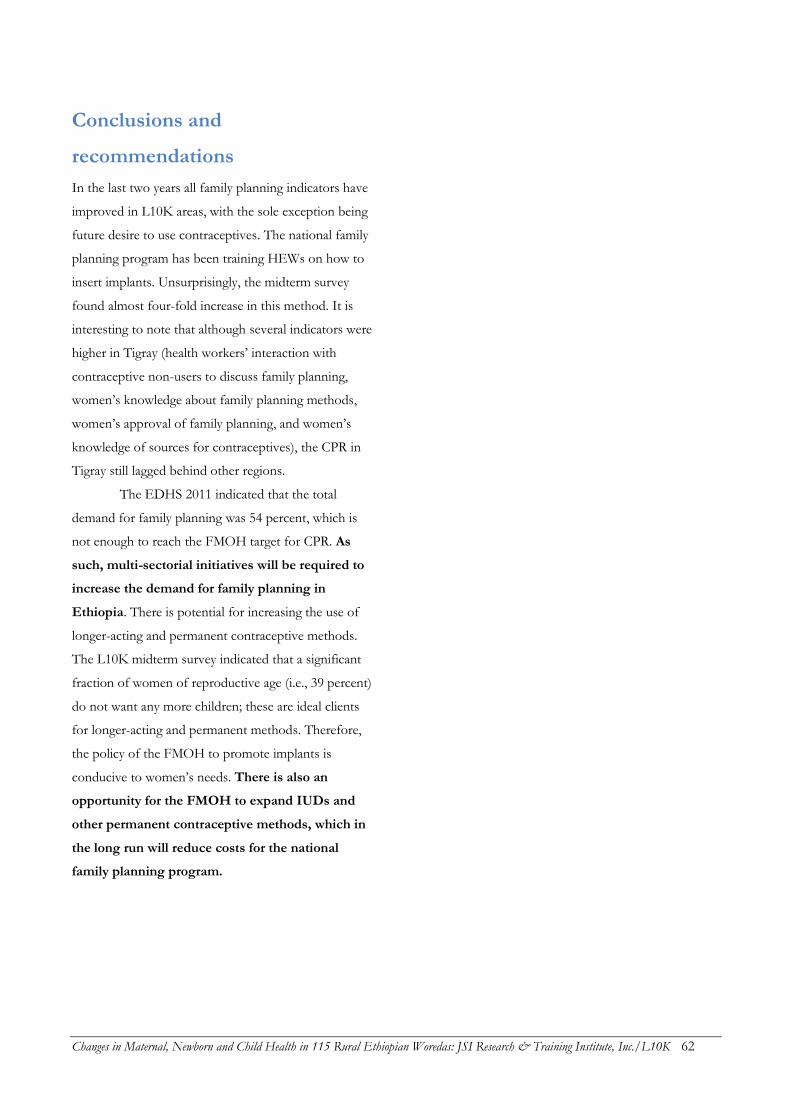
Changes in Maternal, Newborn and Child Health in 115 Rural Ethiopian Woredas: JSI Research & Training Institute, Inc./L10K 62
Conclusions and
recommendations
In the last two years all family planning indicators have
improved in L10K areas, with the sole exception being
future desire to use contraceptives. The national family
planning program has been training HEWs on how to
insert implants. Unsurprisingly, the midterm survey
found almost four-fold increase in this method. It is
interesting to note that although several indicators were
higher in Tigray (health workers’ interaction with
contraceptive non-users to discuss family planning,
women’s knowledge about family planning methods,
women’s approval of family planning, and women’s
knowledge of sources for contraceptives), the CPR in
Tigray still lagged behind other regions.
The EDHS 2011 indicated that the total
demand for family planning was 54 percent, which is
not enough to reach the FMOH target for CPR. As
such, multi-sectorial initiatives will be required to
increase the demand for family planning in
Ethiopia. There is potential for increasing the use of
longer-acting and permanent contraceptive methods.
The L10K midterm survey indicated that a significant
fraction of women of reproductive age (i.e., 39 percent)
do not want any more children; these are ideal clients
for longer-acting and permanent methods. Therefore,
the policy of the FMOH to promote implants is
conducive to women’s needs. There is also an
opportunity for the FMOH to expand IUDs and
other permanent contraceptive methods, which in
the long run will reduce costs for the national
family planning program.
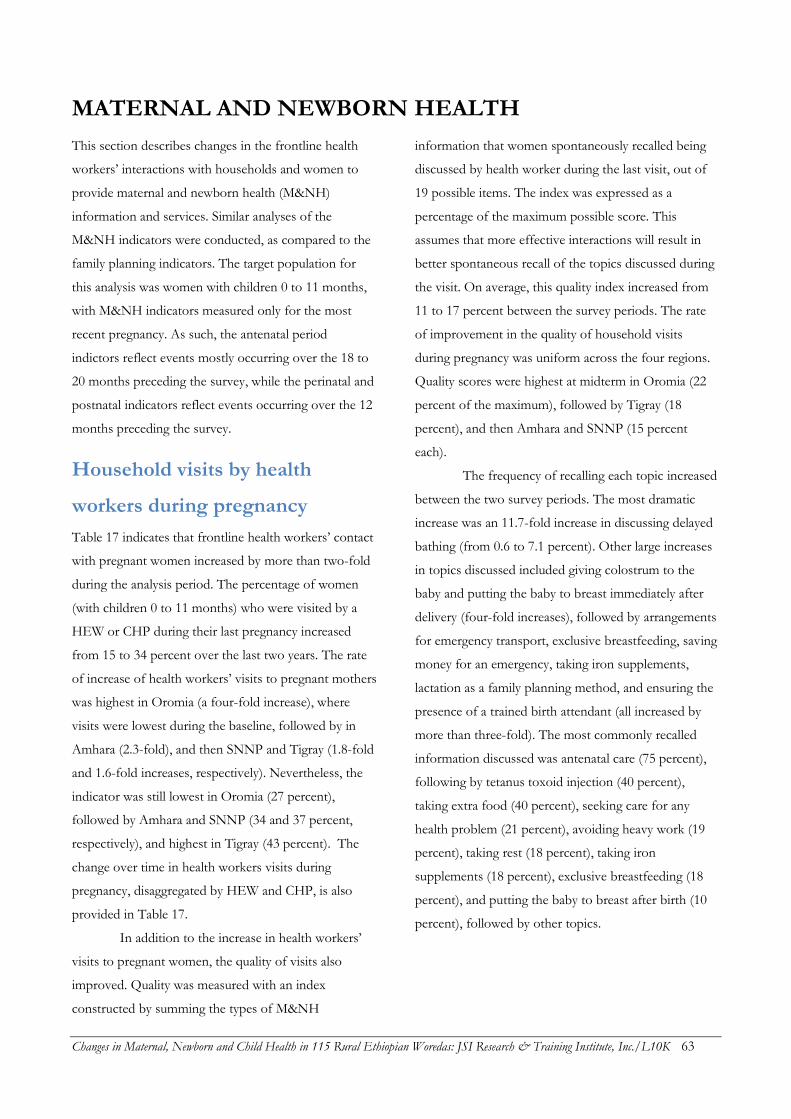
Changes in Maternal, Newborn and Child Health in 115 Rural Ethiopian Woredas: JSI Research & Training Institute, Inc./L10K 63
MATERNAL AND NEWBORN HEALTH
This section describes changes in the frontline health
workers’ interactions with households and women to
provide maternal and newborn health (M&NH)
information and services. Similar analyses of the
M&NH indicators were conducted, as compared to the
family planning indicators. The target population for
this analysis was women with children 0 to 11 months,
with M&NH indicators measured only for the most
recent pregnancy. As such, the antenatal period
indictors reflect events mostly occurring over the 18 to
20 months preceding the survey, while the perinatal and
postnatal indicators reflect events occurring over the 12
months preceding the survey.
Household visits by health
workers during pregnancy
Table 17 indicates that frontline health workers’ contact
with pregnant women increased by more than two-fold
during the analysis period. The percentage of women
(with children 0 to 11 months) who were visited by a
HEW or CHP during their last pregnancy increased
from 15 to 34 percent over the last two years. The rate
of increase of health workers’ visits to pregnant mothers
was highest in Oromia (a four-fold increase), where
visits were lowest during the baseline, followed by in
Amhara (2.3-fold), and then SNNP and Tigray (1.8-fold
and 1.6-fold increases, respectively). Nevertheless, the
indicator was still lowest in Oromia (27 percent),
followed by Amhara and SNNP (34 and 37 percent,
respectively), and highest in Tigray (43 percent). The
change over time in health workers visits during
pregnancy, disaggregated by HEW and CHP, is also
provided in Table 17.
In addition to the increase in health workers’
visits to pregnant women, the quality of visits also
improved. Quality was measured with an index
constructed by summing the types of M&NH
information that women spontaneously recalled being
discussed by health worker during the last visit, out of
19 possible items. The index was expressed as a
percentage of the maximum possible score. This
assumes that more effective interactions will result in
better spontaneous recall of the topics discussed during
the visit. On average, this quality index increased from
11 to 17 percent between the survey periods. The rate
of improvement in the quality of household visits
during pregnancy was uniform across the four regions.
Quality scores were highest at midterm in Oromia (22
percent of the maximum), followed by Tigray (18
percent), and then Amhara and SNNP (15 percent
each).
The frequency of recalling each topic increased
between the two survey periods. The most dramatic
increase was an 11.7-fold increase in discussing delayed
bathing (from 0.6 to 7.1 percent). Other large increases
in topics discussed included giving colostrum to the
baby and putting the baby to breast immediately after
delivery (four-fold increases), followed by arrangements
for emergency transport, exclusive breastfeeding, saving
money for an emergency, taking iron supplements,
lactation as a family planning method, and ensuring the
presence of a trained birth attendant (all increased by
more than three-fold). The most commonly recalled
information discussed was antenatal care (75 percent),
following by tetanus toxoid injection (40 percent),
taking extra food (40 percent), seeking care for any
health problem (21 percent), avoiding heavy work (19
percent), taking rest (18 percent), taking iron
supplements (18 percent), exclusive breastfeeding (18
percent), and putting the baby to breast after birth (10
percent), followed by other topics.
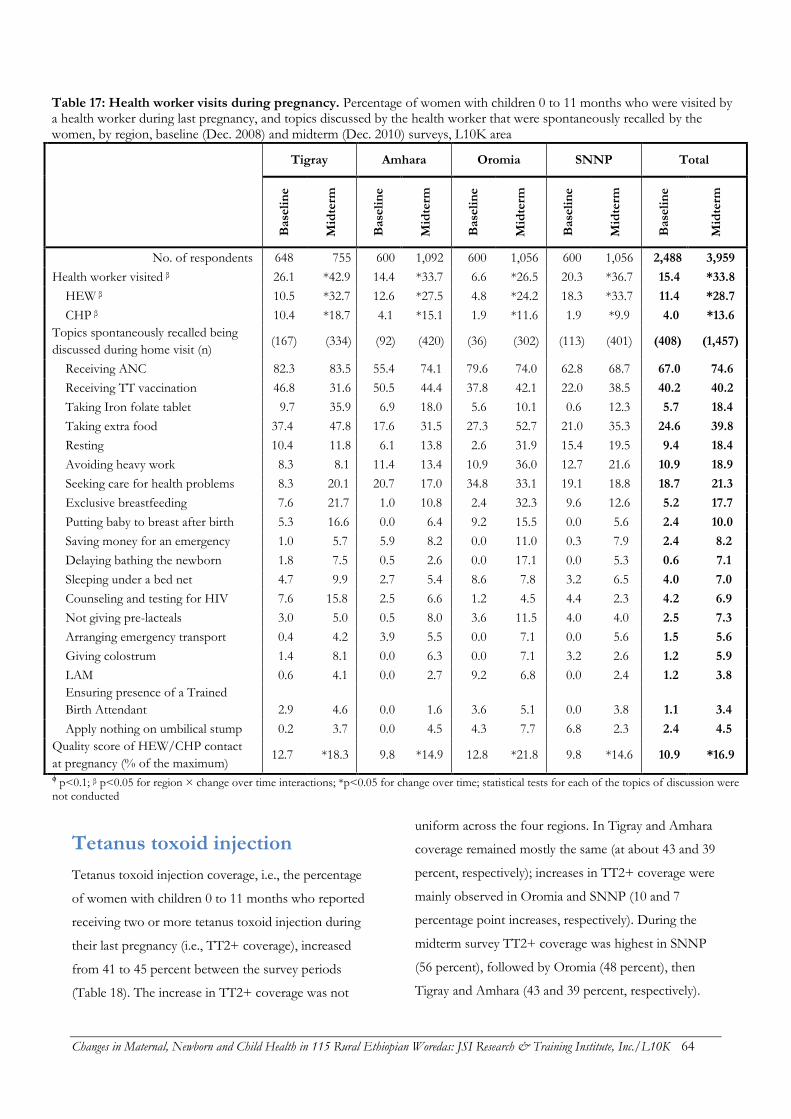
Changes in Maternal, Newborn and Child Health in 115 Rural Ethiopian Woredas: JSI Research & Training Institute, Inc./L10K 64
Table 17: Health worker visits during pregnancy. Percentage of women with children 0 to 11 months who were visited by a health worker during last pregnancy, and topics discussed by the health worker that were spontaneously recalled by the women, by region, baseline (Dec. 2008) and midterm (Dec. 2010) surveys, L10K area
Tigray Amhara Oromia SNNP Total
Base
lin
e
Mid
term
Base
lin
e
Mid
term
Base
lin
e
Mid
term
Base
lin
e
Mid
term
Base
lin
e
Mid
term
No. of respondents 648 755 600 1,092 600 1,056 600 1,056 2,488 3,959
Health worker visited β 26.1 *42.9 14.4 *33.7 6.6 *26.5 20.3 *36.7 15.4 *33.8
HEW β 10.5 *32.7 12.6 *27.5 4.8 *24.2 18.3 *33.7 11.4 *28.7
CHP β 10.4 *18.7 4.1 *15.1 1.9 *11.6 1.9 *9.9 4.0 *13.6
Topics spontaneously recalled being
discussed during home visit (n) (167) (334) (92) (420) (36) (302) (113) (401) (408) (1,457)
Receiving ANC 82.3 83.5 55.4 74.1 79.6 74.0 62.8 68.7 67.0 74.6
Receiving TT vaccination 46.8 31.6 50.5 44.4 37.8 42.1 22.0 38.5 40.2 40.2
Taking Iron folate tablet 9.7 35.9 6.9 18.0 5.6 10.1 0.6 12.3 5.7 18.4
Taking extra food 37.4 47.8 17.6 31.5 27.3 52.7 21.0 35.3 24.6 39.8
Resting 10.4 11.8 6.1 13.8 2.6 31.9 15.4 19.5 9.4 18.4
Avoiding heavy work 8.3 8.1 11.4 13.4 10.9 36.0 12.7 21.6 10.9 18.9
Seeking care for health problems 8.3 20.1 20.7 17.0 34.8 33.1 19.1 18.8 18.7 21.3
Exclusive breastfeeding 7.6 21.7 1.0 10.8 2.4 32.3 9.6 12.6 5.2 17.7
Putting baby to breast after birth 5.3 16.6 0.0 6.4 9.2 15.5 0.0 5.6 2.4 10.0
Saving money for an emergency 1.0 5.7 5.9 8.2 0.0 11.0 0.3 7.9 2.4 8.2
Delaying bathing the newborn 1.8 7.5 0.5 2.6 0.0 17.1 0.0 5.3 0.6 7.1
Sleeping under a bed net 4.7 9.9 2.7 5.4 8.6 7.8 3.2 6.5 4.0 7.0
Counseling and testing for HIV 7.6 15.8 2.5 6.6 1.2 4.5 4.4 2.3 4.2 6.9
Not giving pre-lacteals 3.0 5.0 0.5 8.0 3.6 11.5 4.0 4.0 2.5 7.3
Arranging emergency transport 0.4 4.2 3.9 5.5 0.0 7.1 0.0 5.6 1.5 5.6
Giving colostrum 1.4 8.1 0.0 6.3 0.0 7.1 3.2 2.6 1.2 5.9
LAM 0.6 4.1 0.0 2.7 9.2 6.8 0.0 2.4 1.2 3.8
Ensuring presence of a Trained
Birth Attendant 2.9 4.6 0.0 1.6 3.6 5.1 0.0 3.8 1.1 3.4
Apply nothing on umbilical stump 0.2 3.7 0.0 4.5 4.3 7.7 6.8 2.3 2.4 4.5
Quality score of HEW/CHP contact
at pregnancy (% of the maximum) 12.7 *18.3 9.8 *14.9 12.8 *21.8 9.8 *14.6 10.9 *16.9
ϕ p<0.1; β p<0.05 for region × change over time interactions; *p<0.05 for change over time; statistical tests for each of the topics of discussion were not conducted
Tetanus toxoid injection
Tetanus toxoid injection coverage, i.e., the percentage
of women with children 0 to 11 months who reported
receiving two or more tetanus toxoid injection during
their last pregnancy (i.e., TT2+ coverage), increased
from 41 to 45 percent between the survey periods
(Table 18). The increase in TT2+ coverage was not
uniform across the four regions. In Tigray and Amhara
coverage remained mostly the same (at about 43 and 39
percent, respectively); increases in TT2+ coverage were
mainly observed in Oromia and SNNP (10 and 7
percentage point increases, respectively). During the
midterm survey TT2+ coverage was highest in SNNP
(56 percent), followed by Oromia (48 percent), then
Tigray and Amhara (43 and 39 percent, respectively).
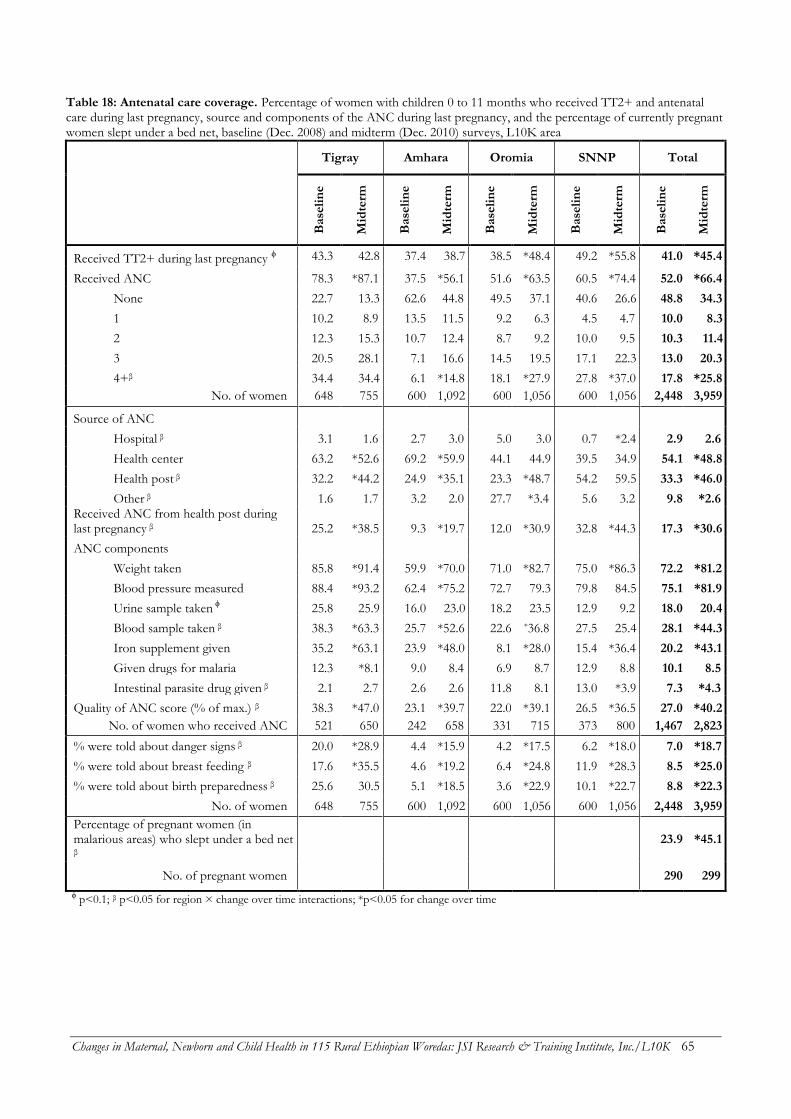
Changes in Maternal, Newborn and Child Health in 115 Rural Ethiopian Woredas: JSI Research & Training Institute, Inc./L10K 65
Table 18: Antenatal care coverage. Percentage of women with children 0 to 11 months who received TT2+ and antenatal care during last pregnancy, source and components of the ANC during last pregnancy, and the percentage of currently pregnant women slept under a bed net, baseline (Dec. 2008) and midterm (Dec. 2010) surveys, L10K area
Tigray Amhara Oromia SNNP Total
Base
lin
e
Mid
term
Base
lin
e
Mid
term
Base
lin
e
Mid
term
Base
lin
e
Mid
term
Base
lin
e
Mid
term
Received TT2+ during last pregnancy ϕ 43.3 42.8 37.4 38.7 38.5 *48.4 49.2 *55.8 41.0 *45.4
Received ANC 78.3 *87.1 37.5 *56.1 51.6 *63.5 60.5 *74.4 52.0 *66.4
None 22.7 13.3 62.6 44.8 49.5 37.1 40.6 26.6 48.8 34.3
1 10.2 8.9 13.5 11.5 9.2 6.3 4.5 4.7 10.0 8.3
2 12.3 15.3 10.7 12.4 8.7 9.2 10.0 9.5 10.3 11.4
3 20.5 28.1 7.1 16.6 14.5 19.5 17.1 22.3 13.0 20.3
4+β 34.4 34.4 6.1 *14.8 18.1 *27.9 27.8 *37.0 17.8 *25.8
No. of women 648 755 600 1,092 600 1,056 600 1,056 2,448 3,959
Source of ANC
Hospital β 3.1 1.6 2.7 3.0 5.0 3.0 0.7 *2.4 2.9 2.6
Health center 63.2 *52.6 69.2 *59.9 44.1 44.9 39.5 34.9 54.1 *48.8
Health post β 32.2 *44.2 24.9 *35.1 23.3 *48.7 54.2 59.5 33.3 *46.0
Other β 1.6 1.7 3.2 2.0 27.7 *3.4 5.6 3.2 9.8 *2.6 Received ANC from health post during last pregnancy β 25.2 *38.5 9.3 *19.7 12.0 *30.9 32.8 *44.3 17.3 *30.6
ANC components
Weight taken 85.8 *91.4 59.9 *70.0 71.0 *82.7 75.0 *86.3 72.2 *81.2
Blood pressure measured 88.4 *93.2 62.4 *75.2 72.7 79.3 79.8 84.5 75.1 *81.9
Urine sample taken ϕ 25.8 25.9 16.0 23.0 18.2 23.5 12.9 9.2 18.0 20.4
Blood sample taken β 38.3 *63.3 25.7 *52.6 22.6 *36.8 27.5 25.4 28.1 *44.3
Iron supplement given 35.2 *63.1 23.9 *48.0 8.1 *28.0 15.4 *36.4 20.2 *43.1
Given drugs for malaria 12.3 *8.1 9.0 8.4 6.9 8.7 12.9 8.8 10.1 8.5
Intestinal parasite drug given β 2.1 2.7 2.6 2.6 11.8 8.1 13.0 *3.9 7.3 *4.3
Quality of ANC score (% of max.) β 38.3 *47.0 23.1 *39.7 22.0 *39.1 26.5 *36.5 27.0 *40.2
No. of women who received ANC 521 650 242 658 331 715 373 800 1,467 2,823
% were told about danger signs β 20.0 *28.9 4.4 *15.9 4.2 *17.5 6.2 *18.0 7.0 *18.7
% were told about breast feeding β 17.6 *35.5 4.6 *19.2 6.4 *24.8 11.9 *28.3 8.5 *25.0
% were told about birth preparedness β 25.6 30.5 5.1 *18.5 3.6 *22.9 10.1 *22.7 8.8 *22.3
No. of women 648 755 600 1,092 600 1,056 600 1,056 2,448 3,959
Percentage of pregnant women (in malarious areas) who slept under a bed net
β 23.9 *45.1
No. of pregnant women
290 299
ϕ p<0.1; β p<0.05 for region × change over time interactions; *p<0.05 for change over time
Changes in Maternal, Newborn and Child Health in 115 Rural Ethiopian Woredas: JSI Research & Training Institute, Inc./L10K 66
Antenatal care
Antenatal care coverage, at least one visit and at least
four visits, were the indicators for measuring progress
towards MDG 5. The percentage of women with
children 0 to 11 months who visited a health facility
during her last pregnancy for check-up (i.e., ANC
coverage) increased by 14 percentage points from 52
percent in baseline to 66 percent in the midterm (Table
18). Similar rates of increases in ANC coverage were
observed across all four regions. ANC coverage was
highest at midterm in Tigray (87 percent), then SNNP
(74 percent), Oromia (64 percent), and then the lowest
in Amhara (56 percent).
The proportion of women (with children 0 to
11 months) who received four or more ANC visits (i.e.,
ANC 4+ coverage) increased from 18 to 26 percent
over the last two years (Table 18; Figure 20). Although
in Tigray the ANC 4+ coverage stayed the same (at 34
percent), the region was still among the highest for
ANC 4+ coverage along with SNNP (37 percent).
Amhara had the lowest current ANC 4+ coverage (15
percent) followed by Oromia (28 percent).
The source of ANC changed over the analysis
period (Table 18). During the baseline survey the
majority of women (54 percent) obtained their ANC
from health centers; this declined to 49 percent during
the midterm survey. The proportion of pregnant
women receiving ANC from health posts increased
from 33 to 46 percent. The decline in health centers’
share as the source for ANC was mostly observed in
Tigray and Amhara (each saw about a 10 percentage
point decline); changes in the other two regions were
not statistically significant. The trend of more ANC
visits taking place in health posts was observed in
Tigray, Amhara and Oromia, but not in SNNP.
The proportion of expectant mothers
obtaining ANC from health posts is a better
measurement of HEP performance. ANC coverage
from health posts increased from 17 to 31 percent
between the survey periods. This increase in ANC from
health posts was observed in all four regions, with the
greatest increases in Oromia (19 percentage point
increase). Other regions saw increases of 11 to 13
percentage points. ANC from health posts was highest
at midterm in SNNP (44 percent), followed by Tigray
(39 percent), Oromia (31 percent), and then Amhara (20
percent).
The quality of ANC was measured with an
index; ANC components received by women at least
once during their last pregnancy were summed to create
a score out of a maximum possible score of 7, and then
expressed as a percentage of the maximum. As
measured by this index, ANC quality improved from 27
to 40 percent of the maximum possible score during the
survey period (Table 18). Improvement in ANC quality
was observed in all four regions; Amhara and Oromia
(17 percentage points each), and Tigray and SNNP
(between 9 and 10 percentage points) all saw
improvement. The observed improvement in the ANC
quality index were primarily attribute to improvements
in taking weight (from 72 to 81 percent), measuring
blood pressure (from 75 to 82 percent), testing blood
(from 28 to 44 percent), and giving iron supplements
(from 20 to 43 percent). There was a decline in de-
worming (from 7 to 4 percent), while testing urine and
malaria preventive therapy remained unchanged (about
20 and 8 percent at midterm, respectively). ANC quality
was highest at midterm in Tigray (47 percent of the
maximum), followed by Amhara and Oromia (about 39
percent), and then SNNP (37 percent).
A woman was said to have complete ANC
coverage if her weight was taken, blood pressure was
measured, and urine and blood were tested at least once
during pregnancy (Figure 21). Coverage of complete
ANC increased from six to 10 percent between the
survey periods, with the bulk of improvement observed
in Amhara and Oromia (increases of six and seven
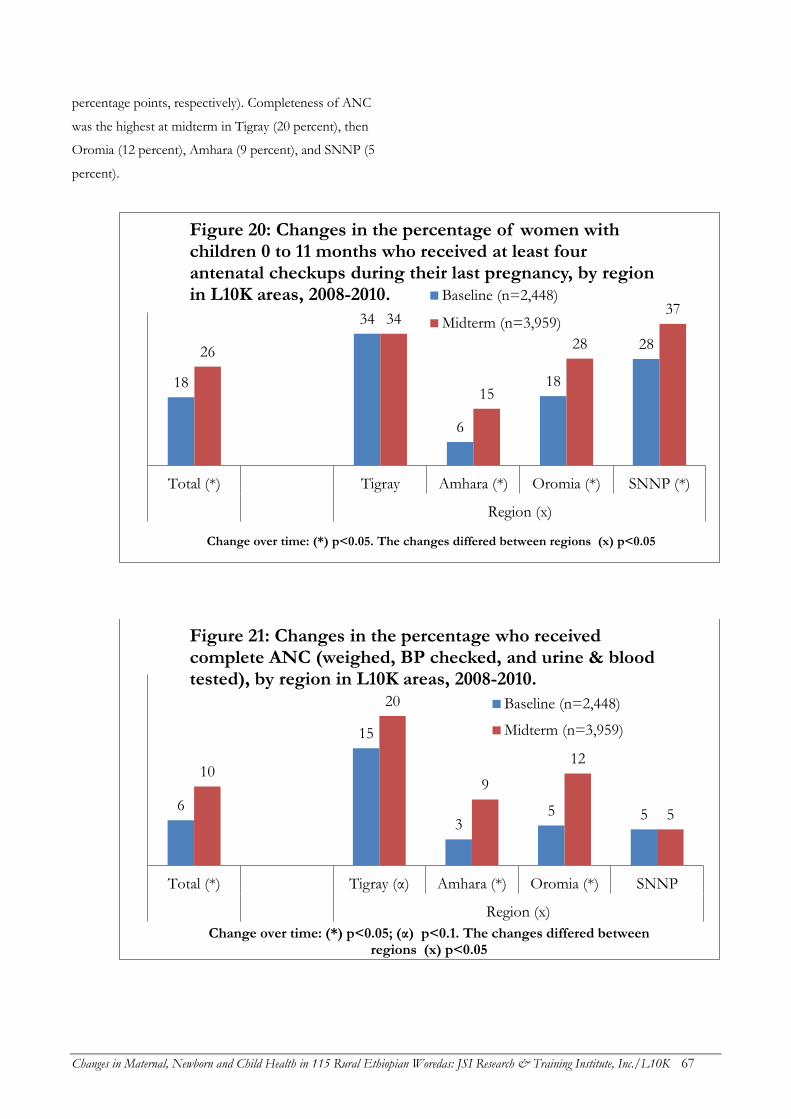
Changes in Maternal, Newborn and Child Health in 115 Rural Ethiopian Woredas: JSI Research & Training Institute, Inc./L10K 67
percentage points, respectively). Completeness of ANC
was the highest at midterm in Tigray (20 percent), then
Oromia (12 percent), Amhara (9 percent), and SNNP (5
percent).
18
34
6
18
28 26
34
15
28
37
Total (*) Tigray Amhara (*) Oromia (*) SNNP (*)
Region (x)
Change over time: (*) p<0.05. The changes differed between regions (x) p<0.05
Figure 20: Changes in the percentage of women with children 0 to 11 months who received at least four antenatal checkups during their last pregnancy, by region in L10K areas, 2008-2010. Baseline (n=2,448)
Midterm (n=3,959)
6
15
3 5 5
10
20
9
12
5
Total (*) Tigray (α) Amhara (*) Oromia (*) SNNP
Region (x)
Change over time: (*) p<0.05; (α) p<0.1. The changes differed between regions (x) p<0.05
Figure 21: Changes in the percentage who received complete ANC (weighed, BP checked, and urine & blood tested), by region in L10K areas, 2008-2010.
Baseline (n=2,448)
Midterm (n=3,959)
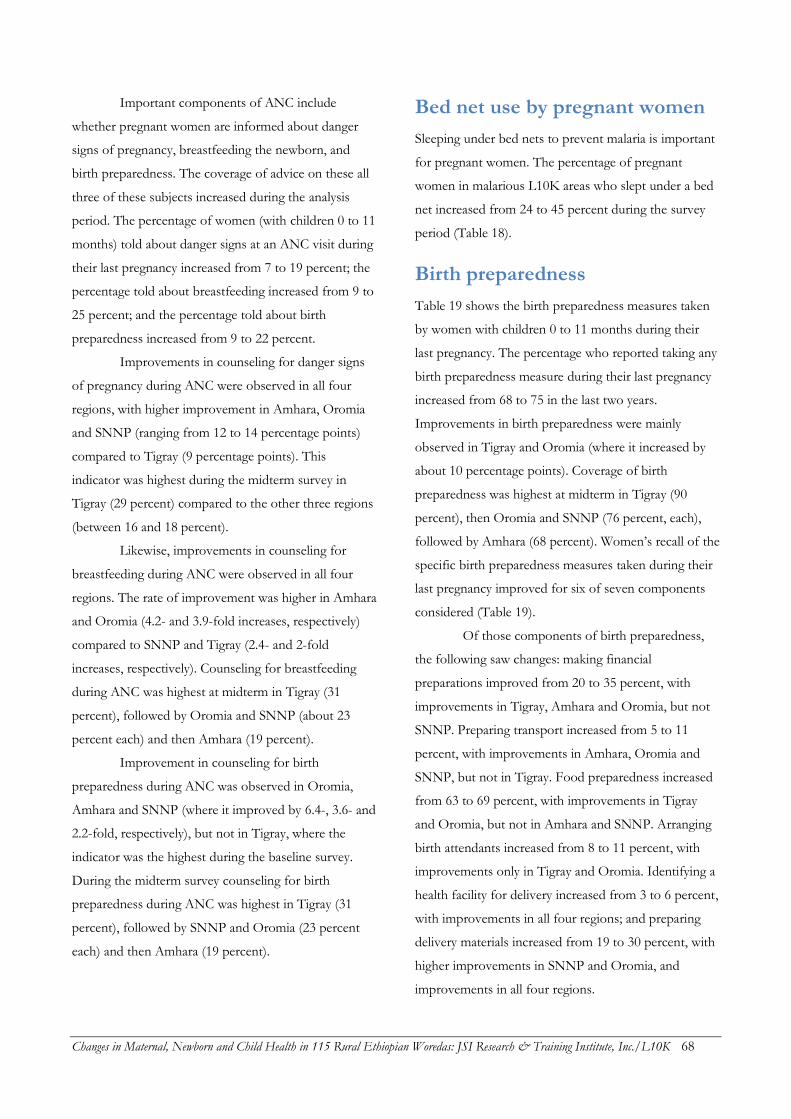
Changes in Maternal, Newborn and Child Health in 115 Rural Ethiopian Woredas: JSI Research & Training Institute, Inc./L10K 68
Important components of ANC include
whether pregnant women are informed about danger
signs of pregnancy, breastfeeding the newborn, and
birth preparedness. The coverage of advice on these all
three of these subjects increased during the analysis
period. The percentage of women (with children 0 to 11
months) told about danger signs at an ANC visit during
their last pregnancy increased from 7 to 19 percent; the
percentage told about breastfeeding increased from 9 to
25 percent; and the percentage told about birth
preparedness increased from 9 to 22 percent.
Improvements in counseling for danger signs
of pregnancy during ANC were observed in all four
regions, with higher improvement in Amhara, Oromia
and SNNP (ranging from 12 to 14 percentage points)
compared to Tigray (9 percentage points). This
indicator was highest during the midterm survey in
Tigray (29 percent) compared to the other three regions
(between 16 and 18 percent).
Likewise, improvements in counseling for
breastfeeding during ANC were observed in all four
regions. The rate of improvement was higher in Amhara
and Oromia (4.2- and 3.9-fold increases, respectively)
compared to SNNP and Tigray (2.4- and 2-fold
increases, respectively). Counseling for breastfeeding
during ANC was highest at midterm in Tigray (31
percent), followed by Oromia and SNNP (about 23
percent each) and then Amhara (19 percent).
Improvement in counseling for birth
preparedness during ANC was observed in Oromia,
Amhara and SNNP (where it improved by 6.4-, 3.6- and
2.2-fold, respectively), but not in Tigray, where the
indicator was the highest during the baseline survey.
During the midterm survey counseling for birth
preparedness during ANC was highest in Tigray (31
percent), followed by SNNP and Oromia (23 percent
each) and then Amhara (19 percent).
Bed net use by pregnant women
Sleeping under bed nets to prevent malaria is important
for pregnant women. The percentage of pregnant
women in malarious L10K areas who slept under a bed
net increased from 24 to 45 percent during the survey
period (Table 18).
Birth preparedness
Table 19 shows the birth preparedness measures taken
by women with children 0 to 11 months during their
last pregnancy. The percentage who reported taking any
birth preparedness measure during their last pregnancy
increased from 68 to 75 in the last two years.
Improvements in birth preparedness were mainly
observed in Tigray and Oromia (where it increased by
about 10 percentage points). Coverage of birth
preparedness was highest at midterm in Tigray (90
percent), then Oromia and SNNP (76 percent, each),
followed by Amhara (68 percent). Women’s recall of the
specific birth preparedness measures taken during their
last pregnancy improved for six of seven components
considered (Table 19).
Of those components of birth preparedness,
the following saw changes: making financial
preparations improved from 20 to 35 percent, with
improvements in Tigray, Amhara and Oromia, but not
SNNP. Preparing transport increased from 5 to 11
percent, with improvements in Amhara, Oromia and
SNNP, but not in Tigray. Food preparedness increased
from 63 to 69 percent, with improvements in Tigray
and Oromia, but not in Amhara and SNNP. Arranging
birth attendants increased from 8 to 11 percent, with
improvements only in Tigray and Oromia. Identifying a
health facility for delivery increased from 3 to 6 percent,
with improvements in all four regions; and preparing
delivery materials increased from 19 to 30 percent, with
higher improvements in SNNP and Oromia, and
improvements in all four regions.
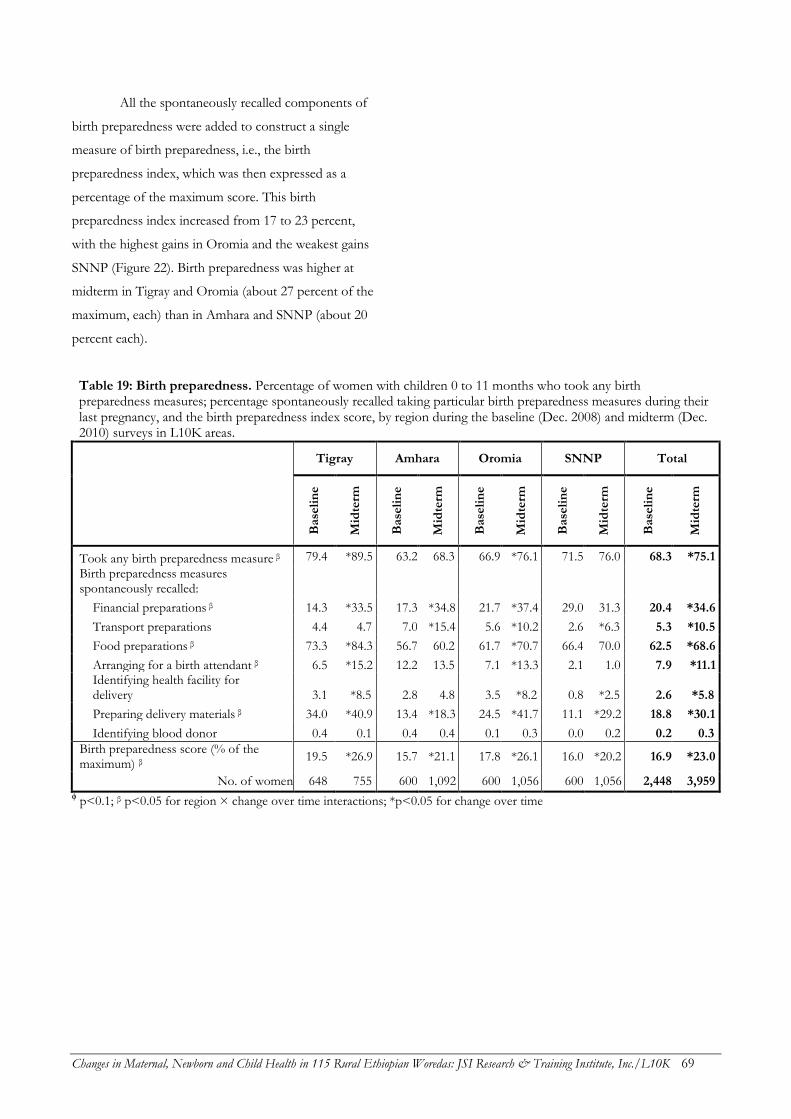
Changes in Maternal, Newborn and Child Health in 115 Rural Ethiopian Woredas: JSI Research & Training Institute, Inc./L10K 69
All the spontaneously recalled components of
birth preparedness were added to construct a single
measure of birth preparedness, i.e., the birth
preparedness index, which was then expressed as a
percentage of the maximum score. This birth
preparedness index increased from 17 to 23 percent,
with the highest gains in Oromia and the weakest gains
SNNP (Figure 22). Birth preparedness was higher at
midterm in Tigray and Oromia (about 27 percent of the
maximum, each) than in Amhara and SNNP (about 20
percent each).
Table 19: Birth preparedness. Percentage of women with children 0 to 11 months who took any birth preparedness measures; percentage spontaneously recalled taking particular birth preparedness measures during their last pregnancy, and the birth preparedness index score, by region during the baseline (Dec. 2008) and midterm (Dec. 2010) surveys in L10K areas.
Tigray Amhara Oromia SNNP Total
Base
lin
e
Mid
term
Base
lin
e
Mid
term
Base
lin
e
Mid
term
Base
lin
e
Mid
term
Base
lin
e
Mid
term
Took any birth preparedness measure β 79.4 *89.5 63.2 68.3 66.9 *76.1 71.5 76.0 68.3 *75.1
Birth preparedness measures spontaneously recalled:
Financial preparations β 14.3 *33.5 17.3 *34.8 21.7 *37.4 29.0 31.3 20.4 *34.6
Transport preparations 4.4 4.7 7.0 *15.4 5.6 *10.2 2.6 *6.3 5.3 *10.5
Food preparations β 73.3 *84.3 56.7 60.2 61.7 *70.7 66.4 70.0 62.5 *68.6
Arranging for a birth attendant β 6.5 *15.2 12.2 13.5 7.1 *13.3 2.1 1.0 7.9 *11.1 Identifying health facility for delivery 3.1 *8.5 2.8 4.8 3.5 *8.2 0.8 *2.5 2.6 *5.8
Preparing delivery materials β 34.0 *40.9 13.4 *18.3 24.5 *41.7 11.1 *29.2 18.8 *30.1
Identifying blood donor 0.4 0.1 0.4 0.4 0.1 0.3 0.0 0.2 0.2 0.3
Birth preparedness score (% of the maximum) β
19.5 *26.9 15.7 *21.1 17.8 *26.1 16.0 *20.2 16.9 *23.0
No. of women 648 755 600 1,092 600 1,056 600 1,056 2,448 3,959 ϕ p<0.1; β p<0.05 for region × change over time interactions; *p<0.05 for change over time
Changes in Maternal, Newborn and Child Health in 115 Rural Ethiopian Woredas: JSI Research & Training Institute, Inc./L10K 70
Safe and clean delivery
Fatal complications of pregnancy usually take place
during childbirth or just afterwards. As such,
institutional deliveries and deliveries attended by skilled
professionals are key to reducing maternal morbidity
and mortality (Campbell et al. 2006; Koblinsky et al.
2006). Since access to health facilities with basic
obstetric care and access to skilled birth attendants are
still not readily available in Ethiopia, L10K encourages
HEWs to attend deliveries to ensure cleanliness and
appropriate newborn care.
Institutional delivery
Among women with children 0 to 11 months, the
percentage of institutional deliveries (for the last birth)
increased by nearly two-fold in L10K areas, from 6 to
11 percent between the survey periods. Changes were
similar changes across all regions (Table 20).
Institutional deliveries were more common at midterm
in Tigray (18 percent) compared to the other three
regions, where it ranged between 9 and 11 percent.
Deliveries assisted by trained professionals
Table 20 indicates that the percentage of women with
children 0 to 11 months whose last birth was assisted by
a health professional increased from 10 to 16 percent
over the last two years. Rates of change in delivery
assisted by a health professional were similar across the
four regions. However, the proportion of deliveries
assisted by a health professional was the highest at
midterm in Tigray (26 percent) followed by Oromia and
SNNP (16 percent), and then Amhara (11 percent).
The proportion of deliveries assisted by HEWs
is a more precise measurement of the performance of
the HEP and the support it receives from L10K.
Between the survey periods, the percent of HEW-
assisted deliveries in L10K areas increased modestly,
from 3.6 to 5.8 percent. The percent of HEW-assisted
deliveries did not increase in Amhara. During the
midterm survey HEW-assisted delivery was more
common in Tigray (10 percent), followed by SNNP and
Oromia (between 6 and 7 percent), and then Amhara (3
percent).
17 20
16 18
16
23
27
21
26
20
Total (*) Tigray (*) Amhara (*) Oromia (*) SNNP (*)
Region (x)
Change over time: (*) p<0.05. The changes differed between regions (x) p<0.05
Figure 22: Changes in birth preparedness score (percentage of the maximum possible score), by region in L10K areas, 2008-2010.
Baseline (n=2,448) Midterm (n=3,959)
Changes in Maternal, Newborn and Child Health in 115 Rural Ethiopian Woredas: JSI Research & Training Institute, Inc./L10K 71
Table 20: Safe and clean delivery and postnatal care. Percentage of women with children 0 to 11 months whose last delivery took place at home; took place at an institution, was assisted by a health professional; was assisted by a HEW; was followed by PNC; and was followed by PNC by a HEW, during the baseline (Dec. 2008) and midterm (Dec. 2010) surveys in L10K areas.
Tigray Amhara Oromia SNNP Total
Base
lin
e
Mid
term
Base
lin
e
Mid
term
Base
lin
e
Mid
term
Base
lin
e
Mid
term
Base
lin
e
Mid
term
Safe and clean delivery
% delivered at home 88.0 *81.6 96.6 *90.5 93.2 *89.0 94.0 91.3 93.9 *88.9
% institutional delivery 12.0 *18.4 3.4 *9.5 6.8 *11.0 6.0 8.7 6.1 *11.1
% delivered by health professional 18.5 *26.2 6.8 *11.3 11.0 *16.1 10.3 *15.5 10.4 *15.7
% HEW-assisted deliveries β 4.8 *10.0 3.8 3.0 2.4 *6.2 3.8 *7.3 3.6 *5.8
At home 4.6 7.1 3.0 2.0 1.8 4.3 3.3 6.2 3.0 4.2
At health post 0.3 2.9 0.8 1.0 0.6 2.0 0.6 1.2 0.6 1.6
% cut cord with clean/sterile blade (among home deliveries)
96.7 97.3 94.6 95.8 96.2 97.6 96.5 96.9 95.7 96.7
% tied cord with clean/sterile thread β 85.3 84.1 41.0 *51.8 50.4 *59.9 58.4 *78.9 53.7 *64.4
% applied something to cord β 48.1 *36.5 44.2 *34.4 21.0 25.3 15.7 12.1 32.4 *27.5
% applied butter to cord β 46.4 *35.2 39.3 *30.2 18.9 22.7 13.2 9.8 29.3 *24.6
% took clean cord care χ, β 39.6 *47.1 15.9 *30.0 36.1 39.4 41.9 *63.4 29.8 *41.7
Postnatal period
% received any PNC ϕ 12.5 *21.6 5.6 *15.9 5.4 *17.6 9.9 *23.3 7.5 *18.8
% home deliveries received PNC 9.3 *19.2 5.7 *15.0 5.1 *17.3 9.5 *24.2 6.9 *18.2
% home del. received PNC in 7 days 6.8 *16.9 3.7 *10.8 2.7 *11.0 5.6 *20.0 4.2 *13.6
% home del. rec. PNC by HEW in 7 days 4.2 *14.3 2.7 *9.7 1.3 *9.1 4.7 *17.6 3.0 *11.9
% home del. received PNC in 2 days 3.6 *7.4 0.7 *4.1 1.4 *4.2 2.4 *10.0 1.6 *5.8
% home del. rec. PNC by HEW in 2 days 1.9 *6.4 0.5 *4.0 0.7 *4.0 2.2 *9.1 1.1 *5.4
% received postnatal vitamin A β 21.4 *43.2 7.0 *15.4 23.5 *30.0 15.1 18.9 15.2 *24.0
% visited by CHP after delivery β 5.1 7.8 2.0 *5.2 0.6 *9.1 0.2 *5.8 1.7 *6.8
No. of women 648 755 600 1,092 600 1,056 600 1,056 2,448 3,959
No. of home deliveries 516 564 557 943 530 859 524 870 2,127 3,236
Quality of HEW/CHP counseling during postnatal period index score (in % of the max.)
14.2 *24.1
No. of women 213 904
PNC components …
Examined body 44.7 35.9
Checked breast 23.8 25.1
Checked for heavy bleeding 26.9 26.4
Counseled on danger signs 14.8 19.0
Counseled on family planning 15.7 25.9
Counseled on nutrition 25.8 42.0
Referred to health center/hospital 3.9 4.3
Quality of PNC score (% of max.) 22.2 25.5
No. of women
132 372
ϕ p<0.1; β p<0.05 for region × change over time interactions; *p<0.05 for change over time; χ cord cleanly cut, tied and applied nothing on cord among deliveries un attended by skilled health professionals
Changes in Maternal, Newborn and Child Health in 115 Rural Ethiopian Woredas: JSI Research & Training Institute, Inc./L10K 72
Clean umbilical cord care
Table 20 indicates that cutting the umbilical cord with a
clean or sterile blade during the last birth among
women with children 0 to 11 months was almost
universal during baseline and midterm surveys (96 and
97 percent, respectively). Tying the cord with sterile or
clean thread increased from 54 to 64 percent. The rate
of increase in this indicator was highest in SNNP (by 36
percent) followed by Oromia and Amhara (between 19
and 26 percent); no change was observed in Tigray. The
practice was most common at midterm in Tigray (84
percent) followed by SNNP (79 percent), Oromia (60
percent), and Amhara (52 percent).
Application of butter to the stump of the
umbilical cord declined from 29 to 25 percent in the last
two years. However, reduction in this harmful practice
was not observed in Oromia and SNNP. The practice
was least common in SNNP (10 percent), followed by
Oromia (23 percent), then Amhara and Tigray (30 and
35 percent, respectively).
A composite indicator for clean cord care is
defined if umbilical cord was cleanly cut and cleanly
tied, and if nothing was applied to the cut stump.
Among women whose delivery was not attended by a
skilled health professional, the proportion who followed
all three guidelines and thus took clean care of the umbilical
cord increased from 30 to 42 percent during the last two
years. The rate of increase in clean cord care was
highest in Amhara and SNNP (increases of 89 and 51
percent, respectively), followed by Tigray (19 percent
increase); and no improvement in Oromia. Clean cord
care was highest during the midterm survey in SNNP
(63 percent), followed by Tigray and Oromia (47 and 39
percent, respectively), and then Amhara (30 percent).
Postnatal period
Postnatal care
Early postnatal care is crucial for both the mother and
the baby. The percentage of women with children 0 to
11 months whose last birth took place at home and who
visited a health facility, or were visited by a HEW at
home for check-up within 7 days (i.e., PNC in 7 days)
increased from 4 to 14 percent in the last two years. The
percentage who received such visits within 48 hours
(i.e., PNC in 48 hours) increased from 1.6 to 5.8 percent
(Table 20). The rates of increase in PNC within 7 days
and PNC within 48 hours were uniform across the four
regions. The highest coverage of PNC in 7 days
coverage at midterm was observed in SNNP and Tigray
(20 and 17 percent, respectively), followed by Oromia
and Amhara (11 percent each); with similar patterns for
PNC in 48 hours.
PNC coverage by HEWs is a better measure of
HEP performance. Most (80 percent) of the PNC
coverage observed was carried out by HEWs. As such,
patterns of PNC by HEWs within 7 days and within 48
hours coverage are similar to those discussed above (see
Table 20).
The quality of PNC counseling by HEWs or
CHPs was measured with an index created by summing
types of information provided during the PNC visit, as
spontaneously recalled by women. The index score was
expressed as a percentage of the maximum possible
score (which is 10 in this case).The quality of
HEW/CHP counseling during PNC increased during
the analysis period from 14 to 24 percent of the
maximum (Table 20). Similarly, the quality of PNC
index is measured by summing the number of PNC
check-up components that are spontaneously recalled
by the women (see Table 20 for the list). The quality of
the PNC index is expressed as the percentage of the
maximum considered (in this case 7); higher score
indicated better quality of the PNC. The quality of the
Changes in Maternal, Newborn and Child Health in 115 Rural Ethiopian Woredas: JSI Research & Training Institute, Inc./L10K 73
Table 21: Newborn check-up components. Components of newborn check-up and its quality, during the baseline (Dec. 2008) and midterm (Dec. 2010) surveys in L10K areas.
Baseline Midterm
Percentage reporting components of newborn care…
Examined baby's body 24.0 28.4
Weighed baby 21.6 20.5
Checked cord 12.7 *33.2
Counseled on breastfeeding 23.2 *46.2
Observed breastfeeding 8.7 *28.0
Counseled on keeping baby warm 8.4 *21.4
Checked on danger signs 4.8 10.8
Counseled on danger signs 6.4 12.4
Referred to health center/hospital 0.6 *4.0
Newborn check-up quality score (% of max.) 12.2 *22.6
No. of women 132 372
* p<0.05
PNC did not change significantly during the analysis
period.
Newborn check-up
PNC coverage was also used as a proxy for newborn
check-up coverage. Mothers were also asked to recall
components of newborn checkups, and changes in
these components are reported in Table 21. The
proportion of women recalling a specific component
increased for five of the nine items considered. The
mostly commonly recalled newborn checkup
components during the midterm survey were counseling
for breastfeeding (46 percent), checking the umbilical
cord (33 percent), examining the baby’s body (28
1.6
3.6
0.7 1.4
2.4
5.8
7.4
4.1 4.2
10.0
Total (*) Tigray (*) Amhara (*) Oromia (*) SNNP (*)
Region
Change over time: (*) p<0.05. The changes did not vary between regions (p>0.1)
Figure 23: Changes in the percentage of women with children 0 to 11 months whose last delivery was at home and who received PNC, by region in L10K areas, 2008-2010. Baseline (n=2,127)
Midterm (n=3,236)
Changes in Maternal, Newborn and Child Health in 115 Rural Ethiopian Woredas: JSI Research & Training Institute, Inc./L10K 74
Table 22: Newborn health care practices. Prevalence of selected newborn care behaviors associated with the last birth among women with children 0 to 11 months; and the percentage of women with children 0 to 5 months who were currently giving only breast milk to their baby, by region during baseline (Dec. 2008) and midterm (Dec. 2010) surveys in L10K areas.
Tigray Amhara Oromia SNNP Total
Base
lin
e
Mid
term
Base
lin
e
Mid
term
Base
lin
e
Mid
term
Base
lin
e
Mid
term
Base
lin
e
Mid
term
Dried & wrapped baby after delivery β 66.2 *74.6 74.5 67.7 69.8 *88.4 69.9 67.6 71.1 *74.1
Always/frequent skin-to-skin contact β 51.7 *80.0 67.6 *50.8 88.6 *94.1 75.6 *84.9 72.4 73.6
Delay bathing newborn for >6 hours β 27.2 *37.4 39.0 *49.0 12.6 *32.4 23.6 *44.2 27.2 *42.0
Took thermal care of the baby χ, β 10.4 *25.1 17.8 16.7 7.5 *28.1 8.7 *27.9 12.1 *23.3
Baby put to breast within an hour of delivery β
40.0 *53.9 20.2 *34.2 64.7 65.9 60.7 67.9 43.3 *52.5
First milk (colostrum) given to baby β 47.4 *69.4 32.6 *43.9 50.1 *57.8 52.9 52.0 43.6 *53.0
Fed only breast milk during 1st 3 days of life
81.8 *88.7 40.9 *60.0 92.5 *95.9 88.0 91.3 70.4 *80.3
No. of women 648 755 600 1,092 600 1,056 600 1,056 2,448 3,959
Exclusively breastfed baby β 67.3 *86.9 77.4 82.5 55.2 *72.7 58.1 *81.7 66.2 *80.2
No. of women 322 359 276 517 258 545 259 568 1,115 1,989
ϕ p<0.1; β p<0.05 for region × change over time interactions; *p<0.05 for change over time; χ dried and wrapped baby immediately after birth, delayed bath by >6 hours & always maintained skin-to-skin contact
percent), counseling to keep baby warm (21 percent),
weighing the baby (21 percent), counseling on danger
signs (12 percent), and checking on danger signs (11
percent).
As with quality of PNC, the quality of
newborn check-ups was measured with an index that
summed the components of the check-up, which was
then expressed as a percentage of the maximum
possible score. This index increased by nearly two-
fold during the analysis period, from 12 to 23 percent
of the maximum.
Newborn health care
Simple newborn health care practices at the household
level can avert significant neonatal morbidity and
mortality (Darmstadt 2005 et al.). Thus the L10K
project promotes hygiene during delivery, keeping the
newborn warm, early initiation of breastfeeding, and
exclusive breast-feeding. Coverage of hygienic delivery
has already been discussed.
Keeping the baby warm
Thermal protection of the newborn includes a series of
measures at birth and during the first days of life, all of
which ensure that the baby does not become either too
cold or too hot, but rather maintains a normal body
temperature. At birth the newborn should immediately
be dried and covered, before the cord is cut. While the
baby is being dried, s/he should be on a warm surface
such as the mother's chest or abdomen (skin-to-skin
contact). Bathing the baby immediately after birth
should be postponed (McCall et al. 2010).
The percentage of women with children 0 to
11 months in L10K areas who reported that they dried
and wrapped the baby before the placenta was delivered or
immediately after birth increased meagerly, from 71 to
74 percent (Table 22). However, changes in newborn
care practice were not uniform across the four regions.
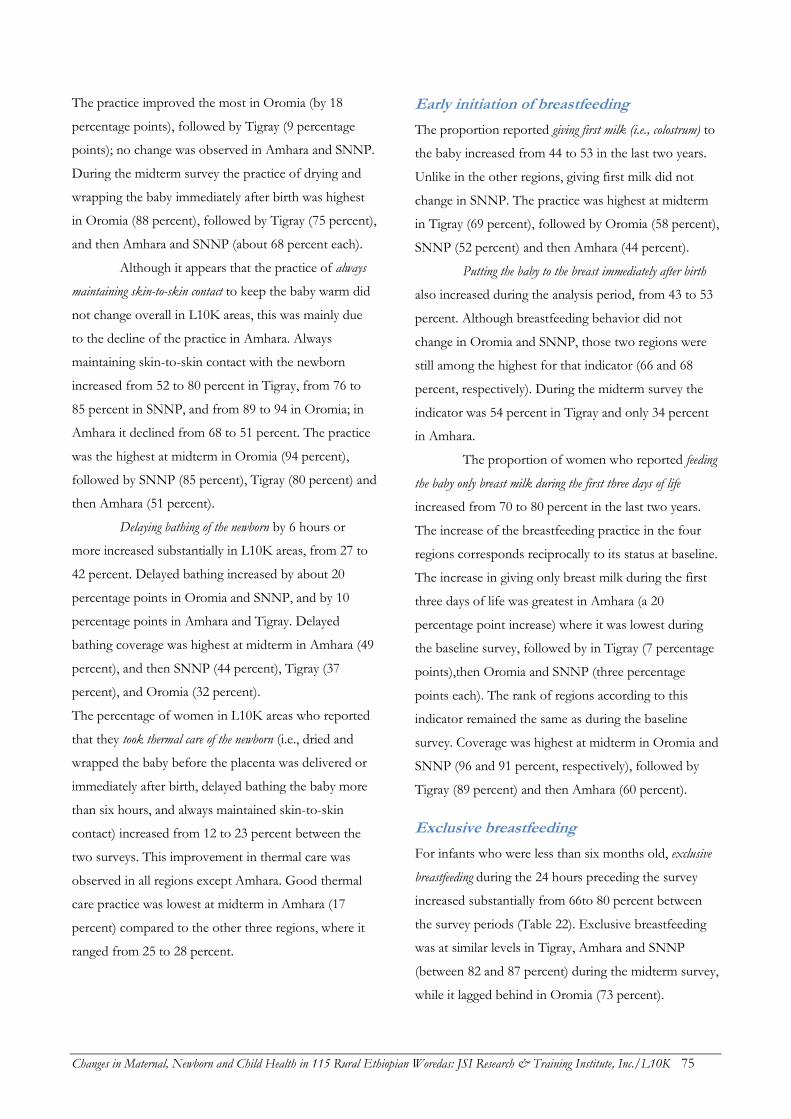
Changes in Maternal, Newborn and Child Health in 115 Rural Ethiopian Woredas: JSI Research & Training Institute, Inc./L10K 75
The practice improved the most in Oromia (by 18
percentage points), followed by Tigray (9 percentage
points); no change was observed in Amhara and SNNP.
During the midterm survey the practice of drying and
wrapping the baby immediately after birth was highest
in Oromia (88 percent), followed by Tigray (75 percent),
and then Amhara and SNNP (about 68 percent each).
Although it appears that the practice of always
maintaining skin-to-skin contact to keep the baby warm did
not change overall in L10K areas, this was mainly due
to the decline of the practice in Amhara. Always
maintaining skin-to-skin contact with the newborn
increased from 52 to 80 percent in Tigray, from 76 to
85 percent in SNNP, and from 89 to 94 in Oromia; in
Amhara it declined from 68 to 51 percent. The practice
was the highest at midterm in Oromia (94 percent),
followed by SNNP (85 percent), Tigray (80 percent) and
then Amhara (51 percent).
Delaying bathing of the newborn by 6 hours or
more increased substantially in L10K areas, from 27 to
42 percent. Delayed bathing increased by about 20
percentage points in Oromia and SNNP, and by 10
percentage points in Amhara and Tigray. Delayed
bathing coverage was highest at midterm in Amhara (49
percent), and then SNNP (44 percent), Tigray (37
percent), and Oromia (32 percent).
The percentage of women in L10K areas who reported
that they took thermal care of the newborn (i.e., dried and
wrapped the baby before the placenta was delivered or
immediately after birth, delayed bathing the baby more
than six hours, and always maintained skin-to-skin
contact) increased from 12 to 23 percent between the
two surveys. This improvement in thermal care was
observed in all regions except Amhara. Good thermal
care practice was lowest at midterm in Amhara (17
percent) compared to the other three regions, where it
ranged from 25 to 28 percent.
Early initiation of breastfeeding
The proportion reported giving first milk (i.e., colostrum) to
the baby increased from 44 to 53 in the last two years.
Unlike in the other regions, giving first milk did not
change in SNNP. The practice was highest at midterm
in Tigray (69 percent), followed by Oromia (58 percent),
SNNP (52 percent) and then Amhara (44 percent).
Putting the baby to the breast immediately after birth
also increased during the analysis period, from 43 to 53
percent. Although breastfeeding behavior did not
change in Oromia and SNNP, those two regions were
still among the highest for that indicator (66 and 68
percent, respectively). During the midterm survey the
indicator was 54 percent in Tigray and only 34 percent
in Amhara.
The proportion of women who reported feeding
the baby only breast milk during the first three days of life
increased from 70 to 80 percent in the last two years.
The increase of the breastfeeding practice in the four
regions corresponds reciprocally to its status at baseline.
The increase in giving only breast milk during the first
three days of life was greatest in Amhara (a 20
percentage point increase) where it was lowest during
the baseline survey, followed by in Tigray (7 percentage
points),then Oromia and SNNP (three percentage
points each). The rank of regions according to this
indicator remained the same as during the baseline
survey. Coverage was highest at midterm in Oromia and
SNNP (96 and 91 percent, respectively), followed by
Tigray (89 percent) and then Amhara (60 percent).
Exclusive breastfeeding
For infants who were less than six months old, exclusive
breastfeeding during the 24 hours preceding the survey
increased substantially from 66to 80 percent between
the survey periods (Table 22). Exclusive breastfeeding
was at similar levels in Tigray, Amhara and SNNP
(between 82 and 87 percent) during the midterm survey,
while it lagged behind in Oromia (73 percent).
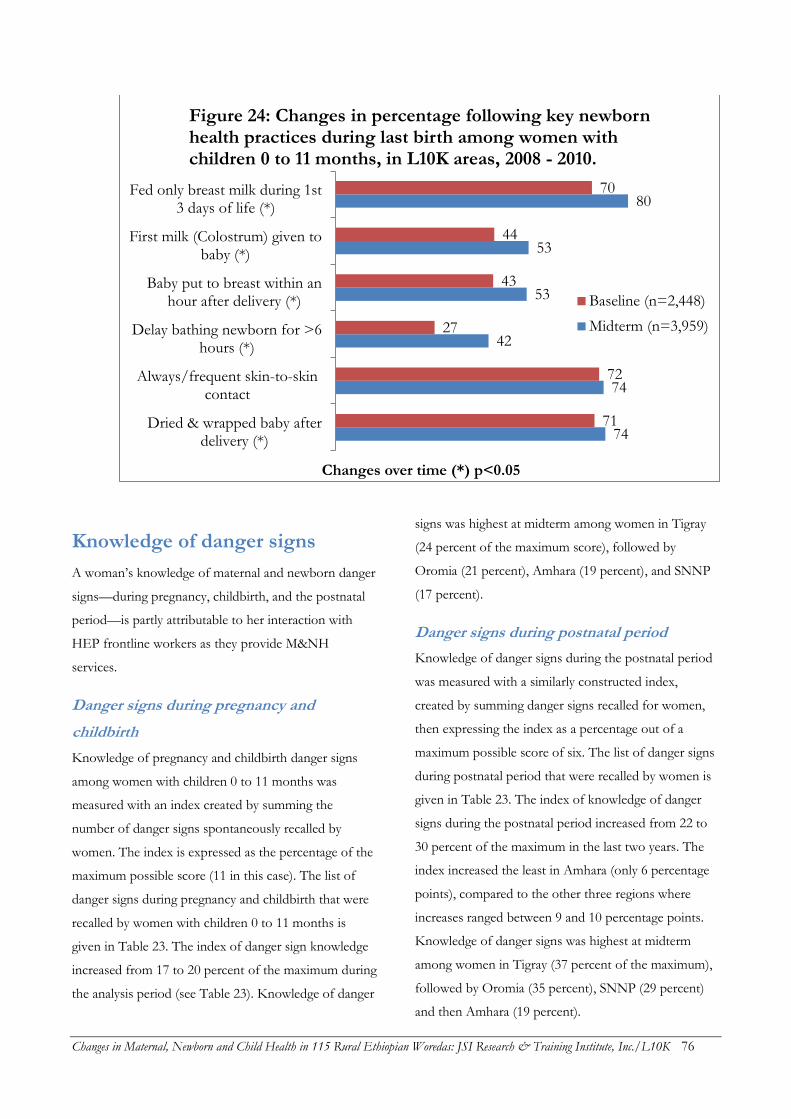
Changes in Maternal, Newborn and Child Health in 115 Rural Ethiopian Woredas: JSI Research & Training Institute, Inc./L10K 76
Knowledge of danger signs
A woman’s knowledge of maternal and newborn danger
signs—during pregnancy, childbirth, and the postnatal
period—is partly attributable to her interaction with
HEP frontline workers as they provide M&NH
services.
Danger signs during pregnancy and
childbirth
Knowledge of pregnancy and childbirth danger signs
among women with children 0 to 11 months was
measured with an index created by summing the
number of danger signs spontaneously recalled by
women. The index is expressed as the percentage of the
maximum possible score (11 in this case). The list of
danger signs during pregnancy and childbirth that were
recalled by women with children 0 to 11 months is
given in Table 23. The index of danger sign knowledge
increased from 17 to 20 percent of the maximum during
the analysis period (see Table 23). Knowledge of danger
signs was highest at midterm among women in Tigray
(24 percent of the maximum score), followed by
Oromia (21 percent), Amhara (19 percent), and SNNP
(17 percent).
Danger signs during postnatal period
Knowledge of danger signs during the postnatal period
was measured with a similarly constructed index,
created by summing danger signs recalled for women,
then expressing the index as a percentage out of a
maximum possible score of six. The list of danger signs
during postnatal period that were recalled by women is
given in Table 23. The index of knowledge of danger
signs during the postnatal period increased from 22 to
30 percent of the maximum in the last two years. The
index increased the least in Amhara (only 6 percentage
points), compared to the other three regions where
increases ranged between 9 and 10 percentage points.
Knowledge of danger signs was highest at midterm
among women in Tigray (37 percent of the maximum),
followed by Oromia (35 percent), SNNP (29 percent)
and then Amhara (19 percent).
74
74
42
53
53
80
71
72
27
43
44
70
Dried & wrapped baby afterdelivery (*)
Always/frequent skin-to-skincontact
Delay bathing newborn for >6hours (*)
Baby put to breast within anhour after delivery (*)
First milk (Colostrum) given tobaby (*)
Fed only breast milk during 1st3 days of life (*)
Changes over time (*) p<0.05
Figure 24: Changes in percentage following key newborn health practices during last birth among women with children 0 to 11 months, in L10K areas, 2008 - 2010.
Baseline (n=2,448)
Midterm (n=3,959)
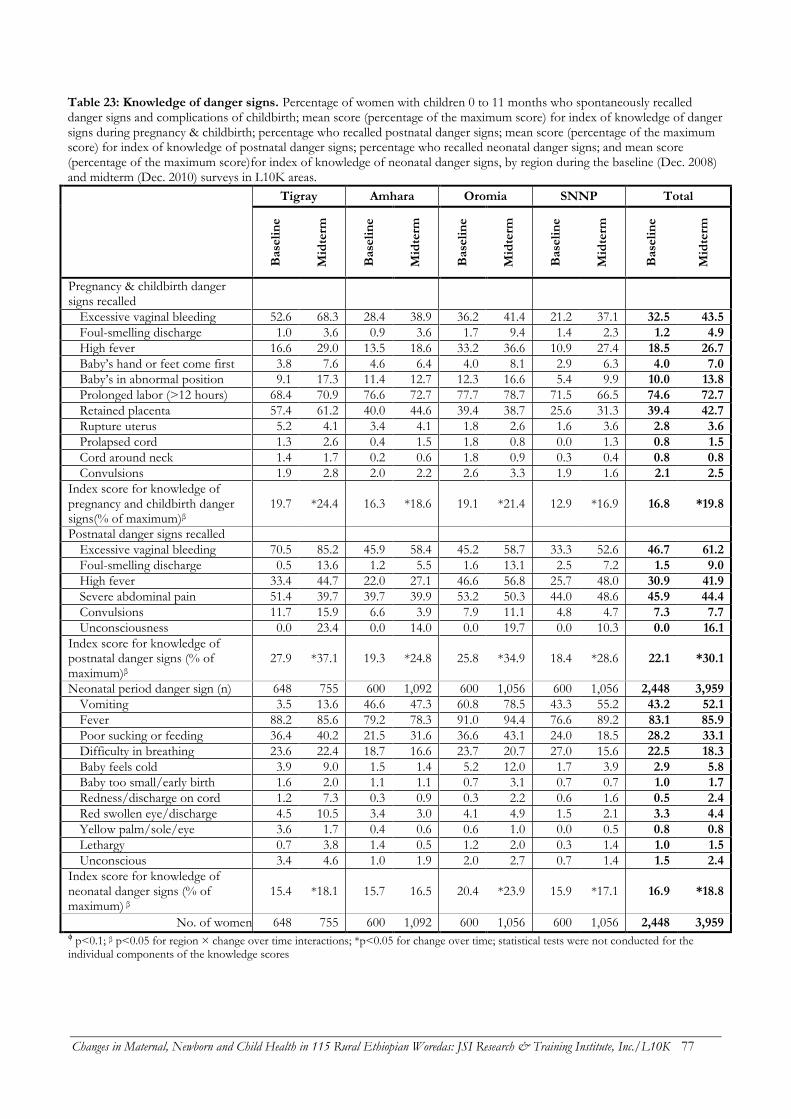
Changes in Maternal, Newborn and Child Health in 115 Rural Ethiopian Woredas: JSI Research & Training Institute, Inc./L10K 77
Table 23: Knowledge of danger signs. Percentage of women with children 0 to 11 months who spontaneously recalled danger signs and complications of childbirth; mean score (percentage of the maximum score) for index of knowledge of danger signs during pregnancy & childbirth; percentage who recalled postnatal danger signs; mean score (percentage of the maximum score) for index of knowledge of postnatal danger signs; percentage who recalled neonatal danger signs; and mean score (percentage of the maximum score)for index of knowledge of neonatal danger signs, by region during the baseline (Dec. 2008) and midterm (Dec. 2010) surveys in L10K areas.
Tigray Amhara Oromia SNNP Total
B
ase
lin
e
Mid
term
Base
lin
e
Mid
term
Base
lin
e
Mid
term
Base
lin
e
Mid
term
Base
lin
e
Mid
term
Pregnancy & childbirth danger signs recalled
Excessive vaginal bleeding 52.6 68.3 28.4 38.9 36.2 41.4 21.2 37.1 32.5 43.5
Foul-smelling discharge 1.0 3.6 0.9 3.6 1.7 9.4 1.4 2.3 1.2 4.9
High fever 16.6 29.0 13.5 18.6 33.2 36.6 10.9 27.4 18.5 26.7
Baby’s hand or feet come first 3.8 7.6 4.6 6.4 4.0 8.1 2.9 6.3 4.0 7.0
Baby’s in abnormal position 9.1 17.3 11.4 12.7 12.3 16.6 5.4 9.9 10.0 13.8
Prolonged labor (>12 hours) 68.4 70.9 76.6 72.7 77.7 78.7 71.5 66.5 74.6 72.7
Retained placenta 57.4 61.2 40.0 44.6 39.4 38.7 25.6 31.3 39.4 42.7
Rupture uterus 5.2 4.1 3.4 4.1 1.8 2.6 1.6 3.6 2.8 3.6
Prolapsed cord 1.3 2.6 0.4 1.5 1.8 0.8 0.0 1.3 0.8 1.5
Cord around neck 1.4 1.7 0.2 0.6 1.8 0.9 0.3 0.4 0.8 0.8
Convulsions 1.9 2.8 2.0 2.2 2.6 3.3 1.9 1.6 2.1 2.5
Index score for knowledge of pregnancy and childbirth danger signs(% of maximum)β
19.7 *24.4 16.3 *18.6 19.1 *21.4 12.9 *16.9 16.8 *19.8
Postnatal danger signs recalled
Excessive vaginal bleeding 70.5 85.2 45.9 58.4 45.2 58.7 33.3 52.6 46.7 61.2
Foul-smelling discharge 0.5 13.6 1.2 5.5 1.6 13.1 2.5 7.2 1.5 9.0
High fever 33.4 44.7 22.0 27.1 46.6 56.8 25.7 48.0 30.9 41.9
Severe abdominal pain 51.4 39.7 39.7 39.9 53.2 50.3 44.0 48.6 45.9 44.4
Convulsions 11.7 15.9 6.6 3.9 7.9 11.1 4.8 4.7 7.3 7.7
Unconsciousness 0.0 23.4 0.0 14.0 0.0 19.7 0.0 10.3 0.0 16.1
Index score for knowledge of postnatal danger signs (% of maximum)β
27.9 *37.1 19.3 *24.8 25.8 *34.9 18.4 *28.6 22.1 *30.1
Neonatal period danger sign (n) 648 755 600 1,092 600 1,056 600 1,056 2,448 3,959
Vomiting 3.5 13.6 46.6 47.3 60.8 78.5 43.3 55.2 43.2 52.1
Fever 88.2 85.6 79.2 78.3 91.0 94.4 76.6 89.2 83.1 85.9
Poor sucking or feeding 36.4 40.2 21.5 31.6 36.6 43.1 24.0 18.5 28.2 33.1
Difficulty in breathing 23.6 22.4 18.7 16.6 23.7 20.7 27.0 15.6 22.5 18.3
Baby feels cold 3.9 9.0 1.5 1.4 5.2 12.0 1.7 3.9 2.9 5.8
Baby too small/early birth 1.6 2.0 1.1 1.1 0.7 3.1 0.7 0.7 1.0 1.7
Redness/discharge on cord 1.2 7.3 0.3 0.9 0.3 2.2 0.6 1.6 0.5 2.4
Red swollen eye/discharge 4.5 10.5 3.4 3.0 4.1 4.9 1.5 2.1 3.3 4.4
Yellow palm/sole/eye 3.6 1.7 0.4 0.6 0.6 1.0 0.0 0.5 0.8 0.8
Lethargy 0.7 3.8 1.4 0.5 1.2 2.0 0.3 1.4 1.0 1.5
Unconscious 3.4 4.6 1.0 1.9 2.0 2.7 0.7 1.4 1.5 2.4
Index score for knowledge of neonatal danger signs (% of maximum) β
15.4 *18.1 15.7 16.5 20.4 *23.9 15.9 *17.1 16.9 *18.8
No. of women 648 755 600 1,092 600 1,056 600 1,056 2,448 3,959 ϕ p<0.1; β p<0.05 for region × change over time interactions; *p<0.05 for change over time; statistical tests were not conducted for the individual components of the knowledge scores
Changes in Maternal, Newborn and Child Health in 115 Rural Ethiopian Woredas: JSI Research & Training Institute, Inc./L10K 78
Danger signs during neonatal period
The neonatal period danger signs spontaneously
recalled by women with children 0 to 11 months are
given in Table 23. These danger signs were summed to
create a neonatal danger sign knowledge index,
expressed as the percentage of the maximum (11 in this
case). The neonatal danger sign knowledge index
increased modestly from 17 to 19 percent of the
maximum in the last two years (Figure 25). The index
did not improve in Amhara. Knowledge of neonatal
danger signs was highest during the midterm survey
among women in Oromia (24 percent of the
maximum), followed by Tigray (18 percent), and then
SNNP and Amhara (about 17 percent each).
Conclusions and
recommendations
Since the beginning of the L10K project more
interactions between HEP frontline health workers and
women have been taking place during pregnancy,
delivery, and the postnatal periods. M&NH behaviors
and outcomes have correspondingly increased. There is
evidence that the quality of these interactions, for the
most part, have also improved in L10K areas. These
improvements in the frequency and quality of
interactions between frontline workers and women and
households have been achieved without any significant
change in ratio of HEWs to population density; this
indicates that the HEP has become considerably more
efficient at providing M&NH services.
Although the observed improvement in
M&NH indictors have generally occurred in all four
regions, M&NH indicator levels are better in some
regions than in others. In general, Tigray is doing better
in terms of maternal health indicators, while Oromia is
doing better on newborn health indicators. Best
practices for achieving improved maternal health in
Tigray and best practices for achieving better
newborn health in Oromia should be identified and
replicated throughout all four regions. Nevertheless,
even reaching the levels of maternal health intervention
17 15 16
20
16
19 18 17
24
17
Total (*) Tigray (*) Amhara Oromia (*) SNNP (*)
Region (x)
Change over time: (*) p<0.05. The changes varied between regions (x) p>0.1
Figure 25: Changes in women's (with children 0 to 11 months) knowledge of neonatal danger signs score (percentage of the maximum possible score), by region in L10K areas, 2008-2010.
Baseline (n=2,448) Midterm (n=3,959)
Changes in Maternal, Newborn and Child Health in 115 Rural Ethiopian Woredas: JSI Research & Training Institute, Inc./L10K 79
coverage in Tigray would not be sufficient to attain
some of the MDG targets set by HSDP IV. Special
initiatives will thus be required to increase PNC,
skilled attendance during delivery, and institutional
deliveries.
Lastly, it should be noted that although the
quality of the services provided by frontline health
workers are generally improving, they are still less than
optimal. Alarmingly, the quality of PNC did not change
over the last two years. As such, special strategies are
needed to further improve the quality of M&NH
services provided by frontline health workers.

Changes in Maternal, Newborn and Child Health in 115 Rural Ethiopian Woredas: JSI Research & Training Institute, Inc./L10K 80
Changes in Maternal, Newborn and Child Health in 115 Rural Ethiopian Woredas: JSI Research & Training Institute, Inc./L10K 81
CHILD HEALTH
This section describes change in interactions between
frontline health workers and women and households to
provide child nutritional advice, improve childhood
immunization coverage, and improve childhood
illnesses care-seeking behaviors. Analyses of these child
health indicators were similar to the previous analyses.
The analysis of childhood nutritional counseling and
childhood illness indicators is among children 0 to 23
months of age, while the analysis of childhood
immunization is among children 12 to 23 months.
Health workers’ interaction with
households for child nutrition
The proportion of women with children 0 to 23 months
who were visited by a health worker (i.e., HEW or
CHP) to discuss the health and nutrition of their child
increased from 11 to 26 percent between the two
surveys (Table 24). The rate of increase in child
nutrition interactions between health workers and
women was highest in Oromia (a 4.7-fold increase),
followed by Amhara and SNNP (2.6- and 2-fold,
respectively) and Tigray (1.5-fold). Child nutrition
interactions with households were most common at
midterm in Tigray (32 percent), followed by SNNP (27
percent), and finally Oromia and Amhara (about 24
percent each).
Women were asked to recall what information
health workers provided during visits regarding child
health and nutrition. The percentage of the total
number of topics women recalled discussing (out of a
total of 11 topics) was used as an index to measure the
quality of the interaction. The quality of household
visits by health workers for child nutrition counseling
increased from 20 to 27 percent between the baseline
and midterm surveys (Table 24); the largest increase was
in Oromia (14 percentage points), followed by Amhara
(8 percentage points) and SNNP (4 percentage points);
there was no change in Tigray. The quality of
interactions index was highest at midterm in Oromia
(32 percent), followed by Amhara and Tigray (about 26
percent each), then SNNP (22 percent). The most
common information recalled by mothers was to
consume extra food (72 percent), followed by
exclusively breastfeeding the baby until six months of
age (50 percent), beginning complementary feeding at
six months (40 percent), immunizing the child (26
percent), frequency of breastfeeding (24 percent), using
different foods to enrich porridge (19 percent), family
planning (19 percent), continuing breastfeeding until
two years and beyond (16 percent), frequency of
feeding (16 percent), and then other topics.
Childhood immunization,
vitamin A and de-worming
Table 25 presents changes in immunization, vitamin A
and de-worming coverage among children 12 to 23
months between the two survey periods. Women with
children 12 to 23 months were asked whether they had
a vaccination card for the child. If a card was available,
the vaccination information from it was recorded. If the
card was not available then the mother was asked
whether the child had received BCG, pentavalent
(PENTA), poliomyelitis (Polio) and measles vaccines.
For PENTA and Polio, the number of injections or oral
doses given was also obtained. Estimation of
immunization coverage was based on either the
information obtained from the card (if available) or
mother’s recall (if the card was not available). The
proportion of women with children 0 to 11 months in
L10K areas who had immunization cards declined
slightly over the last two years, from 40 to 36 percent.
Access to immunization, as measured by BCG
coverage, remained unchanged between the surveys (at
about 84 percent). BCG coverage at midterm was the
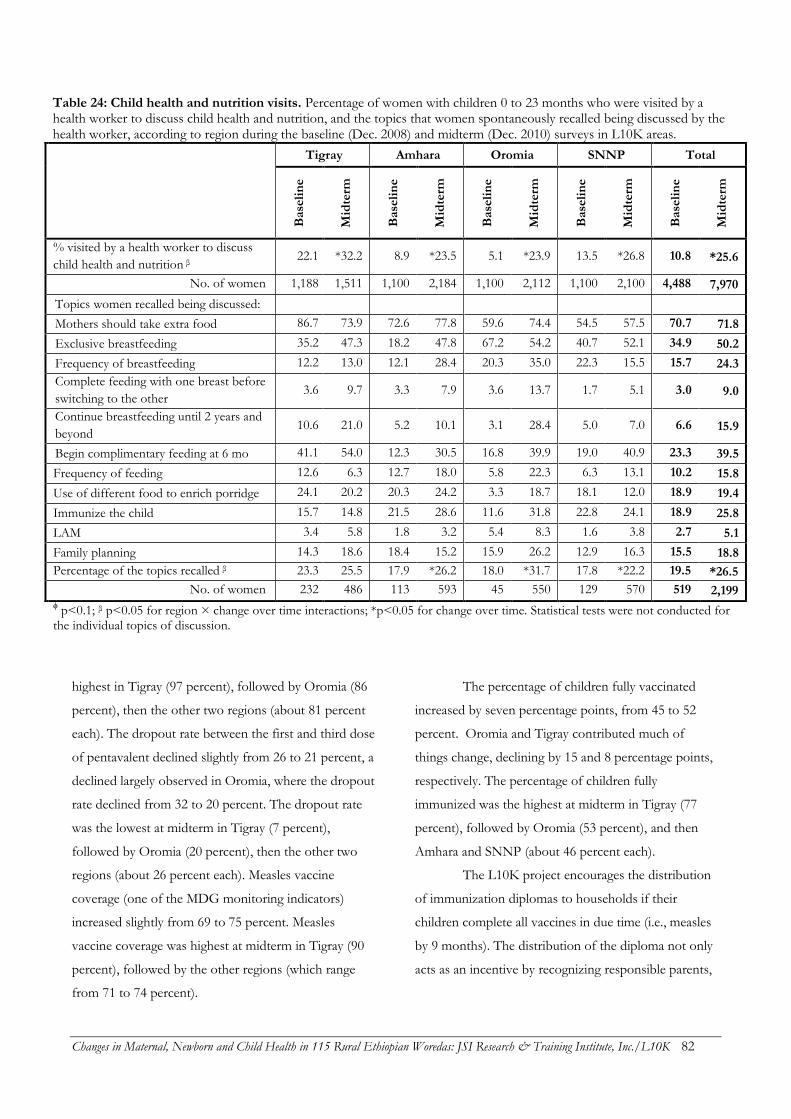
Changes in Maternal, Newborn and Child Health in 115 Rural Ethiopian Woredas: JSI Research & Training Institute, Inc./L10K 82
Table 24: Child health and nutrition visits. Percentage of women with children 0 to 23 months who were visited by a health worker to discuss child health and nutrition, and the topics that women spontaneously recalled being discussed by the health worker, according to region during the baseline (Dec. 2008) and midterm (Dec. 2010) surveys in L10K areas.
Tigray Amhara Oromia SNNP Total
Base
lin
e
Mid
term
Base
lin
e
Mid
term
Base
lin
e
Mid
term
Base
lin
e
Mid
term
Base
lin
e
Mid
term
% visited by a health worker to discuss
child health and nutrition β 22.1 *32.2 8.9 *23.5 5.1 *23.9 13.5 *26.8 10.8 *25.6
No. of women 1,188 1,511 1,100 2,184 1,100 2,112 1,100 2,100 4,488 7,970
Topics women recalled being discussed:
Mothers should take extra food 86.7 73.9 72.6 77.8 59.6 74.4 54.5 57.5 70.7 71.8
Exclusive breastfeeding 35.2 47.3 18.2 47.8 67.2 54.2 40.7 52.1 34.9 50.2
Frequency of breastfeeding 12.2 13.0 12.1 28.4 20.3 35.0 22.3 15.5 15.7 24.3
Complete feeding with one breast before
switching to the other 3.6 9.7 3.3 7.9 3.6 13.7 1.7 5.1 3.0 9.0
Continue breastfeeding until 2 years and
beyond 10.6 21.0 5.2 10.1 3.1 28.4 5.0 7.0 6.6 15.9
Begin complimentary feeding at 6 mo 41.1 54.0 12.3 30.5 16.8 39.9 19.0 40.9 23.3 39.5
Frequency of feeding 12.6 6.3 12.7 18.0 5.8 22.3 6.3 13.1 10.2 15.8
Use of different food to enrich porridge 24.1 20.2 20.3 24.2 3.3 18.7 18.1 12.0 18.9 19.4
Immunize the child 15.7 14.8 21.5 28.6 11.6 31.8 22.8 24.1 18.9 25.8
LAM 3.4 5.8 1.8 3.2 5.4 8.3 1.6 3.8 2.7 5.1
Family planning 14.3 18.6 18.4 15.2 15.9 26.2 12.9 16.3 15.5 18.8
Percentage of the topics recalled β 23.3 25.5 17.9 *26.2 18.0 *31.7 17.8 *22.2 19.5 *26.5
No. of women 232 486 113 593 45 550 129 570 519 2,199 ϕ p<0.1; β p<0.05 for region × change over time interactions; *p<0.05 for change over time. Statistical tests were not conducted for the individual topics of discussion.
highest in Tigray (97 percent), followed by Oromia (86
percent), then the other two regions (about 81 percent
each). The dropout rate between the first and third dose
of pentavalent declined slightly from 26 to 21 percent, a
declined largely observed in Oromia, where the dropout
rate declined from 32 to 20 percent. The dropout rate
was the lowest at midterm in Tigray (7 percent),
followed by Oromia (20 percent), then the other two
regions (about 26 percent each). Measles vaccine
coverage (one of the MDG monitoring indicators)
increased slightly from 69 to 75 percent. Measles
vaccine coverage was highest at midterm in Tigray (90
percent), followed by the other regions (which range
from 71 to 74 percent).
The percentage of children fully vaccinated
increased by seven percentage points, from 45 to 52
percent. Oromia and Tigray contributed much of
things change, declining by 15 and 8 percentage points,
respectively. The percentage of children fully
immunized was the highest at midterm in Tigray (77
percent), followed by Oromia (53 percent), and then
Amhara and SNNP (about 46 percent each).
The L10K project encourages the distribution
of immunization diplomas to households if their
children complete all vaccines in due time (i.e., measles
by 9 months). The distribution of the diploma not only
acts as an incentive by recognizing responsible parents,
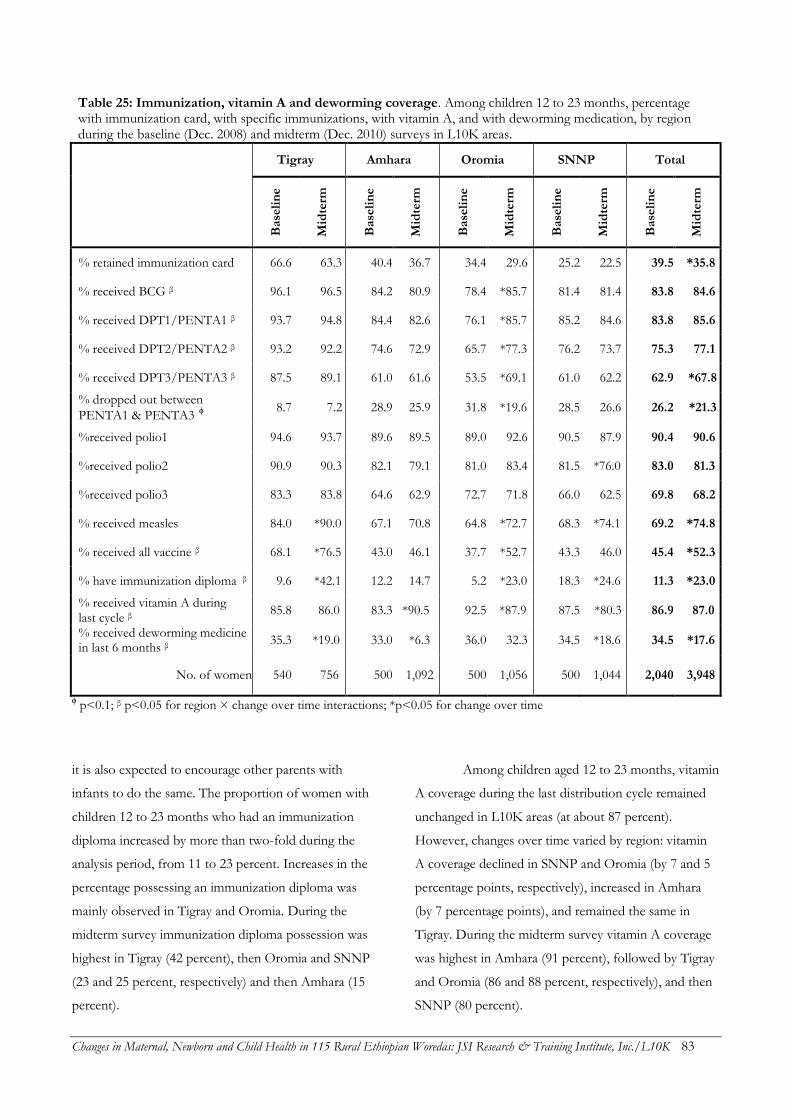
Changes in Maternal, Newborn and Child Health in 115 Rural Ethiopian Woredas: JSI Research & Training Institute, Inc./L10K 83
Table 25: Immunization, vitamin A and deworming coverage. Among children 12 to 23 months, percentage with immunization card, with specific immunizations, with vitamin A, and with deworming medication, by region during the baseline (Dec. 2008) and midterm (Dec. 2010) surveys in L10K areas.
Tigray Amhara Oromia SNNP Total
Base
lin
e
Mid
term
Base
lin
e
Mid
term
Base
lin
e
Mid
term
Base
lin
e
Mid
term
Base
lin
e
Mid
term
% retained immunization card 66.6 63.3 40.4 36.7 34.4 29.6 25.2 22.5 39.5 *35.8
% received BCG β 96.1 96.5 84.2 80.9 78.4 *85.7 81.4 81.4 83.8 84.6
% received DPT1/PENTA1 β 93.7 94.8 84.4 82.6 76.1 *85.7 85.2 84.6 83.8 85.6
% received DPT2/PENTA2 β 93.2 92.2 74.6 72.9 65.7 *77.3 76.2 73.7 75.3 77.1
% received DPT3/PENTA3 β 87.5 89.1 61.0 61.6 53.5 *69.1 61.0 62.2 62.9 *67.8
% dropped out between
PENTA1 & PENTA3 ϕ 8.7 7.2 28.9 25.9 31.8 *19.6 28.5 26.6 26.2 *21.3
%received polio1 94.6 93.7 89.6 89.5 89.0 92.6 90.5 87.9 90.4 90.6
%received polio2 90.9 90.3 82.1 79.1 81.0 83.4 81.5 *76.0 83.0 81.3
%received polio3 83.3 83.8 64.6 62.9 72.7 71.8 66.0 62.5 69.8 68.2
% received measles 84.0 *90.0 67.1 70.8 64.8 *72.7 68.3 *74.1 69.2 *74.8
% received all vaccine β 68.1 *76.5 43.0 46.1 37.7 *52.7 43.3 46.0 45.4 *52.3
% have immunization diploma β 9.6 *42.1 12.2 14.7 5.2 *23.0 18.3 *24.6 11.3 *23.0
% received vitamin A during last cycle β
85.8 86.0 83.3 *90.5 92.5 *87.9 87.5 *80.3 86.9 87.0
% received deworming medicine in last 6 months β
35.3 *19.0 33.0 *6.3 36.0 32.3 34.5 *18.6 34.5 *17.6
No. of women 540 756 500 1,092 500 1,056 500 1,044 2,040 3,948
ϕ p<0.1; β p<0.05 for region × change over time interactions; *p<0.05 for change over time
it is also expected to encourage other parents with
infants to do the same. The proportion of women with
children 12 to 23 months who had an immunization
diploma increased by more than two-fold during the
analysis period, from 11 to 23 percent. Increases in the
percentage possessing an immunization diploma was
mainly observed in Tigray and Oromia. During the
midterm survey immunization diploma possession was
highest in Tigray (42 percent), then Oromia and SNNP
(23 and 25 percent, respectively) and then Amhara (15
percent).
Among children aged 12 to 23 months, vitamin
A coverage during the last distribution cycle remained
unchanged in L10K areas (at about 87 percent).
However, changes over time varied by region: vitamin
A coverage declined in SNNP and Oromia (by 7 and 5
percentage points, respectively), increased in Amhara
(by 7 percentage points), and remained the same in
Tigray. During the midterm survey vitamin A coverage
was highest in Amhara (91 percent), followed by Tigray
and Oromia (86 and 88 percent, respectively), and then
SNNP (80 percent).
Changes in Maternal, Newborn and Child Health in 115 Rural Ethiopian Woredas: JSI Research & Training Institute, Inc./L10K 84
Table 26: Reasons for not vaccinating children. Lack of knowledge and barriers to access to immunization according to region during the baseline (Dec. 2008) and midterm (Dec. 2010) surveys in L10K areas.
Tigray Amhara Oromia SNNP Total
Base
lin
e
Mid
term
Base
lin
e
Mid
term
Base
lin
e
Mid
term
Base
lin
e
Mid
term
Base
lin
e
Mid
term
Lack of knowledge 28.6 19.1 70.3 *58.0 54.2 45.6 62.2 *47.6 59.7 *49.9
Place and time not known 4.8 0.9 7.5 10.9 22.9 19.6 22.4 16.6 16.6 14.1
Unaware of the need 11.5 1.8 18.4 17.2 9.0 11.0 11.0 10.4 12.7 13.0
Unaware of need to return 3.4 6.0 23.4 10.0 13.4 9.2 17.1 11.4 16.9 9.9
Postponed until another time 9.4 8.6 13.9 7.3 8.3 5.9 5.8 8.3 9.6 7.2
Fear of side reactions 0.0 0.0 14.2 11.4 3.9 1.0 8.1 2.1 8.0 5.6
Incorrect ideas about contraindications
1.3 0.0 11.6 7.6 3.4 5.6 4.6 3.1 6.2 5.5
No faith in immunization 1.1 3.5 2.6 0.8 1.1 1.6 1.6 1.5 1.7 1.3
Rumors 0.7 0.0 1.0 0.5 0.0 0.6 5.2 1.1 1.5 0.6
Barriers to access 15.6 27.3 35.7 37.2 46.1 49.9 39.8 46.5 39.4 42.5
Mother too busy 4.1 12.8 17.3 21.8 25.9 25.3 16.1 27.4 19.5 23.6
Vaccinators absent 0.5 8.1 3.7 4.7 5.9 8.1 4.2 7.6 4.4 6.5
Vaccine not available 0.6 0.9 5.2 1.7 3.8 9.4 10.9 8.6 5.6 5.5
Time of immunization inconvenience
0.6 0.0 6.2 3.1 3.8 6.9 4.6 2.3 4.5 3.9
Place of immunization too far 10.0 1.3 4.0 4.9 5.8 3.8 5.8 2.5 5.5 3.8
Child ill - not brought 0.0 4.2 0.4 3.0 9.2 5.4 1.5 1.6 4.0 3.5
Child ill -brought but not given immunization
0.0 0.6 0.9 0.0 0.5 0.9 0.2 1.8 0.5 0.7
Long waiting time 0.0 0.0 0.9 0.7 1.2 0.3 0.5 0.6 0.8 0.5
No. of children 99 83 165 350 266 348 191 375 721 1,156 ϕ p<0.1; β p<0.05 for region × change over time interactions; *p<0.05 for change over time
It is discouraging to note that deworming
among children 12 to 23 months declined in L10K areas
from 35 to 18 percent between the two surveys. This
decline in deworming coverage was not significant in
Oromia. Deworming coverage was lowest at midterm in
Amhara (6 percent), followed by Tigray and SNNP (19
percent each), and then Oromia (32 percent).
Reasons for not immunizing children are given
in Table 26. Reasons related to lack of knowledge or
misinformation declined during the analysis period from
60 to 50 percent. Reasons related to lack of knowledge
that play the greatest role were not knowing
immunization times (14 percent), unaware of the need
of immunization (13 percent), unaware of the need to
return for the 2nd or 3rd dose (10 percent), postponed
until another time (7 percent), fear of reactions and
wrong ideas about contra-indications (6 percent each),
and then others reasons. Reasons for not immunizing
children associated with barriers to access remained
mostly the same, varying between 39 and 43 percent.
Current major barriers to access included the mother
being too busy (24 percent), followed by vaccinator
absence (7 percent), unavailable vaccines (6 percent),
and inconvenient immunization timing, inconvenient
place of immunization, and ill child (4 percent each),
and then others.
Changes in Maternal, Newborn and Child Health in 115 Rural Ethiopian Woredas: JSI Research & Training Institute, Inc./L10K 85
Table 27: Childhood illnesses. Among children 0 to 23 months, prevalence of ARI, diarrhea, and fever and associated care-seeking behavior, by region during the baseline (Dec. 2008) and midterm (Dec. 2010) surveys in L10K areas.
Tigray Amhara Oromia SNNP Total
Base
lin
e
Mid
term
Base
lin
e
Mid
term
Base
lin
e
Mid
term
Base
lin
e
Mid
term
Base
lin
e
Mid
term
Prevalence of ARI β 13.6 *4.7 5.0 *4.3 13.8 *10.1 12.6 *9.4 10.2 *7.0
% with ARI taken to (n) … (162) (69) (62) (99) (138) (216) (151) (213) (513) (597)
taken to any provider 40.8 35.2 27.9 24.7 19.5 *34.8 51.8 45.3 33.7 35.5
taken to Hospital 0.0 3.7 0.7 0.0 0.0 0.9 0.5 0.0 0.3 0.7
taken to Health Center 27.9 30.7 17.6 21.6 4.1 17.1 33.3 29.5 19.0 23.0
taken clinic/health station 2.6 0.0 0.0 0.0 3.1 2.8 1.5 3.2 2.0 2.0
taken to Health Post 9.8 2.0 2.9 0.6 3.9 2.2 5.3 4.0 5.2 2.3
taken to other providers 2.6 2.0 9.6 2.5 10.7 16.7 16.0 12.0 10.3 10.6
given antibiotics 28.5 26.5 12.2 16.8 11.8 *27.7 39.4 35.7 22.4 27.3
Prevalence of diarrhea 22.0 *14.2 17.7 *12.9 27.5 *15.7 31.3 *23.2 23.8 *16.0
Prevalence of bloody diarrhea 6.0 *2.5 2.4 *1.2 4.4 *2.2 5.5 *3.6 4.1 *2.2
% of diarrhea cases taken to (n) … (251) (191) (193) (254) (273) (313) (338) (490) (1,055) (1,248)
taken to any health provider 39.4 44.1 29.9 36.6 35.4 *47.6 39.9 *49.9 35.6 *44.5
taken to hospital 0.4 0.0 1.1 0.8 0.9 1.1 0.0 0.1 0.6 0.6
taken to health center 26.6 34.4 19.8 20.9 8.0 20.1 21.8 30.8 17.7 25.4
taken clinic/health station 0.8 0.0 1.9 0.1 6.1 5.7 0.7 4.2 2.7 2.8
taken to health post 12.6 10.9 6.0 8.8 12.5 4.6 6.8 5.7 9.1 7.1
taken to other providers 4.6 4.5 5.4 10.3 12.4 22.3 17.0 15.9 10.6 14.3
% of diarrhea cases given ORS 35.2 33.7 23.0 24.6 21.7 26.5 19.8 *30.3 23.4 *28.0
% of diarrhea cases given ORT 61.8 57.6 39.1 46.4 43.7 49.5 37.7 44.7 43.2 48.1
Prevalence of fever β 24.5 *11.6 14.1 *10.6 27.9 *15.0 26.5 *18.3 21.9 *13.5
Number of fever cases (n) (283) (161) (163) (232) (289) (320) (297) (407) (1,032) (1,120)
% taken to any health provider 40.1 48.3 34.6 33.9 22.6 *36.7 50.4 48.4 35.6 40.6
% taken to hospital 0.7 2.2 2.1 0.4 0.0 1.0 0.8 0.8 0.8 0.9
% taken to health center 24.4 36.3 21.3 20.6 3.8 18.0 28.0 30.7 17.7 24.7
% taken to clinic/health station 1.5 1.1 0.0 0.1 3.7 2.6 1.0 3.3 1.8 1.9
% taken to health post 10.8 7.9 7.6 2.8 4.5 3.1 7.9 4.8 7.2 4.1
% taken to other providers 4.7 4.3 6.2 12.1 11.7 16.3 17.1 12.1 10.6 12.3
% given anti-malarial 2.0 1.8 5.3 3.7 2.5 2.7 6.5 5.4 4.1 3.7
% slept under a bed net 41.4 *46.3 34.6 *47.1 22.9 *41.5 28.7 *40.3 31.3 *44.1 % slept under a bed net (malarious areas only)
45.6 *55.3 38.0 *58.3 26.7 *45.5 37.5 *61.6 36.0 *54.8
No. of children 0 to 23 months 1,188 1,511 1,100 2,184 1,100 2,112 1,100 2,100 4,488 7,907 No. of children 0 to 23 months in malarious areas
1,012 1,223 858 1,584 902 1,608 748 1,116 3,520 5,531
ϕ p<0.1; β p<0.05 for region × change over time interactions; *p<0.05
Changes in Maternal, Newborn and Child Health in 115 Rural Ethiopian Woredas: JSI Research & Training Institute, Inc./L10K 86
Childhood illness and care-
seeking behaviors
Table 27 presents changes in the prevalence of
childhood illnesses and related care-seeking behaviors
over the analysis period. Interestingly, the prevalence of
childhood illness during the two weeks preceding the
survey among children aged 0 to 23 months declined
over the last two years. Prevalence of acute respiratory
infection (ARI) declined from 10 to 7 percent; diarrhea
prevalence declined from 24 to 16 percent; bloody
diarrhea declined from 4 to 2 percent; and the
prevalence of fever declined from 22 to 14 percent.
Although the prevalence measures in both surveys were
taken during the same time of the year, it is still possible
that the observed decline in childhood illnesses
prevalence was due to seasonal variation and
epidemiologic patterns rather than actual declines.
Care-seeking behavior for childhood illnesses
remained similar for ARI and fever. During the
midterm survey 27 percent of children aged 0 to 23
months with ARI received antibiotics, while only four
percent of those who had fever received anti-malarial
treatment. Children 0 to 23 months of age with diarrhea
were more likely to be taken to health providers (45
percent) during the midterm survey than they were
during the baseline survey (36 percent). Consequently,
children with diarrhea were more likely to receive oral
rehydration solution at midterm, increasing from 23 to
28 percent in the last two years.
The proportion of children aged 0 and 23
months in L10K areas who slept under beds net the
night before the survey increased from 31 to 44 percent.
In malarious areas the increase was even higher (from
36 to 55 percent). The rate of increase in children
sleeping under bed nets observed in the surveys was
uniform across the four regions. The midterm
proportion of children in malarious areas who were
sleeping under bed nets lagged behind in Oromia (46
percent) compared to the other regions (where it ranged
between 55 and 62 percent).
Knowledge of danger signs of
childhood illnesses
Mothers of children aged 0 to 23 months were asked to
spontaneously recall signs and symptoms of illnesses
that require the child to be taken to a health facility or
to a health worker; results are listed in Table 28. The
number of danger signs spontaneously reported
produced an index of knowledge of childhood illness
danger signs, expressed as a percentage of a maximum
of 19 danger signs. This index improved from 18 to 23
percent between the two survey periods. Improvements
in knowledge of childhood illness danger signs was
lower in SNNP (3.3 percentage points) compared to the
other three regions (where improvements ranged from
4.9 to 5.7 percentage points). Knowledge of childhood
illness danger signs among women was higher at
midterm in Tigray and Oromia (about 25 percent of the
maximum score in each) compared to Amhara and
SNNP (22 and 19 percent of the maximum,
respectively).
Conclusions and
recommendations
Child immunization coverage improved in L10K areas
over the last two years. Although lack of knowledge
declined as a reason for not immunizing children,
barriers to access remained unchanged. The situation
analysis of kebele health systems indicate that although
vaccine availability improved, it was only 36 percent at
midterm, indicating that there are still supply side
barriers to childhood immunization services. Childhood
immunization coverage in SNNP, Oromia and Amhara
lagged behind Tigray; this is consistent with the EDHS
2011. The strategies implemented by Tigray to
Changes in Maternal, Newborn and Child Health in 115 Rural Ethiopian Woredas: JSI Research & Training Institute, Inc./L10K 87
Table 28: Childhood illness danger signs. Percentage of women with children 0 to 23 months who spontaneously recalled danger signs of childhood illnesses, by region during the baseline (Dec. 2008) and midterm (Dec. 2010) surveys in L10K areas.
Tigray Amhara Oromia SNNP Total
Base
lin
e
Mid
term
Base
lin
e
Mid
term
Base
lin
e
Mid
term
Base
lin
e
Mid
term
Base
lin
e
Mid
term
Percentage recalling childhood illness danger signs:
Repeated watery stools 29.8 52.2 50.1 73.4 36.5 65.5 32.3 67.9 39.8 67.0
Any watery stools 63.8 61.0 32.9 41.6 43.7 37.9 35.7 28.7 40.9 40.8
Repeated vomiting 52.7 70.8 41.3 54.1 38.9 59.1 23.0 42.9 38.5 55.6
Any vomiting 15.6 28.8 23.1 27.6 31.1 36.2 20.7 18.5 23.6 28.1
Blood in stools 12.0 22.6 7.4 26.8 8.3 17.1 4.1 7.3 7.6 19.5
Fast breathing 9.4 16.5 10.3 12.8 11.4 18.0 9.7 7.4 10.3 13.6
Difficult breathing 8.5 13.3 13.3 12.1 12.9 17.0 13.3 9.4 12.5 13.0
Noisy breathing 3.1 6.9 1.6 6.4 3.8 7.1 1.9 2.3 2.5 5.8
Fever 85.9 85.1 75.8 73.5 72.2 79.2 74.6 80.2 76.1 78.1
Convulsions 5.1 7.4 1.3 4.8 2.9 11.6 8.8 4.6 3.9 6.9
Stiff neck 0.2 3.4 1.2 3.2 0.4 4.0 1.6 1.0 0.9 3.0
Marked thirst 0.6 3.1 1.1 2.5 1.7 4.1 1.0 1.7 1.2 2.9
Unable to drink 2.5 7.6 2.8 7.9 7.2 8.7 3.3 5.0 4.0 7.5
Not eating/not drinking well 19.8 12.3 16.2 18.4 24.8 24.3 9.8 13.2 17.7 18.0
Getting sicker/very sick 10.0 10.7 5.0 10.6 13.7 8.7 2.1 6.1 7.4 9.2
Not getting better 1.5 7.3 4.2 7.8 4.1 6.3 1.7 3.3 3.3 6.4
Sick for a long time 3.7 5.7 5.3 8.8 8.2 9.6 1.6 3.1 5.0 7.4
Sunken eyes 2.3 1.9 1.1 3.4 3.0 4.5 1.8 1.0 1.9 3.0
Cough 64.1 68.3 23.1 34.9 40.1 49.7 45.7 51.2 38.4 47.2
Index score for knowledge of childhood illness danger signs(%
of maximum)ϕ
20.4 *25.4 16.7 *22.4 19.1 *24.6 15.3 *18.6 17.6 *22.6
Number of women 1,188 1,511 1,100 2,184 1,100 2,112 1,100 2,100 4,488 7,907 ϕ p<0.1; β p<0.05 for region × change over time interactions; *p<0.05 for change over time. Statistical tests were not done for the individual items of the knowledge score.
improve immunization coverage should be
identified and replicated in the other regions.
The decline in deworming in L10K areas (with
the exception of Oromia) is concerning. Other than
improvements in oral rehydration therapy for treating
diarrhea, there have not been major improvements in
the management of childhood illness in L10K areas.
Therefore, it is encouraging to note that the Integrated
Community Case Management of Common Childhood
Illnesses (ICCM) is being scaled up in Ethiopia.

Changes in Maternal, Newborn and Child Health in 115 Rural Ethiopian Woredas: JSI Research & Training Institute, Inc./L10K 88
Changes in Maternal, Newborn and Child Health in 115 Rural Ethiopian Woredas: JSI Research & Training Institute, Inc./L10K 89
REFERENCES
Admassie, Assefa, Degnet Abebaw and Andinet D. Woldemichael. 2009. Impact evaluation of the Ethiopian Health Services Extension Programme. Journal of Development Effectiveness, 1:4, 430-449.
Bhutta, Zulfiqar A, Zahid A Memon, Sajid Soofi, Muhammad Suhail Salat, Simon Cousens and Jose Martines. 2008. Implementing community-based perinatal care: results from a pilot study in rural Pakistan. Bulletin of the World Health Organization, 86:452–459.
Bill & Melinda Gates Foundation. 2009. Maternal, Neonatal, and Child Health Strategy Overview. Bill & Melinda Gates Foundation, Seattle, Washington; http://www.gatesfoundation.org/maternalnewbornandchildhealth/; accessed on June 6, 2011.
Bill & Melinda Gates Foundation. 2011. Maternal, Neonatal, and Child Health Strategy. Presented at the inception meeting with Bill & Melinda Gates Foundation maternal, newborn and child health implementation grantees: Ethiopia, Addis Ababa, Feb 28 – Mar 1, 2011.
Campbell, Oona M R and Wendy J Graham et al. 2006. Strategies for reducing maternal mortality: Getting on with what works. Lancet. 368(9544): 1284-1299.
Center for National Health Development in Ethiopia (CNHDE). 2008. Ethiopia Health Extension Program Evaluation Study, 2005-2007. Addis Ababa, Ethiopia: Center for National Health Development in Ethiopia.
Central Statistical Agency [Ethiopia] and ORC Macro. 2006. Ethiopia Demographic and Health Survey (EDHS) 2005. Addis Ababa, Ethiopia and Calverton, Maryland, USA: Central Statistical Agency and ORC Macro.
Central Statistical Agency [Ethiopia] and ICF Macro. 2011. Ethiopia Demographic and Health Survey (EDHS) 2011: Preliminary Report. Addis Ababa, Ethiopia and Calverton, Maryland, USA: Central Statistical Agency and MEASURE DHS, ICF Macro.
Darmstadt, Gary L., Zulfiqar A Bhutta, and Simon Cousens et al. 2005. Evidence-based, cost-effective interventions: how many newborn babies can we save? Lancet, 365: 977-988.
Dieltiens G, H Dewan, R Botlero, N Alam, E Chowdhury, and C Ronsmans et al. 2005. Pregnancy-related mortality and access to obstetric services in Matlab, Bangladesh. Tours: International Union for the Scientific Study of Population.
Essential Services for Health in Ethiopia (ESHE). 2008. Household End-line Survey Synthesis Report. John Snow, Inc. (JSI). Addis Ababa; 2008.
The Federal Ministry of Health (FMOH). 2007. Implementation Guidelines of Health Extension Program. Addis Ababa, February 2007. Federal Ministry of Health.
Federal Democratic Republic of Ethiopia Ministry of Health (FMOH). 2010. Health Sector Development Program (HSDP) IV, 2010 – 2014. Chapter 3.6 Targets and Strategic Initiatives of HSDP IV. Addis Ababa.
Federal Democratic Republic of Ethiopia Ministry of Health (FMOH). 2010a. Health Sector Development Program III: Annual Performance Report 2009 – 2010. Addis Ababa.
Federal Democratic Republic of Ethiopia Ministry of Health (FMOH). 2011. Health Sector Development Program (HSDP) IV: Annual Performance Report 2010 – 2011. Addis Ababa.
Hart, Carolyn. 2004. Commentary: No Product? No Program! Public Health Reports 119 (1): 23–24.
Jokhio, Abdul Hakeem, Heather R. Winter, and Kar Keung Cheng. 2005. An Intervention Involving Traditional Birth Attendants and Perinatal and Maternal Mortality in Pakistan. New England Journal of Medicine. 352: 2091-2099.
Karim, Ali Mehryar, Wuleta Betemariam, Samuel Yalew, Hibret Alemu, Mary Carnell, and Yared Mekonnen. 2010. Programmatic correlates of maternal healthcare seeking behaviors in Ethiopia. Ethiopian Journal of Health Development, 24 (Special Issue 1): 92-99.
Koblinsky, Marge, Z Matthews, J Hussein, D Mavalankar, MK Mridha, and I Anwar et al. 2006. Going to scale with professional skilled care. Lancet. 368(9544): 1377-1386.
Changes in Maternal, Newborn and Child Health in 115 Rural Ethiopian Woredas: JSI Research & Training Institute, Inc./L10K 90
Koblinsky, Marge, Frances Tain, Asheber Gaym, Ali Karim, Mary Carnell, and Solomon Tesfaye. 2010. Responding to the maternal health care challenge: The Ethiopian Health Extension Program. Ethiopian Journal of Health Development. 24 (Special Issue 1): 105-109.
Kumar, Vishwajeet Kumar, Saroj Mohanty, Aarti Kumar, Rajendra P Misra, Mathuram Santosham, and Shally Awasthi et al. 2008. Effect of community-based behavior change management on neonatal mortality in Shivgarh, Uttar Pradesh, India: a cluster-randomised controlled trial. Lancet. 372:1151-1162.
Manandhar, Dharma, David Osrin, Bhim Prasad Shrestha, Natasha Mesko, Joanna Morrison, and Kirti Man Tumbahangphe et al. 2004. Effect of a participatory intervention with women’s groups on birth outcomes in Nepal: cluster-randomised controlled trial. Lancet. 364: 970-979.
McCall EM, F Alderdice, HL Halliday, JG Jenkins et al., and Vohra S. Interventions to prevent hypothermia at birth in preterm and/or low birthweight infants. Cochrane Database of Systematic Reviews 2010; Issue 3. Art. No.: CD004210.
The Last Ten Kilometers Project (L10K). 2009. Baseline Household Health Survey: Amhara, Oromia, SNNP and Tigray. JSI Research & Training Institute, Inc., Addis Ababa, Ethiopia.
Lemeshow S and D Robinson. 1985. Surveys to measure programme coverage and impact: A review of the methodology used by the Expanded Programme on Immunization. World Health Statistics Quarterly, 38: 65-75.
Oestergaard, Mikkel Zahle, Mie Inoue, Sachiyo Yoshida, Wahyu Retno Mahanani, Fiona M. Gore, and Simon Cousens et al. 2011. Neonatal Mortality Levels for 193 Countries in 2009 with Trends since 1990: A Systematic Analysis of Progress, Projections, and Priorities. PLoS Med 8(8): e1001080. doi:10.1371/journal.pmed.1001080
StataCorp. 2009. Stata: Release 11. Statistical Software. College Station, TX: StataCorp LP.
Stover, John and John Ross. 2010. How increased contraceptive use has reduced maternal mortality. Maternal Child Health Journal. 14(5): 687-695. DOI 10.1007/s10995-009-0505-y
Temiess, W. 2008. Health extension program in Ethiopia: Towards better access to health services for the rural poor. Federal Democratic Republic of Ethiopia, Ministry of Health, Quarterly Health Bulletin, 1(1): 3-9.
Wakabi, W. 2008. World report: Extension workers drive Ethiopia’s primary health. Lancet. 372(9642): 880.
The World Bank. 2005. Maintaining Momentum to 2015? An Impact Evaluation of Interventions to Improve Maternal and Child Health and Nutrition in Bangladesh. The World Bank. Washington D.C.
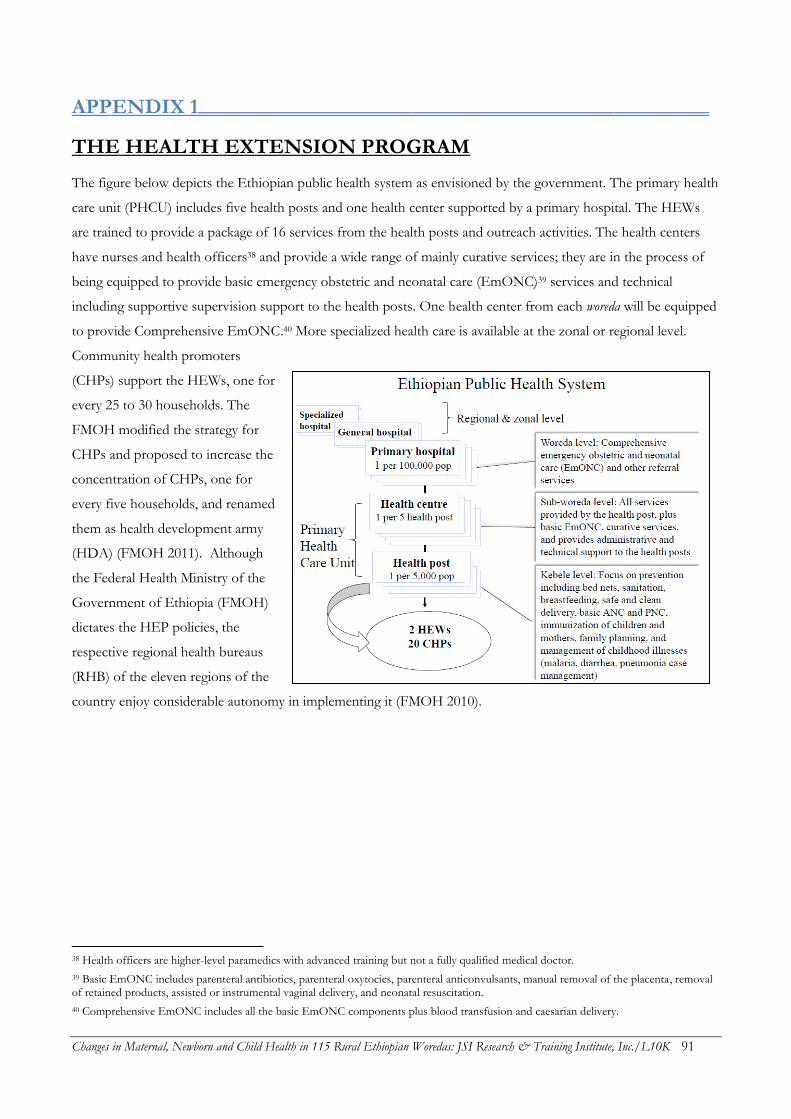
Changes in Maternal, Newborn and Child Health in 115 Rural Ethiopian Woredas: JSI Research & Training Institute, Inc./L10K 91
APPENDIX 1________________________________________________
THE HEALTH EXTENSION PROGRAM
The figure below depicts the Ethiopian public health system as envisioned by the government. The primary health
care unit (PHCU) includes five health posts and one health center supported by a primary hospital. The HEWs
are trained to provide a package of 16 services from the health posts and outreach activities. The health centers
have nurses and health officers38 and provide a wide range of mainly curative services; they are in the process of
being equipped to provide basic emergency obstetric and neonatal care (EmONC)39 services and technical
including supportive supervision support to the health posts. One health center from each woreda will be equipped
to provide Comprehensive EmONC.40 More specialized health care is available at the zonal or regional level.
Community health promoters
(CHPs) support the HEWs, one for
every 25 to 30 households. The
FMOH modified the strategy for
CHPs and proposed to increase the
concentration of CHPs, one for
every five households, and renamed
them as health development army
(HDA) (FMOH 2011). Although
the Federal Health Ministry of the
Government of Ethiopia (FMOH)
dictates the HEP policies, the
respective regional health bureaus
(RHB) of the eleven regions of the
country enjoy considerable autonomy in implementing it (FMOH 2010).
38 Health officers are higher-level paramedics with advanced training but not a fully qualified medical doctor.
39 Basic EmONC includes parenteral antibiotics, parenteral oxytocics, parenteral anticonvulsants, manual removal of the placenta, removal of retained products, assisted or instrumental vaginal delivery, and neonatal resuscitation.
40 Comprehensive EmONC includes all the basic EmONC components plus blood transfusion and caesarian delivery.

Changes in Maternal, Newborn and Child Health in 115 Rural Ethiopian Woredas: JSI Research & Training Institute, Inc./L10K 92
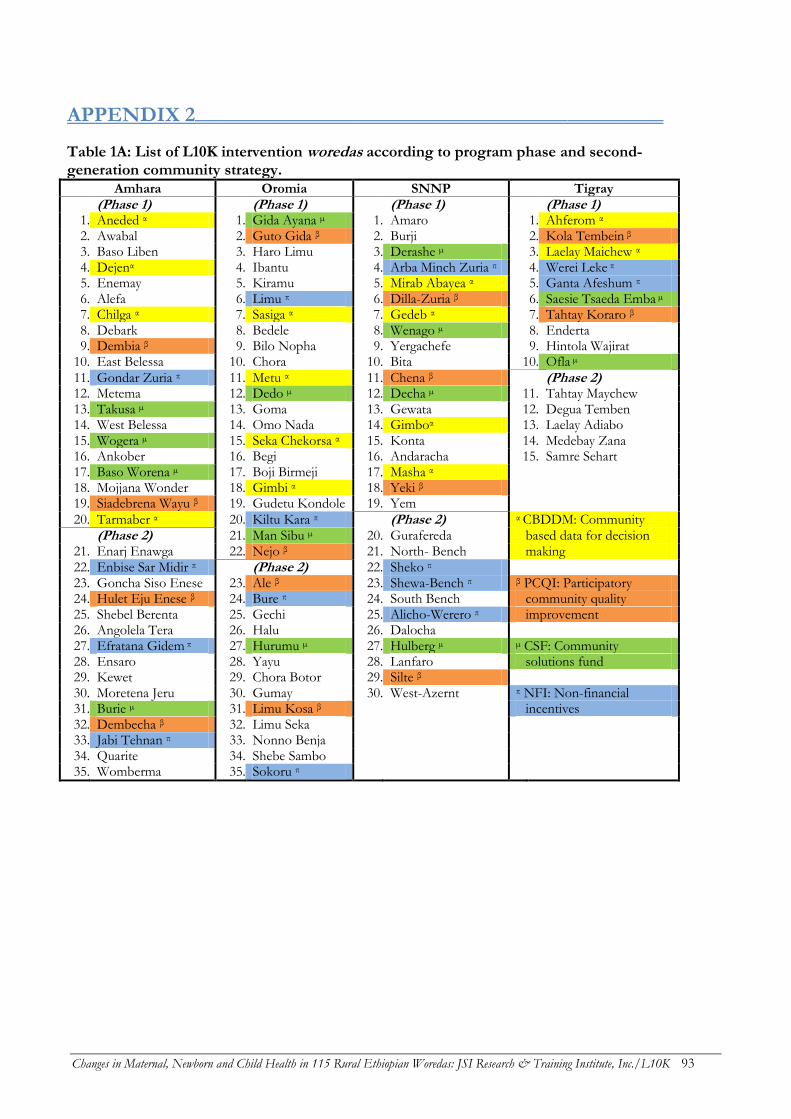
Changes in Maternal, Newborn and Child Health in 115 Rural Ethiopian Woredas: JSI Research & Training Institute, Inc./L10K 93
APPENDIX 2____________________________________________
Table 1A: List of L10K intervention woredas according to program phase and second-generation community strategy.
Amhara Oromia SNNP Tigray
(Phase 1)
(Phase 1)
(Phase 1)
(Phase 1)
1. Aneded α 1. Gida Ayana µ 1. Amaro 1. Ahferom α 2. Awabal 2. Guto Gida β 2. Burji 2. Kola Tembein β 3. Baso Liben 3. Haro Limu 3. Derashe µ 3. Laelay Maichew α 4. Dejenα 4. Ibantu 4. Arba Minch Zuria π 4. Werei Leke π 5. Enemay 5. Kiramu 5. Mirab Abayea α 5. Ganta Afeshum π 6. Alefa 6. Limu π 6. Dilla-Zuria β 6. Saesie Tsaeda Emba µ 7. Chilga α 7. Sasiga α 7. Gedeb α 7. Tahtay Koraro β 8. Debark 8. Bedele 8. Wenago µ 8. Enderta 9. Dembia β 9. Bilo Nopha 9. Yergachefe 9. Hintola Wajirat
10. East Belessa 10. Chora 10. Bita 10. Ofla µ
11. Gondar Zuria π 11. Metu α 11. Chena β
(Phase 2) 12. Metema 12. Dedo µ 12. Decha µ 11. Tahtay Maychew 13. Takusa µ 13. Goma 13. Gewata 12. Degua Temben 14. West Belessa 14. Omo Nada 14. Gimboα 13. Laelay Adiabo 15. Wogera µ 15. Seka Chekorsa α 15. Konta 14. Medebay Zana 16. Ankober 16. Begi 16. Andaracha 15. Samre Sehart 17. Baso Worena µ 17. Boji Birmeji 17. Masha α
18. Mojjana Wonder 18. Gimbi α 18. Yeki β 19. Siadebrena Wayu β 19. Gudetu Kondole 19. Yem
20. Tarmaber α 20. Kiltu Kara π
(Phase 2) α CBDDM: Community
(Phase 2) 21. Man Sibu µ 20. Gurafereda based data for decision
21. Enarj Enawga 22. Nejo β 21. North- Bench making 22. Enbise Sar Midir π
(Phase 2) 22. Sheko π
23. Goncha Siso Enese 23. Ale β 23. Shewa-Bench π β PCQI: Participatory 24. Hulet Eju Enese β 24. Bure π 24. South Bench community quality 25. Shebel Berenta 25. Gechi 25. Alicho-Werero π improvement 26. Angolela Tera 26. Halu 26. Dalocha
27. Efratana Gidem π 27. Hurumu µ 27. Hulberg µ µ CSF: Community 28. Ensaro 28. Yayu 28. Lanfaro solutions fund 29. Kewet 29. Chora Botor 29. Silte β
30. Moretena Jeru 30. Gumay 30. West-Azernt π NFI: Non-financial 31. Burie µ 31. Limu Kosa β
incentives
32. Dembecha β 32. Limu Seka 33. Jabi Tehnan π 33. Nonno Benja 34. Quarite 34. Shebe Sambo 35. Womberma 35. Sokoru π

Changes in Maternal, Newborn and Child Health in 115 Rural Ethiopian Woredas: JSI Research & Training Institute, Inc./L10K 94
Changes in Maternal, Newborn and Child Health in 115 Rural Ethiopian Woredas: JSI Research & Training Institute, Inc./L10K 95
APPENDIX 3________________________________________________
TIER ONE L10K GRANTEES
The L10K Project provides financial and technical
support to 12 local civil society organizations, or first
tier grantees, to manage L10K community-based
project activities in the four project regions of
Amhara, Oromia, SNNP and Tigray. The
organizations collaborate with woreda and kebele
administrations to improve reproductive, maternal,
neonatal, and child health (RMNCH) outcomes.
List of L10K partners (Tier 1 Grantees)
by Region
Amhara
1. Amhara Development Association (ADA): The
mission of ADA is to focus on the development
endeavors of the Amhara people in the areas of
health, education, basic skills training, and
development through community participation and
mobilization of resources. ADA covers all the 35
L10K woredas in Amhara.
Oromia
2. Oromia Development Association (ODA):
Committed to the social and economic development
of the Oromia, ODA has supported the construction
of schools, water distribution points, roads, and flour
mills. They have also been instrumental in supporting
the training and deployment of community-based
reproductive health agents. ODA covers 26 of the 35
L10K woredas in Oromia.
3. Fayyaa Integrated Development Organization
(FIDO): FIDO was established with the aim to
address the root causes of poverty and empower
communities to help themselves by providing
economic opportunity, accessible basic services, relief
in emergencies, and addressing discrimination. FIDO
covers four of the 35 L10K woredas in Oromia.
4. Illu Women and Children Integrated
Development Association (IWCIDA): The goal of
IWCIDA is to improve the lives of needy people,
particularly women and children affected by HIV and
AIDS. They focus on promoting literacy, rights, and
health of girls and children. It covers five of the 35
woredas in Oromia.
Southern Nations, Nationalities and
People’s Region (SNNPR)
5. Bench Maji Development Association (BDA):
BDA aims to alleviate poverty and improve the lives
of people in the Bench Maji Zone by mobilizing the
talents and resources of its people to create
sustainable development and accessible basic
services. BDA covers five of the 30 L10K woredas in
SNNPR.
6. Ethiopian Kale Hiwot Church (EKHC): One
of the oldest Evangelical nonprofit churches in the
country, EKHC now encompasses over 7,000 local
churches. It has implemented community
development projects in the fields of agriculture,
reforestation, water and sanitation, health and
nutrition, urban income generating activities, as well
as gender and human rights. It covers six of the 30
L10K woredas in SNNPR.
7. Kaffa Development Association (KDA): KDA
is devoted to improving the social and economic
development of the Kaffa people, aiming for
community empowerment as their ultimate goal.
They have implemented projects in health education,
water, women’s empowerment and harmful
traditional practices. Notably, they have established a
Changes in Maternal, Newborn and Child Health in 115 Rural Ethiopian Woredas: JSI Research & Training Institute, Inc./L10K 96
revolving drug fund to address a drug shortage and
provided special support for education for the Menja
sub-ethnic group. It covers five of the 30 L10K
woredas in SNNPR.
8. Sheka Peoples’ Development Association
(SPDA): SPDA is committed to furthering the social
and economic development of the Sheka people.
They have implemented projects in education and
health, focusing on reproductive health, in all woredas
of the Sheka Zone. It covers three of the 30 L10K
woredas in SNNPR.
9. Siltie Development Association (SDA): SDA
seeks to bring economic development, prosperity,
and social justice to the Siltie people. The
Organization has supported various development
activities in the sectors of health and HIV prevention,
education, water provision, and natural resource
preservation. It covers six of the 30 L10K woredas in
SNNPR.
10. Southern Region’s Women’s Association
(SRWA): SRWA’s mission is to advocate for the
economic, social, and political rights of women in an
effort to achieve women’s equality. It has also
implemented trainings for women on lobbying skills,
provided non-formal education to rural women,
facilitated scholarships for girl students, and
organized awareness raising workshops on
reproductive health, gender issues, women’s rights,
and HTPs. It covers five of the 30 L10K woredas in
SNNPR.
Tigray
11. Relief Society of Tigray (REST): REST was
originally established to meet the needs of people
affected by the civil war and drought in Tigray. It
eventually started supporting the agricultural sector
through rehabilitation and disaster preparedness
programs. Today, the organization focuses on health,
education, and women’s empowerment. It covers ten
of the 15 l10K woredas in Tigray.
12. Women’s Association of Tigray (WAT): WAT
is a women-led association with members in every
kebele of Tigray. The Association seeks to empower
women by improving their socio-economic and
political conditions, raising awareness, and mobilizing
women’s participation in development activities. It
covers five of the 15 L10K woredas in Tigray.
Changes in Maternal, Newborn and Child Health in 115 Rural Ethiopian Woredas: JSI Research & Training Institute, Inc./L10K 97
APPENDIX 4________________________________________________
SURVEY TEAM
Coordinators from L10K Staff:
Agazi Ameha
Bizuhan Gelaw
Desalew Emaway
Luche Tadesse
Nebiyu Getachew
Regional Coordinator Consultants:
Ambanesh Necho
Dawit Birhanu
Hibret Bireda
Kasahun Mengistu
Legesse Hadush
Saail Mohammed
Dr. Alemayehu Mekonnen also served as a consultant for the data collectors training.
Survey Supervisors by Region:
Region: Amhara Oromia SNNP Tigray
Supervisors: Belay Haffa Alemayehu Kumsa Abdrezak Reshid Abrehet Kidanu
Genetu Addisu Daniel Geleta Asnake Major Bitweded Birhane
Getaneh Tadesse Gelana Mekonnen Birhanu Ware G/selassie Kahsay
Kassawmar Andargie Habtamu Getahun Edgete Lemma G/wahid Yohannes
Miku Hailu Kedir Abdella Helen Tesfaye Harnet Adane
Mohammed Hussien Meseret Raga Kibre Jembere Kalayu Tsebeyom
Tadesse Alamir Regassa Gelana Shemsedin Jemal Yirga Ebuy
Wondimagegn Meshesha Wondwosen Mitiku Shimels Abebe
Continued on next page...
Changes in Maternal, Newborn and Child Health in 115 Rural Ethiopian Woredas: JSI Research & Training Institute, Inc./L10K 98
Survey Enumerators by Region:
Region: Amhara Oromia SNNP Tigray
Enumerators: Asmamaw Limeneh Abayneh Diga Abdulreshim Gtalen Abraham Tsehaya
Abebe W/Selassie Abdi Kebede Abebaw Foge Abrha G/haweria
Anteneh Jemberie Ahmed Abdiyo Abnet Abse Abrhet Zeray
Aschenafi Belayhin Alemu Mekonnen Alem Fereja Alganesh Mehari
Assefa Fetene Aweke Mekonnen Alemayehu Moga Almaz G/meskel
Awoke Azanaw Ayehu Kebede Atakilt Muez Altayesh Alemayehu
Ayele Kibret Bahiru Tujuba Bajura Zeritu Asrat Woldegerima
Bisrat Tache Belayneh Mengist Bogale Haile Ataklti Berhane
Eshetu Gebey Daniel Wegari Chiksa Sultan Equare Gebre
Esubalew Berihun Desalegn Tamiru Dagim Fetene G/her Desta
Fantahun Worku Endalew Melaku Daniel Endale G/her Ebuy
Getachew Hussien Feyuma Debeli Debena Daca G/her Yohanes
Jejaw Berihun Hailu Bogale Degu Gebre Michael Guesh
Kiflemariam Tsegaye Haimanot Yitagesu Endale Emiru Huluagersh Kassaye
Mebrihit Rezene Jebena Beyena Fikadu Zeleke Kindeya Halefom
Melkamu Amera Kelbessa Abdisa Getahun Gaye Lemlem Kebede
Menbere Bicha Lenjisa Kebebe Henok Tafese Mihret Abera
Mohammed Ahmed Leta Ayele Hirut Assefa Nigsti G/her
Nigussie Gatahun Mekonnen Kebede Kisaso S/r Temesgen Desta
Robel Abate Meseret Mengesha Medina Hamza Seble Mhari
Shewangizaw Mamsha Shibiru Fekadu Mikrachew Tamrat G/yesus
Taye Endalemaw Silenat Alemu Seide Kelifa Yibrah Alemu
Tesfaye Ashebir Tekilu Merga Tamiru Gerito Yonas G/medhin
Teshager Assefa Temesgen Jaleta Tarekegn Gebre Yosuf Ibrahim
Teshome Kokebe Temesgen Bulti Tsega Kokeb Zaid Hagos
Walelign Aschale Tesfeye Emiru Wasihun H/Mikael Zemichael K/mariam
Yemarwuha Abebe Tsegaye Boru Wendemalem Taye
Yeneneh Ayalew Tulu Lemi Wolde Worku
Yeshanew Asnake Yohannes Terekbe Yeshimebet Gebeyehu
Yibeyin Mulualem Yoseph Terfasa Yonas Hagos
Yohannis Achaw Zelalem Daniel
Zewudu Muniye Zelalem Marema