Embed Size (px)
Citation preview
Chapter 20Dipolar Spectroscopy – Single-resonanceMethods
Peter P. Borbat and Jack H. FreedCornell University, Ithaca, NY, USA
20.1 Introduction 42520.2 Basic Theoretical Aspects of PDS
Methods 42720.3 Double-quantum Coherence EPR, Six-pulse
Sequence 43420.4 Four- and Five-pulse ‘Single-quantum
Coherence’ PDS Sequences 43820.5 Other Single-frequency PDS
Methods 44620.6 2D-FT Orientation-correlation PDS 45120.7 Relaxation and Instantaneous
Diffusion 45620.8 Conclusions 458
Acknowledgments 459References 459
20.1 INTRODUCTION
Distance measurements on the nanometer scale bypulse EPR have developed into a widely used bio-physical method, for which a number of applicationsand completed studies exist, benefiting particularlythe field of structural biology. A key early application
EPR Spectroscopy: Fundamentals and Methods.Edited by Daniella Goldfarb and Stefan Stoll© 2018 John Wiley & Sons, Ltd. ISBN: 978-1-119-16299-5Also published in eMagRes (online edition)DOI: 10.1002/9780470034590.emrstm1519
of pulse EPR was concerned with determining thespatial distributions of paramagnetic centers pro-duced in solids by radiolysis. The main approachesto reporting on spatial distributions of radicals inthose cases were based on measuring relaxation ef-fects on the primary or stimulated echo, from whichconcentration-dependent contributions to relaxationcould be estimated.1,2 The local concentrations af-fected spectral diffusion in a complicated way due tothe inherent complexity of the underlying relaxationprocesses, but in a more tractable way by the mech-anism of ‘instantaneous diffusion’ (ID),3–5 whichis due to spin echo dephasing caused by the staticdipole–dipole interactions among unpaired electronspins of the radicals generated in the radiation tracks.These studies yielded insights into the nature of thedominant solid-state relaxation mechanisms and un-derlying stochastic processes.1,2 Notably, the distinctelectron spin-echo envelope modulation (ESEEM)in the primary echo (PE) decay due to the dipolarinteractions in spin pairs of SO4
− radicals produced insingle crystal of K2S2O8 was reported,3,6 showing thatthe echo decay could be used to determine distances.However, in typical amorphous solids, the echo de-cays were dominated by phase relaxation and nuclearESEEM,7–9 making extracting distance information avery difficult task that was further complicated by longdead times ≈0.3–0.5 μs after the microwave (MW)pulses, leading to a loss of the key part of the signalemanating from the electron spin dipolar couplingrelated ESEEM.
Goldfarb, Daniella, and Stefan Stoll. Modern EPR Spectroscopy, John Wiley & Sons, Incorporated, 2018. ProQuest Ebook Central, http://ebookcentral.proquest.com/lib/cornell/detail.action?docID=5317477.Created from cornell on 2018-05-24 10:45:55.
Cop
yrig
ht ©
201
8. J
ohn
Wile
y &
Son
s, In
corp
orat
ed. A
ll rig
hts
rese
rved
.
426 High-Resolution Pulse Techniques
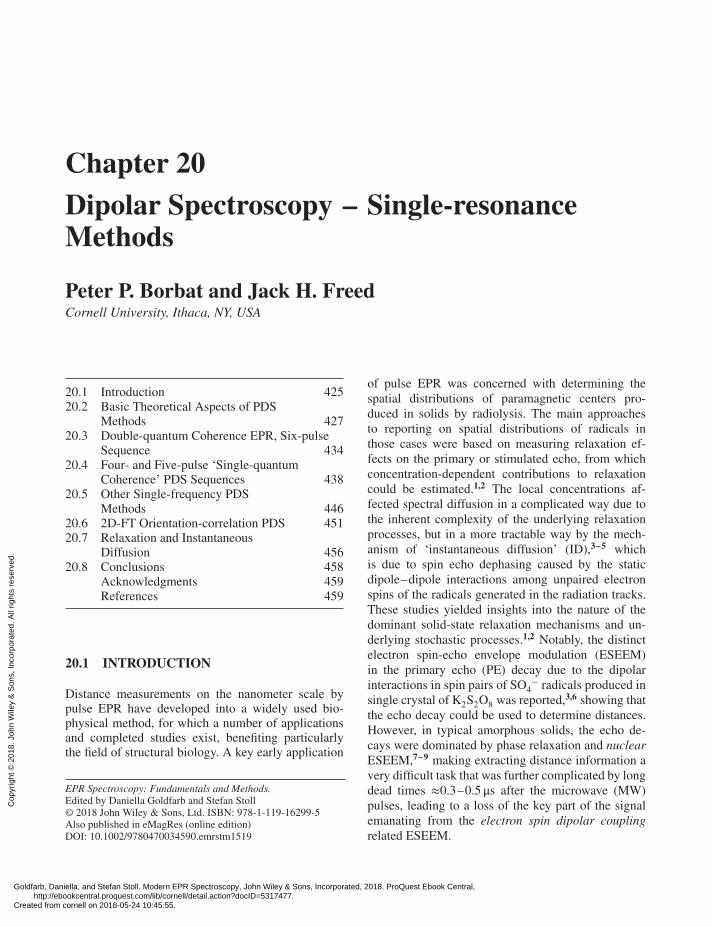
Ideally, such experiments should be performedwith very strong or ‘hard’ pulses that irradiatethe whole spectrum, although the dead time couldstill be a serious impediment. These issues wereovercome when a method originally developed inNMR10 was implemented in EPR (in 1981)11 asDEER ESE (double electron–electron resonancein electron spin-echo) or simply as DEER (doubleelectron–electron resonance), and since 1998 anothername PELDOR (pulsed electron double resonance)has been in use.12 In this method, the ‘pump’ pulsefrom an MW power source is applied to affect theamplitude of the electron spin echo formed by thetwo-pulse ‘detection’ sequence derived from anotherMW pulse source operating at a different frequency(see Figure 20.1a and Chapter 19).11 The spectralexcitations at the two frequencies should not overlap,so the response to the pump pulse is then primarilydetermined by the electron–electron spin dipolar (aswell as electron spin exchange) couplings, producingdistinct changes in the amplitude of the spin-echorecorded vs time delay of the pump pulse. The in-strumental setup used two independent high-powerMW sources, a TWTA (traveling wave tube amplifier)and a magnetron, applied to an MW bimodal cavityresonator housing the sample.
Relaxation effects were small because a fixeddelay was used between the detection MW pulses,which were relatively soft and applied at a substantialfrequency separation from the pump pulse lead-ing to much reduced nuclear ESEEM.8 It was latershown that a single TWTA operating in the linearregime can be used for the task,14 but before that thesingle-frequency technique of ‘2+1’ (Figure 20.1a)was introduced and applied to biological systems3,15
to overcome the need for two high-power MW sourcesand associated bimodal resonators and to enabledistance measurements on narrow EPR spectra. Sub-sequently, in another development, the addition of arefocusing pulse to the three-pulse sequence yieldedthe four-pulse DEER sequence (Figure 20.1b) simpli-fying technical issues by eliminating the need for thesecond MW power source.16–18 Earlier in an initialstudy,19 the fully coherent single-resonance techniqueof DQC EPR was introduced. It was successfully im-plemented at Ku band (≈17 GHz) as a powerful highlysensitive method offering several distinct advantagesbased on the use of double-quantum filtering of thedipolar signal as well as the use of ‘constant time’pulse sequences14,20–22 minimizing relaxation effects.It yields clean dipolar signals, zero dead time, and a
(a)
(b)
(c)
ω
π/2
π/2
π/2 π/2 π/2
β π
π
π
π π π
π
(1) (2)
(3)
(6)(5)(4)(3)(2)(1)
(2)(1)ωdetect
ωpump
ω
Echo (t)
Echo (tp)
τ τt
(“+1”)
t2 – t1t2t1
t1
2tp 2tDQ 2(tm – tp)
t
Figure 20.1. The DQC; ‘2+1’, and DEER pulse sequencesare shown. (a) The three-pulse DEER (PELDOR), and itsanalog, ‘2+1’ rely on PE formed by the fixed-position pulses1 and 2. The dipolar modulation of the echo is produced byletting the spin-flipping ‘pump’ pulse in the middle scan thewhole range (0,𝜏) between the pulses 1 and 2. In PELDOR,the pump pulse labeled 𝛽 is at a frequency shifted far enoughso as not to affect the spins forming the echo, whereas in‘2+1’ all the pulses are at (about) the same frequency, so thepulses must not overlap. (b) The four-pulse DEER sequenceis formed by adding a π pulse to three-pulse DEER indicatedas pulse 3; this converts the PE sequence to a refocusedecho. The pump pulse no longer needs to be brought closeto pulse 2 as in (a). (c) The six-pulse DQC sequence is muchdifferent from the abovementioned sequences by having allsix pulses derived from the same coherent source so that eachspin participates in ‘pumping’ and detection. The distancebetween the first pulse and the echo is kept constant, whileother pulse positions are varied in a special way to producethe dipolar modulation. (Reproduced with permission fromRef. 13. © Elsevier, 2014)
broad distance range. Since then, there have been twoprincipal single- and double-resonance techniquesin existence, which are known collectively as pulsedipolar EPR spectroscopy (or PDS for short).
PDS has since been enriched with severalsingle- and double-resonance type techniques,21–25
Goldfarb, Daniella, and Stefan Stoll. Modern EPR Spectroscopy, John Wiley & Sons, Incorporated, 2018. ProQuest Ebook Central, http://ebookcentral.proquest.com/lib/cornell/detail.action?docID=5317477.Created from cornell on 2018-05-24 10:45:55.
Cop
yrig
ht ©
201
8. J
ohn
Wile
y &
Son
s, In
corp
orat
ed. A
ll rig
hts
rese
rved
.
Dipolar Spectroscopy – Single-resonance Methods 427
as well as not so distinct types among whichRIDME (relaxation-induced dipolar modulationenhancement)26,27 recently underwent extensive studyand further development.28–30 PDS has proved itspotential as a sensitive and robust technology tostudy the structure and function of a broad rangeof biomolecules14,31–35 and a variety of other sys-tems. In the past two decades, there has been arapid development of newer technical aspects ofPDS22,24,36–41 including the commercial implemen-tation of four-pulse DEER at X-band (9.4 GHz) and,more recently, the more sensitive Q-band (34 GHz).
20.2 BASIC THEORETICAL ASPECTS OFPDS METHODS
20.2.1 Single and Double Resonance
As we outlined in the Introduction, different PDSmethods have been developed to measure electronspin dipolar interactions from which distances canbe obtained, to help solve a broad range of molec-ular structural issues. The whole family of PDSmethods continues to expand. This article focuseson single-resonance techniques as a subset. As wenote in the following section, the distinction betweensingle- and double-resonance experiments is not al-ways obvious. In this context, we cite the definitionof double-resonance techniques as given by Slichterin p. 248 of his book42 which includes: ‘… The thirdcategory [of double resonance] depends in generalon the existence of spin–spin couplings which inmany cases must not be unduly obscured by eitherspin–lattice relaxation or cross-relaxation. We shalltherefore call it spin coherence double resonancebecause it depends on the ability of spins to precesscoherently for a sufficient time to reveal the spin–spinsplitting. Typically, one here makes use of the factthat when two nuclei [or electron spins] are coupled,changing the spin orientation of one nucleus [orelectron spin] changes the precession frequency of thenuclei [or an electron spin] to which it is coupled, sothat the second nucleus [spin] can reveal in this waywhen the first nucleus [spin] is being subjected to aresonant alternating magnetic field. . . . . Moreover,2D-FT NMR [or EPR] involving only one nuclear[or electronic] species is not a double-resonanceexperiment (only one oscillator is used), but it canbe conceptually viewed as one in which the abilityof a large H1 … obviates the necessity of having a
separate oscillator for each NMR line [each separateportion of the EPR spectrum].’ The reader may notethat we introduced EPR parlance in parallel withSlichter’s original quote, as it is equally applicablefor EPR and NMR. We already sense a vaguenessin trying to define precisely double resonance asjust the existence of coherent precession effects dueto coupling, which may encompass the whole PDSEPR. However, we do know that there are clearlytwo distinct approaches to PDS, and having a ‘singleoscillator’ is not necessarily the main criterion thatsets them apart. The issue of a ‘single-frequency’experiment is somewhat complicated, particularly sowith the advent of modern MW technology whereusing an NCO (numerically controlled oscillator), onecan generate complex time-dependent gigahertz-widespectrum pulses, which could be polychromatic41;so we do not necessarily equate single-frequencyexcitation with single-resonance PDS methods, andwe center our discussion around the latter. Our focushere is on ‘genuine’ single-resonance EPR methods,which for the most part employ coherent pulses tocontrol two coupled spins in a coordinated mannerand are single-frequency only in that they use a ‘sin-gle oscillator’ and are typically best performed withstrong B1 MW fields. Specifically, we would like tomention in this context that such a single-resonancemeasures coupling that exists in a single group of(electron) spin centers (A-spins), which may be ofdifferent types but all contribute to the detected signalformed with a sequence of MW pulses, preferablyintense ones. All these spins are manipulated bythe pulses to transcribe the effect of the couplingonto the evolution of coherences, yielding amplitudemodulation of the signal to the maximum effect.On the contrary, in pure double resonance, spins areseparated into two groups; one is used to detect thesignal, whereas the coupling is revealed typicallyby using the selective effect of pulse(s) at anotherfrequency or other factors acting on another groupof spins, B-spins that are dipolar coupled to theA-spins. However, double-resonance experimentscould in principle be conducted as a single-frequencyexperiment, for example, ‘light-induced magneticdipolar spectroscopy’43 and RIDME,27,30,44 both aresingle-frequency experiments, but the evolution ofcouplings to B-spins is measured.
Goldfarb, Daniella, and Stefan Stoll. Modern EPR Spectroscopy, John Wiley & Sons, Incorporated, 2018. ProQuest Ebook Central, http://ebookcentral.proquest.com/lib/cornell/detail.action?docID=5317477.Created from cornell on 2018-05-24 10:45:55.
Cop
yrig
ht ©
201
8. J
ohn
Wile
y &
Son
s, In
corp
orat
ed. A
ll rig
hts
rese
rved
.
428 High-Resolution Pulse Techniques
20.2.2 Spin Hamiltonian for Coupled ElectronSpins
The theoretical background for PDS has been devel-oped from the concepts utilized in NMR based on theelegant formalism of density matrices, coherences, andproduct operators (POs) (see Chapter 8).45–47 We in-troduce a simplified form of this here.
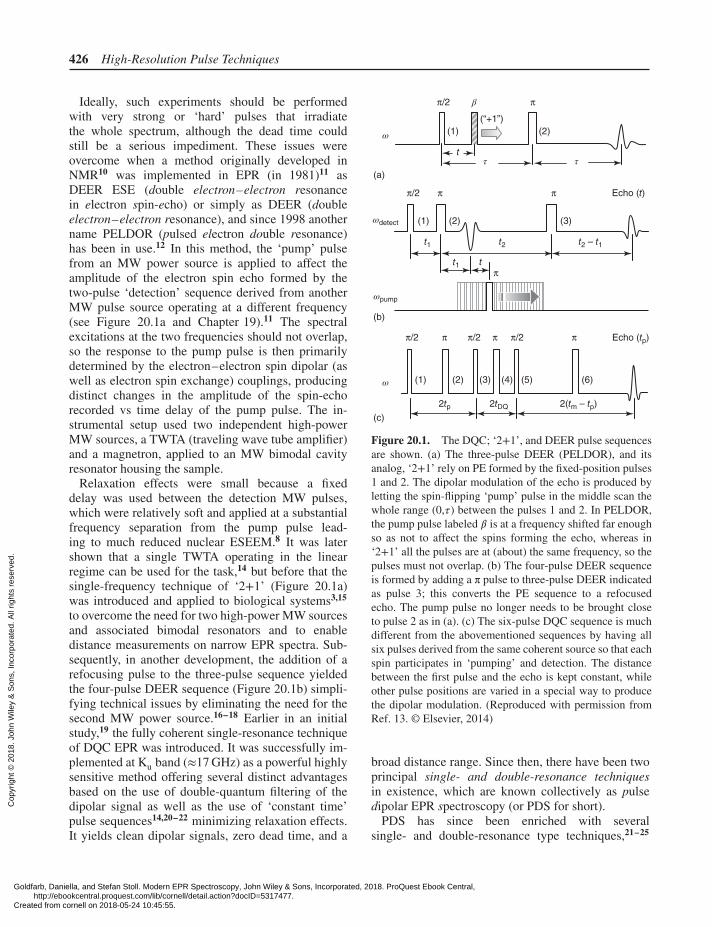
For an isolated pair of electron spins, 1 and 2, con-nected by the vector r12 at angle 𝜃 relative to the staticfield B0, the spin Hamiltonian can be written as
H0 ≡ H0∕ℏ = (𝜇B∕ℏ)B0 ⋅ g1 ⋅ S1 + I(k)1 ⋅ A(k)
1 ⋅ S1z
+ (𝜇B∕ℏ)B0 ⋅ g2 ⋅ S2 + I(l)2 ⋅ A(l)
2 ⋅ S2z
− 𝛾 (k)N1B0 I(k)1z − 𝛾 (l)N2B0 I(l)2z + I(k)1 ⋅ P(k)
1 ⋅ I(k)1
+ I(l)2 ⋅ P(l)
2 ⋅ I(l)2 + d(3S1zS2z − S1 ⋅ S2)∕2
+ J(1∕2 − 2S1 ⋅ S2) (20.1)
Here, the first two lines contain electron Zeeman termsfor both electron spins and their couplings to their re-spective sets of nuclei, {k} and {l} with the summationover these indices implied; A(k)
1 , A(l)2 and g1, g2 are the
hyperfine (hf) and g-tensors of the coupled spins bothassumed to be spin 1/2. These are followed by nuclearZeeman and quadrupole terms, which generally can-not be discounted in single-resonance PDS, e.g., dueto the development of nuclear ESEEM.7–9 However,keeping these terms would be too cumbersome amatter or necessitate numerical treatment. The lasttwo terms describes the electron spin dipolar interac-tion with the coupling constant d=𝜔dd(1− 3cos2𝜃)with 𝜔dd = 𝛾2
eℏ∕r312 and the electron exchange with
exchange integral J(r12). In the dipolar couplingterm, only the so-called secular terms A and B wereretained, while the nonsecular terms referred to asC, D, E, and F were neglected as is appropriate forhigh fields.4,48 We will simplify the discussion byignoring other complications and dropping the nuclearspin terms (Zeeman and quadrupole) in line 3. Thisis the level of approximation used to analyze mostPDS experiments, i.e., nitroxides, for which they areinsignificant, and also the g-tensor anisotropy is small.These simplifications will work well for the purposeof this article where we wish to avoid unnecessarycomplexity. We further simplify with
H0 = H12 + Hdd, where H12 = 𝛺L1S1z +𝛺L2S2z
and Hdd = aS1zS2z + bff(S+1 S−
2 + S−1 S+
2 )∕2 (20.2)
Here, H 12 describes the Zeeman and hf terms in lines 1and 2 of equation (20.1) very simply; this gives us the
(a)
(b) (c)
B0
S2
r12
S1
d dΔω12
Δω12>>ωdd
Δω12<<ωdd
3ωdd/2
ωdd 2ωdd
ω1 ω2
θφ
Figure 20.2. (a) Electron spins S1 and S2 coupled via theelectron spin dipole–dipole interaction. Vector r12, connect-ing the spins, is aligned with the z-axis defined in the molec-ular frame of reference. This frame is given by Euler angles𝛺= (0, 𝜃, 𝜑) relative to the direction of the external mag-netic field B0. (b) Dipolar coupling d splits the spectral linesof the electron spins into doublets at offsets Δ𝜔1 and Δ𝜔2. (c)The lineshape in disordered samples resulting from electronspin dipolar couplings for all 𝛺’s. (Adapted from, Borbat &Freed 2014. (Reproduced with permission from Ref. 22. ©Springer, 2014)
frequency spectrum, in the EPR spectral dimension.H dd contains the couplings, with a= d+ 2J the secular(A) part and bff =−d/2+ 2J, the pseudosecular (orflip-flop, B) part. In the frame of reference rotatingwith the frequency 𝜔0 of the applied MW field (therotating frame, for short), we replace the Larmor fre-quencies 𝛺Lk with their offsets Δ𝜔k =𝛺Lk −𝜔0. Thedipolar coupling term in equation (20.2) splits each ofthe two resonant lines at Δ𝜔1 and Δ𝜔2 into two linesseparated by d for 𝜔dd ≪Δ𝜔12 = |Δ𝜔1 −Δ𝜔2|; but by3d/2 in the opposite case of 𝜔dd ≫Δ𝜔12 (Figure 20.2).In samples with an isotropic distribution of ori-entations, the dipolar lineshape averaged over allorientations takes the form of a Pake doublet8,49,50 inboth cases. In intermediate cases, when 𝜔dd ≈Δ𝜔12,the lineshape is more complex and can be obtainednumerically.
20.2.3 Density Operator and Coherences
The ensemble of electron spin pairs in a PDS sampleis defined by the density operator (see Chapter 8). Atequilibrium temperature T, it is given by4
��eq = exp(−H0∕kT)∕tr(exp(−H0∕kT)) (20.3)
Goldfarb, Daniella, and Stefan Stoll. Modern EPR Spectroscopy, John Wiley & Sons, Incorporated, 2018. ProQuest Ebook Central, http://ebookcentral.proquest.com/lib/cornell/detail.action?docID=5317477.Created from cornell on 2018-05-24 10:45:55.
Cop
yrig
ht ©
201
8. J
ohn
Wile
y &
Son
s, In
corp
orat
ed. A
ll rig
hts
rese
rved
.
Dipolar Spectroscopy – Single-resonance Methods 429
where H0 = ℏH 0 is generally a many-bodyspin-Hamiltonian, which for a spin pair is given byequation (20.2). In a magnetically dilute sample, themagnetic interaction of all the spins pairs in the sam-ple is described by the secular dipolar Hamiltonian.48
The intramolecular couplings within each spin pairare dominant in PDS, so that we omit for now in-termolecular interactions with the electron spins onsurrounding molecules, but we introduce them later,as needed. The equilibrium density operator at highmagnetic field and high temperature for a spin paircan be reduced to the form of just a series expansionof the exponential operator where in lowest order48
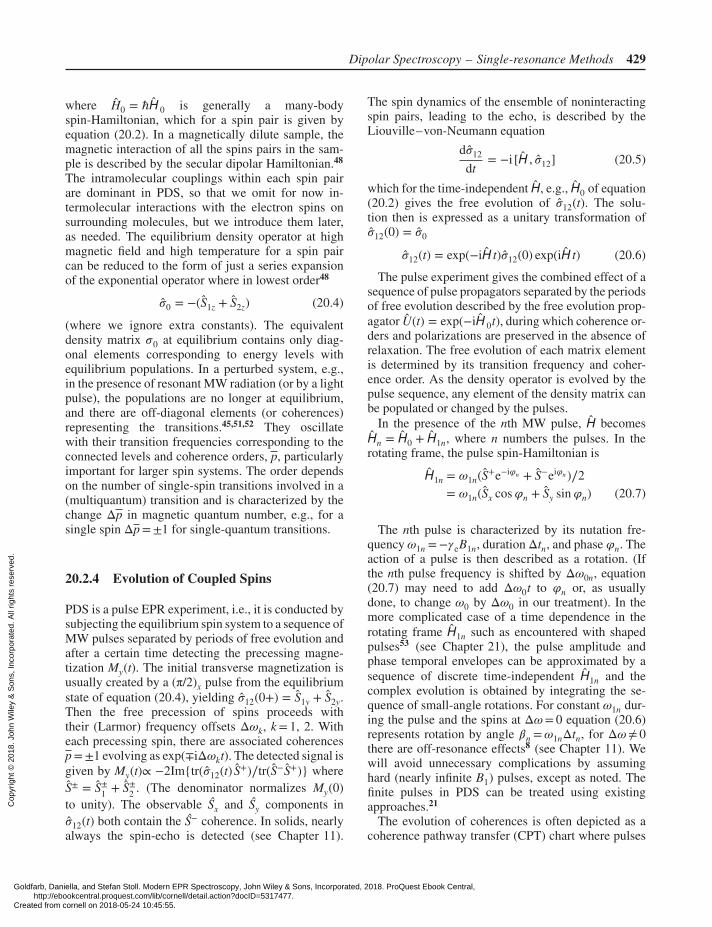
��0 = −(S1z + S2z) (20.4)
(where we ignore extra constants). The equivalentdensity matrix 𝜎0 at equilibrium contains only diag-onal elements corresponding to energy levels withequilibrium populations. In a perturbed system, e.g.,in the presence of resonant MW radiation (or by a lightpulse), the populations are no longer at equilibrium,and there are off-diagonal elements (or coherences)representing the transitions.45,51,52 They oscillatewith their transition frequencies corresponding to theconnected levels and coherence orders, p, particularlyimportant for larger spin systems. The order dependson the number of single-spin transitions involved in a(multiquantum) transition and is characterized by thechange Δp in magnetic quantum number, e.g., for asingle spin Δp=±1 for single-quantum transitions.
20.2.4 Evolution of Coupled Spins
PDS is a pulse EPR experiment, i.e., it is conducted bysubjecting the equilibrium spin system to a sequence ofMW pulses separated by periods of free evolution andafter a certain time detecting the precessing magne-tization My(t). The initial transverse magnetization isusually created by a (π/2)x pulse from the equilibriumstate of equation (20.4), yielding ��12(0+) = S1y + S2y.Then the free precession of spins proceeds withtheir (Larmor) frequency offsets Δ𝜔k, k= 1, 2. Witheach precessing spin, there are associated coherencesp=±1 evolving as exp(∓iΔ𝜔kt). The detected signal isgiven by My(t)∝ −2Im{tr(��12(t) S+)∕tr(S−S+)} whereS± = S±
1 + S±2 . (The denominator normalizes My(0)
to unity). The observable Sx and Sy components in��12(t) both contain the S− coherence. In solids, nearlyalways the spin-echo is detected (see Chapter 11).
The spin dynamics of the ensemble of noninteractingspin pairs, leading to the echo, is described by theLiouville–von-Neumann equation
d��12
dt= −i [H , ��12] (20.5)
which for the time-independent H, e.g., H0 of equation(20.2) gives the free evolution of ��12(t). The solu-tion then is expressed as a unitary transformation of��12(0) = ��0
��12(t) = exp(−iH t)��12(0) exp(iH t) (20.6)
The pulse experiment gives the combined effect of asequence of pulse propagators separated by the periodsof free evolution described by the free evolution prop-agator U(t) = exp(−iH 0t), during which coherence or-ders and polarizations are preserved in the absence ofrelaxation. The free evolution of each matrix elementis determined by its transition frequency and coher-ence order. As the density operator is evolved by thepulse sequence, any element of the density matrix canbe populated or changed by the pulses.
In the presence of the nth MW pulse, H becomesHn = H0 + H1n, where n numbers the pulses. In therotating frame, the pulse spin-Hamiltonian is
H1n = 𝜔1n(S+e−i𝜑n + S−ei𝜑n )∕2= 𝜔1n(Sx cos𝜑n + Sy sin𝜑n) (20.7)
The nth pulse is characterized by its nutation fre-quency 𝜔1n =−𝛾eB1n, duration Δtn, and phase 𝜑n. Theaction of a pulse is then described as a rotation. (Ifthe nth pulse frequency is shifted by Δ𝜔0n, equation(20.7) may need to add Δ𝜔0t to 𝜑n or, as usuallydone, to change 𝜔0 by Δ𝜔0 in our treatment). In themore complicated case of a time dependence in therotating frame H1n such as encountered with shapedpulses53 (see Chapter 21), the pulse amplitude andphase temporal envelopes can be approximated by asequence of discrete time-independent H1n and thecomplex evolution is obtained by integrating the se-quence of small-angle rotations. For constant 𝜔1n dur-ing the pulse and the spins at Δ𝜔= 0 equation (20.6)represents rotation by angle 𝛽n =𝜔1nΔtn, for Δ𝜔≠ 0there are off-resonance effects8 (see Chapter 11). Wewill avoid unnecessary complications by assuminghard (nearly infinite B1) pulses, except as noted. Thefinite pulses in PDS can be treated using existingapproaches.21
The evolution of coherences is often depicted as acoherence pathway transfer (CPT) chart where pulses
Goldfarb, Daniella, and Stefan Stoll. Modern EPR Spectroscopy, John Wiley & Sons, Incorporated, 2018. ProQuest Ebook Central, http://ebookcentral.proquest.com/lib/cornell/detail.action?docID=5317477.Created from cornell on 2018-05-24 10:45:55.
Cop
yrig
ht ©
201
8. J
ohn
Wile
y &
Son
s, In
corp
orat
ed. A
ll rig
hts
rese
rved
.
430 High-Resolution Pulse Techniques
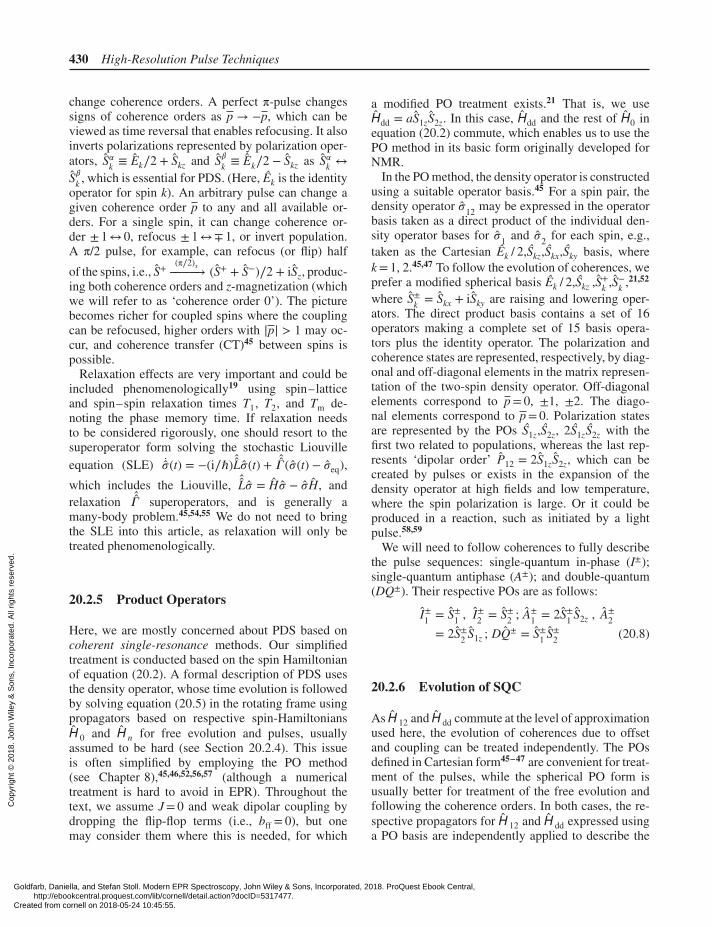
change coherence orders. A perfect π-pulse changessigns of coherence orders as p → −p, which can beviewed as time reversal that enables refocusing. It alsoinverts polarizations represented by polarization oper-ators, S𝛼k ≡ Ek∕2 + Skz and S𝛽k ≡ Ek∕2 − Skz as S𝛼k ↔
S𝛽k , which is essential for PDS. (Here, Êk is the identityoperator for spin k). An arbitrary pulse can change agiven coherence order p to any and all available or-ders. For a single spin, it can change coherence or-der ± 1↔ 0, refocus ± 1↔∓ 1, or invert population.A π/2 pulse, for example, can refocus (or flip) half
of the spins, i.e., S+ (π∕2)x−−−−−→ (S+ + S−)∕2 + iSz, produc-ing both coherence orders and z-magnetization (whichwe will refer to as ‘coherence order 0’). The picturebecomes richer for coupled spins where the couplingcan be refocused, higher orders with |p| > 1 may oc-cur, and coherence transfer (CT)45 between spins ispossible.
Relaxation effects are very important and could beincluded phenomenologically19 using spin–latticeand spin–spin relaxation times T1, T2, and Tm de-noting the phase memory time. If relaxation needsto be considered rigorously, one should resort to thesuperoperator form solving the stochastic Liouvilleequation (SLE) 𝜎(t) = −(i∕ℏ) L��(t) +
𝛤 (��(t) − ��eq),which includes the Liouville, L�� = H�� − ��H, andrelaxation
𝛤 superoperators, and is generally amany-body problem.45,54,55 We do not need to bringthe SLE into this article, as relaxation will only betreated phenomenologically.
20.2.5 Product Operators
Here, we are mostly concerned about PDS based oncoherent single-resonance methods. Our simplifiedtreatment is conducted based on the spin Hamiltonianof equation (20.2). A formal description of PDS usesthe density operator, whose time evolution is followedby solving equation (20.5) in the rotating frame usingpropagators based on respective spin-HamiltoniansH 0 and H n for free evolution and pulses, usuallyassumed to be hard (see Section 20.2.4). This issueis often simplified by employing the PO method(see Chapter 8),45,46,52,56,57 (although a numericaltreatment is hard to avoid in EPR). Throughout thetext, we assume J= 0 and weak dipolar coupling bydropping the flip-flop terms (i.e., bff = 0), but onemay consider them where this is needed, for which
a modified PO treatment exists.21 That is, we useHdd = aS1zS2z. In this case, Hdd and the rest of H0 inequation (20.2) commute, which enables us to use thePO method in its basic form originally developed forNMR.
In the PO method, the density operator is constructedusing a suitable operator basis.45 For a spin pair, thedensity operator ��12 may be expressed in the operatorbasis taken as a direct product of the individual den-sity operator bases for ��1 and ��2 for each spin, e.g.,taken as the Cartesian Êk / 2,Skz,Skx,Sky basis, wherek= 1, 2.45,47 To follow the evolution of coherences, weprefer a modified spherical basis Êk / 2,Skz ,S+
k ,S−k ,21,52
where S±k = Skx + iSky are raising and lowering oper-
ators. The direct product basis contains a set of 16operators making a complete set of 15 basis opera-tors plus the identity operator. The polarization andcoherence states are represented, respectively, by diag-onal and off-diagonal elements in the matrix represen-tation of the two-spin density operator. Off-diagonalelements correspond to p= 0, ±1, ±2. The diago-nal elements correspond to p= 0. Polarization statesare represented by the POs S1z,S2z, 2S1zS2z with thefirst two related to populations, whereas the last rep-resents ‘dipolar order’ P12 = 2S1zS2z, which can becreated by pulses or exists in the expansion of thedensity operator at high fields and low temperature,where the spin polarization is large. Or it could beproduced in a reaction, such as initiated by a lightpulse.58,59
We will need to follow coherences to fully describethe pulse sequences: single-quantum in-phase (I±);single-quantum antiphase (A±); and double-quantum(DQ±). Their respective POs are as follows:
I±1 = S±1 , I±2 = S±
2 ; A±1 = 2S±
1 S2z , A±2
= 2S±2 S1z ; DQ± = S±
1 S±2 (20.8)
20.2.6 Evolution of SQC
As H 12 and H dd commute at the level of approximationused here, the evolution of coherences due to offsetand coupling can be treated independently. The POsdefined in Cartesian form45–47 are convenient for treat-ment of the pulses, while the spherical PO form isusually better for treatment of the free evolution andfollowing the coherence orders. In both cases, the re-spective propagators for H 12 and H dd expressed usinga PO basis are independently applied to describe the
Goldfarb, Daniella, and Stefan Stoll. Modern EPR Spectroscopy, John Wiley & Sons, Incorporated, 2018. ProQuest Ebook Central, http://ebookcentral.proquest.com/lib/cornell/detail.action?docID=5317477.Created from cornell on 2018-05-24 10:45:55.
Cop
yrig
ht ©
201
8. J
ohn
Wile
y &
Son
s, In
corp
orat
ed. A
ll rig
hts
rese
rved
.
Dipolar Spectroscopy – Single-resonance Methods 431
evolution of the density operator �� 12. The free evolu-tion may thus be conveniently followed in the sphericalbasis. It is given as:
S±k
H12t−−−−→ S±
k exp(∓iΔ𝜔kt) (20.9)
S±k
Hddt−−−−→ S±
k (cos at∕2 ∓ i2Sjz sin at∕2) (20.10)
where the subscript j≠ k is for the other spin (j, k= 1,2) and a is their coupling. The S±
k evolves due to H 12 asgiven by equation (20.9), describing two first-order co-herences (p=±1) associated with precession at offsetΔ𝜔k. We characterize this evolution by the phase 𝛷offor ‘offset phase’, with time derivative ��off = Δ𝜔k(t)p.The evolution due to Hdd in equation (20.10) describesthe evolution as interconversion between two terms ofwhich the first is observable, whereas the second term,2S±
k Snz, describes the ‘antiphase’ order that developsbetween the two spins and is not directly observable,as its trace product with S−
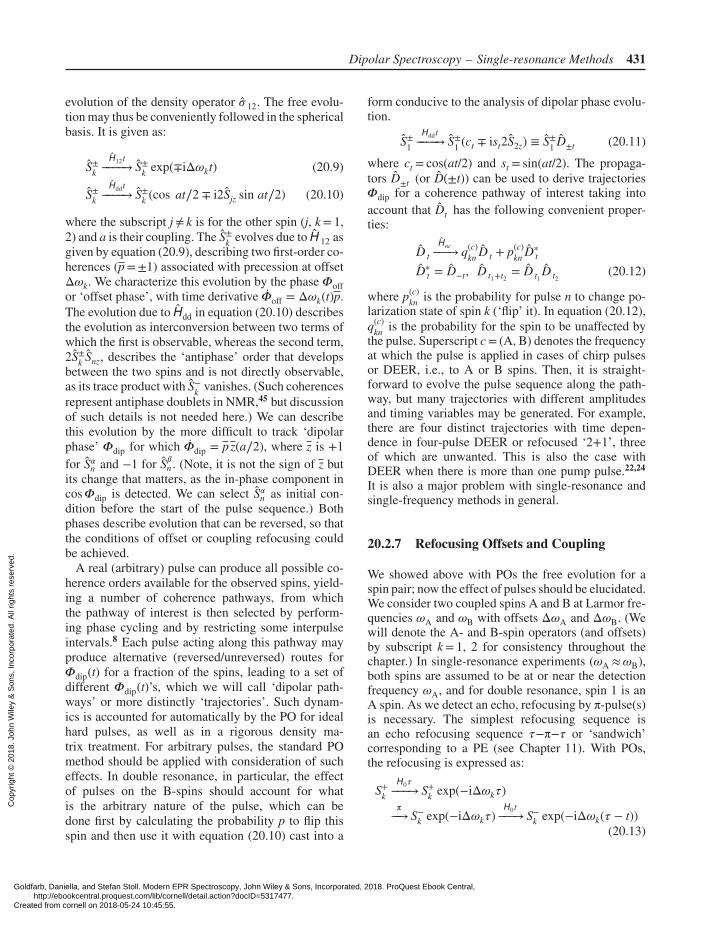
k vanishes. (Such coherencesrepresent antiphase doublets in NMR,45 but discussionof such details is not needed here.) We can describethis evolution by the more difficult to track ‘dipolarphase’ 𝛷dip for which ��dip = pz(a∕2), where z is +1for S𝛼n and −1 for S𝛽n . (Note, it is not the sign of z butits change that matters, as the in-phase component incos𝛷dip is detected. We can select S𝛼n as initial con-dition before the start of the pulse sequence.) Bothphases describe evolution that can be reversed, so thatthe conditions of offset or coupling refocusing couldbe achieved.
A real (arbitrary) pulse can produce all possible co-herence orders available for the observed spins, yield-ing a number of coherence pathways, from whichthe pathway of interest is then selected by perform-ing phase cycling and by restricting some interpulseintervals.8 Each pulse acting along this pathway mayproduce alternative (reversed/unreversed) routes for𝛷dip(t) for a fraction of the spins, leading to a set ofdifferent 𝛷dip(t)’s, which we will call ‘dipolar path-ways’ or more distinctly ‘trajectories’. Such dynam-ics is accounted for automatically by the PO for idealhard pulses, as well as in a rigorous density ma-trix treatment. For arbitrary pulses, the standard POmethod should be applied with consideration of sucheffects. In double resonance, in particular, the effectof pulses on the B-spins should account for whatis the arbitrary nature of the pulse, which can bedone first by calculating the probability p to flip thisspin and then use it with equation (20.10) cast into a
form conducive to the analysis of dipolar phase evolu-tion.
S±1
Hddt−−−−→ S±
1 (ct ∓ ist2S2z) ≡ S±1 D±t (20.11)
where ct = cos(at/2) and st = sin(at/2). The propaga-tors D±t (or D(±t)) can be used to derive trajectories𝛷dip for a coherence pathway of interest taking intoaccount that Dt has the following convenient proper-ties:
D t
Hnc−−−→ q(c)kn D t + p(c)
kn D∗t
D∗t = D−t, D t1+t2
= D t1D t2
(20.12)
where p(c)kn is the probability for pulse n to change po-
larization state of spin k (‘flip’ it). In equation (20.12),q(c)
kn is the probability for the spin to be unaffected bythe pulse. Superscript c= (A, B) denotes the frequencyat which the pulse is applied in cases of chirp pulsesor DEER, i.e., to A or B spins. Then, it is straight-forward to evolve the pulse sequence along the path-way, but many trajectories with different amplitudesand timing variables may be generated. For example,there are four distinct trajectories with time depen-dence in four-pulse DEER or refocused ‘2+1’, threeof which are unwanted. This is also the case withDEER when there is more than one pump pulse.22,24
It is also a major problem with single-resonance andsingle-frequency methods in general.
20.2.7 Refocusing Offsets and Coupling
We showed above with POs the free evolution for aspin pair; now the effect of pulses should be elucidated.We consider two coupled spins A and B at Larmor fre-quencies 𝜔A and 𝜔B with offsets Δ𝜔A and Δ𝜔B. (Wewill denote the A- and B-spin operators (and offsets)by subscript k= 1, 2 for consistency throughout thechapter.) In single-resonance experiments (𝜔A ≈𝜔B),both spins are assumed to be at or near the detectionfrequency 𝜔A, and for double resonance, spin 1 is anA spin. As we detect an echo, refocusing by π-pulse(s)is necessary. The simplest refocusing sequence isan echo refocusing sequence 𝜏−π−𝜏 or ‘sandwich’corresponding to a PE (see Chapter 11). With POs,the refocusing is expressed as:
S+k
H0𝜏−−−→ S+k exp(−iΔ𝜔k𝜏)
π−−→ S−
k exp(−iΔ𝜔k𝜏)H0t−−−→ S−
k exp(−iΔ𝜔k(𝜏 − t))(20.13)
Goldfarb, Daniella, and Stefan Stoll. Modern EPR Spectroscopy, John Wiley & Sons, Incorporated, 2018. ProQuest Ebook Central, http://ebookcentral.proquest.com/lib/cornell/detail.action?docID=5317477.Created from cornell on 2018-05-24 10:45:55.
Cop
yrig
ht ©
201
8. J
ohn
Wile
y &
Son
s, In
corp
orat
ed. A
ll rig
hts
rese
rved
.
432 High-Resolution Pulse Techniques
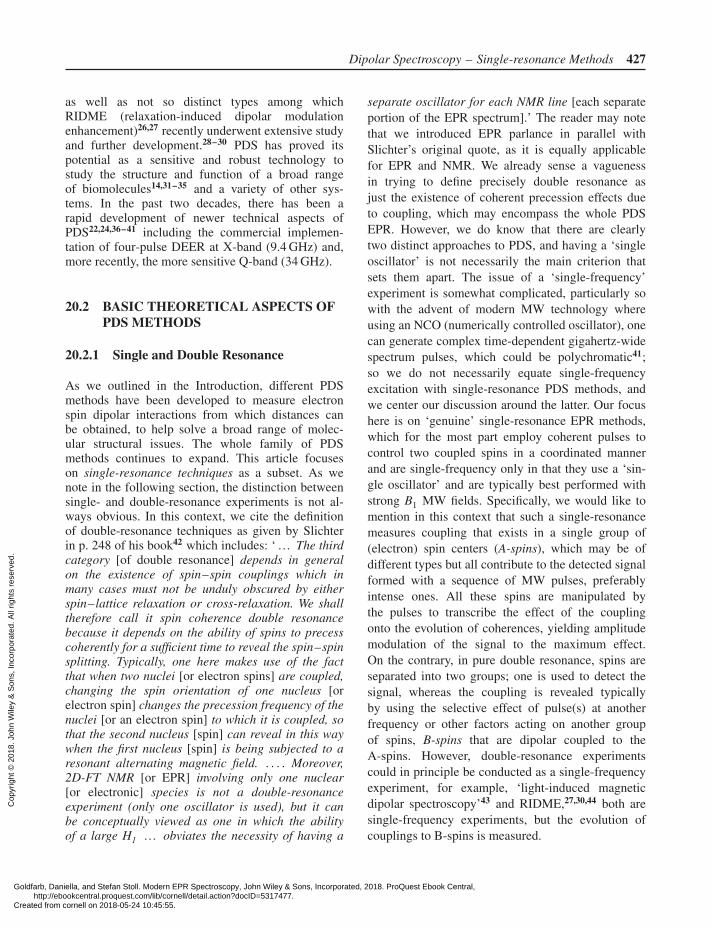
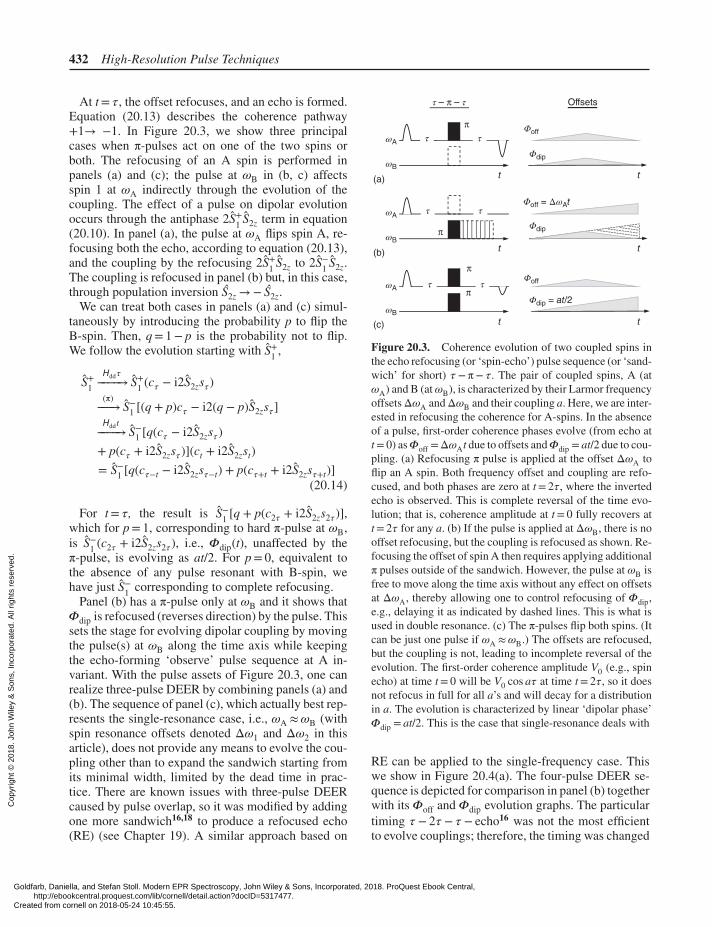
At t= 𝜏, the offset refocuses, and an echo is formed.Equation (20.13) describes the coherence pathway+1→ −1. In Figure 20.3, we show three principalcases when π-pulses act on one of the two spins orboth. The refocusing of an A spin is performed inpanels (a) and (c); the pulse at 𝜔B in (b, c) affectsspin 1 at 𝜔A indirectly through the evolution of thecoupling. The effect of a pulse on dipolar evolutionoccurs through the antiphase 2S+
1 S2z term in equation(20.10). In panel (a), the pulse at 𝜔A flips spin A, re-focusing both the echo, according to equation (20.13),and the coupling by the refocusing 2S+
1 S2z to 2S−1 S2z.
The coupling is refocused in panel (b) but, in this case,through population inversion S2z →− S2z.
We can treat both cases in panels (a) and (c) simul-taneously by introducing the probability p to flip theB-spin. Then, q= 1− p is the probability not to flip.We follow the evolution starting with S+
1 ,
S+1
Hdd𝜏−−−−→ S+1 (c𝜏 − i2S2zs𝜏 )
(π)−−−→ S−
1 [(q + p)c𝜏 − i2(q − p)S2zs𝜏 ]Hddt−−−−→ S−
1 [q(c𝜏 − i2S2zs𝜏 )+ p(c𝜏 + i2S2zs𝜏 )](ct + i2S2zst)= S−
1 [q(c𝜏−t − i2S2zs𝜏−t) + p(c𝜏+t + i2S2zs𝜏+t)](20.14)
For t= 𝜏, the result is S−1 [q + p(c2𝜏 + i2S2zs2𝜏)],
which for p= 1, corresponding to hard π-pulse at 𝜔B,is S−
1 (c2𝜏 + i2S2zs2𝜏 ), i.e., 𝛷dip(t), unaffected by theπ-pulse, is evolving as at/2. For p= 0, equivalent tothe absence of any pulse resonant with B-spin, wehave just S−
1 corresponding to complete refocusing.Panel (b) has a π-pulse only at 𝜔B and it shows that
𝛷dip is refocused (reverses direction) by the pulse. Thissets the stage for evolving dipolar coupling by movingthe pulse(s) at 𝜔B along the time axis while keepingthe echo-forming ‘observe’ pulse sequence at A in-variant. With the pulse assets of Figure 20.3, one canrealize three-pulse DEER by combining panels (a) and(b). The sequence of panel (c), which actually best rep-resents the single-resonance case, i.e., 𝜔A ≈𝜔B (withspin resonance offsets denoted Δ𝜔1 and Δ𝜔2 in thisarticle), does not provide any means to evolve the cou-pling other than to expand the sandwich starting fromits minimal width, limited by the dead time in prac-tice. There are known issues with three-pulse DEERcaused by pulse overlap, so it was modified by addingone more sandwich16,18 to produce a refocused echo(RE) (see Chapter 19). A similar approach based on
t
t
(a)
(c)
(b)
t
t
t
t
Offsets
τ τ
τ
ττ
τ
τ – π – τ
π
π
π
π
Φdip
Φdip
Φoff
Φoff
Φoff = ΔωAt
Φdip = at/2
ωA
ωB
ωA
ωB
ωA
ωB
Figure 20.3. Coherence evolution of two coupled spins inthe echo refocusing (or ‘spin-echo’) pulse sequence (or ‘sand-wich’ for short) 𝜏 −π− 𝜏. The pair of coupled spins, A (at𝜔A) and B (at𝜔B), is characterized by their Larmor frequencyoffsetsΔ𝜔A andΔ𝜔B and their coupling a. Here, we are inter-ested in refocusing the coherence for A-spins. In the absenceof a pulse, first-order coherence phases evolve (from echo att= 0) as𝛷off =Δ𝜔At due to offsets and𝛷dip = at/2 due to cou-pling. (a) Refocusing π pulse is applied at the offset Δ𝜔A toflip an A spin. Both frequency offset and coupling are refo-cused, and both phases are zero at t= 2𝜏, where the invertedecho is observed. This is complete reversal of the time evo-lution; that is, coherence amplitude at t= 0 fully recovers att= 2𝜏 for any a. (b) If the pulse is applied at Δ𝜔B, there is nooffset refocusing, but the coupling is refocused as shown. Re-focusing the offset of spin A then requires applying additionalπ pulses outside of the sandwich. However, the pulse at 𝜔B isfree to move along the time axis without any effect on offsetsat Δ𝜔A, thereby allowing one to control refocusing of 𝛷dip,e.g., delaying it as indicated by dashed lines. This is what isused in double resonance. (c) The π-pulses flip both spins. (Itcan be just one pulse if 𝜔A ≈𝜔B.) The offsets are refocused,but the coupling is not, leading to incomplete reversal of theevolution. The first-order coherence amplitude V0 (e.g., spinecho) at time t= 0 will be V0 cos a𝜏 at time t= 2𝜏, so it doesnot refocus in full for all a’s and will decay for a distributionin a. The evolution is characterized by linear ‘dipolar phase’𝛷dip = at/2. This is the case that single-resonance deals with
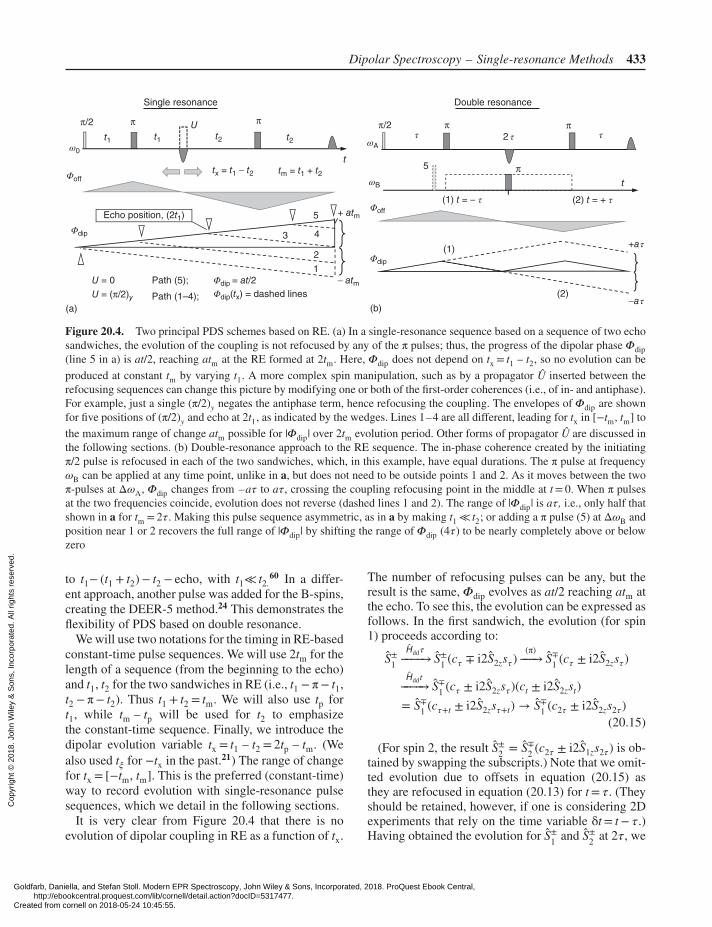
RE can be applied to the single-frequency case. Thiswe show in Figure 20.4(a). The four-pulse DEER se-quence is depicted for comparison in panel (b) togetherwith its 𝛷off and 𝛷dip evolution graphs. The particulartiming 𝜏 − 2𝜏 − 𝜏 − echo16 was not the most efficientto evolve couplings; therefore, the timing was changed
Goldfarb, Daniella, and Stefan Stoll. Modern EPR Spectroscopy, John Wiley & Sons, Incorporated, 2018. ProQuest Ebook Central, http://ebookcentral.proquest.com/lib/cornell/detail.action?docID=5317477.Created from cornell on 2018-05-24 10:45:55.
Cop
yrig
ht ©
201
8. J
ohn
Wile
y &
Son
s, In
corp
orat
ed. A
ll rig
hts
rese
rved
.
Dipolar Spectroscopy – Single-resonance Methods 433
(a)
+ atm
− atm
Single resonance
U = 0 Path (5);
Path (1–4);
Φdip = at/2
U = (π/2)y Φdip(tx) = dashed lines
v
1
3
2
4
5
5
Echo position, (2t1)
t
t
(1)
(2)
Double resonance
(b)
Φdip
Φoff
ωB
ω0ωA
Φdip
Φoff
π/2 π π
t2t2t1t1
U
tm = t1 + t2
(1) t = − τ
+a τ
−a τ
(2) t = + τ
tx = t1 − t2
τ 2 τ τππ/2
π
π
Figure 20.4. Two principal PDS schemes based on RE. (a) In a single-resonance sequence based on a sequence of two echosandwiches, the evolution of the coupling is not refocused by any of the π pulses; thus, the progress of the dipolar phase 𝛷dip(line 5 in a) is at/2, reaching atm at the RE formed at 2tm. Here, 𝛷dip does not depend on tx = t1 – t2, so no evolution can be
produced at constant tm by varying t1. A more complex spin manipulation, such as by a propagator Û inserted between therefocusing sequences can change this picture by modifying one or both of the first-order coherences (i.e., of in- and antiphase).For example, just a single (π/2)y negates the antiphase term, hence refocusing the coupling. The envelopes of 𝛷dip are shownfor five positions of (π/2)y and echo at 2t1, as indicated by the wedges. Lines 1–4 are all different, leading for tx in [−tm, tm] to
the maximum range of change atm possible for |𝛷dip| over 2tm evolution period. Other forms of propagator Û are discussed inthe following sections. (b) Double-resonance approach to the RE sequence. The in-phase coherence created by the initiatingπ/2 pulse is refocused in each of the two sandwiches, which, in this example, have equal durations. The π pulse at frequency𝜔B can be applied at any time point, unlike in a, but does not need to be outside points 1 and 2. As it moves between the twoπ-pulses at Δ𝜔A, 𝛷dip changes from –a𝜏 to a𝜏, crossing the coupling refocusing point in the middle at t= 0. When π pulsesat the two frequencies coincide, evolution does not reverse (dashed lines 1 and 2). The range of |𝛷dip| is a𝜏, i.e., only half thatshown in a for tm = 2𝜏. Making this pulse sequence asymmetric, as in a by making t1 ≪ t2; or adding a π pulse (5) at Δ𝜔B andposition near 1 or 2 recovers the full range of |𝛷dip| by shifting the range of 𝛷dip (4𝜏) to be nearly completely above or belowzero
to t1− (t1 + t2)− t2 − echo, with t1≪ t2.60 In a differ-
ent approach, another pulse was added for the B-spins,creating the DEER-5 method.24 This demonstrates theflexibility of PDS based on double resonance.
We will use two notations for the timing in RE-basedconstant-time pulse sequences. We will use 2tm for thelength of a sequence (from the beginning to the echo)and t1, t2 for the two sandwiches in RE (i.e., t1 −π− t1,t2 −π− t2). Thus t1 + t2 = tm. We will also use tp fort1, while tm – tp will be used for t2 to emphasizethe constant-time sequence. Finally, we introduce thedipolar evolution variable tx = t1 – t2 = 2tp – tm. (Wealso used t𝜉 for −tx in the past.21) The range of changefor tx = [−tm, tm]. This is the preferred (constant-time)way to record evolution with single-resonance pulsesequences, which we detail in the following sections.
It is very clear from Figure 20.4 that there is noevolution of dipolar coupling in RE as a function of tx.
The number of refocusing pulses can be any, but theresult is the same, 𝛷dip evolves as at/2 reaching atm atthe echo. To see this, the evolution can be expressed asfollows. In the first sandwich, the evolution (for spin1) proceeds according to:
S±1
Hdd𝜏−−−−→ S±1 (c𝜏 ∓ i2S2zs𝜏 )
(π)−−−→ S∓
1 (c𝜏 ± i2S2zs𝜏 )Hddt−−−−→ S∓
1 (c𝜏 ± i2S2zs𝜏 )(ct ± i2S2zst)= S∓
1 (c𝜏+t ± i2S2zs𝜏+t) → S∓1 (c2𝜏 ± i2S2zs2𝜏)
(20.15)
(For spin 2, the result S±2 = S∓
2 (c2𝜏 ± i2S1zs2𝜏 ) is ob-tained by swapping the subscripts.) Note that we omit-ted evolution due to offsets in equation (20.15) asthey are refocused in equation (20.13) for t= 𝜏. (Theyshould be retained, however, if one is considering 2Dexperiments that rely on the time variable δt= t− 𝜏.)Having obtained the evolution for S±
1 and S±2 at 2𝜏, we
Goldfarb, Daniella, and Stefan Stoll. Modern EPR Spectroscopy, John Wiley & Sons, Incorporated, 2018. ProQuest Ebook Central, http://ebookcentral.proquest.com/lib/cornell/detail.action?docID=5317477.Created from cornell on 2018-05-24 10:45:55.
Cop
yrig
ht ©
201
8. J
ohn
Wile
y &
Son
s, In
corp
orat
ed. A
ll rig
hts
rese
rved
.
434 High-Resolution Pulse Techniques
then switch to Cartesian PO’s
S1y = (S+1 − S−
1 )∕2i = [S−1 (c2𝜏 + i2S2zs2𝜏 )
− S+1 (c2𝜏 − i2S2zs2𝜏 )]∕2i = −S1yc2𝜏 + i2S1xS2zs2𝜏
(20.16)
Similar to equation (20.15), S2y =− S2yc2𝜏 +i2S2xS1zs2𝜏 and finally for (S1y + S2y),
−(S1y + S2y)c2𝜏 + i(2S1xS2z + 2S2xS1z)s2𝜏 (20.17)
or simply cos a𝜏 for evolution. The evolution of cou-pling in an RE can be described as follows. We willtrack spin 1, then after the first sandwich (t1 −π− t1)according to equation (20.16), there is in-phase co-herence Î1(t1)=− S1y cos at1 and antiphase coherenceÂ1(t1)= 2S1xS2z sin at1. After the second sandwich,these terms evolve into detectable in-phase terms as
I1(t1) + A1(t1) → I1(t1 + t2)= S1y(cos at1 cos at2 − sin at1 sin at2) (20.18)
The term in cosines can be viewed as the evo-lution path Î1(0)→ Î1(t1)→ Î1(t1 + t2), while that insines as Î1(0)→ Â1(t1)→ Î1(t1 + t2). The outcome isS1y cos atm, the same as in the case with PE; the onlydipolar evolution possible is that by varying tm, start-ing from the end of the dead time, tmin. To overcomethis trend, we need somehow to refocus 𝛷dip, a taskthat unlike in double resonance just cannot be accom-plished with π-pulses. However, this can be done, forexample, by inserting between the sandwiches a prop-agator Û, which is able to refocus directly or indirectly,as we will soon show. Û will be allowed to evolve co-herence orders 0 and ±2. It may contain several pulses,may have a long duration, and can make use of phaserelaxation or of any other spin manipulation. We de-scribe its transfer properties in an arbitrary manner asCIÎk +CAÂk, where k= 1, 2 numbers the two spins and|CI(A)|≤ 1. As the evolution is for p= 0, ±2 orders, nodipolar evolution takes place and the (stored) dipolarphase is carried through. Relaxation can render zeroeither CI or CA, as we will see. (Phase cycling canproduce an equivalent result.) Then, equation (20.18)transforms to
I1(t1) + A1(t1)U−−→CI I1(t1) + CAA1(t1)
t2−−→ S1y(CI cos at1 cos at2 − CA sin at1 sin at2)= S1y[(CI + CA) cos atm + (CI − CA) sin atx]
(20.19)
If CI =−CA, only cos atx remains; this is the caseof coupling completely being refocused at tx = 0. This
can be achieved by solid-echo refocusing,61 i.e., apply-ing Û= (π/2)y refocuses the coupling according to
− (S1y + S2y)c2t1+ i(2S1xS2z + 2S2xS1z)s2t1
(π∕2)y−−−−−→ − (S1y + S2y)c2t1
− i(2S2xS1z + 2S1xS2z)s2t1(20.20)
This is equivalent to t1 →− t1 in sin atp, i.e., timereversal, but it comes at the expense of swappingantiphase coherences of the spins. A (π/2)x pulseinstead stores Sky as − Skz, plus it generates pureDQy = (2S1xS2y + 2S2xS1y)/2.47 This requires one toadd more pulses to Û in order not to lose the signal.
It is possible to selectively make either CI or CAzero, producing a sum or difference of the terms in cosatx and cos atm. In all cases, the dipolar signal can beacquired using fixed tm by changing just tx. This wouldalleviate (but not remove) issues with relaxation, andnuclear ESEEM should be suppressed to the extentpossible. It usually decays as tm increases. This iswhat single-resonance PDS sequences have to do intheir work. We will show the effects of particularÛ’s when discussing the respective pulse sequences.Briefly, Û’s in use are [(π/2)x − td −π− td − (π/2)];(π/2)y; [(π/2)x − T− (π/2)]; and [(π/4)y − T− (π/4)].They make up, respectively, six-, four-, and five-pulsesingle-resonance experiments that we discuss in thefollowing section.
20.3 DOUBLE-QUANTUM COHERENCEEPR, SIX-PULSE SEQUENCE
20.3.1 Development of DQC EPR
The need to improve sensitivity inspired efforts todevelop DQC EPR, which was expected to producestrong dipolar signals, but the initial attempts were notparticularly convincing.19 Renewed effort resolved allissues20,21 with the demonstration of strong primaryDQC signals, which are well in line with the basictheoretical concepts. Furthermore, the implementationof the method at Ku band at ≈17 GHz using an effi-cient dielectric resonator and intense nanosecond MWpulses22,24,62 yielded a very sensitive technique. It isnot unusual to obtain a DQC dipolar signal with anSNR in the thousands for a typical spin concentrationin the range ∼100–200 μM or as high as several hun-dreds on lower concentration samples (≤50 μM).
Goldfarb, Daniella, and Stefan Stoll. Modern EPR Spectroscopy, John Wiley & Sons, Incorporated, 2018. ProQuest Ebook Central, http://ebookcentral.proquest.com/lib/cornell/detail.action?docID=5317477.Created from cornell on 2018-05-24 10:45:55.
Cop
yrig
ht ©
201
8. J
ohn
Wile
y &
Son
s, In
corp
orat
ed. A
ll rig
hts
rese
rved
.
Dipolar Spectroscopy – Single-resonance Methods 435
DQC-6
1 2 3 4 5 6
Echo
2tp 2td 2(tm–tp) δt
ΔtΔt 2Δt
πππ π/2π/2π/2
p–
2
1
0
−1
−2
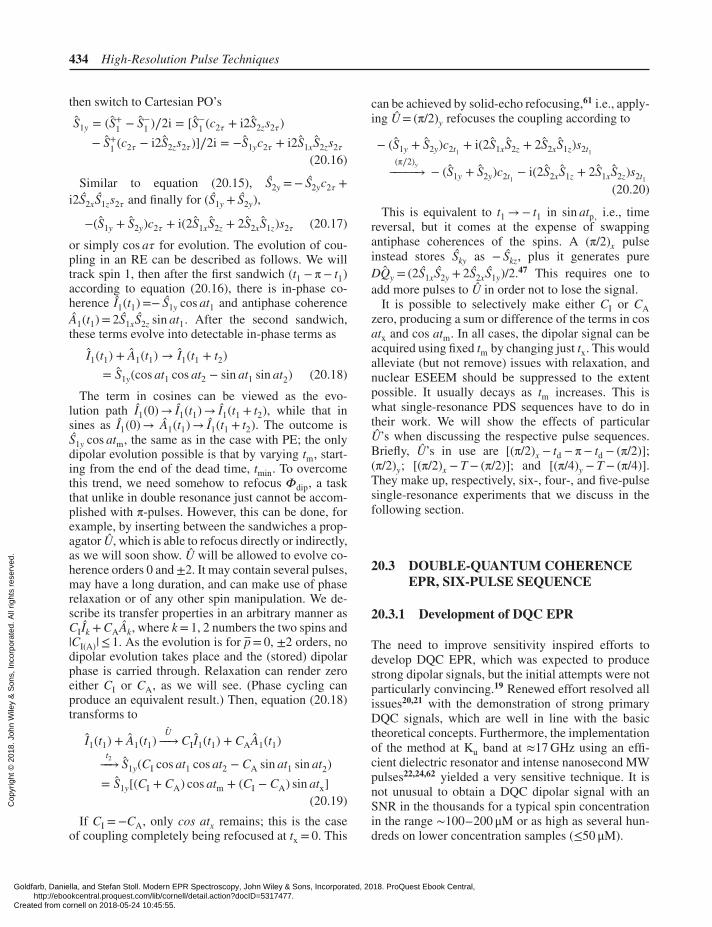
Figure 20.5. The six-pulse DQC sequence is based on REformed by pulses 1, 2, and 6. The three remaining pulses 3, 4,and 5 constitute a composite propagator Û, which is a fixedrefocusing sequence (td −π− td) flanked by π/2 pulses. Thepurpose of Û here is to enable DQ filtering (DQF) by creatingDQC from refocused antiphase coherence by (π/2)x pulse 3,refocusing it with the π pulse 4, and then converting it backto antiphase coherence by π/2 pulse 5, which then evolves tocontribute into the detectable echo. This contribution from thespins that have passed through DQC paths is then isolated byperforming phase cycling. The pulses are advanced in steps,as shown, as the timing variable is tx = tm – 2tp. The recordedsignal is symmetric with respect to tx = 0; thus, it usually canbe varied just from slightly less than 0 to tm
20.3.2 Six-pulse DQC EPR Sequence: BasicPrinciples
The details of the constant-time six-pulse DQCsequence depicted in Figure 20.5 are explainedelsewhere,14,17,22 but a basic description useful forunderstanding single-resonance methods has beenprovided in Section 20.2. Here, we limit the discus-sion to key aspects involved in the function of thisimportant DQC technique before discussing othersingle-resonance techniques. The pulse sequence inFigure 20.5 is composed of three refocusing sand-wiches separated by π/2 pulses serving to changecoherence levels in the desired way. This sequencecan be viewed as a constant-time RE sequence ofSection 20.2 with two sandwiches centered at π-pulses2 and 6 separated by the three-pulse propagator, Û(pulses 3–5), which is used to generate and refocussecond-order coherence and then return it back tothe p=+1 pathway where it evolves into detectablecoherence at time 2tm after the first pulse labeled 1.
This sequence can also be viewed (as in MQC NMR)as a preparation – evolution – detection sequence,45
where the first sandwich prepares antiphase coherence,which is converted to DQC, refocused in the evolution
sandwich, and converted back to antiphase coherenceevolving in the last sandwich into observable in-phasecoherence for detection.
Starting from the equilibrium state ��12(0), in-phasecoherence Î12 = (S1y + S2y) is produced by the first(π/2)x pulse. In the first sandwich, Î12 evolves into Î12+ Â12, with Î12 = −(S1y + S2y) ⋅ cos atp and Â12 =(S1xS2z + S2xS1z) ⋅ sin atp, and offsets are refocused.The (π/2)x pulse 3 stores the Î12 as −(S1z + S2z) ⋅ cosatp and converts Â12 to DQy = − sin atp ⋅ (S−
1 S−2 −
S+1 S+
2 )∕2i, which evolves due to the frequency offsetsof both spins as DQy(t) = sin atp ⋅ (S
−1 S−
2 ei(Δ𝜔1+Δ𝜔2)t −S+1 S+
2 e−i(Δ𝜔1+Δ𝜔2)t)∕2i, with the time t referred to thethird pulse. DQy(t) is refocused in the (td − π − td)sandwich, and the third (π/2)x pulse 5 converts theresulting DQy(2td) = (S−
1 S−2 − S+
1 S+2 ) ⋅ sin atp back to
Â12 = (S1xS2z + S2xS1z) ⋅ sin atp labeled with the phaseof the dipolar evolution at 2tp. Finally, the last re-focusing sandwich evolves Â12 into in-phase (S1y +S2y) ⋅ sin(atm − atp) ⋅ sin atp and the antiphase −(S1xS2z
+ S2xS1z) ⋅ cos(atm − atp) ⋅ sin atp coherences, of whichonly the in-phase term is observable.
Î12 at 2tp passes through the U(π/2− td −π− td −π/2)propagator, which we will call for convenience a‘double-quantum filter’ or DQF, for short. The DQFdoes not actually remove any signal component,rather it ‘labels’ the DQC signal leaving it to thephase cycling to achieve the final filtering. Î12 passesthrough the DQF as (S1z + S2z) carrying with it thephase 𝛷dip(2tp)= cos atp. After the filter, it is againÎ12 =− (S1y + S2y) cos atp, which evolves into theobservable (S1y + S2y) ⋅ cos atp ⋅ cos(atm − atp). Notethat the sum of the two contributions to observableÎ12 coherence is (S1y + S2y) ⋅ cos atm, just as what oneexpects from the basic RE for pulses 1, 2, and 6 ifthe DQF is simply viewed as the equivalent of a 2πrotation, which could be a reasonably accurate picturein the absence of coupling and relaxation. It shouldbe emphasized that there is no refocusing of dipolarcoupling in the DQC-6 sequence. The refocusing is‘virtual’ by separating two components constitutingthe RE into complementary contributions of the refo-cused type. It is the DQC path enabled by the couplingthat makes it possible to separate them by deeplysuppressing the unwanted in-phase component byconstructing a phase cycle that selects only the path-ways passing through DQC order.21,24 The basic phasecycle would involve cycling the phases 𝜙k, (k= 1… 3)of the pulses 1–3 and the receiver phase 𝜙R in four
Goldfarb, Daniella, and Stefan Stoll. Modern EPR Spectroscopy, John Wiley & Sons, Incorporated, 2018. ProQuest Ebook Central, http://ebookcentral.proquest.com/lib/cornell/detail.action?docID=5317477.Created from cornell on 2018-05-24 10:45:55.
Cop
yrig
ht ©
201
8. J
ohn
Wile
y &
Son
s, In
corp
orat
ed. A
ll rig
hts
rese
rved
.
436 High-Resolution Pulse Techniques
steps as (𝜙1, 𝜙2, 𝜙3, 𝜙R)= {(x, x, x, y); (y, y, y, −y);(−x, −x, −x, y); (−y, −y, −y, −y)}. The last π/2 pulseas well as all π pulses can be cycled independentlyto improve the performance, enabling an extendedphase cycle sequence up to 256 steps.21 This veryrobust filtering technique provides deep suppressionof unwanted coherence pathways irrespective of thearbitrary nature of the pulses or their imperfections.This was also demonstrated at X band31 where astandard TE012 cavity resonator and 16 ns π pulseswere used.
The filtering properties of the DQF have other veryimportant implications. First, we stress that adequatephase cycling21,24,63,64 ensures very deep suppressionof unwanted pathways. The second key property is thateven in the case of strong but finite pulses, π pulses arenot able to refocus all the spins, and consequently, theydo not invert all the Sz spins in the antiphase coher-ence terms. This spawns a spurious dipolar trajectoryin the evolution, but in this case, the dipolar coupling isrefocused in the preparation sandwich, and the respec-tive trajectory does not generate antiphase coherence;consequently, it does not contribute to the DQC path-way selected by the phase cycling and is suppressed.Similarly, the finite refocusing pulse in the detectionsandwich after the DQF does not contribute anotherdipolar trajectory to the amplitude of the detected echo.The same holds for single spins: there is no DQC fromthem (!) and they can only contribute to the extentthat DQC is formed with other spins on surroundingmolecules. (This effect becomes insignificant in dilutesamples.) This property means that the treatment basedon hard pulses describes the performance of this pulsesequence very adequately.
The omitted flip-flop terms in equation (20.2), whichexchange dipolar evolutions of coupled spins in anoffset-dependent manner, are more difficult to considerin a closed-form analysis, but this has been done un-der minimal assumptions.21 It has been shown that theclosed-form expression for the DQC amplitude21,65 isadequate for accurate representation of the signal fordistances as short as ≈1.0 nm given large enough B1(>40 G) for such a case of strong coupling. It was alsoshown that for most practical cases their effects arerelatively insignificant. Finally, in a rigorous numer-ical treatment, one can consider the dipolar couplingduring the pulses. What one qualitatively expects fromthis case is a production of all five coherence path-ways including p=±2 by a finite-length pulse. Thiscase was considered as a central focus in the frame-work of the generation of ‘forbidden’ DQCs.19 For the
short intense pulses that we currently employ theseeffects can safely be neglected for distances greaterthan ≈1.2 nm.
20.3.3 DQC-6: Experimental Examples
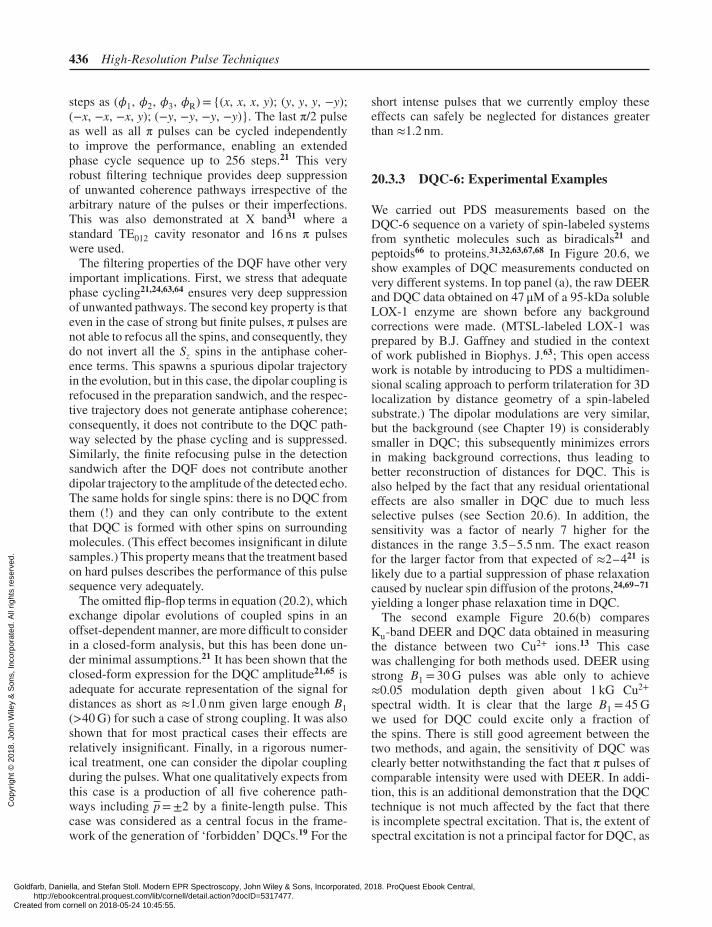
We carried out PDS measurements based on theDQC-6 sequence on a variety of spin-labeled systemsfrom synthetic molecules such as biradicals21 andpeptoids66 to proteins.31,32,63,67,68 In Figure 20.6, weshow examples of DQC measurements conducted onvery different systems. In top panel (a), the raw DEERand DQC data obtained on 47 μM of a 95-kDa solubleLOX-1 enzyme are shown before any backgroundcorrections were made. (MTSL-labeled LOX-1 wasprepared by B.J. Gaffney and studied in the contextof work published in Biophys. J.63; This open accesswork is notable by introducing to PDS a multidimen-sional scaling approach to perform trilateration for 3Dlocalization by distance geometry of a spin-labeledsubstrate.) The dipolar modulations are very similar,but the background (see Chapter 19) is considerablysmaller in DQC; this subsequently minimizes errorsin making background corrections, thus leading tobetter reconstruction of distances for DQC. This isalso helped by the fact that any residual orientationaleffects are also smaller in DQC due to much lessselective pulses (see Section 20.6). In addition, thesensitivity was a factor of nearly 7 higher for thedistances in the range 3.5–5.5 nm. The exact reasonfor the larger factor from that expected of ≈2–421 islikely due to a partial suppression of phase relaxationcaused by nuclear spin diffusion of the protons,24,69–71
yielding a longer phase relaxation time in DQC.The second example Figure 20.6(b) compares
Ku-band DEER and DQC data obtained in measuringthe distance between two Cu2+ ions.13 This casewas challenging for both methods used. DEER usingstrong B1 = 30 G pulses was able only to achieve≈0.05 modulation depth given about 1 kG Cu2+
spectral width. It is clear that the large B1 = 45 Gwe used for DQC could excite only a fraction ofthe spins. There is still good agreement between thetwo methods, and again, the sensitivity of DQC wasclearly better notwithstanding the fact that π pulses ofcomparable intensity were used with DEER. In addi-tion, this is an additional demonstration that the DQCtechnique is not much affected by the fact that thereis incomplete spectral excitation. That is, the extent ofspectral excitation is not a principal factor for DQC, as
Goldfarb, Daniella, and Stefan Stoll. Modern EPR Spectroscopy, John Wiley & Sons, Incorporated, 2018. ProQuest Ebook Central, http://ebookcentral.proquest.com/lib/cornell/detail.action?docID=5317477.Created from cornell on 2018-05-24 10:45:55.
Cop
yrig
ht ©
201
8. J
ohn
Wile
y &
Son
s, In
corp
orat
ed. A
ll rig
hts
rese
rved
.
Dipolar Spectroscopy – Single-resonance Methods 437
(a)
(c)
(b)
(d)
0 0
0
0.1
0.2
0.3
0.4
0.5
0.6
0.5 1 1.5 2 32.5
0−0.1
2
4
6
1 2 3 4 5 6
Time (μs)
Am
plit
ud
e (
a.u
.)
Am
plit
ud
e (
a.u
.)
(2)
(1)
×3
−400 −200 −2000 200 0 100−100 200
0° tilt
90° tilt
400
tx (ns) Time (ns)
Time (μs)
DQ echo amplitudeRe F.T.
90°0°
0MHz
50−50
*
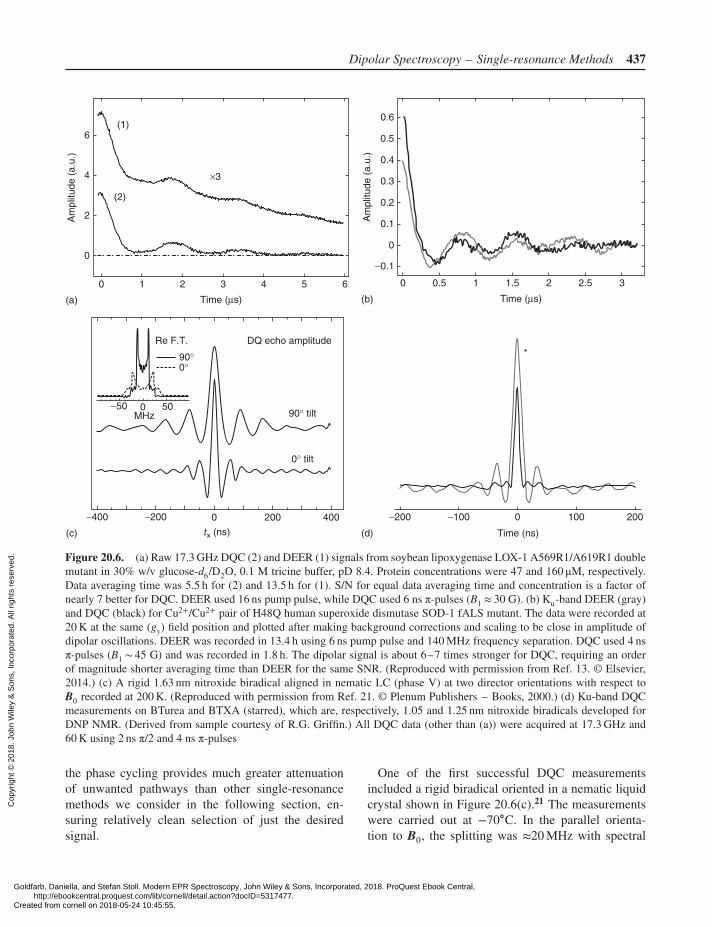
Figure 20.6. (a) Raw 17.3 GHz DQC (2) and DEER (1) signals from soybean lipoxygenase LOX-1 A569R1/A619R1 doublemutant in 30% w/v glucose-d6/D2O, 0.1 M tricine buffer, pD 8.4. Protein concentrations were 47 and 160 μM, respectively.Data averaging time was 5.5 h for (2) and 13.5 h for (1). S/N for equal data averaging time and concentration is a factor ofnearly 7 better for DQC. DEER used 16 ns pump pulse, while DQC used 6 ns π-pulses (B1 ≈ 30 G). (b) Ku-band DEER (gray)and DQC (black) for Cu2+/Cu2+ pair of H48Q human superoxide dismutase SOD-1 fALS mutant. The data were recorded at20 K at the same (gy) field position and plotted after making background corrections and scaling to be close in amplitude ofdipolar oscillations. DEER was recorded in 13.4 h using 6 ns pump pulse and 140 MHz frequency separation. DQC used 4 nsπ-pulses (B1 ∼ 45 G) and was recorded in 1.8 h. The dipolar signal is about 6–7 times stronger for DQC, requiring an orderof magnitude shorter averaging time than DEER for the same SNR. (Reproduced with permission from Ref. 13. © Elsevier,2014.) (c) A rigid 1.63 nm nitroxide biradical aligned in nematic LC (phase V) at two director orientations with respect toB0 recorded at 200 K. (Reproduced with permission from Ref. 21. © Plenum Publishers – Books, 2000.) (d) Ku-band DQCmeasurements on BTurea and BTXA (starred), which are, respectively, 1.05 and 1.25 nm nitroxide biradicals developed forDNP NMR. (Derived from sample courtesy of R.G. Griffin.) All DQC data (other than (a)) were acquired at 17.3 GHz and60 K using 2 ns π/2 and 4 ns π-pulses
the phase cycling provides much greater attenuationof unwanted pathways than other single-resonancemethods we consider in the following section, en-suring relatively clean selection of just the desiredsignal.
One of the first successful DQC measurementsincluded a rigid biradical oriented in a nematic liquidcrystal shown in Figure 20.6(c).21 The measurementswere carried out at −70∘C. In the parallel orienta-tion to B0, the splitting was ≈20 MHz with spectral
Goldfarb, Daniella, and Stefan Stoll. Modern EPR Spectroscopy, John Wiley & Sons, Incorporated, 2018. ProQuest Ebook Central, http://ebookcentral.proquest.com/lib/cornell/detail.action?docID=5317477.Created from cornell on 2018-05-24 10:45:55.
Cop
yrig
ht ©
201
8. J
ohn
Wile
y &
Son
s, In
corp
orat
ed. A
ll rig
hts
rese
rved
.
438 High-Resolution Pulse Techniques
components at 32 MHz due to the pseudosecular termalso visible.
In Figure 20.6(d), very short distances 1.05 and1.25 nm were recorded on biradicals developed forDNP22,72 without encountering any significant prob-lem. The first distance is about the shortest DQC canmeasure as the dipolar coupling constant 𝜔dd/2π is45 MHz (≈16 G), which according to our numericalsimulations65 is close to maximum for a B1 of 45 G.For greater dipolar coupling, its presence during thepulse should be considered and J(r12) is likely to be-come large.
All the abovementioned measurements used a64-step phase cycle for DQ filtering. This phasecycle was derived from the full 256-step phase cycledescribed in21 as follows: the first 32 lines in thephase cycle table are copied to make lines 33–64.In this table for the 32 added lines, the phase of thesixth pulse is y and the receiver phases inverted. TheCYCLOPS steps used for constructing the 128- and256-step phase tables were omitted. Nuclear ESEEMfrom protons was suppressed by summing four datasets with tm incremented for the subsequent set byhalf a period (19 ns) of the ESEEM. This describesone of the standard ESEEM suppression routines wedeveloped to record DQC (and DEER) data14; otherapproaches used with low-resolution timing are alsoknown.63
20.4 FOUR- AND FIVE-PULSE‘SINGLE-QUANTUM COHERENCE’PDS SEQUENCES
20.4.1 The Four-pulse SIFTER Experiment
The adoption of key NMR pulse methods added toPDS a group of four- and five-pulse constant-timesingle-resonance experiments.8,21,23 Similar to DQC,they benefit from applying strong (almost) nonselec-tive pulses, potentially covering nearly the entire spec-tral width for a nitroxide. The methods are based onsimultaneous manipulation with the coherences of thetwo spins by switching the course of evolution of dipo-lar coupling in the RE sequence (see Section 20.2). Thespecifics are in how the refocused signal is modified ineach case.
We now discuss single-resonance pulse sequencesthat can benefit from strong pulses by first assum-ing ideal infinite pulses to simplify the initial discus-sion. In Figure 20.4, we show an RE, which is at the
‘SIFTER’
Δtp 2Δtp Δtp
(π/2)x (π/2)y ππ
2tp 2 (tm – tp)
ωA
+1
−1
0
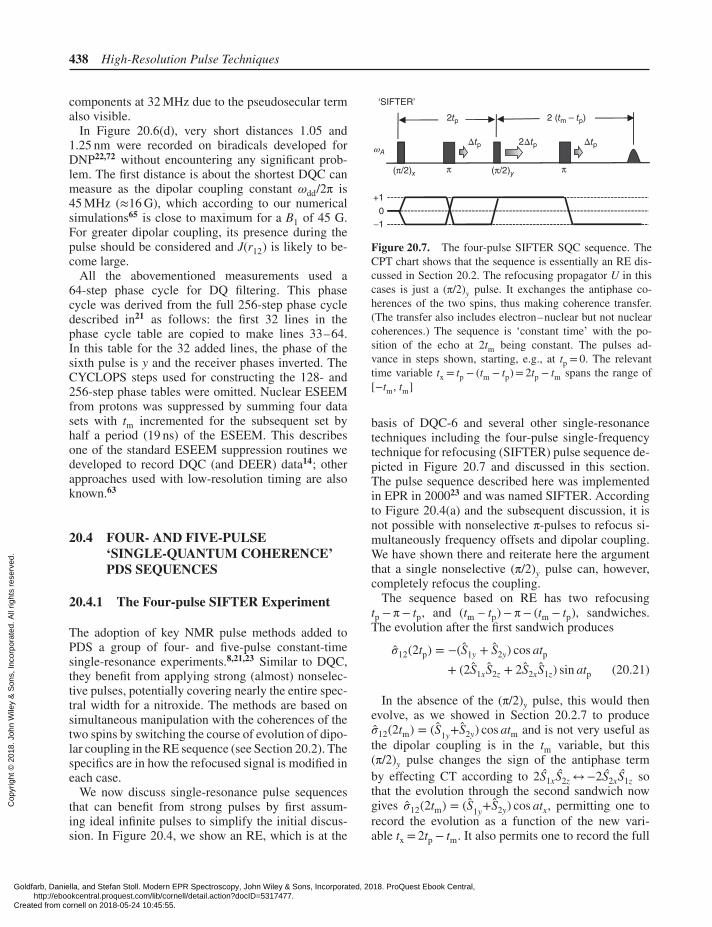
Figure 20.7. The four-pulse SIFTER SQC sequence. TheCPT chart shows that the sequence is essentially an RE dis-cussed in Section 20.2. The refocusing propagator U in thiscases is just a (π/2)y pulse. It exchanges the antiphase co-herences of the two spins, thus making coherence transfer.(The transfer also includes electron–nuclear but not nuclearcoherences.) The sequence is ‘constant time’ with the po-sition of the echo at 2tm being constant. The pulses ad-vance in steps shown, starting, e.g., at tp = 0. The relevanttime variable tx = tp − (tm − tp)= 2tp − tm spans the range of[−tm, tm]
basis of DQC-6 and several other single-resonancetechniques including the four-pulse single-frequencytechnique for refocusing (SIFTER) pulse sequence de-picted in Figure 20.7 and discussed in this section.The pulse sequence described here was implementedin EPR in 200023 and was named SIFTER. Accordingto Figure 20.4(a) and the subsequent discussion, it isnot possible with nonselective π-pulses to refocus si-multaneously frequency offsets and dipolar coupling.We have shown there and reiterate here the argumentthat a single nonselective (π/2)y pulse can, however,completely refocus the coupling.
The sequence based on RE has two refocusingtp −π− tp, and (tm – tp)−π− (tm − tp), sandwiches.The evolution after the first sandwich produces
��12(2tp) = −(S1y + S2y) cos atp+ (2S1xS2z + 2S2xS1z) sin atp (20.21)
In the absence of the (π/2)y pulse, this would thenevolve, as we showed in Section 20.2.7 to produce��12(2tm) = (S1y+S2y) cos atm and is not very useful asthe dipolar coupling is in the tm variable, but this(π/2)y pulse changes the sign of the antiphase termby effecting CT according to 2S1xS2z ↔−2S2xS1z sothat the evolution through the second sandwich nowgives ��12(2tm) = (S1y+S2y) cos atx, permitting one torecord the evolution as a function of the new vari-able tx = 2tp − tm. It also permits one to record the full
Goldfarb, Daniella, and Stefan Stoll. Modern EPR Spectroscopy, John Wiley & Sons, Incorporated, 2018. ProQuest Ebook Central, http://ebookcentral.proquest.com/lib/cornell/detail.action?docID=5317477.Created from cornell on 2018-05-24 10:45:55.
Cop
yrig
ht ©
201
8. J
ohn
Wile
y &
Son
s, In
corp
orat
ed. A
ll rig
hts
rese
rved
.
Dipolar Spectroscopy – Single-resonance Methods 439
echo, 100% modulated with the dipolar oscillations,which is a very attractive property of this pulse se-quence. Unlike DQC-6, there is no constant term in(S1y + S2y)cos atm.
20.4.2 Effects of Finite Pulses in SIFTER
We have discussed SIFTER in the hard-pulse limitusing POs to describe the spin dynamics. Performancewith real finite pulses complicates the case to someextent. We will now look into the main implicationsof finite pulses with SIFTER. SIFTER does nothave a mechanism for filtering (see Section 20.3.3).Therefore, with real finite pulses, all possible dipolartrajectories (see Section 20.2) will be produced anddetected. Specifically, what happens during eachrefocusing sandwich in the case of finite pulses canbe described as follows. We assume that the finiteπ-pulse can flip a fraction p of spins while the fractionq= 1 – p remains unaffected (for a subensemble ofsingle spins q= 1). Otherwise, the pulses are taken asideal. The evolution proceeds as
S1y
t1−π−t1−−−−−−→ − qS1y + p(S1y cos at1 + 2S1xS2z sin at1)(π∕2)y−−−−−→ − qS1y + p(S1y cos at1 − 2S1xS2z sin at1)
t2−π−t2−−−−−−→ S1y[(q + p cos at1)(q + p cos at2)+ p2(− sin at2) sin at1] + 2S1xS2z(… ) (20.22)
The (π/2)y pulse changes the sign of the antiphaseterm as (S2xS1z + S1xS2z)→−(S1xS2z + S2xS1z). Theevolution for the second spin is obtained by swappingsubscripts 1 and 2. One thus detects
(S1y + S2y){q2 + pq cos[a(tm − tx)∕2]+ pq cos[a(tm + tx)∕2] + p2 cos atx} (20.23)
The last term in cos atx in equation (20.23) has itsmaximum at tx = 0 in the center of evolution inter-val [−tm, tm] as we found from this sequence withhard pulses. The first term is a constant background,whereas the next two terms are dipolar signals os-cillating at half the dipolar frequency, and they startat the opposite ends of the full evolution interval intx. For the pulse sequence to be useful, the conditionp≫ q for spins contributing to the signal should bemet, so only the last term is significant. This wouldbe difficult to accomplish even for nitroxides but ismore feasible for much narrower spectra such as trityl
or some organic radicals (e.g., tyrosyl or flavin radi-cal cofactors). Single spins, if present, will add to thebackground term in q2. The only way to deal with theseissues is to achieve the conditions to ensure small qfor spins contributing to the signal using very intensepulses or shaped pulses designed to minimize the prod-uct term p(Δ𝜔)q(Δ𝜔) by achieving uniform profile ofq(Δ𝜔)≈ 0 for flipped spins73 (see Chapter 21).
The situation is markedly different in DQC-6. Asdiscussed in Section 20.3.3, phase cycling selects onlythose coherences that have passed through the DQCchannel. Consequently, single spins do not contributeto this signal. For finite pulses, as we discussed, thisis also true for that fraction of coupled spins whereonly one offset-refocused spin was effected by thefirst π pulse; consequently, they do not contribute toany DQ-filtered pathway and are suppressed, so onlythe p2 term is detected. Thus, with finite pulses, theperformance of DQC-6 is not beset with the problemsone has to address with SIFTER.
20.4.3 An Example of SIFTER and DQC-6with Strong-B1 Pulses
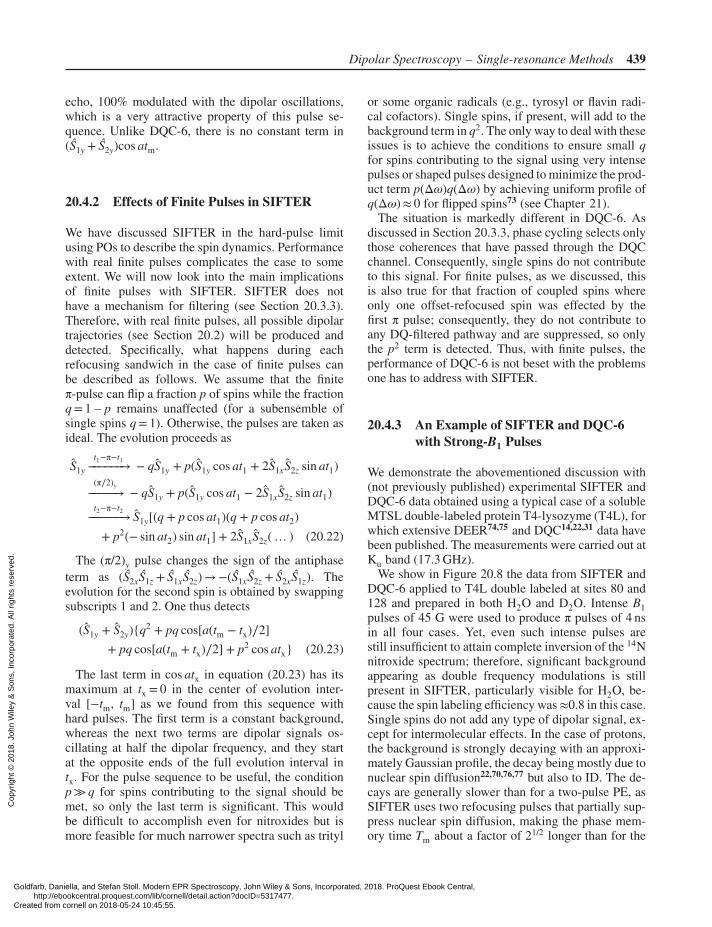
We demonstrate the abovementioned discussion with(not previously published) experimental SIFTER andDQC-6 data obtained using a typical case of a solubleMTSL double-labeled protein T4-lysozyme (T4L), forwhich extensive DEER74,75 and DQC14,22,31 data havebeen published. The measurements were carried out atKu band (17.3 GHz).
We show in Figure 20.8 the data from SIFTER andDQC-6 applied to T4L double labeled at sites 80 and128 and prepared in both H2O and D2O. Intense B1pulses of 45 G were used to produce π pulses of 4 nsin all four cases. Yet, even such intense pulses arestill insufficient to attain complete inversion of the 14Nnitroxide spectrum; therefore, significant backgroundappearing as double frequency modulations is stillpresent in SIFTER, particularly visible for H2O, be-cause the spin labeling efficiency was≈0.8 in this case.Single spins do not add any type of dipolar signal, ex-cept for intermolecular effects. In the case of protons,the background is strongly decaying with an approxi-mately Gaussian profile, the decay being mostly due tonuclear spin diffusion22,70,76,77 but also to ID. The de-cays are generally slower than for a two-pulse PE, asSIFTER uses two refocusing pulses that partially sup-press nuclear spin diffusion, making the phase mem-ory time Tm about a factor of 21/2 longer than for the
Goldfarb, Daniella, and Stefan Stoll. Modern EPR Spectroscopy, John Wiley & Sons, Incorporated, 2018. ProQuest Ebook Central, http://ebookcentral.proquest.com/lib/cornell/detail.action?docID=5317477.Created from cornell on 2018-05-24 10:45:55.
Cop
yrig
ht ©
201
8. J
ohn
Wile
y &
Son
s, In
corp
orat
ed. A
ll rig
hts
rese
rved
.
440 High-Resolution Pulse Techniques
0 1 2 3 4
0
50
100
150
200
V(t
) (a
.u.)
0 1 2 3 4
−5
0
5
10
15
20
25
30
Time (μs)
V(t
) (a
.u.)
1
2
4
1
2
3
(a)
(b)
Figure 20.8. (a) 17.3 GHz SIFTER (1, 2) and DQC (3, 4)data taken on a 15-μl sample of T4 Lysozyme, double labeledwith MTSL at positions 80 and 128. Samples were preparedin either H2O or D2O working buffers. Protein concentra-tion was 48 μM in H2O buffer (1, 3) and 42 μM for D2O (2,4). Spin-labeling efficiency was 0.8 for the H2O sample and≈1 in case of D2O, as estimated using the DEER modula-tion depth. (The data for H2O and D2O are not plotted tothe same scale.) The DQC data were scaled up by the fac-tor of ≈2.5 to match the intensity of dipolar oscillation inSIFTER. The dashed curve for 1 is then fit to the baseline,whose temporal profile is dominated by nuclear spin diffusion(∼exp[−(2t/Tnsd)𝜅], 𝜅 ≈ 2, Tnsd ≈ 4 μs for H2O solutions) andID (see Section 20.7). This was done by subtracting (3) from(1) and then fitting to a third-order polynomial the logarithmof the remainder without using the latter 1 μs of the recorddistorted by spurious contributions. All pulse sequences usedπ/2 pulses of 2 ns and π pulses of 4 ns, sample temperaturewas 60 K. A 64-step phase cycle was used for DQC, as wellas for SIFTER. Data averaging times were 1 h for 1 and 3 and4.6 h for 2 and 4. (b) The DQC data sets shown in (a) are plot-ted after making corrections for the small background presentin the raw data (3 and 4)
PE.22,69 In cases of stretched exponential decay24 as isthe case here, the relaxation envelope is present in thedata because the time intervals t1 = tp and t2 = tm − tpare variable.22,69 There are no such problems in DEERas the detection pulse sequence is fixed.
DQC-6 exhibits a very small baseline, so that evendeep ESEEM by deuterium nuclei does not appear asa significant problem. The data for H2O and D2O aresimilar, with somewhat deeper dipolar oscillations inD2O. Note that for H2O the DQC data are also modi-fied by relaxation caused by nuclear spin diffusion,31
although the contribution to the decay due to ID is ex-pected to be less than in SIFTER (see Section 20.7).The decay could result in a small broadening of the re-constructed distance distributions for distances <5 nmand can be partly corrected,31 if so desired. As thebackground is very small, it is much easier to cor-rect for it than in DEER and introduces smaller er-rors. We do find that Tiknonov regularization22,78 canoften be applied directly to DQC data to reconstructdistances without any baseline correction, leading tolow-intensity broad humps at long distances, but withlittle if any effect on the main distance peaks at mod-erate and short distances.
20.4.4 Five-pulse SQC Sequences,Jeener–Broekaert Sequence
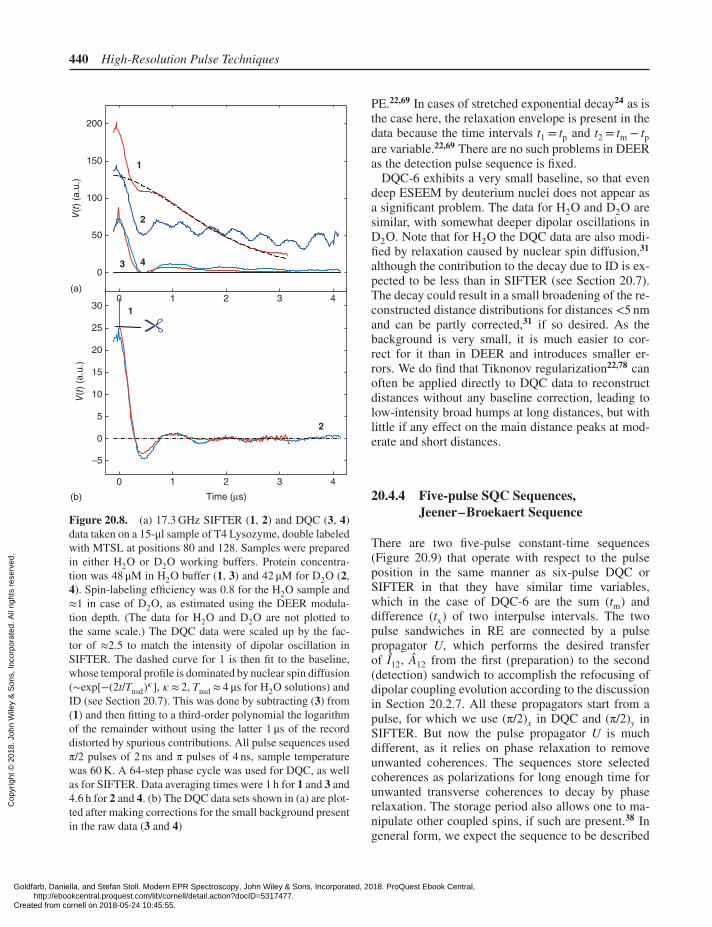
There are two five-pulse constant-time sequences(Figure 20.9) that operate with respect to the pulseposition in the same manner as six-pulse DQC orSIFTER in that they have similar time variables,which in the case of DQC-6 are the sum (tm) anddifference (tx) of two interpulse intervals. The twopulse sandwiches in RE are connected by a pulsepropagator U, which performs the desired transferof Î12, Â12 from the first (preparation) to the second(detection) sandwich to accomplish the refocusing ofdipolar coupling evolution according to the discussionin Section 20.2.7. All these propagators start from apulse, for which we use (π/2)x in DQC and (π/2)y inSIFTER. But now the pulse propagator U is muchdifferent, as it relies on phase relaxation to removeunwanted coherences. The sequences store selectedcoherences as polarizations for long enough time forunwanted transverse coherences to decay by phaserelaxation. The storage period also allows one to ma-nipulate other coupled spins, if such are present.38 Ingeneral form, we expect the sequence to be described
Goldfarb, Daniella, and Stefan Stoll. Modern EPR Spectroscopy, John Wiley & Sons, Incorporated, 2018. ProQuest Ebook Central, http://ebookcentral.proquest.com/lib/cornell/detail.action?docID=5317477.Created from cornell on 2018-05-24 10:45:55.
Cop
yrig
ht ©
201
8. J
ohn
Wile
y &
Son
s, In
corp
orat
ed. A
ll rig
hts
rese
rved
.
Dipolar Spectroscopy – Single-resonance Methods 441
+1
0
−1
ππ βφ β(π/2)x
U(βφ, β, T)
2tp T 2(tm–tp)
ωA
Δtp Δtp2Δtp2Δtp
‘5-pulse SQC’
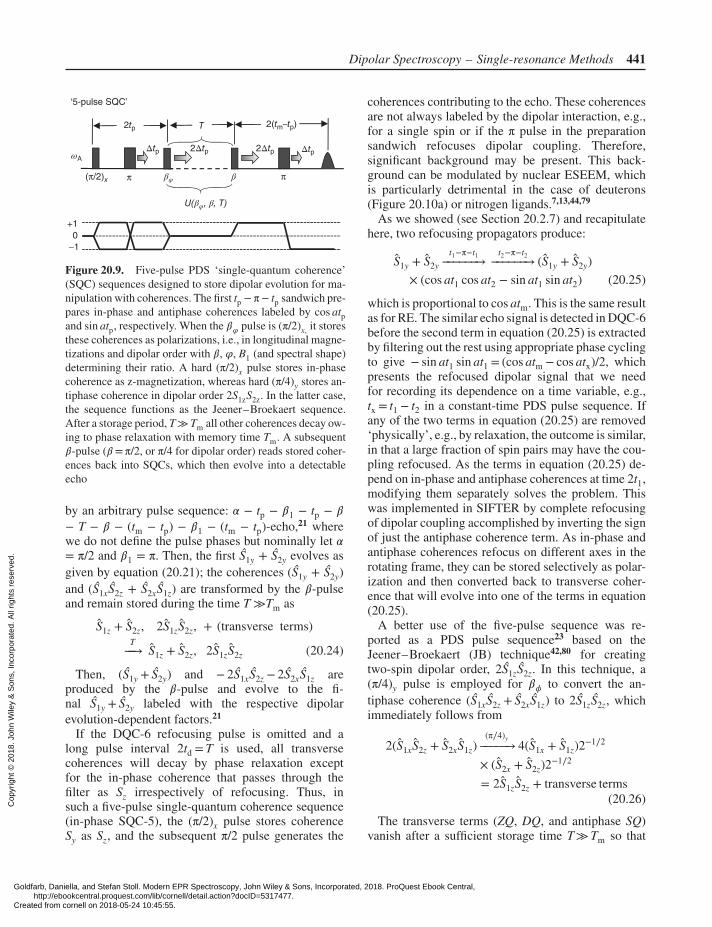
Figure 20.9. Five-pulse PDS ‘single-quantum coherence’(SQC) sequences designed to store dipolar evolution for ma-nipulation with coherences. The first tp −π− tp sandwich pre-pares in-phase and antiphase coherences labeled by cos atpand sin atp, respectively. When the 𝛽𝜑 pulse is (π/2)x, it storesthese coherences as polarizations, i.e., in longitudinal magne-tizations and dipolar order with 𝛽, 𝜑, B1 (and spectral shape)determining their ratio. A hard (π/2)x pulse stores in-phasecoherence as z-magnetization, whereas hard (π/4)y stores an-tiphase coherence in dipolar order 2S1zS2z. In the latter case,the sequence functions as the Jeener–Broekaert sequence.After a storage period, T≫Tm all other coherences decay ow-ing to phase relaxation with memory time Tm. A subsequent𝛽-pulse (𝛽 =π/2, or π/4 for dipolar order) reads stored coher-ences back into SQCs, which then evolve into a detectableecho
by an arbitrary pulse sequence: 𝛼 − tp − 𝛽1 − tp − 𝛽
− T − 𝛽 − (tm − tp) − 𝛽1 − (tm − tp)-echo,21 wherewe do not define the pulse phases but nominally let 𝛼= π/2 and 𝛽1 = π. Then, the first S1y + S2y evolves asgiven by equation (20.21); the coherences (S1y + S2y)and (S1xS2z + S2xS1z) are transformed by the 𝛽-pulseand remain stored during the time T ≫Tm as
S1z + S2z, 2S1zS2z, + (transverse terms)T−−→ S1z + S2z, 2S1zS2z (20.24)
Then, (S1y + S2y) and − 2S1xS2z − 2S2xS1z areproduced by the 𝛽-pulse and evolve to the fi-nal S1y + S2y labeled with the respective dipolarevolution-dependent factors.21
If the DQC-6 refocusing pulse is omitted and along pulse interval 2td = T is used, all transversecoherences will decay by phase relaxation exceptfor the in-phase coherence that passes through thefilter as Sz irrespectively of refocusing. Thus, insuch a five-pulse single-quantum coherence sequence(in-phase SQC-5), the (π/2)x pulse stores coherenceSy as Sz, and the subsequent π/2 pulse generates the
coherences contributing to the echo. These coherencesare not always labeled by the dipolar interaction, e.g.,for a single spin or if the π pulse in the preparationsandwich refocuses dipolar coupling. Therefore,significant background may be present. This back-ground can be modulated by nuclear ESEEM, whichis particularly detrimental in the case of deuterons(Figure 20.10a) or nitrogen ligands.7,13,44,79
As we showed (see Section 20.2.7) and recapitulatehere, two refocusing propagators produce:
S1y + S2y
t1−π−t1−−−−−−→t2−π−t2−−−−−−→ (S1y + S2y)
× (cos at1 cos at2 − sin at1 sin at2) (20.25)
which is proportional to cos atm. This is the same resultas for RE. The similar echo signal is detected in DQC-6before the second term in equation (20.25) is extractedby filtering out the rest using appropriate phase cyclingto give − sin at1 sin at1 = (cos atm − cos atx)/2, whichpresents the refocused dipolar signal that we needfor recording its dependence on a time variable, e.g.,tx = t1 − t2 in a constant-time PDS pulse sequence. Ifany of the two terms in equation (20.25) are removed‘physically’, e.g., by relaxation, the outcome is similar,in that a large fraction of spin pairs may have the cou-pling refocused. As the terms in equation (20.25) de-pend on in-phase and antiphase coherences at time 2t1,modifying them separately solves the problem. Thiswas implemented in SIFTER by complete refocusingof dipolar coupling accomplished by inverting the signof just the antiphase coherence term. As in-phase andantiphase coherences refocus on different axes in therotating frame, they can be stored selectively as polar-ization and then converted back to transverse coher-ence that will evolve into one of the terms in equation(20.25).
A better use of the five-pulse sequence was re-ported as a PDS pulse sequence23 based on theJeener–Broekaert (JB) technique42,80 for creatingtwo-spin dipolar order, 2S1zS2z. In this technique, a(π/4)y pulse is employed for 𝛽𝜙 to convert the an-tiphase coherence (S1xS2z + S2xS1z) to 2S1zS2z, whichimmediately follows from
2(S1xS2z + S2xS1z)(π∕4)y−−−−−→ 4(S1x + S1z)2−1∕2
× (S2x + S2z)2−1∕2
= 2S1zS2z + transverse terms(20.26)
The transverse terms (ZQ, DQ, and antiphase SQ)vanish after a sufficient storage time T≫Tm so that
Goldfarb, Daniella, and Stefan Stoll. Modern EPR Spectroscopy, John Wiley & Sons, Incorporated, 2018. ProQuest Ebook Central, http://ebookcentral.proquest.com/lib/cornell/detail.action?docID=5317477.Created from cornell on 2018-05-24 10:45:55.
Cop
yrig
ht ©
201
8. J
ohn
Wile
y &
Son
s, In
corp
orat
ed. A
ll rig
hts
rese
rved
.
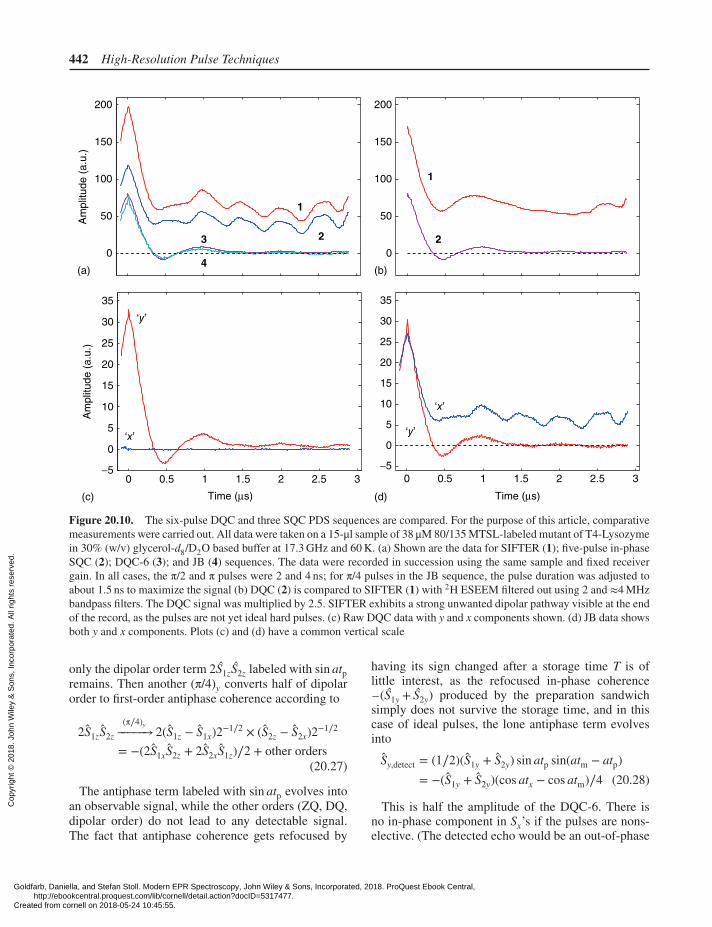
442 High-Resolution Pulse Techniques
200
150
50Am
plit
ude (
a.u
.)A
mplit
ude (
a.u
.)
0
35
30
25
20
15
10
5
−5
0
35
30
25
20
15
10
5
−5
0
0 0.5 1 1.5 2 3
Time (μs) Time (μs)
2.5 0 0.5 1 1.5 2 32.5
100
200
150
50
0
100
3
4
1
1
2 2
(a)
(c) (d)
(b)
‘x’
‘x’
‘y’
‘y’
Figure 20.10. The six-pulse DQC and three SQC PDS sequences are compared. For the purpose of this article, comparativemeasurements were carried out. All data were taken on a 15-μl sample of 38 μM 80/135 MTSL-labeled mutant of T4-Lysozymein 30% (w/v) glycerol-d8/D2O based buffer at 17.3 GHz and 60 K. (a) Shown are the data for SIFTER (1); five-pulse in-phaseSQC (2); DQC-6 (3); and JB (4) sequences. The data were recorded in succession using the same sample and fixed receivergain. In all cases, the π/2 and π pulses were 2 and 4 ns; for π/4 pulses in the JB sequence, the pulse duration was adjusted toabout 1.5 ns to maximize the signal (b) DQC (2) is compared to SIFTER (1) with 2H ESEEM filtered out using 2 and ≈4 MHzbandpass filters. The DQC signal was multiplied by 2.5. SIFTER exhibits a strong unwanted dipolar pathway visible at the endof the record, as the pulses are not yet ideal hard pulses. (c) Raw DQC data with y and x components shown. (d) JB data showsboth y and x components. Plots (c) and (d) have a common vertical scale
only the dipolar order term 2S1zS2z labeled with sin atpremains. Then another (π/4)y converts half of dipolarorder to first-order antiphase coherence according to
2S1zS2z
(π∕4)y−−−−−→ 2(S1z − S1x)2−1∕2 × (S2z − S2x)2−1∕2
= −(2S1xS2z + 2S2xS1z)∕2 + other orders(20.27)
The antiphase term labeled with sin atp evolves intoan observable signal, while the other orders (ZQ, DQ,dipolar order) do not lead to any detectable signal.The fact that antiphase coherence gets refocused by
having its sign changed after a storage time T is oflittle interest, as the refocused in-phase coherence–(S1y + S2y) produced by the preparation sandwichsimply does not survive the storage time, and in thiscase of ideal pulses, the lone antiphase term evolvesinto
Sy,detect = (1∕2)(S1y + S2y) sin atp sin(atm − atp)= −(S1y + S2y)(cos atx − cos atm)∕4 (20.28)
This is half the amplitude of the DQC-6. There isno in-phase component in Sx’s if the pulses are nons-elective. (The detected echo would be an out-of-phase
Goldfarb, Daniella, and Stefan Stoll. Modern EPR Spectroscopy, John Wiley & Sons, Incorporated, 2018. ProQuest Ebook Central, http://ebookcentral.proquest.com/lib/cornell/detail.action?docID=5317477.Created from cornell on 2018-05-24 10:45:55.
Cop
yrig
ht ©
201
8. J
ohn
Wile
y &
Son
s, In
corp
orat
ed. A
ll rig
hts
rese
rved
.
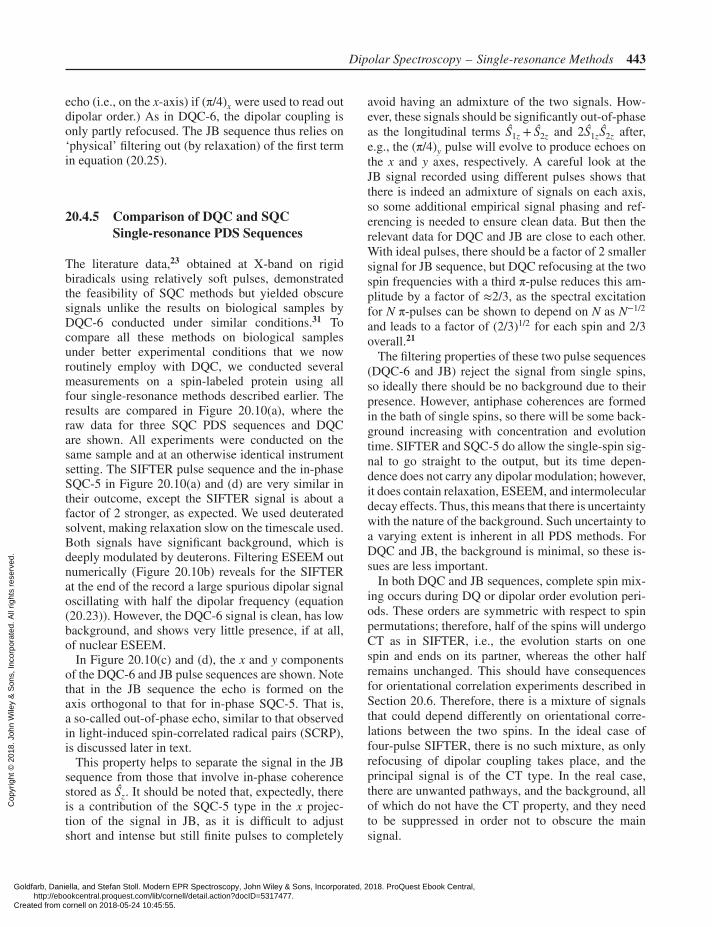
Dipolar Spectroscopy – Single-resonance Methods 443
echo (i.e., on the x-axis) if (π/4)x were used to read outdipolar order.) As in DQC-6, the dipolar coupling isonly partly refocused. The JB sequence thus relies on‘physical’ filtering out (by relaxation) of the first termin equation (20.25).
20.4.5 Comparison of DQC and SQCSingle-resonance PDS Sequences
The literature data,23 obtained at X-band on rigidbiradicals using relatively soft pulses, demonstratedthe feasibility of SQC methods but yielded obscuresignals unlike the results on biological samples byDQC-6 conducted under similar conditions.31 Tocompare all these methods on biological samplesunder better experimental conditions that we nowroutinely employ with DQC, we conducted severalmeasurements on a spin-labeled protein using allfour single-resonance methods described earlier. Theresults are compared in Figure 20.10(a), where theraw data for three SQC PDS sequences and DQCare shown. All experiments were conducted on thesame sample and at an otherwise identical instrumentsetting. The SIFTER pulse sequence and the in-phaseSQC-5 in Figure 20.10(a) and (d) are very similar intheir outcome, except the SIFTER signal is about afactor of 2 stronger, as expected. We used deuteratedsolvent, making relaxation slow on the timescale used.Both signals have significant background, which isdeeply modulated by deuterons. Filtering ESEEM outnumerically (Figure 20.10b) reveals for the SIFTERat the end of the record a large spurious dipolar signaloscillating with half the dipolar frequency (equation(20.23)). However, the DQC-6 signal is clean, has lowbackground, and shows very little presence, if at all,of nuclear ESEEM.
In Figure 20.10(c) and (d), the x and y componentsof the DQC-6 and JB pulse sequences are shown. Notethat in the JB sequence the echo is formed on theaxis orthogonal to that for in-phase SQC-5. That is,a so-called out-of-phase echo, similar to that observedin light-induced spin-correlated radical pairs (SCRP),is discussed later in text.
This property helps to separate the signal in the JBsequence from those that involve in-phase coherencestored as Sz. It should be noted that, expectedly, thereis a contribution of the SQC-5 type in the x projec-tion of the signal in JB, as it is difficult to adjustshort and intense but still finite pulses to completely
avoid having an admixture of the two signals. How-ever, these signals should be significantly out-of-phaseas the longitudinal terms S1z + S2z and 2S1zS2z after,e.g., the (π/4)y pulse will evolve to produce echoes onthe x and y axes, respectively. A careful look at theJB signal recorded using different pulses shows thatthere is indeed an admixture of signals on each axis,so some additional empirical signal phasing and ref-erencing is needed to ensure clean data. But then therelevant data for DQC and JB are close to each other.With ideal pulses, there should be a factor of 2 smallersignal for JB sequence, but DQC refocusing at the twospin frequencies with a third π-pulse reduces this am-plitude by a factor of ≈2/3, as the spectral excitationfor N π-pulses can be shown to depend on N as N−1/2
and leads to a factor of (2/3)1/2 for each spin and 2/3overall.21
The filtering properties of these two pulse sequences(DQC-6 and JB) reject the signal from single spins,so ideally there should be no background due to theirpresence. However, antiphase coherences are formedin the bath of single spins, so there will be some back-ground increasing with concentration and evolutiontime. SIFTER and SQC-5 do allow the single-spin sig-nal to go straight to the output, but its time depen-dence does not carry any dipolar modulation; however,it does contain relaxation, ESEEM, and intermoleculardecay effects. Thus, this means that there is uncertaintywith the nature of the background. Such uncertainty toa varying extent is inherent in all PDS methods. ForDQC and JB, the background is minimal, so these is-sues are less important.
In both DQC and JB sequences, complete spin mix-ing occurs during DQ or dipolar order evolution peri-ods. These orders are symmetric with respect to spinpermutations; therefore, half of the spins will undergoCT as in SIFTER, i.e., the evolution starts on onespin and ends on its partner, whereas the other halfremains unchanged. This should have consequencesfor orientational correlation experiments described inSection 20.6. Therefore, there is a mixture of signalsthat could depend differently on orientational corre-lations between the two spins. In the ideal case offour-pulse SIFTER, there is no such mixture, as onlyrefocusing of dipolar coupling takes place, and theprincipal signal is of the CT type. In the real case,there are unwanted pathways, and the background, allof which do not have the CT property, and they needto be suppressed in order not to obscure the mainsignal.
Goldfarb, Daniella, and Stefan Stoll. Modern EPR Spectroscopy, John Wiley & Sons, Incorporated, 2018. ProQuest Ebook Central, http://ebookcentral.proquest.com/lib/cornell/detail.action?docID=5317477.Created from cornell on 2018-05-24 10:45:55.
Cop
yrig
ht ©
201
8. J
ohn
Wile
y &
Son
s, In
corp
orat
ed. A
ll rig
hts
rese
rved
.
444 High-Resolution Pulse Techniques
At present, with rectangular pulses, DQC-6 and JBsequences present a better choice for distance mea-surements. In our limited experience with SQC se-quences, we find it is more complex to implement JBfiltering compared to DQ filtering. The latter is veryforgiving for pulse and phase mistuning. A long stor-age time T is needed in the JB sequence creating someextra complications with the pulse amplifier, more sowhen it is a TWTA.
20.4.6 SIFTER and DQC on Trityl Biradical
Even though SIFTER yields the strongest dipolar sig-nals, there are currently only a few examples of itsapplications in the literature. This is not entirely un-expected but is due to the extent of unwanted ef-fects that are difficult to avoid in a multipulse EPRpulse sequence with finite pulses. This greatly compli-cates what could work perfectly otherwise. This hasalso been our experience with this group of meth-ods. Over the course of 15 years, we have conducteda substantial number of DQC experiments, and inmany of these cases, SIFTER has also been attempted,but even with the largest B1’s available to us (45G), the outcome was as a rule too convoluted, withan admixture of unwanted dipolar signals, makingthe task of removal of unwanted signals and back-ground correction an uncertain procedure leading tolarge residual errors. The background, as we see inFigures 20.8 and 20.10, in addition to relaxation de-cay, could be modulated with a strong nuclear ES-EEM, for which a higher working frequency thanKu or even Ka band would be needed to make themsmaller.
While proton ESEEM is easily suppressed byfour-point averaging for protons,21,31 often deeplow-frequency ESEEM of the background by deu-terium or nitrogen nuclei is very objectionable, easilyoverwhelming the dipolar signal, especially whenspin labeling efficiency is not high enough, as isfrequently the case. This was also true for in-phaseSQC-5, which also requires (nearly) ideal pulses.Nevertheless, systems with narrow EPR spectra canbe more amenable to SIFTER and SQC-5. A goodtarget is the trityl radical, which could be studied evenat ambient temperature in liquids.68 One does not nec-essarily expect efficient spin labeling with trityl, so thesingle-label background could substantially hamperthese two methods. Both, JB and DQC-6, however,have good filtering properties. DQC-6 yields slightly
higher signal and (at least in our experience) is easierto perform. In part, this is caused by the need to set upthree types of pulses, and the second issue is with theTWTA, which has to stay in transmission mode longerby ≈T, so that one has to break it into a sequenceof shorter transmissions, leading to signal artifacts.DQC indeed was very successful for trityl-labeledimmobilized T4L68 and RNA81 in solutions at am-bient temperatures. None of these single-resonancesequences (DQC included) is expected to work in thecase of high-spin Gd3+ due to its very large pseu-dosecular term and a potential to exhibit multiplehigher coherences within each spin. (All our attemptsto detect at 17 GHz and 10 K a DQC signal on thenarrow central transition of Gd3+/DOTA in 60 μMsample of doubly labeled T4L 8C/128C mutant thusproved unsuccessful. The DEER signal, however,was readily recorded yielding an SNR of about 30%of that for these sites labeled with MTSL, beingrecorded at 60 K. The lower SNR for Gd3+ comparedto MTSL may be due to the insufficiently high work-ing frequency of 17 GHz, as Gd3+ DEER becomesefficient at frequencies at Q-band (33–50 GHz) andabove.)
SIFTER was successfully conducted on a tritylbiradical in frozen solution with the results shownin Figure 20.11 where it is compared to those ofDQC-6.82 The time-domain data from both techniquesare very similar but not identical, as modulation ismore pronounced in SIFTER. The distance distri-butions reconstructed with DeerAnalysis 201383 arealso different. The supplementary information forthis work indicated large enough backgrounds so thateven for this narrow spectrum there is still greaterpotential for uncertainty in extracting the dipolarsignal in SIFTER compared to DQC, thus showingSIFTER requires still harder pulses than the 22 nsπ-pulses used as well as tougher requirements for spinlabeling.
20.4.7 New Approaches Based on UniformSpectral Excitation by Adiabatic Pulses
As we have shown, even for sufficiently intense pulses,there still is a problem with the outcome of SQC (asdistinct from DQC) PDS experiments. Even more in-tense pulses may be desirable, but this would requiresmaller resonators than we currently employ withsome loss of sensitivity possible. It is also worth men-tioning that relaxation, nuclear ESEEM, and flip-flop
Goldfarb, Daniella, and Stefan Stoll. Modern EPR Spectroscopy, John Wiley & Sons, Incorporated, 2018. ProQuest Ebook Central, http://ebookcentral.proquest.com/lib/cornell/detail.action?docID=5317477.Created from cornell on 2018-05-24 10:45:55.
Cop
yrig
ht ©
201
8. J
ohn
Wile
y &
Son
s, In
corp
orat
ed. A
ll rig
hts
rese
rved
.
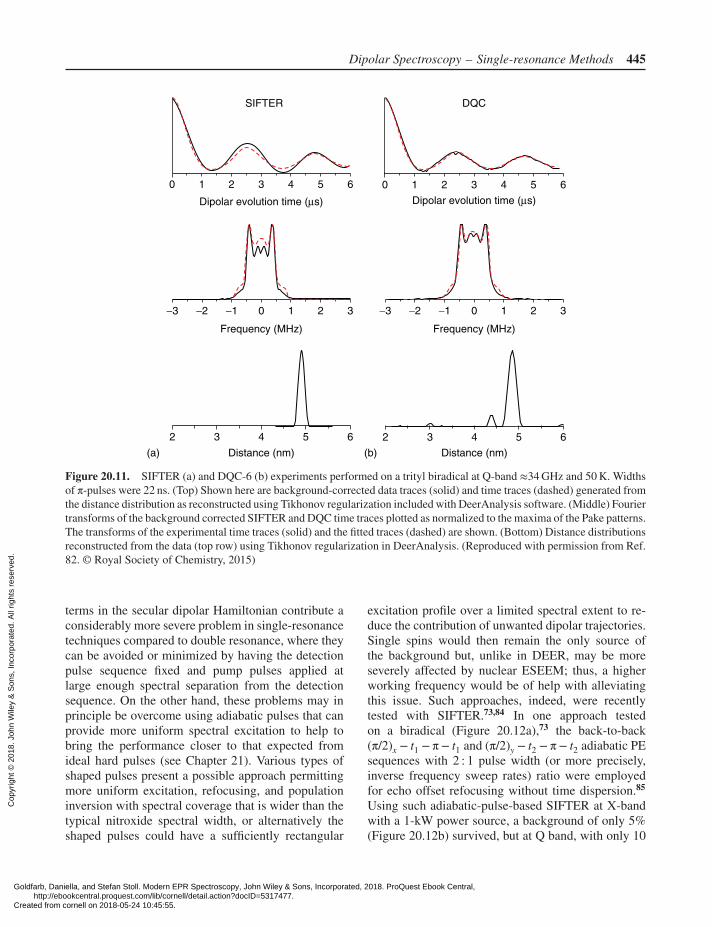
Dipolar Spectroscopy – Single-resonance Methods 445
SIFTER DQC
Frequency (MHz) Frequency (MHz)
Distance (nm)Distance (nm)(a) (b)
Dipolar evolution time (μs) Dipolar evolution time (μs)
2 3 4 5 6 2
−2 −1−3
3 4
0
0 1 2 3 4 5 60 1 2 3 4 5 6
5
1 2 3−2 −1−3 0 1 2 3
6
Figure 20.11. SIFTER (a) and DQC-6 (b) experiments performed on a trityl biradical at Q-band ≈34 GHz and 50 K. Widthsof π-pulses were 22 ns. (Top) Shown here are background-corrected data traces (solid) and time traces (dashed) generated fromthe distance distribution as reconstructed using Tikhonov regularization included with DeerAnalysis software. (Middle) Fouriertransforms of the background corrected SIFTER and DQC time traces plotted as normalized to the maxima of the Pake patterns.The transforms of the experimental time traces (solid) and the fitted traces (dashed) are shown. (Bottom) Distance distributionsreconstructed from the data (top row) using Tikhonov regularization in DeerAnalysis. (Reproduced with permission from Ref.82. © Royal Society of Chemistry, 2015)
terms in the secular dipolar Hamiltonian contribute aconsiderably more severe problem in single-resonancetechniques compared to double resonance, where theycan be avoided or minimized by having the detectionpulse sequence fixed and pump pulses applied atlarge enough spectral separation from the detectionsequence. On the other hand, these problems may inprinciple be overcome using adiabatic pulses that canprovide more uniform spectral excitation to help tobring the performance closer to that expected fromideal hard pulses (see Chapter 21). Various types ofshaped pulses present a possible approach permittingmore uniform excitation, refocusing, and populationinversion with spectral coverage that is wider than thetypical nitroxide spectral width, or alternatively theshaped pulses could have a sufficiently rectangular
excitation profile over a limited spectral extent to re-duce the contribution of unwanted dipolar trajectories.Single spins would then remain the only source ofthe background but, unlike in DEER, may be moreseverely affected by nuclear ESEEM; thus, a higherworking frequency would be of help with alleviatingthis issue. Such approaches, indeed, were recentlytested with SIFTER.73,84 In one approach testedon a biradical (Figure 20.12a),73 the back-to-back(π/2)x − t1 −π− t1 and (π/2)y − t2 −π− t2 adiabatic PEsequences with 2 : 1 pulse width (or more precisely,inverse frequency sweep rates) ratio were employedfor echo offset refocusing without time dispersion.85
Using such adiabatic-pulse-based SIFTER at X-bandwith a 1-kW power source, a background of only 5%(Figure 20.12b) survived, but at Q band, with only 10
Goldfarb, Daniella, and Stefan Stoll. Modern EPR Spectroscopy, John Wiley & Sons, Incorporated, 2018. ProQuest Ebook Central, http://ebookcentral.proquest.com/lib/cornell/detail.action?docID=5317477.Created from cornell on 2018-05-24 10:45:55.
Cop
yrig
ht ©
201
8. J
ohn
Wile
y &
Son
s, In
corp
orat
ed. A
ll rig
hts
rese
rved
.
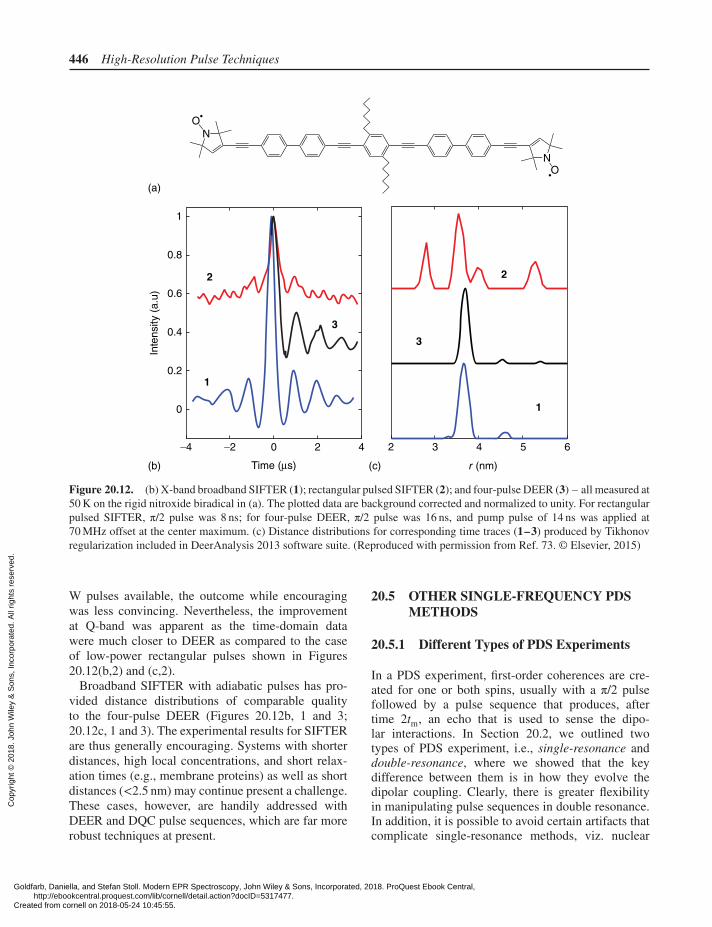
446 High-Resolution Pulse Techniques
N
O
NO
1
0.8
0.6
0.4
Inte
nsity (
a.u
)
0.2
0
0
Time (μs) r (nm)
−4 −2 2 2 3 4 5 64
1
1
3
3
22
(a)
(b) (c)
Figure 20.12. (b) X-band broadband SIFTER (1); rectangular pulsed SIFTER (2); and four-pulse DEER (3) – all measured at50 K on the rigid nitroxide biradical in (a). The plotted data are background corrected and normalized to unity. For rectangularpulsed SIFTER, π/2 pulse was 8 ns; for four-pulse DEER, π/2 pulse was 16 ns, and pump pulse of 14 ns was applied at70 MHz offset at the center maximum. (c) Distance distributions for corresponding time traces (1–3) produced by Tikhonovregularization included in DeerAnalysis 2013 software suite. (Reproduced with permission from Ref. 73. © Elsevier, 2015)
W pulses available, the outcome while encouragingwas less convincing. Nevertheless, the improvementat Q-band was apparent as the time-domain datawere much closer to DEER as compared to the caseof low-power rectangular pulses shown in Figures20.12(b,2) and (c,2).
Broadband SIFTER with adiabatic pulses has pro-vided distance distributions of comparable qualityto the four-pulse DEER (Figures 20.12b, 1 and 3;20.12c, 1 and 3). The experimental results for SIFTERare thus generally encouraging. Systems with shorterdistances, high local concentrations, and short relax-ation times (e.g., membrane proteins) as well as shortdistances (<2.5 nm) may continue present a challenge.These cases, however, are handily addressed withDEER and DQC pulse sequences, which are far morerobust techniques at present.
20.5 OTHER SINGLE-FREQUENCY PDSMETHODS
20.5.1 Different Types of PDS Experiments
In a PDS experiment, first-order coherences are cre-ated for one or both spins, usually with a π/2 pulsefollowed by a pulse sequence that produces, aftertime 2tm, an echo that is used to sense the dipo-lar interactions. In Section 20.2, we outlined twotypes of PDS experiment, i.e., single-resonance anddouble-resonance, where we showed that the keydifference between them is in how they evolve thedipolar coupling. Clearly, there is greater flexibilityin manipulating pulse sequences in double resonance.In addition, it is possible to avoid certain artifacts thatcomplicate single-resonance methods, viz. nuclear
Goldfarb, Daniella, and Stefan Stoll. Modern EPR Spectroscopy, John Wiley & Sons, Incorporated, 2018. ProQuest Ebook Central, http://ebookcentral.proquest.com/lib/cornell/detail.action?docID=5317477.Created from cornell on 2018-05-24 10:45:55.
Cop
yrig
ht ©
201
8. J
ohn
Wile
y &
Son
s, In
corp
orat
ed. A
ll rig
hts
rese
rved
.
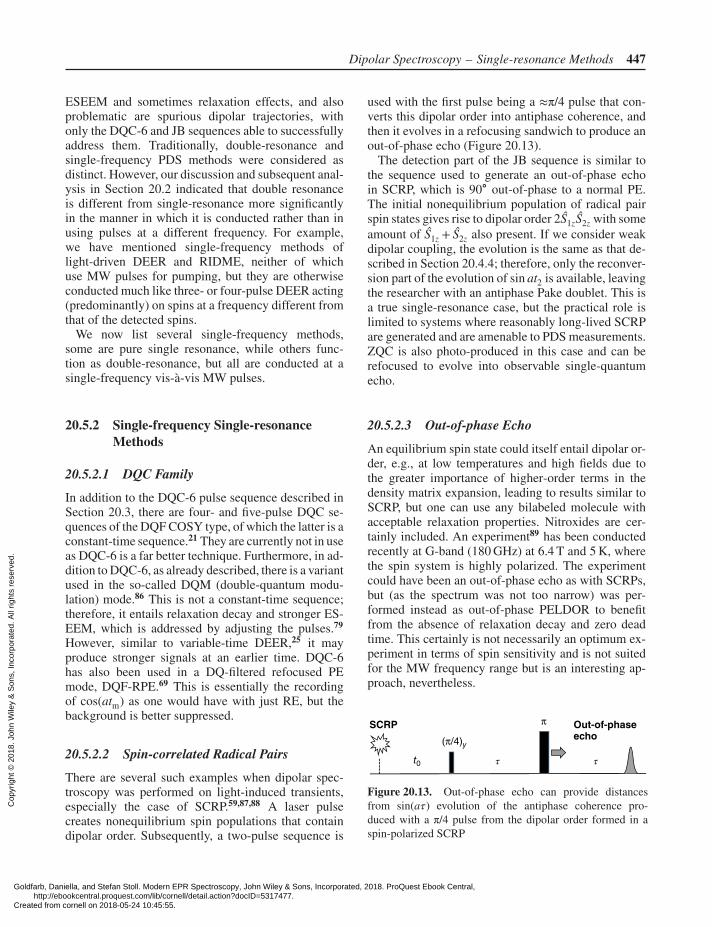
Dipolar Spectroscopy – Single-resonance Methods 447
ESEEM and sometimes relaxation effects, and alsoproblematic are spurious dipolar trajectories, withonly the DQC-6 and JB sequences able to successfullyaddress them. Traditionally, double-resonance andsingle-frequency PDS methods were considered asdistinct. However, our discussion and subsequent anal-ysis in Section 20.2 indicated that double resonanceis different from single-resonance more significantlyin the manner in which it is conducted rather than inusing pulses at a different frequency. For example,we have mentioned single-frequency methods oflight-driven DEER and RIDME, neither of whichuse MW pulses for pumping, but they are otherwiseconducted much like three- or four-pulse DEER acting(predominantly) on spins at a frequency different fromthat of the detected spins.
We now list several single-frequency methods,some are pure single resonance, while others func-tion as double-resonance, but all are conducted at asingle-frequency vis-à-vis MW pulses.
20.5.2 Single-frequency Single-resonanceMethods
20.5.2.1 DQC Family
In addition to the DQC-6 pulse sequence described inSection 20.3, there are four- and five-pulse DQC se-quences of the DQF COSY type, of which the latter is aconstant-time sequence.21 They are currently not in useas DQC-6 is a far better technique. Furthermore, in ad-dition to DQC-6, as already described, there is a variantused in the so-called DQM (double-quantum modu-lation) mode.86 This is not a constant-time sequence;therefore, it entails relaxation decay and stronger ES-EEM, which is addressed by adjusting the pulses.79
However, similar to variable-time DEER,25 it mayproduce stronger signals at an earlier time. DQC-6has also been used in a DQ-filtered refocused PEmode, DQF-RPE.69 This is essentially the recordingof cos(atm) as one would have with just RE, but thebackground is better suppressed.
20.5.2.2 Spin-correlated Radical Pairs
There are several such examples when dipolar spec-troscopy was performed on light-induced transients,especially the case of SCRP.59,87,88 A laser pulsecreates nonequilibrium spin populations that containdipolar order. Subsequently, a two-pulse sequence is
used with the first pulse being a ≈π/4 pulse that con-verts this dipolar order into antiphase coherence, andthen it evolves in a refocusing sandwich to produce anout-of-phase echo (Figure 20.13).
The detection part of the JB sequence is similar tothe sequence used to generate an out-of-phase echoin SCRP, which is 90∘ out-of-phase to a normal PE.The initial nonequilibrium population of radical pairspin states gives rise to dipolar order 2S1zS2z with someamount of S1z + S2z also present. If we consider weakdipolar coupling, the evolution is the same as that de-scribed in Section 20.4.4; therefore, only the reconver-sion part of the evolution of sin at2 is available, leavingthe researcher with an antiphase Pake doublet. This isa true single-resonance case, but the practical role islimited to systems where reasonably long-lived SCRPare generated and are amenable to PDS measurements.ZQC is also photo-produced in this case and can berefocused to evolve into observable single-quantumecho.
20.5.2.3 Out-of-phase Echo
An equilibrium spin state could itself entail dipolar or-der, e.g., at low temperatures and high fields due tothe greater importance of higher-order terms in thedensity matrix expansion, leading to results similar toSCRP, but one can use any bilabeled molecule withacceptable relaxation properties. Nitroxides are cer-tainly included. An experiment89 has been conductedrecently at G-band (180 GHz) at 6.4 T and 5 K, wherethe spin system is highly polarized. The experimentcould have been an out-of-phase echo as with SCRPs,but (as the spectrum was not too narrow) was per-formed instead as out-of-phase PELDOR to benefitfrom the absence of relaxation decay and zero deadtime. This certainly is not necessarily an optimum ex-periment in terms of spin sensitivity and is not suitedfor the MW frequency range but is an interesting ap-proach, nevertheless.
SCRP
t0 τ τ
π Out-of-phaseecho
(π/4)y
Figure 20.13. Out-of-phase echo can provide distancesfrom sin(a𝜏) evolution of the antiphase coherence pro-duced with a π/4 pulse from the dipolar order formed in aspin-polarized SCRP
Goldfarb, Daniella, and Stefan Stoll. Modern EPR Spectroscopy, John Wiley & Sons, Incorporated, 2018. ProQuest Ebook Central, http://ebookcentral.proquest.com/lib/cornell/detail.action?docID=5317477.Created from cornell on 2018-05-24 10:45:55.
Cop
yrig
ht ©
201
8. J
ohn
Wile
y &
Son
s, In
corp
orat
ed. A
ll rig
hts
rese
rved
.
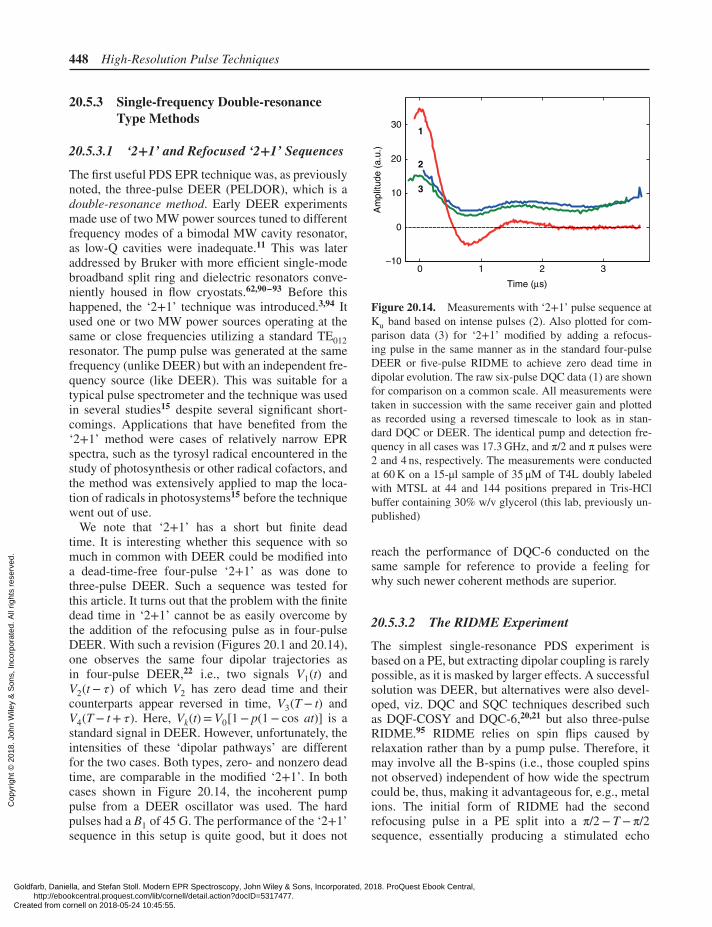
448 High-Resolution Pulse Techniques
20.5.3 Single-frequency Double-resonanceType Methods
20.5.3.1 ‘2+1’ and Refocused ‘2+1’ Sequences
The first useful PDS EPR technique was, as previouslynoted, the three-pulse DEER (PELDOR), which is adouble-resonance method. Early DEER experimentsmade use of two MW power sources tuned to differentfrequency modes of a bimodal MW cavity resonator,as low-Q cavities were inadequate.11 This was lateraddressed by Bruker with more efficient single-modebroadband split ring and dielectric resonators conve-niently housed in flow cryostats.62,90–93 Before thishappened, the ‘2+1’ technique was introduced.3,94 Itused one or two MW power sources operating at thesame or close frequencies utilizing a standard TE012resonator. The pump pulse was generated at the samefrequency (unlike DEER) but with an independent fre-quency source (like DEER). This was suitable for atypical pulse spectrometer and the technique was usedin several studies15 despite several significant short-comings. Applications that have benefited from the‘2+1’ method were cases of relatively narrow EPRspectra, such as the tyrosyl radical encountered in thestudy of photosynthesis or other radical cofactors, andthe method was extensively applied to map the loca-tion of radicals in photosystems15 before the techniquewent out of use.
We note that ‘2+1’ has a short but finite deadtime. It is interesting whether this sequence with somuch in common with DEER could be modified intoa dead-time-free four-pulse ‘2+1’ as was done tothree-pulse DEER. Such a sequence was tested forthis article. It turns out that the problem with the finitedead time in ‘2+1’ cannot be as easily overcome bythe addition of the refocusing pulse as in four-pulseDEER. With such a revision (Figures 20.1 and 20.14),one observes the same four dipolar trajectories asin four-pulse DEER,22 i.e., two signals V1(t) andV2(t− 𝜏) of which V2 has zero dead time and theircounterparts appear reversed in time, V3(T− t) andV4(T− t+ 𝜏). Here, Vk(t)=V0[1− p(1− cos at)] is astandard signal in DEER. However, unfortunately, theintensities of these ‘dipolar pathways’ are differentfor the two cases. Both types, zero- and nonzero deadtime, are comparable in the modified ‘2+1’. In bothcases shown in Figure 20.14, the incoherent pumppulse from a DEER oscillator was used. The hardpulses had a B1 of 45 G. The performance of the ‘2+1’sequence in this setup is quite good, but it does not
1
2
3
0
0
10
20
30
−101 2 3
Time (μs)
Am
plit
ud
e (
a.u
.)
Figure 20.14. Measurements with ‘2+1’ pulse sequence atKu band based on intense pulses (2). Also plotted for com-parison data (3) for ‘2+1’ modified by adding a refocus-ing pulse in the same manner as in the standard four-pulseDEER or five-pulse RIDME to achieve zero dead time indipolar evolution. The raw six-pulse DQC data (1) are shownfor comparison on a common scale. All measurements weretaken in succession with the same receiver gain and plottedas recorded using a reversed timescale to look as in stan-dard DQC or DEER. The identical pump and detection fre-quency in all cases was 17.3 GHz, and π/2 and π pulses were2 and 4 ns, respectively. The measurements were conductedat 60 K on a 15-μl sample of 35 μM of T4L doubly labeledwith MTSL at 44 and 144 positions prepared in Tris-HClbuffer containing 30% w/v glycerol (this lab, previously un-published)
reach the performance of DQC-6 conducted on thesame sample for reference to provide a feeling forwhy such newer coherent methods are superior.
20.5.3.2 The RIDME Experiment
The simplest single-resonance PDS experiment isbased on a PE, but extracting dipolar coupling is rarelypossible, as it is masked by larger effects. A successfulsolution was DEER, but alternatives were also devel-oped, viz. DQC and SQC techniques described suchas DQF-COSY and DQC-6,20,21 but also three-pulseRIDME.95 RIDME relies on spin flips caused byrelaxation rather than by a pump pulse. Therefore, itmay involve all the B-spins (i.e., those coupled spinsnot observed) independent of how wide the spectrumcould be, thus, making it advantageous for, e.g., metalions. The initial form of RIDME had the secondrefocusing pulse in a PE split into a π/2− T−π/2sequence, essentially producing a stimulated echo
Goldfarb, Daniella, and Stefan Stoll. Modern EPR Spectroscopy, John Wiley & Sons, Incorporated, 2018. ProQuest Ebook Central, http://ebookcentral.proquest.com/lib/cornell/detail.action?docID=5317477.Created from cornell on 2018-05-24 10:45:55.
Cop
yrig
ht ©
201
8. J
ohn
Wile
y &
Son
s, In
corp
orat
ed. A
ll rig
hts
rese
rved
.
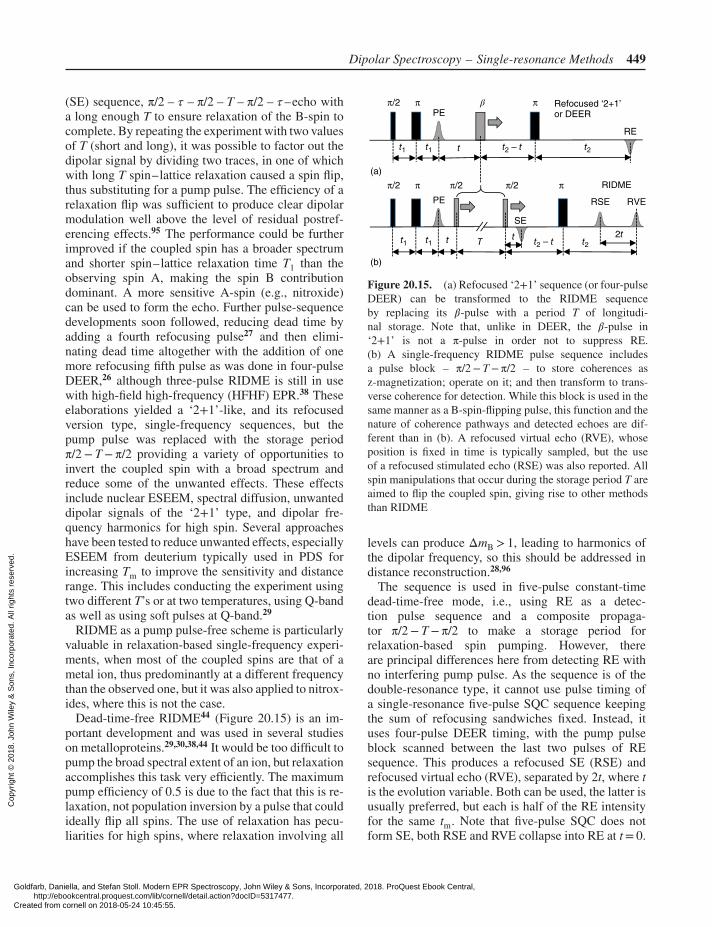
Dipolar Spectroscopy – Single-resonance Methods 449
(SE) sequence, π/2 – 𝜏 – π/2 – T – π/2 – 𝜏 –echo witha long enough T to ensure relaxation of the B-spin tocomplete. By repeating the experiment with two valuesof T (short and long), it was possible to factor out thedipolar signal by dividing two traces, in one of whichwith long T spin–lattice relaxation caused a spin flip,thus substituting for a pump pulse. The efficiency of arelaxation flip was sufficient to produce clear dipolarmodulation well above the level of residual postref-erencing effects.95 The performance could be furtherimproved if the coupled spin has a broader spectrumand shorter spin–lattice relaxation time T1 than theobserving spin A, making the spin B contributiondominant. A more sensitive A-spin (e.g., nitroxide)can be used to form the echo. Further pulse-sequencedevelopments soon followed, reducing dead time byadding a fourth refocusing pulse27 and then elimi-nating dead time altogether with the addition of onemore refocusing fifth pulse as was done in four-pulseDEER,26 although three-pulse RIDME is still in usewith high-field high-frequency (HFHF) EPR.38 Theseelaborations yielded a ‘2+1’-like, and its refocusedversion type, single-frequency sequences, but thepump pulse was replaced with the storage periodπ/2−T−π/2 providing a variety of opportunities toinvert the coupled spin with a broad spectrum andreduce some of the unwanted effects. These effectsinclude nuclear ESEEM, spectral diffusion, unwanteddipolar signals of the ‘2+1’ type, and dipolar fre-quency harmonics for high spin. Several approacheshave been tested to reduce unwanted effects, especiallyESEEM from deuterium typically used in PDS forincreasing Tm to improve the sensitivity and distancerange. This includes conducting the experiment usingtwo different T’s or at two temperatures, using Q-bandas well as using soft pulses at Q-band.29
RIDME as a pump pulse-free scheme is particularlyvaluable in relaxation-based single-frequency experi-ments, when most of the coupled spins are that of ametal ion, thus predominantly at a different frequencythan the observed one, but it was also applied to nitrox-ides, where this is not the case.
Dead-time-free RIDME44 (Figure 20.15) is an im-portant development and was used in several studieson metalloproteins.29,30,38,44 It would be too difficult topump the broad spectral extent of an ion, but relaxationaccomplishes this task very efficiently. The maximumpump efficiency of 0.5 is due to the fact that this is re-laxation, not population inversion by a pulse that couldideally flip all spins. The use of relaxation has pecu-liarities for high spins, where relaxation involving all
π/2
π/2 π/2 π/2
π
π
π
π
β
t1 t1
t1t1
t
t
T t t2 – t
t2 – t
t2
t2
2t
RSE
RE
PE
PE
SE
RVE
RIDME
Refocused ‘2+1’or DEER
(a)
(b)
Figure 20.15. (a) Refocused ‘2+1’ sequence (or four-pulseDEER) can be transformed to the RIDME sequenceby replacing its 𝛽-pulse with a period T of longitudi-nal storage. Note that, unlike in DEER, the 𝛽-pulse in‘2+1’ is not a π-pulse in order not to suppress RE.(b) A single-frequency RIDME pulse sequence includesa pulse block – π/2−T−π/2 – to store coherences asz-magnetization; operate on it; and then transform to trans-verse coherence for detection. While this block is used in thesame manner as a B-spin-flipping pulse, this function and thenature of coherence pathways and detected echoes are dif-ferent than in (b). A refocused virtual echo (RVE), whoseposition is fixed in time is typically sampled, but the useof a refocused stimulated echo (RSE) was also reported. Allspin manipulations that occur during the storage period T areaimed to flip the coupled spin, giving rise to other methodsthan RIDME
levels can produce ΔmB > 1, leading to harmonics ofthe dipolar frequency, so this should be addressed indistance reconstruction.28,96
The sequence is used in five-pulse constant-timedead-time-free mode, i.e., using RE as a detec-tion pulse sequence and a composite propaga-tor π/2−T−π/2 to make a storage period forrelaxation-based spin pumping. However, thereare principal differences here from detecting RE withno interfering pump pulse. As the sequence is of thedouble-resonance type, it cannot use pulse timing ofa single-resonance five-pulse SQC sequence keepingthe sum of refocusing sandwiches fixed. Instead, ituses four-pulse DEER timing, with the pump pulseblock scanned between the last two pulses of REsequence. This produces a refocused SE (RSE) andrefocused virtual echo (RVE), separated by 2t, where tis the evolution variable. Both can be used, the latter isusually preferred, but each is half of the RE intensityfor the same tm. Note that five-pulse SQC does notform SE, both RSE and RVE collapse into RE at t= 0.
Goldfarb, Daniella, and Stefan Stoll. Modern EPR Spectroscopy, John Wiley & Sons, Incorporated, 2018. ProQuest Ebook Central, http://ebookcentral.proquest.com/lib/cornell/detail.action?docID=5317477.Created from cornell on 2018-05-24 10:45:55.
Cop
yrig
ht ©
201
8. J
ohn
Wile
y &
Son
s, In
corp
orat
ed. A
ll rig
hts
rese
rved
.
450 High-Resolution Pulse Techniques
Therefore, the storage block is just a delay in SQC-5in the absence of phase relaxation whose existenceis necessary for this propagator to attain its purpose.Moreover, pumping B-spin during storage is basicallyof no use for SQC-5, as it is truly different from doubleresonance in dipolar evolution.
As for using moving pulses at the detection fre-quency, there are several artifacts; particularly, nuclearESEEM issues have to be addressed for deuterium.This was investigated29 as we previously noted andthe referencing was made based on using differenttemperatures, soft pulses, and different durationsof storage period. In such methods, ‘pumping’ ondetected spins (A-spins) produces artifacts, so thisis undesirable.3,22,40 And when they are intentionallyapplied to operate on detected spins (e.g., RIDMEon nitroxides), their performance has not been yet asconvincing as that of standard robust techniques suchas DEER or DQC due to artifacts and significant lossof signal.
All in all, the use of a storage propagator is enablingapproaches to improve sensitivity in the case of broadspectra of metal ions, for which there are few alterna-tives, and in addition, it offers a variety of methods toflip B-spins other than by relaxation in RIDME. Thatis, one can use other suitable means that can change thedipolar coupling – e.g., light pulse, electron beam, re-laxation, chemical reaction, or some other process thatcan change polarization or create, modify, or removespin density.
20.5.3.3 Field-jump PDS Experiment and ItsModern Analogs
Another example of single-frequency dipolarspectroscopy is the field-jump (FJ) DEER ex-periment based on a (π/2)A − 𝜏 − (π/2)A −T – (π/2)A – 𝜏 –echo-stimulated echo (SE) pulsesequence with the pumping of a different spectralregion performed during the π/2−T−π/2 storageperiod.27,38 It does not require a different frequencysource to pump, but a field jump or sweep producedby a current pulse is utilized to make the equivalentof pumping B-spins at a different spectral region orcreating an adiabatic population-inversion pulse41 us-ing a long MW pulse and a field sweep in a collectiveaction during the storage period, thereby presentinga rather complex propagator, which flips spins atdifferent spectral regions, as does DEER. The pulsesequence, however, was exercised as SEDOR,38 i.e.,by advancing pulse sequence length similar to PE
or RE. The method entails phase relaxation decayand nuclear ESEEM issues. Signal referencing, re-sembling RIDME, was utilized to remove most ofESEEM and to account for relaxation decay. Thedead-time issues were partly mitigated by addinga fourth refocusing pulse to the stimulated-echosequence used. The four-pulse sequence resembled‘2+1’ with a pump pulse replaced with a π/2− T−π/2magnetization storage period and all the pumpingbeing located there. However, the constant-time se-quence mode was not used. Recent rethinking of thefield sweep approach produced an experiment dubbedCIDME (chirp-induced dipolar modulation enhance-ment), which uses frequency-chirped adiabatic MWpulses40 instead of magnetic field sweep for popula-tion inversion. However, it also adds a fifth pulse26
enabling zero-dead-time implementation based onthe scheme developed and now routinely employedwith the latest RIDME technique discussed earlier. Itwas shown that for nitroxides it could be beneficialfor low-power spectrometers as the adiabatic pulsecould be long but without delay effects (see Section20.6.5).
20.5.3.4 Laser-induced DEER
There are more single-frequency PDS experi-ments known; however, some (or most) of thesesingle-frequency methods are actually double res-onance. This includes laser-induced PDS,43 whichcan use a high-Q single-mode resonator and providepump action optically by effecting a change in spinpolarization, e.g., by optical generation of a porphyrintriplet with a laser pulse. With a short enough opti-cal pulse, it is possible to access a shorter range ofdistances than in standard DEER, especially if thedetection pulses are made as intense as in DQC. Atriplet-state EPR spectrum is much wider than that ofa nitroxide, so there are relatively few molecules inthe triplet state at the same frequency as a nitroxide,which will otherwise contribute ‘2+1’-like type spindynamics as noted in Section 20.5.1. Therefore, itis still a double-resonance experiment, even thoughno MW pulses at the second frequency are needed.In addition, refocusing and pulse evolution (fixeddetection sequence) are particularly in line with adouble-resonance (DEER) approach. The only poten-tial issue is the quantum yield, as it is desirable that atleast 10% of the nitroxides have their partner with itsspin flipped.
Goldfarb, Daniella, and Stefan Stoll. Modern EPR Spectroscopy, John Wiley & Sons, Incorporated, 2018. ProQuest Ebook Central, http://ebookcentral.proquest.com/lib/cornell/detail.action?docID=5317477.Created from cornell on 2018-05-24 10:45:55.
Cop
yrig
ht ©
201
8. J
ohn
Wile
y &
Son
s, In
corp
orat
ed. A
ll rig
hts
rese
rved
.
Dipolar Spectroscopy – Single-resonance Methods 451
20.6 2D-FT ORIENTATION-CORRELATION PDS
20.6.1 Orientational Aspects in PDS
The primary goal of any PDS experiment is to deter-mine distances between electron spins. The outcomecould be affected by the fact that the time-domainsignal recorded in a PDS experiment can be sensitiveto orientations of the coupled magnetic dipoles in themolecular frame, which gives rise to effects knownas orientation selection or correlation97 (see alsoChapters 11 and 19). In the fully isotropic case fora pair of coupled electron spins for each interspinorientation of the vector r12 connecting the spins,all orientations of r12 relative the static field B0are described by the polar and azimuthal angles 𝜃and 𝜑 and are equally probable, e.g., for two pointdipoles. The dipolar coupling then depends only on𝜃 as (3cos2𝜃 − 1), and this gives rise to the charac-teristic dipolar line shape (Section 20.2.2) knownas a Pake doublet.49,50 However, for a spin labelthe orientation of the spin-bearing moiety may befixed and tilted relative to r12 if it is not flexiblytethered. The EPR spectra in solids are determinedby the hf and g-tensors whose anisotropies are de-fined in their respective principal frames. (The hfand g-tensor principal frames may not necessarilycoincide, but in the case of nitroxides, the differ-ences are typically small and can largely be ignored.)The orientations 𝛺k = (𝛼k, 𝛽k, 𝛾k), k= 1, 2 of theseframes are then defined relative to r12 taken as thepolar axis giving five independent Euler angles with𝛼1 = 0.65 Nearly always, the finite pulses in PDSexcite only a fraction, frequently a small fraction ofthe EPR spectrum; this particularly is true at highfields where EPR spectra are often dominated bythe g-factor anisotropy.38 Therefore, in cases of pro-nounced anisotropy with well-defined orientationsof the magnetic frames relative to r12, each r12 ori-entation selects a range of orientations in B0 andconsequently a subset of possible dipolar couplings,so that the dipolar spectrum no longer has the shape ofan ideal Pake doublet. Thus, PDS experiments at highfields, which are usually DEER or RIDME28,38,40,44
type double-resonance experiments, could be verysensitive to molecular orientations and can be explic-itly directed toward obtaining additional details ofmolecular structure.
Our focus will be on nitroxides as they have beenused in most studies. One expects less pronounced
orientation effects (correlations) as well as a greaterrelative contribution of hf tensor anisotropy as com-pared to the g-tensor at fields up to Q-band. This iscertainly the case for nitroxide spin labels, where sucheffects are not highly pronounced and would requiremagnetic frames of electron spins to be well fixedrelative to the molecular frame. Typically, nitrox-ide spin labels exhibit low anisotropy because theirflexible side chains give rise to several rotamers.98,99
Nevertheless, orientation correlations were revealedby conducting DEER experiments from X to Q bandusing several pump and detection frequencies over theEPR spectrum. This could be a very time-consumingendeavor.
20.6.2 2D-DQC Correlation Maps
The standard DQC-6 experiment under nonselectivespectral excitation is focused on accurate distancesand suppresses the manifestation of orientational ef-fects in the dipolar evolution signal, as the spins ofmolecules at all orientations relative to B0 contributeequally to the signal. This ideal picture of eliminat-ing the orientation effects in the DQC-6 experimentis limited by the finite nature of the pulses. (The con-tribution of the flip-flop terms in the secular part ofthe dipolar spin-Hamiltonian depends on the orienta-tionally dependent frequency separation between spec-tral components underlying the spectrum. However,these effects are usually relatively small unless thecoupling becomes strong, i.e., at distances as short as1.0–1.5 nm.) The dipolar evolution is acquired as theamplitude of the spin echo, i.e., each at refocusingpoint; thus, there is no dependence on frequency off-set. Nevertheless, the spin-echo envelope, determinedby the EPR spectrum shape, does encode the informa-tion on orientations of the magnetic frames of cou-pled electron spins, enabling an orientation selection2D-DQC technique. This hidden orientational infor-mation can be revealed if one elicits the contributionsto the full dipolar signal made by each spectral com-ponent contributing to the spin-echo signal. This isrevealed by taking the Fourier transformation (FT) ofthe spin-echo shape, providing the EPR spectrum, andenabling a 2D-FT plot of the dipolar spectrum vs therigid-limit nitroxide spectrum, each point of whichcorresponds to a set of molecular orientations. Thisyields a 2D-FT frequency correlation plot, which is afingerprint of the orientation-dependent effects causedby the anisotropy of magnetic tensors. In the actual
Goldfarb, Daniella, and Stefan Stoll. Modern EPR Spectroscopy, John Wiley & Sons, Incorporated, 2018. ProQuest Ebook Central, http://ebookcentral.proquest.com/lib/cornell/detail.action?docID=5317477.Created from cornell on 2018-05-24 10:45:55.
Cop
yrig
ht ©
201
8. J
ohn
Wile
y &
Son
s, In
corp
orat
ed. A
ll rig
hts
rese
rved
.
452 High-Resolution Pulse Techniques
DQC experiment, the full echo envelope is capturedby a fast ADC, sampling at GHz rates and can bestored for 2D processing. (For further FT techniques,see Chapter 15.)
Assuming ideal pulses, the dipolar signal relevant for2D-DQC experiment can be written out. For spin 1,antiphase coherence 2S1xS2z produced after the DQFby the π/2 pulse 5 evolves into observable in-phasecoherence in the last t2 −π− t2 sandwich (t2 = tm − tp)as
2S1xS2z→(S1y cosΔ𝜔1δt − S1x sinΔ𝜔1δt)(st2
ct2+δt + ct2st2+δt) (20.29)
Here, δt is the time variable taken from the refocusingtime 2t2. After adding to equation (20.29), the dipolarevolution phase sin atp acquired through the evolutionin the preparation period before the filter, the detectedin-phase component in equation (20.29) is
S1y cos(Δ𝜔1δt) sin(at1) sin(at2 + aδt∕2)= S1y cos(Δ𝜔1δt) sin(atp) sin(atm − atp + aδt∕2)= S1y cos(Δ𝜔1δt) ⋅ [cos(atx − aδt∕2)− cos(atm + aδt∕2)] (20.30)
For the second spin, Δ𝜔2 is replaced by Δ𝜔1, but thedipolar part is the same. We now define the spin-echotime techo ≡ δt and the dipolar evolution time tdip ≡ txvariables, and also tdip
′ = tdip + techo/2. The 2D sig-nal F(techo, tdip
′) is in terms of these variables. Af-ter a 2D FT, followed by a shear transformation ofthe frequency variables,65 a 2D-FT plot V(𝜈echo, 𝜈dip)is produced. The resulting 2D plot (or map) givesthe dipolar spectrum for each frequency in the spec-trum. Figure 20.16(a) and (b) shows examples of suchdistinctive 2D maps simulated for uncorrelated andstrongly orientationally correlated cases. On the sideof the plots are the spectral sums calculated along 𝜈dipand 𝜈echo. They give, respectively, the 1D EPR spec-trum (with no dipolar effects in it) and the pure the 1Ddipolar spectrum (Pake doublet without the orientationeffects), as for any spin all its partners contribute to thesum, so all orientations contribute equally.
In Figure 20.16(c), we show the 2D DQC data ob-tained at 17.25 GHz and 60 K on 15 μl of 15 μM solu-tion of a 3-nm rigid rod biradical21 in o-terphenyl-d24glass. The shortest π pulse available for a sample ofthis size was 4 ns, yielding a B1 of 45 G. Yet, this B1is insufficient to provide completely uniform spectralcoverage for the whole 14N nitroxide spectrum. How-ever, this is not a very serious problem. As most ofthe spectrum is covered, the outcome can be simulated
for the finite B1 used.65 In addition, one could increasethe B1 to ≈60 G using a somewhat smaller resonator.Nevertheless, two separate data collections were madeto widen the coverage. The pulse sequences were ap-plied 30 G apart at the low- and high-field parts ofthe spectrum, respectively. The individual 2D spectrawere then truncated on opposite sides at a selected fre-quency and combined into the single spectrum shownin Figure 20.16(c,2). This manipulation is not abso-lutely necessary, as fitting each of the 2D spectra suf-fices to reveal the key orientational properties. Thisapproach based on recording two spectra does not in-cur a significant penalty in acquisition time, as mostof it is used to produce good SNR for the high-fieldside of the spectrum, which has a factor of ≈3 lowerintensity than the more intense central and low-fieldregions.
For this nearly linear biradical, the nitroxide moietieshave their beta angles, 𝛽1(2) at about 90∘ relative to theinterspin vector, r12, connecting the points located atthree-fourth of the NO bond length toward the nitro-gens. As confirmed by simulations, the remaining an-gles are relatively unimportant. Molecular modeling21
has determined |r12|= 2.89 nm and the following setof Euler angles: 𝛺1 = (0∘, 75∘, 0∘), 𝛺2 = (90∘, 111∘,0∘).21,22 We show in Figure 20.16(c) the correlationmaps for experimental and calculated data, renderedas normalized filled contour plots. The plots are quitesimilar, i.e., nitroxide orientations are of the expectedtype as simulated in Figure 20.16(b), but there aresome visible differences that could be addressed bymodeling. One may also need to account for the ef-fects of the resonator bandwidth, which would requiremore substantial computational efforts than used inthis work. In summary, we note that acquiring orien-tational information by DEER necessitates recordingseveral traces,100 whereas 2D DQC can do it in a sin-gle pass (or just two). The outcome is not the fullequivalent of ideal hard pulses but is deemed to beclose enough in information content as we have shownabove. However, DEER, to its advantage, is not limitedto just nitroxides and can be applied to infer orienta-tional information from very broad spectra of metalions and at high fields from orientationally better re-solved spectra.101 It is, however, worth mentioning thatthe 2D-DQC technique, as for the 1D-DQC on whichit is based, presents a robust sensitive and low-artifacttechnique covering three octaves in distance (i.e., a fac-tor of ≈500 in dipolar frequency). The upper rangeof distances is limited by the phase memory time Tm
Goldfarb, Daniella, and Stefan Stoll. Modern EPR Spectroscopy, John Wiley & Sons, Incorporated, 2018. ProQuest Ebook Central, http://ebookcentral.proquest.com/lib/cornell/detail.action?docID=5317477.Created from cornell on 2018-05-24 10:45:55.
Cop
yrig
ht ©
201
8. J
ohn
Wile
y &
Son
s, In
corp
orat
ed. A
ll rig
hts
rese
rved
.
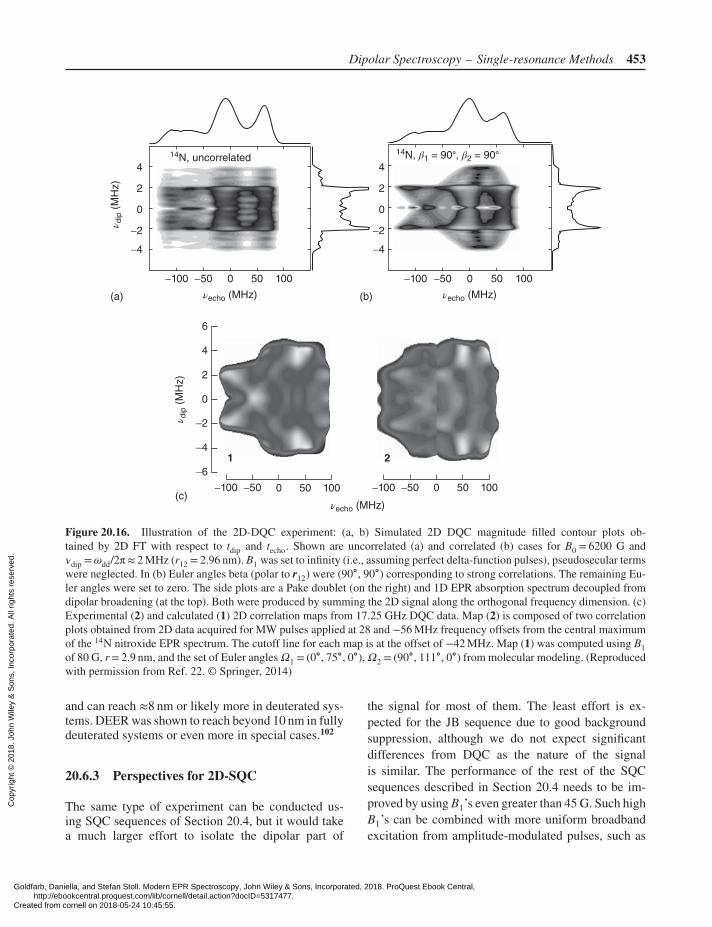
Dipolar Spectroscopy – Single-resonance Methods 453
(a) (b)
(c)
4
2
0
0 50 100
νecho (MHz)
ν dip
(M
Hz)
−2
−4
4
2
0
−2
−4
−6
6
4
2
0
ν dip
(M
Hz)
−2
−4
−100 −50 0 50 100
νecho (MHz)
−100 −50
0 50 100
νecho (MHz)
−100 −500 50 100−100 −50
14N, uncorrelated14N, β1 = 90°, β2 = 90°
1 2
Figure 20.16. Illustration of the 2D-DQC experiment: (a, b) Simulated 2D DQC magnitude filled contour plots ob-tained by 2D FT with respect to tdip and techo. Shown are uncorrelated (a) and correlated (b) cases for B0 = 6200 G and𝜈dip =𝜔dd/2π≈ 2 MHz (r12 = 2.96 nm). B1 was set to infinity (i.e., assuming perfect delta-function pulses), pseudosecular termswere neglected. In (b) Euler angles beta (polar to r12) were (90∘, 90∘) corresponding to strong correlations. The remaining Eu-ler angles were set to zero. The side plots are a Pake doublet (on the right) and 1D EPR absorption spectrum decoupled fromdipolar broadening (at the top). Both were produced by summing the 2D signal along the orthogonal frequency dimension. (c)Experimental (2) and calculated (1) 2D correlation maps from 17.25 GHz DQC data. Map (2) is composed of two correlationplots obtained from 2D data acquired for MW pulses applied at 28 and −56 MHz frequency offsets from the central maximumof the 14N nitroxide EPR spectrum. The cutoff line for each map is at the offset of −42 MHz. Map (1) was computed using B1of 80 G, r= 2.9 nm, and the set of Euler angles𝛺1 = (0∘, 75∘, 0∘),𝛺2 = (90∘, 111∘, 0∘) from molecular modeling. (Reproducedwith permission from Ref. 22. © Springer, 2014)
and can reach ≈8 nm or likely more in deuterated sys-tems. DEER was shown to reach beyond 10 nm in fullydeuterated systems or even more in special cases.102
20.6.3 Perspectives for 2D-SQC
The same type of experiment can be conducted us-ing SQC sequences of Section 20.4, but it would takea much larger effort to isolate the dipolar part of
the signal for most of them. The least effort is ex-pected for the JB sequence due to good backgroundsuppression, although we do not expect significantdifferences from DQC as the nature of the signalis similar. The performance of the rest of the SQCsequences described in Section 20.4 needs to be im-proved by using B1’s even greater than 45 G. Such highB1’s can be combined with more uniform broadbandexcitation from amplitude-modulated pulses, such as
Goldfarb, Daniella, and Stefan Stoll. Modern EPR Spectroscopy, John Wiley & Sons, Incorporated, 2018. ProQuest Ebook Central, http://ebookcentral.proquest.com/lib/cornell/detail.action?docID=5317477.Created from cornell on 2018-05-24 10:45:55.
Cop
yrig
ht ©
201
8. J
ohn
Wile
y &
Son
s, In
corp
orat
ed. A
ll rig
hts
rese
rved
.
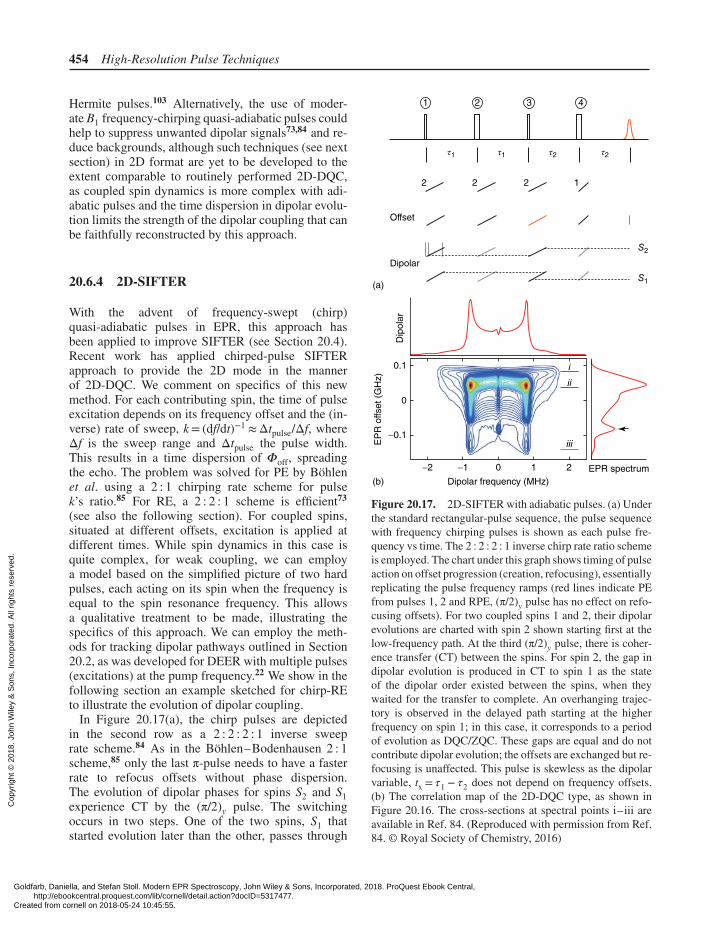
454 High-Resolution Pulse Techniques
Hermite pulses.103 Alternatively, the use of moder-ate B1 frequency-chirping quasi-adiabatic pulses couldhelp to suppress unwanted dipolar signals73,84 and re-duce backgrounds, although such techniques (see nextsection) in 2D format are yet to be developed to theextent comparable to routinely performed 2D-DQC,as coupled spin dynamics is more complex with adi-abatic pulses and the time dispersion in dipolar evolu-tion limits the strength of the dipolar coupling that canbe faithfully reconstructed by this approach.
20.6.4 2D-SIFTER
With the advent of frequency-swept (chirp)quasi-adiabatic pulses in EPR, this approach hasbeen applied to improve SIFTER (see Section 20.4).Recent work has applied chirped-pulse SIFTERapproach to provide the 2D mode in the mannerof 2D-DQC. We comment on specifics of this newmethod. For each contributing spin, the time of pulseexcitation depends on its frequency offset and the (in-verse) rate of sweep, k= (df/dt)−1 ≈Δtpulse/Δf, whereΔf is the sweep range and Δtpulse the pulse width.This results in a time dispersion of 𝛷off, spreadingthe echo. The problem was solved for PE by Böhlenet al. using a 2 : 1 chirping rate scheme for pulsek’s ratio.85 For RE, a 2 : 2 : 1 scheme is efficient73
(see also the following section). For coupled spins,situated at different offsets, excitation is applied atdifferent times. While spin dynamics in this case isquite complex, for weak coupling, we can employa model based on the simplified picture of two hardpulses, each acting on its spin when the frequency isequal to the spin resonance frequency. This allowsa qualitative treatment to be made, illustrating thespecifics of this approach. We can employ the meth-ods for tracking dipolar pathways outlined in Section20.2, as was developed for DEER with multiple pulses(excitations) at the pump frequency.22 We show in thefollowing section an example sketched for chirp-REto illustrate the evolution of dipolar coupling.
In Figure 20.17(a), the chirp pulses are depictedin the second row as a 2 : 2 : 2 : 1 inverse sweeprate scheme.84 As in the Böhlen–Bodenhausen 2 : 1scheme,85 only the last π-pulse needs to have a fasterrate to refocus offsets without phase dispersion.The evolution of dipolar phases for spins S2 and S1experience CT by the (π/2)y pulse. The switchingoccurs in two steps. One of the two spins, S1 thatstarted evolution later than the other, passes through
iii
ii
i
1 2 3 4
τ2τ2τ1τ1
222 1
Offset
Dipolar
0.1
−0.1
−2 −1
0
0 1 2
Dip
ola
r
EP
R o
ffse
t (G
Hz)
S2
S1(a)
(b) Dipolar frequency (MHz)
EPR spectrum
Figure 20.17. 2D-SIFTER with adiabatic pulses. (a) Underthe standard rectangular-pulse sequence, the pulse sequencewith frequency chirping pulses is shown as each pulse fre-quency vs time. The 2 : 2 : 2 : 1 inverse chirp rate ratio schemeis employed. The chart under this graph shows timing of pulseaction on offset progression (creation, refocusing), essentiallyreplicating the pulse frequency ramps (red lines indicate PEfrom pulses 1, 2 and RPE, (π/2)y pulse has no effect on refo-cusing offsets). For two coupled spins 1 and 2, their dipolarevolutions are charted with spin 2 shown starting first at thelow-frequency path. At the third (π/2)y pulse, there is coher-ence transfer (CT) between the spins. For spin 2, the gap indipolar evolution is produced in CT to spin 1 as the stateof the dipolar order existed between the spins, when theywaited for the transfer to complete. An overhanging trajec-tory is observed in the delayed path starting at the higherfrequency on spin 1; in this case, it corresponds to a periodof evolution as DQC/ZQC. These gaps are equal and do notcontribute dipolar evolution; the offsets are exchanged but re-focusing is unaffected. This pulse is skewless as the dipolarvariable, tx = 𝜏1 − 𝜏2 does not depend on frequency offsets.(b) The correlation map of the 2D-DQC type, as shown inFigure 20.16. The cross-sections at spectral points i–iii areavailable in Ref. 84. (Reproduced with permission from Ref.84. © Royal Society of Chemistry, 2016)
Goldfarb, Daniella, and Stefan Stoll. Modern EPR Spectroscopy, John Wiley & Sons, Incorporated, 2018. ProQuest Ebook Central, http://ebookcentral.proquest.com/lib/cornell/detail.action?docID=5317477.Created from cornell on 2018-05-24 10:45:55.
Cop
yrig
ht ©
201
8. J
ohn
Wile
y &
Son
s, In
corp
orat
ed. A
ll rig
hts
rese
rved
.
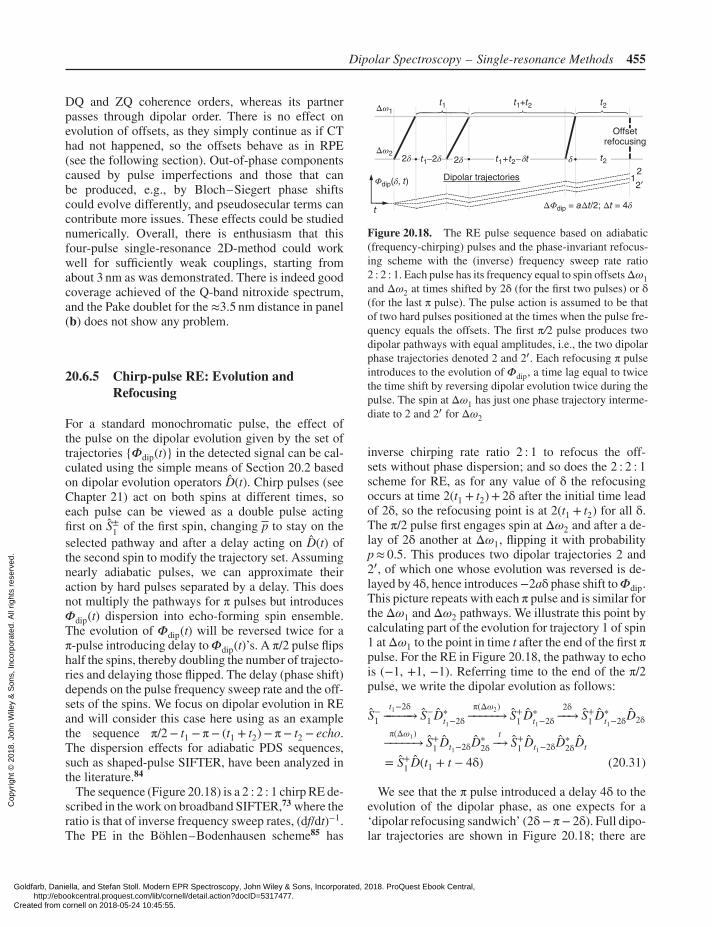
Dipolar Spectroscopy – Single-resonance Methods 455
DQ and ZQ coherence orders, whereas its partnerpasses through dipolar order. There is no effect onevolution of offsets, as they simply continue as if CThad not happened, so the offsets behave as in RPE(see the following section). Out-of-phase componentscaused by pulse imperfections and those that canbe produced, e.g., by Bloch–Siegert phase shiftscould evolve differently, and pseudosecular terms cancontribute more issues. These effects could be studiednumerically. Overall, there is enthusiasm that thisfour-pulse single-resonance 2D-method could workwell for sufficiently weak couplings, starting fromabout 3 nm as was demonstrated. There is indeed goodcoverage achieved of the Q-band nitroxide spectrum,and the Pake doublet for the ≈3.5 nm distance in panel(b) does not show any problem.
20.6.5 Chirp-pulse RE: Evolution andRefocusing
For a standard monochromatic pulse, the effect ofthe pulse on the dipolar evolution given by the set oftrajectories {𝛷dip(t)} in the detected signal can be cal-culated using the simple means of Section 20.2 basedon dipolar evolution operators D(t). Chirp pulses (seeChapter 21) act on both spins at different times, soeach pulse can be viewed as a double pulse actingfirst on S±
1 of the first spin, changing p to stay on theselected pathway and after a delay acting on D(t) ofthe second spin to modify the trajectory set. Assumingnearly adiabatic pulses, we can approximate theiraction by hard pulses separated by a delay. This doesnot multiply the pathways for π pulses but introduces𝛷dip(t) dispersion into echo-forming spin ensemble.The evolution of 𝛷dip(t) will be reversed twice for aπ-pulse introducing delay to𝛷dip(t)’s. A π/2 pulse flipshalf the spins, thereby doubling the number of trajecto-ries and delaying those flipped. The delay (phase shift)depends on the pulse frequency sweep rate and the off-sets of the spins. We focus on dipolar evolution in REand will consider this case here using as an examplethe sequence π/2− t1 −π− (t1 + t2)−π− t2 − echo.The dispersion effects for adiabatic PDS sequences,such as shaped-pulse SIFTER, have been analyzed inthe literature.84
The sequence (Figure 20.18) is a 2 : 2 : 1 chirp RE de-scribed in the work on broadband SIFTER,73 where theratio is that of inverse frequency sweep rates, (df/dt)−1.The PE in the Böhlen–Bodenhausen scheme85 has
Dipolar trajectories
Offsetrefocusing
t
Φdip(δ, t)
ΔΦdip = aΔt/2; Δt = 4δ
Δω2
Δω1
2δ t1−2δ t1+ t2−δt
t1+t2t1
t2
t2
δ2δ2
2′1
Figure 20.18. The RE pulse sequence based on adiabatic(frequency-chirping) pulses and the phase-invariant refocus-ing scheme with the (inverse) frequency sweep rate ratio2 : 2 : 1. Each pulse has its frequency equal to spin offsetsΔ𝜔1and Δ𝜔2 at times shifted by 2δ (for the first two pulses) or δ(for the last π pulse). The pulse action is assumed to be thatof two hard pulses positioned at the times when the pulse fre-quency equals the offsets. The first π/2 pulse produces twodipolar pathways with equal amplitudes, i.e., the two dipolarphase trajectories denoted 2 and 2′. Each refocusing π pulseintroduces to the evolution of 𝛷dip, a time lag equal to twicethe time shift by reversing dipolar evolution twice during thepulse. The spin at Δ𝜔1 has just one phase trajectory interme-diate to 2 and 2′ for Δ𝜔2
inverse chirping rate ratio 2 : 1 to refocus the off-sets without phase dispersion; and so does the 2 : 2 : 1scheme for RE, as for any value of δ the refocusingoccurs at time 2(t1 + t2)+ 2δ after the initial time leadof 2δ, so the refocusing point is at 2(t1 + t2) for all δ.The π/2 pulse first engages spin at Δ𝜔2 and after a de-lay of 2δ another at Δ𝜔1, flipping it with probabilityp≈ 0.5. This produces two dipolar trajectories 2 and2′, of which one whose evolution was reversed is de-layed by 4δ, hence introduces−2aδ phase shift to𝛷dip.This picture repeats with each π pulse and is similar forthe Δ𝜔1 and Δ𝜔2 pathways. We illustrate this point bycalculating part of the evolution for trajectory 1 of spin1 at Δ𝜔1 to the point in time t after the end of the first πpulse. For the RE in Figure 20.18, the pathway to echois (−1, +1, −1). Referring time to the end of the π/2pulse, we write the dipolar evolution as follows:
S−1
t1−2δ−−−−−→ S−
1 D∗t1−2δ
π(Δ𝜔2)−−−−−→ S+1 D∗
t1−2δ2δ−−→ S+
1 D∗t1−2δD2δ
π(Δ𝜔1)−−−−−→ S+1 Dt1−2δD∗
2δt−→ S+
1 Dt1−2δD∗2δDt
= S+1 D(t1 + t − 4δ) (20.31)
We see that the π pulse introduced a delay 4δ to theevolution of the dipolar phase, as one expects for a‘dipolar refocusing sandwich’ (2δ− π− 2δ). Full dipo-lar trajectories are shown in Figure 20.18; there are
Goldfarb, Daniella, and Stefan Stoll. Modern EPR Spectroscopy, John Wiley & Sons, Incorporated, 2018. ProQuest Ebook Central, http://ebookcentral.proquest.com/lib/cornell/detail.action?docID=5317477.Created from cornell on 2018-05-24 10:45:55.
Cop
yrig
ht ©
201
8. J
ohn
Wile
y &
Son
s, In
corp
orat
ed. A
ll rig
hts
rese
rved
.
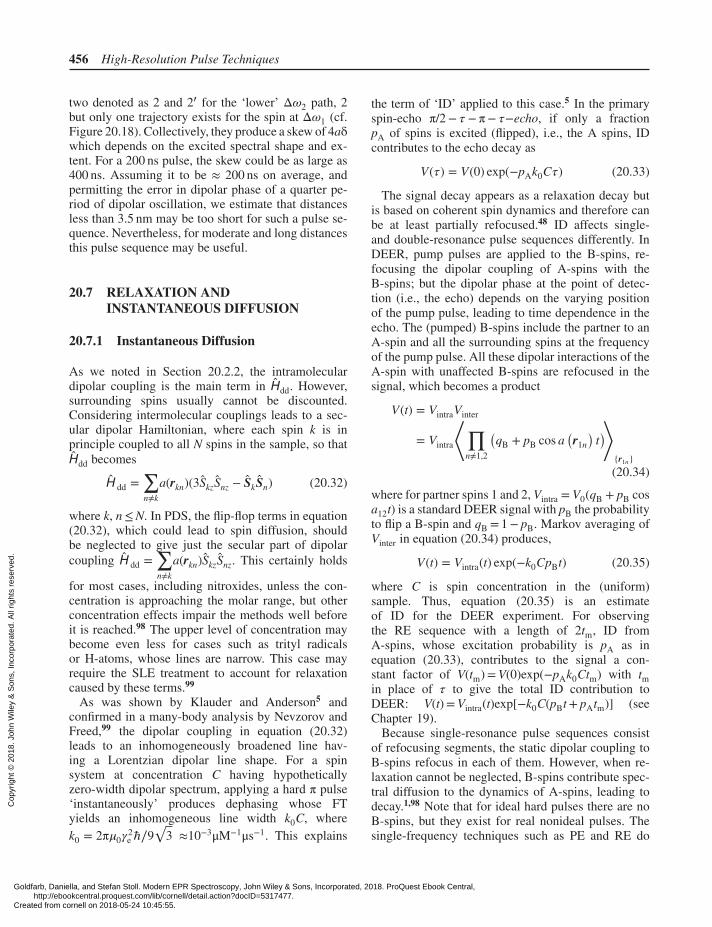
456 High-Resolution Pulse Techniques
two denoted as 2 and 2′ for the ‘lower’ Δ𝜔2 path, 2but only one trajectory exists for the spin at Δ𝜔1 (cf.Figure 20.18). Collectively, they produce a skew of 4aδwhich depends on the excited spectral shape and ex-tent. For a 200 ns pulse, the skew could be as large as400 ns. Assuming it to be ≈ 200 ns on average, andpermitting the error in dipolar phase of a quarter pe-riod of dipolar oscillation, we estimate that distancesless than 3.5 nm may be too short for such a pulse se-quence. Nevertheless, for moderate and long distancesthis pulse sequence may be useful.
20.7 RELAXATION ANDINSTANTANEOUS DIFFUSION
20.7.1 Instantaneous Diffusion
As we noted in Section 20.2.2, the intramoleculardipolar coupling is the main term in Hdd. However,surrounding spins usually cannot be discounted.Considering intermolecular couplings leads to a sec-ular dipolar Hamiltonian, where each spin k is inprinciple coupled to all N spins in the sample, so thatHdd becomes
H dd =∑n≠k
a(rkn)(3SkzSnz − SkSn) (20.32)
where k, n≤N. In PDS, the flip-flop terms in equation(20.32), which could lead to spin diffusion, shouldbe neglected to give just the secular part of dipolarcoupling H dd =
∑n≠k
a(rkn)SkzSnz. This certainly holds
for most cases, including nitroxides, unless the con-centration is approaching the molar range, but otherconcentration effects impair the methods well beforeit is reached.98 The upper level of concentration maybecome even less for cases such as trityl radicalsor H-atoms, whose lines are narrow. This case mayrequire the SLE treatment to account for relaxationcaused by these terms.99
As was shown by Klauder and Anderson5 andconfirmed in a many-body analysis by Nevzorov andFreed,99 the dipolar coupling in equation (20.32)leads to an inhomogeneously broadened line hav-ing a Lorentzian dipolar line shape. For a spinsystem at concentration C having hypotheticallyzero-width dipolar spectrum, applying a hard π pulse‘instantaneously’ produces dephasing whose FTyields an inhomogeneous line width k0C, wherek0 = 2π𝜇0𝛾
2eℏ∕9
√3 ≈10−3μM−1μs−1. This explains
the term of ‘ID’ applied to this case.5 In the primaryspin-echo π/2− 𝜏 −π− 𝜏−echo, if only a fractionpA of spins is excited (flipped), i.e., the A spins, IDcontributes to the echo decay as
V(𝜏) = V(0) exp(−pAk0C𝜏) (20.33)
The signal decay appears as a relaxation decay butis based on coherent spin dynamics and therefore canbe at least partially refocused.48 ID affects single-and double-resonance pulse sequences differently. InDEER, pump pulses are applied to the B-spins, re-focusing the dipolar coupling of A-spins with theB-spins; but the dipolar phase at the point of detec-tion (i.e., the echo) depends on the varying positionof the pump pulse, leading to time dependence in theecho. The (pumped) B-spins include the partner to anA-spin and all the surrounding spins at the frequencyof the pump pulse. All these dipolar interactions of theA-spin with unaffected B-spins are refocused in thesignal, which becomes a product
V(t) = VintraVinter
= Vintra
⟨∏n≠1,2
(qB + pB cos a
(r1n
)t)⟩
{r1n}(20.34)
where for partner spins 1 and 2, Vintra = V0(qB + pB cosa12t) is a standard DEER signal with pB the probabilityto flip a B-spin and qB = 1− pB. Markov averaging ofVinter in equation (20.34) produces,
V(t) = Vintra(t) exp(−k0CpBt) (20.35)
where C is spin concentration in the (uniform)sample. Thus, equation (20.35) is an estimateof ID for the DEER experiment. For observingthe RE sequence with a length of 2tm, ID fromA-spins, whose excitation probability is pA as inequation (20.33), contributes to the signal a con-stant factor of V(tm)=V(0)exp(−pAk0Ctm) with tmin place of 𝜏 to give the total ID contribution toDEER: V(t)=Vintra(t)exp[−k0C(pBt+ pAtm)] (seeChapter 19).
Because single-resonance pulse sequences consistof refocusing segments, the static dipolar coupling toB-spins refocus in each of them. However, when re-laxation cannot be neglected, B-spins contribute spec-tral diffusion to the dynamics of A-spins, leading todecay.1,98 Note that for ideal hard pulses there are noB-spins, but they exist for real nonideal pulses. Thesingle-frequency techniques such as PE and RE do
Goldfarb, Daniella, and Stefan Stoll. Modern EPR Spectroscopy, John Wiley & Sons, Incorporated, 2018. ProQuest Ebook Central, http://ebookcentral.proquest.com/lib/cornell/detail.action?docID=5317477.Created from cornell on 2018-05-24 10:45:55.
Cop
yrig
ht ©
201
8. J
ohn
Wile
y &
Son
s, In
corp
orat
ed. A
ll rig
hts
rese
rved
.
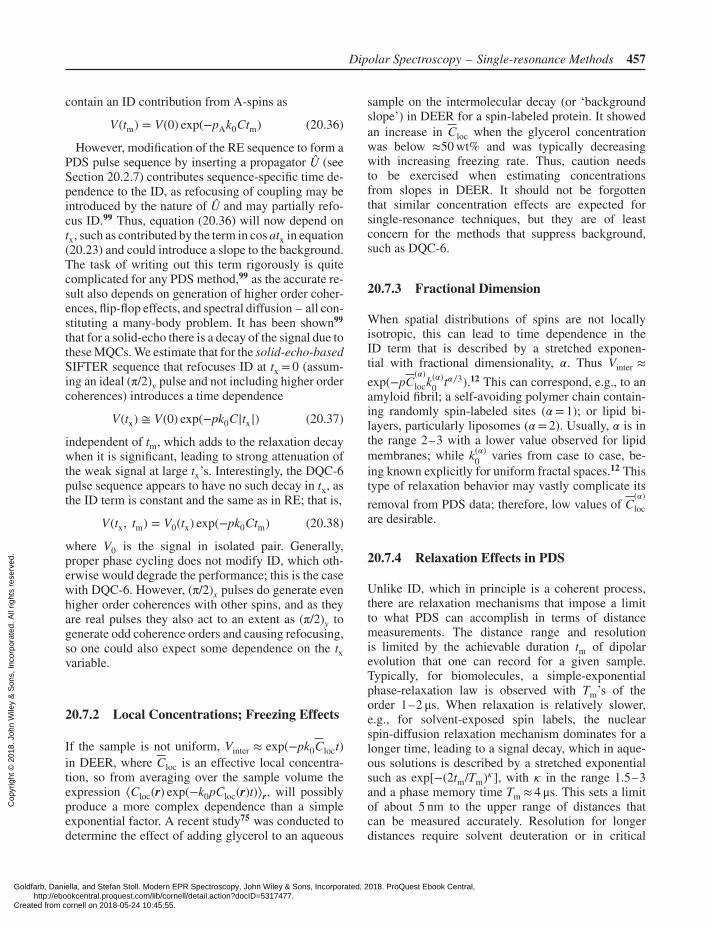
Dipolar Spectroscopy – Single-resonance Methods 457
contain an ID contribution from A-spins as
V(tm) = V(0) exp(−pAk0Ctm) (20.36)
However, modification of the RE sequence to form aPDS pulse sequence by inserting a propagator Û (seeSection 20.2.7) contributes sequence-specific time de-pendence to the ID, as refocusing of coupling may beintroduced by the nature of Û and may partially refo-cus ID.99 Thus, equation (20.36) will now depend ontx, such as contributed by the term in cos atx in equation(20.23) and could introduce a slope to the background.The task of writing out this term rigorously is quitecomplicated for any PDS method,99 as the accurate re-sult also depends on generation of higher order coher-ences, flip-flop effects, and spectral diffusion – all con-stituting a many-body problem. It has been shown99
that for a solid-echo there is a decay of the signal due tothese MQCs. We estimate that for the solid-echo-basedSIFTER sequence that refocuses ID at tx = 0 (assum-ing an ideal (π/2)y pulse and not including higher ordercoherences) introduces a time dependence
V(tx) ≅ V(0) exp(−pk0C|tx|) (20.37)
independent of tm, which adds to the relaxation decaywhen it is significant, leading to strong attenuation ofthe weak signal at large tx’s. Interestingly, the DQC-6pulse sequence appears to have no such decay in tx, asthe ID term is constant and the same as in RE; that is,
V(tx, tm) = V0(tx) exp(−pk0Ctm) (20.38)
where V0 is the signal in isolated pair. Generally,proper phase cycling does not modify ID, which oth-erwise would degrade the performance; this is the casewith DQC-6. However, (π/2)x pulses do generate evenhigher order coherences with other spins, and as theyare real pulses they also act to an extent as (π/2)y togenerate odd coherence orders and causing refocusing,so one could also expect some dependence on the txvariable.
20.7.2 Local Concentrations; Freezing Effects
If the sample is not uniform, Vinter ≈ exp(−pk0Cloct)in DEER, where Cloc is an effective local concentra-tion, so from averaging over the sample volume theexpression ⟨Cloc(r) exp(−k0pCloc(r)t)⟩r, will possiblyproduce a more complex dependence than a simpleexponential factor. A recent study75 was conducted todetermine the effect of adding glycerol to an aqueous
sample on the intermolecular decay (or ‘backgroundslope’) in DEER for a spin-labeled protein. It showedan increase in Cloc when the glycerol concentrationwas below ≈50 wt% and was typically decreasingwith increasing freezing rate. Thus, caution needsto be exercised when estimating concentrationsfrom slopes in DEER. It should not be forgottenthat similar concentration effects are expected forsingle-resonance techniques, but they are of leastconcern for the methods that suppress background,such as DQC-6.
20.7.3 Fractional Dimension
When spatial distributions of spins are not locallyisotropic, this can lead to time dependence in theID term that is described by a stretched exponen-tial with fractional dimensionality, 𝛼. Thus Vinter ≈exp(−pC
(𝛼)lock(𝛼)0 t𝛼∕3).12 This can correspond, e.g., to an
amyloid fibril; a self-avoiding polymer chain contain-ing randomly spin-labeled sites (𝛼 = 1); or lipid bi-layers, particularly liposomes (𝛼 = 2). Usually, 𝛼 is inthe range 2–3 with a lower value observed for lipidmembranes; while k(𝛼)0 varies from case to case, be-ing known explicitly for uniform fractal spaces.12 Thistype of relaxation behavior may vastly complicate its
removal from PDS data; therefore, low values of C(𝛼)loc
are desirable.
20.7.4 Relaxation Effects in PDS
Unlike ID, which in principle is a coherent process,there are relaxation mechanisms that impose a limitto what PDS can accomplish in terms of distancemeasurements. The distance range and resolutionis limited by the achievable duration tm of dipolarevolution that one can record for a given sample.Typically, for biomolecules, a simple-exponentialphase-relaxation law is observed with Tm’s of theorder 1–2 μs. When relaxation is relatively slower,e.g., for solvent-exposed spin labels, the nuclearspin-diffusion relaxation mechanism dominates for alonger time, leading to a signal decay, which in aque-ous solutions is described by a stretched exponentialsuch as exp[−(2tm/Tm)𝜅], with 𝜅 in the range 1.5–3and a phase memory time Tm ≈ 4 μs. This sets a limitof about 5 nm to the upper range of distances thatcan be measured accurately. Resolution for longerdistances require solvent deuteration or in critical
Goldfarb, Daniella, and Stefan Stoll. Modern EPR Spectroscopy, John Wiley & Sons, Incorporated, 2018. ProQuest Ebook Central, http://ebookcentral.proquest.com/lib/cornell/detail.action?docID=5317477.Created from cornell on 2018-05-24 10:45:55.
Cop
yrig
ht ©
201
8. J
ohn
Wile
y &
Son
s, In
corp
orat
ed. A
ll rig
hts
rese
rved
.
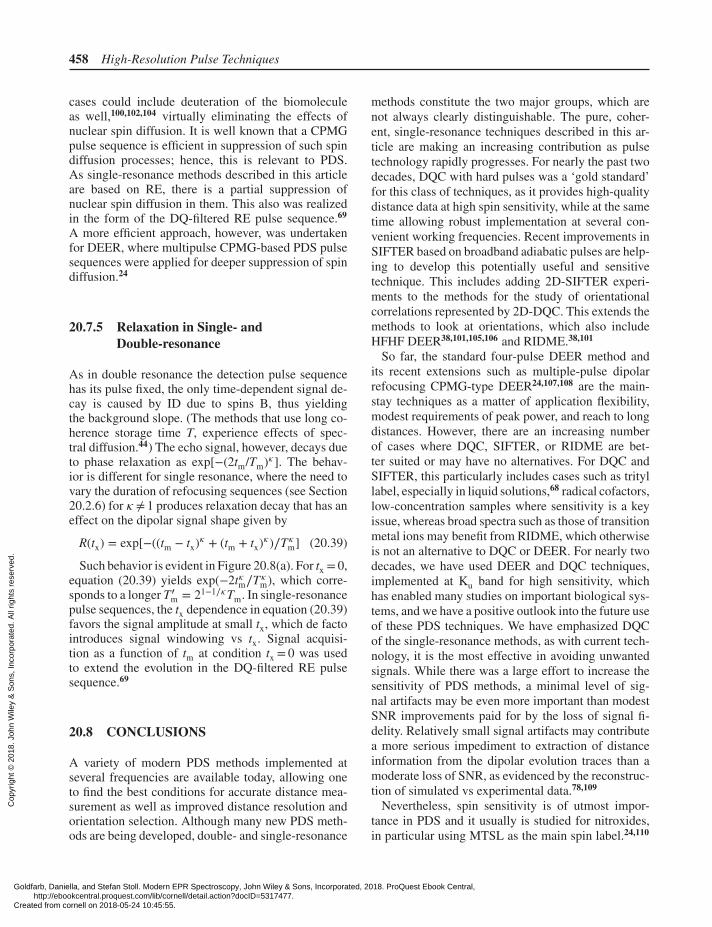
458 High-Resolution Pulse Techniques
cases could include deuteration of the biomoleculeas well,100,102,104 virtually eliminating the effects ofnuclear spin diffusion. It is well known that a CPMGpulse sequence is efficient in suppression of such spindiffusion processes; hence, this is relevant to PDS.As single-resonance methods described in this articleare based on RE, there is a partial suppression ofnuclear spin diffusion in them. This also was realizedin the form of the DQ-filtered RE pulse sequence.69
A more efficient approach, however, was undertakenfor DEER, where multipulse CPMG-based PDS pulsesequences were applied for deeper suppression of spindiffusion.24
20.7.5 Relaxation in Single- andDouble-resonance
As in double resonance the detection pulse sequencehas its pulse fixed, the only time-dependent signal de-cay is caused by ID due to spins B, thus yieldingthe background slope. (The methods that use long co-herence storage time T, experience effects of spec-tral diffusion.44) The echo signal, however, decays dueto phase relaxation as exp[−(2tm/Tm)𝜅]. The behav-ior is different for single resonance, where the need tovary the duration of refocusing sequences (see Section20.2.6) for 𝜅 ≠ 1 produces relaxation decay that has aneffect on the dipolar signal shape given by
R(tx) = exp[−((tm − tx)𝜅 + (tm + tx)𝜅)∕T𝜅m] (20.39)
Such behavior is evident in Figure 20.8(a). For tx = 0,equation (20.39) yields exp(−2t𝜅m∕T𝜅m), which corre-sponds to a longer T ′
m = 21−1∕𝜅Tm. In single-resonancepulse sequences, the tx dependence in equation (20.39)favors the signal amplitude at small tx, which de factointroduces signal windowing vs tx. Signal acquisi-tion as a function of tm at condition tx = 0 was usedto extend the evolution in the DQ-filtered RE pulsesequence.69
20.8 CONCLUSIONS
A variety of modern PDS methods implemented atseveral frequencies are available today, allowing oneto find the best conditions for accurate distance mea-surement as well as improved distance resolution andorientation selection. Although many new PDS meth-ods are being developed, double- and single-resonance
methods constitute the two major groups, which arenot always clearly distinguishable. The pure, coher-ent, single-resonance techniques described in this ar-ticle are making an increasing contribution as pulsetechnology rapidly progresses. For nearly the past twodecades, DQC with hard pulses was a ‘gold standard’for this class of techniques, as it provides high-qualitydistance data at high spin sensitivity, while at the sametime allowing robust implementation at several con-venient working frequencies. Recent improvements inSIFTER based on broadband adiabatic pulses are help-ing to develop this potentially useful and sensitivetechnique. This includes adding 2D-SIFTER experi-ments to the methods for the study of orientationalcorrelations represented by 2D-DQC. This extends themethods to look at orientations, which also includeHFHF DEER38,101,105,106 and RIDME.38,101
So far, the standard four-pulse DEER method andits recent extensions such as multiple-pulse dipolarrefocusing CPMG-type DEER24,107,108 are the main-stay techniques as a matter of application flexibility,modest requirements of peak power, and reach to longdistances. However, there are an increasing numberof cases where DQC, SIFTER, or RIDME are bet-ter suited or may have no alternatives. For DQC andSIFTER, this particularly includes cases such as trityllabel, especially in liquid solutions,68 radical cofactors,low-concentration samples where sensitivity is a keyissue, whereas broad spectra such as those of transitionmetal ions may benefit from RIDME, which otherwiseis not an alternative to DQC or DEER. For nearly twodecades, we have used DEER and DQC techniques,implemented at Ku band for high sensitivity, whichhas enabled many studies on important biological sys-tems, and we have a positive outlook into the future useof these PDS techniques. We have emphasized DQCof the single-resonance methods, as with current tech-nology, it is the most effective in avoiding unwantedsignals. While there was a large effort to increase thesensitivity of PDS methods, a minimal level of sig-nal artifacts may be even more important than modestSNR improvements paid for by the loss of signal fi-delity. Relatively small signal artifacts may contributea more serious impediment to extraction of distanceinformation from the dipolar evolution traces than amoderate loss of SNR, as evidenced by the reconstruc-tion of simulated vs experimental data.78,109
Nevertheless, spin sensitivity is of utmost impor-tance in PDS and it usually is studied for nitroxides,in particular using MTSL as the main spin label.24,110
Goldfarb, Daniella, and Stefan Stoll. Modern EPR Spectroscopy, John Wiley & Sons, Incorporated, 2018. ProQuest Ebook Central, http://ebookcentral.proquest.com/lib/cornell/detail.action?docID=5317477.Created from cornell on 2018-05-24 10:45:55.
Cop
yrig
ht ©
201
8. J
ohn
Wile
y &
Son
s, In
corp
orat
ed. A
ll rig
hts
rese
rved
.
Dipolar Spectroscopy – Single-resonance Methods 459
Furthermore, we mention new methods of signal pro-cessing the PDS data, which are an additional approachto significantly improving the SNR of the experiment,somewhat relaxing the need of high SNR.109,111 How-ever, today, there is a large and increasing variety ofspin labels based on nitroxides, trityls, photoexitedstates, cofactors, or metal ions, both endo- and exoge-nous, as well as a plurality of vastly different PDSmethods.82,97,106,112 The particular experiment or spinlabel often benefits from using the most suitable tech-nique, and single-resonance methods such as DQC andSIFTER and others described here will play increas-ingly valuable roles.
ACKNOWLEDGMENTS
The authors acknowledge NIH NIGMS Grant P41GM103521 to ACERT National Biomedical Centerfor Advanced EPR Technology. The authors are grate-ful to Dr. Elka R. Georgieva for providing spin-labeledT4-lysozyme protein samples that enabled us to obtainmodel DQC and SQC data shown in this chapter. Theauthors are thankful to our multiple collaborators andgroup members that over the course of 15 years madea great contribution to the development of biomolec-ular PDS spectroscopy at ACERT. In particular theefforts of Brian R. Crane, Elka R. Georgieva, DavidEliezer, Betty J. Gaffney, Hassane S. Mchaourab, OlgaBoudker, Sang-Youn Park, Jaya Bhatnagar, Yun-WejChiang, Wayne L. Hubbell, Samuel E. Butcher, DaleEdmondson, Anup Upadhyay, Shaogeng Tang, ScottD. Emr, Charles P. Scholes, Ria Sircar, DipanjanSamanta, Gregory E. Merz, Kent Kirshenbaum,Boris D. Dzikovski, Yeon-Kyun Shin, Jiansong Tong,Vladimir M. Grigoryants, Trudy F. Ramlall, ZhongyuYang, Alexandrine M. Crane, Songi Han, Neil A. Es-chmann, Sushil K. Misra, Aaron T. Fafarman, MichaelV. Airola, David E. Budil, Michael G. Malkowski,Benjamin J. Orlando, Elizabeth D. Getzoff, NattakanSukomon are highly appreciated.
REFERENCES
1. A. M. Raitsimring and K. M. Salikhov, Bull. Magn.Reson., 1985, 7, 184.
2. L. Kevan and R. N. Schwartz, in Time DomainElectron Spin Resonance, eds L. Kevan and R.N. Schwartz, John Wiley & Sons, Inc.: New York,1979.
3. A. Raitsimring, in Biological Magnetic Resonance,eds L. J. Berliner, G. R. Eaton and S. S. Eaton, KluwerAcademic: New York, 2000, Vol. 19, p 385.
4. A. Abragam, The Principles of Nuclear Magnetism,Clarendon Press: Oxford, 1961.
5. J. Klauder and P. Anderson, Phys. Rev., 1962, 125,912.
6. V. F. Yudanov, K. M. Salikhov, G. M. Zhidormirov,and Y. D. Tsvetkov, Theor. Exp. Chem., 1972, 5, 451.
7. S. A. Dikanov and Y. Tsvetkov, Electron Spin EchoEnvelope Modulation (ESEEM) Spectroscopy, Tay-lor & Francis: London, 1992.
8. A. Schweiger and G. Jeschke, Principles of PulseElectron Paramagnetic Resonance, Oxford UniversityPress: Oxford, 2001.
9. W. B. Mims, Phys. Rev. B Solid State, 1972, 5, 2409.
10. M. Emshwiller, E. L. Hahn, and D. Kaplan, Phys.Rev., 1960, 118, 414.
11. A. D. Milov, K. M. Salikhov, and M. D. Shirov, Sov.Phys. Solid State, 1981, 23, 565.
12. A. D. Milov and Y. D. Tsvetkov, Appl. Magn. Reson.,1997, 12, 495.
13. G. E. Merz, P. P. Borbat, A. J. Pratt, E. D. Getzoff,J. H. Freed, and B. R. Crane, Biophys. J., 2014, 107,1669.
14. P. P. Borbat and J. H. Freed, in Two-Component Sig-naling Systems, Pt B, eds M. I. Simon, B. R. Craneand A. Crane, Elsevier Academic Press Inc: SanDiego, 2007, Vol. 423, p 52.
15. A. V. Astashkin and A. Kawamori, in BiophysicalTechniques in Photosynthesis, eds T. Aartsma andJ. Matysik, Springer: Dordrecht, Netherlands, 2008,Vol. 2, p 325.
16. M. Pannier, S. Veit, A. Godt, G. Jeschke, and H.W. Spiess, J. Magn. Reson., 2000, 142, 331.
17. L. J. Berliner, G. R. Eaton, and S. S. Eaton, Dis-tance Measurements in Biological Systems by EPR,Kluwer Academic: New York, 2000.
18. R. E. Martin, M. Pannier, F. Diederich, V. Gramlich,M. Hubrich, and H. W. Spiess, Angew. Chem. Int. Ed.,1998, 37, 2834.
19. S. Saxena and J. H. Freed, J. Chem. Phys., 1997, 107,1317.
20. P. P. Borbat and J. H. Freed, Chem. Phys. Lett., 1999,313, 145.
21. P. P. Borbat and J. H. Freed, in Biological MagneticResonance, eds L. J. Berliner, G. R. Eaton and S.
Goldfarb, Daniella, and Stefan Stoll. Modern EPR Spectroscopy, John Wiley & Sons, Incorporated, 2018. ProQuest Ebook Central, http://ebookcentral.proquest.com/lib/cornell/detail.action?docID=5317477.Created from cornell on 2018-05-24 10:45:55.
Cop
yrig
ht ©
201
8. J
ohn
Wile
y &
Son
s, In
corp
orat
ed. A
ll rig
hts
rese
rved
.
460 High-Resolution Pulse Techniques
S. Eaton, Academic/Plenum Publishers: New York,2000, Vol. 19, p 385.
22. P. P. Borbat and J. H. Freed, in Structural Informationfrom Spin-Labels and Intrinsic Paramagnetic Cen-tres in the Biosciences, eds C. R. Timmel and J.R. Harmer, Springer-Verlag: Berlin, 2014, Vol. 152,p 1.
23. G. Jeschke, M. Pannier, A. Godt, and H. W. Spiess,Chem. Phys. Lett., 2000, 331, 243.
24. P. P. Borbat, E. R. Georgieva, and J. H. Freed, J. Phys.Chem. Lett., 2013, 4, 170.
25. G. Jeschke, A. Bender, H. Paulsen, H. Zimmermann,and A. Godt, J. Magn. Reson., 2004, 169, 1.
26. S. Milikisyants, F. Scarpelli, M. G. Finiguerra,M. Ubbink, and M. Huber, J. Magn. Reson., 2009,201, 48.
27. L. V. Kulik, Y. A. Grishin, S. A. Dzuba, I. A. Grig-oryev, S. V. Klyatskaya, S. F. Vasilevsky, and Y.D. Tsvetkov, J. Magn. Reson., 2002, 157, 61.
28. S. Razzaghi, M. Qi, A. I. Nalepa, A. Godt, G. Jeschke,A. Savitsky, and M. Yulikov, J. Phys. Chem. Lett.,2014, 5, 3970.
29. D. Abdullin, F. Duthie, A. Meyer, E. S. Muller,G. Hagelueken, and O. Schiemann, J. Phys. Chem.B, 2015, 119, 13534.
30. A. Collauto, V. Frydman, M. D. Lee, E. H. Abdelka-der, A. Feintuch, J. D. Swarbrick, B. Graham, G. Ot-ting, and D. Goldfarb, Phys. Chem. Chem. Phys.,2016, 18, 19037.
31. P. P. Borbat, H. S. Mchaourab, and J. H. Freed, J. Am.Chem. Soc., 2002, 124, 5304.
32. S.-Y. Park, P. P. Borbat, G. Gonzalez-Bonet, J. Bhat-nagar, A. M. Pollard, J. H. Freed, A. M. Bilwes, andB. R. Crane, Nat. Struct. Mol. Biol., 2006, 13, 400.
33. G. Jeschke, C. Wegener, M. Nietschke, H. Jung, andH.-J. Steinhoff, Biophys. J., 2004, 86, 2551.
34. B. G. Dzikovski, P. P. Borbat, and J. H. Freed, Bio-phys. J., 2004, 87, 3504.
35. O. Schiemann, N. Piton, Y. G. Mu, G. Stock, J. W. En-gels, and T. F. Prisner, J. Am. Chem. Soc., 2004, 126,5722.
36. P. A. S. Cruickshank, D. R. Bolton, D. A. Robertson,R. I. Hunter, R. J. Wylde, and G. M. Smith, Rev. Sci.Instrum., 2009, 80, 103102.
37. G. W. Reginsson, R. I. Hunter, P. A. S. Cruickshank,D. R. Bolton, S. T. Sigurdsson, G. M. Smith, andO. Schiemann, J. Magn. Reson., 2012, 216, 175.
38. K. Möbius and A. Savitsky, High-Field EPR Spec-troscopy on Proteins and Their Model Systems : Char-acterization of Transient Paramagnetic States, RoyalSociety of Chemistry: Cambridge, 2009.
39. P. E. Spindler, P. Schops, A. M. Bowen, B. Endeward,and T. F. Prisner, eMagRes, 2016, 5, 1477.
40. A. Doll, M. Qi, A. Godt, and G. Jeschke, J. Magn.Reson., 2016, 273, 73.
41. A. Doll, M. A. Qi, S. Pribitzer, N. Wili, M. Yulikov,A. Godt, and G. Jeschke, Phys. Chem. Chem. Phys.,2015, 17, 7334.
42. C. P. Slichter, Principles of Magnetic Resonance,Springer-Verlag: Berlin, 1990, p 248.
43. C. Hintze, D. Bucker, S. D. Kohler, G. Jeschke, andM. Drescher, J. Phys. Chem. Lett., 2016, 7, 2204.
44. A. V. Astashkin, in Electron Paramagnetic ResonanceInvestigations of Biological Systems by Using SpinLabels, Spin Probes, and Intrinsic Metal Ions, Pt A,eds P. Z. Qin and K. Warncke, 2015, Vol. 563, p 251.
45. R. R. Ernst et al., Principles of Nuclear MagneticResonance in One and Two Dimensions, ClarendonPress: Oxford [Oxfordshire], 1987.
46. O. W. Sorensen, G. W. Eich, M. H. Levitt, G. Boden-hausen, and R. R. Ernst, Prog. Nucl. Magn. Reson.Spectrosc., 1983, 16, 163.
47. J. Cavanagh, Protein NMR Spectroscopy: Principlesand Practice, Academic Press, 1996.
48. C. P. Slichter, Principles of Magnetic Resonance, 3rdedn, Springer-Verlag: Berlin-Heidelberg-New-York,1990.
49. G. E. Pake, J. Chem. Phys., 1948, 16, 327.
50. H. W. Spiess and K. Schmidt-Rohr, MultidimensionalSolid-State NMR and Polymers, Academic Press:London, 1994.
51. A. D. Bain, D. A. Fletcher, and P. Hazendonk, Con-cepts Magn. Reson., 1998, 10, 85.
52. J. Shriver, Concepts Magn. Reson., 1992, 4, 1.
53. M. H. Levitt, eMagRes, John Wiley & Sons, Ltd:Chichester, 2007.
54. J. H. Freed, Annu. Rev. Phys. Chem., 2000, 51, 655.
55. J. H. Freed, Annu. Rev. Phys. Chem., 1972, 23, 265.
56. M. H. Levitt, Pulse Methods in 1D & 2DLiquid-Phase NMR, Academic Press: San Diego,1988, p 111.
57. M. H. Levitt, Spin Dynamics: Basics of Nuclear Mag-netic Resonance, John Wiley & Sons, Ltd: Chichester,2008.
Goldfarb, Daniella, and Stefan Stoll. Modern EPR Spectroscopy, John Wiley & Sons, Incorporated, 2018. ProQuest Ebook Central, http://ebookcentral.proquest.com/lib/cornell/detail.action?docID=5317477.Created from cornell on 2018-05-24 10:45:55.
Cop
yrig
ht ©
201
8. J
ohn
Wile
y &
Son
s, In
corp
orat
ed. A
ll rig
hts
rese
rved
.
Dipolar Spectroscopy – Single-resonance Methods 461
58. M. Di Valentin, M. Albertini, E. Zurlo, M. Gobbo,and D. Carbonera, J. Am. Chem. Soc., 2014, 136,6582.
59. S. A. Dzuba and A. Hoff, in Biological MagneticResonance, eds L. J. Berliner, G. R. Eaton and S.S. Eaton, Academic/Plenum Publishers: New York,2000, Vol. 19, p 569.
60. G. Jeschke, M. Pannier, and H. W. Spiess, in DistanceMeasurements in Biological Systems by EPR, eds L.J. Berliner, G. R. Eaton and S. S. Eaton, Springer:Boston, MA, 2002, p 493.
61. J. G. Powles and P. Mansfield, Phys. Lett., 1962, 2,58.
62. P. P. Borbat, R. H. Crepeau, and J. H. Freed, J. Magn.Reson., 1997, 127, 155.
63. B. J. Gaffney, M. D. Bradshaw, S. D. Frausto, F.Y. Wu, J. H. Freed, and P. Borbat, Biophys. J., 2012,103, 2134.
64. C. E. Tait and S. Stoll, Phys. Chem. Chem. Phys.,2016, 18, 18470.
65. S. K. Misra, P. P. Borbat, and J. H. Freed, Appl. Magn.Reson., 2009, 36, 237.
66. A. T. Fafarman, P. P. Borbat, J. H. Freed, and K. Kir-shenbaum, Chem. Commun., 2007, 377.
67. M. Bennati, J. H. Robblee, V. Mugnaini, J. Stubbe,J. H. Freed, and P. Borbat, J. Am. Chem. Soc., 2005,127, 15014.
68. Z. Y. Yang, Y. P. Liu, P. Borbat, J. L. Zweier, J.H. Freed, and W. L. Hubbell, J. Am. Chem. Soc., 2012,134, 9950.
69. P. P. Borbat, J. H. Davis, S. E. Butcher, and J.H. Freed, J. Am. Chem. Soc., 2004, 126, 7746.
70. M. Huber, M. Lindgren, P. Hammarstrom,L.-G. Martensson, U. Carlsson, G. R. Eaton,and S. S. Eaton, Biophys. Chem., 2001, 94, 245.
71. A. D. Milov, K. M. Salikhov, and Y. D. Tsvetkov, Fiz.Tverd. Tela, 1973, 15, 1187.
72. K. N. Hu, C. Song, H. H. Yu, T. M. Swager, and R.G. Griffin, J. Chem. Phys., 2008, 128.
73. P. Schoeps, P. E. Spindler, A. Marko, and T. F. Prisner,J. Magn. Reson., 2015, 250, 55.
74. S. M. Islam, R. A. Stein, H. S. Mchaourab, andB. Roux, J. Phys. Chem. B, 2013, 117, 4740.
75. E. R. Georgieva, A. S. Roy, V. M. Grigoryants, P.P. Borbat, K. A. Earle, C. P. Scholes, and J. H. Freed,J. Magn. Reson., 2012, 216, 69.
76. M. Lindgren, G. R. Eaton, S. S. Eaton, B.-H. Jonsson,P. Hammarstrom, M. Svensson, and U. Carlsson, J.Chem. Soc. Perkin Trans., 1997, 2, 2549.
77. A. D. Milov, K. M. Salikhov, and Y. D. Tsvetkov, Sov.Phys. Solid State, 1973, 15, 802.
78. Y.-W. Chiang, P. P. Borbat, and J. H. Freed, J. Magn.Reson., 2005, 172, 279.
79. S. Ruthstein, M. Ji, B. K. Shin, and S. Saxena, J.Magn. Reson., 2015, 257, 45.
80. J. Jeener and P. Broekaert, Phys. Rev., 1967, 157, 232.
81. G. Y. Shevelev, O. A. Krumkacheva, A. A. Lomzov,A. A. Kuzhelev, O. Y. Rogozhnikova, D. V. Trukhin,T. I. Troitskaya, V. M. Tormyshev, M. V. Fedin, D.V. Pyshnyi, and E. G. Bagryanskaya, J. Am. Chem.Soc., 2014, 136, 9874.
82. D. Akhmetzyanov, P. Schops, A. Marko, N. C. Kun-jir, S. T. Sigurdsson, and T. F. Prisner, Phys. Chem.Chem. Phys., 2015, 17, 24446.
83. G. Jeschke, V. Chechik, P. Ionita, A. Godt, H. Zim-mermann, J. Banham, C. R. Timmel, D. Hilger, andH. Jung, Appl. Magn. Reson., 2006, 30, 473.
84. A. Doll and G. Jeschke, Phys. Chem. Chem. Phys.,2016, 18, 23111.
85. J. M. Bohlen and G. Bodenhausen, J. Magn. Reson.Ser. A, 1993, 102, 293.
86. M. Bonora, J. Becker, and S. Saxena, J. Magn. Reson.,2004, 170, 278.
87. A. J. Hoff, P. Gast, S. A. Dzuba, C. R. Timmel, C.E. Fursman, and P. J. Hore, Spectrochim. Acta Mol.Biomol. Spectrosc., 1998, 54, 2283.
88. J. Tang, M. C. Thurnauer, and J. R. Norris, Chem.Phys. Lett., 1994, 219, 283.
89. A. Marko, V. Denysenkov, and T. F. Prisner, Mol.Phys., 2013, 111, 2834.
90. R. R. Mett, J. W. Sidabras, I. S. Golovina, and J.S. Hyde, Rev. Sci. Instrum., 2008, 79, Article number:094702.
91. R. R. Mett, J. W. Sidabras, and J. S. Hyde, Appl.Magn. Reson., 2007, 31, 573.
92. J. Forrer, I. Garcia-Rubio, R. Schuhmam,R. Tschaggelar, and J. Harmer, J. Magn. Reson.,2008, 190, 280.
93. S. Pfenninger, J. Forrer, A. Schweiger, and T. Wei-land, Rev. Sci. Instrum., 1988, 59, 752.
94. V. V. Kurshev, A. M. Raitsimring, and Y. D. Tsvetkov,J. Magn. Reson., 1989, 81, 441.
Goldfarb, Daniella, and Stefan Stoll. Modern EPR Spectroscopy, John Wiley & Sons, Incorporated, 2018. ProQuest Ebook Central, http://ebookcentral.proquest.com/lib/cornell/detail.action?docID=5317477.Created from cornell on 2018-05-24 10:45:55.
Cop
yrig
ht ©
201
8. J
ohn
Wile
y &
Son
s, In
corp
orat
ed. A
ll rig
hts
rese
rved
.
462 High-Resolution Pulse Techniques
95. L. V. Kulik, S. A. Dzuba, I. A. Grigoryev, andY. D. Tsvetkov, Chem. Phys. Lett., 2001, 343,315.
96. A. Meyer and O. Schiemann, J. Phys. Chem. A, 2016,120, 3463.
97. A. M. Bowen, C. E. Tait, C. R. Timmel, andJ. R. Harmer, in Structural Information fromSpin-Labels and Intrinsic Paramagnetic Centres inthe Biosciences, eds C. R. Timmel and J. R. Harmer,Springer: Berlin, 2013, p 283.
98. V. V. Kurshev and T. Ichikawa, J. Magn. Reson., 1992,96, 563.
99. A. A. Nevzorov and J. H. Freed, J. Chem. Phys., 2001,115, 2401.
100. E. R. Georgieva, T. F. Ramlall, P. P. Borbat, J.H. Freed, and D. Eliezer, J. Biol. Chem., 2010, 285,28261.
101. A. Savitsky, J. Niklas, J. H. Golbeck, K. Mobius, andW. Lubitz, J. Phys. Chem. B, 2013, 117, 11184.
102. T. Schmidt, M. A. Walti, J. L. Baber, E. J. Hustedt,and G. M. Clore, Angew. Chem. Int. Ed., 2016, 55,15905.
103. W. S. Warren, J. Chem. Phys., 1984, 81, 5437.
104. W. Richard, A. Bowman, E. Sozudogru,H. El-Mkami, T. Owen-Hughes, and D. G. Norman,J. Magn. Reson., 2010, 207, 164.
105. C. L. Motion, J. E. Lovett, S. Bell, S. L. Cassidy, P.A. S. Cruickshank, D. R. Bolton, R. I. Hunter, H. ElMkami, S. Van Doorslaer, and G. M. Smith, J. Phys.Chem. Lett., 2016, 7, 1411.
106. D. Goldfarb, in Structural Information fromSpin-Labels and Intrinsic Paramagnetic Centres inthe Biosciences, eds C. R. Timmel and J. R. Harmer,Springer: Heidelberg, 2013, p 163.
107. P. E. Spindler, I. Waclawska, B. Endeward, J. Plack-rneyer, C. Ziegler, and T. F. Prisner, J. Phys. Chem.Lett., 2015, 6, 4331.
108. J. M. Soetbeer, Dynamical Decoupling in DistanceMeasurements by Double Electron–electron Reso-nance, Springer Spektrum: Wiesbaden, 2016.
109. M. Srivastava, E. R. Georgieva, and J. H. Freed, J.Phys. Chem. A, 2017, 121, 2452.
110. R. Tschaggelar, B. Kasumaj, M. G. Santangelo,J. Forrer, P. Leger, H. Dube, F. Diederich, J. Harmer,R. Schuhmann, I. Garcia-Rubio, and G. Jeschke, J.Magn. Reson., 2009, 200, 81.
111. M. Srivastava, C. L. Anderson, and J. H. Freed, IEEEAccess, 2016, 4, 3862.
112. Z. Y. Yang, M. Ji, T. F. Cunningham, and S. Saxena,in Electron Paramagnetic Resonance Investigationsof Biological Systems by Using Spin Labels, SpinProbes, and Intrinsic Metal Ions, Pt A, eds P. Z. Qinand K. Warncke, 2015, Vol. 563, p 459.
Goldfarb, Daniella, and Stefan Stoll. Modern EPR Spectroscopy, John Wiley & Sons, Incorporated, 2018. ProQuest Ebook Central, http://ebookcentral.proquest.com/lib/cornell/detail.action?docID=5317477.Created from cornell on 2018-05-24 10:45:55.
Cop
yrig
ht ©
201
8. J
ohn
Wile
y &
Son
s, In
corp
orat
ed. A
ll rig
hts
rese
rved
.


![Dynamics of Rhodobacter capsulatus [2Fe-2S] Ferredoxin VI and Aquifex aeolicus Ferredoxin 5 via Nuclear Resonance Vibrational Spectroscopy (NRVS) and Resonance Raman Spectroscopy †](https://img.pdfslide.net/doc/110x75/6339a813908ccdf2c60c38ab/dynamics-of-rhodobacter-capsulatus-2fe-2s-ferredoxin-vi-and-aquifex-aeolicus-ferredoxin.jpg)


