Embed Size (px)
Citation preview

CHAPTER 20 Economic And Financial Evaluation
The Improvement of Transport System in the Metropolitan Area of Belem
587
20. ECONOMIC AND FINANCIAL EVALUATION
20.1. INTRODUCTION
Both the trunk bus system project and the road projects are evaluated in this chapter, from the economic and financial viewpoints. The economic evaluation is to examine the economic viability of a project by comparing economic cost of the projects and economic return (so-called social benefits) to be generated in the regional or national economy by the projects, while the financial evaluation is to analyze profitability of a project to the operating agency, through comparison of revenue and expenditure.
While there are many differences between the economic and the financial evaluations, the most essential is their standpoints. The economic evaluation is made from the standpoint of the regional economy and the financial evaluation is from the standpoint of specified stakeholders—the trunk bus company in this study. Subsequently, the cost and benefit in the economic evaluation are measured by the economic price, and the cost and revenue in the financial analysis are measured by the market price. (Table 20.1-1)
The economic project life is assumed to be 25 years for the road projects and 15 years after full operation for the trunk bus system project. The latter is a software project to plan how to efficiently use the limited road space, and the operation of the trunk bus service can be terminated anytime depending on the situation. Accordingly, its project life is assumed to be shorter.
Table 20.1-1 Economic vs. Financial Evaluation
Economic Evaluation Financial Evaluation Project Trunk Bus System + Road Trunk Bus System Viewpoint Regional Economy Bus Operator (Bus Company) Investor Government Private Sector Evaluation Method • Cost / Benefit Analysis
• With / Without Comparison • Economic Price
• Cost / Profit Analysis • Analysis of Financial Statement • Market Price
Inflation & Tax Not accounted for Accounted for Direct Beneficiaries • Car & Bus Users • Stockholders
• Financiers • Employees
20.2. ECONOMIC EVALUATION
20.2.1. APPROACH AND ASSUMPTIONS
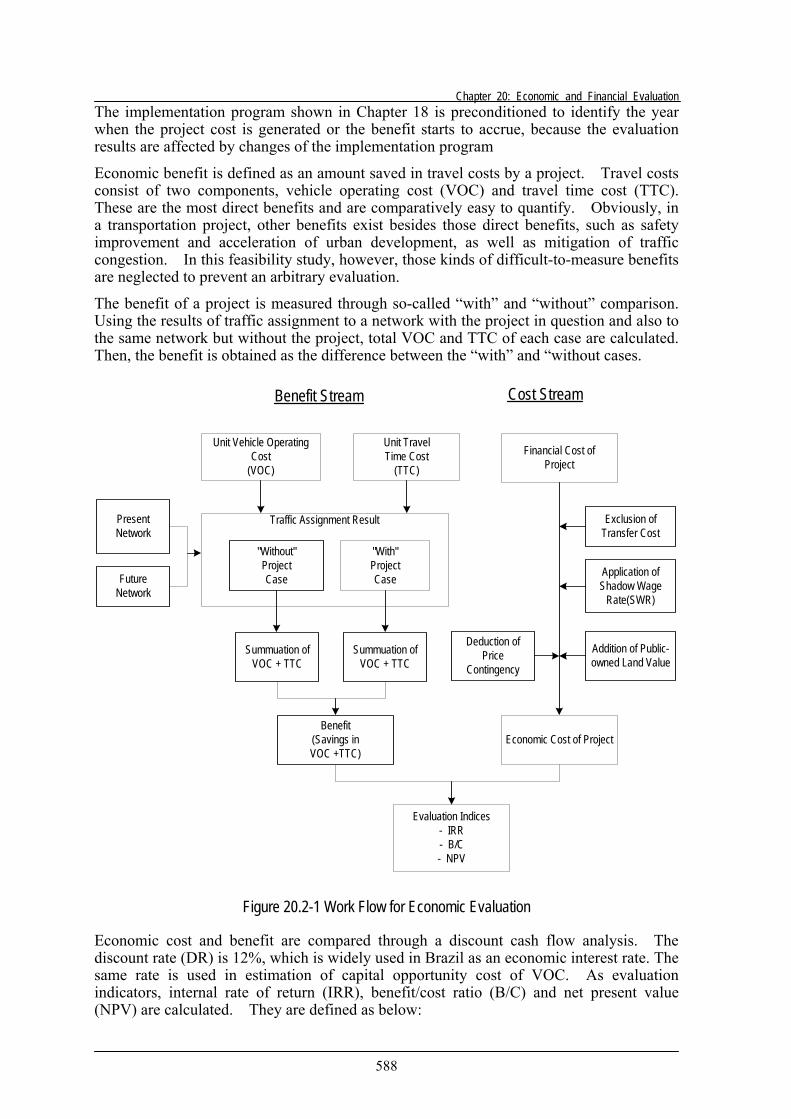
In this section, the trunk bus system project and the road projects are evaluated from the economic viewpoint, following a normative method of the cost-benefit analysis. To measure and compare cost and benefit of the projects in economic price, the procedure shown in Figure 20.2-1 was taken.
Economic cost is a monetary expression of goods and services really consumed for a project implementation. Then, all the transfer cost (tax and subsidy) will be deducted from the cost measured in market price. In addition, shadow wage rates (SWRs) are applied to unskilled labor costs included in the project cost. The same process is taken to estimate unit cost of vehicle operation, which is used for estimation of economic benefits, by excluding all taxes and applying the SWRs to labor cost of mechanics and crews.
Chapter 20: Economic and Financial Evaluation
588
The implementation program shown in Chapter 18 is preconditioned to identify the year when the project cost is generated or the benefit starts to accrue, because the evaluation results are affected by changes of the implementation program
Economic benefit is defined as an amount saved in travel costs by a project. Travel costs consist of two components, vehicle operating cost (VOC) and travel time cost (TTC). These are the most direct benefits and are comparatively easy to quantify. Obviously, in a transportation project, other benefits exist besides those direct benefits, such as safety improvement and acceleration of urban development, as well as mitigation of traffic congestion. In this feasibility study, however, those kinds of difficult-to-measure benefits are neglected to prevent an arbitrary evaluation.
The benefit of a project is measured through so-called “with” and “without” comparison. Using the results of traffic assignment to a network with the project in question and also to the same network but without the project, total VOC and TTC of each case are calculated. Then, the benefit is obtained as the difference between the “with” and “without cases.
Traffic Assignment ResultPresentNetwork
FutureNetwork
Unit TravelTime Cost
(TTC)
"Without"ProjectCase
Unit Vehicle OperatingCost
(VOC)
Evaluation Indices- IRR- B/C- NPV
Benefit(Savings inVOC +TTC)
Summuation ofVOC + TTC
Summuation ofVOC + TTC
Economic Cost of Project
Application ofShadow Wage
Rate(SWR)
Exclusion ofTransfer Cost
Financial Cost ofProject
"With"ProjectCase
Addition of Public-owned Land Value
Deduction ofPrice
Contingency
Benefit Stream Cost Stream
Figure 20.2-1 Work Flow for Economic Evaluation
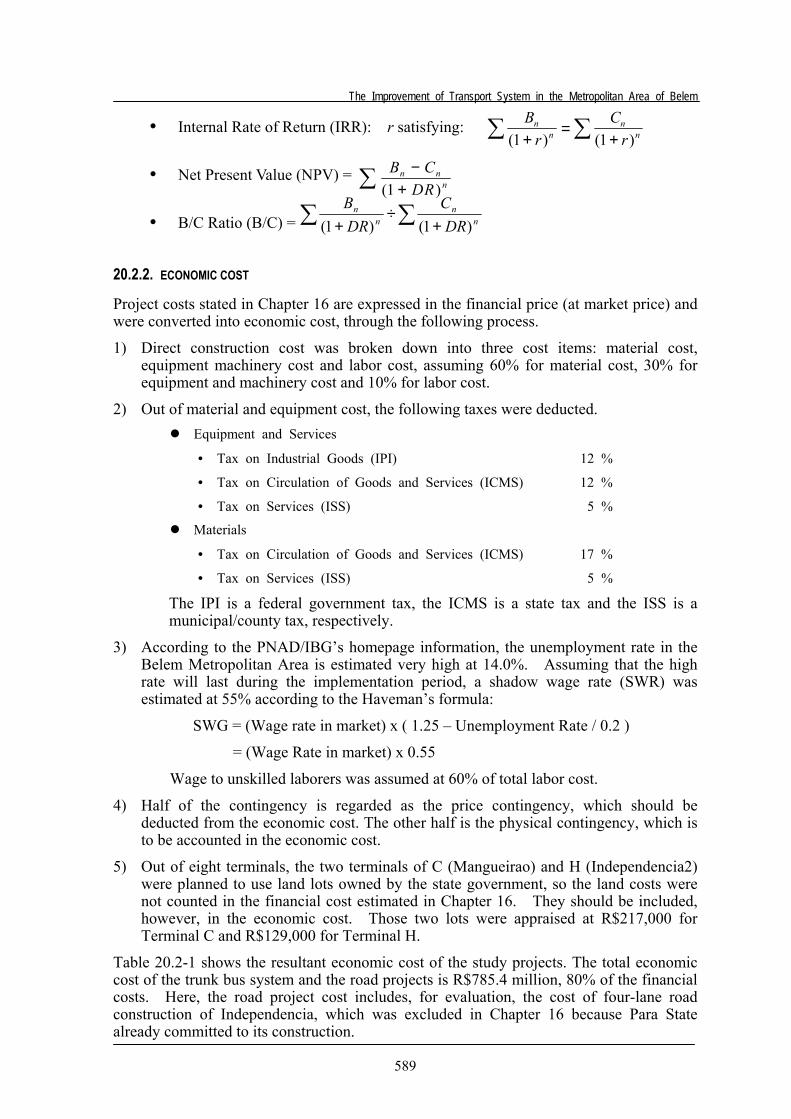
Economic cost and benefit are compared through a discount cash flow analysis. The discount rate (DR) is 12%, which is widely used in Brazil as an economic interest rate. The same rate is used in estimation of capital opportunity cost of VOC. As evaluation indicators, internal rate of return (IRR), benefit/cost ratio (B/C) and net present value (NPV) are calculated. They are defined as below:
The Improvement of Transport System in the Metropolitan Area of Belem
589
20.2.2. ECONOMIC COST
Project costs stated in Chapter 16 are expressed in the financial price (at market price) and were converted into economic cost, through the following process.
1) Direct construction cost was broken down into three cost items: material cost, equipment machinery cost and labor cost, assuming 60% for material cost, 30% for equipment and machinery cost and 10% for labor cost.
2) Out of material and equipment cost, the following taxes were deducted. Equipment and Services
• Tax on Industrial Goods (IPI) 12 %
• Tax on Circulation of Goods and Services (ICMS) 12 %
• Tax on Services (ISS) 5 %
Materials
• Tax on Circulation of Goods and Services (ICMS) 17 %
• Tax on Services (ISS) 5 %
The IPI is a federal government tax, the ICMS is a state tax and the ISS is a municipal/county tax, respectively.
3) According to the PNAD/IBG’s homepage information, the unemployment rate in the Belem Metropolitan Area is estimated very high at 14.0%. Assuming that the high rate will last during the implementation period, a shadow wage rate (SWR) was estimated at 55% according to the Haveman’s formula:
SWG = (Wage rate in market) x ( 1.25 – Unemployment Rate / 0.2 )
= (Wage Rate in market) x 0.55
Wage to unskilled laborers was assumed at 60% of total labor cost.
4) Half of the contingency is regarded as the price contingency, which should be deducted from the economic cost. The other half is the physical contingency, which is to be accounted in the economic cost.
5) Out of eight terminals, the two terminals of C (Mangueirao) and H (Independencia2) were planned to use land lots owned by the state government, so the land costs were not counted in the financial cost estimated in Chapter 16. They should be included, however, in the economic cost. Those two lots were appraised at R$217,000 for Terminal C and R$129,000 for Terminal H.
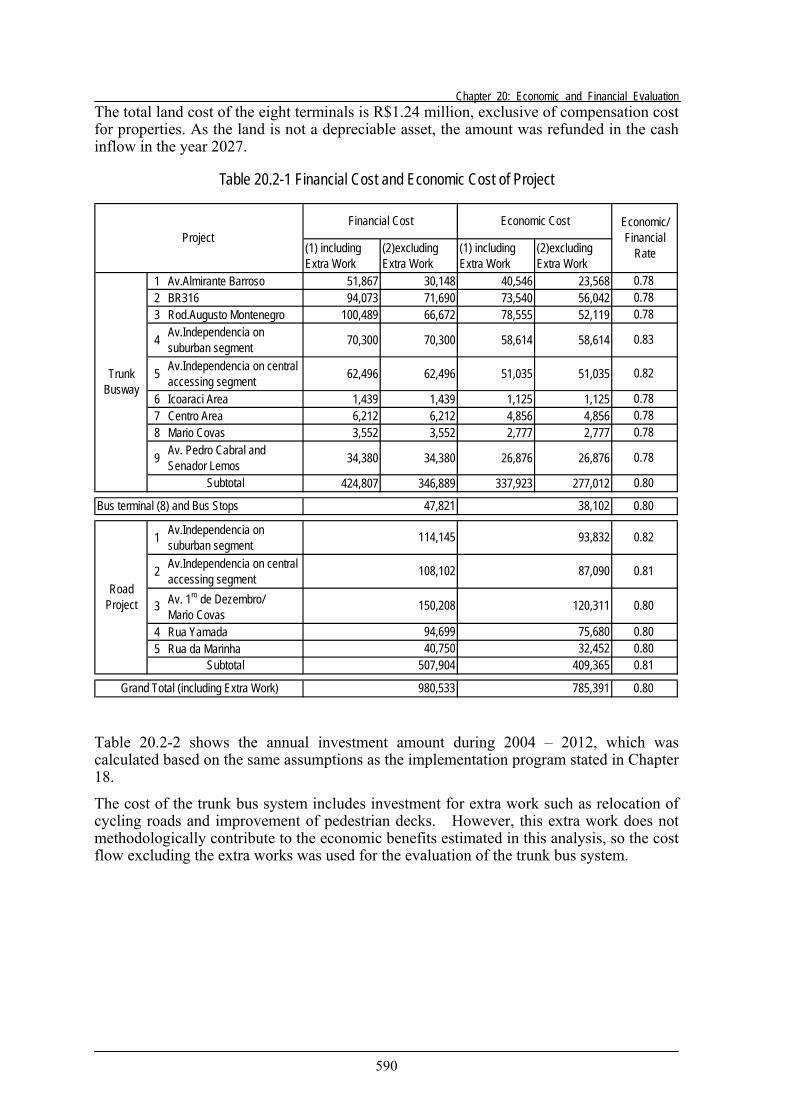
Table 20.2-1 shows the resultant economic cost of the study projects. The total economic cost of the trunk bus system and the road projects is R$785.4 million, 80% of the financial costs. Here, the road project cost includes, for evaluation, the cost of four-lane road construction of Independencia, which was excluded in Chapter 16 because Para State already committed to its construction.
Br
Cr
nn
nn( ) ( )1 1+
=+∑ ∑• Internal Rate of Return (IRR): r satisfying:
• Net Present Value (NPV) = B CDR
n nn
−+∑ ( )1
• B/C Ratio (B/C) = ∑∑ +÷
+ nn
nn
DRC
DRB
)1()1(
Chapter 20: Economic and Financial Evaluation
590
The total land cost of the eight terminals is R$1.24 million, exclusive of compensation cost for properties. As the land is not a depreciable asset, the amount was refunded in the cash inflow in the year 2027.
Table 20.2-1 Financial Cost and Economic Cost of Project
(1) includingExtra Work
(2)excludingExtra Work
(1) includingExtra Work
(2)excludingExtra Work
1 Av.Almirante Barroso 51,867 30,148 40,546 23,5682 BR316 94,073 71,690 73,540 56,0423 Rod.Augusto Montenegro 100,489 66,672 78,555 52,119
4 Av.Independencia onsuburban segment 70,300 70,300 58,614 58,614
5 Av.Independencia on centralaccessing segment 62,496 62,496 51,035 51,035
6 Icoaraci Area 1,439 1,439 1,125 1,1257 Centro Area 6,212 6,212 4,856 4,8568 Mario Covas 3,552 3,552 2,777 2,777
9 Av. Pedro Cabral andSenador Lemos 34,380 34,380 26,876 26,876
424,807 346,889 337,923 277,012
1 Av.Independencia onsuburban segment
2 Av.Independencia on centralaccessing segment
3 Av. 1ro de Dezembro/Mario Covas
4 Rua Yamada5 Rua da Marinha
0.80
0.800.80
Economic Cost
93,832 0.82
0.780.780.78
0.83
Subtotal 507,904 409,365
0.81
150,208
94,69940,750
120,311
75,68032,452
0.78
Economic/Financial
Rate
TrunkBusway
Subtotal
0.82
0.780.780.78
Project Financial Cost
0.81
0.80
Grand Total (including Extra Work) 980,533 785,391 0.80
114,145
108,102 87,090Road
Project
Bus terminal (8) and Bus Stops 47,821 38,102 0.80
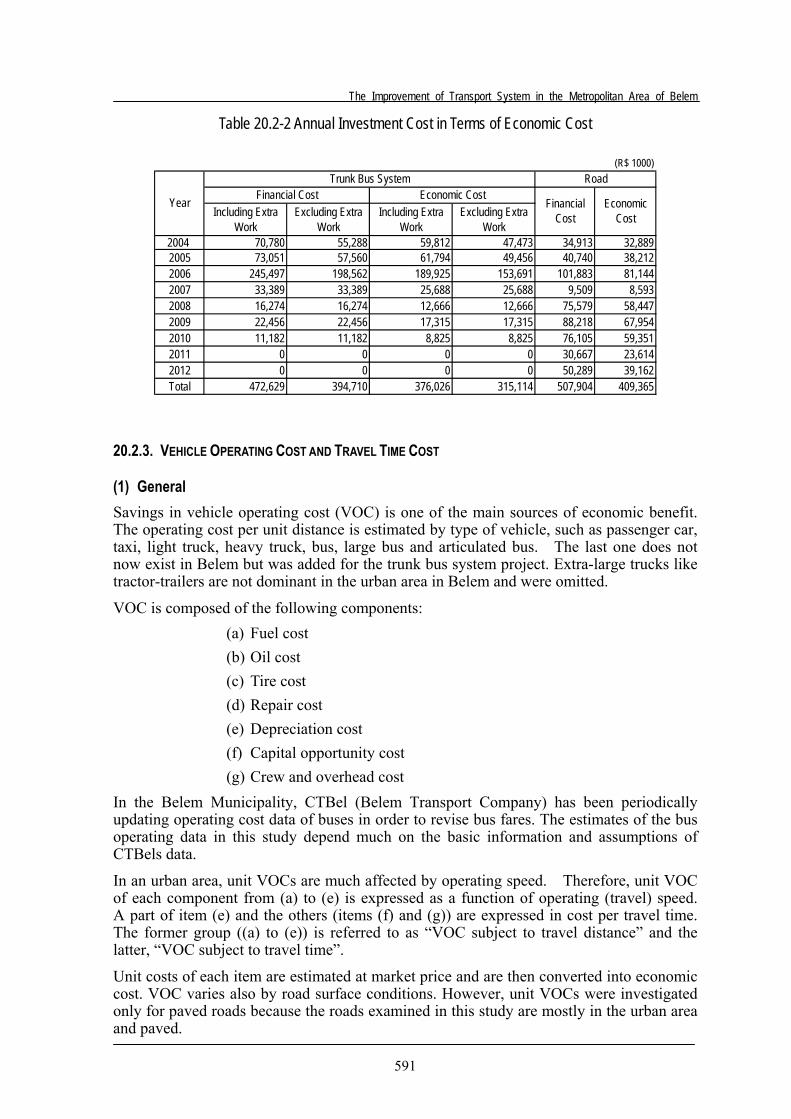
Table 20.2-2 shows the annual investment amount during 2004 – 2012, which was calculated based on the same assumptions as the implementation program stated in Chapter 18.
The cost of the trunk bus system includes investment for extra work such as relocation of cycling roads and improvement of pedestrian decks. However, this extra work does not methodologically contribute to the economic benefits estimated in this analysis, so the cost flow excluding the extra works was used for the evaluation of the trunk bus system.
The Improvement of Transport System in the Metropolitan Area of Belem
591
Table 20.2-2 Annual Investment Cost in Terms of Economic Cost
(R$ 1000)
Including ExtraWork
Excluding ExtraWork
Including ExtraWork
Excluding ExtraWork
2004 70,780 55,288 59,812 47,473 34,913 32,8892005 73,051 57,560 61,794 49,456 40,740 38,2122006 245,497 198,562 189,925 153,691 101,883 81,1442007 33,389 33,389 25,688 25,688 9,509 8,5932008 16,274 16,274 12,666 12,666 75,579 58,4472009 22,456 22,456 17,315 17,315 88,218 67,9542010 11,182 11,182 8,825 8,825 76,105 59,3512011 0 0 0 0 30,667 23,6142012 0 0 0 0 50,289 39,162Total 472,629 394,710 376,026 315,114 507,904 409,365
Year
Trunk Bus System RoadFinancial Cost Economic Cost
FinancialCost
EconomicCost
20.2.3. VEHICLE OPERATING COST AND TRAVEL TIME COST
(1) General Savings in vehicle operating cost (VOC) is one of the main sources of economic benefit. The operating cost per unit distance is estimated by type of vehicle, such as passenger car, taxi, light truck, heavy truck, bus, large bus and articulated bus. The last one does not now exist in Belem but was added for the trunk bus system project. Extra-large trucks like tractor-trailers are not dominant in the urban area in Belem and were omitted.
VOC is composed of the following components: (a) Fuel cost (b) Oil cost (c) Tire cost (d) Repair cost (e) Depreciation cost (f) Capital opportunity cost (g) Crew and overhead cost
In the Belem Municipality, CTBel (Belem Transport Company) has been periodically updating operating cost data of buses in order to revise bus fares. The estimates of the bus operating data in this study depend much on the basic information and assumptions of CTBels data.
In an urban area, unit VOCs are much affected by operating speed. Therefore, unit VOC of each component from (a) to (e) is expressed as a function of operating (travel) speed. A part of item (e) and the others (items (f) and (g)) are expressed in cost per travel time. The former group ((a) to (e)) is referred to as “VOC subject to travel distance” and the latter, “VOC subject to travel time”.
Unit costs of each item are estimated at market price and are then converted into economic cost. VOC varies also by road surface conditions. However, unit VOCs were investigated only for paved roads because the roads examined in this study are mostly in the urban area and paved.
Chapter 20: Economic and Financial Evaluation
592
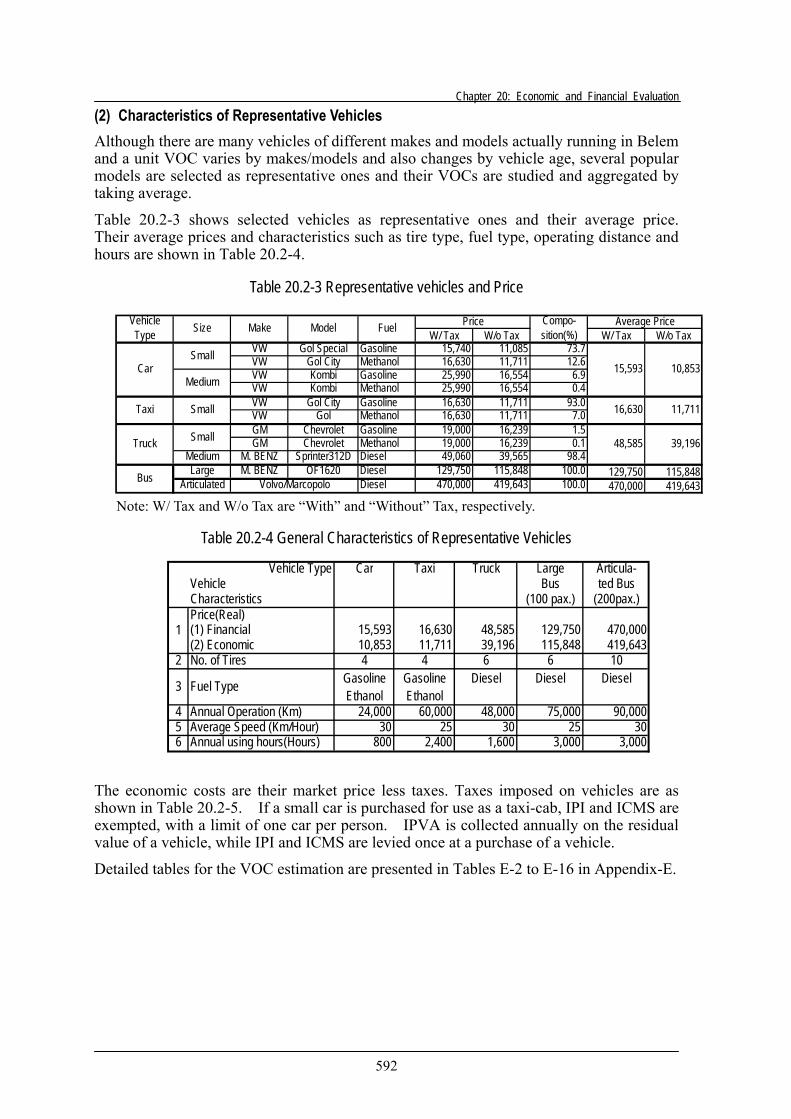
(2) Characteristics of Representative Vehicles Although there are many vehicles of different makes and models actually running in Belem and a unit VOC varies by makes/models and also changes by vehicle age, several popular models are selected as representative ones and their VOCs are studied and aggregated by taking average.
Table 20.2-3 shows selected vehicles as representative ones and their average price. Their average prices and characteristics such as tire type, fuel type, operating distance and hours are shown in Table 20.2-4.
Table 20.2-3 Representative vehicles and Price
Note: W/ Tax and W/o Tax are “With” and “Without” Tax, respectively.
Table 20.2-4 General Characteristics of Representative Vehicles
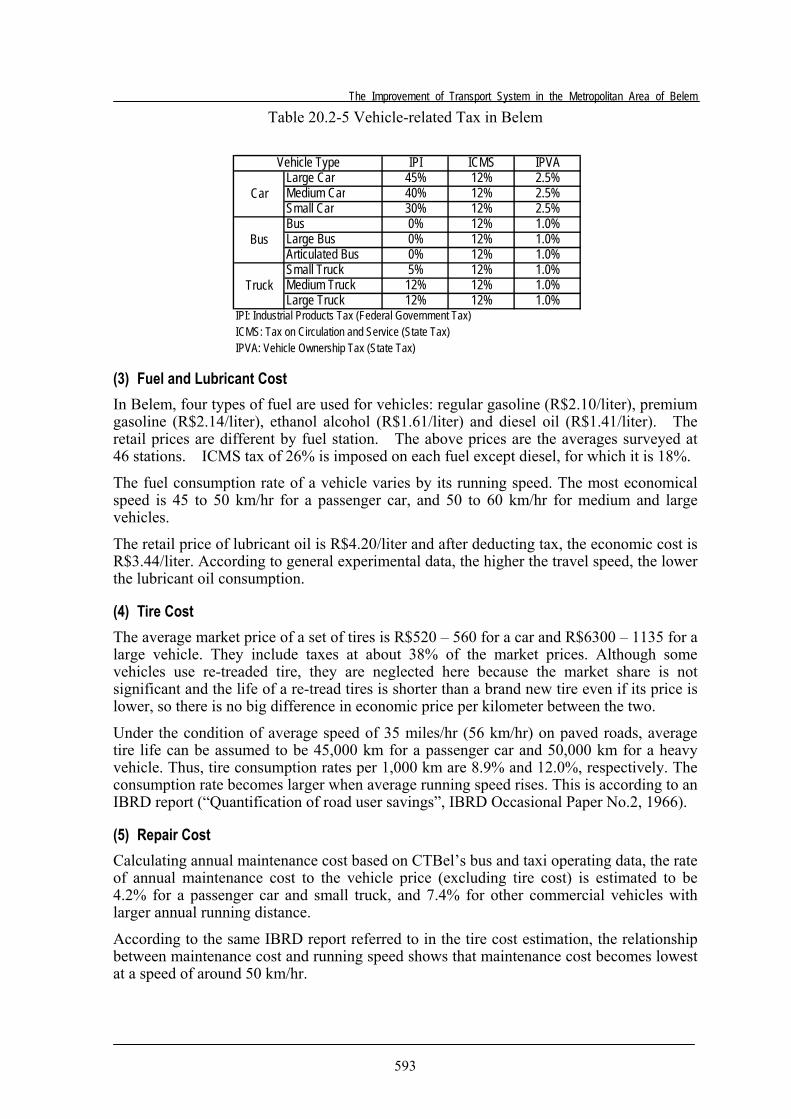
The economic costs are their market price less taxes. Taxes imposed on vehicles are as shown in Table 20.2-5. If a small car is purchased for use as a taxi-cab, IPI and ICMS are exempted, with a limit of one car per person. IPVA is collected annually on the residual value of a vehicle, while IPI and ICMS are levied once at a purchase of a vehicle.
Detailed tables for the VOC estimation are presented in Tables E-2 to E-16 in Appendix-E.
W/ Tax W/o Tax W/ Tax W/o TaxVW Gol Special Gasoline 15,740 11,085 73.7VW Gol City Methanol 16,630 11,711 12.6VW Kombi Gasoline 25,990 16,554 6.9VW Kombi Methanol 25,990 16,554 0.4VW Gol City Gasoline 16,630 11,711 93.0VW Gol Methanol 16,630 11,711 7.0GM Chevrolet Gasoline 19,000 16,239 1.5GM Chevrolet Methanol 19,000 16,239 0.1
Medium M. BENZ Sprinter312D Diesel 49,060 39,565 98.4Large M. BENZ OF1620 Diesel 129,750 115,848 100.0 129,750 115,848
Articulated Diesel 470,000 419,643 100.0 470,000 419,643
15,593
16,630
48,585
Average Price
10,853
11,711
39,196
Make Model
Taxi
Truck
Small
Small
Fuel
Volvo/MarcopoloBus
Compo-sition(%)
Car
Size
Small
Medium
PriceVehicleType
Vehicle Type Car Taxi Truck Large Articula-Vehicle Bus ted BusCharacteristics (100 pax.) (200pax.)
15,593 16,630 48,585 129,750 470,00010,853 11,711 39,196 115,848 419,643
2 4 4 6 6 10Gasoline Gasoline Diesel Diesel DieselEthanol Ethanol
4 24,000 60,000 48,000 75,000 90,0005 30 25 30 25 306 800 2,400 1,600 3,000 3,000
Average Speed (Km/Hour)Annual using hours(Hours)
Price(Real)(1) Financial(2) EconomicNo. of Tires
3 Fuel Type
1
Annual Operation (Km)
The Improvement of Transport System in the Metropolitan Area of Belem
593
Table 20.2-5 Vehicle-related Tax in Belem
(3) Fuel and Lubricant Cost In Belem, four types of fuel are used for vehicles: regular gasoline (R$2.10/liter), premium gasoline (R$2.14/liter), ethanol alcohol (R$1.61/liter) and diesel oil (R$1.41/liter). The retail prices are different by fuel station. The above prices are the averages surveyed at 46 stations. ICMS tax of 26% is imposed on each fuel except diesel, for which it is 18%.
The fuel consumption rate of a vehicle varies by its running speed. The most economical speed is 45 to 50 km/hr for a passenger car, and 50 to 60 km/hr for medium and large vehicles.
The retail price of lubricant oil is R$4.20/liter and after deducting tax, the economic cost is R$3.44/liter. According to general experimental data, the higher the travel speed, the lower the lubricant oil consumption.
(4) Tire Cost The average market price of a set of tires is R$520 – 560 for a car and R$6300 – 1135 for a large vehicle. They include taxes at about 38% of the market prices. Although some vehicles use re-treaded tire, they are neglected here because the market share is not significant and the life of a re-tread tires is shorter than a brand new tire even if its price is lower, so there is no big difference in economic price per kilometer between the two.
Under the condition of average speed of 35 miles/hr (56 km/hr) on paved roads, average tire life can be assumed to be 45,000 km for a passenger car and 50,000 km for a heavy vehicle. Thus, tire consumption rates per 1,000 km are 8.9% and 12.0%, respectively. The consumption rate becomes larger when average running speed rises. This is according to an IBRD report (“Quantification of road user savings”, IBRD Occasional Paper No.2, 1966).
(5) Repair Cost Calculating annual maintenance cost based on CTBel’s bus and taxi operating data, the rate of annual maintenance cost to the vehicle price (excluding tire cost) is estimated to be 4.2% for a passenger car and small truck, and 7.4% for other commercial vehicles with larger annual running distance.
According to the same IBRD report referred to in the tire cost estimation, the relationship between maintenance cost and running speed shows that maintenance cost becomes lowest at a speed of around 50 km/hr.
IPI ICMS IPVALarge Car 45% 12% 2.5%Medium Car 40% 12% 2.5%Small Car 30% 12% 2.5%Bus 0% 12% 1.0%Large Bus 0% 12% 1.0%Articulated Bus 0% 12% 1.0%Small Truck 5% 12% 1.0%Medium Truck 12% 12% 1.0%Large Truck 12% 12% 1.0%
IPI: Industrial Products Tax (Federal Government Tax)ICMS: Tax on Circulation and Service (State Tax)IPVA: Vehicle Ownership Tax (State Tax)
Car
Bus
Truck
Vehicle Type
Chapter 20: Economic and Financial Evaluation
594
(6) Depreciation Cost Depreciable amount is defined as the vehicle economic cost (without tire cost) less salvage cost after use during vehicle life. In Belem, where the market for secondhand vehicles and spare parts is well developed, the salvage value rate should be assumed at a rather high rate, specifically, 25% for a passenger car, 10% for a taxi, 15% for a small truck and 20% for buses.
Vehicles are devalued through their use in proportion to running kilometers, while their value will decrease as they become old, even without use. Particularly, passenger cars lose value rapidly as time passes. Therefore, the proportion of depreciation subject to use and depreciation subject to time may be assumed as follows: 50:50 for passenger car and 70:30 for others.
Depreciation subject to use is further subdivided into two parts. It is assumed that one third of this cost depends on the driven distance and two thirds is affected by running speed, in the same way as maintenance cost.
Time-related depreciation in the table presents daily depreciation cost which is the depreciable amount divided by number of days during the life period. This cost is independent from driven distance and from running speed. Therefore, this cost shall be calculated separately based on the number of vehicles in the region and added to the other costs which are affected by running speed. The same can be said for the capital opportunity cost, crew cost and overhead cost.
(7) Capital Opportunity Cost (Interest) This cost is not affected by use but accrues only as time passes and is determined by vehicle price, life period, salvage value rate and interest rate, using the following formula:
C = P (1 - r) F – P / n + i r P F = i (1 + i)n / ( (1 + i)n – 1) Where, C : Capital opportunity cost (Interest)
P : Economic cost of vehicle F : Capital recovery factor r : Salvage value rate i : Interest rate n : Durability (Vehicle life)
Interest rate is assumed at 12% which is the same rate as the discount rate used when calculating evaluation indices. Total capital opportunity cost in the study area is the product of this daily cost and total number of vehicles existing in the area. Therefore, in a with-and-without comparison for project evaluation, this cost will be cancelled if both cases have the same number of vehicles.
(8) Crew Cost and Overhead Cost Also, this cost is not affected by driven distance but is proportional to time. According to CTBel’s data, the average annual wage of a bus driver is about R$15,000 (13 times the monthly salary) while that of a taxi drivers is lower than this amount by approximately 45%. The average wage of a truck driver is the same as a bus driver’s.
The Improvement of Transport System in the Metropolitan Area of Belem
595
In Belem, most taxis and trucks are owned by individuals, not by an enterprise. Under these circumstances, therefore, not much overhead cost is needed. Bus owner’s profit is not regarded as economic cost, and the overhead cost of the truck transport business is about 30% of crew cost.
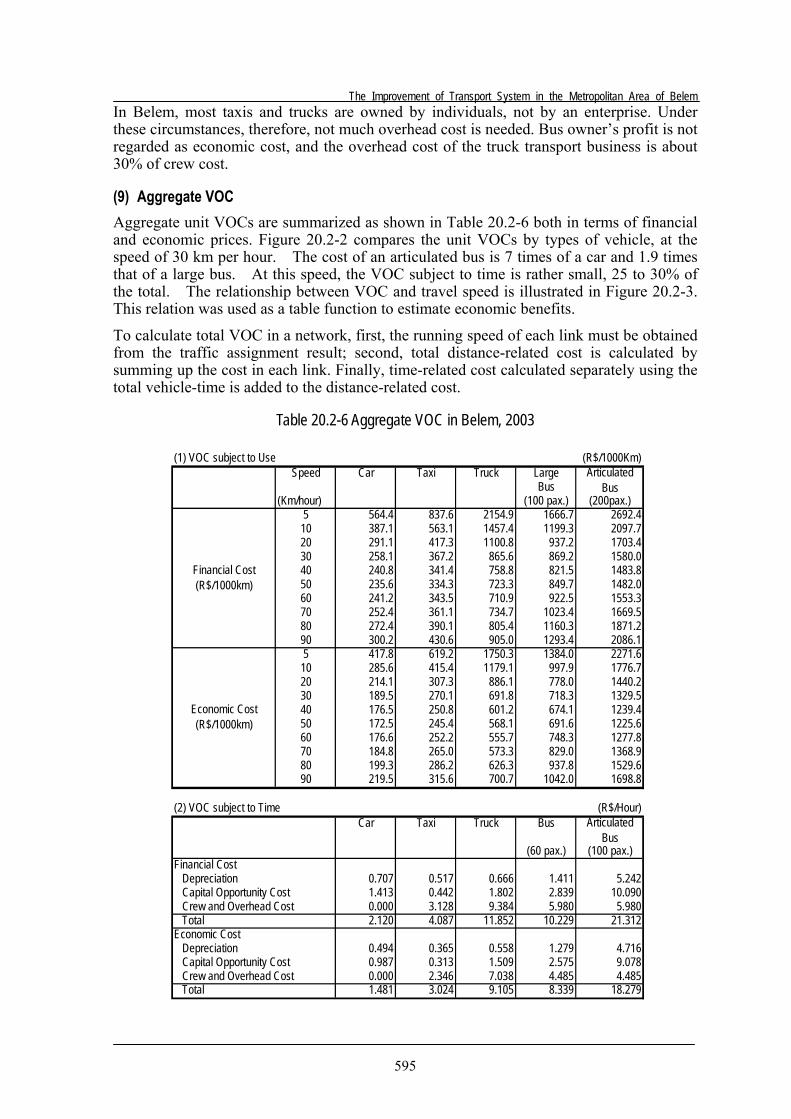
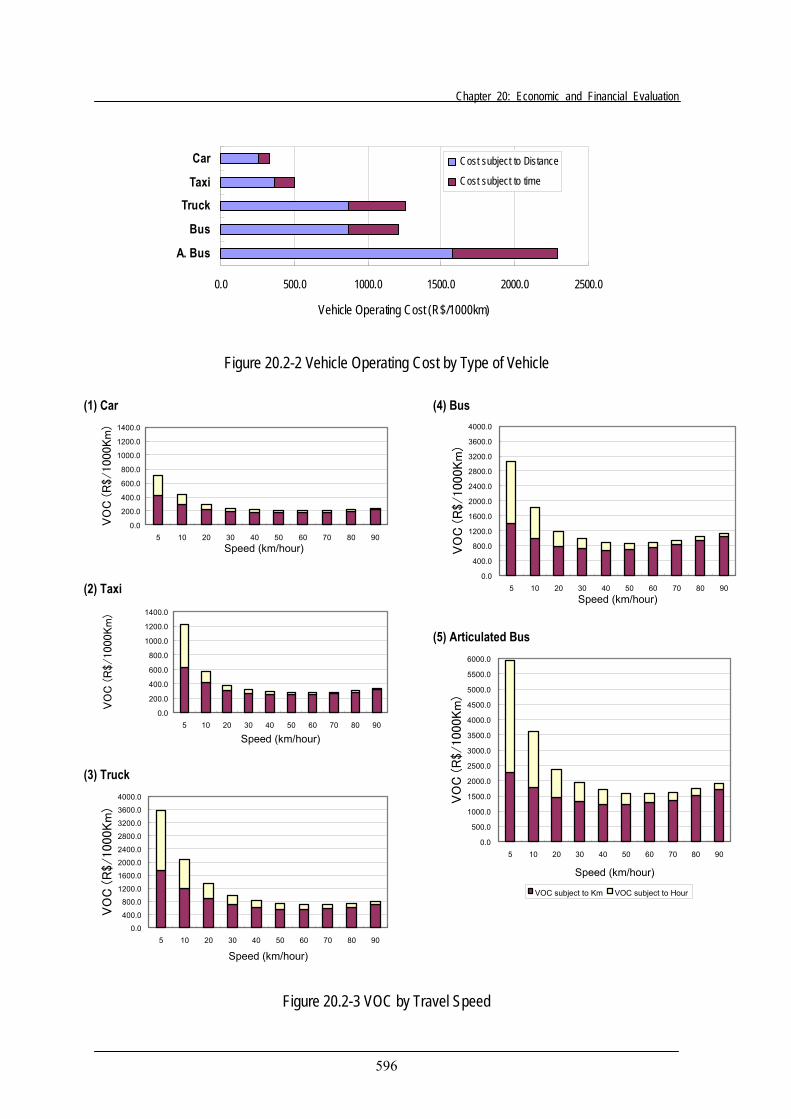
(9) Aggregate VOC Aggregate unit VOCs are summarized as shown in Table 20.2-6 both in terms of financial and economic prices. Figure 20.2-2 compares the unit VOCs by types of vehicle, at the speed of 30 km per hour. The cost of an articulated bus is 7 times of a car and 1.9 times that of a large bus. At this speed, the VOC subject to time is rather small, 25 to 30% of the total. The relationship between VOC and travel speed is illustrated in Figure 20.2-3. This relation was used as a table function to estimate economic benefits.
To calculate total VOC in a network, first, the running speed of each link must be obtained from the traffic assignment result; second, total distance-related cost is calculated by summing up the cost in each link. Finally, time-related cost calculated separately using the total vehicle-time is added to the distance-related cost.
Table 20.2-6 Aggregate VOC in Belem, 2003
(1) VOC subject to Use (R$/1000Km)Speed Car Taxi Truck Large
Bus(Km/hour) (100 pax.) (200pax.)
5 564.4 837.6 2154.9 1666.7 2692.410 387.1 563.1 1457.4 1199.3 2097.720 291.1 417.3 1100.8 937.2 1703.430 258.1 367.2 865.6 869.2 1580.040 240.8 341.4 758.8 821.5 1483.850 235.6 334.3 723.3 849.7 1482.060 241.2 343.5 710.9 922.5 1553.370 252.4 361.1 734.7 1023.4 1669.580 272.4 390.1 805.4 1160.3 1871.290 300.2 430.6 905.0 1293.4 2086.15 417.8 619.2 1750.3 1384.0 2271.610 285.6 415.4 1179.1 997.9 1776.720 214.1 307.3 886.1 778.0 1440.230 189.5 270.1 691.8 718.3 1329.540 176.5 250.8 601.2 674.1 1239.450 172.5 245.4 568.1 691.6 1225.660 176.6 252.2 555.7 748.3 1277.870 184.8 265.0 573.3 829.0 1368.980 199.3 286.2 626.3 937.8 1529.690 219.5 315.6 700.7 1042.0 1698.8
(2) VOC subject to Time (R$/Hour)Car Taxi Truck Bus
(60 pax.) (100 pax.)Financial Cost Depreciation 0.707 0.517 0.666 1.411 5.242 Capital Opportunity Cost 1.413 0.442 1.802 2.839 10.090 Crew and Overhead Cost 0.000 3.128 9.384 5.980 5.980 Total 2.120 4.087 11.852 10.229 21.312Economic Cost Depreciation 0.494 0.365 0.558 1.279 4.716 Capital Opportunity Cost 0.987 0.313 1.509 2.575 9.078 Crew and Overhead Cost 0.000 2.346 7.038 4.485 4.485 Total 1.481 3.024 9.105 8.339 18.279
ArticulatedBus
ArticulatedBus
Financial Cost(R$/1000km)
Economic Cost(R$/1000km)
Chapter 20: Economic and Financial Evaluation
596
0.0 500.0 1000.0 1500.0 2000.0 2500.0
A. Bus
Bus
Truck
Taxi
Car
Vehicle Operating Cost (R$/1000km)
Cost subject to Distance
Cost subject to time
Figure 20.2-2 Vehicle Operating Cost by Type of Vehicle
Figure 20.2-3 VOC by Travel Speed
(1) Car (4) Bus
(2) Taxi
(5) Articulated Bus
(3) Truck
0.0
200.0
400.0
600.0
800.0
1000.0
1200.0
1400.0
5 10 20 30 40 50 60 70 80 90Speed (km/hour)
VO
C (R
$/1000Km
)
0.0
200.0
400.0
600.0
800.0
1000.0
1200.0
1400.0
5 10 20 30 40 50 60 70 80 90
Speed (km/hour)
VO
C (
R$/1000Km
)
0.0
400.0
800.0
1200.0
1600.0
2000.0
2400.0
2800.0
3200.0
3600.0
4000.0
5 10 20 30 40 50 60 70 80 90
Speed (km/hour)
VO
C (
R$/1000Km
)
0.0
400.0
800.0
1200.0
1600.0
2000.0
2400.0
2800.0
3200.0
3600.0
4000.0
5 10 20 30 40 50 60 70 80 90Speed (km/hour)
VO
C (
R$/1000Km
)
0.0
500.0
1000.0
1500.0
2000.0
2500.0
3000.0
3500.0
4000.0
4500.0
5000.0
5500.0
6000.0
5 10 20 30 40 50 60 70 80 90
Speed (km/hour)
VO
C (
R$/1000Km
)
VOC subject to Km VOC subject to Hour
The Improvement of Transport System in the Metropolitan Area of Belem
597
20.2.4. TRAVEL TIME VALUE
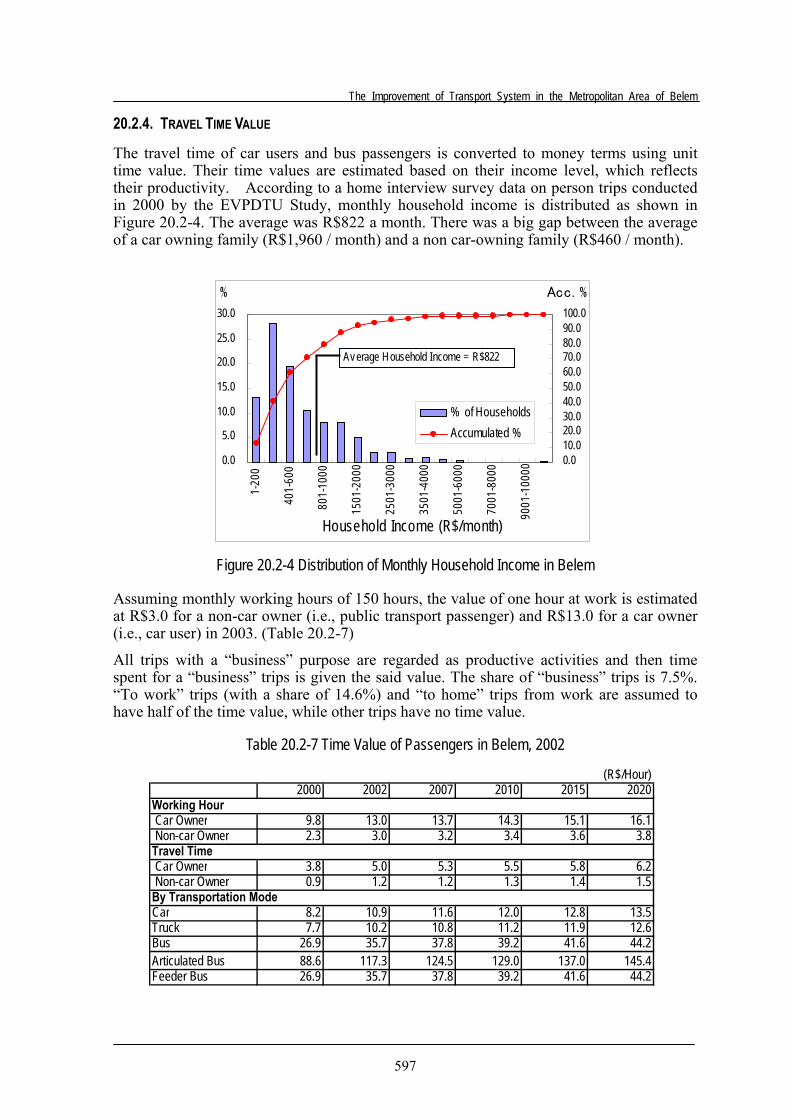
The travel time of car users and bus passengers is converted to money terms using unit time value. Their time values are estimated based on their income level, which reflects their productivity. According to a home interview survey data on person trips conducted in 2000 by the EVPDTU Study, monthly household income is distributed as shown in Figure 20.2-4. The average was R$822 a month. There was a big gap between the average of a car owning family (R$1,960 / month) and a non car-owning family (R$460 / month).
Figure 20.2-4 Distribution of Monthly Household Income in Belem
Assuming monthly working hours of 150 hours, the value of one hour at work is estimated at R$3.0 for a non-car owner (i.e., public transport passenger) and R$13.0 for a car owner (i.e., car user) in 2003. (Table 20.2-7)
All trips with a “business” purpose are regarded as productive activities and then time spent for a “business” trips is given the said value. The share of “business” trips is 7.5%. “To work” trips (with a share of 14.6%) and “to home” trips from work are assumed to have half of the time value, while other trips have no time value.
Table 20.2-7 Time Value of Passengers in Belem, 2002
(R$/Hour)2000 2002 2007 2010 2015 2020
Working Hour Car Owner 9.8 13.0 13.7 14.3 15.1 16.1 Non-car Owner 2.3 3.0 3.2 3.4 3.6 3.8Travel Time Car Owner 3.8 5.0 5.3 5.5 5.8 6.2 Non-car Owner 0.9 1.2 1.2 1.3 1.4 1.5By Transportation ModeCar 8.2 10.9 11.6 12.0 12.8 13.5Truck 7.7 10.2 10.8 11.2 11.9 12.6Bus 26.9 35.7 37.8 39.2 41.6 44.2Articulated Bus 88.6 117.3 124.5 129.0 137.0 145.4Feeder Bus 26.9 35.7 37.8 39.2 41.6 44.2
0.0
5.0
10.0
15.0
20.0
25.0
30.0
1-20
0
401-
600
801-
1000
1501
-200
0
2501
-300
0
3501
-400
0
5001
-600
0
7001
-800
0
9001
-100
00Household Income (R$/month)
%
0.010.020.030.040.050.060.070.080.090.0100.0
Acc. %
% of HouseholdsAccumulated %
Average Household Income = R$822
Chapter 20: Economic and Financial Evaluation
598
Time value will change by year. The higher people’s productivity rises, the larger the time value becomes. Then, it may be reasonable to assume the time value will rise at the same rate as GRDP per capita growth. In this study, GRDP per capita is assumed to grow at 1.2% p.a., and accordingly, time values will rise to 1.24 times those in 2002.
Total TTC is estimated by multiplying these unit time values by aggregate passenger-hours by a mode calculated from assigned traffic in a network.
20.2.5. RESULTS OF ECONOMIC EVALUATION
(1) Entire Projects
1) Economic Benefit
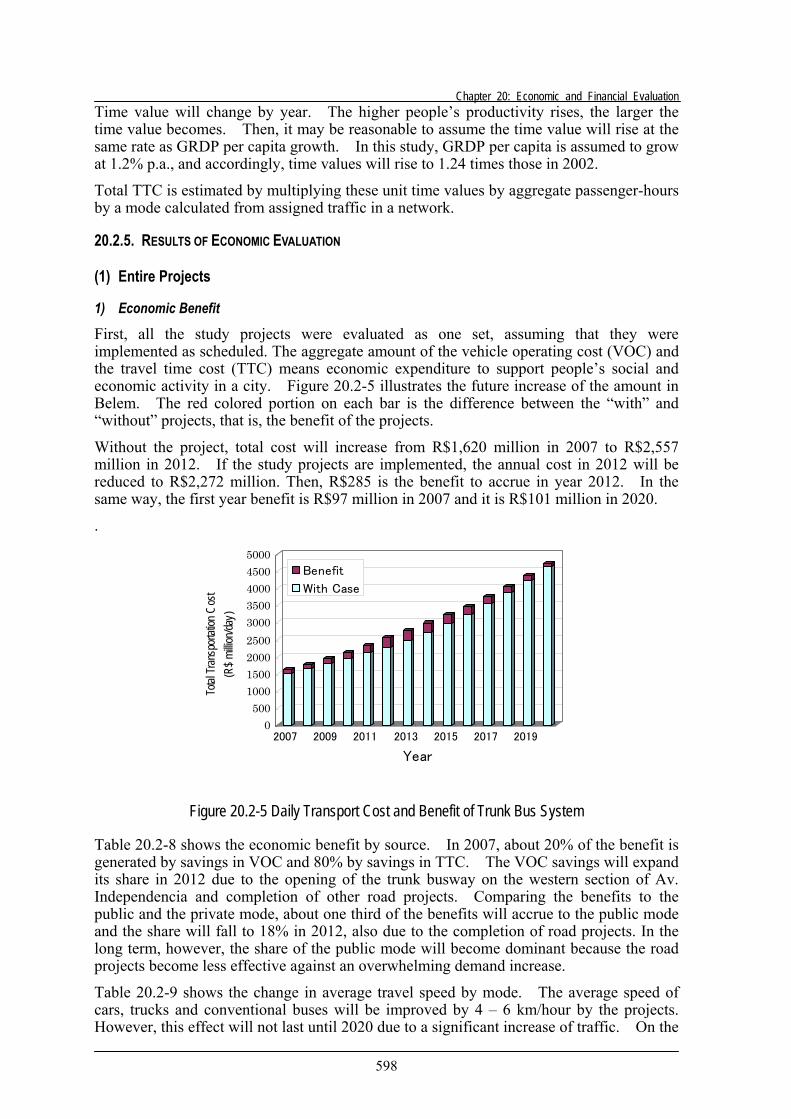
First, all the study projects were evaluated as one set, assuming that they were implemented as scheduled. The aggregate amount of the vehicle operating cost (VOC) and the travel time cost (TTC) means economic expenditure to support people’s social and economic activity in a city. Figure 20.2-5 illustrates the future increase of the amount in Belem. The red colored portion on each bar is the difference between the “with” and “without” projects, that is, the benefit of the projects.
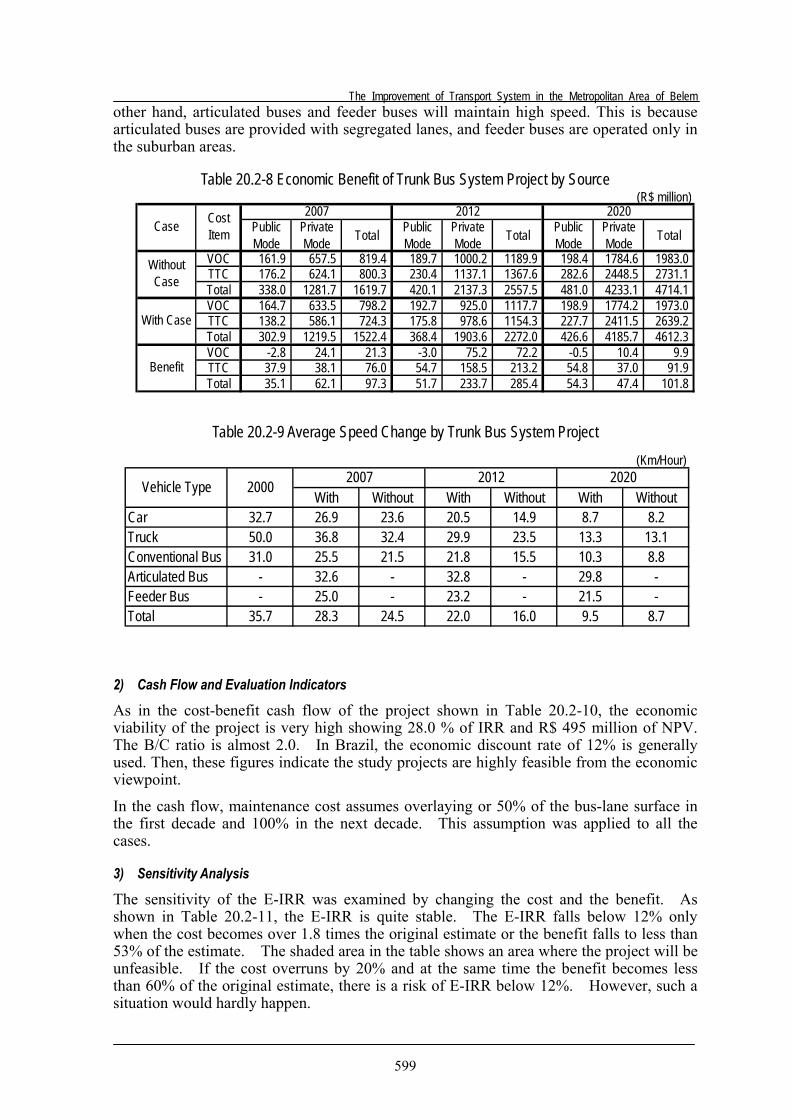
Without the project, total cost will increase from R$1,620 million in 2007 to R$2,557 million in 2012. If the study projects are implemented, the annual cost in 2012 will be reduced to R$2,272 million. Then, R$285 is the benefit to accrue in year 2012. In the same way, the first year benefit is R$97 million in 2007 and it is R$101 million in 2020.
.
Figure 20.2-5 Daily Transport Cost and Benefit of Trunk Bus System
Table 20.2-8 shows the economic benefit by source. In 2007, about 20% of the benefit is generated by savings in VOC and 80% by savings in TTC. The VOC savings will expand its share in 2012 due to the opening of the trunk busway on the western section of Av. Independencia and completion of other road projects. Comparing the benefits to the public and the private mode, about one third of the benefits will accrue to the public mode and the share will fall to 18% in 2012, also due to the completion of road projects. In the long term, however, the share of the public mode will become dominant because the road projects become less effective against an overwhelming demand increase.
Table 20.2-9 shows the change in average travel speed by mode. The average speed of cars, trucks and conventional buses will be improved by 4 – 6 km/hour by the projects. However, this effect will not last until 2020 due to a significant increase of traffic. On the
0500
100015002000250030003500400045005000
Total
Tran
sport
ation
Cos
t(R
$ millio
n/day
)
2007 2009 2011 2013 2015 2017 2019
Year
Benefit
With Case
The Improvement of Transport System in the Metropolitan Area of Belem
599
other hand, articulated buses and feeder buses will maintain high speed. This is because articulated buses are provided with segregated lanes, and feeder buses are operated only in the suburban areas.
Table 20.2-8 Economic Benefit of Trunk Bus System Project by Source
Table 20.2-9 Average Speed Change by Trunk Bus System Project
2) Cash Flow and Evaluation Indicators
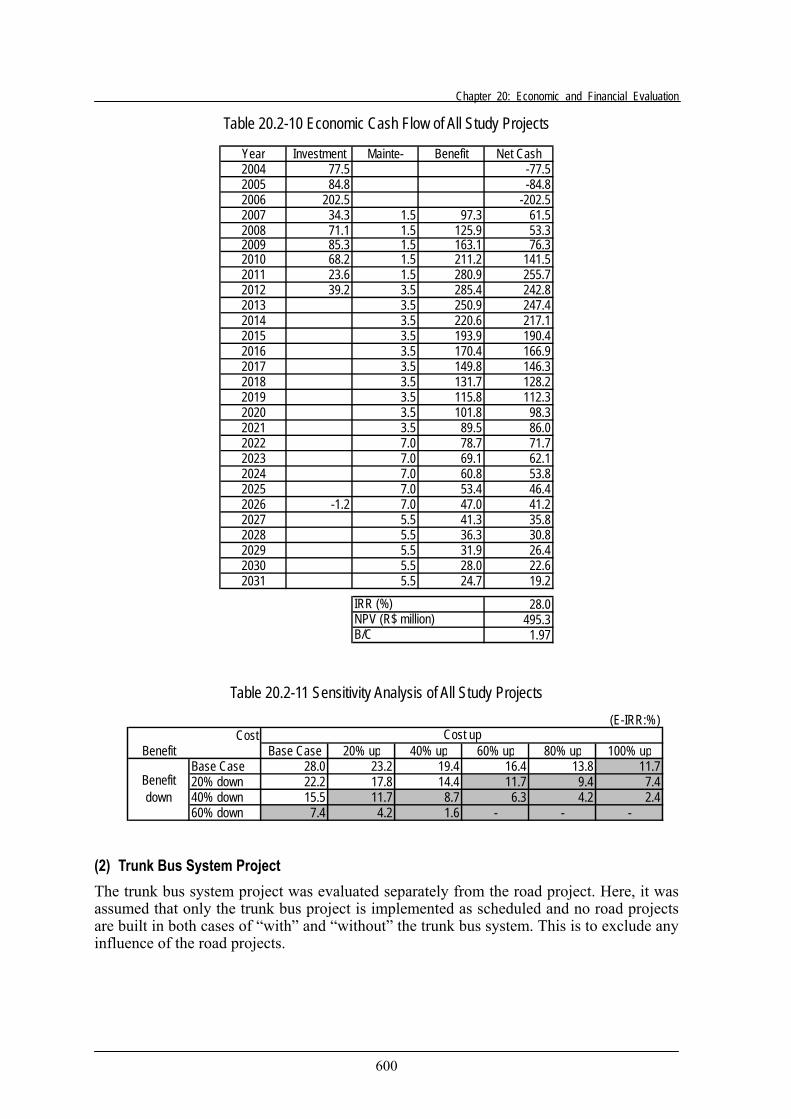
As in the cost-benefit cash flow of the project shown in Table 20.2-10, the economic viability of the project is very high showing 28.0 % of IRR and R$ 495 million of NPV. The B/C ratio is almost 2.0. In Brazil, the economic discount rate of 12% is generally used. Then, these figures indicate the study projects are highly feasible from the economic viewpoint.
In the cash flow, maintenance cost assumes overlaying or 50% of the bus-lane surface in the first decade and 100% in the next decade. This assumption was applied to all the cases.
3) Sensitivity Analysis
The sensitivity of the E-IRR was examined by changing the cost and the benefit. As shown in Table 20.2-11, the E-IRR is quite stable. The E-IRR falls below 12% only when the cost becomes over 1.8 times the original estimate or the benefit falls to less than 53% of the estimate. The shaded area in the table shows an area where the project will be unfeasible. If the cost overruns by 20% and at the same time the benefit becomes less than 60% of the original estimate, there is a risk of E-IRR below 12%. However, such a situation would hardly happen.
(R$ million)
PublicMode
PrivateMode Total Public
ModePrivateMode Total Public
ModePrivateMode Total
VOC 161.9 657.5 819.4 189.7 1000.2 1189.9 198.4 1784.6 1983.0TTC 176.2 624.1 800.3 230.4 1137.1 1367.6 282.6 2448.5 2731.1Total 338.0 1281.7 1619.7 420.1 2137.3 2557.5 481.0 4233.1 4714.1VOC 164.7 633.5 798.2 192.7 925.0 1117.7 198.9 1774.2 1973.0TTC 138.2 586.1 724.3 175.8 978.6 1154.3 227.7 2411.5 2639.2Total 302.9 1219.5 1522.4 368.4 1903.6 2272.0 426.6 4185.7 4612.3VOC -2.8 24.1 21.3 -3.0 75.2 72.2 -0.5 10.4 9.9TTC 37.9 38.1 76.0 54.7 158.5 213.2 54.8 37.0 91.9Total 35.1 62.1 97.3 51.7 233.7 285.4 54.3 47.4 101.8
With Case
Benefit
Case CostItem
2007 2012 2020
WithoutCase
(Km/Hour)
With Without With Without With WithoutCar 32.7 26.9 23.6 20.5 14.9 8.7 8.2Truck 50.0 36.8 32.4 29.9 23.5 13.3 13.1Conventional Bus 31.0 25.5 21.5 21.8 15.5 10.3 8.8Articulated Bus - 32.6 - 32.8 - 29.8 -Feeder Bus - 25.0 - 23.2 - 21.5 -Total 35.7 28.3 24.5 22.0 16.0 9.5 8.7
2007 2012 2020Vehicle Type 2000
Chapter 20: Economic and Financial Evaluation
600
Table 20.2-10 Economic Cash Flow of All Study Projects
Year Investment Mainte- Benefit Net Cash2004 77.5 -77.52005 84.8 -84.82006 202.5 -202.52007 34.3 1.5 97.3 61.52008 71.1 1.5 125.9 53.32009 85.3 1.5 163.1 76.32010 68.2 1.5 211.2 141.52011 23.6 1.5 280.9 255.72012 39.2 3.5 285.4 242.82013 3.5 250.9 247.42014 3.5 220.6 217.12015 3.5 193.9 190.42016 3.5 170.4 166.92017 3.5 149.8 146.32018 3.5 131.7 128.22019 3.5 115.8 112.32020 3.5 101.8 98.32021 3.5 89.5 86.02022 7.0 78.7 71.72023 7.0 69.1 62.12024 7.0 60.8 53.82025 7.0 53.4 46.42026 -1.2 7.0 47.0 41.22027 5.5 41.3 35.82028 5.5 36.3 30.82029 5.5 31.9 26.42030 5.5 28.0 22.62031 5.5 24.7 19.2
28.0495.3
1.97
IRR (%)NPV (R$ million)B/C
Table 20.2-11 Sensitivity Analysis of All Study Projects
(2) Trunk Bus System Project The trunk bus system project was evaluated separately from the road project. Here, it was assumed that only the trunk bus project is implemented as scheduled and no road projects are built in both cases of “with” and “without” the trunk bus system. This is to exclude any influence of the road projects.
(E-IRR:%)Cost
Benefit Base Case 20% up 40% up 60% up 80% up 100% upBase Case 28.0 23.2 19.4 16.4 13.8 11.720% down 22.2 17.8 14.4 11.7 9.4 7.440% down 15.5 11.7 8.7 6.3 4.2 2.460% down 7.4 4.2 1.6 - - -
Cost up
Benefitdown
The Improvement of Transport System in the Metropolitan Area of Belem
601
1) Sources of Economic Benefit
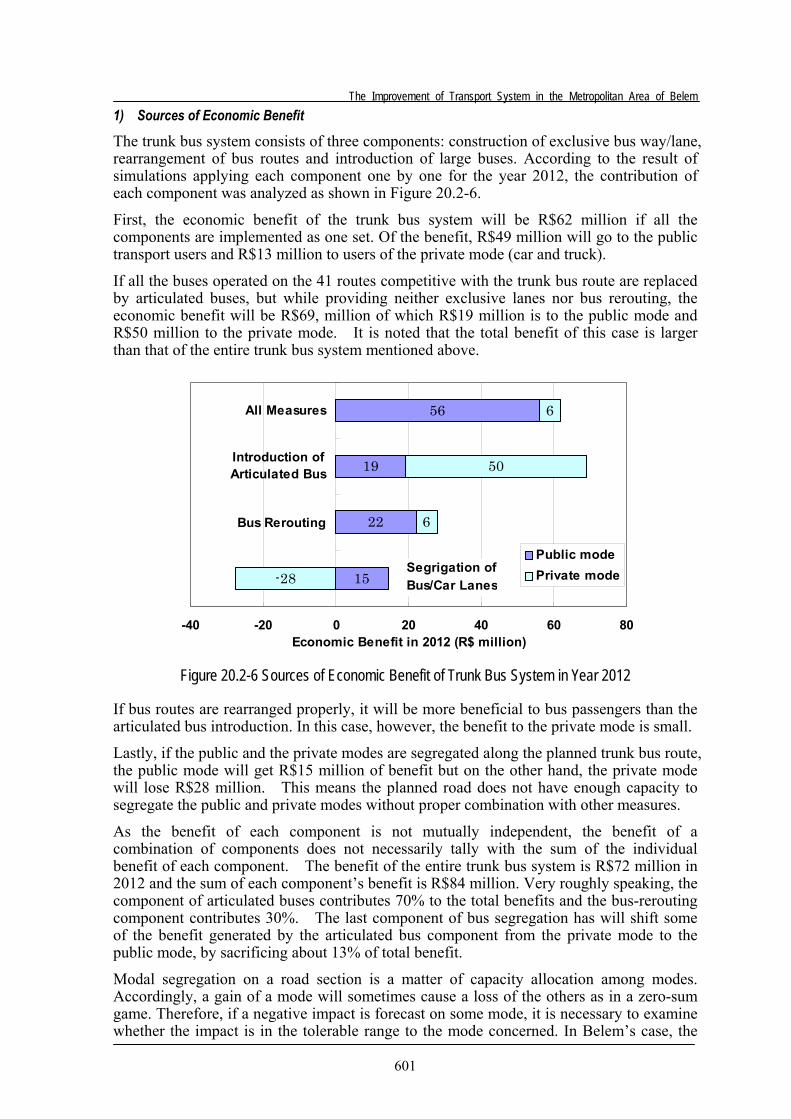
The trunk bus system consists of three components: construction of exclusive bus way/lane, rearrangement of bus routes and introduction of large buses. According to the result of simulations applying each component one by one for the year 2012, the contribution of each component was analyzed as shown in Figure 20.2-6.
First, the economic benefit of the trunk bus system will be R$62 million if all the components are implemented as one set. Of the benefit, R$49 million will go to the public transport users and R$13 million to users of the private mode (car and truck).
If all the buses operated on the 41 routes competitive with the trunk bus route are replaced by articulated buses, but while providing neither exclusive lanes nor bus rerouting, the economic benefit will be R$69, million of which R$19 million is to the public mode and R$50 million to the private mode. It is noted that the total benefit of this case is larger than that of the entire trunk bus system mentioned above.
Figure 20.2-6 Sources of Economic Benefit of Trunk Bus System in Year 2012
If bus routes are rearranged properly, it will be more beneficial to bus passengers than the articulated bus introduction. In this case, however, the benefit to the private mode is small.
Lastly, if the public and the private modes are segregated along the planned trunk bus route, the public mode will get R$15 million of benefit but on the other hand, the private mode will lose R$28 million. This means the planned road does not have enough capacity to segregate the public and private modes without proper combination with other measures.
As the benefit of each component is not mutually independent, the benefit of a combination of components does not necessarily tally with the sum of the individual benefit of each component. The benefit of the entire trunk bus system is R$72 million in 2012 and the sum of each component’s benefit is R$84 million. Very roughly speaking, the component of articulated buses contributes 70% to the total benefits and the bus-rerouting component contributes 30%. The last component of bus segregation has will shift some of the benefit generated by the articulated bus component from the private mode to the public mode, by sacrificing about 13% of total benefit.
Modal segregation on a road section is a matter of capacity allocation among modes. Accordingly, a gain of a mode will sometimes cause a loss of the others as in a zero-sum game. Therefore, if a negative impact is forecast on some mode, it is necessary to examine whether the impact is in the tolerable range to the mode concerned. In Belem’s case, the
15
22
19
56
-28
6
50
6
-40 -20 0 20 40 60 80
Bus Rerouting
Introduction ofArticulated Bus
All Measures
Economic Benefit in 2012 (R$ million)
Public modePrivate modeSegrigation of
Bus/Car Lanes
Chapter 20: Economic and Financial Evaluation
602
private mode will suffer a loss by the exclusive bus lane. However, the loss will be recovered by other components and in the end, the entire trunk bus system will bring a benefit also to the private mode, as shown in Figure 20.2-6.
2) Evaluation Results and Sensitivity Analysis
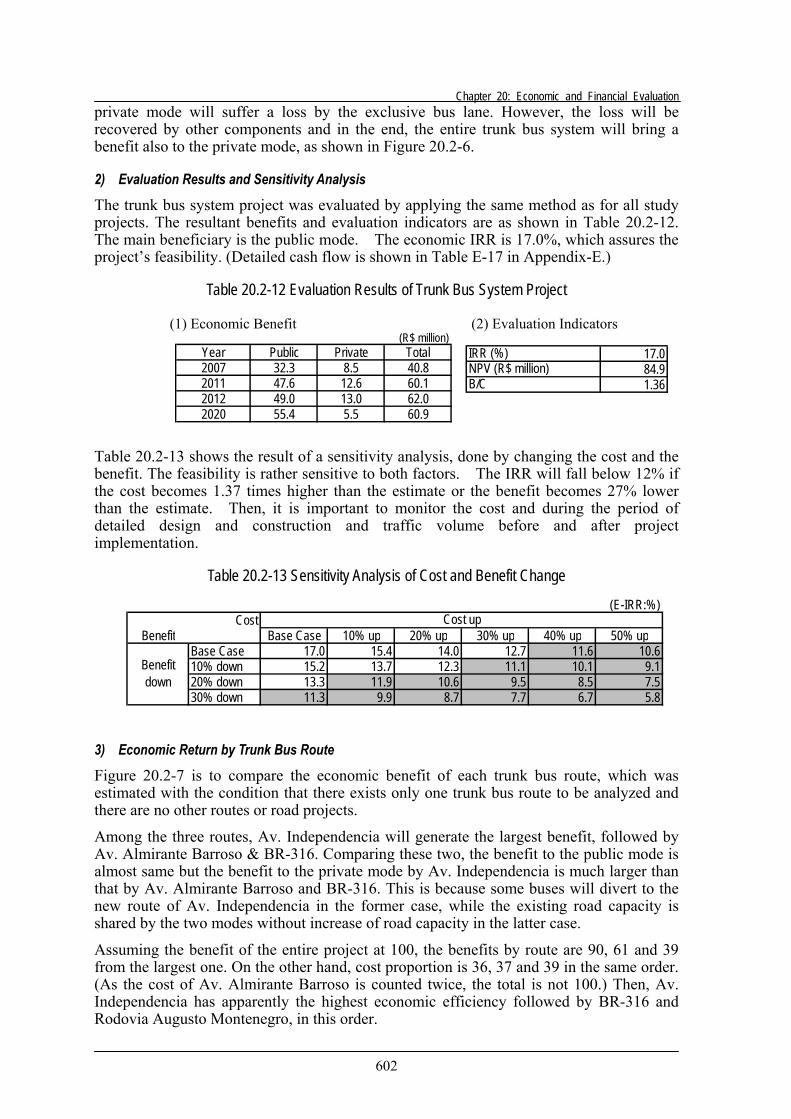
The trunk bus system project was evaluated by applying the same method as for all study projects. The resultant benefits and evaluation indicators are as shown in Table 20.2-12. The main beneficiary is the public mode. The economic IRR is 17.0%, which assures the project’s feasibility. (Detailed cash flow is shown in Table E-17 in Appendix-E.)
Table 20.2-12 Evaluation Results of Trunk Bus System Project
(1) Economic Benefit (2) Evaluation Indicators
Table 20.2-13 shows the result of a sensitivity analysis, done by changing the cost and the benefit. The feasibility is rather sensitive to both factors. The IRR will fall below 12% if the cost becomes 1.37 times higher than the estimate or the benefit becomes 27% lower than the estimate. Then, it is important to monitor the cost and during the period of detailed design and construction and traffic volume before and after project implementation.
Table 20.2-13 Sensitivity Analysis of Cost and Benefit Change
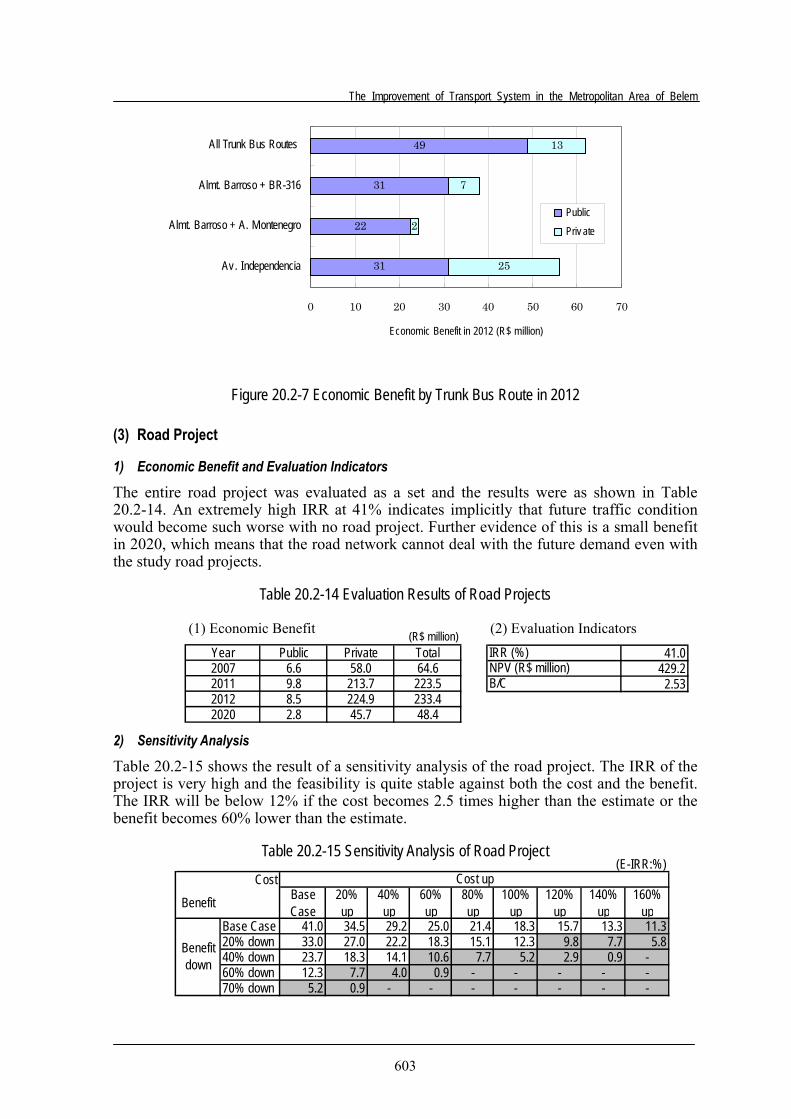
3) Economic Return by Trunk Bus Route
Figure 20.2-7 is to compare the economic benefit of each trunk bus route, which was estimated with the condition that there exists only one trunk bus route to be analyzed and there are no other routes or road projects.
Among the three routes, Av. Independencia will generate the largest benefit, followed by Av. Almirante Barroso & BR-316. Comparing these two, the benefit to the public mode is almost same but the benefit to the private mode by Av. Independencia is much larger than that by Av. Almirante Barroso and BR-316. This is because some buses will divert to the new route of Av. Independencia in the former case, while the existing road capacity is shared by the two modes without increase of road capacity in the latter case.
Assuming the benefit of the entire project at 100, the benefits by route are 90, 61 and 39 from the largest one. On the other hand, cost proportion is 36, 37 and 39 in the same order. (As the cost of Av. Almirante Barroso is counted twice, the total is not 100.) Then, Av. Independencia has apparently the highest economic efficiency followed by BR-316 and Rodovia Augusto Montenegro, in this order.
(E-IRR:%)Cost
Benefit Base Case 10% up 20% up 30% up 40% up 50% upBase Case 17.0 15.4 14.0 12.7 11.6 10.610% down 15.2 13.7 12.3 11.1 10.1 9.120% down 13.3 11.9 10.6 9.5 8.5 7.530% down 11.3 9.9 8.7 7.7 6.7 5.8
Cost up
Benefitdown
17.084.91.36
IRR (%)NPV (R$ million)B/C
(R$ million)Year Public Private Total2007 32.3 8.5 40.82011 47.6 12.6 60.12012 49.0 13.0 62.02020 55.4 5.5 60.9
The Improvement of Transport System in the Metropolitan Area of Belem
603
31
22
31
49
25
2
7
13
0 10 20 30 40 50 60 70
Av. Independencia
Almt. Barroso + A. Montenegro
Almt. Barroso + BR-316
All Trunk Bus Routes
Economic Benefit in 2012 (R$ million)
PublicPriv ate
Figure 20.2-7 Economic Benefit by Trunk Bus Route in 2012
(3) Road Project
1) Economic Benefit and Evaluation Indicators
The entire road project was evaluated as a set and the results were as shown in Table 20.2-14. An extremely high IRR at 41% indicates implicitly that future traffic condition would become such worse with no road project. Further evidence of this is a small benefit in 2020, which means that the road network cannot deal with the future demand even with the study road projects.
Table 20.2-14 Evaluation Results of Road Projects
(1) Economic Benefit (2) Evaluation Indicators
2) Sensitivity Analysis
Table 20.2-15 shows the result of a sensitivity analysis of the road project. The IRR of the project is very high and the feasibility is quite stable against both the cost and the benefit. The IRR will be below 12% if the cost becomes 2.5 times higher than the estimate or the benefit becomes 60% lower than the estimate.
Table 20.2-15 Sensitivity Analysis of Road Project
(E-IRR:%)Cost
Benefit BaseCase
20%up
40%up
60%up
80%up
100%up
120%up
140%up
160%up
Base Case 41.0 34.5 29.2 25.0 21.4 18.3 15.7 13.3 11.320% down 33.0 27.0 22.2 18.3 15.1 12.3 9.8 7.7 5.840% down 23.7 18.3 14.1 10.6 7.7 5.2 2.9 0.9 -60% down 12.3 7.7 4.0 0.9 - - - - -70% down 5.2 0.9 - - - - - - -
Cost up
Benefitdown
41.0429.2
2.53
IRR (%)NPV (R$ million)B/C
(R$ million)Year Public Private Total2007 6.6 58.0 64.62011 9.8 213.7 223.52012 8.5 224.9 233.42020 2.8 45.7 48.4
Chapter 20: Economic and Financial Evaluation
604
3) Evaluation of Individual Road Project
The study road project consists of four road projects. They were evaluated individually, by analyzing “with” and “without” cases one by one. The results are shown in Table 20.2-16. Av. Primeiro de Dezembro implies the highest economic return of 45%, followed by Av. Independencia of 43%, Rua da Marinha of 38% and lastly, Rua Yamada of 18%. The top two projects are large in terms of investment scale, compared with the other two. Accordingly, NPVs are also large. All the road projects are judged economically to be good and their early implementation is highly recommended.
Table 20.2-16 Economic Evaluation of Individual Road Project
Financial Economic E-IRR NPV B/C(R$ million) (R$ million) (%) (R$ million) -
Independencia 19.6 222.2 180.9 42.8 247.8 2.75Av.Primeiro de Dezembro 10.1 150.2 120.3 45.2 330.7 5.12Rua Yamada 10.0 94.7 75.7 18.0 37.6 1.80Rua da Marinha 4.6 40.8 32.5 37.9 49.2 4.05Entire Road Projects 44.2 507.9 409.4 41.0 429.2 2.53
Project Extension(km)
Cost (R$ million) Economic Evaluation
(4) Investigation on Economic Evaluation Results The following is notes on important information, found in the course of the economic analysis or deduced from the results of the evaluation.
1) Project Life
As shown in this chapter, the trunk bus system and road projects studied in the study will improve transportation conditions in Belem and their economic return will be significant. It should be noted, however, the effects of travel speed improvement and economic return will be canceled out by the future traffic increase within 15 to 20 years.
Car traffic is forecast to grow 3.5 times by 2020, while public transport demand will increase only 1.3 times. Current capacity of the road network is absolutely insufficient to cope with such an increase of car traffic. Besides the study projects, comprehensive measures should be taken, covering not road improvement but a variety of measures such as demand management, introduction of mass-transit and decentralization of urban functions. In this sense, the trunk bus is a transitional measure to a mass-transit era and its life is possibly 15 – 20 years.
2) Creation of Job Opportunity
The Belem Metropolitan area is now suffering from an unemployment problem with a 14% unemployment rate. This means more than 100,000 people are looking for a job. Under such a situation, the study projects are significant also in job creation in the course of implementation.
Total project cost of the study is estimated at R$747 million, if deducting compensation cost and contingency. Out of the total, R$497 million is the direct cost. Assuming that 10% of direct cost and 5% of other costs (indirect cost, engineering and administration cost) are personnel cost, and that 30% of personnel cost in the direct cost and 20% of personnel cost in the other costs are paid to the unskilled, then total wage payments will reach 62,300 man-months, of which 27,900 man-months are for the unskilled. Thus, the study projects are expected to contribute to mitigation of the unemployment issue. (Here, the average monthly salary is assumed at R$480 for the unskilled and R$1,000 for the skilled.)
The Improvement of Transport System in the Metropolitan Area of Belem
605
3) Savings in Fuel Consumption
Although saving of fuel consumption is only a minor part of the entire economic benefit, it may be a key issue to car users and also important for environmental conservation. In 2012, the study projects will reduce the total daily running distance by 274,000 car-km, 2.3% of the distance in the “without” case. By this, R$23.8 million will be saved in a year. In addition, the projects will improve running speed from 15 km/hour to 16 km/hour on average. This slightly improved speed will result in a saving of R$0.7 million. Thus, a total of R$24.5 million of fuel cost will be saved in a year. This is equivalent to more than 100,000 barrels of gasoline.
20.3. FINANCIAL ANALYSIS OF TRUNK BUS SYSTEM
20.3.1. STANDPOINT AND METHODOLOGY OF FINANCIAL ANALYSIS
(1) Standpoint and Scope of Analysis The objective of this financial analysis is to examine the profitability of the trunk bus operation business in Belem. The business scope of the trunk bus operator has not been clearly defined yet. It may operate some conventional bus routes, too. It may not cover the operation of bus terminals. In this analysis, however, the business scope of the operator is limited for analytical purposes, to (1) trunk bus operation, (2) feeder bus operation and (3) terminal operation directly related to the trunk bus operation.
It is also possible that the trunk bus be operated by multiple entities such as a consortium of existing bus companies, instead of a single entity. Even in such a case, the analysis regards such multiple entities as one bus company. In case, for example, the third entity manages the trunk/feeder bus system and undertakes clearance of the bus fare revenue, the cost for such work should be made endogenous (i.e. regarded as an internal cost).
The analysis assumed that all the infrastructure and terminals for the trunk bus system should be prepared by public investment of Para State or the municipalities belonging to the Belem Metropolitan Area. Accordingly, the trunk bus operators need not bear any financial burden for investment in infrastructure and terminals.
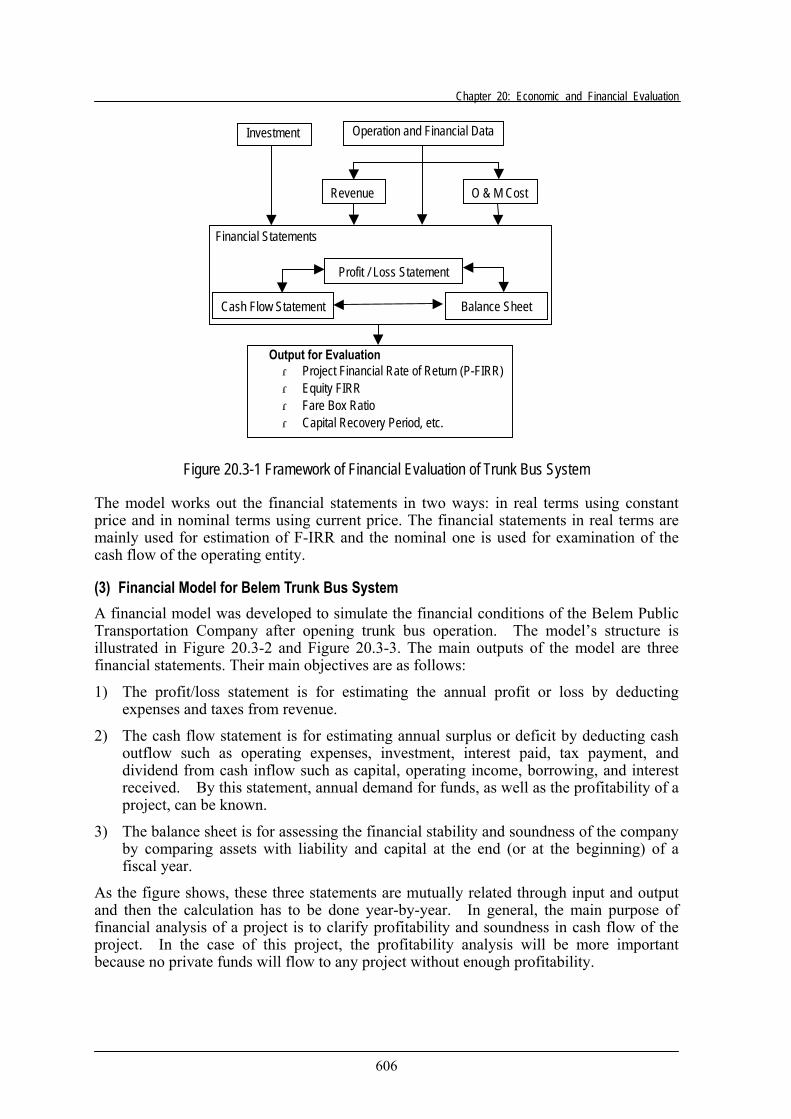
(2) Overall method The analysis was made in the framework shown in Figure 20.3-1. The main work is to prepare inputs to the financial model. The main external (exogenous) variables are investment, revenue and operation/maintenance cost. The model will create pro-forma financial statements and deduct indicators for evaluation.
Chapter 20: Economic and Financial Evaluation
606
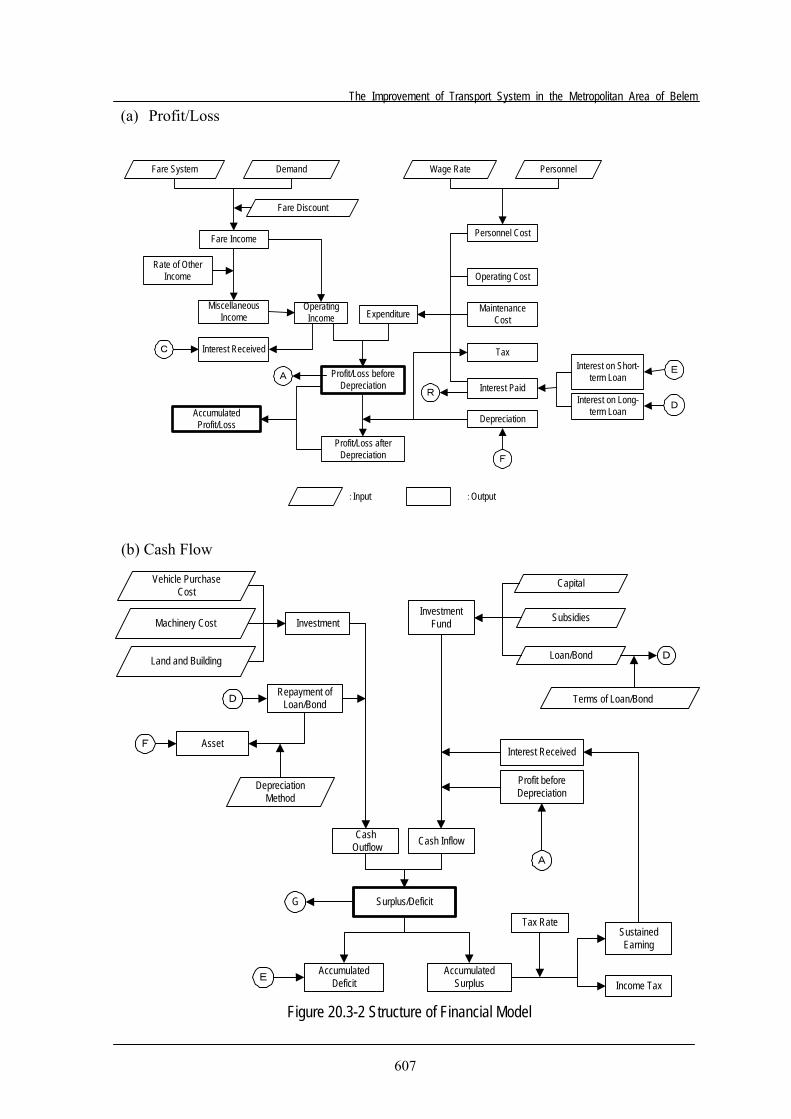
Figure 20.3-1 Framework of Financial Evaluation of Trunk Bus System
The model works out the financial statements in two ways: in real terms using constant price and in nominal terms using current price. The financial statements in real terms are mainly used for estimation of F-IRR and the nominal one is used for examination of the cash flow of the operating entity.
(3) Financial Model for Belem Trunk Bus System A financial model was developed to simulate the financial conditions of the Belem Public Transportation Company after opening trunk bus operation. The model’s structure is illustrated in Figure 20.3-2 and Figure 20.3-3. The main outputs of the model are three financial statements. Their main objectives are as follows:
1) The profit/loss statement is for estimating the annual profit or loss by deducting expenses and taxes from revenue.
2) The cash flow statement is for estimating annual surplus or deficit by deducting cash outflow such as operating expenses, investment, interest paid, tax payment, and dividend from cash inflow such as capital, operating income, borrowing, and interest received. By this statement, annual demand for funds, as well as the profitability of a project, can be known.
3) The balance sheet is for assessing the financial stability and soundness of the company by comparing assets with liability and capital at the end (or at the beginning) of a fiscal year.
As the figure shows, these three statements are mutually related through input and output and then the calculation has to be done year-by-year. In general, the main purpose of financial analysis of a project is to clarify profitability and soundness in cash flow of the project. In the case of this project, the profitability analysis will be more important because no private funds will flow to any project without enough profitability.
Financial Statements
Profit / Loss Statement
Cash Flow Statement Balance Sheet
Output for Evaluation ・ Project Financial Rate of Return (P-FIRR)・ Equity FIRR ・ Fare Box Ratio ・ Capital Recovery Period, etc.
Operation and Financial DataInvestment
Revenue O & M Cost
The Improvement of Transport System in the Metropolitan Area of Belem
607
(a) Profit/Loss
:Input :Output
Fare Income
Fare System Demand
Fare Discount
Wage Rate Personnel
Rate of OtherIncome
MiscellaneousIncome
OperatingIncome
Personnel Cost
Operating Cost
MaintenanceCost
Tax
Interest Paid
Depreciation
Expenditure
Interest Received
Profit/Loss beforeDepreciation
Profit/Loss afterDepreciation
AccumulatedProfit/Loss
Interest on Short-term Loan
Interest on Long-term Loan
C
A
R
F
D
E
(b) Cash Flow
Vehicle PurchaseCost
Terms of Loan/Bond
Loan/Bond
Subsidies
Capital
DepreciationMethod
Land and Building
Machinery Cost Investment
Asset
Repayment ofLoan/Bond
Income Tax
SustainedEarning
Tax Rate
AccumulatedSurplus
AccumulatedDeficit
Cash Outflow Cash Inflow
Profit beforeDepreciation
Interest Received
InvestmentFund
Surplus/Deficit
D
E
F
A
D
G
Figure 20.3-2 Structure of Financial Model
Chapter 20: Economic and Financial Evaluation
608
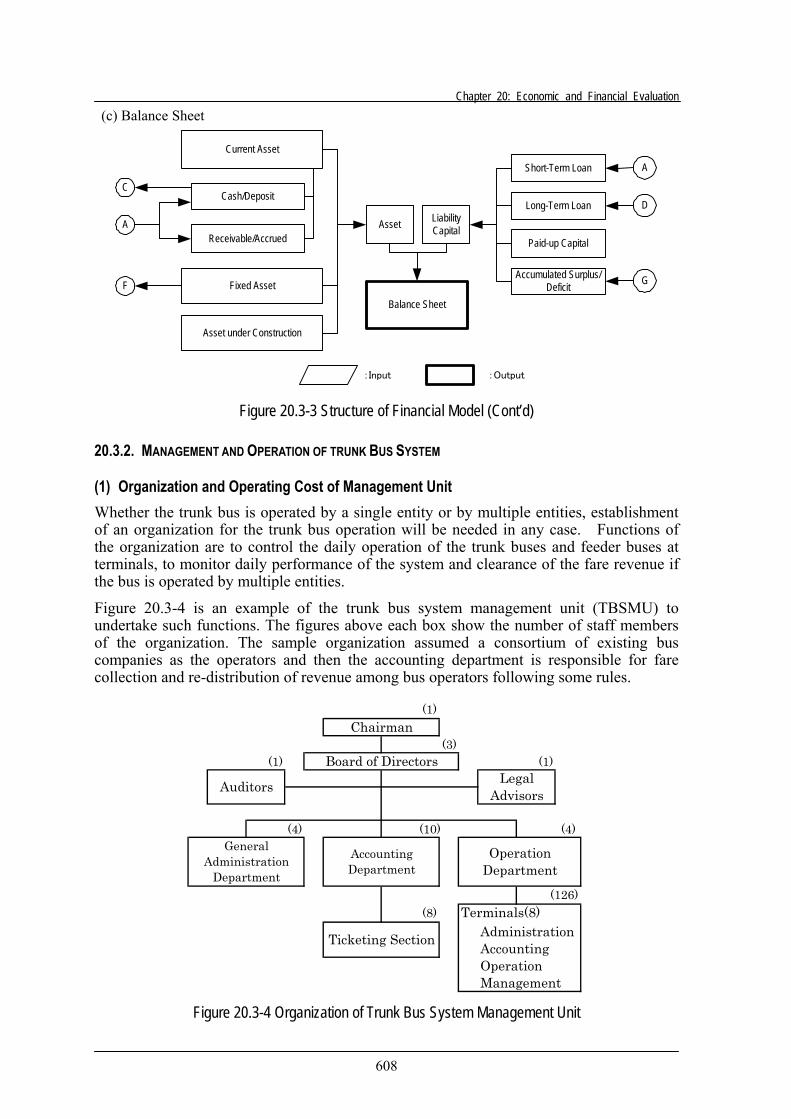
(c) Balance Sheet
Cash/Deposit
Current Asset
Receivable/AccruedAsset
Short-Term Loan
Paid-up Capital
Long-Term LoanLiabilityCapital
Balance Sheet
C
A
GFixed AssetF
Asset under Construction
Accumulated Surplus/Deficit
A
D
:Input :Output
Figure 20.3-3 Structure of Financial Model (Cont’d)
20.3.2. MANAGEMENT AND OPERATION OF TRUNK BUS SYSTEM
(1) Organization and Operating Cost of Management Unit Whether the trunk bus is operated by a single entity or by multiple entities, establishment of an organization for the trunk bus operation will be needed in any case. Functions of the organization are to control the daily operation of the trunk buses and feeder buses at terminals, to monitor daily performance of the system and clearance of the fare revenue if the bus is operated by multiple entities.
Figure 20.3-4 is an example of the trunk bus system management unit (TBSMU) to undertake such functions. The figures above each box show the number of staff members of the organization. The sample organization assumed a consortium of existing bus companies as the operators and then the accounting department is responsible for fare collection and re-distribution of revenue among bus operators following some rules.
Figure 20.3-4 Organization of Trunk Bus System Management Unit
(1)
(3)(1) (1)
(4) (10) (4)
(126)(8) Terminals(8)
AdministrationAccountingOperationManagement
LegalAdvisors
OperationDepartment
GeneralAdministration
Department
AccountingDepartment
Ticketing Section
Chairman
Board of Directors
Auditors
The Improvement of Transport System in the Metropolitan Area of Belem
609
The operation department has a duty to control daily operation, to monitor demand and supply and to coordinate fleet assignment among bus operators. Under the department, there are eight terminal sections that employ dispatchers, inspectors and staff for maintenance of terminal facilities, in addition to the managerial personnel and staff for administration and accounting of each terminal. The total staff number is 156 persons.
Table 20.3-1 shows annual operating cost of the TBSMU. Total estimated cost is about R$2.8 million a year, which corresponds to 1.5 % to 1.6% of the annual fare revenue after 2012. Bus operators should evenly shoulder this amount as an additional overhead cost.
(2) Trunk Bus Operator As stated before, there are two possibilities about “who will be the operator”. One is the winner of the bidding for the new public transportation business. This is the case in which the Government puts the project up for bidding through a public tender. The other is the present bus operators. This is the case in which the Government carries out the project not as a new bus service, but as a readjustment or re-organization of bus routes. It has not been concluded yet which one will be the actual case.
Table 20.3-1 Operating Expense of Trunk Bus System Operating Unit
(1) Staffing and Personnel Cost (1000 R$/Year)
Function QuantityMonthlySalary
Total AnnualSalary (R$1000)
1 Headquarter 30 - 387.0Managerial Personnel 4 1500 101.0General Administration Dept. Daily administration works 4 700 47.0Accounting Department Accounting and clearance 10 700 118.0 Ticketing Section 4 persons x 2 shirts 8 550 74.0Operation Department Management of terminals,
Operation & Fleet plan 4 700 47.02 Terminals 126 - 1292.0
Managerial Personnel 2 persons x 8 terminals 16 700 189.0General Administration Section 2 persons x 8 terminals 16 700 189.0Accounting Section 2 persons x 8 terminals 16 700 189.0Operation Section 4 persons x 2 shifts x 8 terminals
x 120% 78 550 725.03 Total 156 - 1679.0
(2) Operating Cost (1000 R$/Year)Quantity Unit Cost Total Cost
1 Headquarter - 604.51.1 Personnel Cost 1679.0 387.01.2 Office Rent 750m2x R$10/month x 12 months 1 24.0 24.01.3 Office Expense & Miscellaneous 50% of personnel cost 193.5
2 Terminals - 2211.22.1 Personnel Cost 1292.02.2 Office Rent R$1500/monthx12months x 8
terminals 8 18.0 144.02.3 Office Expense & Miscellaneous 30% of personnel cost 387.62.4 Maintenance Expense 30% of personnel cost 387.6
3 Total - 2815.7
Department/Section
Cost Item
In this analysis, the latter case is assumed. The bus fleet now operated on the 41 routes to be abolished after the trunk bus service opens is recommended for use as trunk buses during the transitional period, in order to economize the project and also to make a smooth switchover from the current system to the trunk bus system.
This is just an assumption for the purpose of analysis. However, even if the other case happens, the results and conclusion will not be affected much, as long as the operator will invest the same amount as the assumed case.
Chapter 20: Economic and Financial Evaluation
610
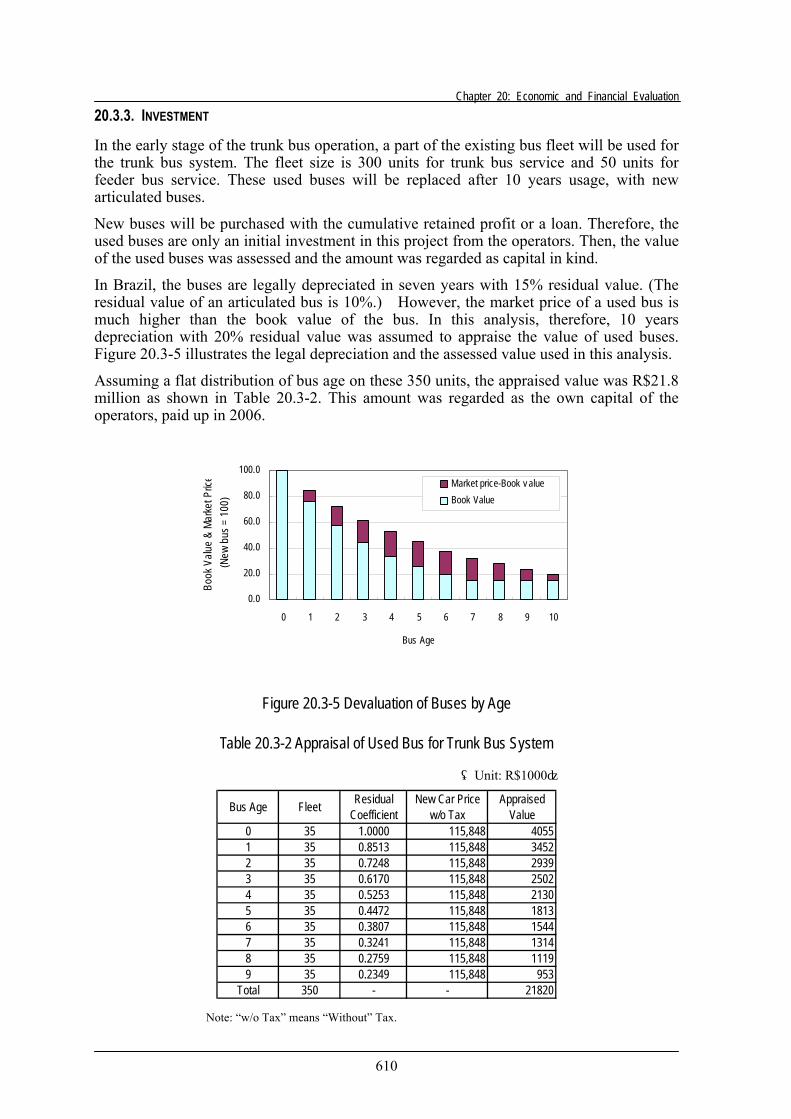
20.3.3. INVESTMENT
In the early stage of the trunk bus operation, a part of the existing bus fleet will be used for the trunk bus system. The fleet size is 300 units for trunk bus service and 50 units for feeder bus service. These used buses will be replaced after 10 years usage, with new articulated buses.
New buses will be purchased with the cumulative retained profit or a loan. Therefore, the used buses are only an initial investment in this project from the operators. Then, the value of the used buses was assessed and the amount was regarded as capital in kind.
In Brazil, the buses are legally depreciated in seven years with 15% residual value. (The residual value of an articulated bus is 10%.) However, the market price of a used bus is much higher than the book value of the bus. In this analysis, therefore, 10 years depreciation with 20% residual value was assumed to appraise the value of used buses. Figure 20.3-5 illustrates the legal depreciation and the assessed value used in this analysis.
Assuming a flat distribution of bus age on these 350 units, the appraised value was R$21.8 million as shown in Table 20.3-2. This amount was regarded as the own capital of the operators, paid up in 2006.
0.0
20.0
40.0
60.0
80.0
100.0
0 1 2 3 4 5 6 7 8 9 10
Bus Age
Book
Valu
e &
Marke
t Pric
e (N
ew b
us =
100
)
Market price-Book v alueBook Value
Figure 20.3-5 Devaluation of Buses by Age
Table 20.3-2 Appraisal of Used Bus for Trunk Bus System
(Unit: R$1000)
Bus Age Fleet ResidualCoefficient
New Car Pricew/o Tax
AppraisedValue
0 35 1.0000 115,848 40551 35 0.8513 115,848 34522 35 0.7248 115,848 29393 35 0.6170 115,848 25024 35 0.5253 115,848 21305 35 0.4472 115,848 18136 35 0.3807 115,848 15447 35 0.3241 115,848 13148 35 0.2759 115,848 11199 35 0.2349 115,848 953
Total 350 - - 21820 Note: “w/o Tax” means “Without” Tax.
The Improvement of Transport System in the Metropolitan Area of Belem
611
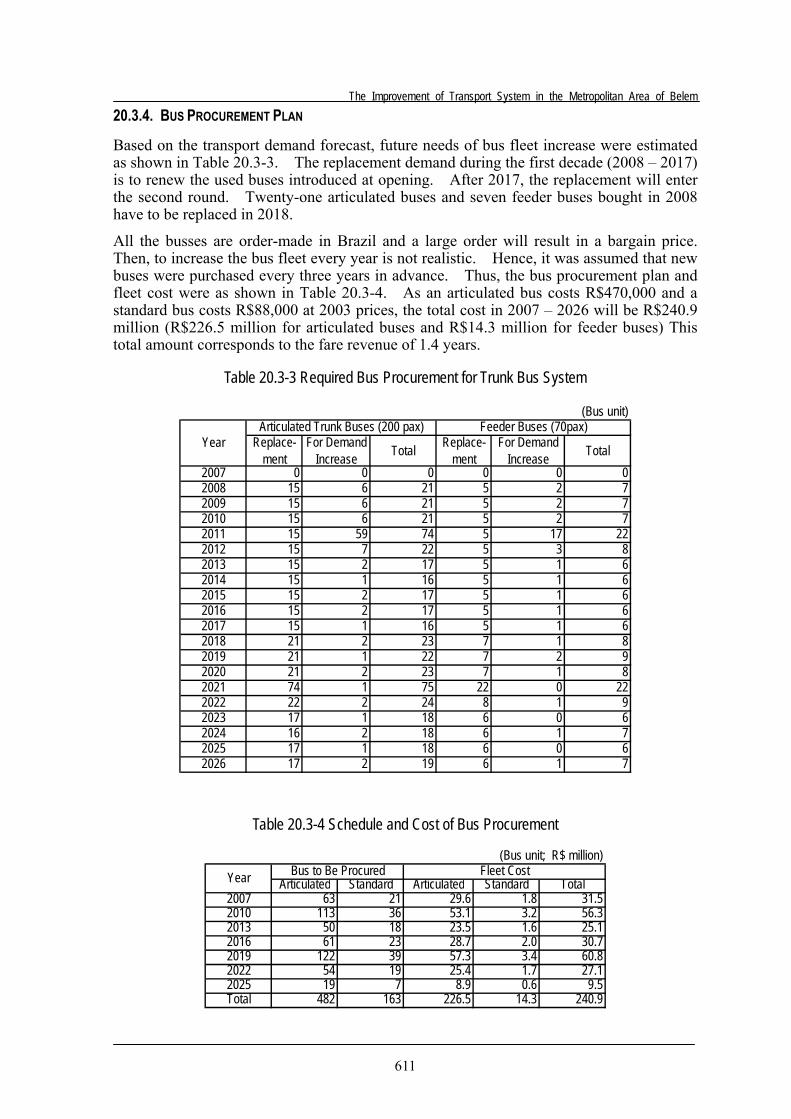
20.3.4. BUS PROCUREMENT PLAN
Based on the transport demand forecast, future needs of bus fleet increase were estimated as shown in Table 20.3-3. The replacement demand during the first decade (2008 – 2017) is to renew the used buses introduced at opening. After 2017, the replacement will enter the second round. Twenty-one articulated buses and seven feeder buses bought in 2008 have to be replaced in 2018.
All the busses are order-made in Brazil and a large order will result in a bargain price. Then, to increase the bus fleet every year is not realistic. Hence, it was assumed that new buses were purchased every three years in advance. Thus, the bus procurement plan and fleet cost were as shown in Table 20.3-4. As an articulated bus costs R$470,000 and a standard bus costs R$88,000 at 2003 prices, the total cost in 2007 – 2026 will be R$240.9 million (R$226.5 million for articulated buses and R$14.3 million for feeder buses) This total amount corresponds to the fare revenue of 1.4 years.
Table 20.3-3 Required Bus Procurement for Trunk Bus System
(Bus unit)
Replace-ment
For DemandIncrease Total Replace-
mentFor Demand
Increase Total2007 0 0 0 0 0 02008 15 6 21 5 2 72009 15 6 21 5 2 72010 15 6 21 5 2 72011 15 59 74 5 17 222012 15 7 22 5 3 82013 15 2 17 5 1 62014 15 1 16 5 1 62015 15 2 17 5 1 62016 15 2 17 5 1 62017 15 1 16 5 1 62018 21 2 23 7 1 82019 21 1 22 7 2 92020 21 2 23 7 1 82021 74 1 75 22 0 222022 22 2 24 8 1 92023 17 1 18 6 0 62024 16 2 18 6 1 72025 17 1 18 6 0 62026 17 2 19 6 1 7
YearArticulated Trunk Buses (200 pax) Feeder Buses (70pax)
Table 20.3-4 Schedule and Cost of Bus Procurement
(Bus unit; R$ million)
Articulated Standard Articulated Standard Total2007 63 21 29.6 1.8 31.52010 113 36 53.1 3.2 56.32013 50 18 23.5 1.6 25.12016 61 23 28.7 2.0 30.72019 122 39 57.3 3.4 60.82022 54 19 25.4 1.7 27.12025 19 7 8.9 0.6 9.5Total 482 163 226.5 14.3 240.9
Year Bus to Be Procured Fleet Cost
Chapter 20: Economic and Financial Evaluation
612
20.3.5. FARE REVENUE OF TRUNK BUS SYSTEM
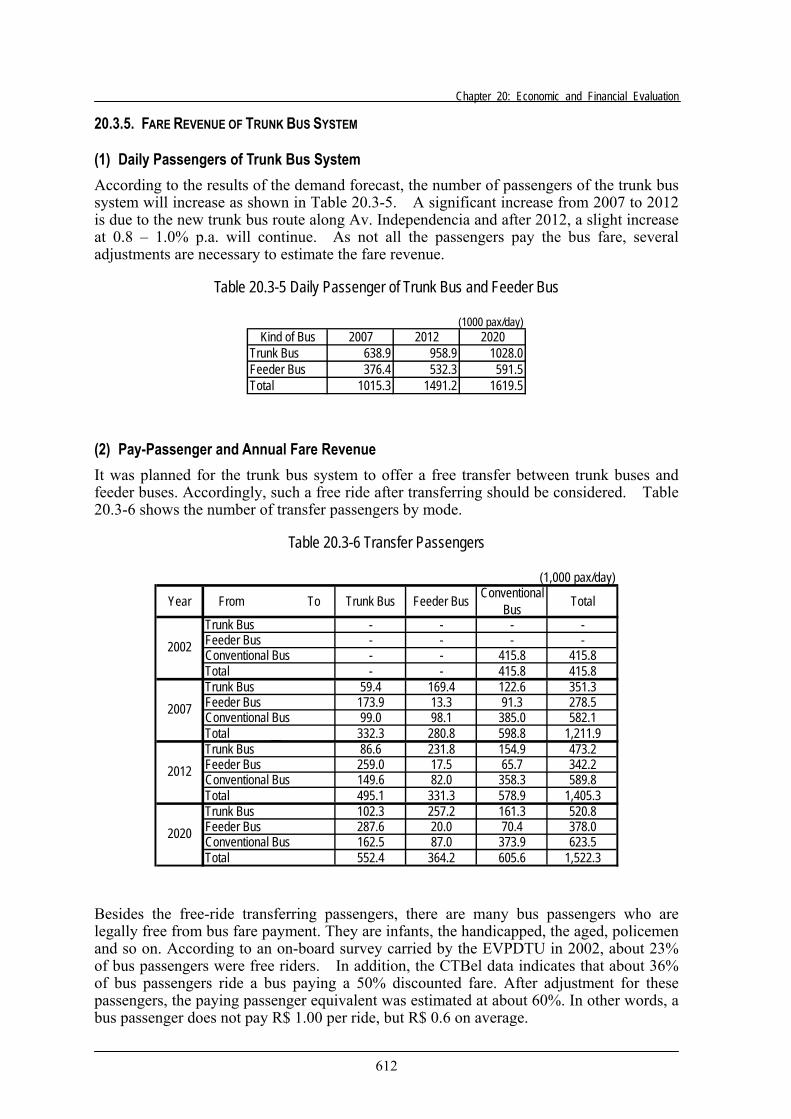
(1) Daily Passengers of Trunk Bus System According to the results of the demand forecast, the number of passengers of the trunk bus system will increase as shown in Table 20.3-5. A significant increase from 2007 to 2012 is due to the new trunk bus route along Av. Independencia and after 2012, a slight increase at 0.8 – 1.0% p.a. will continue. As not all the passengers pay the bus fare, several adjustments are necessary to estimate the fare revenue.
Table 20.3-5 Daily Passenger of Trunk Bus and Feeder Bus
(1000 pax/day)Kind of Bus 2007 2012 2020
Trunk Bus 638.9 958.9 1028.0Feeder Bus 376.4 532.3 591.5Total 1015.3 1491.2 1619.5
(2) Pay-Passenger and Annual Fare Revenue It was planned for the trunk bus system to offer a free transfer between trunk buses and feeder buses. Accordingly, such a free ride after transferring should be considered. Table 20.3-6 shows the number of transfer passengers by mode.
Table 20.3-6 Transfer Passengers
(1,000 pax/day)
Year From To Trunk Bus Feeder Bus ConventionalBus Total
Trunk Bus - - - -Feeder Bus - - - -Conventional Bus - - 415.8 415.8Total - - 415.8 415.8Trunk Bus 59.4 169.4 122.6 351.3Feeder Bus 173.9 13.3 91.3 278.5Conventional Bus 99.0 98.1 385.0 582.1Total 332.3 280.8 598.8 1,211.9Trunk Bus 86.6 231.8 154.9 473.2Feeder Bus 259.0 17.5 65.7 342.2Conventional Bus 149.6 82.0 358.3 589.8Total 495.1 331.3 578.9 1,405.3Trunk Bus 102.3 257.2 161.3 520.8Feeder Bus 287.6 20.0 70.4 378.0Conventional Bus 162.5 87.0 373.9 623.5Total 552.4 364.2 605.6 1,522.3
2002
2007
2012
2020
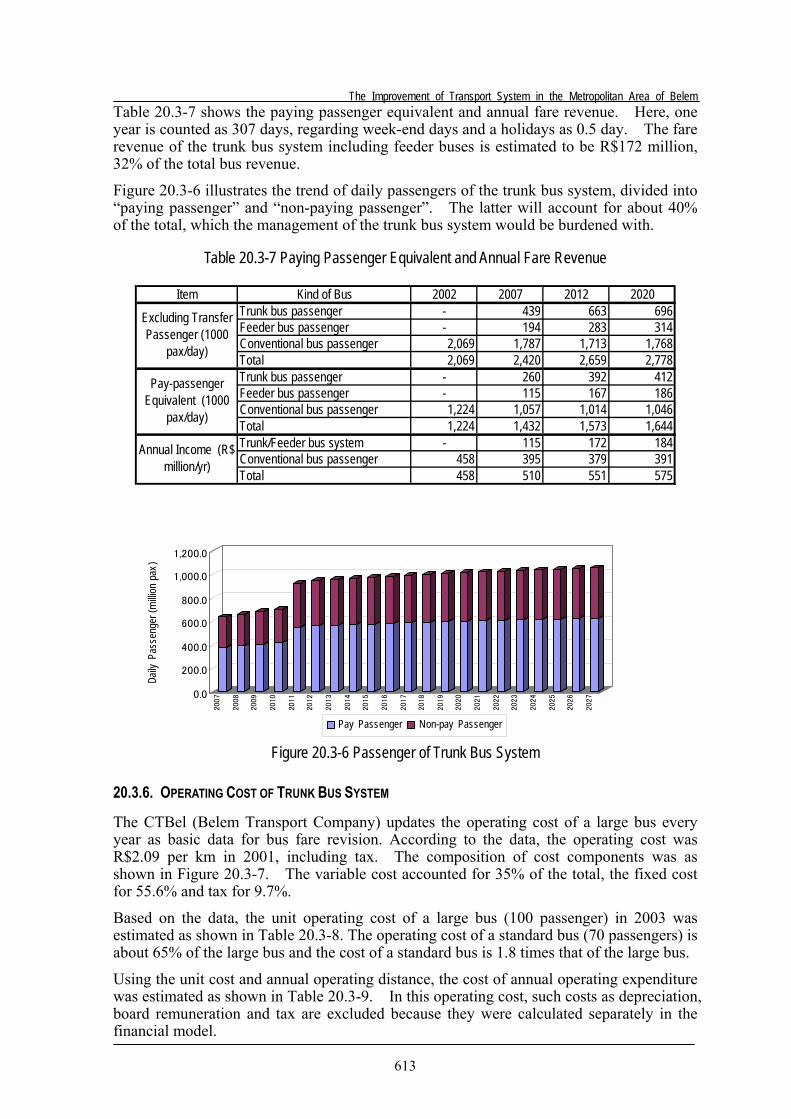
Besides the free-ride transferring passengers, there are many bus passengers who are legally free from bus fare payment. They are infants, the handicapped, the aged, policemen and so on. According to an on-board survey carried by the EVPDTU in 2002, about 23% of bus passengers were free riders. In addition, the CTBel data indicates that about 36% of bus passengers ride a bus paying a 50% discounted fare. After adjustment for these passengers, the paying passenger equivalent was estimated at about 60%. In other words, a bus passenger does not pay R$ 1.00 per ride, but R$ 0.6 on average.
The Improvement of Transport System in the Metropolitan Area of Belem
613
Table 20.3-7 shows the paying passenger equivalent and annual fare revenue. Here, one year is counted as 307 days, regarding week-end days and a holidays as 0.5 day. The fare revenue of the trunk bus system including feeder buses is estimated to be R$172 million, 32% of the total bus revenue.
Figure 20.3-6 illustrates the trend of daily passengers of the trunk bus system, divided into “paying passenger” and “non-paying passenger”. The latter will account for about 40% of the total, which the management of the trunk bus system would be burdened with.
Table 20.3-7 Paying Passenger Equivalent and Annual Fare Revenue
Item Kind of Bus 2002 2007 2012 2020Trunk bus passenger - 439 663 696Feeder bus passenger - 194 283 314Conventional bus passenger 2,069 1,787 1,713 1,768Total 2,069 2,420 2,659 2,778Trunk bus passenger - 260 392 412Feeder bus passenger - 115 167 186Conventional bus passenger 1,224 1,057 1,014 1,046Total 1,224 1,432 1,573 1,644Trunk/Feeder bus system - 115 172 184Conventional bus passenger 458 395 379 391Total 458 510 551 575
Excluding TransferPassenger (1000
pax/day)
Pay-passengerEquivalent (1000
pax/day)
Annual Income (R$million/yr)
Figure 20.3-6 Passenger of Trunk Bus System
20.3.6. OPERATING COST OF TRUNK BUS SYSTEM
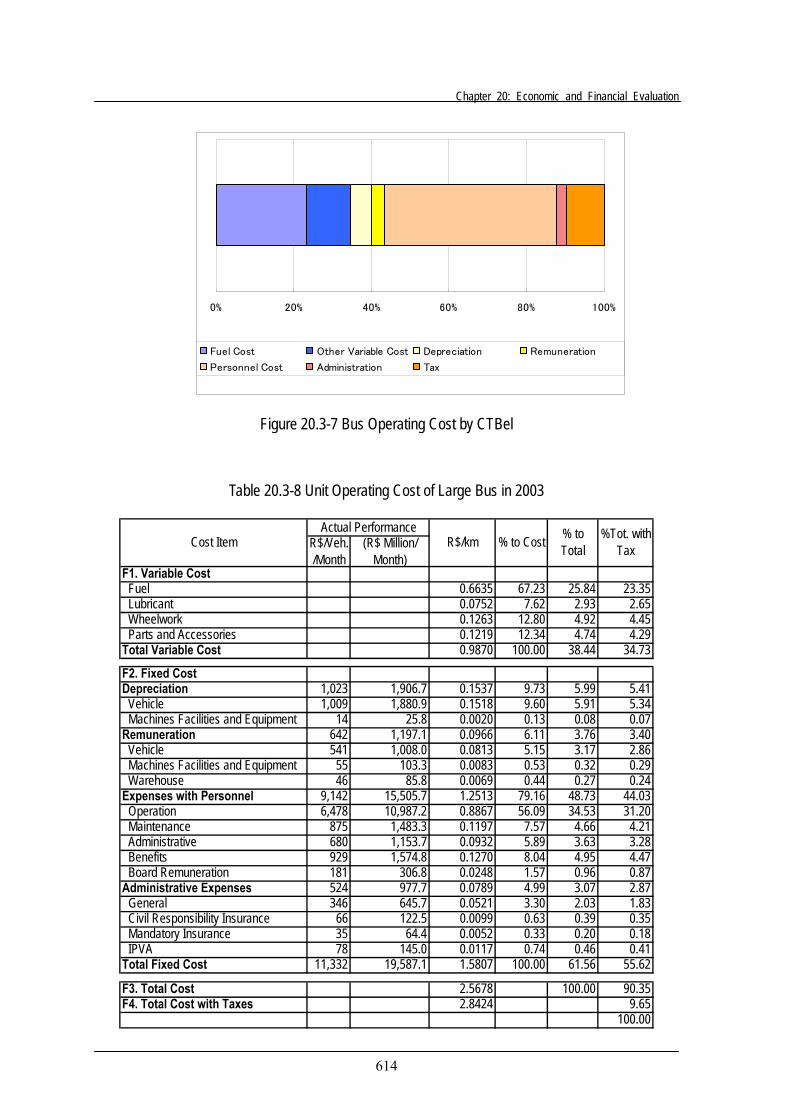
The CTBel (Belem Transport Company) updates the operating cost of a large bus every year as basic data for bus fare revision. According to the data, the operating cost was R$2.09 per km in 2001, including tax. The composition of cost components was as shown in Figure 20.3-7. The variable cost accounted for 35% of the total, the fixed cost for 55.6% and tax for 9.7%.
Based on the data, the unit operating cost of a large bus (100 passenger) in 2003 was estimated as shown in Table 20.3-8. The operating cost of a standard bus (70 passengers) is about 65% of the large bus and the cost of a standard bus is 1.8 times that of the large bus.
Using the unit cost and annual operating distance, the cost of annual operating expenditure was estimated as shown in Table 20.3-9. In this operating cost, such costs as depreciation, board remuneration and tax are excluded because they were calculated separately in the financial model.
0.0
200.0
400.0
600.0
800.0
1,000.0
1,200.0
Daily
Pas
seng
er (m
illion
pax
)
2007
2008
2009
2010
2011
2012
2013
2014
2015
2016
2017
2018
2019
2020
2021
2022
2023
2024
2025
2026
2027
YearPay Passenger Non-pay Passenger
Chapter 20: Economic and Financial Evaluation
614
Figure 20.3-7 Bus Operating Cost by CTBel
Table 20.3-8 Unit Operating Cost of Large Bus in 2003
R$/Veh./Month
(R$ Million/Month)
F1. Variable Cost Fuel 0.6635 67.23 25.84 23.35 Lubricant 0.0752 7.62 2.93 2.65 Wheelwork 0.1263 12.80 4.92 4.45 Parts and Accessories 0.1219 12.34 4.74 4.29Total Variable Cost 0.9870 100.00 38.44 34.73
F2. Fixed CostDepreciation 1,023 1,906.7 0.1537 9.73 5.99 5.41 Vehicle 1,009 1,880.9 0.1518 9.60 5.91 5.34 Machines Facilities and Equipment 14 25.8 0.0020 0.13 0.08 0.07Remuneration 642 1,197.1 0.0966 6.11 3.76 3.40 Vehicle 541 1,008.0 0.0813 5.15 3.17 2.86 Machines Facilities and Equipment 55 103.3 0.0083 0.53 0.32 0.29 Warehouse 46 85.8 0.0069 0.44 0.27 0.24Expenses with Personnel 9,142 15,505.7 1.2513 79.16 48.73 44.03 Operation 6,478 10,987.2 0.8867 56.09 34.53 31.20 Maintenance 875 1,483.3 0.1197 7.57 4.66 4.21 Administrative 680 1,153.7 0.0932 5.89 3.63 3.28 Benefits 929 1,574.8 0.1270 8.04 4.95 4.47 Board Remuneration 181 306.8 0.0248 1.57 0.96 0.87Administrative Expenses 524 977.7 0.0789 4.99 3.07 2.87 General 346 645.7 0.0521 3.30 2.03 1.83 Civil Responsibility Insurance 66 122.5 0.0099 0.63 0.39 0.35 Mandatory Insurance 35 64.4 0.0052 0.33 0.20 0.18 IPVA 78 145.0 0.0117 0.74 0.46 0.41Total Fixed Cost 11,332 19,587.1 1.5807 100.00 61.56 55.62
F3. Total Cost 2.5678 100.00 90.35F4. Total Cost with Taxes 2.8424 9.65
100.00
% to Cost % toTotal
%Tot. withTaxCost Item
Actual PerformanceR$/km
0% 20% 40% 60% 80% 100%
Fuel Cost Other Variable Cost Depreciation Remuneration
Personnel Cost Administration Tax
The Improvement of Transport System in the Metropolitan Area of Belem
615
Table 20.3-9 Annual Operating Cost of Trunk Bus System
20.3.7. RESULT OF FINANCIAL EVALUATION
(1) Additional Assumptions for Financial Analysis The financial statements were forecast based on the following assumptions on inflation, interest rate, tax and others.
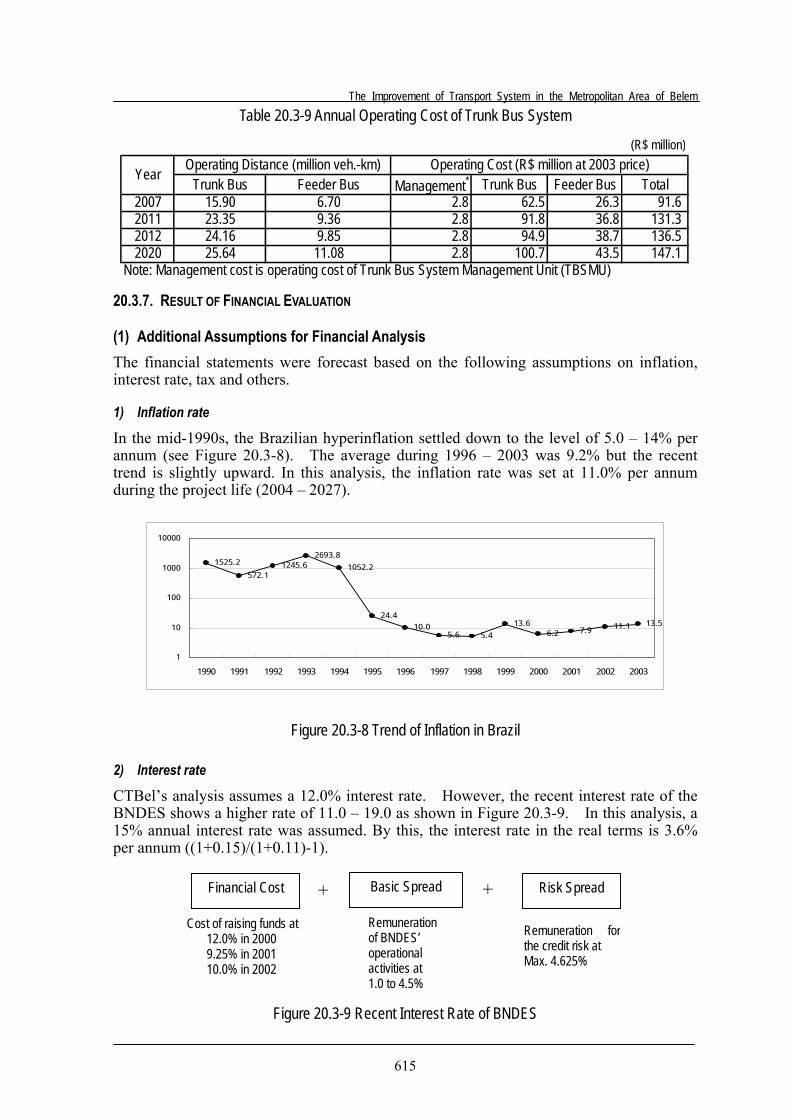
1) Inflation rate
In the mid-1990s, the Brazilian hyperinflation settled down to the level of 5.0 – 14% per annum (see Figure 20.3-8). The average during 1996 – 2003 was 9.2% but the recent trend is slightly upward. In this analysis, the inflation rate was set at 11.0% per annum during the project life (2004 – 2027).
1525.2572.1
1245.62693.8
1052.2
24.410.0
5.6 5.413.6
6.2 7.9 11.1 13.5
1
10
100
1000
10000
1990 1991 1992 1993 1994 1995 1996 1997 1998 1999 2000 2001 2002 2003
Figure 20.3-8 Trend of Inflation in Brazil
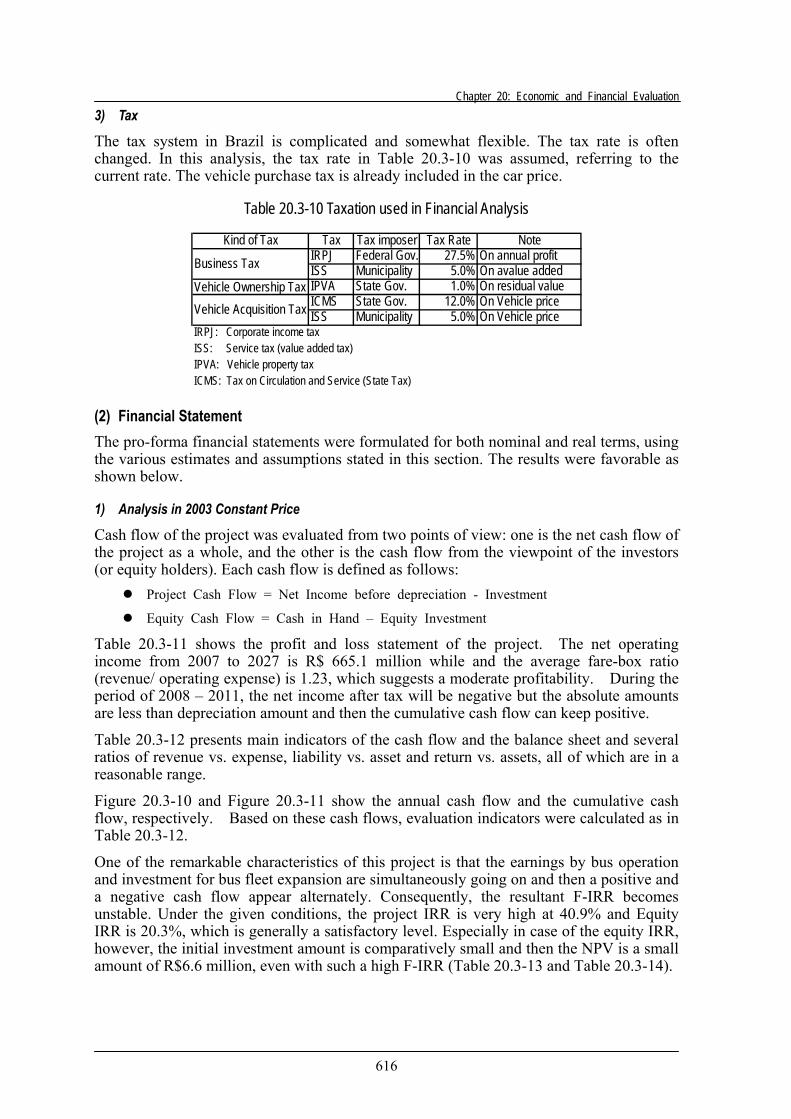
2) Interest rate
CTBel’s analysis assumes a 12.0% interest rate. However, the recent interest rate of the BNDES shows a higher rate of 11.0 – 19.0 as shown in Figure 20.3-9. In this analysis, a 15% annual interest rate was assumed. By this, the interest rate in the real terms is 3.6% per annum ((1+0.15)/(1+0.11)-1).
Figure 20.3-9 Recent Interest Rate of BNDES
Basic Spread Risk Spread
Cost of raising funds at 12.0% in 2000 9.25% in 2001 10.0% in 2002
Remuneration of BNDES’ operational activities at 1.0 to 4.5%
Remuneration forthe credit risk at Max. 4.625%
Financial Cost + +
(R$ million)
Trunk Bus Feeder Bus Management* Trunk Bus Feeder Bus Total2007 15.90 6.70 2.8 62.5 26.3 91.62011 23.35 9.36 2.8 91.8 36.8 131.32012 24.16 9.85 2.8 94.9 38.7 136.52020 25.64 11.08 2.8 100.7 43.5 147.1
Note: Management cost is operating cost of Trunk Bus System Management Unit (TBSMU)
Year Operating Distance (million veh.-km) Operating Cost (R$ million at 2003 price)
Chapter 20: Economic and Financial Evaluation
616
3) Tax
The tax system in Brazil is complicated and somewhat flexible. The tax rate is often changed. In this analysis, the tax rate in Table 20.3-10 was assumed, referring to the current rate. The vehicle purchase tax is already included in the car price.
Table 20.3-10 Taxation used in Financial Analysis
Kind of Tax Tax Tax imposer Tax Rate NoteIRPJ Federal Gov. 27.5% On annual profitISS Municipality 5.0% On avalue added
Vehicle Ownership Tax IPVA State Gov. 1.0% On residual valueICMS State Gov. 12.0% On Vehicle priceISS Municipality 5.0% On Vehicle price
IRPJ: Corporate income taxISS: Service tax (value added tax)IPVA: Vehicle property taxICMS: Tax on Circulation and Service (State Tax)
Vehicle Acquisition Tax
Business Tax
(2) Financial Statement The pro-forma financial statements were formulated for both nominal and real terms, using the various estimates and assumptions stated in this section. The results were favorable as shown below.
1) Analysis in 2003 Constant Price
Cash flow of the project was evaluated from two points of view: one is the net cash flow of the project as a whole, and the other is the cash flow from the viewpoint of the investors (or equity holders). Each cash flow is defined as follows:
Project Cash Flow = Net Income before depreciation - Investment
Equity Cash Flow = Cash in Hand – Equity Investment
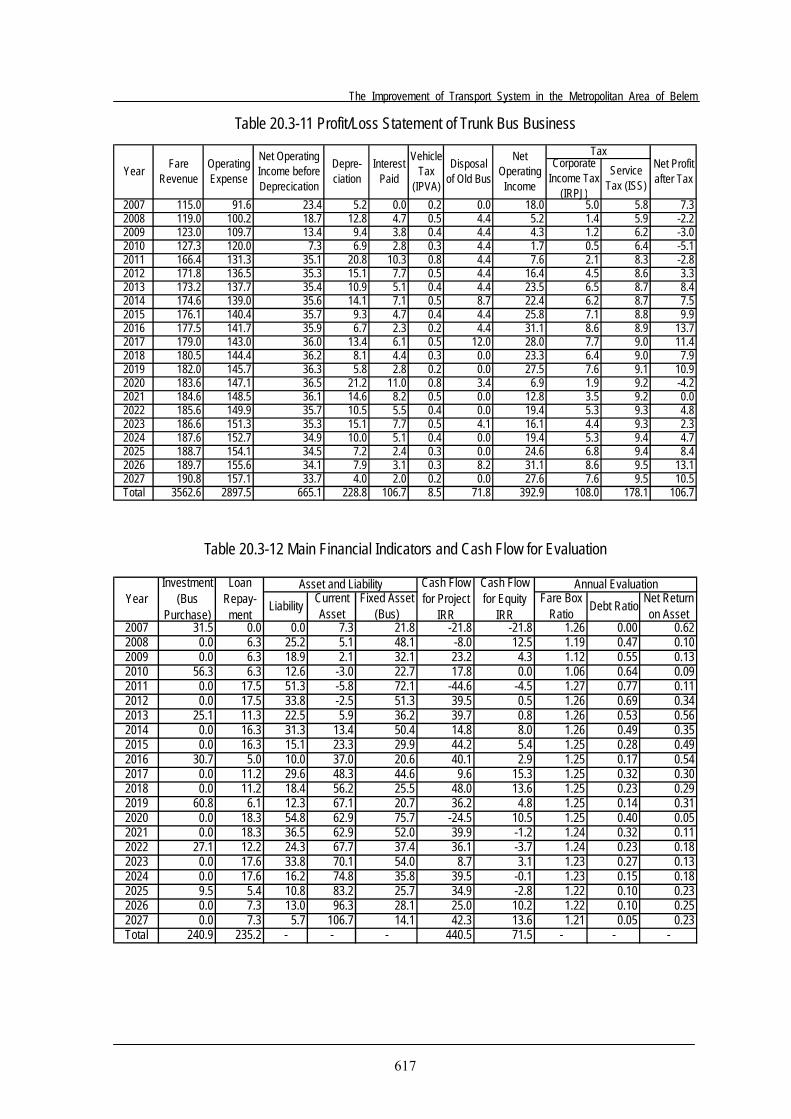
Table 20.3-11 shows the profit and loss statement of the project. The net operating income from 2007 to 2027 is R$ 665.1 million while and the average fare-box ratio (revenue/ operating expense) is 1.23, which suggests a moderate profitability. During the period of 2008 – 2011, the net income after tax will be negative but the absolute amounts are less than depreciation amount and then the cumulative cash flow can keep positive.
Table 20.3-12 presents main indicators of the cash flow and the balance sheet and several ratios of revenue vs. expense, liability vs. asset and return vs. assets, all of which are in a reasonable range.
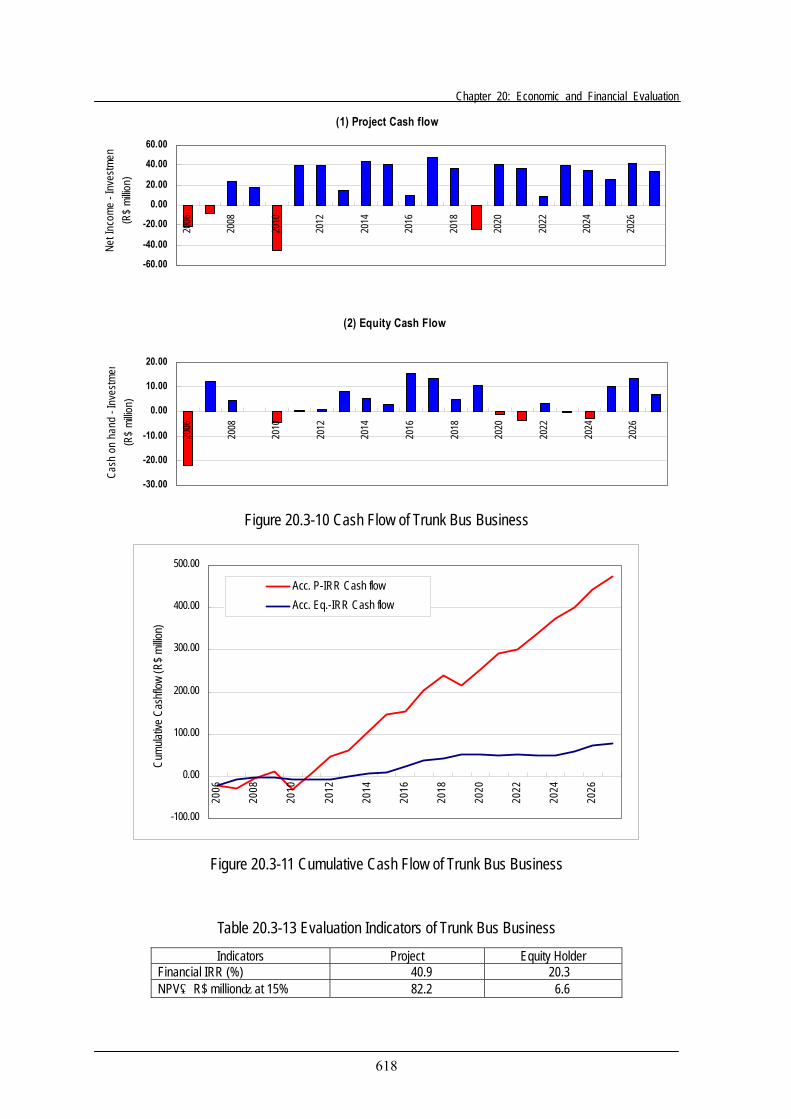
Figure 20.3-10 and Figure 20.3-11 show the annual cash flow and the cumulative cash flow, respectively. Based on these cash flows, evaluation indicators were calculated as in Table 20.3-12.
One of the remarkable characteristics of this project is that the earnings by bus operation and investment for bus fleet expansion are simultaneously going on and then a positive and a negative cash flow appear alternately. Consequently, the resultant F-IRR becomes unstable. Under the given conditions, the project IRR is very high at 40.9% and Equity IRR is 20.3%, which is generally a satisfactory level. Especially in case of the equity IRR, however, the initial investment amount is comparatively small and then the NPV is a small amount of R$6.6 million, even with such a high F-IRR (Table 20.3-13 and Table 20.3-14).
The Improvement of Transport System in the Metropolitan Area of Belem
617
Table 20.3-11 Profit/Loss Statement of Trunk Bus Business
2007 115.0 91.6 23.4 5.2 0.0 0.2 0.0 18.0 5.0 5.8 7.32008 119.0 100.2 18.7 12.8 4.7 0.5 4.4 5.2 1.4 5.9 -2.22009 123.0 109.7 13.4 9.4 3.8 0.4 4.4 4.3 1.2 6.2 -3.02010 127.3 120.0 7.3 6.9 2.8 0.3 4.4 1.7 0.5 6.4 -5.12011 166.4 131.3 35.1 20.8 10.3 0.8 4.4 7.6 2.1 8.3 -2.82012 171.8 136.5 35.3 15.1 7.7 0.5 4.4 16.4 4.5 8.6 3.32013 173.2 137.7 35.4 10.9 5.1 0.4 4.4 23.5 6.5 8.7 8.42014 174.6 139.0 35.6 14.1 7.1 0.5 8.7 22.4 6.2 8.7 7.52015 176.1 140.4 35.7 9.3 4.7 0.4 4.4 25.8 7.1 8.8 9.92016 177.5 141.7 35.9 6.7 2.3 0.2 4.4 31.1 8.6 8.9 13.72017 179.0 143.0 36.0 13.4 6.1 0.5 12.0 28.0 7.7 9.0 11.42018 180.5 144.4 36.2 8.1 4.4 0.3 0.0 23.3 6.4 9.0 7.92019 182.0 145.7 36.3 5.8 2.8 0.2 0.0 27.5 7.6 9.1 10.92020 183.6 147.1 36.5 21.2 11.0 0.8 3.4 6.9 1.9 9.2 -4.22021 184.6 148.5 36.1 14.6 8.2 0.5 0.0 12.8 3.5 9.2 0.02022 185.6 149.9 35.7 10.5 5.5 0.4 0.0 19.4 5.3 9.3 4.82023 186.6 151.3 35.3 15.1 7.7 0.5 4.1 16.1 4.4 9.3 2.32024 187.6 152.7 34.9 10.0 5.1 0.4 0.0 19.4 5.3 9.4 4.72025 188.7 154.1 34.5 7.2 2.4 0.3 0.0 24.6 6.8 9.4 8.42026 189.7 155.6 34.1 7.9 3.1 0.3 8.2 31.1 8.6 9.5 13.12027 190.8 157.1 33.7 4.0 2.0 0.2 0.0 27.6 7.6 9.5 10.5Total 3562.6 2897.5 665.1 228.8 106.7 8.5 71.8 392.9 108.0 178.1 106.7
TaxCorporate
Income Tax(IRPJ)
ServiceTax (ISS)
Net Profitafter Tax
InterestPaid
VehicleTax
(IPVA)
Disposalof Old Bus
NetOperating
IncomeYear Operating
Expense
Net OperatingIncome beforeDeprecication
Depre-ciation
FareRevenue
Table 20.3-12 Main Financial Indicators and Cash Flow for Evaluation
2007 31.5 0.0 0.0 7.3 21.8 -21.8 -21.8 1.26 0.00 0.622008 0.0 6.3 25.2 5.1 48.1 -8.0 12.5 1.19 0.47 0.102009 0.0 6.3 18.9 2.1 32.1 23.2 4.3 1.12 0.55 0.132010 56.3 6.3 12.6 -3.0 22.7 17.8 0.0 1.06 0.64 0.092011 0.0 17.5 51.3 -5.8 72.1 -44.6 -4.5 1.27 0.77 0.112012 0.0 17.5 33.8 -2.5 51.3 39.5 0.5 1.26 0.69 0.342013 25.1 11.3 22.5 5.9 36.2 39.7 0.8 1.26 0.53 0.562014 0.0 16.3 31.3 13.4 50.4 14.8 8.0 1.26 0.49 0.352015 0.0 16.3 15.1 23.3 29.9 44.2 5.4 1.25 0.28 0.492016 30.7 5.0 10.0 37.0 20.6 40.1 2.9 1.25 0.17 0.542017 0.0 11.2 29.6 48.3 44.6 9.6 15.3 1.25 0.32 0.302018 0.0 11.2 18.4 56.2 25.5 48.0 13.6 1.25 0.23 0.292019 60.8 6.1 12.3 67.1 20.7 36.2 4.8 1.25 0.14 0.312020 0.0 18.3 54.8 62.9 75.7 -24.5 10.5 1.25 0.40 0.052021 0.0 18.3 36.5 62.9 52.0 39.9 -1.2 1.24 0.32 0.112022 27.1 12.2 24.3 67.7 37.4 36.1 -3.7 1.24 0.23 0.182023 0.0 17.6 33.8 70.1 54.0 8.7 3.1 1.23 0.27 0.132024 0.0 17.6 16.2 74.8 35.8 39.5 -0.1 1.23 0.15 0.182025 9.5 5.4 10.8 83.2 25.7 34.9 -2.8 1.22 0.10 0.232026 0.0 7.3 13.0 96.3 28.1 25.0 10.2 1.22 0.10 0.252027 0.0 7.3 5.7 106.7 14.1 42.3 13.6 1.21 0.05 0.23Total 240.9 235.2 - - - 440.5 71.5 - - -
Fare BoxRatio Debt Ratio
Cash Flowfor Equity
IRR
Annual EvaluationNet Returnon Asset
YearInvestment
(BusPurchase)
LoanRepay-ment
Cash Flowfor Project
IRR
Asset and LiabilityLiability Current
AssetFixed Asset
(Bus)
Chapter 20: Economic and Financial Evaluation
618
Figure 20.3-10 Cash Flow of Trunk Bus Business
-100.00
0.00
100.00
200.00
300.00
400.00
500.00
2006
2008
2010
2012
2014
2016
2018
2020
2022
2024
2026
Cumu
lative
Cas
hflow
(R$ m
illion)
Acc. P-IRR Cash flowAcc. Eq.-IRR Cash flow
Figure 20.3-11 Cumulative Cash Flow of Trunk Bus Business
Table 20.3-13 Evaluation Indicators of Trunk Bus Business Indicators Project Equity Holder
Financial IRR (%) 40.9 20.3 NPV(R$ million)at 15% 82.2 6.6
(1) Project Cash flow
-60.00
-40.00
-20.00
0.00
20.00
40.00
60.00
2006
2008
2010
2012
2014
2016
2018
2020
2022
2024
2026
Net I
ncom
e - I
nves
tmen
(R$
millio
n)
(2) Equity Cash Flow
-30.00
-20.00
-10.00
0.00
10.00
20.00
2006
2008
2010
2012
2014
2016
2018
2020
2022
2024
2026
Cash
on
hand
- In
vestm
en(R
$ mi
llion)
The Improvement of Transport System in the Metropolitan Area of Belem
619
Table 20.3-14 Sensitivity of Financial IRR and NPV
Project IRR NPV Equity IRR NPV% R$ million % R$ million
Base Case - 40.9 82.2 20.3 6.65% UP 43.7 90.7 24.9 12.8
5% down 38.1 73.7 15.4 0.410% down 35.4 65.2 9.7 -5.710% down 45.2 91.2 25.0 13.1
10% up 36.9 73.2 15.2 0.220% up 33.3 64.2 9.3 -6.3
10% down - - 25.7 14.010% up - - 17.4 7.920% up - - 14.4 -0.7
15% - 2.5% - - 23.0 10.215% + 2.5% - - 17.5 3.115% + 5.0% - - 14.6 -0.5
Revenue
Price of Bus
Tax
Interest Rate
Project Evaluation Shareholder's EvaluationFactor to Change Conditions
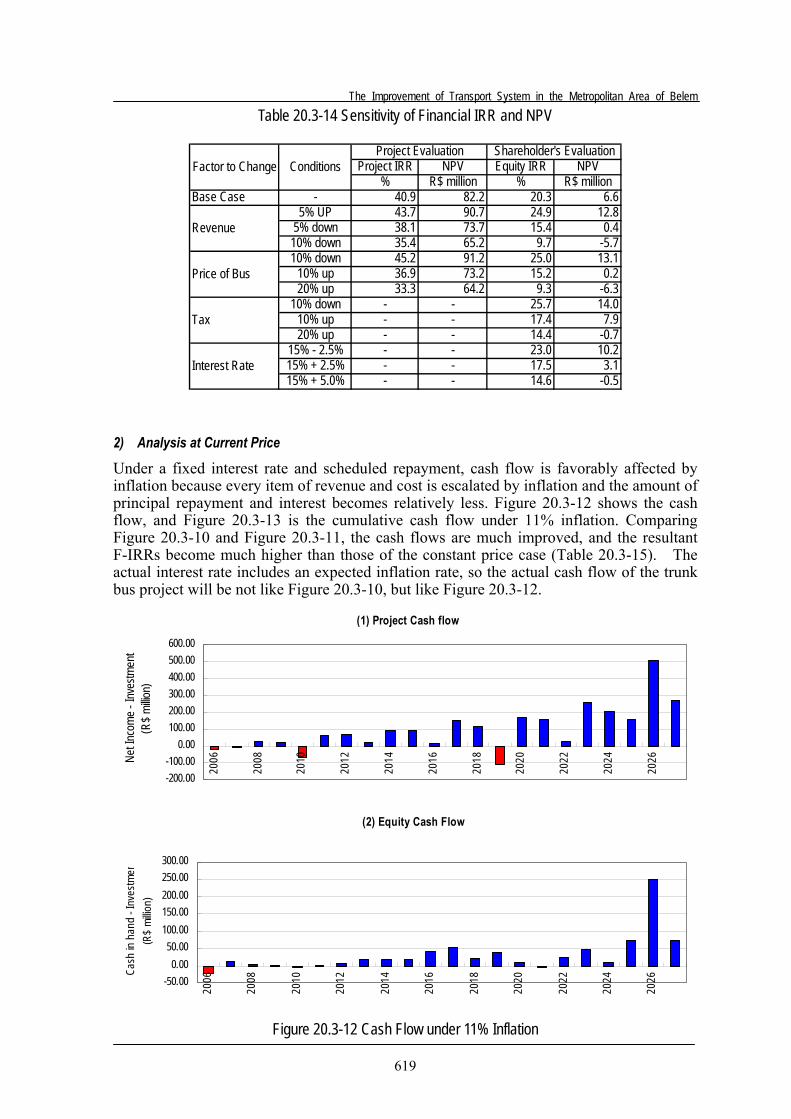
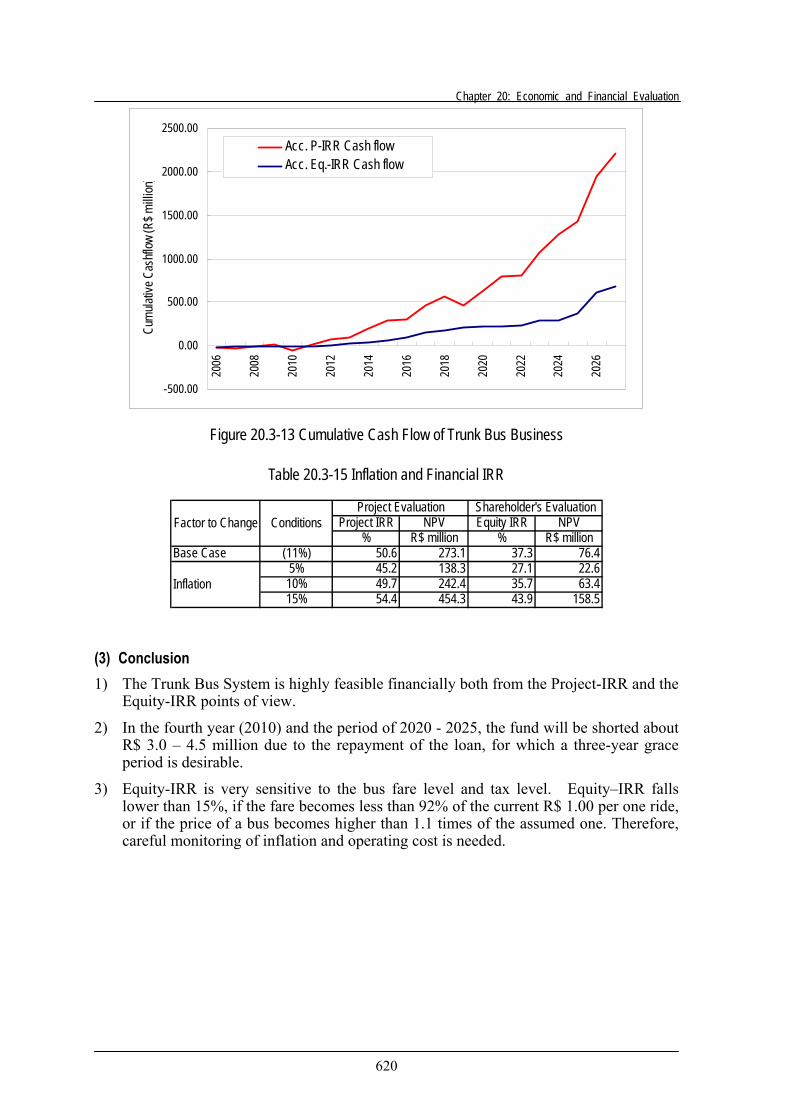
2) Analysis at Current Price
Under a fixed interest rate and scheduled repayment, cash flow is favorably affected by inflation because every item of revenue and cost is escalated by inflation and the amount of principal repayment and interest becomes relatively less. Figure 20.3-12 shows the cash flow, and Figure 20.3-13 is the cumulative cash flow under 11% inflation. Comparing Figure 20.3-10 and Figure 20.3-11, the cash flows are much improved, and the resultant F-IRRs become much higher than those of the constant price case (Table 20.3-15). The actual interest rate includes an expected inflation rate, so the actual cash flow of the trunk bus project will be not like Figure 20.3-10, but like Figure 20.3-12.
Figure 20.3-12 Cash Flow under 11% Inflation
(1) Project Cash flow
-200.00-100.00
0.00100.00200.00300.00400.00500.00600.00
2006
2008
2010
2012
2014
2016
2018
2020
2022
2024
2026Ne
t Inco
me -
Inves
tmen
t(R
$ millio
n)
(2) Equity Cash Flow
-50.000.00
50.00100.00150.00200.00250.00300.00
2006
2008
2010
2012
2014
2016
2018
2020
2022
2024
2026Ca
sh in
han
d - I
nves
tme n
(R$
millio
n)
Chapter 20: Economic and Financial Evaluation
620
-500.00
0.00
500.00
1000.00
1500.00
2000.00
2500.00
2006
2008
2010
2012
2014
2016
2018
2020
2022
2024
2026
Cum
ulativ
e Cas
hflow
(R$ m
illion
)Acc. P-IRR Cash flowAcc. Eq.-IRR Cash flow
Figure 20.3-13 Cumulative Cash Flow of Trunk Bus Business
Table 20.3-15 Inflation and Financial IRR
Project IRR NPV Equity IRR NPV% R$ million % R$ million
Base Case (11%) 50.6 273.1 37.3 76.45% 45.2 138.3 27.1 22.6
10% 49.7 242.4 35.7 63.415% 54.4 454.3 43.9 158.5
Shareholder's Evaluation
Inflation
Factor to Change ConditionsProject Evaluation
(3) Conclusion 1) The Trunk Bus System is highly feasible financially both from the Project-IRR and the
Equity-IRR points of view.
2) In the fourth year (2010) and the period of 2020 - 2025, the fund will be shorted about R$ 3.0 – 4.5 million due to the repayment of the loan, for which a three-year grace period is desirable.
3) Equity-IRR is very sensitive to the bus fare level and tax level. Equity–IRR falls lower than 15%, if the fare becomes less than 92% of the current R$ 1.00 per one ride, or if the price of a bus becomes higher than 1.1 times of the assumed one. Therefore, careful monitoring of inflation and operating cost is needed.
CHAPTER 21 Transport Demand Management (TDM)
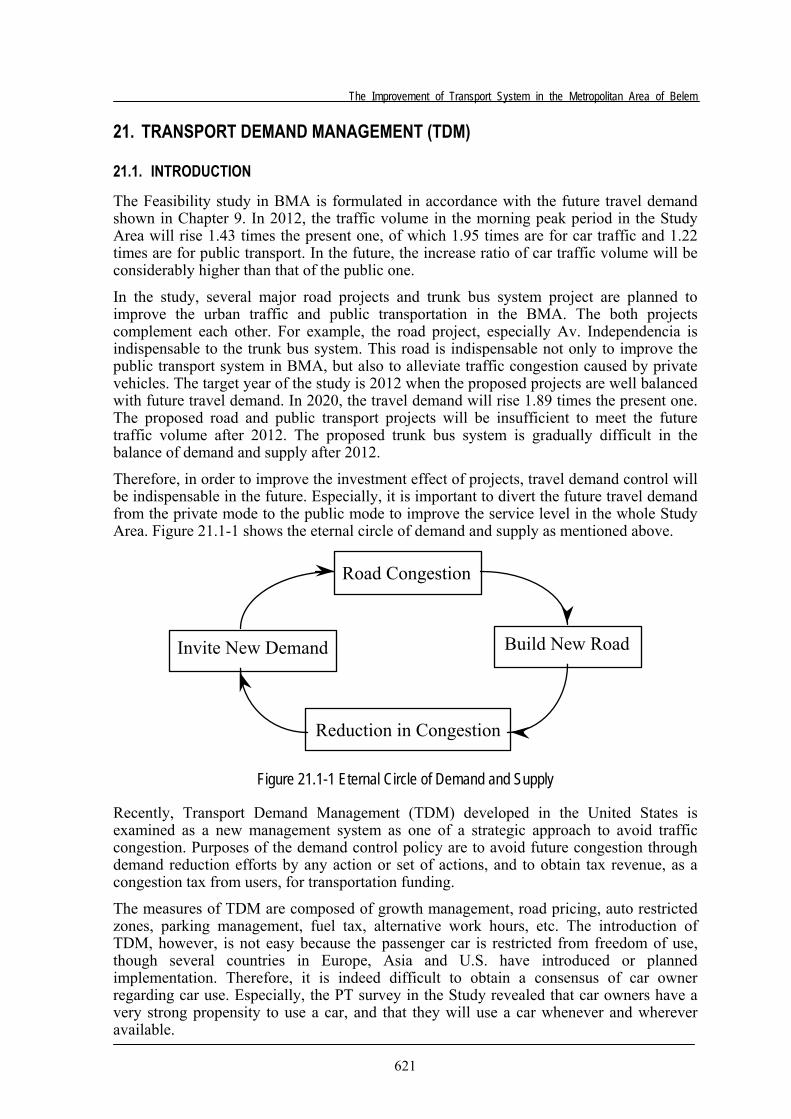
The Improvement of Transport System in the Metropolitan Area of Belem
621
21. TRANSPORT DEMAND MANAGEMENT (TDM)
21.1. INTRODUCTION
The Feasibility study in BMA is formulated in accordance with the future travel demand shown in Chapter 9. In 2012, the traffic volume in the morning peak period in the Study Area will rise 1.43 times the present one, of which 1.95 times are for car traffic and 1.22 times are for public transport. In the future, the increase ratio of car traffic volume will be considerably higher than that of the public one.
In the study, several major road projects and trunk bus system project are planned to improve the urban traffic and public transportation in the BMA. The both projects complement each other. For example, the road project, especially Av. Independencia is indispensable to the trunk bus system. This road is indispensable not only to improve the public transport system in BMA, but also to alleviate traffic congestion caused by private vehicles. The target year of the study is 2012 when the proposed projects are well balanced with future travel demand. In 2020, the travel demand will rise 1.89 times the present one. The proposed road and public transport projects will be insufficient to meet the future traffic volume after 2012. The proposed trunk bus system is gradually difficult in the balance of demand and supply after 2012.
Therefore, in order to improve the investment effect of projects, travel demand control will be indispensable in the future. Especially, it is important to divert the future travel demand from the private mode to the public mode to improve the service level in the whole Study Area. Figure 21.1-1 shows the eternal circle of demand and supply as mentioned above.
Road Congestion
Build New Road
Reduction in Congestion
Invite New Demand
Figure 21.1-1 Eternal Circle of Demand and Supply
Recently, Transport Demand Management (TDM) developed in the United States is examined as a new management system as one of a strategic approach to avoid traffic congestion. Purposes of the demand control policy are to avoid future congestion through demand reduction efforts by any action or set of actions, and to obtain tax revenue, as a congestion tax from users, for transportation funding.
The measures of TDM are composed of growth management, road pricing, auto restricted zones, parking management, fuel tax, alternative work hours, etc. The introduction of TDM, however, is not easy because the passenger car is restricted from freedom of use, though several countries in Europe, Asia and U.S. have introduced or planned implementation. Therefore, it is indeed difficult to obtain a consensus of car owner regarding car use. Especially, the PT survey in the Study revealed that car owners have a very strong propensity to use a car, and that they will use a car whenever and wherever available.
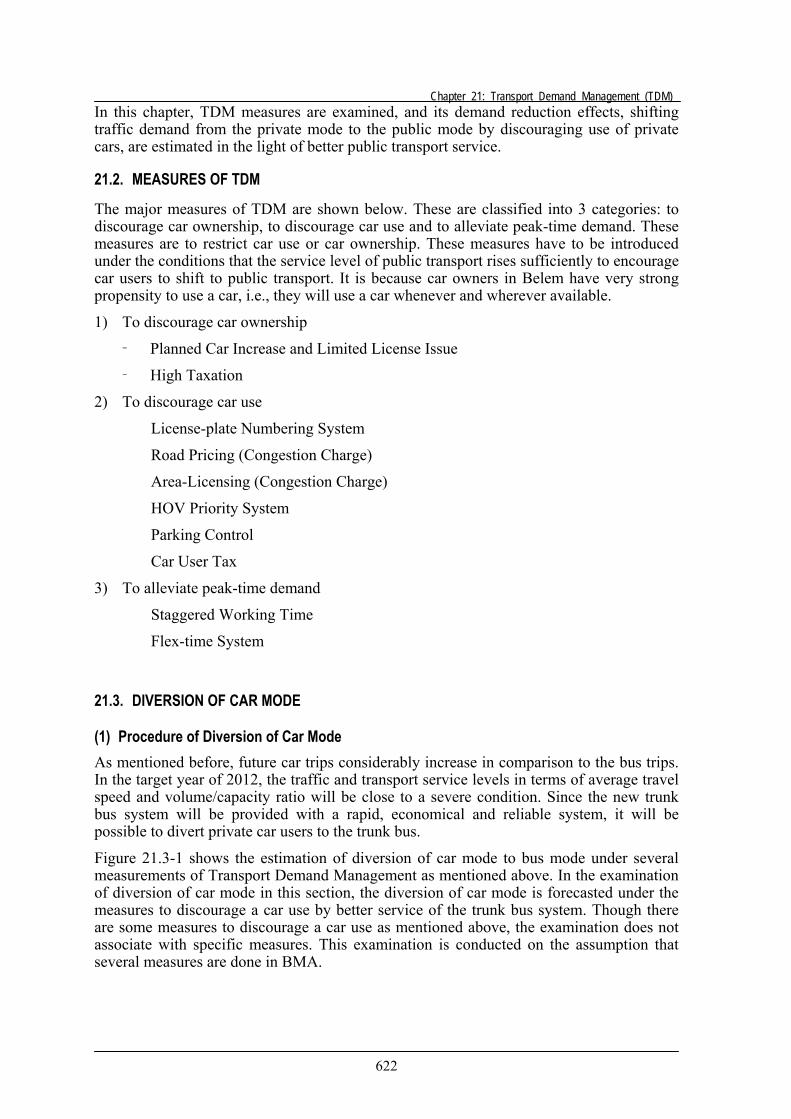
Chapter 21: Transport Demand Management (TDM)
622
In this chapter, TDM measures are examined, and its demand reduction effects, shifting traffic demand from the private mode to the public mode by discouraging use of private cars, are estimated in the light of better public transport service.
21.2. MEASURES OF TDM
The major measures of TDM are shown below. These are classified into 3 categories: to discourage car ownership, to discourage car use and to alleviate peak-time demand. These measures are to restrict car use or car ownership. These measures have to be introduced under the conditions that the service level of public transport rises sufficiently to encourage car users to shift to public transport. It is because car owners in Belem have very strong propensity to use a car, i.e., they will use a car whenever and wherever available.
1) To discourage car ownership
‑ Planned Car Increase and Limited License Issue
‑ High Taxation
2) To discourage car use
License-plate Numbering System
Road Pricing (Congestion Charge)
Area-Licensing (Congestion Charge)
HOV Priority System
Parking Control
Car User Tax
3) To alleviate peak-time demand
Staggered Working Time
Flex-time System
21.3. DIVERSION OF CAR MODE
(1) Procedure of Diversion of Car Mode As mentioned before, future car trips considerably increase in comparison to the bus trips. In the target year of 2012, the traffic and transport service levels in terms of average travel speed and volume/capacity ratio will be close to a severe condition. Since the new trunk bus system will be provided with a rapid, economical and reliable system, it will be possible to divert private car users to the trunk bus.
Figure 21.3-1 shows the estimation of diversion of car mode to bus mode under several measurements of Transport Demand Management as mentioned above. In the examination of diversion of car mode in this section, the diversion of car mode is forecasted under the measures to discourage a car use by better service of the trunk bus system. Though there are some measures to discourage a car use as mentioned above, the examination does not associate with specific measures. This examination is conducted on the assumption that several measures are done in BMA.
The Improvement of Transport System in the Metropolitan Area of Belem
623
Figure 21.3-1 Estimation Flowchart for Transport Demand Management
As can be seen, the diversion of private car users was examined according to the data from a survey of a choice between bus under the trunk bus system and car. In the interview survey a sample of 300 was collected in October, 2002 and analyzed as shown in Figure 21.3-2, in which the diversion ratio of car users to the trunk buses is shown against time difference between car and bus travel times. As can be seen, it indicates that when the difference in travel time is 10 minutes, approximately 30% of car users will divert to the trunk buses. Incidentally, approximately 60% of interviewees are in the range of 10 to 30 minutes in the travel time.
Proposed Trunk Bus System(Improvement of Public Transportation System)
Traffic and Transport Conditions in 2002
Trunk Bus System Projectsand Road Projects
Future Traffic Demand in 2007 and 2012
Demand/Supply Analysis
Trunk Bus Flow Conditions by Simulation Model- Travel Speed- Queue Length- Delay Time
Transport Service LevelExampe: Travel Speed, Road Congenstion
Necessity of Traffic Demand Management(TDM)
Diversion of car trips to public transport
Making Diversion Curve made by Car Owner Survey
Reduction of Car Trips
Measures of TDM to Discourage a Car UseFor Examples:- License-plate Numbering System-Road Pricing- HOV Priority System- Parking Control- Car User Tax
Chapter 21: Transport Demand Management (TDM)
624
Diversion Curve
0.000
0.100
0.200
0.300
0.400
0.500
0.600
0.700
5min. 10min. 15min. 20min. 25min. 30min.
Time Difference
Div
ers
ion R
atio
Interviewed
Estimated Value
Figure 21.3-2 Diversion Curve of Car Users to Bus Transportation
Diversion’s equation:
Here: P : Diversion ratio of car users to the trunk buses W : Time difference (car travel time – bus travel time) minutes K : 0.8
α : 162.457
β : -1.923
S : 0.752202 in 2012
(2) Projection of Diversion to Public Mode The TDM analysis was done using the equation for the diversion for 2012, when the trunk bus system will be operated. In the estimation of bus travel time, the waiting time at bus stops, transfer time at bus stops and terminals, and walking time are included referring to the public transport survey data, while in the car trips those are not included. Table 21.3-1 shows the number of trips by type of vehicle in 2012 according to diversion of car trips. As can be seen, approximately 7% of the total car trips will divert to bus passengers in the morning peak hour. As a result, the total bus trips will increase by approximately 4%.
Table 21.3-1 Number of Trips by Diversion of Cars in 2012
Base Case After Analysis Diversion Trips Diversion RatioDaily Base Car 1,723,802 1,649,104 -74,698 -4.3% Bus 2,088,226 2,162,924 74,698 3.6%Peak Hour Car 216,825 201,641 -15,184 -7.0% Bus 366,191 381,375 15,184 4.1%
KP=
-β1+α×(W/S)
The Improvement of Transport System in the Metropolitan Area of Belem
625
According to the diversion of car users, in 2012, travel conditions will be improved as shown in Figure 21.3-3 and Figure 21.3-4 in which the estimated value is shown as a triangle symbol. The average travel speed is a typical index to show a service level. In the peak hour average travel speed in 2012, it is slightly better in the diversion case than that With project case (base case). The figure increases from 34 km/h in the base case to 41 km/h. This travel speed is the same as that at the present level (42km/h). The peak hour average volume/capacity ratio as a index of traffic congestion is somewhat better than that in base case. The figure decreases from 0.75 in the base case to 0.66 in the diversion case.
Although this is the sensitivity analysis, the introduction of the trunk bus system as well as road planning will be expected for the improvement of traffic and transport conditions.
Figure 21.3-3 Peak Hour Average Travel Speed
Figure 21.3-4 Peak Hour Average Volume/Capacity Ratio
Peak Hour Travel Speed
0.0
5.0
10.0
15.0
20.0
25.0
30.0
35.0
40.0
45.0
2002 2007 2012 2020Year
Km
/hr
Without Case
With Case
Diversion
Peak Hour Average Volume/ Capacity Ra tio
0.00
0.20
0.40
0.60
0.80
1.00
1.20
1.40
1.60
1.802.00
2002 2007 2012 2020Year
Ratio
Without Case
With Case
Divers ion
APPENDIX
The Improvement of Transport System in the Metropolitan Area of Belem
(1)
TABLE OF CONTENTS
Appendix A: A.6 INITIAL ENVIRONMENTAL EXAMINATION ......................................................A-1 (1) Air Quality Survey Results (NOX)....................................................................A-1 (2) Air Quality Survey Results (CO).......................................................................A-8 (3) Noise Survey Results .......................................................................................A-15 (4) Vibration Survey Results .................................................................................A-22
Appendix B: B.11 TRUNK BUS OPERATION PLAN.....................................................................B-1 (1) Electronic Fare Payment Technology................................................................B-1 (2) Automated Vehicle Location System (AVL System)........................................B-7
Appendix C: C.16 CONSTRUCTION PLANNING AND COST ESTIMATE .................................. C-1
Appendix D: D.17 ENVIRONMENTAL IMPACT ASSESSMENT.................................................. D-1 (1) Case Study of Expropriation and Resettlement caused by Public Works .........D-1 (2) Wall Construction Project for protection of water resource - COHAB.............D-2 (3) Projeto Una (Macro Drainage) - COSANPA.....................................................D-3 (4) Extension of Av. Primeiro de Dezembro - Belem Municipality .......................D-6 (5) Av. Independencia Construction - Para State ....................................................D-7 (6) Result of Case Study..........................................................................................D-9 (7) Compensation for Expropriation and Resettlement.........................................D-11
Appendix E: E.20 ECONOMIC AND FINANCIAL EVALUATION ..................................................E-1
(2)
List of Appendix Tables Appendix B Table B-1 Current and Planned Multipurpose Transit Projects ......................................... B-1 Table B-2 Closed versus Open System.............................................................................. B-2 Appendix C Table C-1 Unit Cost ........................................................................................................... C-1 Appendix D Table D-1 Main components..............................................................................................D-4 Table D-2 Characteristics and Situation of Expropriation by Case Study Project...........D-10 Table D-3 Characteristics and Compensation Cost by Case Study Project .....................D-11 Appendix E Table E-1 Investment Schedule in Financial and Economic Cost ..................................... E-1 Table E-2 Vehicle Operating Cost in Belem...................................................................... E-4 Table E-3 Characteristics of Representative Vehicle......................................................... E-4 Table E-4 Composition of Fuel Consumption and Average Fuel Cost by Type of VehicleE-4 Table E-5 Fuel Consumption Rate and Cost by Type of Vehicle...................................... E-5 Table E-6 Oil Consumption Rate and Cost by Type of Vehicle........................................ E-5 Table E-7 Financial and Economic Cost by Types ............................................................ E-6 Table E-8 Type Consumption Rate and Cost by Type of Vehicle..................................... E-6 Table E-9 Assumptions for Repair Cost Estimation .......................................................... E-7 Table E-10 Financial and Economic Repair Cost .............................................................. E-7 Table E-11 Assumptions for Depreciation Cost Estimation .............................................. E-8 Table E-12 Financial and Economic Depreciation Cost Subject to Use............................ E-9 Table E-13 Depreciation Cost Subject to Time ................................................................. E-9 Table E-14 Capital Opportunity Cost by Type of Vehicle............................................... E-10 Table E-15 Crew Cost and Overhead Cost by Type of Vehicle ...................................... E-10 Table E-16 Aggregate Vehicle Operating Coat by Type of Vehicle ............................... E-11 Table E-17 Cost Benefit Flow for Economic Evaluation ................................................ E-12
The Improvement of Transport System in the Metropolitan Area of Belem
(3)
List of Appendix Figures Appendix A Figure A-1 Roadside A/Q Survey Results (NOX, Utinga, June/16/02) ...........................A-1 Figure A-2 Roadside A/Q Survey Results (NOX, Primeiro de Dezembro, June/18/02) ...A-1 Figure A-3 Roadside A/Q Survey Results (NOX, Independencia, June/19/02) ................A-1 Figure A-4 Roadside A/Q Survey Results (NOX, BR316, June/20/02) ............................A-2 Figure A-5 Roadside A/Q Survey Results (NOX, Nazare, June/21/02) ............................A-2 Figure A-6 Roadside A/Q Survey Results (NOX, Nazare, June/22/02) ............................A-2 Figure A-7 Roadside A/Q Survey Results (NOX, Nazare, Nov/19/02).............................A-3 Figure A-8 Roadside A/Q Survey Results (NOX, Nazare, Nov/23/02).............................A-3 Figure A-9 Roadside A/Q Survey Results (NOX, Tamandare, June/23/02)......................A-3 Figure A-10 Roadside A/Q Survey Results (NOX, Tamandare, Nov/20/02) ....................A-4 Figure A-11 Roadside A/Q Survey Results (NOX, Tamandare, Nov/24/02) ....................A-4 Figure A-12 Roadside A/Q Survey Results (NOX, Sao-Braz, June/24/02).......................A-4 Figure A-13 Roadside A/Q Survey Results (NOX, Sao-Braz, June/28/02).......................A-5 Figure A-14 Roadside A/Q Survey Results (NOX, Sao-Braz, Nov/19/02) .......................A-5 Figure A-15 Roadside A/Q Survey Results (NOX, Joao Balbi, June/25/02).....................A-5 Figure A-16 Roadside A/Q Survey Results (NOX, Joao Balbi, Nov/27/02) .....................A-6 Figure A-17 Roadside A/Q Survey Results (NOX, Bosque, June/26/02)..........................A-6 Figure A-18 Roadside A/Q Survey Results (NOX, Bosque, Nov/26/02) ..........................A-6 Figure A-19 Roadside A/Q Survey Results (NOX, Augusto Montenegro, June/27/02)....A-7 Figure A-20 Roadside A/Q Survey Results (NOX, Augusto Montenegro, Nov/25/02) ....A-7 Figure A-21 Roadside A/Q Survey Results (CO, Utinga, June/16/02) ..............................A-8 Figure A-22 Roadside A/Q Survey Results (CO, Primeiro de Dezembro, June/18/02) ....A-8 Figure A-23 Roadside A/Q Survey Results (CO, Independencia, June/19/02) .................A-8 Figure A-24 Roadside A/Q Survey Results (CO, BR316, June/20/02) .............................A-9 Figure A-25 Roadside A/Q Survey Results (CO, Nazare, June/21/02) .............................A-9 Figure A-26 Roadside A/Q Survey Results (CO, Nazare, June/22/02) .............................A-9 Figure A-27 Roadside A/Q Survey Results (CO, Nazare, Nov/20/02) ............................A-10 Figure A-28 Roadside A/Q Survey Results (CO, Nazare, Nov/23/02) ............................A-10 Figure A-29 Roadside A/Q Survey Results (CO, Tamandare, June/23/02).....................A-10 Figure A-30 Roadside A/Q Survey Results (CO, Tamandare, Nov/21/02) .....................A-11 Figure A-31 Roadside A/Q Survey Results (CO, Tamandare, Nov/24/02) .....................A-11 Figure A-32 Roadside A/Q Survey Results (CO, Sao-Braz, June/24/02) ........................A-11 Figure A-33 Roadside A/Q Survey Results (CO, Sao-Braz, June/28/02) ........................A-12 Figure A-34 Roadside A/Q Survey Results (CO, Sao-Braz, Nov/19/02) ........................A-12 Figure A-35 Roadside A/Q Survey Results (CO, Joao Balbi, June/25/02)......................A-12 Figure A-36 Roadside A/Q Survey Results (CO, Joao Balbi, Nov/27/02) ......................A-13 Figure A-37 Roadside A/Q Survey Results (CO, Bosque, June/26/02)...........................A-13 Figure A-38 Roadside A/Q Survey Results (CO, Bosque, Nov/26/02) ...........................A-13 Figure A-39 Roadside A/Q Survey Results (CO, Augusto Montenegro, June/27/02).....A-14 Figure A-40 Roadside A/Q Survey Results (CO, Augusto Montenegro, Nov/25/02) .....A-14 Figure A-41 Noise Measurement Results (Utinga, Nov/21/02) .......................................A-15 Figure A-42 Noise Measurement Results (Primeiro de Dezembro, Nov/28/02) .............A-15 Figure A-43 Noise Measurement Results (Independencia, June/17/02) ..........................A-15 Figure A-44 Noise Measurement Results (Independencia, Nov/18/02)...........................A-16 Figure A-45 Noise Measurement Results (BR316, June/21/02) ......................................A-16
(4)
Figure A-46 Noise Measurement Results (BR316, Nov/25/02) ......................................A-16 Figure A-47 Noise Measurement Results (Nazare, Nov/18/02) ......................................A-17 Figure A-48 Noise Measurement Results (Nazare, Nov/19/02) ......................................A-17 Figure A-49 Noise Measurement Results (Nazare, Nov/24/02) ......................................A-17 Figure A-50 Noise Measurement Results (Tamandare, June/24/02) ...............................A-18 Figure A-51 Noise Measurement Results (Tamandare, Nov/23/02)................................A-18 Figure A-52 Noise Measurement Results (Tamandare, Nov/27/02)................................A-18 Figure A-53 Noise Measurement Results (Sao Braz, June/27/02)...................................A-19 Figure A-54 Noise Measurement Results (Sao Braz, Nov/21/02) ...................................A-19 Figure A-55 Noise Measurement Results (Joao Balbi, Nov/19/02).................................A-19 Figure A-56 Noise Measurement Results (Joao Balbi, Nov/20/02).................................A-20 Figure A-57 Noise Measurement Results (Bosque, June/26/02) .....................................A-20 Figure A-58 Noise Measurement Results (Bosque, Nov/29/02)......................................A-20 Figure A-59 Noise Measurement Results (Augusto Montenegro, June/28/02) ...............A-21 Figure A-60 Noise Measurement Results (Augusto Montenegro, Nov/26/02) ...............A-21 Figure A-61 Vibration Measurement Result (Utinga, Nov/21/02) ..................................A-22 Figure A-62 Vibration Measurement Result (Primeiro de Dezembro, Nov/28/02).........A-22 Figure A-63 Vibration Measurement Result (Independencia, Nov/18/02)......................A-22 Figure A-64 Vibration Measurement Result (Independencia, Nov/27/02)......................A-23 Figure A-65 Vibration Measurement Result (BR316, Nov/24/02)..................................A-23 Figure A-66 Vibration Measurement Result (BR316, Nov/25/02)..................................A-23 Figure A-67 Vibration Measurement Result (Nazare, Nov/18/02)..................................A-24 Figure A-68 Vibration Measurement Result (Nazare, Nov/19/02)..................................A-24 Figure A-69 Vibration Measurement Result (Nazare, Nov/24/02)..................................A-24 Figure A-70 Vibration Measurement Result (Tamandare, Nov/23/02) ...........................A-25 Figure A-71 Vibration Measurement Result (Tamandare, Nov/27/02) ...........................A-25 Figure A-72 Vibration Measurement Result (Tamandare, Nov/28/02) ...........................A-25 Figure A-73 Vibration Measurement Result (Sao-Braz, Nov/22/02) ..............................A-26 Figure A-74 Vibration Measurement Result (Sao-Braz, Nov/26/02) ..............................A-26 Figure A-75 Vibration Measurement Result (Joao Balbi, Nov/19/02) ............................A-26 Figure A-76 Vibration Measurement Result (Joao Balbi, Nov/20/02) ............................A-27 Figure A-77 Vibration Measurement Result (Bosque, Nov/25/02) .................................A-27 Figure A-78 Vibration Measurement Result (Bosque, Nov/29/02) .................................A-27 Figure A-79 Vibration Measurement Result (Augusto Montenegro, Nov/23/02) ...........A-28 Figure A-80 Vibration Measurement Result (Augusto Montenegro, Nov/26/02) ...........A-28 Appendix B Figure B-1 Closed (Transportation only, Multi-operator) Payment System...................... B-3 Figure B-2 Open Payment System..................................................................................... B-4 Figure B-3 Structure of the Whole System ........................................................................ B-9 Figure B-4 Operation Situation Screen (the Display of a Bus Office)............................. B-10 Figure B-5 Structure of the Equipment on the Bus.......................................................... B-10 Appendix D Figure D-1 Location of Case Study Projects and Resettlement Areas...............................D-1

Appendix-A A.6 Initial Environmental Examination
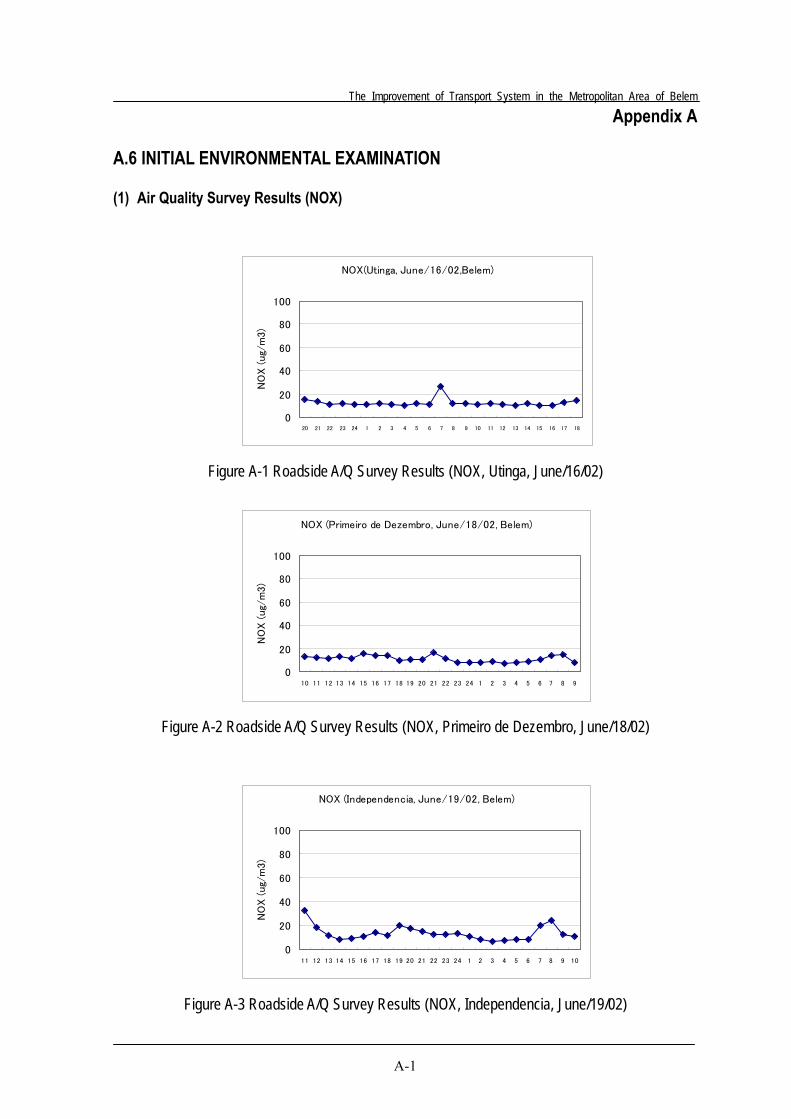
The Improvement of Transport System in the Metropolitan Area of Belem
A-1
Appendix A
A.6 INITIAL ENVIRONMENTAL EXAMINATION
(1) Air Quality Survey Results (NOX)
Figure A-1 Roadside A/Q Survey Results (NOX, Utinga, June/16/02)
Figure A-2 Roadside A/Q Survey Results (NOX, Primeiro de Dezembro, June/18/02)
Figure A-3 Roadside A/Q Survey Results (NOX, Independencia, June/19/02)
NOX(Utinga, June/16/02,Belem)
0
20
40
60
80
100
20 21 22 23 24 1 2 3 4 5 6 7 8 9 10 11 12 13 14 15 16 17 18
NO
X (
ug/m
3)
NOX (Primeiro de Dezembro, June/18/02, Belem)
0
20
40
60
80
100
10 11 12 13 14 15 16 17 18 19 20 21 22 23 24 1 2 3 4 5 6 7 8 9
NO
X (
ug/m
3)
NOX (Independencia, June/19/02, Belem)
0
20
40
60
80
100
11 12 13 14 15 16 17 18 19 20 21 22 23 24 1 2 3 4 5 6 7 8 9 10
NO
X (
ug/m
3)
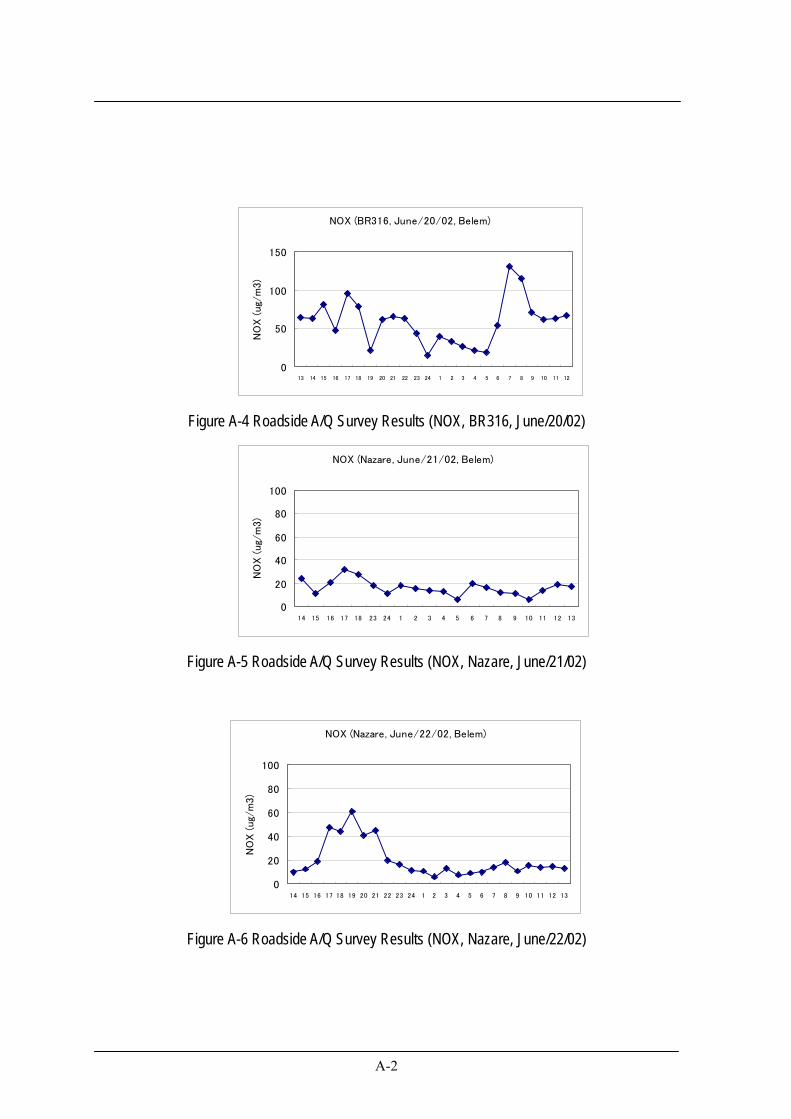
A-2
Figure A-4 Roadside A/Q Survey Results (NOX, BR316, June/20/02)
Figure A-5 Roadside A/Q Survey Results (NOX, Nazare, June/21/02)
Figure A-6 Roadside A/Q Survey Results (NOX, Nazare, June/22/02)
NOX (BR316, June/20/02, Belem)
0
50
100
150
13 14 15 16 17 18 19 20 21 22 23 24 1 2 3 4 5 6 7 8 9 10 11 12
NO
X (
ug/m
3)
NOX (Nazare, June/21/02, Belem)
0
20
40
60
80
100
14 15 16 17 18 23 24 1 2 3 4 5 6 7 8 9 10 11 12 13
NO
X (
ug/m
3)
NOX (Nazare, June/22/02, Belem)
0
20
40
60
80
100
14 15 16 17 18 19 20 21 22 23 24 1 2 3 4 5 6 7 8 9 10 11 12 13
NO
X (
ug/m
3)
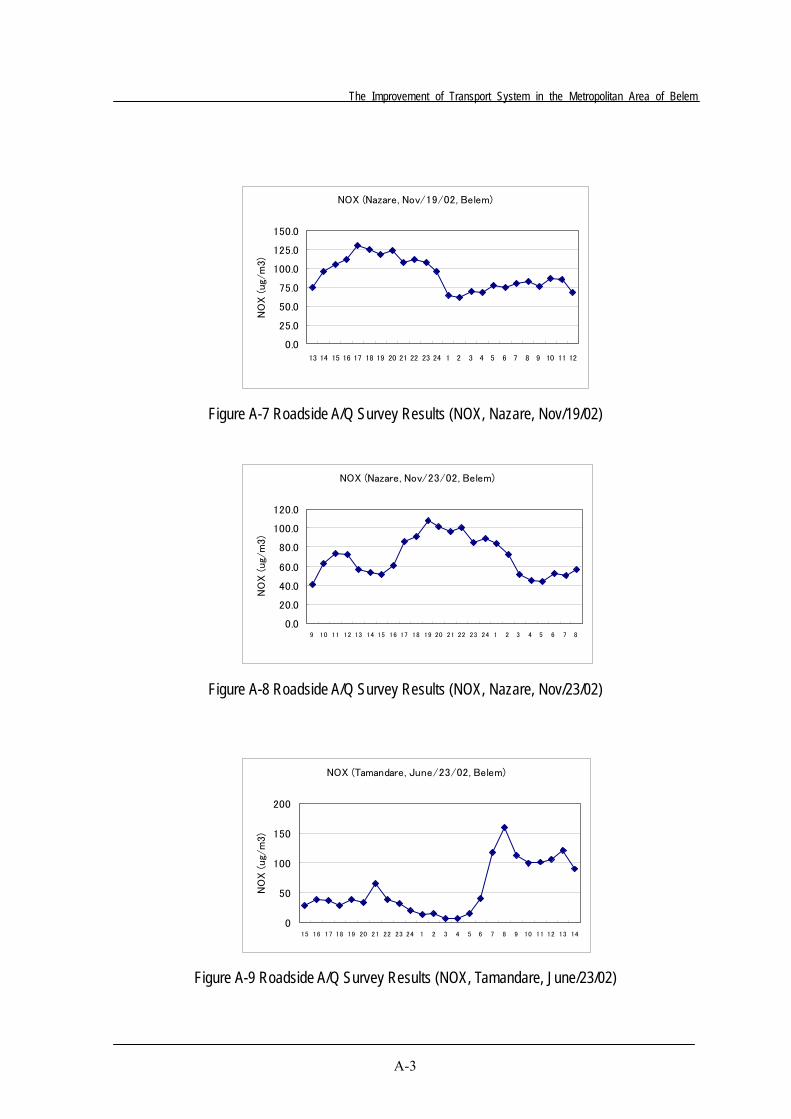
The Improvement of Transport System in the Metropolitan Area of Belem
A-3
Figure A-7 Roadside A/Q Survey Results (NOX, Nazare, Nov/19/02)
Figure A-8 Roadside A/Q Survey Results (NOX, Nazare, Nov/23/02)
Figure A-9 Roadside A/Q Survey Results (NOX, Tamandare, June/23/02)
NOX (Nazare, Nov/19/02, Belem)
0.0
25.0
50.0
75.0
100.0
125.0
150.0
13 14 15 16 17 18 19 20 21 22 23 24 1 2 3 4 5 6 7 8 9 10 11 12
NO
X (
ug/m
3)
NOX (Nazare, Nov/23/02, Belem)
0.0
20.0
40.0
60.0
80.0
100.0
120.0
9 10 11 12 13 14 15 16 17 18 19 20 21 22 23 24 1 2 3 4 5 6 7 8
NO
X (
ug/m
3)
NOX (Tamandare, June/23/02, Belem)
0
50
100
150
200
15 16 17 18 19 20 21 22 23 24 1 2 3 4 5 6 7 8 9 10 11 12 13 14
NO
X (
ug/m
3)
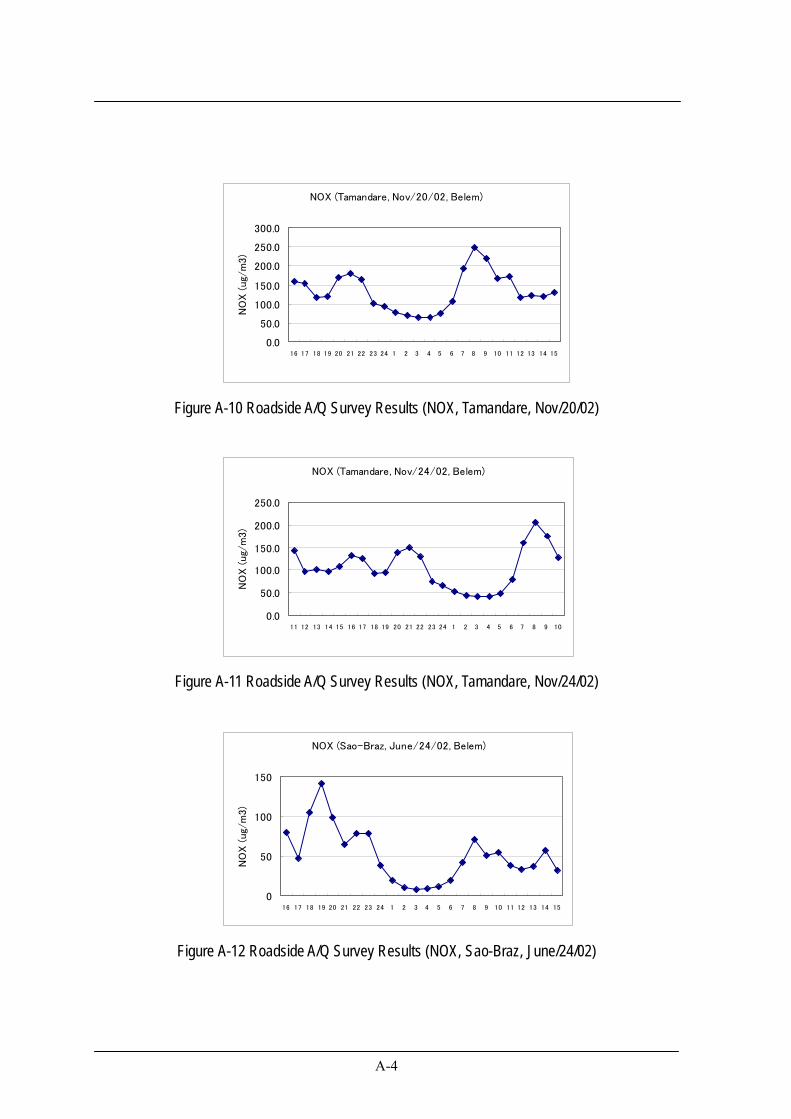
A-4
Figure A-10 Roadside A/Q Survey Results (NOX, Tamandare, Nov/20/02)
Figure A-11 Roadside A/Q Survey Results (NOX, Tamandare, Nov/24/02)
Figure A-12 Roadside A/Q Survey Results (NOX, Sao-Braz, June/24/02)
NOX (Tamandare, Nov/20/02, Belem)
0.0
50.0
100.0
150.0
200.0
250.0
300.0
16 17 18 19 20 21 22 23 24 1 2 3 4 5 6 7 8 9 10 11 12 13 14 15
NO
X (
ug/m
3)
NOX (Tamandare, Nov/24/02, Belem)
0.0
50.0
100.0
150.0
200.0
250.0
11 12 13 14 15 16 17 18 19 20 21 22 23 24 1 2 3 4 5 6 7 8 9 10
NO
X (
ug/m
3)
NOX (Sao-Braz, June/24/02, Belem)
0
50
100
150
16 17 18 19 20 21 22 23 24 1 2 3 4 5 6 7 8 9 10 11 12 13 14 15
NO
X (
ug/m
3)
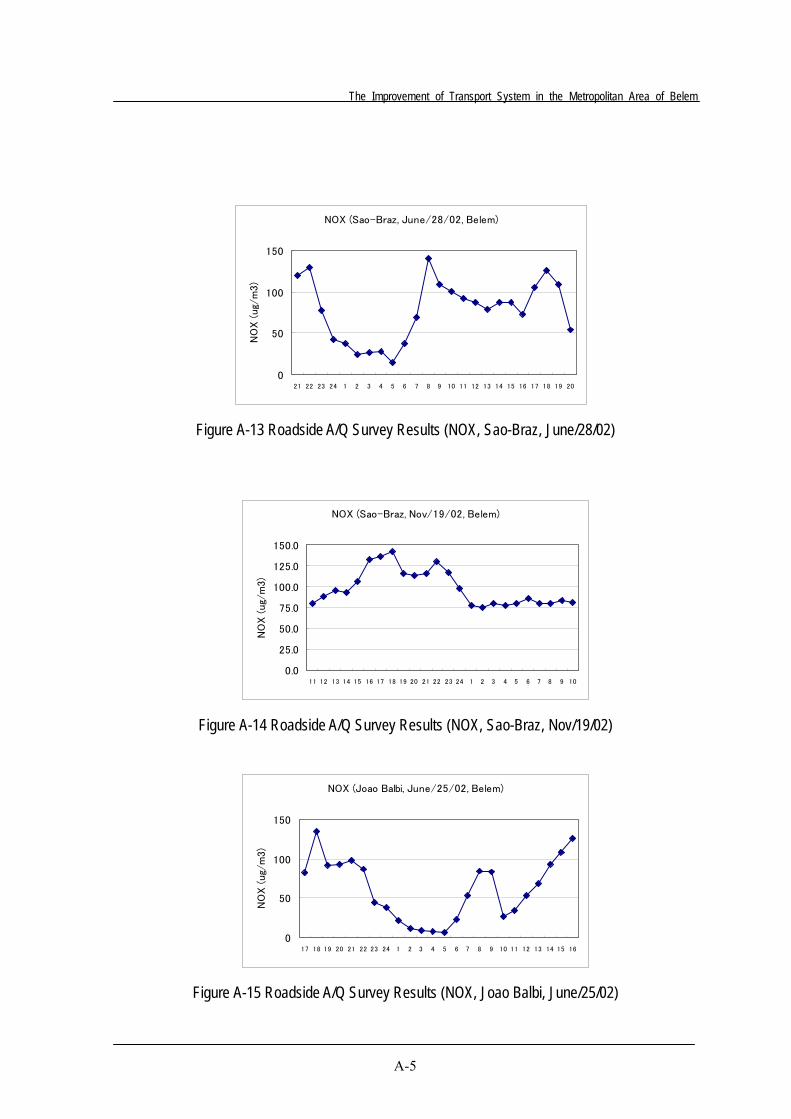
The Improvement of Transport System in the Metropolitan Area of Belem
A-5
Figure A-13 Roadside A/Q Survey Results (NOX, Sao-Braz, June/28/02)
Figure A-14 Roadside A/Q Survey Results (NOX, Sao-Braz, Nov/19/02)
Figure A-15 Roadside A/Q Survey Results (NOX, Joao Balbi, June/25/02)
NOX (Sao-Braz, June/28/02, Belem)
0
50
100
150
21 22 23 24 1 2 3 4 5 6 7 8 9 10 11 12 13 14 15 16 17 18 19 20
NO
X (
ug/m
3)
NOX (Sao-Braz, Nov/19/02, Belem)
0.0
25.0
50.0
75.0
100.0
125.0
150.0
11 12 13 14 15 16 17 18 19 20 21 22 23 24 1 2 3 4 5 6 7 8 9 10
NO
X (
ug/m
3)
NOX (Joao Balbi, June/25/02, Belem)
0
50
100
150
17 18 19 20 21 22 23 24 1 2 3 4 5 6 7 8 9 10 11 12 13 14 15 16
NO
X (
ug/m
3)
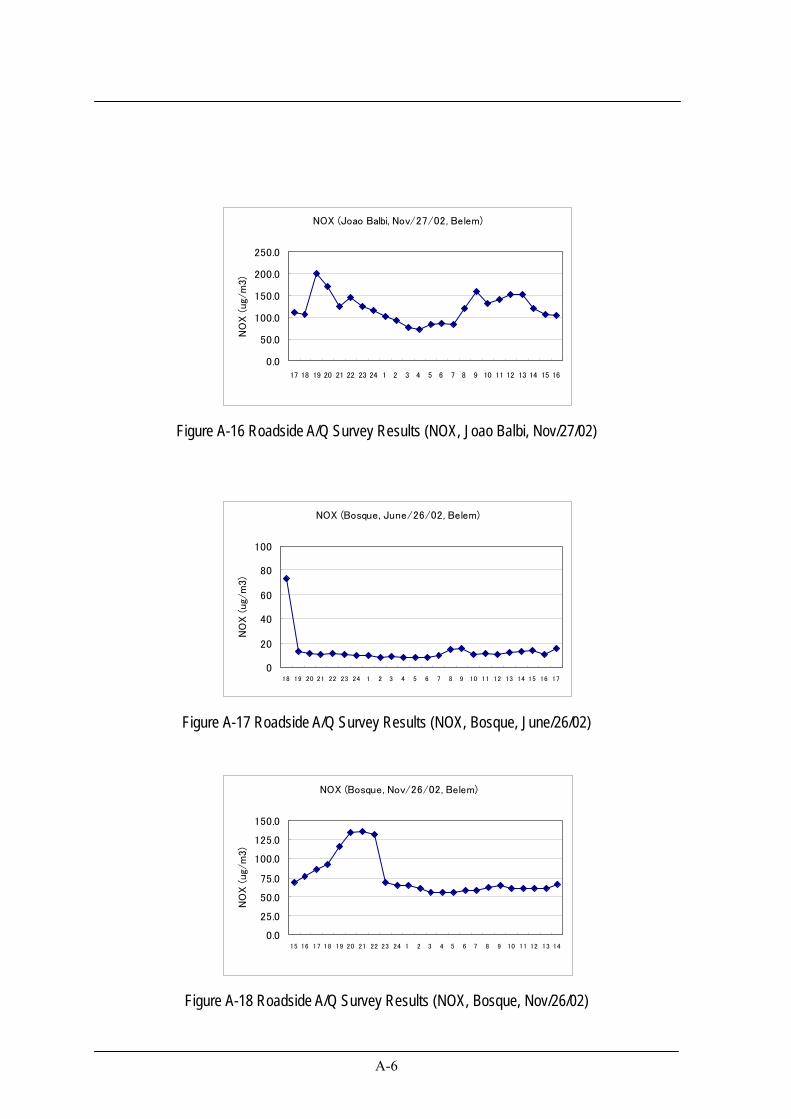
A-6
Figure A-16 Roadside A/Q Survey Results (NOX, Joao Balbi, Nov/27/02)
Figure A-17 Roadside A/Q Survey Results (NOX, Bosque, June/26/02)
Figure A-18 Roadside A/Q Survey Results (NOX, Bosque, Nov/26/02)
NOX (Joao Balbi, Nov/27/02, Belem)
0.0
50.0
100.0
150.0
200.0
250.0
17 18 19 20 21 22 23 24 1 2 3 4 5 6 7 8 9 10 11 12 13 14 15 16
NO
X (
ug/m
3)
NOX (Bosque, June/26/02, Belem)
0
20
40
60
80
100
18 19 20 21 22 23 24 1 2 3 4 5 6 7 8 9 10 11 12 13 14 15 16 17
NO
X (
ug/m
3)
NOX (Bosque, Nov/26/02, Belem)
0.0
25.0
50.0
75.0
100.0
125.0
150.0
15 16 17 18 19 20 21 22 23 24 1 2 3 4 5 6 7 8 9 10 11 12 13 14
NO
X (
ug/m
3)
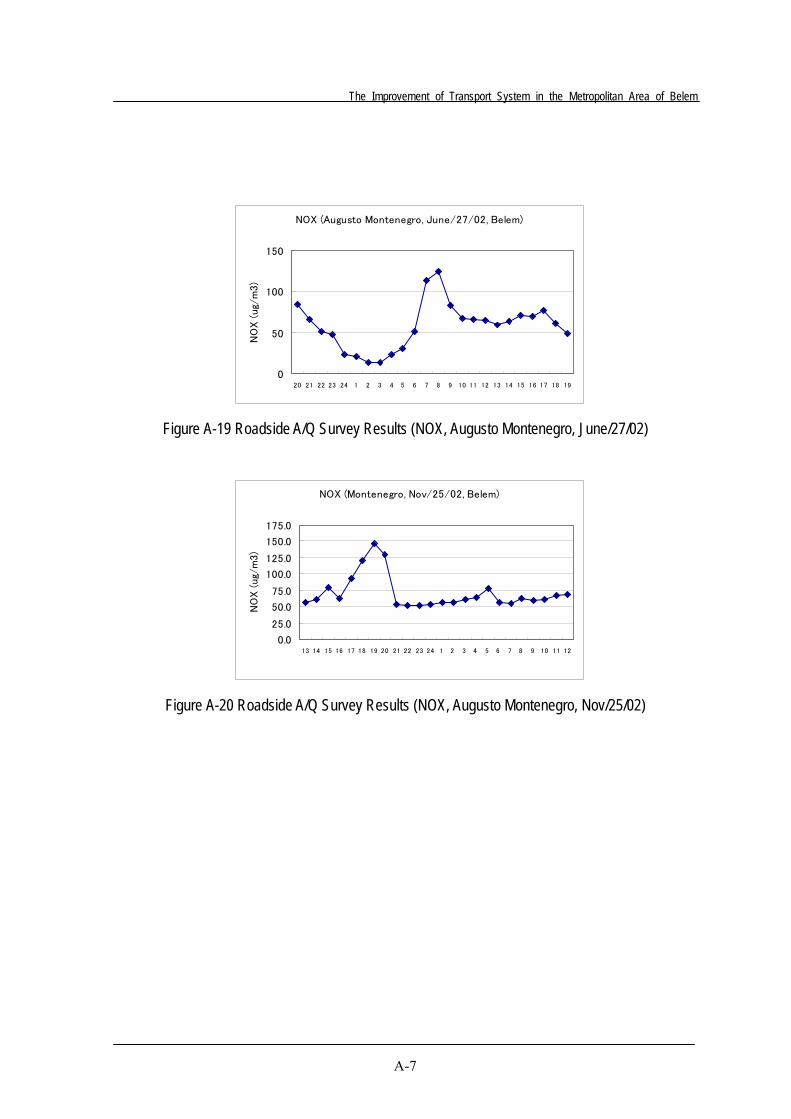
The Improvement of Transport System in the Metropolitan Area of Belem
A-7
Figure A-19 Roadside A/Q Survey Results (NOX, Augusto Montenegro, June/27/02)
Figure A-20 Roadside A/Q Survey Results (NOX, Augusto Montenegro, Nov/25/02)
NOX (Augusto Montenegro, June/27/02, Belem)
0
50
100
150
20 21 22 23 24 1 2 3 4 5 6 7 8 9 10 11 12 13 14 15 16 17 18 19
NO
X (
ug/m
3)
NOX (Montenegro, Nov/25/02, Belem)
0.0
25.0
50.0
75.0
100.0
125.0
150.0
175.0
13 14 15 16 17 18 19 20 21 22 23 24 1 2 3 4 5 6 7 8 9 10 11 12
NO
X (
ug/m
3)
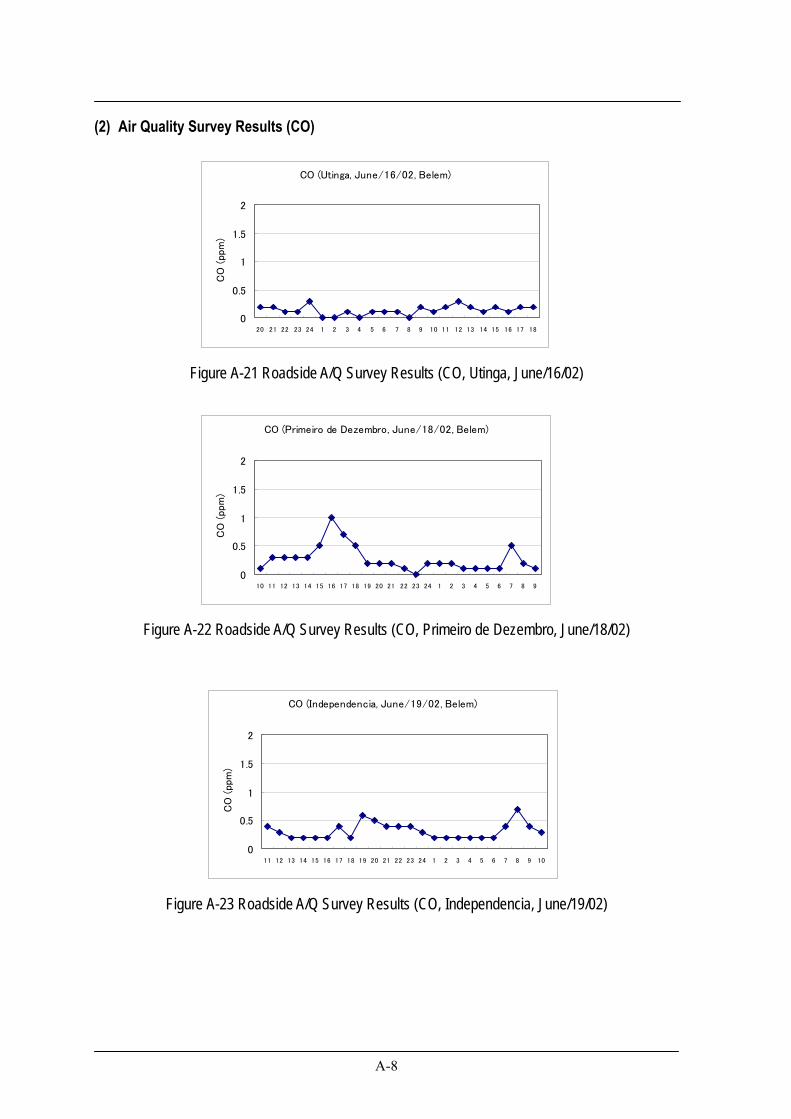
A-8
(2) Air Quality Survey Results (CO)
Figure A-21 Roadside A/Q Survey Results (CO, Utinga, June/16/02)
Figure A-22 Roadside A/Q Survey Results (CO, Primeiro de Dezembro, June/18/02)
Figure A-23 Roadside A/Q Survey Results (CO, Independencia, June/19/02)
CO (Utinga, June/16/02, Belem)
0
0.5
1
1.5
2
20 21 22 23 24 1 2 3 4 5 6 7 8 9 10 11 12 13 14 15 16 17 18
CO
(pp
m)
CO (Primeiro de Dezembro, June/18/02, Belem)
0
0.5
1
1.5
2
10 11 12 13 14 15 16 17 18 19 20 21 22 23 24 1 2 3 4 5 6 7 8 9
CO
(pp
m)
CO (Independencia, June/19/02, Belem)
0
0.5
1
1.5
2
11 12 13 14 15 16 17 18 19 20 21 22 23 24 1 2 3 4 5 6 7 8 9 10
CO
(pp
m)
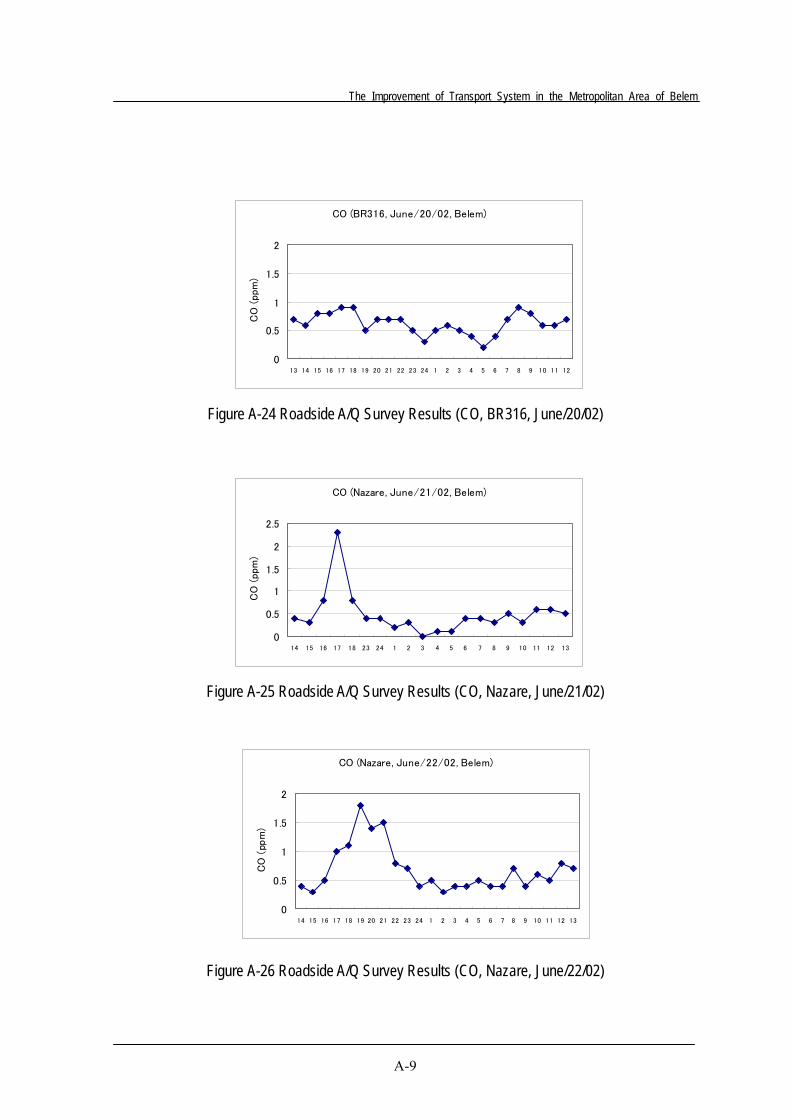
The Improvement of Transport System in the Metropolitan Area of Belem
A-9
Figure A-24 Roadside A/Q Survey Results (CO, BR316, June/20/02)
Figure A-25 Roadside A/Q Survey Results (CO, Nazare, June/21/02)
Figure A-26 Roadside A/Q Survey Results (CO, Nazare, June/22/02)
CO (BR316, June/20/02, Belem)
0
0.5
1
1.5
2
13 14 15 16 17 18 19 20 21 22 23 24 1 2 3 4 5 6 7 8 9 10 11 12
CO
(pp
m)
CO (Nazare, June/21/02, Belem)
0
0.5
1
1.5
2
2.5
14 15 16 17 18 23 24 1 2 3 4 5 6 7 8 9 10 11 12 13
CO
(pp
m)
CO (Nazare, June/22/02, Belem)
0
0.5
1
1.5
2
14 15 16 17 18 19 20 21 22 23 24 1 2 3 4 5 6 7 8 9 10 11 12 13
CO
(pp
m)
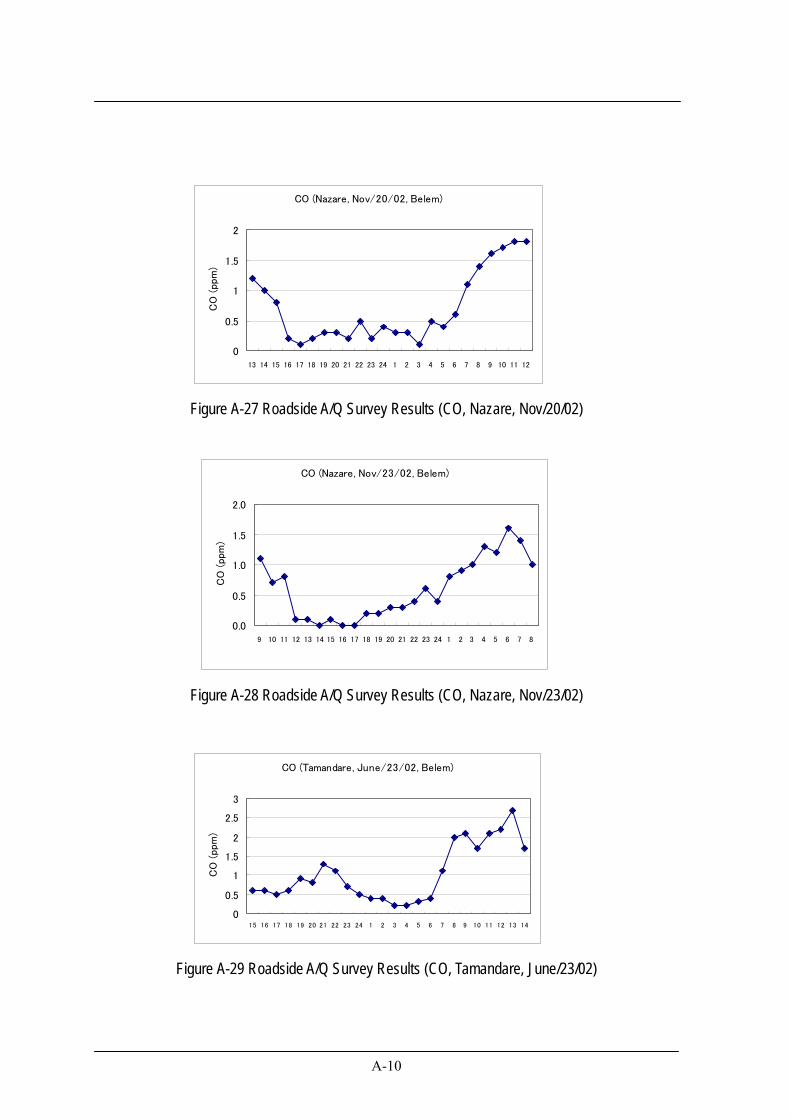
A-10
Figure A-27 Roadside A/Q Survey Results (CO, Nazare, Nov/20/02)
Figure A-28 Roadside A/Q Survey Results (CO, Nazare, Nov/23/02)
Figure A-29 Roadside A/Q Survey Results (CO, Tamandare, June/23/02)
CO (Nazare, Nov/20/02, Belem)
0
0.5
1
1.5
2
13 14 15 16 17 18 19 20 21 22 23 24 1 2 3 4 5 6 7 8 9 10 11 12
CO
(pp
m)
CO (Nazare, Nov/23/02, Belem)
0.0
0.5
1.0
1.5
2.0
9 10 11 12 13 14 15 16 17 18 19 20 21 22 23 24 1 2 3 4 5 6 7 8
CO
(pp
m)
CO (Tamandare, June/23/02, Belem)
0
0.5
1
1.5
2
2.5
3
15 16 17 18 19 20 21 22 23 24 1 2 3 4 5 6 7 8 9 10 11 12 13 14
CO
(pp
m)
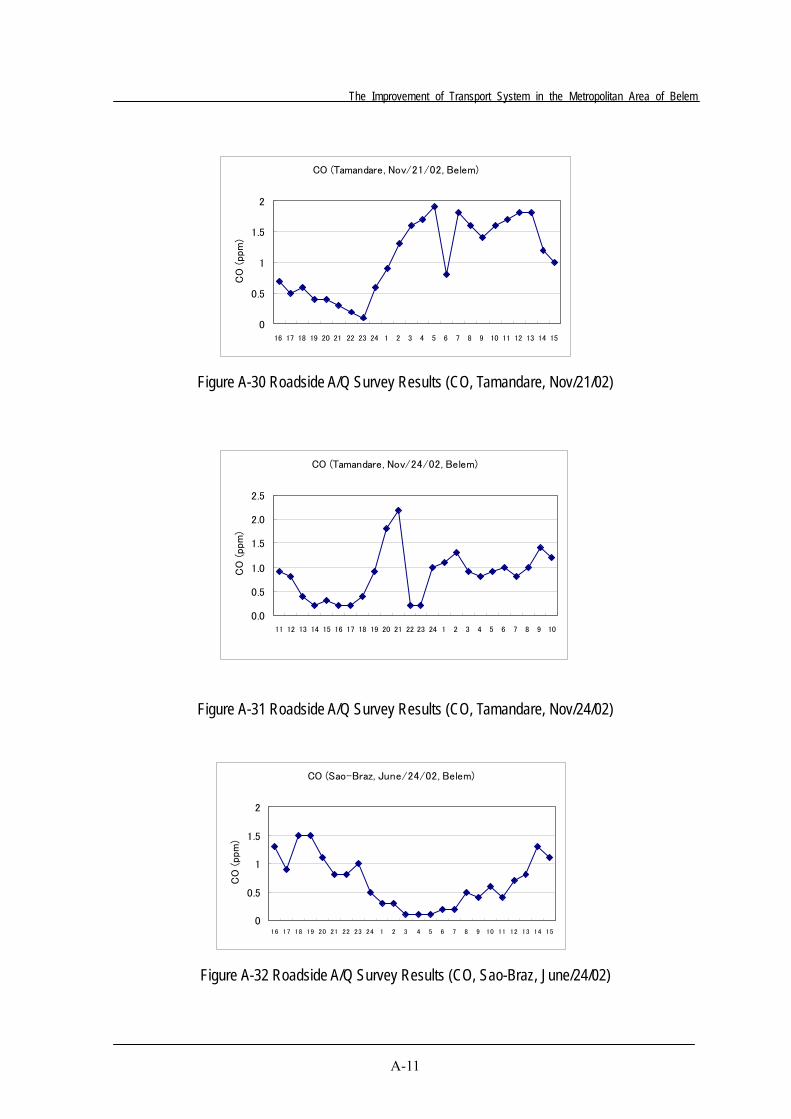
The Improvement of Transport System in the Metropolitan Area of Belem
A-11
Figure A-30 Roadside A/Q Survey Results (CO, Tamandare, Nov/21/02)
Figure A-31 Roadside A/Q Survey Results (CO, Tamandare, Nov/24/02)
Figure A-32 Roadside A/Q Survey Results (CO, Sao-Braz, June/24/02)
CO (Tamandare, Nov/21/02, Belem)
0
0.5
1
1.5
2
16 17 18 19 20 21 22 23 24 1 2 3 4 5 6 7 8 9 10 11 12 13 14 15
CO
(pp
m)
CO (Tamandare, Nov/24/02, Belem)
0.0
0.5
1.0
1.5
2.0
2.5
11 12 13 14 15 16 17 18 19 20 21 22 23 24 1 2 3 4 5 6 7 8 9 10
CO
(pp
m)
CO (Sao-Braz, June/24/02, Belem)
0
0.5
1
1.5
2
16 17 18 19 20 21 22 23 24 1 2 3 4 5 6 7 8 9 10 11 12 13 14 15
CO
(pp
m)
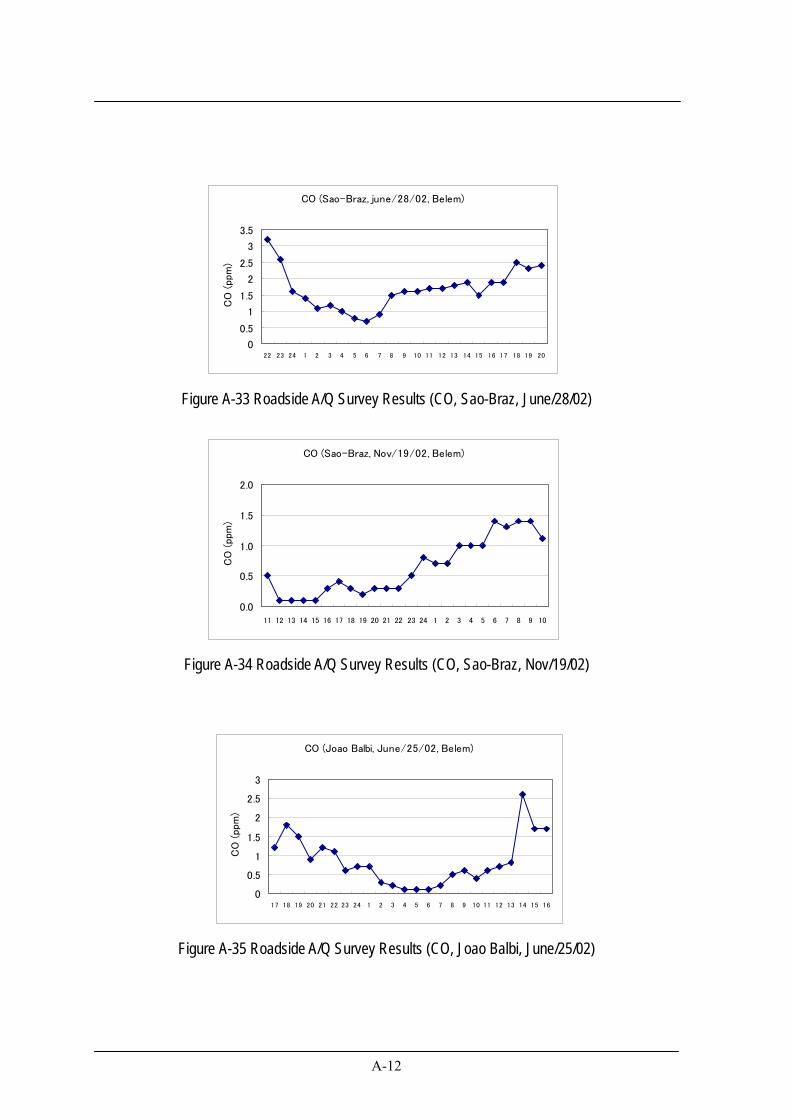
A-12
Figure A-33 Roadside A/Q Survey Results (CO, Sao-Braz, June/28/02)
Figure A-34 Roadside A/Q Survey Results (CO, Sao-Braz, Nov/19/02)
Figure A-35 Roadside A/Q Survey Results (CO, Joao Balbi, June/25/02)
CO (Sao-Braz, june/28/02, Belem)
0
0.5
1
1.5
2
2.5
3
3.5
22 23 24 1 2 3 4 5 6 7 8 9 10 11 12 13 14 15 16 17 18 19 20
CO
(pp
m)
CO (Sao-Braz, Nov/19/02, Belem)
0.0
0.5
1.0
1.5
2.0
11 12 13 14 15 16 17 18 19 20 21 22 23 24 1 2 3 4 5 6 7 8 9 10
CO
(pp
m)
CO (Joao Balbi, June/25/02, Belem)
0
0.5
1
1.5
2
2.5
3
17 18 19 20 21 22 23 24 1 2 3 4 5 6 7 8 9 10 11 12 13 14 15 16
CO
(pp
m)
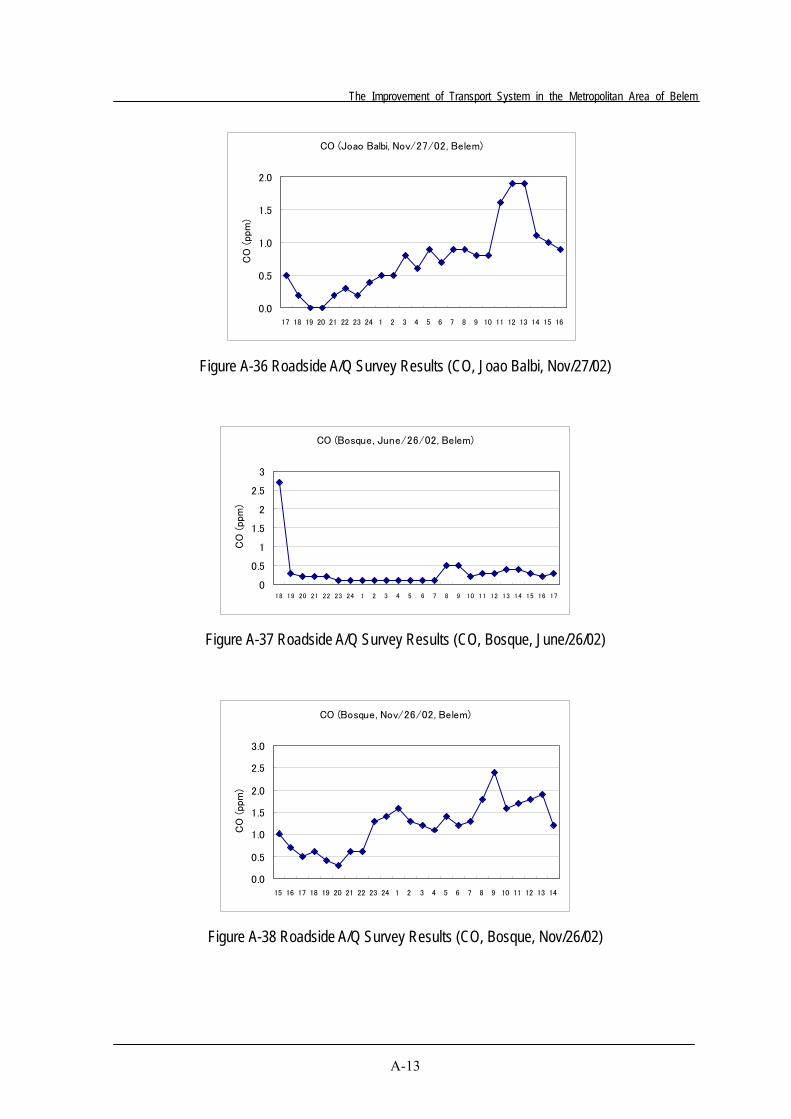
The Improvement of Transport System in the Metropolitan Area of Belem
A-13
Figure A-36 Roadside A/Q Survey Results (CO, Joao Balbi, Nov/27/02)
Figure A-37 Roadside A/Q Survey Results (CO, Bosque, June/26/02)
Figure A-38 Roadside A/Q Survey Results (CO, Bosque, Nov/26/02)
CO (Joao Balbi, Nov/27/02, Belem)
0.0
0.5
1.0
1.5
2.0
17 18 19 20 21 22 23 24 1 2 3 4 5 6 7 8 9 10 11 12 13 14 15 16
CO
(pp
m)
CO (Bosque, June/26/02, Belem)
0
0.5
1
1.5
2
2.5
3
18 19 20 21 22 23 24 1 2 3 4 5 6 7 8 9 10 11 12 13 14 15 16 17
CO
(pp
m)
CO (Bosque, Nov/26/02, Belem)
0.0
0.5
1.0
1.5
2.0
2.5
3.0
15 16 17 18 19 20 21 22 23 24 1 2 3 4 5 6 7 8 9 10 11 12 13 14
CO
(pp
m)
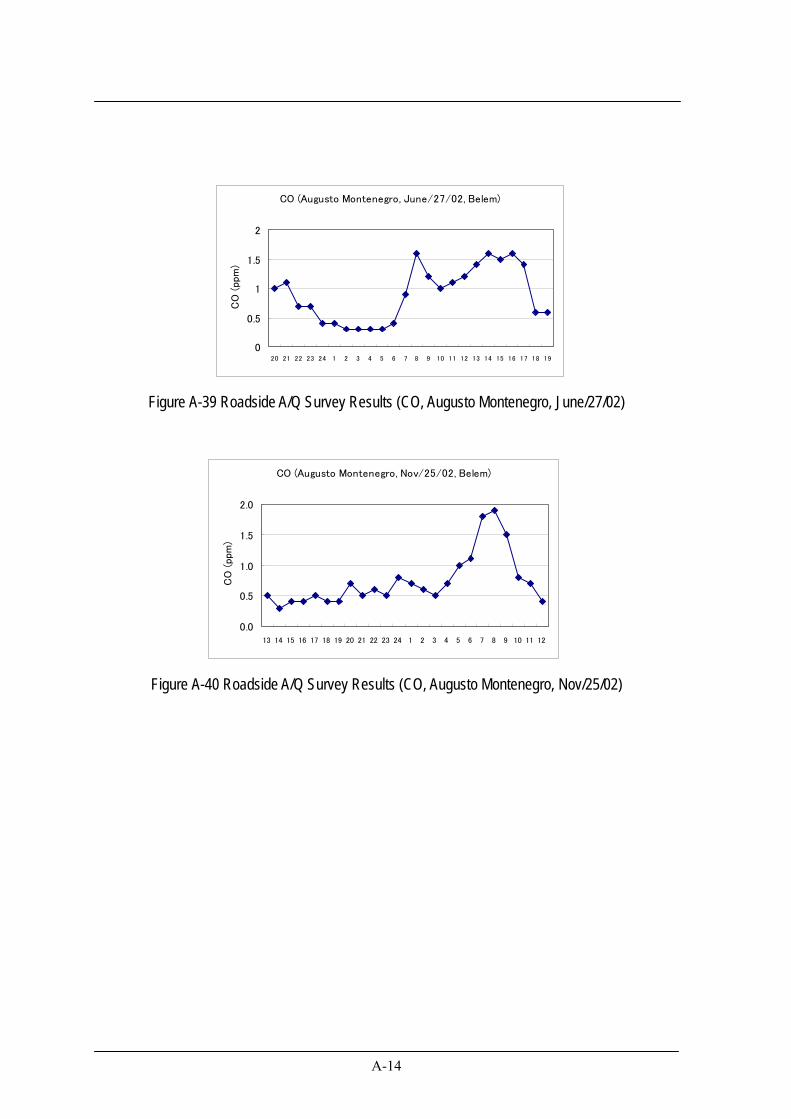
A-14
Figure A-39 Roadside A/Q Survey Results (CO, Augusto Montenegro, June/27/02)
Figure A-40 Roadside A/Q Survey Results (CO, Augusto Montenegro, Nov/25/02)
CO (Augusto Montenegro, June/27/02, Belem)
0
0.5
1
1.5
2
20 21 22 23 24 1 2 3 4 5 6 7 8 9 10 11 12 13 14 15 16 17 18 19
CO
(pp
m)
CO (Augusto Montenegro, Nov/25/02, Belem)
0.0
0.5
1.0
1.5
2.0
13 14 15 16 17 18 19 20 21 22 23 24 1 2 3 4 5 6 7 8 9 10 11 12
CO
(pp
m)
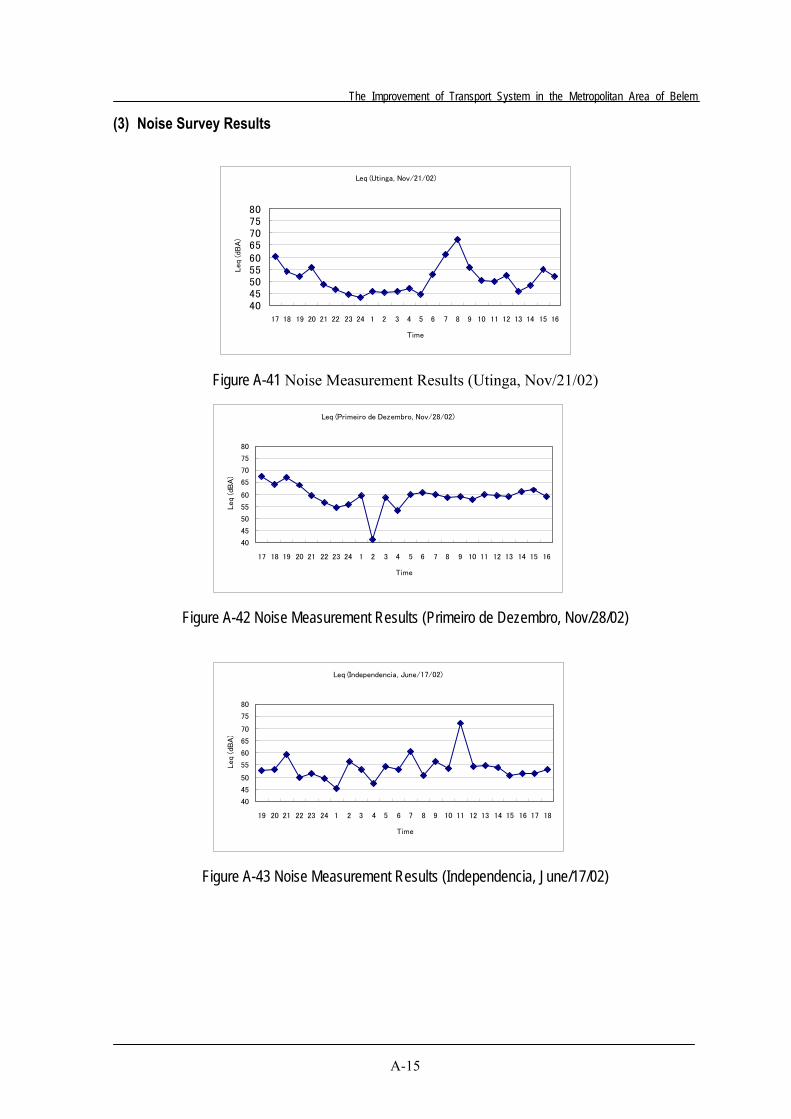
The Improvement of Transport System in the Metropolitan Area of Belem
A-15
(3) Noise Survey Results
Figure A-41 Noise Measurement Results (Utinga, Nov/21/02)
Figure A-42 Noise Measurement Results (Primeiro de Dezembro, Nov/28/02)
Figure A-43 Noise Measurement Results (Independencia, June/17/02)
Leq (Utinga, Nov/21/02)
404550556065707580
17 18 19 20 21 22 23 24 1 2 3 4 5 6 7 8 9 10 11 12 13 14 15 16
Time
Leq
(dB
A)
Leq (Primeiro de Dezembro, Nov/28/02)
40
45
50
55
60
65
70
75
80
17 18 19 20 21 22 23 24 1 2 3 4 5 6 7 8 9 10 11 12 13 14 15 16
Time
Leq
(dB
A)
Leq (Independencia, June/17/02)
40
45
50
55
60
65
70
75
80
19 20 21 22 23 24 1 2 3 4 5 6 7 8 9 10 11 12 13 14 15 16 17 18
Time
Leq
(dB
A)
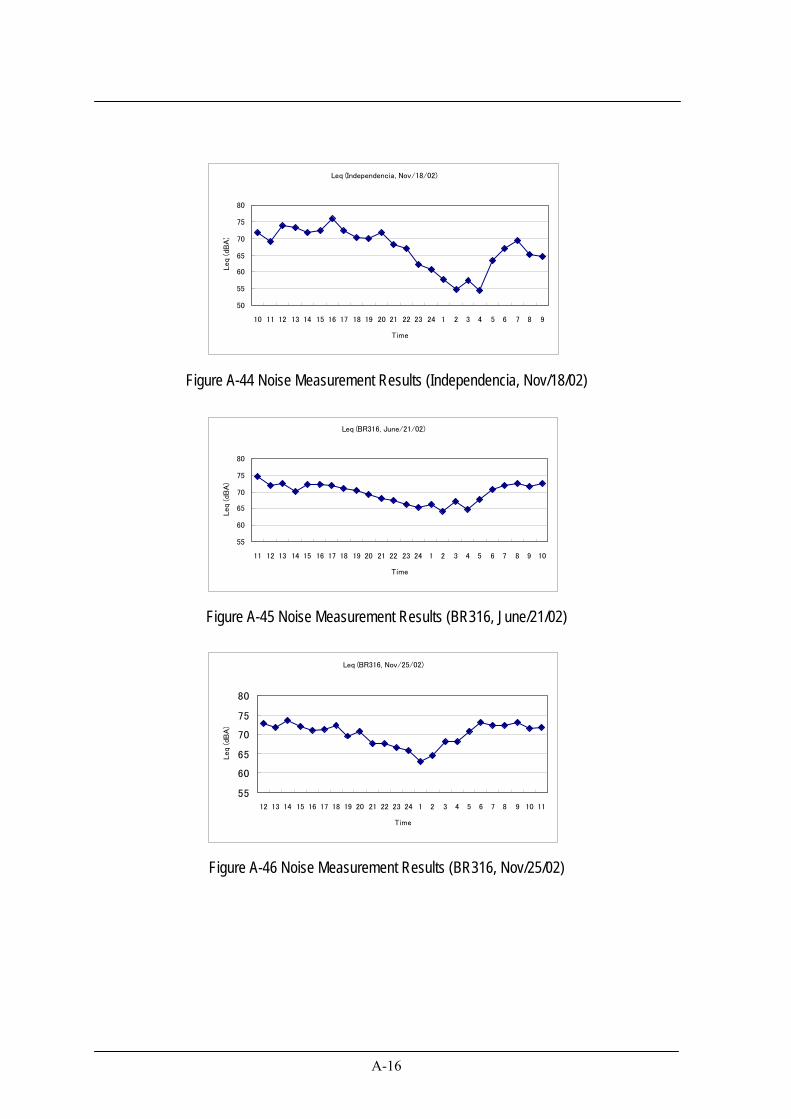
A-16
Figure A-44 Noise Measurement Results (Independencia, Nov/18/02)
Figure A-45 Noise Measurement Results (BR316, June/21/02)
Figure A-46 Noise Measurement Results (BR316, Nov/25/02)
Leq (Independencia, Nov/18/02)
50
55
60
65
70
75
80
10 11 12 13 14 15 16 17 18 19 20 21 22 23 24 1 2 3 4 5 6 7 8 9
Time
Leq
(dB
A)
Leq (BR316, June/21/02)
55
60
65
70
75
80
11 12 13 14 15 16 17 18 19 20 21 22 23 24 1 2 3 4 5 6 7 8 9 10
Time
Leq
(dB
A)
Leq (BR316, Nov/25/02)
55
60
65
70
75
80
12 13 14 15 16 17 18 19 20 21 22 23 24 1 2 3 4 5 6 7 8 9 10 11
Time
Leq
(dB
A)
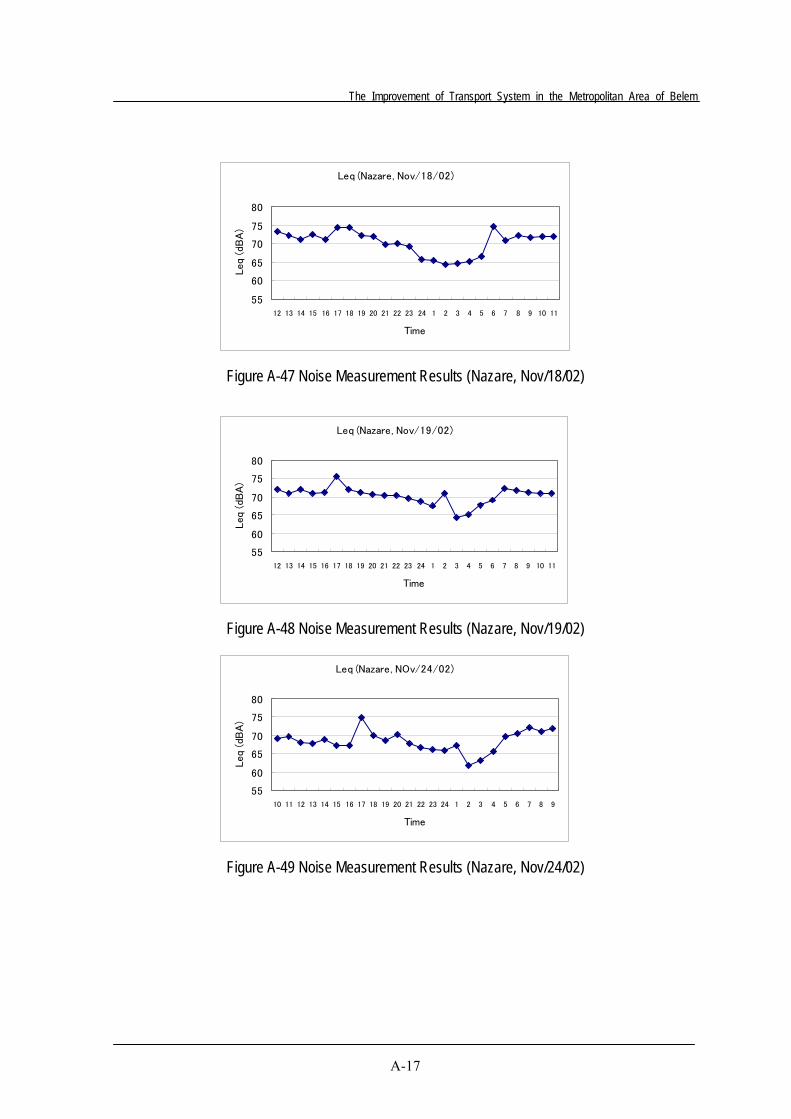
The Improvement of Transport System in the Metropolitan Area of Belem
A-17
Figure A-47 Noise Measurement Results (Nazare, Nov/18/02)
Figure A-48 Noise Measurement Results (Nazare, Nov/19/02)
Figure A-49 Noise Measurement Results (Nazare, Nov/24/02)
Leq (Nazare, Nov/18/02)
55
60
65
70
75
80
12 13 14 15 16 17 18 19 20 21 22 23 24 1 2 3 4 5 6 7 8 9 10 11
Time
Leq
(dB
A)
Leq (Nazare, Nov/19/02)
55
60
65
70
75
80
12 13 14 15 16 17 18 19 20 21 22 23 24 1 2 3 4 5 6 7 8 9 10 11
Time
Leq
(dB
A)
Leq (Nazare, NOv/24/02)
55
60
65
70
75
80
10 11 12 13 14 15 16 17 18 19 20 21 22 23 24 1 2 3 4 5 6 7 8 9
Time
Leq
(dB
A)
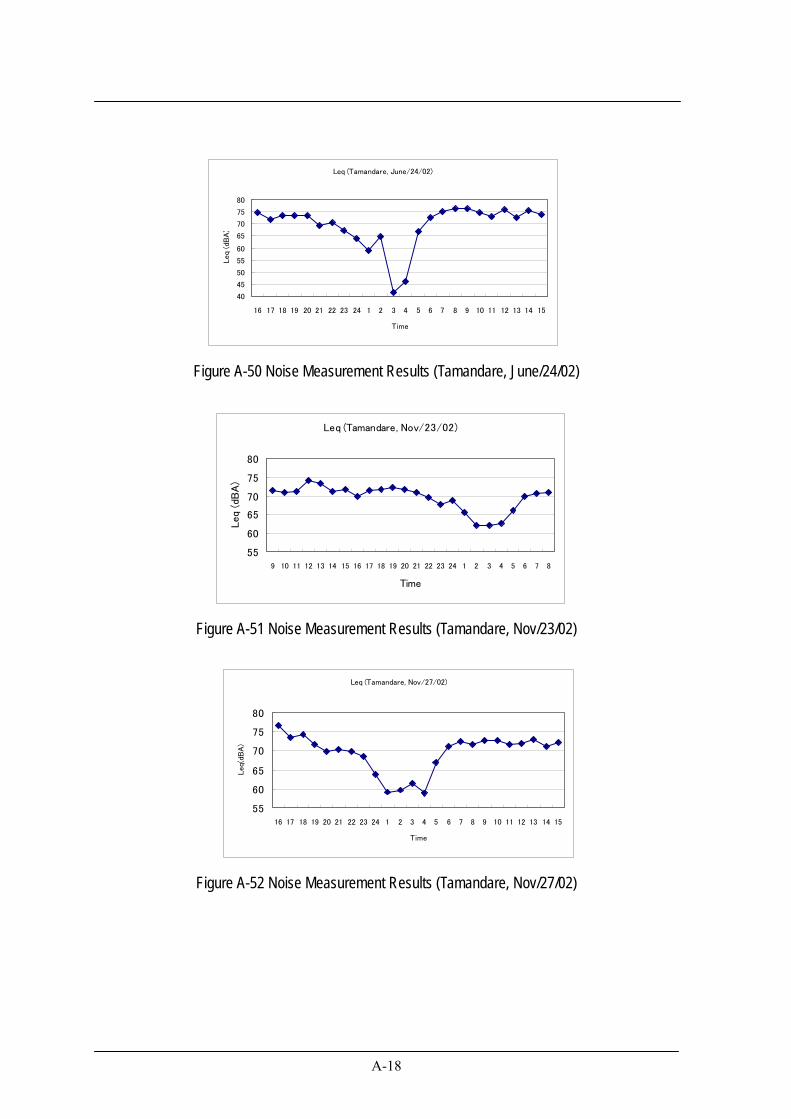
A-18
Figure A-50 Noise Measurement Results (Tamandare, June/24/02)
Figure A-51 Noise Measurement Results (Tamandare, Nov/23/02)
Figure A-52 Noise Measurement Results (Tamandare, Nov/27/02)
Leq (Tamandare, June/24/02)
40
45
50
55
60
65
70
75
80
16 17 18 19 20 21 22 23 24 1 2 3 4 5 6 7 8 9 10 11 12 13 14 15
Time
Leq
(dB
A)
Leq (Tamandare, Nov/23/02)
55
60
65
70
75
80
9 10 11 12 13 14 15 16 17 18 19 20 21 22 23 24 1 2 3 4 5 6 7 8
Time
Leq
(dB
A)
Leq (Tamandare, Nov/27/02)
55
60
65
70
75
80
16 17 18 19 20 21 22 23 24 1 2 3 4 5 6 7 8 9 10 11 12 13 14 15
Time
Leq(
dBA
)
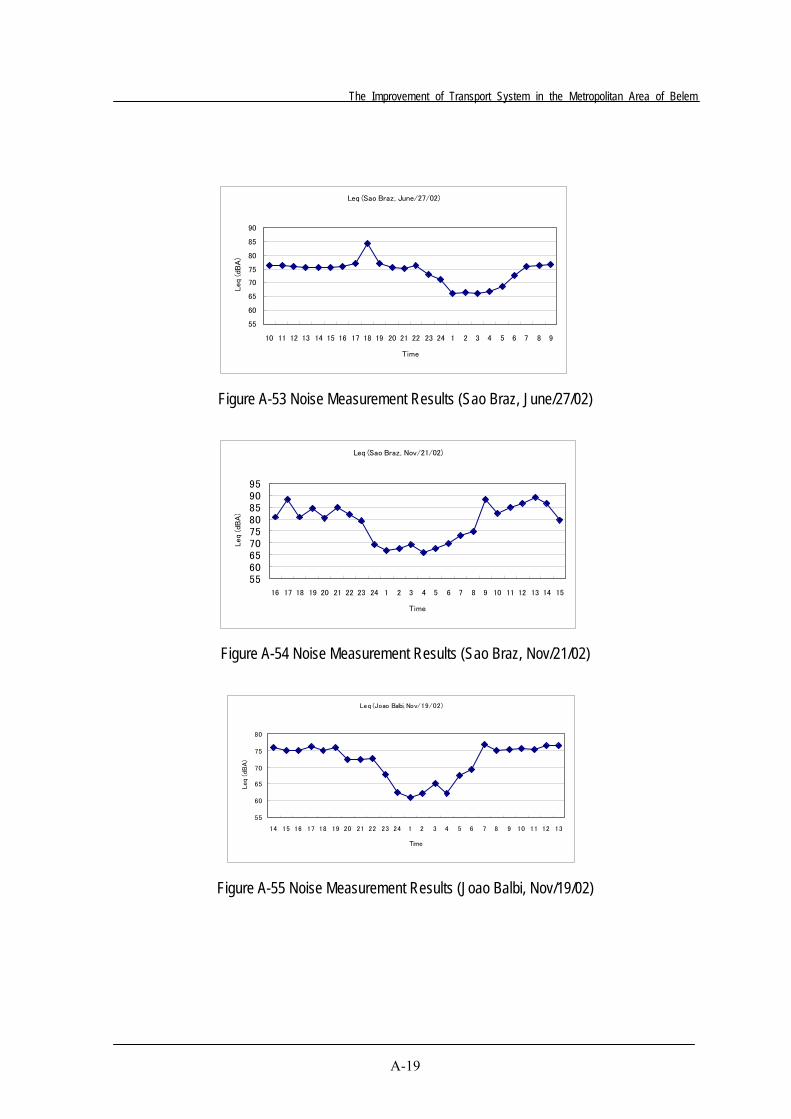
The Improvement of Transport System in the Metropolitan Area of Belem
A-19
Figure A-53 Noise Measurement Results (Sao Braz, June/27/02)
Figure A-54 Noise Measurement Results (Sao Braz, Nov/21/02)
Figure A-55 Noise Measurement Results (Joao Balbi, Nov/19/02)
Leq (Sao Braz, June/27/02)
55
60
65
70
75
80
85
90
10 11 12 13 14 15 16 17 18 19 20 21 22 23 24 1 2 3 4 5 6 7 8 9
Time
Leq
(dB
A)
Leq (Sao Braz, Nov/21/02)
556065707580859095
16 17 18 19 20 21 22 23 24 1 2 3 4 5 6 7 8 9 10 11 12 13 14 15
Time
Leq
(dB
A)
Leq (Joao Balbi, Nov/19/02)
55
60
65
70
75
80
14 15 16 17 18 19 20 21 22 23 24 1 2 3 4 5 6 7 8 9 10 11 12 13
Time
Leq
(dB
A)
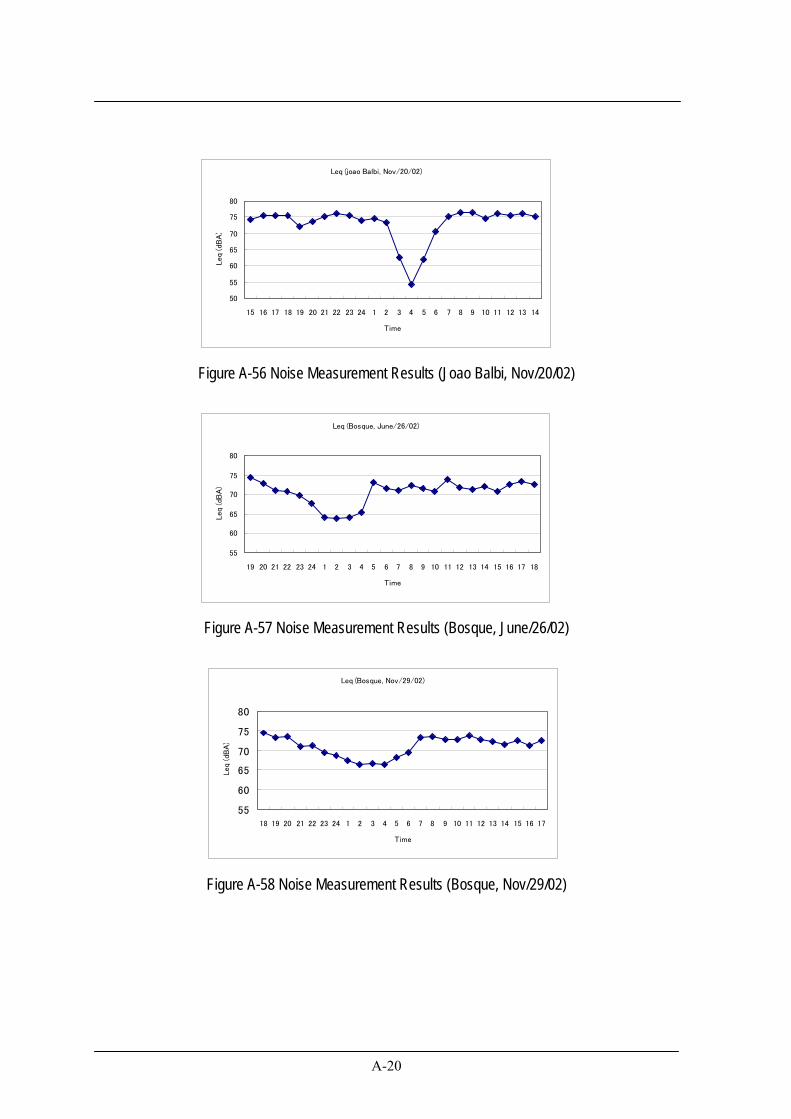
A-20
Figure A-56 Noise Measurement Results (Joao Balbi, Nov/20/02)
Figure A-57 Noise Measurement Results (Bosque, June/26/02)
Figure A-58 Noise Measurement Results (Bosque, Nov/29/02)
Leq (joao Balbi, Nov/20/02)
50
55
60
65
70
75
80
15 16 17 18 19 20 21 22 23 24 1 2 3 4 5 6 7 8 9 10 11 12 13 14
Time
Leq
(dB
A)
Leq (Bosque, June/26/02)
55
60
65
70
75
80
19 20 21 22 23 24 1 2 3 4 5 6 7 8 9 10 11 12 13 14 15 16 17 18
Time
Leq
(dB
A)
Leq (Bosque, Nov/29/02)
55
60
65
70
75
80
18 19 20 21 22 23 24 1 2 3 4 5 6 7 8 9 10 11 12 13 14 15 16 17
Time
Leq
(dB
A)
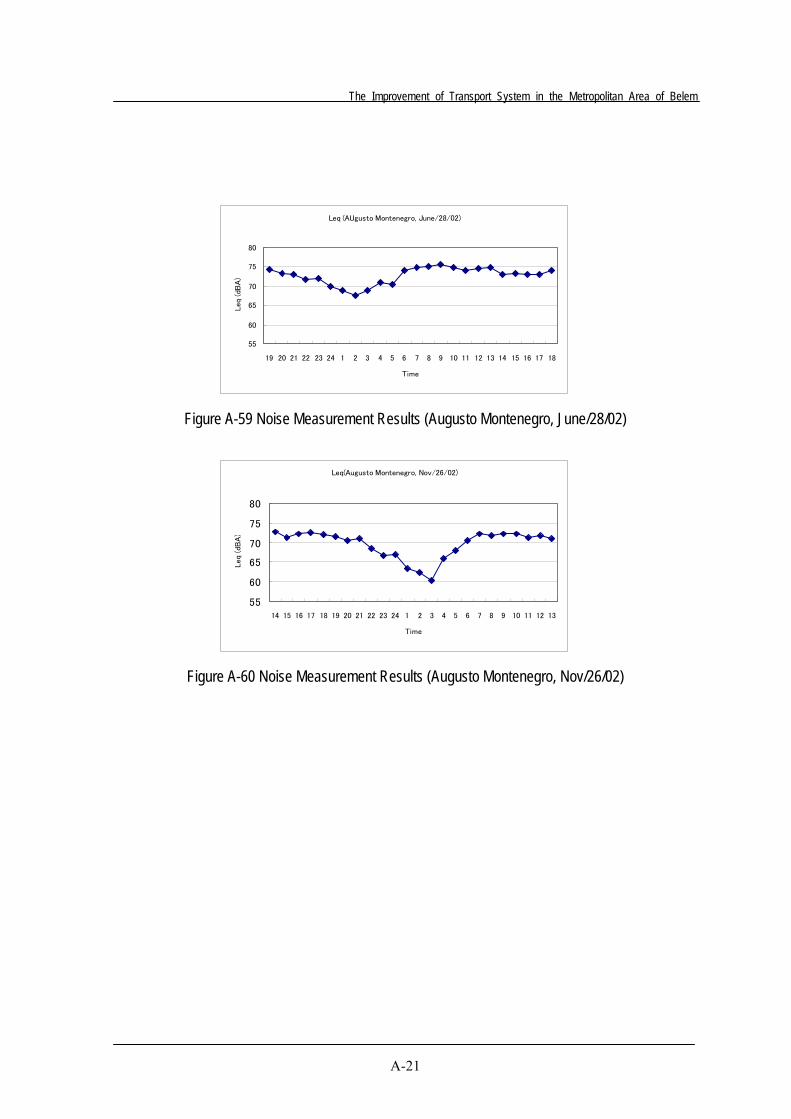
The Improvement of Transport System in the Metropolitan Area of Belem
A-21
Figure A-59 Noise Measurement Results (Augusto Montenegro, June/28/02)
Figure A-60 Noise Measurement Results (Augusto Montenegro, Nov/26/02)
Leq (AUgusto Montenegro, June/28/02)
55
60
65
70
75
80
19 20 21 22 23 24 1 2 3 4 5 6 7 8 9 10 11 12 13 14 15 16 17 18
Time
Leq
(dB
A)
Leq(Augusto Montenegro, Nov/26/02)
55
60
65
70
75
80
14 15 16 17 18 19 20 21 22 23 24 1 2 3 4 5 6 7 8 9 10 11 12 13
Time
Leq
(dB
A)
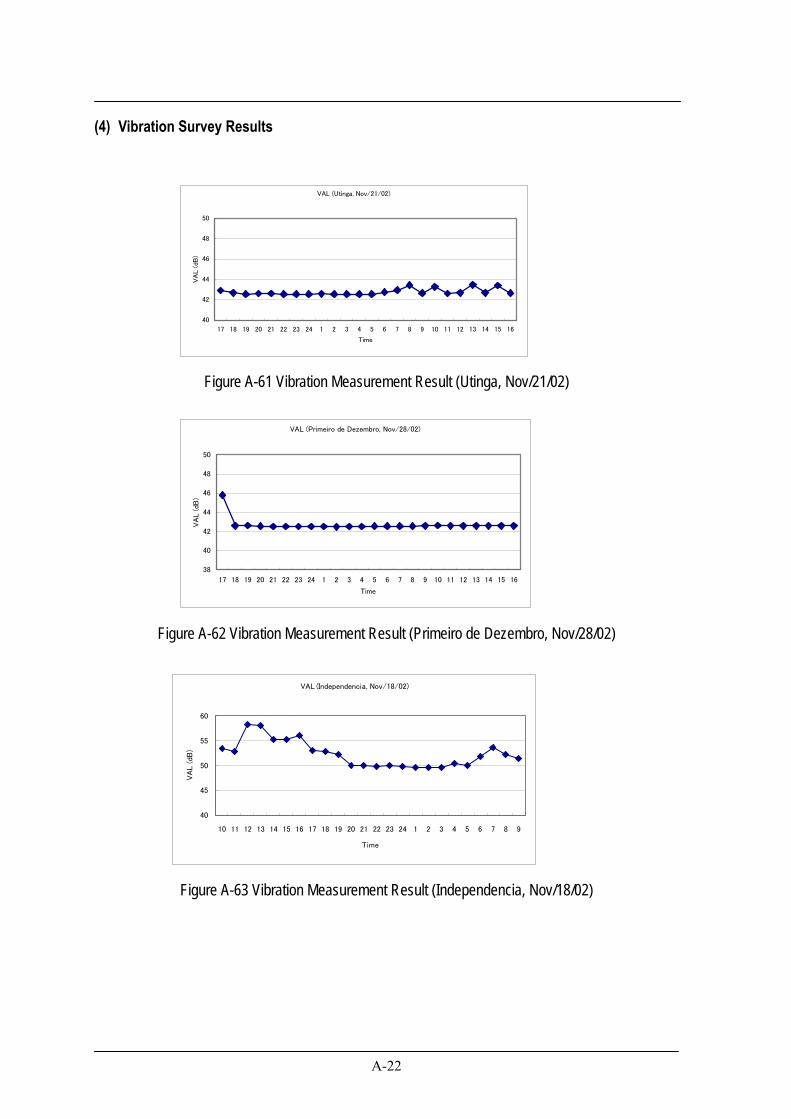
A-22
(4) Vibration Survey Results
Figure A-61 Vibration Measurement Result (Utinga, Nov/21/02)
Figure A-62 Vibration Measurement Result (Primeiro de Dezembro, Nov/28/02)
Figure A-63 Vibration Measurement Result (Independencia, Nov/18/02)
VAL (Utinga, Nov/21/02)
40
42
44
46
48
50
17 18 19 20 21 22 23 24 1 2 3 4 5 6 7 8 9 10 11 12 13 14 15 16
Time
VA
L (
dB
)
VAL (Primeiro de Dezembro, Nov/28/02)
38
40
42
44
46
48
50
17 18 19 20 21 22 23 24 1 2 3 4 5 6 7 8 9 10 11 12 13 14 15 16
Time
VA
L (dB
)
VAL (Independencia, Nov/18/02)
40
45
50
55
60
10 11 12 13 14 15 16 17 18 19 20 21 22 23 24 1 2 3 4 5 6 7 8 9
Time
VA
L (dB
)
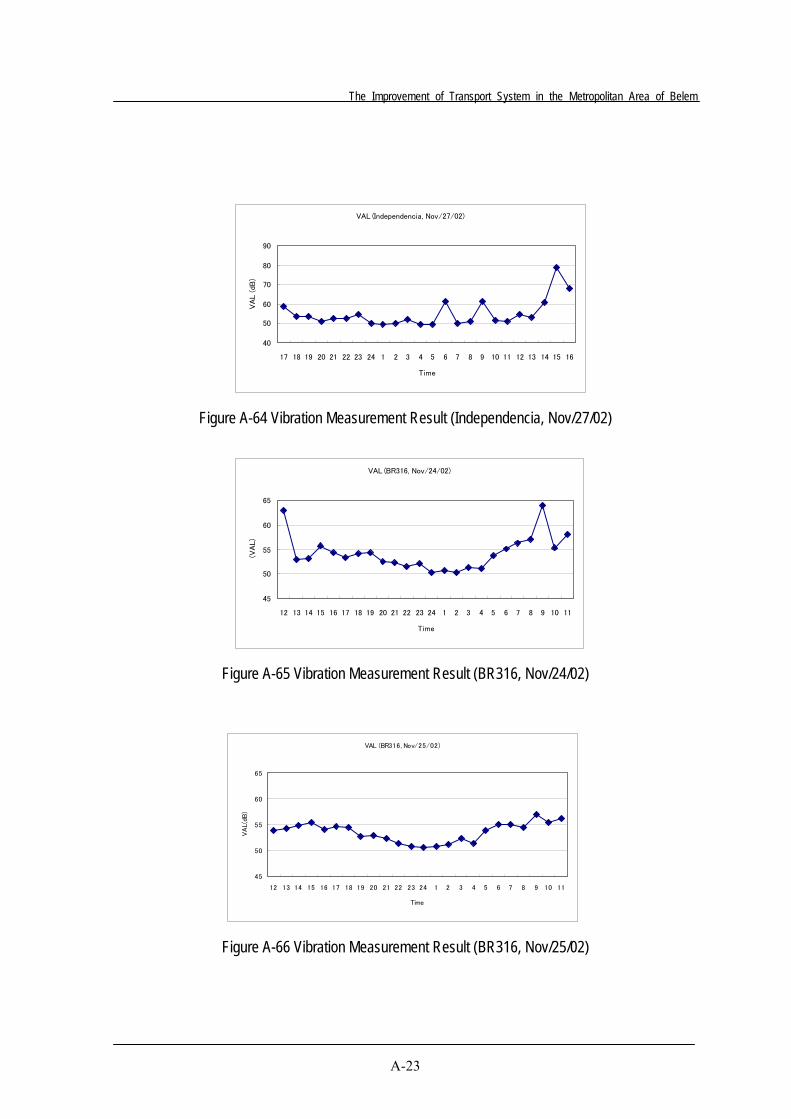
The Improvement of Transport System in the Metropolitan Area of Belem
A-23
Figure A-64 Vibration Measurement Result (Independencia, Nov/27/02)
Figure A-65 Vibration Measurement Result (BR316, Nov/24/02)
Figure A-66 Vibration Measurement Result (BR316, Nov/25/02)
VAL (Independencia, Nov/27/02)
40
50
60
70
80
90
17 18 19 20 21 22 23 24 1 2 3 4 5 6 7 8 9 10 11 12 13 14 15 16
Time
VA
L (dB
)
VAL (BR316, Nov/24/02)
45
50
55
60
65
12 13 14 15 16 17 18 19 20 21 22 23 24 1 2 3 4 5 6 7 8 9 10 11
Time
(VA
L)
VAL (BR316, Nov/25/02)
45
50
55
60
65
12 13 14 15 16 17 18 19 20 21 22 23 24 1 2 3 4 5 6 7 8 9 10 11
Time
VA
L(d
B)
A-24
Figure A-67 Vibration Measurement Result (Nazare, Nov/18/02)
Figure A-68 Vibration Measurement Result (Nazare, Nov/19/02)
Figure A-69 Vibration Measurement Result (Nazare, Nov/24/02)
VAL (Nazare, Nov/18/02)
20
30
40
50
60
70
80
12 13 14 15 16 17 18 19 20 21 22 23 24 1 2 3 4 5 6 7 8 9 10 11
Time
VA
L (
dB)
VAL (Nazare, Nov/19/02)
20
30
40
50
60
70
80
12 13 14 15 16 17 18 19 20 21 22 23 24 1 2 3 4 5 6 7 8 9 10 11
Time
VA
L (
dB)
VAL (Nazare, Nov/24/02)
30
35
40
45
50
55
60
10 11 12 13 14 15 16 17 18 19 20 21 22 23 24 1 2 3 4 5 6 7 8 9
Time
VA
L (
dB)
The Improvement of Transport System in the Metropolitan Area of Belem
A-25
Figure A-70 Vibration Measurement Result (Tamandare, Nov/23/02)
Figure A-71 Vibration Measurement Result (Tamandare, Nov/27/02)
Figure A-72 Vibration Measurement Result (Tamandare, Nov/28/02)
VAL (Tamandare, Nov/23/02)
40
42
44
46
48
50
9 10 11 12 13 14 15 16 17 18 19 20 21 22 23 24 1 2 3 4 5 6 7 8
Time
VA
L (dB
)
VAL (Tamandare, Nov/27/02)
40
42
44
46
48
50
16 17 18 19 20 21 22 23 24 1 2 3 4 5 6 7 8 9 10 11 12 13 14 15
Time
VA
L(d
B)
VAL (Tamandare, Nov/28/02)
20
30
40
50
60
70
80
19 20 21 22 23 24 1 2 3 4 5 6 7 8 9 10 11 12 13 14 15 16 17 18
Time
VA
L (dB
)
A-26
Figure A-73 Vibration Measurement Result (Sao-Braz, Nov/22/02)
Figure A-74 Vibration Measurement Result (Sao-Braz, Nov/26/02)
Figure A-75 Vibration Measurement Result (Joao Balbi, Nov/19/02)
VAL (Sao Braz, Nov/22/02)
20
30
40
50
60
70
80
90
9 10 11 12 13 14 15 16 17 18 19 20 21 22 23 24 1 2 3 4 5 6 7 8
Time
VA
L (dB
)
VAL (Sao Braz, Nov/26/02)
20
30
40
50
60
70
80
15 16 17 18 19 20 21 22 23 24 1 2 3 4 5 6 7 8 9 10 11 12 13 14
Time
VA
L (dB
)
VAL(Joao Balbi, Nov/19/02)
20
30
40
50
60
70
80
14 15 16 17 18 19 20 21 22 23 24 1 2 3 4 5 6 7 8 9 10 11 12 13
Time
VA
L (dB
)
The Improvement of Transport System in the Metropolitan Area of Belem
A-27
Figure A-76 Vibration Measurement Result (Joao Balbi, Nov/20/02)
Figure A-77 Vibration Measurement Result (Bosque, Nov/25/02)
Figure A-78 Vibration Measurement Result (Bosque, Nov/29/02)
VAL (Joao Balbi, Nov/20/02)
20
30
40
50
60
70
80
15 16 17 18 19 20 21 22 23 24 1 2 3 4 5 6 7 8 9 10 11 12 13 14
Time
VA
L (dB
)
VAL (Bosque, Nov/25/02)
40
42
44
46
48
50
13 14 15 16 17 18 19 20 21 22 23 24 1 2 3 4 5 6 7 8 9 10 11 12
Time
VA
L (dB
)
VAL (Bosque, Nov/29/02)
38
40
42
44
46
48
50
18 19 20 21 22 23 24 1 2 3 4 5 6 7 8 9 10 11 12 13 14 15 16 17
Time
VA
L (dB
)
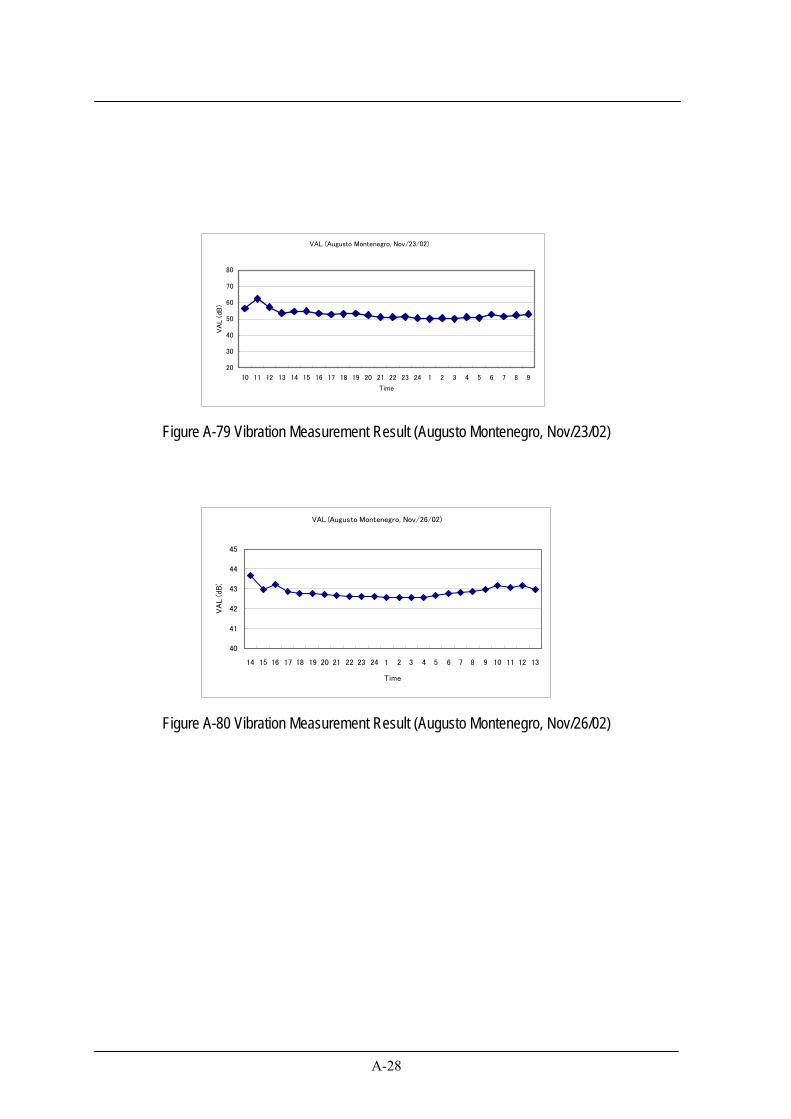
A-28
Figure A-79 Vibration Measurement Result (Augusto Montenegro, Nov/23/02)
Figure A-80 Vibration Measurement Result (Augusto Montenegro, Nov/26/02)
VAL (Augusto Montenegro, Nov/23/02)
20
30
40
50
60
70
80
10 11 12 13 14 15 16 17 18 19 20 21 22 23 24 1 2 3 4 5 6 7 8 9
Time
VA
L (dB
)
VAL (Augusto Montenegro, Nov/26/02)
40
41
42
43
44
45
14 15 16 17 18 19 20 21 22 23 24 1 2 3 4 5 6 7 8 9 10 11 12 13
Time
VA
L (dB
)
The Improvement of Transport System in the Metropolitan Area of Belem
A-29
A.6 INITIAL ENVIRONMENTAL EXAMINATION .............................................................A-1
(1) Air Quality Survey Results (NOX) ......................................................................................A-1 (2) Air Quality Survey Results (CO) .........................................................................................A-8 (3) Noise Survey Results..........................................................................................................A-15 (4) Vibration Survey Results ...................................................................................................A-22
Appendix A 6.9. Air Quality Survey Results (Nox) 6-67 6.10. Air Quality Survey Results (Co) 6-74 6.11. Noise Survey Results 6-81 6.12. Vibration Survey Results 6-88
エラー! 図表目次項目が見つかりません。
Figure A-1 Roadside A/Q Survey Results (NOX, Utinga, June/16/02) ................................ A-1 Figure A-2 Roadside A/Q Survey Results (NOX, Primeiro de Dezembro, June/18/02) ........ A-1 Figure A-3 Roadside A/Q Survey Results (NOX, Independencia, June/19/02) ..................... A-1 Figure A-4 Roadside A/Q Survey Results (NOX, BR316, June/20/02) ................................. A-2 Figure A-5 Roadside A/Q Survey Results (NOX, Nazare, June/21/02) ................................. A-2 Figure A-6 Roadside A/Q Survey Results (NOX, Nazare, June/22/02) ................................. A-2 Figure A-7 Roadside A/Q Survey Results (NOX, Nazare, Nov/19/02).................................. A-3 Figure A-8 Roadside A/Q Survey Results (NOX, Nazare, Nov/23/02).................................. A-3 Figure A-9 Roadside A/Q Survey Results (NOX, Tamandare, June/23/02)........................... A-3 Figure A-10 Roadside A/Q Survey Results (NOX, Tamandare, Nov/20/02) ......................... A-4 Figure A-11 Roadside A/Q Survey Results (NOX, Tamandare, Nov/24/02) ......................... A-4 Figure A-12 Roadside A/Q Survey Results (NOX, Sao-Braz, June/24/02)............................ A-4 Figure A-13 Roadside A/Q Survey Results (NOX, Sao-Braz, June/28/02)............................ A-5 Figure A-14 Roadside A/Q Survey Results (NOX, Sao-Braz, Nov/19/02) ............................ A-5 Figure A-15 Roadside A/Q Survey Results (NOX, Joao Balbi, June/25/02) ......................... A-5 Figure A-16 Roadside A/Q Survey Results (NOX, Joao Balbi, Nov/27/02).......................... A-6 Figure A-17 Roadside A/Q Survey Results (NOX, Bosque, June/26/02) .............................. A-6 Figure A-18 Roadside A/Q Survey Results (NOX, Bosque, Nov/26/02)............................... A-6 Figure A-19 Roadside A/Q Survey Results (NOX, Augusto Montenegro, June/27/02)......... A-7 Figure A-20 Roadside A/Q Survey Results (NOX, Augusto Montenegro, Nov/25/02) ......... A-7 Figure A-21 Roadside A/Q Survey Results (CO, Utinga, June/16/02)................................... A-8 Figure A-22 Roadside A/Q Survey Results (CO, Primeiro de Dezembro, June/18/02) ......... A-8
A-30
Figure A-23 Roadside A/Q Survey Results (CO, Independencia, June/19/02) ...................... A-8 Figure A-24 Roadside A/Q Survey Results (CO, BR316, June/20/02) .................................. A-9 Figure A-25 Roadside A/Q Survey Results (CO, Nazare, June/21/02) .................................. A-9 Figure A-26 Roadside A/Q Survey Results (CO, Nazare, June/22/02) .................................. A-9 Figure A-27 Roadside A/Q Survey Results (CO, Nazare, Nov/20/02)................................. A-10 Figure A-28 Roadside A/Q Survey Results (CO, Nazare, Nov/23/02)................................. A-10 Figure A-29 Roadside A/Q Survey Results (CO, Tamandare, June/23/02) .......................... A-10 Figure A-30 Roadside A/Q Survey Results (CO, Tamandare, Nov/21/02) .......................... A-11 Figure A-31 Roadside A/Q Survey Results (CO, Tamandare, Nov/24/02) .......................... A-11 Figure A-32 Roadside A/Q Survey Results (CO, Sao-Braz, June/24/02)............................. A-11 Figure A-33 Roadside A/Q Survey Results (CO, Sao-Braz, June/28/02)............................. A-12 Figure A-34 Roadside A/Q Survey Results (CO, Sao-Braz, Nov/19/02) ............................. A-12 Figure A-35 Roadside A/Q Survey Results (CO, Joao Balbi, June/25/02)........................... A-12 Figure A-36 Roadside A/Q Survey Results (CO, Joao Balbi, Nov/27/02) ........................... A-13 Figure A-37 Roadside A/Q Survey Results (CO, Bosque, June/26/02)................................ A-13 Figure A-38 Roadside A/Q Survey Results (CO, Bosque, Nov/26/02) ................................ A-13 Figure A-39 Roadside A/Q Survey Results (CO, Augusto Montenegro, June/27/02).......... A-14 Figure A-40 Roadside A/Q Survey Results (CO, Augusto Montenegro, Nov/25/02) .......... A-14 Figure A-41 Noise Measurement Results (Utinga, Nov/21/02)............................................ A-15 Figure A-42 Noise Measurement Results (Primeiro de Dezembro, Nov/28/02) .................. A-15 Figure A-43 Noise Measurement Results (Independencia, June/17/02)............................... A-15 Figure A-44 Noise Measurement Results (Independencia, Nov/18/02) ............................... A-16 Figure A-45 Noise Measurement Results (BR316, June/21/02)........................................... A-16 Figure A-46 Noise Measurement Results (BR316, Nov/25/02) ........................................... A-16 Figure A-47 Noise Measurement Results (Nazare, Nov/18/02) ........................................... A-17 Figure A-48 Noise Measurement Results (Nazare, Nov/19/02) ........................................... A-17 Figure A-49 Noise Measurement Results (Nazare, Nov/24/02) ........................................... A-17 Figure A-50 Noise Measurement Results (Tamandare, June/24/02) .................................... A-18 Figure A-51 Noise Measurement Results (Tamandare, Nov/23/02)..................................... A-18 Figure A-52 Noise Measurement Results (Tamandare, Nov/27/02)..................................... A-18 Figure A-53 Noise Measurement Results (Sao Braz, June/27/02) ....................................... A-19 Figure A-54 Noise Measurement Results (Sao Braz, Nov/21/02)........................................ A-19 Figure A-55 Noise Measurement Results (Joao Balbi, Nov/19/02) ..................................... A-19 Figure A-56 Noise Measurement Results (Joao Balbi, Nov/20/02) ..................................... A-20 Figure A-57 Noise Measurement Results (Bosque, June/26/02) .......................................... A-20 Figure A-58 Noise Measurement Results (Bosque, Nov/29/02) .......................................... A-20 Figure A-59 Noise Measurement Results (Augusto Montenegro, June/28/02) .................... A-21 Figure A-60 Noise Measurement Results (Augusto Montenegro, Nov/26/02) .................... A-21 Figure A-61 Vibration Measurement Result (Utinga, Nov/21/02) ....................................... A-22
The Improvement of Transport System in the Metropolitan Area of Belem
A-31
Figure A-62 Vibration Measurement Result (Primeiro de Dezembro, Nov/28/02).............. A-22 Figure A-63 Vibration Measurement Result (Independencia, Nov/18/02)........................... A-22 Figure A-64 Vibration Measurement Result (Independencia, Nov/27/02)........................... A-23 Figure A-65 Vibration Measurement Result (BR316, Nov/24/02)....................................... A-23 Figure A-66 Vibration Measurement Result (BR316, Nov/25/02)....................................... A-23 Figure A-67 Vibration Measurement Result (Nazare, Nov/18/02)....................................... A-24 Figure A-68 Vibration Measurement Result (Nazare, Nov/19/02)....................................... A-24 Figure A-69 Vibration Measurement Result (Nazare, Nov/24/02)....................................... A-24 Figure A-70 Vibration Measurement Result (Tamandare, Nov/23/02) ................................ A-25 Figure A-71 Vibration Measurement Result (Tamandare, Nov/27/02) ................................ A-25 Figure A-72 Vibration Measurement Result (Tamandare, Nov/28/02) ................................ A-25 Figure A-73 Vibration Measurement Result (Sao-Braz, Nov/22/02) ................................... A-26 Figure A-74 Vibration Measurement Result (Sao-Braz, Nov/26/02) ................................... A-26 Figure A-75 Vibration Measurement Result (Joao Balbi, Nov/19/02) ................................. A-26 Figure A-76 Vibration Measurement Result (Joao Balbi, Nov/20/02) ................................. A-27 Figure A-77 Vibration Measurement Result (Bosque, Nov/25/02) ...................................... A-27 Figure A-78 Vibration Measurement Result (Bosque, Nov/29/02) ...................................... A-27 Figure A-79 Vibration Measurement Result (Augusto Montenegro, Nov/23/02) ................ A-28 Figure A-80 Vibration Measurement Result (Augusto Montenegro, Nov/26/02) ................ A-28
Appendix-B B.11 Trunk Bus Operation Plan
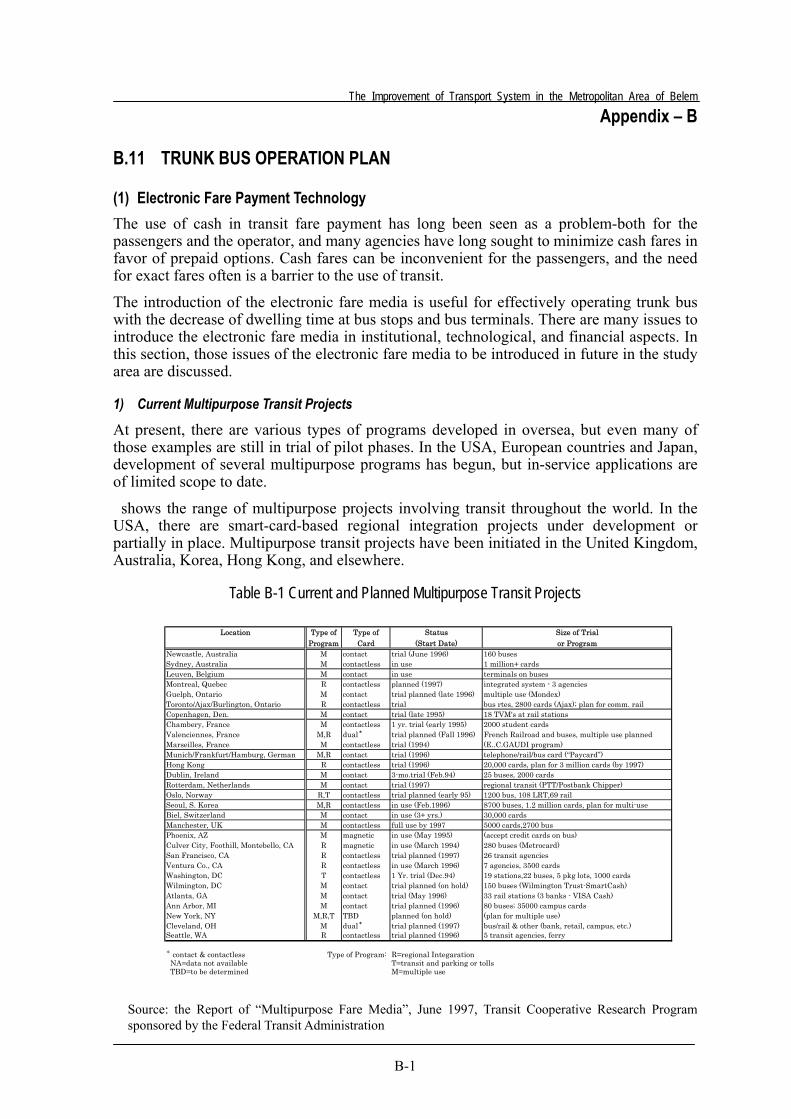
The Improvement of Transport System in the Metropolitan Area of Belem
B-1
Appendix – B
B.11 TRUNK BUS OPERATION PLAN
(1) Electronic Fare Payment Technology The use of cash in transit fare payment has long been seen as a problem-both for the passengers and the operator, and many agencies have long sought to minimize cash fares in favor of prepaid options. Cash fares can be inconvenient for the passengers, and the need for exact fares often is a barrier to the use of transit.
The introduction of the electronic fare media is useful for effectively operating trunk bus with the decrease of dwelling time at bus stops and bus terminals. There are many issues to introduce the electronic fare media in institutional, technological, and financial aspects. In this section, those issues of the electronic fare media to be introduced in future in the study area are discussed.
1) Current Multipurpose Transit Projects
At present, there are various types of programs developed in oversea, but even many of those examples are still in trial of pilot phases. In the USA, European countries and Japan, development of several multipurpose programs has begun, but in-service applications are of limited scope to date.
shows the range of multipurpose projects involving transit throughout the world. In the USA, there are smart-card-based regional integration projects under development or partially in place. Multipurpose transit projects have been initiated in the United Kingdom, Australia, Korea, Hong Kong, and elsewhere.
Table B-1 Current and Planned Multipurpose Transit Projects
Source: the Report of “Multipurpose Fare Media”, June 1997, Transit Cooperative Research Program sponsored by the Federal Transit Administration
Location Type of Type of Status Size of TrialProgram Card (Start Date) or Program
Newcastle, Australia M contact trial (June 1996) 160 busesSydney, Australia M contactless in use 1 million+ cardsLeuven, Belgium M contact in use terminals on busesMontreal, Quebec R contactless planned (1997) integrated system - 3 agenciesGuelph, Ontario M contact trial planned (late 1996) multiple use (Mondex)Toronto/Ajax/Burlington, Ontario R contactless trial bus rtes, 2800 cards (Ajax); plan for comm. railCopenhagen, Den. M contact trial (late 1995) 18 TVM's at rail stationsChambery, France M contactless 1 yr. trial (early 1995) 2000 student cardsValenciennes, France M,R dual* trial planned (Fall 1996) French Railroad and buses, multiple use plannedMarseilles, France M contactless trial (1994) (E..C.GAUDI program)Munich/Frankfurt/Hamburg, German M,R contact trial (1996) telephone/rail/bus card (“Paycard”)Hong Kong R contactless trial (1996) 20,000 cards, plan for 3 million cards (by 1997)Dublin, Ireland M contact 3-mo.trial (Feb.94) 25 buses, 2000 cardsRotterdam, Netherlands M contact trial (1997) regional transit (PTT/Postbank Chipper)Oslo, Norway R,T contactless trial planned (early 95) 1200 bus, 108 LRT,69 railSeoul, S. Korea M,R contactless in use (Feb.1996) 8700 buses, 1.2 million cards, plan for multi-useBiel, Switzerland M contact in use (3+ yrs.) 30,000 cardsManchester, UK M contactless full use by 1997 5000 cards,2700 busPhoenix, AZ M magnetic in use (May 1995) (accept credit cards on bus)Culver City, Foothill, Montebello, CA R magnetic in use (March 1994) 280 buses (Metrocard)San Francisco, CA R contactless trial planned (1997) 26 transit agenciesVentura Co., CA R contactless in use (March 1996) 7 agencies, 3500 cardsWashington, DC T contactless 1 Yr. trial (Dec.94) 19 stations,22 buses, 5 pkg lots, 1000 cardsWilmington, DC M contact trial planned (on hold) 150 buses (Wilmington Trust-SmartCash)Atlanta, GA M contact trial (May 1996) 33 rail stations (3 banks - VISA Cash)Ann Arbor, MI M contact trial planned (1996) 80 buses; 35000 campus cardsNew York, NY M,R,T TBD planned (on hold) (plan for multiple use)Cleveland, OH M dual* trial planned (1997) bus/rail & other (bank, retail, campus, etc.)Seattle, WA R contactless trial planned (1996) 5 transit agencies, ferry
* contact & contactless R=regional Integaration NA=data not available T=transit and parking or tolls TBD=to be determined M=multiple use
Type of Program:
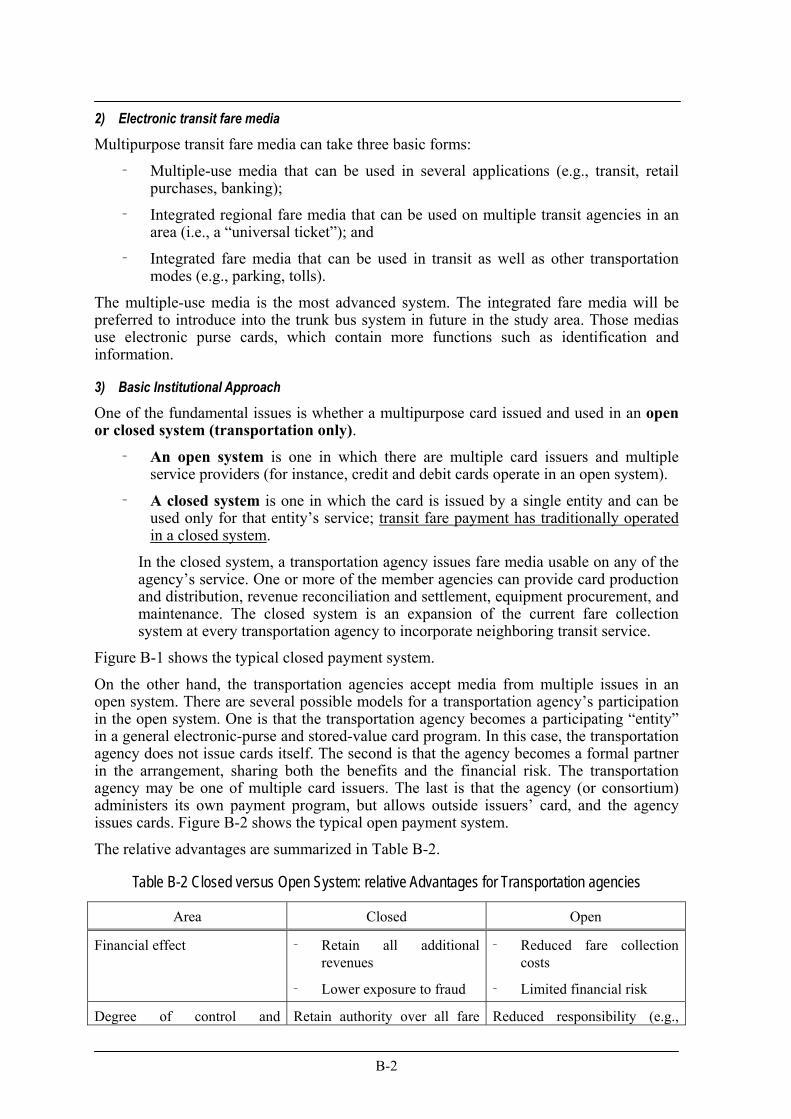
B-2
2) Electronic transit fare media
Multipurpose transit fare media can take three basic forms:
‑ Multiple-use media that can be used in several applications (e.g., transit, retail purchases, banking);
‑ Integrated regional fare media that can be used on multiple transit agencies in an area (i.e., a “universal ticket”); and
‑ Integrated fare media that can be used in transit as well as other transportation modes (e.g., parking, tolls).
The multiple-use media is the most advanced system. The integrated fare media will be preferred to introduce into the trunk bus system in future in the study area. Those medias use electronic purse cards, which contain more functions such as identification and information.
3) Basic Institutional Approach
One of the fundamental issues is whether a multipurpose card issued and used in an open or closed system (transportation only).
‑ An open system is one in which there are multiple card issuers and multiple service providers (for instance, credit and debit cards operate in an open system).
‑ A closed system is one in which the card is issued by a single entity and can be used only for that entity’s service; transit fare payment has traditionally operated in a closed system.
In the closed system, a transportation agency issues fare media usable on any of the agency’s service. One or more of the member agencies can provide card production and distribution, revenue reconciliation and settlement, equipment procurement, and maintenance. The closed system is an expansion of the current fare collection system at every transportation agency to incorporate neighboring transit service.
Figure B-1 shows the typical closed payment system.
On the other hand, the transportation agencies accept media from multiple issues in an open system. There are several possible models for a transportation agency’s participation in the open system. One is that the transportation agency becomes a participating “entity” in a general electronic-purse and stored-value card program. In this case, the transportation agency does not issue cards itself. The second is that the agency becomes a formal partner in the arrangement, sharing both the benefits and the financial risk. The transportation agency may be one of multiple card issuers. The last is that the agency (or consortium) administers its own payment program, but allows outside issuers’ card, and the agency issues cards. Figure B-2 shows the typical open payment system.
The relative advantages are summarized in Table B-2.
Table B-2 Closed versus Open System: relative Advantages for Transportation agencies
Area Closed Open
Financial effect ‑ Retain all additional revenues
‑ Lower exposure to fraud
‑ Reduced fare collection costs
‑ Limited financial risk
Degree of control and Retain authority over all fare Reduced responsibility (e.g.,
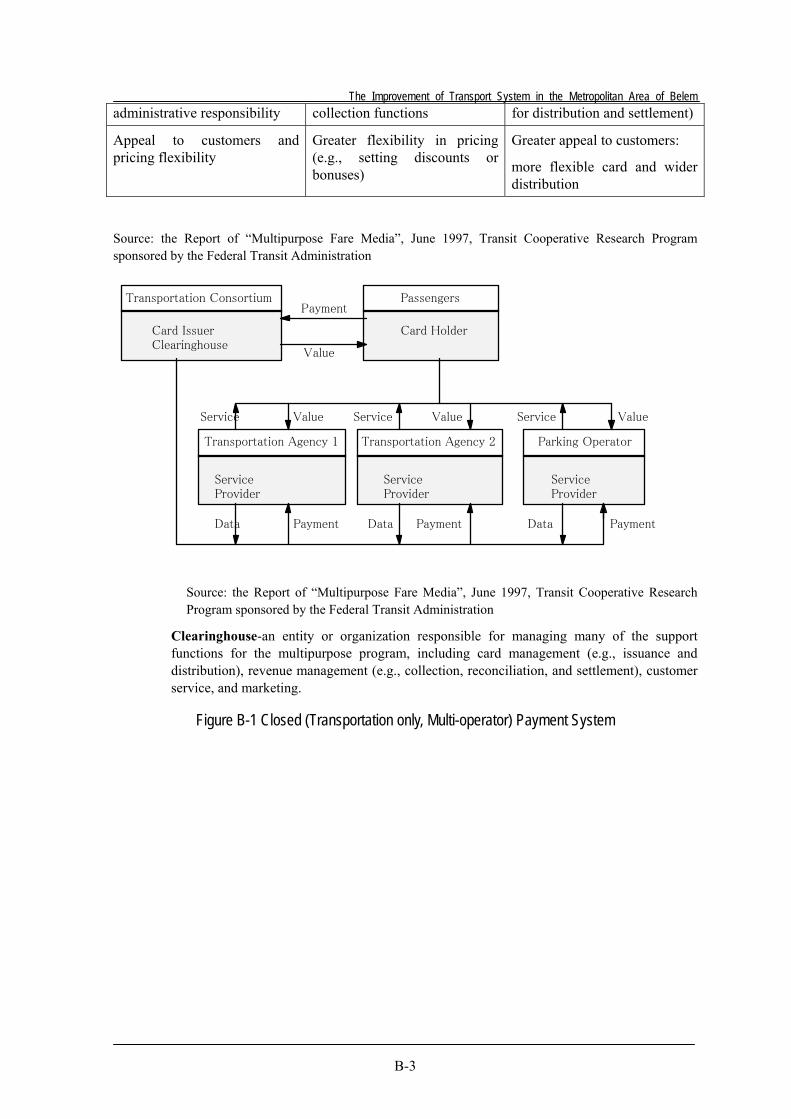
The Improvement of Transport System in the Metropolitan Area of Belem
B-3
administrative responsibility collection functions for distribution and settlement)
Appeal to customers and pricing flexibility
Greater flexibility in pricing (e.g., setting discounts or bonuses)
Greater appeal to customers:
more flexible card and wider distribution
Source: the Report of “Multipurpose Fare Media”, June 1997, Transit Cooperative Research Program sponsored by the Federal Transit Administration
Source: the Report of “Multipurpose Fare Media”, June 1997, Transit Cooperative Research Program sponsored by the Federal Transit Administration
Clearinghouse-an entity or organization responsible for managing many of the support functions for the multipurpose program, including card management (e.g., issuance and distribution), revenue management (e.g., collection, reconciliation, and settlement), customer service, and marketing.
Figure B-1 Closed (Transportation only, Multi-operator) Payment System
Transportation Consortium
Card IssuerClearinghouse
Passengers
Card Holder
Transportation Agency 1
ServiceProvider
ServiceProvider
Transportation Agency 2
ServiceProvider
Parking Operator
Payment
Value
Service Service ServiceValue Value Value
Data Data DataPayment Payment Payment
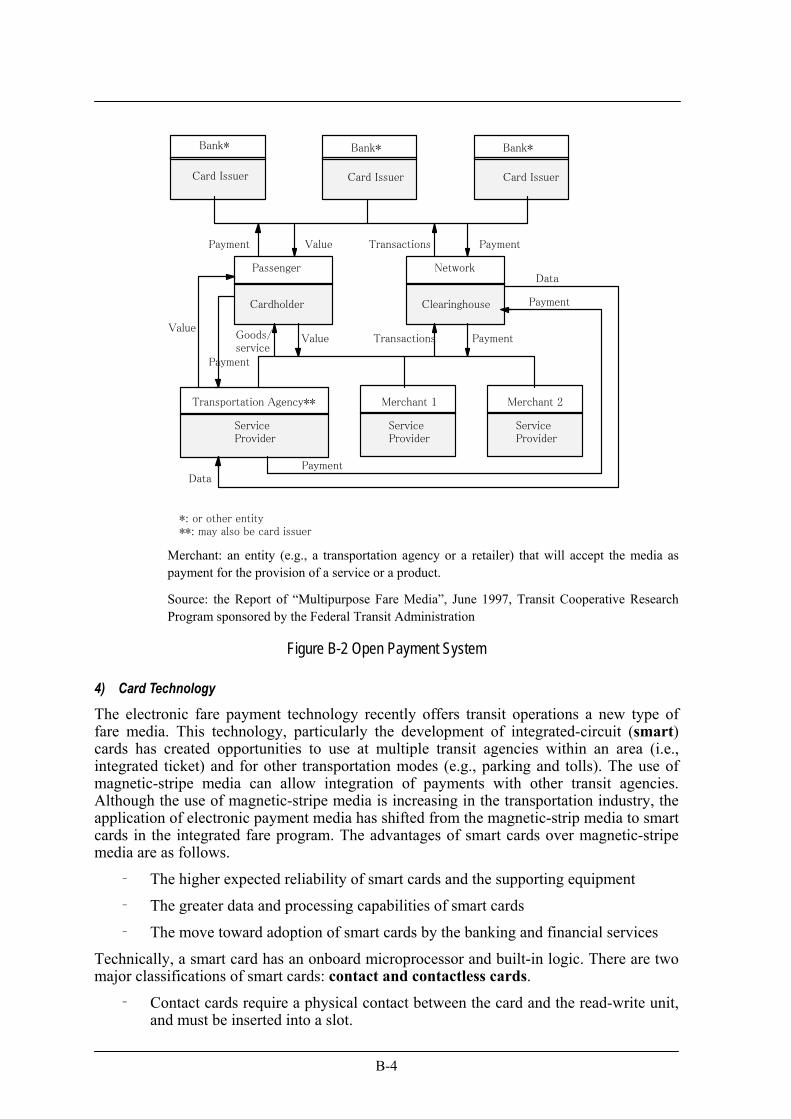
B-4
Merchant: an entity (e.g., a transportation agency or a retailer) that will accept the media as payment for the provision of a service or a product.
Source: the Report of “Multipurpose Fare Media”, June 1997, Transit Cooperative Research Program sponsored by the Federal Transit Administration
Figure B-2 Open Payment System
4) Card Technology
The electronic fare payment technology recently offers transit operations a new type of fare media. This technology, particularly the development of integrated-circuit (smart) cards has created opportunities to use at multiple transit agencies within an area (i.e., integrated ticket) and for other transportation modes (e.g., parking and tolls). The use of magnetic-stripe media can allow integration of payments with other transit agencies. Although the use of magnetic-stripe media is increasing in the transportation industry, the application of electronic payment media has shifted from the magnetic-strip media to smart cards in the integrated fare program. The advantages of smart cards over magnetic-stripe media are as follows.
‑ The higher expected reliability of smart cards and the supporting equipment
‑ The greater data and processing capabilities of smart cards
‑ The move toward adoption of smart cards by the banking and financial services
Technically, a smart card has an onboard microprocessor and built-in logic. There are two major classifications of smart cards: contact and contactless cards.
‑ Contact cards require a physical contact between the card and the read-write unit, and must be inserted into a slot.
Bank*
Card Issuer
Bank*
Card Issuer
Bank*
Card Issuer
Passenger
Cardholder
Network
Clearinghouse
Transportation Agency**
ServiceProvider
Merchant 1
ServiceProvider
Merchant 2
ServiceProvider
Payment Value Transactions Payment
Data
Payment
PaymentData
Value
Payment
Goods/service
Value Transactions Payment
*: or other entity**: may also be card issuer
The Improvement of Transport System in the Metropolitan Area of Belem
B-5
‑ Contactless cards do not have to be inserted into a slot, but rather can be ready by passing the card close to the read-write unit.
One type of hybrid card combines a smart card with a magneticstripe, while a newer option (better known as a combi-card or dual-interface card) combines the attributes of contact and contactless cards- either using two separate chips or a single chip capable.
The advantages of contactless card systems for transit agencies are as follows:
‑ Potential for lower fare collection equipment maintenance costs, because there are no moving parts in the read-write units
‑ Greater reliability of equipment, because there are no open slot that can be jammed
‑ Greater convenience for passengers, especially for elderly or disabled passengers who may have difficulty inserting a card
‑ Faster boarding of buses and entry through turnstiles
In general, the key concerns in choosing a particular type of media or equipment for a multipurpose program may include the following factors.
‑ The agency’s fare media needs and fare collection goals
‑ System costs and the funding available
‑ The technology to be used by other entities
5) Issues and Concerns
The development of electronic card system will require a fundamental change, which applies to the customer (bus passengers), the transit agency, and the financial institution.
‑ Institutional: who are the participants in the program, how is the program organized and operated, and what are the legal and regulatory requirements that must be addressed?
‑ Technological: what types card will form the basis for the program, what are the design requirements, how will the new technology be integrated into the existing system?
‑ Financial: what are the expected costs and benefits of the program to each potential participant?
‑ Customer-Related: to what extent will customers participate in the program, and how will their concerns be addressed (e.g., related to privacy)?
As the transportation companies in Brazil are beginning to recognize the benefits of the electronic fare payment media in facilitating such fare integration, the issues in institutional, technological, financial and customer-related aspects have to be discussed with related agencies for the introduction of the program into the trunk bus system operated in 2007.
6) Present conditions of Fare collection system in the USA
The following shows the results of a survey of transit agencies conducted in the USA, which refer to the Report of “Multipurpose Fare Media”, June 1997, Transit Cooperative Research Program sponsored by the Federal Transit Administration. The focus of the survey was on current fare collection practices and costs, plans for use of emerging technologies, agency goals for improving fare collection systems, and issues and concerns regarding possible multiple-use payment arrangements. 86 transport agencies included
B-6
rapid rail, commuter rail, or light rail service and bus-only system (i.e., bus-only transportation), were surveyed.
A. Present Fare Collection System
Under the multiple responses, cash (98%), tokens (50%), and magnetic-stripe cards (35%) are predominant. Smart card (6%) and Debit cards (9%) are few percentages.
B. Existing Fare Collection Equipment
Electronic registering fareboxes (83%) are the most widely used pieces of fare collection equipment. Magnetic-card swipe readers are the next most widely used with 33%. Nonregistering fareboxes are used by only 29% of the agencies.
C. Plan for New Fare Collection System
A magneticstripe, stored-value card technology was the most often cited with 71%. Contactless and contact smart-card technologies are expected to be implemented by 34% and 29% of the respondents, respectively.
D. Fare System Cost
A percentage of “Production and distribution costs” to total fare revenue is approximately 1% for bus-only system (bus companies). As for “Collection and Processing” costs, bus-only system responded at 1.9% of total fare revenue.
E. Goal for Improving Fare System
The following are the five goals by bus-only system.
‑ Improve the convenience for passengers
‑ Improve the ability to collect needed data (e.g., origin and destination data)
‑ Improve the ease of administrating fare collection by bus operators and other personnel
‑ Improve the ability to integrate with other onboard technologies (e.g., automated vehicle location (AVL) or automated passenger counter)
‑ Improve card read-write unit reliability.
F. Issues and Concerns related to Potential Multiple-Use Arrangement
The following list presents the issues by bus-only system in order of overall importance:
‑ Institutional issues (e.g., maintaining control over the fare system, including the ability to modify fare structures)
‑ Cost of providing electronic fare media and of participating in a multiple transit use or joint banking and transit program
‑ Card technology issues (e.g., the need to accept technology selected by other agencies)
‑ Privacy issues for passengers
‑ Clearinghouse/settlement issues (e.g., related to apportioning revenues among participating agencies)
‑ Legal and regulatory issues (e.g., constraints on an agency’s ability to enter into agreements with other entities)
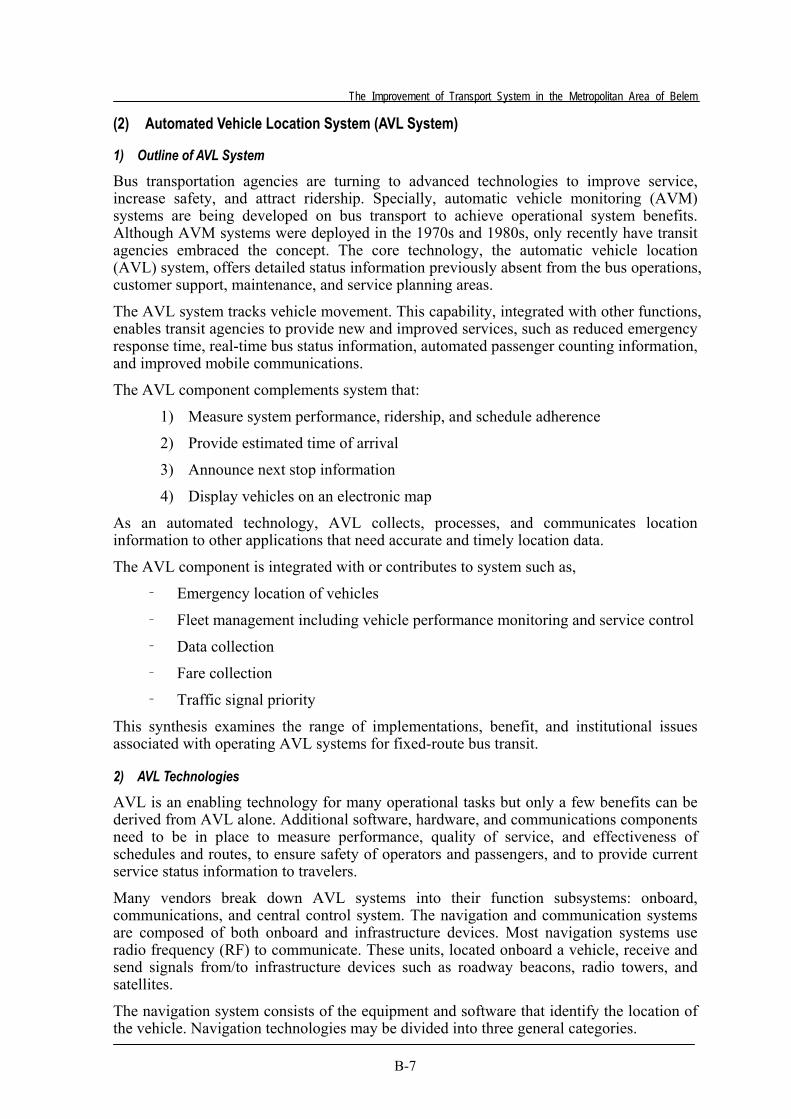
The Improvement of Transport System in the Metropolitan Area of Belem
B-7
(2) Automated Vehicle Location System (AVL System)
1) Outline of AVL System
Bus transportation agencies are turning to advanced technologies to improve service, increase safety, and attract ridership. Specially, automatic vehicle monitoring (AVM) systems are being developed on bus transport to achieve operational system benefits. Although AVM systems were deployed in the 1970s and 1980s, only recently have transit agencies embraced the concept. The core technology, the automatic vehicle location (AVL) system, offers detailed status information previously absent from the bus operations, customer support, maintenance, and service planning areas.
The AVL system tracks vehicle movement. This capability, integrated with other functions, enables transit agencies to provide new and improved services, such as reduced emergency response time, real-time bus status information, automated passenger counting information, and improved mobile communications.
The AVL component complements system that:
1) Measure system performance, ridership, and schedule adherence
2) Provide estimated time of arrival
3) Announce next stop information
4) Display vehicles on an electronic map
As an automated technology, AVL collects, processes, and communicates location information to other applications that need accurate and timely location data.
The AVL component is integrated with or contributes to system such as,
‑ Emergency location of vehicles
‑ Fleet management including vehicle performance monitoring and service control
‑ Data collection
‑ Fare collection
‑ Traffic signal priority
This synthesis examines the range of implementations, benefit, and institutional issues associated with operating AVL systems for fixed-route bus transit.
2) AVL Technologies
AVL is an enabling technology for many operational tasks but only a few benefits can be derived from AVL alone. Additional software, hardware, and communications components need to be in place to measure performance, quality of service, and effectiveness of schedules and routes, to ensure safety of operators and passengers, and to provide current service status information to travelers.
Many vendors break down AVL systems into their function subsystems: onboard, communications, and central control system. The navigation and communication systems are composed of both onboard and infrastructure devices. Most navigation systems use radio frequency (RF) to communicate. These units, located onboard a vehicle, receive and send signals from/to infrastructure devices such as roadway beacons, radio towers, and satellites.
The navigation system consists of the equipment and software that identify the location of the vehicle. Navigation technologies may be divided into three general categories.
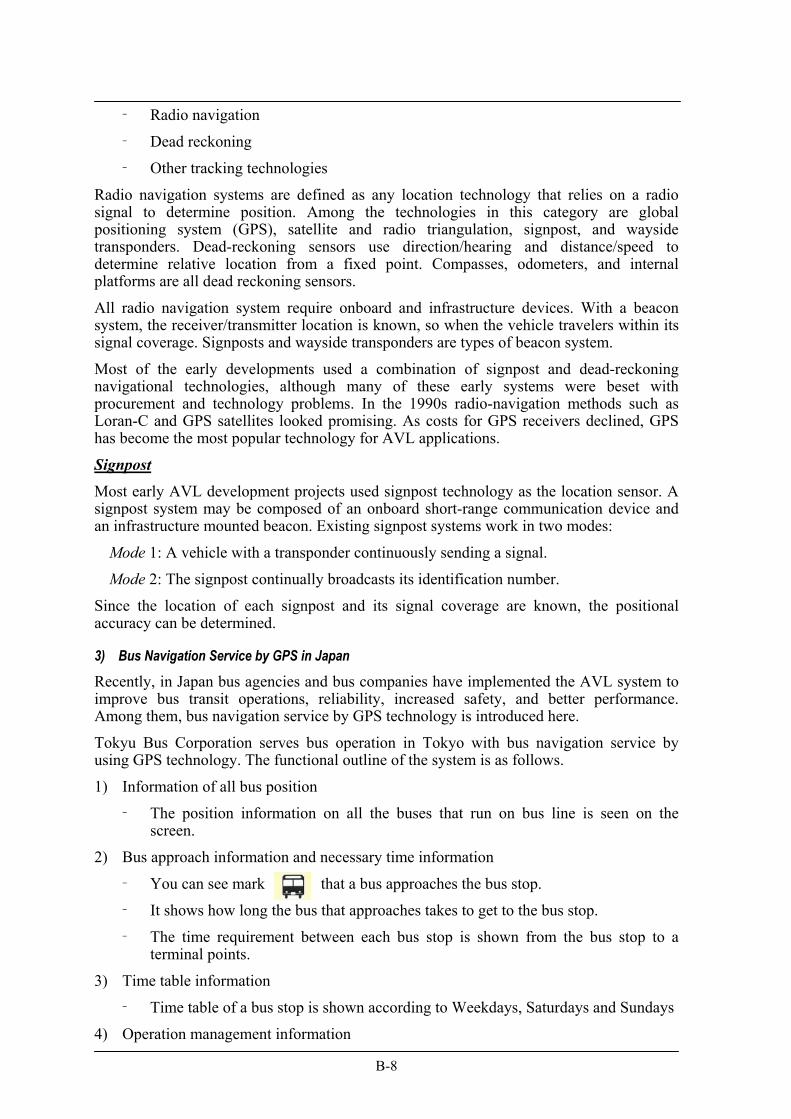
B-8
‑ Radio navigation
‑ Dead reckoning
‑ Other tracking technologies
Radio navigation systems are defined as any location technology that relies on a radio signal to determine position. Among the technologies in this category are global positioning system (GPS), satellite and radio triangulation, signpost, and wayside transponders. Dead-reckoning sensors use direction/hearing and distance/speed to determine relative location from a fixed point. Compasses, odometers, and internal platforms are all dead reckoning sensors.
All radio navigation system require onboard and infrastructure devices. With a beacon system, the receiver/transmitter location is known, so when the vehicle travelers within its signal coverage. Signposts and wayside transponders are types of beacon system.
Most of the early developments used a combination of signpost and dead-reckoning navigational technologies, although many of these early systems were beset with procurement and technology problems. In the 1990s radio-navigation methods such as Loran-C and GPS satellites looked promising. As costs for GPS receivers declined, GPS has become the most popular technology for AVL applications.
Signpost Most early AVL development projects used signpost technology as the location sensor. A signpost system may be composed of an onboard short-range communication device and an infrastructure mounted beacon. Existing signpost systems work in two modes:
Mode 1: A vehicle with a transponder continuously sending a signal.
Mode 2: The signpost continually broadcasts its identification number.
Since the location of each signpost and its signal coverage are known, the positional accuracy can be determined.
3) Bus Navigation Service by GPS in Japan
Recently, in Japan bus agencies and bus companies have implemented the AVL system to improve bus transit operations, reliability, increased safety, and better performance. Among them, bus navigation service by GPS technology is introduced here.
Tokyu Bus Corporation serves bus operation in Tokyo with bus navigation service by using GPS technology. The functional outline of the system is as follows.
1) Information of all bus position
‑ The position information on all the buses that run on bus line is seen on the screen.
2) Bus approach information and necessary time information
‑ You can see mark that a bus approaches the bus stop.
‑ It shows how long the bus that approaches takes to get to the bus stop.
‑ The time requirement between each bus stop is shown from the bus stop to a terminal points.
3) Time table information
‑ Time table of a bus stop is shown according to Weekdays, Saturdays and Sundays
4) Operation management information
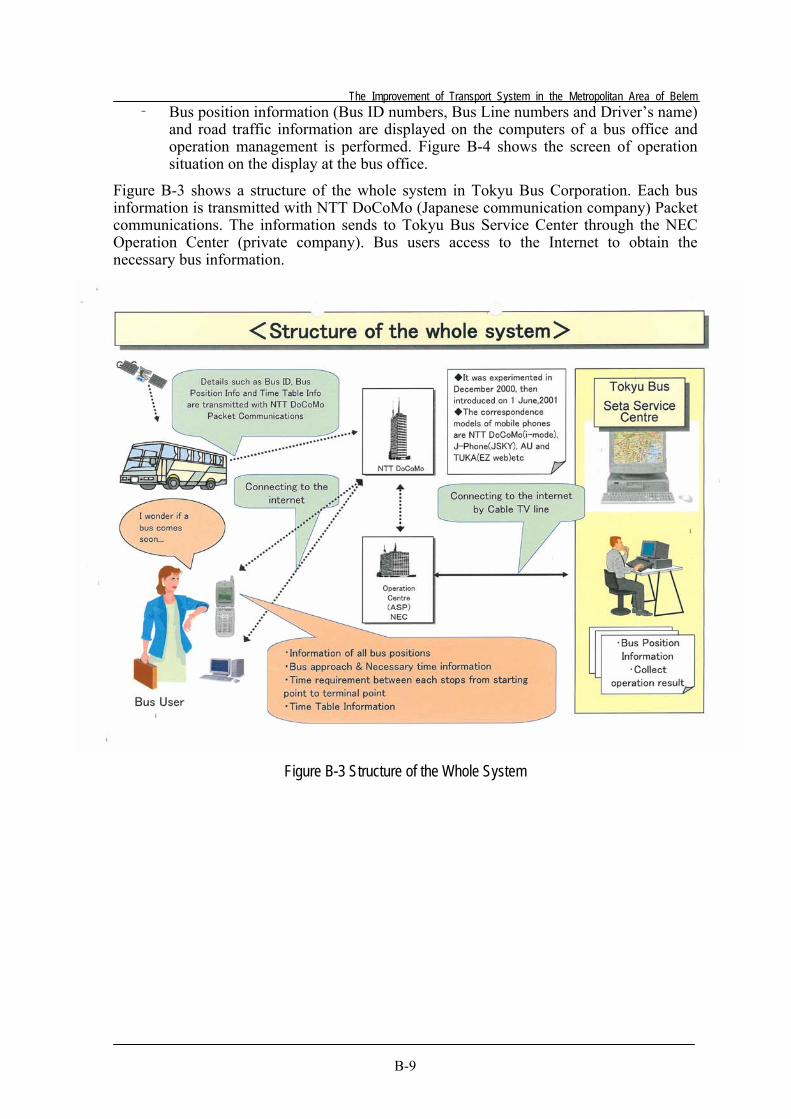
The Improvement of Transport System in the Metropolitan Area of Belem
B-9
‑ Bus position information (Bus ID numbers, Bus Line numbers and Driver’s name) and road traffic information are displayed on the computers of a bus office and operation management is performed. Figure B-4 shows the screen of operation situation on the display at the bus office.
Figure B-3 shows a structure of the whole system in Tokyu Bus Corporation. Each bus information is transmitted with NTT DoCoMo (Japanese communication company) Packet communications. The information sends to Tokyu Bus Service Center through the NEC Operation Center (private company). Bus users access to the Internet to obtain the necessary bus information.
Figure B-3 Structure of the Whole System
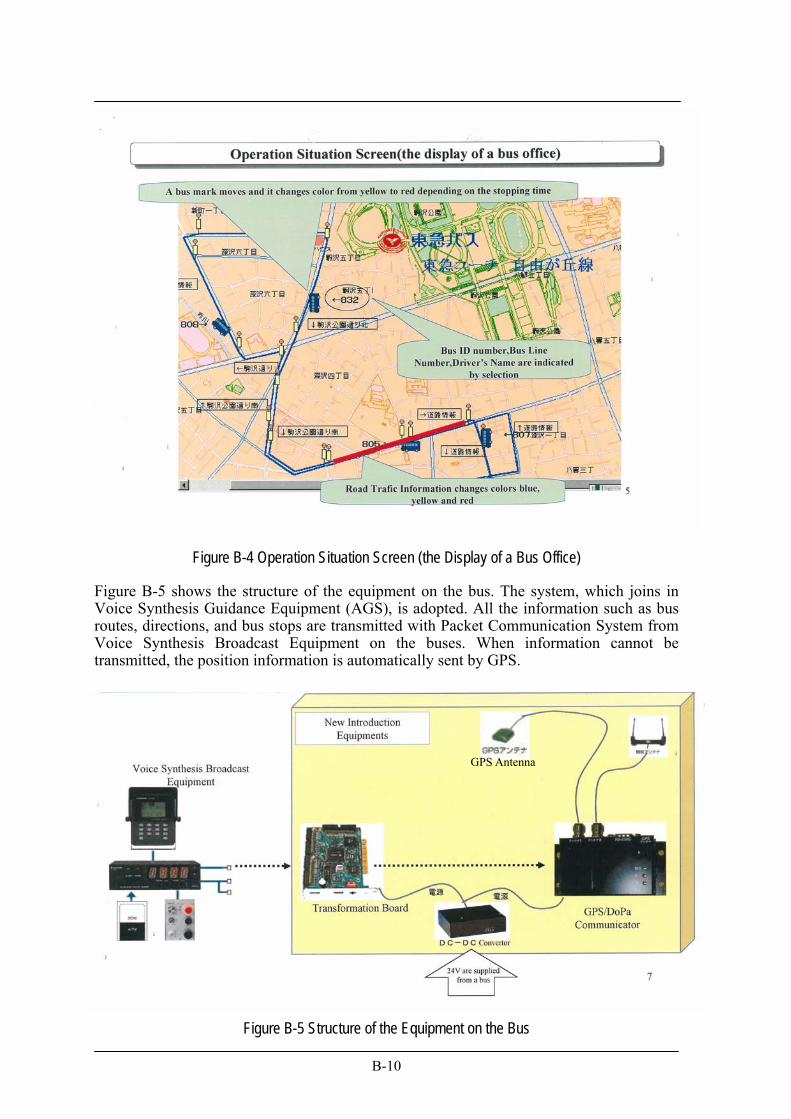
B-10
Figure B-4 Operation Situation Screen (the Display of a Bus Office)
Figure B-5 shows the structure of the equipment on the bus. The system, which joins in Voice Synthesis Guidance Equipment (AGS), is adopted. All the information such as bus routes, directions, and bus stops are transmitted with Packet Communication System from Voice Synthesis Broadcast Equipment on the buses. When information cannot be transmitted, the position information is automatically sent by GPS.
Figure B-5 Structure of the Equipment on the Bus
GPS Antenna
The Improvement of Transport System in the Metropolitan Area of Belem
B-11
B.11 TRUNK BUS OPERATION PLAN..................................................................................B-1
(1) Electronic Fare Payment Technology ..................................................................................B-1 (2) Automated Vehicle Location System (AVL System)............................................................B-7
Table B-1 Current and Planned Multipurpose Transit Projects .............................................. B-1 Table B-2 Closed versus Open System: relative Advantages for Transportation agencies .... B-2
Figure B-1 Closed (Transportation only, Multi-operator) Payment System........................... B-3 Figure B-2 Open Payment System ......................................................................................... B-4 Figure B-3 Structure of the Whole System............................................................................. B-9 Figure B-4 Operation Situation Screen (the Display of a Bus Office) ................................. B-10 Figure B-5 Structure of the Equipment on the Bus .............................................................. B-10
Appendix-C C.16 Construction Planning And Cost Estimate
The Improvement of Transport System in the Metropolitan Area of Belem
C-1
Appendix C
C.16 CONSTRUCTION PLANNING AND COST ESTIMATE
Table C-1 Unit Direct Cost
Table16- 1 Leveling (common soil )
m3Quantity of work Unit Uunit-price (R$) Sub.total (R$) Remarks
EquipmentMotor Grader 0.60 hr. 94.03 56.41
0.0056.41
LaborForeman 0.20 hr. 5.22 1.04Operator 0.60 hr. 4.81 2.88Worker 4.00 hr. 2.31 9.24
13.1630.00 m3
2.32Material
0.000.00
Unit cost (R$) 2.32 per m3
m3Quantity of work Unit Uunit-price (R$) Sub.total (R$) Remarks
EquipmentDumpTruck 1.00 hr. 56.44 56.44Backhoe 1.00 hr. 45.42 45.42Truck with crane 1.00 hr. 39.67 39.67Mobil Crane 0.80 hr. 255.00 204.00
345.53Labor
Foreman 0.50 hr. 5.22 2.61Operator 1.80 hr. 4.81 8.65Driver 2.00 hr. 4.29 8.58Skilled Worker 1.50 hr. 3.92 5.88Worker 2.00 hr. 2.31 4.62
30.3410.00 m337.59
Material0.000.00
Unit cost (R$) 37.59 per m3
m3Quantity of work Unit Uunit-price (R$) Sub.total (R$) Remarks
EquipmentDumpTruck 1.00 hr. 56.44 56.44Bulltozer 2.00 hr. 106.20 212.40Backhoe 1.50 hr. 74.45 111.67Truck with crane 1.00 hr. 39.67 39.67Mobil Crane 1.00 hr. 255.00 255.00
675.18Labor
Foreman 0.50 hr. 5.22 2.61Operator 4.50 hr. 4.81 21.64Driver 2.00 hr. 4.29 8.58Worker 4.00 hr. 2.31 9.24
42.075.00 m3
143.45Material
0.000.00
Unit cost (R$) 143.45 per m3
Construction work Leveling (common soil )Unit of work 1.00Work item
(A) Total
(E) Total(D)+(E)
(B)Total (C) Quantity of product
(D) Unit of product(A/C+B/C)
Table16- 2 Demolition of existing medium platation ( demolish curbs, move plan ,transport distance 5km, replantation)
Construction workDemolition of existing medium platation ( demolish curbs, move plan ,transport
distance 5km, replantation)Unit of work 1.00
(B) Ttotal
Work item
(A) Total
(C) Quantity of product(D) Unit of product(A/C+B/C)
(E) Total(D)+(E)
Construction workDemolition of existing medium bikeway ( demolish bikeway, move plan ,transport
distance 5km, replantation)Unit of work 1.00
(B) Ttotal
Work item
(A) Total
(C) Quantity of product(D) Unit of product(A/C+B/C)
(E) Total(D)+(E)
Table16-3 Demolition of existing medium bikeway ( demolish bikeway, move plan ,transport distance 5km, replantation)
C-2
volQuantity of work Unit Uunit-price (R$) Sub.total (R$) Remarks
EquipmentDumpTruck 0.50 hr. 56.44 28.22Backhoe 0.50 hr. 45.42 22.71Truck with crane 0.40 hr. 39.67 15.86
66.79Labor
Foreman 1.00 hr. 5.22 5.22Operator 0.50 hr. 4.81 2.40Driver 0.90 hr. 4.29 3.86Technician(electrician) 3.00 hr. 3.92 11.76Worker 6.00 hr. 2.31 13.86
37.101.00 vol
103.89Material
0.000.00
Unit cost (R$) 103.89 per vol
Table16- 5
m3Quantity of work Unit Uunit-price (R$) Sub.total (R$) Remarks
EquipmentDumpTruck 1.50 hr. 56.44 84.66Backhoe 2.00 hr. 45.42 90.84 95hp
175.50Labor
Foreman 0.50 hr. 5.22 2.61Operator 2.00 hr. 4.81 9.62Driver 1.50 hr. 4.29 6.43Worker 4.00 hr. 2.31 9.24
27.9050.00 m3
4.07Material
0.000.00
Unit cost (R$) 4.07 per m3
Table16- 6 Excavation - existing asphalt include base and sub-base ( excavate, load , transport distance 5km, unload)
m3Quantity of work Unit Uunit-price (R$) Sub.total (R$) Remarks
EquipmentDumpTruck 2.00 hr. 56.44 112.88Motor Grader 2.00 hr. 94.03 188.06Backhoe 3.00 hr. 45.42 136.26 95hp
437.20Labor
Foreman 1.00 hr. 5.22 5.22Operator 5.00 hr. 4.81 24.05Driver 2.00 hr. 4.29 8.58Worker 7.00 hr. 2.31 16.17
54.025.00 m3
98.24Material
0.000.00
Unit cost (R$) 98.24 per m3
Construction work Excavation - commom soil ( excavate, load , transport distance 5km, unload)Unit of work 1.00
Excavation - commom soil ( excavate, load , transport distance 5km, unload)
Work item
(A) Total
(E) Total
(B) Ttotal (C) Quantity of product
(D) Unit of product(A/C+B/C)
(D)+(E)
Unit of work 1.00
(D) Unit of product(A/C+B/C)
Work item
(A) Total
Construction work Excavation - existing asphalt include base and sub-base ( excavate, load , transport
(E) Total(D)+(E)
(B) Ttotal (C) Quantity of product
Construction work Demolition of existing light and electric poleUnit of work 1.00
(B) Ttotal
Work item
(A) Total
(C) Quantity of product(D) Unit of product(A/C+B/C)
(E) Total(D)+(E)
Table16- 4 Demolition of existing light and electric pole
The Improvement of Transport System in the Metropolitan Area of Belem
C-3
m3
Quantity of work Unit Uunit-price (R$) Sub.total (R$) RemarksEquipment
Road Roller 0.15 hr. 61.52 9.22
9.22Labor
Foreman 0.10 hr. 5.22 0.52Operator 0.15 hr. 4.81 0.72Worker 1.00 hr. 2.31 2.31
3.555.00 m32.55
MaterialBorrowed Soil 1.00 m3 9.00 9.00
9.00Unit cost (R$) 11.55 per m3
Table16-8 Subbase course for Carriageway t=40cm
m2Quantity of work Unit Uunit-price (R$) Sub.total (R$) Remarks
EquipmentMotor Grader 0.10 hr. 94.03 9.40Road Roller 0.10 hr. 61.52 6.15Tire Roller 0.10 hr. 62.02 6.20
21.75Labor
Foreman 0.10 hr. 5.22 0.52Operator 0.30 hr. 4.81 1.44Worker 0.40 hr. 2.31 0.92
2.882.00 m2
12.32Material
Fine Aggregate 1.00 m3 12.00 12.0012.00
Unit cost (R$) 24.32 per m2
Table16-9 Base course for Carriageway t=20cm
m2Quantity of work Unit Uunit-price (R$) Sub.total (R$) Remarks
EquipmentMotor Grader 0.10 hr. 94.03 9.40Tire Roller 0.10 hr. 62.02 6.20Road Roller 0.10 hr. 61.52 6.15
21.75Labor
Foreman 0.10 hr. 5.22 0.52Operator 0.30 hr. 4.81 1.44Worker 0.50 hr. 2.31 1.15
3.112.00 m2
12.43Material
Crush Stone 0.20 m3 35.00 7.00Fine Aggregate 0.80 m3 12.00 9.60
16.60Unit cost (R$) 29.03 per m2
Table16- 7 Backfill (fill soil, compaction)
(D)+(E)
1.00Construction work Base course for Carriageway t=20cm
(D) Unit of product(A/C+B/C)
(E) Total
(D)+(E)
Construction work Backfill (fill soil, compaction)Unit of work 1.00Work item
(A) Total
(E) Total(D)+(E)
(B) Total (C) Quantity of product
(D) Unit of product(A/C+B/C)
(E) Total
(B) Total (C) Quantity of product
(D) Unit of product(A/C+B/C)
Work item
(A) Total
Unit of work
(B) Total (C) Quantity of product
Work item
(A) Total
Unit of work 1.00Construction work Subbase course for Carriageway t=40cm
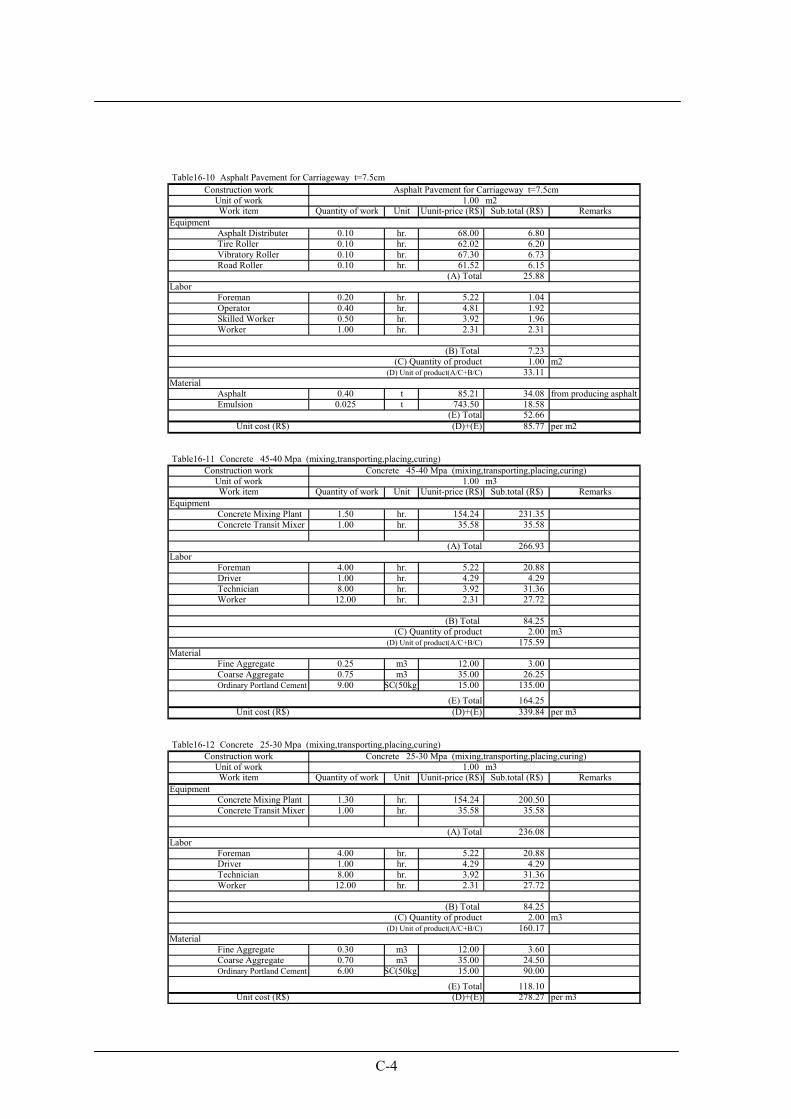
C-4
Table16-10 Asphalt Pavement for Carriageway t=7.5cm
m2Quantity of work Unit Uunit-price (R$) Sub.total (R$) Remarks
EquipmentAsphalt Distributer 0.10 hr. 68.00 6.80Tire Roller 0.10 hr. 62.02 6.20Vibratory Roller 0.10 hr. 67.30 6.73Road Roller 0.10 hr. 61.52 6.15
25.88Labor
Foreman 0.20 hr. 5.22 1.04Operator 0.40 hr. 4.81 1.92Skilled Worker 0.50 hr. 3.92 1.96Worker 1.00 hr. 2.31 2.31
7.231.00 m2
33.11Material
Asphalt 0.40 t 85.21 34.08 from producing asphaltEmulsion 0.025 t 743.50 18.58
52.66Unit cost (R$) 85.77 per m2
Table16-11 Concrete 45-40 Mpa (mixing,transporting,placing,curing)
m3Quantity of work Unit Uunit-price (R$) Sub.total (R$) Remarks
EquipmentConcrete Mixing Plant 1.50 hr. 154.24 231.35Concrete Transit Mixer 1.00 hr. 35.58 35.58
266.93Labor
Foreman 4.00 hr. 5.22 20.88Driver 1.00 hr. 4.29 4.29Technician 8.00 hr. 3.92 31.36Worker 12.00 hr. 2.31 27.72
84.252.00 m3
175.59Material
Fine Aggregate 0.25 m3 12.00 3.00Coarse Aggregate 0.75 m3 35.00 26.25Ordinary Portland Cement 9.00 SC(50kg) 15.00 135.00
164.25Unit cost (R$) 339.84 per m3
Table16-12 Concrete 25-30 Mpa (mixing,transporting,placing,curing)
m3Quantity of work Unit Uunit-price (R$) Sub.total (R$) Remarks
EquipmentConcrete Mixing Plant 1.30 hr. 154.24 200.50Concrete Transit Mixer 1.00 hr. 35.58 35.58
236.08Labor
Foreman 4.00 hr. 5.22 20.88Driver 1.00 hr. 4.29 4.29Technician 8.00 hr. 3.92 31.36Worker 12.00 hr. 2.31 27.72
84.252.00 m3
160.17Material
Fine Aggregate 0.30 m3 12.00 3.60Coarse Aggregate 0.70 m3 35.00 24.50Ordinary Portland Cement 6.00 SC(50kg) 15.00 90.00
118.10Unit cost (R$) 278.27 per m3
Construction work Asphalt Pavement for Carriageway t=7.5cmUnit of work 1.00Work item
(A) Total
(B) Total (C) Quantity of product
(D) Unit of product(A/C+B/C)
(E) Total(D)+(E)
Construction work Concrete 45-40 Mpa (mixing,transporting,placing,curing)Unit of work 1.00Work item
(A) Total
(B) Total (C) Quantity of product
(D) Unit of product(A/C+B/C)
(E) Total(D)+(E)
Construction work Concrete 25-30 Mpa (mixing,transporting,placing,curing)Unit of work 1.00Work item
(A) Total
(B) Total (C) Quantity of product
(D) Unit of product(A/C+B/C)
(E) Total(D)+(E)
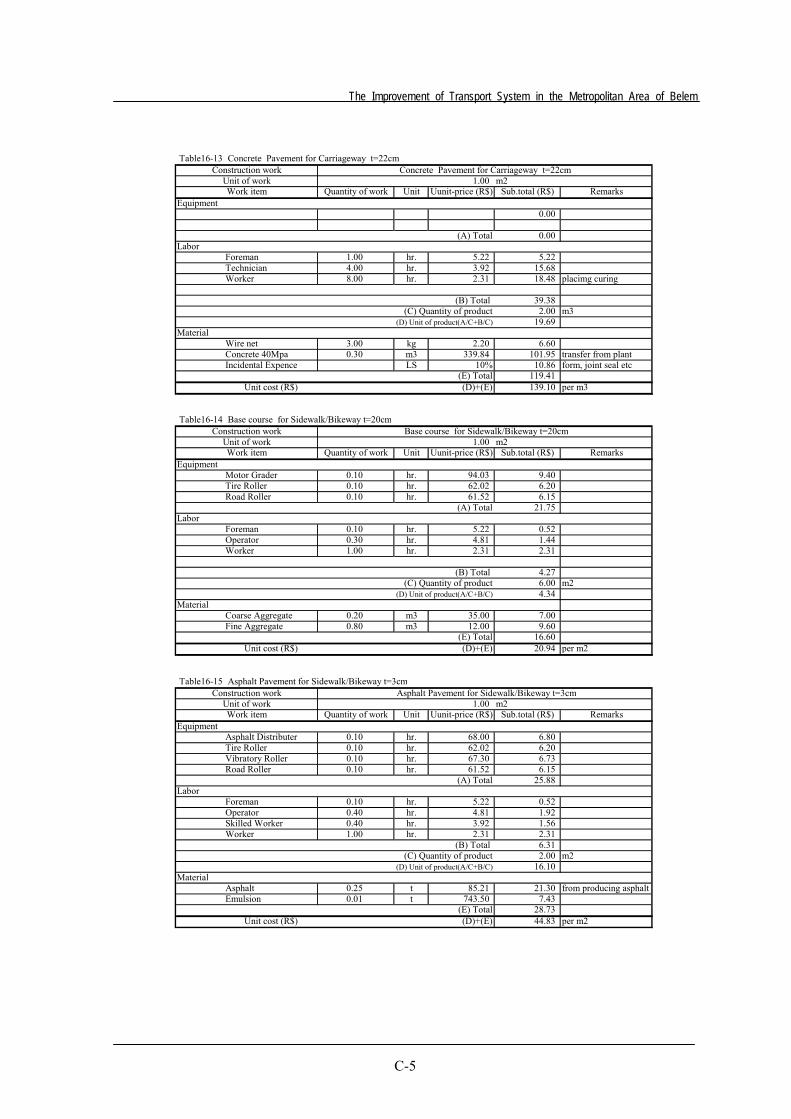
The Improvement of Transport System in the Metropolitan Area of Belem
C-5
Table16-13 Concrete Pavement for Carriageway t=22cm
m2Quantity of work Unit Uunit-price (R$) Sub.total (R$) Remarks
Equipment0.00
0.00Labor
Foreman 1.00 hr. 5.22 5.22Technician 4.00 hr. 3.92 15.68Worker 8.00 hr. 2.31 18.48 placimg curing
39.382.00 m3
19.69Material
Wire net 3.00 kg 2.20 6.60Concrete 40Mpa 0.30 m3 339.84 101.95 transfer from plantIncidental Expence LS 10% 10.86 form, joint seal etc
119.41Unit cost (R$) 139.10 per m3
Table16-14 Base course for Sidewalk/Bikeway t=20cm
m2Quantity of work Unit Uunit-price (R$) Sub.total (R$) Remarks
EquipmentMotor Grader 0.10 hr. 94.03 9.40Tire Roller 0.10 hr. 62.02 6.20Road Roller 0.10 hr. 61.52 6.15
21.75Labor
Foreman 0.10 hr. 5.22 0.52Operator 0.30 hr. 4.81 1.44Worker 1.00 hr. 2.31 2.31
4.276.00 m24.34
MaterialCoarse Aggregate 0.20 m3 35.00 7.00Fine Aggregate 0.80 m3 12.00 9.60
16.60Unit cost (R$) 20.94 per m2
Table16-15 Asphalt Pavement for Sidewalk/Bikeway t=3cm
m2Quantity of work Unit Uunit-price (R$) Sub.total (R$) Remarks
EquipmentAsphalt Distributer 0.10 hr. 68.00 6.80Tire Roller 0.10 hr. 62.02 6.20Vibratory Roller 0.10 hr. 67.30 6.73Road Roller 0.10 hr. 61.52 6.15
25.88Labor
Foreman 0.10 hr. 5.22 0.52Operator 0.40 hr. 4.81 1.92Skilled Worker 0.40 hr. 3.92 1.56Worker 1.00 hr. 2.31 2.31
6.312.00 m2
16.10Material
Asphalt 0.25 t 85.21 21.30 from producing asphaltEmulsion 0.01 t 743.50 7.43
28.73Unit cost (R$) 44.83 per m2
(D) Unit of product(A/C+B/C)
(E) Total
(B) Total (C) Quantity of product
Work item
(A) Total
(D)+(E)
Unit of work 1.00
(D)+(E)
Construction work Asphalt Pavement for Sidewalk/Bikeway t=3cm
(D) Unit of product(A/C+B/C)
(E) Total
(B) Total (C) Quantity of product
Work item
(A) Total
Unit of work 1.00Construction work Base course for Sidewalk/Bikeway t=20cm
Construction work Concrete Pavement for Carriageway t=22cm Unit of work 1.00
(D) Unit of product(A/C+B/C)
(E) Total(D)+(E)
Work item
(A) Total
(B) Total (C) Quantity of product
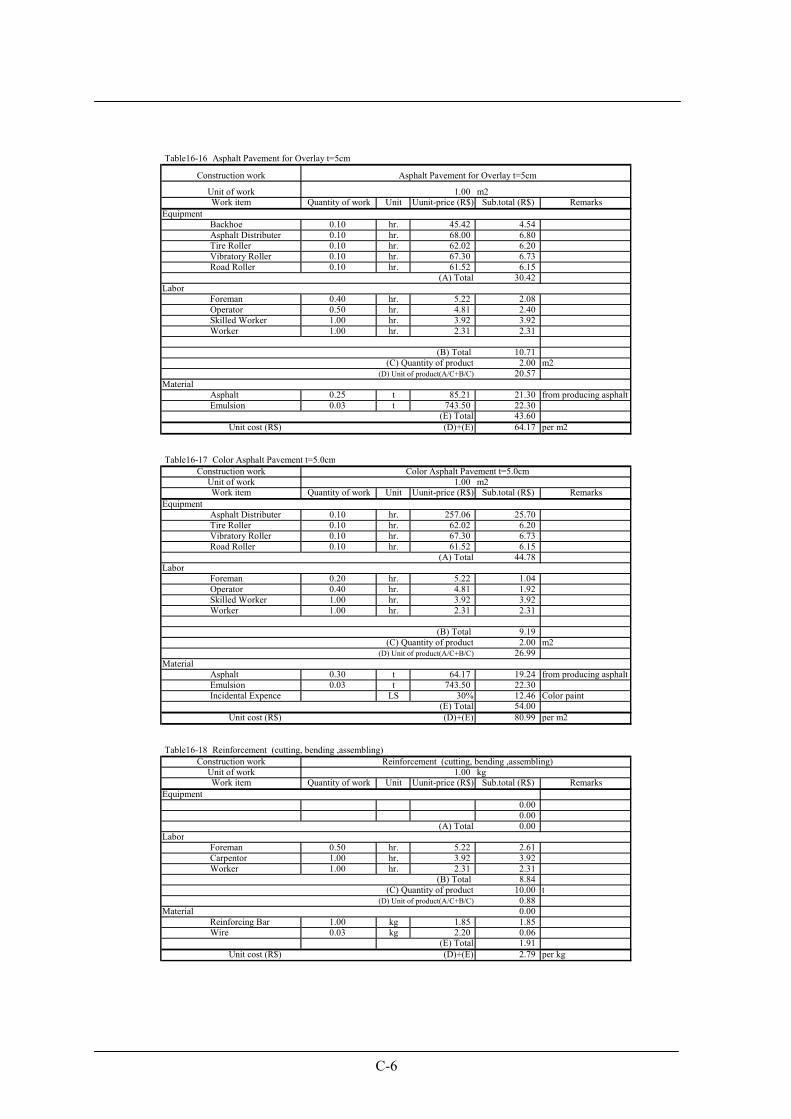
C-6
Table16-16 Asphalt Pavement for Overlay t=5cm
m2Quantity of work Unit Uunit-price (R$) Sub.total (R$) Remarks
EquipmentBackhoe 0.10 hr. 45.42 4.54Asphalt Distributer 0.10 hr. 68.00 6.80Tire Roller 0.10 hr. 62.02 6.20Vibratory Roller 0.10 hr. 67.30 6.73Road Roller 0.10 hr. 61.52 6.15
30.42Labor
Foreman 0.40 hr. 5.22 2.08Operator 0.50 hr. 4.81 2.40Skilled Worker 1.00 hr. 3.92 3.92Worker 1.00 hr. 2.31 2.31
10.712.00 m2
20.57Material
Asphalt 0.25 t 85.21 21.30 from producing asphaltEmulsion 0.03 t 743.50 22.30
43.60Unit cost (R$) 64.17 per m2
Table16-17 Color Asphalt Pavement t=5.0cm
m2Quantity of work Unit Uunit-price (R$) Sub.total (R$) Remarks
EquipmentAsphalt Distributer 0.10 hr. 257.06 25.70Tire Roller 0.10 hr. 62.02 6.20Vibratory Roller 0.10 hr. 67.30 6.73Road Roller 0.10 hr. 61.52 6.15
44.78Labor
Foreman 0.20 hr. 5.22 1.04Operator 0.40 hr. 4.81 1.92Skilled Worker 1.00 hr. 3.92 3.92Worker 1.00 hr. 2.31 2.31
9.192.00 m2
26.99Material
Asphalt 0.30 t 64.17 19.24 from producing asphaltEmulsion 0.03 t 743.50 22.30Incidental Expence LS 30% 12.46 Color paint
54.00Unit cost (R$) 80.99 per m2
Table16-18 Reinforcement (cutting, bending ,assembling)
kgQuantity of work Unit Uunit-price (R$) Sub.total (R$) Remarks
Equipment0.000.000.00
LaborForeman 0.50 hr. 5.22 2.61Carpentor 1.00 hr. 3.92 3.92Worker 1.00 hr. 2.31 2.31
8.8410.00 t
0.88Material 0.00
Reinforcing Bar 1.00 kg 1.85 1.85Wire 0.03 kg 2.20 0.06
1.91Unit cost (R$) 2.79 per kg
(D) Unit of product(A/C+B/C)
(E) Total(D)+(E)
Work item
(A) Total
(B) Total (C) Quantity of product
Construction work Asphalt Pavement for Overlay t=5cm
Unit of work 1.00Work item
(A) Total
Construction work Reinforcement (cutting, bending ,assembling)Unit of work 1.00
Construction work Color Asphalt Pavement t=5.0cm
(C) Quantity of product(D) Unit of product(A/C+B/C)
(B) Total
Unit of work 1.00
(E) Total(D)+(E)
Work item
(A) Total
(B) Total (C) Quantity of product
(D) Unit of product(A/C+B/C)
(D)+(E)(E) Total
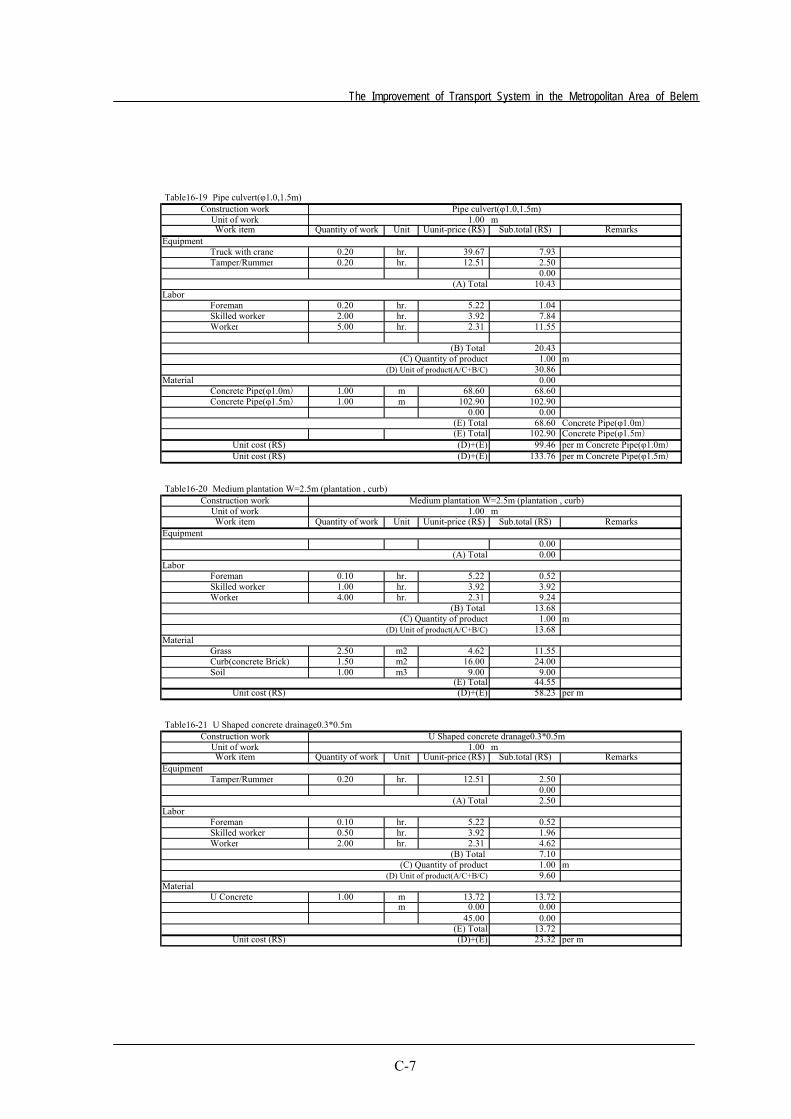
The Improvement of Transport System in the Metropolitan Area of Belem
C-7
Table16-19 Pipe culvert(φ1.0,1.5m)
mQuantity of work Unit Uunit-price (R$) Sub.total (R$) Remarks
EquipmentTruck with crane 0.20 hr. 39.67 7.93Tamper/Rummer 0.20 hr. 12.51 2.50
0.0010.43
LaborForeman 0.20 hr. 5.22 1.04Skilled worker 2.00 hr. 3.92 7.84Worker 5.00 hr. 2.31 11.55
20.431.00 m
30.86Material 0.00
Concrete Pipe(φ1.0m) 1.00 m 68.60 68.60Concrete Pipe(φ1.5m) 1.00 m 102.90 102.90
0.00 0.0068.60 Concrete Pipe(φ1.0m)
102.90 Concrete Pipe(φ1.5m)Unit cost (R$) 99.46 per m Concrete Pipe(φ1.0m)Unit cost (R$) 133.76 per m Concrete Pipe(φ1.5m)
Table16-20 Medium plantation W=2.5m (plantation , curb)
mQuantity of work Unit Uunit-price (R$) Sub.total (R$) Remarks
Equipment0.000.00
LaborForeman 0.10 hr. 5.22 0.52Skilled worker 1.00 hr. 3.92 3.92Worker 4.00 hr. 2.31 9.24
13.681.00 m
13.68Material
Grass 2.50 m2 4.62 11.55Curb(concrete Brick) 1.50 m2 16.00 24.00Soil 1.00 m3 9.00 9.00
44.55Unit cost (R$) 58.23 per m
Table16-21 U Shaped concrete drainage0.3*0.5m
mQuantity of work Unit Uunit-price (R$) Sub.total (R$) Remarks
EquipmentTamper/Rummer 0.20 hr. 12.51 2.50
0.002.50
LaborForeman 0.10 hr. 5.22 0.52Skilled worker 0.50 hr. 3.92 1.96Worker 2.00 hr. 2.31 4.62
7.101.00 m9.60
MaterialU Concrete 1.00 m 13.72 13.72
m 0.00 0.0045.00 0.00
13.72Unit cost (R$) 23.32 per m
(A) Total
(D) Unit of product(A/C+B/C)
(D)+(E)
(E) Total(E) Total(D)+(E)(D)+(E)
Construction work Pipe culvert(φ1.0,1.5m)Unit of work 1.00Work item
(A) Total
(B) Total (C) Quantity of product
(D) Unit of product(A/C+B/C)
(B) Total (C) Quantity of product
(E) Total
Unit of work 1.00Work item
(E) Total
(B) Total
(D)+(E)
Construction work U Shaped concrete dranage0.3*0.5m
Work item
(A) Total
(C) Quantity of product(D) Unit of product(A/C+B/C)
Construction work Medium plantation W=2.5m (plantation , curb)Unit of work 1.00
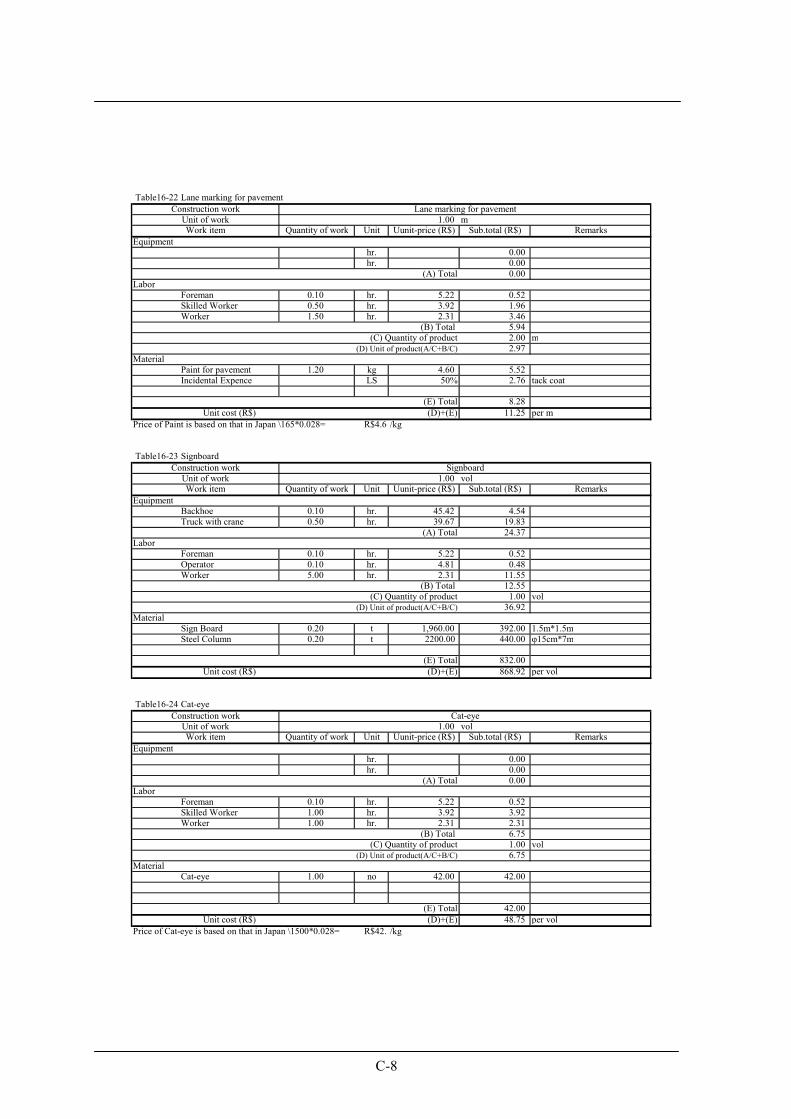
C-8
Table16-22 Lane marking for pavement
mQuantity of work Unit Uunit-price (R$) Sub.total (R$) Remarks
Equipmenthr. 0.00hr. 0.00
0.00Labor
Foreman 0.10 hr. 5.22 0.52Skilled Worker 0.50 hr. 3.92 1.96Worker 1.50 hr. 2.31 3.46
5.942.00 m2.97
MaterialPaint for pavement 1.20 kg 4.60 5.52Incidental Expence LS 50% 2.76 tack coat
8.28Unit cost (R$) 11.25 per m
Price of Paint is based on that in Japan \165*0.028= R$4.6 /kg
Table16-23 Signboard
volQuantity of work Unit Uunit-price (R$) Sub.total (R$) Remarks
EquipmentBackhoe 0.10 hr. 45.42 4.54Truck with crane 0.50 hr. 39.67 19.83
24.37Labor
Foreman 0.10 hr. 5.22 0.52Operator 0.10 hr. 4.81 0.48Worker 5.00 hr. 2.31 11.55
12.551.00 vol
36.92Material
Sign Board 0.20 t 1,960.00 392.00 1.5m*1.5mSteel Column 0.20 t 2200.00 440.00 φ15cm*7m
832.00Unit cost (R$) 868.92 per vol
Table16-24 Cat-eye
volQuantity of work Unit Uunit-price (R$) Sub.total (R$) Remarks
Equipmenthr. 0.00hr. 0.00
0.00Labor
Foreman 0.10 hr. 5.22 0.52Skilled Worker 1.00 hr. 3.92 3.92Worker 1.00 hr. 2.31 2.31
6.751.00 vol6.75
MaterialCat-eye 1.00 no 42.00 42.00
42.00Unit cost (R$) 48.75 per vol
Price of Cat-eye is based on that in Japan \1500*0.028= R$42. /kg
Work item
(A) Total
(D)+(E)
(B) Total (C) Quantity of product
(D) Unit of product(A/C+B/C)
(E) Total
Construction work Cat-eyeUnit of work 1.00
(E) Total(D)+(E)
(B) Total (C) Quantity of product
(D) Unit of product(A/C+B/C)
Work item
(A) Total
Unit of work 1.00
(D)+(E)
Construction work Signboard
(D) Unit of product(A/C+B/C)
Construction work Lane marking for pavement
(E) Total
(B) Total (C) Quantity of product
Unit of work 1.00Work item
(A) Total
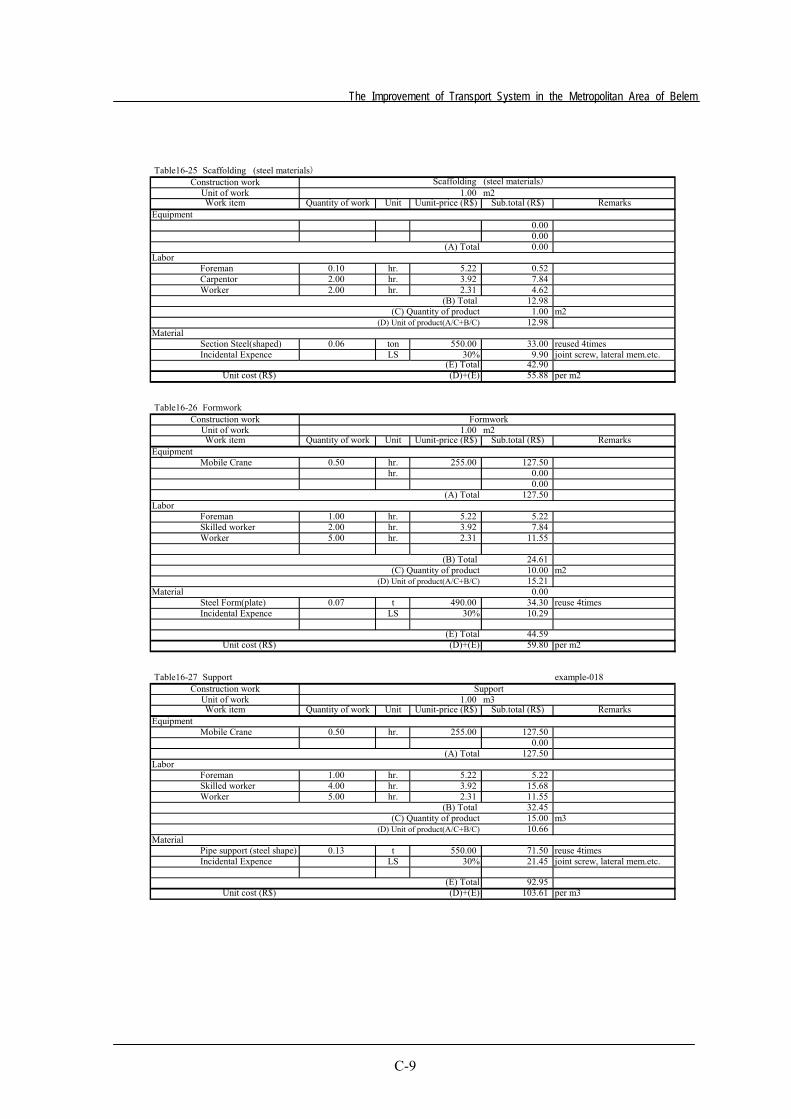
The Improvement of Transport System in the Metropolitan Area of Belem
C-9
Table16-25 Scaffolding (steel materials)
m2Quantity of work Unit Uunit-price (R$) Sub.total (R$) Remarks
Equipment0.000.000.00
LaborForeman 0.10 hr. 5.22 0.52Carpentor 2.00 hr. 3.92 7.84Worker 2.00 hr. 2.31 4.62
12.981.00 m2
12.98Material
Section Steel(shaped) 0.06 ton 550.00 33.00 reused 4timesIncidental Expence LS 30% 9.90 joint screw, lateral mem.etc.
42.90Unit cost (R$) 55.88 per m2
Table16-26 Formwork
m2Quantity of work Unit Uunit-price (R$) Sub.total (R$) Remarks
EquipmentMobile Crane 0.50 hr. 255.00 127.50
hr. 0.000.00
127.50Labor
Foreman 1.00 hr. 5.22 5.22Skilled worker 2.00 hr. 3.92 7.84Worker 5.00 hr. 2.31 11.55
24.6110.00 m215.21
Material 0.00Steel Form(plate) 0.07 t 490.00 34.30 reuse 4timesIncidental Expence LS 30% 10.29
44.59Unit cost (R$) 59.80 per m2
Table16-27 Support example-018
m3Quantity of work Unit Uunit-price (R$) Sub.total (R$) Remarks
EquipmentMobile Crane 0.50 hr. 255.00 127.50
0.00127.50
LaborForeman 1.00 hr. 5.22 5.22Skilled worker 4.00 hr. 3.92 15.68Worker 5.00 hr. 2.31 11.55
32.4515.00 m310.66
MaterialPipe support (steel shape) 0.13 t 550.00 71.50 reuse 4timesIncidental Expence LS 30% 21.45 joint screw, lateral mem.etc.
92.95Unit cost (R$) 103.61 per m3
Construction work Scaffolding (steel materials)Unit of work 1.00Work item
(B) Total
(A) Total
(C) Quantity of product(D) Unit of product(A/C+B/C)
(E) Total(D)+(E)
Construction work FormworkUnit of work 1.00
(A) Total
Work item
(B) Total (C) Quantity of product
(E) Total
(D) Unit of product(A/C+B/C)
(D)+(E)
Construction work SupportUnit of work 1.00Work item
(B) Total
(A) Total
(C) Quantity of product(D) Unit of product(A/C+B/C)
(E) Total(D)+(E)
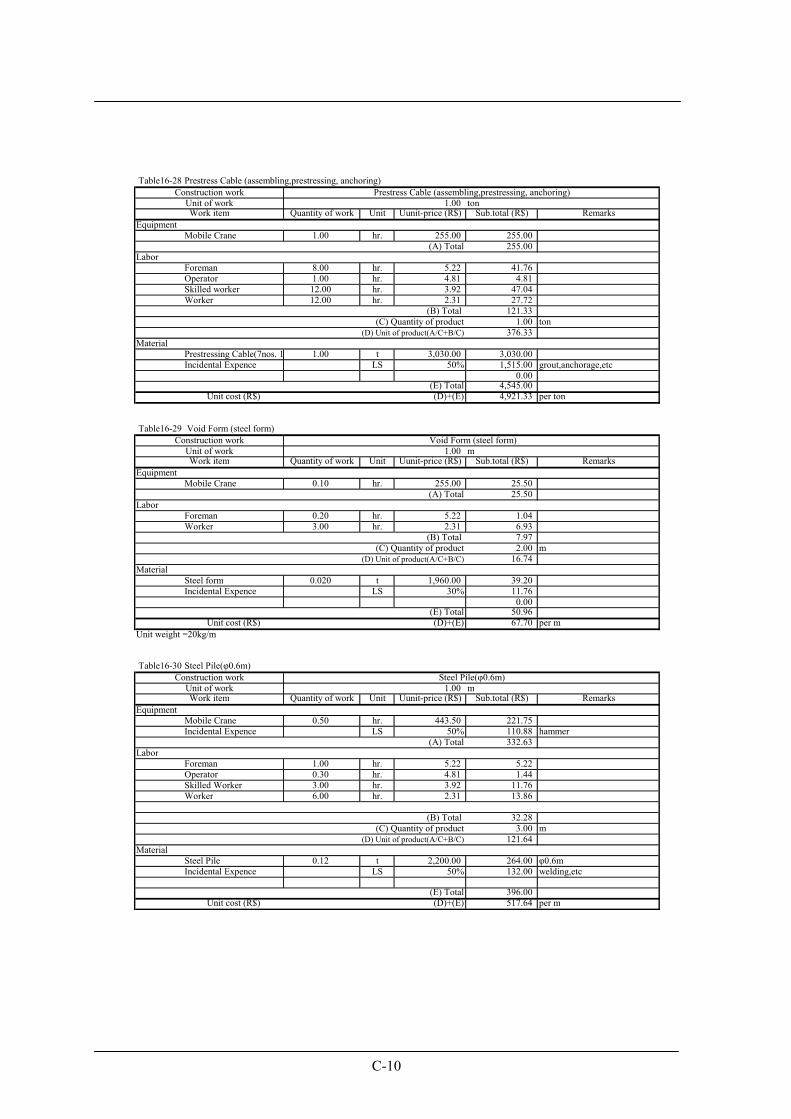
C-10
Table16-28 Prestress Cable (assembling,prestressing, anchoring)
tonQuantity of work Unit Uunit-price (R$) Sub.total (R$) Remarks
EquipmentMobile Crane 1.00 hr. 255.00 255.00
255.00Labor
Foreman 8.00 hr. 5.22 41.76Operator 1.00 hr. 4.81 4.81Skilled worker 12.00 hr. 3.92 47.04Worker 12.00 hr. 2.31 27.72
121.331.00 ton
376.33Material
Prestressing Cable(7nos. 1 1.00 t 3,030.00 3,030.00Incidental Expence LS 50% 1,515.00 grout,anchorage,etc
0.004,545.00
Unit cost (R$) 4,921.33 per ton
Table16-29 Void Form (steel form)
mQuantity of work Unit Uunit-price (R$) Sub.total (R$) Remarks
EquipmentMobile Crane 0.10 hr. 255.00 25.50
25.50Labor
Foreman 0.20 hr. 5.22 1.04Worker 3.00 hr. 2.31 6.93
7.972.00 m
16.74Material
Steel form 0.020 t 1,960.00 39.20Incidental Expence LS 30% 11.76
0.0050.96
Unit cost (R$) 67.70 per m Unit weight =20kg/m
Table16-30 Steel Pile(φ0.6m)
mQuantity of work Unit Uunit-price (R$) Sub.total (R$) Remarks
EquipmentMobile Crane 0.50 hr. 443.50 221.75Incidental Expence LS 50% 110.88 hammer
332.63Labor
Foreman 1.00 hr. 5.22 5.22Operator 0.30 hr. 4.81 1.44Skilled Worker 3.00 hr. 3.92 11.76Worker 6.00 hr. 2.31 13.86
32.283.00 m
121.64Material
Steel Pile 0.12 t 2,200.00 264.00 φ0.6mIncidental Expence LS 50% 132.00 welding,etc
396.00Unit cost (R$) 517.64 per m
Construction work Prestress Cable (assembling,prestressing, anchoring)Unit of work 1.00Work item
Work itemUnit of work
Construction work
(B) Total
(A) Total
(C) Quantity of product(D) Unit of product(A/C+B/C)
(E) Total
(C) Quantity of product(B) Total
(A) Total
1.00Steel Pile(φ0.6m)
Construction work Void Form (steel form)
(D)+(E)
Unit of work 1.00Work item
(E) Total(D)+(E)
(B) Total (C) Quantity of product
(D) Unit of product(A/C+B/C)
(A) Total
(D) Unit of product(A/C+B/C)
(E) Total(D)+(E)
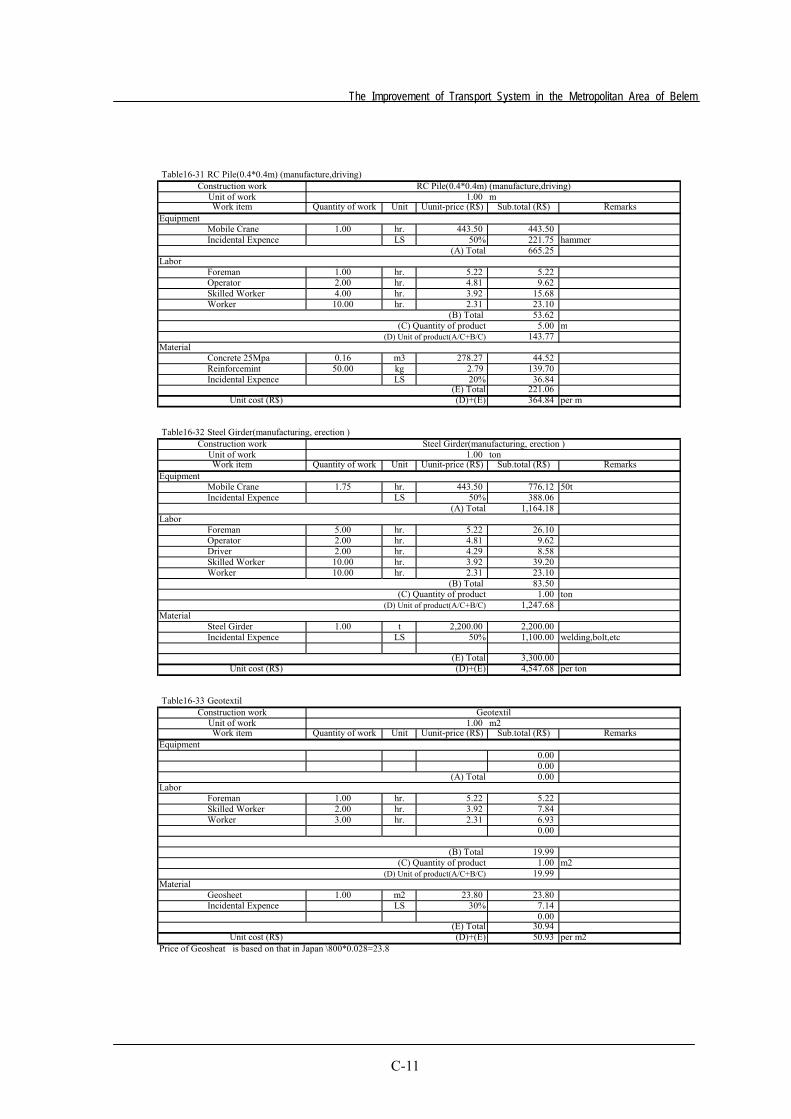
The Improvement of Transport System in the Metropolitan Area of Belem
C-11
Table16-31 RC Pile(0.4*0.4m) (manufacture,driving)
mQuantity of work Unit Uunit-price (R$) Sub.total (R$) Remarks
EquipmentMobile Crane 1.00 hr. 443.50 443.50Incidental Expence LS 50% 221.75 hammer
665.25Labor
Foreman 1.00 hr. 5.22 5.22Operator 2.00 hr. 4.81 9.62Skilled Worker 4.00 hr. 3.92 15.68Worker 10.00 hr. 2.31 23.10
53.625.00 m
143.77Material
Concrete 25Mpa 0.16 m3 278.27 44.52Reinforcemint 50.00 kg 2.79 139.70Incidental Expence LS 20% 36.84
221.06Unit cost (R$) 364.84 per m
Table16-32 Steel Girder(manufacturing, erection )
tonQuantity of work Unit Uunit-price (R$) Sub.total (R$) Remarks
EquipmentMobile Crane 1.75 hr. 443.50 776.12 50tIncidental Expence LS 50% 388.06
1,164.18Labor
Foreman 5.00 hr. 5.22 26.10Operator 2.00 hr. 4.81 9.62Driver 2.00 hr. 4.29 8.58Skilled Worker 10.00 hr. 3.92 39.20Worker 10.00 hr. 2.31 23.10
83.501.00 ton
1,247.68Material
Steel Girder 1.00 t 2,200.00 2,200.00Incidental Expence LS 50% 1,100.00 welding,bolt,etc
3,300.00Unit cost (R$) 4,547.68 per ton
Table16-33 Geotextil
m2Quantity of work Unit Uunit-price (R$) Sub.total (R$) Remarks
Equipment0.000.000.00
LaborForeman 1.00 hr. 5.22 5.22Skilled Worker 2.00 hr. 3.92 7.84Worker 3.00 hr. 2.31 6.93
0.00
19.991.00 m2
19.99Material
Geosheet 1.00 m2 23.80 23.80Incidental Expence LS 30% 7.14
0.0030.94
Unit cost (R$) 50.93 per m2Price of Geosheat is based on that in Japan \800*0.028=23.8
Work itemUnit of work 1.00
Construction work RC Pile(0.4*0.4m) (manufacture,driving)
(C) Quantity of product
(B) Total
(A) Total
(A) Total
1.00
(D) Unit of product(A/C+B/C)
(C) Quantity of product
(B) Total
Steel Girder(manufacturing, erection )
(D)+(E)
(D) Unit of product(A/C+B/C)
Construction work Geotextil
(E) Total(D)+(E)
(E) Total
Work itemUnit of work
Construction work
(A) Total
Work itemUnit of work 1.00
(D)+(E)(E) Total
(D) Unit of product(A/C+B/C)
(B) Total (C) Quantity of product
C-12
C.16 CONSTRUCTION PLANNING AND COST ESTIMATE...........................................C-1
Table C-1 Unit Direct Cost ..................................................................................................... C-1

Appendix-D D.17 Environmental Impact Assessment
The Improvement of Transport System in the Metropolitan Area of Belem
D-1
Appendix D
D.17 ENVIRONMENTAL IMPACT ASSESSMENT
(1) Case Study of Expropriation and Resettlement caused by Public Works in Belem Four (4) projects as case studies of expropriation and resettlement caused by the public work done in the Belem Metropolitan Area were studied. (Refer to Figure D-1.)
Figure D-1 Location of Case Study Projects and Resettlement Areas
D-2
(2) Wall Construction Project for protection of water resource - COHAB Objective of the Project:
To protect the quality of the source of water supplying Belem Municipality
Project Area: Surrounding area of Lake Agua Preta and Lake Bolonha
Implementation Body: Government of the State of Para
Beginning of the Project: Year 1999
Project Components:
The main components of this project are to move out families illegally occupying land within a protection area for the source of drinking water. To achieve this, construction of a wall (total 18km, (2km has already been constructed), refer to ) surrounding the area of Lake Agua Preta and Lake Bolonha had been planned.
Project Cost:
Construction of Wall – R$1.6 million
Beginning of Negotiation for Expropriation: March 2001 Total Number of Families Affected by the Project: 1,215 families
Total Compensation Cost for the Project:
Total compensation cost for the project is about R$14.0 million
Process of Expropriation and Resettlement:
Expropriation and resettlement was conducted as follows: 1) Identification and demarcation of necessary protection area 2) Identification of families to be removed (1,215 families) 3) Meetings and discussions with community leaders and families 4) Implementation of physical and socio-economic survey 5) Evaluation of properties 6) Provision of alternative of compensation for each family
- Compensation in cash - New plot and house provided by COHAB (COHAB developed three new
residential areas with infrastructure and a total of 791 plots, and is preparing houses for families moving in.)
7) Meetings and discussions with community leaders and families
Present Situation of Expropriation and Resettlement:
- Thirty-two percent of families agreed to move to plots and houses provided by COHAB. The size of each plot and house they moved in was 160m2 and 25m2 respectively with a bedroom, a kitchen and a bathroom. In case the property evaluation was over R$7,500, the family could have a 29.64m2 house with two bedrooms, a kitchen and a bathroom. The average cost paid for a plot and a house was approximately R$7,550 (R$3,000 for land and R$4,550 for the house).
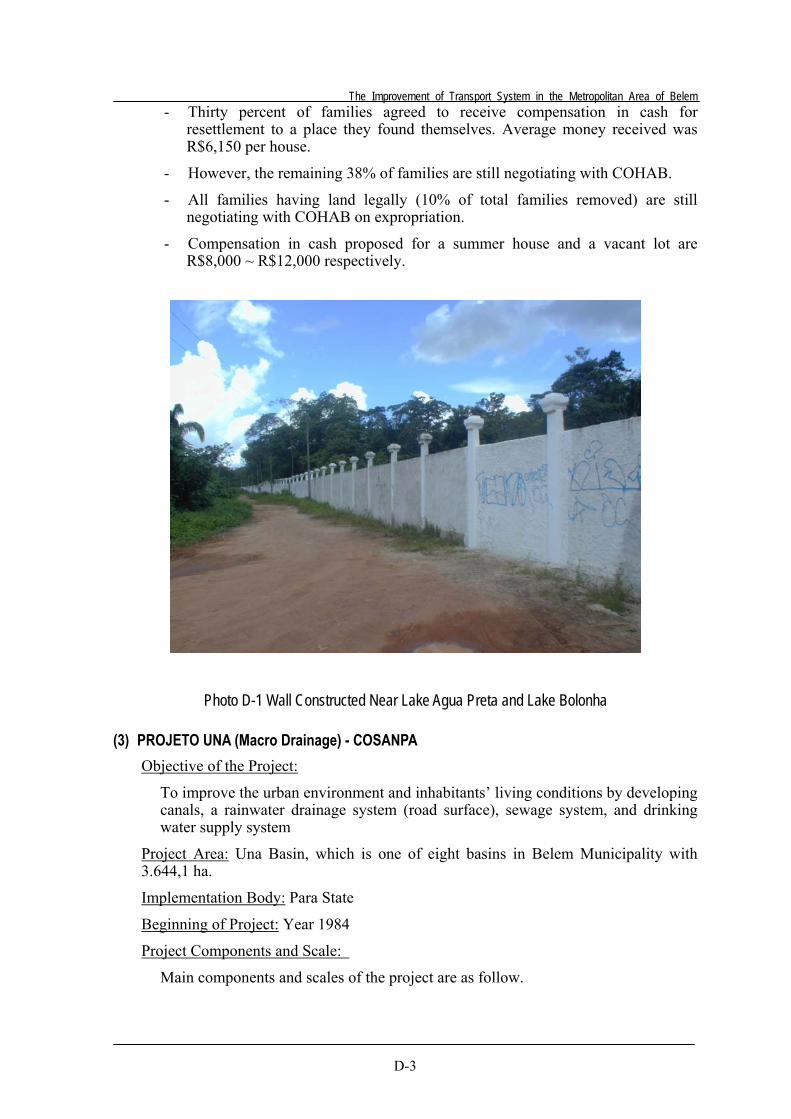
The Improvement of Transport System in the Metropolitan Area of Belem
D-3
- Thirty percent of families agreed to receive compensation in cash for resettlement to a place they found themselves. Average money received was R$6,150 per house.
- However, the remaining 38% of families are still negotiating with COHAB.
- All families having land legally (10% of total families removed) are still negotiating with COHAB on expropriation.
- Compensation in cash proposed for a summer house and a vacant lot are R$8,000 ~ R$12,000 respectively.
Photo D-1 Wall Constructed Near Lake Agua Preta and Lake Bolonha
(3) PROJETO UNA (Macro Drainage) - COSANPA Objective of the Project:
To improve the urban environment and inhabitants’ living conditions by developing canals, a rainwater drainage system (road surface), sewage system, and drinking water supply system
Project Area: Una Basin, which is one of eight basins in Belem Municipality with 3.644,1 ha.
Implementation Body: Para State
Beginning of Project: Year 1984
Project Components and Scale:
Main components and scales of the project are as follow.
D-4
Table D-1 Main components
Project Component Unit Amount
Canals/Gallery Development (Refer to Photo 7.5-2.) km 24.2
Development of Bridges/Overpasses unit 79
Road Development km 157.2
Rainwater Drainage System Development km 16.3
Sewage System/Connection System Development km 283.9
Installation of Cesspits unit 26,656
Drinking Water Supply System Development km 148.3
Photo D-2 Improved Canal
Project Cost and Resource:
Project cost by resource was as follows.
(Million US$) State Government IDB Total
126.0 145.0 271.0
Beginning of Negotiation for Expropriation: Year 1993
Total Number of Families Affected by the Project:
The total number of houses affected by the project was about 4,310.
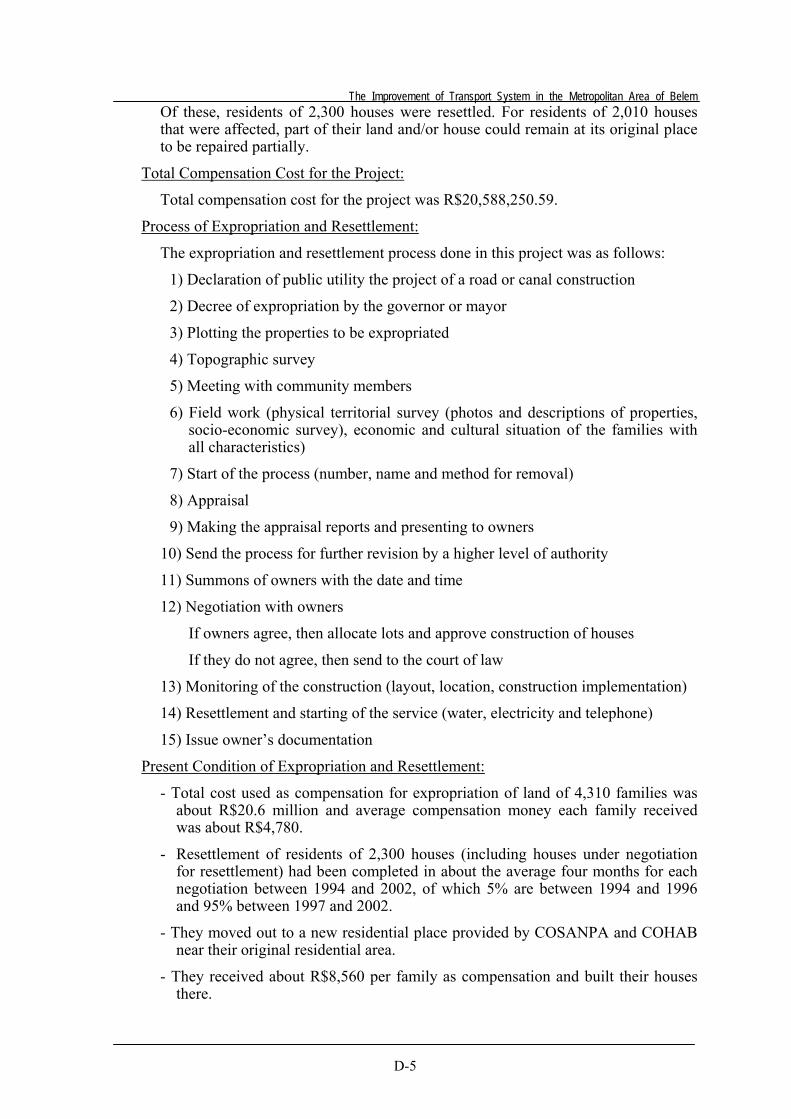
The Improvement of Transport System in the Metropolitan Area of Belem
D-5
Of these, residents of 2,300 houses were resettled. For residents of 2,010 houses that were affected, part of their land and/or house could remain at its original place to be repaired partially.
Total Compensation Cost for the Project:
Total compensation cost for the project was R$20,588,250.59.
Process of Expropriation and Resettlement:
The expropriation and resettlement process done in this project was as follows:
1) Declaration of public utility the project of a road or canal construction
2) Decree of expropriation by the governor or mayor
3) Plotting the properties to be expropriated
4) Topographic survey
5) Meeting with community members
6) Field work (physical territorial survey (photos and descriptions of properties, socio-economic survey), economic and cultural situation of the families with all characteristics)
7) Start of the process (number, name and method for removal)
8) Appraisal
9) Making the appraisal reports and presenting to owners
10) Send the process for further revision by a higher level of authority
11) Summons of owners with the date and time
12) Negotiation with owners
If owners agree, then allocate lots and approve construction of houses
If they do not agree, then send to the court of law
13) Monitoring of the construction (layout, location, construction implementation)
14) Resettlement and starting of the service (water, electricity and telephone)
15) Issue owner’s documentation
Present Condition of Expropriation and Resettlement:
- Total cost used as compensation for expropriation of land of 4,310 families was about R$20.6 million and average compensation money each family received was about R$4,780.
- Resettlement of residents of 2,300 houses (including houses under negotiation for resettlement) had been completed in about the average four months for each negotiation between 1994 and 2002, of which 5% are between 1994 and 1996 and 95% between 1997 and 2002.
- They moved out to a new residential place provided by COSANPA and COHAB near their original residential area.
- They received about R$8,560 per family as compensation and built their houses there.
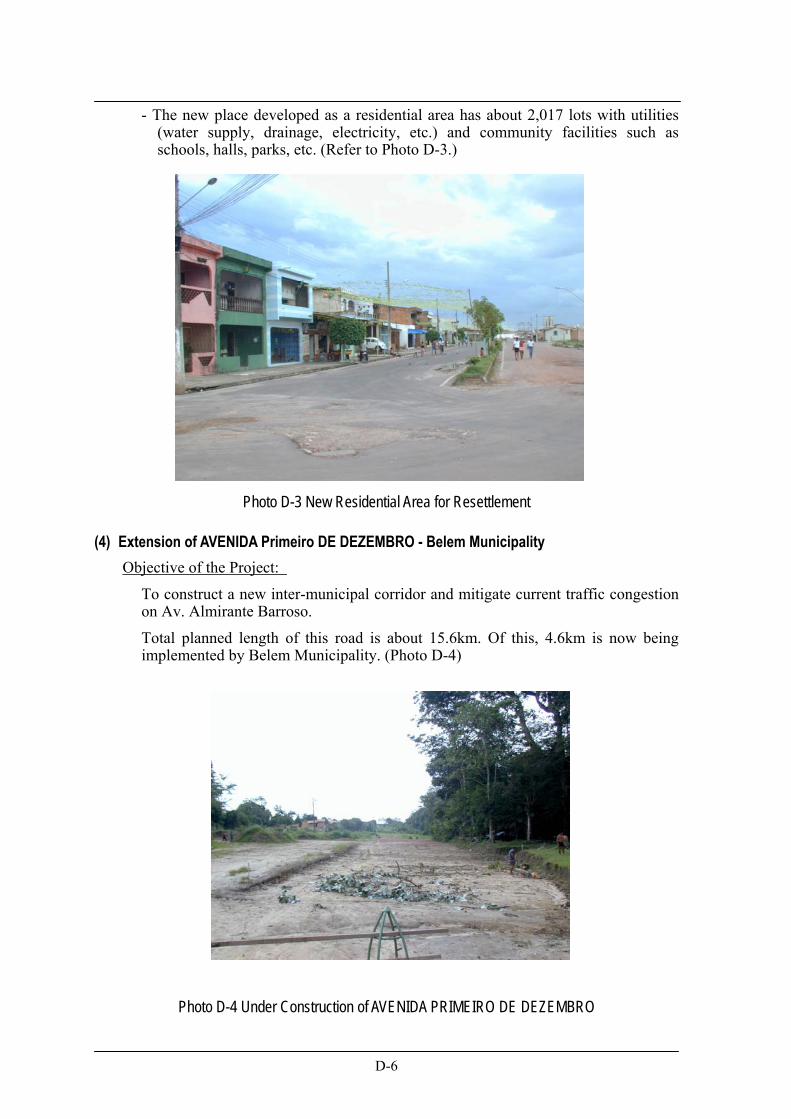
D-6
- The new place developed as a residential area has about 2,017 lots with utilities (water supply, drainage, electricity, etc.) and community facilities such as schools, halls, parks, etc. (Refer to Photo D-3.)
Photo D-3 New Residential Area for Resettlement
(4) Extension of AVENIDA Primeiro DE DEZEMBRO - Belem Municipality Objective of the Project:
To construct a new inter-municipal corridor and mitigate current traffic congestion on Av. Almirante Barroso.
Total planned length of this road is about 15.6km. Of this, 4.6km is now being implemented by Belem Municipality. (Photo D-4)
Photo D-4 Under Construction of AVENIDA PRIMEIRO DE DEZEMBRO
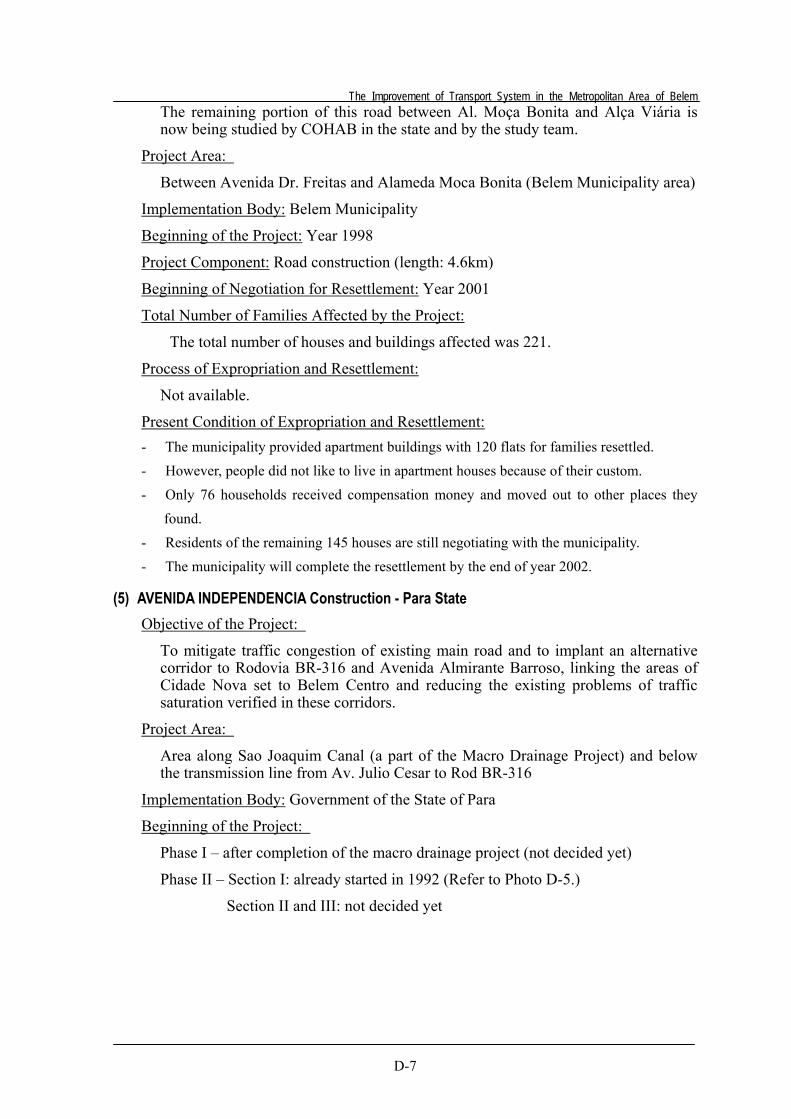
The Improvement of Transport System in the Metropolitan Area of Belem
D-7
The remaining portion of this road between Al. Moça Bonita and Alça Viária is now being studied by COHAB in the state and by the study team.
Project Area:
Between Avenida Dr. Freitas and Alameda Moca Bonita (Belem Municipality area)
Implementation Body: Belem Municipality
Beginning of the Project: Year 1998
Project Component: Road construction (length: 4.6km)
Beginning of Negotiation for Resettlement: Year 2001
Total Number of Families Affected by the Project:
The total number of houses and buildings affected was 221.
Process of Expropriation and Resettlement:
Not available.
Present Condition of Expropriation and Resettlement: - The municipality provided apartment buildings with 120 flats for families resettled. - However, people did not like to live in apartment houses because of their custom. - Only 76 households received compensation money and moved out to other places they
found. - Residents of the remaining 145 houses are still negotiating with the municipality. - The municipality will complete the resettlement by the end of year 2002.
(5) AVENIDA INDEPENDENCIA Construction - Para State Objective of the Project:
To mitigate traffic congestion of existing main road and to implant an alternative corridor to Rodovia BR-316 and Avenida Almirante Barroso, linking the areas of Cidade Nova set to Belem Centro and reducing the existing problems of traffic saturation verified in these corridors.
Project Area:
Area along Sao Joaquim Canal (a part of the Macro Drainage Project) and below the transmission line from Av. Julio Cesar to Rod BR-316
Implementation Body: Government of the State of Para
Beginning of the Project:
Phase I – after completion of the macro drainage project (not decided yet)
Phase II – Section I: already started in 1992 (Refer to Photo D-5.)
Section II and III: not decided yet
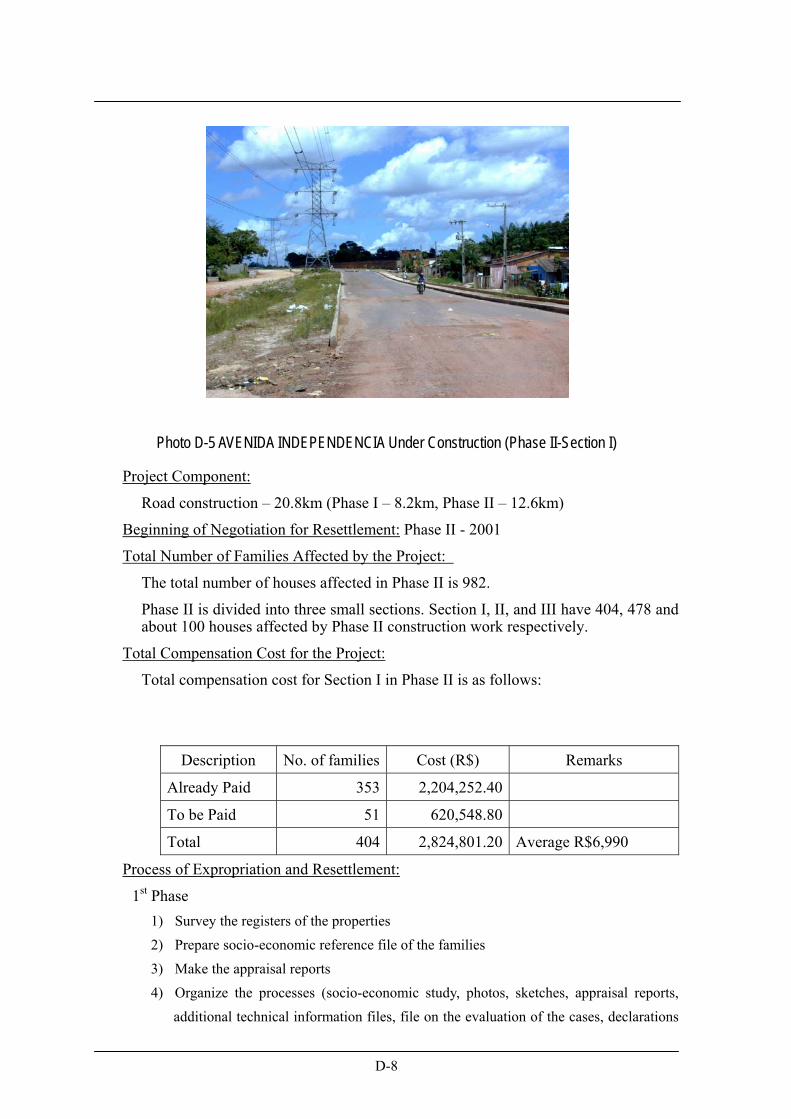
D-8
Photo D-5 AVENIDA INDEPENDENCIA Under Construction (Phase II-Section I)
Project Component:
Road construction – 20.8km (Phase I – 8.2km, Phase II – 12.6km)
Beginning of Negotiation for Resettlement: Phase II - 2001
Total Number of Families Affected by the Project:
The total number of houses affected in Phase II is 982.
Phase II is divided into three small sections. Section I, II, and III have 404, 478 and about 100 houses affected by Phase II construction work respectively.
Total Compensation Cost for the Project:
Total compensation cost for Section I in Phase II is as follows:
Description No. of families Cost (R$) Remarks
Already Paid 353 2,204,252.40
To be Paid 51 620,548.80
Total 404 2,824,801.20 Average R$6,990
Process of Expropriation and Resettlement:
1st Phase 1) Survey the registers of the properties 2) Prepare socio-economic reference file of the families 3) Make the appraisal reports 4) Organize the processes (socio-economic study, photos, sketches, appraisal reports,
additional technical information files, file on the evaluation of the cases, declarations
The Improvement of Transport System in the Metropolitan Area of Belem
D-9
and documentation of owners)
2nd Phase 1) Summon the property owners 2) Negotiations 3) Send the processes
a) Payment (COHAB/SECTRAN) b) Legal counsels: Payment (if no changes in the appraisal report) otherwise settle
in court
3rd Phase 1) Payment of expropriation 2) Check the removal from the properties
Present Condition of Expropriation and Resettlement:
- Section I of Phase II has already begun construction of the road.
- Total cost for compensation provided for 404 families removed is R$2,824,801.
- In Section I, 351 of 404 families had already agreed on resettlement with the state.
- Of these, 100 families received money (average R$16,330) from COHAB and 196 families got compensation in cash (average R$2,130) from SETRAN. They moved out to other places they found.
- Twenty-seven families received money (average R$4,520) and moved in to the new residential area provided by the state.
- Twenty-eight properties are not within the project area, however, they may be expropriated if necessary. They agreed to be expropriated and will receive a certain amount of money.
- It took only about four months to finish procedures for expropriation and resettlement of 353 families, which is over 85% of the total.
- 51 of 404 families are now negotiating or in the court for arbitration.
- Of these, 22 families did not agree to the state’s offer (average R$9,770), and now the court is mediating on the price between the two parties. Twenty-five families are negotiating on compensation (average R$16,230) offered by the state.
(6) Result of Case Study In all four (4) cases, the procedure of expropriation and compensation for resettlement has been implemented obeying the law. They never expropriated properties nor resettled people compulsorily.
Table D-2 shows characteristics and situation of expropriation by case study project.
D-10
Table D-2 Characteristics and Situation of Expropriation by Case Study Project
Project Name Wall Construction Primeiro de Dezembro
Macro Drainage Independencia
Phase II, Section I
Location of Project Near urban area Near urban area Within urban area Suburban area
Characteristics of Project
-Protection of area for water source -Secure vast area
-Road construction
-Line development
-Redevelopment of urban area
-Road construction
-Line development
Property/Homes Expropriated
-Total 1,215 -Total 221 -Total 4,310 -Total 404
New Residential Area provided by Project
New area, but far from the project area
Apartment-type buildings
New area near the project area
New area near the project area
Situation of Expropriation and Resettlement
About 40% are still negotiating
145 families are still negotiating.
Almost completed Almost completed
From the point of view of expropriation and compensation, there were two cases that have been implemented very smoothly and two cases that have not.
1) Successful Cases
In the cases of Macro-Drainage and Av. Independencia, it took only about the average four (4) months per family to complete the procedure from beginning of expropriation and end of resettlement. The main reason that they were implemented smoothly is that both projects provided new residential areas for inhabitants resettled by public projects at places near where the inhabitants lived before. Therefore, they could continue their work and/or businesses at the same place, and they did not oppose resettlement so strongly.
Furthermore, they lived under bad environmental conditions before. Infrastructure such as roads, water supply, drainage and sewage were not developed well at previous residential areas where they lived. However, the new residential area provided not only well-developed infrastructure but also community halls, schools, parks and clinics that are indispensable to form a community. They can live in a good living environment.
2) Difficult Cases
Procedures of expropriation and resettlement for the Wall Construction Project and Extension of Avenida Primeiro de Dezembro took a long time and have not been finished yet.
Two projects are being implemented at places very near to an urban area and to a main road. Therefore, people living in these areas can go their work places and/or get jobs easily. They also are getting services of water supply, electricity. It is a very convenient place for them to live.
These two projects also provided new places or housing for resettlement. However, the provided new places were far from the original places that people were living. Furthermore, the provided housing was apartment buildings, which people did not have a custom of living in and they did not want to live together in separated spaces within a building.
The Improvement of Transport System in the Metropolitan Area of Belem
D-11
In this study, the study team proposes two new projects for improvement of the transport system in the metropolitan area of Belem. Expropriation of property and resettlement of inhabitants will be a big obstacle when new projects will be implemented.
To avoid this and to carry out projects smoothly, it is very important to provide new resettlement land at places near where inhabitants to be moved by new projects live at present. Provision of enough budget for expropriation and resettlement is also important.
(7) Compensation for Expropriation and Resettlement Table D-3 shows characteristics of projects, average compensation cost of projects and average compensation cost for families resettled by case study project.
Table D-3 Characteristics and Compensation Cost by Case Study Project
Project Name Wall Construction Primeiro De Dezembro Macro Drainage Independencia
Location of Project Near urban area Near urban area Within urban area Suburb area
Characteristics of Project
-Protection of area for water source -Secure vast area
-Road construction
-Line development
-Drainage with Redevelopment of urban area
-Road construction
-Line development
Average Compensation Cost of Project (R$/family)
11,520 No data 4,780 6,990
Average Compensation Cost of Family Moved to New Area Provided (R$/family)
7,550 No data 8,560 4,520
Compensation cost that should be provided is largely affected by characteristics of a project and property expropriated by a project implemented.
Projects proposed in this study are improvement and/or construction of roads and introduction of the trunk bus system. Roads that will be improved and/or constructed are or will be all located near urban or suburban areas of Belem Municipality.
Considering that projects are improvement and/or construction of roads and that locations of roads are near urban or suburban areas, average compensation cost per family for land expropriated by “the Independencia Road Construction Project” will be a good guide for the proposed road projects. Therefore, to estimate the compensation cost for the road projects US$2,500 (x R$2.8/US$ = R$7,000) as a unit cost per family will be employed. However, this figure should be reconsidered when route and width of the roads proposed are decided and more detailed characteristics of properties to be expropriated are investigated.
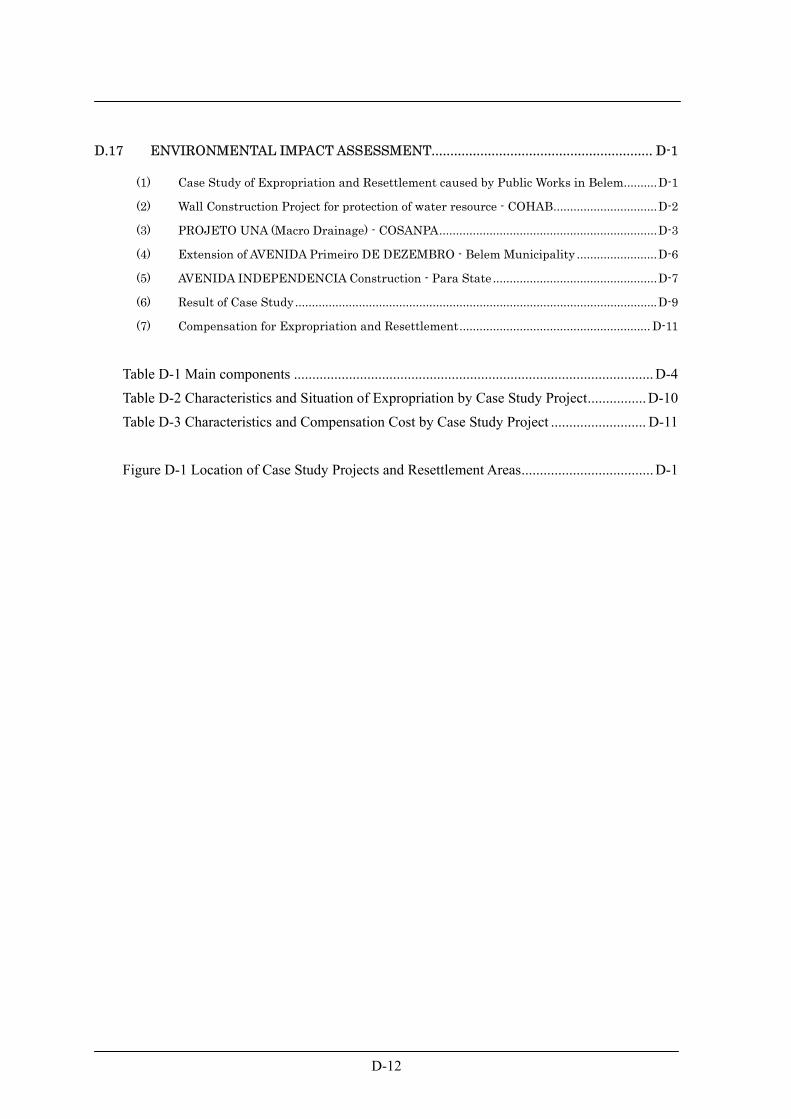
D-12
D.17 ENVIRONMENTAL IMPACT ASSESSMENT........................................................... D-1
(1) Case Study of Expropriation and Resettlement caused by Public Works in Belem..........D-1 (2) Wall Construction Project for protection of water resource - COHAB...............................D-2 (3) PROJETO UNA (Macro Drainage) - COSANPA.................................................................D-3 (4) Extension of AVENIDA Primeiro DE DEZEMBRO - Belem Municipality ........................D-6 (5) AVENIDA INDEPENDENCIA Construction - Para State .................................................D-7 (6) Result of Case Study............................................................................................................D-9 (7) Compensation for Expropriation and Resettlement......................................................... D-11
Table D-1 Main components .................................................................................................. D-4 Table D-2 Characteristics and Situation of Expropriation by Case Study Project................ D-10 Table D-3 Characteristics and Compensation Cost by Case Study Project .......................... D-11
Figure D-1 Location of Case Study Projects and Resettlement Areas.................................... D-1
Appendix-E E.20 Economic And Financial Evaluation
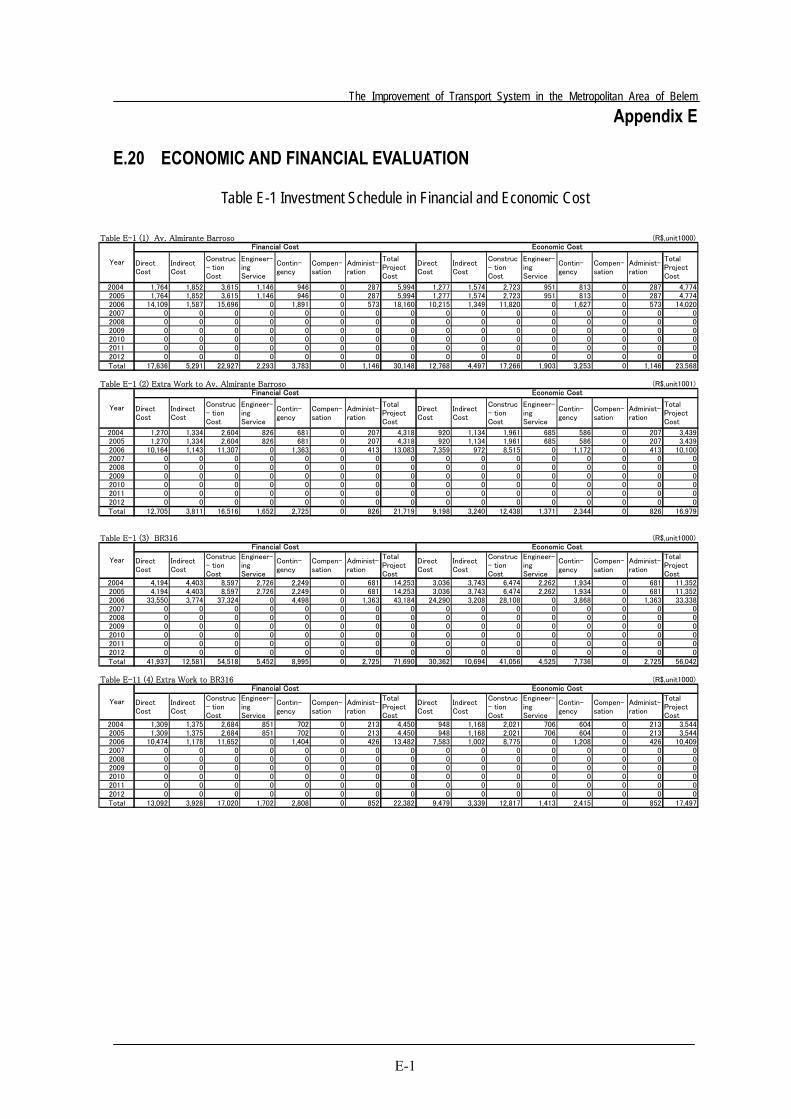
The Improvement of Transport System in the Metropolitan Area of Belem
E-1
Appendix E
E.20 ECONOMIC AND FINANCIAL EVALUATION
Table E-1 Investment Schedule in Financial and Economic Cost
Table E-1 (1) Av. Almirante Barroso (R$,unit1000)
DirectCost
IndirectCost
Construc- tionCost
Engineer-ingService
Contin-gency
Compen-sation
Administ-ration
TotalProjectCost
DirectCost
IndirectCost
Construc- tionCost
Engineer-ingService
Contin-gency
Compen-sation
Administ-ration
TotalProjectCost
2004 1,764 1,852 3,615 1,146 946 0 287 5,994 1,277 1,574 2,723 951 813 0 287 4,7742005 1,764 1,852 3,615 1,146 946 0 287 5,994 1,277 1,574 2,723 951 813 0 287 4,7742006 14,109 1,587 15,696 0 1,891 0 573 18,160 10,215 1,349 11,820 0 1,627 0 573 14,0202007 0 0 0 0 0 0 0 0 0 0 0 0 0 0 0 02008 0 0 0 0 0 0 0 0 0 0 0 0 0 0 0 02009 0 0 0 0 0 0 0 0 0 0 0 0 0 0 0 02010 0 0 0 0 0 0 0 0 0 0 0 0 0 0 0 02011 0 0 0 0 0 0 0 0 0 0 0 0 0 0 0 02012 0 0 0 0 0 0 0 0 0 0 0 0 0 0 0 0Total 17,636 5,291 22,927 2,293 3,783 0 1,146 30,148 12,768 4,497 17,266 1,903 3,253 0 1,146 23,568
Table E-1 (2) Extra Work to Av. Almirante Barroso (R$,unit1001)
DirectCost
IndirectCost
Construc- tionCost
Engineer-ingService
Contin-gency
Compen-sation
Administ-ration
TotalProjectCost
DirectCost
IndirectCost
Construc- tionCost
Engineer-ingService
Contin-gency
Compen-sation
Administ-ration
TotalProjectCost
2004 1,270 1,334 2,604 826 681 0 207 4,318 920 1,134 1,961 685 586 0 207 3,4392005 1,270 1,334 2,604 826 681 0 207 4,318 920 1,134 1,961 685 586 0 207 3,4392006 10,164 1,143 11,307 0 1,363 0 413 13,083 7,359 972 8,515 0 1,172 0 413 10,1002007 0 0 0 0 0 0 0 0 0 0 0 0 0 0 0 02008 0 0 0 0 0 0 0 0 0 0 0 0 0 0 0 02009 0 0 0 0 0 0 0 0 0 0 0 0 0 0 0 02010 0 0 0 0 0 0 0 0 0 0 0 0 0 0 0 02011 0 0 0 0 0 0 0 0 0 0 0 0 0 0 0 02012 0 0 0 0 0 0 0 0 0 0 0 0 0 0 0 0Total 12,705 3,811 16,516 1,652 2,725 0 826 21,719 9,198 3,240 12,438 1,371 2,344 0 826 16,979
Table E-1 (3) BR316 (R$,unit1000)
DirectCost
IndirectCost
Construc- tionCost
Engineer-ingService
Contin-gency
Compen-sation
Administ-ration
TotalProjectCost
DirectCost
IndirectCost
Construc- tionCost
Engineer-ingService
Contin-gency
Compen-sation
Administ-ration
TotalProjectCost
2004 4,194 4,403 8,597 2,726 2,249 0 681 14,253 3,036 3,743 6,474 2,262 1,934 0 681 11,3522005 4,194 4,403 8,597 2,726 2,249 0 681 14,253 3,036 3,743 6,474 2,262 1,934 0 681 11,3522006 33,550 3,774 37,324 0 4,498 0 1,363 43,184 24,290 3,208 28,108 0 3,868 0 1,363 33,3382007 0 0 0 0 0 0 0 0 0 0 0 0 0 0 0 02008 0 0 0 0 0 0 0 0 0 0 0 0 0 0 0 02009 0 0 0 0 0 0 0 0 0 0 0 0 0 0 0 02010 0 0 0 0 0 0 0 0 0 0 0 0 0 0 0 02011 0 0 0 0 0 0 0 0 0 0 0 0 0 0 0 02012 0 0 0 0 0 0 0 0 0 0 0 0 0 0 0 0Total 41,937 12,581 54,518 5,452 8,995 0 2,725 71,690 30,362 10,694 41,056 4,525 7,736 0 2,725 56,042
Table E-11 (4) Extra Work to BR316 (R$,unit1000)
DirectCost
IndirectCost
Construc- tionCost
Engineer-ingService
Contin-gency
Compen-sation
Administ-ration
TotalProjectCost
DirectCost
IndirectCost
Construc- tionCost
Engineer-ingService
Contin-gency
Compen-sation
Administ-ration
TotalProjectCost
2004 1,309 1,375 2,684 851 702 0 213 4,450 948 1,168 2,021 706 604 0 213 3,5442005 1,309 1,375 2,684 851 702 0 213 4,450 948 1,168 2,021 706 604 0 213 3,5442006 10,474 1,178 11,652 0 1,404 0 426 13,482 7,583 1,002 8,775 0 1,208 0 426 10,4092007 0 0 0 0 0 0 0 0 0 0 0 0 0 0 0 02008 0 0 0 0 0 0 0 0 0 0 0 0 0 0 0 02009 0 0 0 0 0 0 0 0 0 0 0 0 0 0 0 02010 0 0 0 0 0 0 0 0 0 0 0 0 0 0 0 02011 0 0 0 0 0 0 0 0 0 0 0 0 0 0 0 02012 0 0 0 0 0 0 0 0 0 0 0 0 0 0 0 0Total 13,092 3,928 17,020 1,702 2,808 0 852 22,382 9,479 3,339 12,817 1,413 2,415 0 852 17,497
Financial Cost
Year
Economic Cost
Economic Cost
Year
Financial Cost Economic Cost
Year
Financial Cost
Year
Financial Cost Economic Cost
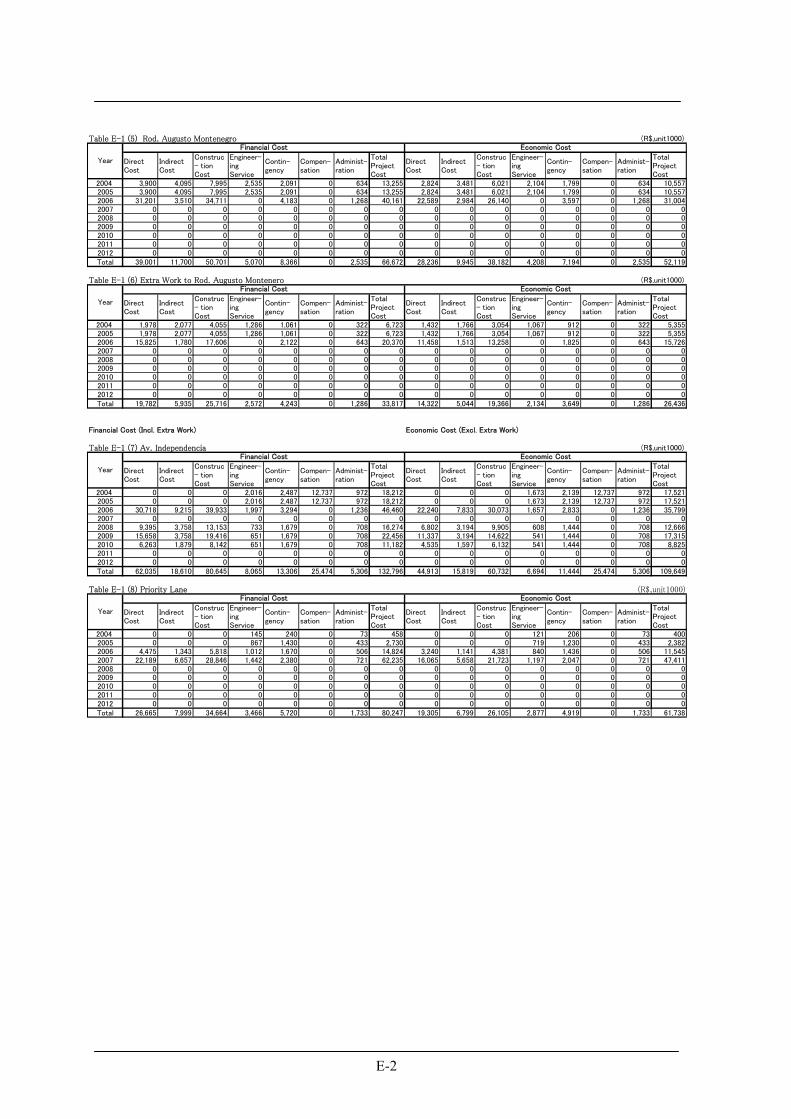
E-2
Table E-1 (5) Rod. Augusto Montenegro (R$,unit1000)
DirectCost
IndirectCost
Construc- tionCost
Engineer-ingService
Contin-gency
Compen-sation
Administ-ration
TotalProjectCost
DirectCost
IndirectCost
Construc- tionCost
Engineer-ingService
Contin-gency
Compen-sation
Administ-ration
TotalProjectCost
2004 3,900 4,095 7,995 2,535 2,091 0 634 13,255 2,824 3,481 6,021 2,104 1,799 0 634 10,5572005 3,900 4,095 7,995 2,535 2,091 0 634 13,255 2,824 3,481 6,021 2,104 1,799 0 634 10,5572006 31,201 3,510 34,711 0 4,183 0 1,268 40,161 22,589 2,984 26,140 0 3,597 0 1,268 31,0042007 0 0 0 0 0 0 0 0 0 0 0 0 0 0 0 02008 0 0 0 0 0 0 0 0 0 0 0 0 0 0 0 02009 0 0 0 0 0 0 0 0 0 0 0 0 0 0 0 02010 0 0 0 0 0 0 0 0 0 0 0 0 0 0 0 02011 0 0 0 0 0 0 0 0 0 0 0 0 0 0 0 02012 0 0 0 0 0 0 0 0 0 0 0 0 0 0 0 0Total 39,001 11,700 50,701 5,070 8,366 0 2,535 66,672 28,236 9,945 38,182 4,208 7,194 0 2,535 52,119
Table E-1 (6) Extra Work to Rod. Augusto Montenero (R$,unit1000)
DirectCost
IndirectCost
Construc- tionCost
Engineer-ingService
Contin-gency
Compen-sation
Administ-ration
TotalProjectCost
DirectCost
IndirectCost
Construc- tionCost
Engineer-ingService
Contin-gency
Compen-sation
Administ-ration
TotalProjectCost
2004 1,978 2,077 4,055 1,286 1,061 0 322 6,723 1,432 1,766 3,054 1,067 912 0 322 5,3552005 1,978 2,077 4,055 1,286 1,061 0 322 6,723 1,432 1,766 3,054 1,067 912 0 322 5,3552006 15,825 1,780 17,606 0 2,122 0 643 20,370 11,458 1,513 13,258 0 1,825 0 643 15,7262007 0 0 0 0 0 0 0 0 0 0 0 0 0 0 0 02008 0 0 0 0 0 0 0 0 0 0 0 0 0 0 0 02009 0 0 0 0 0 0 0 0 0 0 0 0 0 0 0 02010 0 0 0 0 0 0 0 0 0 0 0 0 0 0 0 02011 0 0 0 0 0 0 0 0 0 0 0 0 0 0 0 02012 0 0 0 0 0 0 0 0 0 0 0 0 0 0 0 0Total 19,782 5,935 25,716 2,572 4,243 0 1,286 33,817 14,322 5,044 19,366 2,134 3,649 0 1,286 26,436
Financial Cost (Incl. Extra Work) Economic Cost (Excl. Extra Work)
Table E-1 (7) Av. Independencia (R$,unit1000)
DirectCost
IndirectCost
Construc- tionCost
Engineer-ingService
Contin-gency
Compen-sation
Administ-ration
TotalProjectCost
DirectCost
IndirectCost
Construc- tionCost
Engineer-ingService
Contin-gency
Compen-sation
Administ-ration
TotalProjectCost
2004 0 0 0 2,016 2,487 12,737 972 18,212 0 0 0 1,673 2,139 12,737 972 17,5212005 0 0 0 2,016 2,487 12,737 972 18,212 0 0 0 1,673 2,139 12,737 972 17,5212006 30,718 9,215 39,933 1,997 3,294 0 1,236 46,460 22,240 7,833 30,073 1,657 2,833 0 1,236 35,7992007 0 0 0 0 0 0 0 0 0 0 0 0 0 0 0 02008 9,395 3,758 13,153 733 1,679 0 708 16,274 6,802 3,194 9,905 608 1,444 0 708 12,6662009 15,658 3,758 19,416 651 1,679 0 708 22,456 11,337 3,194 14,622 541 1,444 0 708 17,3152010 6,263 1,879 8,142 651 1,679 0 708 11,182 4,535 1,597 6,132 541 1,444 0 708 8,8252011 0 0 0 0 0 0 0 0 0 0 0 0 0 0 0 02012 0 0 0 0 0 0 0 0 0 0 0 0 0 0 0 0Total 62,035 18,610 80,645 8,065 13,306 25,474 5,306 132,796 44,913 15,819 60,732 6,694 11,444 25,474 5,306 109,649
Table E-1 (8) Priority Lane (R$,unit1000)
DirectCost
IndirectCost
Construc- tionCost
Engineer-ingService
Contin-gency
Compen-sation
Administ-ration
TotalProjectCost
DirectCost
IndirectCost
Construc- tionCost
Engineer-ingService
Contin-gency
Compen-sation
Administ-ration
TotalProjectCost
2004 0 0 0 145 240 0 73 458 0 0 0 121 206 0 73 4002005 0 0 0 867 1,430 0 433 2,730 0 0 0 719 1,230 0 433 2,3822006 4,475 1,343 5,818 1,012 1,670 0 506 14,824 3,240 1,141 4,381 840 1,436 0 506 11,5452007 22,189 6,657 28,846 1,442 2,380 0 721 62,235 16,065 5,658 21,723 1,197 2,047 0 721 47,4112008 0 0 0 0 0 0 0 0 0 0 0 0 0 0 0 02009 0 0 0 0 0 0 0 0 0 0 0 0 0 0 0 02010 0 0 0 0 0 0 0 0 0 0 0 0 0 0 0 02011 0 0 0 0 0 0 0 0 0 0 0 0 0 0 0 02012 0 0 0 0 0 0 0 0 0 0 0 0 0 0 0 0Total 26,665 7,999 34,664 3,466 5,720 0 1,733 80,247 19,305 6,799 26,105 2,877 4,919 0 1,733 61,738
Year
Financial Cost Economic Cost
Year
Financial Cost Economic Cost
Year
Financial Cost Economic Cost
Year
Financial Cost Economic Cost
The Improvement of Transport System in the Metropolitan Area of Belem
E-3
Table E-1 (13) Rua de Marinha (R$,unit1000)
DirectCost
IndirectCost
Construc- tionCost
Engineer-ingService
Contin-gency
Compen-sation
Administ-ration
TotalProjectCost
DirectCost
IndirectCost
Construc- tionCost
Engineer-ingService
Contin-gency
Compen-sation
Administ-ration
TotalProjectCost
2004 0 0 0 0 0 0 0 0 0 0 0 0 0 0 0 02005 0 0 0 0 0 0 0 0 0 0 0 0 0 0 0 02006 0 0 0 1,446 1,193 651 394 3,683 0 0 0 1,200 1,026 651 394 3,2702007 0 0 0 1,446 1,193 651 394 3,683 0 0 0 1,200 1,026 651 394 3,2702008 0 0 0 0 0 0 0 0 0 0 0 0 0 0 0 02009 0 0 0 0 0 0 0 0 0 0 0 0 0 0 0 02010 0 0 0 0 0 0 0 0 0 0 0 0 0 0 0 02011 0 0 0 0 0 0 0 0 0 0 0 0 0 0 0 02012 22,238 6,672 28,910 0 2,385 1,302 788 33,385 16,101 5,671 21,771 0 2,051 1,302 788 25,912Total 22,238 6,672 28,910 2,891 4,770 2,603 1,576 40,750 16,101 5,671 21,771 2,400 4,102 2,603 1,576 32,452
Year
Financial Cost Economic Cost
Table E-1 (9)Bus Facility (R$,unit1000)
DirectCost
IndirectCost
Construc- tionCost
Engineer-ingService
Contin-gency
Compen-sation
Administ-ration
TotalProjectCost
DirectCost
IndirectCost
Construc- tionCost
Engineer-ingService
Contin-gency
Compen-sation
Administ-ration
TotalProjectCost
2004 0 0 0 884 1,459 315 458 3,116 0 0 0 734 1,254 422 458 2,8692005 0 0 0 884 1,459 315 458 3,116 0 0 0 734 1,254 422 458 2,8692006 27,199 8,160 35,359 1,768 2,917 630 916 76,949 19,692 6,936 26,628 1,467 2,509 845 916 58,9932007 0 0 0 0 0 0 0 0 0 0 0 0 0 0 0 02008 0 0 0 0 0 0 0 0 0 0 0 0 0 0 0 02009 0 0 0 0 0 0 0 0 0 0 0 0 0 0 0 02010 0 0 0 0 0 0 0 0 0 0 0 0 0 0 0 02011 0 0 0 0 0 0 0 0 0 0 0 0 0 0 0 02012 0 0 0 0 0 0 0 0 0 0 0 0 0 0 0 0Total 27,199 8,160 35,359 3,536 5,834 1,260 1,832 83,181 19,692 6,936 26,628 2,935 5,017 1,690 1,832 64,731
Table E-1 (10) Independensia 7.Independensia (R$,unit1000)
DirectCost
IndirectCost
Construc- tionCost
Engineer-ingService
Contin-gency
Compen-sation
Administ-ration
TotalProjectCost
DirectCost
IndirectCost
Construc- tionCost
Engineer-ingService
Contin-gency
Compen-sation
Administ-ration
TotalProjectCost
2004 0 0 0 3,599 4,440 15,675 1,606 25,321 0 0 0 2,988 3,818 15,675 1,606 24,0872005 0 0 0 3,599 4,440 15,675 1,606 25,321 0 0 0 2,988 3,818 15,675 1,606 24,0872006 54,841 16,452 71,293 3,565 5,882 0 2,042 82,782 39,705 13,984 53,689 2,959 5,058 0 2,042 63,7482007 0 0 0 0 0 0 0 0 0 0 0 0 0 0 0 02008 16,773 6,709 23,482 1,308 2,998 0 1,170 28,959 12,144 5,703 17,684 1,086 2,578 0 1,170 22,5192009 27,955 6,709 34,664 1,163 2,998 0 1,170 39,996 20,240 5,703 26,105 965 2,578 0 1,170 30,8192010 11,182 3,355 14,537 1,163 2,998 0 1,170 19,868 8,096 2,851 10,947 965 2,578 0 1,170 15,6612011 0 0 0 0 0 0 0 0 0 0 0 0 0 0 0 02012 0 0 0 0 0 0 0 0 0 0 0 0 0 0 0 0Total 110,752 33,225 143,977 14,398 23,756 31,350 8,766 222,247 80,184 28,242 108,426 11,950 20,430 31,350 8,766 180,922
Table E-1 (11) Av.Primero de Dezwembro (R$,unit1000)
DirectCost
IndirectCost
Construc- tionCost
Engineer-ingService
Contin-gency
Compen-sation
Administ-ration
TotalProjectCost
DirectCost
IndirectCost
Construc- tionCost
Engineer-ingService
Contin-gency
Compen-sation
Administ-ration
TotalProjectCost
2004 0 0 0 3,472 1,432 4,202 487 9,592 0 0 0 2,882 1,232 4,202 487 8,8022005 0 0 0 3,472 1,432 4,202 487 9,592 0 0 0 2,882 1,232 4,202 487 8,8022006 0 0 0 3,472 1,432 4,202 487 9,592 0 0 0 2,882 1,232 4,202 487 8,8022007 0 0 0 0 0 0 0 0 0 0 0 0 0 0 0 02008 24,037 16,826 40,864 0 4,297 0 1,460 46,620 17,403 14,302 30,773 0 3,695 0 1,460 35,9282009 40,062 2,404 42,466 0 4,297 0 1,460 48,222 29,005 2,043 31,980 0 3,695 0 1,460 37,1352010 16,025 4,807 20,832 0 4,297 0 1,460 26,589 11,602 4,086 15,688 0 3,695 0 1,460 20,8432011 0 0 0 0 0 0 0 0 0 0 0 0 0 0 0 02012 0 0 0 0 0 0 0 0 0 0 0 0 0 0 0 0Total 80,125 24,037 104,162 10,416 17,187 12,605 5,838 150,208 58,010 20,432 78,442 8,645 14,781 12,605 5,838 120,311
Table E-1 (12) Rua Yamada (R$,unit1000)
DirectCost
IndirectCost
Construc- tionCost
Engineer-ingService
Contin-gency
Compen-sation
Administ-ration
TotalProjectCost
DirectCost
IndirectCost
Construc- tionCost
Engineer-ingService
Contin-gency
Compen-sation
Administ-ration
TotalProjectCost
2004 0 0 0 0 0 0 0 0 0 0 0 0 0 0 0 02005 0 0 0 2,209 911 2,400 306 5,826 0 0 0 1,833 784 2,400 306 5,3232006 0 0 0 2,209 911 2,400 306 5,826 0 0 0 1,833 784 2,400 306 5,3232007 0 0 0 2,209 911 2,400 306 5,826 0 0 0 1,833 784 2,400 306 5,3232008 0 0 0 0 0 0 0 0 0 0 0 0 0 0 0 02009 0 0 0 0 0 0 0 0 0 0 0 0 0 0 0 02010 15,292 10,704 25,996 0 2,733 0 918 29,648 11,071 9,099 19,577 0 2,351 0 918 22,8462011 25,487 1,529 27,016 0 2,733 0 918 30,667 18,452 1,300 20,345 0 2,351 0 918 23,6142012 10,195 3,058 13,253 0 2,733 0 918 16,905 7,381 2,600 9,981 0 2,351 0 918 13,250Total 50,973 15,292 66,265 6,627 10,934 7,201 3,673 94,699 36,905 12,998 49,903 5,500 9,403 7,201 3,673 75,680
Year
Financial Cost Economic Cost
Year
Financial Cost Economic Cost
Year
Financial Cost Economic Cost
Year
Financial Cost Economic Cost
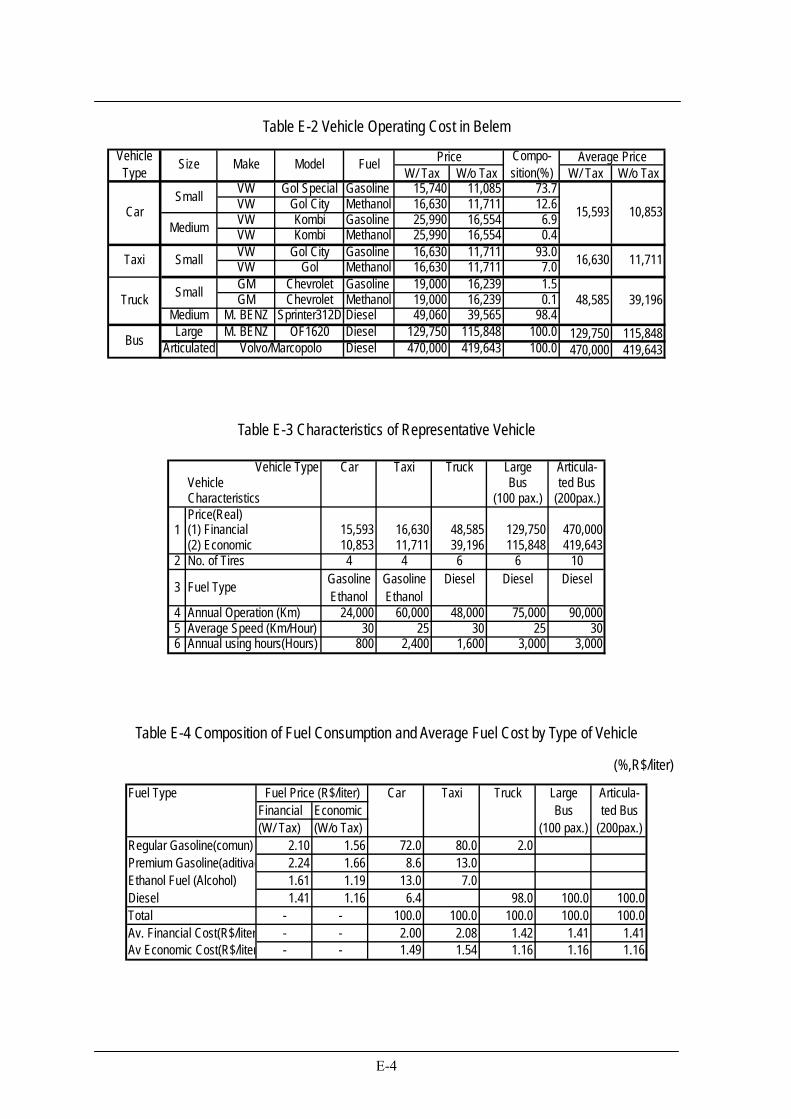
E-4
Table E-2 Vehicle Operating Cost in Belem
W/ Tax W/o Tax W/ Tax W/o TaxVW Gol Special Gasoline 15,740 11,085 73.7VW Gol City Methanol 16,630 11,711 12.6VW Kombi Gasoline 25,990 16,554 6.9VW Kombi Methanol 25,990 16,554 0.4VW Gol City Gasoline 16,630 11,711 93.0VW Gol Methanol 16,630 11,711 7.0GM Chevrolet Gasoline 19,000 16,239 1.5GM Chevrolet Methanol 19,000 16,239 0.1
Medium M. BENZ Sprinter312D Diesel 49,060 39,565 98.4Large M. BENZ OF1620 Diesel 129,750 115,848 100.0 129,750 115,848
Articulated Diesel 470,000 419,643 100.0 470,000 419,643
Fuel
Volvo/MarcopoloBus
Compo-sition(%)
Car
Size
Small
Medium
PriceVehicleType Make Model
Taxi
Truck
Small
Small
15,593
16,630
48,585
Average Price
10,853
11,711
39,196
Table E-3 Characteristics of Representative Vehicle
Vehicle Type Car Taxi Truck Large Articula-Vehicle Bus ted BusCharacteristics (100 pax.) (200pax.)
15,593 16,630 48,585 129,750 470,00010,853 11,711 39,196 115,848 419,643
2 4 4 6 6 10Gasoline Gasoline Diesel Diesel DieselEthanol Ethanol
4 24,000 60,000 48,000 75,000 90,0005 30 25 30 25 306 800 2,400 1,600 3,000 3,000
3 Fuel Type
1
Annual Operation (Km)Average Speed (Km/Hour)Annual using hours(Hours)
Price(Real)(1) Financial(2) EconomicNo. of Tires
Table E-4 Composition of Fuel Consumption and Average Fuel Cost by Type of Vehicle
(%,R$/liter)
Fuel Type Car Taxi Truck Large Articula-Financial Economic Bus ted Bus(W/ Tax) (W/o Tax) (100 pax.) (200pax.)
Regular Gasoline(comun) 2.10 1.56 72.0 80.0 2.0Premium Gasoline(aditivad 2.24 1.66 8.6 13.0Ethanol Fuel (Alcohol) 1.61 1.19 13.0 7.0Diesel 1.41 1.16 6.4 98.0 100.0 100.0Total - - 100.0 100.0 100.0 100.0 100.0Av. Financial Cost(R$/liter - - 2.00 2.08 1.42 1.41 1.41Av Economic Cost(R$/liter - - 1.49 1.54 1.16 1.16 1.16
Fuel Price (R$/liter)
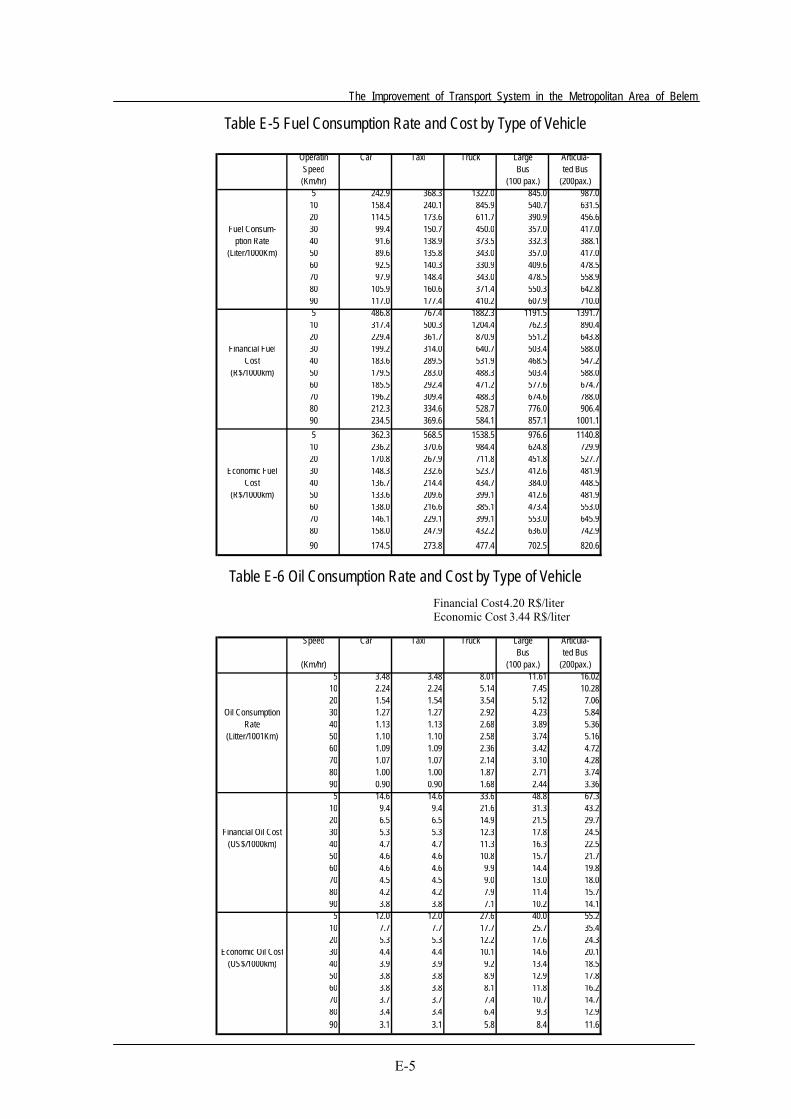
The Improvement of Transport System in the Metropolitan Area of Belem
E-5
Table E-5 Fuel Consumption Rate and Cost by Type of Vehicle
Table E-6 Oil Consumption Rate and Cost by Type of Vehicle Financial Cost 4.20 R$/liter Economic Cost 3.44 R$/liter
Speed Car Taxi Truck Large Articula-Bus ted Bus
(Km/hr) (100 pax.) (200pax.)5 3.48 3.48 8.01 11.61 16.02
10 2.24 2.24 5.14 7.45 10.2820 1.54 1.54 3.54 5.12 7.06
Oil Consumption 30 1.27 1.27 2.92 4.23 5.84Rate 40 1.13 1.13 2.68 3.89 5.36
(Litter/1001Km) 50 1.10 1.10 2.58 3.74 5.1660 1.09 1.09 2.36 3.42 4.7270 1.07 1.07 2.14 3.10 4.2880 1.00 1.00 1.87 2.71 3.7490 0.90 0.90 1.68 2.44 3.365 14.6 14.6 33.6 48.8 67.3
10 9.4 9.4 21.6 31.3 43.220 6.5 6.5 14.9 21.5 29.7
Financial Oil Cost 30 5.3 5.3 12.3 17.8 24.5(US$/1000km) 40 4.7 4.7 11.3 16.3 22.5
50 4.6 4.6 10.8 15.7 21.760 4.6 4.6 9.9 14.4 19.870 4.5 4.5 9.0 13.0 18.080 4.2 4.2 7.9 11.4 15.790 3.8 3.8 7.1 10.2 14.15 12.0 12.0 27.6 40.0 55.2
10 7.7 7.7 17.7 25.7 35.420 5.3 5.3 12.2 17.6 24.3
Economic Oil Cost 30 4.4 4.4 10.1 14.6 20.1(US$/1000km) 40 3.9 3.9 9.2 13.4 18.5
50 3.8 3.8 8.9 12.9 17.860 3.8 3.8 8.1 11.8 16.270 3.7 3.7 7.4 10.7 14.780 3.4 3.4 6.4 9.3 12.990 3.1 3.1 5.8 8.4 11.6
Operatin Car Taxi Truck Large Articula-Speed Bus ted Bus(Km/hr) (100 pax.) (200pax.)
5 242.9 368.3 1322.0 845.0 987.010 158.4 240.1 845.9 540.7 631.520 114.5 173.6 611.7 390.9 456.6
Fuel Consum- 30 99.4 150.7 450.0 357.0 417.0ption Rate 40 91.6 138.9 373.5 332.3 388.1
(Liter/1000Km) 50 89.6 135.8 343.0 357.0 417.060 92.5 140.3 330.9 409.6 478.570 97.9 148.4 343.0 478.5 558.980 105.9 160.6 371.4 550.3 642.890 117.0 177.4 410.2 607.9 710.05 486.8 767.4 1882.3 1191.5 1391.710 317.4 500.3 1204.4 762.3 890.420 229.4 361.7 870.9 551.2 643.8
Financial Fuel 30 199.2 314.0 640.7 503.4 588.0Cost 40 183.6 289.5 531.9 468.5 547.2
(R$/1000km) 50 179.5 283.0 488.3 503.4 588.060 185.5 292.4 471.2 577.6 674.770 196.2 309.4 488.3 674.6 788.080 212.3 334.6 528.7 776.0 906.490 234.5 369.6 584.1 857.1 1001.15 362.3 568.5 1538.5 976.6 1140.810 236.2 370.6 984.4 624.8 729.920 170.8 267.9 711.8 451.8 527.7
Economic Fuel 30 148.3 232.6 523.7 412.6 481.9Cost 40 136.7 214.4 434.7 384.0 448.5
(R$/1000km) 50 133.6 209.6 399.1 412.6 481.960 138.0 216.6 385.1 473.4 553.070 146.1 229.1 399.1 553.0 645.980 158.0 247.9 432.2 636.0 742.990 174.5 273.8 477.4 702.5 820.6
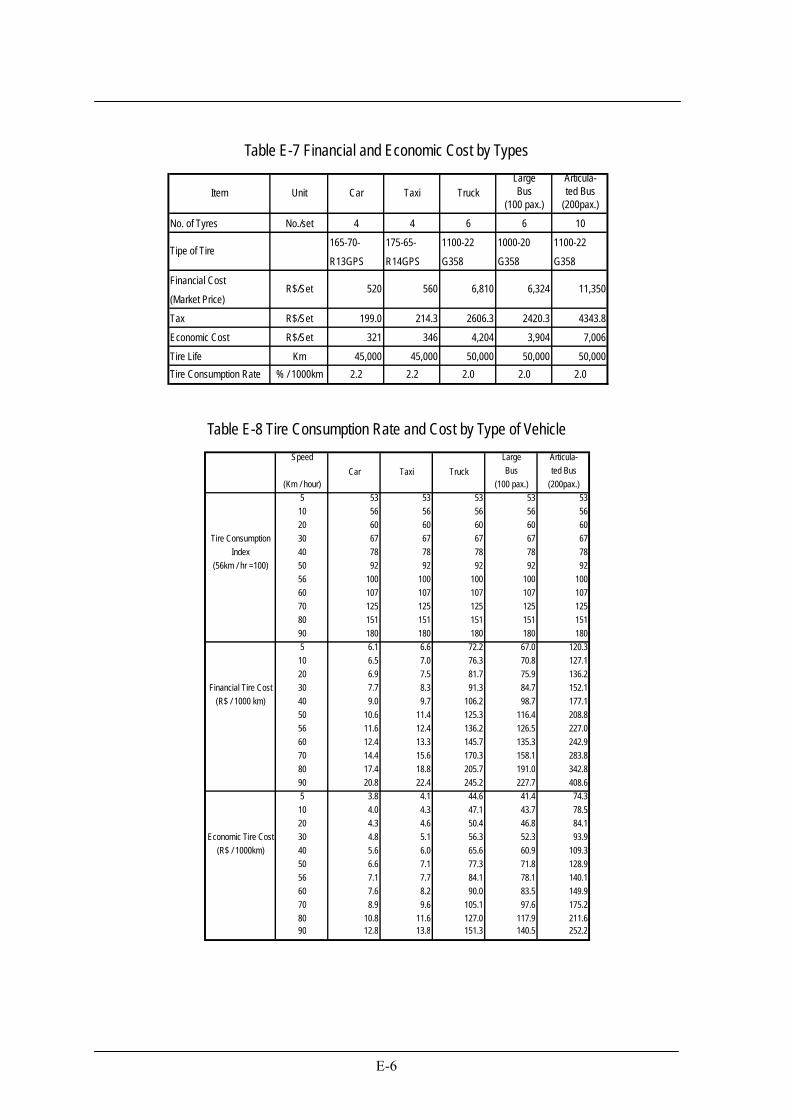
E-6
Table E-7 Financial and Economic Cost by Types
Table E-8 Tire Consumption Rate and Cost by Type of Vehicle
Large Articula-Bus ted Bus
(100 pax.) (200pax.)
No. of Tyres No./set 4 4 6 6 10
165-70- 175-65- 1100-22 1000-20 1100-22
R13GPS R14GPS G358 G358 G358
Financial Cost
(Market Price)
Tax R$/Set 199.0 214.3 2606.3 2420.3 4343.8
Economic Cost R$/Set 321 346 4,204 3,904 7,006
Tire Life Km 45,000 45,000 50,000 50,000 50,000Tire Consumption Rate % / 1000km 2.2 2.2 2.0 2.0 2.0
R$/Set
Tipe of Tire
Truck
520 560 6,810
Item Unit Car Taxi
11,3506,324
Speed Large Articula-Bus ted Bus
(Km / hour) (100 pax.) (200pax.)5 53 53 53 53 5310 56 56 56 56 5620 60 60 60 60 60
Tire Consumption 30 67 67 67 67 67Index 40 78 78 78 78 78
(56km / hr =100) 50 92 92 92 92 9256 100 100 100 100 10060 107 107 107 107 10770 125 125 125 125 12580 151 151 151 151 15190 180 180 180 180 1805 6.1 6.6 72.2 67.0 120.310 6.5 7.0 76.3 70.8 127.120 6.9 7.5 81.7 75.9 136.2
Financial Tire Cost 30 7.7 8.3 91.3 84.7 152.1(R$ / 1000 km) 40 9.0 9.7 106.2 98.7 177.1
50 10.6 11.4 125.3 116.4 208.856 11.6 12.4 136.2 126.5 227.060 12.4 13.3 145.7 135.3 242.970 14.4 15.6 170.3 158.1 283.880 17.4 18.8 205.7 191.0 342.890 20.8 22.4 245.2 227.7 408.65 3.8 4.1 44.6 41.4 74.310 4.0 4.3 47.1 43.7 78.520 4.3 4.6 50.4 46.8 84.1
Economic Tire Cost 30 4.8 5.1 56.3 52.3 93.9(R$ / 1000km) 40 5.6 6.0 65.6 60.9 109.3
50 6.6 7.1 77.3 71.8 128.956 7.1 7.7 84.1 78.1 140.160 7.6 8.2 90.0 83.5 149.970 8.9 9.6 105.1 97.6 175.280 10.8 11.6 127.0 117.9 211.690 12.8 13.8 151.3 140.5 252.2
Car Taxi Truck
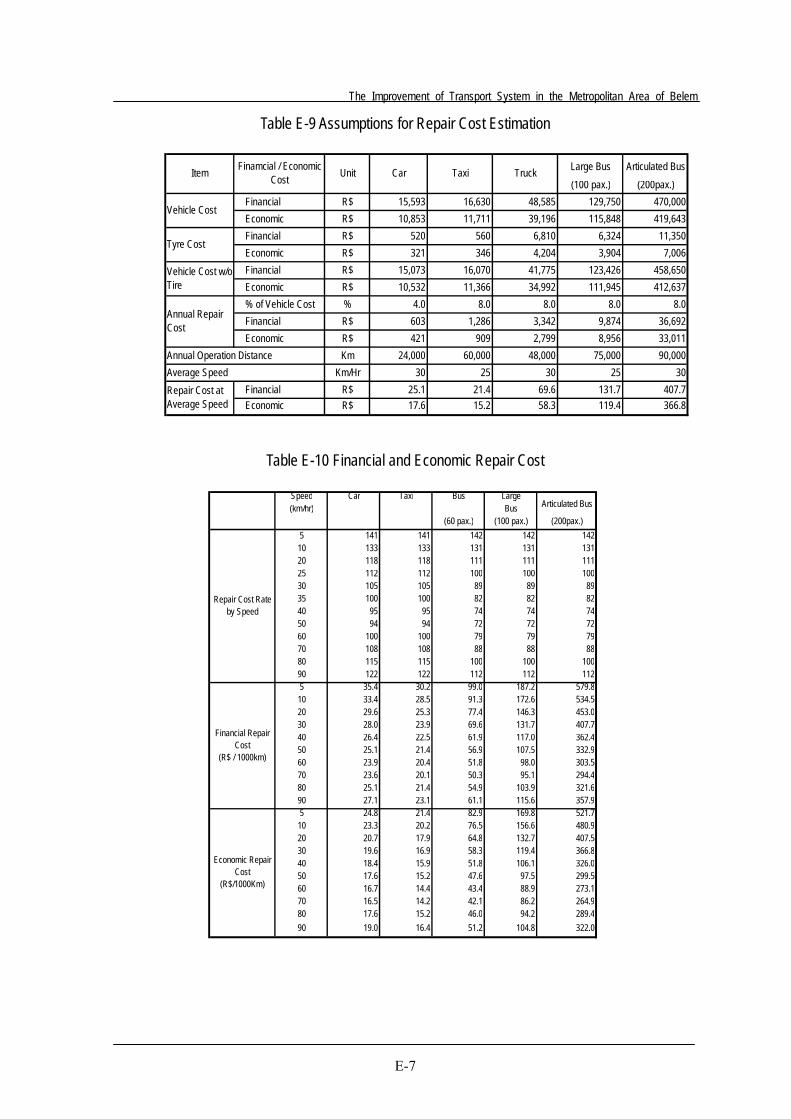
The Improvement of Transport System in the Metropolitan Area of Belem
E-7
Table E-9 Assumptions for Repair Cost Estimation
Table E-10 Financial and Economic Repair Cost
(100 pax.) (200pax.) Financial R$ 15,593 16,630 48,585 129,750 470,000 Economic R$ 10,853 11,711 39,196 115,848 419,643 Financial R$ 520 560 6,810 6,324 11,350 Economic R$ 321 346 4,204 3,904 7,006 Financial R$ 15,073 16,070 41,775 123,426 458,650 Economic R$ 10,532 11,366 34,992 111,945 412,637 % of Vehicle Cost % 4.0 8.0 8.0 8.0 8.0 Financial R$ 603 1,286 3,342 9,874 36,692 Economic R$ 421 909 2,799 8,956 33,011
Km 24,000 60,000 48,000 75,000 90,000Km/Hr 30 25 30 25 30
Financial R$ 25.1 21.4 69.6 131.7 407.7 Economic R$ 17.6 15.2 58.3 119.4 366.8
TruckCar Taxi
Annual Operation Distance
Vehicle Cost w/oTire
Average Speed
Large Bus Articulated Bus
Repair Cost atAverage Speed
Annual RepairCost
Item
Vehicle Cost
Tyre Cost
UnitFinamcial / EconomicCost
Speed Car Taxi Bus Large(km/hr) Bus
(60 pax.) (100 pax.) (200pax.)5 141 141 142 142 14210 133 133 131 131 13120 118 118 111 111 11125 112 112 100 100 10030 105 105 89 89 8935 100 100 82 82 8240 95 95 74 74 7450 94 94 72 72 7260 100 100 79 79 7970 108 108 88 88 8880 115 115 100 100 10090 122 122 112 112 1125 35.4 30.2 99.0 187.2 579.810 33.4 28.5 91.3 172.6 534.520 29.6 25.3 77.4 146.3 453.030 28.0 23.9 69.6 131.7 407.740 26.4 22.5 61.9 117.0 362.450 25.1 21.4 56.9 107.5 332.960 23.9 20.4 51.8 98.0 303.570 23.6 20.1 50.3 95.1 294.480 25.1 21.4 54.9 103.9 321.690 27.1 23.1 61.1 115.6 357.95 24.8 21.4 82.9 169.8 521.710 23.3 20.2 76.5 156.6 480.920 20.7 17.9 64.8 132.7 407.530 19.6 16.9 58.3 119.4 366.840 18.4 15.9 51.8 106.1 326.050 17.6 15.2 47.6 97.5 299.560 16.7 14.4 43.4 88.9 273.170 16.5 14.2 42.1 86.2 264.980 17.6 15.2 46.0 94.2 289.490 19.0 16.4 51.2 104.8 322.0
Articulated Bus
Financial RepairCost
(R$ / 1000km)
Economic RepairCost
(R$/1000Km)
Repair Cost Rateby Speed
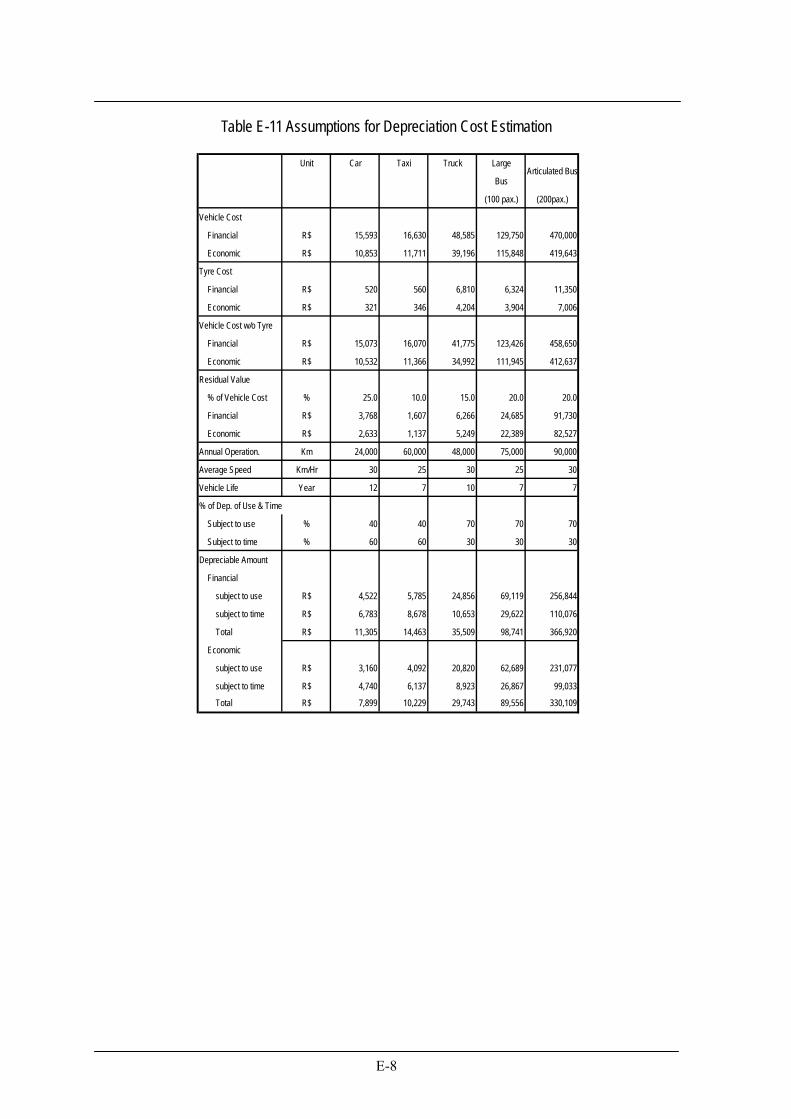
E-8
Table E-11 Assumptions for Depreciation Cost Estimation
Unit Car Taxi Truck Large
Bus
(100 pax.) (200pax.)
Vehicle Cost
Financial R$ 15,593 16,630 48,585 129,750 470,000
Economic R$ 10,853 11,711 39,196 115,848 419,643
Tyre Cost
Financial R$ 520 560 6,810 6,324 11,350
Economic R$ 321 346 4,204 3,904 7,006
Vehicle Cost w/o Tyre
Financial R$ 15,073 16,070 41,775 123,426 458,650
Economic R$ 10,532 11,366 34,992 111,945 412,637
Residual Value
% of Vehicle Cost % 25.0 10.0 15.0 20.0 20.0
Financial R$ 3,768 1,607 6,266 24,685 91,730
Economic R$ 2,633 1,137 5,249 22,389 82,527
Annual Operation. Km 24,000 60,000 48,000 75,000 90,000
Average Speed Km/Hr 30 25 30 25 30
Vehicle Life Year 12 7 10 7 7
% of Dep. of Use & Time
Subject to use % 40 40 70 70 70
Subject to time % 60 60 30 30 30
Depreciable Amount
Financial
subject to use R$ 4,522 5,785 24,856 69,119 256,844
subject to time R$ 6,783 8,678 10,653 29,622 110,076
Total R$ 11,305 14,463 35,509 98,741 366,920
Economic
subject to use R$ 3,160 4,092 20,820 62,689 231,077
subject to time R$ 4,740 6,137 8,923 26,867 99,033
Total R$ 7,899 10,229 29,743 89,556 330,109
Articulated Bus
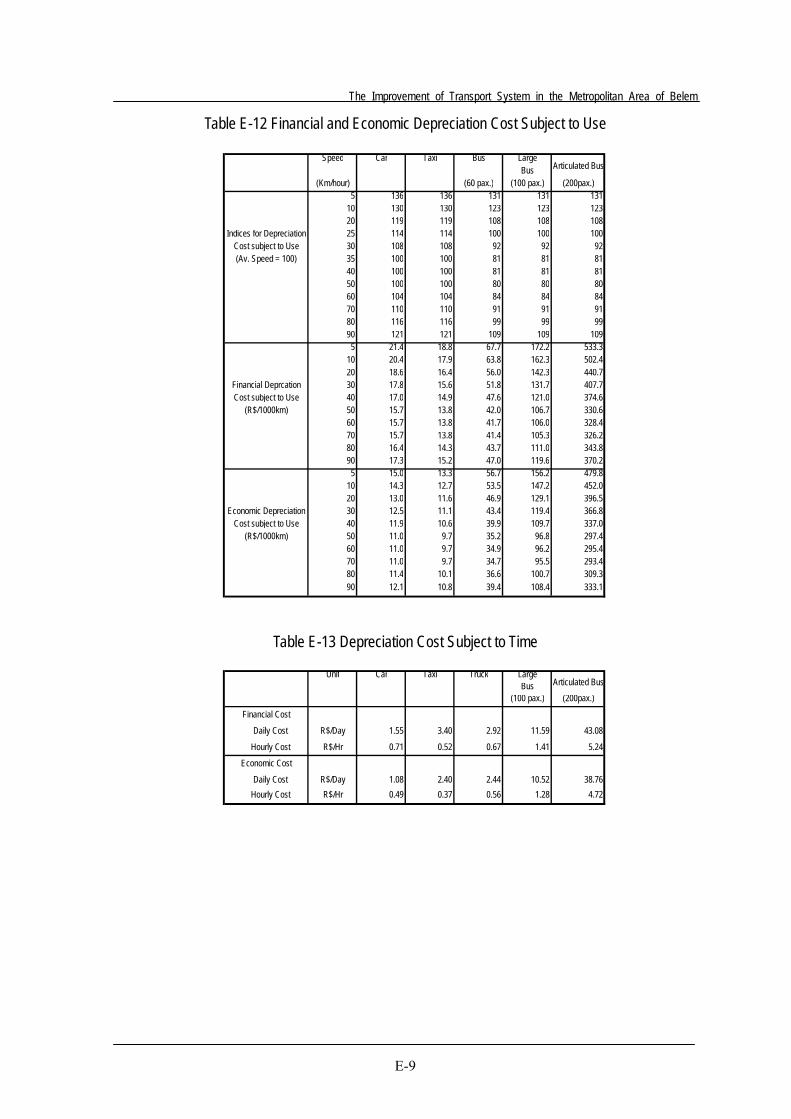
The Improvement of Transport System in the Metropolitan Area of Belem
E-9
Table E-12 Financial and Economic Depreciation Cost Subject to Use
Table E-13 Depreciation Cost Subject to Time
Speed Car Taxi Bus LargeBus
(Km/hour) (60 pax.) (100 pax.) (200pax.)5 136 136 131 131 131
10 130 130 123 123 12320 119 119 108 108 108
Indices for Depreciation 25 114 114 100 100 100Cost subject to Use 30 108 108 92 92 92(Av. Speed = 100) 35 100 100 81 81 81
40 100 100 81 81 8150 100 100 80 80 8060 104 104 84 84 8470 110 110 91 91 9180 116 116 99 99 9990 121 121 109 109 1095 21.4 18.8 67.7 172.2 533.3
10 20.4 17.9 63.8 162.3 502.420 18.6 16.4 56.0 142.3 440.7
Financial Deprcation 30 17.8 15.6 51.8 131.7 407.7Cost subject to Use 40 17.0 14.9 47.6 121.0 374.6
(R$/1000km) 50 15.7 13.8 42.0 106.7 330.660 15.7 13.8 41.7 106.0 328.470 15.7 13.8 41.4 105.3 326.280 16.4 14.3 43.7 111.0 343.890 17.3 15.2 47.0 119.6 370.25 15.0 13.3 56.7 156.2 479.8
10 14.3 12.7 53.5 147.2 452.020 13.0 11.6 46.9 129.1 396.5
Economic Depreciation 30 12.5 11.1 43.4 119.4 366.8Cost subject to Use 40 11.9 10.6 39.9 109.7 337.0
(R$/1000km) 50 11.0 9.7 35.2 96.8 297.460 11.0 9.7 34.9 96.2 295.470 11.0 9.7 34.7 95.5 293.480 11.4 10.1 36.6 100.7 309.390 12.1 10.8 39.4 108.4 333.1
Articulated Bus
Unit Car Taxi Truck LargeBus
(100 pax.) (200pax.)
Financial Cost
Daily Cost R$/Day 1.55 3.40 2.92 11.59 43.08
Hourly Cost R$/Hr 0.71 0.52 0.67 1.41 5.24
Economic Cost
Daily Cost R$/Day 1.08 2.40 2.44 10.52 38.76 Hourly Cost R$/Hr 0.49 0.37 0.56 1.28 4.72
Articulated Bus
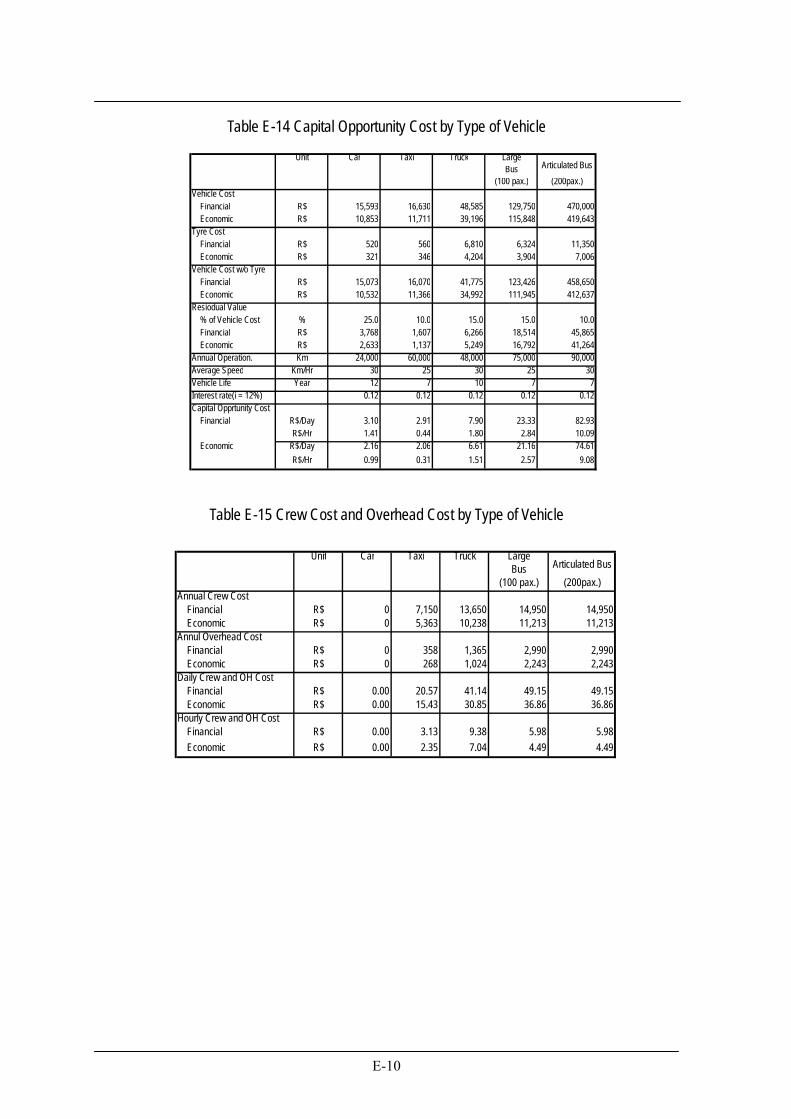
E-10
Table E-14 Capital Opportunity Cost by Type of Vehicle
Table E-15 Crew Cost and Overhead Cost by Type of Vehicle
Unit Car Taxi Truck LargeBus
(100 pax.) (200pax.)Vehicle Cost Financial R$ 15,593 16,630 48,585 129,750 470,000 Economic R$ 10,853 11,711 39,196 115,848 419,643Tyre Cost Financial R$ 520 560 6,810 6,324 11,350 Economic R$ 321 346 4,204 3,904 7,006Vehicle Cost w/o Tyre Financial R$ 15,073 16,070 41,775 123,426 458,650 Economic R$ 10,532 11,366 34,992 111,945 412,637Resiodual Value % of Vehicle Cost % 25.0 10.0 15.0 15.0 10.0 Financial R$ 3,768 1,607 6,266 18,514 45,865 Economic R$ 2,633 1,137 5,249 16,792 41,264Annual Operation. Km 24,000 60,000 48,000 75,000 90,000Average Speed Km/Hr 30 25 30 25 30Vehicle Life Year 12 7 10 7 7Interest rate(i = 12%) 0.12 0.12 0.12 0.12 0.12Capital Opprtunity Cost Financial R$/Day 3.10 2.91 7.90 23.33 82.93
R$/Hr 1.41 0.44 1.80 2.84 10.09 Economic R$/Day 2.16 2.06 6.61 21.16 74.61
R$/Hr 0.99 0.31 1.51 2.57 9.08
Articulated Bus
Unit Car Taxi Truck LargeBus
(100 pax.) (200pax.)Annual Crew Cost Financial R$ 0 7,150 13,650 14,950 14,950 Economic R$ 0 5,363 10,238 11,213 11,213Annul Overhead Cost Financial R$ 0 358 1,365 2,990 2,990 Economic R$ 0 268 1,024 2,243 2,243Daily Crew and OH Cost Financial R$ 0.00 20.57 41.14 49.15 49.15 Economic R$ 0.00 15.43 30.85 36.86 36.86Hourly Crew and OH Cost Financial R$ 0.00 3.13 9.38 5.98 5.98 Economic R$ 0.00 2.35 7.04 4.49 4.49
Articulated Bus
The Improvement of Transport System in the Metropolitan Area of Belem
E-11
Table E-16 Aggregate Vehicle Operating Coat by Type of Vehicle
(1) VOC subject to Use
(2) VOC subject to Time
Speed Car Taxi Truck LargeBus
(Km/hour) (100 pax.) (200pax.)5 564.4 837.6 2,154.9 1,666.7 2,692.4
10 387.1 563.1 1,457.4 1,199.3 2,097.720 291.1 417.3 1,100.8 937.2 1,703.430 258.1 367.2 865.6 869.2 1,580.040 240.8 341.4 758.8 821.5 1,483.850 235.6 334.3 723.3 849.7 1,482.060 241.2 343.5 710.9 922.5 1,553.370 252.4 361.1 734.7 1,023.4 1,669.580 272.4 390.1 805.4 1,160.3 1,871.290 300.2 430.6 905.0 1,293.4 2,086.15 417.8 619.2 1,750.3 1,384.0 2,271.6
10 285.6 415.4 1,179.1 997.9 1,776.720 214.1 307.3 886.1 778.0 1,440.230 189.5 270.1 691.8 718.3 1,329.540 176.5 250.8 601.2 674.1 1,239.450 172.5 245.4 568.1 691.6 1,225.660 176.6 252.2 555.7 748.3 1,277.870 184.8 265.0 573.3 829.0 1,368.980 199.3 286.2 626.3 937.8 1,529.690 219.5 315.6 700.7 1,042.0 1,698.8
ArticulatedBus
Financial Cost(R$/1000km)
Economic Cost(R$/1000km)
Car Taxi Truck LargeBus
(100 pax.) (200pax.)Financial Cost Depreciation 0.707 0.517 0.666 1.411 5.242 Capital Opportunity Cost 1.413 0.442 1.802 2.839 10.090 Crew and Overhead Cost 0.000 3.128 9.384 5.980 5.980 Total 2.120 4.087 11.852 10.229 21.312Economic Cost Depreciation 0.494 0.365 0.558 1.279 4.716 Capital Opportunity Cost 0.987 0.313 1.509 2.575 9.078 Crew and Overhead Cost 0.000 2.346 7.038 4.485 4.485 Total 1.481 3.024 9.105 8.339 18.279
ArticulatedBus
E-12
Table E-17 Cost Benefit Flow for Economic Evaluation
(1) Entire ProjectsYear Invest- Mainte- Benefit Net Cash2004 77.5 -77.52005 84.8 -84.82006 202.5 -202.52007 34.3 1.5 97.3 61.52008 71.1 1.5 125.9 53.32009 85.3 1.5 163.1 76.32010 68.2 1.5 211.2 141.52011 23.6 1.5 280.9 255.72012 39.2 3.5 285.4 242.82013 3.5 250.9 247.42014 3.5 220.6 217.12015 3.5 193.9 190.42016 3.5 170.4 166.92017 3.5 149.8 146.32018 3.5 131.7 128.22019 3.5 115.8 112.32020 3.5 101.8 98.32021 3.5 89.5 86.02022 7.0 78.7 71.72023 7.0 69.1 62.12024 7.0 60.8 53.82025 7.0 53.4 46.42026 -1.2 7.0 47.0 41.22027 5.5 41.3 35.82028 5.5 36.3 30.82029 5.5 31.9 26.42030 5.5 28.0 22.62031 5.5 24.7 19.2
28.0495.31.97
(2) Trunk Busway System (R$ million) (3) Entire Road Project (R$ million)Year Invest-ment Mainte- Benefit Net Cash Year Invest-ment Mainte- Benefit Net Cash2004 44.6 -44.6 2004 32.9 -32.92005 46.6 -46.6 2005 38.2 -38.22006 121.3 -121.3 2006 81.1 -81.12007 25.7 1.5 40.8 13.6 2007 8.6 64.6 56.02008 12.7 1.5 42.2 28.0 2008 58.4 1.5 88.9 28.92009 17.3 1.5 43.7 24.8 2009 68.0 1.5 120.8 51.42010 8.8 1.5 45.2 34.9 2010 59.4 1.5 168.1 107.22011 1.5 60.1 58.6 2011 23.6 1.5 223.5 198.42012 1.5 62.0 60.5 2012 39.2 1.5 233.4 192.82013 1.5 61.8 60.3 2013 1.5 191.8 190.32014 1.5 61.7 60.2 2014 1.5 157.5 156.02015 1.5 61.6 60.0 2015 1.5 129.4 127.92016 1.5 61.4 59.9 2016 1.5 106.3 104.82017 3.0 61.3 58.3 2017 3.0 87.3 84.32018 3.0 61.2 58.1 2018 3.0 71.7 68.72019 3.0 61.0 58.0 2019 3.0 58.9 55.92020 3.0 60.9 57.8 2020 3.0 48.4 45.42021 3.0 60.7 57.7 2021 3.0 39.8 36.72022 3.0 60.6 57.6 2022 3.0 32.7 29.62023 3.0 60.5 57.4 2023 3.0 26.8 23.82024 3.0 60.3 57.3 2024 3.0 22.1 19.02025 3.0 60.2 57.2 2025 3.0 18.1 15.12026 -1.2 3.0 60.1 58.3 2026 3.0 14.9 11.8
2027 3.0 12.2 9.22028 3.0 10.0 7.02029 3.0 8.2 5.22030 3.0 6.8 3.72031 3.0 5.6 2.5
17.0 41.084.9 429.21.36 2.53
IRR (%)NPV (R$ million)
B/C
IRR (%)
B/C
NPV (R$ million)B/C
IRR (%)NPV (R$ million)
The Improvement of Transport System in the Metropolitan Area of Belem
E-13
(4) Marinha (5) YamadaYear Invest- Mainte- Benefit Net Cash Year Invest- Mainte- Benefit Net Cash2004 0.0 0.0 2004 0.0 0.02005 0.0 0.0 2005 5.3 -5.32006 3.3 -3.3 2006 5.3 -5.32007 3.3 -3.3 2007 5.3 -5.32008 0.0 0.0 2008 0.0 0.02009 0.0 0.0 2009 0.0 0.02010 0.0 0.0 2010 22.8 -22.82011 0.0 0.0 2011 23.6 -23.62012 25.9 1.6 -24.3 2012 13.2 0.8 -12.42013 0.20 20.9 20.7 2013 1.5 11.4 9.92014 0.20 23.1 22.9 2014 1.5 12.9 11.42015 0.20 25.5 25.3 2015 1.5 14.5 13.02016 0.20 28.2 28.0 2016 1.5 16.4 14.92017 0.20 31.2 31.0 2017 1.5 18.6 17.02018 0.20 34.4 34.2 2018 3.0 21.0 17.92019 0.20 38.1 37.9 2019 3.0 23.7 20.62020 0.20 15.0 14.8 2020 3.0 26.8 23.72021 0.20 14.3 14.1 2021 3.0 30.2 27.22022 0.20 13.6 13.4 2022 3.0 34.1 31.12023 0.41 13.0 12.6 2023 3.0 38.6 35.52024 0.41 12.4 12.0 2024 3.0 43.6 40.52025 0.41 11.8 11.4 2025 3.0 49.2 46.22026 0.41 11.3 10.8 2026 3.0 55.6 52.62027 0.41 10.7 10.3 2027 3.0 62.8 59.82028 0.41 10.2 9.8 2028 3.0 71.0 67.92029 0.41 9.8 9.4 2029 3.0 80.2 77.12030 0.41 9.3 8.9 2030 3.0 90.6 87.52031 0.41 8.9 8.5 2031 3.0 102.3 99.3
IRR (%) 37.9 18.0NPV (R$ million) 49.2 37.6
4.05 1.80
(6) Dezembro (7) IndependenciaYear Invest- Mainte- Benefit Net Cash Year Invest- Mainte- Benefit Net Cash2004 8.8 -8.8 2004 24.1 -24.12005 8.8 -8.8 2005 24.1 -24.12006 8.8 -8.8 2006 63.7 -63.72007 0.0 0.0 2007 0.0 0.6 67.4 66.92008 35.9 -35.9 2008 22.5 0.6 69.8 46.72009 37.1 -37.1 2009 30.8 0.6 72.2 40.92010 20.8 -20.8 2010 15.7 0.6 76.8 60.62011 0.45 150.8 150.3 2011 0.6 102.2 101.72012 0.45 173.8 173.4 2012 0.9 120.2 119.32013 0.45 162.4 161.9 2013 0.9 96.5 95.62014 0.45 151.7 151.2 2014 0.9 77.5 76.62015 0.45 141.7 141.2 2015 0.9 62.2 61.32016 0.45 132.3 131.9 2016 0.9 49.9 49.12017 0.45 123.6 123.2 2017 1.4 40.1 38.72018 0.45 115.5 115.0 2018 1.4 32.2 30.82019 0.45 107.9 107.4 2019 1.4 25.8 24.42020 0.45 32.6 32.2 2020 1.4 20.8 19.32021 0.90 26.5 25.6 2021 1.4 16.7 15.22022 0.90 21.5 20.6 2022 1.8 13.4 11.62023 0.90 17.4 16.5 2023 1.8 10.7 9.02024 0.90 14.1 13.2 2024 1.8 8.6 6.92025 0.90 11.5 10.6 2025 1.8 6.9 5.22026 0.90 9.3 8.4 2026 1.8 5.6 3.82027 0.90 7.5 6.6 2027 1.8 4.5 2.72028 0.90 6.1 5.2 2028 1.8 3.6 1.82029 0.90 5.0 4.1 2029 1.8 2.9 1.12030 0.90 4.0 3.1 2030 1.8 2.3 0.62031 0.90 3.3 2.4 2031 1.8 1.9 0.1
IRR (%) 45.2 42.8NPV (R$ million) 330.7 247.8
5.12 2.75
B/C
IRR (%)NPV (R$ million)
B/C
B/C
IRR (%)NPV (R$ million)B/C
E-14
E.20 ECONOMIC AND FINANCIAL EVALUATION .........................................................E-1
Table E-1 Investment Schedule in Financial and Economic Cost .......................................... E-1 Table E-2 Vehicle Operating Cost in Belem........................................................................... E-4 Table E-3 Characteristics of Representative Vehicle .............................................................. E-4 Table E-4 Composition of Fuel Consumption and Average Fuel Cost by Type of Vehicle .... E-4 Table E-5 Fuel Consumption Rate and Cost by Type of Vehicle............................................ E-5 Table E-6 Oil Consumption Rate and Cost by Type of Vehicle.............................................. E-5 Table E-7 Financial and Economic Cost by Types ................................................................. E-6 Table E-8 Type Consumption Rate and Cost by Type of Vehicle........................................... E-6 Table E-9 Assumptions for Repair Cost Estimation ............................................................... E-7 Table E-10 Financial and Economic Repair Cost ................................................................... E-7 Table E-11 Assumptions for Depreciation Cost Estimation ................................................... E-8 Table E-12 Financial and Economic Depreciation Cost Subject to Use................................. E-9 Table E-13 Depreciation Cost Subject to Time ...................................................................... E-9 Table E-14 Capital Opportunity Cost by Type of Vehicle .................................................... E-10 Table E-15 Crew Cost and Overhead Cost by Type of Vehicle ............................................ E-10 Table E-16 Aggregate Vehicle Operating Coat by Type of Vehicle.......................................E-11 Table E-17 Cost Benefit Flow for Economic Evaluation ..................................................... E-12
エラー! 図表目次項目が見つかりません。


