Embed Size (px)
Citation preview
Chapter 6-
ISSUES TO ADDRESS...• Stress and strain: What are they and why are
they used instead of load and deformation?• Elastic behavior: When loads are small, how much
deformation occurs? What materials deform least?• Plastic behavior: At what point do dislocations
cause permanent deformation? What materials aremost resistant to permanent deformation?
1
• Toughness and ductility: What are they and howdo we measure them?
CHAPTER 6: Mechanical properties
Chapter 6-
F
δ
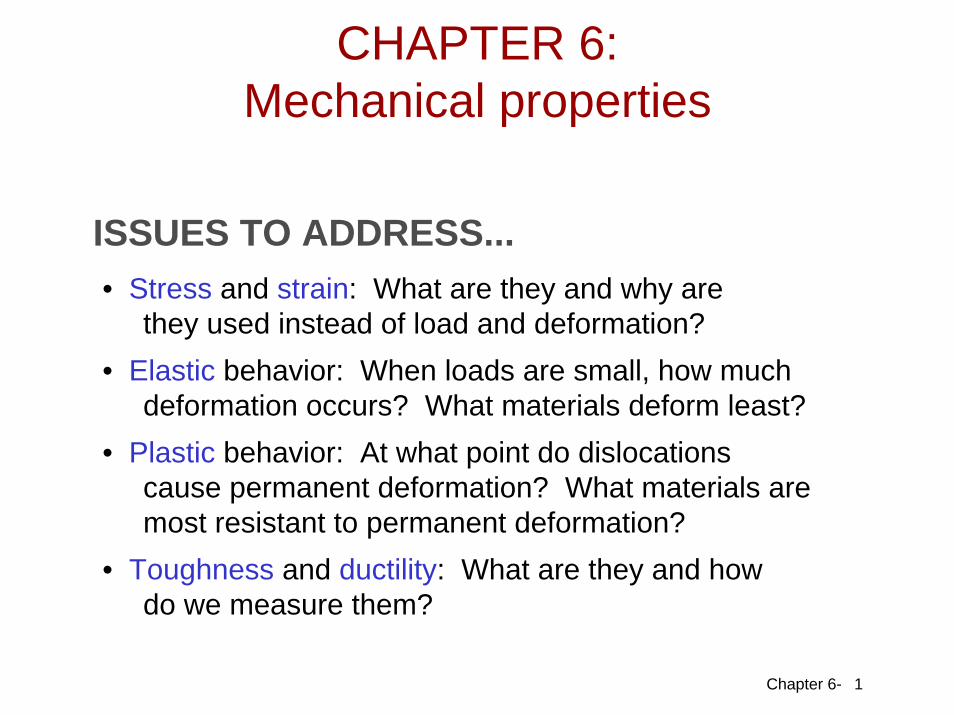
bonds stretch
return to initial
2
1. Initial 2. Small load 3. Unload
Elastic means reversible!
F
δ
Linear- elastic
Non-Linear-elastic
Elastic deformation
Chapter 6- 3
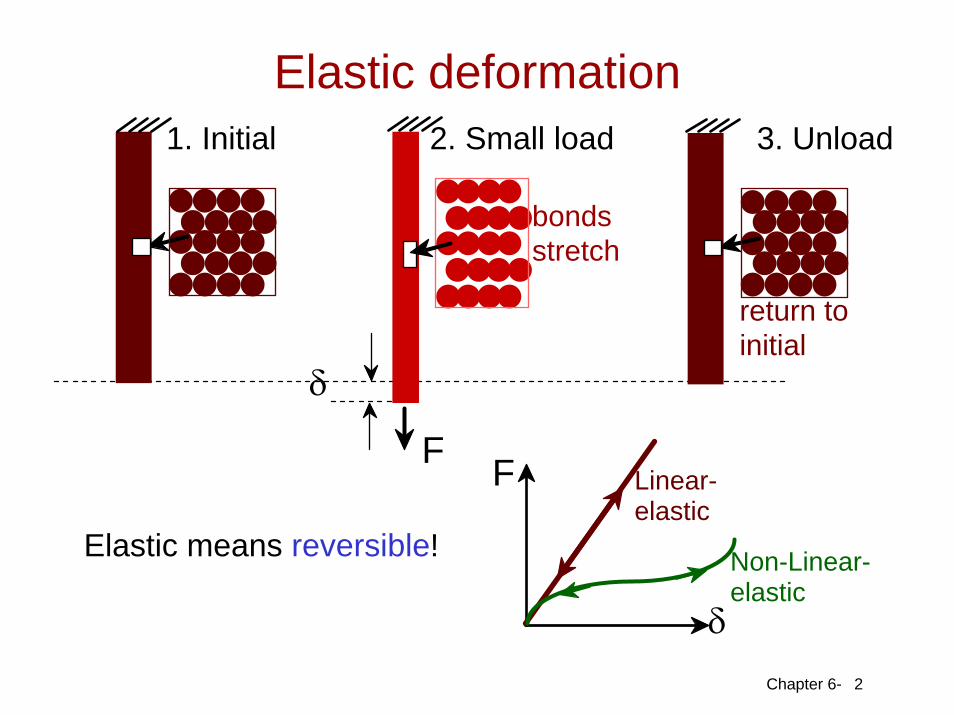
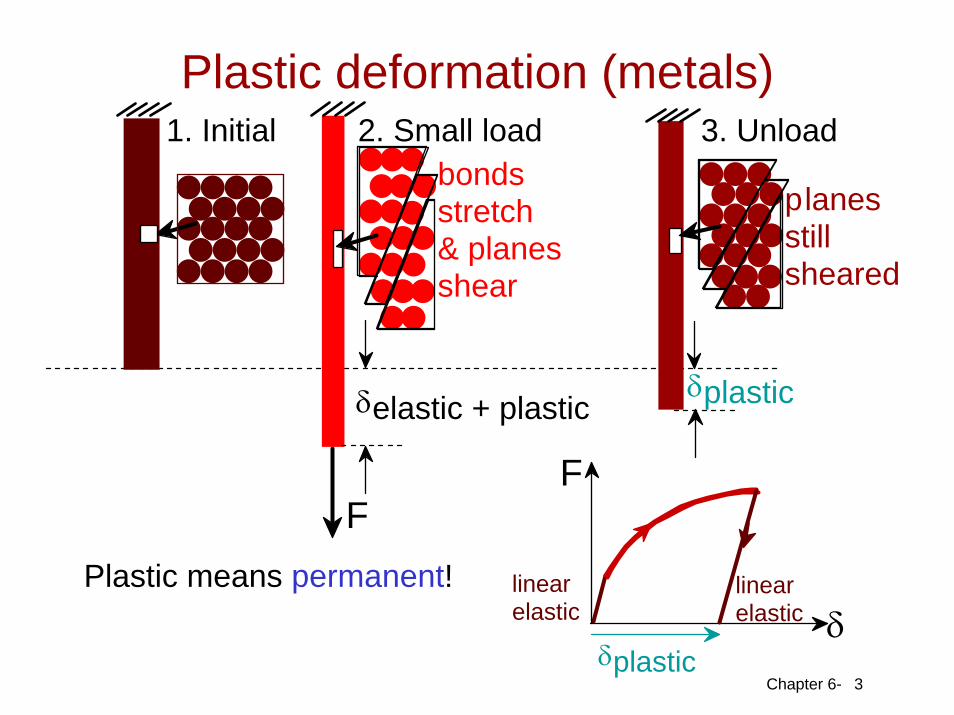
1. Initial 2. Small load 3. Unload
Plastic means permanent!
F
δlinear elastic
linear elastic
δplastic
planes still sheared
F
δelastic + plastic
bonds stretch & planes shear
δplastic
Plastic deformation (metals)
Chapter 6- 4
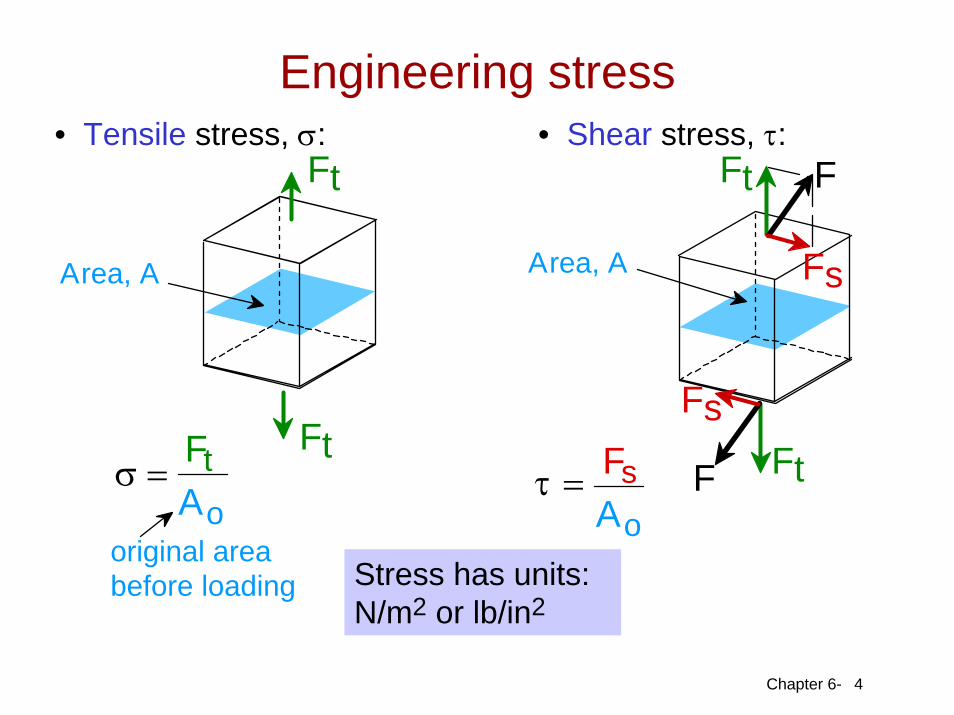
• Tensile stress, σ: • Shear stress, τ:
Area, A
Ft
Ft
σ =FtAo
original area before loading
Area, A
Ft
Ft
Fs
F
F
Fs
τ = FsAo
Stress has units:N/m2 or lb/in2
Engineering stress
Chapter 6- 5
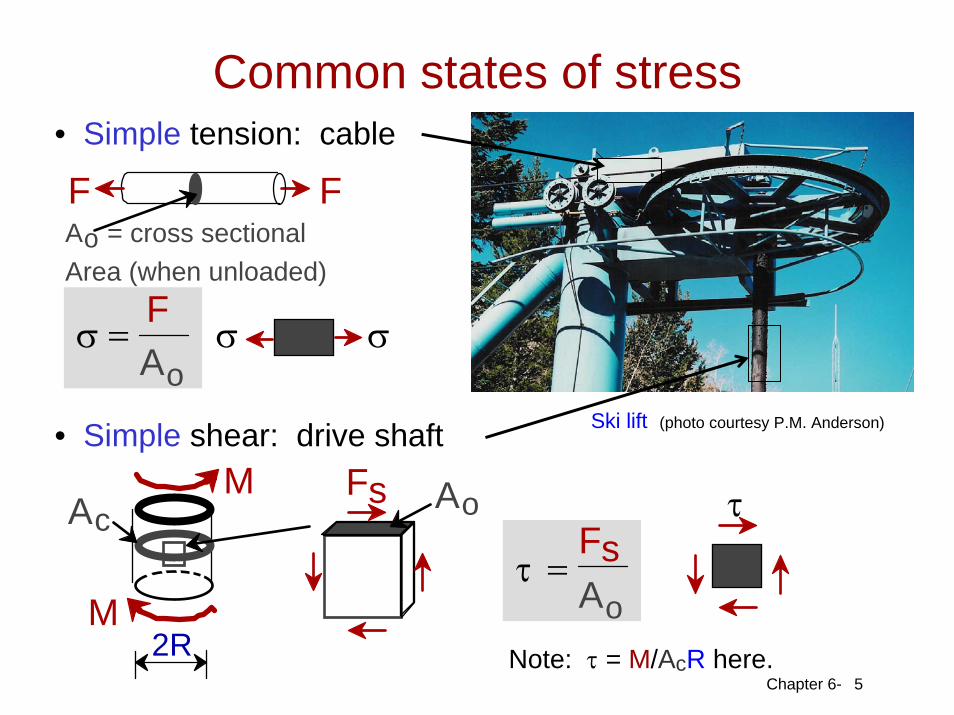
• Simple tension: cable
oσ =
FA
• Simple shear: drive shaft
Ao = cross sectional Area (when unloaded)
FF
σσ
oτ =
FsA
τ
Note: τ = M/AcR here.
Ski lift (photo courtesy P.M. Anderson)
Common states of stress
M
M Ao
2R
FsAc
Chapter 6-
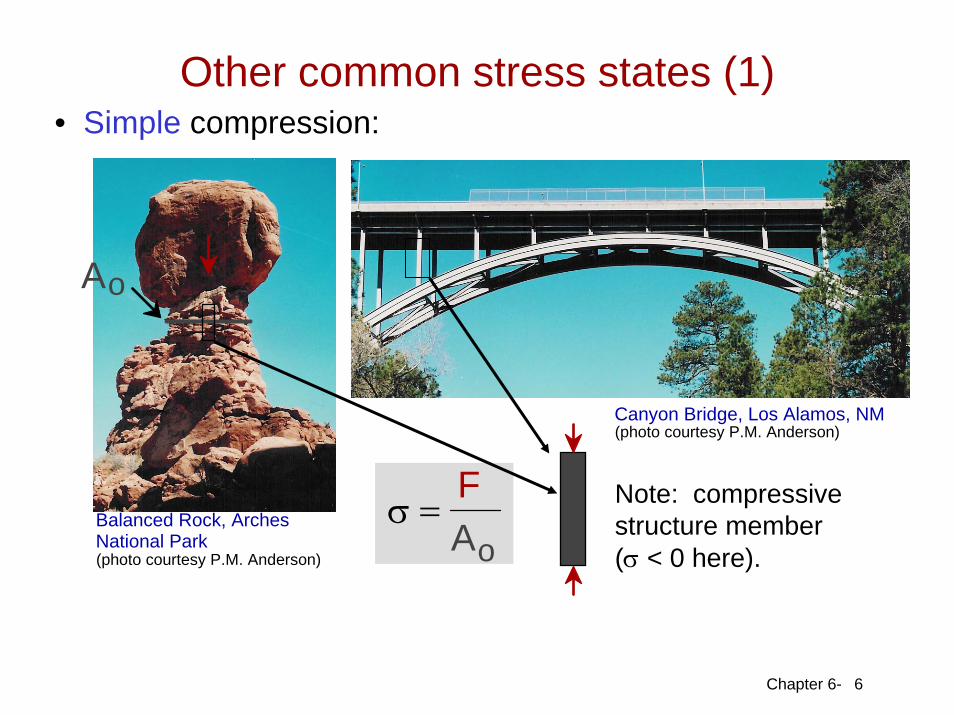
Canyon Bridge, Los Alamos, NM
• Simple compression:
6
Ao
Balanced Rock, Arches National Park o
σ =FA
Note: compressivestructure member(σ < 0 here).
(photo courtesy P.M. Anderson)
(photo courtesy P.M. Anderson)
Other common stress states (1)
Chapter 6- 7
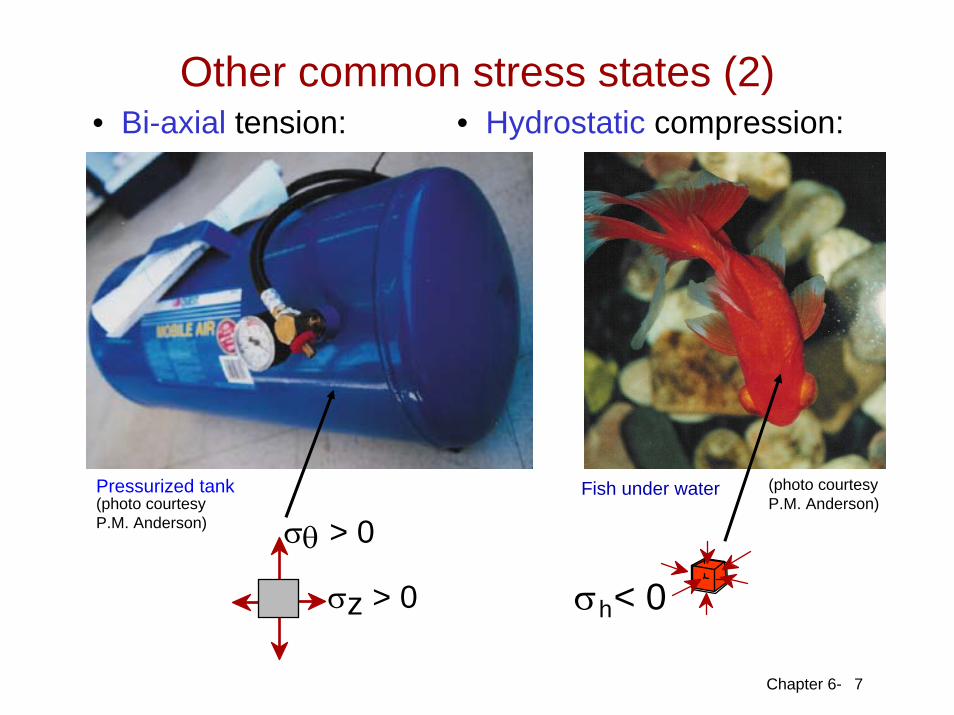
• Bi-axial tension: • Hydrostatic compression:
Fish under waterPressurized tank
σz > 0
σθ > 0(photo courtesyP.M. Anderson)
σ < 0h
(photo courtesyP.M. Anderson)
Other common stress states (2)
Chapter 6- 8
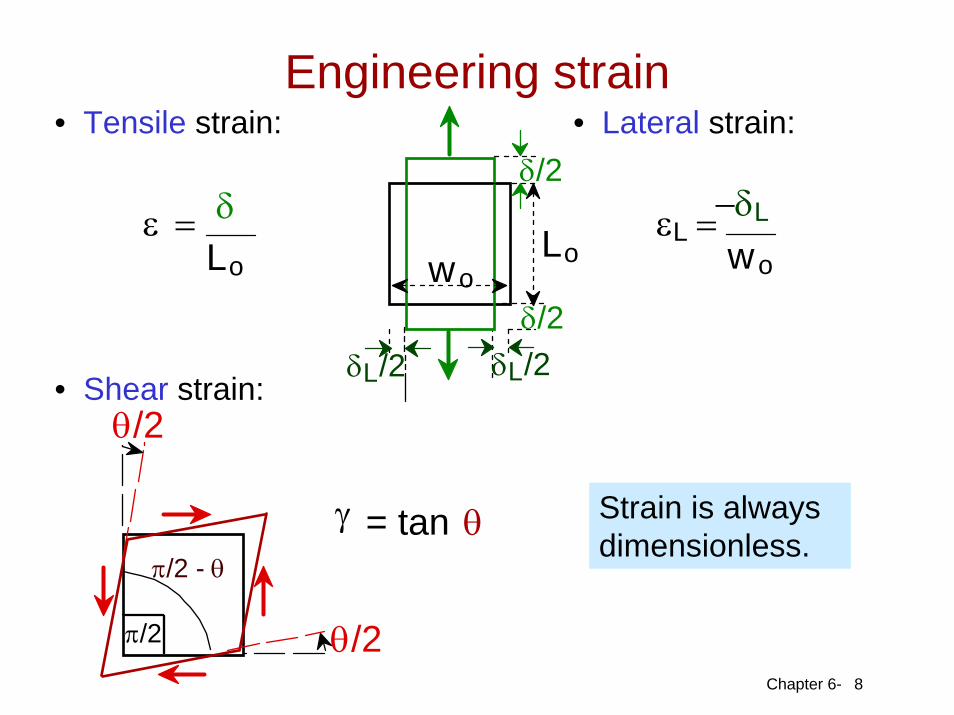
• Tensile strain: • Lateral strain:
• Shear strain:θ/2
π/2
π/2 - θ
θ/2
δ/2
δ/2δL/2δL/2
Lowo
ε = δLo
εL =−δL
wo
γ = tan θ Strain is alwaysdimensionless.
Engineering strain
Chapter 6-
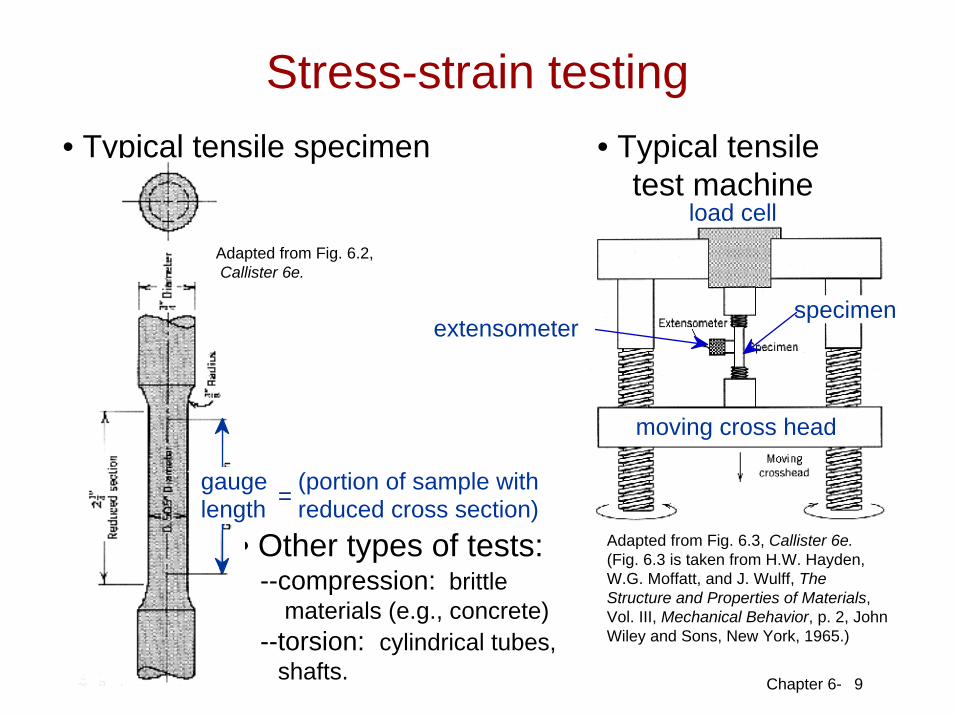
• Typical tensile specimen
9
• Other types of tests:--compression: brittle
materials (e.g., concrete)--torsion: cylindrical tubes,
shafts.
gauge length
(portion of sample with reduced cross section)=
• Typical tensiletest machine
load cell
extensometerspecimen
moving cross head
Adapted from Fig. 6.2,Callister 6e.
Adapted from Fig. 6.3, Callister 6e.(Fig. 6.3 is taken from H.W. Hayden, W.G. Moffatt, and J. Wulff, The Structure and Properties of Materials, Vol. III, Mechanical Behavior, p. 2, John Wiley and Sons, New York, 1965.)
Stress-strain testing
Chapter 6-
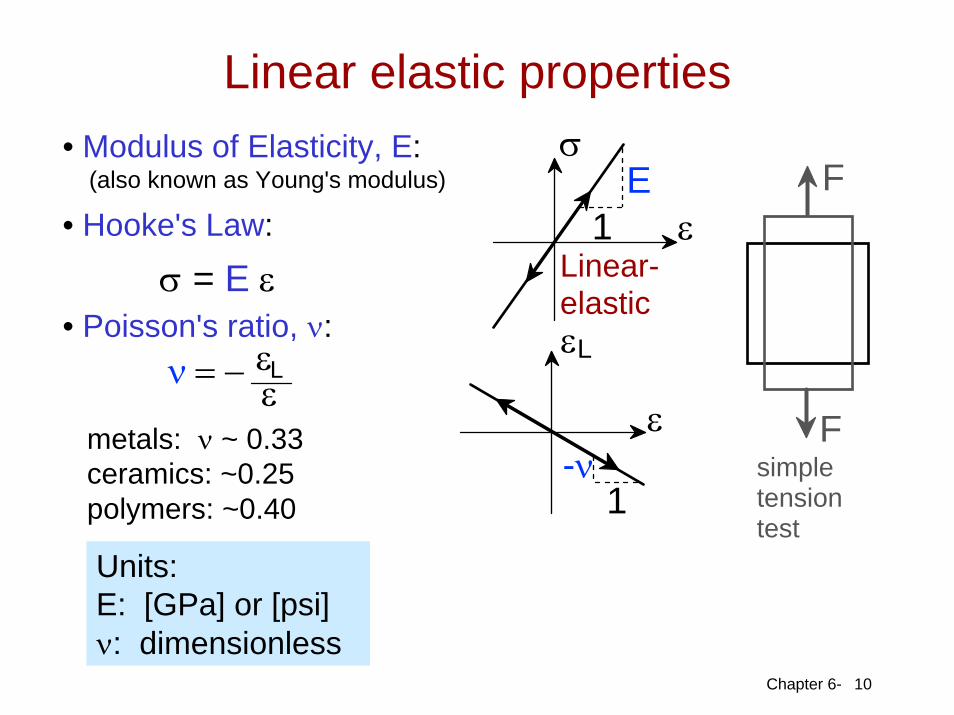
• Modulus of Elasticity, E:(also known as Young's modulus)
10
• Hooke's Law:
σ = E ε• Poisson's ratio, ν:
metals: ν ~ 0.33ceramics: ~0.25polymers: ~0.40
εν = − Lε
εL
ε
1-ν
F
Fsimple tension test
σ
Linear- elastic
1E
ε
Units:E: [GPa] or [psi]ν: dimensionless
Linear elastic properties
Chapter 6-
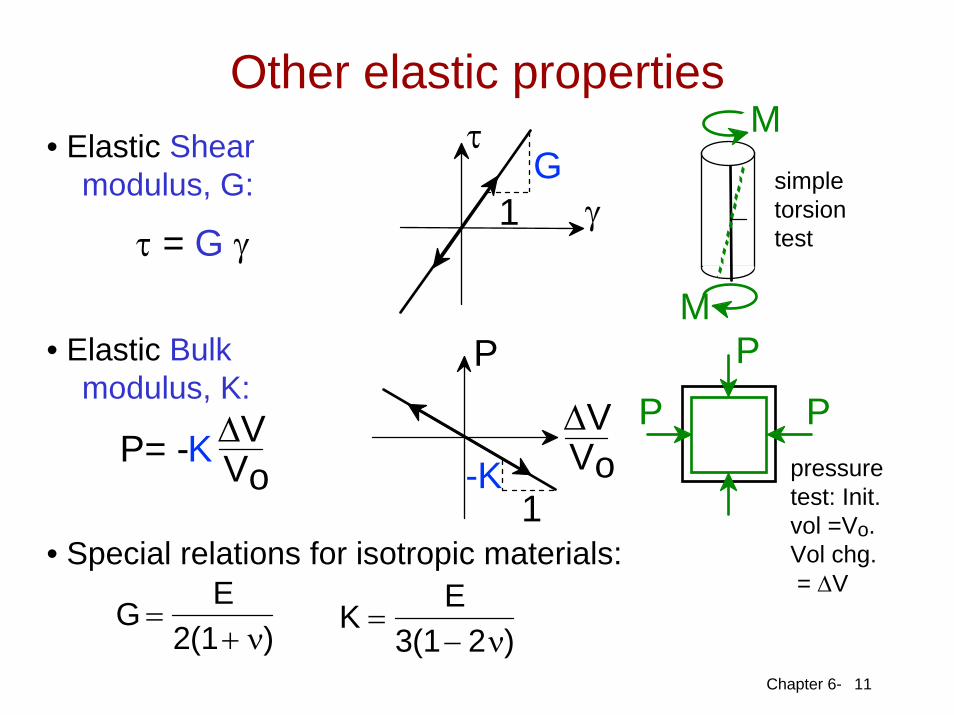
• Elastic Shearmodulus, G:
τ
11
1G
γτ = G γ
• Elastic Bulkmodulus, K:
P= -K ΔVVo
P
ΔV
1-K Vo
• Special relations for isotropic materials:
PP P
M
M
G =
E2(1+ ν)
K =E
3(1− 2ν)
simpletorsiontest
pressuretest: Init.vol =Vo. Vol chg.= ΔV
Other elastic properties
Chapter 6- 120.2
8
0.6
1
Magnesium,Aluminum
Platinum
Silver, Gold
Tantalum
Zinc, Ti
Steel, NiMolybdenum
Graphite
Si crystal
Glass -soda
Concrete
Si nitrideAl oxide
PC
Wood( grain)
AFRE( fibers) *
CFRE*GFRE*
Glass fibers only
Carbon fibers only
Aramid fibers only
Epoxy only
0.4
0.8
2
46
10
20
406080
100
200
600800
10001200
400
Tin
Cu alloys
Tungsten
<100>
<111>
Si carbide
Diamond
PTFE
HDPE
LDPE
PP
Polyester
PSPET
CFRE( fibers) *
GFRE( fibers)*
GFRE(|| fibers)*
AFRE(|| fibers)*
CFRE(|| fibers)*
MetalsAlloys
GraphiteCeramicsSemicond
Polymers Composites/fibers
E(GPa)
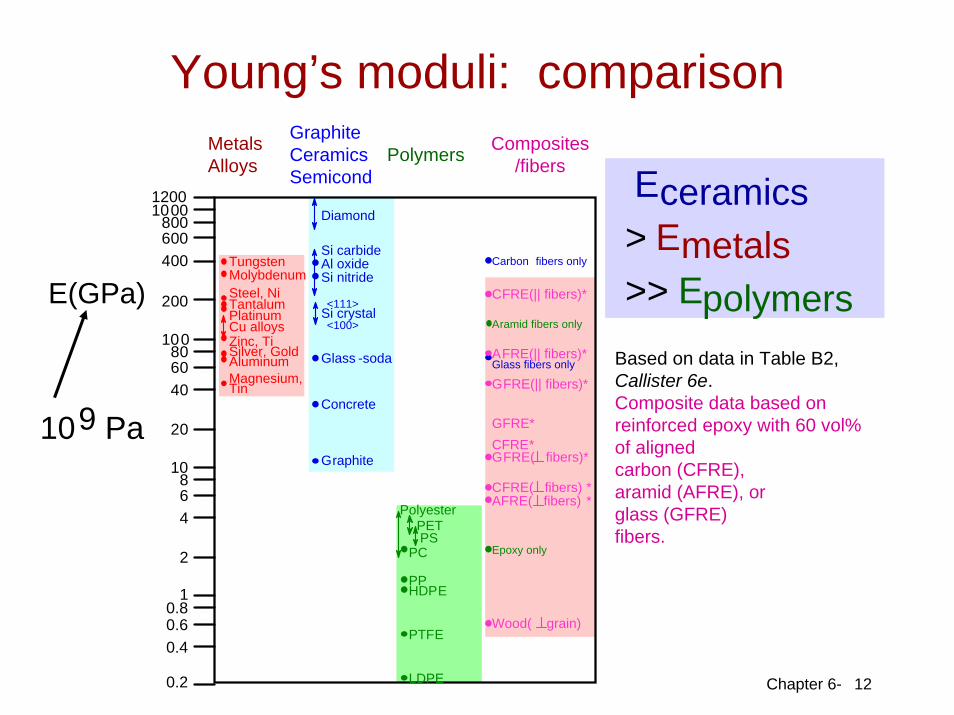
Eceramics > Emetals >> Epolymers
109 Pa
Based on data in Table B2,Callister 6e.Composite data based onreinforced epoxy with 60 vol%of alignedcarbon (CFRE),aramid (AFRE), orglass (GFRE)fibers.
Young’s moduli: comparison
Chapter 6-
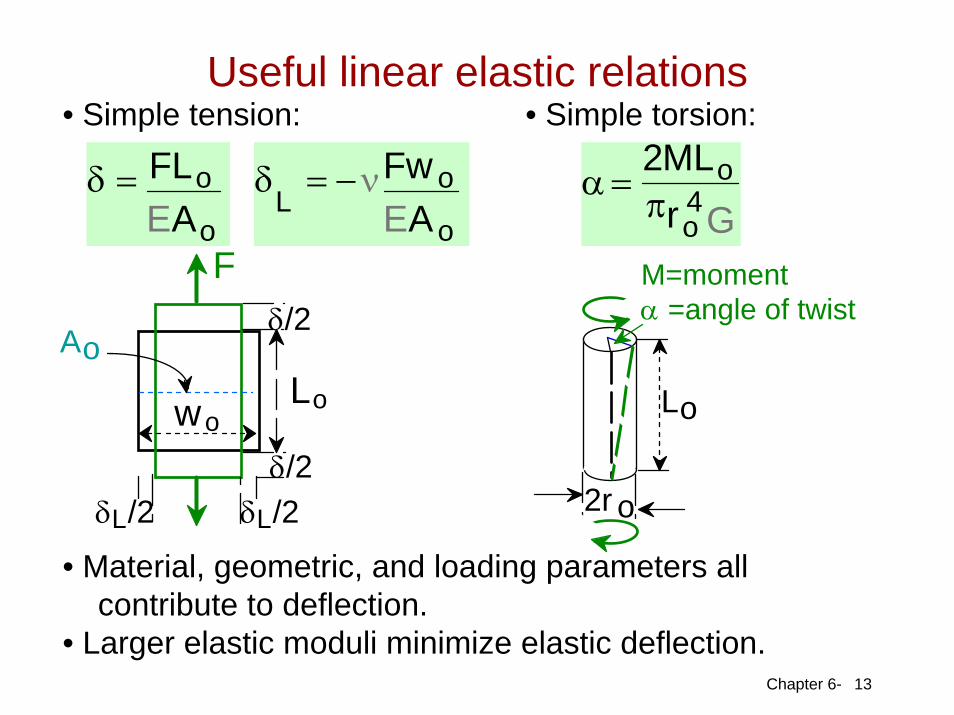
• Simple tension:
δ = FLoEAo
13
δL
= −νFw oEAo
δ/2
δ/2δL/2δL/2
Lowo
F
Ao
• Simple torsion:
M=moment α =angle of twist
2r o
Lo
α =2MLoπro
4G
• Material, geometric, and loading parameters allcontribute to deflection.
• Larger elastic moduli minimize elastic deflection.
Useful linear elastic relations
Chapter 6- 14
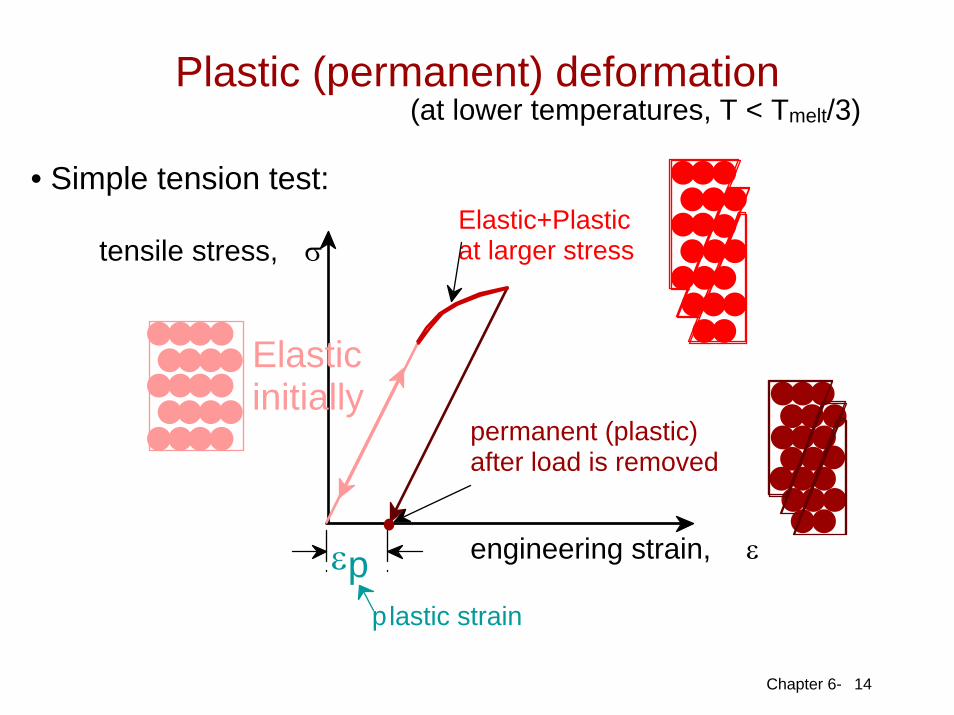
• Simple tension test:
tensile stress, σ
engineering strain, ε
(at lower temperatures, T < Tmelt/3)
Elastic initially
Elastic+Plastic at larger stress
permanent (plastic) after load is removed
εpplastic strain
Plastic (permanent) deformation
Chapter 6- 15
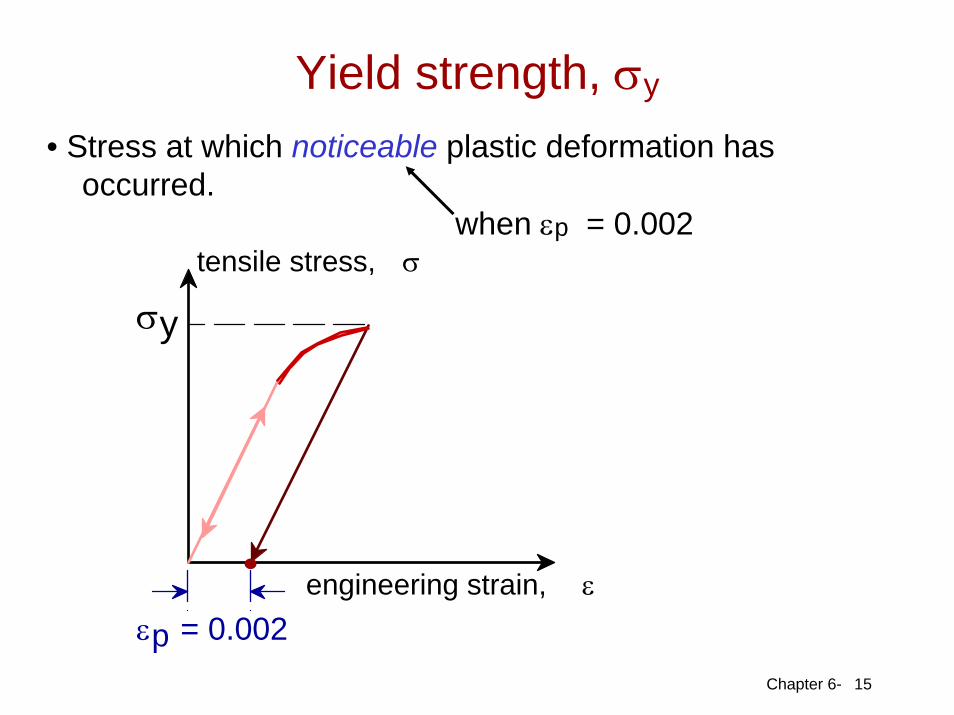
• Stress at which noticeable plastic deformation hasoccurred.
when εp = 0.002 tensile stress, σ
engineering strain, ε
σy
εp = 0.002
Yield strength, σy
Chapter 6- 16
Graphite/ Ceramics/ Semicond
Metals/ Alloys
Composites/ fibersPolymers
Yie
ld s
treng
th,
σ y (M
Pa)
PVC
Har
d to
mea
sure
, si
nce
in te
nsio
n, fr
actu
re u
sual
ly o
ccur
s be
fore
yie
ld.
Nylon 6,6
LDPE
70
20
40
6050
100
10
30
200
300400500600700
1000
2000
Tin (pure)
Al (6061) a
Al (6061) ag
Cu (71500) hrTa (pure)Ti (pure) aSteel (1020) hr
Steel (1020) cdSteel (4140) a
Steel (4140) qt
Ti (5Al-2.5Sn) aW (pure)
Mo (pure)Cu (71500) cw
Har
d to
mea
sure
, in
cer
amic
mat
rix a
nd e
poxy
mat
rix c
ompo
site
s, s
ince
in
tens
ion,
frac
ture
usu
ally
occ
urs
befo
re y
ield
.HDPEPP
humid
dryPC
PET
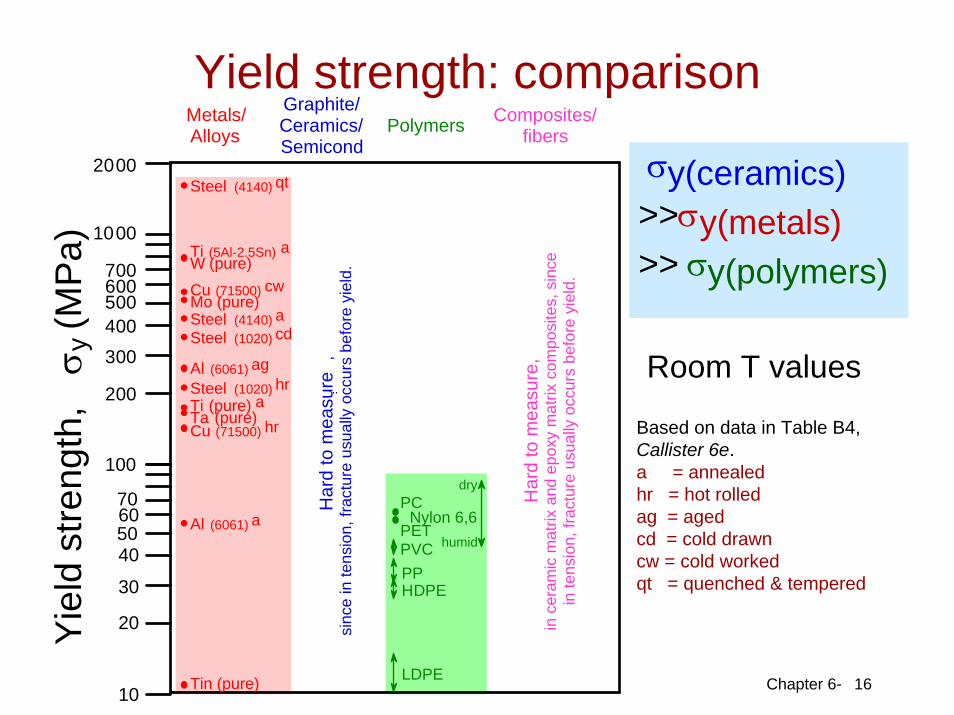
¨Room T values
σy(ceramics) >>σy(metals) >> σy(polymers)
Based on data in Table B4,Callister 6e.a = annealedhr = hot rolledag = agedcd = cold drawncw = cold workedqt = quenched & tempered
Yield strength: comparison
Chapter 6- 17
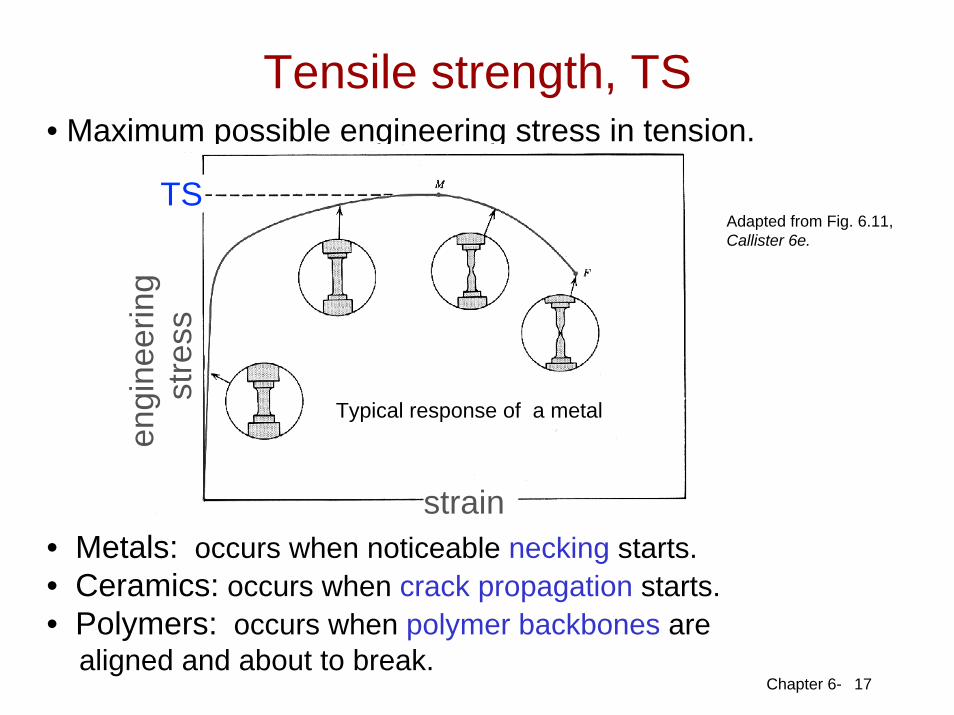
• Maximum possible engineering stress in tension.
• Metals: occurs when noticeable necking starts.• Ceramics: occurs when crack propagation starts.• Polymers: occurs when polymer backbones are
aligned and about to break.
Adapted from Fig. 6.11, Callister 6e.
Tensile strength, TS
strain
eng
inee
ring
stre
ssTS
Typical response of a metal
Chapter 6- 18
Room T valuesSi crystal
<100>
Graphite/ Ceramics/ Semicond
Metals/ Alloys
Composites/ fibersPolymers
Tens
ile s
treng
th, T
S
(MP
a)
PVC
Nylon 6,6
10
100
200300
1000
Al (6061) a
Al (6061) agCu (71500) hr
Ta (pure)Ti (pure) aSteel (1020)
Steel (4140) a
Steel (4140) qt
Ti (5Al-2.5Sn) aW (pure)
Cu (71500) cw
LDPE
PPPC PET
20
3040
20003000
5000
Graphite
Al oxide
Concrete
Diamond
Glass-soda
Si nitride
HDPE
wood ( fiber)
wood(|| fiber)
1
GFRE(|| fiber)
GFRE( fiber)
CFRE(|| fiber)
CFRE( fiber)
AFRE(|| fiber)
AFRE( fiber)
E-glass fibC fibers
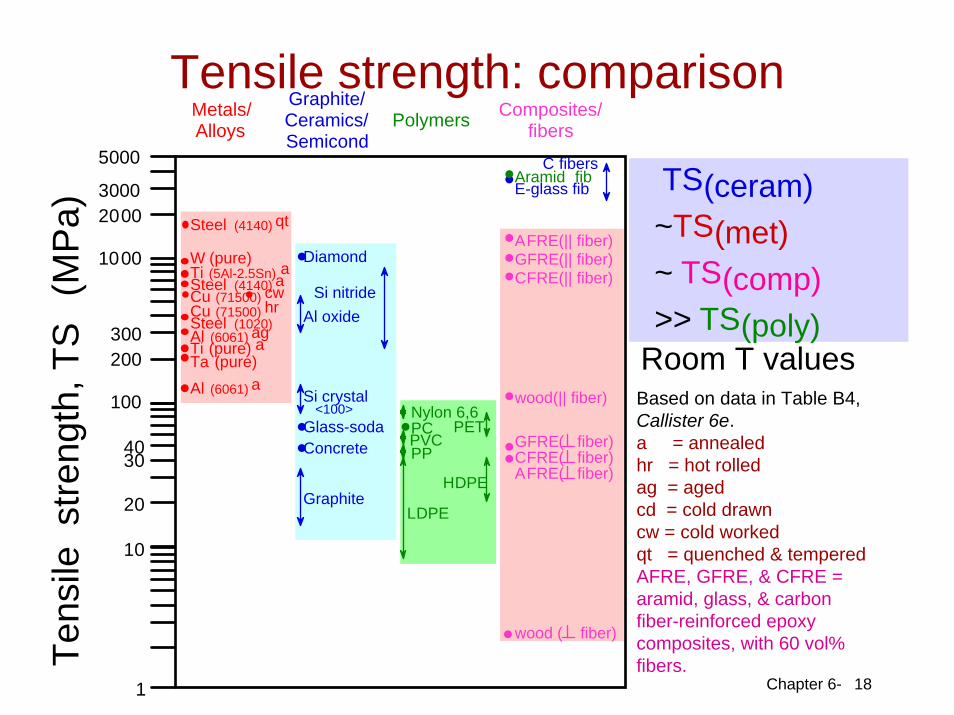
Aramid fib TS(ceram) ~TS(met) ~ TS(comp) >> TS(poly)
Based on data in Table B4,Callister 6e.a = annealedhr = hot rolledag = agedcd = cold drawncw = cold workedqt = quenched & temperedAFRE, GFRE, & CFRE =aramid, glass, & carbonfiber-reinforced epoxycomposites, with 60 vol%fibers.
Tensile strength: comparison
Chapter 6-
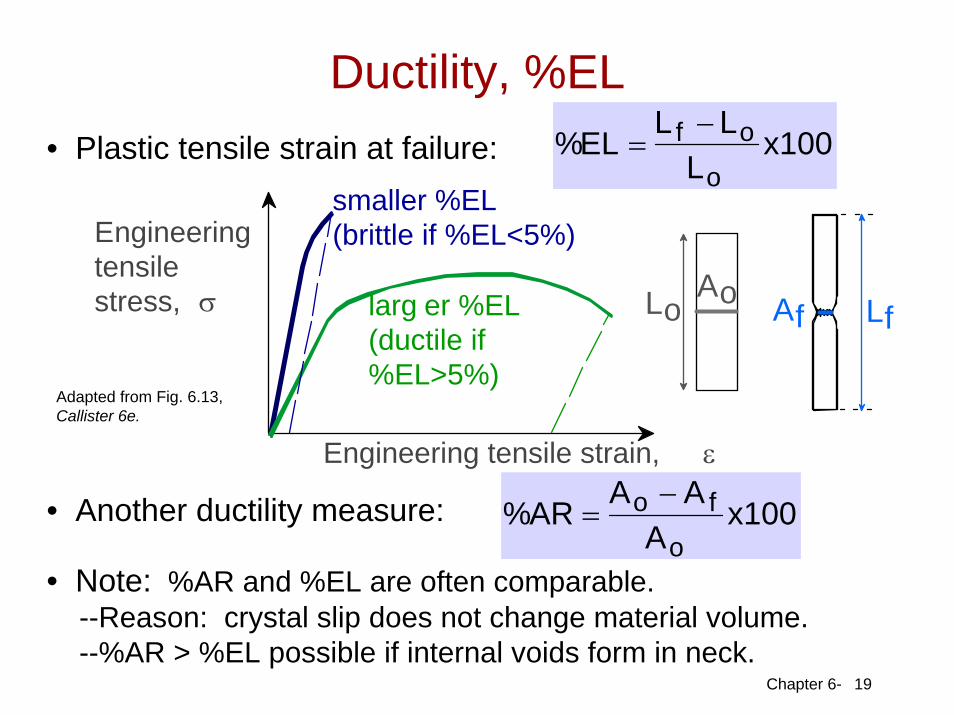
• Plastic tensile strain at failure:
19
Engineering tensile strain, ε
Engineering tensile stress, σ
smaller %EL (brittle if %EL<5%)
larg er %EL (ductile if %EL>5%)
• Another ductility measure: %AR =
Ao − AfAo
x100
• Note: %AR and %EL are often comparable.--Reason: crystal slip does not change material volume.--%AR > %EL possible if internal voids form in neck.
Lo LfAo Af
%EL =
Lf − LoLo
x100
Adapted from Fig. 6.13, Callister 6e.
Ductility, %EL
Chapter 6-
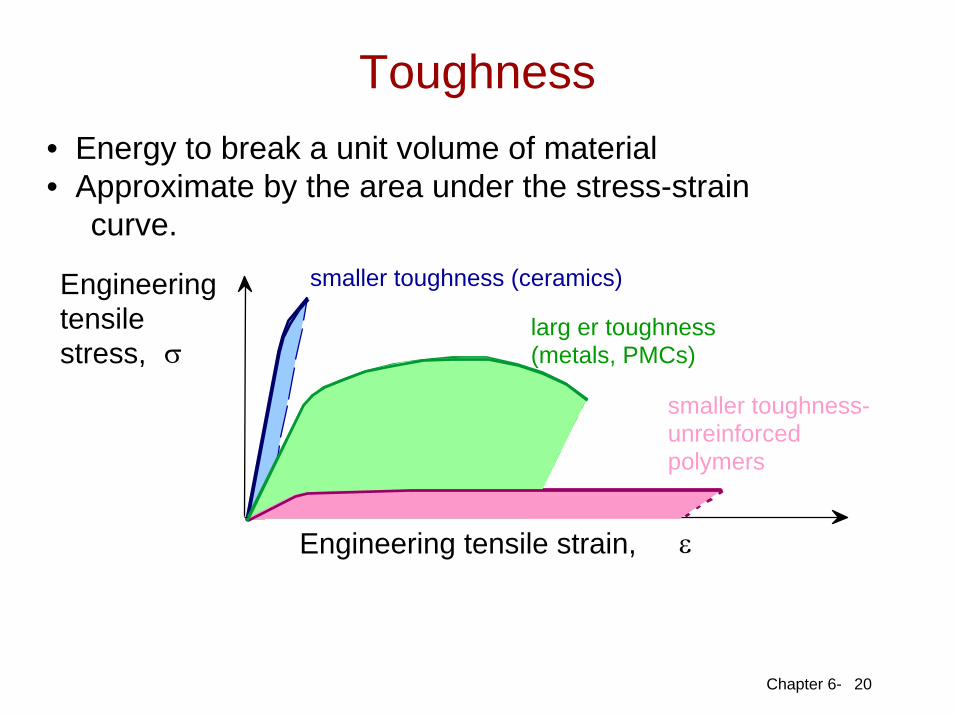
• Energy to break a unit volume of material• Approximate by the area under the stress-strain
curve.
20
smaller toughness-unreinforcedpolymers
Engineering tensile strain, ε
Engineeringtensile stress, σ
smaller toughness (ceramics)
larg er toughness (metals, PMCs)
Toughness
Chapter 6-
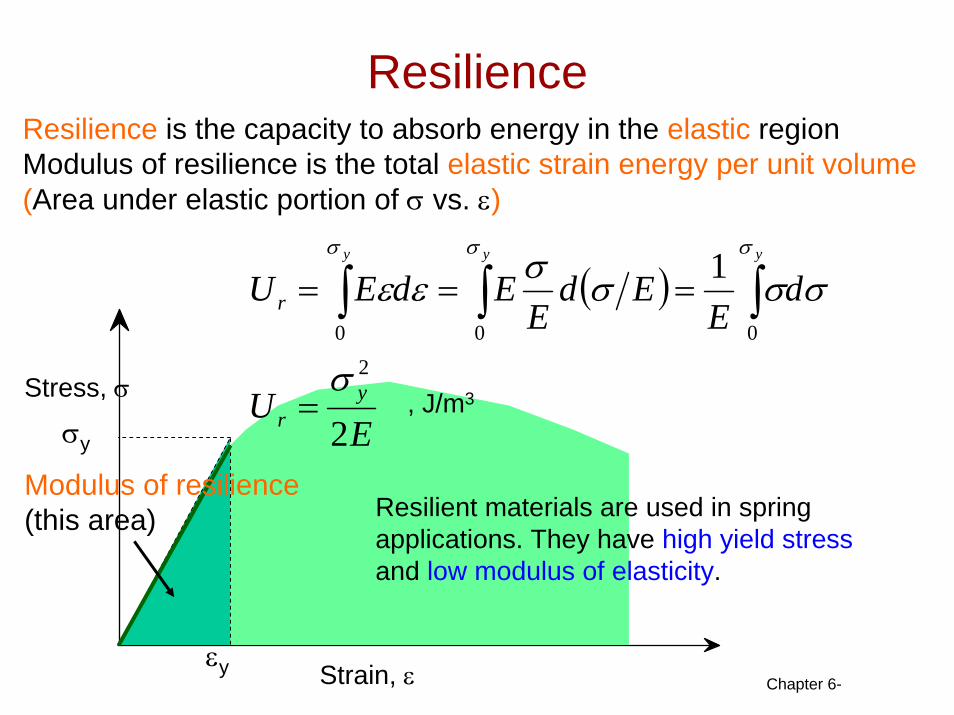
Resilience
σy
Resilience is the capacity to absorb energy in the elastic regionModulus of resilience is the total elastic strain energy per unit volume (Area under elastic portion of σ vs. ε)
Modulus of resilience(this area)
( )
EU
dE
EdE
EdEU
yr
r
yyy
2
1
2000
σ
σσσσεεσσσ
=
=== ∫∫∫
Resilient materials are used in spring applications. They have high yield stressand low modulus of elasticity.
Strain, εεy
Stress, σ , J/m3
Chapter 6-
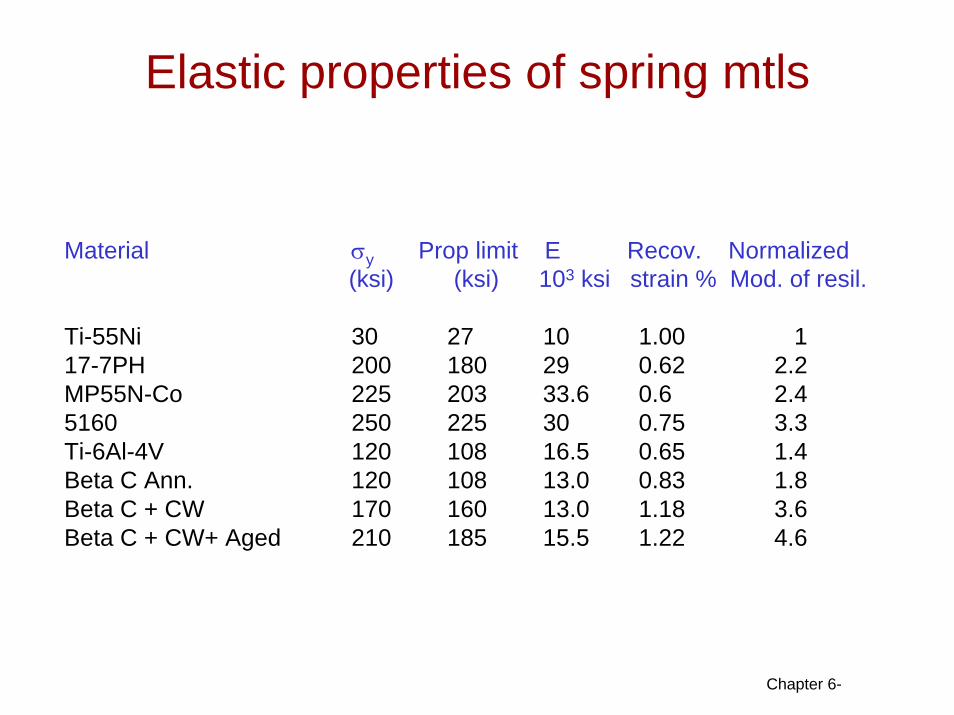
Elastic properties of spring mtls
Material σy Prop limit E Recov. Normalized(ksi) (ksi) 103 ksi strain % Mod. of resil.
Ti-55Ni 30 27 10 1.00 117-7PH 200 180 29 0.62 2.2MP55N-Co 225 203 33.6 0.6 2.45160 250 225 30 0.75 3.3Ti-6Al-4V 120 108 16.5 0.65 1.4Beta C Ann. 120 108 13.0 0.83 1.8Beta C + CW 170 160 13.0 1.18 3.6Beta C + CW+ Aged 210 185 15.5 1.22 4.6
Chapter 6-
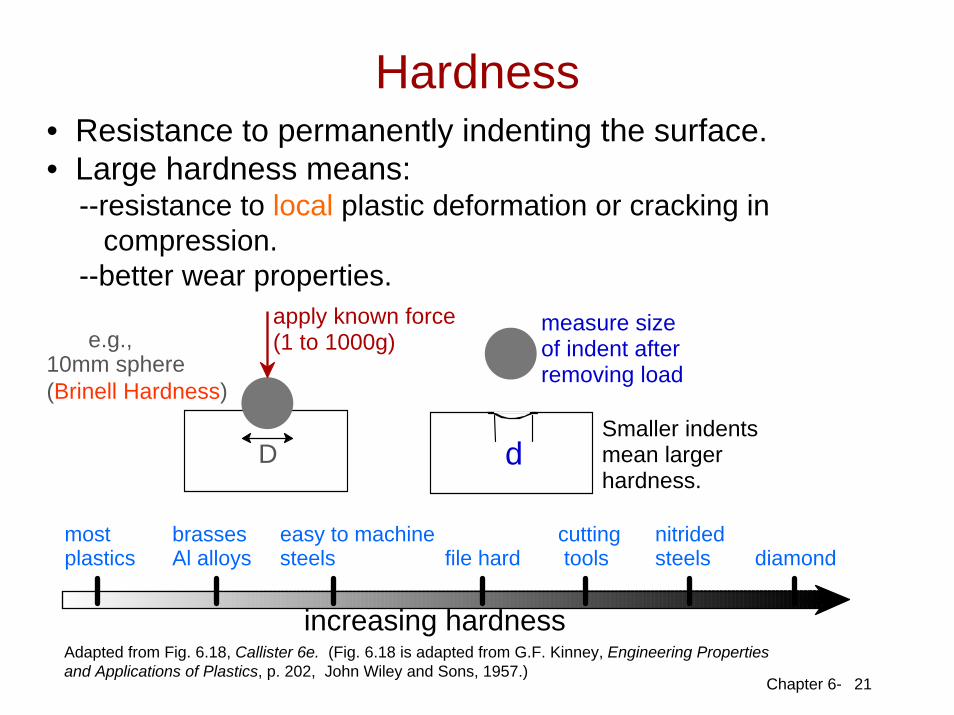
• Resistance to permanently indenting the surface.• Large hardness means:
--resistance to local plastic deformation or cracking incompression.
--better wear properties.
21
e.g., 10mm sphere(Brinell Hardness)
apply known force (1 to 1000g)
measure size of indent after removing load
dDSmaller indents mean larger hardness.
increasing hardness
most plastics
brasses Al alloys
easy to machine steels file hard
cutting tools
nitrided steels diamond
Adapted from Fig. 6.18, Callister 6e. (Fig. 6.18 is adapted from G.F. Kinney, Engineering Propertiesand Applications of Plastics, p. 202, John Wiley and Sons, 1957.)
Hardness
Chapter 6-
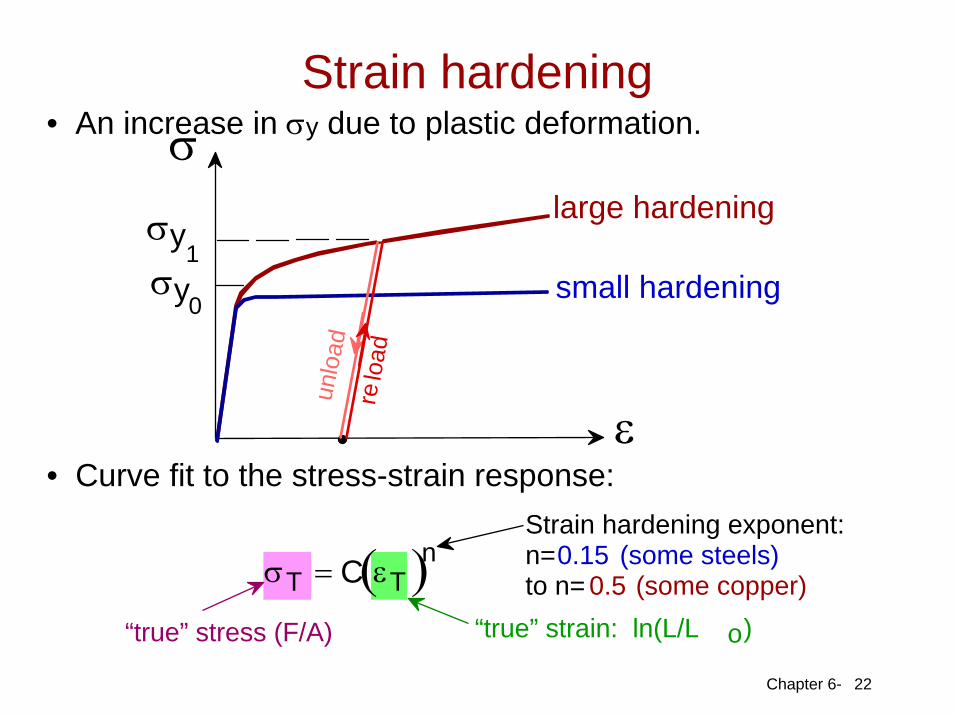
• An increase in σy due to plastic deformation.
• Curve fit to the stress-strain response:
22
σ
ε
large hardening
small hardeningun
load
relo
ad
σy 0
σy 1
σT = C εT( )n“true” stress (F/A) “true” strain: ln(L/L o)
Strain hardening exponent:n=0.15 (some steels)to n= 0.5 (some copper)
Strain hardening
Chapter 6-
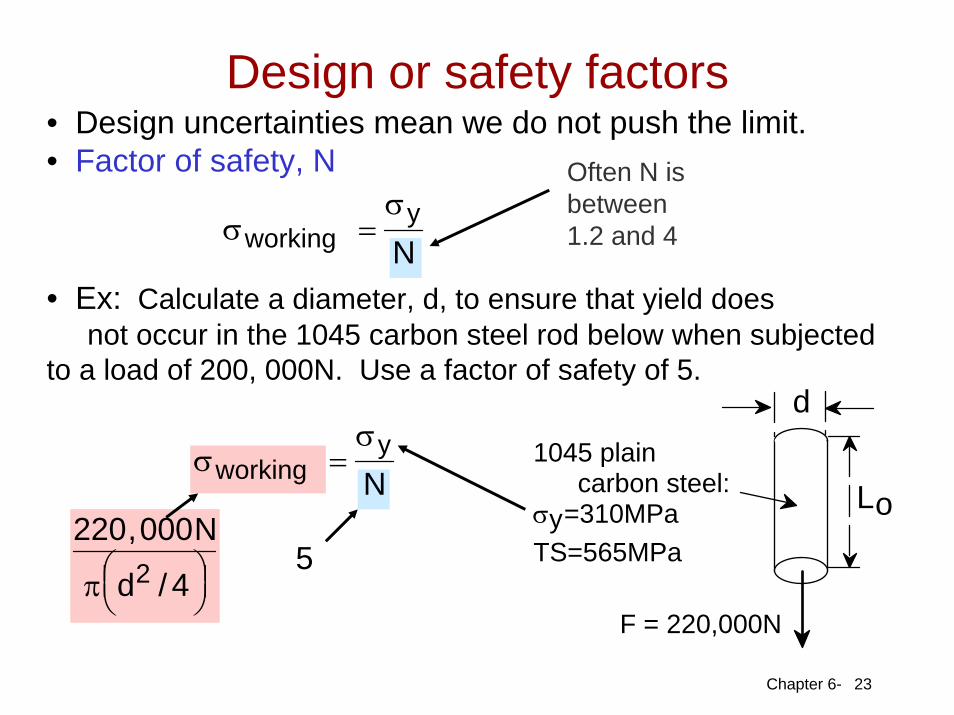
• Design uncertainties mean we do not push the limit.• Factor of safety, N
23
σworking =
σyN
Often N isbetween1.2 and 4
• Ex: Calculate a diameter, d, to ensure that yield doesnot occur in the 1045 carbon steel rod below when subjected
to a load of 200, 000N. Use a factor of safety of 5.
1045 plain carbon steel: σy=310MPa TS=565MPa
F = 220,000N
d
Lo σworking =
σyN
220,000N
π d2 / 4⎛ ⎝ ⎜ ⎞
⎠ ⎟ 5
Design or safety factors
Chapter 6-
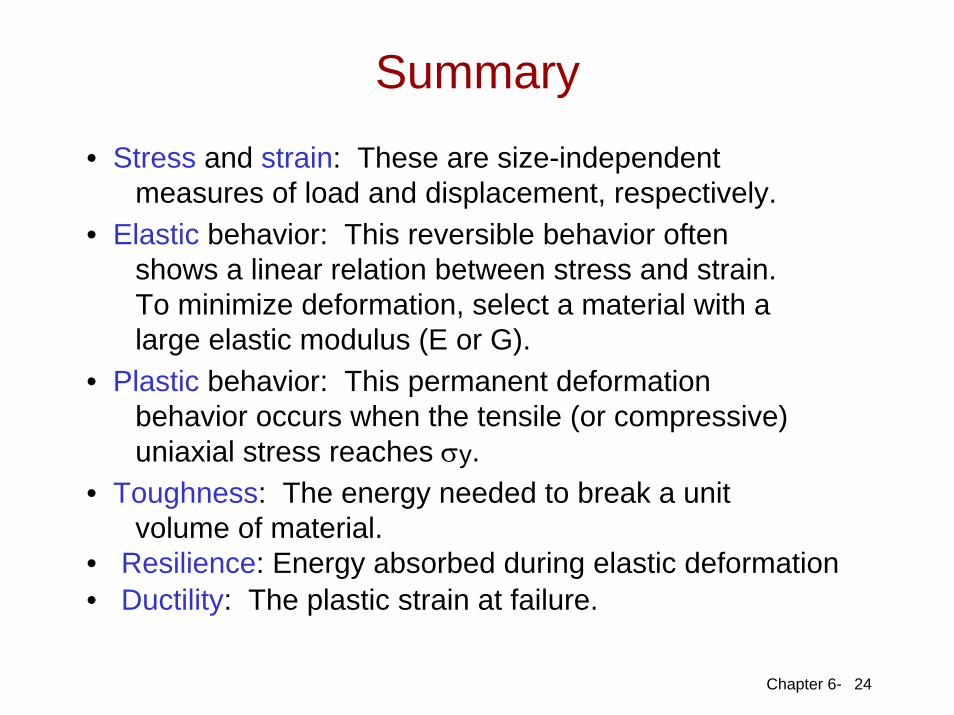
• Stress and strain: These are size-independentmeasures of load and displacement, respectively.
• Elastic behavior: This reversible behavior oftenshows a linear relation between stress and strain.To minimize deformation, select a material with alarge elastic modulus (E or G).
• Plastic behavior: This permanent deformationbehavior occurs when the tensile (or compressive)uniaxial stress reaches σy.
• Toughness: The energy needed to break a unitvolume of material.
• Resilience: Energy absorbed during elastic deformation• Ductility: The plastic strain at failure.
24
Summary
Chapter 6-
Reading: Chapter 6.1-12
Core Problems: Chapter 6, Problems 4, 8, 25, 29, 46
Self-help Problems: Review Example problems 6.2, 6.3, 6.4, 6.4, 6.5
0
ANNOUNCEMENTS
Course Title : Material ScienceCourse Number : EMEC 2430
Credits : 4
Dr. M Shaaban Hussain
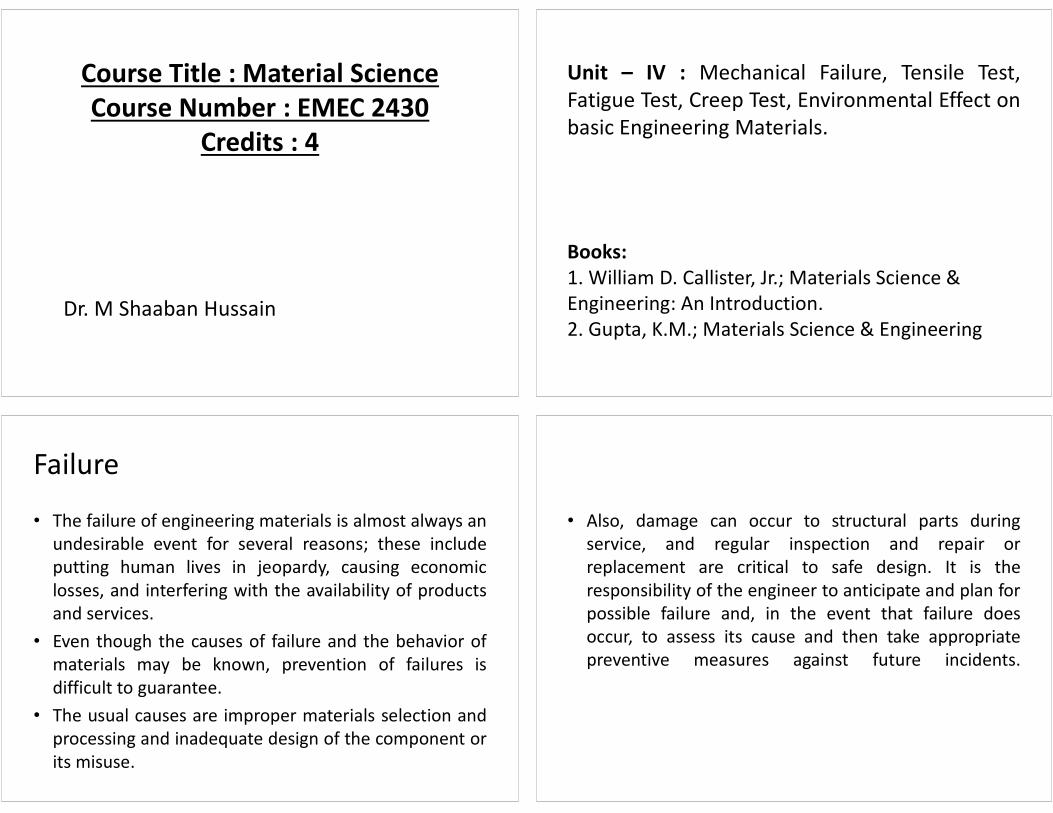
Unit – IV : Mechanical Failure, Tensile Test,Fatigue Test, Creep Test, Environmental Effect onbasic Engineering Materials.
Books:1. William D. Callister, Jr.; Materials Science & Engineering: An Introduction.2. Gupta, K.M.; Materials Science & Engineering
Failure
• The failure of engineering materials is almost always anundesirable event for several reasons; these includeputting human lives in jeopardy, causing economiclosses, and interfering with the availability of productsand services.
• Even though the causes of failure and the behavior ofmaterials may be known, prevention of failures isdifficult to guarantee.
• The usual causes are improper materials selection andprocessing and inadequate design of the component orits misuse.
• Also, damage can occur to structural parts duringservice, and regular inspection and repair orreplacement are critical to safe design. It is theresponsibility of the engineer to anticipate and plan forpossible failure and, in the event that failure doesoccur, to assess its cause and then take appropriatepreventive measures against future incidents.
Mechanical Properties
• Three factors that should be considered indesigning laboratory tests to assess themechanical characteristics of materials for serviceuse are:
• the nature of the applied load (i.e., tension,compression, shear),
• load duration, and
• environmental conditions.
Fracture
• Simple fracture is the separation of a body into two ormore pieces in response to an imposed stress that isstatic (i.e., constant or slowly changing with time) andat temperatures that are low relative to the meltingtemperature of the material.
• Fracture can also occur from fatigue (when cyclicstresses are imposed) and creep (time-dependentdeformation, normally at elevated temperatures)
• Although applied stresses may be tensile,compressive, shear, or torsional (or combinations ofthese)
• For metals, two fracture modes are possible: ductile andbrittle. Classification is based on the ability of a materialto experience plastic deformation.
• Ductile metals typically exhibit substantial plasticdeformation with high energy absorption before fracture.However, there is normally little or no plasticdeformation with low energy absorption accompanying abrittle fracture.
• Any fracture process involves two steps—crack formationand propagation—in response to an imposed stress.
• The mode of fracture is highly dependent on themechanism of crack propagation.
• Ductile fracture is characterized by extensive plasticdeformation in the vicinity of an advancing crack.
• Furthermore, the process proceeds relatively slowly asthe crack length is extended. Such a crack is often saidto be stable—that is, it resists any further extensionunless there is an increase in the applied stress.
• In addition, there typically is evidence of appreciablegross deformation at the fracture surfaces (e.g.,twisting and tearing).
• However, for brittle fracture, cracks may spreadextremely rapidly, with very little accompanying plasticdeformation
• Such cracks may be said to be unstable, and crackpropagation, once started, continues spontaneouslywithout an increase in magnitude of the applied stress.
• Ductile fracture is almost always preferred to brittlefracture for two reasons:
• First, brittle fracture occurs suddenly and catastrophicallywithout any warning; this is a consequence of thespontaneous and rapid crack propagation.
• However, for ductile fracture, the presence of plasticdeformation gives warning that failure is imminent,allowing preventive measures to be taken.
• Second, more strain energy is required to induce ductilefracture in as much as these materials are generallytougher.
• Under the action of an applied tensile stress, many metalalloys are ductile, whereas ceramics are typically brittle,and polymers may exhibit a range of behaviors.
DUCTILE FRACTURE
• Ductile fracture surfaces have distinctive features on bothmacroscopic and microscopic levels.
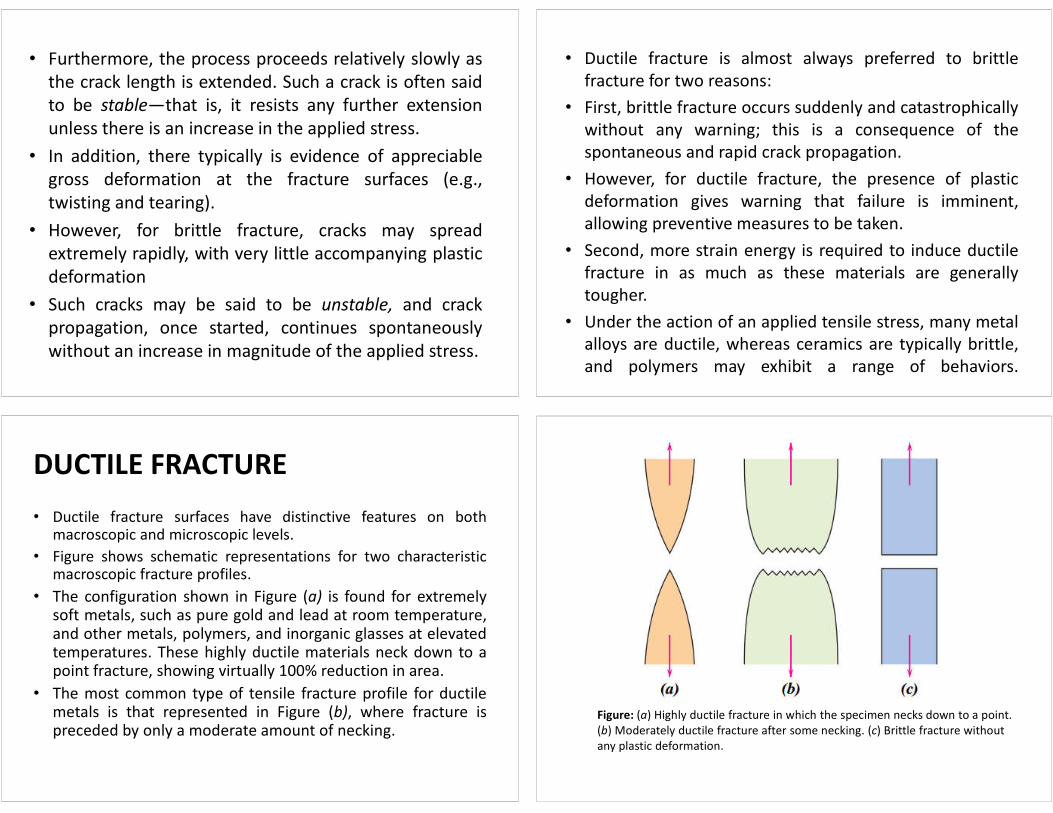
• Figure shows schematic representations for two characteristicmacroscopic fracture profiles.
• The configuration shown in Figure (a) is found for extremelysoft metals, such as pure gold and lead at room temperature,and other metals, polymers, and inorganic glasses at elevatedtemperatures. These highly ductile materials neck down to apoint fracture, showing virtually 100% reduction in area.
• The most common type of tensile fracture profile for ductilemetals is that represented in Figure (b), where fracture ispreceded by only a moderate amount of necking.
Figure: (a) Highly ductile fracture in which the specimen necks down to a point.(b) Moderately ductile fracture after some necking. (c) Brittle fracture without any plastic deformation.
Mechanism of Fracture (Ductile)
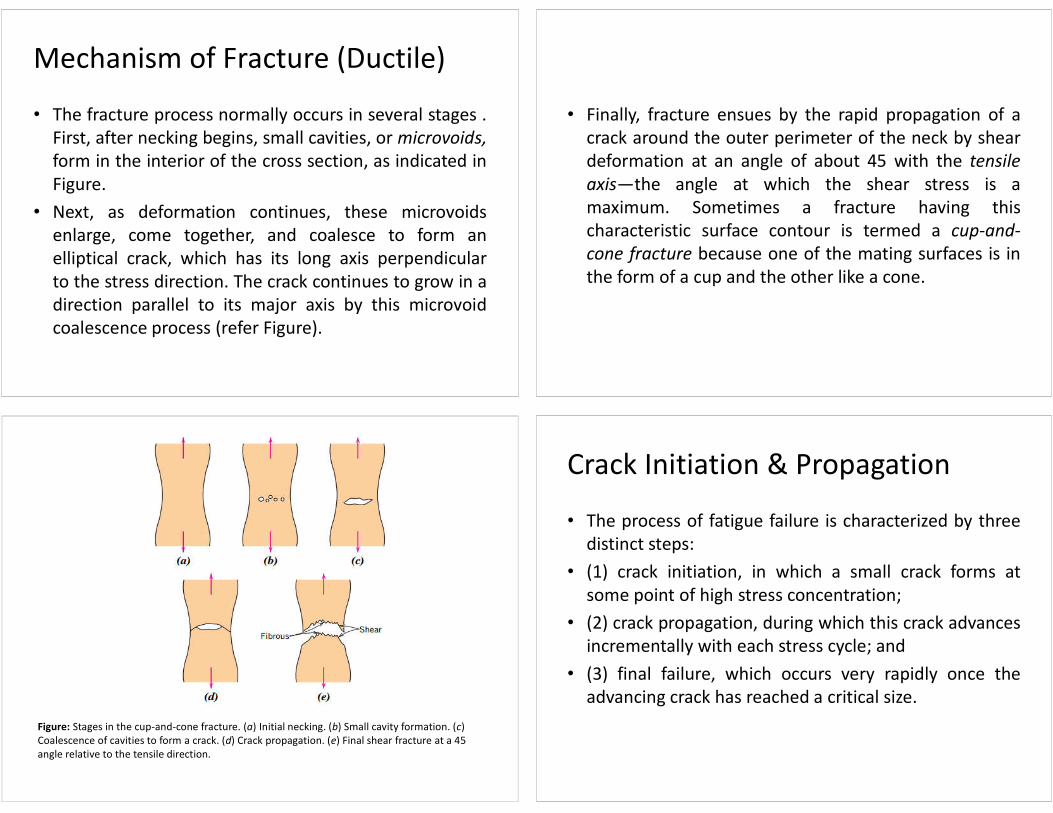
• The fracture process normally occurs in several stages .First, after necking begins, small cavities, or microvoids,form in the interior of the cross section, as indicated inFigure.
• Next, as deformation continues, these microvoidsenlarge, come together, and coalesce to form anelliptical crack, which has its long axis perpendicularto the stress direction. The crack continues to grow in adirection parallel to its major axis by this microvoidcoalescence process (refer Figure).
• Finally, fracture ensues by the rapid propagation of acrack around the outer perimeter of the neck by sheardeformation at an angle of about 45 with the tensileaxis—the angle at which the shear stress is amaximum. Sometimes a fracture having thischaracteristic surface contour is termed a cup-and-cone fracture because one of the mating surfaces is inthe form of a cup and the other like a cone.
Figure: Stages in the cup-and-cone fracture. (a) Initial necking. (b) Small cavity formation. (c) Coalescence of cavities to form a crack. (d) Crack propagation. (e) Final shear fracture at a 45angle relative to the tensile direction.
Crack Initiation & Propagation
• The process of fatigue failure is characterized by threedistinct steps:
• (1) crack initiation, in which a small crack forms atsome point of high stress concentration;
• (2) crack propagation, during which this crack advancesincrementally with each stress cycle; and
• (3) final failure, which occurs very rapidly once theadvancing crack has reached a critical size.
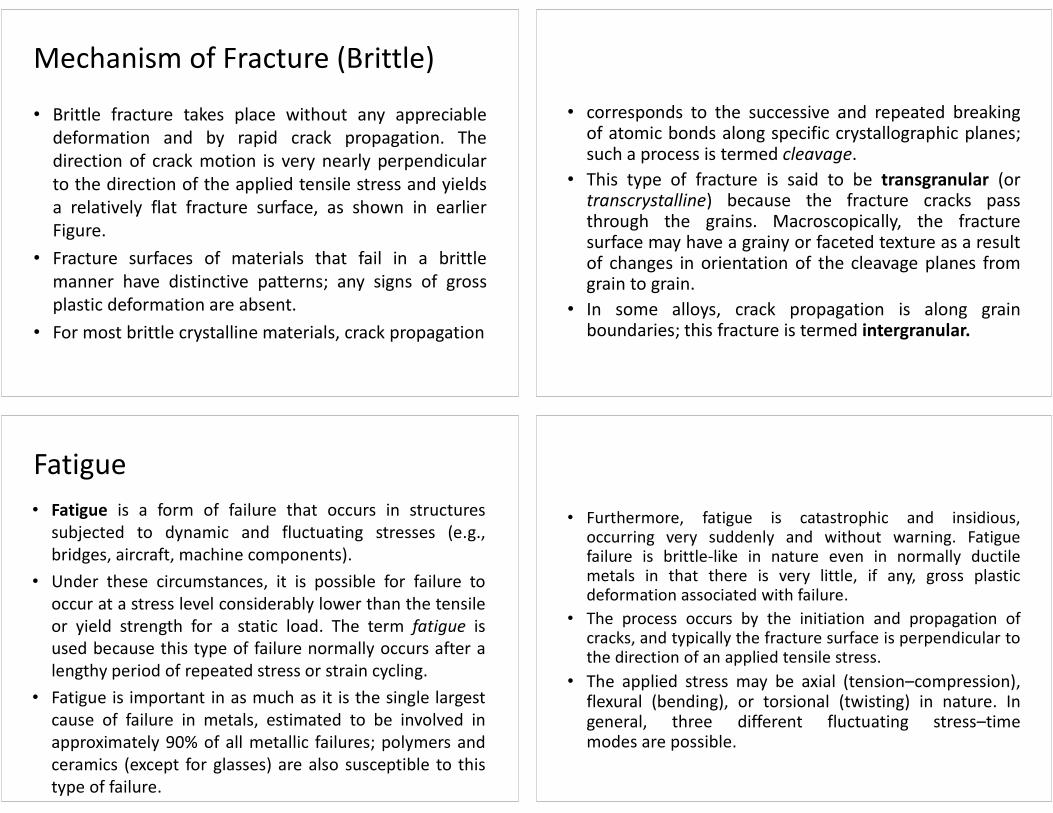
Mechanism of Fracture (Brittle)
• Brittle fracture takes place without any appreciabledeformation and by rapid crack propagation. Thedirection of crack motion is very nearly perpendicularto the direction of the applied tensile stress and yieldsa relatively flat fracture surface, as shown in earlierFigure.
• Fracture surfaces of materials that fail in a brittlemanner have distinctive patterns; any signs of grossplastic deformation are absent.
• For most brittle crystalline materials, crack propagation
• corresponds to the successive and repeated breakingof atomic bonds along specific crystallographic planes;such a process is termed cleavage.
• This type of fracture is said to be transgranular (ortranscrystalline) because the fracture cracks passthrough the grains. Macroscopically, the fracturesurface may have a grainy or faceted texture as a resultof changes in orientation of the cleavage planes fromgrain to grain.
• In some alloys, crack propagation is along grainboundaries; this fracture is termed intergranular.
Fatigue
• Fatigue is a form of failure that occurs in structuressubjected to dynamic and fluctuating stresses (e.g.,bridges, aircraft, machine components).
• Under these circumstances, it is possible for failure tooccur at a stress level considerably lower than the tensileor yield strength for a static load. The term fatigue isused because this type of failure normally occurs after alengthy period of repeated stress or strain cycling.
• Fatigue is important in as much as it is the single largestcause of failure in metals, estimated to be involved inapproximately 90% of all metallic failures; polymers andceramics (except for glasses) are also susceptible to thistype of failure.
• Furthermore, fatigue is catastrophic and insidious,occurring very suddenly and without warning. Fatiguefailure is brittle-like in nature even in normally ductilemetals in that there is very little, if any, gross plasticdeformation associated with failure.
• The process occurs by the initiation and propagation ofcracks, and typically the fracture surface is perpendicular tothe direction of an applied tensile stress.
• The applied stress may be axial (tension–compression),flexural (bending), or torsional (twisting) in nature. Ingeneral, three different fluctuating stress–timemodes are possible.
THE S–N CURVE
• As with other mechanical characteristics, the fatigueproperties of materials can be determined fromlaboratory simulation tests.
• A test apparatus should be designed to duplicate asnearly as possible the service stress conditions (stresslevel, time frequency, stress pattern, etc.).
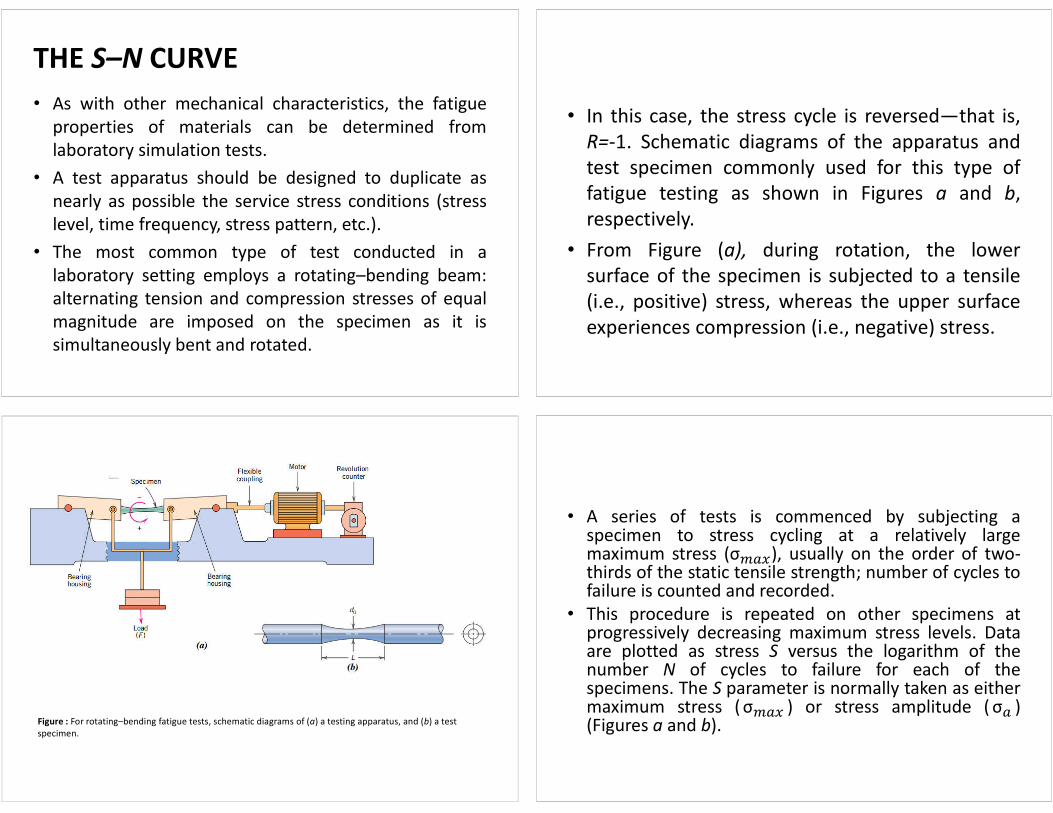
• The most common type of test conducted in alaboratory setting employs a rotating–bending beam:alternating tension and compression stresses of equalmagnitude are imposed on the specimen as it issimultaneously bent and rotated.
• In this case, the stress cycle is reversed—that is,R=-1. Schematic diagrams of the apparatus andtest specimen commonly used for this type offatigue testing as shown in Figures a and b,respectively.
• From Figure (a), during rotation, the lowersurface of the specimen is subjected to a tensile(i.e., positive) stress, whereas the upper surfaceexperiences compression (i.e., negative) stress.
Figure : For rotating–bending fatigue tests, schematic diagrams of (a) a testing apparatus, and (b) a test specimen.
• A series of tests is commenced by subjecting aspecimen to stress cycling at a relatively largemaximum stress (σ���), usually on the order of two-thirds of the static tensile strength; number of cycles tofailure is counted and recorded.
• This procedure is repeated on other specimens atprogressively decreasing maximum stress levels. Dataare plotted as stress S versus the logarithm of thenumber N of cycles to failure for each of thespecimens. The S parameter is normally taken as eithermaximum stress (σ��� ) or stress amplitude (σ� )(Figures a and b).
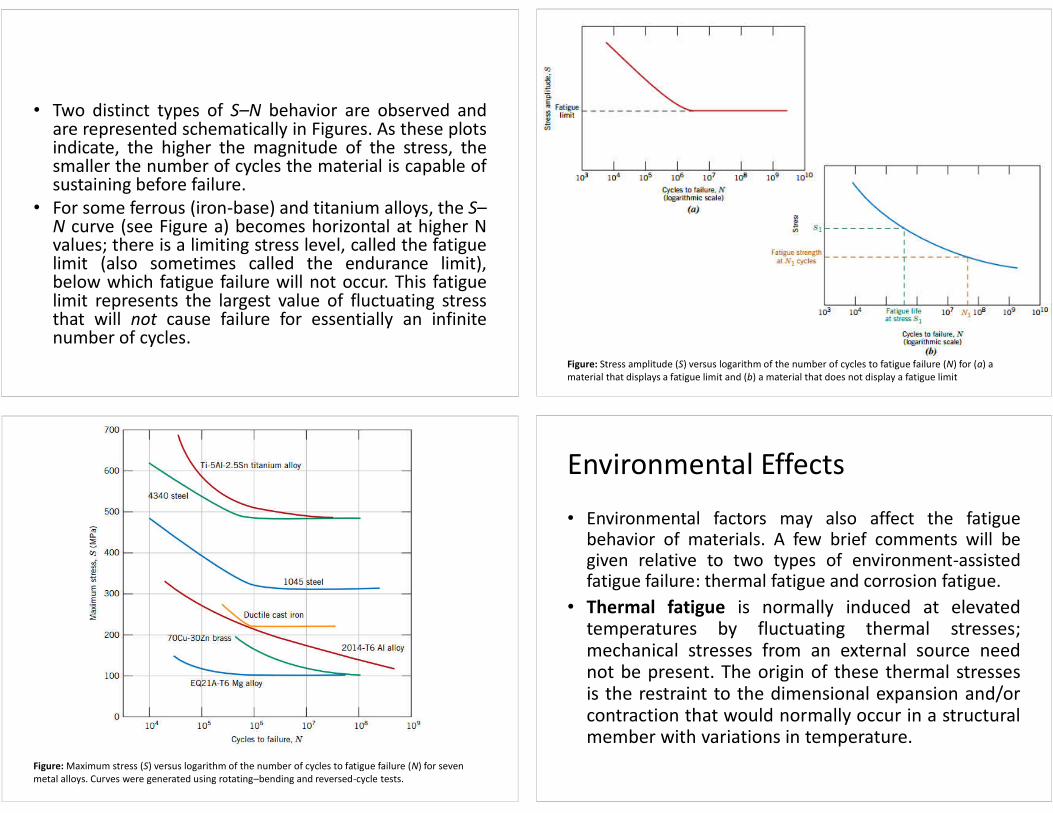
• Two distinct types of S–N behavior are observed andare represented schematically in Figures. As these plotsindicate, the higher the magnitude of the stress, thesmaller the number of cycles the material is capable ofsustaining before failure.
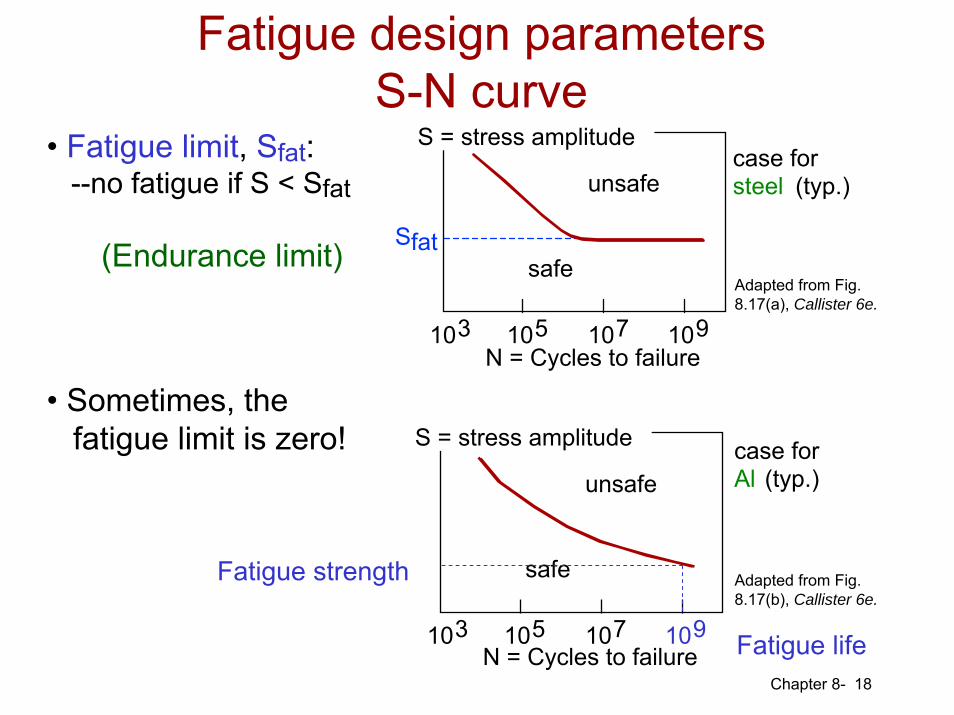
• For some ferrous (iron-base) and titanium alloys, the S–N curve (see Figure a) becomes horizontal at higher Nvalues; there is a limiting stress level, called the fatiguelimit (also sometimes called the endurance limit),below which fatigue failure will not occur. This fatiguelimit represents the largest value of fluctuating stressthat will not cause failure for essentially an infinitenumber of cycles.
Figure: Stress amplitude (S) versus logarithm of the number of cycles to fatigue failure (N) for (a) a material that displays a fatigue limit and (b) a material that does not display a fatigue limit
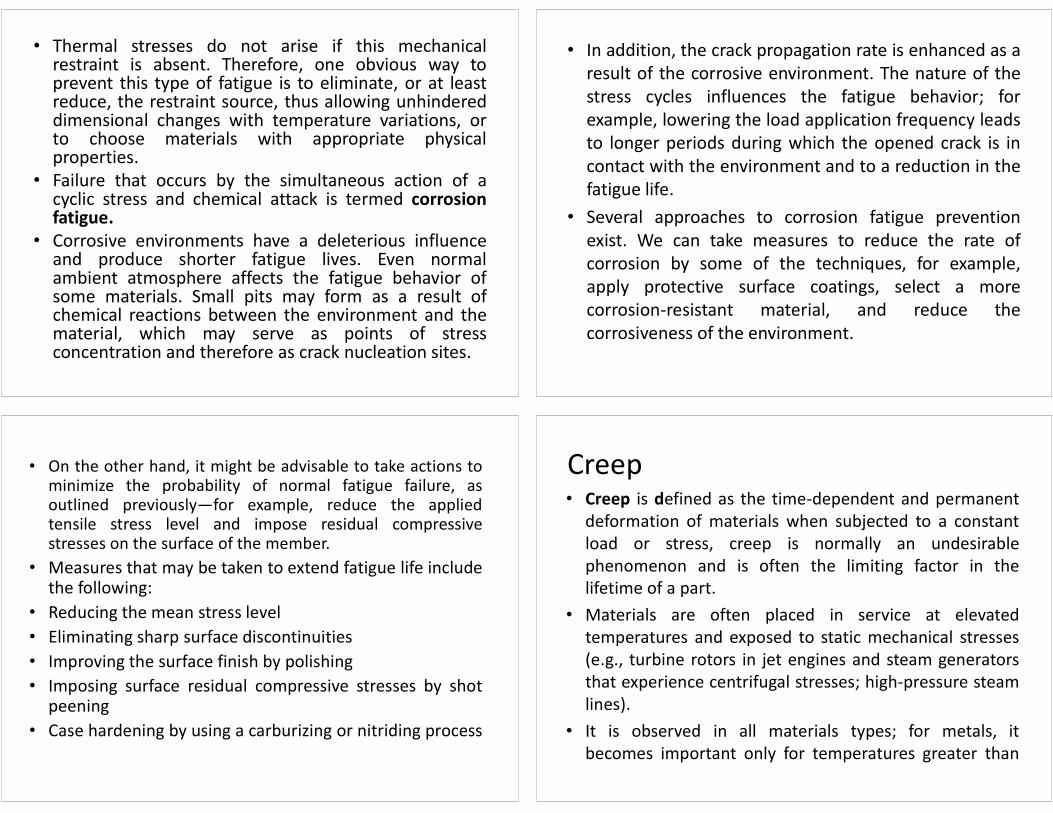
Figure: Maximum stress (S) versus logarithm of the number of cycles to fatigue failure (N) for seven metal alloys. Curves were generated using rotating–bending and reversed-cycle tests.
Environmental Effects
• Environmental factors may also affect the fatiguebehavior of materials. A few brief comments will begiven relative to two types of environment-assistedfatigue failure: thermal fatigue and corrosion fatigue.
• Thermal fatigue is normally induced at elevatedtemperatures by fluctuating thermal stresses;mechanical stresses from an external source neednot be present. The origin of these thermal stressesis the restraint to the dimensional expansion and/orcontraction that would normally occur in a structuralmember with variations in temperature.
• Thermal stresses do not arise if this mechanicalrestraint is absent. Therefore, one obvious way toprevent this type of fatigue is to eliminate, or at leastreduce, the restraint source, thus allowing unhindereddimensional changes with temperature variations, orto choose materials with appropriate physicalproperties.
• Failure that occurs by the simultaneous action of acyclic stress and chemical attack is termed corrosionfatigue.
• Corrosive environments have a deleterious influenceand produce shorter fatigue lives. Even normalambient atmosphere affects the fatigue behavior ofsome materials. Small pits may form as a result ofchemical reactions between the environment and thematerial, which may serve as points of stressconcentration and therefore as crack nucleation sites.
• In addition, the crack propagation rate is enhanced as aresult of the corrosive environment. The nature of thestress cycles influences the fatigue behavior; forexample, lowering the load application frequency leadsto longer periods during which the opened crack is incontact with the environment and to a reduction in thefatigue life.
• Several approaches to corrosion fatigue preventionexist. We can take measures to reduce the rate ofcorrosion by some of the techniques, for example,apply protective surface coatings, select a morecorrosion-resistant material, and reduce thecorrosiveness of the environment.
• On the other hand, it might be advisable to take actions tominimize the probability of normal fatigue failure, asoutlined previously—for example, reduce the appliedtensile stress level and impose residual compressivestresses on the surface of the member.
• Measures that may be taken to extend fatigue life includethe following:
• Reducing the mean stress level
• Eliminating sharp surface discontinuities
• Improving the surface finish by polishing
• Imposing surface residual compressive stresses by shotpeening
• Case hardening by using a carburizing or nitriding process
Creep• Creep is defined as the time-dependent and permanent
deformation of materials when subjected to a constantload or stress, creep is normally an undesirablephenomenon and is often the limiting factor in thelifetime of a part.
• Materials are often placed in service at elevatedtemperatures and exposed to static mechanical stresses(e.g., turbine rotors in jet engines and steam generatorsthat experience centrifugal stresses; high-pressure steamlines).
• It is observed in all materials types; for metals, itbecomes important only for temperatures greater than
• about 0.4Tm, where Tm is the absolute meltingtemperature. Amorphous polymers, which include plasticsand rubbers, are especially sensitive to creep deformation.
• A typical creep test consists of subjecting a specimen to aconstant load or stress while maintaining thetemperature constant; deformation or strain is measuredand plotted as a function of elapsed time. Most tests arethe constant-load type, which yield information of anengineering nature; constant-stress tests are employedto provide a better understanding of the mechanisms ofcreep.
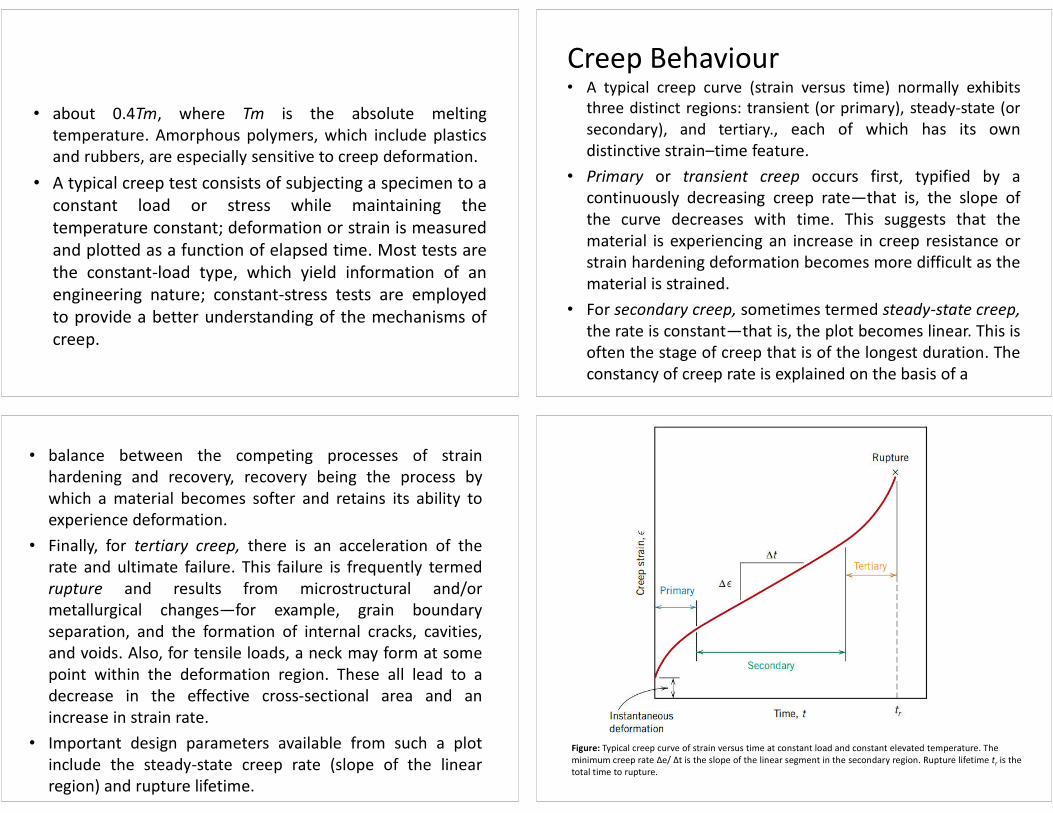
Creep Behaviour• A typical creep curve (strain versus time) normally exhibits
three distinct regions: transient (or primary), steady-state (or
secondary), and tertiary., each of which has its owndistinctive strain–time feature.
• Primary or transient creep occurs first, typified by acontinuously decreasing creep rate—that is, the slope ofthe curve decreases with time. This suggests that thematerial is experiencing an increase in creep resistance orstrain hardening deformation becomes more difficult as thematerial is strained.
• For secondary creep, sometimes termed steady-state creep,the rate is constant—that is, the plot becomes linear. This isoften the stage of creep that is of the longest duration. Theconstancy of creep rate is explained on the basis of a
• balance between the competing processes of strainhardening and recovery, recovery being the process bywhich a material becomes softer and retains its ability toexperience deformation.
• Finally, for tertiary creep, there is an acceleration of therate and ultimate failure. This failure is frequently termedrupture and results from microstructural and/ormetallurgical changes—for example, grain boundaryseparation, and the formation of internal cracks, cavities,and voids. Also, for tensile loads, a neck may form at somepoint within the deformation region. These all lead to adecrease in the effective cross-sectional area and anincrease in strain rate.
• Important design parameters available from such a plotinclude the steady-state creep rate (slope of the linearregion) and rupture lifetime.
Figure: Typical creep curve of strain versus time at constant load and constant elevated temperature. The minimum creep rate Δe/ Δt is the slope of the linear segment in the secondary region. Rupture lifetime tr is the total time to rupture.
• For metallic materials, most creep tests are conducted inuniaxial tension using a specimen having the samegeometry as for tensile tests. However, uniaxialcompression tests are more appropriate for brittlematerials; these provide a better measure of the intrinsiccreep properties because there is no stress amplificationand crack propagation, as with tensile loads. Compressivetest specimens are usually right cylinders or parallelepipedshaving length-to-diameter ratios ranging from about 2 to 4.
• For most materials, creep properties are virtuallyindependent of loading direction. Possibly the mostimportant parameter from a creep test is the slope of thesecondary portion of the creep curve; this is often calledthe minimum or steady-state creep rate. It is theengineering design parameter that is considered for long-life applications, such as a nuclear power plant component.
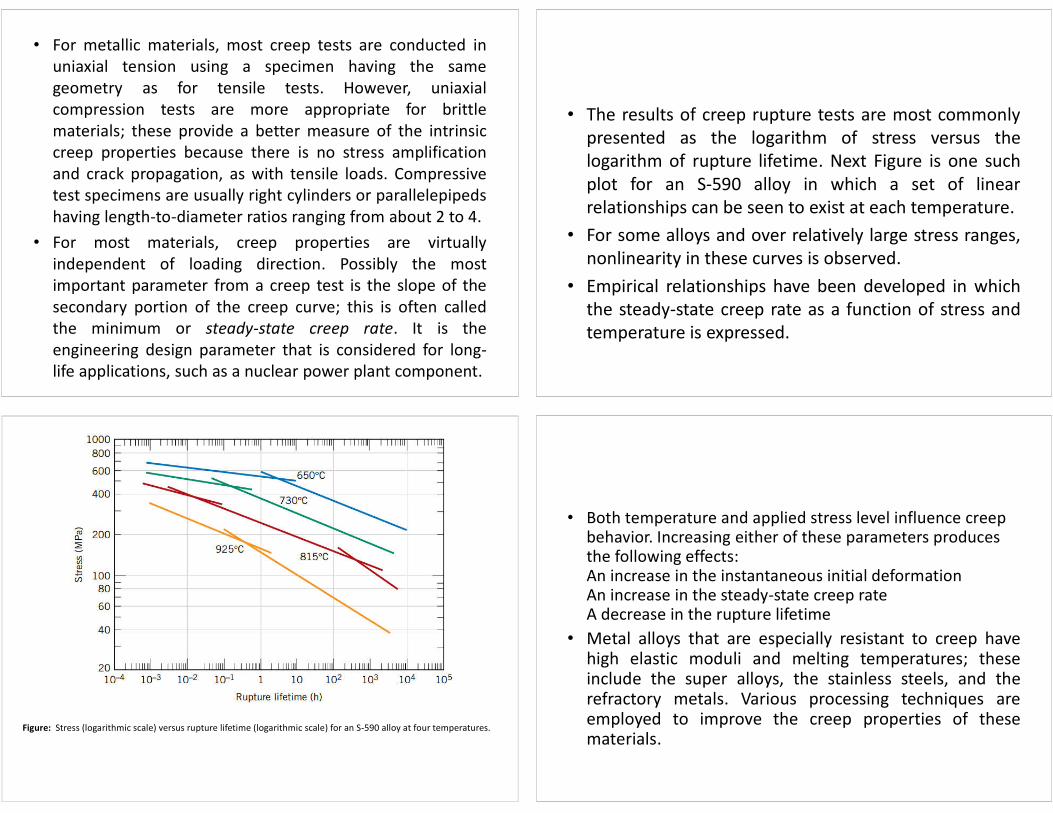
• The results of creep rupture tests are most commonlypresented as the logarithm of stress versus thelogarithm of rupture lifetime. Next Figure is one suchplot for an S-590 alloy in which a set of linearrelationships can be seen to exist at each temperature.
• For some alloys and over relatively large stress ranges,nonlinearity in these curves is observed.
• Empirical relationships have been developed in whichthe steady-state creep rate as a function of stress andtemperature is expressed.
Figure: Stress (logarithmic scale) versus rupture lifetime (logarithmic scale) for an S-590 alloy at four temperatures.
• Both temperature and applied stress level influence creep behavior. Increasing either of these parameters produces the following effects:An increase in the instantaneous initial deformationAn increase in the steady-state creep rateA decrease in the rupture lifetime
• Metal alloys that are especially resistant to creep havehigh elastic moduli and melting temperatures; theseinclude the super alloys, the stainless steels, and therefractory metals. Various processing techniques areemployed to improve the creep properties of thesematerials.
Chapter 8-
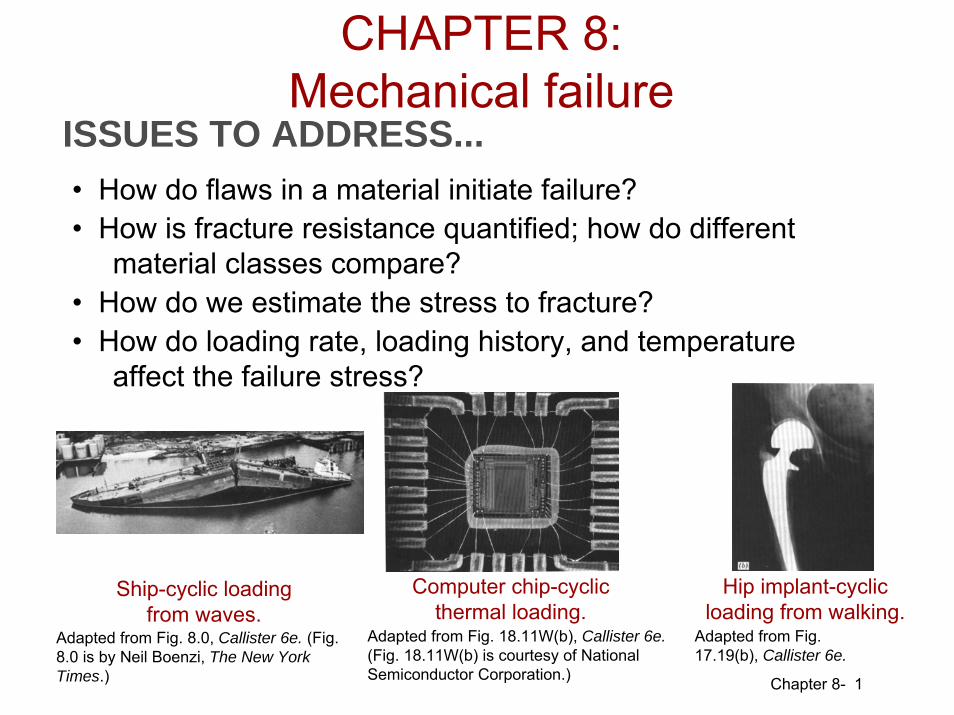
ISSUES TO ADDRESS...• How do flaws in a material initiate failure?• How is fracture resistance quantified; how do different
material classes compare?• How do we estimate the stress to fracture?
1
• How do loading rate, loading history, and temperatureaffect the failure stress?
Ship-cyclic loadingfrom waves.
Computer chip-cyclicthermal loading.
Hip implant-cyclicloading from walking.
Adapted from Fig. 8.0, Callister 6e. (Fig. 8.0 is by Neil Boenzi, The New York Times.)
Adapted from Fig. 18.11W(b), Callister 6e.(Fig. 18.11W(b) is courtesy of National Semiconductor Corporation.)
Adapted from Fig. 17.19(b), Callister 6e.
CHAPTER 8:Mechanical failure
Chapter 8-
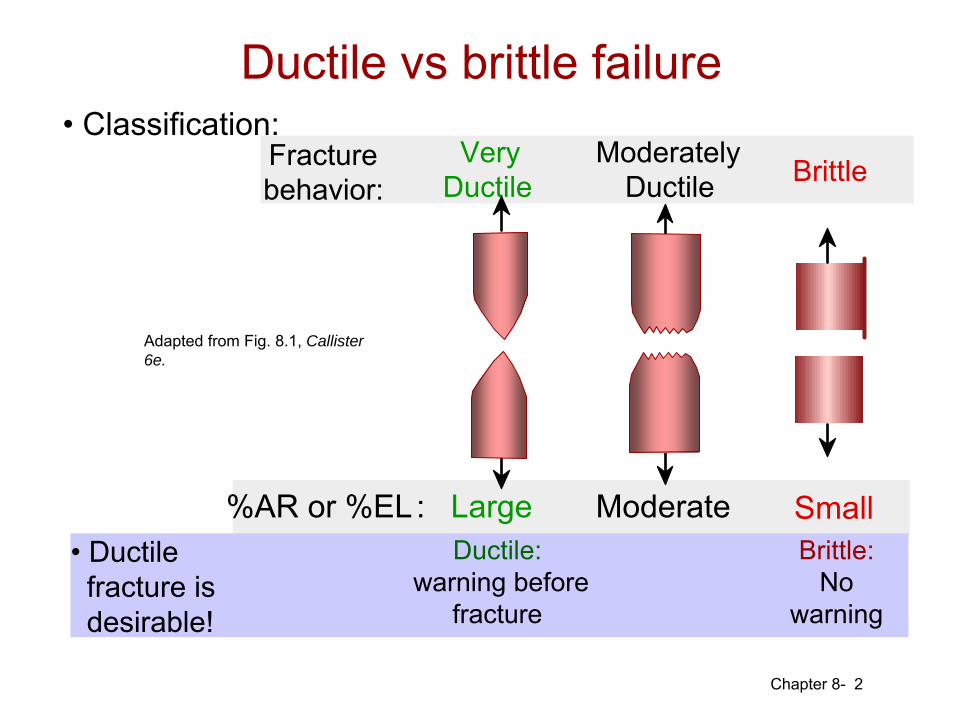
Very Ductile
Moderately Ductile BrittleFracture
behavior:
Large Moderate%AR or %EL: Small
2
• Ductilefracture isdesirable!
• Classification:
Ductile:warning before
fracture
Brittle:No
warning
Adapted from Fig. 8.1, Callister 6e.
Ductile vs brittle failure
Chapter 8- 3
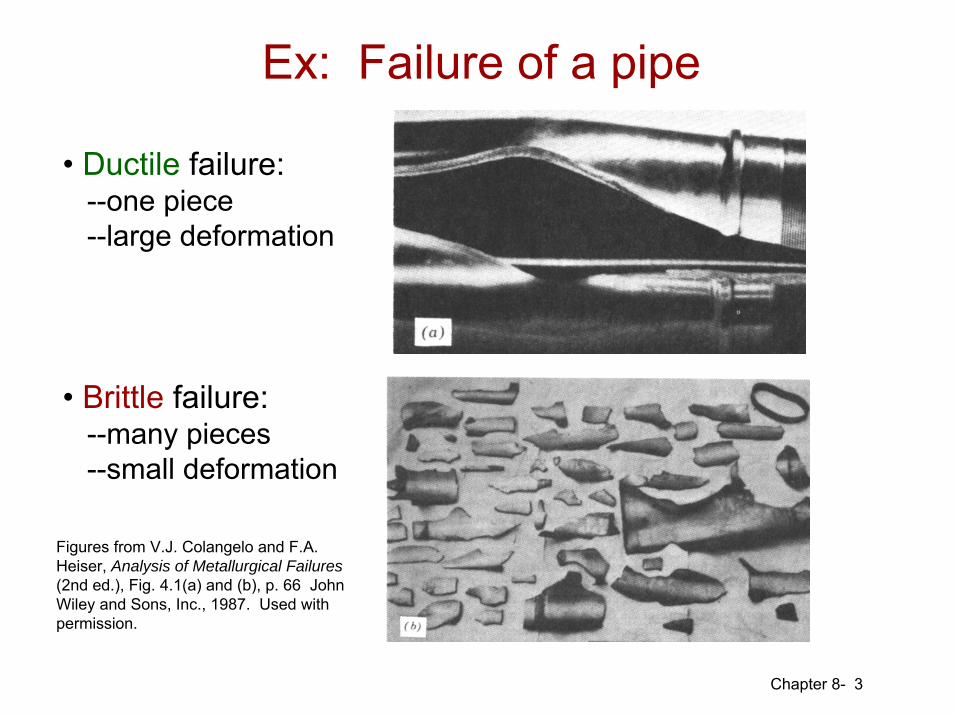
• Ductile failure:--one piece--large deformation
• Brittle failure:--many pieces--small deformation
Figures from V.J. Colangelo and F.A. Heiser, Analysis of Metallurgical Failures(2nd ed.), Fig. 4.1(a) and (b), p. 66 John Wiley and Sons, Inc., 1987. Used with permission.
Ex: Failure of a pipe
Chapter 8- 4
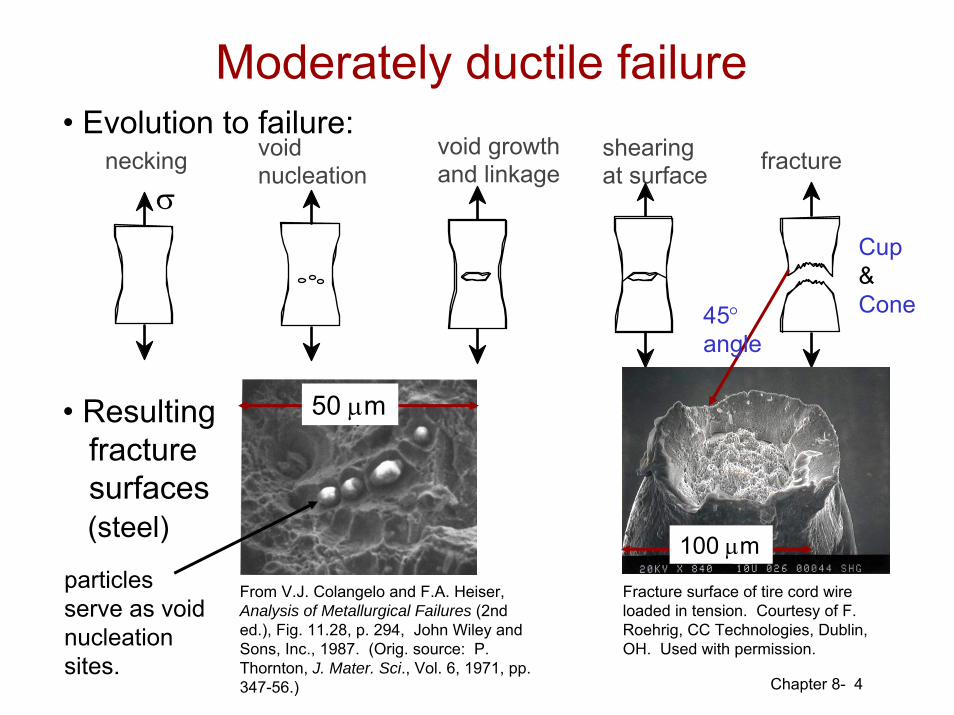
• Evolution to failure:necking void
nucleationvoid growth and linkage
shearing at surface fracture
σ
• Resultingfracturesurfaces(steel)
50 μm
particlesserve as voidnucleationsites.
50 μm
100 μm
From V.J. Colangelo and F.A. Heiser, Analysis of Metallurgical Failures (2nd ed.), Fig. 11.28, p. 294, John Wiley and Sons, Inc., 1987. (Orig. source: P. Thornton, J. Mater. Sci., Vol. 6, 1971, pp. 347-56.)
Fracture surface of tire cord wire loaded in tension. Courtesy of F. Roehrig, CC Technologies, Dublin, OH. Used with permission.
Cup & Cone45°
angle
Moderately ductile failure
Chapter 8- 5
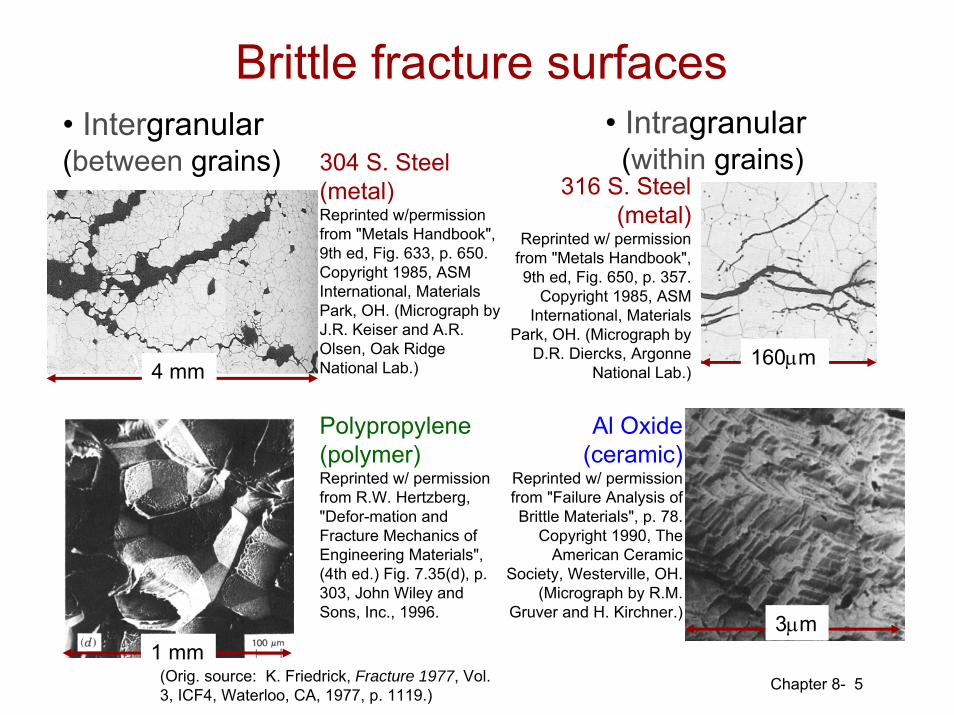
• Intergranular(between grains)
• Intragranular(within grains)
Al Oxide(ceramic)
Reprinted w/ permission from "Failure Analysis of Brittle Materials", p. 78.
Copyright 1990, The American Ceramic
Society, Westerville, OH. (Micrograph by R.M.
Gruver and H. Kirchner.)
316 S. Steel (metal)
Reprinted w/ permission from "Metals Handbook", 9th ed, Fig. 650, p. 357.
Copyright 1985, ASM International, Materials
Park, OH. (Micrograph by D.R. Diercks, Argonne
National Lab.)
304 S. Steel (metal)Reprinted w/permission from "Metals Handbook", 9th ed, Fig. 633, p. 650. Copyright 1985, ASM International, Materials Park, OH. (Micrograph by J.R. Keiser and A.R. Olsen, Oak Ridge National Lab.)
Polypropylene(polymer)Reprinted w/ permission from R.W. Hertzberg, "Defor-mation and Fracture Mechanics of Engineering Materials", (4th ed.) Fig. 7.35(d), p. 303, John Wiley and Sons, Inc., 1996. 3μm
4 mm 160μm
1 mm(Orig. source: K. Friedrick, Fracture 1977, Vol. 3, ICF4, Waterloo, CA, 1977, p. 1119.)
Brittle fracture surfaces
Chapter 8- 6
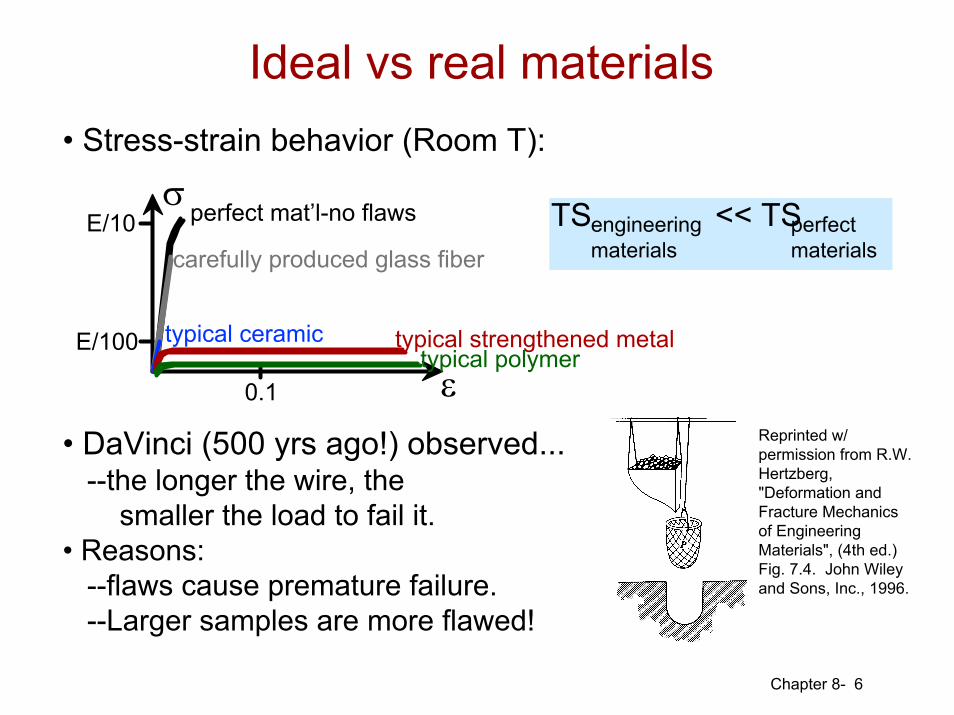
• Stress-strain behavior (Room T):
σ
ε
E/10
E/100
0.1
perfect mat’l-no flaws
carefully produced glass fiber
typical ceramic typical strengthened metaltypical polymer
TS << TSengineeringmaterials
perfectmaterials
• DaVinci (500 yrs ago!) observed...--the longer the wire, the
smaller the load to fail it.• Reasons:
--flaws cause premature failure.--Larger samples are more flawed!
Reprinted w/ permission from R.W. Hertzberg, "Deformation and Fracture Mechanics of Engineering Materials", (4th ed.) Fig. 7.4. John Wiley and Sons, Inc., 1996.
Ideal vs real materials
Chapter 8- 7
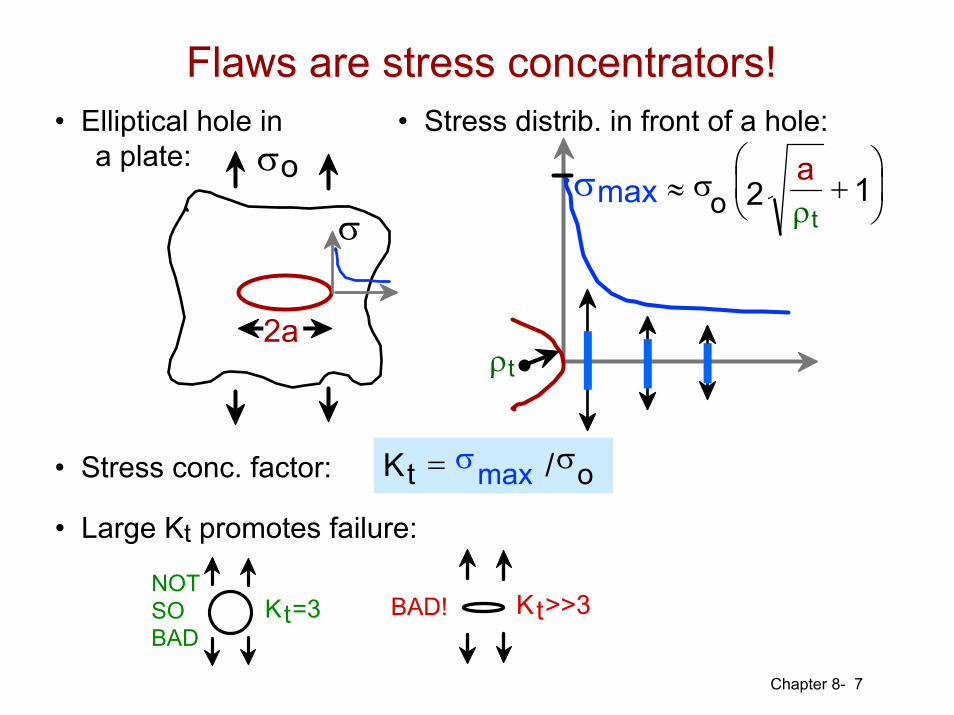
• Elliptical hole ina plate:
• Stress distrib. in front of a hole:
• Stress conc. factor:
BAD! Kt>>3NOT SO BAD
Kt=3
σmax
ρt
≈ 2σoa + 1
⎛ ⎝ ⎜
⎞ ⎠ ⎟
ρtσ
σo
2a
Kt = σmax /σo
• Large Kt promotes failure:
Flaws are stress concentrators!
Chapter 8- 8
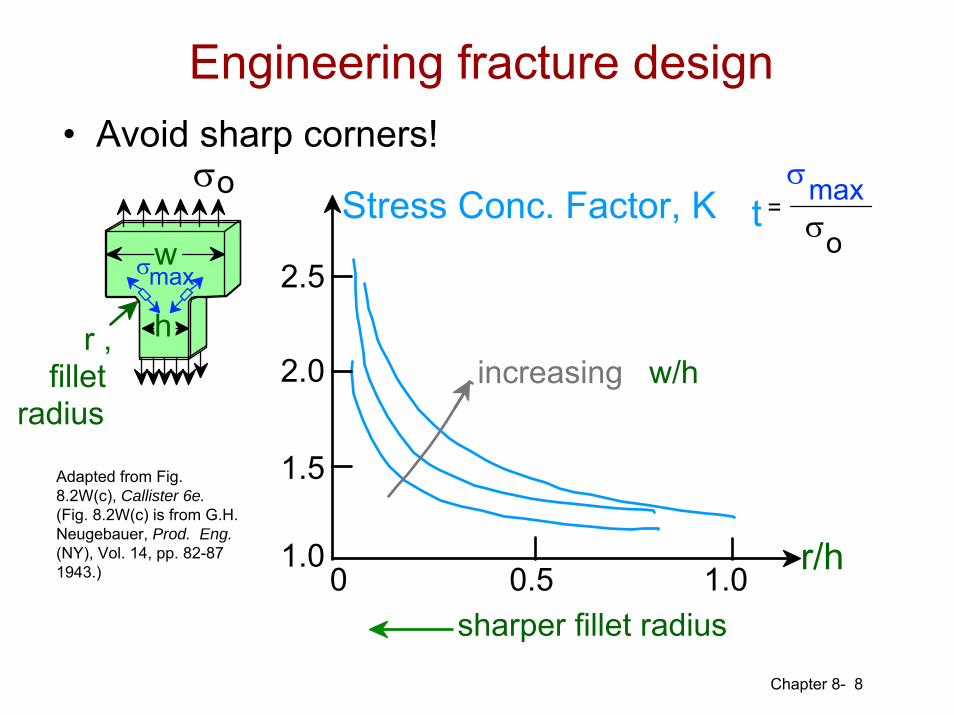
• Avoid sharp corners!
r/h
sharper fillet radius
increasing w/h
0 0.5 1.01.0
1.5
2.0
2.5
Stress Conc. Factor, K tσmax
σo=
Adapted from Fig. 8.2W(c), Callister 6e.(Fig. 8.2W(c) is from G.H. Neugebauer, Prod. Eng.(NY), Vol. 14, pp. 82-87 1943.)
Engineering fracture design
r , fillet
radius
w
h
σo
σmax
Chapter 8-
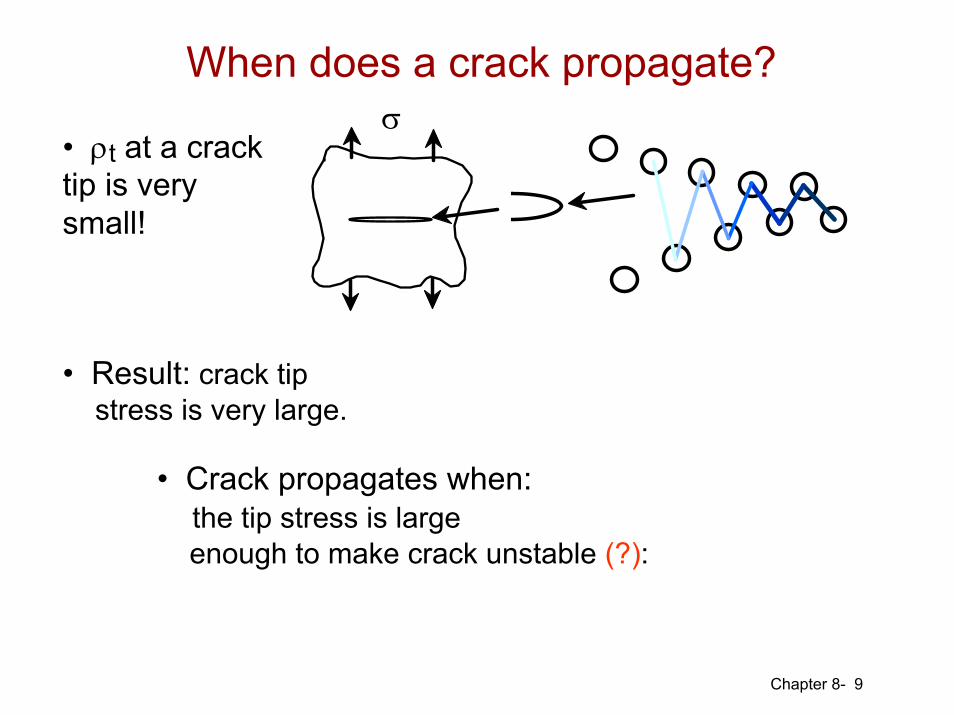
• ρt at a cracktip is verysmall!
9
σ
• Result: crack tipstress is very large.
• Crack propagates when:the tip stress is largeenough to make crack unstable (?):
When does a crack propagate?
Chapter 8-
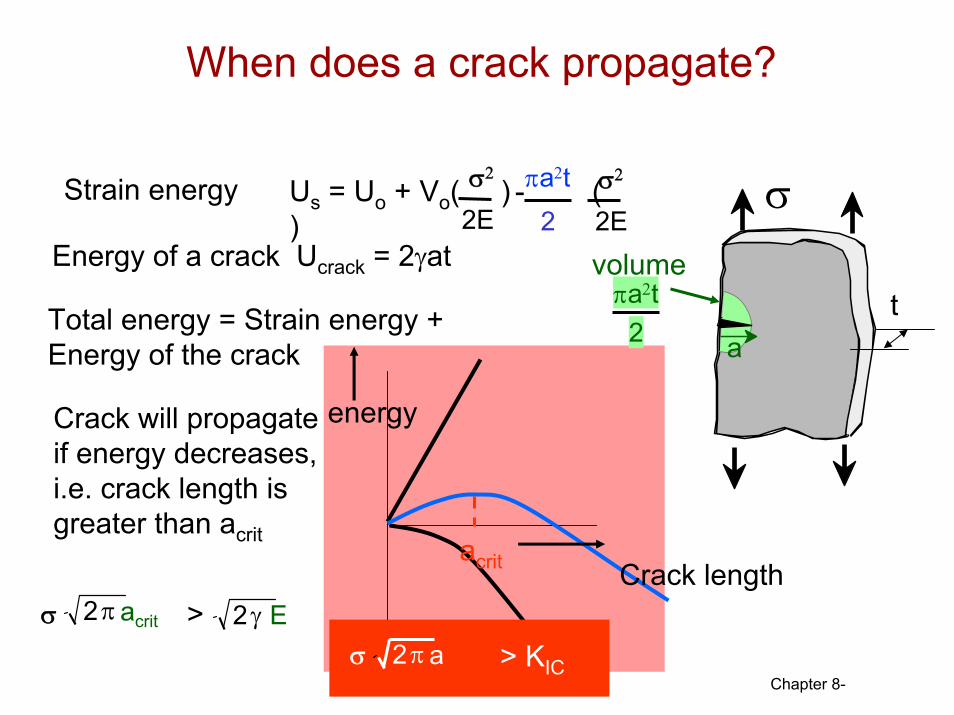
σ
aatπa2t
2
Strain energy Us = Uo + Vo( ) ( )
σ2
2Eσ2
2Eπa2t
2-
Energy of a crack Ucrack = 2γat volume
Total energy = Strain energy + Energy of the crack
Crack will propagate if energy decreases, i.e. crack length is greater than acrit acrit
energy
Crack length2π acrit
When does a crack propagate?
2γ Eσ > 2π aσ > KIC
Chapter 8- 10
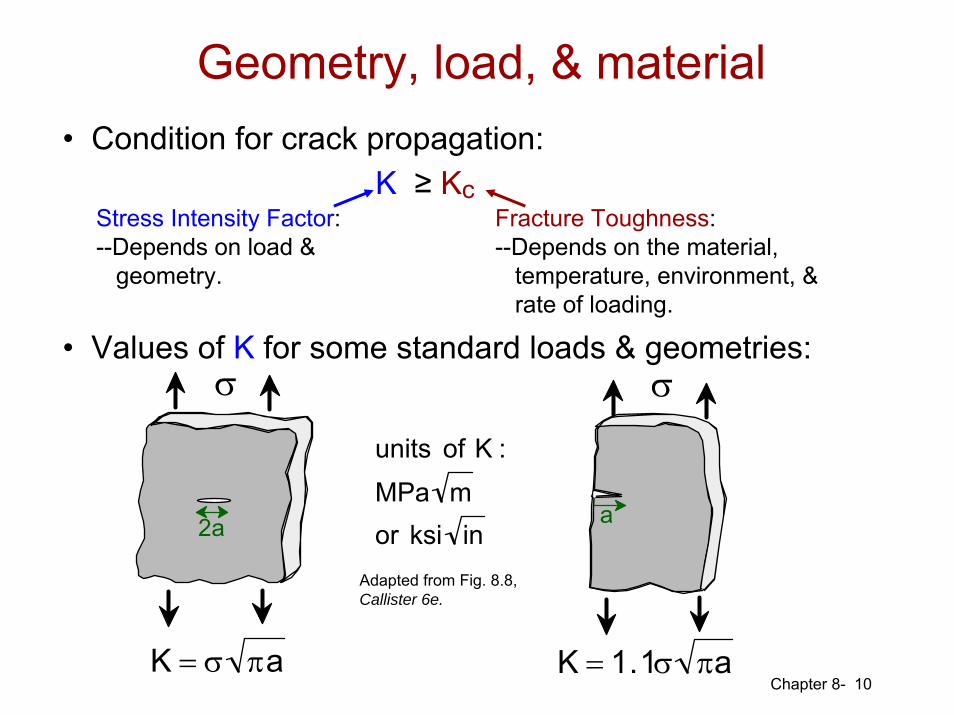
• Condition for crack propagation:
• Values of K for some standard loads & geometries:σ
2a2a
σ
aa
K = σ πa K = 1.1σ πa
K ≥ KcStress Intensity Factor:--Depends on load &
geometry.
Fracture Toughness:--Depends on the material,
temperature, environment, &rate of loading.
units of K :MPa mor ksi in
Adapted from Fig. 8.8, Callister 6e.
Geometry, load, & material
Chapter 8- 11
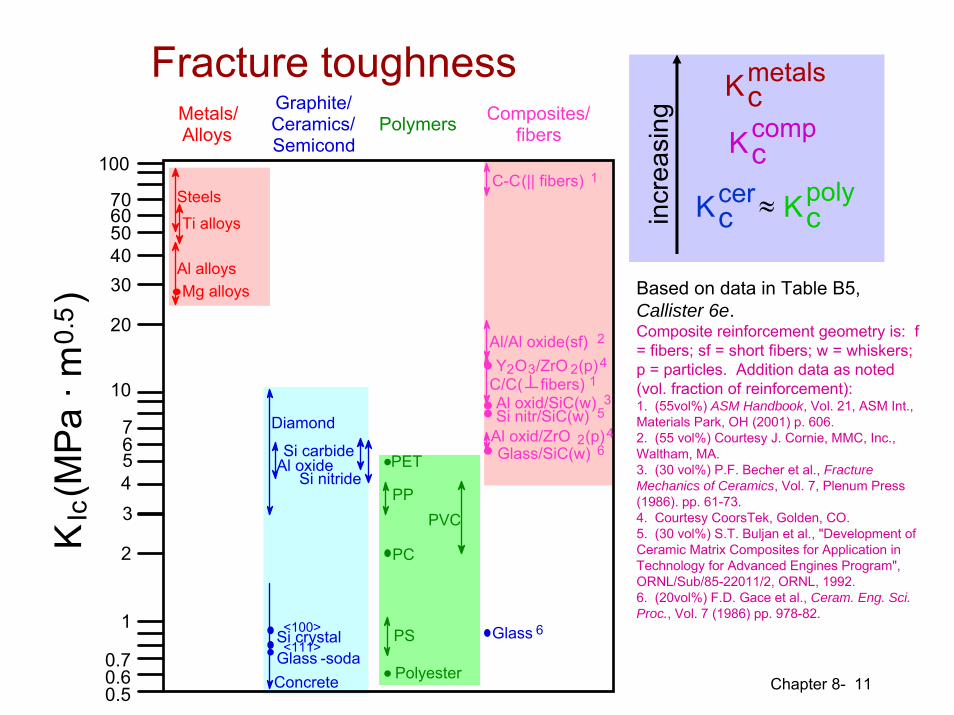
Graphite/ Ceramics/ Semicond
Metals/ Alloys
Composites/ fibersPolymers
5
KIc
(MP
a · m
0.5)
1
Mg alloysAl alloys
Ti alloys
Steels
Si crystalGlass -sodaConcrete
Si carbide
PC
Glass 6
0.5
0.7
2
43
10
20
30
<100><111>
Diamond
PVCPP
Polyester
PS
PET
C-C(|| fibers) 1
0.6
67
40506070
100
Al oxideSi nitride
C/C( fibers) 1
Al/Al oxide(sf) 2
Al oxid/SiC(w) 3
Al oxid/ZrO 2(p)4Si nitr/SiC(w) 5
Glass/SiC(w) 6
Y2O3/ZrO 2(p)4
Kcmetals
Kccomp
Kccer ≈ Kc
poly
incr
easi
ng
Based on data in Table B5,Callister 6e.Composite reinforcement geometry is: f = fibers; sf = short fibers; w = whiskers; p = particles. Addition data as noted (vol. fraction of reinforcement):1. (55vol%) ASM Handbook, Vol. 21, ASM Int., Materials Park, OH (2001) p. 606.2. (55 vol%) Courtesy J. Cornie, MMC, Inc., Waltham, MA.3. (30 vol%) P.F. Becher et al., Fracture Mechanics of Ceramics, Vol. 7, Plenum Press (1986). pp. 61-73.4. Courtesy CoorsTek, Golden, CO.5. (30 vol%) S.T. Buljan et al., "Development of Ceramic Matrix Composites for Application in Technology for Advanced Engines Program", ORNL/Sub/85-22011/2, ORNL, 1992.6. (20vol%) F.D. Gace et al., Ceram. Eng. Sci. Proc., Vol. 7 (1986) pp. 978-82.
Fracture toughness
Chapter 8- 12
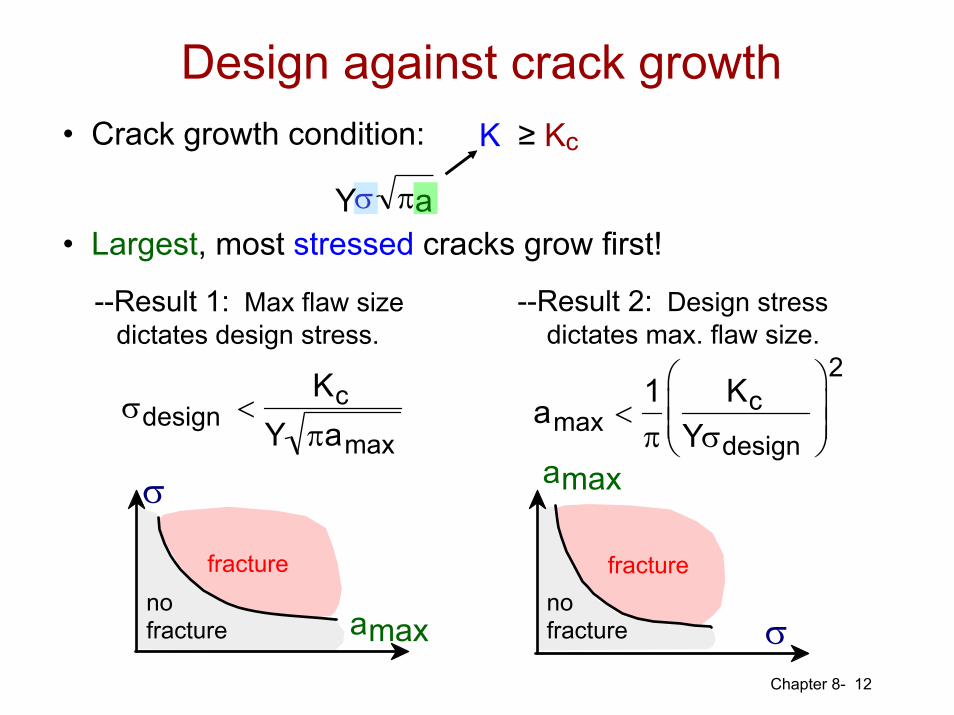
• Crack growth condition:
Yσ πa• Largest, most stressed cracks grow first!
--Result 1: Max flaw sizedictates design stress.
--Result 2: Design stressdictates max. flaw size.
σdesign <
KcY πamax
amax <1π
KcYσdesign
⎛
⎝ ⎜ ⎜
⎞
⎠ ⎟ ⎟
2
K ≥ Kc
amax
σ
no fracture
fracture
amax
σno fracture
fracture
Design against crack growth
Chapter 8- 13
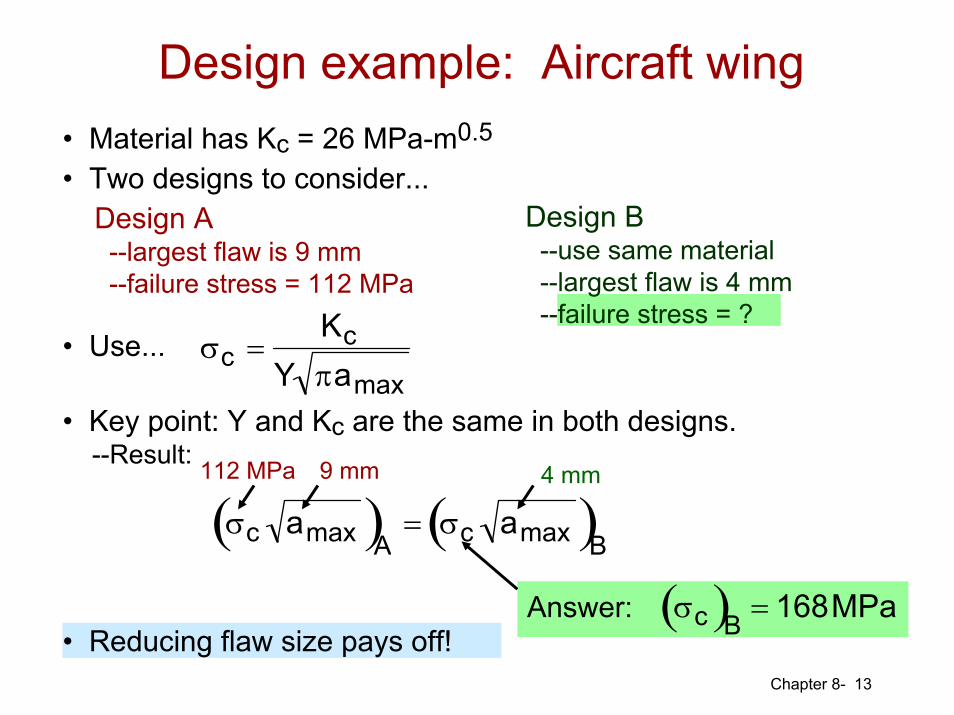
• Two designs to consider...Design A--largest flaw is 9 mm--failure stress = 112 MPa
Design B--use same material--largest flaw is 4 mm--failure stress = ?
• Use... σc =
KcY πamax
• Key point: Y and Kc are the same in both designs.--Result:
σc amax( )A = σc amax( )B
9 mm112 MPa 4 mm
Answer: σc( )B = 168MPa• Reducing flaw size pays off!
• Material has Kc = 26 MPa-m0.5
Design example: Aircraft wing
Chapter 8- 14
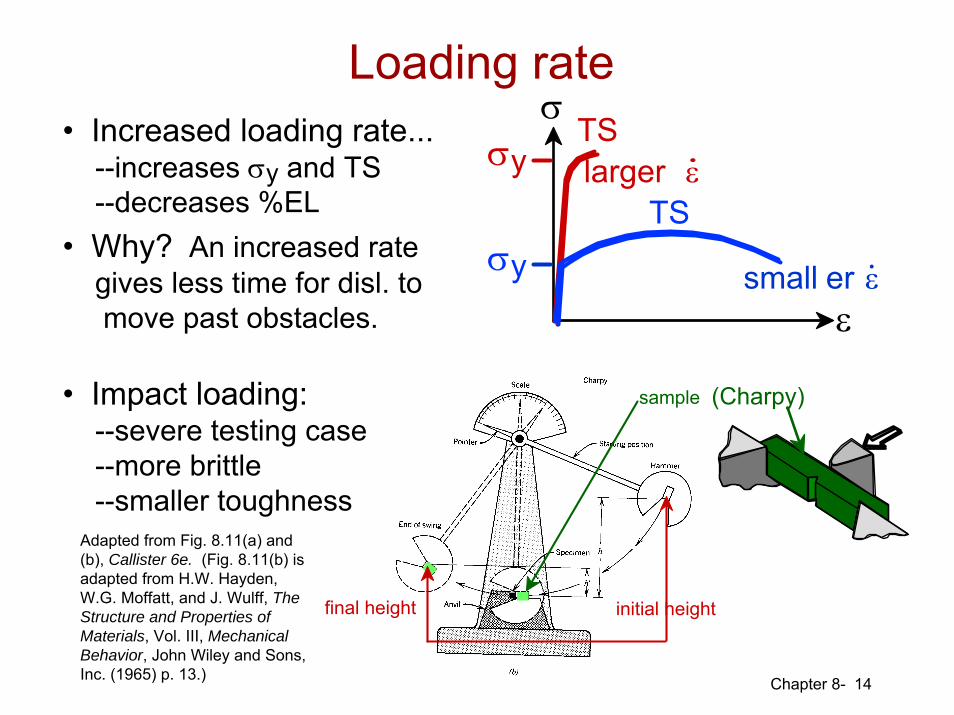
• Increased loading rate...--increases σy and TS--decreases %EL
• Why? An increased rategives less time for disl. tomove past obstacles.
initial heightfinal height
sample
σ
ε
σy
σy
TS
TSlarger ε
small er ε
(Charpy)• Impact loading:--severe testing case--more brittle--smaller toughness
Adapted from Fig. 8.11(a) and (b), Callister 6e. (Fig. 8.11(b) is adapted from H.W. Hayden, W.G. Moffatt, and J. Wulff, The Structure and Properties of Materials, Vol. III, Mechanical Behavior, John Wiley and Sons, Inc. (1965) p. 13.)
Loading rate
Chapter 8- 15
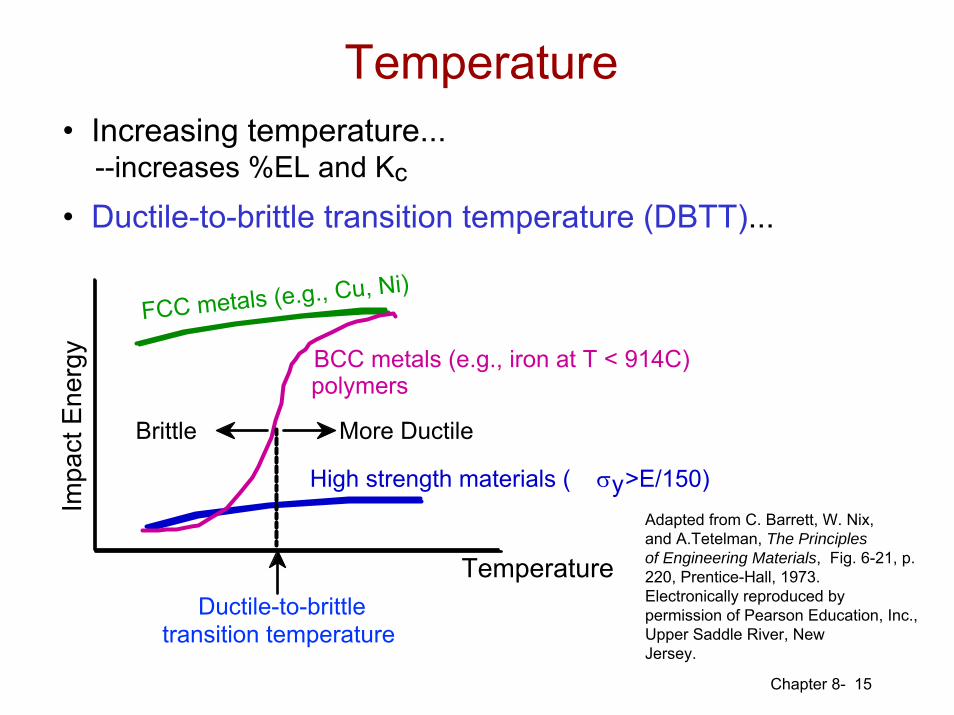
BCC metals (e.g., iron at T < 914C)
Impa
ct E
nerg
y
Temperature
• Increasing temperature...--increases %EL and Kc
• Ductile-to-brittle transition temperature (DBTT)...
FCC metals (e.g., Cu, Ni)
High strength materials ( σy>E/150)
polymers
More Ductile Brittle
Ductile-to-brittle transition temperature
Adapted from C. Barrett, W. Nix,and A.Tetelman, The Principlesof Engineering Materials, Fig. 6-21, p. 220, Prentice-Hall, 1973.Electronically reproduced by permission of Pearson Education, Inc., Upper Saddle River, NewJersey.
Temperature
Chapter 8- 16
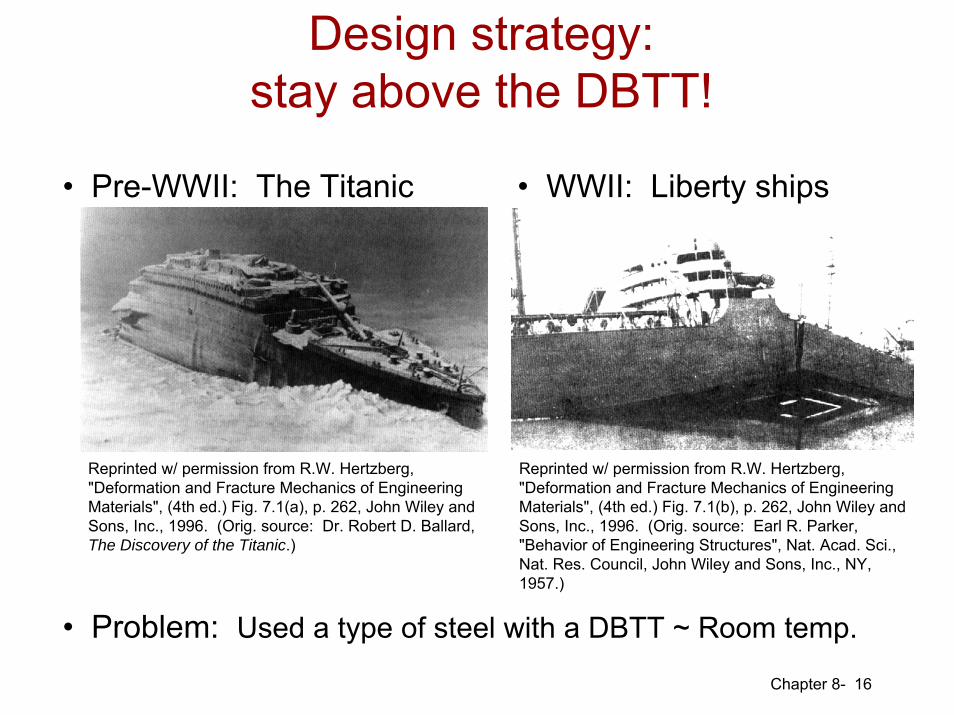
• Pre-WWII: The Titanic • WWII: Liberty ships
• Problem: Used a type of steel with a DBTT ~ Room temp.
Reprinted w/ permission from R.W. Hertzberg, "Deformation and Fracture Mechanics of Engineering Materials", (4th ed.) Fig. 7.1(a), p. 262, John Wiley and Sons, Inc., 1996. (Orig. source: Dr. Robert D. Ballard, The Discovery of the Titanic.)
Reprinted w/ permission from R.W. Hertzberg, "Deformation and Fracture Mechanics of Engineering Materials", (4th ed.) Fig. 7.1(b), p. 262, John Wiley and Sons, Inc., 1996. (Orig. source: Earl R. Parker, "Behavior of Engineering Structures", Nat. Acad. Sci., Nat. Res. Council, John Wiley and Sons, Inc., NY, 1957.)
Design strategy:stay above the DBTT!
Chapter 8- 17
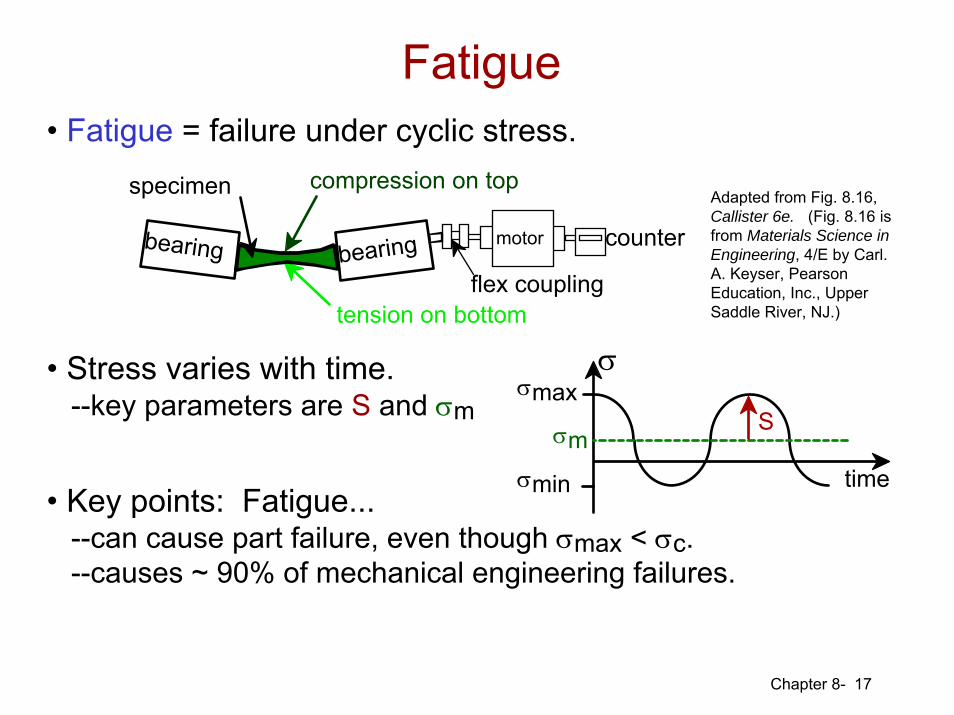
• Fatigue = failure under cyclic stress.
tension on bottom
compression on top
countermotor
flex coupling
bearing bearing
specimen
• Stress varies with time.--key parameters are S and σm
σmax
σmin
σ
time
σmS
• Key points: Fatigue...--can cause part failure, even though σmax < σc.--causes ~ 90% of mechanical engineering failures.
Adapted from Fig. 8.16, Callister 6e. (Fig. 8.16 is from Materials Science in Engineering, 4/E by Carl. A. Keyser, Pearson Education, Inc., Upper Saddle River, NJ.)
Fatigue
Chapter 8- 18
• Fatigue limit, Sfat:--no fatigue if S < Sfat
• Sometimes, thefatigue limit is zero!
Sfat
case for steel (typ.)
N = Cycles to failure103 105 107 109
unsafe
safe
S = stress amplitude
case for Al (typ.)
N = Cycles to failure103 105 107 109
unsafe
safe
S = stress amplitude
Adapted from Fig. 8.17(a), Callister 6e.
Adapted from Fig. 8.17(b), Callister 6e.
Fatigue design parametersS-N curve
(Endurance limit)
Fatigue strength
Fatigue life
Chapter 8- 19
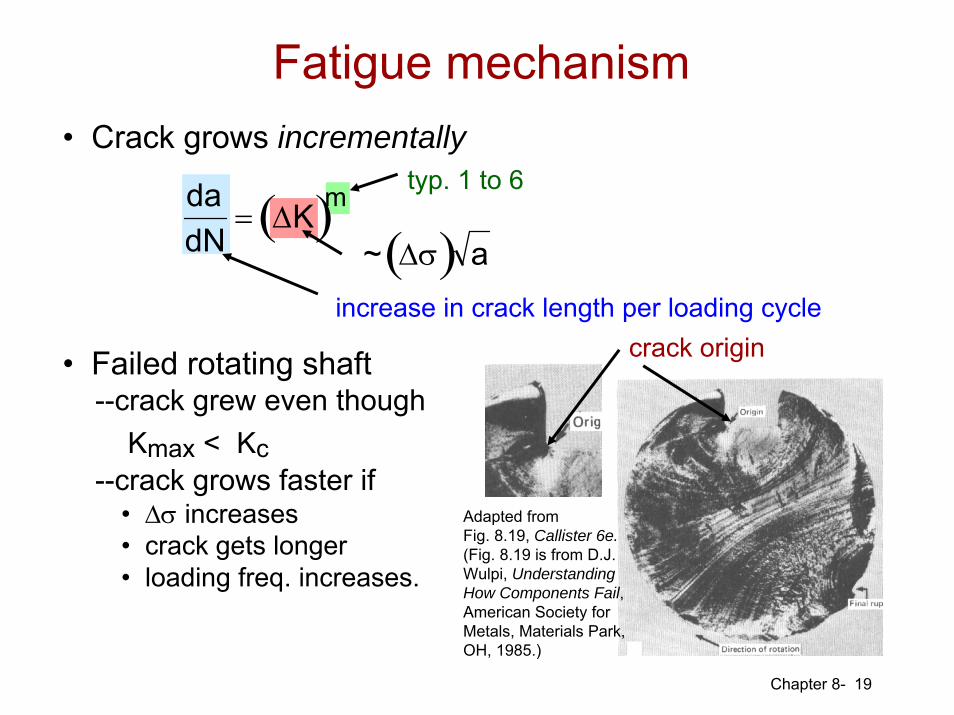
• Crack grows incrementally
dadN
= ΔK( )mtyp. 1 to 6
~ Δσ( ) aincrease in crack length per loading cycle
• Failed rotating shaft--crack grew even though
Kmax < Kc--crack grows faster if
• Δσ increases• crack gets longer• loading freq. increases.
crack origin
Adapted fromFig. 8.19, Callister 6e.(Fig. 8.19 is from D.J. Wulpi, Understanding How Components Fail, American Society for Metals, Materials Park, OH, 1985.)
Fatigue mechanism
Chapter 8-
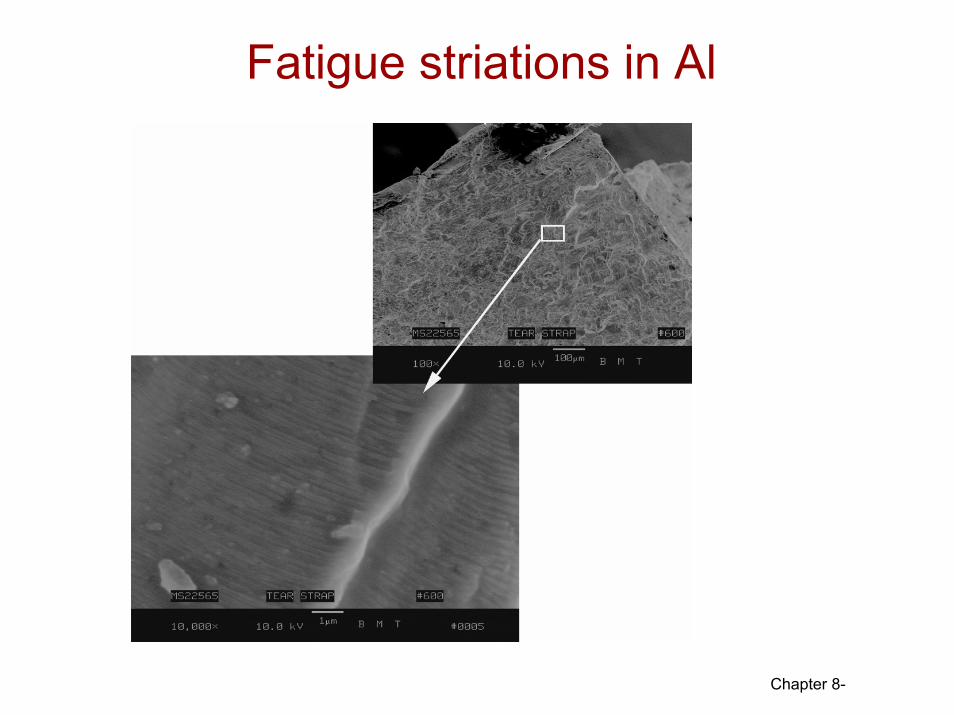
Fatigue striations in Al
Chapter 8-
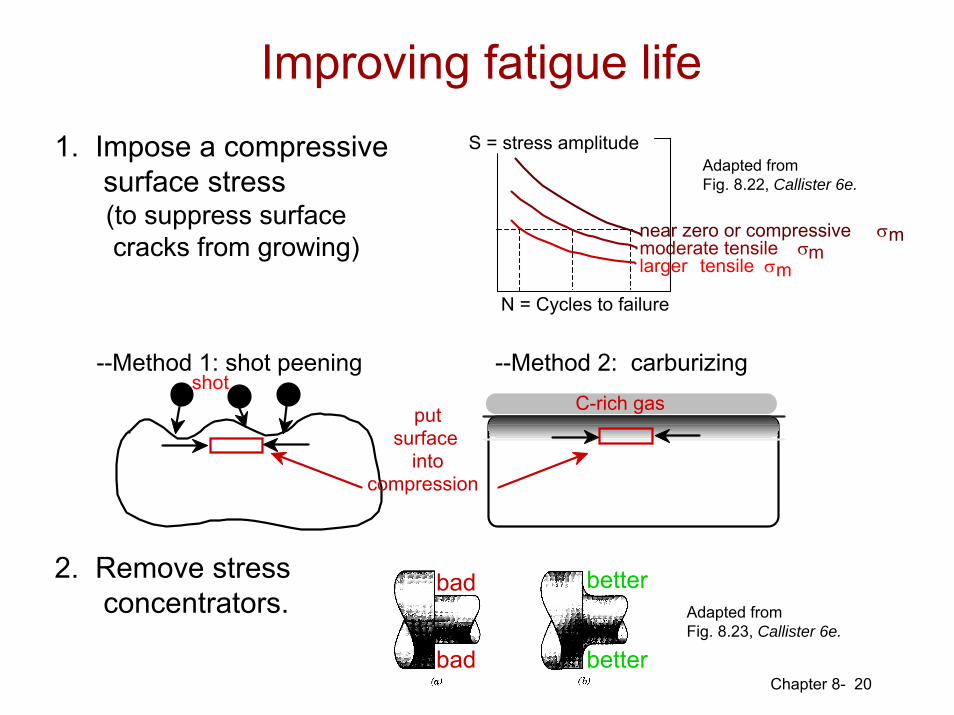
1. Impose a compressivesurface stress(to suppress surfacecracks from growing)
20
--Method 1: shot peening
2. Remove stressconcentrators.
bad
bad
better
better
--Method 2: carburizingC-rich gasput
surface into
compression
shot
Adapted fromFig. 8.23, Callister 6e.
N = Cycles to failure
moderate tensile σmlarger tensile σm
S = stress amplitude
near zero or compressive σm
Adapted fromFig. 8.22, Callister 6e.
Improving fatigue life
Chapter 8-
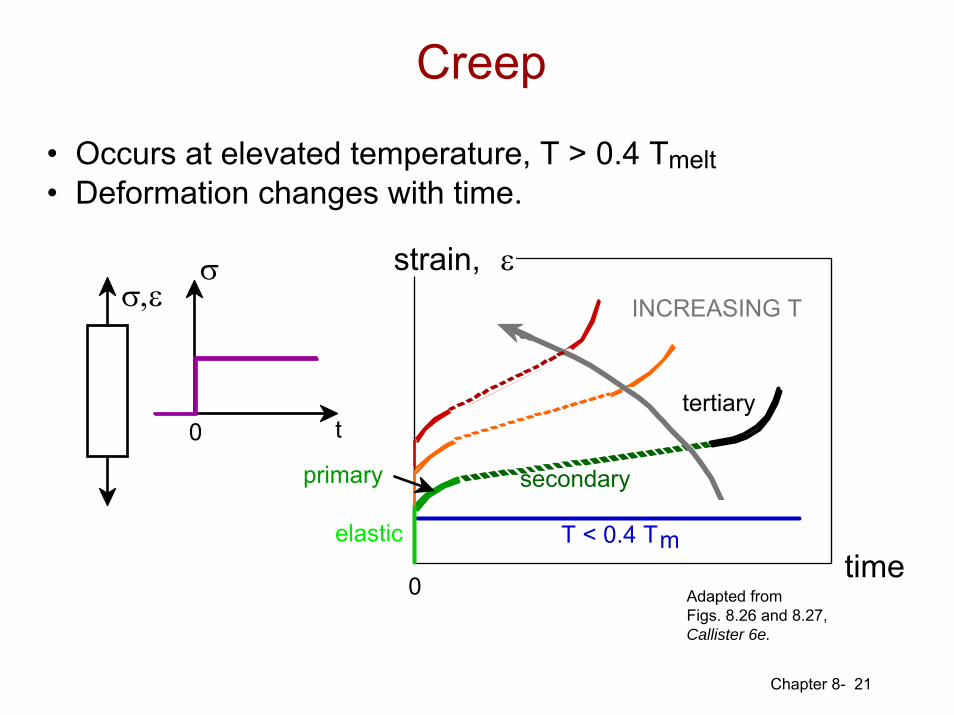
timeelastic
primary secondary
tertiary
T < 0.4 Tm
INCREASING T
0
strain, ε
• Occurs at elevated temperature, T > 0.4 Tmelt• Deformation changes with time.
21
Adapted fromFigs. 8.26 and 8.27, Callister 6e.
Creep
σ,εσ
0 t
Chapter 8-
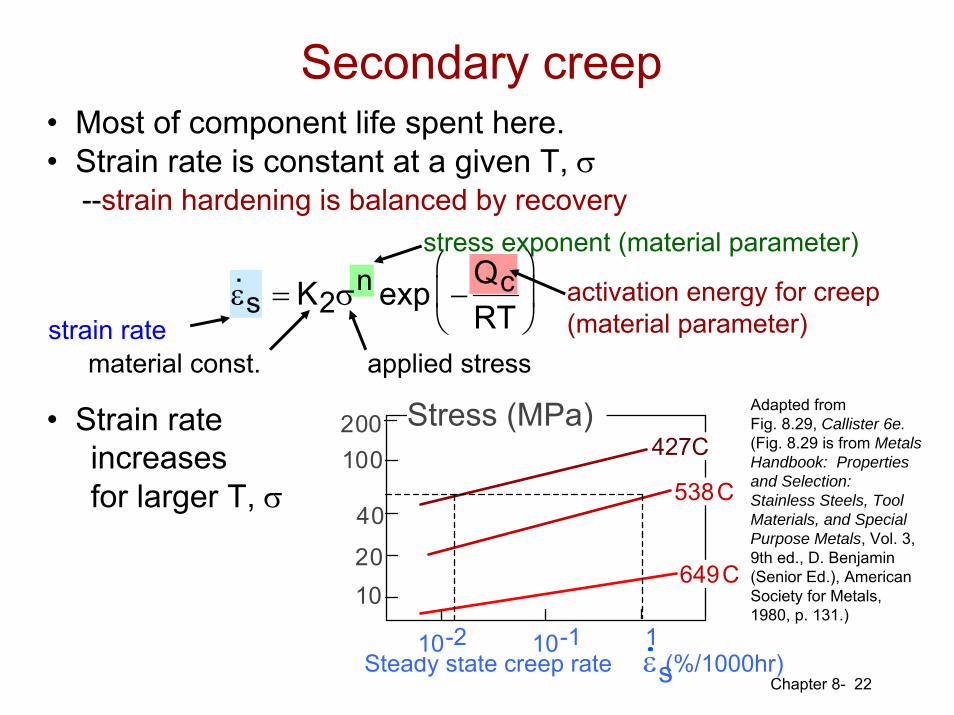
• Most of component life spent here.• Strain rate is constant at a given T, σ
--strain hardening is balanced by recovery
22
stress exponent (material parameter)
strain rateactivation energy for creep(material parameter)
applied stressmaterial const.
• Strain rateincreasesfor larger T, σ
1020
40
100200
Steady state creep rate (%/1000hr)10-2 10-1 1
ε s
Stress (MPa)427C
538C
649C
Adapted fromFig. 8.29, Callister 6e.(Fig. 8.29 is from Metals Handbook: Properties and Selection: Stainless Steels, Tool Materials, and Special Purpose Metals, Vol. 3, 9th ed., D. Benjamin (Senior Ed.), American Society for Metals, 1980, p. 131.)
εs = K2σn exp −
QcRT
⎛
⎝ ⎜
⎞
⎠ ⎟
.
Secondary creep
Chapter 8- 24
• Engineering materials don't reach theoretical strength.• Flaws produce stress concentrations that cause
premature failure.• Sharp corners produce large stress concentrations
and premature failure.• Failure type depends on T and stress:
-for noncyclic σ and T < 0.4Tm, failure stress decreases with:increased maximum flaw size,decreased T,increased rate of loading.
-for cyclic σ:cycles to fail decreases as Δσ increases.
-for higher T (T > 0.4Tm):time to fail decreases as σ or T increases.
Summary