Embed Size (px)
Citation preview

8. THIRD-COUNTRY NATIONALS’ INTEGRATION IN THE EUROPEAN UNION │ 223
SETTLING IN 2018: INDICATORS OF IMMIGRANT INTEGRATION © OECD/EUROPEAN UNION 2018
Chapter 8. Third-country nationals’ integration in the European Union
This chapter considers the full set of “Zaragoza indicators” for third-country nationals
(TCN) in the European Union, comparing their outcomes with those of host-country
nationals and EU nationals. The chapter looks first at the size and composition of third-
country national populations (8.1). It then goes on to consider their countries of
citizenship and length of residence (8.2), before analysing outcomes in employment and
activity (8.3), unemployment (8.4), self-employment (8.5), over-qualification (8.6), levels
of education (8.7), income (8.8), poverty (8.9), housing tenure status (8.10), perceived
health status (8.11), long-term resident status (8.12), participation in voting (8.13), the
acquisition of nationality (8.14), and perceived discrimination (8.15).


8. THIRD-COUNTRY NATIONALS’ INTEGRATION IN THE EUROPEAN UNION │ 225
SETTLING IN 2018: INDICATORS OF IMMIGRANT INTEGRATION © OECD/EUROPEAN UNION 2018
Box 8.1. The “Zaragoza” indicators: indicators for monitoring integration policy
outcomes in the European Union
“Migrants” in the context of the European Union are understood to be non-EU, or third
country, nationals who reside legally in the European Union. Their situations often differ
markedly from those of EU citizens moving between or living in EU member states other than
their own. Although many enjoy equal rights with host-country nationals, not all third-country
nationals have access to the labour market and there are greater restrictions on their mobility
within the European Union. Their reasons for migrating are also likely to be different from
those that prompt EU nationals to move and are more often related to asylum or family
reunification.
The Europe 2020 strategy considers better integration of third-country nationals as a factor that
will help it meet its first headline target of a 75% employment rate among 20-64 year-olds,
given the share of non-EU nationals in its labour force as well as the gap in employment rate
with host-country nationals.
Although integration policies are defined and implemented primarily at national or subnational
level, they are closely linked to the EU equality framework and to EU provisions that grant
migrants residing in the European Union certain rights (e.g. equal working conditions and
equal access to goods and services). The European Union indeed has adopted a number of EU
non-discrimination laws that are of relevance for the integration of third-country nationals, in
particular the Directive 2000/43/EC on racial equality and the employment equality directive
(Directive 2000/78/EC). Moreover, since 2009, the Treaty on the Functioning of the European
Union states, in Article 79.4, that the European Union may offer support and incentives to
member states who take action to promote the integration of legally resident third-country
nationals (though that does not include any legal harmonisation).
The European Union has also developed Common Basic Principles for Immigrant Integration
Policy. They were adopted in 2004 and reaffirmed in 2014 as the general framework for EU
policy co-operation on integration and for member countries’ assessments of their own efforts.
The Common Basic Principles cover the main aspects of integration – employment, education,
access to institutions, goods and services, and integration into the society in general. And, most
importantly, they define it as a two-way process of mutual accommodation between migrants
and host-country nationals.
The so-called “Zaragoza indicators” were introduced at a ministerial conference under the
Spanish presidency of the European Union in April 2010. Following the conclusions on
integration adopted by the Justice and Home Affairs (JHA) Council in June 2010, the
European Commission worked with member states to draw up those indicators for monitoring
the results of integration policies in the four areas of employment, education, social inclusion
and active citizenship. These indicators are in line with the Europe 2020 strategy and its related
monitoring indicators and targets. A pilot study on the common indicators published its
findings in a report, “Using EU Indicators of Immigrant integration”, which was unveiled in
2013. Eurostat updates the indicators annually, drawing on already harmonised data sources,
such as the EU Labour Force Survey and the EU Survey on Income and Living Conditions.
Moreover, since 2018, Eurostat also started publishing some of these indicators at regional
level and by level or urbanisation in order to take into account the sub-national dimension of
immigrants' integration.

226 │ 8. THIRD-COUNTRY NATIONALS’ INTEGRATION IN THE EUROPEAN UNION
SETTLING IN 2018: INDICATORS OF IMMIGRANT INTEGRATION © OECD/EUROPEAN UNION 2018
Key findings
In 2017, the EU was home to 21.6 million third-country nationals (TCNs). High numbers of non-EU
nationals live in the EU-15 countries and relatively fewer in other member states.
TCNs account for 4.2% of the total population in the European Union. Compared to ten years earlier,
rises were steepest in Sweden and Slovenia and declines largest in Latvia and Estonia.
Almost half of third-country nationals in the EU have lived in their host country for 10 years or
longer – 49% EU-wide. Further, only 6% of non-EU nationals were born in their country of
residence.
EU-wide, 55% of TCNs are in employment compared to nationals’ 68%. Overall, 8.8 million non-EU
nationals are employed in the EU, and over 10.5 million economically active.
Labour-related gaps between third-country and host-country nationals are wider among women.
Non-EU women are less likely to be economically active than their national peers in almost every EU
country (save Portugal). EU-wide, 55% are part of the labour market and 45% employed.
The highly educated always have a greater chance of being in work, while workers with little
education have higher unemployment rates, both irrespective of nationality. Gaps between host- and
third-country nationals are, however, wider among the highly than the poorly educated.
TCN’s unemployment rate of 16.5% is over double that among nationals (7%), EU-wide. In total,
1.75 million third-country nationals, are unemployed, thus over 9% of all unemployed in the EU are
nationals of a non-EU country.
About 1 million third-country nationals are self-employed in the EU and over one in four self-
employed TCNs has employees.
In the 10 years following the economic crisis and in those countries most affects by it (Southern
Europe and Ireland) the share of self-employed among non-EU nationals in employment rose, while
falling among nationals.
EU-wide, 42% of non-EU nationals are over-qualified for the job they do, against 22% of nationals.
Over the past decade, the over-qualification gap between third- and host-country nationals has
dwindled, as the over-qualification rate fell by 7 percentage points among TCNs and increased by
2 points among nationals.
Having a host-country degree halves the over-qualification rates of non-EU nationals in Sweden,
Germany and the Netherlands, compared to their foreign-educated peers. However, even with host-
country degree TCNs remain more likely to be overqualified than nationals everywhere except
Germany.
Of non-EU nationals aged 15 to 64 years old, 19% – 2.6 million individuals – went no further than
primary school education. While that share has declined by 2.5 percentage points over the last
decade, it remains almost 4 times as high as among nationals. On the other hand, 24% of third-
country nationals are highly educated, a share only 5 percentage points lower than among nationals.
Non-EU nationals have a lower annual disposable household income than nationals in virtually every
EU country. In Benelux, Spain and Sweden, it is less than 60% of nationals’ median income.
EU-wide, 5.7 million TCNs live in relative poverty. That number translates into a 39% share, over
twice nationals’ 17% and considerably higher than EU mobiles' 24%. In most countries, more than
one-third live in poverty, rising to over half in Belgium, the Netherlands, Sweden and Spain.

8. THIRD-COUNTRY NATIONALS’ INTEGRATION IN THE EUROPEAN UNION │ 227
SETTLING IN 2018: INDICATORS OF IMMIGRANT INTEGRATION © OECD/EUROPEAN UNION 2018
Poverty hit non-EU nationals harder in the wake of the economic crisis. Their EU-wide poverty rate
increased by over 7 percentage points, while remaining the same for nationals.
Less than 25% of non-EU national households own the accommodation that they occupy, compared
to over 72% among nationals. At the same time, TCNs are equally or less likely than host-country
nationals to be low-rent tenants, with the exception of Finland.
Across the EU, seven out of ten foreigners – 69% of third-country nationals and 70% of EU nationals
– report that they are in good health (shares adjusted by age). The share is slightly above the 67% of
nationals.
Host-country nationals born in a non-EU country were less likely to vote in national elections than
their native-born peers between 2008 and 2016. The respective shares were 73% and 79%, EU-wide.
The turnout gap was widest in Ireland, where non-EU-born nationals were 26 percentage points less
likely to vote than their native-born peers.
Close to one in five third-country nationals EU-wide feel that they belong to a group that is
discriminated against on the grounds of ethnicity, nationality or race. Almost 40% of non-EU
nationals in Greece and more than one-third in Belgium consider that they belong to a group that has
been subject to discrimination.

228 │ 8. THIRD-COUNTRY NATIONALS’ INTEGRATION IN THE EUROPEAN UNION
SETTLING IN 2018: INDICATORS OF IMMIGRANT INTEGRATION © OECD/EUROPEAN UNION 2018
8.1. Size and composition by age
Definition
A third-country national is a foreigner who has the nationality of a non-EU country (see Glossary).
Coverage
Total population in EU countries.
The EU is home to over 21.6 million third-country nationals, who make up more than 4% of the
population EU-wide. Nearly one-quarter live in Germany, while Italy accounts for 16%, France 14%, and
Spain and the United Kingdom for above 11% each. The populations of Estonia and Latvia boast the
largest shares of non-EU nationals relative to their population size: about 14%, predominantly Russian
citizens. In most other Central and Eastern European countries, by contrast, with the exception of
Slovenia and the Czech Republic, third-country nationals make up less than 1% of the population. In
Southern Europe, though, more than 5% of the population are non-EU nationals, and their share is even
higher in Germany (6%), Luxembourg (7%) and Austria (8%). Just as third-country nationals outnumber
the 17 million EU foreigners living in the European Union, so they outnumber them in most countries.
Belgium, however, is home to twice as many EU foreigners as non-EU nationals, Ireland and the
Slovak Republic to over three times as many, and Luxembourg to six times more.
EU-wide, 77% of third-country nationals are of working age (between 15 and 64 years old), 7% are
over 64, and 16% under 15. As the chances of obtaining host-country nationality increase with length of
stay, the younger age brackets account for the bulk of the foreign population. One-third of foreigners –
third-country and EU-nationals alike – are aged between 25 and 39. Moreover, while one in five host-
country nationals is 65 and over, only 1 in 15 non-EU nationals is. Indeed, EU-wide and in most
countries non-EU nationals are in their mid- to late-20s and 30s. Only in the Baltic countries are they
much older – older, in fact, than the national population – with more than a quarter aged over 64. At the
opposite end of the spectrum, many non-EU nationals in Southern Europe and destinations of recent
humanitarian migration are children under the age of 15. In Greece, almost a quarter fall into that age
group, while in Croatia and Sweden almost 20% non-EU nationals are children.
Over the last decade, the share of third-country nationals in the EU population increased slightly – by
about 0.6 percentage points EU-wide. The rise was below 1 point in most countries, including the
longstanding immigration destinations that are home to many non-EU nationals, such as France,
Germany, Spain and the United Kingdom. In Sweden and Slovenia, however, it was about 2.5 percentage
points and in Italy and Austria a little less than 2 points. As for the Baltic countries, whose non-EU
population has been shaped by border changes and is older than in other EU countries, they recorded
declines in the third-country shares of their populations. In fact, they were the steepest in the EU. In
Latvia, for example, the fall was almost 5 percentage points, due mostly to ageing-related deaths of the
third-country population. Altogether, the age structure of the non-EU population is fairly similar to a
decade ago.

8. THIRD-COUNTRY NATIONALS’ INTEGRATION IN THE EUROPEAN UNION │ 229
SETTLING IN 2018: INDICATORS OF IMMIGRANT INTEGRATION © OECD/EUROPEAN UNION 2018
Figure 8.1. Third-country nationals
Percentages of the total population, 2007 and 2017
StatLink 2 https://doi.org/10.1787/888933845187
Figure 8.2. Age distribution, by citizenship
Percentages of the third-country, EU and host-country national populations, respectively, 2017
StatLink 2 http://dx.doi.org/10.1787/888933844674
Notes and sources are to be found at the end of the chapter.
0
2
4
6
8
10
12
14
2017 2007
17 19
20172007
051015
Men
0 5 10 15
under 5 years
5 to 9 years
10 to 14 years
15 to 19 years
20 to 24 years
25 to 29 years
30 to 34 years
35 to 39 years
40 to 44 years
45 to 49 years
50 to 54 years
55 to 59 years
60 to 64 years
65 to 69 years
70 to 74 years
75 to 79 years
80 to 84 years
85 to 89 years
90 to 94 years
95 to 99 years
above 99 yearsWomen
Third-country national EU national National

230 │ 8. THIRD-COUNTRY NATIONALS’ INTEGRATION IN THE EUROPEAN UNION
SETTLING IN 2018: INDICATORS OF IMMIGRANT INTEGRATION © OECD/EUROPEAN UNION 2018
8.2. Duration of stay and regions of nationality
Definition
The duration of stay Indicator refers to the length of time that has elapsed since a third-country
national’s (TCN’s) year of arrival. Region of nationality denotes five broad regions, namely Asia,
Africa, Europe (including Turkey), Latin America and the Caribbean, and Canada-United States-
Oceania.
Coverage
TCNs aged between 15 and 64 years old, excluding those whose country of nationality is not reported.
Over one in three third-country nationals of working age EU-wide is citizen of a European non-EU
country. Thus, non-EU European countries constitute the top region of nationality among third-country
nationals. Next comes Asia – about 30% of non-EU nationals are nationals of an Asian country. One in
five has an African nationality, one in seven that of a country from the rest of the world – namely, the
Americas and Oceania.
European non-EU citizens make up the largest share of third-country nationals in the populations of most
Central and Eastern European countries. In these countries, third-country nationals are chiefly Russian
and Ukrainian. In Austria and Germany European non-EU citizens are the largest TCN group, too, with
Turks and citizens of former Yugoslavia forming the bulk of non-EU nationals. Asian citizens account
for most third-country nationals in Ireland, Hungary and the Nordic countries. Their origins and profiles
vary widely, though. Some came to the EU as labour immigrants, like Indians in Ireland and Chinese in
Hungary, while others, such as Afghans, Iraqis and Syrians in the Nordic countries, are humanitarian
migrants. Historic, cultural and linguistic ties between EU countries and countries outside Europe have
shaped immigrant populations. The largest group of third-country nationals in Spain and Portugal, for
instance, are nationals of a Latin American country, while the largest group of non-EU citizens in
Belgium are nationals of an African country.
Almost half of third-country nationals in the EU have lived in their host country for 10 years or longer –
49% EU-wide. The share is even higher in long-standing immigrant destinations like Austria, France and
the Netherlands, as well as in Southern Europe. A number of countries, by contrast, are home to high
shares of non-EU nationals who have arrived in the last five years. They include Ireland, Luxembourg,
and the United Kingdom, which have seen large inflows of highly educated immigrants and where more
than one-third of non-EU nationals – almost a half in Ireland – are recent arrivals. Newcomers account
for considerable shares, too, in countries that have taken in significant recent inflows of humanitarian
migrants and allow non-EU nationals to naturalise relatively quickly. In Sweden, for instance, 63% of
non-EU nationals have arrived over the last five years. Most immigrants from a third country who have
settled for 10 years have indeed already acquired the Swedish citizenship.
EU-wide, only 6% of third-country nationals were born in their country of residence. In Estonia and
Latvia, by contrast, shares of host-country-born non-EU nationals are much higher. The reason is that, on
independence, neither country automatically granted nationality to the offspring of residents who had
immigrated during the Soviet era. As for third-country nationals in Germany, 13.5% were born there, as
the country did generally not grant German nationality to native-born children of foreigners. This was
changed in a reform in 1999 for children born in or after 2000.

8. THIRD-COUNTRY NATIONALS’ INTEGRATION IN THE EUROPEAN UNION │ 231
SETTLING IN 2018: INDICATORS OF IMMIGRANT INTEGRATION © OECD/EUROPEAN UNION 2018
Figure 8.3. Region of citizenship
Composition, 15- to 64-year-olds, 2017
StatLink 2 http://doi.org/10.1787/888933844693
Figure 8.4. Third-country nationals by duration of stay
Total = 100, 15- to 64-year-olds, 2015-16
StatLink 2 http://dx.doi.org/10.1787/888933844712
Notes and sources are to be found at the end of the chapter.
Switzerland
Norway
Iceland
Spain
Ireland
Sweden
Portugal
Belgium
Netherlands
Hungary
Italy
Finland
Denmark
EU total (21)
Luxembourg
Romania
Germany
Slovak Republic
Czech Republic
Austria
Bulgaria
Lithuania
Estonia
Latvia
Slovenia
Switzerland
Norway
Iceland
Spain
Ireland
Sweden
Portugal
Belgium
Netherlands
Hungary
Italy
Finland
Denmark
EU total (21)
Luxembourg
Romania
Germany
Slovak Republic
Czech Republic
Austria
Bulgaria
Lithuania
Estonia
Latvia
Slovenia
Africa Asia Latin Americaand the Caribbean
United States,Canada and Oceania
Europe
0 100 0 100 0 100 0 100 0 100
SwedenIrelandCyprus 1,2Slovak RepublicLuxembourgUnited KingdomBelgiumDenmarkFinlandGermanyPortugalSloveniaEU total (26)AustriaHungaryCzech RepublicFranceLithuaniaNetherlandsItalySpainGreeceLatviaEstonia
NorwayIcelandSwitzerland
10 years and +
SwedenIreland
Cyprus 1,2Slovak Republic
LuxembourgUnited Kingdom
BelgiumDenmark
FinlandGermanyPortugalSlovenia
EU total (26)Austria
HungaryCzech Republic
FranceLithuania
NetherlandsItaly
SpainGreece
LatviaEstonia
NorwayIceland
Switzerland
< 5 years 5-9 years 10 years and + Born in country
0 100 0 100 0 100 0 100

232 │ 8. THIRD-COUNTRY NATIONALS’ INTEGRATION IN THE EUROPEAN UNION
SETTLING IN 2018: INDICATORS OF IMMIGRANT INTEGRATION © OECD/EUROPEAN UNION 2018
8.3. Employment and labour market participation
Definition
The employment rate denotes people in employment as a percentage of the population of working age,
aged between 15 and 64 years old. The International Labour Organization (ILO) defines an employed
person as one who, in the course of the reference week, worked at least one hour or who had a job but
was absent from work. The participation rate (or activity rate) denotes the economically active
population (employed and unemployed) as a share of the working age population.
Coverage
Working age population, 15 to 64 years old, including those in education, unless indicated otherwise.
Third-country nationals (TCNs) in the EU are less likely to be employed than their host-country peers.
Their EU-wide employment rate is 55%, compared to nationals’ 68%. The gap in labour market
participation is narrower, however – two-thirds against 73.5%. Overall, 8.8 million third-country workers
are employed in the EU, and 10.5 million economically active. In Finland, Sweden, Greece and
longstanding immigration countries with high shares of low-educated immigrants, the employment rate
among third-country nationals is particularly low. Less than 55% have a job, while their host-country
peers are 1.5 times more likely to have one. Among third-country nationals, no country boasts an
employment rate of 75% – the Europe 2020 employment target – and only Denmark, Germany, the
Netherlands and Sweden reach it among nationals. As for citizens from other EU countries, they have an
employment rate of 73% and labour market participation rate of 79%, thus outperforming nationals.
Indeed, eight countries reach the Europe 2020 employment target as far as EU foreigners are concerned.
Employment and labour market participation gaps between third-country and host-country nationals are
now higher than ten years earlier. The employment rate fell by 4 percentage points among non-EU
nationals and rose by 3 points among nationals. The trend was observable in some two-thirds of
countries, and starkest in recent destinations of low-skilled labour migration. In Spain and Greece, where
employment rates among host-country nationals declined by 4 and 7 percentage points respectively, they
dropped by 15 and 18 points among TCNs. By contrast, in countries where the share of host-country
nationals in work increased by over 5 points – such as Germany, Poland and the Czech Republic – third-
country nationals are now more likely to have a job than ten years earlier.
Labour-related gaps between third-country and host-country nationals are wider among women and the
highly educated. Although male third-country nationals are almost as economically active as their host-
country peers, with participation of over 75% in both cases, fewer TCN have jobs – 64% versus 73% of
nationals EU-wide. Non-EU women, on the other hand, are less likely to be economically active than
female nationals in most EU countries (with the exception of Southern and Central Europe). Across the
EU, only 55% are part of the labour market and 45% employed – respectively, 13 and 18 percentage
points less than their national peers. And in Germany, Belgium, the Netherlands and Finland, the
shortfall exceeds 25 points for both employment and participation rates. The highly educated always
have a greater chance of being in work, irrespective of nationality. However, highly educated non-EU
nationals fare worse than their national peers in every EU country, with a 16-point lower employment
rate in the union as a whole. Overall employment rates among low-educated third-country workers are
closer to those of their host-country peers, with a gap of only 4 points. In one-third of countries,
particularly those where foreign workers came to meet low-skilled labour market demand (as in Southern
Europe), low-educated third-country nationals tend to be more likely to have a job than their national
peers.

8. THIRD-COUNTRY NATIONALS’ INTEGRATION IN THE EUROPEAN UNION │ 233
SETTLING IN 2018: INDICATORS OF IMMIGRANT INTEGRATION © OECD/EUROPEAN UNION 2018
Figure 8.5. Employment and labour market participation rates, by citizenship
Percentages, 15- to 64-year-olds, 2017
StatLink 2 https://doi.org/10.1787/888933844731
Figure 8.6. Employment rates of third-country nationals, by level of education
Difference in percentage points with nationals, 15- to 64-year-olds not in education, 2015-16
StatLink 2https://doi.org/10.1787/888933844750/
Notes and sources are to be found at the end of the chapter.
30 40 50 60 70 80 90
Czech Republic
Estonia
Poland
Slovenia
Lithuania
Portugal
Slovak Republic
Latvia
Cyprus 1,2
Hungary
United Kingdom
Ireland
Italy
Denmark
Spain
EU total (27)
Luxembourg
Austria
Germany
Greece
Sweden
Netherlands
Finland
France
Belgium
Iceland
Switzerland
Norway
Employment rate
30 40 50 60 70 80 90
Estonia
Portugal
Czech Republic
Slovenia
Poland
Spain
Latvia
Greece
Lithuania
Sweden
Cyprus 1,2
Italy
Slovak Republic
Denmark
Ireland
United Kingdom
EU total (27)
Luxembourg
Austria
Hungary
Finland
France
Germany
Netherlands
Belgium
Iceland
Switzerland
Norway
Participation rate
95
Third-country national National
-40
-30
-20
-10
0
10
20
30
40
Low-educated Highly educated

234 │ 8. THIRD-COUNTRY NATIONALS’ INTEGRATION IN THE EUROPEAN UNION
SETTLING IN 2018: INDICATORS OF IMMIGRANT INTEGRATION © OECD/EUROPEAN UNION 2018
8.4. Unemployment
Definition
The International Labour Organization (ILO) defines the unemployed as people without, but available
for, work, and who have been seeking work in the course of the reference week. The unemployment
rate is the percentage of unemployed people in the labour force (the sum of employed and unemployed
individuals).
Coverage
The economically active population of working age (15 to 64 years old).
The unemployment rate of third-country nationals across the EU is 16.5%, against 8% among EU
foreigners and 7% among host-country nationals. In total, 1.75 million third-country nationals and
765 000 EU foreigners are unemployed. In other words, over 9% of all unemployed in the EU are
nationals of a non-EU country. In most EU countries, their jobless rates exceed those of their host-
country peers. In Spain and Greece, the two countries with the highest unemployment rates among
nationals in the EU, more than one-quarter of non-EU nationals are unemployed. This is also the case in
Sweden, where many third-country nationals are recent refugees. At 15 percentage points or more,
unemployment rate differences compared with nationals are particularly pronounced in Belgium, France
and again Sweden. Indeed, in all Nordic countries and long-standing immigration destinations with large
shares of poorly educated immigrants, third-country national unemployment rates are over twice those of
nationals. The unemployment gap between nationals from other EU countries and their host-country
peers is narrower, however, at less than 3 percentage points in most countries. In most Central European
and Baltic countries, EU foreigners are even less affected by unemployment than nationals.
The EU-wide unemployment rates of host-country nationals and EU foreigners are back to their levels
prior to the economic crisis. By contrast, the rate among third-country workers is 1.6 percentage points
higher than before. In most countries, third- and host-country national unemployment rates evolved in the
same direction over the 10 years that followed the crisis. In around one-third of countries, particularly in
Southern Europe and Sweden, joblessness among non-EU nationals increased by at least 5 percentage
points. Overall unemployment dropped in Germany, however – once again more significantly among
third-country nationals. Poland was the only country where it fell markedly among nationals, but remain
similar than before the crisis for third-country nationals.
Workers with little education have higher unemployment rates irrespective of their nationality. Among
third-country nationals, the unemployment rate of those who are educated only to low levels reaches
23%, a full 10 percentage points higher than the rate of the highly educated. Unemployment hits poorly
educated third-country nationals in the labour force particularly hard in Sweden, Spain and Belgium.
Gaps between host- and third-country nationals are, however, wider among the highly than the poorly
educated. In Belgium, Sweden and in all German-speaking countries, highly-educated third-country
nationals are at least four times more likely to be unemployed than their national peers.

8. THIRD-COUNTRY NATIONALS’ INTEGRATION IN THE EUROPEAN UNION │ 235
SETTLING IN 2018: INDICATORS OF IMMIGRANT INTEGRATION © OECD/EUROPEAN UNION 2018
Figure 8.7. Unemployment rates, by citizenship and education
Percentages, 15- to 64-year-olds, 2017
StatLink 2 https://doi.org/10.1787/888933844769
Figure 8.8. How unemployment rates have evolved, by citizenship
Changes in percentage points, 15- to 64-year-olds, between 2006-07 and 2017
StatLink 2 https://doi.org/10.1787/888933844788
Notes and sources are to be found at the end of the chapter.
0 10 20 30 40
Sweden
Spain
Belgium
France
Greece
Latvia
Ireland
Luxembourg
EU total (27)
Portugal
Finland
Slovenia
Netherlands
Austria
Estonia
Denmark
Italy
Germany
United Kingdom
Cyprus 1,2
Czech Republic
Norway
Switzerland
Iceland
Low-educated
// 43
0 10 20 30 40
Greece
Spain
Portugal
Sweden
Belgium
France
Italy
Denmark
Luxembourg
EU total (27)
Finland
Poland
Austria
Cyprus 1,2
Ireland
Estonia
Latvia
Germany
Netherlands
Czech Republic
United Kingdom
Norway
Switzerland
Iceland
Highly educated
0 10 20 30 40
Sweden
Greece
Spain
Belgium
France
Finland
EU total (27)
Luxembourg
Austria
Italy
Portugal
Netherlands
Denmark
Latvia
Germany
Estonia
Cyprus 1,2
Slovenia
Poland
Ireland
United Kingdom
Czech Republic
Norway
Switzerland
Iceland
Total
Third-country national National
-15
-10
-5
0
5
10
15
20
25
Third-country national National EU national

236 │ 8. THIRD-COUNTRY NATIONALS’ INTEGRATION IN THE EUROPEAN UNION
SETTLING IN 2018: INDICATORS OF IMMIGRANT INTEGRATION © OECD/EUROPEAN UNION 2018
8.5. Self-employment
Definition
The self-employed are people who work in their own firms or create their own businesses, sometimes
hiring employees. Self-employment includes entrepreneurs, the liberal professions, artisans, traders,
and many other freelance activities.
Coverage
Population aged between 15 and 64 who are in employment, excluding the agricultural sector.
About 1 million third-country nationals (TCN) and roughly 1.1 million EU foreigners are self-employed
in the EU. At 12%, the self-employment rates of third- and host-country nationals are similar, whereas
they are 1 percentage point higher among EU foreigners. High proportions of TCN are self-employed in
countries where numbers of immigrants are low. In some Central European countries, for example, more
than 25% of third-country nationals are self-employed, double the share of nationals. They are, however,
less likely to be self-employed than nationals in countries with larger numbers of immigrants, especially
in those where many TCN arrived prior to the economic crisis to fill labour market needs. In Italy and
Greece, for instance, more than one in five employed nationals are self-employed, but only between
one in seven to one in nine third-country nationals.
In the 10 years following the economic crisis, the share of the self-employed among non-EU nationals
increased by 3 percentage points, fell by 2 points among their host-country peers, and remained the same
among EU foreigners. Variations relative to host-country nationals in the proportions of third-country
nationals in self-employment were sharpest in the countries worst hit by the economic crisis. In Southern
Europe and Ireland, for example, the share of self-employed workers among non-EU nationals rose,
while falling among nationals. Self-employment among immigrants is often a strategy to avoid
marginalisation in the labour market, and indeed the observed growth in these countries was partly driven
by self-employed with no employees. When self-employment followed the same trend in both groups –
increasing in the United Kingdom and the Netherlands, for instance, and declining in Sweden, Hungary
and Poland – that trend was always more pronounced among non-EU nationals.
EU-wide, over one in four self-employed third-country nationals has employees – slightly less
(5 percentage points) than among host-country nationals. Most businesses are small, however, and less
than 3% employ more than 10 people, while 6% of those run by nationals do. EU foreigners are the most
likely to run one-person businesses, with 78% of self-employed EU foreigners operating as sole traders
and only 2% employing more than 10 people. In two countries in five, third-country nationals are more
likely to have employees than nationals. In Finland, for instance, almost every second business owned by
third-country nationals employs at least another person, while among business owned by nationals the
share is roughly one in three. In Austria, most non-EU entrepreneurs provide jobs for at least one person
and 10% for more than 10. In Southern Europe, by contrast, self-employed third-country nationals are
more likely to have no employees.

8. THIRD-COUNTRY NATIONALS’ INTEGRATION IN THE EUROPEAN UNION │ 237
SETTLING IN 2018: INDICATORS OF IMMIGRANT INTEGRATION © OECD/EUROPEAN UNION 2018
Figure 8.9. Self-employed workers, by citizenship
Percentages, excluding the agricultural sector, 15- to 64-year-olds in employment, 2015-16
StatLink 2 https://doi.org/10.1787/888933844807
Figure 8.10. The self-employed, by firm size and citizenship
Total =100, excluding agricultural sector, 15- to 64-year-olds, 2015-16
StatLink 2https://doi.org/10.1787/888933844826
Notes and sources are to be found at the end of the chapter.
0
5
10
15
20
25
30
35
40
Third-country national National EU national
0
20
40
60
80
100
TCN no employee TCN 1-10 employees TCN 11+ employees National no employee National 10 employees or less

238 │ 8. THIRD-COUNTRY NATIONALS’ INTEGRATION IN THE EUROPEAN UNION
SETTLING IN 2018: INDICATORS OF IMMIGRANT INTEGRATION © OECD/EUROPEAN UNION 2018
8.6. Over-qualification
Definition
The over-qualification rate is the share of the highly educated, i.e. educated to ISCED Levels 5-8 (see
Indicator 8.7), who work in a job that is ISCO-classified as low- or medium-skilled, i.e.
ISCO Levels 4-9 (see Indicator 3.9).
Coverage
People not in education aged 15 to 64 years old, who are in employment and highly educated (not
including military occupations [ISCO 0], where data on skills levels are not referenced).
In all EU countries, highly educated non-EU nationals are more likely than their host-country peers to
work in jobs for which they are over-qualified. EU-wide, 42% are over-qualified, against 22% of
nationals. In the new destinations of Southern Europe, where many immigrants arrived prior to the
economic crisis to do low-skilled work, over-qualification is particularly widespread, affecting at least
two-thirds of highly educated third-country nationals. Against this backdrop, the gap between host-
country and non-EU nationals is widest in Italy, where over-qualification is 4 times more prevalent
among the latter, and in Portugal, where it is 5 times greater. In fact, Luxembourg and the
United Kingdom are the only countries where non-EU nationals’ over-qualification rates are less than
10 percentage points above those of nationals.
In most countries, women are more likely than men to work in jobs for which they are over-qualified,
irrespective of their nationality. Yet, the over-qualification ratio between third-country female nationals
and their host-country peers is similar than that for men, around two to one.
Over the past decade, the over-qualification gap between third- and host-country nationals has dwindled,
with third-country over-qualification rates falling by 7 percentage points and those of nationals
increasing by 2 points. In Poland, however, as in Portugal, Ireland and the United Kingdom, third-
country nationals are now more likely to be over-qualified than a decade ago. In Southern Europe and
Luxembourg, by contrast, over-qualification among third-country nationals dropped drastically, while
rising among nationals. It also declined among EU foreigners in almost all countries, and by
15 percentage points EU-wide.
Across the EU, third-country nationals who obtained their degree in the host country slot into jobs more
in keeping with their level of education than those with foreign credentials. Nevertheless, they remain
more likely to be over-qualified than nationals everywhere except Germany. A host-country degree
halves the over-qualification rates of non-EU nationals in Sweden, Germany and the Netherlands,
compared to their foreign-educated peers. In Estonia and Latvia, by contrast, where many third-country
nationals are native-born Russians, as well as in the United Kingdom and Ireland, where non-EU
nationals are particularly highly educated, those trained in the country fare worse than those trained
abroad.

8. THIRD-COUNTRY NATIONALS’ INTEGRATION IN THE EUROPEAN UNION │ 239
SETTLING IN 2018: INDICATORS OF IMMIGRANT INTEGRATION © OECD/EUROPEAN UNION 2018
Figure 8.11. Over-qualification rates, by citizenship and gender
Percentages of highly educated, 15- to 64-year-olds, 2015-16
StatLink 2 https://doi.org/10.1787/888933844845
Figure 8.12. How over-qualification rates have evolved, by citizenship
Changes in percentage points of highly educated, 15- to 64-year-olds, between 2006-07 and 2015-16
StatLink 2 http://dx.doi.org/10.1787/888933844864
Notes and sources are to be found at the end of the chapter.
0 20 40 60 80
Italy
Cyprus 1,2
Greece
Spain
Portugal
Hungary
France
Austria
Estonia
Belgium
Ireland
EU total (27)
Finland
Czech Republic
Sweden
Denmark
Germany
United Kingdom
Netherlands
Latvia
Luxembourg
Norway
Switzerland
Women
0 20 40 60 80
Greece
Italy
Spain
Austria
Estonia
Finland
France
Sweden
Belgium
Denmark
Ireland
Cyprus 1,2
Latvia
EU total (27)
Germany
Hungary
Netherlands
United Kingdom
Czech Republic
Luxembourg
Norway
Switzerland
Men
0 20 40 60 80
Italy
Greece
Spain
Portugal
Cyprus 1,2
Austria
Estonia
France
Finland
Belgium
Ireland
EU total (27)
Sweden
Denmark
Poland
Germany
Latvia
United Kingdom
Czech Republic
Netherlands
Luxembourg
Norway
Switzerland
Iceland
Total
Third-country national National
-40
-30
-20
-10
0
10
20
Third-country national National EU national
240 │ 8. THIRD-COUNTRY NATIONALS’ INTEGRATION IN THE EUROPEAN UNION
SETTLING IN 2018: INDICATORS OF IMMIGRANT INTEGRATION © OECD/EUROPEAN UNION 2018
8.7. Educational attainment
Definition
This section measures educational attainment against the International Standard Classification of
Educational Degrees (ISCED). It considers three levels: i) low, no higher than lower secondary
education (ISCED Levels 0-2); ii) very low, no higher than completed primary education (ISCED
Levels 0-1); iii) high, tertiary education (ISCED Levels 5-8).
Coverage
People not in education aged 15 to 64 years old.
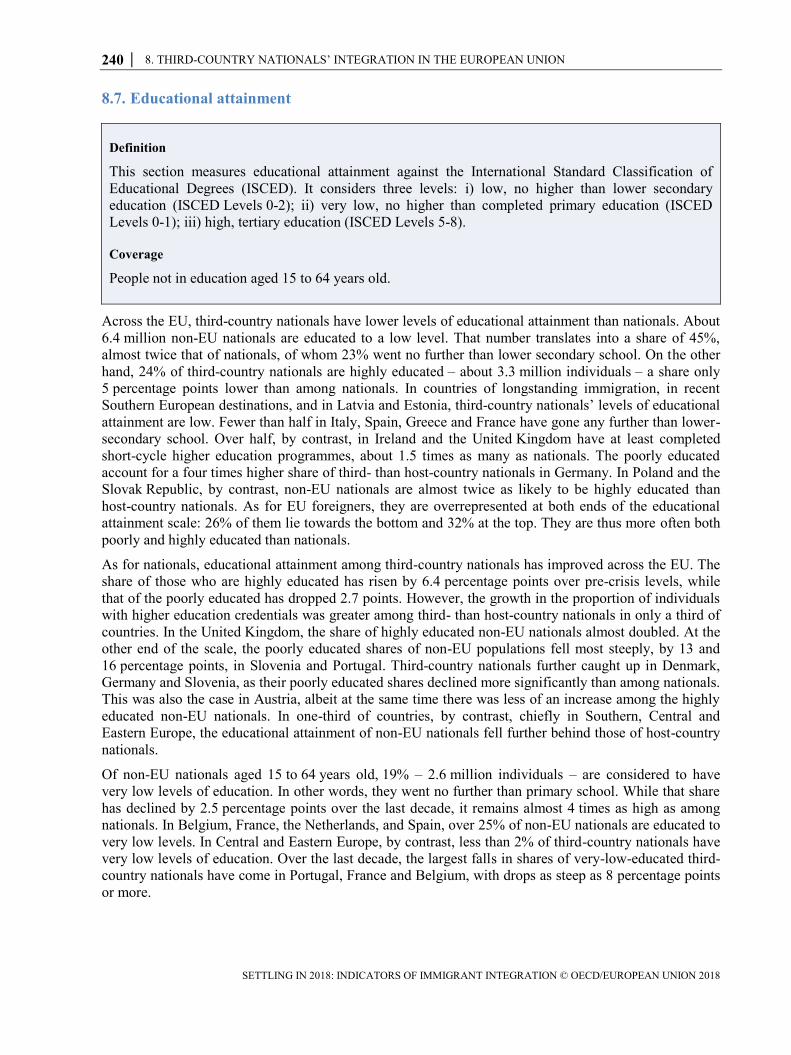
Across the EU, third-country nationals have lower levels of educational attainment than nationals. About
6.4 million non-EU nationals are educated to a low level. That number translates into a share of 45%,
almost twice that of nationals, of whom 23% went no further than lower secondary school. On the other
hand, 24% of third-country nationals are highly educated – about 3.3 million individuals – a share only
5 percentage points lower than among nationals. In countries of longstanding immigration, in recent
Southern European destinations, and in Latvia and Estonia, third-country nationals’ levels of educational
attainment are low. Fewer than half in Italy, Spain, Greece and France have gone any further than lower-
secondary school. Over half, by contrast, in Ireland and the United Kingdom have at least completed
short-cycle higher education programmes, about 1.5 times as many as nationals. The poorly educated
account for a four times higher share of third- than host-country nationals in Germany. In Poland and the
Slovak Republic, by contrast, non-EU nationals are almost twice as likely to be highly educated than
host-country nationals. As for EU foreigners, they are overrepresented at both ends of the educational
attainment scale: 26% of them lie towards the bottom and 32% at the top. They are thus more often both
poorly and highly educated than nationals.
As for nationals, educational attainment among third-country nationals has improved across the EU. The
share of those who are highly educated has risen by 6.4 percentage points over pre-crisis levels, while
that of the poorly educated has dropped 2.7 points. However, the growth in the proportion of individuals
with higher education credentials was greater among third- than host-country nationals in only a third of
countries. In the United Kingdom, the share of highly educated non-EU nationals almost doubled. At the
other end of the scale, the poorly educated shares of non-EU populations fell most steeply, by 13 and
16 percentage points, in Slovenia and Portugal. Third-country nationals further caught up in Denmark,
Germany and Slovenia, as their poorly educated shares declined more significantly than among nationals.
This was also the case in Austria, albeit at the same time there was less of an increase among the highly
educated non-EU nationals. In one-third of countries, by contrast, chiefly in Southern, Central and
Eastern Europe, the educational attainment of non-EU nationals fell further behind those of host-country
nationals.
Of non-EU nationals aged 15 to 64 years old, 19% – 2.6 million individuals – are considered to have
very low levels of education. In other words, they went no further than primary school. While that share
has declined by 2.5 percentage points over the last decade, it remains almost 4 times as high as among
nationals. In Belgium, France, the Netherlands, and Spain, over 25% of non-EU nationals are educated to
very low levels. In Central and Eastern Europe, by contrast, less than 2% of third-country nationals have
very low levels of education. Over the last decade, the largest falls in shares of very-low-educated third-
country nationals have come in Portugal, France and Belgium, with drops as steep as 8 percentage points
or more.

8. THIRD-COUNTRY NATIONALS’ INTEGRATION IN THE EUROPEAN UNION │ 241
SETTLING IN 2018: INDICATORS OF IMMIGRANT INTEGRATION © OECD/EUROPEAN UNION 2018
Figure 8.13. Low- and highly educated, by citizenship
Percentages, 15- to 64-year-olds, 2015-16
StatLink 2https://doi.org/10.1787/888933844883
Figure 8.14. How shares of highly educated have evolved, by citizenship
Changes in percentage points, 15- to 64-year-olds, between 2006-07 and 2015-16
StatLink 2 http://dx.doi.org/10.1787/888933844902
Notes and sources are to be found at the end of the chapter.
0 10 20 30 40 50 60
Italy
Spain
Greece
France
Germany
Belgium
EU total (27)
Sweden
Netherlands
Portugal
Austria
Cyprus 1,2
Finland
Denmark
Luxembourg
Slovenia
Hungary
United Kingdom
Czech Republic
Slovak Republic
Estonia
Latvia
Ireland
Lithuania
Poland
Iceland
Switzerland
Norway
Low-educated
0 10 20 30 40 50 60
Ireland
United Kingdom
Poland
Lithuania
Luxembourg
Slovak Republic
Sweden
Denmark
Cyprus 1,2
Hungary
Finland
Czech Republic
Estonia
EU total (27)
Belgium
France
Netherlands
Austria
Germany
Latvia
Spain
Portugal
Italy
Greece
Slovenia
Norway
Iceland
Switzerland
Highly educated
64
Third-country national National
-15
-10
-5
0
5
10
15
20
25
30
Third-country national National
242 │ 8. THIRD-COUNTRY NATIONALS’ INTEGRATION IN THE EUROPEAN UNION
SETTLING IN 2018: INDICATORS OF IMMIGRANT INTEGRATION © OECD/EUROPEAN UNION 2018
8.8. Household income
Definition
A household’s annual equivalised disposable income is the income per capita adjusted by the square
root of household size. Income is expressed in euros (EUR) at constant prices (2010=100) based on
purchasing power parity (PPP) for 2014. It includes earnings from labour and capital. The median
income divides households into two halves: one-half receives less and the other more than the median
income. One-tenth of the population has an income lower than the first decile (D1) and one-tenth
higher than the ninth decile (D9).
Coverage
People aged 16 years old and over who live in ordinary housing. The household's annual equivalised
income is attributed to each individual member.
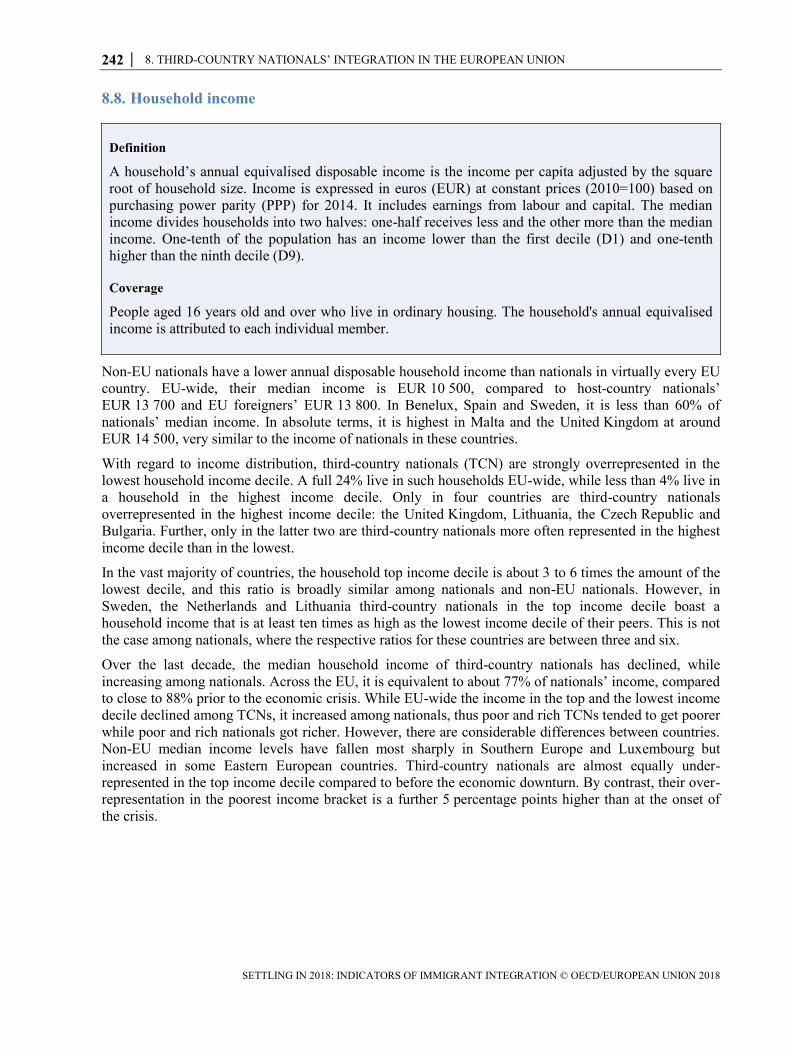
Non-EU nationals have a lower annual disposable household income than nationals in virtually every EU
country. EU-wide, their median income is EUR 10 500, compared to host-country nationals’
EUR 13 700 and EU foreigners’ EUR 13 800. In Benelux, Spain and Sweden, it is less than 60% of
nationals’ median income. In absolute terms, it is highest in Malta and the United Kingdom at around
EUR 14 500, very similar to the income of nationals in these countries.
With regard to income distribution, third-country nationals (TCN) are strongly overrepresented in the
lowest household income decile. A full 24% live in such households EU-wide, while less than 4% live in
a household in the highest income decile. Only in four countries are third-country nationals
overrepresented in the highest income decile: the United Kingdom, Lithuania, the Czech Republic and
Bulgaria. Further, only in the latter two are third-country nationals more often represented in the highest
income decile than in the lowest.
In the vast majority of countries, the household top income decile is about 3 to 6 times the amount of the
lowest decile, and this ratio is broadly similar among nationals and non-EU nationals. However, in
Sweden, the Netherlands and Lithuania third-country nationals in the top income decile boast a
household income that is at least ten times as high as the lowest income decile of their peers. This is not
the case among nationals, where the respective ratios for these countries are between three and six.
Over the last decade, the median household income of third-country nationals has declined, while
increasing among nationals. Across the EU, it is equivalent to about 77% of nationals’ income, compared
to close to 88% prior to the economic crisis. While EU-wide the income in the top and the lowest income
decile declined among TCNs, it increased among nationals, thus poor and rich TCNs tended to get poorer
while poor and rich nationals got richer. However, there are considerable differences between countries.
Non-EU median income levels have fallen most sharply in Southern Europe and Luxembourg but
increased in some Eastern European countries. Third-country nationals are almost equally under-
represented in the top income decile compared to before the economic downturn. By contrast, their over-
representation in the poorest income bracket is a further 5 percentage points higher than at the onset of
the crisis.

8. THIRD-COUNTRY NATIONALS’ INTEGRATION IN THE EUROPEAN UNION │ 243
SETTLING IN 2018: INDICATORS OF IMMIGRANT INTEGRATION © OECD/EUROPEAN UNION 2018
Figure 8.15. Income deciles of third-country nationals
Percentages, aged 16 and above, 2016
StatLink 2 http://dx.doi.org/10.1787/888933844921
Figure 8.16. Median income, by citizenship
EUR in constant prices (based on 2014 PPP), aged 16 and above, 2016
StatLink 2 https://doi.org/10.1787/888933844940
Notes and sources are to be found at the end of the chapter.
0
5
10
15
20
25
30
35
40
45
% lowest income decile % highest income decile
0
5000
10000
15000
20000
25000
Third-country national National EU national

244 │ 8. THIRD-COUNTRY NATIONALS’ INTEGRATION IN THE EUROPEAN UNION
SETTLING IN 2018: INDICATORS OF IMMIGRANT INTEGRATION © OECD/EUROPEAN UNION 2018
8.9. Relative poverty
Definition
The poverty rate is the proportion of individuals living below the poverty threshold. The Eurostat
definition of the poverty threshold used here is 60% of the median equivalised disposable income in
each country.
Coverage
All people aged 16 years old and over living in ordinary housing. The annual equivalised household
income is attributed to each individual.
A large number of third-country nationals – 5.7 million – live in relative poverty. That number translates
into a 39% share, over twice nationals’ 17% and considerably higher than EU foreigners’ 24%. In most
countries, more than one-third live in poverty, rising to over half in Belgium, the Netherlands, Sweden
and Spain. Fewer than a quarter are affected in four countries only, namely the United Kingdom and
Malta, both destination countries for the highly educated, as well as Bulgaria and the Czech Republic.
While non-EU nationals are 2.3 times more likely to live in poverty than their host-country peers across
the EU, the widest in-country differences come in Luxembourg where non-EU nationals are over 4 times
more likely than nationals to be poor. Gaps are also high in longstanding destinations like the
Netherlands, Belgium and France as well as in Sweden. In Central Europe and the United Kingdom,
discrepancies are narrower between host- and third-country nationals, with the latter less likely than the
former to be poor only in Bulgaria.
Poverty hit non-EU nationals harder in the wake of the economic crisis. Their EU-wide poverty rate
increased by over 7 percentage points, while remaining the same among nationals. In Portugal, they were
over twice as likely to live in poverty 10 years after the crisis as before it. In about one-third of countries,
by contrast, non-EU national poverty rates declined, most steeply in the Czech Republic, where it halved.
As for EU foreigners, their situation worsened in the 10 years after the onset of the crisis, with their
EU-wide poverty rate rising 5 percentage points. Increases were steep in the Southern European
countries of Spain, Greece, and Italy at over 10 percentage points. The steepest of all, however, came in
Austria, where the 18-point rise doubled the share of those in poverty among EU nationals.

8. THIRD-COUNTRY NATIONALS’ INTEGRATION IN THE EUROPEAN UNION │ 245
SETTLING IN 2018: INDICATORS OF IMMIGRANT INTEGRATION © OECD/EUROPEAN UNION 2018
Figure 8.17. Relative poverty rates, by citizenship
Percentages, aged 16 and above, 2016
StatLink 2 https://doi.org/10.1787/888933844959
Figure 8.18. How relative poverty rates have evolved, by citizenship
Changes in percentage points, aged 16 and above, between 2007 and 2016
StatLink 2 http://doi.org/10.1787/888933844978
Notes and sources are to be found at the end of the chapter.
0
10
20
30
40
50
60
Third-country national National EU national
-15 -10 -5 0 5 10 15 20 25
Czech Republic
Finland
Ireland
Denmark
United Kingdom
France
Belgium
Germany
Luxembourg
Cyprus 1,2
EU total (22)
Austria
Italy
Greece
Lithuania
Sweden
Portugal
Spain
Iceland
Norway
Third-country national National

246 │ 8. THIRD-COUNTRY NATIONALS’ INTEGRATION IN THE EUROPEAN UNION
SETTLING IN 2018: INDICATORS OF IMMIGRANT INTEGRATION © OECD/EUROPEAN UNION 2018
8.10. Housing tenure
Definition
There are three main types of housing tenure: owner occupancy, tenancy, and free occupancy. In most
EU member states, tenants pay rents at market rates or occupy low-rent accommodation, i.e. public
social housing, employer-funded social housing, or housing where rents are capped by law.
Coverage
Households with individuals living in an ordinary residence where at least one principal occupant is
aged over 15 years old.
Across the EU, less than 25% of non-EU national households own the accommodation that they occupy,
compared to over 72% among nationals. As for EU nationals’, owner occupancy is at 37% and thus more
widespread than among third-country nationals, and just over half the rate of nationals. In fact, the
majority of nationals in every country own the property in which they live, while the opposite is true of
third-country nationals in most countries. While large shares own their homes in some Central and
Eastern European countries, less than a quarter do so in longstanding immigration destinations and
Southern Europe. The lowest shares come in Austria, Belgium, Ireland, Italy and Sweden with less than
one-fifth.
In some two-thirds of countries, non-EU national households are less likely to own their homes than ten
years ago. How home ownership by citizenship has evolved is attributable partly to a change in the
make-up of the foreign population. In countries with large recent intakes of migrants, many may not yet
have been able to save enough to buy their own homes. Accordingly, 4 percentage points fewer non-EU
nationals own their homes than before the crisis EU-wide, while nationals’ home ownership rates have
shown a slight increase of 2 points. The fall is very steep among immigrant households in Sweden, –
19 percentage points. Among EU foreigners, owner-occupancy rates are down 7 points on pre-crisis
levels, with the largest drop of 17.5 points coming in the United Kingdom.
As the incomes of third-country nationals are generally lower than nationals’, it may be expected that
they are more likely to occupy low-rent housing. In fact, the opposite is true. While 24% of host-country
nationals are low-rent tenants EU-wide, only 13% of third-country nationals are. They are more likely to
be so in Finland alone, while in about a quarter of countries they are just as likely as nationals. They are
markedly less likely to live in low-rent accommodation in countries like Malta, Ireland and the
United Kingdom, with recent high intakes of highly educated third-country nationals.
Several factors affect the lower access to housing of third-country nationals, such as their lower income
and their lack of knowledge of the housing market. They may also be prone to discrimination from
property owners. According to the second wave of the European Union Minorities and Discrimination
Survey (EU-MIDIS II), 7% of the third-country nationals in the largest ethnic minorities stated that they
had experienced discrimination in the last 12 months because of skin colour/ethnic origin or religion
when trying to rent or buy housing. Perceptions of discrimination were most widespread among nationals
from Africa, especially in Belgium, Austria, Luxembourg and Italy.

8. THIRD-COUNTRY NATIONALS’ INTEGRATION IN THE EUROPEAN UNION │ 247
SETTLING IN 2018: INDICATORS OF IMMIGRANT INTEGRATION © OECD/EUROPEAN UNION 2018
Figure 8.19. Rates of home ownership, by citizenship
Percentages of all households, 2016
StatLink 2 https://doi.org/10.1787/888933844997
Figure 8.20. How home ownership rates have evolved, by citizenship
Changes in percentage points, between 2007 and 2016
StatLink 2 http://doi.org/10.1787/888933845016
Notes and sources are to be found at the end of the chapter.
0
10
20
30
40
50
60
70
80
90
100
Third-country national National
-20 -15 -10 -5 0 5
Sweden
Belgium
United Kingdom
Portugal
Italy
Spain
Austria
EU total (22)
Cyprus 1,2
Luxembourg
Lithuania
Finland
Ireland
Denmark
Germany
France
Greece
Czech Republic
Iceland
Norway
Third-country national National

248 │ 8. THIRD-COUNTRY NATIONALS’ INTEGRATION IN THE EUROPEAN UNION
SETTLING IN 2018: INDICATORS OF IMMIGRANT INTEGRATION © OECD/EUROPEAN UNION 2018
8.11. Self-reported health status
Definition
Self-reported health status denotes how people perceive their physiological and psychological health.
The share of those in good health is the share of individuals who rate their health as “good” or better.
As health status is strongly age-dependent, and immigrants tend to be younger in most countries, that
share in immigrant populations is adjusted to estimate what outcomes would be if immigrants had the
same age structure as the native-born.
Coverage
People aged 16 years and over.
Across the EU, seven out of ten foreigners – 69% of third-country nationals and 70% of EU nationals –
report that they are in good health. The share is slightly above the 67% of nationals. Differences between
countries are wider than between nationals and foreigners within countries. Third-country nationals feel
particularly healthy in Sweden, destinations with intakes of recent highly educated immigrants (like
Ireland and the United Kingdom), and in the Southern European countries. At the other end of the scale
lies Germany, where less than one in two third-country nationals (and host-country nationals) claim good
health.
Ten years after the crisis, fewer third-country nationals reported good health than before, albeit only by a
single percentage point EU-wide. The trend was much the same among nationals. EU nationals, by
contrast, felt slightly healthier – they were 2 percentage points more likely than before the crisis to rate
their own health as good or better. Third-country nationals reported better health in nearly half of
countries, with a particular improvement in Austria. As for the biggest drops in self-reported good health,
they came in Germany and Sweden. In two-third of countries the same trend was observed among third-
and host-country nationals. Not in Sweden and Luxembourg, however, where nationals reported much
better health status and non-EU nationals much worse.
Differences in the self-reported health status of third- and host-country nationals may also be attributable
to a number of factors not included in the analysis – e.g. gender, lifestyle or other social and economic
circumstances. They may also indicate different degrees of satisfaction with health and social security
systems.

8. THIRD-COUNTRY NATIONALS’ INTEGRATION IN THE EUROPEAN UNION │ 249
SETTLING IN 2018: INDICATORS OF IMMIGRANT INTEGRATION © OECD/EUROPEAN UNION 2018
Figure 8.21. Good self-reported health status, by citizenship
Percentages, aged 16 and above, 2016
StatLink 2 https://doi.org/10.1787/888933845035
Figure 8.22. How the shares of individuals in good health have evolved, by citizenship
Changes in percentage points, aged 16 and above, between 2007 and 2016
StatLink 2 https://doi.org/10.1787/888933845054
Notes and sources are to be found at the end of the chapter.
0
10
20
30
40
50
60
70
80
90
100
Third-country national adjusted National EU national adjusted
-15 -10 -5 0 5 10
Sweden
Germany
Czech Republic
Luxembourg
Italy
Cyprus 1,2
Bulgaria
Spain
Portugal
EU total (23)
France
Belgium
Denmark
Finland
United Kingdom
Ireland
Greece
Austria
Norway
Third-country national adjusted National

250 │ 8. THIRD-COUNTRY NATIONALS’ INTEGRATION IN THE EUROPEAN UNION
SETTLING IN 2018: INDICATORS OF IMMIGRANT INTEGRATION © OECD/EUROPEAN UNION 2018
8.12. Long-term residents
Definition
A long-term resident is a third-country national who has been granted long-term residence status in
accordance with Directive 2003/109/EC of 25 November 2003. The status may be granted to all non-
EU citizens if they have resided legally and continuously for five years in an EU member state, have
health insurance coverage, and enjoy sufficient financial resources not to have to rely on social
assistance. Some countries may also have additional requirements, such as proficiency in the host-
country language. Long-term residents enjoy the same rights of residence as EU nationals, particularly
that of residing in an EU country other than the one where they were awarded long-term residence.
This indicator relates to the share of long-term residents among third-country nationals who live
legally in the European Union. EU member countries may deliver permanent residence permits that
confer more advantageous conditions than foreseen in the Directive. The collection of data on long-
term residence permits includes countries’ permanent residence permits, even if they do not entitle
residents to live in other EU countries.
Coverage
All third-country nationals with a valid residence permit.
An average of four TCNs in ten benefit from long-term residence status in the EU (both EU long-term
resident status and national permanent status included). From country to country, however, that share
varies greatly. More than 85% of third-country nationals are long-term residents in Latvia and Estonia,
countries where the non-EU population was largely shaped by border changes and includes national
minorities. In Sweden and France, about 75% of non-EU nationals enjoy long-term residence status.
Fewer than one in two do, however, in two-thirds of countries, and only about 1 in 50 in Portugal and
Finland.
The permanent residence permits granted by some countries before Directive 2003/109/EC came into
effect may be more advantageous than the long-term status conferred by the directive. In countries that
grant permanent residence entitlements, it is not in third-country nationals’ interest to apply for a long-
term EU residence permit unless they wish to settle later on in another member state. The long-term
residence data generally collected include the permanent residence permits granted by certain countries.
For instance in France, Germany, Belgium and Spain, where more than half of third-country nationals
enjoy long-term residence status, it is mainly under national permanent residence permits, while the share
of those having EU long-term residence status is lower than 3%.
The proportion of third-country nationals with long-term residence status has increased in most countries
over the past decade. However, because countries have taken different lengths of time to implement
Directive 2003/109/EC and because data collection does not always include the permanent permits
granted by certain countries, cross-country comparisons over time may not be meaningful.

8. THIRD-COUNTRY NATIONALS’ INTEGRATION IN THE EUROPEAN UNION │ 251
SETTLING IN 2018: INDICATORS OF IMMIGRANT INTEGRATION © OECD/EUROPEAN UNION 2018
Figure 8.23. Proportions of third-country nationals with long-term residence status
Percentages, EU long-term resident status and national permanent status included, 2016
StatLink 2 https://doi.org/10.1787/888933845073
Notes and sources are to be found at the end of the chapter.
0
10
20
30
40
50
60
70
80
90
100

252 │ 8. THIRD-COUNTRY NATIONALS’ INTEGRATION IN THE EUROPEAN UNION
SETTLING IN 2018: INDICATORS OF IMMIGRANT INTEGRATION © OECD/EUROPEAN UNION 2018
8.13. Voter participation
Definition
Voter participation is the share of voters who report that they cast a ballot in the most recent national
parliamentary election in the country of residence.
Coverage
All nationals of the country of residence aged 18 and above who are eligible to vote in national
elections.
EU-wide, host-country nationals born in a third country were less likely to vote in national elections than
their native-born peers between 2008 and 2016. The respective shares were 73% and 79%. Host-country
nationals born in other EU countries came in between, with 76% voting in the most recent national
election.
Non-EU-born voter turnout was lower not only EU-wide, but in most countries, too. The turnout gap was
widest in Ireland, where non-EU-born with host-country citizenship were 26 points less likely to cast a
vote than their native-born peers. In the Nordic countries, Southern Europe, Germany and the
Netherlands, gaps were wide, too, at over 10 percentage points. In about half of countries, however,
including most of Eastern Europe and some longstanding destinations like Austria, France and the
United Kingdom, differences in non-EU-born and native-born voter participation were not significant.
As for host-country nationals born in other EU countries, though less likely to vote than their native-born
peers EU-wide, there is no significant difference in turnout in half of countries. In virtually all countries,
however, they are more likely to vote than non-EU-born nationals. In fact, only in Belgium and the
United Kingdom do nationals born in other EU countries vote in lower proportions than non-EU-born
nationals. Commonwealth citizenship may have something to do with the relatively high turnout of non-
EU-born nationals in the United Kingdom. As immigrants with a nationality from the Commonwealth
can take part in national elections when residing in the United Kingdom, they may be familiar with the
voting system and more likely to cast their vote, including after naturalisation.

8. THIRD-COUNTRY NATIONALS’ INTEGRATION IN THE EUROPEAN UNION │ 253
SETTLING IN 2018: INDICATORS OF IMMIGRANT INTEGRATION © OECD/EUROPEAN UNION 2018
Figure 8.24. Self-reported participation in most recent election by place of birth
Percentages of population with the country’s nationality, aged 18 and above, 2008-16
StatLink 2 https://doi.org/10.1787/888933845092
Notes and sources are to be found at the end of the chapter.
0
10
20
30
40
50
60
70
80
90
100
Born in a third country Native-born Born in the EU-28

254 │ 8. THIRD-COUNTRY NATIONALS’ INTEGRATION IN THE EUROPEAN UNION
SETTLING IN 2018: INDICATORS OF IMMIGRANT INTEGRATION © OECD/EUROPEAN UNION 2018
8.14. Acquisition of nationality
Definition
The acquisition of nationality is the process through which immigrants become citizens of the host
country in which they reside. Immigrants must have lived for a certain time in the host country before
they can apply for nationality. Required durations vary according to the host country and the
immigrant group. On average, most immigrants are eligible for citizenship after 10 years of residence.
This section uses the term “acquisition rate” to denote the share of immigrants who have resided in the
host country for at least 10 years and hold its nationality. This rate is based on EU-LFS and not
administrative headcount data.
Coverage
Immigrants aged 15 years and above who have resided in the host country for at least 10 years (settled
immigrants). Immigrants who acquire the nationality of the host country at birth (e.g. expatriates) are
also included since they cannot be separately identified.
A majority of non-EU born – 60% EU-wide – who resided in the EU in 2015-16 have taken their host-
country’s nationality after 10 years of residence. Among EU migrants, the share is lower, at 46%. Over
90% of settled non-EU migrants in Croatia, Lithuania, Sweden and the Slovak Republic became host-
country citizens, while less than half did so in about one-third of countries. Rates are particularly low in
Latvia, Estonia, Italy and Greece, where no more than 36% of settled non-EU born take up nationality.
In most countries, EU migrants are less likely to take up host-country nationality than non-EU migrants –
partly because they already enjoy the benefits of EU citizenship. Immigrants born in another EU country
are much more likely to have naturalised in member states that joined the EU and its free movement area
more recently – particularly in the Czech Republic and, to a lesser extent, in Latvia, Hungary and
Slovenia. This is partly linked to border changes. By contrast, no more than one in three settled EU-
migrants has acquired nationality in the United Kingdom, Denmark, Spain or Luxembourg.
The EU-wide nationality acquisition rate has fallen substantially over the last 10 years. In three countries
in five actually, immigrants from a third country were less likely to be host-country nationals 10 years
after the economic crisis than at its onset. The decline was close to 9 percentage points among non-EU
migrants and 13 points among those from other EU countries. By contrast, there were significant rises
among both non-EU and EU migrants in Luxembourg and Portugal. In almost all countries, the rates of
non-EU and EU migrants acquiring nationality followed the same trend. The only exceptions were
Greece, Spain and Finland, where immigrants from other EU-28 countries became less likely to take up
host-country nationality, while those from outside the EU became more likely to do so.

8. THIRD-COUNTRY NATIONALS’ INTEGRATION IN THE EUROPEAN UNION │ 255
SETTLING IN 2018: INDICATORS OF IMMIGRANT INTEGRATION © OECD/EUROPEAN UNION 2018
Figure 8.25. Acquisition of nationality, by place of birth
Percentages of settled immigrants who became host-country nationals, aged 15 and above, 2015-16
StatLink 2 https://doi.org/10.1787/888933845111
Figure 8.26. How the acquisition of nationality rate has evolved, by place of birth
Changes in percentage points, aged 15 and above, between 2006-07 and 2015-16
StatLink 2 https://doi.org/10.1787/888933845130
Notes and sources are to be found at the end of the chapter.
0
10
20
30
40
50
60
70
80
90
100
Born in a third country Born in the EU-28
-25 -20 -15 -10 -5 0 5 10 15
Czech Republic
Cyprus 1,2
Estonia
Italy
Denmark
Ireland
Slovenia
EU total (26)
France
Netherlands
Austria
United Kingdom
Lithuania
Hungary
Croatia
Belgium
Sweden
Spain
Slovak Republic
Greece
Finland
Portugal
Luxembourg
Bulgaria
Norway
Switzerland
Born in a third country Born in the EU-28
-40

256 │ 8. THIRD-COUNTRY NATIONALS’ INTEGRATION IN THE EUROPEAN UNION
SETTLING IN 2018: INDICATORS OF IMMIGRANT INTEGRATION © OECD/EUROPEAN UNION 2018
8.15. Perceived discrimination
Definition
This section considers shares of immigrants who report having experienced discrimination. In the EU,
perceived discrimination among immigrants is the sentiment of belonging to a group that is
discriminated against on grounds of ethnicity, nationality, or race. In Australia and Canada, perceived
discrimination relates to reported personal experience of discrimination. In the United States, only
work-related discrimination is covered, people who feel they have been discriminated against with
regard to work over the past five years (2016 data).
Coverage
Foreigners aged 15 to 64 years old.
Close to one in five third-country nationals EU-wide feel that they belong to a group that is discriminated
against on the grounds of ethnicity, nationality or race. The sentiment varies widely from country to
country, however. Almost 40% of non-EU nationals in Greece and more than one-third in Belgium
consider that they belong to a group that has been subject to discrimination. Shares are lower in the
Nordic countries, Ireland and the United Kingdom.
The sentiment is much less prevalent among EU foreigners, only 10% of whom feel part of a group that
is singled out for discrimination. The incidence is particularly low in Belgium, where less than 7% of EU
foreigners share that perception. By contrast, EU foreigners in Sweden and the United Kingdom feel
similarly or even more discriminated against than non-EU nationals.
Fewer third-country nationals EU-wide feel discriminated against today than a decade ago. Between
2010 and 2016, a 5-point lower share than between 2002 and 2008 reported discrimination on the
grounds of belonging to a particular group. Although the sense of discrimination lessened among third-
country nationals in Austria and, to a lesser extent, the Netherlands and Ireland, it rose to double pre-
crisis levels in Belgium. As for EU foreigners, the reported incidence of discrimination remained much
the same EU-wide. It rose however by about 5 percentage points in France, Belgium and the
United Kingdom, while declining particularly steeply in Austria and to a lesser extent in Germany.
While shares of male and female EU nationals report to be part of a discriminated group in similar
proportions, non-EU national men were much more likely to do so than non-EU national women.
Foreigners from North and Sub-Saharan Africa and Asia perceive greater discrimination than those born
in other parts of the world – i.e. Europe, Oceania and the Americas. Discrimination seems to single out
foreigners of working age (between the ages of 25 and 54), particularly those who are unemployed and
regardless of whether they are EU or third-country nationals. Language, however, appears to be less of a
factor in perceptions of discrimination among third-country nationals, who report broadly the same
shares irrespective of whether or not their first language is the host-country’s. By contrast, EU nationals
whose first language is not the one spoken in the host-country are twice as likely to feel that they belong
to a group that is discriminated against as those who share a first language with host-country nationals.

8. THIRD-COUNTRY NATIONALS’ INTEGRATION IN THE EUROPEAN UNION │ 257
SETTLING IN 2018: INDICATORS OF IMMIGRANT INTEGRATION © OECD/EUROPEAN UNION 2018
Figure 8.27. Self-reported discrimination, by citizenship
Percentages, 15- to 64-year-olds, 2008-16
StatLink 2 https://doi.org/10.1787/888933845149
Figure 8.28. Self-reported discrimination, by several characteristics and citizenship
Percentages, 15- to 64-year-olds, 2012-16
StatLink 2 https://doi.org/10.1787/888933845168
Notes and sources are to be found at the end of the chapter.
0
5
10
15
20
25
30
35
40
Third-country national EU national
0 5 10 15 20 25 30
Total
Other Europe
North Africa
Sub-Saharan Africa
South and Central America
North America and Oceania
Asia
Women
Men
15-24 years old
25-54 years old
55-64 years old
Low-educated
Medium-educated
Highly educated
Foreign-born
Native-born
Inactive
Unemployed
Employed
First language is foreign language
First language is host-country language
Third-country national EU national

258 │ 8. THIRD-COUNTRY NATIONALS’ INTEGRATION IN THE EUROPEAN UNION
SETTLING IN 2018: INDICATORS OF IMMIGRANT INTEGRATION © OECD/EUROPEAN UNION 2018
Notes and sources
Notes on Cyprus
1. Note by Turkey: The information in this document with reference to “Cyprus” relates to the southern
part of the Island. There is no single authority representing both Turkish and Greek Cypriot people
on the Island. Turkey recognises the Turkish Republic of Northern Cyprus (TRNC). Until a lasting
and equitable solution is found within the context of the United Nations, Turkey shall preserve its
position concerning the “Cyprus issue”.
2. Note by all the European Union Member States of the OECD and the European Union: The Republic
of Cyprus is recognised by all members of the United Nations with the exception of Turkey. The
information in this document relates to the area under the effective control of the Government of the
Republic of Cyprus.
Note on Israel
The statistical data for Israel are supplied by and under the responsibility of the relevant Israeli
authorities. The use of such data by the OECD is without prejudice to the status of the Golan Heights,
East Jerusalem and Israeli settlements in the West Bank under the terms of international law.
Notes on figures and tables
EU totals factor in rates that cannot be published individually because sample sizes are too small.
EU totals in figures on evolutions from Indicator 8.3 to 8.11 and 8.14 exclude Latvia.
In the EU-LFS data for Malta it is not possible to distinguish EU nationals from third-country nationals.
As a result, all figure EU totals for third-country nationals based on EU-LFS data exclude Malta.
Figure 8.1: EU total (25) excludes data for Croatia, Romania and Malta for 2007 and 2017. The figure
displays EU-25 4.4% (2017) and 3.8% (2007). The EU-28 share for 2017 is 4.2%.
Figure 8.3: For Spain, the region of citizenship United States, Canada and Oceania only includes data for
the United States.
Figure 8.15 and Figure 8.16: Purchasing power parities (PPP) in national currencies per euro (EU=1.00),
2014.
Figure 8.21 and Figure 8.22: Adjusted rates refer to the hypothetical situation if third-country nationals
had the same age distribution as nationals.
For further detailed data, see Annex A.
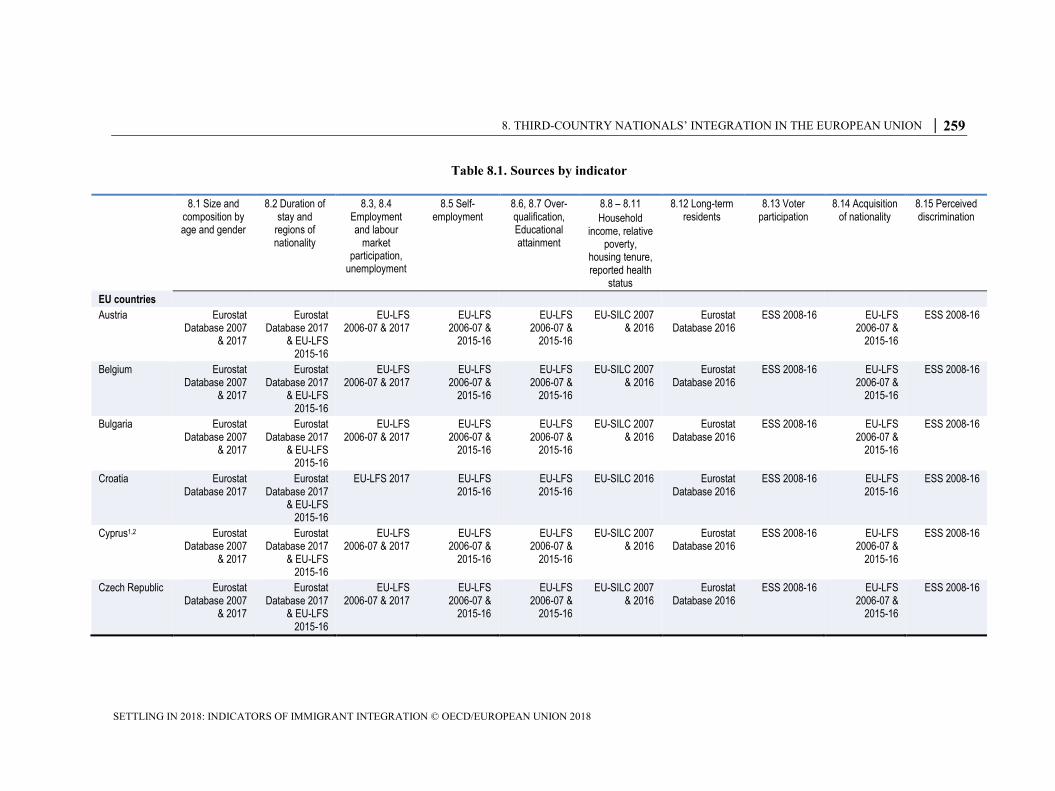
8. THIRD-COUNTRY NATIONALS’ INTEGRATION IN THE EUROPEAN UNION │ 259
SETTLING IN 2018: INDICATORS OF IMMIGRANT INTEGRATION © OECD/EUROPEAN UNION 2018
Table 8.1. Sources by indicator
8.1 Size and composition by age and gender
8.2 Duration of stay and
regions of nationality
8.3, 8.4 Employment and labour
market participation,
unemployment
8.5 Self-employment
8.6, 8.7 Over-qualification, Educational attainment
8.8 – 8.11
Household income, relative
poverty, housing tenure, reported health
status
8.12 Long-term residents
8.13 Voter participation
8.14 Acquisition of nationality
8.15 Perceived discrimination
EU countries
Austria Eurostat Database 2007
& 2017
Eurostat Database 2017
& EU-LFS 2015-16
EU-LFS 2006-07 & 2017
EU-LFS 2006-07 &
2015-16
EU-LFS 2006-07 &
2015-16
EU-SILC 2007 & 2016
Eurostat Database 2016
ESS 2008-16 EU-LFS 2006-07 &
2015-16
ESS 2008-16
Belgium Eurostat Database 2007
& 2017
Eurostat Database 2017
& EU-LFS 2015-16
EU-LFS 2006-07 & 2017
EU-LFS 2006-07 &
2015-16
EU-LFS 2006-07 &
2015-16
EU-SILC 2007 & 2016
Eurostat Database 2016
ESS 2008-16 EU-LFS 2006-07 &
2015-16
ESS 2008-16
Bulgaria Eurostat Database 2007
& 2017
Eurostat Database 2017
& EU-LFS 2015-16
EU-LFS 2006-07 & 2017
EU-LFS 2006-07 &
2015-16
EU-LFS 2006-07 &
2015-16
EU-SILC 2007 & 2016
Eurostat Database 2016
ESS 2008-16 EU-LFS 2006-07 &
2015-16
ESS 2008-16
Croatia Eurostat Database 2017
Eurostat Database 2017
& EU-LFS 2015-16
EU-LFS 2017 EU-LFS 2015-16
EU-LFS 2015-16
EU-SILC 2016 Eurostat Database 2016
ESS 2008-16 EU-LFS 2015-16
ESS 2008-16
Cyprus1,2 Eurostat Database 2007
& 2017
Eurostat Database 2017
& EU-LFS 2015-16
EU-LFS 2006-07 & 2017
EU-LFS 2006-07 &
2015-16
EU-LFS 2006-07 &
2015-16
EU-SILC 2007 & 2016
Eurostat Database 2016
ESS 2008-16 EU-LFS 2006-07 &
2015-16
ESS 2008-16
Czech Republic Eurostat Database 2007
& 2017
Eurostat Database 2017
& EU-LFS 2015-16
EU-LFS 2006-07 & 2017
EU-LFS 2006-07 &
2015-16
EU-LFS 2006-07 &
2015-16
EU-SILC 2007 & 2016
Eurostat Database 2016
ESS 2008-16 EU-LFS 2006-07 &
2015-16
ESS 2008-16

260 │ 8. THIRD-COUNTRY NATIONALS’ INTEGRATON IN THE EUROPEAN UNIION
SETTLING IN 2018: INDICATORS OF IMMIGRANT INTEGRATION © OECD/EUROPEAN UNION 2018
8.1 Size and composition by age and gender
8.2 Duration of stay and
regions of nationality
8.3, 8.4 Employment and labour
market participation,
unemployment
8.5 Self-employment
8.6, 8.7 Over-qualification, Educational attainment
8.8 – 8.11
Household income, relative
poverty, housing tenure, reported health
status
8.12 Long-term residents
8.13 Voter participation
8.14 Acquisition of nationality
8.15 Perceived discrimination
Denmark Eurostat Database 2007
& 2017
Eurostat Database 2017
& EU-LFS 2015-16
EU-LFS 2006-07 & 2017
EU-LFS 2006-07 &
2015-16
EU-LFS 2006-07 &
2015-16
EU-SILC 2007 & 2016
Eurostat Database 2016
ESS 2008-16 EU-LFS 2006-07 &
2015-16
ESS 2008-16
Estonia Eurostat Database 2007
& 2017
Eurostat Database 2017
& EU-LFS 2015-16
EU-LFS 2006-07 & 2017
EU-LFS 2006-07 &
2015-16
EU-LFS 2006-07 &
2015-16
EU-SILC 2007 & 2016
Eurostat Database 2016
ESS 2008-16 EU-LFS 2006-07 &
2015-16
ESS 2008-16
Finland Eurostat Database 2007
& 2017
Eurostat Database 2017
& EU-LFS 2015-16
EU-LFS 2006-07 & 2017
AHM 2014
EU-LFS 2006-07 &
2015-16
EU-LFS AHM 2014
EU-SILC 2007 & 2016
Eurostat Database 2016
ESS 2008-16 EU-LFS 2006-07 &
2015-16
ESS 2008-16
France Eurostat Database 2007
& 2017
Eurostat Database 2017
& EU-LFS 2015-16
EU-LFS 2006-07 & 2017
EU-LFS 2006-07 &
2015-16
EU-LFS 2006-07 &
2015-16
EU-SILC 2007 & 2016
Eurostat Database 2016
ESS 2008-16 EU-LFS 2006-07 &
2015-16
ESS 2008-16
Germany Eurostat Database 2007
& 2017
Eurostat Database 2017
& EU-LFS 2015-16
EU-LFS 2006-07 & 2017
EU-LFS 2006-07 &
Mikrozensus 2016
EU-LFS 2006-07 &
Mikrozensus 2016
G-SOEP 2007 & 2016
Eurostat Database 2016
ESS 2008-16 .. ESS 2008-16
Greece Eurostat Database 2007
& 2017
Eurostat Database 2017
& EU-LFS 2015-16
EU-LFS 2006-07 & 2017
EU-LFS 2006-07 &
2015-16
EU-LFS 2006-07 &
2015-16
EU-SILC 2007 & 2016
Eurostat Database 2016
ESS 2008-16 EU-LFS 2006-07 &
2015-16
ESS 2008-16
Hungary Eurostat Database 2007
& 2017
Eurostat Database 2017
& EU-LFS 2015-16
EU-LFS 2006-07 & 2017
EU-LFS 2006-07 &
2015-16
EU-LFS 2006-07 &
2015-16
EU-SILC 2007 & 2016
Eurostat Database 2016
ESS 2008-16 EU-LFS 2006-07 &
2015-16
ESS 2008-16

8. THIRD-COUNTRY NATIONALS’ INTEGRATION IN THE EUROPEAN UNION │ 261
SETTLING IN 2018: INDICATORS OF IMMIGRANT INTEGRATION © OECD/EUROPEAN UNION 2018
8.1 Size and composition by age and gender
8.2 Duration of stay and
regions of nationality
8.3, 8.4 Employment and labour
market participation,
unemployment
8.5 Self-employment
8.6, 8.7 Over-qualification, Educational attainment
8.8 – 8.11
Household income, relative
poverty, housing tenure, reported health
status
8.12 Long-term residents
8.13 Voter participation
8.14 Acquisition of nationality
8.15 Perceived discrimination
Ireland Eurostat Database 2007
& 2017
Eurostat Database 2017
& EU-LFS 2015-16
EU-LFS 2006-07 & 2017
EU-LFS 2006-07 &
2015-16
EU-LFS 2006-07 &
2015-16
EU-SILC 2007 & 2016
Eurostat Database 2016
ESS 2008-16 EU-LFS 2006-07 &
2015-16
ESS 2008-16
Italy Eurostat Database 2007
& 2017
Eurostat Database 2017
& EU-LFS 2015-16
EU-LFS 2006-07 & 2017
EU-LFS 2006-07 &
2015-16
EU-LFS 2006-07 &
2015-16
EU-SILC 2007 & 2016
Eurostat Database 2016
ESS 2008-16 EU-LFS 2006-07 &
2015-16
ESS 2008-16
Latvia Eurostat Database 2007
& 2017
Eurostat Database 2017
& EU-LFS 2015-16
EU-LFS 2006-07 & 2017
EU-LFS 2006-07 &
2015-16
EU-LFS 2006-07 &
2015-16
EU-SILC 2007 & 2016
Eurostat Database 2016
ESS 2008-16 EU-LFS 2006-07 &
2015-16
ESS 2008-16
Lithuania Eurostat Database 2007
& 2017
Eurostat Database 2017
& EU-LFS 2015-16
EU-LFS 2006-07 & 2017
EU-LFS 2006-07 &
2015-16
EU-LFS 2006-07 &
2015-16
EU-SILC 2007& 2016
Eurostat Database 2016
ESS 2008-16 EU-LFS 2006-07 &
2015-16
ESS 2008-16
Luxembourg Eurostat Database 2007
& 2017
Eurostat Database 2017
& EU-LFS 2015-16
EU-LFS 2006-07 & 2017
EU-LFS 2006-07 &
2015-16
EU-LFS 2006-07 &
2015-16
EU-SILC 2007 & 2016
Eurostat Database 2016
ESS 2008-16 EU-LFS 2006-07 &
2015-16
ESS 2008-16
Malta Eurostat Database 2017
Eurostat Database 2017
.. .. .. EU-SILC 2007 & 2016
Eurostat Database 2016
ESS 2008-16 .. ESS 2008-16
Netherlands Eurostat Database 2007
& 2017
Eurostat Database 2017
& EU-LFS 2015-16
EU-LFS 2006-07 & 2017
EU-LFS 2006-07 &
2015-16
EU-LFS 2006-07 &
2015-16
EU-SILC 2007 & 2016
Eurostat Database 2016
ESS 2008-16 EU-LFS 2006-07 &
2015-16
ESS 2008-16
Poland Eurostat Database 2007
& 2017
Eurostat Database 2017
& EU-LFS 2015-16
EU-LFS 2006-07 & 2017
EU-LFS 2006-07 &
2015-16
EU-LFS 2006-07 &
2015-16
EU-SILC 2007 & 2016
Eurostat Database 2016
ESS 2008-16 .. ESS 2008-16

262 │ 8. THIRD-COUNTRY NATIONALS’ INTEGRATON IN THE EUROPEAN UNIION
SETTLING IN 2018: INDICATORS OF IMMIGRANT INTEGRATION © OECD/EUROPEAN UNION 2018
8.1 Size and composition by age and gender
8.2 Duration of stay and
regions of nationality
8.3, 8.4 Employment and labour
market participation,
unemployment
8.5 Self-employment
8.6, 8.7 Over-qualification, Educational attainment
8.8 – 8.11
Household income, relative
poverty, housing tenure, reported health
status
8.12 Long-term residents
8.13 Voter participation
8.14 Acquisition of nationality
8.15 Perceived discrimination
Portugal Eurostat Database 2007
& 2017
Eurostat Database 2017
& EU-LFS 2015-16
EU-LFS 2006-07 & 2017
EU-LFS 2006-07 &
2015-16
EU-LFS 2006-07 &
2015-16
EU-SILC 2007 & 2016
Eurostat Database 2016
ESS 2008-16 EU-LFS 2006-07 &
2015-16
ESS 2008-16
Romania Eurostat Database 2017
Eurostat Database 2017
& EU-LFS 2015-16
EU-LFS 2006-07 & 2017
EU-LFS 2006-07 &
2015-16
EU-LFS 2006-07 &
2015-16
EU-SILC 2007 & 2016
Eurostat Database 2016
ESS 2008-16 EU-LFS 2006-07 &
2015-16
ESS 2008-16
Slovak Republic Eurostat Database 2007
& 2017
Eurostat Database 2017
& EU-LFS 2015-16
EU-LFS 2006-07 & 2017
EU-LFS 2006-07 &
2015-16
EU-LFS 2006-07 &
2015-16
EU-SILC 2007 & 2016
Eurostat Database 2016
ESS 2008-16 EU-LFS 2006-07 &
2015-16
ESS 2008-16
Slovenia Eurostat Database 2007
& 2017
Eurostat Database 2017
& EU-LFS 2015-16
EU-LFS 2006-07 & 2017
EU-LFS 2006-07 &
2015-16
EU-LFS 2006-07 &
2015-16
EU-SILC 2007 & 2016
Eurostat Database 2016
ESS 2008-16 EU-LFS 2006-07 &
2015-16
ESS 2008-16
Spain Eurostat Database 2007
& 2017
Eurostat Database 2017
& EU-LFS 2015-16
EU-LFS 2006-07 & 2017
EU-LFS 2006-07 &
2015-16
EU-LFS 2006-07 &
2015-16
EU-SILC 2007 & 2016
Eurostat Database 2016
ESS 2008-16 EU-LFS 2006-07 &
2015-16
ESS 2008-16
Sweden Eurostat Database 2007
& 2017
Eurostat Database 2017
& EU-LFS 2015-16
EU-LFS 2006-07 & 2017
EU-LFS 2006-07 &
2015-16
EU-LFS 2006-07 &
2015-16
EU-SILC 2007 & 2016
Eurostat Database 2016
ESS 2008-16 EU-LFS 2006-07 &
2015-16
ESS 2008-16
United Kingdom Eurostat Database 2007
& 2017
Eurostat Database 2017
& EU-LFS 2015-16
EU-LFS 2006-07 & 2017
EU-LFS 2006-07 &
2015-16
EU-LFS 2006-07 &
2015-16
EU-SILC 2007 & 2016
Eurostat Database 2016
ESS 2008-16 EU-LFS 2006-07 &
2015-16
ESS 2008-16

8. THIRD-COUNTRY NATIONALS’ INTEGRATION IN THE EUROPEAN UNION │ 263
SETTLING IN 2018: INDICATORS OF IMMIGRANT INTEGRATION © OECD/EUROPEAN UNION 2018
8.1 Size and composition by age and gender
8.2 Duration of stay and
regions of nationality
8.3, 8.4 Employment and labour
market participation,
unemployment
8.5 Self-employment
8.6, 8.7 Over-qualification, Educational attainment
8.8 – 8.11
Household income, relative
poverty, housing tenure, reported health
status
8.12 Long-term residents
8.13 Voter participation
8.14 Acquisition of nationality
8.15 Perceived discrimination
Non-EU countries
Iceland Eurostat Database 2007
& 2017
Eurostat Database 2017
& EU-LFS 2015-16
EU-LFS 2006-07 &
2015-16
EU-SILC 2007& 2016
Eurostat Database 2016
ESS 2008-16 EU-LFS 2006-07 &
2015-16
ESS 2008-16 .. ..
Norway Eurostat Database 2007
& 2017
Eurostat Database 2017
& EU-LFS 2015-16
EU-LFS 2006-07 &
2015-16
EU-SILC 2007& 2016
Eurostat Database 2016
ESS 2008-16 EU-LFS 2006-07 &
2015-16
ESS 2008-16 .. ..
Switzerland Eurostat Database 2007
& 2017
Eurostat Database 2017
& EU-LFS 2015-16
EU-LFS 2006-07 &
2015-16
EU-SILC 2007& 2016
Eurostat Database 2016
ESS 2008-16 EU-LFS 2006-07 &
2015-16
ESS 2008-16 .. ..
Turkey Eurostat Database 2007
& 2017
.. .. .. .. .. .. .. .. ..
StatLink 2https://doi.org/10.1787/888933845206


From:Settling In 2018Indicators of Immigrant Integration
Access the complete publication at:https://doi.org/10.1787/9789264307216-en
Please cite this chapter as:
OECD/European Union (2019), “Third-country nationals' integration in the European Union”, in Settling In2018: Indicators of Immigrant Integration, OECD Publishing, Paris/European Union, Brussels.
DOI: https://doi.org/10.1787/9789264307216-12-en
This work is published under the responsibility of the Secretary-General of the OECD. The opinions expressed and argumentsemployed herein do not necessarily reflect the official views of OECD member countries.
This document and any map included herein are without prejudice to the status of or sovereignty over any territory, to thedelimitation of international frontiers and boundaries and to the name of any territory, city or area.
You can copy, download or print OECD content for your own use, and you can include excerpts from OECD publications,databases and multimedia products in your own documents, presentations, blogs, websites and teaching materials, providedthat suitable acknowledgment of OECD as source and copyright owner is given. All requests for public or commercial use andtranslation rights should be submitted to [email protected]. Requests for permission to photocopy portions of this material forpublic or commercial use shall be addressed directly to the Copyright Clearance Center (CCC) at [email protected] or theCentre français d’exploitation du droit de copie (CFC) at [email protected].


