Embed Size (px)
Citation preview

CHAPTER2
Source Gases: Trends and Budgets
Lead Author: E. Sanhueza
Co-authors: P.J. Fraser
R.J. Zander
Contributors: F.N. Alyea
M.O. Andreae
J.H. Butler
D.N. Cunnold J. Dignon
E. Dlugokencky D.H. Ehhalt
J.W. Elkins
D. Etheridge
D.W. Fahey
D.A. Fisher
J.A. Kaye
M.A.K. Khalil
P. Middleton
P.C . Novelli
J. Penner
M.J. Prather
R.G. Prinn
W .S . Reeburgh
J. Rudolph
P. Simmonds
L.P. Steele
M . Trainer
R.F. Weiss
D.J. Wuebbles

CHAPTER 2
SOURCE GASES: TRENDS AND BUDGETS
Contents
SCIENTIFIC SUMMARY ........................................................................................................................................... 2.1
2.1 INTRODUCTION ................................................................................................. ............ ................................. 2.3
2.2 HALOCARBONS ............................................................................................................................................... 2.3 2.2.1 Tropospheric Distributions and Trends ..................................................................................................... 2.3
CFCs and Carbon Tetrachloride Methyl Chloroform and HCFCs Brominated Compounds Perfluorinated Species Other Halogenated Species
2.2.2 Stratospheric Observations ....................................................................................................................... 2.8 2.2.3 Sources of Halocarbons ....................................................................................................................... ... 2.11 2.2.4 Halocarbon Sinks .................................................................................................................................... 2.14 2.2.5 Lifetimes .......................... ....................................................................................................................... 2.14
2.3 STRATOSPHERIC INPUTS OF CHLORINE AND PARTICULATES FROM ROCKETS ........................... 2.15 2.3 .1 Stratospheric Chlorine Input ................................................................................................................... 2.15 2.3.2 Particulates from Solid-Fuel Rockets .............................................. ................... .................................... 2.15
2.4 METHANE .................................................................................. ........................ ............................................. 2.16 2.4.1 Atmospheric Distribution and Trends ..................................................................................................... 2.16 2.4.2 Sources ........................................................................................................................... . ........................ 2.18 2.4.3 Sinks ........................................................................................................................................................ 2.20 2.4.4 Potential Feedbacks from a Changed Climate ............... ......................................................................... 2.20
2.5 NITROUS OXIDE ............................................................................................................................................ 2.20 2.5 .1 Atmospheric Distribution and Trends ..................................................................................................... 2.20 2.5.2 Sources .................................................................................................................................................... 2.21 2.5 .3 Sinks ........................................................................................................................................................ 2.22
2.6 SHORT-LIVED OZONE PRECURSOR GASES ................................................ ............................................ 2.22 2.6.1 Nitrogen Oxides ...................................................................................................................................... 2.22
2.6.1.1 Tropospheric Distribution ......................... .................................................................................. 2.22 2.6.1.2 Sources ............................................................... ........................................................................ 2.22 2.6.1.3 Sinks ............... . ........................................................................................................................... 2.23
2.6.2 Non-Methane Hydrocarbons ................................................................................................................... 2.24 2.6.2.1 Atmospheric Distribution .... .......... ......... ........................................................... ......................... 2.24
2.6.2.2 Sources ..................................................................................................................... .................. 2.24 2.6.2.3 Sinks ..................................................................... . ..................................................................... 2.24
2.6.3 Carbon Monoxide ................................................................................................................................... 2.24
2.6.3.1 Atmospheric Distribution and Trends ......................................................................................... 2.24 2.6.3.2 Sources ....................................................................................................................................... 2.25 2.6.3.3 Sinks ................................................................ ........................................................................... 2.26
2.7 CARBON DIOXIDE .................................................................................................................................. ...... 2.26
REFERENCES ........................................................................................................................................................... 2.27

SOURCE GASES
SCIENTIFIC SUMMARY
Tropospheric growth rates of the major anthropogenic source species for stratospheric chlorine and bromine
(chlorofluorocarbons (CFCs), carbon tetrachloride, methyl chloroform, halons) have slowed significantly, in response
to substantially reduced emissions required by the Montreal Protocol . Total tropospheric chlorine grew by about 60 pptv
( 1 .6%) in 1 992 compared to 1 1 0 pptv (2.9%) in 1 989. Tropospheric bromine in the form of halons grew by 0.2-0.3 pptv
in 1 992, compared to 0 .6- 1 . 1 pptv in 1 989.
Hydrochlorofluorocarbon (HCFC) growth rates are accelerating, as they are being used increasingly as CFC
substitutes. Tropospheric chlorine as HCFCs increased in 1 992 by about 10 pptv, thus accounting for about 15% of total
tropospheric chlorine growth, compared to 5 pptv in 1 989 (5% of tropospheric chlorine growth) .
The atmospheric residence times of CFC- 1 1 and methyl chloroform are now better known. Model studies simu
lating atmospheric abundances using more realistic emission amounts have led to best-estimated lifetimes of 50 years
for CFC- 1 1 and 5 .4 years for methyl chloroform, with uncertainties of about 10%. These models, calibrated against
CFC- 1 1 and methyl chloroform, are used to calculate the lifetimes, and hence ODPs (Ozone Depletion Potentials), of
other gases destroyed only in the stratosphere (other CFCs and nitrous oxide) and those reacting significantly with
tropospheric hydroxyl radicals (HCFCs and hydrofluorocarbons (HFCs)) .
Methyl chloride, released from the oceans (natural) and biomass burning (anthropogenic) , is a significant source
of tropospheric chlorine, contributing about 1 5 % of the total tropospheric chlorine abundance in 1 992 (3 .8 ppbv). Data
collected from the late 1 970s to the mid- 1 980s showed no long-term trend. A paucity of published observational data
since means that the likely existence of a global trend in this important species cannot be assessed further.
The total abundance of organic halocarbons in the lower stratosphere is well characterized by in situ and remote
observations of individual species. Observed totals are consistent with abundances of primary species in the tropo
sphere, suggesting that other source species are not important in the stratosphere. Loss of halocarbons is found as their
residence time in the stratosphere increases, consistent with destruction by known photochemical processes. Since the
loss of halocarbons produces inorganic chlorine and bromine species associated with ozone loss processes, these obser
vations also constrain the abundance of these organic species in the lower stratosphere.
Volcanoes are an insignificant source of stratospheric chlorine. Satellite and aircraft observations of upper and
lower stratospheric hydrochloric acid (HCl) are consistent with stratospheric chlorine being organic, largely anthropo
genic, in origin. No significant increase in HCl was found in the stratosphere following the intense eruption of Mt.
Pinatubo in 1 99 1 . Elevated HCl levels were detected in the eruption cloud of the El Chich6n volcano in 1 982, but no
related change in global stratospheric HCl was observed.
The 1 980s were characterized by declining global methane growth rates, being approximately 20 ppbv per year in
1 980 declining approximately monotonically to 1 0 ppbv per year by the end of the decade. Methane growth rates
slowed dramatically in 1 99 1 - 1 992, but probably started to increase in late 1 993 . During 1 992 global methane levels
grew by only 5 ppbv. The causes of this global anomaly (which manifested predominantly at high latitudes in the
Northern Hemisphere) are not known with certainty, but are probably due to changes in methane sources rather than in
methane sinks . Global growth rate anomalies have been observed in methane records in the 1 920s and 1 970s from air
trapped in Antarctic ice.
Despite the increased methane levels, the total amount of carbon monoxide (CO) in today's atmosphere is less
than it was a decade ago . Recent analyses of global CO data show that tropospheric levels grew from the early 1 980s to
about 1 987 and have declined from the late 1 980s to the present. The causes of this behavior have not been identified.
2. 1

:;,
2.1 INTRODUCTION
Recent trends of atmospheric trace gases are im
portant in understanding stratospheric ozone depletion
and changes to the current radiative forcing of climate.
Estimates of budgets and lifetimes are required to pre
dict future impacts. Likewise, these data are needed to
accurately predict what levels of emission reductions are
needed in order to stabilize and/or reduce present con
centrations. In this assessment we will deal with gases
emitted by natural and/or anthropogenic sources that in
fluence the chemical composition of the atmosphere. It
includes long-lived gases that contribute to stratospheric
ozone depletion (i. e., chlorofluorocarbons (CFCs), ha
lons, nitrous oxide (N20)) and/or radiative forcing of the
atmosphere (i. e., carbon dioxide (C02), CFCs, methane
(CH4), N20), and short-lived compounds that are in
volved in the 03 chemistry of the troposphere ( i. e.,
carbon monoxide (CO), nitrogen oxides (NOx), non
methane hydrocarbons). Reduced sulfur gases are
important in the formation of tropospheric aerosols and
therefore in the climate system; however, these com
pounds are not included in this Chapter and the reader is
referred to Chapter 3 of the IPCC 1994 Interim Report
for an updated discussion of these source gases. The cur
rent concentrations and recent trends of long-lived gases
are summarized in Table 2-1. Lifetimes (i.e., total global
burden of the gas divided by its globally integrated sink
strength) are also given.
2.2 HALOCARBONS
Halocarbons play an important role in stratospher
ic ozone depletion and are powerful greenhouse gases. A
recent, comprehensive review (Kaye et al. , 1994) has
provided extensive details on the global distributions,
trends, emissions, and lifetimes of CFCs (chlorofluoro
carbons), halons, and related species. This section
provides an updated summary review.
2.2.1 Tropospheric Distributions and Trends
Tropospheric measurements are mostly made in
situ at fixed sites distributed between the two hemi
spheres, supplemented by data collected on ships and
aircraft (WMO, 1992). Information on the free tropo
spheric burdens of atmospheric gases and their time
variations has further been obtained through spectro-
2.3
SOURCE GASES
scopic remote measurements made from various obser
vational platforms. Recent concentration trends of
ha1ocarbons and those reported in the 1991 Assessment
(WMO, 1992) are summarized in Table 2-2, indicating
that significant changes in trends have been observed for
most gases during the last few years. The total Cl in
crease in 1992 was -60 pptv/yr, whereas the 1989
increase was -110 pptv/yr (WMO, 1992).
CFCs AND CARBON TETRACHLORIDE CCl3F (CFC-11), CCl2F2 (CFC-12), CCI2FCCIF2
(CFC-113), and carbon tetrachloride (CC14) have been
measured in a number of global programs and their tro
pospheric mixing ratios have been increasing steadily
over the past fifteen years (Fraser et al., 1994a, and refer
ences therein).
There is now clear evidence that the growth rates
of the CFCs have slowed significantly in recent years
(Figure 2-1), presumably in response to reduced emis
sions (see Section 2.2.3). CFC- 12 and CFC-1 1 trends in
the late 1970s to late 1980s were about 16-20 pptv/yr
and 9-11 pptv/yr, respectively. These declined to about
16 and 7 pptv/yr, respectively, around 1990 and to about
11 and 3 pptv /yr by 1993 (Elkins et al., 1993; Khalil and
Rasmussen, 1993a; Simmonds et al., 1993; Cunnold et
al., 1994; Makide et al., 1994; Rowland et al., 1994).
The global CFC-113 data up to the end of 1990
have been reviewed recently (Fraser et al., 1994a). A
global average trend of about 6 pptv/yr was observed for
CFC-113, with no sign of a slowing down such as ob
served for CFCs-11 and -12. However, data up to the end
of 1992 now indicate that the growth rate has started to
decrease (Fraser et al., 1994a, b, c). Carbon tetrachloride
appears to have stopped accumulating in the atmosphere
and data collected at Cape Grim, Tasmania, indicate that
the background levels of this trace gas may have actually
started to decline (Fraser and Derek, 1994 ).
METHYL CHLOROFORM AND THE HYDROCHLOROFLUOROCARBONS (HCFCs)
Global methyl chloroform (CH3CCl3) and HCFC-
22 (CHClF2) data up to the end of 1990 have been
reviewed by Fraser et al. (1994a), with growth rates in
1990 equal to 4-5 and 6-7 pptv/yr, respectively.
Methyl chloroform data up to the end of 1992 are
shown in Figure 2-2, indicating that the slowing of the

SOURCE GASES
TABLE 2-1. Current atmospheric levels, changes in abundance (1992 minus 1 990) and lifetimes of long-lived trace gases. (Adapted from IPCC, 1994a.)
Species Chern. mixing ratios growth burden lifetimea
Formula ( 1 992) ( 1 992- 1 990) (Tg) (years)
ppbv ppbv
CFC- 1 1 CCI3F 0.268 0.005 6.2 50 (±5)
CFC- 1 2 CCI2F2 0.503 0.026 1 0.3 1 02
CFC- 1 1 3 CCI2FCCIF2 0.082 0.005 2.6 85
CFC- 1 1 4 CCIF2CCIF2 0.020 0.00 1 300
CCI4 0 . 1 32 -0.002 3.4 42
CH3CCl3 0. 1 60 0.007 3 .5 5.4 (±0.4)
CH3Cl 0.600 ? 5.0 1 .5
HCFC-22 CHCIF2 0. 1 02 0.0 1 4 1 .5 1 3.3
HCFC- 1 4 l b CH3CCl2F 0.0003 9.4
HCFC- 1 42b CH3CClF2 0.0035 1 9.5
CH3Br (see Chapter 1 0)
H- 1 2 1 1 CBrClF2 0.0025 0.000 1 0.08 20
H- 1 30 1 CBrF3 0.0020 0 .0003 0.05 65
CF4 0.070 0.9 50000
C2F6 0.004 1 0000
SF6 [0.002-0.003] 3200
N20 (N) 3 1 0 1 .4 1 480 1 20
CH4 1 7 1 4 1 4 4850 lOb
C02 (C) 356000 2000 760000 (50-200)c
a Lifetimes of additional halocarbons are given in Chapter 1 3 .
b The adjustment time is 1 2 to 1 7 years ; this takes into account the indirect effect o f methane o n its own lifetime
(IPCC, 1 994a).
c No single lifetime can be defined because of the different rates of uptake by different sink processes (IPCC, 1 994b ).
2.4

SOURCE GASES
TABLE 2-2. Recent halocarbon trends compared with the values given in the 1 991 assessment.
This Assessmenta 1991 Assessment b Compound Period
CFC-11 90-92
CFC-12 90-92
CFC-113 90-92
CCl4 90-92
CH3CCl3 90-92
HCFC-22 92
HCFC-142b 92
HCFC-14lb 93
H-1211 90-92
H-1301 90-92
Total Cl
Total Brc
a see text for references
b 1989 increase (WMO, 1992)
c bromine in the form of halons
pptv/yr
2.5
13
2.5
-1
3.5
7.0
-1
-0.75
0.075
0.16
-60
0.2-0.3
growth rate observed in 1990 has continued, presumably
due to reduced emissions in 1991-92 as compared to
1990 and in part to increasing OH levels (1 ± 0.8 %/yr;
Prinn et al., 1992). The methyl chloroform calibration
problems detailed in Fraser et al. ( 1994a) have yet to be
resolved.
Recent global HCFC-22 data (Montzka et al.,
1993) indicate a global mixing ratio in 1992 of 102 ± 1
pptv, an interhemispheric difference of 13 ± 1 pptv, and a
globally averaged growth rate of 7.3 ± 0.3 %/yr, or 7.4 ±
0.3 pptv/yr, from mid-1987 to 1992. Based on the latest
industry estimates of HCFC-22 emissions (Midgley and
Fisher, 1993) the data indicate an atmospheric lifetime
for HCFC-22 of 13.3 (15.5-12.1) years. Regular vertical
column abundances measured by infrared solar absorp
tion spectroscopy in Arizona (32°N), Switzerland
(46.6°N) (Zander et al., 1994a), and California (34.4°N)
(Irion et al., 1994) have revealed rates of increase of 7.0
± 0.2%/yr (1981-1992), 7.0 ± 0.5%/yr (1981-1992), and
6.5 ± 0.5%/yr (1985-1990), respectively. Using the
%/yr pptv/yr %/yr
0.9 9.3-10.1 3.7-3.8
2.6 16.9-18.2 3.7-4.0
3.1 5.4- 6.2 9.1
-0.8 1- 1.5 1.2
2.2 4.8- 5.1 3.7
6.9 5- 6 6-7
-30 n.d. n.d.
-200 n.d. n.d.
2.5
3 0.2-0.4 15
8 0.4-0.7 20
-110
0.6-1.1
HCFC-22 column abundances obtained at McMurdo,
Antarctica (78°S), Irion et al. (1994) derived a south
north interhemispheric growth rate ratio of 0.85, in good
agreement with the ratio of 0.88 obtained by Montzka et
al. ( 1993) from in situ surface measurements. The latest
1993 HCFC-22 data indicate that the near-linear trend
observed in earlier data has continued (J. Elkins, NOAA;
R. Zander, LA., Univ. of Liege, personal communica
tions to E.S.).
CH3CCIF2 (HCFC-142b) and CH3CCl2F (HCFC-
141 b) have been recently introduced as CFC substitutes.
For HCFC-142b the National Oceanic and Atmospheric
Administration (NOAA) flask network results indicate
an atmospheric concentration of 3.1 pptv for 1992, with
a growth rate of -1 pptv/yr ( -30%/yr) (Swanson et al.,
1993). The concentration of HCFC-14lb for the last quar
ter of 1992 was 0.36 pptv and 1.12 pptv at the end of 1993
(-0.75 pptv/yr or -200%/yr) (Montzka et al. , 1994). Pol
lock et al. ( 1992) detected upper tropospheric levels of
HCFC-142b at about 1.1 pptv in 1989, growing at 7%/yr.

SOURCE GASES
280 gooN- 30°N 500 gooN- 30°N
240 450 400
200 350 160 300
30°N- EO 500 30°N- EO 280 Mauna Loa (NOAA) > Mauna Loa (NOAA) > -Barbados - 450 -Barbados (GAGE) 0.. 240 0.. s s 400 0 200 0 350 ·� 160 ·� 300 rr: rr: Ol Ol
c c EO- 30°8 ·x EO- 30°8 ·x 475
� 260 Samoa (NOAA) � Samoa (NOAA)
425 - Samoa (GAG E)
220 C\1 ,-
0 375 I 0 180 lL lL 325 0 0 140 275
30°8- goos 475 3oos- goos 260 Tasmania (NOAA)
Tasm8nia (NOAA) � - Tasmania (GAGE) 425 - Tasmania (GAGE) 220 SouthPole(N1� - South Pole(N� 375
180 325
� � 140 I 275
78 80 82 84 86 88 go g2 78 80 82 84 86 88 go g2 Year Year
Figure 2-1. a) CFC-11 and b) CFC-12, from the NOAA-CMOL (Elkins eta!., 1993) and ALE/GAGE. (Cunnold
et at., 1994; Fraser and Derek, 1994) global networks. The ALE/GAGE data from 1992 are unpublished and subject to revision.
BROMINATED CoMPOUNDS Recently interest and understanding of brominated
species in the background atmosphere have expanded
considerably, driven by the recognition of bromine's sig
nificant role in stratospheric ozone depletion (e.g. ,
Albritton and Watson, 1992).
The most abundant organobrornine species in the
lower atmosphere is methyl bromide (CH3Br), which
has both natural and anthropogenic sources. Available
data on the global distribution of this gas have been re
viewed by Albritton and Watson (1992). An updated
evaluation of this important trace gas is given in Chapter
10 of this assessment
2.6
The available halon-1211 (CBrClF2) and halon-
1301 (CBrF3) data from the NOAA Climate Monitoring
and Diagnostics Laboratory (CMDL) flask sampling
network show that the global background levels are
about 2.5 pptv (H-1211) and 2.0 pptv (H-1301), current
ly growing at about 3%/yr and 8%/yr, respectively
(Butler et al., 1992, 1994). These rates have slowed sig
nificantly in recent years, consistent with reduced
emissions (McCulloch, 1992), and their atmospheric
mixing ratios may stabilize in a few years.
Data from the tropical Pacific Ocean (Atlas et al.,
1993) indicate concentrations of dibromomethane
(CH2Br2), bromoform (CHBr3), and dibromochlo
romethane (CHBr2Cl) of 1.8, 1.8, and 0.2 pptv,
respectively. Bromoform and dibromochloromethane
180
160
140
120
160 > c.. 140 a.
...._,
0 120 :;:::; � 100 Cl c
:g 2 140
� 120 () � 100 I () 80
140
120
100
80
--- Ireland (GAGE) - Oregon (GAGE)
\-
' ' '
' . ,.
' , . ,, - · .. .. ..
•'
\.�
30°N- EQ /'\ /'tV.. tv - Barbados (GAGE) nf rv· y v
v� EQ- 30°S - Samoa (GAGE)
�
�� /
30°S- 90°S -Tasmania (GAGE)
�
/� 78 80 82 84 86 88 90 92
Year
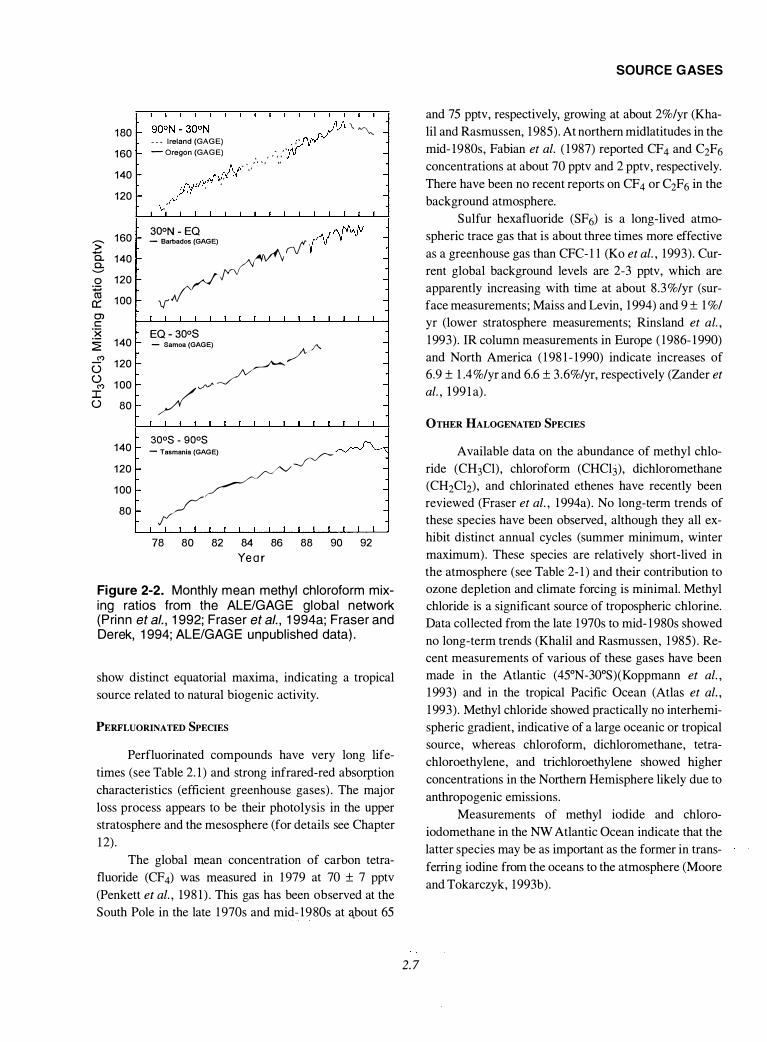
Figure 2-2. Monthly mean methyl chloroform mixing ratios from the ALE/GAGE global network (Prinn et a/., 1992; Fraser et a/., 1994a; Fraser and Derek, 1994; ALE/GAGE unpublished data).
show distinct equatorial maxima, indicating a tropical
source related to natural biogenic activity.
PERFLUORINATED SPECIES
Perfluorinated compounds have very long life
times (see Table 2. 1 ) and strong infrared-red absorption
characteristics (efficient greenhouse gases) . The major
loss process appears to be their photolysis in the upper
stratosphere and the mesosphere (for details see Chapter
1 2) .
The global mean concentration of carbon tetra
fluoride (CF4) was measured in 1 979 at 70 ± 7 pptv
(Penkett et al. , 198 1 ) . This gas has been observed at the
South Pole in the late 1 970s and mid- 1980s at �bout 65
2. 7
SOURCE GASES
and 75 pptv, respectively, growing at about 2%/yr (Kha
lil and Rasmussen, 1 985) . At northern midlatitudes in the
mid- 1980s, Fabian et al. ( 1 987) reported CF4 and CzF6
concentrations at about 70 pptv and 2 pptv, respectively.
There have been no recent reports on CF4 or CzF6 in the
background atmosphere.
Sulfur hexafluoride (SF6) is a long-lived atmo
spheric trace gas that is about three times more effective
as a greenhouse gas than CFC- 1 1 (Ko et al. , 1993) . Cur
rent global background levels are 2-3 pptv, which are
apparently increasing with time at about 8 .3 %/yr (sur
face measurements ; Maiss and Levin, 1 994) and 9 ± 1 %/
yr (lower stratosphere measurements; Rinsland et al. ,
1 993) . IR column measurements in Europe ( 1986- 1 990)
and North America ( 1 98 1- 1 990) indicate increases of
6.9 ± 1 .4%/yr and 6.6 ± 3 .6%/yr, respectively (Zander et
al. , 1 99la) .
OTHER HALOGENATED SPECIES
Available data on the abundance of methyl chlo
ride (CH3Cl), chloroform (CHClj), dichloromethane
(CHzClz), and chlorinated ethenes have recently been
reviewed (Fraser et al. , 1 994a) . No long-term trends of
these species have been observed, although they all ex
hibit distinct annual cycles (summer minimum, winter
maximum) . These species are relatively short-lived in
the atmosphere (see Table 2- 1 ) and their contribution to
ozone depletion and climate forcing is minimal. Methyl
chloride is a significant source of tropospheric chlorine.
Data collected from the late 1 970s to mid- 1 980s showed
no long-term trends (Khalil and Rasmussen, 1 985) . Re
cent measurements of various of these gases have been
made in the Atlantic (45°N-30°S)(Koppmann et al. ,
1 993) and in the tropical Pacific Ocean (Atlas et al. ,
1 993) . Methyl chloride showed practically no interhemi
spheric gradient, indicative of a large oceanic or tropical
source, whereas chloroform, dichloromethane, tetra
chloroethylene, and trichloroethylene showed higher
concentrations in the Northern Hemisphere likely due to
anthropogenic emissions.
Measurements of methyl iodide and chloro
iodomethane in the NW Atlantic Ocean indicate that the
latter species may be as important as the former in trans
ferring iodine from the oceans to the atmosphere (Moore
and Tokarczyk, 1993b) .

SOURCE GASES
Northern Mid- Latitudes
40
E 30 ..>e.
w Cl 20 ::> I-
I- 1 0 .....J <[
0 .
A
CHCIF2
' ' .
� ' . ' .
' ,.
-
'
'
0.001 0.01 0 . 1 10 100 1000 20 40 60 80 RAT I 0
20 40 60 80 100 120 VOLUME MIXING (pptv)
o KFA Jul1ch 05-Feb-87
• 14-Feb-87
68'N • MPAE,26 -Mor-87,17'N
' ,23 -Jun -87, 44'N
o M PAE 10-Sep-83 44'N
() 01- 0ct-84
0 0 1-Feb-87 - ATMOS/SL3, 1- M ay-85, 30' N 19-Jun -85
6 I 0- Feb -88 ······ ATMO S I SL3 01- May-85 30'N
12 - Jan-90 ·-·-·Fabia n M A P profile 44'N
0 09 -Feb-90
Fa b1 an MAP prof1le 44'N
Figure 2-3. Vertical distributions of CCI3F, CHCIF2, and CF4 volume mixing ratios. Source: Adapted from Fraser et at., 1994a.
2.2.2 Stratospheric Observations
When investigating the concentrations of halocar
bons in the stratosphere, the main objectives are to
determine partitioning among chlorine and bromine
"families," their total loading and their time variations. It
is therefore important to measure simultaneously and
regularly the largest possible number of halocarbons in
order to meet these objectives. For obvious technical rea
sons, such combined stratospheric measurements have
been much sparser during the last decade than tropo
spheric investigations. The measurements are generally
performed using in situ air sampling techniques aboard
airplane and balloons, and through infrared remote ob
servations made from airplane, balloon, and orbiting
platforms.
A recent thorough review dealing with measure
ments of the stratospheric abundance and distribution of
2.8
halocarbons can be found in Chapter 1 of the NASA Re
port (Fraser et al., 1994a) . The review is a compilation of
measured concentrations expressed as volume mixing
ratios versus altitude for CCl3F, CCl2F2, CCl4, CHClF2,
CH3Cl, CH3CC13, C2Cl3F3, C2Cl4F2, C2C1Fs, C2F6,
CC1F3, CF4, CH3Br, CBrF3, and CBrClF2, gathered be
tween 1 984 and 1 990. As an example the concentration
profiles for three halogenated methanes at northern mid
latitudes are shown in Figure 2-3. The relative changes in
stratospheric concentrations are due to different photo
chemical destruction rates of these compounds in the
stratosphere: CCl3F > CHClF2 >> CF4.
The in situ measurements at sub-tropical, mid- and
high northern latitudes of the long-lived chlorinated ha
locarbons indicate that (i) the concentrations observed in
the sub-tropics decline less rapidly with altitude than at
midlatitudes, because of increased upward motion at

such latitudes (i. e., Kaye et al. , 1991), thus allowing for
photodissociation to occur at higher altitudes; (ii) the
concentrations of both the halocarbons and the long
lived "reference" gases observed in the Arctic show a
much more rapid decline with altitude than at midlati
tudes, in particular within the winter vortex where
subsidence is often present (Schmidt et al. , 1991; Toon
et al. , 1992a, b, c). Thus, surfaces of constant mixing ra
tio of long-lived chlorinated halocarbons slope poleward
and downward in the lower stratosphere.
During recent years, a few investigations dealing
with simultaneous measurements of many chlorine- and/
or bromine-bearing gases and related inventories have
been reported. One of these concerns the budget of Cl
(sources, sinks, and reservoirs) between 12.5 and 55 km altitude, near 30° north latitude, based on the 1985
ATMOS (Atmospheric Trace Molecule Spectroscopy
Experiment)/Spacelab 3 measurements of HCl, CH3Cl,
ClON02, CCl4, CCl2F2, CCl3F, and CHClF2, comple
mented by results for CH3CCl3, C2Cl3F3, ClO, HOCI,
and COCIF obtained by other techniques (Zander et al. ,
1992 and references therein). The main conclusions of
this work indicate that (i) within the observed uncertain
ty, partitioning among chlorinated source, sink, and
reservoir species is consistent with the conservation of
Cl throughout the stratosphere; (ii) the mean 1985 con
centration of stratospheric Cl was found equal to 2.55 ±
0.28 ppbv; (iii) above 50 km altitude, the inorganic chlo
rine burden is predominantly contained in the form of
HCl, thus making this measurement a unique and simple
way of assessing the effective stratospheric chlorine
loading.
Based on historical emissions for the main chlori
nated source gases, Weisenstein et al. (1992) used a
time-dependent model to calculate the atmospheric total
chlorine as a function of time, latitude, and altitude.
Their results indicate that the total Cl mixing ratio for
1985 reaches an asymptotic value of 2.35 ppbv in the
upper stratosphere. Considering that the source input
fluxes to the model are probably too low by about 15%
because they do not include emission from China, the
former Soviet Union, and Eastern Europe, it can be con
cluded that the result found by Weisenstein et al. (1992)
for 1985 is in good agreement with the stratospheric Cl
budget derived from the 1985 ATMOS observations
(Zander et al. , 1992).
2.9
SOURCE GASES
The ATMOS instrument was flown again in 1992
(Gunson, 1992) and 1993 as part of the Atmospheric
Laboratory for Applications and Science (ATLAS) 1 and
2 Missions to Planet Earth. HCl mixing ratios in the
range 3.4 ± 0.3 ppbv were measured above 50 km alti
tude at different latitudes (30°N to 55°S) during
March-April 1992, as compared to the measured value
of 2.55 ± 0.28 ppbv in April-May 1985 (Gunson et al. ,
1994). This corresponds to an increase of 35% over the 7
years between both measurements and is in excellent
agreement with model-predicted increases of about 0.11
to 0.13 ppbv per year (Prather and Watson, 1990; WMO,
1992; Weisenstein et al. , 1992).
During the 1991/92 Airborne Arctic Stratospheric
Expedition II (AASE II), a whole air sampler developed
by NCAR-NASA/Ames (Heidt et al. , 1989) was operat
ed on board the NASA ER-2 aircraft, which attempted to
determine the amounts of organic chlorine and bromine
entering the stratosphere. Over 600 air samples were col
lected during AASE II. Twelve of these that were
sampled in the latitude/altitude range of the tropical
tropopause, between 23.8°N and 25.3°N, have been ana
lyzed by Schauffler et al. ( 1993) for the mixing ratios of
12 chlorinated species (CCl3F, CCl2F2, C2Cl3F3,
C2CI2F4, C2CIF5, CHC1F2, CH3CC1F2, CH3Cl, CH2CI2,
CHCl3, CH3CCl3, and CC4) and 5 brominated com
pounds (CBrF3, CBrClF2, C2Br2F4, CH3Br, and
CH2Br2). From this extensive suite of measurements,
Schauffler et al. (1993) derived average total mixing ra
tios of 3.50 ± 0.06 ppbv for Cl and 21.1 ± 0.8 pptv for
Br. The natural source of chlorine is -0.5 ppbv of the
total. Since inorganic chlorine species are negligible at
the tropopause, total chlorine at this level is dominated
by the anthropogenic release of chlorinated halocarbons
at the surface. The stratospheric Cl concentrations de
rived from the March-April 1992 ATMOS
measurements and the January-March 1992 burdens
found by Schauffler et al. (1993) near the tropopause
provide a further confirmation of the conservation of
chlorine throughout the stratosphere. The individual
contributions to the total organic budget of bromine near
the tropical tropopause were found equal to 54% for
CH3Br, -7% for CH2Br2, and the remaining 39% nearly
evenly distributed among the halons CBrF3, CBrClF2,
and C2Br2F 4·
On the NASA DC-8 aircraft that also participated
in the AASE II campaign, Toon et al. (1993) operated a

SOURCE GASES
600
500
400
300
200
100
0 ->
+-' 0...
300 0... .._.
0 +-' ctS 200 0: 0> c 100 ·:x: �
0
500
400
300
200
100
0 50
CFC-12
CFC-11 methylchloroform
CH3CI HCFC-22 CFC-113
100
0
0 0 0
150 200 250 N20 (ppbv)
Do 0 <0 0
0 <P
0 0
++ • ..,. +
8 0 0
oo Do o
�0 0
0
0
�·� . +f!t+ -ff +
300 350
Figure 2-4. Concentrations of halocarbons in the lower stratosphere from NCAR/NASA Ames Whole Air Sampler plotter vs. ATLAS N20. Source: Woodbridge et at., 1994.
2. 10
high-resolution Fourier transform infrared (FTIR) spec
trometer to determine the stratospheric columns above
about 11 krn cruising altitude of a number of trace gases,
including CCl2F2 and CCl3F. Based on these and other
long-lived gases (e.g., N20, Cf4), they found consider
ably more uplifting ( -4 krn) near the equator than in the
sub-tropics.
Above the tropopause, the AASE II data set can be
used to describe the depletion of chlorinated halocar
bons in the lower stratosphere. As residence time in the
stratosphere increases, destruction primarily by UV pho
tolysis liberates Cl and Br from individual halocarbon
species, thereby forming the inorganic halocarbon reser
voir species HCl and ClON02. Nitrous oxide can be
used as an index to examine changes in halocarbon abun
dances (Kawa et al., 1992). N20 has a near-uniform
abundance in the troposphere of approximately 310
ppbv and is destroyed in the mid-stratosphere with a life
time near 120 years. Figure 2-4 shows the correlation of
several chlorinated halocarbon species with simulta
neous measurements of N 20 within the AASE II data set
(Woodbridge et al., 1994). The seven species shown rep
resent approximately 99 percent of organic halocarbon
species with lifetimes over a year. For each species a dis
tinct correlation is found, with the halocarbon species
decreasing with decreasing N20. In each case, the de
crease begins at upper tropospheric altitudes as reported
by Schauffler et al. (1993). The slope of each correlation
near tropospheric values is related to the ratio of the life
time of the halocarbons species to that of N20 (Plumb
and Ko, 1992). The compact nature of ranges of these
correlations demonstrates the systematic degradation of
the chlorinated halocarbons in the stratosphere. The net
loss of these organic species over a range of N20 bounds
the available inorganic chlorine reservoir in the lower
stratosphere (see Chapter 3). Inorganic species partici
pate in the principal catalytic loss cycles that destroy
stratospheric ozone.
The emission of HCl from volcanoes can exceed
the annual anthropogenic emissions of total organic
chlorine (e.g., CFCs, HCFCs) to the atmosphere. How
ever, emitted HCl is largely removed in the troposphere
before it can enter the stratosphere. For the recent Mt.
Pinatubo eruption, column measurements of HCl before
and after the eruption confirmed that the increase of HCl
in the stratosphere was negligible (Wallace and Living
ston, 1992; Mankin et al. , 1992). Elevated HCl levels
2. 1 1
SOURCE GASES
were detected in the eruption cloud of the El Chich6n
volcano in 1982 (Mankin and Coffey, 1984), but signifi
cant changes in the global stratospheric HCl were not
observed. The removal of HCl and H20 is expected to
result from scavenging on liquid water droplets formed
in the volcanic plume (Tabazadeh and Turco, 1993).
Additional material of relevance to this section can
be found in Chapter 3 (Polar Ozone), which also deals
with stratospheric abundances of both total organic chlo
rine and total available chlorine during the Arctic winter;
these data may be compared with the mixing ratios of
total chlorine quoted here before.
2.2.3 Sources of Halocarbons
CFCs, halons, HCFCs, and hydrofluorocarbons
(HFCs) are exclusively of industrial origin, as are methyl
chloroform and carbon tetrachloride. Their primary uses
are as refrigerants (CFCs-11, 12, and -114; HCFC-22;
HFC-134a), foam blowing agents (HCFCs-22 and
-142b; CFCs-11 and -12), solvents and feedstocks
(CFC-113, carbon tetrachloride, and methyl chloro
form), and fire retardants (halons-1211 and -1301).
Worldwide emissions of individual halocarbons have
fallen significantly following enactment of the Montreal
Protocol (Figure 2-5; AFEAS, 1993, 1994; Fisher et al.,
1994). From 1988 to 1992 annual emissions of CFCs
into the atmosphere have decreased by approximately
34%. Emission levels of methyl chloroform have also
declined over this period, with a very large emission re
duction (-50%) from 1992 to 1993 (P. Midgley, personal
communication to P.F.). HCFC-22 has shown a contin
ued rise (Midgley and Fisher, 1993) ; it has replaced
CFCs in many applications as its use has not been re
stricted by the Protocol. HCFC-142b release began in
the early 1980s and is growing rapidly (35%/yr since
1987). Emissions in 1992 were 10.8xl06 kg (AFEAS,
1994). Emissions are difficult to estimate accurately as
the bulk of the production (90%) is used in closed cell
foams with residence times greater than 10 years. Be
tween 1987 and 1990, emissions of halons have dropped
substantially (McCulloch, 1992) (no data are available
yet for 1991 and 1992). No emission data are available
for carbon tetrachloride as its production and use has not
been surveyed. A detailed update of the anthropogenic
emissions of methyl bromide is given in Chapter 10.
Recently, using the atmospheric data and the equi
librium lifetimes, Cunnold et al. (1994) estimated the

SOURCE GASES
---.....
I !.... >.
........ � --
(/) c 0 (/) (/)
E (!)
---.....
I !.... >.
........ � --
(/) c 0 (/) en
E (!)
700
600
500
400
300
200
100
18
16
14
12
10
8
6
4
2
0
1972 1974 1976 1978 1980 1982 1984 1986 1988 1990 1992
1972 1974 1976 1978 1980 1982 1984 1986 1988 1990 1992
Year
• CFC 11
D CFC12 6. CFC 113
0 HCFC 22 + CH3CCI3
• CFC 114
D CFC 115
6. H 1211
0 H 1301
+ HCFC 142b
Figure 2-5. Annual emissions of halocarbons in kVyr. The CFC-11, -12 and -113 data are estimates of global emissions, whereas the remaining estimates are based on data only from reporting companies. Source: AFEAS, 1993; Fisher et at., 1994; D. Fisher, Du Pont, personal communication to P.F.; P. Midgley, M&D Consulting, personal communication to P. F.
2. 12

SOURCE GASES
ANNUAL RELEASES 600
500
0 CFC-12 � z 0 400 H �
� CFC-11
300 X /
200������--��������������--�
1975 1980 1985 YEAR
1990 1995
Figure 2-6. Annual releases of CCI3F and CCI2F2 estimated from 13 years of ALE/GAGE data (points are joined by a full line), and most recent estimates of world releases of these compounds (Fisher et a/., 1994). Source: Cunnold et a/., 1994.
1 990 CFC- 1 1 and CFC- 1 2 releases to be 249 ± 28 kton
and 366 ± 30 kton, respectively. These values are compa
rable to the global emissions assembled by Fisher et al.
( 1 994) (CFC- 1 1 : 255 .2 kton and CFC- 1 2: 385 .6 kton)
(Figure 2-6) .
CH2Cl2 and CHClCCl2 are used as industrial
cleaning solvents. Sources of 0.9 and 0.6 Tg/yr have
been recently estimated from observed atmospheric
abundances (Koppmann et al. , 1 993) . Industry estimates
of 1 992 emissions for CCI2CC12, CHClCCl2, and
CH2Cl2 were 0.24, 0. 1 6, and 0.39 Tg, respectively. Total
emissions for these species have declined by 40% since
1 982 (P. Midgley, personal communication to P.F.) . The
aluminum refining industry produces CF4 (0.0 1 8 Tg/yr)
2. 13
and C2F6 (0.00 1 Tg/yr), however, there are no estimates
of other potential sources (Cicerone, 1 979). 80% of SF6
production (0.005 Tg in 1989) is used for insulation of
electrical equipment, 5- 1 0% for degassing molted reac
tive metals , and a small amount as an atmospheric tracer
(Ko et al. , 1 993) . The rate of increase of SF6 in the atmo
sphere (Zander et al. , 1 99la; Rinsland et al. , 1 993;
Maiss and Levin, 1 994) implies that its sources are in
creasing.
Methyl halides are produced during biomass burn
ing. Annual emissions of 1 .5- 1 . 8 Tg/yr (Lobert et al. ,
1 99 1 ; Andreae, 1993) and 30 Gg/yr (Marro and Andreae,
1 994) have been estimated for CH3Cl and CH3Br, re
spectively.

SOURCE GASES
A major source of methyl halides appears to be the
marine/aquatic environment, likely associated with algal
growth (Sturges et al., 1993; Moore and Tokarczyk,
1993a). Methyl chloride, present in the troposphere at
about 600 pptv, is the most prevalent halogenated meth
ane in the atmosphere. Maintaining this steady-state
mixing ratio with an atmospheric lifetime of the order of
two years requires a production of around 3.5 Tg/yr,
most of which comes from the ocean and biomass burn
ing. The atmospheric budget of methyl bromide is
discussed in Chapter 10. Other halogenated methanes,
such as CHBr3, CHBrzCl, and CHzCBrz, are produced
by macrophytic algae (seaweeds) in coastal regions
(Manley et al., 1992) and possibly by open ocean phy
toplankton (Tokarczyk and Moore, 1994), but they do
not accumulate significantly in the atmosphere.
2.2.4 Halocarbon Sinks
Fully halogenated halocarbons are destroyed pri
marily by photodissociation in the mid-to-upper
stratosphere. These gases have atmospheric lifetimes of
decades to centuries (Table 2-1).
Halocarbons containing at least one hydrogen
atom, such as HCFC-22, chloroform, methyl chloro
form, the methyl halides, and other HCFCs and HFCs
are removed from the troposphere mainly by reaction
with OH. The atmospheric lifetimes of these gases range
from years to decades, except for iodinated compounds
such as methyl iodide, which have lifetimes of the order
of days to months. However, some of these gases also
react with seawater. About 5-10% of the methyl chloro
form in the atmosphere is lost to the oceans, presumably
by hydrolysis (Butler et al., 1991). About 2% of atmo
spheric HCFC-22 is apparently destroyed in the ocean,
mainly in tropical surface waters (Lobert et al., 1993).
Methyl bromide sinks are discussed in Chapter 10.
Recent studies show that carbon tetrachloride may
be destroyed in the ocean. Widespread, negative satura
tion anomalies (-6 to -8%) of carbon tetrachloride,
consistent with a subsurface sink (Lobert et al., 1993),
have been reported in both the Pacific and Atlantic
oceans (Butler et al., 1993; Wallace et al., 1994). Pub
lished hydrolysis rates for carbon tetrachloride are not
sufficient to support these observed saturation anomalies
(Jeffers et al., 1989) which, nevertheless, indicate that
about 20% of the carbon tetrachloride in the atmosphere
is lost in the oceans.
2. 14
Recent investigation of the atmospheric lifetimes
of perfluorinated species CF4, CF3CF3, and SF6 indi
cates lifetimes of >50,000, >10,000, and 3200 years
(Ravishankara et al., 1993). Loss processes considered
include photolysis, reaction with O(ID), combustion, re
action with halons, and removal by lightning.
2.2.5 Lifetimes
Lifetimes are given in Table 2-1. An assessment
and re-evaluation of the empirical models used to derive
the atmospheric residence lifetime of two major industri
al halocarbons, CH3CC13 and CFC-11, have been made
recently (Bloomfield, 1994). The analysis uses four
components: observed concentrations, history of emis
sions, a predictive atmospheric model, and an estimation
procedure for describing an optimal model. An optimal
fit to the observed concentrations at the five Atmospheric
Lifetime Experiment/Global Atmospheric Gases Experi
ment (ALE/GAGE) surface sites over the period
1978-1990 was done with two statistical/atmospheric
models: the ALE/GAGE 12-box atmospheric model
with optimal inversion (Prinn et al., 1992) and the North
Carolina State University/University of California-Irv
ine 3D-Goddard Institute for Space Studies (NCSUIUCI
3D-GISS) model with autoregression statistics (Bloom
field, 1994). There are well-defined differences in these
atmospheric models, which contribute to the uncertainty
of derived lifetimes.
The lifetime deduced for CH3CC13 is 5.4 years
with an uncertainty range of ±0.4 yr (IPCC, 1994a).
From this total atmospheric lifetime, the losses to the
ocean and the stratosphere are used to derive a tropo
spheric lifetime for reaction with OH radicals of 6.6 yr
(±25% ); this value is used to scale the lifetimes of
HCFCs and HFCs (e.g., Prather and Spivakousky, 1990).
On the other hand, the semi-empirical lifetime for CFC-
11 of 50 ± 5 years (IPCC, 1994a) provides an important
transfer standard for species that are mainly removed in
the stratosphere, i.e., the relative modeled lifetimes giv
en in Table 2-1 for CFCs, H -1301, and N zO are scaled to
a CFC-11 lifetime of 50 yr.
A more recent analysis of the ALE/GAGE data
( 1978-1991) using the ALE/GAGE model and a revised
CFC-11 calibration scale (SIO 93) gives an equilibrium
lifetime for CFC-11 of 44 (+17/-10) years (Cunnold et al., 1994).

2.3 STRATOSPHERIC INPUTS OF CHLORINE
AND PARTICULATES FROM ROCKETS
Solid-fuel rocket motors of launch vehicles release
chemicals in the stratosphere, including chlorine (main
ly HCl), nitrogen, and hydrogen compounds that,
directly or indirectly, can contribute to the catalytic de
struction of ozone. Chapter 1 0 of the WMO-Report No.
25 covers this subject (Harwood et al. , 1 992) . Since that
report, which summarized model studies that evaluated
the chlorine buildup in the stratosphere and its impact on
the ozone layer, based on the projected launches of the
larger rocket types (Space Shuttle and Titan IV by Prath
er et al. , 1 990, and by Karol et al. , 199 1 ; Ariane 5 by
Pyle and Jones, 1 99 1 ) , no additional studies have been
released. The main conclusions arrived at by Harwood et
al. ( 1 992) were: i) within the expanding exhaust trail of a
large rocket, stratospheric ozone can be reduced sub
stantially, up to >80% at some heights and up to 3 hours
after launch; ii) because of the slant layout of the trajec
tory, column ozone is probably reduced by less than 10%
over an area of a few hundred square kilometers; iii) the
local plume ozone reductions decrease to near zero with
in 24 hours and the regional effects are too small to be
detected by satellite observations; iv) steady-state model
calculations for realistic launch scenarios of large rock
ets by NASA and ESA (European Space Agency) show
that for both scenarios, ozone decreases are less than
0 .2% locally in the region of maximum chlorine in
crease, with corresponding changes in ozone column of
much less than 0. 1 % .
2.3.1 Stratospheric Chlorine Input
The specific chlorine (Cl) input to the stratosphere
(above 15 km altitude) from rocket exhausts can be esti
mated if the Cl amount and its time-dependent release
along the ascent are known. Such evaluations were re
ported by Prather et al. ( 1 990) regarding the Space
Shuttle (68 tons Cl) and the Titan IV launcher (32 tons
Cl), and by Pyle and Jones ( 1 99 1 ) for Ariane 5 (57 tons
Cl). Assuming a projection of 1 0 launches per year for
each of these chlorine-releasing rocket types, a total of
1 570 tons of Cl is then deposited in the stratosphere each
year. This corresponds to only 0 .064% of the present
day stratospheric burden of chlorine (based on a Cl
volume mixing ratio of 3 .5 ppbv, or a total of 2.45xl 06
tons of Cl above 1 5 km altitude) . However, at the rate of
2. 15
SOURCE G A SES
increase of the stratospheric chlorine loading measured
between 1985 and 1 992, i.e., 0. 1 3 ppbv per year (see
Section 2.2 .2) caused by the release of 30x 1 ()4 tons/yr of
Cl from the photodissociation of CFCs in the strato
sphere (Prather et al. , 1990), the scenario of large rocket
launches envisaged here corresponds to an additional in
jection of Cl above 1 5 km equal to about 0.6% per year.
This percentage will increase as CFCs are phased out.
No similar Cl input to the stratosphere can be evaluated
for a large number of smaller rockets, because their ex
haust characteristics as well as their number of launches
worldwide (maybe some 1 00, all types combined; Har
wood et al., 1 992) are poorly documented or
inaccessible.
2.3.2 Particulates from Solid-Fuel Rockets
Besides gases, solid-fuel rocket motors release
particulates in the form of aluminum oxide (Al203),
soot, and ice. Attempts to determine the distribution of
exhausted aluminum oxide particles in the rocket ex
hausts are limited, with only one Shuttle-related set of
measurements made some 10 years ago (Cofer et al. ,
1 985) indicating a distribution of particles with signifi
cantly more particles below 1 11m than above 1 11m in
size. The lack of satisfactory information on rocket par
ticulate releases significantly hampers the quantification
of impacts that heterogeneous chemistry (Hofmann and
Solomon, 1989; Granier and Brasseur, 1992) may have
on ozone depletion by rockets.
The only research programs that have provided
some indication about the recent evolution of particu
lates and aerosols in the stratosphere are by Zolensky et
al. ( 1 989) and by Hofmann ( 1 990, 1 99 1 ) . From impac
tion collections sampled in 1 978 and 1984, Zolensky et
al. ( 1 989) found an order of magnitude increase in alu
minum-rich particles of >0.5 11m diameter at 1 7- 1 9 km altitude; they suggested that this rise is likely due to the
influx of solid rocket motor exhaust and ablating rocket
and satellite debris into the stratosphere in increasingly
larger amounts, with the latter predominating. Hofmann
( 1 990) observed an increase by about 80% of the back
ground (non-volcanic) stratospheric sulfate burden at
northern midlatitudes between 1 979 and 1 990. He spec
ulated (Hofmann, 1 99 1 ) that it may be partially caused
by the increase in air traffic during that same period, bas
ing his evaluation on a representative fleet and engine
SOURCE GASES
emission index of sulfur dioxide (S02) , as well as on a
realistic lifetime for the stratospheric aerosol. However,
Bekki and Pyle (1992) concluded that the increase in
aerosol mass between 1979 and 1990 due to the rise of
air traffic is largely insufficient to account for the ob
served mass trend and suggest that a rise in
submicrometer particles due to the influx of solid rocket
exhaust and ablating spacecraft material merits further
investigations. Clearly, particulates from solid-fuel rock
ets deserve careful attention, especially as their
stratospheric abundance may increase in the near future.
2.4 M ETHANE (CH4)
Methane is an important greenhouse gas that is
also a reactive gas that participates in establishing the
oxidizing capacity of the troposphere, and therefore af
fects the lifetime of many other trace gases. In the
stratosphere it is a source of hydrogen and water vapor,
and a sink of atomic chlorine. It is mainly produced from
a wide variety of anaerobic processes and removed by
the hydroxyl radical. Its abundance in the atmosphere
has been rising since the Industrial Revolution with its
global 1992 tropospheric mixing ratio being equal to
1.714 ppmv. A large fraction of methane is released to
the atmosphere from anthropogenic sources (-2/3) and
is therefore susceptible to possible emission controls. A
reduction of about 10% of anthropogenic emissions
would stabilize the concentration at today's level (IPCC,
1994a).
2.4.1 Atmospheric Distribution and Trends
Due to the distribution of CH4 sources, there is an
excess Northern Hemispheric source of about 280 Tg/yr,
and atmospheric concentrations in the Southern Hemi
sphere are -6% lower. Recent modeling (Law and Pyle,
1993) and isotopic (Lassey et al. , 1993) studies confirm
that the seasonal cycle of methane (±1.2% at midlati
tudes) in the Southern Hemisphere is mainly controlled
by the seasonality of methane oxidation by OH radicals
in the lower troposphere and the transport of air from
tropical regions that are affected by biomass burning.
During the past decade, global methane has in
creased on average by about 7% (Dlugokencky et al., 1994a). The declining atmospheric methane growth
identified in the previous assessment has continued.
2. 1 6
Measurements from two global observing networks
show a steady decline in the globally averaged growth
rate since the early 1980s (Steele et at., 1992; Khalil and
Rasmussen, 1993b; Khalil et al. , 1993a; Dlugokencky et al. , 1994c), being approximately 20 ppbv/yr in 1979-
1980, 13 ppbv/yr in 1983, 10 ppbv/yr in 1990, and about
5 ppbv/yr in 1992 (Dlugokencky et al., 1994c). The de
cline of the growth rate in the 30°-90°N semi-hemisphere
was 2-3 times more rapid than in the other semi-hemi
sphere. The 1992 increase in the Northern Hemisphere
was only 1.8 ± 1.6 ppbv (Dlugokencky et al., 1994c).
The cause of this global decline in methane growth is not
entirely clear, but could be related to changes in emis
sions from fossil fuel (particularly natural gas) in the
former Soviet Union (Dlugokencky et al., 1994c) and
from biomass burning in the tropics (Lowe et al., 1994).
Observed methane levels in the high Arctic (Alert, 83°N)
in 1993 were actually lower than those observed in 1992
(Worthy et al., 1994). Data reported for Antarctica (Aoki
et al. , 1992) show the same trend observed by the
NOAA-CMDL station in the same region. Vertical col
umn abundance measurements above the Jungfraujoch
station, Switzerland, between February 1985 and May
1994 indicate a rate of increase in the atmospheric bur
den of CH4 equal to 0.73 ± 0.13 %/yr over the period
1985-1989, which slowed to 0.46 ± 0.11 %/yr between
1990 and May 1994 (Zander et al., 1994c; R. Zander,
personal communication to E.S.).
A significant decrease in BCH4 has been observed
in the Southern Hemisphere since mid-1991, coincident
with significant changes in the CH4 growth rate (15 ppb/
yr in 1991; 5 ppb/yr in 1992) (Lowe et al., 1994). The
isotopic data imply that the change in CH4 growth rate is
due to: i) decreasing sources rather than increasing sinks,
and ii) a combination of decreased tropical biomass
burning and a lower release of fossil CH4 in the Northern
Hemisphere.
Global measurements of C� between 100 and 0.1
mb pressure levels have been performed by various in
struments aboard the Upper Atmosphere Research
Satellite (UARS). Since October 1991, the UARS Halo
gen Occultation Experiment (HALO E) has made routine
measurements of methane concentrations at latitudes
ranging from -80°N to -80°S. These measurements have
been used in conjunction with other HALOE observa
tions to evaluate vertical subsidence in the Antarctic
spring polar vortex (Russell et al. , 1993); they have un-

SOURCE GASES
1 6 5 0 >
..0 1 5 5 0 0.. 0 D E0 8 0.. 1 4 5 0
.__.. 0 S i t e J c 1 3 5 0 • M i z u h o 0
- 1 2 5 0 X S u m m i t ( B e r n ) 0 � 1 1 5 0 6 S u m m i t ( G re n o b l e )
-c 1 0 5 0 Q)
-- C a p e G r i m u c 9 5 0 0
u 8 5 0 �
I 7 5 0 u X X X X
6 50�--�--�----���--�----�--�----�--�--�--�
900 1 0 00 1 1 00 1 200 1 300 1 40 0 1 50 0 1 6 00 1 700 1 8 00 1 900 2000 Y e a r A D
Figure 2-7. Methane mixing ratios observed in ice cores from Antarctica (Law Dome: Etheridge et at., 1992; Mizuho: Nakazawa et at., 1993) and Greenland (Site J : Nakazawa et at., 1993; Summit: Blunier et at., 1993) over the past 1 000 years. Atmospheric data from Cape Grim, Tasmania , are included to demonstrate the smooth transition from ice core to atmospheric measurements. Source: I PCC , 1994a.
dergone intercomparison with ER-2 airplane observa
tions (Tuck et al. , 1 993), as part of validation exercises.
The Cryogenic Limb Array Etalon Spectrometer
(CLAES) UARS experiment also measured Cl4 con
centrations globally, but results have only been reported
so far as sample cases, as additional validation is re
quired prior to releasing this data base (Kumer et al. ,
1 993) . Although limited in time and in global coverage,
the high spectral-resolution, multiple-species (over two
dozen gases) observations made by the shuttle-based At
mospheric Trace Molecule Spectroscopy Experiment
(ATMOS) instrument during the Spacelab 3 (April-May,
1 985), ATLAS 1 (March-April, 1 992) and ATLAS 2
(April, 1 993) missions (Farmer, 1987; Gunson et a!. ,
1 990; Gunson, 1 992) are unique "benchmarks" for
trends evaluations and for validation exercises.
The paleo record of atmospheric methane concen
tration has been improved by the analysis of new ice
cores (Etheridge et al. , 1 992; Nakazawa et al. , 1 993 ;
Blunier et al. , 1 993 ; Jouzel et al. , 1993 ; Chappellaz et
al. , 1993) . Antarctic ice core data (Law Dome), which
overlap the direct atmospheric measurements, indicate
2. 1 7
that the growth rate was not always monotonic, with ap
parent stabilization periods around the 1 920s and again
during the 1970s (see Figure 2-7 ; Etheridge et al. , 1992;
Dlugokencky et al. , 1 994a) . From Greenland and Ant
arctic ice cores, Nakazawa et al. ( 1 993) conclude that the
pre-industrial natural sources in the Northern Hemi
sphere were larger than those in the Southern
Hemisphere. New data from Antarctic Vostok ice core
have extended the methane record from 1 60 thousand
year BP (kaBP) through the penultimate glaciation to the
end of the previous interglacial, about 220 kaBP (Jouzel
et al. , 1 993) . Recent analyses of Greenland ice cores
have provided additional climatic and atmospheric com
position records (Chappellaz et al. , 1 993) . The methane
concentration through the deglaciation is observed to be
in phase with temperature. Warm periods, each lasting
hundreds of years, are associated with methane peaks of
about 1 00 ppbv. These variations have not been observed
in the Antarctic ice cores, likely due to the coarse sam
pling interval and the slower pore close-off of the
Antarctic sites .

SOURCE GASES
2.4.2 Sources
A detailed discussion of the natural and anthropo
genic sources of methane has been given in previous
assessments (WMO, 1 992; IPCC, 1 990, 1 992) and only
an update is presented here. Methane sources are listed
in Table 2-3.
Wetlands. Natural wetlands are the major source
of methane and in recent years considerable new data on
methane flux from these ecosystems have been pub
lished. Recent t1ux data from the Amazon region suggest
that a large fraction of CH4 is emitted from tropical wet
lands (20°N-30°S) , with a global estimate of -60 Tg/yr
(Bartlett et al. , 1 990; Bartlett and Harris, 1 993) . High
northern latitude studies indicate emissions ranging
from 20 to 60 Tg/yr (Whalen and Reeburgh, 1 992; Ree
burgh et al. , 1994) . Information from large areas of the
world is lacking, particularly in the tropics and the Sibe
rian Lowland (Bartlett and Harris, 1 993) . Recently,
atmospheric data have been used to constrain emission
estimates from wetlands in the former Soviet Union
(Dlugokencky et al. , 1 994b).
Ocean and Freshwater Ecosystems. A re-evalu
ation of the ocean source was performed by Lambert and
Schmidt ( 1 993). According to these authors only -3.5
Tg/yr are emitted by the open oceans, but emissions
from methane-rich areas could be considerably more
important, producing a total oceanic source of the order
of 50 Tg/yr. There is no new information about the con
tribution of freshwater ecosystems.
Termites. A recent estimate made by Martius et
al. ( 1 993) for the contribution of termites to the global
CH4 budget agrees well with the central value of 20 Tg/y
given in the 1 992 IPCC Supplement.
Other Natural Sources. New estimates have been
made for volcanoes (3 .5 ± 2.7 Tg/yr), hydrothermal
emissions (2.3 ± 2.7 Tg/yr), and hydrates (-3 Tg/yr)
(Judd et al. , 1993; Lacroix, 1 993) .
Fossil Carbon Related Sources. From studies of
the carbon- 14 content of atmospheric CH4 it was estab
lished that about 20% ( - 100 Tg) of total annual CH4
emission is from fossil carbon sources (IPCC, 1 992).
However, there are large uncertainties in the contribution
of the various related sources : coal mines, natural gas
and petroleum industry. New global estimates from coal
mines are: 25 Tg/yr (CIAB, 1 992), 1 7 Tg/yr (Miiller,
1 992), 43 Tg/yr (Beck, 1 993), 49 Tg/yr (Subak et al. ,
2. 18
1 993), and 45 .6 Tg/yr (Kirchgessner et al. , 1 993) .
Miiller ( 1 992) gives an emission from natural gas activi
ties of 65 Tg/yr, which is much higher than the values
given in the IPCC ( 1 992) (25-42 Tg/yr) . Khalil et al.
( 1 993b) proposed that low-temperature combustion of
coal (not included previously) could be a significant
source of methane, with a global emission of - 1 6 Tg/yr.
However, the emission factor derived by Khalil et al. is
higher than the values obtained by Fynes et al. ( 1 993)
from coal-fired plants and the one quoted for handfired
coal units by the Air Pollution Engineering Manual (Air
and Waste Management Assn., USA, 1 992); further re
search is clearly required to refine this estimate.
Waste Management Systems. Landfills, animal
waste, and domestic sewage are significant global
sources of methane, with a total emission estimate of
-80 Tg/yr (IPCC, 1 992). New global estimates from
landfills are 40 Tg/yr (Miiller, 1 992), 36 Tg/yr (Subak et
al. , 1 993) , and 22 Tg/yr (Thorneloe et al. , 1 993), in good
agreement with the mean value (30Tg/yr) given previ
ously (IPPC, 1 992) . No additional information has been
published for animal waste and domestic sewage.
Enteric Fermentation. Anastasi and Simpson
( 1 993) estimated for 1 990 an emission of 84 Tg/yr from
enteric fermentation in cattle, sheep, and buffalo. This
result suggests that the strength of enteric fermentation
be in the upper part of the range given in 1 992 (65- 100
Tg/yr) . Furthermore, Minson ( 1 993) in a re-evaluation
of this source in Australia found values 43% higher than
previous estimates for this country. Johnson et al. ( 1 993)
estimated a global emission of 79 Tg/yr.
Biomass Burning. New global estimates of this
source are: 30.5 Tg/yr (Hao and Ward, 1 993), 36 Tg/yr
(Subak et al. , 1 993) , and 43 Tg/yr (Andreae and Warnek,
1 994) . These values are within the range of data reported
previously (IPCC, 1 992).
Rice Paddies. There is a very large uncertainty
associated with the emissions estimate from rice paddies
(IPCC, 1 992). Three-dimensional (3-D) model calcula
tions constrain estimates of methane emission from rice
cultivation to - 1 00 Tg/yr (Fung et al. , 1 99 1 ; Dlugo
kencky et al. , 1 994b) . The results reported earlier (IPCC,
1 990, 1 992) and recent estimates (i. e. , Wassman et al. ,
1 993; Delwiche and Cicerone, 1 993; Bachelet and Neue,
1 993; Subak et al. , 1 993; La! et al. , 1 993; Shearer and
Khalil, 1 993; Neue and Roger, 1 993) suggest an emis-

SOURCE GASES
TABLE 2-3. Estimated sources and sinks of methane (Tg CH4 per year).
Range Likely Totals
Sources
Natural
Wetlands a
Tropics 30-80 -60
Northern Latitudes 20-60 40
Others 5- 1 0 1 0
Termites 1 0-50 20
Ocean 5 -5oa 1 0
Freshwater 1 -25 5
Others a 8- 1 3 1 0
Total Natural 1 55
Anthropogenic
Fossil Fuel Related 1 00b
Coal Mines 1 5-45a
Natural Gas 25-5oa
Petroleum Industry 5-30
Coal Combustion 7-3oa
Waste Management System
Landfills 20-70 30
Animal Waste 20-30 25
Domestic Sewage Treatment ? 25
Enteric Fermentation 65- 1 00 80
Biomass Burning 20-80 40
Rice Paddiesa 20- 1 00 60
Total Anthropogenic 360
Total Source 5 1 5
Sinks
Reaction with OHa 330-560 445
Removal in Stratospherea 25-55 40
Removal by Soils 15 -45 30
Atmospheric Increase 30-40 37
Total Sink 552
a indicates revised estimates since previous assessments
b from carbon- 1 4 studies (IPCC, 1 992)
2. 19

SOURCE GASES
sion range of 20- 100 Tg/yr with a most likely value of 60
Tg/yr.
2.4.3 Sinks
CH4 is mainly removed through chemical reac
tions in the troposphere and stratosphere (485 Tg/yr). A
growing number of studies (reviewed by Reeburgh et al. ,
1 994) show that methane is consumed by soil microbial
communities in the range between 20 and 60 Tg/yr.
Methane oxidation is expected to be particularly impor
tant in modulating methane emissions from rice paddies,
wetlands, and landfills. Ojima et al. ( 1 993) estimate that
-20 Tg of methane is consumed annually by temperate
soil, and that this sink has decreased by -30% due to soil
disturbance.
2.4.4 Potential Feedbacks from a Changed
Climate
There are several potential climate feedbacks that
could affect the atmospheric methane budget (IPCC,
1 990). At present, however, the attention has focused on
northern wetlands and on permafrost.
High-Latitude Wetlands. Changes in surface
temperature and rainfall are predicted by general circula
tion models (GCMs) to occur in high-latitude regions.
When changes in temperature are considered alone, an
increase in the emission of CH4 is predicted (Hameed
and Cess, 1983 ; Lashoff, 1989). Recent calculations
suggest only a moderate increase in CH4 emissions in a
2xC02 scenario (Harris and Frolking, 1 992). On the oth
er hand, using a hydro-thermal model, Roulet et al.
( 1 992) estimated a significant decrease in moisture stor
age that resulted in an 80% decrease in CH4 fluxes
(negative feedback) ; the corresponding increase due to
temperature changes is only 1 5 %. These estimates have
been confirmed by measurements indicating a reduced
CH4 flux from drained northern peatlands (Roulet et al. ,
1 993). 1t seems that northern wetlands are more sensitive
to changes in moisture than temperature; however, the
biospheric feedback mechanisms are poorly understood
(Reeburgh et al. , 1 994).
Permafrost. The methane content of permafrost
in Fairbanks (Kvenvolden and Lorenson, 1 993) and
northern Alaska (Rasmussen et al. , 1 993) was recently
evaluated at 2-3 mg!kg. Using these concentrations and
the changes in temperature predicted by various
2.20
scenarios, K venvolden and Lorensen ( 1 993) predict that
in 100 years the maximum methane release rate will be
-27 Tg/yr and that during the first 30 years no significant
release will occur. The heat transfer and gas diffusion
model of Moraes and Khalil ( 1 993) indicates that in the
future, permafrost is likely to contribute less than 10 Tg
of methane per year.
2.5 NITROUS OXIDE (N20)
Nitrous oxide has a long atmospheric lifetime. It is
the major source of stratospheric nitrogen oxides, which
are important in regulating stratospheric ozone. N20 is
also a greenhouse gas. It is emitted by several small
sources, which have large uncertainties, and its atmo
spheric budget is difficult to reconcile. It is removed by
photolysis and oxidation in the stratosphere and micro
bial oxidation in soils. A reduction of more than 50% of
anthropogenic sources would stabilize its concentration
at today's level of about 3 1 0 ppbv (IPCC, 1 994a).
2.5.1 Atmospheric Distribution and Trends
The available global nitrous oxide data indicate
that the trend over the past decade is very variable, rang
ing from 0.5 to 1 . 2 ppbv/yr (WMO, 1 992; Khalil and
Rasmussen, 1 992). A recent analysis of seventeen years
of data collected on oceanic expeditions as well as in
Alaska, Hawaii, and Antarctica (Weiss, 1 994) and six
teen years of data from the NOAA global network
(Swanson et al. , 1 993) shows that the global average
abundance at the beginning of 1 976 was 299 ppbv,
which has risen to 3 1 0 ppbv at the beginning of 1 993.
During 1 976-82 the growth rate was about 0.5-0.6 ppbv/
yr, which increased to a maximum of 0.8- 1 ppbv/yr in
1988-89, declining to the current rate of 0.5-0.6 ppbv/yr.
An analysis of IR solar absorption spectra record
ed at the Jungfraujoch Station (46.6°N) in 1 950-5 1 and
from 1 984 to 1 992 has been recently performed by
Zander et al. ( 1 994b). The results indicate that the rate of
increase of the column of N20 was 0.23 ± 0.04 for the
period 1 95 1 to 1 984, and 0.36 ± 0.06 %/yr from 1 984 to
1 992. The corresponding volume mixing ratios at the
levels of the site (3.58 km altitude) increased from 275
ppbv to 305 ppbv between 195 1 and 1 992. The 1 95 1
concentration is quite similar to the pre-industrial values
obtained from ice cores (285 ppbv; IPCC, 1 990) , sug-

SOURCE GASES
TABLE 2-4. Estimated sources and sinks of N20 (Tg N per year).
Sources
A. Natural
Oceans
Tropical Soils
1 .4-5.2*
Wet forests
Dry savannas
Temperate Soils
Forests
Grasslands
2.2-3.7
0.5-2.0
0.05-2.0
?
B. Anthropogenic
Cultivated Soils
Animal Waste*
Biomass Burning
Stationary Combustion
Mobile Sources*
Adipic Acid Production
Nitric Acid Production
1 -3
0 .2-0.5
0.2- 1 .0
0. 1 -0.3
0. 1 -0.6
0.4-0.6
0. 1 -0.3
Sinks
Removal by Soils
Photolysis in the Stratosphere* ?
1 2.3 (9- 1 7)
Atmospheric increase* 3. 1 -4.7
* indicates revised estimates since previous assessment
gesting that the pre-industrial level was lower (see be
low), or that it persisted until the middle of this century
and that the increase occurred thereafter.
Satellite global measurements of N20 have been
made by CLAES and ISAMS (Improved Stratospheric
and Mesospheric Sounder) aboard UARS (Kumer et al.,
1 993 ; Taylor et al., 1993), but no validated results have
been released so far.
Ice core records of N20 show an increase of about
8 % over the industrial period (IPCC, 1 990). New records
covering the last 45 ka were obtained from Antarctica
and Greenland (Leuenberger and Siegenthaler, 1992).
The Greenland record suggests a pre-industrial level of
about 260 ppbv, 1 0 to 25 ppbv lower than previous
records (IPCC, 1 990). The Antarctic core shows that
N20 was lower during glacial periods, consistent with
2.21
the hypothesis that soils are a major natural source of
nitrous oxide.
2.5.2 Sources
A detailed presentation of N20 sources was made
in IPCC ( 1 990) and a revised budget was given in the
1 99 1 ozone assessment (WMO, 1 992). N20 is emitted
by a large number of small sources, most of them diffi
cult to evaluate and the estimates are very uncertain.
Here we will only present new information not included
in previous assessments. The updated budget is present
ed in Table 2-4. The overall uncertainty in the N20
budget suggests that it could be balanced with the cur
rently identified sources.

SOURCE GASES
N20 fluxes from an upwelling area of the Indian
Ocean (Law and Owen, 1990) and the Peruvian up
welling region (Codispoti et al. , 1992) indicate that the
oceans may be a larger source of this gas . Weiss ( 1 994)
calculated that the total pre-industrial source of N20 was
-9 TgN/yr, of which -3 TgN/yr was oceanic . An isotopic
study (nitrogen- 1 5 and oxygen- 1 8) of atmospheric N20
suggests a large gross ocean-atmosphere flux (Kim and
Craig, 1 993) . Therefore, the upper range for that source
has been extended to 5 .2 TgN/yr in this assessment.
Recent emission estimates from some anthropo
genic sources made by Subak et al. ( 1 993) agree well
with previous values. The increasing use of catalytic
converters in cars stimulated the evaluation of the global
contribution of this source: from tailpipe emission mea
surements, Dasch (1 992) derived a global emission of
0 . 1 3 Tg N/yr; Khalil and Rasmussen ( 1 992) from mea
surements in crowded highways in California estimate a
global emission of 0.06-0.6 TgN/yr; Berges et al. ( 1 993)
from measurements in two tunnels (Stockholm and
Hamburg) estimate a global emission of 0 .24 ± 0. 14
TgN/yr. This new information on N20 emissions from
catalytic converters, together with previous estimates
(WMO, 1 992) results in a revised emission range of 0 . 1 -
0 .6 TgN/yr.
Important emissions are produced by agricultural
activities . Recent global estimates from fertilized soils
are 0.9 TgN/yr (Kreileman and Bouwman, 1 994) and 2
TgN/yr (Pepper et al. , 1 992). A source that was not in
cluded in the 1 992 Report is cattle and feed lots. Based
on the ratios of excess N20 to excess CH4 in bam stud
ies, Khalil and Rasmussen ( 1 992) estimate a source of
0 .2-0.5 TgN/yr from cattle. Kreileman and Bouwman
( 1 994) estimate for 1 990 a global emission of 0.6 TgN/
yr for the animal waste source. New information in trop
ical land use change indicates that the flux of N20
depends on the age of the pasture, with young pastures
(< 1 0 years) emitting 3- 10 times more N20 than tropical
forests, whereas older pastures emit less (Keller et al. ,
1 993) . A rather low source of 0.2 TgN/yr was estimated
by Kreileman and Bouwman ( 1 994) due to enhanced
soil N20 emission following deforestation. More re
search on tropical agricultural systems is required before
conclusions can be reached concerning the relative im
portance of tropical agricultural systems as a growing
N20 source (Keller and Matson, 1994) .
2.22
2.5.3 Sinks
The major sink of N20 is photodissociation in the
stratosphere; a secondary loss of about 10% occurs
through reaction with O( I D) . The lifetime is 1 20 ± 30 yr
(Prather and Remsberg, 1 992). Important evidence of
N20 consumption by soils was reported by Donoso et al.
( 1 993), but there are insufficient data to determine
whether soil provides a significant global N20 sink.
Based on recent data (Swanson et al., 1 993 ; Weiss,
1 994) the atmospheric increase is estimated to be 3 . 1 -4 .7
TgN/yr. The estimated sinks (including the atmospheric
increase) range from - 1 2 to -21 TgN/yr; therefore, to
balance the N20 atmospheric budget, all sources should
be near their upper limits. This is in agreement with cal
culations based on ice core records and atmospheric
concentrations that suggest a total anthropogenic emis
sion of -4.5 TgN/yr and -9.5 TgN/yr for the natural
sources (Khalil and Rasmussen, 1 992) .
2.6 SHORT-LIVED OZONE PRECURSOR
GASES
Tropospheric ozone is a greenhouse gas, of partic
ular importance in the upper troposphere. It also plays a
significant role in the oxidizing capacity of the atmo
sphere. A detailed evaluation of tropospheric ozone is
made in Chapter 5. Since the concentration of 03 de
pends on the levels of its precursors (i.e., NOx, CO, CH4,
NMHC), we assess their sources, sinks and atmospheric
distributions in the following sub-sections.
2.6.1 Nitrogen Oxides (NOx = NO + N02)
2.6.1 .1 TROPOSPHERIC DISTRIBUTION
Because of its complex geographical source pat
tern and its short lifetime, the spatial and temporal
distribution of tropospheric NOx is complex and highly
variable, over 3 orders of magnitude in non urban areas
(Carroll and Thompson, 1 994) . A detailed discussion of
the tropospheric distribution of NOx is presented in
Chapter 5 .
2.6.1.2 SOURCES
Estimated NOx source strengths are summarized
in Table 2-5 .

TA BLE 2-5. Estimated sources of NOx (TgN/yr).
Range Likely
Natural Soils 5- 1 2
Lightning 3-20
Biomass Burning 3- 1 3
Subsonic Aircraft 0.2- 1
Fossil Fuel 2 1 -25
Agricultural Soils ?
Soils. Soil microbial activity is an important natu
ral source of NOx, but a very large uncertainty affects its
estimate (IPCC, 1 992). Recently, Williams et al. ( 1992)
derived an emission of only -0. 1 TgN/yr from natural
soils (grassland, forest, and wetlands) within the U.S .
From studies in Venezuela, S anhueza ( 1 992) estimated
an emission of -4 TgN/yr for the global savannah region.
Tropical forest soils produce large amounts of NO; how
ever, due to removal processes inside the forest itself,
most of the NO never reaches the "open" atmosphere
(Bakwin et al. , 1 990) . Recent global estimates of this
source include: Davidson ( 1 99 1 ) , 1 3 TgN/yr; Muller
( 1 992), 4.7 TgN/yr; and Dignon et al. ( 1 992), 5 TgN/yr.
Agricultural soils could be an important source of
NOx, but no reliable global budgets exist. Cultivated
soils from the U .S . emit 0 .2 TgN/yr (Williams et al. ,
1 992); plowing of tropical savannah soil produces a
large increase of NO emissions (Sanhueza et al., 1 994),
but the impact to the global budget has not been estimat
ed.
Lightning. The global estimates of NOx produc
tion by lightning show a very large uncertainty (Liaw et
al., 1 990) . Using a global chemistry, transport, and depo
sition model, Atherton et al. ( 1 993) found that a
lightning source of 5- 1 0 TgN/yr (with an upper limit of
20 TgN/yr) is compatible with the NOy levels in remote
locations. This is in agreement with Logan ( 1 983), who
indicates that the distribution of nitric acid (HN03) in
the remote troposphere is consistent with a lightning
NOx source of < 1 0 TgN/yr.
Biomass burning. Tropical biomass burning is an
important source of NOx (Crutzen and Andreae, 1 990;
Lobert et al. , 1 99 1 ; Andreae, 1 99 1 ; Penner et al., 1 99 1 ;
Muller, 1 992), ranging from 2 to 8 TgN/yr. Estimates in
cluding extratropical burning indicate global production
7
7
8
0.4
24
?
2.23
SOURCE GASES
of 9.6 TgN/yr (Andreae, 1 993) and 1 3 TgN/yr (Dignon
and Penner, 1 99 1 ) .
Aircraft. Emissions from aircraft are a relatively
small source of NO. However, since a large fraction of
the NOx is released at altitudes between 9- 1 3 km, this
has a large impact on the photochemistry of the free tro
posphere (Johnson et al., 1 992; Beck et al., 1 992), and is
likely responsible for a large fraction of the N Ox found at
those altitudes at northern midlatitudes (Ehhalt et al.,
1 992) . Estimates of the global source from aircraft range
from 0.23 to 1 .0 TgN/yr (Egli, 1 990; Johnson et al.,
1 992; Beck et al., 1 992; Penner et al., 1 994) . A very de
tailed evaluation of this source has been recently
completed (Baughcum et al., 1 993) . This study includes
emissions from scheduled airliner and cargo, scheduled
turboprop, charter, military, and former Soviet Union
aircraft. The results indicate a global emission of 0.44
TgN/yr, with 7% of the emission occurring in the South
ern Hemisphere. A detailed geographical distribution of
this source is given in Chapter 1 1 .
Fossil Fuel Combustion. This is the largest
source of NOx (24 TgN/yr) and its global distribution is
relatively well known (Dignon and Hameed, 1 989;
Hameed and Dignon, 1 99 1 ; Muller, 1 992; Dignon,
1 992) . According to Hameed and Dignon ( 1 99 1 ) , the
emission of NOx increased from 1 8 . 1 TgN/yr in 1 970 to
24.3 TgN/yr in 1986 (25 % increase).
2.6.1.3 SINKS
The removal processes of NOx (atmospheric oxi
dation of NOx and dry deposition of N02) are
reasonably well known. However, it is not possible to
make a direct estimate of the global NOx sink since the
global distribution of NOx is too poorly known.

SOURCE G ASES
TABLE 2-6. Estimated sources of N M H C (TgC/yr) .
Vegetation*
Oceans
Biomass Burning
Technological
* mainly isoprene and terpenes
Range
230-800
20- 1 50
30-90
60- 1 00
2.6.2 Non- Methane H ydrocarbons (NM H Cs)
2.6.2. 1 ATMOSPHERIC DISTRIBUTION
Most NMHCs (heavier alkanes, alkenes, alkyl
benzenes, isoprene, terpenes) have atmospheric life
times of less than a week (sometimes less than a day) . In
this case the atmospheric distributions reflect the source
pattern and the regional transport situation, and the mix
ing ratios generally range from several ppbv in the
boundary layer near the sources to a few pptv or less in
the background atmosphere. NMHCs with predominant
ly anthropogenic sources exhibit a maximum in winter,
reflecting the seasonality of the removal by OH radicals .
Biogenic NMHCs ( i. e. , isoprene, terpenes) present very
low mixing ratios in winter and highest abundance in
summer, a consequence of the seasonality of the emis
sion rate (Fehsenfeld et al. , 1 992).
For NMHCs with lifetimes of few weeks or more
(i. e. , ethane, acetylene, propane) there is a better under
standing of their atmospheric distributions (Ehhalt,
1 992; Rudolph et a!. , 1 992). Seasonal cycles and long
term trends in the vertical column abundances of ethane
and acetylene above the Jungfraujoch station, Switzer
land, have been investigated by Ehhalt et al. ( 1 99 1 ) and
Zander et al. ( 1 99 l b) .
2.6.2.2 SouRcEs
Estimated source strengths of NMHCs are report
ed in Table 2-6.
Vegetation. Foliar emissions are, by far, the most
important sources of NMHC. Rasmussen ( 1 972) esti
mated a global emission ranging from 230 to 440 TgC/
yr. Zimmerman et al. ( 1 978) found that vegetation emits
350 TgC/yr of isoprene and 480 TgC/yr of terpenes . Re
cently, Muller ( 1 992) reported the following values (in
Likely
2.24
500
? 40
70
TgC/yr) : isoprene 250, terpenes 1 47, aromatics 42, and
paraffins 52 (total 49 1 TgC/yr); Allwine et al. ( 1 994) es
timate a total NMHC emission of 827 Tg/yr.
Oceans. Ehhalt and Rudolph ( 1 984) estimate a
global rate from the ocean of 2 1 TgC/yr (C2-C6 hydro
carbons), whereas Bonsang et al. ( 1 988) report a much
larger rate of 52 TgC/yr. Based on the results of Donahue
and Prinn ( 1 990), Muller ( 1 992) indicates that there is a
large uncertainty in marine emissions and gives a range
of 30-300 TgC/yr.
Biomass burning. Emissions of NMHC from bio
mass burning range from 36 to 90 TgC/yr (Lobert et al.
1 99 1 ; Muller, 1 992; Andreae, 1 993) . Ethane, ethene,
propene, acetylene, and benzene are emitted with a rate
>2 TgC/yr (Lobert et al. , 199 1 ; Bonsang et al. , 1 99 1 ) .
Technological sources. These include gasoline
handling, natural gas, refuse disposal, and chemical
manufacturing, and produce a global emission ranging
between 60 and 1 40 TgC/yr (Warneck, 1988; Muller,
1992; Piccot et al. , 1 992; Bouwman, 1 993) .
2.6.2.3 SINKS
NMHCs react rapidly with the OH radical (unsatu
rated compounds also react with 03) and with the
exception of ethane (lifetime 2-3 months), their atmo
spheric lifetimes are shorter than one month; isoprene
and terpenes have lifetimes of only a few hours.
2.6.3 Carbon Monoxide (CO)
2.6.3. 1 ATMOSPHERIC DISTRIBUTION AND TRENDS
The atmospheric distribution and trends of CO
were reviewed previously (WMO, 1 992; IPCC, 1 992).
CO mixing ratios in the troposphere present systematic
latitudinal and seasonal variations, ranging from around
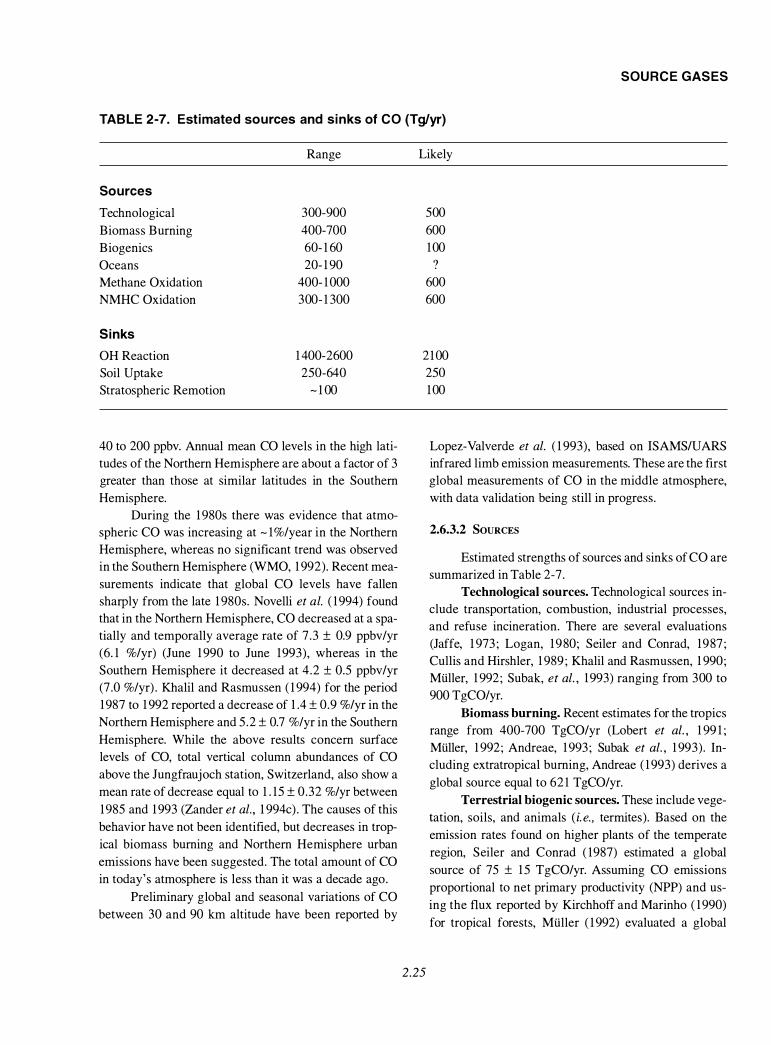
SOURCE G ASES
TABLE 2-7. Estimated sources and sin ks of CO (Tg/yr)
Sources
Technological
Biomass Burning
Biogenics
Oceans
Methane Oxidation
NMHC Oxidation
Sinks
OH Reaction
Soil Uptake
Stratospheric Remotion
Range
300-900
400-700
60- 1 60
20- 1 90
400- 1 000
300- 1 300
1 400-2600
250-640
- 1 00
40 to 200 ppbv. Annual mean CO levels in the high lati
tudes of the Northern Hemisphere are about a factor of 3
greater than those at similar latitudes in the Southern
Hemisphere.
During the 1 980s there was evidence that atmo
spheric CO was increasing at - 1 %/year in the Northern
Hemisphere, whereas no significant trend was observed
in the Southern Hemisphere (WMO, 1 992) . Recent mea
surements indicate that global CO levels have fallen
sharply from the late 1 980s. Novelli et al. ( 1 994) found
that in the Northern Hemisphere, CO decreased at a spa
tially and temporally average rate of 7 .3 ± 0.9 ppbv/yr
(6. 1 %/yr) (June 1 990 to June 1993), whereas in the
Southern Hemisphere it decreased at 4 .2 ± 0.5 ppbv/yr
(7 .0 %/yr) . Khalil and Rasmussen ( 1 994) for the period
1 987 to 1 992 reported a decrease of 1 .4 ± 0.9 %/yr in the
Northern Hemisphere and 5 .2 ± 0.7 %/yr in the Southern
Hemisphere. While the above results concern surface
levels of CO, total vertical column abundances of CO
above the Jungfraujoch station, Switzerland, also show a
mean rate of decrease equal to 1 . 15 ± 0.32 %/yr between
1 985 and 1 993 (Zander et al., 1 994c) . The causes of this
behavior have not been identified, but decreases in trop
ical biomass burning and Northern Hemisphere urban
emissions have been suggested. The total amount of CO
in today's atmosphere is less than it was a decade ago.
Preliminary global and seasonal variations of CO
between 30 and 90 km altitude have been reported by
Likely
500
600
1 00
? 600
600
2 1 00
250
1 00
2.25
Lopez-Valverde et al. ( 1 993), based on ISAMS/UARS
infrared limb emission measurements. These are the first
global measurements of CO in the middle atmosphere,
with data validation being still in progress.
2.6.3.2 SouRcEs
Estimated strengths of sources and sinks of CO are
summarized in Table 2-7 .
Technological sources. Technological sources in
clude transportation, combustion, industrial processes,
and refuse incineration. There are several evaluations
(Jaffe, 1 973; Logan, 1 9 80; Seiler and Conrad, 1987;
Cullis and Hirshler, 1 989; Khalil and Rasmussen, 1 990;
Muller, 1 992; Subak, et al. , 1 993) ranging from 300 to
900 TgCO/yr.
Biomass burning. Recent estimates for the tropics
range from 400-700 TgCO/yr (Lobert et al. , 1 99 1 ;
Muller, 1 992; Andreae, 1 993; Subak et al. , 1 993) . In
cluding extratropical burning, Andreae ( 1 993) derives a
global source equal to 62 1 TgCO/yr.
Terrestrial biogenic sources. These include vege
tation, soils, and animals ( i. e. , termites). Based on the
emission rates found on higher plants of the temperate
region, Seiler and Conrad ( 1987) estimated a global
source of 75 ± 1 5 TgCO/yr. Assuming CO emissions
proportional to net primary productivity (NPP) and us
ing the flux reported by Kirchhoff and Marinho ( 1 990)
for tropical forests, Muller ( 1 992) evaluated a global

SOURCE GASES
biogenic source at 165 T gCO/yr. Photoproduction of CO
from dead plant matter has been reported (Valentine and
Zepp, 1993; Tarr et al. , 1994), however, no global evalu
ation of this source has been made.
Oceans. Early estimates of CO emissions from the
oceans (IPCC, 1992) range from 20 to 190 TgCO/yr.
Using an atmospheric general circulation model, Erick
son ( 1989) calculated a global ocean source equal to 165
± 80 TgCO/yr.
Hydrocarbon oxidation. This is the most impor
tant source of atmospheric CO. The production of CO
from methane oxidation ranges from 400 to 1000 TgCO/
yr, and 300 to 1300 TgCO/yr from NMHC (Zimmerman
et al. , 1978; Logan, 1980; Khalil and Rasmussen, 1990;
Crutzen and Zimmerman, 1991).
2.6.3.3 SINKS
Reaction with the OH radical is the major sink for
CO. Soil uptake and removal in the stratosphere are mi
nor sinks. In principle, the atmospheric removal rates for
CO can be calculated from the atmospheric CO distribu
tion, the distribution of the OH radical concentration,
and the related reaction rate. Model calculations predict
a removal rate of about 2000 Tg(CO)/yr (WMO, 1986;
Seiler and Conrad, 1987; Khalil and Rasmussen 1990;
Crutzen and Zimmerman, 1991).
2.7 CARBON DIOXIDE (C02)
The change in atmospheric concentration of C02,
from 280 ppmv pre-industrial to -360 ppmv in 1993, is
the major contributor to the calculated increase in radia
tive forcing since the pre-industrial period (i. e. , 1.5 W
m-2). An updated review of the C02 budget has been
made in the 1994 IPCC report (IPCC, 1994b).
Observations of C02 since the 1950s show sys
tematic upward trends, in both concentration and rate of
concentration increase, albeit with substantial variation
in the rate of increase from year to year. During the peri
od 1991 to 1993, the rate of increase of C02 per year
slowed substantially (to as low as 0.5 ppmv/yr from the
long-term average of 1.5 ppmv/yr). There are numerous
examples in the record of short periods where growth
rates are higher or lower than the long-term mean. The
most recent observations indicate that growth rates are
now increasing again (IPCC, 1994b).
2.26
C02 emission from industrial processes (mainly
fossil fuel combustion and cement production) in 1991 is
estimated at 6.2 GtC/yr (Andres et al. , 1994), compared
with 6.0 ± 0.5 GtC in 1990 (IPCC, 1992). The cumula
tive input since the pre-industrial period is estimated at
230 GtC (Andres et al. , 1994). Recent satellite remote
sensing measurements of land clearing rates in the Bra
zilian Amazon have resulted in substantially reduced
estimates (by -50%) for this area (INPE, 1992; Skole
and Tucker, 1993). However, deforestation rates for the
rest of the tropics remain poorly quantified. Current net
flux estimates (in GtC/yr) that include regrowth after de
forestation are: 0.6 for Latin America, 0. 7 for South and
Southeast Asia, 0.3 for Africa, and -0.3 to -1.1 for mid/
high latitudes, producing a global mean for the 1980s of
1.1 ± 1.2 GtC/yr (IPCC, 1994b). The oceans represent a
significant sink of atmospheric C02, averaging 2.0 ± 0.8
GtC/yr over the decade 1980-89.
The imbalance between atmospheric concentra
tion changes, estimated emissions, and estimated ocean
uptake, as well as the discrepancies between the ob
served and calculated inter-hemispheric gradients of
C02, indicate the existence of an unaccounted-for terres
trial sink of 1.2 ± 1.6 GtC/yr, probably attributable to a
combination of C02-induced plant growth (0.5-2.0 Gt/
yr), nitrogen fertilization (0.2-1.0 Gt/yr), and possible
climatic effects (0-1.0 Gt/yr) (IPCC, 1994b).
Climatic feedback appears to be positive, amplify
ing the effect of anthropogenic emissions, although this
amplification may be reduced due to feedbacks and
compensating processes within the marine and terrestrial
systems. It is likely that the effect of C02 fertilization on
plant production will be substantially smaller than the
20-40% observed in most agricultural plants. An impor
tant body of data supports the view that responses of
plant production to elevated C02 are restricted in nutri
ent-limited ecosystems (e. g. , Dfaz et a!. , 1993) ; however,
it is possible that N deposition arising from the use of
fertilizers and fossil fuel combustion will reduce the in
tensity or spatial distribution of nitrogen limitation.
Carbon cycle modeling studies of C02 concentra
tions, under a range of emissions scenarios and for a
range of stabilized C02 concentrations up to 750 ppmv,
yield the following results (IPCC, 1994b): i) because of
the long residence time for carbon dioxide, stabilization
of anthropogenic emissions at projected 2000 levels
(from IS92a scenario) leads to a nearly constant rate of

increase in atmospheric concentrations for at least two
centuries; modeled concentrations reach 480-540 ppbv
by 2 100; ii) stable C02 concentration at values up to 750
ppmv can be maintained only with anthropogenic emis
sions that eventually drop below 1990 levels ; iii) there is
a close relationship between the eventual stabilized con
centration and the integrated C02 emission from now
until the time of stabilization. Integrated emissions for
stabilization at levels lower than 750 ppmv are less than
those calculated for the IS92 a, b, e, and f scenarios .
REFERENCES
AFEAS, Production, Sales and Atmospheric Release of
Fluorocarbons through 1 992, Alternative Fluoro
carbons Environmental Acceptability Study,
SPA-AFEAS, Inc. , Washington, D.C. , USA, 1993 .
AFEAS, Historic Production, Sales and Atmospheric
Release of HCFC-142b, Alternative Fluorocar
bons Environmental Acceptability Study,
SPA-AFEAS, Inc. , Washington, D.C., USA, 1994.
Albritton, D. , and R. Watson, Methyl bromide and the
ozone layer: A summary of current understanding,
in Methyl Bromide: Its Atmospheric Science, Tech
nology, and Economics, Montreal Protocol
Assessment Supplement, edited by R. Watson, D.
Albritton, S. Anderson and S. Lee-Bapty, United
Nations Environment Programme, Nairobi, Ken
ya, 1992.
Allwine, et al. , An initial global inventory of biogenic
VOC emitted from terrestrial sources, submitted to
1. Geophys. Res. , 1 994.
Anastasi, C. , and V.J. Simpson, Future methane emis
sions from animals, 1. Geophys. Res., 98,
7 1 8 1 -7 1 86, 1 993.
Andreae, M.O., Biomass burning : Its history, use, and
distribution and its impact on environmental qual
ity and global climate, in Global Biomass
Burning: Atmospheric, Climatic and Biospheric
Implications, edited by J.S. Levine, MIT Press, 3-
2 1 , 199 1 .
Andreae, M.O., The influence of tropical biomass burn
ing on climate and the atmospheric chemistry, in
Biogeochemistry of Global Change: Radiatively
Active Trace Gases, edited by R.S. Oreland, Chap
man and Hall, New York, 1 1 3- 1 50, 1 993 .
2 .27
SOU RCE GASES
Andreae, M.O. , and P. Warneck, Global methane emis
sions from biomass burning and comparison with
other sources, Pure andAppl. Chern., 66, 1 62- 1 69,
1 994.
Andres, T.J. , G. Marland, T. Boden, and S. Bischoff,
Carbon dioxide emissions from fossil fuel com
bustion and cement manufacture 1 7 5 1 - 199 1 and
an estimate for their isotopic composition and lati
tudinal distribution, Global Change Institute,
Snowmass, Colorado, USA, 1994.
Aoki, S., T. Nakazawa, S . Murayama, and S. Kawagu
chi, Measurements of atmospheric methane at the
Japanese Antarctic Station, Syowa, Tellus, 44B,
273-28 1 , 1 992.
Atherton, C.S. , J.E. Penner, and J.J. Walton, The role of
lightning in the tropospheric nitrogen budget:
model investigations, in preparation, 1 993.
Atlas, E., W. Pollock, J . Greenberg, L. Heidt, and A.M.
Thompson, Alkyl nitrates, nonmethane hydrocar
bons, and halocarbon gases over the equatorial
Pacific Ocean during SAGA 3, 1. Geophys. Res .,
98D, 1 6933- 1 6947, 1 993.
Bachelet, D. , and H.U. Neue, Methane emissions from
wetland rice areas of Asia, Chemosphere, 26, 2 1 9-
237, 1 993.
Bakwin, P.S. , S.C. Wofsy, S.M. Fan, M. Keller, S.E.
Trumbore, and J .M. da Costa, Emissions of nitric
oxide (NO) from tropical forest soils and ex
change of NO between the forest canopy and
atmospheric boundary layers, 1. Geophys. Res.,
95, 1 6765 - 1 6774, 1 990.
Bartlett, K.B. , and R.C. Harris, Review and assessment
of methane emissions from wetlands, Chemo
sphere, 26, 26 1 -320, 1 993.
B artlett, K.B. , P.M. Crill, J.A. Bonassi, J.E. Richey, and
R.C. Harris, Methane flux from the Amazon River
floodplain: Emissions during rising water, 1. Geo
phys. Res., 95, 1 6773- 1 6788, 1990.
Baughcum, S.L. , M. Metwally, R.K. Seals, and D.J.
Wuebbles, Emissions scenarios development:
Complete scenario database (Subchapter 3-4), in
The Atmospheric Effects of Stratospheric Aircraft:
A Third Program Report, edited by R.S. Stolarski
and H.L. Wesoky, NASA Ref. Publ. 1 3 1 3 , 1 85-
208, 1 993.
SOURCE G ASES
Beck, J.P. , C .E. Reeves, F.A.A.M. de Leeuw, and S .A.
Penkett, The effect of aircraft emissions on tropo
spheric ozone in the northern hemisphere, Atmos.
Environ., 26A, 17-29, 1992.
Beck, L.L., A global methane emissions program for
landfills, coal mines, and natural gas systems,
Chemosphere, 26, 447-452, 1993 .
Bekki, S ., and J .A. Pyle, Two-dimensional assessment of
the impact of aircraft sulphur emissions on the
stratospheric sulphate aerosol layer, 1. Geophys.
Res. , 97, 1 5839- 15847, 1 992.
Berges, M.G.M., R.M. Hofmann, D. Scharffe, and P.J.
Crutzen, Nitrous oxide emissions from motor ve
hicles in tunnels and their global extrapolation, 1.
Geophys. Res., 98D, 1 8527- 1 853 1 , 1 993 .
Bloomfield, P., Inferred lifetimes, Chapter 3 in NASA
Report on Concentrations, Lifetimes and Trends of
CFCs, Halons and Related Species, edited by J .
Kaye, S . Penkett and F. Osmond, NASA Refer
ence Publication 1 339, Washington D.C. ,
3 . 1 -3 .23, 1 994.
Blunier, T. , J . Chappellaz, J. Schwander, J . Bamola, T.
Desperts, B . Stauffer, and D. Raynaud, Atmo
spheric methane record from a Greenland ice core
over the past 1000 years, Geophys. Res. Lett., 20,
22 1 9-2222, 1993.
Bonsang, B. , M. Kanakidou, G. Lambert, and P. Man
fray, The marine source of C2-C6 aliphatic
hydrocarbons, 1. Atmos. Chern., 6, 3-20, 1988 .
Bonsang, B . , G. Lambert, and C. Boissard, Light hydro
carbons emissions from African savannah burning,
in Global Biomass Burning; Atmospheric, Climat
ic and Biospheric Implications, edited by J .S .
Levine, MIT Press, 1 5 5- 1 6 1 , 199 1 .
Bouwman, A.F., Report of the third workshop of the
Global Emission Inventory Activity (GEIA) .
RIVM Report 48 1 507002, RIVM, Bilthoven, The
Netherlands, 1993 .
Butler, J .H. , J .W. Elkins, T.M. Thompson, B .D. Hall, and
V. Koropalov, Oceanic consumption of CH3CCl3:
Implications for tropospheric OH, 1. Geophys.
Res., 96, 22347-22355, 1 99 1 .
Butler, J .H. , J.W. Elkins, B .D. Hall, S .O. Cummings, and
S .A. Montzka, A decrease in the growth rates of
atmospheric halon concentrations, Nature, 359,
403-405 , 1 992.
2.28
Butler J .H. , J .W. Elkins, T.M. Thompson, B .D. Hall,
J.M. Lobert, T.H. Swanson, and V. Koropalov, A
significant oceanic sink for atmospheric CCl4, The
Oceanography Society, Third Scientific Meeting,
April 1 3- 1 6, Seattle, USA. Abstracts, p .55, 1 993.
Butler, J . , J . Elkins, B . Hall, S . Montzka, S . Cummings,
P. Fraser, and L. Porter, Recent trends in the global
atmospheric mixing ratios of halon- 1 30 1 and ha
lon- 1 2 1 1 , in Baseline 91, edited by C. Dick and J.
Gras, Bureau of Meteorology-Commonwealth
Science and Industrial Research Organization
(CSIRO), in press, 1 994.
Carroll, M.A. , and A.M. Thompson, NOx in the non-ur
ban troposphere, in Current Problems and
Progress in Atmospheric Chemistry, edited by J .R.
B arker, Advances in Physical Chemistry, in press,
1 994.
Chappellaz, J., T. Blunier, D . Raynaud, J.M. Barnola, J.
Schwander, and B. Stauffer, Synchronous changes
in atmospheric C� and Greenland climate be
tween 40 and 8 kyr BP, Nature, 366, 443-445 ,
1 993 .
CIAB, Global Methane Emissions from the Coal Indus
try, Coal Industry Advisory Board, Global Climate
Committee, October, 1 992.
Cicerone, R.J. , Atmospheric carbon tetrafluoride: A
nearly inert gas, Science, 206, 59-6 1 , 1 979.
Codispoti, L . , J . Elkins, T. Yoshinari, G. Frederich, C.
S akamoto, and T. Packard, On the nitrous oxide
flux from productive regions that contain low oxy
gen waters, in Oceanography of the Indian Ocean,
edited by B. Desai, 27 1 -284, Oxford & IBH Pub
lishing Co., New Delhi, India, 1 992.
Cofer, W.R. , III, R.J . Bendura, D.I . Sebacher, G.L. Pel
let, G.L. Gregory, and G.L. Maddrea, Jr. , Airborne
measurements of Space Shuttle exhaust constitu
ents, AIAA 1. , 23, 283-287, 1985 .
Crutzen, P.J . , and M.O. Andreae, Biomass burning in the
tropics: Impact on atmospheric chemistry and bio
geochemical cycles, Science, 250, 1 669- 1 679,
1 990.
Crutzen, P.J . , and P.H. Zimmerman, The changing pho
tochemistry of the troposphere, Tellus, 43AB,
1 36- 1 5 1 , 199 1 .
Cullis, C .F. , and M.M. Hirschler, Man's emissions of
carbon monoxide and hydrocarbons into the atmo
sphere, Atmos. Environ., 23, 1 1 95- 1 203, 1989.
Cunnold, D. , P. Fraser, R. Weiss, R. Prinn, P. Simmonds,
B. Miller, F. Alyea, and A. Crawford, Global
trends and annual releases of CCl3F and CCl2F2
estimated from ALE/GAGE and other measure
ments from July 1978 to June 1 99 1 , 1. Geophys.
Res . , 99, 1 1 07- 1 1 26, 1 994.
Dasch, J .M. , Nitrous oxide emissions from vehicles, 1. Air Waste Manage. Assoc. , 42, 63-67, 1 992.
Davidson, E.A., Fluxes of nitrous oxide and nitric oxide
from terrestrial ecosystems, in Microbial Produc
tion and Consumption of Greenhouse Gases:
Methane, Nitrogen Oxides, and Halomethanes,
edited by J.E. Rogers and W.B . Whitman, Wash
ington, D.C. , 2 1 9-235, 1 99 1 .
Delwiche, C.C. , and R.J. Cicerone, Factors affecting
methane production under rice, Global Bio
geochem. Cycles, 7, 1 43 - 1 55 , 1993 .
Dfaz, S . , J .P. Grime, J . Harris, and E. McPherson, Evi
dence of a feedback mechanism limiting plant
response to elevated carbon dioxide, Nature, 364,
6 1 6-6 1 7, 1 993.
Dignon, J . , NOx and SOx emissions from fossil fuels : A
global distribution, Atmos. Environ. , 26A, 1 1 57-
1 1 63 , 1 992.
Dignon, J. , C .S . Atherton, J .E. Penner, and J.J. Walton,
NOx pollution from biomass burning: A global
study, Proceedings of the l i th Conference on Fire
and Forest Meteorology, Missoula, Montana. April
1 6- 1 9, 1 99 1 .
Dignon, J . , and S . Hameed, Global emission of nitrogen
and sulfur oxides from 1 960 to 1 980, 1. Air Poll.
Control Assoc. , 39, 1 80- 1 86, 1 989.
Dignon, J . , and J .E. Penner, B iomass burning: A source
of nitrogen oxides in the atmosphere, in Global
Biomass Burning: Atmospheric, Climatic and Bio
spheric Implications, edited by J .S . Levine, MIT
Press, 370-375 , 1 99 1 .
Dignon, J . , J .E. Penner, C .S . Atherton, and J.J . Walton,
Atmospheric reactive nitrogen: A model study of
natural and anthropogenic sources and the role of
microbial soil emissions, in Proceedings of
CHEMRAWN VII World Conference on the Chem
istry of the Atmosphere: Its Impact on Global
Change, Baltimore, Maryland, December 2-6,
1 992.
2.29
SOU RCE GASES
Dlugokencky, E.J. , L.P. Steele, P.M. Lang, and K.A.
Masarie, The growth rate and distribution of atmo
spheric methane, J. Geophys. Res. , 99D,
1 702 1 - 1 7043, 1 994a.
Dlugokencky, E.J . , J.M. Harris, Y.S . Chung, P.P. Tans,
and I. Fung, The relationship between the methane
seasonal cycle and regional sources and sinks at
Tae-ahn Peninsula, Korea, Atmos. Environ. , 27 A,
2 1 1 5- 2 1 20, 1 994b.
Dlugokencky, E.J. , K.A. Masarie, P.M. Lang, P.P. Tans,
L .P. Steele, and E.G. Nisbet, A dramatic decrease
in the growth rate of atmospheric methane in the
northern hemisphere during 1 992, Geophys. Res.
Lett. , 21, 45-48, 1 994c.
Donahue, N.M., and R.G. Prinn, Non-methane hydro
carbon chemistry in the remote marine boundary
layer, 1. Geophys. Res. , 95, 1 8387- 1 84 1 1 , 1 990.
Donoso, L., R. Santana, and E. Sanhueza, Seasonal vari
ation of N20 fluxes at a tropical savannah site:
Soil consumption of N20 during the dry season,
Geophys. Res. Lett. , 20, 1 379- 1 382, 1 993.
Egli, R.A. , Nitrogen oxide emissions from air traffic,
Chimia, 44, 369-37 1 , 1 990.
Ehhalt, D.H. , Concentrations and distributions of atmo
spheric trace gases, Ber. Bunsenges, Phys. Chem. ,
96, 229-240, 1 992.
Ehhalt, D.H., and J . Rudolph, On the importance of light
hydrocarbons in multiphase atmospheric systems,
Berichte der Kernforschungsanlage 1iilich, No
1 942, Institut fiir Chemie 3 , Atmospharische Che
mie, Eds. , 1 -43, 1 984.
Ehhalt, D.H., U. Schmidt, R. Zander, P. Demoulin, and
C.P. Rinsland, Seasonal cycle and secular trend of
the total and tropospheric column abundance of
ethane above the Jungfraujoch, 1. Geophys. Res. ,
96, 4985-4994, 1 99 1 .
Ehhalt, D.H. , F. Rohrer, and A . Wahner, Sources and dis
tribution of NOx in the upper troposphere at
northern mid-latitudes, 1. Geophys. Res. , 97,
3725-3738, 1 992.
Elkins, J. , T. Thompson, T. Swanson, J . Butler, B. Hall,
S. Cummings, D. Fisher, and A. Raffo, Decrease in
the growth rates of atmospheric chlorofluorocar
bons- 1 1 and - 1 2, Nature, 364, 780-783, 1 993 .

SOURCE GASES
Erickson, D.J . , Ocean to atmosphere carbon monoxide
flux: global inventory and climate implications,
Global Biogeochem. Cycles, 3, 305-3 1 4, 1 989.
Etheridge, D.M., Pearman, G.I . , and Fraser, P.J . ,
Changes in tropospheric methane between 1 84 1
and 1 978 from a high accumulation rate Antarctic
ice core, Tellus, 44B, 282-294, 1 992.
Fabian, P. Borcher, B .C. Kruger, and S. Lal, CF4 and
C2F6 in the atmosphere, J. Geophys. Res. , 92,
983 1 -9835, 1 987.
Farmer, C.B. , High resolution infrared spectroscopy of
the sun and earth's atmosphere from space, Micro
chim. Acta (Wien) III, 1 98-2 1 4, 1 987.
Fehsenfeld, F., J . Calvert, R. Fall, P. Goldan, A. Guen
ther, C.N. Hewitt, B. Lamb, S. Liu, M. Trainer, H.
Westberg, and P. Zimmerman, Emissions of vola
tile organic compounds from vegetation and the
implications for atmospheric chemistry, Global
Biogeochem. Cycles, 6, 3 89-430, 1 992.
Fisher, D., T. Duafala, P. Midgley, and C. Niemi, Produc
tion and emissions of CFCs, halons and related
molecules, Chapter 2 in NASA Report on Concen
trations, Lifetimes and Trends of CFCs, Halons
and Related Species, edited by J. Kaye, S . Penkett,
and F. Osmond, NASA Reference Publication
1 339, Washington, D.C. , 2 . 1 -2 .35, 1 994.
Fraser, P., and N. Derek, Halocarbons, nitrous oxide,
methane and carbon monoxide-the GAGE pro
gram, in Baseline 9I , edited by C. Dick and J .
Gras, Bureau of Meteorology-Commonwealth
Science and Industrial Research Organization, in
press, 1 994.
Fraser, P. , S. Penkett, M. Gunson, R. Weiss, and F. S .
Rowland, Measurements, Chapter 1 i n NASA Re
port on Concentrations, Lifetimes and Trends of
CFCs, Halons and Related Species edited by J .
Kaye, S . Penkett, and F. Ormond, NASA Refer
ence Publication 1 339, Washington, D.C. ,
1 . 1 - 1 .68, 1994a.
Fraser, P. , N. Derek, L. Porter, D. Cunnold, F. Alyea, R.
Prinn, P. Simmonds, and R. Weiss, Atmospheric
chlorocarbons: Trends, lifetimes and emissions
from ALE/GAGE global observations, in Fourth
International Conference on Southern Hemi
sphere Meteorology and Oceanography, preprints,
Hobart, March 1 993, American Meteorology So
ciety, 426-428, 1994b.
2.30
Fraser, P. , D. Cunnold, F. Alyea, R. Prinn, P. Simonds, R.
Weiss, B . Miller, and A. Crawford, Lifetime and
emission estimates of 1 , 1 ,2 trichlorotrifluoro
ethane (CFC- 1 1 3 ) from ALE/GAGE and other
measurements, 1 978- 1 992, in preparation, 1 994c.
Fung, 1 . , J . John, J . Lerner, E. Matthews, M. Prather, L .P.
Steele, and P.J. Fraser, Three-dimensional model
synthesis of the global methane cycle, J. Geophys.
Res. , 96, 1 3033 - 1 3065 , 1 99 1 .
Pynes, G., I .S .C . Hughes, and P.W. Sage, The contribu
tion of coal combustion to non-C02 greenhouse
gas emissions inventories, International Sympo
sium on Non-C02 Greenhouse Gases, Why and
How to Control?, Maastricht, December, 1 993 .
Granier, C . , and G. Brasseur, Impact of heterogeneous
chemistry on model predictions of ozone changes,
J. Geophys. Res. , 97, 1 80 1 5- 1 8033 , 1 992.
Gunson, M.R. , The atmospheric trace molecule spec
troscopy (ATMOS) experiment-the Atlas- 1
mission, SPIE vol. 1 7 1 5 , Optical Methods in At
mospheric Chemistry, 5 1 3-52 1 , 1 992.
Gunson, M.R., C.B. Farmer, R.H. Norton, R. Zander,
C.P. Rinsland, J .H. Shaw, and B. C. Gao, Measure
ments of CH4, N20, CO, H20 and 03 in the
middle atmosphere by the Atmospheric Trace
Molecule Spectroscopy Experiment on Spacelab
3, J. Geophys. Res . , 95, 1 3867- 1 3 882, 1 990.
Gunson, M.R. , M.C. Abrams, L.L. Lowes, E. Mahieu, R.
Zander, C.P. Rinsland, M.K.W. Ko, N.D. Sze, and
D .K. Weisenstein, Increase in levels of strato
spheric chlorine and fluorine loading between
1 985 and 1 992, Geophys. Res. Lett. , in press,
1 994.
Hameed, S . , and R. Cess, Impact of global warming on
biospheric sources of methane and its climate con
sequences, Tellus, 35B, 1 -7, 1 983 .
Hameed, S . , and J . Dignon, Global emissions of nitrogen
and sulfur oxides in fossil fuel combustion 1 970-
1 986, J. Air Waste Manage. Assoc. , 42, 1 59- 1 63 ,
1 99 1 .
Hao, W.M., and D.E. Ward, Methane production from
global biomass burning, J. Geophys. Res. , 98,
20657-2066 1 , 1 993 .
Harris, R.C. , and S. Frolking, The sensitivity of methane
emissions from northern freshwater wetlands to
global change, in Global Warming and Freshwater
Ecosystems, edited by P. Firth and S . Fisher, in
press, 1 992.
Harwood, R.S. , C.H. Jackman, I.L. Karol, and L.X. Qiu,
Predicted rocket and shuttle effects on stratospher
ic ozone, Chapter 1 0 in Scientific Assessment of
Ozone Depletion: 1991, WMO Global Ozone Re
search and Monitoring Project-Report No. 25,
pp. 1 0. 1 - 1 0. 1 2, World Meteorological Organiza
tion, Geneva, Switzerland, 1 992.
Heidt, L.E., J .F. Vedder, W.H. Pollock, R.A. Lueb, and
B .E. Henry, Trace gases in the Antarctic atmo
sphere, J. Geophys. Res. , 94, 1 1 599- 1 1 6 1 1 , 1989.
Hofmann, D.J . , and S . Solomon, Ozone destruction
through heterogeneous chemistry following the
eruption of El Chich6n, J. Geophys. Res. , 94,
5029-504 1 , 1 989.
Hofmann, D.J., Increase in the stratospheric background
sulfuric acid aerosol mass in the past 1 0 years, Sci
ence, 248, 996- 1 000, 1 990.
Hofmann, D.J . , Aircraft sulfur emissions, Nature, 349,
659, 1 99 1 .
INPE, Deforestation in Brazilian Amazonia, Instituto
Nacional de Pesquisas Espaciais, Sao Paulo, Bra
zil, 1 992.
IPCC, Intergovernmental Panel on Climate Change, R.
Watson, H. Rodhe, H . Oeschger, and U. Siegen
thaler, Greenhouse gases and aerosols, Chapter 1
in Climate Change, The 1PCC Scientific Assess
ment, edited by J.T. Houghton, G.J. Jenkins, and
J.J. Ephroums, Cambridge University Press, Cam
bridge, 1 -40, 1 990.
IPCC, Intergovernmental Panel on Climate Change, R.
Watson, L.G. Meira-Filho, E. Sanhueza, and A.
Janetos, Greenhouse gases: sources and sinks,
Chapter A l in Climate Change 1992, The Supple
mentary Report to the IPCC Scientific Assessment,
edited by J.T. Houghton, B .A. Callander, and S .K.
Varney, Cambridge University Press, Cambridge,
28-46, 1 992.
2.31
SOU RCE GASES
IPCC, Intergovernmental Panel on Climate Change, M.
Prather, R. Derwent, D. Ehhalt, P. Fraser, E. San
hueza, and X. Zhou, Other trace gases and
atmospheric chemistry, Chapter 2 in 1994 IPCC
Interim Report, Radiative Forcing of Climate
Change 1994, in preparation, 1 994a.
IPCC, Intergovernmental Panel on Climate Change, D.
Schimel, I. Enting, M. Heimann, T. Wigley, D.
Raynaud, D. Alves, and U. Siegenthaler, The car
bon cycle, Chapter 1 , in 1994 1PCC Interim
Report, Radiative Forcing of Climate Change
1 994, in preparation, 1 994b.
IPCC, Intergovernmental Panel on Climate Change, P.R.
Jonas, R.J. Charlson, and H. Rodhe, Aerosols,
Chapter 3, in 1994 IPCC Interim Report, Radia
tive Forcing of Climate Change 1994, in
preparation, 1 994c.
Irion, F.W. , M. Brown, G.C. Toon, and M.R. Gunson,
Increase in atmospheric CHC1F2 (HCFC-22) over
southern California from 1 985 to 1 990, Geophys.
Res. Lett. , 21, 1 723- 1 726, 1 994.
Jaffe, L.S . , Carbon monoxide in the biosphere: Sources,
distribution, and concentrations, J. Geophys. Res. ,
78, 5293-5305, 1973 .
Jeffers, P.M. , L .M. Ward, L.M. Woytowitch, and N.L.
Wolfe, Homogenous hydrolysis rate constants for
selected chlorinated methanes, ethanes, ethenes,
and propanes, Environ. Sci. Techno!. , 23, 965-969,
1 989.
Johnson, C. , J. Henshaw, and G. Mcinnes, Impact of air
craft and surface emissions of nitrogen oxides on
tropospheric ozone and global warming, Nature,
355, 69-7 1 , 1992.
Johnson D.E., T.M. Hill, G.M. Ward, K.A. Johnson,
M.E. Branine, B .R. Carmean, and D.W. Lodman,
Ruminant and other animals, in Atmospheric
Methane: Sources, Sinks, and Role in Global
Change, edited by M.A.K. Khalil, Springer
Verlag, Berlin, 1 99-229, 1993.
Jouzel, J . , N.I . Barkov, J.M. Barnola, M. Bender, J.
Chappellaz, C. Genthon, V.M. Kotlyakov, V.
Lipenkov, C. Lorius, J.R. Petit, D . Raynaud, G.
Raisbeck, C. Ritz, T. Sowers, M. Stievenard, F.
Yiou, and P. Yiou, Extending the Vostok ice-core
record of paleoclimate to the penultimate glacial
period, Nature, 364, 407-4 1 2, 1 993 .

SOURCE GASES
Judd, A. G., R.H. Chalier, A. Lacroix, G. Lambert, and C.
Rowland, Minor sources of methane, in Atmo
spheric Methane: Sources, Sinks, and Role in
Global Change, edited by M.A.K. Khalil, Spring
er-Verlag, Berlin, 432-456, 1993.
Karol, I.L., Y.E. Ozolin, and E.V. Rozanov, Effect of
space rocket launches on ozone and other atmo
spheric gases, paper presented at the European
Geophys. Assoc. Conference, Wiesbaden, 1991.
Kawa, S.R., D.W. Fahey, L.E. Heidt, W.H. Pollock, S.
Solomon, D.E. Anderson, M. Loewenstein, M.H.
Proffitt, J.J. Margitan and K.R. Chan, Photochem
ical partitioning of the reactive nitrogen and
chlorine reservoirs in the high-latitude strato
sphere, J. Geophys. Res. , 97, 7905-7923, 1992.
Kaye, J., S. Penkett and F. Ormond (Eds.) , Report on
Concentrations, Lifetimes and Trends of CFCs,
Halons, and Related Species, NASA Reference
Publication 1339, Washington, D.C., 1994.
Kaye, J.A., A.R. Douglass, C.H. Jackman, R.S. Stolars
ki, R. Zander and G. Roland, Two-dimensional
model calculation of fluorine-containing reservoir
species in the stratosphere, J. Geophys. Res, 96,
12865-12881, 1991.
Keller, M., and P. Matson, Biosphere-atmosphere ex
change of trace gases in the tropics: Evaluating the
effects of land use change, in Global Atmospheric
Biospheric Chemistry: The First IGAC Scientific
Conference, edited by R.G. Prinn, 103-117, 1994.
Keller, M., E. Veldkamp, A.M. Weis, and W.A. Reiners,
Pasture age effect on soil-atmosphere trace gas ex
change in a deforested area of Costa Rica, Nature,
365, 244-246, 1993.
Khalil, M.A.K., and R.A. Rasmussen, Atmospheric car
bon tetrafluoride (CF4): Sources and trends,
Geophys. Res. Lett. , 12, 671-672, 1985.
Khalil, M.A.K., and R.A. Rasmussen, The global cycle
of carbon monoxide: Trends and mass balance,
Chemosphere, 20, 227-242, 1990.
Khalil, M.A.K., and R.A. Rasmussen, The global sourc
es of nitrous oxide, J. Geophys. Res. , 97,
14651-14660, 1992.
Khalil, M.A.K., and R.A. Rasmussen, The environmen
tal history and probable future of fluorocarbon 11,
J. Geophys. Res. , 98, 23091-23106, 1993a.
2.32
Khalil, M.A.K., and R.A. Rasmussen, Decreasing trend
of methane: Unpredictability of future concentra
tions, Chemosphere, 26, 803-814, 1993b.
Khalil, M.A.K., and R.A. Rasmussen, Global decrease
of atmospheric carbon monoxide, Nature, 370,
639-641, 1994.
Khalil, M.A.K., R.A. Rasmussen, and F. Moraes, Atmo
spheric methane at Cape Meares: Analysis of a
high resolution data base and its environmental
implications, J. Geophys. Res. , 98, 14753-14770,
1993a.
Khalil, M.A.K., R.A. Rasmussen, M.J. Shearer, S. Ge,
and J.A. Rau, Methane from coal burning, Chemo
sphere, 26, 473-477, 1993b.
Kim, K.R. and H. Craig, Nitrogen-15 and oxygen-18
characteristics of nitrous oxide: A global perspec
tive, Science, 262, 1855-1857, 1993.
Kirchgessner, D.A., S.D. Piccot, and J.D. Winkler, Esti
mate of global methane emissions from coal
mines, Chemosphere, 26, 453-472, 1993.
Kirchhoff, V.W.J.H., and E.V.A. Marinho, Surface car
bon monoxide measurements in Amazonia, J. Geophys. Res. , 95, 16933-16943, 1990.
Ko, M., N. Sze, W.-C. Wang, G. Shia, A. Goldman, F.
Murcray, D. Murcray, and C. Rinsland, Atmo
spheric sulfur hexafluoride: Sources, sinks and
greenhouse warming, J. Geophys. Res., 98, 10499-
10507, 1993.
Koppmann, R., F.J. Johnen, C. Plass-Diilmer, and J. Ru
dolph, Distribution of methylchloride,
dichloromethane, trichloroethene and tetrachloro
ethene over the North and South Atlantic, J. Geophys. Res. , 98, 20517-20526, 1993.
Kreileman, G.J.J., and A.F. Bouwman, Computing land
use emissions of greenhouse gases, Water, Air and
Soil Poll. , 76, 231-258, 1994.
Kumer, J.B., J.L. Mergenthaler, and A.E. Roche,
CLAES CH4, N20 and CCl2F2 (F12) global data,
Geophys. Res. Lett. , 20, 1239-1242, 1993.
Kvenvolden, K.A., and T.D. Lorenson, Methane in per
mafrost: Preliminary results � from coring at
Fairbanks, Alaska, Chemosphere, 26, 609-616,
1993.

Lacroix, A. V., t.Jnaccounted-for sources of fossil and
isotopically-enriched methane and their contribu
tion to the emissions inventory, Chemosphere, 26,
507-557, 1993.
Lal, S. , S. Venkataramani, and B.H. Subbaraya, Methane
flux measurements from paddy fields in the tropi
cal Indian region, Atmos. Environ. , 2 7A,
1 69 1 - 1 694, 1 993.
Lambert, G. , and S. Schmidt, Reevaluation of the ocean
ic flux of methane: Uncertainties and long term
variations, Chemosphere, 26, 579-589, 1993.
Lashoff, D.A. , The dynamic greenhouse: Feedback pro
cesses that may influence future concentrations of
atmospheric trace gases and climate change, Clim.
Change, 14, 2 1 3-242, 1 989.
Lassey, K.R., D.C. Lowe, C.A.M. Brenninkmeijer, and
A.J. Gomez, Atmospheric methane and its carbon
isotopes in the southern hemisphere: Their time
series and an instructive model, Chemosphere, 26,
95- 1 09, 1 993.
Law, C.S. , and N.J.P. Owen, S ignificant flux of atmo
spheric nitrous oxide from the northwest Indian
Ocean, Nature, 346, 826-828, 1 990.
Law, K.S. , and J.A. Pyle, Modeling trace gas budgets in
the troposphere, 2: CH4 and CO, J. Geophys. Res. ,
98, 1 840 1 - 1 84 1 2, 1 993.
Leuenberger, M. , and U. Siegenthaler, Ice-age atmo
spheric concentration of nitrous oxide from an
Antarctic ice core, Nature, 360, 449-45 1 , 1992.
Liaw, Y.P. , D.L. Sisterson, and N.L. Miller, Comparison
of field, laboratory, and theoretical estimates of
global nitrogen fixation by lightning, J. Geophys.
Res. , 95, 22489-22494, 1 990.
Lobert, J.M. , D.H. Scharffe, W.M. Hao, T.A. Kuhlbusch,
R. Seuwen, P. Warneck, and P.J. Crutzen, Biomass
burning: Experimental evaluation of biomass
burning emissions: Nitrogen and carbon contain
ing compounds, in Global Biomass Burning:
Atmospheric, Climatic and Biospheric Implica
tions, edited by J.S. Levine, MIT Press, 289-304,
1 99 1 .
2.33
SOURCE GASES
Lobert, J.M. , T.J. Baring, J.H. Butler, S.A. Montzka,
R.C. Myers, and J.W. Elkins, Ocean-atmosphere
exchange of trace compounds, 1992. Final report
to AFEAS on oceanic measurements of HCFC- 22,
methylchloroform, and other selected halocar
bons. National Oceanic and Atmospheric
Administration/Climate Monitoring and Diagnos
tics Laboratory, Boulder, Colorado, USA, 1 993.
Logan, J.A. , Nitrogen oxides in the troposphere: Global
and regional budgets, J. Geophys. Res. , 88, 1 0785-
1 0807, 1 983.
Logan, J.A. , Sources and sinks for carbon monoxide, in
Proceedings of the NATO Advanced Study Insti
tute on Atmospheric Ozone: Its Variation and
Human Influences, Aldeia Las Acoteias, Algarre,
Portugal. October 1 - 1 3 , 323-342, 1980.
Lopez-Valverde, M.A., M. Lopez-Puertas, C.J. Marks,
and F.W. Taylor, Global and seasonal variations in
middle atmosphere CO from UARS/ISAMS, Geo
phys. Res. Lett. , 20, 1 247- 1 250, 1 993.
Lowe, D., C.A.M. Brenninkmeijer, G. Brailsford, K.
Lassey, and A. Gomez, Concentration and 1 3C
records of atmospheric methane in New Zealand
and Antarctica: Evidence for changes in methane
sources, J. Geophys. Res. , 99D, 1 69 1 3 - 1 6925,
1 994.
Maiss, M. , and I. Levin, Global increase of SF6 observed
in the atmosphere, Geophys. Res. Lett. , 21, 569-
573 , 1 994.
Makide, Y. , L. Chen, and T. Toninaga, Accurate mea
surements and changing trends of atmospheric
concentrations of CFC- 1 1 , CFC- 1 2, CFC- 1 1 3 ,
CFC- 1 1 4, CH3CC13, CCl4, halon- 1 30 1 and halon-
1 2 1 1 , Proc. International Symposium on Global
Cycles of Atmospheric Greenhouse Gases, Sendai,
Japan, March, 3 8-5 1 , 1994.
Mankin, W.G. , and M.T. Coffey, Increased stratospheric
hydrogen chloride in the El Chich6n cloud, Na
ture, 226, 1 70- 1 74, 1984.
Mankin, W.G. , M.T. Coffey, and A. Goldman, Airborne
observation of S02, HCl, and 03 in the strato
spheric plume of the Pinatubo volcano in July
1 99 1 , Geophys. Res. Lett. , 19, 1 79- 1 82, 1 992.

SOURCE GASES
Manley, S.L., K. Goodwin, and W.J. North, Laboratory
production of bromoform, methylene bromide,
and methyl iodide by macroalgae and distribution
in nearshore southern California waters, Limnol.
Oceanogr. , 37, 1652-1659, 1992.
Mano, S., and M.O. Andreae, Emission of methyl bro
mide from biomass burning, Science, 263,
1255-1257, 1994.
Martius, C., R. Wassmann, U. Thein, A. Bandeira, H.
Rennenberg, W. Junk, and W. Seiler, Methane
emission from wood-feeding termites in Amazo
nia, Chemosphere, 26, 623-632, 1993.
McCulloch, A., Global production and emissions of
bromochloro-difluoromethane and bromotri
fluoromethane (halons 1211 and 1301), Atmos.
Environ., 26A, 1325-1329, 1992.
Midgley, P., and D. Fisher, The production and release to
the atmosphere of chlorodifluoromethane (HCFC-
22), Atmos. Environ. , 27A, 2215-2223, 1993.
Minson, D.J., Methane production by sheep and cattle in
Australia, Tellus, 45B, 86-88, 1993.
Montzka, S.A., R.C. Myers, J.H. Butler, and J.W. Elkins,
Global tropospheric distribution and calibration
scale of HCFC-22, Geophys. Res. Lett., 20, 703-
706, 1993.
Montzka, S.A., R.C. Myers, J.W Elkins, J.H. Butler, and
S.O. Cummings, Measurements of HCFC-141b
{1,1-dichloro-1-fluoroethane) and HCFC-142b (1-
chloro-1, 1-difluoroethane) in ambient air samples
from the NOAA/CMDL global flask network,
manuscript in preparation, 1994.
Moore, R.M., and R. Tokarczyk, Volatile biogenic halo
carbons in the northwest Atlantic, Global
Biogeochem. Cycles, 7(1) , 195-210, 1993a.
Moore, R.M., and R. Tokarczyk, Chloro-iodomethane in
N. Atlantic waters: A potentially significant source
of atmospheric iodine, Geophys. Res. Lett., 1 9,
1779-1782, 1993b.
Moraes, F., and M.A.K. Khalil, Permafrost methane
content: 2. Modelling theory and results, Chemo
sphere, 26, 595-607, 1993.
Muller, J.F., Geographical distribution and seasonal vari
ation of surface emissions and deposition
velocities of atmospheric trace gases, J. Geophys.
Res. , 97, 3787-3804, 1992.
2.34
Nakazawa, T., T. Machida, M. Tanaka, Y. Fujii, S. Aoki,
and 0. Watanabe, Differences of the atmospheric
CH4 concentration between the Arctic and Antarc
tic regions in preindustrial/agricultural era,
Geophys. Res. Lett., 20, 943-946, 1993.
Neue, H.U. and P.A. Roger, Rice agriculture: Factor con
trolling emissions, in Atmospheric Methane:
Sources, Sinks, and Role in Global Change, edited
by M.A.K. Khalil, Springer-Verlag, Berlin, 254-
298, 1993.
Novelli, P.C., K.A. Masarie, P.P. Tans, and P.M. Lang,
Recent changes in atmospheric carbon monoxide,
Science, 263, 1587-1590, 1994.
Ojima, D.S., D.W. Valentine, A.R. Mosier, W.J. Parton,
and D.S. Schimel, Effect of land use change on
methane oxidation in temperate forest and grass
land soils, Chemosphere, 26, 675-685, 1993.
Penkett S.A., J.D. Prosser, R.A. Rasmussen, and M.A.K.
Khalil, Atmospheric measurements of CF4 and
other fluorocarbons containing the CF3 grouping,
J. Geophys. Res. , 86, 5172-5178, 1981.
Penner, J.E., C.S. Atherton, J. Dignon, S.J. Ghan, J.J.
Walton, and S. Hameed, Tropospheric nitrogen: A
three-dimensional study of sources, distributions,
and deposition, J. Geophys. Res. , 96, 959-990,
1991.
Penner, J.E., C.S. Atherton, and T.E. Graedel, Global
emissions and models of photochemically active
compounds, in Global Atmospheric-Biospheric
Chemistry: The First JGAC Scientific Conference,
edited by R.G. Prinn, in press, 1994.
Pepper, W., J. Legger, R. Swart, J. Watson, J. Edmonds,
and I. Mintzer, Emission Scenarios for the JPCC:
An Update. Assumptions, Methodology and Re
sults, prepared for IPCC WG I, May 1992, 115
pp., 1992.
Piccot, S.D., J.J. Watson, and J.W. Jones, A global inven
tory of volatile organic compound emissions from
anthropogenic sources, J. Geophys. Res. , 97,
9897-9912, 1992.
Plumb, R.A., and M.K.W. Ko, Interrelationships be
tween mixing ratios of long-lived stratospheric
constituents, J. Geophys. Res. , 97, 10145-10156,
1992.

Pollock, W.H. , L.E. Heidt, R.A. Lueb, J.F. Vedder, M.J.
Mills, and S . Solomon, On the age of stratospheric
air and ozone depletion potentials in polar regions,
J. Geophys. Res. , 97, 1 2993- 1 2999, 1 992.
Prather, M.J. , and R.T. Watson, Stratospheric ozone de
pletion and future levels of atmospheric chlorine
and bromine, Nature, 344, 729-734, 1 990.
Prather, M.J., and C.M. Spivakovsky, Tropospheric OH
and the lifetime of hydrochlorofluorocarbons
(HCFCs), J. Geophys. Res. , 95, 1 8723- 1 8729,
1 990.
Prather, M.J. , and E.E. Remsberg, Eds. , The Atmospher
ic Effects of Stratospheric Aircraft: Report of the
1 992 Model and Measurements Workshop, NASA
Reference Publication 1 292, 1 992.
Prather, M.J., M.M. Garcia, A.R. Douglas, C.H. Jack
man, M.K.W. Ko and N.D. Sze, The space shuttle's
impact on the stratosphere, J. Geophys. Res. , 95,
1 8583- 1 8590, 1 990.
Prinn, R., D. Cunnold, P. Simmonds, F. Alyea, R. Boldi,
A. Crawford, P. Fraser, D. Gutzler, D. Hartley, R.
Rosen, and R. Rasmussen, Global average concen
tration and trend for hydroxyl radicals deduced
from ALE/GAGE trichloroethane (methyl chloro
form) data for 1 978- 1 990, J. Geophys. Res. , 97,
2445-246 1 , 1 992.
Pyle, J .A., and A. E. Jones, An investigation of the impact
of the Ariane-5 launches on stratospheric ozone.
Report to the European Space Agency, 1 99 1 .
Rasmussen, R.A., Isoprene: Identification as a forest
type emission to the atmosphere, Environ. Sci.
Techno!., 4, 667-67 1 , 1 972.
Rasmussen, R.A. , M.A.K. Khalil, and F. Moraes, Perma
frost methane content: 1 . Experimental data from
sites in Northern Alaska, Chemosphere, 26, 591 -
594, 1 993 .
Ravishankara, A.R., S . Solomon, A.A. Turnipseed, and
R.F. Warren, Atmospheric lifetimes of long-lived
halogenated species, Science, 259, 1 94- 1 99, 1 993.
Reeburgh, W.S . , N.T. Roulet, and B .H. Svensson, Ter
restrial biosphere-atmosphere exchange in high
latitudes, in Global Atmospheric-Biospheric
Chemistry: The First IGAC Scientific Conference,
edited by R.G. Prinn, 1 65- 178 , 1994.
2.35
SOURCE G ASES
Rinsland, C.P. , M.R. Gunson, M.C. Abrams, L.L.
Lowes, R. Zander, and E. Mahieu, ATMOS/AT
LAS 1 measurements of sulphur hexafluoride
(SF6) in the lower stratosphere and upper tropo
sphere, J. Geophys. Res. , 98, 2049 1 -20494, 1 993 .
Roulet, N . , T. Moore, J. Bubier, and P. Lafleur, Northern
fens : Methane flux and climatic change, Tellus,
44B, 1 00- 1 05 , 1 992.
Roulet, N .T. , R. Ash, W. Quinton, and T. Moore, Meth
ane flux from drained northern peatlands: Effect of
a persistent water table lowering on flux, Bio
geochem. Cycles, 7, 749-769, 1 993.
Rowland, F.S. , C. Warg, and D. Blake, Reduction in the
rates of growth of global atmospheric concentra
tions for CCl3F (CFC- 1 1 ) and CCl2F2 (CFC- 1 2) ,
in Proceedings International Symposium on Glo
bal Cycles of Atmospheric Greenhouse Gases,
Sendai, Japan, 7- 1 0 March, 38-5 1 , 1 994.
Rudolph, J., A. Khedim, T. Clarkson, and D. Wagen
bach, Long term measurements of light alkanes
and acetylene in the Antarctic troposphere, Tellus,
44B, 252-26 1 , 1 992.
Russell, J .M. III, A.F. Tuck, L.L. Gordley, J .H. Park,
S .R. Drayson, J.E. Harries, R.J. Cicerone, and P.J.
Crutzen, HALOE Antarctic observations in the
spring of 1 99 1 , Geophys. Res. Lett., 20, 7 1 8-72 1 ,
1 993 .
Sanhueza, E. , Biogenic emissions of NO and N20 from
tropical savanna soils, in Proceedings Internation
al Symposium on Global Change (IGBP), Tokyo,
Japan, March 27-29, 24-34, 1 992.
Sanhueza, E., L . Cardenas, L . Donoso and M. Santana,
1 994: Effect of plowing on C02, CO, CH4, N20
and NO fluxes from tropical savannah soils . J. Geophys. Res. , 99D, 1 6429- 1 6434, 1 994.
Schauffler, S .M. , L.E. Heidt, W.L. Pollock, T.M. Gilpin,
J.F. Vedder, S. Solomon, R.A. Lueb, and E.L. At
las, Measurements of halogenated organic
compounds near the tropical tropopause, Geophys.
Res. Lett., 20, 2567-2570, 1 993.
Schmidt, U., R. Bauer, A. Khedim, G. Kulessa, and C.
Schiller, Profile observations of long-lived trace
gases in the Arctic vortex, Geophys. Res. Lett. , 18,
767-770, 1 99 1 .

SOU RCE GASES
Seiler, W. , and R. Conrad, Contribution of tropical eco
systems to the global budgets of trace gases,
especially CH4, H2o CO, and N20, in The Ceo
physiology of Amazonia, edited by R. Dickenson,
Wiley, New York, 1 33- 1 60, 1 987.
Shearer, M.J. , and M.A.K. Khalil, Rice agriculture:
Emissions, in Atmospheric Methane: Sources,
Sinks, and Role in Global Change, edited by
M.A.K. Khalil, Springer-Verlag, Berlin, 230-253 ,
1 993 .
Simmonds, P. , D. Cunnold, G. Dolland, T. Davies, A.
McCulloch, and R. Derwent, Evidence of the
phase out of CFC use over Europe over the period
1 987- 1 990, Atmos. Environ. , 2 7A, 1 397- 1 407,
1 993 .
Skole, D. , and C. Tucker, Tropical deforestation and hab
itat fragmentation in the Amazon: Satellite data
from 1 978 to 1 988, Science, 260, 1 905- 1 9 1 0,
1 993 .
Steele, L.P. , E.J. Dlugokencky, P.M. Lang, P.P. Tans,
R.C. Martin, and K.A. Masarie, Slowing down of
the global accumulation of atmospheric methane
during the 1 980's, Nature, 358, 3 1 3-3 1 6, 1 992.
Sturges, W.T. , C.W. Sullivan, R.C. Schnell, L.E. Heidt,
W.H. Pollock, and C.E. Quincy, Bromoalkane pro
duction by Antarctic ice algae: A possible link to
surface ozone loss, Tellus, 45B, 1 20- 1 26, 1 993 .
Subak, S . , P. Raskin, and D.V. Hippe!, National green
house gases accounts : Current anthropogenic
sources and sinks, Climate Change, 25, 1 5-58,
1 993 .
Swanson, T. , J.W. Elkins, J.H. Butler, S .A. Montzka,
R.C. Myers, T.M. Thompson, T.J . Baring, S .O.
Cumming, G.S . Dutton, A.H. Hayden, J .M.
Lobert, G.A. Holcomb, W.T. Sturges, and T.M.
Gilpin, Nitrous Oxide and Halocarbons Division,
Section 5 of CMDL No. 2 1 Summary Report
1 992, edited by J.T. Peterson and R.M. Rosson,
59-75, 1 993.
Tabazadeh, A., and R.P. Turco, Stratospheric chlorine
injection by volcanic eruptions: HCl scavenging
and implications for ozone, Science, 260, 1 082-
1 086, 1 993.
Tarr, M.A. , W.L. Miller, and R.G. Zepp, Direct photo
production of carbon monoxide from plant matter,
J. Geophys. Res. , submitted, 1 994.
2.36
Taylor, F.W. , et a!. , Remote sensing of atmospheric
structure and composition by pressure modulator
radiometer from space: The ISAMS experiment
on UARS , J. Geophys. Res. , 98, 1 0799- 108 1 4,
1 993.
Thorneloe, S .A. , M.A. Barlaz, R. Peer, L.C. Huff, L.
Davis , and J . Mangino, Waste management, in At
mospheric Methane: Source, Sinks, and Role in
Global Change, edited by M.A.K. Khalil, Spring
er-Verlag, Berlin, 362-398, 1 993.
Tokarczyk, R., and R.M. Moore, Production of volatile
organohalogens by phytoplankton cultures, Geo
phys. Res. Lett. , 21 , 285-288, 1 994.
Toon, G.C., C .B . Farmer, P.W. Schaper, L.L. Lowes, and
R.H. Norton, Composition measurements of the
1 989 Arctic winter stratosphere by airborne infra
red solar absorption spectroscopy, J. Geophys.
Res. , 97, 7939-796 1 , 1 992a.
Toon, G.C. , C .B . Farmer, P.W. Schaper, L.L. Lowes, and
R.H. Norton, Evidence for subsidence in the 1 989
Arctic winter stratosphere from airborne infrared
composition measurements, f. Geophys. Res. , 97,
7963-7970, 1 992b.
Toon, G.C. , J.F. Blavier, J .N. Solario, and J.T. Szeto, Air
borne observations of the 1 992 Arctic winter
stratosphere by FTIR solar absorption spectrosco
py, in Optical Methods in Atmospheric Chemistry,
SPIE Vol. 1 7 1 5 , 457-467, 1 992c.
Toon, G.C., J.F. Blavier, J.N. Solario, and J.T. Szeto, Air
borne observations of the composition of the 1 992
tropical stratosphere by FTIR solar absorption
spectrometry, Geophys. Res. Lett., 20, 2503-2506,
1 993.
Tuck, A.F. , S .J . Hovde, K.K. Kelly, J .M. Russell III, C.R.
Webster, and R.D. May, lntercomparison of HAL
OE and ER-2 aircraft H20 and CH4 observations
collected during the second Airborne Arctic
Stratospheric Experiment (AASE-II) , Geophys.
Res. Lett. , 20, 1 243- 1 246, 1 993.
Valentine, R.L. , and R.G. Zepp, Formation of carbon
monoxide from photodegradation of terrestrial
dissolved organic carbon in natural waters, Envi
ron. Sci. Techno!. , 2 7, 409-4 1 2, 1 993.
Wallace, L. , and W. Livingston, The effect of the Pinatu
bo cloud on hydrogen chloride and hydrogen
fluoride, Geophys. Res. Lett. , 19, 1 209- 1 2 1 2,
1 992.

Wallace, D.W.R., P. Beinung and A. Putzka, Carbon tet
rachloride and chlorofluorocarbons in the South
Atlantic Ocean, l 9°S, submitted to 1. Geophys.
Res. , 1 994.
Warneck, P. , Chemistry of the natural atmosphere, Int.
Geophys. Ser. , 41, Academic, San Diego, Califor
nia, 1 988 .
Wassmann, R. , H. Papen, and H. Rennenberg, Methane
emission from rice paddies and possible mitiga
tion strategies, Chemosphere, 26, 20 1 -2 1 7, 1 993 .
Weisenstein, D.K. , M.K.W. Ko, and N.D. Sze , The chlo
rine budget of the present-day atmosphere: A
modeling study, 1. Geophys. Res. , 97, 2547-2559,
1 992.
Weiss, R., Changing global concentration of atmospher
ic nitrous oxide, in Proceedings International
Symposium on Global Cycles of Atmospheric
Greenhouse Gases, Sendai, Japan, 7- 1 0 March,
1 994.
Whalen, S .C . , and W. Reeburgh, Interannual variations
in tundra methane emission: A 4-year time series
at fixed sites, Global Biogeochem. Cycles, 6, 1 39-
1 59, 1 992.
Williams, E.J . , A. Guenther, and F.C. Fehsenfeld, An in
ventory of nitric oxide emissions from soils in the
United States, J. Geophys. Res. , 97, 75 1 1 -75 1 9,
1 992.
WMO, Atmospheric Ozone I 985: Assessment of Our
Understanding of the Processes Controlling Its
Present Distribution and Change, World Meteoro
logical Organization, Global Ozone Research and
Monitoring Project - Report No. 1 6, Geneva,
Switzerland, 1 986.
WMO, Scientific Assessment of Ozone Depletion: I99I,
World Meteorological Organization, Global
Ozone Research and Monitoring Project - Report
No. 25, Geneva, Switzerland, 1 992.
Woodbridge et al. , Estimates of total organic and inor
ganic chlorine in the lower stratosphere from in
situ measurements during AASE II, submitted to 1.
Geophys. Res. , 1 994.
2 .37
SOURCE GASES
Worthy, D. , N. Trivett, K. Higuchi, J . Hopper, E. Dlugo
kencky, M. Ernst, and M. Glumpak, Six years of in
situ atmospheric methane measurements at Alert,
N.W.T. , Canada, 1 988- 1 993: Seasonal variations,
decreasing growth rate and long range transport, in
Proceedings International Symposium on Global
Cycles of Atmospheric Greenhouse Gases, Sendai,
Japan, 7- 1 0 March, 1 30- 1 33 , 1 994.
Zander, R. , C.P. Rinsland, and P. Demoulin, Infrared
spectroscopic measurements of the vertical col
umn abundance of sulphur hexafluoride, SF6,
from the ground, J. Geophys. Res. , 96, 1 5447-
1 5454, 1 99 l a.
Zander, R . , C.P. Rinsland, D.H. Ehhalt, J. Rudolph, and
Ph. Demoulin, Vertical column abundances and
seasonal cycle of acetylene, C2H2, above the Jung
fraujoch station, derived from IR solar
observations, 1. Atmos. Chern. , /3, 359-372,
1 99 l b.
Zander, R. , M.R. Gunson, C .B . Farmer, C.P. Rinsland,
F.W. Irion, and E. Mahieu, The 1 985 chlorine and
fluorine inventories in the stratosphere based on
ATMOS at 30° north latitude, 1. Atmos. Chern. , I 5,
1 7 1 - 1 86, 1 992.
Zander, R., E. Mahieu, P. Demoulin, C.P. Rinsland, D .K.
Weisenstein, M.K.W. Ko, N.D. Sze, and M.R.
Gunson, Secular evolution of the vertical column
abundances of CHClF2 (HCFC-22) in the Earth's
atmosphere inferred from ground-based IR solar
observations at Jungfraujoch and at Kitt Peak, and
comparison with model calculations, J. Atmos.
Chern. , 18, 1 29- 148 , 1 994a.
Zander, R . , D.H. Ehhalt, C .P. Rinsland, U. Schmidt, E.
Mahieu, J. Rudolph, P. Demoulin, G. Roland, L.
Delbouille, and A.J . Sauval, Secular trend and sea
sonal variability of the column abundance of N20
above the Jungfraujoch station determined from
IR solar spectra, 1. Geophys. Res. , 99D, 1 6745-
1 6756, 1 994b.

SOU RCE GASES
Zander, R., Ph. Demoulin, and E. Mahieu, Monitoring of
the atmospheric burdens of CH4, N20, CO,
CHClF2 and CF2Cl2 above central Europe during
the last decade, in Proceedings of International
Symposium on Non-C02 Greenhouse Gases
Why and How to Control?, Maastricht, Dec.
1 3 - 1 5 , 1 993 , to appear in Environmental Monitor
ing and Assessment, Kluwer Academic Pub. ,
1 994c.
2.38
Zimmerman, P.R. , R.B. Chatfield, J . Fishman, P.J.
Crutzen, and P.L. Hanst, Estimates on the produc
tion of CO and H2 from the oxidation of
hydrocarbon emissions from vegetation, Geophys.
Res. Lett., 5, 679-682, 1 978 .
Zolensky, M.E., D .S . McKay, and L.A. Kaczor, A ten
fold increase in the abundance of large solid
particles in the stratosphere, as measured over the
period 1 976- 1 984, J. Geophys. Res. , 94, 1 047-
1 056, 1 989.


