Embed Size (px)
Citation preview
CHAPTER 2CAPITAL BUDGETINGPresenter’s namePresenter’s titledd Month yyyy
1. INTRODUCTION•Capital budgeting is the allocation of funds to long-lived capital projects.
•A capital project is a long-term investment in tangible assets.
•The principles and tools of capital budgeting are applied in many different aspects of a business entity’s decision making and in security valuation and portfolio management.
•A company’s capital budgeting process and prowess are important in valuing a company.
Copyright © 2013 CFA Institute 2
2. THE CAPITAL BUDGETING PROCESS
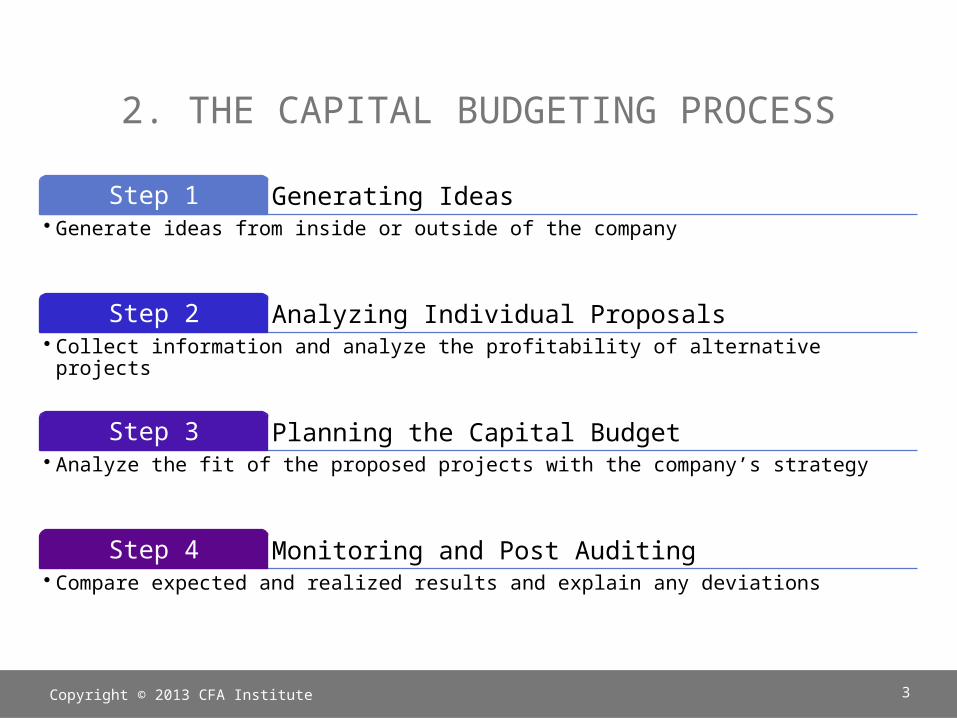
Generating IdeasStep 1• Generate ideas from inside or outside of the company
Analyzing Individual ProposalsStep 2• Collect information and analyze the profitability of alternative projects
Planning the Capital BudgetStep 3• Analyze the fit of the proposed projects with the company’s strategy
Monitoring and Post AuditingStep 4• Compare expected and realized results and explain any deviations
Copyright © 2013 CFA Institute 3
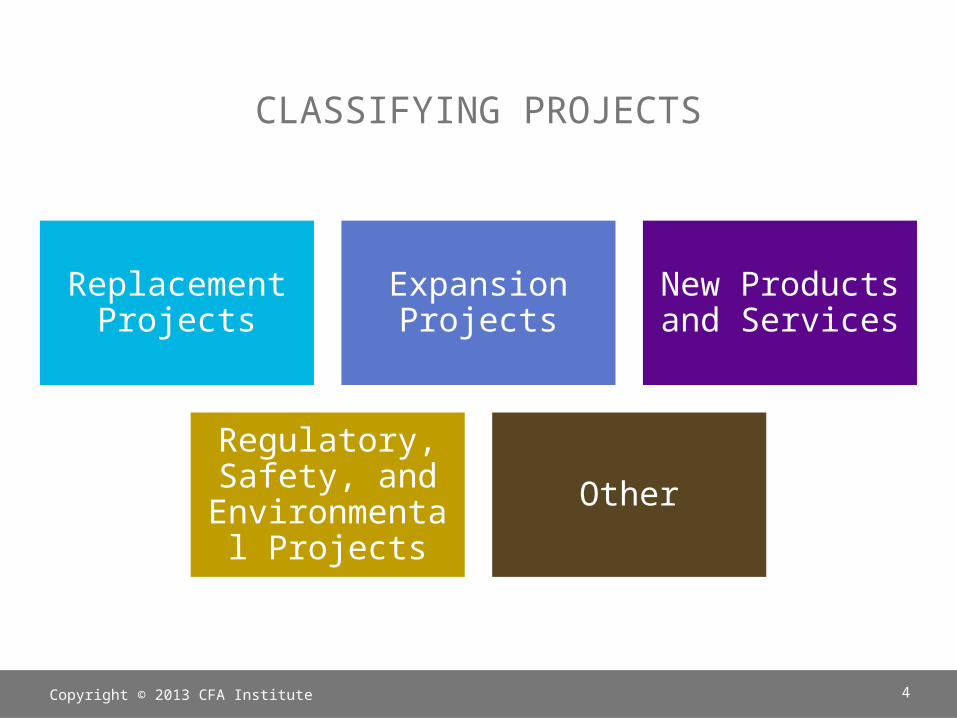
CLASSIFYING PROJECTS
Replacement Projects
Expansion Projects
New Products and Services
Regulatory, Safety, and Environmental Projects
Other
Copyright © 2013 CFA Institute 4
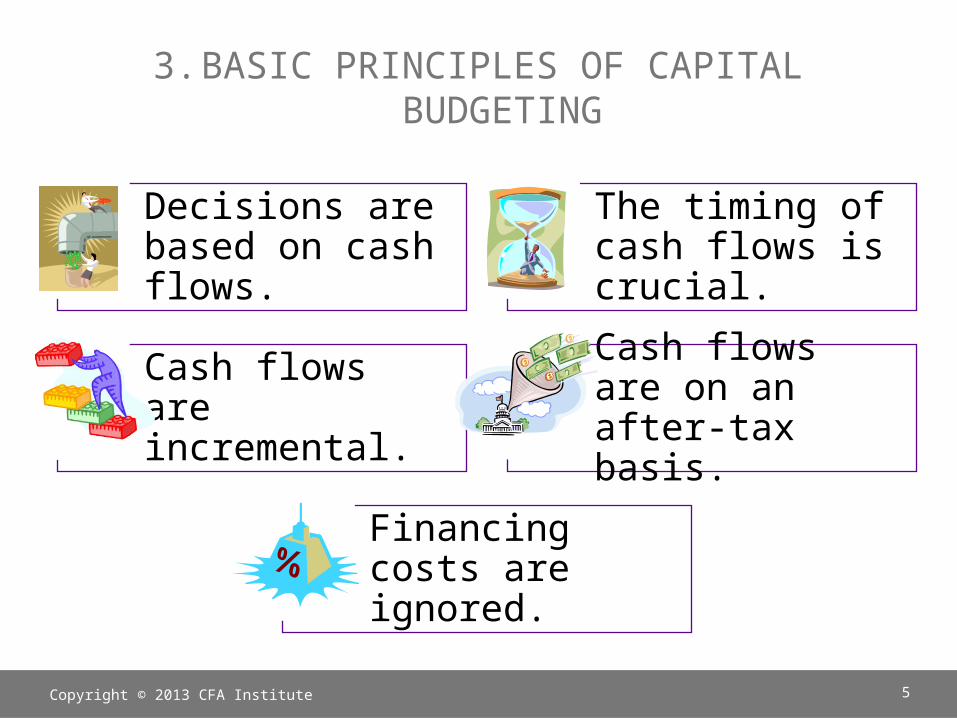
3.BASIC PRINCIPLES OF CAPITAL BUDGETING
Decisions are based on cash flows.
The timing of cash flows is crucial.
Cash flows are incremental.
Cash flows are on an after-tax basis.
Financing costs are ignored.
Copyright © 2013 CFA Institute 5
COSTS: INCLUDE OR EXCLUDE?•A sunk cost is a cost that has already occurred, so it cannot be part of the incremental cash flows of a capital budgeting analysis.
•An opportunity cost is what would be earned on the next-best use of the assets.
•An incremental cash flow is the difference in a company’s cash flows with and without the project.
•An externality is an effect that the investment project has on something else, whether inside or outside of the company.-Cannibalization is an externality in which the investment reduces cash flows elsewhere in the company (e.g., takes sales from an existing company project).
Copyright © 2013 CFA Institute 6
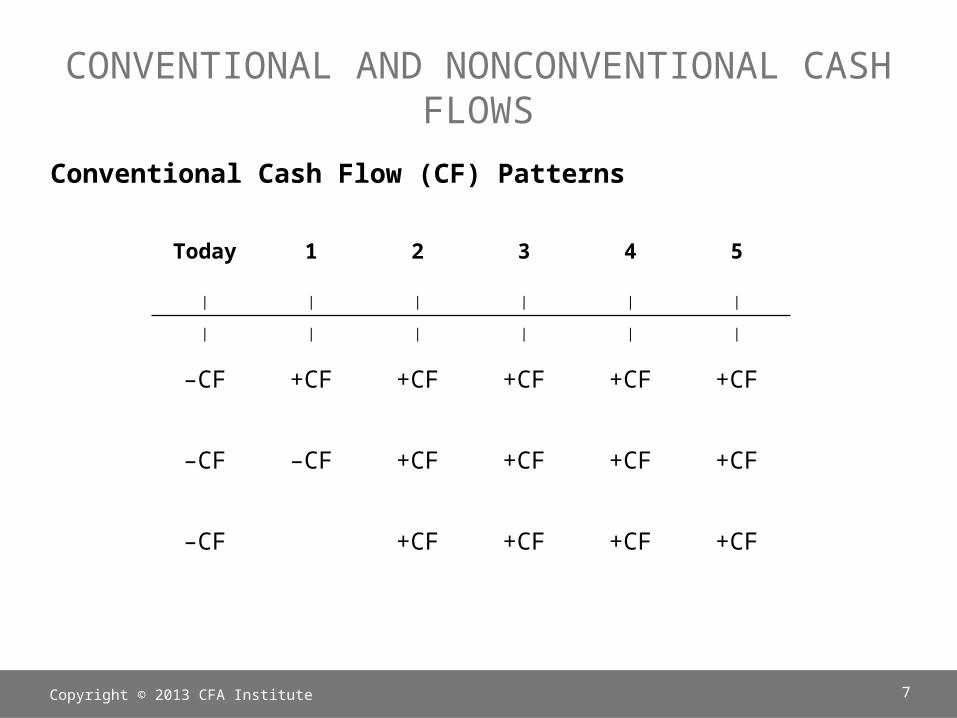
CONVENTIONAL AND NONCONVENTIONAL CASH FLOWS
Conventional Cash Flow (CF) Patterns
Copyright © 2013 CFA Institute 7
Today 1 2 3 4 5
| | | | | |
| | | | | |
–CF +CF +CF +CF +CF +CF
–CF –CF +CF +CF +CF +CF
–CF +CF +CF +CF +CF
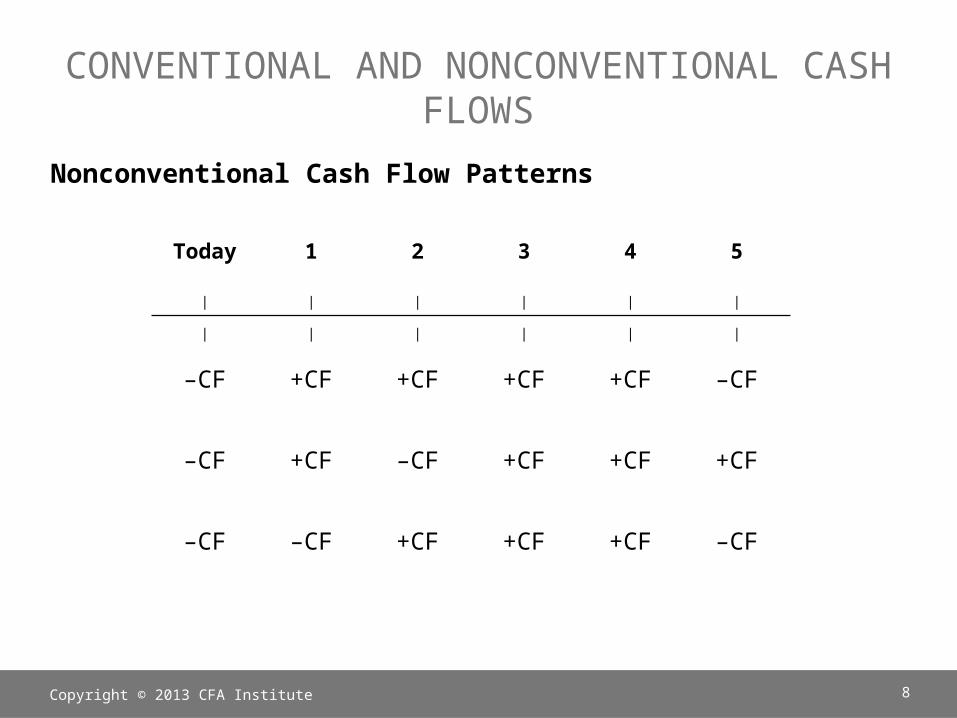
CONVENTIONAL AND NONCONVENTIONAL CASH FLOWS
Nonconventional Cash Flow Patterns
Copyright © 2013 CFA Institute 8
Today 1 2 3 4 5
| | | | | |
| | | | | |
–CF +CF +CF +CF +CF –CF
–CF +CF –CF +CF +CF +CF
–CF –CF +CF +CF +CF –CF

INDEPENDENT VS. MUTUALLY EXCLUSIVE PROJECTS
•When evaluating more than one project at a time, it is important to identify whether the projects are independent or mutually exclusive-This makes a difference when selecting the tools to evaluate the projects.
•Independent projects are projects in which the acceptance of one project does not preclude the acceptance of the other(s).
•Mutually exclusive projects are projects in which the acceptance of one project precludes the acceptance of another or others.
Copyright © 2013 CFA Institute 9
PROJECT SEQUENCING•Capital projects may be sequenced, which means a project contains an option to invest in another project. -Projects often have real options associated with them; so the company can choose to expand or abandon the project, for example, after reviewing the performance of the initial capital project.
Copyright © 2013 CFA Institute 10
CAPITAL RATIONING•Capital rationing is when the amount of expenditure for capital projects in a given period is limited.
•If the company has so many profitable projects that the initial expenditures in total would exceed the budget for capital projects for the period, the company’s management must determine which of the projects to select.
•The objective is to maximize owners’ wealth, subject to the constraint on the capital budget.-Capital rationing may result in the rejection of profitable projects.
Copyright © 2013 CFA Institute 11
4. INVESTMENT DECISION CRITERIA
Net Present Value (NPV)
Internal Rate of Return (IRR)
Payback Period
Discounted Payback PeriodAverage Accounting Rate of Return (AAR)
Profitability Index (PI)
Copyright © 2013 CFA Institute 12
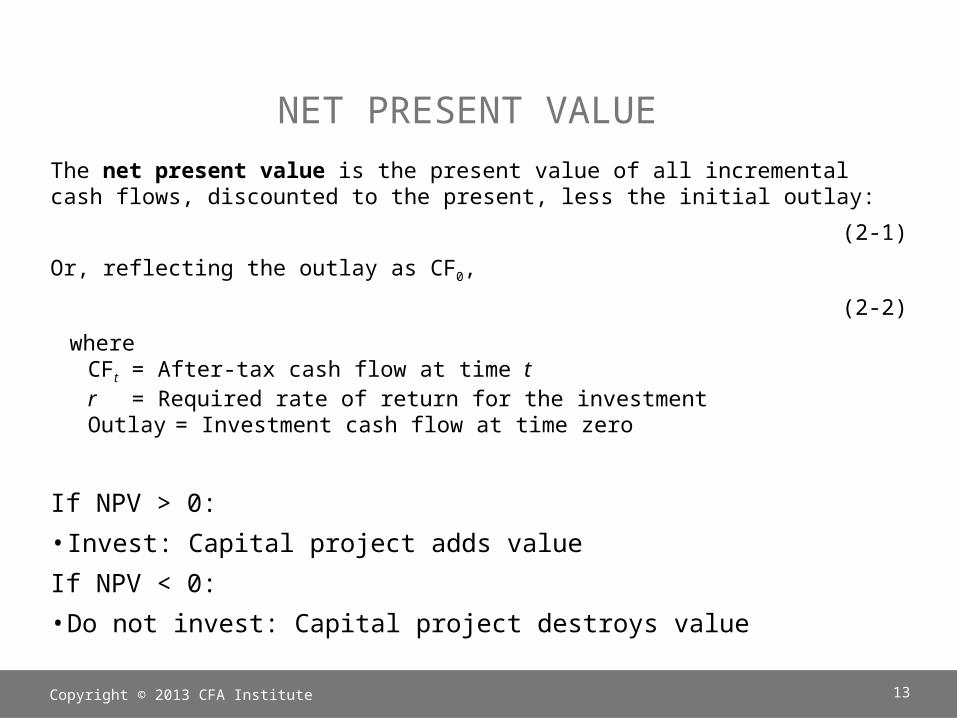
NET PRESENT VALUE The net present value is the present value of all incremental cash flows, discounted to the present, less the initial outlay:
(2-1)Or, reflecting the outlay as CF0,
(2-2)whereCFt = After-tax cash flow at time tr = Required rate of return for the investmentOutlay = Investment cash flow at time zero
If NPV > 0:•Invest: Capital project adds valueIf NPV < 0:•Do not invest: Capital project destroys value
Copyright © 2013 CFA Institute 13
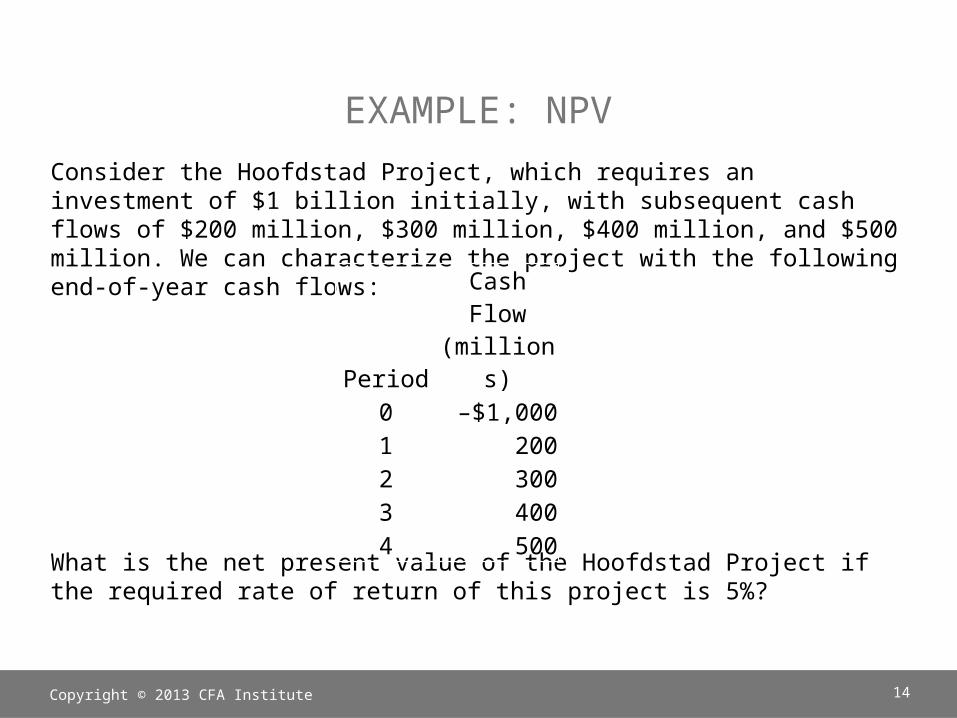
EXAMPLE: NPVConsider the Hoofdstad Project, which requires an investment of $1 billion initially, with subsequent cash flows of $200 million, $300 million, $400 million, and $500 million. We can characterize the project with the following end-of-year cash flows:
What is the net present value of the Hoofdstad Project if the required rate of return of this project is 5%?
Copyright © 2013 CFA Institute 14
Period
Cash Flow
(millions)
0 –$1,0001 2002 3003 4004 500
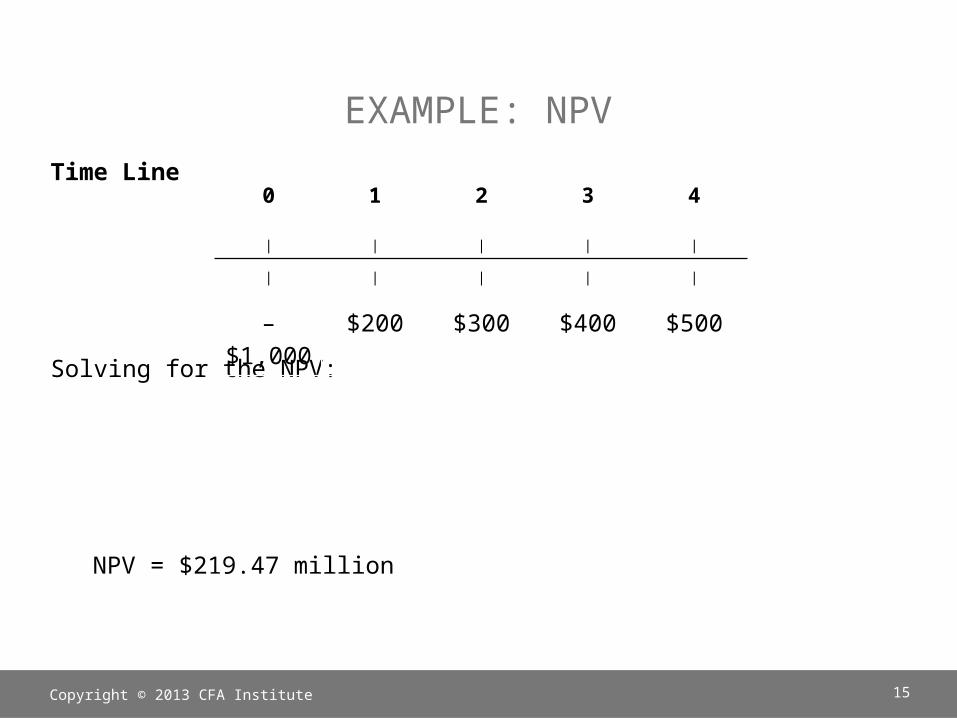
EXAMPLE: NPVTime Line
Solving for the NPV:
NPV = $219.47 million
Copyright © 2013 CFA Institute 15
0 1 2 3 4
| | | | |
| | | | |
–$1,000
$200 $300 $400 $500
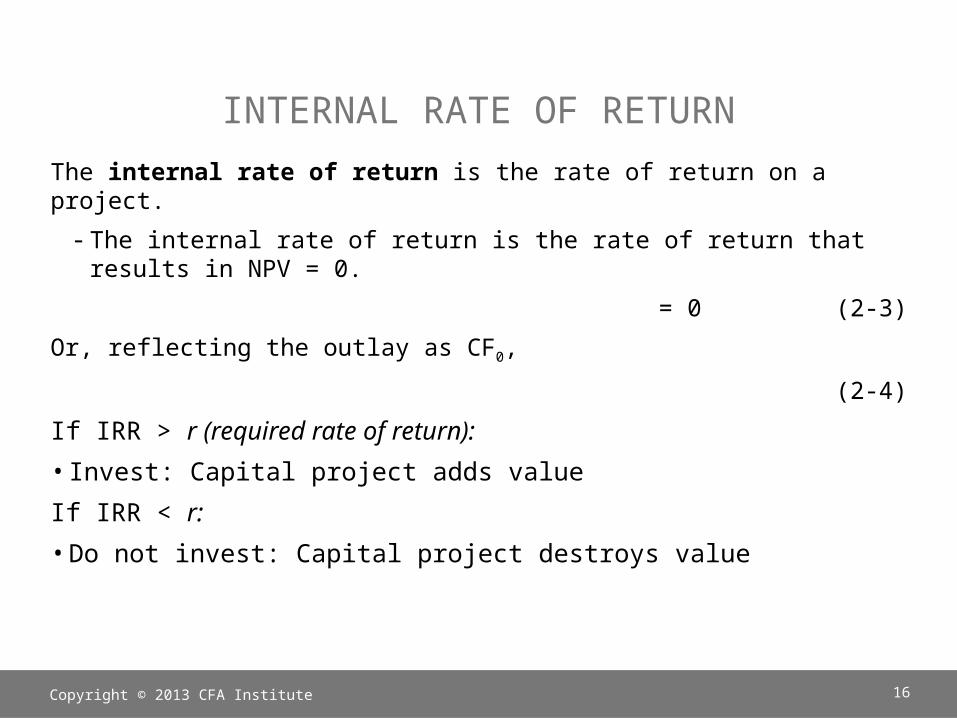
INTERNAL RATE OF RETURNThe internal rate of return is the rate of return on a project.-The internal rate of return is the rate of return that results in NPV = 0.
= 0 (2-3)Or, reflecting the outlay as CF0,
(2-4)If IRR > r (required rate of return):•Invest: Capital project adds valueIf IRR < r:•Do not invest: Capital project destroys value
Copyright © 2013 CFA Institute 16
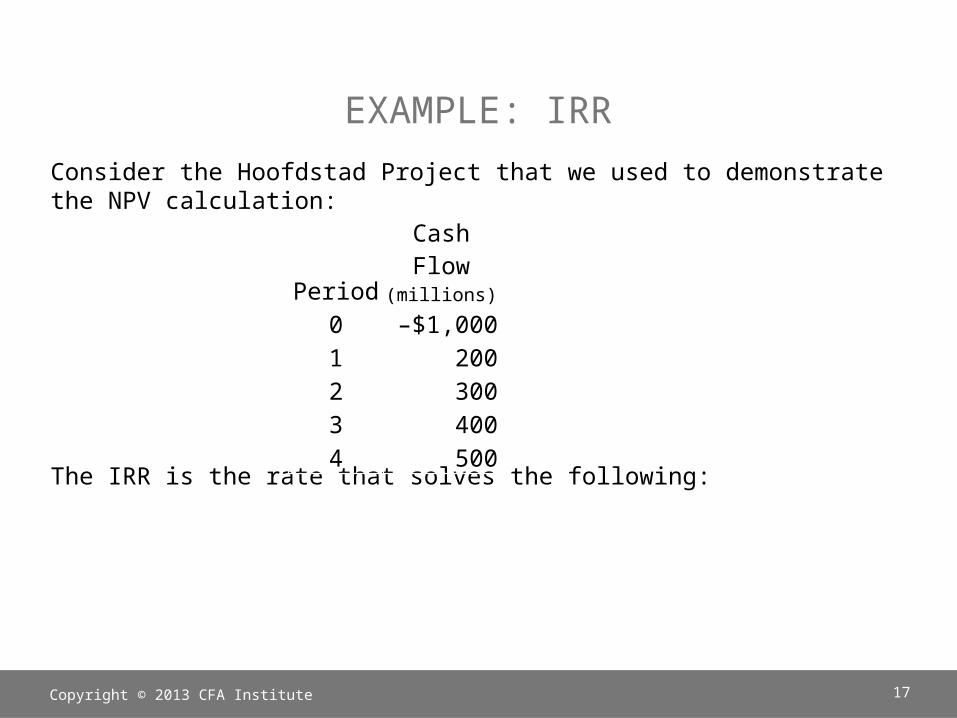
EXAMPLE: IRRConsider the Hoofdstad Project that we used to demonstrate the NPV calculation:
The IRR is the rate that solves the following:
Copyright © 2013 CFA Institute 17
Period
Cash Flow
(millions)0 –$1,0001 2002 3003 4004 500
A NOTE ON SOLVING FOR IRR•The IRR is the rate that causes the NPV to be equal to zero.
•The problem is that we cannot solve directly for IRR, but rather must either iterate (trying different values of IRR until the NPV is zero) or use a financial calculator or spreadsheet program to solve for IRR.
•In this example, IRR = 12.826%:
Copyright © 2013 CFA Institute 18
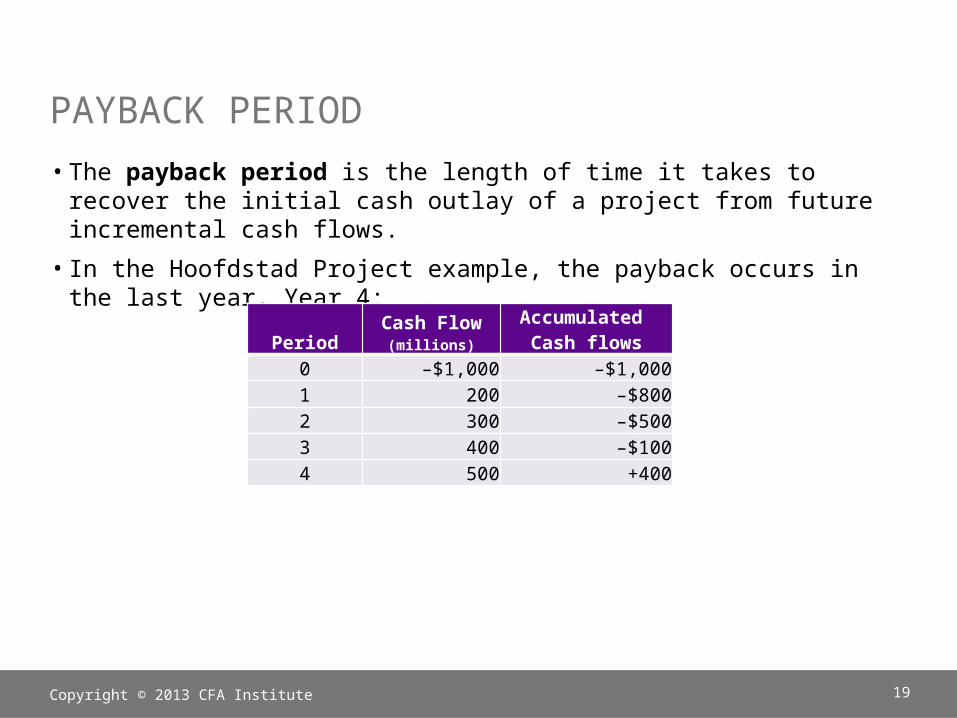
PAYBACK PERIOD•The payback period is the length of time it takes to recover the initial cash outlay of a project from future incremental cash flows.
•In the Hoofdstad Project example, the payback occurs in the last year, Year 4:
Copyright © 2013 CFA Institute 19
PeriodCash Flow(millions)
Accumulated Cash flows
0 –$1,000 –$1,0001 200 –$8002 300 –$5003 400 –$1004 500 +400
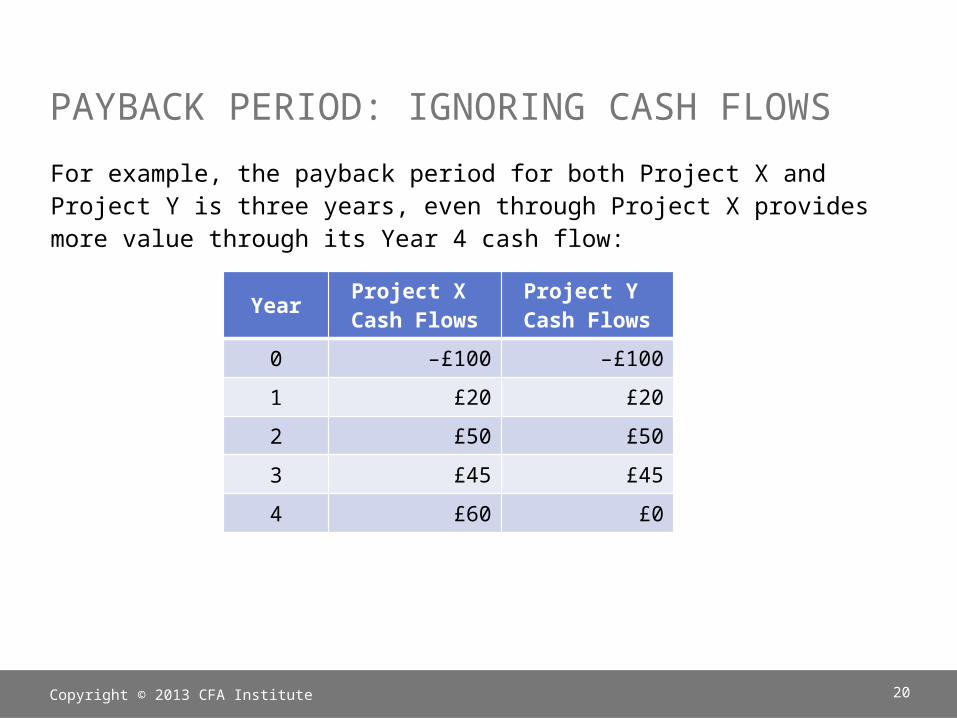
PAYBACK PERIOD: IGNORING CASH FLOWSFor example, the payback period for both Project X and Project Y is three years, even through Project X provides more value through its Year 4 cash flow:
Copyright © 2013 CFA Institute 20
Year Project X Cash Flows
Project Y Cash Flows
0 –£100 –£1001 £20 £202 £50 £503 £45 £454 £60 £0
DISCOUNTED PAYBACK PERIOD•The discounted payback period is the length of time it takes for the cumulative discounted cash flows to equal the initial outlay.-In other words, it is the length of time for the project to reach NPV = 0.
Copyright © 2013 CFA Institute 21
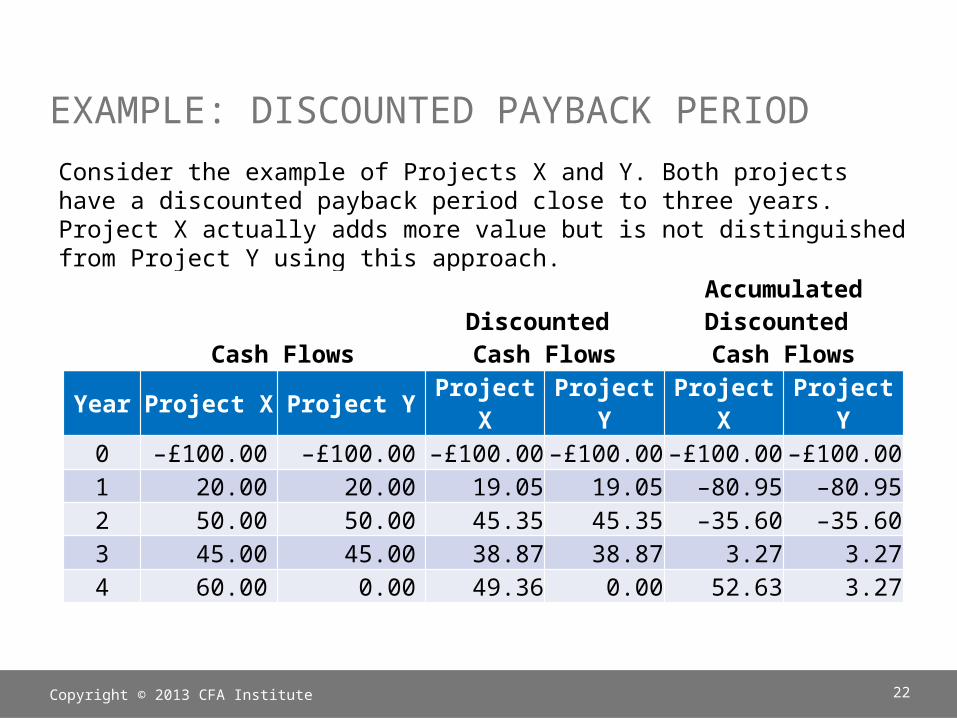
EXAMPLE: DISCOUNTED PAYBACK PERIODConsider the example of Projects X and Y. Both projects have a discounted payback period close to three years. Project X actually adds more value but is not distinguished from Project Y using this approach.
Copyright © 2013 CFA Institute 22
Cash FlowsDiscounted Cash Flows
Accumulated Discounted Cash Flows
Year Project X Project Y Project X
Project Y
Project X
Project Y
0 –£100.00 –£100.00 –£100.00 –£100.00 –£100.00 –£100.001 20.00 20.00 19.05 19.05 –80.95 –80.952 50.00 50.00 45.35 45.35 –35.60 –35.603 45.00 45.00 38.87 38.87 3.27 3.274 60.00 0.00 49.36 0.00 52.63 3.27
AVERAGE ACCOUNTING RATE OF RETURN•The average accounting rate of return (AAR) is the ratio of the average net income from the project to the average book value of assets in the project:
Copyright © 2013 CFA Institute 23
PROFITABILITY INDEXThe profitability index (PI) is the ratio of the present value of future cash flows to the initial outlay:
(2-5)
If PI > 1.0:•Invest•Capital project adds value
If PI < 0:•Do not invest•Capital project destroys value
Copyright © 2013 CFA Institute 24
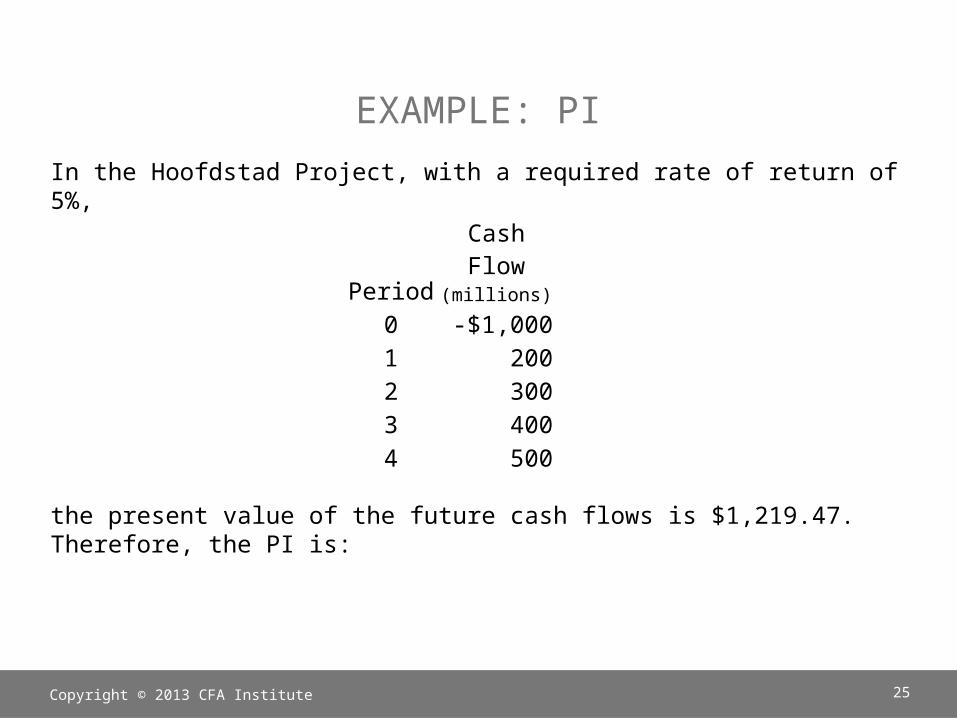
EXAMPLE: PIIn the Hoofdstad Project, with a required rate of return of 5%,
the present value of the future cash flows is $1,219.47. Therefore, the PI is:
Copyright © 2013 CFA Institute 25
Period
Cash Flow
(millions)0 -$1,0001 2002 3003 4004 500
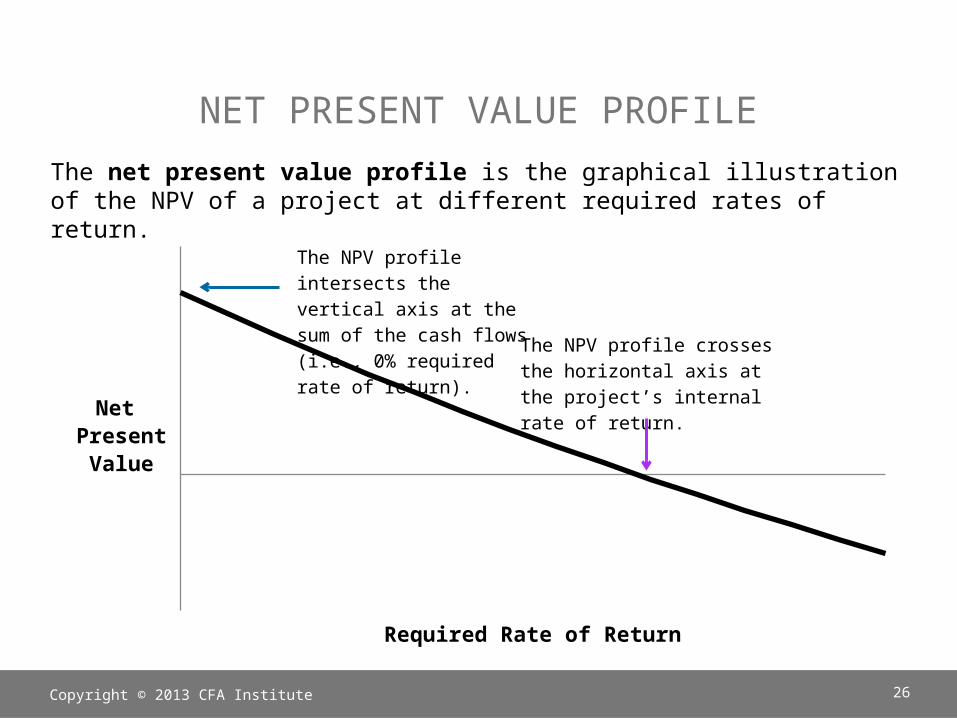
NET PRESENT VALUE PROFILEThe net present value profile is the graphical illustration of the NPV of a project at different required rates of return.
Copyright © 2013 CFA Institute 26
Required Rate of Return
Net PresentValue
The NPV profile crosses the horizontal axis at the project’s internal rate of return.
The NPV profile intersects the vertical axis at the sum of the cash flows (i.e., 0% required rate of return).
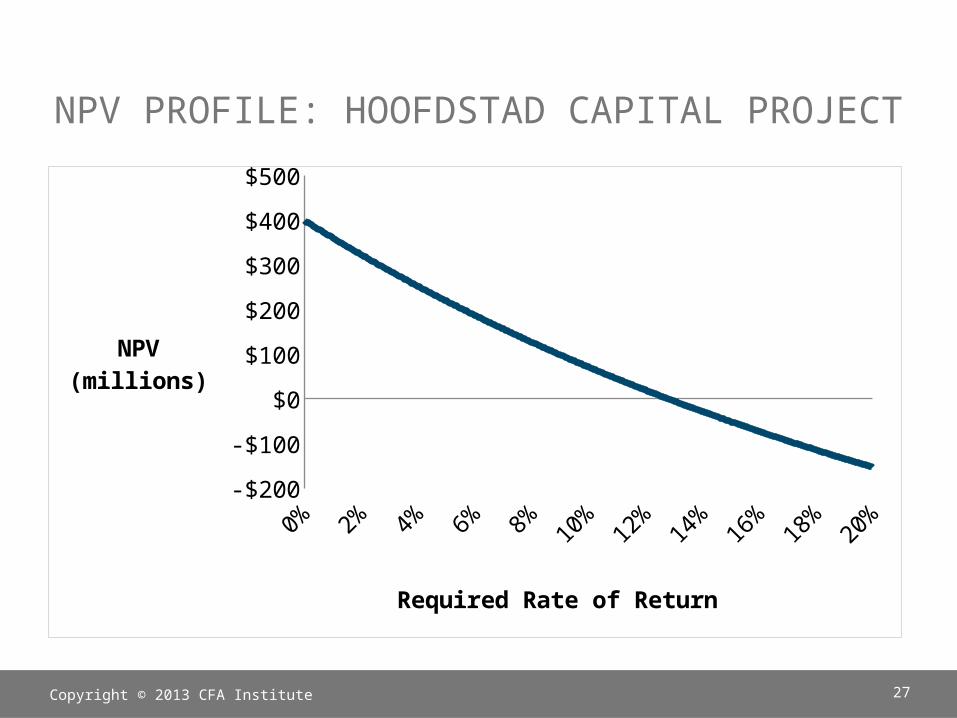
NPV PROFILE: HOOFDSTAD CAPITAL PROJECT
Copyright © 2013 CFA Institute 27
-$200-$100
$0$100$200$300$400$500
Required Rate of Return
NPV(millions)
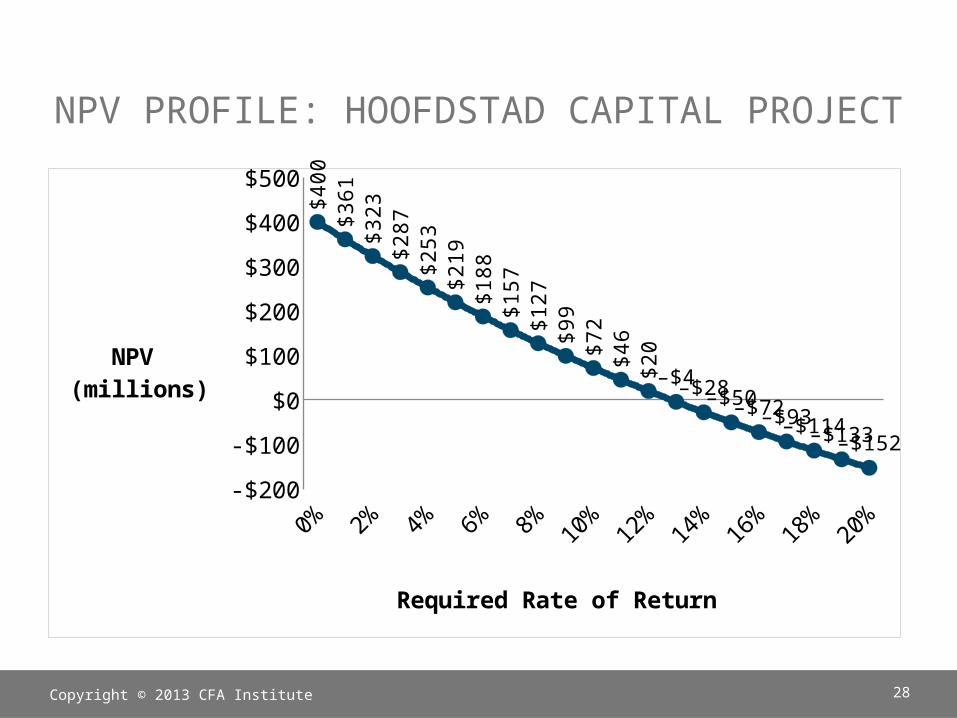
NPV PROFILE: HOOFDSTAD CAPITAL PROJECT
Copyright © 2013 CFA Institute 28
-$200-$100
$0$100$200$300$400$500
$400
$361
$323
$287
$253
$219
$188
$157
$127
$99
$72
$46
$20
–$4–$28–$50–$72–$93–$114–$133–$152
Required Rate of Return
NPV (millions)
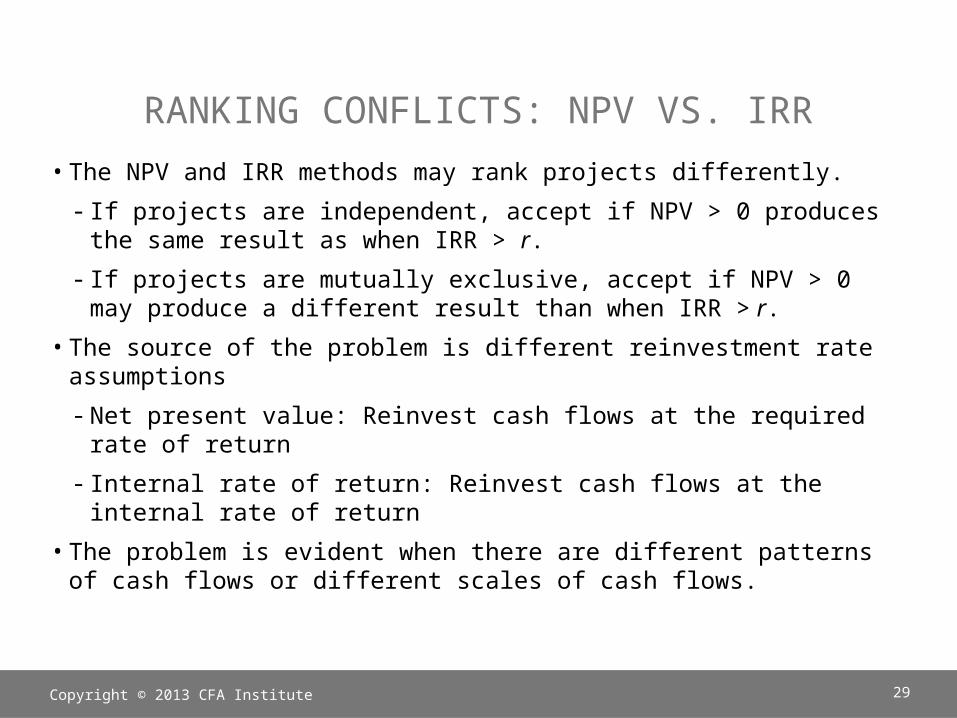
RANKING CONFLICTS: NPV VS. IRR•The NPV and IRR methods may rank projects differently.-If projects are independent, accept if NPV > 0 produces the same result as when IRR > r.
-If projects are mutually exclusive, accept if NPV > 0 may produce a different result than when IRR > r.
•The source of the problem is different reinvestment rate assumptions-Net present value: Reinvest cash flows at the required rate of return
-Internal rate of return: Reinvest cash flows at the internal rate of return
•The problem is evident when there are different patterns of cash flows or different scales of cash flows.
Copyright © 2013 CFA Institute 29
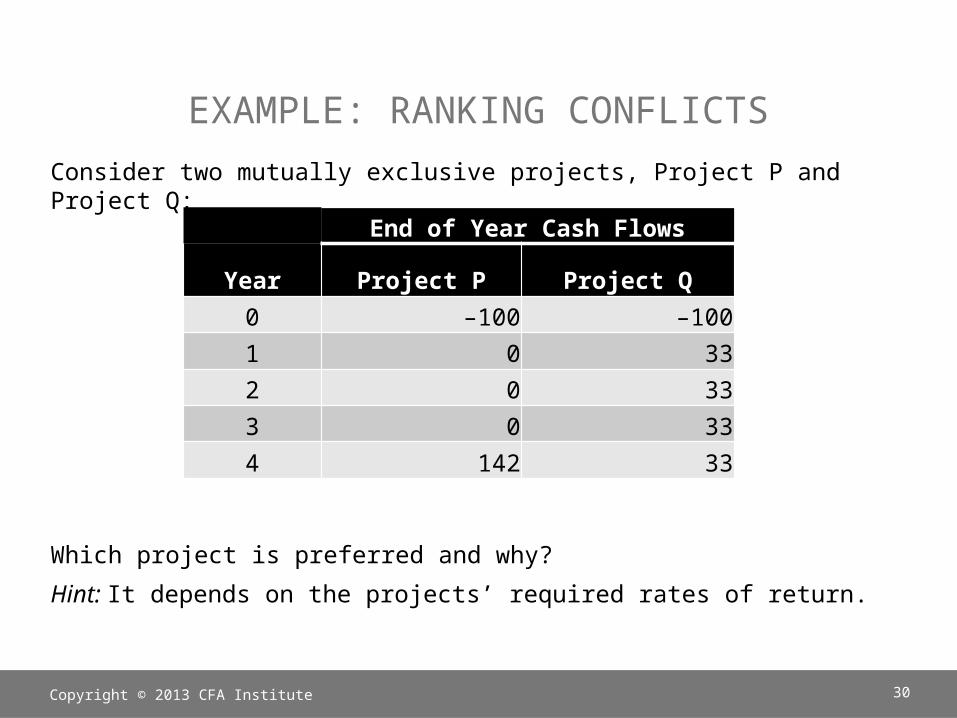
EXAMPLE: RANKING CONFLICTSConsider two mutually exclusive projects, Project P and Project Q:
Which project is preferred and why?Hint: It depends on the projects’ required rates of return.
Copyright © 2013 CFA Institute 30
End of Year Cash Flows
Year Project P Project Q0 –100 –1001 0 332 0 333 0 334 142 33
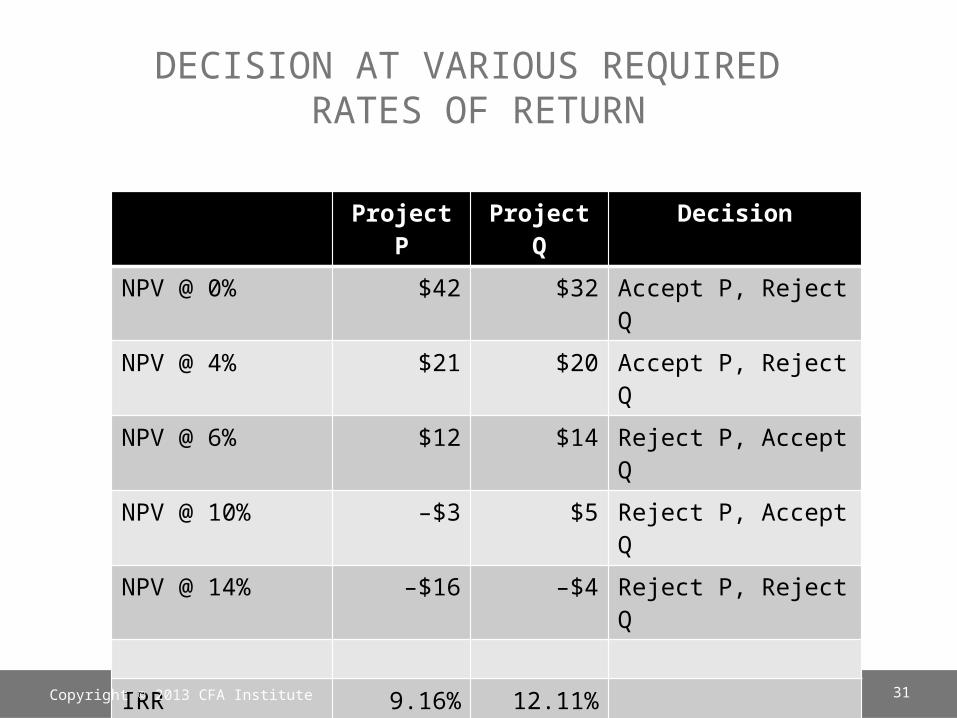
DECISION AT VARIOUS REQUIRED RATES OF RETURN
Project P
Project Q
Decision
NPV @ 0% $42 $32 Accept P, Reject Q
NPV @ 4% $21 $20 Accept P, Reject Q
NPV @ 6% $12 $14 Reject P, Accept Q
NPV @ 10% –$3 $5 Reject P, Accept Q
NPV @ 14% –$16 –$4 Reject P, Reject Q
IRR 9.16% 12.11%Copyright © 2013 CFA Institute 31
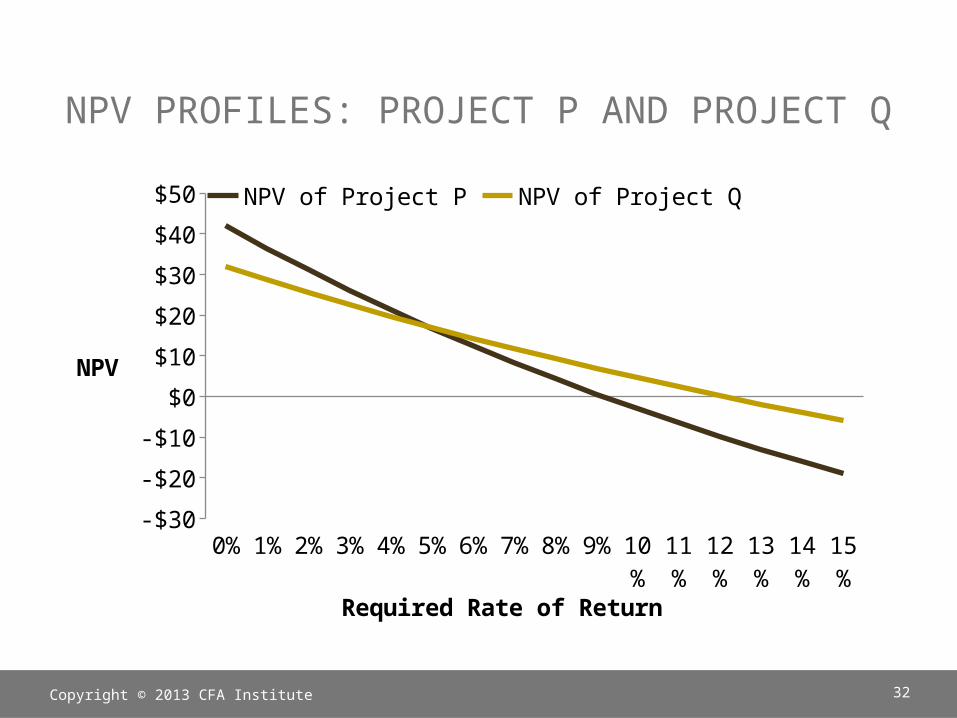
NPV PROFILES: PROJECT P AND PROJECT Q
Copyright © 2013 CFA Institute 32
0% 1% 2% 3% 4% 5% 6% 7% 8% 9% 10%
11%
12%
13%
14%
15%
-$30-$20-$10$0$10$20$30$40$50 NPV of Project P NPV of Project Q
Required Rate of Return
NPV
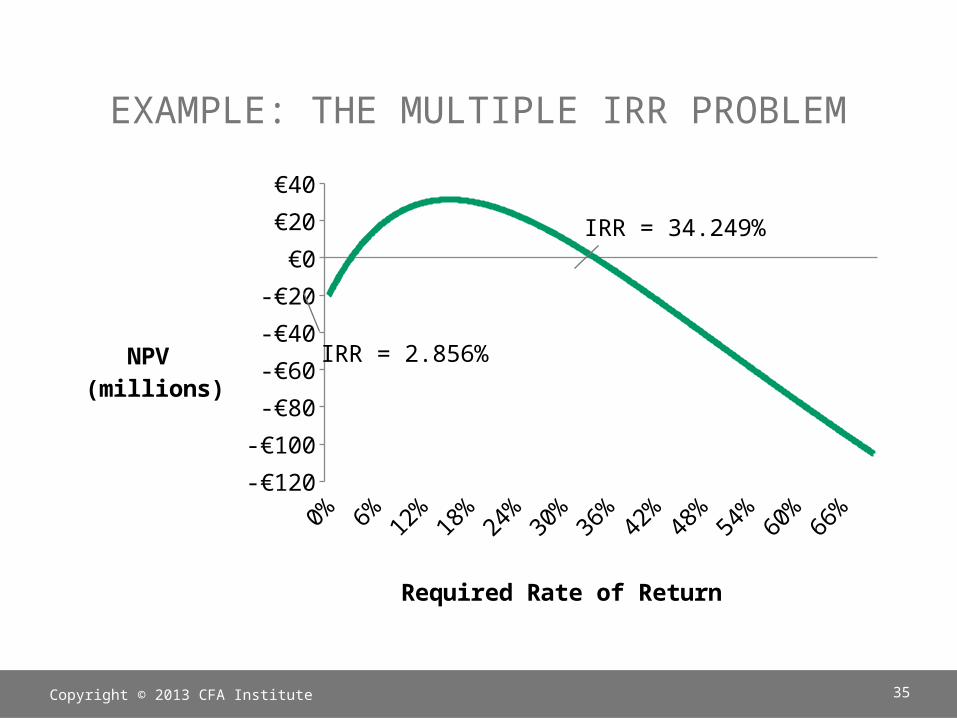
THE MULTIPLE IRR PROBLEM •If cash flows change sign more than once during the life of the project, there may be more than one rate that can force the present value of the cash flows to be equal to zero.-This scenario is called the “multiple IRR problem.”-In other words, there is no unique IRR if the cash flows are nonconventional.
Copyright © 2013 CFA Institute 33
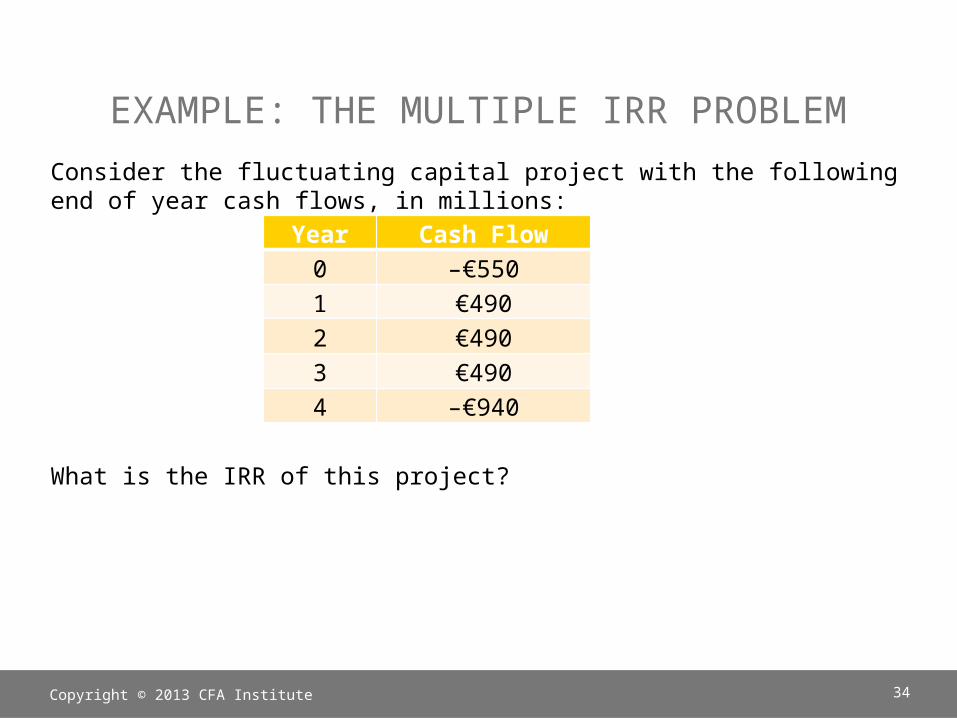
EXAMPLE: THE MULTIPLE IRR PROBLEMConsider the fluctuating capital project with the following end of year cash flows, in millions:
What is the IRR of this project?
Copyright © 2013 CFA Institute 34
Year Cash Flow0 –€5501 €4902 €4903 €4904 –€940
EXAMPLE: THE MULTIPLE IRR PROBLEM
Copyright © 2013 CFA Institute 35
-€120-€100-€80-€60-€40-€20€0€20€40
Required Rate of Return
NPV (millions)
IRR = 2.856%
IRR = 34.249%
POPULARITY AND USAGE OF CAPITAL BUDGETING METHODS
•In terms of consistency with owners’ wealth maximization, NPV and IRR are preferred over other methods.
•Larger companies tend to prefer NPV and IRR over the payback period method.
•The payback period is still used, despite its failings.•The NPV is the estimated added value from investing in the project; therefore, this added value should be reflected in the company’s stock price.
Copyright © 2013 CFA Institute 36
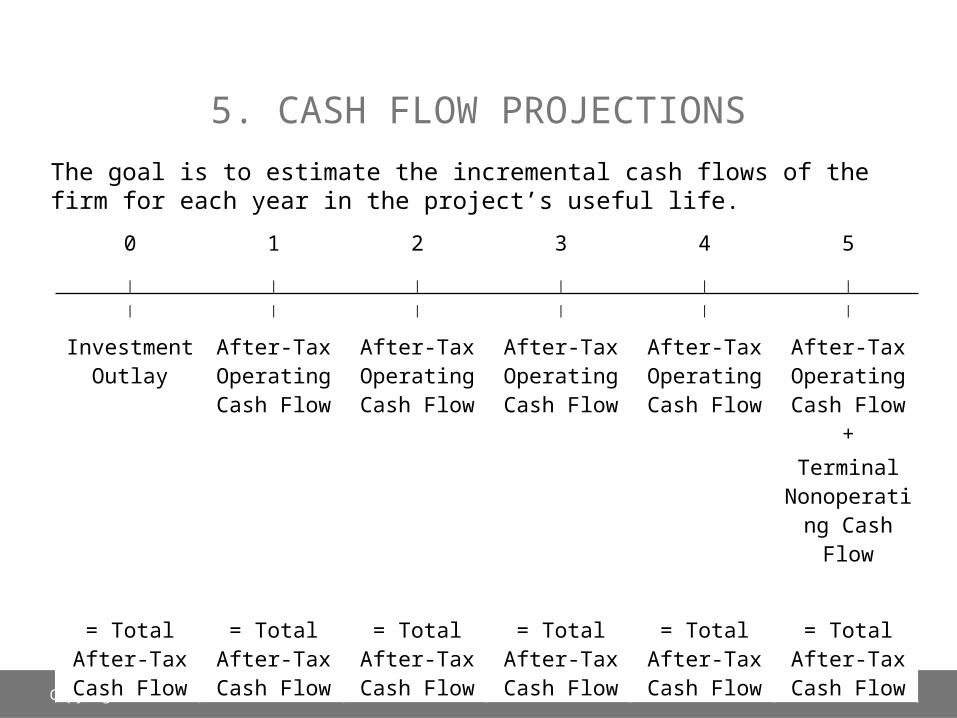
5. CASH FLOW PROJECTIONSThe goal is to estimate the incremental cash flows of the firm for each year in the project’s useful life.
Copyright © 2013 CFA Institute 37
0 1 2 3 4 5| | | | | || | | | | |
Investment Outlay
After-Tax Operating Cash Flow
After-Tax Operating Cash Flow
After-Tax Operating Cash Flow
After-Tax Operating Cash Flow
After-Tax Operating Cash Flow
+Terminal
Nonoperating Cash Flow
= Total After-Tax Cash Flow
= Total After-Tax Cash Flow
= Total After-Tax Cash Flow
= Total After-Tax Cash Flow
= Total After-Tax Cash Flow
= Total After-Tax Cash Flow
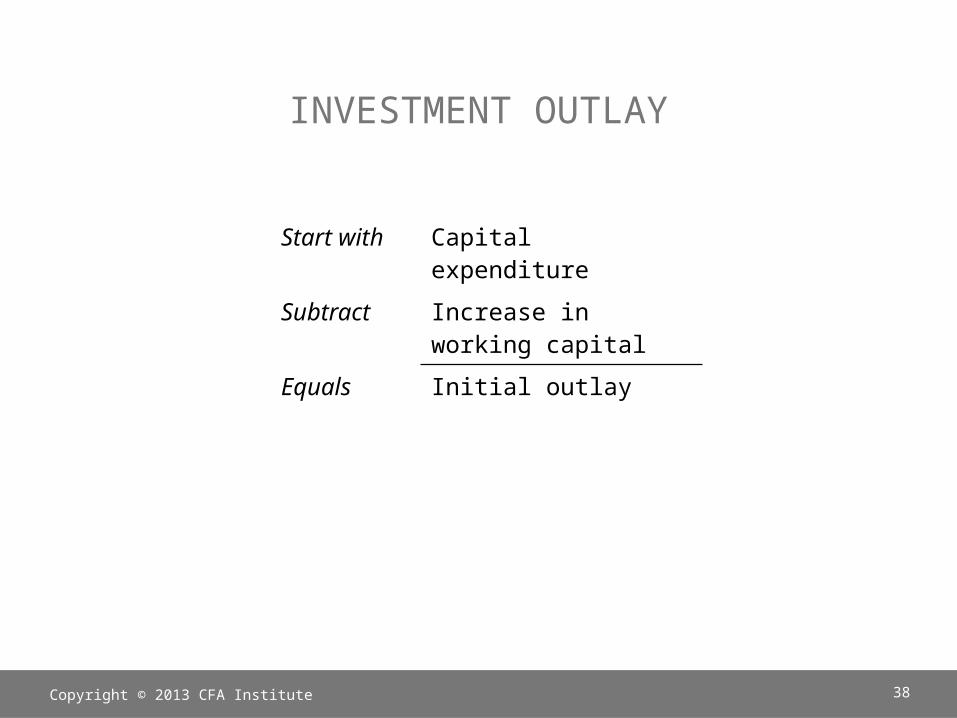
INVESTMENT OUTLAY
Start with Capital expenditure
Subtract Increase in working capital
Equals Initial outlay
Copyright © 2013 CFA Institute 38
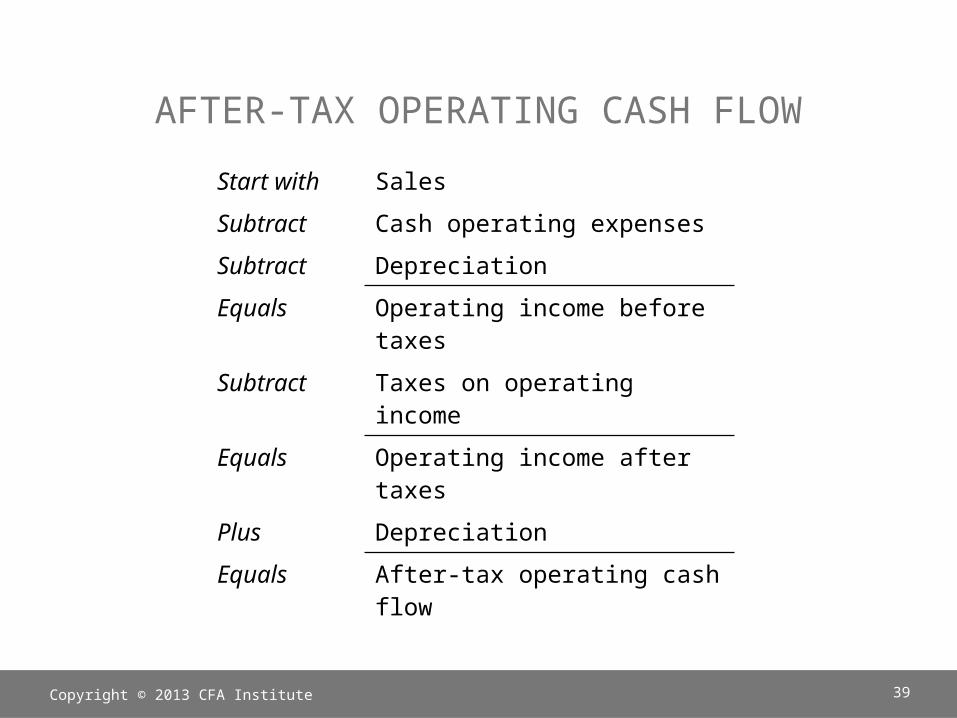
AFTER-TAX OPERATING CASH FLOWStart with SalesSubtract Cash operating expensesSubtract DepreciationEquals Operating income before
taxesSubtract Taxes on operating
incomeEquals Operating income after
taxesPlus DepreciationEquals After-tax operating cash
flow
Copyright © 2013 CFA Institute 39
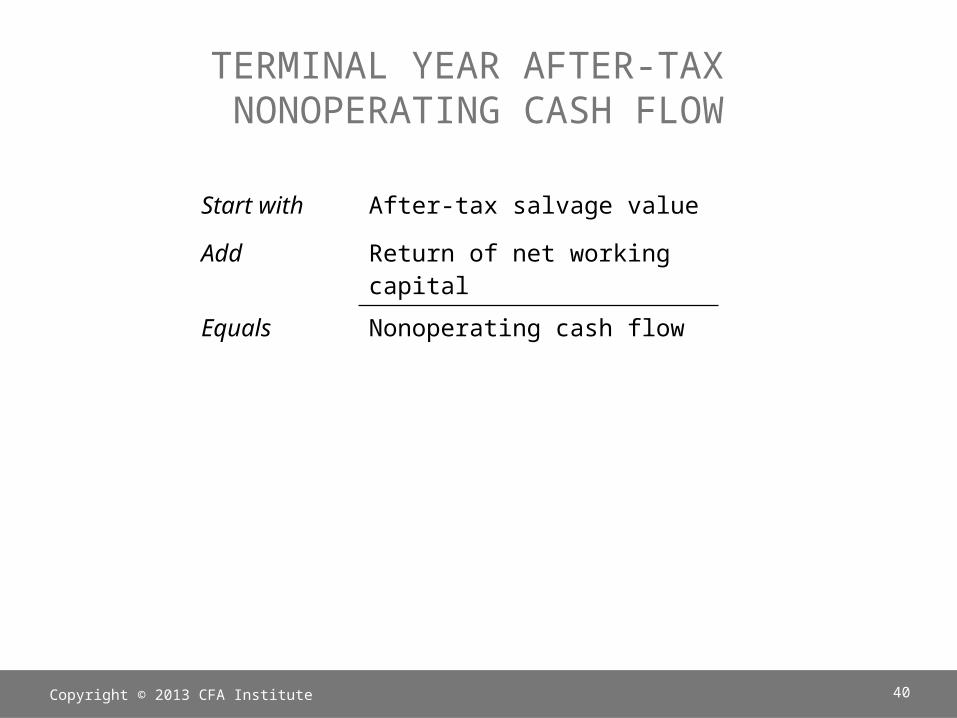
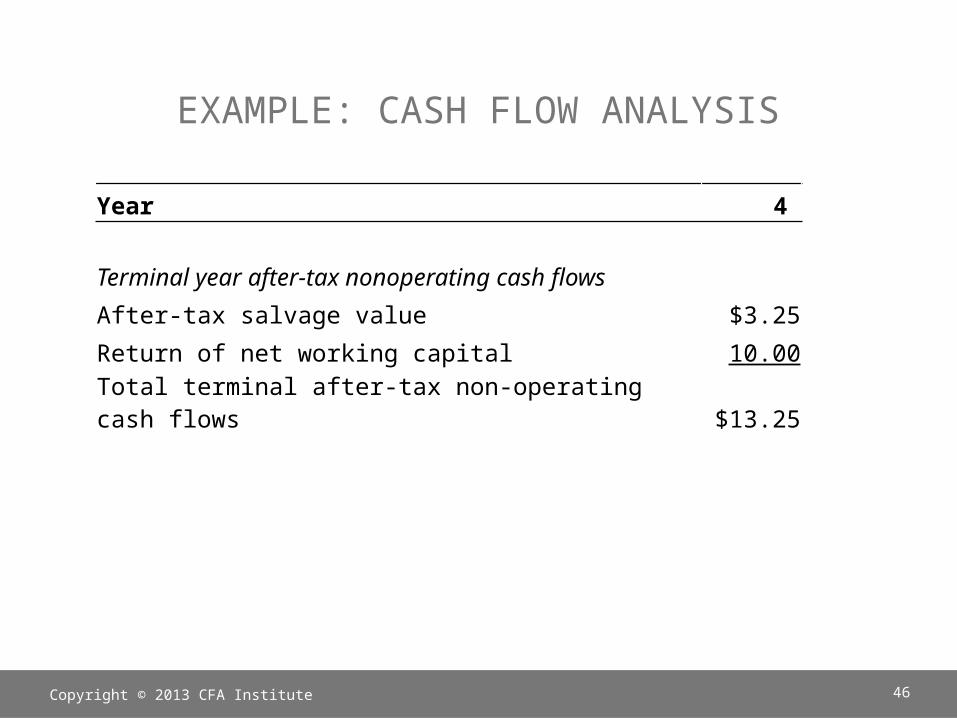
TERMINAL YEAR AFTER-TAX NONOPERATING CASH FLOW
Start with After-tax salvage valueAdd Return of net working
capitalEquals Nonoperating cash flow
Copyright © 2013 CFA Institute 40
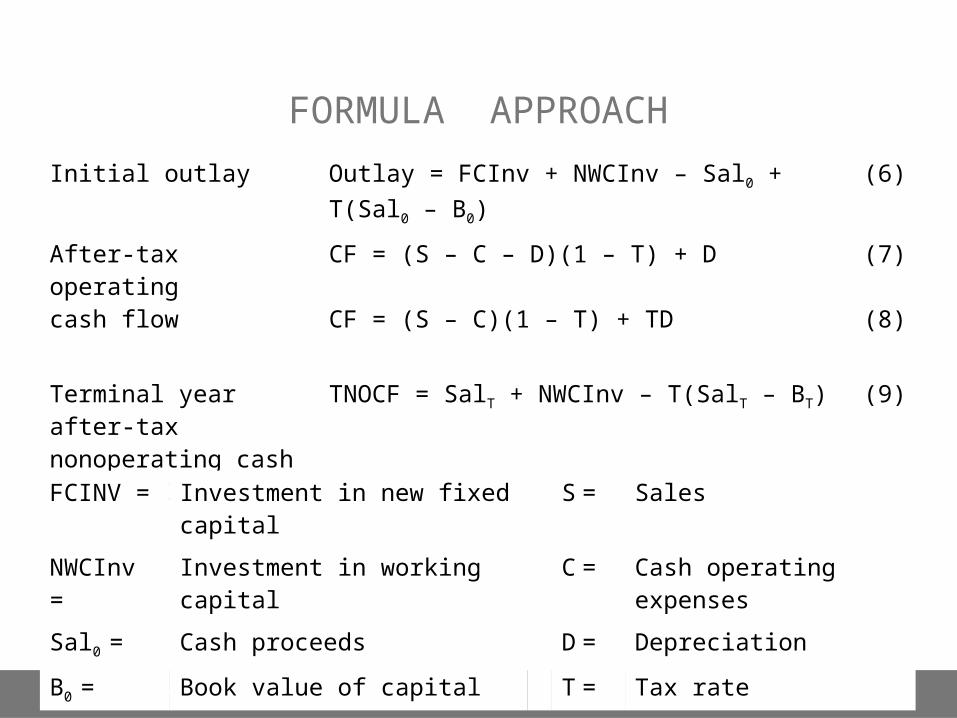
FORMULA APPROACHInitial outlay Outlay = FCInv + NWCInv – Sal0 +
T(Sal0 – B0) (6)
After-tax operating cash flow
CF = (S – C – D)(1 – T) + D
CF = (S – C)(1 – T) + TD
(7)
(8)
Terminal year after-tax nonoperating cash flow (TNOCF)
TNOCF = SalT + NWCInv – T(SalT – BT) (9)
Copyright © 2013 CFA Institute 41
FCINV = Investment in new fixed capital
S = Sales
NWCInv =
Investment in working capital
C = Cash operating expenses
Sal0 = Cash proceeds D = DepreciationB0 = Book value of capital T = Tax rate
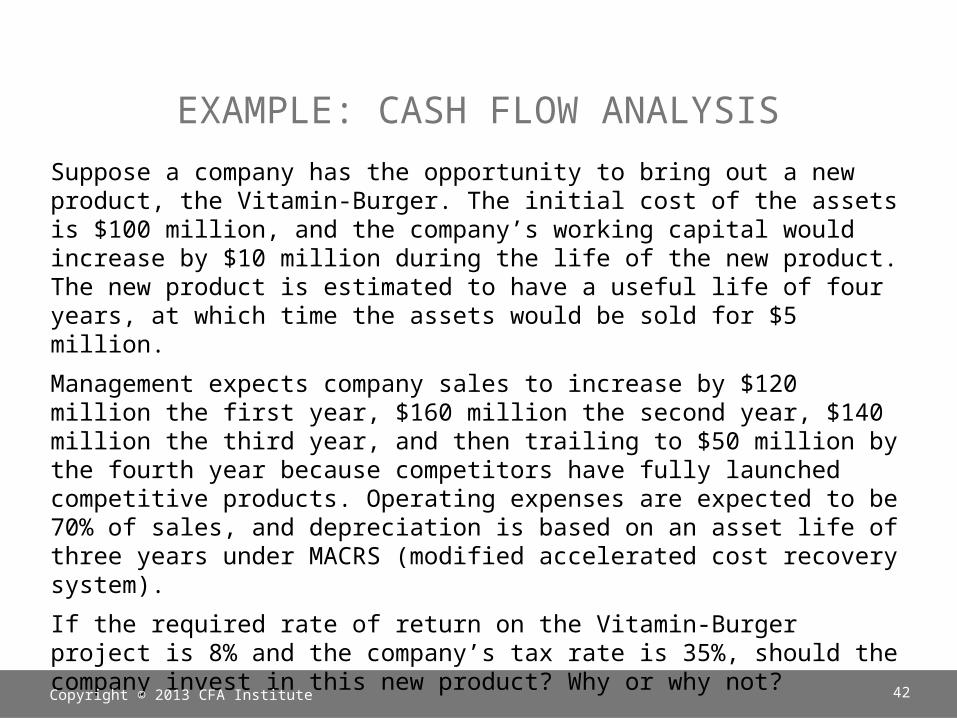
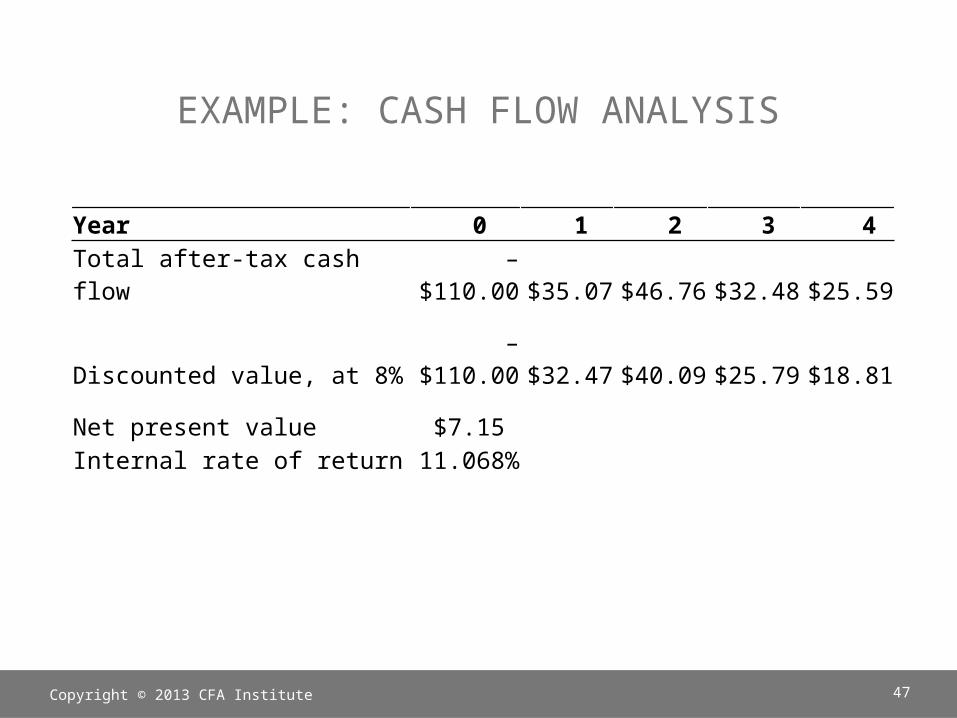
EXAMPLE: CASH FLOW ANALYSISSuppose a company has the opportunity to bring out a new product, the Vitamin-Burger. The initial cost of the assets is $100 million, and the company’s working capital would increase by $10 million during the life of the new product. The new product is estimated to have a useful life of four years, at which time the assets would be sold for $5 million.Management expects company sales to increase by $120 million the first year, $160 million the second year, $140 million the third year, and then trailing to $50 million by the fourth year because competitors have fully launched competitive products. Operating expenses are expected to be 70% of sales, and depreciation is based on an asset life of three years under MACRS (modified accelerated cost recovery system).If the required rate of return on the Vitamin-Burger project is 8% and the company’s tax rate is 35%, should the company invest in this new product? Why or why not?Copyright © 2013 CFA Institute 42
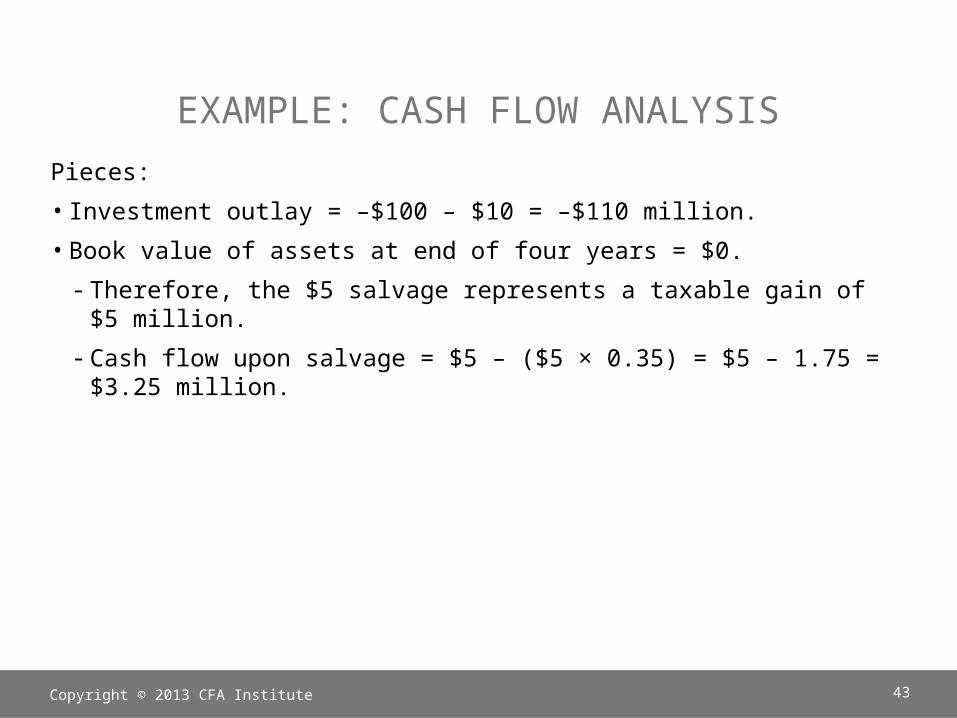
EXAMPLE: CASH FLOW ANALYSISPieces:•Investment outlay = –$100 – $10 = –$110 million.•Book value of assets at end of four years = $0.-Therefore, the $5 salvage represents a taxable gain of $5 million.
-Cash flow upon salvage = $5 – ($5 × 0.35) = $5 – 1.75 = $3.25 million.
Copyright © 2013 CFA Institute 43
EXAMPLE: CASH FLOW ANALYSIS
Copyright © 2013 CFA Institute 44
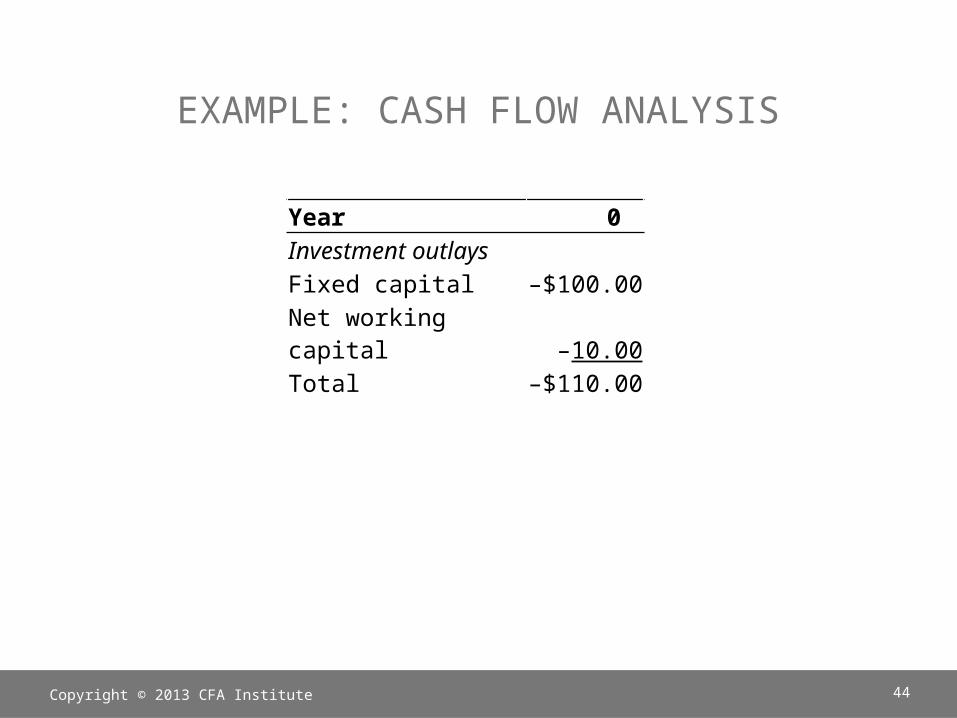
Year 0Investment outlaysFixed capital –$100.00Net working capital –10.00Total –$110.00
EXAMPLE: CASH FLOW ANALYSIS
Copyright © 2013 CFA Institute 45
Year 1 2 3 4Annual after-tax operating cash flows
Sales$120.0
0$160.0
0$140.0
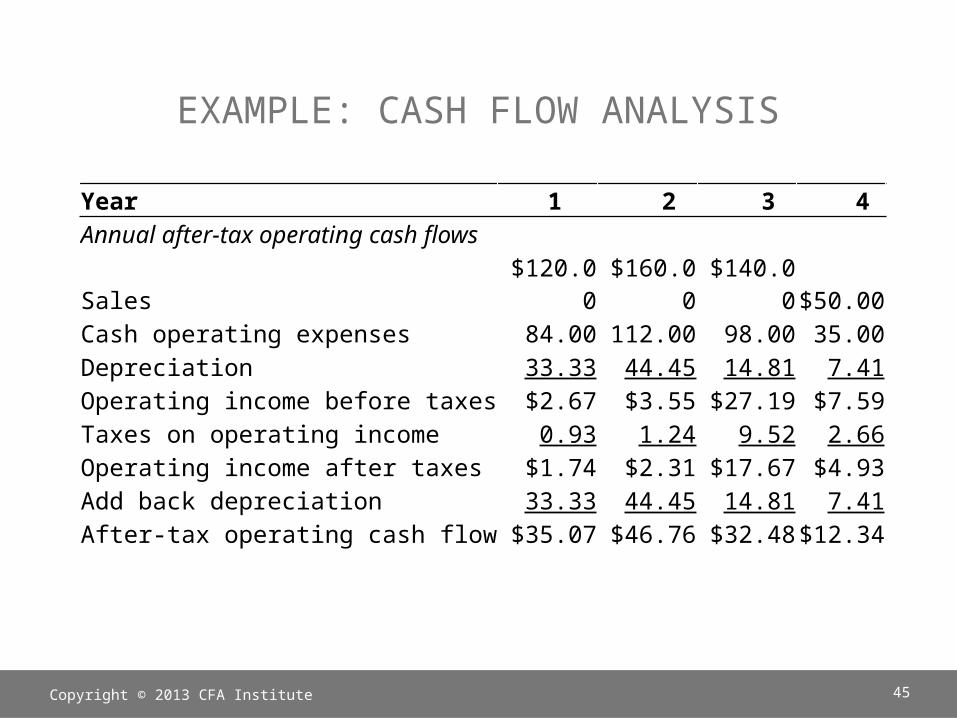
0$50.00Cash operating expenses 84.00 112.00 98.00 35.00Depreciation 33.33 44.45 14.81 7.41Operating income before taxes $2.67 $3.55 $27.19 $7.59Taxes on operating income 0.93 1.24 9.52 2.66Operating income after taxes $1.74 $2.31 $17.67 $4.93Add back depreciation 33.33 44.45 14.81 7.41After-tax operating cash flow $35.07 $46.76 $32.48$12.34
EXAMPLE: CASH FLOW ANALYSIS
Copyright © 2013 CFA Institute 46
Year 4
Terminal year after-tax nonoperating cash flowsAfter-tax salvage value $3.25Return of net working capital 10.00Total terminal after-tax non-operating cash flows $13.25
EXAMPLE: CASH FLOW ANALYSIS
Copyright © 2013 CFA Institute 47
Year 0 1 2 3 4Total after-tax cash flow
–$110.00 $35.07 $46.76 $32.48 $25.59
Discounted value, at 8%–
$110.00 $32.47 $40.09 $25.79 $18.81
Net present value $7.15 Internal rate of return 11.068%
6.MORE ON CASH FLOW PROJECTIONS
Depreciation Issues
Replacement Decisions
Inflation
Copyright © 2013 CFA Institute 48
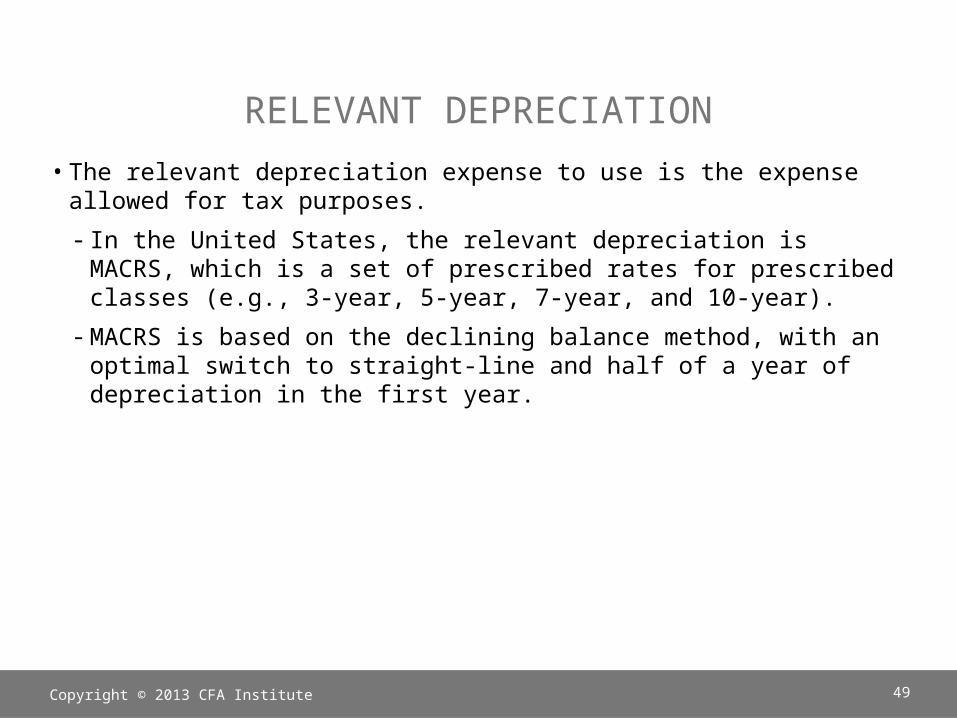
RELEVANT DEPRECIATION•The relevant depreciation expense to use is the expense allowed for tax purposes.-In the United States, the relevant depreciation is MACRS, which is a set of prescribed rates for prescribed classes (e.g., 3-year, 5-year, 7-year, and 10-year).
-MACRS is based on the declining balance method, with an optimal switch to straight-line and half of a year of depreciation in the first year.
Copyright © 2013 CFA Institute 49
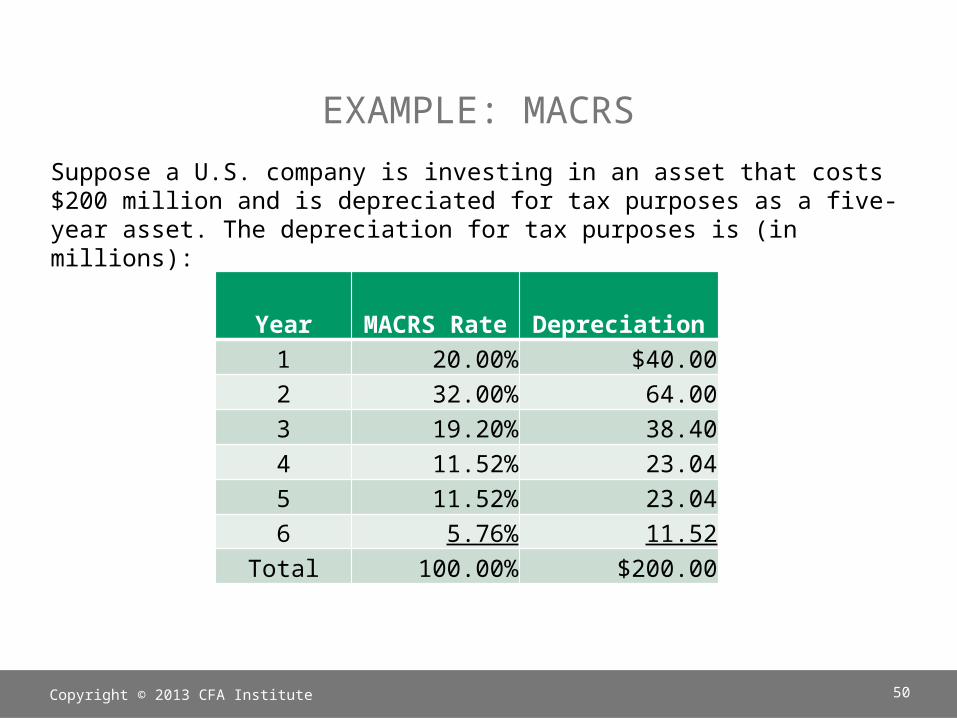
EXAMPLE: MACRSSuppose a U.S. company is investing in an asset that costs $200 million and is depreciated for tax purposes as a five-year asset. The depreciation for tax purposes is (in millions):
Copyright © 2013 CFA Institute 50
Year MACRS Rate Depreciation1 20.00% $40.002 32.00% 64.003 19.20% 38.404 11.52% 23.045 11.52% 23.046 5.76% 11.52
Total 100.00% $200.00
PRESENT VALUE OF DEPRECIATION TAX SAVINGS
•The cash flow generated from the deductibility of depreciation (which itself is a noncash expense) is the product of the tax rate and the depreciation expense.-If the depreciation expense is $40 million, the cash flow from this expense is $40 million × Tax rate.
-The present value of these cash flows over the life of the project is the present value of tax savings from depreciation.
Copyright © 2013 CFA Institute 51
PRESENT VALUE OF DEPRECIATION TAX SAVINGS
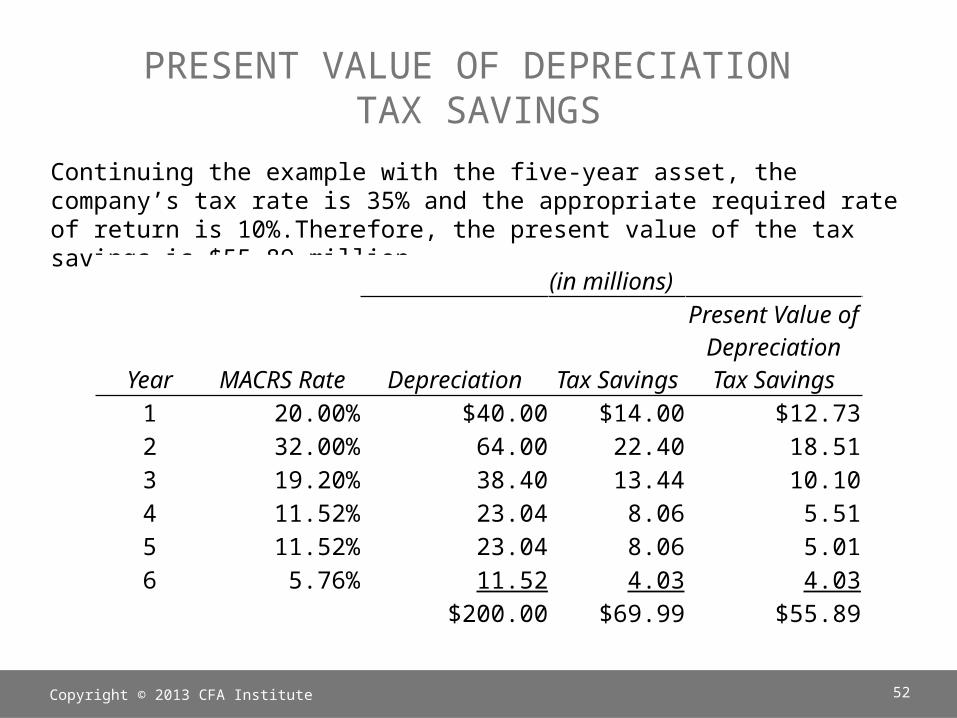
Continuing the example with the five-year asset, the company’s tax rate is 35% and the appropriate required rate of return is 10%.Therefore, the present value of the tax savings is $55.89 million.
Copyright © 2013 CFA Institute 52
(in millions)
Year MACRS Rate Depreciation Tax Savings
Present Value of DepreciationTax Savings
1 20.00% $40.00 $14.00 $12.732 32.00% 64.00 22.40 18.513 19.20% 38.40 13.44 10.104 11.52% 23.04 8.06 5.515 11.52% 23.04 8.06 5.016 5.76% 11.52 4.03 4.03
$200.00 $69.99 $55.89
CASH FLOWS FOR A REPLACEMENT PROJECT•When there is a replacement decision, the relevant cash flows expand to consider the disposition of the replaced assets:-Incremental depreciation expense (old versus new depreciation)
-Other incremental operating expenses-Nonoperating expenses
•Key: The relevant cash flows are those that change with the replacement.
Copyright © 2013 CFA Institute 53
SPREADSHEET MODELING•We can use spreadsheets (e.g., Microsoft Excel) to model the capital budgeting problem.
•Useful Excel functions:-Data tables-NPV-IRR
•A spreadsheet makes it easier for the user to perform sensitivity and simulation analyses.
Copyright © 2013 CFA Institute 54
EFFECTS OF INFLATION ON CAPITAL BUDGETING ANALYSIS
•Issue: Although the nominal required rate of return reflects inflation expectations and sales and operating expenses are affected by inflation,-The effect of inflation may not be the same for sales as operating expenses.
-Depreciation is not affected by inflation.-The fixed cost nature of payments to bondholders may result in a benefit or a cost to the company, depending on inflation relative to expected inflation.
Copyright © 2013 CFA Institute 55
7.PROJECT ANALYSIS AND EVALUATION
What if we are choosing among mutually exclusive projects that have different useful lives?
What happens under capital rationing?
How do we deal with risk?
Copyright © 2013 CFA Institute 56
MUTUALLY EXCLUSIVE PROJECTS WITH UNEQUAL LIVES
•When comparing projects that have different useful lives, we cannot simply compare NPVs because the timing of replacing the projects would be different, and hence, the number of replacements between the projects would be different in order to accomplish the same function.
•Approaches1. Determine the least common life for a finite number of
replacements and calculate NPV for each project.2. Determine the annual annuity that is equivalent to
investing in each project ad infinitum (that is, calculate the equivalent annual annuity, or EAA).
Copyright © 2013 CFA Institute 57
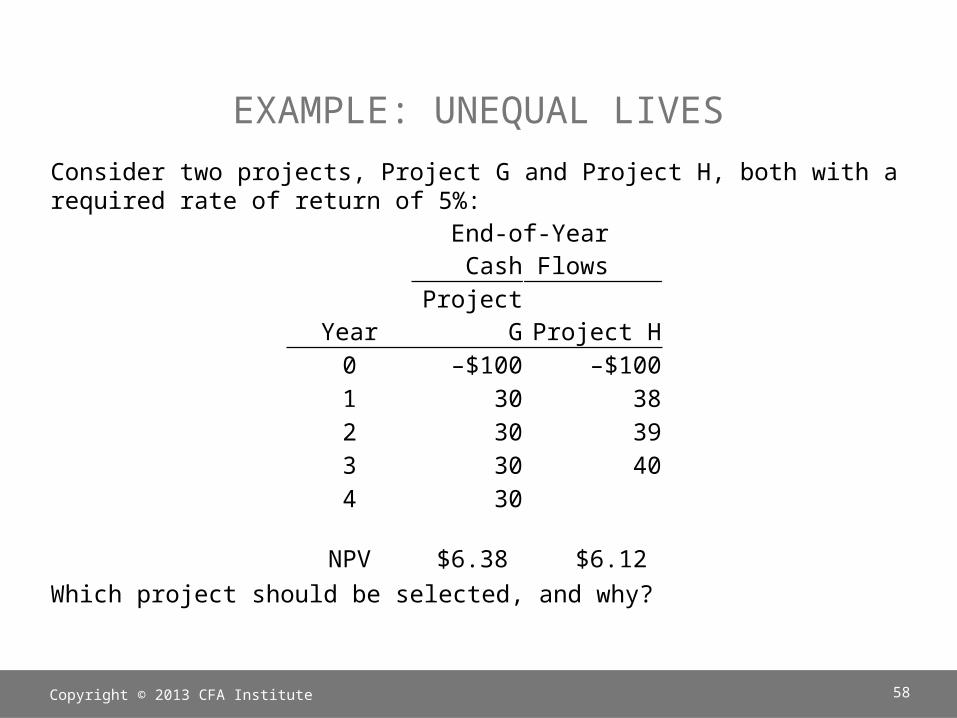
EXAMPLE: UNEQUAL LIVESConsider two projects, Project G and Project H, both with a required rate of return of 5%:
Which project should be selected, and why?
Copyright © 2013 CFA Institute 58
End-of-Year Cash Flows
YearProject
G Project H0 –$100 –$1001 30 382 30 393 30 404 30
NPV $6.38 $6.12
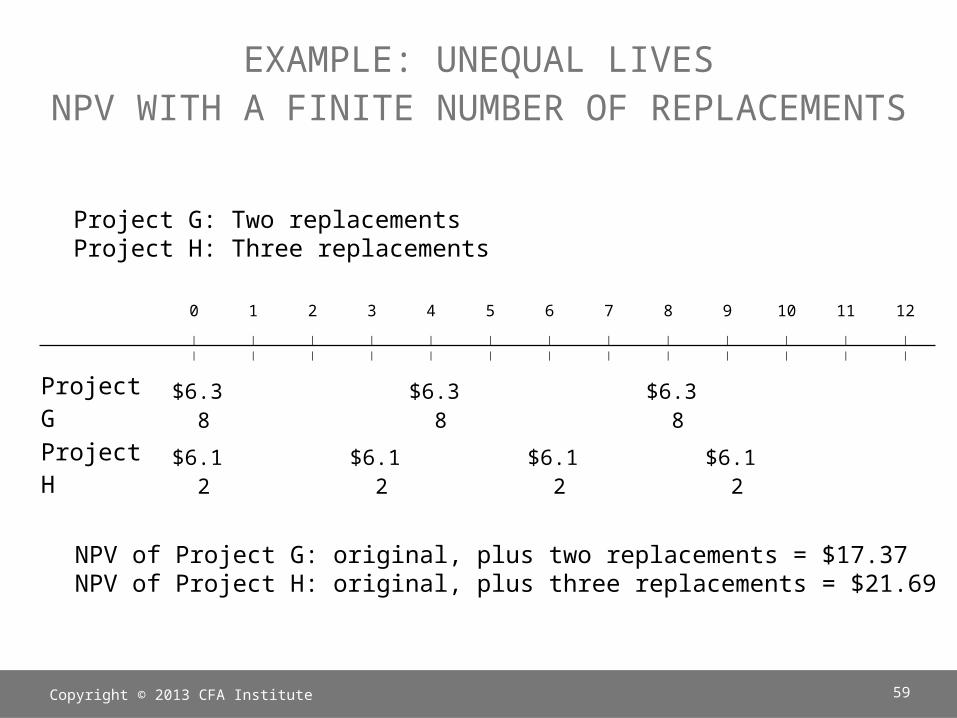
EXAMPLE: UNEQUAL LIVESNPV WITH A FINITE NUMBER OF REPLACEMENTS
Copyright © 2013 CFA Institute 59
0 1 2 3 4 5 6 7 8 9 10 11 12| | | | | | | | | | | | || | | | | | | | | | | | |
Project G
$6.38
$6.38
$6.38
Project H
$6.12
$6.12
$6.12
$6.12
Project G: Two replacementsProject H: Three replacements
NPV of Project G: original, plus two replacements = $17.37NPV of Project H: original, plus three replacements = $21.69
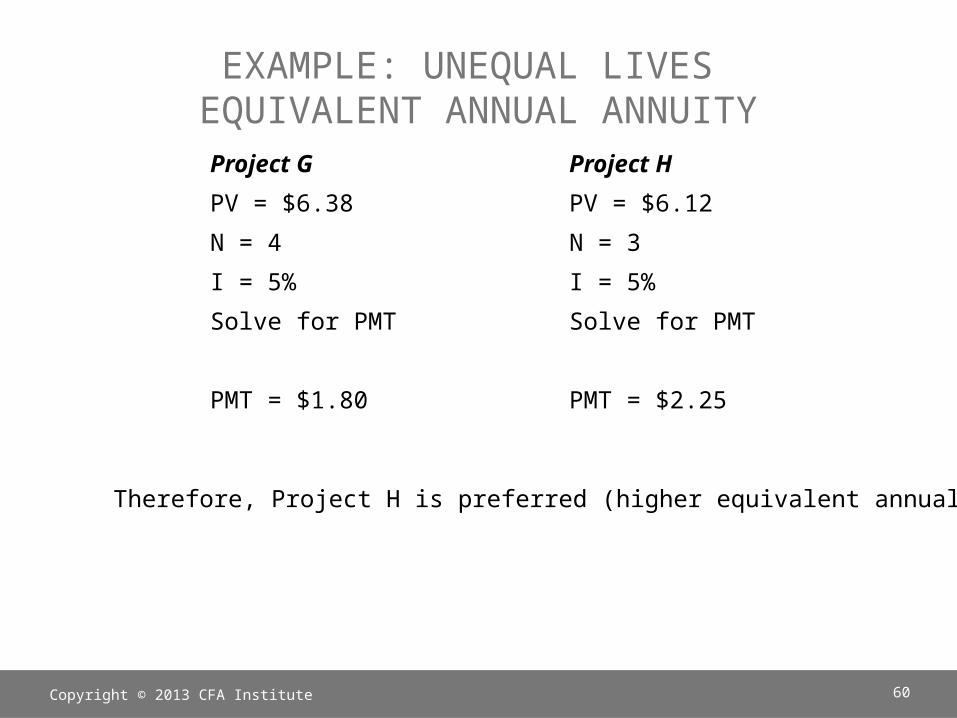
EXAMPLE: UNEQUAL LIVES EQUIVALENT ANNUAL ANNUITYProject GPV = $6.38N = 4I = 5%Solve for PMT
PMT = $1.80
Project HPV = $6.12N = 3I = 5%Solve for PMT
PMT = $2.25
Copyright © 2013 CFA Institute 60
Therefore, Project H is preferred (higher equivalent annual annuity).
DECISION MAKING UNDER CAPITAL RATIONING
•When there is capital rationing, the company may not be able to invest in all profitable projects.
•The key to decision making under capital rationing is to select those projects that maximize the total net present value given the limit on the capital budget.
Copyright © 2013 CFA Institute 61
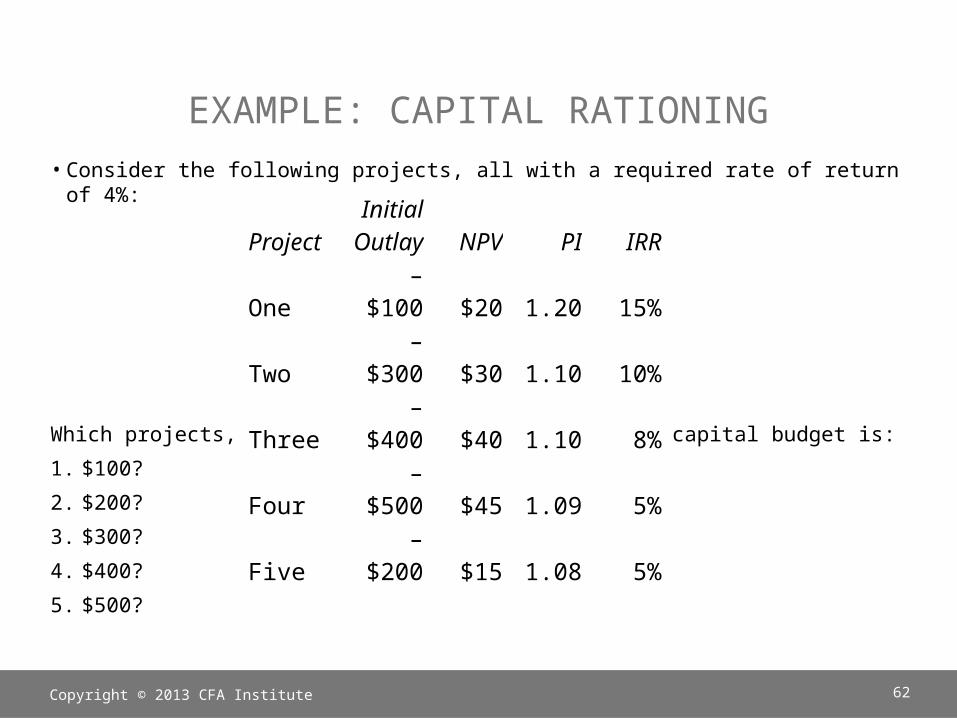
EXAMPLE: CAPITAL RATIONING•Consider the following projects, all with a required rate of return of 4%:
Which projects, if any, should be selected if the capital budget is:1. $100?2. $200?3. $300?4. $400?5. $500?
Copyright © 2013 CFA Institute 62
ProjectInitial
Outlay NPV PI IRR
One–
$100 $20 1.20 15%
Two–
$300 $30 1.10 10%
Three–
$400 $40 1.10 8%
Four–
$500 $45 1.09 5%
Five–
$200 $15 1.08 5%
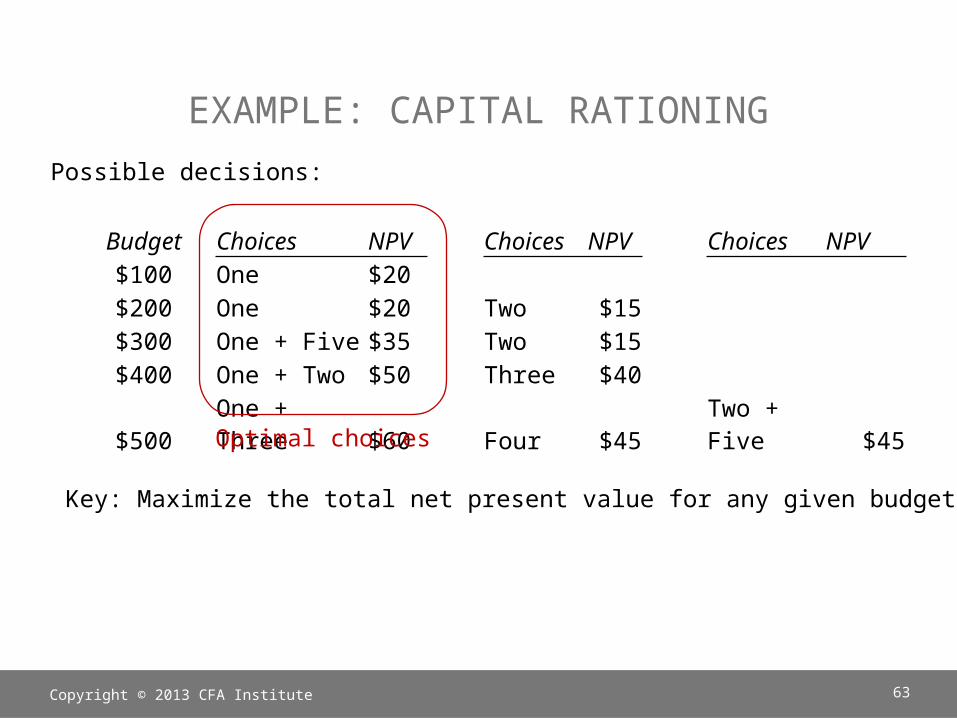
EXAMPLE: CAPITAL RATIONINGPossible decisions:
Copyright © 2013 CFA Institute 63
Budget Choices NPV Choices NPV Choices NPV$100 One $20$200 One $20 Two $15$300 One + Five $35 Two $15$400 One + Two $50 Three $40
$500One + Three $60 Four $45
Two + Five $45
Key: Maximize the total net present value for any given budget.
Optimal choices
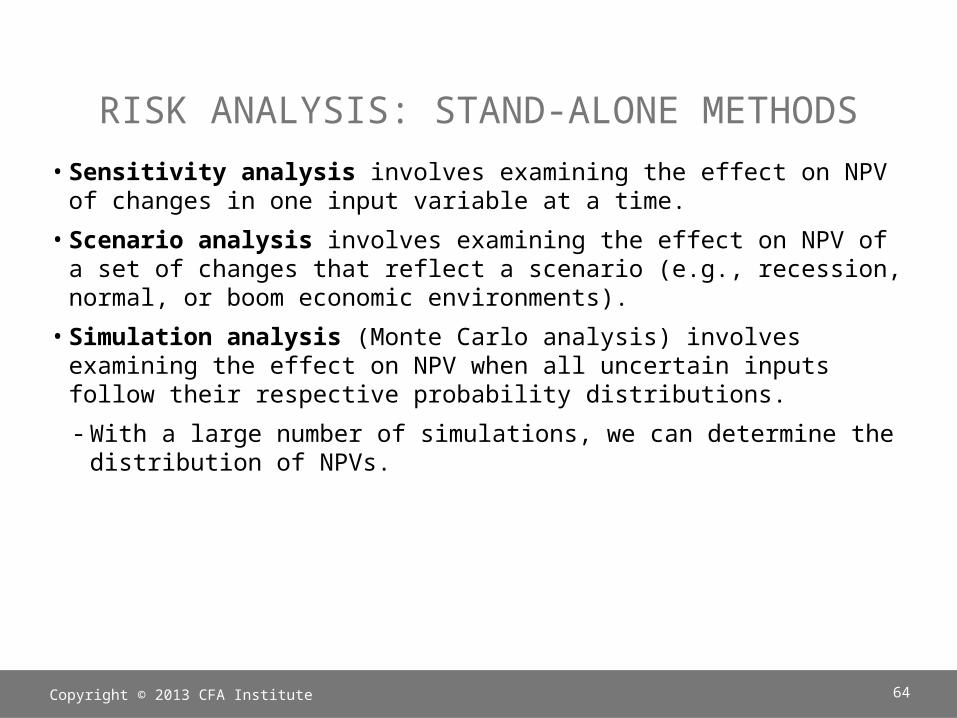
RISK ANALYSIS: STAND-ALONE METHODS•Sensitivity analysis involves examining the effect on NPV of changes in one input variable at a time.
•Scenario analysis involves examining the effect on NPV of a set of changes that reflect a scenario (e.g., recession, normal, or boom economic environments).
•Simulation analysis (Monte Carlo analysis) involves examining the effect on NPV when all uncertain inputs follow their respective probability distributions.-With a large number of simulations, we can determine the distribution of NPVs.
Copyright © 2013 CFA Institute 64
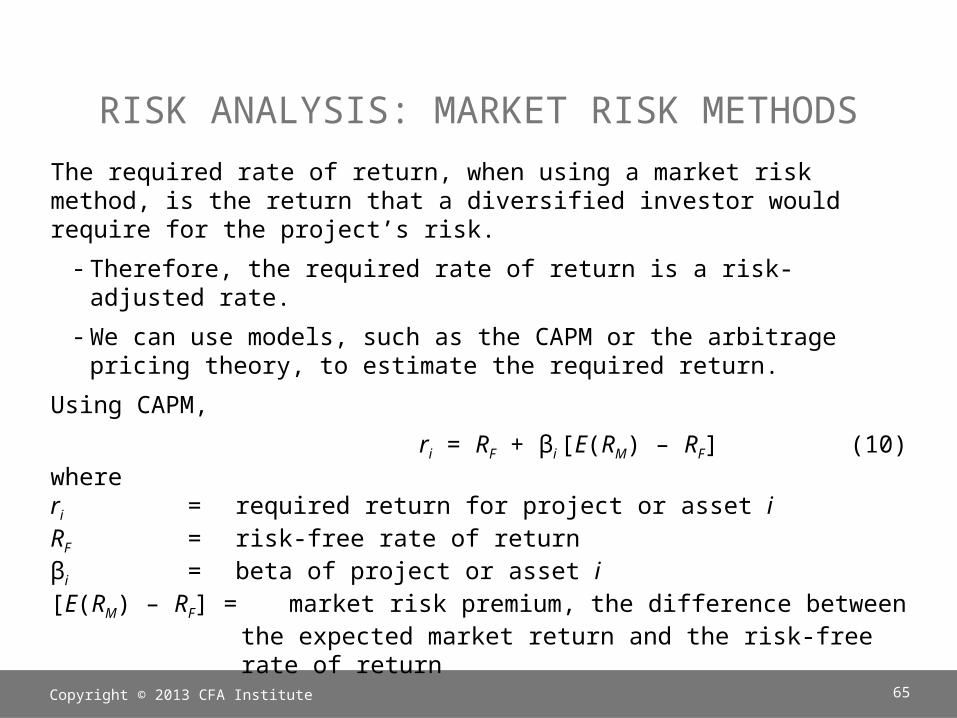
RISK ANALYSIS: MARKET RISK METHODSThe required rate of return, when using a market risk method, is the return that a diversified investor would require for the project’s risk.-Therefore, the required rate of return is a risk-adjusted rate.
-We can use models, such as the CAPM or the arbitrage pricing theory, to estimate the required return.
Using CAPM, ri = RF + βi [E(RM) – RF] (10)
whereri = required return for project or asset iRF = risk-free rate of returnβi = beta of project or asset i[E(RM) – RF] = market risk premium, the difference between
the expected market return and the risk-free rate of return
Copyright © 2013 CFA Institute 65
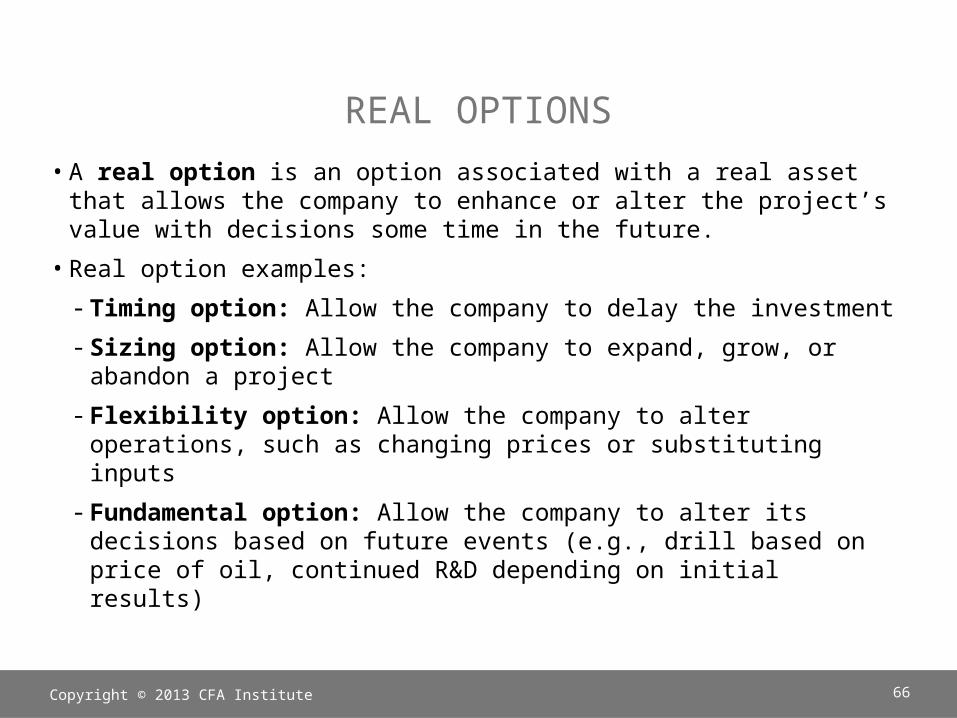
REAL OPTIONS•A real option is an option associated with a real asset that allows the company to enhance or alter the project’s value with decisions some time in the future.
•Real option examples:-Timing option: Allow the company to delay the investment-Sizing option: Allow the company to expand, grow, or abandon a project
-Flexibility option: Allow the company to alter operations, such as changing prices or substituting inputs
-Fundamental option: Allow the company to alter its decisions based on future events (e.g., drill based on price of oil, continued R&D depending on initial results)
Copyright © 2013 CFA Institute 66
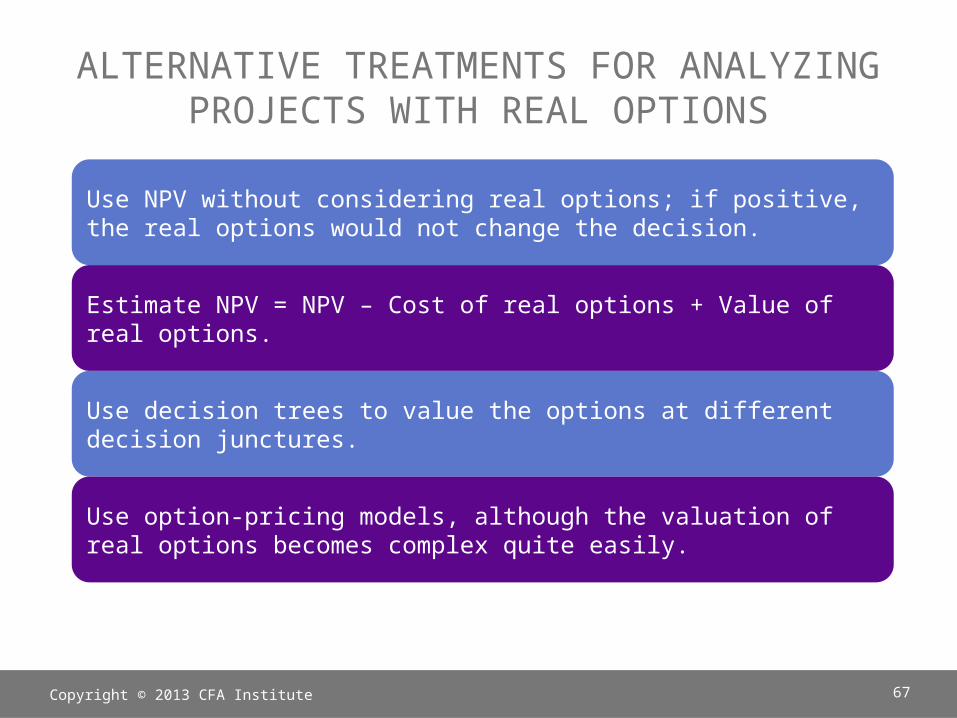
ALTERNATIVE TREATMENTS FOR ANALYZING PROJECTS WITH REAL OPTIONS
Use NPV without considering real options; if positive, the real options would not change the decision.
Estimate NPV = NPV – Cost of real options + Value of real options.
Use decision trees to value the options at different decision junctures.
Use option-pricing models, although the valuation of real options becomes complex quite easily.
Copyright © 2013 CFA Institute 67
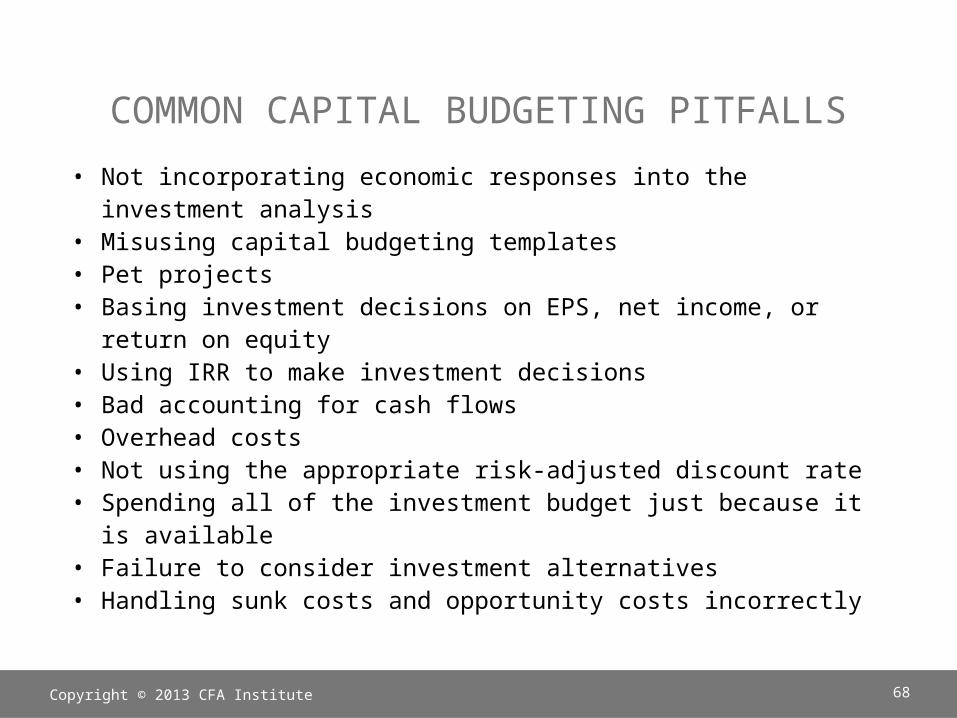
COMMON CAPITAL BUDGETING PITFALLS• Not incorporating economic responses into the
investment analysis• Misusing capital budgeting templates • Pet projects • Basing investment decisions on EPS, net income, or
return on equity • Using IRR to make investment decisions • Bad accounting for cash flows• Overhead costs• Not using the appropriate risk-adjusted discount rate• Spending all of the investment budget just because it
is available • Failure to consider investment alternatives• Handling sunk costs and opportunity costs incorrectly
Copyright © 2013 CFA Institute 68
8.OTHER INCOME MEASURES AND VALUATION MODELS
•In the basic capital budgeting model, we estimate the incremental cash flows associated with acquiring the assets, operating the project, and terminating the project.
•Once we have the incremental cash flows for each period of the capital project’s useful life, including the initial outlay, we apply the net present value or internal rate of return methods to evaluate the project.
•Other income measures are variations on the basic capital budgeting model.
Copyright © 2013 CFA Institute 69
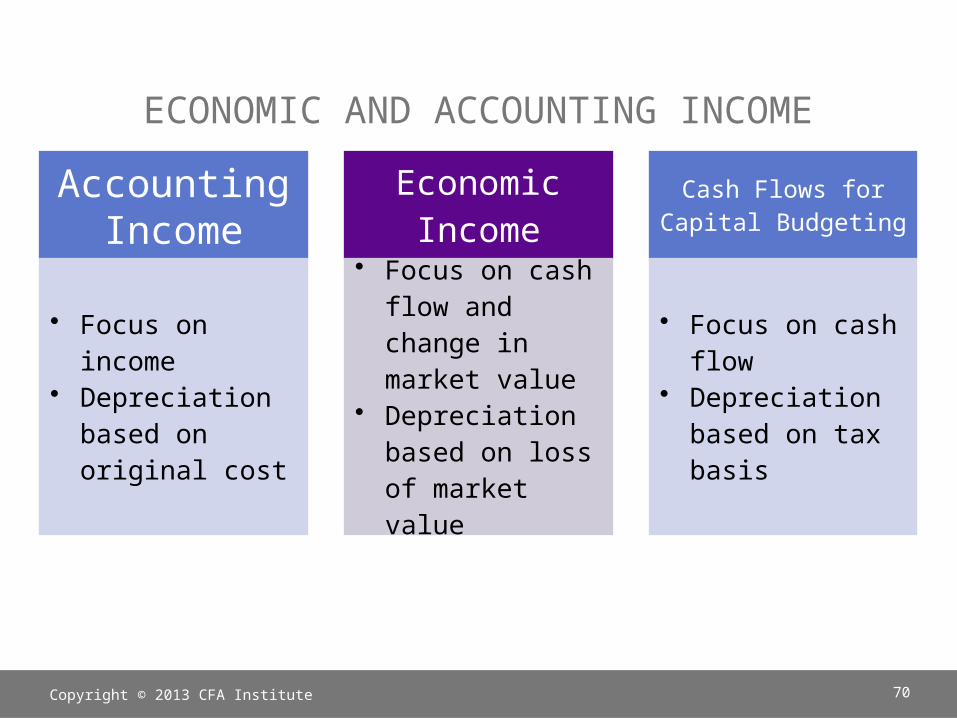
ECONOMIC AND ACCOUNTING INCOMEAccounting
Income
• Focus on income
• Depreciation based on original cost
EconomicIncome
• Focus on cash flow and change in market value
• Depreciation based on loss of market value
Cash Flows for Capital Budgeting
• Focus on cash flow
• Depreciation based on tax basis
Copyright © 2013 CFA Institute 70
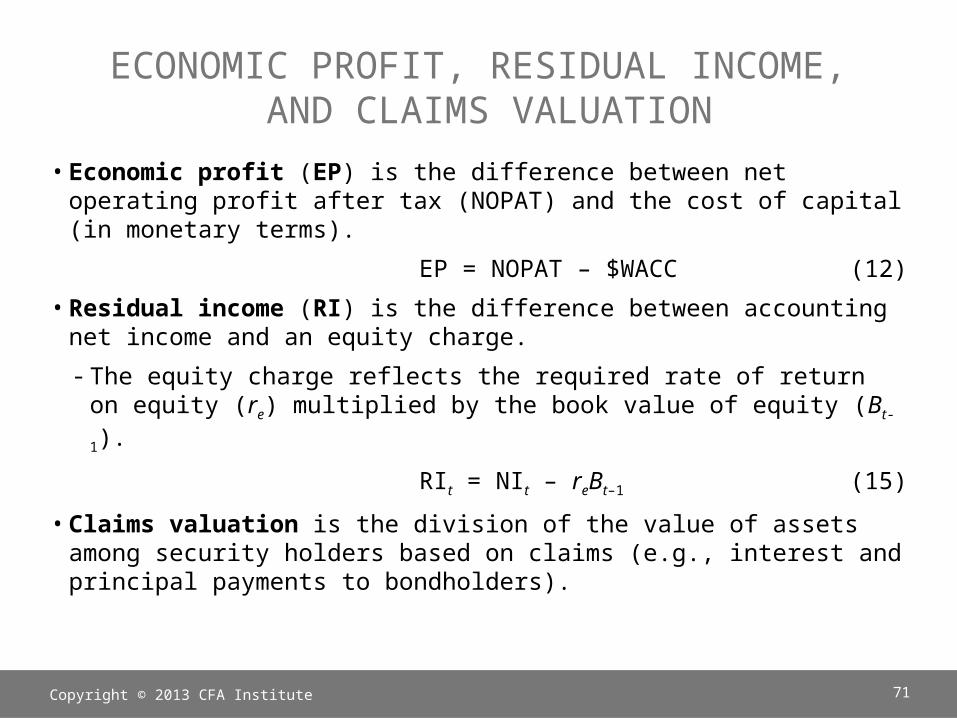
ECONOMIC PROFIT, RESIDUAL INCOME, AND CLAIMS VALUATION
•Economic profit (EP) is the difference between net operating profit after tax (NOPAT) and the cost of capital (in monetary terms).
EP = NOPAT – $WACC (12)•Residual income (RI) is the difference between accounting net income and an equity charge.-The equity charge reflects the required rate of return on equity (re) multiplied by the book value of equity (Bt-
1).RIt = NIt – reBt–1 (15)
•Claims valuation is the division of the value of assets among security holders based on claims (e.g., interest and principal payments to bondholders).
Copyright © 2013 CFA Institute 71
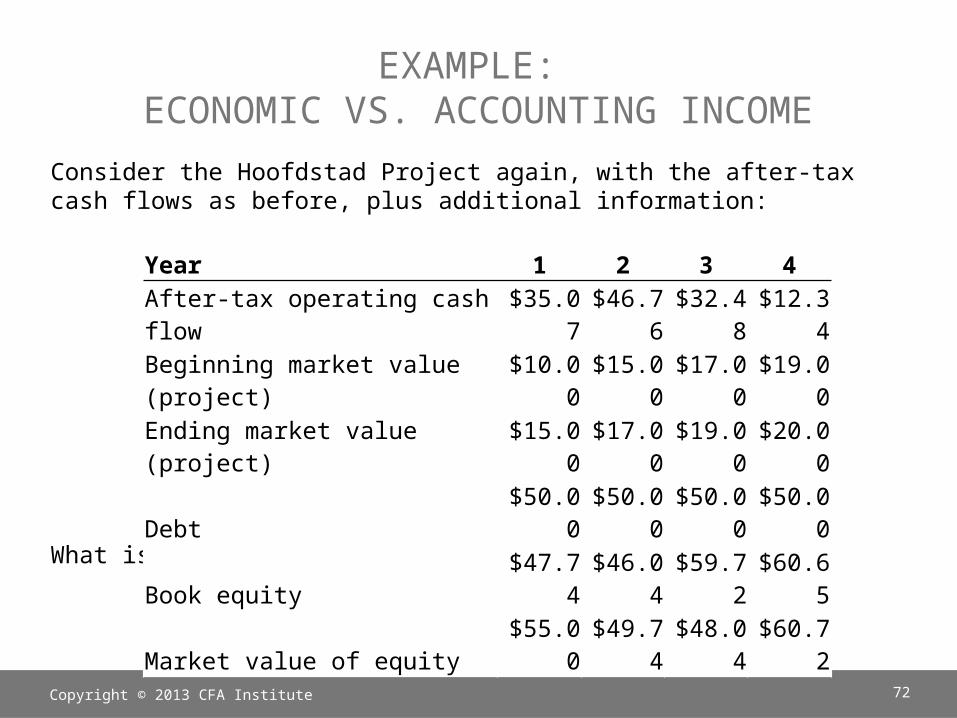
EXAMPLE: ECONOMIC VS. ACCOUNTING INCOME
Consider the Hoofdstad Project again, with the after-tax cash flows as before, plus additional information:
What is this project’s economic and accounting income?
Copyright © 2013 CFA Institute 72
Year 1 2 3 4After-tax operating cash flow
$35.07$46.7
6$32.4
8$12.3
4Beginning market value (project)
$10.00$15.0
0$17.0
0$19.0
0Ending market value (project)
$15.00$17.0
0$19.0
0$20.0
0
Debt$50.0
0$50.0
0$50.0
0$50.0
0
Book equity$47.7
4$46.0
4$59.7
2$60.6
5
Market value of equity$55.0
0$49.7
4$48.0
4$60.7
2
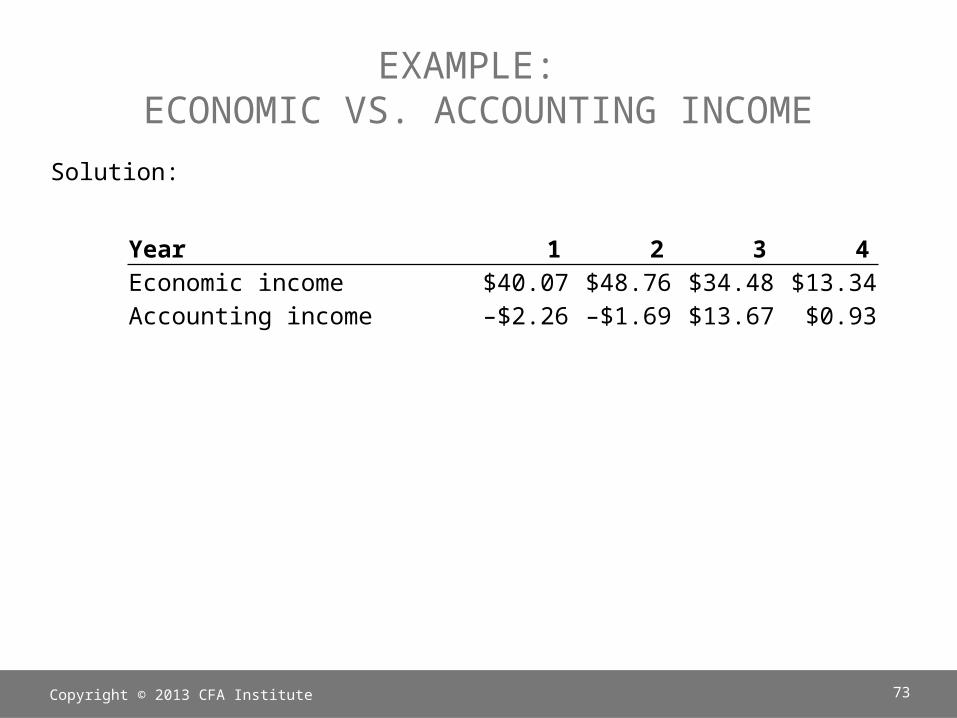
EXAMPLE: ECONOMIC VS. ACCOUNTING INCOME
Solution:
Copyright © 2013 CFA Institute 73
Year 1 2 3 4Economic income $40.07 $48.76 $34.48 $13.34Accounting income –$2.26 –$1.69 $13.67 $0.93
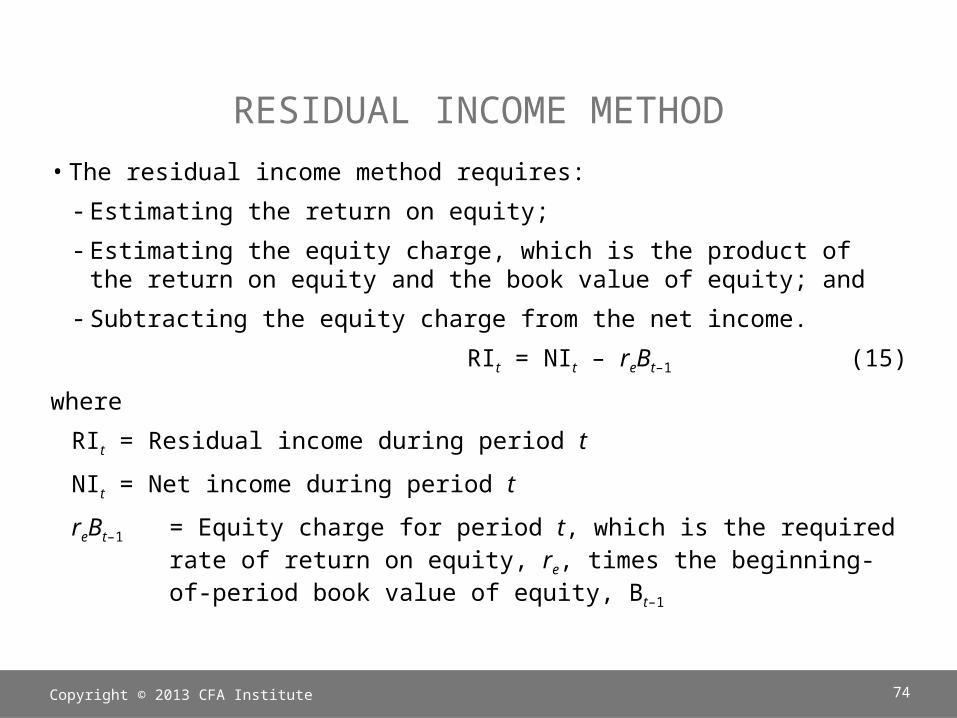
RESIDUAL INCOME METHOD•The residual income method requires:-Estimating the return on equity;-Estimating the equity charge, which is the product of the return on equity and the book value of equity; and
-Subtracting the equity charge from the net income. RIt = NIt – reBt–1 (15)
whereRIt = Residual income during period tNIt = Net income during period treBt–1 = Equity charge for period t, which is the required
rate of return on equity, re, times the beginning-of-period book value of equity, Bt–1
Copyright © 2013 CFA Institute 74
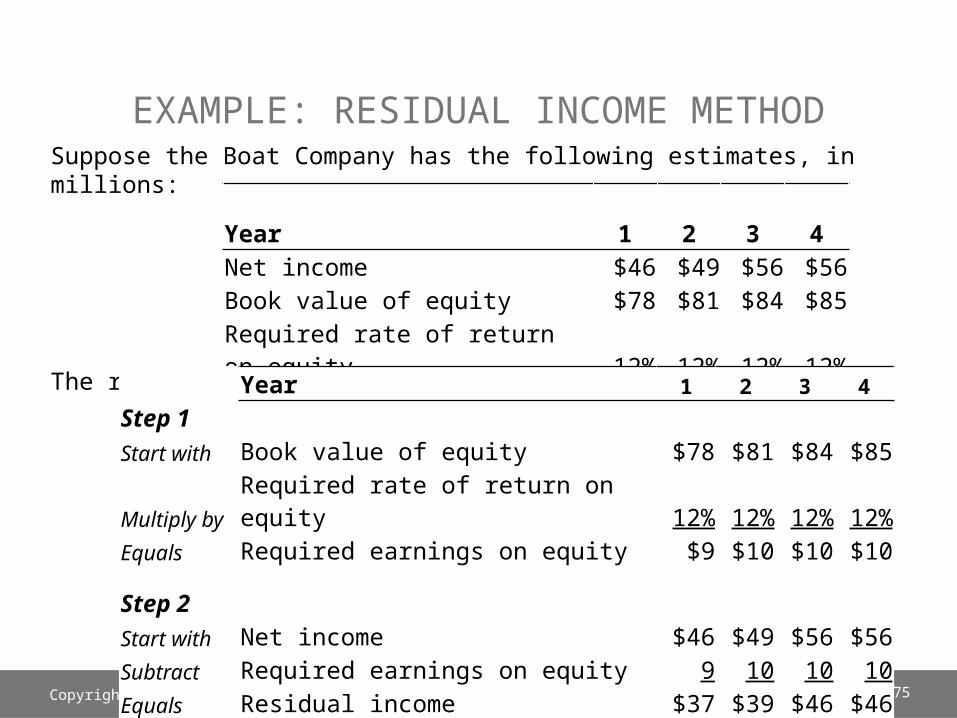
EXAMPLE: RESIDUAL INCOME METHODSuppose the Boat Company has the following estimates, in millions:
The residual income for each year, in millions:
Copyright © 2013 CFA Institute 75
Year 1
2
3
4
Net income $46 $49 $56 $56Book value of equity $78 $81 $84 $85Required rate of return on equity 12% 12% 12% 12%Year 1 2 3 4
Step 1Start with Book value of equity $78 $81 $84 $85
Multiply byRequired rate of return on equity 12% 12% 12% 12%
Equals Required earnings on equity $9 $10 $10 $10
Step 2Start with Net income $46 $49 $56 $56Subtract Required earnings on equity 9 10 10 10Equals Residual income $37 $39 $46 $46
EXAMPLE: RESIDUAL METHOD•The present value of the residual income, discounted using the 12% required rate of return, is $126 million.
•This is an estimate of how much value a project will add (or subtract, if negative).
Copyright © 2013 CFA Institute 76
CLAIMS VALUATION•The claims valuation method simply divides the “claims” of the suppliers of capital (creditors and owners) and then values the equity distributions.-The claims of creditors are the interest and principal payments on the debt.
-The claims of the owners are the anticipated dividends.
Copyright © 2013 CFA Institute 77
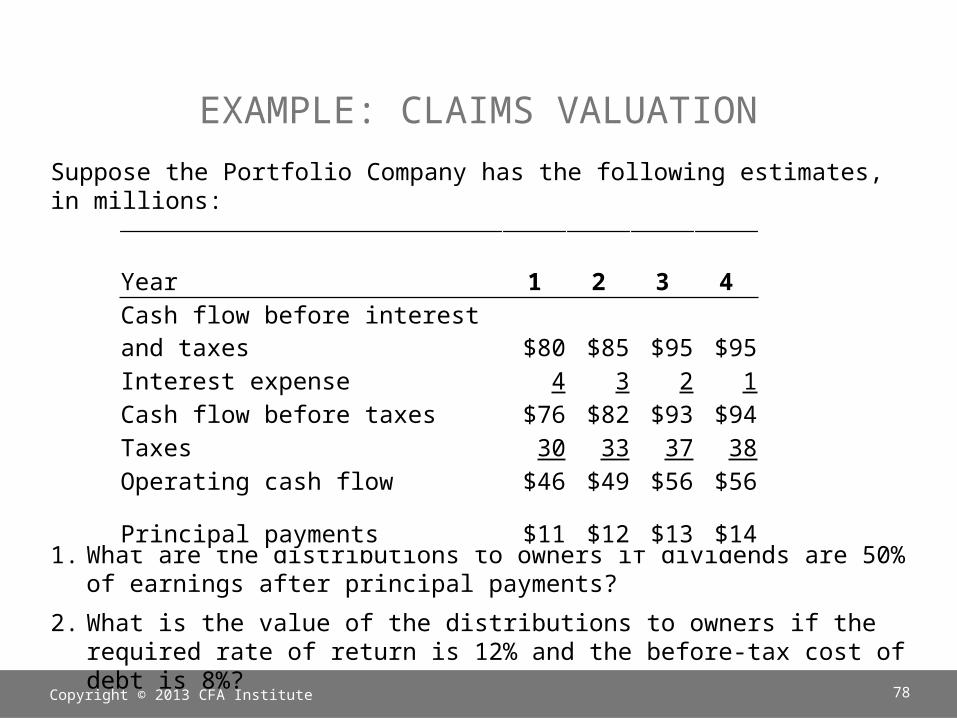
EXAMPLE: CLAIMS VALUATIONSuppose the Portfolio Company has the following estimates, in millions:
1. What are the distributions to owners if dividends are 50% of earnings after principal payments?
2. What is the value of the distributions to owners if the required rate of return is 12% and the before-tax cost of debt is 8%?Copyright © 2013 CFA Institute 78
Year 1
2
3
4
Cash flow before interest and taxes $80 $85 $95 $95Interest expense 4 3 2 1Cash flow before taxes $76 $82 $93 $94Taxes 30 33 37 38Operating cash flow $46 $49 $56 $56
Principal payments $11 $12 $13 $14
EXAMPLE: CLAIMS VALUATION
Year 1 2
3 4
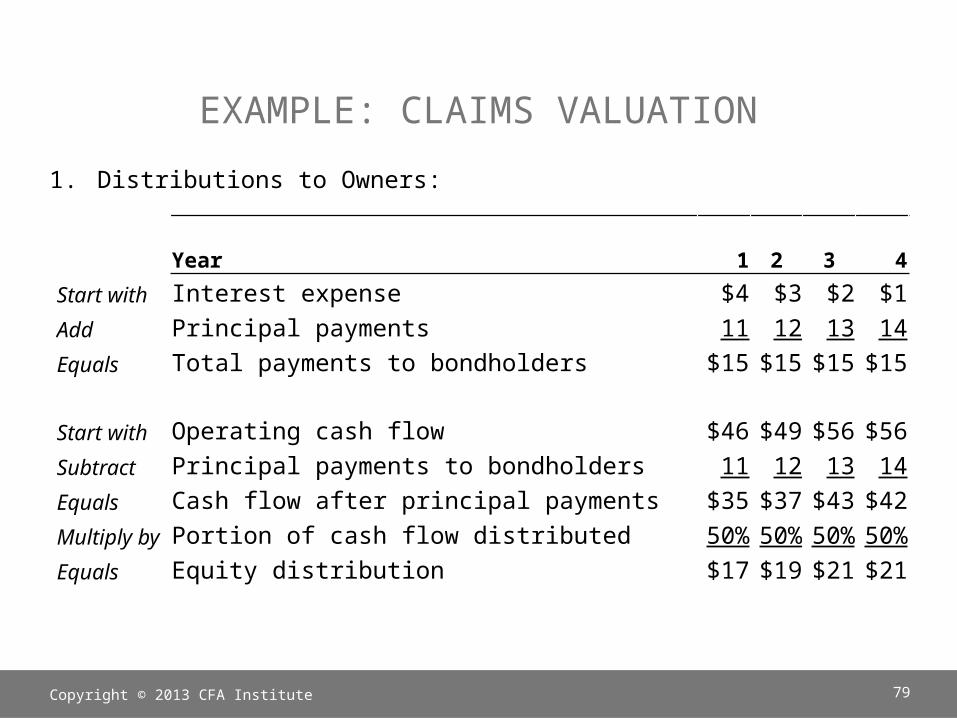
Start with Interest expense $4 $3 $2 $1Add Principal payments 11 12 13 14Equals Total payments to bondholders $15 $15 $15 $15
Start with Operating cash flow $46 $49 $56 $56Subtract Principal payments to bondholders 11 12 13 14Equals Cash flow after principal payments $35 $37 $43 $42Multiply by Portion of cash flow distributed 50% 50% 50% 50%Equals Equity distribution $17 $19 $21 $21
Copyright © 2013 CFA Institute 79
1. Distributions to Owners:
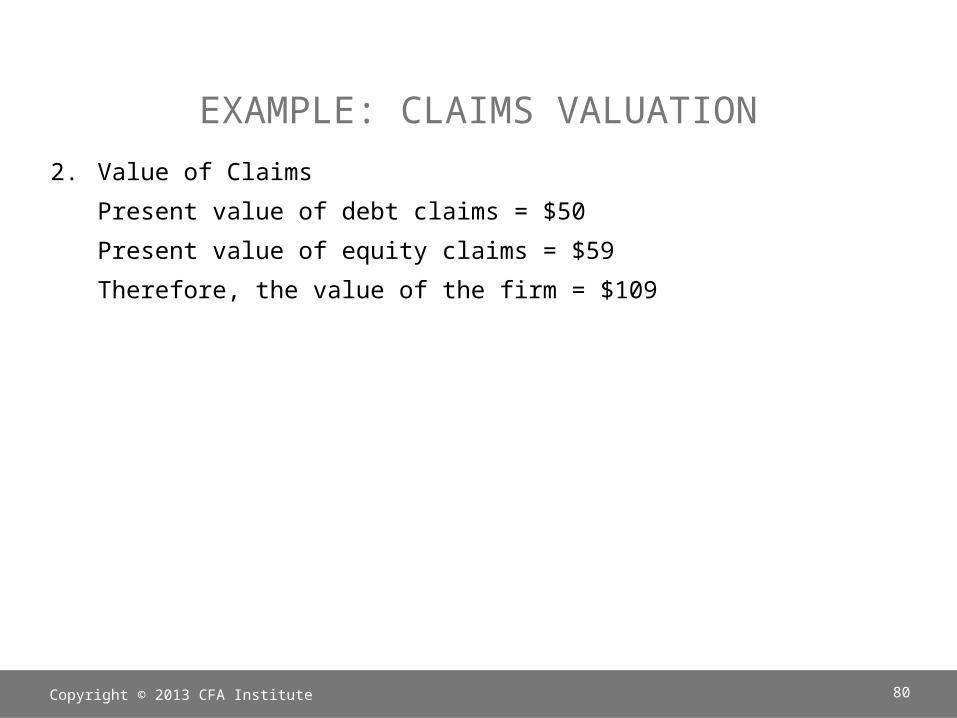
EXAMPLE: CLAIMS VALUATION2. Value of Claims
Present value of debt claims = $50Present value of equity claims = $59Therefore, the value of the firm = $109
Copyright © 2013 CFA Institute 80
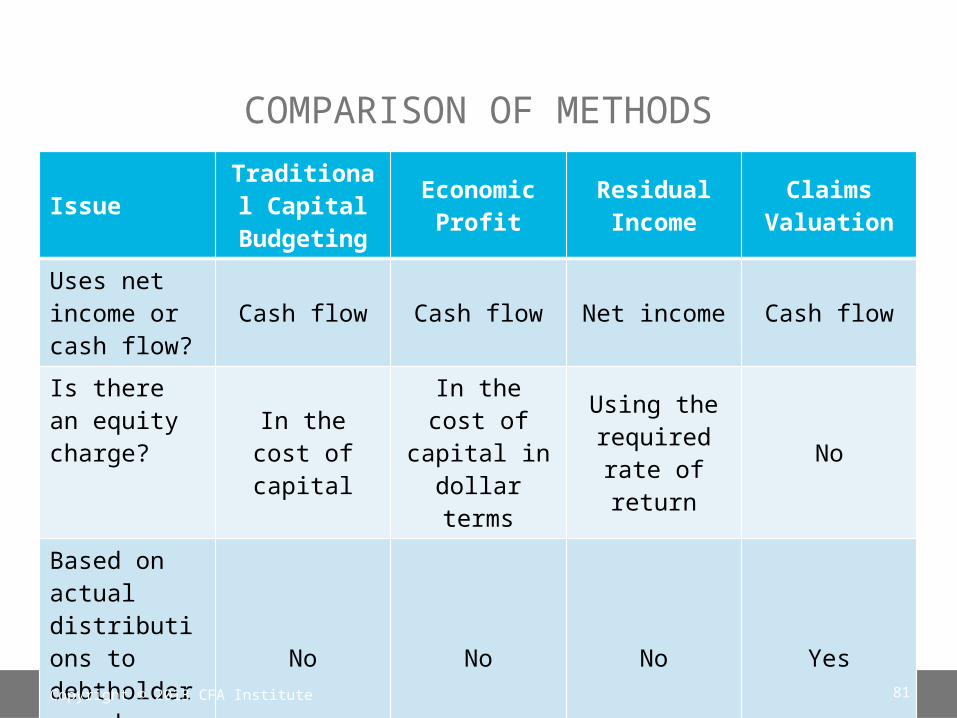
COMPARISON OF METHODS
IssueTraditional Capital Budgeting
Economic Profit
Residual Income
Claims Valuation
Uses net income or cash flow?
Cash flow Cash flow Net income Cash flow
Is there an equity charge?
In the cost of capital
In the cost of
capital in dollar terms
Using the required rate of return
No
Based on actual distributions to debtholders and owners?
No No No YesCopyright © 2013 CFA Institute 81
9. SUMMARY•Capital budgeting is used by most large companies to select among available long-term investments.
•The process involves generating ideas, analyzing proposed projects, planning the budget, and monitoring and evaluating the results.
•Projects may be of many different types (e.g., replacement, new product), but the principles of analysis are the same: Identify incremental cash flows for each relevant period.
•Incremental cash flows do not explicitly include financing costs, but are discounted at a risk-adjusted rate that reflects what owners require.
•Methods of evaluating a project’s cash flows include the net present value, the internal rate of return, the payback period, the discounted payback period, the accounting rate of return, and the profitability index.
Copyright © 2013 CFA Institute 82
SUMMARY (CONTINUED)•The preferred capital budgeting methods are the net present value, internal rate of return, and the profitability index.-In the case of selecting among mutually exclusive projects, analysts should use the NPV method.
-The IRR method may be problematic when a project has a nonconventional cash flow pattern.
-The NPV is the expected added value from a project.•We can look at the sensitivity of the NPV of a project using the NPV profile, which illustrates the NPV for different required rates of return.
•We can identify cash flows relating to the initial outlay, operating cash flows, and terminal, nonoperating cash flows.- Inflation may affect the various cash flows differently, so this should be explicitly included in the analysis.Copyright © 2013 CFA Institute 83
SUMMARY (CONTINUED)•When comparing projects that have different useful lives, we can either assume a finite number of replacements of each so that the projects have a common life or we can use the equivalent annual annuity approach.
•We can use sensitivity analysis, scenario analysis, or simulation to examine a project’s attractiveness under different conditions.
•The discount rate applied to cash flows or used as a hurdle in the internal rate of return method should reflect the project’s risk.-We can use different methods, such as the capital asset pricing model, to estimate a project’s required rate of return.
•Most projects have some form of real options built in, and the value of a real option may affect the project’s attractiveness.
•There are valuation alternatives to traditional capital budgeting methods, including economic profit, residual income, and claims valuation.
Copyright © 2013 CFA Institute 84


