Embed Size (px)
Citation preview

Ž .Biochimica et Biophysica Acta 1406 1998 175–187
Characterization of Actinobacillus actinomycetemcomitans leukotoxinpore formation in HL60 cells
Darcy Karakelian a, James D. Lear b, Edward T. Lally a, Jacqueline C. Tanaka a,)
a Department of Pathology, UniÕersity of PennsylÕania School of Dental Medicine, Philadelphia, PA, USAb Department of Biochemistry and Biophysics, UniÕersity of PennsylÕania School of Medicine, Philadelphia, PA, USA
Received 29 October 1997; accepted 16 December 1997
Abstract
Ž .The mechanism of cell death induced by Actinobacillus actinomycetemcomitans leukotoxin LTX has been investigatedŽ .with flow cytometry and patch electrode recording using cultured HL60 cells. The kinetics of propidium iodide PI positive
staining of HL60 cells was measured as a function of LTX concentration at 378C. Results showed a concentration-depen-dent decrease in the t times. Cell kill was slow at -1 mgrml LTX concentrations with fewer than 50% of the cells killedk
after 1 h; at 1 mgrml, the t times ranged from ;15 to 30 min. At higher concentrations, the t times decreased rapidly.k k
The rate of cell kill was appreciably slowed at 208C. HL60 whole cell currents were recorded with patch electrodes.Immediately following exposure to high concentrations of LTX, large currents were recorded suggesting that the membranepotential of these cells had collapsed due to the large conductance increases. At low toxin concentrations, rapid conductancefluctuations were seen suggestive of a limited number of toxin-mediated events. Cells exposed to low concentrations ofLTX exhibited these conductance fluctuations for up to 1 h, whereas toxin-insensitive cells were unaffected by longexposures to high concentrations of toxin. Our results are consistent with LTX-induced pores in susceptible cells whichoverwhelm the ability of the cell to maintain osmotic homeostasis causing cell death. q 1998 Elsevier Science B.V.
Keywords: Actinobacillus actinomycetemcomitans leukotoxin; HL60 cell; Ion channel; Bacterial toxin; Single channel conductance;Ž .Membrane pore; Patch clamp; RTX toxin; Actinobacillus actinomycetemcomitans Pathology
1. Introduction
Actinobacillus actinomycetemcomitans leukotoxinŽ . Ž .LTX is a member of the RTX Repeats in ToXinfamily of pore-forming cytotoxinsrhemolysins which
Abbreviations: RTX, Repeats in ToXin; E. coli, Escherichiacoli; Aa., Actinobacillus actinomycetemcomitans; PI, propidiumiodide, LTX, Aa leukotoxin
) Corresponding author. Department of Pathology, School ofDental Medicine, University of Pennsylvania, 326 Levy Building,4010 Locust St., Philadelphia, PA 19104-6002, USA. Tel.: q1-2 1 5 -8 9 8 -4 7 6 9 ; fax : q 1 -2 1 5 -5 7 3 -2 0 5 0 ; E -m ail:[email protected]
are produced by a diverse group of gram-negativew xbacteria 1–10 . The bacteria are important in both
human and veterinary pathology, and they producevarious infections in humans including infective en-docarditis and several forms of periodontal diseasew x11–14 . The leukotoxin is a 116 kDa water-soluble
w xprotein expressed on the surface of the bacteria 15 .Based on the amino acid sequence, LTX was dividedinto four regions designated N-terminal, central, re-peat and C-terminal. The N-terminal region sharessequence homology with the C-terminal pore-forming
w xdomain of Colicin Ia 1,16,17 . Since Colicin Iaw xforms membrane pores 18 , the sequence conserva-
0925-4439r98r$19.00 q 1998 Elsevier Science B.V. All rights reserved.Ž .PII S0925-4439 98 00002-7

( )D. Karakelian et al.rBiochimica et Biophysica Acta 1406 1998 175–187176
tion raised the possibility that LTX may also formpores in susceptible cell membranes. The centralregion of LTX shares homology with several relatedtoxins and contains two acylation sites, similar to
w xEscherichia coli hemolysin 16,19 , which are re-quired to produce functionally-active toxin. The re-peat region consists of multiple copies of a 9-aminoacid cassette which is involved in recognition of thetarget cell. The C-terminal region appears to regulateinteractions with secretory proteins and is requiredfor translocation of the toxin protein to the bacteriasurface. In contrast to many bacterial toxins, LTXexhibits a marked cytolytic specificity, destroyinghuman polymorphonuclear leukocytes andmacrophages without destroying erythrocytes,
w xplatelets and most other cell types 20 . The toxinalso exhibits a marked species specificity such thatleukocytes of Old-World monkeys and great apes aresusceptible to the toxin but not leukocytes of New-
w xWorld monkeys 21 . Two long-standing questionsabout LTX are what is the molecular basis of thecytolytic specificity of the toxin and how does LTXkill susceptible cells.
The first question was recently answered by aseries of experiments showing that LTX binds to ab 2 integrin, lymphocyte function-associated antigenŽ . w x1 LFA-1 22 . LFA-1 is expressed on immune cell
surfaces matching the profile of cytolytic targets.LTX binding to LFA-1 receptors appears to be amandatory first step in a multistep process that en-ables the toxin to undergo the requisite transitionfrom the water-soluble form to the membrane-in-serted form. In the absence of LFA-1 receptors, themembrane-inserted form of the toxin is unable toform and the toxin has no cytotoxic activity.
Here we investigate the question of how the toxinkills target cells. A number of bacterial toxins insertinto the target cell membrane and form ion permeablechannels that dissipate essential cell gradients leading
w xto rapid cell death 2,7 . The homology with thepore-forming domain of Colicin Ia as well as a
w xnumber of previous studies 23,24 suggest that LTXforms an ion channel, but no electrophysiologicalevidence for channel activity in susceptible cells hasbeen presented to date. Indirect evidence that LTXforms membrane pores has been obtained from exper-
w ximents with artificial bilayers 2,23 . In our experi-ments, when LTX was added to the bathing solution
of an artificial bilayer, no channel activity was seenw x23 . If, however, LTX was added to the lipid mono-layer before forming the bilayer, large conductancefluctuations were seen in the bilayer. We interpretedthis result to imply that the aqueous form of the toxinwill not spontaneously incorporate into a bilayer, butif the toxin is partially unfolded, as likely happens atthe lipid monolayer–water interface, insertion intothe membrane occurs and channels are formed. Theseare also consistent with LTX being required to inter-act with a cell surface receptor in order to facilitatetoxin activation.
In the experiments described in this report, wehave examined the kinetics of toxin-dependent cellkill as a function of toxin concentration and tempera-ture using flow cytometry with HL60 cells. Theseexperiments were undertaken to better understand themechanisms involved in toxin-mediated kill and toestablish the appropriate conditions for toxin applica-tion in patch electrode recording. Conductancechanges in HL60 cells were then monitored followingLTX exposure using whole cell patch clamp record-ing. At high toxin exposures, toxin-induced currentsresulted in rapid cell death. At low toxin exposures,rapid conductance fluctuations were observed sugges-tive of a single or few toxin-mediated events. Theactivity produced in response to low levels of LTXwas stable for more than an hour suggesting that cellscan tolerate a limited toxin exposure without thecollapse of the cell membrane gradients.
2. Materials and methods
2.1. Cell culture
HL60 cells were grown in suspension in RPMI1640 media with either 5% heat-inactivated fetal
Ž .bovine serum Media I or with 10% heat-inactivatedfetal bovine serum, 1% L-glutamine, 1% nonessentialamino acids, 1% gentamycin, 1% MEM vitamin solu-
Ž .tion Media II . Cells were grown in humidified airwith 5% CO at 378C and subcultured 3–4 times a2
week.
2.2. Purification of LTX
A. actinomycetemcomitans, strain JP2, used in thisstudy was extracted and purified as previously re-
( )D. Karakelian et al.rBiochimica et Biophysica Acta 1406 1998 175–187 177
w x Žported 24 . The strain was grown in PYG medium 5g Bactopeptone, 5 g Tryptone, 10 g yeast extract, 10g dextrose, 8 mg CaCl , 8 mg MgSO , 40 mg2 4
KH PO , 400 mg NaHCO , 80 mg NaCl in 1 l of2 4 3.dH 0 for 24 h at 378C in an atmosphere of 5% CO .2 2
After washing the bacteria twice in phosphate-Ž .buffered saline pH 6.5 , leukotoxin was extracted
and purified by a modification of the procedure pre-viously described. Briefly, the bacteria were incu-bated at 378C for 1 h in 2% polymyxin B sulfate in0.01 M phosphate buffer, pH 6.5 with protease in-
Žhibitors 5 mM EDTA, 10 mM ´-amino caproic acid,.0.1 mM PMSF, 5 mM sodium tetrathionate . After
incubation, bacterial cells and debris were removedby centrifugation at 7000 rpm for 30 min at 48C andthe supernatant was passed over a sulphopropyl Zeta
Ž . Ž .Prep disk 60 mm CUNO, Meriden, CT and afterwashing, the leukotoxin-containing fraction waseluted with 1.0 M NaCl. The eluent was concen-trated, re-equilibrated in 0.01 M phosphate buffer, pH
Ž6.5 and applied to a 5r5 Mono S Pharmacia, Piscat-. Žaway, NJ column and a NaCl gradient 0–0.2 M
NaCl over 10 min; isocratic at 0.2 M NaCl for 30.min; and 0.2–0.7 M NaCl over 10 min was passed
over the column. Leukotoxin-containing fractionsidentified with anti-leukotoxin monoclonal antibodyw x25 were recovered from the 0.2–0.7 M NaCl frac-tions, concentrated and subjected to gel filtration on a
Ž .10r30 Superose 6 column Pharmacia .
2.3. Flow cytometry
HL60 cells were washed by centrifugation at 1000rpm for 6–10 min and suspended at ;2=106rmlin Solution B containing 140 mM NaCl, 5 mM KCl,
Ž1.2 mM KH PO , 2 mM CaCl unless otherwise2 4 2.noted , 1.2 mM MgSO , 6 mM glucose, 25 mM4
HEPES, pH 7.3. Cell samples were analyzed by flowŽ .cytometry using propidium iodide PI staining, an
indicator of cell death, on a Coulter EPICS EliteŽ . ŽCoulter, Hialeah, FL . PI final concentration 10
.mgrml and LTX were added to cells at ts0 and PIfluorescence was monitored at a constant tempera-ture. Controls in each experiment monitored theamount of cell death due to PI alone over time. Cellswere considered to be PI positive, if fluorescenceintensities were greater than the intensity of 95% ofthe control cells.
2.4. Estimation of time required to kill ;50% of thecells
The percentage of PI positive cells vs. time was fitto a form of the Hill equation to estimate the timerequired to kill 50% of the cells in TableCurveŽ .Jandel Scientific . The percentage of PI positivecells vs. time could be described by the equation:
Nht% PI Positive cellss InitialqB 1q0 ž /tk
The fit estimates of the number of cells dead at theŽ .outset of the measurements Initial , the cooperativ-
ity, N , and the maximal percentage of cells killed,h
B . The parameters in this equation cannot be inter-0
preted uniquely without knowing the mechanism ofcell kill, but t roughly measures the time required tok
Žkill a significant fraction of the cells 50% if Initials.0, B s100%, N s1 . This equation was chosen to0 h
represent the small but significant initial lag andsubsequent rapid increase in cell kill observed in theexperiments.
2.5. Whole cell current recording
To allow whole cell recording with patch pipettes,HL60 cells in Media I were washed twice in Solution
ŽA with 5 mM glucose Solution A: 137 mM NaCl, 5mM KCl, 2 mM CaCl , 0.8 mM MgCl , 10 mM2 2
.HEPES, pH 7.3 . Aliquots of cells were added toround glass coverslips in tissue culture dishes withSolution A and allowed to attach to the glass. Glasscoverslips were placed in the recording chamber afterthe cells attached. Cells were used from 10 min toseveral hours after plating, depending on the condi-tion of the cells. In some experiments, HL60 cellsgrown in Media II were placed directly on glasscoverslips without washing. Both procedures wereused in the experiments reported here. The majordifference is that better whole cell seals were ob-tained with cells grown in Media II. The 4=12 mmPlexiglass recording chamber with a glass coverslipbottom was placed in a Dagan TC-10 Temperature
Ž .Controller Dagan, Minneapolis, MN containing So-lution A on a Nikon inverted microscope. Whencurrents were not being recorded, Solution A continu-ously flowed into the chamber; outflow was via afine suction capillary. All patching was done at 268C.
( )D. Karakelian et al.rBiochimica et Biophysica Acta 1406 1998 175–187178
Patch pipettes of 5–8 MV were pulled from Da-gan LG16 borosilicate glass as previously describedw x26,27 . Pipette tips were coated with Sylgard andheat polished with a Narishige MF-83 fire polisherŽ .Narishige Scientific Instrument Lab., Tokyo, Japan .The pipette solution contained 140 mM KCl, 1.1 mMEGTA, 0.1 mM CaCl , 2.0 mM MgCl , 10 mM2 2
HEPES, pH 7.3. Recording electrodes were con-nected to the headstage of a Dagan 8900 patch clampamplifier; AgrAgCl electrodes in 200 mM KCl agarbridges were inserted into a standard polystyrene
Ž .electrode holder E.W. Wright, Guliford, CT . Simi-lar agar bridges were used for both the ground elec-trode and a bath reference amplifier. The output was
Žfiltered at 1 kHz eight-pole Bessel, model 902LPT,.Frequency Devices, Haverhill, MA and digitizedŽwith a Digidata 1200 ArD converter Axon Instru-
.ments, Foster City, CA . Capacitative current wasadjusted with capacitance compensation controls onthe amplifier. Macroscopic currents were recorded,stored and analyzed using the pCLAMP 6 programon a 80486 PC. To follow the time course of theentire experiment, the holding potential and currentswere continuously recorded on VHS tape using a
Ž .Vetter PCM recorder A.R. Vetter, Rebersburg, PAand video recorder. These tapes were later used forsingle channel analysis with pCLAMP 6.
Ž .Macroscopic current–voltage I–V relations wereobtained from either steady-state current traces orinstantaneous voltage ramps. For steady-state cur-rents, the membrane potential was held at y50 mVfor 50 ms and then a series of increasing 50 msvoltage steps was applied from y80 mV to 80 mV in20 mV increments. I–V relations were determined byaveraging the currents during the voltage pulse dura-tion. Changes in the I–V relations immediately afterestablishing the whole cell configuration are dis-cussed in the results. Ramp I–Vs were generatedfrom a 74-ms linear voltage ramp from y80 to q80mV followed by a decreasing, symmetrical ramp.Correction for linear capacitative offset currents pro-duced by stray capacitance between the preamplifierinput and ground was partially compensated by digi-tally combining the up and down ramps as described
w xelsewhere 26 . In general, ramp I–Vs were usedfollowing the application of high concentrations ofLTX in order to follow the rapid changes in macro-scopic currents before the loss of the seal.
2.6. LTX application
It was important to use stable patches in order todistinguish the effects of LTX from constitutivechannel activity andror seal breakdown. The abilityto achieve tight whole cell seals varied greatly de-pending on the condition of the cells and type ofgrowth media. Cells maintained at low densities pro-duced the best results. Generally, patches with lowresistance seals -1 GV were unstable and eitherruptured or the resistance decreased substantiallywithin the first 5 min. These cells were discarded.Usually, seals pre-screened in this manner lasted upto an hour without decreasing in resistance and rarelyruptured unless provoked. Long-lasting cells wereused to determine the effects of high concentrationsof LTX as well as to monitor the effects of lowerconcentrations over long times. In all experiments,steady whole cell seals )1 GV were obtained about5–10 min prior to toxin application. In order toconserve the amount of toxin required for these ex-periments, toxin was manually applied with pressure
Žusing a separate patch pipette tip diameter ;100.mm back-filled with toxin in the tip and positioned
near the recording electrode. The concentrations ofthe toxin in the pipette are reported for each experi-ment.
3. Results
3.1. Kinetics of LTX-induced cell kill
The kinetics of cell kill at various toxin concentra-tions were determined by flow cytometry with HL60
Ž .cells using propidium iodide PI as an indicator ofcytotoxicity. PI is normally excluded from cells butonce a cell membrane is permeabilized, PI interactswith cellular DNA and RNA to form a highly fluo-
w xrescent conjugate 27 . Our results show that LTXacts rapidly, in a dose-dependent manner, to kill cellsand that all cells are susceptible to the toxin atconcentrations greater than 5–10 mgrml.
Fig. 1A,B shows the kinetics of LTX-induced cellkill at 378C in two separate experiments. In Fig. 1A,the t times, defined in Section 2, were estimated tok
be 29 min at 1 mgrml, 12.5 min at 2 mgrml and 7.7min at 4 mgrml. In the experiment shown in Fig. 1B,

( )D. Karakelian et al.rBiochimica et Biophysica Acta 1406 1998 175–187 179
cell kill was faster at all concentrations illustratingthe variability between experiments. The t timesk
were 16.4 min, 3.4 min and 2.9 min for 1 mgrml, 4mgrml and 8 mgrml, respectively. Based on thesetwo experiments as well as other observations, itwould appear that the cells vary somewhat in theirsensitivity to kill perhaps relative to the culture con-ditions or receptor expression at the time of theexperiment since these two experiments were per-formed with the same batch of purified toxin. Controlexperiments were performed with a resistant cell,
w xmurine SP2 myloma cells 24 . At times as long as 30min, less than 11% of the cells were PI positive,similar to the PI control in this experiment, at 4mgrml of LTX.
The variability between experiments makes it diffi-cult to analyze the kinetics of cell kill using flowcytometry. Nevertheless, several features were seen
Ž .Fig. 1. A Concentration dependence of LTX-induced cell kill.Using flow cytometric analysis, the percentage of PI positivecells was followed over time at three toxin concentrations and a
Ž . Žzero toxin concentration control squares . Data were fit solid.lines to a nonlinear form of the Hill equation. The data at 4
Ž .mgrml triangles were fitted with a half-time of 7.7 min and anŽ .N of 1.6; the maximal kill was 92%. At 2 mgrml circles , theh
half-time was 12.5 min and the N was 1.7 with maximal kill athŽ .52%. At 1 mgrml diamonds , toxin data were fit with a
half-time of 29 min, an N value of 1.0 and the maximal kill wash
72%. The maximal kill in this determination was obviouslyaffected by the scatter in the data at longer times. This concentra-tion was the final sample tested and the time course was limitedby the available number of cells. The experiment was done at
Ž .378C. B A separate experiment showing the concentration-de-pendence of cell kill. The experiment followed the same protocolas A. Data were fitted to the Hill equation and the half-timeswere 2.9 min at 8 mgrml, 3.4 min at 4 mgrml and 16.4 min at 1mgrml. The N values for these concentrations were 2.0, 1.9 andh
1.0 and the maximal kill values were 93%, 77% and 83%,respectively. Data in the diamonds were cells exposed to 0.1mgrml of LTX. The PI control showed about the same % kill
Ž .over time as the low concentration exposure. C Temperaturedependence of LTX-induced cell kill. The kinetics of LTX-in-duced cell kill was monitored at three temperatures; the control,with PI but no LTX added, was measured at 378C. These datawere also fitted to estimate the half-times. At 288C, the half-timewas 6.4 min with a maximal kill of 96% and an N value ofh
2.35. At 378C, the half-time was 7.2 min with maximal kill at93% and an N of 2.7. At 208C, the half-time was 18.0 min withh
a maximal kill of 94% and an N of 2.1. The toxin concentrationh
was 2 mgrml.

( )D. Karakelian et al.rBiochimica et Biophysica Acta 1406 1998 175–187180
in all experiments and may provide insights into theunderlying processes involved in kill. First, at con-centrations of toxin below ;1 mgrml, there was noappreciable cell kill. For example, in Fig. 1B, thetotal fraction of PI positive cells at 0.1 mgrml is
Ž .similar to PI control not shown of 17% after 30min. At higher concentrations, the number of PIpositive cells increased with time, but often ap-proached a limiting value less than 100% which wasrelated to the concentration. This concentration-de-pendent limit of cell kill is consistent with an irre-versible toxin–cell interaction which requires cooper-ation of multiple toxin molecules, either alone or inassociation with a receptor. The idea of cooperativitywas supported by the Hill coefficients at least forconcentrations above 1 mgrml. These higher concen-trations had cooperativity indexes between 1.6 and
Ž .2.0 details given in Figure legend , whereas thecooperativity at 1 mgrml in both experiments was1.0.
Another feature of the kinetics of cell kill was theinitial time lag. Although not appreciated in the timecourse of the data shown in Fig. 1A,B, this lag phaseis readily apparent in the next experiment, Fig. 1C,which examines the effect of temperature on cell kill.Previous work showed that incubating LTX at 608C
w xinactivates the toxin 24 . On the other hand, reducingthe assay temperature to 208C greatly retarded theability of the toxin to kill target cells. It was impor-tant to establish a temperature for patch clamprecording where we could expect reasonable cell killwithin 15 to 30 min, the average lifetime of a patchsince patch recording is typically done at room tem-perature. At 2 mgrml LTX at assay temperatures of20, 28 and 378C the t times were 18.0 min, 6.4 mink
and 7.2 min, respectively. In this experiment, cellswere preincubated at the assay temperature for ;10min before the toxin was added. The results showthat the rate of kill is similar at 28 and 378C but isappreciably slowed by reducing the temperature to208C. At long times, the total fraction of cells killedis roughly the same at all three temperatures. Thenext set of experiments examined the effects of LTXon single cells.
3.2. Electrophysiological measurements ofLTX-induced effects on HL60 cells
Whole cell currents were recorded from HL60cells in a temperature-controlled bath held at 268C.Patching at higher temperatures was problematic be-cause it was difficult to obtain stable seals and the
Ž .Fig. 2. A Application of high LTX concentrations to HL60 cells. Instantaneous I–Vs were recorded from a cell before and after theapplication of 200 mgrml LTX using a ramp voltage pulse table. The control record was taken 3.5 min after establishing a 1 GV wholecell seal. Slope conductance is 6 pS. LTX was applied to the cell and another ramp was applied 90 s later. The slope conductance
Ž .following toxin addition was calculated to be 1.0 nS. The seal was lost almost immediately after this record was recorded. B Applicationof low concentrations of LTX to HL60 cells. Steady-state I–V plots were recorded before and ;30 min after 30 mgrml of LTX wasapplied to a ;2 GV whole cell. The control was taken shortly after establishing the whole cell configuration. An outward rectificationwas apparent in the control and was no longer seen 30 min after toxin was applied to the seal. In general, control cells sometimes lost theoutward rectification over time perhaps due, in part, to dialysis of the cell with the patch pipette solution. However, the inwardrectification that develops in the toxin-treated cell is produced by the toxin. At the time of this recording, individual channel activity was
Ž .clearly evident while macroscopic currents changed only slightly 96116c2 .
( )D. Karakelian et al.rBiochimica et Biophysica Acta 1406 1998 175–187 181
cells died much faster than cells held at either 268Cor room temperature. Two voltage protocols were
Ž .used to determine the current–voltage I–V rela-tions as described in Section 2. The I–V recordsgenerally showed small currents with weak outwardrectification in the absence of toxin exposure. Inresponse to the voltage steps, the currents activatedrapidly and displayed no inactivation. During the first5 min after obtaining a seal, the I–V often becamemore linear as the cell interior was dialyzed with thepipette solution. Also, during this initial settling pe-riod, the currents sometimes decreased due to anincrease in the seal resistance.
Previous electrophysiological studies with HL60cells reported potassium and chloride currents that
w xproduce outward rectification 28,29 . Contributionsfrom these currents are directly related to the concen-tration of permeant or blocking ions in the bath andin the pipette. Since our experimental protocol wasnot designed to block or eliminate these constitutivecurrents, the weak outwardly rectifying I–Vs mostlikely reflected contributions from these currents. Inour experiments, cells were selected for toxin applica-tion if and only if the whole cell currents were stablefor at least 5 min. This time window seemed ade-quate to eliminate fragile cells. All cells selected withthese criteria, unless perturbed in some unintendedway, were stable for long periods of time.
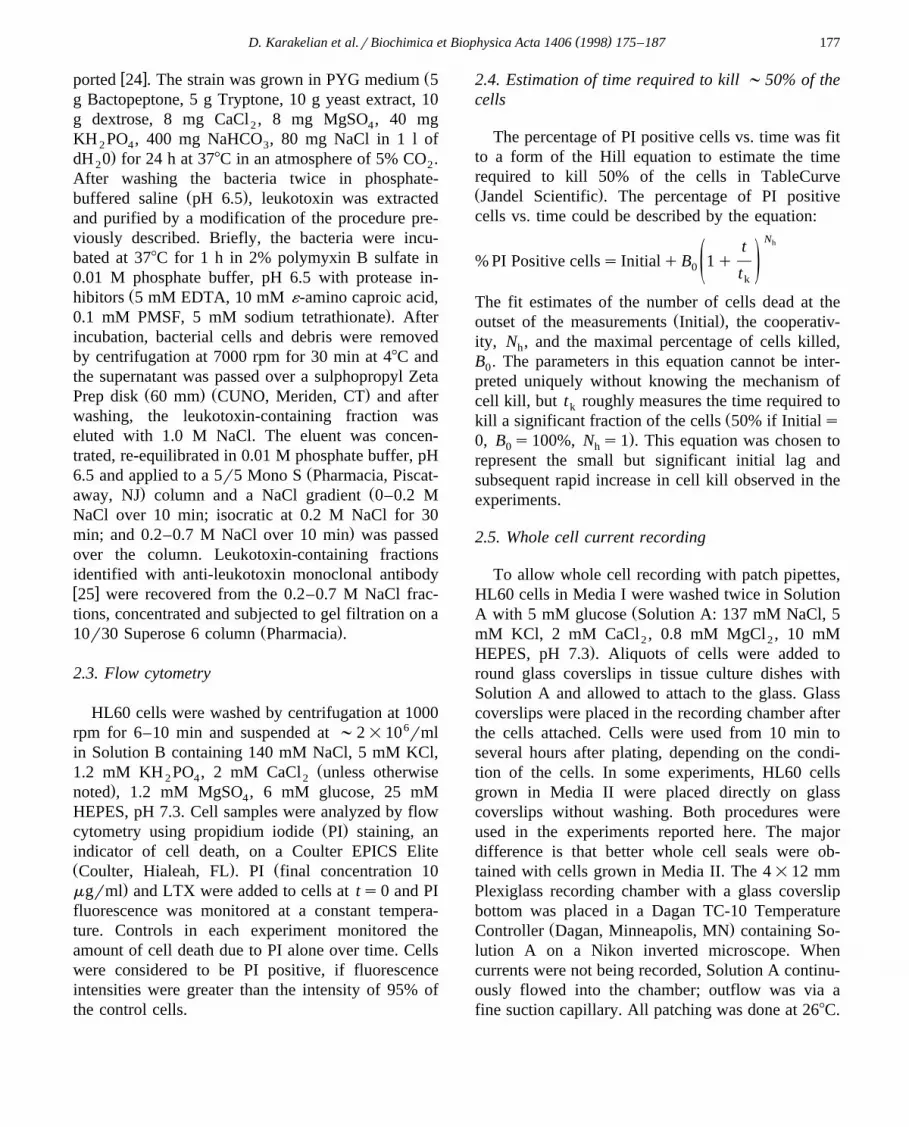
LTX was applied to selected cells following thecriteria mentioned above. Various concentrations oftoxin were used in the application pipette as de-scribed in Section 2. Fig. 2A shows whole cellcurrents recorded from a cell prior to and 90 sfollowing a pulse of toxin from the pipette which
Fig. 3. Morphological changes in HL60 cells following toxinŽ .exposure. A Morphological changes in the cells were seen
following 200 mgrml LTX exposure. The first photograph wastaken 35 min following LTX exposure. Several healthy HL60cells, about 10 mm in diameter, are shown at the lower edge of
Ž .the field note the arrows and appear to be unaffected by thetoxin. The toxin reached most of the cells in this field. Fig. 4Bshows another coverslip 12 min after exposure to the sameconcentration of toxin. The patch electrode with the recordingcell attached is visible in this field. This photograph shows thebeginning stages of visible LTX-induced kill. Fig. 4C showsanother coverslip 55 min following exposure at 200 mgrmlLTX. All of the cells in this frame were affected by the toxin.
contained 200 mgrml. The concentration of toxin atthe cell surface, although not known exactly, was lessthan that in the pipette due to dilution into the bath.The dispensing pipette was positioned as close asfeasible to the clamped cell, and, at this high concen-tration, the effects of the toxin were very fast asshown in Fig. 2. Immediately after this I–V was

( )D. Karakelian et al.rBiochimica et Biophysica Acta 1406 1998 175–187182
recorded, the amplifier current saturated, indicating alarge decrease in the cell membrane resistance. Infour other patches in which concentrations of toxinfrom 67 to 200 mgrml were applied, similar in-creases in the current were seen indicating loss of themembrane resistance within 3 min after applying thetoxin.
The effects of LTX on HL60 cells were visuallystriking. Fig. 3 shows HL60 cells in the field of thepatching microscope after 200 mgrml of LTX hadbeen applied. Fig. 3A shows healthy cells at thebottom edge which are small, round and displaydistinct dark outlines, whereas cells affected by thetoxin in the remaining field of view are large, flat,irregular cells with a granular-appearing nucleus notseen in the healthy cells. Fig. 3B shows another fieldof cells around the patch electrode as the effects ofthe toxin become evident. By the time these effectsare visible in the microscope, usually several min-utes, the seal is gone. Fig. 3C shows a field of cellsafter 55 min of toxin exposure. These cells no longerhave distinct membranes, and no healthy cells areseen in the field. In experiments where large currentswere not seen after the application of toxin, the mostlikely reason was that toxin did not reach the in-tended cell. This interpretation was supported byvisual inspection of the patching field which showedno evidence of toxin effects on the general neighbor-hood of the cell.
To prolong the period during which electrical mea-surements could be made and to examine the singlechannel behavior, experiments were done using lower
concentrations of toxin in the dispensing pipette. InFig. 2B, I–Vs are shown following the application of30 mgrml LTX in the dispensing pipette. In this andsimilar experiments, the application of low concentra-tions of toxin resulted in the induction of a smallinward current and a reduction in the in-situ outwardcurrent. The control I–V shows the characteristic
Žoutwardly rectifying shape seen in HL60 cells Fig. 1w x.28 . The I–V recorded 30 min after toxin applica-tion shows the increase in inward current and thedecreased outward current producing the inward rec-tification. Consistent with this small current induc-tion, low concentrations of toxin produced no obvi-ous changes in cell morphology over times as long asan hour.
As a control, high concentrations of LTX wereapplied to human K562 erythroleukemia cells underpatch electrode voltage clamp as described for HL60cells. These cells have been shown to be resistant to
w xLTX in previous experiments 24 . Unlike the rapidresponses to toxin application seen with HL60 cells,these cells showed no evidence of toxin-mediatedpore formation even for times up to 30 min.
3.3. LTX-induced conductance fluctuations
Previous work showed that purified LTX inducedrelatively small, discrete conductance fluctuations in
w xplanar bilayer membranes 23 . The application of 30mgrml of LTX to HL60 cells resulted in the appear-ance of conduction fluctuations, Fig. 4, somewhatsuggestive of the type of voltage-dependent channel
Fig. 4. LTX-induced voltage dependent conductance fluctuations. Whole cell current recordings of 45 s times are shown followingexposure to 30 mgrml LTX at ;30 min. Holding potentials of 50, 30, 0, to y30, and y50 mV are shown from the top to the bottomtrace, respectively. Larger conductance fluctuations were evident at negative holding potentials consistent with short openings of ;400
Ž .pS channels 96116c2 .
( )D. Karakelian et al.rBiochimica et Biophysica Acta 1406 1998 175–187 183
activity seen in bilayers but with very rapid fluctua-tions between conductance levels. In the top tracerecorded at q50 mV, the membrane is relativelynonconductive with the only channel activity beingthat of a small conductance, long lifetime constitutivechannel observed in the absence of toxin. This chan-nel appears to be active at positive potentials in thepresence of toxin as well. Toxin effects are seen at 0mV and at y30 and y50 mV. As the membrane
potential decreases, the LTX-induced conductancefluctuations increase. At y50 mV, the fluctuationsare large and nearly continuous. The control shows asmall, long-lived channel at y30 mV but almost noactivity at y50 mV consistent with the I–Vs recordedbefore toxin application.
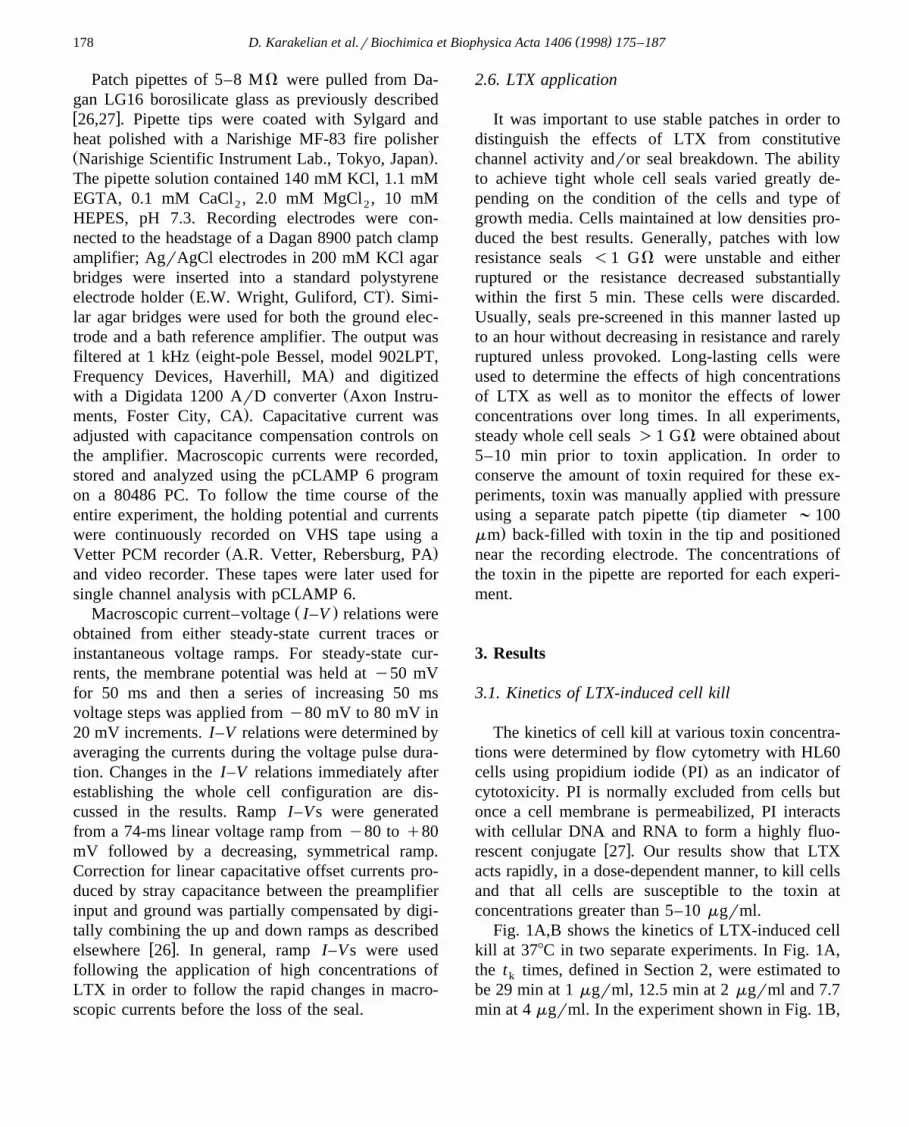
The small constitutive channels seen at q50 mVwere more active in the control recording and thisfeature was seen in other experiments as well sug-
Fig. 5. Amplitude histograms of 90 s current recordings for control and toxin-exposed cell. Data shown in the previous figures were usedto generate 90-s histograms before and after the addition of toxin. As suggested by the channel diary in Fig. 4, there is no appreciableincrease in channel activity at positive potentials. Toxin activity is clearly seen by the increase in the events at negative holding potentials.

( )D. Karakelian et al.rBiochimica et Biophysica Acta 1406 1998 175–187184
gesting that the toxin can inhibit constitutive channelactivity in some way. The conductance of this chan-nel was ;60 pS. At y50 mV, the control recordshows little channel activity in the absence of toxin incontrast to the very active membrane following theaddition of toxin. The largest current fluctuationsobserved in this trace correspond to a conductance of400 pS, but these events are brief and might representthe simultaneous opening of multiple channels. Theconductance transitions between the closed and openstates are very rapid, and no long-lived channel activ-ity is seen making it difficult to characterize unitaryevents.
We examined the voltage dependence of the con-ductance properties of the toxin by constructing am-plitude histograms of 90-s recordings at several mem-brane potentials. These histograms are compared be-fore and after toxin exposure in Fig. 5. At q50 andq30 mV, there is little difference between the con-trol and toxin histograms. Toxin activity is dramati-cally increased at y30 and y50 mV, suggesting avoltage-dependent activity. Single channels could notbe resolved into separate histogram peaks, consistentwith multiple conductance states of short lifetimes.
The membrane conductance activity induced byLTX was seen in eight other cells three of whichmaintained stable activity for )30 min. In fiveadditional cells, higher concentrations of toxin wereapplied. These cells displayed a higher level of activ-ity, but the cells did not last as long and stablerecordings could not be obtained at all potentials.Current fluctuations appeared at various times afterthe application of toxin. This variability may be due,in part, to the local diffusion patterns in the chamberat the cell surface. In some cases, the toxin-inducedchannels appeared within minutes of toxin applica-tion but in others, the delay was as long as 15 min.Considering the variability, we observed in the kinet-ics of cell kill using flow cytometry, the cell responsetimes may reflect unexamined parameters related tocell properties as well.
4. Discussion
We have studied the effects of a bacterial proteintoxin, LTX, in sensitive and insensitive cells. Follow-ing exposure to concentrations of toxin in the range
of 5 mgrml, rapid cell death ensues. When recordingthe conductance of a single cell following exposureto high concentrations of LTX, large increases areseen within seconds of toxin exposure in toxin-sensi-tive cells but no changes are seen in insensitive cells.Cells exposed to high concentrations undergo mor-phological changes consistent with rapid cell death.At lower concentrations of toxin, rapid conductancefluctuations were observed but were not well-re-solved. These conductance changes did not exhibitthe long-lived, stable conductances exhibited by many
w xvoltage-gated ion channels 30 , however the fluctua-tions could be observed for periods as long as anhour without a loss of the membrane seal suggestingthey were LTX-mediated.
Under conditions where toxin-induced membranedisruption is less than catastrophic, the conductanceshowed a striking voltage-dependence. At positivepotentials, almost no conductance increases were seenafter toxin exposure, whereas at negative potentials,the activity was persistent. Interestingly, a similarvoltage dependence was observed for the toxin-in-duced individual state transitions in bilayer experi-ments, demonstrating that the pore activity of LTX is,to a large extent, associated with the toxin alone. TheLTX-mediated activity in bilayers and cells differedin conductance lifetimes, however. In patches, con-ductance transitions were always rapid with severalapparent levels of conductance between 150 and 400pS, whereas in bilayers, channel openings had muchlonger lifetimes and conductance levels 118, 262 and406 pS were observed. These differences may reflectthe different lipid environment of the toxin in bilay-ers as opposed to cells. It is also possible that anumber of LTX molecules associate to form a pore.The observation of multiple LTX conductance statessuggests that oligomerization of LTX molecules is apossibility.
4.1. The kinetics of cell kill are complex
The kinetics of cell kill at various toxin concentra-tions were determined by flow cytometry using PI asan indicator of cytotoxicity. At concentrations oftoxin less than 1 mgrml, the total fraction of PIpositive cells was small, even over periods up to an
Ž .hour. At intermediate e.g., 1 and 2 mgrml concen-trations, PI positive cells appeared to approach a

( )D. Karakelian et al.rBiochimica et Biophysica Acta 1406 1998 175–187 185
limiting value considerably less than 100%. At higherconcentrations, there was a steep increase in the rateof cell kill suggesting that cell kill might requirecooperation of multiple toxin molecules, either aloneor in association. The observation of a plateau valuemuch less than 100% kill at low toxin concentrationsalso suggests that the toxin–cell interaction responsi-ble for killing is either irreversible or very slow onthe time scale of these experiments. Finally, as seenmost prominently in Fig. 1C, there appears to be atime lag between exposure to toxin and the initiationof cell killing. Altogether, the kinetics indicates thatcell killing is an irreversible, multi-step process in-volving the interaction of multiple toxin moleculeswith a single cell. Based on these observations, wepropose a multistep mechanism for cell kill that
Ž .involves a the toxin binding to a cell surface recep-Ž .tor, b the irreversible membrane insertion of the
Ž .toxin or toxin complex, c the formation of anŽ .oligomeric pore, and d subsequent overwhelming of
cell repair mechanisms when a critical number ofpores have been formed. Future experiments may beable to test each of these specific steps in the toxin-mediated cell kill.
4.2. Role of LFA-1 in pore formation
Identification of LFA-1 as the cell surface receptorw xfor LTX 92 strengthens the idea that a toxin-recep-
tor complex is a required initial step in the process ofcell kill by LTX. Since bacterial protein toxins arewater-soluble and yet must form an integral mem-brane pore in the target cell, they must find a way toovercome the natural energy barrier to unfolding.
w xEvidence from other bacterial protein toxins 31–34suggests that a partial unfolding of the water-solubleform of the toxin is required for membrane insertion.Presumably, the toxin undergoes partial refolding tothe lipid-soluble form once insertion is achieved. Inorder to achieve this dichotomous existence, someassistance is required to initiate the unfolding of thetoxin. In the bilayer experiments, the partial unfold-ing is likely achieved by the partitioning of the toxininto the lipid monolayer–water interface. In leuko-cytes and related cells, LFA-1 binding could providean efficient mechanism to lower this barrier andcatalyze a partial unfolding of the toxin leading to
exposure of sequestered hydrophobic residues thatinteract with the cell membrane lipid environment.
4.3. The role of LTX-mediated conductances in cellkill
The electrophysiological features of cell death seenwith high concentrations of LTX exposure can becompared to changes seen in patch clamp recordingsfor magainin antimicrobial peptides, perforin-media-
Ž .ted cytotoxicity and haemolysin A toxin HlyA . Therelatively nonselective, large conductance pores cre-ated by all of these cytotoxic molecules are associ-ated with large ion fluxes, diminishing electrochemi-cal gradients, intracellular Ca2q overload and charac-teristic changes in cell morphology. A number ofdifferences in electrophysiological properties distin-guish each of these pore types. Magainin peptidesgave conductances ranging from 680 to 1900 pS in
w xplanar bilayer 35,36 . In patch recordings, exposureto magainins resulted in the rapid loss of membraneintegrity at high concentrations and low, sustained
w xlevels of activity at low concentrations 27 . Perforinresults in large conductance channels in susceptiblecells. The conductances range from 440–1400 pS and
w xthe channels have long open times 37–39 . The poreis thought to involve an aggregation of 4 to 20perforin molecules. HlyA is a member of the RTXfamily and shares some features with LTX but doesnot exhibit the species and cell-type specificity ofLTX. HlyA formed large conductance pores in hu-man macrophages which showed a large single chan-nel conductance with long lifetimes, cation selectivitywith little discrimination among different cations and
w xa nearly linear current–voltage relationship 40 . Inbilayer experiments, the channel properties were sim-
w xilar to those seen in macrophages 41 . LTX-inducedconductances range from 150–400 pS in both bilayerand patch recordings with a characteristic voltage-de-pendent activity. In HL60 cells, persistent activitywas recorded y50 and y30 mV while very littleactivity was observed at positive holding potentials.The major difference between the bilayer and wholecell activity was seen in the kinetics. In lipid bilayer,the channel openings were well-resolved even with50 Hz filtering, but in the whole cell recordings,long-lived channel events were not resolved at 1 kHzfiltering. The whole cell kinetics, while difficult to
( )D. Karakelian et al.rBiochimica et Biophysica Acta 1406 1998 175–187186
analyze, are not inconsistent with channel formation,however. For example, cGMP-activated channels inretina photoreceptors show rapidly fluctuating con-ductances similar to the LTX-mediated conductances
w xwe observe in the HL60 cells 42,43 . It is certainlypossible that the lipid composition as well as theLFA-1 receptor alter the LTX conductance proper-ties.
The well-known signalling role of LFA-1 receptorsw x44,45 , as well as previous work showing that LTX
2q w xelevates intracellular Ca levels 24 , suggest thatLTX may also be involved in an additional cytotoxicpathway at low toxin concentrations. It is possiblethat a limiting number of LTX-mediated pores couldlead to an elevation of intracellular Caq2 withoutcausing collapse of the electrochemical gradients ofthe cell. In this case, the overload of intracellularCaq2 could lead to the well-recognized forms of
q2 w xCa -induced cell damage 46 . In addition to induc-ing DNA fragmentation and mitochondrial damage,elevated Caq2 can directly affect cytoskeletal organi-
w xzation and induce surface blebs 47 . Evidence fromflow cytometry, morphologic and gel electrophoresisstudies have shown that cells treated with low dosesof LTX show signs that are consistent with apoptosis
w xor programmed cell-death 48 . These data suggestthat downstream signalling events may be initiated byLFA-1 binding in addition to the rapid, direct, toxin-mediated cell kill seen in patch clamped cells. Thereis, in fact, precedence for two distinct pathways incytotoxic T lymphocyte destruction of target cellsw x37 . The non-perforin pathway triggers apoptosisthrough the Fas receptors on the target cell surface. Inthe case of LTX-mediated cell death, the physio-logical role of LTX-mediated apoptosis remains to beunderstood.
Acknowledgements
Support for this research was provided from grantsRO1 DE09517 and P50 DE08239 from the NationalInstitute of Dental Research.
References
w x1 E.T. Lally, E.E. Golub, I.R. Kieba, N.S. Taichman, J.Rosenbloom, J.C. Rosenbloom, C.W. Gibson, D.R. Demuth,
Ž .J. Biol. Chem. 264 1989 15451–15456.
w x2 G. Menestrina, M.D. Serra, C. Pederzolli, M. Bregante, F.Ž .Gambale, Biosci. Rep. 15 1995 543–551.
w x3 R. Benz, A. Schmid, W. Wagner, W. Goebel, Infect. Im-Ž .mun. 57 1989 887–895.
w x Ž .4 M.E. Bauer, R.A. Welch, Infect. Immun. 64 1996 4665–4672.
w x Ž .5 M.E. Bauer, R.A. Welch, Infect. Immun. 64 1996 167–175.w x6 R.A. Welch, M.E. Bauer, A.D. Kent, J.A. Leeds, M. Myay-
eri, L.B. Regassa, D.L. Swenson, Infect. Agents Dis. 4Ž .1995 254–272.
w x7 S. Bhakdi, J. Tranum-Jensen, Rev. Physiol. Biochem. Phar-Ž .macol. 107 1987 147–223.
w x8 G. Lalonde, T.V. McDonald, P. Gardner, P.D. O’Hanley, J.Ž .Biol. Chem. 264 1989 13559–13564.
w x Ž .9 R.A. Welch, R. Hull, S. Falkow, Infect. Immun. 42 1983178–186.
w x10 V. Koronakis, E. Koronakis, C. Hughes, Mol. Gen. Genet.Ž .312 1988 551–555.
w x Ž .11 J.J. Zambon, J. Clin. Periodontol. 12 1985 1–20.w x Ž .12 C.A. Strathdee, R.Y.C. Lo, Infect. Immun. 1997 3233.w x Ž .13 M.I. Page, E.O. King, N. Engl. J. Med. 275 1966 181–188.w x14 P.J. Block, C. Yoran, A.C. Fox, A.J. Kaltman, Am. J. Med.
Ž .Sci. 266 1973 387–392.w x15 C.C. Tsai, B.J. Shenker, J.M. DiRienzio, D. Malamud, N.S.
Ž .Taichman, Infect. Immun. 43 1984 700–705.w x16 E.T. Lally, I.R. Kieba, E.E. Golub, J.D. Lear, J.C. Tanaka,
Ž .J. Periodontol. 67 1996 17–27.w x Ž .17 R.A. Welch, Mol. Microbiol. 5 1991 521–528.w x Ž .18 S.J. Schein, B.L. Kagan, A. Finkelstein, Nature 276 1978
159–163.w x19 P. Stanley, L.C. Packman, V. Koronakis, C. Hughes, Sci-
Ž .ence 266 1994 1992–1996.w x20 N.S. Taichman, R.T. Dean, C.J. Sanderson, Infect. Immun.
Ž .28 1980 258–268.w x21 N.S. Taichman, D.L. Simpson, S. Sakurada, M. Cranfield, J.
Ž .DiRienzio, J. Slots, Oral Microbiol. Immunol. 2 198797–104.
w x22 E.T. Lally, I.R. Kieba, A. Sato, C.L. Green, J. Rosenbloom,J.M. Korostoff, J.F. Wang, B.J. Shenker, S. Ortlepp, M.K.
Ž .Robinson, P.C. Billings, J. Biol. Chem. 272 1997 30463–30469.
w x23 J.D. Lear, U.G. Furblur, E.T. Lally, J.C. Tanaka, Biochim.Ž .Biophys. Acta 1238 1995 34–41.
w x24 M. Iwase, E.T. Lally, P. Berthold, H.M. Korchack, N.S.Ž .Taichman, Infect. Immun. 58 1990 1782–1788.
w x25 M. Pallis, A. Robins, R. Powell, Scand. J. Immunol. 38Ž .1993 559–564.
w x Ž .26 R.E. Furman, J.C. Tanaka, J. Gen. Physiol. 96 199057–82.
w x27 B. Haimovich, J.C. Tanaka, Biochim. Biophys. Acta 1240Ž .1995 149–158.
w x28 S.J. Wieland, R.H. Chou, Q. Gong, J. Cell. Physiol. 142Ž .1990 643–651.
w x29 S. Gollapudi, T. McDonald, P. Gardner, N. Kang, S. Gupta,Ž .Cancer Lett. 66 1992 83–89.
w x30 B. Hille, Ionic Channels of Excitable Membranes, SinauerAssociates, Sunderland, MA, 1992.

( )D. Karakelian et al.rBiochimica et Biophysica Acta 1406 1998 175–187 187
w x Ž .31 M.W. Parker, F. Pattus, Trends Biochem. Sci. 18 1993391–395.
w x32 A.R. Merrill, L.R. Palmer, A.G. Gzabo, Biochemistry 32Ž .1993 6974–6981.
w x33 A.R. Merrill, F.S. Cohen, W.A. Cramer, Biochemistry 29Ž .1990 5829–5836.
w x34 F.G. Van der Goot, J.M. Gonzalez-Manas, J.H. Kakey, F.Ž .Pattus, Nature 354 1991 408–410.
w x Ž .35 H. Duclohier, G. Molle, G. Spach, Biophys. J. 56 19891017–1021.
w x36 R.A. Cruciani, J.L. Barker, S.R. Durell, G. Raghunathan,H.R. Guy, M. Zasloff, E.F. Stanley, Eur. J. Pharmacol. 226Ž .1992 287–296.
w x37 R. Lavy, Y.H. Mika, D. Rosen, G. Berke, O. Binah, J.Ž .Immunol. 154 1995 5039–5048.
w x38 P.M. Persechini, J.D. Young, W. Almers, J. Cell Biol. 110Ž .1990 2109–2116.
w x39 B. Felzen, G. Berke, D. Rosen, R. Coleman, J. Tschopp,Ž .J.D. Young, O. Binah, Cardiovasc. Res. 28 1994 643–649.
w x40 G. Menestrina, C. Pederzolli, M. Dalla Serra, M. Bregante,Ž .F. Gambale, J. Membr. Biol. 149 1996 113–121.
w x41 G. Menestrina, C. Moser, S. Pellet, R. Welch, ToxicologyŽ .87 1994 249–267.
w x42 J.C. Tanaka, R.E. Furman, W.H. Cobbs, P. Mueller, Proc.Ž .Natl. Acad. Sci. U.S.A. 84 1987 724–728.
w x Ž .43 K. Yau, D.A. Baylor, Ann. Rev. Neurosci. 12 1989 289–327.
w x Ž .44 R.T. Hynes, Cell 69 1992 11–25.w x45 M.A. Schwartz, M.D. Schaller, M.H. Ginsberg, Annu. Rev.
Ž .Cell Dev. Biol. 11 1995 549–599.w x46 S. Orrenius, D.J. McConkey, G. Bellomo, P. Nicotera,
Ž .Trends Pharmacol. Sci. 10 1989 281–285.w x47 P. Nicotera, P. Hartzell, G. Davis, S. Orrenius, FEBS Lett.
Ž .209 1986 139–142.w x48 B.J. Shenker, L.A. Vitale, I. Keiba, G. Harrison, P. Berthold,
Ž .E. Golub, E.T. Lally, J. Leukocyte Biol. 55 1994 153–160.


