Embed Size (px)
Citation preview

BioMed CentralBMC Systems Biology
ss
Open AcceResearch articleUsing cell fate attractors to uncover transcriptional regulation of HL60 neutrophil differentiationAlbert C Huang1,2, Limei Hu3, Stuart A Kauffman4, Wei Zhang3 and Ilya Shmulevich*2Address: 1Molecular and Cellular Biology Program, University of Washington, Seattle, Washington, DC, USA, 2Institute for Systems Biology, Seattle, Washington, DC, USA, 3Cancer Genomics Laboratory, University of Texas M.D. Anderson Cancer Center, Houston, Texas, USA and 4Institute for Biocomplexity and Informatics, University of Calgary, Calgary, Alberta, Canada
Email: Albert C Huang - [email protected]; Limei Hu - [email protected]; Stuart A Kauffman - [email protected]; Wei Zhang - [email protected]; Ilya Shmulevich* - [email protected]
* Corresponding author
AbstractBackground: The process of cellular differentiation is governed by complex dynamical biomolecularnetworks consisting of a multitude of genes and their products acting in concert to determine a particularcell fate. Thus, a systems level view is necessary for understanding how a cell coordinates this process andfor developing effective therapeutic strategies to treat diseases, such as cancer, in which differentiationplays a significant role. Theoretical considerations and recent experimental evidence support the view thatcell fates are high dimensional attractor states of the underlying molecular networks. The temporalbehavior of the network states progressing toward different cell fate attractors has the potential toelucidate the underlying molecular mechanisms governing differentiation.
Results: Using the HL60 multipotent promyelocytic leukemia cell line, we performed experiments thatultimately led to two different cell fate attractors by two treatments of varying dosage and duration of thedifferentiation agent all-trans-retinoic acid (ATRA). The dosage and duration combinations of the twotreatments were chosen by means of flow cytometric measurements of CD11b, a well-known earlydifferentiation marker, such that they generated two intermediate populations that were poised at theapparently same stage of differentiation. However, the population of one treatment proceeded toward theterminally differentiated neutrophil attractor while that of the other treatment reverted back toward theundifferentiated promyelocytic attractor. We monitored the gene expression changes in the twopopulations after their respective treatments over a period of five days and identified a set of genes thatdiverged in their expression, a subset of which promotes neutrophil differentiation while the otherrepresses cell cycle progression. By employing promoter based transcription factor binding site analysis,we found enrichment in the set of divergent genes, of transcription factors functionally linked to tumorprogression, cell cycle, and development.
Conclusion: Since many of the transcription factors identified by this approach are also known to beimplicated in hematopoietic differentiation and leukemia, this study points to the utility of incorporating adynamical systems level view into a computational analysis framework for elucidating transcriptionalmechanisms regulating differentiation.
Published: 18 February 2009
BMC Systems Biology 2009, 3:20 doi:10.1186/1752-0509-3-20
Received: 21 August 2008Accepted: 18 February 2009
This article is available from: http://www.biomedcentral.com/1752-0509/3/20
© 2009 Huang et al; licensee BioMed Central Ltd. This is an Open Access article distributed under the terms of the Creative Commons Attribution License (http://creativecommons.org/licenses/by/2.0), which permits unrestricted use, distribution, and reproduction in any medium, provided the original work is properly cited.
Page 1 of 13(page number not for citation purposes)

BMC Systems Biology 2009, 3:20 http://www.biomedcentral.com/1752-0509/3/20
BackgroundThe process of cellular differentiation is central to ourunderstanding of the nature of multicellular living sys-tems, their stability in a changing environment, and howsuch systems fail in diseases, such as cancer [1,2]. Thisdevelopmental process of individual cells in a multicellu-lar organism committing to their specialized phenotypiccharacteristics is temporally coordinated by a complexdynamical system comprised of large numbers of interact-ing genes and their products [3-5]. Not surprisingly,dynamical systems theory has been used to study cell dif-ferentiation [6-8].
Despite its tremendous importance, there is very littleaccumulated knowledge of the process of differentiationfrom a systems perspective and of the role of molecularprograms involved in this process. Even for an agent thatcauses differentiation to a common recognizable state, wedo not know whether the cells, as manifestations of theunderlying dynamic bio-molecular systems, always fol-low common or different molecular paths (or system statetrajectories). In the latter case, we also do not know whichof those paths is the most stable and least reversible.
Since a cell's phenotype and behavior are largely deter-mined by the activities of the genes and proteins constitut-ing a genetic network, it follows that the rules ofinteractions between these elements translate directly intorules of cellular behavior. That is, the enormous statespace of a genetic network (i.e., the space of all possibleconfigurations activities of the constituent elements)becomes reduced into a relatively small number of trajec-tories and steady states (attractors) of the dynamical sys-tem. Kauffman postulated that these attractor states inmodel networks correspond to the cell types in multicel-lular organisms [9,10], and the process of differentiationcorresponds to a trajectory (in the state space) leading intoone of the attractors. The cellular fate is thus determinedby the attractor in which the genetic network eventuallyends up; this can, to a large extent, be controlled by appro-priate external stimuli that place the system into differentinitial states. It is important to note that many trajectoriesensuing from such different initial states can flow to acommon attractor and thus constitute its basin of attrac-tion.
Consider that small molecule chemicals, such as dimethylsulfoxide (DMSO) and a host of others can induce cell dif-ferentiation in a variety of cell systems along with con-comitant cellular properties [11-15]. This rather amazingfact implies the pre-existence of cellular fates that needonly be selected by means of external stimuli rather thancreated by specific molecular events. This 'selection' of cellfates occurs by means of the inherent nature of thedynamical system to flow to an attractor when placed in
some initial transient state and thus, differentiation is aprocess of selecting a particular attractor in a genetic regu-latory network. This view has been supported experimen-tally by Huang et al. using genome-wide mRNAexpression profiling [16] as well as by means of analyzingcell fates in response to generalized physical stimuli, suchas cell distortion [17]. For a more extended discussion onthis topic, see [10].
The homeostatic stability of a differentiated cell is a con-sequence of the underlying stability of the attractor –'nearby' states, which may occur as a consequence of nat-ural environmental variation, simply flow back to theattractor. It is known that normal cells have a balancedstate of proliferation and differentiation, resulting inhomeostatic stability [18,19]. A block of normal differen-tiation and abnormal reversal of differentiation (some-times called de-differentiation) [20] are believed to besome of the hallmarks of cancer [21]. Accordingly, thera-peutic strategies have been designed to facilitate cancercells to reenter the differentiation program, often termeddifferentiation therapy [22,23].
The success of such therapeutic strategies depends on ourability to systematically determine appropriate molecular'lever points', the perturbations of which place the biomo-lecular system into states that are poised to differentiate.Indeed, such a strategy corresponds to placing the systemin a state by means of a stimulus, such as a therapeuticagent, and allowing the system to naturally flow towardan attractor that corresponds to the desired cellular end-point [24-26]. To identify such targets for intervention, itis necessary to characterize the underlying molecularmechanisms, such as transcriptional regulatory networks,governing the process of differentiation. Systems biologyapproaches, which are predicated on global measure-ments and data integration, are now beginning to revealtranscriptional machinery underlying complex biologicalprocesses [27-30]. The rationale behind our study was toexplore whether the aforementioned systems-level view ofcell fates as attractors and differentiation as a route towardan attractor, when coupled with computational systemsbiology approaches, is informative for elucidating thetranscriptional regulatory mechanisms governing differ-entiation.
To this end, we have selected a well-established differenti-ation model, human promyelocytic leukemia cells(HL60) originally isolated by Dr. Steven Collins from a37-year-old female acute promyelocytic leukemia (APL)patient [31]. The HL60 is a multi-potent cell line that canbe stimulated to differentiate using a variety of chemicalagents, including DMSO [32], all-trans-retinoic acid(ATRA) [33], 1,25 -dihydroxyvitamin D3 [34], 12-O-tetra-decanoylphorbol 13-acetate (TPA) [35], and granulocyte
Page 2 of 13(page number not for citation purposes)

BMC Systems Biology 2009, 3:20 http://www.biomedcentral.com/1752-0509/3/20
macrophage colony-stimulating factor (GM-CSF) [36].With the addition of ATRA, the HL60 cells differentiateinto neutrophils, while displaying the early differentia-tion marker, CD11b, which begins to be expressed withinone day of treatment [37]. Although there are others,CD11b is an early differentiation marker, which allowsone to capture the initial stage of the process. The CD11b+differentiated HL60 cells can be stained with fluorescent-labeled anti-CD11b antibody and easily recognized bycommonly used flow-cytometry methods and isolated byflow-sorting for further culturing and experimentation, aswe have done here. The HL60 system was also used byHuang et al. [16] to demonstrate the correspondencebetween cell fates and high-dimensional attractor states ofthe underlying genetic network.
One could reason as follows. If we could place the HL60into a state from which the system would dynamicallyflow towards the "neutrophil" attractor, as demonstratedby Huang et al., then the genes that show altered behavioralong the time-course trajectory relative to unstimulatedcontrols could be hypothesized to be implicated in theneutrophil differentiation process. This, of course, may bethe case, though the interpretation is confounded by thepossibility that the genes exhibiting altered behavior areresponsive to the particular mechanisms activated by thestimulus used, such as ATRA. Indeed, Huang et al. alsoconfronted this conceptual difficulty when they comparedtrajectories from ATRA-treated and DMSO-treated HL60cells, finding that certain genes may behave differentlysimply as a result of different stimuli activating differentbiological pathways, while many other genes dynamicallyconverge towards a common attractor, despite the systemflowing from distinct starting states corresponding toATRA and DMSO treatments [16]. To identify genes thatare not stimulus dependent, but are involved in the proc-ess of neutrophil differentiation, one could then use onlyone treatment, but in a way that allows one to alter cellu-lar fate, namely, terminal differentiation into neutrophilsor reversion back to the undifferentiated state.
The HL60 was shown to exhibit such behavior in two sep-arate studies both demonstrating that this differentiationprocess contains at least two steps in which a precommit-ment stage precedes the decision to differentiate. Yen et al.observed that with continuous exposure of ATRA at a highconcentration, the HL60 proceeds through differentia-tion, but upon removal of the stimulus, the HL60 fallsback to the undifferentiated state [38]. By analogy, such aprecommitment stage corresponds to a gradually slopingplateau between a valley and a mountain such that a ballsitting on this plateau would roll down into the "undiffer-entiated" valley in the absence of additional energy neces-sary to make it over the "terminally differentiated"mountain. More recently, Chang et al. reported a popula-
tion of "primed," undifferentiated CD11b- cells uponexposure to a low dose DMSO [39]. Though these cells arenegative with respect to the CD11b marker, thus consid-ered to be "undifferentiated," upon encountering a sec-ond dose of DMSO stimulation, they exhibited anincreased rate of differentiation, suggesting that the firstlow dose DMSO had placed them in a "primed" interme-diate differentiated state.
We thus decided to determine two different treatments,both with ATRA, but with different concentrations andincubation times such that the two cell populations corre-sponding to these treatments would be poised at the samestage of differentiation (precommitment), but so that onepopulation follows through to the terminally differenti-ated neutrophil attractor, while the other reverts back bydynamically flowing towards the undifferentiated state.The genes that would exhibit different behavior betweenthese two trajectories would then be potentially impli-cated in the differentiation process.
To identify two such precommitment states, we used thepercentage of CD11b+ cells at the end of a particular treat-ment as a measure of the stage of differentiation. We per-formed 80 ATRA treatments consisting of 8 doses (0.0005M to 1 M) and 10 durations (4 to 13 days) in triplicateand measured percentages of CD11b+ cells, relative to anisotype antibody control, using FACS analysis. Considerloci in the two-dimensional dose × duration stimulusspace, where all points on a particular locus correspond toa constant fraction of CD11b+ cells. Thus, two cell popu-lations on the same locus can be said to be at the same"stage" of differentiation at least as it pertains to CD11b.We chose two such populations, one with a higher doseand a shorter duration and the other with a lower doseand a longer duration, such that the cells treated with thehigher dose proceeded with differentiation into neu-trophils while the cells treated with the lower dosereverted back to the undifferentiated state, despite bothpopulations exhibiting the same percentage of CD11b+cells at the end of their respective treatments. The cellswere live-sorted, cultured in fresh media, and profiledevery 24 hours with microarrays for five days in triplicate.This additional Fluorescence Activated Cell Sorting(FACS) step mitigates the confounding effects of cellularheterogeneity due to subpopulations that do not initiatethe differentiation program (i.e. CD11b- cells). In thismanner, the gene expression programs of the two cellpopulations, one differentiating and one reverting, couldbe analyzed using computational approaches.
We defined a criterion to identify genes whose behaviorover time exhibits a divergence between the two treat-ments. It is these genes that are hypothesized to beinvolved in the differentiation process. We analyzed the
Page 3 of 13(page number not for citation purposes)

BMC Systems Biology 2009, 3:20 http://www.biomedcentral.com/1752-0509/3/20
promoters of these genes and found that they are overrep-resented with known transcription factors functionallylinked to myeloid differentiation, cell cycle, and develop-ment. This study points to the utility of incorporating asystems-level view of global dynamics, as distinguishedfrom the dynamics or kinetic behavior of the individualelements of a system, into a computational analysisframework that can be used for studying transcriptionalregulatory mechanisms governing a complex biologicalprocess such as differentiation.
Results and discussionTwo comparable dosage/duration treatment combinations lead to different macroscopic cell fate attractorsOur first goal was to determine two dosage/duration stim-ulation conditions that yield comparable stages of differ-entiated HL60 cells, with one condition ultimatelyleading to neutrophil differentiation and the other revert-ing back to the undifferentiated state. In other words, wesought to identify two perturbations that place the ATRA-treated cells in two different basins of attraction or initialstates leading to two different attractors – the promyelo-cyte attractor and the neutrophil attractor. This informa-tion allows us to culture large quantities of the HL60 cellsunder these conditions and isolate mRNA for time courseexperiments to examine the set of genes differentiallyexpressed between these treatments that could explain thedifferences in their eventual cell fates.
To achieve this goal, we set up a two-factor dosage andduration experiment with eight and ten levels respectively,ranging from 0.0005 M to 1 M with 4 to 13 days of treat-ment. We used a well-established early marker for neu-trophil differentiation, CD11b, as our surrogate for'differentiated' and 'undifferentiated' state [37]. We meas-ured the CD11b expression for each experimental condi-tion and calculated the percentage of HL60 cells that areCD11b+ by comparing to the untreated samples. Underthis construction, the percentage of CD11b+ cellsbecomes a proxy for the developmental stage of neu-trophil differentiation on a population level. The result ofthis dosage and duration experiment is summarized anddisplayed in a contour plot (Figure 1), showing a generaltrend – as the dosage or duration of ATRA treatmentincreases, the percentage of CD11b+ cells also increases.The treatment combinations, 0.5 M/11 Days producedthe highest percentage of CD11b+ cells at 82.7%. Asexpected, this result conforms with our general intuitionregarding ATRA treatment, that an increase in the dosageor the duration of treatments results in an increase in thepercentage of differentiated CD11b+ cells. See AdditionalFile 1 for the percentages of CD11b expression of the var-ious treatments.
From the contour plot, we identified two treatments thatboth gave rise to 54 percent of CD11b positive cells,namely, 1 M/5 Days and 0.05 M/7 Days. These two treat-ment combinations were picked because they producedsimilar levels of positive CD11b expression, yet one treat-ment is of higher dosage with shorter duration, while theother is of lower dosage with longer duration. We grew theHL60 cells under those conditions and isolated theCD11b+ population of these cells by FACS and re-cul-tured these cells in fresh, ATRA-free RPMI-1640 media.We collected the re-cultured cells and isolated the mRNAfor whole-genome expression analysis each day for fivedays. At the end of this period, we also collected cells fromboth treatments for Wright-Giemsa staining, a histologi-cal method that could be used to determine hematopoi-etic cell types based on cell morphology. The 0.05 M/7Days treatment resembles that of the untreated HL60cells, with clear visible nucleoli and large nuclear to cyto-plasm ratios, suggesting a reversal of cell fate back to theundifferentiated HL60 state; whereas the 1 M/5 Daystreatment shows morphology resembling that of differen-tiated neutrophils, with characteristic decreased nuclear tocytoplasmic ratio, and convolution and segmentation ofthe nuclei, suggesting a completion of cell fate toward thedifferentiated neutrophil attractor. Our observation is inaccordance with the notion of a "precommitment" statepreviously described [39-41], whereupon the removal of
Contour plot of the percentage of CD11b+ cells after ATRA treatmentFigure 1Contour plot of the percentage of CD11b+ cells after ATRA treatment. The x-axis represents the duration of ATRA treatment (Days). The y-axis represents the dosage of ATRA treatment ( M). The ovals represent the 1 M/5 Days and 0.05 M/7 Days dosage/duration culture conditions uti-lized for gene expression analysis. An increase in dosage or duration leads to an increase in CD11b+ cells.
0.2
0.20.2
0.30.3
0.30.3
0.40.4
0.40.4
0.4
0.5
0.5
0.50.5
0.5
0.5
0.6
0.6
0.60.6
0.70.7
0.7
0.8
Dos
age
(μM
)
Duration (Days)4 5 6 7 8 9 10 11 12 13
0.0005
0.001
0.005
0.01
0.05
0.1
0.5
1
0.2
0.3
0.4
0.5
0.6
0.7
0.8
Page 4 of 13(page number not for citation purposes)

BMC Systems Biology 2009, 3:20 http://www.biomedcentral.com/1752-0509/3/20
the stimulating agent, the HL60 can revert back to theundifferentiated state. Taken together, we have estab-lished a system where we identified two perturbationsthat place the HL60 cells in different basins of attraction,leading to different eventual macroscopic cell fates.
A subset of the genes leading to different cell fate attractors exhibit a divergent expression patternTo understand how the macroscopic cell fates that weobserved could have arisen from these two perturbationconditions, we analyzed the gene expression profiles ofthe treated HL60 cells. We reasoned that we had placedthe treated HL60 cells in their perspective basins of attrac-tion when we re-cultured the sorted CD11b+ cells fromthese two treatments in ATRA-free media. Hence, the geneexpression trajectories reflected the natural consequencesof placing the HL60 cells in these specific parts of thegenomic expression space. Therefore, when we looked atthe gene expression profiles of differentially expressedgenes between the two trajectories, the pattern weobserved could potentially explain the observed macro-scopic cell fate.
Interestingly, while the majority of the differentiallyexpressed genes (relative to untreated controls) exhibit aflat and unchanging average gene expression profie underboth (1 M/5 Days) and (0.05 M/7 Days) treatment con-ditions, there is a small subset of the genes (154, using ourcriterion) that exhibit a divergent gene expression profile.That is, after the high dosage/short duration treatment (1M/5 Days), their expression levels deviate further and fur-ther away from their levels under the untreated ATRA con-dition, whereas their expression levels after the lowdosage/long duration treatment (0.05 M/7 Days) con-verge toward the gene expression levels of those underuntreated ATRA condition (Figure 2). These divergentgenes can be separated further into two distinct classes,the up-regulated, and the down-regulated genes. The up-regulated (respectively, down-regulated) genes are theones that have elevated (respectively, repressed) expres-sion under both high dosage/short duration and low dos-age/long duration treatments relative to their expressionunder the untreated ATRA condition. In both cases, thisdisplay of differential expression behavior reflects themacroscopic cell fate observed, namely that the HL60 cellsfrom the high dosage/short duration treatment continuetoward differentiation whereas cells subjected to low dos-age/long duration treatment revert back toward the undif-ferentiated state. We hypothesized that these divergentgenes participate in the selection of a particular attractorfrom a set of pre-existing ones. See Additional File 2 for alist of the divergent genes as well as magnitude of diver-gence.
Divergent genes promote cellular differentiation and repress cell cycle progressionAfter we identified the set of divergent genes and theirunique gene expression patterns, we set out to investigatetheir known biological functions, with the goal of eluci-dating how these genes coordinate the transition of theHL60 cells from the promyelocyte attractor into the neu-trophil attractor. In particular, cellular differentiationprocesses frequently entail an up-regulation of genesinvolved in specialization while simultaneously down-regulating genes related to proliferation and cell cycle[18,19].
Indeed, a number of the up-regulated divergent genes areinvolved in the activation and specialization of neu-trophils. At the top of the up-regulated divergence genelist is ankyrin repeat and SOCS box-containing 2 (ASB2),which is known to be a retinoic acid-response gene and abinding target of the promyelocytic leukemia retinoic acidreceptor-alpha (RAR ) oncogenic protein [42]. WhenASB2 is expressed in leukemia cells, it inhibits growth andfurthers myelocytic commitment, precisely as seen in theHL60 cell differentiation model system. Inherent to theprocess of neutrophil activation are genes promoting the
Average mRNA gene expression of the differentially expressed genesFigure 2Average mRNA gene expression of the differentially expressed genes. The left panel shows the divergent genes. The right panel shows the non-divergent genes. The upper parts of the figures represent the genes that are up-regulated in both 1 M/5 Days and 0.05 M/7 Days treatments relative to untreated controls. The lower parts represent the genes that are down-regulated in both 1 M/5 Days and 0.05 M/7 Days treatments relative to untreated controls.
0 1 2 3 4−2
−1.5
−1
−0.5
0
0.5
1
1.5
2
Days Post SortingLo
g F
old
Exp
ress
ion
rel.
Unt
reat
ed
Average Expression of 154 Divergent Genes
1μM ATRA
0.05μM ATRAUntreated
0 1 2 3 4−2
−1.5
−1
−0.5
0
0.5
1
1.5
2
Days Post Sorting
Log
Fol
d E
xpre
ssio
n re
l. U
ntre
ated
Average Expression of 14856 Non−Divergent Genes
1μM ATRA0.05μM ATRAUntreated
Page 5 of 13(page number not for citation purposes)
BMC Systems Biology 2009, 3:20 http://www.biomedcentral.com/1752-0509/3/20
homing and migration of neutrophils to the sites ofinflammation. Examples of these genes among this list areorosomucoid 1 (ORM1), interleukin 8 receptor beta(IL8R ), and vanin2 (VNN2). ORM1 is highly expressedduring acute inflammation and has been suggested as asignaling molecule that binds to L-selectin on the neu-trophil cell surface to allow neutrophils to enter secondarylymphoid tissues via the high endothelial venules [43].IL8R , also known as CXCR2, is a receptor of interleukin 8(IL8) and facilitates neutrophil migration to the site ofinflammation [44]. Recently, its ligand was identified tobe the cytokine, macrophage migration inhibitory factor(MIF) [45]. Finally, expressed mainly on human neu-trophils [46] and anchored on the cell surface by glycosyl-phosphatidylinositol (GPI), VNN2 physically associatedwith 2 integrin (CD11b), the neutrophil differentiationmarker for our study [47].
Besides neutrophil activation, response to inflammationis another process in which several of the up-regulateddivergent genes including leukocyte immunoglobulin-like receptor subfamily B member 3 (LILRB3) and NOD9(NLR X1) participate. Expressed LILRB3 protein binds tothe MHC class I molecules on antigen-presenting cells tocontrol inflammatory responses and cytotoxicity by trans-ducing a negative signal that inhibits immune responseand limits autoreactivity [45]. NOD9 is a member of theNLR family known to recognize microbial molecules thatactivate inflammatory caspases, causing cleavage and acti-vation of inflammatory cytokines [48]. Collectively, theseup-regulated divergent genes promote requisite activitiesof activated neutrophils.
The list of down-regulated divergent genes, on the otherhand, contains many genes necessary for the progressionof cell cycle. We found members of the well-known cyclinand cell division cycle (CDC) gene families [49] includingcyclin d2 (CCND2), cyclin E1 (CCNE1), cell divisioncycle 2 (CDC2), cell division cycle 7 (CDC7), CDC28 pro-tein kinase regulatory subunit 1B (CKS1B), and cell divi-sion cycle associated 5 (CDCA5). CCND2 forms acomplex with cyclin dependent kinase 4 (CDK4) [50] andregulates cell cycle G0/G1 to S transition [51]. Similarly,CCNE1 is necessary for the progression of G1 to S transi-tion. It interacts with cyclin dependent kinase 2 (Cdk2) tophosphorylate the target genes nuclear protein ataxia-tel-angiectasia locus (NPAT) and nucleophosmin, criticalcomponents of cell proliferation and DNA replication,respectively [52]. CDC2 encodes a Ser/Thr kinase and isthe catalytic subunit of M-phase promoting factor (MPF),critical for G1/S and G2/M transitions [53]. CDC7encodes a kinase that is essential for DNA replication aswell as the transition between G1/S phase [54]. CKS1Bbinds to cyclin A for targeted degradation and passagethrough the spindle checkpoint [55]. CDCA5, also known
as sororin, controls the separation of sister chromatidsduring mitosis by stabilizing centromeric cohesin [56]. Inaddition to the cyclin and CDC gene families, other genesintegral to cell cycle progression were also found. TTK pro-tein kinase (TTK) is a cell cycle-regulated kinase with max-imal activity during M phase, localizing to kinetochores[57]. It is required for centrosome duplication and normalprogression of mitosis [58]. Kinesin family member 20A(KIF20A) accumulates in mitotic cells where it localizes tothe midzone of the spindle during anaphase, and to thecleavage furrow and midbody during telophase, essentialfor cytokinesis to proceed [59]. Interestingly, KIF20A is atarget of polo like kinase 1 (PLK1), a protein that we alsoidentified as a divergent gene. Together, they are necessaryfor proper spindle assembly and function during ana-phase and telophase of the cell cycle [60]. Jointly, thedown-regulated divergent genes suppress the HL60 cellsfrom progressing through the cell cycle.
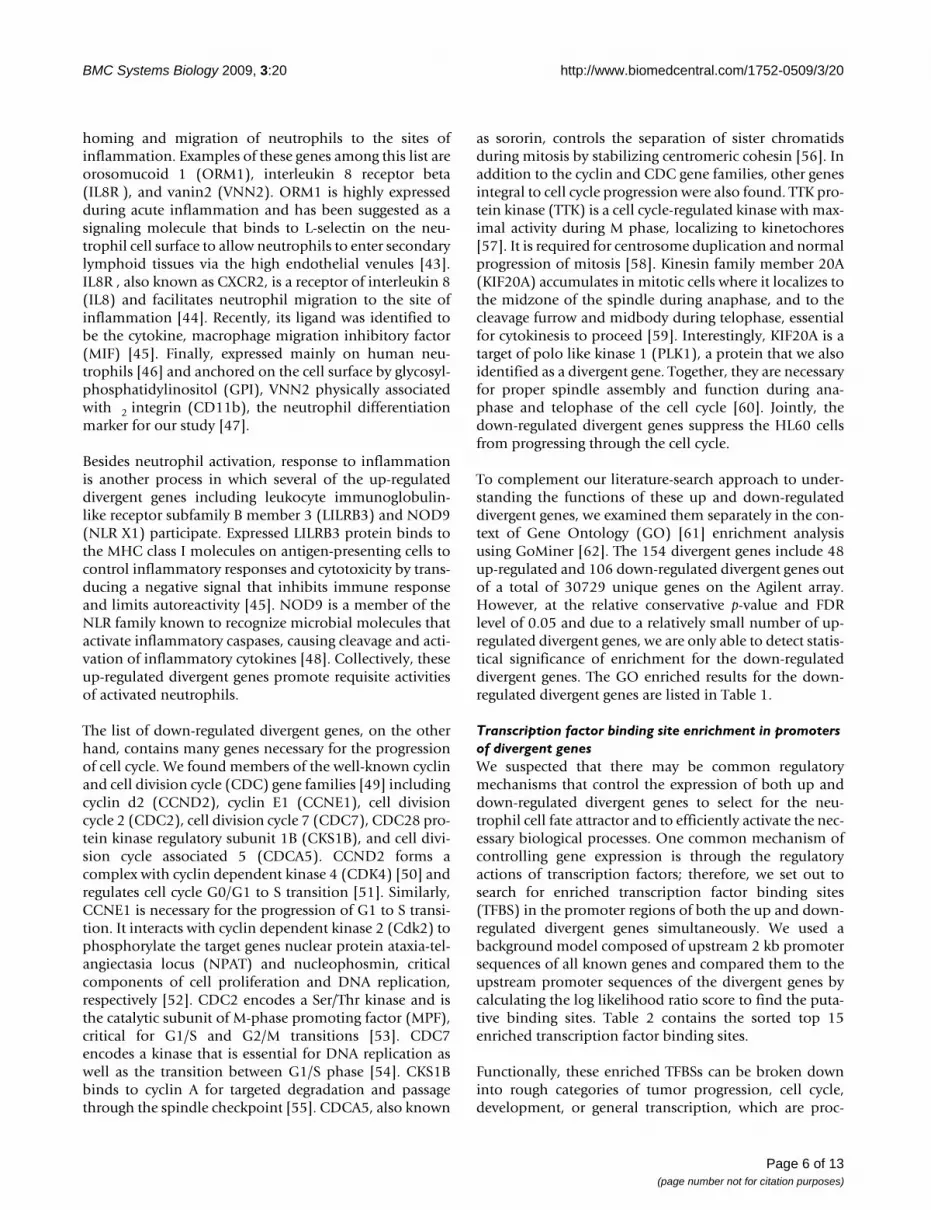
To complement our literature-search approach to under-standing the functions of these up and down-regulateddivergent genes, we examined them separately in the con-text of Gene Ontology (GO) [61] enrichment analysisusing GoMiner [62]. The 154 divergent genes include 48up-regulated and 106 down-regulated divergent genes outof a total of 30729 unique genes on the Agilent array.However, at the relative conservative p-value and FDRlevel of 0.05 and due to a relatively small number of up-regulated divergent genes, we are only able to detect statis-tical significance of enrichment for the down-regulateddivergent genes. The GO enriched results for the down-regulated divergent genes are listed in Table 1.
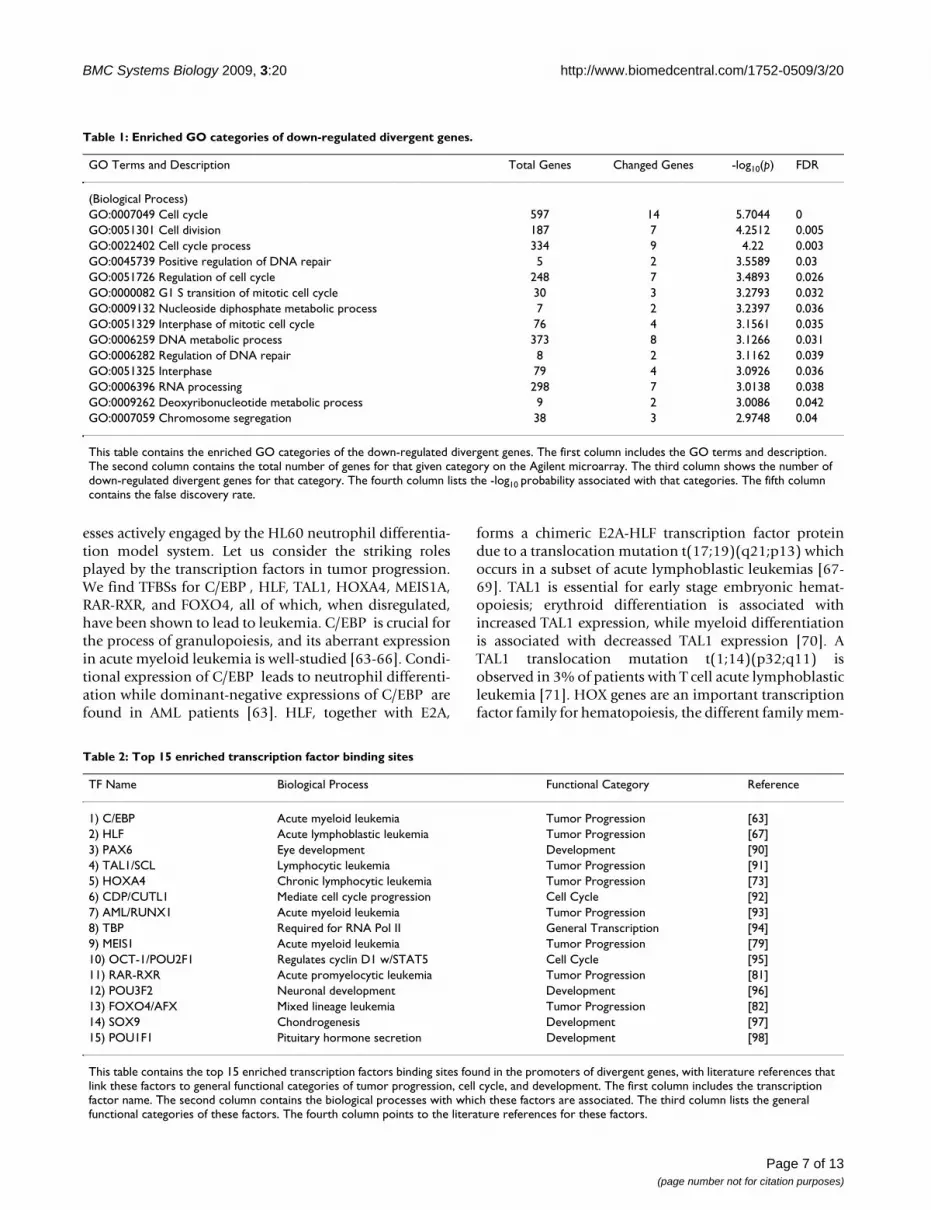
Transcription factor binding site enrichment in promoters of divergent genesWe suspected that there may be common regulatorymechanisms that control the expression of both up anddown-regulated divergent genes to select for the neu-trophil cell fate attractor and to efficiently activate the nec-essary biological processes. One common mechanism ofcontrolling gene expression is through the regulatoryactions of transcription factors; therefore, we set out tosearch for enriched transcription factor binding sites(TFBS) in the promoter regions of both the up and down-regulated divergent genes simultaneously. We used abackground model composed of upstream 2 kb promotersequences of all known genes and compared them to theupstream promoter sequences of the divergent genes bycalculating the log likelihood ratio score to find the puta-tive binding sites. Table 2 contains the sorted top 15enriched transcription factor binding sites.
Functionally, these enriched TFBSs can be broken downinto rough categories of tumor progression, cell cycle,development, or general transcription, which are proc-
Page 6 of 13(page number not for citation purposes)
BMC Systems Biology 2009, 3:20 http://www.biomedcentral.com/1752-0509/3/20
esses actively engaged by the HL60 neutrophil differentia-tion model system. Let us consider the striking rolesplayed by the transcription factors in tumor progression.We find TFBSs for C/EBP , HLF, TAL1, HOXA4, MEIS1A,RAR-RXR, and FOXO4, all of which, when disregulated,have been shown to lead to leukemia. C/EBP is crucial forthe process of granulopoiesis, and its aberrant expressionin acute myeloid leukemia is well-studied [63-66]. Condi-tional expression of C/EBP leads to neutrophil differenti-ation while dominant-negative expressions of C/EBP arefound in AML patients [63]. HLF, together with E2A,
forms a chimeric E2A-HLF transcription factor proteindue to a translocation mutation t(17;19)(q21;p13) whichoccurs in a subset of acute lymphoblastic leukemias [67-69]. TAL1 is essential for early stage embryonic hemat-opoiesis; erythroid differentiation is associated withincreased TAL1 expression, while myeloid differentiationis associated with decreassed TAL1 expression [70]. ATAL1 translocation mutation t(1;14)(p32;q11) isobserved in 3% of patients with T cell acute lymphoblasticleukemia [71]. HOX genes are an important transcriptionfactor family for hematopoiesis, the different family mem-
Table 1: Enriched GO categories of down-regulated divergent genes.
GO Terms and Description Total Genes Changed Genes -log10(p) FDR
(Biological Process)GO:0007049 Cell cycle 597 14 5.7044 0GO:0051301 Cell division 187 7 4.2512 0.005GO:0022402 Cell cycle process 334 9 4.22 0.003GO:0045739 Positive regulation of DNA repair 5 2 3.5589 0.03GO:0051726 Regulation of cell cycle 248 7 3.4893 0.026GO:0000082 G1 S transition of mitotic cell cycle 30 3 3.2793 0.032GO:0009132 Nucleoside diphosphate metabolic process 7 2 3.2397 0.036GO:0051329 Interphase of mitotic cell cycle 76 4 3.1561 0.035GO:0006259 DNA metabolic process 373 8 3.1266 0.031GO:0006282 Regulation of DNA repair 8 2 3.1162 0.039GO:0051325 Interphase 79 4 3.0926 0.036GO:0006396 RNA processing 298 7 3.0138 0.038GO:0009262 Deoxyribonucleotide metabolic process 9 2 3.0086 0.042GO:0007059 Chromosome segregation 38 3 2.9748 0.04
This table contains the enriched GO categories of the down-regulated divergent genes. The first column includes the GO terms and description. The second column contains the total number of genes for that given category on the Agilent microarray. The third column shows the number of down-regulated divergent genes for that category. The fourth column lists the -log10 probability associated with that categories. The fifth column contains the false discovery rate.
Table 2: Top 15 enriched transcription factor binding sites
TF Name Biological Process Functional Category Reference
1) C/EBP Acute myeloid leukemia Tumor Progression [63]2) HLF Acute lymphoblastic leukemia Tumor Progression [67]3) PAX6 Eye development Development [90]4) TAL1/SCL Lymphocytic leukemia Tumor Progression [91]5) HOXA4 Chronic lymphocytic leukemia Tumor Progression [73]6) CDP/CUTL1 Mediate cell cycle progression Cell Cycle [92]7) AML/RUNX1 Acute myeloid leukemia Tumor Progression [93]8) TBP Required for RNA Pol II General Transcription [94]9) MEIS1 Acute myeloid leukemia Tumor Progression [79]10) OCT-1/POU2F1 Regulates cyclin D1 w/STAT5 Cell Cycle [95]11) RAR-RXR Acute promyelocytic leukemia Tumor Progression [81]12) POU3F2 Neuronal development Development [96]13) FOXO4/AFX Mixed lineage leukemia Tumor Progression [82]14) SOX9 Chondrogenesis Development [97]15) POU1F1 Pituitary hormone secretion Development [98]
This table contains the top 15 enriched transcription factors binding sites found in the promoters of divergent genes, with literature references that link these factors to general functional categories of tumor progression, cell cycle, and development. The first column includes the transcription factor name. The second column contains the biological processes with which these factors are associated. The third column lists the general functional categories of these factors. The fourth column points to the literature references for these factors.
Page 7 of 13(page number not for citation purposes)
BMC Systems Biology 2009, 3:20 http://www.biomedcentral.com/1752-0509/3/20
bers of which are required to specify particular stages ofhematopoietic development [72]. Further, HoxA4 pro-moter hypermethylation has recently been linked tomutational status in chronic lymphocytic leukemia [73].AML/Runx1 is also linked to hematopoiesis and leukemictumor progression [74]. It is the DNA binding element ofthe core binding factor (CBF) transcription complex andis required for hematopoiesis as shown in knock-outmouse studies [75]. Mutations of RUNX1 have been iden-tified in familial platelet disorder (FPD) along with a con-genital predisposition to the development of acutemyeloid leukemia (AML) [76]. MEIS1, another proteinwith enriched TFBS, cooperates with both HOXB3 andHOXA9 to induce the transcription factor AML [77,78] bydown-regulating its expression through promoter hyper-methylation in a subset of AMLs [79]. The RAR-RXR het-erodimer TFBS is also enriched in the promoter regions ofour divergent genes. Since the HL60 neutrophil differenti-ation is induced through the actions of retinoid acid, it isreasonable that we observed an enrichment of retinoidacid receptor binding sites. Though it is well-establishedthat the chimeric fusion protein from RAR-PML transloca-tion mutation, t(15;17), is frequently associated withacute promyelocytic leukemia [80], methylation analysisof the RAR promoter further cements its involvement[81]. Finally, FOXO4 has also been linked with acuteleukemias. A translocation mutation t(X;11)(q13;q23),which fuses it with the gene MLL, was observed andcloned [82]. In summary, the list of enriched TFBSs reca-pitulates many important regulators of hematopoiesis,which are intimately tied to leukemia pathology, illustrat-ing the potential utility of such systems-level experimentaldesigns.
ConclusionIn this study, we perturbed the HL60 cells into the basinsof attraction of two distinct cell fate attractors using twodifferent ATRA dosage/duration treatments such that bothcell populations are poised at the same stage of differenti-ation. By tracking the gene expression changes en route tothese cell fates, we found a subset of the differentiallyexpressed genes that exhibited a divergent gene expressionpattern, hypothesized to correspond to the observed mac-roscopic cell type phenotype. Literature searches identi-fied the possible functions of these divergent genes to beinvolved in promoting neutrophil differentiation andrepressing cell cycle progression. Analyses of the promotersequences of the divergent genes further showed that theyare enriched with transcription factor binding sites knownto be linked to hematopoiesis, tumorigenesis, cell cycle,and development, suggesting the utility of systems levelanalysis for deriving valuable molecular level insights.
It is worth noting that our study suffers from a number ofinherent limitations. With our attractor-based experimen-
tal setup, we could not detect early onset genes that leadto the "precommitment" state. Since gene expression pro-files are only recorded after the two populations of thecells have achieved similar percentages of CD11b expres-sion, prior cellular events of interest that culminate intheir perspective promyelocyte and neutrophil attractorswould be missed. In addition, since our study is based ona population of cells, inherent to all microarrays studies,only measurements of the average cellular behavior arepossible. Indeed, it is known that the expression kineticson a single cell level can exhibit an all-or-none switch likebehavior, unlike the seemingly gradual change of expres-sion when measured as a population average [39]. Fur-ther, recent evidence now suggests that transcriptionalnoise inherent to individual cells underlies clonal hetero-geneity [83]. In light of this, an analysis on the geneexpression changes of individual cells flowing toward thepromyelocyte and neutrophil attractors would providevaluable insights.
Our study also suggests a number of natural extensions.For example, since transcription factor binding sites fre-quently occur in clusters and exert their effects simultane-ously, instead of looking for enrichment of individualtranscription factors, one can investigate enrichment ofmultiple transcription factors. Another possible extensionis the incorporation of protein-protein interaction net-works in order to identify potential co-activators of thetranscriptional complexes governing HL60 differentia-tion. Further, one can search for common interactionpartners to multiple enriched transcription factors. Addi-tionally, in our characterization of divergent genes, com-parisons of gene expression were made on a daily basis. Tomitigate the effects of measurement noise and daily fluc-tuations, it is possible to model the entire time coursegene expression profile for each gene by fitting a regres-sion curve, promoting a possibly more robust identifica-tion of divergent genes.
Our study also raises an important question – can the con-cept of cell fate be sufficiently described by the use of oneor few markers? Traditionally, cell fate has been intimatelytied to the expression of cell surface receptors. However,in our study, two populations of ATRA-stimulated HL60cells can both exhibit characteristic cell fate markers, yetbe destined to have distinct cell fates, namely a promyelo-cyte or a neutrophil. This suggests two populations of cellsmay have the same "apparent" state as measured by cellsurface markers while differing in other state space dimen-sions, ultimately leading them to disparate cell fates. Like-wise, Chang et al. [39] also came to similar conclusions intheir observation that low-dose DMSO-treated CD11b-cells are in a "primed" differentiated state as compared toDMSO-untreated CD11b- cells.
Page 8 of 13(page number not for citation purposes)

BMC Systems Biology 2009, 3:20 http://www.biomedcentral.com/1752-0509/3/20
This study suggests that systems-level dynamics, such asthe partitioning of the state space into distinct basins ofattraction, have the potential to convey informationabout the molecular-level control of biological processes.
MethodsCells and chemicalsEarly passaged HL60 cells were generously provided byDr. Steven Collins (Fred Hutchinson Cancer ResearchCenter). The cells were cultured in T/25 flasks with RPMI-1640 media (Gibco) supplemented with 10% heat-inacti-vated fetal calf serum (Sigma). Cells were grown in mediacontaining All-Trans Retinoic Acid (Sigma) to induce neu-trophil differentiation [33]. ATRA was stored in -30°Cand dissolved in 95% ethanol to make stock solution.
Dosage and duration of ATRA treatmentsA two-factor dosage and duration experiment was set upwith eight and ten levels, respectively. HL60 cells weresubjected to the following dosages ( M): 1, 0.5, 0.1, 0.05,0.01, 0.005, 0.001, and 0.0005 in conjunction with thefollowing durations (Days of Treatment): 4, 5, 6, 7, 8, 9,10, 11, 12, and 13. For example, one of the eighty treat-ment combinations is 1 M/4 Days, in which, we treatedthe HL60 cells with 1 M of ATRA for 4 Days and measuredthe CD11b expression of these treated cells by flowcytometry. Each of the 80 dosage/duration combinationsand CD11b measurements were performed in triplicate.
Flow cytometry to detect surface CD11b expressionSurface CD11b is an early marker of neutrophil differenti-ation in HL60. Cells (106) were harvested, washed twicewith PBS buffer, and incubated on ice for an hour with PE-conjugated CD11b antibody or its isotype control (MouseIgG1 ) from BD Pharmingen. Cells were then washed twomore times with PBS buffer and fluorescence was meas-ured by FACSCalibur using CellQuest software (BD Bio-sciences). The CD11b expression levels were compared tothe isotype control to correct for any non-specific binding.Untreated HL60 cells stained with the isotype controlwere used as background for undifferentiated cells.
Dosage and duration contour plot constructionOne million cells were collected for each experiment. Per-centages of CD11b+ expression were calculated by com-paring ATRA treated HL60 samples to untreated samples.Triplicate values of the percentage of differentiation wereaveraged and the result was displayed as a contour plot(Figure 1). In constructing the dosage/duration contourplot, one round of linear interpolation was performed toobtain a finer sampling of the dosage/duration grid.
Wright-Giemsa stain to observe nuclear morphologyTreated and untreated cells (105) were harvested, washedonce with PBS buffer, spun down on microscope slides
using Cytospin 2 (Shandon Inc.) and air-dried. Slideswere then flooded with 2 mL Modified Wright-Giemsastain (Sigma-Aldridge) and soaked for 1 minute. 2 mLdeionized water was added, the slides were soaked for 3minutes, rinsed with deionized water, and air dried.
Microarray experiment and analysis to measure changes in mRNA levelsTwo treatment combinations that yielded similar levels ofCD11b expression were identified from the dosage andduration contour plot: 1) high dosage/short duration (1M ATRA/5 Days) and 2) low dosage/long duration (0.05M ATRA/7 Days). HL60 cells were cultured under thesetwo conditions and fifteen million CD11b positive cellswere collected from each condition using the CytopeiainFlux V-Gs high-speed sorter. Sorted CD11b positivecells were then re-cultured in fresh ATRA-free RPMImedia. After six hours of allowing these cells to recoverfrom the sorting process, one million cells were collected.For the next five days, one million cells were collectedevery twenty-four hours, culminating in a total of 5 timepoints – Day 0 (6 hours post-sorting) to Day 4 (102 hourspost sorting). For each time point, total RNA from cellsamples were isolated with Trizol and quantified usingThermo Scientific NanoDrop 1000. RNA quantity forthree technical replicates was collected for each timepoint, except day0, day1, and day4 of the 1 M treatment,where unfortunately the RNA quantity was only sufficientfor two replicates, resulting in a total of 27 microarrayexperiments on Agilent human whole genome oligoarrays with 44 k 60-mer probes. ATRA-treated samplesfrom each time point were labeled with the Cy5 dye, whileuntreated HL60 cells were labeled with the Cy3 dye forcomparison. Each hybridized array was scanned with theAgilent dual laser-based scanner. Feature Extraction soft-ware version 8.0 (Agilent Technologies) was used to out-put the relative fluorescence intensity between the treatedand untreated samples.
After the microarray experiments, the slides were scannedand the raw spot intensity (gProcessedSignal and rProc-essedSignal from the feature extraction software) wereused for subsequent data analysis in Matlab (The Math-works, Inc). Of the 43931 spots on the Agilent array, spotsthat were designated for quality control, spots that weresaturated, and spots that had signals too low to bedetected were filtered out, resulting in 41509 spotsremaining. The log intensity values were normalizedusing quantile normalization [84]. Replicate array inten-sity values were averaged to obtain the mean fluorescenceintensity. Differentially expressed genes were picked usingSAM [85] (Two class Paired). After this filtering step,14949 differentially expressed genes remained. We com-pared the expression of 1 M ATRA/5 Days treatment with0.05 M ATRA/7 Days treatment to identify genes that
Page 9 of 13(page number not for citation purposes)

BMC Systems Biology 2009, 3:20 http://www.biomedcentral.com/1752-0509/3/20
showed a steady daily increase of divergence in expressionof 5% or larger, and designated these as divergent genes.Of these genes, those with elevated (respectively, sup-pressed) expression under both 1 M ATRA/5 Days treat-ment and 0.05 M ATRA/7 Days treatment relative to theuntreated condition during the first three time points weredeemed to be up-regulated (respectively, down-regu-lated). Comparisons of expressions were done on a dailybasis, yielding a total of 176 divergent probes, 48 up-reg-ulated and 128 down-regulated. A complete list of diver-gent gene probes is available in the supplementarysection. Gene probes are sorted based on log2 fold diver-gence of Day 4 expression between 1 M ATRA/5 Daystreatment and 0.05 M ATRA/7 Days treatment. The 176divergent spots identified corresponded to 154 uniquegenes, 48 up-regulated genes and 106 down-regulatedgenes (some genes have multiple probes on the array).
Functional enrichment of divergent genes by Gene Ontology (GO)Up-regulated divergent genes and down-regulated diver-gent genes were submitted separately to GoMiner [62] foran analysis of enriched biological processes at the p-valuelevel of 0.05 and FDR of 0.05.
Searching for enriched transcription factor binding sitesUpstream 2 kb promoter regions of the divergent geneswere downloaded from EMBL (NCBI36) using theBioMart interface [86]. Prepackaged upstream 2 kbregions of all RefSeq genes were also downloaded usingthe UCSC genome browser (hg18) [87]. After filtering outduplicated sequences and sequences containing ambigu-ous nucleotide bases, 18827 sequences remained. 429human TRANSFAC (Professional 9.4) matrices [88] wereused to calculate the log likelihood ratio scores of tran-scription factor binding for the divergent genes as well asthe RefSeq genes, as
where L is the log likelihood ratio score, Ms is the TRANS-FAC matrix model, Mb is the zeroth order Markov back-ground model with frequencies of A:0.2583 C:0.2457G:0.2425 T:0.2535, which were calculated by countingthe occurrences of the nucleotides in all promotersequences. si is the ith nucleotide of the motif site underconsideration, and n is the length of the motif site.
Since binding sites tend to occur in clusters in highereukaryotes [89], attention was paid to find stretches of theDNA sequences (100 bp) with large numbers of putativebinding sites. Hence, log likelihood ratio scores from all429 TRANSFAC matrices were summed at each nucleotideposition for all RefSeq promoter sequences. The top 1% of
these 100 bp highest scoring regions were picked as cut-off values to represent regions with clusters of putativebinding sites. This cut-off value was then used to searchfor clusters of putative binding sites in the divergentgenes, resulting in 262 of these clusters of binding sitesbeing identified for the divergent genes. Expected num-bers of binding sites were calculated by counting the totalnumber of binding sites within the high-scoring regionsdivided by the total number of high-scoring regions foreach transcription factor. This calculation was repeated foreach TRANSFAC matrix. Enriched transcription factorbinding sites were then ranked by the differences betweenthe expected values for the divergent gene set and the setof all RefSeq promoters (Table 2).
Authors' contributionsConceived and designed the experiments: AH, SK, WZ, IS.Performed the experiments: AH, LH. Analyzed the data:AH. Contributed reagents/materials/analysis tools: WZ,IS. Wrote the paper: AH, IS.
Additional material
AcknowledgementsWe thank Alan Aderem for providing lab space and equipment, Steven Col-lins for the HL60 cell line and many helpful suggestions, Alvin Liu for access to microscopes and the color camera, and Stephen Ramsey for valuable comments. This work was supported by grants R21 GM070600, R01 GM072855 and P50 GM076547 from NIH/NIGMS.
References1. Alberts B, Johnson A, Lewis J, Raff M, Roberts K, Walter P: Molecular
Biology of the Cell. Garland Science 5th edition. 2007.2. Gilbert S: Spook and Spookier code for stage-specific compo-
nents of the ecdysone biosynthetic pathway in Diptera. InDev Biol 8th edition. Sinauer Associates Inc; 2006.
3. Di Cara A, Garg A, De Micheli G, Xenarios I, Mendoza L: Dynamicsimulation of regulatory networks using SQUAD. BMC Bioin-formatics 2007, 8:462.
4. Newman S, Christley S, Glimm T, Hentschel H, Kazmierczak B, ZhangY, Zhu J, Alber M: Multiscale models for vertebrate limb devel-opment. Curr Top Dev Biol 2008, 81:311-340.
L P M s P M si s i i b i
i
n
i
n
= −==∑∑ log( ( | )) log( ( | ))
11
(1)
Additional file 1Numerical CD11b expression of ATRA-treated HL60 cells. This file contains the underlying numerical values of the CD11b expression pre-sented in the contour plot figure.Click here for file[http://www.biomedcentral.com/content/supplementary/1752-0509-3-20-S1.xls]
Additional file 2List of divergent genes along with magnitude of divergence. This file contains the complete list of identified divergent genes along with magni-tude of log2 fold divergence.Click here for file[http://www.biomedcentral.com/content/supplementary/1752-0509-3-20-S2.xls]
Page 10 of 13(page number not for citation purposes)

BMC Systems Biology 2009, 3:20 http://www.biomedcentral.com/1752-0509/3/20
5. Takagi H, Kaneko K: Dynamical systems basis of metamorpho-sis: diversity and plasticity of cellular states in reaction diffu-sion network. J Theor Biol 2005, 234:173-186.
6. Kaneko K, Yomo T: Isologous diversification: a theory of celldifferentiation. Bull Math Biol 1997, 59:139-196.
7. Qu K, Abi Haidar A, Fan J, Ensman L, Tuncay K, Jolly M, Ortoleva P:Cancer onset and progression: a genome-wide, nonlineardynamical systems perspective on onconetworks. J Theor Biol2007, 246:234-244.
8. Mendoza L: A network model for the control of the differenti-ation process in Th cells. BioSystems 2006, 84:101-114.
9. Kauffman SA: Metabolic stability and epigenesis in randomlyconstructed genetic nets. Journal of Theoretical Biology 1969,22(3):437-467.
10. Kauffman SA: The Origins of Order: Self-Organization and Selection in Evo-lution Oxford University Press, New York; 1993.
11. Yu Z, Quinn P: Dimethyl sulphoxide: a review of its applica-tions in cell biology. Biosci Rep 1994, 14:259-281.
12. Kulyk W, Hoffman L: Ethanol exposure stimulates cartilage dif-ferentiation by embryonic limb mesenchyme cells. Exp CellRes 1996, 223:290-300.
13. Woodbury D, Schwarz E, Prockop D, Black I: Adult rat and humanbone marrow stromal cells differentiate into neurons. J Neu-rosci Res 2000, 61:364-370.
14. Kalf G, O'Connor A: The effects of benzene and hydroquinoneon myeloid differentiation of HL-60 promyelocytic leukemiacells. Leuk Lymphoma 1993, 11:331-338.
15. Constantinou A, Huberman E: Genistein as an inducer of tumorcell differentiation: possible mechanisms of action. Proc SocExp Biol Med 1995, 208:109-115.
16. Huang S, Eichler G, Bar-Yam Y, Ingber DE: Cell Fates as High-Dimensional Attractor States of a Complex Gene Regula-tory Network. Physical Review Letters 2005, 94(12):128701.
17. Huang S, Ingber D: Shape-dependent control of cell growth, dif-ferentiation, and apoptosis: switching between attractors incell regulatory networks. Exp Cell Res 2000, 261:91-103.
18. Chen J, Mandel E, Thomson J, Wu Q, Callis T, Hammond S, ConlonF, Wang D: The role of microRNA-1 and microRNA-133 inskeletal muscle proliferation and differentiation. Nat Genet2006, 38:228-233.
19. Garcia A, Vega M, Boettiger D: Modulation of cell proliferationand differentiation through substrate-dependent changes infibronectin conformation. Mol Biol Cell 1999, 10:785-798.
20. Sell S: Cellular origin of cancer: dedifferentiation or stem cellmaturation arrest? Environ Health Perspect 1993, 101(Suppl5):15-26.
21. Huang S, Ingber D: Cell tension, matrix mechanics, and cancerdevelopment. Cancer Cell 2005, 8:175-176.
22. Sell S: Stem cell origin of cancer and differentiation therapy.Crit Rev Oncol Hematol 2004, 51:1-28.
23. Pollett J, Corsi K, Weiss K, Cooper G, Barry D, Gharaibeh B, HuardJ: Malignant transformation of multipotent muscle-derivedcells by concurrent differentiation signals. Stem Cells 2007,25:2302-2311.
24. Shmulevich I, Dougherty E, Zhang W: Gene perturbation andintervention in probabilistic Boolean networks. Bioinformatics2002, 18:1319-1331.
25. Datta A, Choudhary A, Bittner M, Dougherty E: External controlin Markovian genetic regulatory networks: the imperfectinformation case. Bioinformatics 2004, 20:924-930.
26. Datta A, Choudhary A, Bittner M, Dougherty E: ControlApproaches for Probabilistic Gene Regulatory Networks.IEEE Signal Processing Magazine 2007, 24:54-63.
27. Gilchrist M, Thorsson V, Li B, Rust A, Korb M, Roach J, Kennedy K,Hai T, Bolouri H, Aderem A: Systems biology approaches iden-tify ATF3 as a negative regulator of Toll-like receptor 4.Nature 2006, 441:173-178.
28. Miller J, Oldham M, Geschwind D: A systems level analysis oftranscriptional changes in Alzheimer's disease and normalaging. J Neurosci 2008, 28:1410-1420.
29. Bonneau R, Facciotti M, Reiss D, Schmid A, Pan M, Kaur A, ThorssonV, Shannon P, Johnson M, Bare J, Longabaugh W, Vuthoori M, White-head K, Madar A, Suzuki L, Mori T, Chang D, Diruggiero J, Johnson C,Hood L, Baliga N: A predictive model for transcriptional con-trol of physiology in a free living cell. Cell 2007, 131:1354-1365.
30. Ramsey S, Klemm S, Zak D, Kennedy K, Thorsson V, Li B, GilchristM, Gold E, Johnson C, Litvak V, Navarro G, Roach J, Rosenberger C,Rust A, Yudkovsky N, Aderem A, Shmulevich I: Uncovering a mac-rophage transcriptional program by integrating evidencefrom motif scanning and expression dynamics. PLoS ComputBiol 2008, 4:e1000021.
31. Gallagher R, Collins S, Trujillo J, McCredie K, Ahearn M, Tsai S, Metz-gar R, Aulakh G, Ting R, Ruscetti F, Gallo R: Characterization ofthe continuous, differentiating myeloid cell line(HL-60) froma patient with acute promyelocytic leukemia. Blood 1979,54(3):713-733.
32. Collins S, Ruscetti F, Gallagher R, Gallo R: Terminal differentia-tion of human promyelocytic leukemia cells induced bydimethyl sulfoxide and other polar compounds. Proc Natl AcadSci USA 1978, 75:2458-2462.
33. Breitman T, Selonick S, Collins S: Induction of differentiation ofthe human promyelocytic leukemia cell line (HL-60) byretinoic acid. Proc Natl Acad Sci USA 1980, 77:2936-2940.
34. McCarthy D, San Miguel J, Freake H, Green P, Zola H, Catovsky D,Goldman J: 1,25-dihydroxyvitamin D3 inhibits proliferation ofhuman promyelocytic leukaemia (HL60) cells and inducesmonocyte-macrophage differentiation in HL60 and normalhuman bone marrow cells. Leuk Res 1983, 7:51-55.
35. Rovera G, Santoli D, Damsky C: Human promyelocytic leukemiacells in culture differentiate into macrophage-like cellswhentreated with a phorbol diester. Proc Natl Acad Sci USA1979, 76:2779-2783.
36. Tomonaga M, Golde D, Gasson J: Biosynthetic (recombinant)human granulocyte-macrophage colony-stimulating factor:effect on normal bone marrow and leukemia cell lines. Blood1986, 67:31-36.
37. Drayson MT, Michell R, Durham J, Brown G: Cellproliferation andCD11b expression are controlled independently duringHL60 cell differentiation initiated by 1,25 -dihydroxyvitaminD3 or all-trans-retinoic acid. Experimental Cell Research 2001,266:126-134.
38. Yen A, Reece S, Albright K: Dependence of HL-60 myeloid celldifferentiation on continuous and split retinoic acid expo-sures: precommitment memory associated with alterednuclear structure. J Cell Physiol 1984, 118:277-286.
39. Chang H, Oh P, Ingber D, Huang S: Multistable and multistepdynamics in neutrophil differentiation. BMC Cell Biol 2006, 7:11.
40. Yen A, Reece S, Albright K: Membrane origin for a signal elicit-ing a program of cell differentiation. Exp Cell Res 1984,152:493-499.
41. Yen A, Reece S, Albright K: Control of cell differentiation duringproliferation. II. Myeloid differentiation and cell cycle arrestof HL-60 promyelocytes preceded by nuclear structuralchanges. Leuk Res 1985, 9:51-71.
42. Heuze M, Guibal F, Banks C, Conaway J, Conaway R, Cayre Y,Benecke A, Lutz P: ASB2 is an Elongin BC-interacting proteinthat can assemble with Cullin 5 and Rbx1 to reconstitute anE3 ubiquitin ligase complex. J Biol Chem 2005, 280:5468-5474.
43. Gunnarsson P, Levander L, Pahlsson P, Grenegard M: The acute-phase protein alpha 1-acid glycoprotein (AGP) induces risesin cytosolic Ca2+ in neutrophil granulocytes via sialic acidbinding immunoglobulin-like lectins (siglecs). FASEB J 2007,21:4059-4069.
44. Catusse J, Liotard A, Loillier B, Pruneau D, Paquet J: Characteriza-tion of the molecular interactions of interleukin-8 (CXCL8),growth related oncogen alpha (CXCL1) and a non-peptideantagonist (SB 225002) with the human CXCR2. BiochemPharmacol 2003, 65:813-821.
45. Wang J, Shiratori I, Satoh T, Lanier L, Arase H: An essential role ofsialylated O-linked sugar chains in the recognition of mouseCD99 by paired Ig-like type 2 receptor (PILR). J Immunol 2008,180:1686-1693.
46. Sendo D, Takeda Y, Ishikawa H, Sendo F, Araki Y: Localization ofGPI-80, a beta2-integrin-associated glycosylphosphatidyl-inositol anchored protein, on strongly CD14-positive humanmonocytes. Immunobiology 2003, 207:217-221.
47. Yoshitake H, Takeda Y, Nitto T, Sendo F, Araki Y: GPI-80, a beta2integrin associated glycosylphosphatidylinositol-anchoredprotein, concentrates on pseudopodia without associationwith beta2 integrin during neutrophil migration. Immunobiol-ogy 2003, 208:391-399.
Page 11 of 13(page number not for citation purposes)

BMC Systems Biology 2009, 3:20 http://www.biomedcentral.com/1752-0509/3/20
48. Ting J, Willingham S, Bergstralh D: NLRs at the intersection ofcell death and immunity. Nat Rev Immunol 2008, 8:372-379.
49. Hartwell L, Culotti J, Reid B: Genetic control of the cell-divisioncycle in yeast. I. Detection of mutants. Proc Natl Acad Sci USA1970, 66:352-359.
50. Ewen M, Sluss H, Sherr C, Matsushime H, Kato J, Livingston D: Func-tional interactions of the retinoblastoma protein with mam-malian D-type cyclins. Cell 1993, 73:487-497.
51. Inaba T, Matsushime H, Valentine M, Roussel M, Sherr C, Look A:Genomic organization, chromosomal localization, and inde-pendent expression of human cyclin D genes. Genomics 1992,13:565-574.
52. Mazumder S, DuPree E, Almasan A: A dual role of cyclin E in cellproliferation and apoptosis may provide a target for cancertherapy. Curr Cancer Drug Targets 2004, 4:65-75.
53. Draetta G, Beach D: The mammalian cdc2 protein kinase:mechanisms of regulation during the cell cycle. J Cell Sci Suppl1989, 12:21-27.
54. Tenca P, Brotherton D, Montagnoli A, Rainoldi S, Albanese C, Santo-canale C: Cdc7 is an active kinase in human cancer cellsundergoing replication stress. J Biol Chem 2007, 282:208-215.
55. Wolthuis R, Clay-Farrace L, van Zon W, Yekezare M, Koop L, OginkJ, Medema R, Pines J: Cdc20 and Cks direct the spindle check-point-independent destruction of cyclin A. Mol Cell 2008,30:290-302.
56. Diaz-Martinez L, Gimenez-Abian J, Clarke D: Regulation of centro-meric cohesion by sororin independently of the APC/C. CellCycle 2007, 6:714-724.
57. Stucke V, Sillje H, Arnaud L, Nigg E: Human Mps1 kinase isrequired for the spindle assembly checkpoint but not forcentrosome duplication. EMBO J 2002, 21:1723-1732.
58. Fisk H, Mattison C, Winey M: Human Mps1 protein kinase isrequired for centrosome duplication and normal mitoticprogression. Proc Natl Acad Sci USA 2003, 100:14875-14880.
59. Hill E, Clarke M, Barr F: The Rab6-binding kinesin, Rab6-KIFL,is required for cytokinesis. EMBO J 2000, 19:5711-5719.
60. Sumara I, Gimenez-Abian J, Gerlich D, Hirota T, Kraft C, de la TorreC, Ellenberg J, Peters J: Roles of polo-like kinase 1 in the assem-bly of functional mitotic spindles. Curr Biol 2004, 14:1712-1722.
61. Ashburner M, Ball C, Blake J, Botstein D, Butler H, Cherry J, Davis A,Dolinski K, Dwight S, Eppig J, Harris M, Hill D, Issel-Tarver L, Kasar-skis A, Lewis S, Matese J, Richardson J, Ringwald M, Rubin G, SherlockG: Gene ontology: tool for the unification of biology. TheGene Ontology Consortium. Nat Genet 2000, 25:25-29.
62. Zeeberg BR, Feng W, Wang G, Wang MD, Fojo AT, Sunshine M, Nar-asimhan S, Kane DW, Reinhold WC, Lababidi S, Bussey KJ, Riss J, Bar-rett JC, Weinstein JN: GoMiner: A Resource for BiologicalInterpretation of Genomic and Proteomic Data. Genome Biol-ogy 2003, 4(4):R28.
63. Pabst T, Mueller B, Harakawa N, Schoch C, Haferlach T, Behre G,Hiddemann W, Zhang D, Tenen D: AML1-ETO downregulatesthe granulocytic differentiation factor C/EBPalpha in t(8;21)myeloid leukemia. Nat Med 2001, 7:444-451.
64. Kirstetter P, Schuster M, Bereshchenko O, Moore S, Dvinge H, KurzE, Theilgaard-Monch K, Mansson R, Pedersen T, Pabst T, Schrock E,Porse B, Jacobsen S, Bertone P, Tenen D, Nerlov C: Modeling of C/EBPalpha mutant acute myeloid leukemia reveals a com-mon expression signature of committed myeloid leukemia-initiating cells. Cancer Cell 2008, 13:299-310.
65. Castilla L: C/EBPalpha in leukemogenesis: a matter of being inthe right place with the right signals. Cancer Cell 2008,13:289-291.
66. Pabst T, Mueller B, Zhang P, Radomska H, Narravula S, Schnittger S,Behre G, Hiddemann W, Tenen D: Dominant-negative muta-tions of CEBPA, encoding CCAAT/enhancer binding pro-tein-alpha (C/EBPalpha), in acute myeloid leukemia. NatGenet 2001, 27:263-270.
67. Devaraj P, Foroni L, Sekhar M, Butler T, Wright F, Mehta A, SamsonD, Prentice H, Hoffbrand A, Secker-Walker L: E2A/HLF fusioncDNAs and the use of RT-PCR for the detection of minimalresidual disease in t(17;19)(q22;p13) acute lymphoblasticleukemia. Leukemia 1994, 8:1131-1138.
68. LeBrun D: E2A basic helix-loop-helix transcription factors inhuman leukemia. Front Biosci 2003, 8:s206-222.
69. Inukai T, Hirose K, Inaba T, Kurosawa H, Hama A, Inada H, Chin M,Nagatoshi Y, Ohtsuka Y, Oda M, Goto H, Endo M, Morimoto A, Imai-
zumi M, Kawamura N, Miyajima Y, Ohtake M, Miyaji R, Saito M, TawaA, Yanai F, Goi K, Nakazawa S, Sugita K: Hypercalcemia in child-hood acute lymphoblastic leukemia: frequent implication ofparathyroid hormone-related peptide and E2A-HLF fromtranslocation 17;19. Leukemia 2007, 21:288-296.
70. Begley C, Green A: The SCL gene: from case report to criticalhematopoietic regulator. Blood 1999, 93:2760-2770.
71. Hall M, Curtis D, Metcalf D, Elefanty A, Sourris K, Robb L, Gothert J,Jane S, Begley C: The critical regulator of embryonic hemat-opoiesis, SCL, is vital in the adult for megakaryopoiesis,erythropoiesis, and lineage choice in CFU-S12. Proc Natl AcadSci USA 2003, 100:992-997.
72. Abramovich C, Humphries R: Hox regulation of normal andleukemic hematopoietic stem cells. Curr Opin Hematol 2005,12:210-216.
73. Strathdee G, Sim A, Parker A, Oscier D, Brown R: Promoterhypermethylation silences expression of the HoxA4 geneand correlates with IgVh mutational status in CLL. Leukemia2006, 20:1326-1329.
74. Okuda T, van Deursen J, Hiebert S, Grosveld G, Downing J: AML1,the target of multiple chromosomal translocations in humanleukemia, is essential for normal fetal liver hematopoiesis.Cell 1996, 84:321-330.
75. Sasaki K, Yagi H, Bronson R, Tominaga K, Matsunashi T, Deguchi K,Tani Y, Kishimoto T, Komori T: Absence of fetal liver hemat-opoiesis in mice deficient in transcriptional coactivator corebinding factor beta. Proc Natl Acad Sci USA 1996, 93:12359-12363.
76. Michaud J, Wu F, Osato M, Cottles G, Yanagida M, Asou N, ShigesadaK, Ito Y, Benson K, Raskind W, Rossier C, Antonarakis S, Israels S,McNicol A, Weiss H, Horwitz M, Scott H: In vitro analyses ofknown and novel RUNX1/AML1 mutations in dominantfamilial platelet disorder with predisposition to acute myel-ogenous leukemia: implications for mechanisms of patho-genesis. Blood 2002, 99:1364-1372.
77. Calvo K, Knoepfler P, Sykes D, Pasillas M, Kamps M: Meis1a sup-presses differentiation by G-CSF and promotes proliferationby SCF: potential mechanisms of cooperativity with Hoxa9in myeloid leukemia. Proc Natl Acad Sci USA 2001,98:13120-13125.
78. Thorsteinsdottir U, Kroon E, Jerome L, Blasi F, Sauvageau G: Defin-ing roles for HOX and MEIS1 genes in induction of acutemyeloid leukemia. Mol Cell Biol 2001, 21:224-234.
79. Lasa A, Carnicer M, Aventin A, Estivill C, Brunet S, Sierra J, Nomde-deu J: MEIS 1 expression is downregulated through promoterhypermethylation in AML1-ETO acute myeloid leukemias.Leukemia 2004, 18:1231-1237.
80. Melnick A, Licht J: Deconstructing a disease: RARalpha, itsfusion partners, and their roles in the pathogenesis of acutepromyelocytic leukemia. Blood 1999, 93:3167-3215.
81. Chim C, Wong S, Pang A, Chu P, Lau J, Wong K, Kwong Y: Aberrantpromoter methylation of the retinoic acid receptor alphagene in acute promyelocytic leukemia. Leukemia 2005,19:2241-2246.
82. Borkhardt A, Repp R, Haas OA, Leis T, Harbott J, Kreuder J, Ham-mermann J, Henn T, Lampert F: Cloning and characterization ofAFX, the gene that fuses to MLL in acute leukemias with at(X;11)(q13;q23). Oncogene 1997, 14:195-202.
83. Chang H, Hemberg M, Barahona M, Ingber D, Huang S: Transcrip-tome-wide noise controls lineage choice in mammalian pro-genitor cells. Nature 2008, 453:544-547.
84. Bolstad BM, Irizarry RA, Astrand M, Speed TP: A comparison ofnormalization methods for high density oligonucleotidearray data based on variance and bias. Bioinformatics 2003,19(2):185-193.
85. Tusher VG, Tibshirani R, Chu G: Significance analysis of micro-arrays applied to the ionizing radiation response. Pro Nat lAcad Sci U S A 2001, 98(9):5116-5121.
86. Hubbard TJP, Aken BL, Beal1 K, Ballester1 B, Caccamo M, Chen Y,Clarke L, Coates G, Cunningham F, Cutts T, Down T, Dyer SC, Fit-zgerald S, Fernandez-Banet J, Graf S, Haider S, Hammond M, HerreroJ, Holland R, Howe K, Howe K, Johnson N, Kahari A, Keefe D,Kokocinski F, Kulesha E, Lawson D, Longden I, Melsopp C, Megy K,Meidl P, Overduin B, Parker A, Prlic A, Rice S, Rios D, Schuster M,Sealy I, Severin J, Slater G, Smedley D, Spudich G, Trevanion S, VilellaA, Vogel J, White S, Wood M, Cox T, Curwen V, Durbin R, Fernan-dez-Suarez XM, Flicek P, Kasprzyk A, Proctor G, Searle S, Smith J,
Page 12 of 13(page number not for citation purposes)
BMC Systems Biology 2009, 3:20 http://www.biomedcentral.com/1752-0509/3/20
Publish with BioMed Central and every scientist can read your work free of charge
"BioMed Central will be the most significant development for disseminating the results of biomedical research in our lifetime."
Sir Paul Nurse, Cancer Research UK
Your research papers will be:
available free of charge to the entire biomedical community
peer reviewed and published immediately upon acceptance
cited in PubMed and archived on PubMed Central
yours — you keep the copyright
Submit your manuscript here:http://www.biomedcentral.com/info/publishing_adv.asp
BioMedcentral
Ureta-Vidal A, Birney E: Ensembl 2007. Nucleic Acids Res 2007,35(Database issue):D610-D618.
87. Kent WJ, Sugnet CW, Furey TS, Roskin KM, Pringle TH, Zahler AM,Haussler D: The human genome browser at UCSC. GenomeResearch 2002, 12(6):996-1006.
88. Wingender E, Dietze D, Karas H, Knüppel R: TRANSFAC: a data-base on transcription factors and their DNA binding sites.Nucleic Acids Research 1996, 24:238-241.
89. Berman B, Nibu Y, Pfeiffer B, Tomancak P, Celniker S, Levine M, RubinG, Eisen M: Exploiting transcription factor binding site cluster-ing to identify cis-regulatory modules involved in pattern for-mation in the Drosophila genome. Proceedings of the NationalAcademy of Sciences of the United States of America 2002, 99(2):757-62.
90. Ashery-Padan R, Gruss P: Pax6 lights-up the way for eye devel-opment. Curr Opin Cell Biol 2001, 13:706-714.
91. Brown L, Cheng JT, Chen Q, Siciliano MJ, Christ W, Buchanan G, BaerR: Site-specific recombination of the tal-1 gene is a commonoccurence in human T cell leukemia. EMBO J 1990,9:3343-3351.
92. Michl P, Knobel B, Downward J: CUTL1 is phosphorylated byprotein kinase A, modulating its effects on cell proliferationand motility. J Biol Chem 2006, 281:15138-15144.
93. Hart S, Foroni L: Core binding factor genes and human leuke-mia. Haematologica 2002, 87(12):1307-1323.
94. Rowlands T, Baumann P, Jackson SP: The TATA-binding protein:a general transcription factor in eukaryotes and archaebac-teria. Science 1994, 264:1326-1329.
95. Magne S, Caron S, Charon M, Rouyez MC, Dusanter-Fourt I: STAT5and Oct-1 Form a Stable Complex That Modulates CyclinD1 Expression. Mol Cell Biol 2003, 23(24):8934-8945.
96. Sugitani Y, Nakai S, Minowa O, Nishi M, Jishage K, Kawano H, MoriK, Ogawa M, Noda T: Brn-1 and Brn-2 share crucial roles in theproduction and positioning of mouse neocortical neurons.Genes Dev 2002, 16:1760-1765.
97. Guimont P, Grondin F, Dubois C: Sox9-dependent transcrip-tional regulation of the proprotein convertase furin. Americanjournal of physiology. Cell physiology 2007, 293:C172-183.
98. Quentien M, Barlier A, Franc J, Pellegrini I, Brue T, Enjalbert A: Pitu-itary transcription factors: from congenital deficiencies togene therapy. J Neuroendocrinol 2006, 18:633-642.
Page 13 of 13(page number not for citation purposes)


