Embed Size (px)
Citation preview

Characterization of an Anisotropic Hydrogel Tissue Substrate forInfusion Testing
Sung Jin Lee1, Gregory L. Pishko1, Garret W. Astary2, Thomas H. Mareci3, and MalisaSarntinoranont11 Department of Mechanical and Aerospace Engineering, University of Florida, Gainesville, FL326112 Department of Biomedical Engineering, University of Florida, Gainesville, FL 326113 Department of Biochemistry and Molecular Biology, University of Florida, Gainesville, FL 32611
AbstractArtificial tissue models that capture specific transport properties are useful for investigating physicalphenomena important to drug delivery. In this study, an in vitro tissue model was developed andcharacterized with the goal of mimicking aligned tissue. An anisotropic porous medium wasdeveloped by the construction of a 1% agarose hydrogel implanted with different volume fractions(~ 5, 10, and 20%) of 10-μm-diameter glass fibers. The developed substrate was able to captureanisotropic transport after the direct infusion of a macromolecular tracer, Evans blue albumin (EBA).To further characterize the test substrate, the diffusion tensor of water was measured by diffusiontensor imaging, and the ratios of the diffusivities in the directions parallel and perpendicular to theglass fibers were 1.16, 1.20, and 1.26 for 5, 10, and 20% fiber volume fractions, respectively. Thehydraulic conductivity was estimated by the measurement of pressure gradients across samples undercontrolled microflow conditions in the direction parallel to implanted fibers. The hydraulicconductivities at various hydrogel concentrations without fibers and in a 1% hydrogel with variousfiber volume fractions were measured; for example, K|| = 1.20 × 10⁻¹² m4 N−1 s−1 (where K|| is theconductivity component in the direction parallel to the glass fibers) for 20% fiber volume fractions.Also, EBA distributions were fit to porous medium transport models to estimate hydraulicconductivity in the direction perpendicular to glass fibers. The estimated ratio of directional hydraulicconductivity, K||/K⊥ (where K⊥ is the conductivity component in the direction perpendicular to theglass fibers), ranged from approximately 3 to 5, from 6 to 10, and from 40 to 90 for 5, 10, and 20%fiber volume fractions, respectively. These agarose hydrogel models provided convenient media forquantifying infusion protocols at low flow rates.
Keywordsbioengineering; biopolymers; diffusion; drug delivery systems; hydrogels
INTRODUCTIONIn tissue engineering and drug delivery, agarose hydrogels are popular because they havemacromolecular properties similar to those of natural extracellular matrix,1,2 are easy tofabricate, and are mechanically stable.3 These hydrogels have a porous structure characterizedby isotropic transport. However, the addition of longitudinally oriented fibers to hydrogels can
Correspondence to: M. Sarntinoranont ([email protected]).
NIH Public AccessAuthor ManuscriptJ Appl Polym Sci Symp. Author manuscript; available in PMC 2010 September 15.
Published in final edited form as:J Appl Polym Sci Symp. 2009 November 15; 114(4): 1992–2002. doi:10.1002/app.30639.
NIH
-PA Author Manuscript
NIH
-PA Author Manuscript
NIH
-PA Author Manuscript
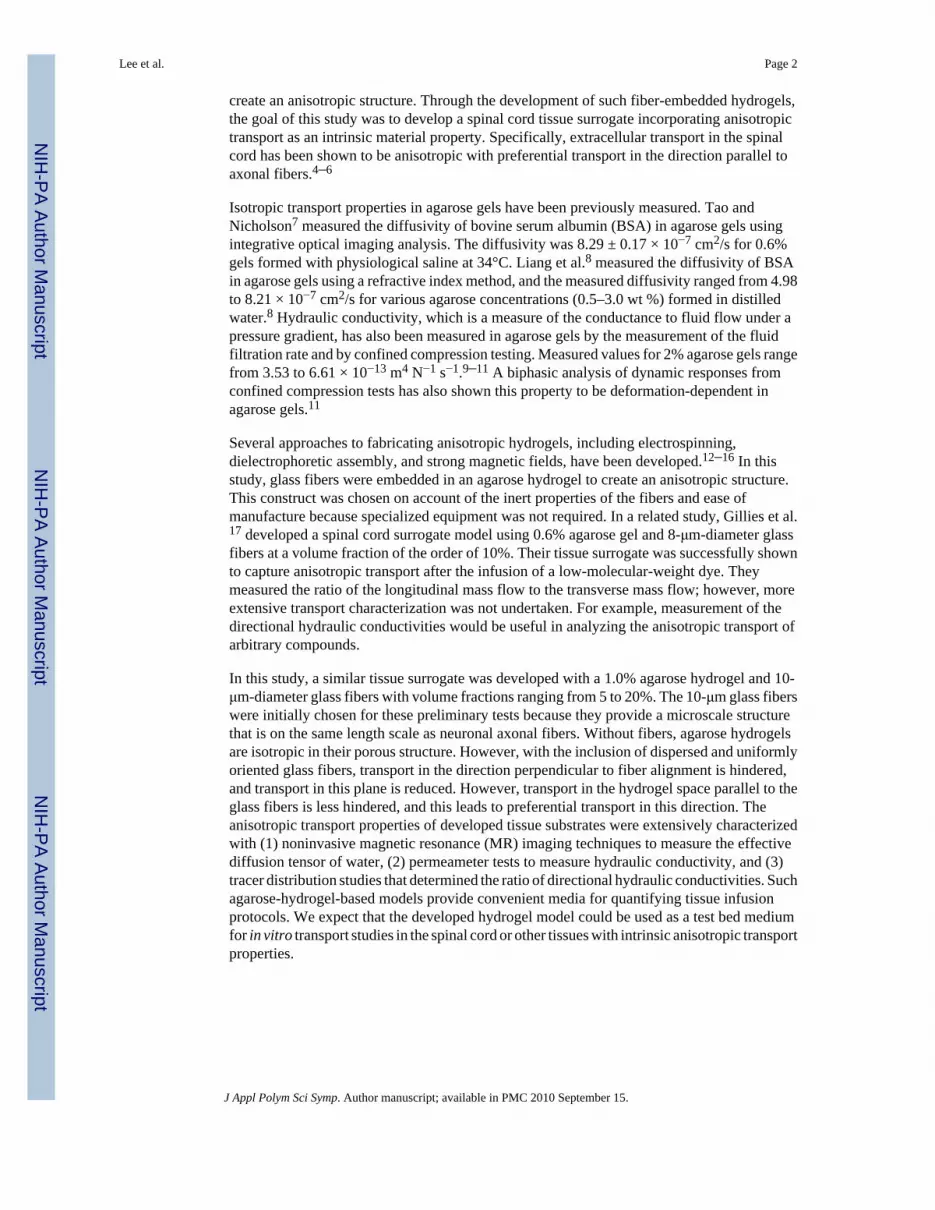
create an anisotropic structure. Through the development of such fiber-embedded hydrogels,the goal of this study was to develop a spinal cord tissue surrogate incorporating anisotropictransport as an intrinsic material property. Specifically, extracellular transport in the spinalcord has been shown to be anisotropic with preferential transport in the direction parallel toaxonal fibers.4–6
Isotropic transport properties in agarose gels have been previously measured. Tao andNicholson7 measured the diffusivity of bovine serum albumin (BSA) in agarose gels usingintegrative optical imaging analysis. The diffusivity was 8.29 ± 0.17 × 10⁻⁷ cm2/s for 0.6%gels formed with physiological saline at 34°C. Liang et al.8 measured the diffusivity of BSAin agarose gels using a refractive index method, and the measured diffusivity ranged from 4.98to 8.21 × 10⁻⁷ cm2/s for various agarose concentrations (0.5–3.0 wt %) formed in distilledwater.8 Hydraulic conductivity, which is a measure of the conductance to fluid flow under apressure gradient, has also been measured in agarose gels by the measurement of the fluidfiltration rate and by confined compression testing. Measured values for 2% agarose gels rangefrom 3.53 to 6.61 × 10⁻¹³ m4 N−1 s−1.9–11 A biphasic analysis of dynamic responses fromconfined compression tests has also shown this property to be deformation-dependent inagarose gels.11
Several approaches to fabricating anisotropic hydrogels, including electrospinning,dielectrophoretic assembly, and strong magnetic fields, have been developed.12–16 In thisstudy, glass fibers were embedded in an agarose hydrogel to create an anisotropic structure.This construct was chosen on account of the inert properties of the fibers and ease ofmanufacture because specialized equipment was not required. In a related study, Gillies et al.17 developed a spinal cord surrogate model using 0.6% agarose gel and 8-μm-diameter glassfibers at a volume fraction of the order of 10%. Their tissue surrogate was successfully shownto capture anisotropic transport after the infusion of a low-molecular-weight dye. Theymeasured the ratio of the longitudinal mass flow to the transverse mass flow; however, moreextensive transport characterization was not undertaken. For example, measurement of thedirectional hydraulic conductivities would be useful in analyzing the anisotropic transport ofarbitrary compounds.
In this study, a similar tissue surrogate was developed with a 1.0% agarose hydrogel and 10-μm-diameter glass fibers with volume fractions ranging from 5 to 20%. The 10-μm glass fiberswere initially chosen for these preliminary tests because they provide a microscale structurethat is on the same length scale as neuronal axonal fibers. Without fibers, agarose hydrogelsare isotropic in their porous structure. However, with the inclusion of dispersed and uniformlyoriented glass fibers, transport in the direction perpendicular to fiber alignment is hindered,and transport in this plane is reduced. However, transport in the hydrogel space parallel to theglass fibers is less hindered, and this leads to preferential transport in this direction. Theanisotropic transport properties of developed tissue substrates were extensively characterizedwith (1) noninvasive magnetic resonance (MR) imaging techniques to measure the effectivediffusion tensor of water, (2) permeameter tests to measure hydraulic conductivity, and (3)tracer distribution studies that determined the ratio of directional hydraulic conductivities. Suchagarose-hydrogel-based models provide convenient media for quantifying tissue infusionprotocols. We expect that the developed hydrogel model could be used as a test bed mediumfor in vitro transport studies in the spinal cord or other tissues with intrinsic anisotropic transportproperties.
Lee et al. Page 2
J Appl Polym Sci Symp. Author manuscript; available in PMC 2010 September 15.
NIH
-PA Author Manuscript
NIH
-PA Author Manuscript
NIH
-PA Author Manuscript

EXPERIMENTALSample preparation
Glass fibers (10 μm in diameter) were cut to a length of 20 mm and placed in a glass tubecontainer with a 4.2-mm inner diameter, filling 5, 10, or 20% of the tube volume. To minimizethe volume of air bubbles within the final sample, the following protocol was adopted. Thesamples were submerged under water and heated at 60°C for approximately 3 h, they wereallowed to cool at room temperature, and then any air bubbles that formed were eliminatedwith a vacuum pump. An agarose based hydrogel, Trevigel 5000 (Trevigen, Gaithersburg,MD), was used to form the homogeneous gel structure. Transport properties were measuredin hydrogels with and without fibers. For samples without fibers, hydrogel powders atconcentrations of 0.5, 0.75, 1, and 1.5% (w/v) were dissolved and heated in deionized water.For samples with embedded fibers, a 1% (w/v) agarose hydrogel was used with various volumefractions of glass fibers. Next, the glass tube containing the hydrated glass-fiber bundle wassubmerged vertically in the hydrogel solution, and tweezers were used to mix and distributethe fibers evenly. Because of the relative stiffness and short length of the fibers, the glass fibersstayed relatively straight within the glass tubes. Finally, samples were cooled to roomtemperature over approximately 2 h and stored at 4°C until testing. The aligned microstructureof a sample specimen with a 20% fiber volume fraction after freezing and dissection is shownin Figure 1.
High-resolution MR imaging and diffusion tensor imaging (DTI)MR images of hydrogel samples embedded with glass fibers at a concentration of 0, 5, 10, or20% (one sample each) were captured at 19°C with a 14.1-T (at 600 MHz) MR imagingspectrometer (Bruker NMR Instruments, Billeria, MA). High-resolution images weremeasured with a three-dimensional gradient echo sequence with a recovery time of 150 ms andan echo time of 10 ms with four signal averages. The field of view was 10 mm × 5 mm × 5mm in a matrix of 256 × 128 × 128. Diffusion-weighted images were measured with a multiple-slice, spin-echo sequence with a recovery time of 1400 ms and an echo time of 28 ms with foursignal averages. The field of view was 4.2 mm × 4.2 mm in a matrix of 70 × 70 with 12 slices0.3 mm thick. A total of 27 diffusion-weighted images were measured: 6 images with lowdiffusion weighting (98 s/mm2) and 21 with high diffusion weighting (1240 s/mm2). Thediffusion weighting directions were equally distributed over a unit hemisphere. Customsoftware, written in the interactive data language (Research Systems, Inc., Boulder, CO), wasused to process the image data. The spatially encoded data were Fourier-transformed to produceboth high-resolution images and diffusion-weighted images. Then, diffusion-weighted imageswere interpolated (bilinear interpolation with nearest neighbor sampling) by a factor of 2 ineach dimension. After the initial image processing, the multiple-slice, diffusion-weightedimage data were fit to a rank-2 tensor model of water translational diffusion (De) with multiplelinear regression.18 Because of the alignment of the sample with the measured coordinatesystem (the z direction is parallel to the glass fibers), the effective diffusion tensor can beexpressed as follows:
(1)
where λx, λy, and λz are the diffusivity eigenvalues. The anisotropy of translational diffusionis characterized by the fractional anisotropy (FA), which increases in magnitude withincreasing diffusion anisotropy:
Lee et al. Page 3
J Appl Polym Sci Symp. Author manuscript; available in PMC 2010 September 15.
NIH
-PA Author Manuscript
NIH
-PA Author Manuscript
NIH
-PA Author Manuscript

(2)
where D ̄ is the mean diffusivity. D ̄ was calculated with D ̄ = Tr(De)/3. Both De and FA werecalculated on a voxel-by-voxel basis.
Hydraulic conductivity testsHydraulic conductivity was measured with a one-dimensional flow-controlled permeametersystem. Hydrogel samples with and without glass fibers were tested. The first test group withno glass fibers included 0.5, 0.75, 1, and 1.5% agarose hydrogel concentrations. Samples withno fibers were tested to determine the ideal hydrogel percentage for fibers with respect tofabrication and infusion issues. Also, we were interested in establishing baseline values for thehydraulic conductivity of the agarose hydrogel for comparison with the measured values inhydrogel–fiber composites. For each hydrogel concentration, five samples were tested. In thesetests, the low-concentration hydrogels (0.5%) were difficult to use because of their softness,whereas higher concentration (2%) hydrogels were stiffer and more prone to damage withcannula insertion (e.g., infusate backflow along the cannula). The 1% concentration providedgood mechanical properties for handling, and this concentration was used in all glass-fiberinfusion studies. In the second group, glass fibers at concentrations of 5, 10, and 20% (v/v)were embedded in 1% agarose hydrogels. For each fiber volume fraction, four samples weretested.
For these tests, hydrogel samples were surrounded by an acrylic tube (4-mm inner diameterand 10-mm length). The permeameter consisted of a syringe pump (model 100, KD Scientific,Holliston, MA), a syringe connected to a hydrogel holder with noncompliant poly(ether etherketone) tubing, brass fittings (Swagelok, Solon, OH), and a pressure transducer (Fig. 2). Toeliminate air bubbles, the system was assembled while submerged in deionized water. Thesyringe pump drove deionized water from a 250-μL gas-tight syringe (Hamilton, Reno, NV)through the hydrogel sample at constant flow rates of 10–50 μL/h. Filter paper and a wire meshprovided mechanical support for the hydrogel sample. A variable-reluctance differentialpressure transducer (DP15-32, Validyne, Northridge, CA) was connected upstream anddownstream of the hydrogel holder to measure the pressure difference across the sample.Output signals were sent to a demodulator (CD280-4, Validyne) for amplification and to a dataacquisition (DAQ) box for input into LabVIEW Express, version 7 (National Instruments,Austin, TX), which converted the voltage signal to a pressure reading. The transducer wascalibrated by being connected to a set of differential height water columns, which were variedfrom 0 to 14.7 kPa (150 cm H2O). A linear relationship was determined between the voltageand pressure. Also, the pressure drop due to the tubing, fittings, filter paper, and mesh supportwas found to be negligible (<±0.035 kPa).
The steady-state pressure drop (ΔP) across the hydrogel samples was measured between 40and 80 min after the initiation of flow once pressure variations were less than 1% over a 10-min period. ΔP was used to calculate the apparent hydraulic conductivity (K) at each flow ratewith Darcy’s law:
(3)
where V is the volume-averaged fluid velocity and L is the length of the sample.
Lee et al. Page 4
J Appl Polym Sci Symp. Author manuscript; available in PMC 2010 September 15.
NIH
-PA Author Manuscript
NIH
-PA Author Manuscript
NIH
-PA Author Manuscript
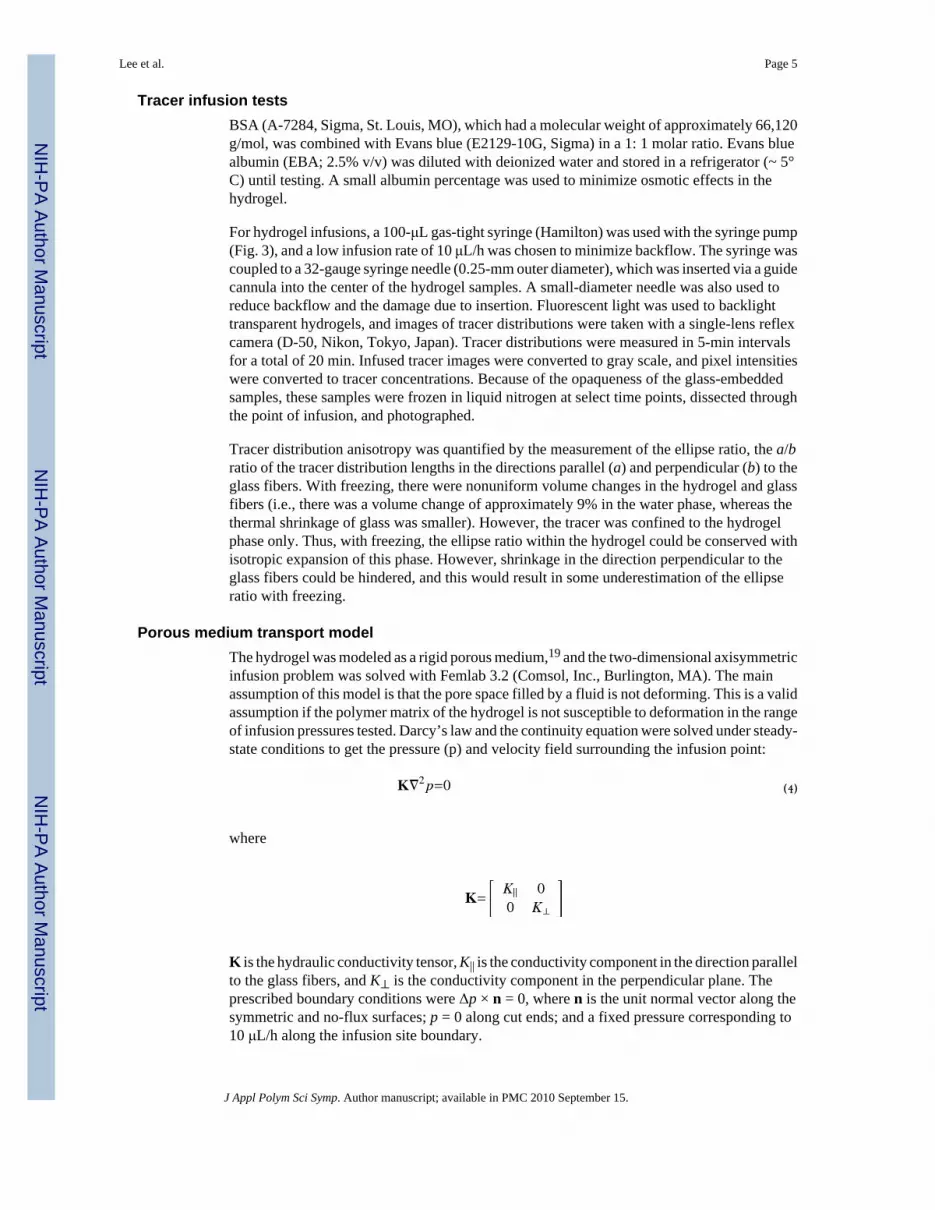
Tracer infusion testsBSA (A-7284, Sigma, St. Louis, MO), which had a molecular weight of approximately 66,120g/mol, was combined with Evans blue (E2129-10G, Sigma) in a 1: 1 molar ratio. Evans bluealbumin (EBA; 2.5% v/v) was diluted with deionized water and stored in a refrigerator (~ 5°C) until testing. A small albumin percentage was used to minimize osmotic effects in thehydrogel.
For hydrogel infusions, a 100-μL gas-tight syringe (Hamilton) was used with the syringe pump(Fig. 3), and a low infusion rate of 10 μL/h was chosen to minimize backflow. The syringe wascoupled to a 32-gauge syringe needle (0.25-mm outer diameter), which was inserted via a guidecannula into the center of the hydrogel samples. A small-diameter needle was also used toreduce backflow and the damage due to insertion. Fluorescent light was used to backlighttransparent hydrogels, and images of tracer distributions were taken with a single-lens reflexcamera (D-50, Nikon, Tokyo, Japan). Tracer distributions were measured in 5-min intervalsfor a total of 20 min. Infused tracer images were converted to gray scale, and pixel intensitieswere converted to tracer concentrations. Because of the opaqueness of the glass-embeddedsamples, these samples were frozen in liquid nitrogen at select time points, dissected throughthe point of infusion, and photographed.
Tracer distribution anisotropy was quantified by the measurement of the ellipse ratio, the a/bratio of the tracer distribution lengths in the directions parallel (a) and perpendicular (b) to theglass fibers. With freezing, there were nonuniform volume changes in the hydrogel and glassfibers (i.e., there was a volume change of approximately 9% in the water phase, whereas thethermal shrinkage of glass was smaller). However, the tracer was confined to the hydrogelphase only. Thus, with freezing, the ellipse ratio within the hydrogel could be conserved withisotropic expansion of this phase. However, shrinkage in the direction perpendicular to theglass fibers could be hindered, and this would result in some underestimation of the ellipseratio with freezing.
Porous medium transport modelThe hydrogel was modeled as a rigid porous medium,19 and the two-dimensional axisymmetricinfusion problem was solved with Femlab 3.2 (Comsol, Inc., Burlington, MA). The mainassumption of this model is that the pore space filled by a fluid is not deforming. This is a validassumption if the polymer matrix of the hydrogel is not susceptible to deformation in the rangeof infusion pressures tested. Darcy’s law and the continuity equation were solved under steady-state conditions to get the pressure (p) and velocity field surrounding the infusion point:
(4)
where
K is the hydraulic conductivity tensor, K|| is the conductivity component in the direction parallelto the glass fibers, and K⊥ is the conductivity component in the perpendicular plane. Theprescribed boundary conditions were Δp × n = 0, where n is the unit normal vector along thesymmetric and no-flux surfaces; p = 0 along cut ends; and a fixed pressure corresponding to10 μL/h along the infusion site boundary.
Lee et al. Page 5
J Appl Polym Sci Symp. Author manuscript; available in PMC 2010 September 15.
NIH
-PA Author Manuscript
NIH
-PA Author Manuscript
NIH
-PA Author Manuscript

The unsteady transport equation governing the EBA tracer concentration (C) was
(5)
where
u is the volume-averaged velocity, φ is the porosity or fluid volume fraction, and D is thediffusion tensor for the EBA tracer in the hydrogel. D|| is the diffusion component in thedirection parallel to the glass fibers, and D⊥ is the diffusion component in the perpendicularplane. In the pure hydrogel, which is isotropic, D|| = D⊥ = D. The prescribed boundary conditionwas ∇C × n = 0 along axisymmetric and no-flux surfaces, C = 0 along cut ends, and C/Co = 1(with a normalized concentration, where Co is the maximum concentration) along the infusionsite boundary.
Diffusivity of EBATracer diffusivity was estimated through an analysis of EBA infusion distributions in fiber-free hydrogels. Numerical simulations for porous medium transport were performed for a rangeof EBA tracer diffusivities, 4.0–9 × 10⁻⁷ cm2/s, in intervals of 1.0 × 10⁻⁷ and for a range ofφ values, 0.4–0.9, in intervals of 0.1. The range of D was selected to cover a physically relevantrange. The high value of 9 × 10⁻⁷ cm2/s is equivalent to BSA diffusivity in water, and the lowvalue is bounded by BSA diffusivity measured in a higher (3%) concentration of agarose gel.8 The increment of 10−7 cm2/s was considered sufficient because predicted concentrationprofiles were not very sensitive to smaller increments. φ ranges were based on previoushydrogel infusion studies.20 Tracer distribution images represented the integratedconcentration through the hydrogel samples. Therefore, the numerical concentration solutionswere integrated over the thickness of the hydrogels. These integrated concentration profileswere compared to the image data collected. Some concentration variations in the vicinity ofthe infusion cannula were induced by the formation of a local infusion cavity, hydrogel damagedue to cannula insertion, or backflow. Because porous medium tracer simulations did not modelthese effects, experimental and numerical distribution data were compared at a set distancefrom the infusion point (r/a > 1.0, where r is the radial coordinate and a is the outer diameterof the syringe needle). Fifty spatial points along normalized concentration profiles at four timepoints (5, 10, 15, and 20 min) were compared with numerical simulations. Optimal values forD and φ were estimated by minimization of the mean square error (MSE) function:
(6)
where m is the total number of time points (m = 4); q is the total number of points along a
concentration profile (q = 50); and and are the experimental and computationalintegrated concentration values, respectively.
Lee et al. Page 6
J Appl Polym Sci Symp. Author manuscript; available in PMC 2010 September 15.
NIH
-PA Author Manuscript
NIH
-PA Author Manuscript
NIH
-PA Author Manuscript

K⊥K||/K⊥ was estimated by an analysis of EBA distributions after infusion into 5, 10, and 20%fiber-embedded hydrogels. In numerical simulations using the porous medium transport model,the estimated ratio of water diffusivity from DTI was used to estimate the ratio of EBAdiffusivities: λz/λx = D||/D⊥. D|| was set to the value measured in the fiber-free hydrogel. K||was set to the value measured in hydraulic conductivity tests. K||/K⊥ was estimated to rangefrom 20 to 200. The tracer ellipse from porous medium predictions was directly compared withmeasured EBA ellipse ratios. K||/K⊥ was estimated within a range of ±1 standard deviation(SD) of measured EBA ellipse ratios for each fiber volume fraction. In these comparisons, athreshold value of C/Co = 0.05 was used to calculate the distribution contours.
RESULTSHigh-resolution MR images and DTI
High-resolution MR images of the tissue surrogate (Fig. 4) clearly indicate regions of hydrogel(white), glass fibers (gray), and air bubbles (dark spots). The dark spots can be classified as airbubbles because they display the characteristic susceptibility artifact of air in an MR image.21 The apparent size of air bubbles in the central regions of infusion was approximately 17μm; however, the actual size was smaller because of the boundary effects of magneticsusceptibility between air and water. These microscopic air bubbles were not expected tosignificantly affect macromolecular transport. Diffusion tensor images along with derived two-dimensional parametric maps are presented in Figure 5 for a glass-fiber/agarose-hydrogelsample (20% fiber volume fraction). These images show clear diffusional anisotropy withmaximum diffusion in the z direction of fiber alignment.
Effective diffusivities of water in 1% hydrogel samples are presented in Table I for variousfiber volume fractions. Water diffusivities in the fiber-free hydrogels were nearly isotropic andhomogeneous with λz/λ⊥ = 1.1 and FA = 0.065 ± 0.017. With increasing glass-fiber content,water diffusivity in the plane perpendicular to the aligned fibers (x and y) decreased, andanisotropy measures, λz/λ⊥ and FA, were found to increase. In the 20% volume fraction sample,FA was 0.15 ± 0.002, which was larger than that for fiber-free samples (FA20%fiber/FAfiber-free = 2.34). Local diffusivity measures within a region of interest (ROI) were alsocompared with average values calculated over the entire sample. FA measured within high-fiber-density regions [circled regions within Fig. 5(A,B)] was approximately 10 to 30% higherthan that over the entire sample. This variation indicates some spatial nonuniformity in thefiber distribution.
Hydraulic conductivity testingIn fiber-free samples, K varied with the agarose hydrogel concentration, that is, the volumefraction of water (Fig. 6). K decreased more than 10-fold as the concentration increased from0.5 to 1.5%. (Note that data from previous hydrogel studies are plotted for reference.) MeasuredK values are listed in Table II, and K was 1.47 ± 0.3 × 10⁻¹² m4 N−1 s−1 for 1.0% hydrogels.
The effect of glass-fiber inclusion on hydrogel hydraulic conductivity was also measured atlow average velocities (0.2–1.1 × 10⁻⁶ m/s). For both fiber-free and 20% fiber samples,increases in fluid flow rates resulted in approximately linear increases in the pressure drop[Fig. 7(A)]. Measured pressure drops within 20% fiber samples were consistently greater thanthose within fiber-free samples. In all samples, there was greater variation in pressure responses(larger SD) with increasing flow rates. Corresponding hydraulic conductivities were notsensitive to changes in the flow rate in either type of sample over the flow range tested [Fig. 7(B)]. K|| in 20% fiber volume samples was slightly lower than that in other 1% hydrogel samples[Fig. 7(B) and Table II]. For example, K|| in 20% fiber volume samples was measured to be
Lee et al. Page 7
J Appl Polym Sci Symp. Author manuscript; available in PMC 2010 September 15.
NIH
-PA Author Manuscript
NIH
-PA Author Manuscript
NIH
-PA Author Manuscript

1.20 ± 0.22 × 10⁻¹² m4 N−1 s−1, which was approximately 18% lower than that in fiber-freesamples. For other 1% hydrogel samples (0–10% fiber volume fractions), only small changesin K|| were measured (Table II).
Tracer infusion testsEBA tracer distributions into fiber-free hydrogels were approximately spherical [Fig. 8(A)],and minimal backflow was observed. By the fitting of measured concentration profiles tonumerical porous medium solutions [Fig. 9(A)], optimal φ and D values for the 1% hydrogelwere estimated by minimization of the MSE value [Fig. 9(B)]. φ was estimated to be 0.6, andD was estimated to be 7.0 × 10⁻⁷ cm2/s. As can be seen in the MSE map, numerical solutionswere more sensitive to changes in φ than to changes in tracer diffusivity. This was likely dueto the short times of tracer transport and/or the relatively high flow rates used in theseexperiments; that is, transport was not diffusion-dominated.
In the hydrogel samples with embedded fibers, EBA tracer distributions were approximatelyelliptical [Fig. 8(B)]. Ellipse ratios were found to increase nonlinearly with increasing fibercontent (Table III). In these experiments, substantial backflow was observed in some infusedsamples; however, these samples were excluded from our analysis.
In a parameter sensitivity analysis, tracer transport in the porous medium model was simulatedfor various K||/K⊥ ratios. The relationship between the predicted tracer ellipse ratio and K||/K⊥ (with K|| kept fixed) is shown in Figure 10. Three lines are plotted for various fiber contents(5, 10, and 20%) with estimated transport properties. (Input φ values of 0.57, 0.54, and 0.48were lower bound values based on the fiber volume and the baseline 1.0% hydrogel φ valueof 0.6.) The ellipse ratio was found to change nonlinearly with K||/K⊥. There were large changesin the ellipse ratio for small changes in the K||/K⊥ ratio at low values of K||/K⊥, and the ellipseratio became less sensitive to changes as the magnitude of K||/K⊥ increased. By a comparisonof these simulation results with the experimentally measured ellipse ratios from EBA infusions(Table III), the ranges for K||/K⊥, based on ±1 SD, were estimated to be 3–5, 6–10, and 40–90for 5, 10, and 20% volume fiber fractions, respectively.
DISCUSSIONA tissue surrogate was developed, consisting of agarose hydrogel and glass fibers. A varietyof agarose hydrogel concentrations were tested, and a 1% concentration was selected for themajority of tests because of the ease of handling, overall stiffness, and minimal experimentalbackflow. With the inclusion of aligned glass fibers, anisotropic transport was due to bulkalignment, where transport in the direction perpendicular to fiber alignment was hinderedbecause the fibers acted as obstacles, and transport in the direction parallel with fibers was nothindered. Thus, preferential hydrogel transport occurred in the direction parallel with fibers.Anisotropic transport was extensively characterized through DTI, pressure measurements, andtracer transport studies. The microscale composite structure was not quantified throughimaging or microscopy studies because this is difficult to do at the resolution and under thehydrated conditions required.
With 5, 10, and 20% glass-fiber volume fractions, the tissue surrogate successfully providedpreferential diffusional transport, as measured by DTI. The effective diffusivities for waterwere reduced in the transverse direction with the introduction of fibers that hindered diffusion.In the direction parallel to the fibers, the effective diffusivity was the same as that of the purehydrogel. However, our surrogate had less diffusional anisotropy than in tissue. For example,in previous spinal cord DTI studies, the FA was determined to be between 0.67 and 0.87 inwhite matter regions.22,23 This discrepancy is likely due to the relatively low glass-fibervolume fractions used in this study as well as the more uniform geometry of glass fibers
Lee et al. Page 8
J Appl Polym Sci Symp. Author manuscript; available in PMC 2010 September 15.
NIH
-PA Author Manuscript
NIH
-PA Author Manuscript
NIH
-PA Author Manuscript

compared with cellular structures. Also, the φ values of the hydrogel samples were estimatedto be between 0.48 and 0.6, somewhat higher than the φ value of the extracellular space innervous tissues, which is approximately 0.2.24 By comparing tissue distributions of the albumintracer to porous medium simulations, our group has previously estimated the K||/K⊥ ratio inspinal cord tissues to be 16–20 for a 0.1 μL/min infusion.16,25 This ratio is in the range estimatedfor this hydrogel surrogate.
In hydrogel-only samples, K was found to be highly sensitive to the water content. In this study,in comparison with previous studies by Johnson and Deen10 and Gu et al.,11 K was measuredfor lower hydrogel concentrations. However, the measured behavior of K, specifically thechange in K with the hydrogel concentration, was consistent with the power-law behaviormeasured in these previous studies. In samples with fibers, the hydraulic conductivity insamples with 5 and 10% fiber contents did not differ greatly; however, for a 20% fiber volumefraction, K|| was lower in the direction parallel with the glass fibers in comparison withhydrogel-only samples. This may indicate that a threshold volume fraction may need to bereached before flow is hindered. Also, the measured hydraulic conductivities at a given fibercontent were approximately constant and did not vary with the flow rate over the range tested.
Correspondingly, a rigid porous medium was considered for EBA transport simulations. Fornonrigid media, the porous matrix structure is susceptible to deformation, which changes fluidtransport properties, including hydraulic conductivity.11 However, no clear changes inhydraulic conductivity were measured for the range of flow rates used in this study. Thisindicates that deformation did not have a large effect on transport and that a rigid mediummodel is reasonable. This contrasts with creep and dynamic loading studies by Gu et al.,11 whoestimated hydraulic permeability for agarose gels (no fibers) via fitting to biphasic solutions.They found K to be strongly dependent on the strain rate or hydrogel deformation. However,their creep and dynamic loading likely resulted in greater pore deformation than occurred inour study, in which pressures were low and significant deformation was not observed.
Transport anisotropy and increases in the measured K|| values could also be due to delaminationor separation between the glass fibers and hydrogel interfaces. However, in our measurements,the hydraulic conductivity of the fiber-free hydrogels was higher than that of the hydrogelswith 20% fiber content. This indicates that fluid flow was through the hydrogel space only,and separation was not a likely contributing factor at the low flow rates tested. If separationwere an issue, the measured hydraulic conductivity of the hydrogel–fiber composite would behigher in the direction parallel to the fibers because the fluid would flow in separated regionsmore easily.
In EBA infusion studies, low volume fractions of fibers (<10%) did not result in extensivetracer transport anisotropy. However, transport anisotropy increased with the fiber content,especially with 20% fiber volume fractions. This behavior may indicate that a threshold fiberdensity is required before anisotropic fluid flow behavior becomes significant (e.g., flow ishindered in the plane perpendicular to fiber alignment). Through the use of tracer distributiondata, the estimated ratio of directional hydraulic conductivity, K||/K⊥, was determined toincrease with the fiber content. The estimated ranges for K||/K⊥ also increased with the fibervolume fraction increasing. These increases were due to the nonlinear relationship betweenthe tracer distribution ellipse ratio and K||/K⊥ (see Fig. 10). Thus, the larger range of K||/K⊥for samples with 20% fiber content was due to the lesser sensitivity of the tracer transportsolutions to large values of K||/K⊥. Such nonlinear behavior was expected because tissuetransport is governed by coupled contributions of diffusion and convection. Convection, whichis driven by a pressure gradient, is dominant near the infusion site, where the decay in thepressure is steepest and the velocities are greatest. With increasing distance from the infusionsite, the contribution by diffusion to transport increases, and this results in nonlinear behavior.
Lee et al. Page 9
J Appl Polym Sci Symp. Author manuscript; available in PMC 2010 September 15.
NIH
-PA Author Manuscript
NIH
-PA Author Manuscript
NIH
-PA Author Manuscript

For the infusion volumes and flow rates studied, convection and diffusion were of the sameorder.
The Peclet number (Pe), which is the ratio of the characteristic time of diffusion (td) to thecharacteristic time of convection (tc; Pe = td/tc), was calculated to compare the relativecontributions of convection and diffusion to EBA tracer transport. Transport is diffusion-dominated for small Pe values (~ 1 or less) and convection-dominated for large Pe values (~10 or more). td is given by td = (r ̄)2/Deff, where Deff is the effective tracer diffusivity and (r ̄)
is the characteristic length. tc is described by . Pe for a constant flow rate infusionwas calculated as follows26:
where Q is the infusion flow rate. For a constant infusion of EBA at 3.33 μL/h, Pe for thehydrogel was 7.6 when Deff was 7.0 × 10⁻⁵ mm2/s, a was 0.25 mm, Q was 10 μL/h, and r was1 mm. This analysis also shows convection and diffusion to be of the same order.
CONCLUSIONSIn the fabrication of these fiber-embedded hydrogels, care must be taken to minimize air bubbleformation and provide an even distribution of fibers. An experimental source of error thatcontributed to variation in the measured K|| values and ellipse ratios was likely thenonuniformity of the distributed glass fibers in the hydrogel; however, the bulk of the fibersappeared to be aligned. Overall, the developed hydrogel model was able to provide a uniform,anisotropic test medium suitable for low-flow-rate infusion studies. At higher infusion rates,backflow as well as weak connectivity between the hydrogel and glass fibers may beintroduced. We expect that the developed hydrogel model can be used for in vitro transportstudies to mimic the extracellular transport of anisotropic tissues, and measurements ofhydraulic conductivity are useful for the analysis of convective transport. In future studies, thefabrication methodology may be modified for various applications. For example, hydrogelproperties, such as the polymer size and crosslinker concentration, may be altered.17 Also,glass fibers were chosen to provide an underlying aligned structure. However, they do not havethe biodegradability of some polymers. In future studies, fibers of alternate compositions maybe substituted.
AcknowledgmentsThe authors thank Roger Tran-Son-Tay and Bhavani Shankar for providing testing facilities, equipment, and materials.They also thank Daisy Evans and Prinda Wanakule for aiding with the experimental studies. The MR imaging datawere obtained at the Advanced Magnetic Resonance Imaging and Spectroscopy Facility of the McKnight BrainInstitute and at the National High Magnetic Field Laboratory of the University of Florida.
Contract grant sponsor: National Institutes of Health; contract grant number: R21 NS052670.
References1. Drury JL, Mooney DJ. Biomaterials 2003;24:4337. [PubMed: 12922147]2. Suh JKF, Matthew HWT. Biomaterials 2000;21:2589. [PubMed: 11071608]3. Lee CH, Singla A, Lee Y. Int J Pharm 2001;221:1. [PubMed: 11397563]4. Bobo RH, Laske DW, Akbasak A, Morrison PF, Dedrick RL, Oldfield EH. Proc Natl Acad Sci
1994;91:2076. [PubMed: 8134351]
Lee et al. Page 10
J Appl Polym Sci Symp. Author manuscript; available in PMC 2010 September 15.
NIH
-PA Author Manuscript
NIH
-PA Author Manuscript
NIH
-PA Author Manuscript

5. Lonser RR, Gogate N, Morrison PF, Wood JD, Old-field EH. J Neurosurg 1998;89:610. [PubMed:9761055]
6. Prokopova S, Vargova L, Sykova E. NeuroReport 1997;8:3527. [PubMed: 9427320]7. Tao L, Nicholson C. Neuroscience 1996;75:839. [PubMed: 8951877]8. Liang SM, Xu J, Weng LH, Dai HJ, Zhang XL, Zhang LN. J Controlled Release 2006;115:189.9. Buschmann MD, Gluzband YA, Grodzinsky AJ, Hunziker EB. J Cell Sci 1995;108:1497. [PubMed:
7615670]10. Johnson EM, Deen WM. AIChE J 1996;42:1220.11. Gu WY, Yao H, Huang CY, Cheung HS. J Biomech 2003;36:593. [PubMed: 12600349]12. Huang Z, Zhang YZ, Kotaki M, Ramakrishna S. Compos Sci Technol 2003;63:2223.13. Subbiah T, Bhat GS, Tock RW, Parameswaran S, Ramkumar SS. J Appl Polym Sci 2005;96:557.14. Small WR, Paunov VN. J Mater Chem 2008;18:2082.15. Green NG, Morgan H. J Phys D: Appl Phys 1997;30:2626.16. Yamamoto I, Ozawa S, Makino T, Yamaguchi M, Takamasu T. Sci Technol Adv Mater
2008;9:024214.17. Gillies GT, Wilhelm TD, Humphrey JAC, Fillmore HL, Holloway KL, Broaddus WC.
Nanotechnology 2002;13:587.18. Basser PJ, Mattiello J, Lebihan D. Biophys J 1994;66:259. [PubMed: 8130344]19. Chen XM, Sarntinoranont M. Ann Biomed Eng 2007;35:2145. [PubMed: 17846894]20. Chen X, Astary GW, Sepulveda H, Mareci TH, Sarntinoranont M. Magn Reson Imaging
2008;26:1433. [PubMed: 18583082]21. Schenck JF. Med Phys 1996;23:815. [PubMed: 8798169]22. Gullapalli J, Krejza J, Schwartz ED. J Magn Reson Imaging 2006;24:231. [PubMed: 16767707]23. Sarntinoranont M, Chen XM, Zhao JB, Mareci TH. Ann Biomed Eng 2006;34:1304. [PubMed:
16832605]24. Nicholson C, Sykova E. Trends Neurosci 1998;21:207. [PubMed: 9610885]25. Sarntinoranont M, Banerjee RK, Lonser RR, Morrison PF. Ann Biomed Eng 2003;31:448. [PubMed:
12723686]26. Netti PA, Travascio F, Jain RK. AIChE J 2003;49:1580.
Lee et al. Page 11
J Appl Polym Sci Symp. Author manuscript; available in PMC 2010 September 15.
NIH
-PA Author Manuscript
NIH
-PA Author Manuscript
NIH
-PA Author Manuscript
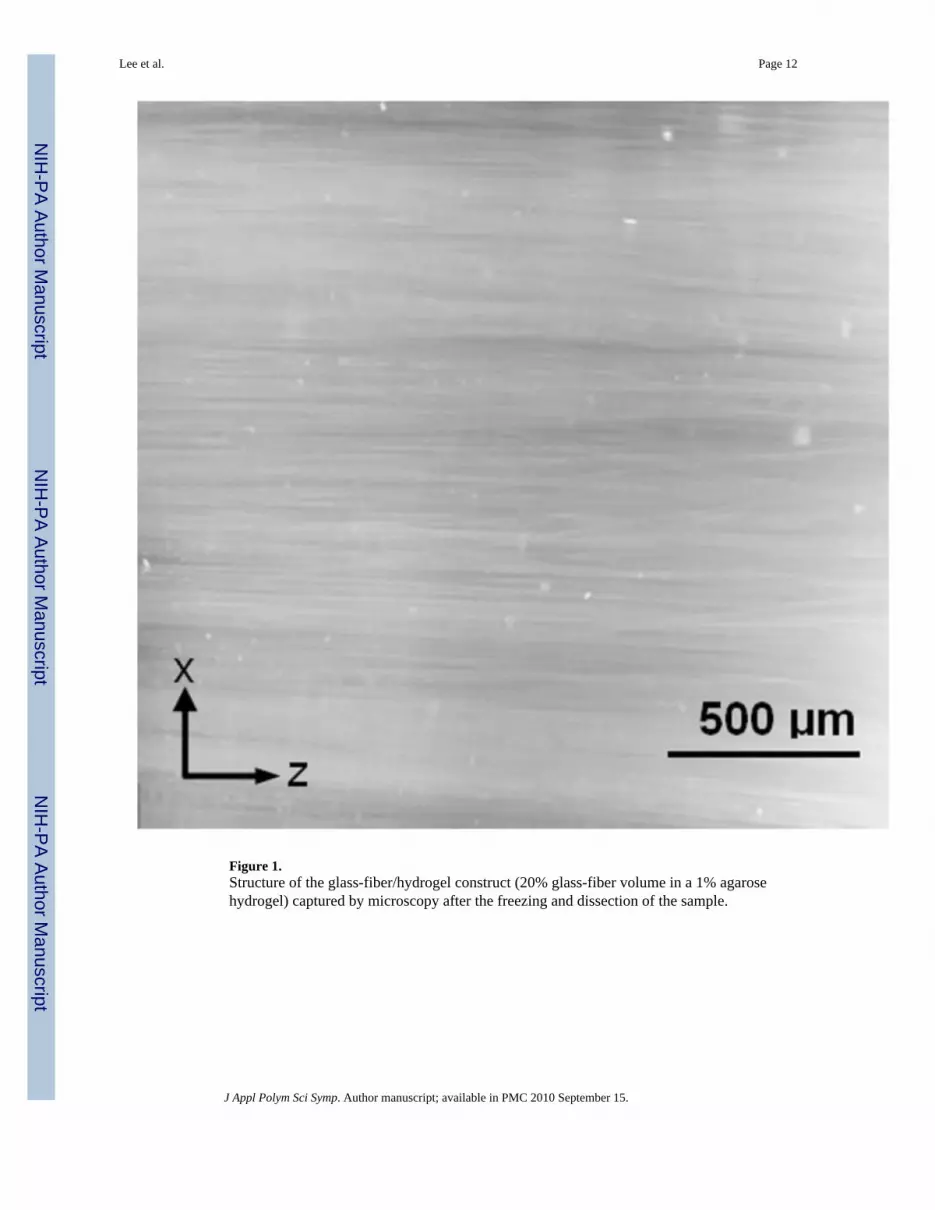
Figure 1.Structure of the glass-fiber/hydrogel construct (20% glass-fiber volume in a 1% agarosehydrogel) captured by microscopy after the freezing and dissection of the sample.
Lee et al. Page 12
J Appl Polym Sci Symp. Author manuscript; available in PMC 2010 September 15.
NIH
-PA Author Manuscript
NIH
-PA Author Manuscript
NIH
-PA Author Manuscript

Figure 2.Experimental setup for the measurement of the hydraulic conductivity in the agarose hydrogelsamples. The pressure drop was measured across samples subject to a constant flow rate. Forsamples with fibers, the fiber alignment was in the direction parallel to the flow through thesample.
Lee et al. Page 13
J Appl Polym Sci Symp. Author manuscript; available in PMC 2010 September 15.
NIH
-PA Author Manuscript
NIH
-PA Author Manuscript
NIH
-PA Author Manuscript

Figure 3.Experimental setup for the tracer infusion tests. [Color figure can be viewed in the online issue,which is available at www.interscience.wiley.com.]
Lee et al. Page 14
J Appl Polym Sci Symp. Author manuscript; available in PMC 2010 September 15.
NIH
-PA Author Manuscript
NIH
-PA Author Manuscript
NIH
-PA Author Manuscript

Figure 4.High-resolution MR images of the fabricated tissue surrogate (20% glass-fiber volume in a 1%agarose hydrogel) clearly showing the aligned glass-fiber structure. The transverse image (left)had a 5 × 5 mm2 field of view, whereas the axial image (right) had a 5 × 7.6 mm2 field of view(truncated for display). The black dots correspond to microscopic air bubbles. The voxelresolution was 40 × 40 × 40 μm3.
Lee et al. Page 15
J Appl Polym Sci Symp. Author manuscript; available in PMC 2010 September 15.
NIH
-PA Author Manuscript
NIH
-PA Author Manuscript
NIH
-PA Author Manuscript

Figure 5.Diffusion tensor images of 1% hydrogels with various fiber contents obtained on a 14.1-Tmagnet system (field of view = 4.2 × 4.2 mm2). (A) Sample with 20% fibers. The top rowcontains the De tensor element Deij images Dexx, Dexy, and Dexz in gray scale. The second rowcontains the image without diffusion weighting (So) and the tensor elements Deyy and Deyz.The third row contains the mean diffusivity (D ̄) and Dezz. The fourth row contains the FA imagewith the circular ROI used in Table I and an orientation map (Orient) image representing thedirections of maximum diffusivity. The Orient image is colored according to the directionindicated by the color sphere on the right with the color intensity scaled by the FA. Bluerepresents the direction perpendicular to the image plane, green represents up and down, andred represents left to right. (B) FA images for samples with various fiber contents. Red circles
Lee et al. Page 16
J Appl Polym Sci Symp. Author manuscript; available in PMC 2010 September 15.
NIH
-PA Author Manuscript
NIH
-PA Author Manuscript
NIH
-PA Author Manuscript

correspond to the ROI used in Table I. [Color figure can be viewed in the online issue, whichis available at www.interscience.wiley.com.]
Lee et al. Page 17
J Appl Polym Sci Symp. Author manuscript; available in PMC 2010 September 15.
NIH
-PA Author Manuscript
NIH
-PA Author Manuscript
NIH
-PA Author Manuscript

Figure 6.Measured hydraulic conductivity of fiber-free agarose hydrogels at low concentrations. Each□ data point is the average of four samples tested over a V range of 0.2–1.5 × 10⁻⁶ m/s. Thebars correspond to ±1 SD. For reference, data from previous hydrogel studies by (△) Johnsonand Deen10 and (○) Gu et al.11 are also graphed. The Darcy permeability in ref. 11 wasconverted to hydraulic conductivity through division by the water viscosity (μ = 0.001 N s/m2). The power-law fit is given by K = 1.0 × 10⁻¹²(Cw)−2.23 m4 N−1 s−1 (where Cw = Weightof the hydrogel/Total water volume; R2 = 0.9706).
Lee et al. Page 18
J Appl Polym Sci Symp. Author manuscript; available in PMC 2010 September 15.
NIH
-PA Author Manuscript
NIH
-PA Author Manuscript
NIH
-PA Author Manuscript

Figure 7.Effect of embedded glass fibers on K. (A) Measured pressure drop across the hydrogel samplesversus V for fiber-free hydrogels (n = 5) and hydrogels implanted with glass fibers (n = 4).Linear curve fits are also plotted (R2 = 0.99). (B) K versus V. K = K|| in the hydrogel with fibers.The bars correspond to ±1 SD, and n is the number of samples tested.
Lee et al. Page 19
J Appl Polym Sci Symp. Author manuscript; available in PMC 2010 September 15.
NIH
-PA Author Manuscript
NIH
-PA Author Manuscript
NIH
-PA Author Manuscript

Figure 8.Images of the distribution of the EBA tracer into (A) fiber-free 1% hydrogel samples at variousinfusion times and (B) 1.0% hydrogel samples with various fiber contents at 20 min. Theinfusion flow rate was 10 μL/h. [Color figure can be viewed in the online issue, which isavailable at www.interscience.wiley.com.]
Lee et al. Page 20
J Appl Polym Sci Symp. Author manuscript; available in PMC 2010 September 15.
NIH
-PA Author Manuscript
NIH
-PA Author Manuscript
NIH
-PA Author Manuscript

Figure 9.Diffusivity of EBA. (A) Experimental concentration profiles versus integrated concentrationprofiles for EBA infusions into 1.0% hydrogels. Average experimental (points) andcomputational concentration profiles (lines) are plotted with the distance from the infusionpoint. Simulated profiles use best fit parameters obtained by minimization of the MSE function.C/Co is the normalized EBA concentration, and a is the outer diameter of the infusion cannula(a = 0.25 mm). (B) MSE map comparing the experimental EBA distribution data withnumerical porous medium solutions. φ was estimated to be 0.6, and EBA diffusivity wasestimated to be 7.0 × 10⁻⁷ cm2/s for 1.0 < R/a < 6.
Lee et al. Page 21
J Appl Polym Sci Symp. Author manuscript; available in PMC 2010 September 15.
NIH
-PA Author Manuscript
NIH
-PA Author Manuscript
NIH
-PA Author Manuscript

Figure 10.Numerical parameter analysis for EBA tracer transport in anisotropic porous media. Thepredicted EBA tracer distribution ellipse ratios versus hydraulic conductivity ratios (K||/K⊥)were plotted after 20-min infusions (3.3 μL). Three cases were considered for glass-fibervolume fractions of (—) 20, (- - -) 10, and (– - –) 5% with estimated transport properties. (Forthe simulations, the properties for 20% fiber content were K|| = 1.20 × 10⁻¹² m4 N−1 s−1, D|| =7.0 × 10⁻⁷ cm2/s, D||/D⊥ = 1.26, and φ = 0.48. For 10% fiber content, the properties were K||= 1.40 × 10⁻¹² m4 N−1 s−1, D|| = 7.0 × 10⁻⁷ cm2/s, D||/D⊥ = 1.20, and φ = 0.54, and for 5%fiber content, the properties were K|| = 1.47 × 10⁻¹² m4 N−1 s−1, D|| = 7.0 × 10⁻⁷ cm2/s, D||/D⊥ = 1.16, and φ = 0.57.) The horizontal gray bands correspond to the experimentally measuredellipse ratios ± 1 SD. The vertical gray bands provide the corresponding K||/K⊥ ranges.
Lee et al. Page 22
J Appl Polym Sci Symp. Author manuscript; available in PMC 2010 September 15.
NIH
-PA Author Manuscript
NIH
-PA Author Manuscript
NIH
-PA Author Manuscript

NIH
-PA Author Manuscript
NIH
-PA Author Manuscript
NIH
-PA Author Manuscript
Lee et al. Page 23
TAB
LE I
Effe
ctiv
e D
iffus
ivity
and
FA
of W
ater
as M
easu
red
by D
TI in
1%
Hyd
roge
l Sam
ples
Em
bedd
ed w
ith G
lass
Fib
ers
Diff
usiv
ity in
the
entir
e sa
mpl
eD
iffus
ivity
in a
n R
OI
Gla
ssfib
er (%
)
λ z (c
m2 /s
)λ x
(cm
2 /s)
λ y (c
m2 /s
)FA
λ z/λ⊥
a
λ z (c
m2 /s
)λ x
(cm
2 /s)
λ y (c
m2 /s
)FA
λ z/λ⊥
aM
ean
(×10
−7)
SD(×
10−9
)M
ean
(×10
−7)
SD(×
10−9
)M
ean
(×10
−7)
SD(×
10−9
)M
ean
SD(×
10−3
)M
ean
(×10
−7)
SD(×
10−9
)M
ean
(×10
−7)
SD(×
10−9
)M
ean
(×10
−7)
SD(×
10−9
)M
ean
SD(×
10−3
)
02.
132.
641.
983.
231.
880.
350.
064
6.45
1.10
2.13
0.76
1.97
0.98
1.88
0.84
0.06
51.
691.
10
52.
170.
751.
930.
451.
800.
690.
098
2.69
1.16
2.19
0.84
1.77
1.45
1.64
1.31
0.16
4.94
1.28
102.
160.
751.
850.
831.
731.
010.
122.
341.
202.
161.
151.
651.
631.
521.
530.
26.
501.
36
202.
292.
621.
891.
871.
752.
040.
151.
961.
262.
311.
141.
711.
071.
581.
210.
213.
821.
40
Mea
sure
s wer
e ov
er th
e en
tire
sam
ple
and
a lo
cal R
OI (
see
Fig.
3).
a λ⊥
was
cal
cula
ted
as th
e av
erag
e of
λx
and λ y
.
J Appl Polym Sci Symp. Author manuscript; available in PMC 2010 September 15.

NIH
-PA Author Manuscript
NIH
-PA Author Manuscript
NIH
-PA Author Manuscript
Lee et al. Page 24
TABLE II
Permeameter-Measured Hydraulic Conductivities (K and K||) in the Tissue Surrogate
w/v (%) K (10−12 m4 N−1 s−1) SD (10−12 m4 N−1 s−1)
Agarose hydrogel 0.5 3.35 0.401
0.75 2.15 0.251
1 1.47 0.225
1.5 0.74 0.043
1% agarose hydrogel with glass fibers 5 1.46 0.159
10 1.41 0.169
20 1.20 0.079
Average values over the flow rate range of 10–50 μL/h (0.2–1.1 × 10⁻⁶ m/s) are presented.
J Appl Polym Sci Symp. Author manuscript; available in PMC 2010 September 15.

NIH
-PA Author Manuscript
NIH
-PA Author Manuscript
NIH
-PA Author Manuscript
Lee et al. Page 25
TABLE III
Ellipse Ratios for the EBA Tracer Distributions in 1% Hydrogels with Various Volume Fractions of Glass Fibers
Fiber volume (%)
Ellipse ratio
Mean SD
0 1.1 0.07
5 1.5 0.2
10 1.9 0.3
20 3.2 0.3
Distributions were for infusions of 3.3 μL (10 μL/h for 20 min).
J Appl Polym Sci Symp. Author manuscript; available in PMC 2010 September 15.


