Embed Size (px)
Citation preview
www.elsevier.com/locate/margeo
Marine Geology 222–22
Characterization of deltaic sediment bodies based on in situ
CPT/CPTU profiles: A case study on the Llobregat delta plain,
Barcelona, Spain
S. Lafuerza a, M. Canals a,*, J.L. Casamor a, J.M. Devincenzi b
a GRC Geociencies Marines, Dept. d’Estratigrafia, Paleontologia i Geociencies Marines, Universitat de Barcelona, E-08028, Spainb IGEOTEST, E-17 600, Spain
Accepted 15 June 2005
Abstract
This article describes a preliminary study on the Llobregat delta, Spain, which includes the construction of a 3D model from
cone penetration tests (CPT) and piezocone tests (CPTU) in order to establish the architectural stacking pattern of deltaic
sediment bodies. The sediment facies identified from boreholes have been characterized by using their mechanical behaviour
and have been used to identify the depositional sequence of the Llobregat delta.
Within the general architectural frame, flood plain silts and silty sands, crevasse sands, fluvial channel sands, sand ridges,
delta front silts and clays, and prodelta silts and clays have been characterized as a function of cone tip resistance ( qc) and
sleeve friction ( fs). From the sediment facies characterization, a depositional sequence constituted by three systems tracts is
proposed. The sequence is divided into: a lowstand systems tract (LST) represented by fluvial gravels, a transgressive systems
tract (TST) constituted by a fining-upward sequence with a thin sand sheet below silts and clays, and the highstand systems tract
(HST) represented by three prograding wedges displaying coarsening-upward sequences.
We emphasize the simplicity, speed, high spatial resolution and low cost of CPT/CPTU grids as a new tool enabling us to
reconstruct the three-dimensional structure of deltaic environments for sedimentological and stratigraphical purposes.
D 2005 Elsevier B.V. All rights reserved.
Keywords: cone penetration test; piezocone test; 3D geometry; sequence stratigraphy; delta facies; Llobregat delta
0025-3227/$ - see front matter D 2005 Elsevier B.V. All rights reserved.
doi:10.1016/j.margeo.2005.06.043
* Corresponding author. Tel.: +34 934021360; fax: +34
934021340.
E-mail address: [email protected] (M. Canals).
1. Introduction
Most of the modern deltas throughout the Mediter-
ranean Sea developed as a response to the deceleration
in post-glacial sea level rise during the Holocene. In
terms of sequence stratigraphy, the majority of Medi-
terranean deltas contain: (i) a basal sequence, namely
3 (2005) 497–510

S. Lafuerza et al. / Marine Geology 222–223 (2005) 497–510498
the lowstand systems tract (LST), constituted by late
Pleistocene fluvial deposits, (ii) a transgressive systems
tract (TST), made of shallowmarine transgressive early
Holocene deposits, and (iii) an overlying highstand
systems tract (HST), resulting from the accumulation
of Holocene deltaic aggradational to progradational
deposits (Stanley andWarne, 1994). The internal struc-
ture of HST deltaic deposits has been related to high
frequency (fifth- and six-order) sea level oscillations
(Somoza et al., 1998; Ridente and Trincardi, 2002;
Fernandez-Salas et al., 2003).
Deltas represent an historical record of environ-
mental changes since they are subject to continuous
physical changes (river migration, floods, regres-
sions–transgressions and subsidence) at different
time-scales. On a millennial scale, the effects of cli-
matic changes modify deltas by ice cap contraction
and expansion controlling the sediment supply. On a
centennial to decadal scale, human activities have
generated shifts in the balance between coastal sedi-
mentation and erosion by changes in land use and/or
flooding frequency because of river damming and
regulation. Deltas can be considered as quite unstable
sedimentary systems so humans, who are increasingly
exploiting and altering them, remain vulnerable to
these physical changes. Therefore, to implement
potentially successful plans and protection strategies,
understanding the architecture of deltas and the factors
involved on their formation becomes essential.
Cone penetration (CPT) and piezocone (CPTU)
tests are widely used in geotechnical subsuperficial
studies because of their excellent potential for in situ
continuous vertical profiling in non-cemented soils at
fast rate and low cost. Piezocones are CPT cones that
incorporate a pore pressure element thus allowing us
to perform the so-called CPTU tests. Both types of
tests are used to measure the mechanical behaviour of
soils and estimate physical properties such as soil
density, overconsolidation ratio and in situ horizontal
stress, amongst others. CPT tests provide accurate
data, most often yielding one measurement or bsignalQper centimeters of downhole penetration. CPT/CPTU
tests provide high resolution estimates of grain
size vertical variations in a way that the resulting
logs can be directly compared with sedimentary suc-
cessions in terms of coarsening and thickening
sequences and cyclicities (Moran et al., 1989). This
allows characterizing sedimentological trends and
sequence boundaries, both aspects highly relevant to
sedimentology and sequence stratigraphy as shown by
Campanella et al. (1983), Moran et al. (1989), Robert-
son (1990), Robertson et al. (1996), Amorosi and
Marchi (1999) and Devincenzi et al. (2003). In addi-
tion, distributed grids of CPT/CPTU profiles allow the
3D reconstruction of the geometry of sediment bodies.
Finally, boreholes are essential for groundtruthing
purposes.
In this paper, we aim to demonstrate the utility of
CPT/CPTU data to the study of the sedimentology
and stratigraphy of Holocene deltas, applied to the
Llobregat delta, in the NE section of the Iberian
Peninsula. Scattered CPT/CPTU data have been trans-
formed into a regularly spaced three-dimensional grid
depicting the geometry of sediment bodies constitut-
ing the Llobregat delta.
2. Regional setting
The study area covers 1.43�3.3 km on the right
bank of the Llobregat river delta plain, nearby the city
of Barcelona (Fig. 1). The subaqueous part of Llobre-
gat delta lies on an 8 km wide, 0.38 to 0.78 slope
continental shelf, the southern edge of which is
incised by the Foix Canyon. The delta plain spreads
over 95 km2 with 23 km of shoreline length. North-
westwards, the Llobregat prodelta interfingers with
the prodelta of the Besos river. Altogether, the Llo-
bregat–Besos prodelta system covers an area of 165
km2 along the inner and mid-shelf (Checa et al.,
1988).
The Llobregat continental shelf is dominated by a
low-energy wave regime, with a strong southward
geostrophic flow (30 cmd s�1) on the outer shelf (La
Violette et al., 1990). The Foix Canyon likely funnels
most of the fine material escaping from the continen-
tal shelf as suggested by a well preserved 137Cs signal.
This is further supported by the fact that centennial to
modern sedimentation rates show higher values in the
canyon upper course than off the Llobregat river
mouth where rates from 5.8F0.3 to 3.7F 0.12
mmd yr�1 have been measured from 137Cs and 210Pb
dating methods (Sanchez-Cabeza et al., 1999).
The thickness of Holocene deposits in the Llobre-
gat delta ranges from 20 m close to the delta apex 8
km landward from the present coastline to 60 m at the

Fig. 1. Location of the study area in the Llobregat delta near Barcelona harbour, northeast Spain. Location of the S7 borehole from where dated
samples were available is also shown. Main rivers and submarine canyons are indicated: (1) Llobregat river, (2) Besos river and (3) Foix
Canyon. See also location of Fig. 2. UTM coordinates.
S. Lafuerza et al. / Marine Geology 222–223 (2005) 497–510 499
present coastline, with a thickness of 64 m near the
present river mouth (Marques, 1974; Manzano, 1986).
Two radiocarbon dates from prodelta silts (unit E in
F
A Clays (bedrock)B ClaysC Sands and gravels
D Sand sheetE Impermeable siltsF Silts and clays
Lithological units described for the Llobregat Delta
Fig. 2. NW–SE geological cross-section showing the general architecture o
are shown: unit A corresponds to lower Pliocene blue clays, unit B to Plei
sands and gravels; unit D is constituted by transgressive sands; unit E is
gravels, sands and some silts from delta front and delta plain environments
sediments. Modified from Marques (1974), Bayo (1985) and Ventayol (20
Fig. 2) at 58.5 and 37.5 m below the present delta
plain surface obtained from a borehole having its top
at 3.5 m above sea level yielded 10 900F140 yr BP
Study area NW-SE
Mediterranean Sea
s.l.
A
BC
C
0 1 2 3 4 5Km
0
50
100
150
m
D
E
f the Llobregat delta (see location on Fig. 1). Main lithological units
stocene clays; the lower part of C is made of ravinement and fluvial
represented by Holocene prodelta deposits; the upper part of C are
; and unit F corresponds to the superficial level with flood plain fine
03).

S. Lafuerza et al. / Marine Geology 222–223 (2005) 497–510500
and 2300F 1200 yr BP, which represent sedimenta-
tion rates between 5.3 and 5.4 mmd yr�1, and 10.7
and 34 mm yr�1, respectively (Marques, 1974; Man-
zano, 1986). These values are in good agreement with
those from Sanchez-Cabeza et al. (1999).
The general architecture of the Llobregat delta
consists of six lithological units (Fig. 2), which from
bottom to top are: (i) a lower unit of Pliocene blue
clays and shales with shell fragments (A in Fig. 2); (ii)
Pleistocene fluvial gravels probably younger than
18000–15000 yr BP, forming a lower aquifer, that
grade to offshore clays (lower part of C and B in Fig.
2); (iii) transgressive sands (D in Fig. 2); (iv) Holo-
cene prodelta deposits made of impermeable clayey
silts (E in Fig. 2); (v) delta front and delta plain
gravels, sands and some silts, forming an upper aqui-
fer (upper part of C in Fig. 2); and (vi) an uppermost
unit made of flood plain fine sands, silts, clays and
marsh clays (F in Fig. 2) (Marques, 1974; Bayo, 1985;
Ventayol, 2003).
According to Checa et al. (1988), a relict delta
formed at the end of the Versilian transgression from
426800 42
426800 42
4574000
4573600
4373200
rotated grid
CPTU4
4D04
1PZ3
CPTU8
9D07
CPTU78
CPTU33
1D01
CPTU30
12D09
200
m
200 m
Fig. 3. Sampling location. Rotated gridding boundaries correspond to a r
course (see Fig. 1). See also location of Fig. 7. UTM coordinates.
10900 to 6000 yr BP, both ages corresponding to sea
level stabilizations at 65 and 22 m below present sea
level, respectively. During that period, the Llobregat
mouth migrated 30 km northeastwards from a former
location close to the head of the Foix Canyon to its
current location as a response to sea level rise. This
was a local effect of a synchronous reorganization of
sedimentary systems detected along the continental
shelves in the entire Northwestern Mediterranean
(Aloısi, 1978).
3. Materials and methods
Data from 19 CPT and 47 CPTU tests and 18
boreholes performed in direct relation and prior to
the construction of a large new sewage treatment
plant on the delta plain of the Llobregat river have
been used in this study (Fig. 3). Most of the boreholes
reach subsurface depths between 40 and 66 m. The
sediment facies in the boreholes used for groundtruth-
ing purposes are described in Domınguez (2002). The
7200 427600
7200 427600
4574000
4573600
4373200
boundaries
CPTU47SP3
Figure 7
Boreholes
CPT/CPTU
S
W
N
E
egular grid orientated parallel (1358) to the modern Llobregat river

0 2 4 6 8
1198 7
65
4
3
21
Friction Ratio FR (%)
Con
etip
resi
stan
ceq
(Mpa
)c
0. 1
1
10
100
1210 Flood plains ilts and
silty sands
C
1198 7
6
5 43
21
Friction Ratio FR( %)
Con
etip
resi
stan
ceq
(Mpa
)c
0. 1
1
10
100
1210 Crevasse sands
D
0.1
1
10
100
1112
10
98 7
6
5 43
21
Friction Ratio FR (%)
Con
etip
resi
stan
ceq
(Mpa
)c
Fluvial channel sands
E0.1
1
10
100
1112
10
98 7
6
5 43
21
Friction Ratio FR (%)
Con
etip
resi
s tan
ceq
( Mpa
)c
Sand ridges
F
0. 1
1
10
100
1112
10
98 7
6
5 43
21
Friction Ratio FR (%)
Con
etip
resi
stan
ceq
(Mpa
)c
Prodelta silts and clays
H
1112
10
98 7
6
5 43
21
Friction Ratio FR (%)
Con
etip
resi
stan
ceq
(Mpa
)c
Delta front silts and clays
G0.1
1
10
100
Facies
Delta plain faciesFlood plain silts and silty sandsCrevasse sandsFluvial channel sands
Delta Front faciesSand ridgesDelta front silts and clays
Prodelta silts and clays
q ( MPa)c
2 - 46 - 914 - 25
8 - 201 - 3
1 - 1.7
FR (%)
0.7 - 50.5 - 3.50.2 - 0.7
0.3 - 1.42.3 - 6
1.5 - 6
Sediment facies characterization from the study areaB
q /FR Soil behaviour typec
(*overconsolidate or cemented)
123456789
101112
Sensitive fine grainedOrganic materialClaySilt clay to clayClayey silt to silty claySandy silt to silty claySilty sand to sandy siltSand to silty sandSandGravelly sand to sandVery stiff fine grained*Sand to clayey sand*
Soil behaviour type identification from Robertson et al. 1986A
7531
0 2 4 6 87531
0 2 4 6 87531 0 2 4 6 87531
0 2 4 6 87531
0 2 4 6 87531
Fig. 4. A: qc/FR values and soil behaviour type given in the chart of Robertson et al. (1986) of soil classification. B: Characterization of sediment facies in the study area. C to H: qc/
FR values for each type of sediment facies in the study area.
S.Lafuerza
etal./Marin
eGeology222–223(2005)497–510
501

S. Lafuerza et al. / Marine Geology 222–223 (2005) 497–510502
penetration depth of the CPT/CPTU tests varies from
26 to 63.8 m. As related to the size of the study area
(1430�330 m=471 900 m2), this represents one CPT/
CPTU tests for each 7150 m2 and one borehole for
each 26217 m2, approximately. However, while the
number of in situ tests and boreholes can be considered
high, their spatial distribution was not perfectly regu-
lar, as shown in Fig. 3. This required applying specific
interpolation techniques in order to construct a 3D
model of the study area (see Section 3.2).
3.1. CPT/CPTU tests: measurements and procedures
CPT and CPTU testing tools consist of a cone (608of cone opening angle, 3 cm of height and 10 cm2 of
basal area) located at the lower end of a succession of
metallic cylinders pushed down at constant speed by
the force of a push engine located on a truck or
platform. The thrust capacity for the equipment used
was 20 tonnes (200 KN). A conducting cable through
the cylinders links the cone tip to the recording units
so that data are acquired and could be displayed on
line.
The tested parameters are (i) cone resistance ( qc,
measured in MPa), corresponding to the soil resis-
tance per unit area to penetration at the cone penet-
rometer tip, (ii) the friction ( fs, measured in MPa) of
the sediment per unit area along the 150 cm2 sleeve of
the tool and (iii) the pore pressure at the tip (u,
measured in MPa), which can be assessed only with
piezocones (CPTU). These parameters are measured
at a constant speed of 2 cmd s�1, visualized and
recorded in real time. Equipment and procedures
were in accordance with ASTMD (2000).
Cone tip resistance, qc, is an indicator of density
and consistency of soil changes. The most often used
parameter for friction is the friction ratio (FR, mea-
sured in %), which has been found to be indicative
of grain size and texture. FR and fs, are related by
Eq. (1):
FR %ð Þ ¼ fs=qc � 100: ð1Þ
When qc is plotted against FR, every soil can be
classified as an expression of grain size and consis-
tency, where increasing FR corresponds to increasing
fine content. The most often used qc/FR plot is known
as Robertson’s classification chart from Robertson
et al. (1986) (see further below).
When the cone is subjected under an all-around
water pressure during a CPTU test, there is usually a
shift in the zero for both friction sleeve and cone tip
resistance measurements. In this case, the cone tip
records a stress that is less than the applied all-
around pressure because of the unequal area at the
tip. Because of this effect, often referred as the
bunequal area effectQ, it is recommended for qcvalues to be reported as total resistance qt whenever
possible (Campanella et al., 1983). This correction
Eq. (2) is important in soft clays and silts where qc is
generally low and the excess pore pressure is very
high:
qt ¼ qc þ u 1� að Þ ð2Þ
where u is the pore pressure acting behind the cone
and a is the cone area ratio (Robertson, 1990). The
measured pore pressure changes are a function of in-
situ pore pressure, stress state, sediment permeability,
density, plasticity and stress history. Therefore, pore
pressure is considered to be a more reliable parameter
than qc in resolving unit boundaries so the differentia-
tion of lithological units by the cone is made using the
excess pore-pressure data, whereas the characteriza-
tion of each individual unit can be made using any of
the measured or derivative parameters, qc, fs, u or FR
or combinations of these parameters (Moran et al.,
1989).
Nevertheless, after groundtruthing CPT/CPTU pro-
files with the boreholes from the study area (Fig. 4)
we noticed that qc allowed us to distinguish sedimen-
tary facies most effectively. Differentiating between qcand qt did not bring any additional advantage in
distinguishing soil types, at least in our case. Gener-
ally, the measured and corrected tip resistance ( qc and
qt) in sands are essentially the same value (Lunne et
al., 1997; Liao et al., 2002). Therefore, qc was chosen
to identify sediment bodies as for this purpose correc-
tion Eq. (2) proved negligible (Devincenzi et al.,
2003). The use of qc also permits us to directly use
CPT/CPTU data since this parameter is measured in
both tests.
Among the several charts existing for evaluating
the soil type, we have used the Robertson’s chart (Fig.
4), which is based on qc and FR. This chart identifies
twelve soil types according to their behaviour in terms
of qc /FR ratio, as described in Fig. 4A. These range
from sensitive fine grained, organic and clayey soils to

S. Lafuerza et al. / Marine Geology 222–223 (2005) 497–510 503
gravelly sands to overconsolidated or cemented sands.
After facies correlation, data groups were plotted in
Robertson’s chart as derived from qc and FR profiles,
thus allowing the geotechnical characterization of the
sedimentary facies (Fig. 4B-H).
3.2. 3D modelling
A 3D model of the study area in the Llobregat delta
was created from irregularly spaced data with x, y and
z coordinates and a property value (e.g. qc). Regrid-
ding of those data was performed in order to obtain a
regularly spaced three-dimensional grid. Different
types of statistical approaches can be used to distri-
bute data into a grid. Several authors have processed
previously CPT/CPTU data with the same purpose by
clustering, grouping methods and geostatistics
(Nadim, 1988; Lacasse, 1995; Hegazy and Mayne,
2002; Devincenzi et al., 2003).
In our work, we have used the 3D Minimum Ten-
sion Gridding (3D-MTG) technique, which is an
extension of the Minimum Tension Gridding (MTG)
bi-cubic spline algorithm used to calculate 3D grid
spacing from scattered data points of a given property.
Splines have been already used in geological model-
ling (Eddy and Looney, 1993; Flach et al., 2003) and
it has been proved that splines are as accurate for
interpolation as kriging (Hutchinson and Gessler,
1994).
Applying the MTG technique involves an iterative
process, which respects the input data when calculat-
ing the evenly spaced grid. First, a coarse grid is
calculated and its cubic function is fitted to the grid
nodes using the original input data. Following the
iterations, the value of the grid node is evaluated
and compared to the input data. If an original data
point is located within half of the width of a grid cell,
the point is compared to the grid node. As gridding
progresses, the remainder between grid nodes and the
original input data points usually decreases. However,
if the remainder increases, each grid node is reset to
the value that is numerically closest to the input data
point.
3D grids of scattered data enable information to be
shared along a finite number of spatial planes within a
specific volume, therefore producing an accurate
representation of the spatial variation of the property
considered. However, careful evaluation of the results
throughout the modelling process and technically
based decisions in setting variable parameters are
key elements in the ultimate success of this type of
application.
In our modelling, a grid rotation of 1358 was
chosen to minimize extrapolation effects where data
were missing since this angle corresponds to the main
directional trend of sedimentation in the study area,
roughly coinciding with the orientation of the river’s
course. A grid rotation only implies a new coordinate
system rotated 1358 with respect to the input data
system of coordinates. A very low value, 0.01, was
selected for vertical influence to remove weight from
data above or below each interpolation node relative
to data on the horizontal plane of that node (Flach et
al., 2003). Otherwise, high smoothing may occur in
the horizontal plane. In addition, a low vertical influ-
ence factor results in the elongation of the sediment
bodies thus yielding more realistic models for coastal
plain environments (Eddy and Looney, 1993). The
grid size applied in our study was 5�5�0.5 ms (x,
y, z).
A different interpolation technique using kriging
algorithms was applied to the same study area by
Devincenzi et al. (2003), who obtained very similar
geometries to the ones from the present study where
the MTG technique has been employed. For that
reason, the application of the MTG is recommended
when a high density of data is available and simple
architectures are expected.
4. Results
4.1. Sediment facies characterization based on qcand FR
Sediment facies have been characterized from qcand FR values. The general response of qc and fs to
changes of material type generally results in high qc(N8 MPa) and low FR (b2%) for sandy soils whereas
soft clayey soils tend to give low qc (b4 MPa) and
high FR (N4%) (Lunne et al., 1997). A general
increase of qc from bottom to top may be expected
in the study area since deltas are made of coarsening-
upwards sequences (Shepard et al., 1960). Consolida-
tion effects may also produce increasing qc with
depth.

Cla
ysS
ilts
San
dsG
rave
ls
0
10
20
30
40
50
10
20
30
40
gene
ral C
oars
enin
g-U
pwar
ds s
eque
nce
Prodelta
Delta front(I)
Delta front(II)
Delta front(III)
Delta Plain
qc (MPa)
sand ridges
sand ridges
sand ridges
CU
CU
CU
sand ridges
CPTU33 Borehole 1D01
10 20 300
(m)
50
+2.5 m abovecurrent sea level0
(m)
Fig. 5. Correlation between the qc profile from the CPTU33 test and
the borehole 1D01 (see location in Fig. 3). Borehole 1D01 vertica
scale has been cut at 50m of depth. Minor coarsening-upwards
sequences (CU) within the general coarsening-upwards sequence
have been easily detected by the penetration tests, according to the
stratigraphic record (see delta, prodelta and delta front environ-
ments, I-II-III, and sand ridges) of borehole 1D01.
S. Lafuerza et al. / Marine Geology 222–223 (2005) 497–510504
qc and FR values found for the sediment facies are
given in section B of Fig. 4, which includes attribution
to specific sedimentary environments obtained from
groundtruthing with boreholes of nearby CPT/CPTU
sites within the overall study area. The values in Fig.
4B correspond to intervals of qc /FR values including
more than 70% of the data points represented on each
sediment facies specific plot from Fig. 4C to H.
Delta plain facies display a broad qc range (2 to 25
MPa) as could be expected from the variety of depos-
its accumulating in this environment, which includes
flood plain silts and silty sands, crevasse sands and
fluvial channel sands. Flood plain silts and silty sands
are the most common sediment type, with N70% of
the qc values from 2 to 4 MPa and 0.7 to 5% FR.
However, observed lower qc values and higher FR
values (Fig. 4C) in flood plain sediments of the study
area have been attributed to the presence of organic
material and clays as mostly indicated by scattered
data fitting into Robertson’s soil types 2 and 3. Cre-
vasse sands mostly display qc values between 6 and 9
MPa with FR values between 0.5 and 3.5% (Fig. 4D).
Finally, fluvial channel sands present the highest qc(14–25 MPa) and the lowest FR (0.2–0.7%) (Fig. 4E).
As can be deduced from the above data and the plots
in Fig. 4, the higher qc values corresponds to the
coarser sediment type and, viceversa, the lowest qccorresponds to the finest sediment type. FR shows an
opposite behaviour as should be expected from
expression Eq. (1) above (see Section 3.1).
Delta front facies are mainly made of sand ridges
where coarsening-upwards sequences ranging from
fine sands and silts with variable clay content to
upper well sorted sands. In sand ridges, most qcvalues shift from 8 to 20 MPa whereas FR values
mainly fit in the range of 0.3% to 1.4% (Fig. 4F).
More than 70% delta front silts range between 1 and 3
MPa for qc and 2.3% and 6% for FR, though some
variability has been observed in the study area (Fig.
4G) likely due to lower sorting. In comparison with
fluvial channel sands, delta front sand ridges tend to
show lower qc values (occasionally b10 MPa) due to
their relative smaller grain size. Minor order coarsen-
ing-upwards sequences have been registered by
increases in qc from delta front silts and clays to
sand ridges (Fig. 5). The distinction between delta
front silts and flood plain silts is more subtle although
in general delta front silts tend to be somewhat finer.
l
Prodelta facies consist of silts with clayey silt and
clay intervals. Also rare thin sandy intercalations are
observed, with qc values up to 10 MPa. Dominant
prodelta facies have a narrow range of qc, between 1
and 1.7 MPa, with few samples showing higher
values. FR varies from 1.5% to 6% (Fig. 4H).
Most of the CPT/CPTU penetration depths in the
study area were shallower than the top of the
transgressive sand sheet. The basal gravels described
in the literature (units C and D in Fig. 2) were not
profiled, though they were sampled in the bore-
holes. Penetrating coarse materials may seriously
damage the delicate cone tip used in the tests and,
therefore, we stopped testing before reaching such
materials.

6E
grid boundaries
rotated grid boundaries
N W
4573200 4573400 4573600 4573800 4574000 4574200
0
10
20
30
40
50
60
6F
6G
6D
A
B
NW
NE
U1
U2U3
U3-U4
U4 U2U3
U1
U1
U2U3
U4
U1
U2
U3-U4
U1
U2
U2
U3U4
U2
U3
U4
U3-U4U4
fluvial channel sandsU3
U4
6H
024681012141618202224262830
qcolourscale(MPa)
c
NW
0
60
0
60
13 m
34 m
37
10 m
47 m1
U3-4
6H U46B
C
D
E F G
H
U2
U3-U4
6H
6C
S
E
SE
SWNESWNESW
SE
NESW SE NW
Fig. 6. 3D model of qc. Isosurfaces correspond to 2MPa intervals. A qc colour scale is shown on the left border. The rotated grid boundaries and
general grid boundaries are given with UTM coordinates in meters. Sediment bodies identified from the model are indicated as U1, U2, U3 and
U4 from bottom to top. The 3D model clearly displays high qc values at top and low values at the bottom (dominance of green tones at the top
and blue tones at the bottom). A: General view of the qc 3D model. B: Highest qc values are found at the top of the sediment wedges (U3 and
U4) suggesting coarsening-upward sequences. C: Sand-filled fluvial channels cut in the sand ridges of wedge U2. D: SE–NW cross-section
showing inclinations of the boundaries of each wedge and reference depths. Wedges U2 and U3 display 78 and 38 slopes. E to G: SW–NE cross-
sections showing lateral changes in qc values and the depths at which wedges are found. H: Horizontal slice at �5 m where U4 changes in qcvalues are displayed.
S. Lafuerza et al. / Marine Geology 222–223 (2005) 497–510 505

S. Lafuerza et al. / Marine Geology 222–223 (2005) 497–510506
4.2. Identification of sediment bodies from the 3D
model
The qc isosurface model constructed from the inter-
polated grid, obtained after application of the 3D-
MTG technique (see Section 3.2) on the original
data, is useful to identify the geometries of the
wedge-shaped sediment bodies in the study area,
and the 3D variability of each soil property. The
boundaries of the model have been adjusted to the
precise location of the outermost data in the study area
with the aim of avoiding wrong calculated values to
appear. A general view of the 3D isosurface model
showing the geometries of sediment bodies in the
study block is presented in Fig. 6.
The 3D model clearly displays high qc values at
top and low values at the bottom (Fig. 6). Decreasing
qc values with depth prove the expected general coar-
sening-upwards sequence (see Section 4.1) since we
consider consolidation effects to be little significance.
Four wedge-shaped sediment bodies U1 to U4 pro-
grading southeastwards have been identified and
described according to the sediment facies character-
ization (Section 4.1.) and their stratigraphic location
(Fig. 6).
The top of the basal U1 in Fig. 6A lies at 47 to 60
m depth below sea level (0 line in Fig. 6) with depth
increasing from NW (landward) to SE (seaward).
According to the general model in Fig. 2, such a
depth is just above the sands left by the transgression.
We hypothesize that the silts tested would have been
deposited during the transgression on top of the sands,
thus resulting in a fining upwards transgressive
sequence. Transgressive sands would equally grade
seaward into finer silty sediments. qc values of basal
transgressive silts ranging from 2 to 6 MPa could be
erroneously attributed to flood plain silts and silty
sands because of their similar qc values, the 3D
model being of fundamental importance to avoid
such as potential mistake.
The three upper bodies (U2, U3 and U4 in Fig.
6A) present similar qc distributions, with highest
values at the top of each. The top of the units is,
therefore, likely made of sand ridges ( qc between 8
and 20 MPa, green tones) separated from underlying
delta front silts and clays and prodelta silts and
clays ( qc lower than 8 MPa, Fig. 6B) by sharp
boundaries. These qc trends clearly indicate that
sediment bodies U2, U3 and U4 form coarsening-
upwards sequences.
Fluvial channels (Fig. 6C) with qc values of 26–32
MPa filled by sand ridges are observed close to the
northwestern end of sediment body U2 of Fig. 6. This
sediment body is 37 m thick at the landward end of
the study block, where its top is located at 10 m depth,
and N26 m at its seaward end (Fig. 6D). Its upper
boundary is tilted 78 seaward. Decreasing qc in the
upper levels of sediment body U2 seaward illustrates
how delta front sand ridges pinch out to the SE.
Sediment body U3 (Fig. 6) is 19 m thick at the SE
end (seaward) of the 3D block and its upper boundary
displays a slope of up to 38. Because of qc values thatdo not vary greatly, it has not been possible to
identify its upper boundary and thus sediments bodies
U3 and U4 appear amalgamated landwards (Fig. 6D),
where they have 10 m of thickness altogether. The
upper boundary of sediment body U4 constitutes the
modern delta plain. The thickness of this body ranges
from 13 m at the SE end to less than 10 m at the NW
end (Fig. 6C).
Whereas section 6D shows that the depth distribu-
tion of qc values varies along the main SE–NWaxis of
the 3D block, cross-sections 6E to 6G also illustrate
SW–NE heterogeneities in the distribution of qcvalues corresponding to lateral changes of sediment
properties (Fig. 6D to G). This is particularly the case
for the upper part of sediment body U2 as shown in
Fig. 6F. Fig. 6H shows a horizontal slice at 5 m depth
below sea level highlightening qc variability in the
upper sediment wedge or body U4. Slicing at greater
depths would show a similar pattern for the sediment
bodies below.
5. Discussion
The high potential for distributed grids of CPT/
CPTU tests to identify the geometry of sediment
bodies in deltaic settings and to discriminate the
associated sediment facies and their lateral and ver-
tical relations is illustrated by the study case of the
Llobregat delta. The use of just one property mea-
sured directly ( qc) and a second derived parameter
(FR) has proved to be sufficient to image with high
resolution the 3D structure of the delta. In this way,
three prograding sediment wedges, which we have
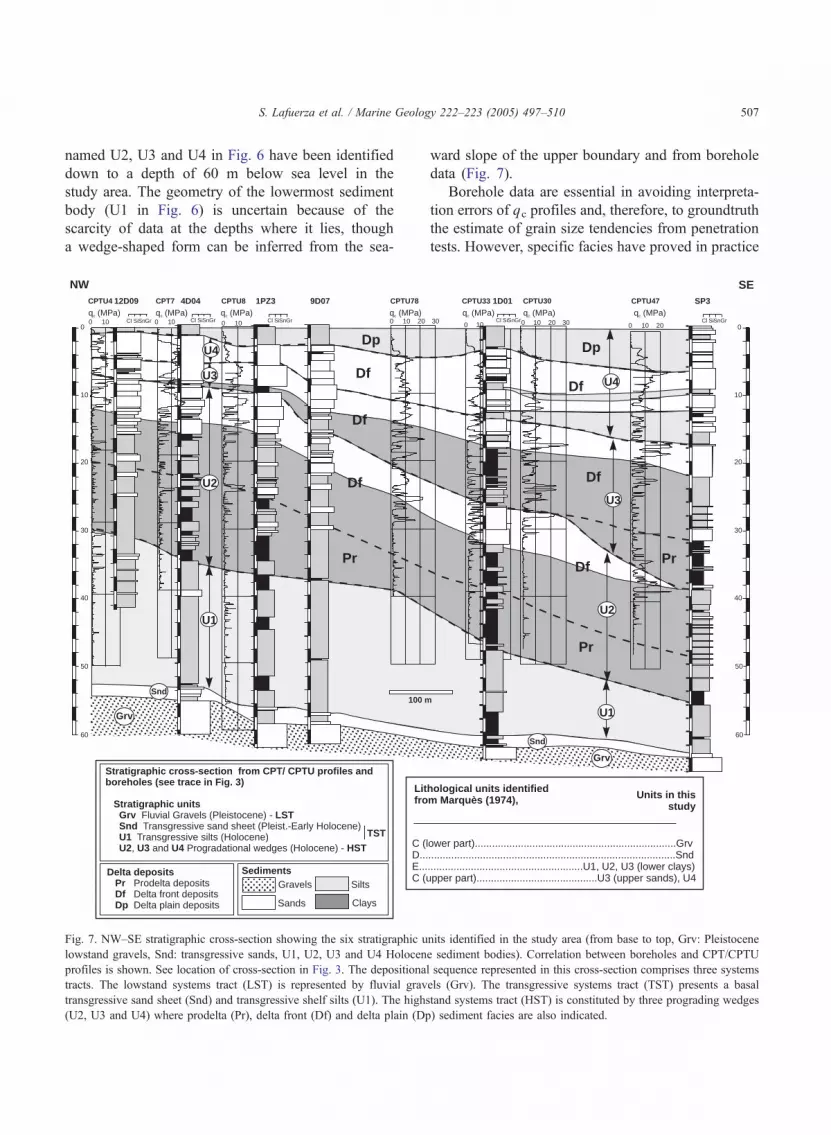
S. Lafuerza et al. / Marine Geology 222–223 (2005) 497–510 507
named U2, U3 and U4 in Fig. 6 have been identified
down to a depth of 60 m below sea level in the
study area. The geometry of the lowermost sediment
body (U1 in Fig. 6) is uncertain because of the
scarcity of data at the depths where it lies, though
a wedge-shaped form can be inferred from the sea-
Cl SiSnGr 0 10 20Cl SiSnGr
4D04 9D071PZ3
0 10
12D09
100 m
CPTU78CPTU8CPTU4 CPT7
0 10 GrCl SiSn 0 10
Df
Df
Pr
Dp
Df
Litfro
C (lD...E...C (u
Snd
Grv
U1
U2
NW
qc (MPa)qc (MPa)qc (MPa)qc (MPa)
Stratigraphic cross-section from CPT/ CPTU profiles andboreholes
Stratigraphic unitsGrv LSTSndU1U2 U3 U4 HST
(see trace in Fig. 3)
Fluvial Gravels (Pleistocene) -Transgressive sand sheet (Pleist.-Early Holocene)
Transgressive silts (Holocene), and Progradational wedges (Holocene) -
Gravels
Sands
Silts
Clays
SedimentsDelta depositsPrDfDp
Prodelta depositsDelta front depositsDelta plain deposits
TST
U4
U3
0
10
20
30
40
50
60
Fig. 7. NW–SE stratigraphic cross-section showing the six stratigraphic u
lowstand gravels, Snd: transgressive sands, U1, U2, U3 and U4 Holocen
profiles is shown. See location of cross-section in Fig. 3. The depositiona
tracts. The lowstand systems tract (LST) is represented by fluvial grav
transgressive sand sheet (Snd) and transgressive shelf silts (U1). The highs
(U2, U3 and U4) where prodelta (Pr), delta front (Df) and delta plain (Dp
ward slope of the upper boundary and from borehole
data (Fig. 7).
Borehole data are essential in avoiding interpreta-
tion errors of qc profiles and, therefore, to groundtruth
the estimate of grain size tendencies from penetration
tests. However, specific facies have proved in practice
030 0 10 20 30Cl SiSnGr
1D01
0
10
20
30
40
50
60
0 10 20
SP3
SE
Cl SiSnGr
CPTU30CPTU33 CPTU47
U3
U4
U2
U1
Snd
Grv
Df
Pr
Dp
DfPr
Df
hological units identifiedm Marquès (1974), Units in this
study
ower part)......................................................................Grv......................................................................................Snd......................................................U1, U2, U3 (lower clays)pper part)..........................................U3 (upper sands), U4
qc (MPa)qc (MPa)qc (MPa)10
nits identified in the study area (from base to top, Grv: Pleistocene
e sediment bodies). Correlation between boreholes and CPT/CPTU
l sequence represented in this cross-section comprises three systems
els (Grv). The transgressive systems tract (TST) presents a basal
tand systems tract (HST) is constituted by three prograding wedges
) sediment facies are also indicated.

S. Lafuerza et al. / Marine Geology 222–223 (2005) 497–510508
difficult to differentiate not only from qc profiles but
also in borehole cores by simply using grain size
criteria. This is in particular the case of silts and
clays from the delta front and prodelta environments,
which show very similar qc values and similar grain
sizes (see Fig. 4B). It has to be taken into account that
under specific circumstances, like the appearance of
very thin layers of silts and clays, the cone may
continue sensing the sediment just above even when
it has already entered a new material, which may thus
not be sensed (Lunne et al., 1997). Facies associations
provide clues to differentiate sedimentary environ-
ments. For example, delta front silts and clays are
usually associated with sand ridges (see Fig. 6B)
whereas prodelta silts and clays do not appear to be
associated with this type of proximal, shallower sedi-
ment facies (see U4 in Fig. 7).
The general architecture of the Llobregat delta
depicted by the four sediment bodies U1 to U4 and
the general coarsening-upwards sequence given by the
qc values is consistent with the expected classical
general stratigraphic architecture of Holocene deltas
as described by Stanley and Warne (1994).
The LST is represented by the lowermost gravels in
Fig. 7. These gravels likely correspond to a ravine-
ment surface and to the infill of river channels during
the last sea level lowstand. Gravelly units from older
Pleistocene lowstands would be found southeastward
of the present delta, towards the Foix Canyon area.
Lowstand gravels are overlain by a thin transgressive
sand sheet (Fig. 7) accumulated during the shoreface
retreat associated with the pre-Holocene and early
Holocene rise in sea level. These transgressive sands
rapidly were replaced by successions of silts (U1 in
Figs. 6 and 7) resulting in a TST fining-upwards
sequence, as has been shown in other deltas like the
Song Hong delta (Hori et al., 2004). However, TST
coarsening-upwards sequences have also been
described in the Po and Tevere deltas (Amorosi and
Milli, 2001).
The HST consists of the three prograding wedges
U2, U3 and U4 in Figs. 6 and 7 indicative of sustained
delta growth and shoreline advance phases that,
according to Checa et al. (1988), were likely favoured
by the stabilization of sea level from 6000 yr BP
onwards. At that time, shallowing because of sedi-
ment input started to exceed the relative sea level rise
along the shoreline of the Llobregat delta. These
progradational wedges built an overall coarsening-
upwards sequence with vertical transition from pro-
delta to delta front and delta plain environments (Figs.
6 and 7). Similar depositional sequences, starting by
basal LST deposits overlain by TST and HST depos-
its, have been identified in other areas of the Spanish
continental shelf (Hernandez-Molina et al., 1994;
Somoza et al., 1998; Fernandez-Salas et al., 2003).
The observed progradational stacking pattern likely
reflects three cycles of deltaic build-up on the Llobre-
gat coast produced by high frequency sea level oscil-
lations (sixth-order sea level cycles of 1–2�103
years), as has also been observed in the Ebro delta
by Somoza et al. (1998) and in southern Spain (Her-
nandez-Molina et al., 2002; Fernandez-Salas et al.,
2003). High frequency climatic fluctuations, inter-
preted as related to short cool/humid events observed
in the Ebro delta (Somoza et al., 1998), would cause
relative sea level falls and increases in the sediment
supply related to higher precipitation. Therefore, del-
taic progradations identified in this study are may
occur during stillstands after sea level falls of varying
amplitudes related to such climatic excursions.
6. Conclusions
The cone tip resistance ( qc) constitutes a simple
parameter that can be interpreted in terms of sediment
facies. Prodelta, delta front and delta plain sediments
have been characterized in terms of lithology, geome-
try and vertical grain size variations. Particularly,
flood plain silts and silty sands, crevasse sands, fluvial
channel sands, sand ridges, delta front-prodelta silts
and clays, have been identified using boreholes. The
use of qc is suitable for discriminating between sedi-
ments with contrasting grain size. As an example, a
distinction between delta front silts and prodelta silts
is not obvious from qc only.
CPT/CPTU measurements provided a high-resolu-
tion data set of the Llobregat delta suitable for 3D
modelling. The 3D Minimum Tension Gridding tech-
nique constitutes a useful and practical tool to inter-
polate these data since its application has proved to be
simpler than other methods and no large calculations
are required. Extension of CPT/CPTU into the study
area allowed us to delineate sediment bodies in a three
dimensional space, improving interpretations.
S. Lafuerza et al. / Marine Geology 222–223 (2005) 497–510 509
A 3D model integrating data from 65 CPT/CPTU
tests has shown with great detail the internal structure
of the Holocene highstand sediment package in the
study area, which is represented by three prograding
wedges. The high stratigraphic potential of the CPT/
CPTU profiles has allowed us to recognize small-
scale grain size variations (Fig. 5), such as the few-
meter thick coarsening-upwards sequences present in
the prograding wedges (Fig. 6B) and fluvial-channel
sands (Fig. 6C). The progradational phases identified
in the HST are related to relative sea level changes
caused by high frequency climatic events according to
observations in neighbouring delta areas.
Ongoing 14C AMS radiocarbon dating will provide,
in the near future, a much more precise time frame for
the 3D evolution of the Llobregat delta and the age of
its building blocks, namely the sandy and silty HST
prograding wedges and the interfingering finer layers.
Imaging the 3D geometries and understanding how
they form is of prime importance for sequence strati-
graphy and reservoir purposes as well as for geotech-
nical engineering. Diagnostic geotechnical properties
from which other interesting parameters are derived
could be predicted spatially through 3D modelling as
illustrated by this Llobregat delta case study.
Acknowledgements
The authors would like to thank DEPURBAIX, S.A.
for releasing the data used in the work. We wish to
express our gratitude to Pere Busquets and Oriol Fali-
vene, University of Barcelona, for interfacing with
DEPURBAIX and for helpful advice and reviewing.
This research is supported by the EC EURODELTA
(EVK3-CT-2002-20001) and PROMESS 1 (EVR1-
CT-2001-00041) projects and the Spanish PRODELTA
project (REN2002-02323). GRCGM is funded by Ge-
neralitat de Catalunya through its research groups pro-
gram (ref. 2001 SGR-00076). SL benefited from a
Ministry of Education and Science grant.
References
Aloısi, J.C., 1978. The Holocene transgression in the golfe du Lion,
southwestern France: paleogeographic and paleobotanical evo-
lution. Gegr. Phys. Quat. 32 (2), 145–182.
Amorosi, A., Marchi, N., 1999. High-resolution sequence stratigra-
phy from piezocone tests: an example from the late Quaternary
deposits of the south-eastern Po plain. Sediment. Geol. 128,
67–81.
Amorosi, A., Milli, S., 2001. Late Quaternary depositional archi-
tecture of Po and Tevere river deltas (Italy) and worldwide
comparison with coeval deltaic successions. Sediment. Geol.
144, 357–375.
ASTMD, 2000. Standard Test for Performing Electronic Friction
Cone and Piezocone Penetration Testing of Soils (ASTM D
5778-95). Annual Book of ASTM Standards, Vol. 04.09.
Bayo, A., 1985. Les aigues. Historia Natural dels Paısos Catalans,
vol. 3. Enciclopedia Catalana, Barcelona, pp. 21–41.
Campanella, R.G., Robertson, P.K., Gillespie, D., 1983. Cone pene-
tration testing in deltaic soils. Can. Geotech. J. 20, 23–35.
Checa, A., Dıaz, J.I., Farran, M., Maldonado, A., 1988. Sistemas
deltaicos holocenos de los rıos Llobregat, Besos y Foix: mode-
los evolutivos transgresivos. Acta Geol. Hisp. 23, 225–241.
Devincenzi, M.J., Colas, S., Casamor, J.L., Canals, M., Falivene,
O., Busquets, P., 2003. Aplicacion del piezocono para el estudio
sedimentologico de detalle de los sedimentos cuaternarios del
delta del Llobregat, Barcelona. III Congreso andaluz de carre-
teras, Sevilla. October 2003, pp. 937–954.
Domınguez, O., 2002. Estudi sedimentologic aplicat al delta del riu
Llobregat. Degree thesis (Treball de final de carrera), University
of Barcelona. 254 pp.
Eddy, C.A., Looney, B.B., 1993. Three-dimensional digital imaging
of environmental data: selection of gridding parameters. Int. J.
Geogr. Inf. Syst. 7 (2), 165–172.
Fernandez-Salas, L.M., Lobo, F.J., Hernandez-Molina, F.J.,
Somoza, L., Rodero, J., Dıaz del Rıo, V., Maldonado, A.,
2003. High-resolution architecture of Late Holocene highstand
prodeltaic deposits from southern Spain: the imprint of high-
frequency climatic and relative sea level changes. Cont. Shelf
Res. 23, 1037–1054.
Flach, P.G., Ham, L.L, Harris, M.K., Thayer, P.A., Haselow, J.S.,
Smits, A.D., 2003. A method for characterizing hydrogeologic
heterogeneity using lithologic data. In: Fraser, G., Davis, J.M.
(Eds.), SEPM Concepts in Hydrogeology and Environmental
Geology 1, pp. 119–137.
Hegazy, Y.A., Mayne, P., 2002. Objective site characterization using
clustering of piezocone data. J. Geotech. Geoenviron. Eng. 128
(12), 986–996.
Hernandez-Molina, F.J., Somoza, L., Pomar, L., 1994. Late Pleis-
tocene sediments on the Spanish continental shelves: model for
very high resolution sequence stratigraphy. Mar. Geol. 120,
129–174.
Hernandez-Molina, F.J., Somoza, L., Vazquez, J.T., Lobo, F.,
Fernandez-Puga, M.C., Llave, E., Dıaz-del Rıo, V., 2002.
Quaternary stratigraphic stacking patterns on the continental
shelves of the southern Iberian Peninsula: their relationship
with global climate and paleoceanographic changes. Quat. Int.
92, 5–23.
Hori, K., Tanabe, S., Saito, Y., Haruyama, Sh., Nguyen, V., Kita-
mura, A., 2004. Delta initiation and Holocene sea level change:
example from the Song Hong (Red River) delta, Vietnam.
Sediment. Geol. 164, 237–249.

S. Lafuerza et al. / Marine Geology 222–223 (2005) 497–510510
Hutchinson, M.F., Gessler, P.E., 1994. Splines—more than just a
smooth interpolator. Geoderma 62, 45–67.
Lacasse, S., 1995. Statistical treatment of CPT data. International
symposium on cone penetration testing. Technical papers. Swed.
Geotech. Soc. 627 (2), 369–377.
La Violette, P.E., Tintore, J., Font, J., 1990. The surface circulation
of the Balearic Sea. J. Geophys. Res. 98, 1377–1398.
Liao, T., Mayne, P.W., Tuttle, M.P., Schweig, E.S., Van Arsdale,
R.B., 2002. CPT site characterization for seismic hazards in
the New Madrid seismic zone. Soil Dyn. Earthqu. Eng. 22,
943–950.
Lunne, T., Robertson, P.K., Powell, J.J.M., 1997. Cone penetration
testing in geotechnical practice. Blackie academic/ EF Spon/
Rutledge Publishing Company. 312 pp.
Manzano, M., 1986. Estudio sedimentologico del prodelta holoceno
del Llobregat. Thesis. University of Barcelona, Barcelona.
150 pp.
Marques, M.A., 1974. Las formaciones cuaternarias del delta del
Llobregat. Thesis. University of Barcelona, Barcelona. 401 pp.
Moran, K., Hill, P.R., Blasco, S.M., 1989. Interpretation of piezo-
cone penetrometer profiles in sediment from the Mackenzie
through, Canadian Beaufort Sea. J. Sediment. Petrol. 59 (1),
88–97.
Nadim, F., 1988. Geotechnical site description using stochastic
interpolation. 10th Nord, Geotek. Oslo, Norway (May 1988),
pp. 158–161.
Ridente, D., Trincardi, F., 2002. Eustatic and tectonic control on
deposition and lateral variability of Quaternary regressive
sequences in the Adriatic basin (Italy). Mar. Geol. 184,
273–293.
Robertson, P.K., 1990. Soil classification using the cone penetration
test. Can. Geotech. J. 27, 151–158.
Robertson, P.K., Campanella, R.G., Gillespie, D., Grieg, J., 1986.
Use of piezometer cone data. Proceedings, in-situ ’86, ASCE
Specialty conference, Blacksburg, VA, United States (June
1986), pp. 1263–1280.
Robertson, P.K., Lunne, T., Powell, J., 1996. Applications of pene-
tration tests for geo-environmental purposes. In: Telford, Thomas
(Ed.), Advances in Site Investigation Practice, pp. 407–420.
London.
Sanchez-Cabeza, J.A., Masque, P., Ani-Ragolta, I., Merino, J.,
Alvisi, F., Palanques, A., Puig, P., 1999. Sediment accumulation
rates in the southern Barcelona continental margin (NW Medi-
terranean Sea) derived from 210Pb and 137Cs chronology. Prog.
Oceanogr. 44, 313–332.
Shepard, F.P., Phleger, F.B., Van Andel, T.H. (Eds.), 1960. Recent
sediments, Northwest Gulf of Mexico, Amer. Assoc. Petro.
Geol. 394 pp.
Stanley, D.J., Warne, A.G., 1994. Worldwide initiation of Holocene
marine deltas by deceleration of sea level rise. Science 265,
228–231.
Somoza, L., Barnolas, A., Arasa, A., Maestro, A., Rees, J.G.,
Hernandez-Molina, F.J., 1998. Architectural stacking patterns
of the Ebro delta controlled by Holocene high-frequency
eustatic fluctuations, delta-lobe switching and subsidence pro-
cesses. Sediment. Geol. 117, 11–32.
Ventayol, A., 2003. Caracterizacion geotecnica de sedimentos del-
taicos mediante piezoconos. In: Gimeno, Lopez (Ed.), Aplica-
cion al margen izquierdo del delta del Llobregat. Ingenierıa del
terreno, INGEOTER, vol. 2 (C), pp. 413–433.


