Embed Size (px)
Citation preview
�����������������
Citation: Cheung, M.M.; Kramer, M.;
Beauchamp, G.K.; Puputti, S.; Wise,
P.M. Characterizing Individual
Differences in Sweet Taste Hedonics:
Test Methods, Locations, and Stimuli.
Nutrients 2022, 14, 370. https://
doi.org/10.3390/nu14020370
Academic Editor: David J. Mela
Received: 20 December 2021
Accepted: 12 January 2022
Published: 15 January 2022
Publisher’s Note: MDPI stays neutral
with regard to jurisdictional claims in
published maps and institutional affil-
iations.
Copyright: © 2022 by the authors.
Licensee MDPI, Basel, Switzerland.
This article is an open access article
distributed under the terms and
conditions of the Creative Commons
Attribution (CC BY) license (https://
creativecommons.org/licenses/by/
4.0/).
nutrients
Article
Characterizing Individual Differences in Sweet Taste Hedonics:Test Methods, Locations, and StimuliMay M. Cheung 1,*, Matthew Kramer 2 , Gary K. Beauchamp 1, Sari Puputti 3 and Paul M. Wise 1
1 Monell Chemical Senses Center, 3500 Market St., Philadelphia, PA 19104, USA;[email protected] (G.K.B.); [email protected] (P.M.W.)
2 Beltsville Agricultural Research Center, United States Department of Agriculture, 10300 Baltimore Ave.,Beltsville, MD 20705, USA; [email protected]
3 Functional Foods Forum, Faculty of Medicine, University of Turku, 20014 Turku, Finland; [email protected]* Correspondence: [email protected]
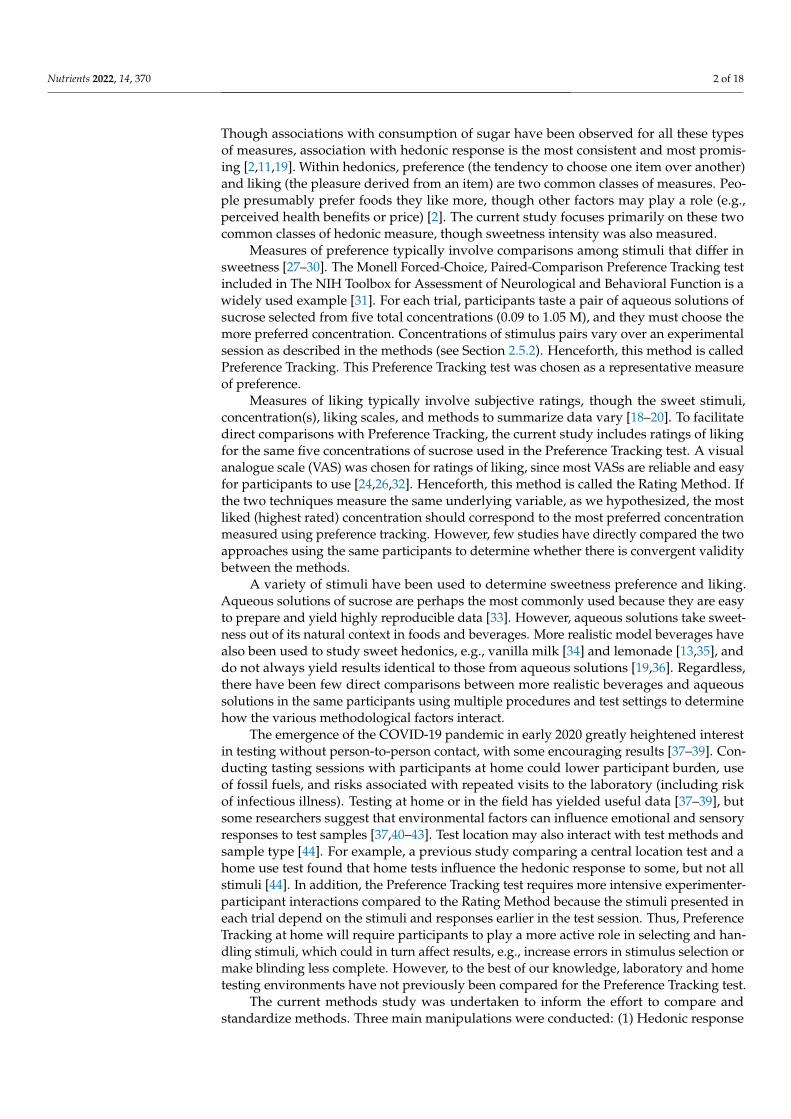
Abstract: Sweetness drives the consumption of added sugars, so understanding how to best measuresweet hedonics is important for developing strategies to lower sugar intake. However, methodsto assess hedonic response to sweetness vary, making results across studies difficult to integrate.We compared methods to measure optimal sucrose concentration in 21 healthy adults (1) usingpaired-comparison preference tracking vs. ratings of liking, (2) with participants in the laboratory vs.at home, and (3) using aqueous solutions vs. vanilla milk. Tests were replicated on separate days toassess test-retest reliability. Test-retest reliability was similar between laboratory and home testing,but tended to be better for vanilla milk and preference tracking. Optimal sucrose concentrationwas virtually identical between laboratory and home, slightly lower when estimated via preferencetracking, and about 50% lower in vanilla milk. However, optimal sucrose concentration correlatedstrongly between methods, locations, and stimuli. More than 50% of the variability in optimal sucroseconcentration could be attributed to consistent differences among individuals, while much lessvariability was attributable to differences between methods. These results demonstrate convergentvalidity between methods, support testing at home, and suggest that aqueous solutions can be usefulproxies for some commonly consumed beverages for measuring individual differences.
Keywords: sweet taste; hedonics; individual differences; methodology; sugar; remote testing; home-usage testing
1. Introduction
The appeal (hedonic response) of sweetness is a key driver of consuming foods highin added sugars [1,2]. Overconsumption of added sugars contributes to increased risk ofobesity and related chronic illnesses such as type 2 diabetes mellitus and cardiovascular dis-ease [3–5]. A number of leading health agencies have recommended a reduction in intakeof added sugars to improve public health and prevent chronic disease [6,7]. To developsuccessful treatments or policies to reduce intake of sugar, it is vital to understand individ-ual differences in sweet taste and how they interact with diet to drive consumption. Yet,research on the relationship between sweet taste, diet and health has been equivocal [8–23].Some researchers have found significant associations between perception of sweetness andintake of sugars [19], carbohydrates [9,10,20], energy from sweetened beverages [16,21],total energy intake [20], and body composition [15]. Other researchers have found noassociations [12–14,18,22,23]. Differences in outcomes may be due in part to differences inmethods and stimuli used to measure sweet perception, and several recent reviews haveidentified a need to standardize procedures [2,11,15,24–26].
Measures of sweet perception range from tests of sensitivity (e.g., minimum amountof sweetener detected or recognized as sweet) to supra-threshold intensity (sweetness ratedon various scales) and hedonic response (liking, preference, and related constructs) [18–20].
Nutrients 2022, 14, 370. https://doi.org/10.3390/nu14020370 https://www.mdpi.com/journal/nutrients
Nutrients 2022, 14, 370 2 of 18
Though associations with consumption of sugar have been observed for all these typesof measures, association with hedonic response is the most consistent and most promis-ing [2,11,19]. Within hedonics, preference (the tendency to choose one item over another)and liking (the pleasure derived from an item) are two common classes of measures. Peo-ple presumably prefer foods they like more, though other factors may play a role (e.g.,perceived health benefits or price) [2]. The current study focuses primarily on these twocommon classes of hedonic measure, though sweetness intensity was also measured.
Measures of preference typically involve comparisons among stimuli that differ insweetness [27–30]. The Monell Forced-Choice, Paired-Comparison Preference Tracking testincluded in The NIH Toolbox for Assessment of Neurological and Behavioral Function is awidely used example [31]. For each trial, participants taste a pair of aqueous solutions ofsucrose selected from five total concentrations (0.09 to 1.05 M), and they must choose themore preferred concentration. Concentrations of stimulus pairs vary over an experimentalsession as described in the methods (see Section 2.5.2). Henceforth, this method is calledPreference Tracking. This Preference Tracking test was chosen as a representative measureof preference.
Measures of liking typically involve subjective ratings, though the sweet stimuli,concentration(s), liking scales, and methods to summarize data vary [18–20]. To facilitatedirect comparisons with Preference Tracking, the current study includes ratings of likingfor the same five concentrations of sucrose used in the Preference Tracking test. A visualanalogue scale (VAS) was chosen for ratings of liking, since most VASs are reliable and easyfor participants to use [24,26,32]. Henceforth, this method is called the Rating Method. Ifthe two techniques measure the same underlying variable, as we hypothesized, the mostliked (highest rated) concentration should correspond to the most preferred concentrationmeasured using preference tracking. However, few studies have directly compared the twoapproaches using the same participants to determine whether there is convergent validitybetween the methods.
A variety of stimuli have been used to determine sweetness preference and liking.Aqueous solutions of sucrose are perhaps the most commonly used because they are easyto prepare and yield highly reproducible data [33]. However, aqueous solutions take sweet-ness out of its natural context in foods and beverages. More realistic model beverages havealso been used to study sweet hedonics, e.g., vanilla milk [34] and lemonade [13,35], anddo not always yield results identical to those from aqueous solutions [19,36]. Regardless,there have been few direct comparisons between more realistic beverages and aqueoussolutions in the same participants using multiple procedures and test settings to determinehow the various methodological factors interact.
The emergence of the COVID-19 pandemic in early 2020 greatly heightened interestin testing without person-to-person contact, with some encouraging results [37–39]. Con-ducting tasting sessions with participants at home could lower participant burden, useof fossil fuels, and risks associated with repeated visits to the laboratory (including riskof infectious illness). Testing at home or in the field has yielded useful data [37–39], butsome researchers suggest that environmental factors can influence emotional and sensoryresponses to test samples [37,40–43]. Test location may also interact with test methods andsample type [44]. For example, a previous study comparing a central location test and ahome use test found that home tests influence the hedonic response to some, but not allstimuli [44]. In addition, the Preference Tracking test requires more intensive experimenter-participant interactions compared to the Rating Method because the stimuli presented ineach trial depend on the stimuli and responses earlier in the test session. Thus, PreferenceTracking at home will require participants to play a more active role in selecting and han-dling stimuli, which could in turn affect results, e.g., increase errors in stimulus selection ormake blinding less complete. However, to the best of our knowledge, laboratory and hometesting environments have not previously been compared for the Preference Tracking test.
The current methods study was undertaken to inform the effort to compare andstandardize methods. Three main manipulations were conducted: (1) Hedonic response
Nutrients 2022, 14, 370 3 of 18
measurement Methods (paired-comparison judgments of preference vs. rated liking);(2) test locations (in the laboratory vs. at home, supervised via video conferencing); (3) twostimulus matrices (simple aqueous solution of sucrose vs. sucrose in vanilla milk). Allparticipants were tested under all conditions. This allowed us to determine if the variousmethodological factors interact, e.g., whether differences between home and laboratorytesting are general or particular to sensory methods or stimuli.
2. Materials and Methods2.1. Ethics Statement
Study procedures were reviewed by an institutional review board (IRB) at the Uni-versity of Pennsylvania (protocol # 844423) and were determined to be exempt (category6, flavor evaluation of wholesome foods/ingredients). The study was conducted in accor-dance with the guidelines of the Declaration of Helsinki, and participants provided written,informed consent prior to engaging in study procedures.
2.2. Participants
We recruited women and men between the ages of 21 and 65 years old from theGreater Philadelphia area between January and June 2021. Participants were recruitedusing flyers and from a pool of previous Monell participants who opted to be contactedagain for future studies. We included generally healthy adults free of chronic diseases.We excluded individuals with current and chronic illnesses (e.g., heart diseases, diabetes,HIV/AIDS, kidney diseases), those with a history of food allergies or sensitivities, andthose who took medication daily (except for birth control). Participants were screened via aphone interview for inclusion and exclusion criteria prior to enrollment. Informed consentwas obtained from each participant prior to all data collection.
2.3. Design
All participants were tested under all conditions. After an initial laboratory sessiondedicated to instructions and practice as described below, participants completed foursensory testing sessions. Two replicate sessions were conducted in a sensory testing facilityat the Monell Chemical Senses Center (lab), and two were conducted with participantsat home, guided via video conferencing (home). Eleven participants had alternating testsettings as follows: lab, home, lab, home. Ten participants had the alternating settingsof home, lab, home, lab. Assignment to the two orders was counter-balanced. In eachsession, participants completed both sensory tasks, i.e., Preference Tracking (i.e., paired-comparisons) and ratings (i.e., ratings of liking and intensity of sweetness). The order ofthe sensory tasks (Preference Tracking and Rating Method) was counter-balanced acrossreplicate sessions. Within each sensory task, participants tasted both stimuli (aqueous solu-tions and vanilla milk). The order of the stimuli within the sensory task was randomizedwithin sessions.
Safety measures were developed in consultation with the Monell Human SubjectsCommittee. Participants were screened for symptoms and known or suspected exposurethe night before and the day of each visit. One participant was tested at a time, with atleast 30 min between participants for aerosols to clear via the building ventilation (withUV filtration) and to disinfect the testing room. Participants wore masks while not tasting.The experimenter wore a dental gown, N-94 or N-95 mask, face shield, gloves, and haircovering. Social distancing was practiced to the extent possible. Neither experimenters norparticipants reported symptoms or positive COVID-19 tests during this study.
2.4. Stimulus Materials
Stimuli were prepared using food-grade sucrose (Fisher Chemical, crystalline/NF,catalog # S3-500) dissolved in either MilliporeTM (MilliporeSigma, Burlington, MA, USA) fil-tered, distilled, deionized water or in vanilla milk. Aqueous solutions were prepared at thefive concentrations used in the Preference Tracking test [27]: 0.09, 0.18, 0.35, 0.70, and 1.05 M.
Nutrients 2022, 14, 370 4 of 18
Vanilla milk consisted of 2% fat milk (Giant™ brand, Giant Food Stores, LLC, Carlisle, PA,USA, SKU# 688267008634), and vanilla extract (1 mL per liter; Nature’s Promise Organic,SKU# 688267156502). Milk and vanilla were purchased from a local grocery store. Milkwas stored under refrigeration and never used past use-by dates. Sucrose concentrationsin vanilla milk were 0.03, 0.12, 0.23, 0.47, and 0.70 M. These concentrations were selectedbased on pilot work to approximately match the sweetness of aqueous solutions at eachstep. Briefly, experimenters first tasted and adjusted concentrations of sucrose in vanillamilk to approximately match the sweetness of each of the five concentrations in the aqueoussolutions. A group of 20 healthy adults with minimal training (just general Labeled Magni-tude Scale(gLMS) instructions) rated the sweetness intensity of each concentration twicein blocked random order using procedures similar to those described in Section 2.5.3. Nosignificant differences in sweetness intensity were found. Solutions were prepared usingsterile glassware. Samples were presented as 10 mL aliquots in 30 mL plastic medicinecups and served cold, at approximately 4 ◦C.
For lab tests, experimenters poured samples out of participants’ sight. For home tests,participants poured 10 mL samples themselves, using graduated plastic medicine cupsprovided. Home test kits included twenty 120 mL bottles (two instances of each of the fiveconcentrations of each stimulus, sufficient for one test session). Bottles were labeled withrandom alpha-numeric codes and packed in cooler bags with ice packs for transport. Laband home sessions alternated, as described in Section 2.3, so participants received a test kitto take home at the end of lab sessions. Participants were instructed to take the kits directlyhome and refrigerate samples until the scheduled sessions. Samples were used within 5 days.
2.5. Procedures2.5.1. Training
The training session was dedicated to measurement of participant height/weight, col-lection of demographic information, and task instructions. Participants received standardinstructions on the use of the gLMS for measuring sweetness intensity, then practiced byrating the intensities of real and imagined sensations [45]. The gLMS is a vertical scale withintensity descriptors as follows: “barely detectable”, “weak”, “moderate”, “strong”, “verystrong” and “strongest imaginable sensation of any kind”, with the spacing of the descrip-tors on the scale determined empirically to be proportional to strength of sensation [42].Next, participants were instructed in the use of a 100-point visual analogue scale (VAS)for rated liking (horizontal scale, anchored with “dislike extremely” on the left and “likeextremely” on the right) [31]. Participants practiced by rating liking for remembered orimagined sensations.
2.5.2. Preference Tracking
Procedures for the Monell Forced-Choice, Paired-Comparison Tracking Procedurehave been published elsewhere [27]. Participants completed the Preference Trackingprocedure for each stimulus during each session, with breaks of 5 min between PreferenceTracking runs for the two stimuli. Participants began each session by rinsing the mouthfour times with distilled water (Good & GatherTM, Target Brands, Inc, Minneapolis, MN,USA, SKU#: 085239047675). For each trial, participants tasted pairs of 10 mL samplesof liquid presented in 30 mL plastic medicine cups, with a 1 min break between pairs.Participants then chose which stimulus they preferred. The first pair of samples werethe from the middle of the range (0.18 M vs. 0.70 M for the aqueous solutions). Eachsubsequent pair contained the participant’s preceding preferred concentration paired withan adjacent stimulus concentration. This pattern continued until the participant chose twoconsecutive times either the same concentration of sucrose paired with both a higher andlower concentration or the highest (1.05 M) or lowest (0.09 M) concentration. The entiretask was repeated after a 5 min break, with the stimulus pairs presented in reverse order.The procedure was repeated twice within a session, and the geometric mean of the twotrials was defined as the most preferred concentration.
Nutrients 2022, 14, 370 5 of 18
2.5.3. Ratings of Sweetness and Liking
Participants sampled by taking the entire contents of the cup into the mouth, moving theliquid around in the mouth for several seconds, then rating liking and sweetness intensity inthat order [24,45]. Stimulus presentation and tasting followed the procedures in Section 2.5.2.Next, participants expectorated the sample and rinsed with water at least twice to begin a1 min pause before the next sample. Each sensory test session included 20 trials, separatedinto two blocks of 10 (all five concentrations for a given stimulus in random order, thenagain in random order). A 5 min break separated blocks for the two stimuli.
2.6. Data Analysis2.6.1. Sensory Endpoints
The measures of main interest included optimal sucrose concentration estimated viaPreference Tracking (most preferred) and optimal sucrose concentration estimated via theRating Method (most liked) at different locations (lab vs. home) in two stimulus matrices(aqueous solution vs. vanilla milk). Methods for calculating most preferred concentrationhave been described previously [27]. Most liked was defined as the concentration associatedwith the maximum (among presented concentrations) in rated liking. To find maxima, ratedliking was plotted against the cube root of sucrose concentration (to space concentrationsapproximately equal distances apart). Functions of liking vs. transformed concentrationwere fitted using stepwise regression (lowest BIC criterion), up to a cubic polynomial. Ifthe resulting model was intercept only (flat), the most liked concentration was definedas the geometric mean of the two concentrations associated with the highest ratings (seeSupplementary Material Table S1 for fit parameters). These parametric estimates of mostliked concentration correlated strongly (r = 0.86 for aqueous solutions, r = 0.94 for vanillamilk) with the concentration associated with the highest rating of liking; because the twomethods for estimating most liked concentration supported the same conclusions, onlyvalues from model fits are reported.
Most preferred and most liked concentrations were both positively skewed. Thebest common Box-Cox power transformation (λ = 0.22) was used for both PreferenceTracking and the Rating Method prior to inferential analysis. Mean values of optimalsucrose concentration, defined as the most preferred or the most liked concentrations fromPreference Tracking or the Rating Method, were back-transformed and reported in theoriginal units (molar concentration of sucrose). Rated sweetness intensity (gLMS) wasof secondary interest. Ratings made using the gLMS were also positively skewed. Theoptimal Box-Cox power transform (λ = 0.47) was used for inferential analysis for sweetintensity. Mean values were back-transformed and reported in units ranging from 0 (“nosensation”) to 100 (“strongest imaginable sensation of any kind”).
2.6.2. Statistics
Test-retest reliability between replicate sessions was evaluated using Pearson’s correla-tion coefficients (r). To examine differences in test-retest reliability between locations (labvs. home), stimuli (aqueous solution vs. vanilla milk), and methods (Preference Trackingvs. the Rating Method) for estimating optimal sucrose concentration, we tested pairs ofpartial correlation coefficients using the Fisher r-to-z transformation. For example, to assesswhether optimal concentration is more reliable in the laboratory than at home, the partialcorrelation (across participants, adjusting for stimulus and method) between session 1and session 2 in the laboratory was compared to the corresponding partial correlationbetween session 1 and session 2 at home. Partial correlations were tested in the same wayfor method and stimulus. Repeated measures analysis of variance (ANOVA) was usedto assess the effects of experimental conditions on average values of sensory measures.ANOVA models included main effects and all second-order interactions. Overall variancein optimal concentration was decomposed using a linear mixed model with all effectsrandom (to estimate variances). The main effects were method, stimulus, location, andparticipant. All second-order interactions were also included. The residual terms contained
Nutrients 2022, 14, 370 6 of 18
within subjects variability, unexplained variability (not due to included terms, such ashigher order interactions or unmeasured independent variables), and model error. Analy-ses were conducted using the lme4 package [46] in R (version 3.6.2., R Development CoreTeam, 2021) and Microsoft Excel (Version 16.52, Redmond, WA, Microsoft Corporation). Allresults, unless otherwise indicated, were reported in mean ± standard deviation or (95%confidence interval).
3. Results3.1. Participant Characteristics
Twenty-one healthy adults between the ages of 21 and 49 (33.1 ± 10.0 years) partici-pated. Eleven self-identified as female, and the rest self-identified as male. Self-identifiedracial demographics were as follows: 16 Caucasian; 3 African-American/Black; 1 Asian;1 multi-racial. Average body mass index (BMI) was 29.6 ± 7.8 kg/m2. Four participantswere normal weight (BMI < 25 kg/m2); ten were overweight (BMI between 25 to 30 kg/m2),and seven were obese (BMI ≥ 30 kg/m2).
3.2. Hedonic Measures3.2.1. Test-Retest Reliability
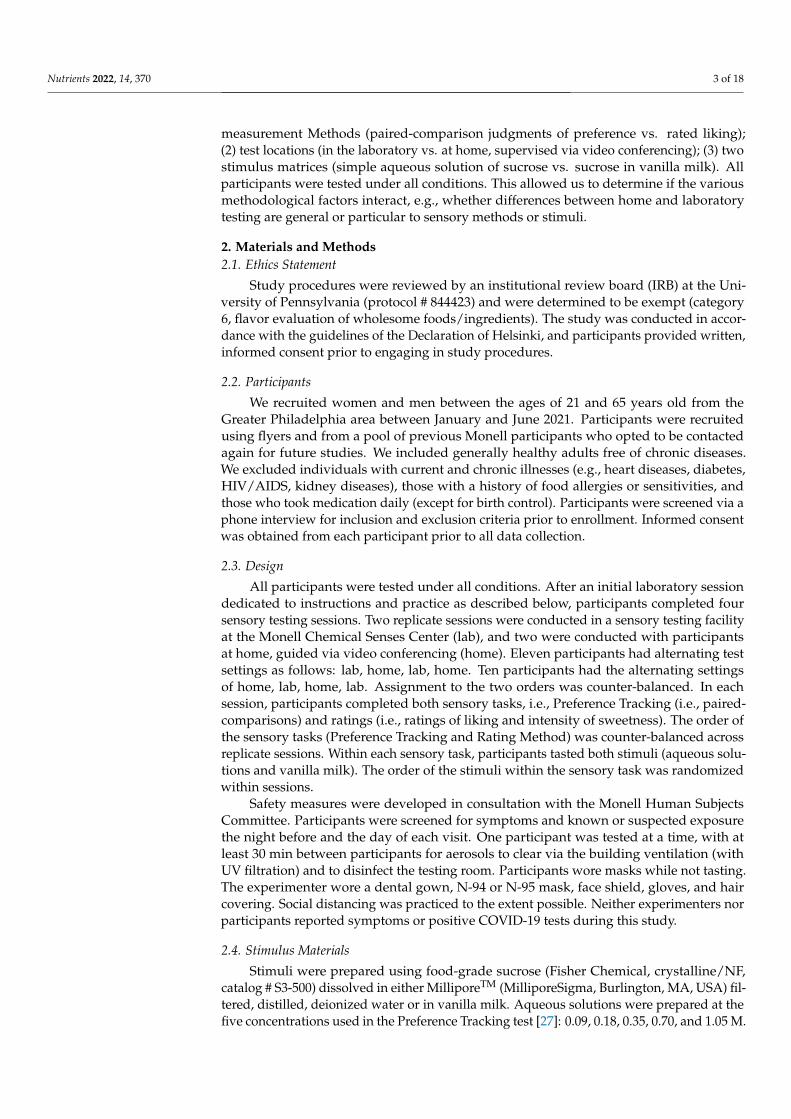
Test-retest reliabilities were assessed to determine the stability of hedonic responsemeasures across replicate sessions within subjects. For rated liking, averaged across concen-trations, test-retest reliability coefficients were r = 0.66 ± 0.13 and 0.64 ± 0.11 for aqueoussolutions tested in lab and at home, respectively. Average test-retest reliability coefficientswere r = 0.67 ± 0.16 and 0.72 ± 0.11 for vanilla milk tested in lab and at home, respec-tively. Test-retest reliability for optimal concentrations derived from Preference Tracking(most preferred) and ratings of liking (most liked, as described in Section 2.5.3) were ofcomparable strength (Table 1), though test-retest reliability was lower for the most likedconcentration in aqueous solutions.
Table 1. Test-retest reliabilities over two sessions (Pearson’s r) for ratings of liking and hedonicallyoptimal sucrose concentration.
Aqueous Solution Lab Home
0.09 M 0.82 0.790.18 M 0.76 0.570.35 M 0.52 0.580.70 M 0.54 0.541.05 M 0.64 0.71Pref a 0.71 0.73
Liked b 0.60 0.42
Vanilla Milk Lab Home
0.03 M 0.88 0.750.12 M 0.47 0.540.23 M 0.64 0.700.47 M 0.79 0.790.70 M 0.65 0.81Pref a 0.79 0.86
Liked b 0.72 0.79a Most preferred, preference tracking; b Most liked, rating method.
Differences in test-retest reliability between test locations were not statistically signifi-cant (p = 0.72). Reliability for vanilla milk was significantly greater than for the aqueoussolutions (p = 0.02). Preference Tracking tended to be more reliable than the Rating Method,though this difference was statistically marginal (p = 0.06).
Nutrients 2022, 14, 370 7 of 18
3.2.2. Mean Values of Optimal Concentration
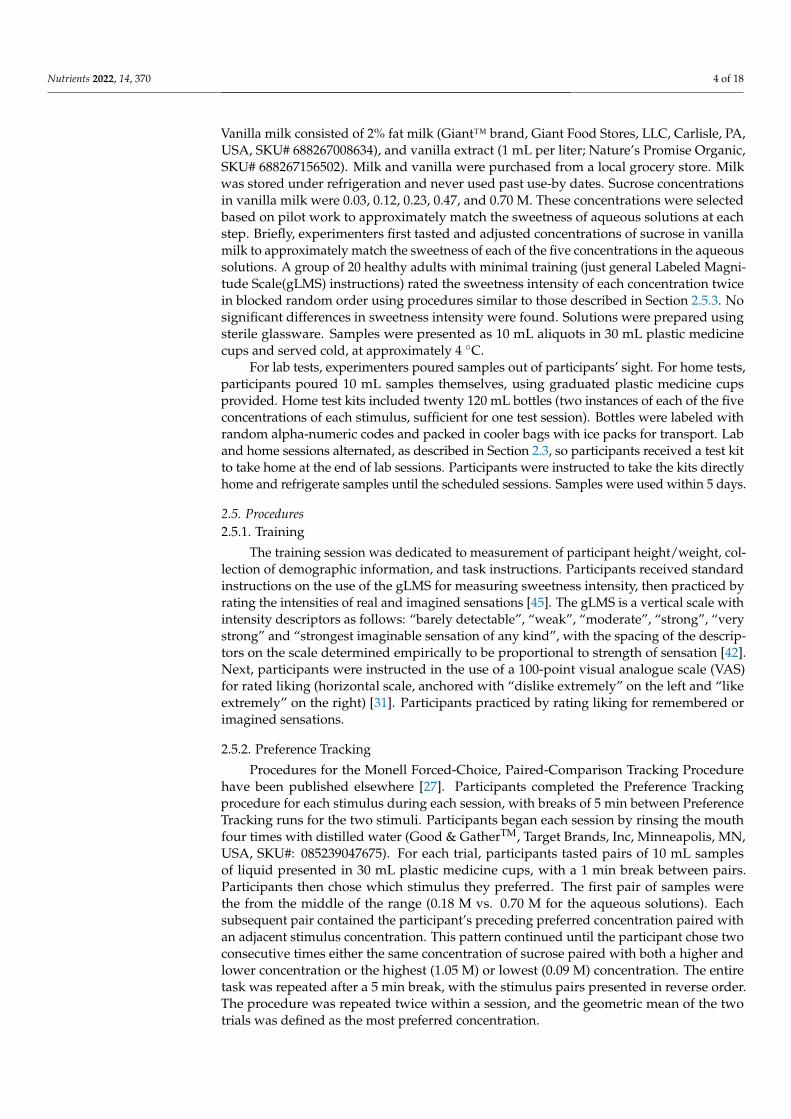
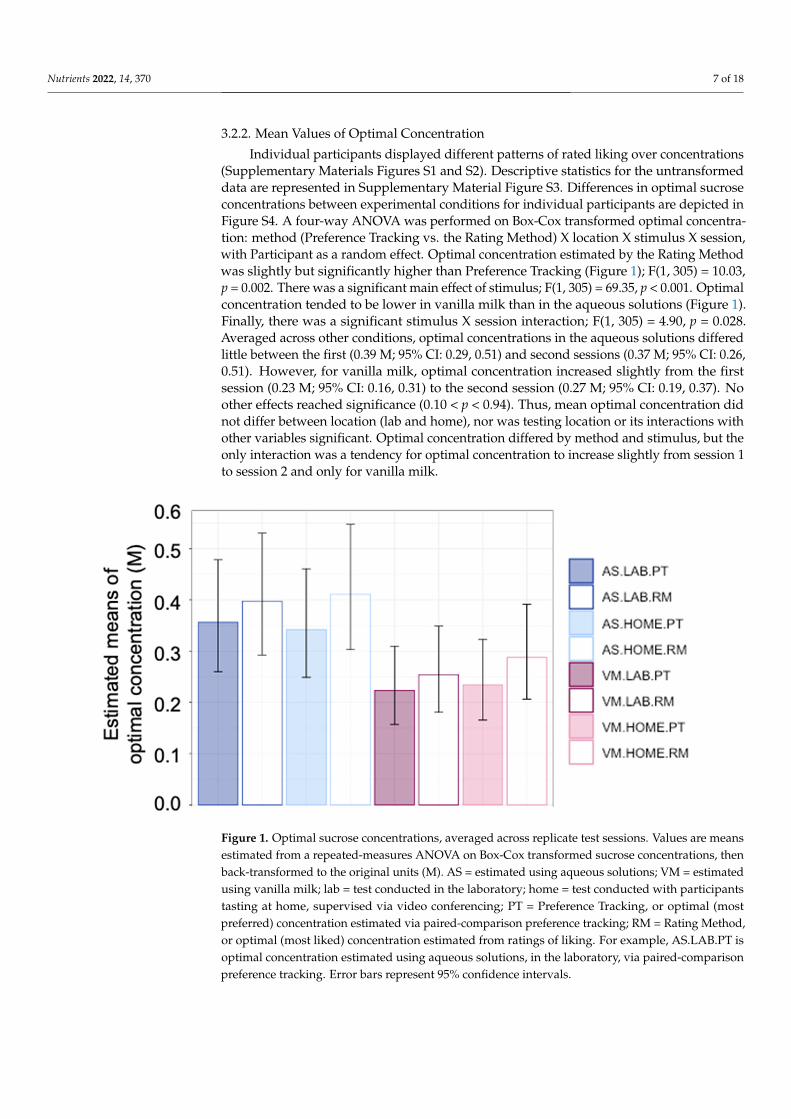
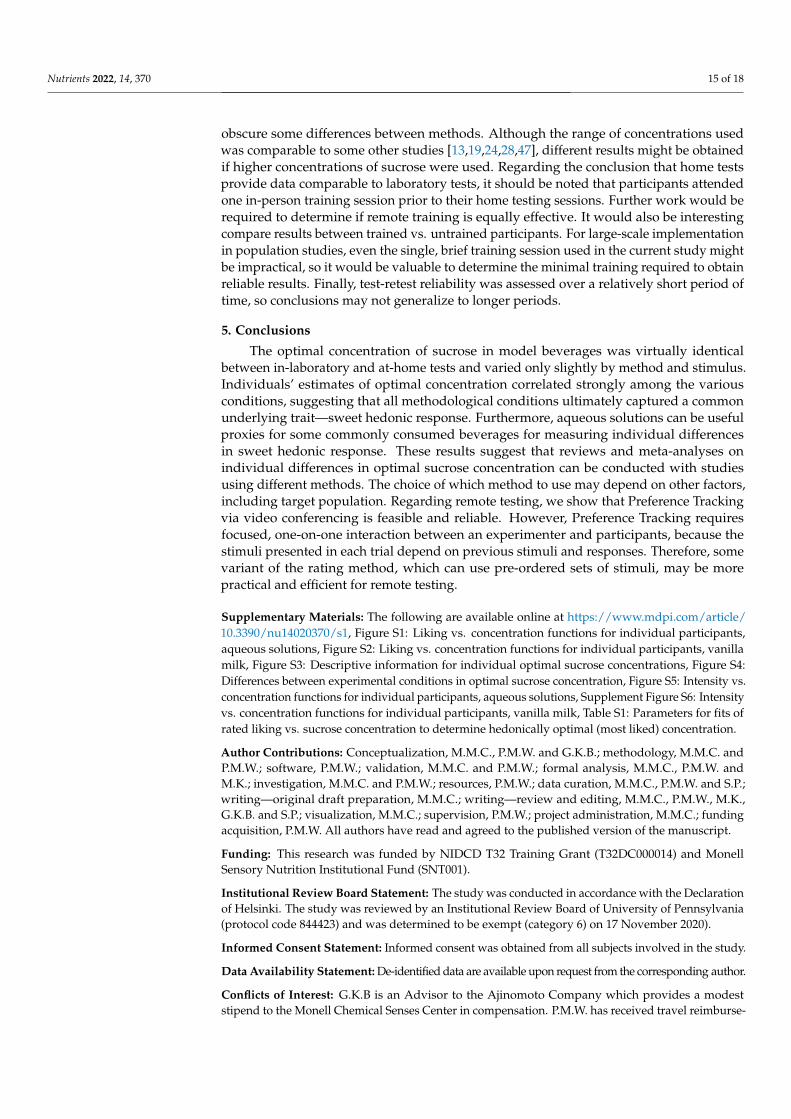
Individual participants displayed different patterns of rated liking over concentrations(Supplementary Materials Figures S1 and S2). Descriptive statistics for the untransformeddata are represented in Supplementary Material Figure S3. Differences in optimal sucroseconcentrations between experimental conditions for individual participants are depicted inFigure S4. A four-way ANOVA was performed on Box-Cox transformed optimal concentra-tion: method (Preference Tracking vs. the Rating Method) X location X stimulus X session,with Participant as a random effect. Optimal concentration estimated by the Rating Methodwas slightly but significantly higher than Preference Tracking (Figure 1); F(1, 305) = 10.03,p = 0.002. There was a significant main effect of stimulus; F(1, 305) = 69.35, p < 0.001. Optimalconcentration tended to be lower in vanilla milk than in the aqueous solutions (Figure 1).Finally, there was a significant stimulus X session interaction; F(1, 305) = 4.90, p = 0.028.Averaged across other conditions, optimal concentrations in the aqueous solutions differedlittle between the first (0.39 M; 95% CI: 0.29, 0.51) and second sessions (0.37 M; 95% CI: 0.26,0.51). However, for vanilla milk, optimal concentration increased slightly from the firstsession (0.23 M; 95% CI: 0.16, 0.31) to the second session (0.27 M; 95% CI: 0.19, 0.37). Noother effects reached significance (0.10 < p < 0.94). Thus, mean optimal concentration didnot differ between location (lab and home), nor was testing location or its interactions withother variables significant. Optimal concentration differed by method and stimulus, but theonly interaction was a tendency for optimal concentration to increase slightly from session 1to session 2 and only for vanilla milk.
Nutrients 2022, 14, x FOR PEER REVIEW 7 of 19
0.47 M 0.79 0.79 0.70 M 0.65 0.81 Pref a 0.79 0.86
Liked b 0.72 0.79 a Most preferred, preference tracking; b Most liked, rating method.
Differences in test-retest reliability between test locations were not statistically sig-nificant (p = 0.72). Reliability for vanilla milk was significantly greater than for the aqueous solutions (p = 0.02). Preference Tracking tended to be more reliable than the Rating Method, though this difference was statistically marginal (p = 0.06).
3.2.2. Mean Values of Optimal Concentration Individual participants displayed different patterns of rated liking over concentra-
tions (Supplementary Materials Figures S1 and S2). Descriptive statistics for the untrans-formed data are represented in Supplementary Material Figure S3. Differences in optimal sucrose concentrations between experimental conditions for individual participants are depicted in Figure S4. A four-way ANOVA was performed on Box-Cox transformed op-timal concentration: method (Preference Tracking vs. the Rating Method) X location X stimulus X session, with Participant as a random effect. Optimal concentration estimated by the Rating Method was slightly but significantly higher than Preference Tracking (Fig-ure 1); F(1, 305) = 10.03, p = 0.002. There was a significant main effect of stimulus; F(1, 305) = 69.35, p < 0.001. Optimal concentration tended to be lower in vanilla milk than in the aqueous solutions (Figure 1). Finally, there was a significant stimulus X session interac-tion; F(1, 305) = 4.90, p = 0.028. Averaged across other conditions, optimal concentrations in the aqueous solutions differed little between the first (0.39 M; 95% CI: 0.29, 0.51) and second sessions (0.37 M; 95% CI: 0.26, 0.51). However, for vanilla milk, optimal concentra-tion increased slightly from the first session (0.23 M; 95% CI: 0.16, 0.31) to the second ses-sion (0.27 M; 95% CI: 0.19, 0.37). No other effects reached significance (0.10 < p < 0.94). Thus, mean optimal concentration did not differ between location (lab and home), nor was testing location or its interactions with other variables significant. Optimal concen-tration differed by method and stimulus, but the only interaction was a tendency for op-timal concentration to increase slightly from session 1 to session 2 and only for vanilla milk.
Figure 1. Optimal sucrose concentrations, averaged across replicate test sessions. Values are meansestimated from a repeated-measures ANOVA on Box-Cox transformed sucrose concentrations, thenback-transformed to the original units (M). AS = estimated using aqueous solutions; VM = estimatedusing vanilla milk; lab = test conducted in the laboratory; home = test conducted with participantstasting at home, supervised via video conferencing; PT = Preference Tracking, or optimal (mostpreferred) concentration estimated via paired-comparison preference tracking; RM = Rating Method,or optimal (most liked) concentration estimated from ratings of liking. For example, AS.LAB.PT isoptimal concentration estimated using aqueous solutions, in the laboratory, via paired-comparisonpreference tracking. Error bars represent 95% confidence intervals.
Nutrients 2022, 14, 370 8 of 18
3.2.3. Correlations between Conditions across Individuals
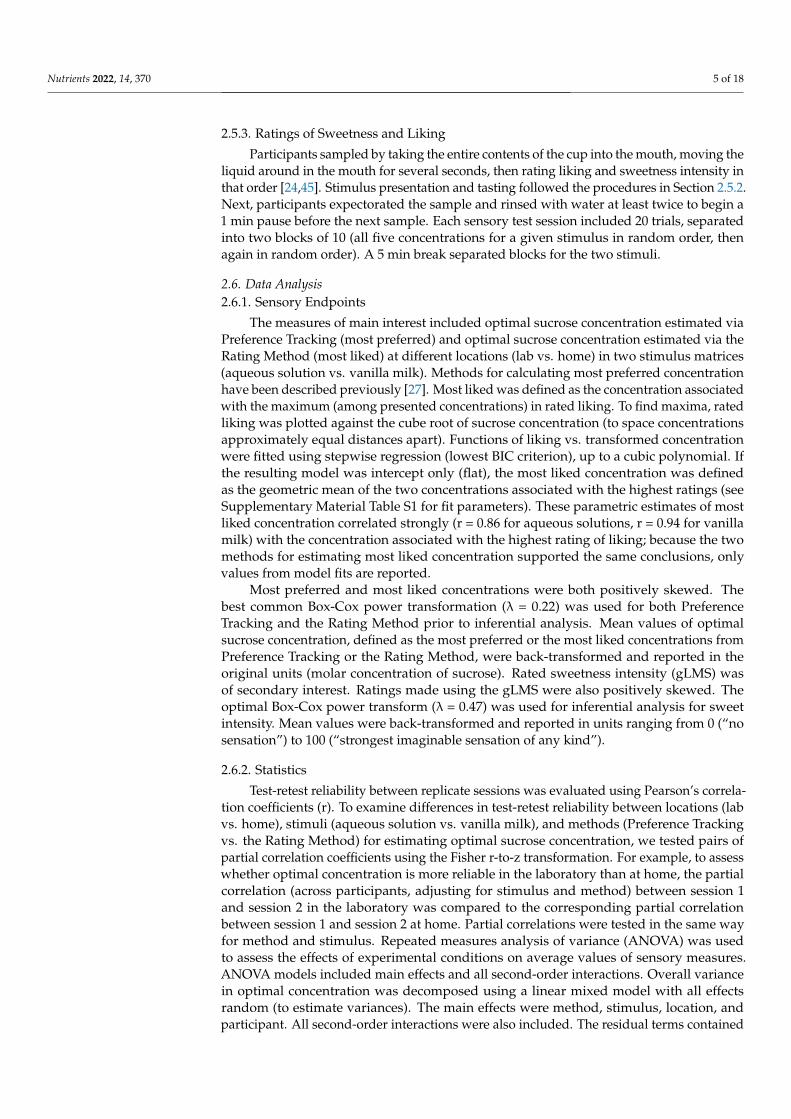
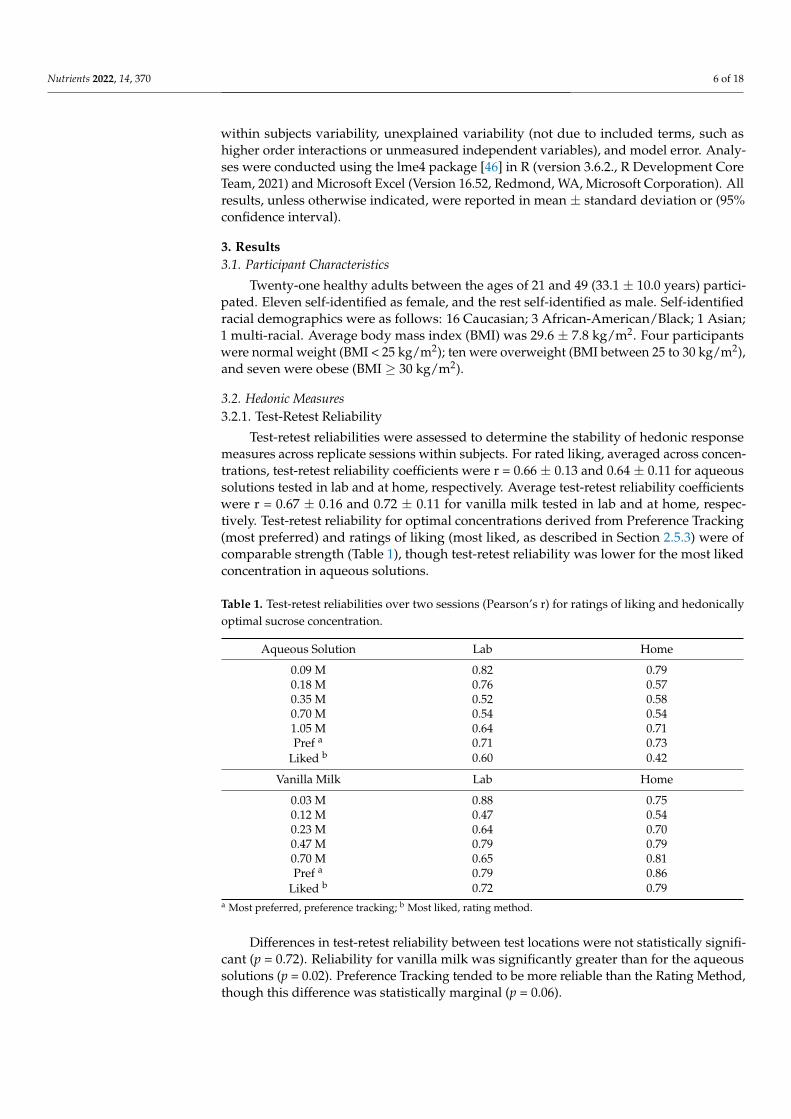
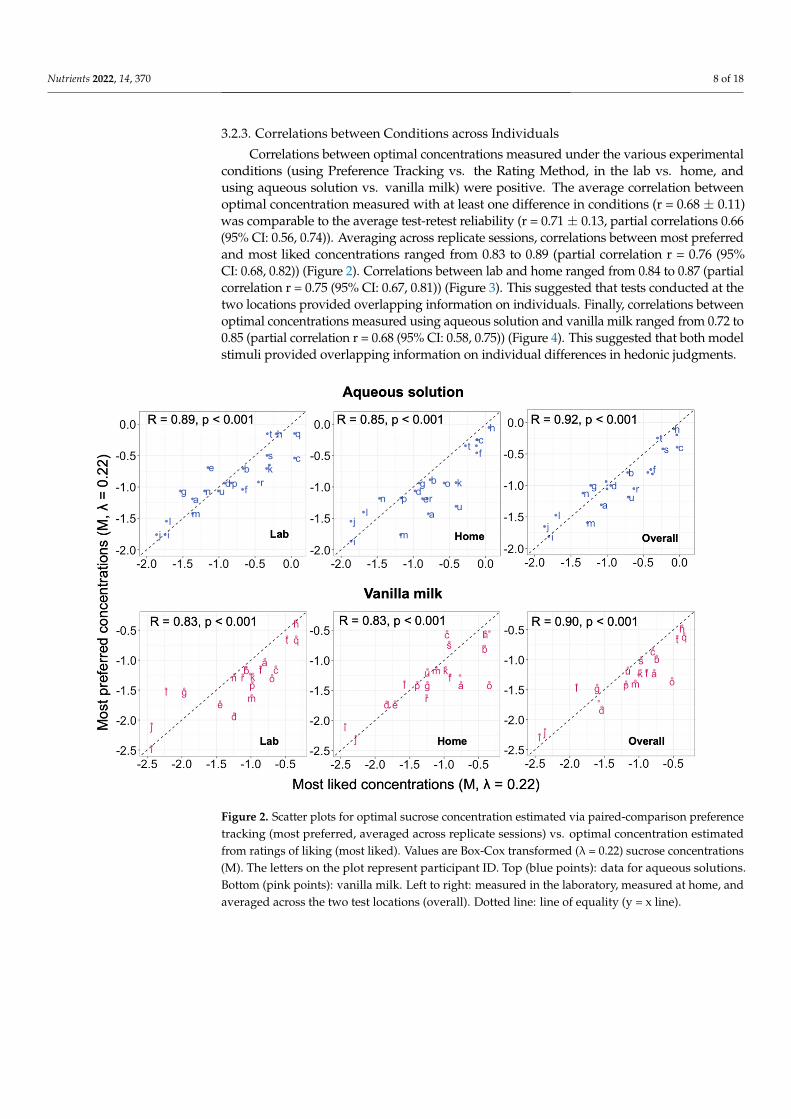
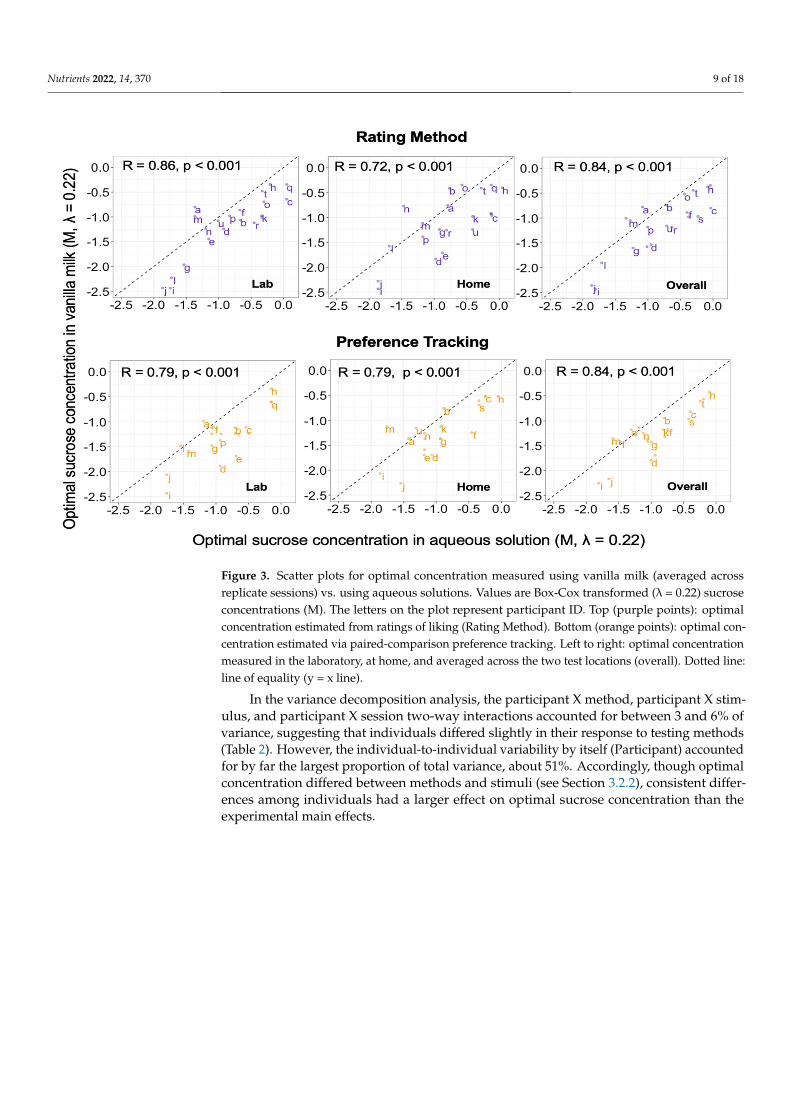
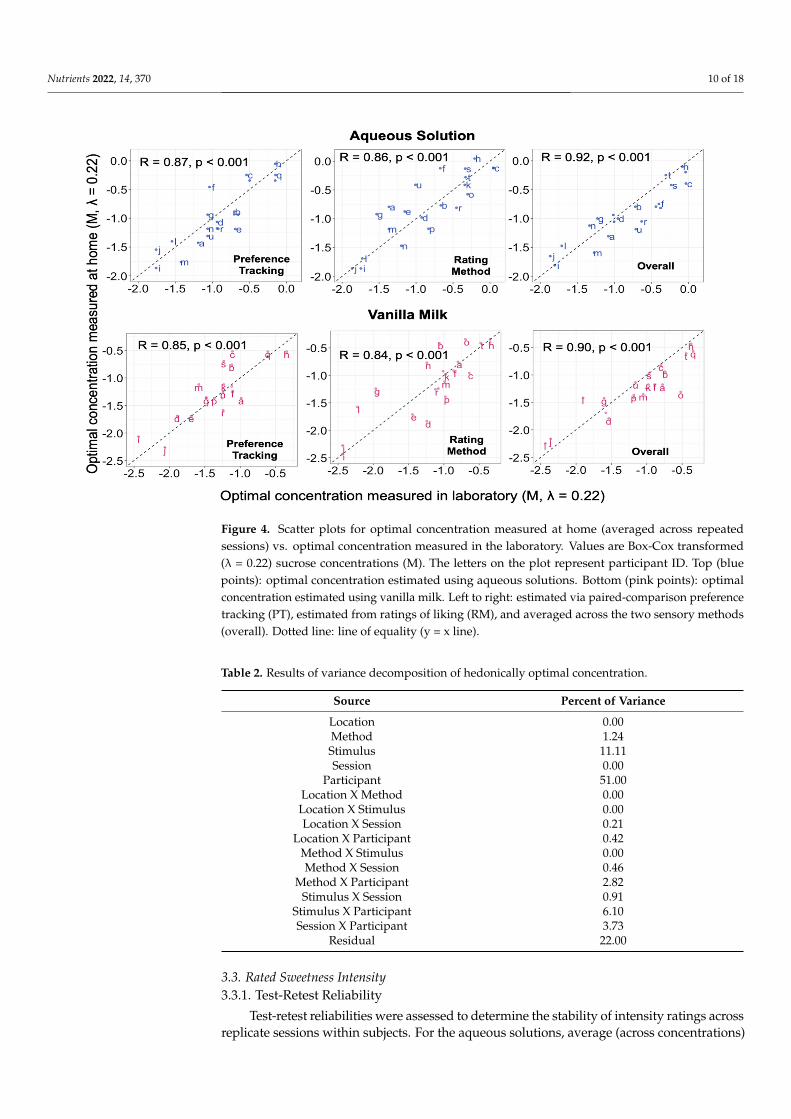
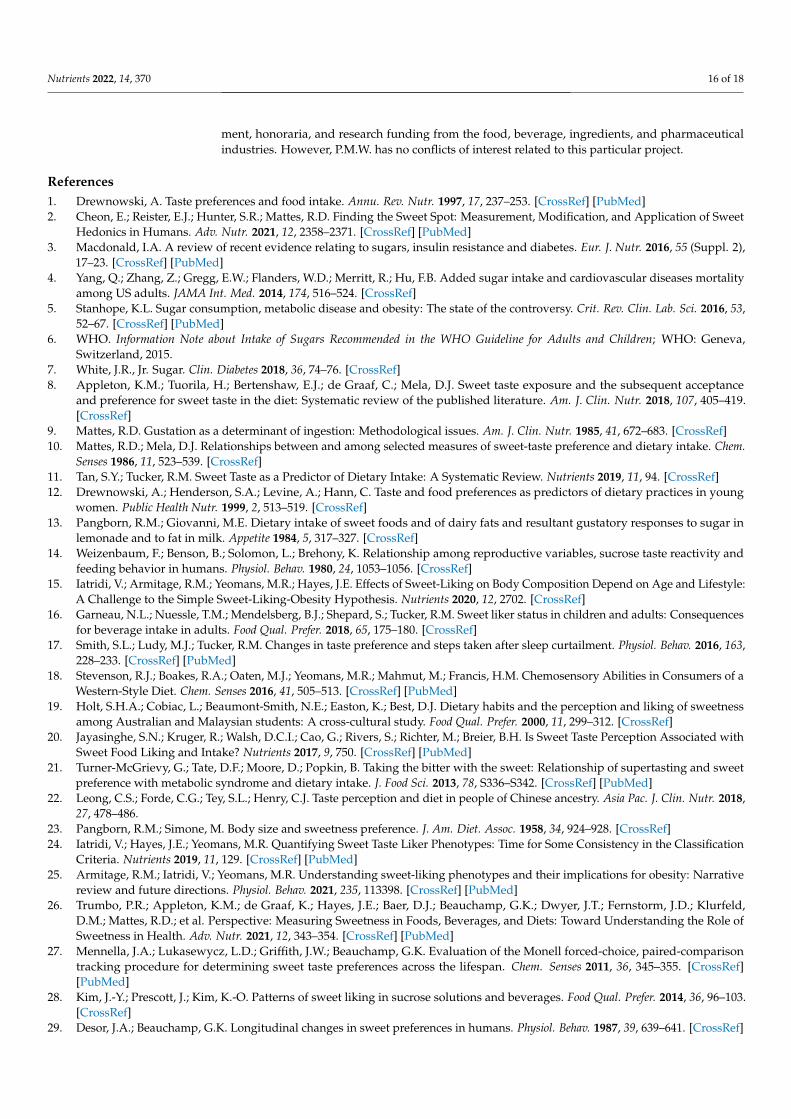
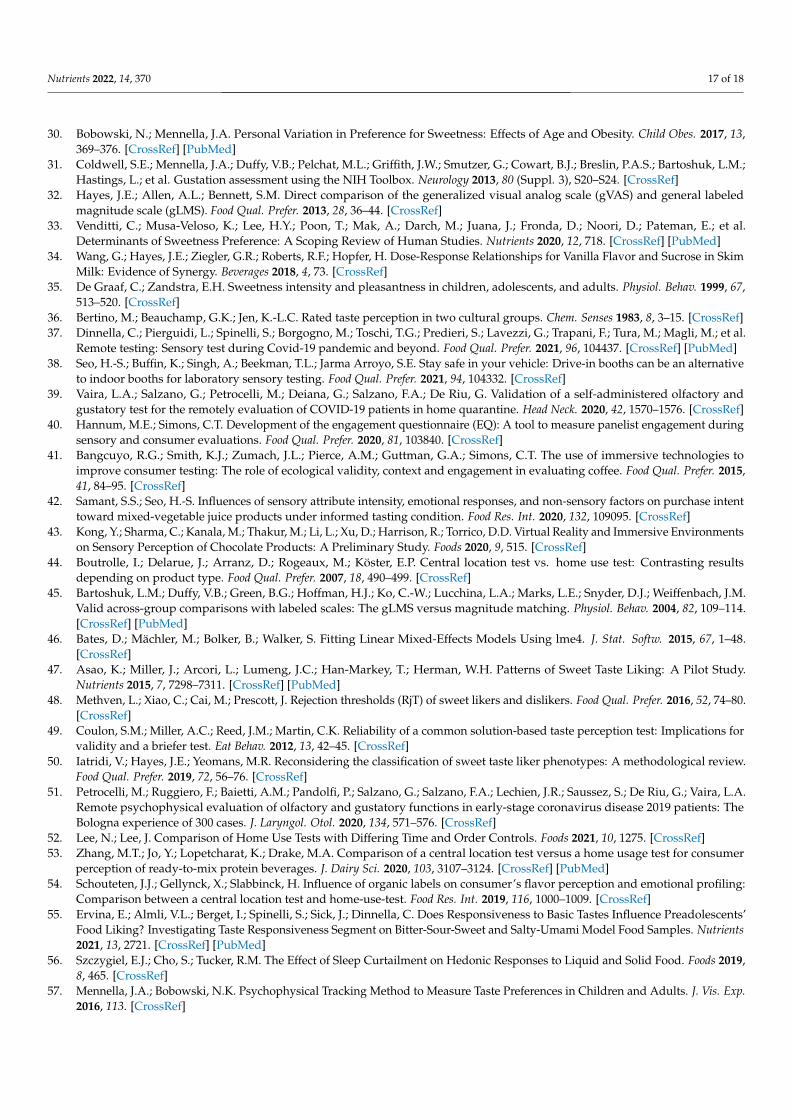
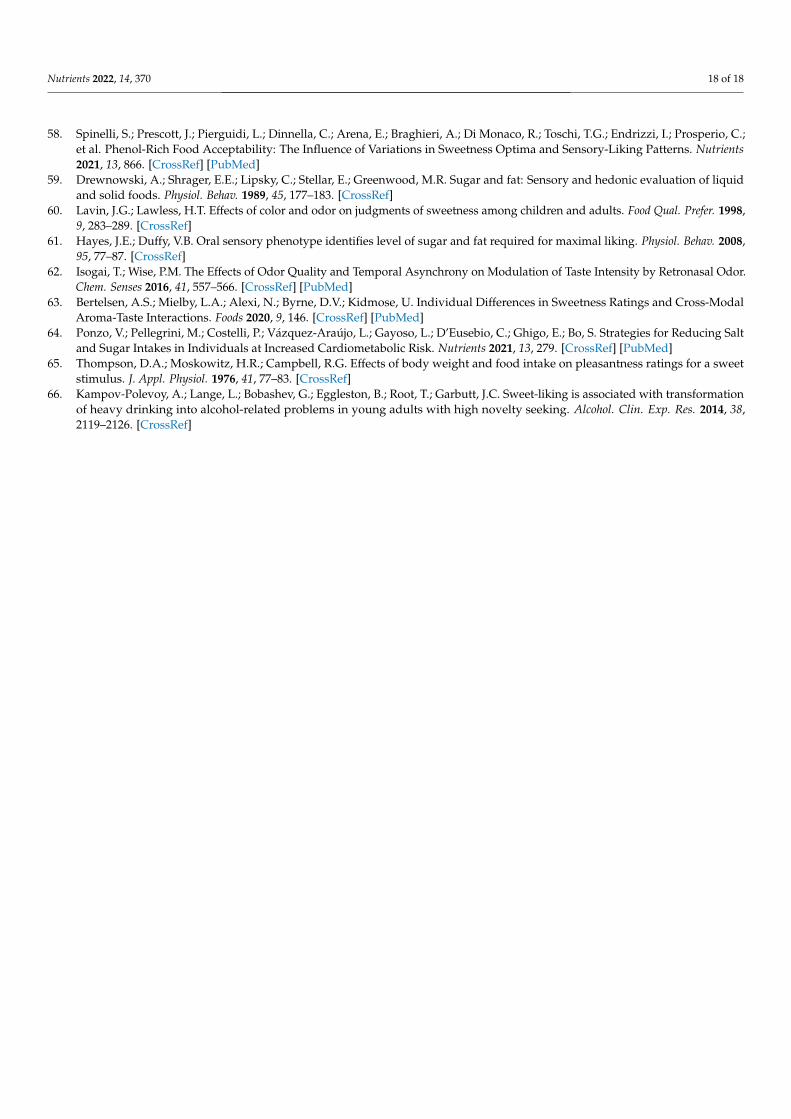
Correlations between optimal concentrations measured under the various experimentalconditions (using Preference Tracking vs. the Rating Method, in the lab vs. home, andusing aqueous solution vs. vanilla milk) were positive. The average correlation betweenoptimal concentration measured with at least one difference in conditions (r = 0.68 ± 0.11)was comparable to the average test-retest reliability (r = 0.71 ± 0.13, partial correlations 0.66(95% CI: 0.56, 0.74)). Averaging across replicate sessions, correlations between most preferredand most liked concentrations ranged from 0.83 to 0.89 (partial correlation r = 0.76 (95%CI: 0.68, 0.82)) (Figure 2). Correlations between lab and home ranged from 0.84 to 0.87 (partialcorrelation r = 0.75 (95% CI: 0.67, 0.81)) (Figure 3). This suggested that tests conducted at thetwo locations provided overlapping information on individuals. Finally, correlations betweenoptimal concentrations measured using aqueous solution and vanilla milk ranged from 0.72 to0.85 (partial correlation r = 0.68 (95% CI: 0.58, 0.75)) (Figure 4). This suggested that both modelstimuli provided overlapping information on individual differences in hedonic judgments.
Nutrients 2022, 14, x FOR PEER REVIEW 8 of 19
Figure 1. Optimal sucrose concentrations, averaged across replicate test sessions. Values are means estimated from a repeated-measures ANOVA on Box-Cox transformed sucrose concentra-tions, then back-transformed to the original units (M). AS = estimated using aqueous solutions; VM = estimated using vanilla milk; lab = test conducted in the laboratory; home = test conducted with participants tasting at home, supervised via video conferencing; PT = Preference Tracking, or optimal (most preferred) concentration estimated via paired-comparison preference tracking; RM = Rating Method, or optimal (most liked) concentration estimated from ratings of liking. For exam-ple, AS.LAB.PT is optimal concentration estimated using aqueous solutions, in the laboratory, via paired-comparison preference tracking. Error bars represent 95% confidence intervals.
3.2.3. Correlations between Conditions across Individuals Correlations between optimal concentrations measured under the various experi-
mental conditions (using Preference Tracking vs. the Rating Method, in the lab vs. home, and using aqueous solution vs. vanilla milk) were positive. The average correlation be-tween optimal concentration measured with at least one difference in conditions (r = 0.68 ± 0.11) was comparable to the average test-retest reliability (r = 0.71 ± 0.13, partial correla-tions 0.66 (95% CI: 0.56, 0.74)). Averaging across replicate sessions, correlations between most preferred and most liked concentrations ranged from 0.83 to 0.89 (partial correlation r = 0.76 (95% CI: 0.68, 0.82)) (Figure 2). Correlations between lab and home ranged from 0.84 to 0.87 (partial correlation r = 0.75 (95% CI: 0.67, 0.81)) (Figure 3). This suggested that tests conducted at the two locations provided overlapping information on individuals. Finally, correlations between optimal concentrations measured using aqueous solution and vanilla milk ranged from 0.72 to 0.85 (partial correlation r = 0.68 (95% CI: 0.58, 0.75)) (Figure 4). This suggested that both model stimuli provided overlapping information on individual differences in hedonic judgments.
Figure 2. Scatter plots for optimal sucrose concentration estimated via paired-comparison prefer-ence tracking (most preferred, averaged across replicate sessions) vs. optimal concentration esti-mated from ratings of liking (most liked). Values are Box-Cox transformed (λ = 0.22) sucrose con-
Figure 2. Scatter plots for optimal sucrose concentration estimated via paired-comparison preferencetracking (most preferred, averaged across replicate sessions) vs. optimal concentration estimatedfrom ratings of liking (most liked). Values are Box-Cox transformed (λ = 0.22) sucrose concentrations(M). The letters on the plot represent participant ID. Top (blue points): data for aqueous solutions.Bottom (pink points): vanilla milk. Left to right: measured in the laboratory, measured at home, andaveraged across the two test locations (overall). Dotted line: line of equality (y = x line).
Nutrients 2022, 14, 370 9 of 18
Nutrients 2022, 14, x FOR PEER REVIEW 9 of 19
centrations (M). The letters on the plot represent participant ID. Top (blue points): data for aque-ous solutions. Bottom (pink points): vanilla milk. Left to right: measured in the laboratory, meas-ured at home, and averaged across the two test locations (overall). Dotted line: line of equality (y = x line).
Figure 3. Scatter plots for optimal concentration measured using vanilla milk (averaged across replicate sessions) vs. using aqueous solutions. Values are Box-Cox transformed (λ = 0.22) sucrose concentrations (M). The letters on the plot represent participant ID. Top (purple points): optimal concentration estimated from ratings of liking (Rating Method). Bottom (orange points): optimal concentration estimated via paired-comparison preference tracking. Left to right: optimal concen-tration measured in the laboratory, at home, and averaged across the two test locations (overall). Dotted line: line of equality (y = x line).
Figure 3. Scatter plots for optimal concentration measured using vanilla milk (averaged acrossreplicate sessions) vs. using aqueous solutions. Values are Box-Cox transformed (λ = 0.22) sucroseconcentrations (M). The letters on the plot represent participant ID. Top (purple points): optimalconcentration estimated from ratings of liking (Rating Method). Bottom (orange points): optimal con-centration estimated via paired-comparison preference tracking. Left to right: optimal concentrationmeasured in the laboratory, at home, and averaged across the two test locations (overall). Dotted line:line of equality (y = x line).
In the variance decomposition analysis, the participant X method, participant X stim-ulus, and participant X session two-way interactions accounted for between 3 and 6% ofvariance, suggesting that individuals differed slightly in their response to testing methods(Table 2). However, the individual-to-individual variability by itself (Participant) accountedfor by far the largest proportion of total variance, about 51%. Accordingly, though optimalconcentration differed between methods and stimuli (see Section 3.2.2), consistent differ-ences among individuals had a larger effect on optimal sucrose concentration than theexperimental main effects.
Nutrients 2022, 14, 370 10 of 18Nutrients 2022, 14, x FOR PEER REVIEW 10 of 19
Figure 4. Scatter plots for optimal concentration measured at home (averaged across repeated ses-sions) vs. optimal concentration measured in the laboratory. Values are Box-Cox transformed (λ = 0.22) sucrose concentrations (M). The letters on the plot represent participant ID. Top (blue points): optimal concentration estimated using aqueous solutions. Bottom (pink points): optimal concen-tration estimated using vanilla milk. Left to right: estimated via paired-comparison preference tracking (PT), estimated from ratings of liking (RM), and averaged across the two sensory meth-ods (overall). Dotted line: line of equality (y = x line).
In the variance decomposition analysis, the participant X method, participant X stim-ulus, and participant X session two-way interactions accounted for between 3 and 6% of variance, suggesting that individuals differed slightly in their response to testing methods (Table 2). However, the individual-to-individual variability by itself (Participant) ac-counted for by far the largest proportion of total variance, about 51%. Accordingly, though optimal concentration differed between methods and stimuli (see Section 3.2.2), consistent differences among individuals had a larger effect on optimal sucrose concentration than the experimental main effects.
Table 2. Results of variance decomposition of hedonically optimal concentration.
Source Percent of Variance Location 0.00 Method 1.24 Stimulus 11.11 Session 0.00
Participant 51.00 Location X Method 0.00 Location X Stimulus 0.00 Location X Session 0.21
Location X Participant 0.42 Method X Stimulus 0.00 Method X Session 0.46
Figure 4. Scatter plots for optimal concentration measured at home (averaged across repeatedsessions) vs. optimal concentration measured in the laboratory. Values are Box-Cox transformed(λ = 0.22) sucrose concentrations (M). The letters on the plot represent participant ID. Top (bluepoints): optimal concentration estimated using aqueous solutions. Bottom (pink points): optimalconcentration estimated using vanilla milk. Left to right: estimated via paired-comparison preferencetracking (PT), estimated from ratings of liking (RM), and averaged across the two sensory methods(overall). Dotted line: line of equality (y = x line).
Table 2. Results of variance decomposition of hedonically optimal concentration.
Source Percent of Variance
Location 0.00Method 1.24Stimulus 11.11Session 0.00
Participant 51.00Location X Method 0.00Location X Stimulus 0.00Location X Session 0.21
Location X Participant 0.42Method X Stimulus 0.00Method X Session 0.46
Method X Participant 2.82Stimulus X Session 0.91
Stimulus X Participant 6.10Session X Participant 3.73
Residual 22.00
3.3. Rated Sweetness Intensity3.3.1. Test-Retest Reliability
Test-retest reliabilities were assessed to determine the stability of intensity ratings acrossreplicate sessions within subjects. For the aqueous solutions, average (across concentrations)
Nutrients 2022, 14, 370 11 of 18
test-retest reliability coefficients were similar between test locations (lab r = 0.65 ± 0.08;home r = 0.64 ± 0.14). For vanilla milk, average test-retest reliability was also comparablebetween locations (lab r = 0.50 ± 0.30; home r = 0.56 ± 0.16). A four-way, repeated measuresANOVA was performed on transformed ratings: location X stimulus X Sweetness Level (thefive concentrations per stimulus) X session, with Participant as a random effect. There was asignificant main effect of session; F(1, 1637) = 11.53, p < 0.001. Ratings were lower overallin session 1 (19.29; 95% CI = 16.35, 22.36) than in session 2 (19.76; 95% CI 16.94, 22.83). Asignificant location X session interaction; F(1, 1637) = 6.27, p < 0.02, reflected a differencebetween sessions in the laboratory: Ratings were slightly lower in session 1 (18.75; 95%CI = 15.53, 22.29) than in session 2 (20.13; 95% CI 17.11, 23.42). There were no differencesbetween session 1 (19.53; 95% CI = 16.24, 23.14) and session 2 (19.54; 95% CI 16.56, 22.76) athome. Thus, differences between sessions were small in practical terms and suggest greaterstability at home. No other effects involving location reached significance. In general, therewas good agreement between lab and home tests (agreement between locations also held atthe individual participant level; see Supplementary Materials Figures S5 and S6).
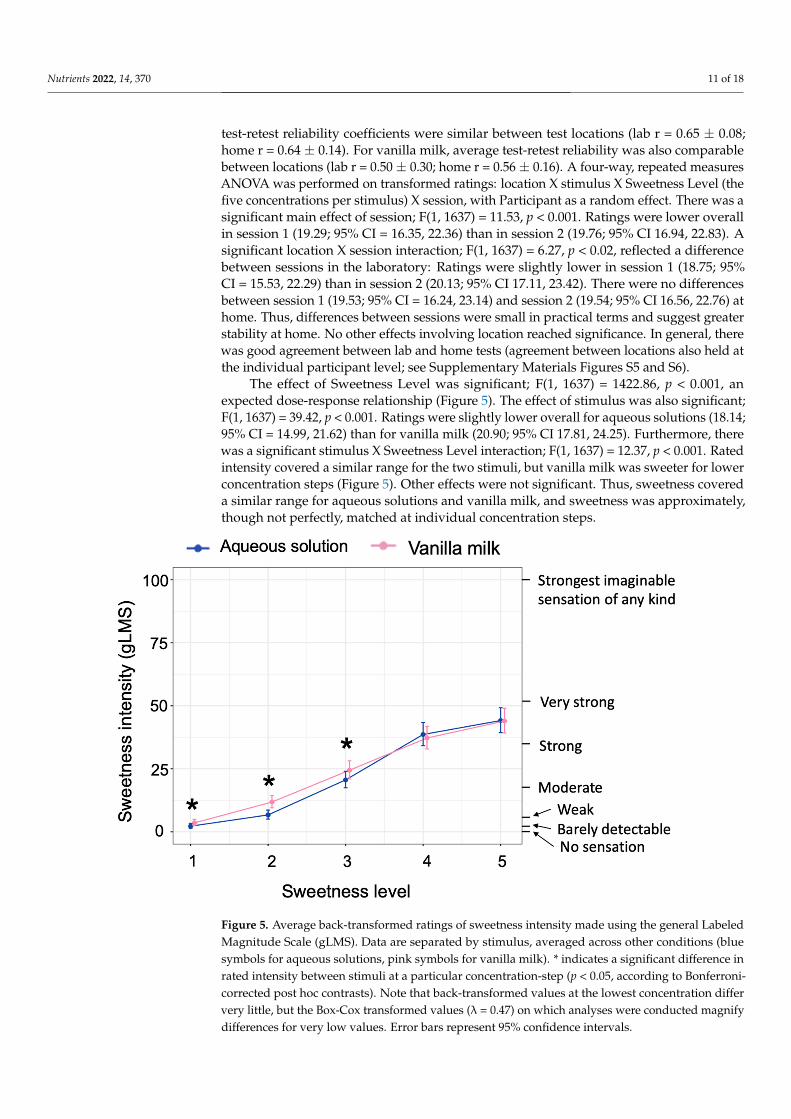
The effect of Sweetness Level was significant; F(1, 1637) = 1422.86, p < 0.001, anexpected dose-response relationship (Figure 5). The effect of stimulus was also significant;F(1, 1637) = 39.42, p < 0.001. Ratings were slightly lower overall for aqueous solutions (18.14;95% CI = 14.99, 21.62) than for vanilla milk (20.90; 95% CI 17.81, 24.25). Furthermore, therewas a significant stimulus X Sweetness Level interaction; F(1, 1637) = 12.37, p < 0.001. Ratedintensity covered a similar range for the two stimuli, but vanilla milk was sweeter for lowerconcentration steps (Figure 5). Other effects were not significant. Thus, sweetness covereda similar range for aqueous solutions and vanilla milk, and sweetness was approximately,though not perfectly, matched at individual concentration steps.
Nutrients 2022, 14, x FOR PEER REVIEW 12 of 19
Figure 5. Average back-transformed ratings of sweetness intensity made using the general Labeled Magnitude Scale (gLMS). Data are separated by stimulus, averaged across other conditions (blue symbols for aqueous solutions, pink symbols for vanilla milk). * indicates a significant difference in rated intensity between stimuli at a particular concentration-step (p < 0.05, according to Bonferroni-corrected post hoc contrasts). Note that back-transformed values at the lowest concentration differ very little, but the Box-Cox transformed values (λ = 0.47) on which analyses were conducted mag-nify differences for very low values. Error bars represent 95% confidence intervals.
3.3.2. Correlations between Sweetness Intensity and Optimal Concentration To determine if individual differences in sweetness intensity were associated with
individuals’ optimal concentration, average (across concentrations) sweet intensity was calculated as a measure of sweet taste sensitivity. The rated intensity for aqueous solutions was not significantly (p > 0.05) correlated with either the most preferred (r = 0.07) or most liked (r = 0.07) concentration in aqueous solutions. Similarly, the rated intensity for vanilla milk was not significantly correlated with either the most preferred (r = −0.10) or most liked (r = −0.09) concentration. Accordingly, the data analyses provide no evidence that individual differences in rated sweetness intensity are associated with individual esti-mates of optimal concentration of sucrose.
4. Discussion 4.1. Summary of Major Findings
The current study assessed the effects of method (Preference Tracking vs. Rating Method), test location (lab vs. home), and stimulus (aqueous solution vs. vanilla milk) on optimal concentration of sucrose in model beverages. Between methods, test-retest relia-bility for most preferred (Preference Tracking) and for most liked (Rating Method) con-centration did not differ significantly, although the former tended to be greater than the
Figure 5. Average back-transformed ratings of sweetness intensity made using the general LabeledMagnitude Scale (gLMS). Data are separated by stimulus, averaged across other conditions (bluesymbols for aqueous solutions, pink symbols for vanilla milk). * indicates a significant difference inrated intensity between stimuli at a particular concentration-step (p < 0.05, according to Bonferroni-corrected post hoc contrasts). Note that back-transformed values at the lowest concentration differvery little, but the Box-Cox transformed values (λ = 0.47) on which analyses were conducted magnifydifferences for very low values. Error bars represent 95% confidence intervals.
Nutrients 2022, 14, 370 12 of 18
3.3.2. Correlations between Sweetness Intensity and Optimal Concentration
To determine if individual differences in sweetness intensity were associated withindividuals’ optimal concentration, average (across concentrations) sweet intensity wascalculated as a measure of sweet taste sensitivity. The rated intensity for aqueous solutionswas not significantly (p > 0.05) correlated with either the most preferred (r = 0.07) or mostliked (r = 0.07) concentration in aqueous solutions. Similarly, the rated intensity for vanillamilk was not significantly correlated with either the most preferred (r = −0.10) or mostliked (r = −0.09) concentration. Accordingly, the data analyses provide no evidence thatindividual differences in rated sweetness intensity are associated with individual estimatesof optimal concentration of sucrose.
4. Discussion4.1. Summary of Major Findings
The current study assessed the effects of method (Preference Tracking vs. RatingMethod), test location (lab vs. home), and stimulus (aqueous solution vs. vanilla milk)on optimal concentration of sucrose in model beverages. Between methods, test-retestreliability for most preferred (Preference Tracking) and for most liked (Rating Method)concentration did not differ significantly, although the former tended to be greater thanthe latter. Optimal concentration across participants tended to be slightly higher forthe Rating method than for Preference Tracking, but the two measures were stronglycorrelated across individuals. In terms of location, results were essentially identical betweentest locations in terms of test-retest reliability, mean values, and patterns of individualdifferences. For stimulus, the optimal sucrose concentration averaged across participantswas higher in aqueous solutions than in vanilla milk (by about 50%, on average), but valuesfor the two stimuli were strongly correlated across individuals. Test-retest reliability wassignificantly greater for vanilla milk than for aqueous solutions. Rated sweetness intensitywas similar between lab and home for both stimuli. Overall, the results suggested that allmethods tested in the current study captured the same latent variable in optimal sucroseconcentration in model beverages.
4.2. Preference Tracking vs. the Rating Method
Judgments of preference and ratings of liking are different tasks for measuring sweethedonics, but they captured similar person-to-person differences. Results from the twomethods (Preference Tracking vs. the Rating Method) correlated strongly (0.83 ≤ r ≤ 0.89),and the variance decomposition suggested that method accounted for only about 1% of totalvariance in selecting the optimal concentration, compared to consistent differences amongindividuals, which accounted for about 51% of the total variance, i.e., method was not asignificant contributor to the differences in optimal concentration. These findings confirmthose of Asao and colleagues, who found a strong association between the most preferredand most liked concentration of sucrose in aqueous solutions using similar methods [47].The current study extends those findings to show associations of comparable strengthacross two stimuli and testing environments. Other studies, which did not focus on optimalconcentration for both tasks, found that the most preferred concentration differed acrosssweet-liker phenotypes, defined according to the overall shapes of functions of rated likingvs. concentration [28]. Another study found that rejection thresholds, or the concentrationdifferences at which people choose a low sugar formulation of orange juice over a highersugar formulation in preference judgements, were only measurable for people whoseratings of liking decreased at high concentrations [48]. Our results add to the accumulatingevidence that judgments of preference and of ratings of liking are related. Here, tests usedthe same stimulus, with the same participants, tested at the same time. Agreement betweenPreference Tracking and the Rating Method might be weaker if the tests also differed instimuli, concentration range, number of concentration steps, or other factors. However,these finding suggest that studies of individual differences in sweet hedonics that use
Nutrients 2022, 14, 370 13 of 18
paired-comparison preference judgements and ratings of liking could be meaningfullyintegrated in reviews or meta-analyses.
Ratings of liking may yield higher optimal concentration compared to judgements ofpreference. Note that the difference between the methods was small and consistent acrosstest locations and stimuli, which suggests that an adjustment factor could be applied ifone desired to use one test as a proxy for the other. Preference Tracking was slightly morereliable and may provide practical advantages in some situations. For both methods, test-retest reliability in the current study fell well within the range previously reported usingsimilar methods [20,27,47,49,50]. The small difference in test-retest reliability between themethods may mean more replicate measures using the Rating Method might be required tomatch the test-retest reliability of Preference Tracking.
4.3. In-Laboratory vs. At-Home Tests
Consistent with other studies, our findings show that sensory tests conducted outsidea carefully controlled laboratory setting are feasible and generally comparable to laboratorytests [37–39,44,51–54]. For example, a study by Seo and colleagues compared data fromdrive-in sensory booths to data from the laboratory in 106 consumers [38]. Hedonic andemotional responses to model beverages were not statistically different between testingconditions [38]. Another study conducted by the Italian Sensory Science Society comparedlaboratory and remote (at work and at home) sensory tests, including ratings of liking withmultiple food items, and found similar results between test locations [37]. With adequateguidance by experimenters via video conferencing, most remote tests (including ratingsof liking) yielded data comparable to those from laboratory tests [37]. Consistent withthese findings, test-retest reliability, mean values, and patterns of individual differencesin optimal sucrose concentration were essentially identical between test locations in thecurrent study, as was rated sweetness. There were no strong interactions between locationand other test conditions, with the caveat that only second-order interactions were tested.Overall, the results suggested that, to a first approximation, hedonic response remainedstable across test methods and stimuli, regardless of test location. Furthermore, variancedecomposition suggested that test location and second-order interactions involving locationaccounted for little or no variance in optimal concentration. The current study extendsprevious findings to paired-comparison Preference Tracking of sweetness in two modelstimuli. Thus, results suggest that remote evaluation of hedonic response to sweetness isfeasible and comparable to laboratory tests. Limiting or eliminating visits to the laboratorycould reduce participant burden, use of fossil fuels, and risk of exposure to infectiousillnesses such as COVID-19. Remote testing would also expand the pool of potentialparticipants beyond those available locally, which could in turn ease recruitment effortsand facilitate studies with more generally representative samples.
4.4. Aqueous Solutions vs. Vanilla Milk
The sample matrix used in sensory tests can affect hedonic responses [19,28,36,55,56].The most commonly used stimuli for measuring individual differences in hedonic responseto sweetness are simple aqueous solutions of sucrose [26,57]. However, aqueous solutionstake sweetness out of the natural context of foods and beverages, which might affect pat-terns of individual differences. For example, Bertino and colleagues found that Taiwan-bornstudents studying in the US tended to show higher preference for sucrose solutions thanstudents of European descent, but preferred lower concentrations in cookies [36]. Similarly,Holt and colleagues found differences in rated liking for orange juice and biscuits betweenMalaysian-born and Australian-born students, but hedonic response to sucrose solutionsdid not predict these differences [19]. Thus, experience and culture may play a role in de-termining optimal sweetness in particular foods [33]. Furthermore, individual differencesin sensitivity to sourness, bitterness, and astringency (sensations that are often amelioratedby sweetness) might interact with liking for sweetness to drive preference in foods andbeverages in which these generally negative sensations are prominent [55,58]. However,
Nutrients 2022, 14, 370 14 of 18
the current study found that the optimal concentrations of sucrose were correlated betweenaqueous solutions and vanilla milk (0.77 ≤ r ≤ 0.85). The variance decomposition suggestedthat stimulus accounted for about 10% of total variance in optimal concentration (consis-tent with a significant mean difference between stimuli), and second-order interactionsinvolving stimulus accounted for up to only 6%. Thus, within the sample of participantsliving in the Philadelphia area of the United States, aqueous solutions and vanilla milkprovided comparable information on individual estimates of optimal sucrose concentration.This result suggests that individual estimates of optimal sucrose concentration in aqueoussolutions can be generalized to some more realistic beverages [28], though based on pastwork, we expect that the results may not generalize to all model foods [59].
Although the hedonic results from the aqueous solutions and vanilla milk are stronglycorrelated, the overall optimal concentration of sucrose was substantially lower in vanillamilk than in the aqueous solution, an effect that was consistent across sensory methodsand test locations. Previous studies have suggested that sweetness might interact withother flavor components of foods and beverages, including fat and aroma, to shape hedonicresponse [59–61]. In particular, vanilla flavor can enhance sweetness in both simple modelsolutions and dairy beverages in cultures and ethnic groups where vanilla is associatedwith sweet taste [34,62,63]. In addition, the slightly higher test-retest reliability in vanillamilk compared to aqueous solutions measured at home might be because it is easierfor participants to choose an optimal concentration in a more familiar beverage context.Consistent with sweetness enhancement by vanilla, participants rated vanilla milk asequally sweet or even sweeter than aqueous solution at each concentration step, despitelower sucrose concentrations. It would be interesting to repeat the comparison betweenstimuli using nose-clips to block retro-nasal aroma to see if the optimal concentrations stilldiffer between stimuli. The results might be relevant to the hypothesis that aroma can beused to partially compensate for reduced sugar levels in beverages [64].
4.5. Rated Sweetness Intensity
Rated sweetness was not associated with individual differences in optimal sucrose con-centration. This result is consistent with many studies on sweet hedonics, which have foundthat sweet liking is weakly associated with perceived intensity of sweetness [16,24,28,65,66].Despite good matching at each sweetness concentration step in a pilot study, the currentsample of participants rated the lower concentration steps of vanilla milk as sweeter thanthe corresponding steps of aqueous solutions, though differences in rated sweetness weremodest in magnitude. Though perceived sweetness covered a similar range for the twostimuli, the imbalance at lower steps is consistent with the lower optimal concentrationsfound in vanilla milk, as discussed above (see Section 4.4). However, the imbalances inintensity did not affect the correlation between individual optimal concentration betweenthe two stimuli.
4.6. Limitations
This study has several limitations. First, this study has a modest sample size relativeto many past studies of hedonic response to sweetness. The sample size was sufficient todiscern modest differences in optimal sucrose concentration between test conditions andassociations between methods in individual response. However, conclusions regardingapparent differences in correlations between methods and stimuli require confirmation in alarger sample. Another limitation is that the study included a limited array of methods.Only one realistic model beverage was compared to aqueous solutions. More beveragesand foods, particularly solid foods, would be useful to evaluate the generality of thefindings, but it would be difficult to include enough model foods in a single study to reachvery broad conclusions. In addition, other endpoints related to hedonic response, e.g.,wanting and purchase intent, could be incorporated in future studies. Furthermore, weonly used five sucrose concentrations, considerably fewer than in some studies [16,24,47].This might limit resolution of individual hedonic response, which could, in principle,
Nutrients 2022, 14, 370 15 of 18
obscure some differences between methods. Although the range of concentrations usedwas comparable to some other studies [13,19,24,28,47], different results might be obtainedif higher concentrations of sucrose were used. Regarding the conclusion that home testsprovide data comparable to laboratory tests, it should be noted that participants attendedone in-person training session prior to their home testing sessions. Further work would berequired to determine if remote training is equally effective. It would also be interestingcompare results between trained vs. untrained participants. For large-scale implementationin population studies, even the single, brief training session used in the current study mightbe impractical, so it would be valuable to determine the minimal training required to obtainreliable results. Finally, test-retest reliability was assessed over a relatively short period oftime, so conclusions may not generalize to longer periods.
5. Conclusions
The optimal concentration of sucrose in model beverages was virtually identicalbetween in-laboratory and at-home tests and varied only slightly by method and stimulus.Individuals’ estimates of optimal concentration correlated strongly among the variousconditions, suggesting that all methodological conditions ultimately captured a commonunderlying trait—sweet hedonic response. Furthermore, aqueous solutions can be usefulproxies for some commonly consumed beverages for measuring individual differencesin sweet hedonic response. These results suggest that reviews and meta-analyses onindividual differences in optimal sucrose concentration can be conducted with studiesusing different methods. The choice of which method to use may depend on other factors,including target population. Regarding remote testing, we show that Preference Trackingvia video conferencing is feasible and reliable. However, Preference Tracking requiresfocused, one-on-one interaction between an experimenter and participants, because thestimuli presented in each trial depend on previous stimuli and responses. Therefore, somevariant of the rating method, which can use pre-ordered sets of stimuli, may be morepractical and efficient for remote testing.
Supplementary Materials: The following are available online at https://www.mdpi.com/article/10.3390/nu14020370/s1, Figure S1: Liking vs. concentration functions for individual participants,aqueous solutions, Figure S2: Liking vs. concentration functions for individual participants, vanillamilk, Figure S3: Descriptive information for individual optimal sucrose concentrations, Figure S4:Differences between experimental conditions in optimal sucrose concentration, Figure S5: Intensity vs.concentration functions for individual participants, aqueous solutions, Supplement Figure S6: Intensityvs. concentration functions for individual participants, vanilla milk, Table S1: Parameters for fits ofrated liking vs. sucrose concentration to determine hedonically optimal (most liked) concentration.
Author Contributions: Conceptualization, M.M.C., P.M.W. and G.K.B.; methodology, M.M.C. andP.M.W.; software, P.M.W.; validation, M.M.C. and P.M.W.; formal analysis, M.M.C., P.M.W. andM.K.; investigation, M.M.C. and P.M.W.; resources, P.M.W.; data curation, M.M.C., P.M.W. and S.P.;writing—original draft preparation, M.M.C.; writing—review and editing, M.M.C., P.M.W., M.K.,G.K.B. and S.P.; visualization, M.M.C.; supervision, P.M.W.; project administration, M.M.C.; fundingacquisition, P.M.W. All authors have read and agreed to the published version of the manuscript.
Funding: This research was funded by NIDCD T32 Training Grant (T32DC000014) and MonellSensory Nutrition Institutional Fund (SNT001).
Institutional Review Board Statement: The study was conducted in accordance with the Declarationof Helsinki. The study was reviewed by an Institutional Review Board of University of Pennsylvania(protocol code 844423) and was determined to be exempt (category 6) on 17 November 2020).
Informed Consent Statement: Informed consent was obtained from all subjects involved in the study.
Data Availability Statement: De-identified data are available upon request from the corresponding author.
Conflicts of Interest: G.K.B is an Advisor to the Ajinomoto Company which provides a modeststipend to the Monell Chemical Senses Center in compensation. P.M.W. has received travel reimburse-
Nutrients 2022, 14, 370 16 of 18
ment, honoraria, and research funding from the food, beverage, ingredients, and pharmaceuticalindustries. However, P.M.W. has no conflicts of interest related to this particular project.
References1. Drewnowski, A. Taste preferences and food intake. Annu. Rev. Nutr. 1997, 17, 237–253. [CrossRef] [PubMed]2. Cheon, E.; Reister, E.J.; Hunter, S.R.; Mattes, R.D. Finding the Sweet Spot: Measurement, Modification, and Application of Sweet
Hedonics in Humans. Adv. Nutr. 2021, 12, 2358–2371. [CrossRef] [PubMed]3. Macdonald, I.A. A review of recent evidence relating to sugars, insulin resistance and diabetes. Eur. J. Nutr. 2016, 55 (Suppl. 2),
17–23. [CrossRef] [PubMed]4. Yang, Q.; Zhang, Z.; Gregg, E.W.; Flanders, W.D.; Merritt, R.; Hu, F.B. Added sugar intake and cardiovascular diseases mortality
among US adults. JAMA Int. Med. 2014, 174, 516–524. [CrossRef]5. Stanhope, K.L. Sugar consumption, metabolic disease and obesity: The state of the controversy. Crit. Rev. Clin. Lab. Sci. 2016, 53,
52–67. [CrossRef] [PubMed]6. WHO. Information Note about Intake of Sugars Recommended in the WHO Guideline for Adults and Children; WHO: Geneva,
Switzerland, 2015.7. White, J.R., Jr. Sugar. Clin. Diabetes 2018, 36, 74–76. [CrossRef]8. Appleton, K.M.; Tuorila, H.; Bertenshaw, E.J.; de Graaf, C.; Mela, D.J. Sweet taste exposure and the subsequent acceptance
and preference for sweet taste in the diet: Systematic review of the published literature. Am. J. Clin. Nutr. 2018, 107, 405–419.[CrossRef]
9. Mattes, R.D. Gustation as a determinant of ingestion: Methodological issues. Am. J. Clin. Nutr. 1985, 41, 672–683. [CrossRef]10. Mattes, R.D.; Mela, D.J. Relationships between and among selected measures of sweet-taste preference and dietary intake. Chem.
Senses 1986, 11, 523–539. [CrossRef]11. Tan, S.Y.; Tucker, R.M. Sweet Taste as a Predictor of Dietary Intake: A Systematic Review. Nutrients 2019, 11, 94. [CrossRef]12. Drewnowski, A.; Henderson, S.A.; Levine, A.; Hann, C. Taste and food preferences as predictors of dietary practices in young
women. Public Health Nutr. 1999, 2, 513–519. [CrossRef]13. Pangborn, R.M.; Giovanni, M.E. Dietary intake of sweet foods and of dairy fats and resultant gustatory responses to sugar in
lemonade and to fat in milk. Appetite 1984, 5, 317–327. [CrossRef]14. Weizenbaum, F.; Benson, B.; Solomon, L.; Brehony, K. Relationship among reproductive variables, sucrose taste reactivity and
feeding behavior in humans. Physiol. Behav. 1980, 24, 1053–1056. [CrossRef]15. Iatridi, V.; Armitage, R.M.; Yeomans, M.R.; Hayes, J.E. Effects of Sweet-Liking on Body Composition Depend on Age and Lifestyle:
A Challenge to the Simple Sweet-Liking-Obesity Hypothesis. Nutrients 2020, 12, 2702. [CrossRef]16. Garneau, N.L.; Nuessle, T.M.; Mendelsberg, B.J.; Shepard, S.; Tucker, R.M. Sweet liker status in children and adults: Consequences
for beverage intake in adults. Food Qual. Prefer. 2018, 65, 175–180. [CrossRef]17. Smith, S.L.; Ludy, M.J.; Tucker, R.M. Changes in taste preference and steps taken after sleep curtailment. Physiol. Behav. 2016, 163,
228–233. [CrossRef] [PubMed]18. Stevenson, R.J.; Boakes, R.A.; Oaten, M.J.; Yeomans, M.R.; Mahmut, M.; Francis, H.M. Chemosensory Abilities in Consumers of a
Western-Style Diet. Chem. Senses 2016, 41, 505–513. [CrossRef] [PubMed]19. Holt, S.H.A.; Cobiac, L.; Beaumont-Smith, N.E.; Easton, K.; Best, D.J. Dietary habits and the perception and liking of sweetness
among Australian and Malaysian students: A cross-cultural study. Food Qual. Prefer. 2000, 11, 299–312. [CrossRef]20. Jayasinghe, S.N.; Kruger, R.; Walsh, D.C.I.; Cao, G.; Rivers, S.; Richter, M.; Breier, B.H. Is Sweet Taste Perception Associated with
Sweet Food Liking and Intake? Nutrients 2017, 9, 750. [CrossRef] [PubMed]21. Turner-McGrievy, G.; Tate, D.F.; Moore, D.; Popkin, B. Taking the bitter with the sweet: Relationship of supertasting and sweet
preference with metabolic syndrome and dietary intake. J. Food Sci. 2013, 78, S336–S342. [CrossRef] [PubMed]22. Leong, C.S.; Forde, C.G.; Tey, S.L.; Henry, C.J. Taste perception and diet in people of Chinese ancestry. Asia Pac. J. Clin. Nutr. 2018,
27, 478–486.23. Pangborn, R.M.; Simone, M. Body size and sweetness preference. J. Am. Diet. Assoc. 1958, 34, 924–928. [CrossRef]24. Iatridi, V.; Hayes, J.E.; Yeomans, M.R. Quantifying Sweet Taste Liker Phenotypes: Time for Some Consistency in the Classification
Criteria. Nutrients 2019, 11, 129. [CrossRef] [PubMed]25. Armitage, R.M.; Iatridi, V.; Yeomans, M.R. Understanding sweet-liking phenotypes and their implications for obesity: Narrative
review and future directions. Physiol. Behav. 2021, 235, 113398. [CrossRef] [PubMed]26. Trumbo, P.R.; Appleton, K.M.; de Graaf, K.; Hayes, J.E.; Baer, D.J.; Beauchamp, G.K.; Dwyer, J.T.; Fernstorm, J.D.; Klurfeld,
D.M.; Mattes, R.D.; et al. Perspective: Measuring Sweetness in Foods, Beverages, and Diets: Toward Understanding the Role ofSweetness in Health. Adv. Nutr. 2021, 12, 343–354. [CrossRef] [PubMed]
27. Mennella, J.A.; Lukasewycz, L.D.; Griffith, J.W.; Beauchamp, G.K. Evaluation of the Monell forced-choice, paired-comparisontracking procedure for determining sweet taste preferences across the lifespan. Chem. Senses 2011, 36, 345–355. [CrossRef][PubMed]
28. Kim, J.-Y.; Prescott, J.; Kim, K.-O. Patterns of sweet liking in sucrose solutions and beverages. Food Qual. Prefer. 2014, 36, 96–103.[CrossRef]
29. Desor, J.A.; Beauchamp, G.K. Longitudinal changes in sweet preferences in humans. Physiol. Behav. 1987, 39, 639–641. [CrossRef]
Nutrients 2022, 14, 370 17 of 18
30. Bobowski, N.; Mennella, J.A. Personal Variation in Preference for Sweetness: Effects of Age and Obesity. Child Obes. 2017, 13,369–376. [CrossRef] [PubMed]
31. Coldwell, S.E.; Mennella, J.A.; Duffy, V.B.; Pelchat, M.L.; Griffith, J.W.; Smutzer, G.; Cowart, B.J.; Breslin, P.A.S.; Bartoshuk, L.M.;Hastings, L.; et al. Gustation assessment using the NIH Toolbox. Neurology 2013, 80 (Suppl. 3), S20–S24. [CrossRef]
32. Hayes, J.E.; Allen, A.L.; Bennett, S.M. Direct comparison of the generalized visual analog scale (gVAS) and general labeledmagnitude scale (gLMS). Food Qual. Prefer. 2013, 28, 36–44. [CrossRef]
33. Venditti, C.; Musa-Veloso, K.; Lee, H.Y.; Poon, T.; Mak, A.; Darch, M.; Juana, J.; Fronda, D.; Noori, D.; Pateman, E.; et al.Determinants of Sweetness Preference: A Scoping Review of Human Studies. Nutrients 2020, 12, 718. [CrossRef] [PubMed]
34. Wang, G.; Hayes, J.E.; Ziegler, G.R.; Roberts, R.F.; Hopfer, H. Dose-Response Relationships for Vanilla Flavor and Sucrose in SkimMilk: Evidence of Synergy. Beverages 2018, 4, 73. [CrossRef]
35. De Graaf, C.; Zandstra, E.H. Sweetness intensity and pleasantness in children, adolescents, and adults. Physiol. Behav. 1999, 67,513–520. [CrossRef]
36. Bertino, M.; Beauchamp, G.K.; Jen, K.-L.C. Rated taste perception in two cultural groups. Chem. Senses 1983, 8, 3–15. [CrossRef]37. Dinnella, C.; Pierguidi, L.; Spinelli, S.; Borgogno, M.; Toschi, T.G.; Predieri, S.; Lavezzi, G.; Trapani, F.; Tura, M.; Magli, M.; et al.
Remote testing: Sensory test during Covid-19 pandemic and beyond. Food Qual. Prefer. 2021, 96, 104437. [CrossRef] [PubMed]38. Seo, H.-S.; Buffin, K.; Singh, A.; Beekman, T.L.; Jarma Arroyo, S.E. Stay safe in your vehicle: Drive-in booths can be an alternative
to indoor booths for laboratory sensory testing. Food Qual. Prefer. 2021, 94, 104332. [CrossRef]39. Vaira, L.A.; Salzano, G.; Petrocelli, M.; Deiana, G.; Salzano, F.A.; De Riu, G. Validation of a self-administered olfactory and
gustatory test for the remotely evaluation of COVID-19 patients in home quarantine. Head Neck. 2020, 42, 1570–1576. [CrossRef]40. Hannum, M.E.; Simons, C.T. Development of the engagement questionnaire (EQ): A tool to measure panelist engagement during
sensory and consumer evaluations. Food Qual. Prefer. 2020, 81, 103840. [CrossRef]41. Bangcuyo, R.G.; Smith, K.J.; Zumach, J.L.; Pierce, A.M.; Guttman, G.A.; Simons, C.T. The use of immersive technologies to
improve consumer testing: The role of ecological validity, context and engagement in evaluating coffee. Food Qual. Prefer. 2015,41, 84–95. [CrossRef]
42. Samant, S.S.; Seo, H.-S. Influences of sensory attribute intensity, emotional responses, and non-sensory factors on purchase intenttoward mixed-vegetable juice products under informed tasting condition. Food Res. Int. 2020, 132, 109095. [CrossRef]
43. Kong, Y.; Sharma, C.; Kanala, M.; Thakur, M.; Li, L.; Xu, D.; Harrison, R.; Torrico, D.D. Virtual Reality and Immersive Environmentson Sensory Perception of Chocolate Products: A Preliminary Study. Foods 2020, 9, 515. [CrossRef]
44. Boutrolle, I.; Delarue, J.; Arranz, D.; Rogeaux, M.; Köster, E.P. Central location test vs. home use test: Contrasting resultsdepending on product type. Food Qual. Prefer. 2007, 18, 490–499. [CrossRef]
45. Bartoshuk, L.M.; Duffy, V.B.; Green, B.G.; Hoffman, H.J.; Ko, C.-W.; Lucchina, L.A.; Marks, L.E.; Snyder, D.J.; Weiffenbach, J.M.Valid across-group comparisons with labeled scales: The gLMS versus magnitude matching. Physiol. Behav. 2004, 82, 109–114.[CrossRef] [PubMed]
46. Bates, D.; Mächler, M.; Bolker, B.; Walker, S. Fitting Linear Mixed-Effects Models Using lme4. J. Stat. Softw. 2015, 67, 1–48.[CrossRef]
47. Asao, K.; Miller, J.; Arcori, L.; Lumeng, J.C.; Han-Markey, T.; Herman, W.H. Patterns of Sweet Taste Liking: A Pilot Study.Nutrients 2015, 7, 7298–7311. [CrossRef] [PubMed]
48. Methven, L.; Xiao, C.; Cai, M.; Prescott, J. Rejection thresholds (RjT) of sweet likers and dislikers. Food Qual. Prefer. 2016, 52, 74–80.[CrossRef]
49. Coulon, S.M.; Miller, A.C.; Reed, J.M.; Martin, C.K. Reliability of a common solution-based taste perception test: Implications forvalidity and a briefer test. Eat Behav. 2012, 13, 42–45. [CrossRef]
50. Iatridi, V.; Hayes, J.E.; Yeomans, M.R. Reconsidering the classification of sweet taste liker phenotypes: A methodological review.Food Qual. Prefer. 2019, 72, 56–76. [CrossRef]
51. Petrocelli, M.; Ruggiero, F.; Baietti, A.M.; Pandolfi, P.; Salzano, G.; Salzano, F.A.; Lechien, J.R.; Saussez, S.; De Riu, G.; Vaira, L.A.Remote psychophysical evaluation of olfactory and gustatory functions in early-stage coronavirus disease 2019 patients: TheBologna experience of 300 cases. J. Laryngol. Otol. 2020, 134, 571–576. [CrossRef]
52. Lee, N.; Lee, J. Comparison of Home Use Tests with Differing Time and Order Controls. Foods 2021, 10, 1275. [CrossRef]53. Zhang, M.T.; Jo, Y.; Lopetcharat, K.; Drake, M.A. Comparison of a central location test versus a home usage test for consumer
perception of ready-to-mix protein beverages. J. Dairy Sci. 2020, 103, 3107–3124. [CrossRef] [PubMed]54. Schouteten, J.J.; Gellynck, X.; Slabbinck, H. Influence of organic labels on consumer’s flavor perception and emotional profiling:
Comparison between a central location test and home-use-test. Food Res. Int. 2019, 116, 1000–1009. [CrossRef]55. Ervina, E.; Almli, V.L.; Berget, I.; Spinelli, S.; Sick, J.; Dinnella, C. Does Responsiveness to Basic Tastes Influence Preadolescents’
Food Liking? Investigating Taste Responsiveness Segment on Bitter-Sour-Sweet and Salty-Umami Model Food Samples. Nutrients2021, 13, 2721. [CrossRef] [PubMed]
56. Szczygiel, E.J.; Cho, S.; Tucker, R.M. The Effect of Sleep Curtailment on Hedonic Responses to Liquid and Solid Food. Foods 2019,8, 465. [CrossRef]
57. Mennella, J.A.; Bobowski, N.K. Psychophysical Tracking Method to Measure Taste Preferences in Children and Adults. J. Vis. Exp.2016, 113. [CrossRef]
Nutrients 2022, 14, 370 18 of 18
58. Spinelli, S.; Prescott, J.; Pierguidi, L.; Dinnella, C.; Arena, E.; Braghieri, A.; Di Monaco, R.; Toschi, T.G.; Endrizzi, I.; Prosperio, C.;et al. Phenol-Rich Food Acceptability: The Influence of Variations in Sweetness Optima and Sensory-Liking Patterns. Nutrients2021, 13, 866. [CrossRef] [PubMed]
59. Drewnowski, A.; Shrager, E.E.; Lipsky, C.; Stellar, E.; Greenwood, M.R. Sugar and fat: Sensory and hedonic evaluation of liquidand solid foods. Physiol. Behav. 1989, 45, 177–183. [CrossRef]
60. Lavin, J.G.; Lawless, H.T. Effects of color and odor on judgments of sweetness among children and adults. Food Qual. Prefer. 1998,9, 283–289. [CrossRef]
61. Hayes, J.E.; Duffy, V.B. Oral sensory phenotype identifies level of sugar and fat required for maximal liking. Physiol. Behav. 2008,95, 77–87. [CrossRef]
62. Isogai, T.; Wise, P.M. The Effects of Odor Quality and Temporal Asynchrony on Modulation of Taste Intensity by Retronasal Odor.Chem. Senses 2016, 41, 557–566. [CrossRef] [PubMed]
63. Bertelsen, A.S.; Mielby, L.A.; Alexi, N.; Byrne, D.V.; Kidmose, U. Individual Differences in Sweetness Ratings and Cross-ModalAroma-Taste Interactions. Foods 2020, 9, 146. [CrossRef] [PubMed]
64. Ponzo, V.; Pellegrini, M.; Costelli, P.; Vázquez-Araújo, L.; Gayoso, L.; D’Eusebio, C.; Ghigo, E.; Bo, S. Strategies for Reducing Saltand Sugar Intakes in Individuals at Increased Cardiometabolic Risk. Nutrients 2021, 13, 279. [CrossRef] [PubMed]
65. Thompson, D.A.; Moskowitz, H.R.; Campbell, R.G. Effects of body weight and food intake on pleasantness ratings for a sweetstimulus. J. Appl. Physiol. 1976, 41, 77–83. [CrossRef]
66. Kampov-Polevoy, A.; Lange, L.; Bobashev, G.; Eggleston, B.; Root, T.; Garbutt, J.C. Sweet-liking is associated with transformationof heavy drinking into alcohol-related problems in young adults with high novelty seeking. Alcohol. Clin. Exp. Res. 2014, 38,2119–2126. [CrossRef]