Embed Size (px)
Citation preview
Genome Analysis
Characterizing Regulatory and Functional Differentiationbetween Maize Mesophyll and Bundle Sheath Cells byTranscriptomic Analysis1[W][OA]
Yao-Ming Chang, Wen-Yu Liu, Arthur Chun-Chieh Shih, Meng-Ni Shen, Chen-Hua Lu,Mei-Yeh Jade Lu, Hui-Wen Yang, Tzi-Yuan Wang, Sean C.-C. Chen, Stella Maris Chen,Wen-Hsiung Li*, and Maurice S.B. Ku
Biodiversity Research Center (Y.-M.C., W.-Y.L., M.-N.S., M.-Y.J.L., T.-Y.W., W.-H.L.), Genomics ResearchCenter (Y.-M.C., W.-Y.L., S.M.C., W.-H.L.), and Institute of Information Science (A.C.-C.S., C.-H.L.), AcademiaSinica, Taipei, Taiwan 115; Institute of Bioagricultural Science, National Chiayi University, Chiayi, Taiwan 600(H.-W.Y., M.S.B.K.); Department of Ecology and Evolution, University of Chicago, Chicago, Illinois 60637(S.C.-C.C., W.-H.L.); and School of Biological Sciences, Washington State University, Pullman, Washington99164–4238 (M.S.B.K.)
To study the regulatory and functional differentiation between the mesophyll (M) and bundle sheath (BS) cells of maize (Zeamays), we isolated large quantities of highly homogeneous M and BS cells from newly matured second leaves for transcriptomeprofiling by RNA sequencing. A total of 52,421 annotated genes with at least one read were found in the two transcriptomes.Defining a gene with more than one read per kilobase per million mapped reads as expressed, we identified 18,482 expressedgenes; 14,972 were expressed in M cells, including 53 M-enriched transcription factor (TF) genes, whereas 17,269 were expressedin BS cells, including 214 BS-enriched TF genes. Interestingly, many TF gene families show a conspicuous BS preference inexpression. Pathway analyses reveal differentiation between the two cell types in various functional categories, with the M cellsplaying more important roles in light reaction, protein synthesis and folding, tetrapyrrole synthesis, and RNA binding, while theBS cells specialize in transport, signaling, protein degradation and posttranslational modification, major carbon, hydrogen, andoxygen metabolism, cell division and organization, and development. Genes coding for several transporters involved in theshuttle of C4 metabolites and BS cell wall development have been identified, to our knowledge, for the first time. Thiscomprehensive data set will be useful for studying M/BS differentiation in regulation and function.
C4 plants, with few exceptions, require the coordi-nation of the mesophyll (M) and bundle sheath (BS)cells, arranged in a wreath structure called Kranz leafanatomy (Hatch and Agostino, 1992), to confer highrates of photosynthesis. The initial carboxylation phaseof the C4 pathway takes place in the M cells, while thedecarboxylation phase is restricted to the BS cells. Thehigh photosynthetic capacity of C4 plants implies amassive efflux of C4-related metabolites between Mand BS cells and between the cytosol and organelles ineach cell type (Weber and von Caemmerer, 2010).
Although research in the past few decades hasgreatly increased our understanding of the biochemicalreactions and the enzymes involved in the C4 pathway
of photosynthesis, little is known about the specificgenes involved in the development of the Kranz leafanatomy, the C4 biochemical pathway, and the un-derlying regulatory mechanisms for the high-levelexpression of C4-specific genes in a cell-, organ-, ordevelopment-specific manner. With the advancement ingenomics, the genomic sequences of several C3 and C4model plants have become available. These advanceshave allowed in-depth comparative proteomic andtranscriptomic analyses of the whole leaves of typical C3and C4 plants and their closely related C3-C4 interme-diate species of Cleome and Flaveria (Gowik et al., 2011).These comparative studies allow deduction on howmany genes are required to make a C4 plant and pos-sibly on how they may have been regulated at thegenetic level. In addition, attempts have been maderecently to characterize the transcriptomic profile ofmaize (Zea mays) leaf in a development-dependentmanner (Li et al., 2010). Also, the laser-capture micro-dissection (LCM) technique was used to isolate bothM and BS cells from mature maize leaves for tran-scriptome analysis. However, LCM has a limitation inthe amount of cells that can be isolated and has thepotential of cross-contamination.
To gain a comprehensive understanding of the C4photosynthesis pathway and related processes, we havemodified current methods to isolate large quantities of
1 This work was supported by Academia Sinica and the NationalScience Council, Taiwan (grant nos. NSC 99–2321–B–001–041–MY2and 99B1–114).
* Corresponding author; e-mail [email protected] author responsible for distribution of materials integral to the
findings presented in this article in accordance with the policy de-scribed in the Instructions for Authors (www.plantphysiol.org) is:Wen-Hsiung Li ([email protected]).
[W] The online version of this article contains Web-only data.[OA] Open Access articles can be viewed online without a subscrip-
tion.www.plantphysiol.org/cgi/doi/10.1104/pp.112.203810
Plant Physiology�, September 2012, Vol. 160, pp. 165–177, www.plantphysiol.org � 2012 American Society of Plant Biologists. All Rights Reserved. 165

highly purified M and BS cells from mature maizeleaves for RNA extraction and detailed transcriptomeanalyses of M and BS cells. Our study reveals thefunctional differentiation and coordination of the twocell types in various metabolic pathways and providesinsights into the possible regulatory network underlyingthe development of Kranz leaf anatomy and the opera-tion of the photosynthetic and other metabolic pathwaysin the NADP-malic enzyme (ME) subtype C4 plants.
RESULTS AND DISCUSSION
Isolation of Highly Pure M Protoplasts and BS Strands
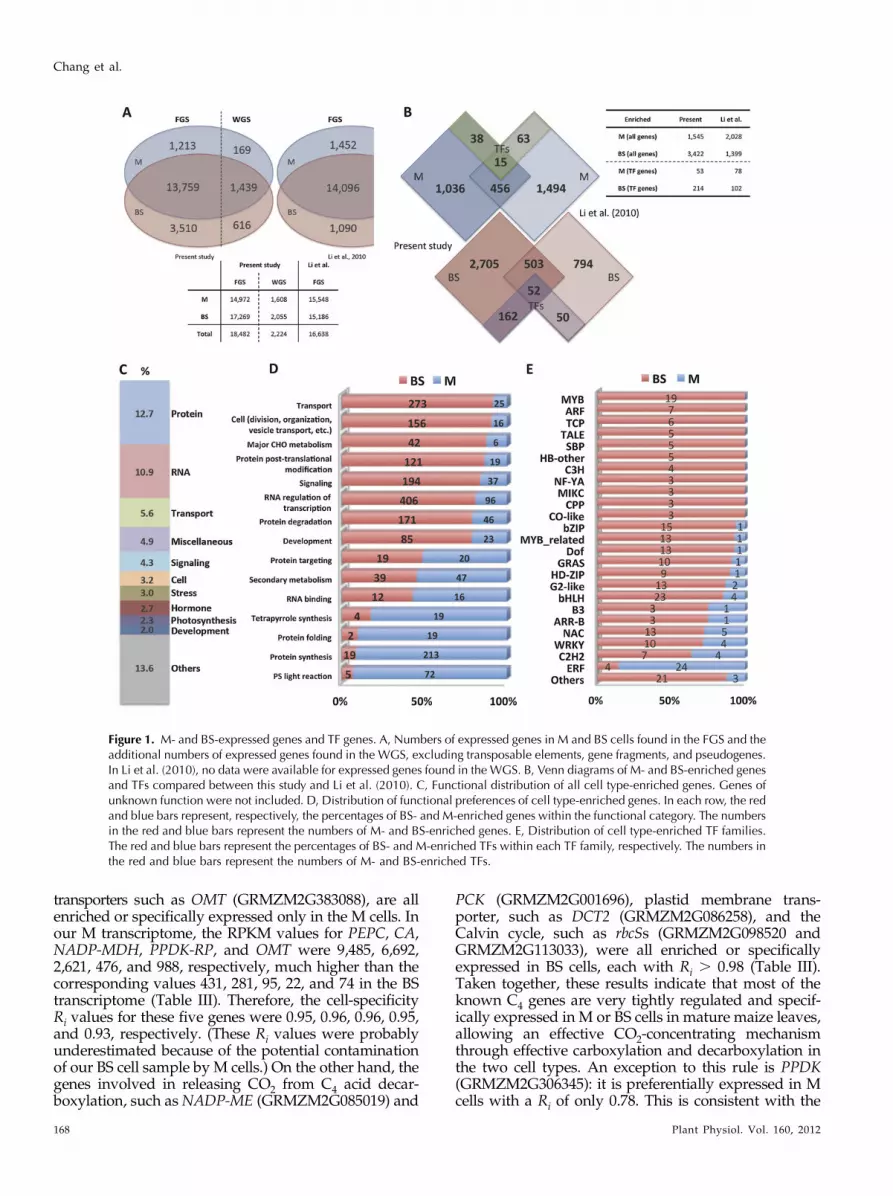
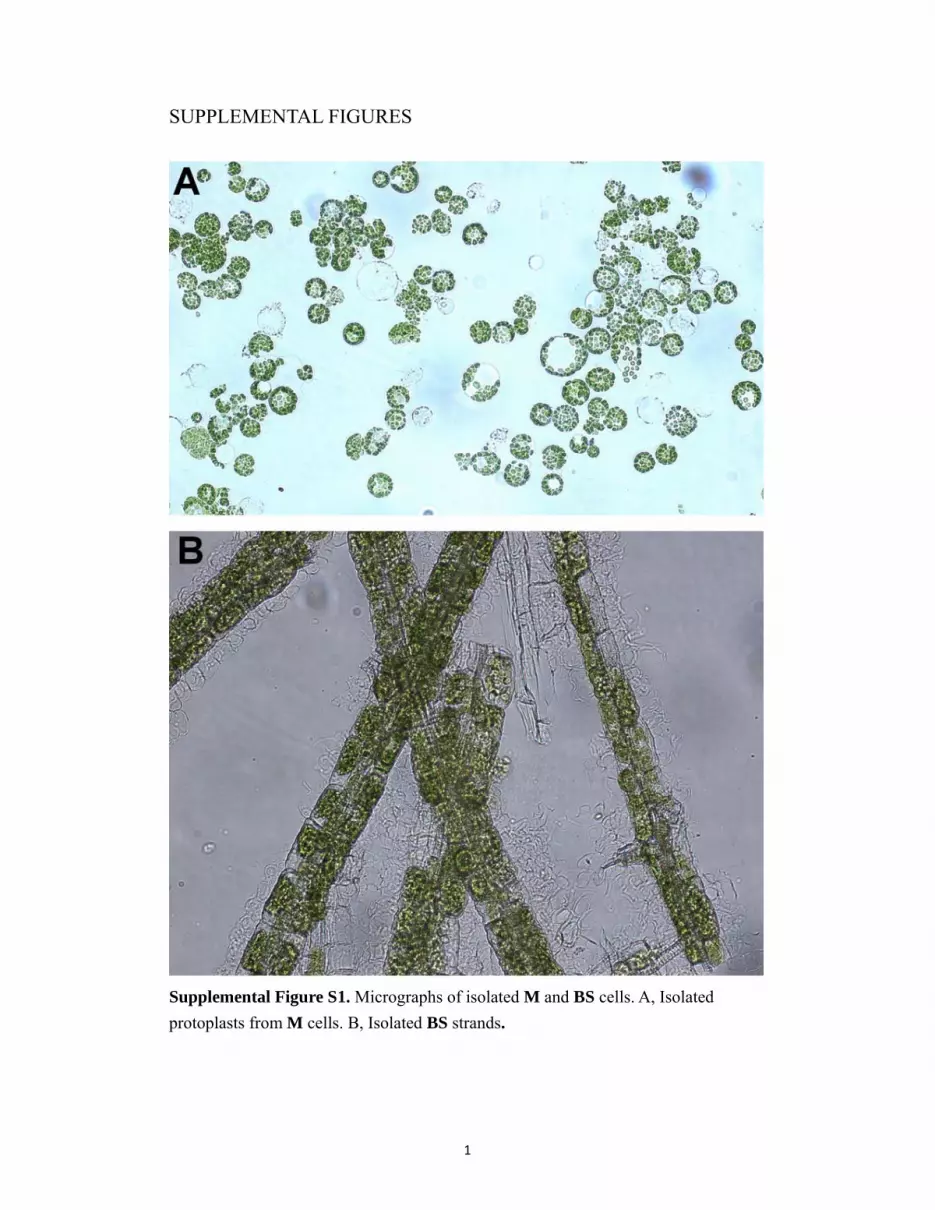
In this study, highly purified mesophyll protoplasts(MP) and bundle sheath strands (BSS) were obtainedin large quantities from newly matured second leaves(Supplemental Fig. S1) for transcriptome analyses.Examination by light microscopy showed that themechanically purified BSS was attached with verylittle M tissue, except M cell wall and vascular andepidermal tissues. To further assess the purity of theisolated cells, the activities of two key C4 photosyn-thesis marker enzymes for M and BS cells wereassayed. On a chlorophyll basis, the high activity ofNADP-ME, a key C4 acid decarboxylase located in theBS cells of maize, was almost exclusively associatedwith the BSS isolated (Supplemental Table S1). On theother hand, the high activity of phosphoenolpyruvatecarboxylase (PEPC) was mainly associated with theMP isolated by enzymatic digestion, although a lowactivity of PEPC was also detected in the BSS isolated,which might be due to the presence of the C3-typePEPC in the BS cells. Immunoblot analysis using spe-cific antibodies raised against the maize proteins alsodemonstrated the high homogeneity of the two celltypes isolated (Supplemental Fig. S2).
Raw Read Processing and Definition of Expressed Genes
To clean the sequencing raw reads, we deleted readsthat contain any N (unknown nucleotide) or have apoor quality score (Table I). Using Tophat version 1.3.3(Trapnell et al., 2009; http://tophat.cbcb.umd.edu/),we found 78% and 79% of the cleaned reads can bemapped to the maize B73 genome (Maize GenomeAGP version 2, release 5a.59).
We used Cufflinks version 1.2.1 (Trapnell et al., 2010;http://cufflinks.cbcb.umd.edu/) to calculate the ex-pression level of each gene in terms of reads per kilobase
per million mapped reads (RPKM; Mortazavi et al.,2008). RPKM is normalized by the length of the exonand the total mappable reads and can be used toquantify the expression level of a gene from the mappedread count. A total of 52,421 annotated genes with atleast one read were found in the two transcriptomes(Table II). (All genes with at least one read are listed inSupplemental Data S1 with their RPKM values.) Themaximum RPKM were 35,421 and 31,561, and the me-dian RPKM were 0.55 and 0.73 in the M and BS celltranscriptomes, respectively. Only approximately 2% ofthe genes had a very high expression level (RPKM $100) in either M or BS cells.
The quality of the transcriptomes, the potentialcontamination of BS cells by epidermal and vascularbundle tissues, and the potential effects of long incu-bation time during the isolation of M protoplasts arediscussed in Supplemental Materials and Methods S1and Supplemental Fig. S3.
Following the criterion of Li et al. (2010), we definedan “expressed gene” as a gene with RPKM . 1 in thetranscriptome. In all analyses below, only expressedgenes were considered. If the Filtered Gene Set (FGS)was chosen, we identified 14,972 and 17,269 expressedgenes in the M and BS transcriptomes of maize, re-spectively (Fig. 1A). In total, we identified 18,482 genesexpressed in either the M or BS transcriptome or both,which is 1,844 genes more than were identified by Liet al. (2010; Fig. 1A). If the Working Gene Set (WGS)was chosen, then we gained an additional 2,224expressed genes (Fig. 1A).
Low Degrees of Cross-Contamination between the TwoRNA Samples
It is important to know the degree of cross-contamination between the two transcriptomes, becausecross-contamination can affect the estimation of thenumber of expressed genes in a transcriptome (one celltype) and the number of differentially expressed genesbetween the two transcriptomes (two cell types). To ad-dress this issue, we used the expression levels of 10 se-lected C4 marker genes to estimate the degrees of cross-contamination in the two RNA samples from the isolatedM cells and BS cells (Table III). The proteins encoded bythese genes play key roles in C4 photosynthesis and areassumed to be exclusively or almost exclusively expressedin only one cell type (Supplemental Data S1). Among the10 selected genes, NADP-ME (GRMZM2G085019), DCT2(for dicarboxylate transporter; GRMZM2G086258), PCK
Table I. Statistics of the transcriptome data
Cell Type Total Reads Trimmed Reads Mapped Reads (Mappable Rate)a Unique Hits
M 177,363,768 125,841,884 98,048,470 (78%) 89,522,392BS 193,418,692 135,111,940 107,090,765 (79%) 100,493,851
aThe mappable rate is defined as the ratio of the mapped reads to the trimmed reads.
166 Plant Physiol. Vol. 160, 2012
Chang et al.

(GRMZM2G001696), and two rbcSs (GRMZM2G098520and GRMZM2G113033) are supposed to be BS specific,while PEPC (GRMZM2G083841), CA (GRMZM2G121878),NADP-MDH (GRMZM2G129513), OMT (for 2-oxogluta-rate/malate transporter; GRMZM2G383088), and PPDK-RP(GRMZM2G131286) are supposed to be M specific. UsingEquations 2 and 4 as shown in “Materials and Methods,”we obtained an upper estimate of c1 = 1.2% for thecontamination rate of M cells by BS cells and an upperestimate of c2 = 4.5% for the contamination rate of BScells by M cells (Table III). These are considered theupper estimates because the assumption of exclusiveexpression of a key C4 gene in a cell-specific manner(e.g. PEPC in M cells) may not be absolutely true. Inany case, these calculations suggest that the degrees ofcross-contamination in our two RNA samples werereasonably low, which is crucial for us to accuratelydetermine the expression profile of a given gene in acell-specific manner.We checked the above conclusion on the purity of
our isolated M and BS cells by quantitative reversetranscription-PCR (Supplemental Table S2 and S3). Forthe three BS-specific genes studied (rbcS-2, rbcS-4, andNADP-ME), the respective M/BS expression ratioswere 0.001, 0.049, and 0.004, which are indeed similarto the ratios obtained from the transcriptome data(0.022, 0.022, and 0.007). These data support the con-clusion of very low contamination of our M cell sampleby BS cells. For the three M-specific genes studied(PEPC, NADP-MDH, and OMT), the respective BS/Mratios were 0.055, 0.050, and 0.037, which are also veryclose to the BS/M ratios of 0.048, 0.039, and 0.045 fromour transcriptome data (Supplemental Table S2), sup-porting an estimate of approximately 4.5% contami-nation of our BS sample by M cells.Li et al. (2010) had reported two sets of deep-
sequencing transcriptomic data from the maize Mand BS cells isolated by LCM. In their data, nine outof the above 10 C4 marker genes, except PPDK-RP(GRMZM2G131286), were listed as cell type-enrichedgenes. Applying the same equations to analyze theirdata, we estimated the upper contamination ratesof c1 = 9.2% and c2 = 21.6% for their M and BScell preparations. These results indicate that our isola-tion methods caused a much lower level of cross-contamination than the LCM method they used.Consequently, our data would give a more accurateestimation of genes differentially expressed betweenthe M and BS cells.
Genes Differentially Expressed between the TwoCell Types
To estimate the differential expression of genes be-tween the two cell types, we defined the degree of cellspecificity of gene i as Ri = |mi – bi|/max(mi, bi), wheremi and bi represent the RPKM of gene i in the M and BSRNA samples, respectively. By this definition, Ri = 1 ifgene i is exclusively expressed in only one cell type,and Ri = 0 if gene i is equally expressed in the two celltypes. To define “differentially expressed genes,” weused the criterion of Ri = 0.8, which corresponds to a5-fold difference in RPKM value between the twocell types. This criterion is more stringent than thecriterion used by Li et al. (2010); 72% of their differ-entially expressed genes had only 4-fold or smallerdifferences. In the differentially expressed gene set,there were 1,545 and 3,422 genes enriched in the M andBS transcriptomes, respectively (Fig. 1B). That is, 4,697(1,545 + 3,422) genes, or approximately 25% of allexpressed genes in the FGS (18,482), were differentiallyexpressed between the two cell types. In contrast, Liet al. (2010) identified only 3,427 (2,028 + 1,399) dif-ferentially expressed genes, or approximately 21% ofall expressed genes (16,638), even though they used alooser criterion (Fig. 1B). The lower percentage couldbe due to the high cross-contamination rates in thestudy of Li et al. (2010; see above). In our data, therewere many more BS-enriched genes than M-enrichedgenes (Table II). This observation is opposite to the Liet al. (2010) observation of more M- than BS-enrichedgenes. Only 30% and 16% of M- and BS-enriched genesin this study overlapped with the Li et al. (2010) data(Fig. 1B). Thus, many more cell-specific genes havebeen identified from our study. For genes with Ri .0.99, which can be taken as truly cell-specific genes,there were only 65 genes in M cells but 688 genes in BScells (Supplemental Data S2). This result suggests thatmaize BS cells have assumed a more important meta-bolic role in C4 photosynthesis and other metabolicprocesses.
The major difference in photosynthetic biochemistrybetween C3 and C4 plants is that in C4 plants the CO2-concentrating mechanism and the Calvin cycle are di-vided between M and BS cells. To achieve an effectiveCO2-concentrating mechanism, genes that are involved incarbon fixation, such as PEPC (GRMZM2G083841), CA(GRMZM2G121878),NADP-MDH (GRMZM2G129513),and PPDK-RP (GRMZM2G131286), and plastid membrane
Table II. Numbers of expressed genes, cell type-enriched genes, and TF genes in the two transcriptomes
Parameter M Cells BS Cells Total
Detected genes (at least one read)a 43,934 48,888 52,421Expressed genes in the FGS 14,972 17,269 18,482Expressed TF genes in the FGS 653 819 880Enriched expressed genes in the FGS 1,545 3,422 4,967Enriched expressed TF genes in the FGS 53 214 267
aThe total numbers of annotated genes in the WGS and the FGS of AGPv2 (release 5a.59) were 110,028and 39,656, respectively.
Plant Physiol. Vol. 160, 2012 167
Transcriptomes of Maize Leaf Cells
transporters such as OMT (GRMZM2G383088), are allenriched or specifically expressed only in the M cells. Inour M transcriptome, the RPKM values for PEPC, CA,NADP-MDH, PPDK-RP, and OMT were 9,485, 6,692,2,621, 476, and 988, respectively, much higher than thecorresponding values 431, 281, 95, 22, and 74 in the BStranscriptome (Table III). Therefore, the cell-specificityRi values for these five genes were 0.95, 0.96, 0.96, 0.95,and 0.93, respectively. (These Ri values were probablyunderestimated because of the potential contaminationof our BS cell sample by M cells.) On the other hand, thegenes involved in releasing CO2 from C4 acid decar-boxylation, such asNADP-ME (GRMZM2G085019) and
PCK (GRMZM2G001696), plastid membrane trans-porter, such as DCT2 (GRMZM2G086258), and theCalvin cycle, such as rbcSs (GRMZM2G098520 andGRMZM2G113033), were all enriched or specificallyexpressed in BS cells, each with Ri . 0.98 (Table III).Taken together, these results indicate that most of theknown C4 genes are very tightly regulated and specif-ically expressed in M or BS cells in mature maize leaves,allowing an effective CO2-concentrating mechanismthrough effective carboxylation and decarboxylation inthe two cell types. An exception to this rule is PPDK(GRMZM2G306345): it is preferentially expressed in Mcells with a Ri of only 0.78. This is consistent with the
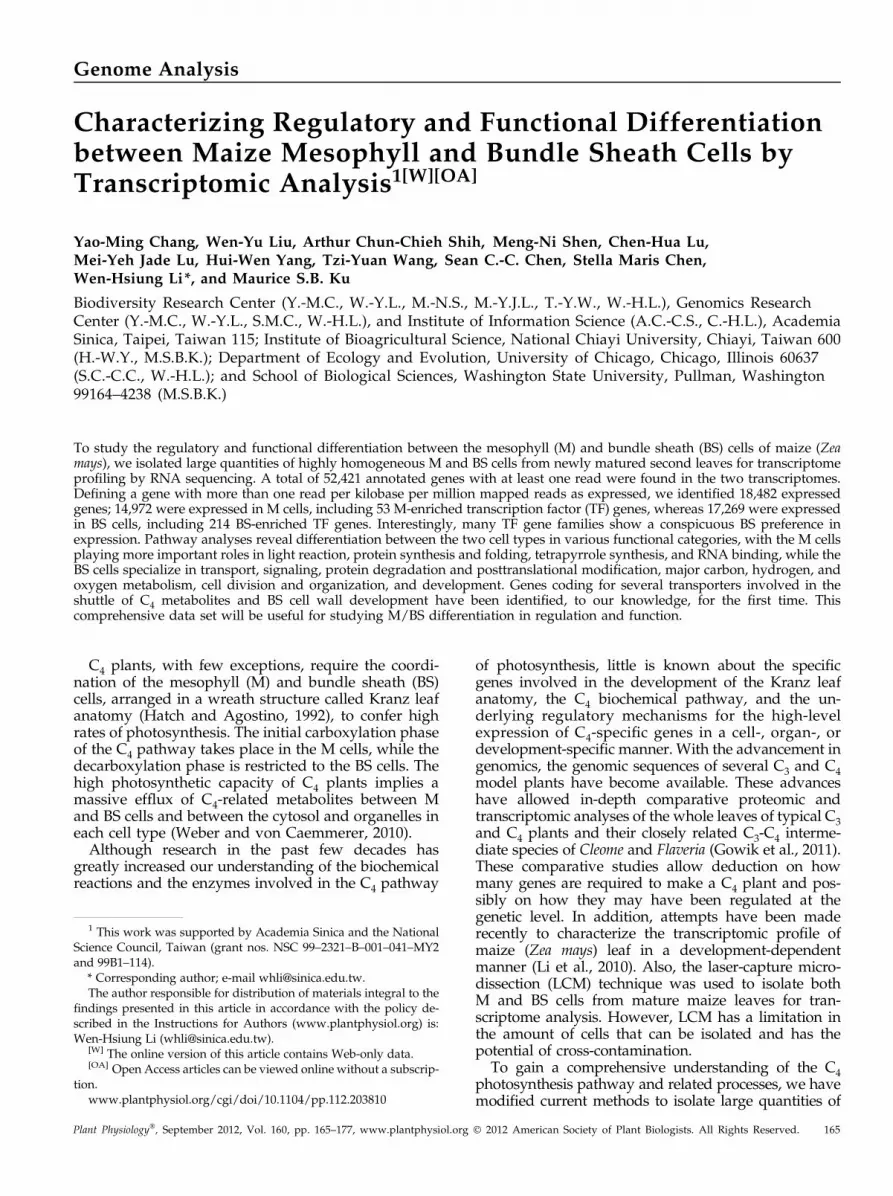
Figure 1. M- and BS-expressed genes and TF genes. A, Numbers of expressed genes in M and BS cells found in the FGS and theadditional numbers of expressed genes found in the WGS, excluding transposable elements, gene fragments, and pseudogenes.In Li et al. (2010), no data were available for expressed genes found in the WGS. B, Venn diagrams of M- and BS-enriched genesand TFs compared between this study and Li et al. (2010). C, Functional distribution of all cell type-enriched genes. Genes ofunknown function were not included. D, Distribution of functional preferences of cell type-enriched genes. In each row, the redand blue bars represent, respectively, the percentages of BS- and M-enriched genes within the functional category. The numbersin the red and blue bars represent the numbers of M- and BS-enriched genes. E, Distribution of cell type-enriched TF families.The red and blue bars represent the percentages of BS- and M-enriched TFs within each TF family, respectively. The numbers inthe red and blue bars represent the numbers of M- and BS-enriched TFs.
168 Plant Physiol. Vol. 160, 2012
Chang et al.

biochemical study by Aoyagi and Nakamoto (1985),which found substantial activity and protein of PPDKpresent in the maize BS cells. The conversion of phos-phoenolpyruvate (PEP) to pyruvate and ATP catalyzedby the reversible PPDK is another metabolic way forcells to produce ATP.There is strong biochemical evidence that the PCK
subtype C4 photosynthesis plays a substantial role insome NADP-ME subtype C4 plants, such as maize(Wingler et al., 1999; Leegood and Walker, 2003).Consistent with this notion, PCK was found to beexpressed at an extremely high level and exclusively inBS cells (i.e. Ri = 1.00; Table III). Two other enzymesare also required to support the operation of the PCKdecarboxylation system in both cell types, namely as-partate aminotransferase (AspAT) and alanine ami-notransferase (AlaAT). There are two major paralogsof AspAT found in maize with a high level of expres-sion: one (GRMZM5G836910) is M specific (Ri = 0.97),which encodes a chloroplast enzyme, confirming thebiochemical results of Gutierrez et al. (1974), while theother (GRMZM2G094712) is BS enriched (Ri = 0.79),which encodes a mitochondrial enzyme (SupplementalData S3). In contrast, the two AlaAT paralogous genesshowed moderate expression levels, both with an Mcell preference. The presence of a large amount ofAspAT transcript in M cells is necessary for the oper-ation of the PCK decarboxylation system in maizeleaves, as OAA is very labile and once producedshould be taken up quickly by the M chloroplast forreduction to malate by NADP-MDH or transaminatedto Asp by AspAT.
Functional Differentiation between M and BS Cellsand Identification of Genes Involved in KranzStructure Formation
For the 1,545 M-enriched and 3,422 BS-enrichedgenes identified, their biological functions were furtherelucidated using MapMan (http://mapman.gabipd.org/): 71% of the enriched genes (3,358 genes: 1,015M enriched and 2,343 BS enriched) have been assignedto known biological processes or metabolic pathways.
Except for those that have been classified as “others”(14%), the three most abundant functional groups areprotein metabolism (13%), RNA metabolism (11%),and transport (6%; Fig. 1C). The other abundantfunctional groups are miscellaneous (5%), signaling(4%), cell (3%), stress (3%), hormone metabolism (3%),photosynthesis (2%), and development (2%; Fig. 1C).When considering the functions of these genes in M orBS cells, we identified 15 cell type-enriched functionalgroups using the Fisher exact test (P , 0.05 for eachgroup; Fig. 1D). The difference in the number ofcell type-enriched genes between M and BS cellswithin each function is quite large, except for theprotein-targeting category. Overall, the number of BS-enriched genes (3,422) is much higher than that ofM-enriched genes (1,545). As expected, the transcriptsof genes coding for photosynthesis light reactioncomponents were more abundant in M than in BS cells.Interestingly, over 90% of the genes related to proteinsynthesis (for ribosomal proteins) and protein foldingwere preferentially expressed in M cells, while thoseinvolved in protein degradation were predominantlyexpressed in BS cells. These observations indicate thatmany proteins were synthesized and folded in Mcells but eventually degraded in BS cells, which sur-round the vasculature. This arrangement facilitates thetransport of amino acids released from protein degra-dation to other plant parts. Genes involved in RNAregulation of transcription, transport, signaling, celldivision, organization and vesicle transport, develop-ment, and major carbon, hydrogen, and oxygen me-tabolism were predominantly expressed in BS cells,but genes involved in secondary metabolism, tetra-pyrrole synthesis, and RNA binding showed an M cellexpression preference. Most of the secondary metab-olites accumulate in the epidermis cells, adjacent to Mcells.
For the 85 BS-enriched genes involved in develop-ment, we found that 22 genes encode the nodulinMtN3 and MtN21 family proteins, which were origi-nally identified as root nodule proteins of the legumeMedicago truncatula (Gamas et al., 1996). MtN3 andMtN21 also have recently been shown to be crucialfor exine pattern formation and cell integrity of
Table III. Differential expression of C4 photosynthesis-specific genes between M and BS cells, calculatedfrom the transcriptome data
Gene Identifier SymbolOur Data Li et al. (2010)
M Cells BS Cells Ri M Cells BS Cells Ri
GRMZM2G083841 PEPC 9,485 431 0.95 14,963 3,289 0.78GRMZM2G121878 CA 6,692 281 0.96 10,615 2,261 0.79GRMZM2G129513 NADP-MDH 2,621 95 0.96 2,523 531 0.79GRMZM2G383088 OMT 476 22 0.95 13 5 0.65GRMZM2G131286 PPDK-RP 988 74 0.93 0 0 0GRMZM2G085019 NADP-ME 87 12,192 0.99 2,016 18,850 0.89GRMZM2G086258 DCT2 7 545 0.99 1 7 0.93GRMZM2G001696 PCK 21 7,801 1.00 1,431 12,987 0.89GRMZM2G098520 rbsS-4 87 4,256 0.98 1,754 23,683 0.93GRMZM2G113033 rbsS-2 109 5,280 0.98 1,323 15,420 0.91
Plant Physiol. Vol. 160, 2012 169
Transcriptomes of Maize Leaf Cells

microspores (Guan et al., 2008) and secondary wallformation in xylary and cotton fibers (Ranocha et al.,2010), respectively. These genes code for transmem-brane proteins involved in the cell wall developmentof specialized plant cells that require stringent imper-meability to specific substances (e.g. oxygen). There-fore, the counterparts in maize leaves might beinvolved in the development of the BS cell wall, whichplays a key role in preventing the leakage of CO2 re-leased from C4 acid decarboxylation in order tomaintain a high CO2 concentration in BS cells (Hatchet al., 1995). At present, little is known about the bio-chemical composition of the C4 BS cell wall. For thefirst time, to our knowledge, our data suggest that C4plants may have adopted the exine composition ofmicrospore and pollen for its impermeability to anumber of substances, such as CO2. Further analysison the expression profile of these genes along the de-velopment of the Kranz anatomy in C4 leaves shouldprovide insights into their functional roles.
Cell Type-Enriched Transcription Factors
Among the 2,056 annotated transcription factor (TF)genes in maize, 654 and 820 were expressed in M and BScells, respectively (Table II). The median RPKM for allexpressed TFs in the two cell types were 5.7 and 7.1,respectively (Supplemental Data S4). We identified 53TF genes as M enriched and 214 TF genes as BS enriched(Table II), which, according to the TF family databasePlantTFDB version 2 (Zhang et al., 2011), belong to 16and 38 TF families, respectively. Six of the BS-enrichedTFs were assigned to two different families simulta-neously, because of two different types of DNA-bindingdomains in a protein. Three TFs, MYB59 (GRMZM2-G130149), MYB111 (GRMZM2G305856), and anotherMYB family protein (GRMZM2G002128), belong to bothMYB and MYB-related families. The other three TFs areAGL12 (GRMZM2G105387), which belongs to bothM-type and MIKC families, RPL (GRMZM2G154641),which belongs to both HB-other and TALE families, anda zinc finger (B-box type) family protein (GRMZM2-G075562), which belongs to both CO-like and DBBfamilies. Interestingly, in 11 of the families with celltype-enriched TF genes, all members showed BS en-richment, whereas none has all members showing Menrichment (Fig. 1E). This observation suggests thatmany TF families have a cell type preference, indicatinga differentiation in regulatory network for the functionaldifferentiation of the two photosynthetic cell types inmaize leaves. Comparison of the distributions of celltype-enriched TF families between this study and Liet al. (2010) shows some similarities but many differ-ences. For example, Li et al. (2010) identified only twoARF genes enriched in M cells and none enriched in BScells (Fig. 5d in Li et al., 2010), while we identified sevenARF genes enriched in BS cells but none enriched in Mcells (Fig. 1E). Cross-contamination of isolated M and BScells will lead to underestimation of cell-specific genes.
We searched the literature to identify the functionsor pathways where a TF might be involved (Table IV).Most M-enriched TFs are involved in the pathwaysof responses to environmental stimuli. For example,the three paralogs of DREB1A (GRMZM2G380377,GRMZM2G069146, and GRMZM2G069126) are re-lated to the function of cold acclimation (Novillo et al.,2007). The two ERF TFs, CBF4 (GRMZM2G124037)and ERF7 (GRMZM2G089995), are involved in thepathways of responses to drought and abscisic acid(Haake et al., 2002; Song et al., 2005), respectively. Inaddition, three TFs in the NAC family and two in theWRKY family are induced by wounding and patho-gens (Collinge and Boller, 2001; Xu et al., 2006; Zhenget al., 2006), respectively. Two other M-enriched TFswere GLK1 (GRMZM2G026833), which is involved inpathways of chloroplast development specific to Mcells (Nakamura et al., 2009), and ARR10 (GRMZM2-G013612), which is related to protoxylem differentia-tion (Yokoyama et al., 2007; Table IV).
Very different from the M-enriched TFs, most BS-enriched TFs are related to development or the bio-synthesis of cells and organelles. These functions includechlorophyll biosynthesis, secondary cell wall biosyn-thesis, cell division, cell differentiation, or develop-ment of chloroplast and leaves. The observations alsomatch some functional preferences of BS-enrichedgenes: categories of development and cell (division,organization, vesicle transport, etc.; Fig. 1D). ThreeTFs, MYB20 (GRMZM2G055158), MYB52 (GRMZM2-G455869), and MYB54 (GRMZM2G077147), in the MYBfamily, and ATAF1 (GRMZM2G179049) in the NACfamily, are related to secondary cell wall biosyn-thesis (Zhong et al., 2006, 2008). Two TFs, TCP4(AC205574.3_FG006) and TCP5 (GRMZM2G120151),in the TCP family are related to cell division (Cubaset al., 1999; Aggarwal et al., 2011). The GRAS TFs,RGA1 (GRMZM2G023872) and SHR (GRMZM2-G132794), are related to asymmetric cell division(Truong et al., 1997; Heidstra et al., 2004). Two bHLHTFs, PIL5 (GRMZM2G165042) and FMA (GRMZM2-G162450), are related to chlorophyll biosynthesis andcell differentiation (Huq et al., 2004; Gray, 2007), re-spectively. Three ARF TFs, ARF3 (GRMZM2G056120),ARF6 (GRMZM2G317900), and ARF8 (GRMZM2-G078274), are related to leaf or floral organ develop-ment (Finet et al., 2010; Tabata et al., 2010; Table IV).
Interestingly, the ERF family was the only one thatshowed a larger number of M-enriched TFs than BS-enriched TFs. Many of these M-enriched ERF TFs havebeen shown to play a role in response to environmentstimuli, but none of the BS-enriched ERF TFs areknown to play such a role. Our data also showed thatGOLDEN2 (GLK2; GRMZM2G087804) was preferen-tially expressed in BS cells of mature maize leavesat a moderate level (RPKM = 29) with Ri = 0.78(Supplemental Data S1). GLK2 has been shown to beinvolved in maize chloroplast development in the BScells independent of light, but it is not involved in rbcSaccumulation (Hall et al., 1998; Cribb et al., 2001). On
170 Plant Physiol. Vol. 160, 2012
Chang et al.

the other hand, GLK1 was highly and preferentiallyexpressed in M cells (Ri = 0.89). These data suggest thatGLK1 may regulate plastid development in M cells,while GLK2 may regulate plastid development in BScells of C4 leaves.
More Genes Are Expressed in M and BS Cells ThanPreviously Known
Recently, Li et al. (2010) examined the transcriptomesof M and BS cells isolated from fully expanded thirdmaize leaves by LCM. About 41 million 32-bp se-quencing reads from the two cell transcriptomes wereobtained. In this study, we generated approximately370 million 120-bp reads from M and BS RNA samples(approximately 177 and approximately 193 millionreads, respectively). Our data allowed the identificationof 18,482 expressed genes in total, while Li et al. (2010)detected only 16,638 expressed genes. Another possiblereason for the above difference between the two studiesis that Li et al. (2010) used an earlier annotationversion (APGv1) and only included genes with com-plementary DNA (cDNA) support, while we usedAPGv2. As a result, the total number of expressedgenes obtained from our data is higher than thatobtained by Li et al. (2010).
In addition to the expressed genes in the FGS, wedetected an additional 2,224 expressed genes in theWGS (Fig. 1A), with the exclusion of transposableelements, gene fragments, and pseudogenes. Manygenes in this additional gene set were highly expressed,with RPKM . 100 for 85 M-enriched genes and 86BS-enriched genes. The highest RPKM values in thisset were 4,900 (GRMZM5G809350; a paralog ofLHCII type 1 CAB2) and 31,561 (GRMZM2G142891; aparalog of b-glucosidase aggregating factor) in M andBS cells, respectively. Furthermore, we detected 178M-enriched and 610 BS-enriched genes in the WGS.Although there is no MapMan annotation for the genesin the WGS, 263 of the 2,224 expressed genes in theWGS are found to have one or more Gene Ontologyterms (http://www.geneontology.org/); the five mostabundant terms in molecular functions are ATP bind-ing (23%), ice binding (13%), zinc ion binding (12%),DNA binding (10%), and protein binding (10%). ThreeM-enriched genes (GRMZM2G411457, GRMZM2-G030616, and GRMZM2G152576) are related to lightreaction in photosynthesis (Supplemental Data S1).
Notably, our data reveal more genes expressed in BSthan in M cells in mature maize leaves. Expressedgenes from vascular tissues (e.g. sieve element) in theBS cell preparation might have contributed to thecategory of BS-expressed genes, as the BSS isolated in
Table IV. Selected cell type-enriched TFs and related functions or pathways
Cell TF Familya Gene Identifier M BS Ri Gene Name Function or Pathway
M G2-like GRMZM2G026833 125.41 15.16 0.88 GLK1 Chloroplast developmentM ARR-B GRMZM2G013612 55.22 10.27 0.81 ARR10 Protoxylem differentiationM WRKY GRMZM2G449681 22.82 4.42 0.81 WRKY33 Pathogen inducedM WRKY AC209050.3_FG003 2.21 0.21 0.91 WRKY18 Pathogen inducedM ERF GRMZM2G380377 4.81 0.32 0.93 DREB1A Cold acclimationM ERF GRMZM2G069146 69.81 5.53 0.92 DREB1A Cold acclimationM ERF GRMZM2G069126 39.81 2.78 0.93 DREB1A Cold acclimationM ERF GRMZM2G124037 7.19 0.03 1.00 CBF4 Drought adaptationM NAC GRMZM2G336533 2.16 0.13 0.94 ATAF1 Induced by woundingM NAC GRMZM2G060116 11.36 0.86 0.92 ATAF2 Induced by woundingM NAC GRMZM2G126936 19.29 1.73 0.91 ATAF2 Induced by woundingBS bHLH GRMZM2G165042 0.80 41.36 0.98 PIL5 Chlorophyll biosynthesisBS MYB GRMZM2G455869 0.04 13.31 1.00 MYB52 Secondary wallBS MYB GRMZM2G077147 0.01 4.13 1.00 MYB54 Secondary wallBS MYB GRMZM2G055158 0.08 1.07 0.93 MYB20 Secondary wallBS NAC GRMZM2G179049 0.12 2.82 0.96 ATAF1 Secondary wallBS TCP GRMZM2G120151 1.34 42.49 0.97 TCP5 Cell division, proliferationBS TCP AC205574.3_FG006 0.00 1.53 1.00 TCP4 Cell division, proliferationBS bHLH GRMZM2G162450 0.06 3.13 0.98 FMA Cell differentiationBS ARR-B GRMZM2G479110 1.05 14.69 0.93 ARR12 Protoxylem differentiationBS ARF GRMZM2G056120 0.63 11.66 0.95 ARF3 Development of floral organs and leavesBS ARF GRMZM2G078274 0.44 7.86 0.94 ARF8 Development of floral organsBS ARF GRMZM2G317900 0.17 12.34 0.99 ARF6 Development of floral organsBS GRAS GRMZM2G023872 0.00 1.20 1.00 RGA1 Asymmetric cell divisionBS GRAS GRMZM2G132794 0.02 2.29 0.99 SHR Asymmetric cell division
aTF family names are as follows: G2-like, GOLDEN2-like; ARR-B, type B phospho-Accepting Response Regulator; WRKY, conserved WRKYdomains, about 60 amino acid residues with the WRKYGQK sequence followed by a C2H2 or C2HC zinc finger motif; ERF, Ethylene-ResponsiveElement Binding Factor; NAC, NAM (no apical meristem), ATAF, and CUC (cup-shaped cotyledon) TFs; bHLH, basic helix-loop-helix proteins; MYB,myeloblastosis virus; TCP, TEOSINTE BRANCHED1 from maize, CYCLOIDEA from snapdragon (Antirrhinum majus), and PROLIFERATING CELLFACTOR1 and -2 from rice (Oryza sativa); ARF, Auxin Response Factor; GRAS, GAI, RGA, and SCR genes.
Plant Physiol. Vol. 160, 2012 171
Transcriptomes of Maize Leaf Cells

this study contained the vascular tissue (SupplementalTable S4) and sieve elements are active cells fortransport function. Thus, as discussed above, a smallportion of the RNA from vascular tissues might havecontributed to our BS transcriptome. However, it ismost likely that more genes are expressed in BS cellsthan in M cells because of functional necessity, inagreement with the observation that the BS cells in C4plants play much more important roles than theM cells in various physiological processes (Majeranet al., 2005; Leegood, 2008). In addition to genes re-lated to C4 acid decarboxylation, expression of specificgenes related to the metabolism of photorespiration,nitrate, sulfate, ammonium, starch, ion transport, sec-ondary metabolites, and cell wall structure is largelyconfined to BS cells.
Light Reaction, Carbon Fixation Pathway, andRelated Transporters
Many of the maize genes coding for the PSI compo-nents are highly expressed in both cell types, but withhigher expression levels in M cells (Supplemental DataS3). In contrast, many of the maize genes coding forthe PSII components are highly and predominantlyexpressed in M cells, with Ri . 0.9 for most of the genes.Transcripts for the two genes coding for ATP synthase,however, are found in both cell types. Most of the NDF(for NDH-dependent cyclic electron flow) genes codingfor the iron-sulfur cluster-binding protein involved incyclic electron transport exhibited a preferential ex-pression in BS cells, with Ri ranging from 0.67 to 0.86,whereas two NDF genes (GRMZM2G865543 andGRMZM2G162233) showed a moderate preference inexpression in BS cells, with Ri of 0.38 and 0.36, respec-tively. These data are in agreement with the observa-tions that maize BS cells possess a higher capacity forcyclic electron transport (Ivanov et al., 2007).
Based on the expression profiles of C4-specific genes(Table III; Supplemental Data S1 and S3), we proposethe partition of the key biochemical reactions of the C4photosynthesis pathway between M and BS cells ofmaize, an NADP-ME subtype C4 plant (Fig. 2). Hy-dration of CO2 to bicarbonate, generation of PEP frompyruvate, carboxylation of bicarbonate to OAA, and itssubsequent transamination to Asp or reduction tomalate in the chloroplast all take place in the M cells. Incontrast, decarboxylation of OAA to PEP and CO2 anddecarboxylation of malate to pyruvate and CO2 occurin the cytosol and chloroplast of BS cells, respectively.The high expression levels of NADP-ME and PCKsuggest that the PCK decarboxylation system plays asubstantial role in maize C4 photosynthesis, consistentwith previous biochemical studies (Furumoto et al.,1999, 2000; Wingler et al., 1999; Furbank, 2011). Thedual decarboxylation system in some NADP-ME sub-type C4 plants, such as maize, probably makes themthe most efficient photosynthetic plants.
High rates of photosynthesis by C4 plants imply highfluxes of metabolites intercellularly and intracellularly.
In C4 plants, most of the photosynthetic metabolites areknown to be transported symplastically between M andBS cells through plasmodesmata. However, within eachcell type, transporters on the chloroplast envelope mustbe active to substantiate the heavy traffic of relatedmetabolites between cytosol and chloroplast. A maizegene coding for a 2-oxoglutarate/malate translocator(ZmpOMT1; GRMZM2G383088) was highly and pre-dominantly expressed in M cells, and a dicarboxylatetransporter gene (ZmpDCT1; GRMZM2G040933) wasalso preferentially expressed in M cells at a moderatelevel. Thus, these two transporters may be responsiblefor the uptake of OAA and the export of malate by Mchloroplasts, respectively (Taniguchi et al., 2004). Incontrast, the transcript for another maize gene codingfor DCT (ZmpDCT2; GRMZM2G086258) was highlyand almost exclusively expressed in BS cells, which maybe responsible for the import of malate by BS chloro-plasts, as suggested previously by Taniguchi et al.(2004).
In C3 plants the chloroplast phosphate translocatortriose phosphate/phosphate translocator (TPT) is tho-ught to have a central role in the partitioning of fixedcarbon between starch in the chloroplast and Suc in thecytosol. Inorganic phosphate is taken up by the trans-locator in exchange for triose phosphate, which is thenmetabolized to Suc in the cytosol. In NADP-ME subtypeC4 plants, BS chloroplasts are deficient in PSII, so thetriose phosphate produced must be transported to Mchloroplasts for reduction. Consistent with this role, thetranscript of a maize TPT gene (APE2; GRMZM2-G070605) was expressed with very high RPKM valuesof 2,069 and 1,551 in M and BS cells, respectively(Supplemental Data S3).
In C4 plants, pyruvate produced from malate de-carboxylation in the BS chloroplasts must be returnedto M chloroplasts for regeneration of PEP via PPDKwith the input of ATP, and PEP is subsequentlyexported to the cytosol for carboxylation by PEPC.Earlier biochemical and molecular studies suggestedthat to accommodate these new transport functions inC4 plants, TPT has been adopted and modified for theexchange of phosphate and PEP (PPT; Flugge, 1999),and two types of light-dependent pyruvate transporterhave been employed by the M chloroplasts for theuptake of pyruvate in a wide range of C4 plants, onesodium dependent (Ohnishi et al., 1990; Ohnishi andKanai, 1990; Aoki et al., 1992) and one proton depen-dent (Aoki et al., 1992). The NADP-ME subtype C4Flaveria spp. use the sodium/pyruvate symporter(Gowik et al., 2011), but maize, a NADP-ME subtypemonocot, uses the proton/pyruvate symporter (Ohnishiet al., 1990; Ohnishi and Kanai, 1990; Aoki et al., 1992).The gene coding for the sodium-dependent pyruvatetransporter BASS2, a bile acid:sodium symporter familyprotein 2, has been cloned recently from C4 Flaveria spp.(Furumoto et al., 2011), but the gene(s) coding for theproton-dependent one remains elusive. Transcripts ofseveral maize PPTs were detected in this study. Oneof them (GRMZM2G174107) was highly enriched in
172 Plant Physiol. Vol. 160, 2012
Chang et al.

M cells, whereas a second one (GRMZM2G066413) wasmoderately enriched in BS cells. Thus, the GRMZM2-G174107 gene may specifically code for the exchanger oftriose phosphate and PEP in theM chloroplasts of maizeleaves. In addition, our transcriptome data showed thatfor the three MEP (for methyl erythritol phosphate)genes coding for the inner envelope transporter pro-teins, MEP3 (GRMZM2G138258) was expressed exclu-sively in BS cells (Ri = 0.99) at an extremely high level(RPKM = 2,734), GRMZM2G305851 was moderatelyexpressed with a preference in M cells, whereas MEP2(GRMZM2G077222) was equally expressed in both celltypes at relatively low levels. The exact physiologicalroles of MEP transporters in maize have not beenestablished, but all three MEP transporters havechloroplast-targeting sequences (by TargetP; http://www.cbs.dtu.dk/services/TargetP/) and transmem-brane domains (by DAS; http://mendel.imp.ac.at/sat/DAS/DAS.html), which suggest that they areplastidial transporters. Since pyruvate is one of the twocrucial substrates of the MEP pathway in plastids, wepropose that the two MEP3 paralogs may code for theinner chloroplast envelope proteins responsible forpyruvate export from BS chloroplasts and import of
pyruvate by M chloroplasts, respectively, whereasMEP2 may mainly function to supply pyruvate to theMEP pathway, as in C3 plants. In agreement with ourdata, Friso et al. (2010) suggested earlier that MEP2,4and MEP3/4 may function as pyruvate transporters inM and BS chloroplasts, respectively, based on proteo-mic studies of isolated maize M and BS chloroplasts.
Although photorespiration is not apparent in C4plants under ambient atmospheric conditions, mea-surable photorespiratory activity can be detected atlow CO2 conditions (de Veau and Burris, 1989; Daiet al., 1993) and in young leaves (Dai et al., 1993, 1995).Consistent with the localization of Rubisco in theBS chloroplasts of C4 plants, the expression of genescoding for most of the key photorespiratory enzymesexhibited a BS specificity (Supplemental Data S3).High levels of transcript were detected in the BS cellsfor glycolate oxidase (GRMZM2G129246), Gly decar-boxylase (GRMZM2G399183 and GRMZM2G104310),and Ser hydroxymethyltransferase (GRMZM2G135283),with Ri values ranging from 0.94 to 1.00. However,expression of two of the photorespiratory pathwayenzymes, chloroplast phosphoglycolate phosphataseand peroxisomal NAD-hydroxypyruvate reductase,
Figure 2. Cellular compartmentation of the key C4 biochemical reactions in the NADP-ME subtype maize leaves. Enzymespresented are CA (carbonic anhydrase; GRMZM2G121878) and PEPC (phosphoenolpyruvate carboxylase; GRMZM2G083841)in the cytosol and AspAT (aspartate aminotransferase; GRMZM5G836910), NADP-MDH (NADP-malate dehydrogenase;GRMZM2G129513), and PPDK (pyruvate, Pi dikinase; GRMZM2G306345) in the chloroplast of M cells, as well as PCK(phosphoenolpyruvate carboxykinase; GRMZM2G001696) and AspAT (aspartate aminotransferase; GRMZM2G094712) in thecytosol and mitochondria, respectively, and NADP-ME (NADP-malic enzyme; GRMZM2G085019) and Rubisco (large subunit,GRMZM5G815453; small subunit, GRMZM2G098520 and GRMZM2G113033) in the chloroplast in BS cells. The majormetabolite transporters involved are as follows: (1) OMT1 (2-oxoglutarate/malate transporter; GRMZM2G383088), (2) DIT1(dicarboxylate transporter; GRMZM2G040933), (3) DCT2 (dicarboxylate transporter; GRMZM2G086258), (4) MEP3 (BS; pu-tative proton/pyruvate symporter; GRMZM2G138258), (5) MEP3 (M; putative proton/pyruvate symporter; GRMZM2G305851),(6) PPT (phosphoenolpyruvate/phosphate translocator; GRMZM2G174107), (7) TPT (triose phosphate/phosphate antiporter;GRMZM2G070605), (8) SUT1/2 (Suc transporters; GRMZM2G034302 and GRMZM2G087901) in companion cells (C.C.), and(9) SUT4 (Suc transporter; GRMZM2G307561).
Plant Physiol. Vol. 160, 2012 173
Transcriptomes of Maize Leaf Cells

did not show strong BS preference, presumably dueto their housekeeping roles in the organelles. Also,chloroplast is known to be capable of assimilatingammonium, a toxic compound released from Serdecarboxylation in mitochondria, through Glu syn-thetase and Gln synthase. In accordance, genes forGlu synthetase (GRMZM2G098290) and Gln synthase(GRMZM2G036609) were highly expressed in bothcells. It is also notable that several paralogs of Serhydroxymethyltransferase were expressed in maize,but only one of them (GRMZM2G135283) was exclu-sively expressed in BS cells, which could have beenacquired during the evolution of C4 plants.
Development, Cell Wall, and Plasmodesmata Formation
Kranz leaf anatomy is essential for most C4 plants toconcentrate CO2 around Rubisco in the chloroplasts ofBS cells to suppress its oxygenase and the associatedphotorespiratory activity. Consequently, the BS cellwall in many C4 plants is thickened and specializedwith a suberin layer to prevent CO2 leakage (Evansand Von Caemmerer, 1996; Leegood, 2002). Our datadepict the expression of many cell wall-associatedgenes specifically expressed in BS cells, which in-clude genes coding for cell wall-associated kinase(GRMZM2G135291 and GRMZM2G062471) and sev-eral highly expressed nodulin-type proteins (MtN3and MtN21). Therefore, these genes may be relatedto the differentiation of C4 BS cell walls. In contrast,only one cell wall-related gene coding for expansin(GRMZM2G094990) is specifically expressed in M cells.
Intercellular transport of metabolites between M andBS cells (Evert et al., 1977; Robards and Lucas, 1990)and between the BS and the adjacent vascular paren-chyma cells (Botha et al., 2000) in C4 leaves is mainlyby diffusion through interconnecting plasmodesmata,which are concentrated along the cell wall betweenthese cell types. Interestingly, our data reveal that thegenes coding for plasmodesmata-located proteins(signaling receptor kinases), plasmodesmata callose-binding proteins (b-1,3-glucan hydrolases), and cal-lose synthase are almost exclusively expressed in BScells (Supplemental Data S3), suggesting that genesrelated to plasmodesmata development may be con-trolled by the regulatory network of BS cells. Callose,which differs from cellulose in consisting of a b-1,3-glucan chain, is known to be made by a few cell typesat a specific stage during cell wall development, suchas microspore and pollen. It is also ectopically depos-ited over the cell wall between the BS and vascularparenchyma cells in maize leaf minor veins, therebyoccluding the plasmodesmata (Botha et al., 2000).Therefore, we speculate that a similar cell wall com-position may be shared by nodule, microspore, pollen,xylary fiber, and C4 BS cells. C4 plants regulatethe expression of these cell wall-related genes in anorgan- and cell-specific manner to function in the CO2-concentrating mechanism.
CONCLUSION
The C4 physiology is an integrated syndrome of de-velopmental, anatomical, cellular, and biochemicaltraits that must rely on regulatory networks that controlthe functional differentiation of M and BS cells. Ourtranscriptome profiling of the two photosynthetic celltypes of mature maize leaves reveals the cell differen-tiation of gene expression at both regulatory and func-tional levels. To our knowledge for the first time, genescoding for the transporters of several C4 metabolitesand the development of the BS cell wall have beenidentified that express in a cell-specific manner. Clearly,both cell types are specialized in different metabolicfunctions but are also coordinated to provide a highefficiency in carbon, mineral, and water use. In addi-tion, many TF genes have been shown to express in acell-specific manner. Thus, the comprehensive data setsfrom this study have laid a solid foundation for furtherstudy of the regulation of the expression and evolutionof C4-specific and -related genes.
Although C4 plants represent only approximately 3%of plant species, they contribute to about 30% of terres-trial carbon fixation, and 60% of C4 plants are grasses,which include some of our most important food crops,such as maize, sugarcane (Saccharum officinarum), millet(Pennisetum americanum), and sorghum (Sorghum bicolor)of the NADP-ME subtype. Despite this scarcity, some ofthe most productive crops and noxious weeds on earthbelong to the C4 plants, which make this photosyntheticproperty a desirable trait for introduction into the lessproductive C3 crops (Hibberd et al., 2008). However, atpresent, very little is known about the molecular regu-latory networks underlying the development of Kranzleaf anatomy and the functional differentiation of itsphotosynthetic cells in C4 photosynthesis and other me-tabolism. A comprehensive understanding of the C4syndrome is required before we can effectively transferthe C4 traits into C3 crops, such as rice (Oryza sativa),wheat (Triticum aestivum), and soybean (Glycine max).A thorough and systematic examination of the regula-tory networks involved in C4 syndrome from compara-tive C3, C3-C4 intermediate, and C4 transcriptome study(Gowik and Westhoff, 2011) and from developmentaland cellular transcriptome profiling of C4 leaves (Li et al.,2010; this study) should streamline this process.
MATERIALS AND METHODS
Plant Growth Conditions and Leaf Sample Collection
Seeds of maize (Zea mays ‘White Crystal’), a glutinous cultivar, were ger-minated and cultivated in the greenhouse in June 2011 under natural sunlightconditions (13–14 h) with a maximum photosynthetic photon flux density of1,600 mmol m22 s21, day/night temperatures of 28°C to 32°C/25°C to 28°C,and 60% to 70% relative humidity. The second newly expanded leaves of9-d-old plants were harvested around 9 AM for isolation of M and BS cells inthe laboratory and extraction of total RNA.
Enzymatic Isolation of M Protoplasts
MP were isolated from the mid section (5 cm) of newly matured secondleaves by digesting leaf segments in a cell wall digestive medium, according to
174 Plant Physiol. Vol. 160, 2012
Chang et al.

the procedures of Kanai and Edwards (1973), Sheen (1995), Markelz et al.(2003), Sawers et al. (2007), and Sharpe et al. (2011) with minor modifications.All solutions and glassware were sterilized either by filtration or by treatmentwith diethyl pyrocarbonate water followed by autoclave. The digestive me-dium, containing 1.5% (w/v) cellulose (Onozuka RS), 0.1% (w/v) macer-ozyme (Onozuka R-10), 20 mM MES (pH 5.8), 0.6 M sorbitol, 5 mM
b-mercaptoethanol, 1 mM CaCl2, 0.1% bovine serum albumin, and 10 mM di-thiothreitol (DTT), was prepared freshly from filter-sterilized stock solutions.MES buffer solution was preheated to 70°C for 5 min and cooled to roomtemperature before the addition of sorbitol and digestive enzymes. The me-dium was then heated to 55°C for 10 min to solubilize the enzymes as well asto inactivate DNase, and other components were added. Several leaf bladeswere stacked and cut perpendicularly to the long axis into 0.5- to 1-mm sliceswith sterilized razor blades and then quickly transferred into a 50-mL sterilebeaker containing 20 mL of digestive medium. The medium with leaf sliceswas vacuum infiltrated twice and incubated at 23°C under low light (100 mmolm22 s21) for 3 h without shaking.
At the end of digestion, the mixture was first filtered through a 500-mmmesh,and the materials retained on the mesh were washed gently with 100 mL ofsterile sorbitol wash medium (0.6 M sorbitol, 5 mM HEPES-KOH, pH 7.0, 100 mM
b-mercaptoethanol, and 1 mM CaCl2) to release more MP. The filtrate was thenfiltered through an 80-mm nylon net to retain undigested tissue and BS, whileMP (15–35 mm diameter) in the filtrate was collected by centrifugation at300g for 5 min. The crude MP pellet was gently resuspended in 4 to 6 mL of 13%(w/v) dextran-Suc solution (13% dextran, 0.6 M Suc, 5 mM HEPES-KOH, pH 7.0,100 mM b-mercaptoethanol, 1 mM CaCl2, and 10 mM DTT). For purification, theMP crude suspension was transferred to a 13-mL test tube and gently overlaidsequentially with 2 mL of 10.7% (w/v) dextran-Suc solution and 2 mL of sorbitolwash medium. The gradient was centrifuged at 300g in a swing-bucket rotor for20 min, and pure MP was collected from the interphase between the sorbitolwash medium and 10.7% dextran-Suc solution and diluted in a small volume ofsorbitol wash medium before isolation of RNA. The purity of isolated MP wasexamined with a light microscope.
Mechanical Isolation of BSS
To avoid damage to BS cells during enzymatic digestion, a mechanicalmethod was adopted for rapid isolation of BS cells. The isolation mediumcontained 0.6 M sorbitol, 50 mM Tris-HCl (pH 8.0), 5 mM EDTA, 0.5% poly-vinylpyrrolidone-10, 10 mM DTT, and 100 mM b-mercaptoethanol. Leaf slices,prepared as described above, were quickly added to 50 mL of cold BS cellisolation medium and homogenized twice (10 s each) at high speed in aWaring blender. After blending, the mixture was first filtered through a500-mm mesh, the crude tissue retained on the 500-mm mesh was resuspendedin another 50-mL isolation medium, and the blending and filtration processeswere repeated. BS cells that passed through the 500-mm mesh were filteredand retained on an 80-mm nylon net. The purity of BS cells was monitoredwith a light microscope, and if deemed necessary, the collected BS cells werefurther washed with the cold isolation medium to remove attached M tissueand the epidermal tissue floating on top of the isolation medium. The wholeisolation procedure was completed within 10 min.
Enzyme Assay and Immunoblot Analysis
The activities of NADP-ME and PEPC were assayed at 30°C using aspectrophotometer according to Kanai and Edwards (1973). The procedure ofMurphy et al. (2007) was followed for immunoblot analysis using specificantibodies.
RNA Isolation, Library Preparation, andDeep Sequencing
Total RNA from isolated cells was extracted using Trizol reagent (Invi-trogen) and purified using acid phenol-chloroform extraction. The quality ofextracted RNA was examined by gel electrophoresis and by BioAnalyzer(Agilent).
Using the Illumina mRNA-seq kit, 10 to 15 mg of a total RNA sample waspurified for poly(A) RNA and subjected to fragmentation for 3 min at 94°C.The mRNA fragments were then converted into single-stranded cDNA, andthe ends were modified and ligated to the paired-end adaptors. The ligationproducts were size selected on agarose gels (independent slices of 250–350 and
350–450 bp), amplified by 15 cycles of PCR, cleaned up using Ampure beads(Beckman Agencourt), and examined by Qubit (Invitrogen) and BioAnalyzerHigh Sensitivity DNA chip (Agilent). Paired-end 2- 3 120-nucleotide se-quencing was performed on Illumina Genome Analyzer IIx, and two lanes ofdata were obtained for each cell type by sequencing two independently sizedselected libraries. Approximately 177.4 million and 193.4 million reads wereobtained from the M and BS RNA samples, respectively.
Deep-Sequencing Data Processing, Mapping, andExpression Level Calculation
We processed and mapped raw reads to the maize genome (B73) using themapping tool Tophat version 1.3.3 (http://tophat.cbcb.umd.edu/) with de-fault parameters (maximum allowed mismatches, two; maximum number ofhits for a read, 10). Based on the APGv2 annotation downloaded from http://ftp.maizesequence.org/, we calculated the expression levels of each annotatedgene in RPKM (Mortazavi et al., 2008) using the expression calculation toolCufflinks version 1.2.1 (http://cufflinks.cbcb.umd.edu/).
Estimation of Cell Type Specificity
As described in “Results,” to estimate the degree of differential expressionof genes between the two cell types, we defined the degree of cell specificity ofgene i as Ri = |mi – bi|/max(mi, bi), where mi and bi represent the RPKM ofgene i in the M and BS RNA samples, respectively. Applying this measure tothe transcriptome data, one can study the gene expression differences betweenthe M and BS cells.
Estimation of Contamination Rates
We can use the transcriptome data to obtain an approximate estimate of thecontamination rate in the M (or BS) cells isolated. Let c1 be the percentagecontamination of the isolated M cells by BS cells. That is, c1 is the proportion ofBS cells in the sample of M cells. For gene i, let xi and yi be the expected ex-pression levels in M cells and in BS cells, respectively, under no contamination.Then, the expected expression level of gene i in the isolated M cells, denotedby mi, should be given by
mi ¼ ð12 c1Þxi þ c1yi ð1Þ
Equation 1 cannot be solved because there are two unknowns, c1 and mi.However, if gene i is supposed not to be expressed in M cells, we can assumexi = 0 and obtain c1 = mi/yi.
Since using one gene to estimate c1 may not be reliable, we estimate c by
c1 ¼ ∑mi=∑yi ð2Þwhere the summation is over the genes that are supposed to be expressed onlyin BS cells but not in M cells. We can take the estimate as an upper estimatebecause one or more of the genes used may not be absolutely only expressedin BS cells.
Similarly, let c2 be the rate of contamination of BS cells by M cells and let bibe the observed level of expression in the transcriptome data of the BS cellsisolated. Then, we have
bi ¼ c2xi þ ð12 c2Þ yi ð3Þ
c2 ¼ ∑bi=∑xi ð4Þwhere the summation is over the genes that are supposed to be expressed onlyin M cells but not in BS cells.
Functional Annotation
The identified cell type-enriched genes were annotated with biologicalfunctions and metabolic pathways by MapMan (Thimm et al., 2004; http://mapman.gabipd.org/). The TF information was downloaded from PlantTFDB version 2.0 (Zhang et al., 2011; http://planttfdb.cbi.pku.edu.cn/).
The read data have been submitted to the National Center for BiotechnologyInformation Short Read Archive under accession number SRP009063.
Supplemental Data
The following materials are available in the online version of this article.
Plant Physiol. Vol. 160, 2012 175
Transcriptomes of Maize Leaf Cells

Supplemental Figure S1. Micrographs of isolated M and BS cells.
Supplemental Figure S2. Immunoblot analysis in mature leaves and iso-lated M and BS cells (two preparations).
Supplemental Figure S3. Median depth of read-mapping coverage alongthe cDNA.
Supplemental Table S1. Activities of PEPC and NADP-ME in the wholeleaf and in the isolated M and BS cells of maize.
Supplemental Table S2. Validation of cell type-specific gene expression.
Supplemental Table S3. List of quantitative reverse transcription-PCRprimers, Universal Probe Library probe, and PCR efficiency.
Supplemental Table S4. RPKM of selected genes of vascular and epider-mal tissues.
Supplemental Data S1. RPKM values of all genes with at least one read inone of the two transcriptomes.
Supplemental Data S2. List of genes with Ri . 0.99 in the two cell types.
Supplemental Data S3. Differential expression between M and BS cells ofgenes.
Supplemental Data S4. List of cell type-enriched TFs.
Supplemental Materials and Methods S1.
ACKNOWLEDGMENTS
We thank Jen Sheen and Shin-Han Shiu for valuable comments andsuggestions on the manuscript. The transcriptome sequencing was conductedby the High Throughput Sequencing Core, Academia Sinica, Taiwan.
Received July 17, 2012; accepted July 23, 2012; published July 24, 2012.
LITERATURE CITED
Aggarwal P, Padmanabhan B, Bhat A, Sarvepalli K, Sadhale PP, Nath U(2011) The TCP4 transcription factor of Arabidopsis blocks cell divisionin yeast at G1→S transition. Biochem Biophys Res Commun 410:276–281
Aoki N, Ohnishi J-i, Kanai R (1992) Two different mechanisms for trans-port of pyruvate into mesophyll chloroplasts of C4 plants: a comparativestudy. Plant Cell Physiol 33: 805–809
Aoyagi K, Nakamoto H (1985) Pyruvate, Pi dikinase in bundle sheathstrands as well as in mesophyll cells in maize leaves. Plant Physiol 78:661–664
Botha C, Cross R, van Bel A, Peter C (2000) Phloem loading in the sucrose-export-defective (SXD-1) mutant maize is limited by callose depositionat plasmodesmata in bundle sheath-vascular parenchyma interface.Protoplasma 214: 65–72
Collinge M, Boller T (2001) Differential induction of two potato genes,Stprx2 and StNAC, in response to infection by Phytophthora infestansand to wounding. Plant Mol Biol 46: 521–529
Cribb L, Hall LN, Langdale JA (2001) Four mutant alleles elucidate the roleof the G2 protein in the development of C(4) and C(3) photosynthesizingmaize tissues. Genetics 159: 787–797
Cubas P, Lauter N, Doebley J, Coen E (1999) The TCP domain: a motiffound in proteins regulating plant growth and development. Plant J 18:215–222
Dai Z, Ku M, Edwards GE (1993) C4 photosynthesis (the CO2-concentratingmechanism and photorespiration). Plant Physiol 103: 83–90
Dai Z, Ku M, Edwards GE (1995) C4 photosynthesis (the effects of leafdevelopment on the CO2-concentrating mechanism and photorespira-tion in maize). Plant Physiol 107: 815–825
de Veau EJ, Burris JE (1989) Photorespiratory rates in wheat and maize asdetermined by o-labeling. Plant Physiol 90: 500–511
Evans JR, Von Caemmerer S (1996) Carbon dioxide diffusion inside leaves.Plant Physiol 110: 339–346
Evert RF, Eschrich W, Heyser W (1977) Distribution and structure of theplasmodesmata in mesophyll and bundle-sheath cells of Zea mays L.Planta 136: 77–89
Finet C, Fourquin C, Vinauger M, Berne-Dedieu A, Chambrier P,Paindavoine S, Scutt CP (2010) Parallel structural evolution of auxinresponse factors in the angiosperms. Plant J 63: 952–959
Flugge UI (1999) Phosphate translocators in plastids. Annu Rev PlantPhysiol Plant Mol Biol 50: 27–45
Friso G, Majeran W, Huang M, Sun Q, van Wijk KJ (2010) Reconstructionof metabolic pathways, protein expression, and homeostasis machiner-ies across maize bundle sheath and mesophyll chloroplasts: large-scalequantitative proteomics using the first maize genome assembly. PlantPhysiol 152: 1219–1250
Furbank RT (2011) Evolution of the C(4) photosynthetic mechanism: are therereally three C(4) acid decarboxylation types? J Exp Bot 62: 3103–3108
Furumoto T, Hata S, Izui K (1999) cDNA cloning and characterizationof maize phosphoenolpyruvate carboxykinase, a bundle sheath cell-specific enzyme. Plant Mol Biol 41: 301–311
Furumoto T, Hata S, Izui K (2000) Isolation and characterization of cDNAsfor differentially accumulated transcripts between mesophyll cells andbundle sheath strands of maize leaves. Plant Cell Physiol 41: 1200–1209
Furumoto T, Yamaguchi T, Ohshima-Ichie Y, Nakamura M, Tsuchida-Iwata Y, Shimamura M, Ohnishi J, Hata S, Gowik U, Westhoff P, et al(2011) A plastidial sodium-dependent pyruvate transporter. Nature 476:472–475
Gamas P, Niebel FdeC, Lescure N, Cullimore J (1996) Use of a subtractivehybridization approach to identify new Medicago truncatula genes in-duced during root nodule development. Mol Plant Microbe Interact 9:233–242
Gowik U, Bräutigam A, Weber KL, Weber AP, Westhoff P (2011) Evolu-tion of C4 photosynthesis in the genus Flaveria: how many and whichgenes does it take to make C4? Plant Cell 23: 2087–2105
Gowik U, Westhoff P (2011) The path from C3 to C4 photosynthesis. PlantPhysiol 155: 56–63
Gray JE (2007) Plant development: three steps for stomata. Curr Biol 17:R213–R215
Guan YF, Huang XY, Zhu J, Gao JF, Zhang HX, Yang ZN (2008) RUP-TURED POLLEN GRAIN1, a member of the MtN3/saliva gene family, iscrucial for exine pattern formation and cell integrity of microspores inArabidopsis. Plant Physiol 147: 852–863
Gutierrez M, Huber SC, Ku SB, Kanai R, Edwards GE (1974). Intracellularlocalization of carbon metabolism in mesophyll cells of C4 plants. In MAvron, ed, III International Congress on Photosynthesis Research.Elsevier Science Publishers, Amsterdam, The Netherlands, pp 1219–1230
Haake V, Cook D, Riechmann JL, Pineda O, Thomashow MF, Zhang JZ(2002) Transcription factor CBF4 is a regulator of drought adaptation inArabidopsis. Plant Physiol 130: 639–648
Hall LN, Rossini L, Cribb L, Langdale JA (1998) GOLDEN 2: a noveltranscriptional regulator of cellular differentiation in the maize leaf.Plant Cell 10: 925–936
Hatch MD, Agostino A (1992) Bilevel disulfide group reduction in theactivation of C4 leaf nicotinamide adenine dinucleotide phosphate-malate dehydrogenase. Plant Physiol 100: 360–366
Hatch MD, Agostino A, Jenkins C (1995) Measurement of the leakage ofCO2 from bundle-sheath cells of leaves during C4 photosynthesis. PlantPhysiol 108: 173–181
Heidstra R, Welch D, Scheres B (2004) Mosaic analyses using markedactivation and deletion clones dissect Arabidopsis SCARECROW actionin asymmetric cell division. Genes Dev 18: 1964–1969
Hibberd JM, Sheehy JE, Langdale JA (2008) Using C4 photosynthesis toincrease the yield of rice: rationale and feasibility. Curr Opin Plant Biol11: 228–231
Huq E, Al-Sady B, Hudson M, Kim C, Apel K, Quail PH (2004)Phytochrome-interacting factor 1 is a critical bHLH regulator of chlo-rophyll biosynthesis. Science 305: 1937–1941
Ivanov B, Asada K, Edwards GE (2007) Analysis of donors of electrons tophotosystem I and cyclic electron flow by redox kinetics of P700 inchloroplasts of isolated bundle sheath strands of maize. Photosynth Res92: 65–74
Kanai R, Edwards GE (1973) Separation of mesophyll protoplasts andbundle sheath cells from maize leaves for photosynthetic studies. PlantPhysiol 51: 1133–1137
Leegood RC (2002) C(4) photosynthesis: principles of CO(2) concentrationand prospects for its introduction into C(3) plants. J Exp Bot 53: 581–590
Leegood RC (2008) Roles of the bundle sheath cells in leaves of C3 plants. JExp Bot 59: 1663–1673
176 Plant Physiol. Vol. 160, 2012
Chang et al.

Leegood RC, Walker RP (2003) Regulation and roles of phosphoenolpyr-uvate carboxykinase in plants. Arch Biochem Biophys 414: 204–210
Li P, Ponnala L, Gandotra N, Wang L, Si Y, Tausta SL, Kebrom TH,Provart N, Patel R, Myers CR, et al (2010) The developmental dynamicsof the maize leaf transcriptome. Nat Genet 42: 1060–1067
Majeran W, Cai Y, Sun Q, van Wijk KJ (2005) Functional differentiation ofbundle sheath and mesophyll maize chloroplasts determined by com-parative proteomics. Plant Cell 17: 3111–3140
Markelz NH, Costich DE, Brutnell TP (2003) Photomorphogenic responsesin maize seedling development. Plant Physiol 133: 1578–1591
Mortazavi A, Williams BA, McCue K, Schaeffer L, Wold B (2008) Map-ping and quantifying mammalian transcriptomes by RNA-Seq. NatMethods 5: 621–628
Murphy LR, Barroca J, Franceschi VR, Lee R, Roalson EH, Edwards GE,Ku MSB (2007) Diversity and plasticity of C4 photosynthesis in Eleo-charis (Cyperaceae). Funct Plant Biol 34: 571–580
Nakamura H, Muramatsu M, Hakata M, Ueno O, Nagamura Y, HirochikaH, Takano M, Ichikawa H (2009) Ectopic overexpression of the tran-scription factor OsGLK1 induces chloroplast development in non-greenrice cells. Plant Cell Physiol 50: 1933–1949
Nakazono M, Qiu F, Borsuk LA, Schnable PS (2003) Laser-capture mi-crodissection, a tool for the global analysis of gene expression in specificplant cell types: identification of genes expressed differentially in epi-dermal cells or vascular tissues of maize. Plant Cell 15: 583–596
Novillo F, Medina J, Salinas J (2007) Arabidopsis CBF1 and CBF3 have adifferent function than CBF2 in cold acclimation and define differentgene classes in the CBF regulon. Proc Natl Acad Sci USA 104: 21002–21007
Ohnishi J, Flügge UI, Heldt HW, Kanai R (1990) Involvement of Na+ inactive uptake of pyruvate in mesophyll chloroplasts of some C4 plants:Na+/pyruvate cotransport. Plant Physiol 94: 950–959
Ohnishi J, Kanai R (1990) Pyruvate uptake induced by a pH jump in me-sophyll chloroplasts of maize and sorghum, NADP-malic enzyme typeC4 species. FEBS Lett 269: 122–124
Ranocha P, Denancé N, Vanholme R, Freydier A, Martinez Y, Hoffmann L,Köhler L, Pouzet C, Renou JP, Sundberg B, et al (2010) Walls are thin 1(WAT1), an Arabidopsis homolog of Medicago truncatula NODULIN21, is atonoplast-localized protein required for secondary wall formation in fibers.Plant J 63: 469–483
Robards AW, Lucas WJ (1990) Plasmodesmata. Annu Rev Plant PhysiolPlant Mol Biol 41: 369–419
Sawers RJ, Liu P, Anufrikova K, Hwang JT, Brutnell TP (2007) A multi-treatment experimental system to examine photosynthetic differentia-tion in the maize leaf. BMC Genomics 8: 12
Sharpe RM, Mahajan A, Takacs EM, Stern DB, Cahoon AB (2011) Develop-mental and cell type characterization of bundle sheath and mesophyll chlo-roplast transcript abundance in maize. Curr Genet 57: 89–102
Sheen J (1995) Methods for mesophyll and bundle sheath cell separation.Methods Cell Biol 49: 305–314
Song CP, Agarwal M, Ohta M, Guo Y, Halfter U, Wang P, Zhu JK (2005)Role of an Arabidopsis AP2/EREBP-type transcriptional repressor inabscisic acid and drought stress responses. Plant Cell 17: 2384–2396
Tabata R, Ikezaki M, Fujibe T, Aida M, Tian CE, Ueno Y, Yamamoto KT,Machida Y, Nakamura K, Ishiguro S (2010) Arabidopsis auxin responsefactor6 and 8 regulate jasmonic acid biosynthesis and floral organ de-velopment via repression of class 1 KNOX genes. Plant Cell Physiol 51:164–175
Taniguchi Y, Nagasaki J, Kawasaki M, Miyake H, Sugiyama T, TaniguchiM (2004) Differentiation of dicarboxylate transporters in mesophyll andbundle sheath chloroplasts of maize. Plant Cell Physiol 45: 187–200
Thimm O, Bläsing O, Gibon Y, Nagel A, Meyer S, Krüger P, Selbig J,Müller LA, Rhee SY, Stitt M (2004) MAPMAN: a user-driven tool todisplay genomics data sets onto diagrams of metabolic pathways andother biological processes. Plant J 37: 914–939
Trapnell C, Pachter L, Salzberg SL (2009) TopHat: discovering splicejunctions with RNA-Seq. Bioinformatics 25: 1105–1111
Trapnell C, Williams BA, Pertea G, Mortazavi A, Kwan G, van Baren MJ,Salzberg SL, Wold BJ, Pachter L (2010) Transcript assembly andquantification by RNA-Seq reveals unannotated transcripts and isoformswitching during cell differentiation. Nat Biotechnol 28: 511–515
Truong HN, Caboche M, Daniel-Vedele F (1997) Sequence and charac-terization of two Arabidopsis thaliana cDNAs isolated by functionalcomplementation of a yeast gln3 gdh1 mutant. FEBS Lett 410: 213–218
Weber AP, von Caemmerer S (2010) Plastid transport and metabolism ofC3 and C4 plants: comparative analysis and possible biotechnologicalexploitation. Curr Opin Plant Biol 13: 257–265
Wingler A, Walker RP, Chen ZH, Leegood RC (1999) Phosphoenolpyr-uvate carboxykinase is involved in the decarboxylation of aspartate inthe bundle sheath of maize. Plant Physiol 120: 539–546
Xu X, Chen C, Fan B, Chen Z (2006) Physical and functional interactionsbetween pathogen-induced Arabidopsis WRKY18, WRKY40, andWRKY60 transcription factors. Plant Cell 18: 1310–1326
Yokoyama A, Yamashino T, Amano Y, Tajima Y, Imamura A, Sakakibara H,Mizuno T (2007) Type-B ARR transcription factors, ARR10 and ARR12, areimplicated in cytokinin-mediated regulation of protoxylem differentiationin roots of Arabidopsis thaliana. Plant Cell Physiol 48: 84–96
Zhang H, Jin J, Tang L, Zhao Y, Gu X, Gao G, Luo J (2011) PlantTFDB 2.0:update and improvement of the comprehensive plant transcriptionfactor database. Nucleic Acids Res 39: D1114–D1117
Zheng Z, Qamar SA, Chen Z, Mengiste T (2006) Arabidopsis WRKY33transcription factor is required for resistance to necrotrophic fungalpathogens. Plant J 48: 592–605
Zhong R, Demura T, Ye ZH (2006) SND1, a NAC domain transcriptionfactor, is a key regulator of secondary wall synthesis in fibers of Arabi-dopsis. Plant Cell 18: 3158–3170
Zhong R, Lee C, Zhou J, McCarthy RL, Ye ZH (2008) A battery of tran-scription factors involved in the regulation of secondary cell wall bio-synthesis in Arabidopsis. Plant Cell 20: 2763–2782
Plant Physiol. Vol. 160, 2012 177
Transcriptomes of Maize Leaf Cells
1
SUPPLEMENTAL FIGURES
Supplemental Figure S1. Micrographs of isolated M and BS cells. A, Isolated protoplasts from M cells. B, Isolated BS strands.

2
Supplemental Figure S2. Immunoblot analysis of PEPC, NADP-ME and Rubisco large and small subunits (RbcL, RbcS) in mature leaves and isolated M and BS cells (two preparations). Ten μg of soluble protein was loaded for each lane. Notation: WL, whole leaf; BS1 and BS2, two independent BS cell isolations, MP, M cell isolation.

3
Supplemental Figure S3. The median depth of read mapping coverage along the cDNA. The top two figures were taken from Figures 2c and 2d of Li et al. (2010) and represent, respectively, the median depth of coverage of the leaf transcriptome and that of the M and BS transcriptomes. While the distribution in A, is quite uniform along the cDNA, indicating a high quality transcriptome, the distribution in B, is strongly biased toward the 3’ end, likely due to the 3’-anchored antisense RNA amplification. The bottom two figures C and D are from the present study. The curve for the genes with top 10% RPKMs in both figures has a peak near the middle of the cDNA, showing some degree of bias. The other two curves in both figures are quite uniform.
4
SUPPLEMENTAL TABLES Supplemental Table S1. Activities of PEPC and NADP-ME (μmole/mg Chl/h) in the whole leaf and
in the isolated M and BS cells of maize.
Each value denotes the mean ± S.D. from four replicated assays.
Tissue or cell type PEPC NADP-ME
Whole leaf 991.2 ± 47.9 342.5 ± 21.7
Isolated mesophyll protoplasts 1183.9 ± 52.2 5.4 ± 1.6
Isolated bundle sheath strands 34.0 ± 2.3 545.3 ± 28.8

5
Supplemental Table S2. Validation of cell type-specific gene expression.
BS-specific genes qPCR (RQa over eIF) RPKM
BS M M/BSb BS M M/BS
rbcS-2 0.1045±0.0123 0.00016±0.00006 0.001 165 7,545 0.022
rbcS-4 0.0055±0.0011 0.00027±0.00018 0.049 141 6,299 0.022
NADP-ME 0.0489±0.0097 0.0002±0.0001 0.004 73 10,800 0.007
M-specific genes qPCR (RQ over eIF) RPKM
BS M BS/Mb BS M BS/M
PEPC 7.1±0.3 128.5±3.8 0.055 391 8,117 0.048
NADP-MDH 0.077±0.0006 1.54±0.03 0.050 80 2,038 0.039
OMT 0.049±0.004 8.09±0.25 0.037 31 701 0.045
a Relative quantification (RQ values) were derived by normalization of the test gene's Cp over that of
eIF in the same RNA. b Fold change serves here as a qualitative measurement to show direction of the biased expression and
the extent of expression difference between the two cell types.
qRT-PCR was conducted according to the following protocol:
The first-strand cDNAs were synthesized from 5 μg of RNA using SuperScript®
III First-Strand Synthesis SuperMix Kit (Invitrogen). qRT-PCR was performed using 250-fold dilution of the cDNA on a LightCycler® 480 Instrument system (Roche) along with hydrolysis probe assays and LightCycler® Probes Master mix kit (Roche). All assays were measured in triplicates using the following program: enzyme activation by 95°C/10 min and amplification by 45 cycles of 95°C/10 sec (ramp: 4.8°C/s) followed by 60°C/30 s (ramp: 2.5°C/s). Hydrolysis probe assays consist of respective gene-specific primer sequences, which were designed using the Universal ProbeLibrary by the ProbeFinder software (http://www.roche-applied-science.com/), and the amplification efficiency of the PCR was determined following the manufacturer’s instructions. For relative quantification of gene expression, we used the E-method (Roche) to minimize the difference in amplification efficiency between different targets, as well as to normalize run-to-run differences (Tellman, 2006). eIF-4A (GRMZM2G027995) was chosen as a normalization reference because it showed very small fluctuations in expression level among the two cell types. PCR primers used in this study were listed in Supplemental Table S3.

6
Supplemental Table S3. List of qRT-PCR primers, UPL probe, and PCR efficiency.
Gene ID Symbol Enriched Primer (F) Primer (R) UPL probe Amplicon (nt) PCR efficiency
GRMZM2G083841 PEPC M cttcttggatgggtggtgac tcttcaatctgatcgatgtacaagt 46 121 1.967
GRMZM2G129513 NADP-MDH M gcaccacctacgacctcaag cctcaccagaagcgagtttg 62 126 1.867
GRMZM2G383088 OMT M tggttcagtgagactgttgtga gaacattgctccgatgtgtg 140 138 1.918
GRMZM2G085019 NADP-ME BS ggagacggagaaggagcag gtggtgtggatccctcaaaa 10 112 1.963
GRMZM2G098520 RBCS-4 BS tcagcccaattctgtagatcc gcagttttggctctttgcat 84 85 1.978
GRMZM2G113033 RBCS-2 BS ctgcagctagccagtgagc cgcacacacatggtacatca 154 69 1.963
GRMZM2G027995 eIF4A Reference gene cccgagggttctcagtttg tcctcagtctcaccagtgctc 17 77 1.932
7
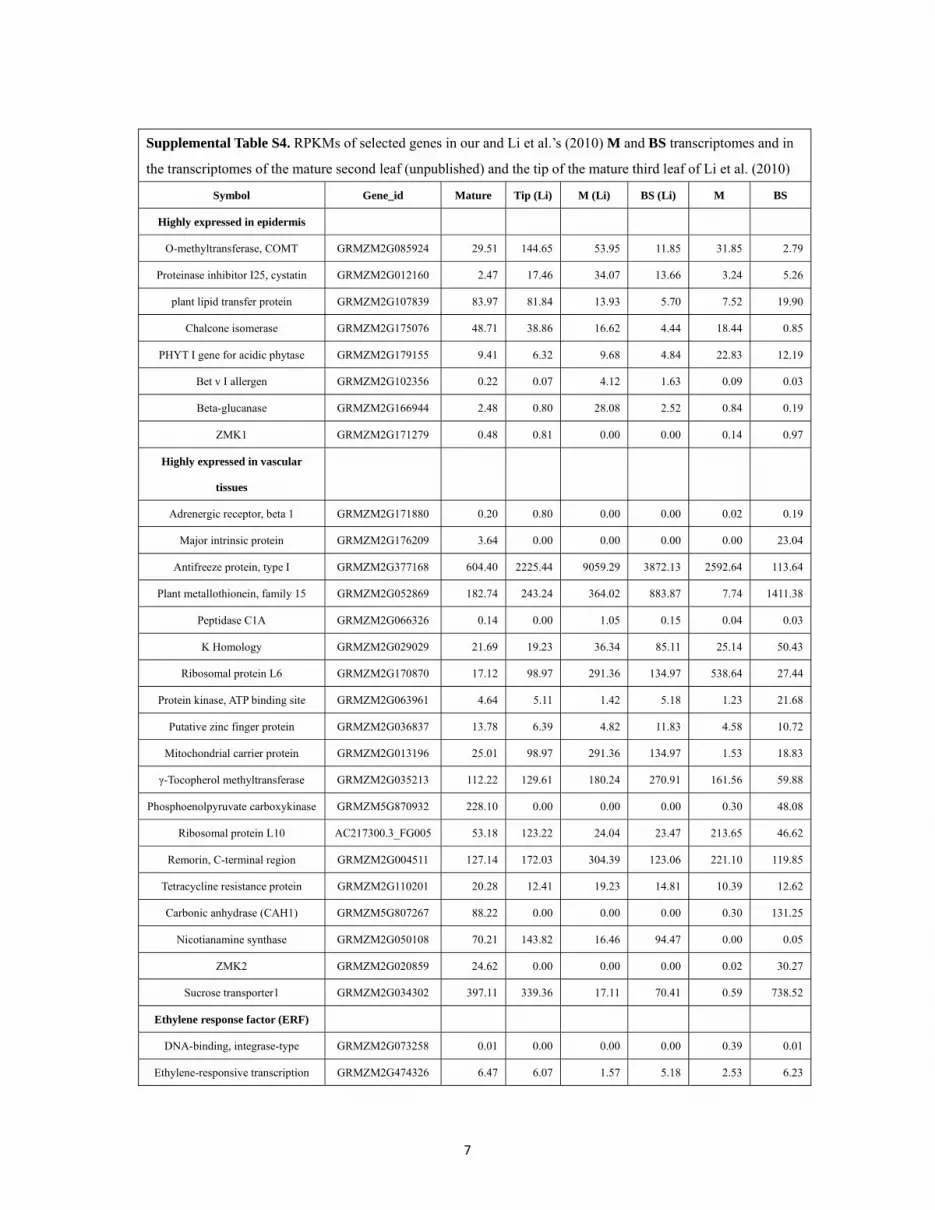
Supplemental Table S4. RPKMs of selected genes in our and Li et al.’s (2010) M and BS transcriptomes and in
the transcriptomes of the mature second leaf (unpublished) and the tip of the mature third leaf of Li et al. (2010)
Symbol Gene_id Mature Tip (Li) M (Li) BS (Li) M BS
Highly expressed in epidermis
O-methyltransferase, COMT GRMZM2G085924 29.51 144.65 53.95 11.85 31.85 2.79
Proteinase inhibitor I25, cystatin GRMZM2G012160 2.47 17.46 34.07 13.66 3.24 5.26
plant lipid transfer protein GRMZM2G107839 83.97 81.84 13.93 5.70 7.52 19.90
Chalcone isomerase GRMZM2G175076 48.71 38.86 16.62 4.44 18.44 0.85
PHYT I gene for acidic phytase GRMZM2G179155 9.41 6.32 9.68 4.84 22.83 12.19
Bet v I allergen GRMZM2G102356 0.22 0.07 4.12 1.63 0.09 0.03
Beta-glucanase GRMZM2G166944 2.48 0.80 28.08 2.52 0.84 0.19
ZMK1 GRMZM2G171279 0.48 0.81 0.00 0.00 0.14 0.97
Highly expressed in vascular
tissues
Adrenergic receptor, beta 1 GRMZM2G171880 0.20 0.80 0.00 0.00 0.02 0.19
Major intrinsic protein GRMZM2G176209 3.64 0.00 0.00 0.00 0.00 23.04
Antifreeze protein, type I GRMZM2G377168 604.40 2225.44 9059.29 3872.13 2592.64 113.64
Plant metallothionein, family 15 GRMZM2G052869 182.74 243.24 364.02 883.87 7.74 1411.38
Peptidase C1A GRMZM2G066326 0.14 0.00 1.05 0.15 0.04 0.03
K Homology GRMZM2G029029 21.69 19.23 36.34 85.11 25.14 50.43
Ribosomal protein L6 GRMZM2G170870 17.12 98.97 291.36 134.97 538.64 27.44
Protein kinase, ATP binding site GRMZM2G063961 4.64 5.11 1.42 5.18 1.23 21.68
Putative zinc finger protein GRMZM2G036837 13.78 6.39 4.82 11.83 4.58 10.72
Mitochondrial carrier protein GRMZM2G013196 25.01 98.97 291.36 134.97 1.53 18.83
γ-Tocopherol methyltransferase GRMZM2G035213 112.22 129.61 180.24 270.91 161.56 59.88
Phosphoenolpyruvate carboxykinase GRMZM5G870932 228.10 0.00 0.00 0.00 0.30 48.08
Ribosomal protein L10 AC217300.3_FG005 53.18 123.22 24.04 23.47 213.65 46.62
Remorin, C-terminal region GRMZM2G004511 127.14 172.03 304.39 123.06 221.10 119.85
Tetracycline resistance protein GRMZM2G110201 20.28 12.41 19.23 14.81 10.39 12.62
Carbonic anhydrase (CAH1) GRMZM5G807267 88.22 0.00 0.00 0.00 0.30 131.25
Nicotianamine synthase GRMZM2G050108 70.21 143.82 16.46 94.47 0.00 0.05
ZMK2 GRMZM2G020859 24.62 0.00 0.00 0.00 0.02 30.27
Sucrose transporter1 GRMZM2G034302 397.11 339.36 17.11 70.41 0.59 738.52
Ethylene response factor (ERF)
DNA-binding, integrase-type GRMZM2G073258 0.01 0.00 0.00 0.00 0.39 0.01
Ethylene-responsive transcription GRMZM2G474326 6.47 6.07 1.57 5.18 2.53 6.23

8
factor 2
Ethylene-responsive transcription
factor 2 GRMZM2G055180 13.04 4.30 3.67 0.15 40.34 7.29
DNA-binding, integrase-type GRMZM2G169382 0.18 0.20 0.00 0.00 0.33 0.00
DNA-binding, integrase-type AC198979.4_FG009 0.01 0.00 0.00 0.00 0.00 0.04
DNA-binding, integrase-type GRMZM2G024871 0.00 0.00 0.00 0.00 0.00 0.00
DNA-binding, integrase-type GRMZM2G060517 0.00 0.00 0.00 0.00 0.00 0.00
DNA-binding, integrase-type GRMZM2G073258 0.01 0.00 0.00 0.00 0.39 0.01
DNA-binding, integrase-type GRMZM5G837876 0.00 0.00 0.00 0.00 0.14 0.00
Wound-induced protein
Proteinase inhibitor I12,
Bowman-Birk GRMZM2G011523 0.87 0.82 2.36 1.02 0.82 1.51
Proteinase inhibitor I12,
Bowman-Birk GRMZM2G156632 0.00 0.00 0.00 0.00 17.71 0.09
Chitin-binding, type 1(ZmPR4) GRMZM2G129189 6.22 2.40 2.85 0.15 14.23 6.44
Hsp90
Heat shock protein 90-1 GRMZM2G024668 461.49 39.71 443.33 113.50 457.86 371.16
Heat shock protein 90-2 GRMZM2G012631 176.06 161.57 368.75 298.10 95.95 138.54
Hsp70
Heat shock protein 70 GRMZM2G310431 40.88 70.65 203.22 355.42 100.93 75.32
Heat shock protein 70 GRMZM2G340251 157.03 210.29 290.77 208.87 338.65 309.50
Heat shock protein 70 GRMZM2G365374 14.40 27.20 38.29 63.30 9.30 12.59
Heat shock protein 70 GRMZM2G114793 17.37 0.00 0.00 0.00 7.48 41.59
Heat shock protein 70 GRMZM2G415007 10.60 18.25 1.55 7.15 5.63 17.62
Heat shock protein 70 GRMZM2G340251 157.03 210.29 290.77 208.87 338.65 309.50
Hsp60
Chaperone GRMZM2G111477 5.97 0.00 0.00 0.00 5.28 3.42
Peptidase C1A GRMZM2G150276 0.03 0.00 0.00 0.00 0.01 0.00
Hsp20
Heat shock protein Hsp20 GRMZM2G413897 59.21 97.02 158.60 36.25 99.25 9.39
Heat shock protein Hsp20 GRMZM2G158232 4.72 44.81 183.67 91.68 488.83 22.18
Heat shock protein Hsp20 GRMZM2G437100 0.36 6.05 22.21 23.03 63.02 3.07
Heat shock protein Hsp20 GRMZM2G333635 0.63 2.73 0.87 0.61 9.14 0.26
Heat shock protein Hsp20 GRMZM2G049767 0.00 0.28 0.00 0.00 4.43 0.04
Heat shock protein Hsp20 GRMZM2G335242 0.74 9.02 22.91 13.85 53.65 1.94
Heat shock protein Hsp20 GRMZM2G034157 0.52 7.87 5.05 10.08 41.53 1.33
Heat shock protein Hsp20 GRMZM2G346839 0.00 0.11 0.00 0.00 0.09 0.00

9
Heat shock protein Hsp20 GRMZM2G331701 0.00 0.36 0.67 0.07 2.54 0.01
Heat shock protein Hsp20 GRMZM2G375517 0.15 0.13 0.00 0.00 4.02 0.06
Heat shock protein Hsp20 GRMZM2G404249 1.96 15.63 1.10 4.95 4.07 1.35
Heat shock protein Hsp20 GRMZM5G899188 1.75 0.00 0.00 0.00 46.38 13.48
Heat shock protein Hsp20 GRMZM2G098167 1.86 6.42 7.19 13.25 26.46 5.85
Heat shock protein Hsp20 GRMZM2G083810 2.03 28.83 117.12 245.23 28.00 11.11
Heat shock protein Hsp20 GRMZM2G404249 1.96 15.63 1.10 4.95 4.07 1.35
Glutathione peroxidase
Glutathione peroxidase GRMZM5G884600 23.70 0.00 0.00 0.00 49.06 30.46
Glutathione peroxidase GRMZM2G144153 58.29 0.00 0.00 0.00 90.41 81.10
Glutathione peroxidase GRMZM2G135893 26.56 21.18 6.14 11.99 7.09 27.60
Glutathione peroxidase GRMZM2G329144 41.42 92.49 184.96 71.97 148.64 61.00
SOD
Superoxide dismutase GRMZM2G005526 0.20 2.37 1.93 2.35 0.18 0.22
Superoxide dismutase GRMZM2G042080 3.76 26.08 27.86 27.17 10.67 3.65
Superoxide dismutase GRMZM2G059991 8.75 0.00 0.00 0.00 21.05 35.74
Superoxide dismutase GRMZM2G071270 0.03 0.07 0.00 0.00 0.00 0.00
Superoxide dismutase GRMZM2G073371 0.08 2.85 1.15 2.62 0.24 0.01
Superoxide dismutase GRMZM2G081585 0.53 2.99 1.38 2.24 0.99 0.95
Superoxide dismutase GRMZM2G101088 0.16 0.00 0.00 0.00 0.00 0.00
Superoxide dismutase GRMZM2G117016 1.85 0.00 0.00 0.00 1.25 2.45
Superoxide dismutase GRMZM2G124455 3.83 16.45 0.64 2.21 1.82 9.75
Superoxide dismutase GRMZM2G173628 2.58 3.06 0.00 0.00 12.12 1.12
Superoxide dismutase GRMZM2G390498 0.00 0.23 2.14 1.44 0.03 0.03
Superoxide dismutase GRMZM2G025992 83.10 189.22 237.26 250.80 72.34 107.12
Superoxide dismutase GRMZM2G058522 37.81 310.23 273.20 532.50 37.65 133.35
Superoxide dismutase GRMZM2G106928 22.76 265.80 429.21 492.50 264.23 56.30
Superoxide dismutase GRMZM2G169890 14.73 99.77 46.05 98.05 13.83 20.11
Catalase
Catalase GRMZM2G079348 11.64 4.76 3.07 6.55 2.55 0.66
Catalase GRMZM2G088212 37.59 30.35 52.64 100.03 9.44 102.18
Catalase GRMZM2G090568 389.08 303.51 367.55 1177.27 108.85 588.63
Catalase GRMZM2G088212 37.59 30.35 52.64 100.03 9.44 102.18
Catalase-peroxidase haem GRMZM2G004211 0.00 0.17 0.00 0.00 0.01 0.14
Catalase-peroxidase haem GRMZM2G047968 4.46 10.02 0.19 1.92 13.50 34.12
Catalase-peroxidase haem GRMZM2G054300 53.54 87.93 202.44 108.10 65.23 61.39
Catalase-peroxidase haem GRMZM2G137839 69.51 232.68 503.46 328.71 93.17 160.61
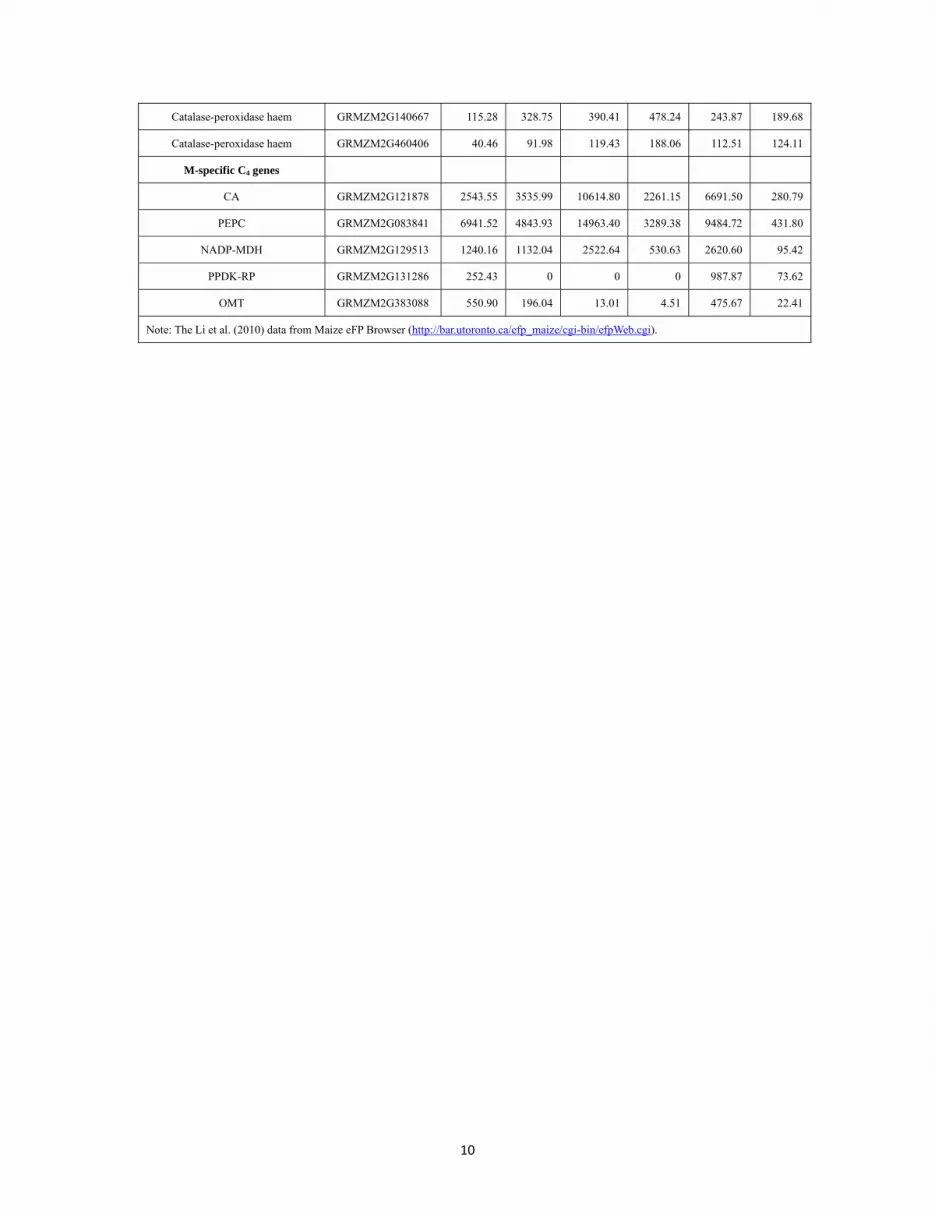
10
Catalase-peroxidase haem GRMZM2G140667 115.28 328.75 390.41 478.24 243.87 189.68
Catalase-peroxidase haem GRMZM2G460406 40.46 91.98 119.43 188.06 112.51 124.11
M-specific C4 genes
CA GRMZM2G121878 2543.55 3535.99 10614.80 2261.15 6691.50 280.79
PEPC GRMZM2G083841 6941.52 4843.93 14963.40 3289.38 9484.72 431.80
NADP-MDH GRMZM2G129513 1240.16 1132.04 2522.64 530.63 2620.60 95.42
PPDK-RP GRMZM2G131286 252.43 0 0 0 987.87 73.62
OMT GRMZM2G383088 550.90 196.04 13.01 4.51 475.67 22.41
Note: The Li et al. (2010) data from Maize eFP Browser (http://bar.utoronto.ca/efp_maize/cgi-bin/efpWeb.cgi).

11
SUPPLEMENTAL DATA Supplemental Data S1. The RPKM values of all genes with at least one read in one of the two transcriptomes. Supplemental Data S2. List of genes with Ri > 0.99 in the two cell types. Supplemental Data S3. Differential expression between M and BS cells of genes involved in light reaction, transport of C4 metabolites, photorespiration, sucrose, starch, amino acid, nitrogen and sulfur metabolism, ion transport, secondary metabolism, development, cell wall and plasmodesmata formation. Location of the proteins encoded by the genes was predicted by TargetP 1.1 (http://www.cbs.dtu.dk/services/TargetP/). Supplemental Data S4. List of cell-type enriched TFs.
12
SUPPLEMENTAL MATERIALS
Transcriptome quality
One way to check the quality of a transcriptome is to examine the depth of the read
mapping coverage along the cDNA (the transcribed regions of a gene). A good quality
transcriptome should show a uniform distribution as in the case of Supplemental
Figure S3A. (Note that the definition of RPKM assumes a uniform distribution.)
Supplemental Figure S3B shows that in Li et al.’s (2010) M and BS transcriptomes
the median depth of coverage was highly uneven along the cDNA, with a strong bias
toward the 3’ end of the cDNA. The main reason for this strong bias might be related
to the fact that to compensate for the limited numbers of cells isolated by LCM, the
input RNA samples (only 100 ng total RNA) were amplified using T7 RNA
polymerase via T7 promoter anchored at 3’-end during the 1st strand cDNA synthesis,
and the amplified antisense RNAs were then used for the RNA-seq library
construction. In comparison, the RNA samples from our M cells and BS cells were
large enough for the library construction without any amplification. In both of our M
and BS transcriptomes, the median depth of coverage along the cDNA is fairly
uniform, except that for the top 10% highly expressed genes there was a bias toward
the middle of the cDNA (Supplemental Fig. S3C, D). These comparisons indicate that
our M and BS transcriptomes are of better quality than those of Li et al. (2010).
Potential contamination of BS cells by epidermal and vascular bundle tissues
To address whether our BS cell preparation was contaminated by epidermal and
vascular tissues, we compared our BS transcriptome data with that of Li et al. (2010);
the transcriptome of the tip of mature third leaves of Li et al. (2010) and our
transcriptome of mature second leaves (unpublished) were also included for
comparison (Supplemental Table S4). From Nakazono et al. (2003), we selected the

13
maize genes that were at least five times more highly expressed in epidermis than in
vascular tissues (vascular bundles and bundle sheath cells) for comparison. If our BS
transcriptome was significantly contaminated by epidermal cells, the RPKM values
for these genes would be higher in our BS transcriptome than in Li et al.’s (2010).
However, in 5 of the 8 genes selected, the RPKM values in our BS transcriptome were
lower than those in Li et al.’s (2010) BS transcriptome. For the putative epidermal
marker gene ZMK1, the RPKM was 0.97 in our BS transcriptome but not detected by
Li et al. (2010), which may suggest some degree of contamination of our BS cells by
epidermal cells. However, as the RPKM for ZMK1 was 0.14 in our M transcriptome
and 0.81 in Li et al.’s (2010) leaf tip transcriptome, ZMK1 may not be strictly
epidermis-specific. At any rate, an RPKM of 0.97 is slightly below 1, so it was not
included in our list of “expressed genes”. Thus, there is no evidence of significant
contamination of our BS transcriptome by epidermal cells.
To consider the possibility of contamination of our BS cell preparation by
vascular bundles, we found 19 genes from Nakazono et al. (2003) that were at least
five times more highly expressed in vascular tissues than in epidermal cells. For
sucrose transporter 1 (a putative vascular bundle marker), the RPKM value was high
(738) in our BS transcriptome (Supplemental Table S4). However, as the RPKM
values for this gene were 70 and 17 in the BS and M transcriptomes of Li et al. (2010),
respectively, sucrose transporter 1 may not be vascular bundle specific. For ZMK2
(another vascular bundle marker) the RPKM values were 30.3 and 0.02 in our BS and
M transcriptomes but were 0.00 in Li et al.’s (2010) BS and M transcriptomes. These
comparisons do suggest a substantial contamination of our BS transcriptome by
vascular bundles, as expected since our BSS contained vascular tissues (Supplemental
Fig. 1). However, for the other 17 genes on the list, the RPKM values from our
transcriptomes were on average lower than those of Li et al. (2010). For example, for

14
the type I antifreeze protein gene, the RPKM value was only 113 in our BS
transcriptome but 3872 in Li et al.’s (2010) data. Thus, the contamination of our BS
transcriptome by vascular bundles does not seem to be substantial except for some
genes. Since there is evidence of contamination, our BS transcriptome data should be
taken with caution.
Potential effects of long incubation time during the isolation of M protoplasts
Sawer et al. (2007) found that the procedure used to obtain mesophyll protoplasts
might raise the expression level of stress-induced genes. The lower half of
Supplemental Table S4 shows a list of such genes. For the 9 ethylene response factor
and related genes and 3 wound-induced genes, the RPKM values were low in our M
transcriptome, except for ethylene-responsive transcription factor 2 (RPKM = 40),
proteinase inhibitor I12-Bowman-Birk type (18) and chitin-binding, type 1 (ZmPR4)
(14). For the heat shock proteins and chaperones (25 genes) on the list, some of our
RPKMs were higher, while others were lower than those of Li et al. (2010), showing
no evidence of elevated expression. For example, for heat shock protein 90-1, our
RPKM (457.86) is similar to Li et al’s value (443.33), while for heat shock protein
90-2 our RPKM (95.95) is much lower than Li et al.’s value (368.75). For the 4
glutathione peroxidase genes, 15 superoxide dismutase genes, and 10 catalase and
catalase-peroxidase haem genes, the RPKM values in our M transcriptome tend to be
lower than those of Li et al.’s M transcriptome. In summary, there is no evidence that
our M cell isolation procedure had highly increased the expression levels of
stress-induced genes in our M transcriptome.
We also assessed the possible effect of enzymatic digestion on the expression of
M-specific C4 genes (CA, PEPC, PPDK-RP, NADP-MDH, OMT) by comparing the
RPKM values between our and Li et al.’s (2010) M transcriptomes. The values for CA

15
and PEPC in our M transcriptome were high (6692 and 9485), but were 30-40%
lower than those of Li et al (2010). These comparisons might be taken to indicate
decreased expression levels of these genes during the 2.5-h digestion under low light
conditions (Supplemental Table S4). Alternatively, it might be related to the
differences in leaf age used between the two studies. However, the RPKM value for
NADP-MDH was slightly higher in our M transcriptome (2,620) than in Li et al.’s
(2,522). Moreover, the RPKM for PPDK-RP was high (988) in our M transcriptome,
but was 0 in the M transcriptome of Li et al. (2010). For the OAA transporter (OMT),
the value in our M transcriptome was high (476), but was very low (13) in the M
transcriptome of Li et al. (2010). Therefore, our M cell isolation procedure might
have affected the expression level of some M-specific C4 genes but did not seem to
have a general tendency to underestimate the expression level of C4 specific genes or
affect the determination of their cell-specificity in expression.

16
SUPPLEMENTAL NOTES
Functional differentiation between M and BS cells
(1) Amino acid metabolism
Several amino acids are known to be involved in the C4 pathway of
photosynthesis, photorespiration and sulfur metabolism. In addition to malate,
aspartate is another important C4 metabolite synthesized in M cells and transported to
BS cells for decarboxylation in the NADP-ME and PCK subtypes. One of the three
paralogous genes coding for the chloroplastic aspartate aminotransferase (AspAT)
was expressed in M cells at extremely high levels, while a second one coding for the
mitochondrial enzyme was preferentially expressed in BS cells at a moderate level. In
addition, four of the expressed alanine-glyoxylate aminotransferase paralogous genes
were predominantly expressed in BS cells. Similarly, two of the five expressed
alanine-oxoglutarate aminotransferase were also highly expressed in M cells. These
results suggest the active role played by BS cells in alanine metabolism, but its
participation in biochemical function remains to be elucidated.
After absorption from roots sulfate is reduced to cysteine in plants, which is then
used as a substrate for synthesis of methionine or glucosinolates through different
pathways. Besides protein synthesis, methionine is also used for the synthesis of
ethylene and polyamines via the intermediate of S-adenosylmethionine by
S-adenosylmethionine synthetase (SAM). In C4 plants, sulfate reduction is mainly
reduced in BS cells (see a later section), and it is not surprising to find that two of the
four paralogous genes coding for SAM (GRMZM2G117198, GRMZM2G061135)
were almost exclusively expressed in BS cells.
(2) N metabolism
Enzymes participating in the assimilation of nitrogen are localized in a
cell-specific manner in various C4 plants; nitrate reductase (NR) and nitrite reductase

17
are specifically localized in M cells, glutamine synthetase is equally distributed in M
and BS cells, and glutamate synthetase and glutamate dehydrogenase are
predominantly but not exclusively localized in BS cells (Rathnam and Edwards, 1976;
Moore and Black, 1979). Ferredoxin-independent glutamate synthase, however, was
found to be BS-specific by immunoblotting (Becker et al., 1993). Whether the
compartmentalization of nitrogen metabolism contributes to improved nitrogen use
efficiency in C4 plants and what the mechanism could be is, however, still unknown.
Previous cellular localization studies with enzymes related to N and S metabolism
suggest that some of the reactions may be specifically confined in M (e.g. nitrate
reduction) or BS cells (e.g. sulfate reduction, ammonium assimilation) (Rathnam and
Edwards, 1976; Neyra and Hageman, 1978; Sclimutz and Brunold, 1985; Becker et al.,
1993; Kopriva and Koprivova, 2005). Consistent with this view, one of the three
expressed nitrate reductase genes (NIA1) (GRMZM2G568636) was highly expressed
in M cells, while the two other genes were moderately expressed in BS cells
(Supplemental Data S3). Also, two Fd-nitrite reductase genes
(NIR1-GRMZM2G079381, NIR-GRMZM2G102959) were preferentially expressed
in BS cells. To our surprise, two of the seven expressed nitrate transporter genes,
NPT3 (GRMZM2G176253) and NTP2 (GRMZM2G064091), were highly expressed
in a BS cell specific manner. In contrast, one of the nine expressed high affinity
dipeptide/nitrate transporter genes (GRMZM2G012434) was preferentially expressed
at a moderate level in M cells, while two or three other members expressed
preferentially in BS cells at low levels. The localization of these transporters on the
plasma membrane or chloroplast envelope remains to be determined. Expression of
the Mo-cofactor for nitrate reductase and nitrate-inducible TFs was found in both cell
types. These data in general support previous biochemical evidence for the major role
played by M cells in nitrate reduction. For each cell type, specific transporters with

18
differences in absorption affinity may be involved. Also, no nitrite transporter was
found, suggesting that besides ammonium, nitrate is another major form of nitrogen
sources absorbed by plants.
In leaves, nitrate is reduced to ammonium by cytosolic nitrate reductase (NR; EC
1.6.6.1), and then by plastidial ferredoxin-nitrite reductase (Fd-NiR, EC 1.6.6.4)
(Moore and Black, 1979). Ammonium, derived from photorespiration, is assimilated
first into the glutamineamide group by glutamine synthetase (cytosolic GS1 and
plastidial GS2, EC 6.3.1.2) and then into the glutamate-amino group by glutamate
synthase (Fd-GOGAT, EC 1.4.7.1; NADH-GOGAT, EC 1.4.1.14) in vegetative organs.
The GS-GOGAT (glutamine synthetase-glutamate synthase) cycle is known to be the
principle ammonium assimilation pathway in plants. High transcript levels of GS2
(GRMZM2G098290, coding for chloroplast localized GS2) and Glu1 (Fd-glutamate
synthase, GRMZM2G036609, coding for chloroplast localized Fd-GOGAT) were
found more in M than in BS cells, as nitrate reductase and nitrite reductase,
respectively. However, one of the seven expressed Cu-dependent glutamine synthase
genes (GRMZM2G050514) was expressed exclusively in BS cells (Ri=0.99) at a very
high level, while two other members (GRMZM5G872068, GRMZM2G036464)
showed a moderate level of expression and with a slight M cell preference (Ri = 0.21
and 0.03). Thus, our data suggests that at least two different enzymes, probably with
different intracellular localizations and kinetic properties, are involved in glutamine
synthesis in both cell types. However, most of the high affinity ammonium transporter
genes showed low expression levels in both cell types. In contrast, an
ammonium/methylammonium transporter/water channel was highly expressed in BS
cells (Ri = 0.94), which may be the major ammonium transporter in BS cells. These
ammonium/methylammonium transporters are also classified as water channels or
aquaporin proteins, which are integral membrane proteins that regulate the flow of

19
water. GRMZM2G027098 and GRMZM2G121275 encode aquaporin TIP2;1
(tonoplast intrinsic protein 2-1; ZmTIP2-1) and tonoplast aquaporin TIP2;3. The
Arabidopsis orthologs, AtTIP2;1 and AtTIP2;3, are known to mediate the
extracytosolic transport of methyl-NH2 and NH3 across the tonoplast membrane and
may thus participate in vacuolar ammonium compartmentation (Loqué et al., 2005).
Glutamate dehydrogenase (GDH) can catalyze both the synthesis of glutamate
and its catabolism. A GDH gene coding for the ATP/NADP-dependant glutamate
dehydrogenase (GRMZM2G178415) was almost exclusively expressed in BS cells at
a high level (Ri = 0.99). The expression of two other paralogs was also BS enriched,
but at lower levels. Being ATP and NADP dependent, these GDHs are located in the
BS chloroplasts. Besides its catabolic role, it may be involved in re-fixation of
ammonium produced from glycine decarboxylation in photorespiration, although
photorespiration is low in C4 plants.
(3) S metabolism
Sulfate assimilation is essential for plant primary metabolism, delivering reduced
sulfur for synthesis of amino acids, co-enzymes, and a variety of secondary
compounds (Kopriva and Koprivova, 2005). As the significance of the cell-specific
distribution of sulfate assimilation in C4 leaves is not clear, the question whether the
exclusive localization of ATP sulfurylase (ATPS) and APR (adenylphosphosulfate
reductase) in BS cells is a prerequisite or a consequence of C4 photosynthesis, is of
great importance.
Plants reduce sulfate to sulfite for subsequent assimilation into cysteine. Sulfate
taken up in the cells by sulfate transporters is first activated by ATPS to adenosine
5-phosphosulfate (APS). Several groups reported that 75–100% of total leaf ATPS
activity in maize was confined to BS cells (Gerwick and Black, 1979; Passera and
Ghisi, 1982; Burnell, 1984; Schmutz and Brunold, 1984), and APS reductase was

20
found almost exclusively in BS cells of maize (Schmutz and Brunold, 1984; Burgener
et al., 1998). All four expressed ATPS genes showed a BS-enriched expression pattern,
and two of them (GRMZM2G149952, GRMZM2G051270) were highly expressed in
BS cells with Ri > 0.89. High levels of expression of two APS reductase occurred also
predominantly in BS cells. Consistent with the preferential location of transcripts for
these enzymes for activation and reduction of sulfate, most of the 10 expressed sulfate
transporters were expressed exclusively in BS cells. On the other hand, some genes
coding for serine-O-acetyltransferase were preferentially expressed in M cells, while
others were more preferentially expressed in BS cells. These results suggest that the
majority of sulfate uptake, activation and reduction take place in the BS chloroplasts,
while synthesis of cysteine may occur in both cell types. No transporters responsible
for the uptake of nitrite and sulfite were found in either cell types. This implies that
after reduction of nitrate to nitrite (in M cells) and from sulfate to sulfite (in BS cells),
these two metabolites are further metabolized in where they are synthesized.
(4) Ion/water transport
Since BS cells are adjacent to vascular tissues, many ions are probably first
absorbed by BS and the associated companion cells and sieve elements. The major
intrinsic proteins (MIPs) facilitate the transport of water and neutral solutes across the
lipid bilayers. There are four subfamilies of MIPs: plasma membrane intrinsic
proteins (PIPs), tonoplast intrinsic proteins (TIPs), nodulin 26-like intrinsic proteins
(NIPs) and small and basic intrinsic proteins (SIPs) (Bansal and Sankararamakrishnan,
2007). NIP has been shown to transport glycerol (Wallace et al., 2002; Wallace and
Roberts, 2005), and one of the three maize paralogous genes coding for NIP
(GRMZM2G137108) was highly and exclusively expressed in BS cells, and the other
two were also exclusively expressed in BS cells but at lower levels. Similarly, several
of the expressed paralogous genes encoding for the plasma membrane intrinsic
21
protein (PIP) involved in water channel, which may contribute to CO2 diffusion
across leaf tissues (Uehlein et al., 2003), were also highly expressed in BS cells
(GRMZM2G081843, GRMZM2G014914, GRMZM2G092125), while one of them
was equally expressed in both cells (GRMZM2G174807). Several TIPs have been
reported to transport of urea and ammonia (Liu et al., 2003; Jahn et al., 2004; Loque
et al., 2005), and one of the maize genes coding for TIP (GRMZM2G027098) was
highly and predominantly expressed in BS cells. Taken together, these results suggest
that water and ion movement from vascular tissues to leaf tissue is mainly through the
adjacent BS cells, as one would expect.
(5) Secondary metabolism
Plants produce a vast and diverse variety of organic compounds, referred to as
secondary metabolites or natural products, which are mainly for structural (e.g. lignin,
suberin) and defense functions (pigments, terpenoids, alkaloids) and are very
important for plant survival and human medicinal use. A quick scan of the expression
profiles for the genes involved in the biosynthesis of these secondary metabolites
between the two photosynthetic cell types in maize leaves revealed that the majority
of the genes are preferentially expressed in M cells, with few exceptions
(Supplemental Data S3). For example, genes for enzymes involved in chalcone
synthesis, such as naringenin-chalcone synthase, chalcone-flavanone isomerase and
chalcone synthase, were more highly expressed in M cells than in BS cells, though
chalcone isomerase was almost exclusively expressed in BS cells.
Genes coding for many enzymes involved in carotenoid biosynthesis (e.g.
lycopene synthase, lycopene β-cyclase) were also highly expressed in M cells.
Transcript for violaxanthin de-epoxidase (GRMZM2G027219), which is involved in
photoprotection, was enriched in M cells as well. Expression of genes coding for
many enzymes involved in the isoprenoid biosyntheic pathway was also highly and

22
preferentially expressed in M cells: geranygeranyl reductase, 1-deoxy-D-xylulose 5-P
synthase, solanesyl diphosphate synthase, ent-kaurene synthase, phytoene desaturase,
gama-tocopherol cyclase, tocopherol methyltransferase. Genes coding for
hydroxycinnamoyl CoA shikimate/quinate hydroxycinnamoyl transferase and
4-coumarate CoA ligase in the biosynthesis of phenylprepanoids were also highly
expressed in M cells, except for cinnamoyl alcohol dehydrogenase whose transcript
was more enriched in BS cells. It is probably not too surprising that the M cells of
maize leaf and probably leaves of other C4 plants as well are specialized in synthesis
of defense-related secondary metabolites since M cells are next to epidermis cells.
The exact biological functions for some of these genes remain to be elucidated and
future metabolomic profiling of the two maize cell types should facilitate the
functional interpretation of the transcriptomic data obtained in this study.

23
SUPPLEMENTAL LITERATURE CITED Bansal A, Sankararamakrishnan R (2007) Homology modeling of major intrinsic
proteins in rice, maize and Arabidopsis: comparative analysis of transmembrane helix association and aromatic/arginine selectivity filters. BMC Struct Biol 7: 27
Becker TW, Perrot-Rechenmann C, Suzuki A, Hirel B (1993) Subcellular and immunocytochemical localization of the enzymes involved in ammonia assimilation in mesophyll and bundle-sheath cells of maize leaves. Planta 191: 129-136
Burgener M, Suter M, Jones S, Brunold C (1998) Cyst(e)ine is the transport metabolite of assimilated sulfur from bundle-sheath to mesophyll cells in maize leaves. Plant Physiol 116: 1315-1322
Burnell JN (1984) Sulfate assimilation in C4 plants: intercellular and intracellular location of ATP sulfurylase, cysteine synthase, and cystathionine beta-lyase in maize leaves. Plant Physiol 75: 873-875
Gerwick BC, Black CC (1979) Sulfur assimilation in C4 plants: intercellular compartmentation of adenosine 5'-triphosphate sulfurylase in crabgrass leaves. Plant Physiol 64: 590-593
Jahn TP, Møller ALB, Zeuthen T, Holm LM, Klærke DA, Mohsin B, Kühlbrandt W, Schjoerring JK (2004) Aquaporin homologues in plants and mammals transport ammonia. FEBS lett 574: 31-36
Kopriva S, Koprivova A (2005) Sulfate assimilation and glutathione synthesis in C4 plants Photosynth Res 86: 363-372
Liu L-H, Ludewig U, Gassert B, Frommer WB, von Wirén N (2003) Urea transport by nitrogen-regulated tonoplast intrinsic proteins in Arabidopsis. Plant Physiol 133: 1220-1228
Loque D, Ludewig U, Yuan L, von Wiren N (2005) Tonoplast intrinsic proteins AtTIP2;1 and AtTIP2;3 faciliate NH3 transport into the vacuole. Plant Physiol 137: 671-680
Moore R, Black CC (1979) Nitrogen assimilation pathways in leaf mesophyll and bundle sheath cells of C4 photosynthesis plants formulated from comparative studies with Digitaria sanguinalis (L.) Scop. Plant Physiol 64: 309-313
Neyra CA, Hageman RH (1978) Pathway for nitrate assimilation in corn (Zea mays L.) leaves: cellular distribution of enzymes and energy sources for nitrate reduction. Plant Physiol 62: 618-621
Passera C, Ghisi R (1982) ATP sulphurylase and O-acetylserine sulphydrylase in isolated mesophyll protoplasts and bundle sheath Strands of S-deprived maize

24
leaves. J Exp Bot 33: 432-438 Rathnam CK, Edwards GE (1976) Distribution of nitrate-assimilating enzymes
between mesophyll protoplasts and bundle sheath cells in leaves of three groups of C4 Plants. Plant Physiol 57: 881-885
Schmutz D, Brunold C (1984) Intercellular localization of assimilatory sulfate reduction in leaves of Zea mays and Triticum aestivum. Plant Physiol 74: 866-870
Sclimutz D, Brunold C (1985) Localization of nitrite and sulfite reductase in bundle sheath and mesophyll cells of maize leaves. Physiologia Plantarum 64: 523-528
Tellman G (2006) The E-Method: a highly accurate technique for gene-expression analysis. Nat Methods 3: i-ii
Uehlein N, Lovisolo C, Siefritz F, Kaldenhoff R (2003) The tobacco aquaporin NtAQP1 is a membrane CO2 pore with physiological functions. Nature 425: 734-737


