Embed Size (px)
Citation preview

-1
Chemical characteristics and origin of dissolved
organic matter in the Yukon River
CELINE GUEGUEN1,*, LAODONG GUO1, DELI WANG1,NORIYUKI TANAKA1 and CHIN-CHANG HUNG2
1International Arctic research Center, University of Alaska Fairbanks, Fairbanks, AK 99775, USA;2Laboratory for Oceanographic and Environmental Research, Department of Oceanography, Texas
A&M University, 5007 Ave. U, Galveston, TX 77551, USA; *Author for correspondence (Present
address: Earth and Ocean Sciences, University of British Columbia, Vancouver, BC V6T 1Z4. e-mail:
[email protected]; phone: (604) 827 5459; fax: (604) 474 2679)
Received 23 December 2003; accepted in revised form 18 January 2005
Key words: Carbohydrate, Colored dissolved organic matter, Dissolved organic carbon, Soil
organic carbon, Yukon River
Abstract. Monthly (or bi-weekly) water samples were collected from the Yukon River, one of the
largest rivers in North America, at a station near the US Geological Survey Stevens Village
hydrological station, Alaska from May to September 2002, to examine the quantity and quality of
dissolved organic matter (DOM) and its seasonal variations. DOM was further size fractionated
into high molecular weight (HMW or colloidal, 1 kDa–0.45 lm) and low molecular weight (LMW,
<1 kDa) fractions. Dissolved organic carbon (DOC), colored dissolved organic matter (C-DOM)
and total dissolved carbohydrate (TCHO) species were measured in the size fractionated DOM
samples. Concentrations of DOC were as high as 2830 lmol-C l�1 during the spring breakup in
May and decreased significantly to 508–558 lmol-C l�1 during open-water season (June–Septem-
ber). Within the DOC pool, up to 85% was in the colloidal fraction (1 kDa–0.45 lm) in early May.
As DOC concentration decreased, this colloidal portion remained high (70–85% of the bulk DOC)
throughout the sampling season. Concentrations of TCHO, including monosaccharides (MCHO)
and polysaccharides (PCHO), varied from 722 lmol-C l�1 in May to 129 lmol-C l�1 in September,
which comprised a fairly constant portion of bulk DOC (24±2%). Within the TCHO pool, the
MCHO/TCHO ratio consistently increased from May to September. The C-DOM/DOM ratio and
the size fractionated DOM increased from May to September, indicating that DOM draining into
the Yukon River contained increased amounts of humified materials, likely related to a greater soil
leaching efficiency in summer. The average composition of DOM was 76% pedogenic humic matter
and 24% aquagenic CHO. Characteristics of soil-derived humic substances and low chlorophyll-a
concentrations support a dominance of terrestrial DOM in Yukon River waters.
Introduction
Dissolved organic matter (DOM) is an important component and an inter-mediary in global carbon cycles (Hedges et al. 1997). It plays significant roles inaquatic food webs (Thingstad 2003 and references therein), regulates the bio-availability of dissolved nutrients and metals (Koukal et al. 2003; Gueguenet al. 2004), and affects the optical properties of natural waters (Schindler et al.1997; Gueguen et al. 2003). The composition and transport of DOM dependprimarily on whether the origin is from soil and plant material or from in situ
Biogeochemistry (2006) 77: 139–155 � Springer 2006
DOI 10.1007/s10533-005-0806-1

production. Pedogenic organic matter results from leaching of decompositionbyproducts of microorganisms and higher plants. It is largely composed ofrefractory and aromatic humic substances (or colored dissolved organic mat-ter, C-DOM) (Buffle 1988). The aquagenic DOM produced by the excretionand decomposition of aquatic macrophytes and plankton includes mainlycarbohydrates (CHO; Bertilsson and Jones 2003 and references therein). Thecontribution of other organic molecules such as lipids, amino acids and pro-teins is relatively small in rivers because of their sorption onto particles andtheir rapid degradation (Wilkinson et al. 1997). The in situ production of DOMis often small compared to the soil-derived DOM in major rivers (Thurmanet al. 1985; Buffle 1988).
The typical concentration of dissolved organic carbon (DOC) in river watersvaries primarily by climate and watershed characteristics (Meybeck 1998). Thehighest DOC values are usually measured in taiga and tundra tropics (up to�600 lmol-C l�1 ; Meybeck 1998; McLean et al. 1999). Furthermore, a peak inDOM flux has been measured in high latitudes during spring breakup, when40–80% of arctic river discharge occurs (Gordeev et al. 1996). Rember andTrefry (2004) showed that DOC decreased from 742 lmol-C l�1 during springfloods to 167 lmol-C l�1 at off peak flow in Alaskan streams. Similar resultshave been reported for the Mackenzie River where �35% of the annual DOCflux occurred during the spring breakup (Telang 1985). Nevertheless, thevariation in chemical composition of DOM from the river breakup to the endof the Arctic summer remains poorly understood.
The Yukon River is one of the largest river systems in North America, anddrains an area of 840·103 km2 in a taiga-dominated system. With an annualdischarge of more than 200 billion m3 of freshwater, it contributes �8% of thetotal freshwater to the Arctic Ocean (Aagaard and Carmack 1989). The YukonRiver is frozen from October to May/June. Due to its remoteness and theextreme weather conditions, the Yukon River Basin remains pristine andunderstudied. Biogeochemical processes as a result of climate change in theYukon River watershed are poorly understood. Knowledge of how the envi-ronmental change influences the carbon cycle in Arctic rivers will provideinsights into biogeochemical consequences of climate change. In the presentstudy, we examined the seasonal variations in concentration, flux and parti-tioning of DOM, C-DOM, and CHO species in the upper Yukon River fromspring breakup to open-water season.
Material and methods
Site description and sampling
Yukon Flats is a � 40,000 km2 complex of wetlands and contributes largeamounts of organic carbon to the Yukon River. The sampling site (65 �52¢ N,
140

149 �43¢ W) was located between the Dalton Highway Bridge and the USGSStevens Village hydrological station, downstream of Yukon Flats (Figure 1).
The long-term (1977–2000) mean discharge of the Yukon River at theStevens Village station shows a flow pattern typical of arctic rivers (Figure 2),with a low flow rate during the frozen season and high flow in the summer(Lammers et al. 2001). Due to the increase of air temperatures in May, springbreakup results in a peak in river discharge, sometimes amplified by rainfall. Asshown in Figure 2, the discharge increased by a factor of �10 in the periodfrom early May to the end of May 2002.
Monthly (or biweekly) water samples were collected from May to September2002 to cover the time period with significant flow rate variations (Figure 2;Table 1). During the spring breakup (May), two samples were collected
Figure 1. Map of the Yukon River Basin and the sampling location.
141

(YR-01, YR-02). The other four samples (YR-03, YR-04, YR-05, YR-06) weretaken from June to September when river discharge was relatively constant(�5000 m3/s).
Surface water samples at �1 m depth were obtained using a peristaltic pumpwith acid cleaned polypropylene tubing. Water samples were pumped directlythrough a 0.45 lm polycarbonate filter cartridge (Osmonics) into acid cleaned20 l polypropylene containers, or brought back to the laboratory for filtrationwithin 4 h (Figure 3). Immediately after prefiltration, a ultrafiltration (UF)system equipped with a 1 kDa regenerated cellulose cartridge (Amicon, S10Y1)was used to size fractionate the <0.45 lm DOM into high molecular weight(HMW, 1 kDa–0.45 lm) and low molecular weight (LMW, <1 kDa) fractions
Figure 2. Long term daily mean flow rates of the Yukon River at the USGS Stevens Village
Station (1977–2000), with the minimum and maximum of discharge in dashed lines (data from the
USGS at www.usgs.gov). Open circles symbolize the sampling dates with their instantaneous
discharge rate.
Table 1. Sampling dates, freshwater discharge, pH, conductivity, suspended particulate matter
(SPM), chlorophyll a (Chl-a), concentrations of dissolved organic carbon (DOC) and optical
properties in the Yukon River waters.
Sample ID Date Discharge
(m3 s�1)
pH Cond.
(lS cm�1)
SPM
(mg l�1)
Chla
(lg l�1)
DOC
(lmol-C l�1)
a280/DOC
(m�1/(mmol-C l�1)
YR-01 05/15/02 991 7.5 163 92 <0.20 2835 64.9
YR-02 05/31/02 10337 7.4 174 331 1.57 1158 70.4
YR-03 06/14/02 7080 7.7 209 153 0.97 725 61.4
YR-04 07/12/02 5721 7.9 227 175 5.07 558 57.3
YR-05 08/09/02 4984 7.9 224 101 0.73 508 73.0
YR-06 09/12/02 5098 7.9 226 53 0.56 533 72.3
142

in the laboratory (Guo et al. 2000; Gueguen et al. 2002). The concentrationfactors (Cf) applied for ultrafiltration were between 7 and 13. Aliquots of allultrafiltration samples, including the <0.45 lm, the 1 kDa–0.45 lm, and the<1 kDa fractions, were collected for measurements of DOC, C-DOM, andCHO concentrations. Mass balance for DOC (88±6%, n=6) was relativelylow, likely due to the presence of high DOM concentrations and sorption lostin the cartridge.
River discharge data were obtained from the USGS website athttp://www.usgs.gov. Conductivity was measured using an YSI Model 30conductance meter. pH was measured using a DigiSense pH meter with anOrion electrode.
Analytical methods
DOC concentration was measured by the high temperature combustionmethod on a Shimadzu TOC-V analyzer (Guo et al. 1995). To remove inor-ganic carbon before the analysis, samples (�20 ml each) were acidified withtwo drops of concentrated HCl to a pH £ 2 and purged with ultra-pure air.Three to five replicate injections (150 ll each) were performed for each sample,resulting in a typical coefficient of variation <2%.
Figure 3. Schematic of organic matter size fractionation using filtration and ultrafiltration.
143

Carbohydrate species were determined on a spectrophotometer using amodified colorimetric method (Hung et al. 2001). Concentrations of mono-saccharide (MCHO) were directly determined after oxidizing free reducedsugars with the 2,4,6-tripyridyl-s-triazine (TPTZ), while total dissolved car-bohydrate (TCHO) concentrations were measured at 150 �C after hydrolysiswith HCl (Hung et al. 2001). The concentration of polysaccharides (PCHO)was calculated from the difference between TCHO and MCHO concentrations(all in lmol-C l�1). The reagent blank in Milli-Q water was subtracted beforecalculating the final concentration of the MCHO. The variation coefficient was<5%.
Absorbance of DOM was measured on an UV–visible spectrophotometer(Agilent 8453) with a 1 cm quartz cuvette using Milli-Q water as a reference.Values of average absorbance at 700 nm were set to zero to correct the spectrafor refractive index effects (Green and Blough 1994). The absorbance acquiredwas converted to an absorption coefficient (m�1) according to the equation: a(k)=2.303 A (k)/L, where A (k) is the absorbance and L the pathlength of theoptical cell in meters. The pedogenic (soil derived) contribution to DOC wasestimated by using the ratio of the absorbance (280 nm) to DOC and assumingthat only pedogenic humic compounds contribute to the absorbance at 280 nm(Buffle 1988; Zumstein and Buffle 1989).
Both excitation and emission fluorescence measurements were made with aFluoroMax 3 Jobin Yvon fluorometer equipped with two monochromators.Samples were contained in a 1 cm path length quartz cell. The recorded spectrawere corrected for instrumental response (Ewald et al. 1993; De Souza-Sierraet al. 1994). Milli-Q water was used as a blank and subtracted from samplespectra. All fluorescence intensities were converted to fluorescence units(Fl.U.), based on the measurement of corrected fluorescence intensity of 1 ppbquinine sulfate dihydrate (NIST 936a) in 0.105 M perchloric acid.
Chlorophyll-a (Chl-a), collected on a GF/F filter and extracted with 90%acetone, was measured by the method described in Strickland and Parsons(1972).
Total suspended particulate matter (SPM) concentrations were determinedby filtering a known volume of river water sample through a pre-weighedpolycarbonate membrane dried at 60 �C. The filters were dried and weighed2–3 times until a constant weight was obtained.
Results and discussion
Hydrology
Values of conductivity and pH were lower during spring breakup in May as aresult of dilution with melting snow and ice, and slightly increased from June toJuly–September (Table 1). From June to September, both conductivity and pHwere relatively constant, with values of 224–227 lS cm�1 for conductivity and
144

7.9 for pH, respectively. In general, water conductivity decreased withincreasing discharge except for data collected during the early spring breakup(YR-01). The steady increase in conductivity from spring breakup to open-water season to post peak discharge suggested more weathering between Juneand September. The SPM load had a maximum during the spring breakup(331 mg l�1, YR-02) mainly due to the peak discharge associated with meltingsnow and rainfall. In the open-water season, SPM ranged from 53 to173 mg l�1, which is similar to other arctic rivers (8–207 mg l�1 ; Rachold et al.2003). Chl-a concentrations were low (from <0.2 to 5 lg l�1) (Table 1),indicating a small overall contribution of DOM derived from phytoplanktonfrom spring breakup to open-water season.
Concentration and flux of dissolved organic carbon (DOC)
Concentrations of DOC in Yukon River waters decreased from 2835 lmol-C l�1
in mid-May to 725 lmol-C l�1 in June followed by a relatively constant valueof 530±30 lmol-C l�1 (ranging from 508 to 558 lmol-C l�1) (Table 2). Thetypical DOC concentrations in the tundra and taiga climate zone were from167 to 583 lmol-C l�1 (Meybeck 1988; McLean et al. 1999), which is consistentwith DOC concentrations measured in the Yukon River during the open waterseason. Concentration of Yukon River DOC decreased with decreasing dis-charge during the open-water season (n=4, R2=0.97). The positive correlationbetween DOC concentration and river discharge, which has also been observedin other stream systems (Heikkinen 1994; Schiff et al. 1997), is consistent withwhat has been measured in major world rivers (Spitzy and Leenheer 1991). Adistinctive feature of dissolved organic matter variation in arctic river systemsis a maximum concentration being measured during the breakup period.
Together with the discharge data, these DOC concentrations correspond toan instantaneous DOC flux from the upper Yukon River ranging from 30 to144 kg-C s�1 (or 2.6 106 kg-C d�1). The maximum flux occurred during the
Table 2. Concentrations of total DOC (lmol-C l�1) and carbohydrate species (lmol-C l�1) in
dissolved (<0.45 lm) and LMW (<1 kDa) fractions in the Yukon River samples with values of
SD inside parenthesis.
Sample
ID
DOC <0.45 lm <1 kDa
TCHO MCHO PCHO DOC/
TCHO
TCHO MCHO PCHO LMW
DOC/TCHO
YR-01 2835 722 493 (0.68) 229 (0.32) 3.91 71 60 (0.84) 11 (0.16) 5.39
YR-02 1158 312 230 (0.74) 82 (0.26) 3.71 35 32 (0.91) 2.7 (0.08) 7.06
YR-03 725 160 122 (0.76) 38 (0.24) 4.53 25 23 (0.92) 1.2 (0.05) 6.51
YR-04 558 120 92 (0.77) 28 (0.23) 4.65 21 20 (0.95) 0.9 (0.04) 7.82
YR-05 508 138 107 (0.78) 30 (0.22) 3.68 24 21 (0.88) 2.8 (0.12) 5.00
YR-06 533 129 102 (0.79) 26 (0.21) 4.13 26 21 (0.81) 4.8 (0.19) 5.76
TCHO, total dissolved carbohydrates; MCHO, monosaccharides; PCHO, polysaccharides.
145

breakup season; �50% of the annual total DOC flux measured in this studyoccurred during breakup. The open season instantaneous DOC fluxes wererelatively constant, ranging from 30 to 34 kg-C s�1. This seasonal cycle in thedischarge of organic matter in the Yukon is consistent with that found in theSiberian Arctic Rivers where the spring breakup period accounts for 58–78%of the annual OC discharge (Maltseva et al. 1987).
DOC size distribution data showed that a considerable portion of the riv-erine DOC pool was present in a colloidal or HMW fraction (1 kDa–0.45 lm)(Figure 4). On average, colloidal organic carbon (COC) made up 73±6% ofDOC in all samples. Up to 84% of COC was observed in mid-May when theDOC concentration was the highest. Even though the DOC concentrationdropped to an average of 533±25 lmol-C l�1, the percentage of DOCoccurring as COC was still as high as 71±3%, varying from 67 to 74%. Thishigh percentage of COC indicated that colloids are the predominant phase inbulk DOC transported by the Yukon River, which is in agreement withobservations for other river systems (e.g., Benner and Hedges 1993; Guo andSantschi 1997; Gueguen and Dominik 2003).
Partitioning and transformation of carbohydrate species
The distributions of MCHO, PCHO and TCHO in the <0.45 lm fraction aresummarized in Table 2 and Figure 4. Concentrations of TCHO decreased from722 lmol-C l�1 during spring breakup in May to �120 lmol-C l�1 during theopen season from June to September. Within the <0.45 lm TCHO pool,MCHO constituted, on average, 75±4% of the TCHO. Even though con-centrations of MCHO, PCHO and TCHO all consistently decreased from Mayto September, the percentage of MCHO in the TCHO increased from 68% inMay to 79% in September. In contrast, the percentage of PCHO in the TCHOdecreased from 32% in May to 21% in September (Table 2).
Measurements of carbohydrate species in size fractionated DOM phasesshowed that concentrations of TCHO in the <1 kDa LMW fraction rangedfrom 21 to 71 lmol-C l�1, with the highest value observed during breakup inMay and an average of 24 ±2lM-C measured from June to September.Within the LMW TCHO pool, on average, 89±6% was measured as MCHOand only 11±6% was in the PCHO fraction. Compared to the partitioning ofCHO species in the <0.45 lm pool, MCHO was more important in the LMWTCHO pool (89±6% vs. 75±4%).
Using TCHO concentrations measured in both the <0.45 lm and the<1 kDa fractions, the size distribution of TCHO between colloidal and<1 kDa LMW fractions can be calculated. On average, 85±4% of theTCHO was in the colloidal phase, ranging from 80% in September to 90%during breakup in May, and 15±4% of the TCHO was in the <1 kDa phase,varying from 10% in May to 20% in September. Interestingly, even thoughTCHO concentrations decreased from 722 lmol-C l�1 in May to
146

137±17 lmol-C l�1 between June and September, the percentage of colloidalCHO species remained fairly constant. For example, colloidal MCHO was, onaverage, 82±4% of the total MCHO, whereas colloidal PCHO was 93±6%of the total PCHO, similar to the colloidal TCHO (on average, 85±4% of thetotal TCHO). High percentages of colloidal CHO species indicate that the
Figure 4. Variations of (a) dissolved organic carbon in the HMW (1 kDa–0.45 lm) and the LMW
(<1 kDa) fractions and (b) concentrations of carbohydrate species, including monosaccharides
(MCHO) and polysaccharides (PCHO), in the <0.45 lm DOM fraction.
147

carbohydrates in Yukon River waters were mostly partitioned and trans-ported in the colloidal phase. As shown in Figures 4 and 5, the MCHOfraction was consistently the dominant component of the TCHO pool, but theratio of both MCHO and PCHO to TCHO changed as the season progressed;the PCHO/TCHO ratio was higher in May and lower in September, while theMCHO/TCHO ratio was lower in May and higher in September. This rela-tionship between MCHO/TCHO and PCHO/TCHO indicated a transforma-tion between carbohydrate and other organic carbon species during thesampling season; increases in water temperature, microbial activity andphotochemical reactions could be responsible for the observed transforma-tion. More studies are needed to better understand the pathways and mech-anisms controlling the transformation of organic carbon species in the arcticriver system.
The distribution of TCHO in the Yukon River showed a pattern analogousto that of DOC, with a significant correlation between concentrations of allcarbohydrate fractions and DOC concentration (Figure 5). Since the interceptwas close to zero, values of the linear regression slopes indicated that MCHO,PCHO and TCHO made up about 18, 8 and 25% of the <0.45 lm DOC and15, 2 and 17% of the LMW DOC, respectively. Interestingly, the percentage ofTCHO in the bulk DOC reported here is similar not only to that found infreshwater systems (e.g. Wilkinson et al. 1997) but also to that measured inmarine systems (e.g. Pakulski and Benner 1994; Skoog and Benner 1998).Comparable DOM composition (or TCHO/DOC ratio) between freshwaterand seawater suggests common production and cycling processes for naturalorganic matter. These linear relationships also implied a constant carbohydratefraction in the DOC pool from initial snowmelt to ice open season. Further-more, a constant carbohydrate composition also indicated a consistent DOMsource in the Yukon River Basin.
Characteristics of colored dissolved organic matter (C-DOM)
C-DOM in size fractionated DOM fractions was characterized by its opticalproperties, including absorption and fluorescence. The proportion of C-DOMin the DOM pool increased from May to September in both fractions(Figure 6), indicating that DOM draining into the Yukon River containedincreased amounts of humified materials.
To study the compositional changes of C-DOM from spring breakup toopen season, the variations in the spectral slope parameter and shifts in thewavelength of the emission maximum at an excitation wavelength of 313 nmwere examined. In a previous study of the absorption spectra, Gueguen et al.(2003) showed that, while the S-values (spectral slope) in the <0.45 lmC-DOM were relatively constant, the size fractionated HMW and LMWfractions were markedly different from each other. During the breakup season,S-values were lower than during the ice open season for both size fractions:
148

0.011–0.014 vs. 0.016–0.017 nm�1 for the HMW DOM and 0.013–0.017 vs.0.021–0.023 nm�1 for the LMWDOM fractions, respectively, between breakupand open season (Gueguen et al. 2003). Within the <0.45 lm C-DOMpool, the wavelength of the emission maximum, related to the C-DOM origin(De Souza Sierra et al. 1994; Coble 1996), decreased from 444 nm during
Figure 5. Linear correlations of TCHO (d), MCHO (n) and PCHO (n) with DOC concentra-
tions in the <0.45 lm and the <1 kDa LMW fractions in Yukon River waters.
149

breakup in May to 439 nm during the open season from June to September(Figure 7). Differences as large as 5 nm in emission maximum wavelength wereobserved between samples from breakup and those from open season for bothsize fractionated DOM fractions. It has been shown that HMW compoundsare characterized by a longer emission wavelength maximum as compared toLMW molecules in fresh waters (Belin et al. 1993, 1996; Gueguen et al. 2002).
Figure 6. Variations in C-DOM /DOM* ratio in the <0.45 lm, HMW (1 kDa–0.45 lM) and
LMW (<1 kDa) fractions. *assuming DOM =2 · DOC.
Figure 7. Changes in the emission maximum (k=313 nm) of colored DOM in the <0.45 lm,
HMW and LMW fractions.
150
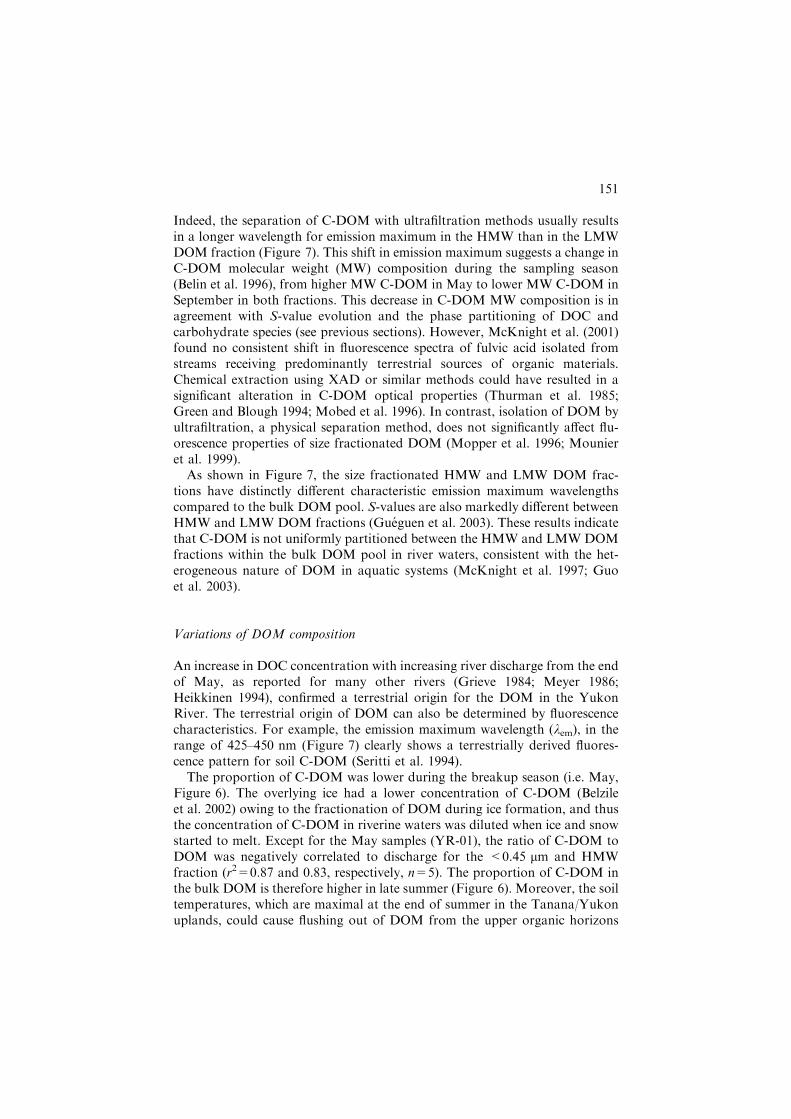
Indeed, the separation of C-DOM with ultrafiltration methods usually resultsin a longer wavelength for emission maximum in the HMW than in the LMWDOM fraction (Figure 7). This shift in emission maximum suggests a change inC-DOM molecular weight (MW) composition during the sampling season(Belin et al. 1996), from higher MW C-DOM in May to lower MW C-DOM inSeptember in both fractions. This decrease in C-DOM MW composition is inagreement with S-value evolution and the phase partitioning of DOC andcarbohydrate species (see previous sections). However, McKnight et al. (2001)found no consistent shift in fluorescence spectra of fulvic acid isolated fromstreams receiving predominantly terrestrial sources of organic materials.Chemical extraction using XAD or similar methods could have resulted in asignificant alteration in C-DOM optical properties (Thurman et al. 1985;Green and Blough 1994; Mobed et al. 1996). In contrast, isolation of DOM byultrafiltration, a physical separation method, does not significantly affect flu-orescence properties of size fractionated DOM (Mopper et al. 1996; Mounieret al. 1999).
As shown in Figure 7, the size fractionated HMW and LMW DOM frac-tions have distinctly different characteristic emission maximum wavelengthscompared to the bulk DOM pool. S-values are also markedly different betweenHMW and LMW DOM fractions (Gueguen et al. 2003). These results indicatethat C-DOM is not uniformly partitioned between the HMW and LMW DOMfractions within the bulk DOM pool in river waters, consistent with the het-erogeneous nature of DOM in aquatic systems (McKnight et al. 1997; Guoet al. 2003).
Variations of DOM composition
An increase in DOC concentration with increasing river discharge from the endof May, as reported for many other rivers (Grieve 1984; Meyer 1986;Heikkinen 1994), confirmed a terrestrial origin for the DOM in the YukonRiver. The terrestrial origin of DOM can also be determined by fluorescencecharacteristics. For example, the emission maximum wavelength (kem), in therange of 425–450 nm (Figure 7) clearly shows a terrestrially derived fluores-cence pattern for soil C-DOM (Seritti et al. 1994).
The proportion of C-DOM was lower during the breakup season (i.e. May,Figure 6). The overlying ice had a lower concentration of C-DOM (Belzileet al. 2002) owing to the fractionation of DOM during ice formation, and thusthe concentration of C-DOM in riverine waters was diluted when ice and snowstarted to melt. Except for the May samples (YR-01), the ratio of C-DOM toDOM was negatively correlated to discharge for the <0.45 lm and HMWfraction (r2=0.87 and 0.83, respectively, n=5). The proportion of C-DOM inthe bulk DOM is therefore higher in late summer (Figure 6). Moreover, the soiltemperatures, which are maximal at the end of summer in the Tanana/Yukonuplands, could cause flushing out of DOM from the upper organic horizons
151
(McLean et al. 1999), consistent with the maximal soil-derived fraction ofDOM being found in August–September.
The pedogenic contribution to DOC can be estimated by using the ratio ofabsorbance at 280 nm to DOC (a280/DOC ratio; Wilkinson et al. 1997). Innatural environments, a much higher a280/DOC ratio is found for pedogenicthan for aquagenic organic matter (�1.7; Buffle 1988). The Yukon RiverDOM, with a280/DOC ratio of 57.3–73.0 m�1/(mmol-C l�1)�1 (Table 1),showed a pedogenic origin throughout the sampling season. The relativeDOM composition, pedogenic organic matter vs. carbohydrate, can be esti-mated from both the a280/DOC ratio and CHO concentrations, assuming aconstant a280/DOC ratio for the pedogenic contribution (Zumstein and Buffle1989). We also assume that carbohydrates and pedogenic humic matter arethe dominant autochthonous and pedogenic sources, respectively, as carbo-hydrates leached from soil make only a small contribution (Wetzel 1983).Accordingly, the DOM sample collected in May (YR-01) contained 26% ofCHO and 74% of pedogenic humic matter (i.e. a280 /DOC=64.9 m�1/(mmol-C l�1)�1, Table 1). The high percentage of pedogenic organic matterindicated that soil derived organic matter dominated the bulk DOM in theYukon River. On average, the proportion of pedogenic DOM was estimatedto be 76±7% of the total DOM. The highest proportion of soil-derivedDOM was measured at the end of the summer (82 and 83% for YR-05 andYR-06 samples, respectively). The overall lower contribution of aquagenicDOM (�24%) is further supported by the low Chl-a concentrations, andconsistent with previous studies. In a study of White Clay Creek, 20% of theDOC was found to be derived from in situ production (Kaplan and Bott1982). Similarly, Wilkinson et al. (1997) suggested that 11–29% of the DOCin Lake Bret was derived from biological processes. Concordance betweenthese independent determinations indicates that terrestrially-derived C-DOMdominates the DOM pool in the Yukon River from breakup to the open-water season.
Conclusions
Concentrations of DOC in the Yukon River had a significant temporalvariation. The highest DOC (up to 2825 lmol-C l�1) was measured beforethe river ice broke up, followed by a rapid decrease from the peak in Mayto a stable, lower level between June and September. DOC transported bythe Yukon River was predominately in the colloidal form with a size rangefrom 0.001 to 0.45 lm. Within the bulk DOC pool, on average, colloidalorganic carbon comprised up to 73±6% of the bulk DOC, ranging from84% in May to 68% in September. Similar to the variation trend of DOCconcentrations, concentrations of all carbohydrate species, including MCHOand PCHO, decreased consistently from 722 lmol-C l�1 in May to129 lmol-C l�1 in September. Within the TCHO pool, the percentage of
152

MCHO consistently increased from May to September despite the overalldecrease in TCHO concentration. The hypothesis that transformationbetween organic carbon species is occurring was further supported by theoptical properties observed for C-DOM in the HMW and LMW organicmatter fractions. The characteristics of C-DOM indicates a typical DOMsource from land weathering associated with snow and ice melting. About50% of DOC flux occurred during the breakup period. The optical prop-erties of C-DOM, overall low Chl-a concentrations and CHO abundance allpoint to a consistent pedogenic-dominated DOM source throughout thesampling seasons. The contribution of pedogenic DOC is estimated to be76±7% of the bulk DOC.
Acknowledgements
We gratefully acknowledge Travis Hines for his assistance during the fieldsampling. We thank two anonymous reviewers for valuable comments onearlier version of the manuscript. This work was supported, in part, by theFrontier Observational Research System for Global Change/IARC and a SwissNSF fellowship.
References
Aagaard K. and Carmack E.C. 1989. The role of sea ice and other fresh water in the Arctic
circulation. J. Geophys. Res. 94: 14485–14498.
Belin C., Croue J.P., Lamotte M., Deguin A. and Legube B. 1996. Characterization of Natural
Organic Matter using Fluorescence Spectroscopy. In: Proceedings of natural organic matter
workshop, LCEN-ESIP-IWSA, Poitiers, France, 18–19th September 1996.
Belin C., Quellec C., Lamotte M., Ewald M. and Simon P. 1993. Characterization by fluorescence
of the dissolved organic matter. Application to fractions obtained by tangential ultrafiltration
and XAD resin isolation. Environ. Technol. 14: 1131–1144.
Belzile C., Gibson J.A.E. and Vincent W.F. 2002. Colored dissolved organic matter and dissolved
organic carbon exclusion from lake ice: implications for irradiance transmission and carbon
cycling. Limnol. Oceanogr. 47: 1283–1293.
Benner R. and Hedges J.I. 1993. A test of the accuracy of freshwater DOC measurements by high-
temperature catalytic oxidation and UV-promoted persulfate oxidation. Mar. Chem. 41: 161–
166.
Bertilsson S. and Jones J.B.Jr 2003. Supply of dissolved organic matter to aquatic ecosystems:
autochthonous sources. In: Findlay S.E.G. and Sinsabaugh R.L. (eds), Aquatic Ecosystems –
Interactivity of Dissolved Organic Matter. Academic Press, San Diego, pp. 4–25
Buffle J. 1988. Complexation reactions in aquatic systems – analytical approach. Ellis Horwood
Series 88: 692.
Coble P.G. 1996. Characterization of marine and terrestrial DOM in seawater using excitation-
emission matrix spectroscopy. Mar. Chem. 51: 325–346.
De Souza-Sierra M.M., Donard O.F.X. and Lamotte M. 1994. Spectral identification and
behaviour of dissolved organic fluorescent material during estuarine mixing processes. Mar.
Chem. 58: 51–58.
153

Ewald M., Belin C., Berger P. and Weber J.H. 1993. Corrected fluorescence spectra of fulvic acids
isolated from soil and water. Environ. Sci. Technol. 17: 501–504.
Gordeev V.V., Martin J.M., Sidorov I.S. and Sidorova M.V. 1996. A reassessment of the Eurasian
river input of water, sediment, major elements, and nutrients to the Arctic Ocean. Am. J. Sci.
296: 664–691.
Green S.A. and Blough N.V. 1994. Optical absorption and fluorescence properties of chromo-
phoric dissolved organic matter in natural waters. Limnol. Oceanogr. 39: 1903–1916.
Grieve I.C. 1984. Concentrations and annual loading of dissolved organic matter in a small
moorland stream. Freshwater Biol. 14: 533–537.
Gueguen C., Belin C. and Dominik J. 2002. Organic colloid separation in contrasting aquatic
environments with tangential flow filtration. Water Res. 36: 1677–1684.
Gueguen C. and Dominik J. 2003. Partitioning of trace metals between particulate, colloidal and
truly dissolved fractions in a polluted river: the Upper Vistula River (Poland). Appl. Geochem.
18: 457–470.
Gueguen C., Gilbin R., Pardos M. and Dominik J. 2004. Water toxicity and metal contamination
assessment of a polluted river: the Upper Vistula River (Poland). Appl. Geochem. 19: 153–162.
Gueguen C., Wang D. and Guo L. 2003. Optical properties of natural organic matter in the Yukon
River Basin. Tohoku Geophys. J. 36: 434–438.
Guo L., Lehner J.K., White D.M. and Garland D.S. 2003. Heterogeneity of natural organic matter
from the Chena River, Alaska. Water Res. 37: 1015–1022.
Guo L. and Santschi P.H. 1997. Composition and cycling of colloids in marine environments. Rev.
Geophys. 35: 17–40.
Guo L., Santschi P.H. and Warnken K.W. 1995. Dynamics of dissolved organic carbon in oceanic
environments. Limnol. Oceanogr. 40: 1392–1403.
Guo L., Wen L., Tang D. and Santschi P.H. 2000. Re-examination of cross flow ultrafiltration for
sampling aquatic colloids: evidence from molecular probes. Mar. Chem. 69: 75–90.
Hedges J.I., Keil R.G. and Benner R. 1997. What happens to terrestrial organic matter in the
ocean? Org. Geochem. 27: 195–212.
Heikkinen K. 1994. Organic matter, iron and nutrient transport and nature of dissolved organic
matter in the drainage basin of a boreal humic river in northern Finland. Sci. Total Environ. 152:
81–89.
Hung C.C., Tang D., Wanken K.W. and Santschi P.H. 2001. Distributions of carbohydrates,
including uronic acids, in estuarine waters of Galveston Bay. Mar. Chem. 73: 305–318.
Kaplan L.A. and Bott T.L. 1982. Diel fluctuations of DOC generated by algae in piedmont stream.
Limnol. Oceanogr. 27: 1091–1100.
Koukal B., Gueguen C., Pardos M. and Dominik J. 2003. Influence of humic substances on the
toxic effects of cadmium and zinc to the green alga Pseudokirchneriella subcapitata. Chemosphere
53: 953–961.
Lammers R.B., Shiklomanov A.I., Vorosmarty C.J. and Peterson B.J. 2001. Assessment of con-
temporary arctic river runoff based on observational discharge records. J. Geophys. Res. 106:
3321–3334.
Maltseva A.V., Tarasov M.N. and Smirnov M.P. 1987. The Discharge of Organic Substances from
Soviet Territories. Gidrokhimicheskiye Materialy, Vol. 102. Gidrometeoizdat, Leningrad.
118 pp. (in Russian).
McKnight D.M., Boyer E.W., Westerhoff P.K., Doran P.T., Kulbe T. and Andersen D.T. 2001.
Spectrofluorometric characterization of dissolved organic matter for indication of precursor
organic material and aromaticity. Limnol. Oceanogr. 46: 38–48.
McKnight D.M., Harnish R., Wershaw R.L., Baron J.S. and Schiff S. 1997. Chemical character-
istics of particulate, colloidal and dissolved organic materials in Loch Vale watershed, Rocky
Mountain National Park. Biogeochemistry 36: 99–124.
McLean R., Oswood M.W., Irons J.G.III. and McDowell W.H. 1999. The effects of permafrost on
stream biogeochemistry: a case study of two streams in the Alaskan (USA) taiga. Biogeo-
chemistry 47: 239–267.
154

Meybeck M. 1998. How to establish and use world budgets of riverine materials. In: Lerman A.
and Meybeck M. (eds), Physical and Chemical Weathering in Geochemical Cycles. Kluwer
Academic, Dordrecht, pp. 247–272.
Meyer J.L. 1986. Dissolved organic carbon dynamics in two subtropical blackwater rivers. Arch.
Hydrobiol. 108: 119–134.
Mobed J.J., Hemmingsen S.L., Autry J.L. and McGrown L.B. 1996. Fluorescence characterization
of IHSS humic substances: total luminescence spectra with absorbance correction. Environ. Sci.
Technol. 30: 3061–3065.
Mopper K., Feng Z., Bentjen S.B. and Chen R.F. 1996. Effects of cross-flow filtration on the
absorption and fluorescence properties of seawater. Mar. Chem. 55: 53–74.
Mounier S., Patel N., Quilici L., Benaim Y. and Benamou C. 1999. Three dimensional fluorescence
of the dissolved organic carbon in the Amazon River. Water Res. 33: 1523–1533.
Pakulski J.D. and Benner R. 1994. Abundance and distribution of carbohydrates in the ocean.
Limnol. Oceanogr. 39: 930–940.
Rachold V., Eicken H., Gordeev V.V., Grigoriev M.N., Hubberten H.W., Lisitzin A.P., Shev-
chenko V.P. and Schirmeister L. 2003. Modern terrigenous organic carbon input to the Arctic
Ocean. In: Stein R and Macdonald RW (eds), The Organic Carbon Cycle in the Arctic Ocean.
Springer Verlag, Berlin, pp. 33–55.
Rember R.D. and Trefry J.H. 2004. Increased concentrations of dissolved trace metals and organic
carbon during snowmelt in rivers of the Alaskan Arctic. Geochim. Cosmo. Acta. 68: 477–489.
Schiff S.L., Aravena R., Trumbore S.E., Hinton M.J., Elgood R. and Dillon P.J. 1997. Export of
DOC from forested catchments on the Precambrian Shield of Central Ontario: Clues from C-13
and C-14. Biogeochemistry 36: 43–65.
Schindler D.W., Curtis P.J., Baylery S.E., Parker B.R., Beaty K.G. and Stainton M.P. 1997.
Climate induced changes in the dissolved organic carbon budgets of boreal lakes. Biogeo-
chemistry 36: 9–28.
Seritti A., Morelli E., Nannicini L., Giambelluca A. and Scarano G. 1994. Fluorescence emission
characteristics of naturally occurring organic matter in relation to metal complexation studies.
Sci. Total Environ. 148: 73–81.
Skoog A. and Benner R 1998. Aldoses in various size fractions of marine organic matter: impli-
cations for carbon cycling. Limnol. Oceanogr. 40: 1803–1813.
Spitzy A. and Leenheer J. 1991. Dissolved organic carbon in rivers. In: Degens E.T., Kempe S. and
Richey J.E. (eds), Biogeochemistry of Major world Rivers. Wiley, Chichester, UK pp. 213–232.
Strickland J.D.H. and Parsons T.R. 1972. A Practical Handbook of Seawater Analysis, Vol. 167.
Bulletin of the Fisheries Research Board Canada, pp. 201.
Telang S.A. 1985. Transport of carbon and minerals in the Mackenzie River. In Degens E.T.,
Kempe S. and Herrera R. (eds), Transport of Carbon and Minerals in the Major World Rivers,
Part 3. Mitt. Geol.-Paleont. Inst. Univ. Hamburg, SCOPE/UNEP Soderbd., pp. 337–344.
Thingstad T.F. 2003. Physiological models in the context of microbial food webs. In: Findlay
S.E.G. and Sinsabaugh R.L. (eds), Aquatic Ecosystems. Interactivity of Dissolved Organic
Matter. Academic press, Burlington, MA pp. 383–397.
Thurman E.M., Aiken G.R., Ewald M., Ficher W.R., Forstener U., Hack A.H., Mantoura R.F.C.,
Parsons J.W., Pocklington R., Stevenson F.J., Swift R.S. and Szpakowska B. 1985. Isolation of
soil and aquatic humic substances (Group report). In: Frimmel F.H. and Christman R.F.(eds),
Humic Substance and their Role in the Environment, John Wiley and Sons, pp. 31–43.
Wetzel R.G. 1983. Limnology, 2nd ed. Saunders, Philadelphia, 767 pp.
Wilkinson K.J., Joz-Roland A. and Buffle J. 1997. Different roles of pedogenic fulvic acids and
aquagenic biopolymers on colloid aggregation and stability in freshwaters. Limnol. Oceanogr.
42: 1714–1724.
Zumstein J. and Buffle J. 1989. Circulation of pedogenic and aquagenic organic matter in an
eutrophic lake. Water Res. 23: 229–239.
155