Embed Size (px)
Citation preview

An Open Education Resource
Chemistry 101 - Introduction to Chemistry I
Jay C. McLaughlin, Ph.D.
Colorado Northwestern Community College
Credit: https://www.pxfuel.com/en/free-photo-qngaq\

An Open Education Resource
credit: https://commons.wikimedia.org/
wiki/File:Marie-Curie.jpg
.
“Life is not easy for any of us,but what of that? We musthave perseverance and aboveall confidence in ourselves. Wemust believe that we are giftedin something, and that this thing,at whatever cost, must be at-tained.”
— Marie Curie
DisclaimerThis is the first draft of a laboratory manual designed to meet the needs of the CHE 101 - Introductionto Chemistry I in Colorado.
CopyrightCreative Commons Attribution 4.0 International License (CC BY SA 4.0).
PublisherFirst printed in September 2021 by Colorado Northwestern Community College

List of Experiments
1 Lab Safety . . . . . . . . . . . . . . . . . . . . . . . . . . . . . . . . . . . . . . . . . . . . 52 Determination of an Unknown Anion . . . . . . . . . . . . . . . . . . . . . . . . . . . . . . 173 Measurements - Length . . . . . . . . . . . . . . . . . . . . . . . . . . . . . . . . . . . . . 294 Measurements - Temperature . . . . . . . . . . . . . . . . . . . . . . . . . . . . . . . . . . 355 Measurements - Mass . . . . . . . . . . . . . . . . . . . . . . . . . . . . . . . . . . . . . . 456 Measurements - Volume . . . . . . . . . . . . . . . . . . . . . . . . . . . . . . . . . . . . . 517 Measurements - Density . . . . . . . . . . . . . . . . . . . . . . . . . . . . . . . . . . . . . 618 Graphing Experimental Data . . . . . . . . . . . . . . . . . . . . . . . . . . . . . . . . . . . 699 Specific Heat . . . . . . . . . . . . . . . . . . . . . . . . . . . . . . . . . . . . . . . . . . . 8310 Double Displacement Reactions . . . . . . . . . . . . . . . . . . . . . . . . . . . . . . . . . 9711 Single Displacement Reactions . . . . . . . . . . . . . . . . . . . . . . . . . . . . . . . . . 10712 Stoichiometry . . . . . . . . . . . . . . . . . . . . . . . . . . . . . . . . . . . . . . . . . . . 11513 Titrations . . . . . . . . . . . . . . . . . . . . . . . . . . . . . . . . . . . . . . . . . . . . . 12714 Percent Composition - Water in Hydrates . . . . . . . . . . . . . . . . . . . . . . . . . . . . 14115 Molecular Compounds and Lewis Structures . . . . . . . . . . . . . . . . . . . . . . . . . . 15516 Properties of Solutions . . . . . . . . . . . . . . . . . . . . . . . . . . . . . . . . . . . . . . 16917 Acids and Bases . . . . . . . . . . . . . . . . . . . . . . . . . . . . . . . . . . . . . . . . . 187
Credit: https://www.pxfuel.com/en/free-photo-oidlc

.

Experiment 1Lab SafetyJay C. McLaughlinColorado Northwestern Community College
CC-BY-SA - August 19, 2021
Name:
Date:
Key Objectives
1. Understand basic rules of laboratory safety.
2. Learn the number 1 rule.
3. Pass safety quiz with 80% or higher
Discussion
Science is about discovery, and one way you will be making discoveries is through science investiga-tions. Some of these investigations make use of equipment and chemicals that must be used safely.Accidents in a chemical laboratory usually result from improper judgment on the part of the victim orone of his or her neighbors. Learn and observe the safety and laboratory rules listed below. The sci-ence department continues to do its part in assuring that you will have a safe experience, but you mustdo your part, too.
Please read the following safety contract, than sign it signifying that you understand it, so that we canbe sure that everyone is committed to safe laboratory practice. Every student must also take an examover these rules and score 80% in order to be allowed in the laboratory.
General Rules
1. Follow all written and verbal instructions carefully. If youdo not understand a direction or part of the procedure, ifyou don’t know ask the teacher before proceeding.
2. Act appropriately at all times in the laboratory. The samehigh level of care and attentiveness is required as mightbe found in a wood working shop or any place wherethere are potential hazards. The laboratory is not theplace for horseplay, jokes, or pranks. In other words,think before acting. Perform procedures with delibera-tion; do not rush.
3. When first entering a science room, do not touch any equipment, chemicals, or other materials inthe laboratory area until you are instructed to do so.
4. Eating, drinking, and smoking: Smoke outside. Eating and Drinking are only allowed in the“classroom” side of the room, never in the “lab” side.
5

Experiment 1 Lab Safety
5. Be prepared for your investigation
(a) Come to class on time and prepared. For reasons of safety, you may not be allowed toattend lab if you are late. This will result in a zero for that lab.
(b) Read all procedures carefully before coming to class. Make a note of any questions youhave and ask them in class before beginning the experiment.
(c) Complete any pre-lab assignment before coming to class
6. Never work alone: Never work in the laboratory without the instructor present including settingup equipment. Simply wait until instructed to begin.
Figure 1.1: Never work along in lab. Your instructor should always be present. credit:https://inside.ewu.edu/ehs/laboratories-and-shops/laboratory-safety/
7. Notify the instructor immediately of any unsafe conditions you observe.
8. Neighbors: Be aware of your lab neighbors’ activities; you may be a victim of their mistakes. Ifyou observe improper techniques or unsafe practices, advise your neighbor and your instructor ifnecessary.
9. Perform only authorized experiments: Unless authorized to do so by the instructor, a studentwill be subject to immediate and permanent expulsion from the lab if found attempting to conductunauthorized experiments or attempting variations of the experiment in the lab manual. Set upand use the prescribed equipment as directed in the laboratory instructions or by your instructor.
10. Do not remove any chemicals from the lab: This will result in permanent expulsion from the lab.
11. Clean and Orderly work-space: Keep your work-space orderly.
(a) Place tall items, such as graduated cylinders, toward the back of the workbench so they willnot be overturned by reaching over them.
(b) Clean up all chemical spills, scraps of paper, and broken glassware immediately.
(c) Keep drawers closed while working and the aisles free of any obstructions, including chairs.
(d) Keep the work area clear of everything except for materials, data sheets, and instructionsheets.
(e) Never place coats, books, and other belongings on the laboratory bench where they will
6

Experiment 1 Lab Safety
interfere with the experiment and are likely to be damaged.
(f) Keep aisles clear. Do not crowd around hot plates, balances, or laboratory stations.
12. When using chemicals, keep hands away from face, eyes, mouth and body. Avoid rubbing youreyes unless you know your hands are clean. Wash your hands with soap and water after per-forming all investigations. Clean all work surfaces and equipment at the end of the experiment,and return all equipment to the proper storage area.
13. 1Do not leave an investigation unattended. For example, do not wander from your assigned areato talk with friends if you are in the middle of a procedure.
14. Students are not to enter science storage areas except under the direct instruction or supervisionof the instructor.
15. If you have an allergy or sensitivity to chemicals, please inform your teacher.
16. Before you leave:
(a) Clean your workspace – Return all glassware and equipment, turn off gas and water, wipeoff your desktop.
(b) Always wash your hands, before leaving the lab since toxic chemicals may be transferred tothe mouth at a later time.
(c) Notify your instructor.
Clothing
1. Safety Goggles (REQUIRED): Because the eyes maybe permanently damaged by spilled chemicals and fly-ing broken equipment, be sure to wear Z-87 safety gog-gles or safety glasses (State law) whenever anyone isworking in the lab. Not wearing safety goggles will re-sult in loss 10% on the lab grade for the day. Multipleinfractions will result in a cumulative loss.
2. Suitable clothing (RECOMMENDED): Wear clothingthat will protect you against spilled chemicals or flam-ing liquids. Hard-soled, close toed, covered footwearand pants/skirts that cover your legs.
.
credit: https://openclipart.
org/detail/251205/
chemistry-is-cool-by-b-lachner
Accidents and Injury
1. Notify your instructor at once in case of ALL (no matter how apparently minor) accidents or per-sonal injuries to you or your neighbor. If your instructor is temporarily absent, notify the instructorin the adjoining lab. If you are asked to go to the hospital, you must go. Refusal to do so is
7

Experiment 1 Lab Safety
grounds for being dropped from the course.
2. Chemicals:
(a) Chemical splashes in your eye(s): If you get any-thing in your eye, use the eye wash immediately,and then report it to your instructor. Use yourhands to hold your eye open so that it can berinsed thoroughly. Rinse for 15 minutes. Note: Eyewashing with a contact lens in place will not clear asplashed chemical from the eye. The contact mustbe removed for effective cleansing. It is advisablefor those wearing contacts to switch to glasses forthe lab period.
(b) Chemical splashes on the skin, flush with water. In-form the instructor immediately.
.
credit: https://commons.
wikimedia.org/wiki/File:
Salle-blanche-rince-oeil-rot.
jpg
(c) Chemical spills on lab benches or floor. Inform the instructor immediately.
3. Report any broken glassware to the instructor.
4. Fires: If it is a small, contained fire, such as in a flask or beaker, cover the container with a pieceof ceramic, cutting off the supply of oxygen to the fire and thus putting it out. If it is open fire, suchas a large chemical spill on a lab bench, the correct extinguisher should be used. Inform yourinstructor immediately.
5. Evacuation: If we are forced to evacuate the building due to fire, chemical spills, or other reason,meet on the step in front of the McLaughlin Building. Do not leave campus, attendance will betaken to be sure that everyone is safe.
6. Be familiar with the location of exits and all safety equipment (Fire extinguisher, fire blanket, eye-wash, medical kits, phones, fire alarms, safety shower).
Handling Chemicals
1. All chemicals in the laboratory are to be considered dangerous. Do not touch, taste, or smell anychemicals unless specifically instructed to do so.
2. Smelling Chemicals: When smelling chemical, do not inhale a large amount. Waft a smallamount towards you as you move the container slowing towards you.
3. Tasting Chemicals: Don’t ever taste a chemical or place it in your mouth.
4. Double check all labels on chemicals before using them. If you are uncertain a chemical is theone required for the experiment, ask your instructor.
5. Never return unused chemicals to their original containers.
8

Experiment 1 Lab Safety
6. When transferring chemicals from one container to another, hold the containers away from yourbody.
7. Acids require special care. You will be shown the proper way to dilute acids. Dilute concentratedacids and bases by pouring the reagent into water (room temperature or lower) while stirringconstantly. Never pour water into concentrated acids; the heat of solution will cause the water toboil and the acid to splatter.
8. Never dispense flammable liquids anywhere near an open flame or source of heat.
9. Mixing chemicals: Always add a reagent slowly–never "dump" in. Some reactions give off a lotof heat, and unless adding slowly, can become too vigorous and out of control. If you make amistake and choose the wrong chemical, adding slowly decreases the possibility of causing aserious accident.
10. Dispose of all chemical waste properly. Your instructor will tell what materials can be poured downthe drain and what materials must be placed in a waste container. In general, solid chemicals,metals, matches, filter paper, and all other insoluble materials are to be disposed of in the properwaste containers, not in the sink.
Figure 1.2: Dispose of waste in the properly marked containers. If you don’t knowASK! credit: https://en.wikipedia.org/wiki/Chemical_waste/media/File:Chemical_Waste_
Disposal_Guideline.jpg
Glassware
1. General: Always check glassware for cracks or chips before using. If it is cracked or chipped askyour instructor for a new piece.
9

Experiment 1 Lab Safety
2. Never handle broken glass with your bare hands. Use a brush and dustpan to clean up brokenglass. Place broken or waste glassware in the designated glass disposal container.
3. When working with glass tubing, follow the specific instructions of your teacher. Puncture woundsby broken glass are some of the most common laboratory injuries.
4. Never use dirty glassware. Improperly cleaned glassware may give incorrect results for chemicaltests. Always clean glassware before using it.
5. Do not immerse hot glassware in cold water; it may shatter.
Electrical Equipment
1. When removing an electrical plug from its socket, grasp the plug, not the electrical cord. Handsmust be completely dry before touching an electrical switch, plug, or outlet.
2. Report damaged electrical equipment immediately. Look for things such as frayed cords, exposedwires, and loose connections. Do not use damaged electrical equipment.
3. Electronic Balances: Do not spill chemicals (liquid or solids) on the scales.
(a) Never pour liquids over the scale. Use a tared beaker and pour the liquid into it while thebeaker is on the lab bench.
(b) Measure out solids carefully.
(c) Clean scales after each use.
4. If you do not understand how to use a piece of equipment, ask the instructor for help.
Heating Substances
1. Be careful around any heating device, but be especially cautious around open flames. Take carethat hair, clothing and hands are a safe distance from the flame.
2. Never heat heavy glassware such as graduated cylinders, suction flasks, or reagent bottles sincethey might shatter. Only heat beakers, Erlenmeyer flasks, test tubes (without corks), and cru-cibles.
Figure 1.3: Only heat the following objects. credit: author
10

Experiment 1 Lab Safety
3. Do not put any substance into a flame unless specifically instructed to do so.
4. Do not reach over any heating device.
5. Do not leave a heating device unattended, and turn off a heating device when not in use. Neverpoint a test tube towards a laboratory neighbor or yourself when heating or carrying out a chemicalreaction. (It is like a loaded gun).
6. Heated metals and glass remain very hot for a long time. They should be identified (set on aceramic pad) as being hot and set aside to cool.
7. Never look into a container that is being heated.
8. Be careful not to place hot equipment on flammable material.
9. Use tongs or heat-protective gloves if necessary.
10. Bunsen Burners:
(a) The burner should be burning only for the period of timein which it is actually utilized.
(b) Before lighting your burner carefully position it onthe desk away from flammable materials, overhangingreagent shelves, flammable reagents such as acetone,toluene, and alcohol on neighboring desks.
(c) Be careful not to extend your arm over a burner whilereaching for something. Keep long hair tied back so thatit cannot fall forward into a flame. Keep beards awayfrom flames.
(d) Always adjust your Bunsen burner to provide a smallblue flame by adjusting the oxygen (by turning the bar-rel) and the gas (by turning the screw at the base).NEVER adjust the flame at the stop-cock. Be sure toturn off the Bunsen burner at the stop-cock (not at thebase).
.
credit: unknown
Miscellaneous Procedures
1. Boiling Water: Add boiling chips to minimize bumping. Never fill the beaker over 75% full. Do notexcessively heat the water. Make sure the container does not boil dry.
2. Round objects roll.
3. Detecting Temperature Changes: Carefully hold your hand near the object and feel for heat. If notheat is detected lightly touch the object. If no heat is detected you may hold the object normally.Hot objects are hot.
4. Fume Hoods. Any experiment involving the use of or production of poisonous or irritating gases
11

Experiment 1 Lab Safety
must be performed in a hood. Be sure the fume hood is turned on and that air is flowing from theroom into the fume hood.
5. Assemble safe apparatus: Always assemble an apparatus as outlined in your instructions. Ob-tain instructor approval after apparatus is assembled before using it. Makeshift equipment andpoor apparatus assemblies are the first steps to an accident.
Hazardous Materials (Chemical Safety and Waste Disposal)
1. General: Treat all chemicals as Hazardous unless you know for sure it is not.
2. MSDS: Material Safety Data Sheets are available for all chemicals used in lab. You may requestto see them at any time (preferably prior to lab, to avoid unnecessary disruptions).
(a) PEL/TLV’s - Permissible Exposure Limit and Threshold Limit Value
(b) Physical and Chemical Properties - BP, MP, VP, Solubility, Evaporation Rate
(c) Fire and Explosion Hazards - Flash point, Auto ignition, Flammability limits, recommendedextinguishing media
(d) Health Hazard Data - LD50, LC50
Figure 1.4: Internationally accepted safey symbols. credit: Globally Harmonized System of Classifica-tion and Labeling of Chemicals, United Nations New York and Geneva, 2005
3. Classes of Hazardous Materials: Chemicals are often grouped into different classes of hazardsmaterials. Learn each class.
(a) Avoid Contact – general irritant
(b) Carcinogen – cause cancer
(c) Corrosive – destroy living tissue/equipment
(d) Danger Unknown - Unknown
(e) Explosive – may explode under some conditions
(f) Flammable – vapors are flammable
(g) Irritant – may irritate eyes, skin, respiratory tract
(h) Lachrymator – as above but more severe
12

Experiment 1 Lab Safety
(i) Mutagen – can cause genetic damage
(j) Peroxide Former – very explosive
(k) Poison – serious effects on body, often lethal
(l) Stench – they smell, open only in hood
(m) Teratogen – cause defects in fetus and embryo
(n) Toxic – hazardous to health if exposed
4. Types of Hazards:
(a) Acute Poisoning: Rapid absorption leading to sudden and severe effects. Ex: CO, Cyanidepoisoning
(b) Chronic Poisoning: Prolonged or repeated exposure over long times, symptoms may notbe immediate. Ex: Pb or Hg poisoning
(c) Substances in combination: Two or more substances that interact leading to a largereffect. Ex: Alcohol + Chlorinated Solvents or Depressants
Figure 1.5: Acute and chronic poisoning symbols. credit: author
5. Read the label: Read the label carefully, read it twice, before taking anything from a bottle. Manychemicals have similar names and chemical formula’s, such as sodium sulfate and sodium sulfite.Using the wrong reagent can spoil an experiment or can cause a serious accident.
6. Excess Chemicals: Avoid using excessive amounts of reagent.
(a) Never obtain more than called for in the experiment.
(b) Do not return any excess chemical to the reagent bottle; share it with another student ordispose of it according the instructions given in the lab.
(c) If you are uncertain how to dispose of an excess of a specific chemical, consult your instruc-tor.
7. Matches/Burning Splits: Never throw lighted matches or wooden splits into a sink it may ignitea discarded flammable liquid. Wet the match or splint and dispose of in the properly labeledcontainer.
8. Waste Chemical: Excess chemicals, or completed experiments should be discarded as instructed
13

Experiment 1 Lab Safety
in the lab manual. This will generally consist of placing the chemicals in the properly labeledcontainer in the hood.
(a) Sinks and Drains: Never dispose of chemicals down the drain unless explicitly told to do soby the instructor or laboratory instructions.
(b) Liquids: labeled containers in the hood.
(c) Solids: labeled container in the hood.
(d) Paper Towels: Trash can.
(e) Glass: Tubing waste or broken glass should be placed in the broken glass container.
The most important rule: “IF YOU DON’T KNOW ASK!”
Figure 1.6: Quick safety quiz. For more examples visit the link. credit: https://www.wisc-online.com/learn/abe-ell/science/sce0919/introduction-to-safety-in-the-chemistry-lab-v
14
Experiment 1 Lab Safety
15

Experiment 1 Lab Safety
.
16

Experiment 2Determination of an Unknown AnionJay C. McLaughlinColorado Northwestern Community College
CC-BY-SA - August 19, 2021
Name:
Date:
Key Objectives
1. Difference between qualitative and quantitative measurements.
2. Five signs that a chemical reaction has occurred.
3. Logical reasoning - inclusive, exclusive and indeterminate results.
Discussion
You accidentally forgot to label a bottle of clear liquid, how can you determine its contents? Or perhapsyou find a mysterious bottle on the shelf, how can you identify it? We will explore using the chemicalproperties of compounds to identify an unknown liquid based on its characteristic chemical reactions.We will become familiar with the signs and observations that a chemical reaction has occurred. We willalso explore several logic concepts including inclusive, exclusive, and indeterminate results.
Physical and Chemical Properties
Physical properties of substances is a characteristic of a substance that can be observed or measuredwithout changing the identity of the substance, no chemical bonds are broken or formed. Physicalproperties include color, density, hardness, and melting and boiling points.
Chemical property describes the ability of a substance to undergo a specific chemical change. Thesubstance is chemically changed, chemical bonds are broken and reformed resulting in a new sub-stance with different physical and chemical properties.
In this experiment you will be given aqueous samples of sodium chloride (NaCl),sodium iodide (NaI),sodium hydrogen carbonate (NaHCO3), sodium carbonate (Na2CO3), sodium hydrogen phosphate(Na2HPO4), and sodium sulfate (Na2SO4). You will test these compounds for characteristic reactionswith nitric acid (HNO3), barium nitrate (Ba(NO3)2), silver nitrate (AgNO3), nitric acid (HNO3), ammoniumhydroxide (NH4OH), and an acid-base indicator called thymol blue.
You will also be given an unknown sample that will be identical to one of the aqueous samples. Aftertesting the known compounds, you will subject your unknown substance to those same tests. You willbe able to determine the unknown sample’s identity by matching its characteristic reactions with thoseof the known samples.
This experiment emphasizes the importance of accurate observations, properly recording them, and theuse of deductive logic to draw conclusions from those observations. If you make accurate observationsand record them faithfully, you will be able to identify the unknown compound without difficulty. Accurateobservations are the only criterion for success. No prior knowledge of the chemistry that you willobserve is necessary or assumed.
17

Experiment 2 Determination of an Unknown Anion
Signs of a Chemical Reaction
We will be observing the characteristic chemical properties of compounds through a series of tests withdifferent reagents and observing if a chemical reaction occurs or not, and if so what specifically occurs.There are several signs that a chemical reaction has occurred. These signs are:
1. Color changes, that are not the result of simple dilution.
2. Evolution of a gas forming many bubbles rapidly.
3. Formation of a precipitate, normally a solid which will settle to the bottom of a test tube, butoccasionally a finely divided precipitate that does not settle and often appears as only a milkycolor.
4. Disappearance of a precipitate.
5. Endothermic or Exothermic reactions (creation of heat or cold).
There are several cases where it is difficult to tell if a chemical reaction occurred. When dissolving asolid or precipitate, only a portion is dissolved, thus leaving some behind, and fooling a student intoincorrectly reporting that no reaction occurred, or that a precipitate formed. This can be avoided byrealizing that the original compounds are generally crystalline, and will sit at the bottom of a test tube(or settle out quickly), while a precipitate will have a milky appearance, and tend to spread evenlythroughout the solution. A less common mistake is mistaking a lightening in color of a solution as acolor change when it is simply due to the dilution of the original color. In general color changes will befairly drastic, red to blue, green to yellow, not blue to light blue. Another common mistake is observingone or two bubbles due to the mixing or stirring of a liquid solution and reporting it as the formation of agas. Generally the formation of a gas will be very rapid and vigorous, and should be very noticeable.
Standard nomenclature for these observations are shown below in Table 2.1. The exact nomenclaturewill vary from book to book, and person to person, but these general rules work well.
Observation Nomenclature ExampleColor change color 1 −−→ color 2 red −−→ blueGas formation (g) - descriptor (g) - vigorous
Formation of a precipitate ppt - descriptor milky white pptDisappearance of a precipitate ppt dissolves (descriptor) ppt dissolves (2 drops)
Exothermic or Endothermic hot/cold hotNo reaction NR or x NR or x
Table 2.1: Typical nomenclature used to describe chemical properties.
Inclusive and Exclusive Reasoning
When making observations and applying them to determining the identity of an unknown that may bea single chemical or a mixture of two or more chemicals, it is often necessary to determine whether atest provides an inclusive, exclusive or indeterminate answer. A test would be considered inclusive ifthe result indicated that a specific substance must be in the unknown mixture, an exclusive test wouldindicate that a specific substance must be excluded from the mixture. A third situation does exist whichis when a test is indeterminate about whether a substance is in the mixture, neither including it or
18

Experiment 2 Determination of an Unknown Anion
excluding it. Consider the following set of results in Table 2.6.
Compound Reagent 1 Reagent 2 Reagent 3A ppt occurs no reaction hotB ppt occurs ppt occurs hotC no reaction ppt occurs (g) - No temp changeD (g) no reaction hot
Unknown ppt occurs ppt occurs hotTable 2.2: Reaction Data for Several Compounds
Assuming you have an unknown mixture of two of the compounds A, B, C, and D and mixed theunknown with each of the Reagents 1-3. Table 2.3 summarize the results. The results from reagent 1are inclusive in that that you must have either compound A and/or B in your mixture, excludes compoundD because no gas is observed and is indeterminate for compound C because it could be masked byA or B. The results from reagent 2 are inclusive in that you must have either B and/or C, but you can’texclude A or D being present because their presence could be masked by B or C. Reagent 3 is inclusivefor A, B, and D but excludes C since no gas was formed. Combining our results we can state that ourunknown can not contain C and D and therefore must be a mixture of compounds A and B.
Another way to view the results above would be to create a small table showing all possible combina-tions of the solutions and crossing off combinations that are excluded based on your observations. Inthis problem, there are 4 solutions, taken 2 at a time means that there are 6 possible combinations (asshown in the last column below). Combining the results from all 3 tests, the only solution not crossedoff is the mixture of compounds A and B.
Reagent Inclusive Exclusive Indeterminate Combinations(a,b) (a,c)���(a,d)
Reagent 1 A and/or B D C (b,c)���(b,d)
���(c,d)(a,b) (a,c) (a,d)
Reagent 2 B and/or C none A and D (b,c) (b,d)(c,d)(a,b)���(a,c) (a,d)
Reagent 3 A, B, D C none ���(b,c) (b,d)
���(c,d)Table 2.3: Inclusive, Exclusive, and Indeterminate results
19

Experiment 2 Determination of an Unknown Anion
Procedure
In this experiment you will be observing the reactions of 6 known compounds and one unknown com-pound with different reagents. Record all observations you make in the appropriate place. The testsare separated into 4 different tests (Parts 1-4), you may perform the tests in any order. You may workin pairs to perform Parts 1-4, but each individual should obtain a different unknown to identify.
Read the entire procedure before beginning the experiment.
Part 1 - Testing for Gas Evolution (Station 1)
1. Label 6 clean test tubes with the identity of each known compound and place 1 ml (about 20drops) of each known liquid in each using a disposable pipet.
2. Add 5 drops of 3 M Nitric Acid to each test tube and record your observations. Be very carefulwith the Nitric Acid, it will eat holes in your clothes!
3. Discard the contents of the test tube in the sink and rinse with distilled water. You may use thesesame test tubes for the rest of the experiment.
Part 2 - Barium Nitrate and Nitric Acid Test (Station 2)
1. Label 6 clean test tubes with the identity of each known compound
2. Using the known solutions available in the laboratory place 1 mL (20 drops) of each known com-pound into your labelled test tubes.
3. Add 3 drops of ammonia to each test tube and stir with a clean stirring rod. Remove the stirringrod and touch a drop of each solution to a strip of red litmus paper. The paper should turn fromred to blue, if it does not add drops of ammonia to the solution until it does. Do not record anyresults for this step, we are simply preparing the solution for the next step.
4. Add 5 drops of the Barium Nitrate solution to each test tube. Mix each tube gently (as demon-strated in class) to obtain a homogeneous solution. Record your observations in the columnlabelled Barium Nitrate.
5. The next step only applies to those test tubes that contained precipitates. Add 5 drops of 6 MNitric Acid to each of these test tubes. Using a clean stirring rod, test each solution with a stripof blue litmus paper. If the paper does not turn from blue to pink, continue adding drops until itdoes. Examine each test tube carefully and note which of the precipitates has dissolved. Recordyour observations in the Barium Nitrate + Nitric Acid column.
6. Discard the solutions in the test tubes in the Waste Container labelled “Barium or Ba+2 Waste”which can be found in the hood.
7. Wash your test tubes and rinse them with distilled water.
20

Experiment 2 Determination of an Unknown Anion
Part 3 - Silver Nitrate and Nitric Acid Test (Station 3)
1. Label 6 clean test tubes with the identity of each known compound
2. Using the known solutions available in the laboratory place 1 mL (20 drops) of each known com-pound into your labelled test tubes.
3. Add 5 drops of 0.1 M Silver Nitrate solution to each test tube. Mix each tube gently (as demon-strated in class) to obtain a homogeneous solution. Record your observations in the columnlabelled Silver Nitrate.
4. The next step only apply to those test tubes that contained precipitates. Add 10 drops of 6 MNitric Acid to each of these test tubes. Using a clean stirring rod, test each solution with a stripof blue litmus paper. If the paper does not turn from blue to pink, continue adding drops until itdoes. Examine each test tube carefully and note which of the precipitates has dissolved. Recordyour observations in the Silver Nitrate + Nitric Acid column.
5. Discard the solutions in the test tubes in the Waste Container labeled “Silver or Ag+ Waste” whichcan be found in the hood.
6. Wash your test tubes and rinse them with distilled water.
Part 4 - Thymol Blue test (Station 4)
Thymol blue is a strong dying agent, it will stain clothing and fingers so be careful with it.
1. Label 6 clean test tubes with the identity of each known compound
2. Using the known solutions available in the laboratory place 1 mL (20 drops) of each known com-pound into your labeled test tubes.
3. Add 5 drops of thymol blue to each test tube.
4. Dilute each solution by adding 2.5 mL of water.
5. Record your observations.
6. Carefully add 1 drop of 6 M Nitric Acid to each test tube.
7. Stir each tube gently and record your observations in the column labeled Thymol Blue.
8. Discard the solutions in the test tubes in the sink.
9. Wash your test tubes and rinse them with distilled water.
Part 5 - Identifying an unknown solution
1. Perform each of the above tests (Parts 1-4) on your unknown solution and record your results.
2. You should be able to identify your unknown solution after comparing the results of your unknownwith those of the known solutions. If any ambiguities occur or you are unable to identify your
21
Experiment 2 Determination of an Unknown Anion
unknown repeat as many of the tests as you find necessary. You may consult your instructor asto which tests are most likely to be in error.
3. The Thymol Blue test is very sensitive to the concentration of the solutions tested. If your resultsfor your unknown do not match any of the known compounds, you may try adding a little more ofyour unknown to the solution to make it more concentrated, and/or add water to the solution tomake it more dilute.
4. Identify your unknown, and provide an explanation as to why you believe it to be the compoundyou chose.
22

Experiment 2 Determination of an Unknown Anion
Results
Station 1 Station 2
Compound Gas Evolution Barium NitrateBarium Nitrate + Nitric
Acid
NaCl
NaI
NaHCO3
Na2CO3
Na2HPO4
Na2SO4
Unknown#
Table 2.4: Results: Part 1-2
23

Experiment 2 Determination of an Unknown Anion
Station 3 Station 4
Compound Silver NitrateSilver Nitrate + Nitric
AcidThymol Blue
NaCl
NaI
NaHCO3
Na2CO3
Na2HPO4
Na2SO4
Unknown#
Table 2.5: Results: Part 3-4
I was given unknown NUMBER I think it is because ...( Explain)
24

Experiment 2 Determination of an Unknown Anion
Post Lab Questions
1. An unknown sample contains two out of the following five compounds. Use information recordedbelow to determine the identity of the unknown. For each of the results below state which com-pounds are Inclusive (could be in your unknown), Exclusive (can’t be in your unknown), or areIndeterminate (may or may not be in your unknown). Finally, cross out any combinations (solution)that are excluded by the test by crossing out the number/solution in the chart.
Compound Reagent 1 Reagent 2 Reagent 3 Reagent 4 Reagent 51 ppt NR NR (g) NR2 ppt ppt NR NR ppt3 NR ppt Hot (g) NR4 NR NR Hot (g) NR5 ppt NR Hot NR ppt
Unknown ppt ppt Hot (g) NRTable 2.6: Reaction Data for Several Compounds
1(a) Reagent 1 Results: A white fluffy ppt wasformed.
Inclusive:
Exclusive:
Indeterminate:
(1,2) (1,3) (1,4) (1,5)(2,3) (2,4) (2,5)(3,4) (3,5)(4,5)
1(b) Reagent 2 Results: A chunky yellow ppt isformed.
Inclusive:
Exclusive:
Indeterminate:
(1,2) (1,3) (1,4) (1,5)(2,3) (2,4) (2,5)(3,4) (3,5)(4,5)
1(c) Reagent 3 Results: The reaction mixturewas warm to the touch.
Inclusive:
Exclusive:
Indeterminate:
(1,2) (1,3) (1,4) (1,5)(2,3) (2,4) (2,5)(3,4) (3,5)(4,5)
1(d) Reagent 4 Results: Vigorous gas wasevolved.
Inclusive:
Exclusive:
Indeterminate:
(1,2) (1,3) (1,4) (1,5)(2,3) (2,4) (2,5)(3,4) (3,5)(4,5)
1(e) Reagent 5 Results: No reaction occured
Inclusive:
Exclusive:
Indeterminate:
(1,2) (1,3) (1,4) (1,5)(2,3) (2,4) (2,5)(3,4) (3,5)(4,5)
25

Experiment 2 Determination of an Unknown Anion
2. Which 2 compounds are in the unknown? Explain.
3. Based on chemical properties, is it possible to be 100% sure that a chemical unknown you testwhich matches the properties of an existing compound is indeed that compound? Explain.
This page left intentionally blank.
26

Experiment 2 Determination of an Unknown Anion
Name: Class: Date:
Prelab Questions
1. What is the difference between an inclusive, exclusive and indeterminate test results?
2. List the five signs that a chemical reaction has occurred.
3. List two typical mistakes that a student might make when deciding whether a chemical reactionoccurred or not.
4. When adding Thymol blue (a dark blue liquid) to a clear liquid, the resulting solution is light blue.Did a reaction occur? Explain.
27

Experiment 2 Determination of an Unknown Anion
.
28

Experiment 3Measurements - LengthJay C. McLaughlinColorado Northwestern Community College
CC-BY-SA - August 19, 2021
Name:
Date:
Key Objectives
1. Understand Accuracy and Precision.
2. Identify what type of measurements need to be made to determine accuracy and precision.
3. Understanding how to take and report measurements with the proper number of significant figure.
4. Make length measurements with a variety of measuring devices.
5. Use of Dimensional Analysis in routine calculations.
Discussion
Accuracy and Precision
Through observation of the world around us both qualitatively and quantitatively we as scientists seekto formulate hypothesis, theories, rules and laws to describe how matter behaves. Our ability to acquireaccurate and precise data is crucial to our success as scientists. In this (and the next few) experimentswe will learn how to obtain correct measurements that are as accurate and precise as possible.
The Accuracy of a measurement or calculation is how close the result is to the correct value. Thisis most often determined by making measurements on known materials and comparing the measuredvalue to the accepted (or literature) value. The correct values used to be tabulated in the Handbook ofChemistry and Physics but usually these values can now be found on the internet, though one shouldalways used a reputable site like NIST - National Institute of Standards and Technology or check severalsite to see that the correct values agree with each other.
The Precision of a measurement or calculation is how reproducible the result is if the experiment isperformed multiple times or how close repeated measurements are to each other. In practice thismeans that you must take many measurements of an observed quantity to determine how precise yourmeasurement is.
An Analogy for Accuracy and Precision
The term precision and accuracy are often confused by students. A representation of the differencescan be seen in Figure 3.1. Precision is how close each × is to each other, while accuracy is a measureof how close the × is to the center of the target. The worst measurements are represented by thefirst target which is neither precise nor accurate. The best measurements are represented by thefourth target which is both precise and accurate. Targets two and three represent precision or accuracybut not both at the same time and either target could be an acceptable measurement depending onthe requirements of the measurement. We always strive for both accuracy and precision but quiteoften there is not time in lab to do both, in which case it is important to know whether you measuredsomething accurately or precisely.
29

Experiment 3 Measurements - Length
Figure 3.1: Targets illustrating the 4 possible combinations of accuracy and precision. Credit: unknown
Making Measurements in Lab
Scientific measurements always contain some amount of error in them. Even something as simple ascounting the number of people the class room could result in errors if someone is counted twice or isout of the room using the bath room. Another example would be measuring the height of a person, didthey have their shoes on or off, did they stand straight or slouch, are they bald or have lots of hair.
Even the devices used to make measurements are subject to error, often making it impossible to obtainthe exact same measurement repeatedly. For example when you step on your bathroom scale it rarelyreads the same weight. To indicate how well a measurement is made, record all the digits of themeasurement using the markings that are known exactly and one further digit that is estimated oruncertain. The estimated or uncertain digit is obtained by noting the smallest unit of measurementgiven and then estimating between the values. These digits are collectively referred to as significantfigures. Significant figures represent how well a measurement is made, the more significant figuresin the measurement the better it is considered. Significant figures do not represent how accurate orprecise a measurement is only how well you can make the measurement.
Figure 3.2: (a) Measuring a pencil with two different rulers will result in a different number of significantfigures. (b) Anther example of how to read a ruler. credit: (a) author (b) unknown
For example in Figure 3.2 shows how one would report a measurement depends on what ruler is used tomeasure the pencil. Using the Ruler 1, the first digit is certainly 1, but we must estimate the tenths place.The length of the pencil, using Ruler 1, and written using the proper number of significant figures, wouldthen be 1.5 inches, where the tenths place is an estimate. The second ruler has additional markingsand allows a measurement with more significant figures to be made. The pencil is certainly between1.5 and 1.6 inches, and we then must estimate the hundredths digit. The length of the pencil usingRuler 2 would be written as 1.55 inches.
30

Experiment 3 Measurements - Length
In another example, the ruler shown in Figure 3.2 has large marks every 1 cm, and smaller marks everymm. The length of the nail is certainly between 3.7 and 3.8 cm, thus indicating at least 2 significantfigures. However, you can add one more digit to your reported value by estimating the value betweenthe lines. Thus, you could report the length of the nail as 3.75 cm, where the last digit represents your"estimated" value. The first rule is one should always try to "‘read between the lines"’. A second rule toremember when making measurements is that if the length of the nail was exactly on the 4 cm line, youshould indicate the number of significant figures to which you can make this measurement by addingzero’s to your value and record the length as 4.00 cm.
The precision in a measurement is often quoted in terms of how inaccurate the estimated digit is.For example in Figure 3.2 the precision would be stated to be ± 0.05 cm. The ± indicates that themeasurement could be shorter or longer then the stated value. The 0.05 cm indicates two things, firstthe number of places past the decimal point it is possible to read (in this case 2) and the precision towhich the last digit can be estimated (in this case you can probably distinguish if a length was 1/2 waybetween the two millimeter marks (0.05 cm), but can not guess if it was 0.01 or 0.02 cm).
Key Idea: Making Measurements
Remember, ALWAYS read between the lines, and report measurements to as many decimalplaces as possible, using zeros to indicate additional precision if needed.
31

Experiment 3 Measurements - Length
Procedure
To get you started performing measurements we will begin with a few simple exercises. Be sure torecord data in the appropriate places in the results section as you complete each measurement. Allresults should be written with the proper number of significant figures and units. ALL calculationsshould be shown in the space provided.
A. Small Ruler
1. Measure the length of the following lines as accurately as possible using centimeters.Line 1:Line 2:
2. Make sure to record to the proper number of significant figures and include units in your answer.
B. Meter Stick
1. Measure the length and width of a piece of paper as accurately as possible using a meter stick incentimeters.
2. Measure the height of the lab bench.
C. Wood Block
1. Write down the Identity (ID) of the block.2. Measure the Length, Width, Height of the block.3. Calculate the volume of the block (Volume = L × W × H). Be sure to use the proper number of
Significant Figures and units in your answer.4. Check your answer with the instructor.
32

Experiment 3 Measurements - Length
Results
All results should be written with the proper number of significant figures and include units. ALL calcu-lations should be shown in the space provided.
A. Small Ruler
1. Length can be measured with the smaller ruler with what uncertainty? (±):
2. Length of the first line
3. Length of the second line
B. Meter Stick
1. Length can be measured with the meter stick with what uncertainty? (±):
2. Length of a piece of paper
3. Width of a piece of paper
4. Height of the Lab Bench.
C. Wooden Block
1. Identity of the wooden block
2. Length
3. Width
4. Height
5. Volume
6. Correct Answer (Check with instructor)
33

Experiment 3 Measurements - Length
Questions
1. What two rules should one remember when measuring (in general, and specifically when using aruler)?
2. The directions for an experiment state "cut a piece of chromatography paper 5.8 cm long".
(a) Give the minimum length of paper that would satisfy these directions. 2(a)
(b) Give the maximum length of paper that would satisfy these directions. 2(b)
3. Discuss the precision and accuracy of the shooter given the following target. Explain.
4. An alien from mars was measuring the length a football field using a meter stick. The alien saidthe room is 9100 cm long. What is wrong with the alien’s answer? What should the alien’s answerhave been?
Credit: https://freesvg.org/angry-alien
34

Experiment 4Measurements - TemperatureJay C. McLaughlinColorado Northwestern Community College
CC-BY-SA - August 19, 2021
Name:
Date:
Key Objectives
1. Deepen our understanding of accuracy and precision.
2. Use of Percent Error.
3. Determine if a measurement is accurate or precise.
4. Understand the difference between Fahrenheit ( ◦F ), Celsius (� ), and Kelvin (K) scales
5. Convert between ◦F , � , and K scales.
Discussion
Temperature Measurements
Temperature is commonly measured in one of three units, degrees Fahrenheit ( ◦F ), degrees Celsius(� ) and Kelvin (K ) as shown in Figure 4.1. In the United states the use of Fahrenheit is consideredstandard, while the rest of the world uses the metric Celsius scale. The Kelvin scale is an absolute scalewhich scientists frequently use and is used when discussing gas laws, thermodynamics and kinetics.For now the use of the Celsius scale will be considered our standard unit, with the introduction of theKelvin scale discussed later.
Figure 4.1: The relationship between the three most common temperature scales: degrees Fahrenheit( ◦F ), degrees Celsius (� ) and Kelvin (K ) credit: https://commons.wikimedia.org/wiki/File:
Temperature-Scale_diagram.jpg
The main difference between the three temperature scales is the choice of standards for the freezing
35

Experiment 4 Measurements - Temperature
◦F = 1.8× � + 32
� =( ◦F − 32)
1.8K = � + 273.15
Figure 4.2: Equations for converting between the three most common temperature scales.
and boiling points and the size of the degree. The Fahrenheit scale was based on the freezing point ofa salt water solution (0 � ) and the average human body temperature (originally set at 96 ◦F ). Thescale results in the freezing point of pure water as 32 ◦F and boiling water as 212 ◦F . There are 180degrees separating the two values.
The Celsius scale sets the freezing point and boiling point of pure water at 0 � and 100 � and isbased on the metric system resulting in the 100 units being placed between the two standards.
The Kelvin scale is based on the motion of atoms with 0 K (also known as absolute zero) being thetemperature at which no molecular motion occurs. The size of the Kelvin unit is based on the metricsystem, thus the same size as the Celsius degree. The freezing point of water on the Kelvin scale is273.15 K, while the boiling point is 373.15 K.
Conversions between the three temperature scales can be done using the equations in Figure 4.2.You do not have to memorize the formula, they are given on your cheat sheet. Other mathematicalrepresentations of the formula are possible with the factor of 1.8 often being replaced with the fraction9/5, which is the ratio of the 180 Fahrenheit degree’s to the 100 Celsius degree’s. The addition orsubtraction of 32 (and 273.15) is to correct for the different definitions of zero for each scale.
Error’s in Measurements
In statistics error is the difference between the computed, estimated. exerimental or measured valueand the true, specified or theoretically correct value. Errors are not mistakes. All measurements how-ever are subject to a variety of errors which can result in incorrect values. Several examples are humanerror (simply being human is enough to get some things wrong), incorrect procedures, broken measur-ing instruments, and poorly calibrated instruments. The goal of a scientist is to minimize the possiblesources of error in any measurement. The list of ways to do this is large, but the most common onesused in class will be by (1) following proper procedures, (2) calibrating instruments, (3) testing versusknown quantities, and (4) making multiple measurements.
Percent Error
One measure of accuracy is to calculate the Percent Error in your measurement which represents thedifference between the experimental or measured value and the theoretical or correct value scaled bythe theoretical/correct value. It is given by the following formula:
Percent Error =
∣∣∣∣(Experimental Value− Theoretical Value)
Theoretical Value
∣∣∣∣× 100
36

Experiment 4 Measurements - Temperature
For example know value for the boiling point of water is 100.0 � , but if you measure the temperatureof boiling water in lab as 94.5 � then the percent error in your measurement would be 5.5%. Makesure you try to calculation yourself and get the same result.
Calibration
Calibration is the validation of specific measurement techniques and equipment. At the simplest level,calibration is a comparison between measurements of known quantities and the value obtained usingthe measuring instrument. Many devices come pre-calibrated, but most electronic devices and ther-mometers do not come calibrated. The accuracy of the device is established by measuring knownquantities and correlating this with the values measured on the laboratory equipment. This process isknown as calibration. In general glassware for measuring volume is purchased already calibrated, thuswe will only need to calibrate thermometers and balances (scales).
Your first task will be to check the accuracy of your thermometer by calibrating it to two known values.The two temperatures you will use are transition between ice and water (melting point) which occursat 0 °C and the transition from liquid to gas (boiling point) which occurs at 100 °C at sea level. Themelting point is not affected to a noticeable degree by elevation, in contrast, the boiling point is affectedby elevation. Those curious may read about this in Hein Ch. 13.5 (p. 305), Chang Ch. 11.8 (p. 466)or in McMurry Ch. 10.5 (p. 396). The boiling point is the temperature at which the vapor pressure of aliquid is equal to the external pressure (generally atmospheric pressure) above the liquid. In RangelyCO, we are at an elevation of approximately 1 mile, this will result in the lowering of the boiling point ofwater to approximately 94.7 °C .
Figure 4.3: Boiling point of water at different elevations. credit: author
Thermometer Basics
The simple act of measuring temperature with a thermometer can easily involve many errors. Whenmeasuring the temperature of a liquid one can minimize error by observing the following procedures:
1. Hold the thermometer away from the walls of the container.2. The bulb of the thermometer should be fully immersed in the water.3. Allow sufficient time for the thermometer to reach equilibrium with the liquid.
37

Experiment 4 Measurements - Temperature
4. Be sure the liquid is adequately mixed.5. Always make readings at eye-level.6. Sometimes a note card placed behind the thermometer makes the mercury easier to see.
Some additional pointers for using a thermometer:
1. Thermometers are round. Round objects on flat surfaces (lab bench tops) tend to roll. Alwaysplace your thermometer such that it will not roll off the lab bench top.
2. Thermometers are fragile, do not use them as stirring rods. Stirring rods should be used to stirliquids.
3. Always secure your thermometer with a clamp.4. Many thermometers contain mercury (a toxic heavy metal), if you break a thermometer immedi-
ately inform your instructor so the proper hazardous waste procedures can be followed.
Proper use of Bunsen Burners
We will be using Bunsen burners for the first time in this experiment. Bunsen burners can be found inthe tall drawer at the lab benches. Figure 4.4 below shows the proper set-up for a bunsen burner
1. Check the rubber hose attached to the Bunsen burner for cracks or splits. Report any bad hosesto your instructor so they may be replaced. Attach the hose to the stop-cock.
2. Check the turn screw at the bottom of the Bunsen burner, and leave it partially open (this controlsthe amount of gas burning).
3. Clear the area of flammable substances.4. Turn the stop-cock perpendicular (90 degrees) to the pipe. Never adjust the amount of gas going
to the Bunsen burner with the stop-cock, use the valve at the bottom of the burner. The stop-cockshould always be either on or off, never between.
5. Adjust the flame using the screw at the bottom of the burner to adjust the gas flow, and the tubeof the burner to adjust the oxygen flow. The goal is to form a small blue cone. The hottest part ofthe flame is the tip of the blue cone. It does not have to be large in order to provide the maximumamount of heat.
6. When done using a Bunsen burner turn it off at the stop-cock.7. Allow the Bunsen burner to cool, then replace the Bunsen burner in the cabinet.
Procedure
A. Measure the melting point of ice
1. You will need a ring stand (in the cabinets under the lab benches), a ring clamp, wire pad, and athermometer clamp.
2. Set up a ring stand as shown in Figure 4.5 and as can be seen at the instructor lab bench.3. Have your instructor check your assembled apparatus before proceeding.4. Fill a 500 mL beaker with approximately 75% ice and 25% distilled water.5. Place the thermometer in the ice water solution and allow 3-5 minutes for the system to equili-
brate.
38

Experiment 4 Measurements - Temperature
Figure 4.4: Typical bunsen burner. The flame on the bunsen burner is adjusted by changing the amountof air and gas. credit: unknown
6. Record the temperature on the results page.7. If your results are not within 2 °C of the expected temperature, consult your laboratory instructor.
B. Measure the boiling point of water
1. Place approximately 350 mL of distilled water in a 500 mL beaker. (75% full)2. Place 1-2 *boiling chips in the beaker.3. Place the beaker on the ring stand as shown in Figure 4.5. Be sure to cover the ring stand with a
piece of wire screening to set the beaker on.4. Light the Bunsen burner and adjust the flame such that the blue cone is just touching the beaker.5. Allow the water to boil for 3-5 minutes to establish a consistent temperature.6. Obtain a small thermometer from your instructor.7. Record the temperature of the water in the beaker.8. If your results are not within 2 °C of the expected temperature of 96 °C consult your laboratory
instructor.9. Allow your water bath to cool before attempting to dispose of the water in the sink.
*Boiling results in the rapid formation of bubbles of air in a solution. In small containers (such as thebeakers used in laboratory) or in pure liquids (such as the distilled water used in laboratory) the rapidformation of a large bubble can cause the beaker to "‘bump"’ or move abruptly causing it to be knockedoff the ring stand. Boiling chips are used when boiling substances to prevent this from occurring bycreating places for bubbles to form in a controlled manner.
39

Experiment 4 Measurements - Temperature
C. Comparing Thermometers
1. Obtain a second (long) thermometer from your instructor.2. The thermometer you received is expensive, take extremely good care of it to avoid the wrath of
your instructor.3. Record your observations of the thermometer in the results section.
Figure 4.5: (a) Using a bunsen burner to boil water. (b) Using a hot-plate to boil water. credit: (a)https://chem.libretexts.org/@go/page/95586 (accessed Jun 19, 2021) (b) unknown
40
Experiment 4 Measurements - Temperature
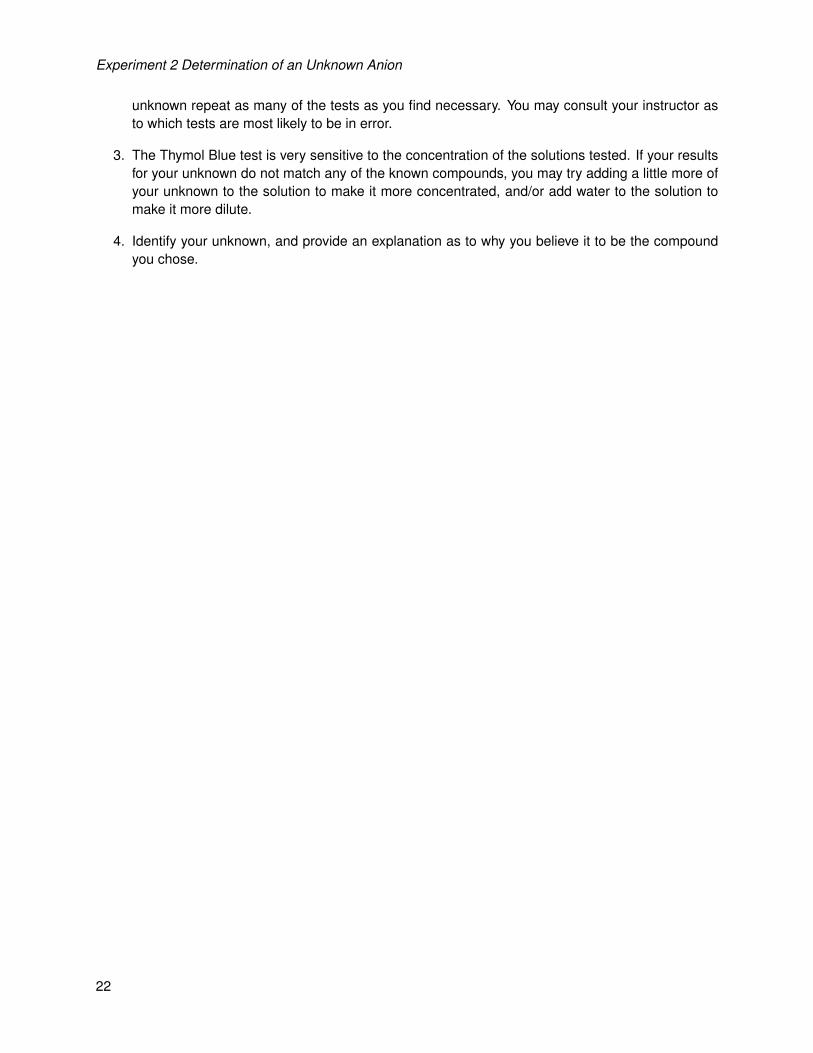
Results
Cheap Thermometer
1. Temperature can be read with what uncertainty(±) (cheap thermometer):
2. Temperature of ice-water bath (cheap thermometer):
3. Percent Error in Freezing Point(show calculation below):
4. Temperature of boiling water bath (cheap thermometer):
5. Percent Error in Boiling Point (show calculation below):
Expensive Thermometer
1. Temperature can be read with what uncertainty(±) (expensive thermome-ter)
2. Temperature of ice-water bath (expensive thermometer):
3. Percent Error in Freezing Point(show calculation below):
4. Temperature of boiling water bath (expensive thermometer):
5. Percent Error in Boiling Point (show calculation below):
41

Experiment 4 Measurements - Temperature
Questions
1. What are 4 most common ways to try to control or eliminate errors when performing experiments?
2. Are we testing the accuracy or the precision of the thermometer in this experiment? Explain.
3. Why is the second thermometer much more expensive than the first thermometer (used to measurethe freezing point and boiling point of water)? Explain.
4. What should you do if you break a thermometer?
5. What basic rules should you follow when using bunsen burners?
42

Experiment 4 Measurements - Temperature
6. Perform the following three conversions. Make sure to show your calculation, and include thecorrect number of Significant Figures and Units for each.
(a) Convert 220 °C to °F. 6(a)
(b) Convert 15.4 °F to °C. 6(b)
(c) Convert 400. °F to Kelvin. 6(c)
43

Experiment 4 Measurements - Temperature
.
44

Experiment 5Measurements - MassJay C. McLaughlinColorado Northwestern Community College
CC-BY-SA - August 19, 2021
Name:
Date:
Key Objectives
1. Understand the difference between Accuracy and Precision.
2. Understand how electronic instruments are calibrated.
3. Measure a requested quantity of a solid chemical.
Discussion
The mass of an object indicates the amount of matter present in the object. The weight of an object isa measure of the attraction that Earth has for the object. Because this attraction is proportional to themass of the object, we will use the terms mass and weight interchangeably. The two most commondevices used to measure mass are discussed below.
Triple beam balance
Before the advent of electronic balances, the triple beam balance was routinely used to measuremasses. This is a direct measurement of mass by comparing the mass in the pan to the masseson the other side of the scale. While very accurate, triple beam balances are slow to use. We will notbe using the triple beam balance in class.
Figure 5.1: (a) Triple beam balance (b) Electronic balance. credit: (a) unknown (b) https://commons.wikimedia.org/wiki/File:Electronic_scale.jpg
Electronic balance The electronic balance provides an easy, precise and accurate way to measuremass. The precision and accuracy of electronic balances is generally a function of cost and can rangefrom 0.1 gram (for 20 dollars) to 0.0001 gram (1000’s of dollars). Electronic balances are an indirect
45

Experiment 5 Measurements - Mass
way to measure mass, the mass push’s down on the pan resulting in a change in magnetic field re-quired to balance the weight. The balance must have calibration adjustments made to compensatefor gravitational differences from changing locations and altitudes. This is achieved by calibrating thescale to a two known masses. The first mass used is generally zero (empty) and the second dependson the mass range of the scale (100.0 grams for out scales).
The electronic balances are an expensive piece of laboratory equipment and the utmost care shouldbe taken when using them. Do not pour liquids over the scale, instead pour them into a pre-weighedor tared beaker. Abuse or misuse of the scales will result in removal and usage of the triple beambalances only.
Calibration
1. Calibration should be done the first time a measurement is made or anytime the scale is moved,bumped, left sitting for an extended period of time or if you looked at it cross-eyed. Subsequentmeasurements made should double check the calibration of your scale.
2. Turn the scale on by holding the ”ON” button for 5 seconds. The screen should read a modelnumber and then read ”MENU”. Release the button.
3. The screen should then read ”CAL” which means the scale is in calibration mode.4. With no mass on the scale push the ”ON/ZERO” button to calibrate the zero point on the scale.5. After the scale is done blinking (1-2 seconds) the scale will prompt you to place the ”100 g”
calibration mass on the balance. After placing the mass on the scale push the ”ON/ZERO” button.6. The calibration is now complete.7. The calibration mass should be within 0.005 grams of the correct value, if not inform your labora-
tory instructor.8. Remove the mass and zero the scale.9. The scale is now ready for making mass measurements.
Measurements
Mass measurements can be made one of two ways. The method of differences requires one to weighthe container used to mass a chemical, and then subtract that from the mass of the chemical pluscontainer. This method is useful when sharing a scale, making measurements over a long period oftime, or making measurements with liquids and will be used in some experiments.
For quick measurements or measurements that need to only be made once, the second method oftaring is preferred. Using this method of weighing a chemical one places the empty weighing containeron the scale and then tares or rezero the scale. This eliminates the mass of the weighing containerand one is then able to measure only the mass of the chemical. The general procedure for makingmeasurements in this manner is described below.
1. Tare the balance by placing the container you will measure your chemical in on the balance andpushing the "’Tare"’ or "‘Zero"’ button.
2. Remove the container from the scale and add the chemical to be massed.3. Place the container + chemical to be measured in the balance pan. NEVER place chemicals
directly on the balance pan, always use an appropriate container to hold the chemicals.
46
Experiment 5 Measurements - Mass
4. NEVER pour liquids directly over the scale, instead weight or tare the appropriate container,remove it from the scale, pour the liquid in, and place the container+liquid on the scale to beweighed.
5. NEVER overload the scale. The maximum mass placed on the scale should be 120 grams.6. When measuring small masses (less then 1 gram) lower the plastic air shield to improve the
accuracy of your measurements.
Measuring Requested Quantities
In most laboratory exercises you will be required to make many different measurements of volume,mass, and other quantities. Often, the precision required to produce a reliable results is quite differentthan the precision to which you can make the measurement. While you should always write downthe measured value with as many significant figures as possible as possible, you do not always needexactly the specified value. For instance, if the instructions say to measure out 1.0 gram of a substanceit is implied that the needed amount is 1.0 ± 0.1 grams, thus you should make sure your measurementis between 0.9 and 1.1 grams. It is not necessary (nor desirable) to try to measure exactly 1.000 gramsof solid out, and often it is a waste of time to do so. When in doubt about how precise a measurementshould be, ask your laboratory instructor.
Key Idea: Making Measurements
Always calibrate your scale before use. When measuring required quantities weigh out an ap-proximate amount, but always record your result to as many significant figures as possible.
Procedure
1. Check the calibration of the balance using the instructions given in the discussion portion of thelaboratory.
2. Record the mass written on the reference/known weight.3. Record the measured mass of the reference/known weight. The reference/known mass should
be within 0.005 g of the correct mass. If it is not, recalibrate the scale and inform the instructor.4. Obtain an unknown mass from your instructor and record the identity of the unknown mass.5. Record the mass of your unknown.6. Verify you measured the correct mass by comparing your answer to the instructors answer. If
your answers are more than 0.005 grams apart, you will need to redo the measurement.
47
Experiment 5 Measurements - Mass
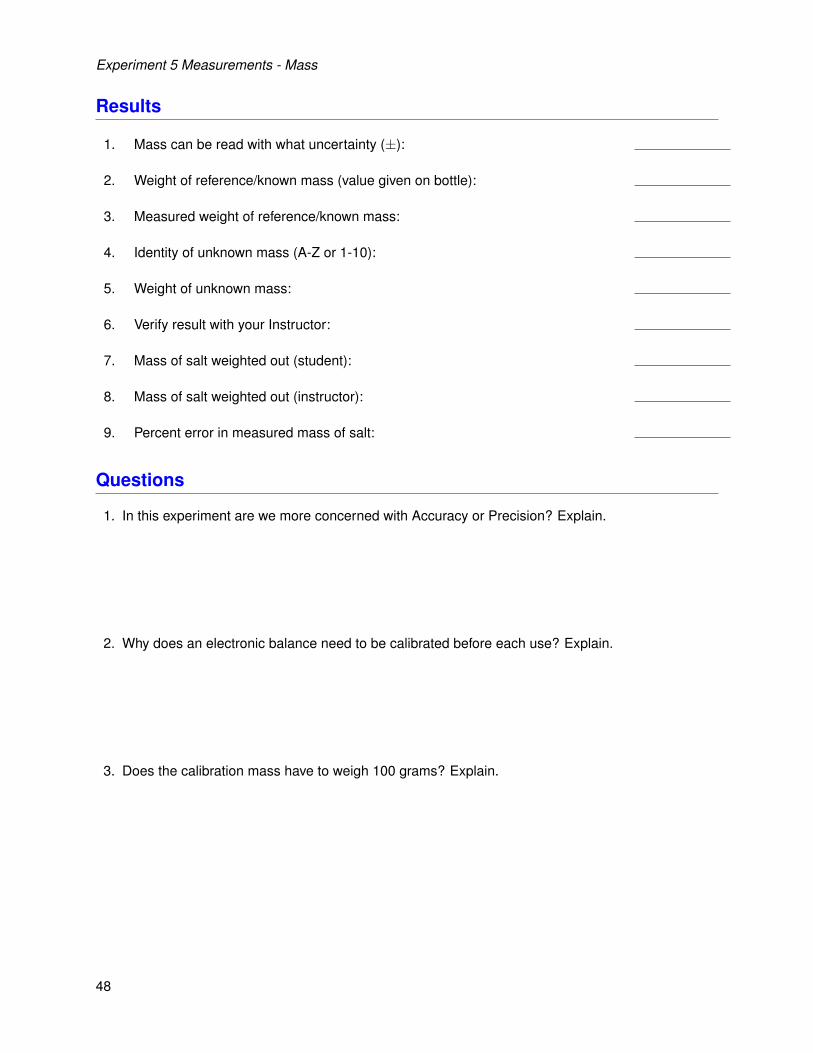
Results
1. Mass can be read with what uncertainty (±):
2. Weight of reference/known mass (value given on bottle):
3. Measured weight of reference/known mass:
4. Identity of unknown mass (A-Z or 1-10):
5. Weight of unknown mass:
6. Verify result with your Instructor:
7. Mass of salt weighted out (student):
8. Mass of salt weighted out (instructor):
9. Percent error in measured mass of salt:
Questions
1. In this experiment are we more concerned with Accuracy or Precision? Explain.
2. Why does an electronic balance need to be calibrated before each use? Explain.
3. Does the calibration mass have to weigh 100 grams? Explain.
48

Experiment 5 Measurements - Mass
4. The directions for an experiment state "weigh 15.50 grams of sodium chloride".
(a) Minimum amount of sodium chloride that would satisfy the directions. 4(a)
(b) Maximum amount of sodium chloride that would satisfy the directions. 4(b)
5. If asked to weigh out 6.70 oz of sodium chloride, how many grams shouldyou weigh out? Explain.
5.
49

Experiment 5 Measurements - Mass
.
50

Experiment 6Measurements - VolumeJay C. McLaughlinColorado Northwestern Community College
CC-BY-SA - August 19, 2021
Name:
Date:
Key Objectives
1. Understand the difference between Accuracy and Precision.
2. Calculate average and standard deviation
3. Measure volume using a variety of techniques
Discussion
The volume of a substance refers to the space it occupies. In chemistry labs liquids are most frequentlymeasured by volume, though the may occasionally be measured by mass if the density is known.
Most liquids form a meniscus due to different attractive forces between the liquid and the liquid (co-hesive) and the liquid and the container (adhesive). The formation of a meniscus is most apparent innarrow tubes. For water the menisus curves upwards (is concave) as the attractive forces between thewater and the glass is larger than that between the water and other water molecules. For mercury it isthe opposite, the meniscus curves downwards (concave) as mercury is more attracted to mercury thanglass.
Volume measurements are commonly made by reading the point on the graduated scale that coincideswith the bottom of the curved surface called the meniscus of the liquid as shown in Figure 13.2. Adiscussion of why a meniscus is formed can be found in Hein Ch. 13.5 (p. 305), Chang Ch. 11.3 (p.443) or McMurry Ch. 10.4 (p. 391).
Figure 6.1: (a) Two types of meniscus, (b) When measuring the volume of liquids always look at eye leveland for water read the bottom of the meniscus. credit: (a) http://water.usgs.gov/edu/meniscus.html (b) E. Generalic, https://glossary.periodni.com/glossary.php?en=meniscus
Several methods for measuring liquid volumes are described below. Measurements in this laboratory
51

Experiment 6 Measurements - Volume
will most often be done with graduated cylinders and pipets.
Beakers: Beakers are the most inaccurate way to measure volume, and are used only when the volumeof a liquid is not important. They are inaccurate because of the large meniscus.
Graduated Cylinders: A graduated cylinder is a quick and easy (though less accurate) way to measurethe volume of a liquid. They are useful for measuring any volume of liquid.
Plastic Pipets: Pipets come in two general types. Plastic pipets are used to quickly measure a volumeof liquid when accuracy and precision do not matter. It is often assumed that 1 drop from a pipet isequal to 0.05 mL, thus there are 20 drops/mL.
Volumetric Flasks: These flasks are generally the most accurate measuring device, but are onlydesigned to measure one specific volume. Common volumes are generally 100.0 mL, 200.0 mL, 250.0mL, 500.0 mL, and 1000.0 mL.
Figure 6.2: 4 different methods for measuring volume - beakers, graduated cylinders, volumetric pipetsand volumetric flask. Each gives a different level of accuracy and precision. credit: author
Burets: A buret is used for measuring varying volumes of liquids and for delivering volumes of liquidsaccurately.
The proper use of burets is not obvious, the following steps should be followed:
1. Set up the buret as shown in Figure 13.1.2. When reading the meniscus level your line of sight should be level with the meniscus to obtain
the most accurate reading.3. Note the numbering is reversed on a buret.4. Add between 40 and 45 mL of distilled water to the buret using a funnel placed on the top of the
buret. Be sure to check for air bubbles in the tip of the buret, if found you need to dispense yourliquid until they are removed. Record your initial reading on your data sheet. Verify the reading.
52

Experiment 6 Measurements - Volume
Figure 6.3: (a) How to setup and fill a buret. (b) Note the scale on a buret goes in the reverse direction.Be careful when making measurements. credit: (a) Monash Scientific 03 9797 4442 (b) https://effectiveness.lahc.edu/
5. Weigh an empty beaker.6. Place an empty beaker below your buret and dispense 10 mL of distilled water into it. Record
your final reading. Verify the reading.7. Record the mass of water dispensed.8. Calculate the volume of water dispensed into your beaker. (Show work)9. If you have any troubles with this portion of the lab, or your mass and volume measurements
disagree too much, consult your instructor, and do a second trial if needed.10. Any water used in this part of the experiment may be disposed of down the sink.
53

Experiment 6 Measurements - Volume
Figure 6.4: How to read a buret. Take the final volume - Initial volume = Volume dispensed. credit:author
Volumetric Pipets: Glass pipets are commonly called volumetric pipets because they are a simple,yet very accurate way to measure volume. Volumetric pipets are so accurate because the long neckdecreases the error in measuring volume of the meniscus. They are only designed to measure onespecific volume and commonly come in sizes 5 mL, 10 mL, 25 mL, and 50 mL. The accuracy of avolumetric pipets is commonly taken to be ± 0.01 mL. The pipet is read by placing the bottom of themeniscus on the measuring line. They are designed to leave one drop of liquid in the tip.
The proper use of pipets is not obvious, the following steps should be followed:
1. Place the pipet or suction bulb over the top of the pipet.2. Evacuate air from the suction bulb by squeezing open the top valve (Labeled A) and gently
squeezing air out of the bulb. When the bulb is empty release the top valve.3. Place the pipet in the liquid being measured. Do not place the bottom of the pipet on the bottom
of the container as this may damage the pipet.4. Slowly open the valve between the suction bulb and the pipet (Labeled S) and allow liquid to fill
the pipet to just past the reference line. Release the valve. Be careful not to overfill the pipet orget liquid into the bulb, as this may ruin the bulb.
5. Use the side valve (Labeled E) to lower the level of liquid in the pipet until the bottom of themeniscus is on the reference line. Close the valve.
6. Remove the pipet from the liquid being measured and place it over the container you are placingthe liquid into. Use the side valve to release the liquid.
7. There will be a tiny amount of liquid left in the tip of the pipet, this is normal and the pipet iscalibrated to leave this amount in the tip. If you blow out this liquid, your measurement will beinaccurate.
54

Experiment 6 Measurements - Volume
Figure 6.5: How to use a pipet bulb. Insert pipet into bulb, remove (Air) from pipet, (S)iphon liquid intopipet, (E)mpty pipet. credit: author
Density
Mass measures the amount of matter in an object, while volume measures that space the object takesup. Both mass and volume are extensive properties, meaning that they depend on the size of anobject. The larger the object the larger its mass and volume. Extensive properties are not very usefulfor determining the identity of the object since they are size dependent.
Density is the ratio of an objects mass to its volume. Density is an intensive property and does notdepend on the size of the object. The density of any substance is the same no mater the size of theobject. Density is also relatively unique for each substance (best seen by examining the density ofdifferent elements in a future experiment).
The density of water (by definition) is 1.000 grams/mL. We can use this fact to verify the volume of watermeasured by different laboratory equipment by comparing the volume measured to the mass measuredwhich should be the same.
Accuracy and Precision
Recall in earlier labs we learned that the accuracy of a measurement is determined by how close themeasurement is to the true value and we learned how to calculate the Percent Error in the measure-ment. To determine the precision of a measurement, multiple trials are required. The average value willbe used when calculating the percent error. The average is given in Figure 6.6 in two forms, on the leftis the formal mathematical expression, on the right is the more standard form.
Average =x1 + x2 + x3....
n
x = Average
x =1
n×
n∑i=1
xi i = individual measurement
n = number of measurements
Figure 6.6: (a) Standard Definition of Average. (b) Formal Mathematical Definition of an Average.
55
Experiment 6 Measurements - Volume
How close each measurement is to each other gives an estimate of the precision (reproducibility).Mathematically this is determined by calculating the standard deviation of the measurement. This isbeyond the scope of this class, however you can still estimate which set of measurements is mostreproducible and thus the most precise.
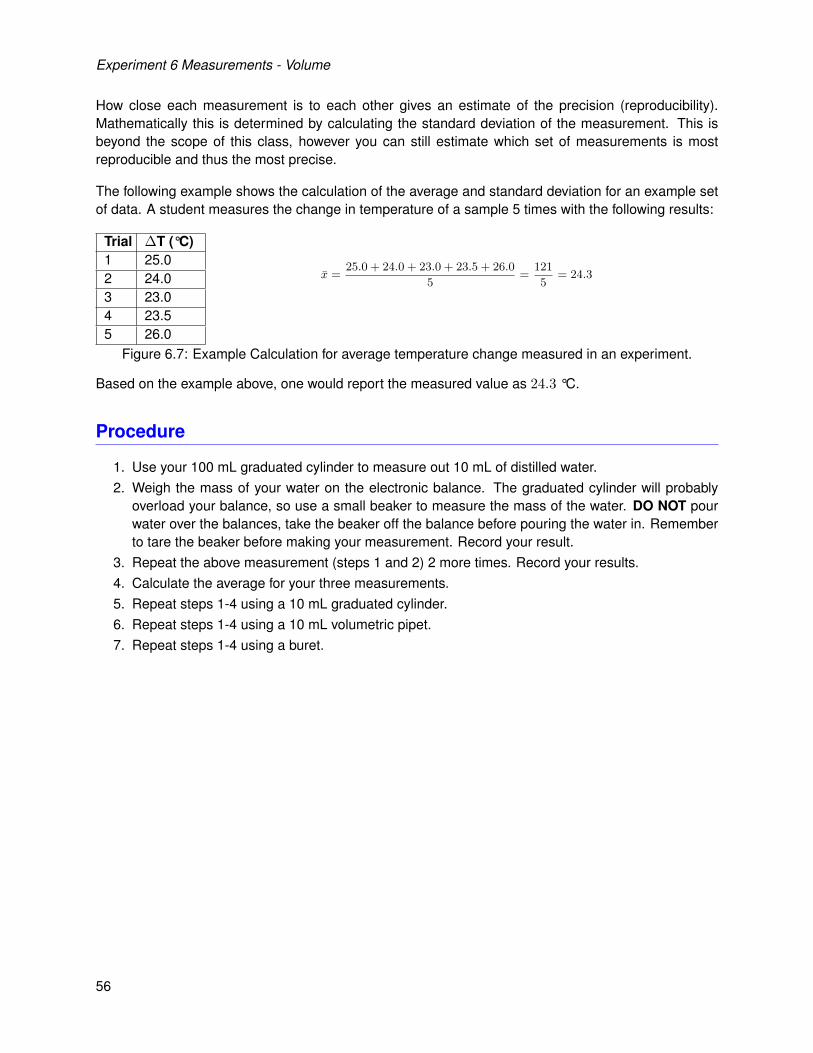
The following example shows the calculation of the average and standard deviation for an example setof data. A student measures the change in temperature of a sample 5 times with the following results:
Trial ∆T (°C)1 25.02 24.03 23.04 23.55 26.0
x =25.0 + 24.0 + 23.0 + 23.5 + 26.0
5=
121
5= 24.3
Figure 6.7: Example Calculation for average temperature change measured in an experiment.
Based on the example above, one would report the measured value as 24.3 °C.
Procedure
1. Use your 100 mL graduated cylinder to measure out 10 mL of distilled water.2. Weigh the mass of your water on the electronic balance. The graduated cylinder will probably
overload your balance, so use a small beaker to measure the mass of the water. DO NOT pourwater over the balances, take the beaker off the balance before pouring the water in. Rememberto tare the beaker before making your measurement. Record your result.
3. Repeat the above measurement (steps 1 and 2) 2 more times. Record your results.4. Calculate the average for your three measurements.5. Repeat steps 1-4 using a 10 mL graduated cylinder.6. Repeat steps 1-4 using a 10 mL volumetric pipet.7. Repeat steps 1-4 using a buret.
56

Experiment 6 Measurements - Volume
Results
A. 100 mL Graduated Cylinder
1. Volume can be read to what uncertainty? (±):
2. Weight of water in trial 1:
3. Weight of water in trial 2:
4. Weight of water in trial 3:
5. Average weight of water in trials 1-3:(Trial 1+Trial 2+Trial 3
3
)
B. 10 mL Graduated Cylinder
1. Volume can be read to what uncertainty (±):
2. Weight of water in trial 1:
3. Weight of water in trial 2:
4. Weight of water in trial 3:
5. Average weight of water in trials 1-3:(Trial 1+Trial 2+Trial 3
3
)
C. 10 mL Volumetric Pipet
1. Volume can be read to what uncertainty (±):
2. Weight of water in trial 1:
3. Weight of water in trial 2:
4. Weight of water in trial 3:
5. Average weight of water in trials 1-3:(Trial 1+Trial 2+Trial 3
3
)
57

Experiment 6 Measurements - Volume
D. Buret
1. Volume can be read to what uncertainty (±):
2. Initial volume of water in the buret (trial 1):
3. Final volume of water in the buret (trial 1):
4. Difference in volume (trial 1):
5. Weight of water (trial 1:)
6. Initial volume of water in the buret (trial 2):
7. Final volume of water in the buret (trial 2):
8. Difference in volume (trial 2):
9. Weight of water (trial 2:)
10. Initial volume of water in the buret (trial 3):
11. Final volume of water in the buret (trial 3):
12. Difference in volume (trial 3):
13. Weight of water (trial 3:)
14. Average volume of water in trials 1-3:(Trial 1+Trial 2+Trial 3
3
)15. Average weight of water in trials 1-3:
(Trial 1+Trial 2+Trial 3
3
)
58
Experiment 6 Measurements - Volume
Questions
1. When making volume measurements one should read the level of water at the top, middle, orbottom of the meniscus?
2. What mass should your water have if you measured out 10.0 mL of water? Show your calculationor Explain.
3. In this lab are we measuring Accuracy or Precision? Explain.
4. Based on your measurements made in class, which measurement device was the most accurate?Explain.
5. Based on your measurements made in class, which measurement device was the most precise?Explain.
6. What sources of error could lead to imprecise and inaccurate measurements in measuring volumewith the graduated cylinders? (Give 2 sources of error) Exlain.
59

Experiment 6 Measurements - Volume
.
60

Experiment 7Measurements - DensityJay C. McLaughlinColorado Northwestern Community College
CC-BY-SA - August 19, 2021
Name:
Date:
Key Objectives
1. Understand the difference between Accuracy and Precision.
2. Make all measurements with the correct number of Significant Figures.
3. Calculate average, standard deviation, and percent error.
4. Measure density by calculating volume of a regular object.
5. Calculate density by volume displacement method.
Discussion
The density of an object is the ratio of the mass to volume, and is unique for any given compoundor element. By measuring the density of an object, it is often possible to determine the nature of anunknown compound. A discussion of density can be found in Hein Ch. 2.9 (p. 37), Chang Ch. 1.7 (p.18), or McMurry 1.10 (p. 16).
Density is defined as the ratio of an objects mass to its volume. Mathematically we can use the equationbelow where D = Density(in g/mL), M = mass (in grams) and V = volume (in mL).
D =M
V(1)
While the equation form is useful and is taught in many schools, we should try to think of Density assimply another conversion factor that allows one to convert between mass and volume. Using Densityas a conversion factor will also help us if a problem is given in non-standard units, for instance lb/ft3.
For example we can ask what is the volume of 25.0 grams of gold. Using the equation method wewould solve:
19.3 g/mL =25.0 g
X mL(2)
If instead we think of it as a conversion factor we would solve:
25.0 g
1× 1 mL
19.3 g= 1.30 mL (3)
The mass of an object is relatively easy to measure using a balance. Volume is more difficult andis generally measured in two ways. Regular objects (such as cubes, cylinders, and spheres) can bemeasured with a ruler and the volume calculated mathematically as shown in Figure 7.1. The volume
61

Experiment 7 Measurements - Density
Figure 7.1: (a) Formula’s for finding volume of regular objects. (b) Method of water displacementfor finding volume of irregular objects. credit: (a) Author (b) https://en.wikipedia.org/wiki/
Displacement_(fluid)
of irregular objects is generally measured by the water displacement method, the object is submergedin water and the change in volume of the water is the volume of the object. In this lab both methods willbe used.
Because most substances change in volume when heated or cooled due to expansion or contraction,the density of an object is also temperature-dependent. Usually the variance is quite small for instance,the density of water at 3.98 °C is 1.0000 g/mL which decreases to 0.99987 g/mL at 0 °C. We willgenerally assume the density of water is 1.00 g/mL at room temperatures.
The density of the samples used in class can be found in the table below. Additional values can befound on the back of your Cheat Sheet.
Object Density (g/ml) Object Density (g/mL)Water (4 °C) 1.000 Aluminum 2.70Copper 8.96 Lead 11.34Mercury 13.55 Gold 19.3Brass 8.5 Iron 7.86Nickel 8.90 Steel 7.8Tin 7.28 Manganese 7.20Zinc 7.10 Woods Alloy 9.63
Table 7.1: Density of Common Metals
62

Experiment 7 Measurements - Density
Procedure
A. Density of a regular object
1. Obtain a regular shaped object from your laboratory instructor. Record its identity.2. Weigh the object, record your result.3. Measure the objects length, width, and height.4. Calculate the volume of the object. Be sure to show your calculation.5. Calculate the density of the object. Be sure to show your calculation.
B. Density of an irregular object
1. Obtain an irregular shaped object from your laboratory instructor. Record its’ identity.2. Weigh the object and record your result.3. Fill a burret half full of water. Record the volume.4. Carefully (slide it down the side of the tube, do not drop it in) place your irregular object in the
burret and record the volume.5. Calculate the volume of the item.6. Calculate the density of the item using the appropriate formula.7. Compare the density of the item with the value given by your instructor, if your measurement is
within 0.2 g/mL of the correct value move onto the next section, if not, redo this section.
C. Density of an unknown object
1. Obtain an unknown object from your instructor. Record its identity.2. Determine the density of the object using the methods described above.3. Do 3 trials and average your result.4. Compare your experimental density with the density of the known elements provided in the dis-
cussion section.5. Write down the identity of the known element which most closely matches your measured density.
63

Experiment 7 Measurements - Density
.
64

Experiment 7 Measurements - Density
Results
A. Density of a regular object
1. Identity of regular object:
2. Mass of regular object:
3. Length of regular object:
4. Height of regular object:
5. Width of regular object:
6. Calculate the volume of the regular object, show the formula used and thecalculation:
7. Calculate the density of the regular object: (Show formula and work)
8. Correct value for density of regular object (ask instructor)
9. Your answer should be within 0.05 g/mL of the correct answer. If your an-swer is not, redo steps 1-8.
10. Calculate the Percent Error in your measurement using the following for-mula: |Actual Density−Measured Density
ActualDensity | ∗ 100 %
B. Density of an irregular object
1. Identity of irregular object:
2. Mass of irregular object:
3. Initial volume of water in the buret:
4. Final volume of water in the buret after adding irregular object:
5. Calculate the volume of the irregular object. (Show work):
6. Calculate the density of the irregular object (Show work):
7. Correct value for density (obtained from cheat sheet):
8. Your answer should be within 0.2 g/mL of the correct answer. If your answeris not inform your instructor, redo steps 1-8.
9. Calculate the Percent Error in your measurement:
65

Experiment 7 Measurements - Density
C. Density of an unknown object (3 Trials)
Trial 1 Trial 2 Trial 3
1. Identity of unknown object:
2. Mass of unknown object:
3. Initial volume of water in the burret:
4. Final volume of water in the burret after addingunknown object:
5. Volume of unknown object (show work):
6. Measured density of unknown object (showwork):
7. Average density of unknown object:
8. Using Table 1, what metal is the unknown ob-ject?
9. What is the percent error in your measurement?
66
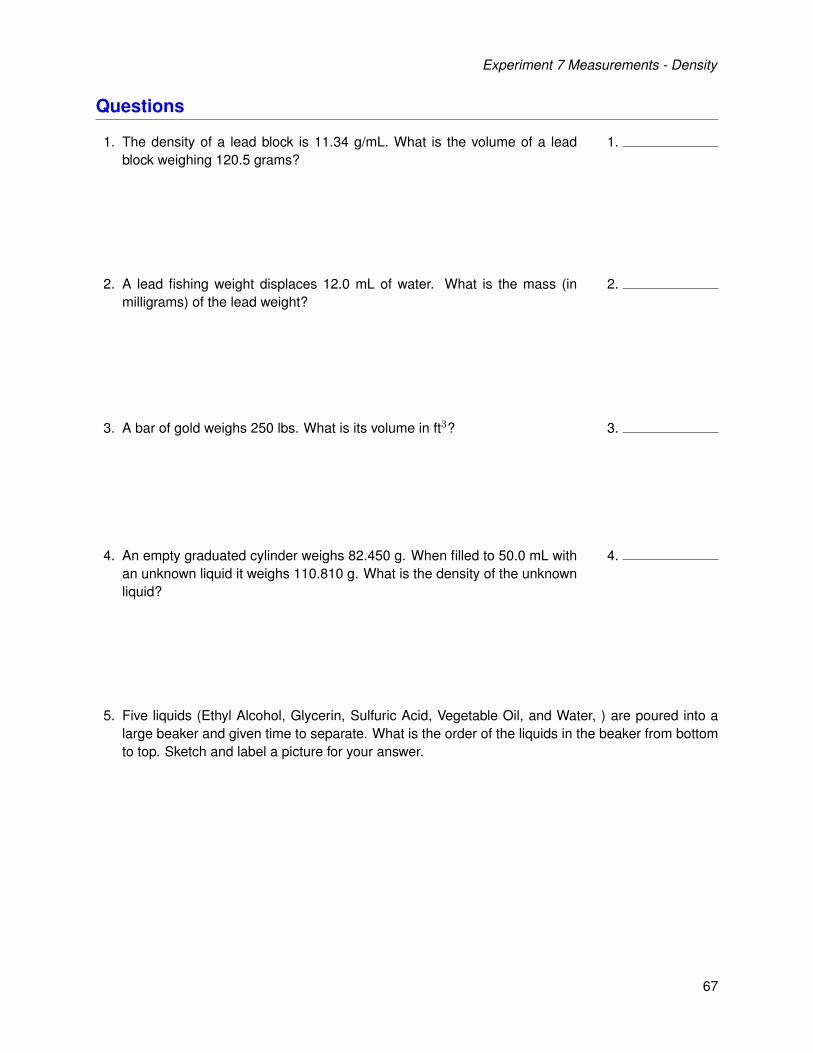
Experiment 7 Measurements - Density
Questions
1. The density of a lead block is 11.34 g/mL. What is the volume of a leadblock weighing 120.5 grams?
1.
2. A lead fishing weight displaces 12.0 mL of water. What is the mass (inmilligrams) of the lead weight?
2.
3. A bar of gold weighs 250 lbs. What is its volume in ft3? 3.
4. An empty graduated cylinder weighs 82.450 g. When filled to 50.0 mL withan unknown liquid it weighs 110.810 g. What is the density of the unknownliquid?
4.
5. Five liquids (Ethyl Alcohol, Glycerin, Sulfuric Acid, Vegetable Oil, and Water, ) are poured into alarge beaker and given time to separate. What is the order of the liquids in the beaker from bottomto top. Sketch and label a picture for your answer.
67

Experiment 7 Measurements - Density
.
68

Experiment 8GraphingJay C. McLaughlinColorado Northwestern Community College
CC-BY-SA - August 19, 2021
Name:
Date:
Key Objectives
1. Graph experimental data.
2. Make a "good" looking graph.
3. Labeling and numbering of axis.
4. Adding a curve-fit to a graph.
Discussion
It is often said that a picture is worth 1,000 words, or for scien-tists we might rephrase it to say that a graph is worth 1,000 words.Graphs are most often used to express data in a clear, concise andmeaningful way. Trends are readily apparent, and information iseasy to extract. In today’s laboratory we will learn how to properlypresent data in a graphical format. Graph terminology, basic graphfeatures, basic graphing skills using excel, and general graph func-tions will be mastered.
Various types of graphs are possible, the most common type uses the Cartesian coordinate systemto show the relationship between two variables, the independent (x) and dependent (y) variables. Theindependent (x) variable is generally controlled by the experimenter (or naturally increments) and isplotted on the x-axis (horizontal axis) while the dependent (y) variable changes as the independentvariable changes and is generally plotted on the y-axis (vertical axis). The goal of any graph is tomaximize the amount of data shown in the space provided.
A. Graph Terminology
The terminology used in making graphs may be new to many of you. Figure 8.1 shows features com-monly found on graphs.
1. X-axis: Generally the independent variable is plotted on the horizontal axis.
2. Y-axis: Generally the dependent variable(s) are plotted on the vertical axis.
3. Title: A general description of what is being graphed.
4. Axis Title: Titles for X and Y axis. The title should include a Label for what you are plotting andthe Units you are plotting with.
69

Experiment 8 Graphing
Figure 8.1: Anatomy of a graph. credit: author
5. Legend: Describes the independent variables being graphed. It includes the symbol representingeach individual variable and a description or identifier.
6. Grid Lines: Lines on the graph drawn parallel to the X or Y axis. They generally are used asguides for the eye to make it easier to see the value of data points.
7. Tick Mark: Small hash mark on X or Y axis that denotes a specific value. Major: A label and gridline are normally drawn here. Minor: Normally just a tick mark on axis to indicate smaller units.Normally not labeled or given grid lines.
8. Tick Label: Label associated with tick marks on the X and Y axis.
9. Data Symbols: Symbols used to mark the data points on a graph.
10. Error bars: Horizontal bars (X error bars) or vertical (Y error bars) sometimes found attached todata points indicating the error involved in the measurement.
B. Good vs. Bad Graphs
A good graph is designed to convey a large amount of information in a small space. It is important tomake full use of the space provided to maximize the information. An example of a good graph is shownin Figure 8.2. Several design goals are listed below.
1. Title - All graphs should have a title which conveys what is being graphed.
70

Experiment 8 Graphing
Figure 8.2: An example of a good graph. credit: author
2. Labels - All graphs should have both axis properly labeled with what is being plotted and the units.
3. The x and y axis should use convenient units (both major and minor). The X and Y axis labelsare reasonably spaced (i.e. not too close together or too far apart).
4. Legend - All graphs should include a legend if more than one set of data is being plotted thatprovides information about the different data sets.
5. Text should be readable. Don’t use fancy fonts or fonts too small to read.
6. Symbols used for data points should be:
(a) Proper size (not too big or small)
(b) Proper color (easy to distinguish). Generally use black and white only as people may not beable to print graphs in color.
(c) Proper shape (don’t use crosses or dashes and avoid open symbols when possible)
(d) Avoid using duplicate shapes in different colors. It looks fine on a computer screen but ifprinted in black and white it will be impossible to distinguish between them.
7. Maximize the size of your graph. It is often convenient to drag the Legend inside the graph sothat you can resize the graph and make it larger and easier to read.
71

Experiment 8 Graphing
We will look next at several bad graphs. Figure 8.3 has several things wrong with it.
1. No title
2. Missing label on Y axis
3. Missing units on X axis
4. No legend
5. X axis units are too close together, overlap, and are nearly impossible to read.
6. Y axis units are spaced so far apart they are useless
Figure 8.3: An example of a bad graph. credit: author
72

Experiment 8 Graphing
Figure 8.4: Another example of a bad graph. credit: author
Another example of a bad graph is shown in Figure 8.4.
1. Title is not descriptive
2. X axis uses odd spacing and makes no sense. The minor tick marks are not evenly divisible unitsof the major tick mark.
3. The symbols used for the data points are poor: Series 1 is too big. Series 2 is too small. Series3 is a hard to see color, (yellow is most often a poor color choice) and the symbol "-" is almostimpossible to see on the graph. Series 4 and 5 are the same symbol but different colors. It looksgood on the screen but if you print it in black and white you will not be able to tell the differencebetween the symbols
73

Experiment 8 Graphing
Figure 8.5: Another example of a bad graph. credit: author
One last example of a bad graph is shown in Figure 8.5.
1. The range of the X and Y axis is too large. The data does not span the range selected and endsup in only one small corner of your graph. This leaves a lot of empty unused space which is awaste.
2. The labels for the X axis are too small to read. The font size should be increased.
3. The labels for the Y axis are unnecessarily large and look out of place. The font size should bedecreased.
4. The title is rather poor and non-descriptive.
5. The curve fit information overlaps the axis and is hard to read.
74
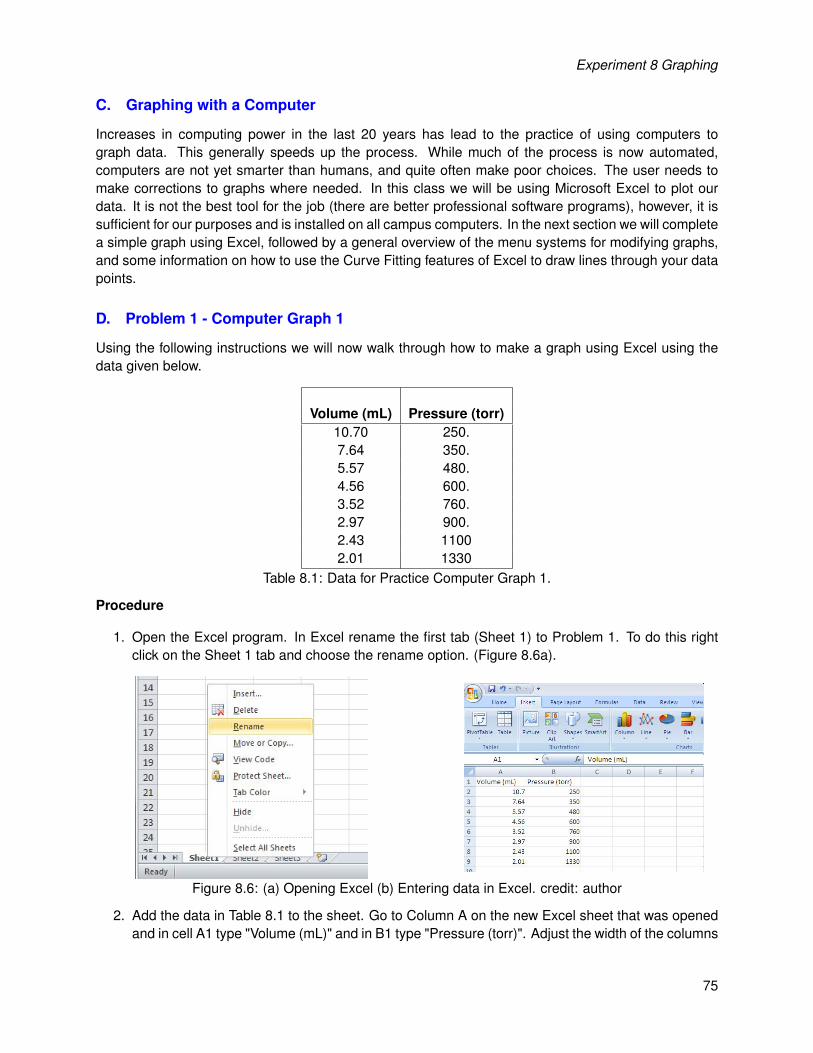
Experiment 8 Graphing
C. Graphing with a Computer
Increases in computing power in the last 20 years has lead to the practice of using computers tograph data. This generally speeds up the process. While much of the process is now automated,computers are not yet smarter than humans, and quite often make poor choices. The user needs tomake corrections to graphs where needed. In this class we will be using Microsoft Excel to plot ourdata. It is not the best tool for the job (there are better professional software programs), however, it issufficient for our purposes and is installed on all campus computers. In the next section we will completea simple graph using Excel, followed by a general overview of the menu systems for modifying graphs,and some information on how to use the Curve Fitting features of Excel to draw lines through your datapoints.
D. Problem 1 - Computer Graph 1
Using the following instructions we will now walk through how to make a graph using Excel using thedata given below.
Volume (mL) Pressure (torr)10.70 250.7.64 350.5.57 480.4.56 600.3.52 760.2.97 900.2.43 11002.01 1330
Table 8.1: Data for Practice Computer Graph 1.
Procedure
1. Open the Excel program. In Excel rename the first tab (Sheet 1) to Problem 1. To do this rightclick on the Sheet 1 tab and choose the rename option. (Figure 8.6a).
Figure 8.6: (a) Opening Excel (b) Entering data in Excel. credit: author
2. Add the data in Table 8.1 to the sheet. Go to Column A on the new Excel sheet that was openedand in cell A1 type "Volume (mL)" and in B1 type "Pressure (torr)". Adjust the width of the columns
75
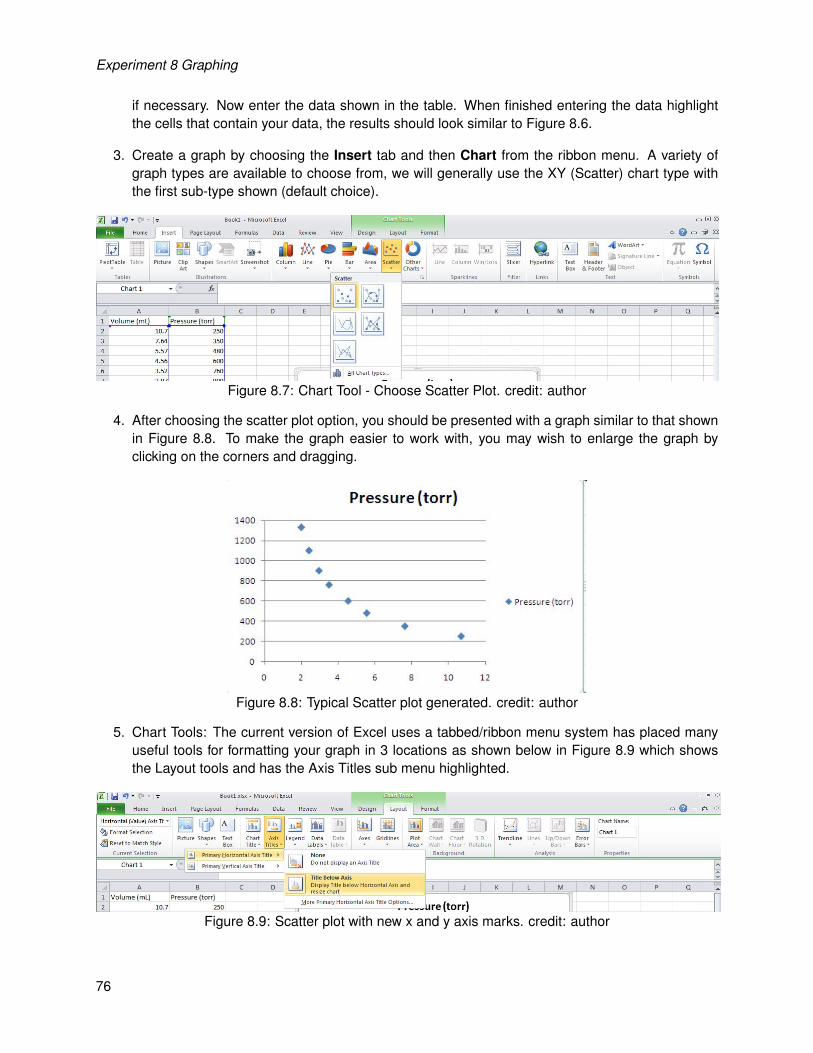
Experiment 8 Graphing
if necessary. Now enter the data shown in the table. When finished entering the data highlightthe cells that contain your data, the results should look similar to Figure 8.6.
3. Create a graph by choosing the Insert tab and then Chart from the ribbon menu. A variety ofgraph types are available to choose from, we will generally use the XY (Scatter) chart type withthe first sub-type shown (default choice).
Figure 8.7: Chart Tool - Choose Scatter Plot. credit: author
4. After choosing the scatter plot option, you should be presented with a graph similar to that shownin Figure 8.8. To make the graph easier to work with, you may wish to enlarge the graph byclicking on the corners and dragging.
Figure 8.8: Typical Scatter plot generated. credit: author
5. Chart Tools: The current version of Excel uses a tabbed/ribbon menu system has placed manyuseful tools for formatting your graph in 3 locations as shown below in Figure 8.9 which showsthe Layout tools and has the Axis Titles sub menu highlighted.
Figure 8.9: Scatter plot with new x and y axis marks. credit: author
76

Experiment 8 Graphing
(a) Chart Design Tab: This tab contains many options for formatting the data used in the plot,and some layout features such as changing the shape and size of the data points on thegraph.
(b) Chart Layout Tab: This tab contains many options for formatting specific features of yourchart. You can add/change the Chart Title, Axis Titles, Legends, Data Labels, Grid Lines,Trendlines and many other features.
(c) Chart Format Tab: This tab contains many options for formatting colors and fonts used inyour chart. You can change the color, font, shape, alignment and add special effects to yourgraph.
6. There is no general rule for bringing up menu’s in Excel (which is one reason it can be frustrating).In general double clicking on a feature will bring up the default menu, while right clicking (andholding) will bring up a list with many options. To master the use of Excel requires practice andpatience.
7. There are several different menu’s for changing the major chart options, formatting the axis, for-matting data series and many other options. You can access these options by left-clicking on thedesired feature and then right-clicking to bring up an options menu for that feature. For example,left-clicking on labels for the y-axis will bring up the format axis menu which allows you to setminimum and maximum values, spacings, tick marks and many other options. (See Figure 8.10.)
While you are here you may as well change the maximum value on the y-axis to 1600, the minorunit to 50.0, and change the drop down menu for minor tick marks to show inside the graph.
Figure 8.10: The Format Axis Menu. credit: author
77

Experiment 8 Graphing
8. Now change the x-axis values (using what you have just learned) to label the axis every 2 unitswith a minor tick mark every 0.5 units. Change the labels on the axis to reflect the precision ofyour data (to the hundredths). This can be accomplished by changing the number format in yourgraph from "general" to "number" and choosing to display the numbers to 2 decimal places. Theresulting graph should now look similar to what is shown below in Figure 8.11.
Figure 8.11: Scatter plot with new x and y axis marks. credit author
9. The next several items are some of the more important options you can change. Explore! It is theonly way to really learn to properly use Excel to graph data.
10. Change the shape of your data points to be open circles with size = 8.
11. Add Axis titles to your graph. Label the x-axis Volume (mL) and the y-axis Pressure (torr).
12. Add a Chart title to your graph. Name the Graph: Computer Graph 1 - Volume vs. Pressure.
13. Remove the minor and major grid lines.
14. Add a border line around the entire graph.
15. Move the Legend inside the graph (it is a waste of space to leave it outside the graph).
16. Resize your graph to make maximum use of the space on the page.
78

Experiment 8 Graphing
17. Curve Fitting/Trend Lines: It is often desirable to either draw a line though your data to make iteasier to follow separate data sets, or more importantly to fit a mathematical equation to yourdata in order to extract experimental information. The most common equation to fit to is that ofa straight line with the formula y = mx + b where m = slope and b = intercept. It is also usefulto print the R2 value of the equation, because it tells you how good of a curve fit it is, 1 = perfectcorrelation, 0 = no correlation. An R2 value greater then 0.95 is generally considered good,anything lower indicates either poor data or the equation used to fit the line is not the correct one.
(a) Open the Add Trend line menu (Figure 8.12) by selecting a data point on the graph andright clicking or chosing the Trendline option on the Chart Tools Layout menu.
(b) Under the Type tab select Power Series.
(c) Under the Options tab select the boxes to display the equation on the chart, and to displaythe R-squared value.
(d) Move the equation and R-squared value to nice location that does not overlap anything.
Figure 8.12: Adding a curve fit (trend line). credit: author
18. Add your name and date to the upper right hand corner of your graph. You can use the Inserttab or the Chart Tools Layout tab which are selectable from the top menu. Select the Add Textbox option.
19. Take one last look at your graph. It should look similar to the one shown in Figure 8.13. Are thereany more changes you need to make? If so make them.
20. You should be done with your graph now. Show it to your instructor, and print a copy to be turnedin with this lab.
79

Experiment 8 Graphing
Figure 8.13: Completed computer graph. credit: author
E. Problem 2: Computer Graph 2
Using data provided in Table 8.2 you will make a graph following the instructions below. The data showsthe temperature effect on the solubility (how many grams will dissolve in 100. g of water) of four salts.The temperature (x-axis) is measured in °C and the solubility (y-axis)in grams substance/100 g water.
1. Type the data set into Excel.
2. The degree symbol for °C is found on the top tab under Insert than the Symbols menu. Scroll tothe top and click down three rows, it is located on the right side.
3. Using the mouse highlight the entire data set.
4. Choose the XY (scatter) plot and Click Next.
5. Click the Grid lines tab and add vertical grid lines. Click Next.
Now its time to make the graph look better. Make the following changes to your graph:
1. Change scales on axis. You may need to turn off the "auto" feature in Excel in order to set specificvalues.
(a) Change the scale on the X axis to go from 0 to 100 with labels every 10 °C. Add minor tickmarks every 5 °C.
80

Experiment 8 Graphing
Temperature (°C) KCl (g) NaCl (g) KBr (g) BaCl2 (g)0.0 27.6 35.7 53.5 31.610. 31.0 35.8 59.5 33.320. 34.0 36.0 65.2 35.730. 37.0 36.3 70.6 38.240. 40.0 36.6 75.5 40.750. 42.6 37.0 80.2 43.660. 45.5 37.3 85.5 46.670. 48.3 37.8 90.0 49.480. 51.1 38.4 95.0 52.690. 54.0 39.0 99.2 55.7100. 55.6 39.8 104 58.8
Table 8.2: Data for Problem 4
(b) Change the scale on the Y axis to go from 0 to 110 with labels every 10 grams and minortick marks every 2 grams.
2. Remove the grid lines in the X and Y directions. (Hold Right Click choose Chart Options - Gridlines tab)
3. Add a border to your graph. (Hold Right Click choose Format Plot Area).
4. Change the data symbols to all be black and white and size 8. Change the shape so that 2 =KCl,© = NaCl ,4 = KBr and •= BaCl2.
5. Use the Insert Tools tab and then shapes draw an arrow pointing to the solubility of NaCl at 20°C and use the Text Box tool to add a text at the end of the arrow saying "Solubility of NaCl at 20°C".
6. Curve Fitting: Right click on the KBr data and choose the "Add Trend line" option. Under the"Type" tab choose Linear. Under the "Options" tab click the check box’s for Display Equation andDisplay R Value. Draw an arrow from the equation to the trend line.
7. Move the Legend to inside your graph in the lower right hand corner. Now drag your graph so ittakes up most of the space in the graphing window. You always want to maximize the size of yourgraph so that it is easy to see and read your data.
8. Compare this graph to your first graph and make any changes required to make it a "good" graph.
81
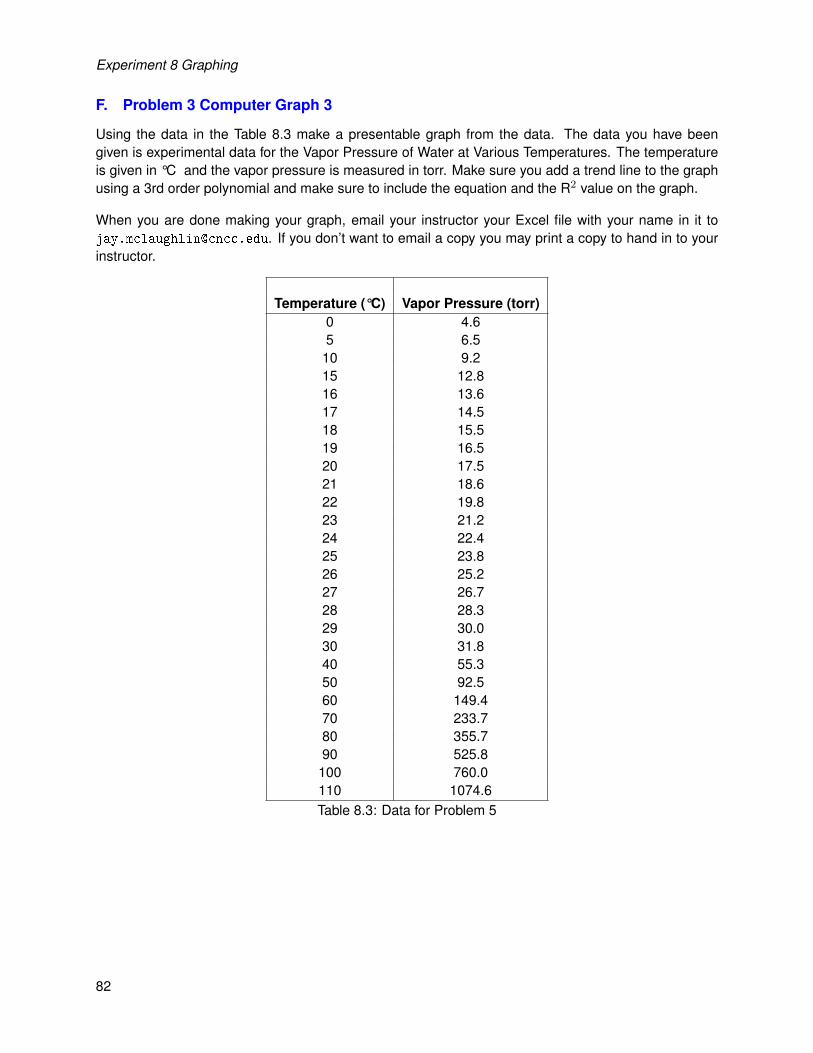
Experiment 8 Graphing
F. Problem 3 Computer Graph 3
Using the data in the Table 8.3 make a presentable graph from the data. The data you have beengiven is experimental data for the Vapor Pressure of Water at Various Temperatures. The temperatureis given in °C and the vapor pressure is measured in torr. Make sure you add a trend line to the graphusing a 3rd order polynomial and make sure to include the equation and the R2 value on the graph.
When you are done making your graph, email your instructor your Excel file with your name in it [email protected]. If you don’t want to email a copy you may print a copy to hand in to yourinstructor.
Temperature (°C) Vapor Pressure (torr)0 4.65 6.510 9.215 12.816 13.617 14.518 15.519 16.520 17.521 18.622 19.823 21.224 22.425 23.826 25.227 26.728 28.329 30.030 31.840 55.350 92.560 149.470 233.780 355.790 525.8100 760.0110 1074.6Table 8.3: Data for Problem 5
82

Experiment 9Specific HeatJay C. McLaughlinColorado Northwestern Community College
CC-BY-SA - August 19, 2021
Name:
Date:
Key Objectives
1. Understand the equation q = ms∆T, what each variable represents and typical units.
2. Solve problems using q = ms∆T.
3. Difference between heat and temperature.
4. Use of Significant Figures in calculations.
Discussion
Calorimetry is the science of measuring heat. We will use a calorimeter to measure the amount of heattransferred from an unknown metal to water. By knowing the value of the specific heat of water we willthen be able to calculate the specific heat of the unknown metal and identify it based on a comparisonto known values. In addition we will be able to work on our graphing skills. A basic discussion ofcalorimetry can be found in Hein Ch. 4.5 (p. 71) and in McMurry Ch. 8.8 (p. 311).
The Temperature of an object is a measure of how rapidly the atoms composing an object are moving.The faster the atoms move, the higher the temperature. Temperature is an intensive property that doesnot depend on the amount of matter present, thus the temperature of a cup of coffee and a bathtub fullof water can be the same. Temperature is generally measured in degrees Celsius (°C), Fahrenheit (°F),or Kelvin (K).
Heat is defined as the transfer of thermal energy, which is associated with the random motion of atomsand molecules, between two bodies that are at different temperatures. Heat is an extensive propertythat does depend on the amount of matter present, thus the heat content of cup of water is very differentfrom the heat content of a bathtub full of water. Heat is generally measured in energy units as joules (J)or calories (cal) where 4.184 joules = 1 calorie. The calorie is defined as the amount of energy requiredto heat 1 gram of water 1 °C.
The Specific heat of a substance is an intensive property that relates the temperature and heat of anobject. It is defined as the quantity of heat required to raise 1 gram of a substance by 1 °C and hasunits of (J/g·°C, cal/g·°C, or J/mol·°C). The relationship between heat (q), specific heat (s), mass (m)and a temperature change (∆t or tf − ti) can be expressed mathematically as:
q = m · s ·∆T (4)
The change in temperature of a substance is often expressed using the greek letter delta (∆) “whichmeans the change in”. This can also be expressed as the final temperature (tf ) minus the initial (ti) ofan object. Knowing 3 of the variables in the equation above allows us to solve for the fourth variable. Afact we will make use of in this experiment.
83

Experiment 9 Specific Heat
Based on our definitions of specific heat and joules/calories, the specific heat of water is exactly 4.184J/g·°C or 1.00 cal/g·°C. Knowing this value we will be able to determine the specific heat of a knownmetal and an unknown metal. We will do so by heating the metal to a known temperature and thenplacing it in contact with water at a known temperature. The heat from the metal will be transferred tothe water raising the temperature. Using the final measured temperature of the water we will be ableto determine the amount of heat transferred from the metal to the water and thus calculate the specificheat of the metal. The following equations show the relationships that allow us to determine the specificheat of the metal. Variables with a subscript “w” refer to the water while a subscript “m” will refer to ourmetal.
qw = mw · sw · (∆tw) (5)
qm = mm · sm · (∆tm) (6)
We can combine the above equations into a single equation by realizing that all of the heat that thewater absorbed had to come from the metal sample, thus:
qw = qm (7)
mw · sw · (∆tw) = mm · sm · (∆tm) (8)
Figure 9.1 shows the rough setup for the experiment and Table 9.1 shows the values measured in theexperiment, because we know all the values for water, we can calculate qw and using equation 7 wethen know qm and can calculate the specific heat of the metal.
Variable Water Metalm measured measureds measured ??tf same valueti measured measuredq same value
Table 9.1: Values measured in the experiment.
84

Experiment 9 Specific Heat
Figure 9.1: Experimental setup for finding the specific heat of an unknown metal. credit: author
Procedure
Read the entire procedure before beginning the experiment. Day one you will use a known sample(most likely Copper (Cu) to test the accuracy and precision of the measurement. Day two you willrepeat the experiment on on unknown sample and calculate its specific heat and using Table 9.2 try todetermine its identity.
1. Be sure to record all measured values with the appropriate number of significant figures and unit.Be sure to show all calculations required.
2. Obtain a known metal sample (most likely Copper (Cu)) from your instructor and record the nameof the known in the results section.
3. Weigh the known metal sample. Record it in the results section.
4. Construct the apparatus shown in Figure 9.2a. Place the metal sample carefully in the beaker(do not drop it, you might break the beaker) before placing the thermometer in. Use the smallerthermometer and be sure to clamp the thermometer in place. Adjust the height above the flameto ensure rapid heating.
5. Fill the beaker with tap water so the height of the water is a least 2 inches higher than the top ofthe metal sample.
6. Begin heating the water in the beaker and continue with the next step(s). As you are working,check the water frequently and note when it starts to boil. Turn down the burner, but keep thewater gently boiling. Do not do step 11 until the water has been boiling for about 10 minutes andthe temperature of the metal object has stabilized.
7. Obtain a calorimeter (Figure 9.2b) and record the mass of the inner cylinder on your data sheet.
8. Add approximately 50 mL of water to the calorimeter (enough to cover the metal sample) by no
85

Experiment 9 Specific Heat
more than 1/2 inch. Use the minimum amount of water to cover the sample so the measuredchange in temperature will be as large as possible. Record the mass of the calorimeter + thewater.
9. Use a cardboard cover to trap heat and slide the thermometer through it, clamp a large ther-mometer carefully and make sure the water will cover the mercury bulb. Adjust it so that it hangssuspended just above the bottom of the calorimeter, but will be covered by the water. Clamp it toa ring stand to prevent it from falling over.
10. Measure the initial temperature of the water in the calorimeter. Use a second ring stand to securethe thermometer in place.
11. After the water in the beaker has been boiling for 10 minutes and the temperature of the metalsample has been stable for 5 minutes record the temperature in the results section. Remove thethermometer from the test tube and set it aside.
12. Using tongs, transfer the metal sample from the boiling water to the calorimeter. It is importantthat the transfer take place quickly and that no water is transferred along with the metal. Be sureto remove the thermometer from the calorimeter and set it carefully aside so you don’t break itwhen you place the metal sample in the calorimeter. Try to minimize splashing. Be sure not toconfuse the two thermometers.
13. Once the metal sample is in the calorimeter, quickly place the cover on and the thermometerin the water. Stir gently by swirling the calorimeter. Watch the temperature of the water in thecalorimeter, and note the peak temperature. If the temperature does not reach a maximum valueand decrease then record the temperature when it has been stable for one minute.
14. Calculate the specific heat of your unknown sample. Compare the sample to the known value. Ifyou are within 0.05 J/g·°C of the correct value continue to the next step. If you were not accurateenough on the first trial of your known metal consult your instructor and perform a second trial.
15. Obtain an unknown sample and determine its specific heat. Do 2-3 trials (as time permits) on theunknown sample.
16. Ask your instructor for permission to start.
86

Experiment 9 Specific Heat
Figure 9.2: (a) Heat the metal in a beaker then transfer the metal to the (b) calorimeter and measure thetemperature change. credit: (a) https://seedsconnections.org (b) https://chemdemos.uoregon.edu/demos/Comparing-Specific-Heats-of-Metals
Metal Atomic Mass (amu) Specific Heat (J/g·°C)Aluminum 26.98 0.900
Brass N/A 0.380Copper 63.55 0.385
Gold 197.0 0.131Iron 55.85 0.451Lead 207.2 0.128
Magnesium 24.305 1.02Silver 107.9 0.237Tin 118.7 0.222Zinc 65.39 0.390
Table 9.2: Specific Heat of Selected Metals
87

Experiment 9 Specific Heat
This page intentionally left blank.
88

Experiment 9 Specific Heat
Results
A. Known Metal Sample - Data
Trial 1 Trial 2 Trial 3
1. Identity of known metal
2. Uncertainty in mass measure-ments:
3. Mass of metal sample:
4. Mass of calorimeter:
5. Mass of calorimeter + water:
6. Uncertainty in temperature mea-surements (heating appratus):
7. Uncertainty in temperature mea-surements (calorimeter):
8. Initial temperature of water incalorimeter:
9. Initial temperature of metal sample:
10.Final temperature of water andmetal:
89

Experiment 9 Specific Heat
B. Known Metal Sample - Calculations
Show example calculations for Trial 1 in the space provided below.
Trial 1 Trial 2 Trial 3
1. Mass of Water:
2. Change in temperature of water:
3. Change in temperature of metal:
4. Heat gained by water:
5. Heat lost by metal:
6. Specific Heat of Metal (Experimen-tal):
7. Average Specific Heat:
8. Theoretical specific heat of metal:
9. Calculate the Percent Errorusing the following formula:∣∣Actual Value−Measured Value
ActualValue
∣∣ ∗ 100 %
90

Experiment 9 Specific Heat
C. Unknown Metal Sample - Data and Results
Trial 1 Trial 2 Trial 3
1. Identity of unknown metal
2. Mass of metal sample:
3. Mass of calorimeter:
4. Mass of calorimeter + water:
5. Initial temperature of water incalorimeter:
6. Initial temperature of metal sample:
7. Final temperature of water andmetal:
8. Mass of Water:
9. Change in temperature of water:
10.Change in temperature of metal:
11.Heat gained by water:
12.Heat lost by metal:
13.Specific Heat of Metal (Experimen-tal):
14.Average Specific Heat:
15.Which element is your metal madefrom:
16.Explain why you chose the abovemetal (as opposed to other possi-bilites):
17.Theoretical specific heat of metal:
18.Calculate the Percent Errorusing the following formula:∣∣Actual Value−Measured Value
ActualValue
∣∣ ∗ 100 %
91

Experiment 9 Specific Heat
Post Lab Questions
1. Why is it more accurate to weigh the mass of the calorimeter and the calorimeter + water insteadof simply measuring the mass of water in a beaker and pouring it into the calorimeter?
2. Why do we want the water in the calorimeter to barely cover the metal sample (but not entirely fillup the calorimeter)?
3. Why do we want to be careful not to mix up which thermometer we use to measure the metalsample and which we use to measure the temperature in the calorimeter?
4. What effect does the initial temperature of the water in the calorimeter have on the change intemperature of the water after the hot metal sample is added, consider the following two scenario’s.
4(a) For instance what if you used water at 5°C in your calorimeter instead of room temperaturewater? Explain.
4(b) What if a mixture of ice and water was used? Explain.
5. Based on YOUR experimental data, which was better, the precision or the accuracy? Explain.
92

Experiment 9 Specific Heat
6. In this experiment you measured the specific heat of your known and un-known three times. Why did you do this?
7. Bob heats 25.00 grams of an unknown metal in a calorimeter from18.0°C to 23.0°C using 500.0 J of heat. What is the specific heat of themetal?
7.
8. Bob’s brother heated up 2.5×10³ L of Sulfuric Acid from 15.00°C to 39.0°C .How many nJ of heat did he use? The specific heat of Sulfuric Acid is 2.59J / g � .
8.
9. Bob’s sister uses 2.45×10⁴ J of energy to heat a copper pan weighting 250grams. If the final temperature of the pan was 600.°C what was the initialtemperature of the pan?
9.
10. Bob’s father heated a metal bar weighting 50.0 grams to 200.0°C andplaced it in a calorimeter containing 75.00 grams of water at an initial tem-perature of 30.0 °C. If the final temperature of the metal object in the waterwas 45.0°C what is the specific heat of the metal?
10.
93

Experiment 9 Specific Heat
94
Experiment 9 Specific Heat
Name: Class: Date:
Prelab Questions
1. Why are we measuring the specific heat of a known compound (Cu - Copper) before we measureit for an unknown compound?
2. How much energy (in kJ) is required to heat a cup of coffee (mostly water) weighing 0.50 lbs from25 °Cto 75 °C?
3. What is the final temperature of a gold sample weighing 10.5 grams which absorbs 814 J of energyif it starts at 20.0 °C? Explain.
4. A metal sample weighing 32.250 g was heated to 100.0 °C , then quickly transferred to a calorime-ter containing 53.247 g of water at 18.0 °C. The temperature of the water increased to 20.6 °C.Calculate the specific heat of the metal in J/g·°C. (Hint: where did all the heat lost by the metalgo?)
95

Experiment 9 Specific Heat
This is the back of the page, totally uninteresting.
96

Experiment 10Double Displacement ReactionsJay C. McLaughlinColorado Northwestern Community College
CC-BY-SA - August 19, 2021
Name:
Date:
Key Objectives
1. Five signs a reaction occurred.
2. Write complete Double Displacement chemical reactions(a) Balance charges.(b) Balance atoms.(c) Include states when known.
3. Recognize when no reaction (NR) occurs.
4. Use a solubility table to determine the state of compounds.
Discussion
Double displacement reactions are among the most common of the simple chemical reactions to studyand understand. We will explore the driving forces behind the chemical reactions, and use observationsmade about individual reactions to write complete chemical equations.
In examining the characteristic chemical properties of several compounds we will recall that there areseveral readily apparent signs that a chemical reaction between two solutions has occurred. Thosesigns were:
1. Color changes, that are not the result of simple dilution.
2. Evolution of a gas forming many bubbles rapidly.
3. Formation of a precipitate, normally a solid which will settle to the bottom of a test tube, butoccasionally a finely divided precipitate that does not settle and often appears as only a milkycolor.
4. Disappearance of a precipitate.
5. Endothermic or Exothermic reactions (creation of heat or cold).
Each of these signs will be used in this experiment to determine if a chemical reaction has occurred. Forthose experiments in which a reaction occurred we will write a balanced chemical reaction, includingthe states of products based on our observations.
Chemical reactions occur for a number of reasons. A detailed discussion is beyond the scope of thislab, however a brief discussion will provide insight into why each of the observable signs of a chemicalreaction occur. Enthalpy is a measure of the energy flow in a reaction, while Entropy is a measureof the randomness or disorder in a system. Spontaneous chemical reactions seek to decrease theenthalpy of the products and increase the entropy of the products. One or both of these conditions
97
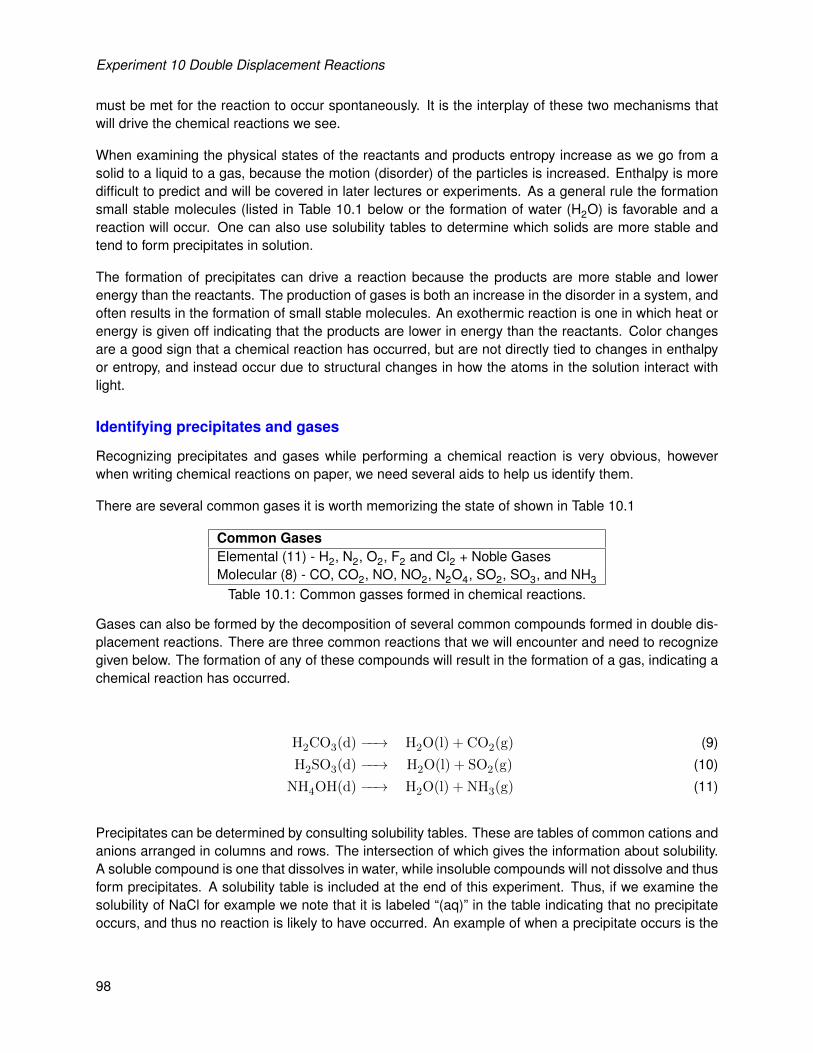
Experiment 10 Double Displacement Reactions
must be met for the reaction to occur spontaneously. It is the interplay of these two mechanisms thatwill drive the chemical reactions we see.
When examining the physical states of the reactants and products entropy increase as we go from asolid to a liquid to a gas, because the motion (disorder) of the particles is increased. Enthalpy is moredifficult to predict and will be covered in later lectures or experiments. As a general rule the formationsmall stable molecules (listed in Table 10.1 below or the formation of water (H2O) is favorable and areaction will occur. One can also use solubility tables to determine which solids are more stable andtend to form precipitates in solution.
The formation of precipitates can drive a reaction because the products are more stable and lowerenergy than the reactants. The production of gases is both an increase in the disorder in a system, andoften results in the formation of small stable molecules. An exothermic reaction is one in which heat orenergy is given off indicating that the products are lower in energy than the reactants. Color changesare a good sign that a chemical reaction has occurred, but are not directly tied to changes in enthalpyor entropy, and instead occur due to structural changes in how the atoms in the solution interact withlight.
Identifying precipitates and gases
Recognizing precipitates and gases while performing a chemical reaction is very obvious, howeverwhen writing chemical reactions on paper, we need several aids to help us identify them.
There are several common gases it is worth memorizing the state of shown in Table 10.1
Common GasesElemental (11) - H2, N2, O2, F2 and Cl2 + Noble GasesMolecular (8) - CO, CO2, NO, NO2, N2O4, SO2, SO3, and NH3
Table 10.1: Common gasses formed in chemical reactions.
Gases can also be formed by the decomposition of several common compounds formed in double dis-placement reactions. There are three common reactions that we will encounter and need to recognizegiven below. The formation of any of these compounds will result in the formation of a gas, indicating achemical reaction has occurred.
H2CO3(d) −−→ H2O(l) + CO2(g) (9)
H2SO3(d) −−→ H2O(l) + SO2(g) (10)
NH4OH(d) −−→ H2O(l) + NH3(g) (11)
Precipitates can be determined by consulting solubility tables. These are tables of common cations andanions arranged in columns and rows. The intersection of which gives the information about solubility.A soluble compound is one that dissolves in water, while insoluble compounds will not dissolve and thusform precipitates. A solubility table is included at the end of this experiment. Thus, if we examine thesolubility of NaCl for example we note that it is labeled “(aq)” in the table indicating that no precipitateoccurs, and thus no reaction is likely to have occurred. An example of when a precipitate occurs is the
98

Experiment 10 Double Displacement Reactions
reaction of Ag + Cl to form AgCl which is labeled as “I” indicating that it would form a precipitate and areaction would occur.
A. Exothermic and Endothermic Reactions
Recognizing temperature while performing a chemical reaction is very obvious, however when writingchemical reactions on paper, we need several aids to help us identify them. In this experiment we willonly examine exothermic reactions, the classic example being the reaction of an acid and a base. Thegeneral reaction is shown below.
Acid + Base −−→ Ionic Salt + H2O(l) + Heat (12)
Table 10.2 lists the most common acids and bases. In order to write the chemical reactions it will benecessary to recognize them in chemical reactions.
The heat in an acid/base reaction occurs because of the formation of a slightly ionized compound (inthis case water). Thus, we can add an additional sign that a reaction has occurred which is wheneverwater is formed in a chemical reaction. The heat is produced because water is a highly stable molecule,and when formed is lower in energy than the reactants, resulting in the release of heat. Other examplesof slightly ionized compounds formed in double displacement reactions are acetic acid (HC2H3O2),oxalic acid (H2C2O4), and phosphoric acid (H3PO4).
Acids (start with H) HF, HCl, HBr, HI, H3PO4, H2SO4, HNO3, H2CO3, HC2H3O2, HClO4Bases (contain OH) NaOH, KOH, Ba(OH)2, Ca(OH)2, NH4OH
Table 10.2: Common Acids and Bases.
Double Displacement Reactions
In the double displacement reactions in this experiment two aqueous solutions each containing an ioniccompound will be mixed. The general reaction is given by:
AB + CD −−→ AD + CB (13)
Each ionic compound (AB and CD) when dissolved in water will be present as a cation and anion pair.This implies that when the solutions are mixed we will have a mixture containing A+, B– , C+, and D–
cations and anions. As the ions interact with each other there are six possible combinations of ions thatcould result in a reaction. The six outcomes are shown in Table 10.3.
Double displacement reactions are named because the reaction can be viewed as one cation displacingthe other cation from the molecule and forming a new compound. These reactions are also oftenreferred to as Double Replacement reactions since we can view one cation as replacing the other toform a new compound. A third way of viewing these reactions is illustrated below in Figure 10.1 wherewe can imagine that the cations simply swap places and each of the new combinations has the potentialto cause a reaction to occur.
99

Experiment 10 Double Displacement Reactions
Combination ResultA+B– The ions recombine into the starting reactants.C+D– This can not result in a reaction because no change occurs.A+C+ This can not result in a reaction because like charges repel eachB– D– other. No exchange of electrons can occur to form a compound.A+D– This may result in a reaction if a precipitate or gas is formed.C+B–
Table 10.3: Possible outcomes of a double displacement reaction.
Figure 10.1: Double displacement reactions occur if the products formed by swapping cations are lowerin energy than the reactants. credit: author
Example 1:
A solution of sodium chloride and lead (II) nitrate are mixed. A white precipitate is formed. Write thecomplete chemical reaction.
The precipitate is definite evidence that a chemical reaction occurred. We swap the sodium and leadcations to form new compounds, and checking the solubility tables we note that PbCl2 is listed as (I),indicating it forms a solid precipitate, while NaNO3 is listed as aqueous. We can then write:
2 NaCl(aq) + 1 Pb(NO3)2(aq) −−→ 1 PbCl2(s) + 2 NaNO3(aq) (14)
Example 2:
A solution of sodium carbonate and sulfuric acid are mixed, resulting in the formation of a gas. Writethe complete chemical reaction.
1 Na2CO3(aq) + 1 H2SO4(aq) −−→ 1 Na2SO4(aq) + 1 H2CO3(aq) (15)
Examining the solubility tables indicates that neither product forms a precipitate. There is an acid in thereaction, however there is no base for it to react with, the experimenter did not note any temperaturechange. Gas was observed indicating that a chemical reaction must have occurred, and we must recallthat H2CO3 readily decomposes into water and carbon dioxide. The final chemical reaction would thenbe:
1 Na2CO3(aq) + 1 H2SO4(aq) −−→ 1 Na2SO4(aq) + 1 H2O(l) + 1 CO2(g) (16)
100

Experiment 10 Double Displacement Reactions
Example 3:
A solution of magnesium hydroxide and hydrochloric acid are mixed, no visible sign of a reaction oc-curred but the test tube feels warm to the touch. The double displacement reaction is written as:
1 Mg(OH)2(aq) + 2 HCl(aq) −−→ 1 MgCl2(aq) + 2 H2O(l) (17)
Neither product is a precipitate or gas, however, we should recognize this as an acid/base reaction.Additionally we could note that water was formed in the reaction, indicating a reaction occurred. Bothacid/base reactions and the formation of water result in the release of heat. We can write the finalreaction then as:
1 Mg(OH)2(aq) + 2 HCl(aq) −−→ 1 MgCl2(a1) + 2 H2O(l) + Heat (18)
Example 4:
A solution of sodium chloride and potassium nitrate are mixed. Write the complete chemical reaction.No change is observed in the test tube.
NaCl(aq) + KNO3(aq) −−→ KCl(aq) + NaNO3(aq) (19)
We write the initial reaction by simply swapping the sodium and potassium cations. We then need tocheck the solubility tables for KCl and NaNO3, from which we note both compounds form aqueouscompounds. Neither compound is a gas or decomposes and the reactants are not acids and bases,thus we conclude that no reaction (NR) occurred and would write:
NaCl(aq) + KCl(aq) −−→ NR (20)
Procedure
Obtain 12 medium sized test tubes and a test tube rack. Performthe following 12 reactions as described below. Each part of theexperiment involves mixing equal volumes of solution (about 1 mLor 20 drop) in a standard sized test tube. If you are unsure ofyour observation you may add another milliliter of each solution.For each reaction record your observations at the time of mixing.Feel each tube to determine if heat was evolved. The followingterminology should be used:
Observation NotationPrecipitate ppt - color
Gas (g)Heat Heat
No reaction NR
For each reaction write the complete chemical equation. Be sure to balance each product formed, andthe overall chemical equation. Include the states of the reactants and products when known, if the stateis not known leave empty bracket ( ). If the reaction is exothermic add “heat” as a product. If there isno evidence of a reaction write cross out the products and write “No Reaction” or “NR” as the products.
101

Experiment 10 Double Displacement Reactions
All reactions written should reflect observations (and vice versa), consult with your instructor about anydiscrepancies.
Perform the following twelve chemical reactions in any order.
1. Mix 0.1 M sodium chloride and 0.1 M potassium nitrate solutions.
2. Mix 0.1 M sodium chloride and 0.1 M silver nitrate solutions.
3. Mix 0.5 M sodium carbonate and concentrated (6 M) hydrochloric acid solutions.
4. Mix 20% sodium hydroxide and 6 M hydrochloric acid solutions.
5. Mix 0.1 M barium chloride and 9 M sulfuric acid solutions.
6. Mix 6 M ammonium hydroxide and 3 M sulfuric acid solutions.
7. Mix 0.1 M copper (II) sulfate and 0.1 M zinc nitrate solutions.
8. Mix 0.1 M sodium carbonate and 0.1 M calcium chloride solutions.
9. Mix 0.1 M copper (II) sulfate and 0.1 M ammonium chloride solutions.
10. Mix 20% sodium hydroxide and 6 M nitric acid solutions.
11. Mix 0.1 M iron (III) chloride and 6 M ammonium hydroxide solutions.
12. In the hood add 1 g of sodium sulfite to a test tube. Then add 2 mL of water and swirl vigorouslyto dissolve the solid (some small amount of solid may remain, this is acceptable). This producesan aqueous solution of sodium sulfite which we will consider as the reactant. Slowly (drop bydrop) add 1 mL of 18 M sulfuric acid to the sodium sulfite solution.
Dispose of mixtures 2, 5, 7, 9 in the “Experiment 6 Heavy Metal Waste” container. Dispose of allother mixtures in the sink and flush with water.
102

Experiment 10 Double Displacement Reactions
Name: Class: Date:
Results
For each reaction write the observed results from lab. Then write the complete chemical reaction. Besure to balance each reactant and product compounds charges, and the overall chemical equation.Include the states of the reactants and products when known, if the state is not known leave emptybracket ( ). If the reaction is exothermic add “+ heat” as a product. If there is no evidence of a reactioncross out the products and write “No Reaction” or “NR” as the products. All reactions written shouldreflect observations (and vice versa), consult with your instructor about any discrepancies.
# Observations Complete Chemical Reaction1.
2.
3.
4.
5.
6.
7.
8.
9.
10.
11.
12.
Table 10.4: Results
103

Experiment 10 Double Displacement Reactions
Post Lab Questions
1. Write the complete chemical reaction for the decomposition of sulfurous acid (H2SO3).
2. Using the criteria for double displacement reactions occurring, solubility tables, and the knowledgegained in this experiment predict whether a double displacement reaction will occur in each exam-ple below. If the reaction will occur complete and balance each compound, and equation, properlyindicate the state of gases and precipitates, and indicate if the reaction is exothermic by includ-ing “heat” as a product. If no reaction will occur write “No reaction” or “NR” as the products. Allreactants are assumed to be aqueous.
(a) K2S(aq) + CuSO4(aq) −−→
(b) NH4OH(aq) + H2C2O4(aq) −−→
(c) KOH(aq) + NH4Cl(aq) −−→
(d) Na2CrO4(aq) + Pb(C2H3O2)2(aq) −−→
(e) (NH4)2SO4(aq) + NaI(aq) −−→
(f) FeCl3(aq) + NaOH(aq) −−→
(g) KC2H3O2(aq) + CoSO4(aq) −−→
(h) Na2CO3(aq) + HNO3(aq) −−→
(i) ZnBr2(aq) + K3PO4(aq) −−→
(j) KOH(aq) + H3PO4(aq) −−→
104

Experiment 10 Double Displacement Reactions
Name: Class: Date:
Prelab Questions
1. What are the 4 signs that a double displacement reaction has occurred in LAB.
2. Complete the table below listing all of the chemical compounds used in lab.
Name Formula
Sodium Chloride
Potassium Nitrate
Silver Nitrate
Sodium Carbonate
Hydrochloric Acid
Nitric Acid
Sodium Sulfite
BaCl2
H2SO4
NH4OH
CuSO4
Zn(NO3)2
CaCl2
FeCl3
105

Experiment 10 Double Displacement Reactions
106

Experiment 11Single Displacement ReactionsJay C. McLaughlinColorado Northwestern Community College
CC-BY-SA - August 19, 2021
Name:
Date:
Key Objectives
1. Understand Activity Series and use it to predict if a reaction occurs.
2. Write complete Single Displacement chemical reactions(a) Balance charges.(b) Balance atoms.(c) Include states when known.
3. Recognize when no reaction (NR) occurs.
4. Use a solubility table to determine the state of compounds.
Discussion
The chemical reactivity of elements varies over an immense range. Some, like sodium and chlorineare so reactive that they are never found in a pure state, and instead always form compounds. Otherslike xenon and platinum are nearly inert and can be made to form compounds with other elements onlyunder special conditions. In this experiment we will explore the relative reactivity of the elements, andestablish a reactivity order.
The reactivity of an element is related to its tendency to gain and lose electrons. An element whichloses electrons in a reaction is said to be oxidized, and an element that gains electrons in a reactionis said to be reduced. In a chemical reaction, oxidation and reduction of elements is always paired,resulting in an exchange of electrons. It is this exchange of electrons which is the primary drivingforce for the reaction to occur. Oxidation and reductions reactions are very important industrially for theelectroplating of metals, production of batteries and cathodic protection.
It is possible to arrange nearly all of the elements into a single series in order of their reactivities (abilityto be oxidized or reduced). A series of this kind is commonly called an activity series.
Figure 11.1: The reactivity of elements decreases going from left (most active) to right (least active).credit: author
One key to successfully completing single displacement reactions is to know which elements are metalsand form cations (+) and which elements are nonmetals and form anions (-). Metals are to the left of
107

Experiment 11 Single Displacement Reactions
the metalloids (B, Si, Ge, As, Sb, Te and Po/At) except for Hydrogen which is considered a nonmetal.The nonmetals are to the right of the metalloids as shown in Figure 11.2.
Figure 11.2: Periodic table illustrating the metalloids, metals and nonmetals. credit: unknown
A generalized single displacement reaction is given below. If the element A is more reactive then itwill displace the less reactive element and form a new compound. If element A is less active then noreaction will occur. Which reaction occurs depends on if element A is a metal or nonmetal and thusmore likely to form a cation or anion. If element A is a metal it will displace the metal/cation (B) in thecompound or if element A is a nonmetal it will displace the nonmetal/anion (C) in the compound,
A + BC(aq) −−→ B + AC(aq) or A + BC(aq) −−→ C + BA(aq) (21)
A more visual representation of what occurs is shown in Figure 11.3, the Element (E) swaps with eitherthe cation (if E is a metal) or the anion (if E is a nonmetal) as long as the Element (E) is more reactivethan the cation or anion in the compound. If it is not no reaction will occur.
Figure 11.3: Another way of visualizing single displacement reactions. The nature of the element (metalor nonmetal) determine what elements swap (cations or anions). credit: author
One last way of thinking about single displacement reactions is illustrated in the cartoon in Figure 11.4.
A couple of examples will help to clarify what will occur in this experiment.
108

Experiment 11 Single Displacement Reactions
Figure 11.4: Cartoon illustrating the concept of single displacement reactions, the better dancer (A)displaces the bad dancer (B) and gets to dance with the girl (C). credit: unknown
Example 1
A few drops of mercury metal is reacted with a solution of copper (II) chloride. No reaction is observed.We can write the complete chemical equation as:
Hg(l) + CuCl2(aq) −−→ NR (22)
We conclude then that mercury is less reactive than copper (Hg < Cu) because it will not displacecopper from the compound. Similarly we could say that Cu is more reactive than Hg and thus desiresto be in the compound more than Hg. (Cu > Hg)
Example 2
A strip of metallic copper is immersed in a solution of mercury (II) chloride. After several minutes, thesolution becomes pale green and the copper strip is coated with a metallic color. We can write thecomplete chemical reaction as:
Cu(s) + HgCl2(aq) −−→ Hg(s) + CuCl2(aq) (23)
We conclude then that copper is more reactive than mercury and will displace mercury from com-pounds. (Cu > Hg)
From the second example we can see that the oxidation number (relative charge on the atoms) thatthe copper lost two electrons and went from an oxidation number of 0 −−→ + 2, thus it was oxidized.Mercury gained two electrons and went from an oxidation number of + 2 −−→ 0, thus it was reduced.The chlorine remained unchanged in the reaction with an oxidation state of −1. We can summarize thisby stating:
109

Experiment 11 Single Displacement Reactions
Cu0(s) + Hg+2(aq) −−→ Hg0(s) + Cu+2(aq) (24)
Procedure
An exciting new discovery has been made! Six new elements (5 metals and 1 gas) have been discov-ered. It is your job to create an activity series for these new elements. In this experiment you will beobserving the reactions of various solid metals and aqueous solutions of a second metal. From thisdata we will be able to generate an activity series for the new elements.
The new metals are being named after their discoverer and have the temporary symbols of J1, J2, J3,J4, J5, J6. The charges of each metal have been determined to be: J1+2, J2+2, J3+1, J4+3, J5+2,J6+1.
Read the entire procedure before beginning the experiment.
1. The reactions may be done in any order desired.
2. Label 6 clean test tubes 1-6. To each test tube add about 3 mL of the aqueous solution.
3. Add the appropriate thin strip of the solid metal to the test tube indicated.
(a) Tube 1: J3 (I) Nitrate + J4 strip.
(b) Tube 2: J4 (III) Nitrate + J1 strip.
(c) Tube 3: J1 (II) Nitrate + J2 strip.
(d) Tube 4: J5 (II) Sulfate + J2 strip.
(e) Tube 5: J6 (I) Sulfate + J2 strip.
(f) Tube 6: J6 (I) Sulfate + J4 strip.
4. Observe the contents of each tube carefully and record any evidence of a chemical reaction.Some reactions may be slow to occur or difficult to detect. If no immediate evidence of a reactionoccurs, set the tube aside for 10 minutes and then reexamine it.
5. After the reactions are complete:
(a) Remove the metal strips from each test tube and place them in the labeled beaker.
(b) Pour the solutions in each test tube into the “Experiment SD - Heavy Metals” waste con-tainer.
6. Write the complete chemical reaction (balanced, and include the states where known) for eachtest tube in the data table. If NO REACTION occurs write the reactants −−→ NR. Answer all ofthe questions before leaving. Ex: J32SO4(aq) + J1(s) −−→
110

Experiment 11 Single Displacement Reactions
Results
TT#
Observations Complete Chemical Equation
1.
2.
3.
4.
5.
6.
Table 11.1: Results
Post Lab Questions
1. Complete the following table by writing the symbols of the two elements whose reactivities arebeing compared in each test. Explain how you determined which element was the most active inthe space below the table.
TT # 1 2 3 4 5 6More Active Metal:Less Active Metal:
Table 11.2: Relative Activity of Tested Metals
Explanation:
111

Experiment 11 Single Displacement Reactions
2. Arrange J1, J2, and J4 in order from highest activity to lowest activity (Ex: A > B > C).
3. Arrange J5, J6, and J3 in order from highest activity to lowest activity (Ex: A > B > C).
4. Arrange J3, J4, and J5 in order from highest activity to lowest activity (Ex: A > B > C).
5. Arrange all 5 metals (excluding J6) in order from highest activity to lowest activity (Ex: A > B >C). Explain your ordering based on the observations made in test tubes 1-6 or on the previous 3questions.
6. On the basis of the reactions observed in test tubes 1-6 explain why it is not possible to place J6 inthe activity series in the previous question?
7. Write a chemical reaction(s) (using chemicals available in the experiment) that would allow you toplace J6 in the activity series. Only write the Reactants side of the reaction.
8. If the reaction written in the previous question results in NO REACTION, write the complete activityseries for all 6 elements in order from highest activity to lowest activity.
112

Experiment 11 Single Displacement Reactions
9. Using the activity series in your book/cheat sheet complete the following reactions. If the reactionwill occur complete and balance each compound, and equation, properly indicate the state of allproducts where known. If no reaction will occur write “No reaction” or “NR” as the products.
(a) H2(g) + AgNO3(aq) −−→
(b) Pb(C2H3O2)2(aq) + Na(s) −−→
(c) H2SO4(aq) + Mg(s) −−→
(d) Pb(s) + Cu(NO3)2(aq) −−→
(e) AlBr3(aq) + Cl2(g) −−→
(f) ZnSO4(aq) + Mg(s) −−→
(g) Cl2(g) + NaI(aq) −−→
(h) Al2(SO4)3(aq) + Na(s) −−→
(i) MgF2(aq) + I2(s) −−→
(j) Zn(s) + H3PO4(aq) −−→
113

Experiment 11 Single Displacement Reactions
I thought of adding a bunch of extra questions to fill up the blank space, but was in a good/lazy moodwhen I wrote this so didn’t add any!
114

Experiment 12StoichiometryJay C. McLaughlinColorado Northwestern Community College
CC-BY-SA - August 19, 2021
Name:
Date:
Key Objectives
1. Calculate Molecular Weight (MW).
2. Calculate Limiting Reactant (LR).
3. Calculate Excess Reactant left over (ER).
4. Calculate Theoretical Yield.
5. Calculate Percent Yield.
Discussion
A common chemical question is how much of a product can I make, or how much of a reactant do Ineed in a chemical reaction. In this lab you will learn how to answer both of these questions and a fewmore!
Stoichiometry calculations are about calculating the amounts of substances that react and form in achemical reaction. The word “stoichiometry” comes from the Greek stoikheion "element" and metria"measure."
Based on the balanced chemical equation, we can calculate the amount of a product substance thatwill form if we begin with a specific amount of one or more reactants. Or, you may have a target amountof product to prepare. How much starting compounds are needed to prepare this amount? These arepractical calculations that are done frequently by chemists.
Kitchen Chemistry
Chemistry and eating have a lot in common (ok its a stretch). In Figure ?? you have 10 wieners + 8buns and can make 8 hot dogs but you will have 2 left over weiners.
Figure 12.1: Why do wieners come in packages of 10 but the buns in a package of 8. That leaves 2 leftover wieners. credit: author
115

Experiment 12 Stoichiometry
In the previous example it was easy to do the math, lets take a look at a slightly harder example andinclude some math. Imagine you are making a sandwich using the following recipe:
2 slice bread + 3 slices ham + 3 slices turkey −−→ 1 great sandwich (25)
If you have 12 slices of bread, 24 slices of ham and 36 slices of turkey how many sandwich’s canyou make? Since this is real life it seems easier than chemistry (hint: it might be, but you can takeyour experience in real life and apply it to chemistry!). What you (probably without thinking of it) woulddetermine is how many sandwich’s you can make with each ingredient: 12 slices of bread you can make6 sandwich’s, with 24 slices of ham you can make 8 sandwich’s and with 36 slices of turkey you couldmake 12 sandwich’s. Thus you can make 6 sandwich’s before you run out of bread. That makes breadyour Limiting Reactant (LR)! In other words, the reactant you run out of in a reaction is the LimitingReactant.
If we imagined this as a chemist would you might do something like the following and deduce that thesmallest number of sandwich’s made tells us the Limiting Reactant.
12 slices bread × 1 sandwich
2 slices bread= 6 sandwich′s (26)
24 slices ham × 1 sandwich
3 slices ham= 8 sandwich′s (27)
36 slices turkey × 1 sandwich
3 slices turkey= 12 sandwich′s (28)
We can now define a few more terms:
Excess Reactant (ER): The reactant that you have excess (or left over of).
Theoretical Yield: The maximum amount of a product you can make based on calculations.
Actual Yield: The actual yield of a product in the laboratory (or kitchen), What you actually mea-sure/make.
Percent Yield: Is the percentage of the theoretical value you make in the lab or kitchen. It is essentiallyyour "grade".
Mathematically we can write:
Percent Yield =Actual Yield
Theoretical Yield× 100 (29)
If we take our sandwich making example then we could say that the we have Excess ham (6 slices)and turkey (18 slices) and we can Theoretically make 6 sandwich’s. If we dropped a slice of bread
116

Experiment 12 Stoichiometry
(yuck, no 5 second rule in chemistry lab) then our Yield of sandwich’s would go down because we canonly make 5 sandwich’s.
Again switching to thinking like a chemist we might formulate the problem as follows:
To find the Excess Reactant left over we start with Limiting Reactant and calculate how much of theExcess Reactant we use and subtract it from what we started with to get the amount left over.
12 slices bread × 3 slices ham
2 slices bread= 18 slice′s ham ∴ 24− 18 = 6 slice′s ham left over (30)
12 slices bread × 3 slices turkey
2 slices bread= 18 slice′s turkey ∴ 36− 18 = 18 slice′s turkey left over (31)
We have already calculated our Theoretical Yield of sandwich’s when we calculated the LR in equation2-4 and found we can only make 6 sandwich’s
Our Percent Yield (assuming we dropped a slice of bread would be:
Percent Yield =5 sandwich′s
6 sandwich′s× 100 = 83% (32)
Mol to Mol ratio
When making sandwich’s we know the amount of ingredients to use, so to in chemistry we have achemical reaction that tells us the amount of each chemical to use. Instead of slices chemists use amole (or mol for short) which is just a ridiculously large number of slices. 6.02×10²³ to be exact. To givecredit where it is due, Avagadro discovered this and so its generally referred to as Avagadro’s number:1 mol = 6.02× 10²³ anything.
For our sandwich recipe we might write the reactions below. The first reaction we are measuringeverything by the "slice". In the second reaction we use the chemistry term "mol" which just means lotsand lots and lots of slices. In the third recipe/reaction we omit the word "mol" because we are chemistsand we know we measure everything in "mols"
2 slicebread
+ 3 slice ham +3 slice
turkey−→ 1 sandwich
2 mol bread + 3 mol ham + 3 mol turkey −→ 1 mol sandwich2 bread + 3 ham + 3 turkey −→ 1 sandwich
Thus, we can have a slice/slice ratio if making sandwich’s and a mol/mol ratio if we are in the chemistrylab.
1 sandwich
3 slices hamor
1 mol sandwich
3 mol ham(33)
117

Experiment 12 Stoichiometry
Molecular Weight (MW)
If we went to the Deli to buy sandwich meat to make our sandwich’s we would probably buy everythingby the ounce (oz). If we did this then we might need to know how many slices of ham are in each ounceof ham we order (same goes for turkey). This would then be a conversion factor, for example we mightsay that 1 ounce of ham = 6 slices, but turkey is sliced thicker and 1 ounce of turkey = 3 slices. Thus, toorder the same number of ham and turkey slices we would need to buy twice as many ounces of turkeyas of ham. The number of ham/turkey slices and the mass of the ham/turkey are different.
1 oz ham
6 slices hamand
1 oz turkey
3 slices turkey(34)
If we went to the store and wanted to buy 24 slices of ham we could calculate how many ounces weneeded:
24 slices ham × 1 oz ham
6 slices ham= 4 oz ham (35)
In the kitchen we might use cups or ounces to measure things but in the chemistry lab we measure outour chemicals in grams. Just like our ham and turkey each chemical compound has a different mass. Inorder to get from the grams that we measure in lab to the moles that our balanced equation is written inwe will need to calculate the Molecular Weight (MW) or it is sometimes referred to as the Molar Mass.This is the weight of 1 mole (6.02 × 10²³ atoms or molecules) of a substance and is calculated usingthe weight of 1 mole of each element on the periodic table.
For example we can calculate the MW of Mg3(PO4)2:
Mg = 3× 24.305 = 72.915 g/mol
P = 2× 30.974 = 61.948 g/mol
O = 8× 15.999 = 127.992 g/mol
Mg3(PO4)2 = 262.853 g/mol
(36)
General Procedure
Generically we can apply the following procedure to calculate our Limiting Reactant (LR), Excess Re-actant left over (ER), Theoretical and Percent Yields.
118

Experiment 12 Stoichiometry
Quantity Calculationg R1 −−→ mol R1 −−→ mol P1 −−→ g P1
Limiting Reactant g R2 −−→ mol R2 −−→ mol P1 −−→ g P1The Limiting Reactant (LR) is the reactant that produces the least amount of Prod-uct.
Excess Reactant g LR −−→ mol LR −−→ mol ER −−→ g ERThe Excess Reactant is found by subtraction: Start g ER - Used g ER = Left OverER
Theoretical YieldAlready calculated! The minimum amount of product made when you calculatedyour LR.
Percent Yield Actual
Theoretical× 100
Chemistry Example
We can now graduate from the kitchen to the laboratory with one good example below. Given thereaction below assuming you start with 25.0 g of H2SO4 and 50.0 g H3PO4.
3 Mg(OH)2(aq) + 2 H3PO4 −−→ 1 Mg3(PO4)2(s) + 6 H2O(l)
58.32 g/mol 98.00 g/mol 262.85 g/mol 18.02 g/mol(37)
Below each reactant and product is the molecular weight which we will need in our calculations. Youcan double check my calculations to make sure that you remember how to do it!
We will answer the following 5 questions (given that you start with 25.0 g of H2SO4 and 50.0 g H3PO4:
1. Calculate the Limiting Reactant (LR).
2. Calculate the Theoretical Yield of Mg3(PO4)2.
3. Calculate the Theoretical Yield of H2O.
4. Calculate the amount of Excess Reactant left over.
5. Calculate the Percent Yield if in lab you produced 25.0 g of Mg3(PO4)2.
Calculating the Limiting Reactant by determining how much of a product can be produced with eachreactant. The reactant that produces the least product is your limiting reactant, and as a bonus, youalso get the theoretical yield of that product (a 2 for 1 deal!).
25.0 gMg(OH)2 × 1molMg(OH)258.32 gMg(OH)2
× 1molMg3(PO4)23molMg(OH)2
× 262.85 gMg3(PO4)21molMg3(PO4)2
= 37.6 gMg3(PO4)2
50.0 gH3PO4 × 1molH3PO4
98.00 gH3PO4
× 1molMg3(PO4)22molH3PO4
× 262.85 gMg3(PO4)21molMg3(PO4)2
= 67.1 gMg3(PO4)2
From the calculations above the least amount of product (37.56 g Mg3(PO4)2 which is our Theoretical
119

Experiment 12 Stoichiometry
Yield and is produced by Mg(OH)2 which is the Limiting Reactant. We have answered question 1 and2.
To determine theoretical yield of our other product we will start with our Limiting Reactant and determinethe amount of water produced.
25.0 gMg(OH)2 × 1molMg(OH)258.32 gMg(OH)2
× 6molH2O
3molMg(OH)2× 18.02 gH2O
1molH2O= 15.5 gH2O
To calculate the amount of Excess Reactant left over we start with our Limiting Reactant, calculate theamount of the other reactant used and subtract it from our starting amount.
25.0 gMg(OH)2 × 1molMg(OH)258.32 gMg(OH)2
× 2molH3PO4
3molMg(OH)2× 98.00 gH3PO4
1molH3PO4
= 28.0 gH3PO4
Start - Used = Left Over50.0 - 28.0 = 22.0 g H3PO4 Left Over
The last calculation is the Percent Yield.
% Yield =Actual
Theoretical× 100
% Yield =25.0 gMg3(PO4)
37.6 gMg3(PO4)2× 100 = 66.5%
To summarize our answers for the 5 questions we posed:
1. Calculate the Limiting Reactant (LR). Mg(OH)2
2. Calculate the Theoretical Yield of Mg3(PO4)2. 37.6 g Mg3(PO4)2
3. Calculate the Theoretical Yield of H2O. 15.5 g H2O
4. Calculate the amount of Excess Reactant left over. 28.0 g H3PO4
5. Calculate the Percent Yield if in lab you produced 25.0 g of Mg3(PO4)2. 66.5 %
120

Experiment 12 Stoichiometry
Procedure
In this experiment, you will prepare copper metal (Cu) from the reaction of aluminum metal (Al) witha solution of copper(II) sulfate (CuSO4). From the amounts of the reactants, you will determine whichreactant is the limiting reactant, and from this amount, calculate the theoretical yield of copper metal.From the actual amount of copper obtained, you can then calculate your percent yield of copper.
The reaction we will be studying is given below:
2 Al(s) + 3 CuSO4(aq) −−→ 3 Cu(s) + 1 Al2(SO4)3(aq)
1. Weigh a clean, dry 150 mL beaker and record its weight.
2. Weigh out approximately 2.0 g of CuSO4 into the beaker.
3. Add approximately 10. mL of water to the beaker and swirl to dissolve the CuSO4. Record thecolor of the solution.
4. Measure approximately 2.0 mL of 6 M HCl and add it to the beaker
5. Weigh out approximately 0.25 g of aluminum foil in small pieces and record the mass.
6. Add the pieces of Al foil to the beaker containing the CuSO4 little at a time, stirring the mixturecontinuously. Use caution as the reaction is very Exothermic. After all the aluminum foil is addedto the beaker add an additional 5.0 mL of 6 M HCl to the beaker to facilitate the reaction of anyexcess Al foil. Record the color of the solution and the solid precipitate.
7. After the reaction is complete allow the solid particles of copper to settle and carefully decant thesolution from the solid (leaving the copper behind in the beaker) into a 2nd beaker.
8. Add 20 mL of water to the beaker containing the copper stir well and decant again. Do this steptwice.
9. Add 10 mL of methanol to the copper, stir and decant.
10. Dispose of liquids decanted into the waste container labeled "Experiment 14 Waste".
11. Heat the beaker on a hot plate at a medium heat setting (4 out of 10) until the solid and beaker arethoroughly dry. Allow the beaker to cool (so you can touch it) and weight it on the scale. Recordthe mass.
12. If time permits, reheat the beaker for an additional 10 minutes and record the mass to ensure thatthe sample was completely dry. This is called heating to a constant mass.
13. Dispose of your copper metal in the container labeled "Solid Copper Metal Waste"
Dispose of any excess materials in the Heavy Metals waste jug (if liquid) or in the providedcontainer (if solid).
121

Experiment 12 Stoichiometry
.
122

Experiment 12 Stoichiometry
Results
1. Mass of 150 mL beaker 1.
2. Mass of 150 mL beaker + CuSO4: 2.
3. Mass of CuSO4 used: 3.
4. Color of solution (before adding Al foil) 4.
5. Mass of Al foil: 5.
6. Color of solution (after adding Al foil) 6.
7. Mass of dry Cu + beaker (after 1st heating): 7.
8. Mass of dry Cu + beaker (after 2nd heating): 8.
9. Mass of dry Cu: 9.
Post Lab Questions
1. Write the complete (balanced, and include states) chemical reaction thatoccurred in the lab.
2. Below each Reactant and Product in the previous reaction write the molec-ular weight of the compound.
3. Determine the theoretical amount of Copper metal from the starting valuesfor the mass of CuSO4. (Show calculation)
3.
123

Experiment 12 Stoichiometry
4. Determine the theoretical amount of Copper metal from the starting valuesfor the mass of Al. (Show calculation)
4.
5. What is the Theoretical Yield of Copper metal. Explain. 5.
6. What is the Limiting Reactant. Explain. 6.
7. What is the Percent Yield of Copper? (Show calculation) 7.
8. What is the amount of Excess Reactant Left over? (Show calculation) 8.
9. What is the theoretical mass of the Al2(SO4)3 produced? (Show calcula-tion.)
9.
10. Did you obey Lavoisier Conservation of Mass law? Explain. 10.
124

Experiment 12 Stoichiometry
Name: Class: Date:
Prelab Questions
1. Complete the following table.
Name Formula Molecular Weight
Aluminum Sulfate
Copper (II) Sulfate CuSO4
HCl
AlCl3
Methanol CH3OH
125

Experiment 12 Stoichiometry
.
126

Experiment 13TitrationsJay C. McLaughlinColorado Northwestern Community College
CC-BY-SA - August 19, 2021
Name:
Date:
Key Objectives
1. Nomenclature - Titration, End point, Indicator, Standard solution, Meniscus.
2. Solving titration problems.
3. Use of molecular weight and mol-to-mol ratio’s.
4. Determine the concentration of an unknown solution.
Discussion
Titrations are a standard technique used to determine the concentration of a solution by chemicallyreacting it with a known solution. There are a variety of techniques for doing this, we will focus on themost basic technique realizing that we can apply it to more complicated problems if required.
Figure 13.1: Typical setup for performing a titration. credit: author
A discussion of titrations can be found in Hein Ch. 15.10 or in McMurry Ch 3.10. Titrations are amethod for determining the amount or concentration of an unknown in a solution. Titrations react a so-lution of known concentration (the standard) with a solution of unknown concentration (the unknown).If the reaction goes to completion, and the yield is 100%, then the concentration of the unknown so-lution can be determined through the stoichiometry of the chemical reaction. The completion of thereaction is determined by a variety of methods including color changes, pH, and electrical conductivity.
127

Experiment 13 Titrations
Concentration is generally measured in terms of Molarity (M), which has units of (moles of solute/L ofsolution), or (mol/L).
A typical reaction which goes to completion with 100% yield is the reaction of an acid with a base. Suchreactions are also commonly referred to as neutralization reactions. Generally we can write:
Acid + Base −−→ Salt + Water + Heat (38)
In this lab we will use the reaction of potassium hydrogen phthalate, KHC8H4O4, commonly known as“KHP” with Magnesium Hydroxide (Mg(OH)2). The reaction is balanced as shown below.
2 KHC8H4O4(aq) + 1 Mg(OH)2(aq) −−→ 1 Mg(KC8H4O4)2(aq) + 2 H2O(l) (39)
The choice of reaction to study is made because KHP is a solid at room temperatures, we can measureits concentration by mass, which is much more accurate and precise then measuring liquid volumes.We will use this to titrate an unknown concentration of Mg(OH)2.
The end point of a reaction is the point at which the reaction is neutralized (the concentration of thereactants are equal) or 100% complete and is determined by using an indicator. Most indicators signalthe end point of a reaction by changing colors, though other changes are possible. The indicator chosenfor this reaction is phenophthalein, an organic dye, that is colorless in acid solutions (the KHP solution)and turns pink in basic solution (when enough Mg(OH)2 is added).
The standard instrument used in titrations is the Buret which is a piece of calibrated glassware usedto accurately measure volumes of liquids. Figure 13.1 shows a typical example. The buret is filled withthe solution (Mg(OH)2) to be titrated and is often referred to as the titrant.
Volume measurements are made by reading the point on the graduated scale that coincides with thebottom of the curved surface called the meniscus of the liquid as shown in Figure 13.2. A discussionof why a meniscus is formed can be found in Hein Ch. 13.4, Chang Ch. 11.3, or McMurry Ch. 10.4.
Do not waste your time trying to fill the buret to the zero line or some other round number, becauseThe exact volume to which the buret is filled is unimportant because we are measuring the differencein volume (∆v).
The titrant is now added to a solution made from the KHP, water, and indicator. Titrant is added untiljust one drop changes the solution from colorless to a faint pink color. The exact process will bedemonstrated in class by your instructor. The final volume of liquid is then measured.
Using the mass of the KHP, the volume of Mg(OH)2 used and the stoichiometry of the reaction it is thenpossible to determine the molarity of the Mg(OH)2 solution.
For example, if you start with 1.025 g of KHP and add 22.50 mL of an unknown Molarity of Mg(OH)2calculate the Molarity of the solution.
1.025 g KHP22.50mL
× 1mol KHP204.2 g KHP
× 1molMg(OH)22mol KHP
× 1mL
0.001L= 0.1116 M Mg(OH)2
128

Experiment 13 Titrations
Figure 13.2: (a) Always read a buret with your eyes level with the bottom of the meniscus. (b) Noticethe numbering on the scale, it goes from top to bottom (opposite of a beaker). credit: (a) E. Gener-alic, https://glossary.periodni.com/glossary.php?en=meniscus (b) https://effectiveness.lahc.edu/academic_affairs/sfcs/chemistry/Shared
Figure 13.3: Using conversion factors to solve a titration problem. credit: author
Procedure
In this experiment you will be titrating a known mass of an acid (KHP) with an unknown concentrationof base (Mg(OH)2). After determining the concentration of the base solution you will use it to determinethe concentration of acetic acid in vinegar and compare it to the manufactures claimed concentration.
Read the entire procedure before beginning the experiment.
Part 1 - Practice using the buret
1. When reading the meniscus level in the buret, you may find it helpful to hold a white card (Fig-ure ??) marked with a dark strip (or a dark colored object) behind and slightly below the meniscus.Remember, your line of sight should be level with the meniscus to obtain the most accurate read-ing.
129

Experiment 13 Titrations
2. To what uncertainty can you measure volume using a buret?
3. Add between 40 and 45 mL of distilled water to the buret using a funnel placed on the top of theburet. Be sure to check for air bubbles in the tip of the buret, if found you need to dispense yourliquid until they are removed. Record your reading on your data sheet and have your instructorverify the reading.
4. Weigh an empty beaker.
5. Place an empty beaker below your buret and dispense between 10 and 12 mL of distilled waterinto it. Record your final reading, and have your instructor verify it.
6. Record the mass of water dispensed.
7. Calculate the volume of water dispensed into your beaker. (Show work)
8. Calculate the difference between the volume of water dispensed and the mass of water dis-pensed. Does the calculated volume of water dispensed into your beaker agree with the massof the water dispensed into the beaker within 0.1g of the expected value? If not consult yourinstructor.
9. If you have any troubles with this portion of the lab, or your mass and volume measurementsdisagree too much, consult your instructor, and do a second trial if needed.
10. Continue practicing dispensing varying amounts of water, at varying rates from the buret into abeaker until you feel comfortable controlling the water flow using the stopcock.
11. Finish by draining all of the water from the buret into the beaker.
12. Any water used in this part of the experiment may be disposed of down the sink.
Part 2 - Obtaining a Mg(OH)2 sample, and filling the buret.
You will need the Mg(OH)2 solution for titrating both the KHP standard Each titration should take be-tween 10-20 mL of the Mg(OH)2 solution.
1. Obtain about 250 mL of the Mg(OH)2 solution from your instructor. Put your name on the Erlen-meyer flask.
2. Close the stopcock on your buret and carefully add through a funnel 5 mL of your Mg(OH)2solution. Remove the funnel. Remove the buret from the support stand, and hold it almosthorizontally. Carefully rotate so that the Mg(OH)2 solution contacts the entire inner surface.
3. Drain the Mg(OH)2 solution through the buret tip into a beaker labeled “Discarded Rinse Solu-tions” or dispose of it down the sink.
4. Clamp the buret into the support stand. Fill the buret to a point slightly below the 0 mL calibrationmark.
5. Dispense the Mg(OH)2 solution though the stopcock and remove any air bubbles present. If you
130

Experiment 13 Titrations
can not remove the air bubbles consult your instructor.
6. Once all air bubbles are removed, refill the buret to between the 0 and 10 mL mark.
Part 3 - Preparing the KHP sample
1. Obtain a 250 mL Erlenmeyer flask.
2. Calibrate your scale (hold button down until the calibration menu is reached. Then hit the onbutton, wait until it flashes 100 g. Place the 100 g calibration weight on the scale and push the onbutton again. Wait until the calibration is complete). Be sure to recalibrate the scale if you moveit or spill anything on it.
3. Using weighing paper or boat, carefully weigh out about 1.0 grams (between 0.9 and 1.1 grams)of KHP onto the paper. (Be sure to tare the mass of the weigh boat or paper).
4. Carefully pour the KHP into the 250 mL Erlenmeyer flask. Add about 75 mL of distilled water(measured with graduated cylinder) into the Erlenmeyer flask and gently swirl the flask and itscontents until the KHP is fully dissolved.
5. Add 3 drops of phenolphthalein indicator solution to the KHP solution and swirl gently to mix.
Part 4 - Titrating the KHP
1. Place the Erlenmeyer flask containing the KHP sample under the buret as shown in Figure 13.1.
2. Place a white sheet of paper under the solution. This will make it much easier to detect the colorchange.
3. Record the value of the starting volume on your data sheet.
4. Add 1-2 mL volumes of the Mg(OH)2 solution from the buret to the KHP solution, while swirlinggently.
5. A faint pink color will appear with each addition. When the pink persists for a second or two startadding the Mg(OH)2 in smaller volumes. The goal of a titration is to have the solution be clear andafter adding a single drop of KHP to the solution it will turn a faint pink color. You will be requiredto be this accurate in order to complete the lab.
6. You may wash down the sides of your container if you need to with distilled water from a washbottle.
7. When a single drop of the Mg(OH)2 solution causes a pink color to persist for 30 seconds you aredone with the titration.
8. Have your instructor check your result to see if it is a good trial. This will be accomplished byadding several drops of an acid solution to your now pink KHP solution. If the color changes backto clear it is a successful trial. If it does not you will need to repeat the trial.
9. Record the final volume on your data sheet.
131

Experiment 13 Titrations
10. Repeat Parts 4 and 5 until you have a total of 3 good trials approved by your instructor. If youneed another data sheet ask your instructor for one.
11. Finish your calculations for each trial and calculate the average molarity of the unknown Mg(OH)2solution. You will be graded on both the accuracy of your result and the precision.
132
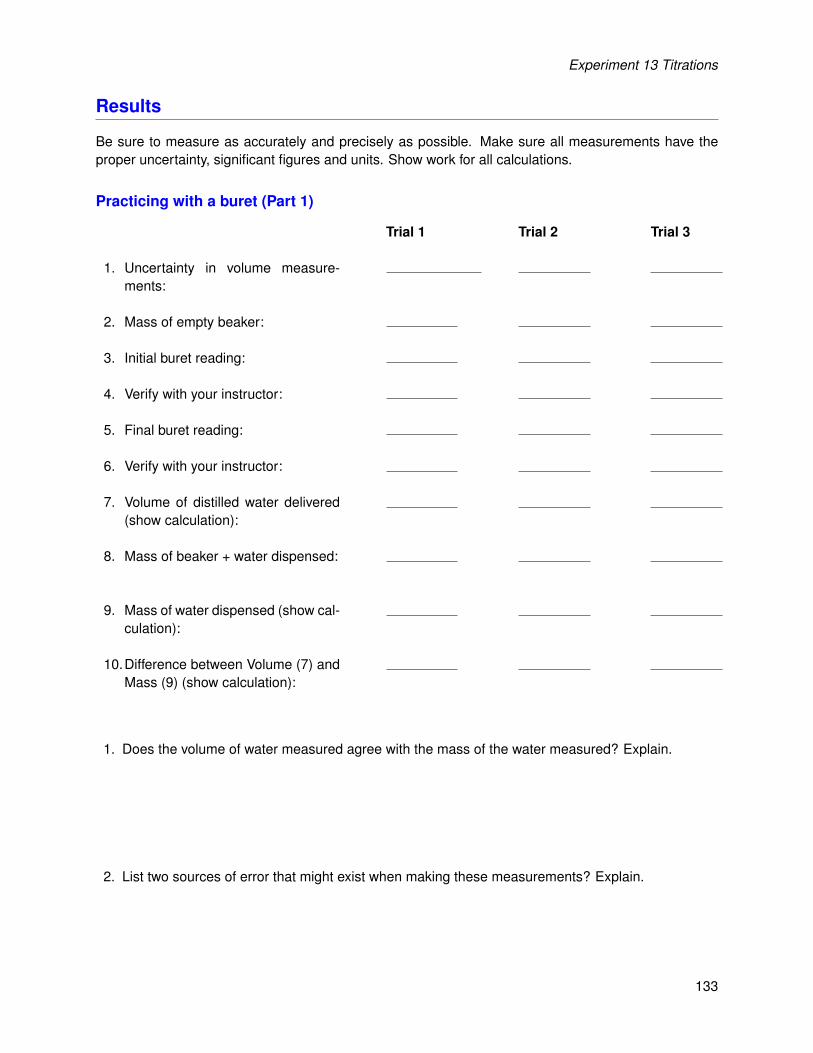
Experiment 13 Titrations
Results
Be sure to measure as accurately and precisely as possible. Make sure all measurements have theproper uncertainty, significant figures and units. Show work for all calculations.
Practicing with a buret (Part 1)
Trial 1 Trial 2 Trial 3
1. Uncertainty in volume measure-ments:
2. Mass of empty beaker:
3. Initial buret reading:
4. Verify with your instructor:
5. Final buret reading:
6. Verify with your instructor:
7. Volume of distilled water delivered(show calculation):
8. Mass of beaker + water dispensed:
9. Mass of water dispensed (show cal-culation):
10.Difference between Volume (7) andMass (9) (show calculation):
1. Does the volume of water measured agree with the mass of the water measured? Explain.
2. List two sources of error that might exist when making these measurements? Explain.
133

Experiment 13 Titrations
Titration of KHP (Part 4)
Trial 1 Trial 2 Trial 3
1. Mass of KHP::
2. Uncertainty in volume measure-ments:
3. Initial buret reading:
4. Final buret reading:
5. Verify titration (drops of acidadded):
6. Volume of Mg(OH)2 delivered(show calculation):
Trial 4 Trial 5 Trial 6
1. Mass of KHP::
2. Uncertainty in volume measure-ments:
3. Initial buret reading:
4. Final buret reading:
5. Verify titration (drops of acidadded):
6. Volume of Mg(OH)2 delivered(show calculation):
134

Experiment 13 Titrations
Trial 7 Trial 8 Trial 9
1. Mass of KHP::
2. Uncertainty in volume measure-ments:
3. Initial buret reading:
4. Final buret reading:
5. Verify titration (drops of acidadded):
6. Volume of Mg(OH)2 delivered(show calculation):
Trial 10 Trial 11 Trial 12
1. Mass of KHP::
2. Uncertainty in volume measure-ments:
3. Initial buret reading:
4. Final buret reading:
5. Verify titration (drops of acidadded):
6. Volume of Mg(OH)2 delivered(show calculation):
135

Experiment 13 Titrations
1. What is the molecular weight of KHP. (Remember KHP is an abbreviation for Potassium HydrogenPhthalate).
2. Write the complete and balance reaction that occurs when KHP reacts with Mg(OH)2.
3. In the space below show a sample calculation for determining the Molarity of your solution for yourfirst "Good" trial.
4. List the Trial Number and Molarity of your 3 best trials. Calculate the Average Molarity (showcalculation).
Trial Number:
Trial Number:
Trial Number:
Average Molarity:
136
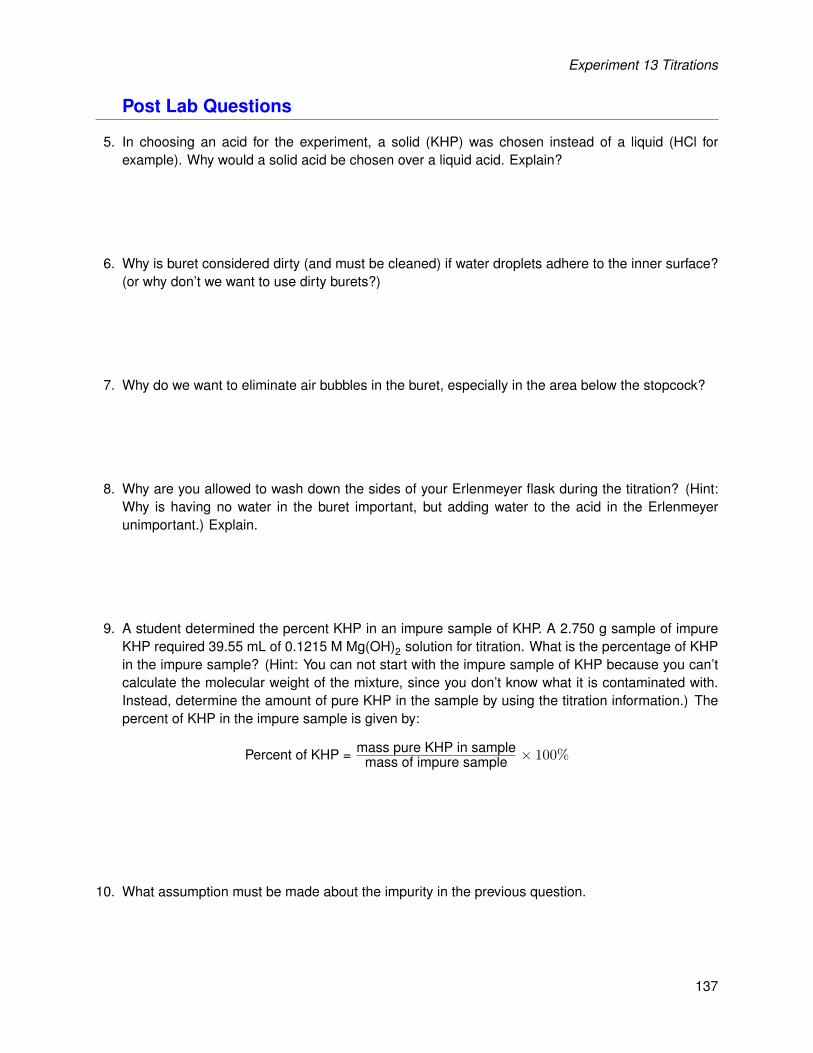
Experiment 13 Titrations
Post Lab Questions
5. In choosing an acid for the experiment, a solid (KHP) was chosen instead of a liquid (HCl forexample). Why would a solid acid be chosen over a liquid acid. Explain?
6. Why is buret considered dirty (and must be cleaned) if water droplets adhere to the inner surface?(or why don’t we want to use dirty burets?)
7. Why do we want to eliminate air bubbles in the buret, especially in the area below the stopcock?
8. Why are you allowed to wash down the sides of your Erlenmeyer flask during the titration? (Hint:Why is having no water in the buret important, but adding water to the acid in the Erlenmeyerunimportant.) Explain.
9. A student determined the percent KHP in an impure sample of KHP. A 2.750 g sample of impureKHP required 39.55 mL of 0.1215 M Mg(OH)2 solution for titration. What is the percentage of KHPin the impure sample? (Hint: You can not start with the impure sample of KHP because you can’tcalculate the molecular weight of the mixture, since you don’t know what it is contaminated with.Instead, determine the amount of pure KHP in the sample by using the titration information.) Thepercent of KHP in the impure sample is given by:
Percent of KHP = mass pure KHP in samplemass of impure sample × 100%
10. What assumption must be made about the impurity in the previous question.
137

Experiment 13 Titrations
.
138

Experiment 13 Titrations
Name: Class: Date:
Prelab Questions
1. Define each of the following terms as they relate to the experiment:
(a) Titration
(b) End point
(c) Indicator
(d) Standard Solution
(e) Meniscus
2. What is the molecular weight of KHP. (Remember KHP is an abbreviation for Potassium HydrogenPhthalate).
3. Write the complete and balance reaction that occurs when KHP reacts with Magnesium Hydroxide.
4. A student standardized a Mg(OH)2 solution, following the procedures outlined in this experiment.The student weighed a samples of KHP (1.350 g) and transferred it to a 250 mL Erlenmeyer flasks.She added distilled water, the indicator, and then titrated the sample with 18.75 mL an unknownconcentration of Mg(OH)2 solution. Calculate the Molarity of the Mg(OH)2 Be sure to include thecorrect units and SF for all answers.
139

Experiment 13 Titrations
140

Experiment 14Water in HydratesJay C. McLaughlinColorado Northwestern Community College
CC-BY-SA - August 19, 2021
Name:
Date:
Key Objectives
1. Calculate molecular weight of compounds.
2. Calculate percent composition of compounds.
Discussion
Certain ionic compounds form with large spaces in their crystalline structures as shown in Figure 14.1.These spaces are a perfect fit for many small molecules which are trapped there. When water is trappedin the lattice these compounds are often referred to as hydrates. The water which is chemically bondedto the hydrate is often called the water of crystallization or water of hydration. In a hydrate the watermolecules are a distinct part of the compound and are joined to it by bonds that are significantly weakerthan those forming the ionic lattice. To indicate this, the formula for hydrates is written with a dotused to separate the formula of the ionic salt from that of the trapped water molecules. The name ofthe compounds are slightly different also, the ionic part is named as usual, and we use indicate theadditional water by giving the number of water molecules (using di, tri, etc.) and the word hydrate. Forexample CaSO4 · 2 H2O would be called calcium sulfate dihydrate.
Figure 14.1: (a) and (b) Hydrates are crystalline compounds that have water trapped in the empty spacewithin the crystalline lattice. Similar compounds shown here are chlathrate hydrate structures whichare crystalline compounds in gas molecules are trapped in the spaces inside the crystal structure offrozen water. credit: (a) https://ps.uci.edu/group/kcjanda/research/gas-hydrate-structure(b) http://dusk.geo.orst.edu/oceans/deep_currents.html
These compounds have many industrial uses, as well possibly playing an important role in environ-mental issues such as global warming. We will briefly discuss two of the many uses for these types ofcompounds.
141

Experiment 14 Water in Hydrates
Natural gas hydrates (also commonly referred to as: clathrates, gas hydrates, methane hydrates) aresolid compounds formed from small gas molecules (natural gas/methane), and water that are formedat low temperatures and high pressures. An example of a clathrate is shown in Figure 14.1. Someestimates predict that the total amount of gas hydrates could be as large as all the known reservesof coal, oil and gas combined, and could last for 1,000 years at current rates of use. Clathrates arecrystalline water based solids physically resembling ice, in which small non polar molecules (typicallygases) are trapped inside "cages" of hydrogen bonded water molecules. Without the support of thetrapped molecules, the lattice structure of hydrate clathrates would collapse into conventional ice crystalstructure or liquid water. Most low molecular weight gases (including O2, H2, N2, CO2, CH4, H2S, Ar, Kr,and Xe), as well as some higher hydrocarbons and freons will form hydrates at suitable temperaturesand pressures. Clathrate hydrates are not chemical compounds as the sequestered molecules arenever bonded to the lattice.
Hand warmers also make use of crystalline compounds with trapped molecules in them. Solid sodiumacetate trihydrate (NaC2H3O2 · 3 H2O) when heated forms a solution of sodium acetate dissolved in thewater which was trapped in the solids lattice. This solution is super-saturated and when disturbed willreform the solid compound liberating large quantities of heat. The compound makes excellent, reusablehand warmers because the reaction can be cycled many times. We can write a chemical equation forthe reaction as:
NaC2H3O2 · 3 H2O(s) + EnergyHeator−−−−−−−→
Boiling WaterNaC2H3O2 + 3H2O(l) (40)
The reaction is of course reversible if water is added to the anhydrous sodium acetate, crystalizationoccurs as the water is absorbed into the solid lattice resulting in an exothermic reaction occurring whichreleasing energy/heat (i.e. a hand warmer).
NaC2H3O2 + 3H2O(l)Crystallization−−−−−−−−−→ NaC2H3O2 · 3 H2O(s) + Energy (41)
Figure 14.2: (a) Cold hands? (b) Get some mittens and a reusable hot pack! credit:(a) https://www.pxfuel.com/en/free-photo-qtjlg (b) https://commons.wikimedia.org/wiki/File:Handwaermer12.jpg
142

Experiment 14 Water in Hydrates
Calculating Molecular Weight and Percent Composition
In the quantitative section of the lab you will measure the mass of water lost by a hyrdated sample uponheating. Using this information you will be able to determine the percentage of water in the sample, andcompare it to several known hydrates to determine the identity of an unknown hydrate. In order to doso we will need to calculate the molar mass or molecular weight of each compound and the percentageof water in each compound.
The molar mass/molecular weight of a compound is the atomic mass of all the elements in the com-pound expressed in grams/mol. For example, the molecular weight of NaCl is the sum of the molarmasses of Na and Cl which is 22.99 g/mol and 35.45 g/mol for a total of 58.44 g/mol. For a morecomplicated example we can calculate the molecular weight of CaSO4 · 2 H2O.
Element # Atoms Molar Mass (g/mol) Total Mass (g/mol)Ca 1 40.08 1(40.08) = 40.08S 1 32.07 1(32.07) = 32.07O 6 16.00 6(16.00) = 96.00H 4 1.008 4(1.008) = 4.032
CaSO4 · 2 H2O - - 172.2Figure 14.3: Example of calculating the Molecular Weight (MW) of a compound.
The percent composition of a compound is found by dividing the total mass of each element by the totalmass of the compound and multiplying by 100. An example calculation for CaSO4 · 2 H2O in Figure 14.4.
MW of elementMW compound × 100
Molar MassElement # Atoms (g/mol) Percent Composition
Ca 1 40.08 1(40.08)172.2 × 100 = 23.28%
S 1 32.07 1(32.07172.2 × 100 = 18.63%
O 6 16.00 6(16.00)172.2 × 100 = 55.76%
H 4 1.008 4(1.008)172.2 × 100 = 2.341%
CaSO4 · 2 H2O - - 100.0%Figure 14.4: (a) Formula for calculating percent composition of an element in a compound, (b) Tableshowing example calculation for CaSO4 · 2 H2O.
If we want to know the percentage of water in the compound than we need to take the molar mass ofthe water in the compound divided by the total molar mass as shown in the equation below.
total mass of the H2O
total molar mass× 100
For CaSO4 · 2 H2O the equation would be:
36.03 g/mol H2O
172.2 g/mol CaSO4 · 2 H2O× 100 = 20.92 % H2O
143

Experiment 14 Water in Hydrates
Procedure
This experiment will consist of two parts, heating a hydrated compound to remove the trapped moleculesinside from the lattice leaving us with an anhydrous salt (the compound without water) and an unknownliquid. We will then attempt to characterize the liquid component of the hydrate and prove that it isindeed water. In the second part of the experiment we will quantitatively determine the percentage ofwater trapped in an unknown hydrate.
Part 1 - Qualitative Determination of Water
In this part of the experiment our goal is to place a finely ground sample of copper (II) sulfate pentahy-drate in the bottom of a test tube without having any stick to the sides of the test tube. We will then heatthe bottom of the test tube slowly in order to free the molecules trapped in the lattice of the copper (II)pentahydrate. The resulting gas will condense on the sides of the test tube and drip into the receivingtest tube. We will then perform a series of tests on the collected liquid to prove it is water.
1. Obtain a medium sized test tube, a ring stand, clamp, erlenmeyer flask, and a bunsen burner.
2. Fold a 2.5 by 20 cm strip of paper lengthwise to form a V-shaped trough or chute.
3. Weigh about 3 grams of copper (II) sulfate pentahydrate and spread it evenly along the length ofthe trough. Assemble the apparatus as shown below in Figure 14.7. Clamp the test tube so thatits mouth is 15-20 degrees above the horizontal. Carefully place the loaded trough containingthe copper (II) sulfate pentahydrate into the bottom of the test tube. Tap the paper chute gently ifneeded, being careful not allow any copper (II) sulfate pentahydrate to adhere to the sides of thetest tube.
4. Remove the chute and turn the test tube until it slants downward at an angle of 15-20 degreesbelow the horizontal (Figure 14.7c). Make sure the copper (II) sulfate pentahydrate does not slidedownward, and remains at the bottom of the tube. Place a test tube in an erlenmeyer flask t0catch the liquid that will condense in the test tube as it is heated.
5. Heat the hydrate gently at first, to avoid excessive splattering, by waving the bunsen burnerunderneath the solid sample. Gradually increase the rate of heating. Note any changes thatoccur in the results section.
6. Continue heating and collect the liquid which will condense in the cooler part of the test tube.
7. Heat the sample until the original blue color has disappeared, but do not overheat the samplecausing the residue to turn black. (At excessively high temperatures (above 600°C) copper (II)sulfate decomposes into sulfur trioxide which is driven off as a gas, and copper (II) oxide which isa black solid.)
8. It may be necessary to heat the entire length of the test tube for a minute or two to drive most ofthe condensing liquid down the test tube and into the collecting test tube. Be sure to not heat theclamp holding the test tube in place.
9. Allow the test tube and its contents to cool.
144

Experiment 14 Water in Hydrates
Figure 14.5: (a) Use a folded sheet of paper to place the sample in the test tube being careful not tospill. (b) Heating the test tube to drive off the trapped water, be sure to not heat by the clamp. credit:author.
10. Observe and record the odor of the liquid that has been collected.
11. While the tube is cooling, dry a piece of cobalt chloride test paper by holding it about 25 cm abovethe bunsen burner. Heat the paper but do not char or ignite it. When properly dried the test papershould be a blue color. Using a clean stirring rod, place a drop of the collected liquid on the driedcobalt chloride test paper. Record your observations
12. For comparison, place a drop of distilled water on a second piece of dried cobalt chloride testpaper. Record your observations.
13. Empty the anhydrous salt residue onto a watch glass, and divide it into two portions.
14. Place one portion in a test tube, and carefully add 3-4 drops of the liquid collected earlier to theanhydrous salt. Record your observations.
15. Place the second portion into a test tube, and carefully add 3-4 drops distilled water to the anhy-drous salt. Record your observations.
16. Dispose of the solid residue in the waste container labeled “Copper Waste” or “Cu Waste”.
Part 2 - Quantitative Determination of Water in a Hydrate
To insure that all of the water in the sample has been driven off, we will use a technique known asheating to constant weight. Essentially, we will heat and weight the sample until the mass of thesample does not change between heatings indicating that all of the molecules trapped in the latticehave been driven off. Due to limited time, constant weight in this experiment will be achieved when thesample is heated and weighed in successive trials until the weight differs by no more than 0.05 gramsbetween two weighings. This may take 2-3 trials to occur.
An example would be if a student made several heatings as shown in the table below. He would only
145

Experiment 14 Water in Hydrates
be able to stop at the last heating because the difference between the 3rd and 4th trials was less than0.05 grams.
Initial Mass Difference inTrial of Sample Mass Conclusion
Initial Weight 4.000 g - Start heatingMass after 1st Heating 3.500 g - Always do a 2nd heatingMass after 2nd Heating 3.250 g 0.250 g 0.250 > 0.05 therefore keep heatingMass after 3rd Heating 3.150 g 0.100 g 0.100 > 0.05 therefore keep heatingMass after 4th Heating 3.125 g 0.025 g 0.025 < 0.05 therefore we are done!
Figure 14.6: An example of heating to a constant mass. Only when the difference in mass between twotrials is less than 0.05 is the sample considered dry.
1. Obtain a sample of an unknown hydrate from your instructor. Record its identity in the resultssection.
2. Obtain a crucible and cover from your instructor. Clean and dry it. Record the mass of the crucibleand cover.
3. Place between 2 and 3 grams of your unknown into the crucible. Place the cover on top andweigh the crucible + sample.
4. Obtain a bunsen burner, ring stand, ring clamp, clay triangle, tongs, and construct the apparatusshown in Figure ??.
5. Place the covered crucible on the clay triangle and adjust the cover so that it is slightly ajar toallow the water vapor to escape.
6. Heat the crucible very gently for around 5 minutes by waving the flame gently underneath. Becareful not to splatter the sample.
7. After 5 minutes readjust the flame so that a sharp inner-blue cone is formed. Place the bunsenburner underneath the sample and heat for 12 minutes with the tip of the inner-blue cone justtouching the bottom of the crucible. The crucible bottom should be come a dull red color duringthis period.
8. Recall “Hot things are hot!” Handle the crucible with the crucible tongs. It will prove necessaryto remove the cover first and place it on a ceramic pad. Then place the crucible on the pad, andplace the cover on it again.
9. After the first heating is completed, close the cover and allow the crucible to cool for 10 minutes(or longer if required).
10. The crucible should be cool to the touch before placing it on the scale to weigh it.
11. Weigh the cooled crucible.
12. To determine if all of the water in the sample was removed during the initial heating, reheat thecovered crucible and sample for an additional 5 minutes at maximum heat. Allow the sampleto cool for 10 minutes (or longer if required) and weight the sample. The results of the last two
146

Experiment 14 Water in Hydrates
weighing should agree within 0.05 grams. If the decrease in mass is larger than this, repeat theheating and weighing until the results of two successive weighings are within 0.05 grams of eachother.
13. Calculate the percentage of water in your sample on the basis of the final weight measured.
14. Perform 2 trials if time permits (it should) and average the results.
15. Dispose of the solid residue in the waste container labeled “Unknown Heavy Metal Waste” or‘’Unknown Hydrate Waste”.
Figure 14.7: Setup for heating a crucible. Leave the cover ajar, to allow gas to escape but largerparticles can not. credit: " The Composition of Potassium Chlorate (Experiment)" by Santa MonicaCollege, LibreTexts is licensed under CC BY-NC .
147

Experiment 14 Water in Hydrates
.
148
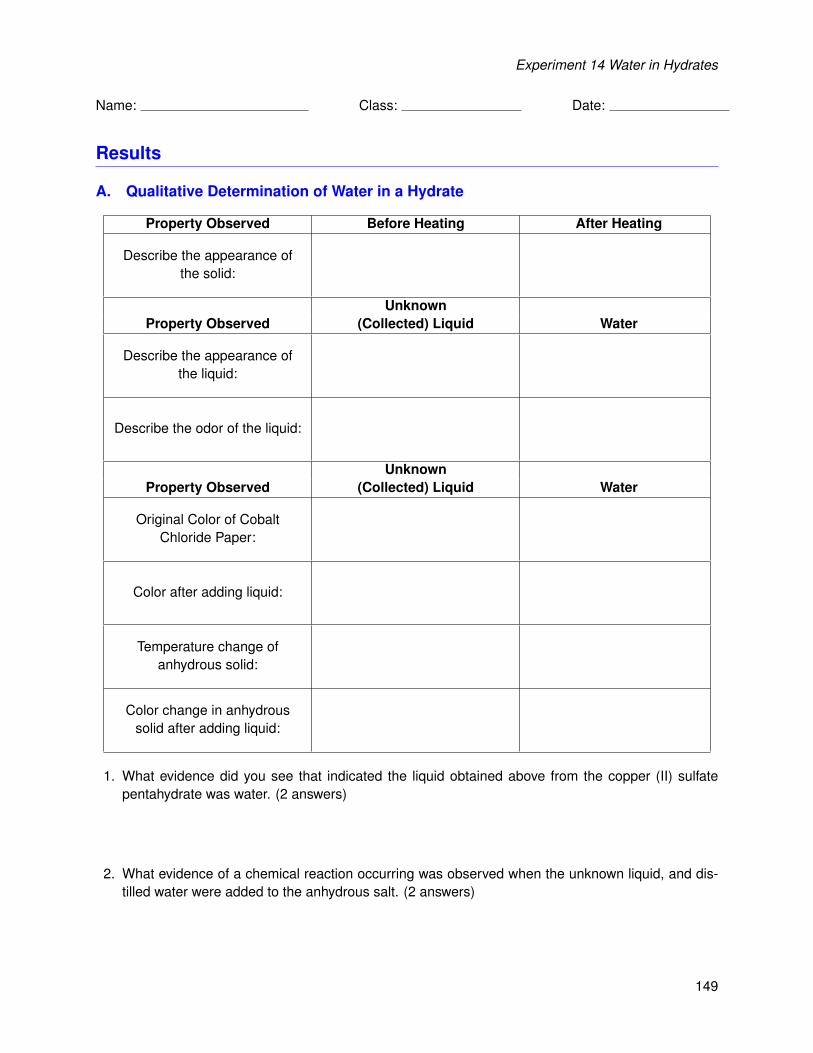
Experiment 14 Water in Hydrates
Name: Class: Date:
Results
A. Qualitative Determination of Water in a Hydrate
Property Observed Before Heating After Heating
Describe the appearance ofthe solid:
UnknownProperty Observed (Collected) Liquid Water
Describe the appearance ofthe liquid:
Describe the odor of the liquid:
UnknownProperty Observed (Collected) Liquid Water
Original Color of CobaltChloride Paper:
Color after adding liquid:
Temperature change ofanhydrous solid:
Color change in anhydroussolid after adding liquid:
1. What evidence did you see that indicated the liquid obtained above from the copper (II) sulfatepentahydrate was water. (2 answers)
2. What evidence of a chemical reaction occurring was observed when the unknown liquid, and dis-tilled water were added to the anhydrous salt. (2 answers)
149

Experiment 14 Water in Hydrates
B. Quantitative Determination of Water in a Hydrate
Trial 1 Trial 21. Unknown Identity:
2. Mass of crucible and cover:
3. Mass of crucible, cover and sample:
4. Mass of crucible, cover, and sample after 1st
heating:
5. Mass of crucible, cover, and sample after 2nd
heating:
6. Mass of crucible, cover, and sample after 3rd
heating:
7. Mass of the original sample (show calc.):
8. Total mass lost by the sample during heating(show calc.):
9. Percentage of water in the sample (show calc.):
10. Average percentage of water in the sample(show calc.):
11. What is the chemical formula of your unknown:
Explain how you identified your unknown:
150

Experiment 14 Water in Hydrates
Post Lab Questions
1. Why do we want to avoid getting any copper (II) sulfate pentahydrate onto the sides of the test tubewhen we heated the sample to collect the molecules trapped inside the lattice?
2. Write a complete (balanced, states etc) chemical equation for the decomposition of copper (II)sulfate pentahydrate assuming it decomposes into copper (II) sulfate and dihydrogen monoxide.
3. Write the complete (balanced, states etc) chemical reaction (including states) for the decompositionof copper (II) sulfate at high temperatures.
4. When the unknown was heated, could the decrease in mass have been partly due to the loss ofsome other substance than water? Explain.
151

Experiment 14 Water in Hydrates
.
152

Experiment 14 Water in Hydrates
Name: Class: Date:
Prelab Questions
1. Complete the following table by filling in the missing name, formula, and molecular weight of thehydrates. Show work for one of the compounds on the back of the page.
Name Formula Molecular Weight (g/mol) % Water
Calcium sulfate dihydrate 172.1816
CoCl2 · 6 H2O
MgSO4 · 7 H2O
Sodium carbonate decahydrate 286.148
Barium chloride dihydrate 244.2616
CuSO4 · 5 H2O
SrCl2 · 6 H2O
2. A student heated a hydrated salt sample with an initial mass of 4.8702 grams. After the firstheating the mass had decreased to 3.0662 grams. If the student is using the method of heatingto a constant weigh described in this experiment, what is the minimum mass that the sample canhave after the second heating to avoid having to heat it a third time? Explain.
2.
3. The student in the previous problem determined that the mass lost by the sample was 1.8053grams. What was the percent water in the original hydrated sample? Explain.
3.
153

Experiment 14 Water in Hydrates
,
154

Experiment 15Molecular Compounds and Lewis StructuresJay C. McLaughlinColorado Northwestern Community College
CC-BY-SA - August 19, 2021
Name:
Date:
Key Objectives
1. Draw Lewis structures.
2. Count valence electrons.
3. Predict shape and bond angles around atoms.
4. Determine if a molecule is polar or non-polar.
5. Memorize different shapes/bond angle combinations.
Discussion
All atoms are formed of a nucleus containing protons and neutrons surrounded in space by electronswhich are held within specific regions of space by the attractive force of the protons. An early theory forpredicting the formation, and structure of molecular compounds was formulated by Lewis. The theorysays that the outermost electrons in an atom, often referred to as valence electrons are involved inbonding atoms together to form compounds. The valence electrons for the representative elements arethe sum of the s and p electrons in the outermost shell (largest principle quantum number), and is alsothe same as the group number on most periodic tables.
Lewis Dot Structures
Lewis electron dot structures or simply Lewis structures are a useful construct to keep track of valenceelectrons in representative elements. In this notation the valence electrons are represented by dotssurrounding the atomic symbol of an element. Several examples are shown below in Figure 15.1.Ions are shown in brackets with the corresponding charge. The formation of ionic compounds will bediscussed in lecture.
Figure 15.1: Example Lewis dot structures for several atoms, and ions. Note that cations and anionsare drawn in brackets and show the charge of the ion. credit: author
The formation of molecular bonds, and the sharing of electrons is driven by the desire for atoms toachieve the noble gas configuration. From quantum mechanics this is represented as having filledorbitals or a s2p6 configuration like that of the noble gases. This is often referred to as the octet rule,meaning that all atoms (except H and He) want to have 8 electrons in the outermost orbital. Ionic com-pounds achieve this by cations losing electrons and anions gaining electrons, but molecular compoundsare forced to share the electrons in order to achieve octets. The octet rule only a general guideline,and breaks down when considering d-orbitals, and in several other cases as discussed in lecture and inyour book. The most important exception is for hydrogen, which only requires two electrons to achievea noble gas configuration (He).
155
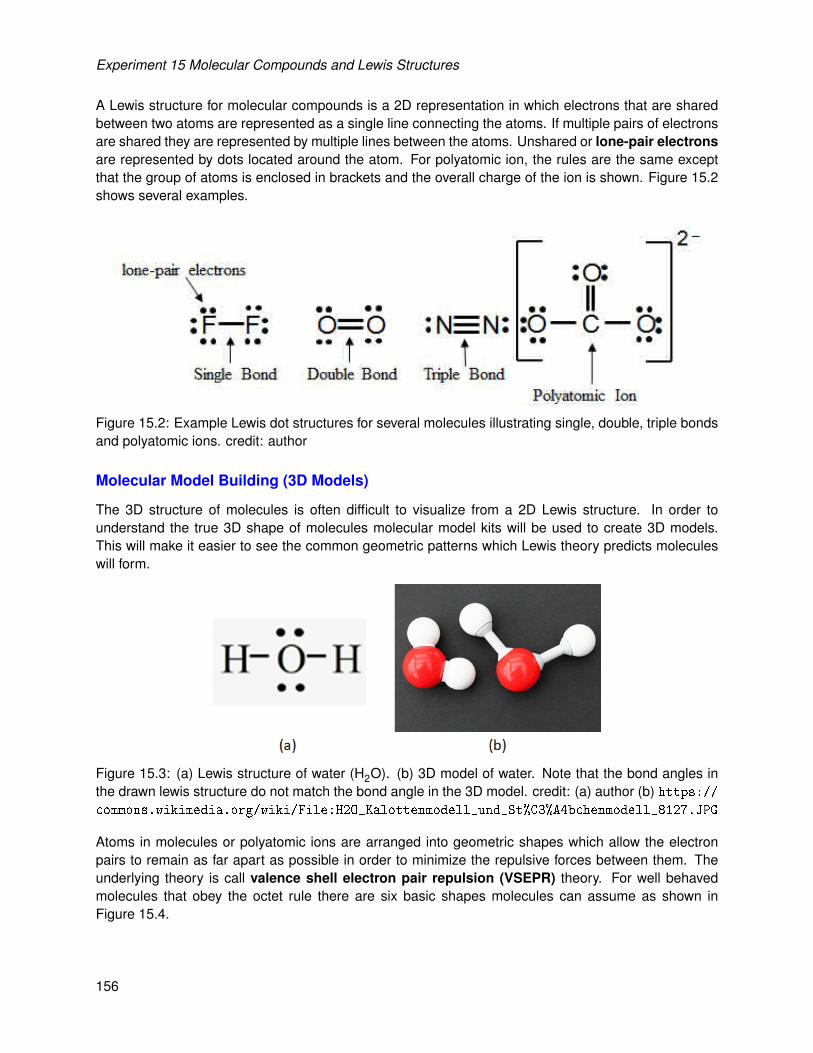
Experiment 15 Molecular Compounds and Lewis Structures
A Lewis structure for molecular compounds is a 2D representation in which electrons that are sharedbetween two atoms are represented as a single line connecting the atoms. If multiple pairs of electronsare shared they are represented by multiple lines between the atoms. Unshared or lone-pair electronsare represented by dots located around the atom. For polyatomic ion, the rules are the same exceptthat the group of atoms is enclosed in brackets and the overall charge of the ion is shown. Figure 15.2shows several examples.
Figure 15.2: Example Lewis dot structures for several molecules illustrating single, double, triple bondsand polyatomic ions. credit: author
Molecular Model Building (3D Models)
The 3D structure of molecules is often difficult to visualize from a 2D Lewis structure. In order tounderstand the true 3D shape of molecules molecular model kits will be used to create 3D models.This will make it easier to see the common geometric patterns which Lewis theory predicts moleculeswill form.
Figure 15.3: (a) Lewis structure of water (H2O). (b) 3D model of water. Note that the bond angles inthe drawn lewis structure do not match the bond angle in the 3D model. credit: (a) author (b) https://commons.wikimedia.org/wiki/File:H2O_Kalottenmodell_und_St%C3%A4bchenmodell_8127.JPG
Atoms in molecules or polyatomic ions are arranged into geometric shapes which allow the electronpairs to remain as far apart as possible in order to minimize the repulsive forces between them. Theunderlying theory is call valence shell electron pair repulsion (VSEPR) theory. For well behavedmolecules that obey the octet rule there are six basic shapes molecules can assume as shown inFigure 15.4.
156

Experiment 15 Molecular Compounds and Lewis Structures
Lewis # atoms # lone Molecular Bond Molecular 3D StructureStructure bonded pairs Shape Angle Polarity
4 0 Tetrahedral 109.5 Non-polar orDipolar
3 1 Trigonal Pyramidal 109.5 Dipolar
2 2 Bent - 109.5 109.5 Dipolar
3 0 Trigonal Planar 120 Non-polar orDipolar
2 1 Bent - 120 120 Dipolar
2 0 Linear 180 Non-polar orDipolar
Figure 15.4: Six basic shapes for Lewis Structures using s and p electrons only and obeying the octetrule. credit: author
Bond angles (Figure 15.5) always refer to the angle formed between two end atoms with respect to acentral atom. If there is no central atom there is no bond angle. The size of the angle depends mainlyon the repulsive forces between electron pairs around the central atom. According to VSEPR theory theatoms and electrons around the central atom try to remain as far apart as possible. The bond angles
157

Experiment 15 Molecular Compounds and Lewis Structures
determined are estimates only, and the real bond angles can differ by several degree’s depending onthe molecule studied.
Figure 15.5: Bond angles occur when three or more atoms are bonded together to form a molecule.credit: author
Bond Polarity
Electrons in molecular compounds are shared between two atoms to form bonds. For atoms that arealike (diatomics) the sharing is equal, but for most other molecules the sharing is unequal. Electroneg-ativity is the attractive force an atom has for the shared electrons in a bond. Electronegativity valuesare assigned to elements, and can be found in Figure 15.6. In general electronegativity increases aswe move across a row, and decreases as we move down a column.
Figure 15.6: Electronegativity values for different elements. The larger the value the more electroneg-ative the element is and the stronger the attractive force for the shared electrons in a molecular bond.credit: Rice University Openstax CC BY NC SA https://openstax.org/books/chemistry-2e/
pages/7-2-covalent-bonding
Atoms that share the electrons in a bond equally are called non-polar covalent bonds or covalentbonds, while those that are shared unequally are called polar covalent bonds. Bond polarity in atomscan be indicated by using the greek symbols δ+ to indicate a small excess of positive charge, or δ−to indicate a small excess of negative charge from the unequal sharing. Another common method is touse a modified line for the bond with an arrow pointed toward s the more electronegative atom, and asmall cross toward s the more electropositive atom. Figure 15.7 shows an example of each method.
158

Experiment 15 Molecular Compounds and Lewis Structures
Figure 15.7: Bond polarity in an ammonium molecule. Nitrogen is more electronegative than hydrogentherefore electrons spend more time closer to the nitrogen than hydrogen resulting in the formation ofpartial charges. credit: author.
Molecular Dipoles
Just as individual bonds in molecules can be polar and non-polar, molecules as a whole are often polarbecause of the net sum of individual bond polarities and lone-pair contributions in the molecule. Theresulting molecular dipoles can be thought of as the center mass of all positive charges being differentthan the center of mass for all negative charges. Another way of looking at it is a “tug of war” betweenthe positive and negative ends of the polar bonds, if polar bonds tug in opposite directions as shown inFigure 15.8 then the molecule is considered nonpolar, but if the polar bonds align, or do not cancel outthen there is a net dipole and we consider the molecule to be dipolar as shown in Figure 15.8.
Figure 15.8: Molecular Dipole occur when there is an unsymmetrical distribution of electrons around anatom. (a) Nonpolar molecule due to symmetry (b) Dipolar molecule. credit: author
159
Experiment 15 Molecular Compounds and Lewis Structures
Drawing Lewis Structures
Drawing Lewis structures takes time and practice, and there is no single set of steps that will alwaysyield the correct answer. Expect to occasionally draw several incorrect models before you find thecorrect one. Learn from each incorrect model what does and does not work, and apply it to drawingfuture Lewis structures. The general rules below will generally lead to the correct structure in one ortwo iterations.
1. Add up the valence electrons
(a) Add up the valence electrons for all regular atoms (s and p orbitals with the highest quantumnumber)
(b) Add electrons for molecules with a negative charge (ex: CO – 23 )
(c) Subtract electrons for molecules with a positive charge (ex: NH +4 )
2. Write a trial structure
(a) Place the least electronegative atom in the center
(b) Carbon is generally a central atom and forms bonds with itself frequently
(c) Make molecules as symmetrical as possible
(d) Hydrogen has only one valence electron, and can only form one bond and is therefore neverthe central atom
(e) Draw one bond between all atoms
(f) Typical bond numbers formed (H = 1, O = 1 or 2, C = 4, N = 1, 2, 3 or 4)
(g) Oxygen rarely bonds to another oxygen (except for peroxides), instead forming single ordouble bonds to other atoms
(h) F, Cl, Br, and I generally form 1 bond (but not always)
3. Count electrons - Subtract 2 electrons for every bond formed
4. Distribute the remaining electrons to give noble gas configurations (octet rule)
(a) Surround each atom with 8 electrons (except H)
(b) Start with the most electronegative atoms first
(c) If all atoms have 8 electrons around them you are done, if not remove unshared electronpairs from outer atoms and form double and triple bonds
160

Experiment 15 Molecular Compounds and Lewis Structures
Building 3D Models
Use the ball and stick kits provided in class to build 3D models of the molecules after you have drawnthe Lewis structures. The balls are color coded as shown in Figure 15.9.
Ball/Stick UseBlack (4 holes) Carbon - tetrahedralBlack (3 holes) Carbon - trigonal planarRed (2 holes) OxygenGreen (1 hole) HalogensWhite (1 hole) HydrogenLight Blue (4 holes) NitrogenInflexible bonds Single bonds, and lone pair electronsFlexible bonds Double and Triple Bonds
Figure 15.9: Ball and stick model parts used in class.
Procedure
For each molecule or polyatomic ion complete the following:
1. Calculate the number of valence electrons.
2. Draw a Lewis Structure.
3. Build a 3D model of the structure. Have your model checked by the instructor.
4. Draw a line pointing to each atom (there may be cases where different atoms have different ge-ometry) that has a molecular geometry and label it with both the geometry (Tetrahedral, TrigonalPyramidal, Bent-109, Trigonal Planar, Bent-120, and Linear) and bond angle.
5. Using your model, and the information on bond polarity, determine if the molecule as a whole isnonpolar (NP) or dipolar (DP).
6. Answer all questions at the end of the lab.
161

Experiment 15 Molecular Compounds and Lewis Structures
162

Experiment 15 Molecular Compounds and Lewis Structures
Results
163
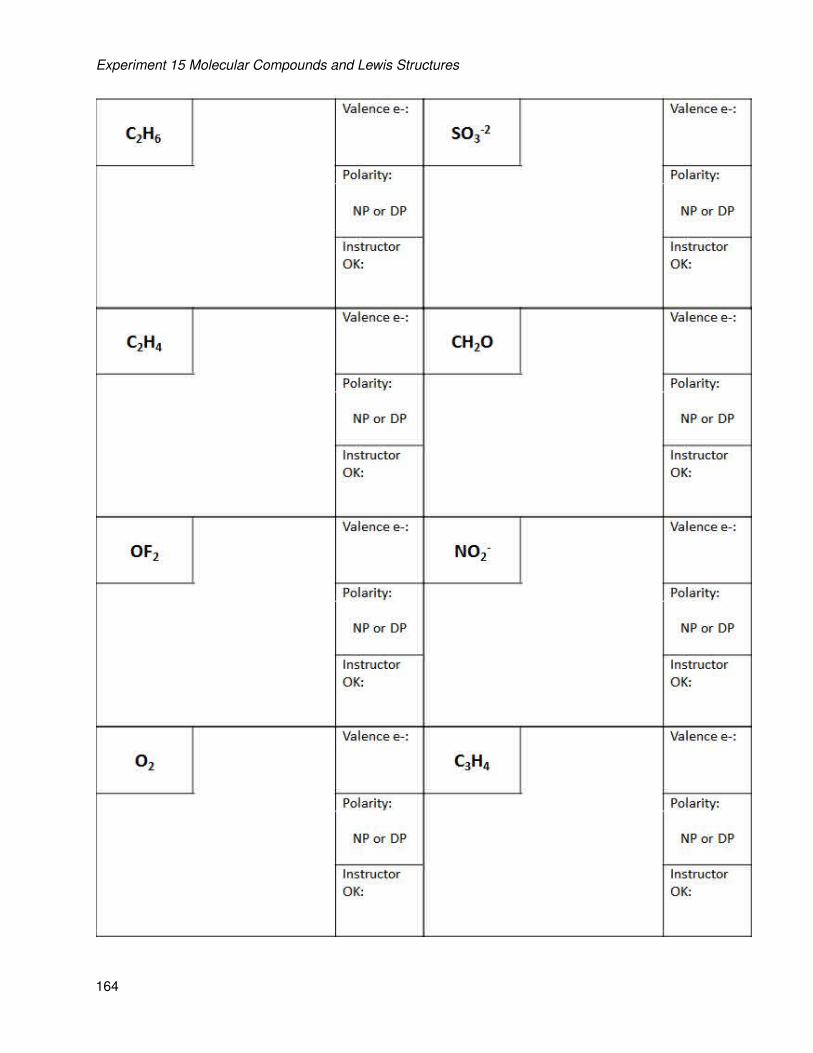
Experiment 15 Molecular Compounds and Lewis Structures
164

Experiment 15 Molecular Compounds and Lewis Structures
1. There are three acceptable Lewis structures for C2H2Cl2. Draw all three structures below. Whatgeometry does each molecule have? Label each as being nonpolar or dipolar.
2. For the molecules drawn above, one is nonpolar and the other two are dipolar. Explain how thisoccurs.
3. There are also three Lewis structures for [NO3]– . Draw all three structures below. What geometrydoes each molecule have? Label each as being nonpolar or dipolar. What property of LewisStructures does this illustrate?
165

Experiment 15 Molecular Compounds and Lewis Structures
.
166

Experiment 15 Molecular Compounds and Lewis Structures
Name: Class: Date:
Prelab Questions
1. Complete the following table by filling in the missing blanks.
Atom # Valence e– Electronegativity Model Color
Hydrogen
Carbon
Nitrogen
Oxygen
Fluorine
Table 15.1: Molecular Model Basics
2. What is the octet rule? What common atom is allowed to violate the octet rule? Explain.
3. What is the difference between Polar Covalent and Non-polar Covalent bonds?
167

Experiment 15 Molecular Compounds and Lewis Structures
,
168

Experiment 16Properties of SolutionsJay C. McLaughlinColorado Northwestern Community College
CC-BY-SA - August 19, 2021
Name:
Date:
Key Objectives
1. Terminology - solution, solute, solvent, precipitate, miscible, immiscible, soluble, insoluble.
2. Effect of temperature on solubility.
3. Effect of particle size on solubility.
4. Use of ratios/proportions to solve solubility problems.
Discussion
Solutions are an important class of materials we each encounter daily. This experiment will probe thephysical properties of solutions. A complete discussion of solutions can be found in Hein Chapter 14,and review of the properties of mixtures can be found in Hein Chapter 3. In addition we will review ourgraphing skills and how to use information in graphs and equations to perform calculations.
Solutions are mixtures of two or more substances. The simplest solution is composed of a solutedissolved in a solvent as shown in Figure 16.3. The solute is the substance that is least abundant inthe solution, while the solvent is the substance that is most abundant. Solutions are commonly namedafter the solute, for instance when 10.0 g of potassium chloride is dissolved in 100 mL of water, wewould refer to the solution as a potassium chloride solution.
Figure 16.1: A solute is dissolved in a solvent to create a solution. credit: unknown (modified by author)
Mixtures are homogeneous, the solute is uniformly distributed throughout the solvent and will not formseparate phases. Mixtures may have variable compositions, meaning the amount of solute dissolved inthe solvent can vary. The particles of a solution are generally small molecules or ions, larger moleculestend to make colloids.
169

Experiment 16 Properties of Solutions
Solutions can be formed from any combination of the normal phases of matter (solid, liquid, and gas)resulting in nine possible combinations. The most commonly encountered types of solution in chemistrylab being solids in liquids or liquids in liquids.
Figure 16.2: Nine different types of solutions. credit: unknown
Solutions are important in chemistry because many reactions will only occur at a meaningful rate insolutions. For instance solid sodium chloride and silver nitrate will not react, while a solution of sodiumchloride and silver nitrate will react instantly to produce a precipitate.
NaCl(s) + AgNO3(s) −−→ No Reaction (42)
NaCl(aq) + AgNO3(aq) −−→ NaNO3(aq) + AgCl(s) (43)
The rate of a reaction is directly proportional to the number of molecules that can interact, and howmuch kinetic energy each molecule has, thus reactions between solids are slow (very few moleculescan interact, and low energy) compared to those between solutions (large numbers of molecules caninteract, higher energy).
Solids in Liquids
The rate at which a solid solute dissolves in a liquid solution depends on a number of factors. Solidscan only dissolve at the surface that is in contact with the solution, thus factors which effect this cancause a solid to dissolve at different rates. We will examine each of these factors in turn:
• Particle size
170

Experiment 16 Properties of Solutions
• Temperature
• Concentration of solute
• Agitation or stirring.
Solubility is defined as the maximum amount of solute that will dissolve in a specific amount of solventunder stated conditions (normally temperature). Solubility is often expressed qualitatively as beingsoluble (will form an aqueous solution), slightly soluble (small amounts will form an aqueous solution),or insoluble (the solute will not dissolve in the solution). Solubility can also be expressed quantitativelyas the grams of solute that will dissolve in 100 grams of water. Table 16.1 shows the solubility data forfour different ionic salts in water.
Temperature (°C) KCl (g) NaCl (g) KBr (g) BaCl2 (g)0.0 27.6 35.7 53.5 31.610. 31 35.8 59.5 33.320. 34 36 65.2 35.730. 37 36.3 70.6 38.240. 40. 36.6 75.5 40.750. 42.6 37 80.2 43.660. 45.5 37.3 85.5 46.670. 48.3 37.8 90 49.480. 51.1 38.4 95 52.690. 54 39 99.2 55.7100. 55.6 39.8 104 58.8
Table 16.1: Solubility Data for Four Salts (g solute/100 g water).
Liquids in Liquids
To qualitatively describe the solubility of two liquids we use the term miscibility. A miscible solution isone in which the liquids are soluble in each other and will mix completely, while the term immiscible isused to describe two liquids that are insoluble in each other, thus will not mix, and will show a visibleline separating the two liquids (or phases). An example of liquids that are miscible would be ethanol andwater (beer), while the phrase “oil and water don’t mix” describes two substances that are immiscible.
Concentration - Qualitative Descriptions
The concentration of a solution is a measure of how much solute is dissolved in a solution. It can begiven both qualitatively and quantitatively.
Qualitatively a dilute solution contains relatively small amounts of solute in a given volume, while aconcentrated solution contains relatively large amounts of solute in a given volume of solution. Theterms are not well defined, and are normally only used to distinguish between two solutions.
A solution can also be described as saturated, unsaturated or supersaturated. A saturated solutioncontains the maximum possible amount of solute dissolved in a solution at a given temperature andpressure. For example a solution consisting of 42.6 grams of KCl dissolved in 100 grams of water at
171
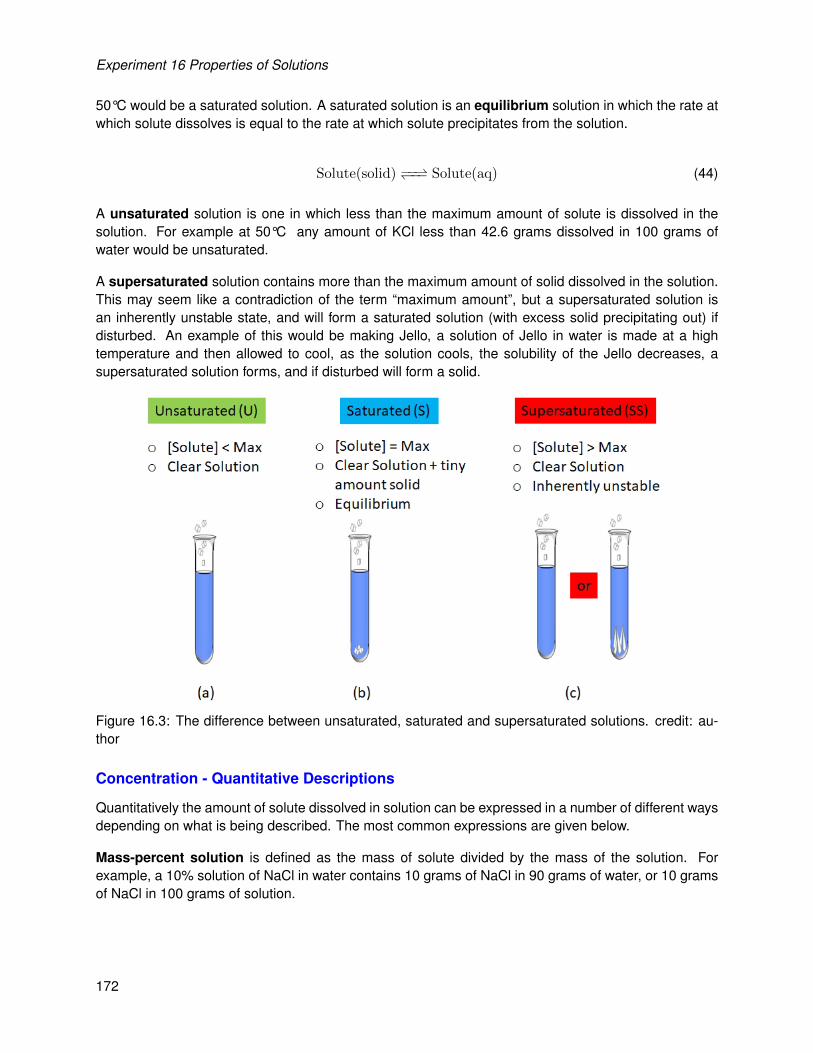
Experiment 16 Properties of Solutions
50°C would be a saturated solution. A saturated solution is an equilibrium solution in which the rate atwhich solute dissolves is equal to the rate at which solute precipitates from the solution.
Solute(solid) −−⇀↽−− Solute(aq) (44)
A unsaturated solution is one in which less than the maximum amount of solute is dissolved in thesolution. For example at 50°C any amount of KCl less than 42.6 grams dissolved in 100 grams ofwater would be unsaturated.
A supersaturated solution contains more than the maximum amount of solid dissolved in the solution.This may seem like a contradiction of the term “maximum amount”, but a supersaturated solution isan inherently unstable state, and will form a saturated solution (with excess solid precipitating out) ifdisturbed. An example of this would be making Jello, a solution of Jello in water is made at a hightemperature and then allowed to cool, as the solution cools, the solubility of the Jello decreases, asupersaturated solution forms, and if disturbed will form a solid.
Figure 16.3: The difference between unsaturated, saturated and supersaturated solutions. credit: au-thor
Concentration - Quantitative Descriptions
Quantitatively the amount of solute dissolved in solution can be expressed in a number of different waysdepending on what is being described. The most common expressions are given below.
Mass-percent solution is defined as the mass of solute divided by the mass of the solution. Forexample, a 10% solution of NaCl in water contains 10 grams of NaCl in 90 grams of water, or 10 gramsof NaCl in 100 grams of solution.
172

Experiment 16 Properties of Solutions
Mass Percent =
(grams solute
grams solute + grams solvent
)∗ (100) =
(grams solute
grams solution
)∗ (100) (45)
173

Experiment 16 Properties of Solutions
Mass per 100 grams solvent is similar to Mass-percent, but is expressed in terms of 100 grams ofsolvent not solution. Thus, the 10 mass-percent solution described above, the Mass per 100 gramssolvent would be 11 grams NaCl per 100 grams of H2O.
(10 grams NaCl
90 grams H2O
)∗ (100) = 11grams =
11 grams NaCl
100 grams H2O(46)
Molarity is the most common quantitative expression of concentration used in chemistry. Molarity isdefined as the moles of solute per liter of solution. The concentration of 10 grams of NaCl in 90 gramsof water discussed above would produce a 1.90 M solution of NaCl.
Molarity = M =moles of solute
liters of solution=
mol
L(47)
174

Experiment 16 Properties of Solutions
Procedure
The experiment is broken apart into several sections. The sections may be completed in any order.
A. Determining the Concentration of a Saturated Solution
In this section you will determine the concentration of KCl in a saturated solution and compare it to thetheoretical value. Make all measurements to the highest precision possible. Perform only one trial, usethe second trial only if you make a mistake in trial 1. The method used in this section is refereed to as"heating to a constant mass", and involves heating the sample multiple times to ensure that all of thewater is removed.
1. Prepare a water bath using a 400 mL beaker 3/4 full of water on which you will place an evapo-rating dish. Before you heat the water, make sure the evaporating dish will fit on top of the beaker(and won’t fall in).
2. Record the temperature of the room.
3. Weigh an empty evaporating dish. Obtain 5-6 mL of saturated potassium chloride solution andpour it into the dish. Weigh the dish + potassium chloride solution. Record all masses on yourdata table.
4. Place the evaporating dish on the beaker of water. Boil the solution until all of the potassiumchloride solution has evaporated to dryness (it should take 30-45 minutes). You may need to addwater to the beaker (DO NOT let it boil dry, you will shatter your beaker and receive a zero for thislab). You may want to periodically break the crust formed over the solution of potassium chlorideto speed evaporation up.
5. While evaporating perform the other sections of the lab.
6. When all of the liquid in the potassium chloride solution in the evaporating dish has evaporatedcool the dish.
7. When cool, wipe any excess water off the bottom of the dish with a paper towel. Place the dish onthe hot plate and heat gently for an additional 1-2 minutes to evaporate any last traces of water.Do not heat strongly because your sample might splatter.
8. Allow your sample to cool and weigh it.
9. Reheat your sample on the hot plate for an additional 1-2 minutes, and allow the sample to cooland reweigh it.
10. When finished allow the dish to cool, dissolve the remaining potassium chloride in water, anddispose of it in the sink.
11. Show calculations for lines 5-12.
175

Experiment 16 Properties of Solutions
B. Solubility versus Temperature (Comparing Saturated and Unsaturated Solutions)
1. Label 4 weighing boats or papers and weigh out the following: 1.0 g NaCl, 1.4 g NaCl, 1.0 gNH4Cl and 1.4 g NH4Cl.
2. Add 1.0 grams of NaCl and NH4Cl to separate test tubes labeled A and B. Add 5.0 mL of dis-tilled water to each. Mix each test tube for 2 minutes. Record your observations by circling theappropriate answers.
3. Add 1.4 grams of NaCl to test tube A, and NH4Cl to test tube B. Mix each test tube for 4 minutes.Record your observations.
4. Place test tube A and B into a beaker of boiling water. Stir occasionally (caution, hot things arehot). Note the results after 5 minutes.
5. Remove the tubes and run under tap water for 2 minutes. Let stand for 5 minutes. Record yourobservations.
6. Dispose of the solutions in the sink.
C. Relative Solubility of a Solute in Two Solvents
1. Add 2 mL of heptane and 5 mL of water to a "large" test tube. Mix vigorously for 30 seconds.Record your results. Wait 2 minutes, and record your results.
2. To the previous test tube add 5 drop of saturated iodine-water solution. Note the color of eachlayer. Mix the contents for 30 seconds. Record your results. Wait 2 minutes, and record yourresults.
3. Dispose of the contents of the test tube in the waste bottle marked “Volatile Wastes”.
D. Miscibility of Liquids
1. Obtain 3 dry test tubes.
2. In test tube 1 mix 1 mL of kerosene and 1 mL of isopropyl alcohol.
3. In test tube 2 mix 1 mL of kerosene and 1 mL of water.
4. In test tube 3 mix 1 mL of water and 1 mL of isopropyl alcohol.
5. Mix each of the three test tubes for 15 seconds. Note which pairs are miscible and which are not.
6. Dispose of the contents of the test tubes in the waste bottle marked “Volatile Wastes”.
176

Experiment 16 Properties of Solutions
E. Rates of Dissolving - Particle Size
1. Obtain two dry test tubes. Fill the first test tube with 0.5 grams of fine NaCl. Fill the second tubewith 0.5 g of coarse (Rock Salt or Tablets) NaCl.
2. Add 10 mL of water to each test tube.
3. Stir both test tubes at the same time, noting the number of seconds each takes to fully dissolve.(You should not have to shake the tubes for more than 2 minutes, if you do inform your instructor).
4. Dispose of both solutions in the sink.
F. Rates of Dissolving - Temperature
1. Weigh out two 0.5 gram samples of fine NaCl.
2. Fill two beakers with 50 mL of water. Heat the water in one beaker to boiling, and allow it to coolfor one minute.
3. Add the 0.5 gram sample of NaCl to each beaker and record the time required for each to dissolvecompletely. Stir gently. Record your results.
4. As soon as the crystals are dissolved in the hot water, take the beaker containing the hot solution,and slowly tilt it back and forth. Observe the layer of denser salt solution on the bottom. Repeatthis step with the cold solution.
5. Dispose of both solutions in the sink.
G. Ionic Reactions in Solution
1. Into four labelled test tubes place a pea-sized quantity of the following salts (one per tube): bariumchloride, sodium sulfate, sodium chloride, and barium sulfate.
2. Add 5 mL of water to each tube, and stir until three of the salts are dissolved. (One of the foursalts will not dissolve).
3. Mix the barium chloride and sodium sulfate solutions together. Record your results.
4. Dispose of all solutions in the "Ba/Barium Waste Container".
177

Experiment 16 Properties of Solutions
Results
A. Determining the Concentration of a Saturated Solution
Trial 1 Trial 21. Room Temperature:
2. Mass of evaporating dish:
3. Mass of evap. dish + KCl solution:
4. Mass of evap. dish + dry KCl after 1st heating:
5. Mass of evap. dish + dry KCl after 2nd heating:
6. Mass of solution. (show calc.)
7. Mass of the KCl (solute) (show calc.):
8. Mass of H2O (solvent) (show calc.):
9. Mass percent of KCl in solution (show calc.):
10. Grams of KCl per 100 grams water (experimen-tal) (show calc.):
11. Grams of KCl per 100 grams water (theoretical)(Explain):
12. Percent Error in grams KCl per 100 grams water(show calc.):
1. In determining the concentration of potassium chloride in a saturated solution you recorded thetemperature of the room. Why?
2. In determining the concentration of potassium chloride in a saturated solution you reheated thesample several times. This procedure is called heating to a (two words). Why do we use thismethod?
178

Experiment 16 Properties of Solutions
B. Solubility versus Temperature (Comparing Saturated and Unsaturated Solutions
Experiment NaCl NH4Cl
Dissolved: ( yes / no ) Dissolved: ( yes / no )1.0 g X + 5 mL water
Saturated / Unsaturated Saturated / Unsaturated
Dissolved: ( yes / no ) Dissolved: ( yes / no )1.0 g X + 5 mL water + 1.4 g X
Saturated / Unsaturated Saturated / Unsaturated
Dissolved: ( yes / no ) Dissolved: ( yes / no )2.4 g X + 5 mL water + heat
Saturated / Unsaturated Saturated / Unsaturated
Dissolved: ( yes / no ) Dissolved: ( yes / no )2.4 g X + 5 mL water + cooled
Saturated / Unsaturated Saturated / Unsaturated
Answer the following questions both qualitatively and quantitatively.
1. At room temperature what can you say about the solubility of NaCl?
2. At room temperature what can you say about the solubility of NH4Cl?
3. At high temperature (boiling) what can you say about the solubility of NaCl?
4. At high temperature (boiling) what can you say about the solubility of NH4Cl?
179

Experiment 16 Properties of Solutions
C. Relative Solubility of a Solute in Two Solvents
1. Sketch a picture of the test tube containing heptane + water after 30 seconds and after two minutes(label your pictures).
2. Which liquid is denser? Explain (based on your experimental observations).
3. Sketch a picture of the test tube containing heptane + water + iodine after 30 seconds and aftertwo minutes (label your pictures, including colors).
4. In which solvent is iodine more soluble? Explain (based on your experimental observations).
5. Explain (in terms of IMF’s) why Iodine was more soluble in the solvent above.
180

Experiment 16 Properties of Solutions
D. Miscibility of Liquids
1. Which liquid pairs tested were miscible?
2. Which liquid pairs tested were immiscible?
3. From the previous section how would you classify the mixture of heptane and water? Explain.
E. Rates of Dissolving - Particle Size
1. Time required for fine salt crystals to dissolve:
2. Time required for coarse salt crystals to dissolve:
3. The amount of salt, the volume of water, and the temperature of the systems were kept constantbetween the two test tubes, only particle size was varied. What trend was observed? Explain whythe trend occurs.
F. Rates of Dissolving - Temperature
1. Time required for fine salt crystals to dissolve in the hot solution:
2. Time required for fine salt crystals to dissolve in the cold solution:
3. The amount of salt, the volume of water, and the particle size of the salt particles were kept constantbetween the two test tubes, only temperature was varied. What trend was observed? Explain whythe trend occurs.
181

Experiment 16 Properties of Solutions
G. Ionic Reactions in Solution
Test Tube Observation
TT 1: BaCl2
TT 2: Na2SO4
TT 3: NaCl
TT 4: BaSO4
TT 5: BaCl2 + Na2SO4
1. Write complete word AND formula equations representing the chemical reaction that occurredwhen the first two test tubes were mixed together.
2. Based on your observations, which of the products produced is the white precipitate:
3. What experimentally observed evidence leads you to this conclusion?
182

Experiment 16 Properties of Solutions
Post Lab Questions
Using the solubility data in Table 16.1 answer the following questions.
1. What is the percentage by mass of NaCl in a saturated solution of sodiumchloride at 50.0°C. Explain.
1.
2. Calculate the solubility of potassium bromide at 23°C. Hint: Assume that thesolubility increases by an equal amount for each degree between 20.0°C,and 30.0°C. Explain.
2.
3. A saturated solution of barium chloride at 40.0°C contains 100. grams ofwater. How much additional barium chloride can be dissolved by heatingthe solution to 70.0°C? Explain.
3.
4. A saturated solution of barium chloride at 30.0°C contains 25.0 grams ofwater. How many grams of barium chloride is dissolved in the water? Ex-plain.
4.
5. A saturated solution of barium chloride at 30.0°C contains 150. grams ofwater. How many additional grams of barium chloride can be dissolved byheating the solution to 60.0°C? Explain.
5.
183

Experiment 16 Properties of Solutions
6. A solution of KCl is saturated at 50°C.
(a) How many grams of solute are dissolved in 100. grams of water? 6(a)
(b) What is the total mass of the solution? Explain. 6(b)
(c) What is the mass percent of this solution? Explain. 6(c)
(d) If the solution is heated to 100°C, how much more KCl can be dissolvedin the solution without adding more water? Explain.
6(d)
(e) If the solution is saturated at 100°C, and then cooled to 30°C, how manygrams of solute will precipitate out? Explain.
6(e)
184

Experiment 16 Properties of Solutions
Blah blah blah.
185

Experiment 16 Properties of Solutions
Name: Class: Date:
Prelab Questions
1. In the discussion section, what class of reaction occurred in equation (2)?
2. What does the term homogeneous mean?
3. Using Excel, graph the data in Table 16.1 showing the solubility of the four salts as a function oftemperature. Attach the graph to the back of the pre-lab. Include a curve fit for the BaCl2 data.
4. Using the graph qualitatively what amount of KCl that will dissolve in 100 grams of water at 95°C.Explain.
5. Using the graph quantitatively determine the amount of BaCl2 that will dissolve in 100 grams ofwater at 43°C. Explain.
6. Prove that a 10-mass percent solution of NaCl is the same as a 1.90 M solution of NaCl.
186

Experiment 17Acids and BasesJay C. McLaughlinColorado Northwestern Community College
CC-BY-SA - August 19, 2021
Name:
Date:
Key Objectives
1. Definitions of Acid and Base.
2. Use of litmus paper to determine if a solution is acidic or basic.
3. Use of pH paper and pH meter to determine pH.
4. Complete Acid/Base reactions.
5. Recognize acid anhydrides, base anhydrides, and neutral salt.
Discussion
Acid-Base reactions are an important, fundamental class of reactions. Equally important is learninghow to make good pH measurements using a variety of tools including a pH meter, universal indicator,red and blue litmus paper and pH paper.
Acid and Bases
A complete discussion of Acid and Bases can be found in your textbook, a brief summary is providedbelow.
There are many definitions of Acids and Bases, the most simple was from Arrhenius which sufficesfor most discussions, though the Bronsted-Lowry defintion is useful in that it allows one to include thecommon base NH3. The Lewis definition is useful in that it extends acid/base chemistry to a whole newseries of compounds, though that is beyond the scope of this course.
Arrhenius Bronsted-Lowry Lewis Jay’s Dfn.Acid: excess H+ proton (H+) donor electron pair acceptor HBase: excess OH– proton (H+) acceptor electron pair donor OH (+NH3)
Many types of compounds when added to water affect the pH of the solution. A not so short list includes:
1. Strong Acids or Strong Bases when dissolved in water, dissociate completely (100%) to produceions and make an acidic or basic solutions.
HCl(aq) + H2O(l) −−→ Cl−(aq) + H3O+(aq) (48)
NaOH(aq) −−→ Na+(aq) + OH−(aq) (49)
187

Experiment 17 Acids and Bases
2. Weak Acids and Weak bases when dissolved in water, dissociate only partially (normally < 10%)to produce ion and make acidic and basic solutions.
HF(aq) + H2O(l) −−⇀↽−− F−(aq) + H3O+(aq) (50)
NH3(aq) + H2O −−⇀↽−− NH +4 (aq) + OH−(aq) (51)
3. Salts (Ionic Compounds) typically dissociate (100%) in water and the resulting cations and anionscan react with water to form acidic, basic, or if they fail to react a neutral solution.
4. Metal cations will form a hydrated cation (sometimes refered to as a complex, hydration shell,or coordination compound) with water that can then undergo hydrolysis resulting in an acidicsolution.
5. Acid Anhydrides are non-metal oxides that produce acids when reacting with water. This is a newtype of reaction called a Combination reaction in which the reactants combine together to for asingle product. In the case of a non-metal oxide it will combine to produce a acid.
SO3(g) + H2O(l) −−→ H2SO4(aq) (52)
6. Base Anydrides are metal oxides that produce bases when reacting with water. This is a newtype of reaction called a Combination reaction in which the reactants combine together to for asingle product. In the case of a non-metal oxide it will combine to produce a base.
Na2O(s) + H2O(l) −−→ 2NaOH(aq) (53)
pH and Concentration of [H+] ions
The strength of an acid or base is generally measured one of two ways. First by calculating the con-centration (Molarity) of hydrogen ions [H+] or hydroxide ions [OH−] in solution. Second by using a logscale, pH or pOH which is defined as follows. The equations do not need to be memorized and canalso be found on your Cheat Sheet.
Figure 17.1: Equations relating pH, pOH, [H+] and [OH−]. The most frequently used scales are the pHand [H+] scales.
Figure 17.2 the relationship between concentration of hydrogen ions [H+] and pH.
188

Experiment 17 Acids and Bases
Figure 17.2: Hydrogen ion concentration scales [H+] in Molarity (M) and pH scale. credit: author
Measuring pH - Test Paper and Indicators
Two methods will be used to measure the pH of the solutions used in lab.
Indicators are organic compounds whose structure is sensitive to the H+ concentration, and the resultingchange in structure is accompanied by a change in the color of the solution.
Figure 17.3: pH Range of Different Indicators. credit: https://commons.wikimedia.org/wiki/File:CNX_Chem_14_07_indicators.png
One of the most common indicators, Phenolphthalein, you may recall was used as the indicator in the
189

Experiment 17 Acids and Bases
Titrations Lab.
pH paper is generally made with one or more acid-base indicators impregnated on paper, which willturn different colors depending on the pH. There are a wide variety of pH papers, some with broadranges (measure pH 1-14), some with very narrow ranges (measure pH ± 1.0 units). We will use avariety of pH papers in lab, so be careful to note the type used and the observed color and pH.
Figure 17.4: Different Brands of pH paper. Those used in lab may be different than those shown here.credit: unknown
Measuring pH - pH Meters
A pH meters is a device that measures the H+ concentration and converts it into an electrical potentialwhich is then read by a volt meter. The electrical conductivity of a solution is measured using anelectrochemical half-cell consisting of twi glass electrodes, a reference electrode and the measuringelectrode. For this laboratory we will just focus on learning to calibrate and use a pH meter.
A pH meter (like all electronic instruments) needs to be calibrated. The Vernier pH meter needs toknow to pH values so it can extrapolate a line between them to measure the pH. We will use two buffersolutions pH = 4.00 and pH = 10.00 to calibrate the meter. Once calibrated it is important to occasionallycheck the calibration with any one of the buffer (pH = 4,5,7, or 10) solutions available.
Figure 17.5: pH Probe and Lab Quest 2 from Vernier. credit: (a)https://www.vernier.com/files/manuals/gdx-ph-bnc/gdx-ph-bnc.pdf (b) https://www.vernier.com/
product/labquest-2/
190

Experiment 17 Acids and Bases
"Pure" Water, Dissolved Carbon Dioxide, and Distilled Water
A solution of pure water (tap water) should be neutral and have a pH = 7.0. However, various substancescan affect the pH of the aqueous solutions used in lab. Carbon Dioxide in the atmosphere will dissolvein water and produce a slightly acidic solution due to the formation of hydrogen carbonate (bicarbonate).This will cause tap water in the laboratory to have a pH in the range of 5.5-6.5.
CO2(aq) + H2O(l) −−⇀↽−− HCO −3 (aq) + H+(aq) (54)
The distilled water produced in lab is very pure and should have a pH of 7.0. However, the water is"too pure" and most pH meters have a hard time reading the pH level, and so can often give "wrong"reading. In this instance pH paper is probably the more accurate measure of pH.
Procedure
A. Qualitative Measurements of pH
1. Obtain 7 Test Tubes, fill each with 1.0 mL of the solution to be tested.
2. Using a glass rod place a small drop of each solution onto the pH test paper. Record the colorobserved and the value of the pH according to the chart.
3. Using a glass rod place a small drop of each solution onto the Blue Litmus paper and note theresults.
4. Using a glass rod place a small drop of each solution onto the Red Litmus paper and note theresults.
5. Add 1 drop of Universal Indicator. Record your results.
6. In the last column indicate if the solution was Acidic (A), Basic (B) or Neutral (N). If there arecontradictory results consult with your instructor.
7. Dispose of pH paper in the trash can.
8. Dispose of the Test Tube containing the Universal Indicatior in the ACID/WASTE jar.
B. Quantitative pH Measurements of Aqueous Solutions
1. Calibrate the pH meter.
(a) On the Lab Quest, choose the Sensors −−→ Calibrate −−→ pH −−→ Calibrate Now.
(b) Place the pH probe in the pH 4.0 buffer and while swirling input the value of the buffer onthe Lab Quest and click "Keep".
(c) Click Calibrate Now.
191

Experiment 17 Acids and Bases
(d) Place the pH probe in the pH 10.0 buffer and while swirling input the value of the buffer onthe Lab Quest and click "Keep".
(e) Click "OK".
(f) Test your calibration using the 7.0 buffer, if it does not read between 6.9 and 7.1 consult yourinstructor.
2. Fill a small beaker/Erlenmeyer flask with 15-20 mL of the solution to be tested.
3. Measure the pH of each solution, record your results. Be sure to rinse the electrode betweenmeasurements with de-ionized water.
4. When you are done making he pH measurements, pour the solution back into the bottle.
C. Reactions of Acids
1. Perform the following reactions in test tubes 1-7.
2. For each test tube write the complete reaction (balanced, states etc).
3. Perform reactions 1-4 by filling a test tube with 2.0 mL of the acid listed on the table and place afew strips of magnesium ribbon into each tube. Place a cork in the test tube and allow the reactionto proceed for 1 minute. In the hood, test the gas generated by placing a burning split into themouth of the tube. EXTINGUISH THE SPLINT IN THE WATER. Record your observations, wasthe gas flammable or non-flammable
4. Perform reactions 5-6 by placing a pea sized (or tip of spatula sized) portion of the solid in thebottom of a test tube. Place 4-5 mL of the acid listed in the table in the test tube. Place a cork inthe test tube and allow the reaction to proceed for 1 minute. In the hood test the gas generated byplacing a burning split into the mouth of the tube. EXTINGUISH THE SPLINT IN THE WATER.Record your observations, was the gas flammable or non-flammable
5. Perform reaction 7 by placing 25 mL of water into a beaker, add 3 drops of phenolphthalein and 5drops of HCl to the solution. Note the color. Drop by drop slowly add the 6.0 M NaOH solution tothe beaker. Stir after each drop. Stop adding the base when the phenolphthalein changes color.
6. Dispose of all solutions in the waste container labeled "ACID/BASE WASTE".
D. Reactions of Metal Oxides
1. Perform the following reactions in test tubes 1-2.
2. For each test tube write the complete reaction (balanced, states etc).
3. Perform reactions 1-2 by placing 10 mL of water, 2 drops of phenolphthalein into each test tube.Then add about a peas sized amount of solid, swirl the solution and record the results.
4. Test the solution with both blue and red litmus paper, and pH paper and note the results.
192

Experiment 17 Acids and Bases
5. Dispose of all solutions in the waste container labeled "ACID/BASE WASTE".
E. Reactions of Nonmetal Oxides and Water
1. Do the following reaction in the hood.
2. For each test tube write the complete reaction (balanced, states etc).
3. Prepare a wide mouth bottle by placing 15 mL of water in it and obtaining a stopper for it.
4. Place a small amount (marble sized) of sulfur powder in a deflagrating spoon and start it burningby heating in a bunsen burner.
5. Holding the wide mouth bottle near horizontal, place the burning sulfur in the deflagration spoonin the wide mouth bottle and collect the gas given off.
6. EXTINGUISH THE BURNING SULFUR IN THE DEFLAGRATION SPOON IN THE WATER.
7. Place a stopper in the bottle and shake to mix the water and gas given off.
8. Remove the deflagration spoon and place it in the distilled water nearby to quench it.
9. Test the solution with both blue and red litmus paper, and pH paper and note the results.
10. Dispose of all solutions in the waste container labeled "ACID/BASE WASTE".
193

Experiment 17 Acids and Bases
.
194

Experiment 17 Acids and Bases
Results
Data Table A: Qualitative Measurements of pH
TT#
CompoundColor pH
PaperValue pH
PaperRed
LitmusBlue
LitmusUniversalIndicator
A/B/N
1 0.1 M KNO3
20.1 M
HC2H3O2
3 0.1 M HCl
4 0.1 M NaOH
5 0.1 M NH3
6 Tap Water
7 Distilled Water
1. Blue Litmus paper turns Red when it reacts with? 1.
2. Red Litmus paper turns Blue when it reacts with? 2.
3. Did all the methods used (pH paper, Litmus paper and Universal Indicator) agree on whether thetested solution was an Acid, Base or Neutral. If not which solutions gave contradictory results?Explain.
195

Experiment 17 Acids and Bases
Data Table B: Quantitative Measurements of pH
TT#
Compound pH meter A/B/NCalc. [H+]
conc.
1 0.1 M KNO3
20.1 M
HC2H3O2
3 0.1 M HCl
4 0.1 M NaOH
5 0.1 M NH3
6 Tap Water
7 Distilled Water
4. Which Test Tubes (#) were:
(a) Acidic: 4(a)
(b) Basic: 4(b)
(c) Neutral: 4(c)
5. Compare the results from Table A (ph Paper) and the values in Table B (ph Meter). Did anycompounds tested produce contradictory results (ie one says a solution is Acidic, one says itsBasic, or if the values are greater then 2 pH units apart). Explain.
6. For each of the solutions based on the pH value measured by the meter calculate the concentrationof hydrogen ions in solution. Show work for Test Tube # 2.
196

Experiment 17 Acids and Bases
Data Table C: Reactions of Acids
TT#
Reaction Observation
1 HCl(aq) + Mg(s) −−→
2 H2SO4(aq) + Mg(s) −−→
3 HNO3(aq) + Mg(s) −−→
4 HC2H3O2(aq) + Mg(s) −−→
5 HCl(aq) + NaHCO3(s) −−→
6 HCl(aq) + CaCO3(s) −−→
7 HCl(aq) + NaOH(aq) −−→
1. What class of reaction (Double Displacement, Single Displacement, Combustion, Acid/Base) oc-curred in each of the test tubes.
(a) Test Tubes 1-4: 1(a)
(b) Test Tubes 5-6: 1(b)
(c) Test Tubes 7: 1(c)
2. Answer the following questions about the flame tests for Test Tubes 1-6:
(a) Based on the products for each reaction, which reactions produced a flammable gas. 2(a)
(b) Based on the products for each reaction, which reactions produced a non–flammable gas.2(b)
(c) Based on the products for each reaction, what was the identity of the flammable gas? 2(c)
197

Experiment 17 Acids and Bases
(d) Based on the products for each reaction, what was the identity of the non-flammable gas?2(d)
3. Based on your observations of the flame test, did any of the acids tested in Reactions 1-4 NOTreact as one would expect? Explain.
4. Based on your observations in reaction # 7 what color is phenolphthalein in:
(a) Basic Solution: 4(a)
(b) Acidic Solution: 4(b)
198

Experiment 17 Acids and Bases
Data Table D: Reactions of Metal Oxides
TT#
ReactionRed
LitmusBlue
LitmuspH Paper
1 H2O(l) + CaO(s) −−→
2 H2O(l) + MgO(s) −−→
Data Table E: Reactions of Nonmetal Oxides
TT#
ReactionRed
LitmusBlue
LitmuspH Paper
1 H2O(l) + SO2(g) −−→
1. Are the solutions produced in Table D (Acidic/Basic/Neutral)? 1.
2. Are the solutions produced in Table E (Acidic/Basic/Neutral)? 2.
199

Experiment 17 Acids and Bases
Post Lab Questions
1. Are the following compounds Acids, Bases, Neutral Salt, an Acid Anhydride, Base Anhydride ornone.
Compound Category Compound Category
CuF2 CaSO4
Ba(OH)2 C2H4
LiOH C12H22O11
HBrO3 HI
RaCO3 P2O5
KNO3 HCN
H2C2O4 MgO
2. Complete the following Combination reactions and name the product formed.
(a) K2O(s) + H2O(l) −−→
(b) SrO(s) + H2O(l) −−→
(c) SO3(g) + H2O(l) −−→
(d) N2O5(g) + H2O(l) −−→
200

Experiment 17 Acids and Bases
Name: Class: Date:
Prelab Questions
1. Give the name or formula for the 10 acids you were required to memorize in class.
2. Give the name or formula for 4 bases.
3. We covered many reactions in class that included acids and bases. There are also two new re-actions to learn. Complete the following reactions and in the answer blank include the class ofreaction.
(a) HCl(aq) + NaOH(aq) −−→
(b) Na2CO3(aq) + HNO3(aq) −−→
(c) H2SO4(aq) + Na(s) −−→
(d) K2O(aq) + HOH(l) −−→
(e) HOH(l) + CO2(g) −−→
201

Experiment 17 Acids and Bases
202